| UNITED STATES | |
| SECURITIES AND EXCHANGE COMMISSION | |
| Washington, D.C. 20549 | |
| FORM N-CSR | |
| CERTIFIED SHAREHOLDER REPORT OF REGISTERED | |
| MANAGEMENT INVESTMENT COMPANIES | |
| Investment Company Act file number 811- 1677 | |
| John Hancock Capital Series | |
| (Exact name of registrant as specified in charter) | |
| 601 Congress Street, Boston, Massachusetts 02210 | |
| (Address of principal executive offices) (Zip code) | |
| Alfred P. Ouellette | |
| Senior Counsel and Assistant Secretary | |
| 601 Congress Street | |
| Boston, Massachusetts 02210 | |
| (Name and address of agent for service) | |
| Registrant's telephone number, including area code: 617-663-4324 | |
| Date of fiscal year end: | December 31 |
| Date of reporting period: | December 31, 2007 |
ITEM 1. REPORT TO SHAREHOLDERS.
Discussion of Fund performance
By Pzena Investment Management, LLC
In 2007, international stocks posted double-digit gains for the fifth consecutive year. Most of the advance occurred in the first half of the year, whereas a meltdown in the U.S. subprime lending industry and a slowing U.S. economy led to more subdued performance in the last six months. Emerging markets generated the best results, while Pacific Rim countries produced the highest returns among developed markets. As growth stocks substantially outperformed value in 2007, the valuation spread between the broad international market and its most undervalued segment widened dramatically after several years at very narrow levels.
“In 2007, international stocks
posted double-digit gains for
the fifth consecutive year.”
For the year ended December 31, 2007, John Hancock International Classic Value Fund’s Class A, Class B, Class C, Class I and Class NAV shares posted total returns of –8.29%, –8.91%, –8.84%, –7.85% and –7.79%, respectively, at net asset value. By comparison, the average foreign large value fund returned 9.01%, according to Morningstar, Inc., and the MSCI EAFE Index returned 11.17% .
The Fund lagged its benchmark index in 2007. More than one third of the portfolio was invested in financial stocks, the only sector within the MSCI EAFE Index to decline in 2007. Japanese consumer finance company Takefuji Corp., which we sold in the period, was the weakest performer in this sector, along with Japanese bank Mitsubishi UFJ Financial Group, Inc. and British financial services firm Royal Bank of Scotland Group Plc.
Other notable decliners in the portfolio included Hong Kong-based electric motor manufacturer Johnson Electric Holdings Ltd., Swiss specialty chemicals producer Clariant AG and French telecommunications equipment maker Alcatel-Lucent.
Utilities stocks generated strong returns, and our top performer was Greek utility Public Power Corp. Positions in Asian automakers (Japanese auto parts maker Aisin Seiki, which we sold, and Korean car manufacturer Hyundai Motor Co.) and European defense stocks (Finmeccanica SpA in Italy and Thales SA in France) also added value.
This commentary reflects the views of the portfolio management team through the end of the Fund’s period discussed in this report. The team’s statements reflect their own opinions. As such, they are in no way guarantees of future events and are not intended to be used as investment advice or a recommendation regarding any specific security. They are also subject to change at any time as market and other conditions warrant.
International Classic Value Fund | Annual report
6
A look at performance
For the periods ended December 31, 2007
| Average annual returns | Cumulative total returns | ||||||||
| with maximum sales charge (POP) | with maximum sales charge (POP) | ||||||||
| Inception | Since | Since | |||||||
| Class | date | 1-year | 5-year | 10-year | inception | 1-year | 5-year | 10-year | inception |
| A | 2-28-06 | –12.87% | — | — | –1.70% | –12.87% | — | — | –3.10% |
| B | 2-28-06 | –13.34 | — | — | –1.63 | –13.34 | — | — | –2.98 |
| C | 2-28-06 | –9.72 | — | — | 0.44 | –9.72 | — | — | 0.82 |
| I1 | 2-28-06 | –7.85 | — | — | 1.47 | –7.85 | — | — | 2.73 |
| NAV1 | 12-28-06 | –7.79 | — | — | –7.63 | –7.79 | — | — | –7.71 |
Performance figures assume all distributions are reinvested. Public offering price (POP) figures reflect maximum sales charge on Class A shares of 5% and the applicable contingent deferred sales charge (CDSC) on Class B and Class C shares. The Class B shares’ CDSC declines annually between years 1 to 6 according to the following schedule: 5, 4, 3, 3, 2, 1%. No sales charge will be assessed after the sixth year. Class C shares held for less than one year are subject to a 1% CDSC. Sales charge is not applicable for Class I and NAV shares.
The expense ratios of the Fund, both net (including any fee waivers or expense limitations) and gross (excluding any fee waivers or expense limitations), are set forth according to the most recent publicly available prospectuses for the Fund and may differ from the expense ratios disclosed in the Financial Highlights tables in this report. The waivers and expense limitations are contractual at least until 4-30-08. The net expenses are as follows: Class A — 1.52%, Class B — 2.22%, Class C — 2.22%, Class I — 1.17%, Class NAV — 1.11% . Had the fee waivers and expense limitations not been in place, the gross expenses would be as follows: Class A — 2.67%, Class B — 3.37%, Class C — 3.37%, Class I — 2.32%, Class NAV — 1.59% .
The returns reflect past results and should not be considered indicative of future performance. The return and principal value of an investment will fluctuate so that shares, when redeemed, may be worth more or less than their original cost. Due to market volatility, the Fund’s current performance may be higher or lower than the performance shown. For performance data current to the most recent month end, please call 1-800-225-5291 or visit the Fund’s Web site at www.jhfunds.com.
The performance table above and the chart on the next page do not reflect the deduction of taxes that a shareholder would pay on fund distributions or the redemption of fund shares.
The Fund’s performance results reflect any applicable expense reductions, without which the expenses would increase and results would have been less favorable.
1 For certain types of investors as described in the Fund’s Class I and NAV share prospectuses.
Annual report | International Classic Value Fund
7
A look at performance
Growth of $10,000
This chart shows what happened to a hypothetical $10,000 investment in International Classic Value Fund Class A shares for the period indicated. For comparison, we’ve shown the same investment in the MSCI EAFE Net Total Return Index.

| With maximum | ||||
| Class | Period beginning | Without sales charge | sales charge | Index |
| B | 2-28-06 | $10,092 | $9,702 | $13,262 |
| C2 | 2-28-06 | 10,082 | 10,082 | 13,262 |
| I3 | 2-28-06 | 10,273 | 10,273 | 13,262 |
| NAV3 | 12-28-06 | 9,229 | 9,229 | 11,140 |
Assuming all distributions were reinvested for the period indicated, the table above shows the value of a $10,000 investment in the Fund’s Class B, Class C, Class I and Class NAV shares, respectively, as of December 31, 2007. Performance of the classes will vary based on the difference in sales charges paid by shareholders investing in the different classes and the fee structure of those classes.
MSCI EAFE Net Total Return Index (Europe, Australasia, Far East) is a free float-adjusted market capitalization index that is designed to measure developed market equity performance, excluding the U.S. and Canada. As of June 2006, the MSCI EAFE Index consisted of the following 21 developed market country indexes: Australia, Austria, Belgium, Denmark, Finland, France, Germany, Greece, Hong Kong, Ireland, Italy, Japan, Netherlands, New Zealand, Norway, Portugal, Singapore, Spain, Sweden, Switzerland and United Kingdom. Returns are calculated and presented net of withholding tax.
It is not possible to invest directly in an index. Index figures do not reflect sales charges, which would have resulted in lower values if they did.
1 NAV represents net asset value and POP represents public offering price.
2 No contingent deferred sales charge applicable.
3 For certain types of investors as described in the Fund’s Class I and Class NAV share prospectuses.
International Classic Value Fund | Annual report
8
Your expenses
These examples are intended to help you understand your ongoing operating expenses.
Understanding fund expenses
As a shareholder of the Fund, you incur two types of costs:
▪ Transaction costs which include sales charges (loads) on purchases or redemptions (varies by share class), minimum account fee charge, etc.
▪ Ongoing operating expenses including management fees, distribution and service fees (if applicable), and other fund expenses.
We are going to present only your ongoing operating expenses here.
Actual expenses/actual returns
This example is intended to provide information about your fund’s actual ongoing operating expenses, and is based on your fund’s actual return. It assumes an account value of $1,000.00 on July 1, 2007, with the same investment held until December 31, 2007.
| Account value | Ending value | Expenses paid during | |
| on 7-1-07 | 12-31-07 | period ended 12-31-071 | |
| Class A | $1,000.00 | $884.30 | $7.49 |
| Class B | 1,000.00 | 881.20 | 10.80 |
| Class C | 1,000.00 | 881.90 | 10.81 |
| Class I | 1,000.00 | 886.20 | 5.51 |
| Class NAV | 1,000.00 | 885.70 | 4.97 |
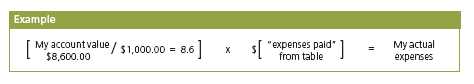
Together with the value of your account, you may use this information to estimate the operating expenses that you paid over the period. Simply divide your account value at December 31, 2007, by $1,000.00, then multiply it by the “expenses paid” for your share class from the table above. For example, for an account value of $8,600.00, the operating expenses should be calculated as follows:
Annual report | International Classic Value Fund
9
Your expenses
Hypothetical example for comparison purposes
This table allows you to compare your fund’s ongoing operating expenses with those of any other fund. It provides an example of the Fund’s hypothetical account values and hypothetical expenses based on each class’s actual expense ratio and an assumed 5% annualized return before expenses (which is not your fund’s actual return). It assumes an account value of $1,000.00 on July 1, 2007, with the same investment held until December 31, 2007. Look in any other fund shareholder report to find its hypothetical example and you will be able to compare these expenses.
| Account value | Ending value | Expenses paid during | |
| on 7-1-07 | 12-31-07 | period ended 12-31-071 | |
| Class A | $1,000.00 | $1,017.26 | $8.02 |
| Class B | 1,000.00 | 1,013.72 | 11.56 |
| Class C | 1,000.00 | 1,013.72 | 11.56 |
| Class I | 1,000.00 | 1,019.86 | 5.85 |
| Class NAV | 1,000.00 | 1,019.93 | 5.33 |
Remember, these examples do not include any transaction costs, such as sales charges; therefore, these examples will not help you to determine the relative total costs of owning different funds. If transaction costs were included, your expenses would have been higher. See the prospectus for details regarding transaction costs.
1 Expenses are equal to the Fund’s annualized expense ratio of 1.58%, 2.28%, 2.28%, 1.16% and 1.05% for Class A, Class B, Class C, Class I and Class NAV, respectively, multiplied by the average account value over the period, multiplied by number of days in most recent fiscal half-year/365 or 366 (to reflect the one-half year period).
International Classic Value Fund | Annual report
10
Portfolio summary
| Top 10 holdings1 | ||||
| Mitsubishi UFJ Financial Group, Inc. | 4.5% | Vivendi Universal SA | 3.6% | |
| Koninklijke (Royal) Philips Electronics NV | 4.2% | Royal Bank of Scotland Group Plc | 3.4% | |
| ING Groep NV | 4.0% | HSBC Holdings Plc | 3.4% | |
| Unilever NV — CVA | 3.7% | Amcor Ltd. | 3.3% | |
| Telefonaktiebolaget LM Ericsson (B Shares) | 3.7% | Credit Agricole SA | 3.3% | |
| Sector distribution1 | ||||
| Financials | 38% | Health care | 3% | |
| Consumer discretionary | 19% | Energy | 2% | |
| Industrials | 15% | Utilities | 1% | |
| Information technology | 13% | Other | 3% | |
| Materials | 6% | |||

1 As a percentage of net assets on December 31, 2007.
Annual report | International Classic Value Fund
11
F I N A N C I A L S T A T E M E N T S
Fund’s investments
Securities owned by the Fund on 12-31-07
This schedule contains one main category: common stocks. Common stocks are further broken down by country.
| Issuer | Shares | Value |
| Common stocks 97.60% | $27,527,579 | |
| (Cost $28,448,883) | ||
| Australia 3.30% | 931,636 | |
| Amcor Ltd. (Paper Packaging) | 153,550 | 931,636 |
| Bermuda 5.27% | 1,485,458 | |
| RenaissanceRe Holdings Ltd. (Reinsurance) | 14,825 | 893,058 |
| XL Capital Ltd. (Class A) (Property & Casualty Insurance) | 11,775 | 592,400 |
| Canada 1.42% | 400,139 | |
| Magna International, Inc. (Class A) (Auto Parts & Equipment) | 4,975 | 400,139 |
| France 8.89% | 2,508,784 | |
| Credit Agricole SA (Diversified Banks) | 27,222 | 918,370 |
| Thales SA (Aerospace & Defense) | 9,800 | 583,770 |
| Vivendi Universal SA (Movies & Entertainment) | 21,925 | 1,006,644 |
| Greece 1.00% | 282,007 | |
| Public Power Corp. (Electric Utilities) | 5,375 | 282,007 |
| Hong Kong 3.16% | 889,965 | |
| Johnson Electric Holdings Ltd. (Electrical Components & Equipment) | 1,633,725 | 889,965 |
| Ireland 1.61% | 453,439 | |
| Kerry Group Plc (Class A) (Packaged Foods & Meats) | 14,200 | 453,439 |
| Italy 3.02% | 851,030 | |
| Finmeccanica SpA (Aerospace & Defense) | 26,525 | 851,030 |
| Japan 18.27% | 5,154,098 | |
| Brother Industries Ltd. (Office Electronics) | 62,200 | 800,761 |
| Mitsubishi UFJ Financial Group, Inc. (Diversified Banks) | 135,375 | 1,276,576 |
| Nippon Television Network Corp. (Broadcasting & Cable TV) | 2,300 | 306,822 |
| Ricoh Co., Ltd. (Office Electronics) | 44,000 | 803,279 |
| Sumitomo Mitsui Financial Group, Inc. (Diversified Banks) | 113 | 836,231 |
| Sumitomo Rubber Industries, Ltd. (Tires & Rubber) | 64,250 | 562,801 |
| USS Co., Ltd. (Automotive Retail) | 9,140 | 567,628 |
| Netherlands 14.65% | 4,130,604 | |
| Aegon NV (Life & Health Insurance) | 43,757 | 771,801 |
| ING Groep NV (Other Diversified Financial Services) | 28,700 | 1,118,308 |
| Koninklijke (Royal) Philips Electronics NV (Industrial Conglomerates) | 27,700 | 1,186,953 |
| Unilever NV — CVA (Packaged Foods & Meats) | 28,675 | 1,053,542 |
See notes to financial statements
International Classic Value Fund | Annual report
12
F I N A N C I A L S T A T E M E N T S
| Issuer | Shares | Value |
| Norway 2.09% | $588,704 | |
| DnB NOR ASA (Diversified Banks) | 38,700 | 588,704 |
| Puerto Rico 1.92% | 542,721 | |
| Popular, Inc. (Regional Banks) | 51,200 | 542,721 |
| South Korea 7.15% | 2,016,127 | |
| Hyundai Motor Co. (Automobile Manufacturers) | 4,200 | 318,319 |
| Kookmin Bank (Diversified Banks) | 9,025 | 665,269 |
| Korea Electric Power Corp. (Electric Utilities) | 10,910 | 458,754 |
| Samsung Electronics Co., Ltd. (Semiconductors) | 975 | 573,785 |
| Sweden 3.64% | 1,028,626 | |
| Telefonaktiebolaget LM Ericsson (B Shares) (Communications Equipment) | 439,475 | 1,028,626 |
| Switzerland 2.88% | 811,288 | |
| Clariant AG (Specialty Chemicals) | 87,875 | 811,288 |
| United Kingdom 19.33% | 5,452,953 | |
| Aviva Plc (Multi-Line Insurance) | 51,800 | 690,363 |
| British Sky Broadcasting Group Plc (Broadcasting & Cable TV) | 35,350 | 434,833 |
| Compass Group Plc (Restaurants) | 126,100 | 769,458 |
| GlaxoSmithKline Plc. (Pharmaceuticals) | 35,625 | 904,753 |
| HSBC Holdings Plc (Diversified Banks) | 56,976 | 959,734 |
| Rentokil Initial Plc (Environmental & Facilities Service) | 305,825 | 729,413 |
| Royal Bank of Scotland Group Plc (Diversified Banks) | 109,225 | 964,399 |
| Total investments (Cost $28,448,883) 97.60% | $27,527,579 | |
| Other assets and liabilities, net 2.40% | $676,720 | |
| Total net assets 100.00% | $28,204,299 | |
The percentage shown for each investment category is the total value of that category as a percentage of the net assets of the Fund.
See notes to financial statements
Annual report | International Classic Value Fund
13
F I N A N C I A L
S T A T E M E N T S
Financial statements
Statement of assets and liabilities 12-31-07
This Statement of Assets and Liabilities is the Fund’s balance sheet. It shows the value of what the Fund owns, is due and owes. You’ll also find the net asset value and the maximum offering price per share.
| Assets | |
| Investments at value (cost $28,448,883) | $27,527,579 |
| Cash | 641,895 |
| Receivable for shares sold | 97,935 |
| Dividends and interest receivable | 67,800 |
| Receivable from affiliates | 186,568 |
| Total assets | 28,521,777 |
| Liabilities | |
| Foreign currency due to custodian at value (cost $25) | 25 |
| Payable for shares repurchased | 43,717 |
| Payable to affiliates | |
| Management fees | 25,739 |
| Distribution and service fees | 1,347 |
| Other | 8,459 |
| Other payables and accrued expenses | 238,191 |
| Total liabilities | 317,478 |
| Net assets | |
| Capital paid-in | 29,901,202 |
| Accumulated net realized loss on investments and foreign currency transactions | (784,445) |
| Net unrealized depreciation of investments and translation of assets and | |
| liabilities in foreign currencies | (919,683) |
| Undistributed net investment income | 7,225 |
| Net assets | $28,204,299 |
| Net asset value per share | |
| Based on net asset values and shares outstanding — the Fund has an | |
| unlimited number of shares authorized with no par value | |
| Class A ($12,821,401 ÷ 1,312,454 shares) | $9.77 |
| Class B ($1,157,347 ÷ 118,839 shares)1 | $9.74 |
| Class C ($3,044,224 ÷ 312,977 shares)1 | $9.73 |
| Class I ($4,499,817 ÷ 459,474 shares) | $9.79 |
| Class NAV ($6,681,510 ÷ 685,623 shares) | $9.75 |
| Maximum offering price per share | |
| Class A2 ($9.77 ÷ 95%) | $10.28 |
1 Redemption price is equal to net asset value less any applicable contingent deferred sales charge.
2 On single retail sales of less than $50,000. On sales of $50,000 or more and on group sales the offering price is reduced.
See notes to financial statements
International Classic Value Fund | Annual report
14
F I N A N C I A L S T A T E M E N T S
Statement of operations For the year ended 12-31-07
This Statement of Operations summarizes the Fund’s investment income earned and expenses incurred in operating the Fund. It also shows net gains (losses) for the period stated.
| Investment income | |
| Dividends (net of foreign withholding taxes of $58,889) | $852,172 |
| Interest | 29,082 |
| Total investment income | 881,254 |
| Expenses | |
| Investment management fees (Note 3) | 353,455 |
| Distribution and service fees (Note 3) | 115,507 |
| Transfer agent fees (Note 3) | 44,750 |
| Accounting and legal services fees (Note 3) | 3,632 |
| Blue sky fees | 101,554 |
| Custodian fees | 25,787 |
| Printing fees | 25,155 |
| Professional fees | 23,384 |
| Trustees’ fees | 1,248 |
| Miscellaneous | 25,637 |
| Total expenses | 720,109 |
| Less expense reductions (Note 3) | (186,861) |
| Net expenses | 533,248 |
| Net investment income | 348,006 |
| Realized and unrealized gain (loss) | |
| Net realized gain (loss) on | |
| Investments | 204,873 |
| Foreign currency transactions | (61,038) |
| 143,835 | |
| Change in net unrealized appreciation (depreciation) of | |
| Investments | (3,060,923) |
| Translation of assets and liabilities in foreign currencies | 1,534 |
| (3,059,389) | |
| Net realized and unrealized loss | (2,915,554) |
| Decrease in net assets from operations | ($2,567,548) |
See notes to financial statements
Annual report | International Classic Value Fund
15
F I N A N C I A L S T A T E M E N T S
Statement of changes in net assets
These Statements of Changes in Net Assets show how the value of the Fund’s net assets has changed during the last two periods. The difference reflects earnings less expenses, any investment gains and losses, distributions, if any, paid to shareholders and the net of Fund share transactions.
| Period | Year | |
| ended | ended | |
| 12-31-061 | 12-31-07 | |
| Increase (decrease) in net assets | ||
| From operations | ||
| Net investment income | $64,884 | $348,006 |
| Net realized gain | 217,162 | 143,835 |
| Change in net unrealized appreciation (depreciation) | 2,139,706 | (3,059,389) |
| Increase (decrease) in net assets resulting from operations | 2,421,752 | (2,567,548) |
| Distributions to shareholders | ||
| From net investment income | ||
| Class A | (60,059) | (124,033) |
| Class B | (3,408) | (2,538) |
| Class C | (11,356) | (6,886) |
| Class I | (7,714) | (65,900) |
| Class NAV | — | (120,035) |
| From net realized gain | ||
| Class A | (100,835) | (318,853) |
| Class B | (6,903) | (29,611) |
| Class C | (23,001) | (80,346) |
| Class I | (11,879) | (114,863) |
| Class NAV | — | (158,150) |
| (225,155) | (1,021,215) | |
| From Fund share transactions (Note 4) | 25,090,869 | 4,505,596 |
| Total increase | 27,287,466 | 916,833 |
| Net assets | ||
| Beginning of year | — | 27,287,466 |
| End of year2 | $27,287,466 | $28,204,299 |
1 Beginning of operations from 2-28-06 to 12-31-06.
2 Includes undistributed (distributions in excess of) net investment income of ($0) and $7,225, respectively.
See notes to financial statements
International Classic Value Fund | Annual report
16
F I N A N C I A L S T A T E M E N T S
Financial highlights
The Financial Highlights show how the Fund’s net asset value for a share has changed since the end of the previous period.
| CLASS A SHARES | ||
| Period ended | 12-31-061 | 12-31-07 |
| Per share operating performance | ||
| Net asset value, beginning of period | $10.00 | $11.03 |
| Net investment income2 | 0.05 | 0.12 |
| Net realized and unrealized | ||
| gain (loss) on investments | 1.08 | (1.03) |
| Total from investment operations | 1.13 | (0.91) |
| Less distributions | ||
| From net investment income | (0.04) | (0.10) |
| From net realized gain | (0.06) | (0.25) |
| (0.10) | (0.35) | |
| Net asset value, end of period | $11.03 | $9.77 |
| Total return3, 4 (%) | 11.255 | (8.29) |
| Ratios and supplemental data | ||
| Net assets, end of period | ||
| (in millions) | $19 | $13 |
| Ratio of net expenses to average | ||
| net assets (%) | 1.526 | 1.587 |
| Ratio of gross expenses to average | ||
| net assets8 (%) | 2.676 | 2.13 |
| Ratio of net investment income | ||
| to average net assets (%) | 0.606 | 1.08 |
| Portfolio turnover (%) | 205 | 53 |
1 Beginning of operations from 2-28-06 to 12-31-06.
2 Based on the average of the shares outstanding.
3 Assumes dividend reinvestment and does not reflect the effect of sales charges.
4 Total returns would have been lower had certain expenses not been reduced during the periods shown.
5 Not annualized.
6 Annualized.
7 Includes transfer agent fee earned credits of less than 0.01% to average net assets.
8 Does not take into consideration expense reductions during the period shown.
See notes to financial statements
Annual report | International Classic Value Fund
17
F I N A N C I A L S T A T E M E N T S
Financial highlights
| CLASS B SHARES | ||
| Period ended | 12-31-061 | 12-31-07 |
| Per share operating performance | ||
| Net asset value, beginning of period | $10.00 | $10.99 |
| Net investment income (loss)2 | (0.01) | 0.04 |
| Net realized and unrealized | ||
| gain (loss) on investments | 1.09 | (1.02) |
| Total from investment operations | 1.08 | (0.98) |
| Less distributions | ||
| From net investment income | (0.03) | (0.02) |
| From net realized gain | (0.06) | (0.25) |
| (0.09) | (0.27) | |
| Net asset value, end of period | $10.99 | $9.74 |
| Total return3, 4 (%) | 10.795 | (8.91) |
| Ratios and supplemental data | ||
| Net assets, end of period | ||
| (in millions) | $1 | $1 |
| Ratio of net expenses to average | ||
| net assets (%) | 2.226 | 2.287 |
| Ratio of gross expenses to average | ||
| net assets8 (%) | 3.376 | 2.84 |
| Ratio of net investment income | ||
| (loss) to average net assets (%) | (0.17)6 | 0.33 |
| Portfolio turnover (%) | 205 | 53 |
1 Beginning of operations from 2-28-06 to 12-31-06.
2 Based on the average of the shares outstanding.
3 Assumes dividend reinvestment and does not reflect the effect of sales charges.
4 Total returns would have been lower had certain expenses not been reduced during the periods shown.
5 Not annualized.
6 Annualized.
7 Includes transfer agent fee earned credits of less than 0.01% to average net assets.
8 Does not take into consideration expense reductions during the period shown.
See notes to financial statements
International Classic Value Fund | Annual report
18
F I N A N C I A L S T A T E M E N T S
Financial highlights
| CLASS C SHARES | ||
| Period ended | 12-31-061 | 12-31-07 |
| Per share operating performance | ||
| Net asset value, beginning of period | $10.00 | $10.97 |
| Net investment income (loss)2 | (0.02) | 0.04 |
| Net realized and unrealized | ||
| gain (loss) on investments | 1.08 | (1.01) |
| Total from investment operations | 1.06 | (0.97) |
| Less distributions | ||
| From net investment income | (0.03) | (0.02) |
| From net realized gain | (0.06) | (0.25) |
| (0.09) | (0.27) | |
| Net asset value, end of period | $10.97 | $9.73 |
| Total return3, 4 (%) | 10.595 | (8.84) |
| Ratios and supplemental data | ||
| Net assets, end of period | ||
| (in millions) | $4 | $3 |
| Ratio of net expenses to average | ||
| net assets (%) | 2.226 | 2.287 |
| Ratio of gross expenses to average | ||
| net assets8 (%) | 3.376 | 2.83 |
| Ratio of net investment income | ||
| (loss) to average net assets (%) | (0.28)6 | 0.35 |
| Portfolio turnover (%) | 205 | 53 |
1 Beginning of operations from 2-28-06 to 12-31-06.
2 Based on the average of the shares outstanding.
3 Assumes dividend reinvestment and does not reflect the effect of sales charges.
4 Total returns would have been lower had certain expenses not been reduced during the periods shown.
5 Not annualized.
6 Annualized.
7 Includes transfer agent fee earned credits of less than 0.01% to average net assets.
8 Does not take into consideration expense reductions during the period shown.
See notes to financial statements
Annual report | International Classic Value Fund
19
F I N A N C I A L S T A T E M E N T S
Financial highlights
| CLASS I SHARES | ||
| Period ended | 12-31-061 | 12-31-07 |
| Per share operating performance | ||
| Net asset value, beginning of period | $10.00 | $11.05 |
| Net investment income2 | 0.06 | 0.15 |
| Net realized and unrealized | ||
| gain (loss) on investments | 1.09 | (1.01) |
| Total from investment operations | 1.15 | (0.86) |
| Less distributions | ||
| From net investment income | (0.04) | (0.15) |
| From net realized gain | (0.06) | (0.25) |
| (0.10) | (0.40) | |
| Net asset value, end of period | $11.05 | $9.79 |
| Total return3, 4 (%) | 11.485 | (7.85) |
| Ratios and supplemental data | ||
| Net assets, end of period | ||
| (in millions) | $2 | $4 |
| Ratio of net expenses to average | ||
| net assets (%) | 1.176 | 1.167 |
| Ratio of gross expenses to average | ||
| net assets8 (%) | 2.326 | 1.71 |
| Ratio of net investment income | ||
| to average net assets (%) | 0.706 | 1.41 |
| Portfolio turnover (%) | 205 | 53 |
1 Beginning of operations from 2-28-06 to 12-31-06.
2 Based on the average of the shares outstanding.
3 Assumes dividend reinvestment and does not reflect the effect of sales charges.
4 Total returns would have been lower had certain expenses not been reduced during the periods shown.
5 Not annualized.
6 Annualized.
7 Includes transfer agent fee earned credits of less than 0.01% to average net assets.
8 Does not take into consideration expense reductions during the period shown.
See notes to financial statements
International Classic Value Fund | Annual report
20
F I N A N C I A L S T A T E M E N T S
Financial highlights
| CLASS NAV SHARES | ||
| Period ended | 12-31-061 | 12-31-07 |
| Per share operating performance | ||
| Net asset value, beginning of period | $11.04 | $11.05 |
| Net investment income (loss)2 | (0.00)3 | 0.15 |
| Net realized and unrealized | ||
| gain (loss) on investments | 0.01 | (1.01) |
| Total from investment operations | 0.01 | (0.86) |
| Less distributions | ||
| From net investment income | — | (0.19) |
| From net realized gain | — | (0.25) |
| — | (0.44) | |
| Net asset value, end of period | $11.05 | $9.75 |
| Total return4 (%) | 0.096 | (7.79)5 |
| Ratios and supplemental data | ||
| Net assets, end of period | ||
| (in millions) | —7 | $7 |
| Ratio of net expenses to average | ||
| net assets (%) | 0.948 | 1.11 |
| Ratio of gross expenses to average | ||
| net assets (%) | 0.948 | 1.669 |
| Ratio of net investment income | ||
| (loss) to average net assets (%) | (0.94)8 | 1.37 |
| Portfolio turnover (%) | 2010 | 53 |
1 Beginning of operations from 12-28-06 to 12-31-06. Class NAV did not participate in distributions of net investment income and net realized gain since it began operations after ex-date.
2 Based on the average of the shares outstanding.
3 Less than ($0.01) per share.
4 Assumes dividend reinvestment and does not reflect the effect of sales charges.
5 Total returns would have been lower had certain expenses not been reduced during the periods shown.
6 Not annualized.
7 Less that $500,000
8 Annualized.
9 Does not take into consideration expense reductions during the period shown.
10 Portfolio turnover shown is calculated for the full fiscal year.
See notes to financial statements
Annual report | International Classic Value Fund
21
Notes to financial statements
Note 1
Organization
John Hancock International Classic Value Fund (the Fund) is a non-diversified series of John Hancock Capital Series (the Trust), an open-end management investment company registered under the Investment Company Act of 1940, as amended (the 1940 Act). The investment objective of the Fund is to achieve long-term growth of capital.
The Trustees have authorized the issuance of multiple classes of shares of the Fund, designated as Class A, Class B, Class C, Class I and Class NAV shares. The shares of each class represent an interest in the same portfolio of investments of the Fund and have equal rights as to voting, redemptions, dividends and liquidation, except that certain expenses, subject to the approval of the Trustees, may be applied differently to each class of shares in accordance with current regulations of the Securities and Exchange Commission (the SEC) and the Internal Revenue Service. Shareholders of a class that bears distribution and service expenses under the terms of a distribution plan have exclusive voting rights to that distribution plan. Class B shares will convert to Class A shares eight years after purchase.
Note 2
Significant accounting policies
The financial statements have been prepared in conformity with accounting principles generally accepted in the United States of America, which require management to make certain estimates and assumptions at the date of the financial statements. Actual results could differ from those estimates. The following summarizes the significant accounting policies of the Fund:
Security valuation
The net asset value of Class A, Class B, Class C, Class I and Class NAV shares of the Fund is determined daily as of the close of the New York Stock Exchange (NYSE), normally at 4:00 p.m., Eastern Time. Short-term debt investments that have a remaining maturity of 60 days or less are valued at amortized cost, and thereafter assume a constant amortization to maturity of any discount or premium, which approximates market value. All other securities held by the Fund are valued at the last sale price or official closing price (closing bid price or last evaluated quote if no sale has occurred) as of the close of business on the principal securities exchange (domestic or foreign) on which they trade or, lacking any sales, at the closing bid price. Securities traded only in the over-the-counter market are valued at the last bid price quoted by brokers making markets in the securities at the close of trading. Securities for which there are no such quotations, principally debt securities, are valued based on the evaluated prices provided by an independent pricing service, which utilizes both dealer-supplied and electronic data processing techniques, which take into account factors such as institutional-size trading in similar groups of securities, yield, quality, coupon rate, maturity, type of issue, trading characteristics and other market data.
Other assets and securities for which no such quotations are readily available are valued at fair value as determined in good faith under consistently applied procedures established by and under the general supervision of the Board of Trustees. Generally, trading in non-U.S. securities is substantially completed each day at various times prior to the close of trading on the NYSE. The values of such securities used in computing the net asset value of the Fund’s shares are generally determined as of such times. Occasionally, significant events that affect the values of such securities may occur between the times at which such values are generally determined and the close of the NYSE. Upon such an occurrence, these securities will be valued at fair value as determined in good faith under consistently applied
International Classic Value Fund | Annual report
22
procedures established by and under the general supervision of the Board of Trustees.
Foreign currency translation
The books and records of the Fund are maintained in U.S. dollars. Investment securities and other assets and liabilities denominated in a foreign currency are translated into U.S. dollars at the prevailing exchange rates at period end. Purchases and sales of investment securities, income and expenses are translated into U.S. dollars at the prevailing exchange rates on the respective dates of the transactions.
Net realized and unrealized gains and losses on foreign currency transactions represent net gains and losses between trade and settlement dates on securities transactions, the disposition of forward foreign currency exchange contracts and foreign currencies, and the difference between the amount of net investment income accrued and the U.S. dollar amount actually received. That portion of both realized and unrealized gains and losses on investments that results from fluctuations in foreign currency exchange rates is not separately disclosed but is included with net realized and unrealized gain/appreciation and loss/depreciation on investments.
Investment transactions
Investment transactions are accounted for on a trade date plus one basis for daily net asset value calculations. However, for financial reporting purposes, investment security transactions are reported on trade date. Interest income is recorded on the accrual basis. Dividend income is recorded on the ex-dividend date net of foreign withholding taxes. Certain dividends from foreign securities may be recorded subsequent to the ex-dividend date as soon as the Fund is informed of such dividends. Discounts/premiums are accreted/amortized for financial reporting purposes. Realized gains and losses from investment transactions are recorded on an identified cost basis.
Class allocations
Income, common expenses and realized and unrealized gains (losses) are determined at the fund level and allocated daily to each class of shares based on the appropriate net asset value of the respective classes.
Distribution and service fees, if any, and transfer agent fees for Class A, Class B, Class C and Class I shares are calculated daily at the class level based on the appropriate net asset value of each class and the specific expense rate(s) applicable to each class.
Guarantees and indemnifications
Under the Fund’s organizational documents, its Officers and Trustees are indemnified against certain liability arising out of the performance of their duties to the Fund. Additionally, in the normal course of business, the Fund enters into contracts with service providers that contain general indemnification clauses. The Fund’s maximum exposure under these arrangements is unknown, as this would involve future claims that may be made against the Fund that have not yet occurred.
Expenses
The majority of expenses are directly identifiable to an individual fund. Expenses that are not readily identifiable to a specific fund are allocated in such a manner as deemed equitable, taking into consideration, among other things, the nature and type of expense and the relative size of the funds.
Bank borrowings
The Fund is permitted to have bank borrowings for temporary or emergency purposes, including the meeting of redemption requests that otherwise might require the untimely disposition of securities. The Fund has entered into a line of credit agreement with The Bank of New York Mellon (BNYM), the Swing Line Lender and Administrative Agent. This agreement enables the Fund to participate, with other funds managed by the Adviser, in an unsecured line of credit with BNYM, which permits borrowings of up to $100 million, collectively. Interest is charged to each fund based on its borrowing. In addition, a commitment fee is charged to each fund based on the average daily unused portion of the line of credit and is allocated among the participating funds. The Fund had no borrowing activity under the line of credit during the year ended December 31, 2007.
Annual report | International Classic Value Fund
23
Forward foreign currency exchange contracts
The Fund may enter into forward foreign currency exchange contracts as a hedge against the effect of fluctuations in currency exchange rates. A forward foreign currency exchange contract involves an obligation to purchase or sell a specific currency at a future date at a set price. The aggregate principal amounts of the contracts are marked to market daily at the applicable foreign currency exchange rates. Any resulting unrealized gains and losses are included in the determination of the Fund’s daily net asset value. The Fund records realized gains and losses at the time the forward foreign currency exchange contracts are closed out. Risks may arise upon entering these contracts from the potential inability of counterparties to meet the terms of the contracts and from unanticipated movements in the value of a foreign currency relative to the U.S. dollar. These contracts involve market or credit risk in excess of the unrealized gain or loss reflected in the Fund’ ;s Statement of Assets and Liabilities.
The Fund may also purchase and sell forward contracts to facilitate the settlement of foreign currency denominated portfolio transactions, under which it intends to take delivery of the foreign currency. Such contracts normally involve no market risk if they are offset by the currency amount of the underlying transactions. The Fund had no open forward foreign currency exchange contracts on December 31, 2007.
Federal income taxes
The Fund qualifies as a regulated investment company by complying with the applicable provisions of the Internal Revenue Code and will not be subject to federal income tax on taxable income that is distributed to shareholders. Therefore, no federal income tax provision is required. Net capital losses of $651,880 and net currency losses of $866 that are attributable to security transactions incurred after October 31, 2007, are treated as arising on January 1, 2008, the first day of the Fund’s next taxable year.
The Fund adopted the provisions of Financial Accounting Standards Board (FASB) Interpretation No. 48, Accounting for Uncertainty in Income Taxes, an interpretation of FASB Statement 109 (FIN 48), on January 1, 2007. FIN 48 prescribes a minimum threshold for financial statement recognition of the benefit of a tax position taken or expected to be taken in a tax return. The implementation of FIN 48 did not result in any unrecognized tax benefits in the accompanying financial statements. Each of the Fund’s federal tax returns for the prior three fiscal years remains subject to examination by the Internal Revenue Service.
New accounting pronouncement
In September 2006, FASB Standard No. 157, Fair Value Measurements (FAS 157), was issued and is effective for fiscal years beginning after November 15, 2007. FAS 157 defines fair value, establishing a framework for measuring fair value and expands disclosure about fair value measurements. Management is currently evaluating the application of FAS 157 to the Fund and its impact, if any, resulting from the adoption of FAS 157 on the Fund’s financial statement disclosures.
Distribution of income and gains
The Fund records distributions to shareholders from net investment income and net realized gains, if any, on the ex-dividend date. During the year ended December 31, 2006, the tax character of distributions paid was as follows: ordinary income $225,155. During the year ended December 31, 2007, the tax character of distributions paid was as follows: ordinary income $680,208 and long-term capital gain $341,007. Distributions paid by the Fund with respect to each class of shares are calculated in the same manner, at the same time and are in the same amount, except for the effect of expenses that may be applied differently to each class.
As of December 31, 2007, there were no distributable earnings on a tax basis.
Such distributions and distributable earnings, on a tax basis, are determined in conformity with income tax regulations, which may differ from accounting principles generally accepted in the United States of America. Distributions in excess of tax basis earnings and profits, if any, are reported in the Fund’s financial statements as a return of capital.
International Classic Value Fund | Annual report
24
Capital accounts within financial statements are adjusted for permanent book-tax differences. These adjustments have no impact on net assets or the results of operations. Temporary book-tax differences will reverse in a subsequent period. Permanent differences are primarily attributable to foreign currency transactions and treating a portion of the proceeds from redemptions as distributions for tax purposes.
Note 3
Management fee and transactions with affiliates and others
The Fund has an investment management contract with the Adviser. Under the investment management contract, the Fund pays a daily management fee to the Adviser equivalent, on an annual basis, to the sum of: (a) 1.05% of the first $1,000,000,000 of the Fund’s average daily net asset value and (b) 1.00% of the Fund’s daily net asset value in excess of $1,000,000,000. The effective management fee rate is 1.05% of the Fund’s average daily net asset value for the year ended December 31, 2007. The Adviser has a subadvisory agreement with Pzena Investment Management LLC. The Fund is not responsible for payment of the subadvisory fees.
The Adviser has agreed to limit the Fund’s total expenses, excluding distribution and service fees and transfer agent fees, to 1.11% of the Fund’s average daily net asset value, on an annual basis, and total operating expenses of Class A shares to 1.71% and Class B and Class C shares to 2.41% of the net asset value of each respective class, until April 30, 2008. Accordingly, the expense reductions related to these total expense limitations amounted to $186,200 and there were no class-specific total expense reductions during the year ended December 31, 2007. The Adviser reserves the right to terminate this limitation in the future.
The Fund has a Distribution Agreement with John Hancock Funds, LLC (JH Funds), a wholly owned subsidiary of the Adviser. The Fund has adopted Distribution Plans with respect to Class A, Class B and Class C, pursuant to Rule 12b-1 under the 1940 Act, to reimburse JH Funds for the services it provides as distributor of shares of the Fund. Accordingly, the Fund makes monthly payments to JH Funds at an annual rate not to exceed 0.30%, 1.00% and 1.00% of average daily net asset value of Class A, Class B and Class C, respectively. A maximum of 0.25% of such payments may be service fees, as defined by the Conduct Rules of the Financial Industry Regulatory Authority (formerly the National Association of Securities Dealers). Under the Conduct Rules, curtailment of a portion of the Fund’s 12b-1 payments could occur under certain circumstances.
Class A shares are assessed up-front sales charges. During the year ended December 31, 2007, JH Funds received net up-front sales charges of $56,759 with regard to sales of Class A shares. Of this amount, $9,081 was retained and used for printing prospectuses, advertising, sales literature and other purposes, $46,484 was paid as sales commissions to unrelated broker-dealers and $1,194 was paid as sales commissions to sales personnel of Signator Investors, Inc. (Signator Investors), a related broker-dealer. The Adviser’s indirect parent, John Hancock Life Insurance Company (JHLICO), is the indirect sole shareholder of Signator Investors.
Class B shares that are redeemed within six years of purchase are subject to a contingent deferred sales charge (CDSC) at declining rates, beginning at 5.00% of the lesser of the current market value at the time of redemption or the original purchase cost of the shares being redeemed. Class C shares that are redeemed within one year of purchase are subject to a CDSC at a rate of 1.00% of the lesser of the current market value at the time of redemption or the original purchase cost of the shares being redeemed. Proceeds from the CDSCs are paid to JH Funds and are used in whole or in part to defray its expenses for providing distribution-related services to the Fund in connection with the sale of Class B and Class C shares. During the year ended December 31, 2007, CDSCs received by JH Funds amounted to $711 for Class B shares and $2,205 for Class C shares.
Annual report | International Classic Value Fund
25
The Fund has a transfer agent agreement with John Hancock Signature Services, Inc. (Signature Services), an indirect subsidiary of JHLICO. The Fund pays a monthly fee which is based on an annual rate of $15.00 for each Class A shareholder account, $17.50 for each Class B shareholder account, $16.50 for each Class C shareholder account, $15.00 for each Class I shareholder account. For Class A, Class B and Class C shares, the Fund pays a monthly transfer agent fee at an annual rate of 0.05% of each class’s average daily net asset value, plus a fee based on the number of shareholder accounts and reimbursement for certain out-of-pocket expenses, aggregated and allocated to each class on the basis of its relative net asset value. For Class I shares, the Fund pays a monthly transfer agent fee at a total annual rate of 0.05% of Class I average daily net asset value. Effective June 1, 2007, for the Class I shares the Fund pays a monthly transfer agent fee at a total annual rate of 0.04% of the Class I average daily net asset value. Signature Services had agreed to limit Class A, Class B, Class C transfer agent fee to 0.30% of each respective class’s average daily net asset value until April 30, 2008. There were no transfer agent fee reductions during the year ended December 31, 2007.
In May 2007, the Fund began receiving earnings credits from its transfer agent as a result of uninvested cash balances. These credits are used to reduce a portion of the Fund’s transfer agent fees and out of pocket expenses. During the year ended December 31, 2007, the Fund’s transfer agent fees and out of pocket expenses were reduced by $661 for transfer agent credits earned.
Expenses under the agreements described above for the year ended December 31, 2007 were as follows:
| Transfer | Distribution and | ||
| Share class | agent fees | service fees | |
| Class A | $32,136 | $56,702 | |
| Class B | 2,574 | 14,623 | |
| Class C | 7,586 | 44,182 | |
| Class I | 2,454 | — | |
| Total | $44,750 | $115,507 | |
The Fund has an agreement with the Adviser and affiliates to perform necessary tax, accounting, compliance, legal and other administrative services for the Fund. The compensation for the year amounted to $3,632 with an effective rate of 0.01% of the Fund’s average daily net asset value.
Mr. James R. Boyle is Chairman of the Adviser, as well as affiliated Trustee of the Fund, and is compensated by the Adviser and/or its affiliates. The compensation of unaffiliated Trustees is borne by the Fund. The unaffiliated Trustees may elect to defer, for tax purposes, their receipt of this compensation under the John Hancock Group of Funds Deferred Compensation Plan. The Fund makes investments into other John Hancock funds, as applicable, to cover its liability for the deferred compensation. Investments to cover the Fund’s deferred compensation liability are recorded on the Fund’s books as an other asset. The deferred compensation liability and the related other asset are always equal and are marked to market on a periodic basis to reflect any income earned by the investments, as well as any unrealized gains or losses. The Deferred Compensation Plan investments had no impact on the operations of the Fund.
International Classic Value Fund | Annual report
26
Note 4
Fund share transactions
This listing illustrates the number of Fund shares sold, reinvested and repurchased during the period ended December 31, 2006 and the year ended December 31, 2007, along with the corresponding dollar value.
| Period ended 12-31-06 | Year ended 12-31-07 | |||
| Shares | Amount | Shares | Amount | |
| Class A shares | ||||
| Sold | 1,841,086 | $18,672,420 | 718,876 | $7,804,742 |
| Distributions reinvested | 13,328 | 145,812 | 40,438 | 403,973 |
| Repurchased | (105,230) | (1,100,406) | (1,196,044) | (13,220,863) |
| Net increase (decrease) | 1,749,184 | $17,717,8261 | (436,730) | ($5,012,148) |
| Class B shares | ||||
| Sold | 142,677 | $1,472,282 | 65,095 | $722,072 |
| Distributions reinvested | 892 | 9,715 | 3,108 | 30,955 |
| Repurchased | (26,609) | (273,766) | (66,324) | (723,741) |
| Net increase | 116,960 | $1,208,2311 | 1,879 | $29,286 |
| Class C shares | ||||
| Sold | 421,668 | $4,217,540 | 112,586 | $1,248,233 |
| Distributions reinvested | 2,978 | 32,433 | 8,462 | 84,196 |
| Repurchased | (31,424) | (306,923) | (201,293) | (2,164,829) |
| Net increase (decrease) | 393,222 | $3,943,0501 | (80,245) | ($832,400) |
| Class I shares | ||||
| Sold | 220,721 | $2,247,000 | 508,810 | $5,702,968 |
| Distributions reinvested | 1,758 | 19,286 | 14,270 | 142,848 |
| Repurchased | (19,724) | (204,524) | (266,361) | (2,887,957) |
| Net increase | 202,755 | $2,061,7621 | 256,719 | $2,957,859 |
| Class NAV shares | ||||
| Sold | 14,478 | $160,000 | 657,918 | $7,242,225 |
| Distributions reinvested | — | — | 27,958 | 278,185 |
| Repurchased | — | — | (14,731) | (157,411) |
| Net increase | 14,478 | $160,0002 | 671,145 | $7,362,999 |
| Net increase | 2,476,599 | $25,090,869 | 412,768 | $4,505,596 |
1Beginning of operations from 2-28-06 to 12-31-06.
2Beginning of operations from 12-28-06 to 12-31-06.
Note 5
Purchase and sales of securities
Purchases and proceeds from sales or maturities of securities, other than short-term securities and obligations of the U.S. government, during the year ended December 31, 2007, aggregated $21,957,286 and $17,172,369, respectively.
The cost of investments owned on December 31, 2007, including short-term investments, for federal income tax purposes was $28,581,448. Gross unrealized appreciation and depreciation of investments aggregated $1,567,066 and $2,620,935, respectively, resulting in net unrealized depreciation of $1,053,869. The difference between book basis and tax basis net unrealized appreciation of investments is attributable primarily to the tax deferral of losses on certain sales of securities.
Annual report | International Classic Value Fund
27
Auditors’ report
Report of Independent Registered Public Accounting Firm
To the Board of Trustees of John Hancock Capital Series and Shareholders of John Hancock International Classic Value Fund,
In our opinion, the accompanying statement of assets and liabilities, including the schedule of investments, and the related statements of operations and of changes in net assets and the financial highlights present fairly, in all material respects, the financial position of John Hancock International Classic Value Fund (the Fund) at December 31, 2007, and the results of its operations, the changes in its net assets and the financial highlights for the periods indicated, in conformity with accounting principles generally accepted in the United States of America. These financial statements and financial highlights (hereafter referred to as “financial statements”) are the responsibility of the Fund’s management. Our responsibility is to express an opinion on these financial statements based on our audits. We conducted our audits of these financial statements in accordance with the standards of the Public Company Accounting Oversight Board (United States). Those standards require that we plan and perform the audit to obtain reasonable assurance about whether the financial statements are free of material misstatement. An audit includes examining, on a test basis, evidence supporting the amounts and disclosures in the financial statements, assessing the accounting principles used and significant estimates made by management, and evaluating the overall financial statement presentation. We believe that our audits, which included confirmation of securities at December 31, 2007 by correspondence with the custodian provide a reasonable basis for our opinion.
PricewaterhouseCoopers LLP
Boston, Massachusetts
February 28, 2008
International Classic Value Fund | Annual report
28
Tax information
Unaudited
For federal income tax purposes, the following information is furnished with respect to the distributions of the Fund, if any, paid during its taxable year ended December 31, 2007.
The Fund has designated distributions to shareholders of $645,744 as a long-term capital gain dividend.
The Fund hereby designates the maximum amount allowable of its net taxable income as qualified dividend income as provided in the Jobs and Growth Tax Relief Reconciliation Act of 2003. This amount will be reflected on Form 1099-DIV for the calendar year 2007.
Shareholders will be mailed a 2007 U.S. Treasury Department Form 1099-DIV in January 2008. This will reflect the total of all distributions that are taxable for calendar year 2007.
Annual report | International Classic Value Fund
29
Board Consideration of and
Continuation of Investment Advisory
Agreement and Subadvisory
Agreement: John Hancock International
Classic Value Fund
The Investment Company Act of 1940 (the 1940 Act) requires the Board of Trustees (the Board) of John Hancock Capital Series (the Trust), including a majority of the Trustees who have no direct or indirect interest in the investment advisory agreement and are not “interested persons” of the Trust, as defined in the 1940 Act (the Independent Trustees), annually to meet in person to review and consider the continuation of: (i) the investment advisory agreement (the Advisory Agreement) with John Hancock Advisers, LLC (the Adviser) and (ii) the investment subadvisory agreement (the Subadvisory Agreement) with Pzena Investment Management, LLC (the Subadviser) for the John Hancock International Classic Value Fund (the Fund). The investment advisory agreement with the Advisor and the investment subadvisory agreement with the Subadviser are collectively referred to as the Advisory Agreements.
At meetings held on May 7 and June 4–5, 2007, the Board considered the factors and reached the conclusions described below relating to the selection of the Adviser and Subadviser and the continuation of the Advisory Agreements. During such meetings, the Board’s Contracts/ Operations Committee and the Independent Trustees also met in executive sessions with their independent legal counsel.
In evaluating the Advisory Agreements, the Board, including the Contracts/Operations Committee and the Independent Trustees, reviewed a broad range of information requested for this purpose by the Independent Trustees, including: (i) advisory and other fees incurred by, and the expense ratios of, the Fund relative to a category of relevant funds (the Category) and a peer group of comparable funds (the Peer Group) each selected by Morningstar, Inc. (Morningstar), an independent provider of investment company data, (ii) the advisory fees of comparable portfolios of other clients of the Adviser and the Subadviser, (iii) the Adviser’s financial results and condition, including its and certain of its affiliates’ profitability from services performed for the Fund, (iv) breakpoints in the Fund’s and the Peer Group’s fees, and information about economies of scale, (v) the Adviser’s and Subadviser’s record of compliance with applicable laws and regulations, with the Fund’s investment policies and restrictions, and with the applicable Code of Ethics, and the structure and responsibilities of the Adviser’s and Subadviser’s compliance department, (vi) the background and experience of senior management and investment professionals, and (vii) the nature, cost and character of advisory and non-investment management services provided by the Adviser and its affiliates and by the Subadviser.
The Independent Trustees considered the legal advice of independent legal counsel and relied on their own business judgment in determining the factors to be considered in evaluating the materials that were presented to them and the weight to be given to each such factor. The Board’s review and conclusions were based on a comprehensive consideration of all information presented to the Board and not the result of any single controlling factor. They principally considered performance and other information from Morningstar as of December 31, 2006. The Board also considered updated performance information provided to it by the Adviser or Subadviser at the May and June 2007 meetings. Performance and other information may be quite different as of the date of this shareholders report. The key factors considered by the Board and the conclusions reached are described below.
Nature, extent and quality of services
The Board considered the ability of the Adviser and the Subadviser, based on their resources, reputation and other attributes, to attract and retain qualified investment professionals, including research, advisory and supervisory personnel. The Board considered the investment philosophy, research and investment decision-making processes of the Adviser and, in particular, the Subadviser. The Board met with representatives of the Subadviser that were responsible for the daily investment activities of the Fund. The Board considered the representatives’ history
International Classic Value Fund | Annual report
30
and experience with the Fund. The Board further considered the culture of compliance, resources dedicated to compliance, compliance programs and compliance records of the Adviser and Subadviser. In addition, the Board took into account the administrative and other non-advisory services provided to the Fund by the Adviser and its affiliates.
Based on the above factors, together with those referenced below, the Board concluded that, within the context of its full deliberations, the nature, extent and quality of the investment advisory services provided to the Fund by the Adviser and Subadviser supported renewal of the Advisory Agreements.
Fund performance
The Board noted that the Fund had less than one year of operational history as of December 31, 2006; therefore, the Board did not receive a comparative analysis of the Fund’s performance from Morningstar. The Board recognized the short operational history of the Fund and indicated its intent to continue to monitor the Fund’s performance trends.
Investment advisory fee and subadvisory fee rates and expenses
The Board reviewed and considered the contractual investment advisory fee rate payable by the Fund to the Adviser for investment advisory services (the Advisory Agreement Rate). The Board received and considered information comparing the Advisory Agreement Rate with the advisory fees for the Peer Group. The Board noted that the Advisory Agreement Rate was higher than the median rate of the Peer Group and the Category.
The Board received and considered expense information regarding the Fund’s various components, including advisory fees, distribution and fees other than advisory and distribution fees, including transfer agent fees, custodian fees and other miscellaneous fees (e.g., fees for accounting and legal services). The Board considered comparisons of these expenses to the Peer Group median. The Board also received and considered expense information regarding the Fund’s total operating expense ratio (Gross Expense Ratio) and total operating expense ratio after taking the fee waiver arrangement applicable to the Advisory Agreement Rate into account (Net Expense Ratio). The Board received and considered information comparing the Gross Expense Ratio and Net Expense Ratio of the Fund to that of the Peer Group and Category medians. The Board noted that the Fund’s Gross and Net Expense Ratios were higher than the medians of the Peer Group and Category. The Board favorably considered the impact of continuing fee waivers towards ultimately lowering the Fund’s total operating expense ratio.
The Adviser also discussed the Morningstar data and rankings, and other relevant information, for the Fund. Based on the above-referenced considerations and other factors, the Board concluded that the Fund’s overall expense results supported the re-approval of the Advisory Agreements.
The Board also received information about the investment subadvisory fee rate (the Subadvisory Agreement Rate) payable by the Adviser to the Subadviser for investment sub-advisory services. The Board concluded that the Subadvisory Agreement Rate was fair and equitable, based on its consideration of the factors described here.
Profitability
The Board received and considered a detailed profitability analysis of the Adviser based on the Advisory Agreements, as well as on other relationships between the Fund and the Adviser and its affiliates. The Board also considered a comparison of the Adviser’s profitability to that of other similar investment advisers whose profitability information is publicly available. The Board concluded that, in light of the costs of providing investment management and other services to the Fund, the profits and other ancillary benefits reported by the Adviser were not unreasonable.
The Board did not consider profitability information with respect to the Subadviser, which is not affiliated with the Adviser. The Board considered that the Subadvisory Rate paid to the Subadviser had been negotiated by the Adviser on an arm’s length basis and that the Subadviser’s separate profitability from its relationship with the Fund was not a material factor in determining whether to renew the agreement.
Annual report | International Classic Value Fund
31
Economies of scale
The Board received and considered general information regarding economies of scale with respect to the management of the Fund, including the Fund’s ability to appropriately benefit from economies of scale under the Fund’s fee structure. The Board recognized the inherent limitations of any analysis of economies of scale, stemming largely from the Board’s understanding that most of the Adviser’s costs are not specific to individual Funds, but rather are incurred across a variety of products and services.
To the extent the Board and the Adviser were able to identify actual or potential economies of scale from Fund-specific or allocated expenses, in order to ensure that any such economies continue to be reasonably shared with the Fund as its assets increase, the Adviser and the Board agreed to an additional breakpoint to the Advisory Agreement Rate.
Information about services to other clients
The Board also received information about the nature, extent and quality of services and fee rates offered by the Adviser and Subadviser to their other clients, including other registered investment companies, institutional investors and separate accounts. The Board concluded that the Advisory Agreement Rate and the Subadvisory Agreement Rate were not unreasonable, taking into account fee rates offered to others by the Adviser and Subadviser, respectively, after giving effect to differences in services.
Other benefits to the Adviser
The Board received information regarding potential “fall-out” or ancillary benefits received by the Adviser and its affiliates as a result of the Adviser’s relationship with the Fund. Such benefits could include, among others, benefits directly attributable to the relationship of the Adviser with the Fund and benefits potentially derived from an increase in the business of the Adviser as a result of its relationship with the Fund (such as the ability to market to shareholders other financial products offered by the Adviser and its affiliates).
The Board also considered the effectiveness of the Adviser’s, Subadviser’s and Fund’s policies and procedures for complying with the requirements of the federal securities laws, including those relating to best execution of portfolio transactions and brokerage allocation.
Other factors and broader review
As discussed above, the Board reviewed detailed materials received from the Adviser and Subadviser as part of the annual re-approval process. The Board also regularly reviews and assesses the quality of the services that the Fund receives throughout the year. In this regard, the Board reviews reports of the Adviser and Subadviser at least quarterly, which include, among other things, fund performance reports and compliance reports. In addition, the Board meets with portfolio managers and senior investment officers at various times throughout the year.
After considering the above-described factors and based on its deliberations and its evaluation of the information described above, the Board concluded that approval of the continuation of the Advisory Agreements for the Fund was in the best interest of the Fund and its shareholders. Accordingly, the Board unanimously approved the continuation of the Advisory Agreements.
International Classic Value Fund | Annual report
32
Trustees and Officers
This chart provides information about the Trustees and Officers who oversee your John Hancock fund. Officers elected by the Trustees manage the day-to-day operations of the Fund and execute policies formulated by the Trustees.
| Independent Trustees | ||
| Name, Year of Birth | Number of | |
| Position(s) held with Fund | Trustee | John Hancock |
| Principal occupation(s) and other | of Fund | funds overseen |
| directorships during past 5 years | since1 | by Trustee |
| James F. Carlin, Born: 1940 | 2006 | 55 |
| Interim Chairman (since December 2007); Director and Treasurer, Alpha Analytical Laboratories, Inc. | ||
| (chemical analysis) (since 1985); Part Owner and Treasurer, Lawrence Carlin Insurance Agency, Inc. | ||
| (since 1995); Part Owner and Vice President, Mone Lawrence Carlin Insurance Agency, Inc. (until 2005); | ||
| Chairman and Chief Executive Officer, Carlin Consolidated, Inc. (management/investments) (since 1987); | ||
| Trustee, Massachusetts Health and Education Tax Exempt Trust (1993–2003). | ||
| William H. Cunningham, Born: 1944 | 2006 | 55 |
| Professor, University of Texas at Austin (since 1971); former Chancellor, University of Texas System and | ||
| former President, University of Texas at Austin (until 2001); Chairman and Chief Executive Officer, IBT | ||
| Technologies (until 2001); Director of the following: Hicks Acquisition Company I, Inc. (since 2007); | ||
| Hire.com (until 2004), STC Broadcasting, Inc. and Sunrise Television Corp. (until 2001), Symtx, Inc. | ||
| (electronic manufacturing) (since 2001), Adorno/Rogers Technology, Inc. (until 2004), Pinnacle Foods | ||
| Corporation (until 2003), rateGenius (until 2003), Lincoln National Corporation (insurance) (since 2006), | ||
| Jefferson-Pilot Corporation (diversified life insurance company) (until 2006), New Century Equity | ||
| Holdings (formerly Billing Concepts) (until 2001), eCertain (until 2001), ClassMap.com (until 2001), | ||
| Agile Ventures (until 2001), AskRed.com (until 2001), Southwest Airlines (since 2000), Introgen (man- | ||
| ufacturer of biopharmaceuticals) (since 2000) and Viasystems Group, Inc. (electronic manufacturer) | ||
| (until 2003); Advisory Director, Interactive Bridge, Inc. (college fundraising) (until 2001); Advisory | ||
| Director, Q Investments (until 2003); Advisory Director, JPMorgan Chase Bank (formerly Texas Commerce | ||
| Bank–Austin), LIN Television (until 2008), WilTel Communications (until 2003) and Hayes Lemmerz | ||
| International, Inc. (diversified automotive parts supply company) (since 2003). | ||
| Charles L. Ladner, 2 Born: 1938 | 2006 | 55 |
| Chairman and Trustee, Dunwoody Village, Inc. (retirement services) (until 2003); Senior Vice President | ||
| and Chief Financial Officer, UGI Corporation (public utility holding company) (retired 1998); Vice | ||
| President and Director, AmeriGas, Inc. (retired 1998); Director, AmeriGas Partners, L.P. (gas distribution) | ||
| (until 1997); Director, EnergyNorth, Inc. (until 1997); Director, Parks and History Association (until 2005). | ||
| John A. Moore,2 Born: 1939 | 2006 | 55 |
| President and Chief Executive Officer, Institute for Evaluating Health Risks (nonprofit institution) | ||
| (until 2001); Senior Scientist, Sciences International (health research) (until 2003); Former Assistant | ||
| Administrator and Deputy Administrator, Environmental Protection Agency; Principal, Hollyhouse | ||
| (consulting) (since 2000); Director, CIIT Center for Health Science Research (nonprofit research) | ||
| (until 2007). | ||
Annual report | International Classic Value Fund
33
| Independent Trustees (continued) | ||
| Name, Year of Birth | Number of | |
| Position(s) held with Fund | Trustee | John Hancock |
| Principal occupation(s) and other | of Fund | funds overseen |
| directorships during past 5 years | since1 | by Trustee |
| Patti McGill Peterson,2 Born: 1943 | 2006 | 55 |
| Senior Associate, Institute for Higher Education Policy (since 2007); Executive Director, Council for | ||
| International Exchange of Scholars and Vice President, Institute of International Education (until 2007); | ||
| Senior Fellow, Cornell Institute of Public Affairs, Cornell University, Ithaca, NY (until 1998); Former | ||
| President, Wells College, Aurora, NY, and St. Lawrence University, Canton, NY; Director, Niagara | ||
| Mohawk Power Corporation (until 2003); Director, Ford Foundation, International Fellowships Program | ||
| (since 2002); Director, Lois Roth Endowment (since 2002); Director, Council for International Educational | ||
| Exchange (since 2003). | ||
| Steven R. Pruchansky, Born: 1944 | 2006 | 55 |
| Chairman and Chief Executive Officer, Greenscapes of Southwest Florida, Inc. (since 2000); Director and | ||
| President, Greenscapes of Southwest Florida, Inc. (until 2000); Managing Director, JonJames, LLC (real | ||
| estate) (since 2000); Director, First Signature Bank & Trust Company (until 1991); Director, Mast Realty | ||
| Trust (until 1994); President, Maxwell Building Corp. (until 1991). | ||
| Non-Independent Trustees3 | ||
| Name, Year of Birth | Number of | |
| Position(s) held with Fund | Trustee | John Hancock |
| Principal occupation(s) and other | of Fund | funds overseen |
| directorships during past 5 years | since1 | by Trustee |
| James R. Boyle, Born: 1959 | 2006 | 265 |
| Executive Vice President, Manulife Financial Corporation (since 1999); President, John Hancock Variable | ||
| Life Insurance Company (since March 2007); Executive Vice President, John Hancock Life Insurance | ||
| Company (since 2004); Chairman and Director, John Hancock Advisers, LLC (the Adviser), John Hancock | ||
| Funds, LLC and The Berkeley Financial Group, LLC (The Berkeley Group) (holding company) (since 2005); | ||
| Senior Vice President, The Manufacturers Life Insurance Company (U.S.A.) (until 2004). | ||
International Classic Value Fund | Annual report
34
| Principal officers who are not Trustees | |
| Name, Year of Birth | |
| Position(s) held with Fund | Officer |
| Principal occupation(s) and other | of Fund |
| directorships during past 5 years | since |
| Keith F. Hartstein, Born: 1956 | 2006 |
| President and Chief Executive Officer | |
| Senior Vice President, Manulife Financial Corporation (since 2004); Director, President and Chief | |
| Executive Officer, the Adviser, The Berkeley Group and John Hancock Funds, LLC (since 2005); Director, | |
| MFC Global Investment Management (U.S.), LLC (MFC Global (U.S.)) (since 2005); Director, John | |
| Hancock Signature Services, Inc. (since 2005); President and Chief Executive Officer, John Hancock | |
| Investment Management Services, LLC (since 2006); President and Chief Executive Officer, John Hancock | |
| Funds, John Hancock Funds II, John Hancock Funds III and John Hancock Trust (since 2005); Director, | |
| Chairman and President, NM Capital Management, Inc. (since 2005); Member, Investment Company | |
| Institute Sales Force Marketing Committee (since 2003); President and Chief Executive Officer, MFC | |
| Global (U.S.) (2005–2006); Executive Vice President, John Hancock Funds, LLC (until 2005). | |
| Thomas M. Kinzler, Born: 1955 | 2006 |
| Secretary and Chief Legal Officer | |
| Vice President and Counsel, John Hancock Life Insurance Company (U.S.A.) (since 2006); Secretary and | |
| Chief Legal Officer, John Hancock Funds and John Hancock Funds II (since 2006); Chief Legal Officer | |
| and Assistant Secretary, John Hancock Trust (since 2006); Vice President and Associate General Counsel, | |
| Massachusetts Mutual Life Insurance Company (1999–2006); Secretary and Chief Legal Counsel, MML | |
| Series Investment Fund (2000–2006); Secretary and Chief Legal Counsel, MassMutual Institutional Funds | |
| (2000–2004); Secretary and Chief Legal Counsel, MassMutual Select Funds and MassMutual Premier | |
| Funds (2004–2006). | |
| Francis V. Knox, Jr., Born: 1947 | 2006 |
| Chief Compliance Officer | |
| Vice President and Chief Compliance Officer, John Hancock Investment Management Services, LLC, | |
| the Adviser and MFC Global (U.S.) (since 2005); Vice President and Chief Compliance Officer, John | |
| Hancock Funds, John Hancock Funds II, John Hancock Funds III and John Hancock Trust (since 2005); | |
| Vice President and Assistant Treasurer, Fidelity Group of Funds (until 2004); Vice President and Ethics & | |
| Compliance Officer, Fidelity Investments (until 2001). | |
| Charles A. Rizzo, Born: 1957 | 2007 |
| Chief Financial Officer | |
| Chief Financial Officer, John Hancock Funds, John Hancock Funds II, John Hancock Funds III and John | |
| Hancock Trust (since June 2007); Assistant Treasurer, Goldman Sachs Mutual Fund Complex (regis- | |
| tered investment companies) (2005–June 2007); Vice President, Goldman Sachs (2005–June 2007); | |
| Managing Director and Treasurer of Scudder Funds, Deutsche Asset Management (2003–2005); | |
| Director, Tax and Financial Reporting, Deutsche Asset Management (2002–2003); Vice President and | |
| Treasurer, Deutsche Global Fund Services (Deutsche Registered Investment Companies) (1999–2002). | |
| Gordon M. Shone, Born: 1956 | 2006 |
| Treasurer | |
| Senior Vice President, John Hancock Life Insurance Company (U.S.A.) (since 2001); Treasurer, John | |
| Hancock Funds (since 2006), John Hancock Funds II, John Hancock Funds III and John Hancock Trust | |
| (since 2005); Vice President and Chief Financial Officer, John Hancock Trust (2003–2005); Vice President, | |
| John Hancock Investment Management Services, Inc., John Hancock Advisers, LLC (since 2006) and The | |
| Manufacturers Life Insurance Company (U.S.A.) (1998–2000). | |
Annual report | International Classic Value Fund
35
| Principal officers who are not Trustees (continued) | |
| Name, Year of Birth | |
| Position(s) held with Fund | Officer |
| Principal occupation(s) and other | of Fund |
| directorships during past 5 years | since |
| John G. Vrysen, Born: 1955 | 2006 |
| Chief Operating Officer | |
| Senior Vice President, Manulife Financial Corporation (since 2006); Director, Executive Vice President | |
| and Chief Operating Officer, the Adviser, The Berkeley Group and John Hancock Funds, LLC (since | |
| June 2007); Executive Vice President and Chief Operating Officer, John Hancock Investment | |
| Management Services, LLC (since December 2007); Chief Operating Officer, John Hancock Funds, | |
| John Hancock Funds II, John Hancock Funds III and John Hancock Trust (since June 2007); Director, | |
| Executive Vice President and Chief Financial Officer, the Adviser, The Berkeley Group and John Hancock | |
| Funds, LLC (2005–2007); Executive Vice President and Chief Financial Officer, John Hancock Investment | |
| Management Services, LLC (2005–2007); Executive Vice President and Chief Financial Officer, MFC | |
| Global (U.S.) (2005 until August 2007); Director, John Hancock Signature Services, Inc. (since 2005); | |
| Chief Financial Officer, John Hancock Funds, John Hancock Funds II, John Hancock Funds III and John | |
| Hancock Trust (2005 until June 2007); Vice President and General Manager, John Hancock Fixed | |
| Annuities, U.S. Wealth Management (2004–2005); Vice President, Operations, Manulife Wood Logan | |
| (2000–2004). | |
The business address for all Trustees and Officers is 601 Congress Street, Boston, Massachusetts 02210-2805.
The Statement of Additional Information of the Fund includes additional information about members of the Board of Trustees of the Fund and is available without charge, upon request, by calling 1-800-225-5291.
1 Each Trustee serves until resignation, retirement age or until his or her successor is elected.
2 Member of Audit and Compliance Committee.
3 Non-Independent Trustee holds positions with the Fund’s investment adviser, underwriter and certain other affiliates.
International Classic Value Fund | Annual report
36
For more information
The Fund’s proxy voting policies, procedures and records are available without charge, upon request:
| By phone | On the Fund’s Web site | On the SEC’s Web site |
| 1-800-225-5291 | www.jhfunds.com/proxy | www.sec.gov |
| Investment adviser | Custodian | Legal counsel |
| John Hancock Advisers, LLC | The Bank of New York | Kirkpatrick & Lockhart |
| 601 Congress Street | One Wall Street | Preston Gates Ellis LLP |
| Boston, MA 02210-2805 | New York, NY 10286 | One Lincoln Street |
| Boston, MA 02111-2950 | ||
| Subadviser | Transfer agent | |
| Pzena Investment | John Hancock Signature | Independent registered public |
| Management, LLC | Services, Inc. | accounting firm |
| 120 West 45th Street, | P.O. Box 9510 | PricewaterhouseCoopers LLP |
| 20th Floor | Portsmouth, NH 03802-9510 | 125 High Street |
| New York, NY 10036 | Boston, MA 02110 | |
| Principal distributor | ||
| John Hancock Funds, LLC | ||
| 601 Congress Street | ||
| Boston, MA 02210-2805 | ||
| How to contact us | ||
| Internet | www.jhfunds.com | |
| Regular mail: | Express mail: | |
| John Hancock Signature | John Hancock Signature | |
| Services, Inc. | Services, Inc. | |
| P.O. Box 9510 | Mutual Fund Image Operations | |
| Portsmouth, NH 03802-9510 | 164 Corporate Drive | |
| Portsmouth, NH 03801 | ||
| Phone | Customer service representatives | 1-800-225-5291 |
| EASI-Line | 1-800-338-8080 | |
| TDD line | 1-800-554-6713 | |
A listing of month-end portfolio holdings is available on our Web site, www.jhfunds.com. A more detailed portfolio holdings summary is available on a quarterly basis 60 days after the fiscal quarter on our Web site or upon request by calling 1-800-225-5291, or on the SEC’s Web site, www.sec.gov.
Annual Report | International Classic Value Fund
37

1-800-225-5291
1-800-554-6713 TDD
1-800-338-8080 EASI-Line
www.jhfunds. com
Now available: electronic delivery
www.jhfunds.com/edelivery
| This report is for the information of the shareholders of John Hancock International Classic Value Fund | 1900A 12/07 |
| It is not authorized for distribution to prospective investors unless preceded or accompanied by a prospectus | 2/08 |
Discussion of Fund performance
By Independence Investments LLC
While the stock market began the year in promising fashion, a worsening of the sub-prime mortgage crisis in the second half of the year resulted in the market giving back some of its first-half gains and undermined hopes for a year-end rally. Additionally, the second half of 2007 featured lackluster consumer spending and crude oil prices near $100 per barrel. Despite several cuts in short-term interest rates by the Federal Reserve Board, the mood at year-end was sober, and the media was filled with talk of a possible recession. Against this backdrop, the Fund’s benchmark, the Russell 1000 Index, returned 5.77% for the 12 months ended December 31, 2007.
“While the stock market began
the year in promising fashion,
a worsening of the subprime
mortgage crisis in the second
half of the year resulted in the
market giving back some of its
first-half gains…”
During the past year, John Hancock Core Equity Fund’s Class A, Class B, Class C and Class I shares returned 3.27%, 2.52%, 2.55% and 3.38%, respectively, at net asset value. The technology sector detracted most from the Fund’s performance. For example, printer maker Lexmark International, Inc. suffered from disappointing sales growth and we eliminated the position. Not owning enough of Internet search and online ad provider Google, Inc. also hurt, as did J.C. Penney Co., Inc. and Kohl’s Corp., which both lowered their earnings guidance in November. Given the deteriorating retail environment, we sold both stocks. In financials, Citigroup, Inc., Freddie Mac and Wachovia Corp. were victims of the subprime crisis. We sold Freddie Mac but held on to the other two. Conversely, stock selection in basic materials, utilities and energy had a positive impact on the Fund’s performance, along with a modest overweighting in energy. Ag ricultural equipment maker AGCO Corp. was a key contributor, riding strong demand for farm equipment. Both aluminum producer Alcan Inc. and Lyondell Chemical Co. were bought by other companies. In the energy sector, Occidental Petroleum Corp. was a standout, along with power utility Constellation Energy Group Inc., which we sold to nail down profits. Lastly, cellular handset maker Nokia Corp. performed well.
This commentary reflects the views of the portfolio management team through the end of the Fund’s period discussed in this report. The team’s statements reflect their own opinions. As such, they are in no way guarantees of future events and are not intended to be used as investment advice or a recommendation regarding any specific security. They are also subject to change at any time as market and other conditions warrant.
Core Equity Fund | Annual report
6
A look at performance
For the periods ended December 31, 2007
| Average annual returns | Cumulative total returns | ||||||||
| with maximum sales charge (POP) | with maximum sales charge (POP) | ||||||||
| Inception | Since | Since | |||||||
| Class | date | 1-year | 5-year | 10-year | inception | 1-year | 5-year | 10-year | inception |
| A | 6-10-91 | –1.89% | 9.98% | 3.98% | — | –1.89% | 60.90% | 47.75% | — |
| B | 9-7-95 | –2.48 | 10.05 | 3.93 | — | –2.48 | 61.45 | 47.06 | — |
| C | 5-1-98 | 1.55 | 10.33 | — | 2.26 | 1.55 | 63.48 | — | 24.07 |
| I1 | 3-1-02 | 3.38 | 11.64 | — | 5.51 | 3.38 | 73.39 | — | 36.79 |
Performance figures assume all distributions are reinvested. Public offering price (POP) figures reflect maximum sales charge on Class A shares of 5% and the applicable contingent deferred sales charge (CDSC) on Class B and Class C shares. The returns for Class C shares have been adjusted to reflect the elimination of the front-end sales charge effective July 15, 2004. The Class B shares’ CDSC declines annually between years 1 to 6 according to the following schedule: 5, 4, 3, 3, 2, 1%. No sales charge will be assessed after the sixth year. Class C shares held for less than one year are subject to a 1% CDSC. Sales charge is not applicable for Class I shares.
The expense ratios of the Fund, both net (including any fee waivers or expense limitations) and gross (excluding any fee waivers or expense limitations), are set forth according to the most recent publicly available prospectuses for the Fund and may differ from the expense ratios disclosed in the Financial Highlights tables in this report. The net expenses equal the gross expenses and are as follows: Class A — 1.47%, Class B — 2.17%, Class C — 2.17%, Class I — 0.89% .
The returns reflect past results and should not be considered indicative of future performance. The return and principal value of an investment will fluctuate so that shares, when redeemed, may be worth more or less than their original cost. Due to market volatility, the Fund’s current performance may be higher or lower than the performance shown. For performance data current to the most recent month end, please call 1-800-225-5291 or visit the Fund’s Web site at www.jhfunds.com.
The performance table above and the chart on the next page do not reflect the deduction of taxes that a shareholder would pay on fund distributions or the redemption of fund shares.
The Fund’s performance results reflect any applicable expense reductions, without which the expenses would increase and results would have been less favorable.
1 For certain types of investors as described in the Fund’s Class I share prospectus.
Annual report | Core Equity Fund
7
A look at performance
Growth of $10,000
This chart shows what happened to a hypothetical $10,000 investment in Core Equity Fund Class A shares for the period indicated. For comparison, we’ve shown the same investment in the Russell 1000 Index.
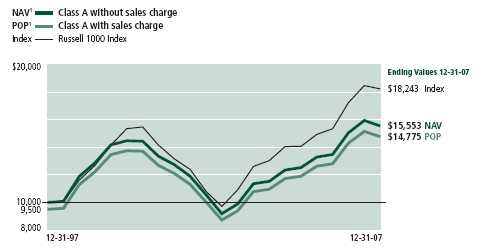
| With maximum | ||||
| Class | Period beginning | Without sales charge | sales charge | Index |
| B2 | 12-31-97 | $14,706 | $14,706 | $18,243 |
| C2,3 | 5-1-98 | 12,407 | 12,407 | 15,928 |
| I3,4 | 3-1-02 | 13,679 | 13,679 | 15,206 |
Assuming all distributions were reinvested for the period indicated, the table above shows the value of a $10,000 investment in the Fund’s Class B, Class C and Class I shares, respectively, as of December 31, 2007. The Class C shares investment with maximum sales charge has been adjusted to reflect the elimination of the front-end sales charge effective July 15, 2004. Performance of the classes will vary based on the difference in sales charges paid by shareholders investing in the different classes and the fee structure of those classes.
Russell 1000 Index is an unmanaged index that includes 1,000 widely traded common stocks.
It is not possible to invest directly in an index. Index figures do not reflect sales charges, which would have resulted in lower values if they did.
1 NAV represents net asset value and POP represents public offering price.
2 No contingent deferred sales charge applicable.
3 Index as of closest month end to inception date.
4 For certain types of investors as described in the Fund’s Class I share prospectus.
Core Equity Fund | Annual report
8
Your expenses
These examples are intended to help you understand your ongoing operating expenses.
Understanding fund expenses
As a shareholder of the Fund, you incur two types of costs:
▪ Transaction costs which include sales charges (loads) on purchases or redemptions (varies by share class), minimum account fee charge, etc.
▪ Ongoing operating expenses including management fees, distribution and service fees (if applicable), and other fund expenses.
We are going to present only your ongoing operating expenses here.
Actual expenses/actual returns
This example is intended to provide information about your fund’s actual ongoing operating expenses, and is based on your fund’s actual return. It assumes an account value of $1,000.00 on July 1, 2007, with the same investment held until December 31, 2007.
| Account value | Ending value | Expenses paid during | |
| on 7-1-07 | on 12-31-07 | period ended 12-31-071 | |
| Class A | $1,000.00 | $975.00 | $7.39 |
| Class B | 1,000.00 | 971.60 | 10.85 |
| Class C | 1,000.00 | 971.60 | 10.86 |
| Class I | 1,000.00 | 973.60 | 4.96 |
Together with the value of your account, you may use this information to estimate the operating expenses that you paid over the period. Simply divide your account value at December 31, 2007, by $1,000.00, then multiply it by the “expenses paid” for your share class from the table above. For example, for an account value of $8,600.00, the operating expenses should be calculated as follows:
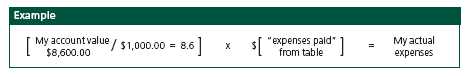
Annual report | Core Equity Fund
9
Your expenses
Hypothetical example for comparison purposes
This table allows you to compare your fund’s ongoing operating expenses with those of any other fund. It provides an example of the Fund’s hypothetical account values and hypothetical expenses based on each class’s actual expense ratio and an assumed 5% annualized return before expenses (which is not your fund’s actual return). It assumes an account value of $1,000.00 on July 1, 2007, with the same investment held until December 31, 2007. Look in any other fund shareholder report to find its hypothetical example and you will be able to compare these expenses.
| Account value | Ending value | Expenses paid during | |
| on 7-1-07 | on 12-31-07 | period ended 12-31-071 | |
| Class A | $1,000.00 | $1,017.72 | $7.55 |
| Class B | 1,000.00 | 1,014.20 | 11.08 |
| Class C | 1,000.00 | 1,014.19 | 11.09 |
| Class I | 1,000.00 | 1,020.18 | 5.08 |
Remember, these examples do not include any transaction costs, such as sales charges; therefore, these examples will not help you to determine the relative total costs of owning different funds. If transaction costs were included, your expenses would have been higher. See the prospectus for details regarding transaction costs.
1 Expenses are equal to the Fund’s annualized expense ratio of 1.48%, 2.18%, 2.19% and 1.00% for Class A, Class B, Class C and Class I, respectively, multiplied by the average account value over the period, multiplied by number of days in most recent fiscal half-year/365 or 366 (to reflect the one-half year period).
Core Equity Fund | Annual report
10
Portfolio summary
| Top 10 holdings1 | ||||
| Exxon Mobil Corp. | 5.2% | Occidental Petroleum Corp. | 2.3% | |
| General Electric Co. | 2.9% | Schering-Plough Corp. | 1.8% | |
| Altria Group, Inc. | 2.8% | Verizon Communications, Inc. | 1.8% | |
| Microsoft Corp. | 2.7% | Nokia Corp. | 1.7% | |
| JPMorgan Chase & Co. | 2.7% | Humana, Inc. | 1.7% | |
| Sector distribution1 | ||||
| Information technology | 19% | Consumer staples | 8% | |
| Financials | 14% | Materials | 4% | |
| Health care | 13% | Utilities | 4% | |
| Industrials | 13% | Telecommunication services | 3% | |
| Energy | 12% | Other | 1% | |
| Consumer discretionary | 9% | |||

1 As a percentage of net assets on December 31, 2007.
Annual report | Core Equity Fund
11
F I N A N C I A L S T A T E M E N T S
Fund’s investments
Securities owned by the Fund on 12-31-07
This schedule is divided into two main categories: common stocks and short-term investments. The common stocks are further broken down by industry group. Short-term investments, which represent the Fund’s cash position, are listed last.
| Issuer | Shares | Value |
| Common stocks 99.62% | $263,628,430 | |
| (Cost $218,195,762) | ||
| Aerospace & Defense 2.02% | 5,338,328 | |
| Boeing Co. (The) | 39,800 | 3,480,908 |
| Raytheon Co. | 30,600 | 1,857,420 |
| Agricultural Products 0.85% | 2,237,926 | |
| Archer-Daniels-Midland Co. | 48,200 | 2,237,926 |
| Air Freight & Logistics 1.23% | 3,253,120 | |
| United Parcel Service, Inc. (Class B) | 46,000 | 3,253,120 |
| Apparel Retail 0.95% | 2,502,528 | |
| Gap, Inc. (The) | 117,600 | 2,502,528 |
| Application Software 0.66% | 1,737,294 | |
| Autodesk, Inc. (I) | 20,400 | 1,015,104 |
| Citrix Systems, Inc. (I) | 19,000 | 722,190 |
| Asset Management & Custody Banks 0.41% | 1,074,645 | |
| Ameriprise Financial, Inc. | 19,500 | 1,074,645 |
| Biotechnology 0.64% | 1,704,676 | |
| Genzyme Corp. (I) | 22,900 | 1,704,676 |
| Broadcasting & Cable TV 1.73% | 4,586,802 | |
| DIRECTV Group, Inc. (The) (I) | 65,200 | 1,507,424 |
| Liberty Global, Inc. (Class A) (I)(L) | 32,800 | 1,285,432 |
| Liberty Media Corp. Capital Ser A (I) | 15,400 | 1,793,946 |
| Communications Equipment 2.35% | 6,219,188 | |
| Cisco Systems, Inc. (I) | 62,400 | 1,689,168 |
| Nokia Corp., ADR (Finland) (F) | 118,000 | 4,530,020 |
| Computer & Electronics Retail 1.43% | 3,777,790 | |
| Best Buy Co., Inc. | 45,800 | 2,411,370 |
| GameStop Corp. (Class A) (I) | 22,000 | 1,366,420 |
| Computer Hardware 3.47% | 9,190,814 | |
| Apple, Inc. (I) | 16,500 | 3,268,320 |
| Hewlett-Packard Co. | 80,500 | 4,063,640 |
| NCR Corp. (I) | 35,400 | 888,540 |
| Teradata Corp. (I) | 35,400 | 970,314 |
See notes to financial statements
Core Equity Fund | Annual report
12
F I N A N C I A L S T A T E M E N T S
| Issuer | Shares | Value |
| Computer Storage & Peripherals 2.12% | $5,614,041 | |
| Network Appliance, Inc. (I) | 30,600 | 763,776 |
| Seagate Technology (Cayman Islands) (F) | 105,500 | 2,690,250 |
| Western Digital Corp. (I) | 71,500 | 2,160,015 |
| Construction & Farm Machinery & Heavy Trucks 1.47% | 3,888,456 | |
| AGCO Corp. (I) | 57,200 | 3,888,456 |
| Construction & Engineering 1.14% | 3,017,057 | |
| Jacobs Engineering Group, Inc. (I) | 13,700 | 1,309,857 |
| KBR, Inc. (I) | 44,000 | 1,707,200 |
| Consumer Finance 0.71% | 1,883,124 | |
| American Express Co. | 36,200 | 1,883,124 |
| Data Processing & Outsourced Services 1.54% | 4,087,331 | |
| Global Payments, Inc. | 16,300 | 758,276 |
| Hewitt Associates, Inc. (Class A) (I) | 19,500 | 746,655 |
| MasterCard, Inc. (Class A) | 12,000 | 2,582,400 |
| Diversified Banks 0.85% | 2,242,484 | |
| Wachovia Corp. | 28,800 | 1,095,264 |
| Wells Fargo & Co. | 38,000 | 1,147,220 |
| Diversified Chemicals 1.58% | 4,183,170 | |
| Dow Chemical Co. (The) | 76,900 | 3,031,398 |
| PPG Industries, Inc. | 16,400 | 1,151,772 |
| Diversified Commercial & Professional Services 0.28% | 728,828 | |
| Brink’s Co. (The) | 12,200 | 728,828 |
| Diversified Metals & Mining 1.41% | 3,725,813 | |
| Freeport-McMoRan Copper & Gold, Inc. (Class B) | 29,700 | 3,042,468 |
| Southern Copper Corp. | 6,500 | 683,345 |
| Electric Utilities 2.20% | 5,829,016 | |
| Duke Energy Corp. | 131,600 | 2,654,372 |
| Pinnacle West Capital Corp. | 27,200 | 1,153,552 |
| PPL Corp. | 38,800 | 2,021,092 |
| Electrical Components & Equipment 0.61% | 1,604,832 | |
| General Cable Corp. (I) | 21,900 | 1,604,832 |
| Fertilizers & Agricultural Chemicals 0.80% | 2,110,941 | |
| Monsanto Co. | 18,900 | 2,110,941 |
| Food Retail 0.43% | 1,146,035 | |
| Safeway, Inc. | 33,500 | 1,146,035 |
| Footwear 0.51% | 1,349,040 | |
| NIKE, Inc. (Class B) | 21,000 | 1,349,040 |
| General Merchandise Stores 0.39% | 1,039,350 | |
| Big Lots, Inc. (I) | 65,000 | 1,039,350 |
| Health Care Distributors 1.57% | 4,146,783 | |
| McKesson Corp. | 63,300 | 4,146,783 |
See notes to financial statements
Annual report | Core Equity Fund
13
F I N A N C I A L S T A T E M E N T S
| Issuer | Shares | Value |
| Health Care Equipment 0.89% | $2,350,483 | |
| Baxter International, Inc. | 12,000 | 696,600 |
| Medtronic, Inc. | 32,900 | 1,653,883 |
| Health Care Technology 0.21% | 554,760 | |
| Hlth Corp. (I) | 41,400 | 554,760 |
| Hotels, Resorts & Cruise Lines 0.96% | 2,537,912 | |
| Royal Caribbean Cruises Ltd. | 59,800 | 2,537,912 |
| Household Products 0.88% | 2,327,414 | |
| Procter & Gamble Co. (The) | 31,700 | 2,327,414 |
| Housewares & Specialties 0.59% | 1,563,152 | |
| Newell Rubbermaid, Inc. | 60,400 | 1,563,152 |
| Human Resource & Employment Services 0.25% | 673,296 | |
| Robert Half International, Inc. | 24,900 | 673,296 |
| Hypermarkets & Super Centers 0.52% | 1,378,370 | |
| Wal-Mart Stores, Inc. | 29,000 | 1,378,370 |
| Independent Power Producers & Energy Traders 0.43% | 1,138,216 | |
| Mirant Corp. (I) | 29,200 | 1,138,216 |
| Industrial Conglomerates 4.09% | 10,819,240 | |
| General Electric Co. | 208,000 | 7,710,560 |
| Textron, Inc. | 43,600 | 3,108,680 |
| Industrial Machinery 1.17% | 3,097,111 | |
| Parker Hannifin Corp. | 24,600 | 1,852,626 |
| SPX Corp. | 12,100 | 1,244,485 |
| Integrated Oil & Gas 8.01% | 21,191,206 | |
| Exxon Mobil Corp. | 145,600 | 13,641,264 |
| Occidental Petroleum Corp. | 79,800 | 6,143,802 |
| Royal Dutch Shell Plc ADR (Netherlands) (F) | 16,700 | 1,406,140 |
| Integrated Telecommunication Services 3.41% | 9,020,515 | |
| AT&T, Inc. | 105,300 | 4,376,268 |
| Verizon Communications, Inc. | 106,300 | 4,644,247 |
| Internet Retail 0.64% | 1,697,994 | |
| Expedia, Inc. (I) | 53,700 | 1,697,994 |
| Internet Software & Services 0.47% | 1,244,664 | |
| Google, Inc. (Class A) (I) | 1,800 | 1,244,664 |
| Investment Banking & Brokerage 1.50% | 3,972,435 | |
| Goldman Sachs Group, Inc. (The) | 11,700 | 2,516,085 |
| Schwab (Charles) Corp. (The) | 57,000 | 1,456,350 |
| IT Consulting & Other Services 0.66% | 1,743,852 | |
| Accenture Ltd. (Class A) (Bermuda) (F) | 48,400 | 1,743,852 |
| Life & Health Insurance 0.27% | 720,954 | |
| MetLife, Inc. | 11,700 | 720,954 |
See notes to financial statements
Core Equity Fund | Annual report
14
F I N A N C I A L S T A T E M E N T S
| Issuer | Shares | Value |
| Life Sciences Tools & Services 0.54% | $1,419,832 | |
| Invitrogen Corp. (I) | 15,200 | 1,419,832 |
| Managed Health Care 4.79% | 12,690,407 | |
| Aetna, Inc. | 44,500 | 2,568,985 |
| CIGNA Corp. | 65,700 | 3,530,061 |
| Humana, Inc. (I) | 60,000 | 4,518,600 |
| Wellcare Health Plans, Inc. (I) | 19,500 | 826,995 |
| WellPoint, Inc. (I) | 14,200 | 1,245,766 |
| Mortgage REITs 0.16% | 427,230 | |
| Annaly Capital Management, Inc. REIT | 23,500 | 427,230 |
| Movies & Entertainment 1.34% | 3,534,525 | |
| News Corp. (Class A) | 172,500 | 3,534,525 |
| Multi-Line Insurance 1.15% | 3,034,212 | |
| Hartford Financial Services Group, Inc. (The) | 34,800 | 3,034,212 |
| Multi-Utilities 1.02% | 2,691,776 | |
| Public Service Enterprise Group, Inc. | 27,400 | 2,691,776 |
| Oil & Gas Drilling 1.00% | 2,641,200 | |
| Diamond Offshore Drilling, Inc. | 18,600 | 2,641,200 |
| Oil & Gas Equipment & Services 1.97% | 5,211,923 | |
| Dresser-Rand Group, Inc. (I) | 16,100 | 628,705 |
| Halliburton Co. | 92,800 | 3,518,048 |
| National-Oilwell Varco, Inc. (I) | 14,500 | 1,065,170 |
| Oil & Gas Exploration & Production 1.46% | 3,876,476 | |
| Devon Energy Corp. | 43,600 | 3,876,476 |
| Other Diversified Financial Services 5.42% | 14,358,354 | |
| Bank of America Corp. | 66,600 | 2,747,916 |
| Citigroup, Inc. | 152,700 | 4,495,488 |
| JPMorgan Chase & Co. | 163,000 | 7,114,950 |
| Packaged Foods & Meats 0.41% | 1,073,100 | |
| Tyson Foods, Inc. (Class A) | 70,000 | 1,073,100 |
| Personal Products 0.27% | 709,660 | |
| NBTY, Inc. (I) | 25,900 | 709,660 |
| Pharmaceuticals 4.47% | 11,837,703 | |
| Bristol-Myers Squibb Co. | 94,900 | 2,516,748 |
| Endo Pharmaceuticals Holdings, Inc. (I) | 40,700 | 1,085,469 |
| Merck & Co., Inc. | 49,700 | 2,888,067 |
| Pfizer, Inc. | 29,100 | 661,443 |
| Schering-Plough Corp. | 175,900 | 4,685,976 |
| Property & Casualty Insurance 1.35% | 3,584,712 | |
| ACE Ltd. (Cayman Islands) (F) | 30,900 | 1,909,002 |
| Axis Capital Holdings Ltd. (Bermuda) (F) | 43,000 | 1,675,710 |
| Railroads 0.66% | 1,756,153 | |
| Burlington Northern Santa Fe Corp. | 21,100 | 1,756,153 |
See notes to financial statements
Annual report | Core Equity Fund
15
F I N A N C I A L S T A T E M E N T S
| Issuer | Shares | Value |
| Reinsurance 0.55% | $1,445,760 | |
| Everest Re Group Ltd. (Bermuda) (F) | 14,400 | 1,445,760 |
| Semiconductor Equipment 1.58% | 4,179,677 | |
| Applied Materials, Inc. | 133,200 | 2,365,632 |
| MEMC Electronic Materials, Inc. (I) | 20,500 | 1,814,045 |
| Semiconductors 1.77% | 4,675,594 | |
| Cypress Semiconductor Corp. (I) | 26,400 | 951,192 |
| Intel Corp. (I) | 139,700 | 3,724,402 |
| Soft Drinks 1.31% | 3,476,220 | |
| PepsiCo, Inc. | 45,800 | 3,476,220 |
| Specialized Finance 0.84% | 2,236,948 | |
| NASDAQ Stock Market, Inc. (I) | 45,200 | 2,236,948 |
| Specialized REITs 0.57% | 1,520,549 | |
| Plum Creek Timber Co., Inc. REIT | 23,100 | 1,063,524 |
| Ventas, Inc. REIT | 10,100 | 457,025 |
| Specialty Stores 0.23% | 620,100 | |
| Barnes & Noble, Inc. | 18,000 | 620,100 |
| Steel 0.30% | 791,320 | |
| Reliance Steel & Aluminum Co. | 14,600 | 791,320 |
| Systems Software 3.79% | 10,036,720 | |
| Check Point Software Technologies Ltd. (Israel) (F)(I) | 94,700 | 2,079,612 |
| Microsoft Corp. | 200,300 | 7,130,680 |
| Oracle Corp. (I) | 36,600 | 826,428 |
| Technology Distributors 0.65% | 1,726,675 | |
| Arrow Electronics, Inc. (I) | 20,900 | 820,952 |
| Avnet, Inc. (I) | 25,900 | 905,723 |
| Thrifts & Mortgage Finance 0.40% | 1,046,894 | |
| Hudson City Bancorp., Inc. | 69,700 | 1,046,894 |
| Tobacco 3.26% | 8,623,932 | |
| Altria Group, Inc. | 97,400 | 7,361,492 |
| Loews Corp. Carolina Group | 14,800 | 1,262,440 |
| Wireless Telecommunication Services 0.06% | 149,792 | |
| NII Holdings, Inc. (I) | 3,100 | 149,792 |
See notes to financial statements
Core Equity Fund | Annual report
16
F I N A N C I A L S T A T E M E N T S
| Interest | |||
| Issuer | rate | Shares | Value |
| Short-term investments 0.35% | $932,284 | ||
| (Cost $932,284) | |||
| Cash Equivalents 0.35% | 932,284 | ||
| John Hancock Cash Investment Trust (T)(W) | 5.10% (Y) | 932,284 | 932,284 |
| Total investments (Cost $219,128,046) 99.97% | $264,560,714 | ||
| Other assets and liabilities, net 0.03% | $89,276 | ||
| Total net assets 100.00% | $264,649,990 | ||
The percentage shown for each investment category is the total value of that category as a percentage of the net assets of the Fund.
ADR American Depositary Receipt
REIT Real Estate Investment Trust
(F) Parenthetical disclosure of a foreign country in the security description represents country of a foreign issuer.
(I) Non-income-producing security.
(L) All or a portion of this security is on loan as of December 31, 2007.
(T) Represents investment of securities lending collateral.
(W) Issuer is an affiliate of John Hancock Advisers, LLC.
(Y) Represents current yield as of December 31, 2007.
See notes to financial statements
Annual report | Core Equity Fund
17
F I N A N C I A L S T A T E M E N T S
Financial statements
Statement of assets and liabilities 12-31-07
This Statement of Assets and Liabilities is the Fund’s balance sheet. It shows the value of what the Fund owns, is due and owes. You’ll also find the net asset value and the maximum offering price per share.
| Assets | |
| Investments in unaffiliated issuers, at value (cost $218,195,762) including | |
| $917,046 of securities loaned (Note 2) | $263,628,430 |
| Investments in affiliated issuers, at value (cost $932,284) | 932,284 |
| Total investments, at value (cost $219,128,046) | 264,560,714 |
| Cash | 955,241 |
| Receivable for shares sold | 190,805 |
| Dividends and interest receivable | 368,270 |
| Receivable from affiliates | 169,053 |
| Total assets | 266,244,083 |
| Liabilities | |
| Payable for shares repurchased | 137,491 |
| Payable upon return of securities loaned (Note 2) | 932,284 |
| Payable to affiliates | |
| Management fees | 170,659 |
| Distribution and service fees | 21,782 |
| Other | 84,939 |
| Accrued expenses | 246,938 |
| Total liabilities | 1,594,093 |
| Net assets | |
| Capital paid-in | 241,875,867 |
| Accumulated net realized loss on investments | (22,641,979) |
| Net unrealized appreciation of investments | 45,432,668 |
| Undistributed net investment loss | (16,566) |
| Net assets | $264,649,990 |
| Net asset value per share | |
| Based on net asset values and shares outstanding — the Fund has an | |
| unlimited number of shares authorized with no par value | |
| Class A ($192,129,063 ÷ 5,525,334 shares) | $34.77 |
| Class B ($60,626,245 ÷ 1,882,767 shares)1 | $32.20 |
| Class C ($11,869,471 ÷ 368,712 shares)1 | $32.19 |
| Class I ($25,211 ÷ 705 shares) | $35.772 |
| Maximum offering price per share | |
| Class A3 ($34.77 ÷ 95%) | $36.60 |
1 Redemption price per share is equal to the net asset value less any applicable contingent deferred sales charge.
2 Net assets and shares outstanding have been rounded for presentation purposes. The net asset value is as reported December 31, 2007.
3 On single retail sales of less than $50,000. On sales of $50,000 or more and on group sales the offering price is reduced.
See notes to financial statements
Core Equity Fund | Annual report
18
F I N A N C I A L S T A T E M E N T S
Statement of operations For the year ended 12-31-07
This Statement of Operations summarizes the Fund’s investment income earned and expenses incurred in operating the Fund. It also shows net gains (losses) for the period stated.
| Investment income | |
| Dividends (net of foreign withholding taxes of $14,585) | $4,703,643 |
| Interest | 56,392 |
| Securities lending | 31,932 |
| Total investment income | 4,791,967 |
| Expenses | |
| Investment management fees (Note 3) | 2,219,233 |
| Distribution and service fees (Note 3) | 1,536,935 |
| Transfer agent fees (Note 3) | 1,069,225 |
| Accounting and legal services fees (Note 3) | 38,547 |
| Printing fees | 81,020 |
| Blue sky fees | 75,199 |
| Custodian fees | 55,208 |
| Professional fees | 25,916 |
| Trustees’ fees | 17,651 |
| Miscellaneous | 22,548 |
| Total expenses | 5,141,482 |
| Less expense reductions (Note 3) | (151,094) |
| Net expenses | 4,990,388 |
| Net investment loss | (198,421) |
| Realized and unrealized gain (loss) | |
| Net realized gain (loss) on investments | 28,134,607 |
| 28,134,607 | |
| Change in net unrealized appreciation (depreciation) of investments | (17,933,945) |
| (17,933,945) | |
| Net realized and unrealized gain | 10,200,662 |
| Increase in net assets from operations | $10,002,241 |
See notes to financial statements
Annual report | Core Equity Fund
19
F I N A N C I A L S T A T E M E N T S
Statement of changes in net assets
These Statements of Changes in Net Assets show how the value of the Fund’s net assets has changed during the last two periods. The difference reflects earnings less expenses, any investment gains and losses, distributions, if any, paid to shareholders and the net of Fund share transactions.
| Year | Year | |
| ended | ended | |
| 12-31-06 | 12-31-07 | |
| Increase (decrease) in net assets | ||
| From operations | ||
| Net investment loss | ($40,939) | ($198,421) |
| Net realized gain | 58,139,604 | 28,134,607 |
| Change in net unrealized appreciation (depreciation) | (19,096,336) | (17,933,945) |
| Increase in net assets resulting from operations | 39,002,329 | 10,002,241 |
| From Fund share transactions (Note 4) | (77,606,704) | (58,098,920) |
| Total decrease | (38,604,375) | (48,096,679) |
| Net assets | ||
| Beginning of year | 351,351,044 | 312,746,669 |
| End of year1 | $312,746,669 | $264,649,990 |
1 Includes undistributed net investment loss of $16,566 and $16,566, respectively.
See notes to financial statements
Core Equity Fund | Annual report
20
F I N A N C I A L S T A T E M E N T S
Financial highlights
The Financial Highlights show how the Fund’s net asset value for a share has changed since the end of the previous period.
| CLASS A SHARES | |||||
| Period ended | 12-31-03 | 12-31-04 | 12-31-05 | 12-31-06 | 12-31-07 |
| Per share operating performance | |||||
| Net asset value, beginning of period | $20.53 | $25.39 | $27.62 | $29.72 | $33.67 |
| Net investment income (loss)1 | 0.002 | 0.10 | 0.01 | 0.09 | 0.05 |
| Net realized and unrealized | |||||
| gain on investments | 4.86 | 2.13 | 2.09 | 3.86 | 1.05 |
| Total from investment operations | 4.86 | 2.23 | 2.10 | 3.95 | 1.10 |
| Net asset value, end of period | $25.39 | $27.62 | $29.72 | $33.67 | $34.77 |
| Total return3 (%) | 23.67 | 8.784 | 7.604 | 13.294 | 3.274 |
| Ratios and supplemental data | |||||
| Net assets, end of period | |||||
| (in millions) | $201 | $193 | $195 | $198 | $192 |
| Ratio of net expenses to average | |||||
| net assets (%) | 1.61 | 1.52 | 1.47 | 1.47 | 1.476 |
| Ratio of gross expenses to average | |||||
| net assets (%) | 1.61 | 1.575 | 1.525 | 1.505 | 1.525 |
| Ratio of net investment income | |||||
| (loss) to average net assets (%) | (0.02) | 0.41 | 0.03 | 0.28 | 0.15 |
| Portfolio turnover (%) | 70 | 68 | 54 | 78 | 147 |
1 Based on the average of the shares outstanding.
2 Less than $0.01 per share.
3 Assumes dividend reinvestment and does not reflect the effect of sales charges.
4 Total returns would have been lower had certain expenses not been reduced during the periods shown.
5 Does not take into consideration expense reductions during the periods shown.
6 Includes transfer agent fee earned credits of less than 0.01% to average net assets.
See notes to financial statements
Annual report | Core Equity Fund
21
F I N A N C I A L S T A T E M E N T S
Financial highlights
| CLASS B SHARES | |||||
| Period ended | 12-31-03 | 12-31-04 | 12-31-05 | 12-31-06 | 12-31-07 |
| Per share operating performance | |||||
| Net asset value, beginning of period | $19.70 | $24.19 | $26.12 | $27.91 | $31.41 |
| Net investment loss1 | (0.15) | (0.08) | (0.18) | (0.13) | (0.18) |
| Net realized and unrealized | |||||
| gain on investments | 4.64 | 2.01 | 1.97 | 3.63 | 0.97 |
| Total from investment operations | 4.49 | 1.93 | 1.79 | 3.50 | 0.79 |
| Net asset value, end of period | $24.19 | $26.12 | $27.91 | $31.41 | $32.20 |
| Total return2 (%) | 22.79 | 7.983 | 6.853 | 12.543 | 2.523 |
| Ratios and supplemental data | |||||
| Net assets, end of period | |||||
| (in millions) | $252 | $197 | $140 | $101 | $61 |
| Ratio of net expenses to average | |||||
| net assets (%) | 2.31 | 2.22 | 2.18 | 2.17 | 2.175 |
| Ratio of gross expenses to average | |||||
| net assets (%) | 2.31 | 2.274 | 2.234 | 2.204 | 2.224 |
| Ratio of net investment loss | |||||
| to average net assets (%) | (0.72) | (0.33) | (0.68) | (0.44) | (0.54) |
| Portfolio turnover (%) | 70 | 68 | 54 | 78 | 147 |
1 Based on the average of the shares outstanding.
2 Assumes dividend reinvestment and does not reflect the effect of sales charges.
3 Total returns would have been lower had certain expenses not been reduced during the periods shown.
4 Does not take into consideration expense reductions during the periods shown.
5 Includes transfer agent fee earned credits of less than 0.01% to average net assets.
See notes to financial statements
Core Equity Fund | Annual report
22
F I N A N C I A L S T A T E M E N T S
Financial highlights
| CLASS C SHARES | |||||
| Period ended | 12-31-03 | 12-31-04 | 12-31-05 | 12-31-06 | 12-31-07 |
| Per share operating performance | |||||
| Net asset value, beginning of period | $19.69 | $24.18 | $26.11 | $27.90 | $31.39 |
| Net investment loss1 | (0.15) | (0.08) | (0.18) | (0.13) | (0.18) |
| Net realized and unrealized | |||||
| gain on investments | 4.64 | 2.01 | 1.97 | 3.62 | 0.98 |
| Total from investment operations | 4.49 | 1.93 | 1.79 | 3.49 | 0.80 |
| Net asset value, end of period | $24.18 | $26.11 | $27.90 | $31.39 | $32.19 |
| Total return2 (%) | 22.80 | 7.983 | 6.863 | 12.513 | 2.553 |
| Ratios and supplemental data | |||||
| Net assets, end of period | |||||
| (in millions) | $24 | $20 | $16 | $14 | $12 |
| Ratio of net expenses to average | |||||
| net assets (%) | 2.31 | 2.22 | 2.18 | 2.17 | 2.175 |
| Ratio of gross expenses to average | |||||
| net assets (%) | 2.31 | 2.274 | 2.234 | 2.204 | 2.224 |
| Ratio of net investment loss | |||||
| to average net assets (%) | (0.72) | (0.31) | (0.68) | (0.43) | (0.55) |
| Portfolio turnover (%) | 70 | 68 | 54 | 78 | 147 |
1 Based on the average of the shares outstanding.
2 Assumes dividend reinvestment and does not reflect the effect of sales charges.
3 Total returns would have been lower had certain expenses not been reduced during the periods shown.
4 Does not take into consideration expense reductions during the periods shown.
5 Includes transfer agent fee earned credits of less than 0.01% to average net assets.
See notes to financial statements
Annual report | Core Equity Fund
23
F I N A N C I A L S T A T E M E N T S
Financial highlights
| CLASS I SHARES | |||||
| Period ended | 12-31-03 | 12-31-04 | 12-31-05 | 12-31-06 | 12-31-07 |
| Per share operating performance | |||||
| Net asset value, beginning of period | $20.63 | $25.66 | $28.07 | $30.37 | $34.60 |
| Net investment income1 | 0.12 | 0.26 | 0.16 | 0.22 | 0.23 |
| Net realized and unrealized | |||||
| gain on investments | 4.91 | 2.15 | 2.14 | 4.01 | 0.94 |
| Total from investment operations | 5.03 | 2.41 | 2.30 | 4.23 | 1.17 |
| Net asset value, end of period | $25.66 | $28.07 | $30.37 | $34.60 | $35.77 |
| Total return2 (%) | 24.38 | 9.39 | 8.19 | 13.93 | 3.38 |
| Ratios and supplemental data | |||||
| Net assets, end of period | |||||
| (in millions) | $2 | —3 | —3 | —3 | —3 |
| Ratio of expenses to average | |||||
| net assets (%) | 1.06 | 0.92 | 0.90 | 0.89 | 0.934 |
| Ratio of net investment income | |||||
| to average net assets (%) | 0.53 | 1.00 | 0.54 | 0.68 | 0.65 |
| Portfolio turnover (%) | 70 | 68 | 54 | 78 | 147 |
1 Based on the average of the shares outstanding.
2 Assumes dividend reinvestment and does not reflect the effect of sales charges.
3 Less than $500,000.
4 Includes transfer agent fee earned credits of 0.02% to average net assets.
See notes to financial statements
Core Equity Fund | Annual report
24
Notes to financial statements
Note 1
Organization
John Hancock Core Equity Fund (the Fund) is a diversified series of John Hancock Capital Series (the Trust), an open-end management investment company registered under the Investment Company Act of 1940, as amended (the 1940 Act). The investment objective of the Fund is to seek above-average total return, consisting of capital appreciation plus current income.
The Trustees have authorized the issuance of multiple classes of shares of the Fund, designated as Class A, Class B, Class C and Class I shares. The shares of each class represent an interest in the same portfolio of investments of the Fund and have equal rights as to voting, redemptions, dividends and liquidation, except that certain expenses, subject to the approval of the Trustees, may be applied differently to each class of shares in accordance with current regulations of the Securities and Exchange Commission (SEC) and the Internal Revenue Service. Shareholders of a class that bears distribution and service expenses under the terms of a distribution plan have exclusive voting rights to that distribution plan. Class B shares will convert to Class A shares eight years after purchase.
Note 2
Significant accounting policies
The financial statements have been prepared in conformity with accounting principles generally accepted in the United States of America, which require management to make certain estimates and assumptions at the date of the financial statements. Actual results could differ from those estimates. The following summarizes the significant accounting policies of the Fund:
Security valuation
The net asset value of Class A, Class B, Class C and Class I shares of the Fund is determined daily as of the close of the New York Stock Exchange (NYSE), normally at 4:00 p.m., Eastern Time. Short-term debt investments that have a remaining maturity of 60 days or less are valued at amortized cost, and thereafter assume a constant amortization to maturity of any discount or premium, which approximates market value. Investments in John Hancock Cash Investment Trust (JHCIT), an affiliate of John Hancock Advisers, LLC (the Adviser), a wholly owned subsidiary of John Hancock Financial Services, Inc., a subsidiary of Manulife Financial Corporation (MFC), are valued at their net asset value each business day. All other securities held by the Fund are valued at the last sale price or official cl osing price (closing bid price or last evaluated quote if no sale has occurred) as of the close of business on the principal securities exchange (domestic or foreign) on which they trade or, lacking any sales, at the closing bid price. Securities traded only in the over-the-counter market are valued at the last bid price quoted by brokers making markets in the securities at the close of trading. Securities for which there are no such quotations, principally debt securities, are valued based on the evaluated prices provided by an independent pricing service, which utilizes both dealer-supplied and electronic data processing techniques, which take into account factors such as institutional-size trading in similar groups of securities, yield, quality, coupon rate, maturity, type of issue, trading characteristics and other market data.
Other assets and securities for which no such quotations are readily available are valued at fair value as determined in good faith under consistently applied procedures established by and under the general supervision of the Board of Trustees. Generally, trading in non-U.S. securities is substantially completed each day at various times prior to the close of trading on the NYSE. The values of such securities used in computing the net asset value of the Fund’s shares are generally determined as of such times. Occasionally, significant events that affect the values of such securities may
Annual report | Core Equity Fund
25
occur between the times at which such values are generally determined and the close of the NYSE. Upon such an occurrence, these securities will be valued at fair value as determined in good faith under consistently applied procedures established by and under the general supervision of the Board of Trustees.
Joint repurchase agreement
Pursuant to an exemptive order issued by the SEC, the Fund, along with other registered investment companies having a management contract with the Adviser, may participate in a joint repurchase agreement transaction. Aggregate cash balances are invested in one or more large repurchase agreements, whose underlying securities are obligations of the U.S. government and/or its agencies. The Fund’s custodian bank receives delivery of the underlying securities for the joint account on the Fund’s behalf.
Investment transactions
Investment transactions are accounted for on a trade date plus one basis for daily net asset value calculations. However, for financial reporting purposes, investment security transactions are reported on trade date. Interest income is recorded on the accrual basis. Dividend income is recorded on the ex-dividend date net of foreign withholding taxes. Discounts/ premiums are accreted/amortized for financial reporting purposes. Realized gains and losses from investment transactions are recorded on an identified cost basis.
Class allocations
Income, common expenses and realized and unrealized gains (losses) are determined at the fund level and allocated daily to each class of shares based on the appropriate net asset value of the respective classes. Distribution and service fees, if any, and transfer agent fees for Class A, Class B, Class C and Class I shares are calculated daily at the class level based on the appropriate net asset value of each class and the specific expense rate(s) applicable to each class.
Guarantees and indemnifications
Under the Fund’s organizational documents, its Officers and Trustees are indemnified against certain liability arising out of the performance of their duties to the Fund. Additionally, in the normal course of business, the Fund enters into contracts with service providers that contain general indemnification clauses. The Fund’s maximum exposure under these arrangements is unknown, as this would involve future claims that may be made against the Fund that have not yet occurred.
Expenses
The majority of expenses are directly identifiable to an individual fund. Expenses that are not readily identifiable to a specific fund are allocated in such a manner as deemed equitable, taking into consideration, among other things, the nature and type of expense and the relative size of the funds.
Bank borrowings
The Fund is permitted to have bank borrowings for temporary or emergency purposes, including the meeting of redemption requests that otherwise might require the untimely disposition of securities. The Fund has entered into a line of credit agreement with The Bank of New York Mellon (BNYM), the Swing Line Lender and Administrative Agent. This agreement enables the Fund to participate, with other funds managed by the Adviser, in an unsecured line of credit with BNYM, which permits borrowings of up to $100 million, collectively. Interest is charged to each fund based on its borrowing. In addition, a commitment fee is charged to each fund based on the average daily unused portion of the line of credit and is allocated among the participating funds. The Fund had no borrowing activity under the line of credit during the year ended December 31, 2007.
Securities lending
The Fund has entered into an agreement with Morgan Stanley & Co. Incorporated and MS Securities Services Inc. (collectively, Morgan Stanley) which permits the Fund to lend securities to Morgan Stanley on a principal basis. Morgan Stanley is the primary borrower of securities of the Fund. The risk of having one primary borrower of Fund securities (as opposed to several borrowers) is that should Morgan Stanley fail financially, all securities lent will be affected by the failure and by
Core Equity Fund | Annual report
26
any delays in recovery of the securities (or in the rare event, loss of rights in the collateral).
The Fund may lend portfolio securities from time to time in order to earn additional income. The Fund retains beneficial ownership of the securities it has loaned and continues to receive interest and dividends paid by the issuer of securities and to participate in any changes in their value. On the settlement date of the loan, the Fund receives collateral against the loaned securities and maintains collateral in an amount not less than 100% of the market value of the loaned securities during the period of the loan. The market value of the loaned securities is determined at the close of business of the Fund and any additional required collateral is delivered to the Fund on the next business day. Any cash collateral received is invested in the JHCIT. If the borrower defaults on its obligation to return the securities loaned because of insolvency or other reasons, a fund could experience delays and costs in recovering the securities loaned or in gaining access to the colla teral. The Fund receives compensation for lending their securities either in the form of fees, guarantees, and/or by retaining a portion of interest on the investment of any cash received as collateral. Prior to May 8, 2007, the Fund paid the Adviser $532 for security lending services relating to an arrangement which ended on May 7, 2007.
Federal income taxes
The Fund qualifies as a regulated investment company by complying with the applicable provisions of the Internal Revenue Code and will not be subject to federal income tax on taxable income that is distributed to shareholders. Therefore, no federal income tax provision is required. For federal income tax purposes, the Fund had $22,394,747 of a capital loss carryforward available, to the extent provided by regulations, to offset future net realized capital gains. To the extent that such carryforward is used by the Fund, no capital gain distributions will be made. The loss carryforward expires as follows: December 31, 2008 — $1,933,874, December 31, 2009 — $1,933,874 and December 31, 2011 — $18,526,999. Net capital losses of $209,673 that are attributable to security transactions incurred after October 31, 2007, are treated as arising on January 1, 2008, the first day of the Fund’s next taxable year. Availability of a cert ain amount of these loss carryforwards, which were acquired on June 7, 2002, in a merger with John Hancock Core Growth Fund and John Hancock Core Value Fund, may be limited in a given year.
The Fund adopted the provisions of Financial Accounting Standards Board (FASB) Interpretation No. 48, Accounting for Uncertainty in Income Taxes, an interpretation of FASB Statement 109 (FIN 48), on January 1, 2007. FIN 48 prescribes a minimum threshold for financial statement recognition of the benefit of a tax position taken or expected to be taken in a tax return. The implementation of FIN 48 did not result in any unrecognized tax benefits in the accompanying financial statements. Each of the Fund’s federal tax returns for the prior three fiscal years remains subject to examination by the Internal Revenue Service.
New accounting pronouncement
In September 2006, FASB Standard No. 157, Fair Value Measurements (FAS 157), was issued and is effective for fiscal years beginning after November 15, 2007. FAS 157 defines fair value, establishing a framework for measuring fair value and expands disclosure about fair value measurements. Management is currently evaluating the application of FAS 157 to the Fund and its impact, if any, resulting from the adoption of FAS 157 on the Fund’s financial statements disclosures.
Distributions of income and gains
The Fund records distributions to shareholders from net investment income and net realized gains, if any, on the ex-dividend date. There were no distributions during the years ended December 31, 2006, and December 31, 2007. Distributions paid by the Fund with respect to each class of shares are calculated in the same manner, at the same time and are in the same amount, except for the effect of expenses that may be applied differently to each class.
As of December 31, 2007, there were no distributable earnings on a tax basis.
Annual report | Core Equity Fund
27
Such distributions and distributable earnings, on a tax basis, are determined in conformity with income tax regulations, which may differ from accounting principles generally accepted in the United States of America. Distributions in excess of tax basis earnings and profits, if any, are reported in the Fund’s financial statements as a return of capital.
Capital accounts within financial statements are adjusted for permanent book-tax differences. These adjustments have no impact on net assets or the results of operations. Temporary book-tax differences will reverse in a subsequent period. Permanent differences are primarily attributable to net operating losses.
Note 3
Management fee and transactions with affiliates and others
The Fund has an investment management contract with the Adviser. Under the investment management contract, the Fund pays a monthly management fee to the Adviser equivalent, on an annual basis, to the sum of: (a) 0.75% of the first $750,000,000 of the Fund’s average daily net asset value and (b) 0.70% of the Fund’s average daily net asset value in excess of $750,000,000. The effective rate for the year ended December 31, 2007 is 0.75% of the Fund’s average daily net asset value. The Adviser has a subadvisory agreement with Independence Investments LLC. The Fund is not responsible for payment of the subadvisory fees.
The Fund has a Distribution Agreement with John Hancock Funds, LLC (JH Funds), a wholly owned subsidiary of the Adviser. The Fund has adopted Distribution Plans with respect to Class A, Class B and Class C, pursuant to Rule 12b-1 under the 1940 Act, to reimburse JH Funds for the services it provides as distributor of shares of the Fund. Accordingly, the Fund makes monthly payments to JH Funds at an annual rate not to exceed 0.30%, 1.00% and 1.00% of average daily net asset value of Class A, Class B and Class C, respectively. A maximum of 0.25% of such payments may be service fees, as defined by the Conduct Rules of the Financial Industry Regulatory Authority (formerly the National Association of Securities Dealers). Under the Conduct Rules, curtailment of a portion of the Fund’s 12b-1 payments could occur under certain circumstances.
Class A shares are assessed up-front sales charges. During the year ended December 31, 2007, JH Funds received net up-front sales charges of $133,671 with regard to sales of Class A shares. Of this amount, $13,212 was retained and used for printing prospectuses, advertising, sales literature and other purposes, $87,986 was paid as sales commissions to unrelated broker-dealers and $32,473 was paid as sales commissions to sales personnel of Signator Investors, Inc. (Signator Investors), a related broker-dealer. The Adviser’s indirect parent, John Hancock Life Insurance Company (JHLICO), is the indirect sole shareholder of Signator Investors.
Class B shares that are redeemed within six years of purchase are subject to a contingent deferred sales charge (CDSC) at declining rates, beginning at 5.00% of the lesser of the current market value at the time of redemption or the original purchase cost of the shares being redeemed. Class C shares that are redeemed within one year of purchase are subject to a CDSC at a rate of 1.00% of the lesser of the current market value at the time of redemption or the original purchase cost of the shares being redeemed. Proceeds from the CDSCs are paid to JH Funds and are used in whole or in part to defray its expenses for providing distribution-related services to the Fund in connection with the sale of Class B and Class C shares. During the year ended December 31, 2007, CDSCs received by JH Funds amounted to $130,092 for Class B shares and $1,422 for Class C shares.
The Fund has a transfer agent agreement with John Hancock Signature Services, Inc. (Signature Services), an indirect subsidiary of JHLICO. For Class A, Class B, Class C and Class I shares, the Fund pays a monthly transfer agent fee at an annual rate of 0.05% of each class’s average daily net asset value, plus a fee based on the number of shareholder accounts and reimbursement for certain out-of-pocket expenses, aggregated and allocated to each
Core Equity Fund | Annual report
28
class on the basis of its relative net asset value. Effective June 1, 2007, for the Class I shares the Fund pays a monthly transfer agent fee at a total annual rate of 0.04% of the Class I average daily net asset value. The Fund pays a monthly fee which is based on an annual rate of $15.00 for each Class A shareholder account, $17.50 for each Class B shareholder account, $16.50 for each Class C shareholder account and $15.00 for each Class I shareholder account. Effective May 1, 2007, Signature Services had agreed to limit Class A, Class B and Class C transfer agent fee to 0.25% of each respective class’s average daily net asset value until April 30, 2008. Accordingly, the transfer agent expense for Class A, Class B and Class C shares was reduced by $134,827 for the year ended December 31, 2007. The effective transfer agent fee expense for the year ended December 31, 2007, was 0.31% . Signature Services reserves the right to terminate this limitation in the future.
In May 2007, the Fund began receiving earnings credits from its transfer agent as a result of uninvested cash balances. These credits are used to reduce a portion of the Fund’s transfer agent fees and out of pocket expenses. During the year ended December 31, 2007, the Fund’s transfer agent fees and out of pocket expenses were reduced by $16,627 for transfer agent credits earned.
Expenses under the agreements described above for the year ended December 31, 2007, were as follows:
| Transfer | Distribution and | |
| Share class | agent fees | service fees |
| Class A | $733,767 | $609,409 |
| Class B | 289,934 | 799,918 |
| Class C | 45,518 | 127,608 |
| Class I | 6 | — |
| Total | $1,069,225 | $1,536,935 |
The Fund has an agreement with the Adviser and affiliates to perform necessary tax, accounting, compliance, legal and other administrative services for the Fund. The compensation for the year amounted to $38,547 with an effective rate of 0.01% of the Fund’s average daily net asset value.
Mr. James R. Boyle is Chairman of the Adviser, as well as affiliated Trustee of the Fund, and is compensated by the Adviser and/or its affiliates. The compensation of unaffiliated Trustees is borne by the Fund. The unaffiliated Trustees may elect to defer, for tax purposes, their receipt of this compensation under the John Hancock Group of Funds Deferred Compensation Plan. The Fund makes investments into other John Hancock funds, as applicable, to cover its liability for the deferred compensation. Investments to cover the Fund’s deferred compensation liability are recorded on the Fund’s books as an other asset. The deferred compensation liability and the related other asset are always equal and are marked to market on a periodic basis to reflect any income earned by the investments, as well as any unrealized gains or losses. The Deferred Compensation Plan investments had no impact on the operations of the Fund.
Annual report | Core Equity Fund
29
Note 4
Fund share transactions
This listing illustrates the number of Fund shares sold, reinvested and repurchased during the years ended December 31, 2006, and December 31, 2007, along with the corresponding dollar value.
| Year ended 12-31-06 | Year ended 12-31-07 | |||
| Shares | Amount | Shares | Amount | |
| Class A shares | ||||
| Sold | 1,279,948 | $39,564,105 | 1,165,438 | $40,633,395 |
| Repurchased | (1,951,434) | (60,601,814) | (1,527,563) | (53,517,439) |
| Net decrease | (671,486) | ($21,037,709) | (362,125) | ($12,884,044) |
| Class B shares | ||||
| Sold | 277,399 | $8,058,350 | 155,147 | $5,041,241 |
| Repurchased | (2,100,542) | (60,689,815) | (1,478,426) | (47,962,580) |
| Net decrease | (1,823,143) | ($52,631,465) | (1,323,279) | ($42,921,339) |
| Class C shares | ||||
| Sold | 45,830 | $1,343,295 | 51,194 | $1,654,212 |
| Repurchased | (174,674) | (5,093,902) | (122,007) | (3,963,845) |
| Net decrease | (128,844) | ($3,750,607) | (70,813) | ($2,309,633) |
| Class I shares | ||||
| Sold | 1,658 | $52,282 | 700 | $24,766 |
| Repurchased | (7,573) | (239,205) | (250) | (8,670) |
| Net increase (decrease) | (5,915) | ($186,923) | 450 | $16,096 |
| Net decrease | (2,629,388) | ($77,606,704) | (1,755,767) | ($58,098,920) |
Note 5
Purchase and sale of securities
Purchases and proceeds from sales or maturities of securities, other than short-term securities and obligations of the U.S. government, during the year ended December 31, 2007, aggregated $431,611,017 and $488,940,506 respectively.
The cost of investments owned on December 31, 2007, including short-term investments, for federal income tax purposes was $219,143,905. Gross unrealized appreciation and depreciation of investments aggregated $50,647,271 and $5,230,462, respectively, resulting in net unrealized appreciation of $45,416,809. The difference between book basis and tax basis net unrealized appreciation of investments is attributable primarily to the tax deferral of losses on certain sales of securities.
Core Equity Fund | Annual report
30
Auditors’ report
Report of Independent Registered Public Accounting Firm
To the Board of Trustees of John Hancock Capital Series and Shareholders of John Hancock Core Equity Fund,
In our opinion, the accompanying statement of assets and liabilities, including the schedule of investments, and the related statements of operations and of changes in net assets and the financial highlights present fairly, in all material respects, the financial position of John Hancock Core Equity Fund (the Fund) at December 31, 2007, and the results of its operations, the changes in its net assets and the financial highlights for the periods indicated, in conformity with accounting principles generally accepted in the United States of America. These financial statements and financial highlights (hereafter referred to as “financial statements”) are the responsibility of the Fund’s management. Our responsibility is to express an opinion on these financial statements based on our audits. We conducted our audits of these financial statements in accordance with the standards of the Public Company Accounting Oversight Board (United States). Those standards re quire that we plan and perform the audit to obtain reasonable assurance about whether the financial statements are free of material misstatement. An audit includes examining, on a test basis, evidence supporting the amounts and disclosures in the financial statements, assessing the accounting principles used and significant estimates made by management, and evaluating the overall financial statement presentation. We believe that our audits, which included confirmation of securities at December 31, 2007 by correspondence with the custodian and brokers, provide a reasonable basis for our opinion.
PricewaterhouseCoopers LLP
Boston, Massachusetts
February 28, 2008
Annual report | Core Equity Fund
31
Tax information
Unaudited
The Fund had no distributions for the year ended December 31, 2007. As a result, the 2007 U.S. Treasury Department Form 1099-DIV is not required to be mailed to shareholders.
Core Equity Fund | Annual report
32
Board Consideration of and
Continuation of Investment Advisory
Agreement and Subadvisory
Agreement: John Hancock
Core Equity Fund
The Investment Company Act of 1940 (the 1940 Act) requires the Board of Trustees (the Board) of John Hancock Capital Series (the Trust), including a majority of the Trustees who have no direct or indirect interest in the investment advisory agreement and are not “interested persons” of the Trust, as defined in the 1940 Act (the Independent Trustees), annually to meet in person to review and consider the continuation of: (i) the investment advisory agreement (the Advisory Agreement) with John Hancock Advisers, LLC (the Adviser) and (ii) the investment subadvisory agreement (the Subadvisory Agreement) with Independence Investment LLC (the Subadviser) for the John Hancock Core Equity Fund (the Fund). The Advisory Agreement with the Adviser and the Subadvisory Agreement with the Subadviser are collectively referred to as the Advisory Agreements.
At meetings held on May 7 and June 4–5, 2007, the Board considered the factors and reached the conclusions described below relating to the selection of the Adviser and Subadviser and the continuation of the Advisory Agreements. During such meetings, the Board’s Contracts/ Operations Committee and the Independent Trustees also met in executive sessions with their independent legal counsel.
In evaluating the Advisory Agreements, the Board, including the Contracts/Operations Committee and the Independent Trustees, reviewed a broad range of information requested for this purpose by the Independent Trustees, including: (i) the investment performance of the Fund relative to a category of relevant funds (the Category) and a peer group of comparable funds (the Peer Group) each selected by Morningstar, Inc. (Morningstar), an independent provider of investment company data, for a range of periods ended December 31, 2006, (ii) advisory and other fees incurred by, and the expense ratios of, the Fund relative to a Category and a Peer Group, (iii) the advisory fees of comparable portfolios of other clients of the Adviser and the Subadviser, (iv) the Adviser’s financial results and condition, including its and certain of its affiliates’ profitability from services performed for the Fund, (v) breakpoints in the Fund’s and the Peer Group’s fees, and information about economies of scale, (vi) the Adviser’s and Subadviser’s record of compliance with applicable laws and regulations, with the Fund’s investment policies and restrictions, and with the applicable Code of Ethics, and the structure and responsibilities of the Adviser’s and Subadviser’s compliance department, (vii) the background and experience of senior management and investment professionals, and (viii) the nature, cost and character of advisory and non-investment management services provided by the Adviser and its affiliates and by the Subadviser.
The Independent Trustees considered the legal advice of independent legal counsel and relied on their own business judgment in determining the factors to be considered in evaluating the materials that were presented to them and the weight to be given to each such factor. The Board’s review and conclusions were based on a comprehensive consideration of all information presented to the Board and not the result of any single controlling factor. They principally considered performance and other information as of December 31, 2006; performance and other information may be quite different as of the date of this shareholders report. The key factors considered by the Board and the conclusions reached are described below.
Nature, extent and quality of services
The Board considered the ability of the Adviser and the Subadviser, based on their resources, reputation and other attributes, to attract and retain qualified investment professionals, including research, advisory and supervisory personnel. The Board considered the investment philosophy, research and investment decision-making processes of the Adviser and Subadviser. The Board further considered the culture of compliance, resources dedicated to compliance, compliance programs and compliance records of the Adviser and Subadviser. In addition, the Board took into account the administrative and
Annual report | Core Equity Fund
33
other non-advisory services provided to the Fund by the Adviser and its affiliates.
Based on the above factors, together with those referenced below, the Board concluded that, within the context of its full deliberations, the nature, extent and quality of the investment advisory services provided to the Fund by the Adviser and Subadviser were sufficient to support renewal of the Advisory Agreements.
Fund performance
The Board considered the performance results for the Fund over various time periods ended December 31, 2006. The Board also considered these results in comparison to the performance of the Category, as well as the Fund’s benchmark index. Morningstar determined the Category and Peer Group for the Fund. The Board reviewed with a representative of Morningstar the methodology used by Morningstar to select the funds in the Category and the Peer Group.
The Board noted that the performance of the Fund during the 1-, 3-, 5- and 10-year periods was equal to or higher than the Peer Group median. The Board also noted that the performance of the Fund over the same time periods was lower than the performance of the Category median, and its benchmark index, the Russell 1000. The Adviser discussed with the Board factors that contributed to the Fund’s underperformance and noted that the Fund’s 2007 year-to-date performance showed improvement. The Adviser discussed with the Board additional measures that had been taken with the objective of improving performance. The Board stated its intent to continue to monitor the Fund’s performance trends to assess whether remedial changes are warranted.
Investment advisory fee and subadvisory fee rates and expenses
The Board reviewed and considered the contractual investment advisory fee rate payable by the Fund to the Adviser for investment advisory services (the Advisory Agreement Rate). The Board received and considered information comparing the Advisory Agreement Rate with the advisory fees for the Peer Group. The Board noted that the Advisory Agreement Rate was equal to the median rate of the Category and not appreciably higher than the median rate of the Peer Group.
The Board received and considered expense information regarding the Fund’s various components, including advisory fees, distribution and fees other than advisory and distribution fees, including transfer agent fees, custodian fees and other miscellaneous fees (e.g., fees for accounting and legal services). The Board considered comparisons of these expenses to the Peer Group median. The Board also received and considered expense information regarding the Fund’s total operating expense ratio (Gross Expense Ratio) and total operating expense ratio after taking the fee waiver arrangement applicable to the Advisory Agreement Rate into account (Net Expense Ratio). The Board received and considered information comparing the Gross Expense Ratio and Net Expense Ratio of the Fund to that of the Peer Group and Category medians. The Board noted that the Fund’s Gross and Net Expense Ratios were higher than the median of the Peer Group and Category. The Board also noted that the most significant contributor to such difference was the Fund’s transfer agency expense. The transfer agent explained that the transfer agency expense had fee caps that were not reflected in the Morningstar analysis. The Board favorably considered the impact of fee caps towards ultimately lowering the Fund’s total operating expense ratio.
The Adviser also discussed the Morningstar data and rankings, and other relevant information, for the Fund. Based on the above-referenced considerations and other factors, the Board concluded that the Fund’s overall performance and expenses supported the re-approval of the Advisory Agreements.
The Board also received information about the investment subadvisory fee rate (the Subadvisory Agreement Rate) payable by the Adviser to the Subadviser for investment sub-advisory services. The Board concluded that the Subadvisory Agreement Rate was fair and equitable, based on its consideration of the factors described here.
Profitability
The Board received and considered a detailed profitability analysis of the Adviser based
Core Equity Fund | Annual report
34
on the Advisory Agreements, as well as on other relationships between the Fund and the Adviser and its affiliates. The Board also considered a comparison of the Adviser’s profitability to that of other similar investment advisers whose profitability information is publicly available. The Board concluded that, in light of the costs of providing investment management and other services to the Fund, the profits and other ancillary benefits reported by the Adviser were not unreasonable.
The Board did not consider profitability information with respect to the Subadviser, which is not affiliated with the Adviser. The Board considered that the Subadvisory Rate paid to the Subadviser had been negotiated by the Adviser on an arm’s length basis and that the Subadviser’s separate profitability from its relationship with the Fund was not a material factor in determining whether to renew the agreement.
Economies of scale
The Board received and considered general information regarding economies of scale with respect to the management of the Fund, including the Fund’s ability to appropriately benefit from economies of scale under the Fund’s fee structure. The Board recognized the inherent limitations of any analysis of economies of scale, stemming largely from the Board’s understanding that most of the Adviser’s costs are not specific to individual Funds, but rather are incurred across a variety of products and services.
To the extent the Board and the Adviser were able to identify actual or potential economies of scale from Fund-specific or allocated expenses, in order to ensure that any such economies continue to be reasonably shared with the Fund as its assets increase, the Adviser and the Board agreed to continue the existing breakpoints to the Advisory Agreement Rate.
Information about services to other clients
The Board also received information about the nature, extent and quality of services and fee rates offered by the Adviser and Subadviser to their other clients, including other registered investment companies, institutional investors and separate accounts. The Board concluded that the Advisory Agreement Rate and the Subadvisory Agreement Rate were not unreasonable, taking into account fee rates offered to others by the Adviser and Subadviser, respectively, after giving effect to differences in services.
Other benefits to the Adviser
The Board received information regarding potential “fall-out” or ancillary benefits received by the Adviser and its affiliates as a result of the Adviser’s relationship with the Fund. Such benefits could include, among others, benefits directly attributable to the relationship of the Adviser with the Fund and benefits potentially derived from an increase in the business of the Adviser as a result of its relationship with the Fund (such as the ability to market to shareholders other financial products offered by the Adviser and its affiliates).
The Board also considered the effectiveness of the Adviser’s, Subadviser’s and Fund’s policies and procedures for complying with the requirements of the federal securities laws, including those relating to best execution of portfolio transactions and brokerage allocation.
Other factors and broader review
As discussed above, the Board reviewed detailed materials received from the Adviser and Subadviser as part of the annual re-approval process. The Board also regularly reviews and assesses the quality of the services that the Fund receives throughout the year. In this regard, the Board reviews reports of the Adviser at least quarterly, which include, among other things, a detailed portfolio review, detailed fund performance reports and compliance reports. In addition, the Board meets with portfolio managers and senior investment officers at various times throughout the year.
After considering the above-described factors and based on its deliberations and its evaluation of the information described above, the Board concluded that approval of the continuation of the Advisory Agreements for the Fund was in the best interest of the Fund and its shareholders. Accordingly, the Board unanimously approved the continuation of the Advisory Agreements.
Annual report | Core Equity Fund
35
Trustees and Officers
This chart provides information about the Trustees and Officers who oversee your John Hancock fund. Officers elected by the Trustees manage the day-to-day operations of the Fund and execute policies formulated by the Trustees.
| Independent Trustees | ||
| Name, Year of Birth | Number of | |
| Position(s) held with Fund | Trustee | John Hancock |
| Principal occupation(s) and other | of Fund | funds overseen |
| directorships during past 5 years | since1 | by Trustee |
| James F. Carlin, Born: 1940 | 2005 | 55 |
| Interim Chairman (since December 2007); Director and Treasurer, Alpha Analytical Laboratories, Inc. | ||
| (chemical analysis) (since 1985); Part Owner and Treasurer, Lawrence Carlin Insurance Agency, Inc. | ||
| (since 1995); Part Owner and Vice President, Mone Lawrence Carlin Insurance Agency, Inc. (until 2005); | ||
| Chairman and Chief Executive Officer, Carlin Consolidated, Inc. (management/investments) (since 1987); | ||
| Trustee, Massachusetts Health and Education Tax Exempt Trust (1993–2003). | ||
| William H. Cunningham, Born: 1944 | 2005 | 55 |
| Professor, University of Texas at Austin (since 1971); former Chancellor, University of Texas System and | ||
| former President, University of Texas at Austin (until 2001); Chairman and Chief Executive Officer, IBT | ||
| Technologies (until 2001); Director of the following: Hicks Acquisition Company I, Inc. (since 2007); | ||
| Hire.com (until 2004), STC Broadcasting, Inc. and Sunrise Television Corp. (until 2001), Symtx, Inc. | ||
| (electronic manufacturing) (since 2001), Adorno/Rogers Technology, Inc. (until 2004), Pinnacle Foods | ||
| Corporation (until 2003), rateGenius (until 2003), Lincoln National Corporation (insurance) (since 2006), | ||
| Jefferson-Pilot Corporation (diversified life insurance company) (until 2006), New Century Equity | ||
| Holdings (formerly Billing Concepts) (until 2001), eCertain (until 2001), ClassMap.com (until 2001), | ||
| Agile Ventures (until 2001), AskRed.com (until 2001), Southwest Airlines (since 2000), Introgen (man- | ||
| ufacturer of biopharmaceuticals) (since 2000) and Viasystems Group, Inc. (electronic manufacturer) | ||
| (until 2003); Advisory Director, Interactive Bridge, Inc. (college fundraising) (until 2001); Advisory | ||
| Director, Q Investments (until 2003); Advisory Director, JPMorgan Chase Bank (formerly Texas Commerce | ||
| Bank–Austin), LIN Television (until 2008), WilTel Communications (until 2003) and Hayes Lemmerz | ||
| International, Inc. (diversified automotive parts supply company) (since 2003). | ||
| Charles L. Ladner, 2 Born: 1938 | 2004 | 55 |
| Chairman and Trustee, Dunwoody Village, Inc. (retirement services) (until 2003); Senior Vice President | ||
| and Chief Financial Officer, UGI Corporation (public utility holding company) (retired 1998); Vice | ||
| President and Director, AmeriGas, Inc. (retired 1998); Director, AmeriGas Partners, L.P. (gas distribution) | ||
| (until 1997); Director, EnergyNorth, Inc. (until 1997); Director, Parks and History Association (until 2005). | ||
| John A. Moore,2 Born: 1939 | 1996 | 55 |
| President and Chief Executive Officer, Institute for Evaluating Health Risks (nonprofit institution) | ||
| (until 2001); Senior Scientist, Sciences International (health research) (until 2003); Former Assistant | ||
| Administrator and Deputy Administrator, Environmental Protection Agency; Principal, Hollyhouse | ||
| (consulting) (since 2000); Director, CIIT Center for Health Science Research (nonprofit research) | ||
| (until 2007). | ||
Core Equity Fund | Annual report
36
| Independent Trustees (continued) | ||
| Name, Year of Birth | Number of | |
| Position(s) held with Fund | Trustee | John Hancock |
| Principal occupation(s) and other | of Fund | funds overseen |
| directorships during past 5 years | since1 | by Trustee |
| Patti McGill Peterson,2 Born: 1943 | 1996 | 55 |
| Senior Associate, Institute for Higher Education Policy (since 2007); Executive Director, Council for | ||
| International Exchange of Scholars and Vice President, Institute of International Education (until 2007); | ||
| Senior Fellow, Cornell Institute of Public Affairs, Cornell University, Ithaca, NY (until 1998); Former | ||
| President, Wells College, Aurora, NY, and St. Lawrence University, Canton, NY; Director, Niagara | ||
| Mohawk Power Corporation (until 2003); Director, Ford Foundation, International Fellowships Program | ||
| (since 2002); Director, Lois Roth Endowment (since 2002); Director, Council for International Educational | ||
| Exchange (since 2003). | ||
| Steven R. Pruchansky, Born: 1944 | 2005 | 55 |
| Chairman and Chief Executive Officer, Greenscapes of Southwest Florida, Inc. (since 2000); Director and | ||
| President, Greenscapes of Southwest Florida, Inc. (until 2000); Managing Director, JonJames, LLC (real | ||
| estate) (since 2000); Director, First Signature Bank & Trust Company (until 1991); Director, Mast Realty | ||
| Trust (until 1994); President, Maxwell Building Corp. (until 1991). | ||
| Non-Independent Trustees3 | ||
| Name, Year of Birth | Number of | |
| Position(s) held with Fund | Trustee | John Hancock |
| Principal occupation(s) and other | of Fund | funds overseen |
| directorships during past 5 years | since1 | by Trustee |
| James R. Boyle, Born: 1959 | 2005 | 265 |
| Executive Vice President, Manulife Financial Corporation (since 1999); President, John Hancock Variable | ||
| Life Insurance Company (since March 2007); Executive Vice President, John Hancock Life Insurance | ||
| Company (since 2004); Chairman and Director, John Hancock Advisers, LLC (the Adviser), John Hancock | ||
| Funds, LLC and The Berkeley Financial Group, LLC (The Berkeley Group) (holding company) (since 2005); | ||
| Senior Vice President, The Manufacturers Life Insurance Company (U.S.A.) (until 2004). | ||
Annual report | Core Equity Fund
37
| Principal officers who are not Trustees | |
| Name, Year of Birth | |
| Position(s) held with Fund | Officer |
| Principal occupation(s) and other | of Fund |
| directorships during past 5 years | since |
| Keith F. Hartstein, Born: 1956 | 2005 |
| President and Chief Executive Officer | |
| Senior Vice President, Manulife Financial Corporation (since 2004); Director, President and Chief | |
| Executive Officer, the Adviser, The Berkeley Group and John Hancock Funds, LLC (since 2005); Director, | |
| MFC Global Investment Management (U.S.), LLC (MFC Global (U.S.)) (since 2005); Director, John | |
| Hancock Signature Services, Inc. (since 2005); President and Chief Executive Officer, John Hancock | |
| Investment Management Services, LLC (since 2006); President and Chief Executive Officer, John Hancock | |
| Funds, John Hancock Funds II, John Hancock Funds III and John Hancock Trust (since 2005); Director, | |
| Chairman and President, NM Capital Management, Inc. (since 2005); Member, Investment Company | |
| Institute Sales Force Marketing Committee (since 2003); President and Chief Executive Officer, MFC | |
| Global (U.S.) (2005–2006); Executive Vice President, John Hancock Funds, LLC (until 2005). | |
| Thomas M. Kinzler, Born: 1955 | 2006 |
| Secretary and Chief Legal Officer | |
| Vice President and Counsel, John Hancock Life Insurance Company (U.S.A.) (since 2006); Secretary and | |
| Chief Legal Officer, John Hancock Funds and John Hancock Funds II (since 2006); Chief Legal Officer | |
| and Assistant Secretary, John Hancock Trust (since 2006); Vice President and Associate General Counsel, | |
| Massachusetts Mutual Life Insurance Company (1999–2006); Secretary and Chief Legal Counsel, MML | |
| Series Investment Fund (2000–2006); Secretary and Chief Legal Counsel, MassMutual Institutional Funds | |
| (2000–2004); Secretary and Chief Legal Counsel, MassMutual Select Funds and MassMutual Premier | |
| Funds (2004–2006). | |
| Francis V. Knox, Jr., Born: 1947 | 2005 |
| Chief Compliance Officer | |
| Vice President and Chief Compliance Officer, John Hancock Investment Management Services, LLC, | |
| the Adviser and MFC Global (U.S.) (since 2005); Vice President and Chief Compliance Officer, John | |
| Hancock Funds, John Hancock Funds II, John Hancock Funds III and John Hancock Trust (since 2005); | |
| Vice President and Assistant Treasurer, Fidelity Group of Funds (until 2004); Vice President and Ethics & | |
| Compliance Officer, Fidelity Investments (until 2001). | |
| Charles A. Rizzo, Born: 1957 | 2007 |
| Chief Financial Officer | |
| Chief Financial Officer, John Hancock Funds, John Hancock Funds II, John Hancock Funds III and John | |
| Hancock Trust (since June 2007); Assistant Treasurer, Goldman Sachs Mutual Fund Complex (regis- | |
| tered investment companies) (2005–June 2007); Vice President, Goldman Sachs (2005–June 2007); | |
| Managing Director and Treasurer of Scudder Funds, Deutsche Asset Management (2003–2005); | |
| Director, Tax and Financial Reporting, Deutsche Asset Management (2002–2003); Vice President and | |
| Treasurer, Deutsche Global Fund Services (Deutsche Registered Investment Companies) (1999–2002). | |
| Gordon M. Shone, Born: 1956 | 2006 |
| Treasurer | |
| Senior Vice President, John Hancock Life Insurance Company (U.S.A.) (since 2001); Treasurer, John | |
| Hancock Funds (since 2006), John Hancock Funds II, John Hancock Funds III and John Hancock Trust | |
| (since 2005); Vice President and Chief Financial Officer, John Hancock Trust (2003–2005); Vice President, | |
| John Hancock Investment Management Services, Inc., John Hancock Advisers, LLC (since 2006) and The | |
| Manufacturers Life Insurance Company (U.S.A.) (1998–2000). | |
Core Equity Fund | Annual report
38
| Principal officers who are not Trustees (continued) | |
| Name, Year of Birth | |
| Position(s) held with Fund | Officer |
| Principal occupation(s) and other | of Fund |
| directorships during past 5 years | since |
| John G. Vrysen, Born: 1955 | 2005 |
| Chief Operating Officer | |
| Senior Vice President, Manulife Financial Corporation (since 2006); Director, Executive Vice President | |
| and Chief Operating Officer, the Adviser, The Berkeley Group and John Hancock Funds, LLC (since | |
| June 2007); Executive Vice President and Chief Operating Officer, John Hancock Investment | |
| Management Services, LLC (since December 2007); Chief Operating Officer, John Hancock Funds, | |
| John Hancock Funds II, John Hancock Funds III and John Hancock Trust (since June 2007); Director, | |
| Executive Vice President and Chief Financial Officer, the Adviser, The Berkeley Group and John Hancock | |
| Funds, LLC (2005–2007); Executive Vice President and Chief Financial Officer, John Hancock Investment | |
| Management Services, LLC (2005–2007); Executive Vice President and Chief Financial Officer, MFC | |
| Global (U.S.) (2005 until August 2007); Director, John Hancock Signature Services, Inc. (since 2005); | |
| Chief Financial Officer, John Hancock Funds, John Hancock Funds II, John Hancock Funds III and John | |
| Hancock Trust (2005 until June 2007); Vice President and General Manager, John Hancock Fixed | |
| Annuities, U.S. Wealth Management (2004–2005); Vice President, Operations, Manulife Wood Logan | |
| (2000–2004). | |
The business address for all Trustees and Officers is 601 Congress Street, Boston, Massachusetts 02210-2805.
The Statement of Additional Information of the Fund includes additional information about members of the Board of Trustees of the Fund and is available without charge, upon request, by calling 1-800-225-5291.
1 Each Trustee serves until resignation, retirement age or until his or her successor is elected.
2 Member of Audit and Compliance Committee.
3 Non-Independent Trustee holds positions with the Fund’s investment adviser, underwriter and certain other affiliates.
Annual report | Core Equity Fund
39
For more information
The Fund’s proxy voting policies, procedures and records are available without charge, upon request:
| By phone | On the Fund’s Web site | On the SEC’s Web site |
| 1-800-225-5291 | www.jhfunds.com/proxy | www.sec.gov |
| Investment adviser | Custodian | Legal counsel |
| John Hancock Advisers, LLC | The Bank of New York | Kirkpatrick & Lockhart |
| 601 Congress Street | One Wall Street | Preston Gates Ellis LLP |
| Boston, MA 02210-2805 | New York, NY 10286 | One Lincoln Street |
| Boston, MA 02111-2950 | ||
| Subadviser | Transfer agent | |
| Independence Investments LLC | John Hancock Signature | Independent registered public |
| 160 Federal Street | Services, Inc. | accounting firm |
| Boston, MA 02110 | P.O. Box 9510 | PricewaterhouseCoopers LLP |
| Portsmouth, NH 03802-9510 | 125 High Street | |
| Principal distributor | Boston, MA 02110 | |
| John Hancock Funds, LLC | ||
| 601 Congress Street | ||
| Boston, MA 02210-2805 | ||
| How to contact us | ||
| Internet | www.jhfunds.com | |
| Regular mail: | Express mail: | |
| John Hancock Signature | John Hancock Signature | |
| Services, Inc. | Services, Inc. | |
| P.O. Box 9510 | Mutual Fund Image Operations | |
| Portsmouth, NH 03802-9510 | 164 Corporate Drive | |
| Portsmouth, NH 03801 | ||
| Phone | Customer service representatives | 1-800-225-5291 |
| EASI-Line | 1-800-338-8080 | |
| TDD line | 1-800-554-6713 | |
A listing of month-end portfolio holdings is available on our Web site, www.jhfunds.com. A more detailed portfolio holdings summary is available on a quarterly basis 60 days after the fiscal quarter on our Web site or upon request by calling 1-800-225-5291, or on the SEC’s Web site, www.sec.gov.
Core Equity Fund | Annual Report
40

1-800-225-5291
1-800-554-6713 TDD
1-800-338-8080 EASI-Line
www.jhfunds. com
Now available: electronic delivery
www.jhfunds.com/edelivery
| This report is for the information of the shareholders of John Hancock International Classic Value Fund | 2500A 12/07 |
| It is not authorized for distribution to prospective investors unless preceded or accompanied by a prospectus | 2/08 |
Discussion of Fund performance
By Sustainable Growth Advisers, LP
In 2007, U.S. stocks advanced for the fifth consecutive year. Much of the rally in stocks occurred in the first six months, whereas a meltdown in the subprime lending industry led to increased volatility and a downturn late in the year. The broad stock indexes gained around 5% for the year, led by large-cap and growth stocks.
For the year ended December 31, 2007, John Hancock U.S. Global Leaders Growth Fund’s Class A, Class B, Class C, Class I and Class R1 shares posted total returns of 3.67%, 2.90%, 2.90%, 4.13% and 3.43%, respectively, at net asset value. The Fund’s performance trailed the 13.35% return of the average large growth fund, according to Morningstar, Inc., as well as the 5.49% return of the S&P 500 Index and the 11.81% return of the Russell 1000 Growth Index.
“In 2007, U.S. stocks advanced
for the fifth consecutive year.”
The Fund lagged its benchmark index and peer group average in 2007. All of the underperformance occurred in the first half of the year; the portfolio outperformed over the last six months.
The bulk of the underperformance came from positions in the retail sector. Coffee retailer Starbucks Corp., home improvement retailer Lowe’s Cos., Inc. and office supply chain Staples, Inc. were the biggest detractors from relative performance. On the positive side, health care stocks were the best performers in the portfolio, led by generic drug maker Teva Pharmaceutical Industries Ltd., biotechnology company Genzyme Corp. and medical products maker Stryker Corp.
We added five new stocks to the portfolio and eliminated four positions in 2007. We sold home improvement retailer Home Depot and purchased Lowe’s, and we shed freight shipper UPS in exchange for FedEx Corp. We also initiated positions in cleaning products maker Ecolab, Inc., drug store chain Walgreen Co. and discount retailer Target Corp. and we sold biotechnology firm Amgen and computer maker Dell.
This commentary reflects the views of the portfolio managers through the end of the Fund’s period discussed in this report. The managers’ statements reflect their own opinions. As such, they are in no way guarantees of future events and are not intended to be used as investment advice or a recommendation regarding any specific security. They are also subject to change at any time as market and other conditions warrant.
U.S. Global Leaders Growth Fund | Annual report
6
A look at performance
| For the periods ended December 31, 2007 | |||||||||
| Average annual returns | Cumulative total returns | ||||||||
| with maximum sales charge (POP) | with maximum sales charge (POP) | ||||||||
| Inception | Since | Since | |||||||
| Class | date | 1-year | 5-year | 10-year | inception | 1-year | 5-year | 10-year | inception |
| A | 9-29-95 | –1.52% | 5.71% | 4.55% | — | –1.52% | 32.03% | 56.00% | — |
| B | 5-20-02 | –2.05 | 5.69 | — | 1.78% | –2.05 | 31.90 | — | 10.39% |
| C | 5-20-02 | 1.91 | 6.01 | — | 1.94 | 1.91 | 33.90 | — | 11.39 |
| I1 | 5-20-02 | 4.13 | 7.28 | — | 3.13 | 4.13 | 42.08 | — | 18.91 |
| R1 1 | 8-5-03 | 3.43 | — | — | 5.90 | 3.43 | — | — | 28.72 |
Performance figures assume all distributions are reinvested. Public offering price (POP) figures reflect maximum sales charge on Class A shares of 5% and the applicable contingent deferred sales charge (CDSC) on Class B and Class C shares. The returns for Class C shares have been adjusted to reflect the elimination of the front-end sales charge effective July 15, 2004. The Class B shares’ CDSC declines annually between years 1 to 6 according to the following schedule: 5, 4, 3, 3, 2, 1%. No sales charge will be assessed after the sixth year. Class C shares held for less than one year are subject to a 1% CDSC. Sales charge is not applicable for Class I and Class R1 shares.
The expense ratios of the Fund, both net (including any fee waivers or expense limitations) and gross (excluding any fee waivers or expense limitations), are set forth according to the most recent publicly available prospectuses for the Fund and may differ from the expense ratios disclosed in the Financial Highlights tables in this report. The waivers and expense limitations are contractual at least until 4-30-08. The net expenses are as follows: Class A — 1.28%, Class B — 2.03%, Class C — 2.03%, Class I — 0.84%, Class R1 — 1.70% . Had the fee waivers and expense limitations not been in place, the gross expenses would be as follows: Class A — 1.31%, Class B — 2.06%, Class C — 2.06%, Class I — 0.87%, Class R1 — 1.73% .
The returns reflect past results and should not be considered indicative of future performance. The return and principal value of an investment will fluctuate so that shares, when redeemed, may be worth more or less than their original cost. Due to market volatility, the Fund’s current performance may be higher or lower than the performance shown. For performance data current to the most recent month end, please call 1-800-225-5291 or visit the Fund’s Web site at www.jhfunds.com.
The performance table above and the chart on the next page do not reflect the deduction of taxes that a shareholder would pay on fund distributions or the redemption of fund shares.
The Fund’s performance results reflect any applicable expense reductions, without which the expenses would increase and results would have been less favorable.
1 For certain types of investors as described in the Fund’s Class I and Class R1 share prospectuses.
Annual report | U.S. Global Leaders Growth Fund
7
A look at performance
Growth of $10,000
This chart shows what happened to a hypothetical $10,000 investment in U.S. Global Leaders Growth Fund Class A shares for the period indicated. For comparison, we’ve shown the same investment in the Standard & Poor’s 500 Index and the Russell 1000 Growth Index.
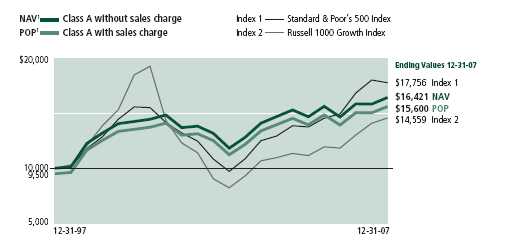
| Without sales | With maximum | ||||
| Class | Period beginning | charge | sales charge | Index 1 | Index 2 |
| B | 5-20-02 | $11,139 | $11,039 | $14,895 | $14,115 |
| C2 | 5-20-02 | 11,139 | 11,139 | 14,895 | 14,115 |
| I3 | 5-20-02 | 11,891 | 11,891 | 14,895 | 14,115 |
| R1 3 | 8-5-03 | 12,872 | 12,872 | 16,492 | 15,687 |
Assuming all distributions were reinvested for the period indicated, the table above shows the value of a $10,000 investment in the Fund’s Class B, Class C, Class I and Class R1 shares, respectively, as of December 31, 2007. The Class C shares investment with maximum sales charge has been adjusted to reflect the elimination of the front-end sales charge effective July 15, 2004. Performance of the classes will vary based on the difference in sales charges paid by shareholders investing in the different classes and the fee structure of those classes.
Standard & Poor’s 500 Index — Index 1 — is an unmanaged index that includes 500 widely traded common stocks.
Russell 1000 Growth Index — Index 2 — is an unmanaged index containing those securities in the Russell 1000 Index with a greater-than-average growth orientation.
It is not possible to invest directly in an index. Index figures do not reflect sales charges, which would have resulted in lower values if they did.
1 NAV represents net asset value and POP represents public offering price.
2 No contingent deferred sales charge applicable.
3 For certain types of investors as described in the Fund’s Class I and Class R1 share prospectuses.
U.S. Global Leaders Growth Fund | Annual report
8
Your expenses
These examples are intended to help you understand your ongoing operating expenses.
Understanding fund expenses
As a shareholder of the Fund, you incur two types of costs:
■ Transaction costs which include sales charges (loads) on purchases or redemptions (varies by share class), minimum account fee charge, etc.
■ Ongoing operating expenses including management fees, distribution and service fees (if applicable), and other fund expenses.
We are going to present only your ongoing operating expenses here.
Actual expenses/actual returns
This example is intended to provide information about your fund’s actual ongoing operating expenses, and is based on your fund’s actual return. It assumes an account value of $1,000.00 on July 1, 2007, with the same investment held until December 31, 2007.
| Account value | Ending value | Expenses paid during | |
| on 7-1-07 | on 12-31-07 | period ended 12-31-071 | |
| Class A | $1,000.00 | $1,038.20 | $6.52 |
| Class B | 1,000.00 | 1,034.50 | 10.38 |
| Class C | 1,000.00 | 1,034.10 | 10.37 |
| Class I | 1,000.00 | 1,040.60 | 4.29 |
| Class R1 | 1,000.00 | 1,038.00 | 7.34 |
Together with the value of your account, you may use this information to estimate the operating expenses that you paid over the period. Simply divide your account value at December 31, 2007, by $1,000.00, then multiply it by the “expenses paid” for your share class from the table above. For example, for an account value of $8,600.00, the operating expenses should be calculated as follows:
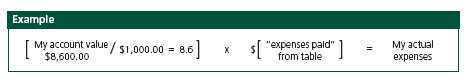
Annual report | U.S. Global Leaders Growth Fund
9
Your expenses
Hypothetical example for comparison purposes
This table allows you to compare your fund’s ongoing operating expenses with those of any other fund. It provides an example of the Fund’s hypothetical account values and hypothetical expenses based on each class’s actual expense ratio and an assumed 5% annualized return before expenses (which is not your fund’s actual return). It assumes an account value of $1,000.00 on July 1, 2007, with the same investment held until December 31, 2007. Look in any other fund shareholder report to find its hypothetical example and you will be able to compare these expenses.
| Account value | Ending value | Expenses paid during | |
| on 7-1-07 | on 12-31-07 | period ended 12-31-071 | |
| Class A | $1,000.00 | $1,018.80 | $6.46 |
| Class B | 1,000.00 | 1,015.00 | 10.28 |
| Class C | 1,000.00 | 1,015.00 | 10.28 |
| Class I | 1,000.00 | 1,021.00 | 4.24 |
| Class R1 | 1,000.00 | 1,018.00 | 7.26 |
Remember, these examples do not include any transaction costs, such as sales charges; therefore, these examples will not help you to determine the relative total costs of owning different funds. If transaction costs were included, your expenses would have been higher. See the prospectus for details regarding transaction costs.
1 Expenses are equal to the Fund’s annualized expense ratio of 1.28%, 2.03%, 2.03%, 0.83% and 1.43% for Class A, Class B, Class C, Class I and Class R1, respectively, multiplied by the average account value over the period, multiplied by number of days in most recent fiscal half-year/365 or 366 (to reflect the one-half year period).
U.S. Global Leaders Growth Fund | Annual report
10
Portfolio summary
| Top 10 holdings1 | ||||
| Staples, Inc. | 6.3% | Automatic Data Processing, Inc. | 5.0% | |
| General Electric Co. | 6.0% | State Street Corp. | 4.3% | |
| Procter & Gamble Co. (The) | 5.4% | Teva Pharmaceutical Industries Ltd. | 4.2% | |
| Microsoft Corp. | 5.3% | Starbucks Corp. | 4.0% | |
| Genzyme Corp. | 5.2% | Medtronic, Inc. | 4.0% | |
| Sector distribution1 | ||||
| Consumer staples | 25% | Industrials | 10% | |
| Information technology | 21% | Financials | 7% | |
| Health care | 19% | Materials | 2% | |
| Consumer discretionary | 15% | Other | 1% | |

1 As a percentage of net assets on December 31, 2007.
Annual report | U.S. Global Leaders Growth Fund
11
F I N A N C I A L S T A T E M E N T S
Fund’s investments
Securities owned by the Fund on 12-31-07
This schedule is divided into two main categories: common stocks and short-term investments. The common stocks are further broken down by industry group. Short-term investments, which represent the Fund’s cash position, are listed last.
| Issuer | Shares | Value |
| Common stocks 99.24% | $1,242,852,792 | |
| (Cost $1,025,769,526) | ||
| Air Freight & Logistics 3.64% | 45,565,870 | |
| FedEx Corp. | 511,000 | 45,565,870 |
| Application Software 2.98% | 37,368,600 | |
| SAP AG, ADR (Germany) (F)(L) | 732,000 | 37,368,600 |
| Asset Management & Custody Banks 4.32% | 54,099,500 | |
| State Street Corp. | 666,250 | 54,099,500 |
| Biotechnology 5.16% | 64,643,696 | |
| Genzyme Corp. (I) | 868,400 | 64,643,696 |
| Communications Equipment 3.53% | 44,249,075 | |
| QUALCOMM, Inc. | 1,124,500 | 44,249,075 |
| Data Processing & Outsourced Services 4.97% | 62,237,354 | |
| Automatic Data Processing, Inc. | 1,397,650 | 62,237,354 |
| Drug Retail 3.15% | 39,508,000 | |
| Walgreen Co. | 1,037,500 | 39,508,000 |
| Food Distributors 2.97% | 37,196,078 | |
| SYSCO Corp. | 1,191,800 | 37,196,078 |
| Food Retail 2.95% | 36,964,800 | |
| Whole Foods Market, Inc. | 906,000 | 36,964,800 |
| General Merchandise Stores 0.95% | 11,900,000 | |
| Target Corp. | 238,000 | 11,900,000 |
| Health Care Equipment 6.04% | 75,594,305 | |
| Medtronic, Inc. | 995,426 | 50,040,065 |
| Stryker Corp. | 342,000 | 25,554,240 |
| Home Entertainment Software 3.13% | 39,233,997 | |
| Electronic Arts, Inc. (I) | 671,700 | 39,233,997 |
| Home Improvement Retail 3.36% | 42,050,580 | |
| Lowe’s Cos., Inc. | 1,859,000 | 42,050,580 |
| Household Products 6.77% | 84,807,079 | |
| Colgate-Palmolive Co. | 222,250 | 17,326,610 |
| Procter & Gamble Co. (The) | 919,102 | 67,480,469 |
See notes to financial statements
U.S. Global Leaders Growth Fund | Annual report
12
F I N A N C I A L S T A T E M E N T S
| Issuer | Shares | Value | ||||
| Hypermarkets & Super Centers 1.65% | $20,600,128 | |||||
| Costco Wholesale Corp. | 295,300 | 20,600,128 | ||||
| Industrial Conglomerates 6.03% | 75,541,246 | |||||
| General Electric Co. | 2,037,800 | 75,541,246 | ||||
| Internet Software & Services 1.35% | 16,873,796 | |||||
| eBay, Inc. (I) | 508,400 | 16,873,796 | ||||
| Multi-Line Insurance 2.50% | 31,293,225 | |||||
| American International Group, Inc. | 536,762 | 31,293,225 | ||||
| Pharmaceuticals 8.21% | 102,768,172 | |||||
| Johnson & Johnson | 747,317 | 49,846,044 | ||||
| Teva Pharmaceutical Industries Ltd., ADR (Israel) (F) | 1,138,600 | 52,922,128 | ||||
| Restaurants 4.02% | 50,332,455 | |||||
| Starbucks Corp. (I) | 2,458,840 | 50,332,455 | ||||
| Soft Drinks 7.39% | 92,579,418 | |||||
| Coca-Cola Co. (The) | 716,400 | 43,965,468 | ||||
| PepsiCo, Inc. | 640,500 | 48,613,950 | ||||
| Specialty Chemicals 2.60% | 32,518,350 | |||||
| Ecolab, Inc. | 635,000 | 32,518,350 | ||||
| Specialty Stores 6.29% | 78,773,368 | |||||
| Staples, Inc. | 3,414,537 | 78,773,368 | ||||
| Systems Software 5.28% | 66,153,700 | |||||
| Microsoft Corp. | 1,858,250 | 66,153,700 | ||||
| Interest | Maturity | Credit | Par value | |||
| Issuer, description | rate | date | rating (A) | (000) | Value | |
| Short-term investments 2.63% | $32,938,021 | |||||
| (Cost $32,937,434) | ||||||
| Government U.S. Agency 0.71% | 8,900,000 | |||||
| Federal Home Loan Mortgage Assn., | ||||||
| Discount Note | 2.00% (Y) | 01-02-08 | AAA | $8,900 | 8,900,000 | |
| Interest | ||||||
| Issuer | rate | Shares | Value | |||
| Cash Equivalents 1.92% | 24,038,021 | |||||
| John Hancock Cash Investment Trust (T)(W) | 5.10% (Y) | 24,038,021 | 24,038,021 | |||
| Total investments (Cost $1,058,706,960) 101.87% | $1,275,790,813 | |||||
| Other assets and liabilities, net (1.87%) | ($23,360,228) | |||||
| Total net assets 100.00% | $1,252,430,585 | |||||
The percentage shown for each investment category is the total value of that category as a percentage of the net assets of the Fund.
See notes to financial statements
Annual report | U.S. Global Leaders Growth Fund
13
F I N A N C I A L S T A T E M E N T S
Notes to Schedule of Investments
ADR American Depositary Receipt
(A) Credit ratings are unaudited and are rated by Moody’s Investors Service where Standard & Poor’s ratings are not available, unless indicated otherwise.
(F) Parenthetical disclosure of a foreign country in the security description represents country of a foreign issuer.
(I) Non-income-producing security.
(L) All or a portion of this security is on loan as of December 31, 2007.
(T) Represents investment of securities lending collateral.
(W) Issuer is an affiliate of John Hancock Advisers, LLC.
(Y) Represents current yield as of December 31, 2007.
See notes to financial statements
U.S. Global Leaders Growth Fund | Annual report
14
F I N A N C I A L S T A T E M E N T S
Financial statements
Statement of assets and liabilities 12-31-07
This Statement of Assets and Liabilities is the Fund’s balance sheet. It shows the value of what the Fund owns, is due and owes. You’ll also find the net asset value and the maximum offering price per share.
| Assets | |
| Investments in unaffiliated issuers, at value (cost $1,034,668,939) including | |
| $23,283,905 of securities loaned (Note 2) | $1,251,752,792 |
| Investments in affiliated issuers, at value (cost $24,038,021) | 24,038,021 |
| Total investments, at value (cost $1,058,706,960) | 1,275,790,813 |
| Cash | 168,680 |
| Receivable for shares sold | 2,612,669 |
| Dividends and interest receivable | 1,916,703 |
| Receivable from affiliates | 638,911 |
| Other assets | 9,325 |
| Total assets | 1,281,137,101 |
| Liabilities | |
| Payable for shares repurchased | 2,464,079 |
| Payable upon return of securities loaned (Note 2) | 24,038,021 |
| Payable to affiliates | |
| Management fees | 806,984 |
| Distribution and service fees | 80,044 |
| Other | 297,419 |
| Accrued expenses | 1,019,969 |
| Total liabilities | 28,706,516 |
| Net assets | |
| Capital paid-in | 1,043,694,559 |
| Accumulated net realized loss on investments | (8,314,414) |
| Net unrealized appreciation of investments | 217,083,853 |
| Distributions in excess of net investment income | (33,413) |
| Net assets | $1,252,430,585 |
| Net asset value per share | |
| Based on net asset values and shares outstanding — the Fund has an | |
| unlimited number of shares authorized with no par value | |
| Class A ($1,021,732,342 ÷ 35,473,148 shares) | $28.80 |
| Class B ($107,269,513 ÷ 3,881,060 shares)1 | $27.64 |
| Class C ($113,937,837 ÷ 4,122,003 shares)1 | $27.64 |
| Class I ($6,615,835 ÷ 225,187 shares) | $29.38 |
| Class R1 ($2,875,058 ÷ 100,882 shares) | $28.50 |
| Maximum offering price per share | |
| Class A2 ($28.80 ÷ 95%) | $30.32 |
1 Redemption price is equal to net asset value less any applicable contingent deferred sales charge.
2 On single retail sales of less than $50,000. On sales of $50,000 or more and on group sales the offering price is reduced.
See notes to financial statements
Annual report | U.S. Global Leaders Growth Fund
15
F I N A N C I A L S T A T E M E N T S
Statement of operations For the year ended 12-31-07
This Statement of Operations summarizes the Fund’s investment income earned and expenses incurred in operating the Fund. It also shows net gains (losses) for the period stated.
| Investment income | |
| Dividends (net of foreign withholding taxes of $154,952) | $18,827,274 |
| Interest | 344,925 |
| Securities lending | 209,049 |
| Total investment income | 19,381,248 |
| Expenses | |
| Investment management fees (Note 3) | 10,564,529 |
| Distribution and service fees (Note 3) | 5,542,904 |
| Transfer agent fees (Note 3) | 3,350,292 |
| Accounting and legal services fees (Note 3) | 186,866 |
| Printing fees | 292,486 |
| Custodian fees | 209,273 |
| Blue sky fees | 188,633 |
| Trustees’ fees | 80,937 |
| Professional fees | 63,800 |
| Miscellaneous | 99,745 |
| Total expenses | 20,579,465 |
| Less expense reductions (Note 3) | (621,261) |
| Net expenses | 19,958,204 |
| Net investment loss | (576,956) |
| Realized and unrealized gain (loss) | |
| Net realized gain on investments | 83,713,573 |
| 83,713,573 | |
| Change in net unrealized appreciation (depreciation) of investments | (36,267,593) |
| (36,267,593) | |
| Net realized and unrealized gain | 47,445,980 |
| Increase in net assets from operations | $46,869,024 |
See notes to financial statements
U.S. Global Leaders Growth Fund | Annual report
16
F I N A N C I A L S T A T E M E N T S
Statement of changes in net assets
These Statements of Changes in Net Assets show how the value of the Fund’s net assets has changed during the last two periods. The difference reflects earnings less expenses, any investment gains and losses, distributions, if any, paid to shareholders and the net of Fund share transactions.
| Year | Year | |
| ended | ended | |
| 12-31-06 | 12-31-07 | |
| Increase (decrease) in net assets | ||
| From operations | ||
| Net investment loss | ($3,042,655) | ($576,956) |
| Net realized gain (loss) | (12,737,688) | 83,713,573 |
| Change in net unrealized appreciation (depreciation) | 30,951,174 | (36,267,593) |
| Increase in net assets resulting from operations | 15,170,831 | 46,869,024 |
| Distributions to shareholders | ||
| From net realized gain | ||
| Class A | — | (38,392,578) |
| Class B | — | (4,258,299) |
| Class C | — | (4,531,561) |
| Class I | — | (251,102) |
| Class R1 | — | (123,445) |
| — | (47,556,985) | |
| From Fund share transactions (Note 4) | (183,965,497) | (369,050,878) |
| Total decrease | (168,794,666) | (369,738,839) |
| Net assets | ||
| Beginning of year | 1,790,964,090 | 1,622,169,424 |
| End of year1 | $1,622,169,424 | $1,252,430,585 |
1 Includes distributions in excess of net investment income of $33,413 and $33,413, respectively.
See notes to financial statements
Annual report | U.S. Global Leaders Growth Fund
17
F I N A N C I A L S T A T E M E N T S
Financial highlights
The Financial Highlights show how the Fund’s net asset value for a share has changed since the end of the previous period.
| CLASS A SHARES | |||||
| Period ended | 12-31-03 | 12-31-04 | 12-31-05 | 12-31-06 | 12-31-07 |
| Per share operating performance | |||||
| Net asset value, beginning of period | $21.57 | $25.72 | $27.84 | $28.44 | $28.85 |
| Net investment income (loss)1 | —2 | 0.15 | (0.04) | —2 | 0.03 |
| Net realized and unrealized | |||||
| gain on investments | 4.15 | 2.04 | 0.64 | 0.41 | 1.04 |
| Total from investment operations | 4.15 | 2.19 | 0.60 | 0.41 | 1.07 |
| Less distributions | |||||
| From net realized gain | — | (0.07) | — | — | (1.12) |
| Net asset value, end of period | $25.72 | $27.84 | $28.44 | $28.85 | $28.80 |
| Total return3 (%) | 19.244 | 8.51 | 2.164 | 1.444 | 3.674 |
| Ratios and supplemental data | |||||
| Net assets, end of period | |||||
| (in millions) | $392 | $893 | $1,271 | $1,263 | $1,022 |
| Ratio of net expenses to average | |||||
| net assets (%) | 1.35 | 1.32 | 1.28 | 1.28 | 1.277 |
| Ratio of gross expenses to average | |||||
| net assets (%) | 1.365 | 1.32 | 1.335 | 1.325 | 1.325 |
| Ratio of net investment income | |||||
| (loss) to average net assets (%) | (0.02) | 0.57 | (0.14) | —6 | 0.10 |
| Portfolio turnover (%) | 15 | 16 | 28 | 34 | 27 |
1 Based on the average of the shares outstanding.
2 Less than $0.01 per share.
3 Assumes dividend reinvestment and does not reflect the effect of sales charges.
4 Total returns would have been lower had certain expenses not been reduced during the periods shown.
5 Does not take into consideration expense reductions during the periods shown.
6 Less than 0.01% .
7 Includes transfer agent fee earned credits of less than 0.01% to average net assets.
See notes to financial statements
U.S. Global Leaders Growth Fund | Annual report
18
F I N A N C I A L S T A T E M E N T S
Financial highlights
| CLASS B SHARES | |||||
| Period ended | 12-31-03 | 12-31-04 | 12-31-05 | 12-31-06 | 12-31-07 |
| Per share operating performance | |||||
| Net asset value, beginning of period | $21.47 | $25.41 | $27.36 | $27.75 | $27.94 |
| Net investment loss1 | (0.18) | (0.05) | (0.24) | (0.20) | (0.18) |
| Net realized and unrealized | |||||
| gain (loss) on investments | 4.12 | 2.00 | 0.63 | 0.39 | 1.00 |
| Total from investment operations | 3.94 | 1.95 | 0.39 | 0.19 | 0.82 |
| Less distributions | |||||
| From net realized gain | — | — | — | — | (1.12) |
| Net asset value, end of period | $25.41 | $27.36 | $27.75 | $27.94 | $27.64 |
| Total return2 (%) | 18.353 | 7.67 | 1.433 | 0.683 | 2.903 |
| Ratios and supplemental data | |||||
| Net assets, end of period | |||||
| (in millions) | $164 | $208 | $218 | $151 | $107 |
| Ratio of net expenses to average | |||||
| net assets (%) | 2.10 | 2.07 | 2.03 | 2.03 | 2.025 |
| Ratio of gross expenses to average | |||||
| net assets (%) | 2.114 | 2.07 | 2.084 | 2.074 | 2.074 |
| Ratio of net investment loss | |||||
| to average net assets (%) | (0.77) | (0.21) | (0.88) | (0.75) | (0.65) |
| Portfolio turnover (%) | 15 | 16 | 28 | 34 | 27 |
1 Based on the average of the shares outstanding.
2 Assumes dividend reinvestment and does not reflect the effect of sales charges.
3 Total returns would have been lower had certain expenses not been reduced during the periods shown.
4 Does not take into consideration expense reductions during the periods shown.
5 Includes transfer agent fee earned credits of less than 0.01% to average net assets.
See notes to financial statements
Annual report | U.S. Global Leaders Growth Fund
19
F I N A N C I A L S T A T E M E N T S
Financial highlights
| CLASS C SHARES | |||||
| Period ended | 12-31-03 | 12-31-04 | 12-31-05 | 12-31-06 | 12-31-07 |
| Per share operating performance | |||||
| Net asset value, beginning of period | $21.47 | $25.41 | $27.36 | $27.75 | $27.94 |
| Net investment loss1 | (0.18) | (0.04) | (0.24) | (0.20) | (0.18) |
| Net realized and unrealized | |||||
| gain (loss) on investments | 4.12 | 1.99 | 0.63 | 0.39 | 1.00 |
| Total from investment operations | 3.94 | 1.95 | 0.39 | 0.19 | 0.82 |
| From net realized gain | — | — | — | — | (1.12) |
| Net asset value, end of period | $25.41 | $27.36 | $27.75 | $27.94 | $27.64 |
| Total return2 (%) | 18.353 | 7.67 | 1.433 | 0.683 | 2.903 |
| Ratios and supplemental data | |||||
| Net assets, end of period | |||||
| (in millions) | $160 | $246 | $284 | $186 | $114 |
| Ratio of net expenses to average | |||||
| net assets (%) | 2.10 | 2.07 | 2.03 | 2.03 | 2.025 |
| Ratio of gross expenses to average | |||||
| net assets (%) | 2.114 | 2.07 | 2.084 | 2.074 | 2.074 |
| Ratio of net investment loss | |||||
| to average net assets (%) | (0.77) | (0.17) | (0.88) | (0.75) | (0.65) |
| Portfolio turnover (%) | 15 | 16 | 28 | 34 | 27 |
1 Based on the average of the shares outstanding.
2 Assumes dividend reinvestment and does not reflect the effect of sales charges.
3 Total returns would have been lower had certain expenses not been reduced during the periods shown.
4 Does not take into consideration expense reductions during the periods shown.
5 Includes transfer agent fee earned credits of less than 0.01% to average net assets.
See notes to financial statements
U.S. Global Leaders Growth Fund | Annual report
20
F I N A N C I A L S T A T E M E N T S
Financial highlights
| CLASS I SHARES | |||||
| Period ended | 12-31-03 | 12-31-04 | 12-31-05 | 12-31-06 | 12-31-07 |
| Per share operating performance | |||||
| Net asset value, beginning of period | $21.60 | $25.87 | $28.00 | $28.74 | $29.28 |
| Net investment income1 | 0.10 | 0.25 | 0.08 | 0.12 | 0.16 |
| Net realized and unrealized | |||||
| gain on investments | 4.17 | 2.06 | 0.66 | 0.42 | 1.06 |
| Total from investment operations | 4.27 | 2.31 | 0.74 | 0.54 | 1.22 |
| Less distributions | |||||
| From net realized gain | — | (0.18) | — | — | (1.12) |
| Net asset value, end of period | $25.87 | $28.00 | $28.74 | $29.28 | $29.38 |
| Total return2 (%) | 19.77 | 8.94 | 2.643 | 1.883 | 4.133 |
| Ratios and supplemental data | |||||
| Net assets, end of period | |||||
| (in millions) | $5 | $8 | $13 | $18 | $7 |
| Ratio of net expenses to average | |||||
| net assets (%) | 0.90 | 0.90 | 0.85 | 0.84 | 0.845 |
| Ratio of gross expenses to average | |||||
| net assets (%) | 0.90 | 0.90 | 0.904 | 0.874 | 0.884 |
| Ratio of net investment income | |||||
| to average net assets (%) | 0.43 | 0.94 | 0.30 | 0.43 | 0.54 |
| Portfolio turnover (%) | 15 | 16 | 28 | 34 | 27 |
1 Based on the average of the shares outstanding.
2 Assumes dividend reinvestment and does not reflect the effect of sales charges.
3 Total returns would have been lower had certain expenses not been reduced during the periods shown.
4 Does not take into consideration expense reductions during the periods shown.
5 Includes transfer agent fee earned credits of less than 0.01% to average net assets.
See notes to financial statements
Annual report | U.S. Global Leaders Growth Fund
21
F I N A N C I A L S T A T E M E N T S
Financial highlights
| CLASS R1 SHARES | |||||
| Period ended | 12-31-031 | 12-31-04 | 12-31-05 | 12-31-06 | 12-31-07 |
| Per share operating performance | |||||
| Net asset value, beginning of period | $23.02 | $25.68 | $27.77 | $28.35 | $28.63 |
| Net investment income (loss)2 | (0.04) | 0.16 | (0.12) | (0.12) | (0.06) |
| Net realized and unrealized | |||||
| gain on investments | 2.70 | 1.95 | 0.70 | 0.40 | 1.05 |
| Total from investment operations | 2.66 | 2.11 | 0.58 | 0.28 | 0.99 |
| Less distributions | |||||
| From net realized gain | — | (0.02) | — | — | (1.12) |
| Net asset value, end of period | $25.68 | $27.77 | $28.35 | $28.63 | $28.50 |
| Total return3 (%) | 11.564 | 8.20 | 2.095 | 0.995 | 3.435 |
| Ratios and supplemental data | |||||
| Net assets, end of period | |||||
| (in millions) | —6 | $2 | $5 | $6 | $3 |
| Ratio of net expenses to average | |||||
| net assets (%) | 1.757 | 1.53 | 1.54 | 1.70 | 1.5910 |
| Ratio of gross expenses to average | |||||
| net assets (%) | 1.757 | 1.53 | 1.598 | 1.738 | 1.638 |
| Ratio of net investment income | |||||
| (loss) to average net assets (%) | (0.42)7 | 0.60 | (0.42) | (0.42) | (0.21) |
| Portfolio turnover (%) | 159 | 16 | 28 | 34 | 27 |
1 Class R1 shares began operations on 8-5-03.
2 Based on the average of the shares outstanding.
3 Assumes dividend reinvestment and does not reflect the effect of sales charges.
4 Not annualized.
5 Total returns would have been lower had certain expenses not been reduced during the periods shown.
6 Less than $500.000.
7 Annualized.
8 Does not take into consideration expense reductions during the periods shown.
9 Portfolio turnover shown is calculated for the Fund for the full fiscal year.
10 Includes transfer agent fee earned credits of less than 0.01% to average net assets.
See notes to financial statements
U.S. Global Leaders Growth Fund | Annual report
22
Notes to financial statements
Note 1
Organization
John Hancock U.S. Global Leaders Growth Fund (the Fund) is a non-diversified series of John Hancock Capital Series Trust (the Trust), an open-end management investment company registered under the Investment Company Act of 1940, as amended (the 1940 Act). The investment objective of the Fund is to achieve long-term growth of capital.
The Trustees have authorized the issuance of multiple classes of shares of the Fund, designated as Class A, Class B, Class C, Class I and Class R1 shares. The shares of each class represent an interest in the same portfolio of investments of the Fund and have equal rights as to voting, redemptions, dividends and liquidation, except that certain expenses, subject to the approval of the Trustees, may be applied differently to each class of shares in accordance with current regulations of the Securities and Exchange Commission (SEC) and the Internal Revenue Service. Shareholders of a class that bears distribution and service expenses under the terms of a distribution plan have exclusive voting rights to that distribution plan. Class B shares will convert to Class A shares eight years after purchase. Effective March 1, 2007, Class R shares were redesignated Class R1 shares.
Note 2
Significant accounting policies
The financial statements have been prepared in conformity with accounting principles generally accepted in the United States of America, which require management to make certain estimates and assumptions at the date of the financial statements. Actual results could differ from those estimates. The following summarizes the significant accounting policies of the Fund:
Security valuation
The net asset value of Class A, Class B, Class C, Class I and Class R1 shares of the Fund is determined daily as of the close of the New York Stock Exchange (NYSE), normally at 4:00 P.M., Eastern Time. Short-term debt investments that have a remaining maturity of 60 days or less are valued at amortized cost, and thereafter assume a constant amortization to maturity of any discount or premium, which approximates market value. Investments in John Hancock Cash Investment Trust (JHCIT), an affiliate of John Hancock Advisers, LLC (the Adviser), a wholly owned subsidiary of John Hancock Financial Services, Inc., a subsidiary of Manulife Financial Corporation (MFC), are valued at their net asset value each business day. All other securities held by the Fund are valued at the last sale price or official closing price (closing bid price or last evaluated quote if no sale has occurred) as of the close of business on the principal securities exchange (domestic or foreign) on which they trade or, lacking any sales, at the closing bid price. Securities traded only in the over-the-counter market are valued at the last bid price quoted by brokers making markets in the securities at the close of trading. Securities for which there are no such quotations, principally debt securities, are valued based on the evaluated prices provided by an independent pricing service, which utilizes both dealer-supplied and electronic data processing techniques, which take into account factors such as institutional-size trading in similar groups of securities, yield, quality, coupon rate, maturity, type of issue, trading characteristics and other market data.
Other assets and securities for which no such quotations are readily available are valued at fair value as determined in good faith under consistently applied procedures established by and under the general supervision of the Board of Trustees. Generally, trading
Annual report | U.S. Global Leaders Growth Fund
23
in non-U.S. securities is substantially completed each day at various times prior to the close of trading on the NYSE. The values of such securities used in computing the net asset value of the Fund’s shares are generally determined as of such times. Occasionally, significant events that affect the values of such securities may occur between the times at which such values are generally determined and the close of the NYSE. Upon such an occurrence, these securities will be valued at fair value as determined in good faith under consistently applied procedures established by and under the general supervision of the Board of Trustees.
Joint repurchase agreement
Pursuant to an exemptive order issued by the SEC, the Fund, along with other registered investment companies having a management contract with the Adviser, may participate in a joint repurchase agreement transaction. Aggregate cash balances are invested in one or more large repurchase agreements, whose underlying securities are obligations of the U.S. government and/or its agencies. The Fund’s custodian bank receives delivery of the underlying securities for the joint account on the Fund’s behalf.
Investment transactions
Investment transactions are accounted for on a trade date plus one basis for daily net asset value calculations. However, for financial reporting purposes, investment security transactions are reported on trade date. Interest income is recorded on the accrual basis. Dividend income is recorded on the ex-dividend date net of foreign withholding taxes. Discounts/premiums are accredited/amortized for financial reporting purposes. Realized gains and losses from investment transactions are recorded on an identified cost basis.
Class allocations
Income, common expenses and realized and unrealized gains (losses) are determined at the fund level and allocated daily to each class of shares based on the appropriate net asset value of the respective classes. Distribution and service fees, if any, and transfer agent fees for Class A, Class B, Class C, Class I and Class R1 shares are calculated daily at the class level based on the appropriate net asset value of each class and the specific expense rate(s) applicable to each class.
Guarantees and indemnifications
Under the Fund’s organizational documents, its Officers and Trustees are indemnified against certain liability arising out of the performance of their duties to the Fund. Additionally, in the normal course of business, the Fund enters into contracts with service providers that contain general indemnification clauses. The Fund’s maximum exposure under these arrangements is unknown, as this would involve future claims that may be made against the Fund that have not yet occurred.
Expenses
The majority of expenses are directly identifiable to an individual fund. Expenses that are not readily identifiable to a specific fund are allocated in such a manner as deemed equitable, taking into consideration, among other things, the nature and type of expense and the relative size of the funds.
Bank borrowings
The Fund is permitted to have bank borrowings for temporary or emergency purposes, including the meeting of redemption requests that otherwise might require the untimely disposition of securities. The Fund has entered into a line of credit agreement with The Bank of New York Mellon (BNYM), the Swing Line Lender and Administrative Agent. This agreement enables the Fund to participate, with other funds managed by the Adviser, in an unsecured line of credit with BNYM, which permits borrowings of up to $100 million, collectively. Interest is charged to each fund based on its borrowing. In addition, a commitment fee is charged to each fund based on the average daily unused portion of the line of credit and is allocated among the participating funds. The Fund had no borrowing activity under the line of credit during the year ended December 31, 2007.
Securities lending
The Fund has entered into an agreement with Morgan Stanley & Co. Incorporated and MS Securities Services Inc. (collectively, Morgan
U.S. Global Leaders Growth Fund | Annual report
24
Stanley) which permits the Fund to lend securities to Morgan Stanley on a principal basis. Morgan Stanley is the primary borrower of securities of the Fund. The risk of having one primary borrower of Fund securities (as opposed to several borrowers) is that should Morgan Stanley fail financially, all securities lent will be affected by the failure and by any delays in recovery of the securities (or in the rare event, loss of rights in the collateral).
The Fund may lend portfolio securities from time to time in order to earn additional income. The Fund retains beneficial ownership of the securities it has loaned and continues to receive interest and dividends paid by the issuer of securities and to participate in any changes in their value. On the settlement date of the loan, the Fund receives collateral against the loaned securities and maintains collateral in an amount not less than 100% of the market value of the loaned securities during the period of the loan. The market value of the loaned securities is determined at the close of business of the Fund and any additional required collateral is delivered to the Fund on the next business day. Any cash collateral received is invested in the JHCIT. If the borrower defaults on its obligation to return the securities loaned because of insolvency or other reasons, a fund could experience delays and costs in recovering the securities loaned or in gaining access to the colla teral. The Fund receives compensation for lending their securities either in the form of fees, guarantees and/or by retaining a portion of interest on the investment of any cash received as collateral. Prior to May 8, 2007, the Fund paid the Adviser $1,760 for security lending services relating to an arrangement which ended on May 7, 2007.
Federal income taxes
The Fund qualifies as a regulated investment company by complying with the applicable provisions of the Internal Revenue Code and will not be subject to federal income tax on taxable income that is distributed to shareholders. Therefore, no federal income tax provision is required. For federal income tax purposes, the Fund has $13,235,648 of a capital loss carryforward available, to the extent provided by regulations, to offset future net realized capital gains. To the extent that such carryforward is used by the Fund, no capital gain distributions will be made. The loss carryforwards expire as follows: December 31, 2008 — $6,617,824 and December 31, 2009 — $6,617,824. Availability of a certain amount of the loss carryforwards, which were acquired on April 8, 2005, in a merger with John Hancock Large Cap Growth Fund, may be limited in a given year.
The Fund adopted the provisions of Financial Accounting Standards Board (FASB) Interpretation No. 48, Accounting for Uncertainty in Income Taxes, an interpretation of FASB Statement 109 (FIN 48), on January 1, 2007. FIN 48 prescribes a minimum threshold for financial statement recognition of the benefit of a tax position taken or expected to be taken in a tax return. The implementation of FIN 48 did not result in any unrecognized tax benefits in the accompanying financial statements. Each of the Fund’s federal tax returns for the prior three fiscal years remains subject to examination by the Internal Revenue Service.
New accounting pronouncement
In September 2006, FASB Standard No. 157, Fair Value Measurements (FAS 157), was issued and is effective for fiscal years beginning after November 15, 2007. FAS 157 defines fair value, establishing a framework for measuring fair value and expands disclosure about fair value measurements. Management is currently evaluating the application of FAS 157 to the Fund and its impact, if any, resulting from the adoption of FAS 157 on the Fund’s financial statement disclosures.
Distribution of income and gains
The Fund records distributions to shareholders from net investment income and net realized gains, if any, on the ex-dividend date. There were no distributions during the year ended December 31, 2006. During the year ended December 31, 2007 the tax character of distributions paid was as follows: long-term capital gain $47,556,985. Distributions paid by the Fund with respect to each class of shares are calculated in the same manner, at the same time and are in the same amount, except
Annual report | U.S. Global Leaders Growth Fund
25
for the effect of expenses that may be applied differently to each class.
As of December 31, 2007, the components of distributable earnings on a tax basis included $9,828,672 of undistributed long-term capital gain.
Such distributions and distributable earnings, on a tax basis, are determined in conformity with income tax regulations, which may differ from accounting principles generally accepted in the United States of America. Distributions in excess of tax basis earnings and profits, if any, are reported in the Fund’s financial statements as a return of capital.
Capital accounts within financial statements are adjusted for permanent book-tax differences. These adjustments have no impact on net assets or the results of operations. Temporary book-tax differences will reverse in a subsequent period. Permanent differences are primarily attributable to net operating losses.
Note 3
Management fee and transactions with
affiliates and others
The Fund has an investment management contract with the Adviser. Under the investment management contract, the Fund pays a monthly management fee to the Adviser equivalent, on an annual basis, to the sum of: (a) 0.75% of the first $2,000,000,000 of the Fund’s average daily net asset value, (b) 0.70% of the next $3,000,000,000 and (c) 0.65% in excess of $5,000,000,000. The effective rate for the year ended December 31, 2007 is 0.75% of the Fund’s average daily net asset value. The Adviser has a subadvisory agreement with Sustainable Growth Advisers, LP. The Fund is not responsible for payment of the subadvisory fees.
The Adviser has agreed to limit the Fund’s total expenses, excluding transfer agent fees and distribution and service fees, to 0.79% of the Fund’s average daily net asset value, on an annual basis, and net operating expenses on Class A, Class B and Class C to 1.32%, 2.07% and 2.07%, respectively, of each class’ average daily net asset value, at least until April 30, 2008. Accordingly, the expense reductions related to this total expense limitation amounted to $560,059 and there were no class-specific total expense reductions during the year ended December 31, 2007. The Adviser reserves the right to terminate these limitations in the future.
The Fund has a Distribution Agreement with John Hancock Funds, LLC (JH Funds), a wholly owned subsidiary of the Adviser. The Fund has adopted Distribution Plans with respect to Class A, Class B, Class C and Class R1, pursuant to Rule 12b-1 under the 1940 Act, to reimburse JH Funds for the services it provides as distributor of shares of the Fund. Accordingly, the Fund makes monthly payments to JH Funds at an annual rate not to exceed 0.25%, 1.00%, 1.00% and 0.50% of average daily net asset value of Class A, Class B, Class C and Class R1, respectively. A maximum of 0.25% of such payments may be service fees, as defined by the Conduct Rules of the Financial Industry Regulatory Authority (formerly the National Association of Securities Dealers). Under the Conduct Rules, curtailment of a portion of the Fund’s 12b-1 payments could occur under certain circumstances. In addition, under a Service Plan for Class R1 shares, the Fund pays up to 0.25% of Class R1 average daily net asset value for certain other services.
Class A shares are assessed up-front sales charges. During the year ended December 31, 2007, JH Funds received net up-front sales charges of $340,868 with regard to sales of Class A shares. Of this amount, $38,500 was retained and used for printing prospectuses, advertising, sales literature and other purposes, $249,021 was paid as sales commissions to unrelated broker-dealers and $53,347 was paid as sales commissions to sales personnel of Signator Investors, Inc. (Signator Investors), a related broker-dealer. The Adviser’s indirect parent, John Hancock Life Insurance Company (JHLICO), is the indirect sole shareholder of Signator Investors.
Class B shares that are redeemed within six years of purchase are subject to a contingent deferred sales charge (CDSC) at declining rates, beginning at 5.00% of the lesser of the current market value at the time of redemption or the original purchase cost
U.S. Global Leaders Growth Fund | Annual report
26
of the shares being redeemed. Class C shares that are redeemed within one year of purchase are subject to a CDSC at a rate of 1.00% of the lesser of the current market value at the time of redemption or the original purchase cost of the shares being redeemed. Proceeds from the CDSCs are paid to JH Funds and are used in whole or in part to defray its expenses for providing distribution-related services to the Fund in connection with the sale of Class B and Class C shares. During the year ended December 31, 2007, CDSCs received by JH Funds amounted to $469,075 for Class B shares and $17,738 for Class C shares.
The Fund has a transfer agent agreement with John Hancock Signature Services, Inc. (Signature Services), an indirect subsidiary of JHLICO. For Class A, Class B, Class C, Class I and Class R1 shares, the Fund pays a monthly transfer agent fee at an annual rate of 0.05% of each class’s average daily net asset value plus a fee based on the number of shareholder accounts and reimbursement for certain out-of-pocket expenses, aggregated and allocated to each class on the basis of its relative net asset value. Effective June 1, 2007, for the Class I shares the Fund pays a monthly transfer agent fee at a total annual rate of 0.04% of the Class I average daily net asset value. The Fund pays a monthly fee which is based on an annual rate of $15.00 for each Class A shareholder account, $17.50 for each Class B shareholder account, $16.50 for each Class C shareholder account, $15.00 for each Class I shareholder account and $15.00 for each Class R1 shareholder account. Signature Services has agreed to limit the Class A, Class B and Class C transfer agent fees to 0.28% of each respective class’ average daily net asset value, until April 30, 2008. There were no expense reductions related to this transfer agent fee limitation during the year ended December 31, 2007.
In May 2007, the Fund began receiving earnings credits from its transfer agent as a result of uninvested cash balances. These credits are used to reduce a portion of the Fund’s transfer agent fees and out of pocket expenses. During the year ended December 31, 2007, the Fund’s transfer agent fees and out of pocket expenses were reduced by $61,202 for transfer agent credits earned.
Expenses under the agreements described above for the year ended December 31, 2007 were as follows:
| Transfer | Distribution and | |
| Share class | agent fees | service fees |
| Class A | $2,678,807 | $2,790,831 |
| Class B | 304,209 | 1,267,698 |
| Class C | 346,433 | 1,462,116 |
| Class I | 7,502 | — |
| Class R1 | 13,341 | 22,259 |
| Total | $3,350,292 | $5,542,904 |
The Fund has an agreement with the Adviser and affiliates to perform necessary tax, accounting, compliance, legal and other administrative services for the Fund. The compensation for the year amounted to $186,866 with an effective rate of 0.01% of the Fund’s average daily net asset value.
Mr. James R. Boyle is Chairman of the Adviser, as well as affiliated Trustee of the Fund, and is compensated by the Adviser and/or its affiliates. The compensation of unaffiliated Trustees is borne by the Fund. The unaffiliated Trustees may elect to defer, for tax purposes, their receipt of this compensation under the John Hancock Group of Funds Deferred Compensation Plan. The Fund makes investments into other John Hancock funds, as applicable, to cover its liability for the deferred compensation. Investments to cover the Fund’s deferred compensation liability are recorded on the Fund’s books as an other asset. The deferred compensation liability and the related other asset are always equal and are marked to market on a periodic basis to reflect any income earned by the investments, as well as any unrealized gains or losses. The Deferred Compensation Plan investments had no impact on the operations of the Fund.
Annual report | U.S. Global Leaders Growth Fund
27
Note 4
Fund share transactions
This listing illustrates the number of Fund shares sold, reinvested and repurchased during the years ended December 31, 2006, and December 31, 2007, along with the corresponding dollar value.
| Year ended 12-31-06 | Year ended 12-31-07 | |||
| Shares | Amount | Shares | Amount | |
| Class A shares | ||||
| Sold | 17,133,890 | $477,600,883 | 10,354,984 | $302,892,029 |
| Distributions reinvested | — | — | 1,236,841 | 36,029,184 |
| Repurchased | (18,061,108) | (502,875,391) | (19,881,793) | (579,961,051) |
| Net decrease | (927,218) | ($25,274,508) | (8,289,968) | ($241,039,838) |
| Class B shares | ||||
| Sold | 481,232 | $13,124,754 | 247,878 | $6,989,908 |
| Distributions reinvested | — | — | 140,833 | 3,937,681 |
| Repurchased | (2,929,359) | (79,575,184) | (1,903,776) | (53,703,289) |
| Net decrease | (2,448,127) | ($66,450,430) | (1,515,065) | ($42,775,700) |
| Class C shares | ||||
| Sold | 915,608 | $24,981,632 | 395,178 | $11,156,071 |
| Distributions reinvested | — | — | 150,235 | 4,200,573 |
| Repurchased | (4,510,273) | (121,996,912) | (3,062,987) | (86,312,659) |
| Net decrease | (3,594,665) | ($97,015,280) | (2,517,574) | ($70,956,015) |
| Class I shares | ||||
| Sold | 438,676 | $12,289,473 | 152,386 | $4,518,555 |
| Distributions reinvested | — | — | 7,933 | 235,616 |
| Repurchased | (288,495) | (7,951,414) | (542,250) | (16,369,985) |
| Net increase (decrease) | 150,181 | $4,338,059 | (381,931) | ($11,615,814) |
| Class R1 shares | ||||
| Sold | 127,883 | $3,615,799 | 46,967 | $1,350,194 |
| Distributions reinvested | — | — | 4,297 | 123,445 |
| Repurchased | (112,753) | (3,179,137) | (142,504) | (4,137,150) |
| Net increase (decrease) | 15,130 | $436,662 | (91,240) | ($2,663,511) |
| Net decrease | (6,804,699) | ($183,965,497) | (12,795,778) | ($369,050,878) |
Note 5
Purchase and sale of securities
Purchases and proceeds from sales or maturities of securities, other than short-term securities and obligations of the U.S. government, during the year ended December 31, 2007, aggregated $379,355,802 and $794,486,828, respectively.
The cost of investments owned on December 31, 2007, including short-term investments, for federal income tax purposes was $1,063,614,398. Gross unrealized appreciation and depreciation of investments aggregated $256,447,568 and $44,271,153, respectively, resulting in net unrealized appreciation of $212,176,415. The difference between book basis and tax basis net unrealized appreciation of investments is attributable primarily to the tax deferral of losses on certain sales of securities.
Note 6
SEC settlement
On June 25, 2007, the Adviser and John Hancock Funds, LLC (the Distributor) and two of their affiliates (collectively, the John Hancock Affiliates) reached a settlement with the SEC that resolved an investigation of certain practices relating to the John Hancock Affiliates’ variable annuity and mutual fund operations involving directed brokerage
U.S. Global Leaders Growth Fund | Annual report
28
and revenue sharing. Under the terms of the settlement, each John Hancock Affiliate was censured and agreed to pay a $500,000 civil penalty to the United States Treasury. In addition, the Adviser and the Distributor agreed to pay disgorgement of $2,087,477 and prejudgment interest of $359,460 to entities, including certain John Hancock Funds, that participated in the Adviser’s directed brokerage program during the period from 2000 to October 2003. Collectively, all John Hancock Affiliates agreed to pay a total disgorgement of $16,926,420 and prejudgment interest of $2,361,460 to the entities advised or distributed by John Hancock Affiliates. The Adviser discontinued the use of directed brokerage in recognition of the sale of fund shares in October 2003. As a result of this settlement, the Fund received $244,201, which was recorded as a realized gain to the Fund’s books on June 25, 2007.
Annual report | U.S. Global Leaders Growth Fund
29
Auditors’ report
Report of Independent Registered Public Accounting Firm
To the Board of Trustees of John Hancock Capital Series and Shareholders of John Hancock U.S. Global Leaders Growth Fund,
In our opinion, the accompanying statement of assets and liabilities, including the schedule of investments, and the related statements of operations and of changes in net assets and the financial highlights present fairly, in all material respects, the financial position of John Hancock U.S. Global Leaders Growth Fund (the Fund) at December 31, 2007, and the results of its operations, the changes in its net assets and the financial highlights for the periods indicated, in conformity with accounting principles generally accepted in the United States of America. These financial statements and financial highlights (hereafter referred to as “financial statements”) are the responsibility of the Fund’s management. Our responsibility is to express an opinion on these financial statements based on our audits. We conducted our audits of these financial statements in accordance with the standards of the Public Company Accounting Oversight Board (United States). Tho se standards require that we plan and perform the audit to obtain reasonable assurance about whether the financial statements are free of material misstatement. An audit includes examining, on a test basis, evidence supporting the amounts and disclosures in the financial statements, assessing the accounting principles used and significant estimates made by management, and evaluating the overall financial statement presentation. We believe that our audits, which included confirmation of securities at December 31, 2007 by correspondence with the custodian provide a reasonable basis for our opinion.
PricewaterhouseCoopers LLP
Boston, Massachusetts
February 28, 2008
U.S. Global Leaders Growth Fund | Annual report
30
Tax information
Unaudited
For federal income tax purposes, the following information is furnished with respect to the distributions of the Fund, if any, paid during its taxable year ended December 31, 2007.
The Fund has designated distributions to shareholders of $47,556,985 as a long-term capital gain dividend.
The Fund hereby designates the maximum amount allowable of its net taxable income as qualified dividend income as provided in the Jobs and Growth Tax Relief Reconciliation Act of 2003. This amount will be reflected on Form 1099-DIV for the calendar year 2007.
Shareholders will be mailed a 2007 U.S. Treasury Department Form 1099-DIV in January 2008. This will reflect the total of all distributions that are taxable for calendar year 2007.
Annual report | U.S. Global Leaders Growth Fund
31
Board Consideration of and Continuation
of Investment Advisory and Subadvisory
Agreement: John Hancock U.S. Global
Leaders Growth Fund
The Investment Company Act of 1940 (the 1940 Act) requires the Board of Trustees (the Board) of John Hancock Capital Series (the Trust), including a majority of the Trustees who have no direct or indirect interest in the investment advisory agreement and are not “interested persons” of the Trust, as defined in the 1940 Act (the Independent Trustees), annually to meet in person to review and consider the continuation of: (i) the investment advisory agreement (the Advisory Agreement) with John Hancock Advisers, LLC (the Adviser) and (ii) the investment subadvisory agreement (the Subadvisory Agreement) with Sustainable Growth Advisers, LP (the Subadviser) for the John Hancock U.S. Global Leaders Growth Fund (the Fund). The investment advisory agreement with the Advisor and the investment subadvisory agreement with the Subadviser are collectively referred to as the Advisory Agreements.
At meetings held on May 7 and June 4–5, 2007, the Board considered the factors and reached the conclusions described below relating to the selection of the Adviser and Subadviser and the continuation of the Advisory Agreements. During such meetings, the Board’s Contracts/ Operations Committee and the Independent Trustees also met in executive sessions with their independent legal counsel.
In evaluating the Advisory Agreements, the Board, including the Contracts/Operations Committee and the Independent Trustees, reviewed a broad range of information requested for this purpose by the Independent Trustees, including: (i) the investment performance of the Fund relative to a category of relevant funds (the Category) and a peer group of comparable funds (the Peer Group) each selected by Morningstar, Inc. (Morningstar), an independent provider of investment company data, for a range of periods ended December 31, 2006, (ii) advisory and other fees incurred by, and the expense ratios of, the Fund relative to a Category and a Peer Group, (iii) the advisory fees of comparable portfolios of other clients of the Adviser and the Sub-adviser, (iv) the Adviser’s financial results and condition, including its and certain of its affiliates’ profitability from services performed for the Fund, (v) breakpoints in the Fund’s and th e Peer Group’s fees, and information about economies of scale, (vi) the Adviser’s and Subadviser’s record of compliance with applicable laws and regulations, with the Fund’s investment policies and restrictions, and with the applicable Code of Ethics, and the structure and responsibilities of the Adviser’s and Subadviser’s compliance department, (vii) the background and experience of senior management and investment professionals, and (viii) the nature, cost and character of advisory and non-investment management services provided by the Adviser and its affiliates and by the Subadviser.
The Independent Trustees considered the legal advice of independent legal counsel and relied on their own business judgment in determining the factors to be considered in evaluating the materials that were presented to them and the weight to be given to each such factor. The Board’s review and conclusions were based on a comprehensive consideration of all information presented to the Board and not the result of any single controlling factor. They principally considered performance and other information as of December 31, 2006; performance and other information may be quite different as of the date of this shareholders report. The key factors considered by the Board and the conclusions reached are described below.
Nature, extent and quality of services
The Board considered the ability of the Adviser and the Subadviser, based on their resources, reputation and other attributes, to attract and retain qualified investment professionals, including research, advisory and supervisory personnel. The Board considered the investment philosophy, research and investment decision-making processes of the Adviser and, in particular, the Subadviser. The Board met with representatives of the Subadviser that were responsible for the daily investment activities of the Fund. The Board considered the representatives’ history and
U.S. Global Leaders Growth Fund | Annual report
32
experience with the Fund. The Board further considered the culture of compliance, resources dedicated to compliance, compliance programs and compliance records of the Adviser and Subadviser. In addition, the Board took into account the administrative and other non-advisory services provided to the Fund by the Adviser and its affiliates.
Based on the above factors, together with those referenced below, the Board concluded that, within the context of its full deliberations, the nature, extent and quality of the investment advisory services provided to the Fund by the Adviser and Subadviser were sufficient to support renewal of the Advisory Agreements.
Fund performance
The Board considered the performance results for the Fund over various time periods ended December 31, 2006. The Board also considered these results in comparison to the performance of the Category, as well as the Fund’s benchmark index. Morningstar determined the Category and Peer Group for the Fund. The Board reviewed with a representative of Morningstar the methodology used by Morningstar to select the funds in the Category and the Peer Group.
The Board noted that the Fund’s performance during the 10-year period was higher than the performance of the Peer Group and Category medians, and one of its benchmark indices, the Russell 1000 Growth Index, but below the performance of its other benchmark index, the Standard & Poor’s 500 Index. The Board noted that the Fund’s performance during the 5-year period was lower than the performance of the Category median and Standard & Poor’s 500 Index, but higher than the performance of the Peer Group median and the Russell 1000 Growth Index. The Board also noted that the more recent performance of the Fund for the 1- and 3-year periods ended December 31, 2006 was lower than the median of its Category and Peer Group, and its benchmark indexes. The Subadviser provided detailed information to the Board regarding factors contributing to the Fund’s performance results, as well as its outlook and investment strategy for the near future. The Board n oted that the Subadviser’s investment decisions were consistent with its investment philosophy and the Fund’s investment objectives. The Board also considered favorable industry reports about the Fund’s investment process and portfolio management team. The Board indicated its intent to continue to monitor the Fund’s performance trends to assess whether remedial changes are warranted.
Investment advisory fee and subadvisory fee rates and expenses
The Board reviewed and considered the contractual investment advisory fee rate payable by the Fund to the Adviser for investment advisory services (the Advisory Agreement Rate). The Board received and considered information comparing the Advisory Agreement Rate with the advisory fees for the Peer Group. The Board noted that the Advisory Agreement Rate was higher than the median rate of the Peer Group and equal to the median rate of the Category.
The Board received and considered expense information regarding the Fund’s various components, including advisory fees, distribution and fees other than advisory and distribution fees, including transfer agent fees, custodian fees and other miscellaneous fees (e.g., fees for accounting and legal services). The Board considered comparisons of these expenses to the Peer Group median. The Board also received and considered expense information regarding the Fund’s total operating expense ratio (Gross Expense Ratio) and total operating expense ratio after taking the fee waiver arrangement applicable to the Advisory Agreement Rate into account (Net Expense Ratio). The Board received and considered information comparing the Gross Expense Ratio and Net Expense Ratio of the Fund to that of the Peer Group and Category medians. The Board noted that the Fund’s Gross and Net Expense Ratios were not ap preciably higher than the median of the Peer Group and Category.
The Adviser also discussed the Morningstar data and rankings, and other relevant information, for the Fund. Based on the above-referenced considerations and other factors, the Board concluded that the Fund’s overall expenses and plans to improve performance supported the re-approval of the Advisory Agreements.
Annual report | U.S. Global Leaders Growth Fund
33
The Board also received information about the investment subadvisory fee rate (the Subadvisory Agreement Rate) payable by the Adviser to the Subadviser for investment subadvisory services. The Board concluded that the Subadvisory Agreement Rate was not unreasonable, based on its consideration of the factors described here.
Profitability
The Board received and considered a detailed profitability analysis of the Adviser based on the Advisory Agreements, as well as on other relationships between the Fund and the Adviser and its affiliates. The Board also considered a comparison of the Adviser’s profitability to that of other similar investment advisers whose profitability information is publicly available. The Board concluded that, in light of the costs of providing investment management and other services to the Fund, the profits and other ancillary benefits reported by the Adviser were not unreasonable.
The Board did not consider profitability information with respect to the Subadviser, which is not affiliated with the Adviser. The Board considered that the Subadvisory Rate paid to the Subadviser had been negotiated by the Adviser on an arm’s length basis and that the Subadviser’s separate profitability from its relationship with the Fund was not a material factor in determining whether to renew the agreement.
Economies of scale
The Board received and considered general information regarding economies of scale with respect to the management of the Fund, including the Fund’s ability to appropriately benefit from economies of scale under the Fund’s fee structure. The Board recognized the inherent limitations of any analysis of economies of scale, stemming largely from the Board’s understanding that most of the Adviser’s costs are not specific to individual Funds, but rather are incurred across a variety of products and services.
To the extent the Board and the Adviser were able to identify actual or potential economies of scale from Fund-specific or allocated expenses, in order to ensure that any such economies continue to be reasonably shared with the Fund as its assets increase, the Adviser and the Board agreed to continue the existing breakpoints to the Advisory Agreement Rate.
Information about services to other clients
The Board also received information about the nature, extent and quality of services and fee rates offered by the Adviser and Subadviser to their other clients, including other registered investment companies, institutional investors and separate accounts. The Board concluded that the Advisory Agreement Rate and the Subadvisory Agreement Rate were not unreasonable, taking into account fee rates offered to others by the Adviser and Subadviser, respectively, after giving effect to differences in services.
Other benefits to the Adviser
The Board received information regarding potential “fall-out” or ancillary benefits received by the Adviser and its affiliates as a result of the Adviser’s relationship with the Fund. Such benefits could include, among others, benefits directly attributable to the relationship of the Adviser with the Fund and benefits potentially derived from an increase in the business of the Adviser as a result of its relationship with the Fund (such as the ability to market to shareholders other financial products offered by the Adviser and its affiliates).
The Board also considered the effectiveness of the Adviser’s, Subadviser’s and Fund’s policies and procedures for complying with the requirements of the federal securities laws, including those relating to best execution of portfolio transactions and brokerage allocation.
Other factors and broader review
As discussed above, the Board reviewed detailed materials received from the Adviser and Subadviser as part of the annual re-approval process. The Board also regularly reviews and assesses the quality of the services that the Fund receives throughout the year. In this regard, the Board reviews reports of the Adviser at least quarterly, which include, among other things, a detailed portfolio review, detailed fund performance reports and compliance reports. In addition, the Board meets with portfolio managers and senior
U.S. Global Leaders Growth Fund | Annual report
34
investment officers at various times throughout the year.
After considering the above-described factors and based on its deliberations and its evaluation of the information described above, the Board concluded that approval of the continuation of the Advisory Agreements for the Fund was in the best interest of the Fund and its shareholders. Accordingly, the Board unanimously approved the continuation of the Advisory Agreements.
Annual report | U.S. Global Leaders Growth Fund
35
Trustees and Officers
This chart provides information about the Trustees and Officers who oversee your John Hancock fund. Officers elected by the Trustees manage the day-to-day operations of the Fund and execute policies formulated by the Trustees.
| Independent Trustees | ||
| Name, Year of Birth | Number of | |
| Position(s) held with Fund | Trustee | John Hancock |
| Principal occupation(s) and other | of Fund | funds overseen |
| directorships during past 5 years | since1 | by Trustee |
| James F. Carlin, Born: 1940 | 2005 | 55 |
| Interim Chairman (since December 2007); Director and Treasurer, Alpha Analytical Laboratories, Inc. | ||
| (chemical analysis) (since 1985); Part Owner and Treasurer, Lawrence Carlin Insurance Agency, Inc. | ||
| (since 1995); Part Owner and Vice President, Mone Lawrence Carlin Insurance Agency, Inc. (until 2005); | ||
| Chairman and Chief Executive Officer, Carlin Consolidated, Inc. (management/investments) (since 1987); | ||
| Trustee, Massachusetts Health and Education Tax Exempt Trust (1993–2003). | ||
| William H. Cunningham, Born: 1944 | 2005 | 55 |
| Professor, University of Texas at Austin (since 1971); former Chancellor, University of Texas System and | ||
| former President, University of Texas at Austin (until 2001); Chairman and Chief Executive Officer, IBT | ||
| Technologies (until 2001); Director of the following: Hicks Acquisition Company I, Inc. (since 2007); | ||
| Hire.com (until 2004), STC Broadcasting, Inc. and Sunrise Television Corp. (until 2001), Symtx, Inc. | ||
| (electronic manufacturing) (since 2001), Adorno/Rogers Technology, Inc. (until 2004), Pinnacle Foods | ||
| Corporation (until 2003), rateGenius (until 2003), Lincoln National Corporation (insurance) (since 2006), | ||
| Jefferson-Pilot Corporation (diversified life insurance company) (until 2006), New Century Equity | ||
| Holdings (formerly Billing Concepts) (until 2001), eCertain (until 2001), ClassMap.com (until 2001), | ||
| Agile Ventures (until 2001), AskRed.com (until 2001), Southwest Airlines (since 2000), Introgen (man- | ||
| ufacturer of biopharmaceuticals) (since 2000) and Viasystems Group, Inc. (electronic manufacturer) | ||
| (until 2003); Advisory Director, Interactive Bridge, Inc. (college fundraising) (until 2001); Advisory | ||
| Director, Q Investments (until 2003); Advisory Director, JPMorgan Chase Bank (formerly Texas Commerce | ||
| Bank–Austin), LIN Television (until 2008), WilTel Communications (until 2003) and Hayes Lemmerz | ||
| International, Inc. (diversified automotive parts supply company) (since 2003). | ||
| Charles L. Ladner, 2 Born: 1938 | 2004 | 55 |
| Chairman and Trustee, Dunwoody Village, Inc. (retirement services) (until 2003); Senior Vice President | ||
| and Chief Financial Officer, UGI Corporation (public utility holding company) (retired 1998); Vice | ||
| President and Director, AmeriGas, Inc. (retired 1998); Director, AmeriGas Partners, L.P. (gas distribution) | ||
| (until 1997); Director, EnergyNorth, Inc. (until 1997); Director, Parks and History Association (until 2005). | ||
| John A. Moore,2 Born: 1939 | 2002 | 55 |
| President and Chief Executive Officer, Institute for Evaluating Health Risks (nonprofit institution) | ||
| (until 2001); Senior Scientist, Sciences International (health research) (until 2003); Former Assistant | ||
| Administrator and Deputy Administrator, Environmental Protection Agency; Principal, Hollyhouse | ||
| (consulting) (since 2000); Director, CIIT Center for Health Science Research (nonprofit research) | ||
| (until 2007). | ||
U.S. Global Leaders Growth Fund | Annual report
36
| Independent Trustees (continued) | ||
| Name, Year of Birth | Number of | |
| Position(s) held with Fund | Trustee | John Hancock |
| Principal occupation(s) and other | of Fund | funds overseen |
| directorships during past 5 years | since1 | by Trustee |
| Patti McGill Peterson,2 Born: 1943 | 2002 | 55 |
| Senior Associate, Institute for Higher Education Policy (since 2007); Executive Director, Council for | ||
| International Exchange of Scholars and Vice President, Institute of International Education (until 2007); | ||
| Senior Fellow, Cornell Institute of Public Affairs, Cornell University, Ithaca, NY (until 1998); Former | ||
| President, Wells College, Aurora, NY, and St. Lawrence University, Canton, NY; Director, Niagara | ||
| Mohawk Power Corporation (until 2003); Director, Ford Foundation, International Fellowships Program | ||
| (since 2002); Director, Lois Roth Endowment (since 2002); Director, Council for International Educational | ||
| Exchange (since 2003). | ||
| Steven R. Pruchansky, Born: 1944 | 2005 | 55 |
| Chairman and Chief Executive Officer, Greenscapes of Southwest Florida, Inc. (since 2000); Director and | ||
| President, Greenscapes of Southwest Florida, Inc. (until 2000); Managing Director, JonJames, LLC (real | ||
| estate) (since 2000); Director, First Signature Bank & Trust Company (until 1991); Director, Mast Realty | ||
| Trust (until 1994); President, Maxwell Building Corp. (until 1991). | ||
| Non-Independent Trustees3 | ||
| Name, Year of Birth | Number of | |
| Position(s) held with Fund | Trustee | John Hancock |
| Principal occupation(s) and other | of Fund | funds overseen |
| directorships during past 5 years | since1 | by Trustee |
| James R. Boyle, Born: 1959 | 2005 | 265 |
| Executive Vice President, Manulife Financial Corporation (since 1999); President, John Hancock Variable | ||
| Life Insurance Company (since March 2007); Executive Vice President, John Hancock Life Insurance | ||
| Company (since 2004); Chairman and Director, John Hancock Advisers, LLC (the Adviser), John Hancock | ||
| Funds, LLC and The Berkeley Financial Group, LLC (The Berkeley Group) (holding company) (since 2005); | ||
| Senior Vice President, The Manufacturers Life Insurance Company (U.S.A.) (until 2004). | ||
Annual report | U.S. Global Leaders Growth Fund
37
| Principal officers who are not Trustees | |
| Name, Year of Birth | |
| Position(s) held with Fund | Officer |
| Principal occupation(s) and other | of Fund |
| directorships during past 5 years | since |
| Keith F. Hartstein, Born: 1956 | 2005 |
| President and Chief Executive Officer | |
| Senior Vice President, Manulife Financial Corporation (since 2004); Director, President and Chief | |
| Executive Officer, the Adviser, The Berkeley Group and John Hancock Funds, LLC (since 2005); Director, | |
| MFC Global Investment Management (U.S.), LLC (MFC Global (U.S.)) (since 2005); Director, John | |
| Hancock Signature Services, Inc. (since 2005); President and Chief Executive Officer, John Hancock | |
| Investment Management Services, LLC (since 2006); President and Chief Executive Officer, John Hancock | |
| Funds, John Hancock Funds II, John Hancock Funds III and John Hancock Trust (since 2005); Director, | |
| Chairman and President, NM Capital Management, Inc. (since 2005); Member, Investment Company | |
| Institute Sales Force Marketing Committee (since 2003); President and Chief Executive Officer, MFC | |
| Global (U.S.) (2005–2006); Executive Vice President, John Hancock Funds, LLC (until 2005). | |
| Thomas M. Kinzler, Born: 1955 | 2006 |
| Secretary and Chief Legal Officer | |
| Vice President and Counsel, John Hancock Life Insurance Company (U.S.A.) (since 2006); Secretary and | |
| Chief Legal Officer, John Hancock Funds and John Hancock Funds II (since 2006); Chief Legal Officer | |
| and Assistant Secretary, John Hancock Trust (since 2006); Vice President and Associate General Counsel, | |
| Massachusetts Mutual Life Insurance Company (1999–2006); Secretary and Chief Legal Counsel, MML | |
| Series Investment Fund (2000–2006); Secretary and Chief Legal Counsel, MassMutual Institutional Funds | |
| (2000–2004); Secretary and Chief Legal Counsel, MassMutual Select Funds and MassMutual Premier | |
| Funds (2004–2006). | |
| Francis V. Knox, Jr., Born: 1947 | 2005 |
| Chief Compliance Officer | |
| Vice President and Chief Compliance Officer, John Hancock Investment Management Services, LLC, | |
| the Adviser and MFC Global (U.S.) (since 2005); Vice President and Chief Compliance Officer, John | |
| Hancock Funds, John Hancock Funds II, John Hancock Funds III and John Hancock Trust (since 2005); | |
| Vice President and Assistant Treasurer, Fidelity Group of Funds (until 2004); Vice President and Ethics & | |
| Compliance Officer, Fidelity Investments (until 2001). | |
| Charles A. Rizzo, Born: 1957 | 2007 |
| Chief Financial Officer | |
| Chief Financial Officer, John Hancock Funds, John Hancock Funds II, John Hancock Funds III and John | |
| Hancock Trust (since June 2007); Assistant Treasurer, Goldman Sachs Mutual Fund Complex (regis- | |
| tered investment companies) (2005–June 2007); Vice President, Goldman Sachs (2005–June 2007); | |
| Managing Director and Treasurer of Scudder Funds, Deutsche Asset Management (2003–2005); | |
| Director, Tax and Financial Reporting, Deutsche Asset Management (2002–2003); Vice President and | |
| Treasurer, Deutsche Global Fund Services (Deutsche Registered Investment Companies) (1999–2002). | |
| Gordon M. Shone, Born: 1956 | 2006 |
| Treasurer | |
| Senior Vice President, John Hancock Life Insurance Company (U.S.A.) (since 2001); Treasurer, John | |
| Hancock Funds (since 2006), John Hancock Funds II, John Hancock Funds III and John Hancock Trust | |
| (since 2005); Vice President and Chief Financial Officer, John Hancock Trust (2003–2005); Vice President, | |
| John Hancock Investment Management Services, Inc., John Hancock Advisers, LLC (since 2006) and The | |
| Manufacturers Life Insurance Company (U.S.A.) (1998–2000). | |
U.S. Global Leaders Growth Fund | Annual report
38
| Principal officers who are not Trustees (continued) | |
| Name, Year of Birth | |
| Position(s) held with Fund | Officer |
| Principal occupation(s) and other | of Fund |
| directorships during past 5 years | since |
| John G. Vrysen, Born: 1955 | 2005 |
| Chief Operating Officer | |
| Senior Vice President, Manulife Financial Corporation (since 2006); Director, Executive Vice President | |
| and Chief Operating Officer, the Adviser, The Berkeley Group and John Hancock Funds, LLC (since | |
| June 2007); Executive Vice President and Chief Operating Officer, John Hancock Investment | |
| Management Services, LLC (since December 2007); Chief Operating Officer, John Hancock Funds, | |
| John Hancock Funds II, John Hancock Funds III and John Hancock Trust (since June 2007); Director, | |
| Executive Vice President and Chief Financial Officer, the Adviser, The Berkeley Group and John Hancock | |
| Funds, LLC (2005–2007); Executive Vice President and Chief Financial Officer, John Hancock Investment | |
| Management Services, LLC (2005–2007); Executive Vice President and Chief Financial Officer, MFC | |
| Global (U.S.) (2005 until August 2007); Director, John Hancock Signature Services, Inc. (since 2005); | |
| Chief Financial Officer, John Hancock Funds, John Hancock Funds II, John Hancock Funds III and John | |
| Hancock Trust (2005 until June 2007); Vice President and General Manager, John Hancock Fixed | |
| Annuities, U.S. Wealth Management (2004–2005); Vice President, Operations, Manulife Wood Logan | |
| (2000–2004). | |
The business address for all Trustees and Officers is 601 Congress Street, Boston, Massachusetts 02210-2805.
The Statement of Additional Information of the Fund includes additional information about members of the Board of Trustees of the Fund and is available without charge, upon request, by calling 1-800-225-5291.
1 Each Trustee serves until resignation, retirement age or until his or her successor is elected.
2 Member of Audit and Compliance Committee.
3 Non-Independent Trustee holds positions with the Fund’s investment adviser, underwriter and certain other affiliates.
Annual report | U.S. Global Leaders Growth Fund
39
For more information
The Fund’s proxy voting policies, procedures and records are available without charge, upon request:
| By phone | On the Fund’s Web site | On the SEC’s Web site |
| 1-800-225-5291 | www.jhfunds.com/proxy | www.sec.gov |
| Investment adviser | Custodian | Legal counsel |
| John Hancock Advisers, LLC | The Bank of New York | Kirkpatrick & Lockhart |
| 601 Congress Street | One Wall Street | Preston Gates Ellis LLP |
| Boston, MA 02210-2805 | New York, NY 10286 | One Lincoln Street |
| Boston, MA 02111-2950 | ||
| Subadviser | Transfer agent | |
| Sustainable Growth | John Hancock Signature | Independent registered public |
| Advisers, LP | Services, Inc. | accounting firm |
| 3 Stamford Plaza | P.O. Box 9510 | PricewaterhouseCoopers LLP |
| 301 Tresser Boulevard, | Portsmouth, NH 03802-9510 | 125 High Street |
| Suite 1310 | Boston, MA 02110 | |
| Stamford, CT 06901 | ||
| Principal distributor | ||
| John Hancock Funds, LLC | ||
| 601 Congress Street | ||
| Boston, MA 02210-2805 | ||
| How to contact us | ||
| Internet | www.jhfunds.com | |
| Regular mail: | Express mail: | |
| John Hancock Signature | John Hancock Signature | |
| Services, Inc. | Services, Inc. | |
| P.O. Box 9510 | Mutual Fund Image Operations | |
| Portsmouth, NH 03802-9510 | 164 Corporate Drive | |
| Portsmouth, NH 03801 | ||
| Phone | Customer service representatives | 1-800-225-5291 |
| EASI-Line | 1-800-338-8080 | |
| TDD line | 1-800-554-6713 | |
A listing of month-end portfolio holdings is available on our Web site, www.jhfunds.com. A more detailed portfolio holdings summary is available on a quarterly basis 60 days after the fiscal quarter on our Web site or upon request by calling 1-800-225-5291, or on the SEC’s Web site, www.sec.gov.
U.S. Global Leaders Growth Fund | Annual Report
40

1-800-225-5291
1-800-554-6713 TDD
1-800-338-8080 EASI-Line
www.jhfunds. com
Now available: electronic delivery
www.jhfunds.com/edelivery
| This report is for the information of the shareholders of John Hancock U.S. Global Leaders Growth Fund. | 2600A 12/07 |
| It is not authorized for distribution to prospective investors unless preceded or accompanied by a prospectus. | 2/08 |
Discussion of Fund performance
By Pzena Investment Management, LLC
U.S. stocks navigated a challenging environment to post moderate gains in 2007. The market advanced in the first half of the year, but a meltdown in the subprime mortgage industry, a credit crunch in the financial sector and a slowing U.S. economy led to a sharp increase in volatility and a stock market decline over the last few months. As growth stocks outperformed value in 2007, the valuation spread between the overall market and its most undervalued segment widened dramatically after several years at very narrow levels. In fact, we have seen large-cap valuation spreads this wide only five times in the last 40 years.
“U.S. stocks navigated
a challenging environment
to post moderate gains in 2007.”
For the year ended December 31, 2007, John Hancock Classic Value II Fund’s Class A, Class B, Class C, Class I and Class R1 shares posted total returns of –13.97%, –14.60%, –14.51%, –13.63% and –13.05%, respectively, at net asset value. The Fund trailed both the –0.17% return of the Russell 1000 Value Index and the 1.42% return of the average large value fund, according to Morningstar, Inc.
The Fund lagged its benchmark index and peer group average in 2007, with most of the underperformance occurring over the last six months. While the outperformance of commodity-based sectors — which we largely avoided because earnings are substantially above historic norms — was a drag on performance throughout the year, the more significant issue was the recent decline in financial stocks, which comprised the portfolio’s largest sector weighting (more than 40% of the portfolio). Government-sponsored mortgage lenders Fannie Mae and Freddie Mac, as well as mortgage provider Countrywide Financial, were the most significant detractors. Outside of financials, telecommunications equipment maker Alcatel-Lucent was the weakest performer.
On the positive side, software makers Microsoft Corp. and Oracle Corp. were the top performance contributors in the portfolio. Other strong performers included Korean auto maker Hyundai Motor Co.
This commentary reflects the views of the portfolio managers through the end of the Fund’s period discussed in this report. The managers’ statements reflect their own opinions. As such, they are in no way guarantees of future events, and are not intended to be used as investment advice or a recommendation regarding any specific security. They are also subject to change at any time as market and other conditions warrant.
Classic Value Fund II | Annual report
6
A look at performance
For the periods ended December 31, 2007
| Average annual returns | Cumulative total returns | ||||||||
| with maximum sales charge (POP) | with maximum sales charge (POP) | ||||||||
| Inception | Since | Since | |||||||
| Class | date | 1-year | 5-year | 10-year | inception | 1-year | 5-year | 10-year | inception |
| A | 7-7-06 | –18.28% | — | — | –4.51% | –18.28% | — | — | –6.62% |
| B | 7-7-06 | –18.85 | — | — | –4.84 | –18.85 | — | — | –7.11 |
| C | 7-7-06 | –15.36 | — | — | –1.80 | –15.36 | — | — | –2.66 |
| I1 | 7-7-06 | –13.63 | — | — | –0.75 | –13.63 | — | — | –1.11 |
| R1 1 | 7-7-06 | –13.05 | — | — | –0.50 | –13.05 | — | — | –0.74 |
Performance figures assume all distributions are reinvested. Public offering price (POP) figures reflect maximum sales charge on Class A shares of 5% and the applicable contingent deferred sales charge (CDSC) on Class B and Class C shares. The Class B shares’ CDSC declines annually between years 1 to 6 according to the following schedule: 5, 4, 3, 3, 2, 1%. No sales charge will be assessed after the sixth year. Class C shares held for less than one year are subject to a 1% CDSC. Sales charge is not applicable for Class I and Class R1 shares.
The expense ratios of the Fund, both net (including any fee waivers or expense limitations) and gross (excluding any fee waivers or expense limitations), are set forth according to the most recent publicly available prospectuses for the Fund and may differ from the expense ratios disclosed in the Financial Highlights tables in this report. The waivers and expense limitations are contractual at least until 4-30-08. The net expenses are as follows: Class A — 1.30%, Class B — 2.05%, Class C — 2.05%, Class I — 0.94%, Class R1 — 1.64% . Had the fee waivers and expense limitations not been in place, the gross expenses would be as follows: Class A — 2.24%, Class B — 2.99%, Class C — 2.99%, Class I — 1.88%, Class R1 — 2.58% .
The returns reflect past results and should not be considered indicative of future performance. The return and principal value of an investment will fluctuate so that shares, when redeemed, may be worth more or less than their original cost. Due to market volatility, the Fund’s current performance may be higher or lower than the performance shown. For performance data current to the most recent month end, please call 1-800-225-5291 or visit the Fund’s Web site at www.jhfunds.com.
The performance table above and the chart on the next page do not reflect the deduction of taxes that a shareholder would pay on fund distributions or the redemption of fund shares.
The Fund’s performance results reflect any applicable expense reductions, without which the expenses would increase and results would have been less favorable.
1 For certain types of investors as described in the Fund’s Class I and Class R1 share prospectuses.
Annual report | Classic Value Fund II
7
A look at performance
Growth of $10,000
This chart shows what happened to a hypothetical $10,000 investment in Classic Value Fund II Class A shares for the period indicated. For comparison, we’ve shown the same investment in the Russell 1000 Value Index.
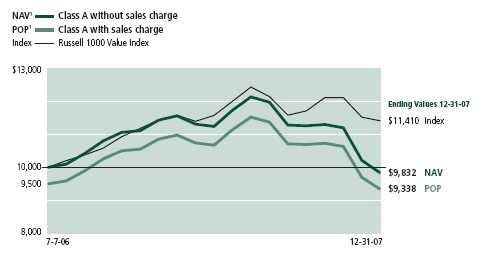
| Without | With maximum | |||
| Class | Period beginning | sales charge | sales charge | Index |
| B | 7-7-06 | $9,723 | $9,289 | $11,410 |
| C | 7-7-06 | 9,734 | 9,734 | 11,410 |
| I2 | 7-7-06 | 9,889 | 9,889 | 11,410 |
| R1 2 | 7-7-06 | 9,926 | 9,926 | 11,410 |
Assuming all distributions were reinvested for the period indicated, the table above shows the value of a $10,000 investment in the Fund’s Class B, Class C, Class I and Class R1 shares, respectively, as of December 31, 2007. Performance of the classes will vary based on the difference in sales charges paid by shareholders investing in the different classes and the fee structure of those classes.
Russell 1000 Value Index is an unmanaged index containing those securities in the Russell 1000 Index with a less-than-average growth orientation.
It is not possible to invest directly in an index. Index figures do not reflect sales charges, which would have resulted in lower values if they did.
1 NAV represents net asset value and POP represents public offering price.
2 For certain types of investors as described in the Fund’s Class I and Class R1 share prospectuses.
Classic Value Fund II | Annual report
8
Your expenses
These examples are intended to help you understand your ongoing operating expenses.
Understanding fund expenses
As a shareholder of the Fund, you incur two types of costs:
▪ Transaction costs which include sales charges (loads) on purchases or redemptions (varies by share class), minimum account fee charge, etc.
▪ Ongoing operating expenses including management fees, distribution and service fees (if applicable), and other fund expenses.
We are going to present only your ongoing operating expenses here.
Actual expenses/actual returns
This example is intended to provide information about your fund’s actual ongoing operating expenses, and is based on your fund’s actual return. It assumes an account value of $1,000.00 on July 1, 2007, with the same investment held until December 31, 2007.
| Account value | Ending value | Expenses paid during | |
| on 7-1-07 | on 12-31-07 | period ended 12-31-071 | |
| Class A | $1,000.00 | $821.30 | $6.06 |
| Class B | 1,000.00 | 818.00 | 9.48 |
| Class C | 1,000.00 | 818.80 | 9.49 |
| Class I | 1,000.00 | 822.60 | 4.33 |
| Class R1 | 1,000.00 | 831.60 | 6.52 |
Together with the value of your account, you may use this information to estimate the operating expenses that you paid over the period. Simply divide your account value at December 31, 2007, by $1,000.00, then multiply it by the “expenses paid” for your share class from the table above. For example, for an account value of $8,600.00, the operating expenses should be calculated as follows:
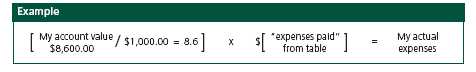
Annual report | Classic Value Fund II
9
Your expenses
Hypothetical example for comparison purposes
This table allows you to compare your fund’s ongoing operating expenses with those of any other fund. It provides an example of the Fund’s hypothetical account values and hypothetical expenses based on each class’s actual expense ratio and an assumed 5% annualized return before expenses (which is not your fund’s actual return). It assumes an account value of $1,000.00 on July 1, 2007, with the same investment held until December 31, 2007. Look in any other fund shareholder report to find its hypothetical example and you will be able to compare these expenses.
| Account value | Ending value | Expenses paid during | |
| on 7-1-07 | on 12-31-07 | period ended 12-31-071 | |
| Class A | $1,000.00 | $1,018.56 | $6.71 |
| Class B | 1,000.00 | 1,014.77 | 10.51 |
| Class C | 1,000.00 | 1,014.77 | 10.51 |
| Class I | 1,000.00 | 1,020.45 | 4.81 |
| Class R1 | 1,000.00 | 1,018.09 | 7.18 |
Remember, these examples do not include any transaction costs, such as sales charges; therefore, these examples will not help you to determine the relative total costs of owning different funds. If transaction costs were included, your expenses would have been higher. See the prospectus for details regarding transaction costs.
1 Expenses are equal to the Fund’s annualized expense ratio of 1.32%, 2.07%, 2.07%, 0.94% and 1.41% for Class A, Class B, Class C, Class I and Class R1, respectively, multiplied by the average account value over the period, multiplied by number of days in most recent fiscal half-year/365 or 366 (to reflect the one-half year period).
Classic Value Fund II | Annual report
10
Portfolio summary
| Top 10 holdings1 | ||||
| Freddie Mac | 4.7% | ING Groep NV | 3.1% | |
| Fannie Mae | 4.6% | Morgan Stanley | 3.1% | |
| Citigroup, Inc. | 4.4% | Capital One Financial Corp. | 3.1% | |
| Alcatel-Lucent | 4.0% | Home Depot, Inc. (The) | 3.1% | |
| Wal-Mart Stores, Inc. | 3.8% | Sumitomo Mitsui Financial Group, Inc. | 3.0% | |
| Sector distribution1 | ||||
| Financials | 46% | Telecommunication services | 5% | |
| Health care | 13% | Industrials | 4% | |
| Consumer discretionary | 13% | Energy | 4% | |
| Information technology | 7% | Utilities | 2% | |
| Consumer staples | 6% | |||

1 As a percentage of net assets on December 31, 2007.
Annual report | Classic Value Fund II
11
F I N A N C I A L S T A T E M E N T S
Fund’s investments
Securities owned by the Fund on 12-31-07
This schedule is divided into two main categories: common stocks and U.S. government and agencies securities. Common stocks are further broken down by industry group. U.S. government and agencies securities, which represent the Fund’s cash position, are listed last.
| Issuer | Shares | Value |
| Common stocks 99.69% | $119,537,604 | |
| (Cost $138,500,927) | ||
| Aerospace & Defense 3.78% | 4,529,819 | |
| L-3 Communications Holdings, Inc. | 21,250 | 2,251,225 |
| Northrop Grumman Corp. | 28,975 | 2,278,594 |
| Apparel Retail 2.07% | 2,485,863 | |
| TJX Cos., Inc. (The) | 86,525 | 2,485,863 |
| Application Software 0.56% | 667,761 | |
| Intuit, Inc. (I) | 21,125 | 667,761 |
| Auto Parts & Equipment 1.63% | 1,960,481 | |
| Magna International, Inc. (Class A) (Canada) (F) | 24,375 | 1,960,481 |
| Automobile Manufacturers 1.57% | 1,887,175 | |
| Hyundai Motor Co. (South Korea) (F) | 24,900 | 1,887,175 |
| Biotechnology 0.90% | 1,073,925 | |
| Amgen, Inc. (I) | 23,125 | 1,073,925 |
| Broadcasting & Cable TV 0.32% | 380,138 | |
| CBS Corp. (Class B) | 13,950 | 380,138 |
| Consumer Finance 3.21% | 3,845,505 | |
| Capital One Financial Corp. | 77,975 | 3,685,099 |
| Discover Financial Services | 10,637 | 160,406 |
| Data Processing & Outsourced Services 1.53% | 1,835,730 | |
| Computer Sciences Corp. (I) | 32,249 | 1,595,358 |
| Western Union Co. | 9,900 | 240,372 |
| Diversified Banks 7.44% | 8,925,235 | |
| Comerica, Inc. | 11,450 | 498,419 |
| Mitsubishi UFJ Financial Group, Inc. (Japan) (F) | 327,500 | 3,088,301 |
| Sumitomo Mitsui Financial Group, Inc. (Japan) (F) | 485 | 3,589,135 |
| Wachovia Corp. | 46,000 | 1,749,380 |
| Diversified Financial Services 11.33% | 13,611,313 | |
| Bank of America Corp. | 67,900 | 2,801,554 |
| Citigroup, Inc. | 178,075 | 5,242,528 |
| ING Groep NV (Netherlands) (F) | 96,975 | 3,778,672 |
| JPMorgan Chase & Co. | 40,975 | 1,788,559 |
See notes to financial statements
Classic Value Fund II | Annual report
12
F I N A N C I A L S T A T E M E N T S
| Issuer | Shares | Value |
| Electric Utilities 1.72% | $2,062,711 | |
| Korea Electric Power Corp. (South Korea) (F) | 49,055 | 2,062,711 |
| Electrical Components & Equipment 0.49% | 592,588 | |
| Tyco Electronics Ltd. (Bermuda) (F) | 7,718 | 286,569 |
| Tyco International Ltd. (Bermuda) (F) | 7,718 | 306,019 |
| Health Care Distributors 2.95% | 3,532,635 | |
| AmerisourceBergen Corp. | 54,750 | 2,456,633 |
| McKesson Corp. | 16,425 | 1,076,002 |
| Health Care Equipment 2.05% | 2,452,186 | |
| Boston Scientific Corp. (I) | 210,850 | 2,452,186 |
| Health Care Supplies 0.29% | 341,830 | |
| Covidien Ltd. | 7,718 | 341,830 |
| Home Improvement Retail 4.55% | 5,458,826 | |
| Home Depot, Inc. (The) | 136,675 | 3,682,025 |
| Lowe’s Cos., Inc. | 78,550 | 1,776,801 |
| Household Products 0.63% | 750,606 | |
| Kimberly-Clark Corp. | 10,825 | 750,606 |
| Hypermarkets & Super Centers 3.83% | 4,596,151 | |
| Wal-Mart Stores, Inc. | 96,700 | 4,596,151 |
| Integrated Oil & Gas 2.47% | 2,964,585 | |
| BP Plc ADR (United Kingdom) (F) | 8,375 | 612,799 |
| Chevron Corp. | 12,550 | 1,171,292 |
| Exxon Mobil Corp. | 12,600 | 1,180,494 |
| Integrated Telecommunication Services 0.78% | 929,905 | |
| AT&T, Inc. | 22,375 | 929,905 |
| Investment Banking & Brokerage 5.20% | 6,236,026 | |
| Lehman Brothers Holdings, Inc. | 38,625 | 2,527,620 |
| Morgan Stanley | 69,825 | 3,708,406 |
| Life & Health Insurance 1.58% | 1,891,908 | |
| Aegon NV (Netherlands) (F) | 45,513 | 802,774 |
| MetLife, Inc. | 17,675 | 1,089,134 |
| Movies & Entertainment 1.02% | 1,227,564 | |
| Viacom, Inc. (Class B) (I) | 27,950 | 1,227,564 |
| Multi-Line Insurance 0.06% | 72,875 | |
| American International Group, Inc. | 1,250 | 72,875 |
| Multi-Utilities 1.38% | 1,652,196 | |
| Sempra Energy | 26,700 | 1,652,196 |
| Office Electronics 0.58% | 693,741 | |
| Ricoh Co., Ltd. (Japan) (F) | 38,000 | 693,741 |
| Packaged Foods & Meats 1.22% | 1,468,463 | |
| Kraft Foods, Inc. (Class A) | 34,200 | 1,115,946 |
| Sara Lee Corp. | 21,950 | 352,517 |
See notes to financial statements
Annual report | Classic Value Fund II
13
F I N A N C I A L S T A T E M E N T S
| Issuer | Shares | Value | ||
| Pharmaceuticals 7.01% | $8,403,553 | |||
| Bristol-Myers Squibb Co. | 67,825 | 1,798,719 | ||
| Johnson & Johnson | 46,475 | 3,099,883 | ||
| Lilly (Eli) & Co. | 11,750 | 627,333 | ||
| Pfizer, Inc. | 126,600 | 2,877,618 | ||
| Property & Casualty Insurance 6.24% | 7,477,586 | |||
| ACE Ltd. (Cayman Islands) (F) | 14,750 | 911,255 | ||
| Allstate Corp. (The) | 46,225 | 2,414,332 | ||
| Chubb Corp. (The) | 14,350 | 783,223 | ||
| Fidelity National Financial, Inc. (Class A) | 6,234 | 91,079 | ||
| XL Capital Ltd. (Class A) (Cayman Islands) (F) | 65,150 | 3,277,697 | ||
| Restaurants 0.61% | 728,422 | |||
| Compass Group PLC (United Kingdom) (F) | 119,375 | 728,422 | ||
| Specialty Stores 0.97% | 1,165,314 | |||
| Bed Bath & Beyond, Inc. (I) | 39,650 | 1,165,314 | ||
| Systems Software 4.71% | 5,643,802 | |||
| CA, Inc. | 77,850 | 1,942,358 | ||
| Microsoft Corp. | 69,675 | 2,480,430 | ||
| Oracle Corp. (I) | 54,075 | 1,221,014 | ||
| Thrifts & Mortgage Finance 11.03% | 13,222,443 | |||
| Countrywide Financial Corp. | 160,325 | 1,433,306 | ||
| Fannie Mae | 138,925 | 5,554,222 | ||
| Freddie Mac | 166,425 | 5,670,100 | ||
| Washington Mutual, Inc. | 41,500 | 564,815 | ||
| Wireless Telecommunication Services 3.98% | 4,768,743 | |||
| Alcatel-Lucent, ADR (France) (F) | 651,469 | 4,768,743 | ||
| Interest | Maturity | Par value | ||
| Issuer, description | rate | date | (000) | Value |
| U.S. government and agencies securities 1.00% | $1,200,000 | |||
| (Cost $1,199,921) | ||||
| Government U.S. Agency 1.00% | 1,200,000 | |||
| Federal Home Loan Mortgage Assn., | ||||
| Discount Note | 4.10% (Y) | 01-02-08 | $1,200 | 1,200,000 |
| Total investments (Cost $139,700,848) 100.69% | $120,737,604 | |||
| Other assets and liabilities, net (0.69%) | ($829,047) | |||
| Total net assets 100.00% | $119,908,557 | |||
The percentage shown for each investment category is the total value of that category as a percentage of the net assets of the Fund.
See notes to financial statements
Classic Value Fund II | Annual report
14
F I N A N C I A L S T A T E M E N T S
Notes to Schedule of Investments
ADR American Depositary Receipt
(F) Parenthetical disclosure of a foreign country in the security description represents country of a foreign issuer.
(I) Non-income-producing security.
(Y) Represents current yield on December 31, 2007.
See notes to financial statements
Annual report | Classic Value Fund II
15
F I N A N C I A L S T A T E M E N T S
Financial statements
Statement of assets and liabilities 12-31-07
This Statement of Assets and Liabilities is the Fund’s balance sheet. It shows the value of what the Fund owns, is due and owes. You’ll also find the net asset value and the maximum offering price per share.
| Assets | |
| Investments at value (cost $139,700,848) | $120,737,604 |
| Cash | 105,038 |
| Receivable for shares sold | 848,713 |
| Dividends and interest receivable | 88,936 |
| Receivable from affiliates | 107,557 |
| Total assets | 121,887,848 |
| Liabilities | |
| Payable for shares repurchased | 1,767,145 |
| Payable to affiliates | |
| Management fees | 82,374 |
| Distribution and service fees | 9,410 |
| Other | 21,124 |
| Accrued expenses | 99,238 |
| Total liabilities | 1,979,291 |
| Net assets | |
| Capital paid-in | 139,608,100 |
| Accumulated net realized loss on investments and foreign currency transactions | (736,299) |
| Net unrealized depreciation of investments | (18,963,244) |
| Net assets | $119,908,557 |
| Net asset value per share | |
| Based on net asset values and shares outstanding — the Fund has an | |
| unlimited number of shares authorized with no par value | |
| Class A ($64,556,721 ÷ 6,673,158 shares) | $9.67 |
| Class B ($8,378,752 ÷ 867,893 shares)1 | $9.65 |
| Class C ($32,047,154 ÷ 3,318,713 shares)1 | $9.66 |
| Class I ($14,789,300 ÷ 1,529,205 shares) | $9.67 |
| Class R1 ($136,630 ÷ 13,942 shares) | $9.80 |
| Maximum offering price per share | |
| Class A2 ($9.67 ÷ 95%)1 | $10.18 |
1 Redemption price is equal to net asset value less any applicable contingent deferred sales charge.
2 On single retail sales of less than $50,000. On sales of $50,000 or more and on group sales the offering price is reduced.
See notes to financial statements
Classic Value Fund II | Annual report
16
F I N A N C I A L S T A T E M E N T S
Statement of operations For the year ended 12-31-07
This Statement of Operations summarizes the Fund’s investment income earned and expenses incurred in operating the Fund. It also shows net gains (losses) for the period stated.
| Investment income | |
| Dividends (net of foreign withholding taxes of $56,494) | $2,976,994 |
| Interest | 110,577 |
| Securities lending | 858 |
| Total investment income | 3,088,429 |
| Expenses | |
| Investment management fees (Note 3) | 1,049,466 |
| Distribution and service fees (Note 3) | 603,539 |
| Transfer agent fees (Note 3) | 221,804 |
| Accounting and legal services fees (Note 3) | 14,464 |
| Blue sky fees | 88,369 |
| Printing fees | 56,209 |
| Custodian fees | 39,213 |
| Professional fees | 13,546 |
| Trustees’ fees | 4,256 |
| Miscellaneous | 8,784 |
| Total expenses | 2,099,650 |
| Less expense reductions (Note 3) | (110,458) |
| Net expenses | 1,989,192 |
| Net investment income | 1,099,237 |
| Realized and unrealized loss | |
| Net realized loss on | |
| Investments | (642,392) |
| Foreign currency transactions | (85,856) |
| (728,248) | |
| Change in net unrealized appreciation (depreciation) of investments | (22,153,376) |
| (22,153,376) | |
| Net realized and unrealized loss | (22,881,624) |
| Decrease in net assets from operations | ($21,782,387) |
See notes to financial statements
Annual report | Classic Value Fund II
17
F I N A N C I A L S T A T E M E N T S
Statement of changes in net assets
These Statements of Changes in Net Assets show how the value of the Fund’s net assets has changed during the last two periods. The difference reflects earnings less expenses, any investment gains and losses, distributions, if any, paid to shareholders and the net of Fund share transactions.
| Period | Year | |
| ended | ended | |
| 12-31-061 | 12-31-07 | |
| Increase (decrease) in net assets | ||
| From operations | ||
| Net investment income | $56,675 | $1,099,237 |
| Net realized gain (loss) | 225,402 | (728,248) |
| Change in net unrealized appreciation (depreciation) | 3,190,132 | (22,153,376) |
| Increase (decrease) in net assets resulting from operations | 3,472,209 | (21,782,387) |
| Distributions to shareholders | ||
| From net investment income | ||
| Class A | (40,455) | (741,831) |
| Class B | — | (30,221) |
| Class C | — | (114,768) |
| Class I | (9,348) | (177,086) |
| Class R1 | — | (1,175) |
| From net realized gain | ||
| Class A | (78,597) | (115,384) |
| Class B | (12,170) | (15,346) |
| Class C | (31,628) | (58,279) |
| Class I | (7,156) | (20,380) |
| Class R1 | (1,259) | (238) |
| (180,613) | (1,274,708) | |
| From Fund share transactions (Note 4) | 60,955,368 | 78,718,688 |
| Total increase | 64,246,964 | 55,661,593 |
| Net assets | ||
| Beginning of year | — | 64,246,964 |
| End of year2 | $64,246,964 | $119,908,557 |
1 Beginning of operations from 7-7-06 to 12-31-06.
2 Includes distributions in excess of net investment of $520 and $0, respectively.
See notes to financial statements
Classic Value Fund II | Annual report
18
F I N A N C I A L S T A T E M E N T S
Financial highlights
The Financial Highlights show how the Fund’s net asset value for a share has changed since the end of the previous period.
| CLASS A SHARES | ||
| Period ended | 12-31-061 | 12-31-07 |
| Per share operating performance | ||
| Net asset value, beginning of period | $10.00 | $11.39 |
| Net investment income2 | 0.03 | 0.12 |
| Net realized and unrealized | ||
| gain (loss) on investments | 1.40 | (1.71) |
| Total from investment operations | 1.43 | (1.59) |
| Less distributions | ||
| From net investment income | (0.01) | (0.11) |
| From net realized gain | (0.03) | (0.02) |
| (0.04) | (0.13) | |
| Net asset value, end of period | $11.39 | $9.67 |
| Total return3 (%) | 14.294,5 | (13.97)4 |
| Ratios and supplemental data | ||
| Net assets, end of period | ||
| (in millions) | $39 | $65 |
| Ratio of net expenses to average | ||
| net assets (%) | 1.306 | 1.328 |
| Ratio of gross expenses to average | ||
| net assets (%) | 2.246,7 | 1.467 |
| Ratio of net investment income | ||
| to average net assets (%) | 0.636 | 1.04 |
| Portfolio turnover (%) | 125 | 52 |
1 Beginning of operations from 7-7-06 to 12-31-06.
2 Based on the average of the shares outstanding.
3 Assumes dividend reinvestment and does not reflect the effect of sales charges.
4 Total returns would have been lower had certain expenses not been reduced during the periods shown.
5 Not annualized.
6 Annualized.
7 Does not take into consideration expense reductions during the periods shown.
8 Includes transfer agent fee earned credits of less than 0.01% to average net assets.
See notes to financial statements
Annual report | Classic Value Fund II
19
F I N A N C I A L S T A T E M E N T S
Financial highlights
| CLASS B SHARES | ||
| Period ended | 12-31-061 | 12-31-07 |
| Per share operating performance | ||
| Net asset value, beginning of period | $10.00 | $11.36 |
| Net investment income (loss)2 | (0.01) | 0.03 |
| Net realized and unrealized | ||
| gain (loss) on investments | 1.40 | (1.69) |
| Total from investment operations | 1.39 | (1.66) |
| Less distributions | ||
| From net investment income | — | (0.03) |
| From net realized gain | (0.03) | (0.02) |
| (0.03) | (0.05) | |
| Net asset value, end of period | $11.36 | $9.65 |
| Total return3 (%) | 13.864,5 | (14.60)4 |
| Ratios and supplemental data | ||
| Net assets, end of period | ||
| (in millions) | $6 | $8 |
| Ratio of net expenses to average | ||
| net assets (%) | 2.056 | 2.078 |
| Ratio of gross expenses to average | ||
| net assets (%) | 2.996,7 | 2.07 |
| Ratio of net investment income | ||
| (loss) to average net assets (%) | (0.11)6 | 0.28 |
| Portfolio turnover (%) | 125 | 52 |
1 Beginning of operations from 7-7-06 to 12-31-06.
2 Based on the average of the shares outstanding.
3 Assumes dividend reinvestment and does not reflect the effect of sales charges.
4 Total returns would have been lower had certain expenses not been reduced during the periods shown.
5 Not annualized.
6 Annualized.
7 Does not take into consideration expense reductions during the periods shown.
8 Includes transfer agent fee earned credits of less than 0.01% to average net assets.
See notes to financial statements
Classic Value Fund II | Annual report
20
F I N A N C I A L S T A T E M E N T S
Financial highlights
| CLASS C SHARES | ||
| Period ended | 12-31-061 | 12-31-07 |
| Per share operating performance | ||
| Net asset value, beginning of period | $10.00 | $11.36 |
| Net investment income (loss)2 | (0.01) | 0.03 |
| Net realized and unrealized | ||
| gain (loss) on investments | 1.40 | (1.68) |
| Total from investment operations | 1.39 | (1.65) |
| Less distributions | ||
| From net investment income | — | (0.03) |
| From net realized gain | (0.03) | (0.02) |
| (0.03) | (0.05) | |
| Net asset value, end of period | $11.36 | $9.66 |
| Total return3 (%) | 13.864,5 | (14.51)4 |
| Ratios and supplemental data | ||
| Net assets, end of period | ||
| (in millions) | $15 | $32 |
| Ratio of net expenses to average | ||
| net assets (%) | 2.056 | 2.078 |
| Ratio of gross expenses to average | ||
| net assets (%) | 2.996,7 | 2.07 |
| Ratio of net investment loss | ||
| to average net assets (%) | (0.15)6 | 0.28 |
| Portfolio turnover (%) | 125 | 52 |
1 Beginning of operations from 7-7-06 to 12-31-06.
2 Based on the average of the shares outstanding.
3 Assumes dividend reinvestment and does not reflect the effect of sales charges.
4 Total returns would have been lower had certain expenses not been reduced during the periods shown.
5 Not annualized.
6 Annualized.
7 Does not take into consideration expense reductions during the periods shown.
8 Includes transfer agent fee earned credits of less than 0.01% to average net assets.
See notes to financial statements
Annual report | Classic Value Fund II
21
F I N A N C I A L S T A T E M E N T S
Financial highlights
| CLASS I SHARES | ||
| Period ended | 12-31-061 | 12-31-07 |
| Per share operating performance | ||
| Net asset value, beginning of period | $10.00 | $11.39 |
| Net investment income2 | 0.04 | 0.16 |
| Net realized and unrealized | ||
| gain (loss) on investments | 1.41 | (1.71) |
| Total from investment operations | 1.45 | (1.55) |
| Less distributions | ||
| From net investment income | (0.03) | (0.15) |
| From net realized gain | (0.03) | (0.02) |
| (0.06) | (0.17) | |
| Net asset value, end of period | $11.39 | $9.67 |
| Total return3 (%) | 14.504,5 | (13.63)4 |
| Ratios and supplemental data | ||
| Net assets, end of period | ||
| (in millions) | $4 | $15 |
| Ratio of net expenses to average | ||
| net assets (%) | 0.946 | 0.948 |
| Ratio of gross expenses to average | ||
| net assets (%) | 1.886,7 | 0.94 |
| Ratio of net investment income | ||
| to average net assets (%) | 0.746 | 1.41 |
| Portfolio turnover (%) | 125 | 52 |
1 Beginning of operations from 7-7-06 to 12-31-06.
2 Based on the average of the shares outstanding.
3 Assumes dividend reinvestment and does not reflect the effect of sales charges.
4 Total returns would have been lower had certain expenses not been reduced during the periods shown.
5 Not annualized.
6 Annualized.
7 Does not take into consideration expense reductions during the periods shown.
8 Includes transfer agent fee earned credits of less than 0.01% to average net assets.
See notes to financial statements
Classic Value Fund II | Annual report
22
F I N A N C I A L S T A T E M E N T S
Financial highlights
| CLASS R1 SHARES | ||
| Period ended | 12-31-061 | 12-31-07 |
| Per share operating performance | ||
| Net asset value, beginning of period | $10.00 | $11.39 |
| Net investment income2 | 0.02 | 0.09 |
| Net realized and unrealized | ||
| gain (loss) on investments | 1.40 | (1.57) |
| Total from investment operations | 1.42 | (1.48) |
| Less distributions | ||
| From net investment income | — | (0.09) |
| From net realized gain | (0.03) | (0.02) |
| (0.03) | (0.11) | |
| Net asset value, end of period | $11.39 | $9.80 |
| Total return3 (%) | 14.164,5 | (13.05)4 |
| Ratios and supplemental data | ||
| Net assets, end of period | ||
| (in millions) | $1 | —6 |
| Ratio of net expenses to average | ||
| net assets (%) | 1.467 | 1.579 |
| Ratio of gross expenses to average | ||
| net assets (%) | 2.407,8 | 1.57 |
| Ratio of net investment income | ||
| to average net assets (%) | 0.467 | 0.80 |
| Portfolio turnover (%) | 125 | 52 |
1 Beginning of operations from 7-7-06 to 12-31-06.
2 Based on the average of the shares outstanding.
3 Assumes dividend reinvestment and does not reflect the effect of sales charges.
4 Total returns would have been lower had certain expenses not been reduced during the periods shown.
5 Not annualized.
6 Less than $500,000.
7 Annualized.
8 Does not take into consideration expense reductions during the periods shown.
9 Includes transfer agent fee earned credits of less than 0.01% to average net assets.
See notes to financial statements
Annual report | Classic Value Fund II
23
Notes to financial statements
Note 1
Organization
John Hancock Classic Value Fund II (the Fund) is a diversified series of John Hancock Capital Series (the Trust), an open-end management investment company registered under the Investment Company Act of 1940, as amended (the 1940 Act). The investment objective of the Fund is to achieve long-term growth of capital. The Fund commenced operations on July 7, 2006.
The Trustees have authorized the issuance of multiple classes of shares of the Fund, designated as Class A, Class B, Class C, Class I and Class R1 shares. The shares of each class represent an interest in the same portfolio of investments of the Fund and have equal rights as to voting, redemptions, dividends and liquidation, except that certain expenses, subject to the approval of the Trustees, may be applied differently to each class of shares in accordance with current regulations of the Securities and Exchange Commission (SEC) and the Internal Revenue Service. Shareholders of a class that bears distribution and service expenses under the terms of a distribution plan have exclusive voting rights to that distribution plan. Class B shares will convert to Class A shares eight years after purchase. Effective March 1, 2007, Class R shares were redesignated Class R1 shares.
Note 2
Significant accounting policies
The financial statements have been prepared in conformity with accounting principles generally accepted in the United States of America, which require management to make certain estimates and assumptions at the date of the financial statements. Actual results could differ from those estimates. The following summarizes the significant accounting policies of the Fund:
Security valuation
The net asset value of Class A, Class B, Class C, Class I and Class R1 shares of the Fund is determined daily as of the close of the New York Stock Exchange (NYSE), normally at 4:00 p.m., Eastern Time. Short-term debt investments that have a remaining maturity of 60 days or less are valued at amortized cost, and thereafter assume a constant amortization to maturity of any discount or premium, which approximates market value. All other securities held by the Fund are valued at the last sale price or official closing price (closing bid price or last evaluated quote if no sale has occurred) as of the close of business on the principal securities exchange (domestic or foreign) on which they trade or, lacking any sales, at the closing bid price. Securities traded only in the over-the-counter market are valued at the last bi d price quoted by brokers making markets in the securities at the close of trading. Securities for which there are no such quotations, principally debt securities, are valued based on the evaluated prices provided by an independent pricing service, which utilizes both dealer-supplied and electronic data processing techniques, which take into account factors such as institutional-size trading in similar groups of securities, yield, quality, coupon rate, maturity, type of issue, trading characteristics and other market data.
Other assets and securities for which no such quotations are readily available are valued at fair value as determined in good faith under consistently applied procedures established by and under the general supervision of the Board of Trustees. Generally, trading in non-U.S. securities is substantially completed each day at various times prior to the close of trading on the NYSE. The values of such securities used in computing the net asset value of the Fund’s shares are generally determined as of such times. Occasionally, significant events that affect the values of such securities may occur between
Classic Value Fund II | Annual report
24
the times at which such values are generally determined and the close of the NYSE. Upon such an occurrence, these securities will be valued at fair value as determined in good faith under consistently applied procedures established by and under the general supervision of the Board of Trustees.
Joint repurchase agreement
Pursuant to an exemptive order issued by the SEC, the Fund, along with other registered investment companies having a management contract with John Hancock Advisers, LLC (the Adviser), a wholly owned subsidiary of John Hancock Financial Services, Inc., a subsidiary of Manulife Financial Corporation (MFC), may participate in a joint repurchase agreement transaction. Aggregate cash balances are invested in one or more large repurchase agreements, whose underlying securities are obligations of the U.S. government and/or its agencies. The Fund’s custodian bank receives delivery of the underlying securities for the joint account on the Fund’s behalf.
Foreign currency translation
The books and records of the Fund are maintained in U.S. dollars. Investment securities and other assets and liabilities denominated in a foreign currency are translated into U.S. dollars at the prevailing exchange rates at period end. Purchases and sales of investment securities, income and expenses are translated into U.S. dollars at the prevailing exchange rates on the respective dates of the transactions.
Net realized and unrealized gains and losses on foreign currency transactions represent net gains and losses between trade and settlement dates on securities transactions, the disposition of forward foreign currency exchange contracts and foreign currencies, and the difference between the amount of net investment income accrued and the U.S. dollar amount actually received. That portion of both realized and unrealized gains and losses on investments that results from fluctuations in foreign currency exchange rates is not separately disclosed but is included with net realized and unrealized gain/appreciation and loss/depreciation on investments.
Investment transactions
Investment transactions are accounted for on a trade date plus one basis for daily net asset value calculations. However, for financial reporting purposes, investment security transactions are reported on trade date. Interest income is recorded on the accrual basis. Dividend income is recorded on the ex-dividend date net of foreign withholding taxes. Certain dividends from foreign securities may be recorded subsequent to the ex-dividend date as soon as the Fund is informed of such dividends. Discounts/premiums are accreted/amortized for financial reporting purposes. Realized gains and losses from investment transactions are recorded on an identified cost basis.
Class allocations
Income, common expenses and realized and unrealized gains (losses) are determined at the fund level and allocated daily to each class of shares based on the appropriate net asset value of the respective classes. Distribution and service fees, if any, and transfer agent fees for Class A, Class B, Class C, Class I and Class R1 shares are calculated daily at the class level based on the appropriate net asset value of each class and the specific expense rate(s) applicable to each class.
Guarantees and indemnifications
Under the Fund’s organizational documents, its Officers and Trustees are indemnified against certain liability arising out of the performance of their duties to the Fund. Additionally, in the normal course of business, the Fund enters into contracts with service providers that contain general indemnification clauses. The Fund’s maximum exposure under these arrangements is unknown, as this would involve future claims that may be made against the Fund that have not yet occurred.
Expenses
The majority of expenses are directly identifiable to an individual fund. Expenses that are not readily identifiable to a specific fund are allocated in such a manner as deemed equitable, taking into consideration, among other things, the nature and type of expense and the relative size of the funds.
Annual report | Classic Value Fund II
25
Bank borrowings
The Fund is permitted to have bank borrowings for temporary or emergency purposes, including the meeting of redemption requests that otherwise might require the untimely disposition of securities. The Fund has entered into a line of credit agreement with The Bank of New York Mellon (BNYM), the Swing Line Lender and Administrative Agent. This agreement enables the Fund to participate, with other funds managed by the Adviser, in an unsecured line of credit with BNYM, which permits borrowings of up to $100 million, collectively. Interest is charged to each fund based on its borrowing. In addition, a commitment fee is charged to each fund based on the average daily unused portion of the line of credit and is allocated among the participating funds. The Fund had no borrowing activity under the line of credit during the year ended December 31, 2007.
Federal income taxes
The Fund qualifies as a regulated investment company by complying with the applicable provisions of the Internal Revenue Code and will not be subject to federal income tax on taxable income that is distributed to shareholders. Therefore, no federal income tax provision is required. Net capital losses of $316,389 that are attributable to security transactions incurred after October 31, 2007, are treated as arising on January 1, 2008, the first day of the Fund’s next taxable year.
The Fund adopted the provisions of Financial Accounting Standards Board (FASB) Interpretation No. 48, Accounting for Uncertainty in Income Taxes, an interpretation of FASB Statement 109 (FIN 48), on January 1, 2007. FIN 48 prescribes a minimum threshold for financial statement recognition of the benefit of a tax position taken or expected to be taken in a tax return. The implementation of FIN 48 did not result in any unrecognized tax benefits in the accompanying financial statements. Each of the Fund’s federal tax returns for the prior three fiscal years remains subject to examination by the Internal Revenue Service.
New accounting pronouncement
In September 2006, FASB Standard No. 157, Fair Value Measurements (FAS 157), was issued and is effective for fiscal years beginning after November 15, 2007. FAS 157 defines fair value, establishing a framework for measuring fair value and expands disclosure about fair value measurements. Management is currently evaluating the application of FAS 157 to the Fund and its impact, if any, resulting from the adoption of FAS 157 on the Fund’s financial statements disclosures.
Distribution of income and gains
The Fund records distributions to shareholders from net investment income and net realized gains, if any, on the ex-dividend date. During the year ended December 31, 2006, the tax character of distributions paid was as follows: ordinary income $180,613. During the year ended December 31, 2007, the tax character of distributions paid was as follows: ordinary income $1,182,829, long-term capital gain $91,879. Distributions paid by the Fund with respect to each class of shares are calculated in the same manner, at the same time and are in the same amount, except for the effect of expenses that may be applied differently to each class.
As of December 31, 2007, there were no distributable earnings on a tax basis.
Such distributions and distributable earnings, on a tax basis, are determined in conformity with income tax regulations, which may differ from accounting principles generally accepted in the United States of America. Distributions in excess of tax basis earnings and profits, if any, are reported in the Fund’s financial statements as a return of capital.
Capital accounts within financial statements are adjusted for permanent book-tax differences. These adjustments have no impact on net assets or the results of operations. Temporary book-tax differences will reverse in a subsequent period. Permanent differences are primarily attributable to foreign currency gains and losses and overdistributions.
Classic Value Fund II | Annual report
26
Note 3
Management fee and transactions with affiliates and others
The Fund has an investment management contract with the Adviser. Under the investment management contract, the Fund pays a daily management fee to the Adviser equivalent, on an annual basis, to the sum of: (a) 0.80% of the first $2,500,000,000 of the Fund’s average daily net asset value, (b) 0.78% of the next $2,500,000,000 and (c) 0.76% in excess of $5,000,000,000 of the Fund’s daily net asset value. The effective rate for the year ended December 31, 2007 is 0.80% of the Fund’s average daily net asset value. The Adviser has a subadvisory agreement with Pzena Investment Management LLC. The Fund is not responsible for payment of the subadvisory fees.
The Adviser contractually limited the Fund’s total expenses to 1.32% of the Fund’s average daily net assets for Class A shares at least until April 30, 2008. Accordingly, the expense reductions related to this total expense limitation amounted to $106,775 for the year ended December 31, 2007. The Adviser reserves the right to terminate this limitation in the future.
The Fund has a Distribution Agreement with John Hancock Funds, LLC (JH Funds), a wholly owned subsidiary of the Adviser. The Fund has adopted Distribution Plans with respect to Class A, Class B, Class C and Class R1, pursuant to Rule 12b-1 under the 1940 Act, to reimburse JH Funds for the services it provides as distributor of shares of the Fund. Accordingly, the Fund makes monthly payments to JH Funds at an annual rate not to exceed 0.25%, 1.00%, 1.00% and 0.50% of average daily net asset value of Class A, Class B, Class C and Class R1, respectively. A maximum of 0.25% of such payments may be service fees, as defined by the Conduct Rules of the Financial Industry Regulatory Authority (formerly the National Association of Securities Dealers). Under the Conduct Rules, curtailment of a portion of the Fund’s 12b-1 payments could occur under certain circumstances. In addition, under a Service Plan for Class R1 shares, the Fund pays up to 0.25% of Class R1 average daily net asset value for certain other services.
Class A shares are assessed up-front sales charges. During the year ended December 31, 2007, JH Funds received net up-front sales charges of $716,720 with regard to sales of Class A shares. Of this amount, $98,065 was retained and used for printing prospectuses, advertising, sales literature and other purposes, $612,019 was paid as sales commissions to unrelated broker-dealers and $6,636 was paid as sales commissions to sales personnel of Signator Investors, Inc. (Signator Investors), a related broker-dealer. The Adviser’s indirect parent, John Hancock Life Insurance Company (JHLICO), is the indirect sole shareholder of Signator Investors.
Class B shares that are redeemed within six years of purchase are subject to a contingent deferred sales charge (CDSC) at declining rates, beginning at 5.00% of the lesser of the current market value at the time of redemption or the original purchase cost of the shares being redeemed. Class C shares that are redeemed within one year of purchase are subject to a CDSC at a rate of 1.00% of the lesser of the current market value at the time of redemption or the original purchase cost of the shares being redeemed. Proceeds from the CDSCs are paid to JH Funds and are used in whole or in part to defray its expenses for providing distribution-related services to the Fund in connection with the sale of Class B and Class C shares. During the year ended December 31, 2007, CDSCs received by JH Funds amounted to $19,875 for Class B shares and $26,619 for Class C shares.
The Fund has a transfer agent agreement with John Hancock Signature Services, Inc. (Signature Services), an indirect subsidiary of JHLICO. For Class A, Class B, Class C, Class I and Class R1 shares, the Fund pays a monthly transfer agent fee at an annual rate of 0.05% of each class’s average daily net asset value, plus a fee based on the number of shareholder accounts and reimbursement for certain out-of-pocket expenses, aggregated and allocated to each class on the basis of its relative net asset value. Effective June 1, 2007, for the Class I shares the Fund pays a monthly transfer agent fee at a total annual rate of 0.04% of the Class I average daily net asset value. The Fund pays
Annual report | Classic Value Fund II
27
a monthly fee which is based on an annual rate of $15.00 for each Class A shareholder account, $17.50 for each Class B shareholder account, $16.50 for each Class C shareholder account, $15.00 for each Class I shareholder account and $15.00 for each Class R1 shareholder account. Signature Services had agreed to limit Class A, Class B and Class C transfer agent fee to 0.18% of each respective class’s average daily net asset value until April 30, 2008. There were no transfer agent fee reductions during the year ended December 31, 2007.
In May 2007, the Fund began receiving earnings credits from its transfer agent as a result of uninvested cash balances. These credits are used to reduce a portion of the Fund’s transfer agent fees and out of pocket expenses. During the year ended December 31, 2007, the Fund’s transfer agent fees and out of pocket expenses were reduced by $3,683 for transfer agent credits earned.
Expenses under the agreements described above for the year ended December 31, 2007 were as follows:
| Transfer | Distribution and | ||
| Share class | agent fees | service fees | |
| Class A | $138,037 | $188,642 | |
| Class B | 17,446 | 94,056 | |
| Class C | 57,979 | 317,157 | |
| Class I | 6,988 | — | |
| Class R1 | 1,354 | 3,684 | |
| Total | $221,804 | $603,539 | |
The Fund has an agreement with the Adviser and affiliates to perform necessary tax, accounting, compliance, legal and other administrative services for the Fund. The compensation for the year amounted to $14,464 with an effective rate of 0.01% of the Fund’s average daily net asset value.
Mr. James R. Boyle is Chairman of the Adviser, as well as affiliated Trustee of the Fund, and is compensated by the Adviser and/or its affiliates. The compensation of unaffiliated Trustees is borne by the Fund. The unaffiliated Trustees may elect to defer, for tax purposes, their receipt of this compensation under the John Hancock Group of Funds Deferred Compensation Plan. The Fund makes investments into other John Hancock funds, as applicable, to cover its liability for the deferred compensation. Investments to cover the Fund’s deferred compensation liability are recorded on the Fund’s books as an other asset. The deferred compensation liability and the related other asset are always equal and are marked to market on a periodic basis to reflect any income earned by the investments, as well as any unrealized gains or losses. The Deferred Compensation Plan investments had no impact on the operations of the Fund.
Classic Value Fund II | Annual report
28
Note 4
Fund share transactions
This listing illustrates the number of Fund shares sold, reinvested and repurchased during the years ended December 31, 2006, and December 31, 2007, along with the corresponding dollar value.
| Year ended 12-31-06 | Year ended 12-31-07 | |||
| Shares | Amount | Shares | Amount | |
| Class A shares | ||||
| Sold | 3,415,796 | $36,642,179 | 7,333,800 | $83,737,825 |
| Distributions reinvested | 9,891 | 112,464 | 78,720 | 773,026 |
| Repurchased | (33,064) | (367,315) | (4,131,985) | (45,786,008) |
| Net increase | 3,392,623 | $36,387,328 | 3,280,535 | $38,724,843 |
| Class B shares | ||||
| Sold | 540,125 | $5,857,582 | 639,959 | $7,329,987 |
| Distributions reinvested | 874 | 9,915 | 4,326 | 42,445 |
| Repurchased | (18,276) | (203,482) | (299,115) | (3,283,672) |
| Net increase | 522,723 | $5,664,015 | 345,170 | $4,088,760 |
| Class C shares | ||||
| Sold | 1,366,860 | $14,895,524 | 2,954,346 | $33,155,576 |
| Distributions reinvested | 2,574 | 29,218 | 16,293 | 159,838 |
| Repurchased | (21,239) | (229,731) | (1,000,121) | (10,515,915) |
| Net increase | 1,348,195 | $14,695,011 | 1,970,518 | $22,799,499 |
| Class I shares | ||||
| Sold | 332,852 | $3,687,416 | 2,474,371 | $27,332,141 |
| Distributions reinvested | 1,413 | 16,063 | 19,621 | 192,679 |
| Repurchased | (997) | (11,084) | (1,298,055) | (14,165,816) |
| Net increase | 333,268 | $3,692,395 | 1,195,937 | $13,359,004 |
| Class R1 shares | ||||
| Sold | 48,760 | $515,380 | 57,023 | $665,402 |
| Distributions reinvested | 111 | 1,259 | 143 | 1,412 |
| Repurchased | (2) | (20) | (92,093) | (920,232) |
| Net increase (decrease) | 48,869 | $516,619 | (34,927) | ($253,418) |
| Net increase | 5,645,678 | $60,955,368 | 6,757,233 | $78,718,688 |
Note 5
Purchase and sales of securities
Purchases and proceeds from sales or maturities of securities, other than short-term securities and obligations of the U.S. government, during the year ended December 31, 2007, aggregated $148,098,595 and $64,960,422, respectively.
The cost of investments owned on December 31, 2007, including short-term investments, for federal income tax purposes was $140,120,758. Gross unrealized appreciation and depreciation of investments aggregated $4,182,092 and $23,565,246, respectively, resulting in net unrealized depreciation of $19,383,154. The difference between book basis and tax basis net unrealized appreciation of investments is attributable primarily to the tax deferral of losses on certain sales of securities.
Annual report | Classic Value Fund II
29
Auditors’ report
Report of Independent Registered Public Accounting Firm
To the Board of Trustees of John Hancock Capital Series and Shareholders of John Hancock Classic Value Fund II,
In our opinion, the accompanying statement of assets and liabilities, including the schedule of investments, and the related statements of operations and of changes in net assets and the financial highlights present fairly, in all material respects, the financial position of John Hancock Classic Value Fund II (the Fund) at December 31, 2007, and the results of its operations, the changes in its net assets and the financial highlights for the periods indicated, in conformity with accounting principles generally accepted in the United States of America. These financial statements and financial highlights (hereafter referred to as “financial statements”) are the responsibility of the Fund’s management. Our responsibility is to express an opinion on these financial statements based on our audits. We conducted our audits of these financial statements in accordance with the standards of the Public Company Accounting Oversight Board (United States). Those standards require that we plan and perform the audit to obtain reasonable assurance about whether the financial statements are free of material misstatement. An audit includes examining, on a test basis, evidence supporting the amounts and disclosures in the financial statements, assessing the accounting principles used and significant estimates made by management, and evaluating the overall financial statement presentation. We believe that our audits, which included confirmation of securities at December 31, 2007 by correspondence with the custodian, provide a reasonable basis for our opinion.
PricewaterhouseCoopers LLP
Boston, Massachusetts
February 28, 2008
Classic Value Fund II | Annual report
30
Tax information
Unaudited
For federal income tax purposes, the following information is furnished with respect to the distributions of the Fund, if any, paid during its taxable year ended December 31, 2007.
The Fund has designated distributions to shareholders of $91,879 as a long-term capital gain dividend.
With respect to the ordinary dividends paid by the Fund for the fiscal year ended December 31, 2007, 100% of the dividends qualifies for the corporate dividends-received deduction.
The Fund hereby designates the maximum amount allowable of its net taxable income as qualified dividend income as provided in the Jobs and Growth Tax Relief Reconciliation Act of 2003. This amount will be reflected on Form 1099-DIV for the calendar year 2007.
Shareholders will be mailed a 2007 U.S. Treasury Department Form 1099-DIV in January 2008. This will reflect the total of all distributions that are taxable for calendar year 2007.
Annual report | Classic Value Fund II
31
Board Consideration of and
Continuation of Investment Advisory
Agreement and Subadvisory
Agreement: John Hancock
Classic Value Fund II
Section 15(c) of the Investment Company Act of 1940 (the 1940 Act) requires the Board of Trustees (the Board) of John Hancock Capital Series (the Trust), including a majority of the Trustees who have no direct or indirect interest in the investment advisory agreement and are not “interested persons” of the Trust, as defined in the 1940 Act (the Independent Trustees), initially to review and approve: (i) the investment advisory agreement (the Advisory Agreement) with John Hancock Advisers, LLC (the Adviser) and (ii) the subadvisory agreement with Pzena Investment Management, LLC (the Subadviser) for the John Hancock Classic Value Fund II (the Fund). The investment advisory agreement with the Adviser and the investment subadvisory agreement with the Subadviser are collectively referred to as the Advisory Agreements.
At meetings held on June 5–6, 2006, the Board, including the Independent Trustees, considered the factors and reached the conclusions described below relating to the selection of the Adviser and Subadviser and the Advisory Agreements. During such meetings, the Board’s Contracts/Operations Committee and the Independent Trustees also met in executive sessions with their independent legal counsel. In evaluating the Advisory Agreements, the Board, including the Contracts/Operations Committee and the Independent Trustees, reviewed a broad range of information requested for this purpose by the Independent Trustees, including but not limited to advisory and other fees incurred by, and the expense ratios of, a group of comparable funds selected by the Adviser and the proposed fee and estimated expense ratio of the Fund. The Independent Trustees also consider information that was provided in connection with the Trustees’ annual review of the advisory agreement for other funds managed by the Adviser including (i) the Adviser’s financial results and condition, (ii) the background and experience of senior management and investment professionals, (iii) the nature, cost and character of advisory and non-investment management services provided by the Adviser and its affiliates to other series of the Trust and (iv) the Adviser’s record of compliance with applicable laws and regulations, with the Fund’s investment policies and restrictions, and with the Fund’s Code of Ethics and the structure and responsibilities of the Adviser’s compliance department.
Nature, extent and quality of services
The Board considered the ability of the Adviser and the Subadviser, based on their resources, reputation and other attributes, to attract and retain qualified investment professionals, including research, advisory and supervisory personnel. The Board further considered the compliance programs and compliance records of the Adviser and Subadviser. In addition, the Board took into account the administrative services provided to the Fund by the Adviser and its affiliates. The Board also reviewed the investment performance of similar accounts managed by the Subadviser compared to the performance of an index.
Based on the above factors, together with those referenced below, the Board concluded that, within the context of its full deliberations, the nature, extent and quality of the investment advisory services provided to the Fund by the Adviser and Subadviser were sufficient to support approval of the Advisory Agreements.
Investment advisory and subadvisory fee rates and expenses
The Board reviewed and considered the contractual investment advisory rate to be payable by the Fund to the Adviser for investment advisory services (the Advisory Agreement Rate). The Board received and considered information comparing the Advisory Agreement Rate with the average fee paid by a group of similar funds selected by the Adviser. The Board concluded that the Advisory Agreement Rate was reasonable in relation to the services to be provided.
The Board received and considered information regarding the Fund’s estimated total operating expense ratio and its various components, including contractual advisory fees, actual advisory fees, non-management
Classic Value Fund II | Annual report
32
fees, Rule 12b-1 and non-Rule 12b-1 service fees. The Board also considered comparisons of these expenses to the expenses information for the similar funds. Based on the above-referenced considerations and other factors, the Board concluded that the Fund’s projected overall expense ratio supported the approval of the Advisory Agreement.
The Board also received information about the investment subadvisory fee rate (the Subadvisory Agreement Rate) payable by the Adviser to the Subadviser for investment sub-advisory services. The Board concluded that the Subadvisory Agreement Rate was fair and equitable, based on its consideration of the factors described above.
Information about services to other clients
The Board also received information about the nature, extent and quality of services and fee rates offered by the Adviser to its other clients, including other registered investment companies, institutional investors and separate accounts. The Board concluded that the Advisory Agreement Rate was not unreasonable, taking into account fee rates offered to others by the Adviser and giving effect to differences in services covered by such fee rates.
Other benefits to the Adviser
The Board received information regarding potential “fall-out” or ancillary benefits received by the Adviser and its affiliates as a result of the Adviser’s relationship with the Fund. Such benefits could include, among others, benefits directly attributable to the relationship of the Adviser with the Fund and benefits potentially derived from an increase in the business of the Adviser as a result of its relationship with the Fund (such as the ability to market to shareholders other financial products offered by the Adviser and its affiliates).
The Board also considered the effectiveness of the Adviser’s and the Fund’s policies and procedures for complying with the requirements of the federal securities laws, including those relating to best execution of portfolio transactions and brokerage allocation.
Factors not considered relevant at this time
In light of the fact that the Fund has not yet commenced normal operations, the Trustees noted that certain factors, such as investment performance, economies of scale and profitability, that will be relevant when the Trustee considers continuing the Advisory Agreement, are not germane to its initial approval.
Other factors and broader review
The Board regularly reviews and assesses the quality of the services that the other funds managed by the Adviser receive throughout the year. In this regard, the Board reviews reports of the Adviser at least quarterly, which include, among other things, a detailed portfolio review, detailed fund performance reports and compliance reports. In addition, the Board meets with portfolio managers and senior investment officers at various times throughout the year.
After considering the above-described factors and based on its deliberations and its evaluation of the information described above, the Board concluded that approval of the Advisory Agreement and the Subadvisory Agreement for the Fund was in the best interest of the Fund and its shareholders. Accordingly, the Board unanimously approved the Advisory Agreement and the Subadvisory Agreements.
Annual report | Classic Value Fund II
33
Trustees and Officers
This chart provides information about the Trustees and Officers who oversee your John Hancock fund. Officers elected by the Trustees manage the day-to-day operations of the Fund and execute policies formulated by the Trustees.
| Independent Trustees | ||
| Name, Year of Birth | Number of | |
| Position(s) held with Fund | Trustee | John Hancock |
| Principal occupation(s) and other | of Fund | funds overseen |
| directorships during past 5 years | since1 | by Trustee |
| James F. Carlin, Born: 1940 | 2006 | 55 |
| Interim Chairman (since December 2007); Director and Treasurer, Alpha Analytical Laboratories, Inc. | ||
| (chemical analysis) (since 1985); Part Owner and Treasurer, Lawrence Carlin Insurance Agency, Inc. | ||
| (since 1995); Part Owner and Vice President, Mone Lawrence Carlin Insurance Agency, Inc. (until 2005); | ||
| Chairman and Chief Executive Officer, Carlin Consolidated, Inc. (management/investments) (since 1987); | ||
| Trustee, Massachusetts Health and Education Tax Exempt Trust (1993–2003). | ||
| William H. Cunningham, Born: 1944 | 2006 | 55 |
| Professor, University of Texas at Austin (since 1971); former Chancellor, University of Texas System and | ||
| former President, University of Texas at Austin (until 2001); Chairman and Chief Executive Officer, IBT | ||
| Technologies (until 2001); Director of the following: Hicks Acquisition Company I, Inc. (since 2007); | ||
| Hire.com (until 2004), STC Broadcasting, Inc. and Sunrise Television Corp. (until 2001), Symtx, Inc. | ||
| (electronic manufacturing) (since 2001), Adorno/Rogers Technology, Inc. (until 2004), Pinnacle Foods | ||
| Corporation (until 2003), rateGenius (until 2003), Lincoln National Corporation (insurance) (since 2006), | ||
| Jefferson-Pilot Corporation (diversified life insurance company) (until 2006), New Century Equity | ||
| Holdings (formerly Billing Concepts) (until 2001), eCertain (until 2001), ClassMap.com (until 2001), | ||
| Agile Ventures (until 2001), AskRed.com (until 2001), Southwest Airlines (since 2000), Introgen (man- | ||
| ufacturer of biopharmaceuticals) (since 2000) and Viasystems Group, Inc. (electronic manufacturer) | ||
| (until 2003); Advisory Director, Interactive Bridge, Inc. (college fundraising) (until 2001); Advisory | ||
| Director, Q Investments (until 2003); Advisory Director, JPMorgan Chase Bank (formerly Texas Commerce | ||
| Bank–Austin), LIN Television (until 2008), WilTel Communications (until 2003) and Hayes Lemmerz | ||
| International, Inc. (diversified automotive parts supply company) (since 2003). | ||
| Charles L. Ladner, 2 Born: 1938 | 2006 | 55 |
| Chairman and Trustee, Dunwoody Village, Inc. (retirement services) (until 2003); Senior Vice President | ||
| and Chief Financial Officer, UGI Corporation (public utility holding company) (retired 1998); Vice | ||
| President and Director, AmeriGas, Inc. (retired 1998); Director, AmeriGas Partners, L.P. (gas distribution) | ||
| (until 1997); Director, EnergyNorth, Inc. (until 1997); Director, Parks and History Association (until 2005). | ||
| John A. Moore,2 Born: 1939 | 2006 | 55 |
| President and Chief Executive Officer, Institute for Evaluating Health Risks (nonprofit institution) | ||
| (until 2001); Senior Scientist, Sciences International (health research) (until 2003); Former Assistant | ||
| Administrator and Deputy Administrator, Environmental Protection Agency; Principal, Hollyhouse | ||
| (consulting) (since 2000); Director, CIIT Center for Health Science Research (nonprofit research) | ||
| (until 2007). | ||
Classic Value Fund II | Annual report
34
| Independent Trustees (continued) | ||
| Name, Year of Birth | Number of | |
| Position(s) held with Fund | Trustee | John Hancock |
| Principal occupation(s) and other | of Fund | funds overseen |
| directorships during past 5 years | since1 | by Trustee |
| Patti McGill Peterson,2 Born: 1943 | 2006 | 55 |
| Senior Associate, Institute for Higher Education Policy (since 2007); Executive Director, Council for | ||
| International Exchange of Scholars and Vice President, Institute of International Education (until 2007); | ||
| Senior Fellow, Cornell Institute of Public Affairs, Cornell University, Ithaca, NY (until 1998); Former | ||
| President, Wells College, Aurora, NY, and St. Lawrence University, Canton, NY; Director, Niagara | ||
| Mohawk Power Corporation (until 2003); Director, Ford Foundation, International Fellowships Program | ||
| (since 2002); Director, Lois Roth Endowment (since 2002); Director, Council for International Educational | ||
| Exchange (since 2003). | ||
| Steven R. Pruchansky, Born: 1944 | 2006 | 55 |
| Chairman and Chief Executive Officer, Greenscapes of Southwest Florida, Inc. (since 2000); Director and | ||
| President, Greenscapes of Southwest Florida, Inc. (until 2000); Managing Director, JonJames, LLC (real | ||
| estate) (since 2000); Director, First Signature Bank & Trust Company (until 1991); Director, Mast Realty | ||
| Trust (until 1994); President, Maxwell Building Corp. (until 1991). | ||
| Non-Independent Trustees3 | ||
| Name, Year of Birth | Number of | |
| Position(s) held with Fund | Trustee | John Hancock |
| Principal occupation(s) and other | of Fund | funds overseen |
| directorships during past 5 years | since1 | by Trustee |
| James R. Boyle, Born: 1959 | 2006 | 265 |
| Executive Vice President, Manulife Financial Corporation (since 1999); President, John Hancock Variable | ||
| Life Insurance Company (since March 2007); Executive Vice President, John Hancock Life Insurance | ||
| Company (since 2004); Chairman and Director, John Hancock Advisers, LLC (the Adviser), John Hancock | ||
| Funds, LLC and The Berkeley Financial Group, LLC (The Berkeley Group) (holding company) (since 2005); | ||
| Senior Vice President, The Manufacturers Life Insurance Company (U.S.A.) (until 2004). | ||
Annual report | Classic Value Fund II
35
| Principal officers who are not Trustees | |
| Name, Year of Birth | |
| Position(s) held with Fund | Officer |
| Principal occupation(s) and other | of Fund |
| directorships during past 5 years | since |
| Keith F. Hartstein, Born: 1956 | 2006 |
| President and Chief Executive Officer | |
| Senior Vice President, Manulife Financial Corporation (since 2004); Director, President and Chief | |
| Executive Officer, the Adviser, The Berkeley Group and John Hancock Funds, LLC (since 2005); Director, | |
| MFC Global Investment Management (U.S.), LLC (MFC Global (U.S.)) (since 2005); Director, John | |
| Hancock Signature Services, Inc. (since 2005); President and Chief Executive Officer, John Hancock | |
| Investment Management Services, LLC (since 2006); President and Chief Executive Officer, John Hancock | |
| Funds, John Hancock Funds II, John Hancock Funds III and John Hancock Trust (since 2005); Director, | |
| Chairman and President, NM Capital Management, Inc. (since 2005); Member, Investment Company | |
| Institute Sales Force Marketing Committee (since 2003); President and Chief Executive Officer, MFC | |
| Global (U.S.) (2005–2006); Executive Vice President, John Hancock Funds, LLC (until 2005). | |
| Thomas M. Kinzler, Born: 1955 | 2006 |
| Secretary and Chief Legal Officer | |
| Vice President and Counsel, John Hancock Life Insurance Company (U.S.A.) (since 2006); Secretary and | |
| Chief Legal Officer, John Hancock Funds and John Hancock Funds II (since 2006); Chief Legal Officer | |
| and Assistant Secretary, John Hancock Trust (since 2006); Vice President and Associate General Counsel, | |
| Massachusetts Mutual Life Insurance Company (1999–2006); Secretary and Chief Legal Counsel, MML | |
| Series Investment Fund (2000–2006); Secretary and Chief Legal Counsel, MassMutual Institutional Funds | |
| (2000–2004); Secretary and Chief Legal Counsel, MassMutual Select Funds and MassMutual Premier | |
| Funds (2004–2006). | |
| Francis V. Knox, Jr., Born: 1947 | 2006 |
| Chief Compliance Officer | |
| Vice President and Chief Compliance Officer, John Hancock Investment Management Services, LLC, | |
| the Adviser and MFC Global (U.S.) (since 2005); Vice President and Chief Compliance Officer, John | |
| Hancock Funds, John Hancock Funds II, John Hancock Funds III and John Hancock Trust (since 2005); | |
| Vice President and Assistant Treasurer, Fidelity Group of Funds (until 2004); Vice President and Ethics & | |
| Compliance Officer, Fidelity Investments (until 2001). | |
| Charles A. Rizzo, Born: 1957 | 2007 |
| Chief Financial Officer | |
| Chief Financial Officer, John Hancock Funds, John Hancock Funds II, John Hancock Funds III and John | |
| Hancock Trust (since June 2007); Assistant Treasurer, Goldman Sachs Mutual Fund Complex (regis- | |
| tered investment companies) (2005–June 2007); Vice President, Goldman Sachs (2005–June 2007); | |
| Managing Director and Treasurer of Scudder Funds, Deutsche Asset Management (2003–2005); | |
| Director, Tax and Financial Reporting, Deutsche Asset Management (2002–2003); Vice President and | |
| Treasurer, Deutsche Global Fund Services (Deutsche Registered Investment Companies) (1999–2002). | |
| Gordon M. Shone, Born: 1956 | 2006 |
| Treasurer | |
| Senior Vice President, John Hancock Life Insurance Company (U.S.A.) (since 2001); Treasurer, John | |
| Hancock Funds (since 2006), John Hancock Funds II, John Hancock Funds III and John Hancock Trust | |
| (since 2005); Vice President and Chief Financial Officer, John Hancock Trust (2003–2005); Vice President, | |
| John Hancock Investment Management Services, Inc., John Hancock Advisers, LLC (since 2006) and The | |
| Manufacturers Life Insurance Company (U.S.A.) (1998–2000). | |
Classic Value Fund II | Annual report
36
| Principal officers who are not Trustees (continued) | |
| Name, Year of Birth | |
| Position(s) held with Fund | Officer |
| Principal occupation(s) and other | of Fund |
| directorships during past 5 years | since |
| John G. Vrysen, Born: 1955 | 2006 |
| Chief Operating Officer | |
| Senior Vice President, Manulife Financial Corporation (since 2006); Director, Executive Vice President | |
| and Chief Operating Officer, the Adviser, The Berkeley Group and John Hancock Funds, LLC (since | |
| June 2007); Executive Vice President and Chief Operating Officer, John Hancock Investment | |
| Management Services, LLC (since December 2007); Chief Operating Officer, John Hancock Funds, | |
| John Hancock Funds II, John Hancock Funds III and John Hancock Trust (since June 2007); Director, | |
| Executive Vice President and Chief Financial Officer, the Adviser, The Berkeley Group and John Hancock | |
| Funds, LLC (2005–2007); Executive Vice President and Chief Financial Officer, John Hancock Investment | |
| Management Services, LLC (2005–2007); Executive Vice President and Chief Financial Officer, MFC | |
| Global (U.S.) (2005 until August 2007); Director, John Hancock Signature Services, Inc. (since 2005); | |
| Chief Financial Officer, John Hancock Funds, John Hancock Funds II, John Hancock Funds III and John | |
| Hancock Trust (2005 until June 2007); Vice President and General Manager, John Hancock Fixed | |
| Annuities, U.S. Wealth Management (2004–2005); Vice President, Operations, Manulife Wood Logan | |
| (2000–2004). | |
The business address for all Trustees and Officers is 601 Congress Street, Boston, Massachusetts 02210-2805.
The Statement of Additional Information of the Fund includes additional information about members of the Board of Trustees of the Fund and is available without charge, upon request, by calling 1-800-225-5291.
1 Each Trustee serves until resignation, retirement age or until his or her successor is elected.
2 Member of Audit and Compliance Committee.
3 Non-Independent Trustee holds positions with the Fund’s investment adviser, underwriter and certain other affiliates.
Annual report | Classic Value Fund II
37
For more information
The Fund’s proxy voting policies, procedures and records are available without charge, upon request:
| By phone | On the Fund’s Web site | On the SEC’s Web site |
| 1-800-225-5291 | www.jhfunds.com/proxy | www.sec.gov |
| Investment adviser | Custodian | Legal counsel |
| John Hancock Advisers, LLC | The Bank of New York | Kirkpatrick & Lockhart |
| 601 Congress Street | One Wall Street | Preston Gates Ellis LLP |
| Boston, MA 02210-2805 | New York, NY 10286 | One Lincoln Street |
| Boston, MA 02111-2950 | ||
| Subadviser | Transfer agent | |
| Pzena Investment | John Hancock Signature | Independent registered public |
| Management, LLC | Services, Inc. | accounting firm |
| 120 West 45th Street, | P.O. Box 9510 | PricewaterhouseCoopers LLP |
| 20th Floor | Portsmouth, NH 03802-9510 | 125 High Street |
| New York, NY 10036 | Boston, MA 02110 | |
| Principal distributor | ||
| John Hancock Funds, LLC | ||
| 601 Congress Street | ||
| Boston, MA 02210-2805 | ||
| How to contact us | ||
| Internet | www.jhfunds.com | |
| Regular mail: | Express mail: | |
| John Hancock Signature | John Hancock Signature | |
| Services, Inc. | Services, Inc. | |
| P.O. Box 9510 | Mutual Fund Image Operations | |
| Portsmouth, NH 03802-9510 | 164 Corporate Drive | |
| Portsmouth, NH 03801 | ||
| Phone | Customer service representatives | 1-800-225-5291 |
| EASI-Line | 1-800-338-8080 | |
| TDD line | 1-800-554-6713 | |
A listing of month-end portfolio holdings is available on our Web site, www.jhfunds.com. A more detailed portfolio holdings summary is available on a quarterly basis 60 days after the fiscal quarter on our Web site or upon request by calling 1-800-225-5291, or on the SEC’s Web site, www.sec.gov.
Classic Value Fund II | Annual Report
38

1-800-225-5291
1-800-554-6713 TDD
1-800-338-8080 EASI-Line
www.jhfunds. com
Now available: electronic delivery
www.jhfunds.com/edelivery
| This report is for the information of the shareholders of John Hancock Classic Value Fund II. | 3500A 12/07 |
| It is not authorized for distribution to prospective investors unless preceded or accompanied by a prospectus. | 2/08 |
Discussion of Fund performance
By Pzena Investment Management LLC
U.S. stocks navigated a challenging environment to post moderate gains in 2007. The market advanced in the first half of the year, but a meltdown in the subprime mortgage industry, a credit crunch in the financial sector and a slowing U.S. economy led to a sharp increase in volatility and a stock market decline over the last few months. As growth stocks outperformed value in 2007, the valuation spread between the overall market and its most undervalued segment widened dramatically after several years at very narrow levels. In fact, we have seen large-cap valuation spreads this wide only five times in the last 40 years.
For the year ended December 31, 2007, John Hancock Classic Value Fund’s Class A, Class B, Class C, Class I and Class R1 shares posted total returns of –14.20%, –14.80%, –14.80%, –13.86% and –14.49%, respectively, at net asset value. The Fund trailed both the –0.17% return of the Russell 1000 Value Index and the 1.42% return of the average large value fund, according to Morningstar, Inc.
“U.S. stocks navigated a challenging
environment to post moderate
gains in 2007.”
The Fund lagged its benchmark index and peer group average in 2007, with most of the underperformance occurring over the last six months. The recent decline in financial stocks, which comprised the portfolio’s largest sector weighting, had the biggest negative impact on performance. Government-sponsored mortgage lenders Fannie Mae and Freddie Mac, as well as diversified financial services provider Citigroup, Inc. were the most significant detractors. Outside of financials, telecommunications equipment maker Alcatel-Lucent was the weakest performer.
On the positive side, software makers Microsoft Corp. and Oracle Corp. were the top performance contributors in the portfolio. Energy and utilities produced the best returns in the broader market, and our modest holdings in these two sectors — including natural gas utility Sempra Energy and oil producer BP Plc — were also among the Fund’s best performers.
This commentary reflects the views of the portfolio managers through the end of the Fund’s period discussed in this report. The managers’ statements reflect their own opinions. As such, they are in no way guarantees of future events, and are not intended to be used as investment advice or a recommendation regarding any specific security. They are also subject to change at any time as market and other conditions warrant.
Classic Value Fund | Annual report
6
A look at performance
| For the periods ended December 31, 2007 | |||||||||
| Average annual returns | Cumulative total returns | ||||||||
| with maximum sales charge (POP) | with maximum sales charge (POP) | ||||||||
| Inception | Since | Since | |||||||
| Class | date | 1-year | 5-year | 10-year | inception | 1-year | 5-year | 10-year | inception |
| A1 | 6-24-96 | –18.50% | 9.99% | 8.15% | — | –18.50% | 60.97% | 118.96% | — |
| B | 11-11-02 | –18.69 | 10.05 | — | 11.30% | –18.69 | 61.43 | — | 73.31% |
| C | 11-11-02 | –15.58 | 10.31 | — | 11.41 | –15.58 | 63.36 | — | 74.24 |
| I2 | 11-11-02 | –13.86 | 11.58 | — | 12.70 | –13.86 | 72.94 | — | 84.83 |
| R1 2 | 8-5-03 | –14.49 | — | — | 9.01 | –14.49 | — | — | 46.25 |
Performance figures assume all distributions are reinvested. Public offering price (POP) figures reflect maximum sales charge on Class A shares of 5% and the applicable contingent deferred sales charge (CDSC) on Class B and Class C shares. The returns for Class C shares have been adjusted to reflect the elimination of the front-end sales charge effective July 15, 2004. The Class B shares’ CDSC declines annually between years 1 to 6 according to the following schedule: 5, 4, 3, 3, 2, 1%. No sales charge will be assessed after the sixth year. Class C shares held for less than one year are subject to a 1% CDSC. Sales charge is not applicable for Class I and Class R1 shares.
The expense ratios of the Fund, both net (including any fee waivers or expense limitations) and gross (excluding any fee waivers or expense limitations), are set forth according to the most recent publicly available prospectuses for the Fund and may differ from the expense ratios disclosed in the Financial Highlights tables in this report. The waivers and expense limitations are contractual at least until 4-30-08. The net expenses are as follows: Class I — 0.89% . Had the fee waivers and expense limitations not been in place, the gross expenses would be as follows: Class I — 0.94% . The net expenses equal the gross expenses and are as follows: Class A — 1.30%, Class B — 2.05%, Class C — 2.05%, Class R1 — 1.68% .
The returns reflect past results and should not be considered indicative of future performance. The return and principal value of an investment will fluctuate so that shares, when redeemed, may be worth more or less than their original cost. Due to market volatility, the Fund’s current performance may be higher or lower than the performance shown. For performance data current to the most recent month end, please call 1-800-225-5291 or visit the Fund’s Web site at www.jhfunds.com.
The performance table above and the chart on the next page do not reflect the deduction of taxes that a shareholder would pay on fund distributions or the redemption of fund shares.
The Fund’s performance results reflect any applicable expense reductions, without which the expenses would increase and results would have been less favorable.
1 Effective November 8, 2002, shareholders of the former Pzena Focused Value Fund became owners of that number of full and fractional shares of John Hancock Classic Value Fund. Additionally, the accounting and performance history of the former Pzena Focused Value Fund was redesignated as that of Class A of John Hancock Classic Value Fund. The performance of the former Pzena Focused Value Fund reflects stocks selected from the largest 1,000 publicly traded U.S. companies, whereas the Fund invests in stocks selected from the 500 largest such companies.
2 For certain types of investors as described in the Fund’s Class I and Class R1 share prospectuses.
Annual report | Classic Value Fund
7
A look at performance
Growth of $10,000
This chart shows what happened to a hypothetical $10,000 investment in Classic Value Fund Class A shares for the period indicated. For comparison, we’ve shown the same investment in the Russell 1000 Value Index.
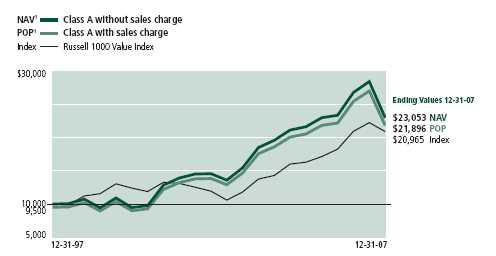
| With maximum | ||||
| Class | Period beginning | Without sales charge | sales charge | Index |
| B | 11-11-02 | $17,431 | $17,331 | $20,395 |
| C2 | 11-11-02 | 17,424 | 17,424 | 20,395 |
| I3 | 11-11-02 | 18,483 | 18,483 | 20,395 |
| R1 3 | 8-5-03 | 14,625 | 14,625 | 17,727 |
Assuming all distributions were reinvested for the period indicated, the table above shows the value of a $10,000 investment in the Fund’s Class B, Class C, Class I and Class R1 shares, respectively, as of December 31, 2007. The Class C shares investment with maximum sales charge has been adjusted to reflect the elimination of the front-end sales charge effective July 15, 2004. Performance of the classes will vary based on the difference in sales charges paid by shareholders investing in the different classes and the fee structure of those classes.
Russell 1000 Value Index is an unmanaged index containing those securities in the Russell 1000 Index with a less-than-average growth orientation.
It is not possible to invest directly in an index. Index figures do not reflect sales charges, which would have resulted in lower values if they did.
1 NAV represents net asset value and POP represents public offering price.
2 No contingent deferred sales charge applicable.
3 For certain types of investors as described in the Fund’s Class I and Class R1 share prospectuses.
Classic Value Fund | Annual report
8
Your expenses
These examples are intended to help you understand your ongoing operating expenses.
Understanding fund expenses
As a shareholder of the Fund, you incur two types of costs:
■ Transaction costs which include sales charges (loads) on purchases or redemptions (varies by share class), minimum account fee charge, etc.
■ Ongoing operating expenses including management fees, distribution and service fees (if applicable), and other fund expenses.
We are going to present only your ongoing operating expenses here.
Actual expenses/actual returns
This example is intended to provide information about your fund’s actual ongoing operating expenses, and is based on your fund’s actual return. It assumes an account value of $1,000.00 on July 1, 2007, with the same investment held until December 31, 2007.
| Account value | Ending value | Expenses paid during | |
| on 7-1-07 | on 12-31-07 | period ended 12-31-071 | |
| Class A | $1,000.00 | $808.00 | $5.71 |
| Class B | 1,000.00 | 805.30 | 9.11 |
| Class C | 1,000.00 | 805.20 | 9.10 |
| Class I | 1,000.00 | 809.40 | 4.08 |
| Class R1 | 1,000.00 | 806.40 | 7.49 |
Together with the value of your account, you may use this information to estimate the operating expenses that you paid over the period. Simply divide your account value at December 31, 2007, by $1,000.00, then multiply it by the “expenses paid” for your share class from the table above. For example, for an account value of $8,600.00, the operating expenses should be calculated as follows:

Annual report | Classic Value Fund
9
Your expenses
Hypothetical example for comparison purposes
This table allows you to compare your fund’s ongoing operating expenses with those of any other fund. It provides an example of the Fund’s hypothetical account values and hypothetical expenses based on each class’s actual expense ratio and an assumed 5% annualized return before expenses (which is not your fund’s actual return). It assumes an account value of $1,000.00 on July 1, 2007, with the same investment held until December 31, 2007. Look in any other fund shareholder report to find its hypothetical example and you will be able to compare these expenses.
| Account value | Ending value | Expenses paid during | |
| on 7-1-07 | on 12-31-07 | period ended 12-31-071 | |
| Class A | $1,000.00 | $1,018.89 | $6.38 |
| Class B | 1,000.00 | 1,015.12 | 10.16 |
| Class C | 1,000.00 | 1,015.12 | 10.16 |
| Class I | 1,000.00 | 1,020.70 | 4.55 |
| Class R1 | 1,000.00 | 1,016.91 | 8.36 |
Remember, these examples do not include any transaction costs, such as sales charges; therefore, these examples will not help you to determine the relative total costs of owning different funds. If transaction costs were included, your expenses would have been higher. See the prospectus for details regarding transaction costs.
1 Expenses are equal to the Fund’s annualized expense ratio of 1.25%, 2.00%, 2.00%, 0.89% and 1.65% for Class A, Class B, Class C, Class I and Class R1, respectively, multiplied by the average account value over the period, multiplied by number of days in most recent fiscal half-year/365 or 366 (to reflect the one-half year period).
Classic Value Fund | Annual report
10
Portfolio summary
| Top 10 holdings1 | ||||
| Freddie Mac | 5.6% | Allstate Corp. (The) | 3.9% | |
| Citigroup, Inc. | 4.7% | Torchmark Corp. | 3.9% | |
| Alcatel-Lucent ADR | 4.6% | Whirlpool Corp. | 3.7% | |
| Wal-Mart Stores, Inc. | 4.5% | XL Capital Ltd. (Class A) | 3.6% | |
| Fannie Mae | 4.1% | Pfizer, Inc. | 3.3% | |
| Sector distribution1 | ||||
| Financials | 44% | Telecommunication services | 5% | |
| Health care | 15% | Industrials | 4% | |
| Consumer discretionary | 12% | Utilities | 4% | |
| Information technology | 8% | Energy | 2% | |
| Consumer staples | 6% | |||
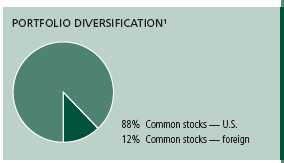
1 As a percentage of net assets on December 31, 2007.
Annual report | Classic Value Fund
11
F I N A N C I A L S T A T E M E N T S
Fund’s investments
Securities owned by the Fund on 12-31-07
This schedule is divided into two main categories: common stocks and short-term investments. Common stocks are further broken down by industry group. Short-term investments, which represent the Fund’s cash position, are listed last.
| Issuer | Shares | Value |
| Common stocks 100.41% | $6,022,698,284 | |
| (Cost $6,801,965,927) | ||
| Aerospace & Defense 2.81% | 168,732,374 | |
| L-3 Communications Holdings, Inc. | 454,500 | 48,149,730 |
| Northrop Grumman Corp. | 1,533,350 | 120,582,644 |
| Apparel Retail 3.03% | 182,274,612 | |
| TJX Cos., Inc. (The) | 6,344,400 | 182,274,612 |
| Auto Parts & Equipment 2.03% | 122,046,493 | |
| Magna International, Inc. (Class A) (Canada) (F) | 1,517,425 | 122,046,493 |
| Biotechnology 2.49% | 149,096,456 | |
| Amgen, Inc. (I)(L) | 3,210,518 | 149,096,456 |
| Consumer Finance 3.51% | 210,419,697 | |
| Capital One Financial Corp. | 4,077,750 | 192,714,465 |
| Discover Financial Services | 1,174,087 | 17,705,232 |
| Data Processing & Outsourced Services 2.01% | 120,369,754 | |
| Affiliated Computer Services, Inc. (Class A) (I) | 872,100 | 39,331,710 |
| Computer Sciences Corp. (I) | 1,638,125 | 81,038,044 |
| Diversified Banks 2.15% | 128,943,478 | |
| Comerica, Inc. | 2,962,175 | 128,943,478 |
| Diversified Financial Services 7.99% | 479,375,498 | |
| Bank of America Corp. | 4,532,425 | 187,007,856 |
| Citigroup, Inc. | 9,707,675 | 285,793,952 |
| JPMorgan Chase & Co. | 150,600 | 6,573,690 |
| Electric Utilities 1.95% | 117,108,582 | |
| Wisconsin Energy Corp. | 2,404,200 | 117,108,582 |
| Electrical Components & Equipment 1.53% | 91,666,530 | |
| Tyco Electronics Ltd. (Bermuda) (F) | 1,198,275 | 44,491,951 |
| Tyco International Ltd. (Bermuda) (F) | 1,189,775 | 47,174,579 |
| Health Care Distributors 2.70% | 161,722,698 | |
| AmerisourceBergen Corp. | 3,604,250 | 161,722,698 |
| Health Care Supplies 0.93% | 55,562,912 | |
| Covidien Ltd. | 1,254,525 | 55,562,912 |
See notes to financial statements
Classic Value Fund | Annual report
12
F I N A N C I A L S T A T E M E N T S
| Issuer | Shares | Value |
| Home Improvement Retail 3.20% | $191,957,603 | |
| Home Depot, Inc. (The) | 7,125,375 | 191,957,603 |
| Household Appliances 3.70% | 222,196,860 | |
| Whirlpool Corp. | 2,722,000 | 222,196,860 |
| Household Products 2.00% | 119,748,447 | |
| Kimberly-Clark Corp. | 1,726,975 | 119,748,447 |
| Hypermarkets & Super Centers 4.48% | 268,658,572 | |
| Wal-Mart Stores, Inc. | 5,652,400 | 268,658,572 |
| Integrated Oil & Gas 1.99% | 119,512,220 | |
| BP Plc ADR (United Kingdom) (F) | 1,633,350 | 119,512,220 |
| Investment Banking & Brokerage 4.27% | 256,011,261 | |
| Lehman Brothers Holdings, Inc. | 1,733,275 | 113,425,516 |
| Morgan Stanley | 2,684,725 | 142,585,745 |
| Life & Health Insurance 4.85% | 290,838,035 | |
| MetLife, Inc. | 950,025 | 58,540,541 |
| Torchmark Corp. | 3,837,725 | 232,297,494 |
| Multi-Utilities 2.02% | 120,967,665 | |
| Sempra Energy | 1,954,875 | 120,967,665 |
| Pharmaceuticals 8.74% | 524,133,042 | |
| Bristol-Myers Squibb Co. | 5,510,225 | 146,131,167 |
| Johnson & Johnson | 2,688,900 | 179,349,630 |
| Pfizer, Inc. | 8,739,650 | 198,652,245 |
| Property & Casualty Insurance 9.43% | 565,452,341 | |
| Allstate Corp. (The) | 4,450,750 | 232,462,673 |
| Fidelity National Financial, Inc. (Class A) | 7,751,931 | 113,255,712 |
| XL Capital Ltd. (Class A) (Cayman Islands) (F) | 4,367,600 | 219,733,956 |
| Systems Software 6.34% | 380,284,505 | |
| CA, Inc. | 6,303,300 | 157,267,335 |
| Microsoft Corp. | 4,180,000 | 148,808,000 |
| Oracle Corp. (I) | 3,286,500 | 74,209,170 |
| Thrifts & Mortgage Finance 11.68% | 700,863,912 | |
| Countrywide Financial Corp. (L) | 8,163,924 | 72,985,481 |
| Fannie Mae | 6,175,950 | 246,914,481 |
| Freddie Mac | 9,924,913 | 338,141,786 |
| Washington Mutual, Inc. | 3,146,375 | 42,822,164 |
| Wireless Telecommunication Services 4.58% | 274,754,737 | |
| Alcatel-Lucent ADR (France) (F)(L) | 37,534,801 | 274,754,737 |
See notes to financial statements
Annual report | Classic Value Fund
13
F I N A N C I A L S T A T E M E N T S
| Interest | |||
| Issuer, description, maturity date | rate | Shares | Value |
| Short-term investments 2.52% | $151,207,807 | ||
| (Cost $151,207,807) | |||
| Cash Equivalents 2.52% | 151,207,807 | ||
| John Hancock Cash Investment Trust (T)(W) | 5.10% (Y) | 151,207,807 | 151,207,807 |
| Total investments (Cost $6,953,173,734) 102.93% | $6,173,906,091 | ||
| Other assets and liabilities, net (2.93%) | ($175,637,326) | ||
| Total net assets 100.00% | $5,998,268,765 | ||
The percentage shown for each investment category is the total value of that category as a percentage of the net assets of the Fund.
ADR American Depositary Receipt
(F) Parenthetical disclosure of a foreign country in the security description represents country of a foreign issuer.
(I) Non-income-producing security.
(L) All or a portion of this security is on loan as of December 31, 2007.
(T) Represents investment of securities lending collateral.
(W) Issuer is an affiliate of John Hancock Advisers, LLC.
(Y) Represents current yield as of December 31, 2007.
See notes to financial statements
Classic Value Fund | Annual report
14
F I N A N C I A L S T A T E M E N T S
Financial statements
Statement of assets and liabilities 12-31-07
This Statement of Assets and Liabilities is the Fund’s balance sheet. It shows the value of what the Fund owns, is due and owes. You’ll also find the net asset value and the maximum offering price per share.
| Assets | |
| Investments in unaffiliated issuers, at value (cost $6,801,965,927) including | |
| $149,778,723 of securities loaned (Note 2) | $6,022,698,284 |
| Investments in affiliated issuers, at value (cost $151,207,807) | 151,207,807 |
| Total investments, at value (cost $6,953,173,734) | 6,173,906,091 |
| Receivable for investments sold | 72,747,961 |
| Receivable for shares sold | 24,255,940 |
| Dividends and interest receivable | 7,338,407 |
| Receivable from affiliates | 161,975 |
| Other assets | 1,791 |
| Total assets | 6,278,412,165 |
| Liabilities | |
| Due to custodian | 41,773,924 |
| Payable for shares repurchased | 80,174,213 |
| Payable upon return of securities loaned (Note 2) | 151,207,807 |
| Payable to affiliates | |
| Management fees | 4,542,390 |
| Distribution and service fees | 309,309 |
| Other | 956,128 |
| Other payables and accrued expenses | 1,179,629 |
| Total liabilities | 280,143,400 |
| Net assets | |
| Capital paid-in | 6,691,631,211 |
| Accumulated net realized gain on investments | 85,906,832 |
| Net unrealized depreciation of investments | (779,267,643) |
| Distributions in excess of net investment income | (1,635) |
| Net assets | $5,998,268,765 |
| Net asset value per share | |
| Based on net asset values and shares outstanding — the Fund has an | |
| unlimited number of shares authorized with no par value | |
| Class A ($4,000,906,223 ÷ 185,801,023 shares) | $21.53 |
| Class B ($208,303,954 ÷ 9,762,618 shares)1 | $21.34 |
| Class C ($612,496,145 ÷ 28,715,999 shares)1 | $21.33 |
| Class I ($1,154,954,051 ÷ 53,535,554 shares) | $21.57 |
| Class R1 ($21,608,392 ÷ 1,002,767 shares) | $21.55 |
| Maximum offering price per share | |
| Class A2 ($21.53 ÷ 95%) | $22.66 |
1 Redemption price is equal to net asset value less any applicable contingent deferred sales charge.
2 On single retail sales of less than $50,000. On sales of $50,000 or more and on group sales the offering price is reduced.
See notes to financial statements
Annual report | Classic Value Fund
15
F I N A N C I A L S T A T E M E N T S
Statement of operations For the year ended 12-31-07
This Statement of Operations summarizes the Fund’s investment income earned and expenses incurred in operating the Fund. It also shows net gains (losses) for the period stated.
| Investment income | |
| Dividends (net of foreign withholding taxes of $2,119,763) | $211,053,480 |
| Interest | 9,326,985 |
| Securities lending | 489,624 |
| Total investment income | 220,870,089 |
| Expenses | |
| Investment management fees (Note 3) | 72,747,627 |
| Distribution and service fees (Note 3) | 28,110,920 |
| Transfer agent fees (Note 3) | 12,645,000 |
| Accounting and legal services fees (Note 3) | 1,059,992 |
| Custodian fees | 1,231,426 |
| Printing fees | 675,374 |
| Trustees’ fees | 409,021 |
| Professional fees | 276,165 |
| Blue sky fees | 18,780 |
| Miscellaneous | 346,343 |
| Total expenses | 117,520,648 |
| Less expense reductions (Note 3) | (844,180) |
| Net expenses | 116,676,468 |
| Net investment income | 104,193,621 |
| Realized and unrealized gain | |
| Net realized gain on investments | 678,062,273 |
| 678,062,273 | |
| Change in net unrealized appreciation (depreciation) of investments | (1,950,836,569) |
| (1,950,836,569) | |
| Net realized and unrealized loss | (1,272,774,296) |
| Decrease in net assets from operations | ($1,168,580,675) |
See notes to financial statements
Classic Value Fund | Annual report
16
F I N A N C I A L S T A T E M E N T S
Statement of changes in net assets
These Statements of Changes in Net Assets show how the value of the Fund’s net assets has changed during the last two periods. The difference reflects earnings less expenses, any investment gains and losses, distributions, if any, paid to shareholders and the net of Fund share transactions.
| Year | Year | |
| ended | ended | |
| 12-31-06 | 12-31-07 | |
| Increase (decrease) in net assets | ||
| From operations | ||
| Net investment income | $56,644,978 | $104,193,621 |
| Net realized gain | 337,448,543 | 678,062,273 |
| Change in net unrealized appreciation (depreciation) | 731,449,003 | (1,950,836,569) |
| Increase (decrease) in net assets resulting from operations | 1,125,542,524 | (1,168,580,675) |
| Distributions to shareholders | ||
| From net investment income | ||
| Class A | (40,222,324) | (73,327,961) |
| Class B | — | (1,891,117) |
| Class C | — | (5,821,733) |
| Class I | (16,820,199) | (26,404,824) |
| Class R1 | (88,050) | (279,498) |
| From net realized gain | ||
| Class A | (176,103,905) | (326,653,899) |
| Class B | (10,051,102) | (16,975,708) |
| Class C | (34,218,336) | (52,259,104) |
| Class I | (46,267,925) | (93,211,048) |
| Class R1 | (853,592) | (1,642,127) |
| (324,625,433) | (598,467,019) | |
| From Fund share transactions (Note 4) | 3,423,713,999 | (1,280,560,604) |
| Total increase (decrease) | 4,224,631,090 | (3,047,608,298) |
| Net assets | ||
| Beginning of year | 4,821,245,973 | 9,045,877,063 |
| End of year1 | $9,045,877,063 | $5,998,268,765 |
1 Includes distributions in excess of net investment of $1,636 and $1,635, respectively.
See notes to financial statements
Annual report | Classic Value Fund
17
F I N A N C I A L S T A T E M E N T S
Financial highlights
The Financial Highlights show how the Fund’s net asset value for a share has changed since the end of the previous period.
| CLASS A SHARES | |||||
| Period ended | 12-31-03 | 12-31-04 | 12-31-05 | 12-31-06 | 12-31-07 |
| Per share operating performance | |||||
| Net asset value, beginning of period | $15.07 | $20.27 | $23.01 | $24.64 | $27.67 |
| Net investment income1 | 0.20 | 0.17 | 0.15 | 0.23 | 0.34 |
| Net realized and unrealized | |||||
| gain (loss) on investments | 5.25 | 2.73 | 1.88 | 3.84 | (4.24) |
| Total from investment operations | 5.45 | 2.90 | 2.03 | 4.07 | (3.90) |
| Less distributions | |||||
| From net investment income | (0.13) | (0.09) | (0.10) | (0.19) | (0.41) |
| From net realized gain | (0.12) | (0.07) | (0.30) | (0.85) | (1.83) |
| (0.25) | (0.16) | (0.40) | (1.04) | (2.24) | |
| Net asset value, end of period | $20.27 | $23.01 | $24.64 | $27.67 | $21.53 |
| Total return2 (%) | 36.253 | 14.283 | 8.813 | 16.54 | (14.20) |
| Ratios and supplemental data | |||||
| Net assets, end of period | |||||
| (in millions) | $145 | $1,223 | $3,017 | $5,987 | $4,000 |
| Ratio of net expenses to average | |||||
| net assets (%) | 1.16 | 1.30 | 1.32 | 1.30 | 1.285 |
| Ratio of gross expenses to average | |||||
| net assets (%) | 1.524 | 1.404 | 1.364 | 1.30 | 1.28 |
| Ratio of net investment income | |||||
| to average net assets (%) | 1.13 | 0.81 | 0.65 | 0.89 | 1.22 |
| Portfolio turnover (%) | 25 | 16 | 27 | 20 | 35 |
1 Based on the average of the shares outstanding.
2 Assumes dividend reinvestment and does not reflect the effect of sales charges.
3 Total returns would have been lower had certain expenses not been reduced during the periods shown.
4 Does not take into consideration expense reductions during the periods shown.
5 Includes transfer agent fee earned credits of less than 0.01% to average net assets.
See notes to financial statements
Classic Value Fund | Annual report
18
F I N A N C I A L S T A T E M E N T S
Financial highlights
| CLASS B SHARES | |||||
| Period ended | 12-31-03 | 12-31-04 | 12-31-05 | 12-31-06 | 12-31-07 |
| Per share operating performance | |||||
| Net asset value, beginning of period | $15.05 | $20.24 | $22.89 | $24.42 | $27.40 |
| Net investment income (loss)1 | 0.07 | 0.01 | (0.03) | 0.04 | 0.13 |
| Net realized and unrealized | |||||
| gain (loss) on investments | 5.24 | 2.71 | 1.86 | 3.79 | (4.16) |
| Total from investment operations | 5.31 | 2.72 | 1.83 | 3.83 | (4.03) |
| Less distributions | |||||
| From net investment income | —2 | — | — | — | (0.20) |
| From net realized gain | (0.12) | (0.07) | (0.30) | (0.85) | (1.83) |
| (0.12) | (0.07) | (0.30) | (0.85) | (2.03) | |
| Net asset value, end of period | $20.24 | $22.89 | $24.42 | $27.40 | $21.34 |
| Total return3 (%) | 35.364 | 13.444 | 7.994 | 15.68 | (14.80) |
| Ratios and supplemental data | |||||
| Net assets, end of period | |||||
| (in millions) | $47 | $200 | $296 | $332 | $208 |
| Ratio of net expenses to average | |||||
| net assets (%) | 1.91 | 2.05 | 2.07 | 2.01 | 2.036 |
| Ratio of gross expenses to average | |||||
| net assets (%) | 2.275 | 2.155 | 2.115 | 2.01 | 2.03 |
| Ratio of net investment income | |||||
| (loss) to average net assets (%) | 0.38 | 0.03 | (0.11) | 0.17 | 0.46 |
| Portfolio turnover (%) | 25 | 16 | 27 | 20 | 35 |
1 Based on the average of the shares outstanding.
2 Less than $0.01 per share.
3 Assumes dividend reinvestment and does not reflect the effect of sales charges.
4 Total returns would have been lower had certain expenses not been reduced during the periods shown.
5 Does not take into consideration expense reductions during the periods shown.
6 Includes transfer agent fee earned credits of less than 0.01% to average net assets.
See notes to financial statements
Annual report | Classic Value Fund
19
F I N A N C I A L S T A T E M E N T S
Financial highlights
| CLASS C SHARES | |||||
| Period ended | 12-31-03 | 12-31-04 | 12-31-05 | 12-31-06 | 12-31-07 |
| Per share operating performance | |||||
| Net asset value, beginning of period | $15.05 | $20.24 | $22.89 | $24.42 | $27.39 |
| Net investment income (loss)1 | 0.07 | 0.01 | (0.02) | 0.03 | 0.13 |
| Net realized and unrealized | |||||
| gain (loss) on investments | 5.24 | 2.71 | 1.85 | 3.79 | (4.16) |
| Total from investment operations | 5.31 | 2.72 | 1.83 | 3.82 | (4.03) |
| Less distributions | |||||
| From net investment income | —2 | — | — | — | (0.20) |
| From net realized gain | (0.12) | (0.07) | (0.30) | (0.85) | (1.83) |
| (0.12) | (0.07) | (0.30) | (0.85) | (2.03) | |
| Net asset value, end of period | $20.24 | $22.89 | $24.42 | $27.39 | $21.33 |
| Total return3 (%) | 35.364 | 13.444 | 7.994 | 15.64 | (14.80) |
| Ratios and supplemental data | |||||
| Net assets, end of period | |||||
| (in millions) | $82 | $423 | $832 | $1,132 | $612 |
| Ratio of net expenses to average | |||||
| net assets (%) | 1.91 | 2.05 | 2.07 | 2.05 | 2.036 |
| Ratio of gross expenses to average | |||||
| net assets (%) | 2.265 | 2.155 | 2.115 | 2.05 | 2.03 |
| Ratio of net investment income | |||||
| (loss) to average net assets (%) | 0.39 | 0.04 | (0.10) | 0.13 | 0.46 |
| Portfolio turnover (%) | 25 | 16 | 27 | 20 | 35 |
1 Based on the average of the shares outstanding.
2 Less than $0.01 per share.
3 Assumes dividend reinvestment and does not reflect the effect of sales charges.
4 Total returns would have been lower had certain expenses not been reduced during the periods shown.
5 Does not take into consideration expense reductions during the periods shown.
6 Includes transfer agent fee earned credits of less than 0.01% to average net assets.
See notes to financial statements
Classic Value Fund | Annual report
20
F I N A N C I A L S T A T E M E N T S
Financial highlights
| CLASS I SHARES | |||||
| Period ended | 12-31-03 | 12-31-04 | 12-31-05 | 12-31-06 | 12-31-07 |
| Per share operating performance | |||||
| Net asset value, beginning of period | $15.08 | $20.30 | $23.05 | $24.69 | $27.73 |
| Net investment income1 | 0.27 | 0.27 | 0.26 | 0.34 | 0.45 |
| Net realized and unrealized | |||||
| gain (loss) on investments | 5.26 | 2.73 | 1.88 | 3.86 | (4.26) |
| Total from investment operations | 5.53 | 3.00 | 2.14 | 4.20 | (3.81) |
| Less distributions | |||||
| From net investment income | (0.19) | (0.18) | (0.20) | (0.31) | (0.52) |
| From net realized gain | (0.12) | (0.07) | (0.30) | (0.85) | (1.83) |
| (0.31) | (0.25) | (0.50) | (1.16) | (2.35) | |
| Net asset value, end of period | $20.30 | $23.05 | $24.69 | $27.73 | $21.57 |
| Total return2,3 (%) | 36.81 | 14.77 | 9.28 | 17.01 | (13.86) |
| Ratios and supplemental data | |||||
| Net assets, end of period | |||||
| (in millions) | $23 | $206 | $665 | $1,567 | $1,155 |
| Ratio of net expenses to average | |||||
| net assets (%) | 0.76 | 0.86 | 0.89 | 0.89 | 0.885 |
| Ratio of gross expenses to average | |||||
| net assets4 (%) | 1.12 | 1.01 | 0.98 | 0.94 | 0.92 |
| Ratio of net investment income | |||||
| to average net assets (%) | 1.54 | 1.25 | 1.09 | 1.30 | 1.61 |
| Portfolio turnover (%) | 25 | 16 | 27 | 20 | 35 |
1 Based on the average of the shares outstanding.
2 Assumes dividend reinvestment and does not reflect the effect of sales charges.
3 Total returns would have been lower had certain expenses not been reduced during the periods shown.
4 Does not take into consideration expense reductions during the periods shown.
5 Includes transfer agent fee earned credits of less than 0.01% to average net assets.
See notes to financial statements
Annual report | Classic Value Fund
21
F I N A N C I A L S T A T E M E N T S
Financial highlights
| CLASS R1 SHARES | |||||
| Period ended | 12-31-031 | 12-31-04 | 12-31-05 | 12-31-06 | 12-31-07 |
| Per share operating performance | |||||
| Net asset value, beginning of period | $17.20 | $20.27 | $23.02 | $24.63 | $27.67 |
| Net investment income2 | 0.05 | 0.07 | 0.08 | 0.13 | 0.23 |
| Net realized and unrealized | |||||
| gain (loss) on investments | 3.24 | 2.75 | 1.86 | 3.85 | (4.21) |
| Total from investment operations | 3.29 | 2.82 | 1.94 | 3.98 | (3.98) |
| Less distributions | |||||
| From net investment income | (0.10) | — | (0.03) | (0.09) | (0.31) |
| From net realized gain | (0.12) | (0.07) | (0.30) | (0.85) | (1.83) |
| (0.22) | (0.07) | (0.33) | (0.94) | (2.14) | |
| Net asset value, end of period | $20.27 | $23.02 | $24.63 | $27.67 | $21.55 |
| Total return3 (%) | 19.214,5 | 13.914 | 8.444 | 16.15 | (14.49) |
| Ratios and supplemental data | |||||
| Net assets, end of period | |||||
| (in millions) | —6 | $2 | $12 | $29 | $22 |
| Ratio of net expenses to average | |||||
| net assets (%) | 1.557 | 1.72 | 1.65 | 1.68 | 1.6410 |
| Ratio of gross expenses to average | |||||
| net assets (%) | 1.917,8 | 1.828 | 1.698 | 1.68 | 1.64 |
| Ratio of net investment income | |||||
| to average net assets (%) | 0.697 | 0.35 | 0.34 | 0.51 | 0.85 |
| Portfolio turnover (%) | 259 | 16 | 27 | 20 | 35 |
1 Class R1 shares began operations on 8-5-03.
2 Based on the average of the shares outstanding.
3 Assumes dividend reinvestment and does not reflect the effect of sales charges.
4 Total returns would have been lower had certain expenses not been reduced during the periods shown.
5 Not annualized.
6 Less than $500,000.
7 Annualized.
8 Does not take into consideration expense reductions during the periods shown.
9 Portfolio turnover shown is calculated for the Fund for the full fiscal year.
10 Includes transfer agent fee earned credits of less than 0.01% to average net assets.
See notes to financial statements
Classic Value Fund | Annual report
22
Notes to financial statements
Note 1
Organization
John Hancock Classic Value Fund (the Fund) is a non-diversified series of John Hancock Capital Series, an open-end management investment company registered under the Investment Company Act of 1940, as amended (the 1940 Act). The investment objective of the Fund is to provide long-term growth of capital. The Fund was closed to most new investors from September 2006 to October 2007.
The Trustees have authorized the issuance of multiple classes of shares of the Fund, designated as Class A, Class B, Class C, Class I and Class R1 shares. The shares of each class represent an interest in the same portfolio of investments of the Fund and have equal rights as to voting, redemptions, dividends and liquidation, except that certain expenses, subject to the approval of the Trustees, may be applied differently to each class of shares in accordance with current regulations of the Securities and Exchange Commission (SEC) and the Internal Revenue Service. Shareholders of a class that bears distribution and service expenses under the terms of a distribution plan have exclusive voting rights to that distribution plan. Class B shares will convert to Class A shares eight years after purchase.
Note 2
Significant accounting policies
The financial statements have been prepared in conformity with accounting principles generally accepted in the United States of America, which require management to make certain estimates and assumptions at the date of the financial statements. Actual results could differ from those estimates. The following summarizes the significant accounting policies of the Fund:
Security valuation
The net asset value of Class A, Class B, Class C, Class I and Class R1 shares of the Fund is determined daily as of the close of the New York Stock Exchange (NYSE), normally at 4:00 p.m., Eastern Time. Short-term debt investments that have a remaining maturity of 60 days or less are valued at amortized cost, and thereafter assume a constant amortization to maturity of any discount or premium, which approximates market value. Investments in John Hancock Cash Investment Trust (JHCIT), an affiliate of John Hancock Advisers, LLC (the Adviser), a wholly owned subsidiary of John Hancock Financial Services, Inc., a subsidiary of Manulife Financial Corporation (MFC), are valued at their net asset value each business day. All other securities held by the Fund are valued at the last sale price or o fficial closing price (closing bid price or last evaluated quote if no sale has occurred) as of the close of business on the principal securities exchange (domestic or foreign) on which they trade or, lacking any sales, at the closing bid price. Securities traded only in the over-the-counter market are valued at the last bid price quoted by brokers making markets in the securities at the close of trading. Securities for which there are no such quotations, principally debt securities, are valued based on the evaluated prices provided by an independent pricing service, which utilizes both dealer-supplied and electronic data processing techniques, which take into account factors such as institutional-size trading in similar groups of securities, yield, quality, coupon rate, maturity, type of issue, trading characteristics and other market data.
Other assets and securities for which no such quotations are readily available are valued at fair value as determined in good faith under consistently applied procedures established by and under the general supervision of the Board of Trustees. Generally, trading in non-U.S. securities is substantially completed each day at various times prior to the close of trading on the NYSE. The values of such securities used in computing the net asset value of the Fund’s shares are generally determined as of
Annual report | Classic Value Fund
23
such times. Occasionally, significant events that affect the values of such securities may occur between the times at which such values are generally determined and the close of the NYSE. Upon such an occurrence, these securities will be valued at fair value as determined in good faith under consistently applied procedures established by and under the general supervision of the Board of Trustees.
Joint repurchase agreement
Pursuant to an exemptive order issued by the SEC, the Fund, along with other registered investment companies having a management contract with the Adviser, may participate in a joint repurchase agreement transaction. Aggregate cash balances are invested in one or more large repurchase agreements, whose underlying securities are obligations of the U.S. government and/or its agencies. The Fund’s custodian bank receives delivery of the underlying securities for the joint account on the Fund’s behalf.
Investment transactions
Investment transactions are accounted for on a trade date plus one basis for daily net asset value calculations. However, for financial reporting purposes, investment security transactions are reported on trade date. Interest income is recorded on the accrual basis. Dividend income is recorded on the ex-dividend date net of foreign withholding taxes. Discounts/ premiums are accreted/amortized for financial reporting purposes. Realized gains and losses from investment transactions are recorded on an identified cost basis.
Class allocations
Income, common expenses and realized and unrealized gains (losses) are determined at the fund level and allocated daily to each class of shares based on the appropriate net asset value of the respective classes. Distribution and service fees, if any, and transfer agent fees for Class A, Class B, Class C, Class I and Class R1 shares are calculated daily at the class level based on the appropriate net asset value of each class and the specific expense rate(s) applicable to each class.
Guarantees and indemnifications
Under the Fund’s organizational documents, its Officers and Trustees are indemnified against certain liability arising out of the performance of their duties to the Fund. Additionally, in the normal course of business, the Fund enters into contracts with service providers that contain general indemnification clauses. The Fund’s maximum exposure under these arrangements is unknown, as this would involve future claims that may be made against the Fund that have not yet occurred.
Expenses
The majority of expenses are directly identifiable to an individual fund. Expenses that are not readily identifiable to a specific fund are allocated in such a manner as deemed equitable, taking into consideration, among other things, the nature and type of expense and the relative size of the funds.
Bank borrowings
The Fund is permitted to have bank borrowings for temporary or emergency purposes, including the meeting of redemption requests that otherwise might require the untimely disposition of securities. The Fund has entered into a line of credit agreement with The Bank of New York Mellon (BNYM), the Swing Line Lender and Administrative Agent. This agreement enables the Fund to participate, with other funds managed by the Adviser, in an unsecured line of credit with BNYM, which permits borrowings of up to $100 million, collectively. Interest is charged to each fund based on its borrowing. In addition, a commitment fee is charged to each fund based on the average daily unused portion of the line of credit and is allocated among the participating funds. The Fund had no borrowing activity under the line of credit during the year ended December 31, 2007.
Securities lending
The Fund has entered into an agreement with Morgan Stanley & Co. Incorporated and MS Securities Services Inc. (collectively, Morgan Stanley) which permits the Fund to lend securities to Morgan Stanley on a principal basis. Morgan Stanley is the primary borrower of securities of the Fund. The risk of having one primary borrower of Fund securities (as
Classic Value Fund | Annual report
24
opposed to several borrowers) is that should Morgan Stanley fail financially, all securities lent will be affected by the failure and by any delays in recovery of the securities (or in the rare event, loss of rights in the collateral).
The Fund may lend portfolio securities from time to time in order to earn additional income. The Fund retains beneficial ownership of the securities it has loaned and continues to receive interest and dividends paid by the issuer of securities and to participate in any changes in their value. On the settlement date of the loan, the Fund receives collateral against the loaned securities and maintains collateral in an amount not less than 100% of the market value of the loaned securities during the period of the loan. The market value of the loaned securities is determined at the close of business of the Fund and any additional required collateral is delivered to the Fund on the next business day. Any cash collateral received is invested in the JHCIT. If the borrower defaults on its obligation to return the securities loaned because of insolvency or other reasons, a fund could experience delays and costs in recovering the securities loaned or in gaining access to the colla teral. The Fund receives compensation for lending their securities either in the form of fees, guarantees, and/or by retaining a portion of interest on the investment of any cash received as collateral. Prior to May 8, 2007, the Fund paid the Adviser $1,540 for security lending services relating to an arrangement which ended on May 7, 2007.
Federal income taxes
The Fund qualifies as a regulated investment company by complying with the applicable provisions of the Internal Revenue Code and will not be subject to federal income tax on taxable income that is distributed to shareholders. Therefore, no federal income tax provision is required.
The Fund adopted the provisions of Financial Accounting Standards Board (FASB) Interpretation No. 48, Accounting for Uncertainty in Income Taxes, an interpretation of FASB Statement 109 (FIN 48), on January 1, 2007. FIN 48 prescribes a minimum threshold for financial statement recognition of the benefit of a tax position taken or expected to be taken in a tax return. The implementation of FIN 48 did not result in any unrecognized tax benefits in the accompanying financial statements. Each of the Fund’s federal tax returns for the prior three fiscal years remains subject to examination by the Internal Revenue Service.
New accounting pronouncement
In September 2006, FASB Standard No. 157, Fair Value Measurements (FAS 157), was issued and is effective for fiscal years beginning after November 15, 2007. FAS 157 defines fair value, establishing a framework for measuring fair value and expands disclosure about fair value measurements. Management is currently evaluating the application of FAS 157 to the Fund and its impact, if any, resulting from the adoption of FAS 157 on the Fund’s financial statement disclosures.
Distribution of income and gains
The Fund records distributions to shareholders from net investment income and net realized gains, if any, on the ex-dividend date. During the year ended December 31, 2006 the tax character of distributions paid was as follows: ordinary income $89,265,564 and long-term capital gain $235,359,869. During the year ended December 31, 2007 the tax character of distributions paid was as follows: ordinary income $122,281,257 and long-term capital gain $476,185,762. Distributions paid by the Fund with respect to each class of shares are calculated in the same manner, at the same time and are in the same amount, except for the effect of expenses that may be applied differently to each class.
As of December 31, 2007, the components of distributable earnings on a tax basis included $88,579,770 of undistributed long-term capital gain.
Such distributions and distributable earnings, on a tax basis, are determined in conformity with income tax regulations, which may differ from accounting principles generally accepted in the United States of America. Distributions in excess of tax basis earnings and profits, if any, are reported in the Fund’s financial statements as a return of capital.
Annual report | Classic Value Fund
25
Capital accounts within financial statements are adjusted for permanent book-tax differences. These adjustments have no impact on net assets or the results of operations. Temporary book-tax differences will reverse in a subsequent period. Permanent differences are primarily attributable to treating a portion of the proceeds from redemptions as a distribution for tax purposes.
Note 3
Management fee and transactions with
affiliates and others
The Fund has an investment management contract with the Adviser. Under the investment management contract, the Fund pays a daily management fee to the Adviser equivalent, on an annual basis, to the sum of: (a) 0.85% of the first $2,500,000,000 of the Fund’s average daily net asset value, (b) 0.825% of the next $2,500,000,000 and (c) 0.80% in excess of $5,000,000,000 of the Fund’s daily net asset value. The effective rate for the year ended December 31, 2007 is 0.82% of the Fund’s average daily net asset value. The Adviser has a subadvisory agreement with Pzena Investment Management LLC. The Fund is not responsible for payment of the subadvisory fees.
The Adviser had agreed to limit the Fund’s total expenses, excluding distribution and service fees and transfer agent fees, to 0.89% of the Fund’s average daily net asset value, on an annual basis, and total operating expenses of Class A shares to 1.32% and Class B and Class C shares to 2.07% of the net asset value of each respective class, on an annual basis, at least until April 30, 2008. There were no expense reductions related to these total expense limitations during the year ended December 31, 2007. The Adviser reserves the right to terminate this limitation in the future.
The Fund has a Distribution Agreement with John Hancock Funds, LLC (JH Funds), a wholly owned subsidiary of the Adviser. The Fund has adopted Distribution Plans with respect to Class A, Class B, Class C and Class R1, pursuant to Rule 12b-1 under the 1940 Act, to reimburse JH Funds for the services it provides as distributor of shares of the Fund. Accordingly, the Fund makes monthly payments to JH Funds at an annual rate not to exceed 0.25%, 1.00%, 1.00% and 0.50% of average daily net asset value of Class A, Class B, Class C and Class R1, respectively. A maximum of 0.25% of such payments may be service fees, as defined by the Conduct Rules of the Financial Industry Regulatory Authority (formerly the National Association of Securities Dealers). Under the Conduct Rules, curtailment of a portion of the Fund’s 12b-1 payments could occur under certain circumstances. In addition, under a Service Plan for Class R1 shares, the Fund pays up to 0 .25% of Class R1 average daily net asset value for certain other services.
Class A shares are assessed up-front sales charges. During the year ended December 31, 2007, JH Funds received net up-front sales charges of $2,000,020 with regard to sales of Class A shares. Of this amount, $139,190 was retained and used for printing prospectuses, advertising, sales literature and other purposes, $1,809,150 was paid as sales commissions to unrelated broker-dealers and $51,680 was paid as sales commissions to sales personnel of Signator Investors, Inc. (Signator Investors), a related broker-dealer. The Adviser’s indirect parent, John Hancock Life Insurance Company (JHLICO), is the indirect sole shareholder of Signator Investors.
Class B shares that are redeemed within six years of purchase are subject to a contingent deferred sales charge (CDSC) at declining rates, beginning at 5.00% of the lesser of the current market value at the time of redemption or the original purchase cost of the shares being redeemed. Class C shares that are redeemed within one year of purchase are subject to a CDSC at a rate of 1.00% of the lesser of the current market value at the time of redemption or the original purchase cost of the shares being redeemed. Proceeds from the CDSCs are paid to JH Funds and are used in whole or in part to defray its expenses for providing distribution-related services to the Fund in connection with the sale of Class B and Class C shares. During the year ended December 31, 2007, CDSCs received by JH Funds amounted to $749,313 for Class B shares and $104,195 for Class C shares.
Classic Value Fund | Annual report
26
The Fund has a transfer agent agreement with John Hancock Signature Services, Inc. (Signature Services), an indirect subsidiary of JHLICO. For Class A, Class B, Class C, Class I and Class R1 shares, the Fund pays a monthly transfer agent fee at an annual rate of 0.05% of each class’s average daily net asset value, plus a fee based on the number of shareholder accounts and reimbursement for certain out-of-pocket expenses, aggregated and allocated to each class on the basis of its relative net asset value. Effective June 1, 2007, for the Class I shares, the Fund pays a monthly transfer agent fee at a total annual rate of 0.04% of Class I average daily net asset value. The Adviser has agreed to reimburse the Class I transfer agent fee. Accordingly, the transfer agent expense for Class I shares was reduced by $689,976 for the year ended December 31, 2007. The Adviser terminated this limitation September 30, 2007. The Fund pays a monthly fee which is based on an annual r ate of $15.00 for each Class A shareholder account, $17.50 for each Class B shareholder account, $16.50 for each Class C shareholder account, $15.00 for each Class I shareholder account and $15.00 for each Class R1 shareholder account. Signature Services had agreed to limit Class A, Class B and Class C transfer agent fees to 0.18% of each respective class’s average daily net asset value until April 30, 2008. There were no expense reductions related to this transfer agent fee limitation during the year ended December 31, 2007.
In May 2007, the Fund began receiving earnings credits from its transfer agent as a result of uninvested cash balances. These credits are used to reduce a portion of the Fund’s transfer agent fees and out of pocket expenses. During the year ended December 31, 2007, the Fund’s transfer agent fees and out of pocket expenses were reduced by $154,204 for transfer agent credits earned.
Expenses under the agreements described above for the year ended December 31, 2007, were as follows:
| Transfer | Distribution and | |
| Share class | agent fees | service fees |
| Class A | $9,568,205 | $14,837,961 |
| Class B | 487,365 | 3,002,807 |
| Class C | 1,626,145 | 10,131,774 |
| Class I | 888,382 | — |
| Class R1 | 74,903 | 138,378 |
| Total | $12,645,000 | $28,110,920 |
The Fund has an agreement with the Adviser and affiliates to perform necessary tax, accounting, compliance, legal and other administrative services for the Fund. The compensation for the year amounted to $1,059,992 with an effective rate of 0.01% of the Fund’s average daily net asset value.
Mr. James R. Boyle is Chairman of the Adviser, as well as affiliated Trustee of the Fund, and is compensated by the Adviser and/or its affiliates. The compensation of unaffiliated Trustees is borne by the Fund. The unaffiliated Trustees may elect to defer, for tax purposes, their receipt of this compensation under the John Hancock Group of Funds Deferred Compensation Plan. The Fund makes investments into other John Hancock funds, as applicable, to cover its liability for the deferred compensation. Investments to cover the Fund’s deferred compensation liability are recorded on the Fund’s books as an other asset. The deferred compensation liability and the related other asset are always equal and are marked to market on a periodic basis to reflect any income earned by the investments, as well as any unrealized gains or losses. The Deferred Compensation Plan investments had no impact on the operations of the Fund.
Annual report | Classic Value Fund
27
Note 4
Fund share transactions
This listing illustrates the number of Fund shares sold, reinvested and repurchased during the years ended December 31, 2006, and December 31, 2007, along with the corresponding dollar value.
| Year ended 12-31-06 | Year ended 12-31-07 | |||
| Shares | Amount | Shares | Amount | |
| Class A shares | ||||
| Sold | 117,043,819 | $3,048,623,694 | 58,641,767 | $1,616,890,345 |
| Distributions reinvested | 7,355,963 | 203,613,033 | 17,287,953 | 378,260,416 |
| Repurchased | (30,461,645) | (800,976,770) | (106,520,477) | (2,788,561,199) |
| Net increase (decrease) | 93,938,137 | $2,451,259,957 | (30,590,757) | ($793,410,438) |
| Class B shares | ||||
| Sold | 2,326,765 | $59,227,030 | 376,700 | $10,255,929 |
| Distributions reinvested | 335,892 | 9,210,152 | 789,591 | 17,126,244 |
| Repurchased | (2,681,332) | (69,005,560) | (3,522,251) | (93,121,578) |
| Net decrease | (18,675) | ($568,378) | (2,355,960) | ($65,739,405) |
| Class C shares | ||||
| Sold | 11,926,885 | $302,851,168 | 1,606,141 | $43,429,412 |
| Distributions reinvested | 1,148,648 | 31,484,442 | 2,477,560 | 53,713,489 |
| Repurchased | (5,825,831) | (150,272,344) | (16,681,013) | (430,300,693) |
| Net increase (decrease) | 7,249,702 | $184,063,266 | (12,597,312) | ($333,157,792) |
| Class I shares | ||||
| Sold | 34,873,183 | $910,196,703 | $21,957,511 | 592,709,537 |
| Distributions reinvested | 1,789,171 | 49,631,588 | 4,735,716 | 103,806,886 |
| Repurchased | (7,086,402) | (185,474,374) | (29,653,564) | (783,321,846) |
| Net increase (decrease) | 29,575,952 | $774,353,917 | (2,960,337) | ($86,805,423) |
| Class R1 shares | ||||
| Sold | 782,124 | $20,447,707 | 350,637 | 9,363,128 |
| Distributions reinvested | 33,785 | 935,166 | 87,625 | 1,919,000 |
| Repurchased | (260,381) | (6,777,636) | (473,051) | (12,729,674) |
| Net increase (decrease) | 555,528 | $14,605,237 | (34,789) | ($1,447,546) |
| Net increase (decrease) | 131,300,644 | $3,423,713,999 | (48,539,155) | ($1,280,560,604) |
Note 5
Purchase and sale of securities
Purchases and proceeds from sales or maturities of securities, other than short-term securities and obligations of the U.S. government, during the year ended December 31, 2007, aggregated $2,979,503,197 and $4,213,559,424, respectively.
The cost of investments owned on December 31, 2007, including short-term investments, for federal income tax purposes was $6,955,846,672. Gross unrealized appreciation and depreciation of investments aggregated $456,635,669 and $1,238,576,250, respectively, resulting in net unrealized depreciation of $781,940,581. The difference between book basis and tax basis net unrealized appreciation of investments is attributable primarily to the tax deferral of losses on certain sales of securities.
Note 6
SEC settlement
On June 25, 2007, the Adviser and John Hancock Funds, LLC (the Distributor) and two of their affiliates (collectively, the John Hancock Affiliates) reached a settlement with SEC that resolved an investigation of certain practices relating to the John Hancock Affiliates’ variable annuity and mutual fund operations involving directed brokerage and revenue
Classic Value Fund | Annual report
28
sharing. Under the terms of the settlement, each John Hancock Affiliate was censured and agreed to pay a $500,000 civil penalty to the United States Treasury. In addition, the Adviser and the Distributor agreed to pay disgorgement of $2,087,477 and prejudgment interest of $359,460 to entities, including certain John Hancock Funds, that participated in the Adviser’s directed brokerage program during the period from 2000 to October 2003. Collectively, all John Hancock Affiliates agreed to pay a total disgorgement of $16,926,420 and prejudgment interest of $2,361,460 to the entities advised or distributed by John Hancock Affiliates. The Adviser discontinued the use of directed brokerage in recognition of the sale of fund shares in October 2003. As a result of this settlement, the Fund received $4,200, which was recorded as a realized gain to the Fund’s books on June 25, 2007.
Annual report | Classic Value Fund
29
Auditors’ report
Report of Independent Registered Public Accounting Firm
To the Board of Trustees of John Hancock Capital Series and Shareholders of John Hancock Classic Value Fund,
In our opinion, the accompanying statement of assets and liabilities, including the schedule of investments, and the related statements of operations and of changes in net assets and the financial highlights present fairly, in all material respects, the financial position of John Hancock Classic Value Fund (the Fund) at December 31, 2007, and the results of its operations, the changes in its net assets and the financial highlights for the periods indicated, in conformity with accounting principles generally accepted in the United States of America. These financial statements and financial highlights (hereafter referred to as “financial statements”) are the responsibility of the Fund’s management. Our responsibility is to express an opinion on these financial statements based on our audits. We conducted our audits of these financial statements in accordance with the standards of the Public Company Accounting Oversight Board (United States). Those standards require that we plan and perform the audit to obtain reasonable assurance about whether the financial statements are free of material misstatement. An audit includes examining, on a test basis, evidence supporting the amounts and disclosures in the financial statements, assessing the accounting principles used and significant estimates made by management, and evaluating the overall financial statement presentation. We believe that our audits, which included confirmation of securities at December 31, 2007 by correspondence with the custodian and brokers, provide a reasonable basis for our opinion.
PricewaterhouseCoopers LLP
Boston, Massachusetts
February 28, 2008
Classic Value Fund | Annual report
30
Tax information
Unaudited
For federal income tax purposes, the following information is furnished with respect to the distributions of the Fund, if any, paid during its taxable year ended December 31, 2007.
The Fund has designated distributions to shareholders of $647,273,191 as a long-term capital gain dividend.
With respect to the ordinary dividends paid by the Fund for the fiscal year ended December 31, 2007, 100% of the dividends qualifies for the corporate dividends-received deduction.
The Fund hereby designates the maximum amount allowable of its net taxable income as qualified dividend income as provided in the Jobs and Growth Tax Relief Reconciliation Act of 2003. This amount will be reflected on Form 1099-DIV for the calendar year 2007.
Shareholders will be mailed a 2007 U.S. Treasury Department Form 1099-DIV in January 2008. This will reflect the total of all distributions that are taxable for calendar year 2007.
Annual report | Classic Value Fund
31
Board Consideration of and
Continuation of Investment Advisory
and Subadvisory Agreement: John
Hancock Classic Value Fund
The Investment Company Act of 1940 (the 1940 Act) requires the Board of Trustees (the Board) of John Hancock Capital Series (the Trust), including a majority of the Trustees who have no direct or indirect interest in the investment advisory agreement and are not “interested persons” of the Trust, as defined in the 1940 Act (the Independent Trustees), annually to meet in person to review and consider the continuation of: (i) the investment advisory agreement (the Advisory Agreement) with John Hancock Advisers, LLC (the Adviser) and (ii) the investment subadvisory agreement (the Subadvisory Agreement) with Pzena Investment Management, LLC (the Subadviser) for the John Hancock Classic Value Fund (the Fund). The investment advisory agreement with the Advisor and the investment subadvisory agreement with the Subadviser are collectively referred to as the Advisory Agreements.
At meetings held on May 7 and June 4–5, 2007, the Board considered the factors and reached the conclusions described below relating to the selection of the Adviser and Subadviser and the continuation of the Advisory Agreements. During such meetings, the Board’s Contracts/ Operations Committee and the Independent Trustees also met in executive sessions with their independent legal counsel.
In evaluating the Advisory Agreements, the Board, including the Contracts/Operations Committee and the Independent Trustees, reviewed a broad range of information requested for this purpose by the Independent Trustees, including: (i) the investment performance of the Fund relative to a category of relevant funds (the Category) and a peer group of comparable funds (the Peer Group) each selected by Morningstar, Inc. (Morningstar), an independent provider of investment company data, for a range of periods ended December 31, 2006, (ii) advisory and other fees incurred by, and the expense ratios of, the Fund relative to a Category and a Peer Group, (iii) the advisory fees of comparable portfolios of other clients of the Adviser and the Subadviser, (iv) the Adviser’s financial results and condition, including its and certain of its affiliates’ profitability from services performed for the Fund, (v) breakpoints in the Fund’s and the Peer Group’s fees, and information about economies of scale, (vi) the Adviser’s and Subadviser’s record of compliance with applicable laws and regulations, with the Fund’s investment policies and restrictions, and with the applicable Code of Ethics, and the structure and responsibilities of the Adviser’s and Subadviser’s compliance department, (vii) the background and experience of senior management and investment professionals, and (viii) the nature, cost and character of advisory and non-investment management services provided by the Adviser and its affiliates and by the Subadviser.
The Independent Trustees considered the legal advice of independent legal counsel and relied on their own business judgment in determining the factors to be considered in evaluating the materials that were presented to them and the weight to be given to each such factor. The Board’s review and conclusions were based on a comprehensive consideration of all information presented to the Board and not the result of any single controlling factor. They principally considered performance and other information from Morningstar as of December 31, 2006. The Board also considered updated performance information provided to it by the Adviser or Subadviser at the May and June 2007 meetings. Performance and other information may be quite different as of the date of this shareholders report. The key factors considered by the Board and the conclusions reached are described below.
Nature, extent and quality of services
The Board considered the ability of the Adviser and the Subadviser, based on their resources, reputation and other attributes, to attract and retain qualified investment professionals, including research, advisory and supervisory personnel. The Board considered the investment philosophy, research and investment decision-making processes of the Adviser and, in particular, the Subadviser. The Board met with representatives of the Subadviser that were responsible for the daily investment activities of the Fund. The Board considered the representatives’ history and experience with the Fund. The Board further considered the culture of
Classic Value Fund | Annual report
32
compliance, resources dedicated to compliance, compliance programs and compliance records of the Adviser and Subadviser. In addition, the Board took into account the administrative and other non-advisory services provided to the Fund by the Adviser and its affiliates.
Based on the above factors, together with those referenced below, the Board concluded that, within the context of its full deliberations, the nature, extent and quality of the investment advisory services provided to the Fund by the Adviser and Subadviser supported renewal of the Advisory Agreements.
Fund performance
The Board considered the performance results for the Fund over various time periods ended December 31, 2006. The Board also considered these results in comparison to the performance of the Category, as well as the Fund’s benchmark index. Morningstar determined the Category and Peer Group for the Fund. The Board reviewed with a representative of Morningstar the methodology used by Morningstar to select the funds in the Category and the Peer Group.
The Board favorably noted that the Fund’s performance during the 5- and 10-year periods was appreciably higher than the performance of the Peer Group and Category medians, and its benchmark index, the Russell 1000 Value Index. The Board also noted that the Fund’s performance was lower than the performance of the Peer Group median and benchmark index for the 3-year period, but higher than the performance of the Category median. The Board noted that the Fund’s performance for the more recent 1-year period was lower than the performance of the Peer Group and Category medians, and its benchmark index. The Subadviser provided the Board with supplemental information, including more recent information regarding the Fund’s performance results, which showed an improvement. The Subadviser also discussed with the Board additional measures that may be taken in the future with the objective of improving performance. The Board intends to continue to monitor the Fund’s performance trends to assess whether remedial changes are warranted.
Investment advisory fee and subadvisory fee rates and expenses
The Board reviewed and considered the contractual investment advisory fee rate payable by the Fund to the Adviser for investment advisory services (the Advisory Agreement Rate). The Board received and considered information comparing the Advisory Agreement Rate with the advisory fees for the Peer Group. The Board noted that the Advisory Agreement Rate was higher than the median rate of the Peer Group and the Category.
The Board received and considered expense information regarding the Fund’s various components, including advisory fees, distribution and fees other than advisory and distribution fees, including transfer agent fees, custodian fees and other miscellaneous fees (e.g., fees for accounting and legal services). The Board considered comparisons of these expenses to the Peer Group median. The Board also received and considered expense information regarding the Fund’s total operating expense ratio (Gross Expense Ratio) and total operating expense ratio after taking the fee waiver arrangement applicable to the Advisory Agreement Rate into account (Net Expense Ratio). The Board received and considered information comparing the Gross Expense Ratio and Net Expense Ratio of the Fund to that of the Peer Group and Category medians. The Board noted that the Fund’s Gross and Net Expense Ratios were higher than the medians of the Peer Group and Category.
The Adviser also discussed the Morningstar data and rankings, and other relevant information, for the Fund. Based on the above-referenced considerations and other factors, the Board concluded that the Fund’s overall performance and expenses supported the re-approval of the Advisory Agreements.
The Board also received information about the investment subadvisory fee rate (the Subadvisory Agreement Rate) payable by the Adviser to the Subadviser for investment sub-advisory services. The Board concluded that the Subadvisory Agreement Rate was fair and equitable, based on its consideration of the factors described here.
Annual report | Classic Value Fund
33
Profitability
The Board received and considered a detailed profitability analysis of the Adviser based on the Advisory Agreements, as well as on other relationships between the Fund and the Adviser and its affiliates. The Board also considered a comparison of the Adviser’s profitability to that of other similar investment advisers whose profitability information is publicly available. The Board concluded that, in light of the costs of providing investment management and other services to the Fund, the profits and other ancillary benefits reported by the Adviser were not unreasonable.
The Board did not consider profitability information with respect to the Subadviser, which is not affiliated with the Adviser. The Board considered that the Subadvisory Rate paid to the Subadviser had been negotiated by the Adviser on an arm’s length basis and that the Subadviser’s separate profitability from its relationship with the Fund was not a material factor in determining whether to renew the agreement.
Economies of scale
The Board received and considered general information regarding economies of scale with respect to the management of the Fund, including the Fund’s ability to appropriately benefit from economies of scale under the Fund’s fee structure. The Board recognized the inherent limitations of any analysis of economies of scale, stemming largely from the Board’s understanding that most of the Adviser’s costs are not specific to individual Funds, but rather are incurred across a variety of products and services.
To the extent the Board and the Adviser were able to identify actual or potential economies of scale from Fund-specific or allocated expenses, in order to ensure that any such economies continue to be reasonably shared with the Fund as its assets increase, the Adviser and the Board agreed to additional breakpoints to the Advisory Agreement Rate.
Information about services to other clients
The Board also received information about the nature, extent and quality of services and fee rates offered by the Adviser and Subadviser to their other clients, including other registered investment companies, institutional investors and separate accounts. The Board concluded that the Advisory Agreement Rate and the Subadvisory Agreement Rate were not unreasonable, taking into account fee rates offered to others by the Adviser and Subadviser, respectively, after giving effect to differences in services.
Other benefits to the Adviser
The Board received information regarding potential “fall-out” or ancillary benefits received by the Adviser and its affiliates as a result of the Adviser’s relationship with the Fund. Such benefits could include, among others, benefits directly attributable to the relationship of the Adviser with the Fund and benefits potentially derived from an increase in the business of the Adviser as a result of its relationship with the Fund (such as the ability to market to shareholders other financial products offered by the Adviser and its affiliates).
The Board also considered the effectiveness of the Adviser’s, Subadviser’s and Fund’s policies and procedures for complying with the requirements of the federal securities laws, including those relating to best execution of portfolio transactions and brokerage allocation.
Other factors and broader review
As discussed above, the Board reviewed detailed materials received from the Adviser and Subadviser as part of the annual re-approval process. The Board also regularly reviews and assesses the quality of the services that the Fund receives throughout the year. In this regard, the Board reviews reports of the Adviser at least quarterly, which include, among other things, a detailed portfolio review, detailed fund performance reports and compliance reports. In addition, the Board meets with portfolio managers and senior investment officers at various times throughout the year.
After considering the above-described factors and based on its deliberations and its evaluation of the information described above, the Board concluded that approval of the continuation of the Advisory Agreements for the Fund was in the best interest of the Fund and its shareholders. Accordingly, the Board unanimously approved the continuation of the Advisory Agreements.
Classic Value Fund | Annual report
34
Trustees and Officers
This chart provides information about the Trustees and Officers who oversee your John Hancock fund. Officers elected by the Trustees manage the day-to-day operations of the Fund and execute policies formulated by the Trustees.
| Independent Trustees | ||
| Name, Year of Birth | Number of | |
| Position(s) held with Fund | Trustee | John Hancock |
| Principal occupation(s) and other | of Fund | funds overseen |
| directorships during past 5 years | since1 | by Trustee |
| James F. Carlin, Born: 1940 | 2005 | 55 |
| Interim Chairman (since December 2007); Director and Treasurer, Alpha Analytical Laboratories, Inc. | ||
| (chemical analysis) (since 1985); Part Owner and Treasurer, Lawrence Carlin Insurance Agency, Inc. | ||
| (since 1995); Part Owner and Vice President, Mone Lawrence Carlin Insurance Agency, Inc. (until 2005); | ||
| Chairman and Chief Executive Officer, Carlin Consolidated, Inc. (management/investments) (since 1987); | ||
| Trustee, Massachusetts Health and Education Tax Exempt Trust (1993–2003). | ||
| William H. Cunningham, Born: 1944 | 2005 | 55 |
| Professor, University of Texas at Austin (since 1971); former Chancellor, University of Texas System and | ||
| former President, University of Texas at Austin (until 2001); Chairman and Chief Executive Officer, IBT | ||
| Technologies (until 2001); Director of the following: Hicks Acquisition Company I, Inc. (since 2007); | ||
| Hire.com (until 2004), STC Broadcasting, Inc. and Sunrise Television Corp. (until 2001), Symtx, Inc. | ||
| (electronic manufacturing) (since 2001), Adorno/Rogers Technology, Inc. (until 2004), Pinnacle Foods | ||
| Corporation (until 2003), rateGenius (until 2003), Lincoln National Corporation (insurance) (since 2006), | ||
| Jefferson-Pilot Corporation (diversified life insurance company) (until 2006), New Century Equity | ||
| Holdings (formerly Billing Concepts) (until 2001), eCertain (until 2001), ClassMap.com (until 2001), | ||
| Agile Ventures (until 2001), AskRed.com (until 2001), Southwest Airlines (since 2000), Introgen (man- | ||
| ufacturer of biopharmaceuticals) (since 2000) and Viasystems Group, Inc. (electronic manufacturer) | ||
| (until 2003); Advisory Director, Interactive Bridge, Inc. (college fundraising) (until 2001); Advisory | ||
| Director, Q Investments (until 2003); Advisory Director, JPMorgan Chase Bank (formerly Texas Commerce | ||
| Bank–Austin), LIN Television (until 2008), WilTel Communications (until 2003) and Hayes Lemmerz | ||
| International, Inc. (diversified automotive parts supply company) (since 2003). | ||
| Charles L. Ladner, 2 Born: 1938 | 2004 | 55 |
| Chairman and Trustee, Dunwoody Village, Inc. (retirement services) (until 2003); Senior Vice President | ||
| and Chief Financial Officer, UGI Corporation (public utility holding company) (retired 1998); Vice | ||
| President and Director, AmeriGas, Inc. (retired 1998); Director, AmeriGas Partners, L.P. (gas distribution) | ||
| (until 1997); Director, EnergyNorth, Inc. (until 1997); Director, Parks and History Association (until 2005). | ||
| John A. Moore,2 Born: 1939 | 2002 | 55 |
| President and Chief Executive Officer, Institute for Evaluating Health Risks (nonprofit institution) | ||
| (until 2001); Senior Scientist, Sciences International (health research) (until 2003); Former Assistant | ||
| Administrator and Deputy Administrator, Environmental Protection Agency; Principal, Hollyhouse | ||
| (consulting) (since 2000); Director, CIIT Center for Health Science Research (nonprofit research) | ||
| (until 2007). | ||
Annual report | Classic Value Fund
35
| Independent Trustees (continued) | ||
| Name, Year of Birth | Number of | |
| Position(s) held with Fund | Trustee | John Hancock |
| Principal occupation(s) and other | of Fund | funds overseen |
| directorships during past 5 years | since1 | by Trustee |
| Patti McGill Peterson,2 Born: 1943 | 2002 | 55 |
| Senior Associate, Institute for Higher Education Policy (since 2007); Executive Director, Council for | ||
| International Exchange of Scholars and Vice President, Institute of International Education (until 2007); | ||
| Senior Fellow, Cornell Institute of Public Affairs, Cornell University, Ithaca, NY (until 1998); Former | ||
| President, Wells College, Aurora, NY, and St. Lawrence University, Canton, NY; Director, Niagara | ||
| Mohawk Power Corporation (until 2003); Director, Ford Foundation, International Fellowships Program | ||
| (since 2002); Director, Lois Roth Endowment (since 2002); Director, Council for International Educational | ||
| Exchange (since 2003). | ||
| Steven R. Pruchansky, Born: 1944 | 2005 | 55 |
| Chairman and Chief Executive Officer, Greenscapes of Southwest Florida, Inc. (since 2000); Director and | ||
| President, Greenscapes of Southwest Florida, Inc. (until 2000); Managing Director, JonJames, LLC (real | ||
| estate) (since 2000); Director, First Signature Bank & Trust Company (until 1991); Director, Mast Realty | ||
| Trust (until 1994); President, Maxwell Building Corp. (until 1991). | ||
| Non-Independent Trustees3 | ||
| Name, Year of Birth | Number of | |
| Position(s) held with Fund | Trustee | John Hancock |
| Principal occupation(s) and other | of Fund | funds overseen |
| directorships during past 5 years | since1 | by Trustee |
| James R. Boyle, Born: 1959 | 2005 | 265 |
| Executive Vice President, Manulife Financial Corporation (since 1999); President, John Hancock Variable | ||
| Life Insurance Company (since March 2007); Executive Vice President, John Hancock Life Insurance | ||
| Company (since 2004); Chairman and Director, John Hancock Advisers, LLC (the Adviser), John Hancock | ||
| Funds, LLC and The Berkeley Financial Group, LLC (The Berkeley Group) (holding company) (since 2005); | ||
| Senior Vice President, The Manufacturers Life Insurance Company (U.S.A.) (until 2004). | ||
Classic Value Fund | Annual report
36
| Principal officers who are not Trustees | |
| Name, Year of Birth | |
| Position(s) held with Fund | Officer |
| Principal occupation(s) and other | of Fund |
| directorships during past 5 years | since |
| Keith F. Hartstein, Born: 1956 | 2005 |
| President and Chief Executive Officer | |
| Senior Vice President, Manulife Financial Corporation (since 2004); Director, President and Chief | |
| Executive Officer, the Adviser, The Berkeley Group and John Hancock Funds, LLC (since 2005); Director, | |
| MFC Global Investment Management (U.S.), LLC (MFC Global (U.S.)) (since 2005); Director, John | |
| Hancock Signature Services, Inc. (since 2005); President and Chief Executive Officer, John Hancock | |
| Investment Management Services, LLC (since 2006); President and Chief Executive Officer, John Hancock | |
| Funds, John Hancock Funds II, John Hancock Funds III and John Hancock Trust (since 2005); Director, | |
| Chairman and President, NM Capital Management, Inc. (since 2005); Member, Investment Company | |
| Institute Sales Force Marketing Committee (since 2003); President and Chief Executive Officer, MFC | |
| Global (U.S.) (2005–2006); Executive Vice President, John Hancock Funds, LLC (until 2005). | |
| Thomas M. Kinzler, Born: 1955 | 2006 |
| Secretary and Chief Legal Officer | |
| Vice President and Counsel, John Hancock Life Insurance Company (U.S.A.) (since 2006); Secretary and | |
| Chief Legal Officer, John Hancock Funds and John Hancock Funds II (since 2006); Chief Legal Officer | |
| and Assistant Secretary, John Hancock Trust (since 2006); Vice President and Associate General Counsel, | |
| Massachusetts Mutual Life Insurance Company (1999–2006); Secretary and Chief Legal Counsel, MML | |
| Series Investment Fund (2000–2006); Secretary and Chief Legal Counsel, MassMutual Institutional Funds | |
| (2000–2004); Secretary and Chief Legal Counsel, MassMutual Select Funds and MassMutual Premier | |
| Funds (2004–2006). | |
| Francis V. Knox, Jr., Born: 1947 | 2005 |
| Chief Compliance Officer | |
| Vice President and Chief Compliance Officer, John Hancock Investment Management Services, LLC, | |
| the Adviser and MFC Global (U.S.) (since 2005); Vice President and Chief Compliance Officer, John | |
| Hancock Funds, John Hancock Funds II, John Hancock Funds III and John Hancock Trust (since 2005); | |
| Vice President and Assistant Treasurer, Fidelity Group of Funds (until 2004); Vice President and Ethics & | |
| Compliance Officer, Fidelity Investments (until 2001). | |
| Charles A. Rizzo, Born: 1957 | 2007 |
| Chief Financial Officer | |
| Chief Financial Officer, John Hancock Funds, John Hancock Funds II, John Hancock Funds III and John | |
| Hancock Trust (since June 2007); Assistant Treasurer, Goldman Sachs Mutual Fund Complex (regis- | |
| tered investment companies) (2005–June 2007); Vice President, Goldman Sachs (2005–June 2007); | |
| Managing Director and Treasurer of Scudder Funds, Deutsche Asset Management (2003–2005); | |
| Director, Tax and Financial Reporting, Deutsche Asset Management (2002–2003); Vice President and | |
| Treasurer, Deutsche Global Fund Services (1999–2002). | |
| Gordon M. Shone, Born: 1956 | 2006 |
| Treasurer | |
| Senior Vice President, John Hancock Life Insurance Company (U.S.A.) (since 2001); Treasurer, John | |
| Hancock Funds (since 2006), John Hancock Funds II, John Hancock Funds III and John Hancock Trust | |
| (since 2005); Vice President and Chief Financial Officer, John Hancock Trust (2003–2005); Vice President, | |
| John Hancock Investment Management Services, Inc., John Hancock Advisers, LLC (since 2006) and The | |
| Manufacturers Life Insurance Company (U.S.A.) (1998–2000). | |
Annual report | Classic Value Fund
37
| Principal officers who are not Trustees (continued) | |
| Name, Year of Birth | |
| Position(s) held with Fund | Officer |
| Principal occupation(s) and other | of Fund |
| directorships during past 5 years | since |
| John G. Vrysen, Born: 1955 | 2005 |
| Chief Operating Officer | |
| Senior Vice President, Manulife Financial Corporation (since 2006); Director, Executive Vice President | |
| and Chief Operating Officer, the Adviser, The Berkeley Group and John Hancock Funds, LLC (since | |
| June 2007); Executive Vice President and Chief Operating Officer, John Hancock Investment | |
| Management Services, LLC (since December 2007); Chief Operating Officer, John Hancock Funds, | |
| John Hancock Funds II, John Hancock Funds III and John Hancock Trust (since June 2007); Director, | |
| Executive Vice President and Chief Financial Officer, the Adviser, The Berkeley Group and John Hancock | |
| Funds, LLC (2005–2007); Executive Vice President and Chief Financial Officer, John Hancock Investment | |
| Management Services, LLC (2005–2007); Executive Vice President and Chief Financial Officer, MFC | |
| Global (U.S.) (2005 until August 2007); Director, John Hancock Signature Services, Inc. (since 2005); | |
| Chief Financial Officer, John Hancock Funds, John Hancock Funds II, John Hancock Funds III and John | |
| Hancock Trust (2005 until June 2007); Vice President and General Manager, John Hancock Fixed | |
| Annuities, U.S. Wealth Management (2004–2005); Vice President, Operations, Manulife Wood Logan | |
| (2000–2004). | |
The business address for all Trustees and Officers is 601 Congress Street, Boston, Massachusetts 02210-2805.
The Statement of Additional Information of the Fund includes additional information about members of the Board of Trustees of the Fund and is available without charge, upon request, by calling 1-800-225-5291.
1 Each Trustee serves until resignation, retirement age or until his or her successor is elected.
2 Member of Audit and Compliance Committee.
3 Non-Independent Trustee holds positions with the Fund’s investment adviser, underwriter and certain other affiliates.
Classic Value Fund | Annual report
38
For more information
The Fund’s proxy voting policies, procedures and records are available without charge, upon request:
| By phone | On the Fund’s Web site | On the SEC’s Web site |
| 1-800-225-5291 | www.jhfunds.com/proxy | www.sec.gov |
| Investment adviser | Custodian | Legal counsel |
| John Hancock Advisers, LLC | The Bank of New York | Kirkpatrick & Lockhart |
| 601 Congress Street | One Wall Street | Preston Gates Ellis LLP |
| Boston, MA 02210-2805 | New York, NY 10286 | One Lincoln Street |
| Boston, MA 02111-2950 | ||
| Subadviser | Transfer agent | |
| Pzena Investment | John Hancock Signature | Independent registered public |
| Management, LLC | Services, Inc. | accounting firm |
| 120 West 45th Street, | P.O. Box 9510 | PricewaterhouseCoopers LLP |
| 20th Floor | Portsmouth, NH 03802-9510 | 125 High Street |
| New York, NY 10036 | Boston, MA 02110 | |
| Principal distributor | ||
| John Hancock Funds, LLC | ||
| 601 Congress Street | ||
| Boston, MA 02210-2805 | ||
| How to contact us | ||
| Internet | www.jhfunds.com | |
| Regular mail: | Express mail: | |
| John Hancock Signature | John Hancock Signature | |
| Services, Inc. | Services, Inc. | |
| P.O. Box 9510 | Mutual Fund Image Operations | |
| Portsmouth, NH 03802-9510 | 164 Corporate Drive | |
| Portsmouth, NH 03801 | ||
| Phone | Customer service representatives | 1-800-225-5291 |
| EASI-Line | 1-800-338-8080 | |
| TDD line | 1-800-554-6713 | |
A listing of month-end portfolio holdings is available on our Web site, www.jhfunds.com. A more detailed portfolio holdings summary is available on a quarterly basis 60 days after the fiscal quarter on our Web site or upon request by calling 1-800-225-5291, or on the SEC’s Web site, www.sec.gov.
Annual report | Classic Value Fund
39

1-800-225-5291
1-800-554-6713 TDD
1-800-338-8080 EASI-Line
www.jhfunds. com
Now available: electronic delivery
www.jhfunds.com/edelivery
| This report is for the information of the shareholders of John Hancock Classic Value Fund. | 3800A 12/07 |
| It is not authorized for distribution to prospective investors unless preceded or accompanied by a prospectus. | 2/08 |
Discussion of Fund performance
By Shay Assets Management, Inc.
U.S. stock returns were respectable, although uninspiring, for the 12-month period ended December 31, 2007, dampened by increasing volatility and a final-quarter decline amid growing concerns about seized-up credit markets, decelerating profit growth and slowing economic growth.
“Our focus on companies that
offer steady and sustainable
earnings growth meant that
the Fund was significantly
underweighted in some of the
index’s best performers…”
For the 12 months ended December 31, 2007, John Hancock Large Cap Select Fund’s Class A, Class B, Class C, Class I and Class R1 shares posted returns of 2.24%, 1.48%, 1.48%, 2.63% and 1.61%, respectively, at net asset value. Meanwhile, Morningstar, Inc.’s average large blend fund rose 6.16% and the Standard & Poor’s 500 Index gained 5.49% . Our focus on companies that offer steady and sustainable earnings growth meant that the Fund was significantly underweighted in some of the index’s best performers, particularly the economically cyclical energy and materials companies. That said, Exxon Mobil Corp., one of our top winners of 2007, is a large energy holding that benefited from rising crude oil prices. Aiding the Fund’s relative returns was our comparatively large stake in consumer staples companies. Procter & Gamble Co. was one of our top performers, buoyed by the positive impact of the lower U.S. dollar on overseas operations. PepsiCo, Inc. and Coca-Cola Co. benefited from similar trends. Microsoft Corp. was another winner, bolstered by a surge in sales for the Office software package and Windows operating system. Shares of Berkshire Hathaway, Inc. climbed, thanks to impressive results at the holding company’s collected operating companies and strong returns on equity investments. UnitedHealth Group, Inc. rose thanks to investors’ growing appetite for recession-resistant companies, as well as impressive earnings and revenue growth. While our underweighting in financial stocks helped, the financial stocks we did hold generally were our worst performers, with losses from Merrill Lynch, which we eliminated from the portfolio, insurance giant American International Group, Inc. and bank Wells Fargo & Co. Home Depot, Inc. declined, suffering from the slumping housing market. FedEx Corp. came under pressure due to the twin boogey men of slowing shipments and higher energy costs.
This commentary reflects the views of the portfolio management team through the end of the Fund’s period discussed in this report. The managers’ statements reflect their own opinions. As such, they are in no way guarantees of future events and are not intended to be used as investment advice or a recommendation regarding any specific security. They are also subject to change at any time as market and other conditions warrant.
Large Cap Select Fund | Annual report
6
A look at performance
For the periods ended December 31, 2007
| Average annual returns | Cumulative total returns | ||||||||
| with maximum sales charge (POP) | with maximum sales charge (POP) | ||||||||
| Inception | Since | Since | |||||||
| Class | date | 1-year | 5-year | 10-year | inception | 1-year | 5-year | 10-year | inception |
| A1 | 12-31-64 | –2.87% | 5.97% | 4.85% | — | –2.87% | 33.64% | 60.56% | — |
| B | 8-25-03 | –3.29 | — | — | 5.39% | –3.29 | — | — | 25.64% |
| C | 8-25-03 | 0.52 | — | — | 5.77 | 0.52 | — | — | 27.64 |
| I2 | 8-25-03 | 2.63 | — | — | 6.99 | 2.63 | — | — | 34.15 |
| R1 2 | 11-3-03 | 1.61 | — | — | 5.09 | 1.61 | — | — | 22.93 |
Performance figures assume all distributions are reinvested. Public offering price (POP) figures reflect maximum sales charge on Class A shares of 5% and the applicable contingent deferred sales charge (CDSC) on Class B and Class C shares. The returns for Class C shares have been adjusted to reflect the elimination of the front-end sales charge effective July 15, 2004. The Class B shares’ CDSC declines annually between years 1 to 6 according to the following schedule: 5, 4, 3, 3, 2, 1%. No sales charge will be assessed after the sixth year. Class C shares held for less than one year are subject to a 1% CDSC. Sales charge is not applicable for Class I and Class R1 shares.
The expense ratios of the Fund, both net (including any fee waivers or expense limitations) and gross (excluding any fee waivers or expense limitations), are set forth according to the most recent publicly available prospectuses for the Fund and may differ from the expense ratios disclosed in the Financial Highlights tables in this report. The waivers and expense limitations are contractual at least until 4-30-08. The net expenses are as follows: Class A — 1.35%, Class B — 2.10%, Class C — 2.10%, Class I — 0.95%, Class R1 — 2.09% . Had the fee waivers and expense limitations not been in place, the gross expenses would be as follows: Class A — 1.48%, Class B — 2.23%, Class C — 2.23%, Class I — 1.08%, Class R1 — 2.22% .
The returns reflect past results and should not be considered indicative of future performance. The return and principal value of an investment will fluctuate so that shares, when redeemed, may be worth more or less than their original cost. Due to market volatility, the Fund’s current performance may be higher or lower than the performance shown. For performance data current to the most recent month end, please call 1-800-225-5291 or visit the Fund’s Web site at www.jhfunds.com.
The performance table above and the chart on the next page do not reflect the deduction of taxes that a shareholder would pay on fund distributions or the redemption of fund shares.
The Fund’s performance results reflect any applicable expense reductions, without which the expenses would increase and results would have been less favorable.
1 Effective August 22, 2003, shareholders of the former M.S.B. Fund, Inc. became owners of that number of full and fractional shares of Class A shares of John Hancock Large Cap Select Fund. Additionally, the accounting and performance history of the former M.S.B. Fund, Inc. was redesignated as that of Class A of John Hancock Large Cap Select Fund.
2 For certain types of investors as described in the Fund’s Class I and Class R1 share prospectuses.
Annual report | Large Cap Select Fund
7
A look at performance
Growth of $10,000
This chart shows what happened to a hypothetical $10,000 investment in Large Cap Select Fund Class A shares for the period indicated. For comparison, we’ve shown the same investment in the Standard & Poor’s 500 Index.
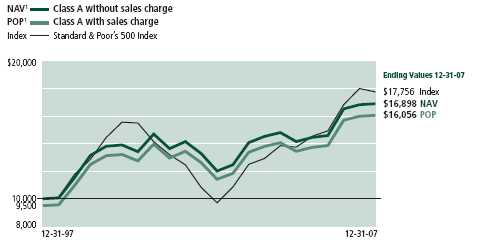
| With maximum | ||||
| Class | Period beginning | Without sales charge | sales charge | Index |
| B | 8-25-03 | $12,764 | $12,564 | $16,003 |
| C2 | 8-25-03 | 12,764 | 12,764 | 16,003 |
| I3 | 8-25-03 | 13,415 | 13,415 | 16,003 |
| R1 3 | 11-3-03 | 12,293 | 12,293 | 14,969 |
Assuming all distributions were reinvested for the period indicated, the table above shows the value of a $10,000 investment in the Fund’s Class B, Class C, Class I and Class R1 shares, respectively, as of December 31, 2007. The Class C shares investment with maximum sales charge has been adjusted to reflect the elimination of the front-end sales charge effective July 15, 2004. Performance of the classes will vary based on the difference in sales charges paid by shareholders investing in the different classes and the fee structure of those classes.
Standard & Poor’s 500 Index is an unmanaged index that includes 500 widely traded common stocks.
It is not possible to invest directly in an index. Index figures do not reflect sales charges, which would have resulted in lower values if they did.
1 NAV represents net asset value and POP represents public offering price.
2 No contingent deferred sales charge applicable.
3 For certain types of investors as described in the Fund’s Class I and Class R1 share prospectuses.
Large Cap Select Fund | Annual report
8
Your expenses
These examples are intended to help you understand your ongoing operating expenses.
Understanding fund expenses
As a shareholder of the Fund, you incur two types of costs:
▪ Transaction costs which include sales charges (loads) on purchases or redemptions (varies by share class), minimum account fee charge, etc.
▪ Ongoing operating expenses including management fees, distribution and service fees (if applicable), and other fund expenses.
We are going to present only your ongoing operating expenses here.
Actual expenses/actual returns
This example is intended to provide information about your fund’s actual ongoing operating expenses, and is based on your fund’s actual return. It assumes an account value of $1,000.00 on July 1, 2007, with the same investment held until December 31, 2007.
| Account value | Ending value | Expenses paid during | |
| on 7-1-07 | on 12-31-07 | period ended 12-31-071 | |
| Class A | $1,000.00 | $1,003.60 | $6.53 |
| Class B | 1,000.00 | 999.90 | 10.30 |
| Class C | 1,000.00 | 1,000.50 | 10.30 |
| Class I | 1,000.00 | 1,006.40 | 4.81 |
| Class R1 | 1,000.00 | 1,000.90 | 10.64 |
Together with the value of your account, you may use this information to estimate the operating expenses that you paid over the period. Simply divide your account value at December 31, 2007, by $1,000.00, then multiply it by the “expenses paid” for your share class from the table above. For example, for an account value of $8,600.00, the operating expenses should be calculated as follows:
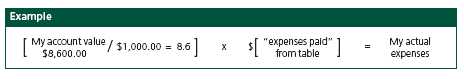
Annual report | Large Cap Select Fund
9
Your expenses
Hypothetical example for comparison purposes
This table allows you to compare your fund’s ongoing operating expenses with those of any other fund. It provides an example of the Fund’s hypothetical account values and hypothetical expenses based on each class’s actual expense ratio and an assumed 5% annualized return before expenses (which is not your fund’s actual return). It assumes an account value of $1,000.00 on July 1, 2007, with the same investment held until December 31, 2007. Look in any other fund shareholder report to find its hypothetical example and you will be able to compare these expenses.
| Account value | Ending value | Expenses paid during | |
| on 7-1-07 | on 12-31-07 | period ended 12-31-071 | |
| Class A | $1,000.00 | $1,018.69 | $6.58 |
| Class B | 1,000.00 | 1,014.90 | 10.38 |
| Class C | 1,000.00 | 1,014.91 | 10.37 |
| Class I | 1,000.00 | 1,020.41 | 4.84 |
| Class R1 | 1,000.00 | 1,015.57 | 10.71 |
Remember, these examples do not include any transaction costs, such as sales charges; therefore, these examples will not help you to determine the relative total costs of owning different funds. If transaction costs were included, your expenses would have been higher. See the prospectus for details regarding transaction costs.
1 Expenses are equal to the Fund’s annualized expense ratio of 1.29%, 2.04%, 2.04%, 0.95% and 2.11% for Class A, Class B, Class C, Class I and Class R1, respectively, multiplied by the average account value over the period, multiplied by number of days in most recent fiscal half-year/365 or 366 (to reflect the one-half year period).
Large Cap Select Fund | Annual report
10
Portfolio summary
| Top 10 holdings1 | ||||
| Berkshire Hathaway, Inc. (Class A) | 5.2% | Coca-Cola Co. (The) | 4.8% | |
| Wal-Mart Stores, Inc. | 5.1% | PepsiCo, Inc. | 4.8% | |
| Johnson & Johnson | 5.1% | General Electric Co. | 4.5% | |
| Procter & Gamble Co. (The) | 4.9% | American International Group, Inc. | 3.9% | |
| Microsoft Corp. | 4.8% | UnitedHealth Group, Inc. | 3.9% | |
| Sector distribution1 | ||||
| Consumer staples | 25% | Industrials | 13% | |
| Information technology | 17% | Consumer discretionary | 10% | |
| Health care | 15% | Energy | 3% | |
| Financials | 14% | Other | 3% | |

1 As a percentage of net assets on December 31, 2007.
Annual report | Large Cap Select Fund
11
F I N A N C I A L S T A T E M E N T S
Fund’s investments
Securities owned by the Fund on 12-31-07
This schedule is divided into two main categories: common stocks and short-term investments. Common stocks are further broken down by industry group. Short-term investments, which represent the Fund’s cash position, are listed last.
| Issuer | Shares | Value |
| Common stocks 97.18% | $58,816,770 | |
| (Cost $42,164,960) | ||
| Advertising 2.83% | 1,711,080 | |
| Omnicom Group, Inc. | 36,000 | 1,711,080 |
| Air Freight & Logistics 2.21% | 1,337,550 | |
| FedEx Corp. | 15,000 | 1,337,550 |
| Brewers 3.46% | 2,093,600 | |
| Anheuser-Busch Cos., Inc. | 40,000 | 2,093,600 |
| Communications Equipment 3.04 % | 1,840,760 | |
| Cisco Systems, Inc. (I) | 68,000 | 1,840,760 |
| Computer Hardware 5.65% | 3,416,400 | |
| Dell, Inc. (I) | 60,000 | 1,470,600 |
| International Business Machines Corp. | 18,000 | 1,945,800 |
| Consumer Finance 2.58% | 1,560,600 | |
| American Express Co. | 30,000 | 1,560,600 |
| Data Processing & Outsourced Services 3.31% | 2,003,850 | |
| Automatic Data Processing, Inc. | 45,000 | 2,003,850 |
| Diversified Banks 2.74% | 1,660,450 | |
| Wells Fargo & Co. | 55,000 | 1,660,450 |
| Food Distributors 2.37% | 1,435,660 | |
| Sysco Corp. | 46,000 | 1,435,660 |
| Health Care Equipment 3.16% | 1,910,260 | |
| Medtronic, Inc. | 38,000 | 1,910,260 |
| Home Improvement Retail 2.89% | 1,751,100 | |
| Home Depot, Inc. (The) | 65,000 | 1,751,100 |
| Household Products 4.85% | 2,936,800 | |
| Procter & Gamble Co. (The) | 40,000 | 2,936,800 |
| Hypermarkets & Super Centers 5.10% | 3,089,450 | |
| Wal-Mart Stores, Inc. | 65,000 | 3,089,450 |
| Industrial Conglomerates 8.02% | 4,851,180 | |
| 3M Co. | 25,000 | 2,108,000 |
| General Electric Co. | 74,000 | 2,743,180 |
See notes to financial statements
Large Cap Select Fund | Annual report
12
F I N A N C I A L S T A T E M E N T S
| Issuer | Shares | Value | |||
| Industrial Machinery 2.92% | $1,766,820 | ||||
| Illinois Tool Works, Inc. | 33,000 | 1,766,820 | |||
| Insurance Brokers 5.15% | 3,115,200 | ||||
| Berkshire Hathaway, Inc. (Class A) (I) | 22 | 3,115,200 | |||
| Integrated Oil & Gas 2.79% | 1,686,420 | ||||
| Exxon Mobil Corp. | 18,000 | 1,686,420 | |||
| Managed Health Care 3.85% | 2,328,000 | ||||
| UnitedHealth Group, Inc. | 40,000 | 2,328,000 | |||
| Motorcycle Manufacturers 1.54% | 934,200 | ||||
| Harley-Davidson, Inc. | 20,000 | 934,200 | |||
| Multi-Line Insurance 3.85% | 2,332,000 | ||||
| American International Group, Inc. | 40,000 | 2,332,000 | |||
| Pharmaceuticals 7.85% | 4,752,700 | ||||
| Abbott Laboratories | 30,000 | 1,684,500 | |||
| Johnson & Johnson | 46,000 | 3,068,200 | |||
| Soft Drinks 9.53% | 5,768,590 | ||||
| Coca-Cola Co. (The) | 47,000 | 2,884,390 | |||
| PepsiCo, Inc. | 38,000 | 2,884,200 | |||
| Specialty Stores 2.67% | 1,614,900 | ||||
| Staples, Inc. | 70,000 | 1,614,900 | |||
| Systems Software 4.82% | 2,919,200 | ||||
| Microsoft Corp. | 82,000 | 2,919,200 | |||
| Interest | Maturity | Par value | |||
| Issuer, description | rate | date | (000) | Value | |
| Short-term investments 2.81% | $1,700,000 | ||||
| (Cost $1,699,888) | |||||
| Government U.S. Agency 2.81% | 1,700,000 | ||||
| Federal Home Loan Bank, | |||||
| Disc Note | 4.150% (Y) | 01-02-08 | $1,700 | 1,700,000 | |
| Total investments (Cost $43,864,848) 99.99% | $60,516,770 | ||||
| Other assets and liabilities, net (0.01%) | 3,077 | ||||
| Total net assets 100.00% | $60,519,847 | ||||
The percentage shown for each investment category is the total value of that category as a percentage of the net assets of the Fund.
(I) Non-income-producing security.
(Y) Represents current yield on December 31, 2007.
See notes to financial statements
Annual report | Large Cap Select Fund
13
F I N A N C I A L S T A T E M E N T S
Financial statements
Statement of assets and liabilities 12-31-07
This Statement of Assets and Liabilities is the Fund’s balance sheet. It shows the value of what the Fund owns, is due and owes. You’ll also find the net asset value and the maximum offering price per share.
| Assets | |
| Investments at value (cost $43,864,848) | $60,516,770 |
| Cash | 66,262 |
| Receivable for shares sold | 8,297 |
| Receivable from affiliates | 1,594 |
| Dividends and interest receivable | 81,076 |
| Other assets | 70,861 |
| Total assets | 60,744,860 |
| Liabilities | |
| Payable for shares repurchased | 58,618 |
| Payable to affiliates | |
| Management fees | 39,038 |
| Distribution and service fees | 3,078 |
| Other | 12,149 |
| Other payables and accrued expenses | 112,130 |
| Total liabilities | 225,013 |
| Net assets | |
| Capital paid-in | 43,372,339 |
| Accumulated net realized gain on investments | 484,908 |
| Net unrealized appreciation of investments | 16,651,922 |
| Undistributed net investment income | 10,678 |
| Net assets | $60,519,847 |
| Net asset value per share | |
| Based on net asset values and shares outstanding — the Fund has an | |
| unlimited number of shares authorized with no par value | |
| Class A ($51,845,626 ÷ 2,820,497 shares) | $18.38 |
| Class B ($3,318,103 ÷ 184,213 shares)1 | $18.01 |
| Class C ($2,130,042 ÷ 118,240 shares)1 | $18.01 |
| Class I ($2,992,689 ÷ 162,569 shares) | $18.41 |
| Class R1 ($233,387 ÷ 12,808 shares) | $18.22 |
| Maximum offering price per share | |
| Class A2 ($18.38 ÷ 95%) | $19.35 |
1 Redemption price is equal to net asset value less any applicable contingent deferred sales charge.
2 On single retail sales of less than $50,000. On sales of $50,000 or more and on group sales the offering price is reduced.
See notes to financial statements
Large Cap Select Fund | Annual report
14
F I N A N C I A L S T A T E M E N T S
Statement of operations For the year ended 12-31-07
This Statement of Operations summarizes the Fund’s investment income earned and expenses incurred in operating the Fund. It also shows net gains (losses) for the period stated.
| Investment income | |
| Dividends | $1,069,572 |
| Interest | 99,244 |
| Securities lending | 4,170 |
| Total investment income | 1,172,986 |
| Expenses | |
| Investment management fees (Note 3) | 485,129 |
| Distribution and service fees (Note 3) | 197,206 |
| Transfer agent fees (Note 3) | 120,037 |
| Accounting and legal services fees (Note 3) | 8,422 |
| Blue sky fees | 63,262 |
| Printing fees | 46,672 |
| Professional fees | 23,139 |
| Custodian fees | 19,617 |
| Trustees’ fees | 3,014 |
| Miscellaneous | 3,756 |
| Total expenses | 970,254 |
| Less expense reductions (Note 3) | (72,698) |
| Net expenses | 897,556 |
| Net investment income | 275,430 |
| Realized and unrealized gain (loss) | |
| Net realized gain on investments | 4,309,028 |
| Change in net unrealized depreciation of investments | (3,083,140) |
| Net realized and unrealized gain | 1,225,888 |
| Increase in net assets from operations | $1,501,318 |
See notes to financial statements
Annual report | Large Cap Select Fund
15
F I N A N C I A L S T A T E M E N T S
Statement of changes in net assets
These Statements of Changes in Net Assets show how the value of the Fund’s net assets has changed during the last two periods. The difference reflects earnings less expenses, any investment gains and losses, distributions, if any, paid to shareholders and the net of Fund share transactions.
| Year | Year | |
| ended | ended | |
| 12-31-06 | 12-31-07 | |
| Increase (decrease) in net assets | ||
| From operations | ||
| Net investment income | $265,891 | $275,430 |
| Net realized gain | 3,552,553 | 4,309,028 |
| Change in net unrealized appreciation (depreciation) | 5,395,848 | (3,083,140) |
| Increase in net assets resulting from operations | 9,214,292 | 1,501,318 |
| Distributions to shareholders | ||
| From net investment income | ||
| Class A | (235,091) | (246,296) |
| Class I | (27,074) | (25,100) |
| From net realized gain | ||
| Class A | (2,577,373) | (3,149,359) |
| Class B | (163,028) | (198,731) |
| Class C | (117,823) | (127,251) |
| Class I | (146,197) | (176,085) |
| Class R1 | (12,570) | (13,024) |
| (3,279,156) | (3,935,846) | |
| From Fund share transactions (Note 4) | (9,112,955) | (7,128,043) |
| Total decrease | (3,177,819) | (9,562,571) |
| Net assets | ||
| Beginning of year | 73,260,237 | 70,082,418 |
| End of year1 | $70,082,418 | $60,519,847 |
1 Includes undistributed net investment income of $6,645 and $10,678, respectively.
See notes to financial statements
Large Cap Select Fund | Annual report
16
F I N A N C I A L S T A T E M E N T S
Financial highlights
The Financial Highlights show how the Fund’s net asset value for a share has changed since the end of the previous period.
| CLASS A SHARES | |||||
| Period ended | 12-31-031 | 12-31-04 | 12-31-05 | 12-31-06 | 12-31-07 |
| Per share operating performance | |||||
| Net asset value, beginning of period | $15.27 | $17.80 | $18.44 | $17.60 | $19.20 |
| Net investment income (loss)2 | (0.01) | 0.08 | 0.05 | 0.08 | 0.09 |
| Net realized and unrealized | |||||
| gain (loss) on investments | 2.63 | 0.84 | (0.48) | 2.46 | 0.36 |
| Total from investment operations | 2.62 | 0.92 | (0.43) | 2.54 | 0.45 |
| Less distributions | |||||
| From net investment income | — | (0.07) | (0.04) | (0.08) | (0.09) |
| From net realized gain | (0.09) | (0.21) | (0.37) | (0.86) | (1.18) |
| (0.09) | (0.28) | (0.41) | (0.94) | (1.27) | |
| Net asset value, end of period | $17.80 | $18.44 | $17.60 | $19.20 | $18.38 |
| Total return3,4 (%) | 17.15 | 5.17 | (2.38) | 14.37 | 2.24 |
| Ratios and supplemental data | |||||
| Net assets, end of period | |||||
| (in millions) | $55 | $65 | $58 | $60 | $52 |
| Ratio of net expenses to average | |||||
| net assets (%) | 1.51 | 1.34 | 1.36 | 1.35 | 1.345 |
| Ratio of gross expenses to average | |||||
| net assets6 (%) | 1.89 | 1.44 | 1.47 | 1.48 | 1.45 |
| Ratio of net investment income | |||||
| (loss) to average net assets (%) | (0.03) | 0.45 | 0.26 | 0.46 | 0.48 |
| Portfolio turnover (%) | 22 | 13 | 23 | 12 | 12 |
1 Effective 8-22-03, shareholders of the former M.S.B. Fund, Inc. became owners of an equal number of full and fractional Class A shares of the John Hancock Large Cap Select Fund. Additionally, the accounting and performance history of the former M.S.B. Fund, Inc. was redesignated as that of Class A of John Hancock Large Cap Select Fund.
2 Based on the average of the shares outstanding.
3 Assumes dividend reinvestment and does not reflect the effect of sales charges.
4 Total returns would have been lower had certain expenses not been reduced during the periods shown.
5 Includes transfer agent fee earned credits of less than 0.01% to average net assets.
6 Does not take into consideration expense reductions during the periods shown.
See notes to financial statements
Annual report | Large Cap Select Fund
17
F I N A N C I A L S T A T E M E N T S
Financial highlights
| CLASS B SHARES | |||||
| Period ended | 12-31-031 | 12-31-04 | 12-31-05 | 12-31-06 | 12-31-07 |
| Per share operating performance | |||||
| Net asset value, beginning of period | $16.29 | $17.76 | $18.33 | $17.39 | $18.89 |
| Net investment loss2 | (0.03) | (0.03) | (0.09) | (0.05) | (0.05) |
| Net realized and unrealized | |||||
| gain (loss) on investments2 | 1.59 | 0.81 | (0.48) | 2.41 | 0.35 |
| Total from investment operations | 1.56 | 0.78 | (0.57) | 2.36 | 0.30 |
| Less distributions | |||||
| From net realized gain | (0.09) | (0.21) | (0.37) | (0.86) | (1.18) |
| Net asset value, end of period | $17.76 | $18.33 | $17.39 | $18.89 | $18.01 |
| Total return3,4 (%) | 9.575 | 4.40 | (3.14) | 13.52 | 1.48 |
| Ratios and supplemental data | |||||
| Net assets, end of period | |||||
| (in millions) | $2 | $6 | $5 | $4 | $3 |
| Ratio of net expenses to average | |||||
| net assets (%) | 2.136 | 2.09 | 2.11 | 2.10 | 2.097 |
| Ratio of gross expenses to average | |||||
| net assets8 (%) | 3.026 | 2.19 | 2.22 | 2.23 | 2.20 |
| Ratio of net investment loss | |||||
| to average net assets (%) | (0.49)6 | (0.18) | (0.50) | (0.29) | (0.27) |
| Portfolio turnover (%) | 229 | 13 | 23 | 12 | 12 |
1 Class B shares began operations on 8-25-03.
2 Based on the average of the shares outstanding.
3 Assumes dividend reinvestment and does not reflect the effect of sales charges.
4 Total returns would have been lower had certain expenses not been reduced during the periods shown.
5 Not annualized.
6 Annualized.
7 Includes transfer agent fee earned credits of less than 0.01% to average net assets.
8 Does not take into consideration expense reductions during the periods shown.
9 Portfolio turnover shown is calculated for the Fund for the full fiscal year.
See notes to financial statements
Large Cap Select Fund | Annual report
18
F I N A N C I A L S T A T E M E N T S
Financial highlights
| CLASS C SHARES | |||||
| Period ended | 12-31-031 | 12-31-04 | 12-31-05 | 12-31-06 | 12-31-07 |
| Per share operating performance | |||||
| Net asset value, beginning of period | $16.29 | $17.76 | $17.76 | $17.39 | $18.89 |
| Net investment loss2 | (0.03) | —3 | (0.09) | (0.05) | (0.05) |
| Net realized and unrealized | |||||
| gain (loss) on investments | 1.59 | 0.78 | (0.48) | 2.41 | 0.35 |
| Total from investment operations | 1.56 | 0.78 | (0.57) | 2.36 | 0.30 |
| Less distributions | |||||
| From net realized gain | (0.09) | (0.21) | (0.37) | (0.86) | (1.18) |
| Net asset value, end of period | $17.76 | $18.33 | $17.39 | $18.89 | $18.01 |
| Total return4,5 (%) | 9.576 | 4.40 | (3.14) | 13.52 | 1.48 |
| Ratios and supplemental data | |||||
| Net assets, end of period | |||||
| (in millions) | $1 | $6 | $7 | $3 | $2 |
| Ratio of net expenses to average | |||||
| net assets (%) | 2.137 | 2.09 | 2.11 | 2.10 | 2.098 |
| Ratio of gross expenses to average | |||||
| net assets9 (%) | 3.027 | 2.19 | 2.22 | 2.23 | 2.20 |
| Ratio of net investment loss | |||||
| to average net assets (%) | (0.45)7 | (0.01) | (0.49) | (0.30) | (0.27) |
| Portfolio turnover (%) | 2210 | 13 | 23 | 12 | 12 |
1 Class C shares began operations on 8-25-03.
2 Based on the average of the shares outstanding.
3 Less than $0.01 per share.
4 Assumes dividend reinvestment and does not reflect the effect of sales charges.
5 Total returns would have been lower had certain expenses not been reduced during the periods shown.
6 Not annualized.
7 Annualized.
8 Includes transfer agent fee earned credits of less than 0.01% to average net assets.
9 Does not take into consideration expense reductions during the periods shown.
10 Portfolio turnover shown is calculated for the Fund for the full fiscal year.
See notes to financial statements
Annual report | Large Cap Select Fund
19
F I N A N C I A L S T A T E M E N T S
Financial highlights
| CLASS I SHARES | |||||
| Period ended | 12-31-031 | 12-31-04 | 12-31-05 | 12-31-06 | 12-31-07 |
| Per share operating performance | |||||
| Net asset value, beginning of period | $16.29 | $17.83 | $18.46 | $17.62 | $19.23 |
| Net investment income2 | 0.04 | 0.15 | 0.12 | 0.16 | 0.17 |
| Net realized and unrealized | |||||
| gain (loss) on investments | 1.59 | 0.84 | (0.48) | 2.47 | 0.36 |
| Total from investment operations | 1.63 | 0.99 | (0.36) | 2.63 | 0.53 |
| Less distributions | |||||
| From net investment income | — | (0.15) | (0.11) | (0.16) | (0.17) |
| From net realized gain | (0.09) | (0.21) | (0.37) | (0.86) | (1.18) |
| (0.09) | (0.36) | (0.48) | (1.02) | (1.35) | |
| Net asset value, end of period | $17.83 | $18.46 | $17.62 | $19.23 | $18.41 |
| Total return3,4 (%) | 10.005 | 5.54 | (1.98) | 14.87 | 2.63 |
| Ratios and supplemental data | |||||
| Net assets, end of period | |||||
| (in millions) | $3 | $3 | $3 | $3 | $3 |
| Ratio of net expenses to average | |||||
| net assets (%) | 0.956 | 0.95 | 0.95 | 0.95 | 0.957 |
| Ratio of gross expenses to average | |||||
| net assets8 (%) | 1.846 | 1.05 | 1.06 | 1.08 | 1.06 |
| Ratio of net investment income | |||||
| to average net assets (%) | 0.616 | 0.83 | 0.67 | 0.85 | 0.86 |
| Portfolio turnover (%) | 229 | 13 | 23 | 12 | 12 |
1 Class I shares began operations on 8-25-03.
2 Based on the average of the shares outstanding.
3 Assumes dividend reinvestment and does not reflect the effect of sales charges.
4 Total returns would have been lower had certain expenses not been reduced during the periods shown.
5 Not annualized.
6 Annualized.
7 Includes transfer agent fee earned credits of less than 0.01% to average net assets.
8 Does not take into consideration expense reductions during the periods shown.
9 Portfolio turnover shown is calculated for the Fund for the full fiscal year.
See notes to financial statements
Large Cap Select Fund | Annual report
20
F I N A N C I A L S T A T E M E N T S
Financial highlights
| CLASS R1 SHARES | |||||
| Period ended | 12-31-031 | 12-31-04 | 12-31-05 | 12-31-06 | 12-31-07 |
| Per share operating performance | |||||
| Net asset value, beginning of period | $17.10 | $17.79 | $18.45 | $17.54 | $19.07 |
| Net investment income (loss)2 | (0.02) | 0.07 | (0.06) | (0.05) | (0.03) |
| Net realized and unrealized | |||||
| gain (loss) on investments | 0.80 | 0.81 | (0.48) | 2.44 | 0.36 |
| Total from investment operations | 0.78 | 0.88 | (0.54) | 2.39 | 0.33 |
| Less distributions | |||||
| From net investment income | — | (0.01) | — | — | — |
| From net realized gain | (0.09) | (0.21) | (0.37) | (0.86) | (1.18) |
| (0.09) | (0.22) | (0.37) | (0.86) | (1.18) | |
| Net asset value, end of period | $17.79 | $18.45 | $17.54 | $19.07 | $18.22 |
| Total return3,4 (%) | 4.565 | 4.98 | (2.96) | 13.58 | 1.61 |
| Ratios and supplemental data | |||||
| Net assets, end of period | |||||
| (in millions) | —6 | —6 | —6 | —6 | —6 |
| Ratio of net expenses to average | |||||
| net assets (%) | 1.887 | 1.44 | 1.98 | 2.09 | 1.948 |
| Ratio of gross expenses to average | |||||
| net assets9 (%) | 2.777 | 1.54 | 2.09 | 2.22 | 2.05 |
| Ratio of net investment income | |||||
| [loss] to average net assets (%) | (0.27)7 | 0.40 | (0.36) | (0.28) | (0.13) |
| Portfolio turnover (%) | 2210 | 13 | 23 | 12 | 12 |
1 Class R1 shares began operations on 11-03-03.
2 Based on the average of the shares outstanding.
3 Assumes dividend reinvestment and does not reflect the effect of sales charges.
4 Total returns would have been lower had certain expenses not been reduced during the periods shown.
5 Not annualized.
6 Less than $500,000.
7 Annualized.
8 Includes transfer agent fee earned credits of less than 0.01% to average net assets.
9 Does not take into consideration expense reductions during the periods shown.
10 Portfolio turnover shown is calculated for the Fund for the full fiscal year.
See notes to financial statements
Annual report | Large Cap Select Fund
21
Notes to financial statements
Note 1
Organization
John Hancock Large Cap Select Fund (the Fund) is a diversified series of John Hancock Capital Series (the Trust), an open-end management investment company registered under the Investment Company Act of 1940, as amended (the 1940 Act). The investment objective of the Fund is to seek long-term capital appreciation.
The Trustees have authorized the issuance of multiple classes of shares of the Fund, designated as Class A, Class B, Class C, Class I and Class R1 shares. The shares of each class represent an interest in the same portfolio of investments of the Fund and have equal rights as to voting, redemptions, dividends and liquidation, except that certain expenses, subject to the approval of the Trustees, may be applied differently to each class of shares in accordance with current regulations of the Securities and Exchange Commission (SEC) and the Internal Revenue Service. Shareholders of a class that bears distribution and service expenses under the terms of a distribution plan have exclusive voting rights to that distribution plan. Class B shares will convert to Class A shares eight years after purchase. Effective March 1, 2007, Class R shares were redesignated as Class R1 shares.
Note 2
Significant accounting policies
The financial statements have been prepared in conformity with accounting principles generally accepted in the United States of America, which require management to make certain estimates and assumptions at the date of the financial statements. Actual results could differ from those estimates. The following summarizes the significant accounting policies of the Fund:
Security valuation
The net asset value of Class A, Class B, Class C, Class I and Class R1 shares of the Fund is determined daily as of the close of the New York Stock Exchange (NYSE), normally at 4:00 p.m., Eastern Time. Short-term debt investments that have a remaining maturity of 60 days or less are valued at amortized cost, and thereafter assume a constant amortization to maturity of any discount or premium, which approximates market value. All other securities held by the Fund are valued at the last sale price or official closing price (closing bid price or last evaluated quote if no sale has occurred) as of the close of business on the principal securities exchange (domestic or foreign) on which they trade or, lacking any sales, at the closing bid price. Securities traded only in the over-the-counter m arket are valued at the last bid price quoted by brokers making markets in the securities at the close of trading. Securities for which there are no such quotations, principally debt securities, are valued based on the evaluated prices provided by an independent pricing service, which utilizes both dealer-supplied and electronic data processing techniques, which take into account factors such as institutional-size trading in similar groups of securities, yield, quality, coupon rate, maturity, type of issue, trading characteristics and other market data.
Other assets and securities for which no such quotations are readily available are valued at fair value as determined in good faith under consistently applied procedures established by and under the general supervision of the Board of Trustees. Generally, trading in non-U.S. securities is substantially completed each day at various times prior to the close of trading on the NYSE. The values of such securities used in computing the net asset value of the Fund’s shares are generally determined as of such times. Occasionally, significant events that affect the values of such securities may occur between the times at which such values are generally determined and the close of the NYSE. Upon such an occurrence, these securities will be valued at fair value as
Large Cap Select Fund | Annual report
22
determined in good faith under consistently applied procedures established by and under the general supervision of the Board of Trustees.
Investment transactions
Investment transactions are accounted for on a trade date plus one basis for daily net asset value calculations. However, for financial reporting purposes, investment security transactions are reported on trade date. Interest income is recorded on the accrual basis. Dividend income is recorded on the ex-dividend date net of foreign withholding taxes. Realized gains and losses from investment transactions are recorded on an identified cost basis.
Class allocations
Income, common expenses and realized and unrealized gains (losses) are determined at the fund level and allocated daily to each class of shares based on the appropriate net asset value of the respective classes. Distribution and service fees, if any, and transfer agent fees for Class A, Class B, Class C, Class I and Class R1 shares are calculated daily at the class level based on the appropriate net asset value of each class and the specific expense rate(s) applicable to each class.
Guarantees and indemnifications
Under the Fund’s organizational documents, its Officers and Trustees are indemnified against certain liability arising out of the performance of their duties to the Fund. Additionally, in the normal course of business, the Fund enters into contracts with service providers that contain general indemnification clauses. The Fund’s maximum exposure under these arrangements is unknown, as this would involve future claims that may be made against the Fund that have not yet occurred.
Expenses
The majority of expenses are directly identifiable to an individual fund. Expenses that are not readily identifiable to a specific fund are allocated in such a manner as deemed equitable, taking into consideration, among other things, the nature and type of expense and the relative size of the funds.
Bank borrowings
The Fund is permitted to have bank borrowings for temporary or emergency purposes, including the meeting of redemption requests that otherwise might require the untimely disposition of securities. The Fund has entered into a line of credit agreement with The Bank of New York Mellon (BNYM), the Swing Line Lender and Administrative Agent. This agreement enables the Fund to participate, with other funds managed by the Adviser, in an unsecured line of credit with BNYM, which permits borrowings of up to $100 million, collectively. Interest is charged to each fund based on its borrowing. In addition, a commitment fee is charged to each fund based on the average daily unused portion of the line of credit and is allocated among the participating funds. The Fund had no borrowing activity under the line of credit during the year ended December 31, 2007.
Securities lending
The Fund has entered into an agreement with Morgan Stanley & Co. Incorporated and MS Securities Services Inc. (collectively, Morgan Stanley) which permits the Fund to lend securities to Morgan Stanley on a principal basis. Morgan Stanley is the primary borrower of securities of the Fund. The risk of having one primary borrower of Fund securities (as opposed to several borrowers) is that should Morgan Stanley fail financially, all securities lent will be affected by the failure and by any delays in recovery of the securities (or in the rare event, loss of rights in the collateral).
The Fund may lend portfolio securities from time to time in order to earn additional income. The Fund retains beneficial ownership of the securities it has loaned and continues to receive interest and dividends paid by the issuer of securities and to participate in any changes in their value. On the settlement date of the loan, the Fund receives collateral against the loaned securities and maintains collateral in an amount not less than 100% of the market value of the loaned securities during the period of the loan. The market value of the loaned securities is determined at the close of business of the Fund and any additional required collateral is delivered to the Fund on the next
Annual report | Large Cap Select Fund
23
business day. Any cash collateral received is invested in the JHCIT. If the borrower defaults on its obligation to return the securities loaned because of insolvency or other reasons, a fund could experience delays and costs in recovering the securities loaned or in gaining access to the collateral. The Fund receives compensation for lending their securities either in the form of fees, guarantees and/or by retaining a portion of interest on the investment of any cash received as collateral.
Federal income taxes
The Fund qualifies as a regulated investment company by complying with the applicable provisions of the Internal Revenue Code and will not be subject to federal income tax on taxable income that is distributed to shareholders. Therefore, no federal income tax provision is required.
The Fund adopted the provisions of Financial Accounting Standards Board (FASB) Interpretation No. 48, Accounting for Uncertainty in Income Taxes, an interpretation of FASB Statement 109 (FIN 48), on January 1, 2007. FIN 48 prescribes a minimum threshold for financial statement recognition of the benefit of a tax position taken or expected to be taken in a tax return. The implementation of FIN 48 did not result in any unrecognized tax benefits in the accompanying financial statements. Each of the Fund’s federal tax returns for the prior three fiscal years remains subject to examination by the Internal Revenue Service.
New accounting pronouncement
In September 2006, FASB Standard No. 157, Fair Value Measurements (FAS 157), was issued and is effective for fiscal years beginning after November 15, 2007. FAS 157 defines fair value, establishing a framework for measuring fair value and expands disclosure about fair value measurements. Management is currently evaluating the application of FAS 157 to the Fund and its impact, if any, resulting from the adoption of FAS 157 on the Fund’s financial statement disclosures.
Distribution of income and gains
The Fund records distributions to shareholders from net investment income and net realized gains, if any, on the ex-dividend date. During the year ended December 31, 2006, the tax character of distributions paid was as follows: ordinary income $746,626 and long-term capital gain $2,532,530. During the year ended December 31, 2007, the tax character of distributions paid was as follows: ordinary income $329,203 and long-term capital gain $3,606,643. Distributions paid by the Fund with respect to each class of shares are calculated in the same manner, at the same time and are in the same amount, except for the effect of expenses that may be applied differently to each class.
As of December 31, 2007, the components of distributable earnings on a tax basis included $10,833 of undistributed ordinary income and $484,908 of undistributed long-term gain.
Such distributions and distributable earnings, on a tax basis, are determined in conformity with income tax regulations, which may differ from accounting principles generally accepted in the United States of America. Distributions in excess of tax basis earnings and profits, if any, are reported in the Fund’s financial statements as a return of capital.
Capital accounts within financial statements are adjusted for permanent book-tax differences. These adjustments have no impact on net assets or the results of operations. Temporary book-tax differences will reverse in a subsequent period. Permanent differences are primarily attributable to equalization.
Note 3
Management fee and transactions with affiliates and others
The Fund has an investment management contract with the Adviser. Under the investment management contract, the Fund pays a daily management fee to the Adviser equivalent, on an annual basis, to the sum of: (a) 0.75% of the first $2,700,000,000 of the Fund’s average daily net asset value and (b) 0.70% of the Fund’s average daily net asset value in excess of $2,700,000,000. The effective rate for the period ended December 31, 2007 is 0.75% of the Fund’s average daily net asset value. The Adviser has a subadvisory
Large Cap Select Fund | Annual report
24
agreement with Shay Assets Management, Inc. The Fund is not responsible for payment of the subadvisory fees.
The Adviser has agreed to limit the Fund’s total expenses, excluding the distribution and service fees and transfer agent fees, to 0.90% of the Fund’s average daily net asset value, on an annual basis, and total expenses on Class A shares to 1.38% of Class A average daily net asset value, on an annual basis, at least until April 30, 2008. Accordingly, the expense reductions, related to limitation of Fund’s total expenses, amounted to $70,860 for the year ended December 31, 2007. The Adviser reserves the right to terminate these limitations in the future.
The Fund has a Distribution Agreement with John Hancock Funds, LLC (JH Funds), a wholly owned subsidiary of the Adviser. The Fund has adopted Distribution Plans with respect to Class A, Class B and Class C and Class R1, pursuant to Rule 12b-1 under the 1940 Act, to reimburse JH Funds for the services it provides as distributor of shares of the Fund. Accordingly, the Fund makes monthly payments to JH Funds at an annual rate not to exceed 0.25%, 1.00%, 1.00% and 0.50% of average daily net asset value of Class A, Class B, Class C and Class R1, respectively. A maximum of 0.25% of such payments may be service fees, as defined by the Conduct Rules of the Financial Industry Regulatory Authority (formerly the National Association of Securities Dealers). Under the Conduct Rules, curtailment of a portion of the Fund’s 12b-1 payments could occur under certain circumstances. In addition, under a Service Plan for Class R1 shares, the Fund pays up to 0.25% of Class R1 average dai ly net asset value for certain other services.
Class A shares are assessed up-front sales charges. During the year ended December 31, 2007, JH Funds received net up-front sales charges of $20,613 with regard to sales of Class A shares. Of this amount, $2,770 was retained and used for printing prospectuses, advertising, sales literature and other purposes; $15,215 was paid as sales commissions to unrelated broker-dealers; and $2,628 was paid as sales commissions to sales personnel of Signator Investors, Inc. (Signator Investors), a related broker-dealer. The Adviser’s indirect parent, John Hancock Life Insurance Company (JHLICO), is the indirect sole shareholder of Signator Investors.
Class B shares that are redeemed within six years of purchase are subject to a contingent deferred sales charge (CDSC) at declining rates, beginning at 5.00% of the lesser of the current market value at the time of redemption or the original purchase cost of the shares being redeemed. Class C shares that are redeemed within one year of purchase are subject to a CDSC at a rate of 1.00% of the lesser of the current market value at the time of redemption or the original purchase cost of the shares being redeemed. Proceeds from the CDSCs are paid to JH Funds and are used in whole or in part to defray its expenses for providing distribution-related services to the Fund in connection with the sale of Class B and Class C shares. During the year ended December 31, 2007, CDSCs received by JH Funds amounted to $8,787 for Class B shares and $1,008 for Class C shares.
The Fund has a transfer agent agreement with John Hancock Signature Services, Inc. (Signature Services), an indirect subsidiary of JHLICO. For Class A, Class B, Class C, Class I and Class R1 shares, the Fund pays a monthly transfer agent fee at an annual rate of 0.05% of each class’s average daily net asset value, plus a fee based on the number of shareholder accounts and reimbursement for certain out-of-pocket expenses, aggregated and allocated to each class on the basis of its relative net asset value. Effective June 1, 2007, for the Class I shares the Fund pays a monthly transfer agent fee at a total annual rate of 0.04% of the Class I average daily net asset value. The Fund pays a monthly fee which is based on an annual rate of $15.00 for each Class A shareholder account, $17.50 for each Class B shareholder account, $16.50 for each Class C shareholder account, $15.00 for each Class I shareholder account and $15.00 for each Class R1 shareholder account. Signature Services had agreed to limit transfer agency fees on Class A, Class B, Class C shares to 0.23% of the average daily net assets of such share classes at least until April 20, 2008. There
Annual report | Large Cap Select Fund
25
were no transfer agent fee reductions during the year ended December 31, 2007.Signature Services reserves the right to terminate this limitation in the future.
In May 2007, the Fund began receiving earnings credits from its transfer agent as a result of uninvested cash balances. These credits are used to reduce a portion of the Fund’s transfer agent fees and out of pocket expenses. During the year ended December 31, 2007, the Fund’s transfer agent fees and out of pocket expenses were reduced by $1,838 for transfer agent credits earned.
Expenses under the agreements described above for the year ended December 31, 2007 were as follows:
| Transfer | Distribution and | ||
| Share class | agent fees | service fees | |
| Class A | $106,269 | $139,422 | |
| Class B | 6,540 | 33,635 | |
| Class C | 4,409 | 22,932 | |
| Class I | 1,509 | — | |
| Class R1 | 1,310 | 1,217 | |
| Total | $120,037 | $197,206 | |
The Fund has an agreement with the Adviser and affiliates to perform necessary tax, accounting, compliance, legal and other administrative services for the Fund. The compensation for the year amounted to $8,422 with an effective rate of 0.01% of the Fund’s average daily net asset value.
Mr. James R. Boyle is Chairman of the Adviser, as well as affiliated Trustee of the Fund, and is compensated by the Adviser and/or its affiliates. The compensation of unaffiliated Trustees is borne by the Fund. The unaffiliated Trustees may elect to defer, for tax purposes, their receipt of this compensation under the John Hancock Group of Funds Deferred Compensation Plan. The Fund makes investments into other John Hancock funds, as applicable, to cover its liability for the deferred compensation. Investments to cover the Fund’s deferred compensation liability are recorded on the Fund’s books as an other asset. The deferred compensation liability and the related other asset are always equal and are marked to market on a periodic basis to reflect any income earned by the investments, as well as any unrealized gains or losses. The Deferred Compensation Plan investments had no impact on the operations of the Fund.
Large Cap Select Fund | Annual report
26
Note 4
Fund share transactions
This listing illustrates the number of Fund shares sold, reinvested and repurchased during the years ended December 31, 2006, and December 31, 2007, along with the corresponding dollar value.
| Year ended 12-31-06 | Year ended 12-31-07 | |||
| Shares | Amount | Shares | Amount | |
| Class A shares | ||||
| Sold | 392,176 | $7,184,208 | 147,812 | $2,859,921 |
| Distributions reinvested | 126,353 | 2,441,138 | 158,317 | 2,957,363 |
| Repurchased | (716,215) | (13,070,626) | (607,432) | (11,859,063) |
| Net decrease | (197,686) | ($3,445,280) | (301,303) | ($6,041,779) |
| Class B shares | ||||
| Sold | 26,539 | $478,037 | 35,051 | $662,157 |
| Distributions reinvested | 7,668 | 145,779 | 9,919 | 181,613 |
| Repurchased | (112,919) | (2,029,004) | (57,988) | (1,100,727) |
| Net decrease | (78,712) | ($1,405,188) | (13,018) | ($256,957) |
| Class C shares | ||||
| Sold | 24,740 | $442,803 | 40,101 | $760,140 |
| Distributions reinvested | 5,439 | 103,400 | 5,733 | 104,963 |
| Repurchased | (263,094) | (4,712,728) | (68,845) | (1,313,530) |
| Net increase (decrease) | (232,915) | ($4,166,525) | (23,011) | ($448,427) |
| Class I shares | ||||
| Sold | 184,326 | $3,336,874 | 17,264 | $334,763 |
| Distributions reinvested | 8,959 | 173,271 | 10,649 | 199,241 |
| Repurchased | (202,241) | (3,646,036) | (44,853) | (869,009) |
| Net increase (decrease) | (8,956) | ($135,891) | (16,940) | ($335,005) |
| Class R1 shares | ||||
| Sold | 2,797 | $51,335 | 3,470 | $65,663 |
| Distributions reinvested | 394 | 7,557 | 701 | 13,023 |
| Repurchased | (1,055) | (18,963) | (6,429) | (124,561) |
| Net increase (decrease) | 2,136 | $39,929 | (2,258) | ($45,875) |
| Net decrease | (516,133) | ($9,112,955) | (356,530) | ($7,128,043) |
Note 5
Purchase and sales of securities
Purchases and proceeds from sales or maturities of securities, other than short-term securities and obligations of the U.S. government, during the year ended December 31, 2007, aggregated $7,822,889 and $18,536,435, respectively.
The cost of investments owned on December 31, 2007, including short-term investments, for federal income tax purposes was $43,864,848. Gross unrealized appreciation and depreciation of investments aggregated $18,588,878 and $1,936,956, respectively, resulting in net unrealized appreciation of $16,651,922.
Annual report | Large Cap Select Fund
27
Auditors’ report
Report of Independent Registered Public Accounting Firm
To the Board of Trustees of John Hancock Capital Series and Shareholders of John Hancock Large Cap Select Fund,
In our opinion, the accompanying statement of assets and liabilities, including the schedule of investments, and the related statements of operations and of changes in net assets and the financial highlights present fairly, in all material respects, the financial position of John Hancock Large Cap Select Fund (Fund) at December 31, 2007, and the results of its operations, the changes in its net assets and the financial highlights for the periods indicated, in conformity with accounting principles generally accepted in the United States of America. These financial statements and financial highlights (hereafter referred to as “financial statements”) are the responsibility of the Fund’s management. Our responsibility is to express an opinion on these financial statements based on our audits. We conducted our audits of these financial statements in accordance with the standards of the Public Company Accounting Oversight Board (United States). Those standards r equire that we plan and perform the audit to obtain reasonable assurance about whether the financial statements are free of material misstatement. An audit includes examining, on a test basis, evidence supporting the amounts and disclosures in the financial statements, assessing the accounting principles used and significant estimates made by management, and evaluating the overall financial statement presentation. We believe that our audits, which included confirmation of securities at December 31, 2007 by correspondence with the custodian, provide a reasonable basis for our opinion.
PricewaterhouseCoopers LLP
Boston, Massachusetts
February 28, 2008
Large Cap Select Fund | Annual report
28
Tax information
Unaudited
For federal income tax purposes, the following information is furnished with respect to the distributions of the Fund, if any, paid during its taxable year ended December 31, 2007.
The Fund has designated distributions to shareholders of $3,961,250 as a long-term capital gain dividend.
With respect to the ordinary dividends paid by the Fund for the fiscal year ended December 31, 2007, 100.00% of the dividends qualifies for the corporate dividends-received deduction.
The Fund hereby designates the maximum amount allowable of its net taxable income as qualified dividend income as provided in the Jobs and Growth Tax Relief Reconciliation Act of 2003. This amount will be reflected on Form 1099-DIV for the calendar year 2007.
Shareholders will be mailed a 2007 U.S. Treasury Department Form 1099-DIV in January 2008. This will reflect the total of all distributions that are taxable for calendar year 2007.
Annual report | Large Cap Select Fund
29
Board Consideration of and
Continuation of Investment Advisory
and Subadvisory Agreement: John
Hancock Large Cap Select Fund
The Investment Company Act of 1940 (the 1940 Act) requires the Board of Trustees (the Board) of John Hancock Capital Series (the Trust), including a majority of the Trustees who have no direct or indirect interest in the investment advisory agreement and are not “interested persons” of the Trust, as defined in the 1940 Act (the Independent Trustees), annually to meet in person to review and consider the continuation of: (i) the investment advisory agreement (the Advisory Agreement) with John Hancock Advisers, LLC (the Adviser) and (ii) the investment subadvisory agreement (the Subadvisory Agreement) with Shay Assets Management, Inc. (the Subadviser) for the John Hancock Large Cap Select Fund (the Fund). The investment advisory agreement with the Advisor and the investment subadvisory agreement with the Subadviser are collectively referred to as the Advisory Agreements.
At meetings held on May 7 and June 4–5, 2007, the Board considered the factors and reached the conclusions described below relating to the selection of the Adviser and Subadviser and the continuation of the Advisory Agreements. During such meetings, the Board’s Contracts/Operations Committee and the Independent Trustees also met in executive sessions with their independent legal counsel.
In evaluating the Advisory Agreements, the Board, including the Contracts/Operations Committee and the Independent Trustees, reviewed a broad range of information requested for this purpose by the Independent Trustees, including: (i) the investment performance of the Fund relative to a category of relevant funds (the Category) and a peer group of comparable funds (the Peer Group) each selected by Morningstar, Inc. (Morningstar), an independent provider of investment company data, for a range of periods ended December 31, 2006, (ii) advisory and other fees incurred by, and the expense ratios of, the Fund relative to a Category and a Peer Group, (iii) the advisory fees of comparable portfolios of other clients of the Adviser and the Subadviser, (iv) the Adviser’s financial results and condition, including its and certain of its affiliates’ profitability from services performed for the Fund, (v) breakpoints in the Fund’s and the Peer Group’s fees, and information about economies of scale, (vi) the Adviser’s and Subadviser’s record of compliance with applicable laws and regulations, with the Fund’s investment policies and restrictions, and with the applicable Code of Ethics, and the structure and responsibilities of the Adviser’s and Subadviser’s compliance department, (vii) the background and experience of senior management and investment professionals, and (viii) the nature, cost and character of advisory and non-investment management services provided by the Adviser and its affiliates and by the Subadviser.
The Independent Trustees considered the legal advice of independent legal counsel and relied on their own business judgment in determining the factors to be considered in evaluating the materials that were presented to them and the weight to be given to each such factor. The Board’s review and conclusions were based on a comprehensive consideration of all information presented to the Board and not the result of any single controlling factor. They principally considered performance and other information as of December 31, 2006; performance and other information may be quite different as of the date of this shareholders report. The key factors considered by the Board and the conclusions reached are described below.
Nature, extent and quality of services
The Board considered the ability of the Adviser and the Subadviser, based on their resources, reputation and other attributes, to attract and retain qualified investment professionals, including research, advisory and supervisory personnel. The Board considered the investment philosophy, research and investment decision-making processes of the Adviser and Subadviser. The Board further considered the culture of compliance, resources dedicated to compliance, compliance programs and compliance records of the Adviser and Subadviser. In addition, the Board took into account the administrative and other non-advisory services provided to the Fund by the Adviser and its affiliates.
Based on the above factors, together with those referenced below, the Board concluded that, within the context of its full deliberations, the
Large Cap Select Fund | Annual report
30
nature, extent and quality of the investment advisory services provided to the Fund by the Adviser and Subadviser were sufficient to support renewal of the Advisory Agreements.
Fund performance
The Board considered the performance results for the Fund over various time periods ended December 31, 2006. The Board also considered these results in comparison to the performance of the Category, as well as the Fund’s benchmark index. Morningstar determined the Category and Peer Group for the Fund. The Board reviewed with a representative of Morningstar the methodology used by Morningstar to select the funds in the Category and the Peer Group.
The Board noted that the Fund’s performance during the 10-year period was generally competitive with the performance of the Peer Group and Category medians, and its benchmark index, the Standard & Poor’s 500 Index. The Board noted that, for the 3- and 5-year periods under review, the Fund’s performance was appreciably lower than the performance of the Peer Group and Category medians, and benchmark index. The Board favorably viewed that the performance of the Fund during the 1-year period was higher than the Peer Group and Category medians, but noted that the Fund’s performance was lower than its benchmark index.
Investment advisory fee and subadvisory fee rates and expenses
The Board reviewed and considered the contractual investment advisory fee rate payable by the Fund to the Adviser for investment advisory services (the Advisory Agreement Rate). The Board received and considered information comparing the Advisory Agreement Rate with the advisory fees for the Peer Group. The Board noted that the Advisory Agreement Rate was higher than the median rate of the Category, but was not appreciably higher than the median rate of the Peer Group.
The Board received and considered expense information regarding the Fund’s various components, including advisory fees, distribution and fees other than advisory and distribution fees, including transfer agent fees, custodian fees and other miscellaneous fees (e.g., fees for accounting and legal services). The Board considered comparisons of these expenses to the Peer Group median. The Board also received and considered expense information regarding the Fund’s total operating expense ratio (Gross Expense Ratio) and total operating expense ratio after taking the fee waiver arrangement applicable to the Advisory Agreement Rate into account (Net Expense Ratio). The Board received and considered information comparing the Gross Expense Ratio and Net Expense Ratio of the Fund to that of the Peer Group and Category medians. The Board noted that the Fund’s Gross and Net Expense Ratios were higher than the median of the Category, but lower than median of the Peer Group. The Board favorably considered the impact of the fee waivers towards ultimately lowering the Fund’s total operating expense ratio.
The Adviser also discussed the Morningstar data and rankings, and other relevant information, for the Fund. Based on the above-referenced considerations and other factors, the Board concluded that the Fund’s overall performance and expenses supported the re-approval of the Advisory Agreements.
The Board also received information about the investment subadvisory fee rate (the Subadvisory Agreement Rate) payable by the Adviser to the Subadviser for investment subadvisory services. The Board concluded that the Subadvisory Agreement Rate was fair and equitable, based on its consideration of the factors described here.
Profitability
The Board received and considered a detailed profitability analysis of the Adviser based on the Advisory Agreements, as well as on other relationships between the Fund and the Adviser and its affiliates. The Board also considered a comparison of the Adviser’s profitability to that of other similar investment advisers whose profitability information is publicly available. The Board concluded that, in light of the costs of providing investment management and other services to the Fund, the profits and other ancillary benefits reported by the Adviser were not unreasonable.
The Board did not consider profitability information with respect to the Subadviser, which is not affiliated with the Adviser. The Board considered that the Subadvisory Rate paid to the Subadviser
Annual report | Large Cap Select Fund
31
had been negotiated by the Adviser on an arm’s length basis and that the Subadviser’s separate profitability from its relationship with the Fund was not a material factor in determining whether to renew the agreement.
Economies of scale
The Board received and considered general information regarding economies of scale with respect to the management of the Fund, including the Fund’s ability to appropriately benefit from economies of scale under the Fund’s fee structure. The Board recognized the inherent limitations of any analysis of economies of scale, stemming largely from the Board’s understanding that most of the Adviser’s costs are not specific to individual Funds, but rather are incurred across a variety of products and services.
To the extent the Board and the Adviser were able to identify actual or potential economies of scale from Fund-specific or allocated expenses, in order to ensure that any such economies continue to be reasonably shared with the Fund as its assets increase, the Adviser and the Board agreed to continue existing breakpoints to the Advisory Agreement Rate.
Information about services to other clients
The Board also received information about the nature, extent and quality of services and fee rates offered by the Adviser and Subadviser to their other clients, including other registered investment companies, institutional investors and separate accounts. The Board concluded that the Advisory Agreement Rate and the Subadvisory Agreement Rate were not unreasonable, taking into account fee rates offered to others by the Adviser and Subadviser, respectively, after giving effect to differences in services.
Other benefits to the Adviser
The Board received information regarding potential “fall-out” or ancillary benefits received by the Adviser and its affiliates as a result of the Adviser’s relationship with the Fund. Such benefits could include, among others, benefits directly attributable to the relationship of the Adviser with the Fund and benefits potentially derived from an increase in the business of the Adviser as a result of its relationship with the Fund (such as the ability to market to shareholders other financial products offered by the Adviser and its affiliates).
The Board also considered the effectiveness of the Adviser’s, Subadviser’s and Fund’s policies and procedures for complying with the requirements of the federal securities laws, including those relating to best execution of portfolio transactions and brokerage allocation.
Other factors and broader review
As discussed above, the Board reviewed detailed materials received from the Adviser and Subadviser as part of the annual re-approval process. The Board also regularly reviews and assesses the quality of the services that the Fund receives throughout the year. In this regard, the Board reviews reports of the Adviser at least quarterly, which include, among other things, a detailed portfolio review, detailed fund performance reports and compliance reports. In addition, the Board meets with portfolio managers and senior investment officers at various times throughout the year.
After considering the above-described factors and based on its deliberations and its evaluation of the information described above, the Board concluded that approval of the continuation of the Advisory Agreements for the Fund was in the best interest of the Fund and its shareholders. Accordingly, the Board unanimously approved the continuation of the Advisory Agreements.
Large Cap Select Fund | Annual report
32
Trustees and Officers
This chart provides information about the Trustees and Officers who oversee your John Hancock fund. Officers elected by the Trustees manage the day-to-day operations of the Fund and execute policies formulated by the Trustees.
| Independent Trustees | ||
| Name, Year of Birth | Number of | |
| Position(s) held with Fund | Trustee | John Hancock |
| Principal occupation(s) and other | of Fund | funds overseen |
| directorships during past 5 years | since1 | by Trustee |
| James F. Carlin, Born: 1940 | 2005 | 55 |
| Interim Chairman (since December 2007); Director and Treasurer, Alpha Analytical Laboratories, Inc. | ||
| (chemical analysis) (since 1985); Part Owner and Treasurer, Lawrence Carlin Insurance Agency, Inc. | ||
| (since 1995); Part Owner and Vice President, Mone Lawrence Carlin Insurance Agency, Inc. (until 2005); | ||
| Chairman and Chief Executive Officer, Carlin Consolidated, Inc. (management/investments) (since 1987); | ||
| Trustee, Massachusetts Health and Education Tax Exempt Trust (1993–2003). | ||
| William H. Cunningham, Born: 1944 | 2005 | 55 |
| Professor, University of Texas at Austin (since 1971); former Chancellor, University of Texas System and | ||
| former President, University of Texas at Austin (until 2001); Chairman and Chief Executive Officer, IBT | ||
| Technologies (until 2001); Director of the following: Hicks Acquisition Company I, Inc. (since 2007); | ||
| Hire.com (until 2004), STC Broadcasting, Inc. and Sunrise Television Corp. (until 2001), Symtx, Inc. | ||
| (electronic manufacturing) (since 2001), Adorno/Rogers Technology, Inc. (until 2004), Pinnacle Foods | ||
| Corporation (until 2003), rateGenius (until 2003), Lincoln National Corporation (insurance) (since 2006), | ||
| Jefferson-Pilot Corporation (diversified life insurance company) (until 2006), New Century Equity | ||
| Holdings (formerly Billing Concepts) (until 2001), eCertain (until 2001), ClassMap.com (until 2001), | ||
| Agile Ventures (until 2001), AskRed.com (until 2001), Southwest Airlines (since 2000), Introgen (man- | ||
| ufacturer of biopharmaceuticals) (since 2000) and Viasystems Group, Inc. (electronic manufacturer) | ||
| (until 2003); Advisory Director, Interactive Bridge, Inc. (college fundraising) (until 2001); Advisory | ||
| Director, Q Investments (until 2003); Advisory Director, JPMorgan Chase Bank (formerly Texas Commerce | ||
| Bank–Austin), LIN Television (until 2008), WilTel Communications (until 2003) and Hayes Lemmerz | ||
| International, Inc. (diversified automotive parts supply company) (since 2003). | ||
| Charles L. Ladner, 2 Born: 1938 | 2004 | 55 |
| Chairman and Trustee, Dunwoody Village, Inc. (retirement services) (until 2003); Senior Vice President | ||
| and Chief Financial Officer, UGI Corporation (public utility holding company) (retired 1998); Vice | ||
| President and Director, AmeriGas, Inc. (retired 1998); Director, AmeriGas Partners, L.P. (gas distribution) | ||
| (until 1997); Director, EnergyNorth, Inc. (until 1997); Director, Parks and History Association (until 2005). | ||
| John A. Moore,2 Born: 1939 | 2003 | 55 |
| President and Chief Executive Officer, Institute for Evaluating Health Risks (nonprofit institution) | ||
| (until 2001); Senior Scientist, Sciences International (health research) (until 2003); Former Assistant | ||
| Administrator and Deputy Administrator, Environmental Protection Agency; Principal, Hollyhouse | ||
| (consulting) (since 2000); Director, CIIT Center for Health Science Research (nonprofit research) | ||
| (until 2007). | ||
Annual report | Large Cap Select Fund
33
| Independent Trustees (continued) | ||
| Name, Year of Birth | Number of | |
| Position(s) held with Fund | Trustee | John Hancock |
| Principal occupation(s) and other | of Fund | funds overseen |
| directorships during past 5 years | since1 | by Trustee |
| Patti McGill Peterson,2 Born: 1943 | 2003 | 55 |
| Senior Associate, Institute for Higher Education Policy (since 2007); Executive Director, Council for | ||
| International Exchange of Scholars and Vice President, Institute of International Education (until 2007); | ||
| Senior Fellow, Cornell Institute of Public Affairs, Cornell University, Ithaca, NY (until 1998); Former | ||
| President, Wells College, Aurora, NY, and St. Lawrence University, Canton, NY; Director, Niagara | ||
| Mohawk Power Corporation (until 2003); Director, Ford Foundation, International Fellowships Program | ||
| (since 2002); Director, Lois Roth Endowment (since 2002); Director, Council for International Educational | ||
| Exchange (since 2003). | ||
| Steven R. Pruchansky, Born: 1944 | 2005 | 55 |
| Chairman and Chief Executive Officer, Greenscapes of Southwest Florida, Inc. (since 2000); Director and | ||
| President, Greenscapes of Southwest Florida, Inc. (until 2000); Managing Director, JonJames, LLC (real | ||
| estate) (since 2000); Director, First Signature Bank & Trust Company (until 1991); Director, Mast Realty | ||
| Trust (until 1994); President, Maxwell Building Corp. (until 1991). | ||
| Non-Independent Trustees3 | ||
| Name, Year of Birth | Number of | |
| Position(s) held with Fund | Trustee | John Hancock |
| Principal occupation(s) and other | of Fund | funds overseen |
| directorships during past 5 years | since1 | by Trustee |
| James R. Boyle, Born: 1959 | 2005 | 265 |
| Executive Vice President, Manulife Financial Corporation (since 1999); President, John Hancock Variable | ||
| Life Insurance Company (since March 2007); Executive Vice President, John Hancock Life Insurance | ||
| Company (since 2004); Chairman and Director, John Hancock Advisers, LLC (the Adviser), John Hancock | ||
| Funds, LLC and The Berkeley Financial Group, LLC (The Berkeley Group) (holding company) (since 2005); | ||
| Senior Vice President, The Manufacturers Life Insurance Company (U.S.A.) (until 2004). | ||
Large Cap Select Fund | Annual report
34
| Principal officers who are not Trustees | |
| Name, Year of Birth | |
| Position(s) held with Fund | Officer |
| Principal occupation(s) and other | of Fund |
| directorships during past 5 years | since |
| Keith F. Hartstein, Born: 1956 | 2005 |
| President and Chief Executive Officer | |
| Senior Vice President, Manulife Financial Corporation (since 2004); Director, President and Chief | |
| Executive Officer, the Adviser, The Berkeley Group and John Hancock Funds, LLC (since 2005); Director, | |
| MFC Global Investment Management (U.S.), LLC (MFC Global (U.S.)) (since 2005); Director, John | |
| Hancock Signature Services, Inc. (since 2005); President and Chief Executive Officer, John Hancock | |
| Investment Management Services, LLC (since 2006); President and Chief Executive Officer, John Hancock | |
| Funds, John Hancock Funds II, John Hancock Funds III and John Hancock Trust (since 2005); Director, | |
| Chairman and President, NM Capital Management, Inc. (since 2005); Member, Investment Company | |
| Institute Sales Force Marketing Committee (since 2003); President and Chief Executive Officer, MFC | |
| Global (U.S.) (2005–2006); Executive Vice President, John Hancock Funds, LLC (until 2005). | |
| Thomas M. Kinzler, Born: 1955 | 2006 |
| Secretary and Chief Legal Officer | |
| Vice President and Counsel, John Hancock Life Insurance Company (U.S.A.) (since 2006); Secretary and | |
| Chief Legal Officer, John Hancock Funds and John Hancock Funds II (since 2006); Chief Legal Officer | |
| and Assistant Secretary, John Hancock Trust (since 2006); Vice President and Associate General Counsel, | |
| Massachusetts Mutual Life Insurance Company (1999–2006); Secretary and Chief Legal Counsel, MML | |
| Series Investment Fund (2000–2006); Secretary and Chief Legal Counsel, MassMutual Institutional Funds | |
| (2000–2004); Secretary and Chief Legal Counsel, MassMutual Select Funds and MassMutual Premier | |
| Funds (2004–2006). | |
| Francis V. Knox, Jr., Born: 1947 | 2005 |
| Chief Compliance Officer | |
| Vice President and Chief Compliance Officer, John Hancock Investment Management Services, LLC, | |
| the Adviser and MFC Global (U.S.) (since 2005); Vice President and Chief Compliance Officer, John | |
| Hancock Funds, John Hancock Funds II, John Hancock Funds III and John Hancock Trust (since 2005); | |
| Vice President and Assistant Treasurer, Fidelity Group of Funds (until 2004); Vice President and Ethics & | |
| Compliance Officer, Fidelity Investments (until 2001). | |
| Charles A. Rizzo, Born: 1957 | 2007 |
| Chief Financial Officer | |
| Chief Financial Officer, John Hancock Funds, John Hancock Funds II, John Hancock Funds III and John | |
| Hancock Trust (since June 2007); Assistant Treasurer, Goldman Sachs Mutual Fund Complex (regis- | |
| tered investment companies) (2005–June 2007); Vice President, Goldman Sachs (2005–June 2007); | |
| Managing Director and Treasurer of Scudder Funds, Deutsche Asset Management (2003–2005); | |
| Director, Tax and Financial Reporting, Deutsche Asset Management (2002–2003); Vice President and | |
| Treasurer, Deutsche Global Fund Services (Deutsche Registered Investment Companies) (1999–2002). | |
| Gordon M. Shone, Born: 1956 | 2006 |
| Treasurer | |
| Senior Vice President, John Hancock Life Insurance Company (U.S.A.) (since 2001); Treasurer, John | |
| Hancock Funds (since 2006), John Hancock Funds II, John Hancock Funds III and John Hancock Trust | |
| (since 2005); Vice President and Chief Financial Officer, John Hancock Trust (2003–2005); Vice President, | |
| John Hancock Investment Management Services, Inc., John Hancock Advisers, LLC (since 2006) and The | |
| Manufacturers Life Insurance Company (U.S.A.) (1998–2000). | |
Annual report | Large Cap Select Fund
35
| Principal officers who are not Trustees (continued) | |
| Name, Year of Birth | |
| Position(s) held with Fund | Officer |
| Principal occupation(s) and other | of Fund |
| directorships during past 5 years | since |
| John G. Vrysen, Born: 1955 | 2005 |
| Chief Operating Officer | |
| Senior Vice President, Manulife Financial Corporation (since 2006); Director, Executive Vice President | |
| and Chief Operating Officer, the Adviser, The Berkeley Group and John Hancock Funds, LLC (since | |
| June 2007); Executive Vice President and Chief Operating Officer, John Hancock Investment | |
| Management Services, LLC (since December 2007); Chief Operating Officer, John Hancock Funds, | |
| John Hancock Funds II, John Hancock Funds III and John Hancock Trust (since June 2007); Director, | |
| Executive Vice President and Chief Financial Officer, the Adviser, The Berkeley Group and John Hancock | |
| Funds, LLC (2005–2007); Executive Vice President and Chief Financial Officer, John Hancock Investment | |
| Management Services, LLC (2005–2007); Executive Vice President and Chief Financial Officer, MFC | |
| Global (U.S.) (2005 until August 2007); Director, John Hancock Signature Services, Inc. (since 2005); | |
| Chief Financial Officer, John Hancock Funds, John Hancock Funds II, John Hancock Funds III and John | |
| Hancock Trust (2005 until June 2007); Vice President and General Manager, John Hancock Fixed | |
| Annuities, U.S. Wealth Management (2004–2005); Vice President, Operations, Manulife Wood Logan | |
| (2000–2004). | |
The business address for all Trustees and Officers is 601 Congress Street, Boston, Massachusetts 02210-2805.
The Statement of Additional Information of the Fund includes additional information about members of the Board of Trustees of the Fund and is available without charge, upon request, by calling 1-800-225-5291.
1 Each Trustee serves until resignation, retirement age or until his or her successor is elected.
2 Member of Audit and Compliance Committee.
3 Non-Independent Trustee holds positions with the Fund’s investment adviser, underwriter and certain other affiliates.
Large Cap Select Fund | Annual report
36
For more information
The Fund’s proxy voting policies, procedures and records are available without charge, upon request:
| By phone | On the Fund’s Web site | On the SEC’s Web site |
| 1-800-225-5291 | www.jhfunds.com/proxy | www.sec.gov |
| Investment adviser | Custodian | Legal counsel |
| John Hancock Advisers, LLC | The Bank of New York | Kirkpatrick & Lockhart |
| 601 Congress Street | One Wall Street | Preston Gates Ellis LLP |
| Boston, MA 02210-2805 | New York, NY 10286 | One Lincoln Street |
| Boston, MA 02111-2950 | ||
| Subadviser | Transfer agent | |
| Shay Assets Management, Inc. | John Hancock Signature | Independent registered public |
| 230 West Monroe Street | Services, Inc. | accounting firm |
| Chicago, IL 60606 | P.O. Box 9510 | PricewaterhouseCoopers LLP |
| Portsmouth, NH 03802-9510 | 125 High Street | |
| Principal distributor | Boston, MA 02110 | |
| John Hancock Funds, LLC | ||
| 601 Congress Street | ||
| Boston, MA 02210-2805 | ||
| How to contact us | ||
| Internet | www.jhfunds.com | |
| Regular mail: | Express mail: | |
| John Hancock Signature | John Hancock Signature | |
| Services, Inc. | Services, Inc. | |
| P.O. Box 9510 | Mutual Fund Image Operations | |
| Portsmouth, NH 03802-9510 | 164 Corporate Drive | |
| Portsmouth, NH 03801 | ||
| Phone | Customer service representatives | 1-800-225-5291 |
| EASI-Line | 1-800-338-8080 | |
| TDD line | 1-800-554-6713 | |
A listing of month-end portfolio holdings is available on our Web site, www.jhfunds.com. A more detailed portfolio holdings summary is available on a quarterly basis 60 days after the fiscal quarter on our Web site or upon request by calling 1-800-225-5291, or on the SEC’s Web site, www.sec.gov.
Annual Report | Large Cap Select Fund
37

1-800-225-5291
1-800-554-6713 TDD
1-800-338-8080 EASI-Line
www.jhfunds. com
Now available: electronic delivery
www.jhfunds.com/edelivery
| This report is for the information of the shareholders of John Hancock Large Cap Select Fund. | 4900A 12/07 |
| It is not authorized for distribution to prospective investors unless preceded or accompanied by a prospectus. | 2/08 |
ITEM 2. CODE OF ETHICS.
As of the end of the period, December 31, 2007, the registrant has adopted a code of ethics, as defined in Item 2 of Form N-CSR, that applies to its Chief Executive Officer, Chief Financial Officer and Treasurer (respectively, the principal executive officer, the principal financial officer and the principal accounting officer, the “Senior Financial Officers”). A copy of the code of ethics is filed as an exhibit to this Form N-CSR.
ITEM 3. AUDIT COMMITTEE FINANCIAL EXPERT.
Charles L. Ladner is the audit committee financial expert and is “independent”, pursuant to general instructions on Form N-CSR Item 3.
ITEM 4. PRINCIPAL ACCOUNTANT FEES AND SERVICES.
(a) Audit Fees
The aggregate fees billed for professional services rendered by the principal accountant(s) for the audit of the registrant’s annual financial statements or services that are normally provided by the accountant(s) in connection with statutory and regulatory filings or engagements amounted to $111,700 for the fiscal year ended December 31, 2007 (broken out as follows: John Hancock Allocation Core Portfolio and John Hancock Allocation Growth and Value merged into another fund September 28, 2007, John Hancock Classic Value Fund - $18,700, John Hancock Classic Value Fund II - $18,800, John Hancock Core Equity Fund - $17,050, John Hancock International Classic Value Fund - $18,800, John Hancock Large Cap Select Fund - $19,050 and John Hancock U.S. Global Leaders Growth Fund - $19,300) and $131,700 for the fiscal year ended December 31, 2006 (broken out as follows: John Hancock Allocation Core Portfolio - $10,000, John Hancock Allocation Growth and Value Portfolio - $10,000, John Hancock Classic Value Fund - $18,700, John Hancock Classic Value Fund II - $18,800, John Hancock Core Equity Fund - $17,050, John Hancock International Classic Value Fund - $18,800, John Hancock Large Cap Select Fund - $19,050 and John Hancock U.S. Global Leaders Growth Fund - $19,300). These fees were billed to the registrant and were approved by the registrant’s audit committee.
(b) Audit-Related Services
There were no audit-related fees during the fiscal year ended December 31, 2007 and fiscal year ended December 31, 2006 billed to the registrant or to the registrant's investment adviser (not including any sub-adviser whose role is primarily portfolio management and is subcontracted with or overseen by another investment adviser), and any entity controlling, controlled by, or under common control with the adviser that provides ongoing services to the registrant ("control affiliates").
(c) Tax Fees
The aggregate fees billed for professional services rendered by the principal accountant(s) for the tax compliance, tax advice and tax planning (“tax fees”) amounted to $15,000 for the fiscal year ended December 31, 2007 (broken out as follows: John Hancock Allocation Core Portfolio and John Hancock Allocation Growth and Value merged into another fund September 28, 2007, John Hancock Classic Value Fund - $2,600, John Hancock Classic Value Fund II - $2,500, John Hancock Core Equity Fund - $2,150, John Hancock International Classic Value Fund - $2,500, John Hancock Large Cap Select Fund - $2,250 and John Hancock U.S. Global Leaders Growth Fund - $3,000) and $17,100 for the fiscal year ended December 31, 2006 (broken out as follows: John Hancock Allocation Core Portfolio - $1,050, John Hancock Allocation Growth and Value Portfolio - $1,050, John Hancock Classic Value Fund - $2,600, John Hancock Classic Value Fund II - $2,500, John Hancock Core Equity Fund - $2,150, John Hancock International Classic Value Fund - $ 2,500, John Hancock Large Cap Select Fund - $2,250 and John Hancock U.S. Global Leaders Growth Fund - $3,000). The nature of the services comprising the tax fees was the review of the registrant’s income tax returns and tax distribution requirements. These fees were
billed to the registrant and were approved by the registrant’s audit committee. There were no tax fees billed to the control affiliates.
(d) All Other Fees
There were no other fees during the fiscal year ended December 31, 2007 and fiscal year ended December 31, 2006 billed to the registrant or to the control affiliates.
(e)(1) Audit Committee Pre-Approval Policies and Procedures:
The trust’s Audit Committee must pre-approve all audit and non-audit services provided by the independent registered public accounting firm (the “Auditor”) relating to the operations or financial reporting of the funds. Prior to the commencement of any audit or non-audit services to a fund, the Audit Committee reviews the services to determine whether they are appropriate and permissible under applicable law.
The trust’s Audit Committee has adopted policies and procedures to, among other purposes, provide a framework for the Committee’s consideration of audit-related and non-audit services by the Auditor. The policies and procedures require that any audit-related and non-audit service provided by the Auditor and any non-audit service provided by the Auditor to a fund service provider that relates directly to the operations and financial reporting of a fund are subject to approval by the Audit Committee before such service is provided. Audit-related services provided by the Auditor that are expected to exceed $50,000 per year/per fund are subject to specific pre-approval by the Audit Committee. Tax services provided by the Auditor that are expected to exceed $50,000 per year/per fund are subject to specific pre-approval by the Audit Committee. Other services provided by the Auditor that are expected to exceed $10,000 per year/per fund are subject to specific pre - -approval by the Audit Committee.
All audit services, as well as the audit-related and non-audit services that are expected to exceed the amounts stated above, must be approved in advance of provision of the service by formal resolution of the Audit Committee. At the regularly scheduled Audit Committee meetings, the Committee reviews a report summarizing the services, including fees, provided by the Auditor.
(e)(2) Services approved pursuant to paragraph (c)(7)(i)(C) of Rule 2-01 of Regulation S-X:
Audit-Related Fees, Tax Fees and All Other Fees:
There were no amounts that were approved by the Audit Committee pursuant to the de minimis exception under Rule 2-01 of Regulation S-X.
(f) According to the registrant’s principal accountant, for the fiscal year ended December 31, 2007, the percentage of hours spent on the audit of the registrant's financial statements for the most recent fiscal year that were attributed to work performed by persons who were not full-time, permanent employees of principal accountant was less than 50%.
(g) The aggregate non-audit fees billed by the registrant's accountant(s) for services rendered to the registrant and rendered to the registrant's control affiliates for each of the last two fiscal years of the registrant were $1,565,823 for the fiscal year ended December 31, 2007, and $872,192 for the fiscal year ended December 31, 2006.
(h) The audit committee of the registrant has considered the non-audit services provided by the registrant’s principal accountant(s) to the control affiliates and has determined that the services that were not pre-approved are compatible with maintaining the principal accountant(s)' independence.
ITEM 5. AUDIT COMMITTEE OF LISTED REGISTRANTS.
The registrant has a separately-designated standing audit committee comprised of independent trustees. The members of the audit committee are as follows:
Dr. John A. Moore - Chairman
Charles L. Ladner
Patti McGill Peterson
ITEM 6. SCHEDULE OF INVESTMENTS.
Not applicable.
ITEM 7. DISCLOSURE OF PROXY VOTING POLICIES AND PROCEDURES FOR CLOSED-END MANAGEMENT INVESTMENT COMPANIES.
Not applicable.
ITEM 8. PORTFOLIO MANAGERS OF CLOSED-END MANAGEMENT INVESTMENT COMPANIES.
Not applicable.
ITEM 9. PURCHASES OF EQUITY SECURITIES BY CLOSED-END MANAGEMENT INVESTMENT COMPANY AND AFFILIATED PURCHASERS.
Not applicable.
ITEM 10. SUBMISSION OF MATTERS TO A VOTE OF SECURITY HOLDERS.
There were no material changes to previously disclosed John Hancock Funds – Governance Committee Charter.
ITEM 11. CONTROLS AND PROCEDURES.
(a) Based upon their evaluation of the registrant's disclosure controls and procedures as conducted within 90 days of the filing date of this Form N-CSR, the registrant's principal executive officer and principal financial officer have concluded that those disclosure controls and procedures provide reasonable assurance that the material information required to be disclosed by the registrant on this report is recorded, processed, summarized and reported within the time periods specified in the Securities and Exchange Commission's rules and forms.
(b) There were no changes in the registrant's internal control over financial reporting that occurred during the registrant's most recent fiscal half-year (the registrant's second fiscal half-year in the case of an annual report) that have materially affected, or are reasonably likely to materially affect, the registrant's internal control over financial reporting.
ITEM 12. EXHIBITS.
(a)(1) Code of Ethics for Senior Financial Officers is attached.
(a)(2) Separate certifications for the registrant's principal executive officer and principal financial officer, as required by Section 302 of the Sarbanes-Oxley Act of 2002 and Rule 30a-2(a) under the Investment Company Act of 1940, are attached.
(b) Separate certifications for the registrant's principal executive officer and principal financial officer, as required by 18 U.S.C. Section 1350, as adopted pursuant to Section 906 of the Sarbanes-Oxley Act of 2002, and Rule 30a-2(b) under the Investment Company Act of 1940, are attached. The certifications furnished pursuant to this paragraph are not deemed to be "filed" for purposes of Section 18 of the Securities Exchange Act of 1934, or otherwise subject to the liability of that section. Such certifications are not deemed to be incorporated by reference into any filing under the Securities Act of 1933 or the Securities Exchange Act of 1934, except to the extent that the Registrant specifically incorporates them by reference.
(c)(1) Submission of Matters to a Vote of Security Holders is attached. See attached “John Hancock Funds – Governance Committee Charter”.
(c)(2) Contact person at the registrant.
SIGNATURES
Pursuant to the requirements of the Securities Exchange Act of 1934 and the Investment Company Act of 1940, the registrant has duly caused this report to be signed on its behalf by the undersigned, thereunto duly authorized.
John Hancock Capital Series
By: /s/ Keith F. Hartstein
-------------------------------------
Keith F. Hartstein
President and Chief Executive Officer
Date: February 28, 2008
Pursuant to the requirements of the Securities Exchange Act of 1934 and the Investment Company Act of 1940, this report has been signed below by the following persons on behalf of the registrant and in the capacities and on the dates indicated.
By: /s/ Keith F. Hartstein
-------------------------------------
Keith F. Hartstein
President and Chief Executive Officer
Date: February 28, 2008
By: /s/ Charles A. Rizzo
-------------------------------------
Charles A. Rizzo
Chief Financial Officer
Date: February 28, 2008