| UNITED STATES | ||
| SECURITIES AND EXCHANGE COMMISSION | ||
| Washington, D.C. 20549 | ||
| FORM N-CSR | ||
| CERTIFIED SHAREHOLDER REPORT OF REGISTERED | ||
| MANAGEMENT INVESTMENT COMPANIES | ||
| Investment Company Act file number 811- 1677 | ||
| John Hancock Capital Series | ||
| (Exact name of registrant as specified in charter) | ||
| 601 Congress Street, Boston, Massachusetts 02210 | ||
| (Address of principal executive offices) (Zip code) | ||
| Alfred P. Ouellette | ||
| Senior Counsel and Assistant Secretary | ||
| 601 Congress Street | ||
| Boston, Massachusetts 02210 | ||
| (Name and address of agent for service) | ||
| Registrant's telephone number, including area code: 617-663-4324 | ||
| Date of fiscal year end: | October 31 | |
| Date of reporting period: | October 31, 2008 | |
ITEM 1. REPORT TO SHAREHOLDERS.
Discussion of Fund performance
By Pzena Investment Management, LLC
The Fund’s fiscal year end has recently changed from December 31 to October 31. What follows are the portfolio managers’ comments for the 10 months ended October 31, 2008.
International stocks fell sharply in the first 10 months of 2008, with much of the decline occurring in the last two months of the period as investor confidence plummeted, economic conditions worsened and market volatility grew more severe. Fear and panic roiled stock markets worldwide as the credit crunch and liquidity crisis that began in the U.S. spread around the world, leading to a likely global recession. Emerging markets suffered the largest declines.
“International stocks fell sharply in
the first 10 months of 2008, with
much of the decline occurring in the
last two months of the period…”
For the 10 months ended October 31, 2008, John Hancock International Classic Value Fund’s Class A shares posted a total return of –45.75% at net asset value. By comparison, the average foreign large value fund returned –43.33%, according to Morningstar, Inc., and the MSCI EAFE Index returned –43.54%. The portfolio’s underperformance of its benchmark index and Morningstar peer group resulted primarily from an overweight position in financial stocks. The portfolio’s most significant underperformers were financials, led by Royal Bank of Scotland Group PLC and Dutch insurers Aegon NV and ING Groep NV. Industrials stocks also underperformed, particularly specialized motor manufacturer Johnson Electric Holdings, Ltd. and British pest control services provider Rentokil Initial PLC. The portfolio’s consumer discretionary holdings outperformed their counterparts in the benchmark index. The top performance contribut or was Japanese tire manufacturer Sumitomo Rubber Industries, Ltd., which benefited from rising profitability thanks to falling commodity prices and higher prices for its products. British caterer Compass Group PLC and Japanese vehicle auction company USS Co., Ltd. were also positive contributors.
This commentary reflects the views of the portfolio management team through the end of the Fund’s period discussed in this report. The team’s statements reflect their own opinions. As such, they are in no way guarantees of future events, and are not intended to be used as investment advice or a recommendation regarding any specific security. They are also subject to change at any time as market and other conditions warrant.
International investing involves special risks such as political, economic and currency risks and differences in accounting standards and financial reporting. These risks are more significant in emerging markets.
Sector investing is subject to greater risks than the market as a whole. Because the Fund may focus on particular sectors of the economy, its performance may depend on the performance of those sectors.
| 6 | International Classic Value Fund | Annual report |
A look at performance
For the period ended October 31, 2008
| Average annual returns (%) | Cumulative total returns (%) | |||||||||
| with maximum sales charge (POP) | with maximum sales charge (POP) | |||||||||
| Inception | Since | Since | ||||||||
| Class | date | 1-year | 5-year | 10-year | inception | 1-year | 5-year | 10-year | inception | |
| A | 2-28-06 | –53.18 | — | — | –21.40 | –53.18 | — | — | –47.44 | |
| B | 2-28-06 | –53.46 | — | — | –21.25 | –53.46 | — | — | –47.18 | |
| C | 2-28-06 | –51.47 | — | — | –20.38 | –51.47 | — | — | –45.60 | |
| I1 | 2-28-06 | –50.50 | — | — | –19.55 | –50.50 | — | — | –44.07 | |
| NAV1 | 12-28-06 | –50.41 | — | — | –31.14 | –50.41 | — | — | –49.74 | |
Performance figures assume all distributions are reinvested. Public offering price (POP) figures reflect maximum sales charges on Class A shares of 5% and the applicable contingent deferred sales charge (CDSC) on Class B and Class C shares. The Class B shares’ CDSC declines annually between years 1 to 6 according to the following schedule: 5, 4, 3, 3, 2, 1%. No sales charge will be assessed after the sixth year. Class C shares held for less than one year are subject to a 1% CDSC. Sales charge is not applicable for Class I and NAV shares.
The expense ratios of the Fund, both net (including any fee waivers or expense limitations) and gross (excluding any fee waivers or expense limitations), are set forth according to the most recent publicly available prospectuses for the Fund and may differ from the expense ratios disclosed in the Financial Highlights tables in this report. The waivers and expense limitations are contractual at least until April 30, 2009. The net expenses are as follows: Class A — 1.58%, Class B — 2.28%, Class C —2.28%, Class I — 1.16%, Class NAV — 1.11%. Had the fee waivers and expense limitations not been in place, the gross expenses would be as follows: Class A — 2.13%, Class B — 2.84%, Class C — 2.83%, Class I — 1.71%, Class NAV — 1.66%.
The returns reflect past results and should not be considered indicative of future performance. The return and principal value of an investment will fluctuate so that shares, when redeemed, may be worth more or less than their original cost. Due to market volatility, the Fund’s current performance may be higher or lower than the performance shown. For current to the most recent month end performance data, please call 1–800–225–5291 or visit the Fund’s Web site at www.jhfunds.com.
The performance table above and the chart on the next page do not reflect the deduction of taxes that a shareholder would pay on fund distributions or the redemption of fund shares.
The Fund’s performance results reflect any applicable expense reductions, without which the expenses would increase and results would have been less favorable.
1 For certain types of investors as described in the Fund’s Class I and NAV share prospectuses.
| Annual report | International Classic Value Fund | 7 |
A look at performance
Growth of $10,000
This chart shows what happened to a hypothetical $10,000 investment in International Classic Value Fund Class A shares for the period indicated. For comparison, we’ve shown the same investment in the MSCI EAFE Net Total Return Index.

| With maximum | ||||
| Class | Period beginning | Without sales charge | sales charge | Index |
| B | 2-28-06 | $5,440 | $5,282 | $7,488 |
| C2 | 2-28-06 | 5,440 | 5,440 | 7,488 |
| I3 | 2-28-06 | 5,593 | 5,593 | 7,488 |
| NAV3 | 12-28-06 | 5,026 | 5,026 | 6,290 |
Assuming all distributions were reinvested for the period indicated, the table above shows the value of a $10,000 investment in the Fund’s Class B, Class C, Class I and Class NAV shares, respectively, as of October 31, 2008. Performance of the classes will vary based on the difference in sales charges paid by shareholders investing in the different classes and the fee structure of those classes.
MSCI EAFE Net Total Return Index (Europe, Australasia, Far East) is a free float-adjusted market capitalization index that is designed to measure the equity market performance of developed markets, excluding the U.S. and Canada. As of June 2007, the MSCI EAFE Index consisted of the following 21 developed market country indexes: Australia, Austria, Belgium, Denmark, Finland, France, Germany, Greece, Hong Kong, Ireland, Italy, Japan, the Netherlands, New Zealand, Norway, Portugal, Singapore, Spain, Sweden, Switzerland and the United Kingdom. Returns are calculated and presented net of withholding tax.
It is not possible to invest directly in an index. Index figures do not reflect sales charges, which would have resulted in lower values if they did.
1 NAV represents net asset value and POP represents public offering price.
2 No contingent deferred sales charge applicable.
3 For certain types of investors as described in the Fund’s Class I and Class NAV share prospectuses.
| 8 | International Classic Value Fund | Annual report |
Your expenses
These examples are intended to help you understand your ongoing operating expenses.
Understanding fund expenses
As a shareholder of the Fund, you incur two types of costs:
▪ Transaction costs which include sales charges (loads) on purchases or redemptions (varies by share class), minimum account fee charge, etc.
▪ Ongoing operating expenses including management fees, distribution and service fees (if applicable), and other fund expenses.
We are going to present only your ongoing operating expenses here.
Actual expenses/actual returns
This example is intended to provide information about your fund’s actual ongoing operating expenses, and is based on your fund’s actual return. It assumes an account value of $1,000.00 on July 1, 2008 with the same investment held until October 31, 2008.
| Account value | Ending value | Expenses paid during | |
| on 7-1-08 | on 10-31-08 | period ended 10-31-081 | |
| Class A | $1,000.00 | $648.70 | $4.49 |
| Class B | 1,000.00 | 647.30 | 6.42 |
| Class C | 1,000.00 | 648.10 | 6.42 |
| Class I | 1,000.00 | 650.00 | 3.22 |
| Class NAV | 1,000.00 | 649.90 | 3.08 |
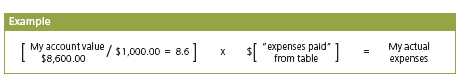
Together with the value of your account, you may use this information to estimate the operating expenses that you paid over the period. Simply divide your account value at October 31, 2008, by $1,000.00, then multiply it by the “expenses paid” for your share class from the table above. For example, for an account value of $8,600.00, the operating expenses should be calculated as follows:
| Annual report | International Classic Value Fund | 9 |
Your expenses
Hypothetical example for comparison purposes
This table allows you to compare your fund’s ongoing operating expenses with those of any other fund. It provides an example of the Fund’s hypothetical account values and hypothetical expenses based on each class’s actual expense ratio and an assumed 5% annualized return before expenses (which is not your fund’s actual return). It assumes an account value of $1,000.00 on May 1, 2008, with the same investment held until October 31, 2008. Look in any other fund shareholder report to find its hypothetical example and you will be able to compare these expenses.
| Account value | Ending value | Expenses paid during | |
| on 5-1-08 | on 10-31-08 | period ended 10-31-081 | |
| Class A | $1,000.00 | $1,017.00 | $8.21 |
| Class B | 1,000.00 | 1,013.50 | 11.74 |
| Class C | 1,000.00 | 1,013.50 | 11.74 |
| Class I | 1,000.00 | 1,019.30 | 5.89 |
| Class NAV | 1,000.00 | 1,019.60 | 5.64 |
Remember, these examples do not include any transaction costs, such as sales charges; therefore, these examples will not help you to determine the relative total costs of owning different funds. If transaction costs were included, your expenses would have been higher. See the prospectus for details regarding transaction costs.
1 Expenses are equal to the Fund’s annualized expense ratio of 1.62%, 2.32%, 2.32%, 1.16% and 1.11% for Class A, Class B, Class C, Class I and Class NAV, respectively, multiplied by the average account value over the period, multiplied by number of days in most recent fiscal half-year/366 (to reflect the one-half year period).
| 10 | International Classic Value Fund | Annual report |
Portfolio summary
| Top 10 holdings1 | ||||
| UBS AG | 5.9% | Credit Agricole SA | 3.7% | |
| Mitsubishi UFJ Financial Group, Inc. | 4.4% | GlaxoSmithKline PLC | 3.6% | |
| RenaissanceRe Holdings Ltd. | 4.1% | Sumitomo Mitsui Financial Group, Inc. | 3.5% | |
| HSBC Holdings Plc | 4.1% | Koninklijke (Royal) Philips Electronics NV | 3.5% | |
| Sumitomo Rubber Industries, Ltd. | 4.0% | Unilever NV | 3.4% | |
| Sector distribution1,2 | ||||
| Financials | 39% | Health care | 4% | |
| Consumer discretionary | 20% | Telecommunicatioin services | 3% | |
| Industrials | 14% | Consumer staples | 2% | |
| Information technology | 9% | Utilities | 2% | |
| Materials | 6% | Other | 1% | |

1 As a percentage of net assets on October 31, 2008
2 Sector investing is subject to greater risks than the market as a whole. Because the Fund may focus on particular sectors of the economy, its performance may depend on the performance of those sectors.
| Annual report | International Classic Value Fund | 11 |
Fund’s investments
F I N A N C I A L S T A T E M E N T S
Securities owned by the Fund on 10-31-08
This schedule contains three main categories: common stocks, rights and short-term investments. Common stocks and rights are further broken down by country. Short-term investments, which represent the Fund’s cash position, are listed last.
| Issuer | Shares | Value |
| Common stocks 99.36% | $12,962,859 | |
| (Cost $24,455,676) | ||
| Australia 2.78% | 363,167 | |
| Amcor, Ltd. (Paper Packaging) | 94,075 | 363,167 |
| Bermuda 4.13% | 538,177 | |
| RenaissanceRe Holdings, Ltd. (Reinsurance) | 11,725 | 538,177 |
| Canada 2.33% | 303,445 | |
| Magna International, Inc., Class A (Auto Parts & Equipment) | 8,975 | 303,445 |
| France 13.90% | 1,813,986 | |
| Alcatel-Lucent (Communications Equipment) | 146,575 | 378,493 |
| Credit Agricole SA (Diversified Banks) | 33,721 | 487,842 |
| Publicis Groupe SA (Advertising) | 11,850 | 267,821 |
| Thales SA (Aerospace & Defense) | 6,650 | 266,832 |
| Vivendi Universal SA (Movies & Entertainment) | 15,800 | 412,998 |
| Germany 2.13% | 278,055 | |
| Henkel AG & Co. KGaA (Household Products) | 9,725 | 278,055 |
| Greece 0.51% | 66,463 | |
| Public Power Corp. (Electric Utilities) | 5,375 | 66,463 |
| Hong Kong 2.14% | 278,552 | |
| Johnson Electric Holdings, Ltd. (Electrical Components & Equipment) | 1,340,625 | 278,552 |
| Ireland 1.16% | 151,529 | |
| Kerry Group PLC (Class A) (Packaged Foods & Meats) | 6,800 | 151,529 |
| Italy 1.44% | 187,273 | |
| Finmeccanica SpA (Aerospace & Defense) | 15,100 | 187,273 |
| Japan 23.05% | 3,007,686 | |
| Aisin Seiki Co., Ltd. (Auto Parts & Equipment) | 16,816 | 297,568 |
| Canon, Inc. (Office Electronics) | 9,400 | 328,921 |
| Mitsubishi UFJ Financial Group, Inc. (Diversified Banks) | 90,525 | 568,875 |
| Nippon Television Network Corp. (Broadcasting & Cable TV) | 2,300 | 221,904 |
| Ricoh Co., Ltd. (Office Electronics) | 26,000 | 279,812 |
| Sumitomo Mitsui Financial Group, Inc. (Diversified Banks) | 113 | 453,002 |
| Sumitomo Rubber Industries, Ltd. (Tires & Rubber) | 59,750 | 527,089 |
| THK Company, Ltd. (Industrial Machinery) | 11,900 | 162,962 |
| Tokyo Electron, Ltd. (Semiconductor Equipment) | 5,025 | 167,553 |
See notes to financial statements
| 12 | International Classic Value Fund | Annual report |
F I N A N C I A L S T A T E M E N T S
| Issuer | Shares | Value |
| Netherlands 10.60% | $1,383,515 | |
| Aegon NV (Life & Health Insurance) | 46,751 | 194,258 |
| European Aeronautic Defence and Space Company (Aerospace & Defense) | 1,575 | 26,196 |
| ING Groep NV (Diversified Financial Services) | 28,825 | 270,389 |
| Koninklijke (Royal) Philips Electronics NV (Industrial Conglomerates) | 24,375 | 450,446 |
| Unilever NV (Packaged Foods & Meats) | 18,350 | 442,226 |
| Norway 1.14% | 148,940 | |
| Den Norske Bank (Diversified Banks) | 25,700 | 148,940 |
| Puerto Rico 2.25% | 293,360 | |
| Popular, Inc. (Regional Banks) | 38,600 | 293,360 |
| South Korea 5.80% | 757,296 | |
| KB Financial Group, Inc. (Diversified Banks) (I) | 11,175 | 277,005 |
| Korea Electric Power Corp. (Electric Utilities) | 10,910 | 216,789 |
| Samsung Electronics Co., Ltd. (Semiconductors) | 625 | 263,502 |
| Switzerland 9.12% | 1,189,832 | |
| Clariant AG (Specialty Chemicals) | 68,325 | 423,878 |
| UBS AG (Diversified Capital Markets) | 45,143 | 765,954 |
| United Kingdom 16.88% | 2,201,583 | |
| Aviva PLC (Multi-Line Insurance) | 51,800 | 308,987 |
| British Sky Broadcasting Group PLC (Broadcasting & Cable TV) | 35,350 | 215,117 |
| Compass Group PLC (Restaurants) | 61,200 | 284,585 |
| GlaxoSmithKline PLC (Pharmaceuticals) | 24,300 | 467,142 |
| HSBC Holdings PLC (Diversified Banks) | 45,176 | 535,074 |
| Rentokil Initial PLC (Environmental & Facilities Services) | 250,650 | 182,170 |
| Royal Bank of Scotland Group PLC (Diversified Banks) | 189,292 | 208,508 |
| Issuer | Shares | Value |
| Rights 0.05% | $6,159 | |
| (Cost $0) | ||
| Italy 0.05% | 6,159 | |
| Finmeccanica SpA (Aerospace & Defense) (I) | 15,100 | 6,159 |
See notes to financial statements
| Annual report | International Classic Value Fund | 13 |
F I N A N C I A L S T A T E M E N T S
| Issuer, description, maturity date | Shares | Value |
| Short-term investments 0.67% | $87,000 | |
| (Cost $87,000) | ||
| United States 0.67% | 87,000 | |
| Joint Repurchase Agreement 0.67% | 87,000 | |
| Joint Repurchase Agreement with Barclays dated 10-31-08 at 0.150% to | ||
| be repurchased at $87,001 on 11-03-08, collateralized by $105,465 U.S. | ||
| Treasury Inflation Indexed Note 1.750% on 1-15-28 (valued at $88,740 | ||
| including interest). | 87,000 | 87,000 |
| Total investments (Cost $24,542,676)† 100.08% | $13,056,018 | |
| Other assets and liabilities, net (0.08%) | ($10,029) | |
| Total net assets 100.00% | $13,045,989 | |
The percentage shown for each investment category is the total value of that category as a percentage of the net assets of the Fund.
(I) Non-income producing security.
† At October 31, 2008, the aggregate cost of investment securities for federal income tax purposes was $24,676,866. Net unrealized depreciation aggregated $11,620,848, of which $59,303 related to appreciated investment securities and $11,680,151 related to depreciated investment securities.
See notes to financial statements
| 14 | International Classic Value Fund | Annual report |
F I N A N C I A L S T A T E M E N T S
Financial statements
Statement of assets and liabilities 10-31-08
This Statement of Assets and Liabilities is the Fund’s balance sheet. It shows the value of what the Fund owns, is due and owes. You’ll also find the net asset value and the maximum offering price per share.
| Assets | |
| Investments at value (Cost $24,542,676) | $13,056,018 |
| Cash | 576 |
| Receivable for investments sold | 2,245 |
| Dividends and interest receivable | 66,695 |
| Receivable from affiliates | 60,376 |
| Total assets | 13,185,910 |
| Liabilities | |
| Payable for shares repurchased | 28,171 |
| Payable to affiliates | |
| Management fees | 12,860 |
| Distribution and service fees | 3,314 |
| Other | 19,404 |
| Other payables and accrued expenses | 76,172 |
| Total liabilities | 139,921 |
| Net assets | |
| Capital paid-in | 26,494,230 |
| Accumulated net realized loss on investments | (2,377,286) |
| Net unrealized depreciation of investments and translation of assets and | |
| liabilities in foreign currencies | (11,488,650) |
| Accumulated net investment income | 417,695 |
| Net assets | $13,045,989 |
| Net asset value per share | |
| Based on net asset values and shares outstanding — the Fund has an | |
| unlimited number of shares authorized with no par value | |
| Class A ($6,179,332 ÷ 1,165,607 shares) | $5.30 |
| Class B ($546,064 ÷ 103,924 shares)1 | $5.25 |
| Class C ($1,287,997 ÷ 245,379 shares)1 | $5.25 |
| Class I ($1,606,697 ÷ 301,171 shares) | $5.33 |
| Class NAV ($3,425,899 ÷ 644,716 shares) | $5.31 |
| Maximum offering price per share | |
| Class A ($5.30 ÷ 95.0%)2 | $5.58 |
1 Redemption price is equal to net asset value less any applicable contingent deferred sales charge.
2 On single retail sales of less than $50,000. On sales of $50,000 or more and on group sales the offering price is reduced.
See notes to financial statements
| Annual report | International Classic Value Fund | 15 |
F I N A N C I A L S T A T E M E N T S
Statement of operations For the period ended 10-31-08
These Statements of Operations summarizes the Fund’s investment income earned and expenses incurred in operating the Fund. It also shows net gains (losses) for the period stated.
| Year | Period | |
| ended | ended | |
| 12-31-07 | 10-31-081 | |
| Investment income | ||
| Dividends (net of foreign withholding taxes of | ||
| $58,889 and $60,170, respectively) | $852,172 | $735,523 |
| Interest | 29,082 | 7,518 |
| Total investment income | 881,254 | 743,041 |
| Expenses | ||
| Investment management fees (Note 5) | 353,455 | 203,670 |
| Distribution and service fees (Note 5) | 115,507 | 54,462 |
| Transfer agent fees (Note 5) | 44,750 | 29,752 |
| Accounting and legal services fees (Note 5) | 3,632 | 2,329 |
| Blue sky fees | 101,554 | 67,596 |
| Custodian fees | 25,787 | 57,253 |
| Professional fees | 23,384 | 35,446 |
| Printing fees | 25,155 | 19,357 |
| Trustees’ fees | 1,248 | 3,311 |
| Miscellaneous | 25,637 | 18,398 |
| Total expenses | 720,109 | 491,574 |
| Less expense reductions (Note 5) | (186,861) | (192,322) |
| Net expenses | 533,248 | 299,252 |
| Net investment income | 348,006 | 443,789 |
| Realized and unrealized gain (loss) | ||
| Net realized gain (loss) on | ||
| Investments | 204,873 | (1,592,841) |
| Foreign currency transactions | (61,038) | (25,228) |
| 143,835 | (1,618,069) | |
| Change in net unrealized appreciation (depreciation) of | ||
| Investments | (3,060,923) | (10,565,354) |
| Translation of assets and liabilities in foreign currencies | 1,534 | (3,613) |
| (3,059,389) | (10,568,967) | |
| Net realized and unrealized loss | (2,915,554) | (12,187,036) |
| Decrease in net assets from operations | ($2,567,548) | ($11,743,247) |
1 For the ten month period ended October 31, 2008. The Fund changed its fiscal year end from December 31 to October 31.
See notes to financial statements
| 16 | International Classic Value Fund | Annual report |
F I N A N C I A L S T A T E M E N T S
Statements of changes in net assets
These Statements of Changes in Net Assets show how the value of the Fund’s net assets has changed during the last three periods. The difference reflects earnings less expenses, any investment gains and losses, distributions, if any, paid to shareholders and the net of Fund share transactions.
| Year | Year | Period | |
| ended | ended | ended | |
| 12-31-06 | 12-31-07 | 10-31-081 | |
| Increase (decrease) in net assets | |||
| From operations | |||
| Net investment income | $64,884 | $348,006 | $443,789 |
| Net realized gain (loss) | 217,162 | 143,835 | (1,618,069) |
| Change in net unrealized appreciation | |||
| (depreciation) | 2,139,706 | (3,059,389) | (10,568,967) |
| Increase (decrease) in net assets | |||
| resulting from operations | 2,421,752 | (2,567,548) | (11,743,247) |
| Distributions to shareholders | |||
| From net investment income | |||
| Class A | (60,059) | (124,033) | — |
| Class B | (3,408) | (2,538) | — |
| Class C | (11,356) | (6,886) | — |
| Class I | (7,714) | (65,900) | — |
| Class NAV | — | (120,035) | — |
| From net realized gain | |||
| Class A | (100,835) | (318,853) | — |
| Class B | (6,903) | (29,611) | — |
| Class C | (23,001) | (80,346) | — |
| Class I | (11,879) | (114,863) | — |
| Class NAV | — | (158,150) | — |
| (225,155) | (1,021,215) | — | |
| From Fund share transactions (Note 6) | 25,090,869 | 4,505,596 | (3,415,063) |
| Total increase (decrease) | 27,287,466 | 916,833 | (15,158,310) |
| Net assets | |||
| Beginning of year | — | 27,287,466 | 28,204,299 |
| End of year2 | $27,287,466 | $28,204,299 | $13,045,989 |
1 For the ten month period ended October 31, 2008. The Fund changed its fiscal year end from December 31 to October 31.
2 Includes accumulated net investment income of $0, $7,225 and $417,695, respectively.
See notes to financial statements
| Annual report | International Classic Value Fund | 17 |
F I N A N C I A L S T A T E M E N T S
Financial highlights
The Financial Highlights show how the Fund’s net asset value for a share has changed since the end of the previous period.
| CLASS A SHARES | ||||
| Period ended | 12-31-061 | 12-31-07 | 10-31-082 | |
| Per share operating performance | ||||
| Net asset value, beginning of year | $10.00 | $11.03 | $9.77 | |
| Net investment income3 | 0.05 | 0.12 | 0.15 | |
| Net realized and unrealized gain | ||||
| (loss) on investments | 1.08 | (1.03) | (4.62) | |
| Total from investment operations | 1.13 | (0.91) | (4.47) | |
| Less distributions | ||||
| From net investment income | (0.04) | (0.10) | — | |
| From net realized gain | (0.06) | (0.25) | — | |
| Total distributions | (0.10) | (0.35) | — | |
| Net asset value, end of year | $11.03 | $9.77 | $5.30 | |
| Total return (%)4,5 | 11.256 | (8.29) | (45.75)6 | |
| Ratios and supplemental data | ||||
| Net assets, end of year (in millions) | $19 | $13 | $6 | |
| Ratios (as a percentage of average net assets): | ||||
| Expenses before reductions | 2.677 | 2.13 | 2.737 | |
| Expenses net of all fee waivers | 1.527 | 1.58 | 1.657 | |
| Expenses net of all fee waivers | ||||
| and credits | 1.527 | 1.58 | 1.657 | |
| Net investment income | 0.607 | 1.08 | 2.177 | |
| Portfolio turnover (%) | 20 | 53 | 27 | |
1 Beginning of operations from 2-28-06 to 12-31-06.
2 For the ten month period ended October 31, 2008. The Fund changed its fiscal year end from December 31 to October 31.
3 Based on the average of the shares outstanding.
4 Assumes dividend reinvestment and does not reflect the effect of sales charges.
5 Total returns would have been lower had certain expenses not been reduced during the periods shown.
6 Not annualized.
7 Annualized.
See notes to financial statements
| 18 | International Classic Value Fund | Annual report |
F I N A N C I A L S T A T E M E N T S
Financial highlights
| CLASS B SHARES | |||
| Period ended | 12-31-061 | 12-31-07 | 10-31-082 |
| Per share operating performance | |||
| Net asset value, beginning of year | $10.00 | $10.99 | $9.74 |
| Net investment income (loss)3 | (0.01) | 0.04 | 0.10 |
| Net realized and unrealized gain | |||
| (loss) on investments | 1.09 | (1.02) | (4.59) |
| Total from investment operations | 1.08 | (0.98) | (4.49) |
| Less distributions | |||
| From net investment income | (0.03) | (0.02) | — |
| From net realized gain | (0.06) | (0.25) | — |
| Total distributions | (0.09) | (0.27) | — |
| Net asset value, end of year | $10.99 | $9.74 | $5.25 |
| Total return (%)4,5 | 10.796 | (8.91) | (46.10)6 |
| Ratios and supplemental data | |||
| Net assets, end of year (in millions) | $1 | $1 | $1 |
| Ratios (as a percentage of average net assets): | |||
| Expenses before reductions | 3.377 | 2.84 | 3.997 |
| Expenses net of all fee waivers | 2.227 | 2.28 | 2.367 |
| Expenses net of all fee waivers | |||
| and credits | 2.227 | 2.28 | 2.357 |
| Net investment income (loss) | (0.17)7 | 0.33 | 1.447 |
| Portfolio turnover (%) | 20 | 53 | 27 |
1 Beginning of operations from 2-28-06 to 12-31-06.
2 For the ten month period ended October 31, 2008. The Fund changed its fiscal year end from December 31 to October 31.
3 Based on the average of the shares outstanding.
4 Assumes dividend reinvestment and does not reflect the effect of sales charges.
5 Total returns would have been lower had certain expenses not been reduced during the periods shown.
6 Not annualized.
7 Annualized.
See notes to financial statements
| Annual report | International Classic Value Fund | 19 |
F I N A N C I A L S T A T E M E N T S
Financial highlights
| CLASS C SHARES | |||
| Period ended | 12-31-061 | 12-31-07 | 10-31-082 |
| Per share operating performance | |||
| Net asset value, beginning of year | $10.00 | $10.97 | $9.73 |
| Net investment income (loss)3 | (0.02) | 0.04 | 0.10 |
| Net realized and unrealized gain | |||
| (loss) on investments | 1.08 | (1.01) | (4.58) |
| Total from investment operations | 1.06 | (0.97) | (4.48) |
| Less distributions | |||
| From net investment income | (0.03) | (0.02) | — |
| From net realized gain | (0.06) | (0.25) | — |
| Total distributions | (0.09) | (0.27) | — |
| Net asset value, end of year | $10.97 | $9.73 | $5.25 |
| Total return (%)4,5 | 10.596 | (8.84) | (46.04)6 |
| Ratios and supplemental data | |||
| Net assets, end of year (in millions) | $4 | $3 | $1 |
| Ratios (as a percentage of average net assets): | |||
| Expenses before reductions | 3.377 | 2.83 | 3.617 |
| Expenses net of all fee waivers | 2.227 | 2.28 | 2.357 |
| Expenses net of all fee waivers | |||
| and credits | 2.227 | 2.28 | 2.357 |
| Net investment income (loss) | (0.28)7 | 0.35 | 1.457 |
| Portfolio turnover (%) | 20 | 53 | 27 |
1 Beginning of operations from 2-28-06 to 12-31-06.
2 For the ten month period ended October 31, 2008. The Fund changed its fiscal year end from December 31 to October 31.
3 Based on the average of the shares outstanding.
4 Assumes dividend reinvestment and does not reflect the effect of sales charges.
5 Total returns would have been lower had certain expenses not been reduced during the periods shown.
6 Not annualized.
7 Annualized.
See notes to financial statements
| 20 | International Classic Value Fund | Annual report |
F I N A N C I A L S T A T E M E N T S
Financial highlights
| CLASS I SHARES | |||
| Period ended | 12-31-061 | 12-31-07 | 10-31-082 |
| Per share operating performance | |||
| Net asset value, beginning of year | $10.00 | $11.05 | $9.79 |
| Net investment income3 | 0.06 | 0.15 | 0.20 |
| Net realized and unrealized gain | |||
| (loss) on investments | 1.09 | (1.01) | (4.66) |
| Total from investment operations | 1.15 | (0.86) | (4.46) |
| Less distributions | |||
| From net investment income | (0.04) | (0.15) | — |
| From net realized gain | (0.06) | (0.25) | — |
| Total distributions | (0.10) | (0.40) | — |
| Net asset value, end of year | $11.05 | $9.79 | $5.33 |
| Total return (%)4,5 | 11.486 | (7.85) | (45.56)6 |
| Ratios and supplemental data | |||
| Net assets, end of year (in millions) | $2 | $4 | $2 |
| Ratios (as a percentage of average net assets): | |||
| Expenses before reductions | 2.327 | 1.71 | 2.277 |
| Expenses net of all fee waivers | 1.177 | 1.16 | 1.167 |
| Expenses net of all fee waivers | |||
| and credits | 1.177 | 1.16 | 1.167 |
| Net investment income | 0.707 | 1.41 | 2.797 |
| Portfolio turnover (%) | 20 | 53 | 27 |
1 Beginning of operations from 2-28-06 to 12-31-06.
2 For the ten month period ended October 31, 2008. The Fund changed its fiscal year end from December 31 to October 31.
3 Based on the average of the shares outstanding.
4 Assumes dividend reinvestment and does not reflect the effect of sales charges.
5 Total returns would have been lower had certain expenses not been reduced during the periods shown.
6 Not annualized.
7 Annualized.
See notes to financial statements
| Annual report | International Classic Value Fund | 21 |
F I N A N C I A L S T A T E M E N T S
Financial highlights
| CLASS NAV SHARES | |||
| Period ended | 12-31-061 | 12-31-07 | 10-31-082 |
| Per share operating performance | |||
| Net asset value, beginning of year | $11.04 | $11.05 | $9.75 |
| Net investment income3 | —4 | 0.15 | 0.19 |
| Net realized and unrealized gain | |||
| (loss) on investments | 0.01 | (1.01) | (4.63) |
| Total from investment operations | 0.01 | (0.86) | (4.44) |
| Less distributions | |||
| From net investment income | — | (0.19) | — |
| From net realized gain | — | (0.25) | — |
| Total distributions | — | (0.44) | — |
| Net asset value, end of year | $11.05 | $9.75 | $5.31 |
| Total return (%)5,6 | 0.097 | (7.79) | (45.54)7 |
| Ratios and supplemental data | |||
| Net assets, end of year (in millions) | —8 | $7 | $3 |
| Ratios (as a percentage of average net assets): | |||
| Expenses before reductions | 0.949 | 1.66 | 1.669 |
| Expenses net of all fee waivers | 0.949 | 1.11 | 1.119 |
| Expenses net of all fee waivers | |||
| and credits | 0.949 | 1.11 | 1.119 |
| Net investment income | (0.94)9 | 1.37 | 2.689 |
| Portfolio turnover (%) | 2010 | 53 | 27 |
1 Beginning of operations from 2-28-06 to 12-31-06.
2 For the ten month period ended October 31, 2008. The Fund changed its fiscal year end from December 31 to October 31.
3 Based on the average of the shares outstanding.
4 Less than $0.01 per share.
5 Assumes dividend reinvestment and does not reflect the effect of sales charges.
6 Total return would have been lower had certain expenses not been reduced during the periods shown.
7 Not annualized.
8 Less than $500,000.
9 Annualized.
10 Portfolio turnover reflects the period ended 12-31-06.
See notes to financial statements
| 22 | International Classic Value Fund | Annual report |
Notes to financial statements
Note 1
Organization
John Hancock International Classic Value Fund (the Fund) is a non-diversified series of John Hancock Capital Series (the Trust), an open-end management investment company registered under the Investment Company Act of 1940, as amended (the 1940 Act). The investment objective of the Fund is to achieve long-term growth of capital.
The Trustees have authorized the issuance of multiple classes of shares of the Fund, designated as Class A, Class B, Class C, Class I and Class NAV. The shares of each class represent an interest in the same portfolio of investments of the Fund and have equal rights as to voting, redemptions, dividends and liquidation, except that certain expenses, subject to the approval of the Trustees, may be applied differently to each class of shares in accordance with current regulations of the Securities and Exchange Commission (SEC) and the Internal Revenue Service. Shareholders of a class that bears distribution and service expenses under the terms of a distribution plan have exclusive voting rights to that distribution plan. Class B shares will convert to Class A shares eight years after purchase.
Note 2
Significant accounting policies
The financial statements have been prepared in conformity with accounting principles generally accepted in the United States of America, which require management to make certain estimates and assumptions at the date of the financial statements. Actual results could differ from those estimates. The following summarizes the significant accounting policies of the Fund:
Security valuation
The net asset value of the Fund is determined daily as of the close of the New York Stock Exchange (NYSE), normally at 4:00 P.M.., Eastern Time. Short-term debt investments that have a remaining maturity of 60 days or less are valued at amortized cost, and thereafter assume a constant amortization to maturity of any discount or premium, which approximates market value. All other securities held by the Fund are valued at the last sale price or official closing price (closing bid price or last evaluated quote if no sale has occurred) as of the close of business on the principal securities exchange (domestic or foreign) on which they trade or, lacking any sales, at the closing bid price. Securities traded only in the over-the-counter market are valued at the last bid price quoted by brokers making markets in the securities at the close of trading. Secu rities for which there are no such quotations, principally debt securities, are valued based on the evaluated prices provided by an independent pricing service, which utilizes both dealer-supplied and electronic data processing techniques, which take into account factors such as institutional-size trading in similar groups of securities, yield, quality, coupon rate, maturity, type of issue, trading characteristics and other market data.
Other portfolio securities and assets for which market quotations are not readily available are valued at fair value as determined in good faith by the Trust’s Pricing Committee in accordance with procedures adopted by the Board of Trustees. Generally, trading in non-U.S. securities is substantially completed each day at various times prior to the close of trading on the NYSE. The values of such securities used in computing the net asset value of the Fund’s shares are generally determined as of such times. Occasionally, significant events that affect the values of such securities may occur between the times at which such values are generally determined and the close of the NYSE. Upon such an occurrence, these securities will be valued at fair value as determined in good faith under consistently applied
| Annual report | International Classic Value Fund | 23 |
procedures established by and under the general supervision of the Board of Trustees.
Valuations change in response to many factors including the historical and prospective earnings of the issuer, the value of the issuer’s assets, general economic conditions, interest rates, investor perceptions and market liquidity.
The Fund adopted Statement of Financial Accounting Standards No. 157 (FAS 157), Fair Value Measurements, effective with the beginning of the Fund’s fiscal year. FAS 157 established a three-tier hierarchy to prioritize the assumptions, referred to as inputs, used in valuation techniques to measure fair value. The three-tier hierarchy of inputs is summarized in the three broad levels listed below:
Level 1 — Quoted prices in active markets for identical securities.
Level 2 — Prices determined using other significant observable inputs. Observable inputs are inputs that other market participants would use in pricing a security. These may include quoted prices for similar securities, interest rates, prepayment speeds, credit risk and others.
Level 3 — Prices determined using significant unobservable inputs. In situations where quoted prices or observable inputs are unavailable, such as when there is little or no market activity for an investment, unobservable inputs may be used. Unobservable inputs reflect the Fund’s own assumptions about the factors that market participants would use in pricing an investment and would be based on the best information available.
The inputs or methodology used for valuing securities are not necessarily an indication of the risk associated with investing in those securities.
The following is a summary of the inputs used to value the Fund’s net assets as of October 31, 2008:
| INVESTMENTS IN | OTHER FINANCIAL | ||
| VALUATION INPUTS | SECURITIES | INSTRUMENTS* | |
| Level 1 — Quoted Prices | $1,141,141 | — | |
| Level 2 — Other Significant Observable Inputs | 11,914,877 | — | |
| Level 3 — Significant Unobservable Inputs | — | — | |
| Total | $13,056,018 | — | |
*Other financial instruments are derivative instruments not reflected in the Portfolio of Investments, such as futures, forwards and swap contracts, which are valued at the unrealized appreciation/depreciation on the instrument.
Joint repurchase agreement
Pursuant to an exemptive order issued by the SEC, the Fund, along with other registered investment companies having a management contract with John Hancock Advisers, LLC (the Adviser), a wholly owned subsidiary of John Hancock Financial Services, Inc., a subsidiary of Manulife Financial Corporation (MFC), may participate in a joint repurchase agreement transaction. Aggregate cash balances are invested in one or more large repurchase agreements, whose underlying securities are obligations of the U.S. government and/or its agencies. The Fund’s custodian bank receives delivery of the underlying securities for the joint account on the Fund’s behalf. When a Fund enters into a repurchase agreement, it receives delivery of collateral, the amount of which at the time of purchase and each subsequent business day is required to be maintained at such a level that the value is generally 102% of the repurchase amount.
Foreign currency translation
The books and records of the Fund are maintained in U.S. dollars. Investment securities and other assets and liabilities denominated in a foreign currency are translated into U.S. dollars at the prevailing exchange rates at period end. Purchases and sales of investment securities, income and expenses are translated into U.S. dollars at the prevailing exchange rates on the respective dates of the transactions.
| 24 | International Classic Value Fund | Annual report |
Net realized and unrealized gains and losses on foreign currency transactions represent net gains and losses between trade and settlement dates on securities transactions, the disposition of forward foreign currency exchange contracts and foreign currencies, and the difference between the amount of net investment income accrued and the U.S. dollar amount actually received. That portion of both realized and unrealized gains and losses on investments that results from fluctuations in foreign currency exchange rates is not separately disclosed but is included with net realized and unrealized gain/appreciation and loss/depreciation on investments.
Investment transactions
Investment transactions are accounted for on a trade date plus one basis for daily net asset value calculations. However, for financial reporting purposes, investment security transactions are reported on trade date. Interest income is recorded on the accrual basis. Dividend income is recorded on the ex-dividend date net of foreign withholding taxes. Realized gains and losses from investment transactions are recorded on an identified cost basis.
Broker commission rebates
The Fund may direct certain security trades to brokers who have agreed to rebate a portion of the related brokerage commission to the Fund. Commission rebates are reflected as a realized gain on securities in the Statement of Operations and amounted to $37.
Class allocations
Income, common expenses and realized and unrealized gains (losses) are determined at the fund level and allocated daily to each class of shares based on the appropriate net asset value of the respective classes. Distribution and service fees, if any, transfer agent fees, printing fees and registration and filing fees for Class A, Class B, Class C and Class I shares are calculated daily at the class level based on the appropriate net asset value of each class and the specific expense rate(s) applicable to each class.
Expenses
The majority of expenses are directly identifiable to an individual fund. Trust expenses that are not readily identifiable to a specific fund are allocated in such a manner as deemed equitable, taking into consideration, among other things, the nature and type of expense and the relative size of the funds. Expense estimates are accrued in the period to which they relate and adjustments are made when actual amounts are known.
Bank borrowings
The Fund is permitted to have bank borrowings for temporary or emergency purposes, including the meeting of redemption requests that otherwise might require the untimely disposition of securities. The Fund has entered into a line of credit agreement with The Bank of New York Mellon (BNYM), the Swing Line Lender and Administrative Agent. This agreement enables the Fund to participate, with other funds managed by the Adviser, in an unsecured line of credit with BNYM, which permits borrowings of up to $150 million, collectively. Interest is charged to each fund based on its borrowing. In addition, a commitment fee is charged to each fund based on the average daily unused portion of the line of credit and is allocated among the participating funds. The fund had no outstanding borrowings under the line of credit during the period ended October 31, 2008.
Pursuant to the custodian agreement, the Custodian may, in its discretion, advance funds to the Fund to make properly authorized payments. When such payments result in an overdraft, the Fund is obligated to repay the Custodian for any overdraft together with interest due thereon. The Custodian has a lien, security interest or security entitlement in any Fund property, to the maximum extent permitted by law to the extent of any overdraft.
Federal income taxes
The Fund qualifies as a regulated investment company by complying with the applicable provisions of the Internal Revenue Code and will not be subject to federal income tax on taxable income that is distributed to shareholders. Therefore, no federal income tax provision is required.
| Annual report | International Classic Value Fund | 25 |
For federal income tax purposes, the Fund has $2,243,096 of a capital loss carryforward available, to the extent provided by regulations, to offset future net realized capital gains. To the extent that such carryforward is used by the Fund, no capital gain distributions will be made. The loss carryforward expires as follows: October 31, 2016 — $2,243,096.
The Fund is subject to the provisions of Financial Accounting Standards Board (FASB) Interpretation No. 48, Accounting for Uncertainty in Income Taxes, an interpretation of FASB Statement 109 (FIN 48). FIN 48 prescribes a minimum threshold for financial statement recognition of the benefit of a tax position taken or expected to be taken in a tax return. The implementation of FIN 48 did not have a material impact on the Fund’s financial statements. Each of the Fund’s federal tax returns for the prior three years remain subject to examination by the Internal Revenue Service.
New accounting pronouncement
In March 2008, FASB No. 161 (FAS 161), Disclosures about Derivative Instruments and Hedging Activities, an amendment of FASB Statement No. 133 (FAS 133), was issued and is effective for fiscal years and interim reporting periods beginning after November 15, 2008. FAS 161 amends and expands the disclosure requirements of FAS 133 in order to provide financial statement users an understanding of a company’s use of derivative instruments, how derivative instruments are accounted for under FAS 133 and related interpretations and how these instruments affect a company’s financial position, performance, and cash flows. FAS 161 requires companies to disclose information detailing the objectives and strategies for using derivative instruments, the level of derivative activity entered into by the company, and any credit risk-related contingent features of the agreements. Management is currently evaluati ng the adoption of FAS 161 on the Fund’s financial statement disclosures.
Distribution of income and gains
The Fund records distributions to shareholders from net investment income and net realized gains, if any, on the ex-dividend date. The Fund generally declares and pays dividends and capital gains distributions, if any, annually. During the year ended December 31, 2006, the tax character of distributions paid was as follows: ordinary income $225,155. During the year ended December 31, 2007, the tax character of distributions paid was as follows: ordinary income $680,208 and long-term capital gain $341,007. There were no distributions during the period ended October 31, 2008. Distributions paid by the Fund with respect to each class of shares are calculated in the same manner, at the same time and are in the same amount, except for the effect of expenses that may be applied differently to each class.
As of October 31, 2008, the components of distributable earnings on a tax basis included $418,021 of undistributed ordinary income.
Such distributions and distributable earnings, on a tax basis, are determined in conformity with income tax regulations, which may differ from accounting principles generally accepted in the United States of America. Distributions in excess of tax basis earnings and profits, if any, are reported in the Fund’s financial statements as a return of capital.
Capital accounts within financial statements are adjusted for permanent book-tax differences. These adjustments have no impact on net assets or the results of operations. Temporary book-tax differences will reverse in a subsequent period. Permanent book-tax differences are primarily attributable to foreign currency transactions.
Note 3
Risks and uncertainties
Sector risk — financial industry
Fund performance will be closely tied to a single sector of the economy, which may underperform other sectors over any given period of time. Financial services companies can be hurt by economic declines, changes in interest rates, regulatory and market impacts. Accordingly, the concentration may make the Fund’s value more volatile and investment values may rise and fall more rapidly.
| 26 | International Classic Value Fund | Annual report |
Risk associated with foreign investments
Investing in securities issued by companies whose principal business activities are outside the United States may involve significant risks not present in domestic investments. For example, there is generally less information available about foreign companies, particularly those not subject to the disclosure and reporting requirements of the U.S. securities laws. Foreign issuers are generally not bound by uniform accounting, auditing, and financial reporting requirements and standards of practice comparable to those applicable to domestic issuers. Investments in foreign securities also involve the risk of possible adverse changes in investment or exchange control regulations, expropriation or confiscatory taxation, limitation on the removal of funds or other assets of the Fund, political or financial instability or diplomatic and other developments which could affect such investments. Foreign stock markets, while growing in volume and sophistication, are generally not as developed as those in the United States, and securities of some foreign issuers (particularly those located in developing countries) may be less liquid and more volatile than securities of comparable U.S. companies. In general, there is less overall governmental supervision and regulation of foreign securities markets, broker-dealers and issuers than in the United States.
Small and medium size company risk
Stocks of small and medium-size companies tend to be more volatile than those of large companies, and may underperform stocks of large companies. Small and mid-cap companies may have limited product lines or markets, less access to financial resources or less operating experience, or may depend on a few key employees. Given this, small and mid-cap stocks may be thinly traded, leading to additional liquidity risk due to the inabilities to trade in large volume.
Note 4
Guarantees and indemnifications
Under the Fund’s organizational documents, its Officers and Trustees are indemnified against certain liability arising out of the performance of their duties to the Fund. Additionally, in the normal course of business, the Fund enters into contracts with service providers that contain general indemnification clauses. The Fund’s maximum exposure under these arrangements is unknown, as this would involve future claims that may be made against the Fund that have not yet occurred.
Note 5
Management fee and transactions with
affiliates and others
The Fund has an investment management contract with the Adviser. Under the investment management contract, the Fund pays a daily management fee to the Adviser equivalent, on an annual basis, to the sum of: (a) 1.05% of the first $1,000,000,000 of the Fund’s average daily net asset value and (b) 1.00% of the Fund’s daily net asset value in excess of $1,000,000,000. The Adviser has a sub-advisory agreement with Pzena Investment Management LLC. The effective management fee rate is 1.05% of the Fund’s average daily net asset value for the period ended October 31, 2008. The Fund is not responsible for payment of the subadvisory fees.
The Adviser has agreed to limit the Fund’s total expenses, excluding distribution and service fees and transfer agent fees, interest and other extraordinary expenses not incurred in the ordinary course of the Fund’s business, to 1.11% of the Fund’s average daily net asset value, on an annual basis, until April 30, 2009. Accordingly, the expense reductions related to these total expense limitations amounted to $192,051 and there were no class-specific total expense reductions during the period ended October 31, 2008. The Adviser reserves the right to terminate this limitation in the future.
The Fund has a Distribution Agreement with John Hancock Funds, LLC (JH Funds), a wholly owned subsidiary of the Adviser. The Fund has adopted Distribution Plans with respect to Class A, Class B and Class C, pursuant to Rule 12b-1 under the 1940 Act, to pay JH Funds for the services it provides as distributor of shares of the Fund. Accordingly, the Fund makes monthly payments to JH Funds
| Annual report | International Classic Value Fund | 27 |
at an annual rate not to exceed 0.30%, 1.00% and 1.00% of average daily net asset value of Class A, Class B and Class C, respectively. A maximum of 0.25% of such payments may be service fees, as defined by the Conduct Rules of the Financial Industry Regulatory Authority (formerly the National Association of Securities Dealers). Under the Conduct Rules, curtailment of a portion of the Fund’s 12b-1 payments could occur under certain circumstances.
Class A shares are assessed up-front sales charges. During the period ended October 31, 2008, JH Funds received net up-front sales charges of $7,230 with regard to sales of Class A shares. Of this amount, $1,145 was retained and used for printing prospectuses, advertising, sales literature and other purposes, $5,842 was paid as sales commissions to unrelated broker-dealers and $243 was paid as sales commissions to sales personnel of Signator Investors, Inc. (Signator Investors), a related broker-dealer. The Adviser’s indirect parent, John Hancock Life Insurance Company (JHLICO), is the indirect sole shareholder of Signator Investors.
Class B shares that are redeemed within six years of purchase are subject to a contingent deferred sales charge (CDSC) at declining rates, beginning at 5.00% of the lesser of the current market value at the time of redemption or the original purchase cost of the shares being redeemed. Class C shares that are redeemed within one year of purchase are subject to a CDSC at a rate of 1.00% of the lesser of the current market value at the time of redemption or the original purchase cost of the shares being redeemed. Proceeds from the CDSCs are paid to JH Funds and are used in whole or in part to defray its expenses for providing distribution-related services to the Fund in connection with the sale of Class B and Class C shares. During the period ended October 31, 2008, CDSCs received by JH Funds amounted to $1,302 for Class B shares and $632 for Class C shares.
The Fund has a transfer agent agreement with John Hancock Signature Services, Inc. (Signature Services), an indirect subsidiary of JHLICO.
The transfer agent fees are made up of three components:
• The Fund pays a monthly transfer agent fee at an annual rate of 0.05%, 0.05%, 0.05% and 0.04% for Classes A, B, C and I, respectively, of each class’s average daily net assets.
• For the period of January 1, 2008 to May 31, 2008, the Fund paid a monthly fee which is based on an annual rate of $15.00, $17.50, $16.50 and $15.00 for each shareholder account for Class A, B, C and I, respectively. Effective June 1, 2008, all classes paid a monthly fee based on an annual rate of $16.50 per shareholder account.
•In addition, Signature Services is reimbursed for certain out-of-pocket expenses.
Signature Services has agreed to contractually limit the transfer agent expenses to 0.30% for Classes A, B and C until April 30, 2009 and thereafter until terminated by Signature Services. There were no waivers and reimbursements under this plan, for the period ended October 31, 2008. In addition, the Fund receives earnings credits from Signature Services as a result of uninvested cash balances. These credits are used to reduce a portion of the Fund’s transfer agent fees and out-of-pocket expenses. During the period ended October 31, 2008, the Fund’s transfer agent fees and out-of-pocket expenses were reduced by $271 for transfer agent credits earned.
| 28 | International Classic Value Fund | Annual report |
Class level expenses for the period ended October 31, 2008 were as follows:
| Distribution and | Transfer | Registration and | ||
| Share class | service fees | agent fees | Printing fees | filling fees |
| Class A | $26,650 | $21,558 | $10,460 | $36,623 |
| Class B | 7,926 | 1,955 | 1,639 | 6,955 |
| Class C | 19,886 | 4,847 | 2,771 | 11,523 |
| Class I | — | 1,392 | 4,487 | 12,495 |
| Total | $54,462 | $29,752 | $19,357 | $67,596 |
The Fund has an agreement with the Adviser and affiliates to perform necessary tax, accounting, compliance, legal and other administrative services for the Fund. The compensation for the year amounted to $2,329 with an effective rate of 0.01% of the Fund’s average daily net asset value.
Mr. James R. Boyle is Chairman of the Adviser, as well as affiliated Trustee of the Fund, and is compensated by the Adviser and/ or its affiliates. The compensation of unaffiliated Trustees is borne by the Fund. The unaffiliated Trustees may elect to defer, for tax purposes, their receipt of this compensation under the John Hancock Group of Funds Deferred Compensation Plan. The Fund makes investments into other John Hancock funds, as applicable, to cover its liability for the deferred compensation. Investments to cover the Fund’s deferred compensation liability are recorded on the Fund’s books as an other asset. The deferred compensation liability and the related other asset are always equal and are marked to market on a periodic basis to reflect any income earned by the investments, as well as any unrealized gains or losses. The Deferred Compensation Plan investments had no impact on the operations of the Fund.
| Annual report | International Classic Value Fund | 29 |
Note 6
Fund share transactions
This listing illustrates the number of Fund shares sold, reinvested and repurchased during the years ended December 31, 2006 and 2007, and the period ended October 31, 2008, along with the corresponding dollar value.
| Year ended 12-31-061 | Period ended 12-31-07 | Period ended 10-31-082 | ||||
| Shares | Amount | Shares | Amount | Shares | Amount | |
| Class A shares | ||||||
| Sold | 1,841,086 | $18,672,420 | 718,876 | $7,804,742 | 251,381 | $2,174,311 |
| Distributions | ||||||
| reinvested | 13,328 | 145,812 | 40,438 | 403,973 | — | — |
| Repurchased | (105,230) | (1,100,406) | (1,196,044) | (13,220,863) | (398,228) | (3,371,491) |
| Net increase | ||||||
| (decrease) | 1,749,184 | $17,717,826 | (436,730) | ($5,012,148) | (146,847) | ($1,197,180) |
| Class B shares | ||||||
| Sold | 142,677 | $1,472,282 | 65,095 | $722,072 | 17,835 | $157,810 |
| Distributions | ||||||
| reinvested | 892 | 9,715 | 3,108 | 30,955 | — | — |
| Repurchased | (26,609) | (273,766) | (66,324) | (723,741) | (32,750) | (270,109) |
| Net increase | ||||||
| (decrease) | 116,960 | $1,208,231 | 1,879 | $29,286 | (14,915) | ($112,299) |
| Class C shares | ||||||
| Sold | 421,668 | $4,217,540 | 112,586 | $1,248,233 | 21,765 | $194,119 |
| Distributions | ||||||
| reinvested | 2,978 | 32,433 | 8,462 | 84,196 | — | — |
| Repurchased | (31,424) | (306,923) | (201,293) | (2,164,829) | (89,363) | (725,774) |
| Net increase | ||||||
| (decrease) | 393,222 | $3,943,050 | (80,245) | ($832,400) | (67,598) | ($531,655) |
| Class I shares | ||||||
| Sold | 220,721 | $2,247,000 | 508,810 | $5,702,968 | 37,849 | $333,333 |
| Distributions | ||||||
| reinvested | 1,758 | 19,286 | 14,270 | 142,848 | — | — |
| Repurchased | (19,724) | (204,524) | (266,361) | (2,887,957) | (196,152) | (1,680,600) |
| Net increase | ||||||
| (decrease) | 202,755 | $2,061,762 | 256,719 | $2,957,859 | (158,303) | ($1,347,267) |
| Class NAV shares | ||||||
| Sold | 14,478 | $160,000 | 657,918 | $7,242,225 | 146,492 | $1,321,379 |
| Distributions | ||||||
| reinvested | — | — | 27,958 | 278,185 | — | — |
| Repurchased | — | — | (14,731) | (157,411) | (187,399) | (1,548,041) |
| Net increase | 14,478 | $160,0003 | 671,145 | $7,362,999 | (40,907) | ($226,662) |
| Net increase | ||||||
| (decrease) | 2,476,599 | $25,090,869 | 412,768 | $4,505,596 | (428,570) | ($3,415,063) |
1Beginning of operations from 2-28-06 to 12-31-06.
2For the ten month period ended October 31, 2008. The Fund changed its fiscal year end from December 31 to October 31.
3Beginning of operations from 12-28-06 to 12-31-06.
| 30 | International Classic Value Fund | Annual report |
Note 7
Purchase and sale of securities
Purchases and proceeds from sales or maturities of securities, other than short-term securities and obligations of the U.S. government, during the period ended October 31, 2008, aggregated $6,055,865 and $8,456,206, respectively.
Note 8
Change in fiscal year end
The Fund’s fiscal year end has changed to October 31, 2008.
| Annual report | International Classic Value Fund | 31 |
| Auditors’ report |
| Report of Independent Registered Public Accounting Firm |
To the Board of Trustees of John Hancock Capital Series and Shareholders of
John Hancock International Classic Value Fund:
In our opinion, the accompanying statement of assets and liabilities, including the schedule of investments, and the related statements of operations and of changes in net assets and the financial highlights present fairly, in all material respects, the financial position of John Hancock International Classic Value Fund (the Fund) at October 31, 2008, and the results of its operations, the changes in its net assets and the financial highlights for the periods indicated, in conformity with accounting principles generally accepted in the United States of America. These financial statements and financial highlights (hereafter referred to as “financial statements”) are the responsibility of the Fund’s management; our responsibility is to express an opinion on these financial statements based on our audits. We conducted our audits of these financial statements in accordance with the standards of the Public Company Accounting Oversight Board (United States). Tho se standards require that we plan and perform the audit to obtain reasonable assurance about whether the financial statements are free of material misstatement. An audit includes examining, on a test basis, evidence supporting the amounts and disclosures in the financial statements, assessing the accounting principles used and significant estimates made by management, and evaluating the overall financial statement presentation. We believe that our audits, which included confirmation of securities as of October 31, 2008 by correspondence with the custodian and brokers, and the application of alternative auditing procedures where securities purchased had not been received, provide a reasonable basis for our opinion.
PricewaterhouseCoopers LLP
Boston, Massachusetts
December 22, 2008
| 32 | International Classic Value Fund | Annual report |
Tax information
Unaudited
For federal income tax purposes, the following information is furnished with respect to the distributions of the Fund, if any, paid during its taxable year ended October 31, 2008.
The Fund hereby designates the maximum amount allowable of its net taxable income as qualified dividend income as provided in the Jobs and Growth Tax Relief Reconciliation Act of 2003. This amount will be reflected on Form 1099-DIV for the calendar year 2008.
Shareholders will be mailed a 2008 U.S. Treasury Department Form 1099-DIV in January 2009. This will reflect the total of all distributions that are taxable for calendar year 2008.
| Annual report | International Classic Value Fund | 33 |
Board Consideration of and
Continuation of Investment Advisory
Agreement and Subadvisory
Agreement: John Hancock International
Classic Value Fund
The Investment Company Act of 1940 (the 1940 Act) requires the Board of Trustees (the Board) of John Hancock Capital Series (the Trust), including a majority of the Trustees who have no direct or indirect interest in the investment advisory agreement and are not “interested persons” of the Trust, as defined in the 1940 Act (the Independent Trustees), annually to meet in person to review and consider the continuation of: (i) the investment advisory agreement (the Advisory Agreement) with John Hancock Advisers, LLC (the Adviser) and (ii) the investment subadvisory agreement (the Subadvisory Agreement) with Pzena Investment Management, LLC (the Subadviser) for the John Hancock International Classic Value Fund (the Fund). The Advisory Agreement and the Subadvisory Agreement are collectively referred to as the Advisory Agreements.
At meetings held on May 5–6 and June 9–10, 2008, the Board considered the factors and reached the conclusions described below relating to the selection of the Adviser and Subadviser and the continuation of the Advisory Agreements. During such meetings, the Board’s Contracts/Operations Committee and the Independent Trustees also met in executive sessions with their independent legal counsel.
In evaluating the Advisory Agreements, the Board, including the Contracts/Operations Committee and its Independent Trustees, reviewed a broad range of information requested for this purpose. This information included:
(i) the investment performance of the Fund relative to a category of relevant funds (the Category) and a peer group of comparable funds (the Peer Group). The funds within each Category and Peer Group were selected by Morningstar Inc. (Morningstar), an independent provider of investment company data. Data covered the period since the Fund’s inception through December 31, 2007,
(ii) advisory and other fees incurred by, and the expense ratios of, the Fund relative to a Category and a Peer Group,
(iii) the advisory fees of comparable portfolios of other clients of the Adviser and the Subadviser,
(iv) the Adviser’s financial results and condition, including its and certain of its affiliates’ profitability from services performed for the Fund,
(v) breakpoints in the Fund’s and the Peer Group’s fees, and information about economies of scale,
(vi) the Adviser’s and Subadviser’s record of compliance with applicable laws and regulations, with the Fund’s investment policies and restrictions, and with the applicable Code of Ethics, and the structure and responsibilities of the Adviser’s and Subadviser’s compliance department,
(vii) the background and experience of senior management and investment professionals, and
(viii) the nature, cost and character of advisory and non-investment management services provided by the Adviser and its affiliates and by the Subadviser.
The Independent Trustees considered the legal advice of independent legal counsel and relied on their own business judgment in determining the factors to be considered in evaluating the materials that were presented to them and the weight to be given to each such factor. The Board’s review and conclusions were based on a comprehensive consideration of all information presented to the Board and not the result of any single controlling factor. The Board principally considered data on performance and other information provided by Morningstar as of December 31, 2007. The Board also considered updated performance information provided to it by the Adviser or Subadviser at its May and June 2008 meetings. Performance and other information may be quite different as of the date of this shareholders report. The key factors considered by the Board and the conclusions reached are described below.
| 34 | International Classic Value Fund | Annual report |
Nature, extent and quality of services
The Board considered the ability of the Adviser and the Subadviser, based on their resources, reputation and other attributes, to attract and retain qualified investment professionals, including research, advisory, and supervisory personnel. The Board considered the investment philosophy, research and investment decision-making processes of the Adviser, Subadviser and representatives of the Subadviser that are responsible for the daily investment activities of the Fund. The Board considered the representatives’ history and experience with the Fund. The Board considered the Adviser’s execution of its oversight responsibilities. The Board further considered the culture of compliance, resources dedicated to compliance, compliance programs and compliance records of the Adviser and Subadviser. In addition, the Board took into account the administrative and other non-advisory services provided to the Fund by the Adviser and its affiliates.
Based on the above factors, together with those referenced below, the Board concluded that, within the context of its full deliberations, the nature, extent and quality of the investment advisory services provided to the Fund by the Adviser and Subadviser supported renewal of the Advisory Agreements.
Fund performance
The Board noted that the Fund had less than two full years of operational history, and considered the performance results for the Fund since its inception in 2006 through December 31, 2007. The Board also considered these results in comparison to the performance of the Category, as well as the Fund’s Peer Group and benchmark index. The Board reviewed with representatives of Morningstar the methodology used by Morningstar to select the funds in the Category and the Peer Group.
The Board noted that the Fund’s performance for the 1-year period under review was lower than the performance of the Peer Group and Category medians, and its benchmark index, the MSCI EAFE Index. The Subadviser provided detailed information about its investment process and discussed the performance of specific portfolio stocks with the Board. The Adviser also discussed with the Board its review and analysis of the Subadviser’s investment process and particular portfolio stocks in light of the Fund’s value orientation. The Board concluded that the investment process and particular portfolio stocks seemed consistent with the Fund’s investment objectives, strategy and style. The Board recognized the short operational history of the Fund and indicated its intent to continue to monitor the Fund’s performance trends.
Investment advisory fee and subadvisory fee rates and expenses
The Board reviewed and considered the contractual investment advisory fee rate payable by the Fund to the Adviser for investment advisory services (the Advisory Agreement Rate). The Board received and considered information comparing the Advisory Agreement Rate with the advisory fees for the Peer Group. The Board noted that the Advisory Agreement Rate was higher than the median rate of the Peer Group and the Category.
The Board received and considered expense information regarding the Fund’s various components, including advisory fees, distribution and fees other than advisory and distribution fees, including transfer agent fees, custodian fees, and other miscellaneous fees (e.g., fees for accounting and legal services). The Board considered comparisons of these expenses to the Peer Group median. The Board also received and considered expense information regarding the Fund’s total operating expense ratio (Gross Expense Ratio) and total operating expense ratio after taking the fee waiver arrangement applicable to the Advisory Agreement Rate into account (Net Expense Ratio). The Board received and considered information comparing the Gross Expense Ratio and Net Expense Ratio of the Fund to that of the Peer Group and Category medians. The Board noted that the Fund’s Gross and Net Expense Ratios were highe r than the medians of the Peer Group and Category. The Board favorably considered the impact of continuing fee waivers towards ultimately lowering the Fund’s total operating expense ratio.
The Adviser also discussed the Morningstar data and rankings, and other relevant information, for the Fund. Based on the above-referenced considerations and other factors, the Board concluded that the Fund’s overall expenses and plans to improve performance supported the re-approval of the Advisory Agreements.
| Annual report | International Classic Value Fund | 35 |
The Board also received information about the investment subadvisory fee rate (the Subadvisory Agreement Rate) payable by the Adviser to the Subadviser for investment subadvisory services. The Board concluded that the Subadvisory Agreement Rate was fair and equitable, based on its consideration of the factors described here.
Profitability
The Board received and considered a detailed profitability analysis of the Adviser based on the Advisory Agreements, as well as on other relationships between the Fund and the Adviser and its affiliates. The Board also considered a comparison of the Adviser’s profitability to that of other similar investment advisers whose profitability information is publicly available. The Board concluded that, in light of the costs of providing investment management and other services to the Fund, the profits and other ancillary benefits reported by the Adviser were not unreasonable.
The Board did not consider profitability information with respect to the Subadviser, which is not affiliated with the Adviser. The Board considered that the Subadvisory Agreement Rate paid to the Subadviser had been negotiated by the Adviser on an arm’s length basis and that the Subadviser’s separate profitability from its relationship with the Fund was not a material factor in determining whether to renew the agreement.
Economies of scale
The Board received and considered general information regarding economies of scale with respect to the management of the Fund, including the Fund’s ability to appropriately benefit from economies of scale under the Fund’s fee structure. The Board recognized the inherent limitations of any analysis of economies of scale, stemming largely from the Board’s understanding that most of the Adviser’s costs are not specific to individual Funds, but rather are incurred across a variety of products and services.
To the extent the Board and the Adviser were able to identify actual or potential economies of scale from Fund-specific or allocated expenses, in order to ensure that any such economies continue to be reasonably shared with the Fund as its assets increase, the Adviser and the Board agreed to continue the existing breakpoints to the Advisory Agreement Rate.
Information about services to other clients
The Board also received information about the nature, extent and quality of services and fee rates offered by the Adviser and Subadviser to their other clients, including other registered investment companies, institutional investors and separate accounts. The Board concluded that the Advisory Agreement Rate and the Subadvisory Agreement Rate were not unreasonable, taking into account fee rates offered to others by the Adviser and Subadviser, respectively, after giving effect to differences in services.
Other benefits to the Adviser
The Board received information regarding potential “fall-out” or ancillary benefits received by the Adviser and its affiliates and the Subadviser as a result of their relationship with the Fund. Such benefits could include, among others, benefits directly attributable to the relationship of the Adviser and Subadviser with the Fund and benefits potentially derived from an increase in business of the Adviser and Subadviser as a result of their relationship with the Fund (such as the ability to market to shareholders other financial products offered by the Adviser and its affiliates).
The Board also considered the effectiveness of the Adviser’s, Subadviser’s and Fund’s policies and procedures for complying with the requirements of the federal securities laws, including those relating to best execution of portfolio transactions and brokerage allocation.
Other factors and broader review
As discussed above, the Board reviewed detailed materials received from the Adviser and Subadviser as part of the annual re-approval process. The Board also regularly reviews and assesses the quality of the services that the Fund receives throughout the year. In this regard, the Board reviews reports of the Adviser at least quarterly, which include, among other things, fund performance reports and compliance reports. In addition, the Board meets with portfolio managers and senior investment officers at various times throughout the year.
After considering the above-described factors and based on its deliberations and its evaluation of the information described above, the Board concluded that approval of the continuation of the Advisory Agreements for the Fund was in the best interest of the Fund and its shareholders. Accordingly, the Board unanimously approved the continuation of the Advisory Agreements.
| 36 | International Classic Value Fund | Annual report |
Trustees and Officers
This chart provides information about the Trustees and Officers who oversee your John Hancock fund. Officers elected by the Trustees manage the day-to-day operations of the Fund and execute policies formulated by the Trustees.
| Independent Trustees | ||
| Name, Year of Birth | Number of | |
| Position(s) held with Fund | Trustee | John Hancock |
| Principal occupation(s) and other | of Fund | funds overseen |
| directorships during past 5 years | since1 | by Trustee |
| James F. Carlin, Born: 1940 | 2006 | 50 |
| Chairman (since December 2007); Director and Treasurer, Alpha Analytical Laboratories, Inc. (chemical | ||
| analysis) (since 1985); Part Owner and Treasurer, Lawrence Carlin Insurance Agency, Inc. (since 1995); | ||
| Part Owner and Vice President, Mone Lawrence Carlin Insurance Agency, Inc. (until 2005); Chairman | ||
| and Chief Executive Officer, Carlin Consolidated, Inc. (management/investments) (since 1987); Trustee, | ||
| Massachusetts Health and Education Tax Exempt Trust (1993–2003). | ||
| William H. Cunningham, Born: 1944 | 2006 | 50 |
| Professor, University of Texas at Austin (since 1971); former Chancellor, University of Texas System and | ||
| former President, University of Texas at Austin (until 2001); Chairman and Chief Executive Officer, IBT | ||
| Technologies (until 2001); Director of the following: Hicks Acquisition Company I, Inc. (since 2007); | ||
| Hire.com (until 2004), STC Broadcasting, Inc. and Sunrise Television Corp. (until 2001), Symtx, Inc. | ||
| (electronic manufacturing) (since 2001), Adorno/Rogers Technology, Inc. (until 2004), Pinnacle Foods | ||
| Corporation (until 2003), rateGenius (until 2003), Lincoln National Corporation (insurance) (since | ||
| 2006), Jefferson-Pilot Corporation (diversified life insurance company) (until 2006), New Century | ||
| Equity Holdings (formerly Billing Concepts) (until 2001), eCertain (until 2001), ClassMap.com (until | ||
| 2001), Agile Ventures (until 2001), AskRed.com (until 2001), Southwest Airlines (since 2000), Introgen | ||
| (manufacturer of biopharmaceuticals) (since 2000) and Viasystems Group, Inc. (electronic manufacturer) | ||
| (until 2003); Advisory Director, Interactive Bridge, Inc. (college fundraising) (until 2001); Advisory | ||
| Director, Q Investments (until 2003); Advisory Director, JPMorgan Chase Bank (formerly Texas Commerce | ||
| Bank–Austin), LIN Television (until 2008), WilTel Communications (until 2003) and Hayes Lemmerz | ||
| International, Inc. (diversified automotive parts supply company) (since 2003). | ||
| Deborah C. Jackson,4 Born: 1952 | 2008 | 50 |
| Chief Executive Officer, American Red Cross of Massachusetts Bay (since 2002); Board of Directors of | ||
| Eastern Bank Corporation (since 2001); Board of Directors of Eastern Bank Charitable Foundation (since | ||
| 2001); Board of Directors of American Student Association Corp. (since 1996); Board of Directors of | ||
| Boston Stock Exchange (2002–2008); Board of Directors of Harvard Pilgrim Healthcare (since 2007). | ||
| Charles L. Ladner,2 Born: 1938 | 2006 | 50 |
| Chairman and Trustee, Dunwoody Village, Inc. (retirement services) (until 2003); Senior Vice President | ||
| and Chief Financial Officer, UGI Corporation (public utility holding company) (retired 1998); Vice | ||
| President and Director, AmeriGas, Inc. (retired 1998); Director, AmeriGas Partners, L.P. (gas distribution) | ||
| (until 1997); Director, EnergyNorth, Inc. (until 1997); Director, Parks and History Association (until 2005). | ||
| Stanley Martin,2,4 Born: 1947 | 2008 | 50 |
| Senior Vice President/Audit Executive, Federal Home Loan Mortgage Corporation (2004–2006); | ||
| Executive Vice President/Consultant, HSBC Bank USA (2000–2003); Chief Financial Officer/Executive | ||
| Vice President, Republic New York Corporation and Republic National Bank of New York (1998–2000); | ||
| Partner, KPMG LLP (1971–1998). | ||
| Annual report | International Classic Value Fund | 37 |
| Independent Trustees (continued) | ||
| Name, Year of Birth | Number of | |
| Position(s) held with Fund | Trustee | John Hancock |
| Principal occupation(s) and other | of Fund | funds overseen |
| directorships during past 5 years | since1 | by Trustee |
| Dr. John A. Moore,2 Born: 1939 | 2006 | 50 |
| President and Chief Executive Officer, Institute for Evaluating Health Risks (nonprofit institution) | ||
| (until 2001); Senior Scientist, Sciences International (health research) (until 2003); Former Assistant | ||
| Administrator and Deputy Administrator, Environmental Protection Agency; Principal, Hollyhouse | ||
| (consulting) (since 2000); Director, CIIT Center for Health Science Research (nonprofit research) | ||
| (until 2007). | ||
| Patti McGill Peterson,2 Born: 1943 | 2006 | 50 |
| Principal, PMP Globalinc (consulting) (since 2007); Senior Associate, Institute for Higher Education Policy | ||
| (since 2007); Executive Director, CIES (international education agency) (until 2007); Vice President, | ||
| Institute of International Education (until 2007); Senior Fellow, Cornell University Institute of Public | ||
| Affairs, Cornell University (until 1998); Former President Wells College, St. Lawrence University and the | ||
| Association of Colleges and Universities of the State of New York. Director of the following: Niagara | ||
| Mohawk Power Corporation (until 2003); Security Mutual Life (insurance) (until 1997); ONBANK (until | ||
| 1993). Trustee of the following: Board of Visitors, The University of Wisconsin, Madison (since 2007); | ||
| Ford Foundation, International Fellowships Program (until 2007); UNCF, International Development | ||
| Partnerships (until 2005); Roth Endowment (since 2002); Council for International Educational Exchange | ||
| (since 2003). | ||
| Steven R. Pruchansky, Born: 1944 | 2006 | 50 |
| Chairman and Chief Executive Officer, Greenscapes of Southwest Florida, Inc. (since 2000); Director | ||
| and President, Greenscapes of Southwest Florida, Inc. (until 2000); Member, Board of Advisors, First | ||
| American Bank (since 2008); Managing Director, JonJames, LLC (real estate) (since 2000); Director, First | ||
| Signature Bank & Trust Company (until 1991); Director, Mast Realty Trust (until 1994); President, Maxwell | ||
| Building Corp. (until 1991). | ||
| Non-Independent Trustees3 | ||
| Name, Year of Birth | Number of | |
| Position(s) held with Fund | Trustee | John Hancock |
| Principal occupation(s) and other | of Fund | funds overseen |
| directorships during past 5 years | since1 | by Trustee |
| James R. Boyle, Born: 1959 | 2006 | 267 |
| Executive Vice President, Manulife Financial Corporation (since 1999); Director and President, John | ||
| Hancock Variable Life Insurance Company (since 2007); Director and Executive Vice President, John | ||
| Hancock Life Insurance Company (since 2004); Chairman and Director, John Hancock Advisers, LLC (the | ||
| Adviser), John Hancock Funds, LLC (John Hancock Funds) and The Berkeley Financial Group, LLC (The | ||
| Berkeley Group) (holding company) (since 2005); Chairman and Director, John Hancock Investment | ||
| Management Services, LLC (since 2006); Senior Vice President, The Manufacturers Life Insurance | ||
| Company (U.S.A.) (until 2004). | ||
| 38 | International Classic Value Fund | Annual report |
| Principal officers who are not Trustees | |
| Name, Year of Birth | |
| Position(s) held with Fund | Officer |
| Principal occupation(s) and other | of Fund |
| directorships during past 5 years | since |
| Keith F. Hartstein, Born: 1956 | 2006 |
| President and Chief Executive Officer | |
| Senior Vice President, Manulife Financial Corporation (since 2004); Director, President and Chief | |
| Executive Officer, the Adviser, The Berkeley Group and John Hancock Funds, LLC (since 2005); Director, | |
| MFC Global Investment Management (U.S.), LLC (MFC Global (U.S.)) (since 2005); Chairman and | |
| Director, John Hancock Signature Services, Inc. (since 2005); Director, President and Chief Executive | |
| Officer, John Hancock Investment Management Services, LLC (since 2006); President and Chief Executive | |
| Officer, John Hancock Funds, John Hancock Funds II, John Hancock Funds III and John Hancock Trust | |
| (since 2005); Director, Chairman and President, NM Capital Management, Inc. (since 2005); Member | |
| and former Chairman, Investment Company Institute Sales Force Marketing Committee (since 2003); | |
| Director, President and Chief Executive Officer, MFC Global (U.S.) (2005–2006); Executive Vice President, | |
| John Hancock Funds, LLC (until 2005). | |
| Thomas M. Kinzler, Born: 1955 | 2006 |
| Secretary and Chief Legal Officer | |
| Vice President and Counsel, John Hancock Life Insurance Company (U.S.A.) (since 2006); Secretary and | |
| Chief Legal Officer, John Hancock Funds, John Hancock Funds II and John Hancock Trust (since 2006); | |
| Vice President and Associate General Counsel, Massachusetts Mutual Life Insurance Company (1999– | |
| 2006); Secretary and Chief Legal Counsel, MML Series Investment Fund (2000–2006); Secretary and | |
| Chief Legal Counsel, MassMutual Institutional Funds (2000–2004); Secretary and Chief Legal Counsel, | |
| MassMutual Select Funds and MassMutual Premier Funds (2004–2006). | |
| Francis V. Knox, Jr., Born: 1947 | 2006 |
| Chief Compliance Officer | |
| Vice President and Chief Compliance Officer, John Hancock Investment Management Services, LLC, | |
| the Adviser and MFC Global (U.S.) (since 2005); Chief Compliance Officer, John Hancock Funds, John | |
| Hancock Funds II, John Hancock Funds III and John Hancock Trust (since 2005); Vice President and | |
| Assistant Treasurer, Fidelity Group of Funds (until 2004); Vice President and Ethics & Compliance Officer, | |
| Fidelity Investments (until 2001). | |
| Charles A. Rizzo, Born: 1957 | 2007 |
| Chief Financial Officer | |
| Chief Financial Officer, John Hancock Funds, John Hancock Funds II, John Hancock Funds III and John | |
| Hancock Trust (since 2007); Assistant Treasurer, Goldman Sachs Mutual Fund Complex (registered | |
| investment companies) (2005–2007); Vice President, Goldman Sachs (2005–2007); Managing Director | |
| and Treasurer of Scudder Funds, Deutsche Asset Management (2003–2005); Director, Tax and Financial | |
| Reporting, Deutsche Asset Management (2002–2003); Vice President and Treasurer, Deutsche Global | |
| Fund Services (1999–2002). | |
| Gordon M. Shone, Born: 1956 | 2006 |
| Treasurer | |
| Senior Vice President, John Hancock Life Insurance Company (U.S.A.) (since 2001); Treasurer, John | |
| Hancock Funds (since 2006), John Hancock Funds II, John Hancock Funds III and John Hancock Trust | |
| (since 2005); Vice President and Chief Financial Officer, John Hancock Trust (2003–2005); Vice President, | |
| John Hancock Investment Management Services, LLC, John Hancock Advisers, LLC (since 2006) and The | |
| Manufacturers Life Insurance Company (U.S.A.) (1998–2000). | |
| Annual report | International Classic Value Fund | 39 |
| Principal officers who are not Trustees (continued) | |
| Name, Year of Birth | |
| Position(s) held with Fund | Officer |
| Principal occupation(s) and other | of Fund |
| directorships during past 5 years | since |
| John G. Vrysen, Born: 1955 | 2006 |
| Chief Operating Officer | |
| Senior Vice President, Manulife Financial Corporation (since 2006); Senior Vice President, John Hancock | |
| Life Insurance Company (since 2004); Director, Executive Vice President and Chief Operating Officer, | |
| the Adviser, The Berkeley Group and John Hancock Funds, LLC (since 2007); Director, Executive Vice | |
| President and Chief Operating Officer, John Hancock Investment Management Services, LLC (since | |
| 2007); Chief Operating Officer, John Hancock Funds, John Hancock Funds II, John Hancock Funds III | |
| and John Hancock Trust (since 2007); Director, Executive Vice President and Chief Financial Officer, | |
| the Adviser, The Berkeley Group and John Hancock Funds, LLC (2005–2007); Director, Executive Vice | |
| President and Chief Financial Officer, John Hancock Investment Management Services, LLC (2005–2007); | |
| Executive Vice President and Chief Financial Officer, MFC Global (U.S.) (2005–2007); Director, John | |
| Hancock Signature Services, Inc. (since 2005); Chief Financial Officer, John Hancock Funds, John Hancock | |
| Funds II, John Hancock Funds III and John Hancock Trust (2005–2007); Vice President and General | |
| Manager, John Hancock Fixed Annuities, U.S. Wealth Management (2004–2005); Vice President, | |
| Operations, Manulife Wood Logan (2000–2004). | |
The business address for all Trustees and Officers is 601 Congress Street, Boston, Massachusetts 02210-2805.
The Statement of Additional Information of the Fund includes additional information about members of the Board of Trustees of the Fund and is available without charge, upon request, by calling 1-800-225-5291.
1 Each Trustee serves until resignation, retirement age or until his or her successor is elected.
2 Member of Audit and Compliance Committee.
3 Non-Independent Trustee holds positions with the Fund’s investment adviser, underwriter and certain other affiliates.
4 Mr. Martin was appointed by the Board as Trustee on September 8, 2008 and Ms. Jackson was appointed effective October 1, 2008.
| 40 | International Classic Value Fund | Annual report |
More information
| Trustees | Investment adviser |
| James F. Carlin, Chairman | John Hancock Advisers, LLC |
| James R. Boyle† | |
| William H. Cunningham | Subadviser |
| Deborah C. Jackson | Pzena Investment Management, LLC |
| Charles L. Ladner* | Principal distributor |
| Stanley Martin* | John Hancock Funds, LLC |
| Dr. John A. Moore* | |
| Patti McGill Peterson* | Custodian |
| Steven R. Pruchansky | State Street Bank & Trust Company |
| *Members of the Audit Committee | Transfer agent |
| †Non-Independent Trustee | State Street Bank & Trust Company |
| Officers | Legal counsel |
| Keith F. Hartstein | K&L Gates LLP |
| President and Chief Executive Officer | |
| Independent registered | |
| Thomas M. Kinzler | public accounting firm |
| Secretary and Chief Legal Officer | PricewaterhouseCoopers LLP |
| Francis V. Knox, Jr. | |
| Chief Compliance Officer | |
| Charles A. Rizzo | |
| Chief Financial Officer | |
| Gordon M. Shone | |
| Treasurer | |
| John G. Vrysen | |
| Chief Operating Officer | |
Additional information about your fund is available without charge in several ways. As required by the SEC, you can access proxy voting information and quarterly portfolio information on your fund. The proxy voting information includes a description of proxy voting policies, procedures and information regarding how the fund voted proxies relating to portfolio securities during the most recent twelve-month period ended June 30. The quarterly portfolio information that includes a complete list of the fund’s holdings for the first and third quarters of the fund’s fiscal period is filed on Form N-Q. You have access to this information:
| By phone | On the fund’s Website | At the SEC |
| 1-800-225-5291 | www.jhfunds.com | www.sec.gov |
| 1-800-SEC-0330 | ||
| SEC Public Reference Room | ||
| You can also contact us: | |
| Regular mail: | Express mail: |
| John Hancock Signature Services, Inc. | John Hancock Signature Services, Inc. |
| P.O. Box 9510 | Mutual Fund Image Operations |
| Portsmouth, NH 03802-9510 | 164 Corporate Drive |
| Portsmouth, NH 03801 | |
Month-end portfolio holdings are available at www.jhfunds.com.
| Annual report | International Classic Value Fund | 41 |

1-800-225-5291
1-800-554-6713 TDD
1-800-338-8080 EASI-Line
www.jhfunds. com
Now available: electronic delivery
www.jhfunds.com/edelivery
| This report is for the information of the shareholders of John Hancock International Classic Value Fund. | 1900A 10/08 |
| It is not authorized for distribution to prospective investors unless preceded or accompanied by a prospectus. | 12/08 |
Discussion of Fund performance
By Sustainable Growth Advisers, LP
The Fund’s fiscal year end recently changed from December 31 to October 31. What follows is a discussion of the Fund’s performance for the 10-month period ended October 31, 2008.
The first 10 months of 2008 comprised one of the most tumultuous periods in the history of the U.S. stock market. The credit environment continued to worsen throughout the period, reaching critical mass in September when a number of venerable financial firms either filed for bankruptcy, were rescued by the federal government or accepted a buyout offer at fire sale prices to avoid insolvency. The crisis took its toll on the U.S. economy and investor confidence, leading to a dramatic stock market swoon in the last two months.
“The first 10 months of 2008
comprised one of the most
tumultuous periods in the history
of the U.S. stock market.”
For the 10 months ended October 31, 2008, John Hancock U.S. Global Leaders Growth Fund’s Class A shares posted a total return of –27.53% at net asset value. By comparison, the Standard & Poor’s 500 Index returned –32.84%, the Russell 1000 Growth Index returned –34.31%, and the average large-cap growth fund returned –36.20%, according to Morningstar, Inc. The portfolio’s year-to-date outperformance reflected a marked deceleration in corporate profit growth. Growth has become scarce, and this has led to increased demand for the sustainable growth companies in which we invest — companies that can, in aggregate, consistently deliver double-digit earnings growth, even in a weaker economic environment. The portfolio’s leading performers came from the consumer staples and health care sectors — two areas that are relatively well insulated from the downturn in the economy. The portfolio’s be st contributors included biotechnology firm Genzyme, Corp., generic drug maker Teva Pharmaceutical Industries, Ltd., and household products company Procter & Gamble Co. On the downside, industrial conglomerate General Electric (which we sold) and video game maker Electronic Arts, Inc. were the biggest detractors from relative performance.
This commentary reflects the views of the portfolio managers through the end of the Fund’s period discussed in this report. The managers’ statements reflect their own opinions. As such, they are in no way guarantees of future events and are not intended to be used as investment advice or a recommendation regarding any specific security. They are also subject to change at any time as market and other conditions warrant.
Sector investing is subject to greater risks than the market as a whole. Because the Fund may focus on particular sectors of the economy, its performance may depend on the performance of those sectors.
| 6 | U.S. Global Leaders Growth Fund | Annual report |
A look at performance
For the period ended October 31, 2008
| Average annual returns (%) | Cumulative total returns (%) | ||||||||||
| with maximum sales charge (POP) | with maximum sales charge (POP) | ||||||||||
| Inception | Since | Since | |||||||||
| Class | date | 1-year | 5-year | 10-year | inception | 1-year | 5-year | 10-year | inception | ||
| A | 9-29-95 | –33.80 | –3.84 | 0.19 | — | –33.80 | –17.79 | 1.96 | — | ||
| B | 5-20-02 | –34.17 | –3.95 | — | –3.36 | –34.17 | –18.24 | — | –19.80 | ||
| C | 5-20-02 | –31.51 | –3.57 | — | –3.36 | –31.51 | –16.64 | — | –19.80 | ||
| I1 | 5-20-02 | –30.00 | –2.42 | — | –2.23 | –30.00 | –11.52 | — | –13.51 | ||
| R11 | 8-5-03 | –30.74 | –3.22 | — | –1.47 | –30.74 | –15.09 | — | –7.46 | ||
Performance figures assume all distributions are reinvested. Public offering price (POP) figures reflect maximum sales charges on Class A shares of 5% and the applicable contingent deferred sales charge (CDSC) on Class B and Class C shares. The returns for Class C shares have been adjusted to reflect the elimination of the front-end sales charge effective July 15, 2004. The Class B shares’ CDSC declines annually between years 1 to 6 according to the following schedule: 5, 4, 3, 3, 2, 1%. No sales charge will be assessed after the sixth year. Class C shares held for less than one year are subject to a 1% CDSC. Sales charge is not applicable for Class I and Class R1 shares.
The expense ratios of the Fund, both net (including any fee waivers or expense limitations) and gross (excluding any fee waivers or expense limitations), are set forth according to the most recent publicly available prospectuses for the Fund and may differ from the expense ratios disclosed in the Financial Highlights tables in this report. The net expenses equal the gross expenses and are as follows: Class A — 1.32%, Class B — 2.07%, Class C — 2.07%, Class I — 0.88%, Class R1 — 1.63%.
The returns reflect past results and should not be considered indicative of future performance. The return and principal value of an investment will fluctuate so that shares, when redeemed, may be worth more or less than their original cost. Due to market volatility, the Fund’s current performance may be higher or lower than the performance shown. For current to the most recent month end performance data, please call 1–800–225–5291 or visit the Fund’s Web site at www.jhfunds.com.
The performance table above and the chart on the next page do not reflect the deduction of taxes that a shareholder would pay on fund distributions or the redemption of fund shares.
The Fund’s performance results reflect any applicable expense reductions, without which the expenses would increase and results would have been less favorable.
1 For certain types of investors, as described in the Fund’s Class I and Class R1 share prospectuses.
| Annual report | U.S. Global Leaders Growth Fund | 7 |
A look at performance
Growth of $10,000
This chart shows what happened to a hypothetical $10,000 investment in U.S. Global Leaders Growth Fund Class A shares for the period indicated. For comparison, we’ve shown the same investment in the Standard & Poor’s 500 Index and the Russell 1000 Growth Index.

| Without sales | With maximum | ||||
| Class | Period beginning | charge | sales charge | Index 1 | Index 2 |
| B2 | 5-20-02 | $8,020 | $8,020 | $10,003 | $9,273 |
| C2 | 5-20-02 | 8,020 | 8,020 | 10,003 | 9,273 |
| I3 | 5-20-02 | 8,649 | 8,649 | 10,003 | 9,273 |
| R13 | 8-5-03 | 9,254 | 9,254 | 11,075 | 10,306 |
Assuming all distributions were reinvested for the period indicated, the table above shows the value of a $10,000 investment in the Fund’s Class B, Class C, Class I and Class R1 shares, respectively, as of October 31, 2008. The Class C shares investment with maximum sales charge has been adjusted to reflect the elimination of the front-end sales charge effective July 15, 2004. Performance of the classes will vary based on the difference in sales charges paid by shareholders investing in the different classes and the fee structure of those classes.
Standard & Poor’s 500 Index — Index 1 — is an unmanaged index that includes 500 widely traded common stocks.
Russell 1000 Growth Index — Index 2 — is an unmanaged index containing those securities in the Russell 1000 Index with a greater-than-average growth orientation.
It is not possible to invest directly in an index. Index figures do not reflect sales charges, which would have resulted in lower values if they did.
1 NAV represents net asset value and POP represents public offering price.
2 No contingent deferred sales charge applicable.
3 For certain types of investors as described in the Fund’s Class I and Class R1 share prospectuses.
| 8 | U.S. Global Leaders Growth Fund | Annual report |
Your expenses
These examples are intended to help you understand your ongoing operating expenses.
Understanding fund expenses
As a shareholder of the Fund, you incur two types of costs:
■ Transaction costs which include sales charges (loads) on purchases or redemptions (varies by share class), minimum account fee charge, etc.
■ Ongoing operating expenses including management fees, distribution and service fees (if applicable), and other fund expenses.
We are going to present only your ongoing operating expenses here.
Actual expenses/actual returns
This example is intended to provide information about your fund’s actual ongoing operating expenses, and is based on your fund’s actual return. It assumes an account value of $1,000.00 on July 1, 2008, with the same investment held until October 31, 2008.
| Account value | Ending value | Expenses paid during | |
| on 7-1-08 | on 10-31-08 | period ended 10-31-081 | |
| Class A | $1,000.00 | $802.70 | $3.91 |
| Class B | 1,000.00 | 800.50 | 6.17 |
| Class C | 1,000.00 | 800.50 | 6.14 |
| Class I | 1,000.00 | 803.70 | 2.58 |
| Class R1 | 1,000.00 | 801.60 | 4.93 |
Together with the value of your account, you may use this information to estimate the operating expenses that you paid over the period. Simply divide your account value at October 31, 2008, by $1,000.00, then multiply it by the “expenses paid” for your share class from the table above. For example, for an account value of $8,600.00, the operating expenses should be calculated as follows:
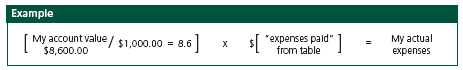
| Annual report | U.S. Global Leaders Growth Fund | 9 |
Your expenses
Hypothetical example for comparison purposes
This table allows you to compare your fund’s ongoing operating expenses with those of any other fund. It provides an example of the Fund’s hypothetical account values and hypothetical expenses based on each class’s actual expense ratio and an assumed 5% annualized return before expenses (which is not your fund’s actual return). It assumes an account value of $1,000.00 on May 1, 2008, with the same investment held until October 31, 2008. Look in any other fund shareholder report to find its hypothetical example and you will be able to compare these expenses.
| Account value | Ending value | Expenses paid during | |
| on 5-1-08 | on 10-31-08 | period ended 10-31-081 | |
| Class A | $1,000.00 | $1,018.70 | $6.55 |
| Class B | 1,000.00 | 1,014.90 | 10.33 |
| Class C | 1,000.00 | 1,014.90 | 10.28 |
| Class I | 1,000.00 | 1,020.90 | 4.32 |
| Class R1 | 1,000.00 | 1,016.90 | 8.26 |
Remember, these examples do not include any transaction costs, such as sales charges; therefore, these examples will not help you to determine the relative total costs of owning different funds. If transaction costs were included, your expenses would have been higher. See the prospectus for details regarding transaction costs.
1 Expenses are equal to the Fund’s annualized expense ratio of 1.29%, 2.04%, 2.03%, 0.85% and 1.63% for Class A, Class B, Class C, Class I and Class R1, respectively, multiplied by the average account value over the period, multiplied by number of days in most recent fiscal half-year/366 (to reflect the one-half year period).
| 10 | U.S. Global Leaders Growth Fund | Annual report |
Portfolio summary
| Top 10 holdings1 | ||||
| Genzyme Corp. | 5.6% | Teva Pharmaceutical Industries Ltd. | 4.7% | |
| Medtronic, Inc. | 5.6% | Lowe’s Cos., Inc. | 4.6% | |
| Procter & Gamble Co. | 5.5% | Electronic Arts, Inc. | 4.4% | |
| Staples, Inc. | 5.0% | Automatic Data Processing, Inc. | 4.1% | |
| Microsoft Corp. | 5.0% | PepsiCo, Inc. | 4.0% | |
| Sector distribution1,2 | ||||
| Information technology | 25% | Financials | 11% | |
| Health care | 22% | Energy | 5% | |
| Consumer staples | 16% | Materials | 5% | |
| Consumer discretionary | 15% | Short-term investments & other | 1% | |

1 As a percentage of the net assets on October 31, 2008.
2 Sector investing is subject to greater risks than the market as a whole. Because the Fund may focus on particular sectors of the economy, its performance may depend on the performance of those sectors.
| Annual report | U.S. Global Leaders Growth Fund | 11 |
F I N A N C I A L S T A T E M E N T S
Fund’s investments
Securities owned by the Fund on 10-31-08
This schedule is divided into two main categories: common stocks and short-term investments. The common stocks are further broken down by industry group. Short-term investments, which represent the Fund’s cash position, are listed last.
| Issuer | Shares | Value | |
| Common stocks 99.45% | $719,337,231 | ||
| (Cost $787,062,112) | |||
| Application Software 2.80% | 20,219,359 | ||
| SAP AG, ADR | 572,300 | 20,219,359 | |
| Asset Management & Custody Banks 3.82% | 27,603,113 | ||
| State Street Corp. | 636,750 | 27,603,113 | |
| Biotechnology 5.59% | 40,470,264 | ||
| Genzyme Corp. (I) | 555,300 | 40,470,264 | |
| Communications Equipment 2.84% | 20,564,750 | ||
| QUALCOMM, Inc. | 537,500 | 20,564,750 | |
| Computer Hardware 2.63% | 19,000,394 | ||
| Apple, Inc. (I) | 176,600 | 19,000,394 | |
| Consumer Finance 6.79% | 49,080,900 | ||
| American Express Co. | 810,600 | 22,291,500 | |
| Visa, Inc. (Class A) | 484,000 | 26,789,400 | |
| Data Processing & Outsourced Services 4.06% | 29,377,223 | ||
| Automatic Data Processing, Inc. | 840,550 | 29,377,223 | |
| Fertilizers & Agricultural Chemicals 1.64% | 11,834,340 | ||
| Monsanto Co. | 133,000 | 11,834,340 | |
| Food Distributors 3.17% | 22,901,420 | ||
| SYSCO Corp. | 874,100 | 22,901,420 | |
| Health Care Distributors 2.35% | 17,020,116 | ||
| Henry Schein, Inc. (I) | 363,600 | 17,020,116 | |
| Health Care Equipment 8.19% | 59,267,134 | ||
| Medtronic, Inc. | 997,426 | 40,226,191 | |
| Zimmer Holdings, Inc. (I) | 410,100 | 19,040,943 | |
| Health Care Supplies 1.74% | 12,562,130 | ||
| Dentsply International, Inc. | 413,500 | 12,562,130 | |
| Home Entertainment Software 4.38% | 31,700,648 | ||
| Electronic Arts, Inc. (I) | 1,391,600 | 31,700,648 | |
| Home Improvement Retail 4.55% | 32,914,560 | ||
| Lowe’s Cos., Inc. | 1,516,800 | 32,914,560 | |
See notes to financial statements
| 12 | U.S. Global Leaders Growth Fund | Annual report |
F I N A N C I A L S T A T E M E N T S
| Issuer | Shares | Value | |
| Household Products 5.46% | $39,466,339 | ||
| Procter & Gamble Co. | 611,502 | 39,466,339 | |
| Internet Retail 3.48% | 25,162,704 | ||
| Amazon.com, Inc. (I) | 439,600 | 25,162,704 | |
| Internet Software & Services 3.34% | 24,181,334 | ||
| Google, Inc. (Class A) (I) | 67,290 | 24,181,334 | |
| Oil & Gas Equipment & Services 5.09% | 36,853,641 | ||
| National-Oilwell Varco, Inc. (I) | 698,850 | 20,888,626 | |
| Schlumberger, Ltd. | 309,100 | 15,965,015 | |
| Pharmaceuticals 4.65% | 33,647,936 | ||
| Teva Pharmaceutical Industries, Ltd., ADR | 784,700 | 33,647,936 | |
| Restaurants 2.19% | 15,864,191 | ||
| Starbucks Corp. (I) | 1,208,240 | 15,864,191 | |
| Soft Drinks 7.76% | 56,145,356 | ||
| Coca-Cola Co. | 621,900 | 27,400,914 | |
| PepsiCo, Inc. | 504,200 | 28,744,442 | |
| Specialty Chemicals 2.86% | 20,694,204 | ||
| Ecolab, Inc. (I)(L) | 555,400 | 20,694,204 | |
| Specialty Stores 5.04% | 36,455,285 | ||
| Staples, Inc. | 1,876,237 | 36,455,285 | |
| Systems Software 5.03% | 36,349,890 | ||
| Microsoft Corp. | 1,627,850 | 36,349,890 | |
| Par value | |||
| Issuer, description, maturity date | (000) | Value | |
| Short-term investments 1.65% | $11,945,166 | ||
| (Cost $11,945,166) | |||
| Joint Repurchase Agreement 0.62% | 4,506,000 | ||
| Joint Repurchase Agreement with Barclays PLC dated | |||
| 10-31-08 at 0.150% to be repurchased at $4,506,056 | |||
| on 11-03-08, collateralized by $5,462,348 U.S. Treasury | |||
| Inflation Indexed Note 1.750% on 1-15-28 (valued | |||
| at $4,596,120 including interest). | $4,506 | 4,506,000 | |
| Interest | |||
| rate | Shares | Value | |
| Cash Equivalents 1.03% | $7,439,166 | ||
| John Hancock Cash Investment Trust (T)(W) | 2.1118% (Y) | $7,439,166 | 7,439,166 |
| Total investments (Cost $799,007,278)† 101.10% | $731,282,397 | ||
| Other assets and liabilities, net (1.10%) | ($7,958,814) | ||
| Total net assets 100.00% | $723,323,583 | ||
The percentage shown for each investment category is the total value of the category as a percentage of the net assets of the Fund.
See notes to financial statements
| Annual report | U.S. Global Leaders Growth Fund | 13 |
F I N A N C I A L S T A T E M E N T S
Notes to Schedule of Investments
ADR American Depositary Receipt
(I) Non-income producing security.
(L) All or a portion of this security is on loan as of October 31, 2008.
(T) Represents investment of securities lending collateral.
(W) Issuer is an affiliate of John Hancock Advisers, LLC.
(Y) Represents current yield as of October 31, 2008.
† At October 31, 2008, the aggregate cost of investment securities for federal income tax purposes was $815,557,061. Net unrealized depreciation aggregated $84,274,664, of which $72,623,626 related to appreciated investment securities and $156,898,290 related to depreciated investment securities.
See notes to financial statements
| 14 | U.S. Global Leaders Growth Fund | Annual report |
F I N A N C I A L S T A T E M E N T S
Financial statements
Statement of assets and liabilities 10-31-08
This Statement of Assets and Liabilities is the Fund’s balance sheet. It shows the value of what the Fund owns, is due and owes. You’ll also find the net asset value and the maximum offering price per share.
| Assets | |
| Investments in unaffiliated issuers, at value (Cost $791,568,112) including | |
| $7,293,300 of securities loaned (Note 2) | $723,843,231 |
| Investments in affiliated issuers, at value (Cost $7,439,166) | 7,439,166 |
| Total investments, at value (Cost $799,007,278) | 731,282,397 |
| Receivable for investments sold | 3,996,401 |
| Receivable for shares sold | 1,213,637 |
| Dividends and interest receivable | 396,785 |
| Receivable from affiliates | 72,061 |
| Other assets | 9,327 |
| Total assets | 736,970,608 |
| Liabilities | |
| Payable for investments purchased | 3,457,914 |
| Payable for shares repurchased | 1,447,271 |
| Payable upon return of securities loaned (Note 2) | 7,439,166 |
| Payable to affiliates | |
| Management fees | 474,366 |
| Distribution and service fees | 218,300 |
| Other | 446,141 |
| Other payables and accrued expenses | 163,867 |
| Total liabilities | 13,647,025 |
| Net assets | |
| Capital paid-in | 810,990,707 |
| Accumulated net realized loss on investments | (19,987,181) |
| Net unrealized depreciation of investments | (67,724,881) |
| Accumulated net investment income | 44,938 |
| Net assets | $723,323,583 |
| Net asset value per share | |
| Based on net asset values and shares outstanding — the Fund has an | |
| unlimited number of shares authorized with no par value | |
| Class A ($552,303,130 ÷ 26,468,682 shares) | $20.87 |
| Class B ($56,084,924 ÷ 2,818,689 shares)1 | $19.90 |
| Class C ($61,830,155 ÷ 3,107,122 shares)1 | $19.90 |
| Class I ($51,298,902 ÷ 2,400,479 shares) | $21.37 |
| Class R1 ($1,806,472 ÷ 88,182 shares) | $20.49 |
| Maximum offering price per share | |
| Class A ($20.87 ÷ 95%)2 | $21.97 |
1 Redemption price is equal to net asset value less any applicable contingent deferred sales charge.
2 On single retail sales of less than $50,000. On sales of $50,000 or more and on group sales the offering price is reduced.
See notes to financial statements
| Annual report | U.S. Global Leaders Growth Fund | 15 |
F I N A N C I A L S T A T E M E N T S
Statement of operations For the period ended 10-31-08
This Statement of Operations summarizes the Fund’s investment income earned and expenses incurred in operating the Fund. It also shows net gains (losses) for the period stated.
| Year | Period | |
| ended | ended | |
| 12-31-07 | 10-31-081 | |
| Investment income | ||
| Dividends (net of foreign withholding taxes of $154,952 | ||
| and $131,076) | $18,827,274 | $11,704,580 |
| Securities lending | 209,049 | 306,781 |
| Interest | 344,925 | 114,476 |
| Total investment income | 19,381,248 | 12,125,837 |
| Expenses | ||
| Investment management fees (Note 5) | 10,564,529 | 6,372,078 |
| Distribution and service fees (Note 5) | 5,542,904 | 3,167,963 |
| Transfer agent fees (Note 5) | 3,350,292 | 2,509,463 |
| Accounting and legal services fees (Note 5) | 186,866 | 109,110 |
| Printing fees | 292,486 | 216,318 |
| Custodian fees | 209,273 | 122,021 |
| Blue sky fees | 188,633 | 93,067 |
| Professional fees | 63,800 | 60,479 |
| Trustees’ fees | 80,937 | 43,838 |
| Miscellaneous | 99,745 | 35,824 |
| Total expenses | 20,579,465 | 12,730,161 |
| Less expense reductions (Note 5) | (621,261) | (682,675) |
| Net expenses | 19,958,204 | 12,047,486 |
| Net investment income (loss) | (576,956) | 78,351 |
| Realized and unrealized gain (loss) | ||
| Net realized gain (loss) on | ||
| Investments | 83,713,573 | (21,320,141) |
| Financial futures contracts | — | 3,029,550 |
| 83,713,573 | (18,290,591) | |
| Change in net unrealized appreciation (depreciation) of investments | (36,267,593) | (284,808,734) |
| (36,267,593) | (284,808,734) | |
| Net realized and unrealized loss | 47,445,980 | (303,099,325) |
| Increase (decrease) in net assets from operations | $46,869,024 | ($303,020,974) |
1 For the ten month period ended October 31, 2008, the Fund changed its fiscal year end from December 31 to October 31.
See notes to financial statements
| 16 | U.S. Global Leaders Growth Fund | Annual report |
F I N A N C I A L S T A T E M E N T S
Statements of changes in net assets
These Statements of Changes in Net Assets show how the value of the Fund’s net assets has changed during the last two periods. The difference reflects earnings less expenses, any investment gains and losses, distributions, if any, paid to shareholders and the net of Fund share transactions.
| Year | Year | Period | |
| ended | ended | ended | |
| 12-31-06 | 12-31-07 | 10-31-081 | |
| Increase (decrease) in net assets | |||
| From operations | |||
| Net investment income (loss) | ($3,042,655) | ($576,956) | $78,351 |
| Net realized gain (loss) | (12,737,688) | 83,713,573 | (18,290,591) |
| Change in net unrealized appreciation | |||
| (depreciation) | 30,951,174 | (36,267,593) | (284,808,734) |
| Increase (decrease) in net assets resulting | |||
| from operations | 15,170,831 | 46,869,024 | (303,020,974) |
| Distributions to shareholders | |||
| From net realized gain | |||
| Class A | — | (38,392,578) | — |
| Class B | — | (4,258,299) | — |
| Class C | — | (4,531,561) | — |
| Class I | — | (251,102) | — |
| Class R1 | — | (123,445) | — |
| — | (47,556,985) | — | |
| From Fund share transactions (Note 6) | (183,965,497) | (369,050,878) | (226,086,028) |
| Total decrease | (168,794,666) | (369,738,839) | (529,107,002) |
| Net assets | |||
| Beginning of year | 1,790,964,090 | 1,622,169,424 | 1,252,430,585 |
| End of year2 | $1,622,169,424 | $1,252,430,585 | $723,323,583 |
1 For the ten month period ended October 31, 2008, the Fund changed its fiscal year end from December 31 to October 31.
2 Includes accumulated net investment income (loss) of ($33,143), ($33,143) and $44,938, respectively.
See notes to financial statements
| Annual report | U.S. Global Leaders Growth Fund | 17 |
F I N A N C I A L S T A T E M E N T S
Financial highlights
The Financial Highlights show how the Fund’s net asset value for a share has changed since the end of the previous period.
CLASS A SHARES
| Period ended | 12-31-03 | 12-31-04 | 12-31-05 | 12-31-06 | 12-31-07 | 10-31-081 |
| Per share operating performance | ||||||
| Net asset value, | ||||||
| beginning of year | $21.57 | $25.72 | $27.84 | $28.44 | $28.85 | $28.80 |
| Net investment income (loss)2 | —3 | 0.15 | (0.04) | —3 | 0.03 | 0.03 |
| Net realized and unrealized | ||||||
| gain (loss) on investments | 4.15 | 2.04 | 0.64 | 0.41 | 1.04 | (7.96) |
| Total from investment operations | 4.15 | 2.19 | 0.60 | 0.41 | 1.07 | (7.93) |
| Less distributions | ||||||
| From net realized gain | — | (0.07) | — | — | (1.12) | — |
| Net asset value, end of year | $25.72 | $27.84 | $28.44 | $28.85 | $28.80 | $20.87 |
| Total return(%)4 | 19.245 | 8.51 | 2.165 | 1.445 | 3.675 | (27.53)5,6 |
| Ratios and supplemental data | ||||||
| Net assets, end of year (in millions) | $392 | $893 | $1,271 | $1,263 | $1,022 | $552 |
| Ratios (as a percentage of average | ||||||
| net assets): | ||||||
| Expenses before reductions | 1.36 | 1.32 | 1.33 | 1.32 | 1.32 | 1.387 |
| Expenses net of all fee waivers | 1.35 | 1.32 | 1.28 | 1.28 | 1.27 | 1.307 |
| Expenses net of all fee waivers | ||||||
| and credits | 1.35 | 1.32 | 1.28 | 1.28 | 1.27 | 1.307 |
| Net investment income (loss) | (0.02) | 0.57 | (0.14) | —8 | 0.10 | 0.137 |
| Portfolio turnover (%) | 15 | 16 | 28 | 34 | 27 | 58 |
1 For the ten month period ended October 31, 2008, the Fund changed its fiscal year end from December 31 to October 31.
2 Based on the average of the shares outstanding.
3 Less than $0.01 per share.
4 Assumes dividend reinvestment and does not reflect the effect of sales charges.
5 Total returns would have been lower had certain expenses not been reduced during the periods shown.
6 Not annualized.
7 Annualized.
8 Less than 0.01% .
See notes to financial statements
| 18 | U.S. Global Leaders Growth Fund | Annual report |
F I N A N C I A L S T A T E M E N T S
Financial highlights
CLASS B SHARES
| Period ended | 12-31-03 | 12-31-04 | 12-31-05 | 12-31-06 | 12-31-07 | 10-31-081 |
| Per share operating performance | ||||||
| Net asset value, | ||||||
| beginning of year | $21.47 | $25.41 | $27.36 | $27.75 | $27.94 | $27.64 |
| Net investment loss2 | (0.18) | (0.05) | (0.24) | (0.20) | (0.18) | (0.13) |
| Net realized and unrealized | ||||||
| gain (loss) on investments | 4.12 | 2.00 | 0.63 | 0.39 | 1.00 | (7.61) |
| Total from investment operations | 3.94 | 1.95 | 0.39 | 0.19 | 0.82 | (7.74) |
| Less distributions | ||||||
| From net realized gain | — | — | — | — | (1.12) | — |
| Net asset value, end of year | $25.41 | $27.36 | $27.75 | $27.94 | $27.64 | $19.90 |
| Total return (%)3 | 18.354 | 7.67 | 1.434 | 0.684 | 2.904 | (28.00)4,5 |
| Ratios and supplemental data | ||||||
| Net assets, end of year (in millions) | $164 | $208 | $218 | $151 | $107 | $56 |
| Ratios (as a percentage of average | ||||||
| net assets): | ||||||
| Expenses before reductions | 2.11 | 2.07 | 2.08 | 2.07 | 2.07 | 2.136 |
| Expenses net of all fee waivers | 2.10 | 2.07 | 2.03 | 2.03 | 2.02 | 2.056 |
| Expenses net of all fee waivers | ||||||
| and credits | 2.10 | 2.07 | 2.03 | 2.03 | 2.02 | 2.056 |
| Net investment income (loss) | (0.77) | (0.21) | (0.88) | (0.75) | (0.65) | (0.63)6 |
| Portfolio turnover (%) | 15 | 16 | 28 | 34 | 27 | 58 |
1 For the ten month period ended October 31, 2008, the Fund changed its fiscal year end from December 31 to October 31.
2 Based on the average of the shares outstanding.
3 Assumes dividend reinvestment and does not reflect the effect of sales charges.
4 Total returns would have been lower had certain expenses not been reduced during the periods shown.
5 Not annualized.
6 Annualized.
See notes to financial statements
| Annual report | U.S. Global Leaders Growth Fund | 19 |
F I N A N C I A L S T A T E M E N T S
Financial highlights
CLASS C SHARES
| Period ended | 12-31-03 | 12-31-04 | 12-31-05 | 12-31-06 | 12-31-07 | 10-31-081 |
| Per share operating performance | ||||||
| Net asset value, | ||||||
| beginning of year | $21.47 | $25.41 | $27.36 | $27.75 | $27.94 | $27.64 |
| Net investment loss2 | (0.18) | (0.04) | (0.24) | (0.20) | (0.18) | (0.13) |
| Net realized and unrealized | ||||||
| gain (loss) on investments | 4.12 | 1.99 | 0.63 | 0.39 | 1.00 | (7.61) |
| Total from investment operations | 3.94 | 1.95 | 0.39 | 0.19 | 0.82 | (7.74) |
| Less distributions | ||||||
| From net realized gain | — | — | — | — | (1.12) | — |
| Net asset value, end of year | $25.41 | $27.36 | $27.75 | $27.94 | $27.64 | $19.90 |
| Total return (%)3 | 18.354 | 7.67 | 1.434 | 0.684 | 2.904 | (28.00)4,5 |
| Ratios and supplemental data | ||||||
| Net assets, end of year (in millions) | $160 | $246 | $284 | $186 | $114 | $62 |
| Ratios (as a percentage of average | ||||||
| net assets): | ||||||
| Expenses before reductions | 2.11 | 2.07 | 2.08 | 2.07 | 2.07 | 2.136 |
| Expenses net of all fee waivers | 2.10 | 2.07 | 2.03 | 2.03 | 2.02 | 2.056 |
| Expenses net of all fee waivers | ||||||
| and credits | 2.10 | 2.07 | 2.03 | 2.03 | 2.02 | 2.056 |
| Net investment income (loss) | (0.77) | (0.17) | (0.88) | (0.75) | (0.65) | (0.63)6 |
| Portfolio turnover (%) | 15 | 16 | 28 | 34 | 27 | 58 |
1 For the ten month period ended October 31, 2008, the Fund changed its fiscal year end from December 31 to October 31.
2 Based on the average of the shares outstanding.
3 Assumes dividend reinvestment and does not reflect the effect of sales charges.
4 Total returns would have been lower had certain expenses not been reduced during the periods shown.
5 Not annualized.
6 Annualized.
See notes to financial statements
| 20 | U.S. Global Leaders Growth Fund | Annual report |
F I N A N C I A L S T A T E M E N T S
Financial highlights
CLASS I SHARES
| Period ended | 12-31-03 | 12-31-04 | 12-31-05 | 12-31-06 | 12-31-07 | 10-31-081 |
| Per share operating performance | ||||||
| Net asset value, | ||||||
| beginning of year | $21.60 | $25.87 | $28.00 | $28.74 | $29.28 | $29.38 |
| Net investment income2 | 0.10 | 0.25 | 0.08 | 0.12 | 0.16 | 0.13 |
| Net realized and unrealized | ||||||
| gain (loss) on investments | 4.17 | 2.06 | 0.66 | 0.42 | 1.06 | (8.14) |
| Total from investment operations | 4.27 | 2.31 | 0.74 | 0.54 | 1.22 | (8.01) |
| Less distributions | ||||||
| From net realized gain | — | (0.18) | — | — | (1.12) | — |
| Net asset value, end of year | $25.87 | $28.00 | $28.74 | $29.28 | $29.38 | $21.37 |
| Total return (%)3 | 19.77 | 8.94 | 2.644 | 1.884 | 4.134 | (27.26)4,5 |
| Ratios and supplemental data | ||||||
| Net assets, end of year (in millions) | $5 | $8 | $13 | $18 | $7 | $51 |
| Ratios (as a percentage of average | ||||||
| net assets): | ||||||
| Expenses before reductions | 0.90 | 0.90 | 0.90 | 0.87 | 0.88 | 0.896 |
| Expenses net of all fee waivers | 0.90 | 0.90 | 0.85 | 0.84 | 0.84 | 0.856 |
| Expenses net of all fee waivers | ||||||
| and credits | 0.90 | 0.90 | 0.85 | 0.84 | 0.84 | 0.856 |
| Net investment income | 0.43 | 0.94 | 0.30 | 0.43 | 0.54 | 0.606 |
| Portfolio turnover (%) | 15 | 16 | 28 | 34 | 27 | 58 |
1 For the ten month period ended October 31, 2008, the Fund changed its fiscal year end from December 31 to October 31.
2 Based on the average of the shares outstanding.
3 Assumes dividend reinvestment and does not reflect the effect of sales charges.
4 Total returns would have been lower had certain expenses not been reduced during the periods shown.
5 Not annualized.
6 Annualized.
See notes to financial statements
| Annual report | U.S. Global Leaders Growth Fund | 21 |
F I N A N C I A L S T A T E M E N T S
Financial highlights
CLASS R1 SHARES
| Period ended | 12-31-031 | 12-31-04 | 12-31-05 | 12-31-06 | 12-31-07 | 10-31-082 |
| Per share operating performance | ||||||
| Net asset value, | ||||||
| beginning of year | $23.02 | $25.68 | $27.77 | $28.35 | $28.63 | $28.50 |
| Net investment income (loss)3 | (0.04) | 0.16 | (0.12) | (0.12) | (0.06) | (0.08) |
| Net realized and unrealized | ||||||
| gain (loss) on investments | 2.70 | 1.95 | 0.70 | 0.40 | 1.05 | (7.93) |
| Total from investment operations | 2.66 | 2.11 | 0.58 | 0.28 | 0.99 | (8.01) |
| Less distributions | ||||||
| From net realized gain | — | (0.02) | — | — | (1.12) | — |
| Net asset value, end of year | $25.68 | $27.77 | $28.35 | $28.63 | $28.50 | $20.49 |
| Total return (%)4 | 11.565 | 8.20 | 2.096 | 0.996 | 3.436 | (28.11)5,6 |
| Ratios and supplemental data | ||||||
| Net assets, end of year (in millions) | —7 | $2 | $5 | $6 | $3 | $2 |
| Ratios (as a percentage of average | ||||||
| net assets): | ||||||
| Expenses before reductions | 1.758 | 1.53 | 1.59 | 1.73 | 1.63 | 1.848 |
| Expenses net of all fee waivers | 1.758 | 1.53 | 1.54 | 1.70 | 1.59 | 1.808 |
| Expenses net of all fee waivers | ||||||
| and credits | 1.758 | 1.53 | 1.54 | 1.70 | 1.59 | 1.808 |
| Net investment income | (0.42)8 | 0.60 | (0.42) | (0.42) | (0.21) | (0.38)8 |
| Portfolio turnover (%) | 15 | 16 | 28 | 34 | 27 | 58 |
1 Class R1 shares began operations on 8-5-03.
2 For the ten month period ended October 31, 2008, the Fund changed its fiscal year end from December 31 to October 31.
3 Based on the average of the shares outstanding.
4 Assumes dividend reinvestment and does not reflect the effect of sales charges.
5 Not annualized.
6 Total returns would have been lower had certain expenses not been reduced during the periods shown.
7 Less than $500,000.
8 Annualized.
See notes to financial statements
| 22 | U.S. Global Leaders Growth Fund | Annual report |
Notes to financial statements
Note 1
Organization
John Hancock U.S. Global Leaders Growth Fund (the Fund) is a non-diversified series of John Hancock Capital Series Trust (the Trust), an open-end management investment company registered under the Investment Company Act of 1940, as amended (the 1940 Act). The investment objective of the Fund is to achieve long-term growth of capital.
The Trustees have authorized the issuance of multiple classes of shares of the Fund, designated as Class A, Class B, Class C, Class I, and Class RI. The shares of each class represent an interest in the same portfolio of investments of the Fund and have equal rights as to voting, redemptions, dividends and liquidation, except that certain expenses, subject to the approval of the Trustees, may be applied differently to each class of shares in accordance with current regulations of the Securities and Exchange Commission (SEC) and the Internal Revenue Service. Shareholders of a class that bears distribution and service expenses under the terms of a distribution plan have exclusive voting rights to that distribution plan. Class B shares will convert to Class A shares eight years after purchase.
Note 2
Significant accounting policies
The financial statements have been prepared in conformity with accounting principles generally accepted in the United States of America, which require management to make certain estimates and assumptions at the date of the financial statements. Actual results could differ from those estimates. The following summarizes the significant accounting policies of the Fund:
Security valuation
The net asset value of the Fund is determined daily as of the close of the New York Stock Exchange (NYSE), normally at 4:00 P.M., Eastern Time. Short-term debt investments that have a remaining maturity of 60 days or less are valued at amortized cost, and thereafter assume a constant amortization to maturity of any discount or premium, which approximates market value. Investments in John Hancock Cash Investment Trust (JHCIT), an affiliate of John Hancock Advisers, LLC (the Adviser), a wholly owned subsidiary of John Hancock Financial Services, Inc., a subsidiary of Manulife Financial Corporation (MFC), are valued at their net asset value each business day. All other securities held by the Fund are valued at the last sale price or official closing price (closing bid price or last evaluated qu ote if no sale has occurred) as of the close of business on the principal securities exchange (domestic or foreign) on which they trade or, lacking any sales, at the closing bid price. Securities traded only in the over-the-counter market are valued at the last bid price quoted by brokers making markets in the securities at the close of trading. Securities for which there are no such quotations, principally debt securities, are valued based on the evaluated prices provided by an independent pricing service, which utilizes both dealer-supplied and electronic data processing techniques, which take into account factors such as institutional-size trading in similar groups of securities, yield, quality, coupon rate, maturity, type of issue, trading characteristics and other market data.
Other portfolio securities and assets for which market quotations are not readily available are valued at fair value as determined in good faith by the Trust’s Pricing Committee in accordance with procedures adopted by the Board of Trustees. Generally, trading in non-U.S. securities is substantially completed each day at various times prior to the close of trading on the NYSE. The values of such securities
| Annual report | U.S. Global Leaders Growth Fund | 23 |
used in computing the net asset value of the Fund’s shares are generally determined as of such times. Occasionally, significant events that affect the values of such securities may occur between the times at which such values are generally determined and the close of the NYSE. Upon such an occurrence, these securities will be valued at fair value as determined in good faith under consistently applied procedures established by and under the general supervision of the Board of Trustees.
Valuations change in response to many factors including the historical and prospective earnings of the issuer, the value of the issuer’s assets, general economic conditions, interest rates, investor perceptions and market liquidity.
The Fund adopted Statement of Financial Accounting Standards No. 157 (FAS 157), Fair Value Measurements, effective with the beginning of the Fund’s fiscal year. FAS 157 established a three-tier hierarchy to prioritize the assumptions, referred to as inputs, used in valuation techniques to measure fair value. The three-tier hierarchy of inputs is summarized in the three broad levels listed below:
Level 1 – Quoted prices in active markets for identical securities.
Level 2 – Prices determined using other significant observable inputs. Observable inputs are inputs that other market participants would use in pricing a security. These may include quoted prices for similar securities, interest rates, prepayment speeds, credit risk and others.
Level 3 – Prices determined using significant unobservable inputs. In situations where quoted prices or observable inputs are unavailable, such as when there is little or no market activity for an investment, unobservable inputs may be used. Unobservable inputs reflect the Fund’s own assumptions about the factors that market participants would use in pricing an investment and would be based on the best information available.
The inputs or methodology used for valuing securities are not necessarily an indication of the risk associated with investing in those securities.
The following is a summary of the inputs used to value the Fund’s net assets as of October 31, 2008:
| INVESTMENTS IN | OTHER FINANCIAL | |
| VALUATION INPUTS | SECURITIES | INSTRUMENTS* |
| Level 1 — Quoted Prices | $726,776,397 | — |
| Level 2 — Other Significant Observable Inputs | 4,506,000 | — |
| Level 3 — Significant Unobservable Inputs | — | — |
| Total | $731,282,397 | — |
*Other financial instruments are derivative instruments not reflected in the Portfolio of Investments, such as futures, forwards and swap contracts, which are valued at the unrealized appreciation/ depreciation on the instrument.
Joint repurchase agreement
Pursuant to an exemptive order issued by the Securities and Exchange Commission (SEC), the Fund, along with other registered investment companies having a management contract with the Adviser, may participate in a joint repurchase agreement transaction. Aggregate cash balances are invested in one or more large repurchase agreements, whose underlying securities are obligations of the U.S. government and/or its agencies. The Fund’s custodian bank receives delivery of the underlying securities for the joint account on the Fund’s behalf. When a Fund enters into a repurchase agreement, it receives delivery of collateral, the amount of which at the time of purchase and each subsequent business day is required to be maintained at such a level that the value is generally 102% of the repurchase amount.
Investment transactions
Investment transactions are accounted for on a trade date plus one basis for daily net asset value calculations. However, for financial reporting purposes, investment security
| 24 | U.S. Global Leaders Growth Fund | Annual report |
transactions are reported on trade date. Interest income is recorded on the accrual basis. Dividend income is recorded on the ex-dividend date net of foreign withholding taxes. Discounts/premiums are accreted/amortized for financial reporting purposes. Realized gains and losses from investment transactions are recorded on an identified cost basis.
Class allocations
Income, common expenses and realized and unrealized gains (losses) are determined at the fund level and allocated daily to each class of shares based on the appropriate net asset value of the respective classes. Distribution and service fees, if any, and transfer agent fees for Class A, Class B, Class C, Class I and R1 shares are calculated daily at the class level based on the appropriate net asset value of each class and the specific expense rate(s) applicable to each class.
Expenses
The majority of expenses are directly identifiable to an individual fund. Trust expenses that are not readily identifiable to a specific fund are allocated in such a manner as deemed equitable, taking into consideration, among other things, the nature and type of expense and the relative size of the funds. Expense estimates are accrued in the period to which they relate and adjustments are made when actual amounts are known.
Bank borrowings
The Fund is permitted to have bank borrowings for temporary or emergency purposes, including the meeting of redemption requests that otherwise might require the untimely disposition of securities. The Fund has entered into a line of credit agreement with The Bank of New York Mellon (BNYM), the Swing Line Lender and Administrative Agent. This agreement enables the Fund to participate, with other funds managed by the Adviser, in an unsecured line of credit with BNYM, which permits borrowings of up to $150 million, collectively. Interest is charged to each fund based on its borrowing. In addition, a commitment fee is charged to each fund based on the average daily unused portion of the line of credit and is allocated among the participating funds. The Fund had no borrowing activity under the line of credit during the period ended October 31, 2008.
Pursuant to the custodian agreements, the Custodian may, in its discretion, advance funds to the Fund to make properly authorized payments. When such payments result in an overdraft, the Fund is obligated to repay the Custodian for any overdraft together with interest due thereon. The Custodian has a lien, security interest or security entitlement in any Fund property, to the maximum extent permitted by law to the extent of any overdraft.
Securities lending
The Fund may lend portfolio securities from time to time in order to earn additional income. The Fund retains beneficial ownership of the securities it has loaned and continues to receive interest and dividends paid by the issuer of securities and to participate in any changes in their value. On the settlement date of the loan, the Fund receives cash collateral against the loaned securities and maintains the cash collateral in an amount not less than 100% of the market value of the loaned securities during the period of the loan. The market value of the loaned securities is determined at the close of business of the Fund and any additional required cash collateral is delivered to the Fund on the next business day. Cash collateral received is invested in the JHCIT. If the borrower defaults on its obligation to return the securities loaned because of insolvency or other reasons, a fund could experience delays and costs in recovering the securities loaned or in gaining access to the collateral. The Fund may receive compensation for lending its securities either in the form of fees, guarantees, and/or by retaining a portion of interest on the investment of any cash received as collateral.
The Fund has entered into an agreement with Morgan Stanley & Co., Inc. and MS Securities Services, Inc. (collectively, Morgan Stanley) which permits the Fund to lend securities to Morgan Stanley on a principal basis. Morgan Stanley is the primary borrower of securities of the Fund. The risk of having one primary borrower of Fund securities (as opposed to several borrowers) is that should Morgan Stanley fail financially, all securities lent may
| Annual report | U.S. Global Leaders Growth Fund | 25 |
be affected by the failure and by any delays in recovery of the securities (or loss of rights in the collateral).
Federal income taxes
The Fund qualifies as a regulated investment company by complying with the applicable provisions of the Internal Revenue Code and will not be subject to federal income tax on taxable income that is distributed to shareholders. Therefore, no federal income tax provision is required.
For federal income tax purposes, the Fund has $13,266,070 of a capital loss carryforward available, to the extent provided by regulations, to offset future net realized capital gains. To the extent that such carryforward is used by the Fund, no capital gain distributions will be made. The loss carryforwards expire as follows: October 31, 2009 — $6,617,824 and October 31, 2016 — $6,648,246. Availability of a certain amount of the loss carryforwards, which were acquired on April 8, 2005, in a merger with John Hancock Large Cap Growth Fund, may be limited in a given year.
The Fund is subject to the provisions of Financial Accounting Standards Board (FASB) Interpretation No. 48, Accounting for Uncertainty in Income Taxes, an interpretation of FASB Statement 109 (FIN 48). FIN 48 prescribes a minimum threshold for financial statement recognition of the benefit of a tax position taken or expected to be taken in a tax return. The implementation of FIN 48 did not have a material impact on the Fund’s financial statements. Each of the Fund’s federal tax returns for the prior three fiscal years remain subject to examination by the Internal Revenue Service.
New accounting pronouncements
In March 2008, FASB No. 161 (FAS 161), Disclosures about Derivative Instruments and Hedging Activities, an amendment of FASB Statement No. 133 (FAS 133), was issued and is effective for fiscal years and interim reporting periods beginning after November 15, 2008. FAS 161 amends and expands the disclosure requirements of FAS 133 in order to provide financial statement users an understanding of a company’s use of derivative instruments, how derivative instruments are accounted for under FAS 133 and related interpretations and how these instruments affect a company’s financial position, performance, and cash flows. FAS 161 requires companies to disclose information detailing the objectives and strategies for using derivative instruments, the level of derivative activity entered into by the company, and any credit risk-related contingent features of the agreements. Mana gement is currently evaluating the adoption of FAS 161 on the Fund’s financial statement disclosures.
Distribution of income and gains
The Fund records distributions to shareholders from net investment income and net realized gains, if any, on the ex-dividend date. The Fund generally declares and pays dividends and capital gains distributions, if any, annually. There were no distributions during the year ended December 31, 2006. During the year ended December 31, 2007 the tax character of distributions paid was as follows: long-term capital gain: $47,556,985. Distributions paid by the Fund with respect to each class of shares are calculated in the same manner, at the same time and are in the same amount, except for the effect of expenses that may be applied differently to each class.
As of October 31, 2008, the components of distributable earnings on a tax basis included $81,492 of undistributed ordinary income and $9,828,672 of undistributed long-term gain.
Such distributions and distributable earnings, on a tax basis, are determined in conformity with income tax regulations, which may differ from accounting principles generally accepted in the United States of America. Distributions in excess of tax basis earnings and profits, if any, are reported in the Fund’s financial statements as a return of capital.
Capital accounts within financial statements are adjusted for permanent book-tax differences. These adjustments have no impact on net assets or the results of operations. Temporary book-tax differences will reverse in a subsequent period. Permanent book-tax differences are primarily attributable to expiration of capital loss carryforwards.
| 26 | U.S. Global Leaders Growth Fund | Annual report |
Note 3
Risk and uncertainties
Concentration risk
The Funds may concentrate investments in a particular industry, sector of the economy or invest in a limited number of companies. Accordingly, the concentration may make the Fund’s value more volatile and investment values may rise and fall more rapidly. In addition, a fund with a concentration is particularly susceptible to the impact of market, economic, regulatory and other factors affecting the specific concentration.
Note 4
Guarantees and indemnifications
Under the Fund’s organizational documents, its Officers and Trustees are indemnified against certain liability arising out of the performance of their duties to the Fund. Additionally, in the normal course of business, the Fund enters into contracts with service providers that contain general indemnification clauses. The Fund’s maximum exposure under these arrangements is unknown, as this would involve future claims that may be made against the Fund that have not yet occurred.
Note 5
Management fee and transactions with
affiliates and others
The Fund has an investment management contract with the Adviser. Under the investment management contract, the Fund pays a monthly management fee to the Adviser equivalent, on an annual basis, to the sum of: (a) 0.75% of the first $2,000,000,000 of the Fund’s average daily net asset value, (b) 0.70% of the next $3,000,000,000 and (c) 0.65% in excess of $5,000,000,000. The effective rate for the year ended October 31, 2008 is 0.75% of the Fund’s average daily net asset value. The Adviser has a subadvisory agreement with Sustainable Growth Advisers, LP. The Fund is not responsible for payment of the subadvisory fees.
The Adviser has voluntarily agreed to limit the Fund’s total expenses, excluding transfer agent fees, distribution and service fees, brokerage commissions, interest and other extraordinary expenses not incurred in the ordinary course of the Fund’s business, to 0.79% of the Fund’s average daily net asset value, on an annual basis. Accordingly, the expense reductions related to this total expense limitation amounted to $336,111 and there were no class-specific total expense reductions during the period ended October 31, 2008. The Adviser reserves the right to terminate these limitations in the future.
The Fund has a Distribution Agreement with John Hancock Funds, LLC (JH Funds), a wholly owned subsidiary of the Adviser. The Fund has adopted Distribution Plans with respect to Class A, Class B, Class C, Class 1 and Class R1, pursuant to Rule 12b-1 under the 1940 Act, to pay JH Funds for the services it provides as distributor of shares of the Fund. Accordingly, the Fund makes monthly payments to JH Funds at an annual rate not to exceed 0.25% 1.00% 1.00% and 0.50% of average daily net asset value of Class A, Class B and Class C, and Class R1, respectively. A maximum of 0.25% of such payments may be service fees, as defined by the Conduct Rules of the Financial Industry Regulatory Authority (formerly the National Association of Securities Dealers). Under the Conduct Rules, curtailment of a portion of the Fund’s 12b-1 payments could occur under certain circumstances. In addition, under a Service Plan for Class R1 shares, the Fund pays up to 0.25% of Class R1 average d aily net asset value for certain other services.
Class A shares are assessed up-front sales charges. During the year ended October 31, 2008, JH Funds received net up-front sales charges of $156,952 with regard to sales of Class A shares. Of this amount, $21,038 was retained and used for printing prospectuses, advertising, sales literature and other purposes, $102,298 was paid as sales commissions to unrelated broker-dealers and $33,616 was paid as sales commissions to sales personnel of Signator Investors, Inc. (Signator Investors), a related broker-dealer. The Adviser’s indirect parent, John Hancock Life Insurance Company (JHLICO), is the indirect sole shareholder of Signator Investors.
Class B shares that are redeemed within six years of purchase are subject to a contingent deferred sales charge (CDSC) at declining rates,
| Annual report | U.S. Global Leaders Growth Fund | 27 |
beginning at 5.00% of the lesser of the current market value at the time of redemption or the original purchase cost of the shares being redeemed. Class C shares that are redeemed within one year of purchase are subject to a CDSC at a rate of 1.00% of the lesser of the current market value at the time of redemption or the original purchase cost of the shares being redeemed. Proceeds from the CDSCs are paid to JH Funds and are used in whole or in part to defray its expenses for providing distribution-related services to the Fund in connection with the sale of Class B and Class C shares. During the year ended October 31, 2008, CDSCs received by JH Funds amounted to $230,253 for Class B shares and $6,328 for Class C shares.
The Fund has a transfer agent agreement with John Hancock Signature Services, Inc. (Signature Services), an indirect subsidiary of JHLICO. The transfer agent fees are made up of three components:
• The Fund pays a monthly transfer agent fee at an annual rate of 0.05%, 0.05%, 0.05%, 0.04%, 0.05% for Classes A, B, C, I, and R1 respectively, of each class’s average daily net assets.
• For the period of January 1, 2008 to May 31, 2008, the Fund paid a monthly fee which is based on an annual rate of $15.00, $17.50, $16.50, $15.00 and $15.00 for each shareholder account for Class A, B, C , I, and R1 respectively. Effective June 1, 2008, all classes paid a monthly fee based on an annual rate of $16.50 per shareholder account.
• Inaddition, Signature Services is reimbursed for certain out-of-pocket expenses.
Signature Services voluntarily agreed to limit the transfer agent expenses to 0.28% for Classes A, B and C. This voluntary waiver will terminate on April 30, 2009. Accordingly, the transfer agent expenses for Classes A, B and C were reduced by $315,578 for the period ended October 31, 2008. In addition, the Fund receives earnings credits from Signature Services as a result of uninvested cash balances. These credits are used to reduce a portion of the Fund’s transfer agent fees and out-of-pocket expenses.
During the year ended October 31, 2008, the Fund’s transfer agent fees and out-of-pocket expenses were reduced by $30,986 for transfer agent credits earned.
Class level expenses for the year ended
October 31, 2008 were as follows:
| Distribution and | Transfer | ||
| Share class | service fees | agent fees | |
| Class A | $1,704,370 | $2,059,402 | |
| Class B | 706,529 | 214,839 | |
| Class C | 740,474 | 218,906 | |
| Class I | — | 10,494 | |
| Class R1 | 16,590 | 5,822 | |
| Total | $3,167,963 | $2,509,463 | |
The Fund has an agreement with the Adviser and affiliates to perform necessary tax, accounting, compliance, legal and other administrative services for the Fund. The compensation for the year ended October 31, 2008 amounted to $109,110 with an effective rate of 0.01% of the Fund’s average daily net asset value.
Mr. James R. Boyle is Chairman of the Adviser, as well as affiliated Trustee of the Fund, and is compensated by the Adviser and/or its affiliates. The compensation of unaffiliated Trustees is borne by the Fund. The unaffiliated Trustees may elect to defer their receipt of this compensation under the John Hancock Group of Funds Deferred Compensation Plan. The Fund makes investments into other John Hancock funds, as applicable, to cover its liability for the deferred compensation. Investments to cover the Fund’s deferred compensation liability are recorded on the Fund’s books as an other asset. The deferred compensation liability and the related other asset are always equal and are marked to market on a periodic basis to reflect any income earned by the investments, as well as any unrealized gains or losses. The Deferred Compensation Plan investments had no impact on the operations of the Fund.
| 28 | U.S. Global Leaders Growth Fund | Annual report |
Note 6
Fund share transactions
This listing illustrates the number of Fund shares sold, reinvested and repurchased during the years ended December 31, 2006 and 2007 and the period ended October 31, 2008, along with the corresponding dollar value.
| Year ended 12-31-06 | Year ended 12-31-07 | Period ended 10-31-081 | ||||
| Shares | Amount | Shares | Amount | Shares | Amount | |
| Class A shares | ||||||
| Sold | 17,133,890 | $477,600,883 | 10,354,984 | $302,892,029 | 9,723,084 | $257,408,383 |
| Distributions reinvested | — | — | 1,236,841 | 36,029,184 | — | — |
| Repurchased | (18,061,108) | (502,875,391) | (19,881,793) | (579,961,051) | (18,727,550) | (492,347,628) |
| Net decrease | (927,218) | ($25,274,508) | (8,289,968) | ($241,039,838) | (9,004,466) | ($234,939,245) |
| Class B shares | ||||||
| Sold | 481,232 | $13,124,754 | 247,878 | $6,989,908 | 129,095 | $3,250,562 |
| Distributions reinvested | — | — | 140,833 | 3,937,681 | — | — |
| Repurchased | (2,929,359) | (79,575,184) | (1,903,776) | (53,703,289) | (1,191,466) | (30,133,775) |
| Net decrease | (2,448,127) | ($66,450,430) | (1,515,065) | ($42,775,700) | (1,062,371) | ($26,883,213) |
| Class C shares | ||||||
| Sold | 915,608 | $24,981,632 | 395,178 | $11,156,071 | 222,396 | $5,411,600 |
| Distributions reinvested | — | — | 150,235 | 4,200,573 | — | — |
| Repurchased | (4,510,273) | (121,996,912) | (3,062,987) | (86,312,659) | (1,237,277) | (31,521,502) |
| Net decrease | (3,594,665) | ($97,015,280) | (2,517,574) | ($70,956,015) | (1,014,881) | ($26,109,902) |
| Class I shares | ||||||
| Sold | 438,676 | $12,289,473 | 152,386 | $4,518,555 | 2,781,045 | $76,147,933 |
| Distributions reinvested | — | — | 7,933 | 235,616 | — | — |
| Repurchased | (288,495) | (7,951,414) | (542,250) | (16,369,985) | (605,753) | (13,925,491) |
| Net increase (decrease) | 150,181 | $4,338,059 | (381,931) | ($11,615,814) | 2,175,292 | $62,222,442 |
| Class R1 shares | ||||||
| Sold | 127,883 | $3,615,799 | 46,967 | $1,350,194 | 38,611 | $978,977 |
| Distributions reinvested | — | — | 4,297 | 123,445 | — | — |
| Repurchased | (112,753) | (3,179,137) | (142,504) | (4,137,150) | (51,311) | (1,355,087) |
| Net increase (decrease) | 15,130 | $436,662 | (91,240) | ($2,663,511) | (12,700) | ($376,110) |
| Net decrease | (6,804,699) | ($183,965,497) | (12,795,778) | ($369,050,878) | (8,919,126) | ($226,086,028) |
1For the ten month period ended October 31, 2008, the Fund changed its fiscal year end from December 31 to October 31.
Note 7
Purchase and sale of securities
Purchases and proceeds from sales or maturities of securities, other than short-term securities and obligations of the U.S. government, during the year ended October 31, 2008, aggregated $583,118,316 and $800,505,590, respectively.
Note 8
Change in fiscal year end
The Fund’s fiscal year end has changed to October 31, 2008.
| Annual report | U.S. Global Leaders Growth Fund | 29 |
Auditors’ report
Report of Independent Registered Public Accounting Firm
To the Board of Trustees of John Hancock Capital Series and Shareholders of John Hancock U.S. Global Leaders Growth Fund:
In our opinion, the accompanying statement of assets and liabilities, including the schedule of investments, and the related statements of operations and of changes in net assets and the financial highlights present fairly, in all material respects, the financial position of John Hancock U.S. Global Leaders Growth Fund (the Fund) at October 31, 2008, and the results of its operations, the changes in its net assets and the financial highlights for the periods indicated, in conformity with accounting principles generally accepted in the United States of America. These financial statements and financial highlights (hereafter referred to as “financial statements”) are the responsibility of the Fund’s management; our responsibility is to express an opinion on these financial statements based on our audits. We conducted our audits of these financial statements in accordance with the standards of the Public Company Accounting Oversight Board (United States). Thos e standards require that we plan and perform the audit to obtain reasonable assurance about whether the financial statements are free of material misstatement. An audit includes examining, on a test basis, evidence supporting the amounts and disclosures in the financial statements, assessing the accounting principles used and significant estimates made by management, and evaluating the overall financial statement presentation. We believe that our audits, which included confirmation of securities as of October 31, 2008 by correspondence with the custodian and brokers, and the application of alternative auditing procedures where securities purchased had not been received, provide a reasonable basis for our opinion.
PricewaterhouseCoopers LLP
Boston, Massachusetts
December 22, 2008
| 30 | U.S. Global Leaders Growth Fund | Annual report |
Tax information
Unaudited
For federal income tax purposes, the following information is furnished with respect to the distributions of the Fund, if any, paid during its taxable period ended October 31, 2008.
Shareholders will be mailed a 2008 U.S. Treasury Department Form 1099-DIV in January 2009. This will reflect the total of all distributions that are taxable for calendar year 2008.
| Annual report | U.S. Global Leaders Growth Fund | 31 |
Board Consideration of and
Continuation of Investment Advisory
Agreement and Subadvisory
Agreement: John Hancock U.S. Global
Leaders Growth Fund
The Investment Company Act of 1940 (the 1940 Act) requires the Board of Trustees (the Board) of John Hancock Capital Series (the Trust), including a majority of the Trustees who have no direct or indirect interest in the investment advisory agreement and are not “interested persons” of the Trust, as defined in the 1940 Act (the Independent Trustees), annually to meet in person to review and consider the continuation of: (i) the investment advisory agreement (the Advisory Agreement) with John Hancock Advisers, LLC (the Adviser) and (ii) the investment subadvisory agreement (the Subadvisory Agreement) with Sustainable Growth Advisers, LP (the Subadviser) for the John Hancock U.S. Global Leaders Growth Fund (the Fund). The Advisory Agreement and the Subadvisory Agreement are collectively referred to as the Advisory Agreements.
At meetings held on May 5–6 and June 9–10, 2008, the Board considered the factors and reached the conclusions described below relating to the selection of the Adviser and Subadviser and the continuation of the Advisory Agreements. During such meetings, the Board’s Contracts/Operations Committee and the Independent Trustees also met in executive sessions with their independent legal counsel.
In evaluating the Advisory Agreements, the Board, including the Contracts/Operations Committee and its Independent Trustees, reviewed a broad range of information requested for this purpose. This information included:
(i) the investment performance of the Fund relative to a category of relevant funds (the Category) and a peer group of comparable funds (the Peer Group). The funds within each Category and Peer Group were selected by Morningstar Inc. (Morningstar), an independent provider of investment company data. Data covered a range of periods ended December 31, 2007,
(ii) advisory and other fees incurred by, and the expense ratios of, the Fund relative to a Category and a Peer Group,
(iii) the advisory fees of comparable portfolios of other clients of the Adviser and the Subadviser,
(iv) the Adviser’s financial results and condition, including its and certain of its affiliates’ profitability from services performed for the Fund,
(v) breakpoints in the Fund’s and the Peer Group’s fees, and information about economies of scale,
(vi) the Adviser’s and Subadviser’s record of compliance with applicable laws and regulations, with the Fund’s investment policies and restrictions, and with the applicable Code of Ethics, and the structure and responsibilities of the Adviser’s and Subadviser’s compliance department,
(vii) the background and experience of senior management and investment professionals, and
(viii) the nature, cost and character of advisory and non-investment management services provided by the Adviser and its affiliates and by the Subadviser.
The Independent Trustees considered the legal advice of independent legal counsel and relied on their own business judgment in determining the factors to be considered in evaluating the materials that were presented to them and the weight to be given to each such factor. The Board’s review and conclusions were based on a comprehensive consideration of all information presented to the Board and not the result of any single controlling factor. The Board principally considered data on performance and other information provided by Morningstar as of December 31, 2007. The Board also considered updated performance information provided to it by the Adviser or Subadviser at its May and June 2008 meetings. Performance and other information may be quite different as of the date of this shareholders report. The key factors considered by the Board and the conclusions reached are described below.
| 32 | U.S. Global Leaders Growth Fund | Annual report |
Nature, extent and quality of services
The Board considered the ability of the Adviser and the Subadviser, based on their resources, reputation and other attributes, to attract and retain qualified investment professionals, including research, advisory, and supervisory personnel. The Board considered the investment philosophy, research and investment decision-making processes of the Adviser, Subadviser and representatives of the Subadviser that are responsible for the daily investment activities of the Fund. The Board considered the representatives’ history and experience with the Fund. The Board considered the Adviser’s execution of its oversight responsibilities. The Board further considered the culture of compliance, resources dedicated to compliance, compliance programs and compliance records of the Adviser and Subadviser. In addition, the Board took into account the administrative and other non-advisory services provided to the Fund by the Adviser and its affiliates.
Based on the above factors, together with those referenced below, the Board concluded that, within the context of its full deliberations, the nature, extent and quality of the investment advisory services provided to the Fund by the Adviser and Subadviser supported renewal of the Advisory Agreements.
Fund performance
The Board considered the performance results for the Fund over various time periods ended December 31, 2007. The Board also considered these results in comparison to the performance of the Category, as well as the Fund’s benchmark indices. The Board reviewed with representatives of Morningstar the methodology used by Morningstar to select the funds in the Category and the Peer Group.
The Board noted that the Fund’s performance for all periods under review was lower than the performance of the Category median, and one of its benchmark indices, the Standard & Poor’s 500 Index. The Board noted that the Fund’s performance during the 1-, 3- and 5-year periods was lower than the performance of its other benchmark index, the Russell 100 Growth Index, but was higher than the performance of the benchmark index during the 10-year period. The Board viewed favorably that the Fund’s performance during the 10-year period was higher than the performance of the Peer Group median. The Board continues to have concerns that the Fund’s performance for more recent periods was lower than the performance of the Peer Group and Category medians. Because of the underperformance for more recent periods, the Board made further inquiry of the Adviser and Subadviser.
The Subadviser provided detailed information about its investment process and discussed the performance of specific portfolio stocks with the Board. The Adviser also discussed with the Board its review and analysis of the Subadviser’s investment process and particular portfolio stocks in light of the Fund’s investment mandates. The Board concluded that the investment process and particular portfolio stocks seemed consistent with the Fund’s investment objectives, strategy and style. The Adviser also presented updated performance analysis to the Board, which showed improved performance.
The Board was satisfied that the Subadviser and Adviser appreciated its concerns, had satisfactorily explained the Fund’s underperformance and were diligently pursuing the Fund’s investment objective consistent with its investment strategy and style. The Board viewed favorably the Fund’s longer-term performance and noted times in the Fund’s history in which it outperformed comparable funds.
Investment advisory fee and subadvisory fee rates and expenses
The Board reviewed and considered the contractual investment advisory fee rate payable by the Fund to the Adviser for investment advisory services (the Advisory Agreement Rate). The Board received and considered information comparing the Advisory Agreement Rate with the advisory fees for the Peer Group. The Board noted that the Advisory Agreement Rate was higher than the median rate of the Peer Group but equal to the median rate of the Category.
The Board received and considered expense information regarding the Fund’s various components, including advisory fees, distribution and fees other than advisory and distribution fees, including transfer agent fees, custodian fees, and other miscellaneous fees (e.g., fees for
| Annual report | U.S. Global Leaders Growth Fund | 33 |
accounting and legal services). The Board considered comparisons of these expenses to the Peer Group median. The Board also received and considered expense information regarding the Fund’s total operating expense ratio (Gross Expense Ratio) and total operating expense ratio after taking the fee waiver arrangement applicable to the Advisory Agreement Rate into account (Net Expense Ratio). The Board received and considered information comparing the Gross Expense Ratio and Net Expense Ratio of the Fund to that of the Peer Group and Category medians. The Board noted that the Fund’s Gross and Net Expense Ratios were higher than the Category median, but not appreciably higher than the Peer Group median. The Board noted that, although contractual fee waiver arrangements had expired, the Adviser voluntarily agreed to limit certain expenses. The Board favorably considered the impact of fee waivers towards ultimately lowering the Fund’s total operating expense ratio .
The Adviser also discussed the Morningstar data and rankings, and other relevant information, for the Fund. Based on the above-referenced considerations and other factors, the Board concluded that the Fund’s overall performance and expenses supported the re-approval of the Advisory Agreements.
The Board also received information about the investment subadvisory fee rate (the Subadvisory Agreement Rate) payable by the Adviser to the Subadviser for investment sub-advisory services. The Board concluded that the Subadvisory Agreement Rate was fair and equitable, based on its consideration of the factors described here.
Profitability
The Board received and considered a detailed profitability analysis of the Adviser based on the Advisory Agreements, as well as on other relationships between the Fund and the Adviser and its affiliates. The Board also considered a comparison of the Adviser’s profitability to that of other similar investment advisers whose profitability information is publicly available. The Board concluded that, in light of the costs of providing investment management and other services to the Fund, the profits and other ancillary benefits reported by the Adviser were not unreasonable.
The Board did not consider profitability information with respect to the Subadviser, which is not affiliated with the Adviser. The Board considered that the Subadvisory Agreement Rate paid to the Subadviser had been negotiated by the Adviser on an arm’s length basis and that the Subadviser’s separate profitability from its relationship with the Fund was not a material factor in determining whether to renew the agreement.
Economies of scale
The Board received and considered general information regarding economies of scale with respect to the management of the Fund, including the Fund’s ability to appropriately benefit from economies of scale under the Fund’s fee structure. The Board recognized the inherent limitations of any analysis of economies of scale, stemming largely from the Board’s understanding that most of the Adviser’s costs are not specific to individual Funds, but rather are incurred across a variety of products and services.
To the extent the Board and the Adviser were able to identify actual or potential economies of scale from Fund-specific or allocated expenses, in order to ensure that any such economies continue to be reasonably shared with the Fund as its assets increase, the Adviser and the Board agreed to continue existing breakpoints to the Advisory Agreement Rate.
Information about services to other clients
The Board also received information about the nature, extent and quality of services and fee rates offered by the Adviser and Subadviser to their other clients, including other registered investment companies, institutional investors and separate accounts. The Board concluded that the Advisory Agreement Rate and the Subadvisory Agreement Rate were not unreasonable, taking into account fee rates offered to others by the Adviser and Subadviser, respectively, after giving effect to differences in services.
Other benefits to the Adviser
The Board received information regarding potential “fall-out” or ancillary benefits received by the Adviser and its affiliates and the Subadviser as a result of their relationship
| 34 | U.S. Global Leaders Growth Fund | Annual report |
with the Fund. Such benefits could include, among others, benefits directly attributable to the relationship of the Adviser and Subadviser with the Fund and benefits potentially derived from an increase in business of the Adviser and Subadviser as a result of their relationship with the Fund (such as the ability to market to shareholders other financial products offered by the Adviser and its affiliates).
The Board also considered the effectiveness of the Adviser’s, Subadviser’s and Fund’s policies and procedures for complying with the requirements of the federal securities laws, including those relating to best execution of portfolio transactions and brokerage allocation.
Other factors and broader review
As discussed above, the Board reviewed detailed materials received from the Adviser and Subadviser as part of the annual re-approval process. The Board also regularly reviews and assesses the quality of the services that the Fund receives throughout the year. In this regard, the Board reviews reports of the Adviser at least quarterly, which include, among other things, fund performance reports and compliance reports. In addition, the Board meets with portfolio managers and senior investment officers at various times throughout the year.
After considering the above-described factors and based on its deliberations and its evaluation of the information described above, the Board concluded that approval of the continuation of the Advisory Agreements for the Fund was in the best interest of the Fund and its shareholders. Accordingly, the Board unanimously approved the continuation of the Advisory Agreements.
| Annual report | U.S. Global Leaders Growth Fund | 35 |
Trustees and Officers
This chart provides information about the Trustees and Officers who oversee your John Hancock fund. Officers elected by the Trustees manage the day-to-day operations of the Fund and execute policies formulated by the Trustees.
Independent Trustees
| Name, Year of Birth | Number of | |
| Position(s) held with Fund | Trustee | John Hancock |
| Principal occupation(s) and other | of Fund | funds overseen |
| directorships during past 5 years | since1 | by Trustee |
| James F. Carlin, Born: 1940 | 2005 | 50 |
| Chairman (since December 2007); Director and Treasurer, Alpha Analytical Laboratories, Inc. (chemical | ||
| analysis) (since 1985); Part Owner and Treasurer, Lawrence Carlin Insurance Agency, Inc. (since 1995); | ||
| Part Owner and Vice President, Mone Lawrence Carlin Insurance Agency, Inc. (until 2005); Chairman | ||
| and Chief Executive Officer, Carlin Consolidated, Inc. (management/investments) (since 1987); Trustee, | ||
| Massachusetts Health and Education Tax Exempt Trust (1993–2003). | ||
| William H. Cunningham, Born: 1944 | 2005 | 50 |
| Professor, University of Texas at Austin (since 1971); former Chancellor, University of Texas System and | ||
| former President, University of Texas at Austin (until 2001); Chairman and Chief Executive Officer, IBT | ||
| Technologies (until 2001); Director of the following: Hicks Acquisition Company I, Inc. (since 2007); | ||
| Hire.com (until 2004), STC Broadcasting, Inc. and Sunrise Television Corp. (until 2001), Symtx, Inc. | ||
| (electronic manufacturing) (since 2001), Adorno/Rogers Technology, Inc. (until 2004), Pinnacle Foods | ||
| Corporation (until 2003), rateGenius (until 2003), Lincoln National Corporation (insurance) (since | ||
| 2006), Jefferson-Pilot Corporation (diversified life insurance company) (until 2006), New Century | ||
| Equity Holdings (formerly Billing Concepts) (until 2001), eCertain (until 2001), ClassMap.com (until | ||
| 2001), Agile Ventures (until 2001), AskRed.com (until 2001), Southwest Airlines (since 2000), Introgen | ||
| (manufacturer of biopharmaceuticals) (since 2000) and Viasystems Group, Inc. (electronic manufacturer) | ||
| (until 2003); Advisory Director, Interactive Bridge, Inc. (college fundraising) (until 2001); Advisory | ||
| Director, Q Investments (until 2003); Advisory Director, JPMorgan Chase Bank (formerly Texas Commerce | ||
| Bank–Austin), LIN Television (until 2008), WilTel Communications (until 2003) and Hayes Lemmerz | ||
| International, Inc. (diversified automotive parts supply company) (since 2003). | ||
| Deborah C. Jackson,4 Born: 1952 | 2008 | 50 |
| Chief Executive Officer, American Red Cross of Massachusetts Bay (since 2002); Board of Directors of | ||
| Eastern Bank Corporation (since 2001); Board of Directors of Eastern Bank Charitable Foundation (since | ||
| 2001); Board of Directors of American Student Association Corp. (since 1996); Board of Directors of | ||
| Boston Stock Exchange (2002–2008); Board of Directors of Harvard Pilgrim Healthcare (since 2007). | ||
| Charles L. Ladner,2 Born: 1938 | 2004 | 50 |
| Chairman and Trustee, Dunwoody Village, Inc. (retirement services) (until 2003); Senior Vice President | ||
| and Chief Financial Officer, UGI Corporation (public utility holding company) (retired 1998); Vice | ||
| President and Director, AmeriGas, Inc. (retired 1998); Director, AmeriGas Partners, L.P. (gas distribution) | ||
| (until 1997); Director, EnergyNorth, Inc. (until 1997); Director, Parks and History Association (until 2005). | ||
| Stanley Martin,2,4 Born: 1947 | 2008 | 50 |
| Senior Vice President/Audit Executive, Federal Home Loan Mortgage Corporation (2004–2006); | ||
| Executive Vice President/Consultant, HSBC Bank USA (2000–2003); Chief Financial Officer/Executive | ||
| Vice President, Republic New York Corporation and Republic National Bank of New York (1998–2000); | ||
| Partner, KPMG LLP (1971–1998). | ||
| 36 | U.S. Global Leaders Growth Fund | Annual report |
Independent Trustees (continued)
| Name, Year of Birth | Number of | |
| Position(s) held with Fund | Trustee | John Hancock |
| Principal occupation(s) and other | of Fund | funds overseen |
| directorships during past 5 years | since1 | by Trustee |
| Dr. John A. Moore,2 Born: 1939 | 2002 | 50 |
| President and Chief Executive Officer, Institute for Evaluating Health Risks (nonprofit institution) | ||
| (until 2001); Senior Scientist, Sciences International (health research) (until 2003); Former Assistant | ||
| Administrator and Deputy Administrator, Environmental Protection Agency; Principal, Hollyhouse | ||
| (consulting) (since 2000); Director, CIIT Center for Health Science Research (nonprofit research) (until | ||
| 2007). | ||
| Patti McGill Peterson,2 Born: 1943 | 2002 | 50 |
| Principal, PMP Globalinc (consulting) (since 2007); Senior Associate, Institute for Higher Education Policy | ||
| (since 2007); Executive Director, CIES (international education agency) (until 2007); Vice President, | ||
| Institute of International Education (until 2007); Senior Fellow, Cornell University Institute of Public | ||
| Affairs, Cornell University (until 1998); Former President Wells College, St. Lawrence University and the | ||
| Association of Colleges and Universities of the State of New York. Director of the following: Niagara | ||
| Mohawk Power Corporation (until 2003); Security Mutual Life (insurance) (until 1997); ONBANK (until | ||
| 1993). Trustee of the following: Board of Visitors, The University of Wisconsin, Madison (since 2007); | ||
| Ford Foundation, International Fellowships Program (until 2007); UNCF, International Development | ||
| Partnerships (until 2005); Roth Endowment (since 2002); Council for International Educational Exchange | ||
| (since 2003). | ||
| Steven R. Pruchansky, Born: 1944 | 2005 | 50 |
| Chairman and Chief Executive Officer, Greenscapes of Southwest Florida, Inc. (since 2000); Director | ||
| and President, Greenscapes of Southwest Florida, Inc. (until 2000); Member, Board of Advisors, First | ||
| American Bank (since 2008); Managing Director, JonJames, LLC (real estate) (since 2000); Director, First | ||
| Signature Bank & Trust Company (until 1991); Director, Mast Realty Trust (until 1994); President, Maxwell | ||
| Building Corp. (until 1991). | ||
| Non-Independent Trustees3 | ||
| Name, Year of Birth | Number of | |
| Position(s) held with Fund | Trustee | John Hancock |
| Principal occupation(s) and other | of Fund | funds overseen |
| directorships during past 5 years | since1 | by Trustee |
| James R. Boyle, Born: 1959 | 2005 | 267 |
| Executive Vice President, Manulife Financial Corporation (since 1999); Director and President, John | ||
| Hancock Variable Life Insurance Company (since 2007); Director and Executive Vice President, John | ||
| Hancock Life Insurance Company (since 2004); Chairman and Director, John Hancock Advisers, LLC (the | ||
| Adviser), John Hancock Funds, LLC (John Hancock Funds) and The Berkeley Financial Group, LLC (The | ||
| Berkeley Group) (holding company) (since 2005); Chairman and Director, John Hancock Investment | ||
| Management Services, LLC (since 2006); Senior Vice President, The Manufacturers Life Insurance | ||
| Company (U.S.A.) (until 2004). | ||
| Annual report | U.S. Global Leaders Growth Fund | 37 |
Principal officers who are not Trustees
| Name, Year of Birth | ||
| Position(s) held with Fund | Officer | |
| Principal occupation(s) and other | of Fund | |
| directorships during past 5 years | since | |
| Keith F. Hartstein, Born: 1956 | 2005 | |
| President and Chief Executive Officer | ||
| Senior Vice President, Manulife Financial Corporation (since 2004); Director, President and Chief | ||
| Executive Officer, the Adviser, The Berkeley Group and John Hancock Funds, LLC (since 2005); Director, | ||
| MFC Global Investment Management (U.S.), LLC (MFC Global (U.S.)) (since 2005); Chairman and | ||
| Director, John Hancock Signature Services, Inc. (since 2005); Director, President and Chief Executive | ||
| Officer, John Hancock Investment Management Services, LLC (since 2006); President and Chief Executive | ||
| Officer, John Hancock Funds, John Hancock Funds II, John Hancock Funds III and John Hancock Trust | ||
| (since 2005); Director, Chairman and President, NM Capital Management, Inc. (since 2005); Member | ||
| and former Chairman, Investment Company Institute Sales Force Marketing Committee (since 2003); | ||
| Director, President and Chief Executive Officer, MFC Global (U.S.) (2005–2006); Executive Vice President, | ||
| John Hancock Funds, LLC (until 2005). | ||
| Thomas M. Kinzler, Born: 1955 | 2006 | |
| Secretary and Chief Legal Officer | ||
| Vice President and Counsel, John Hancock Life Insurance Company (U.S.A.) (since 2006); Secretary and | ||
| Chief Legal Officer, John Hancock Funds, John Hancock Funds II and John Hancock Trust (since 2006); | ||
| Vice President and Associate General Counsel, Massachusetts Mutual Life Insurance Company (1999– | ||
| 2006); Secretary and Chief Legal Counsel, MML Series Investment Fund (2000–2006); Secretary and | ||
| Chief Legal Counsel, MassMutual Institutional Funds (2000–2004); Secretary and Chief Legal Counsel, | ||
| MassMutual Select Funds and MassMutual Premier Funds (2004–2006). | ||
| Francis V. Knox, Jr., Born: 1947 | 2005 | |
| Chief Compliance Officer | ||
| Vice President and Chief Compliance Officer, John Hancock Investment Management Services, LLC, | ||
| the Adviser and MFC Global (U.S.) (since 2005); Chief Compliance Officer, John Hancock Funds, John | ||
| Hancock Funds II, John Hancock Funds III and John Hancock Trust (since 2005); Vice President and | ||
| Assistant Treasurer, Fidelity Group of Funds (until 2004); Vice President and Ethics & Compliance Officer, | ||
| Fidelity Investments (until 2001). | ||
| Charles A. Rizzo, Born: 1957 | 2007 | |
| Chief Financial Officer | ||
| Chief Financial Officer, John Hancock Funds, John Hancock Funds II, John Hancock Funds III and John | ||
| Hancock Trust (since 2007); Assistant Treasurer, Goldman Sachs Mutual Fund Complex (registered | ||
| investment companies) (2005–2007); Vice President, Goldman Sachs (2005–2007); Managing Director | ||
| and Treasurer of Scudder Funds, Deutsche Asset Management (2003–2005); Director, Tax and Financial | ||
| Reporting, Deutsche Asset Management (2002–2003); Vice President and Treasurer, Deutsche Global | ||
| Fund Services (1999–2002). | ||
| Gordon M. Shone, Born: 1956 | 2006 | |
| Treasurer | ||
| Senior Vice President, John Hancock Life Insurance Company (U.S.A.) (since 2001); Treasurer, John | ||
| Hancock Funds (since 2006), John Hancock Funds II, John Hancock Funds III and John Hancock Trust | ||
| (since 2005); Vice President and Chief Financial Officer, John Hancock Trust (2003–2005); Vice President, | ||
| John Hancock Investment Management Services, LLC, John Hancock Advisers, LLC (since 2006) and The | ||
| Manufacturers Life Insurance Company (U.S.A.) (1998–2000). | ||
| 38 | U.S. Global Leaders Growth Fund | Annual report |
Principal officers who are not Trustees (continued)
| Name, Year of Birth | |
| Position(s) held with Fund | Officer |
| Principal occupation(s) and other | of Fund |
| directorships during past 5 years | since |
| John G. Vrysen, Born: 1955 | 2005 |
| Chief Operating Officer | |
| Senior Vice President, Manulife Financial Corporation (since 2006); Senior Vice President, John Hancock | |
| Life Insurance Company (since 2004); Director, Executive Vice President and Chief Operating Officer, | |
| the Adviser, The Berkeley Group and John Hancock Funds, LLC (since 2007); Director, Executive Vice | |
| President and Chief Operating Officer, John Hancock Investment Management Services, LLC (since | |
| 2007); Chief Operating Officer, John Hancock Funds, John Hancock Funds II, John Hancock Funds III | |
| and John Hancock Trust (since 2007); Director, Executive Vice President and Chief Financial Officer, | |
| the Adviser, The Berkeley Group and John Hancock Funds, LLC (2005–2007); Director, Executive Vice | |
| President and Chief Financial Officer, John Hancock Investment Management Services, LLC (2005–2007); | |
| Executive Vice President and Chief Financial Officer, MFC Global (U.S.) (2005–2007); Director, John | |
| Hancock Signature Services, Inc. (since 2005); Chief Financial Officer, John Hancock Funds, John Hancock | |
| Funds II, John Hancock Funds III and John Hancock Trust (2005–2007); Vice President and General | |
| Manager, John Hancock Fixed Annuities, U.S. Wealth Management (2004–2005); Vice President, | |
| Operations, Manulife Wood Logan (2000–2004). | |
The business address for all Trustees and Officers is 601 Congress Street, Boston, Massachusetts 02210-2805.
The Statement of Additional Information of the Fund includes additional information about members of the Board of Trustees of the Fund and is available without charge, upon request, by calling 1-800-225-5291.
1 Each Trustee serves until resignation, retirement age or until his or her successor is elected.
2 Member of Audit and Compliance Committee.
3 Non-Independent Trustee holds positions with the Fund’s investment adviser, underwriter and certain other affiliates.
4 Mr. Martin was appointed by the Board as Trustee on September 8, 2008 and Ms. Jackson was appointed effective October 1, 2008.
| Annual report | U.S. Global Leaders Growth Fund | 39 |
More information
| Trustees | Investment adviser |
| James F. Carlin, Chairman | John Hancock Advisers, LLC |
| James R. Boyle† | |
| William H. Cunningham | Subadviser |
| Deborah C. Jackson | Sustainable Growth Advisers, LP |
| Charles L. Ladner* | |
| Stanley Martin* | Principal distributor |
| Dr. John A. Moore* | John Hancock Funds, LLC |
| Patti McGill Peterson* | |
| Steven R. Pruchansky | Custodian |
| *Members of the Audit Committee | The Bank of New York Mellon |
| †Non-Independent Trustee | |
| Transfer agent | |
| Officers | John Hancock Signature Services, Inc. |
| Keith F. Hartstein | |
| President and Chief Executive Officer | Legal counsel |
| K&L Gates LLP | |
| Thomas M. Kinzler | |
| Secretary and Chief Legal Officer | Independent registered |
| public accounting firm | |
| Francis V. Knox, Jr. | PricewaterhouseCoopers LLP |
| Chief Compliance Officer | |
| Charles A. Rizzo | |
| Chief Financial Officer | |
| Gordon M. Shone | |
| Treasurer | |
| John G. Vrysen | |
| Chief Operating Officer |
Additional information about your fund is available without charge in several ways. As required by the SEC, you can access proxy voting information and quarterly portfolio information on your fund. The proxy voting information includes a description of proxy voting policies, procedures and information regarding how the fund voted proxies relating to portfolio securities during the most recent twelve-month period ended June 30. The quarterly portfolio information that includes a complete list of the fund’s holdings for the first and third quarters of the fund’s fiscal period is filed on Form N-Q. You have access to this information:
| By phone | On the fund’s Website | At the SEC |
| 1-800-225-5291 | www.jhfunds.com | www.sec.gov |
| 1-800-SEC-0330 | ||
| SEC Public Reference Room | ||
| You can also contact us: | ||
| Regular mail: | Express mail: | |
| John Hancock Signature Services, Inc. | John Hancock Signature Services, Inc. | |
| P.O. Box 9510 | Mutual Fund Image Operations | |
| Portsmouth, NH 03802-9510 | 164 Corporate Drive | |
| Portsmouth, NH 03801 | ||
Month-end portfolio holdings are available at www.jhfunds.com.
| 40 | U.S. Global Leaders Growth Fund | Annual report |

1-800-225-5291
1-800-554-6713 TDD
1-800-338-8080 EASI-Line
www.jhfunds.com
Now available: electronic delivery
www.jhfunds.com/edelivery
| This report is for the information of the shareholders of John Hancock U.S. Global Leaders Growth Fund. | 2600A 10/08 |
| It is not authorized for distribution to prospective investors unless preceded or accompanied by a prospectus. | 12/08 |
Discussion of Fund performance
By Pzena Investment Management, LLC
The Fund’s fiscal year end has recently changed from December 31 to October 31. What follows are the portfolio managers’ comments for the 10 months ended October 31, 2008.
The U.S. stock market, roiled by increasing fear and panic, suffered a sharp decline in the first 10 months of 2008. The credit crunch and liquidity crisis worsened steadily throughout the period, putting pressure on the financial sector, and the economy careened toward a recession. As a result, uncertainty and fear dominated the equity market, leading to lower stock prices and a dramatic increase in day-to-day market volatility. Value stocks narrowly outperformed growth issues during the reporting period, largely because the major value indexes had lower weightings in information technology, consumer discretionary and energy stocks — sectors of the market that were hit the hardest during the sharp downswing late in the period.
“The U.S. stock market, roiled by
increasing fear and panic, suffered
a sharp decline in the first 10
months of 2008.”
For the 10 months ended October 31, 2008, John Hancock Classic Value Fund II’s Class A shares posted a total return of –44.16% at net asset value, trailing both the –32.90% return of the Russell 1000 Value Index and the –33.54% return of the average large value fund, according to Morningstar, Inc. The portfolio’s underperformance resulted entirely from the lagging results of the portfolio’s financial stocks, which comprised approximately 40% of the portfolio. Four of the five biggest individual detractors from performance compared with the benchmark index were financial stocks — mortgage lenders Fannie Mae and Freddie Mac, brokerage firm Lehman Brothers, and commercial bank Wachovia. Apart from the financials, the portfolio’s holdings performed relatively well, with stock selection adding value in a number of other sectors of the portfolio. Top contributors included biotechnology firm Amgen, discount retailer WalMart, and apparel retailer TJX, owner of TJ Maxx and Marshall’s. We sold both of these stocks as they reached fair market value.
This commentary reflects the views of the portfolio managers through the end of the Fund’s period discussed in this report. The managers’ statements reflect their own opinions. As such, they are in no way guarantees of future events, and are not intended to be used as investment advice or a recommendation regarding any specific security. They are also subject to change at any time as market and other conditions warrant.
Sector investing is subject to greater risks than the market as a whole. Because the Fund may focus on particular sectors of the economy, its performance may depend on the performance of those sectors. International investing involves special risks such as political, economic and currency risks and differences in accounting standards and financial reporting. These risks are more significant in emerging markets.
| 6 | Classic Value Fund II | Annual report |
A look at performance
For the period ended October 31, 2008
| Average annual returns (%) | Cumulative total returns (%) | ||||||||||
| with maximum sales charge (POP) | with maximum sales charge (POP) | ||||||||||
| Inception | Since | Since | |||||||||
| Class | date | 1-year | 5-year | 10-year | inception | 1-year | 5-year | 10-year | inception | ||
| A | 7-7-06 | –53.43 | — | — | –24.49 | –53.43 | — | — | –47.86 | ||
| B | 7-7-06 | –53.74 | — | — | –24.33 | –53.74 | — | — | –47.60 | ||
| C | 7-7-06 | –51.81 | — | — | –23.34 | –51.81 | — | — | –45.99 | ||
| I1 | 7-7-06 | –50.77 | — | — | –22.48 | –50.77 | — | — | –44.57 | ||
| R11 | 7-7-06 | –50.47 | — | — | –22.61 | –50.47 | — | — | –44.80 | ||
Performance figures assume all distributions are reinvested. Public offering price (POP) figures reflect maximum sales charges on Class A shares of 5% and the applicable contingent deferred sales charge (CDSC) on Class B and Class C shares. The Class B shares’ CDSC declines annually between years 1 to 6 according to the following schedule: 5, 4, 3, 3, 2, 1%. No sales charge will be assessed after the sixth year. Class C shares held for less than one year are subject to a 1% CDSC. Sales charge is not applicable for Class I and Class R1 shares.
The expense ratios of the Fund, both net (including any fee waivers or expense limitations) and gross (excluding any fee waivers or expense limitations), are set forth according to the most recent publicly available prospectuses for the Fund and may differ from the expense ratios disclosed in the Financial Highlights tables in this report. The waivers and expense limitations are contractual at least until April 30, 2009. The net expenses are as follows: Class A — 1.32%. Had the fee waivers and expense limitations not been in place, the gross expenses would be as follows: Class A — 1.46%. For the other classes, the net expenses equal the gross expenses and are as follows: Class B — 2.07%,Class C — 2.07%, Class I — 0.94%, Class R1 — 1.57%.
The returns reflect past results and should not be considered indicative of future performance. The return and principal value of an investment will fluctuate so that shares, when redeemed, may be worth more or less than their original cost. Due to market volatility, the Fund’s current performance may be higher or lower than the performance shown. For current to the most recent month end performance data, please call 1–800–225–5291 or visit the Fund’s Web site at www.jhfunds.com.
The performance table above and the chart on the next page do not reflect the deduction of taxes that a shareholder would pay on fund distributions or the redemption of fund shares.
The Fund’s performance results reflect any applicable expense reductions, without which the expenses would increase and results would have been less favorable.
1 For certain types of investors as described in the Fund’s Class I and Class R1 share prospectuses.
| Annual report | Classic Value Fund II | 7 |
A look at performance
Growth of $10,000
This chart shows what happened to a hypothetical $10,000 investment in Classic Value Fund II Class A shares for the period indicated. For comparison, we’ve shown the same investment in the Russell 1000 Value Index.
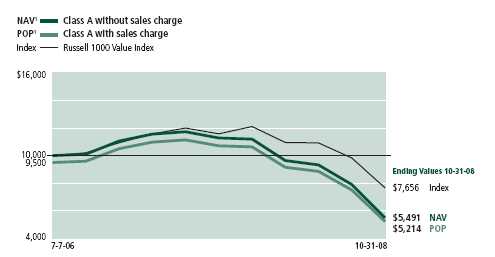
| With maximum | ||||
| Class | Period beginning | Without sales charge | sales charge | Index |
| B | 7-7-06 | $5,401 | $5,240 | $7,656 |
| C2 | 7-7-06 | 5,401 | 5,401 | 7,656 |
| I3 | 7-7-06 | 5,543 | 5,543 | 7,656 |
| R13 | 7-7-06 | 5,520 | 5,520 | 7,656 |
Assuming all distributions were reinvested for the period indicated, the table above shows the value of a $10,000 investment in the Fund’s Class B, Class C, Class I and Class R1 shares, respectively, as of October 31, 2008. Performance of the classes will vary based on the difference in sales charges paid by shareholders investing in the different classes and the fee structure of those classes.
Russell 1000 Value Index is an unmanaged index containing those securities in the Russell 1000 Index with a less-than-average growth orientation.
It is not possible to invest directly in an index. Index figures do not reflect sales charges, which would have resulted in lower values if they did.
1 NAV represents net asset value and POP represents public offering price.
2 No contingent deferred sales charge applicable.
3 For certain types of investors as described in the Fund’s Class I and Class R1 share prospectuses.
| 8 | Classic Value Fund II | Annual report |
Your expenses
These examples are intended to help you understand your ongoing operating expenses.
Understanding fund expenses
As a shareholder of the Fund, you incur two types of costs:
■ Transaction costs which include sales charges (loads) on purchases or redemptions (varies by share class), minimum account fee charge, etc.
■ Ongoing operating expenses including management fees, distribution and service fees (if applicable), and other fund expenses.
We are going to present only your ongoing operating expenses here.
Actual expenses/actual returns
This example is intended to provide information about your fund’s actual ongoing operating expenses, and is based on your fund’s actual return. It assumes an account value of $1,000.00 on July 1, 2008, with the same investment held until October 31, 2008.
| Account value | Ending value | Expenses paid during | |
| on 7-1-08 | on 10-31-08 | period ended 10-31-081 | |
| Class A | $1,000.00 | $696.80 | $3.82 |
| Class B | 1,000.00 | 696.10 | 5.96 |
| Class C | 1,000.00 | 696.10 | 5.96 |
| Class I | 1,000.00 | 698.50 | 2.74 |
| Class R1 | 1,000.00 | 696.90 | 5.25 |
Together with the value of your account, you may use this information to estimate the operating expenses that you paid over the period. Simply divide your account value at October 31, 2008, by $1,000.00, then multiply it by the “expenses paid” for your share class from the table above. For example, for an account value of $8,600.00, the operating expenses should be calculated as follows:
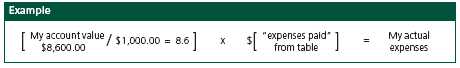
| Annual report | Classic Value Fund II | 9 |
Your expenses
Hypothetical example for comparison purposes
This table allows you to compare your fund’s ongoing operating expenses with those of any other fund. It provides an example of the Fund’s hypothetical account values and hypothetical expenses based on each class’s actual expense ratio and an assumed 5% annualized return before expenses (which is not your fund’s actual return). It assumes an account value of $1,000.00 on May 1, 2008, with the same investment held until October 31, 2008. Look in any other fund shareholder report to find its hypothetical example and you will be able to compare these expenses.
| Account value | Ending value | Expenses paid during | |
| on 5-1-08 | on 10-31-08 | period ended 10-31-081 | |
| Class A | $1,000.00 | $1,018.40 | $6.80 |
| Class B | 1,000.00 | 1,014.60 | 10.58 |
| Class C | 1,000.00 | 1,014.60 | 10.58 |
| Class I | 1,000.00 | 1,020.30 | 4.88 |
| Class R1 | 1,000.00 | 1,015.90 | 9.32 |
Remember, these examples do not include any transaction costs, such as sales charges; therefore, these examples will not help you to determine the relative total costs of owning different funds. If transaction costs were included, your expenses would have been higher. See the prospectus for details regarding transaction costs.
1 Expenses are equal to the Fund’s annualized expense ratio of 1.34%, 2.09%, 2.09%, 0.96% and 1.84% for Class A, Class B, Class C, Class I and Class R1, respectively, multiplied by the average account value over the period, multiplied by number of days in most recent fiscal half-year/365 or 366 (to reflect the one-half year period).
| 10 | Classic Value Fund II | Annual report |
Portfolio summary
| Top 10 holdings1 | ||||
| Capital One Financial Corp. | 4.9% | CA, Inc. | 3.6% | |
| Citigroup, Inc. | 4.8% | Bank of America Corp. | 3.5% | |
| Northrop Grumman Corp. | 4.0% | JPMorgan Chase & Co. | 3.1% | |
| UBS AG | 3.9% | Microsoft Corp. | 3.1% | |
| Alcatel-Lucent | 3.6% | AmerisourceBergen Corp. | 3.0% | |
| Sector distribution1,2 | ||||
| Financials | 36% | Telecommunication services | 5% | |
| Consumer discretionary | 16% | Utilities | 4% | |
| Health care | 14% | Consumer staples | 3% | |
| Information technology | 11% | Energy | 2% | |
| Industrials | 8% | Short-term investments & other | 1% | |
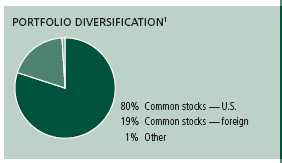
1 As a percentage of net assets on October 31, 2008.
2 Sector investing is subject to greater risks than the market as a whole. Because the Fund may focus on particular sectors of the economy, its performance may depend on the performance of those sectors.
| Annual report | Classic Value Fund II | 11 |
F I N A N C I A L S T A T E M E N T S
Fund’s investments
Securities owned by the Fund on 10-31-08
This schedule consists of one main category: common stocks. Common stocks are further broken down by industry group.
| Issuer | Shares | Value |
| Common stocks 98.54% | $42,510,853 | |
| (Cost $84,221,022) | ||
| Advertising 0.86% | 372,943 | |
| Omnicom Group, Inc. | 12,625 | 372,943 |
| Aerospace & Defense 6.82% | 2,941,614 | |
| L-3 Communications Holdings, Inc. | 15,025 | 1,219,579 |
| Northrop Grumman Corp. | 36,725 | 1,722,035 |
| Application Software 0.57% | 243,709 | |
| Intuit, Inc. (I) | 9,725 | 243,709 |
| Auto Parts & Equipment 1.91% | 824,119 | |
| Magna International, Inc. (Class A) | 24,375 | 824,119 |
| Biotechnology 1.54% | 664,779 | |
| Amgen, Inc. (I) | 11,100 | 664,779 |
| Communications Equipment 5.13% | 2,214,471 | |
| Alcatel-Lucent, ADR (I) | 609,669 | 1,566,849 |
| Motorola, Inc. | 120,600 | 647,622 |
| Computer Hardware 0.47% | 203,816 | |
| Dell, Inc. (I) | 16,775 | 203,816 |
| Consumer Finance 5.15% | 2,223,223 | |
| Capital One Financial Corp. | 53,500 | 2,092,920 |
| Discover Financial Services | 10,637 | 130,303 |
| Data Processing & Outsourced Services 0.50% | 214,106 | |
| Computer Sciences Corp. (I) | 7,099 | 214,106 |
| Department Stores 3.71% | 1,602,207 | |
| J.C. Penney Co., Inc. | 32,175 | 769,626 |
| Kohl’s Corp. (I) | 23,700 | 832,581 |
| Diversified Banks 4.61% | 1,990,420 | |
| Comerica, Inc. | 11,450 | 315,905 |
| Mitsubishi UFJ Financial Group, Inc. | 151,000 | 948,910 |
| Sumitomo Mitsui Financial Group, Inc. (I) | 181 | 725,605 |
| Diversified Capital Markets 3.87% | 1,669,919 | |
| UBS AG (I) | 98,420 | 1,669,919 |
See notes to financial statements
| 12 | Classic Value Fund II | Annual report |
F I N A N C I A L S T A T E M E N T S
| Issuer | Shares | Value |
| Diversified Financial Services 12.24% | $5,280,157 | |
| Bank of America Corp. | 61,550 | 1,487,664 |
| Citigroup, Inc. | 150,250 | 2,050,912 |
| ING Groep NV | 41,425 | 388,581 |
| JPMorgan Chase & Co. | 32,800 | 1,353,000 |
| Electric Utilities 1.74% | 749,421 | |
| Korea Electric Power Corp. | 37,715 | 749,421 |
| Electronic Manufacturing Services 0.74% | 318,194 | |
| Tyco Electronics, Ltd. | 16,368 | 318,194 |
| Health Care Distributors 3.02% | 1,300,832 | |
| AmerisourceBergen Corp. | 41,600 | 1,300,832 |
| Health Care Equipment 1.39% | 598,689 | |
| Boston Scientific Corp. (I) | 66,300 | 598,689 |
| Home Improvement Retail 4.71% | 2,030,712 | |
| Home Depot, Inc. | 44,275 | 1,044,447 |
| Lowe’s Cos., Inc. | 45,450 | 986,265 |
| Homefurnishing Retail 2.41% | 1,037,887 | |
| Bed Bath & Beyond, Inc. (I) | 40,275 | 1,037,887 |
| Household Products 1.08% | 467,336 | |
| Kimberly-Clark Corp. | 7,625 | 467,336 |
| Industrial Conglomerates 0.45% | 195,111 | |
| Tyco International, Ltd. | 7,718 | 195,111 |
| Integrated Oil & Gas 2.43% | 1,048,673 | |
| Chevron Corp. | 3,600 | 268,560 |
| Exxon Mobil Corp. | 10,525 | 780,113 |
| Integrated Telecommunication Services 1.25% | 537,408 | |
| AT&T, Inc. | 20,075 | 537,408 |
| Investment Banking & Brokerage 2.01% | 866,512 | |
| Morgan Stanley | 49,600 | 866,512 |
| Life & Health Insurance 0.44% | 191,798 | |
| Aegon NV | 46,159 | 191,798 |
| Movies & Entertainment 1.98% | 853,015 | |
| Time Warner, Inc. | 38,750 | 390,988 |
| Viacom, Inc. (Class B) (I) | 22,850 | 462,027 |
| Multi-Line Insurance 1.19% | 511,949 | |
| American International Group, Inc. | 32,800 | 62,648 |
| MetLife, Inc. | 13,525 | 449,301 |
| Multi-Utilities 1.87% | 807,081 | |
| Sempra Energy | 18,950 | 807,081 |
| Office Electronics 0.52% | 226,002 | |
| Ricoh Co., Ltd. | 21,000 | 226,002 |
See notes to financial statements
| Annual report | Classic Value Fund II | 13 |
F I N A N C I A L S T A T E M E N T S
| Issuer | Shares | Value |
| Packaged Foods & Meats 1.59% | $687,601 | |
| Kraft Foods, Inc. | 15,175 | 442,200 |
| Sara Lee Corp. | 21,950 | 245,401 |
| Pharmaceuticals 8.35% | 3,600,740 | |
| Bristol-Myers Squibb Co. | 40,250 | 827,138 |
| Johnson & Johnson | 16,750 | 1,027,445 |
| Merck & Co., Inc. | 28,375 | 878,206 |
| Schering-Plough Corp. | 59,900 | 867,951 |
| Property & Casualty Insurance 4.89% | 2,111,028 | |
| ACE, Ltd. | 7,025 | 402,954 |
| Allstate Corp. | 42,375 | 1,118,276 |
| Chubb Corp. | 7,900 | 409,378 |
| XL Capital, Ltd. (Class A) | 18,600 | 180,420 |
| Regional Banks 1.21% | 521,640 | |
| National City Corp. | 193,200 | 521,640 |
| Systems Software 7.34% | 3,165,785 | |
| CA, Inc. | 87,600 | 1,559,280 |
| Microsoft Corp. | 58,900 | 1,315,237 |
| Oracle Corp. (I) | 15,925 | 291,268 |
| Thrifts & Mortgage Finance 0.55% | 237,956 | |
| Federal Home Loan Mortgage Corp. | 150,700 | 155,221 |
| Federal National Mortgage Association | 89,250 | 82,735 |
| Total investments (Cost $84,221,022)† 98.54% | $42,510,853 | |
| Other assets and liabilities, net 1.46% | $630,483 | |
| Total net assets 100.00% | $43,141,336 | |
The percentage shown for each investment category is the total value of the category as a percentage of the net assets of the Fund.
ADR American Depositary Receipt
(I) Non-income producing security.
† At October 31, 2008, the aggregate cost of investment securities for federal income tax purposes was $84,416,929. Net unrealized depreciation aggregated $41,906,076, of which $127,591 related to appreciated investment securities and $42,033,667 related to depreciated investment securities.
See notes to financial statements
| 14 | Classic Value Fund II | Annual report |
F I N A N C I A L S T A T E M E N T S
Financial statements
Statement of assets and liabilities 10-31-08
This Statement of Assets and Liabilities is the Fund’s balance sheet. It shows the value of what the Fund owns, is due and owes. You’ll also find the net asset value and the maximum offering price per share.
| Assets | |
| Investments at value (Cost $84,221,022) | $42,510,853 |
| Receivable for investments sold | 883,150 |
| Receivable for shares sold | 86,393 |
| Dividends and interest receivable | 88,179 |
| Reimbursement receivable | 103,438 |
| Total assets | 43,672,013 |
| Liabilities | |
| Due to custodian | 33,739 |
| Payable for investments purchased | 158,165 |
| Payable for shares repurchased | 152,293 |
| Payable to affiliates | |
| Management fees | 31,235 |
| Distribution and service fees | 16,969 |
| Other | 48,255 |
| Other payables and accrued expenses | 90,021 |
| Total liabilities | 530,677 |
| Net assets | |
| Capital paid-in | 103,063,957 |
| Accumulated net realized loss on investments and foreign currency transactions | (18,950,781) |
| Net unrealized depreciation of investments and translation of assets and | |
| liabilities in foreign currencies | (41,708,282) |
| Accumulated net investment income | 736,442 |
| Net assets | $43,141,336 |
| Net asset value per share | |
| Based on net asset values and shares outstanding — the Fund has an | |
| unlimited number of shares authorized with no par value | |
| Class A ($21,788,776 ÷ 4,032,442 shares) | $5.40 |
| Class B ($3,223,824 ÷ 601,608 shares)1 | $5.36 |
| Class C ($11,326,119 ÷ 2,113,103 shares)1 | $5.36 |
| Class I ($6,680,181 ÷ 1,232,622 shares) | $5.42 |
| Class R1 ($122,436 ÷ 22,469 shares) | $5.45 |
| Maximum offering price per share | |
| Class A ($5.40 ÷ 95.0%)2 | $5.68 |
1 Redemption price is equal to net asset value less any applicable contingent deferred sales charge.
2 On single retail sales of less than $50,000. On sales of $50,000 or more and on group sales the offering price is reduced.
See notes to financial statements
| Annual report | Classic Value Fund II | 15 |
F I N A N C I A L S T A T E M E N T S
Statements of operations For the period ended 10-31-08
These Statements of Operations summarize the Fund’s investment income earned and expenses incurred in operating the Fund. It also shows net gains (losses) for the periods stated.
| Year | Period | |
| ended | ended | |
| 12-31-07 | 10-31-081 | |
| Investment income | ||
| Dividends (net of foreign withholding taxes of | ||
| $56,494 and $35,573, respectively) | $2,976,994 | $1,772,272 |
| Interest | 110,577 | 10,580 |
| Securities lending | 858 | 4,525 |
| Total investment income | 3,088,429 | 1,787,377 |
| Expenses | ||
| Investment management fees (Note 5) | 1,049,466 | 534,516 |
| Distribution and service fees (Note 5) | 603,539 | 315,300 |
| Transfer agent fees (Note 5) | 221,804 | 167,314 |
| Accounting and legal services fees (Note 5) | 14,464 | 7,931 |
| Blue sky fees | 88,369 | 44,449 |
| Printing fees | 56,209 | 49,812 |
| Custodian fees | 39,213 | 33,881 |
| Professional fees | 13,546 | 25,394 |
| Trustees’ fees | 4,256 | 5,178 |
| Miscellaneous | 8,784 | 25,045 |
| Total expenses | 2,099,650 | 1,208,820 |
| Less expense reductions (Note 5) | (110,458) | (183,883) |
| Net expenses | 1,989,192 | 1,024,937 |
| Net investment income | 1,099,237 | 762,440 |
| Realized and unrealized gain (loss) | ||
| Net realized gain (loss) on | ||
| Investments | (642,392) | (18,214,482) |
| Foreign currency transactions | (85,856) | (25,998) |
| (728,248) | (18,240,480) | |
| Change in net unrealized appreciation (depreciation) of | ||
| Investments | (22,153,376) | (22,746,925) |
| Translation of assets and liabilities in foreign currencies | — | 1,887 |
| (22,153,376) | (22,745,038) | |
| Net realized and unrealized loss | (22,881,624) | (40,985,518) |
| Decrease in net assets from operations | ($21,782,387) | ($40,223,078) |
1 For the ten month period ended October 31, 2008, the Fund changed its fiscal year end from December 31 to October 31.
See notes to financial statements
| 16 | Classic Value Fund II | Annual report |
F I N A N C I A L S T A T E M E N T S
Statements of changes in net assets
These Statements of Changes in Net Assets show how the value of the Fund’s net assets has changed during the periods. The difference reflects earnings less expenses, any investment gains and losses, distributions, if any, paid to shareholders and the net of Fund share transactions.
| Period | Year | Period | |
| ended | ended | ended | |
| 12-31-061 | 12-31-07 | 10-31-082 | |
| Increase (decrease) in net assets | |||
| From operations | |||
| Net investment income | $56,675 | $1,099,237 | $762,440 |
| Net realized gain (loss) | 225,402 | (728,248) | (18,240,480) |
| Change in net unrealized appreciation | |||
| (depreciation) | 3,190,132 | (22,153,376) | (22,745,038) |
| Increase (decrease) in net assets resulting | |||
| from operations | 3,472,209 | (21,782,387) | (40,223,078) |
| Distributions to shareholders | |||
| From net investment income | |||
| Class A | (40,455) | (741,831) | — |
| Class B | — | (30,221) | — |
| Class C | — | (114,768) | — |
| Class I | (9,348) | (177,086) | — |
| Class R1 | — | (1,175) | — |
| From net realized gain | |||
| Class A | (78,597) | (115,384) | — |
| Class B | (12,170) | (15,346) | — |
| Class C | (31,628) | (58,279) | — |
| Class I | (7,156) | (20,380) | — |
| Class R1 | (1,259) | (238) | — |
| (180,613) | (1,274,708) | — | |
| From Fund share transactions (Note 6) | 60,955,368 | 78,718,688 | (36,544,143) |
| Total increase (decrease) | 64,246,964 | 55,661,593 | (76,767,221) |
| Net assets | |||
| Beginning of period | — | 64,246,964 | 119,908,557 |
| End of period3 | $64,246,964 | $119,908,557 | $43,141,336 |
1 Beginning of operations from 7-7-06 to 12-31-06.
2 For the ten months ended October 31, 2008, the Fund changed its fisal year end from December 31 to October 31.
3 Includes accumulated (distributions in excess of) net investment income of $520, $0 and $736,442, respectively.
See notes to financial statements
| Annual report | Classic Value Fund II | 17 |
F I N A N C I A L S T A T E M E N T S
Financial highlights
The Financial Highlights show how the Fund’s net asset value for a share has changed since the end of the previous period.
CLASS A SHARES
| Period ended | 12-31-061 | 12-31-07 | 10-31-082 |
| Per share operating performance | |||
| Net asset value, beginning of year | $10.00 | $11.39 | $9.67 |
| Net investment income3 | 0.03 | 0.12 | 0.09 |
| Net realized and unrealized gain | |||
| (loss) on investments | 1.40 | (1.71) | (4.36) |
| Total from investment operations | 1.43 | (1.59) | (4.27) |
| Less distributions | |||
| From net investment income | (0.01) | (0.11) | — |
| From net realized gain | (0.03) | (0.02) | — |
| (0.04) | (0.13) | — | |
| Net asset value, end of year | $11.39 | $9.67 | $5.40 |
| Total return (%)4,5 | 14.296 | (13.97) | (44.16)6 |
| Ratios and supplemental data | |||
| Net assets, end of year (in millions) | $39 | $65 | $22 |
| Ratios (as a percentage of average net assets): | |||
| Expenses before reductions | 2.247 | 1.46 | 1.607 |
| Expenses net of all fee waivers | 1.307 | 1.32 | 1.337,8 |
| Expenses net of all fee waivers | |||
| and credits | 1.307 | 1.32 | 1.337,8 |
| Net investment income | 0.637 | 1.04 | 1.357 |
| Portfolio turnover (%) | 12 | 52 | 30 |
1 Beginning of operations from 7-7-06 to 12-31-06.
2 For the ten month period ended October 31, 2008.
3 Based on the average of the shares outstanding.
4 Assumes dividend reinvestment and does not reflect the effect of sales charges.
5 Total returns would have been lower had certain expenses not been reduced during the periods shown.
6 Not annualized.
7 Annualized.
8 Includes 0.01% related to interest expense.
See notes to financial statements
| 18 | Classic Value Fund II | Annual report |
F I N A N C I A L S T A T E M E N T S
Financial highlights
CLASS B SHARES
| Period ended | 12-31-061 | 12-31-07 | 10-31-082 |
| Per share operating performance | |||
| Net asset value, beginning of year | $10.00 | $11.36 | $9.65 |
| Net investment income (loss)3 | (0.01) | 0.03 | 0.04 |
| Net realized and unrealized gain | |||
| (loss) on investments | 1.40 | (1.69) | (4.33) |
| Total from investment operations | 1.39 | (1.66) | (4.29) |
| Less distributions | |||
| From net investment income | — | (0.03) | — |
| From net realized gain | (0.03) | (0.02) | — |
| (0.03) | (0.05) | — | |
| Net asset value, end of year | $11.36 | $9.65 | $5.36 |
| Total return (%)4,5 | 13.866 | (14.60) | (44.46)6 |
| Ratios and supplemental data | |||
| Net assets, end of year (in millions) | $6 | $8 | $3 |
| Ratios (as a percentage of average net assets): | |||
| Expenses before reductions | 2.997 | 2.07 | 2.357 |
| Expenses net of all fee waivers | 2.057 | 2.07 | 2.087,8 |
| Expenses net of all fee waivers | |||
| and credits | 2.057 | 2.07 | 2.087,8 |
| Net investment income (loss) | (0.11)7 | 0.28 | 0.617 |
| Portfolio turnover (%) | 12 | 52 | 30 |
1 Beginning of operations from 7-7-06 to 12-31-06.
2 For the ten month period ended October 31, 2008.
3 Based on the average of the shares outstanding.
4 Assumes dividend reinvestment and does not reflect the effect of sales charges.
5 Total returns would have been lower had certain expenses not been reduced during the periods shown.
6 Not annualized.
7 Annualized.
8 Includes 0.01% related to interest expense.
See notes to financial statements
| Annual report | Classic Value Fund II | 19 |
F I N A N C I A L S T A T E M E N T S
Financial highlights
CLASS C SHARES
| Period ended | 12-31-061 | 12-31-07 | 10-31-082 |
| Per share operating performance | |||
| Net asset value, beginning of year | $10.00 | $11.36 | $9.66 |
| Net investment income (loss)3 | (0.01) | 0.03 | 0.04 |
| Net realized and unrealized gain | |||
| (loss) on investments | 1.40 | (1.68) | (4.34) |
| Total from investment operations | 1.39 | (1.65) | (4.30) |
| Less distributions | |||
| From net investment income | — | (0.03) | — |
| From net realized gain | (0.03) | (0.02) | — |
| (0.03) | (0.05) | — | |
| Net asset value, end of year | $11.36 | $9.66 | $5.36 |
| Total return (%)4,5 | 13.866 | (14.51) | (44.51)6 |
| Ratios and supplemental data | |||
| Net assets, end of year (in millions) | $15 | $32 | $11 |
| Ratios (as a percentage of average net assets): | |||
| Expenses before reductions | 2.997 | 2.07 | 2.357 |
| Expenses net of all fee waivers | 2.057 | 2.07 | 2.087,8 |
| Expenses net of all fee waivers | |||
| and credits | 2.057 | 2.07 | 2.087,8 |
| Net investment income (loss) | (0.15)7 | 0.28 | 0.597 |
| Portfolio turnover (%) | 12 | 52 | 30 |
1 Beginning of operations from 7-7-06 to 12-31-06.
2 For the ten month period ended October 31, 2008.
3 Based on the average of the shares outstanding.
4 Assumes dividend reinvestment and does not reflect the effect of sales charges.
5 Total returns would have been lower had certain expenses not been reduced during the periods shown.
6 Not annualized.
7 Annualized.
8 Includes 0.01% related to interest expense.
See notes to financial statements
| 20 | Classic Value Fund II | Annual report |
F I N A N C I A L S T A T E M E N T S
Financial highlights
CLASS I SHARES
| Period ended | 12-31-061 | 12-31-07 | 10-31-082 |
| Per share operating performance | |||
| Net asset value, beginning of year | $10.00 | $11.39 | $9.67 |
| Net investment income3 | 0.04 | 0.16 | 0.11 |
| Net realized and unrealized gain | |||
| (loss) on investments | 1.41 | (1.71) | (4.36) |
| Total from investment operations | 1.45 | (1.55) | (4.25) |
| Less distributions | |||
| From net investment income | (0.03) | (0.15) | — |
| From net realized gain | (0.03) | (0.02) | — |
| (0.06) | (0.17) | — | |
| Net asset value, end of year | $11.39 | $9.67 | $5.42 |
| Total return (%)4,5 | 14.506 | (13.63) | (43.95)6 |
| Ratios and supplemental data | |||
| Net assets, end of year (in millions) | $4 | $15 | $7 |
| Ratios (as a percentage of average net assets): | |||
| Expenses before reductions | 1.887 | 0.94 | 1.237 |
| Expenses net of all fee waivers | 0.947 | 0.94 | 0.957,8 |
| Expenses net of all fee waivers | |||
| and credits | 0.947 | 0.94 | 0.957,8 |
| Net investment income | 0.747 | 1.41 | 1.717 |
| Portfolio turnover (%) | 12 | 52 | 30 |
1 Beginning of operations from 7-7-06 to 12-31-06.
2 For the ten month period ended October 31, 2008.
3 Based on the average of the shares outstanding.
4 Assumes dividend reinvestment and does not reflect the effect of sales charges.
5 Total returns would have been lower had certain expenses not been reduced during the periods shown.
6 Not annualized.
7 Annualized.
8 Includes 0.01% related to interest expense.
See notes to financial statements
| Annual report | Classic Value Fund II | 21 |
F I N A N C I A L S T A T E M E N T S
Financial highlights
CLASS R1 SHARES
| Period ended | 12-31-061 | 12-31-07 | 10-31-082 |
| Per share operating performance | |||
| Net asset value, beginning of year | $10.00 | $11.39 | $9.80 |
| Net investment income3 | 0.02 | 0.09 | 0.06 |
| Net realized and unrealized gain | |||
| (loss) on investments | 1.40 | (1.57) | (4.41) |
| Total from investment operations | 1.42 | (1.48) | (4.35) |
| Less distributions | |||
| From net investment income | — | (0.09) | — |
| From net realized gain | (0.03) | (0.02) | — |
| (0.03) | (0.11) | — | |
| Net asset value, end of year | $11.39 | $9.80 | $5.45 |
| Total return (%)4,5 | 14.166 | (13.05) | (44.39)6 |
| Ratios and supplemental data | |||
| Net assets, end of year (in millions) | $1 | —7 | —7 |
| Ratios (as a percentage of average net assets): | |||
| Expenses before reductions | 2.408 | 1.57 | 2.118 |
| Expenses net of all fee waivers | 1.468 | 1.57 | 1.818,9 |
| Expenses net of all fee waivers | |||
| and credits | 1.468 | 1.57 | 1.828,9 |
| Net investment income | 0.468 | 0.80 | 0.888 |
| Portfolio turnover (%) | 12 | 52 | 30 |
1 Beginning of operations from 7-7-06 to 12-31-06.
2 For the ten month period ended October 31, 2008.
3 Based on the average of the shares outstanding.
4 Assumes dividend reinvestment and does not reflect the effect of sales charges.
5 Total returns would have been lower had certain expenses not been reduced during the periods shown.
6 Not annualized.
7 Less than $500,000.
8 Annualized.
9 Includes 0.01% related to interest expense.
See notes to financial statements
| 22 | Classic Value Fund II | Annual report |
Notes to financial statements
Note 1
Organization
John Hancock Classic Value Fund II (the Fund) is a diversified series of John Hancock Capital Series (the Trust), an open-end management investment company registered under the Investment Company Act of 1940, as amended (the 1940 Act). The investment objective of the Fund is to achieve long-term growth of capital.
The Trustees have authorized the issuance of multiple classes of shares of the Fund, designated as Class A, Class B, Class C, Class I and Class R1 shares. The shares of each class represent an interest in the same portfolio of investments of the Fund and have equal rights as to voting, redemptions, dividends and liquidation, except that certain expenses, subject to the approval of the Trustees, may be applied differently to each class of shares in accordance with current regulations of the Securities and Exchange Commission add (SEC) and the Internal Revenue Service. Shareholders of a class that bears distribution and service expenses under the terms of a distribution plan have exclusive voting rights to that distribution plan. Class B shares will convert to Class A shares eight years after purchase.
Note 2
Significant accounting policies
The financial statements have been prepared in conformity with accounting principles generally accepted in the United States of America, which require management to make certain estimates and assumptions at the date of the financial statements. Actual results could differ from those estimates. The following summarizes the significant accounting policies of the Fund:
Security valuation
The net asset value of the Fund is determined daily as of the close of the New York Stock Exchange (NYSE), normally at 4:00 P.M., Eastern Time. Short-term debt investments that have a remaining maturity of 60 days or less are valued at amortized cost, and thereafter assume a constant amortization to maturity of any discount or premium, which approximates market value. All other securities held by the Fund are valued at the last sale price or official closing price (closing bid price or last evaluated quote if no sale has occurred) as of the close of business on the principal securities exchange (domestic or foreign) on which they trade or, lacking any sales, at the closing bid price. Securities traded only in the over-the-counter market are valued at the last bid price quoted by brokers making markets in the securities at the close of trading. Securities for which there are no such quotations, principally debt securities, are valued based on the evaluated prices provided by an independent pricing service, which utilizes both dealer-supplied and electronic data processing techniques, which take into account factors such as institutional-size trading in similar groups of securities, yield, quality, coupon rate, maturity, type of issue, trading characteristics and other market data.
Other portfolio securities and assets for which market quotations are not readily available are valued at fair value as determined in good faith by the Trust’s Pricing Committee in accordance with procedures adopted by the Board of Trustees. Generally, trading in non-U.S. securities is substantially completed each day at various times prior to the close of trading on the NYSE. The values of such securities used in computing the net asset value of the Fund’s shares are generally determined as of such times. Occasionally, significant events that affect the values of such securities may occur between the times at which such values are generally determined and the close of the NYSE. Upon such an occurrence, these securities will be valued at fair value as determined in good faith under consistently applied procedures established by and
| Annual report | Classic Value Fund II | 23 |
under the general supervision of the Board of Trustees.
Valuations change in response to many factors including the historical and prospective earnings of the issuer, the value of the issuer’s assets, general economic conditions, interest rates, investor perceptions and market liquidity.
The Fund adopted Statement of Financial Accounting Standards No. 157 (FAS 157), Fair Value Measurements, effective with the beginning of the Fund’s fiscal year. FAS 157 established a three-tier hierarchy to prioritize the assumptions, referred to as inputs, used in valuation techniques to measure fair value. The three-tier hierarchy of inputs is summarized in the three broad levels listed below:
Level 1 – Quoted prices in active markets for identical securities.
Level 2 – Prices determined using other significant observable inputs. Observable inputs are inputs that other market participants would use in pricing a security. These may include quoted prices for similar securities, interest rates, prepayment speeds, credit risk and others.
Level 3 – Prices determined using significant unobservable inputs. In situations where quoted prices or observable inputs are unavailable, such as when there is little or no market activity for an investment, unobservable inputs may be used. Unobservable inputs reflect the Fund’s own assumptions about the factors that market participants would use in pricing an investment and would be based on the best information available.
The inputs or methodology used for valuing securities are not necessarily an indication of the risk associated with investing in those securities.
The following is a summary of the inputs used to value the Fund’s net assets as of October 31, 2008:
| INVESTMENTS IN | OTHER FINANCIAL | |
| VALUATION INPUTS | SECURITIES | INSTRUMENTS* |
| Level 1 — Quoted Prices | $37,610,615 | — |
| Level 2 — Other Significant Observable Inputs | 4,900,238 | — |
| Level 3 — Significant Unobservable Inputs | — | — |
| Total | $42,510,853 | — |
*Other financial instruments are derivative instruments not reflected in the Portfolio of Investments, such as futures, forwards and swap contracts, which are valued at the unrealized appreciation/ depreciation on the instrument.
Foreign currency translation
The books and records of the Fund are maintained in U.S. dollars. Investment securities and other assets and liabilities denominated in a foreign currency are translated into U.S. dollars at the prevailing exchange rates at period end. Purchases and sales of investment securities, income and expenses are translated into U.S. dollars at the prevailing exchange rates on the respective dates of the transactions.
Net realized and unrealized gains and losses on foreign currency transactions represent net gains and losses between trade and settlement dates on securities transactions, the disposition of forward foreign currency exchange contracts and foreign currencies, and the difference between the amount of net investment income accrued and the U.S. dollar amount actually received. That portion of both realized and unrealized gains and losses on investments that results from fluctuations in foreign currency exchange rates is not separately disclosed but is included with net realized and unrealized gain/appreciation and loss/depreciation on investments.
Investment transactions
Investment transactions are accounted for on a trade date plus one basis for daily net asset value calculations. However, for financial reporting purposes, investment security transactions are reported on trade date. Interest income is recorded on the accrual
| 24 | Classic Value Fund II | Annual report |
basis. Dividend income is recorded on the ex-dividend date net of foreign withholding taxes. Realized gains and losses from investment transactions are recorded on an identified cost basis.
Broker commission rebates
The Fund may direct certain security trades to brokers who have agreed to rebate a portion of the related brokerage commission to the Fund. Commission rebates are reflected as a realized gain on securities in the Statement of Operations and amounted to $2,301.
Class allocations
Income, common expenses and realized and unrealized gains (losses) are determined at the fund level and allocated daily to each class of shares based on the appropriate net asset value of the respective classes. Distribution and service fees, if any, and transfer agent fees for Class A, Class B, Class C, Class I and Class R1 shares are calculated daily at the class level based on the appropriate net asset value of each class and the specific expense rate(s) applicable to each class.
Expenses
The majority of expenses are directly identifiable to an individual fund. Trust expenses that are not readily identifiable to a specific fund are allocated in such a manner as deemed equitable, taking into consideration, among other things, the nature and type of expense and the relative size of the funds. Expense estimates are accrued in the period to which they relate and adjustments are made when actual amounts are known.
Bank borrowings
The Fund is permitted to have bank borrowings for temporary or emergency purposes, including the meeting of redemption requests that otherwise might require the untimely disposition of securities. The Fund has entered into a line of credit agreement with The Bank of New York Mellon (BNYM), the Swing Line Lender and Administrative Agent. This agreement enables the Fund to participate, with other funds managed by the Adviser, in an unsecured line of credit with BNYM, which permits borrowings of up to $150 million, collectively. Interest is charged to each fund based on its borrowing. In addition, a commitment fee is charged to each fund based on the average daily unused portion of the line of credit and is allocated among the participating funds. The Fund had no borrowing activity under the line of credit during the period ended October 31, 2008.
Pursuant to the custodian agreement, the Custodian may, in its discretion, advance funds to the Fund to make properly authorized payments. When such payments result in an overdraft, the Fund is obligated to repay the Custodian for any overdraft together with interest due thereon. The Custodian has a lien, security interest or security entitlement in any Fund property, to the maximum extent permitted by law to the extent of any overdraft.
Securities lending
The Fund may lend portfolio securities from time to time in order to earn additional income. The Fund retains beneficial ownership of the securities it has loaned and continues to receive interest and dividends paid by the issuer of securities and to participate in any changes in their value. On the settlement date of the loan, the Fund receives cash collateral against the loaned securities and maintains the cash collateral in an amount not less than 100% of the market value of the loaned securities during the period of the loan. The market value of the loaned securities is determined at the close of business of the Fund and any additional required cash collateral is delivered to the Fund on the next business day. Cash collateral received is invested in the JHCIT. If the borrower defaults on its obligation to return the securities loaned because of insolvency or other reasons, a fund could experience delays and costs in recovering the securities loaned or in gaining access to the collateral. The Fund may receive compensation for lending its securities either in the form of fees, guarantees, and/or by retaining a portion of interest on the investment of any cash received as collateral.
The Fund has entered into an agreement with Morgan Stanley & Co., Inc. and MS Securities Services, Inc. (collectively, Morgan Stanley) which permits the Fund to lend securities to
| Annual report | Classic Value Fund II | 25 |
Morgan Stanley on a principal basis. Morgan Stanley is the primary borrower of securities of the Fund. The risk of having one primary borrower of Fund securities (as opposed to several borrowers in an agency relationship) is that should Morgan Stanley fail financially, all securities lent may be affected by the failure and by any delays in recovery of the securities (or loss of rights in the collateral).
Forward foreign currency
exchange contracts
The Fund may enter into forward foreign currency exchange contracts as a hedge against the effect of fluctuations in currency exchange rates. A forward foreign currency exchange contract involves an obligation to purchase or sell a specific currency at a future date at a set price. The aggregate principal amounts of the contracts are marked to market daily at the applicable foreign currency exchange rates. Any resulting unrealized gains and losses are included in the determination of the Fund’s daily net asset value. The Fund records realized gains and losses at the time the forward foreign currency exchange contracts are closed out. Risks may arise upon entering these contracts from the potential inability of counterparties to meet the terms of the contracts and from unanticipated movements in the value of a foreign currency relative to the U.S. dollar. These contracts involve market or credit risk in excess of the unrealized gain or loss reflected in the Fund’s Statement of Assets and Liabilities.
The Fund may also purchase and sell forward contracts to facilitate the settlement of foreign currency denominated portfolio transactions, under which it intends to take delivery of the foreign currency. Such contracts normally involve no market risk if they are offset by the currency amount of the underlying transactions. The Fund had no open forward foreign currency exchange contracts on October 31, 2008.
Federal income taxes
The Fund qualifies as a regulated investment company by complying with the applicable provisions of the Internal Revenue Code and will not be subject to federal income tax on taxable income that is distributed to shareholders. Therefore, no federal income tax provision is required.
For federal income tax purposes, the Fund has $18,754,874 of a capital loss carryforward available, to the extent provided by regulations, to offset future net realized capital gains. To the extent that such carryforward is used by the Fund, no capital gain distributions will be made. The loss carryforwards expire as follows: October 31, 2016 — $18,754,874.
The Fund is subject to the provisions of Financial Accounting Standards Board (FASB) Interpretation No. 48, Accounting for Uncertainty in Income Taxes, an interpretation of FASB Statement 109 (FIN 48). FIN 48 prescribes a minimum threshold for financial statement recognition of the benefit of a tax position taken or expected to be taken in a tax return. The implementation of FIN 48 did not have a material impact on the Fund’s financial statements. Each of the Fund’s federal tax returns for the prior three years remain subject to examination by the Internal Revenue Service.
New accounting pronouncements
In March 2008, FASB No. 161 (FAS 161), Disclosures about Derivative Instruments and Hedging Activities, an amendment of FASB Statement No. 133 (FAS 133), was issued and is effective for fiscal years and interim periods beginning after November 15, 2008. FAS 161 amends and expands the disclosure requirements of FAS 133 in order to provide financial statement users an understanding of a company’s use of derivative instruments, how derivative instruments are accounted for under FAS 133 and related interpretations and how these instruments affect a company’s financial position, performance, and cash flows. FAS 161 requires companies to disclose information detailing the objectives and strategies for using derivative instruments, the level of derivative activity entered into by the company, and any credit risk-related contingent features of the agreements. Management is currently evaluating the adopti on of FAS 161 on the Fund’s financial statement disclosures.
Distribution of income and gains
The Fund records distributions to shareholders from net investment income and net realized gains, if any, on the ex-dividend date. The Fund generally declares and pays dividends and capital gains distributions, if any, annually.
| 26 | Classic Value Fund II | Annual report |
During the year ended December 31, 2006, the tax character of distributions paid was as follows: ordinary income $180,613. During the year ended December 31, 2007, the tax character of distributions paid was as follows: ordinary income $1,182,829, long-term capital gain $91,879. Distributions paid by the Fund with respect to each class of shares are calculated in the same manner, at the same time and are in the same amount, except for the effect of expenses that may be applied differently to each class.
As of October 31, 2008, the components of distributable earnings on a tax basis included $735,367 of undistributed ordinary income.
Such distributions and distributable earnings, on a tax basis, are determined in conformity with income tax regulations, which may differ from accounting principles generally accepted in the United States of America. Distributions in excess of tax basis earnings and profits, if any, are reported in the Fund’s financial statements as a return of capital.
Capital accounts within financial statements are adjusted for permanent book-tax differences. These adjustments have no impact on net assets or the results of operations. Temporary book-tax differences will reverse in a subsequent period. For the period ended October 31, 2008, there were no permanent book-tax differences.
Note 3
Risks and uncertainties
Sector risk — financial industry
Fund performance will be closely tied to a single sector of the economy, which may underperform other sectors over any given period of time. Financial companies can be hurt by economic declines and other factors. For instance, when economic conditions deteriorate, financial stocks may decline.
Risk associated with foreign investments
Investing in securities issued by companies whose principal business activities are outside the United States may involve significant risks not present in domestic investments. For example, there is generally less information available about foreign companies, particularly those not subject to the disclosure and reporting requirements of the U.S. securities laws. Foreign issuers are generally not bound by uniform accounting, auditing, and financial reporting requirements and standards of practice comparable to those applicable to domestic issuers. Investments in foreign securities also involve the risk of possible adverse changes in investment or exchange control regulations, expropriation or confiscatory taxation, limitation on the removal of funds or other assets of the Fund, political or financial instability or diplomatic and other developments which could affect such investments. Foreign stock markets, while growing in volume and sophisti cation, are generally not as developed as those in the United States, and securities of some foreign issuers (particularly those located in developing countries) may be less liquid and more volatile than securities of comparable U.S. companies. In general, there is less overall governmental supervision and regulation of foreign securities markets, broker-dealers and issuers than in the United States.
Small and medium size company risk
Stocks of small and medium-size companies tend to be more volatile than those of large companies, and may underperform stocks of large companies. Small and mid-size companies may have limited product lines or markets, less access to financial resources or less operating experience, or may depend on a few key employees. Given this, small and mid-cap stocks may be thinly traded, leading to additional liquidity risk due to the inabilities to trade in large volume.
Note 4
Guarantees and indemnifications
Under the Fund’s organizational documents, its Officers and Trustees are indemnified against certain liability arising out of the performance of their duties to the Fund. Additionally, in the normal course of business, the Fund enters into contracts with service providers that contain general indemnification clauses. The Fund’s maximum exposure under these arrangements is unknown, as this would involve future claims that may be made against the Fund that have not yet occurred.
| Annual report | Classic Value Fund II | 27 |
Note 5
Management fee and transactions with
affiliates and others
The Fund has an investment management contract with the Adviser. Under the investment management contract, the Fund pays a daily management fee to the Adviser equivalent, on an annual basis, to the sum of: (a) 0.80% of the first $2,500,000,000 of the Fund’s average daily net asset value, (b) 0.78% of the next $2,500,000,000 and (c) 0.76% in excess of $5,000,000,000 of the Fund’s daily net asset value. The effective rate for the period ended October 31, 2008 is 0.80% of the Fund’s average daily net asset value. The Adviser has a subadvisory agreement with Pzena Investment Management LLC. The Fund is not responsible for payment of the subadvisory fees.
The Adviser contractually limited the Fund’s total expenses, excluding distribution and service fees, transfer agent fees, brokerage commissions, interest and other extraordinary expenses not incurred in the ordinary course of the Fund’s business, to 0.89% of the Fund’s average daily net assets at least until April 30, 2009. Accordingly, the expense reductions related to this total expense limitation amounted to $126,881 for the period ended October 31, 2008. The Adviser reserves the right to terminate this limitation in the future.
The Fund has a Distribution Agreement with John Hancock Funds, LLC (JH Funds), a wholly owned subsidiary of the Adviser. The Fund has adopted Distribution Plans with respect to Class A, Class B, Class C and Class R1, pursuant to Rule 12b-1 under the 1940 Act, to pay JH Funds for the services it provides as distributor of shares of the Fund. Accordingly, the Fund makes monthly payments to JH Funds at an annual rate not to exceed 0.25%, 1.00% and 1.00% and 0.50% of average daily net asset value of Class A, Class B, Class C and Class R1, respectively. A maximum of 0.25% of such payments may be service fees, as defined by the Conduct Rules of the Financial Industry Regulatory Authority (formerly the National Association of Securities Dealers). Under the Conduct Rules, curtailment of a portion of the Fund’s 12b-1 payments could occur under certain circumstances. In addition, under a Service Plan for Class R1 s hares, the Fund pays up to 0.25% of Class R1 average daily net asset value for certain other services.
Class A shares are assessed up-front sales charges. During the period ended October 31, 2008, JH Funds received net up-front sales charges of $71,491 with regard to sales of Class A shares. Of this amount, $10,553 was retained and used for printing prospectuses, advertising, sales literature and other purposes, $59,117 was paid as sales commissions to unrelated broker-dealers and $1,821 was paid as sales commissions to sales personnel of Signator Investors, Inc. (Signator Investors), a related broker-dealer. The Adviser’s indirect parent, John Hancock Life Insurance Company (JHLICO), is the indirect sole shareholder of Signator Investors.
Class B shares that are redeemed within six years of purchase are subject to a contingent deferred sales charge (CDSC) at declining rates, beginning at 5.00% of the lesser of the current market value at the time of redemption or the original purchase cost of the shares being redeemed. Class C shares that are redeemed within one year of purchase are subject to a CDSC at a rate of 1.00% of the lesser of the current market value at the time of redemption or the original purchase cost of the shares being redeemed. Proceeds from the CDSCs are paid to JH Funds and are used in whole or in part to defray its expenses for providing distribution-related services to the Fund in connection with the sale of Class B and Class C shares. During the period ended October 31, 2008, CDSCs received by JH Funds amounted to $25,678 for Class B shares and $18,127 for Class C shares.
The Fund has a transfer agent agreement with John Hancock Signature Services, Inc. (Signature Services), an indirect subsidiary of JHLICO. The transfer agent fees are made up of three components:
• The Fund pays a monthly transfer agent fee at an annual rate of 0.05%, 0.05%, 0.05%, 0.04% and 0.05% for Classes A,
| 28 | Classic Value Fund II | Annual report |
B, C, I and R1, respectively, of each class’s average daily net assets.
• For the period of January 1, 2008 to May 31, 2008, the Fund paid a monthly fee which is based on an annual rate of $15.00, $17.50, $16.50, $15.00 and $15.00 for each shareholder account for Class A, B, C, I and R1, respectively. Effective June 1, 2008, all classes paid a monthly fee based on an annual rate of $16.50 per shareholder account.
• In addition, Signature Services is reimbursed for certain out-of-pocket expenses.
Signature Services has agreed to contractually limit the transfer agent expenses to 0.18% for Classes A, B and C until April 30, 2009 and thereafter until terminated by Signature Services. Waivers and reimbursements under this plan were $34,375, $4,635 and $16,327 for Classes A, B and C, respectively, for the period ended October 31, 2008. In addition, the Fund receives earnings credits from Signature Services as a result of uninvested cash balances. These credits are used to reduce a portion of the Fund’s transfer agent fees and out-of-pocket expenses. During the period ended October 31, 2008, the Fund’s transfer agent fees and out-of-pocket expenses were reduced by $1,665 for transfer agent credits earned.
Class level expenses for the period ended
October 31, 2008 were as follows:
| Transfer | Distribution and | ||
| Share class | agent fees | service fees | |
| Class A | $101,199 | $91,454 | |
| Class B | 13,751 | 49,323 | |
| Class C | 48,025 | 173,749 | |
| Class I | 3,839 | — | |
| Class R1 | 500 | 774 | |
| Total | $167,314 | $315,300 | |
The Fund has an agreement with the Adviser and affiliates to perform necessary tax, accounting, compliance, legal and other administrative services for the Fund. The compensation for the year amounted to $7,931 with an effective rate of 0.01% of the Fund’s average daily net asset value.
Mr. James R. Boyle is Chairman of the Adviser, as well as affiliated Trustee of the Fund, and is compensated by the Adviser and/ or its affiliates. The compensation of unaffiliated Trustees is borne by the Fund. The unaffiliated Trustees may elect to defer, for tax purposes, their receipt of this compensation under the John Hancock Group of Funds Deferred Compensation Plan. The Fund makes investments into other John Hancock funds, as applicable, to cover its liability for the deferred compensation. Investments to cover the Fund’s deferred compensation liability are recorded on the Fund’s books as an other asset. The deferred compensation liability and the related other asset are always equal and are marked to market on a periodic basis to reflect any income earned by the investments, as well as any unrealized gains or losses. The Deferred Compensation Plan investments had no impact on the operations of the Fund.
| Annual report | Classic Value Fund II | 29 |
Note 6
Fund share transactions
This listing illustrates the number of Fund shares sold, reinvested and repurchased during the period ended December 31, 2006, the year ended December 31, 2007, and the period ended October 31, 2008, along with the corresponding dollar value.
| Period ended 12-31-061 | Year ended 12-31-07 | Period ended 10-31-082 | |||||
| Shares | Amount | Shares | Amount | Shares | Amount | ||
| Class A shares | |||||||
| Sold | 3,415,796 | $36,642,179 | 7,333,800 | $83,737,825 | 949,778 | $7,952,204 | |
| Distributions | |||||||
| reinvested | 9,891 | 112,464 | 78,720 | 773,026 | — | — | |
| Repurchased | (33,064) | (367,315) | (4,131,985) | (45,786,008) | (3,590,494) | (29,502,175) | |
| Net increase | |||||||
| (decrease) | 3,392,623 | $36,387,328 | 3,280,535 | $38,724,843 | (2,640,716) | ($21,549,971) | |
| Class B shares | |||||||
| Sold | 540,125 | $5,857,582 | 639,959 | $7,329,987 | 68,682 | $556,080 | |
| Distributions | |||||||
| reinvested | 874 | 9,915 | 4,326 | 42,445 | — | — | |
| Repurchased | (18,276) | (203,482) | (299,115) | (3,283,672) | (334,967) | (2,765,286) | |
| Net increase | |||||||
| (decrease) | 522,723 | $5,664,015 | 345,170 | $4,088,760 | (266,285) | ($2,209,206) | |
| Class C shares | |||||||
| Sold | 1,366,860 | $14,895,524 | 2,954,346 | $33,155,576 | 382,828 | $3,154,936 | |
| Distributions | |||||||
| reinvested | 2,574 | 29,218 | 16,293 | 159,838 | — | — | |
| Repurchased | (21,239) | (229,731) | (1,000,121) | (10,515,915) | (1,588,438) | (13,354,433) | |
| Net increase | |||||||
| (decrease) | 1,348,195 | $14,695,011 | 1,970,518 | $22,799,499 | (1,205,610) | ($10,199,497) | |
| Class I shares | |||||||
| Sold | 332,852 | $3,687,416 | 2,474,371 | $27,332,141 | 475,930 | $3,969,018 | |
| Distributions | |||||||
| reinvested | 1,413 | 16,063 | 19,621 | 192,679 | — | — | |
| Repurchased | (997) | (11,084) | (1,298,055) | (14,165,816) | (772,513) | (6,629,961) | |
| Net increase | |||||||
| (decrease) | 333,268 | $3,692,395 | 1,195,937 | $13,359,004 | (296,583) | ($2,660,943) | |
| Class R1 shares | |||||||
| Sold | 48,760 | $515,380 | 57,023 | $665,402 | 8,950 | $78,035 | |
| Distributions | |||||||
| reinvested | 111 | 1,259 | 143 | 1,412 | — | — | |
| Repurchased | (2) | (20) | (92,093) | (920,232) | (423) | (2,561) | |
| Net increase | |||||||
| (decrease) | 48,869 | $516,619 | (34,927) | ($253,418) | 8,527 | $75,474 | |
| Net increase | |||||||
| (decrease) | 5,645,678 | $60,955,368 | 6,757,233 | $78,718,688 | (4,400,667) | ($36,544,143) | |
1Beginning of operations from 7-7-06 to 12-31-06.
2For the ten month period ended October 31, 2008, the Fund changed its fiscal year end from December 31 to October 31.
Note 7
Purchase and sale of securities
Purchases and proceeds from sales or maturities of securities, other than short-term securities and obligations of the U.S. government, during the period ended October 31, 2008, aggregated $23,811,213 and $59,876,636, respectively.
Note 8
Change in fiscal year end
The Fund’s fiscal year end has changed to October 31, 2008.
| 30 | Classic Value Fund II | Annual report |
Auditors’ report
Report of Independent Registered Public Accounting Firm
To the Board of Trustees of John Hancock Capital Series and Shareholders of John Hancock Classic Value Fund II:
In our opinion, the accompanying statement of assets and liabilities, including the schedule of investments, and the related statements of operations and of changes in net assets and the financial highlights present fairly, in all material respects, the financial position of John Hancock Classic Value Fund II (the Fund) at October 31, 2008, and the results of its operations, the changes in its net assets and the financial highlights for the periods indicated, in conformity with accounting principles generally accepted in the United States of America. These financial statements and financial highlights (hereafter referred to as “financial statements”) are the responsibility of the Fund’s management; our responsibility is to express an opinion on these financial statements based on our audits. We conducted our audits of these financial statements in accordance with the standards of the Public Company Accounting Oversight Board (United States). Those standard s require that we plan and perform the audit to obtain reasonable assurance about whether the financial statements are free of material misstatement. An audit includes examining, on a test basis, evidence supporting the amounts and disclosures in the financial statements, assessing the accounting principles used and significant estimates made by management, and evaluating the overall financial statement presentation. We believe that our audits, which included confirmation of securities as of October 31, 2008 by correspondence with the custodian and brokers, and the application of alternative auditing procedures where securities purchased had not been received, provide a reasonable basis for our opinion.
PricewaterhouseCoopers LLP
Boston, Massachusetts
December 22, 2008
| Annual report | Classic Value Fund II | 31 |
Tax information
Unaudited
For federal income tax purposes, the following information is furnished with respect to the distributions of the Fund, if any, paid during its taxable year ended October 31, 2008.
Shareholders will be mailed a 2008 U.S. Treasury Department Form 1099-DIV in January 2009. This will reflect the total of all distributions that are taxable for calendar year 2008.
| 32 | Classic Value Fund II | Annual report |
Board Consideration of and
Continuation of Investment
Advisory Agreement and
Subadvisory Agreement:
John Hancock Classic Value Fund II
The Investment Company Act of 1940 (the 1940 Act) requires the Board of Trustees (the Board) of John Hancock Capital Series (the Trust), including a majority of the Trustees who have no direct or indirect interest in the investment advisory agreement and are not “interested persons” of the Trust, as defined in the 1940 Act (the Independent Trustees), annually to meet in person to review and consider the continuation of: (i) the investment advisory agreement (the Advisory Agreement) with John Hancock Advisers, LLC (the Adviser) and (ii) the investment subadvisory agreement (the Subadvisory Agreement) with Pzena Investment Management, LLC (the Subadviser) for the John Hancock Classic Value Fund II (the Fund). The Advisory Agreement and the Subadvisory Agreement are collectively referred to as the Advisory Agreements.
At meetings held on May 5–6 and June 9–10, 2008, the Board considered the factors and reached the conclusions described below relating to the selection of the Adviser and Subadviser and the continuation of the Advisory Agreements. During such meetings, the Board’s Contracts/Operations Committee and the Independent Trustees also met in executive sessions with their independent legal counsel.
In evaluating the Advisory Agreements, the Board, including the Contracts/Operations Committee and its Independent Trustees, reviewed a broad range of information requested for this purpose. This information included:
(i) the investment performance of the Fund relative to a category of relevant funds (the Category) and a peer group of comparable funds (the Peer Group). The funds within each Category and Peer Group were selected by Morningstar Inc. (Morningstar), an independent provider of investment company data. Data covered the period since the Fund’s inception through December 31, 2007,
(ii) advisory and other fees incurred by, and the expense ratios of, the Fund relative to a Category and a Peer Group,
(iii) the advisory fees of comparable portfolios of other clients of the Adviser and the Subadviser,
(iv) the Adviser’s financial results and condition, including its and certain of its affiliates’ profitability from services performed for the Fund,
(v) breakpoints in the Fund’s and the Peer Group’s fees, and information about economies of scale,
(vi) the Adviser’s and Subadviser’s record of compliance with applicable laws and regulations, with the Fund’s investment policies and restrictions, and with the applicable Code of Ethics, and the structure and responsibilities of the Adviser’s and Subadviser’s compliance department,
(vii) the background and experience of senior management and investment professionals, and
(viii) the nature, cost and character of advisory and non-investment management services provided by the Adviser and its affiliates and by the Subadviser.
The Independent Trustees considered the legal advice of independent legal counsel and relied on their own business judgment in determining the factors to be considered in evaluating the materials that were presented to them and the weight to be given to each such factor. The Board’s review and conclusions were based on a comprehensive consideration of all information presented to the Board and not the result of any single controlling factor. The Board principally considered data on performance and other information provided by Morningstar as of December 31, 2007. The Board also considered updated performance information provided to it by the Adviser or Subadviser at its May and June 2008 meetings. Performance and other information may be quite different as of the date of this shareholders report. The key factors considered by the Board and the conclusions reached are described below.
| Annual report | Classic Value Fund II | 33 |
Nature, extent and quality of services
The Board considered the ability of the Adviser and the Subadviser, based on their resources, reputation and other attributes, to attract and retain qualified investment professionals, including research, advisory, and supervisory personnel. The Board considered the investment philosophy, research and investment decision-making processes of the Adviser, Subadviser and representatives of the Subadviser that are responsible for the daily investment activities of the Fund. The Board considered the representatives’ history and experience with the Fund. The Board considered the Adviser’s execution of its oversight responsibilities. The Board further considered the culture of compliance, resources dedicated to compliance, compliance programs and compliance records of the Adviser and Subadviser. In addition, the Board took into account the administrative and other non-advisory services provided to the Fund by the Adviser and its affiliates.
Based on the above factors, together with those referenced below, the Board concluded that, within the context of its full deliberations, the nature, extent and quality of the investment advisory services provided to the Fund by the Adviser and Subadviser supported renewal of the Advisory Agreements.
Fund performance
The Board noted that the Fund had less than two full years of operational history, and considered the performance results for the Fund since its inception in 2006 through December 31, 2007. The Board also considered these results in comparison to the performance of the Category, as well as the Fund’s Peer Group and benchmark index. The Board reviewed with representatives of Morningstar the methodology used by Morningstar to select the funds in the Category and the Peer Group.
The Board noted that the Fund’s performance was lower than the performance of the Category and Peer Group medians, and its benchmark index, the Russell 1000 Value Index, for the 1-year period. The Subadviser provided detailed information about its investment process and discussed the performance of specific portfolio stocks with the Board. The Adviser also discussed with the Board its review and analysis of the Subadviser’s investment process and particular portfolio stocks in light of the Fund’s value orientation. The Board concluded that the investment process and particular portfolio stocks seemed consistent with the Fund’s investment objectives, strategy and style. The Board recognized the short operational history of the Fund and indicated its intent to continue to monitor the Fund’s performance trends.
Investment advisory fee and subadvisory fee rates and expenses
The Board reviewed and considered the contractual investment advisory fee rate payable by the Fund to the Adviser for investment advisory services (the Advisory Agreement Rate). The Board received and considered information comparing the Advisory Agreement Rate with the advisory fees for the Peer Group. The Board noted that the Advisory Agreement Rate was higher than the median rate of the Peer Group and not appreciably higher than the median rate of the Category.
The Board received and considered expense information regarding the Fund’s various components, including advisory fees, distribution and fees other than advisory and distribution fees, including transfer agent fees, custodian fees, and other miscellaneous fees (e.g., fees for accounting and legal services). The Board considered comparisons of these expenses to the Peer Group median. The Board also received and considered expense information regarding the Fund’s total operating expense ratio (Gross Expense Ratio) and total operating expense ratio after taking the fee waiver arrangement applicable to the Advisory Agreement Rate into account (Net Expense Ratio). The Board received and considered information comparing the Gross Expense Ratio and Net Expense Ratio of the Fund to that of the Peer Group and Category medians. The Board noted that the Fund’s Gross Expense Ratio was higher than the Peer Group and Category medians. The Board also noted that the Fund’s Net Expense Ratio was higher than the Category median, but not appreciably higher than the Peer Group median.
The Adviser also discussed the Morningstar data and rankings, and other relevant information, for the Fund. Based on the above-referenced considerations and other factors, the Board concluded that the Fund’s overall expenses and plans to improve performance supported the re-approval of the Advisory Agreements.
| 34 | Classic Value Fund II | Annual report |
The Board also received information about the investment subadvisory fee rate (the Subadvisory Agreement Rate) payable by the Adviser to the Subadviser for investment subadvisory services. The Board concluded that the Subadvisory Agreement Rate was fair and equitable, based on its consideration of the factors described here.
Profitability
The Board received and considered a detailed profitability analysis of the Adviser based on the Advisory Agreements, as well as on other relationships between the Fund and the Adviser and its affiliates. The Board also considered a comparison of the Adviser’s profitability to that of other similar investment advisers whose profitability information is publicly available. The Board concluded that, in light of the costs of providing investment management and other services to the Fund, the profits and other ancillary benefits reported by the Adviser were not unreasonable.
The Board did not consider profitability information with respect to the Subadviser, which is not affiliated with the Adviser. The Board considered that the Subadvisory Agreement Rate paid to the Subadviser had been negotiated by the Adviser on an arm’s length basis and that the Subadviser’s separate profitability from its relationship with the Fund was not a material factor in determining whether to renew the agreement.
Economies of scale
The Board received and considered general information regarding economies of scale with respect to the management of the Fund, including the Fund’s ability to appropriately benefit from economies of scale under the Fund’s fee structure. The Board recognized the inherent limitations of any analysis of economies of scale, stemming largely from the Board’s understanding that most of the Adviser’s costs are not specific to individual Funds, but rather are incurred across a variety of products and services.
To the extent the Board and the Adviser were able to identify actual or potential economies of scale from Fund-specific or allocated expenses, in order to ensure that any such economies continue to be reasonably shared with the Fund as its assets increase, the Adviser and the Board agreed to continue the existing breakpoints to the Advisory Agreement Rate.
Information about services to other clients
The Board also received information about the nature, extent and quality of services and fee rates offered by the Adviser and Subadviser to their other clients, including other registered investment companies, institutional investors and separate accounts. The Board concluded that the Advisory Agreement Rate and the Subadvisory Agreement Rate were not unreasonable, taking into account fee rates offered to others by the Adviser and Subadviser, respectively, after giving effect to differences in services.
Other benefits to the Adviser
The Board received information regarding potential “fall-out” or ancillary benefits received by the Adviser and its affiliates and the Subadviser as a result of their relationship with the Fund. Such benefits could include, among others, benefits directly attributable to the relationship of the Adviser and Subadviser with the Fund and benefits potentially derived from an increase in business of the Adviser and Subadviser as a result of their relationship with the Fund (such as the ability to market to shareholders other financial products offered by the Adviser and its affiliates).
The Board also considered the effectiveness of the Adviser’s, Subadviser’s and Fund’s policies and procedures for complying with the requirements of the federal securities laws, including those relating to best execution of portfolio transactions and brokerage allocation.
Other factors and broader review
As discussed above, the Board reviewed detailed materials received from the Adviser and Subadviser as part of the annual re-approval process. The Board also regularly reviews and assesses the quality of the services that the Fund receives throughout the year. In this regard, the Board reviews reports of the Adviser at least quarterly, which include, among other things, fund performance reports and compliance reports. In addition, the Board meets with portfolio managers and senior investment officers at various times throughout the year.
After considering the above-described factors and based on its deliberations and its evaluation of the information described above, the Board concluded that approval of the continuation of the Advisory Agreements for the Fund was in the best interest of the Fund and its shareholders.
| Annual report | Classic Value Fund II | 35 |
Trustees and Officers
This chart provides information about the Trustees and Officers who oversee your John Hancock fund. Officers elected by the Trustees manage the day-to-day operations of the Fund and execute policies formulated by the Trustees.
Independent Trustees
| Name, Year of Birth | Number of | |
| Position(s) held with Fund | Trustee | John Hancock |
| Principal occupation(s) and other | of Fund | funds overseen |
| directorships during past 5 years | since1 | by Trustee |
| James F. Carlin, Born: 1940 | 2006 | 50 |
| Chairman (since December 2007); Director and Treasurer, Alpha Analytical Laboratories, Inc. (chemical | ||
| analysis) (since 1985); Part Owner and Treasurer, Lawrence Carlin Insurance Agency, Inc. (since 1995); | ||
| Part Owner and Vice President, Mone Lawrence Carlin Insurance Agency, Inc. (until 2005); Chairman | ||
| and Chief Executive Officer, Carlin Consolidated, Inc. (management/investments) (since 1987); Trustee, | ||
| Massachusetts Health and Education Tax Exempt Trust (1993–2003). | ||
| William H. Cunningham, Born: 1944 | 2006 | 50 |
| Professor, University of Texas at Austin (since 1971); former Chancellor, University of Texas System and | ||
| former President, University of Texas at Austin (until 2001); Chairman and Chief Executive Officer, IBT | ||
| Technologies (until 2001); Director of the following: Hicks Acquisition Company I, Inc. (since 2007); | ||
| Hire.com (until 2004), STC Broadcasting, Inc. and Sunrise Television Corp. (until 2001), Symtx, Inc. | ||
| (electronic manufacturing) (since 2001), Adorno/Rogers Technology, Inc. (until 2004), Pinnacle Foods | ||
| Corporation (until 2003), rateGenius (until 2003), Lincoln National Corporation (insurance) (since | ||
| 2006), Jefferson-Pilot Corporation (diversified life insurance company) (until 2006), New Century | ||
| Equity Holdings (formerly Billing Concepts) (until 2001), eCertain (until 2001), ClassMap.com (until | ||
| 2001), Agile Ventures (until 2001), AskRed.com (until 2001), Southwest Airlines (since 2000), Introgen | ||
| (manufacturer of biopharmaceuticals) (since 2000) and Viasystems Group, Inc. (electronic manufacturer) | ||
| (until 2003); Advisory Director, Interactive Bridge, Inc. (college fundraising) (until 2001); Advisory | ||
| Director, Q Investments (until 2003); Advisory Director, JPMorgan Chase Bank (formerly Texas Commerce | ||
| Bank–Austin), LIN Television (until 2008), WilTel Communications (until 2003) and Hayes Lemmerz | ||
| International, Inc. (diversified automotive parts supply company) (since 2003). | ||
| Deborah C. Jackson,4 Born: 1952 | 2008 | 50 |
| Chief Executive Officer, American Red Cross of Massachusetts Bay (since 2002); Board of Directors of | ||
| Eastern Bank Corporation (since 2001); Board of Directors of Eastern Bank Charitable Foundation (since | ||
| 2001); Board of Directors of American Student Association Corp. (since 1996); Board of Directors of | ||
| Boston Stock Exchange (2002–2008); Board of Directors of Harvard Pilgrim Healthcare (since 2007). | ||
| Charles L. Ladner,2 Born: 1938 | 2006 | 50 |
| Chairman and Trustee, Dunwoody Village, Inc. (retirement services) (until 2003); Senior Vice President | ||
| and Chief Financial Officer, UGI Corporation (public utility holding company) (retired 1998); Vice | ||
| President and Director, AmeriGas, Inc. (retired 1998); Director, AmeriGas Partners, L.P. (gas distribution) | ||
| (until 1997); Director, EnergyNorth, Inc. (until 1997); Director, Parks and History Association (until 2005). | ||
| Stanley Martin,2,4 Born: 1947 | 2008 | 50 |
| Senior Vice President/Audit Executive, Federal Home Loan Mortgage Corporation (2004–2006); | ||
| Executive Vice President/Consultant, HSBC Bank USA (2000–2003); Chief Financial Officer/Executive | ||
| Vice President, Republic New York Corporation and Republic National Bank of New York (1998–2000); | ||
| Partner, KPMG LLP (1971–1998). | ||
| 36 | Classic Value Fund II | Annual report |
Independent Trustees (continued)
| Name, Year of Birth | Number of | |
| Position(s) held with Fund | Trustee | John Hancock |
| Principal occupation(s) and other | of Fund | funds overseen |
| directorships during past 5 years | since1 | by Trustee |
| Dr. John A. Moore,2 Born: 1939 | 2006 | 50 |
| President and Chief Executive Officer, Institute for Evaluating Health Risks (nonprofit institution) | ||
| (until 2001); Senior Scientist, Sciences International (health research) (until 2003); Former Assistant | ||
| Administrator and Deputy Administrator, Environmental Protection Agency; Principal, Hollyhouse | ||
| (consulting) (since 2000); Director, CIIT Center for Health Science Research (nonprofit research) | ||
| (until 2007). | ||
| Patti McGill Peterson,2 Born: 1943 | 2006 | 50 |
| Principal, PMP Globalinc (consulting) (since 2007); Senior Associate, Institute for Higher Education Policy | ||
| (since 2007); Executive Director, CIES (international education agency) (until 2007); Vice President, | ||
| Institute of International Education (until 2007); Senior Fellow, Cornell University Institute of Public | ||
| Affairs, Cornell University (until 1998); Former President Wells College, St. Lawrence University and the | ||
| Association of Colleges and Universities of the State of New York. Director of the following: Niagara | ||
| Mohawk Power Corporation (until 2003); Security Mutual Life (insurance) (until 1997); ONBANK (until | ||
| 1993). Trustee of the following: Board of Visitors, The University of Wisconsin, Madison (since 2007); | ||
| Ford Foundation, International Fellowships Program (until 2007); UNCF, International Development | ||
| Partnerships (until 2005); Roth Endowment (since 2002); Council for International Educational Exchange | ||
| (since 2003). | ||
| Steven R. Pruchansky, Born: 1944 | 2006 | 50 |
| Chairman and Chief Executive Officer, Greenscapes of Southwest Florida, Inc. (since 2000); Director | ||
| and President, Greenscapes of Southwest Florida, Inc. (until 2000); Member, Board of Advisors, First | ||
| American Bank (since 2008); Managing Director, JonJames, LLC (real estate) (since 2000); Director, First | ||
| Signature Bank & Trust Company (until 1991); Director, Mast Realty Trust (until 1994); President, Maxwell | ||
| Building Corp. (until 1991). | ||
Non-Independent Trustees3
| Name, Year of Birth | Number of | |
| Position(s) held with Fund | Trustee | John Hancock |
| Principal occupation(s) and other | of Fund | funds overseen |
| directorships during past 5 years | since1 | by Trustee |
| James R. Boyle, Born: 1959 | 2006 | 267 |
| Executive Vice President, Manulife Financial Corporation (since 1999); Director and President, John | ||
| Hancock Variable Life Insurance Company (since 2007); Director and Executive Vice President, John | ||
| Hancock Life Insurance Company (since 2004); Chairman and Director, John Hancock Advisers, LLC (the | ||
| Adviser), John Hancock Funds, LLC (John Hancock Funds) and The Berkeley Financial Group, LLC (The | ||
| Berkeley Group) (holding company) (since 2005); Chairman and Director, John Hancock Investment | ||
| Management Services, LLC (since 2006); Senior Vice President, The Manufacturers Life Insurance | ||
| Company (U.S.A.) (until 2004). | ||
| Annual report | Classic Value Fund II | 37 |
Principal officers who are not Trustees
| Name, Year of Birth | ||
| Position(s) held with Fund | Officer | |
| Principal occupation(s) and other | of Fund | |
| directorships during past 5 years | since | |
| Keith F. Hartstein, Born: 1956 | 2006 | |
| President and Chief Executive Officer | ||
| Senior Vice President, Manulife Financial Corporation (since 2004); Director, President and Chief | ||
| Executive Officer, the Adviser, The Berkeley Group and John Hancock Funds, LLC (since 2005); Director, | ||
| MFC Global Investment Management (U.S.), LLC (MFC Global (U.S.)) (since 2005); Chairman and | ||
| Director, John Hancock Signature Services, Inc. (since 2005); Director, President and Chief Executive | ||
| Officer, John Hancock Investment Management Services, LLC (since 2006); President and Chief Executive | ||
| Officer, John Hancock Funds, John Hancock Funds II, John Hancock Funds III and John Hancock Trust | ||
| (since 2005); Director, Chairman and President, NM Capital Management, Inc. (since 2005); Member | ||
| and former Chairman, Investment Company Institute Sales Force Marketing Committee (since 2003); | ||
| Director, President and Chief Executive Officer, MFC Global (U.S.) (2005–2006); Executive Vice President, | ||
| John Hancock Funds, LLC (until 2005). | ||
| Thomas M. Kinzler, Born: 1955 | 2006 | |
| Secretary and Chief Legal Officer | ||
| Vice President and Counsel, John Hancock Life Insurance Company (U.S.A.) (since 2006); Secretary and | ||
| Chief Legal Officer, John Hancock Funds, John Hancock Funds II and John Hancock Trust (since 2006); | ||
| Vice President and Associate General Counsel, Massachusetts Mutual Life Insurance Company (1999– | ||
| 2006); Secretary and Chief Legal Counsel, MML Series Investment Fund (2000–2006); Secretary and | ||
| Chief Legal Counsel, MassMutual Institutional Funds (2000–2004); Secretary and Chief Legal Counsel, | ||
| MassMutual Select Funds and MassMutual Premier Funds (2004–2006). | ||
| Francis V. Knox, Jr., Born: 1947 | 2006 | |
| Chief Compliance Officer | ||
| Vice President and Chief Compliance Officer, John Hancock Investment Management Services, LLC, | ||
| the Adviser and MFC Global (U.S.) (since 2005); Chief Compliance Officer, John Hancock Funds, John | ||
| Hancock Funds II, John Hancock Funds III and John Hancock Trust (since 2005); Vice President and | ||
| Assistant Treasurer, Fidelity Group of Funds (until 2004); Vice President and Ethics & Compliance Officer, | ||
| Fidelity Investments (until 2001). | ||
| Charles A. Rizzo, Born: 1957 | 2007 | |
| Chief Financial Officer | ||
| Chief Financial Officer, John Hancock Funds, John Hancock Funds II, John Hancock Funds III and John | ||
| Hancock Trust (since 2007); Assistant Treasurer, Goldman Sachs Mutual Fund Complex (registered | ||
| investment companies) (2005–2007); Vice President, Goldman Sachs (2005–2007); Managing Director | ||
| and Treasurer of Scudder Funds, Deutsche Asset Management (2003–2005); Director, Tax and Financial | ||
| Reporting, Deutsche Asset Management (2002–2003); Vice President and Treasurer, Deutsche Global | ||
| Fund Services (1999–2002). | ||
| Gordon M. Shone, Born: 1956 | 2006 | |
| Treasurer | ||
| Senior Vice President, John Hancock Life Insurance Company (U.S.A.) (since 2001); Treasurer, John | ||
| Hancock Funds (since 2006), John Hancock Funds II, John Hancock Funds III and John Hancock Trust | ||
| (since 2005); Vice President and Chief Financial Officer, John Hancock Trust (2003–2005); Vice President, | ||
| John Hancock Investment Management Services, LLC, John Hancock Advisers, LLC (since 2006) and The | ||
| Manufacturers Life Insurance Company (U.S.A.) (1998–2000). | ||
| 38 | Classic Value Fund II | Annual report |
Principal officers who are not Trustees (continued)
| Name, Year of Birth | |
| Position(s) held with Fund | Officer |
| Principal occupation(s) and other | of Fund |
| directorships during past 5 years | since |
| John G. Vrysen, Born: 1955 | 2006 |
| Chief Operating Officer | |
| Senior Vice President, Manulife Financial Corporation (since 2006); Senior Vice President, John Hancock | |
| Life Insurance Company (since 2004); Director, Executive Vice President and Chief Operating Officer, | |
| the Adviser, The Berkeley Group and John Hancock Funds, LLC (since 2007); Director, Executive Vice | |
| President and Chief Operating Officer, John Hancock Investment Management Services, LLC (since | |
| 2007); Chief Operating Officer, John Hancock Funds, John Hancock Funds II, John Hancock Funds III | |
| and John Hancock Trust (since 2007); Director, Executive Vice President and Chief Financial Officer, | |
| the Adviser, The Berkeley Group and John Hancock Funds, LLC (2005–2007); Director, Executive Vice | |
| President and Chief Financial Officer, John Hancock Investment Management Services, LLC (2005–2007); | |
| Executive Vice President and Chief Financial Officer, MFC Global (U.S.) (2005–2007); Director, John | |
| Hancock Signature Services, Inc. (since 2005); Chief Financial Officer, John Hancock Funds, John Hancock | |
| Funds II, John Hancock Funds III and John Hancock Trust (2005–2007); Vice President and General | |
| Manager, John Hancock Fixed Annuities, U.S. Wealth Management (2004–2005); Vice President, | |
| Operations, Manulife Wood Logan (2000–2004). | |
The business address for all Trustees and Officers is 601 Congress Street, Boston, Massachusetts 02210-2805.
The Statement of Additional Information of the Fund includes additional information about members of the Board of Trustees of the Fund and is available without charge, upon request, by calling 1-800-225-5291.
1 Each Trustee serves until resignation, retirement age or until his or her successor is elected.
2 Member of Audit and Compliance Committee.
3 Non-Independent Trustee holds positions with the Fund’s investment adviser, underwriter and certain other affiliates.
4 Mr. Martin was appointed by the Board as Trustee on September 8, 2008 and Ms. Jackson was appointed effective October 1, 2008.
| Annual report | Classic Value Fund II | 39 |
More information
| Trustees | Investment adviser |
| James F. Carlin, Chairman | John Hancock Advisers, LLC |
| James R. Boyle† | |
| William H. Cunningham | Subadviser |
| Deborah C. Jackson | Pzena Investment Management, LLC |
| Charles L. Ladner* | |
| Stanley Martin* | Principal distributor |
| Dr. John A. Moore* | John Hancock Funds, LLC |
| Patti McGill Peterson* | |
| Steven R. Pruchansky | Custodian |
| *Members of the Audit Committee | State Street Bank & Trust Company |
| †Non-Independent Trustee | |
| Transfer agent | |
| Officers | John Hancock Signature Services, Inc. |
| Keith F. Hartstein | |
| President and Chief Executive Officer | Legal counsel |
| K&L Gates LLP | |
| Thomas M. Kinzler | |
| Secretary and Chief Legal Officer | Independent registered |
| public accounting firm | |
| Francis V. Knox, Jr. | PricewaterhouseCoopers LLP |
| Chief Compliance Officer | |
| Charles A. Rizzo | |
| Chief Financial Officer | |
| Gordon M. Shone | |
| Treasurer | |
| John G. Vrysen | |
| Chief Operating Officer | |
Additional information about your fund is available without charge in several ways. As required by the SEC, you can access proxy voting information and quarterly portfolio information on your fund. The proxy voting information includes a description of proxy voting policies, procedures and information regarding how the fund voted proxies relating to portfolio securities during the most recent twelve-month period ended June 30. The quarterly portfolio information that includes a complete list of the fund’s holdings for the first and third quarters of the fund’s fiscal period is filed on Form N-Q. You have access to this information:
| By phone | On the fund’s Website | At the SEC |
| 1-800-225-5291 | www.jhfunds.com | www.sec.gov |
| 1-800-SEC-0330 | ||
| SEC Public Reference Room | ||
| You can also contact us: | ||
| Regular mail: | Express mail: | |
| John Hancock Signature Services, Inc. | John Hancock Signature Services, Inc. | |
| P.O. Box 9510 | Mutual Fund Image Operations | |
| Portsmouth, NH 03802-9510 | 164 Corporate Drive | |
| Portsmouth, NH 03801 | ||
Month-end portfolio holdings are available at www.jhfunds.com.
| 40 | Classic Value Fund II | Annual report |

[-800-225-5291
1-800-554-6713 TDD
1-800-338-8080 EASI-Line
www.jhfunds.com
Now available: electronic delivery
www.jhfunds.com/edelivery
| This report is for the information of the shareholders of John Hancock Classic Value Fund II. | 3500A 10/08 |
| It is not authorized for distribution to prospective investors unless preceded or accompanied by a prospectus. | 12/08 |
Discussion of Fund performance
By Pzena Investment Management, LLC
The Fund’s fiscal year-end recently changed from December 31 to October 31. What follows is a discussion of the Fund’s performance for the 10-month period ended October 31, 2008.
The U.S. stock market, roiled by increasing fear and panic, suffered a sharp decline in the first 10 months of 2008. The credit crunch and liquidity crisis worsened steadily throughout the period, putting pressure on the financial sector, and the economy careened toward a recession. As a result, uncertainty and fear dominated the equity market, leading to lower stock prices and a dramatic increase in day-to-day market volatility.
“The U.S. stock market, roiled by
increasing fear and panic, suffered a
sharp decline in the first 10 months
of 2008.”
For the 10 months ended October 31, 2008, John Hancock Classic Value Fund’s Class A shares posted a total return of –42.50% at net asset value, trailing both the –32.90% return of the Russell 1000 Value Index and the –33.54% return of theaverage large value fund, according to Morningstar, Inc.
The portfolio’s underperformance of its benchmark index and Morningstar peer group resulted entirely from the lagging results of the portfolio’s financial stocks, which comprised approximately 35% of the portfolio at period end. Four of the five biggest individual detractors from performance compared with the benchmark index were financial stocks —mortgage lenders Fannie Mae and Freddie Mac, brokerage firm Lehman Brothers Holdings and commercial bank Wachovia Corp. We sold the latter two.
Apart from the financials, the portfolio’s holdings performed relatively well, with stock selection adding value in a number of other sectors of the portfolio. Top contributors included biotechnology firm Amgen, Inc., discount retailer Wal-Mart, Inc. and apparel retailer TJX, owner of TJ Maxx and Marshall’s. We sold both retailers as they reached fair value.
This commentary reflects the views of the portfolio managers through the end of the Fund’s period discussed in this report. The managers’ statements reflect their own opinions. As such, they are in no way guarantees of future events, and are not intended to be used as investment advice or a recommendation regarding any specific security. They are also subject to change at any time as market and other conditions warrant.
Past performance is no guarantee of future results.
Sector investing is subject to greater risks than the market as a whole. Because the Fund may focus on particular sectors of the economy, its performance may depend on the performance of those sectors.
| 6 | Classic Value Fund | Annual report |
A look at performance
For the period ended October 31, 2008
| Average annual returns (%) | Cumulative total returns (%) | |||||||||
| with maximum sales charge (POP) | with maximum sales charge (POP) | |||||||||
| Inception | Since | Since | ||||||||
| Class | date | 1-year | 5-year | 10-year | inception | 1-year | 5-year | 10-year | inception | |
| A1 | 6-24-96 | –51.93 | –6.05 | 3.74 | — | –51.93 | –26.82 | 44.40 | — | |
| B | 11-11-02 | –52.07 | –6.12 | — | –0.22 | –52.07 | –27.07 | — | –1.29 | |
| C | 11-11-02 | –50.27 | –5.81 | — | –0.08 | –50.27 | –25.88 | — | –0.50 | |
| I2 | 11-11-02 | –49.24 | –4.71 | — | 1.08 | –49.24 | –21.42 | — | 6.60 | |
| R12 | 8-5-03 | –49.61 | –5.42 | — | –3.31 | –49.61 | –24.32 | — | –16.18 | |
Performance figures assume all distributions are reinvested. Public offering price (POP) figures reflect maximum sales charges on Class A shares of 5% and the applicable contingent deferred sales charge (CDSC) on Class B and Class C shares. The returns for Class C shares have been adjusted to reflect the elimination of the front-end sales charge effective July 15, 2004. The Class B shares’ CDSC declines annually between years 1 to 6 according to the following schedule: 5, 4, 3, 3, 2, 1%. No sales charge will be assessed after the sixth year. Class C shares held for less than one year are subject to a 1% CDSC. Sales charge is not applicable for Class I and Class R1 shares.
The expense ratios of the Fund, both net (including any fee waivers or expense limitations) and gross (excluding any fee waivers or expense limitations), are set forth according to the most recent publicly available prospectuses for the Fund and may differ from the expense ratios disclosed in the Financial Highlights tables in this report. The net expenses equal the gross expenses and are as follows: Class A — 1.28%, Class B — 2.03%, Class C — 2.03%, Class I — 0.92%, Class R1 — 1.64%.
The returns reflect past results and should not be considered indicative of future performance. The return and principal value of an investment will fluctuate so that shares, when redeemed, may be worth more or less than their original cost. Due to market volatility, the Fund’s current performance may be higher or lower than the performance shown. For current to the most recent month end performance data, please call 1–800–225–5291 or visit the Fund’s Web site at www.jhfunds.com.
The performance table above and the chart on the next page do not reflect the deduction of taxes that a shareholder would pay on fund distributions or the redemption of fund shares.
The Fund’s performance results reflect any applicable expense reductions, without which the expenses would increase and results would have been less favorable.
1 Effective November 8, 2002, shareholders of the former Pzena Focused Value Fund became owners of that number of full and fractional shares of John Hancock Classic Value Fund. Additionally, the accounting and performance history of the former Pzena Focused Value Fund was redesignated as that of Class A of John Hancock Classic Value Fund. The performance of the former Pzena Focused Value Fund reflects stocks selected from the largest 1,000 publicly traded U.S. companies, whereas the Fund invests in stocks selected from the 500 largest such companies.
2 For certain types of investors as described in the Fund’s Class I and Class R1 share prospectuses.
| Annual report | Classic Value Fund | 7 |
A look at performance
Growth of $10,000
This chart shows what happened to a hypothetical $10,000 investment in Classic Value Fund Class A shares for the period indicated. For comparison, we’ve shown the same investment in the Russell 1000 Value Index.
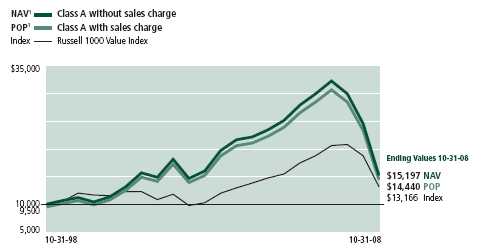
| With maximum | ||||
| Class | Period beginning | Without sales charge | sales charge | Index |
| B | 11-11-02 | $9,957 | $9,871 | $13,685 |
| C2 | 11-11-02 | 9,950 | 9,950 | 13,685 |
| I3 | 11-11-02 | 10,660 | 10,660 | 13,685 |
| R13 | 8-5-03 | 8,382 | 8,382 | 11,895 |
Assuming all distributions were reinvested for the period indicated, the table above shows the value of a $10,000 investment in the Fund’s Class B, Class C, Class I and Class R1 shares, respectively, as of October 31, 2008. The Class C shares investment with maximum sales charge has been adjusted to reflect the elimination of the front-end sales charge effective July 15, 2004. Performance of the classes will vary based on the difference in sales charges paid by shareholders investing in the different classes and the fee structure of those classes.
Russell 1000 Value Index is an unmanaged index containing those securities in the Russell 1000 Index with a less-than-average growth orientation.
It is not possible to invest directly in an index. Index figures do not reflect sales charges, which would have resulted in lower values if they did.
1 NAV represents net asset value and POP represents public offering price.
2 No contingent deferred sales charge applicable.
3 For certain types of investors as described in the Fund’s Class I and Class R1 share prospectuses.
| 8 | Classic Value Fund | Annual report |
Your expenses
These examples are intended to help you understand your ongoing operating expenses.
Understanding fund expenses
As a shareholder of the Fund, you incur two types of costs:
▪ Transaction costs which include sales charges (loads) on purchases or redemptions (varies by share class), minimum account fee charge, etc.
▪ Ongoing operating expenses including management fees, distribution and service fees (if applicable), and other fund expenses.
We are going to present only your ongoing operating expenses here.
Actual expenses/actual returns
This example is intended to provide information about your fund’s actual ongoing operating expenses, and is based on your fund’s actual return. It assumes an account value of $1,000.00 on July 1, 2008 with the same investment held until October 31, 2008.
| Account value | Ending value | Expenses paid during | |
| on 7-1-08 | on 10-31-08 | period ended 10-31-081 | |
| Class A | $1,000.00 | $575.00 | $3.52 |
| Class B | 1,000.00 | 571.20 | 5.49 |
| Class C | 1,000.00 | 571.00 | 5.49 |
| Class I | 1,000.00 | 576.70 | 2.49 |
| Class R1 | 1,000.00 | 573.10 | 4.39 |
Together with the value of your account, you may use this information to estimate the operating expenses that you paid over the period. Simply divide your account value at October 31, 2008, by $1,000.00, then multiply it by the “expenses paid” for your share class from the table above. For example, for an account value of $8,600.00, the operating expenses should be calculated as follows:
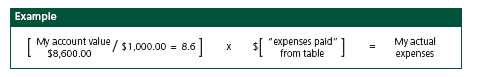
| Annual report | Classic Value Fund | 9 |
Your expenses
Hypothetical example for comparison purposes
This table allows you to compare your fund’s ongoing operating expenses with those of any other fund. It provides an example of the Fund’s hypothetical account values and hypothetical expenses based on each class’s actual expense ratio and an assumed 5% annualized return before expenses (which is not your fund’s actual return). It assumes an account value of $1,000.00 on May 1, 2008 with the same investment held until October 31, 2008. Look in any other fund shareholder report to find its hypothetical example and you will be able to compare these expenses.
| Account value | Ending value | Expenses paid during | |
| on 5-1-08 | on 10-31-08 | period ended 10-31-081 | |
| Class A | $1,000.00 | $1,012.30 | $6.75 |
| Class B | 1,000.00 | 1,009.80 | 10.53 |
| Class C | 1,000.00 | 1,009.80 | 10.53 |
| Class I | 1,000.00 | 1,013.60 | 4.77 |
| Class R1 | 1,000.00 | 1,011.20 | 8.42 |
Remember, these examples do not include any transaction costs, such as sales charges; therefore, these examples will not help you to determine the relative total costs of owning different funds. If transaction costs were included, your expenses would have been higher. See the prospectus for details regarding transaction costs.
1 Expenses are equal to the Fund’s annualized expense ratio of 1.33%, 2.08%, 2.08%, 0.94% and 1.66% for Class A, Class B, Class C, Class I and Class R1 respectively, multiplied by the average account value over the period, multiplied by 184/366 (to reflect the one-half year period).
| 10 | Classic Value Fund | Annual report |
Portfolio summary
| Top 10 holdings1 | ||||
| Bank of America Corp. | 5.3% | AmerisourceBergen Corp. | 3.7% | |
| Capital One Financial Corp. | 5.2% | CA, Inc. | 3.6% | |
| Citigroup, Inc. | 4.4% | Allstate Corp. | 3.5% | |
| Northrop Grumman Corp. | 3.8% | Alcatel-Lucent | 3.4% | |
| JPMorgan Chase & Co. | 3.7% | Home Depot, Inc. | 3.4% | |
| Sector distribution1,2 | ||||
| Financials | 35% | Utilities | 5% | |
| Consumer discretionary | 16% | Consumer staples | 4% | |
| Health care | 15% | Telecommunication services | 3% | |
| Information technology | 11% | Energy | 3% | |
| Industrials | 7% | Other | 1% | |

1 As a percentage of net assets on October 31, 2008.
2 Sector investing is subject to greater risks than the market as a whole. Because the Fund may focus on particular sectors of the economy, its performance may depend on the performance of those sectors.
| Annual report | Classic Value Fund | 11 |
F I N A N C I A L S T A T E M E N T S
Fund’s investments
Securities owned by the Fund on 10-31-08
This schedule is divided into two main categories: common stocks and short-term investments. Common stocks are further broken down by industry group. Short-term investments, which represent the Fund’s cash position, are listed last.
| Issuer | Shares | Value |
| Common stocks 99.23% | $2,644,896,169 | |
| (Cost $4,696,744,367) | ||
| Advertising 1.67% | 44,649,710 | |
| Omnicom Group, Inc. | 1,511,500 | 44,649,710 |
| Aerospace & Defense 5.19% | 138,399,237 | |
| L-3 Communications Holdings, Inc. | 454,500 | 36,891,765 |
| Northrop Grumman Corp. | 2,164,800 | 101,507,472 |
| Auto Parts & Equipment 2.40% | 64,073,331 | |
| Magna International, Inc. (Class A ) | 1,895,100 | 64,073,331 |
| Biotechnology 1.58% | 41,995,946 | |
| Amgen, Inc. (I) | 701,218 | 41,995,946 |
| Communications Equipment 5.04% | 134,462,781 | |
| Alcatel-Lucent, SADR | 35,528,921 | 91,309,327 |
| Motorola, Inc. | 8,036,025 | 43,153,454 |
| Computer Hardware 1.41% | 37,600,605 | |
| Dell, Inc. (I) | 3,094,700 | 37,600,605 |
| Consumer Finance 5.20% | 138,641,319 | |
| Capital One Financial Corp. (L) | 3,544,001 | 138,641,319 |
| Data Processing & Outsourced Services 1.56% | 41,522,422 | |
| Affiliated Computer Services, Inc. (Class A) (I) | 1,012,742 | 41,522,422 |
| Department Stores 4.37% | 116,488,921 | |
| J.C. Penney Co., Inc. | 3,682,575 | 88,087,194 |
| Kohl’s Corp. (I) | 808,475 | 28,401,727 |
| Diversified Banks 2.37% | 63,259,345 | |
| Comerica, Inc. | 2,292,836 | 63,259,345 |
| Diversified Capital Markets 2.44% | 65,151,258 | |
| UBS AG (I) | 3,855,104 | 65,151,258 |
| Diversified Financial Services 13.47% | 358,907,267 | |
| Bank of America Corp. | 5,847,650 | 141,337,701 |
| Citigroup, Inc. | 8,674,025 | 118,400,441 |
| JPMorgan Chase & Co. | 2,404,100 | 99,169,125 |
| Electronic Manufacturing Services 0.82% | 21,781,062 | |
| Tyco Electronics, Ltd. | 1,120,425 | 21,781,062 |
See notes to financial statements
| 12 | Classic Value Fund | Annual report |
F I N A N C I A L S T A T E M E N T S
| Issuer | Shares | Value |
| Health Care Distributors 3.66% | $97,520,936 | |
| AmerisourceBergen Corp. | 3,118,674 | 97,520,936 |
| Home Improvement Retail 3.39% | 90,231,160 | |
| Home Depot, Inc. | 3,824,975 | 90,231,160 |
| Household Appliances 2.12% | 56,460,495 | |
| Whirlpool Corp. | 1,210,300 | 56,460,495 |
| Household Products 2.30% | 61,371,209 | |
| Kimberly-Clark Corp. | 1,001,325 | 61,371,209 |
| Industrial Conglomerates 0.95% | 25,268,624 | |
| Tyco International, Ltd. | 999,550 | 25,268,624 |
| Integrated Oil & Gas 2.83% | 75,519,150 | |
| BP PLC, ADR | 1,519,500 | 75,519,150 |
| Investment Banking & Brokerage 1.42% | 37,722,971 | |
| Morgan Stanley | 2,159,300 | 37,722,971 |
| Leisure Products 1.85% | 49,333,280 | |
| Mattel, Inc. | 3,284,506 | 49,333,280 |
| Life & Health Insurance 2.85% | 75,886,692 | |
| Torchmark Corp. | 1,816,775 | 75,886,692 |
| Multi-Utilities 5.40% | 143,929,713 | |
| Sempra Energy | 2,035,225 | 86,680,233 |
| Wisconsin Energy Corp. | 1,316,080 | 57,249,480 |
| Packaged Foods & Meats 1.89% | 50,252,423 | |
| Sara Lee Corp. | 4,494,850 | 50,252,423 |
| Pharmaceuticals 9.17% | 244,463,936 | |
| Bristol-Myers Squibb Co. | 3,675,525 | 75,532,039 |
| Johnson & Johnson | 1,051,325 | 64,488,276 |
| Merck & Co., Inc. | 2,309,650 | 71,483,667 |
| Schering-Plough Corp. | 2,274,669 | 32,959,954 |
| Property & Casualty Insurance 4.94% | 131,557,236 | |
| Allstate Corp. | 3,567,600 | 94,148,964 |
| Fidelity National Financial, Inc. (L) | 3,889,856 | 35,047,602 |
| XL Capital, Ltd. (Class A) (L) | 243,368 | 2,360,670 |
| Regional Banks 1.63% | 43,427,707 | |
| National City Corp. | 16,084,336 | 43,427,707 |
| Systems Software 6.78% | 180,758,675 | |
| CA, Inc. | 5,456,958 | 97,133,852 |
| Microsoft Corp. | 3,744,954 | 83,624,823 |
| Thrifts & Mortgage Finance 0.53% | 14,258,758 | |
| Federal Home Loan Mortgage Corp. (L) | 8,609,668 | 8,867,958 |
| Federal National Mortgage Association | 5,815,318 | 5,390,800 |
See notes to financial statements
| Annual report | Classic Value Fund | 13 |
F I N A N C I A L S T A T E M E N T S
| Par value | |||
| Issuer, description, maturity date | (000) | Value | |
| Short-term investments 1.22% | $32,408,174 | ||
| (Cost $32,408,174) | |||
| Joint Repurchase Agreement 0.61% | 16,279,000 | ||
| Joint Repurchase Agreement with Barclays PLC dated | |||
| 10-31-08 at 0.15% to be repurchased at $16,279,204 | |||
| on 11-3-08, collateralized by $19,734,035 U.S. Treasury | |||
| Inflation Indexed Note 1.75% on 1-15-28 (valued at | |||
| $16,604,580, including interest). | |||
| $16,279 | 16,279,000 | ||
| Interest | |||
| rate | Shares | Value | |
| Cash Equivalents 0.61% | 16,129,174 | ||
| John Hancock Cash Investment Trust (T)(W) | 2.1118% (Y) | 16,129,174 | 16,129,174 |
| Total investments (Cost $4,729,152,541)† 100.45% | $2,677,304,343 | ||
| Other assets and liabilities, net (0.45%) | ($11,990,268) | ||
| Total net assets 100.00% | $2,665,314,075 | ||
The percentage shown for each investment category is the total value of the category as a percentage of the net assets of the Fund.
ADR American Depositary Receipt
SADR Sponsored American Depositary Receipt
(I) Non-income producing security.
(L) All or a portion of this security is on loan as of October 31, 2008.
(T) Represents investment of securities lending collateral.
(W) Issuer is an affiliate of John Hancock Advisers, LLC.
(Y) Represents current yield as of October 31, 2008.
† At October 31, 2008, the aggregate cost of investment securities for federal income tax purposes was $4,731,166,054. Net unrealized depreciation aggregated $2,053,861,711, of which $33,005,379 related to appreciated investment securities and $2,086,867,090 related to depreciated investment securities.
See notes to financial statements
| 14 | Classic Value Fund | Annual report |
F I N A N C I A L S T A T E M E N T S
Financial statements
Statement of assets and liabilities 10-31-08
This Statement of Assets and Liabilities is the Fund’s balance sheet. It shows the value of what the Fund owns, is due and owes. You’ll also find the net asset value and the maximum offering price per share.
| Assets | |
| Investments in unaffiliated issuers, at value (Cost $4,713,023,367) | |
| including $15,812,916 of securities loaned (Note 2) | $2,661,175,169 |
| Investments in affiliated issuers, at value (Cost $16,129,174) | 16,129,174 |
| Total investments, at value (Cost $4,729,152,541) | 2,677,304,343 |
| Cash | 952 |
| Receivable for investments sold | 18,956,544 |
| Receivable for shares sold | 6,900,879 |
| Dividends and interest receivable | 3,914,720 |
| Receivable from affiliates | 36,511 |
| Other assets | 1,790 |
| Total assets | 2,707,115,739 |
| Liabilities | |
| Payable for investments purchased | 13,761,134 |
| Payable for shares repurchased | 8,031,526 |
| Payable upon return of securities loaned (Note 2) | 16,129,174 |
| Payable to affiliates | |
| Management fees | 1,960,225 |
| Distribution and service fees | 598,194 |
| Other | 1,070,505 |
| Other payables and accrued expenses | 250,906 |
| Total liabilities | 41,801,664 |
| Net assets | |
| Capital paid-in | 5,491,332,511 |
| Accumulated net realized loss on investments | (832,537,254) |
| Net unrealized depreciation of investments | (2,051,848,198) |
| Accumulated net investment income | 58,367,016 |
| Net assets | $2,665,314,075 |
See notes to financial statements
| Annual report | Classic Value Fund | 15 |
F I N A N C I A L S T A T E M E N T S
Statement of assets and liabilities (continued)
| Net asset value per share | |
| Based on net asset values and shares outstanding — the Fund has an | |
| unlimited number of shares authorized with no par value | |
| Class A ($1,711,333,523 ÷ 138,242,450 shares) | $12.38 |
| Class B ($78,682,318 ÷ 6,455,254 shares)1 | $12.19 |
| Class C ($202,008,513 ÷ 16,578,520 shares)1 | $12.18 |
| Class I ($664,153,752 ÷ 53,383,472 shares) | $12.44 |
| Class R1 ($9,135,969 ÷ 739,886 shares) | $12.35 |
| Maximum offering price per share | |
| Class A ($12.38 ÷ 95%)2 | $13.03 |
1 Redemption price is equal to net asset value less any applicable contingent deferred sales charge.
2 On single retail sales of less than $50,000. On sales of $50,000 or more and on group sales the offering price is reduced.
See notes to financial statements
| 16 | Classic Value Fund | Annual report |
F I N A N C I A L S T A T E M E N T S
Statements of operations For the year ended 10-31-08
These Statements of Operations summarize the Fund’s investment income earned and expenses incurred in operating the Fund. It also shows net gains (losses) for the periods stated.
| Year | Period | |
| ended | ended | |
| 12-31-07 | 10-31-081 | |
| Investment income | ||
| Dividends (net of foreign withholding taxes of | ||
| $2,119,763 and $233,766, respectively) | $211,053,480 | $104,928,274 |
| Interest | 9,326,985 | 1,044,166 |
| Securities lending | 489,624 | 821,270 |
| Income from affiliated issuers | — | 233,519 |
| Total investment income | 220,870,089 | 107,027,229 |
| Expenses | ||
| Investment management fees (Note 5) | 72,747,627 | 30,622,526 |
| Distribution and service fees (Note 5) | 28,110,920 | 10,623,874 |
| Transfer agent fees (Note 5) | 12,645,000 | 6,865,078 |
| Accounting and legal services fees (Note 5) | 1,059,992 | 436,006 |
| Custodian fees | 1,231,426 | 382,423 |
| Printing fees | 675,374 | 642,686 |
| Trustees’ fees | 409,021 | 230,910 |
| Professional fees | 276,165 | 205,495 |
| Blue sky fees | 18,780 | 193,360 |
| Miscellaneous | 346,343 | 455,853 |
| Total expenses | 117,520,648 | 50,658,211 |
| Less expense reductions (Note 5) | (844,180) | (1,999,635) |
| Net expenses | 116,676,468 | 48,658,576 |
| Net investment income | 104,193,621 | 58,368,653 |
| Realized and unrealized gain (loss) | ||
| Net realized gain (loss) on investments | 678,062,273 | (918,444,087) |
| 678,062,273 | (918,444,087) | |
| Change in net unrealized appreciation (depreciation) | ||
| of investments | (1,950,836,569) | (1,272,580,555) |
| (1,950,836,569) | (1,272,580,555) | |
| Net realized and unrealized loss | (1,272,774,296) | (2,191,024,642) |
| Decrease in net assets from operations | ($1,168,580,675) | ($2,132,655,989) |
1 For the ten month period ended October 31, 2008, the fund changed its fiscal year end from December 31 to October 31.
See notes to financial statements
| Annual report | Classic Value Fund | 17 |
F I N A N C I A L S T A T E M E N T S
Statements of changes in net assets
These Statements of Changes in Net Assets show how the value of the Fund’s net assets has changed during the last three periods. The difference reflects earnings less expenses, any investment gains and losses, distributions, if any, paid to shareholders and the net of Fund share transactions.
| Year | Year | Period | |
| ended | ended | ended | |
| 12-31-06 | 12-31-07 | 10-31-081 | |
| Increase (decrease) in net assets | |||
| From operations | |||
| Net investment income | $56,644,978 | $104,193,621 | $58,368,653 |
| Net realized gain (loss) | 337,448,543 | 678,062,273 | (918,444,087) |
| Change in net unrealized | |||
| appreciation (depreciation) | 731,449,003 | (1,950,836,569) | (1,272,580,555) |
| Increase (decrease) in net assets | |||
| resulting from operations | 1,125,542,524 | (1,168,580,675) | (2,132,655,989) |
| Distributions to shareholders | |||
| From net investment income | |||
| Class A | (40,222,324) | (73,327,961) | — |
| Class B | — | (1,891,117) | — |
| Class C | — | (5,821,733) | — |
| Class I | (16,820,199) | (26,404,824) | — |
| Class R1 | (88,050) | (279,498) | — |
| From net realized gain | |||
| Class A | (176,103,905) | (326,653,899) | — |
| Class B | (10,051,102) | (16,975,708) | — |
| Class C | (34,218,336) | (52,259,104) | — |
| Class I | (46,267,925) | (93,211,048) | — |
| Class R1 | (853,592) | (1,642,127) | — |
| (324,625,433) | (598,467,019) | — | |
| From Fund share transactions (Note 6) | 3,423,713,999 | (1,280,560,604) | (1,200,298,700) |
| Total increase (decrease) | 4,224,631,090 | (3,047,608,298) | (3,332,954,690) |
| Net assets | |||
| Beginning of period | 4,821,245,973 | 9,045,877,063 | 5,998,268,765 |
| End of period 2 | $9,045,877,063 | $5,998,268,765 | $2,665,314,075 |
1 For the ten month period ended October 31, 2008, the fund changed its fiscal year end from December 31 to October 31.
2 Includes accumulated net investment income (loss) of ($1,636), ($1,635) and $58,367,016, respectively.
See notes to financial statements
| 18 | Classic Value Fund | Annual report |
F I N A N C I A L S T A T E M E N T S
Financial highlights
The Financial Highlights show how the Fund’s net asset value for a share has changed since the end of the previous period.
| CLASS A SHARES | ||||||
| Period ended | 12-31-03 | 12-31-04 | 12-31-05 | 12-31-06 | 12-31-07 | 10-31-081 |
| Per share operating performance | ||||||
| Net asset value, | ||||||
| beginning of year | $15.07 | $20.27 | $23.01 | $24.64 | $27.67 | $21.53 |
| Net investment income2 | 0.20 | 0.17 | 0.15 | 0.23 | 0.34 | 0.25 |
| Net realized and unrealized | ||||||
| gain (loss) on investments | 5.25 | 2.73 | 1.88 | 3.84 | (4.24) | (9.40) |
| Total from investment operations | 5.45 | 2.90 | 2.03 | 4.07 | (3.90) | (9.15) |
| Less distributions | ||||||
| From net investment income | (0.13) | (0.09) | (0.10) | (0.19) | (0.41) | — |
| From net realized gain | (0.12) | (0.07) | (0.30) | (0.85) | (1.83) | — |
| Total distributions | (0.25) | (0.16) | (0.40) | (1.04) | (2.24) | — |
| Net asset value, end of year | $20.27 | $23.01 | $24.64 | $27.67 | $21.53 | $12.38 |
| Total return (%)3 | 36.254 | 14.284 | 8.814 | 16.54 | (14.20) | (42.50)4,6 |
| Ratios and supplemental data | ||||||
| Net assets, end of year (in millions) | $145 | $1,223 | $3,017 | $5,987 | $4,000 | $1,711 |
| Ratios (as a percentage of average | ||||||
| net assets): | ||||||
| Expenses before reductions | 1.52 | 1.40 | 1.36 | 1.30 | 1.28 | 1.385 |
| Expenses net of all fee waivers | 1.16 | 1.30 | 1.32 | 1.30 | 1.28 | 1.325,7 |
| Expenses net of all fee waivers | ||||||
| and credits | 1.16 | 1.30 | 1.32 | 1.30 | 1.28 | 1.325,7 |
| Net investment income | 1.13 | 0.81 | 0.65 | 0.89 | 1.22 | 1.615 |
| Portfolio turnover (%) | 25 | 16 | 27 | 20 | 35 | 30 |
1 For the ten month period ended October 31, 2008, the fund changed its fiscal year end from December 31 to October 31.
2 Based on the average of the shares outstanding.
3 Assumes dividend reinvestment and does not reflect the effect of sales charges.
4 Total returns would have been lower had certain expenses not been reduced during the periods shown.
5 Annualized.
6 Not Annualized.
7 Includes 0.01% related to interest expense.
See notes to financial statements
| Annual report | Classic Value Fund | 19 |
F I N A N C I A L S T A T E M E N T S
Financial highlights
| CLASS B SHARES | ||||||
| Period ended | 12-31-03 | 12-31-04 | 12-31-05 | 12-31-06 | 12-31-07 | 10-31-081 |
| Per share operating performance | ||||||
| Net asset value, | ||||||
| beginning of year | $15.05 | $20.24 | $22.89 | $24.42 | $27.40 | $21.34 |
| Net investment income (loss)2 | 0.07 | 0.01 | (0.03) | 0.04 | 0.13 | 0.13 |
| Net realized and unrealized | ||||||
| gain (loss) on investments | 5.24 | 2.71 | 1.86 | 3.79 | (4.16) | (9.28) |
| Total from investment operations | 5.31 | 2.72 | 1.83 | 3.83 | (4.03) | (9.15) |
| Less distributions | ||||||
| From net investment income | —3 | — | — | — | (0.20) | — |
| From net realized gain | (0.12) | (0.07) | (0.30) | (0.85) | (1.83) | — |
| Total distributions | (0.12) | (0.07) | (0.30) | (0.85) | (2.03) | — |
| Net asset value, end of year | $20.24 | $22.89 | $24.42 | $27.40 | $21.34 | $12.19 |
| Total return (%)4 | 35.365 | 13.445 | 7.995 | 15.68 | (14.80) | (42.88)5,6 |
| Ratios and supplemental data | ||||||
| Net assets, end of year (in millions) | $47 | $200 | $296 | $332 | $208 | $79 |
| Ratios (as a percentage of average | ||||||
| net assets): | ||||||
| Expenses before reductions | 2.27 | 2.15 | 2.11 | 2.01 | 2.03 | 2.137 |
| Expenses net of all fee waivers | 1.91 | 2.05 | 2.07 | 2.01 | 2.03 | 2.077,8 |
| Expenses net of all fee waivers | ||||||
| and credits | 1.91 | 2.05 | 2.07 | 2.01 | 2.03 | 2.067,8 |
| Net investment income (loss) | 0.38 | 0.03 | (0.11) | 0.17 | 0.46 | 0.867 |
| Portfolio turnover (%) | 25 | 16 | 27 | 20 | 35 | 30 |
1 For the ten month period ended October 31, 2008, the fund changed its fiscal year end from December 31 to October 31.
2 Based on the average of the shares outstanding.
3 Less than $0.01 per share.
4 Assumes dividend reinvestment and does not reflect the effect of sales charges.
5 Total returns would have been lower had certain expenses not been reduced during the periods shown.
6 Not annualized.
7 Annualized.
8 Includes 0.01% related to interest expense.
See notes to financial statements
| 20 | Classic Value Fund | Annual report |
F I N A N C I A L S T A T E M E N T S
Financial highlights
| CLASS C SHARES | ||||||
| Period ended | 12-31-03 | 12-31-04 | 12-31-05 | 12-31-06 | 12-31-07 | 10-31-081 |
| Per share operating performance | ||||||
| Net asset value, | ||||||
| beginning of year | $15.05 | $20.24 | $22.89 | $24.42 | $27.39 | $21.33 |
| Net investment income (loss)2 | 0.07 | 0.01 | (0.02) | 0.03 | 0.13 | 0.13 |
| Net realized and unrealized | ||||||
| gain (loss) on investments | 5.24 | 2.71 | 1.85 | 3.79 | (4.16) | (9.28) |
| Total from investment operations | 5.31 | 2.72 | 1.83 | 3.82 | (4.03) | (9.15) |
| Less distributions | ||||||
| From net investment income | —3 | — | — | — | (0.20) | — |
| From net realized gain | (0.12) | (0.07) | (0.30) | (0.85) | (1.83) | — |
| Total distributions | (0.12) | (0.07) | (0.30) | (0.85) | (2.03) | — |
| Net asset value, end of year | $20.24 | $22.89 | $24.42 | $27.39 | $21.33 | $12.18 |
| Total return (%)4 | 35.365 | 13.445 | 7.995 | 15.64 | (14.80) | (42.90)5,6 |
| Ratios and supplemental data | ||||||
| Net assets, end of year (in millions) | $82 | $423 | $832 | $1,132 | $612 | $202 |
| Ratios (as a percentage of average | ||||||
| net assets): | ||||||
| Expenses before reductions | 2.26 | 2.15 | 2.11 | 2.05 | 2.03 | 2.137 |
| Expenses net of all fee waivers | 1.91 | 2.05 | 2.07 | 2.05 | 2.03 | 2.077,8 |
| Expenses net of all fee waivers | ||||||
| and credits | 1.91 | 2.05 | 2.07 | 2.05 | 2.03 | 2.077,8 |
| Net investment income (loss) | 0.39 | 0.04 | (0.10) | 0.13 | 0.46 | 0.857 |
| Portfolio turnover (%) | 25 | 16 | 27 | 20 | 35 | 30 |
1 For the ten month period ended October 31, 2008, the fund changed its fiscal year end from December 31 to October 31.
2 Based on the average of the shares outstanding.
3 Less than $0.01 per share
4 Assumes dividend reinvestment and does not reflect the effect of sales charges.
5 Total returns would have been lower had certain expenses not been reduced during the periods shown.
6 Not annualized.
7 Annualized.
8 Includes 0.01% related to interest expense.
See notes to financial statements
| Annual report | Classic Value Fund | 21 |
F I N A N C I A L S T A T E M E N T S
Financial highlights
| CLASS I SHARES | ||||||
| Period ended | 12-31-03 | 12-31-04 | 12-31-05 | 12-31-06 | 12-31-07 | 10-31-081 |
| Per share operating performance | ||||||
| Net asset value, | ||||||
| beginning of year | $15.08 | $20.30 | $23.05 | $24.69 | $27.73 | $21.57 |
| Net investment income2 | 0.27 | 0.27 | 0.26 | 0.34 | 0.45 | 0.30 |
| Net realized and unrealized | ||||||
| gain (loss) on investments | 5.26 | 2.73 | 1.88 | 3.86 | (4.26) | (9.43) |
| Total from investment operations | 5.53 | 3.00 | 2.14 | 4.20 | (3.81) | (9.13) |
| Less distributions | ||||||
| From net investment income | (0.19) | (0.18) | (0.20) | (0.31) | (0.52) | — |
| From net realized gain | (0.12) | (0.07) | (0.30) | (0.85) | (1.83) | — |
| Total distributions | (0.31) | (0.25) | (0.50) | (1.16) | (2.35) | — |
| Net asset value, end of year | $20.30 | $23.05 | $24.69 | $27.73 | $21.57 | $12.44 |
| Total return (%)3 | 36.814 | 14.774 | 9.284 | 17.014 | (13.86)4 | (42.33)4,5 |
| Ratios and supplemental data | ||||||
| Net assets, end of year (in millions) | $23 | $206 | $665 | $1,567 | $1,155 | $664 |
| Ratios (as a percentage of average | ||||||
| net assets): | ||||||
| Expenses before reductions | 1.12 | 1.01 | 0.98 | 0.94 | 0.92 | 0.966 |
| Expenses net of all fee waivers | 0.76 | 0.86 | 0.89 | 0.89 | 0.88 | 0.946,7 |
| Expenses net of all fee waivers | ||||||
| and credits | 0.76 | 0.86 | 0.89 | 0.89 | 0.88 | 0.946,7 |
| Net investment income | 1.54 | 1.25 | 1.09 | 1.30 | 1.61 | 1.996 |
| Portfolio turnover (%) | 25 | 16 | 27 | 20 | 35 | 30 |
1 For the ten month period ended October 31, 2008, the fund changed its fiscal year end from December 31 to October 31.
2 Based on the average of the shares outstanding.
3 Assumes dividend reinvestment and does not reflect the effect of sales charges.
4 Total returns would have been lower had certain expenses not been reduced during the periods shown.
5 Not annualized.
6 Annualized.
7 Includes 0.01% related to interest expense.
See notes to financial statements
| 22 | Classic Value Fund | Annual report |
F I N A N C I A L S T A T E M E N T S
Financial highlights
| CLASS R1 SHARES | ||||||
| Period ended | 12-31-031 | 12-31-04 | 12-31-05 | 12-31-06 | 12-31-07 | 10-31-082 |
| Per share operating performance | ||||||
| Net asset value, | ||||||
| beginning of year | $17.20 | $20.27 | $23.02 | $24.63 | $27.67 | $21.55 |
| Net investment income3 | 0.05 | 0.07 | 0.08 | 0.13 | 0.23 | 0.19 |
| Net realized and unrealized | ||||||
| gain (loss) on investments | 3.24 | 2.75 | 1.86 | 3.85 | (4.21) | (9.39) |
| Total from investment operations | 3.29 | 2.82 | 1.94 | 3.98 | (3.98) | (9.20) |
| Less distributions | ||||||
| From net investment income | (0.10) | — | (0.03) | (0.09) | (0.31) | — |
| From net realized gain | (0.12) | (0.07) | (0.30) | (0.85) | (1.83) | — |
| Total distributions | (0.22) | (0.07) | (0.33) | (0.94) | (2.14) | — |
| Net asset value, end of year | $20.27 | $23.02 | $24.63 | $27.67 | $21.55 | $12.35 |
| Total return (%)4 | 19.215,6 | 13.916 | 8.446 | 16.15 | (14.49) | (42.69)5,6 |
| Ratios and supplemental data | ||||||
| Net assets, end of year (in millions) | —7 | $2 | $12 | $29 | $22 | $9 |
| Ratios (as a percentage of average | ||||||
| net assets): | ||||||
| Expenses before reductions | 1.918 | 1.82 | 1.69 | 1.68 | 1.64 | 1.688 |
| Expenses net of all fee waivers | 1.558 | 1.72 | 1.65 | 1.68 | 1.64 | 1.668,9 |
| Expenses net of all fee waivers | ||||||
| and credits | 1.558 | 1.72 | 1.65 | 1.68 | 1.64 | 1.668,9 |
| Net investment income | 0.698 | 0.35 | 0.34 | 0.51 | 0.85 | 1.268 |
| Portfolio turnover (%) | 2510 | 16 | 27 | 20 | 35 | 30 |
1 Class R1 shares began operations on 8-5-03.
2 For the ten month period ended October 31, 2008, the fund changed its fiscal year end from December 31 to October 31.
3 Based on the average of the shares outstanding.
4 Assumes dividend reinvestment and does not reflect the effect of sales charges.
5 Not annualized.
6 Total returns would have been lower had certain expenses not been reduced during the periods shown.
7 Less than $500,000.
8 Annualized.
9 Includes 0.01% related to interest expense.
10 The portfolio turnover shown is calculated for the Fund for the full fiscal year.
See notes to financial statements
| Annual report | Classic Value Fund | 23 |
Notes to financial statements
Note 1
Organization
John Hancock Classic Value Fund (the Fund) is a diversified series of John Hancock Capital Series, an open-end management investment company registered under the Investment Company Act of 1940, as amended (the 1940 Act). The investment objective of the Fund is to provide long-term growth of capital.
The Trustees have authorized the issuance of multiple classes of shares of the Fund, designated as Class A, Class B, Class C, Class I and Class R1 shares. The shares of each class represent an interest in the same portfolio of investments of the Fund and have equal rights as to voting, redemptions, dividends and liquidation, except that certain expenses, subject to the approval of the Trustees, may be applied differently to each class of shares in accordance with current regulations of the Securities and Exchange Commission (SEC) and the Internal Revenue Service. Shareholders of a class that bears distribution and service expenses under the terms of a distribution plan have exclusive voting rights to that distribution plan. Class B shares will convert to Class A shares eight years after purchase.
Note 2
Significant accounting policies
The financial statements have been prepared in conformity with accounting principles generally accepted in the United States of America, which require management to make certain estimates and assumptions at the date of the financial statements. Actual results could differ from those estimates. The following summarizes the significant accounting policies of the Fund:
Security valuation
The net asset value of the Fund is determined daily as of the close of the New York Stock Exchange (NYSE), normally at 4:00 P.M., Eastern Time. Short-term debt investments that have a remaining maturity of 60 days or less are valued at amortized cost, and thereafter assume a constant amortization to maturity of any discount or premium, which approximates market value. Investments in John Hancock Cash Investment Trust (JHCIT), an affiliate of John Hancock Advisers, LLC (the Adviser), a wholly owned subsidiary of John Hancock Financial Services, Inc., a subsidiary of Manulife Financial Corporation (MFC), are valued at their net asset value each business day. All other securities held by the Fund are valued at the last sale price or official closing price (closing bid price or last evaluated quote if no sale has occurred) as of the close of business on the principal securities exchange (domestic or foreign) on which they trade or, lacking any sales, at the closing bid price. Securities traded only in the over-the-counter market are valued at the last bid price quoted by brokers making markets in the securities at the close of trading. Securities for which there are no such quotations, principally debt securities, are valued based on the evaluated prices provided by an independent pricing service, which utilizes both dealer-supplied and electronic data processing techniques, which take into account factors such as institutional-size trading in similar groups of securities, yield, quality, coupon rate, maturity, type of issue, trading characteristics and other market data. In periods of decreasing liquidity such securities may also be fair valued.
Other portfolio securities and assets for which market quotations are not readily available are valued at fair value as determined in good faith by the Trust’s Pricing Committee in accordance with procedures adopted by the Board of Trustees. Generally, trading in non-U.S. securities is substantially completed each day at various times prior to the close of trading on the NYSE. The values of such securities
| 24 | Classic Value Fund | Annual report |
used in computing the net asset value of the Fund’s shares are generally determined as of such times. Occasionally, significant events that affect the values of such securities may occur between the times at which such values are generally determined and the close of the NYSE. Upon such an occurrence, these securities will be valued at fair value as determined in good faith under consistently applied procedures established by and under the general supervision of the Board of Trustees.
Valuations change in response to many factors including the historical and prospective earnings of the issuer, the value of the issuer’s assets, general economic conditions, interest rates, investor perceptions and market liquidity.
The Fund adopted Statement of Financial Accounting Standards No. 157 (FAS 157), Fair Value Measurements, effective with the beginning of the Fund’s fiscal year. FAS 157 established a three-tier hierarchy to prioritize the assumptions, referred to as inputs, used in valuation techniques to measure fair value. The three-tier hierarchy of inputs is summarized in the three broad levels listed below:
Level 1 – Quoted prices in active markets for identical securities.
Level 2 – Prices determined using other significant observable inputs. Observable inputs are inputs that other market participants would use in pricing a security. These may include quoted prices for similar securities, interest rates, prepayment speeds, credit risk and others.
Level 3 – Prices determined using significant unobservable inputs. In situations where quoted prices or observable inputs are unavailable, such as when there is little or no market activity for an investment, unobservable inputs may be used. Unobservable inputs reflect the Fund’s own assumptions about the factors that market participants would use in pricing an investment and would be based on the best information available.
The inputs or methodology used for valuing securities are not necessarily an indication of the risk associated with investing in those securities.
The following is a summary of the inputs used to value the Fund’s net assets as of October 31, 2008:
| INVESTMENTS IN | OTHER FINANCIAL | |
| VALUATION INPUTS | SECURITIES | INSTRUMENTS* |
| Level 1 — Quoted Prices | $2,661,025,343 | — |
| Level 2 — Other Significant Observable Inputs | 16,279,000 | — |
| Level 3 — Significant Unobservable Inputs | — | — |
| Total | $2,677,304,343 | — |
*Other financial instruments are derivative instruments not reflected in the Portfolio of Investments, such as futures, forwards and swap contracts, which are valued at the unrealized appreciation/ depreciation on the instrument.
Joint repurchase agreement
Pursuant to an exemptive order issued by the SEC, the Fund, along with other registered investment companies having a management contract with the Adviser, may participate in a joint repurchase agreement transaction. Aggregate cash balances are invested in one or more large repurchase agreements, whose underlying securities are obligations of the U.S. government and/or its agencies. The Fund’s custodian bank receives delivery of the underlying securities for the joint account on the Fund’s behalf. When a Fund enters into a repurchase agreement, it receives delivery of collateral, the amount of which at the time of purchase and each subsequent business day is required to be maintained at such a level that the value is generally 102% of the repurchase amount.
Investment transactions
Investment transactions are accounted for on a trade date plus one basis for daily net asset
| Annual report | Classic Value Fund | 25 |
value calculations. However, for financial reporting purposes, investment security transactions are reported on trade date. Interest income is recorded on the accrual basis. Dividend income is recorded on the ex-dividend date net of foreign withholding taxes. Realized gains and losses from investment transactions are recorded on an identified cost basis.
Broker commission rebates
The Fund may direct certain security trades to brokers who have agreed to rebate a portion of the related brokerage commission to the Fund. Commission rebates are reflected as a realized gain on securities in the Statement of Operations and amounted to $318,339.
Class allocations
Income, common expenses and realized and unrealized gains (losses) are determined at the fund level and allocated daily to each class of shares based on the appropriate net asset value of the respective classes. Distribution and service fees, if any, and transfer agent fees for each class are calculated daily at the class level based on the appropriate net asset value of each class and the specific expense rate(s) applicable to each class.
Expenses
The majority of expenses are directly identifiable to an individual fund. Trust expenses that are not readily identifiable to a specific fund are allocated in such a manner as deemed equitable, taking into consideration, among other things, the nature and type of expense and the relative size of the funds. Expense estimates are accrued in the period to which they relate and adjustments are made when accrual amounts are known.
Bank borrowings
The Fund is permitted to have bank borrowings for temporary or emergency purposes, including the meeting of redemption requests that otherwise might require the untimely disposition of securities. The Fund has entered into a line of credit agreement with The Bank of New York Mellon (BNYM), the Swing Line Lender and Administrative Agent. This agreement enables the Fund to participate, with other funds managed by the Adviser, in an unsecured line of credit with BNYM, which permits borrowings of up to $150 million, collectively. Interest is charged to each fund based on its borrowing. In addition, a commitment fee is charged to each fund based on the average daily unused portion of the line of credit and is allocated among the participating funds. The fund had no outstanding borrowings under the line of credit on October 31, 2008.
Pursuant to the custodian agreement, the Custodian may, in its discretion, advance funds to the Fund to make properly authorized payments. When such payments result in an overdraft, the Fund is obligated to repay the Custodian for any overdraft together with interest due thereon. The Custodian has a lien, security interest or security entitlement in any Fund property, to the maximum extent permitted by law to the extent of any overdraft.
Securities lending
The Fund may lend portfolio securities from time to time in order to earn additional income. The Fund retains beneficial ownership of the securities it has loaned and continues to receive interest and dividends paid by the issuer of securities and to participate in any changes in their value. On the settlement date of the loan, the Fund receives cash collateral against the loaned securities and maintains the cash collateral in an amount not less than 100% of the market value of the loaned securities during the period of the loan. The market value of the loaned securities is determined at the close of business of the Fund and any additional required cash collateral is delivered to the Fund on the next business day. Cash collateral received is invested in the JHCIT. If the borrower defaults on its obligation to return the securities loaned because of insolvency or other reasons, a fund could experience delays and costs in recovering the securities loaned or in gaining acce ss to the collateral. The Fund may receive compensation for lending its securities either in the form of fees, guarantees, and/or by retaining a portion of interest on the investment of any cash received as collateral.
The Fund has entered into an agreement with Morgan Stanley & Co., Inc. and MS Securities Services, Inc. (collectively, Morgan Stanley)
| 26 | Classic Value Fund | Annual report |
which permits the Fund to lend securities to Morgan Stanley on a principal basis. Morgan Stanley is the primary borrower of securities of the Fund. The risk of having one primary borrower of Fund securities (as opposed to several borrowers in an agency relationship) is that should Morgan Stanley fail financially, all securities lent may be affected by the failure and by any delays in recovery of the securities (or loss of rights in the collateral).
Federal income taxes
The Fund qualifies as a regulated investment company by complying with the applicable provisions of the Internal Revenue Code and will not be subject to federal income tax on taxable income that is distributed to shareholders. Therefore, no federal income tax provision is required.
For federal income tax purposes, the Fund has $919,103,512 of a capital loss carryforward available, to the extent provided by regulations, to offset future net realized capital gains. To the extent that such carryforward is used by the Fund, no capital gain distributions will be made. The loss carryforwards expire as follows: October 31, 2016 — $919,103,512.
The Fund is subject to the provisions of Financial Accounting Standards Board (FASB) Interpretation No. 48, Accounting for Uncertainty in Income Taxes, an interpretation of FASB Statement 109 (FIN 48). FIN 48 prescribes a minimum threshold for financial statement recognition of the benefit of a tax position taken or expected to be taken in a tax return. The implementation of FIN 48 did not have a material impact on the Fund’s financial statements. Each of the Fund’s federal tax returns for the prior three years remain subject to examination by the Internal Revenue Service.
New accounting pronouncement
In March 2008, FASB No. 161 (FAS 161), Disclosures about Derivative Instruments and Hedging Activities, an amendment of FASB Statement No. 133 (FAS 133), was issued and is effective for fiscal years or interim periods beginning after November 15, 2008. FAS 161 amends and expands the disclosure requirements of FAS 133 in order to provide financial statement users an understanding of a company’s use of derivative instruments, how derivative instruments are accounted for under FAS 133 and related interpretations and how these instruments affect a company’s financial position, performance, and cash flows. FAS 161 requires companies to disclose information detailing the objectives and strategies for using derivative instruments, the level of derivative activity entered into by the company, and any credit risk-related contingent features of the agreements. Management i s currently evaluating the adoption of FAS 161 on the Fund’s financial statement disclosures.
Distribution of income and gains
The Fund records distributions to shareholders from net investment income and net realized gains, if any, on the ex-dividend date. The Fund generally declares and pays dividends and capital gains distributions, if any, annually. During the year ended December 31, 2007, the tax character of distributions paid was as follows: ordinary income $122,281,257 and long-term capital gain $476,185,762. Distributions paid by the Fund with respect to each class of shares are calculated in the same manner, at the same time and are in the same amount, except for the effect of expenses that may be applied differently to each class.
As of October 31, 2008, the components of distributable earnings on a tax basis included $58,482,256 of undistributed ordinary income and $88,579,771 of undistributed long-term capital gain.
Such distributions and distributable earnings, on a tax basis, are determined in conformity with income tax regulations, which may differ from accounting principles generally accepted in the United States of America. Distributions in excess of tax basis earnings and profits, if any, are reported in the Fund’s financial statements as a return of capital.
Capital accounts within financial statements are adjusted for permanent book-tax differences. These adjustments have no impact on net assets or the results of operations. Temporary book-tax differences will reverse in a subsequent period. For the period ended October 31, 2008, there were no permanent book/tax differences.
| Annual report | Classic Value Fund | 27 |
Note 3
Risks and uncertainties
Sector risk — financial industry
Fund performance will be closely tied to a single sector of the economy, which may underperform other sectors over any given period of time. Financial services companies can be hurt by economic declines, changes in interest rates, regulatory and market impacts. Accordingly, the concentration may make the Fund’s value more volatile and investment values may rise and fall more rapidly.
Note 4
Guarantees and indemnifications
Under the Fund’s organizational documents, its Officers and Trustees are indemnified against certain liability arising out of the performance of their duties to the Fund. Additionally, in the normal course of business, the Fund enters into contracts with service providers that contain general indemnification clauses. The Fund’s maximum exposure under these arrangements is unknown, as this would involve future claims that may be made against the Fund that have not yet occurred.
Note 5
Management fee and transactions with
affiliates and others
The Fund has an investment management contract with the Adviser. Under the investment management contract, the Fund pays a daily management fee to the Adviser equivalent, on an annual basis, to the sum of: (a) 0.85% of the first $2,500,000,000 of the Fund’s average daily net asset value, (b) 0.825% of the next $2,500,000,000 and (c) 0.80% in excess of $5,000,000,000 of the Fund’s daily net asset value. The effective rate for the period ended October 31, 2008 is 0.839% of the Fund’s daily net asset value. The Adviser has a sub-advisory agreement with Pzena Investment Management LLC. The Fund is not responsible for payment of the subadvisory fees.
The Adviser contractually limited the Fund’s total expenses, excluding distribution and service fees, transfer agent fees, brokerage commissions, interest and other extraordinary expenses not incurred in the ordinary course of the Fund’s business, to 0.89% of the Fund’s average daily net assets at least until April 30, 2009. Accordingly, the expense reductions related to this total expense limitation amounted to $703,120 for the period ended October 31, 2008. The Adviser reserves the right to terminate this limitation in the future.
The Fund has a Distribution Agreement with John Hancock Funds, LLC (JH Funds), a wholly owned subsidiary of the Adviser. The Fund has adopted Distribution Plans with respect to Class A, Class B, Class C and Class R1, pursuant to Rule 12b-1 under the 1940 Act, to pay JH Funds for the services it provides as distributor of shares of the Fund. Accordingly, the Fund makes monthly payments to JH Funds at an annual rate not to exceed 0.25%, 1.00%, 1.00% and 0.50% of average daily net asset value of Class A, Class B, Class C and Class R1, respectively. A maximum of 0.25% of such payments may be service fees, as defined by the Conduct Rules of the Financial Industry Regulatory Authority. Under the Conduct Rules, curtailment of a portion of the Fund’s 12b-1 payments could occur under certain circumstances. In addition, under a Service Plan for Class R1 shares, the Fund pays up to 0.25% of Class R1 average daily net asset value for certain other services.
Class A shares are assessed up-front sales charges. During the period ended October 31, 2008, JH Funds received net up-front sales charges of $1,748,659 with regard to sales of Class A shares. Of this amount, $99,791 was retained and used for printing prospectuses, advertising, sales literature and other purposes, $1,624,431 was paid as sales commissions to unrelated broker-dealers and $24,437 was paid as sales commissions to sales personnel of Signator Investors, Inc. (Signator Investors), a related broker-dealer. The Adviser’s indirect parent, John Hancock Life Insurance Company (JHLICO), is the indirect sole shareholder of Signator Investors.
Class B shares that are redeemed within six years of purchase are subject to a contingent deferred sales charge (CDSC) at declining rates, beginning at 5.00% of the lesser of the current market value at the time of redemption or the original purchase cost
| 28 | Classic Value Fund | Annual report |
of the shares being redeemed. Class C shares that are redeemed within one year of purchase are subject to a CDSC at a rate of 1.00% of the lesser of the current market value at the time of redemption or the original purchase cost of the shares being redeemed. Proceeds from the CDSCs are paid to JH Funds and are used in whole or in part to defray its expenses for providing distribution-related services to the Fund in connection with the sale of Class B and Class C shares. During the period ended October 31, 2008, CDSCs received by JH Funds amounted to $597,664 for Class B shares and $51,732 for Class C shares.
The Fund has a transfer agent agreement with John Hancock Signature Services, Inc. (Signature Services), an indirect subsidiary of JHLICO. The transfer agent fees are made up of three components:
• The Fund pays a monthly transfer agent fee at an annual rate of 0.05%, 0.05%, 0.05%, 0.04% and 0.05% for Classes A, B, C, I and R1, respectively, of each class’s average daily net assets.
• For the period o fJanuary 1, 2008 to May 31, 2008, the Fund paid a monthly fee which is based on an annual rate of $15.00, $17.50, $16.50, $15.00 and $15.00 for each shareholder account for Class A, B, C, I and R1, respectively. Effective June 1, 2008, all classes paid a monthly fee based on an annual rate of $16.50 per shareholder account.
• In addition, Signature Services is reimbursed for certain out-of-pocket expenses.
Signature Services has agreed to contractually limit the transfer agent expenses to 0.18% for Classes A, B and C until April 30, 2009 and thereafter until terminated by Signature Services. Waivers and reimbursements under this plan were $1,041,498, $51,122 and $139,896 for Classes A, B and C, respectively, for the year ended October 31, 2008. In addition, the Fund receives earnings credits from Signature Services as a result of uninvested cash balances. These credits are used to reduce a portion of the Fund’s transfer agent fees and out-of-pocket expenses. During the period ended October 31, 2008, the Fund’s transfer agent fees and out-of-pocket expenses were reduced by $63,999 for transfer agent credits earned.
Class level expenses for the period ended October 31, 2008 were as follows:
| Distribution and | Transfer | |
| Share class | service fees | agent fees |
| Class A | $6,076,361 | $5,467,289 |
| Class B | 1,193,042 | 270,074 |
| Class C | 3,264,760 | 734,078 |
| Class I | — | 383,203 |
| Class R1 | 89,711 | 10,434 |
| Total | $10,623,874 | $6,865,078 |
The Fund has an agreement with the Adviser and affiliates to perform necessary tax, accounting, compliance, legal and other administrative services for the Fund. The compensation for the year amounted to $436,006 with an effective rate of 0.01% of the Fund’s average daily net asset value.
Mr. James R. Boyle is Chairman of the Adviser, as well as affiliated Trustee of the Fund, and is compensated by the Adviser and/ or its affiliates. The compensation of unaffiliated Trustees is borne by the Fund. The unaffiliated Trustees may elect to defer, for tax purposes, their receipt of this compensation under the John Hancock Group of Funds Deferred Compensation Plan. The Fund makes investments into other John Hancock funds, as applicable, to cover its liability for the deferred compensation. Investments to cover the Fund’s deferred compensation liability are recorded on the Fund’s books as an other asset. The deferred compensation liability and the related other asset are always equal and are marked to market on a periodic basis to reflect any income earned by the investments, as well as any unrealized gains or losses. The Deferred Compensation Plan investments had no impact on the operations of the Fund.
| Annual report | Classic Value Fund | 29 |
Note 6
Fund share transactions
This listing illustrates the number of Fund shares sold, reinvested and repurchased during the year ended December 31, 2006, the year ended December 31, 2007, and the period ended October 31, 2008, along with the corresponding dollar value.
| Year ended 12-31-06 | Year ended 12-31-07 | Period ended 10-31-081 | ||||
| Shares | Amount | Shares | Amount | Shares | Amount | |
| Class A shares | ||||||
| Sold | 117,043,819 | $3,048,623,694 | 58,641,767 | $1,616,890,345 | 53,342,779 | $931,579,600 |
| Distributions reinvested | 7,355,963 | 203,613,033 | 17,287,953 | 378,260,416 | — | — |
| Repurchased | (30,461,645) | (800,976,770) | (106,520,477) | (2,788,561,199) | (100,901,352) | (1,820,145,494) |
| Net increase (decrease) | 93,938,137 | $2,451,259,957 | (30,590,757) | ($793,410,438) | (47,558,573) | ($888,565,894) |
| Class B shares | ||||||
| Sold | 2,326,765 | $59,227,030 | 376,700 | $10,255,929 | 293,029 | $5,194,793 |
| Distributions reinvested | 335,892 | 9,210,152 | 789,591 | 17,126,244 | — | — |
| Repurchased | (2,681,332) | (69,005,560) | (3,522,251) | (93,121,578) | (3,600,393) | (65,267,143) |
| Net decrease | (18,675) | ($568,378) | (2,355,960) | ($65,739,405) | (3,307,364) | ($60,072,350) |
| Class C shares | ||||||
| Sold | 11,926,885 | $302,851,168 | 1,606,141 | $43,429,412 | 1,377,010 | $25,217,074 |
| Distributions reinvested | 1,148,648 | 31,484,442 | 2,477,560 | 53,713,489 | — | — |
| Repurchased | (5,825,831) | (150,272,344) | (16,681,013) | (430,300,693) | (13,514,489) | (247,067,633) |
| Net increase (decrease) | 7,249,702 | $184,063,266 | (12,597,312) | ($333,157,792) | (12,137,479) | ($221,850,559) |
| Class I shares | ||||||
| Sold | 34,873,183 | $910,196,703 | 21,957,511 | $592,709,537 | 28,719,033 | $481,668,567 |
| Distributions reinvested | 1,789,171 | 49,631,588 | 4,735,716 | 103,806,886 | — | — |
| Repurchased | (7,086,402) | (185,474,374) | (29,653,564) | (783,321,846) | (28,871,115) | (506,599,268) |
| Net increase (decrease) | 29,575,952 | $774,353,917 | (2,960,337) | ($86,805,423) | (152,082) | ($24,930,701) |
| Class R1 shares | ||||||
| Sold | 782,124 | $20,447,707 | 350,637 | $9,363,128 | 276,921 | $5,029,480 |
| Distributions reinvested | 33,785 | 935,166 | 87,625 | 1,919,000 | — | — |
| Repurchased | (260,381) | (6,777,636) | (473,051) | (12,729,674) | (539,802) | (9,908,676) |
| Net increase (decrease) | 555,528 | $14,605,237 | (34,789) | ($1,447,546) | (262,881) | ($4,879,196) |
| Net increase | ||||||
| (decrease) | 131,300,644 | $3,423,713,999 | (48,539,155) | ($1,280,560,604) | (63,418,379) | ($1,200,298,700) |
1For the ten month period ended October 31, 2008, the Fund changed its fiscal year end from December 31 to October 31.
Note 7
Purchase and sale of securities
Purchases and proceeds from sales or maturities of securities, other than short-term securities and obligations of the U.S. government, during the period ended October 31, 2008, aggregated $1,292,853,372 and $2,479,630,845, respectively.
Note 8
Change in fiscal year end
The Fund’s fiscal year end has changed to October 31, 2008.
| 30 | Classic Value Fund | Annual report |
Auditors’ report
Report of Independent Registered Public Accounting Firm
To the Board of Trustees of John Hancock Capital Series and Shareholders of John Hancock Classic Value Fund:
In our opinion, the accompanying statement of assets and liabilities, including the schedule of investments, and the related statements of operations and of changes in net assets and the financial highlights present fairly, in all material respects, the financial position of John Hancock Classic Value Fund (the Fund) at October 31, 2008, and the results of its operations, the changes in its net assets and the financial highlights for the periods indicated, in conformity with accounting principles generally accepted in the United States of America. These financial statements and financial highlights (hereafter referred to as “financial statements”) are the responsibility of the Fund’s management; our responsibility is to express an opinion on these financial statements based on our audits. We conducted our audits of these financial statements in accordance with the standards of the Public Company Accounting Oversight Board (United States). Those standards r equire that we plan and perform the audit to obtain reasonable assurance about whether the financial statements are free of material misstatement. An audit includes examining, on a test basis, evidence supporting the amounts and disclosures in the financial statements, assessing the accounting principles used and significant estimates made by management, and evaluating the overall financial statement presentation. We believe that our audits, which included confirmation of securities as of October 31, 2008 by correspondence with the custodian and brokers, and the application of alternative auditing procedures where securities purchased had not been received, provide a reasonable basis for our opinion.
PricewaterhouseCoopers LLP
Boston, Massachusetts
December 22, 2008
| Annual report | Classic Value Fund | 31 |
Tax information
Unaudited
For federal income tax purposes, the following information is furnished with respect to the distributions of the Fund, if any, paid during its taxable year ended October 31, 2008.
Shareholders will be mailed a 2008 U.S. Treasury Department Form 1099-DIV in January 2009. This will reflect the total of all distributions that are taxable for calendar year 2008.
| 32 | Classic Value Fund | Annual report |
Board Consideration of and Continuation of Investment Advisory Agreement and Subadvisory Agreement: John Hancock Classic Value Fund
The Investment Company Act of 1940 (the 1940 Act) requires the Board of Trustees (the Board) of John Hancock Capital Series (the Trust), including a majority of the Trustees who have no direct or indirect interest in the investment advisory agreement and are not “interested persons” of the Trust, as defined in the 1940 Act (the Independent Trustees), annually to meet in person to review and consider the continuation of: (i) the investment advisory agreement (the Advisory Agreement) with John Hancock Advisers, LLC (the Adviser) and (ii) the investment subadvisory agreement (the Subadvisory Agreement) with Pzena Investment Management, LLC (the Subadviser) for the John Hancock Classic Value Fund (the Fund). The Advisory Agreement and the Subadvisory Agreement are collectively referred to as the Advisory Agreements.
At meetings held on May 5–6 and June 9–10, 2008, the Board considered the factors and reached the conclusions described below relating to the selection of the Adviser and Subadviser and the continuation of the Advisory Agreements. During such meetings, the Board’s Contracts/Operations Committee and the Independent Trustees also met in executive sessions with their independent legal counsel.
In evaluating the Advisory Agreements, the Board, including the Contracts/Operations Committee and its Independent Trustees, reviewed a broad range of information requested for this purpose. This information included:
(i) the investment performance of the Fund relative to a category of relevant funds (the Category) and a peer group of comparable funds (the Peer Group). The funds within each Category and Peer Group were selected by Morningstar Inc. (Morningstar), an independent provider of investment company data. Data covered a range of periods ended December 31, 2007,
(ii) advisory and other fees incurred by, and the expense ratios of, the Fund relative to a Category and a Peer Group,
(iii) the advisory fees of comparable portfolios of other clients of the Adviser and the Subadviser,
(iv) the Adviser’s financial results and condition, including its and certain of its affiliates’ profitability from services performed for the Fund,
(v) breakpoints in the Fund’s and the Peer Group’s fees, and information about economies of scale,
(vi) the Adviser’s and Subadviser’s record of compliance with applicable laws and regulations, with the Fund’s investment policies and restrictions, and with the applicable Code of Ethics, and the structure and responsibilities of the Adviser’s and Subadviser’s compliance department,
(vii) the background and experience of senior management and investment professionals, and
(viii) the nature, cost and character of advisory and non-investment management services provided by the Adviser and its affiliates and by the Subadviser.
The Independent Trustees considered the legal advice of independent legal counsel and relied on their own business judgment in determining the factors to be considered in evaluating the materials that were presented to them and the weight to be given to each such factor. The Board’s review and conclusions were based on a comprehensive consideration of all information presented to the Board and not the result of any single controlling factor. The Board principally considered data on performance and other information provided by Morningstar as of December 31, 2007. The Board also considered updated performance information provided to it by the Adviser or Subadviser at its May and June 2008 meetings. Performance and other information may be quite different as of the date of this shareholders report. The key factors considered by the Board and the conclusions reached are described below.
| Annual report | Classic Value Fund | 33 |
Nature, extent and quality of services
The Board considered the ability of the Adviser and the Subadviser, based on their resources, reputation and other attributes, to attract and retain qualified investment professionals, including research, advisory, and supervisory personnel. The Board considered the investment philosophy, research and investment decision-making processes of the Adviser, Subadviser and representatives of the Subadviser that are responsible for the daily investment activities of the Fund. The Board considered the representatives’ history and experience with the Fund. The Board considered the Adviser’s execution of its oversight responsibilities. The Board further considered the culture of compliance, resources dedicated to compliance, compliance programs and compliance records of the Adviser and Subadviser. In addition, the Board took into account the administrative and other non-advisory services provided to the Fund by the Adviser and its affiliates.
Based on the above factors, together with those referenced below, the Board concluded that, within the context of its full deliberations, the nature, extent and quality of the investment advisory services provided to the Fund by the Adviser and Subadviser supported renewal of the Advisory Agreements.
Fund performance
The Board considered the performance results for the Fund over various time periods ended December 31, 2007. The Board also considered these results in comparison to the performance of the Category, as well as the Fund’s Peer Group and benchmark index. The Board reviewed with representatives of Morningstar the methodology used by Morningstar to select the funds in the Category and the Peer Group.
The Board noted that the Fund’s performance for the 10-year period was higher than the performance of the Peer Group and Category medians, and its benchmark index, the Russell 1000 Value Index. However, the Board continues to have concerns that the Fund’s performance for more recent periods is lower than the performance of the Peer Group and Category medians and benchmark index. Because of the underperformance for more recent periods, the Board made further inquiry of the Adviser and Subadviser.
The Subadviser provided detailed information about its investment process and discussed the performance of specific portfolio stocks with the Board. The Adviser also discussed with the Board its review and analysis of the Subadviser’s investment process and particular portfolio stocks in light of the Fund’s value orientation. The Board concluded that the investment process and particular portfolio stocks seemed consistent with the Fund’s investment objectives, strategy and style.
The Board considered recent market conditions that had a large impact on the Fund’s performance results. The Subadviser explained how recent market conditions disfavored the Fund’s value investment style. The Adviser provided supplemental analysis, which showed how the Subadviser’s investment style performed well under different market conditions.
The Board was satisfied that the Subadviser and Adviser appreciated its concerns, had satisfactorily explained the Fund’s underperformance and were diligently pursuing the Fund’s investment objective consistent with its investment strategy and style. The Board viewed favorably the Fund’s longer-term performance and noted times in the Fund’s history in which it outperformed comparable funds.
Investment advisory fee and subadvisory fee rates and expenses
The Board reviewed and considered the contractual investment advisory fee rate payable by the Fund to the Adviser for investment advisory services (the Advisory Agreement Rate). The Board received and considered information comparing the Advisory Agreement Rate with the advisory fees for the Peer Group. The Board noted that the Advisory Agreement Rate was higher than the median rate of the Peer Group and the Category.
The Board received and considered expense information regarding the Fund’s various components, including advisory fees, distribution and fees other than advisory and distribution fees, including transfer agent fees, custodian fees, and other miscellaneous fees (e.g., fees for accounting and legal services). The Board considered comparisons of these expenses to the Peer Group median. The Board also received
| 34 | Classic Value Fund | Annual report |
and considered expense information regarding the Fund’s total operating expense ratio (Gross Expense Ratio) and total operating expense ratio after taking the fee waiver arrangement applicable to the Advisory Agreement Rate into account (Net Expense Ratio). The Board received and considered information comparing the Gross Expense Ratio and Net Expense Ratio of the Fund to that of the Peer Group and Category medians. The Board noted that the Fund’s Gross and Net Expense Ratios were higher than the medians of the Peer Group and Category. The Board favorably considered the impact of fee waivers towards ultimately lowering the Fund’s total operating expense ratio. The Board noted that the Adviser agreed to maintain the fee waivers for an additional year.
The Adviser also discussed the Morningstar data and rankings, and other relevant information, for the Fund. Based on the above-referenced considerations and other factors, the Board concluded that the Fund’s overall performance and expenses supported the re-approval of the Advisory Agreements.
The Board also received information about the investment subadvisory fee rate (the Subadvisory Agreement Rate) payable by the Adviser to the Subadviser for investment subadvisory services. The Board concluded that the Subadvisory Agreement Rate was fair and equitable, based on its consideration of the factors described here.
Profitability
The Board received and considered a detailed profitability analysis of the Adviser based on the Advisory Agreements, as well as on other relationships between the Fund and the Adviser and its affiliates. The Board also considered a comparison of the Adviser’s profitability to that of other similar investment advisers whose profitability information is publicly available. The Board concluded that, in light of the costs of providing investment management and other services to the Fund, the profits and other ancillary benefits reported by the Adviser were not unreasonable.
The Board did not consider profitability information with respect to the Subadviser, which is not affiliated with the Adviser. The Board considered that the Subadvisory Agreement Rate paid to the Subadviser had been negotiated by the Adviser on an arm’s length basis and that the Subadviser’s separate profitability from its relationship with the Fund was not a material factor in determining whether to renew the agreement.
Economies of scale
The Board received and considered general information regarding economies of scale with respect to the management of the Fund, including the Fund’s ability to appropriately benefit from economies of scale under the Fund’s fee structure. The Board noted that the Fund was closed to new investors for most of 2007 due to capacity constraints and considered the impact of the closure on the Fund’s potential to realize economies of scale. The Board recognized the inherent limitations of any analysis of economies of scale, stemming largely from the Board’s understanding that most of the Adviser’s costs are not specific to individual Funds, but rather are incurred across a variety of products and services.
To the extent the Board and the Adviser were able to identify actual or potential economies of scale from Fund-specific or allocated expenses, in order to ensure that any such economies continue to be reasonably shared with the Fund as its assets increase, the Adviser and the Board agreed to continue the existing breakpoints to the Advisory Agreement Rate.
Information about services to other clients
The Board also received information about the nature, extent and quality of services and fee rates offered by the Adviser and Subadviser to their other clients, including other registered investment companies, institutional investors and separate accounts. The Board concluded that the Advisory Agreement Rate and the Subadvisory Agreement Rate were not unreasonable, taking into account fee rates offered to others by the Adviser and Subadviser, respectively, after giving effect to differences in services.
Other benefits to the Adviser
The Board received information regarding potential “fall-out” or ancillary benefits received by the Adviser and its affiliates and the Subadviser as a result of their relationship with the Fund. Such benefits could include, among others, benefits directly attributable to the relationship of the Adviser and Subadviser with the Fund and
| Annual report | Classic Value Fund | 35 |
benefits potentially derived from an increase in business of the Adviser and Subadviser as a result of their relationship with the Fund (such as the ability to market to shareholders other financial products offered by the Adviser and its affiliates).
The Board also considered the effectiveness of the Adviser’s, Subadviser’s and Fund’s policies and procedures for complying with the requirements of the federal securities laws, including those relating to best execution of portfolio transactions and brokerage allocation.
Other factors and broader review
As discussed above, the Board reviewed detailed materials received from the Adviser and Subadviser as part of the annual re-approval process. The Board also regularly reviews and assesses the quality of the services that the Fund receives throughout the year. In this regard, the Board reviews reports of the Adviser at least quarterly, which include, among other things, fund performance reports and compliance reports. In addition, the Board meets with portfolio managers and senior investment officers at various times throughout the year.
After considering the above-described factors and based on its deliberations and its evaluation of the information described above, the Board concluded that approval of the continuation of the Advisory Agreements for the Fund was in the best interest of the Fund and its shareholders. Accordingly, the Board unanimously approved the continuation of the Advisory Agreements.
| 36 | Classic Value Fund | Annual report |
Trustees and Officers
This chart provides information about the Trustees and Officers who oversee your John Hancock fund. Officers elected by the Trustees manage the day-to-day operations of the Fund and execute policies formulated by the Trustees.
Independent Trustees
| Name, Year of Birth | Number of | |
| Position(s) held with Fund | Trustee | John Hancock |
| Principal occupation(s) and other | of Fund | funds overseen |
| directorships during past 5 years | since1 | by Trustee |
| James F. Carlin, Born: 1940 | 2005 | 50 |
| Chairman (since December 2007); Director and Treasurer, Alpha Analytical Laboratories, Inc. (chemical | ||
| analysis) (since 1985); Part Owner and Treasurer, Lawrence Carlin Insurance Agency, Inc. (since 1995); | ||
| Part Owner and Vice President, Mone Lawrence Carlin Insurance Agency, Inc. (until 2005); Chairman | ||
| and Chief Executive Officer, Carlin Consolidated, Inc. (management/investments) (since 1987); Trustee, | ||
| Massachusetts Health and Education Tax Exempt Trust (1993–2003). | ||
| William H. Cunningham, Born: 1944 | 2005 | 50 |
| Professor, University of Texas at Austin (since 1971); former Chancellor, University of Texas System and | ||
| former President, University of Texas at Austin (until 2001); Chairman and Chief Executive Officer, IBT | ||
| Technologies (until 2001); Director of the following: Hicks Acquisition Company I, Inc. (since 2007); | ||
| Hire.com (until 2004), STC Broadcasting, Inc. and Sunrise Television Corp. (until 2001), Symtx, Inc. | ||
| (electronic manufacturing) (since 2001), Adorno/Rogers Technology, Inc. (until 2004), Pinnacle Foods | ||
| Corporation (until 2003), rateGenius (until 2003), Lincoln National Corporation (insurance) (since | ||
| 2006), Jefferson-Pilot Corporation (diversified life insurance company) (until 2006), New Century | ||
| Equity Holdings (formerly Billing Concepts) (until 2001), eCertain (until 2001), ClassMap.com (until | ||
| 2001), Agile Ventures (until 2001), AskRed.com (until 2001), Southwest Airlines (since 2000), Introgen | ||
| (manufacturer of biopharmaceuticals) (since 2000) and Viasystems Group, Inc. (electronic manufacturer) | ||
| (until 2003); Advisory Director, Interactive Bridge, Inc. (college fundraising) (until 2001); Advisory | ||
| Director, Q Investments (until 2003); Advisory Director, JPMorgan Chase Bank (formerly Texas Commerce | ||
| Bank–Austin), LIN Television (until 2008), WilTel Communications (until 2003) and Hayes Lemmerz | ||
| International, Inc. (diversified automotive parts supply company) (since 2003). | ||
| Deborah C. Jackson,4 Born: 1952 | 2008 | 50 |
| Chief Executive Officer, American Red Cross of Massachusetts Bay (since 2002); Board of Directors of | ||
| Eastern Bank Corporation (since 2001); Board of Directors of Eastern Bank Charitable Foundation (since | ||
| 2001); Board of Directors of American Student Association Corp. (since 1996); Board of Directors of | ||
| Boston Stock Exchange (2002–2008); Board of Directors of Harvard Pilgrim Healthcare (since 2007). | ||
| Charles L. Ladner,2 Born: 1938 | 2004 | 50 |
| Chairman and Trustee, Dunwoody Village, Inc. (retirement services) (until 2003); Senior Vice President | ||
| and Chief Financial Officer, UGI Corporation (public utility holding company) (retired 1998); Vice | ||
| President and Director, AmeriGas, Inc. (retired 1998); Director, AmeriGas Partners, L.P. (gas distribution) | ||
| (until 1997); Director, EnergyNorth, Inc. (until 1997); Director, Parks and History Association (until 2005). | ||
| Stanley Martin,2,4 Born: 1947 | 2008 | 50 |
| Senior Vice President/Audit Executive, Federal Home Loan Mortgage Corporation (2004–2006); | ||
| Executive Vice President/Consultant, HSBC Bank USA (2000–2003); Chief Financial Officer/Executive | ||
| Vice President, Republic New York Corporation and Republic National Bank of New York (1998–2000); | ||
| Partner, KPMG LLP (1971–1998). | ||
| Annual report | Classic Value Fund | 37 |
Independent Trustees (continued)
| Name, Year of Birth | Number of | |
| Position(s) held with Fund | Trustee | John Hancock |
| Principal occupation(s) and other | of Fund | funds overseen |
| directorships during past 5 years | since1 | by Trustee |
| Dr. John A. Moore,2 Born: 1939 | 2002 | 50 |
| President and Chief Executive Officer, Institute for Evaluating Health Risks (nonprofit institution) | ||
| (until 2001); Senior Scientist, Sciences International (health research) (until 2003); Former Assistant | ||
| Administrator and Deputy Administrator, Environmental Protection Agency; Principal, Hollyhouse | ||
| (consulting) (since 2000); Director, CIIT Center for Health Science Research (nonprofit research) (until | ||
| 2007). | ||
| Patti McGill Peterson,2 Born: 1943 | 2002 | 50 |
| Principal, PMP Globalinc (consulting) (since 2007); Senior Associate, Institute for Higher Education Policy | ||
| (since 2007); Executive Director, CIES (international education agency) (until 2007); Vice President, | ||
| Institute of International Education (until 2007); Senior Fellow, Cornell University Institute of Public | ||
| Affairs, Cornell University (until 1998); Former President Wells College, St. Lawrence University and the | ||
| Association of Colleges and Universities of the State of New York. Director of the following: Niagara | ||
| Mohawk Power Corporation (until 2003); Security Mutual Life (insurance) (until 1997); ONBANK (until | ||
| 1993). Trustee of the following: Board of Visitors, The University of Wisconsin, Madison (since 2007); | ||
| Ford Foundation, International Fellowships Program (until 2007); UNCF, International Development | ||
| Partnerships (until 2005); Roth Endowment (since 2002); Council for International Educational Exchange | ||
| (since 2003). | ||
| Steven R. Pruchansky, Born: 1944 | 2005 | 50 |
| Chairman and Chief Executive Officer, Greenscapes of Southwest Florida, Inc. (since 2000); Director | ||
| and President, Greenscapes of Southwest Florida, Inc. (until 2000); Member, Board of Advisors, First | ||
| American Bank (since 2008); Managing Director, JonJames, LLC (real estate) (since 2000); Director, First | ||
| Signature Bank & Trust Company (until 1991); Director, Mast Realty Trust (until 1994); President, Maxwell | ||
| Building Corp. (until 1991). | ||
| Non-Independent Trustees3 | ||
| Name, Year of Birth | Number of | |
| Position(s) held with Fund | Trustee | John Hancock |
| Principal occupation(s) and other | of Fund | funds overseen |
| directorships during past 5 years | since1 | by Trustee |
| James R. Boyle, Born: 1959 | 2005 | 267 |
| Executive Vice President, Manulife Financial Corporation (since 1999); Director and President, John | ||
| Hancock Variable Life Insurance Company (since 2007); Director and Executive Vice President, John | ||
| Hancock Life Insurance Company (since 2004); Chairman and Director, John Hancock Advisers, LLC (the | ||
| Adviser), John Hancock Funds, LLC (John Hancock Funds) and The Berkeley Financial Group, LLC (The | ||
| Berkeley Group) (holding company) (since 2005); Chairman and Director, John Hancock Investment | ||
| Management Services, LLC (since 2006); Senior Vice President, The Manufacturers Life Insurance | ||
| Company (U.S.A.) (until 2004). | ||
| 38 | Classic Value Fund | Annual report |
Principal officers who are not Trustees
| Name, Year of Birth | |
| Position(s) held with Fund | Officer |
| Principal occupation(s) and other | of Fund |
| directorships during past 5 years | since |
| Keith F. Hartstein, Born: 1956 | 2005 |
| President and Chief Executive Officer | |
| Senior Vice President, Manulife Financial Corporation (since 2004); Director, President and Chief | |
| Executive Officer, the Adviser, The Berkeley Group and John Hancock Funds, LLC (since 2005); Director, | |
| MFC Global Investment Management (U.S.), LLC (MFC Global (U.S.)) (since 2005); Chairman and | |
| Director, John Hancock Signature Services, Inc. (since 2005); Director, President and Chief Executive | |
| Officer, John Hancock Investment Management Services, LLC (since 2006); President and Chief Executive | |
| Officer, John Hancock Funds, John Hancock Funds II, John Hancock Funds III and John Hancock Trust | |
| (since 2005); Director, Chairman and President, NM Capital Management, Inc. (since 2005); Member | |
| and former Chairman, Investment Company Institute Sales Force Marketing Committee (since 2003); | |
| Director, President and Chief Executive Officer, MFC Global (U.S.) (2005–2006); Executive Vice President, | |
| John Hancock Funds, LLC (until 2005). | |
| Thomas M. Kinzler, Born: 1955 | 2006 |
| Secretary and Chief Legal Officer | |
| Vice President and Counsel, John Hancock Life Insurance Company (U.S.A.) (since 2006); Secretary | |
| and Chief Legal Officer, John Hancock Funds, John Hancock Funds II and John Hancock Trust (since | |
| 2006); Vice President and Associate General Counsel, Massachusetts Mutual Life Insurance Company | |
| (1999–2006); Secretary and Chief Legal Counsel, MML Series Investment Fund (2000–2006); Secretary | |
| and Chief Legal Counsel, MassMutual Institutional Funds (2000–2004); Secretary and Chief Legal | |
| Counsel, MassMutual Select Funds and MassMutual Premier Funds (2004–2006). | |
| Francis V. Knox, Jr., Born: 1947 | 2005 |
| Chief Compliance Officer | |
| Vice President and Chief Compliance Officer, John Hancock Investment Management Services, LLC, | |
| the Adviser and MFC Global (U.S.) (since 2005); Chief Compliance Officer, John Hancock Funds, John | |
| Hancock Funds II, John Hancock Funds III and John Hancock Trust (since 2005); Vice President and | |
| Assistant Treasurer, Fidelity Group of Funds (until 2004); Vice President and Ethics & Compliance Officer, | |
| Fidelity Investments (until 2001). | |
| Charles A. Rizzo, Born: 1957 | 2007 |
| Chief Financial Officer | |
| Chief Financial Officer, John Hancock Funds, John Hancock Funds II, John Hancock Funds III and John | |
| Hancock Trust (since 2007); Assistant Treasurer, Goldman Sachs Mutual Fund Complex (registered | |
| investment companies) (2005–2007); Vice President, Goldman Sachs (2005–2007); Managing Director | |
| and Treasurer of Scudder Funds, Deutsche Asset Management (2003–2005); Director, Tax and Financial | |
| Reporting, Deutsche Asset Management (2002–2003); Vice President and Treasurer, Deutsche Global | |
| Fund Services (1999–2002). | |
| Gordon M. Shone, Born: 1956 | 2006 |
| Treasurer | |
| Senior Vice President, John Hancock Life Insurance Company (U.S.A.) (since 2001); Treasurer, John | |
| Hancock Funds (since 2006), John Hancock Funds II, John Hancock Funds III and John Hancock Trust | |
| (since 2005); Vice President and Chief Financial Officer, John Hancock Trust (2003–2005); Vice President, | |
| John Hancock Investment Management Services, LLC, John Hancock Advisers, LLC (since 2006) and The | |
| Manufacturers Life Insurance Company (U.S.A.) (1998–2000). | |
| Annual report | Classic Value Fund | 39 |
Principal officers who are not Trustees (continued)
| Name, Year of Birth | |
| Position(s) held with Fund | Officer |
| Principal occupation(s) and other | of Fund |
| directorships during past 5 years | since |
| John G. Vrysen, Born: 1955 | 2005 |
| Chief Operating Officer | |
| Senior Vice President, Manulife Financial Corporation (since 2006); Senior Vice President, John Hancock | |
| Life Insurance Company (since 2004); Director, Executive Vice President and Chief Operating Officer, | |
| the Adviser, The Berkeley Group and John Hancock Funds, LLC (since 2007); Director, Executive Vice | |
| President and Chief Operating Officer, John Hancock Investment Management Services, LLC (since | |
| 2007); Chief Operating Officer, John Hancock Funds, John Hancock Funds II, John Hancock Funds III | |
| and John Hancock Trust (since 2007); Director, Executive Vice President and Chief Financial Officer, | |
| the Adviser, The Berkeley Group and John Hancock Funds, LLC (2005–2007); Director, Executive Vice | |
| President and Chief Financial Officer, John Hancock Investment Management Services, LLC (2005–2007); | |
| Executive Vice President and Chief Financial Officer, MFC Global (U.S.) (2005–2007); Director, John | |
| Hancock Signature Services, Inc. (since 2005); Chief Financial Officer, John Hancock Funds, John Hancock | |
| Funds II, John Hancock Funds III and John Hancock Trust (2005–2007); Vice President and General | |
| Manager, John Hancock Fixed Annuities, U.S. Wealth Management (2004–2005); Vice President, | |
| Operations, Manulife Wood Logan (2000–2004). | |
The business address for all Trustees and Officers is 601 Congress Street, Boston, Massachusetts 02210-2805.
The Statement of Additional Information of the Fund includes additional information about members of the Board of Trustees of the Fund and is available without charge, upon request, by calling 1-800-225-5291.
1 Each Trustee serves until resignation, retirement age or until his or her successor is elected.
2 Member of Audit and Compliance Committee.
3 Non-Independent Trustee holds positions with the Fund’s investment adviser, underwriter and certain other affiliates.
4 Mr. Martin was appointed by the Board as Trustee on September 8, 2008 and Ms. Jackson was appointed effective October 1, 2008.
| 40 | Classic Value Fund | Annual report |
More information
| Trustees | Investment adviser |
| James F. Carlin, Chairman | John Hancock Advisers, LLC |
| James R. Boyle† | |
| William H. Cunningham | Subadviser |
| Deborah C. Jackson | Pzena Investment Management, LLC |
| Charles L. Ladner* | |
| Stanley Martin* | Principal distributor |
| Dr. John A. Moore* | John Hancock Funds, LLC |
| Patti McGill Peterson* | |
| Steven R. Pruchansky | Custodian |
| *Members of the Audit Committee | The Bank of New York Mellon |
| †Non-Independent Trustee | |
| Transfer agent | |
| Officers | John Hancock Signature Services, Inc. |
| Keith F. Hartstein | |
| President and Chief Executive Officer | Legal counsel |
| K&L Gates LLP | |
| Thomas M. Kinzler | |
| Secretary and Chief Legal Officer | Independent registered |
| public accounting firm | |
| Francis V. Knox, Jr. | PricewaterhouseCoopers LLP |
| Chief Compliance Officer | |
| Charles A. Rizzo | |
| Chief Financial Officer | |
| Gordon M. Shone | |
| Treasurer | |
| John G. Vrysen | |
| Chief Operating Officer | |
Additional information about your fund is available without charge in several ways. As required by the SEC, you can access proxy voting information and quarterly portfolio information on your fund. The proxy voting information includes a description of proxy voting policies, procedures and information regarding how the fund voted proxies relating to portfolio securities during the most recent twelve-month period ended June 30. The quarterly portfolio information that includes a complete list of the fund’s holdings for the first and third quarters of the fund’s fiscal period is filed on Form N-Q. You have access to this information:
| By phone | On the fund’s Website | At the SEC |
| 1-800-225-5291 | www.jhfunds.com | www.sec.gov |
| 1-800-SEC-0330 | ||
| SEC Public Reference Room | ||
| You can also contact us: | |
| Regular mail: | Express mail: |
| John Hancock Signature Services, Inc. | John Hancock Signature Services, Inc. |
| P.O. Box 9510 | Mutual Fund Image Operations |
| Portsmouth, NH 03802-9510 | 164 Corporate Drive |
| Portsmouth, NH 03801 | |
Month-end portfolio holdings are available at www.jhfunds.com.
| Annual report | Classic Value Fund | 41 |

1-800-225-5291
1-800-554-6713 TDD
1-800-338-8080 EASI-Line
www.jhfunds.com
Now available: electronic delivery
www.jhfunds.com/edelivery
| This report is for the information of the shareholders of John Hancock Classic Value Fund. | 3800A 10/08 |
| It is not authorized for distribution to prospective investors unless preceded or accompanied by a prospectus. | 12/08 |
ITEM 2. CODE OF ETHICS.
As of the end of the period, October 31, 2008, the registrant has adopted a code of ethics, as defined in Item 2 of Form N-CSR, that applies to its Chief Executive Officer, Chief Financial Officer and Treasurer (respectively, the principal executive officer, the principal financial officer and the principal accounting officer, the “Senior Financial Officers”). A copy of the code of ethics is filed as an exhibit to this Form N-CSR.
ITEM 3. AUDIT COMMITTEE FINANCIAL EXPERT.
Charles L. Ladner is the audit committee financial expert and is “independent”, pursuant to general instructions on Form N-CSR Item 3.
ITEM 4. PRINCIPAL ACCOUNTANT FEES AND SERVICES.
(a) Audit Fees
The aggregate fees billed for professional services rendered by the principal accountant(s) for the audit of the registrant’s annual financial statements or services that are normally provided by the accountant(s) in connection with statutory and regulatory filings or engagements amounted to $117,780 for the fiscal period ended October 31, 2008 (broken out as follows: The following funds of the registrant changed the fiscal year end to October 31: John Hancock Classic Value Fund -$27,566, John Hancock Classic Value Fund II - $26,523, John Hancock International Classic Value Fund - $35,024 and John Hancock U.S. Global Leaders Growth Fund - $28,667) and $111,700 for the fiscal year ended December 31, 2007 (broken out as follows: John Hancock Allocation Core Portfolio and John Hancock Allocation Growth and Value Portfolio merged into another fund September 28, 2007: John Hancock Classic Value Fund - $18,700, John Hancock Classic Value Fund II - $18,800, John Hancock Core Equity Fund - $17,050, John Hancock International Classic Value Fund - $18,800, John Hancock Large Cap Select Fund - $19,050 and John Hancock U.S. Global Leaders Growth Fund - $19,300). These fees were billed to the registrant and were approved by the registrant’s audit committee.
(b) Audit-Related Services
There were no audit-related fees during the fiscal period ended October 31, 2008 and fiscal year ended December 31, 2007 billed to the registrant or to the registrant's investment adviser (not including any sub-adviser whose role is primarily portfolio management and is subcontracted with or overseen by another investment adviser), and any entity controlling, controlled by, or under common control with the adviser that provides ongoing services to the registrant ("control affiliates").
(c) Tax Fees
The aggregate fees billed for professional services rendered by the principal accountant(s) for the tax compliance, tax advice and tax planning (“tax fees”) amounted to $9,250 for the fiscal period ended October 31, 2008 (broken out as follows: John Hancock Classic Value Fund - $2,600, John Hancock Classic Value Fund II - $1,050, John Hancock International Classic Value Fund -$2,600 and John Hancock U.S. Global Leaders Growth Fund - $3,000) and $15,000 for the fiscal year ended December 31, 2007 (John Hancock Classic Value Fund - $2,600, John Hancock Classic Value Fund II - $2,500, John Hancock Core Equity Fund - $2,150, John Hancock International Classic Value Fund - $ 2,500, John Hancock Large Cap Select Fund - $2,250 and John Hancock U.S. Global Leaders Growth Fund - $3,000). The nature of the services comprising the tax fees was the review of the registrant’s income tax returns and tax distribution requirements. These fees were billed to the registrant a nd were approved by the registrant’s audit committee. There were no tax fees billed to the control affiliates.
(d) All Other Fees
There were no other fees during the fiscal period ended October 31, 2008 and fiscal year ended December 31, 2007 billed to the registrant or to the control affiliates.
(e)(1) Audit Committee Pre-Approval Policies and Procedures:
The trust’s Audit Committee must pre-approve all audit and non-audit services provided by the independent registered public accounting firm (the “Auditor”) relating to the operations or financial reporting of the funds. Prior to the commencement of any audit or non-audit services to a fund, the Audit Committee reviews the services to determine whether they are appropriate and permissible under applicable law.
The trust’s Audit Committee has adopted policies and procedures to, among other purposes, provide a framework for the Committee’s consideration of audit-related and non-audit services by the Auditor. The policies and procedures require that any audit-related and non-audit service provided by the Auditor and any non-audit service provided by the Auditor to a fund service provider that relates directly to the operations and financial reporting of a fund are subject to approval by the Audit Committee before such service is provided. Audit-related services provided by the Auditor that are expected to exceed $25,000 per instance/per fund are subject to specific pre-approval by the Audit Committee. Tax services provided by the Auditor that are expected to exceed $30,000 per instance/per fund are subject to specific pre-approval by the Audit Committee.
All audit services, as well as the audit-related and non-audit services that are expected to exceed the amounts stated above, must be approved in advance of provision of the service by formal resolution of the Audit Committee. At the regularly scheduled Audit Committee meetings, the Committee reviews a report summarizing the services, including fees, provided by the Auditor.
(e)(2) Services approved pursuant to paragraph (c)(7)(i)(C) of Rule 2-01 of Regulation S-X:
Audit-Related Fees, Tax Fees and All Other Fees:
There were no amounts that were approved by the Audit Committee pursuant to the de minimis exception under Rule 2-01 of Regulation S-X.
(f) According to the registrant’s principal accountant, for the fiscal period ended October 31, 2008, the percentage of hours spent on the audit of the registrant's financial statements for the most recent fiscal year that were attributed to work performed by persons who were not full-time, permanent employees of principal accountant was less than 50%.
(g) The aggregate non-audit fees billed by the registrant's accountant(s) for services rendered to the registrant and rendered to the registrant's control affiliates for each of the last two fiscal years of the registrant were $4,597,022 for the fiscal period ended October 31, 2008, and $1,565,823 for the fiscal year ended December 31, 2007.
(h) The audit committee of the registrant has considered the non-audit services provided by the registrant’s principal accountant(s) to the control affiliates and has determined that the services that were not pre-approved are compatible with maintaining the principal accountant(s)' independence.
ITEM 5. AUDIT COMMITTEE OF LISTED REGISTRANTS.
The registrant has a separately-designated standing audit committee comprised of independent trustees. The members of the audit committee are as follows:
Dr. John A. Moore - Chairman
Charles L. Ladner
Patti McGill Peterson
ITEM 6. SCHEDULE OF INVESTMENTS.
Not applicable.
ITEM 7. DISCLOSURE OF PROXY VOTING POLICIES AND PROCEDURES FOR CLOSED-END MANAGEMENT INVESTMENT COMPANIES.
Not applicable.
ITEM 8. PORTFOLIO MANAGERS OF CLOSED-END MANAGEMENT INVESTMENT COMPANIES.
Not applicable.
ITEM 9. PURCHASES OF EQUITY SECURITIES BY CLOSED-END MANAGEMENT INVESTMENT COMPANY AND AFFILIATED PURCHASERS.
Not applicable.
ITEM 10. SUBMISSION OF MATTERS TO A VOTE OF SECURITY HOLDERS.
There were no material changes to previously disclosed John Hancock Funds – Governance Committee Charter.
ITEM 11. CONTROLS AND PROCEDURES.
(a) Based upon their evaluation of the registrant's disclosure controls and procedures as conducted within 90 days of the filing date of this Form N-CSR, the registrant's principal executive officer and principal financial officer have concluded that those disclosure controls and procedures provide reasonable assurance that the material information required to be disclosed by the registrant on this report is recorded, processed, summarized and reported within the time periods specified in the Securities and Exchange Commission's rules and forms.
(b) There were no changes in the registrant's internal control over financial reporting that occurred during the registrant's most recent fiscal half-year (the registrant's second fiscal half-year in the case of an annual report) that have materially affected, or are reasonably likely to materially affect, the registrant's internal control over financial reporting.
ITEM 12. EXHIBITS.
(a)(1) Code of Ethics for Senior Financial Officers is attached.
(a)(2) Separate certifications for the registrant's principal executive officer and principal financial officer, as required by Section 302 of the Sarbanes-Oxley Act of 2002 and Rule 30a-2(a) under the Investment Company Act of 1940, are attached.
(b) Separate certifications for the registrant's principal executive officer and principal financial officer, as required by 18 U.S.C. Section 1350, as adopted pursuant to Section 906 of the Sarbanes-Oxley Act of 2002, and Rule 30a-2(b) under the Investment Company Act of 1940, are attached. The certifications furnished pursuant to this paragraph are not deemed to be "filed" for purposes of Section 18 of the Securities Exchange Act of 1934, or otherwise subject to the liability of that section. Such certifications are not deemed to be incorporated by reference into any filing under the Securities Act of 1933 or the Securities Exchange Act of 1934, except to the extent that the Registrant specifically incorporates them by reference.
(c)(1) Submission of Matters to a Vote of Security Holders is attached. See attached “John Hancock Funds – Governance Committee Charter”.
(c)(2) Contact person at the registrant.
| SIGNATURES |
Pursuant to the requirements of the Securities Exchange Act of 1934 and the Investment Company Act of 1940, the registrant has duly caused this report to be signed on its behalf by the undersigned, thereunto duly authorized.
John Hancock Capital Series
By: /s/ Keith F. Hartstein
-------------------------------------
Keith F. Hartstein
President and Chief Executive Officer
Date: December 16, 2008
Pursuant to the requirements of the Securities Exchange Act of 1934 and the Investment Company Act of 1940, this report has been signed below by the following persons on behalf of the registrant and in the capacities and on the dates indicated.
By: /s/ Keith F. Hartstein
-------------------------------------
Keith F. Hartstein
President and Chief Executive Officer
Date: December 16, 2008
By: /s/ Charles A. Rizzo
-------------------------------------
Charles A. Rizzo
Chief Financial Officer
Date: December 16, 2008