| UNITED STATES | |
| SECURITIES AND EXCHANGE COMMISSION | |
| Washington, D.C. 20549 | |
| FORM N-CSR | |
| CERTIFIED SHAREHOLDER REPORT OF REGISTERED | |
| MANAGEMENT INVESTMENT COMPANIES | |
| Investment Company Act file number 811- 1677 | |
| John Hancock Capital Series | |
| (Exact name of registrant as specified in charter) | |
| 601 Congress Street, Boston, Massachusetts 02210 | |
| (Address of principal executive offices) (Zip code) | |
| Michael J. Leary | |
| Treasurer | |
| 601 Congress Street | |
| Boston, Massachusetts 02210 | |
| (Name and address of agent for service) | |
| Registrant's telephone number, including area code: 617-663-4490 | |
| Date of fiscal year end: | October 31 |
| Date of reporting period: | October 31, 2009 |
ITEM 1. REPORT TO SHAREHOLDERS.
Management’s discussion of
Fund performance
By Sustainable Growth Advisers, LP
The U.S. stock market enjoyed a remarkable turnaround during the 12 months ended October 31, 2009. Stocks tumbled in late 2008 and early 2009 amid a severe economic downturn and a liquidity crisis in the credit markets. In March, however, market sentiment changed abruptly as evidence of stabilization in the economy provided the fuel for a robust rally in stocks that extended through the end of the 12-month period. Overall, stocks posted gains of approximately 10%.
For the year ended October 31, 2009, John Hancock U.S. Global Leaders Growth Fund’s Class A shares posted a total return of 16.36% at net asset value. By comparison, the Standard & Poor’s 500 Index returned 9.80%, the Russell 1000 Growth Index returned 17.51%, and the average large-cap growth fund returned 15.35%, according to Morningstar, Inc.
During the 12-month period, the Fund exhibited the ability to both preserve capital in a market downturn and participate fully in the market recovery. One key factor was our commitment to investing in companies with predictable, sustainable earnings growth — a significant advantage at a time when growth was, and remains, a scarce commodity. The Fund also benefited from our ability and readiness to capitalize on the unprecedented investment opportunities that emerged during the severe market downturn in 2008, improving the Fund’s overall growth prospects.
Technology stocks were the best performers in the portfolio, led by online retailer Amazon.com, Inc., consumer electronics maker Apple, Inc., and online advertiser Google, Inc. Other top contributors included coffee retailer Starbucks Corp. and credit card issuer American Express Co. On the downside, the biggest detractors were biotechnology firm Genzyme Corp, which we sold, medical device maker Medtronic, Inc., and agricultural products maker Monsanto Co.
This commentary reflects the views of the portfolio managers through the end of the Fund’s period discussed in this report. The managers’ statements reflect their own opinions. As such, they are in no way guarantees of future events and are not intended to be used as investment advice or a recommendation regarding any specific security. They are also subject to change at any time as market and other conditions warrant.
Past performance is no guarantee of future results.
The Fund is non-diversified, which allows it to make larger investments in individual companies. Non-diversified funds tend to be more volatile than diversified funds and the market as a whole.
| 6 | U.S. Global Leaders Growth Fund | Annual report |
A look at performance
For the period ended October 31, 2009
| Average annual returns (%) | Cumulative total returns (%) | |||||||||
| with maximum sales charge (POP) | with maximum sales charge (POP) | |||||||||
| Since | Since | |||||||||
| Class | 1-year | 5-year | 10-year | inception2 | 1-year | 5-year | 10-year | inception2 | ||
| A | 10.54 | –1.57 | –0.23 | — | 10.54 | –7.59 | –2.27 | — | ||
| B | 10.47 | –1.68 | — | –1.03 | 10.47 | –8.11 | — | –7.39 | ||
| C | 14.53 | –1.29 | — | –1.02 | 14.53 | –6.30 | — | –7.35 | ||
| I1 | 16.94 | –0.10 | — | 0.15 | 16.94 | –0.52 | — | 1.13 | ||
Performance figures assume all distributions are reinvested. Public offering price (POP) figures reflect maximum sales charges on Class A shares of 5% and the applicable contingent deferred sales charge (CDSC) on Class B shares and Class C shares. The returns for Class C shares have been adjusted to reflect the elimination of the front-end sales charge effective July 15, 2004. The Class B shares’ CDSC declines annually between years 1 to 6 according to the following schedule: 5, 4, 3, 3, 2, 1%. No sales charge will be assessed after the sixth year. Class C shares held for less than one year are subject to a 1% CDSC. Sales charges are not applicable for Class I shares.
The expense ratios of the Fund, both net (including any fee waivers or expense limitations) and gross (excluding any fee waivers or expense limitations), are set forth according to the most recent publicly available prospectuses for the Fund and may differ from the expense ratios disclosed in the Financial Highlights tables in this report. The waivers and expense limitations are contractual at least until February 28, 2010. The net expenses are as follows: Class A — 1.30%, Class B — 2.05%, Class C — 2.05% and Class I — 0.85%. Had the fee waivers and expense limitations not been in place, the gross expenses would be as follows: Class A —1.38%, Class B — 2.13%, Class C — 2.13% and Class I — 0.89%. The Fund’s annual operating expenses will likely vary throughout the period and from year to year. The Fund’s expenses for the current fiscal year may be higher than the expenses listed above, for some of the following reasons: i) a significant decrease in average net assets may result in a higher advisory fee rate if advisory fee breakpoints are not achieved; ii) a significant decrease in average net assets may result in an increase in the expense ratio because certain fund expenses do not decrease as asset levels decrease; iii) fees may be incurred for extraordinary events such as fund tax expense; and iv) the termination or expiration of expense cap reimbursements.
The returns reflect past results and should not be considered indicative of future performance. The return and principal value of an investment will fluctuate so that shares, when redeemed, may be worth more or less than their original cost. Due to market volatility, the Fund’s current performance may be higher or lower than the performance shown. For performance data current to the most recent month-end, please call 1–800–225–5291 or visit the Fund’s Web site at www.jhfunds.com.
The performance table above and the chart on the next page do not reflect the deduction of taxes that a shareholder may pay on fund distributions or on the redemption of fund shares.
The Fund’s performance results reflect any applicable fee waivers or expense reductions, without which the expenses may increase and results may have been less favorable.
1 For certain types of investors, as described in the Fund’s Class I shares prospectus.
2 From May 20, 2002.
| Annual report | U.S. Global Leaders Growth Fund | 7 |
A look at performance
Growth of $10,000
This chart shows what happened to a hypothetical $10,000 investment in John Hancock U.S. Global Leaders Growth Fund Class A shares for the period indicated. For comparison, we’ve shown the same investment in two separate indexes.

| Without sales | With maximum | ||||
| Class | Period beginning | charge | sales charge | Index 1 | Index 2 |
| B2 | 5-20-02 | $9,261 | $9,261 | $10,984 | $10,896 |
| C2 | 5-20-02 | 9,265 | 9,265 | 10,984 | 10,896 |
| I3 | 5-20-02 | 10,113 | 10,113 | 10,984 | 10,896 |
Assuming all distributions were reinvested for the period indicated, the table above shows the value of a $10,000 investment in the Fund’s Class B, Class C and Class I shares, respectively, as of October 31, 2009. The Class C shares investment with maximum sales charge has been adjusted to reflect the elimination of the front-end sales charge effective July 15, 2004. Performance of the classes will vary based on the difference in sales charges paid by shareholders investing in the different classes and the fee structure of those classes.
Standard & Poor’s 500 Index — Index 1 — is an unmanaged index that includes 500 widely traded common stocks.
Russell 1000 Growth Index — Index 2 — is an unmanaged index of companies in the Russell 1000 Index (the 1,000 largest U.S. publicly traded companies) with high price-to-book ratios and higher forecasted growth values.
It is not possible to invest directly in an index. Index figures do not reflect sales charges or direct expenses, which would have resulted in lower values if they did.
1 NAV represents net asset value and POP represents public offering price.
2 No contingent deferred sales charge applicable.
3 For certain types of investors, as described in the Fund’s Class I shares prospectus.
| 8 | U.S. Global Leaders Growth Fund | Annual report |
Your expenses
These examples are intended to help you understand your ongoing operating expenses.
Understanding fund expenses
As a shareholder of the Fund, you incur two types of costs:
■ Transaction costs which include sales charges (loads) on purchases or redemptions (varies by share class), minimum account fee charge, etc.
■ Ongoing operating expenses including management fees, distribution and service fees (if applicable), and other fund expenses.
We are going to present only your ongoing operating expenses here.
Actual expenses/actual returns
This example is intended to provide information about your fund’s actual ongoing operating expenses, and is based on your fund’s actual return. It assumes an account value of $1,000.00 on May 1, 2009 with the same investment held until October 31, 2009.
| Account value | Ending value | Expenses paid during | |
| on 5-1-09 | on 10-31-09 | period ended 10-31-091 | |
| Class A | $1,000.00 | $1,174.30 | $7.29 |
| Class B | 1,000.00 | 1,168.60 | 11.31 |
| Class C | 1,000.00 | 1,169.10 | 11.32 |
| Class I | 1,000.00 | 1,175.80 | 4.66 |
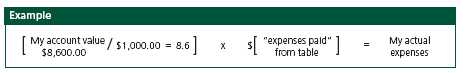
Together with the value of your account, you may use this information to estimate the operating expenses that you paid over the period. Simply divide your account value at October 31, 2009, by $1,000.00, then multiply it by the “expenses paid” for your share class from the table above. For example, for an account value of $8,600.00, the operating expenses should be calculated as follows:
| Annual report | U.S. Global Leaders Growth Fund | 9 |
Your expenses
Hypothetical example for comparison purposes
This table allows you to compare your fund’s ongoing operating expenses with those of any other fund. It provides an example of the Fund’s hypothetical account values and hypothetical expenses based on each class’s actual expense ratio and an assumed 5% annualized return before expenses (which is not your fund’s actual return). It assumes an account value of $1,000.00 on May 1, 2009, with the same investment held until October 31, 2009. Look in any other fund shareholder report to find its hypothetical example and you will be able to compare these expenses.
| Account value | Ending value | Expenses paid during | |
| on 5-1-09 | on 10-31-09 | period ended 10-31-091 | |
| Class A | $1,000.00 | $1,018.50 | $6.77 |
| Class B | 1,000.00 | 1,014.80 | 10.51 |
| Class C | 1,000.00 | 1,014.80 | 10.51 |
| Class I | 1,000.00 | 1,020.90 | 4.33 |
Remember, these examples do not include any transaction costs, therefore, these examples will not help you to determine the relative total costs of owning different funds. If transaction costs were included, your expenses would have been higher. See the prospectus for details regarding transaction costs.
1 Expenses are equal to the Fund’s annualized expense ratio of 1.33%, 2.07%, 2.07% and 0.85% for Class A, Class B, Class C and Class I shares, respectively, multiplied by the average account value over the period, multiplied by 184/365 (to reflect the one-half year period).
| 10 | U.S. Global Leaders Growth Fund | Annual report |
Portfolio summary
| Top 10 Holdings1 | ||||
| Visa, Inc. (Class A) | 5.2% | Coca-Cola Co. | 4.2% | |
| Amazon.com, Inc. | 5.2% | Oracle Corp. | 4.1% | |
| Staples, Inc. | 4.9% | National Oilwell Varco, Inc. | 3.8% | |
| Teva Pharmaceutical Industries, Ltd. | 4.9% | State Street Corp. | 3.8% | |
| Google, Inc. (Class A) | 4.2% | Starbucks Corp. | 3.7% | |
| Sector Composition2,3 | ||||
| Information Technology | 31% | Industrials | 6% | |
| Health Care | 18% | Financials | 6% | |
| Consumer Discretionary | 16% | Materials | 6% | |
| Consumer Staples | 7% | Short-Term Investments & Other | 3% | |
| Energy | 7% | |||

1 As a percentage of net assets on October 31, 2009. Excludes cash and cash equivalents.
2 As a percentage of net assets on October 31, 2009.
3 Sector investing is subject to greater risks than the market as a whole. Because the Fund may focus on particular sectors of the economy, its performance may depend on the performance of those sectors.
| Annual report | U.S. Global Leaders Growth Fund | 11 |
F I N A N C I A L S T A T E M E N T S
Fund’s investments
Securities owned by the Fund on 10-31-09
| Shares | Value | |
| Common Stocks 97.49% | $597,332,802 | |
| (Cost $506,947,407) | ||
| Consumer Discretionary 16.51% | 101,165,453 | |
| Hotels, Restaurants & Leisure 3.72% | ||
| Starbucks Corp. (I) | 1,202,140 | 22,816,615 |
| Internet & Catalog Retail 5.22% | ||
| Amazon.com, Inc. (I)(L) | 269,300 | 31,995,533 |
| Specialty Retail 7.57% | ||
| Lowe’s Companies, Inc. | 824,600 | 16,137,422 |
| Staples, Inc. | 1,392,437 | 30,215,883 |
| Consumer Staples 7.14% | 43,710,954 | |
| Beverages 7.14% | ||
| Coca-Cola Co. | 480,900 | 25,636,779 |
| PepsiCo, Inc. (L) | 298,500 | 18,074,175 |
| Energy 7.04% | 43,144,234 | |
| Energy Equipment & Services 7.04% | ||
| National Oilwell Varco, Inc. (I) | 573,650 | 23,513,914 |
| Schlumberger, Ltd. | 315,600 | 19,630,320 |
| Financials 6.14% | 37,632,231 | |
| Capital Markets 3.78% | ||
| State Street Corp. | 551,850 | 23,166,663 |
| Consumer Finance 2.36% | ||
| American Express Co. | 415,200 | 14,465,568 |
| Health Care 17.65% | 108,144,008 | |
| Health Care Equipment & Supplies 5.55% | ||
| Medtronic, Inc. | 332,726 | 11,878,318 |
| Zimmer Holdings, Inc. (I) | 421,500 | 22,158,255 |
| Health Care Providers & Services 1.90% | ||
| Henry Schein, Inc. (I)(L) | 220,700 | 11,659,581 |
| Health Care Technology 2.29% | ||
| Cerner Corp. (I)(L) | 184,200 | 14,006,568 |
| Pharmaceuticals 7.91% | ||
| Johnson & Johnson | 315,800 | 18,647,990 |
| Teva Pharmaceutical Industries, Ltd., SADR | 590,200 | 29,793,296 |
See notes to financial statements
| 12 | U.S. Global Leaders Growth Fund | Annual report |
F I N A N C I A L S T A T E M E N T S
| Shares | Value | ||
| Industrials 6.42% | $39,342,588 | ||
| Air Freight & Logistics 2.85% | |||
| FedEx Corp. | 240,330 | 17,469,588 | |
| Trading Companies & Distributors 3.57% | |||
| Fastenal Co. (L) | 634,000 | 21,873,000 | |
| Information Technology 30.86% | 189,083,020 | ||
| Communications Equipment 4.74% | |||
| Juniper Networks, Inc. (I)(L) | 458,200 | 11,688,682 | |
| QUALCOMM, Inc. | 418,800 | 17,342,508 | |
| Computers & Peripherals 2.11% | |||
| Apple, Inc. (I) | 68,600 | 12,931,100 | |
| Internet Software & Services 4.20% | |||
| Google, Inc. (Class A) (I) | 48,030 | 25,749,844 | |
| IT Services 8.37% | |||
| Automatic Data Processing, Inc. | 482,650 | 19,209,470 | |
| Visa, Inc. (Class A) (L) | 423,700 | 32,099,512 | |
| Software 11.44% | |||
| Microsoft Corp. | 821,850 | 22,789,901 | |
| Oracle Corp. | 1,189,300 | 25,094,230 | |
| SAP AG, SADR (L) | 489,900 | 22,177,773 | |
| Materials 5.73% | 35,110,314 | ||
| Chemicals 5.73% | |||
| Ecolab, Inc. | 417,400 | 18,348,904 | |
| Monsanto Co. | 249,500 | 16,761,410 | |
| Par value | Value | ||
| Short-Term Investments 21.80% | $133,531,916 | ||
| (Cost $133,502,675) | |||
| Repurchase Agreement 2.40% | 14,685,000 | ||
| Repurchase Agreement with State Street | |||
| Corp. dated 10-30-09 at 0.01% to be | |||
| repurchased at $14,685,012 on 11-2-09, | |||
| collateralized by $14,750,000 Federal Home | |||
| Loan Bank, 1.62% due 12-30-09 (valued at | |||
| $14,980,100, including interest) | $14,685,000 | 14,685,000 | |
| Rate | Shares | Value | |
| Cash Equivalents 19.40% | 118,846,916 | ||
| John Hancock Collateral Investment Trust (T)(W) | 0.2561% (Y) | 11,872,344 | 118,846,916 |
| Total investments (Cost $640,450,082)† 119.29% | $730,864,718 | ||
| Other assets and liabilities, net (19.29%) | ($118,162,667) | ||
| Total net assets 100.00% | $612,702,051 | ||
The percentage shown for each investment category is the total value of the category as a percentage of the net assets of the Fund.
See notes to financial statements
| Annual report | U.S. Global Leaders Growth Fund | 13 |
F I N A N C I A L S T A T E M E N T S
Notes to Schedule of Investments
SADR Sponsored American Depositary Receipts
(I) Non-income producing security.
(L) All or a portion of this security is on loan as of October 31, 2009.
(T) Represents investment of securities lending collateral.
(W) Issuer is an affiliate of the Adviser.
(Y) The rate shown is the annualized seven-day yield as of October 31, 2009.
† At October 31, 2009, the aggregate cost of investment securities for federal income tax purposes was $656,140,423. Net unrealized appreciation aggregated $74,724,295, of which $107,551,571 related to appreciated investment securities and $32,827,276 related to depreciated investment securities.
See notes to financial statements
| 14 | U.S. Global Leaders Growth Fund | Annual report |
F I N A N C I A L S T A T E M E N T S
Financial statements
Statement of assets and liabilities 10-31-09
This Statement of Assets and Liabilities is the Fund’s balance sheet. It shows the value of what the Fund owns, is due and owes. You’ll also find the net asset value and the maximum offering price per share.
| Assets | |
| Investments in unaffiliated issuers, at value (Cost $521,632,407) including | |
| $112,835,419 of securities loaned (Note 2) | $612,017,802 |
| Investments in affiliated issuers, at value (Cost $118,817,675) (Note 2) | 118,846,916 |
| Total investments, at value (Cost $640,450,082) | 730,864,718 |
| Cash | 338 |
| Receivable for fund shares sold | 2,702,776 |
| Dividends and interest receivable | 132,495 |
| Receivable for securities lending income | 14,765 |
| Receivable from affiliates | 1,774 |
| Other receivables | 94,900 |
| Total assets | 733,811,766 |
| Liabilities | |
| Payable for fund shares repurchased | 944,402 |
| Payable upon return of securities loaned (Note 2) | 118,798,161 |
| Payable to affiliates | |
| Accounting and legal services fees | 6,677 |
| Transfer agent fees | 458,252 |
| Distribution and service fees | 192,590 |
| Management fees | 443,276 |
| Other liabilities and accrued expenses | 266,357 |
| Total liabilities | 121,109,715 |
| Net assets | |
| Capital paid-in | $621,172,260 |
| Distributions in excess of net investment income | (38,363) |
| Accumulated net realized loss on investments | (98,846,482) |
| Net unrealized appreciation (depreciation) on investments | 90,414,636 |
| Net assets | $612,702,051 |
| Net asset value per share | |
| Based on net asset values and shares outstanding — the Fund has an | |
| unlimited number of shares authorized with no par value. | |
| Class A ($479,901,927 ÷ 20,089,784 shares) | $23.89 |
| Class B ($47,440,120 ÷ 2,098,763 shares)1 | $22.60 |
| Class C ($59,507,166 ÷ 2,632,350 shares)1 | $22.61 |
| Class I ($25,852,838 ÷ 1,053,105 shares) | $24.55 |
| Maximum offering price per share | |
| Class A (net asset value per share ÷ 95%)2 | $25.15 |
1 Redemption price per share is equal to the net asset value less any applicable contingent deferred sales charge.
2 On single retail sales of less than $50,000. On sales of $50,000 or more and on group sales the offering price is reduced.
See notes to financial statements
| Annual report | U.S. Global Leaders Growth Fund | 15 |
F I N A N C I A L S T A T E M E N T S
Statement of operations For the year ended 10-31-09
This Statement of Operations summarizes the Fund’s investment income earned and expenses incurred in operating the Fund. It also shows net gains (losses) for the period stated.
| Investment income | |
| Dividends | $8,517,019 |
| Securities lending | 134,597 |
| Income from affiliated issuers | 24,874 |
| Interest | 3,010 |
| Less foreign taxes withheld | (126,914) |
| Total investment income | 8,552,586 |
| Expenses | |
| Investment management fees (Note 4) | 4,513,267 |
| Distribution and service fees (Note 4) | 2,193,923 |
| Accounting and legal services fees (Note 4) | 106,162 |
| Transfer agent fees (Note 4) | 3,623,819 |
| Trustees’ fees (Note 5) | 67,043 |
| State registration fees | 48,732 |
| Printing and postage fees | 341,074 |
| Professional fees | 89,546 |
| Custodian fees | 110,470 |
| Registration and filing fees | 26,962 |
| Proxy fees | 178,164 |
| Other | 22,123 |
| Total expenses | 11,321,285 |
| Less expense reductions (Note 4) | (2,742,668) |
| Net expenses | 8,578,617 |
| Net investment loss | (26,031) |
| Realized and unrealized gain (loss) | |
| Net realized gain (loss) on | |
| Investments in unaffiliated issuers | (75,667,967) |
| Investments in affiliated issuers | 19,514 |
| (75,648,453) | |
| Change in net unrealized appreciation (depreciation) of | |
| Investments in unaffiliated issuers | 158,110,276 |
| Investments in affiliated underlying issuers | 29,241 |
| 158,139,517 | |
| Net realized and unrealized gain | 82,491,064 |
| Increase in net assets from operations | $82,465,033 |
See notes to financial statements
| 16 | U.S. Global Leaders Growth Fund | Annual report |
F I N A N C I A L S T A T E M E N T S
Statements of changes in net assets
These Statements of Changes in Net Assets show how the value of the Fund’s net assets has changed during the last three periods. The difference reflects earnings less expenses, any investment gains and losses, distributions, if any, paid to shareholders and the net of Fund share transactions.
| Year | Period | Year | |
| ended | ended | ended | |
| 10-31-09 | 10-31-081 | 12-31-07 | |
| Increase (decrease) in net assets | |||
| From operations | |||
| Net investment income (loss) | ($26,031) | $78,351 | ($576,956) |
| Net realized gain (loss) | (75,648,453) | (18,290,591) | 83,713,573 |
| Change in net unrealized appreciation | |||
| (depreciation) | 158,139,517 | (284,808,734) | (36,267,593) |
| Increase (decrease) in net assets resulting | |||
| from operations | 82,465,033 | (303,020,974) | 46,869,024 |
| Distributions to shareholders | |||
| From net investment income | |||
| Class A | (257,002) | — | — |
| Class I | (99,277) | — | — |
| From net realized gain | |||
| Class A | (7,473,593) | — | (38,392,578) |
| Class B | (780,622) | — | (4,258,299) |
| Class C | (864,357) | — | (4,531,561) |
| Class I | (684,865) | — | (251,102) |
| Class R12 | (25,241) | — | (123,445) |
| Total distributions | (10,184,957) | — | (47,556,985) |
| From Fund share transactions (Note 6) | (182,901,608) | (226,086,028) | (369,050,878) |
| Total decrease | (110,621,532) | (529,107,002) | (369,738,839) |
| Net assets | |||
| Beginning of year | 723,323,583 | 1,252,430,585 | 1,622,169,424 |
| End of year | $612,702,051 | $723,323,583 | $1,252,430,585 |
| Accumulated (Distributions in excess of) | |||
| net investment income | ($38,363) | $44,938 | ($33,143) |
1 For the ten month period ended October 31, 2008. The Fund changed its fiscal year end from December 31 to October 31.
2 Effective August 21, 2009, Class R1 converted into Class A.
See notes to financial statements
| Annual report | U.S. Global Leaders Growth Fund | 17 |
F I N A N C I A L S T A T E M E N T S
Financial highlights
The Financial Highlights show how the Fund’s net asset value for a share has changed since the end of the previous period.
| CLASS A SHARES Period ended | 10-31-09 | 10-31-081 | 12-31-07 | 12-31-06 | 12-31-05 | 12-31-04 |
| Per share operating performance | ||||||
| Net asset value, beginning of year | $20.87 | $28.80 | $28.85 | $28.44 | $27.84 | $25.72 |
| Net investment income (loss)2 | 0.02 | 0.03 | 0.03 | —3 | (0.04) | 0.15 |
| Net realized and unrealized gain (loss) | ||||||
| on investments | 3.30 | (7.96) | 1.04 | 0.41 | 0.64 | 2.04 |
| Total from investment operations | 3.32 | (7.93) | 1.07 | 0.41 | 0.60 | 2.19 |
| Less distributions | ||||||
| From net investment income | (0.01) | — | — | — | — | — |
| From net realized gain | (0.29) | — | (1.12) | — | — | (0.07) |
| Total distributions | (0.30) | — | (1.12) | — | — | (0.07) |
| Net asset value, end of year | $23.89 | $20.87 | $28.80 | $28.85 | $28.44 | $27.84 |
| Total return (%)4 | 16.365 | (27.53)5,6 | 3.675 | 1.445 | 2.165 | 8.51 |
| Ratios and supplemental data | ||||||
| Net assets, end of year (in millions) | $480 | $552 | $1,022 | $1,263 | $1,271 | $893 |
| Ratios (as a percentage of average | ||||||
| net assets): | ||||||
| Expenses before reductions | 1.817 | 1.388 | 1.32 | 1.32 | 1.33 | 1.32 |
| Expenses net of fee waivers | 1.347 | 1.308 | 1.27 | 1.28 | 1.28 | 1.32 |
| Expenses net of fee waivers | ||||||
| and credits | 1.337 | 1.308 | 1.27 | 1.28 | 1.28 | 1.32 |
| Net investment income (loss) | 0.10 | 0.138 | 0.10 | —9 | (0.14) | 0.57 |
| Portfolio turnover (%) | 77 | 58 | 27 | 34 | 28 | 16 |
1 For the ten month period ended October 31, 2008. The Fund changed its fiscal year end from December 31 to October 31.
2 Based on the average daily shares outstanding.
3 Less than $0.01 per share.
4 Assumes dividend reinvestment.
5 Total returns would have been lower had certain expenses not been reduced during the periods shown.
6 Not annualized.
7 Includes the impact of proxy expenses, which amounted to 0.03% of average net assets.
8 Annualized.
9 Less than 0.01%.
See notes to financial statements
| 18 | U.S. Global Leaders Growth Fund | Annual report |
F I N A N C I A L S T A T E M E N T S
| CLASS B SHARES Period ended | 10-31-09 | 10-31-081 | 12-31-07 | 12-31-06 | 12-31-05 | 12-31-04 |
| Per share operating performance | ||||||
| Net asset value, beginning of year | $19.90 | $27.64 | $27.94 | $27.75 | $27.36 | $25.41 |
| Net investment loss2 | (0.13) | (0.13) | (0.18) | (0.20) | (0.24) | (0.05) |
| Net realized and unrealized gain (loss) | ||||||
| on investments | 3.12 | (7.61) | 1.00 | 0.39 | 0.63 | 2.00 |
| Total from investment operations | 2.99 | (7.74) | 0.82 | 0.19 | 0.39 | 1.95 |
| Less distributions | ||||||
| From net realized gain | (0.29) | — | (1.12) | — | — | — |
| Net asset value, end of year | $22.60 | $19.90 | $27.64 | $27.94 | $27.75 | $27.36 |
| Total return (%)3 | 15.474 | (28.00)4,5 | 2.904 | 0.684 | 1.434 | 7.67 |
| Ratios and supplemental data | ||||||
| Net assets, end of year (in millions) | $47 | $56 | $107 | $151 | $218 | $208 |
| Ratios (as a percentage of average | ||||||
| net assets): | ||||||
| Expenses before reductions | 2.506 | 2.137 | 2.07 | 2.07 | 2.08 | 2.07 |
| Expenses net of fee waivers | 2.086 | 2.057 | 2.02 | 2.03 | 2.03 | 2.07 |
| Expenses net of fee waivers | ||||||
| and credits | 2.076 | 2.057 | 2.02 | 2.03 | 2.03 | 2.07 |
| Net investment loss | (0.65) | (0.63)7 | (0.65) | (0.75) | (0.88) | (0.21) |
| Portfolio turnover (%) | 77 | 58 | 27 | 34 | 28 | 16 |
1 For the ten month period ended October 31, 2008. The Fund changed its fiscal year end from December 31 to October 31.
2 Based on the average daily shares outstanding.
3 Assumes dividend reinvestment.
4 Total returns would have been lower had certain expenses not been reduced during the periods shown.
5 Not annualized.
6 Includes the impact of proxy expenses, which amounted to 0.03% of average net assets.
7 Annualized.
| CLASS C SHARES Period ended | 10-31-09 | 10-31-081 | 12-31-07 | 12-31-06 | 12-31-05 | 12-31-04 |
| Per share operating performance | ||||||
| Net asset value, beginning of year | $19.90 | $27.64 | $27.94 | $27.75 | $27.36 | $25.41 |
| Net investment loss2 | (0.12) | (0.13) | (0.18) | (0.20) | (0.24) | (0.04) |
| Net realized and unrealized gain (loss) | ||||||
| on investments | 3.12 | (7.61) | 1.00 | 0.39 | 0.63 | 1.99 |
| Total from investment operations | 3.00 | (7.74) | 0.82 | 0.19 | 0.39 | 1.95 |
| Less distributions | ||||||
| From net realized gain | (0.29) | — | (1.12) | — | — | — |
| Net asset value, end of year | $22.61 | $19.90 | $27.64 | $27.94 | $27.75 | $27.36 |
| Total return (%)3 | 15.534 | (28.00)4,5 | 2.904 | 0.684 | 1.434 | 7.67 |
| Ratios and supplemental data | ||||||
| Net assets, end of year (in millions) | $60 | $62 | $114 | $186 | $284 | $246 |
| Ratios (as a percentage of average | ||||||
| net assets): | ||||||
| Expenses before reductions | 2.516 | 2.137 | 2.07 | 2.07 | 2.08 | 2.07 |
| Expenses net of fee waivers | 2.086 | 2.057 | 2.02 | 2.03 | 2.03 | 2.07 |
| Expenses net of fee waivers | ||||||
| and credits | 2.076 | 2.057 | 2.02 | 2.03 | 2.03 | 2.07 |
| Net investment loss | (0.66) | (0.63)7 | (0.65) | (0.75) | (0.88) | (0.17) |
| Portfolio turnover (%) | 77 | 58 | 27 | 34 | 28 | 16 |
1 For the ten month period ended October 31, 2008. The Fund changed its fiscal year end from December 31 to October 31.
2 Based on the average daily shares outstanding.
3 Assumes dividend reinvestment.
4 Total returns would have been lower had certain expenses not been reduced during the periods shown.
5 Not annualized.
6 Includes the impact of proxy expenses, which amounted to 0.03% of average net assets.
7 Annualized.
See notes to financial statements
| Annual report | U.S. Global Leaders Growth Fund | 19 |
F I N A N C I A L S T A T E M E N T S
| CLASS I SHARES Period ended | 10-31-09 | 10-31-081 | 12-31-07 | 12-31-06 | 12-31-05 | 12-31-04 |
| Per share operating performance | ||||||
| Net asset value, beginning of year | $21.37 | $29.38 | $29.28 | $28.74 | $28.00 | $25.87 |
| Net investment income2 | 0.13 | 0.13 | 0.16 | 0.12 | 0.08 | 0.25 |
| Net realized and unrealized gain (loss) | ||||||
| on investments | 3.38 | (8.14) | 1.06 | 0.42 | 0.66 | 2.06 |
| Total from investment operations | 3.51 | (8.01) | 1.22 | 0.54 | 0.74 | 2.31 |
| Less distributions | ||||||
| From net investment income | (0.04) | — | — | — | — | — |
| From net realized gain | (0.29) | — | (1.12) | — | — | (0.18) |
| Total distributions | (0.33) | — | (1.12) | — | — | (0.18) |
| Net asset value, end of year | $24.55 | $21.37 | $29.38 | $29.28 | $28.74 | $28.00 |
| Total return (%)3 | 16.944 | (27.26)4,5 | 4.134 | 1.884 | 2.644 | 8.94 |
| Ratios and supplemental data | ||||||
| Net assets, end of year (in millions) | $26 | $51 | $7 | $18 | $13 | $8 |
| Ratios (as a percentage of average | ||||||
| net assets): | ||||||
| Expenses before reductions | 0.966 | 0.897 | 0.88 | 0.87 | 0.90 | 0.90 |
| Expenses net of fee waivers | 0.846 | 0.857 | 0.84 | 0.84 | 0.85 | 0.90 |
| Expenses net of fee waivers | ||||||
| and credits | 0.846 | 0.857 | 0.84 | 0.84 | 0.85 | 0.90 |
| Net investment income | 0.60 | 0.607 | 0.54 | 0.43 | 0.30 | 0.94 |
| Portfolio turnover (%) | 77 | 58 | 27 | 34 | 28 | 16 |
1 For the ten month period ended October 31, 2008. The Fund changed its fiscal year end from December 31 to October 31.
2 Based on the average daily shares outstanding.
3 Assumes dividend reinvestment.
4 Total returns would have been lower had certain expenses not been reduced during the periods shown.
5 Not annualized.
6 Includes the impact of proxy expenses, which amounted to 0.03% of average net assets.
7 Annualized.
See notes to financial statements
20 | U.S. Global Leaders Growth Fund | Annual report |
Notes to financial statements
Note 1
Organization
John Hancock U.S. Global Leaders Growth Fund (the Fund) is a non-diversified series of John Hancock Capital Series (the Trust), an open-end management investment company registered under the Investment Company Act of 1940, as amended (the 1940 Act).
John Hancock Advisers, LLC (the Adviser) serves as investment adviser for the Fund. John Hancock Funds, LLC (the Distributor), an affiliate of the Adviser, serves as principal underwriter of the Fund. The Adviser and the Distributor are indirect wholly owned subsidiaries of Manulife Financial Corporation (MFC).
The Board of Trustees has authorized the issuance of multiple classes of shares of the Fund, designated as Class A, Class B, Class C and Class I shares. Class A, Class B and Class C shares are open to all retail investors. Class I shares are offered without any sales charge to various institutional and certain individual investors. The shares of each class represent an interest in the same portfolio of investments of the Fund and have equal rights as to voting, redemptions, dividends and liquidation, except that certain expenses, subject to the approval of the Trustees, may be applied differently to each class of shares in accordance with current regulations of the Securities and Exchange Commission and the Internal Revenue Service. Shareholders of a class that bears distribution and service expenses under the terms of a distribution plan have exclusive voting rights to that distribution plan. Class B shares will convert to Class A shares eight years after purchase. Effective as of August 21, 2009, Class R1 converted into Class A.
Note 2
Significant accounting policies
The financial statements have been prepared in conformity with accounting principles generally accepted in the United States of America, which require management to make certain estimates and assumptions at the date of the financial statements. Actual results could differ from those estimates. Events or transactions occurring after period end through the date that the financial statements were issued, December 18, 2009, have been evaluated in the preparation of the financial statements. The following summarizes the significant accounting policies of the Fund:
Security valuation
Investments are stated at value as of the close of the regular trading on New York Stock Exchange (NYSE), normally at 4:00 P.M., Eastern Time. Equity securities held by the Fund are valued at the last sale price or official closing price (closing bid price or last evaluated price if no sale has occurred) as of the close of business on the principal securities exchange (domestic or foreign) on which they trade. Debt obligations are valued based on the evaluated prices provided by independent pricing services, which utilizes both dealer-supplied quotes and electronic data processing techniques, which take into account factors such as institutional-size trading in similar groups of securities, yield, quality, coupon rate, maturity, type of issue, trading characteristics and other market data. Securities traded only in the over-the-counter market are valued at the last bid price quoted by brokers making markets in the securities at the close of trading. Equity and debt obligations, for which there are no prices available from an independent pricing service, are valued based on bid quotations, or evaluated prices, as applicable, obtained from broker-dealers or fair valued as described below. Certain short-term debt instruments are valued at amortized cost. John Hancock Collateral Investment Trust (JHCIT), an affiliated registered investment company managed by Manulife Global Investment Management (U.S.), LLC, a subsidiary of MFC, is valued at its net asset value each business day. JHCIT is a floating rate fund investing in money market investments as part of the securities lending program.
Other assets and securities for which no such quotations are readily available are valued at fair value as determined in good faith by the Fund’s Pricing Committee in accordance with
| Annual report | U.S. Global Leaders Growth Fund | 21 |
procedures adopted by the Board of Trustees. Generally, trading in non-U.S. securities is substantially completed each day at various times prior to the close of trading on the NYSE. The values of such securities used in computing the net asset value of the Fund’s shares are generally determined as of such times. Occasionally, significant events that affect the values of such securities may occur between the times at which such values are generally determined and the close of the NYSE. Upon such an occurrence, these securities will be valued at fair value as determined in good faith under consistently applied procedures established by and under the general supervision of the Board of Trustees.
Fair value measurements
The Fund uses a three-tier hierarchy to prioritize the assumptions, referred to as inputs, used in valuation techniques to measure fair value. The three-tier hierarchy of inputs and the valuation techniques used are summarized below:
Level 1 — Exchange-traded prices in active markets for identical securities. This technique is used for exchange-traded domestic common and preferred equities, certain foreign equities, warrants, rights, options and futures.
Level 2 — Prices determined using significant observable inputs. Observable inputs may include quoted prices for similar securities, interest rates, prepayment speeds and credit risk. Prices for securities valued using these techniques are received from independent pricing vendors and are based on an evaluation of the inputs described. These techniques are used for certain domestic preferred equities, certain foreign equities, unlisted rights and warrants, and fixed income securities. Also, over-the-counter derivative contracts, including swaps, foreign forward currency contracts, and certain options use these techniques.
Level 3 — Prices determined using significant unobservable inputs. In situations where quoted prices or observable inputs are unavailable, such as when there is little or no market activity for an investment, unobservable inputs may be used. Unobservable inputs reflect the Fund’s Pricing Committee’s own assumptions about the factors that market participants would use in pricing an investment and would be based on the best information available. Securities using this technique are generally thinly traded or privately placed, and may be valued using broker quotes, which may not only use observable or unobservable inputs but may also include the use of the brokers’ own judgments about the assumptions that market participants would use.
The inputs or methodology used for valuing securities are not necessarily an indication of the risk associated with investing in those securities.
The following is a summary of the inputs used to value the Fund’s investments as of October 31, 2009, by major security category or security type.
| INVESTMENTS IN SECURITIES | LEVEL 1 | LEVEL 2 | LEVEL 3 | TOTALS |
| Consumer Discretionary | $101,165,453 | — | — | $101,165,453 |
| Consumer Staples | 43,710,954 | — | — | 43,710,954 |
| Energy | 43,144,234 | — | — | 43,144,234 |
| Financials | 37,632,231 | — | — | 37,632,231 |
| Health Care | 108,144,008 | — | — | 108,144,008 |
| Industrials | 39,342,588 | — | — | 39,342,588 |
| Information Technology | 189,083,020 | — | — | 189,083,020 |
| Materials | 35,110,314 | — | — | 35,110,314 |
| Short Term Investments | 118,846,916 | $14,685,000 | — | 133,531,916 |
| Total Investments | $716,179,718 | $14,685,000 | — | $730,864,718 |
| in Securities | ||||
Repurchase agreements
The Fund may enter into repurchase agreements. When the Fund enters into a repurchase agreement through its custodian, it receives delivery of securities, the amount of which at the time of purchase and each
| 22 | U.S. Global Leaders Growth Fund | Annual report |
subsequent business day is required to be maintained at such a level that the market value is generally at least 102% of the repurchase amount. The Fund will take receipt of all securities underlying the repurchase agreements it has entered into until such agreements expire. If the seller defaults, the Fund would suffer a loss to the extent that proceeds from the sale of underlying securities were less than the repurchase amount. The Fund may enter into repurchase agreements maturing within seven days with domestic dealers, banks or other financial institutions deemed to be creditworthy by the Adviser.
Security transactions and related
investment income
Investment security transactions are accounted for on a trade date plus one basis for daily net asset value calculations. However, for financial reporting purposes, investment transactions are reported on trade date. Interest income is accrued as earned. Dividend income is recorded on the ex-dividend date. Foreign dividends are recorded on the ex-date or when the Fund becomes aware of the dividends from cash collections. Discounts/premiums are accreted/amortized for financial reporting purposes. Debt obligations may be placed in a non-accrual status and related interest income may be reduced by ceasing current accruals and writing off interest receivables when the collection of all or a portion of interest has become doubtful. The Fund uses identified cost method for determining realized gain or loss on investments for both financial statement and federal income tax reporting purposes.
Securities lending
The Fund may lend portfolio securities from time to time in order to earn additional income. The Fund retains beneficial ownership of the securities it has loaned and continues to receive interest and dividends associated with securities and to participate in any changes in their value. On the settlement date of the loan, the Fund receives cash collateral against the loaned securities and maintains the cash collateral in an amount no less than the market value of the loaned securities.
The market value of the loaned securities is determined at the close of business of the Fund. Any additional required cash collateral is delivered to the Fund or excess collateral is returned to the borrower on the next business day. Cash collateral received is invested in JHCIT. JHCIT is not a stable value fund and thus the Fund receives the benefit of any gains and bears any losses generated by JHCIT.
The Fund may receive compensation for lending their securities either in the form of fees, and/or by retaining a portion of interest on the investment of any cash received as collateral. If the borrower defaults on its obligation to return the securities loaned because of insolvency or other reasons, the Fund could experience delays and costs in recovering the securities loaned or in gaining access to the collateral. The Fund bears the risk in the event that invested collateral is not sufficient to meet obligations due on loans.
Expenses
The majority of expenses are directly identifiable to an individual fund. Fund expenses that are not readily identifiable to a specific fund are allocated in such a manner as deemed equitable, taking into consideration, among other things, the nature and type of expense and the relative size of the funds. Expense estimates are accrued in the period to which they relate and adjustments are made when actual amounts are known.
Class allocations
Income, common expenses and realized and unrealized gains (losses) are determined at the fund level and allocated daily to each class of shares based on the appropriate net asset value of the respective classes. Distribution and service fees, if any, and transfer agent fees for all classes are calculated daily at the class level based on the appropriate net asset value of each class and the specific expense rate(s) applicable to each class.
Line of credit
The Fund and other affiliated funds have entered into an agreement which enables them to participate in a $150 million unsecured committed line of credit with the Fund’s custodian. The Fund is permitted to have
| Annual report | U.S. Global Leaders Growth Fund | 23 |
bank borrowings for temporary or emergency purposes, including the meeting of redemption requests that otherwise might require the untimely disposition of securities. Interest is charged to the Fund based on its borrowings at a rate per annum equal to the Federal Funds rate plus 0.50%. In addition, a commitment fee of 0.08% per annum, payable at the end of each calendar quarter, based on the average daily-unused portion of the line of credit, is charged to the Fund on a prorated basis based on average net assets. Prior to February 19, 2009, the commitment fee was 0.05% per annum. For the year ended October 31, 2009, there were no borrowings under the line of credit by the Fund.
Pursuant to the custodian agreement, the custodian may, in its discretion, advance funds to the Fund to make properly authorized payments. When such payments result in an overdraft, the Fund is obligated to repay the custodian for any overdraft, including any costs or expenses associated with the overdraft. The custodian has a lien, security interest or security entitlement in any Fund property, that is not segregated, to the maximum extent permitted by law to the extent of any overdraft.
Federal income taxes
The Fund intends to qualify as a regulated investment company by complying with the applicable provisions of the Internal Revenue Code and will not be subject to federal income tax on taxable income that is distributed to shareholders. Therefore, no federal income tax provision is required.
For federal income tax purposes, the Fund has $83,156,141 of a capital loss carryforward available, to the extent provided by regulations, to offset future net realized capital gains. To the extent that such carryforward is used by the Fund, it will reduce the amount of capital gain distributions to be paid. The loss carryforward expires as follows: October 31, 2016 — $6,648,245 and October 31, 2017 —$76,507,896. Availability of a certain amount of the loss carryforward, which was acquired on April 8, 2005, in a merger with John Hancock Large Cap Growth Fund, may be limited in a given year.
As of October 31, 2009, the Fund had no uncertain tax positions that would require financial statement recognition, de-recognition, or disclosure. The Fund’s federal tax return is subject to examination by the Internal Revenue Service for a period of three years.
Distribution of income and gains
The Fund records distributions to shareholders from net investment income and net realized gains, if any, on the ex-dividend date. The Fund generally declares and pays dividends and capital gain distributions, if any, annually. During the year ended October 31, 2009 the tax character of distributions paid was as follows: ordinary income $356,285 and long-term capital gain $9,828,672. There were no distributions during the period ended October 31, 2008. During the year ended December 31, 2007 the tax character of distributions paid was as follows: long-term capital gain: $47,556,985. Distributions paid by the Fund with respect to each class of shares are calculated in the same manner, at the same time and are in the same amount, except for the effect of expenses that may be applied differently to each class.
As of October 31, 2009, there were no distributable earnings on a tax basis.
Such distributions and distributable earnings, on a tax basis, are determined in conformity with income tax regulations, which may differ from accounting principles generally accepted in the United States of America. Material distributions in excess of tax basis earnings and profits, if any, are reported in the Fund’s financial statements as a return of capital.
Capital accounts within financial statements are adjusted for permanent book-tax differences. These adjustments have no impact on net assets or the results of operations. Temporary book-tax differences will reverse in a subsequent period. Permanent book-tax differences are primarily attributable to expiration of capital loss carryforwards and distributions in excess of net income.
Note 3
Guarantees and indemnifications
Under the Fund’s organizational documents, its Officers and Trustees are indemnified
| 24 | U.S. Global Leaders Growth Fund | Annual report |
against certain liabilities arising out of the performance of their duties to the Fund. Additionally, in the normal course of business, the Fund enters into contracts with service providers that contain general indemnification clauses. The Fund’s maximum exposure under these arrangements is unknown, as this would involve future claims that may be made against the Fund that have not yet occurred.
Note 4
Management fee and transactions with
affiliates and others
The Fund has an investment management contract with the Adviser. Under the investment management contract, the Fund pays a monthly management fee to the Adviser equivalent, on an annual basis, to the sum of: (a) 0.75% of the first $2,000,000,000 of the Fund’s average daily net asset value, (b) 0.70% of the next $3,000,000,000 and (c) 0.65% in excess of $5,000,000,000. The Adviser has a subadvisory agreement with Sustainable Growth Advisers, LP. The Fund is not responsible for payment of the subadvisory fees.
The investment management fees incurred for the year ended October 31, 2009, were equivalent to an annual effective rate of 0.75% of the Fund’s average daily net assets.
The Adviser has contractually agreed through February 28, 2010 to reimburse certain fund expenses (excluding transfer agent fees, 12b-1 fees, brokerage commissions, interest, and other extraordinary expenses not incurred in the ordinary course of the fund’s business) that exceed 0.79% of the Fund’s average net assets effective, May 1, 2009. In addition, the Adviser has agreed to a contractual expense limit through February 28, 2010 on class specific expenses (including transfer agent fees and 12b-1 fees) of 1.30%, 2.05%, 2.05% and 0.85% for Class A, Class B, Class C and Class I shares, respectively. Reimbursements under these plans were $1,315,175, $106,158, $132,453 and $38,350 for Class A, Class B, Class C and Class I shares, respectively, for the year ended October 31, 2009.
Pursuant to the Advisory Agreement, the Fund reimburses the Adviser for all expenses associated with providing the administrative, financial, legal, accounting and recordkeeping services of the Fund, including the preparation of all tax returns, annual, semiannual and periodic reports to shareholders and the preparation of all regulatory reports. These expenses are allocated based on the relative share of net assets of each class at the time the expense was incurred. The accounting and legal service fees for the year ended October 31, 2009, were had an effective rate of 0.02% of the Fund’s average daily net assets.
The Fund has a Distribution Agreement with the Distributor. The Fund has adopted Distribution Plans with respect to Class A, Class B and Class C shares, pursuant to Rule 12b-1 under the 1940 Act, to pay the Distributor for the services it provides as distributor of shares of the Fund. Accordingly, the Fund makes monthly payments to the Distributor at an annual rate not to exceed 0.25%, 1.00% and 1.00% of average daily net asset value of Class A, Class B and Class C shares, respectively. A maximum of 0.25% of such payments may be service fees, as defined by the Conduct Rules of the Financial Industry Regulatory Authority (formerly the National Association of Securities Dealers). Under the Conduct Rules, a curtailment of a portion of the Fund’s Rule 12b-1 payments could occur under certain circumstances.
Class A shares are assessed up-front sales charges. During the year ended October 31, 2009, the Distributor received net up-front sales charges of $174,195 with regard to sales of Class A shares. Of this amount, $25,039 was retained and used for printing prospectuses, advertising, sales literature and other purposes, $124,354 was paid as sales commissions to unrelated broker-dealers and $24,802 was paid as sales commissions to sales personnel of Signator Investors, Inc. (Signator Investors), a related broker-dealer. Signator Investors is an affiliate of the Adviser.
Class B shares that are redeemed within six years of purchase are subject to a contingent deferred sales charge (CDSC) at declining rates, beginning at 5.00% of the lesser of the current market value at the time of redemption or the original purchase cost of the shares being redeemed. Class C shares that are redeemed within one year of purchase are
| Annual report | U.S. Global Leaders Growth Fund | 25 |
subject to a CDSC at a rate of 1.00% of the lesser of the current market value at the time of redemption or the original purchase cost of the shares being redeemed. Proceeds from the CDSCs are paid to the Distributor and are used in whole or in part to defray its expenses for providing distribution-related services to the Fund in connection with the sale of Class B and Class C shares. During the year ended October 31, 2009, CDSCs received by the Distributor amounted to $102,228 for Class B shares and $5,651 for Class C shares.
The Fund has a transfer agent agreement with John Hancock Signature Services, Inc. (Signature Services), an indirect subsidiary of MFC. The transfer agent fees are made up of three components:
• The Fund pays a monthly transfer agent fee at an annual rate of 0.05%, 0.05%, 0.05%, and 0.04% for Classes A, B, C, and I shares, respectively, based on each class’s average daily net assets.
• The Fund pays Signature Services a monthly fee which is based on an annual rate of $16.50 per shareholder account.
• In addition, Signature Services is reimbursed for certain out-of-pocket expenses.
Prior to April 30, 2009, Signature Services had agreed to contractually limit the transfer agent fees to 0.28% for Classes A, B and C shares. Waivers and reimbursements under this plan were $875,481, $90,062 and $101,636 for Classes A, B and C, respectively, for the year ended October 31, 2009. Effective April 30, 2009, this agreement has been terminated.
The Fund receives earnings credits from its transfer agent as a result of uninvested cash balances. These credits are used to reduce a portion of the Fund’s transfer agent fees and out-of-pocket expenses. During the year ended October 31, 2009, the Fund’s transfer agent fees and out-of-pocket expenses were reduced by $400 for transfer agent credits earned.
Certain investor accounts that maintain small balances are charged an annual small accounts fee by Signature Services. Amounts related to these fees are credited by Signature Services to the Fund. For the year ended October 31, 2009, these fees totaled $82,953.
Class level expenses for the year ended October 31, 2009 were as follows:
| Distribution | Transfer | |
| Share class | and service fees | agent fees |
| Class A | $1,163,819 | $2,996,292 |
| Class B | 470,859 | 277,988 |
| Class C | 549,724 | 328,503 |
| Class I | — | 19,893 |
| Converted class | 9,521 | 1,143 |
| Total | $2,193,923 | $3,623,819 |
Note 5
Trustees’ fees
The compensation of unaffiliated Trustees is borne by the Fund. The unaffiliated Trustees may elect to defer, for tax purposes, their receipt of this compensation under the John Hancock Group of Funds Deferred Compensation Plan. The Fund makes investments into other John Hancock funds, as applicable, to cover its liability for the deferred compensation. Investments to cover the Fund’s deferred compensation liability are recorded on the Fund’s books as an other asset. The deferred compensation liability and the related other asset are always equal and are marked to market on a periodic basis to reflect any income earned by the investments, as well as any unrealized gains or losses. The Deferred Compensation Plan investments had no impact on the operations of the Fund.
| 26 | U.S. Global Leaders Growth Fund | Annual report |
Note 6
Fund share transactions
This listing illustrates the number of Fund shares sold, issued in reorganization, reinvested and repurchased during the year ended October 31, 2009, the ten month period ended October 31, 2008, and the year ended December 31, 2007, along with the corresponding dollar value.
| Year ended 10-31-09 | Period ended 10-31-081 | Year ended 12-31-07 | ||||
| Shares | Amount | Shares | Amount | Shares | Amount | |
| Class A shares | ||||||
| Sold | 7,484,590 | $150,891,265 | 9,723,084 | $257,408,383 | 10,354,984 | $302,892,029 |
| Issued in class | 40,569 | 951,060 | — | — | — | — |
| Distributions | ||||||
| reinvested | 412,775 | 7,439,515 | — | — | 1,236,841 | 36,029,184 |
| Repurchased | (14,316,832) | (289,714,804) | (18,727,550) | (492,347,628) | (19,881,793) | (579,961,051) |
| Net decrease | (6,378,898) | ($130,432,964) | (9,004,466) | ($234,939,245) | (8,289,968) | ($241,039,838) |
| Class B shares | ||||||
| Sold | 149,442 | $2,881,929 | 129,095 | $3,250,562 | 247,878 | $6,989,908 |
| Distributions | ||||||
| reinvested | 42,641 | 730,442 | — | — | 140,833 | 3,937,681 |
| Repurchased | (912,009) | (17,239,993) | (1,191,466) | (30,133,775) | (1,903,776) | (53,703,289) |
| Net decrease | (719,926) | ($13,627,622) | (1,062,371) | ($26,883,213) | (1,515,065) | ($42,775,700) |
| Class C shares | ||||||
| Sold | 349,918 | $6,754,191 | 222,396 | $5,411,600 | 395,178 | $11,156,071 |
| Distributions | ||||||
| reinvested | 46,668 | 799,382 | — | — | 150,235 | 4,200,573 |
| Repurchased | (871,358) | (16,303,393) | (1,237,277) | (31,521,502) | (3,062,987) | (86,312,659) |
| Net decrease | (474,772) | ($8,749,820) | (1,014,881) | ($26,109,902) | (2,517,574) | ($70,956,015) |
| Class I shares | ||||||
| Sold | 1,258,824 | $25,981,634 | 2,781,045 | $76,147,933 | 152,386 | $4,518,555 |
| Distributions | ||||||
| reinvested | 33,432 | 615,478 | — | — | 7,933 | 235,616 |
| Repurchased | (2,639,630) | (54,754,896) | (605,753) | (13,925,491) | (542,250) | (16,369,985) |
| Net increase | ||||||
| (decrease) | (1,347,374) | ($28,157,784) | 2,175,292 | $62,222,442 | (381,931) | ($11,615,814) |
| Class R1 shares2 | ||||||
| Sold | 27,811 | $555,622 | 38,611 | $978,977 | 46,967 | $1,350,194 |
| Redeemed | ||||||
| in class | (41,407) | (951,060) | — | — | — | — |
| Distributions | ||||||
| reinvested | 1,429 | 25,241 | — | — | 4,297 | 123,445 |
| Repurchased | (76,015) | (1,563,221) | (51,311) | (1,355,087) | (142,504) | (4,137,150) |
| Net decrease | (88,182) | ($1,933,418) | (12,700) | ($376,110) | (91,240) | ($2,663,511) |
| Net decrease | (9,009,152) | ($182,901,608) | (8,919,126) | ($226,086,028) | (12,795,778) | ($369,050,878) |
1 For the ten month period ended October 31, 2008. The Fund changed its fiscal year end from December 31 to October 31.
2 Effective August 21, 2009, Class R1 converted into Class A.
Note 7
Purchase and sale of securities
Purchases and proceeds from sales or maturities of securities, other than short-term securities, during the year ended October 31, 2009, aggregated $483,534,746 and $568,539,798, respectively.
| Annual report | U.S. Global Leaders Growth Fund | 27 |
Auditors’ report
Report of Independent Registered Public Accounting Firm
To the Board of Trustees of John Hancock Capital Series and Shareholders of
John Hancock U.S. Global Leaders Growth Fund:
In our opinion, the accompanying statement of assets and liabilities, including the schedule of investments, and the related statements of operations and of changes in net assets and the financial highlights present fairly, in all material respects, the financial position of John Hancock U.S. Global Leaders Growth Fund (the “Fund”) at October 31, 2009, and the results of its operations, the changes in its net assets and the financial highlights for each of the periods indicated, in conformity with accounting principles generally accepted in the United States of America. These financial statements and financial highlights (hereafter referred to as “financial statements”) are the responsibility of the Fund’s management; our responsibility is to express an opinion on these financial statements based on our audits. We conducted our audits of these financial statements in accordance with the standards of the Public Company Accounting Ove rsight Board (United States). Those standards require that we plan and perform the audit to obtain reasonable assurance about whether the financial statements are free of material misstatement. An audit includes examining, on a test basis, evidence supporting the amounts and disclosures in the financial statements, assessing the accounting principles used and significant estimates made by management, and evaluating the overall financial statement presentation. We believe that our audits, which included confirmation of securities as of October 31, 2009 by correspondence with the custodian and brokers, provide a reasonable basis for our opinion.
PricewaterhouseCoopers LLP
Boston, Massachusetts
December 18, 2009
| 28 | U.S. Global Leaders Growth Fund | Annual report |
Tax information
Unaudited
For federal income tax purposes, the following information is furnished with respect to the distributions of the Fund, if any, paid during its taxable year ended October 31, 2009.
The Fund has designated distributions to shareholders of $9,828,672 as a long-term capital gain dividend.
With respect to the ordinary dividends paid by the Fund for the fiscal year ended October 31, 2009, 22.87% of the dividends qualifies for the Corporate dividends-received deduction.
The Fund hereby designates the maximum amount allowable of its net taxable income as qualified dividend income as provided in the Jobs and Growth Tax Relief Reconciliation Act of 2003. This amount will be reflected on Form 1099-DIV for the calendar year 2009.
Shareholders will be mailed a 2009 Form 1099-DIV in January 2010. This will reflect the total of all distributions that are taxable for calendar year 2009.
| Annual report | U.S. Global Leaders Growth Fund | 29 |
Board Consideration of and
Continuation of Investment
Advisory Agreement and
Subadvisory Agreement
The Investment Company Act of 1940 (the 1940 Act) requires the Board of Trustees (the Board) of John Hancock Capital Series (the Trust), including a majority of the Trustees who have no direct or indirect interest in the investment advisory agreement and are not “interested persons” of the Trust, as defined in the 1940 Act (the Independent Trustees), annually to meet in person to review and consider the continuation of existing advisory and sub-advisory agreements. At meetings held on May 6-7 and June 8-9, 2009, the Board considered the renewal of:
(i) the investment advisory agreement (the Advisory Agreement) with John Hancock Advisers, LLC (the Adviser) and
(ii) the investment sub-advisory agreement (the Sub-Advisory Agreement) with Sustainable Growth Advisers, LP (the Subadviser) for the John Hancock U.S. Global Leaders Growth Fund (the Fund).
The Advisory Agreement and the Sub-Advisory Agreement are collectively referred to as the Advisory Agreements. The Board considered the factors and reached the conclusions described below relating to the selection of the Adviser and Subadviser and the continuation of the Advisory Agreements. During such meetings, the Board’s Contracts/ Operations Committee and the Independent Trustees also met in executive sessions with their independent legal counsel.
In evaluating the Advisory Agreements, the Board, including the Contracts/Operations Committee and its Independent Trustees, reviewed a broad range of information requested for this purpose. The Independent Trustees considered the legal advice of independent legal counsel and relied on their own business judgment in determining the factors to be considered in evaluating the materials that were presented to them and the weight to be given to each such factor. The Board’s review and conclusions were based on a comprehensive consideration of all information presented to the Board and not the result of any single controlling factor. The key factors considered by the Board and the conclusions reached are described below.
Nature, extent and quality of services
The Board considered the ability of the Adviser and the Subadviser, based on their resources, reputation and other attributes, to attract and retain qualified investment professionals, including research, advisory, and supervisory personnel. It considered the background and experience of senior management and investment professionals responsible for managing the Fund. The Board considered the investment philosophy, research and investment decision-making processes of the Adviser and the Subadviser responsible for the daily investment activities of the Fund. The Board considered the Subadviser’s history and experience with the Fund. The Board considered the Adviser’s execution of its oversight responsibilities. The Board further considered the culture of compliance, resources dedicated to compliance, compliance programs, record of compliance with applicable laws and regulation, with the Fund’s investment policies and restrictions and with the applicable Code of Ethics, and the responsibilities of the Adviser’s and Subadviser’s compliance department. In addition, the Board took into account the administrative and other non-advisory services provided to the Fund by the Adviser and its affiliates.
Based on the above factors, together with those referenced below, the Board concluded that, within the context of its full deliberations, the nature, extent and quality of the investment advisory services provided to the Fund by the Adviser and Subadviser supported renewal of the Advisory Agreements.
Fund performance
The Board considered the performance results for the Fund over various time periods ended December 31, 2008. The Board also considered these results in comparison to the performance of a category of relevant funds (the Category), a peer group of comparable funds (the Peer Group) and two
30 | U.S. Global Leaders Growth Fund | Annual report |
benchmark indices. The funds within each Category and Peer Group were selected by Morningstar Inc. (Morningstar), an independent provider of investment company data. The Board reviewed the methodology used by Morningstar to select the funds in the Category and the Peer Group. The Board also considered updated performance information at its May and June 2009 meetings. Performance and other information may be quite different as of the date of this shareholders report.
The Board noted that the Fund’s performance for the 10-year time period was equal to the Category median and not appreciably lower than the Peer Group median. The Board noted that, for the same time period, the Fund’s performance was lower than one of its benchmark indices, the Standard and Poor’s 500 Index, but higher than its other benchmark index, the Russell 1000 Growth Index. The Board noted that the Fund’s performance was lower than the Category median, and its benchmark indices for the 3- and 5-year periods. The Board also noted that the Fund’s performance was lower than the Peer Group median for the 5-year period, but higher than the Peer Group median for the 3-year period. The Board viewed favorably that the Fund’s performance was higher than its Category and Peer Group medians, and its benchmark indices, for the 1-year period under review.
Investment advisory fee and sub-advisory
fee rates and expenses
The Board reviewed and considered the contractual investment advisory fee rate payable by the Fund to the Adviser for investment advisory services (the Advisory Agreement Rate). The Board received and considered information comparing the Advisory Agreement Rate with the advisory fees for the Category and Peer Group. The Board noted that the Advisory Agreement Rate was equal to the Category median and inline with the Peer Group median.
The Board received and considered expense information regarding the Fund’s various components, including advisory fees, distribution and fees other than advisory and distribution fees, including transfer agent fees, custodian fees, and other miscellaneous fees (e.g., fees for accounting and legal services). The Board considered comparisons of these expenses to the Peer Group median. The Board also received and considered expense information regarding the Fund’s total operating expense ratio (Gross Expense Ratio) and total operating expense ratio after taking the fee waiver arrangement applicable to the Advisory Agreement Rate into account (Net Expense Ratio). The Board received and considered information comparing the Gross Expense Ratio and Net Expense Ratio of the Fund to that of the Peer Group and Category medians. The Board noted the Fund’s Net Expense Ratio was inline with the Peer Group median and not appr eciably higher than the Category median. The Board also noted that the Gross Ratio was not appreciably higher than the Peer Group median and higher than the Category median.
The Adviser also discussed the Morningstar data and rankings, and other relevant information, for the Fund. Based on the above-referenced considerations and other factors, the Board concluded that the Fund’s overall performance and expense results supported the re-approval of the Advisory Agreements.
The Board also received information about the investment sub-advisory fee rate (the Sub-Advisory Agreement Rate) payable by the Adviser to the Subadviser for investment sub-advisory services. The Board concluded that the Sub-Advisory Agreement Rate was fair and equitable, based on its consideration of the factors described here.
Profitability
The Board received and considered a detailed profitability analysis of the Adviser based on the Advisory Agreements, as well as on other relationships between the Fund and the Adviser and its affiliates. The Board also considered a comparison of the Adviser’s profitability to that of other similar investment advisers whose profitability information is publicly available. The Board concluded that, in light of the costs of providing investment management and other services to the Fund, the profits and other ancillary benefits reported by the Adviser were not unreasonable.
| Annual report | U.S. Global Leaders Growth Fund | 31 |
The Board did not consider profitability information with respect to the Subadviser, which is not affiliated with the Adviser. The Board considered that the Sub-Advisory Agreement Rate paid to the Subadviser had been negotiated by the Adviser on an arm’s length basis and that the Subadviser’s separate profitability from its relationship with the Fund was not a material factor in determining whether to renew the agreement.
Economies of scale
The Board received and considered general information regarding economies of scale with respect to the management of the Fund, including the Fund’s ability to appropriately benefit from economies of scale under the Fund’s fee structure. The Board recognized the inherent limitations of any analysis of economies of scale, stemming largely from the Board’s understanding that most of the Adviser’s costs are not specific to individual Funds, but rather are incurred across a variety of products and services. To ensure that any economies are reasonably shared with the Fund as its assets increase, the Adviser and the Board agreed to continue the existing breakpoints to the Advisory Agreement Rate.
Information about services to other clients
The Board also received information about the nature, extent and quality of services and fee rates offered by the Adviser and Subadviser to their other clients, including other registered investment companies, institutional investors and separate accounts. The Board concluded that the Advisory Agreement Rate and the Sub-Advisory Agreement Rate were not unreasonable, taking into account fee rates offered to others by the Adviser and Subadviser, respectively, after giving effect to differences in services.
Other benefits to the Adviser
The Board received information regarding potential “fall-out” or ancillary benefits received by the Adviser and its affiliates and the Subadviser as a result of their relationship with the Fund. Such benefits could include, among others, benefits directly attributable to the relationship of the Adviser and Subadviser with the Fund and benefits potentially derived from an increase in business of the Adviser and Subadviser as a result of their relationship with the Fund (such as the ability to market to shareholders other financial products offered by the Adviser and its affiliates).
Other factors and broader review
As discussed above, the Board reviewed detailed materials received from the Adviser and Subadviser as part of the annual re-approval process. The Board also regularly reviews and assesses the quality of the services that the Fund receives throughout the year. In this regard, the Board reviews reports of the Adviser at least quarterly, which include, among other things, fund performance reports and compliance reports. In addition, the Board meets with senior investment officers at various times throughout the year.
After considering the above-described factors and based on its deliberations and its evaluation of the information described above, the Board concluded that approval of the continuation of the Advisory Agreements for the Fund was in the best interest of the Fund and its shareholders. Accordingly, the Board unanimously approved the continuation of the Advisory Agreements.
| 32 | U.S. Global Leaders Growth Fund | Annual report |
Special Shareholder Meeting (Unaudited)
On April 16, 2009, a Special Meeting of the Shareholders of John Hancock Capital Series and its series, John Hancock U.S. Global Leaders Growth Fund, was held at 601 Congress Street, Boston, Massachusetts for the purpose of considering and voting on:
Proposal 1: Election of eleven Trustees as members of the Board of Trustees of John Hancock Capital Series, (the “Trust”).
PROPOSAL 1 PASSED FOR ALL TRUSTEES ON APRIL 16, 2009.
1. Election of eleven Trustees as members of the Board of Trustees of the Trust:
| % of Outstanding | % of Shares | |||||
| No. of Shares | Shares | Present | ||||
| James R. Boyle | ||||||
| Affirmative | 153,605,601.4781 | 59.782% | 95.228% | |||
| Withhold | 7,697,737.9989 | 2.996% | 4.772% | |||
| TOTAL | 161,303,339.4770 | 62.778% | 100.000% | |||
| John G. Vrysen | ||||||
| Affirmative | 153,671,879.4168 | 59.808% | 95.269% | |||
| Withhold | 7,631,460.0602 | 2.970% | 4.731% | |||
| TOTAL | 161,303,339.4770 | 62.778% | 100.000% | |||
| James F. Carlin | ||||||
| Affirmative | 153,406,809.6394 | 59.705% | 95.105% | |||
| Withhold | 7,896,529.8376 | 3.073% | 4.895% | |||
| TOTAL | 161,303,339.4770 | 62.778% | 100.000% | |||
| William H. Cunningham | ||||||
| Affirmative | 153,539,441.8135 | 59.756% | 95.187% | |||
| Withhold | 7,763,897.6635 | 3.022% | 4.813% | |||
| TOTAL | 161,303,339.4770 | 62.778% | 100.000% | |||
| Deborah Jackson | ||||||
| Affirmative | 153,413,956.1920 | 59.708% | 95.109% | |||
| Withhold | 7,889,383.2850 | 3.070% | 4.891% | |||
| TOTAL | 161,303,339.4770 | 62.778% | 100.000% | |||
| Charles L. Ladner | ||||||
| Affirmative | 153,388,227.3569 | 59.697% | 95.093% | |||
| Withhold | 7,915,112.1201 | 3.081% | 4.907% | |||
| TOTAL | 161,303,339.4770 | 62.778% | 100.000% | |||
| Stanley Martin | ||||||
| Affirmative | 153,518,939.0508 | 59.748% | 95.174% | |||
| Withhold | 7,784,400.4262 | 3.030% | 4.826% | |||
| TOTAL | 161,303,339.4770 | 62.778% | 100.000% | |||
| Patti McGill Peterson | ||||||
| Affirmative | 153,380,504.5348 | 59.694% | 95.088% | |||
| Withhold | 7,922,834.9422 | 3.084% | 4.912% | |||
| TOTAL | 161,303,339.4770 | 62.778% | 100.000% | |||
| Annual report | U.S. Global Leaders Growth Fund | 33 |
| % of Outstanding | % of Shares | |||||
| No. of Shares | Shares | Present | ||||
| John A. Moore | ||||||
| Affirmative | 153,486,399.4544 | 59.736% | 95.154% | |||
| Withhold | 7,816,940.0226 | 3.042% | 4.846% | |||
| TOTAL | 161,303,339.4770 | 62.778% | 100.000% | |||
| Steven R. Pruchansky | ||||||
| Affirmative | 153,551,232.1338 | 59.761% | 95.194% | |||
| Withhold | 7,752,107.3432 | 3.017% | 4.806% | |||
| TOTAL | 161,303,339.4770 | 62.778% | 100.000% | |||
| Gregory A. Russo | ||||||
| Affirmative | 153,542,836.3827 | 59.758% | 95.189% | |||
| Withhold | 7,760,503.0943 | 3.020% | 4.811% | |||
| TOTAL | 161,303,339.4770 | 62.778% | 100.000% | |||
On May 5, 2009, an adjourned session of a Special Meeting of the Shareholders of John Hancock Capital Series and its series, John Hancock U.S. Global Leaders Growth Fund, was held at 601 Congress Street, Boston, Massachusetts, for the purpose of considering and voting on:
Proposal 2: To approve a new form of Advisory Agreement between John Hancock Capital Series and John Hancock Advisers, LLC.
PROPOSAL 2 DID NOT PASS ON MAY 5, 2009.
2. Approval of a new form of Advisory Agreement between each Trust and John Hancock Advisers, LLC.
| % of Outstanding | % of Shares | |||||
| No. of Shares | Shares | Present | ||||
| Affirmative | 9,265,254.1594 | 30.734% | 40.760% | |||
| Against | 640,163.1760 | 2.124% | 2.816% | |||
| Abstain | 660,158.2756 | 2.190% | 2.904% | |||
| Broker Non-Votes | 12,165,771.0000 | 40.355% | 53.520% | |||
| TOTAL | 22,731,346.6110 | 75.403% | 100.000% | |||
Proposal 3: To approve the following changes to fundamental investment restrictions:
PROPOSALS 3A-3F DID NOT PASS ON MAY 5, 2009.
3. Approval of the following changes to fundamental investment restrictions:
| % of Outstanding | % of Shares | |||||
| No. of Shares | Shares | Present | ||||
| 3A. Revise: Concentration | ||||||
| Affirmative | 9,331,877.4082 | 30.955% | 41.053% | |||
| Against | 585,347.9456 | 1.942% | 2.575% | |||
| Abstain | 648,350.2572 | 2.151% | 2.852% | |||
| Broker Non-Votes | 12,165,771.0000 | 40.355% | 53.520% | |||
| TOTAL | 22,731,346.6110 | 75.403% | 100.000% | |||
| 34 | U.S. Global Leaders Growth Fund | Annual report |
| % of Outstanding | % of Shares | |||||
| No. of Shares | Shares | Present | ||||
| 3C. Revise: Underwriting | ||||||
| Affirmative | 9,323,477.7501 | 30.928% | 41.015% | |||
| Against | 635,930.6331 | 2.109% | 2.798% | |||
| Abstain | 606,167.2278 | 2.011% | 2.667% | |||
| Broker Non-Votes | 12,165,771.0000 | 40.355% | 53.520% | |||
| TOTAL | 22,731,346.6110 | 75.403% | 100.000% | |||
| 3D. Revise: Real Estate | ||||||
| Affirmative | 9,238,626.8102 | 30.646% | 40.643% | |||
| Against | 654,685.2768 | 2.172% | 2.880% | |||
| Abstain | 672,267.5240 | 2.230% | 2.957% | |||
| Broker Non-Votes | 12,165,767.0000 | 40.355% | 53.520% | |||
| TOTAL | 22,731,346.6110 | 75.403% | 100.000% | |||
| 3E. Revise: Loans | ||||||
| Affirmative | 9,149,751.8119 | 30.352% | 40.252% | |||
| Against | 703,365.5212 | 2.333% | 3.094% | |||
| Abstain | 712,461.2779 | 2.363% | 3.134% | |||
| Broker Non-Votes | 12,165,768.0000 | 40.355% | 53.520% | |||
| TOTAL | 22,731,346.6110 | 75.403% | 100.000% | |||
| 3F. Revise: Senior Securities | ||||||
| Affirmative | 9,258,380.4020 | 30.712% | 40.730% | |||
| Against | 637,696.0158 | 2.115% | 2.805% | |||
| Abstain | 669,502.1932 | 2.221% | 2.945% | |||
| Broker Non-Votes | 12,165,768.0000 | 40.355% | 53.520% | |||
| TOTAL | 22,731,346.6110 | 75.403% | 100.000% | |||
Proposal 4: To approve amendments changing Rule 12b-1 Plans for certain classes of the Fund from “reimbursement” to “compensation” plans.
PROPOSAL 4 DID NOT PASS FOR ALL CLASSES OF SHARES ON MAY 5, 2009. (There was no quorum for classes C and R1)
Class A—
4. Approval of amendments changing Rule 12b-1 Plans for certain classes of the Funds from “reimbursement” to “compensation” Plans.
| % of Outstanding | % of Shares | |||||
| No. of Shares | Shares | Present | ||||
| Affirmative | 6,728,041.8809 | 28.904% | 35.750% | |||
| Against | 629,050.7016 | 2.702% | 3.343% | |||
| Abstain | 521,503.4515 | 2.240% | 2.771% | |||
| Broker Non-Votes | 10,940,929.0000 | 47.001% | 58.136% | |||
| TOTAL | 18,819,525.0340 | 80.847% | 100.000% | |||
| Annual report | U.S. Global Leaders Growth Fund | 35 |
Class B—
4. Approval of amendments changing Rule 12b-1 Plans for certain classes of the Funds from “reimbursement” to “compensation” Plans.
| % of Outstanding | % of Shares | |||||
| No. of Shares | Shares | Present | ||||
| Affirmative | 1,122,011.2912 | 42.517% | 64.757% | |||
| Against | 50,678.2282 | 1.920% | 2.925% | |||
| Abstain | 99,852.7736 | 3.784% | 5.763% | |||
| Broker Non-Votes | 460,099.0000 | 17.435% | 26.555% | |||
| TOTAL | 1,732,641.2930 | 65.656% | 100.000% | |||
Class C—
4. Approval of amendments changing Rule 12b-1 Plans for certain classes of the Funds from “reimbursement” to “compensation” Plans.
| % of Outstanding | % of Shares | |||||
| No. of Shares | Shares | Present | ||||
| Affirmative | 792,468.0858 | 26.532% | 61.255% | |||
| Against | 76,115.5062 | 2.548% | 5.884% | |||
| Abstain | 56,257.1800 | 1.884% | 4.349% | |||
| Broker Non-Votes | 368,866.0000 | 12.350% | 28.512% | |||
| TOTAL | 1,293,706.7720 | 43.314% | 100.000% | |||
Class R1—
4. Approval of amendments changing Rule 12b-1 Plans for certain classes of the Funds from “reimbursement” to “compensation” Plans.
| % of Outstanding | % of Shares | |||||
| No. of Shares | Shares | Present | ||||
| Affirmative | 39,614.5120 | 43.413% | 87.167% | |||
| Against | 50.0000 | .055% | .110% | |||
| Abstain | 5,782.0000 | 6.336% | 12.723% | |||
| Broker Non-Votes | .0000 | .000% | .000% | |||
| TOTAL | 45,446.5120 | 49.804% | 100.000% | |||
Proposal 5: To adopt a manager of manager structure.
PROPOSAL 5 DID NOT PASS ON MAY 5, 2009.
5. Proposal adopting a manager of manager structure.
| % of Outstanding | % of Shares | |||||
| No. of Shares | Shares | Present | ||||
| Affirmative | 9,015,301.1801 | 29.906% | 39.660% | |||
| Against | 793,777.0061 | 2.633% | 3.492% | |||
| Abstain | 756,502.4248 | 2.509% | 3.328% | |||
| Broker Non-Votes | 12,165,766.0000 | 40.355% | 53.520% | |||
| TOTAL | 22,731,346.6110 | 75.403% | 100.000% | |||
| 36 | U.S. Global Leaders Growth Fund | Annual report |
Proposal 6: To revise merger approval requirements for the Trust.
PROPOSAL 6 DID NOT PASS ON MAY 5, 2009.
6. Revision to merger approval requirements.
| % of Outstanding | % of Shares | |||||
| No. of Shares | Shares | Present | ||||
| Affirmative | 85,422,918.6613 | 33.245% | 52.958% | |||
| Against | 5,230,141.9859 | 2.036% | 3.242% | |||
| Abstain | 3,359,675.8298 | 1.308% | 2.083% | |||
| Broker Non-Votes | 67,290,603.0000 | 26.189% | 41.717% | |||
| TOTAL | 161,303,339.4770 | 62.778% | 100.000% | |||
| Annual report | U.S. Global Leaders Growth Fund | 37 |
Trustees and Officers
This chart provides information about the Trustees and Officers who oversee your John Hancock fund. Officers elected by the Trustees manage the day-to-day operations of the Fund and execute policies formulated by the Trustees.
Independent Trustees
| Name, Year of Birth | Number of John | |
| Position(s) held with Fund | Trustee | Hancock funds |
| Principal occupation(s) and other | of Fund | overseen by |
| directorships during past 5 years | since1 | Trustee |
| Patti McGill Peterson, Born: 1943 | 2002 | 47 |
| Chairperson (since December 2008); Principal, PMP Globalinc (consulting) (since 2007); Senior | ||
| Associate, Institute for Higher Education Policy (since 2007); Executive Director, CIES (international | ||
| education agency) (until 2007); Vice President, Institute of International Education (until 2007); Senior | ||
| Fellow, Cornell University Institute of Public Affairs, Cornell University (until 1998); Former President | ||
| Wells College, St. Lawrence University and the Association of Colleges and Universities of the State | ||
| of New York. Director of the following: Niagara Mohawk Power Corporation (until 2003); Security | ||
| Mutual Life (insurance) (until 1997); ONBANK (until 1993). Trustee of the following: Board of Visitors, | ||
| The University of Wisconsin, Madison (since 2007); Ford Foundation, International Fellowships Program | ||
| (until 2007); UNCF, International Development Partnerships (until 2005); Roth Endowment (since 2002); | ||
| Council for International Educational Exchange (since 2003). | ||
| James F. Carlin, Born: 1940 | 2005 | 47 |
| Director and Treasurer, Alpha Analytical Laboratories, Inc. (chemical analysis) (since 1985); Part Owner | ||
| and Treasurer, Lawrence Carlin Insurance Agency, Inc. (since 1995); Part Owner and Vice President, | ||
| Mone Lawrence Carlin Insurance Agency, Inc. (until 2005); Chairman and Chief Executive Officer, | ||
| Carlin Consolidated, Inc. (management/investments) (since 1987); Trustee, Massachusetts Health and | ||
| Education Tax Exempt Trust (1993–2003). | ||
| William H. Cunningham, Born: 1944 | 2005 | 47 |
| Professor, University of Texas, Austin, Texas (since 1971); former Chancellor, University of Texas System | ||
| and former President of the University of Texas, Austin, Texas; Director of the following: LIN Television | ||
| (since 2009), Lincoln National Corporation (insurance) (since 2006), Resolute Energy Corporation (oil | ||
| and gas) (since 2009), Southwest Airlines (since 2000), Hayes Lemmerz International, Inc. (diversified | ||
| automotive parts supply company) (2003–2009). | ||
| Deborah C. Jackson,2 Born: 1952 | 2008 | 47 |
| Chief Executive Officer, American Red Cross of Massachusetts Bay (since 2002); Board of Directors of | ||
| Eastern Bank Corporation (since 2001); Board of Directors of Eastern Bank Charitable Foundation (since | ||
| 2001); Board of Directors of American Student Association Corp. (since 1996); Board of Directors of | ||
| Boston Stock Exchange (2002–2008); Board of Directors of Harvard Pilgrim Healthcare (since 2007). | ||
| Charles L. Ladner, Born: 1938 | 2004 | 47 |
| Chairman and Trustee, Dunwoody Village, Inc. (retirement services); Senior Vice President and Chief | ||
| Financial Officer, UGI Corporation (public utility holding company) (retired 1998); Vice President and | ||
| Director, AmeriGas, Inc. (retired 1998); Director, AmeriGas Partners, L.P. (gas distribution) (until 1997); | ||
| Director, EnergyNorth, Inc. (until 1997); Director, Parks and History Association (until 2005). | ||
| 38 | U.S. Global Leaders Growth Fund | Annual report |
Independent Trustees (continued)
| Name, Year of Birth | Number of John | |
| Position(s) held with Fund | Trustee | Hancock funds |
| Principal occupation(s) and other | of Fund | overseen by |
| directorships during past 5 years | since1 | Trustee |
| Stanley Martin,2 Born: 1947 | 2008 | 47 |
| Senior Vice President/Audit Executive, Federal Home Loan Mortgage Corporation (2004–2006); | ||
| Executive Vice President/Consultant, HSBC Bank USA (2000–2003); Chief Financial Officer/Executive | ||
| Vice President, Republic New York Corporation and Republic National Bank of New York (1998–2000); | ||
| Partner, KPMG LLP (1971–1998). | ||
| Dr. John A. Moore, Born: 1939 | 2002 | 47 |
| President and Chief Executive Officer, Institute for Evaluating Health Risks (nonprofit institution) | ||
| (until 2001); Senior Scientist, Sciences International (health research) (until 2003); Former | ||
| Assistant Administrator and Deputy Administrator, Environmental Protection Agency; Principal, | ||
| Hollyhouse (consulting) (since 2000); Director, CIIT Center for Health Science Research (nonprofit | ||
| research) (until 2007). | ||
| Steven R. Pruchansky,2 Born: 1944 | 2005 | 47 |
| Chairman and Chief Executive Officer, Greenscapes of Southwest Florida, Inc. (since 2000); Director | ||
| and President, Greenscapes of Southwest Florida, Inc. (until 2000); Member, Board of Advisors, First | ||
| American Bank (since 2008); Managing Director, JonJames, LLC (real estate) (since 2000); Director, | ||
| First Signature Bank & Trust Company (until 1991); Director, Mast Realty Trust (until 1994); President, | ||
| Maxwell Building Corp. (until 1991). | ||
| Gregory A. Russo, Born: 1949 | 2009 | 47 |
| Vice Chairman, Risk & Regulatory Matters, KPMG LLP (KPMG) (2002–2006); Vice Chairman, Industrial | ||
| Markets, KPMG (1998–2002). | ||
| Non-Independent Trustees3 | ||
| Name, Year of Birth | Number of John | |
| Position(s) held with Fund | Trustee | Hancock funds |
| Principal occupation(s) and other | of Fund | overseen by |
| directorships during past 5 years | since1 | Trustee |
| James R. Boyle, Born: 1959 | 2005 | 262 |
| Senior Executive Vice President (since 2009), Executive Vice President (1999–2009), Manulife Financial | ||
| Corporation; Director and President, John Hancock Variable Life Insurance Company (since 2007); | ||
| Director and Executive Vice President, John Hancock Life Insurance Company (since 2004); Chairman | ||
| and Director, John Hancock Advisers, LLC, The Berkeley Financial Group, LLC (holding company) and | ||
| John Hancock Funds, LLC (since 2005); Chairman and Director, John Hancock Investment Management | ||
| Services, LLC (since 2006); Senior Vice President, The Manufacturers Life Insurance Company (U.S.A.) | ||
| (until 2004). | ||
| Annual report | U.S. Global Leaders Growth Fund | 39 |
Non-Independent Trustees3 (continued)
| Name, Year of Birth | Number of John | |
| Position(s) held with Fund | Trustee | Hancock funds |
| Principal occupation(s) and other | of Fund | overseen by |
| directorships during past 5 years | since1 | Trustee |
| John G. Vrysen,4 Born: 1955 | 2009 | 47 |
| Senior Vice President (since 2006), Vice President (until 2006), Manulife Financial Corporation; | ||
| Director, Executive Vice President and Chief Operating Officer, John Hancock Advisers, LLC, The | ||
| Berkeley Financial Group, LLC, John Hancock Investment Management Services, LLC (“JHIMS”), and | ||
| John Hancock Funds, LLC (since 2007); Chief Operating Officer, JHF II and JHT (since 2007); Chief | ||
| Operating Officer, John Hancock Funds and JHF III (2007–2009); Director, John Hancock Signature | ||
| Services, Inc. (“Signature Services”) (since 2005); Chief Financial Officer, John Hancock Advisers, LLC, | ||
| The Berkeley Financial Group, LLC, MFC Global Investment Management (U.S.) (“MFC Global (U.S.)”), | ||
| JHIMS, John Hancock Funds, LLC, JHF, JHF II, JHF III and JHT (2005–2007). | ||
| Principal officers who are not Trustees | ||
| Name, Year of Birth | ||
| Position(s) held with Fund | Officer | |
| Principal occupation(s) and other | of Fund | |
| directorships during past 5 years | since | |
| Keith F. Hartstein, Born: 1956 | 2005 | |
| President and Chief Executive Officer | ||
| Senior Vice President, Manulife Financial Corporation (since 2004); Director, President and Chief | ||
| Executive Officer, John Hancock Advisers, LLC, The Berkeley Financial Group, LLC, John Hancock Funds, | ||
| LLC (since 2005); Director, MFC Global (U.S.) (since 2005); Chairman and Director, Signature Services | ||
| (since 2005); Director, President and Chief Executive Officer, John Hancock Investment Management | ||
| Services, LLC (since 2006); President and Chief Executive Officer, John Hancock Funds (since 2005) and | ||
| JHF III (since 2006); Executive Vice President (since 2009), President and Chief Executive Officer (until | ||
| 2009), JHT and JHF II; Director, Chairman and President, NM Capital Management, Inc. (since 2005); | ||
| Member and former Chairman, Investment Company Institute Sales Force Marketing Committee (since | ||
| 2003); Director, President and Chief Executive Officer, MFC Global (U.S.) (2005–2006); Executive Vice | ||
| President, John Hancock Funds, LLC (until 2005). | ||
| Andrew G. Arnott, Born: 1971 | 2009 | |
| Chief Operating Officer | ||
| Senior Vice President, Manulife Financial Corporation (since 2009); Senior Vice President (since 2007), | ||
| Vice President (2005–2007), John Hancock Advisers, LLC; Senior Vice President (since 2008), Vice | ||
| President (2006–2008), John Hancock Investment Management Services, LLC; Senior Vice President | ||
| (since 2006), Vice President (2005–2006), 2nd Vice President (2004–2005), John Hancock Funds, | ||
| LLC; Chief Operating Officer (since 2009), Vice President (2007–2009), John Hancock Funds and JHF | ||
| III; Vice President (since 2006), John Hancock Funds II and John Hancock Trust; Senior Vice President | ||
| (2005–2009), Product Management and Development for John Hancock Funds, LLC; Vice President and | ||
| Director (1998–2005), Marketing and Product Management for John Hancock Funds, LLC. | ||
| 40 | U.S. Global Leaders Growth Fund | Annual report |
Principal officers who are not Trustees (continued)
| Name, Year of Birth | |
| Position(s) held with Fund | Officer |
| Principal occupation(s) and other | of Fund |
| directorships during past 5 years | since |
| Thomas M. Kinzler, Born: 1955 | 2006 |
| Secretary and Chief Legal Officer | |
| Vice President and Counsel for John Hancock Life Insurance Company (U.S.A.) (since 2006); Secretary | |
| and Chief Legal Officer, John Hancock Funds, JHF II, JHF III and JHT (since 2006); Secretary and Chief | |
| Legal Counsel, John Hancock Advisers, LLC and John Hancock Investment Management Services, LLC | |
| (since 2008); Secretary, John Hancock Funds, LLC and The Berkeley Financial Group, LLC (since 2007); | |
| Vice President and Associate General Counsel for Massachusetts Mutual Life Insurance Company | |
| (1999–2006); Secretary and Chief Legal Counsel for MML Series Investment Fund (2000–2006); | |
| Secretary and Chief Legal Counsel for MassMutual Institutional Funds (2000–2004); Secretary and | |
| Chief Legal Counsel for MassMutual Select Funds and MassMutual Premier Funds (2004–2006). | |
| Francis V. Knox, Jr., Born: 1947 | 2005 |
| Chief Compliance Officer | |
| Chief Compliance Officer, John Hancock Funds, JHF II, JHF III and JHT (since 2005); Chief Compliance | |
| Officer, John Hancock Advisers, LLC and JHIMS (since 2007); Vice President and Chief Compliance | |
| Officer, John Hancock Advisers, LLC and JHIMS (until 2007); Vice President and Chief Compliance | |
| Officer, MFC Global (U.S.) (2005–2008); Vice President and Assistant Treasurer, Fidelity Group of | |
| Funds (until 2005). | |
| Michael J. Leary, Born: 1965 | 2007 |
| Treasurer | |
| Vice President, John Hancock Life Insurance Company (U.S.A.) and Treasurer for John Hancock Funds, | |
| John Hancock Funds II, John Hancock Funds III and John Hancock Trust (since May 2009); Assistant | |
| Treasurer, John Hancock Funds, John Hancock Funds II, John Hancock Funds III and John Hancock | |
| Trust (2007–2009); Vice President and Director of Fund Administration, JP Morgan (2004–2007); Vice | |
| President and Senior Manager of Fund Administration, JP Morgan (1993–2004); Manager, Ernst & | |
| Young, LLC (1988–1993). | |
| Charles A. Rizzo, Born: 1957 | 2007 |
| Chief Financial Officer | |
| Senior Vice President, John Hancock Advisers, LLC and John Hancock Investment Management Services, | |
| LLC (since 2007); Chief Financial Officer, John Hancock Funds, JHF II, JHF III and JHT (since 2007); | |
| Assistant Treasurer, Goldman Sachs Mutual Fund Complex (registered investment companies) (2005– | |
| 2007); Vice President, Goldman Sachs (2005–2007); Managing Director and Treasurer of Scudder | |
| Funds, Deutsche Asset Management (2003–2005). | |
The business address for all Trustees and Officers is 601 Congress Street, Boston, Massachusetts 02210-2805.
The Statement of Additional Information of the Fund includes additional information about members of the Board of Trustees of the Fund and is available without charge, upon request, by calling 1-800-225-5291.
1 Each Trustee serves until resignation, retirement age or until his or her successor is elected.
2 Member of Audit Committee. Mr. Pruchansky was appointed by the Board of Trustees effective September 1, 2009.
3 Non-Independent Trustees hold positions with the Fund’s investment adviser, underwriter and certain other affiliates.
4 Mr. Vrysen was elected by the shareholders at a special meeting on April 16, 2009.
| Annual report | U.S. Global Leaders Growth Fund | 41 |
More information
| Trustees | Investment adviser |
| Patti McGill Peterson, Chairperson | John Hancock Advisers, LLC |
| James R. Boyle† | |
| James F. Carlin | Subadviser |
| William H. Cunningham | Sustainable Growth Advisers, LP |
| Deborah C. Jackson* | |
| Charles L. Ladner | Principal distributor |
| Stanley Martin* | John Hancock Funds, LLC |
| Dr. John A. Moore | |
| Steven R. Pruchansky†† | Custodian |
| Gregory A. Russo | State Street Bank and Trust Company |
| John G. Vrysen† | |
| Transfer agent | |
| Officers | John Hancock Signature Services, Inc. |
| Keith F. Hartstein | |
| President and Chief Executive Officer | Legal counsel |
| K&L Gates LLP | |
| Andrew G. Arnott‡ | |
| Chief Operating Officer | Independent registered |
| public accounting firm | |
| Thomas M. Kinzler | PricewaterhouseCoopers LLP |
| Secretary and Chief Legal Officer | |
| Francis V. Knox, Jr. | |
| Chief Compliance Officer | |
| Michael J. Leary | |
| Treasurer | |
| Charles A. Rizzo | |
| Chief Financial Officer |
*Member of the Audit Committee
††Member of the Audit Committee effective 9-1-09
†Non-Independent Trustee
‡Effective 9-1-09
The Fund’s proxy voting policies and procedures, as well as the Fund’s proxy voting record for the most recent twelve-month period ended June 30, are available free of charge on the Securities and Exchange Commission (SEC) Web site at www.sec.gov or on our Web site.
The Fund’s complete list of portfolio holdings, for the first and third fiscal quarters, is filed with the SEC on Form N-Q. The Fund’s Form N-Q is available on our Web site and the SEC’s Web site, www.sec.gov, and can be reviewed and copied (for a fee) at the SEC’s Public Reference Room in Washington, DC. Call 1-800-SEC-0330 to receive information on the operation of the SEC’s Public Reference Room.
We make this information on your fund, as well as monthly portfolio holdings, and other fund details available on our Web site www.jhfunds.com or by calling 1-800-225-5291.
| You can also contact us: | ||
| 1-800-225-5291 | Regular mail: | Express mail: |
| jhfunds.com | John Hancock Signature Services, Inc. | John Hancock Signature Services, Inc |
| P.O. Box 55913 | Mutual Fund Image Operations | |
| Boston, MA 02205-5913 | 30 Dan Road | |
| Canton, MA 02021 | ||
| 42 | U.S. Global Leaders Growth Fund | Annual report |

1-800-225-5291
1-800-554-6713 TDD
1-800-338-8080 EASI-Line
www.jhfunds.com
Now available: electronic delivery
www.jhfunds.com/edelivery
| This report is for the information of the shareholders of John Hancock U.S. Global Leaders Growth Fund. | 2600A 10/09 |
| It is not authorized for distribution to prospective investors unless preceded or accompanied by a prospectus. | 12/09 |
Management’s discussion of
Fund performance
By Pzena Investment Management, LLC
The year ended October 31, 2009, was an extraordinarily turbulent period for the U.S. stock market. Stocks plummeted in late 2008 and early 2009 as a severe economic downturn and a liquidity crisis in the credit markets led to an extreme period of investor panic and risk aversion, sending valuations down to levels not seen since the 1930s. However, the market bottomed in early March and began a steady climb that persisted through the end of the reporting period as improving credit conditions and signs of economic stabilization and recovery boosted investor confidence. Value stocks lagged their growth counterparts overall but outperformed during the market’s rebound.
For the year ended October 31, 2009, John Hancock Classic Value Fund’s Class A shares posted a total return of 19.84% at net asset value, outpacing both the 4.78% return of the Russell 1000 Value Index and the 9.52% return of the average large value fund, according to Morningstar, Inc.
The Fund’s outperformance of its benchmark index and peer group resulted from investment opportunities in late 2008 and early 2009, when we took advantage of tremendous price dislocations to invest in high-quality companies across a wide variety of market sectors trading at extremely attractive valuations. Many of the Fund’s investments were in high-quality companies with industry-leading positions, solid balance sheets and flexible cost structures, giving them the ability to weather a protracted downturn and flourish during a recovery.
The Fund’s technology and consumer holdings generated the best results. Top contributors included wireless products maker Motorola, Inc., telecom equipment maker Alcatel-Lucent, title insurer Fidelity National Financial, Inc. and department store chain J.C. Penney Co., Inc. On the downside, several financial stocks weighed on results, including Citigroup, Inc. and Bank of America Corp.
This commentary reflects the views of the portfolio managers through the end of the Fund’s period discussed in this report. The managers’ statements reflect their own opinions. As such, they are in no way guarantees of future events and are not intended to be used as investment advice or a recommendation regarding any specific security. They are also subject to change at any time as market and other conditions warrant.
Past performance is no guarantee of future results.
International investing involves special risks such as political, economic and currency risks and differences in accounting standards and financial reporting.
As market leadership changes, the value-investing style may underperform other investing styles.
| 6 | Classic Value Fund | Annual report |
A look at performance
For the period ended October 31, 2009
| Average annual returns (%) | Cumulative total returns (%) | |||||||||
| with maximum sales charge (POP) | with maximum sales charge (POP) | |||||||||
| Since | Since | |||||||||
| Class | 1-year | 5-year | 10-year | inception4 | 1-year | 5-year | 10-year | inception4 | ||
| A1 | 13.86 | –4.86 | 5.22 | — | 13.86 | –22.05 | 66.37 | — | ||
| B | 13.94 | –4.91 | — | 2.46 | 13.94 | –22.24 | — | 18.43 | ||
| C | 17.95 | –4.61 | — | 2.45 | 17.95 | –21.03 | — | 18.35 | ||
| I2 | 20.32 | –3.49 | — | 3.64 | 20.32 | –16.28 | — | 28.26 | ||
| R12,3 | 19.40 | –4.21 | 5.53 | — | 19.40 | –19.35 | 71.27 | — | ||
| R32,3 | 19.44 | -4.20 | 5.52 | — | 19.44 | –19.30 | 71.09 | — | ||
| R42,3 | 19.73 | –3.92 | 5.83 | — | 19.73 | –18.13 | 76.18 | — | ||
| R52,3 | 20.10 | –3.63 | 6.15 | — | 20.10 | –16.88 | 81.55 | — | ||
Performance figures assume all distributions are reinvested. Public offering price (POP) figures reflect maximum sales charges on Class A shares of 5% and the applicable contingent deferred sales charge (CDSC) on Class B shares and Class C shares. The returns for Class C shares have been adjusted to reflect the elimination of the front-end sales charge effective July 15, 2004. The Class B shares’ CDSC declines annually between years 1 to 6 according to the following schedule: 5, 4, 3, 3, 2, 1%. No sales charge will be assessed after the sixth year. Class C shares held for less than one year are subject to a 1% CDSC. Sales charges are not applicable for Class I, Class R1, Class R3, Class R4 and Class R5 shares.
The expense ratios of the Fund, both net (including any fee waivers or expense limitations) and gross (excluding any fee waivers or expense limitations), are set forth according to the most recent publicly available prospectuses for the Fund and may differ from the expense ratios disclosed in the Financial Highlights tables in this report. The waivers and expense limitations are contractual at least until February 28, 2010. The net expenses are as follows: Class A — 1.33%, Class B — 2.08%, Class C — 2.08% and Class I — 0.94%. Had the fee waivers and expense limitations not been in place, the gross expenses would be as follows: Class A —1.37%, Class B — 2.12%, Class C — 2.12% and Class I — 0.95%. The net and gross expenses are as follows: Class R1 –1.67%, Class R3 — 1.63%, Class R4 — 1.33% and Class R5 — 1.03%. The Fund’s annual operating expenses will likely vary throughout the period and from year to year. The Fund’s expenses for the current fiscal year may be higher than the expenses listed above, for some of the following reasons: i) a significant decrease in average net assets may result in a higher advisory fee rate if advisory fee breakpoints are not achieved; ii) a significant decrease in average net assets may result in an increase in the expense ratio because certain fund expenses do not decrease as asset levels decrease; iii) fees may be incurred for extraordinary events such as fund tax expense; and iv) the termination or expiration of expense cap reimbursements.
The returns reflect past results and should not be considered indicative of future performance. The return and principal value of an investment will fluctuate so that shares, when redeemed, may be worth more or less than their original cost. Due to market volatility, the Fund’s current performance may be higher or lower than the performance shown. For current to the most recent month-end performance data, please call 1–800–225–5291 or visit the Fund’s Web site at www.jhfunds.com.
The performance table above and the chart on the next page do not reflect the deduction of taxes that a shareholder may pay on fund distributions or on the redemption of fund shares.
The Fund’s performance results reflect any applicable fee waivers or expense reductions, without which the expenses would increase and results would have been less favorable.
1 Effective November 8, 2002, shareholders of the former Pzena Focused Value Fund became owners of that number of full and fractional shares of John Hancock Classic Value Fund. Additionally, the accounting and performance history of the former Pzena Focused Value Fund was redesignated as that of Class A of John Hancock Classic Value Fund. The performance of the former Pzena Focused Value Fund reflects stocks selected from the largest 1,000 publicly traded U.S. companies, whereas the Fund invests in stocks selected from the 500 largest such companies.
2 For certain types of investors, as described in the Fund’s Class I, Class R1, Class R3, Class R4 and Class R5 share prospectuses.
3 June 24, 1996 is the inception date for the oldest class of shares, Class A shares. The inception date for Class R1 shares is August 5, 2003 and the inception date for Class R3, Class R4 and Class R5 shares is May 22, 2009. The returns prior to this date are those of Class A shares that have been recalculated to apply the gross fees and expenses of Class R1, Class R3, Class R4 and Class R5 shares, respectively.
4 From November 11, 2002.
| Annual report | Classic Value Fund | 7 |
A look at performance
Growth of $10,000
This chart shows what happened to a hypothetical $10,000 investment in John Hancock Classic Value Fund Class A shares for the period indicated. For comparison, we’ve shown the same investment in the Russell 1000 Value Index.

| With maximum | ||||
| Class | Period beginning | Without sales charge | sales charge | Index |
| B2 | 11-11-02 | $11,843 | $11,843 | $14,340 |
| C2 | 11-11-02 | 11,835 | 11,835 | 14,340 |
| I3 | 11-11-02 | 12,826 | 12,826 | 14,340 |
| R13,4 | 10-31-99 | 17,127 | 17,127 | 11,839 |
| R33,4 | 10-31-99 | 17,109 | 17,109 | 11,839 |
| R43,4 | 10-31-99 | 17,618 | 17,618 | 11,839 |
| R53,4 | 10-31-99 | 18,155 | 18,155 | 11,839 |
Assuming all distributions were reinvested for the period indicated, the table above shows the value of a $10,000 investment in the Fund’s Class B, Class C, Class I, Class R1, Class R3, Class R4 and Class R5 shares, respectively, as of October 31, 2009. The Class C shares investment with a maximum sales charge has been adjusted to reflect the elimination of the front-end sales charge effective July 15, 2004. Performance of the classes will vary based on the difference in sales charges paid by shareholders investing in the different classes and the fee structure of those classes.
Russell 1000 Value Index is an unmanaged index containing those securities in the Russell 1000 Index with a less-than-average growth orientation.
It is not possible to invest directly in an index. Index figures do not reflect sales charges or direct expenses, which would have resulted in lower values if they did.
1 NAV represents net asset value and POP represents public offering price.
2 No contingent deferred sales charge applicable.
3 For certain types of investors, as described in the Fund’s Class I, Class R1, Class R3, Class R4 and Class R5 share prospectuses.
4 June 24, 1996 is the inception date for the oldest class of shares, Class A shares. The inception date for Class R1 shares is August 5, 2003 and the inception date for Class R3, Class R4 and Class R5 shares is May 22, 2009. The returns prior to this date are those of Class A shares that have been recalculated to apply the gross fees and expenses of Class R1, Class R3, Class R4 and Class R5 shares, respectively.
| 8 | Classic Value Fund | Annual report |
Your expenses
These examples are intended to help you understand your ongoing operating expenses.
Understanding fund expenses
As a shareholder of the Fund, you incur two types of costs:
■ Transaction costs which include sales charges (loads) on purchases or redemptions (varies by share class), minimum account fee charge, etc.
■ Ongoing operating expenses including management fees, distribution and service fees (if applicable), and other fund expenses.
We are going to present only your ongoing operating expenses here.
Actual expenses/actual returns
This example is intended to provide information about your fund’s actual ongoing operating expenses, and is based on your fund’s actual return. It assumes an account value of $1,000.00 on May 1, 2009, with the same investment held until October 31, 2009.
| Account value | Ending value | Expenses paid during | |
| on 5-1-09 | on 10-31-09 | period ended 10-31-091 | |
| Class A | $1,000.00 | $1,268.00 | $7.60 |
| Class B | 1,000.00 | 1,263.50 | 11.87 |
| Class C | 1,000.00 | 1,262.50 | 11.86 |
| Class I | 1,000.00 | 1,269.50 | 5.38 |
| Class R1 | 1,000.00 | 1,265.60 | 9.59 |
For the classes noted below, the example assumes an account value of $1,000 on May 22, 2009, with the same investment held until October 31, 2009.
| Account value | Ending value | Expenses paid during | |
| on 5-22-09 | on 10-31-09 | period ended 10-31-092 | |
| Class R3 | $1,000.00 | $1,224.20 | $8.59 |
| Class R4 | 1,000.00 | 1,225.10 | 7.10 |
| Class R5 | 1,000.00 | 1,226.90 | 5.62 |
Together with the value of your account, you may use this information to estimate the operating expenses that you paid over the period. Simply divide your account value at October 31, 2009, by $1,000.00, then multiply it by the “expenses paid” for your share class from the table above. For example, for an account value of $8,600.00, the operating expenses should be calculated as follows:
| Annual report | Classic Value Fund | 9 |
Your expenses
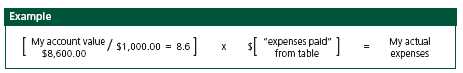
Hypothetical example for comparison purposes
This table allows you to compare your fund’s ongoing operating expenses with those of any other fund. It provides an example of the Fund’s hypothetical account values and hypothetical expenses based on each class’s actual expense ratio and an assumed 5% annualized return before expenses (which is not your fund’s actual return). It assumes an account value of $1,000.00 on May 1, 2009, with the same investment held until October 31, 2009. Look in any other fund shareholder report to find its hypothetical example and you will be able to compare these expenses.
| Account value | Ending value | Expenses paid during | |
| on 5-1-09 | on 10-31-09 | period ended 10-31-093 | |
| Class A | $1,000.00 | $1,018.50 | $6.77 |
| Class B | 1,000.00 | 1,014.70 | 10.56 |
| Class C | 1,000.00 | 1,014.70 | 10.56 |
| Class I | 1,000.00 | 1,020.50 | 4.79 |
| Class R1 | 1,000.00 | 1,016.70 | 8.54 |
| Class R3 | 1,000.00 | 1,016.50 | 8.79 |
| Class R4 | 1,000.00 | 1,018.00 | 7.27 |
| Class R5 | 1,000.00 | 1,019.50 | 5.75 |
Remember, these examples do not include any transaction costs; therefore, these examples will not help you to determine the relative total costs of owning different funds. If transaction costs were included, your expenses would have been higher. See the prospectus for details regarding transaction costs.
1 Expenses are equal to the Fund’s annualized expense ratio of 1.33%, 2.08%, 2.08%, 0.94% and 1.68% for Class A, Class B, Class C, Class I and Class R1 shares, respectively, multiplied by the average account value over the period, multiplied by 184/365 (to reflect the one-half year period).
2 Expenses are equal to the Fund’s annualized expense ratio of 1.73%, 1.43% and 1.13% for Class R3, Class R4 and Class R5 shares, respectively, multiplied by the average account value over the period, multiplied by 163/365 (to reflect the period shown).
3 Expenses are equal to the Fund’s annualized expense ratio multiplied by the average account value over the period, multiplied by 184/365 (to reflect the one-half year period).
| 10 | Classic Value Fund | Annual report |
Portfolio summary
| Top 10 Holdings1 | ||||
| Northrop Grumman Corp. | 4.2% | Tyco Electronics, Ltd. | 3.0% | |
| J.C. Penney Co., Inc. | 3.8% | Magna International, Inc. (Class A) | 3.0% | |
| Boeing Co. | 3.7% | UBS AG | 2.9% | |
| Allstate Corp. | 3.7% | CA, Inc. | 2.9% | |
| Torchmark Corp. | 3.0% | Cardinal Health, Inc. | 2.8% | |
| Sector Composition2,3 | ||||
| Financials | 30% | Energy | 9% | |
| Information Technology | 16% | Consumer Staples | 6% | |
| Consumer Discretionary | 14% | Utilities | 3% | |
| Health Care | 11% | Short-Term Investments & Other | 1% | |
| Industrials | 10% | |||

1 As a percentage of net assets on October 31, 2009. Excludes cash and cash equivalents.
2 As a percentage of net assets on October 31, 2009.
3 Sector investing is subject to greater risks than the market as a whole. Because the Fund may focus on particular sectors of the economy, its performance may depend on the performance of those sectors.
| Annual report | Classic Value Fund | 11 |
F I N A N C I A L S T A T E M E N T S
Fund’s investments
Securities owned by the Fund on 10-31-09
| Shares | Value | |
| Common Stocks 99.30% | $2,390,601,548 | |
| (Cost $2,550,477,713) | ||
| Consumer Discretionary 13.95% | 335,773,115 | |
| Auto Components 3.00% | ||
| Magna International, Inc. (Class A) | 1,819,390 | 72,102,426 |
| Household Durables 2.19% | ||
| Whirlpool Corp. (L) | 737,675 | 52,810,153 |
| Leisure Equipment & Products 0.95% | ||
| Mattel, Inc. | 1,206,956 | 22,847,677 |
| Media 2.74% | ||
| Omnicom Group, Inc. | 1,920,875 | 65,847,595 |
| Multiline Retail 3.76% | ||
| J.C. Penney Co., Inc. (L) | 2,732,650 | 90,532,695 |
| Specialty Retail 1.31% | ||
| Home Depot, Inc. | 1,260,764 | 31,632,569 |
| Consumer Staples 6.04% | 145,481,764 | |
| Food Products 3.93% | ||
| Kraft Foods, Inc. | 1,593,675 | 43,857,936 |
| Sara Lee Corp. | 4,494,850 | 50,746,857 |
| Personal Products 2.11% | ||
| Avon Products, Inc. | 1,587,425 | 50,876,971 |
| Energy 9.59% | 230,814,742 | |
| Energy Equipment & Services 2.01% | ||
| BJ Services Co. | 2,523,475 | 48,450,720 |
| Oil, Gas & Consumable Fuels 7.58% | ||
| Apache Corp. | 514,925 | 48,464,741 |
| BP PLC, SADR | 981,300 | 55,561,206 |
| Exxon Mobil Corp. | 716,675 | 51,364,097 |
| Valero Energy Corp. | 1,490,275 | 26,973,978 |
| Financials 29.61% | 712,829,992 | |
| Capital Markets 5.83% | ||
| Morgan Stanley | 1,781,925 | 57,235,431 |
| State Street Corp. | 309,125 | 12,977,068 |
| UBS AG (I)(L) | 4,232,554 | 70,218,071 |
See notes to financial statements
| 12 | Classic Value Fund | Annual report |
F I N A N C I A L S T A T E M E N T S
| Shares | Value | |
| Commercial Banks 4.74% | ||
| Comerica, Inc. | 1,981,936 | $54,998,724 |
| PNC Financial Services Group, Inc. | 1,208,628 | 59,150,254 |
| Consumer Finance 1.54% | ||
| Capital One Financial Corp. | 1,011,276 | 37,012,702 |
| Diversified Financial Services 6.56% | ||
| Bank of America Corp. | 3,759,000 | 54,806,220 |
| Citigroup, Inc. | 13,618,202 | 55,698,446 |
| JPMorgan Chase & Co. | 1,135,225 | 47,418,348 |
| Insurance 10.94% | ||
| Allstate Corp. | 2,982,400 | 88,189,568 |
| Axis Capital Holdings, Ltd. | 771,065 | 22,276,068 |
| Fidelity National Financial, Inc. | 1,670,652 | 24,284,219 |
| Hartford Financial Services Group, Inc. | 820,375 | 20,115,595 |
| MetLife, Inc. | 1,037,775 | 35,315,483 |
| Torchmark Corp. | 1,801,325 | 73,133,795 |
| Health Care 10.98% | 264,455,353 | |
| Health Care Equipment & Supplies 3.19% | ||
| CareFusion Corp. (I) | 1,187,312 | 26,560,169 |
| Zimmer Holdings, Inc. (I) | 955,282 | 50,219,175 |
| Health Care Providers & Services 6.32% | ||
| Aetna, Inc. | 2,581,875 | 67,206,206 |
| AmerisourceBergen Corp. | 890,230 | 17,760,645 |
| Cardinal Health, Inc. | 2,374,625 | 67,296,873 |
| Pharmaceuticals 1.47% | ||
| Johnson & Johnson | 599,700 | 35,412,285 |
| Industrials 10.44% | 251,220,145 | |
| Aerospace & Defense 10.44% | ||
| Boeing Co. | 1,878,475 | 89,791,105 |
| L-3 Communications Holdings, Inc. | 831,998 | 60,145,135 |
| Northrop Grumman Corp. | 2,020,425 | 101,283,905 |
| Information Technology 15.59% | 375,352,196 | |
| Communications Equipment 4.45% | ||
| Alcatel-Lucent, SADR (I)(L) | 16,736,946 | 61,759,331 |
| Motorola, Inc. | 5,418,636 | 45,250,937 |
| Computers & Peripherals 2.03% | ||
| Dell, Inc. (I) | 3,377,085 | 48,933,962 |
| Electronic Equipment, Instruments & Components 3.02% | ||
| Tyco Electronics, Ltd. | 3,420,297 | 72,681,311 |
| IT Services 0.14% | ||
| Accenture PLC (Class A) | 92,537 | 3,431,272 |
| Semiconductors & Semiconductor Equipment 0.54% | ||
| Lam Research Corp. (I)(L) | 384,000 | 12,948,480 |
| Software 5.41% | ||
| CA, Inc. | 3,312,255 | 69,292,375 |
| Microsoft Corp. | 2,201,750 | 61,054,528 |
See notes to financial statements
| Annual report | Classic Value Fund | 13 |
F I N A N C I A L S T A T E M E N T S
| Shares | Value | ||
| Utilities 3.10% | $74,674,241 | ||
| Electric Utilities 0.37% | |||
| Edison International | 279,150 | 8,882,553 | |
| Multi-Utilities 2.73% | |||
| Sempra Energy | 1,278,750 | 65,791,688 | |
| Rate | Shares | Value | |
| Short-Term Investments 2.76% | $66,476,048 | ||
| (Cost $66,433,440) | |||
| Cash Equivalents 2.15% | 51,894,048 | ||
| John Hancock Collateral Investment Trust (T)(W) | 0.2561% (Y) | 5,184,013 | 51,894,048 |
| Par value | Value | ||
| Repurchase Agreement 0.61% | 14,582,000 | ||
| Repurchase Agreement with State Street Corp. dated 10-30-09 at 0.01% | |||
| to be repurchased at $14,582,012 on 11-2-09, collateralized by | |||
| $14,875,000 Federal National Mortgage Association, 5.00% due | |||
| 05-20-24 (valued at $14,940,400, including interest) | $14,582,000 | 14,582,000 | |
| Total investments (Cost $2,616,911,153)† 102.06% | $2,457,077,596 | ||
| Other assets and liabilities, net (2.06%) | ($49,515,207) | ||
| Total net assets 100.00% | $2,407,562,389 | ||
SADR Sponsored American Depositary Receipts
(I) Non-income producing security.
(L) All or a portion of this security is on loan as of October 31, 2009.
(T) Represents investment of securities lending collateral.
(W) Issuer is an affiliate of the Adviser.
(Y) The rate shown is the annualized seven-day yield as of October 31, 2009.
† At October 31, 2009, the aggregate cost of investment securities for federal income tax purposes was $2,740,056,740. Net unrealized depreciation aggregated $282,979,144, of which $297,364,973 related to appreciated investment securities and $580,344,117 related to depreciated investment securities.
See notes to financial statements
| 14 | Classic Value Fund | Annual report |
F I N A N C I A L S T A T E M E N T S
Financial statements
Statement of assets and liabilities 10-31-09
This Statement of Assets and Liabilities is the Fund’s balance sheet. It shows the value of what the Fund owns, is due and owes. You’ll also find the net asset value and the maximum offering price per share.
| Assets | |
| Investments in unaffiliated issuers, at value (Cost $2,565,059,713) | |
| including $48,247,602 of securities loaned (Note 2) | $2,405,183,548 |
| Investments in affiliated issuers, at value (Cost $51,851,440) (Note 2) | 51,894,048 |
| Total investments, at value (Cost $2,616,911,153) | 2,457,077,596 |
| Cash | 53 |
| Receivable for investments sold | 14,080,750 |
| Receivable for fund shares sold | 4,780,700 |
| Dividends and interest receivable | 852,361 |
| Receivable for securities lending income | 9,822 |
| Receivable from affiliates | 22,411 |
| Other receivables and prepaid assets | 260,259 |
| Total assets | 2,477,083,952 |
| Liabilities | |
| Payable for investments purchased | 6,812,853 |
| Payable for fund shares repurchased | 7,079,863 |
| Payable upon return of securities loaned (Note 2) | 51,836,303 |
| Payable to affiliates | |
| Accounting and legal services fees | 29,904 |
| Transfer agent fees | 881,607 |
| Distribution and service fees | 522,640 |
| Management fees | 1,900,736 |
| Other payables and accrued expenses | 457,657 |
| Total liabilities | 69,521,563 |
| Net assets | |
| Capital paid-in | $5,074,022,576 |
| Undistributed net investment income | 14,834,131 |
| Accumulated net realized loss on investments | (2,521,460,761) |
| Net unrealized depreciation on investments | (159,833,557) |
| Net assets | $2,407,562,389 |
See notes to financial statements
| Annual report | Classic Value Fund | 15 |
F I N A N C I A L S T A T E M E N T S
Statement of assets and liabilities (continued)
| Net asset value per share | |
| Based on net asset values and shares outstanding — the Fund has an | |
| unlimited number of shares authorized with no par value. | |
| Class A ($1,543,707,946 ÷ 112,115,958 shares) | $13.77 |
| Class B ($65,619,442 ÷ 4,818,667 shares)1 | $13.62 |
| Class C ($154,677,713 ÷ 11,362,604 shares)1 | $13.61 |
| Class I ($636,486,841 ÷ 46,104,096 shares) | $13.81 |
| Class R1 ($6,978,542 ÷ 506,775 shares) | $13.77 |
| Class R3 ($30,594 ÷ 2,224 shares) | $13.76 |
| Class R4 ($30,635 ÷ 2,224 shares) | $13.77 |
| Class R5 ($30,676 ÷ 2,224 shares) | $13.79 |
| Maximum offering price per share | |
| Class A (net asset value per share ÷ 95%)2 | $14.49 |
1 Redemption price is equal to net asset value less any applicable contingent deferred sales charge.
2 On single retail sales of less than $50,000. On sales of $50,000 or more and on group sales the offering price is reduced.
See notes to financial statements
| 16 | Classic Value Fund | Annual report |
F I N A N C I A L S T A T E M E N T S
Statement of operations For the year ended 10-31-09
This Statement of Operations summarizes the Fund’s investment income earned, expenses incurred in operating the Fund and net gains (losses) for the period stated.
| Investment income | |
| Dividends | $52,527,214 |
| Securities lending | 4,183,186 |
| Income from affiliated issuers | 100,987 |
| Interest | 29,761 |
| Less foreign taxes withheld | (119,896) |
| Total investment income | 56,721,252 |
| Expenses | |
| Investment management fees (Note 4) | 18,410,323 |
| Distribution and service fees (Note 4) | 5,731,661 |
| Transfer agent fees (Note 4) | 6,617,595 |
| Accounting and legal services fees (Note 4) | 406,434 |
| Trustees’ fees (Note 5) | 227,986 |
| State registration fees | 46,572 |
| Printing and postage fees | 524,269 |
| Professional fees | 223,646 |
| Custodian fees | 421,340 |
| Registration and filing fees | 30,329 |
| Proxy fees | 651,388 |
| Other | 65,025 |
| Total expenses | 33,356,568 |
| Less expense reductions (Note 4) | (4,846,327) |
| Net expenses | 28,510,241 |
| Net investment income | 28,211,011 |
| Realized and unrealized gain (loss) | |
| Net realized gain (loss) on | |
| Investments in unaffiliated issuers | (1,600,367,752) |
| Investments in affiliated issuers | 15,138 |
| (1,600,352,614) | |
| Change in net unrealized appreciation (depreciation) of | |
| Investments in unaffiliated issuers | 1,891,972,033 |
| Investments in affiliated underlying funds | 42,608 |
| 1,892,014,641 | |
| Net realized and unrealized gain | 291,662,027 |
| Increase in net assets from operations | $319,873,038 |
See notes to financial statements
| Annual report | Classic Value Fund | 17 |
F I N A N C I A L S T A T E M E N T S
Statements of changes in net assets
These Statements of Changes in Net Assets show how the value of the Fund’s net assets have changed during the last three periods. The difference reflects earnings less expenses, any investment gains and losses, distributions, if any, paid to shareholders and the net of Fund share transactions.
| Year | Period | Year | |
| ended | ended | ended | |
| 10-31-09 | 10-31-081 | 12-31-07 | |
| Increase (decrease) in net assets | |||
| From operations | |||
| Net investment income | $28,211,011 | $58,368,653 | $104,193,621 |
| Net realized gain (loss) | (1,600,352,614) | (918,444,087) | 678,062,273 |
| Change in net unrealized appreciation | |||
| (depreciation) | 1,892,014,641 | (1,272,580,555) | (1,950,836,569) |
| Increase (decrease) in net assets resulting | |||
| from operations | 319,873,038 | (2,132,655,989) | (1,168,580,675) |
| Distributions to shareholders | |||
| From net investment income | |||
| Class A | (45,687,712) | — | (73,327,961) |
| Class B | (1,309,985) | — | (1,891,117) |
| Class C | (3,202,476) | — | (5,821,733) |
| Class I | (21,338,991) | — | (26,404,824) |
| Class R1 | (204,445) | — | (279,498) |
| From net realized gain | |||
| Class A | (56,776,173) | — | (326,653,899) |
| Class B | (2,641,688) | — | (16,975,708) |
| Class C | (6,458,047) | — | (52,259,104) |
| Class I | (22,392,723) | — | (93,211,048) |
| Class R1 | (311,427) | — | (1,642,127) |
| Total distributions | (160,323,667) | — | (598,467,019) |
| From Fund share transactions (Note 6) | (417,301,057) | (1,200,298,701) | (1,280,560,604) |
| Total decrease | (257,751,686) | (3,332,954,690) | (3,047,608,298) |
| Net assets | |||
| Beginning of year | 2,665,314,075 | 5,998,268,765 | 9,045,877,063 |
| End of year | $2,407,562,389 | $2,665,314,075 | $5,998,268,765 |
| Undistributed (distributions in excess of) | |||
| net investment income | $14,834,131 | $58,367,016 | ($1,635) |
1 For the ten month period ended October 31, 2008. The Fund changed its fiscal year end from December 31 to October 31.
See notes to financial statements
| 18 | Classic Value Fund | Annual report |
F I N A N C I A L S T A T E M E N T S
Financial highlights
The Financial Highlights show how the Fund’s net asset value for a share has changed since the end of the previous period.
| CLASS A SHARES Period ended | 10-31-09 | 10-31-081 | 12-31-07 | 12-31-06 | 12-31-05 | 12-31-04 |
| Per share operating performance | ||||||
| Net asset value, beginning | ||||||
| of period | $12.38 | $21.53 | $27.67 | $24.64 | $23.01 | $20.27 |
| Net investment income2 | 0.14 | 0.25 | 0.34 | 0.23 | 0.15 | 0.17 |
| Net realized and unrealized gain | ||||||
| (loss) on investments | 2.02 | (9.40) | (4.24) | 3.84 | 1.88 | 2.73 |
| Total from investment operations | 2.16 | (9.15) | (3.90) | 4.07 | 2.03 | 2.90 |
| Less distributions | ||||||
| From net investment income | (0.34) | — | (0.41) | (0.19) | (0.10) | (0.09) |
| From net realized gain | (0.43) | — | (1.83) | (0.85) | (0.30) | (0.07) |
| Total distributions | (0.77) | — | (2.24) | (1.04) | (0.40) | (0.16) |
| Net asset value, end of period | $13.77 | $12.38 | $21.53 | $27.67 | $24.64 | $23.01 |
| Total return (%) 3 | 19.844 | (42.50)4,5 | (14.20) | 16.54 | 8.814 | 14.284 |
| Ratios and supplemental data | ||||||
| Net assets, end of period | ||||||
| (in millions) | $1,544 | $1,711 | $4,000 | $5,987 | $3,017 | $1,223 |
| Ratios (as a percentage of average | ||||||
| net assets): | ||||||
| Expenses before reductions | 1.606 | 1.387 | 1.28 | 1.30 | 1.36 | 1.40 |
| Expenses net of fee waivers | 1.336 | 1.327,8 | 1.28 | 1.30 | 1.32 | 1.30 |
| Expenses net of fee waivers | ||||||
| and credits | 1.336 | 1.327,8 | 1.28 | 1.30 | 1.32 | 1.30 |
| Net investment income | 1.27 | 1.617 | 1.22 | 0.89 | 0.65 | 0.81 |
| Portfolio turnover (%) | 67 | 30 | 35 | 20 | 27 | 16 |
1 For the ten month period ended October 31, 2008. The Fund changed its fiscal year end from December 31 to October 31.
2 Based on the average daily shares outstanding.
3 Assumes dividend reinvestment.
4 Total returns would have been lower had certain expenses not been reduced during the periods shown.
5 Not annualized.
6 Includes the impact of proxy expenses, which amounted to 0.03% of average net assets.
7 Annualized.
8 Includes 0.01% related to interest expense.
See notes to financial statements
| Annual report | Classic Value Fund | 19 |
F I N A N C I A L S T A T E M E N T S
| CLASS B SHARES Period ended | 10-31-09 | 10-31-081 | 12-31-07 | 12-31-06 | 12-31-05 | 12-31-04 |
| Per share operating performance | ||||||
| Net asset value, beginning | ||||||
| of period | $12.19 | $21.34 | $27.40 | $24.42 | $22.89 | $20.24 |
| Net investment income (loss)2 | 0.06 | 0.13 | 0.13 | 0.04 | (0.03) | 0.01 |
| Net realized and unrealized gain | ||||||
| (loss) on investments | 2.01 | (9.28) | (4.16) | 3.79 | 1.86 | 2.71 |
| Total from investment | ||||||
| operations | 2.07 | (9.15) | (4.03) | 3.83 | 1.83 | 2.72 |
| Less distributions | ||||||
| From net investment income | (0.21) | — | (0.20) | — | — | — |
| From net realized gain | (0.43) | — | (1.83) | (0.85) | (0.30) | (0.07) |
| Total distributions | (0.64) | — | (2.03) | (0.85) | (0.30) | (0.07) |
| Net asset value, end of period | $13.62 | $12.19 | $21.34 | $27.40 | $24.42 | $22.89 |
| Total return (%)3 | 18.944 | (42.88)4,5 | (14.80) | 15.68 | 7.994 | 13.444 |
| Ratios and supplemental data | ||||||
| Net assets, end of period | ||||||
| (in millions) | $66 | $79 | $208 | $332 | $296 | $200 |
| Ratios (as a percentage of average | ||||||
| net assets): | ||||||
| Expenses before reductions | 2.356 | 2.137 | 2.03 | 2.01 | 2.11 | 2.15 |
| Expenses net of fee waivers | 2.086 | 2.077,8 | 2.03 | 2.01 | 2.07 | 2.05 |
| Expenses net of fee waivers | ||||||
| and credits | 2.086 | 2.067,8 | 2.03 | 2.01 | 2.07 | 2.05 |
| Net investment income (loss) | 0.54 | 0.867 | 0.46 | 0.17 | (0.11) | 0.03 |
| Portfolio turnover (%) | 67 | 30 | 35 | 20 | 27 | 16 |
1 For the ten month period ended October 31, 2008. The Fund changed its fiscal year end from December 31 to October 31.
2 Based on the average daily shares outstanding.
3 Assumes dividend reinvestment.
4 Total returns would have been lower had certain expenses not been reduced during the periods shown.
5 Not annualized.
6 Includes the impact of proxy expenses, which amounted to 0.03% of average net assets.
7 Annualized.
8 Includes 0.01% related to interest expense.
See notes to financial statements
| 20 | Classic Value Fund | Annual report |
F I N A N C I A L S T A T E M E N T S
| CLASS C SHARES Period ended | 10-31-09 | 10-31-081 | 12-31-07 | 12-31-06 | 12-31-05 | 12-31-04 |
| Per share operating performance | ||||||
| Net asset value, beginning | ||||||
| of period | $12.18 | $21.33 | $27.39 | $24.42 | $22.89 | $20.24 |
| Net investment income (loss)2 | 0.06 | 0.13 | 0.13 | 0.03 | (0.02) | 0.01 |
| Net realized and unrealized gain | ||||||
| (loss) on investments | 2.01 | (9.28) | (4.16) | 3.79 | 1.85 | 2.71 |
| Total from investment | ||||||
| operations | 2.07 | (9.15) | (4.03) | 3.82 | 1.83 | 2.72 |
| Less distributions | ||||||
| From net investment income | (0.21) | — | (0.20) | — | — | — |
| From net realized gain | (0.43) | — | (1.83) | (0.85) | (0.30) | (0.07) |
| Total distributions | (0.64) | — | (2.03) | (0.85) | (0.30) | (0.07) |
| Net asset value, end of period | $13.61 | $12.18 | $21.33 | $27.39 | $24.42 | $22.89 |
| Total return (%)3 | 18.954 | (42.90)4,5 | (14.80) | 15.64 | 7.994 | 13.444 |
| Ratios and supplemental data | ||||||
| Net assets, end of period | ||||||
| (in millions) | $155 | $202 | $612 | $1,132 | $832 | $423 |
| Ratios (as a percentage of average | ||||||
| net assets): | ||||||
| Expenses before reductions | 2.346 | 2.137 | 2.03 | 2.05 | 2.11 | 2.15 |
| Expenses net of fee waivers | 2.086 | 2.077,8 | 2.03 | 2.05 | 2.07 | 2.05 |
| Expenses net of fee waivers and | ||||||
| credits | 2.086 | 2.077,8 | 2.03 | 2.05 | 2.07 | 2.05 |
| Net investment income (loss) | 0.57 | 0.857 | 0.46 | 0.13 | (0.10) | 0.04 |
| Portfolio turnover (%) | 67 | 30 | 35 | 20 | 27 | 16 |
1 For the ten month period ended October 31, 2008. The Fund changed its fiscal year end from December 31 to October 31.
2 Based on the average daily shares outstanding.
3 Assumes dividend reinvestment.
4 Total returns would have been lower had certain expenses not been reduced during the periods shown.
5 Not annualized.
6 Includes the impact of proxy expenses, which amounted to 0.03% of average net assets.
7 Annualized.
8 Includes 0.01% related to interest expense.
See notes to financial statements
| Annual report | Classic Value Fund | 21 |
F I N A N C I A L S T A T E M E N T S
| CLASS I SHARES Period ended | 10-31-09 | 10-31-081 | 12-31-07 | 12-31-06 | 12-31-05 | 12-31-04 |
| Per share operating performance | ||||||
| Net asset value, beginning | ||||||
| of period | $12.44 | $21.57 | $27.73 | $24.69 | $23.05 | $20.30 |
| Net investment income2 | 0.19 | 0.30 | 0.45 | 0.34 | 0.26 | 0.27 |
| Net realized and unrealized gain (loss) | ||||||
| on investments | 2.02 | (9.43) | (4.26) | 3.86 | 1.88 | 2.73 |
| Total from investment operations | 2.21 | (9.13) | (3.81) | 4.20 | 2.14 | 3.00 |
| Less distributions | ||||||
| From net investment income | (0.41) | — | (0.52) | (0.31) | (0.20) | (0.18) |
| From net realized gain | (0.43) | — | (1.83) | (0.85) | (0.30) | (0.07) |
| Total distributions | (0.84) | — | (2.35) | (1.16) | (0.50) | (0.25) |
| Net asset value, end of period | $13.81 | $12.44 | $21.57 | $27.73 | $24.69 | $23.05 |
| Total return (%)3,4 | 20.32 | (42.33)5 | (13.86) | 17.01 | 9.28 | 14.77 |
| Ratios and supplemental data | ||||||
| Net assets, end of period (in millions) | $636 | $664 | $1,155 | $1,567 | $665 | $206 |
| Ratios (as a percentage of average | ||||||
| net assets): | ||||||
| Expenses before reductions | 1.036 | 0.967 | 0.92 | 0.94 | 0.98 | 1.01 |
| Expenses net of fee waivers | 0.956 | 0.947,8 | 0.88 | 0.89 | 0.89 | 0.86 |
| Expenses net of fee waivers | ||||||
| and credits | 0.956 | 0.947,8 | 0.88 | 0.89 | 0.89 | 0.86 |
| Net investment income | 1.65 | 1.997 | 1.61 | 1.30 | 1.09 | 1.25 |
| Portfolio turnover (%) | 67 | 30 | 35 | 20 | 27 | 16 |
1 For the ten month period ended October 31, 2008. The Fund changed its fiscal year end from December 31 to October 31.
2 Based on the average daily shares outstanding.
3 Assumes dividend reinvestment.
4 Total returns would have been lower had certain expenses not been reduced during the periods shown.
5 Not annualized.
6 Includes the impact of proxy expenses, which amounted to 0.03% of average net assets.
7 Annualized.
8 Includes 0.01% related to interest expense.
See notes to financial statements
| 22 | Classic Value Fund | Annual report |
F I N A N C I A L S T A T E M E N T S
| CLASS R1 SHARES Period ended | 10-31-09 | 10-31-081 | 12-31-07 | 12-31-06 | 12-31-05 | 12-31-04 |
| Per share operating performance | ||||||
| Net asset value, beginning | ||||||
| of period | $12.35 | $21.55 | $27.67 | $24.63 | $23.02 | $20.27 |
| Net investment income2 | 0.11 | 0.19 | 0.23 | 0.13 | 0.08 | 0.07 |
| Net realized and unrealized gain | ||||||
| (loss) on investments | 2.02 | (9.39) | (4.21) | 3.85 | 1.86 | 2.75 |
| Total from investment operations | 2.13 | (9.20) | (3.98) | 3.98 | 1.94 | 2.82 |
| Less distributions | ||||||
| From net investment income | (0.28) | — | (0.31) | (0.09) | (0.03) | — |
| From net realized gain | (0.43) | — | (1.83) | (0.85) | (0.30) | (0.07) |
| Total distributions | (0.71) | — | (2.14) | (0.94) | (0.33) | (0.07) |
| Net asset value, end of period | $13.77 | $12.35 | $21.55 | $27.67 | $24.63 | $23.02 |
| Total return (%)3 | 19.404 | (42.69)4,5 | (14.49) | 16.15 | 8.444 | 13.914 |
| Ratios and supplemental data | ||||||
| Net assets, end of period | ||||||
| (in millions) | $7 | $9 | $22 | $29 | $12 | $2 |
| Ratios (as a percentage of average | ||||||
| net assets): | ||||||
| Expenses before reductions | 1.756 | 1.687 | 1.64 | 1.68 | 1.69 | 1.82 |
| Expenses net of fee waivers | 1.676 | 1.667,8 | 1.64 | 1.68 | 1.65 | 1.72 |
| Expenses net of fee waivers | ||||||
| and credits | 1.676 | 1.667,8 | 1.64 | 1.68 | 1.65 | 1.72 |
| Net investment income | 1.01 | 1.267 | 0.85 | 0.51 | 0.34 | 0.35 |
| Portfolio turnover (%) | 67 | 30 | 35 | 20 | 27 | 16 |
1 For the ten month period ended October 31, 2008. The Fund changed its fiscal year end from December 31 to October 31.
2 Based on the average daily shares outstanding.
3 Assumes dividend reinvestment.
4 Total returns would have been lower had certain expenses not been reduced during the periods shown.
5 Not annualized.
6 Includes the impact of proxy expenses, which amounted to 0.03% of average net assets.
7 Annualized.
8 Includes 0.01% related to interest expense.
| CLASS R3 SHARES Period ended | 10-31-091 |
| Per share operating performance | |
| Net asset value, beginning of period | $11.24 |
| Net investment income2 | (—)3 |
| Net realized and unrealized gain on investments | 2.52 |
| Total from investment operations | 2.52 |
| Net asset value, end of period | $13.76 |
| Total return (%) | 22.424,5 |
| Ratios and supplemental data | |
| Net assets, end of period (in millions) | —6 |
| Ratios (as a percentage of average net assets): | |
| Expenses before reductions | 3.337 |
| Expenses net of fee waivers | 1.737 |
| Expenses net of fee waivers and credits | 1.737 |
| Net investment loss | (0.04)7 |
| Portfolio turnover (%) | 67 |
1 Period from 5-22-09 (inception date) to 10-31-09.
2 Based on the average daily shares outstanding.
3 Less than ($0.005) per share.
4 Not annualized.
5 Total returns would have been lower had certain expenses not been reduced during the periods shown.
6 Less than $500,000.
7 Annualized.
See notes to financial statements
| Annual report | Classic Value Fund | 23 |
F I N A N C I A L S T A T E M E N T S
| CLASS R4 SHARES Period ended | 10-31-091 |
| Per share operating performance | |
| Net asset value, beginning of period | $11.24 |
| Net investment income2 | 0.02 |
| Net realized and unrealized gain on investments | 2.51 |
| Total from investment operations | 2.53 |
| Net asset value, end of period | $13.77 |
| Total return (%) | 22.513,4 |
| Ratios and supplemental data | |
| Net assets, end of period (in millions) | —5 |
| Ratios (as a percentage of average net assets): | |
| Expenses before reductions | 3.086 |
| Expenses net of fee waivers | 1.436 |
| Expenses net of fee waivers and credits | 1.436 |
| Net investment income | 0.266 |
| Portfolio turnover (%) | 67 |
1 Period from 5-22-09 (inception date) to 10-31-09.
2 Based on the average daily shares outstanding.
3 Not annualized.
4 Total returns would have been lower had certain expenses not been reduced during the periods shown.
5 Less than $500,000.
6 Annualized.
| CLASS R5 SHARES Period ended | 10-31-091 |
| Per share operating performance | |
| Net asset value, beginning of period | $11.24 |
| Net investment income2 | 0.03 |
| Net realized and unrealized gain on investments | 2.52 |
| Total from investment operations | 2.55 |
| Net asset value, end of period | $13.79 |
| Total return (%) | 22.693,4 |
| Ratios and supplemental data | |
| Net assets, end of period (in millions) | —5 |
| Ratios (as a percentage of average net assets): | |
| Expenses before reductions | 2.846 |
| Expenses net of fee waivers | 1.136 |
| Expenses net of fee waivers and credits | 1.136 |
| Net investment income | 0.566 |
| Portfolio turnover (%) | 67 |
1 Period from 5-22-09 (inception date) to 10-31-09.
2 Based on the average daily shares outstanding.
3 Not annualized.
4 Total returns would have been lower had certain expenses not been reduced during the periods shown.
5 Less than $500,000.
6 Annualized.
See notes to financial statements
| 24 | Classic Value Fund | Annual report |
Notes to financial statements
Note 1
Organization
John Hancock Classic Value Fund (the Fund) is a diversified series of John Hancock Capital Series (the Trust), an open-end management investment company registered under the Investment Company Act of 1940, as amended (the 1940 Act). The investment objective of the Fund is to seek long-term growth of capital.
John Hancock Advisers, LLC (the Adviser) serves as investment adviser for the Fund. John Hancock Funds, LLC (the Distributor), an affiliate of the Adviser, serves as principal underwriter of the Fund. The Adviser and the Distributor are indirect wholly owned subsidiaries of Manulife Financial Corporation (MFC).
The Board of Trustees has authorized the issuance of multiple classes of shares of the Fund, designated as Class A, Class B, Class C, Class I, Class R1, Class R3, Class R4 and Class R5 shares. Class A, Class B and Class C shares are open to all retail investors. Class I shares are offered without any sales charge to various institutional and certain individual investors. Class R1, Class R3, Class R4 and Class R5 shares are available only to certain retirement plans. The shares of each class represent an interest in the same portfolio of investments of the Fund and have equal rights as to voting, redemptions, dividends and liquidation, except that certain expenses, subject to the approval of the Trustees, may be applied differently to each class of shares in accordance with current regulations of the Securities and Exchange Commission and the Internal Revenue Service. Shareholders of a class that bear distribution and service expenses under the terms of a di stribution plan have exclusive voting rights to that distribution plan. Class B shares will convert to Class A shares eight years after purchase.
Note 2
Significant accounting policies
The financial statements have been prepared in conformity with accounting principles generally accepted in the United States of America, which require management to make certain estimates and assumptions at the date of the financial statements. Actual results could differ from those estimates. Events or transactions occurring after period end through the date that the financial statements were issued, December 18, 2009, have been evaluated in the preparation of the financial statements. The following summarizes the significant accounting policies of the Fund:
Security valuation
Investments are stated at value as of the close of the regular trading on the New York Stock Exchange (NYSE), normally at 4:00 P.M., Eastern Time. Equity securities held by the Fund are valued at the last sale price or official closing price (closing bid price or last evaluated price if no sale has occurred) as of the close of business on the principal securities exchange (domestic or foreign) on which they trade. Debt obligations are valued based on the evaluated prices provided by independent pricing services, which utilize both dealer-supplied quotes and electronic data processing techniques, which take into account factors such as institutional-size trading in similar groups of securities, yield, quality, coupon rate, maturity, type of issue, trading characteristics and other market data. Foreign secu rities and currencies are valued in U.S. dollars, based on foreign currency exchange rates supplied by an independent pricing service. Securities traded only in the over-the-counter market are valued at the last bid price quoted by brokers making markets in the securities at the close of trading. Equity and debt obligations, for which there are no prices available from an independent pricing service, are valued based on bid quotations, or evaluated prices, as applicable, obtained from broker-dealers or fair valued as described below. Certain short-term debt instruments are valued at amortized cost. John Hancock Collateral Investment Trust (JHCIT), an affiliated registered investment company managed by MFC Global Investment Management (U.S.), LLC, a subsidiary of MFC, is valued at its net asset value each business day.
| Annual report | Classic Value Fund | 25 |
JHCIT is a floating rate fund investing in money market instruments as part of the securities lending program.
Other assets and securities for which no such quotations are readily available are valued at fair value as determined in good faith by the Fund’s Pricing Committee in accordance with procedures adopted by the Board of Trustees. Generally, trading in non-U.S. securities is substantially completed each day at various times prior to the close of trading on the NYSE. The values of such securities used in computing the net asset value of the Fund’s shares are generally determined as of such times. Occasionally, significant events that affect the values of such securities may occur between the times at which such values are generally determined and the close of the NYSE. Upon such an occurrence, these securities will be valued at fair value as determined in good faith under consistently applied procedures established by and under the general supervision of the Board of Trustees.
Fair Value Measurements
The Fund uses a three-tier hierarchy to prioritize the assumptions, referred to as inputs, used in valuation techniques to measure fair value. The three-tier hierarchy of inputs and the valuation techniques used are summarized below:
Level 1 — Exchange-traded prices in active markets for identical securities. This technique is used for exchange-traded domestic common and preferred equities, certain foreign equities, warrants, rights, options and futures.
Level 2 — Prices determined using significant observable inputs. Observable inputs may include quoted prices for similar securities, interest rates, prepayment speeds and credit risk. Prices for securities valued using these techniques are received from independent pricing vendors and are based on an evaluation of the inputs described. These techniques are used for certain domestic preferred equities, certain foreign equities, unlisted rights and warrants, and fixed income securities.
Level 3 — Prices determined using significant unobservable inputs. In situations where quoted prices or observable inputs are unavailable, such as when there is little or no market activity for an investment, unobservable inputs may be used. Unobservable inputs reflect the Fund’s Pricing Committee’s own assumptions about the factors that market participants would use in pricing an investment and would be based on the best information available. Securities using this technique are generally thinly traded or privately placed, and may be valued using broker quotes, which may not only use observable or unobservable inputs but may also include the use of the brokers’ own judgments about the assumptions that market participants would use.
The inputs or methodology used for valuing securities are not necessarily an indication of the risk associated with investing in those securities.
| 26 | Classic Value Fund | Annual report |
The following is a summary of the inputs used to value the Fund’s investments as of October 31, 2009, by major security category or security type.
| INVESTMENTS IN SECURITIES | LEVEL 1 | LEVEL 2 | LEVEL 3 | TOTALS |
| Consumer Discretionary | $335,773,115 | — | — | $335,773,115 |
| Consumer Staples | 145,481,764 | — | — | 145,481,764 |
| Energy | 230,814,742 | — | — | 230,814,742 |
| Financials | 712,829,992 | — | — | 712,829,992 |
| Health Care | 264,455,353 | — | — | 264,455,353 |
| Industrials | 251,220,145 | — | — | 251,220,145 |
| Information Technology | 375,352,196 | — | — | 375,352,196 |
| Utilities | 74,674,241 | — | — | 74,674,241 |
| Short-Term Investments | 51,894,048 | $14,582,000 | — | 66,476,048 |
| Total Investments in | $2,442,495,596 | $14,582,000 | — | $2,457,077,596 |
| Securities | ||||
Repurchase agreements
The Fund may enter into repurchase agreements. When the Fund enters into a repurchase agreement through its custodian, it receives delivery of securities, the amount of which, at the time of purchase and each subsequent business day, is required to be maintained at such a level that the market value is generally at least 102% of the repurchase amount. The Fund will take receipt of all securities underlying the repurchase agreements it has entered into, until such agreements expire. If the seller defaults, the Fund would suffer a loss to the extent that proceeds from the sale of underlying securities were less than the repurchase amount. The Fund may enter into repurchase agreements maturing within seven days with domestic dealers, banks or other financial institutions deemed to be creditworthy by the Adviser.
Security transactions and related
investment income
Investment security transactions are accounted for on a trade date plus one basis for daily net asset value calculations. However, for financial reporting purposes, investment transactions are reported on trade date. Interest income is accrued as earned. Dividend income is recorded on the ex-dividend date. Foreign dividends are recorded on the ex-date or when the Fund becomes aware of the dividends from cash collections. Discounts/premiums are accreted/ amortized for financial reporting purposes. Debt obligations may be placed in a non-accrual status and related interest income may be reduced by ceasing current accruals and writing off interest receivables when the collection of all or a portion of interest has become doubtful. The Fund uses the identified cost method for determining realized gain or loss on investments for both financial statement and federal income tax reporting purposes.
Securities lending
The Fund may lend portfolio securities from time to time in order to earn additional income. The Fund retains beneficial ownership of the securities it has loaned and continues to receive interest and dividends associated with the securities and to participate in any changes in their value. On the settlement date of the loan, the Fund receives cash collateral against the loaned securities and maintains the cash collateral in an amount no less than the market value of the loaned securities.
The market value of the loaned securities is determined at the close of business of the Fund. Any additional required cash collateral is delivered to the Fund or excess collateral is returned to the borrower on the next business day. Cash collateral received is invested in JHCIT. JHCIT is not a stable value fund and thus the Fund receives the benefit of any gains and bears any losses generated by JHCIT.
The Fund may receive compensation for lending its securities either in the form of fees and/ or by retaining a portion of interest on the investment of any cash received as collateral. If the borrower defaults on its obligation to return the securities loaned because of insolvency or other reasons, the Fund could
| Annual report | Classic Value Fund | 27 |
experience delays and costs in recovering the securities loaned or in gaining access to the collateral. The Fund bears the risk in the event that invested collateral is not sufficient to meet obligations due on loans.
Line of credit
The Fund and other affiliated funds have entered into an agreement which enables them to participate in a $150 million unsecured committed line of credit with the Fund’s custodian. The Fund is permitted to have bank borrowings for temporary or emergency purposes, including the meeting of redemption requests that otherwise might require the untimely disposition of securities. Interest is charged to each participating fund based on its borrowings at a rate per annum equal to the Federal Funds rate plus 0.50%. In addition, a commitment fee of 0.08% per annum, payable at the end of each calendar quarter, based on the average daily-unused portion of the line of credit, is charged to each participating fund on a prorated basis based on average net assets. Prior to February 19, 2009, the commitment fee was 0.05% per annum. For the year ended October 31, 2009, there were no borrowings under the line of credit by the Fund.
Pursuant to the custodian agreement, the Custodian may, in its discretion, advance funds to the Fund to make properly authorized payments. When such payments result in an overdraft, the Fund is obligated to repay the Custodian for any overdraft, including any costs or expenses associated with the overdraft. The Custodian has a lien, security interest or security entitlement in any Fund property, that is not segregated, to the maximum extent permitted by law to the extent of any overdraft.
Expenses
The majority of expenses are directly identifiable to an individual fund. Trust expenses that are not readily identifiable to a specific fund are allocated in such a manner as deemed equitable, taking into consideration, among other things, the nature and type of expense and the relative size of the funds. Expense estimates are accrued in the period to which they relate and adjustments are made when actual amounts are known.
Class allocations
Income, common expenses and realized and unrealized gains (losses) are determined at the fund level and allocated daily to each class of shares based on the appropriate net asset value of the respective classes. Distribution and service fees, if any, and transfer agent fees for all classes are calculated daily at the class level based on the appropriate net asset value of each class and the specific expense rate(s) applicable to each class.
Broker commission rebates
The Fund may direct certain security trades to brokers who have agreed to rebate a portion of the related brokerage commission to the Fund. Commission rebates are accounted for as a realized gain on securities and amounted to $701,486.
Federal income taxes
The Fund intends to qualify as a regulated investment company by complying with the applicable provisions of the Internal Revenue Code and will not be subject to federal income tax on taxable income that is distributed to shareholders. Therefore, no federal income tax provision is required.
For federal income tax purposes, the Fund has $2,398,315,174 capital loss carryforward available, to the extent provided by regulations, to offset future net realized capital gains. To the extent that such carryforward is used by the Fund, it will reduce the amount of capital gain distributions to be paid. The loss carryforward expires as follows: October 31, 2016 — $919,103,512 and October 31, 2017 — $1,479,211,662.
As of October 31, 2009, the Fund had no uncertain tax positions that would require financial statement recognition, de-recognition or disclosure. The Fund’s federal tax return is subject to examination by the Internal Revenue Service for a period of three years.
Distribution of income and gains
The Fund records distributions to shareholders from net investment income and net realized gains, if any, on the ex-dividend date. The Fund generally declares and pays dividends and capital gain distributions, if any, annually.
| 28 | Classic Value Fund | Annual report |
During the year ended October 31, 2009, the tax character of distributions paid was as follows: ordinary income $71,743,896 and long-term capital gain $88,579,771. There were no distributions during the period ended October 31, 2008. During the year ended December 31, 2007, the tax character of distributions paid was as follows: ordinary income $122,281,257 and long-term capital gain $476,185,762. Distributions paid by the Fund with respect to each class of shares are calculated in the same manner, at the same time and are in the same amount, except for the effect of expenses that may be applied differently to each class.
As of October 31, 2009, the components of distributable earnings on a tax basis included $14,956,672 of undistributed ordinary income.
Such distributions and distributable earnings, on a tax basis, are determined in conformity with income tax regulations, which may differ from accounting principles generally accepted in the United States of America. Material distributions in excess of tax basis earnings and profits, if any, are reported in the Fund’s financial statements as a return of capital.
Capital accounts within financial statements are adjusted for permanent book-tax differences. These adjustments have no impact on net assets or the results of operations. Temporary book-tax differences will reverse in a subsequent period. There were no permanent book-tax differences for the year ended October 31, 2009.
Note 3
Guarantees and indemnifications
Under the Fund’s organizational documents, its Officers and Trustees are indemnified against certain liabilities arising out of the performance of their duties to the Fund. Additionally, in the normal course of business, the Fund enters into contracts with service providers that contain general indemnification clauses. The Fund’s maximum exposure under these arrangements is unknown, as this would involve future claims that may be made against the Fund that have not yet occurred.
Note 4
Management fee and transactions with
affiliates and others
The Fund has an investment management contract with the Adviser. Effective October 1, 2009, under the investment management contract, the Fund pays a monthly management fee to the Adviser equivalent, on an annual basis, to the sum of: (a) 0.79% of the first $2,500,000,000 of the Fund’s average daily net asset value, (b) 0.78% of the next $2,500,000,000 and (c) 0.77% in excess of $5,000,000,000. Prior to October 1, 2009, under the investment management contract, the Fund paid a monthly management fee to the Adviser equivalent, on an annual basis, to the sum of: (a) 0.85% of the first $2,500,000,000 of the Fund’s average daily net asset value, (b) 0.825% of the next $2,500,000,000 and (c) 0.80% in excess of $5,000,000,000. The Adviser has a subadvisory agreement with Pzena Investment Management, LLC. The Fund is not responsible for payment of the subadvisory fees.
The effective rate for the year ended October 31, 2009, is 0.84% of the Fund’s average daily net asset value.
The Adviser has contractually agreed to limit the Fund’s total expenses, excluding transfer agent fees, distribution and service fees, brokerage commissions, interest and other extraordinary expenses not incurred in the ordinary course of the Fund’s business, to 0.89% of the Fund’s average daily net asset value, on an annual basis. Effective May 1, 2009, the Adviser has contractually agreed to limit the total expenses as follows: 1.33%, 2.08%, 2.08%, 0.94% and 1.83% for Class A, Class B, Class C, Class I and Class R1 shares, respectively, through June 30, 2010. Effective May 22, 2009, the Adviser has contractually agreed to limit the total expenses as follows: 1.73%, 1.43% and 1.13% for Class R3, Class R4 and Class R5 shares, respectively, through June 30, 2010. The Adviser reserves the right to terminate these limitations in the future. Accordingly, the expense reductions related to these total expense limitations amounted to $3,147,181.
Pursuant to the Advisory Agreement, the Fund reimburses the Adviser for all expenses associated with providing the administrative,
| Annual report | Classic Value Fund | 29 |
financial, legal, accounting and recordkeeping services of the Fund, including the preparation of all tax returns, annual, semiannual and periodic reports to shareholders and the preparation of all regulatory reports. These expenses are allocated based on the relative share of net assets of each class at the time the expense was incurred. The accounting and legal services fees incurred for the year ended October 31, 2009, were equivalent to an annual effective rate of 0.02% of the Fund’s average daily net assets.
The Fund has a Distribution Agreement with the Distributor. The Fund has adopted Distribution Plans with respect to Class A, Class B, Class C, Class R1, Class R3 and Class R4 shares, pursuant to Rule 12b-1 under the 1940 Act, to pay the Distributor for the services it provides as distributor of shares of the Fund. Accordingly, the Fund makes monthly payments to the Distributor at an annual rate not to exceed 0.25%, 1.00%, 1.00% and 0.50% of average daily net asset value of Class A, Class B, Class C and Class R1 shares, respectively, and daily payments to the Distributor at an annual rate not to exceed 0.50% and 0.25% of average daily net asset value of Class R3 and Class R4 shares, respectively. A maximum of 0.25% of such payments may be service fees, as defined by the Conduct Rules of the Financial Industry Regulatory Authority (formerly the National Association of Securities Dealers). Under the Conduct Rules, a curtailment of a portion of the Fund’s Rule 12b-1 payments could occur under certain circumstances. In addition, under Service Plans for Class R1, Class R3, Class R4 and Class R5 shares, the Fund pays up to 0.25%, 0.15%, 0.10% and 0.05%, respectively, of average daily net asset value for certain other services.
Class A shares are assessed up-front sales charges. During the year ended October 31, 2009, the Distributor received net up-front sales charges of $534,567 with regard to sales of Class A shares. Of this amount, $33,876 was retained and used for printing prospectuses, advertising, sales literature and other purposes, $487,812 was paid as sales commissions to unrelated broker-dealers and $12,879 was paid as sales commissions to sales personnel of Signator Investors, Inc. (Signator Investors), a related broker-dealer.
Class B shares that are redeemed within six years of purchase are subject to a contingent deferred sales charge (CDSC) at declining rates, beginning at 5.00% of the lesser of the current market value at the time of redemption or the original purchase cost of the shares being redeemed. Class C shares that are redeemed within one year of purchase are subject to a CDSC at a rate of 1.00% of the lesser of the current market value at the time of redemption or the original purchase cost of the shares being redeemed. Proceeds from the CDSCs are paid to the Distributor and are used in whole or in part to defray its expenses for providing distribution-related services to the Fund in connection with the sale of Class B and Class C shares. During the year ended October 31, 2009, CDSCs received by the Distributor amounted to $223,302 for Class B shares and $23,143 for Class C shares.
The Fund has a transfer agent agreement with John Hancock Signature Services, Inc. (Signature Services), an indirect subsidiary of MFC. The transfer agent fees are made up of three components:
• The Fund pays a monthly transfer agent fee at an annual rate of 0.05%, 0.05%, 0.05%, 0.04%, 0.05%, 0.05%, 0.05% and 0.05% for Classes A, B, C, I, R1, R3, R4 and R5 shares, respectively, of each class’s average daily net assets.
• The Fund paid a monthly fee based on an annual rate of $16.50 per shareholder account.
• In addition, Signature Services is reimbursed for certain out-of-pocket expenses.
Signature Services agreed to contractually limit the transfer agent expenses to 0.18% for Classes A, B and C until April 30, 2009, after which it expired. Waivers and reimbursements under this plan were $1,671,041 for the year ended October 31, 2009.
The Fund receives earnings credits from its transfer agent as a result of uninvested cash balances. These credits are used to reduce a
| 30 | Classic Value Fund | Annual report |
portion of the Fund’s transfer agent fees and out-of-pocket expenses. During the year ended October 31, 2009, the Fund’s transfer agent fees and out-of-pocket expenses were reduced by $610 for transfer agent credits earned.
Certain investor accounts that maintain small balances are charged an annual small accounts fee by Signature Services. Amounts related to these fees are credited by Signature Services to the Fund. For the year ended October 31, 2009, these fees totaled $27,495.
Class level expenses for the year ended October 31, 2009, were as follows:
| Distribution and | Transfer | |
| Share class | service fees | agent fees |
| Class A | $3,554,460 | $5,439,555 |
| Class B | 626,567 | 242,930 |
| Class C | 1,500,245 | 562,987 |
| Class I | — | 366,449 |
| Class R1 | 50,293 | 4,941 |
| Class R3 | 64 | 244 |
| Class R4 | 32 | 244 |
| Class R5 | — | 245 |
| Total | $5,731,661 | $6,617,595 |
Note 5
Trustees’ fees
The compensation of unaffiliated Trustees is borne by the Fund. The unaffiliated Trustees may elect to defer, for tax purposes, their receipt of this compensation under the John Hancock Group of Funds Deferred Compensation Plan. The Fund makes investments into other John Hancock funds, as applicable, to cover its liability for the deferred compensation. Investments to cover the Fund’s deferred compensation liability are recorded on the Fund’s books as an other asset. The deferred compensation liability and the related other asset are always equal and are marked to market on a periodic basis to reflect any income earned by the investments, as well as any unrealized gains or losses. The Deferred Compensation Plan investments had no impact on the operations of the Fund.
| Annual report | Classic Value Fund | 31 |
Note 6
Fund share transactions
This listing illustrates the number of Fund shares sold, reinvested and repurchased during the year ended October 31, 2009, the ten month period ended October 31, 2008 and the year ended December 31, 2007, along with the corresponding dollar value.
| Year ended 10-31-09 | Period ended 10-31-081 | Year ended 12-31-07 | ||||
| Shares | Amount | Shares | Amount | Shares | Amount | |
| Class A shares | ||||||
| Sold | 64,244,105 | $675,569,080 | 53,342,779 | $931,579,600 | 58,641,767 | $1,616,890,345 |
| Distributions | ||||||
| reinvested | 9,597,407 | 95,494,199 | — | — | 17,287,953 | 378,260,416 |
| Repurchased | (99,968,004) | (1,054,827,727) | (100,901,352) | (1,820,145,494) | (106,520,477) | (2,788,561,199) |
| Net decrease | (26,126,492) | ($283,764,448) | (47,558,573) | ($888,565,894) | (30,590,757) | ($793,410,438) |
| Class B shares | ||||||
| Sold | 278,350 | $3,003,361 | 293,029 | $5,194,793 | 376,700 | $10,255,929 |
| Distributions | ||||||
| reinvested | 360,741 | 3,571,341 | — | — | 789,591 | 17,126,244 |
| Repurchased | (2,275,678) | (24,206,832) | (3,600,393) | (65,267,143) | (3,522,251) | (93,121,578) |
| Net decrease | (1,636,587) | ($17,632,130) | (3,307,364) | ($60,072,350) | (2,355,960) | ($65,739,405) |
| Class C shares | ||||||
| Sold | 815,610 | $8,901,911 | 1,377,010 | $25,217,074 | 1,606,141 | $43,429,412 |
| Distributions | ||||||
| reinvested | 891,227 | 8,823,144 | — | — | 2,477,560 | 53,713,489 |
| Repurchased | (6,922,753) | (72,980,639) | (13,514,489) | (247,067,633) | (16,681,013) | (430,300,693) |
| Net decrease | (5,215,916) | ($55,255,584) | (12,137,479) | ($221,850,559) | (12,597,312) | ($333,157,792) |
| Class I shares | ||||||
| Sold | 22,453,826 | $256,300,737 | 28,719,033 | $481,668,567 | 21,957,511 | $592,709,537 |
| Distributions | ||||||
| reinvested | 4,193,379 | 41,682,192 | — | — | 4,735,716 | 103,806,886 |
| Repurchased | (33,926,581) | (356,360,821) | (28,871,115) | (506,599,268) | (29,653,564) | (783,321,846) |
| Net decrease | (7,279,376) | ($58,377,892) | (152,082) | ($24,930,701) | (2,960,337) | ($86,805,423) |
| Class R1 shares | ||||||
| Sold | 251,608 | $2,691,375 | 276,921 | $5,029,480 | 350,637 | $9,363,128 |
| Distributions | ||||||
| reinvested | 51,536 | 514,327 | — | — | 87,625 | 1,919,000 |
| Repurchased | (536,255) | (5,551,705) | (539,802) | (9,908,676) | (473,051) | (12,729,674) |
| Net decrease | (233,111) | ($2,346,003) | (262,881) | ($4,879,196) | (34,789) | ($1,447,546) |
| Class R3 shares | ||||||
| Sold | 2,224 | $25,000 | — | — | — | — |
| Net increase | 2,224 | $25,000 | — | — | — | — |
| Class R4 shares | ||||||
| Sold | 2,224 | $25,000 | — | — | — | — |
| Net increase | 2,224 | $25,000 | — | — | — | — |
| Class R5 shares | ||||||
| Sold | 2,224 | $25,000 | — | — | — | — |
| Net increase | 2,224 | $25,000 | — | — | — | — |
| Net decrease | (40,484,810) | ($417,301,057) | (63,418,379) | ($1,200,298,700) | (48,539,155) | ($1,280,560,604) |
1 For the ten month period ended October 31, 2008. The Fund changed its fiscal year end from December 31 to October 31.
| 32 | Classic Value Fund | Annual report |
Note 7
Purchase and sale of securities
Purchases and proceeds from sales or maturities of securities, other than short-term securities, during the year ended October 31, 2009, aggregated $1,470,346,484 and $1,962,451,514, respectively.
| Annual report | Classic Value Fund | 33 |
Auditors’ report
Report of Independent Registered Public Accounting Firm
To the Board of Trustees of John Hancock Capital Series and Shareholders of
John Hancock Classic Value Fund:
In our opinion, the accompanying statement of assets and liabilities, including the schedule of investments, and the related statements of operations and of changes in net assets and the financial highlights present fairly, in all material respects, the financial position of John Hancock Classic Value Fund (the Fund) at October 31, 2009, and the results of its operations, the changes in its net assets and the financial highlights for each of the periods indicated, in conformity with accounting principles generally accepted in the United States of America. These financial statements and financial highlights (hereafter referred to as financial statements) are the responsibility of the Fund’s management; our responsibility is to express an opinion on these financial statements based on our audits. We conducted our audits of these financial statements in accordance with the standards of the Public Company Accounting Oversight Board (United States). Those s tandards require that we plan and perform the audit to obtain reasonable assurance about whether the financial statements are free of material misstatement. An audit includes examining, on a test basis, evidence supporting the amounts and disclosures in the financial statements, assessing the accounting principles used and significant estimates made by management, and evaluating the overall financial statement presentation. We believe that our audits, which included confirmation of securities as of October 31, 2009 by correspondence with the custodian and brokers, provide a reasonable basis for our opinion.
PricewaterhouseCoopers LLP
Boston, Massachusetts
December 18, 2009
| 34 | Classic Value Fund | Annual report |
Tax information
Unaudited
For federal income tax purposes, the following information is furnished with respect to the distributions of the Fund, if any, paid during its taxable year ended October 31, 2009.
The Fund has designated distributions to shareholders of $88,579,771 as a long-term capital gain dividend.
With respect to the ordinary dividends paid by the Fund for the fiscal year ended October 31, 2009, 100% of the dividends qualifies for the corporate dividends-received deduction.
The Fund hereby designates the maximum amount allowable of its net taxable income as qualified dividend income as provided in the Jobs and Growth Tax Relief Reconciliation Act of 2003. This amount will be reflected on Form 1099-DIV for the calendar year 2009.
Shareholders will be mailed a 2009 Form 1099-DIV in January 2010. This will reflect the total of all distributions that are taxable for calendar year 2009.
| Annual report | Classic Value Fund | 35 |
Board Consideration of and
Continuation of Investment
Advisory Agreement and
Subadvisory Agreement
The Investment Company Act of 1940 (the 1940 Act) requires the Board of Trustees (the Board) of John Hancock Capital Series (the Trust), including a majority of the Trustees who have no direct or indirect interest in the investment advisory agreement and are not “interested persons” of the Trust, as defined in the 1940 Act (the Independent Trustees), annually to meet in person to review and consider the continuation of existing advisory and subadvisory agreements. At meetings held on May 6–7 and June 8–9, 2009, the Board considered the renewal of:
(i) the investment advisory agreement (the Advisory Agreement) with John Hancock Advisers, LLC (the Adviser) and
(ii) the investment subadvisory agreement (the Subadvisory Agreement) with Pzena Investment Management, LLC (the Subadviser) for the John Hancock Classic Value Fund (the Fund).
The Advisory Agreement and the Subadvisory Agreement are collectively referred to as the Advisory Agreements. The Board considered the factors and reached the conclusions described below relating to the selection of the Adviser and Subadviser and the continuation of the Advisory Agreements. During such meetings, the Board’s Contracts/Operations Committee and the Independent Trustees also met in executive sessions with their independent legal counsel.
In evaluating the Advisory Agreements, the Board, including the Contracts/Operations Committee and its Independent Trustees, reviewed a broad range of information requested for this purpose. The Independent Trustees considered the legal advice of independent legal counsel and relied on their own business judgment in determining the factors to be considered in evaluating the materials that were presented to them and the weight to be given to each such factor. The Board’s review and conclusions were based on a comprehensive consideration of all information presented to the Board and not the result of any single controlling factor. The key factors considered by the Board and the conclusions reached are described below.
Nature, extent and quality of services
The Board considered the ability of the Adviser and the Subadviser, based on their resources, reputation and other attributes, to attract and retain qualified investment professionals, including research, advisory, and supervisory personnel. It considered the background and experience of senior management and investment professionals responsible for managing the Fund. The Board considered the investment philosophy, research and investment decision-making processes of the Adviser and the Subadviser responsible for the daily investment activities of the Fund. The Board considered the Subadviser’s history and experience with the Fund. The Board considered the Adviser’s execution of its oversight responsibilities. The Board further considered the culture of compliance, resources dedicated to compliance, compliance programs, record of compliance with applicable laws and regulation, with the Fund’s investment policies and restrictions and with the applicable Code of Ethics, and the responsibilities of the Adviser’s and Subadviser’s compliance department. In addition, the Board took into account the administrative and other non-advisory services provided to the Fund by the Adviser and its affiliates.
Based on the above factors, together with those referenced below, the Board concluded that, within the context of its full deliberations, the nature, extent and quality of the investment advisory services provided to the Fund by the Adviser and Subadviser supported renewal of the Advisory Agreements.
Fund performance
The Board considered the performance results for the Fund over various time periods ended December 31, 2008. The Board also considered these results in comparison to the performance of a category of relevant funds (the Category), a peer group of comparable funds (the Peer Group) and a benchmark index. The funds within each Category and Peer Group were selected by Morningstar Inc.
| 36 | Classic Value Fund | Annual report |
(Morningstar), an independent provider of investment company data. The Board reviewed the methodology used by Morningstar to select the funds in the Category and the Peer Group. The Board also considered updated performance information at its May and June 2009 meetings. Performance and other information may be quite different as of the date of this shareholders report.
The Board noted that the Fund’s performance for the 10-year period was higher than the performance of the Peer Group and Category medians, and its benchmark index, the Russell 1000 Value Index. The Board noted that the Fund’s performance for more recent periods is lower than the performance of the Peer Group and Category medians and benchmark index. Because of the underperformance for more recent periods, the Board made further inquiry of the Adviser.
The Adviser provided the Board with additional information regarding the Fund’s performance. The Adviser explained that the Fund has performed in the top quartile as of April 2009. It noted that the Fund’s underperformance in 2007 and 2008 significantly contributed to its below median results for the 1-, 3- and 5-year periods. The Adviser noted that in six of the previous ten years the Fund performed in the top third of its Peer Group. The Board viewed favorably the Fund’s longer-term performance and noted times in the Fund’s history in which it outperformed comparable funds. The Adviser noted that the Fund’s performance as of May and June 2009 was improved. The Board noted that the Subadviser, known for its value-style of investing, remained consistent with its investment style and adhered to its investment mandates. The Board concluded that the Fund’s underperformance was being responsibly addressed by the Adviser and Subadvi ser.
Investment advisory fee and subadvisory fee
rates and expenses
The Board reviewed and considered the contractual investment advisory fee rate payable by the Fund to the Adviser for investment advisory services (the Advisory Agreement Rate). The Board received and considered information comparing the Advisory Agreement Rate with the advisory fees for the Category and Peer Group. The Board noted that the Advisory Agreement Rate was higher than the median rate of the Category and Peer Group. The Board viewed favorably the Adviser’s agreement to voluntarily waive its advisory fees payable by the Fund in an amount equal to 0.10% of the Fund’s average daily net assets, on an annualized basis.
The Board received and considered expense information regarding the Fund’s various components, including advisory fees, distribution and fees other than advisory and distribution fees, including transfer agent fees, custodian fees, and other miscellaneous fees (e.g., fees for accounting and legal services). The Board considered comparisons of these expenses to the Peer Group median. The Board also received and considered expense information regarding the Fund’s total operating expense ratio (Gross Expense Ratio) and total operating expense ratio after taking the fee waiver arrangement applicable to the Advisory Agreement Rate into account (Net Expense Ratio). The Board received and considered information comparing the Gross Expense Ratio and Net Expense Ratio of the Fund to that of the Peer Group and Category medians. The Board noted that the Fund’s Net and Gross Expense Rat ios were higher than the Peer Group and Category medians. The Board favorably considered the impact of fee waivers towards ultimately lowering the Fund’s total operating expense ratio.
The Adviser also discussed the Morningstar data and rankings, and other relevant information, for the Fund. Based on the above-referenced considerations and other factors, the Board concluded that the Fund’s overall performance and expense results supported the re-approval of the Advisory Agreements.
The Board also received information about the investment subadvisory fee rate (the Subadvisory Agreement Rate) payable by the Adviser to the Subadviser for investment subadvisory services. The Board concluded that the Subadvisory Agreement Rate was fair and equitable, based on its consideration of the factors described here.
| Annual report | Classic Value Fund | 37 |
Profitability
The Board received and considered a detailed profitability analysis of the Adviser based on the Advisory Agreements, as well as on other relationships between the Fund and the Adviser and its affiliates. The Board also considered a comparison of the Adviser’s profitability to that of other similar investment advisers whose profitability information is publicly available. The Board concluded that, in light of the costs of providing investment management and other services to the Fund, the profits and other ancillary benefits reported by the Adviser were not unreasonable.
The Board did not consider profitability information with respect to the Subadviser, which is not affiliated with the Adviser. The Board considered that the Subadvisory Agreement Rate paid to the Subadviser had been negotiated by the Adviser on an arm’s length basis and that the Subadviser’s separate profitability from its relationship with the Fund was not a material factor in determining whether to renew the agreement.
Economies of scale
The Board received and considered general information regarding economies of scale with respect to the management of the Fund, including the Fund’s ability to appropriately benefit from economies of scale under the Fund’s fee structure. The Board recognized the inherent limitations of any analysis of economies of scale, stemming largely from the Board’s understanding that most of the Adviser’s costs are not specific to individual Funds, but rather are incurred across a variety of products and services. To ensure that any economies are reasonably shared with the Fund as its assets increase, the Adviser and the Board agreed to continue the existing breakpoints to the Advisory Agreement Rate.
Information about services to other clients
The Board also received information about the nature, extent and quality of services and fee rates offered by the Adviser and Subadviser to their other clients, including other registered investment companies, institutional investors and separate accounts. The Board concluded that the Advisory Agreement Rate and the Subadvisory Agreement Rate were not unreasonable, taking into account fee rates offered to others by the Adviser and Subadviser, respectively, after giving effect to differences in services.
Other benefits to the Adviser
The Board received information regarding potential “fall-out” or ancillary benefits received by the Adviser and its affiliates and the Subadviser as a result of their relationship with the Fund. Such benefits could include, among others, benefits directly attributable to the relationship of the Adviser and Subadviser with the Fund and benefits potentially derived from an increase in business of the Adviser and Subadviser as a result of their relationship with the Fund (such as the ability to market to shareholders other financial products offered by the Adviser and its affiliates).
Other factors and broader review
As discussed above, the Board reviewed detailed materials received from the Adviser and Subadviser as part of the annual re-approval process. The Board also regularly reviews and assesses the quality of the services that the Fund receives throughout the year. In this regard, the Board reviews reports of the Adviser at least quarterly, which include, among other things, fund performance reports and compliance reports. In addition, the Board meets with senior investment officers at various times throughout the year.
After considering the above-described factors and based on its deliberations and its evaluation of the information described above, the Board concluded that approval of the continuation of the Advisory Agreements for the Fund was in the best interest of the Fund and its shareholders. Accordingly, the Board unanimously approved the continuation of the Advisory Agreements.
August 30–September 1, 2009 meeting
At a meeting held on August 30–September 1, 2009, the Board, including the Independent Trustees, considered and approved an amended Advisory Agreement Rate and Subadvisory Agreement Rate that included modified breakpoints. This consideration and approval followed a series of discussions with the Adviser and a review of an additional
| 38 | Classic Value Fund | Annual report |
report prepared by the Adviser at the request of the Independent Trustees following the earlier Board meetings. The requested report compared the Fund’s breakpoints to its Peer Group at various hypothetical asset levels. The Independent Trustees noted that the report was prepared at their request to facilitate a more comprehensive review of the reasonableness of each fund’s breakpoints relative to its Peer Group and asset level. With the modified breakpoints, the Advisory Agreement Rates and Subadvisory Agreement Rates are lower than those under the previously approved Agreements at various asset levels. As a result of the modified breakpoints, the Adviser determined that it would terminate the arrangement whereby it voluntarily agreed to waive its advisory fees payable by the Fund in an amount equal to 0.10% of the Fund’s average daily net assets, on an annualized basis, which had been in effect since May 1, 2009. After review and considerat ion of the report, the Board, including a majority of the Independent Trustees, approved the amended Advisory Agreement Rate and Subadvisory Agreement Rate.
| Annual report | Classic Value Fund | 39 |
Special Shareholder Meeting (unaudited)
On April 16, 2009, a Special Meeting of the Shareholders of John Hancock Capital Series and its series, John Hancock Classic Value Fund, was held at 601 Congress Street, Boston, Massachusetts, for the purpose of considering and voting on:
Proposal 1: Election of eleven Trustees as members of the Board of Trustees of John Hancock Capital Series.
PROPOSAL 1 PASSED FOR ALL TRUSTEES ON APRIL 16, 2009.
1. Election of eleven Trustees as members of the Board of Trustees of the Trust:
| % of Outstanding | % of Shares | ||
| No. of Shares | Shares | Present | |
| James R. Boyle | |||
| Affirmative | 153,605,601.4781 | 59.782% | 95.228% |
| Withhold | 7,697,737.9989 | 2.996% | 4.772% |
| TOTAL | 161,303,339.4770 | 62.778% | 100.000% |
| John G. Vrysen | |||
| Affirmative | 153,671,879.4168 | 59.808% | 95.269% |
| Withhold | 7,631,460.0602 | 2.970% | 4.731% |
| TOTAL | 161,303,339.4770 | 62.778% | 100.000% |
| James F. Carlin | |||
| Affirmative | 153,406,809.6394 | 59.705% | 95.105% |
| Withhold | 7,896,529.8376 | 3.073% | 4.895% |
| TOTAL | 161,303,339.4770 | 62.778% | 100.000% |
| William H. Cunningham | |||
| Affirmative | 153,539,441.8135 | 59.756% | 95.187% |
| Withhold | 7,763,897.6635 | 3.022% | 4.813% |
| TOTAL | 161,303,339.4770 | 62.778% | 100.000% |
| Deborah Jackson | |||
| Affirmative | 153,413,956.1920 | 59.708% | 95.109% |
| Withhold | 7,889,383.2850 | 3.070% | 4.891% |
| TOTAL | 161,303,339.4770 | 62.778% | 100.000% |
| Charles L. Ladner | |||
| Affirmative | 153,388,227.3569 | 59.697% | 95.093% |
| Withhold | 7,915,112.1201 | 3.081% | 4.907% |
| TOTAL | 161,303,339.4770 | 62.778% | 100.000% |
| Stanley Martin | |||
| Affirmative | 153,518,939.0508 | 59.748% | 95.174% |
| Withhold | 7,784,400.4262 | 3.030% | 4.826% |
| TOTAL | 161,303,339.4770 | 62.778% | 100.000% |
| Patti McGill Peterson | |||
| Affirmative | 153,380,504.5348 | 59.694% | 95.088% |
| Withhold | 7,922,834.9422 | 3.084% | 4.912% |
| TOTAL | 161,303,339.4770 | 62.778% | 100.000% |
| 40 | Classic Value Fund | Annual report |
| % of Outstanding | % of Shares | ||
| No. of Shares | Shares | Present | |
| John A. Moore | |||
| Affirmative | 153,486,399.4544 | 59.736% | 95.154% |
| Withhold | 7,816,940.0226 | 3.042% | 4.846% |
| TOTAL | 161,303,339.4770 | 62.778% | 100.000% |
| Steven R. Pruchansky | |||
| Affirmative | 153,551,232.1338 | 59.761% | 95.194% |
| Withhold | 7,752,107.3432 | 3.017% | 4.806% |
| TOTAL | 161,303,339.4770 | 62.778% | 100.000% |
| Gregory A. Russo | |||
| Affirmative | 153,542,836.3827 | 59.758% | 95.189% |
| Withhold | 7,760,503.0943 | 3.020% | 4.811% |
| TOTAL | 161,303,339.4770 | 62.778% | 100.000% |
On May 5, 2009, an adjourned session of a Special Meeting of the Shareholders of John Hancock Capital Series and its series, John Hancock Classic Value Fund, was held at 601 Congress Street, Boston, Massachusetts, for the purpose of considering and voting on:
Proposal 2: To approve a new form of Advisory Agreement between John Hancock Capital Series and John Hancock Advisers, LLC.
PROPOSAL 2 DID NOT PASS ON MAY 5, 2009.
2. Approval of a new form of Advisory Agreement between each Trust and John Hancock Advisers, LLC.
| % of Outstanding | % of Shares | ||
| No. of Shares | Shares | Present | |
| Affirmative | 73,346,456.3160 | 34.232% | 56.089% |
| Against | 2,438,535.8585 | 1.138% | 1.865% |
| Abstain | 2,271,151.5135 | 1.060% | 1.737% |
| Broker Non-Votes | 52,711,211.0000 | 24.601% | 40.309% |
| TOTAL | 130,767,354.6880 | 61.031% | 100.000% |
Proposal 3: To approve the following changes to fundamental investment restrictions:
PROPOSALS 3A-3F DID NOT PASS ON MAY 5, 2009.
3. Approval of the following changes to fundamental investment restrictions:
| % of Outstanding | % of Shares | ||
| No. of Shares | Shares | Present | |
| 3A. Revise: Concentration | |||
| Affirmative | 73,027,268.5226 | 34.083% | 55.845% |
| Against | 2,778,223.7908 | 1.297% | 2.125% |
| Abstain | 2,250,651.3746 | 1.050% | 1.721% |
| Broker Non-Votes | 52,711,211.0000 | 24.601% | 40.309% |
| TOTAL | 130,767,354.6880 | 61.031% | 100.000% |
| Annual report | Classic Value Fund | 41 |
| % of Outstanding | % of Shares | ||
| No. of Shares | Shares | Present | |
| 3B. Revise: Diversification | |||
| Affirmative | 73,139,229.7520 | 34.135% | 55.931% |
| Against | 2,680,842.9008 | 1.251% | 2.050% |
| Abstain | 2,236,069.0352 | 1.044% | 1.710% |
| Broker Non-Votes | 52,711,213.0000 | 24.601% | 40.309% |
| TOTAL | 130,767,354.6880 | 61.031% | 100.000% |
| 3C. Revise: Underwriting | |||
| Affirmative | 72,939,430.0962 | 34.042% | 55.778% |
| Against | 2,752,564.6821 | 1.285% | 2.105% |
| Abstain | 2,364,145.9097 | 1.103% | 1.808% |
| Broker Non-Votes | 52,711,214.0000 | 24.601% | 40.309% |
| TOTAL | 130,767,354.6880 | 61.031% | 100.000% |
| 3D. Revise: Real Estate | |||
| Affirmative | 72,929,340.8826 | 34.037% | 55.770% |
| Against | 2,774,647.1167 | 1.295% | 2.122% |
| Abstain | 2,352,150.6887 | 1.098% | 1.799% |
| Broker Non-Votes | 52,711,216.0000 | 24.601% | 40.309% |
| TOTAL | 130,767,354.6880 | 61.031% | 100.000% |
| 3E. Revise: Loans | |||
| Affirmative | 72,790,337.9838 | 33.973% | 55.664% |
| Against | 2,949,215.9035 | 1.376% | 2.255% |
| Abstain | 2,316,583.8007 | 1.081% | 1.772% |
| Broker Non-Votes | 52,711,217.0000 | 24.601% | 40.309% |
| TOTAL | 130,767,354.6880 | 61.031% | 100.000% |
| 3F. Revise: Senior Securities | |||
| Affirmative | 72,807,780.7221 | 33.980% | 55.678% |
| Against | 2,878,834.9782 | 1.344% | 2.201% |
| Abstain | 2,369,533.9877 | 1.106% | 1.812% |
| Broker Non-Votes | 52,711,205.0000 | 24.601% | 40.309% |
| TOTAL | 130,767,354.6880 | 61.031% | 100.000% |
| 42 | Classic Value Fund | Annual report |
Proposal 4: To approve amendments changing Rule 12b-1 Plans for certain classes of the Fund from “reimbursement” to “compensation” plans.
PROPOSAL 4 DID NOT PASS FOR ALL CLASSES OF SHARES ON MAY 5, 2009. (There was no Quorum for Classes C and R1)
Class A
4. Approval of amendments changing Rule 12b-1 Plans for certain classes of the Funds from “reimbursement” to “compensation” plans.
| % of Outstanding | % of Shares | ||
| No. of Shares | Shares | Present | |
| Affirmative | 47,322,091.8838 | 33.900% | 48.900% |
| Against | 2,481,766.2499 | 1.778% | 2.564% |
| Abstain | 1,768,354.3853 | 1.267% | 1.827% |
| Broker Non-Votes | 45,202,519.0000 | 32.382% | 46.709% |
| TOTAL | 96,774,731.5190 | 69.327% | 100.000% |
Class B
4. Approval of amendments changing Rule 12b-1 Plans for certain classes of the Funds from “reimbursement” to “compensation” Plans.
| % of Outstanding | % of Shares | ||
| No. of Shares | Shares | Present | |
| Affirmative | 1,800,382.9444 | 28.868% | 54.310% |
| Against | 89,874.7805 | 1.441% | 2.711% |
| Abstain | 121,691.9091 | 1.951% | 3.671% |
| Broker Non-Votes | 1,303,055.0000 | 20.893% | 39.308% |
| TOTAL | 3,315,004.6340 | 53.153% | 100.000% |
Class C
4. Approval of amendments changing Rule 12b-1 Plans for certain classes of the Funds from “reimbursement” to “compensation” Plans.
| % of Outstanding | % of Shares | ||
| No. of Shares | Shares | Present | |
| Affirmative | 3,328,830.9812 | 22.112% | 51.462% |
| Against | 309,161.7698 | 2.054% | 4.780% |
| Abstain | 206,312.5740 | 1.371% | 3.190% |
| Broker Non-Votes | 2,624,158.0000 | 17.432% | 40.568% |
| TOTAL | 6,468,463.3250 | 42.969% | 100.000% |
Class R1
4. Approval of amendments changing Rule 12b-1 Plans for certain classes of the Funds from “reimbursement” to “compensation” Plans.
| % of Outstanding | % of Shares | ||
| No. of Shares | Shares | Present | |
| Affirmative | 230,937.7110 | 29.451% | 81.882% |
| Against | 952.0010 | .121% | .338% |
| Abstain | 23,788.0000 | 3.034% | 8.434% |
| Broker Non-Votes | 26,359.0000 | 3.362% | 9.346% |
| TOTAL | 282,036.7120 | 35.968% | 100.000% |
| Annual report | Classic Value Fund | 43 |
Proposal 5: To adopt a manager of manager structure.
PROPOSAL 5 DID NOT PASS ON MAY 5, 2009.
5. Proposal adopting a manager of manager.
| Affirmative | 61,838,734.4293 | 28.861% | 47.290% |
| Against | 13,872,120.1432 | 6.474% | 10.608% |
| Abstain | 2,345,280.1155 | 1.095% | 1.793% |
| Broker Non-Votes | 52,711,220.0000 | 24.601% | 40.309% |
| TOTAL | 130,767,354.6880 | 61.031% | 100.000% |
Proposal 6: To revise merger approval requirements for the Trust.
PROPOSAL 6 DID NOT PASS ON MAY 5, 2009.
6. Revision to merger approval requirements.
| Affirmative | 85,422,918.6613 | 33.245% | 52.958% |
| Against | 5,230,141.9859 | 2.036% | 3.242% |
| Abstain | 3,359,675.8298 | 1.308% | 2.083% |
| Broker Non-Votes | 67,290,603.0000 | 26.189% | 41.717% |
| TOTAL | 161,303,339.4770 | 62.778% | 100.000% |
| 44 | Classic Value Fund | Annual report |
Trustees and Officers
This chart provides information about the Trustees and Officers who oversee your John Hancock fund. Officers elected by the Trustees manage the day-to-day operations of the Fund and execute policies formulated by the Trustees.
Independent Trustees
| Name, Year of Birth | Number of John | |
| Position(s) held with Fund | Trustee | Hancock funds |
| Principal occupation(s) and other | of Fund | overseen by |
| directorships during past 5 years | since1 | Trustee |
| Patti McGill Peterson, Born: 1943 | 2002 | 47 |
| Chairperson (since December 2008); Principal, PMP Globalinc (consulting) (since 2007); Senior | ||
| Associate, Institute for Higher Education Policy (since 2007); Executive Director, CIES (international | ||
| education agency) (until 2007); Vice President, Institute of International Education (until 2007); Senior | ||
| Fellow, Cornell University Institute of Public Affairs, Cornell University (until 1998); Former President | ||
| Wells College, St. Lawrence University and the Association of Colleges and Universities of the State | ||
| of New York. Director of the following: Niagara Mohawk Power Corporation (until 2003); Security | ||
| Mutual Life (insurance) (until 1997); ONBANK (until 1993). Trustee of the following: Board of Visitors, | ||
| The University of Wisconsin, Madison (since 2007); Ford Foundation, International Fellowships Program | ||
| (until 2007); UNCF, International Development Partnerships (until 2005); Roth Endowment (since 2002); | ||
| Council for International Educational Exchange (since 2003). | ||
| James F. Carlin, Born: 1940 | 2005 | 47 |
| Director and Treasurer, Alpha Analytical Laboratories, Inc. (chemical analysis) (since 1985); Part Owner | ||
| and Treasurer, Lawrence Carlin Insurance Agency, Inc. (since 1995); Part Owner and Vice President, | ||
| Mone Lawrence Carlin Insurance Agency, Inc. (until 2005); Chairman and Chief Executive Officer, | ||
| Carlin Consolidated, Inc. (management/investments) (since 1987); Trustee, Massachusetts Health and | ||
| Education Tax Exempt Trust (1993–2003). | ||
| William H. Cunningham, Born: 1944 | 2005 | 47 |
| Professor, University of Texas, Austin, Texas (since 1971); former Chancellor, University of Texas System | ||
| and former President of the University of Texas, Austin, Texas; Director of the following: LIN Television | ||
| (since 2009), Lincoln National Corporation (insurance) (since 2006), Resolute Energy Corporation (oil | ||
| and gas) (since 2009), Southwest Airlines (since 2000), Hayes Lemmerz International, Inc. (diversified | ||
| automotive parts supply company) (2003–2009). | ||
| Deborah C. Jackson,2 Born: 1952 | 2008 | 47 |
| Chief Executive Officer, American Red Cross of Massachusetts Bay (since 2002); Board of Directors of | ||
| Eastern Bank Corporation (since 2001); Board of Directors of Eastern Bank Charitable Foundation (since | ||
| 2001); Board of Directors of American Student Association Corp. (since 1996); Board of Directors of | ||
| Boston Stock Exchange (2002–2008); Board of Directors of Harvard Pilgrim Healthcare (since 2007). | ||
| Charles L. Ladner, Born: 1938 | 2004 | 47 |
| Chairman and Trustee, Dunwoody Village, Inc. (retirement services); Senior Vice President and Chief | ||
| Financial Officer, UGI Corporation (public utility holding company) (retired 1998); Vice President and | ||
| Director, AmeriGas, Inc. (retired 1998); Director, AmeriGas Partners, L.P. (gas distribution) (until 1997); | ||
| Director, EnergyNorth, Inc. (until 1997); Director, Parks and History Association (until 2005). | ||
| Annual report | Classic Value Fund | 45 |
Independent Trustees (continued)
| Name, Year of Birth | Number of John | |
| Position(s) held with Fund | Trustee | Hancock funds |
| Principal occupation(s) and other | of Fund | overseen by |
| directorships during past 5 years | since1 | Trustee |
| Stanley Martin,2 Born: 1947 | 2008 | 47 |
| Senior Vice President/Audit Executive, Federal Home Loan Mortgage Corporation (2004–2006); | ||
| Executive Vice President/Consultant, HSBC Bank USA (2000–2003); Chief Financial Officer/Executive | ||
| Vice President, Republic New York Corporation and Republic National Bank of New York (1998–2000); | ||
| Partner, KPMG LLP (1971–1998). | ||
| Dr. John A. Moore, Born: 1939 | 2002 | 47 |
| President and Chief Executive Officer, Institute for Evaluating Health Risks (nonprofit institution) | ||
| (until 2001); Senior Scientist, Sciences International (health research) (until 2003); Former | ||
| Assistant Administrator and Deputy Administrator, Environmental Protection Agency; Principal, | ||
| Hollyhouse (consulting) (since 2000); Director, CIIT Center for Health Science Research (nonprofit | ||
| research) (until 2007). | ||
| Steven R. Pruchansky,2 Born: 1944 | 2005 | 47 |
| Chairman and Chief Executive Officer, Greenscapes of Southwest Florida, Inc. (since 2000); Director | ||
| and President, Greenscapes of Southwest Florida, Inc. (until 2000); Member, Board of Advisors, First | ||
| American Bank (since 2008); Managing Director, JonJames, LLC (real estate) (since 2000); Director, | ||
| First Signature Bank & Trust Company (until 1991); Director, Mast Realty Trust (until 1994); President, | ||
| Maxwell Building Corp. (until 1991). | ||
| Gregory A. Russo, Born: 1949 | 2009 | 47 |
| Vice Chairman, Risk & Regulatory Matters, KPMG LLP (KPMG) (2002–2006); Vice Chairman, Industrial | ||
| Markets, KPMG (1998–2002). | ||
Non-Independent Trustees3
| Name, Year of Birth | Number of John | |
| Position(s) held with Fund | Trustee | Hancock funds |
| Principal occupation(s) and other | of Fund | overseen by |
| directorships during past 5 years | since1 | Trustee |
| James R. Boyle, Born: 1959 | 2005 | 262 |
| Senior Executive Vice President (since 2009), Executive Vice President (1999–2009), Manulife Financial | ||
| Corporation; Director and President, John Hancock Variable Life Insurance Company (since 2007); | ||
| Director and Executive Vice President, John Hancock Life Insurance Company (since 2004); Chairman | ||
| and Director, John Hancock Advisers, LLC, The Berkeley Financial Group, LLC (holding company) and | ||
| John Hancock Funds, LLC (since 2005); Chairman and Director, John Hancock Investment Management | ||
| Services, LLC (since 2006); Senior Vice President, The Manufacturers Life Insurance Company (U.S.A.) | ||
| (until 2004). | ||
| 46 | Classic Value Fund | Annual report |
Non-Independent Trustees3 (continued)
| Name, Year of Birth | Number of John | |
| Position(s) held with Fund | Trustee | Hancock funds |
| Principal occupation(s) and other | of Fund | overseen by |
| directorships during past 5 years | since1 | Trustee |
| John G. Vrysen,4 Born: 1955 | 2009 | 47 |
| Senior Vice President (since 2006), Vice President (until 2006), Manulife Financial Corporation; | ||
| Director, Executive Vice President and Chief Operating Officer, John Hancock Advisers, LLC, The | ||
| Berkeley Financial Group, LLC, John Hancock Investment Management Services, LLC (“JHIMS”), and | ||
| John Hancock Funds, LLC (since 2007); Chief Operating Officer, JHF II and JHT (since 2007); Chief | ||
| Operating Officer, John Hancock Funds and JHF III (2007–2009); Director, John Hancock Signature | ||
| Services, Inc. (“Signature Services”) (since 2005); Chief Financial Officer, John Hancock Advisers, LLC, | ||
| The Berkeley Financial Group, LLC, MFC Global Investment Management (U.S.) (“MFC Global (U.S.)”), | ||
| JHIMS, John Hancock Funds, LLC, JHF, JHF II, JHF III and JHT (2005–2007). | ||
| Principal officers who are not Trustees | ||
| Name, Year of Birth | ||
| Position(s) held with Fund | Officer | |
| Principal occupation(s) and other | of Fund | |
| directorships during past 5 years | since | |
| Keith F. Hartstein, Born: 1956 | 2005 | |
| President and Chief Executive Officer | ||
| Senior Vice President, Manulife Financial Corporation (since 2004); Director, President and Chief | ||
| Executive Officer, John Hancock Advisers, LLC, The Berkeley Financial Group, LLC, John Hancock Funds, | ||
| LLC (since 2005); Director, MFC Global (U.S.) (since 2005); Chairman and Director, Signature Services | ||
| (since 2005); Director, President and Chief Executive Officer, John Hancock Investment Management | ||
| Services, LLC (since 2006); President and Chief Executive Officer, John Hancock Funds (since 2005) and | ||
| JHF III (since 2006); Executive Vice President (since 2009), President and Chief Executive Officer (until | ||
| 2009), JHT and JHF II; Director, Chairman and President, NM Capital Management, Inc. (since 2005); | ||
| Member and former Chairman, Investment Company Institute Sales Force Marketing Committee (since | ||
| 2003); Director, President and Chief Executive Officer, MFC Global (U.S.) (2005–2006); Executive Vice | ||
| President, John Hancock Funds, LLC (until 2005). | ||
| Andrew G. Arnott, Born: 1971 | 2009 | |
| Chief Operating Officer | ||
| Senior Vice President, Manulife Financial Corporation (since 2009); Senior Vice President (since 2007), | ||
| Vice President (2005–2007), John Hancock Advisers, LLC; Senior Vice President (since 2008), Vice | ||
| President (2006–2008), John Hancock Investment Management Services, LLC; Senior Vice President | ||
| (since 2006), Vice President (2005–2006), 2nd Vice President (2004–2005), John Hancock Funds, | ||
| LLC; Chief Operating Officer (since 2009), Vice President (2007–2009), John Hancock Funds and JHF | ||
| III; Vice President (since 2006), John Hancock Funds II and John Hancock Trust; Senior Vice President | ||
| (2005–2009), Product Management and Development for John Hancock Funds, LLC; Vice President and | ||
| Director (1998–2005), Marketing and Product Management for John Hancock Funds, LLC. | ||
| Annual report | Classic Value Fund | 47 |
Principal officers who are not Trustees (continued)
| Name, Year of Birth | |
| Position(s) held with Fund | Officer |
| Principal occupation(s) and other | of Fund |
| directorships during past 5 years | since |
| Thomas M. Kinzler, Born: 1955 | 2006 |
| Secretary and Chief Legal Officer | |
| Vice President and Counsel for John Hancock Life Insurance Company (U.S.A.) (since 2006); Secretary | |
| and Chief Legal Officer, John Hancock Funds, JHF II, JHF III and JHT (since 2006); Secretary and Chief | |
| Legal Counsel, John Hancock Advisers, LLC and John Hancock Investment Management Services, LLC | |
| (since 2008); Secretary, John Hancock Funds, LLC and The Berkeley Financial Group, LLC (since 2007); | |
| Vice President and Associate General Counsel for Massachusetts Mutual Life Insurance Company | |
| (1999–2006); Secretary and Chief Legal Counsel for MML Series Investment Fund (2000–2006); | |
| Secretary and Chief Legal Counsel for MassMutual Institutional Funds (2000–2004); Secretary and | |
| Chief Legal Counsel for MassMutual Select Funds and MassMutual Premier Funds (2004–2006). | |
| Francis V. Knox, Jr., Born: 1947 | 2005 |
| Chief Compliance Officer | |
| Chief Compliance Officer, John Hancock Funds, JHF II, JHF III and JHT (since 2005); Chief Compliance | |
| Officer, John Hancock Advisers, LLC and JHIMS (since 2007); Vice President and Chief Compliance | |
| Officer, John Hancock Advisers, LLC and JHIMS (until 2007); Vice President and Chief Compliance | |
| Officer, MFC Global (U.S.) (2005–2008); Vice President and Assistant Treasurer, Fidelity Group of | |
| Funds (until 2005). | |
| Michael J. Leary, Born: 1965 | 2007 |
| Treasurer | |
| Vice President, John Hancock Life Insurance Company (U.S.A.) and Treasurer for John Hancock Funds, | |
| John Hancock Funds II, John Hancock Funds III and John Hancock Trust (since May 2009); Assistant | |
| Treasurer, John Hancock Funds, John Hancock Funds II, John Hancock Funds III and John Hancock | |
| Trust (2007–2009); Vice President and Director of Fund Administration, JP Morgan (2004–2007); Vice | |
| President and Senior Manager of Fund Administration, JP Morgan (1993–2004); Manager, Ernst & | |
| Young, LLC (1988–1993). | |
| Charles A. Rizzo, Born: 1957 | 2007 |
| Chief Financial Officer | |
| Senior Vice President, John Hancock Advisers, LLC and John Hancock Investment Management Services, | |
| LLC (since 2007); Chief Financial Officer, John Hancock Funds, JHF II, JHF III and JHT (since 2007); | |
| Assistant Treasurer, Goldman Sachs Mutual Fund Complex (registered investment companies) (2005– | |
| 2007); Vice President, Goldman Sachs (2005–2007); Managing Director and Treasurer of Scudder | |
| Funds, Deutsche Asset Management (2003–2005). | |
The business address for all Trustees and Officers is 601 Congress Street, Boston, Massachusetts 02210-2805.
The Statement of Additional Information of the Fund includes additional information about members of the Board of Trustees of the Fund and is available without charge, upon request, by calling 1-800-225-5291.
1 Each Trustee serves until resignation, retirement age or until his or her successor is elected.
2 Member of Audit Committee. Mr. Pruchansky was appointed by the Board of Trustees effective September 1, 2009.
3 Non-Independent Trustees hold positions with the Fund’s investment adviser, underwriter and certain other affiliates.
4 Mr. Vrysen was elected by the shareholders at a special meeting on April 16, 2009.
| 48 | Classic Value Fund | Annual report |
More information
| Trustees | Investment adviser |
| Patti McGill Peterson, Chairperson | John Hancock Advisers, LLC |
| James R. Boyle† | |
| James F. Carlin | Subadviser |
| William H. Cunningham | Pzena Investment Management, LLC |
| Deborah C. Jackson* | |
| Charles L. Ladner | Principal distributor |
| Stanley Martin* | John Hancock Funds, LLC |
| Dr. John A. Moore | |
| Steven R. Pruchansky†† | Custodian |
| Gregory A. Russo | State Street Bank and Trust Company |
| John G. Vrysen† | |
| Transfer agent | |
| Officers | John Hancock Signature Services, Inc. |
| Keith F. Hartstein | |
| President and Chief Executive Officer | Legal counsel |
| K&L Gates LLP | |
| Andrew G. Arnott‡ | |
| Chief Operating Officer | Independent registered |
| public accounting firm | |
| Thomas M. Kinzler | PricewaterhouseCoopers LLP |
| Secretary and Chief Legal Officer | |
| Francis V. Knox, Jr. | |
| Chief Compliance Officer | |
| Michael J. Leary | |
| Treasurer | |
| Charles A. Rizzo | |
| Chief Financial Officer |
*Member of the Audit Committee
††Member of the Audit Committee effective 9-1-09
†Non-Independent Trustee
‡Effective 9-1-09
The Fund’s proxy voting policies and procedures, as well as the Fund’s proxy voting record for the most recent twelve-month period ended June 30, are available free of charge on the Securities and Exchange Commission (SEC) Web site at www.sec.gov or on our Web site.
The Fund’s complete list of portfolio holdings, for the first and third fiscal quarters, is filed with the SEC on Form N-Q. The Fund’s Form N-Q is available on our Web site and the SEC’s Web site, www.sec.gov, and can be reviewed and copied (for a fee) at the SEC’s Public Reference Room in Washington, DC. Call 1-800-SEC-0330 to receive information on the operation of the SEC’s Public Reference Room.
We make this information on your fund, as well as monthly portfolio holdings, and other fund details available on our Web site www.jhfunds.com or by calling 1-800-225-5291.
| You can also contact us: | ||
| 1-800-225-5291 | Regular mail: | Express mail: |
| jhfunds.com | John Hancock Signature Services, Inc. | John Hancock Signature Services, Inc. |
| P.O. Box 55913 | Mutual Fund Image Operations | |
| Boston, MA 02205-5913 | 30 Dan Road | |
| Canton, MA 02021 | ||
| Annual report | Classic Value Fund | 49 |

1-800-225-5291
1-800-554-6713 TDD
1-800-338-8080 EASI-Line
www.jhfunds.com
Now available: electronic delivery
www.jhfunds.com/edelivery
| This report is for the information of the shareholders of John Hancock Classic Value Fund. | 3800A 10/09 |
| It is not authorized for distribution to prospective investors unless preceded or accompanied by a prospectus. | 12/09 |
ITEM 2. CODE OF ETHICS.
As of the end of the period, October 31, 2009, the registrant has adopted a code of ethics, as defined in Item 2 of Form N-CSR, that applies to its Chief Executive Officer, Chief Financial Officer and Treasurer (respectively, the principal executive officer, the principal financial officer and the principal accounting officer, the “Senior Financial Officers”). A copy of the code of ethics is filed as an exhibit to this Form N-CSR.
ITEM 3. AUDIT COMMITTEE FINANCIAL EXPERT.
Stanley Martin is the audit committee financial expert and is “independent”, pursuant to general instructions on Form N-CSR Item 3.
ITEM 4. PRINCIPAL ACCOUNTANT FEES AND SERVICES.
(a) Audit Fees
The aggregate fees billed for professional services rendered by the principal accountant(s) for the audit of the registrant’s annual financial statements or services that are normally provided by the accountant(s) in connection with statutory and regulatory filings or engagements amounted to $59,111 for the fiscal year ended October 31, 2009 ( itemized as follows: John Hancock Classic Value Fund - $29,243, John Hancock Classic Value Fund II merged into another fund on July, 10, 2009, John Hancock International Classic Value Fund liquidated April 24, 2009 and John Hancock U.S. Global Leaders Growth Fund - $29,868) and $117,780 for the fiscal period ended October 31, 2008 (itemized as follows: The following funds of the registrant changed the fiscal year end to October 31: John Hancock Classic Value Fund - $27,566, John Hancock Classic Value Fund II - $26,523, John Hancock International Classic Value Fund - $35,024 an d John Hancock U.S. Global Leaders Growth Fund - $28,667). These fees were billed to the registrant and were approved by the registrant’s audit committee.
(b) Audit-Related Services
Audit-related service fees for the fiscal year ended October 31, 2009 amounted to $3,368 (itemized as follows: John Hancock Classic Value Fund - $2,184 and John Hancock U.S. Global Leaders Growth Fund - $1,184) and there were no audit-related fees during the fiscal period ended October 31, 2008 billed to the registrant or to the registrant's investment adviser (not including any sub-adviser whose role is primarily portfolio management and is subcontracted with or overseen by another investment adviser), and any entity controlling, controlled by, or under common control with the adviser that provides ongoing services to the registrant ("control affiliates").
(c) Tax Fees
The aggregate fees billed for professional services rendered by the principal accountant(s) for the tax compliance, tax advice and tax planning (“tax fees”) amounted to $6,418 for the fiscal year ended October 31, 2009 (itemized as follows: John Hancock Classic Value Fund - $3,100 and John Hancock U.S. Global Leaders Growth Fund - $3,318) and $9,250 for the fiscal period ended October 31, 2008 (itemized as follows: John Hancock Classic Value Fund - $2,600, John Hancock Classic Value Fund II - $1,050, John Hancock International Classic Value Fund - $2,600 and John Hancock U.S. Global Leaders Growth Fund - $3,000). The nature of the services
comprising the tax fees was the review of the registrant’s income tax returns and tax distribution requirements. These fees were billed to the registrant and were approved by the registrant’s audit committee. There were no tax fees billed to the control affiliates.
(d) All Other Fees
Other fees for the fiscal year ended October 31, 2009 amounted to $110 (itemized as follows: John Hancock Classic Value Fund - $55 and John Hancock U.S. Global Leaders Growth Fund -$55) and there were no other fees during the fiscal period ended October 31, 2008 billed to the registrant or to the control affiliates.
(e)(1) Audit Committee Pre-Approval Policies and Procedures:
The trust’s Audit Committee must pre-approve all audit and non-audit services provided by the independent registered public accounting firm (the “Auditor”) relating to the operations or financial reporting of the funds. Prior to the commencement of any audit or non-audit services to a fund, the Audit Committee reviews the services to determine whether they are appropriate and permissible under applicable law.
The trust’s Audit Committee has adopted policies and procedures to, among other purposes, provide a framework for the Committee’s consideration of audit-related and non-audit services by the Auditor. The policies and procedures require that any audit-related and non-audit service provided by the Auditor and any non-audit service provided by the Auditor to a fund service provider that relates directly to the operations and financial reporting of a fund are subject to approval by the Audit Committee before such service is provided. Audit-related services provided by the Auditor that are expected to exceed $25,000 per instance/per fund are subject to specific pre-approval by the Audit Committee. Tax services provided by the Auditor that are expected to exceed $30,000 per instance/per fund are subject to specific pre-approval by the Audit Committee.
All audit services, as well as the audit-related and non-audit services that are expected to exceed the amounts stated above, must be approved in advance of provision of the service by formal resolution of the Audit Committee. At the regularly scheduled Audit Committee meetings, the Committee reviews a report summarizing the services, including fees, provided by the Auditor.
(e)(2) Services approved pursuant to paragraph (c)(7)(i)(C) of Rule 2-01 of Regulation S-X:
Audit-Related Fees, Tax Fees and All Other Fees:
There were no amounts that were approved by the Audit Committee pursuant to the de minimis exception under Rule 2-01 of Regulation S-X.
(f) According to the registrant’s principal accountant, for the fiscal period ended October 31, 2009, the percentage of hours spent on the audit of the registrant's financial statements for the most recent fiscal year that were attributed to work performed by persons who were not full-time, permanent employees of principal accountant was less than 50%.
(g) The aggregate non-audit fees billed by the registrant's accountant(s) for services rendered to the registrant and rendered to the registrant's control affiliates for each of the last two fiscal years
of the registrant were $8,204,071 for the fiscal year ended October 31, 2009 and $4,597,022 for the fiscal period ended October 31, 2008.
(h) The audit committee of the registrant has considered the non-audit services provided by the registrant’s principal accountant(s) to the control affiliates and has determined that the services that were not pre-approved are compatible with maintaining the principal accountant(s)' independence.
ITEM 5. AUDIT COMMITTEE OF LISTED REGISTRANTS.
The registrant has a separately-designated standing audit committee comprised of independent trustees. The members of the audit committee are as follows:
Stanley Martin - Chairman
Deborah C. Jackson
Steven R. Pruchansky
ITEM 6. SCHEDULE OF INVESTMENTS.
(a) Not applicable.
(b) Not applicable.
ITEM 7. DISCLOSURE OF PROXY VOTING POLICIES AND PROCEDURES FOR CLOSED-END MANAGEMENT INVESTMENT COMPANIES.
Not applicable.
ITEM 8. PORTFOLIO MANAGERS OF CLOSED-END MANAGEMENT INVESTMENT COMPANIES.
Not applicable.
ITEM 9. PURCHASES OF EQUITY SECURITIES BY CLOSED-END MANAGEMENT INVESTMENT COMPANY AND AFFILIATED PURCHASERS.
Not applicable.
ITEM 10. SUBMISSION OF MATTERS TO A VOTE OF SECURITY HOLDERS.
There were no material changes to previously disclosed John Hancock Funds – Governance Committee Charter.
ITEM 11. CONTROLS AND PROCEDURES.
(a) Based upon their evaluation of the registrant's disclosure controls and procedures as conducted within 90 days of the filing date of this Form N-CSR, the registrant's principal executive officer and principal financial officer have concluded that those disclosure controls and
procedures provide reasonable assurance that the material information required to be disclosed by the registrant on this report is recorded, processed, summarized and reported within the time periods specified in the Securities and Exchange Commission's rules and forms.
(b) There were no changes in the registrant's internal control over financial reporting that occurred during the registrant's most recent fiscal half-year (the registrant's second fiscal half-year in the case of an annual report) that have materially affected, or are reasonably likely to materially affect, the registrant's internal control over financial reporting.
ITEM 12. EXHIBITS.
(a)(1) Code of Ethics for Senior Financial Officers is attached.
(a)(2) Separate certifications for the registrant's principal executive officer and principal financial officer, as required by Section 302 of the Sarbanes-Oxley Act of 2002 and Rule 30a-2(a) under the Investment Company Act of 1940, are attached.
(b) Separate certifications for the registrant's principal executive officer and principal financial officer, as required by 18 U.S.C. Section 1350, as adopted pursuant to Section 906 of the Sarbanes-Oxley Act of 2002, and Rule 30a-2(b) under the Investment Company Act of 1940, are attached. The certifications furnished pursuant to this paragraph are not deemed to be "filed" for purposes of Section 18 of the Securities Exchange Act of 1934, or otherwise subject to the liability of that section. Such certifications are not deemed to be incorporated by reference into any filing under the Securities Act of 1933 or the Securities Exchange Act of 1934, except to the extent that the Registrant specifically incorporates them by reference.
(c)(1) Submission of Matters to a Vote of Security Holders is attached. See attached “John Hancock Funds – Governance Committee Charter”.
(c)(2) Contact person at the registrant.
| SIGNATURES |
Pursuant to the requirements of the Securities Exchange Act of 1934 and the Investment Company Act of 1940, the registrant has duly caused this report to be signed on its behalf by the undersigned, thereunto duly authorized.
John Hancock Capital Series
By: /s/ Keith F. Hartstein
-------------------------------------
Keith F. Hartstein
President and Chief Executive Officer
Date: December 18, 2009
Pursuant to the requirements of the Securities Exchange Act of 1934 and the Investment Company Act of 1940, this report has been signed below by the following persons on behalf of the registrant and in the capacities and on the dates indicated.
By: /s/ Keith F. Hartstein
-------------------------------------
Keith F. Hartstein
President and Chief Executive Officer
Date: December 18, 2009
By: /s/ Charles A. Rizzo
-------------------------------------
Charles A. Rizzo
Chief Financial Officer
Date: December 18, 2009