| UNITED STATES | ||
| SECURITIES AND EXCHANGE COMMISSION | ||
| Washington, D.C. 20549 | ||
| FORM N-CSR | ||
| CERTIFIED SHAREHOLDER REPORT OF REGISTERED | ||
| MANAGEMENT INVESTMENT COMPANIES | ||
| Investment Company Act file number 811- 1677 | ||
| John Hancock Capital Series | ||
| (Exact name of registrant as specified in charter) | ||
| 601 Congress Street, Boston, Massachusetts 02210 | ||
| (Address of principal executive offices) (Zip code) | ||
| Salvatore Schiavone | ||
| Treasurer | ||
| 601 Congress Street | ||
| Boston, Massachusetts 02210 | ||
| (Name and address of agent for service) | ||
| Registrant's telephone number, including area code: 617-663-4497 | ||
| Date of fiscal year end: | October 31 | |
| Date of reporting period: | October 31, 2010 | |
ITEM 1. REPORTS TO STOCKHOLDERS.
Management’s discussion of
Fund performance
By Sustainable Growth Advisers, LP
U.S. stocks enjoyed strong returns during the 12 months ended October 31, 2010. The stock market rallied sharply during the first six months of the period as economic conditions and corporate profits improved markedly. Stocks reversed course during the summer as sovereign debt problems in Europe and questions about the durability of the economic recovery undermined investor confidence. However, investor sentiment swung back in a positive direction in the last two months of the period thanks to receding fears of a double-dip recession.
For the year ended October 31, 2010, John Hancock U.S. Global Leaders Growth Fund’s Class A shares posted a total return of 16.58% at net asset value. By comparison, the S&P 500 Index returned 16.52%, the Russell 1000 Growth Index returned 19.65%, and the average large-cap growth fund returned 18.17%, according to Morningstar, Inc. The bulk of the Fund’s underperformance of the Russell 1000 Growth Index occurred during the market downturn in May and June, when profit-taking in several of the Fund’s big winners from 2009 — particularly the largest, most-liquid stocks that were easy to sell as the market tumbled — hurt performance. In addition, stocks exhibiting the opposite characteristics from what we seek in our investments (such as weak earnings, low returns on equity and high debt levels) outperformed.
The Fund’s health care and consumer discretionary holdings detracted the most from relative performance. Orthopedic products maker Zimmer Holdings, Inc., surgical systems manufacturer Intuitive Surgical, Inc., and office supplies retailer Staples, Inc. were the biggest individual detractors. On the positive side, technology stocks were the top performers, led by open-source software firm Red Hat, Inc. and enterprise software maker Oracle Corp. Industrial and construction supplies distributor Fastenal Company and coffee retailer Starbucks Corp. were also strong performers.
This commentary reflects the views of the portfolio managers through the end of the Fund’s period discussed in this report. The managers’ statements reflect their own opinions. As such, they are in no way guarantees of future events and are not intended to be used as investment advice or a recommendation regarding any specific security. They are also subject to change at any time as market and other conditions warrant.
Past performance is no guarantee of future results.
Sector investing is subject to greater risks than the market as a whole. Because the Fund may focus on particular sectors of the economy, its performance may depend on the performance of those sectors. The Fund is non-diversified, which allows it to make larger investments in individual companies. Non-diversified funds tend to be more volatile than diversified funds and the market as a whole.
| 6 | U.S. Global Leaders Growth Fund | Annual report |
A look at performance
For the period ended October 31, 2010
| Average annual total returns (%) | Cumulative total returns (%) | |||||||
| with maximum sales charge (POP) | with maximum sales charge (POP) | |||||||
| Since | Since | |||||||
| 1-year | 5-year | 10-year | inception2 | 1-year | 5-year | 10-year | inception2 | |
| Class A | 10.74 | –0.23 | 0.35 | — | 10.74 | –1.14 | 3.57 | — |
| Class B | 10.75 | –0.33 | — | 0.87 | 10.75 | –1.65 | — | 7.55 |
| Class C | 14.70 | 0.05 | — | 0.83 | 14.70 | 0.24 | — | 7.19 |
| Class I1 | 17.15 | 1.26 | — | 2.03 | 17.15 | 6.48 | — | 18.48 |
Performance figures assume all distributions are reinvested. Public offering price (POP) figures reflect maximum sales charges on Class A shares of 5% and the applicable contingent deferred sales charge (CDSC) on Class B shares and Class C shares. The returns for Class C shares have been adjusted to reflect the elimination of the front-end sales charge effective 7-15-04. The Class B shares’ CDSC declines annually between years 1 to 6 according to the following schedule: 5, 4, 3, 3, 2, 1%. No sales charge will be assessed after the sixth year. Class C shares held for less than one year are subject to a 1% CDSC. Sales charges are not applicable for Class I shares.
The expense ratios of the Fund, both net (including any fee waivers or expense limitations) and gross (excluding any fee waivers or expense limitations), are set forth according to the most recent publicly available prospectuses for the Fund and may differ from the expense ratios disclosed in the Financial Highlights tables in this report. The waivers and expense limitations are contractual at least until 2-28-11. The net expenses are as follows: Class A — 1.30%, Class B — 2.05%, Class C — 2.05% and Class I — 0.85%. Had the fee waivers and expense limitations not been in place, the gross expenses would be as follows: Class A — 1.73%, Class B —2.48%, Class C — 2.48% and Class I — 0.93%.
The returns reflect past results and should not be considered indicative of future performance. The return and principal value of an investment will fluctuate so that shares, when redeemed, may be worth more or less than their original cost. Due to market volatility, the Fund’s current performance may be higher or lower than the performance shown. For performance data current to the most recent month-end, please call 1–800–225–5291 or visit the Fund’s Web site at www.jhfunds.com.
The performance table above and the chart on the next page do not reflect the deduction of taxes that a shareholder may pay on fund distributions or on the redemption of fund shares.
The Fund’s performance results reflect any applicable fee waivers or expense reductions, without which the expenses may increase and results may have been less favorable.
1 For certain types of investors, as described in the Fund’s Class I shares prospectus.
2 From 5-20-02.
| Annual report | U.S. Global Leaders Growth Fund | 7 |
A look at performance
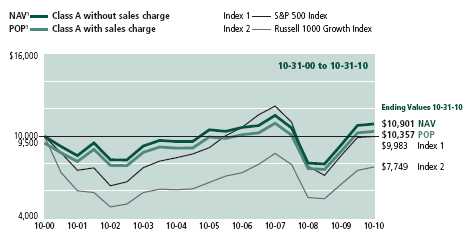
Growth of $10,000
This chart shows what happened to a hypothetical $10,000 investment in John Hancock U.S. Global Leaders Growth Fund Class A shares for the period indicated. For comparison, we’ve shown the same investment in two separate indexes.
| Period | Without | With maximum | |||
| beginning | sales charge | sales charge | Index 1 | Index 2 | |
| Class B2 | 5-20-02 | $10,755 | $10,755 | $12,798 | $13,038 |
| Class C2 | 5-20-02 | 10,719 | 10,719 | 12,798 | 13,038 |
| Class I3 | 5-20-02 | 11,848 | 11,848 | 12,798 | 13,038 |
Assuming all distributions were reinvested for the period indicated, the table above shows the value of a $10,000 investment in the Fund’s Class B, Class C and Class I shares, respectively, as of 10-31-10. The Class C shares investment with maximum sales charge has been adjusted to reflect the elimination of the front-end sales charge effective 7-15-04. Performance of the classes will vary based on the difference in sales charges paid by shareholders investing in the different classes and the fee structure of those classes.
S&P 500 Index — Index 1 — is an unmanaged index that includes 500 widely traded common stocks.
Russell 1000 Growth Index — Index 2 — is an unmanaged index of companies in the Russell 1000 Index (the 1,000 largest U.S. publicly traded companies) with high price-to-book ratios and higher forecasted growth values.
It is not possible to invest directly in an index. Index figures do not reflect sales charges or direct expenses, which would have resulted in lower values if they did.
1 NAV represents net asset value and POP represents public offering price.
2 No contingent deferred sales charge applicable.
3 For certain types of investors, as described in the Fund’s Class I shares prospectus.
| 8 | U.S. Global Leaders Growth Fund | Annual report |
Your expenses
These examples are intended to help you understand your ongoing operating expenses.
Understanding fund expenses
As a shareholder of the Fund, you incur two types of costs:
■ Transaction costs which include sales charges (loads) on purchases or redemptions (varies by share class), minimum account fee charge, etc.
■ Ongoing operating expenses including management fees, distribution and service fees (if applicable), and other fund expenses.
We are going to present only your ongoing operating expenses here.
Actual expenses/actual returns
This example is intended to provide information about your fund’s actual ongoing operating expenses, and is based on your fund’s actual return. It assumes an account value of $1,000.00 on May 1, 2010 with the same investment held until October 31, 2010.
| Account value | Ending value on | Expenses paid during | |
| on 5-1-10 | 10-31-10 | period ended 10-31-101 | |
| Class A | $1,000.00 | $1,010.20 | $6.59 |
| Class B | 1,000.00 | 1,006.50 | 10.37 |
| Class C | 1,000.00 | 1,006.50 | 10.37 |
| Class I | 1,000.00 | 1,012.70 | 4.31 |
Together with the value of your account, you may use this information to estimate the operating expenses that you paid over the period. Simply divide your account value at October 31, 2010, by $1,000.00, then multiply it by the “expenses paid” for your share class from the table above. For example, for an account value of $8,600.00, the operating expenses should be calculated as follows:

| Annual report | U.S. Global Leaders Growth Fund | 9 |
Your expenses
Hypothetical example for comparison purposes
This table allows you to compare your fund’s ongoing operating expenses with those of any other fund. It provides an example of the Fund’s hypothetical account values and hypothetical expenses based on each class’s actual expense ratio and an assumed 5% annualized return before expenses (which is not your fund’s actual return). It assumes an account value of $1,000.00 on May 1, 2010, with the same investment held until October 31, 2010. Look in any other fund shareholder report to find its hypothetical example and you will be able to compare these expenses.
| Account value | Ending value on | Expenses paid during | |
| on 5-1-10 | 10-31-10 | period ended 10-31-101 | |
| Class A | $1,000.00 | $1,018.70 | $6.61 |
| Class B | 1,000.00 | 1,014.90 | 10.41 |
| Class C | 1,000.00 | 1,014.90 | 10.41 |
| Class I | 1,000.00 | 1,020.90 | 4.33 |
Remember, these examples do not include any transaction costs, therefore, these examples will not help you to determine the relative total costs of owning different funds. If transaction costs were included, your expenses would have been higher. See the prospectus for details regarding transaction costs.
1 Expenses are equal to the Fund’s annualized expense ratio of 1.30%, 2.05%, 2.05% and 0.85% for Class A, Class B, Class C and Class I shares, respectively, multiplied by the average account value over the period, multiplied by 184/365 (to reflect the one-half year period).
| 10 | U.S. Global Leaders Growth Fund | Annual report |
Portfolio summary
| Top 10 Holdings1 | ||||
| Visa, Inc., Class A | 5.2% | Automatic Data Processing, Inc. | 4.1% | |
| Oracle Corp. | 4.2% | Apple, Inc. | 4.1% | |
| State Street Corp. | 4.2% | National Oilwell Varco, Inc. | 4.1% | |
| Cerner Corp. | 4.2% | The Coca-Cola Company | 4.0% | |
| Juniper Networks, Inc. | 4.1% | Starbucks Corp. | 4.0% | |
| Sector Composition2,3 | ||||
| Information Technology | 37% | Consumer Staples | 7% | |
| Health Care | 16% | Materials | 4% | |
| Consumer Discretionary | 16% | Financials | 4% | |
| Industrials | 8% | Short-Term Investments & Other | 1% | |
| Energy | 7% | |||

1 As a percentage of net assets on 10-31-10. Cash and cash equivalents are not included in the Top 10 Holdings.
2 As a percentage of net assets on 10-31-10.
3 Sector investing is subject to greater risks than the market as a whole. Because the Fund may focus on particular sectors of the economy, its performance may depend on the performance of those sectors.
| Annual report | U.S. Global Leaders Growth Fund | 11 |
Fund’s investments
As of 10-31-10
| Shares | Value | |
| Common Stocks 99.82% | $400,166,982 | |
| (Cost $281,691,811) | ||
| Consumer Discretionary 15.70% | 62,957,886 | |
| Hotels, Restaurants & Leisure 4.02% | ||
| Starbucks Corp. | 566,340 | 16,129,363 |
| Internet & Catalog Retail 3.95% | ||
| Amazon.com, Inc. (I) | 95,930 | 15,841,880 |
| Specialty Retail 7.73% | ||
| Lowe’s Companies, Inc. | 708,400 | 15,110,172 |
| Staples, Inc. (L) | 775,597 | 15,876,471 |
| Consumer Staples 6.87% | 27,536,028 | |
| Beverages 6.87% | ||
| PepsiCo, Inc. | 173,400 | 11,323,020 |
| The Coca-Cola Company | 264,400 | 16,213,008 |
| Energy 7.61% | 30,504,906 | |
| Energy Equipment & Services 7.61% | ||
| National Oilwell Varco, Inc. | 302,740 | 16,275,302 |
| Schlumberger, Ltd. | 203,600 | 14,229,604 |
| Financials 4.19% | 16,790,026 | |
| Capital Markets 4.19% | ||
| State Street Corp. | 402,060 | 16,790,026 |
| Health Care 16.34% | 65,486,111 | |
| Health Care Equipment & Supplies 5.62% | ||
| Intuitive Surgical, Inc. (I)(L) | 31,040 | 8,161,968 |
| Stryker Corp. (L) | 237,510 | 11,754,370 |
| Zimmer Holdings, Inc. (I) | 55,270 | 2,622,009 |
| Health Care Technology 4.18% | ||
| Cerner Corp. (I)(L) | 190,570 | 16,737,763 |
| Pharmaceuticals 6.54% | ||
| Johnson & Johnson | 186,080 | 11,847,714 |
| Teva Pharmaceutical Industries, Ltd., SADR | 276,730 | 14,362,287 |
| Industrials 7.82% | 31,330,890 | |
| Air Freight & Logistics 4.02% | ||
| FedEx Corp. (L) | 183,750 | 16,118,550 |
| 12 | U.S. Global Leaders Growth Fund | Annual report | See notes to financial statements |
| Shares | Value | |||
| Trading Companies & Distributors 3.80% | ||||
| Fastenal Company (L) | 295,500 | $15,212,340 | ||
| Information Technology 36.80% | 147,544,289 | |||
| Communications Equipment 6.10% | ||||
| Juniper Networks, Inc. (I)(L) | 509,160 | 16,491,692 | ||
| QUALCOMM, Inc. | 176,600 | 7,969,958 | ||
| Computers & Peripherals 4.07% | ||||
| Apple, Inc. (I) | 54,190 | 16,304,145 | ||
| Internet Software & Services 7.97% | ||||
| eBay, Inc. (I) | 465,820 | 13,886,094 | ||
| Google, Inc., Class A (I) | 22,420 | 13,743,236 | ||
| VistaPrint NV (I) | 102,400 | 4,307,968 | ||
| IT Services 9.23% | ||||
| Automatic Data Processing, Inc. | 367,990 | 16,346,116 | ||
| Visa, Inc., Class A (L) | 264,580 | 20,682,219 | ||
| Software 9.43% | ||||
| Microsoft Corp. | 487,720 | 12,992,861 | ||
| Oracle Corp. | 572,920 | 16,843,848 | ||
| Red Hat, Inc. (I) | 188,740 | 7,976,152 | ||
| Materials 4.49% | 18,016,846 | |||
| Chemicals 4.49% | ||||
| Ecolab, Inc. | 242,670 | 11,968,484 | ||
| Monsanto Company | 101,790 | 6,048,362 | ||
| Short-Term Investments 20.15% | $80,755,320 | |||
| (Cost $80,744,634) | ||||
| Maturity | ||||
| Yield* | date | Par value | Value | |
| Short-Term Securities 0.25% | $1,000,000 | |||
| Federal Home Loan Bank Discount Notes | 0.100% | 11-01-10 | $1,000,000 | 1,000,000 |
| Shares | Value | |||
| Securities Lending Collateral 19.90% | $79,755,320 | |||
| John Hancock Collateral Investment Trust (W) | 0.2626% (Y) | 7,968,520 | 79,755,320 | |
| Total investments (Cost $362,436,445)† 119.97% | $480,922,302 | |||
| Other assets and liabilities, net (19.97%) | ($80,038,935) | |||
| Total net assets 100.00% | $400,883,367 | |||
The percentage shown for each investment category is the total value of the category as a percentage of the net assets of the Fund.
| See notes to financial statements | Annual report | U.S. Global Leaders Growth Fund | 13 |
Notes to Schedule of Investments
SADR Sponsored American Depositary Receipts
(I) Non-income producing security.
(L) All or a portion of this security is on loan as of 10-31-10.
(W) Investment is an affiliate of the Fund, the adviser and/or subadviser. Also, it represents the investment of securities lending collateral received.
(Y) The rate shown is the annualized seven-day yield as of 10-31-10.
* Yield represents either the annualized yield at the date of purchase, the stated coupon rate or, for floating rate securities, the rate at period end.
† At 10-31-10, the aggregate cost of investment securities for federal income tax purposes was $373,347,096. Net unrealized appreciation aggregated $107,575,206, of which $122,223,897 related to appreciated investment securities and $14,648,691 related to depreciated investment securities.
| 14 | U.S. Global Leaders Growth Fund | Annual report | See notes to financial statements |
F I N A N C I A L S T A T E M E N T S
Statement of assets and liabilities 10-31-10
This Statement of Assets and Liabilities is the Fund’s balance sheet. It shows the value of what the Fund owns, is due and owes. You’ll also find the net asset value and the maximum offering price per share.
| Assets | |
| Investments in unaffiliated issuers, at value (Cost $282,691,811) including | |
| $78,527,906 of securities loaned (Note 2) | $401,166,982 |
| Investments in affiliated issuers, at value (Cost $79,744,634) (Note 2) | 79,755,320 |
| Total investments, at value (Cost $362,436,445) | 480,922,302 |
| Receivable for investments sold | 6,257,270 |
| Receivable for fund shares sold | 668,727 |
| Dividends and interest receivable | 144,065 |
| Receivable for securities lending income | 9,067 |
| Other receivables and prepaid assets | 76,997 |
| Total assets | 488,078,428 |
| Liabilities | |
| Due to custodian | 980,994 |
| Payable for investments purchased | 5,177,740 |
| Payable for fund shares repurchased | 588,846 |
| Payable upon return of securities loaned (Note 2) | 79,716,812 |
| Payable to affiliates | |
| Accounting and legal services fees | 12,794 |
| Transfer agent fees | 97,384 |
| Distribution and service fees | 138,770 |
| Trustees’ fees | 49,149 |
| Management fees | 279,296 |
| Other liabilities and accrued expenses | 153,276 |
| Total liabilities | 87,195,061 |
| Net assets | |
| Capital paid-in | $327,017,883 |
| Accumulated net investment loss | (31,329) |
| Accumulated net realized loss on investments | (44,589,044) |
| Net unrealized appreciation (depreciation) on investments | 118,485,857 |
| Net assets | $400,883,367 |
| See notes to financial statements | Annual report | U.S. Global Leaders Growth Fund | 15 |
F I N A N C I A L S T A T E M E N T S
Statement of assets and liabilities (continued)
| Net asset value per share | |
| Based on net asset values and shares outstanding — the Fund has an | |
| unlimited number of shares authorized with no par value | |
| Class A ($264,451,355 ÷ 9,501,337 shares) | $27.83 |
| Class B ($39,344,075 ÷ 1,504,126 shares)1 | $26.16 |
| Class C ($59,864,526 ÷ 2,288,134 shares)1 | $26.16 |
| Class I ($37,223,411 ÷ 1,297,620 shares) | $28.69 |
| Maximum offering price per share | |
| Class A (net asset value per share ÷ 95%)2 | $29.29 |
1 Redemption price is equal to net asset value less any applicable contingent deferred sales charge.
2 On single retail sales of less than $50,000. On sales of $50,000 or more and on group sales the offering price is reduced.
| 16 | U.S. Global Leaders Growth Fund | Annual report | See notes to financial statements |
F I N A N C I A L S T A T E M E N T S
Statement of operations For the year ended 10-31-10
This Statement of Operations summarizes the Fund’s investment income earned and expenses incurred in operating the Fund. It also shows net gains (losses) for the period stated.
| Investment income | |
| Dividends | $6,844,491 |
| Securities lending | 129,874 |
| Interest | 97,428 |
| Less foreign taxes withheld | (24,792) |
| Total investment income | 7,047,001 |
| Expenses | |
| Investment management fees (Note 4) | 4,048,093 |
| Distribution and service fees (Note 4) | 2,069,196 |
| Accounting and legal services fees (Note 4) | 128,069 |
| Transfer agent fees (Note 4) | 1,943,744 |
| Trustees’ fees (Note 4) | 51,739 |
| State registration fees | 81,893 |
| Printing and postage | 134,605 |
| Professional fees | 89,286 |
| Custodian fees | 69,808 |
| Registration and filing fees | 23,529 |
| Other | 41,241 |
| Total expenses | 8,681,203 |
| Less expense reductions (Note 4) | (1,013,015) |
| Net expenses | 7,668,188 |
| Net investment loss | (621,187) |
| Realized and unrealized gain (loss) | |
| Net realized gain (loss) on | |
| Investments in unaffiliated issuers | 54,249,128 |
| Investments in affiliated issuers | 8,309 |
| 54,257,437 | |
| Change in net unrealized appreciation (depreciation) of | |
| Investments in unaffiliated issuers | 28,089,776 |
| Investments in affiliated issuers | (18,555) |
| 28,071,221 | |
| Net realized and unrealized gain | 82,328,658 |
| Increase in net assets from operations | $81,707,471 |
| See notes to financial statements | Annual report | U.S. Global Leaders Growth Fund | 17 |
F I N A N C I A L S T A T E M E N T S
Statements of changes in net assets
These Statements of Changes in Net Assets show how the value of the Fund’s net assets has changed during the last two periods. The difference reflects earnings less expenses, any investment gains and losses, distributions, if any, paid to shareholders and the net of Fund share transactions.
| Year | Year | |
| ended | ended | |
| 10-31-10 | 10-31-09 | |
| Increase (decrease) in net assets | ||
| From operations | ||
| Net investment loss | ($621,187) | ($26,031) |
| Net realized gain (loss) | 54,257,437 | (75,648,453) |
| Change in net unrealized appreciation (depreciation) | 28,071,221 | 158,139,517 |
| Increase in net assets resulting from operations | 81,707,471 | 82,465,033 |
| Distributions to shareholders | ||
| From net investment income | ||
| Class A | (383,932) | (257,002) |
| Class I | (68,376) | (99,277) |
| From net realized gain | ||
| Class A | — | (7,473,593) |
| Class B | — | (780,622) |
| Class C | — | (864,357) |
| Class I | — | (684,865) |
| Class R11 | — | (25,241) |
| Total distributions | (452,308) | (10,184,957) |
| From Fund share transactions (Note 5) | (293,073,847) | (182,901,608) |
| Total decrease | (211,818,684) | (110,621,532) |
| Net assets | ||
| Beginning of year | 612,702,051 | 723,323,583 |
| End of year | $400,883,367 | $612,702,051 |
| Accumulated net investment loss | ($31,329) | ($38,363) |
1 Effective at the close of business on 8-21-09, Class R1 converted into Class A.
| 18 | U.S. Global Leaders Growth Fund | Annual report | See notes to financial statements |
Financial highlights
The Financial Highlights show how the Fund’s net asset value for a share has changed since the end of the previous period.
| CLASS A SHARES Period ended | 10-31-10 | 10-31-09 | 10-31-081 | 12-31-07 | 12-31-06 | 12-31-05 |
| Per share operating performance | ||||||
| Net asset value, beginning | ||||||
| of period | $23.89 | $20.87 | $28.80 | $28.85 | $28.44 | $27.84 |
| Net investment income (loss)2 | —3 | 0.02 | 0.03 | 0.03 | —3 | (0.04) |
| Net realized and unrealized gain | ||||||
| (loss) on investments | 3.96 | 3.30 | (7.96) | 1.04 | 0.41 | 0.64 |
| Total from investment operations | 3.96 | 3.32 | (7.93) | 1.07 | 0.41 | 0.60 |
| Less distributions | ||||||
| From net investment income | (0.02) | (0.01) | — | — | — | — |
| From net realized gain | — | (0.29) | — | (1.12) | — | — |
| Total distributions | (0.02) | (0.30) | — | (1.12) | — | — |
| Net asset value, end of period | $27.83 | $23.89 | $20.87 | $28.80 | $28.85 | $28.44 |
| Total return (%)4,5 | 16.58 | 16.36 | (27.53)6 | 3.67 | 1.44 | 2.16 |
| Ratios and supplemental data | ||||||
| Net assets, end of period (in millions) | $264 | $480 | $552 | $1,022 | $1,263 | $1,271 |
| Ratios (as a percentage of average | ||||||
| net assets): | ||||||
| Expenses before reductions | 1.50 | 1.817 | 1.388 | 1.32 | 1.32 | 1.33 |
| Expenses net of fee waivers | 1.30 | 1.347 | 1.308 | 1.27 | 1.28 | 1.28 |
| Expenses net of fee waivers | ||||||
| and credits | 1.30 | 1.337 | 1.308 | 1.27 | 1.28 | 1.28 |
| Net investment income (loss) | 0.01 | 0.10 | 0.138 | 0.10 | —9 | (0.14) |
| Portfolio turnover (%) | 33 | 3710 | 58 | 27 | 34 | 28 |
1 For the ten-month period ended 10-31-08. The Fund changed its fiscal year end from December 31 to October 31.
2 Based on the average daily shares outstanding.
3 Less than $0.005 per share.
4 Does not reflect the effect of sales charges, if any.
5 Total returns would have been lower had certain expenses not been reduced during the periods shown.
6 Not annualized.
7 Includes the impact of proxy expenses, which amounted to 0.03% of average net assets.
8 Annualized.
9 Less than 0.005%.
10 The portfolio turnover rate for the year ended 10-31-09 has been revised from what was previously reported to
exclude the effect of certain short-term investments in a collateral management vehicle.
| See notes to financial statements | Annual report | U.S. Global Leaders Growth Fund | 19 |
| CLASS B SHARES Period ended | 10-31-10 | 10-31-09 | 10-31-081 | 12-31-07 | 12-31-06 | 12-31-05 |
| Per share operating performance | ||||||
| Net asset value, beginning of period | $22.60 | $19.90 | $27.64 | $27.94 | $27.75 | $27.36 |
| Net investment loss2 | (0.19) | (0.13) | (0.13) | (0.18) | (0.20) | (0.24) |
| Net realized and unrealized gain (loss) | ||||||
| on investments | 3.75 | 3.12 | (7.61) | 1.00 | 0.39 | 0.63 |
| Total from investment operations | 3.56 | 2.99 | (7.74) | 0.82 | 0.19 | 0.39 |
| Less distributions | ||||||
| From net realized gain | — | (0.29) | — | (1.12) | — | — |
| Net asset value, end of period | $26.16 | $22.60 | $19.90 | $27.64 | $27.94 | $27.75 |
| Total return (%)3,4 | 15.75 | 15.47 | (28.00)5 | 2.90 | 0.68 | 1.43 |
| Ratios and supplemental data | ||||||
| Net assets, end of period (in millions) | $39 | $47 | $56 | $107 | $151 | $218 |
| Ratios (as a percentage of average | ||||||
| net assets): | ||||||
| Expenses before reductions | 2.24 | 2.506 | 2.137 | 2.07 | 2.07 | 2.08 |
| Expenses net of fee waivers | 2.05 | 2.086 | 2.057 | 2.02 | 2.03 | 2.03 |
| Expenses net of fee waivers | ||||||
| and credits | 2.05 | 2.076 | 2.057 | 2.02 | 2.03 | 2.03 |
| Net investment loss | (0.75) | (0.65) | (0.63)7 | (0.65) | (0.75) | (0.88) |
| Portfolio turnover (%) | 33 | 378 | 58 | 27 | 34 | 28 |
1 For the ten-month period ended 10-31-08. The Fund changed its fiscal year end from December 31 to October 31.
2 Based on the average daily shares outstanding.
3 Does not reflect the effect of sales charges, if any.
4 Total returns would have been lower had certain expenses not been reduced during the periods shown.
5 Not annualized.
6 Includes the impact of proxy expenses, which amounted to 0.03% of average net assets.
7 Annualized.
8 The portfolio turnover rate for the year ended 10-31-09 has been revised from what was previously reported to
exclude the effect of certain short-term investments in a collateral management vehicle.
| CLASS C SHARES Period ended | 10-31-10 | 10-31-09 | 10-31-081 | 12-31-07 | 12-31-06 | 12-31-05 |
| Per share operating performance | ||||||
| Net asset value, beginning of period | $22.61 | $19.90 | $27.64 | $27.94 | $27.75 | $27.36 |
| Net investment loss2 | (0.19) | (0.12) | (0.13) | (0.18) | (0.20) | (0.24) |
| Net realized and unrealized gain (loss) | ||||||
| on investments | 3.74 | 3.12 | (7.61) | 1.00 | 0.39 | 0.63 |
| Total from investment operations | 3.55 | 3.00 | (7.74) | 0.82 | 0.19 | 0.39 |
| Less distributions | ||||||
| From net realized gain | — | (0.29) | — | (1.12) | — | — |
| Total distributions | — | (0.29) | — | (1.12) | — | — |
| Net asset value, end of period | $26.16 | $22.61 | $19.90 | $27.64 | $27.94 | $27.75 |
| Total return (%)3,4 | 15.70 | 15.53 | (28.00)5 | 2.90 | 0.68 | 1.43 |
| Ratios and supplemental data | ||||||
| Net assets, end of period (in millions) | $60 | $60 | $62 | $114 | $186 | $284 |
| Ratios (as a percentage of average | ||||||
| net assets): | ||||||
| Expenses before reductions | 2.23 | 2.516 | 2.137 | 2.07 | 2.07 | 2.08 |
| Expenses net of fee waivers | 2.05 | 2.086 | 2.057 | 2.02 | 2.03 | 2.03 |
| Expenses net of fee waivers | ||||||
| and credits | 2.05 | 2.076 | 2.057 | 2.02 | 2.03 | 2.03 |
| Net investment loss | (0.76) | (0.66) | (0.63)7 | (0.65) | (0.75) | (0.88) |
| Portfolio turnover (%) | 33 | 378 | 58 | 27 | 34 | 28 |
1 For the ten-month period ended 10-31-08. The Fund changed its fiscal year end from December 31 to October 31.
2 Based on the average daily shares outstanding.
3 Does not reflect the effect of sales charges, if any.
4 Total returns would have been lower had certain expenses not been reduced during the periods shown.
5 Not annualized.
6 Includes the impact of proxy expenses, which amounted to 0.03% of average net assets.
7 Annualized.
8 The portfolio turnover rate for the year ended 10-31-09 has been revised from what was previously reported to
exclude the effect of certain short-term investments in a collateral management vehicle.
| 20 | U.S. Global Leaders Growth Fund | Annual report | See notes to financial statements |
| CLASS I SHARES Period ended | 10-31-10 | 10-31-09 | 10-31-081 | 12-31-07 | 12-31-06 | 12-31-05 |
| Per share operating performance | ||||||
| Net asset value, beginning of period | $24.55 | $21.37 | $29.38 | $29.28 | $28.74 | $28.00 |
| Net investment income2 | 0.11 | 0.13 | 0.13 | 0.16 | 0.12 | 0.08 |
| Net realized and unrealized gain (loss) | ||||||
| on investments | 4.10 | 3.38 | (8.14) | 1.06 | 0.42 | 0.66 |
| Total from investment operations | 4.21 | 3.51 | (8.01) | 1.22 | 0.54 | 0.74 |
| Less distributions | ||||||
| From net investment income | (0.07) | (0.04) | — | — | — | — |
| From net realized gain | — | (0.29) | — | (1.12) | — | — |
| Total distributions | (0.07) | (0.33) | — | (1.12) | — | — |
| Net asset value, end of period | $28.69 | $24.55 | $21.37 | $29.38 | $29.28 | $28.74 |
| Total return (%)3 | 17.15 | 16.94 | (27.26)4 | 4.13 | 1.88 | 2.64 |
| Ratios and supplemental data | ||||||
| Net assets, end of period (in millions) | $37 | $26 | $51 | $7 | $18 | $13 |
| Ratios (as a percentage of average | ||||||
| net assets): | ||||||
| Expenses before reductions | 0.93 | 0.965 | 0.896 | 0.88 | 0.87 | 0.90 |
| Expenses net of fee waivers | 0.85 | 0.845 | 0.856 | 0.84 | 0.84 | 0.85 |
| Expenses net of fee waivers | ||||||
| and credits | 0.85 | 0.845 | 0.856 | 0.84 | 0.84 | 0.85 |
| Net investment income | 0.43 | 0.60 | 0.606 | 0.54 | 0.43 | 0.30 |
| Portfolio turnover (%) | 33 | 377 | 58 | 27 | 34 | 28 |
1 For the ten-month period ended 10-31-08. The Fund changed its fiscal year end from December 31 to October 31.
2 Based on the average daily shares outstanding.
3 Total returns would have been lower had certain expenses not been reduced during the periods shown.
4 Not annualized.
5 Includes the impact of proxy expenses, which amounted to 0.03% of average net assets.
6 Annualized.
7 The portfolio turnover rate for the year ended 10-31-09 has been revised from what was previously reported to
exclude the effect of certain short-term investments in a collateral management vehicle.
| See notes to financial statements | Annual report | U.S. Global Leaders Growth Fund | 21 |
Notes to financial statements
Note 1 — Organization
John Hancock U.S. Global Leaders Growth Fund (the Fund) is a non-diversified series of John Hancock Capital Series (the Trust), an open-end management investment company organized as a Massachusetts business trust and registered under the Investment Company Act of 1940, as amended (the 1940 Act). The investment objective of the Fund is to seek long-term growth of capital.
The Fund may offer multiple classes of shares. The shares currently offered are detailed in the Statement of Assets and Liabilities. Class A, Class B and Class C shares are offered to all investors. Class I shares are offered to institutions and certain investors. Shareholders of each class have exclusive voting rights to matters that affect that class. The distribution and service fees and transfer agent fees for each class may differ. Class B shares convert to Class A shares eight years after purchase. Class R1 shares converted to Class A shares on August 21, 2009.
Note 2 — Significant accounting policies
The financial statements have been prepared in conformity with accounting principles generally accepted in the United States of America, which require management to make certain estimates and assumptions at the date of the financial statements. Actual results could differ from those estimates. Events or transactions occurring after the end of the fiscal period through the date that the financial statements were issued have been evaluated in the preparation of the financial statements. The following summarizes the significant accounting policies of the Fund:
Security valuation. Investments are stated at value as of the close of regular trading on the New York Stock Exchange (NYSE), normally at 4:00 P.M., Eastern Time. The Fund uses a three-tier hierarchy to prioritize the pricing assumptions, referred to as inputs, used in valuation techniques to measure fair value. Level 1 includes quoted prices in active markets for identical securities. Level 2 includes significant observable inputs. Observable inputs may include quoted prices for similar securities, interest rates, prepayment speeds and credit risk. Prices for securities valued using these techniques are received from independent pricing vendors and brokers and are based on an evaluation of the inputs described. Level 3 includes significant unobservable inputs when market prices are not readily available or reliable, including the Fund’s own assumptions in determining the fair value of investments. The inputs or methodology used for valuing securities are not necessarily an indication of the risk associated with investing in those securities.
The following is a summary of the values by input classification of the Fund’s investments as of October 31, 2010, by major security category or type:
| 22 | U.S. Global Leaders Growth Fund | Annual report |
| LEVEL 3 | ||||
| LEVEL 2 | SIGNIFICANT | |||
| TOTAL MARKET | LEVEL 1 | SIGNIFICANT | UNOBSERVABLE | |
| VALUE AT 10-31-10 | QUOTED PRICE | OBSERVABLE INPUTS | INPUTS | |
| Common Stocks | ||||
| Consumer Discretionary | $62,957,886 | $62,957,886 | — | — |
| Consumer Staples | 27,536,028 | 27,536,028 | — | — |
| Energy | 30,504,906 | 30,504,906 | — | — |
| Financials | 16,790,026 | 16,790,026 | — | — |
| Health Care | 65,486,111 | 65,486,111 | — | — |
| Industrials | 31,330,890 | 31,330,890 | — | — |
| Information Technology | 147,544,289 | 147,544,289 | — | — |
| Materials | 18,016,846 | 18,016,846 | — | — |
| Short-Term Investments | 80,755,320 | 79,755,320 | $1,000,000 | — |
| Total Investments in | ||||
| Securities | $480,922,302 | $479,922,302 | $1,000,000 | — |
During the year ended October 31, 2010, there were no significant transfers in or out of Level 1 or Level 2 assets.
In order to value the securities, the Fund uses the following valuation techniques. Equity securities held by the Fund are valued at the last sale price or official closing price on the principal securities exchange on which they trade. In the event there were no sales during the day or closing prices are not available, then securities are valued using the last quoted bid or evaluated price. Investments in open end mutual funds, including John Hancock Collateral Investment Trust (JHCIT), are valued at their closing net asset values each day. Foreign securities and currencies are valued in U.S. dollars, based on foreign currency exchange rates supplied by an independent pricing service. Certain securities traded only in the over-the-counter market are valued at the last bid price quoted by brokers making markets in the securities at the close of trading. Certain short-term securities are valued at amortized cost. Other portfolio securities and assets, where market quotations are not readily available, are valued at fair value, as determined in good faith by the Fund’s Pricing Committee, following procedures established by the Board of Trustees.
Security transactions and related investment income. Investment security transactions are accounted for on a trade date plus one basis for daily net asset value calculations. However, for financial reporting purposes, investment transactions are reported on trade date. Interest income is accrued as earned. Gains and losses on securities sold are determined on the basis of identified cost and may include proceeds from litigation. Dividend income is recorded on the ex-date, except for certain foreign dividends where the ex-date may have passed, which are recorded when the Fund becomes aware of the dividends. Interest income includes coupon interest and amortization/accretion of premiums/discounts on debt securities.
Securities lending. The Fund may lend its securities to earn additional income. It receives and maintains cash collateral received from the borrower in an amount not less than the market value of the loaned securities. The Fund will invest its collateral in JHCIT. As a result, the Fund will receive the benefit of any gains and bear any losses generated by JHCIT. Although risk of the loss of the securities lent is mitigated by holding the collateral, the Fund could experience a delay in recovering its securities and a possible loss of income or value if the borrower fails to return the securities or if collateral investments decline in value. The Fund may receive compensation for lending its securities by retaining a portion of the return on the investment of the collateral and compensation from fees earned from borrowers of the securities. Income received from JHCIT is a component of securities lending income as recorded on the Statement of Operations.
| Annual report | U.S. Global Leaders Growth Fund | 23 |
Line of credit. The Fund may borrow from banks for temporary or emergency purposes, including meeting redemption requests that otherwise might require the untimely sale of securities. Pursuant to the custodian agreement, the custodian may loan money to a Fund to make properly authorized payments. The Fund is obligated to repay the custodian for any overdraft, including any related costs or expenses. The custodian has a lien, security interest or security entitlement in any Fund property that is not segregated, to the maximum extent permitted by law for any overdraft.
In addition, the Fund and other affiliated funds have entered into an agreement with State Street Bank and Trust Company which enables them to participate in a $100 million unsecured committed line of credit. Prior to March 31, 2010, the amount of the line of credit was $150 million. A commitment fee, payable at the end of each calendar quarter, based on the average daily unused portion of the line of credit, is charged to each participating fund on a pro rata basis and is reflected in other expenses on the Statement of Operations. For the year ended October 31, 2010, the Fund had no borrowings under the line of credit.
Expenses. The majority of expenses are directly attributable to an individual fund. Expenses that are not readily attributable to a specific fund are allocated among all funds in an equitable manner, taking into consideration, among other things, the nature and type of expense and the fund’s relative assets. Expense estimates are accrued in the period to which they relate and adjustments are made when actual amounts are known.
Class allocations. Income, common expenses, and realized and unrealized gains (losses) are determined at the Fund level and allocated daily to each class of shares based on the net asset value of the class. Class-specific expenses, such as distribution and service fees, if any, and transfer agent fees, for all classes are calculated daily at the class level based on the appropriate net asset value of each class and the specific expense rates applicable to each class.
Federal income taxes. The Fund intends to continue to qualify as a regulated investment company by complying with the applicable provisions of the Internal Revenue Code and will not be subject to federal income tax on taxable income that is distributed to shareholders. Therefore, no federal income tax provision is required.
For federal income tax purposes, the Fund has a capital loss carryforward of $33,678,393 available to offset future net realized capital gains as of October 31, 2010. The loss carryforward expires as follows: October 31, 2017 — $33,678,393.
As of October 31, 2010, the Fund had no uncertain tax positions that would require financial statement recognition, de-recognition or disclosure. The Fund’s federal tax return is subject to examination by the Internal Revenue Service for a period of three years.
Distribution of income and gains. Distributions to shareholders from net investment income and net realized gains, if any, are recorded on the ex-date. The Fund generally declares and pays dividends and capital gain distributions, if any, annually. The tax character of distributions for the years ended October 31, 2010, and October 31, 2009, was as follows:
| OCTOBER 31, 2010 | OCTOBER 31, 2009 | |||
| Ordinary Income | $452,308 | $356,285 | ||
| Long-Term Capital Gain | — | $9,828,672 | ||
Distributions paid by the Fund with respect to each class of shares are calculated in the same manner, at the same time and are in the same amount, except for the effect of expenses that may be applied differently to each class. As of October 31, 2010, the Fund has no distributable earnings on a tax basis.
| 24 | U.S. Global Leaders Growth Fund | Annual report |
Such distributions and distributable earnings, on a tax basis, are determined in conformity with income tax regulations, which may differ from accounting principles generally accepted in the United States of America. Material distributions in excess of tax basis earnings and profits, if any, are reported in the Fund’s financial statements as a return of capital.
Capital accounts within financial statements are adjusted for permanent book-tax differences. These adjustments have no impact on net assets or the results of operations. Temporary book-tax differences, if any, will reverse in a subsequent period. Book-tax differences are primarily attributable to wash sales loss deferrals, net operating losses and characterization of distributions.
Note 3 — Guarantees and indemnifications
Under the Fund’s organizational documents, its Officers and Trustees are indemnified against certain liabilities arising out of the performance of their duties to the Fund. Additionally, in the normal course of business, the Fund enters into contracts with service providers that contain general indemnification clauses. The Fund’s maximum exposure under these arrangements is unknown, as this would involve future claims that may be made against the Fund that have not yet occurred. The risk of material loss from such claims is considered remote.
Note 4 — Fees and transactions with affiliates
John Hancock Advisers, LLC (the Adviser) serves as investment adviser for the Fund. John Hancock Funds, LLC (the Distributor), an affiliate of the Adviser, serves as principal underwriter of the Fund. The Adviser and the Distributor are indirect wholly owned subsidiaries of Manulife Financial Corporation (MFC).
Management fee. The Fund has an investment management contract with the Adviser under which the Fund pays a monthly management fee to the Adviser equivalent, on an annual basis, to the sum of: (a) 0.75% of the first $2,000,000,000 of the Fund’s average daily net assets; (b) 0.70% of the next $3,000,000,000 of the Fund’s average daily net assets; and (c) 0.65% of the Fund’s average daily net assets in excess of $5,000,000,000. The Adviser has a subadvisory agreement with Sustainable Growth Advisers, LP. The Fund is not responsible for payment of the subadvisory fees.
The investment management fees incurred for the year ended October 31, 2010, were equivalent to an annual effective rate of 0.75% of the Fund’s average daily net assets.
Effective March 1, 2010, the Adviser has voluntarily agreed to reimburse certain fund expenses (excluding taxes, brokerage commissions, interest, litigation, extraordinary expenses, underlying fees, 12b-1 fees, transfer agent fees and class level expenses) that exceed 0.82% of the Fund’s average net assets. Prior to March 1, 2010, the contractual reimbursement limitation was 0.79% of the Fund’s average net assets.
In addition, the Adviser has contractually agreed to waive all or a portion of its management fee and reimburse or pay operating expenses of the Fund to the extent necessary to maintain the Fund’s total operating expenses at 1.30%, 2.05%, 2.05% and 0.85% for Class A, Class B, Class C and Class I shares, respectively, excluding certain expenses such as taxes, brokerage commissions, interest, litigation and extraordinary expenses. These expense limitations shall remain in effect until February 28, 2011.
In addition, the Adviser voluntarily waived certain other expenses. Accordingly, the expense reductions or reimbursements related to these agreements were $793,088, $84,121, $111,659 and $24,147 for Class A, Class B, Class C and Class I shares, respectively, for the year ended October 31, 2010.
| Annual report | U.S. Global Leaders Growth Fund | 25 |
Accounting and legal services. Pursuant to the Accounting and Legal Services Agreement, the Fund reimburses the Adviser for all expenses associated with providing the administrative, financial, legal, accounting and recordkeeping services of the Fund, including the preparation of all tax returns, periodic reports to shareholders and regulatory reports, among other services. These expenses are allocated to each share class based on its relative net assets at the time the expense was incurred. The accounting and legal services fees incurred for the year ended October 31, 2010, amounted to an annual rate of 0.02% of the Fund’s average daily net assets.
Distribution and service plans. The Fund has a distribution agreement with the Distributor. The Fund has adopted distribution and service plans with respect to Class A, Class B and Class C shares pursuant to Rule 12b-1 under the 1940 Act, to pay the Distributor for services provided as the distributor of shares of the Fund. The Fund may pay up to the following contractual rates of distribution and service fees under these arrangements, expressed as an annual percentage of average daily net assets for each class of the Fund’s shares.
| CLASS | 12b–1 FEES | ||
| Class A | 0.25% | ||
| Class B | 1.00% | ||
| Class C | 1.00% | ||
Sales charges. Class A shares are assessed up-front sales charges, which resulted in payments to the Distributor amounting to $197,685 for the year ended October 31, 2010. Of this amount, $29,783 was retained and used for printing prospectuses, advertising, sales literature and other purposes, $142,888 was paid as sales commissions to broker-dealers and $25,014 was paid as sales commissions to sales personnel of Signator Investors, Inc. (Signator Investors), a broker-dealer affiliate of the Adviser.
Class B and Class C shares are subject to contingent deferred sales charges (CDSC). Class B shares that are redeemed within six years of purchase are subject to CDSC, at declining rates, beginning at 5.00% of the lesser of the current market value at the time of redemption or the original purchase cost of the shares being redeemed. Class C shares that are redeemed within one year of purchase are subject to a 1.00% CDSC on the lesser of the current market value at the time of redemption or the original purchase cost of the shares being redeemed. Proceeds from CDSCs are used to compensate the Distributor for providing distribution-related services in connection with the sale of these shares. During the year ended October 31, 2010, CDSCs received by the Distributor amounted to $65,605 and $3,140 for Class B and Class C shares, respectively.
Transfer agent fees. The Fund has a transfer agent agreement with John Hancock Signature Services, Inc. (Signature Services or Transfer Agent), an affiliate of the Adviser.
The transfer agent fees paid to Signature Services are determined based on the cost to Signature Services (Signature Services Cost) of providing recordkeeping services. The Signature Services Cost includes a component of allocated John Hancock corporate overhead for providing transfer agent services to the Fund and to all other John Hancock affiliated funds. It also includes out-of-pocket expenses that are comprised of payments made to third-parties for recordkeeping services provided to their clients who invest in one or more John Hancock funds. In addition, Signature Services Cost may be reduced by certain revenues that Signature Services received in connection with the service they provide to the funds. Signature Services Cost is calculated monthly and allocated, as applicable, to four categories of share classes: Institutional Share Classes, Retirement Share Classes, Municipal Bond Classes and all other Retail Share Classes. Within each of these categories, the applicable costs are allocated to the affected John Hancock affiliated funds and/or classes, based on the relative average daily net assets.
| 26 | U.S. Global Leaders Growth Fund | Annual report |
Prior to July 1, 2010, the transfer agent fees were made up of three components:
• The Fund paid a monthly transfer agent fee at an annual rate of 0.05% for Class A, Class B and Class C and 0.04% for Class I shares, based on each class’s average daily net assets.
• The Fund paid a monthly fee based on an annual rate of $16.50 per shareholder account for all classes.
• In addition, Signature Services was reimbursed for certain out-of-pocket expenses.
Class level expenses. Class level expenses for the year ended October 31, 2010 were:
| DISTRIBUTION AND | TRANSFER | |||
| CLASS | SERVICE FEES | AGENT FEES | ||
| Class A | $1,005,074 | $1,532,295 | ||
| Class B | 449,484 | 167,359 | ||
| Class C | 614,638 | 225,260 | ||
| Class I | — | $18,830 | ||
| Total | $2,069,196 | $1,943,744 | ||
Trustee expenses. The Trust compensates each Trustee who is not an employee of the Adviser or its affiliates. These Trustees may, for tax purposes, elect to defer receipt of this compensation under the John Hancock Group of Funds Deferred Compensation Plan (the Plan). Deferred amounts are invested in various John Hancock funds and remain in the funds until distributed in accordance with the Plan. The investment of deferred amounts and the offsetting liability are included within other receivables and prepaid assets and payable to affiliates — Trustees’ fees, respectively, in the accompanying Statement of Assets and Liabilities.
Note 5 — Fund share transactions
Transactions in Fund shares for the years ended October 31, 2010 and October 31, 2009 were as follows:
| Year ended 10-31-10 | Year ended 10-31-09 | |||
| Shares | Amount | Shares | Amount | |
| Class A shares | ||||
| Sold | 3,483,957 | $91,133,071 | 7,484,590 | $150,891,265 |
| Issued in reorganization | — | — | 40,569 | 951,060 |
| Distributions reinvested | 13,785 | 361,572 | 412,775 | 7,439,515 |
| Repurchased | (14,086,189) | (368,600,174) | (14,316,832) | (289,714,804) |
| Net decrease | (10,588,447) | ($277,105,531) | (6,378,898) | ($130,432,964) |
| Class B shares | ||||
| Sold | 87,333 | $2,151,938 | 149,442 | $2,881,929 |
| Distributions reinvested | — | — | 42,641 | 730,442 |
| Repurchased | (681,970) | (16,698,432) | (912,009) | (17,239,993) |
| Net decrease | (594,637) | ($14,546,494) | (719,926) | ($13,627,622) |
| Class C shares | ||||
| Sold | 213,068 | $5,240,330 | 349,918 | $6,754,191 |
| Distributions reinvested | — | — | 46,668 | 799,382 |
| Repurchased | (557,284) | (13,587,234) | (871,358) | (16,303,393) |
| Net decrease | (344,216) | ($8,346,904) | (474,772) | ($8,749,820) |
| Annual report | U.S. Global Leaders Growth Fund | 27 |
| Year ended 10-31-10 | Year ended 10-31-09 | |||
| Shares | Amount | Shares | Amount | |
| Class I shares | ||||
| Sold | 543,793 | $14,860,415 | 1,258,824 | $25,981,634 |
| Distributions reinvested | 580 | 15,615 | 33,432 | 615,478 |
| Repurchased | (299,858) | (7,950,948) | (2,639,630) | (54,754,896) |
| Net increase (decrease) | 244,515 | $6,925,082 | (1,347,374) | ($28,157,784) |
| Class R1 shares | ||||
| Sold | — | — | 27,811 | $555,622 |
| Issued in reorganization | — | — | (41,407) | (951,060) |
| Distributions reinvested | — | — | 1,429 | 25,241 |
| Repurchased | — | — | (76,015) | (1,563,221) |
| Net decrease | — | — | (88,182) | ($1,933,418) |
| Net decrease | (11,282,785) | ($293,073,847) | (9,009,152) | ($182,901,608) |
Note 6 — Purchase and sale of securities
Purchases and sales of securities, other than short-term securities, aggregated $173,457,902 and $452,804,111, respectively, for the year ended October 31, 2010.
| 28 | U.S. Global Leaders Growth Fund | Annual report |
Auditors’ report
Report of Independent Registered Public Accounting Firm
To the Board of Trustees of John Hancock Capital Series and Shareholders of John Hancock U.S. Global Leaders Growth Fund:
In our opinion, the accompanying statement of assets and liabilities, including the schedule of investments, and the related statements of operations and of changes in net assets and the financial highlights present fairly, in all material respects, the financial position of John Hancock U.S. Global Leaders Growth Fund (the “Fund”) at October 31, 2010, and the results of its operations, the changes in its net assets and the financial highlights for each of the periods indicated, in conformity with accounting principles generally accepted in the United States of America. These financial statements and financial highlights (hereafter referred to as “financial statements”) are the responsibility of the Fund’s management; our responsibility is to express an opinion on these financial statements based on our audits. We conducted our audits of these financial statements in accordance with the standards of the Public Company Accounting Oversight Board (United States). Those standards require that we plan and perform the audit to obtain reasonable assurance about whether the financial statements are free of material misstatement. An audit includes examining, on a test basis, evidence supporting the amounts and disclosures in the financial statements, assessing the accounting principles used and significant estimates made by management, and evaluating the overall financial statement presentation. We believe that our audits, which included confirmation of securities as of October 31, 2010 by correspondence with the custodian and brokers, and the application of alternative auditing procedures where securities purchased confirmations had not been received, provide a reasonable basis for our opinion.
PricewaterhouseCoopers LLP
Boston, Massachusetts
December 22, 2010
| Annual report | U.S. Global Leaders Growth Fund | 29 |
Tax information
Unaudited
For federal income tax purposes, the following information is furnished with respect to the distributions of the Fund, if any, paid during its taxable year ended October 31, 2010.
The Fund designates the maximum amount allowable for the corporate dividends received deduction for the fiscal year ended October 31, 2010.
The Fund designates the maximum amount allowable of its net taxable income as qualified dividend income as provided in the Jobs and Growth Tax Relief Reconciliation Act of 2003. This amount will be reflected on Form 1099-DIV for the calendar year 2010.
Shareholders will be mailed a 2010 Form 1099-DIV in January 2011. This will reflect the total of all distributions that are taxable for calendar year 2010.
| 30 | U.S. Global Leaders Growth Fund | Annual report |
Board Consideration of and Continuation of Investment Advisory Agreement and Subadvisory Agreement
The Board of Trustees (the Board, the members of which are referred to as Trustees) of John Hancock U.S. Global Leaders Growth Fund (the Fund), a series of John Hancock Capital Series (the Trust), met in-person on May 2–4 and June 6–8, 2010 to consider the approval of the Fund’s investment advisory agreement (the Advisory Agreement) with John Hancock Advisers, LLC (the Adviser), the Fund’s investment adviser. The Board also considered the approval of the investment subadvisory agreement (the Subadvisory Agreement) among the Adviser, Sustainable Growth Advisers, LP (the Subadviser) and the Trust on behalf of the Fund. The Advisory Agreement and the Subadvisory Agreement are referred to as the Agreements.
Activities and composition of the Board
The Board consists of eleven individuals, nine of whom are Independent Trustees. Independent Trustees are generally those individuals who are unaffiliated with the Fund, the Adviser and the Subadviser. The Trustees are responsible for the oversight of operations of the Fund and perform the various duties required of directors of investment companies by the Investment Company Act of 1940, as amended (the 1940 Act). The Independent Trustees have retained independent legal counsel to assist them in connection with their duties. The Board has appointed an Independent Trustee as Chairperson. The Board has established four standing committees that are composed entirely of Independent Trustees: the Audit Committee; the Compliance Committee; the Nominating, Governance and Administration Committee; and the Contracts/Operations Committee. Additionally, Investment Performance Committee B is a standing committee of the Board that is composed of Independent Trustees and one Trustee who is affiliated with the Adviser. Investment Performance Committee B oversees and monitors matters relating to the investment performance of the Fund. The Board has also designated a Vice Chairperson to serve in the absence of the Chairperson, who also serves as Chairman of the Board’s Nominating, Governance and Administration Committee. The Board also designates working groups or ad hoc committees as it deems appropriate.
The approval process
Pursuant to the 1940 Act, the Board is required to consider the continuation of the Agreements on an annual basis. Throughout the year, the Board, acting directly and through its committees, regularly reviews and assesses the quality of the services that the Fund receives under these Agreements. In this regard, the Board reviews reports of the Adviser at least quarterly, which include, among other things, Fund performance reports and compliance reports. In addition, the Board meets with portfolio managers and senior investment officers at various times throughout the year. The Board considers at each of its meetings factors that are relevant to its annual consideration of the renewal of the Agreements, including the services and support provided by the Adviser and Subadviser to the Fund and its shareholders.
Prior to the May 2–4, 2010 meeting, the Board requested and received materials specifically relating to the Agreements. The materials provided in connection with the May meeting included information independently compiled and prepared by Morningstar, Inc. (Morningstar) on Fund fees and expenses, and the investment performance of the Fund. This Fund information is assembled in a format that permits comparison with similar information from a category of relevant funds (the Category) and a peer group of comparable funds (the Peer Group) as determined by Morningstar, and its benchmark index. Other material provided for the Fund review included (a) information on the profitability of the Agreements to the Adviser and a discussion of any additional benefits to the Adviser and its affiliates that result from being the Adviser to the Fund; (b) a general analysis provided by the Adviser and the Subadviser concerning investment advisory fees charged to other clients, such as institutional clients and other investment companies, under similar investment mandates, as well as the performance of such other clients; (c) the impact of economies of scale;
| Annual report | U.S. Global Leaders Growth Fund | 31 |
(d) a summary of aggregate amounts paid by the Fund to the Adviser; and (e) sales and redemption data regarding the Fund’s shares.
At an in-person meeting held on May 2–4, 2010, the Board reviewed materials relating to its consideration of the Agreements. As a result of the discussions that occurred during the May 2–4, 2010 meeting, the Board presented the Adviser and Subadviser with questions and requests for additional information and the Adviser and Subadviser responded to these requests with additional written information in advance of the June 6–8, 2010 Board meeting. The Board also reviewed these additional materials relating to its consideration of the Agreements.
At an in-person meeting held on June 6–8, 2010, the Board, including the Independent Trustees, formally considered the continuation of the Advisory Agreement between the Adviser and the Fund and the Subadvisory Agreement among the Adviser, the Subadviser and the Trust on behalf of the Fund, each for an additional one-year term. The Board considered all factors it believed relevant with respect to the Fund, including, among other factors: (a) the nature, extent and quality of the services provided by the Adviser and the Subadviser; (b) the investment performance of the Fund and portfolio management of the Subadviser; (c) the advisory fees and the cost of the services and profits to be realized by the Adviser and certain affiliates from their relationship with the Fund; (d) economies of scale; and (e) other factors.
The Board also considered other matters important to the approval process, such as payments made to the Adviser or its affiliates relating to the distribution of Fund shares and other services. The Board reviewed services related to the valuation and pricing of Fund portfolio holdings. Other important matters considered by the Board were the direct and indirect benefits to the Adviser, the Subadviser, and their affiliates from their relationship with the Fund and advice from independent legal counsel with respect to the review process and materials submitted for the Board’s review. Each Trustee may have attributed different weights to the various items considered.
The key factors considered by the Board and the conclusions reached are described below.
Nature, extent and quality of services
The Board, including the Independent Trustees, reviewed the nature, extent and quality of services provided by the Adviser and the Subadviser, including the investment advisory services and the resulting performance of the Fund. The Board reviewed the Adviser’s and Subadviser’s senior management personnel responsible for investment operations, including the senior investment officers. The Board also reviewed the materials provided by the Fund’s portfolio management team discussing Fund performance and the Fund’s investment objective, strategies and outlook.
The Board considered the ability of the Adviser and the Subadviser, based on their resources, reputation and other attributes, to attract and retain qualified investment professionals, including research, advisory, and supervisory personnel. It considered the background and experience of senior management and investment professionals responsible for managing the Fund. The Board considered the investment philosophy, research and investment decision-making processes of the Adviser and the Subadviser responsible for the daily investment activities of the Fund, including, among other things, portfolio trading capabilities, use of technology, commitment to compliance and approach to training and retaining portfolio managers and other research, advisory and management personnel.
The Board considered the Subadviser’s history and experience with the Fund. The Board considered the Adviser’s execution of its oversight responsibilities. The Board further considered the culture of compliance, resources dedicated to compliance, compliance programs, record of compliance with applicable laws and regulation, with the Fund’s investment policies and restrictions and with the applicable Code of Ethics, and the responsibilities of the Adviser’s and Subadviser’s compliance departments.
| 32 | U.S. Global Leaders Growth Fund | Annual report |
In addition to advisory services, the Board considered the quality of the administrative and non-investment advisory services provided to the Fund by the Adviser under separate agreements. The Board noted that the Adviser and its affiliates provide the Fund with certain administrative, transfer agency, shareholder and other services (in addition to any such services provided to the Fund by third parties) and officers and other personnel as are necessary for the operations of the Fund. The Board reviewed the structure and duties of the Adviser’s administration, accounting, legal and compliance departments and considered the Adviser’s policies and procedures for assuring compliance with applicable laws and regulations.
The Board also received information about the nature, extent and quality of services and fee rates offered by the Adviser and Subadviser to their other clients, including other registered investment companies, institutional investors and separate accounts. The Board reviewed a general analysis provided by the Adviser and the Subadviser concerning investment advisory fees charged to such other clients under similar investment mandates, the services provided to such other clients as compared to the services provided to the Fund, the performance of such other clients, and other factors relating to such other clients. The Board considered the significant differences between the Adviser’s and Subadviser’s services to the Fund and those services they provide to other clients which, to the extent the other client is not a mutual fund, may generally be attributable to the greater frequency of shareholder redemptions in a mutual fund, the higher turnover of mutual fund assets, the more burdensome regulatory and legal obligations of mutual funds, and the higher marketing costs for mutual funds.
Fund performance
The Board, including the Independent Trustees, reviewed and considered the performance history of the Fund. The Board was provided with reports, independently prepared by Morningstar, which included a comprehensive analysis of the Fund’s performance. The Board also reviewed a narrative and statistical analysis of the Morningstar data that was prepared by the Adviser, which analyzed various factors that may affect the Morningstar rankings. The Board reviewed information regarding the investment performance of the Fund as compared to its Morningstar Category and Peer Group as well as its benchmark index. The Board noted that the Fund’s performance exceeded the performance of its Category and Peer Group medians and its benchmark index for the one- and three-year periods. The Board also noted that the Fund outperformed its Category and Peer Group medians and its benchmark index over ten years (see chart below). The Board was provided with a description of the methodology used by Morningstar to select the funds in the Category and the Peer Group. The Board also considered updated performance information provided by the Adviser at its May and June 2010 meetings. The Board regularly reviews the performance of the Fund throughout the year and attaches more importance to performance over relatively longer periods of time, typically three to five years.
| 1 YEAR | 3 YEAR | 5 YEAR | 10 YEAR | |
| U.S. Global Leaders Growth Fund | 44.32% | –0.81% | 0.23% | 0.82% |
| S&P 500 Index | 26.46% | –5.63% | 0.42% | –0.95% |
| Large Growth Category Median | 34.36% | –2.70% | 1.35% | –1.59% |
| Morningstar 15(c) Peer Group Median | 35.04% | –2.44% | 0.88% | –2.44% |
The Board considered presentations made by the Subadviser and the Adviser on the investment management style of the Subadviser and noted that the Subadviser has significantly improved performance over the one year period due to improved stock and sector selection. The Board noted that the Subadviser remained consistent with its investment style and adhered to its investment mandates. The Board concluded that the Fund’s underperformance was being responsibly addressed by the Adviser and Subadviser.
| Annual report | U.S. Global Leaders Growth Fund | 33 |
Expenses and fees
The Board, including the Independent Trustees, reviewed the Fund’s contractual advisory fee rate payable by the Fund to the Adviser as compared with the other funds in its Category and Peer Group. The Board also received information about the investment subadvisory fee rate payable by the Adviser to the Subadviser for investment subadvisory services. The Board considered the services provided and the fees charged by the Adviser and the Subadviser to other types of clients with similar investment mandates, including separately managed institutional accounts.
In addition, the Board considered the cost of the services provided to the Fund by the Adviser. The Board received and considered expense information regarding the Fund’s various components, including advisory fees, distribution fees and fees other than advisory and distribution fees, including transfer agent fees, custodian fees, administration fees and other miscellaneous fees (e.g., fees for accounting and legal services). The Board considered comparisons of these expenses to the Peer Group median. The Board also considered expense information regarding the Fund’s total operating expense ratio (Gross Expense Ratio) and total operating expense ratio after taking the fee waiver arrangement applicable to the Advisory Agreement rate into account (Net Expense Ratio). The Board considered information comparing the Gross Expense Ratio and Net Expense Ratio of the Fund to that of the Peer Group and Category medians. As part of its analysis, the Board reviewed the Adviser’s methodology in allocating its costs to the management of the Fund. The Board considered expenses and fee rates to be higher or lower if they were over or under 10 basis points, respectively; slightly higher or slightly lower if they were above or below 6-10 basis points, respectively; and inline if they were above or below by 5 basis points.
The Board noted that the investment advisory rate was inline with the Category and Peer Group medians. The Board viewed favorably the Adviser’s contractual agreement to waive all or a portion of its Advisory Agreement rate and reimburse or pay operating expenses to the extent necessary to maintain the Fund’s Net Expense Ratio at 1.30% for Class A shares, excluding certain expenses such as taxes, brokerage commissions, interest, litigation and extraordinary expenses, until February 28, 2011.
The Board reviewed the Fund’s Gross Expense Ratio of 1.81% for the Fund’s Class A shares. Board noted that the Fund’s Gross Expense Ratio was higher than the Peer Group and Category medians. The Board also noted that the Fund’s Net Expense Ratio was slightly higher than the Peer Group median and higher than the Category median. The Board favorably considered the impact of fee waivers towards ultimately lowering the Fund’s Gross Expense Ratio. The Board also received and considered information relating to the Fund’s Gross Expense Ratio and Net Expense Ratio that reflected a proposed change in the methodology for calculating transfer agent fees.
The Board received and reviewed statements relating to the Adviser’s financial condition and profitability with respect to the services it provides the Fund. The Board was also provided with a profitability analysis that detailed the revenues earned and the expenses incurred by the Adviser for services provided to the Fund. The Board reviewed the Adviser’s profitability with respect to the Fund and other funds the Board currently oversees for the year ended December 31, 2009 compared to available aggregate profitability data provided for the year ended December 31, 2008.
The Board received and considered a detailed profitability analysis of the Adviser based on the Advisory Agreement, as well as on other relationships between the Fund and the Adviser and its affiliates. The Board also considered a comparison of the Adviser’s profitability to that of other similar investment advisers whose profitability information is publicly available. The Board reviewed the Adviser’s profitability with respect to other fund complexes managed by the Adviser and/or its affiliates. The Board reviewed the Adviser’s assumptions and methodology of allocating expenses in the profitability analysis, noting the inherent limitations in allocating costs among various advisory products. The Board recognized that profitability may be affected by numerous
| 34 | U.S. Global Leaders Growth Fund | Annual report |
factors including, among other things, fee waivers and expense reimbursements by the Adviser, the types of funds managed, expense allocations and business mix, and therefore comparability of profitability is somewhat limited.
The Board did not consider profitability information with respect to the Subadviser, which is not affiliated with the Adviser. The Board considered that the subadvisory fee under the Subadvisory Agreement had been negotiated by the Adviser and the Subadviser on an arm’s-length basis and that the Subadviser’s separate profitability from its relationship with the Fund was not a material factor in determining whether to renew the Subadvisory Agreement.
Economies of scale
The Board, including the Independent Trustees, considered the extent to which economies of scale might be realized as the assets of the Fund increase and whether there should be changes in the advisory fee rate or structure in order to enable the Fund to participate in these economies of scale, for example through the use of breakpoints in the advisory fee based upon the assets of the Fund. The Board also considered the Adviser’s overall operations and its efforts to expand the scale of, and improve the quality of, its operations.
The Board recognized the inherent limitations of any analysis of economies of scale, stemming largely from the Board’s understanding that most of the Adviser’s costs are not specific to individual funds, but rather are incurred across a variety of products and services. To ensure that any economies are reasonably shared with the Fund as its assets increase, the Adviser and the Board agreed to continue the existing breakpoints to the Agreement fee rate.
Other benefits to the Adviser and the Subadviser
The Board understands that the Adviser, the Subadviser, or their affiliates may derive other ancillary benefits from their relationship with the Fund, both tangible and intangible, such as their ability to leverage investment professionals who manage other portfolios, an increase in their profile in the investment advisory community, and the engagement of their affiliates and/or significant shareholders as service providers to the Fund, including for administrative, transfer agency and distribution services. The Board believes that certain of these benefits are difficult to quantify. The Board also was informed that the Subadviser may use third party research obtained by soft dollars generated by certain mutual fund transactions to assist itself in managing all or a number of its other client accounts.
Board determination
The Board, including the Independent Trustees, unanimously approved the continuation of the Advisory Agreement between the Adviser and the Fund for an additional one-year term and the Subadvisory Agreement among the Adviser, the Subadviser and the Trust on behalf of the Fund for an additional one-year term. Based upon its evaluation of relevant factors in their totality, the Board, including a majority of the Independent Trustees, was satisfied that the terms of the Agreements were fair and reasonable and in the best interest of the Fund and its shareholders. In arriving at a decision to approve the Agreements, the Board did not identify any single factor listed above, or any group of factors listed above, as all-important or controlling, but considered all factors together, and different Trustees may have attributed different weights to the various factors considered. The Independent Trustees were also assisted by the advice of independent legal counsel in making this determination. The Board noted that contractual fee arrangements for the Fund reflect the results of several years of review by the Board and certain predecessor Trustees, and discussions between such Trustees (and predecessor Trustees) and the Adviser. Certain aspects of the arrangements may be the subject of more attention in some years than in others, and the Trustees’ conclusions may be based in part on their consideration of these arrangements in prior years.
| Annual report | U.S. Global Leaders Growth Fund | 35 |
Trustees and Officers
This chart provides information about the Trustees and Officers who oversee your John Hancock fund. Officers elected by the Trustees manage the day-to-day operations of the Fund and execute policies formulated by the Trustees.
| Independent Trustees | ||
| Name, Year of Birth | Trustee | Number of John |
| Position(s) held with Fund | of the | Hancock funds |
| Principal occupation(s) and other | Trust | overseen by |
| directorships during past 5 years | since1 | Trustee |
| Patti McGill Peterson, Born: 1943 | 2002 | 47 |
| Chairperson (since December 2008); Principal, PMP Globalinc (consulting) (since 2007); Senior | ||
| Associate, Institute for Higher Education Policy (since 2007); Executive Director, CIES (international | ||
| education agency) (until 2007); Vice President, Institute of International Education (until 2007); Senior | ||
| Fellow, Cornell University Institute of Public Affairs, Cornell University (1997–1998); Former President | ||
| Wells College, St. Lawrence University and the Association of Colleges and Universities of the State | ||
| of New York. Director of the following: Niagara Mohawk Power Corporation (until 2003); Security | ||
| Mutual Life (insurance) (until 1997); ONBANK (until 1993). Trustee of the following: Board of Visitors, | ||
| The University of Wisconsin, Madison (since 2007); Ford Foundation, International Fellowships Program | ||
| (until 2007); UNCF, International Development Partnerships (until 2005); Roth Endowment (since 2002); | ||
| Council for International Educational Exchange (since 2003). | ||
| James F. Carlin, Born: 1940 | 2005 | 47 |
| Chief Executive Officer, Director and Treasurer, Alpha Analytical Laboratories (environmental, chemical | ||
| and pharmaceutical analysis) (since 1985); Part Owner and Treasurer, Lawrence Carlin Insurance Agency, | ||
| Inc. (since 1995); Chairman and Chief Executive Officer, Carlin Consolidated, Inc. (management/ | ||
| investments) (since 1987). | ||
| William H. Cunningham, Born: 1944 | 2005 | 47 |
| Professor, University of Texas, Austin, Texas (since 1971); former Chancellor, University of Texas System | ||
| and former President of the University of Texas, Austin, Texas; Director of the following: LIN Television | ||
| (since 2009); Lincoln National Corporation (insurance) (Chairman since 2009 and Director since 2006); | ||
| Resolute Energy Corporation (since 2009); Nanomedical Systems, Inc. (biotechnology company) | ||
| (Chairman since 2008); Yorktown Technologies, LP (tropical fish) (Chairman since 2007); Greater Austin | ||
| Crime Commission (since 2001); Southwest Airlines (since 2000); former Director of the following: | ||
| Introgen (manufacturer of biopharmaceuticals) (until 2008); Hicks Acquisition Company I, Inc. (until | ||
| 2007); Jefferson-Pilot Corporation (diversified life insurance company) (until 2006); and former Advisory | ||
| Director, JP Morgan Chase Bank (formerly Texas Commerce Bank–Austin) (until 2009). | ||
| Deborah C. Jackson,2 Born: 1952 | 2008 | 47 |
| Chief Executive Officer, American Red Cross of Massachusetts Bay (since 2002); Board of Directors of | ||
| Eastern Bank Corporation (since 2001); Board of Directors of Eastern Bank Charitable Foundation (since | ||
| 2001); Board of Directors of American Student Assistance Corp. (1996–2009); Board of Directors of | ||
| Boston Stock Exchange (2002–2008); Board of Directors of Harvard Pilgrim Healthcare (health benefits | ||
| company) (since 2007). | ||
| 36 | U.S. Global Leaders Growth Fund | Annual report |
| Independent Trustees (continued) | ||
| Name, Year of Birth | Trustee | Number of John |
| Position(s) held with Fund | of the | Hancock funds |
| Principal occupation(s) and other | Trust | overseen by |
| directorships during past 5 years | since1 | Trustee |
| Charles L. Ladner, Born: 1938 | 2004 | 47 |
| Chairman and Trustee, Dunwoody Village, Inc. (retirement services) (since 2008); Director, Philadelphia | ||
| Archdiocesan Educational Fund (since 2009); Senior Vice President and Chief Financial Officer, UGI | ||
| Corporation (public utility holding company) (retired 1998); Vice President and Director for AmeriGas, | ||
| Inc. (retired 1998); Director of AmeriGas Partners, L.P. (gas distribution) (until 1997); Director, | ||
| EnergyNorth, Inc. (until 1995); Director, Parks and History Association (Cooperating Association, | ||
| National Park Service) (until 2005). | ||
| Stanley Martin,2 Born: 1947 | 2008 | 47 |
| Senior Vice President/Audit Executive, Federal Home Loan Mortgage Corporation (2004–2006); | ||
| Executive Vice President/Consultant, HSBC Bank USA (2000–2003); Chief Financial Officer/Executive | ||
| Vice President, Republic New York Corporation & Republic National Bank of New York (1998–2000); | ||
| Partner, KPMG LLP (1971–1998). | ||
| Dr. John A. Moore, Born: 1939 | 2002 | 47 |
| President and Chief Executive Officer, Institute for Evaluating Health Risks, (nonprofit institution) | ||
| (until 2001); Senior Scientist, Sciences International (health research) (until 2003); Former | ||
| Assistant Administrator & Deputy Administrator, Environmental Protection Agency; Principal, | ||
| Hollyhouse (consulting) (since 2000); Director, CIIT Center for Health Science Research (nonprofit | ||
| research) (until 2007). | ||
| Steven R. Pruchansky,2 Born: 1944 | 2005 | 47 |
| Chairman and Chief Executive Officer, Greenscapes of Southwest Florida, Inc. (since 2000); Director | ||
| and President, Greenscapes of Southwest Florida, Inc. (until 2000); Member, Board of Advisors, First | ||
| American Bank (since 2008); Managing Director, Jon James, LLC (real estate) (since 2000); Director, | ||
| First Signature Bank & Trust Company (until 1991); Director, Mast Realty Trust (until 1994); President, | ||
| Maxwell Building Corp. (until 1991). | ||
| Gregory A. Russo, Born: 1949 | 2009 | 47 |
| Vice Chairman, Risk & Regulatory Matters, KPMG LLP (“KPMG”) (2002–2006); Vice Chairman, Industrial | ||
| Markets, KPMG (1998–2002). | ||
| Non-Independent Trustees3 | ||
| Name, Year of Birth | Trustee | Number of John |
| Position(s) held with Fund | of the | Hancock funds |
| Principal occupation(s) and other | Trust | overseen by |
| directorships during past 5 years | since1 | Trustee |
| Hugh McHaffie,4 Born: 1959 | 2010 | 47 |
| Executive Vice President, John Hancock Financial Services (since 2006, including prior positions); | ||
| President of John Hancock Trust and John Hancock Funds II (since 2009); Trustee, John Hancock retail | ||
| funds (since 2010); Chairman and Director, John Hancock Advisers, LLC, John Hancock Investment | ||
| Management Services, LLC and John Hancock Funds, LLC (since 2010); Senior Vice President, Individual | ||
| Business Product Management, MetLife, Inc. (1999–2006). | ||
| Annual report | U.S. Global Leaders Growth Fund | 37 |
| Non-Independent Trustees3 (continued) | ||
| Name, Year of Birth | Trustee | Number of John |
| Position(s) held with Fund | of the | Hancock funds |
| Principal occupation(s) and other | Trust | overseen by |
| directorships during past 5 years | since1 | Trustee |
| John G. Vrysen, Born: 1955 | 2009 | 47 |
| Senior Vice President, John Hancock Financial Services (since 2006); Director, Executive Vice President | ||
| and Chief Operating Officer, John Hancock Advisers, LLC, John Hancock Investment Management | ||
| Services, LLC and John Hancock Funds, LLC (since 2005); Chief Operating Officer, John Hancock Funds II | ||
| and John Hancock Trust (since 2007); Chief Operating Officer, John Hancock retail funds (until 2009); | ||
| Trustee, John Hancock retail funds (since 2009). | ||
| Principal officers who are not Trustees | ||
| Name, Year of Birth | Officer | |
| Position(s) held with Fund | of the | |
| Principal occupation(s) and other | Trust | |
| directorships during past 5 years | since | |
| Keith F. Hartstein, Born: 1956 | 2005 | |
| President and Chief Executive Officer | ||
| Senior Vice President, John Hancock Financial Services (since 2004); Director, President and Chief | ||
| Executive Officer, John Hancock Advisers, LLC and John Hancock Funds, LLC (since 2005); Director, | ||
| MFC Global Investment Management (U.S.), LLC (since 2005); Director, John Hancock Investment | ||
| Management Services, LLC (since 2006); President and Chief Executive Officer, John Hancock | ||
| retail funds (since 2005); Member, Investment Company Institute Sales Force Marketing | ||
| Committee (since 2003). | ||
| Andrew G. Arnott, Born: 1971 | 2009 | |
| Senior Vice President and Chief Operating Officer | ||
| Senior Vice President, John Hancock Financial Services (since 2009); Executive Vice President, | ||
| John Hancock Advisers, LLC (since 2005); Executive Vice President, John Hancock Investment | ||
| Management Services, LLC (since 2006); Executive Vice President, John Hancock Funds, LLC (since | ||
| 2004); Chief Operating Officer, John Hancock retail funds (since 2009); Senior Vice President, | ||
| John Hancock retail funds (since 2010); Vice President, John Hancock Funds II and John Hancock Trust | ||
| (since 2006); Senior Vice President, Product Management and Development, John Hancock Funds, | ||
| LLC (until 2009). | ||
| Thomas M. Kinzler, Born: 1955 | 2006 | |
| Secretary and Chief Legal Officer | ||
| Vice President, John Hancock Financial Services (since 2006); Secretary and Chief Legal Counsel, | ||
| John Hancock Advisers, LLC, John Hancock Investment Management Services, LLC and John Hancock | ||
| Funds, LLC (since 2007); Secretary and Chief Legal Officer, John Hancock retail funds, John Hancock | ||
| Funds II and John Hancock Trust (since 2006); Vice President and Associate General Counsel, | ||
| Massachusetts Mutual Life Insurance Company (1999–2006); Secretary and Chief Legal Counsel, MML | ||
| Series Investment Fund (2000–2006); Secretary and Chief Legal Counsel, MassMutual Select Funds and | ||
| MassMutual Premier Funds (2004–2006). | ||
| 38 | U.S. Global Leaders Growth Fund | Annual report |
| Principal officers who are not Trustees (continued) | |
| Name, Year of Birth | Officer |
| Position(s) held with Fund | of the |
| Principal occupation(s) and other | Trust |
| directorships during past 5 years | since |
| Francis V. Knox, Jr., Born: 1947 | 2005 |
| Chief Compliance Officer | |
| Vice President, John Hancock Financial Services (since 2005); Chief Compliance Officer, John Hancock | |
| retail funds, John Hancock Funds II, John Hancock Trust, John Hancock Advisers, LLC and John Hancock | |
| Investment Management Services, LLC (since 2005); Vice President and Chief Compliance Officer, MFC | |
| Global Investment Management (U.S.), LLC (2005–2008). | |
| Charles A. Rizzo, Born: 1957 | 2007 |
| Chief Financial Officer | |
| Vice President, John Hancock Financial Services (since 2008); Senior Vice President, John Hancock | |
| Advisers, LLC and John Hancock Investment Management Services, LLC (since 2008); Chief | |
| Financial Officer, John Hancock retail funds, John Hancock Funds II and John Hancock Trust (since | |
| 2007); Assistant Treasurer, Goldman Sachs Mutual Fund Complex (2005–2007); Vice President, | |
| Goldman Sachs (2005–2007); Managing Director and Treasurer, Scudder Funds, Deutsche Asset | |
| Management (2003–2005). | |
| Salvatore Schiavone,4 Born: 1965 | 2010 |
| Treasurer | |
| Assistant Vice President, John Hancock Financial Services (since 2007); Vice President, John Hancock | |
| Advisers, LLC and John Hancock Investment Management Services, LLC (since 2007); Treasurer, | |
| John Hancock retail funds (since 2010); Treasurer, John Hancock Closed-End Funds (since 2009); | |
| Assistant Treasurer, John Hancock Funds II and John Hancock Trust (since 2010); Assistant Treasurer, | |
| John Hancock retail funds, John Hancock Funds II and John Hancock Trust (2007–2009); Assistant | |
| Treasurer, Fidelity Group of Funds (2005–2007); Vice President, Fidelity Management Research | |
| Company (2005–2007); Assistant Treasurer, Scudder Group of Funds (2003–2005); Director, Deutsche | |
| Asset Management (2003–2005). | |
The business address for all Trustees and Officers is 601 Congress Street, Boston, Massachusetts 02210-2805.
The Statement of Additional Information of the Fund includes additional information about members of the Board of Trustees of the Fund and is available without charge, upon request, by calling 1-800-225-5291.
1 Each Trustee holds office until his or her successor is elected and qualified, or until the Trustee’s death, retirement, resignation or removal.
2 Member of Audit Committee.
3 Because Messrs. McHaffie and Vrysen are senior executives or directors with the Adviser and/or its affiliates, each of them is considered an “interested person,” as defined in the Investment Company Act of 1940, of the Fund.
4 Mr. McHaffie and Mr. Schiavone were appointed by the Board of Trustees effective 8-31-10.
| Annual report | U.S. Global Leaders Growth Fund | 39 |
More information
| Trustees | Investment adviser | ||
| Patti McGill Peterson, Chairperson | John Hancock Advisers, LLC | ||
| James F. Carlin | |||
| William H. Cunningham | Subadviser | ||
| Deborah C. Jackson* | Sustainable Growth Advisers, LP | ||
| Charles L. Ladner | |||
| Stanley Martin* | Principal distributor | ||
| Hugh McHaffie†** | John Hancock Funds, LLC | ||
| Dr. John A. Moore | |||
| Steven R. Pruchansky* | Custodian | ||
| Gregory A. Russo | State Street Bank and Trust Company | ||
| John G. Vrysen† | |||
| Transfer agent | |||
| Officers | John Hancock Signature Services, Inc. | ||
| Keith F. Hartstein | |||
| President and Chief Executive Officer | Legal counsel | ||
| K&L Gates LLP | |||
| Andrew G. Arnott | |||
| Senior Vice President** and Chief Operating Officer | Independent registered | ||
| public accounting firm | |||
| Thomas M. Kinzler | PricewaterhouseCoopers LLP | ||
| Secretary and Chief Legal Officer | |||
| Francis V. Knox, Jr. | The report is certified under the Sarbanes-Oxley | ||
| Chief Compliance Officer | Act, which requires mutual funds and other public | ||
| companies to affirm that, to the best of their | |||
| Charles A. Rizzo | knowledge, the information in their financial reports | ||
| Chief Financial Officer | is fairly and accurately stated in all material respects. | ||
| Salvatore Schiavone** | |||
| Treasurer | |||
| *Member of the Audit Committee | |||
| **Effective 8-31-10 | |||
| †Non-Independent Trustee | |||
The Fund’s proxy voting policies and procedures, as well as the Fund’s proxy voting record for the most recent twelve-month period ended June 30, are available free of charge on the Securities and Exchange Commission (SEC) Web site at www.sec.gov or on our Web site.
The Fund’s complete list of portfolio holdings, for the first and third fiscal quarters, is filed with the SEC on Form N-Q. The Fund’s Form N-Q is available on our Web site and the SEC’s Web site, www.sec.gov, and can be reviewed and copied (for a fee) at the SEC’s Public Reference Room in Washington, DC. Call 1-800-SEC-0330 to receive information on the operation of the SEC’s Public Reference Room.
We make this information on your fund, as well as monthly portfolio holdings, and other fund details available on our Web site www.jhfunds.com or by calling 1-800-225-5291.
| You can also contact us: | ||
| 1-800-225-5291 | Regular mail: | Express mail: |
| jhfunds.com | John Hancock Signature Services, Inc. | John Hancock Signature Services, Inc. |
| P.O. Box 55913 | Mutual Fund Image Operations | |
| Boston, MA 02205-5913 | 30 Dan Road | |
| Canton, MA 02021 |
| 40 | U.S. Global Leaders Growth Fund | Annual report |

1-800-225-5291
1-800-554-6713 TDD
1-800-338-8080 EASI-Line
www.jhfunds.com
Now available: electronic delivery
www.jhfunds.com/edelivery
| This report is for the information of the shareholders of John Hancock U.S. Global Leaders Growth Fund. | 2600A 10/10 |
| It is not authorized for distribution to prospective investors unless preceded or accompanied by a prospectus. | 12/10 |
Management’s discussion of
Fund performance
By Pzena Investment Management, LLC
For the U.S. stock market, the 12 months ended October 31, 2010, consisted of three distinct periods of performance. During the first six months, stocks rallied steadily as the U.S. economy emerged from a deep recession and embarked on the road to recovery. Stocks fell precipitously in May and June and remained volatile throughout the summer months as a host of concerns — ranging from weaker-than-expected economic data to a sovereign debt crisis in Europe to a soaring U.S. fiscal deficit — clouded the economic outlook and sparked fears of a double-dip recession. The equity market shifted gears again in September, finishing the period with a strong rally as investor sentiment swung back toward cautious optimism.
For the year ended October 31, 2010, John Hancock Classic Value Fund’s Class A shares posted a total return of 14.48% at net asset value, trailing the 15.71% return of the Fund’s benchmark, the Russell 1000 Value Index, but outpacing the 13.93% return of the average large value fund, according to Morningstar, Inc.
The Fund’s underperformance of its benchmark index resulted mainly from stock selection in the industrials and information technology sectors. The primary detractors in these two sectors were building products maker Masco Corp. and diversified technology firm Hewlett-Packard Company. The most significant detractor in the Fund for the 12-month period was energy producer BP PLC. On the positive side, the top-performing sector in the Fund was consumer discretionary, and the leading contributors in this sector were auto parts supplier Magna International, Inc. and advertising firm Omnicom Group, Inc. The Fund’s financial stocks also added value, led by life insurance firm Torchmark Corp. and regional bank Comerica, Inc., which we sold. The market volatility over the past 12 months provided opportunities to sell a number of holdings that reached fair value, while also adding some economically sensitive stocks with robust balance sheets that were cyclically depressed.
This commentary reflects the views of the portfolio managers through the end of the Fund’s period discussed in this report. The managers’ statements reflect their own opinions. As such, they are in no way guarantees of future events and are not intended to be used as investment advice or a recommendation regarding any specific security. They are also subject to change at any time as market and other conditions warrant.
Past performance is no guarantee of future results.
Sector investing is subject to greater risks than the market as a whole. Because the Fund may focus on particular sectors of the economy, its performance may depend on the performance of those sectors. International investing involves special risks such as political, economic and currency risks and differences in accounting standards and financial reporting.
| 6 | Classic Value Fund | Annual report |
A look at performance
For the period ended October 31, 2010
| Average annual total returns (%) | Cumulative total returns (%) | ||||||||
| with maximum sales charge (POP) | with maximum sales charge (POP) | ||||||||
| Since | Since | ||||||||
| 1-year | 5-year | 10-year | inception4 | 1-year | 5-year | 10-year | inception4 | ||
| Class A1 | 8.79 | –4.70 | 4.19 | — | 8.79 | –21.38 | 50.75 | — | |
| Class B | 8.63 | –4.74 | — | 3.80 | 8.63 | –21.54 | — | 34.57 | |
| Class C | 12.64 | –4.43 | — | 3.79 | 12.64 | –20.28 | — | 34.49 | |
| Class I2 | 14.95 | –3.32 | — | 4.99 | 14.95 | –15.55 | — | 47.44 | |
| Class R12,3 | 14.38 | –4.02 | 4.47 | — | 14.38 | –18.54 | 54.81 | — | |
| Class R32,3 | 14.04 | –4.04 | 4.43 | — | 14.04 | –18.62 | 54.24 | — | |
| Class R42,3 | 14.38 | –3.76 | 4.74 | — | 14.38 | –17.44 | 58.83 | — | |
| Class R52,3 | 14.72 | –3.47 | 5.05 | — | 14.72 | –16.19 | 63.67 | — | |
Performance figures assume all distributions are reinvested. Public offering price (POP) figures reflect maximum sales charges on Class A shares of 5% and the applicable contingent deferred sales charge (CDSC) on Class B shares and Class C shares. The returns for Class C shares have been adjusted to reflect the elimination of the front-end sales charge effective 7-15-04. The Class B shares’ CDSC declines annually between years 1 to 6 according to the following schedule: 5, 4, 3, 3, 2, 1%. No sales charge will be assessed after the sixth year. Class C shares held for less than one year are subject to a 1% CDSC. Sales charges are not applicable for Class I, Class R1, Class R3, Class R4 and Class R5 shares.
The expense ratios of the Fund, both net (including any fee waivers or expense limitations) and gross (excluding any fee waivers or expense limitations), are set forth according to the most recent publicly available prospectuses for the Fund and may differ from the expense ratios disclosed in the Financial Highlights tables in this report. The waivers and expense limitations are contractual at least until 2-28-11 for Class A, Class B, Class C and Class I shares. The net expenses are as follows: Class A — 1.33%, Class B — 2.08%, Class C — 2.08% and Class I — 0.94%. Had the fee waivers and expense limitations not been in place, the gross expenses would be as follows: Class A — 1.52%, Class B — 2.27%, Class C — 2.27% and Class I — 0.95%. For the other classes, the net expenses equal the gross expenses and are as follows: Class R1 — 1.67%, Class R3 — 1.61%, Class R4 — 1.31% and Class R5 — 1.01%.
The returns reflect past results and should not be considered indicative of future performance. The return and principal value of an investment will fluctuate so that shares, when redeemed, may be worth more or less than their original cost. Due to market volatility, the Fund’s current performance may be higher or lower than the performance shown. For current to the most recent month-end performance data, please call 1–800–225–5291 or visit the Fund’s Web site at www.jhfunds.com.
The performance table above and the chart on the next page do not reflect the deduction of taxes that a shareholder may pay on fund distributions or on the redemption of fund shares.
The Fund’s performance results reflect any applicable fee waivers or expense reductions, without which the expenses would increase and results would have been less favorable.
1 Effective 11-8-02, shareholders of the former Pzena Focused Value Fund became owners of that number of full and fractional shares of John Hancock Classic Value Fund. Additionally, the accounting and performance history of the former Pzena Focused Value Fund was redesignated as that of Class A of John Hancock Classic Value Fund. The performance of the former Pzena Focused Value Fund reflects stocks selected from the largest 1,000 publicly traded U.S. companies, whereas the Fund invests in stocks selected from the 500 largest such companies.
2 For certain types of investors, as described in the Fund’s Class I, Class R1, Class R3, Class R4 and Class R5 shares prospectuses.
3 6-24-96 is the inception date for the oldest class of shares, Class A shares. The inception date for Class R1 shares is 8-5-03 and the inception date for Class R3, Class R4 and Class R5 shares is 5-22-09. The returns prior to these dates are those of Class A shares that have been recalculated to apply the gross fees and expenses of Class R1, Class R3, Class R4 and Class R5 shares, respectively.
4 From 11-11-02.
| Annual report | Classic Value Fund | 7 |
A look at performance
| Period | Without | With maximum | ||
| beginning | sales charge | sales charge | Index | |
| Class B2 | 11-11-02 | $13,457 | $13,457 | $16,592 |
| Class C2 | 11-11-02 | 13,449 | 13,449 | 16,592 |
| Class I3 | 11-11-02 | 14,744 | 14,744 | 16,592 |
| Class R13,4 | 10-31-00 | 15,481 | 15,481 | 12,982 |
| Class R33,4 | 10-31-00 | 15,424 | 15,424 | 12,982 |
| Class R43,4 | 10-31-00 | 15,883 | 15,883 | 12,982 |
| Class R53,4 | 10-31-00 | 16,367 | 16,367 | 12,982 |
Assuming all distributions were reinvested for the period indicated, the table above shows the value of a $10,000 investment in the Fund’s Class B, Class C, Class I, Class R1, Class R3, Class R4 and Class R5 shares, respectively, as of 10-31-10. The Class C shares investment with a maximum sales charge has been adjusted to reflect the elimination of the front-end sales charge effective 7-15-04. Performance of the classes will vary based on the difference in sales charges paid by shareholders investing in the different classes and the fee structure of those classes.
Russell 1000 Value Index is an unmanaged index containing those securities in the Russell 1000 Index with a less-than-average growth orientation.
It is not possible to invest directly in an index. Index figures do not reflect sales charges or direct expenses, which would have resulted in lower values if they did.
1 NAV represents net asset value and POP represents public offering price.
2 No contingent deferred sales charge applicable.
3 For certain types of investors, as described in the Fund’s Class I, Class R1, Class R3, Class R4 and Class R5 shares prospectuses.
4 6-24-96 is the inception date for the oldest class of shares, Class A shares. The inception date for Class R1 shares is 8-5-03 and the inception date for Class R3, Class R4 and Class R5 shares is 5-22-09. The returns prior to these dates are those of Class A shares that have been recalculated to apply the gross fees and expenses of Class R1, Class R3, Class R4 and Class R5 shares, respectively.
| 8 | Classic Value Fund | Annual report |
Your expenses
These examples are intended to help you understand your ongoing operating expenses.
Understanding fund expenses
As a shareholder of the Fund, you incur two types of costs:
▪ Transaction costs which include sales charges (loads) on purchases or redemptions (varies by share class), minimum account fee charge, etc.
▪ Ongoing operating expenses including management fees, distribution and service fees (if applicable), and other fund expenses.
We are going to present only your ongoing operating expenses here.
Actual expenses/actual returns
This example is intended to provide information about your fund’s actual ongoing operating expenses, and is based on your fund’s actual return. It assumes an account value of $1,000.00 on May 1, 2010 with the same investment held until October 31, 2010.
| Account value | Ending value on | Expenses paid during | |
| on 5-1-10 | 10-31-10 | period ended 10-31-101 | |
| Class A | $1,000.00 | $970.20 | $6.60 |
| Class B | 1,000.00 | 966.80 | 10.31 |
| Class C | 1,000.00 | 966.80 | 10.31 |
| Class I | 1,000.00 | 972.70 | 4.52 |
| Class R1 | 1,000.00 | 971.50 | 5.91 |
| Class R3 | 1,000.00 | 969.00 | 8.59 |
| Class R4 | 1,000.00 | 969.60 | 7.15 |
| Class R5 | 1,000.00 | 971.50 | 5.62 |
Together with the value of your account, you may use this information to estimate the operating expenses that you paid over the period. Simply divide your account value at October 31, 2010, by $1,000.00, then multiply it by the “expenses paid” for your share class from the table above. For example, for an account value of $8,600.00, the operating expenses should be calculated as follows:
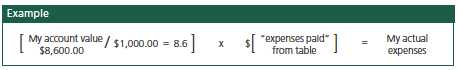
| Annual report | Classic Value Fund | 9 |
Your expenses
Hypothetical example for comparison purposes
This table allows you to compare your fund’s ongoing operating expenses with those of any other fund. It provides an example of the Fund’s hypothetical account values and hypothetical expenses based on each class’s actual expense ratio and an assumed 5% annualized return before expenses (which is not your fund’s actual return). It assumes an account value of $1,000.00 on May 1, 2010, with the same investment held until October 31, 2010. Look in any other fund shareholder report to find its hypothetical example and you will be able to compare these expenses.
| Account value | Ending value on | Expenses paid during | |
| on 5-1-10 | 10-31-10 | period ended 10-31-101 | |
| Class A | $1,000.00 | $1,018.50 | $6.77 |
| Class B | 1,000.00 | 1,014.70 | 10.56 |
| Class C | 1,000.00 | 1,014.70 | 10.56 |
| Class I | 1,000.00 | 1,020.60 | 4.63 |
| Class R1 | 1,000.00 | 1,019.20 | 6.06 |
| Class R3 | 1,000.00 | 1,016.50 | 8.79 |
| Class R4 | 1,000.00 | 1,017.90 | 7.32 |
| Class R5 | 1,000.00 | 1,019.50 | 5.75 |
Remember, these examples do not include any transaction costs, therefore, these examples will not help you to determine the relative total costs of owning different funds. If transaction costs were included, your expenses would have been higher. See the prospectus for details regarding transaction costs.
1 Expenses are equal to the Fund’s annualized expense ratio of 1.33%, 2.08%, 2.08%, 0.91%, 1.19%, 1.73%, 1.44% and 1.13% for Class A, Class B, Class C, Class I, Class R1, Class R3, Class R4 and Class R5 shares, respectively, multiplied by the average account value over the period, multiplied by 184/365 (to reflect the one-half year period).
| 10 | Classic Value Fund | Annual report |
Portfolio summary
| Top 10 Holdings1 | ||||
| Exxon Mobil Corp. | 4.8% | L–3 Communications Holdings, Inc. | 3.5% | |
| Northrop Grumman Corp. | 4.8% | Omnicom Group, Inc. | 3.5% | |
| Hewlett-Packard Company | 4.5% | J.C. Penney Company, Inc. | 3.4% | |
| CA, Inc. | 3.7% | The Allstate Corp. | 3.4% | |
| Tyco Electronics, Ltd. | 3.7% | Torchmark Corp. | 3.3% | |
| Sector Composition2,3 | ||||
| Financials | 36% | Health Care | 9% | |
| Information Technology | 17% | Materials | 4% | |
| Energy | 11% | Utilities | 2% | |
| Industrials | 11% | Short-Term Investments & Other | 1% | |
| Consumer Discretionary | 9% | |||
1 As a percentage of net assets on 10-31-10. Cash and cash equivalents are not included in Top 10 Holdings.
2 As a percentage of net assets on 10-31-10.
3 Sector investing is subject to greater risks than the market as a whole. Because the Fund may focus on particular sectors of the economy, its performance may depend on the performance of those sectors.
| Annual report | Classic Value Fund | 11 |
Fund’s investments
As of 10-31-10
| Shares | Value | |
| Common Stocks 99.27% | $2,107,223,838 | |
| (Cost $1,994,135,903) | ||
| Consumer Discretionary 9.35% | 198,437,587 | |
| Household Durables 2.43% | ||
| Fortune Brands, Inc. (L) | 952,475 | 51,481,274 |
| Media 3.53% | ||
| Omnicom Group, Inc. (L) | 1,704,825 | 74,944,107 |
| Multiline Retail 3.39% | ||
| J.C. Penney Company, Inc. (L) | 2,309,564 | 72,012,206 |
| Energy 11.08% | 235,253,193 | |
| Oil, Gas & Consumable Fuels 11.08% | ||
| Apache Corp. | 413,225 | 41,743,990 |
| BP PLC, SADR (L) | 1,430,675 | 58,414,460 |
| Exxon Mobil Corp. | 1,533,898 | 101,958,199 |
| Valero Energy Corp. | 1,846,047 | 33,136,544 |
| Financials 35.99% | 763,859,893 | |
| Capital Markets 9.43% | ||
| Morgan Stanley | 1,751,950 | 43,570,997 |
| State Street Corp. | 1,100,710 | 45,965,650 |
| The Goldman Sachs Group, Inc. (L) | 293,200 | 47,190,540 |
| UBS AG (I)(L) | 3,728,504 | 63,459,138 |
| Commercial Banks 2.09% | ||
| PNC Financial Services Group, Inc. | 824,328 | 44,431,279 |
| Diversified Financial Services 6.80% | ||
| Bank of America Corp. | 3,415,900 | 39,077,896 |
| Citigroup, Inc. (I) | 14,637,127 | 61,036,820 |
| JPMorgan Chase & Company | 1,171,450 | 44,081,664 |
| Insurance 17.67% | ||
| ACE, Ltd. (L) | 1,088,446 | 64,675,462 |
| Axis Capital Holdings, Ltd. (L) | 1,657,296 | 56,364,637 |
| Fidelity National Financial, Inc., Class A | 2,457,474 | 32,905,577 |
| Hartford Financial Services Group, Inc. (L) | 951,050 | 22,806,179 |
| The Allstate Corp. | 2,347,150 | 71,564,604 |
| Torchmark Corp. (L) | 1,213,025 | 69,482,072 |
| Willis Group Holdings PLC | 1,800,232 | 57,247,378 |
| 12 | Classic Value Fund | Annual report | See notes to financial statements |
| Shares | Value | |
| Health Care 8.72% | $185,194,684 | |
| Health Care Equipment & Supplies 2.71% | ||
| Becton, Dickinson & Company (L) | 194,798 | 14,711,145 |
| Zimmer Holdings, Inc. (I)(L) | 904,532 | 42,910,998 |
| Health Care Providers & Services 3.19% | ||
| Aetna, Inc. | 1,356,877 | 40,516,347 |
| Laboratory Corp. of America Holdings (I)(L) | 335,100 | 27,250,332 |
| Pharmaceuticals 2.82% | ||
| Forest Laboratories, Inc. (I) | 654,250 | 21,622,963 |
| Johnson & Johnson | 599,700 | 38,182,899 |
| Industrials 10.97% | 232,968,966 | |
| Aerospace & Defense 8.32% | ||
| L-3 Communications Holdings, Inc. (L) | 1,041,173 | 75,162,279 |
| Northrop Grumman Corp. (L) | 1,606,657 | 101,556,788 |
| Building Products 2.65% | ||
| Masco Corp. (L) | 5,276,726 | 56,249,899 |
| Information Technology 17.33% | 367,833,037 | |
| Communications Equipment 0.95% | ||
| Alcatel-Lucent, SADR (I)(L) | 5,835,871 | 20,250,472 |
| Computers & Peripherals 6.83% | ||
| Dell, Inc. (I) | 3,510,210 | 50,476,820 |
| Hewlett-Packard Company | 2,245,875 | 94,461,502 |
| Electronic Equipment, Instruments & Components 3.67% | ||
| Tyco Electronics, Ltd. | 2,458,947 | 77,899,440 |
| Software 5.88% | ||
| CA, Inc. | 3,421,005 | 79,401,525 |
| Microsoft Corp. | 1,702,075 | 45,343,278 |
| Materials 3.60% | 76,375,290 | |
| Chemicals 3.60% | ||
| PPG Industries, Inc. (L) | 443,806 | 34,039,920 |
| The Sherwin-Williams Company (L) | 580,175 | 42,335,370 |
| Utilities 2.23% | 47,301,188 | |
| Electric Utilities 2.23% | ||
| Edison International (L) | 1,281,875 | 47,301,188 |
| Short-Term Investments 11.62% | $246,590,418 | |
| (Cost $246,563,950) | ||
| Par value | Value | |
| Repurchase Agreement 0.94% | 19,887,000 | |
| Repurchase Agreement with State Street Corp. dated 10-29-10 at | ||
| 0.010% to be repurchased at $19,887,017 on 11-1-10, collateralized | ||
| by $18,505,000 U.S. Treasury Notes, 3.125% due 4-30-17 (valued at | ||
| $20,288,882, including interest) | $19,887,000 | 19,887,000 |
| See notes to financial statements | Annual report | Classic Value Fund | 13 |
| Yield (%) | Shares | Value | |
| Securities Lending Collateral 10.68% | $226,703,418 | ||
| John Hancock Collateral Investment | |||
| Trust (W)(Y) | 0.2626 | 22,650,409 | 226,703,418 |
| Total investments (Cost $2,240,699,853)† 110.89% | $2,353,814,256 | ||
| Other assets and liabilities, net (10.89%) | ($231,146,141) | ||
| Total net assets 100.00% | $2,122,668,115 | ||
The percentage shown for each investment category is the total value of that category as a percentage of the net assets of the Fund.
SADR Sponsored American Depositary Receipts
(I) Non-income producing security.
(L) All or a portion of this security is on loan as of 10-31-10.
(W) Investment is an affiliate of the Fund, the adviser and/or subadviser. Also, it represents the investment of securities lending collateral received.
(Y) The rate shown is the annualized seven-day yield as of 10-31-10.
† At 10-31-10, the aggregate cost of investment securities for federal income tax purposes was $2,380,378,272. Net unrealized depreciation aggregated $26,564,016, of which $281,163,494 related to appreciated investment securities and $307,727,510 related to depreciated investment securities.
The Fund had the following country concentration as a percentage of total net assets on 10-31-10:
| United States | 83% | |||
| Switzerland | 7% | |||
| United Kingdom | 5% | |||
| Bermuda | 3% | |||
| France | 1% | |||
| Short-Term Investments & Other | 1% |
| 14 | Classic Value Fund | Annual report | See notes to financial statements |
F I N A N C I A L S T A T E M E N T S
Financial statements
Statement of assets and liabilities 10-31-10
This Statement of Assets and Liabilities is the Fund’s balance sheet. It shows the value of what the Fund owns, is due and owes. You’ll also find the net asset value and the maximum offering price per share.
| Assets | |
| Investments in unaffiliated issuers, at value (Cost $2,014,022,903) | |
| including $220,096,634 of securities loaned (Note 2) | $2,127,110,838 |
| Investments in affiliated issuers, at value (Cost $226,676,950) (Note 2) | 226,703,418 |
| Total investments, at value (Cost $2,240,699,853) | 2,353,814,256 |
| Cash | 665 |
| Receivable for investments sold | 9,968,194 |
| Receivable for fund shares sold | 1,820,765 |
| Dividends and interest receivable | 1,798,653 |
| Receivable for securities lending income | 26,402 |
| Other receivables and prepaid assets | 273,826 |
| Total assets | 2,367,702,761 |
| Liabilities | |
| Payable for investments purchased | 11,467,428 |
| Payable for fund shares repurchased | 3,823,954 |
| Payable upon return of securities loaned (Note 2) | 226,651,091 |
| Payable to affiliates | |
| Accounting and legal services fees | 38,853 |
| Transfer agent fees | 410,820 |
| Distribution and service fees | 386,754 |
| Trustees’ fees | 153,831 |
| Management fees | 1,597,011 |
| Other liabilities and accrued expenses | 504,904 |
| Total liabilities | 245,034,646 |
| Net assets | |
| Capital paid-in | $4,496,147,935 |
| Undistributed net investment income | 6,898,864 |
| Accumulated net realized loss on investments | (2,493,493,087) |
| Net unrealized appreciation (depreciation) on investments | 113,114,403 |
| Net assets | $2,122,668,115 |
| See notes to financial statements | Annual report | Classic Value Fund | 15 |
F I N A N C I A L S T A T E M E N T S
Statement of assets and liabilities (continued)
| Net asset value per share | |
| Based on net asset values and shares outstanding — the Fund has an | |
| unlimited number of shares authorized with no par value | |
| Class A ($931,429,720 ÷ 59,547,192 shares) | $15.64 |
| Class B ($57,232,138 ÷ 3,704,693 shares)1 | $15.45 |
| Class C ($132,174,855 ÷ 8,557,918 shares)1 | $15.44 |
| Class I ($994,486,440 ÷ 63,352,336 shares) | $15.70 |
| Class R1 ($7,213,967 ÷ 460,205 shares) | $15.68 |
| Class R3 ($58,900 ÷ 3,771 shares) | $15.62 |
| Class R4 ($34,797 ÷ 2,224.2 shares) | $15.64 |
| Class R5 ($37,298 ÷ 2,380 shares) | $15.67 |
| Maximum offering price per share | |
| Class A (net asset value per share ÷ 95%)2 | $16.46 |
1 Redemption price is equal to net asset value less any applicable contingent deferred sales charge.
2 On single retail sales of less than $50,000. On sales of $50,000 or more and on group sales the offering price is reduced.
| 16 | Classic Value Fund | Annual report | See notes to financial statements |
F I N A N C I A L S T A T E M E N T S
Statement of operations For the year ended 10-31-10
This Statement of Operations summarizes the Fund’s investment income earned and expenses incurred in operating the Fund. It also shows net gains (losses) for the period stated.
| Investment income | |
| Dividends | $42,510,239 |
| Securities lending | 233,742 |
| Interest | 2,754 |
| Less foreign taxes withheld | (5,165) |
| Total investment income | 42,741,570 |
| Expenses | |
| Investment management fees (Note 4) | 18,893,019 |
| Distribution and service fees (Note 4) | 5,813,520 |
| Accounting and legal services fees (Note 4) | 441,395 |
| Transfer agent fees (Note 4) | 5,151,970 |
| Trustees’ fees (Note 4) | 216,527 |
| State registration fees | 144,269 |
| Printing and postage fees | 576,258 |
| Professional fees | 166,134 |
| Custodian fees | 281,442 |
| Registration and filing fees | 28,719 |
| Other | 87,345 |
| Total expenses | 31,800,598 |
| Less expense reductions (Note 4) | (1,281,332) |
| Net expenses | 30,519,266 |
| Net investment income | 12,222,304 |
| Realized and unrealized gain (loss) | |
| Net realized gain on | |
| Investments in unaffiliated issuers | 27,956,953 |
| Investments in affiliated issuers | 10,721 |
| 27,967,674 | |
| Change in net unrealized appreciation (depreciation) of | |
| Investments in unaffiliated issuers | 272,964,100 |
| Investments in affiliated issuers | (16,140) |
| 272,947,960 | |
| Net realized and unrealized gain | 300,915,634 |
| Increase in net assets from operations | $313,137,938 |
| See notes to financial statements | Annual report | Classic Value Fund | 17 |
F I N A N C I A L S T A T E M E N T S
Statements of changes in net assets
These Statements of Changes in Net Assets show how the value of the Fund’s net assets has changed during the last two periods. The difference reflects earnings less expenses, any investment gains and losses, distributions, if any, paid to shareholders and the net of Fund share transactions.
| Year | Year | |||
| ended | ended | |||
| 10-31-10 | 10-31-09 | |||
| Increase (decrease) in net assets | ||||
| From operations | ||||
| Net investment income | $12,222,304 | $28,211,011 | ||
| Net realized gain (loss) | 27,967,674 | (1,600,352,614) | ||
| Change in net unrealized appreciation (depreciation) | 272,947,960 | 1,892,014,641 | ||
| Increase in net assets resulting from operations | 313,137,938 | 319,873,038 | ||
| Distributions to shareholders | ||||
| From net investment income | ||||
| Class A | (12,617,757) | (45,687,712) | ||
| Class B | (117,216) | (1,309,985) | ||
| Class C | (273,577) | (3,202,476) | ||
| Class I | (7,116,016) | (21,338,991) | ||
| Class R1 | (32,321) | (204,445) | ||
| Class R3 | (148) | — | ||
| Class R4 | (228) | — | ||
| Class R5 | (308) | — | ||
| From net realized gain | ||||
| Class A | — | (56,776,173) | ||
| Class B | — | (2,641,688) | ||
| Class C | — | (6,458,047) | ||
| Class I | — | (22,392,723) | ||
| Class R1 | — | (311,427) | ||
| Total distributions | (20,157,571) | (160,323,667) | ||
| From Fund share transactions (Note 5) | (577,874,641) | (417,301,057) | ||
| Total decrease | (284,894,274) | (257,751,686) | ||
| Net assets | ||||
| Beginning of year | 2,407,562,389 | 2,665,314,075 | ||
| End of year | $2,122,668,115 | $2,407,562,389 | ||
| Undistributed net investment income | $6,898,864 | $14,834,131 | ||
| 18 | Classic Value Fund | Annual report | See notes to financial statements |
Financial highlights
The Financial Highlights show how the Fund’s net asset value for a share has changed since the end of the previous period.
| CLASS A SHARES Period ended | 10-31-10 | 10-31-09 | 10-31-081 | 12-31-07 | 12-31-06 | 12-31-05 |
| Per share operating performance | ||||||
| Net asset value, beginning of period | $13.77 | $12.38 | $21.53 | $27.67 | $24.64 | $23.01 |
| Net investment income2 | 0.07 | 0.14 | 0.25 | 0.34 | 0.23 | 0.15 |
| Net realized and unrealized gain (loss) | ||||||
| on investments | 1.91 | 2.02 | (9.40) | (4.24) | 3.84 | 1.88 |
| Total from investment operations | 1.98 | 2.16 | (9.15) | (3.90) | 4.07 | 2.03 |
| Less distributions | ||||||
| From net investment income | (0.11) | (0.34) | — | (0.41) | (0.19) | (0.10) |
| From net realized gain | — | (0.43) | — | (1.83) | (0.85) | (0.30) |
| Total distributions | (0.11) | (0.77) | — | (2.24) | (1.04) | (0.40) |
| Net asset value, end of period | $15.64 | $13.77 | $12.38 | $21.53 | $27.67 | $24.64 |
| Total return (%)3 | 14.484 | 19.844 | (42.50)4,5 | (14.20) | 16.54 | 8.814 |
| Ratios and supplemental data | ||||||
| Net assets, end of period (in millions) | $931 | $1,544 | $1,711 | $4,000 | $5,987 | $3,017 |
| Ratios (as a percentage of average | ||||||
| net assets): | ||||||
| Expenses before reductions | 1.41 | 1.606 | 1.387 | 1.28 | 1.30 | 1.36 |
| Expenses net of fee waivers | 1.33 | 1.336 | 1.327,8 | 1.28 | 1.30 | 1.32 |
| Expenses net of fee waivers | ||||||
| and credits | 1.33 | 1.336 | 1.327,8 | 1.28 | 1.30 | 1.32 |
| Net investment income | 0.47 | 1.27 | 1.617 | 1.22 | 0.89 | 0.65 |
| Portfolio turnover (%) | 55 | 479 | 30 | 35 | 20 | 27 |
1 For the ten-month period ended 10-31-08. The Fund changed its fiscal year end from December 31 to October 31.
2 Based on the average daily shares outstanding.
3 Does not reflect the effect of sales charges, if any.
4 Total returns would have been lower had certain expenses not been reduced during the periods shown.
5 Not annualized.
6 Includes the impact of proxy expenses, which amounted to 0.03% of average net assets.
7 Annualized.
8 Includes 0.01% related to interest expense.
9 The portfolio turnover rate for the year ended 10-31-09 has been revised from what was previously reported to
exclude the effect of certain short-term investments in a collateral management vehicle.
| See notes to financial statements | Annual report | Classic Value Fund | 19 |
| CLASS B SHARES Period ended | 10-31-10 | 10-31-09 | 10-31-081 | 12-31-07 | 12-31-06 | 12-31-05 |
| Per share operating performance | ||||||
| Net asset value, beginning of period | $13.62 | $12.19 | $21.34 | $27.40 | $24.42 | $22.89 |
| Net investment income (loss)2 | (0.04) | 0.06 | 0.13 | 0.13 | 0.04 | (0.03) |
| Net realized and unrealized gain (loss) | ||||||
| on investments | 1.89 | 2.01 | (9.28) | (4.16) | 3.79 | 1.86 |
| Total from investment operations | 1.85 | 2.07 | (9.15) | (4.03) | 3.83 | 1.83 |
| Less distributions | ||||||
| From net investment income | (0.02) | (0.21) | — | (0.20) | — | — |
| From net realized gain | — | (0.43) | — | (1.83) | (0.85) | (0.30) |
| Total distributions | (0.02) | (0.64) | — | (2.03) | (0.85) | (0.30) |
| Net asset value, end of period | $15.45 | $13.62 | $12.19 | $21.34 | $27.40 | $24.42 |
| Total return (%)3 | 13.634 | 18.944 | (42.88)4,5 | (14.80) | 15.68 | 7.994 |
| Ratios and supplemental data | ||||||
| Net assets, end of period (in millions) | $57 | $66 | $79 | $208 | $332 | $296 |
| Ratios (as a percentage of average | ||||||
| net assets): | ||||||
| Expenses before reductions | 2.16 | 2.356 | 2.137 | 2.03 | 2.01 | 2.11 |
| Expenses net of fee waivers | 2.08 | 2.086 | 2.077,8 | 2.03 | 2.01 | 2.07 |
| Expenses net of fee waivers | ||||||
| and credits | 2.08 | 2.086 | 2.067,8 | 2.03 | 2.01 | 2.07 |
| Net investment income (loss) | (0.29) | 0.54 | 0.867 | 0.46 | 0.17 | (0.11) |
| Portfolio turnover (%) | 55 | 479 | 30 | 35 | 20 | 27 |
1 For the ten-month period ended 10-31-08. The Fund changed its fiscal year end from December 31 to October 31.
2 Based on the average daily shares outstanding.
3 Does not reflect the effect of sales charges, if any.
4 Total returns would have been lower had certain expenses not been reduced during the periods shown.
5 Not annualized.
6 Includes the impact of proxy expenses, which amounted to 0.03% of average net assets.
7 Annualized.
8 Includes 0.01% related to interest expense.
9 The portfolio turnover rate for the year ended 10-31-09 has been revised from what was previously reported to
exclude the effect of certain short-term investments in a collateral management vehicle.
| 20 | Classic Value Fund | Annual report | See notes to financial statements |
| CLASS C SHARES Period ended | 10-31-10 | 10-31-09 | 10-31-081 | 12-31-07 | 12-31-06 | 12-31-05 |
| Per share operating performance | ||||||
| Net asset value, beginning of period | $13.61 | $12.18 | $21.33 | $27.39 | $24.42 | $22.89 |
| Net investment income (loss)2 | (0.04) | 0.06 | 0.13 | 0.13 | 0.03 | (0.02) |
| Net realized and unrealized gain (loss) | ||||||
| on investments | 1.89 | 2.01 | (9.28) | (4.16) | 3.79 | 1.85 |
| Total from investment operations | 1.85 | 2.07 | (9.15) | (4.03) | 3.82 | 1.83 |
| Less distributions | ||||||
| From net investment income | (0.02) | (0.21) | — | (0.20) | — | — |
| From net realized gain | — | (0.43) | — | (1.83) | (0.85) | (0.30) |
| Total distributions | (0.02) | (0.64) | — | (2.03) | (0.85) | (0.30) |
| Net asset value, end of period | $15.44 | $13.61 | $12.18 | $21.33 | $27.39 | $24.42 |
| Total return (%)3 | 13.644 | 18.954 | (42.90)4,5 | (14.80) | 15.64 | 7.994 |
| Ratios and supplemental data | ||||||
| Net assets, end of period (in millions) | $132 | $155 | $202 | $612 | $1,132 | $832 |
| Ratios (as a percentage of average | ||||||
| net assets): | ||||||
| Expenses before reductions | 2.16 | 2.346 | 2.137 | 2.03 | 2.05 | 2.11 |
| Expenses net of fee waivers | 2.08 | 2.086 | 2.077,8 | 2.03 | 2.05 | 2.07 |
| Expenses net of fee waivers | ||||||
| and credits | 2.08 | 2.086 | 2.077,8 | 2.03 | 2.05 | 2.07 |
| Net investment income (loss) | (0.29) | 0.57 | 0.857 | 0.46 | 0.13 | (0.10) |
| Portfolio turnover (%) | 55 | 479 | 30 | 35 | 20 | 27 |
1 For the ten-month period ended 10-31-08. The Fund changed its fiscal year end from December 31 to October 31.
2 Based on the average daily shares outstanding.
3 Does not reflect the effect of sales charges, if any.
4 Total returns would have been lower had certain expenses not been reduced during the periods shown.
5 Not annualized.
6 Includes the impact of proxy expenses, which amounted to 0.03% of average net assets.
7 Annualized.
8 Includes 0.01% related to interest expense.
9 The portfolio turnover rate for the year ended 10-31-09 has been revised from what was previously reported to
exclude the effect of certain short-term investments in a collateral management vehicle.
| See notes to financial statements | Annual report | Classic Value Fund | 21 |
| CLASS I SHARES Period ended | 10-31-10 | 10-31-09 | 10-31-081 | 12-31-07 | 12-31-06 | 12-31-05 |
| Per share operating performance | ||||||
| Net asset value, beginning of period | $13.81 | $12.44 | $21.57 | $27.73 | $24.69 | $23.05 |
| Net investment income2 | 0.12 | 0.19 | 0.30 | 0.45 | 0.34 | 0.26 |
| Net realized and unrealized gain (loss) | ||||||
| on investments | 1.93 | 2.02 | (9.43) | (4.26) | 3.86 | 1.88 |
| Total from investment operations | 2.05 | 2.21 | (9.13) | (3.81) | 4.20 | 2.14 |
| Less distributions | ||||||
| From net investment income | (0.16) | (0.41) | — | (0.52) | (0.31) | (0.20) |
| From net realized gain | — | (0.43) | — | (1.83) | (0.85) | (0.30) |
| Total distributions | (0.16) | (0.84) | — | (2.35) | (1.16) | (0.50) |
| Net asset value, end of period | $15.70 | $13.81 | $12.44 | $21.57 | $27.73 | $24.69 |
| Total return (%) | 14.95 | 20.324 | (42.33)3,4 | (13.86)4 | 17.014 | 9.284 |
| Ratios and supplemental data | ||||||
| Net assets, end of period (in millions) | $994 | $636 | $664 | $1,155 | $1,567 | $665 |
| Ratios (as a percentage of average | ||||||
| net assets): | ||||||
| Expenses before reductions | 0.92 | 1.035 | 0.966 | 0.92 | 0.94 | 0.98 |
| Expenses net of fee waivers | 0.92 | 0.955 | 0.946,7 | 0.88 | 0.89 | 0.89 |
| Expenses net of fee waivers and credits | 0.92 | 0.955 | 0.946,7 | 0.88 | 0.89 | 0.89 |
| Net investment income | 0.83 | 1.65 | 1.996 | 1.61 | 1.30 | 1.09 |
| Portfolio turnover (%) | 55 | 478 | 30 | 35 | 20 | 27 |
1 For the ten-month period ended 10-31-08. The Fund changed its fiscal year end from December 31 to October 31.
2 Based on the average daily shares outstanding.
3 Not annualized.
4 Total returns would have been lower had certain expenses not been reduced during the periods shown.
5 Includes the impact of proxy expenses, which amounted to 0.03% of average net assets.
6 Annualized.
7 Includes 0.01% related to interest expense.
8 The portfolio turnover rate for the year ended 10-31-09 has been revised from what was previously reported to
exclude the effect of certain short-term investments in a collateral management vehicle.
| 22 | Classic Value Fund | Annual report | See notes to financial statements |
| CLASS R1 SHARES Period ended | 10-31-10 | 10-31-09 | 10-31-081 | 12-31-07 | 12-31-06 | 12-31-05 |
| Per share operating performance | ||||||
| Net asset value, beginning of period | $13.77 | $12.35 | $21.55 | $27.67 | $24.63 | $23.02 |
| Net investment income2 | 0.05 | 0.11 | 0.19 | 0.23 | 0.13 | 0.08 |
| Net realized and unrealized gain (loss) | ||||||
| on investments | 1.92 | 2.02 | (9.39) | (4.21) | 3.85 | 1.86 |
| Total from investment operations | 1.97 | 2.13 | (9.20) | (3.98) | 3.98 | 1.94 |
| Less distributions | ||||||
| From net investment income | (0.06) | (0.28) | — | (0.31) | (0.09) | (0.03) |
| From net realized gain | — | (0.43) | — | (1.83) | (0.85) | (0.30) |
| Total distributions | (0.06) | (0.71) | — | (2.14) | (0.94) | (0.33) |
| Net asset value, end of period | $15.68 | $13.77 | $12.35 | $21.55 | $27.67 | $24.63 |
| Total return (%) | 14.38 | 19.403 | (42.69)3,4 | (14.49) | 16.15 | 8.443 |
| Ratios and supplemental data | ||||||
| Net assets, end of period (in millions) | $7 | $7 | $9 | $22 | $29 | $12 |
| Ratios (as a percentage of average | ||||||
| net assets): | ||||||
| Expenses before reductions | 1.485 | 1.756 | 1.687 | 1.64 | 1.68 | 1.69 |
| Expenses net of fee waivers | 1.485 | 1.676 | 1.667,8 | 1.64 | 1.68 | 1.65 |
| Expenses net of fee waivers | ||||||
| and credits | 1.485 | 1.676 | 1.667,8 | 1.64 | 1.68 | 1.65 |
| Net investment income | 0.30 | 1.01 | 1.267 | 0.85 | 0.51 | 0.34 |
| Portfolio turnover (%) | 55 | 479 | 30 | 35 | 20 | 27 |
1 For the ten-month period ended 10-31-08. The Fund changed its fiscal year end from December 31 to October 31.
2 Based on the average daily shares outstanding.
3 Total returns would have been lower had certain expenses not been reduced during the periods shown.
4 Not annualized.
5 Includes the impact of a revision of 0.25% related to certain expense accruals. Without this adjustment, net
investment income and total return for the year ended 10-31-10 would have been lower.
6 Includes the impact of proxy expenses, which amounted to 0.03% of average net assets.
7 Annualized.
8 Includes 0.01% related to interest expense.
9 The portfolio turnover rate for the year ended 10-31-09 has been revised from what was previously reported to
exclude the effect of certain short-term investments in a collateral management vehicle.
| CLASS R3 SHARES Period ended | 10-31-10 | 10-31-091 | ||||
| Per share operating performance | ||||||
| Net asset value, beginning of period | $13.76 | $11.24 | ||||
| Net investment income (loss)2 | —3 | (—)4 | ||||
| Net realized and unrealized gain on investments | 1.93 | 2.52 | ||||
| Total from investment operations | 1.93 | 2.52 | ||||
| Less distributions | ||||||
| From net investment income | (0.07) | — | ||||
| Total distributions | (0.07) | — | ||||
| Net asset value, end of period | $15.62 | $13.76 | ||||
| Total return (%)5 | 14.04 | 22.426 | ||||
| Ratios and supplemental data | ||||||
| Net assets, end of period (in millions) | —7 | —7 | ||||
| Ratios (as a percentage of average net assets): | ||||||
| Expenses before reductions | 2.76 | 3.338 | ||||
| Expenses net of fee waivers | 1.73 | 1.738 | ||||
| Expenses net of fee waivers and credits | 1.73 | 1.738 | ||||
| Net investment income (loss) | 0.02 | (0.04)8 | ||||
| Portfolio turnover (%) | 55 | 479 | ||||
1 Period from 5-22-09 (inception date) to 10-31-09.
2 Based on the average daily shares outstanding.
3 Less than $0.005 per share.
4 Less than ($0.005) per share.
5 Total returns would have been lower had certain expenses not been reduced during the periods shown.
6 Not annualized.
7 Less than $500,000.
8 Annualized.
9 The portfolio turnover rate for the year ended 10-31-09 has been revised from what was previously reported to
exclude the effect of certain short-term investments in a collateral management vehicle.
| See notes to financial statements | Annual report | Classic Value Fund | 23 |
| CLASS R4 SHARES Period ended | 10-31-10 | 10-31-091 | ||||
| Per share operating performance | ||||||
| Net asset value, beginning of period | $13.77 | $11.24 | ||||
| Net investment income2 | 0.05 | 0.02 | ||||
| Net realized and unrealized gain on investments | 1.92 | 2.51 | ||||
| Total from investment operations | 1.97 | 2.53 | ||||
| Less distributions | ||||||
| From net investment income | (0.10) | — | ||||
| Total distributions | (0.10) | — | ||||
| Net asset value, end of period | $15.64 | $13.77 | ||||
| Total return (%)3 | 14.38 | 22.514 | ||||
| Ratios and supplemental data | ||||||
| Net assets, end of period (in millions) | —5 | —5 | ||||
| Ratios (as a percentage of average net assets): | ||||||
| Expenses before reductions | 2.87 | 3.086 | ||||
| Expenses net of fee waivers | 1.43 | 1.436 | ||||
| Expenses net of fee waivers and credits | 1.43 | 1.436 | ||||
| Net investment income | 0.34 | 0.266 | ||||
| Portfolio turnover (%) | 55 | 477 | ||||
1 Period from 5-22-09 (inception date) to 10-31-09.
2 Based on the average daily shares outstanding.
3 Total returns would have been lower had certain expenses not been reduced during the periods shown.
4 Not annualized.
5 Less than $500,000.
6 Annualized.
7 The portfolio turnover rate for the year ended 10-31-09 has been revised from what was previously reported to
exclude the effect of certain short-term investments in a collateral management vehicle.
| CLASS R5 SHARES Period ended | 10-31-10 | 10-31-091 | ||||
| Per share operating performance | ||||||
| Net asset value, beginning of period | $13.79 | $11.24 | ||||
| Net investment income2 | 0.09 | 0.03 | ||||
| Net realized and unrealized gain on investments | 1.93 | 2.52 | ||||
| Total from investment operations | 2.02 | 2.55 | ||||
| Less distributions | ||||||
| From net investment income | (0.14) | — | ||||
| Total distributions | (0.14) | — | ||||
| Net asset value, end of period | $15.67 | $13.79 | ||||
| Total return (%)3 | 14.72 | 22.694 | ||||
| Ratios and supplemental data | ||||||
| Net assets, end of period (in millions) | —5 | —5 | ||||
| Ratios (as a percentage of average net assets): | ||||||
| Expenses before reductions | 2.64 | 2.846 | ||||
| Expenses net of fee waivers | 1.13 | 1.136 | ||||
| Expenses net of fee waivers and credits | 1.13 | 1.136 | ||||
| Net investment income | 0.63 | 0.566 | ||||
| Portfolio turnover (%) | 55 | 477 | ||||
1 Period from 5-22-09 (inception date) to 10-31-09.
2 Based on the average daily shares outstanding.
3 Total returns would have been lower had certain expenses not been reduced during the periods shown.
4 Not annualized.
5 Less than $500,000.
6 Annualized.
7 The portfolio turnover rate for the year ended 10-31-09 has been revised from what was previously reported to
exclude the effect of certain short-term investments in a collateral management vehicle.
| 24 | Classic Value Fund | Annual report | See notes to financial statements |
Notes to financial statements
Note 1 — Organization
John Hancock Classic Value Fund (the Fund) is a diversified series of John Hancock Capital Series (the Trust), an open-end management investment company organized as a Massachusetts business trust and registered under the Investment Company Act of 1940, as amended (the 1940 Act). The investment objective of the Fund is to seek long-term growth of capital.
The Fund may offer multiple classes of shares. The shares currently offered are detailed in the Statement of Assets and Liabilities. Class A, Class B and Class C shares are offered to all investors. Class I shares are offered to institutions and certain investors. Class R1, Class R3, Class R4 and Class R5 shares are available only to certain retirement plans. Shareholders of each class have exclusive voting rights to matters that affect that class. The distribution and service fees and transfer agent fees for each class may differ. Class B shares convert to Class A shares eight years after purchase.
Affiliates of the Fund owned 100% of shares of beneficial interest of Class R3, Class R4 and Class R5 shares on October 31, 2010.
Note 2 — Significant accounting policies
The financial statements have been prepared in conformity with accounting principles generally accepted in the United States of America, which require management to make certain estimates and assumptions at the date of the financial statements. Actual results could differ from those estimates. Events or transactions occurring after the end of the fiscal period through the date that the financial statements were issued have been evaluated in the preparation of the financial statements. The following summarizes the significant accounting policies of the Fund:
Security valuation. Investments are stated at value as of the close of regular trading on the New York Stock Exchange (NYSE), normally at 4:00 P.M., Eastern Time. The Fund uses a three-tier hierarchy to prioritize the pricing assumptions, referred to as inputs, used in valuation techniques to measure fair value. Level 1 includes quoted prices in active markets for identical securities. Level 2 includes significant observable inputs. Observable inputs may include quoted prices for similar securities, interest rates, prepayment speeds and credit risk. Prices for securities valued using these techniques are received from independent pricing vendors and brokers and are based on an evaluation of the inputs described. Level 3 includes significant unobservable inputs when market prices are not readily available or reliable, including the Fund’s own assumptions in determining the fair value of investments. The inputs or methodology used for valuing securities are not necessarily an indication of the risk associated with investing in those securities.
| Annual report | Classic Value Fund | 25 |
The following is a summary of the values by input classification of the Fund’s investments as of October 31, 2010, by major security category or type:
| LEVEL 3 | ||||
| LEVEL 2 | SIGNIFICANT | |||
| TOTAL MARKET | LEVEL 1 | SIGNIFICANT | UNOBSERVABLE | |
| VALUE AT 10-31-10 | QUOTED PRICE | OBSERVABLE INPUTS | INPUTS | |
| Common Stocks | ||||
| Consumer Discretionary | $198,437,587 | $198,437,587 | — | — |
| Energy | 235,253,193 | 235,253,193 | — | — |
| Financials | 763,859,893 | 763,859,893 | — | — |
| Health Care | 185,194,684 | 185,194,684 | — | — |
| Industrials | 232,968,966 | 232,968,966 | — | — |
| Information Technology | 367,833,037 | 367,833,037 | — | — |
| Materials | 76,375,290 | 76,375,290 | — | — |
| Utilities | 47,301,188 | 47,301,188 | — | — |
| Short-Term Investments | 246,590,418 | 226,703,418 | $19,887,000 | — |
| Total Investments in | ||||
| Securities | $2,353,814,256 | $2,333,927,256 | $19,887,000 | — |
During the year ended October 31, 2010, there were no significant transfers in or out of Level 1 or Level 2 assets.
In order to value the securities, the Fund uses the following valuation techniques. Equity securities held by the Fund are valued at the last sale price or official closing price on the principal securities exchange on which they trade. In the event there were no sales during the day or closing prices are not available, then securities are valued using the last quoted bid or evaluated price. Investments in open-end mutual funds, including John Hancock Collateral Investment Trust (JHCIT), are valued at their closing net asset values each day. Foreign securities and currencies are valued in U.S. dollars, based on foreign currency exchange rates supplied by an independent pricing service. Certain securities traded only in the over-the-counter market are valued at the last bid price quoted by brokers making markets in the securities at the close of trading. Certain short-term securities are valued at amortized cost.
Other portfolio securities and assets, where market quotations are not readily available, are valued at fair value, as determined in good faith by the Fund’s Pricing Committee, following procedures established by the Board of Trustees. Generally, trading in non-U.S. securities is substantially completed each day at various times prior to the close of trading on the NYSE. Significant market events that affect the values of non-U.S. securities may occur between the time when the valuation of the securities is generally determined and the close of the NYSE. During significant market events, these securities will be valued at fair value, as determined in good faith, following procedures established by the Board of Trustees. The Fund may use a fair valuation model to value non-U.S. securities in order to adjust for events which may occur between the close of foreign exchanges and the close of the NYSE.
Repurchase agreements. The Fund may enter into repurchase agreements. When a Fund enters into a repurchase agreement, it receives collateral which is held in a segregated account by the Fund’s custodian. The collateral amount is marked-to-market and monitored on a daily basis to ensure that the collateral held is in an amount not less than the principal amount of the repurchase agreement plus any accrued interest. In the event of a default by the counterparty, realization of the collateral proceeds could be delayed, during which time the collateral value may decline.
Security transactions and related investment income. Investment security transactions are accounted for on a trade date plus one basis for daily net asset value calculations. However, for financial reporting purposes, investment transactions are reported on trade date. Interest income
| 26 | Classic Value Fund | Annual report |
is accrued as earned. Gains and losses on securities sold are determined on the basis of identified cost and may include proceeds from litigation. Dividend income is recorded on the ex-date, except for certain foreign dividends where the ex-date may have passed, which are recorded when the Fund becomes aware of the dividends. Interest income includes coupon interest and amortization/accretion of premiums/discounts on debt securities.
Securities lending. The Fund may lend its securities to earn additional income. It receives and maintains cash collateral received from the borrower in an amount not less than the market value of the loaned securities. The Fund will invest its collateral in JHCIT. As a result, the Fund will receive the benefit of any gains and bear any losses generated by JHCIT. Although risk of the loss of the securities lent is mitigated by holding the collateral, the Fund could experience a delay in recovering its securities and a possible loss of income or value if the borrower fails to return the securities or if collateral investments decline in value. The Fund may receive compensation for lending its securities by retaining a portion of the return on the investment of the collateral and compensation from fees earned from borrowers of the securities. Income received from JHCIT is a component of securities lending income as recorded on the Statement of Operations.
Line of credit. The Fund may borrow from banks for temporary or emergency purposes, including meeting redemption requests that otherwise might require the untimely sale of securities. Pursuant to the custodian agreement, the custodian may loan money to a Fund to make properly authorized payments. The Fund is obligated to repay the custodian for any overdraft, including any related costs or expenses. The custodian has a lien, security interest or security entitlement in any Fund property that is not segregated, to the maximum extent permitted by law for any overdraft.
In addition, the Fund and other affiliated funds have entered into an agreement with State Street Bank and Trust Company which enables them to participate in a $100 million unsecured committed line of credit. Prior to March 31, 2010, the amount of the line of credit was $150 million. A commitment fee, payable at the end of each calendar quarter, based on the average daily unused portion of the line of credit, is charged to each participating fund on a pro rata basis and is reflected in other expenses on the Statement of Operations. During the year ended October 31, 2010, the Fund paid $1,182 of interest under the line of credit.
Expenses. The majority of expenses are directly attributable to an individual fund. Expenses that are not readily attributable to a specific fund are allocated among all funds in an equitable manner, taking into consideration, among other things, the nature and type of expense and the fund’s relative assets. Expense estimates are accrued in the period to which they relate and adjustments are made when actual amounts are known.
Class allocations. Income, common expenses, and realized and unrealized gains (losses) are determined at the Fund level and allocated daily to each class of shares based on the net asset value of the class. Class-specific expenses, such as distribution and service fees, if any, and transfer agent fees, for all classes are calculated daily at the class level based on the appropriate net asset value of each class and the specific expense rates applicable to each class.
Federal income taxes. The Fund intends to continue to qualify as a regulated investment company by complying with the applicable provisions of the Internal Revenue Code and will not be subject to federal income tax on taxable income that is distributed to shareholders. Therefore, no federal income tax provision is required.
For federal income tax purposes, the Fund has a capital loss carryforward of $2,353,814,668 available to offset future net realized capital gains as of October 31, 2010. The loss carryforward expires as follows: October 31, 2016 — $874,603,006 and October 31, 2017 — $1,479,211,662.
| Annual report | Classic Value Fund | 27 |
As of October 31, 2010, the Fund had no uncertain tax positions that would require financial statement recognition, de-recognition or disclosure. The Fund’s federal tax return is subject to examination by the Internal Revenue Service for a period of three years.
Distribution of income and gains. Distributions to shareholders from net investment income and net realized gains, if any, are recorded on the ex-date. The Fund generally declares and pays dividends and capital gain distributions, if any, annually. The tax character of distributions for the years ended October 31, 2010, and October 31, 2009, was as follows:
| OCTOBER 31, 2010 | OCTOBER 31, 2009 | ||||
| Ordinary Income | $20,157,571 | $71,743,896 | |||
| Long-Term Capital Gain | — | $88,579,771 | |||
Distributions paid by the Fund with respect to each class of shares are calculated in the same manner, at the same time and are in the same amount, except for the effect of expenses that may be applied differently to each class. As of October 31, 2010, the components of distributable earnings on a tax basis included $7,015,609 of undistributed ordinary income.
Such distributions and distributable earnings, on a tax basis, are determined in conformity with income tax regulations, which may differ from accounting principles generally accepted in the United States of America. Material distributions in excess of tax basis earnings and profits, if any, are reported in the Fund’s financial statements as a return of capital.
Capital accounts within financial statements are adjusted for permanent book-tax differences. These adjustments have no impact on net assets or the results of operations. Temporary book-tax differences, if any, will reverse in a subsequent period. Book-tax differences are primarily attributable to wash sales loss deferrals.
Note 3 — Guarantees and indemnifications
Under the Fund’s organizational documents, its Officers and Trustees are indemnified against certain liabilities arising out of the performance of their duties to the Fund. Additionally, in the normal course of business, the Fund enters into contracts with service providers that contain general indemnification clauses. The Fund’s maximum exposure under these arrangements is unknown, as this would involve future claims that may be made against the Fund that have not yet occurred. The risk of material loss from such claims is considered remote.
Note 4 — Fees and transactions with affiliates
John Hancock Advisers, LLC (the Adviser) serves as investment adviser for the Fund. John Hancock Funds, LLC (the Distributor), an affiliate of the Adviser, serves as principal underwriter of the Fund. The Adviser and the Distributor are indirect wholly owned subsidiaries of Manulife Financial Corporation (MFC).
Management fee. The Fund has an investment management contract with the Adviser under which the Fund pays a monthly management fee to the Adviser equivalent, on an annual basis, to the sum of: (a) 0.79% of the first $2,500,000,000 of the Fund’s average daily net assets; (b) 0.78% of the next $2,500,000,000 of the Fund’s average daily net assets; and (c) 0.77% of the Fund’s average daily net assets in excess of $5,000,000,000. The Adviser has a subadvisory agreement with Pzena Investment Management, LLC. The Fund is not responsible for payment of the subadvisory fees.
The investment management fees incurred for the year ended October 31, 2010, were equivalent to an annual effective rate of 0.79% of the Fund’s average daily net assets.
| 28 | Classic Value Fund | Annual report |
The Adviser has contractually agreed to waive fees and/or reimburse certain expenses for each share class of the Fund. This agreement excludes taxes, portfolio brokerage commissions, interest and litigation and indemnification expenses and other extraordinary expenses not incurred in the ordinary course of the Fund’s business. The fee waivers and/or reimbursements are such that these expenses will not exceed 1.33% for Class A, 2.08% for Class B, 2.08% for Class C, 0.94% for Class I, 1.83% for Class R1, 1.73% for Class R3, 1.43% for Class R4 and 1.13% for Class R5 shares, respectively. The fee waivers and/or reimbursements will continue in effect until February 28, 2011.
Prior to March 1, 2010, the Adviser had contractually agreed to waive and/or reimburse certain Fund level expenses to 0.89% of the Fund’s average annual net assets which are allocated pro rata to all share classes of the Fund. This agreement excluded taxes, portfolio brokerage commissions, interest, litigation, underlying fees, distribution and service, transfer agent and other extraordinary expenses not incurred in the ordinary course of the Fund’s business.
Accordingly, these expense reductions amounted to $1,114,214, $48,491, $117,221, $432, $473 and $501 for Class A, Class B, Class C, Class R3, Class R4 and Class R5 shares, respectively, for the year ended October 31, 2010.
Accounting and legal services. Pursuant to an Accounting and Legal Services Agreement, the Fund reimburses the Adviser for all expenses associated with providing the administrative, financial, legal, accounting and recordkeeping services of the Fund, including the preparation of all tax returns, periodic reports to shareholders and regulatory reports, among other services. These expenses are allocated to each share class based on its relative net assets at the time the expense was incurred. The accounting and legal services fees incurred for the year ended October 31, 2010, amounted to an annual rate of 0.02% of the Fund’s average daily net assets.
Distribution and service plans. The Fund has a distribution agreement with the Distributor. The Fund has adopted distribution and service plans with respect to Class A, Class B, Class C, Class R1, Class R3 and Class R4 shares pursuant to Rule 12b-1 under the 1940 Act, to pay the Distributor for services provided as the distributor of shares of the Fund. In addition, under a service plan for Class R1, Class R3, Class R4 and Class R5 shares, the Fund pays for certain other services. The Fund may pay up to the following contractual rates of distribution and service fees under these arrangements, expressed as an annual percentage of average daily net assets for each class of the Fund’s shares.
| CLASS | 12b–1 FEES | SERVICE FEES | ||||
| Class A | 0.25% | — | ||||
| Class B | 1.00% | — | ||||
| Class C | 1.00% | — | ||||
| Class R1 | 0.50% | 0.25% | ||||
| Class R3 | 0.50% | 0.15% | ||||
| Class R4 | 0.25% | 0.10% | ||||
| Class R5 | — | 0.05% | ||||
Sales charges. Class A shares are assessed up-front sales charges, which resulted in payments to the Distributor amounting to $416,607 for the year ended October 31, 2010. Of this amount, $32,464 was retained and used for printing prospectuses, advertising, sales literature and other purposes, $372,728 was paid as sales commissions to broker-dealers and $11,415 was paid as sales commissions to sales personnel of Signator Investors, Inc. (Signator Investors), a broker-dealer affiliate of the Adviser.
Class B and Class C shares are subject to contingent deferred sales charges (CDSC). Class B shares that are redeemed within six years of purchase are subject to CDSC, at declining rates, beginning at 5.00% of the lesser of the current market value at the time of redemption or the original purchase
| Annual report | Classic Value Fund | 29 |
cost of the shares being redeemed. Class C shares that are redeemed within one year of purchase are subject to a 1.00% CDSC on the lesser of the current market value at the time of redemption or the original purchase cost of the shares being redeemed. Proceeds from CDSCs are used to compensate the Distributor for providing distribution-related services in connection with the sale of these shares. During the year ended October 31, 2010, CDSCs received by the Distributor amounted to $124,971 and $10,576 for Class B and Class C shares, respectively.
Transfer agent fees. The Fund has a transfer agent agreement with John Hancock Signature Services, Inc. (Signature Services or Transfer Agent), an affiliate of the Adviser. Effective July 1, 2010, the transfer agent fees paid to Signature Services are determined based on the cost to Signature Services (Signature Services Cost) of providing recordkeeping services. The Signature Services Cost includes a component of allocated John Hancock corporate overhead for providing transfer agent services to the Fund and to all other John Hancock affiliated funds. It also includes out-of-pocket expenses that are comprised of payments made to third-parties for recordkeeping services provided to their clients who invest in one or more John Hancock funds. In addition, Signature Services Cost may be reduced by certain revenues that Signature Services receive in connection with the service they provide to the funds. Signature Services Cost is calculated monthly and allocated, as applicable, to four categories of share classes: Institutional Share Classes, Retirement Share Classes, Municipal Bond Classes and all other Retail Share Classes. Within each of these categories, the applicable costs are allocated to the affected John Hancock affiliated funds and/or classes, based on the relative average daily net assets.
Prior to July 1, 2010, the transfer agent fees were made up of three components:
• The Fund paid a monthly transfer agent fee at an annual rate of 0.05% for Class A, Class B, Class C, Class R1, Class R3, Class R4 and Class R5 shares and 0.04% for Class I shares, based on each class’s average daily net assets.
• The Fund paid a monthly fee based on an annual rate of $16.50 per shareholder account for all classes.
• In addition, Signature Services was reimbursed for certain out-of-pocket expenses.
Class level expenses. Class level expenses for the year ended October 31, 2010 were:
| DISTRIBUTION AND | TRANSFER | |||||
| CLASS | SERVICE FEES | AGENT FEES | ||||
| Class A | $3,674,966 | $4,180,864 | ||||
| Class B | 627,900 | 179,826 | ||||
| Class C | 1,458,669 | 422,429 | ||||
| Class I | — | 357,990 | ||||
| Class R1 | 51,691 | 9,102 | ||||
| Class R3 | 211 | 587 | ||||
| Class R4 | 83 | 580 | ||||
| Class R5 | — | 592 | ||||
| Total | $5,813,520 | $5,151,970 | ||||
Trustee expenses. The Trust compensates each Trustee who is not an employee of the Adviser or its affiliates. These Trustees may, for tax purposes, elect to defer receipt of this compensation under the John Hancock Group of Funds Deferred Compensation Plan (the Plan). Deferred amounts are invested in various John Hancock funds and remain in the funds until distributed in accordance with the Plan. The investment of deferred amounts and the offsetting liability are included within Other receivables and prepaid assets and Payable to affiliates — Trustees’ fees, respectively, in the accompanying Statement of Assets and Liabilities.
| 30 | Classic Value Fund | Annual report |
Note 5 — Fund share transactions
Transactions in Fund shares for the years ended October 31, 2010 and October 31, 2009 were as follows:
| Year ended 10-31-10 | Year ended 10-31-09 | |||
| Shares | Amount | Shares | Amount | |
| Class A shares | ||||
| Sold | 22,908,771 | $338,530,032 | 64,244,105 | $675,569,080 |
| Distributions reinvested | 789,344 | 11,429,640 | 9,597,407 | 95,494,199 |
| Repurchased | (76,266,881) | (1,140,453,961) | (99,968,004) | (1,054,827,727) |
| Net decrease | (52,568,766) | ($790,494,289) | (26,126,492) | ($283,764,448) |
| Class B shares | ||||
| Sold | 138,254 | $2,037,987 | 278,350 | $3,003,361 |
| Distributions reinvested | 6,596 | 94,917 | 360,741 | 3,571,341 |
| Repurchased | (1,258,824) | (18,585,481) | (2,275,678) | (24,206,832) |
| Net decrease | (1,113,974) | ($16,452,577) | (1,636,587) | ($17,632,130) |
| Class C shares | ||||
| Sold | 512,243 | $7,620,193 | 815,610 | $8,901,911 |
| Distributions reinvested | 13,992 | 201,344 | 891,227 | 8,823,144 |
| Repurchased | (3,330,921) | (48,804,227) | (6,922,753) | (72,980,639) |
| Net decrease | (2,804,686) | ($40,982,690) | (5,215,916) | ($55,255,584) |
| Class I shares | ||||
| Sold | 37,873,246 | $574,858,106 | 22,453,826 | $256,300,737 |
| Distributions reinvested | 356,767 | 5,165,988 | 4,193,379 | 41,682,192 |
| Repurchased | (20,981,773) | (309,316,082) | (33,926,581) | (356,360,821) |
| Net increase (decrease) | 17,248,240 | $270,708,012 | (7,279,376) | ($58,377,892) |
| Class R1 shares | ||||
| Sold | 110,299 | $1,644,934 | 251,608 | $2,691,375 |
| Distributions reinvested | 1,778 | 25,815 | 51,536 | 514,327 |
| Repurchased | (158,647) | (2,350,026) | (536,255) | (5,551,705) |
| Net decrease | (46,570) | ($679,277) | (233,111) | ($2,346,003) |
| Class R3 shares | ||||
| Sold | 1,547 | $23,877 | 2,224 | $25,000 |
| Net increase | 1,547 | $23,877 | 2,224 | $25,000 |
| Class R4 shares | ||||
| Sold | — | — | 2,224.2 | $25,000 |
| Net increase | — | — | 2,224.2 | $25,000 |
| Class R5 shares | ||||
| Sold | 156 | $2,303 | 2,224 | $25,000 |
| Net increase | 156 | $2,303 | 2,224 | $25,000 |
| Net decrease | (39,284,053) | ($577,874,641) | (40,484,810) | ($417,301,057) |
Note 6 — Purchase and sale of securities
Purchases and sales of securities, other than short-term securities, aggregated $1,283,291,102 and $1,867,089,306, respectively, for the year ended October 31, 2010.
| Annual report | Classic Value Fund | 31 |
Auditors’ report
Report of Independent Registered Public Accounting Firm
To the Board of Trustees of John Hancock Capital Series and Shareholders of John Hancock Classic Value Fund:
In our opinion, the accompanying statement of assets and liabilities, including the schedule of investments, and the related statements of operations and of changes in net assets and the financial highlights present fairly, in all material respects, the financial position of John Hancock Classic Value Fund (the “Fund”) at October 31, 2010, and the results of its operations, the changes in its net assets and the financial highlights for each of the periods indicated, in conformity with accounting principles generally accepted in the United States of America. These financial statements and financial highlights (hereafter referred to as “financial statements”) are the responsibility of the Fund’s management; our responsibility is to express an opinion on these financial statements based on our audits. We conducted our audits of these financial statements in accordance with the standards of the Public Company Accounting Oversight Board (United States). Those standards require that we plan and perform the audit to obtain reasonable assurance about whether the financial statements are free of material misstatement. An audit includes examining, on a test basis, evidence supporting the amounts and disclosures in the financial statements, assessing the accounting principles used and significant estimates made by management, and evaluating the overall financial statement presentation. We believe that our audits, which included confirmation of securities as of October 31, 2010 by correspondence with the custodian and brokers, and the application of alternative auditing procedures where securities purchased confirmations had not been received, provide a reasonable basis for our opinion.
PricewaterhouseCoopers LLP
Boston, Massachusetts
December 22, 2010
| 32 | Classic Value Fund | Annual report |
Tax information
Unaudited
For federal income tax purposes, the following information is furnished with respect to the distributions of the Fund, if any, paid during its taxable year ended October 31, 2010.
The Fund designates the maximum amount allowable for the corporate dividends received deduction for the fiscal year ended October 31, 2010.
The Fund designates the maximum amount allowable of its net taxable income as qualified dividend income as provided in the Jobs and Growth Tax Relief Reconciliation Act of 2003. This amount will be reflected on Form 1099-DIV for the calendar year 2010.
Shareholders will be mailed a 2010 Form 1099-DIV in January 2011. This will reflect the total of all distributions that are taxable for calendar year 2010.
| Annual report | Classic Value Fund | 33 |
Board Consideration of and Continuation of Investment Advisory Agreement and Subadvisory Agreement
The Board of Trustees (the Board, the members of which are referred to as Trustees) of John Hancock Classic Value Fund (the Fund), a series of John Hancock Capital Series (the Trust), met in-person on May 2–4 and June 6–8, 2010 to consider the approval of the Fund’s investment advisory agreement (the Advisory Agreement) with John Hancock Advisers, LLC (the Adviser), the Fund’s investment adviser. The Board also considered the approval of the investment subadvisory agreement (the Subadvisory Agreement) among the Adviser, Pzena Investment Management, LLC (the Subadviser) and the Trust on behalf of the Fund. The Advisory Agreement and the Subadvisory Agreement are referred to as the Agreements.
Activities and composition of the Board
The Board consists of eleven individuals, nine of whom are Independent Trustees. Independent Trustees are generally those individuals who are unaffiliated with the Fund, the Adviser and the Subadviser. The Trustees are responsible for the oversight of operations of the Fund and perform the various duties required of directors of investment companies by the Investment Company Act of 1940, as amended (the 1940 Act). The Independent Trustees have retained independent legal counsel to assist them in connection with their duties. The Board has appointed an Independent Trustee as Chairperson. The Board has established four standing committees that are composed entirely of Independent Trustees: the Audit Committee; the Compliance Committee; the Nominating, Governance and Administration Committee; and the Contracts/Operations Committee. Additionally, Investment Performance Committee B is a standing committee of the Board that is composed of Independent Trustees and one Trustee who is affiliated with the Adviser. Investment Performance Committee B oversees and monitors matters relating to the investment performance of the Fund. The Board has also designated a Vice Chairperson to serve in the absence of the Chairperson, who also serves as Chairman of the Board’s Nominating, Governance and Administration Committee. The Board also designates working groups or ad hoc committees as it deems appropriate.
The approval process
Pursuant to the 1940 Act, the Board is required to consider the continuation of the Agreements on an annual basis. Throughout the year, the Board, acting directly and through its committees, regularly reviews and assesses the quality of the services that the Fund receives under these Agreements. In this regard, the Board reviews reports of the Adviser at least quarterly, which include, among other things, fund performance reports and compliance reports. In addition, the Board meets with portfolio managers and senior investment officers at various times throughout the year. The Board considers at each of its meetings factors that are relevant to its annual consideration of the renewal of the Agreements, including the services and support provided by the Adviser and Subadviser to the Fund and its shareholders.
Prior to the May 2–4, 2010 meeting, the Board requested and received materials specifically relating to the Agreements. The materials provided in connection with the May meeting included information independently compiled and prepared by Morningstar, Inc. (Morningstar) on Fund fees and expenses, and the investment performance of the Fund. This Fund information is assembled in a format that permits comparison with similar information from a category of relevant funds (the Category) and a peer group of comparable funds (the Peer Group) as determined by Morningstar, and its benchmark index. Other material provided for the Fund review included (a) information on the profitability of the Agreements to the Adviser and a discussion of any additional benefits to the Adviser and its affiliates that result from being the Adviser to the Fund; (b) a general analysis provided by the Adviser and the Subadviser concerning investment advisory fees charged to other clients, such as institutional clients and other investment companies, under similar investment mandates, as well as the performance of such other clients; (c) the impact of economies of scale;
| 34 | Classic Value Fund | Annual report |
(d) a summary of aggregate amounts paid by the Fund to the Adviser; and (e) sales and redemption data regarding the Fund’s shares.
At an in-person meeting held on May 2–4, 2010, the Board reviewed materials relating to its consideration of the Agreements. As a result of the discussions that occurred during the May 2–4, 2010 meeting, the Board presented the Adviser and Subadviser with questions and requests for additional information and the Adviser and Subadviser responded to these requests with additional written information in advance of the June 6–8, 2010 Board meeting. The Board also reviewed these additional materials relating to its consideration of the Agreements.
At an in-person meeting held on June 6–8, 2010, the Board, including the Independent Trustees, formally considered the continuation of the Advisory Agreement between the Adviser and the Fund and the Subadvisory Agreement among the Adviser, the Subadviser and the Trust on behalf of the Fund, each for an additional one-year term. The Board considered all factors it believed relevant with respect to the Fund, including, among other factors: (a) the nature, extent and quality of the services provided by the Adviser and the Subadviser; (b) the investment performance of the Fund and portfolio management of the Subadviser; (c) the advisory fees and the cost of the services and profits to be realized by the Adviser and certain affiliates from their relationship with the Fund; (d) economies of scale; and (e) other factors.
The Board also considered other matters important to the approval process, such as payments made to the Adviser or its affiliates relating to the distribution of Fund shares and other services. The Board reviewed services related to the valuation and pricing of Fund portfolio holdings. Other important matters considered by the Board were the direct and indirect benefits to the Adviser, the Subadviser, and their affiliates from their relationship with the Fund and advice from independent legal counsel with respect to the review process and materials submitted for the Board’s review. Each Trustee may have attributed different weights to the various items considered.
The key factors considered by the Board and the conclusions reached are described below.
Nature, extent and quality of services
The Board, including the Independent Trustees, reviewed the nature, extent and quality of services provided by the Adviser and the Subadviser, including the investment advisory services and the resulting performance of the Fund. The Board reviewed the Adviser’s and Subadviser’s senior management personnel responsible for investment operations, including the senior investment officers. The Board also reviewed the materials provided by the Fund’s portfolio management team discussing Fund performance and the Fund’s investment objective, strategies and outlook.
The Board considered the ability of the Adviser and the Subadviser, based on their resources, reputation and other attributes, to attract and retain qualified investment professionals, including research, advisory and supervisory personnel. It considered the background and experience of senior management and investment professionals responsible for managing the Fund. The Board considered the investment philosophy, research and investment decision-making processes of the Adviser and the Subadviser responsible for the daily investment activities of the Fund, including, among other things, portfolio trading capabilities, use of technology, commitment to compliance and approach to training and retaining portfolio managers and other research, advisory and management personnel.
The Board considered the Subadviser’s history and experience with the Fund. The Board considered the Adviser’s execution of its oversight responsibilities. The Board further considered the culture of compliance, resources dedicated to compliance, compliance programs, record of compliance with applicable laws and regulation, with the Fund’s investment policies and restrictions and with the applicable Code of Ethics, and the responsibilities of the Adviser’s and Subadviser’s compliance departments.
| Annual report | Classic Value Fund | 35 |
In addition to advisory services, the Board considered the quality of the administrative and non-investment advisory services provided to the Fund by the Adviser under separate agreements. The Board noted that the Adviser and its affiliates provide the Fund with certain administrative, transfer agency, shareholder and other services (in addition to any such services provided to the Fund by third parties) and officers and other personnel as are necessary for the operations of the Fund. The Board reviewed the structure and duties of the Adviser’s administration, accounting, legal and compliance departments and considered the Adviser’s policies and procedures for assuring compliance with applicable laws and regulations.
The Board also received information about the nature, extent and quality of services and fee rates offered by the Adviser and Subadviser to their other clients, including other registered investment companies, institutional investors and separate accounts. The Board reviewed a general analysis provided by the Adviser and the Subadviser concerning investment advisory fees charged to such other clients under similar investment mandates, the services provided to such other clients as compared to the services provided to the Fund, the performance of such other clients, and other factors relating to such other clients. The Board considered the significant differences between the Adviser’s and Subadviser’s services to the Fund and those services they provide to other clients which, to the extent the other client is not a mutual fund, may generally be attributable to the greater frequency of shareholder redemptions in a mutual fund, the higher turnover of mutual fund assets, the more burdensome regulatory and legal obligations of mutual funds, and the higher marketing costs for mutual funds.
Fund performance
The Board, including the Independent Trustees, reviewed and considered the performance history of the Fund. The Board was provided with reports, independently prepared by Morningstar, which included a comprehensive analysis of the Fund’s performance. The Board also reviewed a narrative and statistical analysis of the Morningstar data that was prepared by the Adviser, which analyzed various factors that may affect the Morningstar rankings. The Board reviewed information regarding the investment performance of the Fund as compared to its Morningstar Category and Peer Group as well as its benchmark index (see chart below). The Board was provided with a description of the methodology used by Morningstar to select the funds in the Category and the Peer Group. The Board also considered updated performance information provided by the Adviser at its May and June 2010 meetings. The Board regularly reviews the performance of the Fund throughout the year and attaches more importance to performance over relatively longer periods of time, typically three to five years.
| 1 YEAR | 3 YEAR | 5 YEAR | 10 YEAR | |
| Classic Value Fund | 35.80% | –14.61% | –4.61% | 5.87% |
| Russell 1000 Value Index | 19.69% | –8.96% | –0.25% | 2.47% |
| Large Value Category Median | 23.70% | –7.09% | 0.20% | 2.67% |
| Morningstar 15(c) Peer Group Median | 23.68% | –6.36% | 0.85% | 4.34% |
The Board noted that the Subadviser remained consistent with its investment style and adhered to its investment mandates. The Board considered presentations made by the Subadviser and the Adviser on the investment management style of the Subadviser and noted that the Subadviser has improved performance over the one year period due to improved stock and sector selection in its deep value investment style. The Board concluded that the Fund’s underperformance was being responsibly addressed by the Adviser and Subadviser.
Expenses and fees
The Board, including the Independent Trustees, reviewed the Fund’s contractual advisory fee rate payable by the Fund to the Adviser as compared with the other funds in its Category and Peer Group. The Board also received information about the investment subadvisory fee rate payable by the Adviser to the Subadviser for investment subadvisory services. The Board considered the services
| 36 | Classic Value Fund | Annual report |
provided and the fees charged by the Adviser and the Subadviser to other types of clients with similar investment mandates, including separately managed institutional accounts.
In addition, the Board considered the cost of the services provided to the Fund by the Adviser. The Board received and considered expense information regarding the Fund’s various components, including advisory fees, distribution fees and fees other than advisory and distribution fees, including transfer agent fees, custodian fees, administration fees and other miscellaneous fees (e.g., fees for accounting and legal services). The Board considered comparisons of these expenses to the Peer Group median. The Board also received and considered expense information regarding the Fund’s total operating expense ratio (Gross Expense Ratio) and total operating expense ratio after taking the fee waiver arrangement applicable to the Advisory Agreement rate into account (Net Expense Ratio). The Board received and considered information comparing the Gross Expense Ratio and Net Expense Ratio of the Fund to that of the Peer Group and Category medians. As part of its analysis, the Board reviewed the Adviser’s methodology in allocating its costs to the management of the Fund. The Board considered expenses and fee rates to be higher or lower if they were over or under 10 basis points, respectively; slightly higher or slightly lower if they were above or below 6-10 basis points, respectively, and inline if they were above or below by 5 basis points.
The Board noted that the investment advisory rate was slightly higher than the Category median and higher than the Peer Group median. The Board viewed favorably the Adviser’s contractual agreement to waive all or a portion of its Advisory Agreement Rate and reimburse or pay operating expenses to the extent necessary to maintain the Fund’s Net Expense Ratio at 1.33% for Class A shares, excluding certain expenses such as taxes, brokerage commissions, interest, litigation and extraordinary expenses, until February 28, 2011.
The Board reviewed the Fund’s Gross Expense Ratio of 1.55% for the Fund’s Class A shares. The Board noted that the Fund’s Gross Expense Ratio was higher than the Peer Group and Category medians. The Board also noted that the Fund’s Net Expense Ratio was higher than the Peer Group and Category medians. The Board favorably considered the impact of fee waivers towards ultimately lowering the Fund’s Gross Expense Ratio. The Board also received and considered information relating to the Fund’s Gross Expense Ratio and Net Expense Ratio that reflected a proposed change in the methodology for calculating transfer agent fees.
The Board received and reviewed statements relating to the Adviser’s financial condition and profitability with respect to the services it provides the Fund. The Board was also provided with a profitability analysis that detailed the revenues earned and the expenses incurred by the Adviser for services provided to the Fund. The Board reviewed the Adviser’s profitability with respect to the Fund and other funds the Board currently oversees for the year ended December 31, 2009 compared to available aggregate profitability data provided for the year ended December 31, 2008.
The Board received and considered a detailed profitability analysis of the Adviser based on the Advisory Agreement, as well as on other relationships between the Fund and the Adviser and its affiliates. The Board also considered a comparison of the Adviser’s profitability to that of other similar investment advisers whose profitability information is publicly available. The Board reviewed the Adviser’s profitability with respect to other fund complexes managed by the Adviser and/or its affiliates. The Board reviewed the Adviser’s assumptions and methodology of allocating expenses in the profitability analysis, noting the inherent limitations in allocating costs among various advisory products. The Board recognized that profitability may be affected by numerous factors including, among other things, fee waivers and expense reimbursements by the Adviser, the types of funds managed, expense allocations and business mix, and therefore comparability of profitability is somewhat limited.
| Annual report | Classic Value Fund | 37 |
The Board did not consider profitability information with respect to the Subadviser, which is not affiliated with the Adviser. The Board considered that the subadvisory fee under the Subadvisory Agreement had been negotiated by the Adviser and the Subadviser on an arm’s-length basis and that the Subadviser’s separate profitability from its relationship with the Fund was not a material factor in determining whether to renew the Subadvisory Agreement.
Economies of scale
The Board, including the Independent Trustees, considered the extent to which economies of scale might be realized as the assets of the Fund increase and whether there should be changes in the advisory fee rate or structure in order to enable the Fund to participate in these economies of scale, for example through the use of breakpoints in the advisory fee based upon the assets of the Fund. The Board also considered the Adviser’s overall operations and its efforts to expand the scale of, and improve the quality of, its operations.
The Board recognized the inherent limitations of any analysis of economies of scale, stemming largely from the Board’s understanding that most of the Adviser’s costs are not specific to individual funds, but rather are incurred across a variety of products and services. To ensure that any economies are reasonably shared with the Fund as its assets increase, the Adviser and the Board agreed to continue the existing breakpoints to the Agreement fee rate.
Other benefits to the Adviser and the Subadviser
The Board understands that the Adviser, the Subadviser, or their affiliates may derive other ancillary benefits from their relationship with the Fund, both tangible and intangible, such as their ability to leverage investment professionals who manage other portfolios, an increase in their profile in the investment advisory community, and the engagement of their affiliates and/or significant shareholders as service providers to the Fund, including for administrative, transfer agency and distribution services. The Board believes that certain of these benefits are difficult to quantify. The Board also was informed that the Subadviser may use third party research obtained by soft dollars generated by certain mutual fund transactions to assist itself in managing all or a number of its other client accounts.
Board determination
The Board, including the Independent Trustees, unanimously approved the continuation of the Advisory Agreement between the Adviser and the Fund for an additional one-year term and the Subadvisory Agreement among the Adviser, the Subadviser and the Trust on behalf of the Fund for an additional one-year term. Based upon its evaluation of relevant factors in their totality, the Board, including a majority of the Independent Trustees, was satisfied that the terms of the Agreements were fair and reasonable and in the best interest of the Fund and its shareholders. In arriving at a decision to approve the Agreements, the Board did not identify any single factor listed above, or any group of factors listed above, as all-important or controlling, but considered all factors together, and different Trustees may have attributed different weights to the various factors considered. The Independent Trustees were also assisted by the advice of independent legal counsel in making this determination. The Board noted that contractual fee arrangements for the Fund reflect the results of several years of review by the Board and certain predecessor Trustees, and discussions between such Trustees (and predecessor Trustees) and the Adviser. Certain aspects of the arrangements may be the subject of more attention in some years than in others, and the Trustees’ conclusions may be based in part on their consideration of these arrangements in prior years.
| 38 | Classic Value Fund | Annual report |
Trustees and Officers
This chart provides information about the Trustees and Officers who oversee your John Hancock fund. Officers elected by the Trustees manage the day-to-day operations of the Fund and execute policies formulated by the Trustees.
| Independent Trustees | ||
| Name, Year of Birth | Trustee | Number of John |
| Position(s) held with Fund | of the | Hancock funds |
| Principal occupation(s) and other | Trust | overseen by |
| directorships during past 5 years | since1 | Trustee |
| Patti McGill Peterson, Born: 1943 | 2002 | 47 |
| Chairperson (since December 2008); Principal, PMP Globalinc (consulting) (since 2007); Senior | ||
| Associate, Institute for Higher Education Policy (since 2007); Executive Director, CIES (international | ||
| education agency) (until 2007); Vice President, Institute of International Education (until 2007); Senior | ||
| Fellow, Cornell University Institute of Public Affairs, Cornell University (1997–1998); Former President | ||
| Wells College, St. Lawrence University and the Association of Colleges and Universities of the State | ||
| of New York. Director of the following: Niagara Mohawk Power Corporation (until 2003); Security | ||
| Mutual Life (insurance) (until 1997); ONBANK (until 1993). Trustee of the following: Board of Visitors, | ||
| The University of Wisconsin, Madison (since 2007); Ford Foundation, International Fellowships Program | ||
| (until 2007); UNCF, International Development Partnerships (until 2005); Roth Endowment (since 2002); | ||
| Council for International Educational Exchange (since 2003). | ||
| James F. Carlin, Born: 1940 | 2005 | 47 |
| Chief Executive Officer, Director and Treasurer, Alpha Analytical Laboratories (environmental, chemical | ||
| and pharmaceutical analysis) (since 1985); Part Owner and Treasurer, Lawrence Carlin Insurance Agency, | ||
| Inc. (since 1995); Chairman and Chief Executive Officer, Carlin Consolidated, Inc. (management/ | ||
| investments) (since 1987). | ||
| William H. Cunningham, Born: 1944 | 2005 | 47 |
| Professor, University of Texas, Austin, Texas (since 1971); former Chancellor, University of Texas System | ||
| and former President of the University of Texas, Austin, Texas; Director of the following: LIN Television | ||
| (since 2009); Lincoln National Corporation (insurance) (Chairman since 2009 and Director since 2006); | ||
| Resolute Energy Corporation (since 2009); Nanomedical Systems, Inc. (biotechnology company) | ||
| (Chairman since 2008); Yorktown Technologies, LP (tropical fish) (Chairman since 2007); Greater Austin | ||
| Crime Commission (since 2001); Southwest Airlines (since 2000); former Director of the following: | ||
| Introgen (manufacturer of biopharmaceuticals) (until 2008); Hicks Acquisition Company I, Inc. (until | ||
| 2007); Jefferson-Pilot Corporation (diversified life insurance company) (until 2006); and former Advisory | ||
| Director, JP Morgan Chase Bank (formerly Texas Commerce Bank–Austin) (until 2009). | ||
| Deborah C. Jackson,2 Born: 1952 | 2008 | 47 |
| Chief Executive Officer, American Red Cross of Massachusetts Bay (since 2002); Board of Directors of | ||
| Eastern Bank Corporation (since 2001); Board of Directors of Eastern Bank Charitable Foundation (since | ||
| 2001); Board of Directors of American Student Assistance Corp. (1996–2009); Board of Directors of | ||
| Boston Stock Exchange (2002–2008); Board of Directors of Harvard Pilgrim Healthcare (health benefits | ||
| company) (since 2007). | ||
| Annual report | Classic Value Fund | 39 |
| Independent Trustees (continued) | ||
| Name, Year of Birth | Trustee | Number of John |
| Position(s) held with Fund | of the | Hancock funds |
| Principal occupation(s) and other | Trust | overseen by |
| directorships during past 5 years | since1 | Trustee |
| Charles L. Ladner, Born: 1938 | 2004 | 47 |
| Chairman and Trustee, Dunwoody Village, Inc. (retirement services) (since 2008); Director, Philadelphia | ||
| Archdiocesan Educational Fund (since 2009); Senior Vice President and Chief Financial Officer, UGI | ||
| Corporation (public utility holding company) (retired 1998); Vice President and Director for AmeriGas, | ||
| Inc. (retired 1998); Director of AmeriGas Partners, L.P. (gas distribution) (until 1997); Director, | ||
| EnergyNorth, Inc. (until 1995); Director, Parks and History Association (Cooperating Association, | ||
| National Park Service) (until 2005). | ||
| Stanley Martin,2 Born: 1947 | 2008 | 47 |
| Senior Vice President/Audit Executive, Federal Home Loan Mortgage Corporation (2004–2006); | ||
| Executive Vice President/Consultant, HSBC Bank USA (2000–2003); Chief Financial Officer/Executive | ||
| Vice President, Republic New York Corporation & Republic National Bank of New York (1998–2000); | ||
| Partner, KPMG LLP (1971–1998). | ||
| Dr. John A. Moore, Born: 1939 | 2002 | 47 |
| President and Chief Executive Officer, Institute for Evaluating Health Risks, (nonprofit institution) | ||
| (until 2001); Senior Scientist, Sciences International (health research) (until 2003); Former | ||
| Assistant Administrator & Deputy Administrator, Environmental Protection Agency; Principal, | ||
| Hollyhouse (consulting) (since 2000); Director, CIIT Center for Health Science Research (nonprofit | ||
| research) (until 2007). | ||
| Steven R. Pruchansky,2 Born: 1944 | 2005 | 47 |
| Chairman and Chief Executive Officer, Greenscapes of Southwest Florida, Inc. (since 2000); Director | ||
| and President, Greenscapes of Southwest Florida, Inc. (until 2000); Member, Board of Advisors, First | ||
| American Bank (since 2008); Managing Director, Jon James, LLC (real estate) (since 2000); Director, | ||
| First Signature Bank & Trust Company (until 1991); Director, Mast Realty Trust (until 1994); President, | ||
| Maxwell Building Corp. (until 1991). | ||
| Gregory A. Russo, Born: 1949 | 2009 | 47 |
| Vice Chairman, Risk & Regulatory Matters, KPMG LLP (“KPMG”) (2002–2006); Vice Chairman, Industrial | ||
| Markets, KPMG (1998–2002). | ||
| Non-Independent Trustees3 | ||
| Name, Year of Birth | Trustee | Number of John |
| Position(s) held with Fund | of the | Hancock funds |
| Principal occupation(s) and other | Trust | overseen by |
| directorships during past 5 years | since1 | Trustee |
| Hugh McHaffie,4 Born: 1959 | 2010 | 47 |
| Executive Vice President, John Hancock Financial Services (since 2006, including prior positions); | ||
| President of John Hancock Trust and John Hancock Funds II (since 2009); Trustee, John Hancock retail | ||
| funds (since 2010); Chairman and Director, John Hancock Advisers, LLC, John Hancock Investment | ||
| Management Services, LLC and John Hancock Funds, LLC (since 2010); Senior Vice President, Individual | ||
| Business Product Management, MetLife, Inc. (1999–2006). | ||
| 40 | Classic Value Fund | Annual report |
| Non-Independent Trustees3 (continued) | ||
| Name, Year of Birth | Trustee | Number of John |
| Position(s) held with Fund | of the | Hancock funds |
| Principal occupation(s) and other | Trust | overseen by |
| directorships during past 5 years | since1 | Trustee |
| John G. Vrysen, Born: 1955 | 2009 | 47 |
| Senior Vice President, John Hancock Financial Services (since 2006); Director, Executive Vice President | ||
| and Chief Operating Officer, John Hancock Advisers, LLC, John Hancock Investment Management | ||
| Services, LLC and John Hancock Funds, LLC (since 2005); Chief Operating Officer, John Hancock Funds II | ||
| and John Hancock Trust (since 2007); Chief Operating Officer, John Hancock retail funds (until 2009); | ||
| Trustee, John Hancock retail funds (since 2009). | ||
| Principal officers who are not Trustees | ||
| Name, Year of Birth | Officer | |
| Position(s) held with Fund | of the | |
| Principal occupation(s) and other | Trust | |
| directorships during past 5 years | since | |
| Keith F. Hartstein, Born: 1956 | 2005 | |
| President and Chief Executive Officer | ||
| Senior Vice President, John Hancock Financial Services (since 2004); Director, President and Chief | ||
| Executive Officer, John Hancock Advisers, LLC and John Hancock Funds, LLC (since 2005); Director, | ||
| MFC Global Investment Management (U.S.), LLC (since 2005); Director, John Hancock Investment | ||
| Management Services, LLC (since 2006); President and Chief Executive Officer, John Hancock | ||
| retail funds (since 2005); Member, Investment Company Institute Sales Force Marketing | ||
| Committee (since 2003). | ||
| Andrew G. Arnott, Born: 1971 | 2009 | |
| Senior Vice President and Chief Operating Officer | ||
| Senior Vice President, John Hancock Financial Services (since 2009); Executive Vice President, | ||
| John Hancock Advisers, LLC (since 2005); Executive Vice President, John Hancock Investment | ||
| Management Services, LLC (since 2006); Executive Vice President, John Hancock Funds, LLC (since | ||
| 2004); Chief Operating Officer, John Hancock retail funds (since 2009); Senior Vice President, | ||
| John Hancock retail funds (since 2010); Vice President, John Hancock Funds II and John Hancock Trust | ||
| (since 2006); Senior Vice President, Product Management and Development, John Hancock Funds, | ||
| LLC (until 2009). | ||
| Thomas M. Kinzler, Born: 1955 | 2006 | |
| Secretary and Chief Legal Officer | ||
| Vice President, John Hancock Financial Services (since 2006); Secretary and Chief Legal Counsel, | ||
| John Hancock Advisers, LLC, John Hancock Investment Management Services, LLC and John Hancock | ||
| Funds, LLC (since 2007); Secretary and Chief Legal Officer, John Hancock retail funds, John Hancock | ||
| Funds II and John Hancock Trust (since 2006); Vice President and Associate General Counsel, | ||
| Massachusetts Mutual Life Insurance Company (1999–2006); Secretary and Chief Legal Counsel, MML | ||
| Series Investment Fund (2000–2006); Secretary and Chief Legal Counsel, MassMutual Select Funds and | ||
| MassMutual Premier Funds (2004–2006). | ||
| Annual report | Classic Value Fund | 41 |
| Principal officers who are not Trustees (continued) | |
| Name, Year of Birth | Officer |
| Position(s) held with Fund | of the |
| Principal occupation(s) and other | Trust |
| directorships during past 5 years | since |
| Francis V. Knox, Jr., Born: 1947 | 2005 |
| Chief Compliance Officer | |
| Vice President, John Hancock Financial Services (since 2005); Chief Compliance Officer, John Hancock | |
| retail funds, John Hancock Funds II, John Hancock Trust, John Hancock Advisers, LLC and John Hancock | |
| Investment Management Services, LLC (since 2005); Vice President and Chief Compliance Officer, MFC | |
| Global Investment Management (U.S.), LLC (2005–2008). | |
| Charles A. Rizzo, Born: 1957 | 2007 |
| Chief Financial Officer | |
| Vice President, John Hancock Financial Services (since 2008); Senior Vice President, John Hancock | |
| Advisers, LLC and John Hancock Investment Management Services, LLC (since 2008); Chief | |
| Financial Officer, John Hancock retail funds, John Hancock Funds II and John Hancock Trust (since | |
| 2007); Assistant Treasurer, Goldman Sachs Mutual Fund Complex (2005–2007); Vice President, | |
| Goldman Sachs (2005–2007); Managing Director and Treasurer, Scudder Funds, Deutsche Asset | |
| Management (2003–2005). | |
| Salvatore Schiavone,4 Born: 1965 | 2010 |
| Treasurer | |
| Assistant Vice President, John Hancock Financial Services (since 2007); Vice President, John Hancock | |
| Advisers, LLC and John Hancock Investment Management Services, LLC (since 2007); Treasurer, | |
| John Hancock retail funds (since 2010); Treasurer, John Hancock Closed-End Funds (since 2009); | |
| Assistant Treasurer, John Hancock Funds II and John Hancock Trust (since 2010); Assistant Treasurer, | |
| John Hancock retail funds, John Hancock Funds II and John Hancock Trust (2007–2009); Assistant | |
| Treasurer, Fidelity Group of Funds (2005–2007); Vice President, Fidelity Management Research | |
| Company (2005–2007); Assistant Treasurer, Scudder Group of Funds (2003–2005); Director, Deutsche | |
| Asset Management (2003–2005). | |
The business address for all Trustees and Officers is 601 Congress Street, Boston, Massachusetts 02210-2805.
The Statement of Additional Information of the Fund includes additional information about members of the Board of Trustees of the Fund and is available without charge, upon request, by calling 1-800-225-5291.
1 Each Trustee holds office until his or her successor is elected and qualified, or until the Trustee’s death, retirement, resignation or removal.
2 Member of Audit Committee.
3 Because Messrs. McHaffie and Vrysen are senior executives or directors with the Adviser and/or its affiliates, each of them is considered an “interested person,” as defined in the Investment Company Act of 1940, of the Fund.
4 Mr. McHaffie and Mr. Schiavone were appointed by the Board of Trustees effective 8-31-10.
| 42 | Classic Value Fund | Annual report |
More information
| Trustees | Investment adviser | |
| Patti McGill Peterson, Chairperson | John Hancock Advisers, LLC | |
| James F. Carlin | ||
| William H. Cunningham | Subadviser | |
| Deborah C. Jackson* | Pzena Investment Management, LLC | |
| Charles L. Ladner | ||
| Stanley Martin* | Principal distributor | |
| Hugh McHaffie†** | John Hancock Funds, LLC | |
| Dr. John A. Moore | ||
| Steven R. Pruchansky* | Custodian | |
| Gregory A. Russo | State Street Bank and Trust Company | |
| John G. Vrysen† | ||
| Transfer agent | ||
| Officers | John Hancock Signature Services, Inc. | |
| Keith F. Hartstein | ||
| President and Chief Executive Officer | Legal counsel | |
| K&L Gates LLP | ||
| Andrew G. Arnott | ||
| Senior Vice President** and Chief Operating Officer | Independent registered | |
| public accounting firm | ||
| Thomas M. Kinzler | PricewaterhouseCoopers LLP | |
| Secretary and Chief Legal Officer | ||
| Francis V. Knox, Jr. | The report is certified under the Sarbanes-Oxley | |
| Chief Compliance Officer | Act, which requires mutual funds and other public | |
| companies to affirm that, to the best of their | ||
| Charles A. Rizzo | knowledge, the information in their financial reports | |
| Chief Financial Officer | is fairly and accurately stated in all material respects. | |
| Salvatore Schiavone** | ||
| Treasurer | ||
| *Member of the Audit Committee | ||
| **Effective 8-31-10 | ||
| †Non-Independent Trustee | ||
The Fund’s proxy voting policies and procedures, as well as the Fund’s proxy voting record for the most recent twelve-month period ended June 30, are available free of charge on the Securities and Exchange Commission (SEC) Web site at www.sec.gov or on our Web site.
The Fund’s complete list of portfolio holdings, for the first and third fiscal quarters, is filed with the SEC on Form N-Q. The Fund’s Form N-Q is available on our Web site and the SEC’s Web site, www.sec.gov, and can be reviewed and copied (for a fee) at the SEC’s Public Reference Room in Washington, DC. Call 1-800-SEC-0330 to receive information on the operation of the SEC’s Public Reference Room.
We make this information on your fund, as well as monthly portfolio holdings, and other fund details available on our Web site www.jhfunds.com or by calling 1-800-225-5291.
| You can also contact us: | ||
| 1-800-225-5291 | Regular mail: | Express mail: |
| jhfunds.com | John Hancock Signature Services, Inc. | John Hancock Signature Services, Inc. |
| P.O. Box 55913 | Mutual Fund Image Operations | |
| Boston, MA 02205-5913 | 30 Dan Road | |
| Canton, MA 02021 |
| Annual report | Classic Value Fund | 43 |

1-800-225-5291
1-800-554-6713 TDD
1-800-338-8080 EASI-Line
www.jhfunds.com
Now available: electronic delivery
www.jhfunds.com/edelivery
| This report is for the information of the shareholders of John Hancock Classic Value Fund. | 3800A 10/10 |
| It is not authorized for distribution to prospective investors unless preceded or accompanied by a prospectus. | 12/10 |
ITEM 2. CODE OF ETHICS.
As of the end of the period, October 31, 2010, the registrant has adopted a code of ethics, as defined in Item 2 of Form N-CSR, that applies to its Chief Executive Officer, Chief Financial Officer and Treasurer (respectively, the principal executive officer, the principal financial officer and the principal accounting officer, the “Senior Financial Officers”). A copy of the code of ethics is filed as an exhibit to this Form N-CSR.
ITEM 3. AUDIT COMMITTEE FINANCIAL EXPERT.
Stanley Martin is the audit committee financial expert and is “independent”, pursuant to general instructions on Form N-CSR Item 3.
ITEM 4. PRINCIPAL ACCOUNTANT FEES AND SERVICES.
(a) Audit Fees
The aggregate fees billed for professional services rendered by the principal accountant(s) for the audit of the registrant’s annual financial statements or services that are normally provided by the accountant(s) in connection with statutory and regulatory filings or engagements amounted to $50,062 for the fiscal year ended October 31, 2010 (itemized as follows: John Hancock Classic Value Fund - $25,580 and John Hancock U.S. Global Leaders Growth Fund - $24,482)and $59,111 for the fiscal period ended October 31, 2009 (itemized as follows: John Hancock Classic Value Fund - $29,243 and John Hancock U.S. Global Leaders Growth Fund - $29,868). These fees were billed to the registrant and were approved by the registrant’s audit committee.
(b) Audit-Related Services
Audit-related service fees for the fiscal year ended October 31, 2010 amounted to $694 (itemized as follows: John Hancock Classic Value Fund - $347 and John Hancock U.S. Global Leaders Growth Fund - $347) and $3,368 for the fiscal period ended October 31, 2009 (itemized as follows: John Hancock Classic Value Fund - $2,184 and John Hancock U.S. Global Leaders Growth Fund - $1,184) billed to the registrant or to the registrant's investment adviser (not including any sub-adviser whose role is primarily portfolio management and is subcontracted with or overseen by another investment adviser), and any entity controlling, controlled by, or under common control with the adviser that provides ongoing services to the registrant ("control affiliates").
(c) Tax Fees
The aggregate fees billed for professional services rendered by the principal accountant(s) for the tax compliance, tax advice and tax planning (“tax fees”) amounted to $6,610 for the fiscal year ended October 31, 2010 (itemized as follows: John Hancock Classic Value Fund - $3,193 and John Hancock U.S. Global Leaders Growth Fund - $3,417) and $6,418 for the fiscal period ended October 31, 2009 (itemized as follows: John Hancock Classic Value Fund - $3,100 and John Hancock U.S. Global Leaders Growth Fund - $3,318). The nature of the services comprising the tax fees was the review of the registrant’s income tax returns and tax distribution requirements. These fees were billed to the registrant and were approved by the registrant’s audit committee. There were no tax fees billed to the control affiliates.
(d) All Other Fees
Other fees for the fiscal year ended October 31, 2010 amounted to $40 (itemized as follows: John Hancock Classic Value Fund - $20 and John Hancock U.S. Global Leaders Growth Fund - $20) and $110 for the fiscal period ended October 31, 2009 (itemized as follows: John Hancock Classic Value Fund - $55 and John Hancock U.S. Global Leaders Growth Fund - $55) billed to the registrant or to the control affiliates.
(e)(1) Audit Committee Pre-Approval Policies and Procedures:
The trust’s Audit Committee must pre-approve all audit and non-audit services provided by the independent registered public accounting firm (the “Auditor”) relating to the operations or financial reporting of the funds. Prior to the commencement of any audit or non-audit services to a fund,
the Audit Committee reviews the services to determine whether they are appropriate and permissible under applicable law.
The trust’s Audit Committee has adopted policies and procedures to, among other purposes, provide a framework for the Committee’s consideration of audit-related and non-audit services by the Auditor. The policies and procedures require that any audit-related and non-audit service provided by the Auditor and any non-audit service provided by the Auditor to a fund service provider that relates directly to the operations and financial reporting of a fund are subject to approval by the Audit Committee before such service is provided. Audit-related services provided by the Auditor that are expected to exceed $25,000 per instance/per fund are subject to specific pre-approval by the Audit Committee. Tax services provided by the Auditor that are expected to exceed $30,000 per instance/per fund are subject to specific pre-approval by the Audit Committee.
All audit services, as well as the audit-related and non-audit services that are expected to exceed the amounts stated above, must be approved in advance of provision of the service by formal resolution of the Audit Committee. At the regularly scheduled Audit Committee meetings, the Committee reviews a report summarizing the services, including fees, provided by the Auditor.
(e)(2) Services approved pursuant to paragraph (c)(7)(i)(C) of Rule 2-01 of Regulation S-X:
Audit-Related Fees, Tax Fees and All Other Fees:
There were no amounts that were approved by the Audit Committee pursuant to the de minimis exception under Rule 2-01 of Regulation S-X.
(f) According to the registrant’s principal accountant, for the fiscal period ended October 31, 2010, the percentage of hours spent on the audit of the registrant's financial statements for the most recent fiscal year that were attributed to work performed by persons who were not full-time, permanent employees of principal accountant was less than 50%.
(g) The aggregate non-audit fees billed by the registrant's accountant(s) for services rendered to the registrant and rendered to the registrant's control affiliates for each of the last two fiscal years of the registrant were $3,070,439 for the fiscal year ended October 31, 2010 and $8,204,071 for the fiscal period ended October 31, 2009.
(h) The audit committee of the registrant has considered the non-audit services provided by the registrant’s principal accountant(s) to the control affiliates and has determined that the services that were not pre-approved are compatible with maintaining the principal accountant(s)' independence.
ITEM 5. AUDIT COMMITTEE OF LISTED REGISTRANTS.
The registrant has a separately-designated standing audit committee comprised of independent trustees. The members of the audit committee are as follows:
Stanley Martin - Chairman
Deborah C. Jackson
Steven R. Pruchansky
ITEM 6. SCHEDULE OF INVESTMENTS.
(a) Not applicable.
(b) Not applicable.
ITEM 7. DISCLOSURE OF PROXY VOTING POLICIES AND PROCEDURES FOR CLOSED-END MANAGEMENT INVESTMENT COMPANIES.
Not applicable.
ITEM 8. PORTFOLIO MANAGERS OF CLOSED-END MANAGEMENT INVESTMENT COMPANIES.
Not applicable.
ITEM 9. PURCHASES OF EQUITY SECURITIES BY CLOSED-END MANAGEMENT INVESTMENT COMPANY AND AFFILIATED PURCHASERS.
Not applicable.
ITEM 10. SUBMISSION OF MATTERS TO A VOTE OF SECURITY HOLDERS.
There were no material changes to previously disclosed John Hancock Funds – Governance Committee Charter.
ITEM 11. CONTROLS AND PROCEDURES.
(a) Based upon their evaluation of the registrant's disclosure controls and procedures as conducted within 90 days of the filing date of this Form N-CSR, the registrant's principal executive officer and principal financial officer have concluded that those disclosure controls and procedures provide reasonable assurance that the material information required to be disclosed by the registrant on this report is recorded, processed, summarized and reported within the time periods specified in the Securities and Exchange Commission's rules and forms.
(b) There were no changes in the registrant's internal control over financial reporting that occurred during the registrant's most recent fiscal half-year (the registrant's second fiscal half-year in the case of an annual report) that have materially affected, or are reasonably likely to materially affect, the registrant's internal control over financial reporting.
ITEM 12. EXHIBITS.
(a)(1) Code of Ethics for Senior Financial Officers is attached.
(a)(2) Separate certifications for the registrant's principal executive officer and principal financial officer, as required by Section 302 of the Sarbanes-Oxley Act of 2002 and Rule 30a-2(a) under the Investment Company Act of 1940, are attached.
(b) Separate certifications for the registrant's principal executive officer and principal financial officer, as required by 18 U.S.C. Section 1350, as adopted pursuant to Section 906 of the Sarbanes-Oxley Act of 2002, and Rule 30a-2(b) under the Investment Company Act of 1940, are attached. The certifications furnished pursuant to this paragraph are not deemed to be "filed" for purposes of Section 18 of the Securities Exchange Act of 1934, or otherwise subject to the liability of that section. Such certifications are not deemed to be incorporated by reference into any filing under the Securities Act of 1933 or the Securities Exchange Act of 1934, except to the extent that the Registrant specifically incorporates them by reference.
(c)(1) Submission of Matters to a Vote of Security Holders is attached. See attached “John Hancock Funds – Governance Committee Charter”.
(c)(2) Contact person at the registrant.
| SIGNATURES |
Pursuant to the requirements of the Securities Exchange Act of 1934 and the Investment Company Act of 1940, the registrant has duly caused this report to be signed on its behalf by the undersigned, thereunto duly authorized.
John Hancock Capital Series
By: /s/ Keith F. Hartstein
Keith F. Hartstein
President and
Chief Executive Officer
Date: December 17, 2010
Pursuant to the requirements of the Securities Exchange Act of 1934 and the Investment Company Act of 1940, this report has been signed below by the following persons on behalf of the registrant and in the capacities and on the dates indicated.
By: /s/ Keith F. Hartstein
Keith F. Hartstein
President and
Chief Executive Officer
Date: December 17, 2010
By: /s/ Charles A. Rizzo
Charles A. Rizzo
Chief Financial Officer
Date: December 17, 2010