| UNITED STATES | |
| SECURITIES AND EXCHANGE COMMISSION | |
| Washington, D.C. 20549 | |
| FORM N-CSR | |
| CERTIFIED SHAREHOLDER REPORT OF REGISTERED | |
| MANAGEMENT INVESTMENT COMPANIES | |
| Investment Company Act file number 811-1677 | |
| John Hancock Capital Series | |
| (Exact name of registrant as specified in charter) | |
| 601 Congress Street, Boston, Massachusetts 02210 | |
| (Address of principal executive offices) (Zip code) | |
| Salvatore Schiavone | |
| Treasurer | |
| 601 Congress Street | |
| Boston, Massachusetts 02210 | |
| (Name and address of agent for service) | |
| Registrant's telephone number, including area code: 617-663-4497 | |
| Date of fiscal year end: | October 31 |
| Date of reporting period: | October 31, 2013 |
ITEM 1. REPORTS TO STOCKHOLDERS.
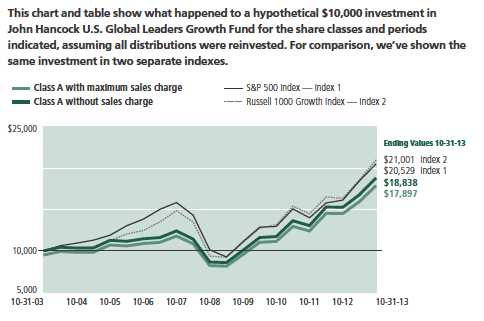
A look at performance
Total returns for the period ended October 31, 2013
| Average annual total returns (%) | Cumulative total returns (%) | ||||||
| with maximum sales charge | with maximum sales charge | ||||||
| 1-year | 5-year | 10-year | 1-year | 5-year | 10-year | ||
| Class A | 17.15 | 15.64 | 5.99 | 17.15 | 106.80 | 78.97 | |
| Class B | 17.37 | 15.74 | 5.90 | 17.37 | 107.66 | 77.45 | |
| Class C | 21.36 | 15.96 | 5.74 | 21.36 | 109.71 | 74.82 | |
| Class I1 | 23.70 | 17.32 | 6.99 | 23.70 | 122.23 | 96.62 | |
| Class R21,2 | 23.31 | 16.79 | 6.46 | 23.31 | 117.29 | 87.10 | |
| Class R61,2 | 23.83 | 17.32 | 6.97 | 23.83 | 122.26 | 96.22 | |
| Index 1† | 27.18 | 15.17 | 7.46 | 27.18 | 102.61 | 105.29 | |
| Index 2† | 28.30 | 17.51 | 7.70 | 28.30 | 124.08 | 110.01 | |
Performance figures assume all distributions have been reinvested. Figures reflect maximum sales charges on Class A shares of 5% and the applicable contingent deferred sales charge (CDSC) on Class B and Class C shares. The returns for Class C shares have been adjusted to reflect the elimination of the front-end sales charge effective 7-15-04. The Class B shares’ CDSC declines annually between years 1 to 6 according to the following schedule: 5%, 4%, 3%, 3%, 2%, 1%. No sales charge will be assessed after the sixth year. Class C shares held for less than one year are subject to a 1% CDSC. Sales charges are not applicable to Class I, Class R2, and Class R6 shares.
The expense ratios of the fund, both net (including any fee waivers or expense limitations) and gross (excluding any fee waivers or expense limitations), are set forth according to the most recent publicly available prospectuses for the fund and may differ from those disclosed in the Financial highlights tables in this report. The fee waivers and expense limitations are contractual at least until 2-28-14 for Class R6 shares. Had the fee waivers and expense limitations not been in place, gross expenses would apply. For all other classes, the net expenses equal the gross expenses. The expense ratios are as follows:
| Class A | Class B | Class C | Class I | Class R2 | Class R6 | |||||
| Net (%) | 1.30 | 2.05 | 2.05 | 0.96 | 1.38 | 0.85 | ||||
| Gross (%) | 1.30 | 2.05 | 2.05 | 0.96 | 1.38 | 0.88 |
The returns reflect past results and should not be considered indicative of future performance. The return and principal value of an investment will fluctuate so that shares, when redeemed, may be worth more or less than their original cost. Due to market volatility, the fund’s current performance may be higher or lower than the performance shown. For performance data current to the most recent month end, please call 800-225-5291 or visit the fund’s website at jhinvestments.com.
The performance table above and the chart on the next page do not reflect the deduction of taxes that a shareholder would pay on fund distributions or the redemption of fund shares. The fund’s performance results reflect any applicable fee waivers or expense reductions, without which the expenses would increase and results would have been less favorable.
† Index 1 is the S&P 500 Index; Index 2 is the Russell 1000 Growth Index.
See the following page for footnotes.
| 6 | U.S. Global Leaders Growth Fund | Annual report |
| With maximum | Without | ||||
| Start date | sales charge | sales charge | Index 1 | Index 2 | |
| Class B3 | 10-31-03 | $17,745 | $17,745 | $20,529 | $21,001 |
| Class C3 | 10-31-03 | 17,482 | 17,482 | 20,529 | 21,001 |
| Class I1 | 10-31-03 | 19,662 | 19,662 | 20,529 | 21,001 |
| Class R21 | 10-31-03 | 18,710 | 18,710 | 20,529 | 21,001 |
| Class R61 | 10-31-03 | 19,622 | 19,622 | 20,529 | 21,001 |
Performance of the classes will vary based on the difference in sales charges paid by shareholders investing in the different classes and the fee structure of those classes.
The Class C shares investment with maximum sales charge has been adjusted to reflect the elimination of the front-end sales charge, effective 7-15-04.
S&P 500 Index is an unmanaged index that includes 500 widely traded common stocks.
Russell 1000 Growth Index is an unmanaged index of companies in the Russell 1000 Index (the 1,000 largest U.S. publicly traded companies) with higher price-to-book ratios and higher forecasted growth values.
It is not possible to invest directly in an index. Index figures do not reflect expenses or sales charges, which would have resulted in lower values.
Footnotes related to performance pages
1 For certain types of investors, as described in the fund’s prospectuses.
2 Class R6 and Class R2 shares were first offered on 9-1-11 and 3-1-12, respectively. The returns prior to these dates are those of Class A shares that have been recalculated to apply the gross fees and expenses of Class R6 and Class R2 shares, as applicable.
3 The contingent deferred sales charge is not applicable.
| Annual report | U.S. Global Leaders Growth Fund | 7 |
Management’s discussion of
Fund performance
U.S. stocks recorded double-digit gains for the 12 months ended October 31, 2013. The United States has proven to be a bright spot in the global economy, despite the fact that its own economic recovery has been somewhat subdued. Historically, deep recessions have been followed by brisk economic recoveries. The exception has been those recoveries following large-scale global financial crises like the one experienced in 2007–2009, which tend to exhibit slower growth. Against that backdrop of slow, but steady, economic growth, there has been a modest recovery in the U.S. housing market, which in turn led to improvements in consumers’ household balance sheets. Due to the wealth effect of higher home valuations and appreciating equities, investors also have begun to increase their spending.
For the 12-month period ended October 31, 2013, John Hancock U.S. Global Leaders Growth Fund’s Class A shares rose 23.30%, excluding sales charges, trailing the 28.30% gain of its benchmark, the Russell 1000 Growth Index, as well as the 27.18% rise of the S&P 500 Index and the 29.40% advance of its peer group, the Morningstar, Inc. large growth fund category.† The fund’s relative performance lagged the benchmark and peer group mainly as a result of inopportune security selection, with its holdings in robotic healthcare devices maker Intuitive Surgical, Inc., global fast-food restaurant operator Yum! Brands, Inc., and Ambev (formerly Brazilian brewer Companhia de Bebidas das Americas) detracting the most from the fund’s performance versus its benchmark. The fund’s positions in Intuitive Surgical and Ambev were sold. Conversely, the fund recognized solid relative contributions from its underweight in consumer electronics giant Apple, Inc., whose share price lost value during the period, and its holding in coffee retailer Starbucks Corp., which delivered robust profit growth during the period. While Starbucks also was a top contributor to the fund’s absolute return, Apple’s loss during the period hurt absolute performance, in spite of its favorable impact relative to the benchmark.
This commentary reflects the views of the portfolio managers through the end of the period discussed in this report. As such, they are in no way guarantees of future events and are not intended to be used as investment advice or a recommendation regarding any specific security. They are also subject to change at any time as market and other conditions warrant.
Past performance is no guarantee of future results.
† Figures from Morningstar, Inc. include reinvested distributions and do not take into account sales charges. Actual load-adjusted performance is lower.
| 8 | U.S. Global Leaders Growth Fund | Annual report |
Your expenses
These examples are intended to help you understand your ongoing operating expenses of investing in the fund so you can compare these costs with the ongoing costs of investing in other mutual funds.
Understanding fund expenses
As a shareholder of the fund, you incur two types of costs:
▪ Transaction costs, which include sales charges (loads) on purchases or redemptions (varies by share class), minimum account fee charge, etc.
▪ Ongoing operating expenses, including management fees, distribution and service fees (if applicable) and other fund expenses.
We are going to present only your ongoing operating expenses here.
Actual expenses/actual returns
This example is intended to provide information about the fund’s actual ongoing operating expenses and is based on the fund’s actual return. It assumes an account value of $1,000.00 on May 1, 2013, with the same investment held until October 31, 2013.
| Account value | Ending value | Expenses paid during | |
| on 5-1-13 | on 10-31-13 | period ended 10-31-131 | |
| Class A | $1,000.00 | $1,121.60 | $6.47 |
| Class B | 1,000.00 | 1,117.40 | 10.46 |
| Class C | 1,000.00 | 1,117.30 | 10.46 |
| Class I | 1,000.00 | 1,123.50 | 4.92 |
| Class R2 | 1,000.00 | 1,121.20 | 7.06 |
| Class R6 | 1,000.00 | 1,123.90 | 4.50 |
Together with the value of your account, you may use this information to estimate the operating expenses that you paid over the period. Simply divide your account value at October 31, 2013, by $1,000.00, then multiply it by the “expenses paid” for your share class from the table above. For example, for an account value of $8,600.00, the operating expenses should be calculated as follows:
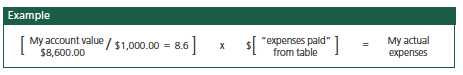
| Annual report | U.S. Global Leaders Growth Fund | 9 |
Your expenses
Hypothetical example for comparison purposes
This table allows you to compare the fund’s ongoing operating expenses with those of any other fund. It provides an example of the fund’s hypothetical account values and hypothetical expenses based on each class’s actual expense ratio and an assumed 5% annualized return before expenses (which is not the fund’s actual return). It assumes an account value of $1,000.00 on May 1, 2013, with the same investment held until October 31, 2013. Look in any other fund shareholder report to find its hypothetical example and you will be able to compare these expenses. Please remember that these hypothetical account values and expenses may not be used to estimate the actual ending account balance or expenses you paid for the period.
| Account value | Ending value | Expenses paid during | |
| on 5-1-13 | on 10-31-13 | period ended 10-31-131 | |
| Class A | $1,000.00 | $1,019.10 | $6.16 |
| Class B | 1,000.00 | 1,015.30 | 9.96 |
| Class C | 1,000.00 | 1,015.30 | 9.96 |
| Class I | 1,000.00 | 1,020.60 | 4.69 |
| Class R2 | 1,000.00 | 1,018.60 | 6.72 |
| Class R6 | 1,000.00 | 1,021.00 | 4.28 |
Remember, these examples do not include any transaction costs, therefore, these examples will not help you to determine the relative total costs of owning different funds. If transaction costs were included, your expenses would have been higher. See the prospectuses for details regarding transaction costs.
1 Expenses are equal to the fund’s annualized expense ratio of 1.21%, 1.96%, 1.96%, 0.92%, 1.32% and 0.84% for Class A, Class B, Class C, Class I, Class R2 and Class R6 shares, respectively, multiplied by the average account value over the period, multiplied by 184/365 (to reflect the one-half year period).
| 10 | U.S. Global Leaders Growth Fund | Annual report |
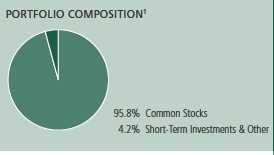
Portfolio summary
| Top 10 Holdings (41.2% of Net Assets on 10-31-13)1,2 | ||||
| eBay, Inc. | 4.6% | Lowe’s Companies, Inc. | 4.1% | |
| Monsanto Company | 4.3% | Fastenal Company | 4.0% | |
| Google, Inc., Class A | 4.3% | Visa, Inc., Class A | 3.9% | |
| Schlumberger, Ltd. | 4.2% | QUALCOMM, Inc. | 3.9% | |
| Ecolab, Inc. | 4.1% | Automatic Data Processing, Inc. | 3.8% | |
| Sector Composition1,3 | ||||
| Information Technology | 31.1% | Financials | 6.7% | |
| Consumer Discretionary | 17.7% | Industrials | 4.0% | |
| Health Care | 14.0% | Consumer Staples | 3.4% | |
| Materials | 11.3% | Short-Term Investments & Other | 4.2% | |
| Energy | 7.6% | |||
1 As a percentage of net assets on 10-31-13.
2 Cash and cash equivalents not included.
3 Growth stocks may be more susceptible to earnings disappointments. Large company stocks could fall out of favor, and foreign investing, especially in emerging markets, has additional risks, such as currency and market volatility and political and social instability. A portfolio concentrated in one sector or that holds a limited number of securities may fluctuate more than a diversified portfolio. Sector investing is subject to greater risks than the market as a whole. Because the fund may focus on particular sectors of the economy, its performance may depend on the performance of those sectors and investments focused in one sector may fluctuate more widely than investments diversified across sectors. Please see fund’s prospectuses for additional risks.
| Annual report | U.S. Global Leaders Growth Fund | 11 |
Fund’s investments
As of 10-31-13
| Shares | Value | |
| Common Stocks 95.8% | $1,152,127,385 | |
| (Cost $814,867,922) | ||
| Consumer Discretionary 17.7% | 212,515,745 | |
| Hotels, Restaurants & Leisure 9.8% | ||
| Starbucks Corp. | 518,200 | 42,000,110 |
| Starwood Hotels & Resorts Worldwide, Inc. | 497,300 | 36,611,226 |
| Yum! Brands, Inc. | 582,060 | 39,358,896 |
| Media 2.0% | ||
| The Walt Disney Company | 347,420 | 23,829,538 |
| Specialty Retail 5.9% | ||
| Lowe’s Companies, Inc. | 997,890 | 49,674,964 |
| Tiffany & Company | 265,770 | 21,041,011 |
| Consumer Staples 3.4% | 41,153,522 | |
| Household Products 3.4% | ||
| Colgate-Palmolive Company | 635,772 | 41,153,522 |
| Energy 7.6% | 92,025,648 | |
| Energy Equipment & Services 7.6% | ||
| National Oilwell Varco, Inc. | 508,800 | 41,304,384 |
| Schlumberger, Ltd. | 541,200 | 50,721,264 |
| Financials 6.7% | 80,193,091 | |
| Capital Markets 3.7% | ||
| State Street Corp. | 633,440 | 44,385,141 |
| Consumer Finance 3.0% | ||
| American Express Company | 437,750 | 35,807,950 |
| Health Care 14.0% | 167,867,037 | |
| Biotechnology 1.8% | ||
| Regeneron Pharmaceuticals, Inc. (I) | 75,220 | 21,633,272 |
| Health Care Equipment & Supplies 1.5% | ||
| IDEXX Laboratories, Inc. (I)(L) | 166,020 | 17,906,917 |
| Health Care Technology 3.2% | ||
| Cerner Corp. (I) | 676,540 | 37,906,536 |
| Pharmaceuticals 7.5% | ||
| Novo Nordisk A/S, ADR | 129,420 | 21,570,431 |
| Perrigo Company (L) | 274,100 | 37,795,649 |
| Sanofi, ADR | 580,670 | 31,054,232 |
| 12 | U.S. Global Leaders Growth Fund | Annual report | See notes to financial statements |
| Shares | Value | ||
| Industrials 4.0% | $48,037,080 | ||
| Trading Companies & Distributors 4.0% | |||
| Fastenal Company (L) | 964,600 | 48,037,080 | |
| Information Technology 31.1% | 374,702,371 | ||
| Communications Equipment 3.9% | |||
| QUALCOMM, Inc. | 668,660 | 46,451,810 | |
| Computers & Peripherals 3.1% | |||
| Apple, Inc. | 72,030 | 37,624,871 | |
| Internet Software & Services 10.5% | |||
| eBay, Inc. (I) | 1,051,660 | 55,432,999 | |
| Google, Inc., Class A (I) | 49,840 | 51,364,107 | |
| LinkedIn Corp., Class A (I) | 88,900 | 19,884,263 | |
| IT Services 7.7% | |||
| Automatic Data Processing, Inc. | 601,890 | 45,123,693 | |
| Visa, Inc., Class A | 241,300 | 47,456,471 | |
| Software 5.9% | |||
| Salesforce.com, Inc. (I)(L) | 681,830 | 36,382,449 | |
| SAP AG, ADR (L) | 446,480 | 34,981,708 | |
| Materials 11.3% | 135,632,891 | ||
| Chemicals 11.3% | |||
| Ecolab, Inc. | 470,290 | 49,850,740 | |
| Monsanto Company | 491,400 | 51,538,032 | |
| Praxair, Inc. | 274,590 | 34,244,119 | |
| Yield (%) | Shares | Value | |
| Securities Lending Collateral 10.4% | $125,482,094 | ||
| (Cost $125,471,488) | |||
| John Hancock Collateral Investment Trust (W) | 0.1934 (Y) | 12,537,928 | 125,482,094 |
| Par value | Value | ||
| Short-Term Investments 4.5% | $54,355,662 | ||
| (Cost $54,355,662) | |||
| Money Market Funds 4.5% | 54,355,662 | ||
| State Street Institutional U.S. Government | |||
| Money Market Fund | 0.0000 (Y) | $54,355,662 | 54,355,662 |
| Total investments (Cost $994,695,072)† 110.7% | $1,331,965,141 | ||
| Other assets and liabilities, net (10.7%) | ($128,939,042) | ||
| Total net assets 100.0% | $1,203,026,099 | ||
The percentage shown for each investment category is the total value of the category as a percentage of the net assets of the fund.
| See notes to financial statements | Annual report | U.S. Global Leaders Growth Fund | 13 |
Notes to Schedule of Investments
ADR American Depositary Receipts
(I) Non-income producing security.
(L) A portion of this security is on loan as of 10-31-13.
(W) Investment is an affiliate of the fund, the advisor and/or subadvisor. This investment represents collateral received for securities lending.
(Y) The rate shown is the annualized seven-day yield as of 10-31-13.
† At 10-31-13, the aggregate cost of investment securities for federal income tax purposes was $1,000,790,307. Net unrealized appreciation aggregated $331,174,834, of which $331,328,090 related to appreciated investment securities and $153,256 related to depreciated investment securities.
| 14 | U.S. Global Leaders Growth Fund | Annual report | See notes to financial statements |
F I N A N C I A L S T A T E M E N T S
Financial statements
Statement of assets and liabilities 10-31-13
This Statement of assets and liabilities is the fund’s balance sheet. It shows the value of what the fund owns, is due and owes. You’ll also find the net asset value and the maximum offering price per share.
| Assets | |
| Investments in unaffiliated issuers, at value (Cost $869,223,584) including | |
| $122,889,770 of securities loaned | $1,206,483,047 |
| Investments in affiliated issuers, at value (Cost $125,471,488) | 125,482,094 |
| Total investments, at value (Cost $994,695,072) | 1,331,965,141 |
| Receivable for fund shares sold | 3,947,270 |
| Dividends and interest receivable | 1,026,776 |
| Receivable for securities lending income | 29,992 |
| Other receivables and prepaid expenses | 89,924 |
| Total assets | 1,337,059,103 |
| Liabilities | |
| Payable for investments purchased | 6,013,178 |
| Payable for fund shares repurchased | 1,196,076 |
| Payable upon return of securities loaned | 125,478,920 |
| Payable to affiliates | |
| Accounting and legal services fees | 36,196 |
| Transfer agent fees | 132,565 |
| Distribution and service fees | 289,262 |
| Trustees’ fees | 34,018 |
| Investment management fees | 732,127 |
| Other liabilities and accrued expenses | 120,662 |
| Total liabilities | 134,033,004 |
| Net assets | $1,203,026,099 |
| Net assets consist of | |
| Paid-in capital | $836,511,796 |
| Undistributed net investment income | 746,625 |
| Accumulated net realized gain (loss) on investments | 28,497,609 |
| Net unrealized appreciation (depreciation) on investments | 337,270,069 |
| Net assets | $1,203,026,099 |
| See notes to financial statements | Annual report | U.S. Global Leaders Growth Fund | 15 |
F I N A N C I A L S T A T E M E N T S
Statement of assets and liabilities (continued)
| Net asset value per share | |
| Based on net asset values and shares outstanding — the fund has an | |
| unlimited number of shares authorized with no par value | |
| Class A ($697,222,010 ÷ 16,502,368 shares)1 | $42.25 |
| Class B ($32,581,229 ÷ 842,986 shares)1 | $38.65 |
| Class C ($130,486,015 ÷ 3,374,897 shares)1 | $38.66 |
| Class I ($307,412,012 ÷ 6,968,420 shares) | $44.12 |
| Class R2 ($31,502,841 ÷ 717,074 shares) | $43.93 |
| Class R6 ($3,821,992 ÷ 86,498 shares) | $44.19 |
| Maximum offering price per share | |
| Class A (net asset value per share ÷ 95%)2 | $44.47 |
1 Redemption price is equal to net asset value less any applicable contingent deferred sales charge.
2 On single retail sales of less than $50,000. On sales of $50,000 or more and on group sales the offering price is reduced.
| 16 | U.S. Global Leaders Growth Fund | Annual report | See notes to financial statements |
F I N A N C I A L S T A T E M E N T S
Statement of operations For the year ended 10-31-13
This Statement of operations summarizes the fund’s investment income earned and expenses incurred in operating the fund. It also shows net gains (losses) for the period stated.
| Investment income | |
| Dividends | $12,653,068 |
| Securities lending | 191,250 |
| Interest | 3,306 |
| Less foreign taxes withheld | (199,542) |
| Total investment income | 12,648,082 |
| Expenses | |
| Investment management fees | 7,055,466 |
| Distribution and service fees | 2,809,963 |
| Accounting and legal services fees | 189,686 |
| Transfer agent fees | 1,403,328 |
| Trustees’ fees | 36,546 |
| State registration fees | 151,166 |
| Printing and postage | 94,528 |
| Professional fees | 69,885 |
| Custodian fees | 100,880 |
| Registration and filing fees | 45,898 |
| Other | 22,620 |
| Total expenses | 11,979,966 |
| Less expense reductions | (25,371) |
| Net expenses | 11,954,595 |
| Net investment income | 693,487 |
| Realized and unrealized gain (loss) | |
| Net realized gain (loss) on | |
| Investments in unaffiliated issuers | 35,324,993 |
| Investments in affiliated issuers | (198) |
| 35,324,795 | |
| Change in net unrealized appreciation (depreciation) of | |
| Investments in unaffiliated issuers | 165,132,079 |
| Investments in affiliated issuers | 4,986 |
| 165,137,065 | |
| Net realized and unrealized gain | 200,461,860 |
| Increase in net assets from operations | $201,155,347 |
| See notes to financial statements | Annual report | U.S. Global Leaders Growth Fund | 17 |
F I N A N C I A L S T A T E M E N T S
Statements of changes in net assets
These Statements of changes in net assets show how the value of the fund’s net assets has changed during the last two periods. The difference reflects earnings less expenses, any investment gains and losses, distributions, if any, paid to shareholders and the net of fund share transactions.
| Year | Year | |
| ended | ended | |
| 10-31-13 | 10-31-12 | |
| Increase (decrease) in net assets | ||
| From operations | ||
| Net investment income (loss) | $693,487 | ($931,333) |
| Net realized gain | 35,324,795 | 16,977,524 |
| Change in net unrealized appreciation | 165,137,065 | 62,236,198 |
| Increase in net assets resulting from operations | 201,155,347 | 78,282,389 |
| Distributions to shareholders | ||
| From net realized gain | ||
| Class A | (9,612,480) | (9,343,569) |
| Class B | (711,742) | (894,644) |
| Class C | (2,051,288) | (1,973,172) |
| Class I | (4,015,442) | (1,730,469) |
| Class R2 | (6,742) | — |
| Class R6 | (47,990) | (3,185) |
| Total distributions | (16,445,684) | (13,945,039) |
| From fund share transactions | 324,317,297 | 207,578,778 |
| Total increase | 509,026,960 | 271,916,128 |
| Net assets | ||
| Beginning of year | 693,999,139 | 422,083,011 |
| End of year | $1,203,026,099 | $693,999,139 |
| Undistributed (accumulated distributions in excess of) net | ||
| investment income | $746,625 | ($31,364) |
| 18 | U.S. Global Leaders Growth Fund | Annual report | See notes to financial statements |
Financial highlights
The Financial highlights show how the fund’s net asset value for a share has changed during the period.
| CLASS A SHARES Period ended | 10-31-13 | 10-31-12 | 10-31-11 | 10-31-10 | 10-31-09 |
| Per share operating performance | |||||
| Net asset value, beginning of period | $35.04 | $30.97 | $27.83 | $23.89 | $20.87 |
| Net investment income (loss)1 | 0.04 | (0.03) | —2 | —2 | 0.02 |
| Net realized and unrealized gain on investments | 7.96 | 5.08 | 3.14 | 3.96 | 3.30 |
| Total from investment operations | 8.00 | 5.05 | 3.14 | 3.96 | 3.32 |
| Less distributions | |||||
| From net investment income | — | — | — | (0.02) | (0.01) |
| From net realized gain | (0.79) | (0.98) | — | — | (0.29) |
| Total distributions | (0.79) | (0.98) | — | (0.02) | (0.30) |
| Net asset value, end of period | $42.25 | $35.04 | $30.97 | $27.83 | $23.89 |
| Total return (%)3,4 | 23.30 | 16.96 | 11.28 | 16.58 | 16.36 |
| Ratios and supplemental data | |||||
| Net assets, end of period (in millions) | $697 | $413 | $282 | $264 | $480 |
| Ratios (as a percentage of average net assets): | |||||
| Expenses before reductions | 1.23 | 1.30 | 1.26 | 1.50 | 1.815 |
| Expenses net of fee waivers | 1.23 | 1.30 | 1.26 | 1.30 | 1.345 |
| Expenses net of fee waivers and credits | 1.23 | 1.30 | 1.26 | 1.30 | 1.335 |
| Net investment income (loss) | 0.10 | (0.10) | (0.01) | 0.01 | 0.10 |
| Portfolio turnover (%) | 30 | 30 | 50 | 33 | 37 |
1 Based on the average daily shares outstanding.
2 Less than $0.005 per share.
3 Does not reflect the effect of sales charges, if any.
4 Total returns would have been lower had certain expenses not been reduced during the applicable periods shown.
5 Includes the impact of proxy expenses, which amounted to 0.03% of average net assets.
| CLASS B SHARES Period ended | 10-31-13 | 10-31-12 | 10-31-11 | 10-31-10 | 10-31-09 |
| Per share operating performance | |||||
| Net asset value, beginning of period | $32.36 | $28.89 | $26.16 | $22.60 | $19.90 |
| Net investment loss1 | (0.22) | (0.26) | (0.21) | (0.19) | (0.13) |
| Net realized and unrealized gain on investments | 7.30 | 4.71 | 2.94 | 3.75 | 3.12 |
| Total from investment operations | 7.08 | 4.45 | 2.73 | 3.56 | 2.99 |
| Less distributions | |||||
| From net realized gain | (0.79) | (0.98) | — | — | (0.29) |
| Net asset value, end of period | $38.65 | $32.36 | $28.89 | $26.16 | $22.60 |
| Total return (%)2,3 | 22.37 | 16.07 | 10.44 | 15.75 | 15.47 |
| Ratios and supplemental data | |||||
| Net assets, end of period (in millions) | $33 | $30 | $27 | $39 | $47 |
| Ratios (as a percentage of average net assets): | |||||
| Expenses before reductions | 1.99 | 2.05 | 2.01 | 2.24 | 2.504 |
| Expenses net of fee waivers | 1.98 | 2.05 | 2.00 | 2.05 | 2.084 |
| Expenses net of fee waivers and credits | 1.98 | 2.05 | 2.00 | 2.05 | 2.074 |
| Net investment loss | (0.64) | (0.85) | (0.75) | (0.75) | (0.65) |
| Portfolio turnover (%) | 30 | 30 | 50 | 33 | 37 |
1 Based on the average daily shares outstanding.
2 Does not reflect the effect of sales charges, if any.
3 Total returns would have been lower had certain expenses not been reduced during the applicable periods shown.
4 Includes the impact of proxy expenses, which amounted to 0.03% of average net assets.
| See notes to financial statements | Annual report | U.S. Global Leaders Growth Fund | 19 |
| CLASS C SHARES Period ended | 10-31-13 | 10-31-12 | 10-31-11 | 10-31-10 | 10-31-09 |
| Per share operating performance | |||||
| Net asset value, beginning of period | $32.37 | $28.90 | $26.16 | $22.61 | $19.90 |
| Net investment loss1 | (0.22) | (0.26) | (0.21) | (0.19) | (0.12) |
| Net realized and unrealized gain on investments | 7.30 | 4.71 | 2.95 | 3.74 | 3.12 |
| Total from investment operations | 7.08 | 4.45 | 2.74 | 3.55 | 3.00 |
| Less distributions | |||||
| From net realized gain | (0.79) | (0.98) | — | — | (0.29) |
| Net asset value, end of period | $38.66 | $32.37 | $28.90 | $26.16 | $22.61 |
| Total return (%)2,3 | 22.36 | 16.07 | 10.47 | 15.70 | 15.53 |
| Ratios and supplemental data | |||||
| Net assets, end of period (in millions) | $130 | $81 | $58 | $60 | $60 |
| Ratios (as a percentage of average net assets): | |||||
| Expenses before reductions | 1.98 | 2.05 | 2.01 | 2.23 | 2.514 |
| Expenses net of fee waivers | 1.98 | 2.05 | 2.01 | 2.05 | 2.084 |
| Expenses net of fee waivers and credits | 1.98 | 2.05 | 2.01 | 2.05 | 2.074 |
| Net investment loss | (0.65) | (0.85) | (0.75) | (0.76) | (0.66) |
| Portfolio turnover (%) | 30 | 30 | 50 | 33 | 37 |
1 Based on the average daily shares outstanding.
2 Does not reflect the effect of sales charges, if any.
3 Total returns would have been lower had certain expenses not been reduced during the applicable periods shown.
4 Includes the impact of proxy expenses, which amounted to 0.03% of average net assets.
| CLASS I SHARES Period ended | 10-31-13 | 10-31-12 | 10-31-11 | 10-31-10 | 10-31-09 |
| Per share operating performance | |||||
| Net asset value, beginning of period | $36.44 | $32.06 | $28.69 | $24.55 | $21.37 |
| Net investment income1 | 0.16 | 0.08 | 0.12 | 0.11 | 0.13 |
| Net realized and unrealized gain on investments | 8.31 | 5.28 | 3.25 | 4.10 | 3.38 |
| Total from investment operations | 8.47 | 5.36 | 3.37 | 4.21 | 3.51 |
| Less distributions | |||||
| From net investment income | — | — | — | (0.07) | (0.04) |
| From net realized gain | (0.79) | (0.98) | — | — | (0.29) |
| Total distributions | (0.79) | (0.98) | — | (0.07) | (0.33) |
| Net asset value, end of period | $44.12 | $36.44 | $32.06 | $28.69 | $24.55 |
| Total return (%)2 | 23.70 | 17.36 | 11.75 | 17.15 | 16.94 |
| Ratios and supplemental data | |||||
| Net assets, end of period (in millions) | $307 | $169 | $55 | $37 | $26 |
| Ratios (as a percentage of average net assets): | |||||
| Expenses before reductions | 0.93 | 0.96 | 0.90 | 0.93 | 0.963 |
| Expenses net of fee waivers | 0.93 | 0.94 | 0.85 | 0.85 | 0.843 |
| Expenses net of fee waivers and credits | 0.93 | 0.94 | 0.85 | 0.85 | 0.843 |
| Net investment income | 0.41 | 0.24 | 0.39 | 0.43 | 0.60 |
| Portfolio turnover (%) | 30 | 30 | 50 | 33 | 37 |
1 Based on the average daily shares outstanding.
2 Total returns would have been lower had certain expenses not been reduced during the applicable periods shown.
3 Includes the impact of proxy expenses, which amounted to 0.03% of average net assets.
| 20 | U.S. Global Leaders Growth Fund | Annual report | See notes to financial statements |
| CLASS R2 SHARES Period ended | 10-31-13 | 10-31-121 | |||
| Per share operating performance | |||||
| Net asset value, beginning of period | $36.40 | $34.46 | |||
| Net investment income (loss)2 | (0.04) | 0.02 | |||
| Net realized and unrealized gain on investments | 8.36 | 1.92 | |||
| Total from investment operations | 8.32 | 1.94 | |||
| Less distributions | |||||
| From net realized gain | (0.79) | — | |||
| Net asset value, end of period | $43.93 | $36.40 | |||
| Total return (%)3 | 23.31 | 5.634 | |||
| Ratios and supplemental data | |||||
| Net assets, end of period (in millions) | $32 | —5 | |||
| Ratios (as a percentage of average net assets): | |||||
| Expenses before reductions | 1.32 | 1.136 | |||
| Expenses net of fee waivers | 1.31 | 1.136 | |||
| Net investment income (loss) | (0.09) | 0.086 | |||
| Portfolio turnover (%) | 30 | 307 | |||
1 The inception date for Class R2 shares is 3-1-12.
2 Based on the average daily shares outstanding.
3 Total returns would have been lower had certain expenses not been reduced during the applicable periods shown.
4 Not annualized.
5 Less than $500,000.
6 Annualized.
7 Portfolio turnover is shown for the period from 11-1-11 to 10-31-12.
| CLASS R6 SHARES Period ended | 10-31-13 | 10-31-12 | 10-31-111 | ||
| Per share operating performance | |||||
| Net asset value, beginning of period | $36.46 | $32.06 | $30.81 | ||
| Net investment income2 | 0.18 | 0.11 | 0.03 | ||
| Net realized and unrealized gain on investments | 8.34 | 5.27 | 1.22 | ||
| Total from investment operations | 8.52 | 5.38 | 1.25 | ||
| Less distributions | |||||
| From net realized gain | (0.79) | (0.98) | — | ||
| Net asset value, end of period | $44.19 | $36.46 | $32.06 | ||
| Total return (%)3 | 23.83 | 17.42 | 4.064 | ||
| Ratios and supplemental data | |||||
| Net assets, end of period (in millions) | $4 | —5 | —5 | ||
| Ratios (as a percentage of average net assets): | |||||
| Expenses before reductions | 0.84 | 0.88 | 0.886 | ||
| Expenses net of fee waivers | 0.84 | 0.85 | 0.856 | ||
| Net investment income | 0.47 | 0.30 | 0.666 | ||
| Portfolio turnover (%) | 30 | 30 | 507 | ||
1 The inception date for Class R6 shares is 9-1-11.
2 Based on the average daily shares outstanding.
3 Total returns would have been lower had certain expenses not been reduced during the applicable periods shown.
4 Not annualized.
5 Less than $500,000.
6 Annualized.
7 Portfolio turnover is shown for the period from 11-1-10 to 10-31-11.
| See notes to financial statements | Annual report | U.S. Global Leaders Growth Fund | 21 |
Notes to financial statements
Note 1 — Organization
John Hancock U.S. Global Leaders Growth Fund (the fund) is a series of John Hancock Capital Series (the Trust), an open-end management investment company organized as a Massachusetts business trust and registered under the Investment Company Act of 1940, as amended (the 1940 Act). The investment objective of the fund is to seek long-term growth of capital.
The fund may offer multiple classes of shares. The shares currently offered are detailed in the Statement of assets and liabilities. Class A and Class C shares are offered to all investors. Class B shares are closed to new investors. Class I shares are offered to institutions and certain investors. Class R2 shares are available only to certain retirement plans. Class R6 shares are available only to certain retirement plans, institutions and other investors. Shareholders of each class have exclusive voting rights to matters that affect that class. The distribution and service fees, if any, and transfer agent fees for each class may differ. Class B shares convert to Class A shares eight years after purchase.
Note 2 — Significant accounting policies
The financial statements have been prepared in conformity with accounting principles generally accepted in the United States of America, which require management to make certain estimates and assumptions as of the date of the financial statements. Actual results could differ from those estimates and those differences could be significant. Events or transactions occurring after the end of the fiscal period through the date that the financial statements were issued have been evaluated in the preparation of the financial statements. The following summarizes the significant accounting policies of the fund:
Security valuation. Investments are stated at value as of the close of regular trading on the New York Stock Exchange (NYSE), normally at 4:00 P.M., Eastern Time. In order to value the securities, the fund uses the following valuation techniques: Equity securities held by the fund are valued at the last sale price or official closing price on the principal securities exchange on which they trade. In the event there were no sales during the day or closing prices are not available, the securities are valued using the last quoted bid or evaluated price. Investments by the fund in open-end mutual funds, including John Hancock Collateral Investment Trust (JHCIT), are valued at their respective net asset values each business day. Certain short-term securities with maturities of 60 days or less at the time of purchase are valued at amortized cost. Other portfolio securities and assets, for which reliable market quotations are not readily available, are valued at fair value as determined in good faith by the fund’s Pricing Committee following procedures established by the Board of Trustees. The frequency with which these fair valuation procedures are used cannot be predicted and fair value of securities may differ significantly from the value that would have been used had a ready market for such securities existed.
The fund uses a three-tier hierarchy to prioritize the pricing assumptions, referred to as inputs, used in valuation techniques to measure fair value. Level 1 includes securities valued using quoted prices in active markets for identical securities. Level 2 includes securities valued using other significant observable inputs. Observable inputs may include quoted prices for similar securities, interest rates, prepayment speeds and credit risk. Prices for securities valued using these inputs are received from independent pricing vendors and brokers and are based on an evaluation of the inputs described. Level 3 includes securities valued using significant unobservable inputs when market prices are not readily available or reliable, including the fund’s own assumptions in determining the fair value
| 22 | U.S. Global Leaders Growth Fund | Annual report |
of investments. Factors used in determining value may include market or issuer specific events or trends, changes in interest rates and credit quality. The inputs or methodology used for valuing securities are not necessarily an indication of the risks associated with investing in those securities. Changes in valuation techniques may result in transfers into or out of an assigned level within the disclosure hierarchy.
As of October 31, 2013, all investments are categorized as Level 1 under the hierarchy described above.
Security transactions and related investment income. Investment security transactions are accounted for on a trade date plus one basis for daily net asset value calculations. However, for financial reporting purposes, investment transactions are reported on trade date. Interest income is accrued as earned. Interest income includes coupon interest and amortization/accretion of premiums/discounts on debt securities. Dividend income is recorded on the ex-date, except for dividends of foreign securities where the dividend may not be known until after the ex-date. In those cases, dividend income, net of withholding taxes, is recorded when the fund becomes aware of the dividends. Foreign taxes are provided for based on the fund’s understanding of the tax rules and rates that exist in the foreign markets in which it invests. Gains and losses on securities sold are determined on the basis of identified cost and may include proceeds from litigation.
Securities lending. The fund may lend its securities to earn additional income. The fund receives cash collateral from the borrower in an amount not less than the market value of the loaned securities. The fund will invest its collateral in JHCIT, an affiliate of the portfolio, which has a floating net asset value (NAV) and is registered with the Securities and Exchange Commission as an investment company. JHCIT invests cash received as collateral as part of the securities lending program in short-term money market investments. The fund will receive the benefit of any gains and bear any losses generated by JHCIT with respect to the cash collateral.
If a borrower fails to return loaned securities when due, then the lending agent is responsible to and indemnifies the fund for the lent securities. The lending agent uses the collateral received from the borrower to purchase replacement securities of the same issue, type, class and series of the loaned securities. If the value of the collateral is less than the purchase cost of replacement securities, the lending agent is responsible for satisfying the shortfall but only to the extent that the shortfall is not due to any decrease in the value of JHCIT.
Although the risk of the loss of the securities lent is mitigated by receiving collateral from the borrower and through lending agent indemnification, the fund could experience a delay in recovering its securities or could experience a lower than expected return if the borrower fails to return the securities on a timely basis. The fund may receive compensation for lending its securities by retaining a portion of the return on the investment of the collateral and compensation from fees earned from borrowers of the securities. Net income received from JHCIT is a component of securities lending income as recorded on the Statement of operations.
Obligations to repay collateral received by the fund is shown on the Statement of assets and liabilities as Payable upon return of securities loaned.
Foreign taxes. The fund may be subject to withholding tax on income and/or capital gains or repatriation taxes imposed by certain countries in which the fund invests. Taxes are accrued based upon investment income, realized gains or unrealized appreciation.
Line of credit. The fund may borrow from banks for temporary or emergency purposes, including meeting redemption requests that otherwise might require the untimely sale of securities. Pursuant to the fund’s custodian agreement, the custodian may loan money to the fund to make properly authorized payments. The fund is obligated to repay the custodian for any overdraft, including any
| Annual report | U.S. Global Leaders Growth Fund | 23 |
related costs or expenses. The custodian may have a lien, security interest or security entitlement in any fund property that is not otherwise segregated or pledged, to the maximum extent permitted by law, to the extent of any overdraft.
In addition, the fund and other affiliated funds have entered into an agreement with Citibank N.A. that enables them to potentially participate in a $300 million unsecured committed line of credit. A commitment fee, payable at the end of each calendar quarter, based on the average daily unused portion of the line of credit, is charged to each participating fund on a pro rata basis and is reflected in other expenses on the Statement of operations. Prior to March 27, 2013, the fund participated in a $100 million unsecured line of credit, also with Citibank N.A., with terms otherwise similar to the existing agreement. Commitment fees for the year ended October 31, 2013 were $1,233. For the year ended October 31, 2013, the fund had no borrowings under either line of credit.
Expenses. Within the John Hancock funds complex, expenses that are directly attributable to an individual fund are allocated to such fund. Expenses that are not readily attributable to a specific fund are allocated among all funds in an equitable manner, taking into consideration, among other things, the nature and type of expense and the fund’s relative net assets. Expense estimates are accrued in the period to which they relate and adjustments are made when actual amounts are known.
Class allocations. Income, common expenses and realized and unrealized gains (losses) are determined at the fund level and allocated daily to each class of shares based on the net assets of the class. Class-specific expenses, such as distribution and service fees, if any, and transfer agent fees, are calculated daily for each class, based on the net asset value of the class and the applicable specific expense rates.
Federal income taxes. The fund intends to continue to qualify as a regulated investment company by complying with the applicable provisions of the Internal Revenue Code and will not be subject to federal income tax on taxable income that is distributed to shareholders. Therefore, no federal income tax provision is required.
As of October 31, 2013, the fund had no uncertain tax positions that would require financial statement recognition, derecognition or disclosure. The fund’s federal tax returns are subject to examination by the Internal Revenue Service for a period of three years.
Distribution of income and gains. Distributions to shareholders from net investment income and net realized gains, if any, are recorded on the ex-date. The fund generally declares and pays dividends and capital gain distributions, if any, annually. The tax character of distributions for the years ended October 31, 2013 and 2012 was as follows:
| OCTOBER 31, 2013 | OCTOBER 31, 2012 | ||||
| Ordinary Income | $6,928,919 | — | |||
| Long-Term Capital Gain | 9,516,765 | $13,945,039 | |||
| Total | $16,445,684 | $13,945,039 | |||
Distributions paid by the fund with respect to each class of shares are calculated in the same manner, at the same time and in the same amount, except for the effect of class level expenses that may be applied differently to each class. As of October 31, 2013, the components of distributable earnings on a tax basis consisted of $761,925 of undistributed ordinary income and $34,592,844 of undistributed long-term capital gains.
Such distributions and distributable earnings, on a tax basis, are determined in conformity with income tax regulations, which may differ from accounting principles generally accepted in the United States of America. Material distributions in excess of tax basis earnings and profits, if any, are reported in the fund’s financial statements as a return of capital.
| 24 | U.S. Global Leaders Growth Fund | Annual report |
Capital accounts within the financial statements are adjusted for permanent book-tax differences. These adjustments have no impact on net assets or the results of operations. Temporary book-tax differences, if any, will reverse in a subsequent period. Book-tax differences are primarily attributable to wash sale loss deferrals.
Note 3 — Guarantees and indemnifications
Under the Trust’s organizational documents, its Officers and Trustees are indemnified against certain liabilities arising out of the performance of their duties to the Trust, including the fund. Additionally, in the normal course of business, the fund enters into contracts with service providers that contain general indemnification clauses. The fund’s maximum exposure under these arrangements is unknown, as this would involve future claims that may be made against the fund that have not yet occurred. The risk of material loss from such claims is considered remote.
Note 4 — Fees and transactions with affiliates
John Hancock Advisers, LLC (the Advisor) serves as investment advisor for the fund. John Hancock Funds, LLC (the Distributor), an affiliate of the Advisor, serves as principal underwriter of the fund. The Advisor and the Distributor are indirect, wholly owned subsidiaries of Manulife Financial Corporation (MFC).
Management fee. The fund has an investment management agreement with the Advisor under which the fund pays a monthly management fee to the Advisor equivalent, on an annual basis, to the sum of: (a) 0.75% of the first $500,000,000 of the fund’s average daily net assets; (b) 0.73% of the next $500,000,000 of the fund’s average daily net assets; (c) 0.71% of the next $1,000,000,000 of the fund’s average daily net assets; (d) 0.70% of the next $3,000,000,000 of the fund’s average daily net assets; and (e) 0.65% of the fund’s average daily net assets in excess of $5,000,000,000. Prior to June 1, 2013, the fund had an investment management agreement with the Advisor under which the fund paid a monthly management fee to the Advisor equivalent, on an annual basis, to the sum of: (a) 0.75% of the first $2,000,000,000 of the fund’s average daily net assets; (b) 0.70% of the next $3,000,000,000 of the fund’s average daily net assets; and (c) 0.65% of the fund’s average daily net assets in excess of $5,000,000,000. The Advisor has a subadvisory agreement with Sustainable Growth Advisers, LP. The fund is not responsible for payment of the subadvisory fees.
Effective June 1, 2013, the Advisor has contractually agreed to waive a portion of its management fee and/or reimburse expenses for certain funds of the John Hancock funds complex, including the fund (the participating portfolios). The waiver equals, on an annualized basis, 0.01% of that portion of the aggregate net assets of all the participating portfolios that exceeds $75 billion but is less than or equal to $125 billion; 0.0125% of that portion of the aggregate net assets of all the participating portfolios that exceeds $125 billion but is less than or equal to $150 billion; and 0.015% of that portion of the aggregate net assets of all the participating portfolios that exceeds $150 billion. The amount of the reimbursement is calculated daily and allocated among all the participating portfolios in proportion to the daily net assets of each fund. This arrangement may be amended or terminated at any time by the Advisor upon notice to the funds and with the approval of the Board of Trustees.
The Advisor has contractually agreed to waive all or a portion of its management fee and/or reimburse or pay operating expenses of the fund to the extent necessary to maintain the fund’s total operating expenses at 1.30%, 2.05%, 2.05%, 0.99%, 1.40% and 0.85% for Class A, Class B, Class C, Class I, Class R2 and Class R6 shares, respectively, excluding certain expenses such as taxes, brokerage commissions, interest expense, litigation and indemnification expenses and other extraordinary expenses not incurred in the ordinary course of the fund’s business, acquired fund fees and expenses paid indirectly and short dividend expense. These expense limitations shall remain in effect until February 28, 2014 for all classes.
| Annual report | U.S. Global Leaders Growth Fund | 25 |
For the year ended October 31, 2013, these expense reductions amounted to the following:
| CLASS A | CLASS B | CLASS C | CLASS I | CLASS R2 | CLASS R6 | TOTAL |
| $14,735 | $728 | $2,781 | $6,554 | $489 | $84 | $25,371 |
The investment management fees, including the impact of the waivers and reimbursements as described above, incurred for the year ended October 31, 2013 were equivalent to a net annual effective rate of 0.74% of the fund’s average daily net assets.
Accounting and legal services. Pursuant to the Accounting and Legal Services Agreement the fund reimburses the Advisor for all expenses associated with providing the administrative, financial, legal, accounting and recordkeeping services to the fund, including the preparation of all tax returns, periodic reports to shareholders and regulatory reports, among other services. These expenses are allocated to each share class based on its relative net assets at the time the expense was incurred. These accounting and legal services fees incurred for the year ended October 31, 2013 amounted to an annual rate of 0.02% of the fund’s average daily net assets.
Distribution and service plans. The fund has a distribution agreement with the Distributor. The fund has adopted distribution and service plans with respect to Class A, Class B, Class C and Class R2 shares pursuant to Rule 12b-1 under the 1940 Act, to pay the Distributor for services provided as the distributor of shares of the fund. In addition, under a service plan for Class R2 shares, the fund pays for certain other services. The fund may pay up to the following contractual rates of distribution and service fees under these arrangements, expressed as an annual percentage of average daily net assets for each class of the fund’s shares.
| CLASS | RULE 12b-1 FEE | SERVICE FEE | |||
| Class A | 0.25% | — | |||
| Class B | 1.00% | — | |||
| Class C | 1.00% | — | |||
| Class R2 | 0.25% | 0.25% | |||
Sales charges. Class A shares are assessed up-front sales charges, which resulted in payments to the Distributor amounting to $2,596,750 for the year ended October 31, 2013. Of this amount, $428,718 was retained and used for printing prospectuses, advertising, sales literature and other purposes, $2,140,481 was paid as sales commissions to broker-dealers and $27,551 was paid as sales commissions to sales personnel of Signator Investors, Inc., a broker-dealer affiliate of the Advisor.
Class A, Class B and Class C shares may be subject to contingent deferred sales charges (CDSCs). Certain Class A shares that are acquired through purchases of $1 million or more and are redeemed within one year of purchase are subject to a 1.00% sales charge. Class B shares that are redeemed within six years of purchase are subject to CDSCs, at declining rates, beginning at 5.00%. Class C shares that are redeemed within one year of purchase are subject to a 1.00% CDSC. CDSCs are applied to the lesser of the current market value at the time of redemption or the original purchase cost of the shares being redeemed. Proceeds from CDSCs are used to compensate the Distributor for providing distribution-related services in connection with the sale of these shares. During the year ended October 31, 2013, CDSCs received by the Distributor amounted to $906, $40,059 and $12,716 for Class A, Class B and Class C shares, respectively.
Transfer agent fees. The fund has a transfer agent agreement with John Hancock Signature Services, Inc. (Signature Services), an affiliate of the Advisor. The transfer agent fees paid to Signature Services are determined based on the cost to Signature Services (Signature Services Cost) of providing recordkeeping services. The Signature Services Cost includes a component of allocated John Hancock corporate overhead for providing transfer agent services to the fund and to all other John Hancock affiliated funds. It also includes out-of-pocket expenses, including payments made
| 26 | U.S. Global Leaders Growth Fund | Annual report |
to third-parties for recordkeeping services provided to their clients who invest in one or more John Hancock funds. In addition, Signature Services Cost may be reduced by certain fees that Signature Services receives in connection with retirement and small accounts. Signature Services Cost is calculated monthly and allocated, as applicable, to five categories of share classes: Retail Share and Institutional Classes of Non-Municipal Bond Funds, Class R6 Shares, Retirement Share Classes, and Municipal Bond Share Classes. Within each of these categories, the applicable costs are allocated to the affected John Hancock affiliated funds and/or classes, based on the relative average daily net assets.
Prior to October 1, 2013, Signature Services Cost was calculated monthly and allocated, as applicable, to four categories of share classes: Institutional Share Classes, Retirement Share Classes, Municipal Bond Share Classes and all other Retail Share Classes. Within each of these categories, the applicable costs were allocated to the affected John Hancock affiliated funds and/or classes, based on the relative average daily net assets.
Class level expenses. Class level expenses for the year ended October 31, 2013 were:
| DISTRIBUTION AND | TRANSFER | ||||
| CLASS | SERVICE FEES | AGENT FEES | |||
| Class A | $1,381,099 | $906,507 | |||
| Class B | 313,662 | 52,092 | |||
| Class C | 1,069,966 | 175,883 | |||
| Class I | — | 265,618 | |||
| Class R2 | 45,236 | 2,462 | |||
| Class R6 | — | 766 | |||
| Total | $2,809,963 | $1,403,328 | |||
Trustee expenses. The fund compensates each Trustee who is not an employee of the Advisor or its affiliates. Under the John Hancock Group of funds Deferred Compensation Plan (the Plan), which was terminated in November 2012, certain Trustees could have elected, for tax purposes, to defer receipt of this compensation. Any deferred amounts were invested in various John Hancock funds. The investment of deferred amounts and the offsetting liability are included within Other receivables and prepaid expenses and Payable to affiliates — Trustees’ fees, respectively, in the accompanying Statement of assets and liabilities. Plan assets will be liquidated in accordance with the Plan documents.
Note 5 — Fund share transactions
Transactions in fund shares for the years ended October 31, 2013 and 2012 were as follows:
| Year ended 10-31-13 | Year ended 10-31-12 | |||
| Shares | Amount | Shares | Amount | |
| Class A shares | ||||
| Sold | 7,552,395 | $285,695,157 | 4,441,325 | $148,909,789 |
| Distributions reinvested | 260,910 | 9,139,675 | 292,135 | 8,504,056 |
| Repurchased | (3,112,320) | (118,601,730) | (2,022,309) | (67,804,726) |
| Net increase | 4,700,985 | $176,233,102 | 2,711,151 | $89,609,119 |
| Class B shares | ||||
| Sold | 216,131 | $7,371,783 | 316,082 | $9,834,703 |
| Distributions reinvested | 18,877 | 608,972 | 29,481 | 797,768 |
| Repurchased | (311,868) | (10,742,604) | (365,405) | (11,244,293) |
| Net decrease | (76,860) | ($2,761,849) | (19,842) | ($611,822) |
| Annual report | U.S. Global Leaders Growth Fund | 27 |
| Year ended 10-31-13 | Year ended 10-31-12 | |||
| Shares | Amount | Shares | Amount | |
| Class C shares | ||||
| Sold | 1,295,938 | $44,579,587 | 860,556 | $26,790,912 |
| Distributions reinvested | 47,542 | 1,534,191 | 51,563 | 1,395,797 |
| Repurchased | (463,049) | (16,202,194) | (430,073) | (13,242,914) |
| Net increase | 880,431 | $29,911,584 | 482,046 | $14,943,795 |
| Class I shares | ||||
| Sold | 5,193,460 | $203,001,398 | 3,846,377 | $135,637,536 |
| Distributions reinvested | 97,013 | 3,539,037 | 45,980 | 1,387,666 |
| Repurchased | (2,971,409) | (117,155,621) | (962,337) | (33,855,255) |
| Net increase | 2,319,064 | $89,384,814 | 2,930,020 | $103,169,947 |
| Class R2 shares1 | ||||
| Sold | 795,078 | $32,190,023 | 8,160 | $296,583 |
| Distributions reinvested | 115 | 4,193 | — | — |
| Repurchased | (86,257) | (3,554,460) | (22) | (819) |
| Net increase | 708,936 | $28,639,756 | 8,138 | $295,764 |
| Class R6 shares | ||||
| Sold | 103,248 | $3,899,717 | 5,163 | $187,035 |
| Distributions reinvested | 1,244 | 45,421 | — | — |
| Repurchased | (25,992) | (1,035,248) | (411) | (15,060) |
| Net increase | 78,500 | $2,909,890 | 4,752 | $171,975 |
| Total net increase | 8,611,056 | $324,317,297 | 6,116,265 | $207,578,778 |
1 The inception date for Class R2 shares is 3-1-12.
Note 6 — Purchase and sale of securities
Purchases and sales of securities, other than short-term securities, amounted to $564,581,376 and $276,375,126, respectively, for the year ended October 31, 2013.
| 28 | U.S. Global Leaders Growth Fund | Annual report |
Auditor’s report
Report of Independent Registered Public Accounting Firm
To the Board of Trustees of John Hancock Capital Series and the
Shareholders of John Hancock U.S. Global Leaders Growth Fund:
In our opinion, the accompanying statement of assets and liabilities, including the portfolio of investments, and the related statements of operations and of changes in net assets and the financial highlights present fairly, in all material respects, the financial position of John Hancock U.S. Global Leaders Growth Fund (the “Fund”) at October 31, 2013, the results of its operations for the year then ended, the changes in its net assets for each of the two years in the period then ended and the financial highlights for each of the periods indicated, in conformity with accounting principles generally accepted in the United States of America. These financial statements and financial highlights (hereafter referred to as “financial statements”) are the responsibility of the Fund’s management; our responsibility is to express an opinion on these financial statements based on our audits. We conducted our audits of these financial statements in accordance with the standards of the Public Company Accounting Oversight Board (United States). Those standards require that we plan and perform the audit to obtain reasonable assurance about whether the financial statements are free of material misstatement. An audit includes examining, on a test basis, evidence supporting the amounts and disclosures in the financial statements, assessing the accounting principles used and significant estimates made by management, and evaluating the overall financial statement presentation. We believe that our audits, which included confirmation of securities at October 31, 2013 by correspondence with the custodian and transfer agents, and the application of alternative auditing procedures where securities purchased confirmations had not been received, provide a reasonable basis for our opinion.
PricewaterhouseCoopers LLP
Boston, Massachusetts
December 20, 2013
| Annual report | U.S. Global Leaders Growth Fund | 29 |
Tax information
Unaudited
For federal income tax purposes, the following information is furnished with respect to the distributions of the fund, if any, paid during its taxable year ended October 31, 2013.
The fund reports the maximum amount allowable of its net taxable income as eligible for the corporate dividends-received deduction.
The fund reports the maximum amount allowable of its net taxable income as qualified dividend income as provided in the Jobs and Growth Tax Relief Reconciliation Act of 2003.
The fund paid $9,516,765 in capital gain dividends.
Eligible shareholders will be mailed a 2013 Form 1099-DIV in early 2014. This will reflect the tax character of all distributions paid in calendar year 2013.
Please consult a tax advisor regarding the tax consequences of your investment in the fund.
| 30 | U.S. Global Leaders Growth Fund | Annual report |
Continuation of Investment Advisory and Subadvisory Agreements
Evaluation of Advisory and Subadvisory Agreements by the Board of Trustees
This section describes the evaluation by the Board of Trustees (the Board) of John Hancock Capital Series (the Trust) of the Advisory Agreement (the Advisory Agreement) with John Hancock Advisers, LLC (the Advisor) and the Subadvisory Agreement (the Subadvisory Agreement) with Sustainable Growth Advisers, LP (the Subadvisor) for John Hancock U.S. Global Leaders Growth Fund (the fund). The Advisory Agreement and Subadvisory Agreement are collectively referred to as the Agreements.
Approval of Advisory and Subadvisory Agreements
At in-person meetings held on May 16–17, 2013, the Board, including the Trustees who are not considered to be interested persons of the Trust under the Investment Company Act of 1940, as amended (the 1940 Act) (the Independent Trustees), reapproved for an annual period the continuation of the Advisory Agreement between the Trust and the Advisor and the Subadvisory Agreement between the Advisor and the Subadvisor with respect to the fund.
In considering the Advisory Agreement and the Subadvisory Agreement, the Board received in advance of the meeting a variety of materials relating to the fund, the Advisor, and the Subadvisor, including comparative performance, fee and expense information for peer groups of similar mutual funds prepared by an independent third-party provider of mutual fund data; performance information for the fund’s benchmark index; and, with respect to the Subadvisor, comparative performance information for comparably managed accounts, as applicable; and other information provided by the Advisor and the Subadvisor regarding the nature, extent, and quality of services provided by the Advisor and the Subadvisor under their respective Agreements, as well as information regarding the Advisor’s revenues and costs of providing services to the fund and any compensation paid to affiliates of the Advisor. At the meeting at which the renewal of the Advisory Agreement and Subadvisory Agreement is considered, particular focus is given to information concerning fund performance, comparability of fees and total expenses and profitability. However, the Board notes that the evaluation process with respect to the Advisor and the Subadvisor is an ongoing one. In this regard, the Board also took into account discussions with management and information provided to the Board at prior meetings with respect to the services provided by the Advisor and the Subadvisor to the fund, including quarterly performance reports prepared by management containing reviews of investment results and prior presentations from the Subadvisor with respect to the fund. The Board also considered the nature, quality, and extent of non-advisory services, if any, to be provided to the fund by the Advisor’s affiliates, including distribution services.
Throughout the process, the Board asked questions of and requested additional information from management. The Board is assisted by counsel for the Trust and the Independent Trustees are also separately assisted by independent legal counsel throughout the process. The Independent Trustees also received a memorandum from their independent counsel discussing the legal standards for their consideration of the proposed continuation of the Agreements and discussed the proposed continuation of the Agreements in private sessions with their independent legal counsel at which no representatives of management were present.
Approval of Advisory Agreement
In approving the Advisory Agreement with respect to the fund, the Board, including the Independent Trustees, considered a variety of factors, including those discussed below. The Board also considered other factors (including conditions and trends prevailing generally in the economy, the securities markets, and the industry) and does not treat any single factor as determinative and each Trustee may attribute different weights to different factors. The Board’s conclusions may be
| Annual report | U.S. Global Leaders Growth Fund | 31 |
based in part on its consideration of the advisory and subadvisory arrangements in prior years and on the Board’s ongoing regular review of fund performance and operations throughout the year.
Nature, extent, and quality of services. Among the information received by the Board from the Advisor relating to the nature, extent, and quality of services provided to the fund, the Board reviewed information provided by the Advisor relating to its operations and personnel, descriptions of its organizational and management structure, and information regarding the Advisor’s compliance and regulatory history, including its Form ADV. The Board also noted that on a regular basis it receives and reviews information from the Trust’s Chief Compliance Officer (CCO) regarding the fund’s compliance policies and procedures established pursuant to Rule 38a-1 under the 1940 Act. The Board also considered the Advisor’s risk management processes. The Board considered that the Advisor is responsible for the management of the day-to-day operations of the fund, including, but not limited to, general supervision of and coordination of the services provided by the Subadvisor, and is also responsible for monitoring and reviewing the activities of the Subadvisor and other third-party service providers.
In considering the nature, extent, and quality of the services provided by the Advisor, the Trustees also took into account their knowledge of the Advisor’s management and the quality of the performance of the Advisor’s duties through Board meetings, discussions, and reports during the preceding year and through each Trustee’s experience as a Trustee of the Trust and of the other trusts in the complex.
In the course of their deliberations regarding the Advisory Agreement, the Board considered, among other things:
(a) the skills and competency with which the Advisor has in the past managed the Trust’s affairs and its subadvisory relationship, the Advisor’s oversight and monitoring of the Subadvisor’s investment performance and compliance programs, such as the Subadvisor’s compliance with fund policies and objective; review of brokerage matters, including with respect to trade allocation and best execution; and the Advisor’s timeliness in responding to performance issues;
(b) the background, qualifications and skills of the Advisor’s personnel;
(c) the Advisor’s compliance policies and procedures and its responsiveness to regulatory changes and mutual fund industry developments;
(d) the Advisor’s administrative capabilities, including its ability to supervise the other service providers for the fund;
(e) the financial condition of the Advisor and whether it has the financial wherewithal to provide a high level and quality of services to the fund; and
(f) the Advisor’s reputation and experience in serving as an investment adviser to the Trust and the benefit to shareholders of investing in funds that are part of a family of funds offering a variety of investments.
The Board concluded that the Advisor may reasonably be expected to continue to provide a high quality of services under the Advisory Agreement with respect to the fund.
Investment performance. In considering the fund’s performance, the Board noted that it reviews at its regularly scheduled meetings information about the fund’s performance results. In connection with the consideration of the Advisory Agreement, the Board:
| 32 | U.S. Global Leaders Growth Fund | Annual report |
(a) reviewed information prepared by management regarding the fund’s performance;
(b) considered the comparative performance of the fund’s benchmark;
(c) considered the performance of comparable funds, if any, as included in the report prepared by an independent third-party provider of mutual fund data. Such report included the fund’s ranking within a smaller group of peer funds and the fund’s ranking within broader groups of funds; and
(d) took into account the Advisor’s analysis of the fund’s performance and its plans and recommendations regarding the Trust’s subadvisory arrangements generally.
The Board noted that the fund outperformed its benchmark index and peer group average for the one-, three-, and five-year periods ended December 31, 2012.
The Board concluded that the performance of the fund has generally been in line with or outperformed the historical performance of comparable funds and the fund’s benchmark.
Fees and expenses. The Board reviewed comparative information prepared by an independent third-party provider of mutual fund data, including, among other data, the fund’s contractual and net management fees and total expenses as compared to similarly situated investment companies deemed to be comparable to the fund. The Board considered the fund’s ranking within a smaller group of peer funds chosen by the independent third-party provider, as well as the fund’s ranking within a broader group of funds. In comparing the fund’s contractual and net management fees to those of comparable funds, the Board noted that such fees include both advisory and administrative costs.
The Board noted that net management fees and total expenses for this fund are higher than the peer group medians. The Board took into account management’s discussion of the fund’s expenses. The Board also took into account that the Advisor and the Subadvisor had agreed to implement an additional breakpoint in the advisory and subadvisory fees of the fund effective June 1, 2012.
The Board took into account management’s discussion with respect to the advisory/subadvisory fee structure, including the amount of the advisory fee retained by the Advisor after payment of the subadvisory fee. The Board also took into account that management had agreed to implement an overall fee waiver across a number of funds in the complex, including the fund, which is discussed further below. The Board also noted that, in addition, the Advisor has agreed to waive fees and/or reimburse expenses with respect to the fund’s share classes if they exceed specified levels. The Board also noted that the Advisor pays the subadvisory fees of the fund, and that such fees are negotiated at arm’s length with respect to the Subadvisor. The Board also noted management’s discussion of the fund’s expenses, as well as certain actions taken over the past several years to reduce the fund’s operating expenses. The Board reviewed information provided by the Advisor concerning investment advisory fees charged to other clients (including other funds in the complex) having similar investment mandates, if any. The Board considered any differences between the Advisor’s and Subadvisor’s services to the fund and the services they provide to other comparable clients or funds. The Board concluded that the advisory fee paid with respect to the fund is reasonable.
Profitability/indirect benefits. In considering the costs of the services to be provided and the profits to be realized by the Advisor and its affiliates from the Advisor’s relationship with the Trust, the Board:
(a) reviewed financial information of the Advisor;
(b) reviewed and considered an analysis presented by the Advisor regarding the net profitability to the Advisor and its affiliates with respect to the fund;
| Annual report | U.S. Global Leaders Growth Fund | 33 |
(c) received and reviewed profitability information with respect to the John Hancock fund complex as a whole;
(d) received information with respect to the Advisor’s allocation methodologies used in preparing the profitability data;
(e) considered that the Advisor also provides administrative services to the fund on a cost basis pursuant to an administrative services agreement;
(f) noted that affiliates of the Advisor provide transfer agency services and distribution services to the fund, and that the Trust’s distributor also receives Rule 12b-1 payments to support distribution of the fund;
(g) noted that the Advisor also derives reputational and other indirect benefits from providing advisory services to the fund;
(h) noted that the subadvisory fees for the fund are paid by the Advisor and are negotiated at arm’s length; and
(i) considered that the Advisor should be entitled to earn a reasonable level of profits in exchange for the level of services it provides to the fund and the entrepreneurial risk that it assumes as Advisor.
Based upon its review, the Board concluded that the level of profitability, if any, of the Advisor and its affiliates from their relationship with the fund was reasonable and not excessive.
Economies of scale. In considering the extent to which economies of scale would be realized as the fund grows and whether fee levels reflect these economies of scale for the benefit of fund shareholders, the Board:
(a) considered that the Advisor has agreed, effective June 1, 2013, to waive its management fee for the fund and each of the open-end funds of John Hancock Funds II, John Hancock Funds III, each other John Hancock fund (except those listed below) (the Participating Portfolios) or otherwise reimburse the expenses of the Participating Portfolios as follows (the Reimbursement):
The Reimbursement shall equal, on an annualized basis, 0.01% of that portion of the aggregate net assets of all the Participating Portfolios that exceeds $75 billion but is less than or equal to $125 billion, 0.0125% of that portion of the aggregate net assets of all the Participating Portfolios that exceeds $125 billion but is less than or equal to $150 billion and 0.015% of that portion of the aggregate net assets of all the Participating Portfolios that exceeds $150 billion. (The funds that are not Participating Portfolios as of the date of this annual report are each of the fund of funds, money market funds, index funds and closed-end funds);
(b) reviewed the Trust’s advisory fee structure and the incorporation therein of any subadvisory fee breakpoints in the advisory fees charged and concluded that (i) the fund’s fee structure contains breakpoints at the subadvisory fee level and that such breakpoints are reflected as breakpoints in the advisory fees for the fund and (ii) although economies of scale cannot be measured with precision, these arrangements permit shareholders of the fund to benefit from economies of scale if the fund grows. The Board also took into account management’s discussion of the fund’s advisory fee structure; and
(c) the Board also considered the effect of the fund’s growth in size on its performance and fees. The Board also noted that if the fund’s assets increase over time, the fund may realize other economies of scale.
| 34 | U.S. Global Leaders Growth Fund | Annual report |
Approval of Subadvisory Agreement
In making its determination with respect to approval of the Subadvisory Agreement, the Board reviewed:
(1) information relating to the Subadvisor’s business, including current subadvisory services to the Trust (and other funds in the John Hancock family of funds);
(2) the historical and current performance of the fund, and comparative performance information relating to the fund’s benchmark and comparable funds;
(3) the subadvisory fee for the fund, including any breakpoints, and comparative fee information, where available, prepared by an independent third-party provider of mutual fund data; and
(4) information relating to the nature and scope of any material relationships and their significance to the Trust’s Advisor and Subadvisor.
Nature, extent, and quality of services. With respect to the services provided by the Subadvisor, the Board received information provided to the Board by the Subadvisor, including the Subadvisor’s Form ADV, as well as took into account information presented throughout the past year. The Board considered the Subadvisor’s current level of staffing and its overall resources, as well as received information relating to the Subadvisor’s compensation program. The Board reviewed the Subadvisor’s history and investment experience, as well as information regarding the qualifications, background, and responsibilities of the Subadvisor’s investment and compliance personnel who provide services to the fund. The Board also considered, among other things, the Subadvisor’s compliance program and any disciplinary history. The Board also considered the Subadvisor’s risk assessment and monitoring process. The Board reviewed the Subadvisor’s regulatory history, including whether it was currently involved in any regulatory actions or investigations as well as material litigation, and any settlements and amelioratory actions undertaken, as appropriate. The Board noted that the Advisor conducts regular, periodic reviews of the Subadvisor and its operations, including regarding investment processes and organizational and staffing matters. The Board also noted that the Trust’s CCO and his staff conduct regular, periodic compliance reviews with the Subadvisor and present reports to the Independent Trustees regarding the same, which includes evaluating the regulatory compliance systems of the Subadvisor and procedures reasonably designed by it to assure compliance with the federal securities laws. The Board also took into account the financial condition of the Subadvisor.
The Board considered the Subadvisor’s investment process and philosophy. The Board took into account that the Subadvisor’s responsibilities include the development and maintenance of an investment program for the fund, that is consistent with the fund’s investment objective, the selection of investment securities and the placement of orders for the purchase and sale of such securities, as well as the implementation of compliance controls related to performance of these services. The Board also received information with respect to the Subadvisor’s brokerage policies and practices, including with respect to best execution and soft dollars.
Subadvisor compensation. In considering the cost of services to be provided by the Subadvisor and the profitability to the Subadvisor of its relationship with the fund, the Board noted that the fees under the Subadvisory Agreement are paid by the Advisor and not the fund.
The Board also relied on the ability of the Advisor to negotiate the Subadvisory Agreement with the Subadvisor, which is not affiliated with the Advisor, and the fees thereunder at arm’s length. As a result, the costs of the services to be provided and the profits to be realized by the Subadvisor from its relationship with the Trust were not a material factor in the Board’s consideration of the Subadvisory Agreement.
| Annual report | U.S. Global Leaders Growth Fund | 35 |
The Board also received information regarding the nature and scope (including their significance to the Advisor and its affiliates and to the Subadvisor) of any material relationships with respect to the Subadvisor, which includes arrangements in which the Subadvisor or its affiliates provide advisory, distribution, or management services in connection with financial products sponsored by the Trust’s Advisor or its affiliates, and may include other registered investment companies, a 529 education savings plan, managed separate account, and exempt group annuity contracts sold to qualified plans. The Board also received information and took into account any other potential conflicts of interest the Advisor might have in connection with the Subadvisory Agreement.
In addition, the Board considered other potential indirect benefits that the Subadvisor and its affiliates may receive from the Subadvisor’s relationship with the fund, such as the opportunity to provide advisory services to additional funds in the John Hancock fund complex and reputational benefits.
Subadvisory fees. The Board considered that the fund pays an advisory fee to the Advisor and that, in turn, the Advisor pays a subadvisory fee to the Subadvisor. The Board also took into account the subadvisory fees paid by the Advisor to the Subadvisor with respect to the fund to fees charged by the fund’s Subadvisor to manage other subadvised portfolios and portfolios not subject to regulation under the 1940 Act, as applicable.
Subadvisor performance. As noted above, the Board considered the fund’s performance as compared to the fund’s peer group and benchmark and noted that the Board reviews information about the fund’s performance results at its regularly scheduled meetings. The Board noted the Advisor’s expertise and resources in monitoring the performance, investment style, and risk-adjusted performance of the Subadvisor. The Board was mindful of the Advisor’s focus on the Subadvisor’s performance. The Board also noted the Subadvisor’s long-term performance record for similar accounts, as applicable.
The Board’s decision to approve the Subadvisory Agreement was based on a number of determinations, including the following:
(1) The Subadvisor has extensive experience and demonstrated skills as a manager;
(2) The performance of the fund generally has been in line with or outperformed the historical performance of comparable funds and the fund’s benchmark and the fund’s overall performance is satisfactory;
(3) The subadvisory fees are reasonable in relation to the level and quality of services being provided; and
(4) Subadvisory fee breakpoints are reflected as breakpoints in the advisory fees for the fund in order to permit shareholders to benefit from economies of scale if the fund grows.
| * * * |
Based on the Board’s evaluation of all factors that the Board deemed to be material, including those factors described above, the Board, including the Independent Trustees, concluded that renewal of the Advisory Agreement and the Subadvisory Agreement would be in the best interest of the fund and its shareholders. Accordingly, the Board, and the Independent Trustees voting separately, approved the Advisory Agreement and Subadvisory Agreement for an additional one-year period.
| 36 | U.S. Global Leaders Growth Fund | Annual report |
Trustees and Officers
This chart provides information about the Trustees and Officers who oversee your John Hancock fund. Officers elected by the Trustees manage the day-to-day operations of the fund and execute policies formulated by the Trustees.
| Independent Trustees | ||
| Name, year of birth | Trustee | Number of John |
| Position(s) held with fund | of the | Hancock funds |
| Principal occupation(s) and other | Trust | overseen by |
| directorships during past 5 years | since1 | Trustee |
| James M. Oates,2 Born: 1946 | 2012 | 233 |
| Managing Director, Wydown Group (financial consulting firm) (since 1994); Chairman and Director, | ||
| Emerson Investment Management, Inc. (since 2000); Independent Chairman, Hudson Castle Group, Inc. | ||
| (formerly IBEX Capital Markets, Inc.) (financial services company) (1997–2011); Director, Stifel Financial | ||
| (since 1996); Director, Investor Financial Services Corporation (1995–2007); Director, Connecticut River | ||
| Bancorp (since 1998); Director, Virtus Funds (formerly Phoenix Mutual Funds) (since 1988). | ||
| Trustee and Chairperson of the Board, John Hancock retail funds4 (since 2012); Trustee (2005–2006 and | ||
| since 2012) and Chairperson of the Board (since 2012), John Hancock Funds III; Trustee (since 2004) and | ||
| Chairperson of the Board (since 2005), John Hancock Variable Insurance Trust; Trustee and Chairperson | ||
| of the Board, John Hancock Funds II (since 2005). | ||
| Charles L. Bardelis,2,3 Born: 1941 | 2012 | 233 |
| Director, Island Commuter Corp. (marine transport). | ||
| Trustee, John Hancock retail funds4 (since 2012); Trustee, John Hancock Funds III (2005–2006 and | ||
| since 2012); Trustee, John Hancock Variable Insurance Trust (since 1988); Trustee, John Hancock | ||
| Funds II (since 2005). | ||
| Peter S. Burgess,2,3 Born: 1942 | 2012 | 233 |
| Consultant (financial, accounting, and auditing matters) (since 1999); Certified Public Accountant; | ||
| Partner, Arthur Andersen (independent public accounting firm) (prior to 1999); Director, Lincoln | ||
| Educational Services Corporation (since 2004); Director, Symetra Financial Corporation (since 2010); | ||
| Director, PMA Capital Corporation (2004–2010). | ||
| Trustee, John Hancock retail funds4 (since 2012); Trustee, John Hancock Funds III (2005–2006 and | ||
| since 2012); Trustee, John Hancock Variable Insurance Trust and John Hancock Funds II (since 2005). | ||
| William H. Cunningham, Born: 1944 | 2005 | 233 |
| Professor, University of Texas, Austin, Texas (since 1971); former Chancellor, University of Texas System | ||
| and former President of the University of Texas, Austin, Texas; Director, LIN Television (since 2009); | ||
| Chairman (since 2009) and Director (since 2006), Lincoln National Corporation (insurance); Director, | ||
| Resolute Energy Corporation (since 2009); Director, Southwest Airlines (since 2000); former Director, | ||
| Introgen (manufacturer of biopharmaceuticals) (until 2008); former Director, Hicks Acquisition Company I, | ||
| Inc. (until 2007); former Director, Texas Exchange Bank, SSB (formerly Bank of Crowley) (until 2009); | ||
| former Advisory Director, JP Morgan Chase Bank (formerly Texas Commerce Bank–Austin) (until 2009). | ||
| Trustee, John Hancock retail funds4 (since 1986); Trustee, John Hancock Variable Insurance Trust | ||
| (since 2012); Trustee, John Hancock Funds II (since 2012 and 2005–2006). | ||
| Annual report | U.S. Global Leaders Growth Fund | 37 |
| Independent Trustees (continued) | ||
| Name, year of birth | Trustee | Number of John |
| Position(s) held with fund | of the | Hancock funds |
| Principal occupation(s) and other | Trust | overseen by |
| directorships during past 5 years | since1 | Trustee |
| Grace K. Fey,2 Born: 1946 | 2012 | 233 |
| Chief Executive Officer, Grace Fey Advisors (since 2007); Director and Executive Vice President, Frontier | ||
| Capital Management Company (1988–2007); Director, Fiduciary Trust (since 2009). | ||
| Trustee, John Hancock retail funds4 (since 2012); Trustee, John Hancock Variable Insurance Trust and | ||
| John Hancock Funds II (since 2008). | ||
| Theron S. Hoffman,2,3 Born: 1947 | 2012 | 233 |
| Chief Executive Officer, T. Hoffman Associates, LLC (consulting firm) (since 2003); Director, The Todd | ||
| Organization (consulting firm) (2003–2010); President, Westport Resources Management (investment | ||
| management consulting firm) (2006–2008); Senior Managing Director, Partner, and Operating Head, | ||
| Putnam Investments (2000–2003); Executive Vice President, The Thomson Corp. (financial and legal | ||
| information publishing) (1997–2000). | ||
| Trustee, John Hancock retail funds4 (since 2012); Trustee, John Hancock Variable Insurance Trust and | ||
| John Hancock Funds II (since 2008). | ||
| Deborah C. Jackson, Born: 1952 | 2008 | 233 |
| President, Cambridge College, Cambridge, Massachusetts (since 2011); Chief Executive Officer, | ||
| American Red Cross of Massachusetts Bay (2002–2011); Board of Directors of Eastern Bank Corporation | ||
| (since 2001); Board of Directors of Eastern Bank Charitable Foundation (since 2001); Board of Directors | ||
| of American Student Assistance Corporation (1996–2009); Board of Directors of Boston Stock Exchange | ||
| (2002–2008); Board of Directors of Harvard Pilgrim Healthcare (health benefits company) (2007–2011). | ||
| Trustee, John Hancock retail funds4 (since 2008); Trustee of John Hancock Variable Insurance Trust and | ||
| John Hancock Funds II (since 2012). | ||
| Hassell H. McClellan,2 Born: 1945 | 2012 | 233 |
| Associate Professor, The Wallace E. Carroll School of Management, Boston College (since 1984); | ||
| Trustee, Virtus Variable Insurance Trust (formerly Phoenix Edge Series Funds) (since 2008); Director, The | ||
| Barnes Group (since 2010). | ||
| Trustee, John Hancock retail funds4 (since 2012); Trustee, John Hancock Funds III (2005–2006 and | ||
| since 2012); Trustee, John Hancock Variable Insurance Trust and John Hancock Funds II (since 2005). | ||
| Steven R. Pruchansky, Born: 1944 | 2005 | 233 |
| Chairman and Chief Executive Officer, Greenscapes of Southwest Florida, Inc. (since 2000); Director | ||
| and President, Greenscapes of Southwest Florida, Inc. (until 2000); Member, Board of Advisors, First | ||
| American Bank (until 2010); Managing Director, Jon James, LLC (real estate) (since 2000); Director, | ||
| First Signature Bank & Trust Company (until 1991); Director, Mast Realty Trust (until 1994); President, | ||
| Maxwell Building Corp. (until 1991). | ||
| Trustee (since 1992) and Chairperson of the Board (2011–2012), John Hancock retail funds4; Trustee and | ||
| Vice Chairperson of the Board, John Hancock retail funds4, John Hancock Variable Insurance Trust, and | ||
| John Hancock Funds II (since 2012). | ||
| 38 | U.S. Global Leaders Growth Fund | Annual report |
| Independent Trustees (continued) | ||
| Name, year of birth | Trustee | Number of John |
| Position(s) held with fund | of the | Hancock funds |
| Principal occupation(s) and other | Trust | overseen by |
| directorships during past 5 years | since1 | Trustee |
| Gregory A. Russo, Born: 1949 | 2009 | 233 |
| Director and Audit Committee Chairman (since 2012), and Member, Audit Committee and Finance | ||
| Committee (since 2011), NCH Healthcare System, Inc. (holding company for multi-entity healthcare | ||
| system); Director and Member of Finance Committee, The Moorings, Inc. (nonprofit continuing care | ||
| community) (since 2012); Vice Chairman, Risk & Regulatory Matters, KPMG LLP (KPMG) (2002–2006); | ||
| Vice Chairman, Industrial Markets, KPMG (1998–2002); Chairman and Treasurer, Westchester County, | ||
| New York, Chamber of Commerce (1986–1992); Director, Treasurer, and Chairman of Audit and | ||
| Finance Committees, Putnam Hospital Center (1989–1995); Director and Chairman of Fundraising | ||
| Campaign, United Way of Westchester and Putnam Counties, New York (1990–1995). | ||
| Trustee, John Hancock retail funds4 (since 2008); Trustee, John Hancock Variable Insurance Trust and | ||
| John Hancock Funds II (since 2012). | ||
| Non-Independent Trustees5 | ||
| Name, year of birth | Trustee | Number of John |
| Position(s) held with fund | of the | Hancock funds |
| Principal occupation(s) and other | Trust | overseen by |
| directorships during past 5 years | since1 | Trustee |
| James R. Boyle,2 Born: 1959 | 2012 | 233 |
| Senior Executive Vice President, John Hancock Financial Services (1999–2012, including prior positions); | ||
| Chairman and Director, John Hancock Advisers, LLC, John Hancock Funds, LLC, and John Hancock | ||
| Investment Management Services, LLC (2005–2010). | ||
| Trustee, John Hancock retail funds4 (since 2012 and 2005–2010); Trustee, John Hancock Variable | ||
| Insurance Trust and John Hancock Funds II (since 2005). | ||
| Craig Bromley,2 Born: 1966 | 2012 | 233 |
| President, John Hancock Financial Services (since 2012); Senior Executive Vice President and General | ||
| Manager, U.S. Division, John Hancock Financial Services (since 2012); President and Chief Executive | ||
| Officer, Manulife Insurance Company (Manulife Japan) (2005–2012, including prior positions). | ||
| Trustee, John Hancock retail funds,4 John Hancock Variable Insurance Trust, and John Hancock Funds | ||
| II (since 2012). | ||
| Warren A. Thomson,2 Born: 1955 | 2012 | 233 |
| Senior Executive Vice President and Chief Investment Officer, Manulife Financial Corporation and The | ||
| Manufacturers Life Insurance Company (since 2009); Chairman and Chief Executive Officer, Manulife | ||
| Asset Management (since 2001, including prior positions); Director (since 2006), and President and | ||
| Chief Executive Officer (since 2013), Manulife Asset Management Limited; Director and Chairman, | ||
| Hancock Natural Resources Group, Inc. (since 2013). | ||
| Trustee, John Hancock retail funds,4 John Hancock Variable Insurance Trust, and John Hancock | ||
| Funds II (since 2012). | ||
| Annual report | U.S. Global Leaders Growth Fund | 39 |
| Principal officers who are not Trustees | |
| Name, year of birth | Officer |
| Position(s) held with fund | of the |
| Principal occupation(s) and other | Trust |
| directorships during past 5 years | since |
| Hugh McHaffie, Born: 1959 | 2012 |
| President | |
| Executive Vice President, John Hancock Financial Services (since 2006, including prior positions); | |
| Chairman and Director, John Hancock Advisers, LLC, John Hancock Investment Management Services, | |
| LLC, and John Hancock Funds, LLC (since 2010); President, John Hancock Advisers, LLC (since 2012); | |
| President, John Hancock Investment Management Services, LLC (since 2010); President (since 2012) and | |
| former Trustee (2010–2012), John Hancock retail funds,4 President, John Hancock Variable Insurance | |
| Trust and John Hancock Funds II (since 2009). | |
| Andrew G. Arnott, Born: 1971 | 2007 |
| Executive Vice President | |
| Senior Vice President, John Hancock Financial Services (since 2009); Director and Executive Vice | |
| President, John Hancock Advisers, LLC (since 2005, including prior positions); Director and Executive | |
| Vice President, John Hancock Investment Management Services, LLC (since 2006, including prior | |
| positions); President, John Hancock Funds, LLC (since 2004, including prior positions); Executive Vice | |
| President, John Hancock retail funds,4 John Hancock Variable Insurance Trust, and John Hancock Funds | |
| II (since 2007, including prior positions). | |
| Thomas M. Kinzler, Born: 1955 | 2006 |
| Secretary and Chief Legal Officer | |
| Vice President, John Hancock Financial Services (since 2006); Secretary and Chief Legal Counsel, | |
| John Hancock Funds, LLC (since 2007); Secretary and Chief Legal Officer, John Hancock retail funds,4 | |
| John Hancock Variable Insurance Trust, and John Hancock Funds II (since 2006). | |
| Francis V. Knox, Jr., Born: 1947 | 2005 |
| Chief Compliance Officer | |
| Vice President, John Hancock Financial Services (since 2005); Chief Compliance Officer, John Hancock | |
| retail funds,4 John Hancock Variable Insurance Trust, John Hancock Funds II, John Hancock Advisers, | |
| LLC, and John Hancock Investment Management Services, LLC (since 2005); Vice President and Chief | |
| Compliance Officer, John Hancock Asset Management a division of Manulife Asset Management (US) | |
| LLC (2005–2008). | |
| Charles A. Rizzo, Born: 1957 | 2007 |
| Chief Financial Officer | |
| Vice President, John Hancock Financial Services (since 2007); Senior Vice President, John Hancock | |
| Advisers, LLC and John Hancock Investment Management Services, LLC (since 2007); Treasurer, | |
| John Hancock retail funds4 (since 2007, including prior positions); Treasurer, John Hancock Variable | |
| Insurance Trust and John Hancock Funds II (since 2007–2009 and since 2010, including prior positions). | |
| 40 | U.S. Global Leaders Growth Fund | Annual report |
| Principal officers who are not Trustees (continued) | |
| Name, year of birth | Officer |
| Position(s) held with fund | of the |
| Principal occupation(s) and other | Trust |
| directorships during past 5 years | since |
| Salvatore Schiavone, Born: 1965 | 2010 |
| Treasurer | |
| Assistant Vice President, John Hancock Financial Services (since 2007); Vice President, John Hancock | |
| Advisers, LLC and John Hancock Investment Management Services, LLC (since 2007); Treasurer, | |
| John Hancock retail funds4 (since 2007, including prior positions); Treasurer, John Hancock Variable | |
| Insurance Trust and John Hancock Funds II (since 2010 and 2007–2009, including prior positions). | |
The business address for all Trustees and Officers is 601 Congress Street, Boston, Massachusetts 02210-2805.
The Statement of Additional Information of the fund includes additional information about members of the Board of Trustees of the Fund and is available without charge, upon request, by calling 800-225-5291.
1 Each Trustee holds office until his or her successor is elected and qualified, or until the Trustee’s death, retirement, resignation or removal.
2 Became a Trustee of the fund effective December 1, 2012.
3 Member of the Audit Committee.
4 “John Hancock retail funds” comprises John Hancock Funds III and 34 other John Hancock funds consisting of 24 series of other John Hancock trusts and 10 closed-end funds.
5 The Trustee is a Non-Independent Trustee due to current or former positions with the Advisor and certain of its affiliates.
| Annual report | U.S. Global Leaders Growth Fund | 41 |
More information
| Trustees | Investment advisor |
| James M. Oates, Chairperson | John Hancock Advisers, LLC |
| Steven R. Pruchansky, Vice Chairperson | |
| Charles L. Bardelis* | Subadvisor |
| James R. Boyle† | Sustainable Growth Advisers, LP |
| Craig Bromley† | |
| Peter S. Burgess* | Principal distributor |
| William H. Cunningham | John Hancock Funds, LLC |
| Grace K. Fey | |
| Theron S. Hoffman* | Custodian |
| Deborah C. Jackson | State Street Bank and Trust Company |
| Hassell H. McClellan | |
| Gregory A. Russo | Transfer agent |
| Warren A. Thomson† | John Hancock Signature Services, Inc. |
| Officers | Legal counsel |
| Hugh McHaffie | K&L Gates LLP |
| President | |
| Independent registered | |
| Andrew G. Arnott | public accounting firm |
| Executive Vice President | PricewaterhouseCoopers LLP |
| Thomas M. Kinzler | |
| Secretary and Chief Legal Officer | |
| Francis V. Knox, Jr. | |
| Chief Compliance Officer | |
| Charles A. Rizzo | |
| Chief Financial Officer | |
| Salvatore Schiavone | |
| Treasurer | |
| *Member of the Audit Committee | |
| †Non-Independent Trustee | |
The fund’s proxy voting policies and procedures, as well as the fund’s proxy voting record for the most recent twelve-month period ended June 30, are available free of charge on the Securities and Exchange Commission (SEC) website at sec.gov or on our website.
The fund’s complete list of portfolio holdings, for the first and third fiscal quarters, is filed with the SEC on Form N-Q. The fund’s Form N-Q is available on our website and the SEC’s website, sec.gov, and can be reviewed and copied (for a fee) at the SEC’s Public Reference Room in Washington, DC. Call 800-SEC-0330 to receive information on the operation of the SEC’s Public Reference Room.
We make this information on your fund, as well as monthly portfolio holdings, and other fund details available on our website at jhinvestments.com or by calling 800-225-5291.
| You can also contact us: | ||
| 800-225-5291 | Regular mail: | Express mail: |
| jhinvestments.com | Investment Operations | Investment Operations |
| John Hancock Signature Services, Inc. | John Hancock Signature Services, Inc. | |
| P.O. Box 55913 | 30 Dan Road | |
| Boston, MA 02205-5913 | Canton, MA 02021 |
| 42 | U.S. Global Leaders Growth Fund | Annual report |

800-225-5291
800-338-8080 EASI-Line
jhinvestments.com

| This report is for the information of the shareholders of John Hancock U.S. Global Leaders Growth Fund. | |
| It is not authorized for distribution to prospective investors unless preceded or accompanied by a prospectus. | 26A 10/13 |
| MF164565 | 12/13 |
A look at performance
Total returns for the period ended October 31, 2013
| Average annual total returns (%) | Cumulative total returns (%) | |||||
| with maximum sales charge | with maximum sales charge | |||||
| 1-year | 5-year | 10-year | 1-year | 5-year | 10-year | |
| Class A | 30.42 | 14.55 | 4.27 | 30.42 | 97.20 | 51.89 |
| Class B | 31.30 | 14.63 | 4.18 | 31.30 | 97.92 | 50.63 |
| Class C | 35.24 | 14.87 | 4.02 | 35.24 | 100.00 | 48.24 |
| Class I1 | 37.76 | 16.15 | 5.21 | 37.76 | 111.38 | 66.10 |
| Class R11 | 36.84 | 15.37 | 4.46 | 36.84 | 104.38 | 54.67 |
| Class R21,2 | 37.53 | 15.73 | 4.74 | 37.53 | 107.62 | 58.94 |
| Class R31,2 | 37.01 | 15.43 | 4.49 | 37.01 | 104.92 | 55.08 |
| Class R41,2 | 37.66 | 15.83 | 4.82 | 37.66 | 108.52 | 60.19 |
| Class R51,2 | 37.87 | 16.11 | 5.11 | 37.87 | 111.03 | 64.57 |
| Class R61,2 | 37.80 | 16.20 | 5.22 | 37.80 | 111.85 | 66.29 |
| index† | 28.29 | 14.06 | 7.81 | 28.29 | 93.01 | 112.09 |
Performance figures assume all distributions have been reinvested. Figures reflect maximum sales charges on Class A shares of 5% and the applicable contingent deferred sales charge (CDSC) on Class B and Class C shares. The returns for Class C shares have been adjusted to reflect the elimination of the front-end sales charge effective 7-15-04. The Class B shares’ CDSC declines annually between years 1 to 6 according to the following schedule: 5%, 4%, 3%, 3%, 2%, 1%. No sales charge will be assessed after the sixth year. Class C shares held for less than one year are subject to a 1% CDSC. Sales charges are not applicable to Class I, Class R1, Class R2, Class R3, Class R4, Class R5, and Class R6 shares.
The expense ratios of the fund, both net (including any fee waivers or expense limitations) and gross (excluding any fee waivers or expense limitations), are set forth according to the most recent publicly available prospectuses for the fund and may differ from those disclosed in the Financial highlights tables in this report. For all classes except Class R4, the net expenses equal the gross expenses. The expense ratios are as follows:
| Class A | Class B | Class C | Class I | Class R1 | Class R2 | Class R3 | Class R4* | Class R5 | Class R6 | |
| Net/Gross (%) | 1.27 | 2.02 | 2.02 | 0.93 | 1.59 | 1.34 | 1.50 | 1.19 | 0.89 | 0.85 |
The net expense ratio for Class R4 is 1.09%.
* The fund’s distributor has contractually agreed to waive 0.10% of Rule 12b-1 fees for Class R4 shares. The current waiver agreement will remain in effect through February 28, 2014, unless renewed by mutual agreement of the fund and the distributor based upon a determination that this is appropriate under the circumstances at that time.
The returns reflect past results and should not be considered indicative of future performance. The return and principal value of an investment will fluctuate so that shares, when redeemed, may be worth more or less than their original cost. Due to market volatility, the fund’s current performance may be higher or lower than the performance shown. For performance data current to the most recent month end, please call 800-225-5291 or visit the fund’s website at jhinvestments.com.
The performance table above and the chart on the next page do not reflect the deduction of taxes that a shareholder would pay on fund distributions or the redemption of fund shares. The fund’s performance results reflect any applicable fee waivers or expense reductions, without which the expenses would increase and results would have been less favorable.
† Index is the Russell 1000 Value Index.
See the following page for footnotes.
| 6 | Classic Value Fund | Annual report |
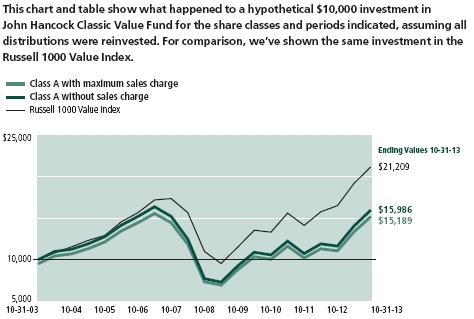
| With maximum | Without | |||
| Start date | sales charge | sales charge | Index | |
| Class B3 | 10-31-03 | $15,063 | $15,063 | $21,209 |
| Class C3 | 10-31-03 | 14,824 | 14,824 | 21,209 |
| Class I1 | 10-31-03 | 16,610 | 16,610 | 21,209 |
| Class R11 | 10-31-03 | 15,467 | 15,467 | 21,209 |
| Class R21 | 10-31-03 | 15,894 | 15,894 | 21,209 |
| Class R31 | 10-31-03 | 15,508 | 15,508 | 21,209 |
| Class R41 | 10-31-03 | 16,019 | 16,019 | 21,209 |
| Class R51 | 10-31-03 | 16,457 | 16,457 | 21,209 |
| Class R61 | 10-31-03 | 16,629 | 16,629 | 21,209 |
Performance of the classes will vary based on the difference in sales charges paid by shareholders investing in the different classes and the fee structure of those classes.
The Class C shares investment with a maximum sales charge has been adjusted to reflect the elimination of the front-end sales charge effective 7-15-04.
Russell 1000 Value Index is an unmanaged index containing those securities in the Russell 1000 Index with a less-than-average growth orientation.
It is not possible to invest directly in an index. Index figures do not reflect expenses or sales charges, which would have resulted in lower values.
Footnotes related to performance pages
1 For certain types of investors, as described in the fund’s prospectuses.
2 6-24-96 is the inception date for the oldest class of shares, Class A shares. Class R3, Class R4, and Class R5 shares were first offered on 5-22-09; Class R6 shares were first offered on 9-1-11; Class R2 shares were first offered on 3-1-12. The returns prior to these dates are those of Class A shares that have been recalculated to apply the gross fees and expenses of Class R3, Class R4, Class R5, Class R6, and Class R2 shares, as applicable.
3 The contingent deferred sales charge is not applicable.
| Annual report | Classic Value Fund | 7 |
Management’s discussion of
Fund performance
By Pzena Investment Management, LLC
The economic recovery during the 12 months ended October 31, 2013, has been slow and gradual. Historically, deep recessions have been followed by brisk economic recoveries. The exception has been those recoveries following large-scale global financial crises like the one experienced in 2007–2009, which tend to exhibit slower growth. This has been the case with the current recovery, with the exception of housing and automotive, which we view to be in the middle stages of recovery. U.S. stocks recorded double-digit gains for the period, appreciating more rapidly than economic growth would indicate.
For the 12 months ended October 31, 2013, John Hancock Classic Value Fund’s Class A shares rose 37.32%, excluding sales charges, outperforming the 28.29% gain of the fund’s benchmark, the Russell 1000 Value Index, and the 26.84% advance of its peer group average, the Morningstar, Inc. large value fund category.† The financials sector was the fund’s largest source of relative outperformance over the period, due primarily to stock selection. Among the top contributors were investment banking firm Morgan Stanley, custodian bank State Street Corp., and diversified insurer ING US, Inc. Within the information technology sector, the fund’s relative outperformance was driven by both stock selection and an overweight in this solidly performing market segment. The most impressive holding within the sector was computer hardware, software, and service company Hewlett-Packard Company (HP), whose share price was up 80% over the 12 months. The largest detractors over the period came from the fund’s out-of-index energy holdings BP PLC and Royal Dutch Shell PLC. Although the share prices of these giant energy companies were up over the period, they lagged the gains realized by the overall market, which hurt the fund’s performance relative to its benchmark.
This commentary reflects the views of the portfolio managers through the end of the period discussed in this report. As such, they are in no way guarantees of future events and are not intended to be used as investment advice or a recommendation regarding any specific security. They are also subject to change at any time as market and other conditions warrant.
Past performance is no guarantee of future results.
† Figures from Morningstar, Inc. include reinvested distributions and do not take into account sales charges. Actual load-adjusted performance is lower.
| 8 | Classic Value Fund | Annual report |
Your expenses
These examples are intended to help you understand your ongoing operating expenses of investing in the fund so you can compare these costs with the ongoing costs of investing in other mutual funds.
Understanding fund expenses
As a shareholder of the fund, you incur two types of costs:
■ Transaction costs, which include sales charges (loads) on purchases or redemptions (varies by share class), minimum account fee charge, etc.
■ Ongoing operating expenses, including management fees, distribution and service fees (if applicable), and other fund expenses.
We are going to present only your ongoing operating expenses here.
Actual expenses/actual returns
This example is intended to provide information about the fund’s actual ongoing operating expenses and is based on the fund’s actual return. It assumes an account value of $1,000.00 on May 1, 2013, with the same investment held until October 31, 2013.
| Account value | Ending value | Expenses paid during | |
| on 5-1-13 | on 10-31-13 | period ended 10-31-131 | |
| Class A | $1,000.00 | $1,136.10 | $6.51 |
| Class B | 1,000.00 | 1,132.00 | 10.53 |
| Class C | 1,000.00 | 1,132.10 | 10.53 |
| Class I | 1,000.00 | 1,137.90 | 4.96 |
| Class R1 | 1,000.00 | 1,134.40 | 8.39 |
| Class R2 | 1,000.00 | 1,137.00 | 5.66 |
| Class R3 | 1,000.00 | 1,135.30 | 7.43 |
| Class R4 | 1,000.00 | 1,137.90 | 5.23 |
| Class R5 | 1,000.00 | 1,138.80 | 4.37 |
| Class R6 | 1,000.00 | 1,138.30 | 4.47 |
Together with the value of your account, you may use this information to estimate the operating expenses that you paid over the period. Simply divide your account value at October 31, 2013, by $1,000.00, then multiply it by the “expenses paid” for your share class from the table above. For example, for an account value of $8,600.00, the operating expenses should be calculated as follows:
| Annual report | Classic Value Fund | 9 |
Your expenses
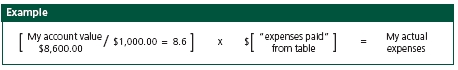
Hypothetical example for comparison purposes
This table allows you to compare the fund’s ongoing operating expenses with those of any other fund. It provides an example of the fund’s hypothetical account values and hypothetical expenses based on each class’s actual expense ratio and an assumed 5% annualized return before expenses (which is not the fund’s actual return). It assumes an account value of $1,000.00 on May 1, 2013, with the same investment held until October 31, 2013. Look in any other fund shareholder report to find its hypothetical example and you will be able to compare these expenses. Please remember that these hypothetical account values and expenses may not be used to estimate the actual ending account balance or expenses you paid for the period.
| Account value | Ending value | Expenses paid during | |
| on 5-1-13 | on 10-31-13 | period ended 10-31-131 | |
| Class A | $1,000.00 | $1,019.10 | $6.16 |
| Class B | 1,000.00 | 1,015.30 | 9.96 |
| Class C | 1,000.00 | 1,015.30 | 9.96 |
| Class I | 1,000.00 | 1,020.60 | 4.69 |
| Class R1 | 1,000.00 | 1,017.30 | 7.93 |
| Class R2 | 1,000.00 | 1,019.90 | 5.35 |
| Class R3 | 1,000.00 | 1,018.20 | 7.02 |
| Class R4 | 1,000.00 | 1,020.30 | 4.94 |
| Class R5 | 1,000.00 | 1,021.10 | 4.13 |
| Class R6 | 1,000.00 | 1,021.00 | 4.23 |
Remember, these examples do not include any transaction costs, therefore, these examples will not help you to determine the relative total costs of owning different funds. If transaction costs were included, your expenses would have been higher. See the prospectuses for details regarding transaction costs.
1 Expenses are equal to the fund’s annualized expense ratio of 1.21%, 1.96%, 1.96%, 0.92%, 1.56%, 1.05%, 1.38%, 0.97%, 0.81%, and 0.83% for Class A, Class B, Class C, Class I, Class R1, Class R2, Class R3, Class R4, Class R5, and Class R6 shares, respectively, multiplied by the average account value over the period, multiplied by 184/365 (to reflect the one-half year period).
| 10 | Classic Value Fund | Annual report |
Portfolio summary
| Top 10 Holdings (35.7% of Net Assets on 10-31-13)1,2 | ||||
| Royal Dutch Shell PLC, ADR | 4.8% | Axis Capital Holdings, Ltd. | 3.3% | |
| BP PLC, ADR | 4.3% | American International Group, Inc. | 3.2% | |
| Hewlett-Packard Company | 4.3% | Microsoft Corp. | 3.1% | |
| Baker Hughes, Inc. | 3.5% | Omnicom Group, Inc. | 3.0% | |
| Oracle Corp. | 3.4% | Staples, Inc. | 2.8% | |
| Sector Composition1,3 | ||||
| Financials | 36.0% | Health Care | 8.9% | |
| Energy | 14.9% | Industrials | 5.9% | |
| Information Technology | 13.7% | Utilities | 2.3% | |
| Consumer Discretionary | 13.5% | Short-Term Investments & Other | 4.8% | |
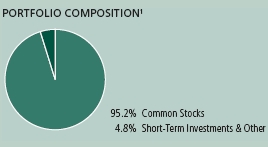
1 As a percentage of net assets on 10-31-13.
2 Cash and cash equivalents not included.
3 Value stocks may decline in price. Foreign investing, especially in emerging markets, has additional risks, such as currency and market volatility and political and social instability. A portfolio concentrated in one sector or that holds a limited number of securities may fluctuate more than a diversified portfolio. Sector investing is subject to greater risks than the market as a whole. Because the fund may focus on particular sectors of the economy, its performance may depend on the performance of those sectors and investments focused in one sector may fluctuate more widely than investments diversified across sectors. Please see the fund’s prospectuses for additional risks.
| Annual report | Classic Value Fund | 11 |
Fund’s investments
As of 10-31-13
| Shares | Value | |
| Common Stocks 95.2% | $2,486,544,352 | |
| (Cost $1,981,072,438) | ||
| Consumer Discretionary 13.5% | 351,995,396 | |
| Auto Components 3.9% | ||
| Delphi Automotive PLC | 857,250 | 49,034,700 |
| TRW Automotive Holdings Corp. (I) | 702,950 | 52,798,575 |
| Automobiles 2.1% | ||
| General Motors Company (I) | 1,443,900 | 53,352,105 |
| Media 4.7% | ||
| News Corp., Class A (I) | 1,295,168 | 22,794,957 |
| News Corp., Class B (I) | 1,143,401 | 20,501,180 |
| Omnicom Group, Inc. | 1,165,456 | 79,379,208 |
| Specialty Retail 2.8% | ||
| Staples, Inc. (L) | 4,598,925 | 74,134,671 |
| Energy 14.9% | 389,590,708 | |
| Energy Equipment & Services 3.5% | ||
| Baker Hughes, Inc. | 1,595,368 | 92,674,927 |
| Oil, Gas & Consumable Fuels 11.4% | ||
| BP PLC, ADR | 2,418,902 | 112,478,943 |
| Exxon Mobil Corp. | 661,398 | 59,274,489 |
| Royal Dutch Shell PLC, ADR | 1,877,623 | 125,162,349 |
| Financials 36.0% | 941,395,466 | |
| Capital Markets 12.8% | ||
| Franklin Resources, Inc. | 1,011,600 | 54,484,776 |
| Invesco, Ltd. | 1,764,725 | 59,559,469 |
| Morgan Stanley | 1,964,850 | 56,450,141 |
| State Street Corp. | 532,985 | 37,346,259 |
| The Goldman Sachs Group, Inc. | 384,950 | 61,923,057 |
| UBS AG (I)(L) | 3,383,329 | 65,501,249 |
| Commercial Banks 3.7% | ||
| Comerica, Inc. | 826,720 | 35,796,976 |
| PNC Financial Services Group, Inc. | 819,178 | 60,234,158 |
| Diversified Financial Services 8.3% | ||
| Bank of America Corp. | 3,450,700 | 48,171,772 |
| Citigroup, Inc. | 1,225,592 | 59,784,378 |
| ING US, Inc. | 1,577,275 | 48,927,071 |
| JPMorgan Chase & Company | 1,167,275 | 60,161,354 |
| 12 | Classic Value Fund | Annual report | See notes to financial statements |
| Shares | Value | ||
| Insurance 11.2% | |||
| American International Group, Inc. | 1,601,259 | $82,705,027 | |
| Axis Capital Holdings, Ltd. | 1,825,310 | 86,556,200 | |
| MetLife, Inc. | 1,564,025 | 73,994,023 | |
| Willis Group Holdings PLC | 1,104,938 | 49,799,556 | |
| Health Care 8.9% | 230,953,424 | ||
| Health Care Equipment & Supplies 4.1% | |||
| Abbott Laboratories | 1,485,235 | 54,285,339 | |
| Becton, Dickinson and Company (L) | 504,496 | 53,037,664 | |
| Health Care Providers & Services 4.8% | |||
| Cigna Corp. | 837,100 | 64,439,958 | |
| Laboratory Corp. of America Holdings (I)(L) | 586,625 | 59,190,463 | |
| Industrials 5.9% | 153,772,975 | ||
| Aerospace & Defense 2.0% | |||
| L-3 Communications Holdings, Inc. | 532,823 | 53,522,070 | |
| Building Products 1.7% | |||
| Masco Corp. | 2,081,410 | 43,980,193 | |
| Machinery 2.2% | |||
| Parker Hannifin Corp. | 482,100 | 56,270,712 | |
| Information Technology 13.7% | 358,823,663 | ||
| Computers & Peripherals 4.3% | |||
| Hewlett-Packard Company | 4,577,704 | 111,558,646 | |
| Electronic Equipment, Instruments & Components 1.9% | |||
| TE Connectivity, Ltd. | 971,211 | 50,007,654 | |
| Internet Software & Services 1.0% | |||
| Google, Inc., Class A (I) | 25,600 | 26,382,848 | |
| Software 6.5% | |||
| Microsoft Corp. | 2,299,400 | 81,283,790 | |
| Oracle Corp. | 2,674,350 | 89,590,725 | |
| Utilities 2.3% | 60,012,720 | ||
| Electric Utilities 2.3% | |||
| Entergy Corp. | 927,267 | 60,012,720 | |
| Yield (%) | Shares | Value | |
| Securities Lending Collateral 2.2% | $56,516,360 | ||
| (Cost $56,508,575) | |||
| John Hancock Collateral Investment Trust (W) | 0.1934 (Y) | 5,647,005 | 56,516,360 |
| See notes to financial statements | Annual report | Classic Value Fund | 13 |
| Par value | Value | |
| Short-Term Investments 5.7% | $150,200,000 | |
| (Cost $150,200,000) | ||
| Repurchase Agreement 5.7% | 150,200,000 | |
| Repurchase Agreement with State Street Corp. dated 10-31-13 at | ||
| 0.000% to be repurchased at $150,200,000 on 11-1-13, collateralized | ||
| by $148,655,000 U.S. Treasury Notes, 1.500% due 7-31-16 (valued at | ||
| $153,207,559, including interest) | $150,200,000 | 150,200,000 |
| Total investments (Cost $2,187,781,013)† 103.1% | $2,693,260,712 | |
| Other assets and liabilities, net (3.1%) | ($80,146,135) | |
| Total net assets 100.0% | $2,613,114,577 | |
The percentage shown for each investment category is the total value of that category as a percentage of the net assets of the fund.
ADR American Depositary Receipts
(I) Non-income producing security.
(L) A portion of this security is on loan as of 10-31-13.
(W) Investment is an affiliate of the fund, the advisor and/or subadvisor. This investment represents collateral received for securities lending.
(Y) The rate shown is the annualized seven-day yield as of 10-31-13.
† At 10-31-13, the aggregate cost of investment securities for federal income tax purposes was $2,252,180,924. Net unrealized appreciation aggregated $441,079,788, of which $472,191,020 related to appreciated investment securities and $31,111,232 related to depreciated investment securities.
The fund had the following country concentration as a percentage of total net assets on 10-31-13:
| United States | 79.4% | |
| United Kingdom | 8.1% | |
| Netherlands | 4.8% | |
| Switzerland | 4.4% | |
| Bermuda | 3.3% | |
| Total | 100.0% |
| 14 | Classic Value Fund | Annual report | See notes to financial statements |
F I N A N CI A L S T A T E M EN T S
Financial statements
Statement of assets and liabilities 10-31-13
This Statement of assets and liabilities is the fund’s balance sheet. It shows the value of what the fund owns, is due and owes. You’ll also find the net asset value and the maximum offering price per share.
| Assets | |
| Investments in unaffiliated issuers, at value (Cost $2,131,272,438) | |
| including $55,881,171 of securities loaned) | $2,636,744,352 |
| Investments in affiliated issuers, at value (Cost $56,508,575) | 56,516,360 |
| Total investments, at value (Cost $2,187,781,013) | 2,693,260,712 |
| Cash | 994 |
| Receivable for investments sold | 3,930,412 |
| Receivable for fund shares sold | 7,977,109 |
| Dividends and interest receivable | 1,381,231 |
| Receivable for securities lending income | 9,419 |
| Other receivables and prepaid expenses | 205,206 |
| Total assets | 2,706,765,083 |
| Liabilities | |
| Payable for investments purchased | 31,188,369 |
| Payable for fund shares repurchased | 3,429,631 |
| Payable upon return of securities loaned | 56,474,875 |
| Payable to affiliates | |
| Accounting and legal services fees | 81,831 |
| Transfer agent fees | 279,891 |
| Distribution and service fees | 198,103 |
| Trustees’ fees | 104,918 |
| Investment management fees | 1,621,789 |
| Other liabilities and accrued expenses | 271,099 |
| Total liabilities | 93,650,506 |
| Net assets | $2,613,114,577 |
| Net assets consist of | |
| Paid-in capital | $4,190,991,947 |
| Undistributed net investment income | 22,710,183 |
| Accumulated net realized gain (loss) on investments | (2,106,067,252) |
| Net unrealized appreciation (depreciation) on investments | 505,479,699 |
| Net assets | $2,613,114,577 |
| See notes to financial statements | Annual report | Classic Value Fund | 15 |
F I N A N CI A L S T A T E M EN T S
Statement of assets and liabilities (continued)
| Net asset value per share | |
| Based on net asset values and shares outstanding — the fund has an | |
| unlimited number of shares authorized with no par value | |
| Class A ($475,502,444 ÷ 20,566,911 shares)1 | $23.12 |
| Class B ($17,869,434 ÷ 786,618 shares)1 | $22.72 |
| Class C ($94,536,913 ÷ 4,162,969 shares)1 | $22.71 |
| Class I ($2,017,892,306 ÷ 87,024,414 shares) | $23.19 |
| Class R1 ($5,860,020 ÷ 253,336 shares) | $23.13 |
| Class R2 ($456,667 ÷ 19,719 shares) | $23.16 |
| Class R3 ($385,273 ÷ 16,690 shares) | $23.08 |
| Class R4 ($51,579 ÷ 2,224 shares) | $23.19 |
| Class R5 ($59,634 ÷ 2,568 shares) | $23.22 |
| Class R6 ($500,307 ÷ 21,552 shares) | $23.21 |
| Maximum offering price per share | |
| Class A (net asset value per share ÷ 95%)2 | $24.34 |
1 Redemption price is equal to net asset value less any applicable contingent deferred sales charge.
2 On single retail sales of less than $50,000. On sales of $50,000 or more and on group sales the offering price is reduced.
| 16 | Classic Value Fund | Annual report | See notes to financial statements |
F I N A N CI A L S T A T E M EN T S
Statement of operations For the year ended 10-31-13
This Statement of operations summarizes the fund’s investment income earned and expenses incurred in operating the fund. It also shows net gains (losses) for the period stated.
| Investment income | |
| Dividends | $46,437,023 |
| Securities lending | 394,231 |
| Interest | 4,237 |
| Total investment income | 46,835,491 |
| Expenses | |
| Investment management fees | 16,437,177 |
| Distribution and service fees | 2,241,181 |
| Accounting and legal services fees | 387,509 |
| Transfer agent fees | 2,627,667 |
| Trustees’ fees | 80,862 |
| State registration fees | 209,561 |
| Printing and postage | 231,036 |
| Professional fees | 105,584 |
| Custodian fees | 204,932 |
| Registration and filing fees | 49,901 |
| Other | 49,279 |
| Total expenses | 22,624,689 |
| Less expense reductions | (56,979) |
| Net expenses | 22,567,710 |
| Net investment income | 24,267,781 |
| Realized and unrealized gain (loss) | |
| Net realized gain (loss) on | |
| Investments in unaffiliated issuers | 118,501,300 |
| Investments in affiliated issuers | 11,311 |
| 118,512,611 | |
| Change in net unrealized appreciation (depreciation) of | |
| Investments in unaffiliated issuers | 507,746,514 |
| Investments in affiliated issuers | 6,759 |
| 507,753,273 | |
| Net realized and unrealized gain | 626,265,884 |
| Increase in net assets from operations | $650,533,665 |
| See notes to financial statements | Annual report | Classic Value Fund | 17 |
F I N A N CI A L S T A T E M EN T S
Statements of changes in net assets
These Statements of changes in net assets show how the value of the fund’s net assets has changed during the last two periods. The difference reflects earnings less expenses, any investment gains and losses, distributions, if any, paid to shareholders and the net of fund share transactions.
| Year | Year | |
| ended | ended | |
| 10-31-13 | 10-31-12 | |
| Increase (decrease) in net assets | ||
| From operations | ||
| Net investment income | $24,267,781 | $21,721,167 |
| Net realized gain | 118,512,611 | 27,316,049 |
| Change in net unrealized appreciation (depreciation) | 507,753,273 | 81,908,525 |
| Increase in net assets resulting from operations | 650,533,665 | 130,945,741 |
| Distributions to shareholders | ||
| From net investment income | ||
| Class A | (4,447,391) | (5,161,307) |
| Class B | (84,926) | (82,021) |
| Class C | (294,696) | (203,907) |
| Class I | (13,972,213) | (13,454,101) |
| Class R1 | (31,871) | (34,000) |
| Class R2 | (1,320) | — |
| Class R3 | (891) | (632) |
| Class R4 | (514) | (413) |
| Class R5 | (624) | (599) |
| Class R6 | (1,654) | (1,489) |
| Total distributions | (18,836,100) | (18,938,469) |
| From fund share transactions | 470,927,923 | (154,857,072) |
| Total increase (decrease) | 1,102,625,488 | (42,849,800) |
| Net assets | ||
| Beginning of year | 1,510,489,089 | 1,553,338,889 |
| End of year | $2,613,114,577 | $1,510,489,089 |
| Undistributed net investment income | $22,710,183 | $16,437,589 |
| ||
| 18 | Classic Value Fund | Annual report | See notes to financial statements |
Financial highlights
The Financial highlights show how the fund’s net asset value for a share has changed during the period.
| CLASS A SHARES Period ended | 10-31-13 | 10-31-12 | 10-31-11 | 10-31-10 | 10-31-09 |
| Per share operating performance | |||||
| Net asset value, beginning of period | $17.02 | $15.86 | $15.64 | $13.77 | $12.38 |
| Net investment income1 | 0.20 | 0.20 | 0.10 | 0.07 | 0.14 |
| Net realized and unrealized gain on investments | 6.09 | 1.12 | 0.15 | 1.91 | 2.02 |
| Total from investment operations | 6.29 | 1.32 | 0.25 | 1.98 | 2.16 |
| Less distributions | |||||
| From net investment income | (0.19) | (0.16) | (0.03) | (0.11) | (0.34) |
| From net realized gain | — | — | — | — | (0.43) |
| Total distributions | (0.19) | (0.16) | (0.03) | (0.11) | (0.77) |
| Net asset value, end of period | $23.12 | $17.02 | $15.86 | $15.64 | $13.77 |
| Total return (%)2,3 | 37.32 | 8.45 | 1.59 | 14.48 | 19.84 |
| Ratios and supplemental data | |||||
| Net assets, end of period (in millions) | $476 | $417 | $557 | $931 | $1,544 |
| Ratios (as a percentage of average net assets): | |||||
| Expenses before reductions | 1.25 | 1.31 | 1.30 | 1.41 | 1.604 |
| Expenses net of fee waivers and credits | 1.25 | 1.31 | 1.30 | 1.33 | 1.334 |
| Net investment income | 1.00 | 1.24 | 0.59 | 0.47 | 1.27 |
| Portfolio turnover (%) | 30 | 37 | 37 | 55 | 47 |
1 Based on the average daily shares outstanding.
2 Does not reflect the effect of sales charges, if any.
3 Total returns would have been lower had certain expenses not been reduced during the applicable periods shown.
4 Includes the impact of proxy expenses, which amounted to 0.03% of average net assets.
| CLASS B SHARES Period ended | 10-31-13 | 10-31-12 | 10-31-11 | 10-31-10 | 10-31-09 |
| Per share operating performance | |||||
| Net asset value, beginning of period | $16.73 | $15.58 | $15.45 | $13.62 | $12.19 |
| Net investment income (loss)1 | 0.07 | 0.08 | (0.03) | (0.04) | 0.06 |
| Net realized and unrealized gain on investments | 5.98 | 1.10 | 0.16 | 1.89 | 2.01 |
| Total from investment operations | 6.05 | 1.18 | 0.13 | 1.85 | 2.07 |
| Less distributions | |||||
| From net investment income | (0.06) | (0.03) | — | (0.02) | (0.21) |
| From net realized gain | — | — | — | — | (0.43) |
| Total distributions | (0.06) | (0.03) | — | (0.02) | (0.64) |
| Net asset value, end of period | $22.72 | $16.73 | $15.58 | $15.45 | $13.62 |
| Total return (%)2,3 | 36.30 | 7.62 | 0.84 | 13.63 | 18.94 |
| Ratios and supplemental data | |||||
| Net assets, end of period (in millions) | $18 | $25 | $41 | $57 | $66 |
| Ratios (as a percentage of average net assets): | |||||
| Expenses before reductions | 2.00 | 2.06 | 2.05 | 2.16 | 2.354 |
| Expenses net of fee waivers and credits | 2.00 | 2.06 | 2.05 | 2.08 | 2.084 |
| Net investment income (loss) | 0.34 | 0.50 | (0.16) | (0.29) | 0.54 |
| Portfolio turnover (%) | 30 | 37 | 37 | 55 | 47 |
1 Based on the average daily shares outstanding.
2 Does not reflect the effect of sales charges, if any.
3 Total returns would have been lower had certain expenses not been reduced during the applicable periods shown.
4 Includes the impact of proxy expenses, which amounted to 0.03% of average net assets.
| See notes to financial statements | Annual report | Classic Value Fund | 19 |
| CLASS C SHARES Period ended | 10-31-13 | 10-31-12 | 10-31-11 | 10-31-10 | 10-31-09 |
| Per share operating performance | |||||
| Net asset value, beginning of period | $16.73 | $15.58 | $15.44 | $13.61 | $12.18 |
| Net investment income (loss)1 | 0.05 | 0.08 | (0.03) | (0.04) | 0.06 |
| Net realized and unrealized gain on investments | 5.99 | 1.10 | 0.17 | 1.89 | 2.01 |
| Total from investment operations | 6.04 | 1.18 | 0.14 | 1.85 | 2.07 |
| Less distributions | |||||
| From net investment income | (0.06) | (0.03) | — | (0.02) | (0.21) |
| From net realized gain | — | — | — | — | (0.43) |
| Total distributions | (0.06) | (0.03) | — | (0.02) | (0.64) |
| Net asset value, end of period | $22.71 | $16.73 | $15.58 | $15.44 | $13.61 |
| Total return (%)2,3 | 36.24 | 7.62 | 0.91 | 13.64 | 18.95 |
| Ratios and supplemental data | |||||
| Net assets, end of period (in millions) | $95 | $81 | $101 | $132 | $155 |
| Ratios (as a percentage of average net assets): | |||||
| Expenses before reductions | 2.00 | 2.06 | 2.05 | 2.16 | 2.344 |
| Expenses net of fee waivers and credits | 2.00 | 2.06 | 2.05 | 2.08 | 2.084 |
| Net investment income (loss) | 0.25 | 0.47 | (0.16) | (0.29) | 0.57 |
| Portfolio turnover (%) | 30 | 37 | 37 | 55 | 47 |
1 Based on the average daily shares outstanding.
2 Does not reflect the effect of sales charges, if any.
3 Total returns would have been lower had certain expenses not been reduced during the applicable periods shown.
4 Includes the impact of proxy expenses, which amounted to 0.03% of average net assets.
| CLASS I SHARES Period ended | 10-31-13 | 10-31-12 | 10-31-11 | 10-31-10 | 10-31-09 |
| Per share operating performance | |||||
| Net asset value, beginning of period | $17.07 | $15.93 | $15.70 | $13.81 | $12.44 |
| Net investment income1 | 0.25 | 0.26 | 0.16 | 0.12 | 0.19 |
| Net realized and unrealized gain on investments | 6.11 | 1.11 | 0.15 | 1.93 | 2.02 |
| Total from investment operations | 6.36 | 1.37 | 0.31 | 2.05 | 2.21 |
| Less distributions | |||||
| From net investment income | (0.24) | (0.23) | (0.08) | (0.16) | (0.41) |
| From net realized gain | — | — | — | — | (0.43) |
| Total distributions | (0.24) | (0.23) | (0.08) | (0.16) | (0.84) |
| Net asset value, end of period | $23.19 | $17.07 | $15.93 | $15.70 | $13.81 |
| Total return (%)2 | 37.76 | 8.78 | 1.98 | 14.95 | 20.32 |
| Ratios and supplemental data | |||||
| Net assets, end of period (in millions) | $2,018 | $982 | $849 | $994 | $636 |
| Ratios (as a percentage of average net assets): | |||||
| Expenses before reductions | 0.94 | 0.97 | 0.94 | 0.92 | 1.033 |
| Expenses net of fee waivers and credits | 0.94 | 0.96 | 0.94 | 0.92 | 0.953 |
| Net investment income | 1.24 | 1.55 | 0.95 | 0.83 | 1.65 |
| Portfolio turnover (%) | 30 | 37 | 37 | 55 | 47 |
1 Based on the average daily shares outstanding.
2 Total returns would have been lower had certain expenses not been reduced during the applicable periods shown.
3 Includes the impact of proxy expenses, which amounted to 0.03% of average net assets.
| 20 | Classic Value Fund | Annual report | See notes to financial statements |
| CLASS R1 SHARES Period ended | 10-31-13 | 10-31-12 | 10-31-11 | 10-31-10 | 10-31-09 |
| Per share operating performance | |||||
| Net asset value, beginning of period | $17.03 | $15.87 | $15.68 | $13.77 | $12.35 |
| Net investment income1 | 0.13 | 0.15 | 0.04 | 0.05 | 0.11 |
| Net realized and unrealized gain on investments | 6.10 | 1.11 | 0.15 | 1.92 | 2.02 |
| Total from investment operations | 6.23 | 1.26 | 0.19 | 1.97 | 2.13 |
| Less distributions | |||||
| From net investment income | (0.13) | (0.10) | — | (0.06) | (0.28) |
| From net realized gain | — | — | — | — | (0.43) |
| Total distributions | (0.13) | (0.10) | — | (0.06) | (0.71) |
| Net asset value, end of period | $23.13 | $17.03 | $15.87 | $15.68 | $13.77 |
| Total return (%)2 | 36.84 | 8.06 | 1.21 | 14.08 | 19.40 |
| Ratios and supplemental data | |||||
| Net assets, end of period (in millions) | $6 | $4 | $5 | $7 | $7 |
| Ratios (as a percentage of average net assets): | |||||
| Expenses before reductions | 1.60 | 1.65 | 1.64 | 1.483 | 1.754 |
| Expenses net of fee waivers and credits | 1.60 | 1.65 | 1.64 | 1.483 | 1.674 |
| Net investment income | 0.63 | 0.88 | 0.24 | 0.30 | 1.01 |
| Portfolio turnover (%) | 30 | 37 | 37 | 55 | 47 |
1 Based on the averge daily shares outstanding.
2 Total returns would have been lower had certain expenses not been reduced during the applicable periods shown.
3 Includes the impact of a revision of 0.25% related to certain expense accruals. Without this adjustment, net
investment income and total return for the year ended 10-31-10 would have been lower.
4 Includes the impact of proxy expenses, which amounted to 0.03% of average net assets.
| CLASS R2 SHARES Period ended | 10-31-13 | 10-31-121 | ||||||
| Per share operating performance | ||||||||
| Net asset value, beginning of period | $17.05 | $17.08 | ||||||
| Net investment income2 | 0.18 | 0.13 | ||||||
| Net realized and unrealized gain (loss) on investments | 6.15 | (0.16) | ||||||
| Total from investment operations | 6.33 | (0.03) | ||||||
| Less distributions | ||||||||
| From net investment income | (0.22) | — | ||||||
| Net asset value, end of period | $23.16 | $17.05 | ||||||
| Total return (%)3 | 37.53 | (0.18)4 | ||||||
| Ratios and supplemental data | ||||||||
| Net assets, end of period (in millions) | —5 | —5 | ||||||
| Ratios (as a percentage of average net assets): | ||||||||
| Expenses before reductions | 1.13 | 1.136 | ||||||
| Expenses net of fee waivers and credits | 1.13 | 1.136 | ||||||
| Net investment income | 0.86 | 1.176 | ||||||
| Portfolio turnover (%) | 30 | 377 | ||||||
1 The inception date for Class R2 shares is 3-1-12.
2 Based on the average daily shares outstanding.
3 Total returns would have been lower had certain expenses not been reduced during the applicable periods shown.
4 Not annualized.
5 Less than $500,000.
6 Annualized.
7 Portfolio turnover is shown for the period from 11-1-11 to 10-31-12.
| See notes to financial statements | Annual report | Classic Value Fund | 21 |
| CLASS R3 SHARES Period ended | 10-31-13 | 10-31-12 | 10-31-11 | 10-31-10 | 10-31-091 |
| Per share operating performance | |||||
| Net asset value, beginning of period | $17.00 | $15.84 | $15.62 | $13.76 | $11.24 |
| Net investment income2 | 0.14 | 0.17 | 0.07 | —3 | —3 |
| Net realized and unrealized gain on investments | 6.10 | 1.12 | 0.15 | 1.93 | 2.52 |
| Total from investment operations | 6.24 | 1.29 | 0.22 | 1.93 | 2.52 |
| Less distributions | |||||
| From net investment income | (0.16) | (0.13) | — | (0.07) | — |
| Net asset value, end of period | $23.08 | $17.00 | $15.84 | $15.62 | $13.76 |
| Total return (%)4 | 37.01 | 8.28 | 1.41 | 14.04 | 22.425 |
| Ratios and supplemental data | |||||
| Net assets, end of period (in millions) | —6 | —6 | —6 | —6 | —6 |
| Ratios (as a percentage of average net assets): | |||||
| Expenses before reductions | 1.42 | 1.48 | 1.48 | 2.76 | 3.337 |
| Expenses net of fee waivers and credits | 1.41 | 1.48 | 1.48 | 1.73 | 1.737 |
| Net investment income (loss) | 0.65 | 1.01 | 0.44 | 0.02 | (0.04)7 |
| Portfolio turnover (%) | 30 | 37 | 37 | 55 | 47 |
1 The inception date for Class R3 shares is 5-22-09.
2 Based on the average daily shares outstanding.
3 Less than $0.005 per share.
4 Total returns would have been lower had certain expenses not been reduced during the applicable periods shown.
5 Not annualized.
6 Less than $500,000.
7 Annualized.
| CLASS R4 SHARES Period ended | 10-31-13 | 10-31-12 | 10-31-11 | 10-31-10 | 10-31-091 |
| Per share operating performance | |||||
| Net asset value, beginning of period | $17.07 | $15.90 | $15.64 | $13.77 | $11.24 |
| Net investment income2 | 0.25 | 0.23 | 0.13 | 0.05 | 0.02 |
| Net realized and unrealized gain on investments | 6.10 | 1.13 | 0.15 | 1.92 | 2.51 |
| Total from investment operations | 6.35 | 1.36 | 0.28 | 1.97 | 2.53 |
| Less distributions | |||||
| From net investment income | (0.23) | (0.19) | (0.02) | (0.10) | — |
| Net asset value, end of period | $23.19 | $17.07 | $15.90 | $15.64 | $13.77 |
| Total return (%)3 | 37.66 | 8.69 | 1.77 | 14.38 | 22.514 |
| Ratios and supplemental data | |||||
| Net assets, end of period (in millions) | —5 | —5 | —5 | —5 | —5 |
| Ratios (as a percentage of average net assets): | |||||
| Expenses before reductions | 1.10 | 1.13 | 1.15 | 2.87 | 3.086 |
| Expenses net of fee waivers and credits | 1.00 | 1.09 | 1.15 | 1.43 | 1.436 |
| Net investment income | 1.23 | 1.41 | 0.76 | 0.34 | 0.266 |
| Portfolio turnover (%) | 30 | 37 | 37 | 55 | 47 |
1 The inception date for Class R4 shares is 5-22-09.
2 Based on the average daily shares outstanding.
3 Total returns would have been lower had certain expenses not been reduced during the applicable periods shown.
4 Not annualized.
5 Less than $500,000.
6 Annualized.
| 22 | Classic Value Fund | Annual report | See notes to financial statements |
| CLASS R5 SHARES Period ended | 10-31-13 | 10-31-12 | 10-31-11 | 10-31-10 | 10-31-091 |
| Per share operating performance | |||||
| Net asset value, beginning of period | $17.09 | $15.94 | $15.67 | $13.79 | $11.24 |
| Net investment income2 | 0.28 | 0.27 | 0.17 | 0.09 | 0.03 |
| Net realized and unrealized gain on investments | 6.11 | 1.11 | 0.15 | 1.93 | 2.52 |
| Total from investment operations | 6.39 | 1.38 | 0.32 | 2.02 | 2.55 |
| Less distributions | |||||
| From net investment income | (0.26) | (0.23) | (0.05) | (0.14) | — |
| Net asset value, end of period | $23.22 | $17.09 | $15.94 | $15.67 | $13.79 |
| Total return (%)3 | 37.87 | 8.85 | 2.07 | 14.72 | 22.694 |
| Ratios and supplemental data | |||||
| Net assets, end of period (in millions) | —5 | —5 | —5 | —5 | —5 |
| Ratios (as a percentage of average net assets): | |||||
| Expenses before reductions | 0.85 | 0.90 | 0.90 | 2.64 | 2.846 |
| Expenses net of fee waivers and credits | 0.85 | 0.90 | 0.90 | 1.13 | 1.136 |
| Net investment income | 1.37 | 1.62 | 1.02 | 0.63 | 0.566 |
| Portfolio turnover (%) | 30 | 37 | 37 | 55 | 47 |
1 The inception date for Class R5 shares is 5-22-09.
2 Based on the average daily shares outstanding.
3 Total returns would have been lower had certain expenses not been reduced during the applicable periods shown.
4 Not annualized.
5 Less than $500,000.
6 Annualized.
| CLASS R6 SHARES Period ended | 10-31-13 | 10-31-12 | 10-31-111 | ||||
| Per share operating performance | |||||||
| Net asset value, beginning of period | $17.09 | $15.93 | $15.38 | ||||
| Net investment income2 | 0.24 | 0.27 | 0.02 | ||||
| Net realized and unrealized gain on investments | 6.13 | 1.12 | 0.53 | ||||
| Total from investment operations | 6.37 | 1.39 | 0.55 | ||||
| Less distributions | |||||||
| From net investment income | (0.25) | (0.23) | — | ||||
| Net asset value, end of period | $23.21 | $17.09 | $15.93 | ||||
| Total return (%)3 | 37.80 | 8.93 | 3.584 | ||||
| Ratios and supplemental data | |||||||
| Net assets, end of period (in millions) | $1 | —5 | —5 | ||||
| Ratios (as a percentage of average net assets): | |||||||
| Expenses before reductions | 0.85 | 0.89 | 0.876 | ||||
| Expenses net of fee waivers and credits | 0.85 | 0.89 | 0.876 | ||||
| Net investment income | 1.13 | 1.61 | 0.906 | ||||
| Portfolio turnover (%) | 30 | 37 | 377 | ||||
1 The inception date for Class R6 shares is 9-1-11.
2 Based on the average daily shares outstanding.
3 Total returns would have been lower had certain expenses not been reduced during the applicable periods shown.
4 Not annualized.
5 Less than $500,000.
6 Annualized.
7 Portfolio turnover is shown for the period from 11-1-10 to 10-31-11.
| See notes to financial statements | Annual report | Classic Value Fund | 23 |
Notes to financial statements
Note 1 — Organization
John Hancock Classic Value Fund (the fund) is a series of John Hancock Capital Series (the Trust), an open-end management investment company organized as a Massachusetts business trust and registered under the Investment Company Act of 1940, as amended (the 1940 Act). The investment objective of the fund is to seek long-term growth of capital.
The fund may offer multiple classes of shares. The shares currently offered are detailed in the Statement of assets and liabilities. Class A and Class C shares are offered to all investors. Class B shares are closed to new investors. Class I shares are offered to institutions and certain investors. Class R1, Class R2, Class R3, Class R4 and Class R5 shares are available only to certain retirement plans. Class R6 shares are available only to certain retirement plans, institutions and other investors. Shareholders of each class have exclusive voting rights to matters that affect that class. The distribution and service fees, if any, and transfer agent fees for each class may differ. Class B shares convert to Class A shares eight years after purchase.
Note 2 — Significant accounting policies
The financial statements have been prepared in conformity with accounting principles generally accepted in the United States of America, which require management to make certain estimates and assumptions as of the date of the financial statements. Actual results could differ from those estimates and those differences could be significant. Events or transactions occurring after the end of the fiscal period through the date that the financial statements were issued have been evaluated in the preparation of the financial statements. The following summarizes the significant accounting policies of the fund:
Security valuation. Investments are stated at value as of the close of regular trading on the New York Stock Exchange (NYSE), normally at 4:00 P.M., Eastern Time. In order to value the securities, the fund uses the following valuation techniques: Equity securities held by the fund are valued at the last sale price or official closing price on the principal securities exchange on which they trade. In the event there were no sales during the day or closing prices are not available, the securities are valued using the last quoted bid or evaluated price. Investments by the fund in open-end mutual funds, including John Hancock Collateral Investment Trust (JHCIT), are valued at their respective net asset values each business day. Foreign securities and currencies are valued in U.S. dollars, based on foreign currency exchange rates supplied by an independent pricing service. Certain securities traded only in the over-the-counter (OTC) market are valued at the last bid price quoted by brokers making markets in the securities at the close of trading. Certain short-term securities with maturities of 60 days or less at the time of purchase are valued at amortized cost. Other portfolio securities and assets, for which reliable market quotations are not readily available, are valued at fair value as determined in good faith by the fund’s Pricing Committee following procedures established by the Board of Trustees. The frequency with which these fair valuation procedures are used cannot be predicted and fair value of securities may differ significantly from the value that would have been used had a ready market for such securities existed.
The fund uses a three-tier hierarchy to prioritize the pricing assumptions, referred to as inputs, used in valuation techniques to measure fair value. Level 1 includes securities valued using quoted prices in active markets for identical securities. Level 2 includes securities valued using other significant observable inputs. Observable inputs may include quoted prices for similar securities, interest rates, prepayment speeds and credit risk. Prices for securities valued using these inputs are received from independent pricing vendors and brokers and are based on an evaluation of the inputs described.
| 24 | Classic Value Fund | Annual report |
Level 3 includes securities valued using significant unobservable inputs when market prices are not readily available or reliable, including the fund’s own assumptions in determining the fair value of investments. Factors used in determining value may include market or issuer specific events or trends, changes in interest rates and credit quality. The inputs or methodology used for valuing securities are not necessarily an indication of the risks associated with investing in those securities. Changes in valuation techniques may result in transfers into or out of an assigned level within the disclosure hierarchy.
As of October 31, 2013, all investments are categorized as Level 1 under the hierarchy described above, except repurchase agreements, which are Level 2.
Repurchase agreements. The fund may enter into repurchase agreements. When the fund enters into a repurchase agreement, it receives collateral that is held in a segregated account by the fund’s custodian. The collateral amount is marked-to-market and monitored on a daily basis to ensure that the collateral held is in an amount not less than the principal amount of the repurchase agreement plus any accrued interest.
Repurchase agreements are typically governed by the terms and conditions of the Master Repurchase Agreement and/or Global Master Repurchase Agreement (collectively, MRA). Upon an event of default, the non-defaulting party may close out all transactions traded under the MRA and net amounts owed. Absent an event of default, the MRA does not result in an offset of the reported amounts of assets and liabilities in the Statement of assets and liabilities. In the event of a default by the counterparty, realization of the collateral proceeds could be delayed, during which time the collateral value may decline or the counterparty may have insufficient assets to pay back claims resulting from close-out of the transactions. Collateral received by the fund for repurchase agreements is disclosed in the Fund’s investments as part of the caption related to the repurchase agreement.
Security transactions and related investment income. Investment security transactions are accounted for on a trade date plus one basis for daily net asset value calculations. However, for financial reporting purposes, investment transactions are reported on trade date. Interest income is accrued as earned. Dividend income is recorded on the ex-date, except for dividends of foreign securities where the dividend may not be known until after the ex-date. In those cases, dividend income, net of withholding taxes, is recorded when the fund becomes aware of the dividends. Foreign taxes are provided for based on the fund’s understanding of the tax rules and rates that exist in the foreign markets in which it invests. Gains and losses on securities sold are determined on the basis of identified cost and may include proceeds from litigation.
Securities lending. The fund may lend its securities to earn additional income. The fund receives cash collateral from the borrower in an amount not less than the market value of the loaned securities. The fund will invest its collateral in JHCIT, an affiliate of the portfolio, which has a floating net asset value (NAV) and is registered with the Securities and Exchange Commission as an investment company. JHCIT invests cash received as collateral as part of the securities lending program in short-term money market investments. The fund will receive the benefit of any gains and bear any losses generated by JHCIT with respect to the cash collateral.
If a borrower fails to return loaned securities when due, then the lending agent is responsible to and indemnifies the fund for the lent securities. The lending agent uses the collateral received from the borrower to purchase replacement securities of the same issue, type, class and series of the loaned securities. If the value of the collateral is less than the purchase cost of replacement securities, the lending agent is responsible for satisfying the shortfall but only to the extent that the shortfall is not due to any decrease in the value of JHCIT.
| Annual report | Classic Value Fund | 25 |
Although the risk of the loss of the securities lent is mitigated by receiving collateral from the borrower and through lending agent indemnification, the fund could experience a delay in recovering its securities or could experience a lower than expected return if the borrower fails to return the securities on a timely basis. The fund may receive compensation for lending its securities by retaining a portion of the return on the investment of the collateral and compensation from fees earned from borrowers of the securities. Net income received from JHCIT is a component of securities lending income as recorded on the Statement of operations.
Obligations to repay collateral received by the fund is shown on the Statement of assets and liabilities as Payable upon return of securities loaned.
Foreign taxes. The fund may be subject to withholding tax on income and/or capital gains or repatriation taxes imposed by certain countries in which the fund invests. Taxes are accrued based upon investment income, realized gains or unrealized appreciation.
Line of credit. The fund may borrow from banks for temporary or emergency purposes, including meeting redemption requests that otherwise might require the untimely sale of securities. Pursuant to the fund’s custodian agreement, the custodian may loan money to the fund to make properly authorized payments. The fund is obligated to repay the custodian for any overdraft, including any related costs or expenses. The custodian may have a lien, security interest or security entitlement in any fund property that is not otherwise segregated or pledged, to the maximum extent permitted by law, to the extent of any overdraft.
In addition, the fund and other affiliated funds have entered into an agreement with Citibank N.A. that enables them to potentially participate in a $300 million unsecured committed line of credit. A commitment fee, payable at the end of each calendar quarter, based on the average daily unused portion of the line of credit, is charged to each participating fund on a pro rata basis and is reflected in other expenses on the Statement of operations. Prior to March 27, 2013, the fund participated in a $100 million unsecured line of credit, also with Citibank N.A., with terms otherwise similar to the existing agreement. Commitment fees for the year ended October 31, 2013 were $2,785.
Expenses. Within the John Hancock funds complex, expenses that are directly attributable to an individual fund are allocated to such fund. Expenses that are not readily attributable to a specific fund are allocated among all funds in an equitable manner, taking into consideration, among other things, the nature and type of expense and the fund’s relative net assets. Expense estimates are accrued in the period to which they relate and adjustments are made when actual amounts are known.
Class allocations. Income, common expenses and realized and unrealized gains (losses) are determined at the fund level and allocated daily to each class of shares based on the net assets of the class. Class-specific expenses, such as distribution and service fees, if any, and transfer agent fees, are calculated daily for each class, based on the net asset value of the class and the applicable specific expense rates.
Federal income taxes. The fund intends to continue to qualify as a regulated investment company by complying with the applicable provisions of the Internal Revenue Code and will not be subject to federal income tax on taxable income that is distributed to shareholders. Therefore, no federal income tax provision is required.
Under the Regulated Investment Company Modernization Act of 2010, the fund is permitted to carry forward capital losses incurred in taxable years beginning after December 22, 2010 for an unlimited period. Any losses incurred during those taxable years will be required to be utilized prior to the losses incurred in pre-enactment taxable years. As a result of this ordering rule, pre-enactment capital loss carryforwards may be more likely to expire unused. Additionally,
| 26 | Classic Value Fund | Annual report |
post-enactment capital losses that are carried forward will retain their character as either short-term or long-term capital losses rather than being considered all short-term as under previous law.
For federal income tax purposes, as of October 31, 2013, the fund has a capital loss carryforward of $2,041,667,342 available to offset future net realized capital gains. These carryforwards expire as follows: October 31, 2016 — $562,455,680 and October 31, 2017 — $1,479,211,662.
As of October 31, 2013, the fund had no uncertain tax positions that would require financial statement recognition, derecognition or disclosure. The fund’s federal tax returns are subject to examination by the Internal Revenue Service for a period of three years.
Distribution of income and gains. Distributions to shareholders from net investment income and net realized gains, if any, are recorded on the ex-date. The fund generally declares and pays dividends and capital gain distributions, if any, annually.
The tax character of distributions for the years ended October 31, 2013 and 2012 was as follows:
| OCTOBER 31, 2013 | OCTOBER 31, 2012 | ||
| Ordinary Income | $18,836,100 | $18,938,469 | |
Distributions paid by the fund with respect to each class of shares are calculated in the same manner, at the same time and in the same amount, except for the effect of class level expenses that may be applied differently to each class. As of October 31, 2013, the components of distributable earnings on a tax basis consisted of $22,757,720 of undistributed ordinary income.
Such distributions and distributable earnings, on a tax basis, are determined in conformity with income tax regulations, which may differ from accounting principles generally accepted in the United States of America. Material distributions in excess of tax basis earnings and profits, if any, are reported in the fund’s financial statements as a return of capital.
Capital accounts within the financial statements are adjusted for permanent book-tax differences. These adjustments have no impact on net assets or the results of operations. Temporary book-tax differences, if any, will reverse in a subsequent period. Book-tax differences are primarily attributable to wash sale loss deferrals and litigation proceeds.
Note 3 — Guarantees and indemnifications
Under the Trust’s organizational documents, its Officers and Trustees are indemnified against certain liabilities arising out of the performance of their duties to the Trust, including the fund. Additionally, in the normal course of business, the fund enters into contracts with service providers that contain general indemnification clauses. The fund’s maximum exposure under these arrangements is unknown, as this would involve future claims that may be made against the fund that have not yet occurred. The risk of material loss from such claims is considered remote.
Note 4 — Fees and transactions with affiliates
John Hancock Advisers, LLC (the Advisor) serves as investment advisor for the fund. John Hancock Funds, LLC (the Distributor), an affiliate of the Advisor, serves as principal underwriter of the fund. The Advisor and the Distributor are indirect, wholly owned subsidiaries of Manulife Financial Corporation (MFC).
Management fee. The fund has an investment management agreement with the Advisor under which the fund pays a monthly management fee to the Advisor equivalent, on an annual basis, to the sum of: (a) 0.75% of the first $2,500,000,000 of the fund’s average daily net assets; (b) 0.74% of the next $2,500,000,000 of the fund’s average daily net assets; and (c) 0.73% of the fund’s average daily net assets in excess of $5,000,000,000. Prior to June 1, 2013, the fund paid a monthly
| Annual report | Classic Value Fund | 27 |
management fee to the Advisor equivalent, on an annual basis, to the sum of: (a) 0.79% of the first $2,500,000,000 of the fund’s average daily net assets; (b) 0.78% of the next $2,500,000,000 of the fund’s average daily net assets; and (c) 0.77% of the fund’s average daily net assets in excess of $5,000,000,000. The Advisor has a subadvisory agreement with Pzena Investment Management, LLC. The fund is not responsible for payment of the subadvisory fees.
Effective June 1, 2013, the Advisor has contractually agreed to waive a portion of its management fee and/or reimburse expenses for certain funds of the John Hancock funds complex, including the fund (the participating portfolios). The waiver equals, on an annualized basis, 0.01% of that portion of the aggregate net assets of all the participating portfolios that exceeds $75 billion but is less than or equal to $125 billion; 0.0125% of that portion of the aggregate net assets of all the participating portfolios that exceeds $125 billion but is less than or equal to $150 billion; and 0.015% of that portion of the aggregate net assets of all the participating portfolios that exceeds $150 billion. The amount of the reimbursement is calculated daily and allocated among all the participating portfolios in proportion to the daily net assets of each fund. This arrangement may be amended or terminated at any time by the Advisor upon notice to the funds and with the approval of the Board of Trustees.
Prior to March 1, 2013 the Advisor had contractually agreed to waive fees and/or reimburse certain expenses for each share class of the fund. This agreement excluded certain expenses such as taxes, brokerage commissions, interest expense, litigation and indemnification expenses and other extraordinary expenses not incurred in the ordinary course of the fund’s business, short dividend expense and acquired fund fees. The fee waivers and/or reimbursements were such that these expenses would not exceed 1.33%, 2.08%, 2.08%, 1.02%, 1.68%, 1.43%, 1.58%, 1.28%, 0.98% and 0.92% for Class A, Class B, Class C, Class I, Class R1, Class R2, Class R3, Class R4, Class R5 and Class R6 shares, respectively.
For the year ended October 31, 2013, these expense reductions amounted to the following:
| CLASS A | CLASS B | CLASS C | CLASS I | CLASS R1 | CLASS R2 | CLASS R3 | CLASS R4 | CLASS R5 | CLASS R6 | TOTAL |
| $10,850 | $445 | $2,118 $43,370 | $123 | $7 | $7 | $1 | $1 | $12 | $56,934 | |
The investment management fees, including the impact of the waivers and/or reimbursements as described above, incurred for the year ended October 31, 2013 were equivalent to a net annual effective rate of 0.77% of the fund’s average daily net assets.
Accounting and legal services. Pursuant to a service agreement, the fund reimburses the Advisor for all expenses associated with providing the administrative, financial, legal, accounting and recordkeeping services to the fund, including the preparation of all tax returns, periodic reports to shareholders and regulatory reports, among other services. These expenses are allocated to each share class based on its relative net assets at the time the expense was incurred. These accounting and legal services fees incurred for the year ended October 31, 2013 amounted to an annual rate of 0.02% of the fund’s average daily net assets.
Distribution and service plans. The fund has a distribution agreement with the Distributor. The fund has adopted distribution and service plans with respect to Class A, Class B, Class C, Class R1, Class R2, Class R3 and Class R4 shares pursuant to Rule 12b-1 under the 1940 Act, to pay the Distributor for services provided as the distributor of shares of the fund. In addition, under a service plan for Class R1, Class R2, Class R3, Class R4 and Class R5 shares, the fund pays for certain other services. The fund pays up to the following contractual rates of distribution and service fees under these arrangements, expressed as an annual percentage of average daily net assets for each class of the fund’s shares.
| 28 | Classic Value Fund | Annual report |
| CLASS | RULE 12b-1 FEE | SERVICE FEE | ||
| Class A | 0.25% | — | ||
| Class B | 1.00% | — | ||
| Class C | 1.00% | — | ||
| Class R1 | 0.50% | 0.25% | ||
| Class R2 | 0.25% | 0.25% | ||
| Class R3 | 0.50% | 0.15% | ||
| Class R4 | 0.25% | 0.10% | ||
| Class R5 | — | 0.05% | ||
The fund’s Distributor has contractually agreed to waive 0.10% of Rule 12b-1 fees for Class R4 shares. The waiver agreement expires on February 28, 2014, unless renewed by mutual agreement of the fund and the Distributor based upon a determination that this is appropriate under the circumstances at the time. Reimbursements related to this contractual waiver amounted to $45 for the year ended October 31, 2013.
Sales charges. Class A shares are assessed up-front sales charges, which resulted in payments to the Distributor amounting to $538,076 for the year ended October 31, 2013. Of this amount, $88,069 was retained and used for printing prospectuses, advertising, sales literature and other purposes, $436,658 was paid as sales commissions to broker-dealers and $13,349 was paid as sales commissions to sales personnel of Signator Investors, Inc., a broker-dealer affiliate of the Advisor.
Class A, Class B and Class C shares may be subject to contingent deferred sales charges (CDSCs). Certain Class A shares that are acquired through purchases of $1 million or more and are redeemed within one year of purchase are subject to a 1.00% sales charge. Class B shares that are redeemed within six years of purchase are subject to CDSCs, at declining rates, beginning at 5.00%. Class C shares that are redeemed within one year of purchase are subject to a 1.00% CDSC. CDSCs are applied to the lesser of the current market value at the time of redemption or the original purchase cost of the shares being redeemed. Proceeds from CDSCs are used to compensate the Distributor for providing distribution-related services in connection with the sale of these shares. During the year ended October 31, 2013, CDSCs received by the Distributor amounted to $2,932, $16,785 and $3,023 for Class A, Class B and Class C shares, respectively.
Transfer agent fees. The fund has a transfer agent agreement with John Hancock Signature Services, Inc. (Signature Services), an affiliate of the Advisor. The transfer agent fees paid to Signature Services are determined based on the cost to Signature Services (Signature Services Cost) of providing recordkeeping services. The Signature Services Cost includes a component of allocated John Hancock corporate overhead for providing transfer agent services to the fund and to all other John Hancock affiliated funds. It also includes out-of-pocket expenses, including payments made to third-parties for recordkeeping services provided to their clients who invest in one or more John Hancock funds. In addition, Signature Services Cost may be reduced by certain fees that Signature Services receives in connection with retirement and small accounts. Signature Services Cost is calculated monthly and allocated, as applicable, to five categories of share classes: Retail Share and Institutional Classes of Non-Municipal Bond Funds, Class R6 Shares, Retirement Share Classes, and Municipal Bond Share Classes. Within each of these categories, the applicable costs are allocated to the affected John Hancock affiliated funds and/or classes, based on the relative average daily net assets.
Prior to October 1, 2013, Signature Services Cost was calculated monthly and allocated, as applicable, to four categories of share classes: Institutional Share Classes, Retirement Share Classes, Municipal Bond Share Classes and all other Retail Share Classes. Within each of these categories, the applicable costs were allocated to the affected John Hancock affiliated funds and/or classes, based on the relative average daily net assets.
| Annual report | Classic Value Fund | 29 |
Class level expenses. Class level expenses for the year ended October 31, 2013 were:
| DISTRIBUTION AND | TRANSFER | |||
| CLASS | SERVICE FEES | AGENT FEES | ||
| Class A | $1,118,249 | $740,539 | ||
| Class B | 213,377 | 35,770 | ||
| Class C | 872,213 | 144,403 | ||
| Class I | — | 1,705,514 | ||
| Class R1 | 35,429 | 1,238 | ||
| Class R2 | 543 | 50 | ||
| Class R3 | 1,258 | 56 | ||
| Class R4 | 112 | 12 | ||
| Class R5 | — | 13 | ||
| Class R6 | — | 72 | ||
| Total | 2,241,181 | 2,627,667 | ||
Trustee expenses. The fund compensates each Trustee who is not an employee of the Advisor or its affiliates. Under the John Hancock Group of funds Deferred Compensation Plan (the Plan), which was terminated in November 2012, certain Trustees could have elected, for tax purposes, to defer receipt of this compensation. Any deferred amounts were invested in various John Hancock funds. The investment of deferred amounts and the offsetting liability are included within Other receivables and prepaid expenses and Payable to affiliates — Trustees’ fees, respectively, in the accompanying Statement of assets and liabilities. Plan assets will be liquidated in accordance with the Plan documents.
Note 5 — Fund share transactions
Transactions in fund shares for the years ended October 31, 2013 and 2012 were as follows:
| Year ended 10-31-13 | Year ended 10-31-12 | |||
| Shares | Amount | Shares | Amount | |
| Class A shares | ||||
| Sold | 3,309,755 | $68,198,272 | 2,187,598 | $36,179,081 |
| Distributions reinvested | 244,120 | 4,242,801 | 284,364 | 4,242,716 |
| Repurchased | (7,484,512) | (149,090,184) | (13,075,936) | (214,564,511) |
| Net decrease | (3,930,637) | ($76,649,111) | (10,603,974) | ($174,142,714) |
| Class B shares | ||||
| Sold | 83,696 | $1,714,456 | 63,662 | $1,030,330 |
| Distributions reinvested | 4,086 | 70,231 | 4,487 | 66,232 |
| Repurchased | (807,414) | (15,767,418) | (1,222,244) | (20,012,221) |
| Net decrease | (719,632) | ($13,982,731) | (1,154,095) | ($18,915,659) |
| Class C shares | ||||
| Sold | 411,076 | $8,548,943 | 195,390 | $3,177,050 |
| Distributions reinvested | 13,083 | 224,894 | 10,268 | 151,554 |
| Repurchased | (1,124,381) | (21,924,454) | (1,804,459) | (29,356,479) |
| Net decrease | (700,222) | ($13,150,617) | (1,598,801) | ($26,027,875) |
| Class I shares | ||||
| Sold | 49,127,030 | $973,418,801 | 28,218,032 | $464,651,734 |
| Distributions reinvested | 680,619 | 11,835,972 | 776,085 | 11,579,181 |
| Repurchased | (20,319,128) | (411,548,827) | (24,750,714) | (410,620,923) |
| Net increase | 29,488,521 | $573,705,946 | 4,243,403 | $65,609,992 |
| 30 | Classic Value Fund | Annual report |
| Year ended 10-31-13 | Year ended 10-31-12 | |||
| Shares | Amount | Shares | Amount | |
| Class R1 shares | ||||
| Sold | 74,870 | $1,571,075 | 48,217 | $796,756 |
| Distributions reinvested | 1,665 | 29,057 | 1,937 | 29,016 |
| Repurchased | (75,071) | (1,455,208) | (137,889) | (2,316,737) |
| Net increase (decrease) | 1,464 | $144,924 | (87,735) | ($1,490,965) |
| Class R2 shares1 | ||||
| Sold | 15,670 | $342,245 | 5,855 | $100,000 |
| Repurchased | (1,806) | (41,038) | — | — |
| Net increase | 13,864 | $301,207 | 5,855 | $100,000 |
| Class R3 shares | ||||
| Sold | 12,278 | $250,954 | 974 | $16,129 |
| Distributions reinvested | 31 | 536 | 23 | 337 |
| Repurchased | (1,062) | (22,424) | (210) | (3,560) |
| Net increase | 11,247 | $229,066 | 787 | $12,906 |
| Class R5 shares | ||||
| Sold | 146 | $3,180 | 358 | $6,047 |
| Distributions reinvested | 3 | 56 | 6 | 93 |
| Repurchased | (22) | (481) | (525) | (8,897) |
| Net increase (decrease) | 127 | $2,755 | (161) | ($2,757) |
| Class R6 shares | ||||
| Sold | 17,218 | $373,839 | — | — |
| Repurchased | (2,168) | (47,355) | — | — |
| Net increase | 15,050 | $326,484 | — | — |
| Total net increase (decrease) | 24,179,782 | $470,927,923 | (9,194,721) | ($154,857,072) |
1 Period from 3-1-12 (inception date) to 10-31-12.
Class R4 shares had no fund share transactions for the years ended October 31, 2013 and 2012.
Affiliates of the fund owned 30%, 13%, 100%, 87%, and 30% of shares of beneficial interest of Class R2, Class R3, Class R4, Class R5, and Class R6, respectively, on October 31, 2013.
Note 6 — Purchase and sale of securities
Purchases and sales of securities, other than short-term securities, amounted to $1,004,197,905 and $609,692,365, respectively, for the year ended October 31, 2013.
| Annual report | Classic Value Fund | 31 |
Auditor’s report
Report of Independent Registered Public Accounting Firm
To the Board of Trustees of John Hancock Capital Series and the
Shareholders of John Hancock Classic Value Fund:
In our opinion, the accompanying statement of assets and liabilities, including the portfolio of investments, and the related statements of operations and of changes in net assets and the financial highlights present fairly, in all material respects, the financial position of John Hancock Classic Value Fund (the “Fund”) at October 31, 2013, the results of its operations for the year then ended, the changes in its net assets for each of the two years in the period then ended and the financial highlights for each of the periods indicated, in conformity with accounting principles generally accepted in the United States of America. These financial statements and financial highlights (hereafter referred to as “financial statements”) are the responsibility of the Fund’s management; our responsibility is to express an opinion on these financial statements based on our audits. We conducted our audits of these financial statements in accordance with the standards of the Public Company Accounting Oversight Board (United States). Those standards require that we plan and perform the audit to obtain reasonable assurance about whether the financial statements are free of material misstatement. An audit includes examining, on a test basis, evidence supporting the amounts and disclosures in the financial statements, assessing the accounting principles used and significant estimates made by management, and evaluating the overall financial statement presentation. We believe that our audits, which included confirmation of securities at October 31, 2013 by correspondence with the custodian, transfer agent and brokers, and the application of alternative auditing procedures where securities purchased confirmations had not been received, provide a reasonable basis for our opinion.
PricewaterhouseCoopers LLP
Boston, Massachusetts
December 20, 2013
| 32 | Classic Value Fund | Annual report |
Tax information
Unaudited
For federal income tax purposes, the following information is furnished with respect to the distributions of the fund, if any, paid during its taxable year ended October 31, 2013.
The fund reports the maximum amount allowable of its net taxable income as eligible for the corporate dividends-received deduction.
The fund reports the maximum amount allowable of its net taxable income as qualified dividend income as provided in the Jobs and Growth Tax Relief Reconciliation Act of 2003.
Eligible shareholders will be mailed a 2013 Form 1099-DIV in early 2014. This will reflect the tax character of all distributions paid in calendar year 2013.
Please consult a tax advisor regarding the tax consequences of your investment in the fund.
| Annual report | Classic Value Fund | 33 |
Continuation of Investment Advisory and Subadvisory Agreements
Evaluation of Advisory and Subadvisory Agreements by the Board of Trustees
This section describes the evaluation by the Board of Trustees (the Board) of John Hancock Capital Series (the Trust) of the Advisory Agreement (the Advisory Agreement) with John Hancock Advisers, LLC (the Advisor) and the Subadvisory Agreement (the Subadvisory Agreement) with Pzena Investment Management, LLC (the Subadvisor) for John Hancock Classic Value Fund (the fund). The Advisory Agreement and Subadvisory Agreement are collectively referred to as the Agreements.
Approval of Advisory and Subadvisory Agreements
At in-person meetings held on May 16–17, 2013, the Board, including the Trustees who are not considered to be interested persons of the Trust under the Investment Company Act of 1940, as amended (the 1940 Act) (the Independent Trustees), reapproved for an annual period the continuation of the Advisory Agreement between the Trust and the Advisor and the Subadvisory Agreement between the Advisor and the Subadvisor with respect to the fund.
In considering the Advisory Agreement and the Subadvisory Agreement, the Board received in advance of the meeting a variety of materials relating to the fund, the Advisor, and the Subadvisor, including comparative performance, fee and expense information for peer groups of similar mutual funds prepared by an independent third-party provider of mutual fund data; performance information for the fund’s benchmark index; and, with respect to the Subadvisor, comparative performance information for comparably managed accounts, as applicable; and other information provided by the Advisor and the Subadvisor regarding the nature, extent, and quality of services provided by the Advisor and the Subadvisor under their respective Agreements, as well as information regarding the Advisor’s revenues and costs of providing services to the fund and any compensation paid to affiliates of the Advisor. At the meeting at which the renewal of the Advisory Agreement and Subadvisory Agreement is considered, particular focus is given to information concerning fund performance, comparability of fees and total expenses and profitability. However, the Board notes that the evaluation process with respect to the Advisor and the Subadvisor is an ongoing one. In this regard, the Board also took into account discussions with management and information provided to the Board at prior meetings with respect to the services provided by the Advisor and the Subadvisor to the fund, including quarterly performance reports prepared by management containing reviews of investment results and prior presentations from the Subadvisor with respect to the fund. The Board also considered the nature, quality, and extent of non-advisory services, if any, to be provided to the fund by the Advisor’s affiliates, including distribution services.
Throughout the process, the Board asked questions of and requested additional information from management. The Board is assisted by counsel for the Trust and the Independent Trustees are also separately assisted by independent legal counsel throughout the process. The Independent Trustees also received a memorandum from their independent counsel discussing the legal standards for their consideration of the proposed continuation of the Agreements and discussed the proposed continuation of the Agreements in private sessions with their independent legal counsel at which no representatives of management were present.
Approval of Advisory Agreement
In approving the Advisory Agreement with respect to the fund, the Board, including the Independent Trustees, considered a variety of factors, including those discussed below. The Board also considered other factors (including conditions and trends prevailing generally in the economy, the securities markets, and the industry) and does not treat any single factor as determinative and each Trustee may attribute different weights to different factors. The Board’s conclusions may be
| 34 | Classic Value Fund | Annual report |
based in part on its consideration of the advisory and subadvisory arrangements in prior years and on the Board’s ongoing regular review of fund performance and operations throughout the year.
Nature, extent, and quality of services. Among the information received by the Board from the Advisor relating to the nature, extent, and quality of services provided to the fund, the Board reviewed information provided by the Advisor relating to its operations and personnel, descriptions of its organizational and management structure, and information regarding the Advisor’s compliance and regulatory history, including its Form ADV. The Board also noted that on a regular basis it receives and reviews information from the Trust’s Chief Compliance Officer (CCO) regarding the fund’s compliance policies and procedures established pursuant to Rule 38a-1 under the 1940 Act. The Board also considered the Advisor’s risk management processes. The Board considered that the Advisor is responsible for the management of the day-to-day operations of the fund, including, but not limited to, general supervision of and coordination of the services provided by the Subadvisor, and is also responsible for monitoring and reviewing the activities of the Subadvisor and other third-party service providers.
In considering the nature, extent, and quality of the services provided by the Advisor, the Trustees also took into account their knowledge of the Advisor’s management and the quality of the performance of the Advisor’s duties through Board meetings, discussions, and reports during the preceding year and through each Trustee’s experience as a Trustee of the Trust and of the other trusts in the complex.
In the course of their deliberations regarding the Advisory Agreement, the Board considered, among other things:
(a) the skills and competency with which the Advisor has in the past managed the Trust’s affairs and its subadvisory relationship, the Advisor’s oversight and monitoring of the Subadvisor’s investment performance and compliance programs, such as the Subadvisor’s compliance with fund policies and objective; review of brokerage matters, including with respect to trade allocation and best execution; and the Advisor’s timeliness in responding to performance issues;
(b) the background, qualifications and skills of the Advisor’s personnel;
(c) the Advisor’s compliance policies and procedures and its responsiveness to regulatory changes and mutual fund industry developments;
(d) the Advisor’s administrative capabilities, including its ability to supervise the other service providers for the fund;
(e) the financial condition of the Advisor and whether it has the financial wherewithal to provide a high level and quality of services to the fund; and
(f) the Advisor’s reputation and experience in serving as an investment adviser to the Trust and the benefit to shareholders of investing in funds that are part of a family of funds offering a variety of investments.
The Board concluded that the Advisor may reasonably be expected to continue to provide a high quality of services under the Advisory Agreement with respect to the fund.
Investment performance. In considering the fund’s performance, the Board noted that it reviews at its regularly scheduled meetings information about the fund’s performance results. In connection with the consideration of the Advisory Agreement, the Board:
| Annual report | Classic Value Fund | 35 |
(a) reviewed information prepared by management regarding the fund’s performance;
(b) considered the comparative performance of the fund’s benchmark;
(c) considered the performance of comparable funds, if any, as included in the report prepared by an independent third-party provider of mutual fund data. Such report included the fund’s ranking within a smaller group of peer funds and the fund’s ranking within broader groups of funds; and
(d) took into account the Advisor’s analysis of the fund’s performance and its plans and recommendations regarding the Trust’s subadvisory arrangements generally.
The Board noted that the fund underperformed its benchmark index and peer group average for the one-, three-, and five-year periods ended December 31, 2012.
The Board took into account management’s discussion of the factors that contributed to the fund’s performance, noting the fund’s more recent improved performance for the one-year and year-to-date periods ended April 30, 2013.
The Board concluded that the fund’s performance is being monitored and reasonably addressed.
Fees and expenses. The Board reviewed comparative information prepared by an independent third-party provider of mutual fund data, including, among other data, the fund’s contractual and net management fees and total expenses as compared to similarly situated investment companies deemed to be comparable to the fund. The Board considered the fund’s ranking within a smaller group of peer funds chosen by the independent third-party provider, as well as the fund’s ranking within a broader group of funds. In comparing the fund’s contractual and net management fees to those of comparable funds, the Board noted that such fees include both advisory and administrative costs.
The Board noted that net management fees and total expenses for this fund are higher than the peer group medians. The Board took into account management’s discussion of the fund’s expenses. The Board noted that the Advisor and the Subadvisor have agreed to a fee reduction in the advisory and subadvisory fee rates. The Board also noted that the fund’s distributor, an affiliate of the Advisor, has agreed to waive a portion of its Rule 12b-1 fee for a share class of the fund.
The Board took into account management’s discussion with respect to the advisory/subadvisory fee structure, including the amount of the advisory fee retained by the Advisor after payment of the subadvisory fee. The Board also took into account that management had agreed to implement an overall fee waiver across a number of funds in the complex, including the fund, which is discussed further below. The Board also noted that the Advisor pays the subadvisory fees of the fund, and that such fees are negotiated at arm’s length with respect to the Subadvisor. The Board also noted management’s discussion of the fund’s expenses, as well as certain actions taken over the past several years to reduce the fund’s operating expenses. The Board reviewed information provided by the Advisor concerning investment advisory fees charged to other clients (including other funds in the complex) having similar investment mandates, if any. The Board considered any differences between the Advisor’s and Subadvisor’s services to the fund and the services they provide to other comparable clients or funds. The Board concluded that the advisory fee paid with respect to the fund is reasonable.
Profitability/indirect benefits. In considering the costs of the services to be provided and the profits to be realized by the Advisor and its affiliates from the Advisor’s relationship with the Trust, the Board:
| 36 | Classic Value Fund | Annual report |
(a) reviewed financial information of the Advisor;
(b) reviewed and considered an analysis presented by the Advisor regarding the net profitability to the Advisor and its affiliates with respect to the fund;
(c) received and reviewed profitability information with respect to the John Hancock fund complex as a whole;
(d) received information with respect to the Advisor’s allocation methodologies used in preparing the profitability data;
(e) considered that the Advisor also provides administrative services to the fund on a cost basis pursuant to an administrative services agreement;
(f) noted that affiliates of the Advisor provide transfer agency services and distribution services to the fund, and that the Trust’s distributor also receives Rule 12b-1 payments to support distribution of the fund;
(g) noted that the Advisor also derives reputational and other indirect benefits from providing advisory services to the fund;
(h) noted that the subadvisory fees for the fund are paid by the Advisor and are negotiated at arm’s length; and
(i) considered that the Advisor should be entitled to earn a reasonable level of profits in exchange for the level of services it provides to the fund and the entrepreneurial risk that it assumes as Advisor.
Based upon its review, the Board concluded that the level of profitability, if any, of the Advisor and its affiliates from their relationship with the fund was reasonable and not excessive.
Economies of scale. In considering the extent to which economies of scale would be realized as the fund grows and whether fee levels reflect these economies of scale for the benefit of fund shareholders, the Board:
(a) considered that the Advisor has agreed, effective June 1, 2013, to waive its management fee for the fund and each of the open-end funds of John Hancock Funds II, John Hancock Funds III, each other John Hancock fund (except those listed below) (the Participating Portfolios) or otherwise reimburse the expenses of the Participating Portfolios as follows (the Reimbursement):
The Reimbursement shall equal, on an annualized basis, 0.0100% of that portion of the aggregate net assets of all the Participating Portfolios that exceeds $75 billion but is less than or equal to $125 billion, 0.0125% of that portion of the aggregate net assets of all the Participating Portfolios that exceeds $125 billion but is less than or equal to $150 bil-lion and 0.0150% of that portion of the aggregate net assets of all the Participating Portfolios that exceeds $150 billion. (The funds that are not Participating Portfolios as of the date of this annual report are each of the fund of funds, money market funds, index funds, and closed-end funds);
(b) reviewed the Trust’s advisory fee structure and the incorporation therein of any subadvisory fee breakpoints in the advisory fees charged and concluded that (i) the fund’s fee structure contains breakpoints at the subadvisory fee level and that such breakpoints are reflected as breakpoints in the advisory fees for the fund and (ii) although economies of scale cannot be measured with precision, these arrangements permit shareholders of the fund to benefit
| Annual report | Classic Value Fund | 37 |
from economies of scale if the fund grows. The Board also took into account management’s discussion of the fund’s advisory fee structure; and
(c) the Board also considered the effect of the fund’s growth in size on its performance and fees. The Board also noted that if the fund’s assets increase over time, the fund may realize other economies of scale.
Approval of Subadvisory Agreement
In making its determination with respect to approval of the Subadvisory Agreement, the Board reviewed:
(1) information relating to the Subadvisor’s business, including current subadvisory services to the Trust (and other funds in the John Hancock family of funds);
(2) the historical and current performance of the fund, and comparative performance information relating to the fund’s benchmark and comparable funds;
(3) the subadvisory fee for the fund, including any breakpoints, and comparative fee information, where available, prepared by an independent third-party provider of mutual fund data; and
(4) information relating to the nature and scope of any material relationships and their significance to the Trust’s Advisor and Subadvisor.
Nature, extent, and quality of services. With respect to the services provided by the Subadvisor, the Board received information provided to the Board by the Subadvisor, including the Subadvisor’s Form ADV, as well as took into account information presented throughout the past year. The Board considered the Subadvisor’s current level of staffing and its overall resources, as well as received information relating to the Subadvisor’s compensation program. The Board reviewed the Subadvisor’s history and investment experience, as well as information regarding the qualifications, background, and responsibilities of the Subadvisor’s investment and compliance personnel who provide services to the fund. The Board also considered, among other things, the Subadvisor’s compliance program and any disciplinary history. The Board also considered the Subadvisor’s risk assessment and monitoring process. The Board reviewed the Subadvisor’s regulatory history, including whether it was currently involved in any regulatory actions or investigations as well as material litigation, and any settlements and amelioratory actions undertaken, as appropriate. The Board noted that the Advisor conducts regular, periodic reviews of the Subadvisor and its operations, including regarding investment processes and organizational and staffing matters. The Board also noted that the Trust’s CCO and his staff conduct regular, periodic compliance reviews with the Subadvisor and present reports to the Independent Trustees regarding the same, which includes evaluating the regulatory compliance systems of the Subadvisor and procedures reasonably designed by it to assure compliance with the federal securities laws. The Board also took into account the financial condition of the Subadvisor.
The Board considered the Subadvisor’s investment process and philosophy. The Board took into account that the Subadvisor’s responsibilities include the development and maintenance of an investment program for the fund, that is consistent with the fund’s investment objective, the selection of investment securities and the placement of orders for the purchase and sale of such securities, as well as the implementation of compliance controls related to performance of these services. The Board also received information with respect to the Subadvisor’s brokerage policies and practices, including with respect to best execution and soft dollars.
Subadvisor compensation. In considering the cost of services to be provided by the Subadvisor and the profitability to the Subadvisor of its relationship with the fund, the Board noted that the fees under the Subadvisory Agreement are paid by the Advisor and not the fund.
| 38 | Classic Value Fund | Annual report |
The Board also relied on the ability of the Advisor to negotiate the Subadvisory Agreement with the Subadvisor, which is not affiliated with the Advisor, and the fees thereunder at arm’s length. As a result, the costs of the services to be provided and the profits to be realized by the Subadvisor from its relationship with the Trust were not a material factor in the Board’s consideration of the Subadvisory Agreement.
The Board also received information regarding the nature and scope (including their significance to the Advisor and its affiliates and to the Subadvisor) of any material relationships with respect to the Subadvisor, which includes arrangements in which the Subadvisor or its affiliates provide advisory, distribution, or management services in connection with financial products sponsored by the Trust’s Advisor or its affiliates, and may include other registered investment companies, a 529 education savings plan, managed separate account, and exempt group annuity contracts sold to qualified plans. The Board also received information and took into account any other potential conflicts of interest the Advisor might have in connection with the Subadvisory Agreement.
In addition, the Board considered other potential indirect benefits that the Subadvisor and its affiliates may receive from the Subadvisor’s relationship with the fund, such as the opportunity to provide advisory services to additional funds in the John Hancock fund complex and reputational benefits.
Subadvisory fees. The Board considered that the fund pays an advisory fee to the Advisor and that, in turn, the Advisor pays a subadvisory fee to the Subadvisor. The Board also took into account the subadvisory fees paid by the Advisor to the Subadvisor with respect to the fund to fees charged by the fund’s Subadvisor to manage other subadvised portfolios and portfolios not subject to regulation under the 1940 Act, as applicable.
Subadvisor performance. As noted above, the Board considered the fund’s performance as compared to the fund’s peer group and benchmark and noted that the Board reviews information about the fund’s performance results at its regularly scheduled meetings. The Board noted the Advisor’s expertise and resources in monitoring the performance, investment style, and risk-adjusted performance of the Subadvisor. The Board was mindful of the Advisor’s focus on the Subadvisor’s performance. The Board also noted the Subadvisor’s long-term performance record for similar accounts, as applicable.
The Board’s decision to approve the Subadvisory Agreement was based on a number of determinations, including the following:
(1) The Subadvisor has extensive experience and demonstrated skills as a manager;
(2) The performance of the fund is being monitored and reasonably addressed;
(3) The subadvisory fees are reasonable in relation to the level and quality of services being provided; and
(4) Subadvisory fee breakpoints are reflected as breakpoints in the advisory fees for the fund in order to permit shareholders to benefit from economies of scale if the fund grows.
| * * * |
Based on the Board’s evaluation of all factors that the Board deemed to be material, including those factors described above, the Board, including the Independent Trustees, concluded that renewal of the Advisory Agreement and the Subadvisory Agreement would be in the best interest of the fund and its shareholders. Accordingly, the Board, and the Independent Trustees voting separately, approved the Advisory Agreement and Subadvisory Agreement for an additional one-year period.
| Annual report | Classic Value Fund | 39 |
Trustees and Officers
This chart provides information about the Trustees and Officers who oversee your John Hancock fund. Officers elected by the Trustees manage the day-to-day operations of the fund and execute policies formulated by the Trustees.
Independent Trustees
| Name, year of birth | Trustee | Number of John |
| Position(s) held with fund | of the | Hancock funds |
| Principal occupation(s) and other | Trust | overseen by |
| directorships during past 5 years | since1 | Trustee |
| James M. Oates,2 Born: 1946 | 2012 | 233 |
| Managing Director, Wydown Group (financial consulting firm) (since 1994); Chairman and Director, | ||
| Emerson Investment Management, Inc. (since 2000); Independent Chairman, Hudson Castle Group, Inc. | ||
| (formerly IBEX Capital Markets, Inc.) (financial services company) (1997–2011); Director, Stifel Financial | ||
| (since 1996); Director, Investor Financial Services Corporation (1995–2007); Director, Connecticut River | ||
| Bancorp (since 1998); Director, Virtus Funds (formerly Phoenix Mutual Funds) (since 1988). | ||
| Trustee and Chairperson of the Board, John Hancock retail funds4 (since 2012); Trustee (2005–2006 and | ||
| since 2012) and Chairperson of the Board (since 2012), John Hancock Funds III; Trustee (since 2004) and | ||
| Chairperson of the Board (since 2005), John Hancock Variable Insurance Trust; Trustee and Chairperson | ||
| of the Board, John Hancock Funds II (since 2005). | ||
| Charles L. Bardelis,2,3 Born: 1941 | 2012 | 233 |
| Director, Island Commuter Corp. (marine transport). | ||
| Trustee, John Hancock retail funds4 (since 2012); Trustee, John Hancock Funds III (2005–2006 and | ||
| since 2012); Trustee, John Hancock Variable Insurance Trust (since 1988); Trustee, John Hancock | ||
| Funds II (since 2005). | ||
| Peter S. Burgess,2,3 Born: 1942 | 2012 | 233 |
| Consultant (financial, accounting, and auditing matters) (since 1999); Certified Public Accountant; | ||
| Partner, Arthur Andersen (independent public accounting firm) (prior to 1999); Director, Lincoln | ||
| Educational Services Corporation (since 2004); Director, Symetra Financial Corporation (since 2010); | ||
| Director, PMA Capital Corporation (2004–2010). | ||
| Trustee, John Hancock retail funds4 (since 2012); Trustee, John Hancock Funds III (2005–2006 and | ||
| since 2012); Trustee, John Hancock Variable Insurance Trust and John Hancock Funds II (since 2005). | ||
| William H. Cunningham, Born: 1944 | 2005 | 233 |
| Professor, University of Texas, Austin, Texas (since 1971); former Chancellor, University of Texas System | ||
| and former President of the University of Texas, Austin, Texas; Director, LIN Television (since 2009); | ||
| Chairman (since 2009) and Director (since 2006), Lincoln National Corporation (insurance); Director, | ||
| Resolute Energy Corporation (since 2009); Director, Southwest Airlines (since 2000); former Director, | ||
| Introgen (manufacturer of biopharmaceuticals) (until 2008); former Director, Hicks Acquisition Company I, | ||
| Inc. (until 2007); former Director, Texas Exchange Bank, SSB (formerly Bank of Crowley) (until 2009); | ||
| former Advisory Director, JP Morgan Chase Bank (formerly Texas Commerce Bank–Austin) (until 2009). | ||
| Trustee, John Hancock retail funds4 (since 1986); Trustee, John Hancock Variable Insurance Trust | ||
| (since 2012); Trustee, John Hancock Funds II (since 2012 and 2005–2006). | ||
| 40 | Classic Value Fund | Annual report |
Independent Trustees (continued)
| Name, year of birth | Trustee | Number of John |
| Position(s) held with fund | of the | Hancock funds |
| Principal occupation(s) and other | Trust | overseen by |
| directorships during past 5 years | since1 | Trustee |
| Grace K. Fey,2 Born: 1946 | 2012 | 233 |
| Chief Executive Officer, Grace Fey Advisors (since 2007); Director and Executive Vice President, Frontier | ||
| Capital Management Company (1988–2007); Director, Fiduciary Trust (since 2009). | ||
| Trustee, John Hancock retail funds4 (since 2012); Trustee, John Hancock Variable Insurance Trust and | ||
| John Hancock Funds II (since 2008). | ||
| Theron S. Hoffman,2,3 Born: 1947 | 2012 | 233 |
| Chief Executive Officer, T. Hoffman Associates, LLC (consulting firm) (since 2003); Director, The Todd | ||
| Organization (consulting firm) (2003–2010); President, Westport Resources Management (investment | ||
| management consulting firm) (2006–2008); Senior Managing Director, Partner, and Operating Head, | ||
| Putnam Investments (2000–2003); Executive Vice President, The Thomson Corp. (financial and legal | ||
| information publishing) (1997–2000). | ||
| Trustee, John Hancock retail funds4 (since 2012); Trustee, John Hancock Variable Insurance Trust and | ||
| John Hancock Funds II (since 2008). | ||
| Deborah C. Jackson, Born: 1952 | 2008 | 233 |
| President, Cambridge College, Cambridge, Massachusetts (since 2011); Chief Executive Officer, | ||
| American Red Cross of Massachusetts Bay (2002–2011); Board of Directors of Eastern Bank Corporation | ||
| (since 2001); Board of Directors of Eastern Bank Charitable Foundation (since 2001); Board of Directors | ||
| of American Student Assistance Corporation (1996–2009); Board of Directors of Boston Stock Exchange | ||
| (2002–2008); Board of Directors of Harvard Pilgrim Healthcare (health benefits company) (2007–2011). | ||
| Trustee, John Hancock retail funds4 (since 2008); Trustee of John Hancock Variable Insurance Trust and | ||
| John Hancock Funds II (since 2012). | ||
| Hassell H. McClellan,2 Born: 1945 | 2012 | 233 |
| Associate Professor, The Wallace E. Carroll School of Management, Boston College (since 1984); | ||
| Trustee, Virtus Variable Insurance Trust (formerly Phoenix Edge Series Funds) (since 2008); Director, The | ||
| Barnes Group (since 2010). | ||
| Trustee, John Hancock retail funds4 (since 2012); Trustee, John Hancock Funds III (2005–2006 and | ||
| since 2012); Trustee, John Hancock Variable Insurance Trust and John Hancock Funds II (since 2005). | ||
| Steven R. Pruchansky, Born: 1944 | 2005 | 233 |
| Chairman and Chief Executive Officer, Greenscapes of Southwest Florida, Inc. (since 2000); Director | ||
| and President, Greenscapes of Southwest Florida, Inc. (until 2000); Member, Board of Advisors, First | ||
| American Bank (until 2010); Managing Director, Jon James, LLC (real estate) (since 2000); Director, | ||
| First Signature Bank & Trust Company (until 1991); Director, Mast Realty Trust (until 1994); President, | ||
| Maxwell Building Corp. (until 1991). | ||
| Trustee (since 1992) and Chairperson of the Board (2011–2012), John Hancock retail funds4; Trustee and | ||
| Vice Chairperson of the Board, John Hancock retail funds4, John Hancock Variable Insurance Trust, and | ||
| John Hancock Funds II (since 2012). | ||
| Annual report | Classic Value Fund | 41 |
Independent Trustees (continued)
| Name, year of birth | Trustee | Number of John |
| Position(s) held with fund | of the | Hancock funds |
| Principal occupation(s) and other | Trust | overseen by |
| directorships during past 5 years | since1 | Trustee |
| Gregory A. Russo, Born: 1949 | 2009 | 233 |
| Director and Audit Committee Chairman (since 2012), and Member, Audit Committee and Finance | ||
| Committee (since 2011), NCH Healthcare System, Inc. (holding company for multi-entity healthcare | ||
| system); Director and Member of Finance Committee, The Moorings, Inc. (nonprofit continuing care | ||
| community) (since 2012); Vice Chairman, Risk & Regulatory Matters, KPMG LLP (KPMG) (2002–2006); | ||
| Vice Chairman, Industrial Markets, KPMG (1998–2002); Chairman and Treasurer, Westchester County, | ||
| New York, Chamber of Commerce (1986–1992); Director, Treasurer, and Chairman of Audit and | ||
| Finance Committees, Putnam Hospital Center (1989–1995); Director and Chairman of Fundraising | ||
| Campaign, United Way of Westchester and Putnam Counties, New York (1990–1995). | ||
| Trustee, John Hancock retail funds4 (since 2008); Trustee, John Hancock Variable Insurance Trust and | ||
| John Hancock Funds II (since 2012). | ||
Non-Independent Trustees5
| Name, year of birth | Trustee | Number of John |
| Position(s) held with fund | of the | Hancock funds |
| Principal occupation(s) and other | Trust | overseen by |
| directorships during past 5 years | since1 | Trustee |
| James R. Boyle,2 Born: 1959 | 2012 | 233 |
| Senior Executive Vice President, John Hancock Financial Services (1999–2012, including prior positions); | ||
| Chairman and Director, John Hancock Advisers, LLC, John Hancock Funds, LLC, and John Hancock | ||
| Investment Management Services, LLC (2005–2010). | ||
| Trustee, John Hancock retail funds4 (since 2012 and 2005–2010); Trustee, John Hancock Variable | ||
| Insurance Trust and John Hancock Funds II (since 2005). | ||
| Craig Bromley,2 Born: 1966 | 2012 | 233 |
| President, John Hancock Financial Services (since 2012); Senior Executive Vice President and General | ||
| Manager, U.S. Division, John Hancock Financial Services (since 2012); President and Chief Executive | ||
| Officer, Manulife Insurance Company (Manulife Japan) (2005–2012, including prior positions). | ||
| Trustee, John Hancock retail funds,4 John Hancock Variable Insurance Trust, and John Hancock Funds | ||
| II (since 2012). | ||
| Warren A. Thomson,2 Born: 1955 | 2012 | 233 |
| Senior Executive Vice President and Chief Investment Officer, Manulife Financial Corporation and The | ||
| Manufacturers Life Insurance Company (since 2009); Chairman and Chief Executive Officer, Manulife | ||
| Asset Management (since 2001, including prior positions); Director (since 2006), and President and | ||
| Chief Executive Officer (since 2013), Manulife Asset Management Limited; Director and Chairman, | ||
| Hancock Natural Resources Group, Inc. (since 2013). | ||
| Trustee, John Hancock retail funds,4 John Hancock Variable Insurance Trust, and John Hancock | ||
| Funds II (since 2012). | ||
| 42 | Classic Value Fund | Annual report |
Principal officers who are not Trustees
| Name, year of birth | Officer | |
| Position(s) held with fund | of the | |
| Principal occupation(s) and other | Trust | |
| directorships during past 5 years | since | |
| Hugh McHaffie, Born: 1959 | 2012 | |
| President | ||
| Executive Vice President, John Hancock Financial Services (since 2006, including prior positions); | ||
| Chairman and Director, John Hancock Advisers, LLC, John Hancock Investment Management Services, | ||
| LLC, and John Hancock Funds, LLC (since 2010); President, John Hancock Advisers, LLC (since 2012); | ||
| President, John Hancock Investment Management Services, LLC (since 2010); President (since 2012) and | ||
| former Trustee (2010–2012), John Hancock retail funds,4 President, John Hancock Variable Insurance | ||
| Trust and John Hancock Funds II (since 2009). | ||
| Andrew G. Arnott, Born: 1971 | 2007 | |
| Executive Vice President | ||
| Senior Vice President, John Hancock Financial Services (since 2009); Director and Executive Vice | ||
| President, John Hancock Advisers, LLC (since 2005, including prior positions); Director and Executive | ||
| Vice President, John Hancock Investment Management Services, LLC (since 2006, including prior | ||
| positions); President, John Hancock Funds, LLC (since 2004, including prior positions); Executive Vice | ||
| President, John Hancock retail funds,4 John Hancock Variable Insurance Trust, and John Hancock Funds | ||
| II (since 2007, including prior positions). | ||
| Thomas M. Kinzler, Born: 1955 | 2006 | |
| Secretary and Chief Legal Officer | ||
| Vice President, John Hancock Financial Services (since 2006); Secretary and Chief Legal Counsel, | ||
| John Hancock Funds, LLC (since 2007); Secretary and Chief Legal Officer, John Hancock retail funds,4 | ||
| John Hancock Variable Insurance Trust, and John Hancock Funds II (since 2006). | ||
| Francis V. Knox, Jr., Born: 1947 | 2005 | |
| Chief Compliance Officer | ||
| Vice President, John Hancock Financial Services (since 2005); Chief Compliance Officer, John Hancock | ||
| retail funds,4 John Hancock Variable Insurance Trust, John Hancock Funds II, John Hancock Advisers, | ||
| LLC, and John Hancock Investment Management Services, LLC (since 2005); Vice President and Chief | ||
| Compliance Officer, John Hancock Asset Management a division of Manulife Asset Management (US) | ||
| LLC (2005–2008). | ||
| Charles A. Rizzo, Born: 1957 | 2007 | |
| Chief Financial Officer | ||
| Vice President, John Hancock Financial Services (since 2007); Senior Vice President, John Hancock | ||
| Advisers, LLC and John Hancock Investment Management Services, LLC (since 2007); Treasurer, | ||
| John Hancock retail funds4 (since 2007, including prior positions); Treasurer, John Hancock Variable | ||
| Insurance Trust and John Hancock Funds II (since 2007–2009 and since 2010, including prior positions). | ||
| Annual report | Classic Value Fund | 43 |
Principal officers who are not Trustees (continued)
| Name, year of birth | Officer | |
| Position(s) held with fund | of the | |
| Principal occupation(s) and other | Trust | |
| directorships during past 5 years | since | |
| Salvatore Schiavone, Born: 1965 | 2010 | |
| Treasurer | ||
| Assistant Vice President, John Hancock Financial Services (since 2007); Vice President, John Hancock | ||
| Advisers, LLC and John Hancock Investment Management Services, LLC (since 2007); Treasurer, | ||
| John Hancock retail funds4 (since 2007, including prior positions); Treasurer, John Hancock Variable | ||
| Insurance Trust and John Hancock Funds II (since 2010 and 2007–2009, including prior positions). | ||
The business address for all Trustees and Officers is 601 Congress Street, Boston, Massachusetts 02210-2805.
The Statement of Additional Information of the fund includes additional information about members of the Board of Trustees of the Fund and is available without charge, upon request, by calling 800-225-5291.
1 Each Trustee holds office until his or her successor is elected and qualified, or until the Trustee’s death, retirement, resignation or removal.
2 Became a Trustee of the fund effective December 1, 2012.
3 Member of the Audit Committee.
4 “John Hancock retail funds” comprises John Hancock Funds III and 34 other John Hancock funds consisting of 24 series of other John Hancock trusts and 10 closed-end funds.
5 The Trustee is a Non-Independent Trustee due to current or former positions with the Advisor and certain of its affiliates.
| 44 | Classic Value Fund | Annual report |
More information
| Trustees | Investment advisor |
| James M. Oates, Chairperson | John Hancock Advisers, LLC |
| Steven R. Pruchansky, Vice Chairperson | |
| Charles L. Bardelis* | Subadvisor |
| James R. Boyle† | Pzena Investment Management, LLC |
| Craig Bromley† | |
| Peter S. Burgess* | |
| William H. Cunningham | Principal distributor |
| Grace K. Fey | John Hancock Funds, LLC |
| Theron S. Hoffman* | |
| Deborah C. Jackson | Custodian |
| Hassell H. McClellan | State Street Bank and Trust Company |
| Gregory A. Russo | |
| Warren A. Thomson† | Transfer agent |
| John Hancock Signature Services, Inc. | |
| Officers | |
| Hugh McHaffie | Legal counsel |
| President | K&L Gates LLP |
| Andrew G. Arnott | Independent registered |
| Executive Vice President | public accounting firm |
| PricewaterhouseCoopers LLP | |
| Thomas M. Kinzler | |
| Secretary and Chief Legal Officer | |
| Francis V. Knox, Jr. | |
| Chief Compliance Officer | |
| Charles A. Rizzo | |
| Chief Financial Officer | |
| Salvatore Schiavone | |
| Treasurer | |
| *Member of the Audit Committee | |
| †Non-Independent Trustee | |
The fund’s proxy voting policies and procedures, as well as the fund’s proxy voting record for the most recent twelve-month period ended June 30, are available free of charge on the Securities and Exchange Commission (SEC) website at sec.gov or on our website.
The fund’s complete list of portfolio holdings, for the first and third fiscal quarters, is filed with the SEC on Form N-Q. The fund’s Form N-Q is available on our website and the SEC’s website, sec.gov, and can be reviewed and copied (for a fee) at the SEC’s Public Reference Room in Washington, DC. Call 800-SEC-0330 to receive information on the operation of the SEC’s Public Reference Room.
We make this information on your fund, as well as monthly portfolio holdings, and other fund details available on our website at jhinvestments.com or by calling 800-225-5291.
| You can also contact us: | ||
| 800-225-5291 | Regular mail: | Express mail: |
| jhinvestments.com | Investment Operations | Investment Operations |
| John Hancock Signature Services, Inc. | John Hancock Signature Services, Inc. | |
| P.O. Box 55913 | 30 Dan Road | |
| Boston, MA 02205-5913 | Canton, MA 02021 |
| Annual report | Classic Value Fund | 45 |

800-225-5291
800-338-8080 EASI-Line
jhinvestments.com

| This report is for the information of the shareholders of John Hancock Classic Value Fund. | |
| It is not authorized for distribution to prospective investors unless preceded or accompanied by a prospectus. | 38A 10/13 |
| MF164568 | 12/13 |
ITEM 2. CODE OF ETHICS.
As of the end of the period, October 31, 2013, the registrant has adopted a code of ethics, as defined in Item 2 of Form N-CSR, that applies to its Chief Executive Officer, Chief Financial Officer and Treasurer (respectively, the principal executive officer, the principal financial officer and the principal accounting officer, the “Senior Financial Officers”). A copy of the code of ethics is filed as an exhibit to this Form N-CSR.
ITEM 3. AUDIT COMMITTEE FINANCIAL EXPERT.
Peter S. Burgess is the audit committee financial expert and is “independent”, pursuant to general instructions on Form N-CSR Item 3.
ITEM 4. PRINCIPAL ACCOUNTANT FEES AND SERVICES.
(a) Audit Fees
The aggregate fees billed for professional services rendered by the principal accountant for the audits of the registrant’s annual financial statements or services that are normally provided by the accountant in connection with statutory and regulatory filings or engagements amounted to the following for the fiscal years ended October 31, 2013 and 2012. These fees were billed to the registrant and were approved by the registrant’s audit committee.
| Fund | October 31, 2013 | October 31, 2012 | ||
| John Hancock Classic Value Fund | $ | 30,140 | $ | 35,015 |
| John Hancock U.S. Global Leaders Growth Fund | 28,958 | 33,834 | ||
| Total | $ | 59,098 | $ | 68,849 |
(b) Audit-Related Services
Audit-related service fees for assurance and related services by the principal accountant are billed to the registrant or to the registrant's investment adviser (not including any sub-adviser whose role is primarily portfolio management and is subcontracted with or overseen by another investment adviser), and any entity controlling, controlled by, or under common control with the adviser (“control affiliates”) that provides ongoing services to the registrant. The nature of the services provided was affiliated service provider internal controls reviews. Amounts billed to the registrant were as follows:
| Fund | October 31, 2013 | October 31, 2012 | ||
| John Hancock Classic Value Fund | $ | 1,236 | $ | 1,094 |
| John Hancock U.S. Global Leaders Growth Fund | 1,236 | 1,094 | ||
| Total | $ | 2,472 | $ | 2,188 |
(c) Tax Fees
The aggregate fees billed for professional services rendered by the principal accountant for tax compliance, tax advice and tax planning (“tax fees”) amounted to the following for the fiscal years ended October 31, 2013 and 2012. The nature of the services comprising the tax fees was the review of the registrant’s tax returns and tax distribution requirements. These fees were billed to the registrant and were approved by the registrant’s audit committee.
| Fund | October 31, 2013 | October 31, 2012 | ||
| John Hancock Classic Value Fund | $ | 3,453 | $ | 3,453 |
| John Hancock U.S. Global Leaders Growth Fund | 3,696 | 3,696 | ||
| Total | $ | 7,149 | $ | 7,149 |
(d) All Other Fees
Other fees billed for professional services rendered by the principal accountant to the registrant or to the control affiliates for the fiscal years ended October 31, 2013 and 2012 amounted to the following:
| Fund | October 31, 2013 | October 31, 2012 | ||
| John Hancock Classic Value Fund | $ | 214 | $ | 171 |
| John Hancock U.S. Global Leaders Growth Fund | 213 | 171 | ||
| Total | $ | 427 | $ | 342 |
(e)(1) Audit Committee Pre-Approval Policies and Procedures:
The trust’s Audit Committee must pre-approve all audit and non-audit services provided by the independent registered public accounting firm (the “Auditor”) relating to the operations or financial reporting of the funds. Prior to the commencement of any audit or non-audit services to a fund, the Audit Committee reviews the services to determine whether they are appropriate and permissible under applicable law.
The trust’s Audit Committee has adopted policies and procedures to, among other purposes, provide a framework for the Committee’s consideration of audit-related and non-audit services by the Auditor. The policies and procedures require that any audit-related and non-audit service provided by the Auditor and any non-audit service provided by the Auditor to a fund service provider that relates directly to the operations and financial reporting of a fund are subject to approval by the Audit Committee before such service is provided. Audit-related services provided by the Auditor that are expected to exceed $25,000 per instance/per fund are subject to specific pre-approval by the Audit Committee. Tax services provided by the Auditor that are expected to exceed $30,000 per instance/per fund are subject to specific pre-approval by the Audit Committee.
All audit services, as well as the audit-related and non-audit services that are expected to exceed the amounts stated above, must be approved in advance of provision of the service by formal resolution of the Audit Committee. At the regularly scheduled Audit Committee meetings, the Committee reviews a report summarizing the services, including fees, provided by the Auditor.
(e)(2) Services approved pursuant to paragraph (c)(7)(i)(C) of Rule 2-01 of Regulation S-X:
Audit-Related Fees, Tax Fees and All Other Fees:
There were no amounts that were approved by the Audit Committee pursuant to the de minimis exception under Rule 2-01 of Regulation S-X.
(f) According to the registrant’s principal accountant, for the fiscal period ended October 31, 2013, the percentage of hours spent on the audit of the registrant's financial statements for the most recent fiscal year that were attributed to work performed by persons who were not full-time, permanent employees of principal accountant was less than 50%.
(g) The aggregate non-audit fees billed by the registrant's accountant for non- audit services rendered to the registrant and rendered to the registrant's control affiliates for the fiscal years ended October 31, 2013 and 2012 amounted to the following:
| Trust | October 31, 2013 | October 31, 2012 | ||
| John Hancock Capital Series | $ | 4,606,445 | $ | 3,663,425 |
(h) The audit committee of the registrant has considered the non-audit services provided by the registrant’s principal accountant(s) to the control affiliates and has determined that the services that were not pre-approved are compatible with maintaining the principal accountant(s)' independence.
ITEM 5. AUDIT COMMITTEE OF LISTED REGISTRANTS.
The registrant has a separately-designated standing audit committee comprised of independent trustees. The members of the audit committee are as follows:
Peter S. Burgess - Chairman
Charles L. Bardelis
Theron S. Hoffman
ITEM 6. SCHEDULE OF INVESTMENTS.
(a) Not applicable.
(b) Not applicable.
ITEM 7. DISCLOSURE OF PROXY VOTING POLICIES AND PROCEDURES FOR CLOSED-END MANAGEMENT INVESTMENT COMPANIES.
Not applicable.
ITEM 8. PORTFOLIO MANAGERS OF CLOSED-END MANAGEMENT INVESTMENT COMPANIES.
Not applicable.
ITEM 9. PURCHASES OF EQUITY SECURITIES BY CLOSED-END MANAGEMENT INVESTMENT COMPANY AND AFFILIATED PURCHASERS.
Not applicable.
ITEM 10. SUBMISSION OF MATTERS TO A VOTE OF SECURITY HOLDERS.
There were no material changes to previously disclosed John Hancock Funds – Governance Committee Charter.
ITEM 11. CONTROLS AND PROCEDURES.
(a) Based upon their evaluation of the registrant's disclosure controls and procedures as conducted within 90 days of the filing date of this Form N-CSR, the registrant's principal executive officer and principal financial officer have concluded that those disclosure controls and procedures provide reasonable assurance that the material information required to be disclosed by the registrant on this report is recorded, processed, summarized and reported within the time periods specified in the Securities and Exchange Commission's rules and forms.
(b) There were no changes in the registrant's internal control over financial reporting that occurred during the registrant's most recent fiscal half-year (the registrant's second fiscal half-year in the case of an annual report) that have materially affected, or are reasonably likely to materially affect, the registrant's internal control over financial reporting.
ITEM 12. EXHIBITS.
(a)(1) Code of Ethics for Senior Financial Officers is attached.
(a)(2) Separate certifications for the registrant's principal executive officer and principal financial officer, as required by Section 302 of the Sarbanes-Oxley Act of 2002 and Rule 30a-2(a) under the Investment Company Act of 1940, are attached.
(b) Separate certifications for the registrant's principal executive officer and principal financial officer, as required by 18 U.S.C. Section 1350, as adopted pursuant to Section 906 of the
Sarbanes-Oxley Act of 2002, and Rule 30a-2(b) under the Investment Company Act of 1940, are attached. The certifications furnished pursuant to this paragraph are not deemed to be "filed" for purposes of Section 18 of the Securities Exchange Act of 1934, or otherwise subject to the liability of that section. Such certifications are not deemed to be incorporated by reference into any filing under the Securities Act of 1933 or the Securities Exchange Act of 1934, except to the extent that the Registrant specifically incorporates them by reference.
(c)(1) Submission of Matters to a Vote of Security Holders is attached. See attached “John Hancock Funds – Governance Committee Charter”.
(c)(2) Contact person at the registrant.
SIGNATURES |
Pursuant to the requirements of the Securities Exchange Act of 1934 and the Investment Company Act of 1940, the registrant has duly caused this report to be signed on its behalf by the undersigned, thereunto duly authorized.
John Hancock Capital Series
| By: | /s/ Hugh McHaffie |
| ------------------------------ | |
| Hugh McHaffie | |
| President | |
| Date: | December 20, 2013 |
Pursuant to the requirements of the Securities Exchange Act of 1934 and the Investment Company Act of 1940, this report has been signed below by the following persons on behalf of the registrant and in the capacities and on the dates indicated.
| By: | /s/ Hugh McHaffie |
| ------------------------------- | |
| Hugh McHaffie | |
| President | |
| Date: | December 20, 2013 |
| By: | /s/ Charles A. Rizzo |
| -------------------------------- | |
| Charles A. Rizzo | |
| Chief Financial Officer | |
| Date: | December 20, 2013 |