UNITED STATES
SECURITIES AND EXCHANGE COMMISSION
Washington, D.C. 20549
FORM N-CSR
CERTIFIED SHAREHOLDER REPORT OF REGISTERED
MANAGEMENT INVESTMENT COMPANIES
Investment Company Act file number 811- 1677
John Hancock Capital Series
(Exact name of registrant as specified in charter)
601 Congress Street, Boston, Massachusetts 02210
(Address of principal executive offices) (Zip code)
Salvatore Schiavone
Treasurer
601 Congress Street
Boston, Massachusetts 02210
(Name and address of agent for service)
Registrant's telephone number, including area code: 617-663-4497
Date of fiscal year end: | October 31 |
|
|
Date of reporting period: | October 31, 2015 |
ITEM 1. SHAREHOLDERS REPORT.
John Hancock
U.S. Global Leaders Growth Fund
Annual report 10/31/15


A message to shareholders
Dear shareholder,
U.S. stocks experienced a spike in volatility in recent months. The pullback we had anticipated for some months took place in August, and stocks experienced their first official correction—a decline of more than 10% in the stock market—in more than four years. There were several headwinds keeping stock prices from moving higher all year, but the headline for this summer's correction was the news of slowing economic growth in China and the effect that might have on global growth. While the market subsequently rebounded, for the time being, global economic data continues to be a leading driver of investor sentiment.
Market volatility is naturally unnerving, which is why we recommend that investors maintain a regular dialogue with their financial advisors. Your advisor can help put market events into context and determine whether your portfolio is sufficiently diversified and continues to match your long-term financial goals.
Introducing John Hancock Multifactor Exchange-Traded Funds (ETFs)
We believe investors benefit from a combination of active and passive strategies in their portfolios. That's why, for years, we've offered actively managed funds to our shareholders, alongside asset allocation portfolios that employ a mix of active and passive strategies. That same thinking is what led us to team up with Dimensional Fund Advisors LP—a company regarded as one of the pioneers in strategic beta investing*—for the launch of the passively managed John Hancock Multifactor ETFs. Each ETF seeks to track a custom index built upon decades of academic research into the factors that drive higher expected returns: smaller capitalizations, lower valuations, and higher profitability. For nearly 30 years, it's just the kind of time-tested approach we have looked for as a manager of managers. For more information, visit our website at jhinvestments.com/etf.
On behalf of everyone at John Hancock Investments, I'd like to take this opportunity to welcome new shareholders and thank existing shareholders for the continued trust you've placed in us.
Sincerely,

Andrew G. Arnott
President and Chief Executive Officer
John Hancock Investments
This commentary reflects the CEO's views as of October 31, 2015. They are subject to change at any time. For more up-to-date information, you can visit our website at jhinvestments.com.
| * | Strategic beta investing ETFs seek to improve upon cap-weighted strategies by tracking a custom index that combines active management insight with the discipline of a rules-based approach. |
John Hancock
U.S. Global Leaders Growth Fund
Table of contents
| 2 | Your fund at a glance | |
| 4 | Discussion of fund performance | |
| 8 | A look at performance | |
| 10 | Your expenses | |
| 12 | Fund's investments | |
| 15 | Financial statements | |
| 19 | Financial highlights | |
| 25 | Notes to financial statements | |
| 31 | Auditor's report | |
| 32 | Tax information | |
| 33 | Continuation of investment advisory and subadvisory agreements | |
| 39 | Trustees and Officers | |
| 43 | More information |
1
INVESTMENT OBJECTIVE
The fund seeks long-term growth of capital.
AVERAGE ANNUAL TOTAL RETURNS AS OF 10/31/15 (%)
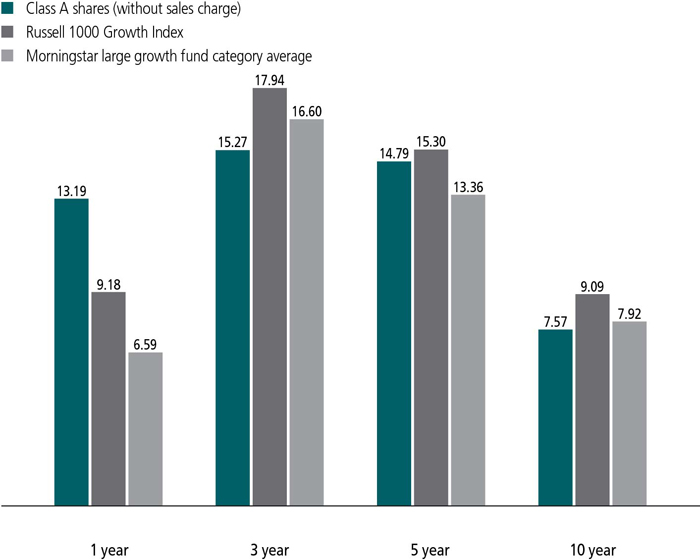
The Russell 1000 Growth Index is an unmanaged index of companies in the Russell 1000 Index (the 1,000 largest U.S. publicly traded companies) with high price-to-book ratios and higher forecasted growth values.
It is not possible to invest directly in an index. Index figures do not reflect expenses or sales charges, which would result in lower returns.
Figures from Morningstar, Inc. include reinvested distributions and do not take into account sales charges. Actual load-adjusted performance is lower.
The past performance shown here reflects reinvested distributions and the beneficial effect of any expense reductions, and does not guarantee future results. Performance of the other share classes will vary based on the difference in the fees and expenses of those classes. Shares will fluctuate in value and, when redeemed, may be worth more or less than their original cost. Current performance may be lower or higher than the performance cited, and can be found at jhinvestments.com or by calling 800-225-5291. For further information on the fund's objectives, risks, and strategy, see the fund's prospectuses.
2
PERFORMANCE HIGHLIGHTS OVER THE LAST TWELVE MONTHS
U.S. stocks advanced
Decelerating global economic growth and the fallout from a stronger U.S. dollar led to significant equity market volatility, but U.S. stocks nonetheless delivered positive returns.
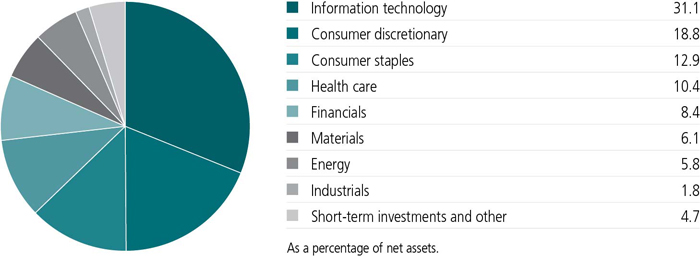
Consumer discretionary stocks helped fund outperform benchmark
The fund posted a double-digit gain and outperformed its benchmark, the Russell 1000 Growth Index, due to strong stock selection in the consumer discretionary sector.
Consumer staples and materials detracted
Stock choices among consumer staples and an overweight in materials stocks detracted from performance compared with the benchmark.
SECTOR COMPOSITION AS OF 10/31/15 (%)
A note about risks
Growth stocks may be more susceptible to earnings disappointments as compared with value stocks, and market values can be more volatile. Large company stocks could fall out of favor. Foreign investing has additional risks, such as currency and market volatility and political and social instability. A portfolio concentrated in one sector or that holds a limited number of securities may fluctuate more than a diversified portfolio. Investments in a non-diversified fund may magnify the fund's losses from adverse events affecting a particular issuer. Please see the fund's prospectuses for additional risks.
3
An interview with Portfolio Manager Gordon M. Marchand, CPA, CFA, CIC, Sustainable Growth Advisers, LP

Gordon M. Marchand, CPA, CFA, CIC
Portfolio Manager
Sustainable Growth Advisors
Can you give us an overview of the market environment over the past year?
U.S. stocks delivered positive returns for the one-year period as the broad S&P 500 Index returned 5.20% and the fund's benchmark, the Russell 1000 Growth Index, returned 9.18%. The reporting period was characterized by significant levels of volatility as the market climbed the proverbial wall of worry. Global economic growth decelerated, particularly in China, where weaker data and a surprise devaluation of the Chinese yuan caused concerns about a potential contagion that negatively affected emerging markets and put additional downward pressure on commodity prices. In addition, the U.S. dollar continued to strengthen against other currencies, leading to reduced demand for American exports and softer profit margins for multinational companies.
For the 12-month period, large-cap stocks outperformed mid- and small-cap issues, while growth-oriented stocks outpaced value by a wide margin. These performance disparities are best illustrated by comparing the 9.18% return of the fund's benchmark, a measure of large-cap growth performance, with the -2.88% return of the Russell 2000 Value Index, a measure of small-cap value performance.
Turning to the portfolio, what factors contributed to the fund's outperformance of the Russell 1000 Growth Index?
We invest in high-quality, large-cap growth stocks that are able to generate robust earnings, revenue, and cash flow growth in a relatively predictable manner. As a result, we track several market metrics associated with quality, and many of these factors outperformed over the past year. For example, as would be expected, stocks with high returns on equity (ROE) outperformed those with low ROE, and companies with lower debt levels outpaced those with greater debt loads. However, companies producing earnings underperformed those with no earnings.
Beyond these positive market trends, individual stock selection was the primary reason for the fund's outperformance of its benchmark, especially in the consumer discretionary sector.
4
Can you give some examples?
The top contributor was e-commerce leader Amazon.com, Inc., which returned more than 100% for the one-year period. The company reported revenues and earnings that consistently exceeded expectations. Growth was especially robust in Amazon Prime membership, as well as Amazon Web Services, the company's commercial cloud computing platform. At the same time, Amazon's profit margins increased thanks to a mix of strong third-party sales and a more stable pricing environment for Amazon Web Services. Although we believe that the drivers behind the company's revenue growth acceleration and margin expansion are sustainable, we have trimmed our position in the stock, consistent with our valuation discipline.
Coffee retailer Starbucks Corp. was another significant contributor during the reporting period, gaining nearly 70%. Starbucks benefited from accelerating sales in North America thanks to an attractive mix of price increases and product innovation. In addition, strong new unit productivity helped lift operating margins and profitability. Starbucks continues to set the standard in the coffee retailing industry, and we remain positive on the stock's long-term prospects.
The portfolio also benefited from a sizable position in home improvement retailer Lowe's Companies, Inc., the largest holding in the portfolio on average during the reporting period. Despite sales weakness early in the period resulting from an especially severe winter, Lowe's continued to deliver strong overall results. The company benefited from improving employment and income trends, favorable industry dynamics, and initiatives implemented by management to improve profitability.
TOP 10 HOLDINGS AS OF 10/31/15 (%)
| Visa, Inc., Class A | 4.4 |
| Lowe's Companies, Inc. | 4.3 |
| Amgen, Inc. | 4.3 |
| Alphabet, Inc., Class C | 4.2 |
| Amazon.com, Inc. | 4.2 |
| Mondelez International, Inc., Class A | 4.2 |
| Ecolab, Inc. | 4.1 |
| The Priceline Group, Inc. | 4.1 |
| Schlumberger, Ltd. | 4.0 |
| Cerner Corp. | 3.5 |
| TOTAL | 41.3 |
| As a percentage of net assets. | |
| Cash and cash equivalents are not included. | |
5
What holdings detracted from performance versus the benchmark?
Energy stocks were the weakest performers in the U.S. stock market over the past year as supply and demand imbalance sent the price of oil tumbling by more than 40%. Energy services and equipment provider Schlumberger, Ltd., a large holding in the energy sector, was the most significant detractor in the portfolio for the reporting period. Slowing global demand for energy led to decreased spending on energy exploration and production, which in turn contributed to a year-over-year decline in revenues and earnings for the company. Our research indicates that supply and demand in the energy sector will gradually return to equilibrium over the next few years, setting the stage for a resumption of revenue and earnings growth for Schlumberger. Multi-year initiatives to improve efficiency have been beneficial during this period of low oil prices, and the recent acquisition of oil field equipment manufacturer Cameron International Corp. should add value going forward.
Natural foods grocery retailer Whole Foods Market, Inc. also detracted from performance. Whole Foods was one of the fund's strongest performers in the first half of the reporting period, but the company reported disappointing earnings and same store sales growth in the last two quarters. Cannibalization of sales from new store openings in Chicago, produce cost deflation, and widely publicized pricing errors in the New York City area contributed to the company's poor results. Nonetheless, we see these issues as short-term in nature and believe our investment thesis for the company—which hinges on strategic advantages over its competitors in terms of scale, superior product quality, and strong supplier relationships—remains intact.
Another notable detractor was financial services provider American Express Company. The stock declined after the company lost co-branding relationships with Costco Wholesale and JetBlue Airways. In addition, American Express faced an adverse court ruling by the Department of Justice that could negatively impact its business going forward. Although American Express has a strong franchise with an attractive customer base, the challenges and uncertainty stemming from these developments led us to sell the stock and redeploy the capital into more attractive growth opportunities.
What other changes did you make to the portfolio during the reporting period?
In addition to American Express, we eliminated four other stocks from the portfolio during the period—industrial products distributor Fastenal Company, over-the-counter drug maker Perrigo Company PLC, pharmaceutical company Sanofi, and wireless technology firm QUALCOMM, Inc. In
6
each case, we chose to sell the stock so that we could fund more attractive investment opportunities with better valuations and/or greater growth potential.
Toward that end, we added six new holdings to the portfolio during the period. These new investments were snack food maker Mondelez International, Inc., oil services provider Core Laboratories NV, risk management services firm Verisk Analytics, Inc., payment product company FleetCor Technologies, Inc., social media leader Facebook, Inc., and energy-efficient chip designer ARM Holdings PLC.
MANAGED BY
 | George P. Fraise On the fund since 2000 Investing since 1987 |
| | Gordon M. Marchand, CPA, CFA, CIC On the fund since 1995 Investing since 1977 |
 | Robert L. Rohn On the fund since 2003 Investing since 1983 |
![]()
7
TOTAL RETURNS FOR THE PERIOD ENDED OCTOBER 31, 2015
| Average annual total returns (%) with maximum sales charge | Cumulative total returns (%) with maximum sales charge | ||||||
| 1-year | 5-year | 10-year | 5-year | 10-year | |||
| Class A | 7.53 | 13.63 | 7.02 | 89.41 | 97.08 | ||
| Class B | 7.56 | 13.69 | 6.92 | 89.93 | 95.32 | ||
| Class C | 11.40 | 13.94 | 6.77 | 92.01 | 92.48 | ||
| Class I1 | 13.48 | 15.16 | 7.99 | 102.53 | 115.66 | ||
| Class R21,2 | 13.01 | 14.72 | 7.48 | 98.73 | 105.76 | ||
| Class R61,2 | 13.61 | 15.25 | 8.00 | 103.34 | 115.87 | ||
| Index 1† | 9.18 | 15.30 | 9.09 | 103.77 | 138.69 | ||
| Index 2† | 5.20 | 14.33 | 7.85 | 95.37 | 112.89 | ||
Performance figures assume all distributions have been reinvested. Figures reflect maximum sales charges on Class A shares of 5% and the applicable contingent deferred sales charge (CDSC) on Class B and Class C shares. The Class B shares' CDSC declines annually between years 1 to 6 according to the following schedule: 5%, 4%, 3%, 3%, 2%, 1%. No sales charge will be assessed after the sixth year. Class C shares sold within one year of purchase are subject to a 1% CDSC. Sales charges are not applicable to Class I, Class R2, and Class R6 shares.
The expense ratios of the fund, both net (including any fee waivers or expense limitations) and gross (excluding any fee waivers or expense limitations), are set forth according to the most recent publicly available prospectuses for the fund and may differ from those disclosed in the Financial highlights tables in this report. Had the fee waivers and expense limitations not been in place, gross expenses would apply. The expense ratios are as follows:
| Class A | Class B | Class C | Class I | Class R2 | Class R6 | |
| Gross (%) | 1.19 | 1.94 | 1.94 | 0.93 | 1.33 | 0.83 |
| Net (%) | 1.19 | 1.94 | 1.94 | 0.93 | 1.33 | 0.81 |
Please refer to the most recent prospectus and annual or semiannual report for more information on expenses and any expense limitation arrangements for each class.
The returns reflect past results and should not be considered indicative of future performance. The return and principal value of an investment will fluctuate so that shares, when redeemed, may be worth more or less than their original cost. Due to market volatility and other factors, the fund's current performance may be higher or lower than the performance shown. For current to the most recent month-end performance data, please call 800-225-5291 or visit the fund's website at jhinvestments.com.
The performance table above and the chart on the next page do not reflect the deduction of taxes that a shareholder would pay on fund distributions or the redemption of fund shares. The fund's performance results reflect any applicable fee waivers or expense reductions, without which the expenses would increase and results would have been less favorable.
| † | Index 1 is the Russell 1000 Growth Index; Index 2 is the S&P 500 Index. |
See the following page for footnotes.
8
This chart and table show what happened to a hypothetical $10,000 investment in John Hancock U.S. Global Leaders Growth Fund for the share classes and periods indicated, assuming all distributions were reinvested. For comparison, we've shown the same investment in two separate indexes.
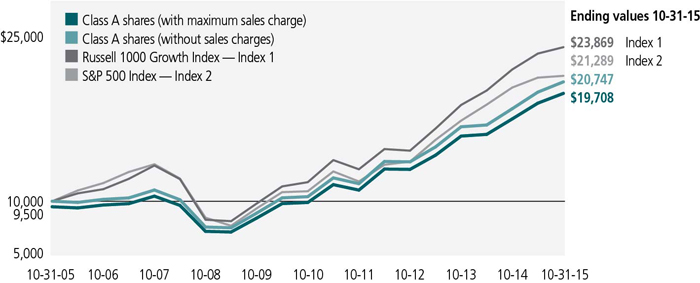
| Start date | With maximum sales charge ($) | Without sales charge ($) | Index 1 ($) | Index 2 ($) | |
| Class B3 | 10-31-05 | 19,532 | 19,532 | 23,869 | 21,289 |
| Class C3 | 10-31-05 | 19,248 | 19,248 | 23,869 | 21,289 |
| Class I1 | 10-31-05 | 21,566 | 21,566 | 23,869 | 21,289 |
| Class R21,2 | 10-31-05 | 20,576 | 20,576 | 23,869 | 21,289 |
| Class R61,2 | 10-31-05 | 21,587 | 21,587 | 23,869 | 21,289 |
Performance of the classes will vary based on the difference in sales charges paid by shareholders investing in the different classes and the fee structure of those classes.
The Russell 1000 Growth Index is an unmanaged index of companies in the Russell 1000 Index (the 1,000 largest U.S. publicly traded companies) with high price-to-book ratios and higher forecasted growth values.
The S&P 500 Index is an unmanaged index that includes 500 widely traded common stocks.
It is not possible to invest directly in an index. Index figures do not reflect expenses or sales charges, which would result in lower returns.
Footnotes related to performance pages
| 1 | For certain types of investors, as described in the fund's prospectuses. |
| 2 | Class R6 and Class R2 shares were first offered on 9-1-11 and 3-1-12, respectively. The returns prior to these dates are those of Class A shares that have been recalculated to apply the gross fees and expenses of Class R6 and Class R2 shares, as applicable. |
| 3 | The contingent deferred sales charge is not applicable. |
9
These examples are intended to help you understand your ongoing operating expenses of investing in the fund so you can compare these costs with the ongoing costs of investing in other mutual funds.
Understanding fund expenses
As a shareholder of the fund, you incur two types of costs:
| • | Transaction costs, which include sales charges (loads) on purchases or redemptions (varies by share class), minimum account fee charge, etc. |
| • | Ongoing operating expenses, including management fees, distribution and service fees (if applicable), and other fund expenses. |
We are presenting only your ongoing operating expenses here.
Actual expenses/actual returns
This example is intended to provide information about the fund's actual ongoing operating expenses, and is based on the fund's actual return. It assumes an account value of $1,000.00 on May 1, 2015, with the same investment held until October 31, 2015.
| Account value on 5-1-2015 | Ending value on 10-31-2015 | Expenses paid during period ended 10-31-20151 | Annualized expense ratio | |
| Class A | $1,000.00 | $1,046.80 | $6.09 | 1.18% |
| Class B | 1,000.00 | 1,042.90 | 9.94 | 1.93% |
| Class C | 1,000.00 | 1,042.90 | 9.94 | 1.93% |
| Class I | 1,000.00 | 1,048.00 | 4.75 | 0.92% |
| Class R2 | 1,000.00 | 1,046.00 | 6.81 | 1.32% |
| Class R6 | 1,000.00 | 1,048.80 | 4.13 | 0.80% |
Together with the value of your account, you may use this information to estimate the operating expenses that you paid over the period. Simply divide your account value at October 31, 2015, by $1,000.00, then multiply it by the "expenses paid" for your share class from the table above. For example, for an account value of $8,600.00, the operating expenses should be calculated as follows:
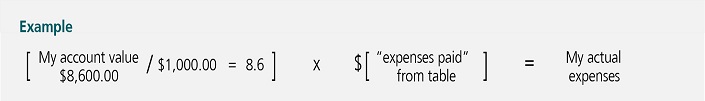
10
Hypothetical example for comparison purposes
This table allows you to compare the fund's ongoing operating expenses with those of any other fund. It provides an example of the fund's hypothetical account values and hypothetical expenses based on each class's actual expense ratio and an assumed 5% annualized return before expenses (which is not the fund's actual return). It assumes an account value of $1,000.00 on May 1, 2015, with the same investment held until October 31, 2015. Look in any other fund shareholder report to find its hypothetical example and you will be able to compare these expenses. Please remember that these hypothetical account values and expenses may not be used to estimate the actual ending account balance or expenses you paid for the period.
| Account value on 5-1-2015 | Ending value on 10-31-2015 | Expenses paid during period ended 10-31-20151 | Annualized expense ratio | |
| Class A | $1,000.00 | $1,019.30 | $6.01 | 1.18% |
| Class B | 1,000.00 | 1,015.50 | 9.80 | 1.93% |
| Class C | 1,000.00 | 1,015.50 | 9.80 | 1.93% |
| Class I | 1,000.00 | 1,020.60 | 4.69 | 0.92% |
| Class R2 | 1,000.00 | 1,018.60 | 6.72 | 1.32% |
| Class R6 | 1,000.00 | 1,021.20 | 4.08 | 0.80% |
Remember, these examples do not include any transaction costs, therefore, these examples will not help you to determine the relative total costs of owning different funds. If transaction costs were included, your expenses would have been higher. See the prospectuses for details regarding transaction costs.
| 1 | Expenses are equal to the fund's annualized expense ratio, multiplied by the average account value over the period, multiplied by 184/365 (to reflect the one-half year period). |
11
Fund's investments
| As of 10-31-15 | ||||||||||||||
| Shares | Value | |||||||||||||
| Common stocks 95.3% | $1,073,463,022 | |||||||||||||
| (Cost $717,562,883) | ||||||||||||||
| Consumer discretionary 18.8% | 211,653,212 | |||||||||||||
| Hotels, restaurants and leisure 3.2% | ||||||||||||||
| Starbucks Corp. | 574,460 | 35,943,962 | ||||||||||||
| Internet and catalog retail 8.3% | ||||||||||||||
| Amazon.com, Inc. (I) | 75,559 | 47,292,378 | ||||||||||||
| The Priceline Group, Inc. (I) | 31,807 | 46,255,012 | ||||||||||||
| Media 3.0% | ||||||||||||||
| The Walt Disney Company | 292,595 | 33,279,755 | ||||||||||||
| Specialty retail 4.3% | ||||||||||||||
| Lowe's Companies, Inc. | 662,090 | 48,882,105 | ||||||||||||
| Consumer staples 12.9% | 144,949,737 | |||||||||||||
| Food and staples retailing 2.4% | ||||||||||||||
| Whole Foods Market, Inc. | 906,960 | 27,172,522 | ||||||||||||
| Food products 7.2% | ||||||||||||||
| Mondelez International, Inc., Class A | 1,017,726 | 46,978,232 | ||||||||||||
| The Hershey Company | 378,665 | 33,583,799 | ||||||||||||
| Household products 3.3% | ||||||||||||||
| Colgate-Palmolive Company | 560,892 | 37,215,184 | ||||||||||||
| Energy 5.8% | 65,522,664 | |||||||||||||
| Energy equipment and services 5.8% | ||||||||||||||
| Core Laboratories NV (L) | 177,447 | 20,642,410 | ||||||||||||
| Schlumberger, Ltd. | 574,210 | 44,880,254 | ||||||||||||
| Financials 8.4% | 94,705,093 | |||||||||||||
| Capital markets 3.1% | ||||||||||||||
| State Street Corp. | 513,940 | 35,461,860 | ||||||||||||
| Insurance 2.6% | ||||||||||||||
| Aon PLC | 314,960 | 29,388,918 | ||||||||||||
| Real estate investment trusts 2.7% | ||||||||||||||
| Equinix, Inc. | 100,628 | 29,854,315 | ||||||||||||
| Health care 10.4% | 116,719,296 | |||||||||||||
| Biotechnology 6.8% | ||||||||||||||
| Amgen, Inc. | 307,190 | 48,591,314 | ||||||||||||
| Regeneron Pharmaceuticals, Inc. (I) | 50,780 | 28,304,264 | ||||||||||||
| Health care technology 3.6% | ||||||||||||||
| Cerner Corp. (I) | 600,750 | 39,823,718 | ||||||||||||
| Shares | Value | |||||||||||||
| Industrials 1.8% | $20,258,111 | |||||||||||||
| Professional services 1.8% | ||||||||||||||
| Verisk Analytics, Inc. (I) | 282,895 | 20,258,111 | ||||||||||||
| Information technology 31.1% | 350,476,486 | |||||||||||||
| Internet software and services 9.0% | ||||||||||||||
| Alphabet, Inc., Class C (I) | 67,141 | 47,724,494 | ||||||||||||
| Facebook, Inc., Class A (I) | 389,900 | 39,758,103 | ||||||||||||
| LinkedIn Corp., Class A (I) | 55,889 | 13,461,983 | ||||||||||||
| IT services 10.7% | ||||||||||||||
| Automatic Data Processing, Inc. | 443,055 | 38,541,354 | ||||||||||||
| FleetCor Technologies, Inc. (I) | 221,220 | 32,045,929 | ||||||||||||
| Visa, Inc., Class A | 645,100 | 50,046,858 | ||||||||||||
| Semiconductors and semiconductor equipment 3.2% | ||||||||||||||
| ARM Holdings PLC, ADR | 763,024 | 36,190,228 | ||||||||||||
| Software 8.2% | ||||||||||||||
| Red Hat, Inc. (I) | 416,910 | 32,981,750 | ||||||||||||
| salesforce.com, Inc. (I) | 311,997 | 24,245,287 | ||||||||||||
| SAP SE, ADR (L) | 450,775 | 35,480,500 | ||||||||||||
| Materials 6.1% | 69,178,423 | |||||||||||||
| Chemicals 6.1% | ||||||||||||||
| Ecolab, Inc. | 384,420 | 46,264,947 | ||||||||||||
| Monsanto Company | 245,800 | 22,913,476 | ||||||||||||
| Yield (%) | Shares | Value | ||||||||||||
| Securities lending collateral 4.3% | $48,884,470 | |||||||||||||
| (Cost $48,882,014) | ||||||||||||||
| John Hancock Collateral Trust (W) | 0.1388(Y | ) | 4,885,711 | 48,884,470 | ||||||||||
| Short-term investments 4.5% | $50,390,569 | |||||||||||||
| (Cost $50,390,569) | ||||||||||||||
| Money market funds 4.5% | 50,390,569 | |||||||||||||
| State Street Institutional U.S. Government Money Market Fund | 0.0000(Y | ) | 50,390,569 | 50,390,569 | ||||||||||
| Total investments (Cost $816,835,466)† 104.1% | $1,172,738,061 | |||||||||||||
| Other assets and liabilities, net (4.1%) | ($46,468,126 | ) | ||||||||||||
| Total net assets 100.0% | $1,126,269,935 | |||||||||||||
| The percentage shown for each investment category is the total value of the category as a percentage of the net assets of the fund. | ||||||||||||||
| Key to Security Abbreviations and Legend | ||||||||||||||
| ADR | American Depositary Receipts | |||||||||||||
| (I) | Non-income producing security. | |||||||||||||
| (L) | A portion of this security is on loan as of 10-31-15. | |||||||||||||
| (W) | Investment is an affiliate of the fund, the advisor and/or subadvisor. This security represents the investment of cash collateral received for securities lending. | |||||||||||||
| (Y) | The rate shown is the annualized seven-day yield as of 10-31-15. | |||||||||||||
| † | At 10-31-15, the aggregate cost of investment securities for federal income tax purposes was $820,294,690. Net unrealized appreciation aggregated $352,443,371, of which $369,289,684 related to appreciated investment securities and $16,846,313 related to depreciated investment securities. | |||||||||||||
Financial statements
STATEMENT OF ASSETS AND LIABILITIES 10-31-15
| Assets | ||||||||||||||||||||||||||||||||||||||||
| Investments in unaffiliated issuers, at value (Cost $767,953,452) including $47,918,358 of securities loaned | $1,123,853,591 | |||||||||||||||||||||||||||||||||||||||
| Investments in affiliated issuers, at value (Cost $48,882,014) | 48,884,470 | |||||||||||||||||||||||||||||||||||||||
| Total investments, at value (Cost $816,835,466) | 1,172,738,061 | |||||||||||||||||||||||||||||||||||||||
| Receivable for fund shares sold | 2,801,522 | |||||||||||||||||||||||||||||||||||||||
| Dividends and interest receivable | 1,989,220 | |||||||||||||||||||||||||||||||||||||||
| Receivable for securities lending income | 17,943 | |||||||||||||||||||||||||||||||||||||||
| Other receivables and prepaid expenses | 67,316 | |||||||||||||||||||||||||||||||||||||||
| Total assets | 1,177,614,062 | |||||||||||||||||||||||||||||||||||||||
| Liabilities | ||||||||||||||||||||||||||||||||||||||||
| Payable for fund shares repurchased | 1,231,996 | |||||||||||||||||||||||||||||||||||||||
| Payable upon return of securities loaned | 48,894,025 | |||||||||||||||||||||||||||||||||||||||
| Payable to affiliates | ||||||||||||||||||||||||||||||||||||||||
| Accounting and legal services fees | 19,407 | |||||||||||||||||||||||||||||||||||||||
| Transfer agent fees | 112,310 | |||||||||||||||||||||||||||||||||||||||
| Distribution and service fees | 268,345 | |||||||||||||||||||||||||||||||||||||||
| Trustees' fees | 1,961 | |||||||||||||||||||||||||||||||||||||||
| Investment management fees | 677,499 | |||||||||||||||||||||||||||||||||||||||
| Other liabilities and accrued expenses | 138,584 | |||||||||||||||||||||||||||||||||||||||
| Total liabilities | 51,344,127 | |||||||||||||||||||||||||||||||||||||||
| Net assets | $1,126,269,935 | |||||||||||||||||||||||||||||||||||||||
| Net assets consist of | ||||||||||||||||||||||||||||||||||||||||
| Paid-in capital | $703,746,304 | |||||||||||||||||||||||||||||||||||||||
| Undistributed net investment income | 1,276,191 | |||||||||||||||||||||||||||||||||||||||
| Accumulated net realized gain (loss) on investments | 65,344,845 | |||||||||||||||||||||||||||||||||||||||
| Net unrealized appreciation (depreciation) on investments | 355,902,595 | |||||||||||||||||||||||||||||||||||||||
| Net assets | $1,126,269,935 | |||||||||||||||||||||||||||||||||||||||
STATEMENT OF ASSETS AND LIABILITIES (continued)
| Net asset value per share | ||||||||||||||||||
| Based on net asset values and shares outstanding-the fund has an unlimited number of shares authorized with no par value | ||||||||||||||||||
| Class A ($659,954,541 ÷ 15,043,928 shares)1 | $43.87 | |||||||||||||||||
| Class B ($24,263,127 ÷ 623,713 shares)1 | $38.90 | |||||||||||||||||
| Class C ($136,259,249 ÷ 3,501,126 shares)1 | $38.92 | |||||||||||||||||
| Class I ($292,593,168 ÷ 6,323,051 shares) | $46.27 | |||||||||||||||||
| Class R2 ($7,677,913 ÷ 167,302 shares) | $45.89 | |||||||||||||||||
| Class R6 ($5,521,937 ÷ 119,028 shares) | $46.39 | |||||||||||||||||
| Maximum offering price per share | ||||||||||||||||||
| Class A (net asset value per share ÷ 95%)2 | $46.18 | |||||||||||||||||
| 1 | Redemption price per share is equal to net asset value less any applicable contingent deferred sales charge. | ||||||||||||||||
| 2 | On single retail sales of less than $50,000. On sales of $50,000 or more and on group sales the offering price is reduced. | ||||||||||||||||
STATEMENT OF OPERATIONS For the year ended 10-31-15
| Investment income | ||||||||||||||||||||||||||||||||||||||||
| Dividends | $14,528,975 | |||||||||||||||||||||||||||||||||||||||
| Securities lending | 150,507 | |||||||||||||||||||||||||||||||||||||||
| Less foreign taxes withheld | (228,614 | ) | ||||||||||||||||||||||||||||||||||||||
| Total investment income | 14,450,868 | |||||||||||||||||||||||||||||||||||||||
| Expenses | ||||||||||||||||||||||||||||||||||||||||
| Investment management fees | 8,045,254 | |||||||||||||||||||||||||||||||||||||||
| Distribution and service fees | 3,204,184 | |||||||||||||||||||||||||||||||||||||||
| Accounting and legal services fees | 206,440 | |||||||||||||||||||||||||||||||||||||||
| Transfer agent fees | 1,281,252 | |||||||||||||||||||||||||||||||||||||||
| Trustees' fees | 22,977 | |||||||||||||||||||||||||||||||||||||||
| State registration fees | 132,623 | |||||||||||||||||||||||||||||||||||||||
| Printing and postage | 91,944 | |||||||||||||||||||||||||||||||||||||||
| Professional fees | 98,351 | |||||||||||||||||||||||||||||||||||||||
| Custodian fees | 123,614 | |||||||||||||||||||||||||||||||||||||||
| Registration and filing fees | 22,464 | |||||||||||||||||||||||||||||||||||||||
| Other | 30,655 | |||||||||||||||||||||||||||||||||||||||
| Total expenses | 13,259,758 | |||||||||||||||||||||||||||||||||||||||
| Less expense reductions | (84,103 | ) | ||||||||||||||||||||||||||||||||||||||
| Net expenses | 13,175,655 | |||||||||||||||||||||||||||||||||||||||
| Net investment income | 1,275,213 | |||||||||||||||||||||||||||||||||||||||
| Realized and unrealized gain (loss) | ||||||||||||||||||||||||||||||||||||||||
| Net realized gain (loss) on | ||||||||||||||||||||||||||||||||||||||||
| Investments in unaffiliated issuers | 69,083,921 | |||||||||||||||||||||||||||||||||||||||
| Investments in affiliated issuers | (3,025 | ) | ||||||||||||||||||||||||||||||||||||||
| 69,080,896 | ||||||||||||||||||||||||||||||||||||||||
| Change in net unrealized appreciation (depreciation) of | ||||||||||||||||||||||||||||||||||||||||
| Investments in unaffiliated issuers | 65,841,966 | |||||||||||||||||||||||||||||||||||||||
| Investments in affiliated issuers | 1,963 | |||||||||||||||||||||||||||||||||||||||
| 65,843,929 | ||||||||||||||||||||||||||||||||||||||||
| Net realized and unrealized gain | 134,924,825 | |||||||||||||||||||||||||||||||||||||||
| Increase in net assets from operations | $136,200,038 | |||||||||||||||||||||||||||||||||||||||
STATEMENTS OF CHANGES IN NET ASSETS
| Year ended 10-31-15 | Year ended 10-31-14 | ||||||||||||||||||||||||||||||||||||||||||||
| Increase (decrease) in net assets | |||||||||||||||||||||||||||||||||||||||||||||
| From operations | |||||||||||||||||||||||||||||||||||||||||||||
| Net investment income | $1,275,213 | $2,782,502 | |||||||||||||||||||||||||||||||||||||||||||
| Net realized gain | 69,080,896 | 151,156,136 | |||||||||||||||||||||||||||||||||||||||||||
| Change in net unrealized appreciation (depreciation) | 65,843,929 | (47,211,403 | ) | ||||||||||||||||||||||||||||||||||||||||||
| Increase in net assets resulting from operations | 136,200,038 | 106,727,235 | |||||||||||||||||||||||||||||||||||||||||||
| Distributions to shareholders | |||||||||||||||||||||||||||||||||||||||||||||
| From net investment income | |||||||||||||||||||||||||||||||||||||||||||||
| Class A | (1,292,278 | ) | (569,456 | ) | |||||||||||||||||||||||||||||||||||||||||
| Class I | (1,203,657 | ) | (674,178 | ) | |||||||||||||||||||||||||||||||||||||||||
| Class R2 | (34,533 | ) | (11,535 | ) | |||||||||||||||||||||||||||||||||||||||||
| Class R6 | (18,692 | ) | (10,189 | ) | |||||||||||||||||||||||||||||||||||||||||
| From net realized gain | |||||||||||||||||||||||||||||||||||||||||||||
| Class A | (80,357,508 | ) | (20,049,098 | ) | |||||||||||||||||||||||||||||||||||||||||
| Class B | (3,938,428 | ) | (999,781 | ) | |||||||||||||||||||||||||||||||||||||||||
| Class C | (19,500,146 | ) | (4,082,434 | ) | |||||||||||||||||||||||||||||||||||||||||
| Class I | (39,880,649 | ) | (8,473,404 | ) | |||||||||||||||||||||||||||||||||||||||||
| Class R2 | (4,345,694 | ) | (886,864 | ) | |||||||||||||||||||||||||||||||||||||||||
| Class R6 | (487,863 | ) | (101,558 | ) | |||||||||||||||||||||||||||||||||||||||||
| Total distributions | (151,059,448 | ) | (35,858,497 | ) | |||||||||||||||||||||||||||||||||||||||||
| From fund share transactions | 26,200,408 | (158,965,900 | ) | ||||||||||||||||||||||||||||||||||||||||||
| Total increase (decrease) | 11,340,998 | (88,097,162 | ) | ||||||||||||||||||||||||||||||||||||||||||
| Net assets | |||||||||||||||||||||||||||||||||||||||||||||
| Beginning of year | 1,114,928,937 | 1,203,026,099 | |||||||||||||||||||||||||||||||||||||||||||
| End of year | $1,126,269,935 | $1,114,928,937 | |||||||||||||||||||||||||||||||||||||||||||
| Undistributed net investment income | $1,276,191 | $2,548,484 | |||||||||||||||||||||||||||||||||||||||||||
Financial highlights
| Class A Shares Period ended | 10-31-15 | 10-31-14 | 10-31-13 | 10-31-12 | 10-31-11 | ||||||||||||||||||||||||||||||||||||||||||||||||||||||||||||||||||||||||||||||||||||||||||||||||||
| Per share operating performance | |||||||||||||||||||||||||||||||||||||||||||||||||||||||||||||||||||||||||||||||||||||||||||||||||||||||
| Net asset value, beginning of period | $45.02 | $42.25 | $35.04 | $30.97 | $27.83 | ||||||||||||||||||||||||||||||||||||||||||||||||||||||||||||||||||||||||||||||||||||||||||||||||||
| Net investment income (loss)1 | 0.07 | 0.11 | 0.04 | (0.03 | ) | — | 2 | ||||||||||||||||||||||||||||||||||||||||||||||||||||||||||||||||||||||||||||||||||||||||||||||||
| Net realized and unrealized gain on investments | 4.98 | 3.90 | 7.96 | 5.08 | 3.14 | ||||||||||||||||||||||||||||||||||||||||||||||||||||||||||||||||||||||||||||||||||||||||||||||||||
| Total from investment operations | 5.05 | 4.01 | 8.00 | 5.05 | 3.14 | ||||||||||||||||||||||||||||||||||||||||||||||||||||||||||||||||||||||||||||||||||||||||||||||||||
| Less distributions | |||||||||||||||||||||||||||||||||||||||||||||||||||||||||||||||||||||||||||||||||||||||||||||||||||||||
| From net investment income | (0.10 | ) | (0.03 | ) | — | — | — | ||||||||||||||||||||||||||||||||||||||||||||||||||||||||||||||||||||||||||||||||||||||||||||||||
| From net realized gain | (6.10 | ) | (1.21 | ) | (0.79 | ) | (0.98 | ) | — | ||||||||||||||||||||||||||||||||||||||||||||||||||||||||||||||||||||||||||||||||||||||||||||||
| Total distributions | (6.20 | ) | (1.24 | ) | (0.79 | ) | (0.98 | ) | — | ||||||||||||||||||||||||||||||||||||||||||||||||||||||||||||||||||||||||||||||||||||||||||||||
| Net asset value, end of period | $43.87 | $45.02 | $42.25 | $35.04 | $30.97 | ||||||||||||||||||||||||||||||||||||||||||||||||||||||||||||||||||||||||||||||||||||||||||||||||||
| Total return (%)3,4 | 13.19 | 9.74 | 23.30 | 16.96 | 11.28 | ||||||||||||||||||||||||||||||||||||||||||||||||||||||||||||||||||||||||||||||||||||||||||||||||||
| Ratios and supplemental data | |||||||||||||||||||||||||||||||||||||||||||||||||||||||||||||||||||||||||||||||||||||||||||||||||||||||
| Net assets, end of period (in millions) | $660 | $600 | $697 | $413 | $282 | ||||||||||||||||||||||||||||||||||||||||||||||||||||||||||||||||||||||||||||||||||||||||||||||||||
| Ratios (as a percentage of average net assets): | |||||||||||||||||||||||||||||||||||||||||||||||||||||||||||||||||||||||||||||||||||||||||||||||||||||||
| Expenses before reductions | 1.18 | 1.19 | 1.23 | 1.30 | 1.26 | ||||||||||||||||||||||||||||||||||||||||||||||||||||||||||||||||||||||||||||||||||||||||||||||||||
| Expenses including reductions | 1.17 | 1.18 | 1.23 | 1.30 | 1.26 | ||||||||||||||||||||||||||||||||||||||||||||||||||||||||||||||||||||||||||||||||||||||||||||||||||
| Net investment income (loss) | 0.16 | 0.27 | 0.10 | (0.10 | ) | (0.01 | ) | ||||||||||||||||||||||||||||||||||||||||||||||||||||||||||||||||||||||||||||||||||||||||||||||||
| Portfolio turnover (%) | 30 | 43 | 30 | 30 | 50 | ||||||||||||||||||||||||||||||||||||||||||||||||||||||||||||||||||||||||||||||||||||||||||||||||||
| 1 | Based on average daily shares outstanding. | ||||||||||||||||||||||||||||||||||||||||||||||||||||||||||||||||||||||||||||||||||
| 2 | Less than $0.005 per share. | ||||||||||||||||||||||||||||||||||||||||||||||||||||||||||||||||||||||||||||||||||
| 3 | Does not reflect the effect of sales charges, if any. | ||||||||||||||||||||||||||||||||||||||||||||||||||||||||||||||||||||||||||||||||||
| 4 | Total returns would have been lower had certain expenses not been reduced during the applicable periods. | ||||||||||||||||||||||||||||||||||||||||||||||||||||||||||||||||||||||||||||||||||
| Class B Shares Period ended | 10-31-15 | 10-31-14 | 10-31-13 | 10-31-12 | 10-31-11 | ||||||||||||||||||||||||||||||||||||||||||||||||||||||||||||||||||||||||||||||||||||||||||||||||||
| Per share operating performance | |||||||||||||||||||||||||||||||||||||||||||||||||||||||||||||||||||||||||||||||||||||||||||||||||||||||
| Net asset value, beginning of period | $40.80 | $38.65 | $32.36 | $28.89 | $26.16 | ||||||||||||||||||||||||||||||||||||||||||||||||||||||||||||||||||||||||||||||||||||||||||||||||||
| Net investment loss1 | (0.22 | ) | (0.19 | ) | (0.22 | ) | (0.26 | ) | (0.21 | ) | |||||||||||||||||||||||||||||||||||||||||||||||||||||||||||||||||||||||||||||||||||||||||||||
| Net realized and unrealized gain on investments | 4.42 | 3.55 | 7.30 | 4.71 | 2.94 | ||||||||||||||||||||||||||||||||||||||||||||||||||||||||||||||||||||||||||||||||||||||||||||||||||
| Total from investment operations | 4.20 | 3.36 | 7.08 | 4.45 | 2.73 | ||||||||||||||||||||||||||||||||||||||||||||||||||||||||||||||||||||||||||||||||||||||||||||||||||
| Less distributions | |||||||||||||||||||||||||||||||||||||||||||||||||||||||||||||||||||||||||||||||||||||||||||||||||||||||
| From net realized gain | (6.10 | ) | (1.21 | ) | (0.79 | ) | (0.98 | ) | — | ||||||||||||||||||||||||||||||||||||||||||||||||||||||||||||||||||||||||||||||||||||||||||||||
| Total distributions | (6.10 | ) | (1.21 | ) | (0.79 | ) | (0.98 | ) | — | ||||||||||||||||||||||||||||||||||||||||||||||||||||||||||||||||||||||||||||||||||||||||||||||
| Net asset value, end of period | $38.90 | $40.80 | $38.65 | $32.36 | $28.89 | ||||||||||||||||||||||||||||||||||||||||||||||||||||||||||||||||||||||||||||||||||||||||||||||||||
| Total return (%)2,3 | 12.33 | 8.93 | 22.37 | 16.07 | 10.44 | ||||||||||||||||||||||||||||||||||||||||||||||||||||||||||||||||||||||||||||||||||||||||||||||||||
| Ratios and supplemental data | |||||||||||||||||||||||||||||||||||||||||||||||||||||||||||||||||||||||||||||||||||||||||||||||||||||||
| Net assets, end of period (in millions) | $24 | $27 | $33 | $30 | $27 | ||||||||||||||||||||||||||||||||||||||||||||||||||||||||||||||||||||||||||||||||||||||||||||||||||
| Ratios (as a percentage of average net assets): | |||||||||||||||||||||||||||||||||||||||||||||||||||||||||||||||||||||||||||||||||||||||||||||||||||||||
| Expenses before reductions | 1.93 | 1.94 | 1.99 | 2.05 | 2.01 | ||||||||||||||||||||||||||||||||||||||||||||||||||||||||||||||||||||||||||||||||||||||||||||||||||
| Expenses including reductions | 1.92 | 1.93 | 1.98 | 2.05 | 2.00 | ||||||||||||||||||||||||||||||||||||||||||||||||||||||||||||||||||||||||||||||||||||||||||||||||||
| Net investment loss | (0.60 | ) | (0.48 | ) | (0.64 | ) | (0.85 | ) | (0.75 | ) | |||||||||||||||||||||||||||||||||||||||||||||||||||||||||||||||||||||||||||||||||||||||||||||
| Portfolio turnover (%) | 30 | 43 | 30 | 30 | 50 | ||||||||||||||||||||||||||||||||||||||||||||||||||||||||||||||||||||||||||||||||||||||||||||||||||
| 1 | Based on average daily shares outstanding. | ||||||||||||||||||||||||||||||||||||||||||||||||||||||||||||||||||||||||||||||||||
| 2 | Does not reflect the effect of sales charges, if any. | ||||||||||||||||||||||||||||||||||||||||||||||||||||||||||||||||||||||||||||||||||
| 3 | Total returns would have been lower had certain expenses not been reduced during the applicable periods. | ||||||||||||||||||||||||||||||||||||||||||||||||||||||||||||||||||||||||||||||||||
| Class C Shares Period ended | 10-31-15 | 10-31-14 | 10-31-13 | 10-31-12 | 10-31-11 | ||||||||||||||||||||||||||||||||||||||||||||||||||||||||||||||||||||||||||||||||||||||||||||||||||
| Per share operating performance | |||||||||||||||||||||||||||||||||||||||||||||||||||||||||||||||||||||||||||||||||||||||||||||||||||||||
| Net asset value, beginning of period | $40.81 | $38.66 | $32.37 | $28.90 | $26.16 | ||||||||||||||||||||||||||||||||||||||||||||||||||||||||||||||||||||||||||||||||||||||||||||||||||
| Net investment loss1 | (0.22 | ) | (0.19 | ) | (0.22 | ) | (0.26 | ) | (0.21 | ) | |||||||||||||||||||||||||||||||||||||||||||||||||||||||||||||||||||||||||||||||||||||||||||||
| Net realized and unrealized gain on investments | 4.43 | 3.55 | 7.30 | 4.71 | 2.95 | ||||||||||||||||||||||||||||||||||||||||||||||||||||||||||||||||||||||||||||||||||||||||||||||||||
| Total from investment operations | 4.21 | 3.36 | 7.08 | 4.45 | 2.74 | ||||||||||||||||||||||||||||||||||||||||||||||||||||||||||||||||||||||||||||||||||||||||||||||||||
| Less distributions | |||||||||||||||||||||||||||||||||||||||||||||||||||||||||||||||||||||||||||||||||||||||||||||||||||||||
| From net realized gain | (6.10 | ) | (1.21 | ) | (0.79 | ) | (0.98 | ) | — | ||||||||||||||||||||||||||||||||||||||||||||||||||||||||||||||||||||||||||||||||||||||||||||||
| Total distributions | (6.10 | ) | (1.21 | ) | (0.79 | ) | (0.98 | ) | — | ||||||||||||||||||||||||||||||||||||||||||||||||||||||||||||||||||||||||||||||||||||||||||||||
| Net asset value, end of period | $38.92 | $40.81 | $38.66 | $32.37 | $28.90 | ||||||||||||||||||||||||||||||||||||||||||||||||||||||||||||||||||||||||||||||||||||||||||||||||||
| Total return (%)2,3 | 12.36 | 8.92 | 22.36 | 16.07 | 10.47 | ||||||||||||||||||||||||||||||||||||||||||||||||||||||||||||||||||||||||||||||||||||||||||||||||||
| Ratios and supplemental data | |||||||||||||||||||||||||||||||||||||||||||||||||||||||||||||||||||||||||||||||||||||||||||||||||||||||
| Net assets, end of period (in millions) | $136 | $133 | $130 | $81 | $58 | ||||||||||||||||||||||||||||||||||||||||||||||||||||||||||||||||||||||||||||||||||||||||||||||||||
| Ratios (as a percentage of average net assets): | |||||||||||||||||||||||||||||||||||||||||||||||||||||||||||||||||||||||||||||||||||||||||||||||||||||||
| Expenses before reductions | 1.93 | 1.94 | 1.98 | 2.05 | 2.01 | ||||||||||||||||||||||||||||||||||||||||||||||||||||||||||||||||||||||||||||||||||||||||||||||||||
| Expenses including reductions | 1.92 | 1.93 | 1.98 | 2.05 | 2.01 | ||||||||||||||||||||||||||||||||||||||||||||||||||||||||||||||||||||||||||||||||||||||||||||||||||
| Net investment loss | (0.59 | ) | (0.48 | ) | (0.65 | ) | (0.85 | ) | (0.75 | ) | |||||||||||||||||||||||||||||||||||||||||||||||||||||||||||||||||||||||||||||||||||||||||||||
| Portfolio turnover (%) | 30 | 43 | 30 | 30 | 50 | ||||||||||||||||||||||||||||||||||||||||||||||||||||||||||||||||||||||||||||||||||||||||||||||||||
| 1 | Based on average daily shares outstanding. | ||||||||||||||||||||||||||||||||||||||||||||||||||||||||||||||||||||||||||||||||||
| 2 | Does not reflect the effect of sales charges, if any. | ||||||||||||||||||||||||||||||||||||||||||||||||||||||||||||||||||||||||||||||||||
| 3 | Total returns would have been lower had certain expenses not been reduced during the applicable periods. | ||||||||||||||||||||||||||||||||||||||||||||||||||||||||||||||||||||||||||||||||||
| Class I Shares Period ended | 10-31-15 | 10-31-14 | 10-31-13 | 10-31-12 | 10-31-11 | ||||||||||||||||||||||||||||||||||||||||||||||||||||||||||||||||||||||||||||||||||||||||||||||||||
| Per share operating performance | |||||||||||||||||||||||||||||||||||||||||||||||||||||||||||||||||||||||||||||||||||||||||||||||||||||||
| Net asset value, beginning of period | $47.12 | $44.12 | $36.44 | $32.06 | $28.69 | ||||||||||||||||||||||||||||||||||||||||||||||||||||||||||||||||||||||||||||||||||||||||||||||||||
| Net investment income1 | 0.18 | 0.24 | 0.16 | 0.08 | 0.12 | ||||||||||||||||||||||||||||||||||||||||||||||||||||||||||||||||||||||||||||||||||||||||||||||||||
| Net realized and unrealized gain (loss) on investments | 5.25 | 4.07 | 8.31 | 5.28 | 3.25 | ||||||||||||||||||||||||||||||||||||||||||||||||||||||||||||||||||||||||||||||||||||||||||||||||||
| Total from investment operations | 5.43 | 4.31 | 8.47 | 5.36 | 3.37 | ||||||||||||||||||||||||||||||||||||||||||||||||||||||||||||||||||||||||||||||||||||||||||||||||||
| Less distributions | |||||||||||||||||||||||||||||||||||||||||||||||||||||||||||||||||||||||||||||||||||||||||||||||||||||||
| From net investment income | (0.18 | ) | (0.10 | ) | — | — | — | ||||||||||||||||||||||||||||||||||||||||||||||||||||||||||||||||||||||||||||||||||||||||||||||||
| From net realized gain | (6.10 | ) | (1.21 | ) | (0.79 | ) | (0.98 | ) | — | ||||||||||||||||||||||||||||||||||||||||||||||||||||||||||||||||||||||||||||||||||||||||||||||
| Total distributions | (6.28 | ) | (1.31 | ) | (0.79 | ) | (0.98 | ) | — | ||||||||||||||||||||||||||||||||||||||||||||||||||||||||||||||||||||||||||||||||||||||||||||||
| Net asset value, end of period | $46.27 | $47.12 | $44.12 | $36.44 | $32.06 | ||||||||||||||||||||||||||||||||||||||||||||||||||||||||||||||||||||||||||||||||||||||||||||||||||
| Total return (%)2 | 13.48 | 10.01 | 23.70 | 17.36 | 11.75 | ||||||||||||||||||||||||||||||||||||||||||||||||||||||||||||||||||||||||||||||||||||||||||||||||||
| Ratios and supplemental data | |||||||||||||||||||||||||||||||||||||||||||||||||||||||||||||||||||||||||||||||||||||||||||||||||||||||
| Net assets, end of period (in millions) | $293 | $317 | $307 | $169 | $55 | ||||||||||||||||||||||||||||||||||||||||||||||||||||||||||||||||||||||||||||||||||||||||||||||||||
| Ratios (as a percentage of average net assets): | |||||||||||||||||||||||||||||||||||||||||||||||||||||||||||||||||||||||||||||||||||||||||||||||||||||||
| Expenses before reductions | 0.91 | 0.93 | 0.93 | 0.96 | 0.90 | ||||||||||||||||||||||||||||||||||||||||||||||||||||||||||||||||||||||||||||||||||||||||||||||||||
| Expenses including reductions | 0.91 | 0.92 | 0.93 | 0.94 | 0.85 | ||||||||||||||||||||||||||||||||||||||||||||||||||||||||||||||||||||||||||||||||||||||||||||||||||
| Net investment income | 0.41 | 0.53 | 0.41 | 0.24 | 0.39 | ||||||||||||||||||||||||||||||||||||||||||||||||||||||||||||||||||||||||||||||||||||||||||||||||||
| Portfolio turnover (%) | 30 | 43 | 30 | 30 | 50 | ||||||||||||||||||||||||||||||||||||||||||||||||||||||||||||||||||||||||||||||||||||||||||||||||||
| 1 | Based on average daily shares outstanding. | ||||||||||||||||||||||||||||||||||||||||||||||||||||||||||||||||||||||||||||||||||
| 2 | Total returns would have been lower had certain expenses not been reduced during the applicable periods. | ||||||||||||||||||||||||||||||||||||||||||||||||||||||||||||||||||||||||||||||||||
| Class R2 Shares Period ended | 10-31-15 | 10-31-14 | 10-31-13 | 10-31-12 | 1 | |||||||||||||||||||||||||||||||||||||||||||||||||||||||||||||||||||||||||||||||||||
| Per share operating performance | ||||||||||||||||||||||||||||||||||||||||||||||||||||||||||||||||||||||||||||||||||||||||
| Net asset value, beginning of period | $46.82 | $43.93 | $36.40 | $34.46 | ||||||||||||||||||||||||||||||||||||||||||||||||||||||||||||||||||||||||||||||||||||
| Net investment income (loss)2 | (0.05 | ) | 0.06 | (0.04 | ) | 0.02 | ||||||||||||||||||||||||||||||||||||||||||||||||||||||||||||||||||||||||||||||||||
| Net realized and unrealized gain on investments | 5.27 | 4.06 | 8.36 | 1.92 | ||||||||||||||||||||||||||||||||||||||||||||||||||||||||||||||||||||||||||||||||||||
| Total from investment operations | 5.22 | 4.12 | 8.32 | 1.94 | ||||||||||||||||||||||||||||||||||||||||||||||||||||||||||||||||||||||||||||||||||||
| Less distributions | ||||||||||||||||||||||||||||||||||||||||||||||||||||||||||||||||||||||||||||||||||||||||
| From net investment income | (0.05 | ) | (0.02 | ) | — | — | ||||||||||||||||||||||||||||||||||||||||||||||||||||||||||||||||||||||||||||||||||
| From net realized gain | (6.10 | ) | (1.21 | ) | (0.79 | ) | — | |||||||||||||||||||||||||||||||||||||||||||||||||||||||||||||||||||||||||||||||||
| Total distributions | (6.15 | ) | (1.23 | ) | (0.79 | ) | — | |||||||||||||||||||||||||||||||||||||||||||||||||||||||||||||||||||||||||||||||||
| Net asset value, end of period | $45.89 | $46.82 | $43.93 | $36.40 | ||||||||||||||||||||||||||||||||||||||||||||||||||||||||||||||||||||||||||||||||||||
| Total return (%)3 | 13.01 | 9.59 | 23.31 | 5.63 | 4 | |||||||||||||||||||||||||||||||||||||||||||||||||||||||||||||||||||||||||||||||||||
| Ratios and supplemental data | ||||||||||||||||||||||||||||||||||||||||||||||||||||||||||||||||||||||||||||||||||||||||
| Net assets, end of period (in millions) | $8 | $34 | $32 | — | 5 | |||||||||||||||||||||||||||||||||||||||||||||||||||||||||||||||||||||||||||||||||||
| Ratios (as a percentage of average net assets): | ||||||||||||||||||||||||||||||||||||||||||||||||||||||||||||||||||||||||||||||||||||||||
| Expenses before reductions | 1.30 | 1.33 | 1.32 | 1.13 | 6 | |||||||||||||||||||||||||||||||||||||||||||||||||||||||||||||||||||||||||||||||||||
| Expenses including reductions | 1.29 | 1.32 | 1.31 | 1.13 | 6 | |||||||||||||||||||||||||||||||||||||||||||||||||||||||||||||||||||||||||||||||||||
| Net investment income (loss) | (0.11 | ) | 0.13 | (0.09 | ) | 0.08 | 6 | |||||||||||||||||||||||||||||||||||||||||||||||||||||||||||||||||||||||||||||||||
| Portfolio turnover (%) | 30 | 43 | 30 | 30 | 7 | |||||||||||||||||||||||||||||||||||||||||||||||||||||||||||||||||||||||||||||||||||
| 1 | The inception date for Class R2 shares is 3-1-12. | ||||||||||||||||||||||||||||||||||||||||||||||||||||||||||||||||||||||||||||||||||
| 2 | Based on average daily shares outstanding. | ||||||||||||||||||||||||||||||||||||||||||||||||||||||||||||||||||||||||||||||||||
| 3 | Total returns would have been lower had certain expenses not been reduced during the applicable periods. | ||||||||||||||||||||||||||||||||||||||||||||||||||||||||||||||||||||||||||||||||||
| 4 | Not annualized. | ||||||||||||||||||||||||||||||||||||||||||||||||||||||||||||||||||||||||||||||||||
| 5 | Less than $500,000. | ||||||||||||||||||||||||||||||||||||||||||||||||||||||||||||||||||||||||||||||||||
| 6 | Annualized. | ||||||||||||||||||||||||||||||||||||||||||||||||||||||||||||||||||||||||||||||||||
| 7 | The portfolio turnover is shown for the period from 11-1-11 to 10-31-12. | ||||||||||||||||||||||||||||||||||||||||||||||||||||||||||||||||||||||||||||||||||
| Class R6 Shares Period ended | 10-31-15 | 10-31-14 | 10-31-13 | 10-31-12 | 10-31-11 | 1 | |||||||||||||||||||||||||||||||||||||||||||||||||||||||||||||||||||||||||||||||||||||||||||||||||
| Per share operating performance | |||||||||||||||||||||||||||||||||||||||||||||||||||||||||||||||||||||||||||||||||||||||||||||||||||||||
| Net asset value, beginning of period | $47.23 | $44.19 | $36.46 | $32.06 | $30.81 | ||||||||||||||||||||||||||||||||||||||||||||||||||||||||||||||||||||||||||||||||||||||||||||||||||
| Net investment income2 | 0.24 | 0.28 | 0.18 | 0.11 | 0.03 | ||||||||||||||||||||||||||||||||||||||||||||||||||||||||||||||||||||||||||||||||||||||||||||||||||
| Net realized and unrealized gain on investments | 5.25 | 4.09 | 8.34 | 5.27 | 1.22 | ||||||||||||||||||||||||||||||||||||||||||||||||||||||||||||||||||||||||||||||||||||||||||||||||||
| Total from investment operations | 5.49 | 4.37 | 8.52 | 5.38 | 1.25 | ||||||||||||||||||||||||||||||||||||||||||||||||||||||||||||||||||||||||||||||||||||||||||||||||||
| Less distributions | |||||||||||||||||||||||||||||||||||||||||||||||||||||||||||||||||||||||||||||||||||||||||||||||||||||||
| From net investment income | (0.23 | ) | (0.12 | ) | — | — | — | ||||||||||||||||||||||||||||||||||||||||||||||||||||||||||||||||||||||||||||||||||||||||||||||||
| From net realized gain | (6.10 | ) | (1.21 | ) | (0.79 | ) | (0.98 | ) | — | ||||||||||||||||||||||||||||||||||||||||||||||||||||||||||||||||||||||||||||||||||||||||||||||
| Total distributions | (6.33 | ) | (1.33 | ) | (0.79 | ) | (0.98 | ) | — | ||||||||||||||||||||||||||||||||||||||||||||||||||||||||||||||||||||||||||||||||||||||||||||||
| Net asset value, end of period | $46.39 | $47.23 | $44.19 | $36.46 | $32.06 | ||||||||||||||||||||||||||||||||||||||||||||||||||||||||||||||||||||||||||||||||||||||||||||||||||
| Total return (%)3 | 13.61 | 10.15 | 23.83 | 17.42 | 4.06 | 4 | |||||||||||||||||||||||||||||||||||||||||||||||||||||||||||||||||||||||||||||||||||||||||||||||||
| Ratios and supplemental data | |||||||||||||||||||||||||||||||||||||||||||||||||||||||||||||||||||||||||||||||||||||||||||||||||||||||
| Net assets, end of period (in millions) | $6 | $4 | $4 | — | 5 | — | 5 | ||||||||||||||||||||||||||||||||||||||||||||||||||||||||||||||||||||||||||||||||||||||||||||||||
| Ratios (as a percentage of average net assets): | |||||||||||||||||||||||||||||||||||||||||||||||||||||||||||||||||||||||||||||||||||||||||||||||||||||||
| Expenses before reductions | 0.82 | 0.83 | 0.84 | 0.88 | 0.88 | 6 | |||||||||||||||||||||||||||||||||||||||||||||||||||||||||||||||||||||||||||||||||||||||||||||||||
| Expenses including reductions | 0.80 | 0.80 | 0.84 | 0.85 | 0.85 | 6 | |||||||||||||||||||||||||||||||||||||||||||||||||||||||||||||||||||||||||||||||||||||||||||||||||
| Net investment income | 0.55 | 0.64 | 0.47 | 0.30 | 0.66 | 6 | |||||||||||||||||||||||||||||||||||||||||||||||||||||||||||||||||||||||||||||||||||||||||||||||||
| Portfolio turnover (%) | 30 | 43 | 30 | 30 | 50 | 7 | |||||||||||||||||||||||||||||||||||||||||||||||||||||||||||||||||||||||||||||||||||||||||||||||||
| 1 | The inception date for Class R6 shares is 9-1-11. | ||||||||||||||||||||||||||||||||||||||||||||||||||||||||||||||||||||||||||||||||||
| 2 | Based on average daily shares outstanding. | ||||||||||||||||||||||||||||||||||||||||||||||||||||||||||||||||||||||||||||||||||
| 3 | Total returns would have been lower had certain expenses not been reduced during the applicable periods. | ||||||||||||||||||||||||||||||||||||||||||||||||||||||||||||||||||||||||||||||||||
| 4 | Not annualized. | ||||||||||||||||||||||||||||||||||||||||||||||||||||||||||||||||||||||||||||||||||
| 5 | Less than $500,000. | ||||||||||||||||||||||||||||||||||||||||||||||||||||||||||||||||||||||||||||||||||
| 6 | Annualized. | ||||||||||||||||||||||||||||||||||||||||||||||||||||||||||||||||||||||||||||||||||
| 7 | The portfolio turnover is shown for the period from 11-1-10 to 10-31-11. | ||||||||||||||||||||||||||||||||||||||||||||||||||||||||||||||||||||||||||||||||||
Note 1 — Organization
John Hancock U.S. Global Leaders Growth Fund (the fund) is a series of John Hancock Capital Series (the Trust), an open-end management investment company organized as a Massachusetts business trust and registered under the Investment Company Act of 1940, as amended (the 1940 Act). The investment objective of the fund is to seek long-term growth of capital.
The fund may offer multiple classes of shares. The shares currently offered are detailed in the Statement of assets and liabilities. Class A and Class C shares are offered to all investors. Class B shares are closed to new investors. Class I shares are offered to institutions and certain investors. Class R2 shares are available only to certain retirement plans. Class R6 shares are available only to certain retirement plans, institutions and other investors. Shareholders of each class have exclusive voting rights to matters that affect that class. The distribution and service fees, if any, and transfer agent fees for each class may differ. Class B shares convert to Class A shares eight years after purchase.
Note 2 — Significant accounting policies
The financial statements have been prepared in conformity with accounting principles generally accepted in the United States of America (US GAAP), which require management to make certain estimates and assumptions as of the date of the financial statements. Actual results could differ from those estimates and those differences could be significant. The fund qualifies as an investment company under Topic 946 of Accounting Standards Codification of US GAAP.
Events or transactions occurring after the end of the fiscal period through the date that the financial statements were issued have been evaluated in the preparation of the financial statements. The following summarizes the significant accounting policies of the fund:
Security valuation. Investments are stated at value as of the close of regular trading on the New York Stock Exchange (NYSE), normally at 4:00 p.m., Eastern Time. In order to value the securities, the fund uses the following valuation techniques: Equity securities held by the fund are valued at the last sale price or official closing price on the exchange where the security was acquired or most likely will be sold. In the event there were no sales during the day or closing prices are not available, the securities are valued using the last available bid price. Investments by the fund in open-end mutual funds, including John Hancock Collateral Trust (JHCT), are valued at their respective net asset values each business day. Foreign securities and currencies are valued in U.S. dollars, based on foreign currency exchange rates supplied by an independent pricing vendor. Other portfolio securities and assets, for which reliable market quotations are not readily available, are valued at fair value as determined in good faith by the fund's Pricing Committee following procedures established by the Board of Trustees. The frequency with which these fair valuation procedures are used cannot be predicted and fair value of securities may differ significantly from the value that would have been used had a ready market for such securities existed.
The fund uses a three-tier hierarchy to prioritize the pricing assumptions, referred to as inputs, used in valuation techniques to measure fair value. Level 1 includes securities valued using quoted prices in active markets for identical securities. Level 2 includes securities valued using other significant observable inputs. Observable inputs may include quoted prices for similar securities, interest rates, prepayment speeds and credit risk. Prices for securities valued using these inputs are received from independent pricing vendors and brokers and are based on an evaluation of the inputs described. Level 3 includes securities valued using significant unobservable inputs when market prices are not readily available or reliable, including the fund's own assumptions in determining the fair value of investments. Factors used in determining value may include market or issuer specific events or trends, changes in interest rates and credit quality. The inputs or methodology used for valuing securities are not necessarily an indication of the risks associated with investing in those securities. Changes in valuation techniques and related inputs may result in transfers into or out of an assigned level within the disclosure hierarchy.
As of October 31, 2015, all investments are categorized as Level 1 under the hierarchy described above.
Security transactions and related investment income. Investment security transactions are accounted for on a trade date plus one basis for daily net asset value calculations. However, for financial reporting purposes, investment transactions are reported on trade date. Interest income is accrued as earned. Dividend income is recorded on the ex-date, except for dividends of foreign securities where the dividend may not be known until after the ex-date. In those cases, dividend income,
25
net of withholding taxes, is recorded when the fund becomes aware of the dividends. Foreign taxes are provided for based on the fund's understanding of the tax rules and rates that exist in the foreign markets in which it invests. Gains and losses on securities sold are determined on the basis of identified cost and may include proceeds from litigation.
Securities lending. The fund may lend its securities to earn additional income. The fund receives cash collateral from the borrower in an amount not less than the market value of the loaned securities. The fund will invest its collateral in JHCT, an affiliate of the fund, which has a floating net asset value and is registered with the Securities and Exchange Commission as an investment company. JHCT invests cash received as collateral as part of the securities lending program in short-term money market investments. The fund will receive the benefit of any gains and bear any losses generated by JHCT with respect to the cash collateral.
The fund has the right to recall loaned securities on demand. If a borrower fails to return loaned securities when due, then the lending agent is responsible and indemnifies the fund for the lent securities. The lending agent uses the collateral received from the borrower to purchase replacement securities of the same issue, type, class and series of the loaned securities. If the value of the collateral is less than the purchase cost of replacement securities, the lending agent is responsible for satisfying the shortfall but only to the extent that the shortfall is not due to any decrease in the value of JHCT.
Although the risk of the loss of the securities lent is mitigated by receiving collateral from the borrower and through lending agent indemnification, the fund could experience a delay in recovering securities or could experience a lower than expected return if the borrower fails to return the securities on a timely basis. The fund may receive compensation for lending its securities by retaining a portion of the return on the investment of the collateral and compensation from fees earned from borrowers of the securities. Net income received from JHCT is a component of securities lending income as recorded on the Statement of operations.
Obligations to repay collateral received by the fund is shown on the Statement of assets and liabilities as Payable upon return of securities loaned, and are secured by the loaned securities. As of October 31, 2015, the fund loaned common stocks valued at $47,918,358 and received $48,894,025 of cash collateral.
Foreign taxes. The fund may be subject to withholding tax on income and/or capital gains or repatriation taxes imposed by certain countries in which the fund invests. Taxes are accrued based upon investment income, realized gains or unrealized appreciation.
Line of credit. The fund may borrow from banks for temporary or emergency purposes, including meeting redemption requests that otherwise might require the untimely sale of securities. Pursuant to the fund's custodian agreement, the custodian may loan money to the fund to make properly authorized payments. The fund is obligated to repay the custodian for any overdraft, including any related costs or expenses. The custodian may have a lien, security interest or security entitlement in any fund property that is not otherwise segregated or pledged, to the extent of any overdraft, and to the maximum extent permitted by law.
The fund and other affiliated funds have entered into a syndicated line of credit agreement, with Citibank, N.A. (Citibank) as the administrative agent, that enables them to participate in a $750 million unsecured committed line of credit. Prior to June 30, 2015, the fund and other affiliated funds had an agreement with Citibank that enabled them to participate in a $300 million unsecured committed line of credit. A commitment fee, payable at the end of each calendar quarter, based on the average daily unused portion of the effective line of credit, is charged to each participating fund on a pro rata basis and is reflected in other expenses on the Statement of operations. Commitment fees for the year ended October 31, 2015 were $6,124. For the year ended October 31, 2015, the fund had no borrowings under either line of credit.
Expenses. Within the John Hancock group of funds complex, expenses that are directly attributable to an individual fund are allocated to such fund. Expenses that are not readily attributable to a specific fund are allocated among all funds in an equitable manner, taking into consideration, among other things, the nature and type of expense and the fund's relative net assets. Expense estimates are accrued in the period to which they relate and adjustments are made when actual amounts are known.
26
Class allocations. Income, common expenses and realized and unrealized gains (losses) are determined at the fund level and allocated daily to each class of shares based on the net assets of the class. Class-specific expenses, such as distribution and service fees, if any, and transfer agent fees, are calculated daily for each class, based on the net asset value of the class and the applicable specific expense rates.
Federal income taxes. The fund intends to continue to qualify as a regulated investment company by complying with the applicable provisions of the Internal Revenue Code and will not be subject to federal income tax on taxable income that is distributed to shareholders. Therefore, no federal income tax provision is required.
As of October 31, 2015, the fund had no uncertain tax positions that would require financial statement recognition, derecognition or disclosure. The fund's federal tax returns are subject to examination by the Internal Revenue Service for a period of three years.
Distribution of income and gains. Distributions to shareholders from net investment income and net realized gains, if any, are recorded on the ex-date. The fund generally declares and pays dividends and capital gain distributions, if any, annually. The tax character of distributions for the years ended October 31, 2015 and 2014 was as follows:
| October 31, 2015 | October 31, 2014 | |
| Ordinary income | $32,535,251 | $1,265,358 |
| Long-term capital gains | 118,524,197 | 34,593,139 |
| Total | $151,059,448 | $35,858,497 |
Distributions paid by the fund with respect to each class of shares are calculated in the same manner, at the same time and in the same amount, except for the effect of class level expenses that may be applied differently to each class. As of October 31, 2015, the components of distributable earnings on a tax basis consisted of $10,347,497 of undistributed ordinary income and $59,732,762 of undistributed long-term capital gains.
Such distributions and distributable earnings, on a tax basis, are determined in conformity with income tax regulations, which may differ from US GAAP. Distributions in excess of tax basis earnings and profits, if any, are reported in the fund's financial statements as a return of capital.
Capital accounts within the financial statements are adjusted for permanent book-tax differences. These adjustments have no impact on net assets or the results of operations. Temporary book-tax differences, if any, will reverse in a subsequent period. Book-tax differences are primarily attributable to wash sale loss deferrals.
Note 3 — Guarantees and indemnifications
Under the Trust's organizational documents, its Officers and Trustees are indemnified against certain liabilities arising out of the performance of their duties to the Trust, including the fund. Additionally, in the normal course of business, the fund enters into contracts with service providers that contain general indemnification clauses. The fund's maximum exposure under these arrangements is unknown, as this would involve future claims that may be made against the fund that have not yet occurred. The risk of material loss from such claims is considered remote.
Note 4 — Fees and transactions with affiliates
John Hancock Advisers, LLC (the Advisor) serves as investment advisor for the fund. John Hancock Funds, LLC (the Distributor), an affiliate of the Advisor, serves as principal underwriter of the fund. The Advisor and the Distributor are indirect, wholly owned subsidiaries of Manulife Financial Corporation (MFC).
Management fee. The fund has an investment management agreement with the Advisor under which the fund pays a monthly management fee to the Advisor, equivalent on an annual basis, to the sum of: (a) 0.75% of the first $500 million of the fund's average daily net assets; (b) 0.73% of the next $500 million of the fund's average daily net assets; (c) 0.71% of the next $1 billion of the fund's average daily net assets; (d) 0.70% of the next $3 billion of the fund's average daily net assets; and (e) 0.65% of the fund's average daily net assets in excess of $5 billion. The Advisor has a subadvisory agreement with Sustainable Growth Advisers, LP. The fund is not responsible for payment of the subadvisory fees.
27
The Advisor has contractually agreed to waive a portion of its management fee and/or reimburse expenses for certain funds of the John Hancock funds complex, including the fund (the participating portfolios). This waiver is based upon aggregate net assets of all the participating portfolios. The amount of the reimbursement is calculated daily and allocated among all the participating portfolios in proportion to the daily net assets of each fund. During the year ended October 31, 2015, this waiver amounted to 0.01% of the fund's average net assets. This arrangement may be amended or terminated at any time by the Advisor upon notice to the funds and with approval of the Board of Trustees.
The Advisor has contractually agreed to waive and/or reimburse all class-specific expenses for Class R6 shares of the fund to the extent they exceed 0.00% of average annual net assets. The waiver expires on February 29, 2016, unless renewed by mutual agreement of the fund and the Advisor based upon a determination that this is appropriate under the circumstances at that time.
Prior to March 1, 2015, the Advisor had contractually agreed to waive and/or reimburse all class specific expenses for Class B shares of the fund, including Rule 12b-1 fees and transfer agency fees and service fees, as applicable, to the extent they exceeded 1.30% of average annual net assets attributable to Class B shares.
Prior to March 1, 2015, the Advisor contractually agreed to reduce its management fee or, if necessary, make payment to Class R6 shares in an amount equal to the amount by which expenses of the share class exceeded 0.85% of average annual net assets.
For the year ended October 31, 2015, these expense reductions described above amounted to the following:
| Class | Expense reduction | Class | Expense reduction | |
| Class A | $47,321 | Class R2 | $1,461 | |
| Class B | 1,946 | Class R6 | 965 | |
| Class C | 10,022 | Total | $84,103 | |
| Class I | 22,388 |
The investment management fees, including the impact of the waivers and reimbursements as described above, incurred for the year ended October 31, 2015 were equivalent to a net annual effective rate of 0.73% of the fund's average daily net assets.
Accounting and legal services. Pursuant to the Accounting and Legal Services Agreement, the fund reimburses the Advisor for all expenses associated with providing the administrative, financial, legal, accounting and recordkeeping services to the fund, including the preparation of all tax returns, periodic reports to shareholders and regulatory reports, among other services. These expenses are allocated to each share class based on its relative net assets at the time the expense was incurred. These accounting and legal services fees incurred for the year ended October 31, 2015 amounted to an annual rate of 0.02% of the fund's average daily net assets.
Distribution and service plans. The fund has a distribution agreement with the Distributor. The fund has adopted distribution and service plans with respect to Class A, Class B, Class C and Class R2 pursuant to Rule 12b-1 under the 1940 Act, to pay the Distributor for services provided as the distributor of shares of the fund. In addition, under a service plan for Class R2 shares, the fund pays for certain other services. The fund may pay up to the following contractual rates of distribution and service fees under these arrangements, expressed as an annual percentage of average daily net assets for each class of the fund's shares:
| Class | Rule 12b-1 fee | Service fee |
| Class A | 0.25% | — |
| Class B | 1.00% | — |
| Class C | 1.00% | — |
| Class R2 | 0.25% | 0.25% |
28
Sales charges. Class A shares are assessed up-front sales charges, which resulted in payments to the Distributor amounting to $1,966,695 for the year ended October 31, 2015. Of this amount, $336,125 was retained and used for printing prospectuses, advertising, sales literature and other purposes, $1,604,868 was paid as sales commissions to broker-dealers and $25,702 was paid as sales commissions to sales personnel of Signator Investors, Inc., a broker-dealer affiliate of the Advisor.
Class A, Class B and Class C shares may be subject to contingent deferred sales charges (CDSCs). Certain Class A shares that are acquired through purchases of $1 million or more and are redeemed within one year of purchase are subject to a 1.00% sales charge. Class B shares that are redeemed within six years of purchase are subject to CDSCs, at declining rates, beginning at 5.00%. Class C shares that are redeemed within one year of purchase are subject to a 1.00% CDSC. CDSCs are applied to the lesser of the current market value at the time of redemption or the original purchase cost of the shares being redeemed. Proceeds from CDSCs are used to compensate the Distributor for providing distribution-related services in connection with the sale of these shares. During the year ended October 31, 2015, CDSCs received by the Distributor amounted to $5,835, $32,343 and $7,803 for Class A, Class B and Class C shares, respectively.
Transfer agent fees. The fund has a transfer agent agreement with John Hancock Signature Services, Inc. (Signature Services), an affiliate of the Advisor. The transfer agent fees paid to Signature Services are determined based on the cost to Signature Services (Signature Services Cost) of providing recordkeeping services. It also includes out-of-pocket expenses, including payments made to third-parties for recordkeeping services provided to their clients who invest in one or more John Hancock funds. In addition, Signature Services Cost may be reduced by certain fees that Signature Services receives in connection with retirement and small accounts. Signature Services Cost is calculated monthly and allocated, as applicable, to five categories of share classes: Retail Share and Institutional Share Classes of Non-Municipal Bond Funds, Class R6 Shares, Retirement Share Classes and Municipal Bond Share Classes. Within each of these categories, the applicable costs are allocated to the affected John Hancock affiliated funds and/or classes, based on the relative average daily net assets.
Class level expenses. Class level expenses for the year ended October 31, 2015 were:
| Class | Distribution and service fees | Transfer agent fees |
| Class A | $1,545,548 | $762,794 |
| Class B | 254,384 | 31,284 |
| Class C | 1,309,873 | 161,411 |
| Class I | — | 322,327 |
| Class R2 | 94,379 | 2,797 |
| Class R6 | — | 639 |
| Total | $3,204,184 | $1,281,252 |
Trustee expenses. The fund compensates each Trustee who is not an employee of the Advisor or its affiliates. The costs of paying Trustee compensation and expenses are allocated to each fund based on its net assets relative to other funds within the John Hancock group of funds complex.
Note 5 — Fund share transactions
Transactions in fund shares for the years ended October 31, 2015 and 2014 were as follows:
| Year ended 10-31-15 | Year ended 10-31-14 | |||||||||||||||||||||||||
| Shares | Amount | Shares | Amount | |||||||||||||||||||||||
| Class A shares | ||||||||||||||||||||||||||
| Sold | 2,884,716 | $120,516,685 | 3,738,416 | $159,056,967 | ||||||||||||||||||||||
| Distributions reinvested | 2,043,001 | 78,369,507 | 477,472 | 19,810,284 | ||||||||||||||||||||||
| Repurchased | (3,208,214 | ) | (133,880,478 | ) | (7,393,831 | ) | (314,311,259 | ) | ||||||||||||||||||
| Net increase (decrease) | 1,719,503 | $65,005,714 | (3,177,943 | ) | ($135,444,008 | ) | ||||||||||||||||||||
29
| Year ended 10-31-15 | Year ended 10-31-14 | |||||||||||||||||||||||||
| Shares | Amount | Shares | Amount | |||||||||||||||||||||||
| Class B shares | ||||||||||||||||||||||||||
| Sold | 21,577 | $779,351 | 39,779 | $1,546,699 | ||||||||||||||||||||||
| Distributions reinvested | 103,355 | 3,538,881 | 22,554 | 853,437 | ||||||||||||||||||||||
| Repurchased | (171,406 | ) | (6,411,181 | ) | (235,132 | ) | (9,106,020 | ) | ||||||||||||||||||
| Net decrease | (46,474 | ) | ($2,092,949 | ) | (172,799 | ) | ($6,705,884 | ) | ||||||||||||||||||
| Class C shares | ||||||||||||||||||||||||||
| Sold | 611,060 | $22,536,120 | 583,313 | $22,598,985 | ||||||||||||||||||||||
| Distributions reinvested | 455,794 | 15,610,952 | 81,395 | 3,081,624 | ||||||||||||||||||||||
| Repurchased | (822,630 | ) | (30,578,584 | ) | (782,703 | ) | (30,326,973 | ) | ||||||||||||||||||
| Net increase (decrease) | 244,224 | $7,568,488 | (117,995 | ) | ($4,646,364 | ) | ||||||||||||||||||||
| Class I shares | ||||||||||||||||||||||||||
| Sold | 1,700,737 | $74,397,159 | 3,152,881 | $140,977,893 | ||||||||||||||||||||||
| Distributions reinvested | 866,698 | 34,988,580 | 167,837 | 7,270,696 | ||||||||||||||||||||||
| Repurchased | (2,976,348 | ) | (130,529,380 | ) | (3,557,174 | ) | (160,154,012 | ) | ||||||||||||||||||
| Net decrease | (408,913 | ) | ($21,143,641 | ) | (236,456 | ) | ($11,905,423 | ) | ||||||||||||||||||
| Class R2 shares | ||||||||||||||||||||||||||
| Sold | 133,382 | $5,717,915 | 411,884 | $18,203,020 | ||||||||||||||||||||||
| Distributions reinvested | 98,228 | 3,946,810 | 16,421 | 709,383 | ||||||||||||||||||||||
| Repurchased | (784,755 | ) | (34,430,858 | ) | (424,932 | ) | (18,951,370 | ) | ||||||||||||||||||
| Net increase (decrease) | (553,145 | ) | ($24,766,133 | ) | 3,373 | ($38,967 | ) | |||||||||||||||||||
| Class R6 shares | ||||||||||||||||||||||||||
| Sold | 55,043 | $2,412,883 | 25,427 | $1,127,747 | ||||||||||||||||||||||
| Distributions reinvested | 12,529 | 506,556 | 2,576 | 111,747 | ||||||||||||||||||||||
| Repurchased | (30,091 | ) | (1,290,510 | ) | (32,954 | ) | (1,464,748 | ) | ||||||||||||||||||
| Net increase (decrease) | 37,481 | $1,628,929 | (4,951 | ) | ($225,254 | ) | ||||||||||||||||||||
| Total net increase (decrease) | 992,676 | $26,200,408 | (3,706,771 | ) | ($158,965,900 | ) | ||||||||||||||||||||
Note 6 — Purchase and sale of securities
Purchases and sales of securities, other than short-term investments, amounted to $318,562,655 and $488,135,620, respectively, for the year ended October 31, 2015.
Note 7 — Industry or sector risk
The fund may invest a large percentage of its assets in one or more particular industries or sectors of the economy. If a large percentage of the fund's assets are economically tied to a single or small number of industries or sectors of the economy, the fund will be less diversified than a more broadly diversified fund, and it may cause the fund to underperform if that industry or sector underperforms. In addition, focusing on a particular industry or sector may make the fund's net asset value more volatile. Further, a fund that invests in particular industries or sectors is particularly susceptible to the impact of market, economic, regulatory and other factors affecting those industries or sectors.
30
Report of Independent Registered Public Accounting Firm
To the Board of Trustees of John Hancock Capital Series and Shareholders of John Hancock U.S. Global Leaders Growth Fund:
In our opinion, the accompanying statement of assets and liabilities, including the fund's investments, and the related statements of operations and of changes in net assets and the financial highlights present fairly, in all material respects, the financial position of John Hancock U.S. Global Leaders Growth Fund (the "Fund") at October 31, 2015, the results of its operations for the year then ended, the changes in its net assets for each of the two years in the period then ended and the financial highlights for each of the periods indicated, in conformity with accounting principles generally accepted in the United States of America. These financial statements and financial highlights (hereafter referred to as "financial statements") are the responsibility of the Fund's management. Our responsibility is to express an opinion on these financial statements based on our audits. We conducted our audits of these financial statements in accordance with the standards of the Public Company Accounting Oversight Board (United States). Those standards require that we plan and perform the audit to obtain reasonable assurance about whether the financial statements are free of material misstatement. An audit includes examining, on a test basis, evidence supporting the amounts and disclosures in the financial statements, assessing the accounting principles used and significant estimates made by management, and evaluating the overall financial statement presentation. We believe that our audits, which included confirmation of securities at October 31, 2015 by correspondence with the custodian and brokers, provide a reasonable basis for our opinion.
PricewaterhouseCoopers LLP
Boston, Massachusetts
December 18, 2015
31
Unaudited
For federal income tax purposes, the following information is furnished with respect to the distributions of the fund, if any, paid during its taxable year ended October 31, 2015.
The fund reports the maximum amount allowable of its net taxable income as eligible for the corporate dividends-received deduction.
The fund reports the maximum amount allowable of its net taxable income as qualified dividend income as provided in the Jobs and Growth Tax Relief Reconciliation Act of 2003.
The fund paid $118,524,197 in capital gain dividends.
Eligible shareholders will be mailed a 2015 Form 1099-DIV in early 2016. This will reflect the tax character of all distributions paid in calendar year 2015.
Please consult a tax advisor regarding the tax consequences of your investment in the fund.
32
Continuation of Investment Advisory and Subadvisory Agreements
Evaluation of Advisory and Subadvisory Agreements by the Board of Trustees
This section describes the evaluation by the Board of Trustees (the Board) of John Hancock Capital Series (the Trust) of the Advisory Agreement (the Advisory Agreement) with John Hancock Advisers, LLC (the Advisor) and the Subadvisory Agreement (the Subadvisory Agreement) with Sustainable Growth Advisers, LP (the Subadvisor), for John Hancock U.S. Global Leaders Growth Fund (the fund). The Advisory Agreement and Subadvisory Agreement are collectively referred to as the Agreements. Prior to the June 23-25, 2015 meeting at which the Agreements were approved, the Board also discussed and considered information regarding the proposed continuation of the Agreements at an in-person meeting held on May 21-22, 2015.
Approval of Advisory and Subadvisory Agreements
At in-person meetings held on June 23-25, 2015, the Board, including the Trustees who are not considered to be interested persons of the Trust under the Investment Company Act of 1940, as amended (the 1940 Act) (the Independent Trustees), reapproved for an annual period the continuation of the Advisory Agreement between the Trust and the Advisor and the Subadvisory Agreement between the Advisor and the Subadvisor with respect to the fund.
In considering the Advisory Agreement and the Subadvisory Agreement, the Board received in advance of the meetings a variety of materials relating to the fund, the Advisor and the Subadvisor, including comparative performance, fee and expense information for a peer group of similar funds prepared by an independent third-party provider of mutual fund data, performance information for an applicable benchmark index; and, with respect to the Subadvisor, comparative performance information for comparably managed accounts, as applicable, and other information provided by the Advisor and the Subadvisor regarding the nature, extent and quality of services provided by the Advisor and the Subadvisor under their respective Agreements, as well as information regarding the Advisor's revenues and costs of providing services to the fund and any compensation paid to affiliates of the Advisor. At the meetings at which the renewal of the Advisory Agreement and Subadvisory Agreement are considered, particular focus is given to information concerning fund performance, comparability of fees and total expenses, and profitability. However, the Board notes that the evaluation process with respect to the Advisor and the Subadvisor is an ongoing one. In this regard, the Board also took into account discussions with management and information provided to the Board at prior meetings with respect to the services provided by the Advisor and the Subadvisor to the fund, including quarterly performance reports prepared by management containing reviews of investment results and prior presentations from the Subadvisor with respect to the fund. The Board also considered the nature, quality, and extent of non-advisory services, if any, to be provided to the fund by the Advisor's affiliates, including distribution services.
Throughout the process, the Board asked questions of and requested additional information from management. The Board is assisted by counsel for the Trust and the Independent Trustees are also separately assisted by independent legal counsel throughout the process. The Independent Trustees also received a memorandum from their independent legal counsel discussing the legal standards for their consideration of the proposed continuation of the Agreements and discussed the proposed continuation of the Agreements in private sessions with their independent legal counsel at which no representatives of management were present.
Approval of Advisory Agreement
In approving the Advisory Agreement with respect to the fund, the Board, including the Independent Trustees, considered a variety of factors, including those discussed below. The Board also considered other factors (including conditions and trends prevailing generally in the economy, the securities markets, and the industry) and does not treat any single factor as determinative, and each Trustee may attribute different weights to different factors. The Board's conclusions may be based in part on its consideration of the advisory and subadvisory arrangements in prior years and on the Board's ongoing regular review of fund performance and operations throughout the year.
33
Nature, extent, and quality of services. Among the information received by the Board from the Advisor relating to the nature, extent, and quality of services provided to the fund, the Board reviewed information provided by the Advisor relating to its operations and personnel, descriptions of its organizational and management structure, and information regarding the Advisor's compliance and regulatory history, including its Form ADV. The Board also noted that on a regular basis it receives and reviews information from the Trust's Chief Compliance Officer (CCO) regarding the fund's compliance policies and procedures established pursuant to Rule 38a-1 under the 1940 Act. The Board also considered the Advisor's risk management processes. The Board considered that the Advisor is responsible for the management of the day-to-day operations of the fund, including, but not limited to, general supervision of and coordination of the services provided by the Subadvisor, and is also responsible for monitoring and reviewing the activities of the Subadvisor and other third-party service providers.
In considering the nature, extent, and quality of the services provided by the Advisor, the Trustees also took into account their knowledge of the Advisor's management and the quality of the performance of the Advisor's duties, through Board meetings, discussions and reports during the preceding year and through each Trustee's experience as a Trustee of the Trust and of the other trusts in the John Hancock group of funds complex (the John Hancock Fund Complex).
In the course of their deliberations regarding the Advisory Agreement, the Board considered, among other things:
| (a) | the skills and competency with which the Advisor has in the past managed the Trust's affairs and its subadvisory relationship, the Advisor's oversight and monitoring of the Subadvisor's investment performance and compliance programs, such as the Subadvisor's compliance with fund policies and objectives, review of brokerage matters, including with respect to trade allocation and best execution and the Advisor's timeliness in responding to performance issues; | |
| (b) | the background, qualifications and skills of the Advisor's personnel; | |
| (c) | the Advisor's compliance policies and procedures and its responsiveness to regulatory changes and mutual fund industry developments; | |
| (d) | the Advisor's administrative capabilities, including its ability to supervise the other service providers for the fund; | |
| (e) | the financial condition of the Advisor and whether it has the financial wherewithal to provide a high level and quality of services to the fund; and | |
| (f) | the Advisor's reputation and experience in serving as an investment advisor to the Trust and the benefit to shareholders of investing in funds that are part of a family of funds offering a variety of investments. |
The Board concluded that the Advisor may reasonably be expected to continue to provide a high quality of services under the Advisory Agreement with respect to the fund.
Investment performance. In considering the fund's performance, the Board noted that it reviews at its regularly scheduled meetings information about the fund's performance results. In connection with the consideration of the Advisory Agreement, the Board:
| (a) | reviewed information prepared by management regarding the fund's performance; | |
| (b) | considered the comparative performance of an applicable benchmark index; | |
| (c) | considered the performance of comparable funds, if any, as included in the report prepared by an independent third-party provider of fund data; and | |
| (d) | took into account the Advisor's analysis of the fund's performance and its plans and recommendations regarding the Trust's subadvisory arrangements generally. |
The Board noted that the fund underperformed its benchmark index and its peer group average for the one-, three- and five-year periods ended December 31, 2014. The Board took into account management's discussion of the fund's performance,
34
including the factors and market conditions that contributed to the underperformance. The Board concluded that the fund's performance is being monitored and reasonably addressed.
Fees and expenses. The Board reviewed comparative information prepared by an independent third-party provider of mutual fund data, including, among other data, the fund's contractual and net management fees (and subadvisory fees, to the extent available) and total expenses as compared to similarly situated investment companies deemed to be comparable to the fund. The Board considered the fund's ranking within a smaller group of peer funds chosen by the independent third-party provider, as well as the fund's ranking within a broader group of funds. In comparing the fund's contractual and net management fees to those of comparable funds, the Board noted that such fees include both advisory and administrative costs. The Board noted that net management fees for the fund are higher than the peer group median and total expenses for the fund are equal to the peer group median.
The Board took into account management's discussion of the fund's expenses. The Board took into account management's discussion with respect to the advisory/subadvisory fee structure, including the amount of the advisory fee retained by the Advisor after payment of the subadvisory fee. The Board also noted that the Advisor pays the subadvisory fee, and that such fees are negotiated at arm's length with respect to the Subadvisor. In addition, the Board took into account that management had agreed to implement an overall fee waiver across the complex, including the fund, which is discussed further below. The Board also noted actions taken over the past several years to reduce the fund's operating expenses. The Board also noted that, in addition, the Advisor is currently waiving fees and/or reimbursing expenses with respect to the fund and that the fund has breakpoints in its contractual management fee schedule that reduces management fees as assets increase. The Board reviewed information provided by the Advisor concerning the investment advisory fee charged by the Advisor or one of its advisory affiliates to other clients (including other funds in the John Hancock Fund Complex) having similar investment mandates, if any. The Board considered any differences between the Advisor's and Subadvisor's services to the fund and the services they provide to other comparable clients or funds. The Board concluded that the advisory fee paid with respect to the fund is reasonable.
Profitability/indirect benefits. In considering the costs of the services to be provided and the profits to be realized by the Advisor and its affiliates from the Advisor's relationship with the Trust, the Board:
| (a) | reviewed financial information of the Advisor; | |||||||
| (b) | reviewed and considered information presented by the Advisor regarding the net profitability to the Advisor and its affiliates with respect to the fund; | |||||||
| (c) | received and reviewed profitability information with respect to the John Hancock Fund Complex as a whole; | |||||||
| (d) | received information with respect to the Advisor's allocation methodologies used in preparing the profitability data; | |||||||
| (e) | considered that the John Hancock insurance companies that are affiliates of the Advisor, as shareholders of the Trust directly or through their separate accounts, receive certain tax credits or deductions relating to foreign taxes paid and dividends received by certain funds of the Trust and noted that these tax benefits, which are not available to participants in qualified retirement plans under applicable income tax law, are reflected in the profitability information reviewed by the Board; | |||||||
| (f) | considered that the Advisor also provides administrative services to the fund on a cost basis pursuant to an administrative services agreement; | |||||||
| (g) | noted that affiliates of the Advisor provide transfer agency services and distribution services to the fund, and that the fund's distributor also receives Rule 12b-1 payments to support distribution of the fund; | |||||||
| (h) | noted that the Advisor also derives reputational and other indirect benefits from providing advisory services to the fund; | |||||||
| (i) | noted that the subadvisory fee for the fund is paid by the Advisor and is negotiated at arm's length; and |
35
| (j) | considered that the Advisor should be entitled to earn a reasonable level of profits in exchange for the level of services it provides to the fund and the entrepreneurial risk that it assumes as Advisor. |
Based upon its review, the Board concluded that the level of profitability, if any, of the Advisor and its affiliates from their relationship with the fund was reasonable and not excessive.
Economies of scale. In considering the extent to which economies of scale would be realized as the fund grows and whether fee levels reflect these economies of scale for the benefit of fund shareholders, the Board:
| (a) | considered that the Advisor has contractually agreed to waive a portion of its management fee for certain funds of the John Hancock Fund Complex, including the fund (the participating portfolios) or otherwise reimburse the expenses of the participating portfolios (the reimbursement). This waiver is based upon aggregate net assets of all the participating portfolios. The amount of the reimbursement is calculated daily and allocated among all the participating portfolios in proportion to the daily net assets of each fund; | |
| (b) | reviewed the fund's advisory fee structure and concluded that: (i) the fund's fee structure contains breakpoints at the subadvisory fee level and that such breakpoints are reflected as breakpoints in the advisory fees for the fund; and (ii) although economies of scale cannot be measured with precision, these arrangements permit shareholders of the fund to benefit from economies of scale if the fund grows. The Board also took into account management's discussion of the fund's advisory fee structure; and | |
| (c) | the Board also considered the effect of the fund's growth in size on its performance and fees. The Board also noted that if the fund's assets increase over time, the fund may realize other economies of scale. |
Approval of Subadvisory Agreement
In making its determination with respect to approval of the Subadvisory Agreement, the Board reviewed:
| (1) | information relating to the Subadvisor's business, including current subadvisory services to the Trust (and other funds in the John Hancock Fund Complex); | |
| (2) | the historical and current performance of the fund and comparative performance information relating to an applicable benchmark index and comparable funds; | |
| (3) | the subadvisory fee for the fund, including any breakpoints, and to the extent available, comparable fee information prepared by an independent third party provider of fund data; and | |
| (4) | information relating to the nature and scope of any material relationships and their significance to the Trust's Advisor and Subadvisor. |
Nature, extent, and quality of services. With respect to the services provided by the Subadvisor, the Board received information provided to the Board by the Subadvisor, including the Subadvisor's Form ADV, as well as took into account information presented throughout the past year. The Board considered the Subadvisor's current level of staffing and its overall resources, as well as received information relating to the Subadvisor's compensation program. The Board reviewed the Subadvisor's history and investment experience, as well as information regarding the qualifications, background, and responsibilities of the Subadvisor's investment and compliance personnel who provide services to the fund. The Board also considered, among other things, the Subadvisor's compliance program and any disciplinary history. The Board also considered the Subadvisor's risk assessment and monitoring process. The Board reviewed the Subadvisor's regulatory history, including whether it was involved in any regulatory actions or investigations as well as material litigation, and any settlements and amelioratory actions undertaken, as appropriate. The Board noted that the Advisor conducts regular, periodic reviews of the Subadvisor and its operations, including regarding investment processes and organizational and staffing matters. The Board also noted that the Trust's CCO and his staff conduct regular, periodic compliance reviews with the Subadvisor and present reports to the Independent Trustees regarding the same, which includes evaluating the
36
regulatory compliance systems of the Subadvisor and procedures reasonably designed to assure compliance with the federal securities laws. The Board also took into account the financial condition of the Subadvisor.
The Board considered the Subadvisor's investment process and philosophy. The Board took into account that the Subadvisor's responsibilities include the development and maintenance of an investment program for the fund that is consistent with the fund's investment objective, the selection of investment securities and the placement of orders for the purchase and sale of such securities, as well as the implementation of compliance controls related to performance of these services. The Board also received information with respect to the Subadvisor's brokerage policies and practices, including with respect to best execution and soft dollars.
Subadvisor compensation. In considering the cost of services to be provided by the Subadvisor and the profitability to the Subadvisor of its relationship with the fund, the Board noted that the fees under the Subadvisory Agreement are paid by the Advisor and not the fund.
The Board also relied on the ability of the Advisor to negotiate the Subadvisory Agreement with the Subadvisor, which is not affiliated with the Advisor, and the fees thereunder at arm's length. As a result, the costs of the services to be provided and the profits to be realized by the Subadvisor from its relationship with the Trust were not a material factor in the Board's consideration of the Subadvisory Agreement.
The Board also received information regarding the nature and scope (including their significance to the Advisor and its affiliates and to the Subadvisor) of any material relationships with respect to the Subadvisor, which include arrangements in which the Subadvisor or its affiliates provide advisory, distribution, or management services in connection with financial products sponsored by the Advisor or its affiliates, and may include other registered investment companies, a 529 education savings plan, managed separate accounts and exempt group annuity contracts sold to qualified plans. The Board also received information and took into account any other potential conflicts of interest the Advisor might have in connection with the Subadvisory Agreement.
In addition, the Board considered other potential indirect benefits that the Subadvisor and its affiliates may receive from the Subadvisor's relationship with the fund, such as the opportunity to provide advisory services to additional funds in the John Hancock Fund Complex and reputational benefits.
Subadvisory fees. The Board considered that the fund pays an advisory fee to the Advisor and that, in turn, the Advisor pays a subadvisory fee to the Subadvisor. As noted above, the Board also considered the fund's subadvisory fees as compared to similarly situated investment companies deemed to be comparable to the fund as included in the report prepared by the independent third party provider of fund data, to the extent available. The Board noted that the subadvisory fees for this fund are lower than the peer group median. The Board also took into account the subadvisory fees paid by the Advisor to the Subadvisor with respect to the fund and compared them to fees charged by the Subadvisor to manage other subadvised portfolios and portfolios not subject to regulation under the 1940 Act, as applicable.
Subadvisor performance. As noted above, the Board considered the fund's performance as compared to the fund's peer group and the benchmark index and noted that the Board reviews information about the fund's performance results at its regularly scheduled meetings. The Board noted the Advisor's expertise and resources in monitoring the performance, investment style and risk-adjusted performance of the Subadvisor. The Board was mindful of the Advisor's focus on the Subadvisor's performance. The Board also noted the Subadvisor's long-term performance record for similar accounts, as applicable.
The Board's decision to approve the Subadvisory Agreement was based on a number of determinations, including the following:
| (1) | the Subadvisor has extensive experience and demonstrated skills as a manager; | |||||||
| (2) | the performance of the fund is being monitored and reasonably addressed; | |||||||
| (3) | the subadvisory fee is reasonable in relation to the level and quality of services being provided; and |
37
| (4) | noted that the subadvisory fees are paid by the Advisor not the fund and that the subadvisory fee breakpoints are reflected as breakpoints in the advisory fees for the fund in order to permit shareholders to benefit from economies of scale if the fund grows. | |||||||
| * * * | ||||||||
Based on the Board's evaluation of all factors that the Board deemed to be material, including those factors described above, the Board, including the Independent Trustees, concluded that renewal of the Advisory Agreement and the Subadvisory Agreement would be in the best interest of the fund and its shareholders. Accordingly, the Board, and the Independent Trustees voting separately, approved the Advisory Agreement and Subadvisory Agreement for an additional one-year period.
38
This chart provides information about the Trustees and Officers who oversee your John Hancock fund. Officers elected by the Trustees manage the day-to-day operations of the fund and execute policies formulated by the Trustees.
Independent Trustees
| Name, year of birth Position(s) held with fund Principal occupation(s) and other directorships during past 5 years | Trustee of the Trust since1 | Number of John Hancock funds overseen by Trustee |
| James M. Oates, Born: 1946 | 2012 | 228 |
| Trustee and Chairperson of the Board Managing Director, Wydown Group (financial consulting firm) (since 1994); Chairman and Director, Emerson Investment Management, Inc. (since 2000); Independent Chairman, Hudson Castle Group, Inc. (formerly IBEX Capital Markets, Inc.) (financial services company) (1997-2011); Director, Stifel Financial (since 1996); Director, Investor Financial Services Corporation (1995-2007); Director, Connecticut River Bancorp (1998-2014); Director, Virtus Funds (formerly Phoenix Mutual Funds) (since 1988). Trustee and Chairperson of the Board, John Hancock Collateral Trust and John Hancock Exchange-Traded Fund Trust (since 2015); Trustee and Chairperson of the Board, John Hancock retail funds3 (since 2012); Trustee (2005-2006 and since 2012) and Chairperson of the Board (since 2012), John Hancock Funds III; Trustee (since 2004) and Chairperson of the Board (since 2005), John Hancock Variable Insurance Trust; Trustee and Chairperson of the Board, John Hancock Funds II (since 2005). | ||
| Charles L. Bardelis,2 Born: 1941 | 2012 | 228 |
| Trustee Director, Island Commuter Corp. (marine transport). Trustee, John Hancock Collateral Trust and John Hancock Exchange-Traded Fund Trust (since 2015); Trustee, John Hancock retail funds3 (since 2012); Trustee, John Hancock Funds III (2005-2006 and since 2012); Trustee, John Hancock Variable Insurance Trust (since 1988); Trustee, John Hancock Funds II (since 2005). | ||
| Peter S. Burgess,2 Born: 1942 | 2012 | 228 |
| Trustee Consultant (financial, accounting, and auditing matters) (since 1999); Certified Public Accountant; Partner, Arthur Andersen (independent public accounting firm) (prior to 1999); Director, Lincoln Educational Services Corporation (since 2004); Director, Symetra Financial Corporation (since 2010); Director, PMA Capital Corporation (2004-2010). Trustee, John Hancock Collateral Trust and John Hancock Exchange-Traded Fund Trust (since 2015); Trustee, John Hancock retail funds3 (since 2012); Trustee, John Hancock Funds III (2005-2006 and since 2012); Trustee, John Hancock Variable Insurance Trust and John Hancock Funds II (since 2005). | ||
| William H. Cunningham, Born: 1944 | 2005 | 228 |
| Trustee Professor, University of Texas, Austin, Texas (since 1971); former Chancellor, University of Texas System and former President of the University of Texas, Austin, Texas; Chairman (since 2009) and Director (since 2006), Lincoln National Corporation (insurance); Director, Southwest Airlines (since 2000); former Director, LIN Television (2009-2014). Trustee, John Hancock retail funds3 (since 1986); Trustee, John Hancock Variable Insurance Trust (since 2012); Trustee, John Hancock Funds II (2005-2006 and since 2012); Trustee, John Hancock Collateral Trust and John Hancock Exchange-Traded Fund Trust (since 2015). | ||
| Grace K. Fey, Born: 1946 | 2012 | 228 |
| Trustee Chief Executive Officer, Grace Fey Advisors (since 2007); Director and Executive Vice President, Frontier Capital Management Company (1988-2007); Director, Fiduciary Trust (since 2009). Trustee, John Hancock Collateral Trust and John Hancock Exchange-Traded Fund Trust (since 2015); Trustee, John Hancock retail funds3 (since 2012); Trustee, John Hancock Variable Insurance Trust and John Hancock Funds II (since 2008). | ||
39
Independent Trustees (continued)
| Name, year of birth Position(s) held with fund Principal occupation(s) and other directorships during past 5 years | Trustee of the Trust since1 | Number of John Hancock funds overseen by Trustee |
| Theron S. Hoffman,2 Born: 1947 | 2012 | 228 |
| Trustee Chief Executive Officer, T. Hoffman Associates, LLC (consulting firm) (since 2003); Director, The Todd Organization (consulting firm) (2003-2010); President, Westport Resources Management (investment management consulting firm) (2006-2008); Senior Managing Director, Partner, and Operating Head, Putnam Investments (2000-2003); Executive Vice President, The Thomson Corp. (financial and legal information publishing) (1997-2000). Trustee, John Hancock Collateral Trust and John Hancock Exchange-Traded Fund Trust (since 2015); Trustee, John Hancock retail funds3 (since 2012); Trustee, John Hancock Variable Insurance Trust and John Hancock Funds II (since 2008). | ||
| Deborah C. Jackson, Born: 1952 | 2008 | 228 |
| Trustee President, Cambridge College, Cambridge, Massachusetts (since 2011); Chief Executive Officer, American Red Cross of Massachusetts Bay (2002-2011); Board of Directors of Eastern Bank Corporation (since 2001); Board of Directors of Eastern Bank Charitable Foundation (since 2001); Board of Directors of American Student Assistance Corporation (1996-2009); Board of Directors of Boston Stock Exchange (2002-2008); Board of Directors of Harvard Pilgrim Healthcare (health benefits company) (2007-2011). Trustee, John Hancock retail funds3 (since 2008); Trustee of John Hancock Variable Insurance Trust and John Hancock Funds II (since 2012); Trustee, John Hancock Collateral Trust and John Hancock Exchange-Traded Fund Trust (since 2015). | ||
| Hassell H. McClellan, Born: 1945 | 2012 | 228 |
| Trustee Trustee, Virtus Variable Insurance Trust (formerly Phoenix Edge Series Funds) (since 2008); Director, The Barnes Group (since 2010); Associate Professor, The Wallace E. Carroll School of Management, Boston College (retired 2013). Trustee, John Hancock Collateral Trust and John Hancock Exchange-Traded Fund Trust (since 2015); Trustee, John Hancock retail funds3 (since 2012); Trustee, John Hancock Funds III (2005-2006 and since 2012); Trustee, John Hancock Variable Insurance Trust and John Hancock Funds II (since 2005). | ||
| Steven R. Pruchansky, Born: 1944 | 2005 | 228 |
| Trustee and Vice Chairperson of the Board Chairman and Chief Executive Officer, Greenscapes of Southwest Florida, Inc. (since 2000); Director and President, Greenscapes of Southwest Florida, Inc. (until 2000); Member, Board of Advisors, First American Bank (until 2010); Managing Director, Jon James, LLC (real estate) (since 2000); Partner, Right Funding, LLC (since 2014); Director, First Signature Bank & Trust Company (until 1991); Director, Mast Realty Trust (until 1994); President, Maxwell Building Corp. (until 1991). Trustee (since 1992) and Chairperson of the Board (2011-2012), John Hancock retail funds3; Trustee and Vice Chairperson of the Board, John Hancock retail funds3 John Hancock Variable Insurance Trust, and John Hancock Funds II (since 2012); Trustee, and Vice Chairperson of the Board, John Hancock Collateral Trust and John Hancock Exchange-Traded Fund Trust (since 2015). | ||
40
Independent Trustees (continued)
| Name, year of birth Position(s) held with fund Principal occupation(s) and other directorships during past 5 years | Trustee of the Trust since1 | Number of John Hancock funds overseen by Trustee |
| Gregory A. Russo, Born: 1949 | 2009 | 228 |
| Trustee Director and Audit Committee Chairman (since 2012), and Member, Audit Committee and Finance Committee (since 2011), NCH Healthcare System, Inc. (holding company for multi-entity healthcare system); Director and Member (since 2012) and Finance Committee Chairman (since 2014), The Moorings, Inc. (nonprofit continuing care community); Vice Chairman, Risk & Regulatory Matters, KPMG LLP (KPMG) (2002-2006); Vice Chairman, Industrial Markets, KPMG (1998-2002); Chairman and Treasurer, Westchester County, New York, Chamber of Commerce (1986-1992); Director, Treasurer, and Chairman of Audit and Finance Committees, Putnam Hospital Center (1989-1995); Director and Chairman of Fundraising Campaign, United Way of Westchester and Putnam Counties, New York (1990-1995). Trustee, John Hancock retail funds3 (since 2008); Trustee, John Hancock Variable Insurance Trust and John Hancock Funds II (since 2012); Trustee, John Hancock Collateral Trust and John Hancock Exchange-Traded Fund Trust (since 2015). | ||
Non-Independent Trustees4
| Name, year of birth Position(s) held with fund Principal occupation(s) and other directorships during past 5 years | Trustee of the Trust since1 | Number of John Hancock funds overseen by Trustee |
| James R. Boyle, Born: 1959 | 2015 | 228 |
| Non-Independent Trustee* Chairman, HealthFleet, Inc. (healthcare) (since 2014); Executive Vice President and Chief Executive Officer, U.S. Life Insurance Division of Genworth Financial, Inc. (insurance) (January 2014-July 2014); Senior Executive Vice President, Manulife Financial, President and Chief Executive Officer, John Hancock (1999-2012); Chairman and Director, John Hancock Advisers, LLC, John Hancock Funds, LLC, and John Hancock Investment Management Services, LLC (2005-2010); Trustee, John Hancock Collateral Trust and John Hancock Exchange-Traded Fund Trust (since 2015); Trustee, John Hancock retail funds3 (2005-2010; 2012-2014 and since 2015); Trustee, John Hancock Variable Insurance Trust and John Hancock Funds II (2005-2014 and since 2015). *Effective 3-10-15. | ||
| Craig Bromley, Born: 1966 | 2012 | 228 |
| Non-Independent Trustee President, John Hancock Financial Service (since 2012); Senior Executive Vice President and General Manager, U.S. Division, Manulife Corporation (since 2012); President and Chief Executive Officer, Manulife Insurance Company (Manulife Japan) (2005-2012, including prior positions). Trustee, John Hancock retail funds,3 John Hancock Variable Insurance Trust, and John Hancock Funds II (since 2012); Trustee, John Hancock Collateral Trust and John Hancock Exchange-Traded Fund Trust (since 2015). | ||
| Warren A. Thomson, Born: 1955 | 2012 | 228 |
| Non-Independent Trustee Senior Executive Vice President and Chief Investment Officer, Manulife Financial Corporation and The Manufacturers Life Insurance Company (since 2009); Chairman, Manulife Asset Management (since 2001, including prior positions); Director and Chairman, Manulife Asset Management Limited (since 2006); Director and Chairman, Hancock Natural Resources Group, Inc. (since 2013). Trustee, John Hancock retail funds,3 John Hancock Variable Insurance Trust, and John Hancock Funds II (since 2012); Trustee, John Hancock Collateral Trust and John Hancock Exchange-Traded Fund Trust (since 2015). | ||
41
Principal officers who are not Trustees
| Name, year of birth Position(s) held with fund Principal occupation(s) and other directorships during past 5 years | Officer of the Trust since |
| Andrew G. Arnott, Born: 1971 | 2007 |
| President Senior Vice President, John Hancock Financial Services (since 2009); Director and Executive Vice President, John Hancock Advisers, LLC (since 2005, including prior positions); Director and Executive Vice President, John Hancock Investment Management Services, LLC (since 2006, including prior positions); President, John Hancock Funds, LLC (since 2004, including prior positions); President, John Hancock retail funds,3 John Hancock Variable Insurance Trust, and John Hancock Funds II (since 2007, including prior positions); President, John Hancock Collateral Trust (since 2015); President, John Hancock Exchange-Traded Fund Trust (since 2014). | |
| John J. Danello, Born: 1955 | 2014 |
| Senior Vice President, Secretary, and Chief Legal Officer Vice President and Chief Counsel, John Hancock Wealth Management (since 2005); Senior Vice President (since 2007) and Chief Legal Counsel (2007-2010), John Hancock Funds, LLC and The Berkeley Financial Group, LLC; Senior Vice President (since 2006, including prior positions) and Chief Legal Officer and Secretary (since 2014), John Hancock retail funds 3, John Hancock Funds II and John Hancock Variable Insurance Trust; Senior Vice President, Chief Legal Officer and Secretary (since 2015), John Hancock Collateral Trust and John Hancock Exchange-Traded Fund Trust; Vice President, John Hancock Life & Health Insurance Company (since 2009); Vice President, John Hancock Life Insurance Company (USA) and John Hancock Life Insurance Company of New York (since 2010); and Senior Vice President, Secretary, and Chief Legal Counsel (2007-2014, including prior positions) of John Hancock Advisers, LLC and John Hancock Investment Management Services, LLC. | |
| Francis V. Knox, Jr., Born: 1947 | 2005 |
| Chief Compliance Officer Vice President, John Hancock Financial Services (since 2005); Chief Compliance Officer, John Hancock retail funds,3 John Hancock Variable Insurance Trust, John Hancock Funds II, John Hancock Advisers, LLC, and John Hancock Investment Management Services, LLC (since 2005); Chief Compliance Officer, John Hancock Collateral Trust and John Hancock Exchange-Traded Fund Trust (since 2015). | |
| Charles A. Rizzo, Born: 1957 | 2007 |
| Chief Financial Officer Vice President, John Hancock Financial Services (since 2008); Senior Vice President, John Hancock Advisers, LLC and John Hancock Investment Management Services, LLC (since 2008); Chief Financial Officer, John Hancock retail funds,3 John Hancock Variable Insurance Trust and John Hancock Funds II (since 2007); Chief Financial Officer, John Hancock Collateral Trust and John Hancock Exchange-Traded Fund Trust (since 2015). | |
| Salvatore Schiavone, Born: 1965 | 2010 |
| Treasurer Assistant Vice President, John Hancock Financial Services (since 2007); Vice President, John Hancock Advisers, LLC and John Hancock Investment Management Services, LLC (since 2007); Treasurer, John Hancock retail funds3 (since 2007, including prior positions); Treasurer, John Hancock Variable Insurance Trust and John Hancock Funds II (2007-2009 and since 2010, including prior positions); Treasurer, John Hancock Collateral Trust and John Hancock Exchange-Traded Fund Trust (since 2015). | |
The business address for all Trustees and Officers is 601 Congress Street, Boston, Massachusetts 02210-2805.
The Statement of Additional Information of the fund includes additional information about members of the Board of Trustees of the Trust and is available without charge, upon request, by calling 800-225-5291.
| 1 | Each Trustee holds office until his or her successor is elected and qualified, or until the Trustee's death, retirement, resignation, or removal. Mr. Boyle has served as Trustee at various times prior to the date listed in the table. |
| 2 | Member of the Audit Committee. |
| 3 | "John Hancock retail funds" comprises John Hancock Funds III and 36 other John Hancock funds consisting of 26 series of other John Hancock trusts and 10 closed-end funds. |
| 4 | The Trustee is a Non-Independent Trustee due to current or former positions with the Advisor and certain affiliates. |
42
Trustees James M. Oates, Chairperson Officers Andrew G. Arnott John J. Danello Francis V. Knox, Jr. Charles A. Rizzo Salvatore Schiavone | Investment advisor John Hancock Advisers, LLC Subadvisor Sustainable Growth Advisers, LP (SGA) Principal distributor John Hancock Funds, LLC Custodian State Street Bank and Trust Company Transfer agent John Hancock Signature Services, Inc. Legal counsel K&L Gates LLP Independent registered public accounting firm PricewaterhouseCoopers LLP |
*Member of the Audit Committee
†Non-Independent Trustee
#Effective 3-10-15
The fund's proxy voting policies and procedures, as well as the fund proxy voting record for the most recent twelve-month period ended June 30, are available free of charge on the Securities and Exchange Commission (SEC) website at sec.gov or on our website.
The fund's complete list of portfolio holdings, for the first and third fiscal quarters, is filed with the SEC on Form N-Q. The fund's Form N-Q is available on our website and the SEC's website, sec.gov, and can be reviewed and copied (for a fee) at the SEC's Public Reference Room in Washington, DC. Call 800-SEC-0330 to receive information on the operation of the SEC's Public Reference Room.
We make this information on your fund, as well as monthly portfolio holdings, and other fund details available on our website at jhinvestments.com or by calling 800-225-5291.
| You can also contact us: | |||
| 800-225-5291 jhinvestments.com | Regular mail: John Hancock Signature Services, Inc. | Express mail: John Hancock Signature Services, Inc. | |
43
John Hancock family of funds
DOMESTIC EQUITY FUNDS Balanced Blue Chip Growth Classic Value Disciplined Value Disciplined Value Mid Cap Equity Income Fundamental All Cap Core Fundamental Large Cap Core Fundamental Large Cap Value Large Cap Equity New Opportunities Select Growth Small Cap Equity Small Cap Value Small Company Strategic Growth U.S. Equity U.S. Global Leaders Growth Value Equity GLOBAL/INTERNATIONAL FUNDS Disciplined Value International Emerging Markets Emerging Markets Equity Global Equity Global Shareholder Yield Greater China Opportunities International Core International Growth International Small Company International Value Equity | INCOME FUNDS Bond California Tax-Free Income Core High Yield Emerging Markets Debt Floating Rate Income Focused High Yield Global Income Government Income High Yield Municipal Bond Income Investment Grade Bond Money Market Short Duration Credit Opportunities Spectrum Income Strategic Income Opportunities Tax-Free Bond ALTERNATIVE/SPECIALTY FUNDS Absolute Return Currency Alternative Asset Allocation Enduring Assets Financial Industries Global Absolute Return Strategies Global Conservative Absolute Return Global Real Estate Natural Resources Redwood Regional Bank Seaport Technical Opportunities |
The fund's investment objectives, risks, charges, and expenses are included in the prospectus and should be considered carefully before investing. For a prospectus, contact your financial professional, call
John Hancock Investments at 800-225-5291, or visit the fund's website at jhinvestments.com. Please read the prospectus carefully before investing or sending money.
ASSET ALLOCATION PORTFOLIOS Income Allocation Fund Lifestyle Aggressive Portfolio Lifestyle Balanced Portfolio Lifestyle Conservative Portfolio Lifestyle Growth Portfolio Lifestyle Moderate Portfolio Retirement Choices Portfolios (2010-2055) Retirement Living Portfolios (2010-2055) Retirement Living II Portfolios (2010-2055) EXCHANGE-TRADED FUNDS John Hancock Multifactor Consumer Discretionary ETF John Hancock Multifactor Financials ETF John Hancock Multifactor Healthcare ETF John Hancock Multifactor Large Cap ETF John Hancock Multifactor Mid Cap ETF John Hancock Multifactor Technology ETF CLOSED-END FUNDS Financial Opportunities Hedged Equity & Income Income Securities Trust Investors Trust Preferred Income Preferred Income II Preferred Income III Premium Dividend Tax-Advantaged Dividend Income Tax-Advantaged Global Shareholder Yield |
"As an investment firm,
upholding the proud
tradition of John Hancock
comes down to one thing:
putting shareholders
first. We believe that if
our shareholders are
successful, then we will
be successful."
Andrew G. Arnott
President and Chief Executive Officer
John Hancock Investments
John Hancock Multifactor ETF shares are bought and sold at market price (not NAV), and are not individually redeemed
from the fund. Brokerage commissions will reduce returns.
John Hancock ETFs are distributed by Foreside Fund Services, LLC, and are subadvised by Dimensional Fund Advisors LP.
Foreside is not affiliated with John Hancock Funds, LLC or Dimensional Fund Advisors LP.
Dimensional Fund Advisors LP receives compensation from John Hancock in connection with licensing rights to the
John Hancock Dimensional indexes. Dimensional Fund Advisors LP does not sponsor, endorse, or sell, and makes no
representation as to the advisability of investing in, John Hancock Multifactor ETFs.
John Hancock Investments
A trusted brand
John Hancock Investments is a premier asset manager representing
one of America's most trusted brands, with a heritage of financial
stewardship dating back to 1862. Helping our shareholders pursue
their financial goals is at the core of everything we do. It's why we
support the role of professional financial advice and operate with the
highest standards of conduct and integrity.
A better way to invest
We build funds based on investor needs, then search the world to find
proven portfolio teams with specialized expertise in those strategies.
As a manager of managers, we apply vigorous oversight to ensure that
they continue to meet our uncompromising standards and serve the
best interests of our shareholders.
Results for investors
Our unique approach to asset management enables us to provide
a diverse set of investments backed by some of the world's best
managers, along with strong risk-adjusted returns across asset classes.

 | John Hancock Funds, LLC n Member FINRA, SIPC 601 Congress Street n Boston, MA 02210-2805 800-225-5291 n jhinvestments.com | |
| This report is for the information of the shareholders of John Hancock U.S. Global Leaders Growth Fund. It is not authorized for distribution to prospective investors unless preceded or accompanied by a prospectus. | ||
| MF230746 | 26A 10/15 12/15 | |
John Hancock
Classic Value Fund
Annual report 10/31/15
A message to shareholders
Dear shareholder,
U.S. stocks experienced a spike in volatility in recent months. The pullback we had anticipated for some months took place in August, and stocks experienced their first official correction—a decline of more than 10% in the stock market—in more than four years. There were several headwinds keeping stock prices from moving higher all year, but the headline for this summer's correction was the news of slowing economic growth in China and the effect that might have on global growth. While the market subsequently rebounded, for the time being, global economic data continues to be a leading driver of investor sentiment.
Market volatility is naturally unnerving, which is why we recommend that investors maintain a regular dialogue with their financial advisors. Your advisor can help put market events into context and determine whether your portfolio is sufficiently diversified and continues to match your long-term financial goals.
Introducing John Hancock Multifactor Exchange-Traded Funds (ETFs)
We believe investors benefit from a combination of active and passive strategies in their portfolios. That's why, for years, we've offered actively managed funds to our shareholders, alongside asset allocation portfolios that employ a mix of active and passive strategies. That same thinking is what led us to team up with Dimensional Fund Advisors LP—a company regarded as one of the pioneers in strategic beta investing*—for the launch of the passively managed John Hancock Multifactor ETFs. Each ETF seeks to track a custom index built upon decades of academic research into the factors that drive higher expected returns: smaller capitalizations, lower valuations, and higher profitability. For nearly 30 years, it's just the kind of time-tested approach we have looked for as a manager of managers. For more information, visit our website at jhinvestments.com/etf.
On behalf of everyone at John Hancock Investments, I'd like to take this opportunity to welcome new shareholders and thank existing shareholders for the continued trust you've placed in us.
Sincerely,
Andrew G. Arnott
President and Chief Executive Officer
John Hancock Investments
This commentary reflects the CEO's views as of October 31, 2015. They are subject to change at any time. For more up-to-date information, you can visit our website at jhinvestments.com.
| * | Strategic beta investing ETFs seek to improve upon cap-weighted strategies by tracking a custom index that combines active management insight with the discipline of a rules-based approach. |
John Hancock
Classic Value Fund
Table of contents
| 2 | Your fund at a glance | |
| 4 | Discussion of fund performance | |
| 8 | A look at performance | |
| 10 | Your expenses | |
| 12 | Fund's investments | |
| 15 | Financial statements | |
| 19 | Financial highlights | |
| 29 | Notes to financial statements | |
| 37 | Auditor's report | |
| 38 | Tax information | |
| 39 | Continuation of investment advisory and subadvisory agreements | |
| 45 | Trustees and Officers | |
| 49 | More information |
1
INVESTMENT OBJECTIVE
The fund seeks long-term growth of capital.
AVERAGE ANNUAL TOTAL RETURNS AS OF 10/31/15 (%)
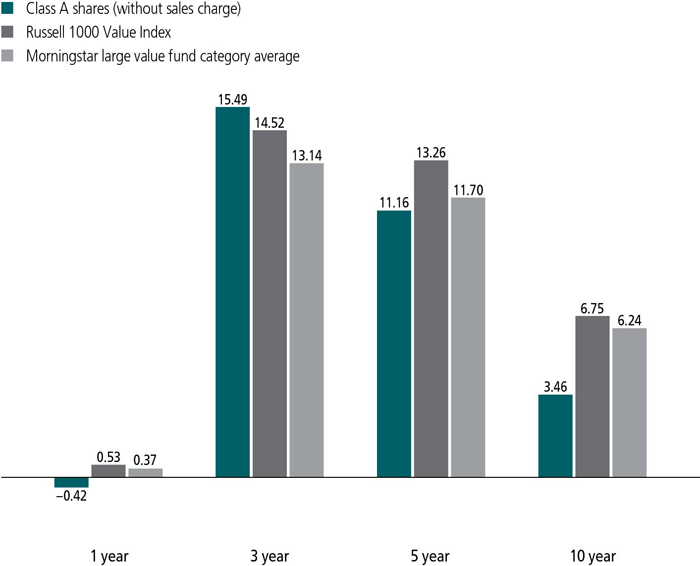
The Russell 1000 Value Index is an unmanaged index containing those securities in the Russell 1000 Index with a less-than-average growth orientation.
It is not possible to invest directly in an index. Index figures do not reflect expenses or sales charges, which would result in lower returns.
Figures from Morningstar, Inc. include reinvested distributions and do not take into account sales charges. Actual load-adjusted performance is lower.
The past performance shown here reflects reinvested distributions and the beneficial effect of any expense reductions, and does not guarantee future results. Performance of the other share classes will vary based on the difference in the fees and expenses of those classes. Shares will fluctuate in value and, when redeemed, may be worth more or less than their original cost. Current performance may be lower or higher than the performance cited, and can be found at jhinvestments.com or by calling 800-225-5291. For further information on the fund's objectives, risks, and strategy, see the fund's prospectuses.
2
PERFORMANCE HIGHLIGHTS OVER THE LAST TWELVE MONTHS
U.S. stocks experienced volatility
The fund's benchmark, the Russell 1000 Value Index, was nearly flat for the year after experiencing both all-time highs and a correction.
Fund trailed its benchmark
The fund trailed its benchmark primarily due to poor stock selection in consumer staples and information technology.
Selections in the industrials sector were contributors
Industrials was the top contributor from a sector standpoint relative to the benchmark.
SECTOR COMPOSITION AS OF 10/31/15 (%)
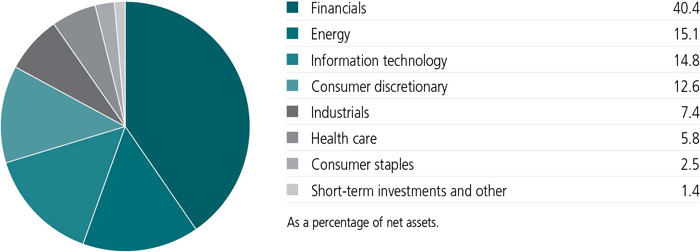
A note about risks
The value of a company's equity securities is subject to changes in the company's financial condition and overall market and economic conditions. The securities of value companies are subject to the risk that the companies may not overcome the adverse business developments or other factors causing their securities to be underpriced or that the market may never come to recognize their fundamental value. Sector investing is subject to greater risks than the market as a whole. Because the fund may focus on particular sectors of the economy, its performance may depend on the performance of those sectors, and investments focused in one sector may fluctuate more widely than investments broadly invested across sectors. Foreign investing has additional risks, such as currency and market volatility and political and social instability. Please see the fund's prospectuses for additional risks.
3
An interview with the portfolio management team from Pzena Investment Management, LLC

Richard S. Pzena
Portfolio Manager
Pzena Investment Management, LLC

John P. Goetz
Portfolio Manager
Pzena Investment Management, LLC

Benjamin S. Silver, CFA, CPA
Portfolio Manager
Pzena Investment Management, LLC
An interview with the portfolio management team from Pzena Investment Management, LLC
Can you briefly describe the market environment over the past 12 months?
The first half of the fiscal year was positive for stocks as the U.S. market was strong and a safe haven from non-U.S. volatility. However, the market worldwide turned negative in the spring and summer due to headline risks, including Chinese stock market volatility and increased concerns about economic growth in emerging markets. Stocks around the globe rallied sharply in October, recapturing a significant amount of the previous two months' losses. Macroeconomic data was mixed for the period, but was generally positive. Value-style investing lagged the market this year due to the aforementioned issues; the fund's benchmark, the Russell 1000 Value Index, rose 0.53% for the year, led by healthcare and the consumer discretionary sectors, offset by losses in energy and materials.
In the latter portion of the year, equities experienced their first correction in more than four years, when the S&P 500 Index declined 11.2% from August 17 through August 25. Global economic data appears to be increasingly driving swings in markets, as the U.S. economy continues on a path of slow and steady recovery. A contributor to U.S. economic growth was strong housing data. Falling commodity prices have generally supported U.S. consumers. Because of uncertainty around the strength of the global economy and the absence of inflationary pressures, the timing of an interest-rate increase by the U.S. Federal Reserve has been deferred, but is expected by the markets by calendar year end.
4
The fund trailed its benchmark. What drove this underperformance?
Stock selection was the biggest hurdle to fund performance. In consumer staples, Wal-Mart Stores Inc. detracted as the company lowered its guidance for operating margins through 2017. The company cited rising wages and investments in operations and its e-commerce platform as factors in its revised guidance. Although a near-term drag on earnings, we believe these investments will ultimately drive same-store sales growth.
In the information technology sector, Hewlett-Packard Company detracted from relative returns on weaker personal computer sales and the impact of adverse foreign currency moves. It remains a compelling investment because of its leading competitive position, and we believe the increased operational focus enabled by its split into two companies will unlock value.
In the poorly performing energy sector, some of the fund's top relative detractors included Royal Dutch Shell PLC, Murphy Oil Corp., and BP PLC. We added value in the sector relative to the benchmark, by owning mostly integrated oil companies rather than oil field services companies.
TOP 10 HOLDINGS AS OF 10/31/15 (%)
| Royal Dutch Shell PLC, ADR, Class A | 4.5 |
| Exxon Mobil Corp. | 4.4 |
| Bank of America Corp. | 3.9 |
| Citigroup, Inc. | 3.7 |
| BP PLC, ADR | 3.7 |
| Hewlett-Packard Company | 3.7 |
| American International Group, Inc. | 3.4 |
| Microsoft Corp. | 3.3 |
| Oracle Corp. | 3.1 |
| Axis Capital Holdings, Ltd. | 3.0 |
| TOTAL | 36.7 |
| As a percentage of net assets. | |
| Cash and cash equivalents are not included. | |
5
Which stocks contributed to relative performance?
Within the industrials sector, Masco Corp. was the top contributor to relative performance, as the company benefited from an improving residential construction landscape. Stanley Black & Decker, Inc. also benefited from positive construction trends coupled with strong sales and innovative products. The maker of power tools and related accessories reported increased demand for its products in its wholesale and retail channels.
In the healthcare sector, Cigna Corp. was the fund's top performer, as the company agreed to be acquired by Anthem, Inc. (not held by the fund) for a significant premium, creating the country's largest health insurance provider in terms of membership. HMOs have been quite strong as investors gain comfort with the sustainability of earnings following the implementation of the Affordable Care Act, as well as an improved medical cost trend. Laboratory Corp. of America and Baxalta, Inc. also generated positive returns and helped relative performance.
How was the portfolio positioned at the end of the period?
We trimmed the fund's healthcare exposure over the period, selling Becton Dickinson & Company and reducing its position in Cigna after the announced merger with Anthem. In the industrials sector, we purchased Stanley Black & Decker, as the company leverages the strength of the construction industry through its cordless tools, expands its footprint into emerging markets, and
COUNTRY COMPOSITION AS OF 10/31/15 (%)
| United States | 84.5 |
| United Kingdom | 5.2 |
| Netherlands | 4.5 |
| Bermuda | 3.0 |
| Switzerland | 2.5 |
| Canada | 0.3 |
| TOTAL | 100.0 |
| As a percentage of net assets. |
6
drives expected improvement in cash flow. We also initiated a position in Dover Corp., a high-quality, diversified global industrial company. Overall, the fund remains exposed to sectors whose earnings are depressed and expectations are low, including financials, energy, and select information technology and industrials stocks. But we believe such sectors offer good value.
MANAGED BY
| | Richard S. Pzena On the fund since 1996 Investing since 1980 |
| | John P. Goetz On the fund since 1996 Investing since 1979 |
| | Benjamin S. Silver, CFA, CPA On the fund since 2012 Investing since 1991 |
![]()
7
TOTAL RETURNS FOR THE PERIOD ENDED OCTOBER 31, 2015
| Average annual total returns (%) with maximum sales charge | Cumulative total returns (%) with maximum sales charge | ||||||
| 1-year | 5-year | 10-year | 5-year | 10-year | |||
| Class A | -5.40 | 10.03 | 2.92 | 61.24 | 33.40 | ||
| Class B | -6.11 | 10.05 | 2.84 | 61.42 | 32.35 | ||
| Class C | -2.16 | 10.33 | 2.68 | 63.47 | 30.32 | ||
| Class I1 | -0.19 | 11.49 | 3.82 | 72.28 | 45.49 | ||
| Class R11 | -0.82 | 10.74 | 3.10 | 66.55 | 35.67 | ||
| Class R21,2 | -0.56 | 11.18 | 3.42 | 69.85 | 39.97 | ||
| Class R31,2 | -0.73 | 10.90 | 3.16 | 67.78 | 36.53 | ||
| Class R41,2 | -0.24 | 11.39 | 3.54 | 71.51 | 41.60 | ||
| Class R51,2 | -0.11 | 11.58 | 3.78 | 72.92 | 44.93 | ||
| Class R61,2 | -0.09 | 11.59 | 3.87 | 73.03 | 46.21 | ||
| Index† | 0.53 | 13.26 | 6.75 | 86.38 | 92.25 | ||
Performance figures assume all distributions have been reinvested. Figures reflect maximum sales charges on Class A shares of 5% and the applicable contingent deferred sales charge (CDSC) on Class B and Class C shares. The Class B shares' CDSC declines annually between years 1 to 6 according to the following schedule: 5%, 4%, 3%, 3%, 2%, 1%. No sales charge will be assessed after the sixth year. Class C shares held for less than one year are subject to a 1% CDSC. Sales charges are not applicable to Class I, Class R1, Class R2, Class R3, Class R4, Class R5, and Class R6 shares.
The expense ratios of the fund, both net (including any fee waivers and/or expense limitations) and gross (excluding any fee waivers and/or expense limitations), are set forth according to the most recent publicly available prospectuses for the fund and may differ from those disclosed in the Financial highlights tables in this report. Had the fee waivers and expense limitations not been in place, gross expenses would apply. The expense ratios are as follows:
| Class A | Class B | Class C | Class I | Class R1 | Class R2 | Class R3 | Class R4 | Class R5 | Class R6 | |
| Gross (%) | 1.19 | 1.94 | 1.94 | 0.93 | 1.57 | 1.33 | 1.47 | 1.17 | 0.88 | 0.83 |
| Net (%) | 1.19 | 1.94 | 1.94 | 0.93 | 1.57 | 1.33 | 1.47 | 1.07 | 0.88 | 0.81 |
Please refer to the most recent prospectus and annual or semiannual report for more information on expenses and any expense limitation arrangements for each class.
The returns reflect past results and should not be considered indicative of future performance. The return and principal value of an investment will fluctuate so that shares, when redeemed, may be worth more or less than their original cost. Due to market volatility and other factors, the fund's current performance may be higher or lower than the performance shown. For current to the most recent month-end performance data, please call 800-225-5291 or visit the fund's website at jhinvestments.com.
The performance table above and the chart on the next page do not reflect the deduction of taxes that a shareholder would pay on fund distributions or the redemption of fund shares. The fund's performance results reflect any applicable fee waivers or expense reductions, without which the expenses would increase and results would have been less favorable.
| † | Index is the Russell 1000 Value Index. |
See the following page for footnotes.
8
This chart and table show what happened to a hypothetical $10,000 investment in John Hancock Classic Value Fund for the share classes and periods indicated, assuming all distributions were reinvested. For comparison, we've shown the same investment in the Russell 1000 Value Index.
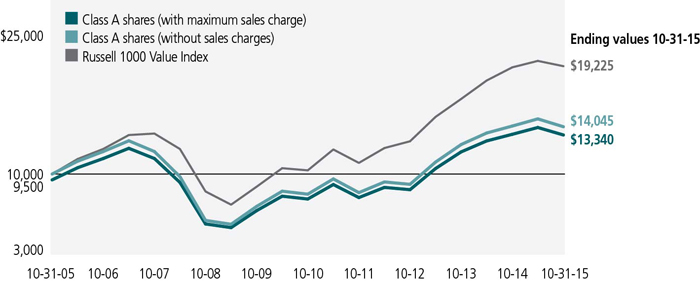
| Start date | With maximum sales charge ($) | Without sales charge ($) | Index ($) | |
| Class B3 | 10-31-05 | 13,235 | 13,235 | 19,225 |
| Class C3 | 10-31-05 | 13,032 | 13,032 | 19,225 |
| Class I1 | 10-31-05 | 14,549 | 14,549 | 19,225 |
| Class R11 | 10-31-05 | 13,567 | 13,567 | 19,225 |
| Class R21,2 | 10-31-05 | 13,997 | 13,997 | 19,225 |
| Class R31,2 | 10-31-05 | 13,653 | 13,653 | 19,225 |
| Class R41,2 | 10-31-05 | 14,160 | 14,160 | 19,225 |
| Class R51,2 | 10-31-05 | 14,493 | 14,493 | 19,225 |
| Class R61,2 | 10-31-05 | 14,621 | 14,621 | 19,225 |
Performance of the classes will vary based on the difference in sales charges paid by shareholders investing in the different classes and the fee structure of those classes.
The Russell 1000 Value Index is an unmanaged index containing those securities in the Russell 1000 Index with a less-than-average growth orientation.
It is not possible to invest directly in an index. Index figures do not reflect expenses or sales charges, which would result in lower returns.
Footnotes related to performance pages
| 1 | For certain types of investors, as described in the fund's prospectuses. |
| 2 | Class R3, Class R4, and Class R5 shares were first offered on 5-22-09; Class R6 shares were first offered on 9-1-11; Class R2 shares were first offered on 3-1-12. The returns prior to these dates are those of Class A shares that have been recalculated to apply the gross fees and expenses of Class R3, Class R4, Class R5, Class R6, and Class R2 shares, as applicable. |
| 3 | The contingent deferred sales charge is not applicable. |
9
These examples are intended to help you understand your ongoing operating expenses of investing in the fund so you can compare these costs with the ongoing costs of investing in other mutual funds.
Understanding fund expenses
As a shareholder of the fund, you incur two types of costs:
| • | Transaction costs, which include sales charges (loads) on purchases or redemptions (varies by share class), minimum account fee charge, etc. |
| • | Ongoing operating expenses, including management fees, distribution and service fees (if applicable), and other fund expenses. |
We are presenting only your ongoing operating expenses here.
Actual expenses/actual returns
This example is intended to provide information about the fund's actual ongoing operating expenses, and is based on the fund's actual return. It assumes an account value of $1,000.00 on May 1, 2015, with the same investment held until October 31, 2015.
| Account value on 5-1-2015 | Ending value on 10-31-2015 | Expenses paid during period ended 10-31-20151 | Annualized expense ratio | |
| Class A | $1,000.00 | $954.30 | $5.86 | 1.19% |
| Class B | 1,000.00 | 951.00 | 9.54 | 1.94% |
| Class C | 1,000.00 | 951.00 | 9.54 | 1.94% |
| Class I | 1,000.00 | 955.50 | 4.58 | 0.93% |
| Class R1 | 1,000.00 | 952.50 | 7.78 | 1.58% |
| Class R2 | 1,000.00 | 953.90 | 6.55 | 1.33% |
| Class R3 | 1,000.00 | 953.10 | 7.29 | 1.48% |
| Class R4 | 1,000.00 | 955.50 | 4.83 | 0.98% |
| Class R5 | 1,000.00 | 955.90 | 4.19 | 0.85% |
| Class R6 | 1,000.00 | 956.30 | 3.99 | 0.81% |
Together with the value of your account, you may use this information to estimate the operating expenses that you paid over the period. Simply divide your account value at October 31, 2015, by $1,000.00, then multiply it by the "expenses paid" for your share class from the table above. For example, for an account value of $8,600.00, the operating expenses should be calculated as follows:
10
Hypothetical example for comparison purposes
This table allows you to compare the fund's ongoing operating expenses with those of any other fund. It provides an example of the fund's hypothetical account values and hypothetical expenses based on each class's actual expense ratio and an assumed 5% annualized return before expenses (which is not the fund's actual return). It assumes an account value of $1,000.00 on May 1, 2015, with the same investment held until October 31, 2015. Look in any other fund shareholder report to find its hypothetical example and you will be able to compare these expenses. Please remember that these hypothetical account values and expenses may not be used to estimate the actual ending account balance or expenses you paid for the period.
| Account value on 5-1-2015 | Ending value on 10-31-2015 | Expenses paid during period ended 10-31-20151 | Annualized expense ratio | |
| Class A | $1,000.00 | $1,019.20 | $6.06 | 1.19% |
| Class B | 1,000.00 | 1,015.40 | 9.86 | 1.94% |
| Class C | 1,000.00 | 1,015.40 | 9.86 | 1.94% |
| Class I | 1,000.00 | 1,020.50 | 4.74 | 0.93% |
| Class R1 | 1,000.00 | 1,017.20 | 8.03 | 1.58% |
| Class R2 | 1,000.00 | 1,018.50 | 6.77 | 1.33% |
| Class R3 | 1,000.00 | 1,017.70 | 7.53 | 1.48% |
| Class R4 | 1,000.00 | 1,020.30 | 4.99 | 0.98% |
| Class R5 | 1,000.00 | 1,020.90 | 4.33 | 0.85% |
| Class R6 | 1,000.00 | 1,021.10 | 4.13 | 0.81% |
Remember, these examples do not include any transaction costs, therefore, these examples will not help you to determine the relative total costs of owning different funds. If transaction costs were included, your expenses would have been higher. See the prospectuses for details regarding transaction costs.
| 1 | Expenses are equal to the fund's annualized expense ratio, multiplied by the average account value over the period, multiplied by 184/365 (to reflect the one-half year period). |
11
Fund's investments
| As of 10-31-15 | |||||||||||||||||
| Shares | Value | ||||||||||||||||
| Common stocks 98.6% | $2,015,460,992 | ||||||||||||||||
| (Cost $1,663,764,247) | |||||||||||||||||
| Consumer discretionary 12.6% | 256,514,801 | ||||||||||||||||
| Automobiles 2.5% | |||||||||||||||||
| Ford Motor Company | 3,342,715 | 49,505,609 | |||||||||||||||
| Media 7.7% | |||||||||||||||||
| News Corp., Class A | 3,925,115 | 60,446,771 | |||||||||||||||
| News Corp., Class B | 626,734 | 9,701,842 | |||||||||||||||
| Omnicom Group, Inc. | 700,889 | 52,510,604 | |||||||||||||||
| The Interpublic Group of Companies, Inc. | 1,525,475 | 34,979,142 | |||||||||||||||
| Specialty retail 2.4% | |||||||||||||||||
| Staples, Inc. | 3,800,680 | 49,370,833 | |||||||||||||||
| Consumer staples 2.5% | 52,048,332 | ||||||||||||||||
| Food and staples retailing 2.5% | |||||||||||||||||
| Wal-Mart Stores, Inc. | 909,300 | 52,048,332 | |||||||||||||||
| Energy 15.1% | 309,493,516 | ||||||||||||||||
| Energy equipment and services 0.9% | |||||||||||||||||
| Baker Hughes, Inc. | 357,995 | 18,859,177 | |||||||||||||||
| Oil, gas and consumable fuels 14.2% | |||||||||||||||||
| BP PLC, ADR | 2,111,345 | 75,375,017 | |||||||||||||||
| Cenovus Energy, Inc. | 408,053 | 6,084,070 | |||||||||||||||
| Exxon Mobil Corp. | 1,080,040 | 89,362,510 | |||||||||||||||
| Murphy Oil Corp. | 959,700 | 27,284,271 | |||||||||||||||
| Royal Dutch Shell PLC, ADR, Class A | 1,763,791 | 92,528,471 | |||||||||||||||
| Financials 40.4% | 824,775,263 | ||||||||||||||||
| Banks 14.8% | |||||||||||||||||
| Bank of America Corp. | 4,730,038 | 79,370,038 | |||||||||||||||
| Citigroup, Inc. | 1,426,091 | 75,825,258 | |||||||||||||||
| JPMorgan Chase & Co. | 837,286 | 53,795,626 | |||||||||||||||
| Regions Financial Corp. | 5,498,600 | 51,411,910 | |||||||||||||||
| The PNC Financial Services Group, Inc. | 458,691 | 41,401,450 | |||||||||||||||
| Capital markets 12.5% | |||||||||||||||||
| Franklin Resources, Inc. | 1,334,417 | 54,390,837 | |||||||||||||||
| Morgan Stanley | 1,466,521 | 48,351,197 | |||||||||||||||
| State Street Corp. | 732,202 | 50,521,938 | |||||||||||||||
| The Goldman Sachs Group, Inc. | 273,653 | 51,309,938 | |||||||||||||||
| UBS Group AG (L) | 2,577,126 | 51,619,834 | |||||||||||||||
| Diversified financial services 2.5% | |||||||||||||||||
| Voya Financial, Inc. | 1,234,493 | 50,083,381 | |||||||||||||||
| Shares | Value | ||||||||||||||||
| Financials (continued) | |||||||||||||||||
| Insurance 10.6% | |||||||||||||||||
| American International Group, Inc. | 1,107,452 | $69,835,923 | |||||||||||||||
| Axis Capital Holdings, Ltd. | 1,133,949 | 61,233,246 | |||||||||||||||
| MetLife, Inc. | 1,069,068 | 53,859,646 | |||||||||||||||
| Willis Group Holdings PLC | 712,061 | 31,765,041 | |||||||||||||||
| Health care 5.8% | 118,066,480 | ||||||||||||||||
| Biotechnology 0.7% | |||||||||||||||||
| Baxalta, Inc. | 383,650 | 13,220,579 | |||||||||||||||
| Health care equipment and supplies 3.4% | |||||||||||||||||
| Abbott Laboratories | 904,327 | 40,513,850 | |||||||||||||||
| Baxter International, Inc. | 773,825 | 28,933,317 | |||||||||||||||
| Health care providers and services 1.7% | |||||||||||||||||
| Cigna Corp. | 214,667 | 28,773,965 | |||||||||||||||
| Laboratory Corp. of America Holdings (I) | 53,974 | 6,624,769 | |||||||||||||||
| Industrials 7.4% | 151,980,295 | ||||||||||||||||
| Building products 0.5% | |||||||||||||||||
| Masco Corp. | 383,597 | 11,124,313 | |||||||||||||||
| Machinery 6.9% | |||||||||||||||||
| Dover Corp. | 550,150 | 35,446,165 | |||||||||||||||
| Parker-Hannifin Corp. | 468,225 | 49,023,158 | |||||||||||||||
| Stanley Black & Decker, Inc. | 532,050 | 56,386,659 | |||||||||||||||
| Information technology 14.8% | 302,582,305 | ||||||||||||||||
| Electronic equipment, instruments and components 1.9% | |||||||||||||||||
| Corning, Inc. | 2,144,050 | 39,879,330 | |||||||||||||||
| Semiconductors and semiconductor equipment 2.8% | |||||||||||||||||
| Intel Corp. | 1,697,939 | 57,492,215 | |||||||||||||||
| Software 6.4% | |||||||||||||||||
| Microsoft Corp. | 1,283,398 | 67,558,071 | |||||||||||||||
| Oracle Corp. | 1,615,664 | 62,752,390 | |||||||||||||||
| Technology hardware, storage and peripherals 3.7% | |||||||||||||||||
| Hewlett-Packard Company (I) | 2,778,201 | 74,900,299 | |||||||||||||||
| Yield (%) | Shares | Value | |||||||||||||||
| Securities lending collateral 0.7% | $13,430,221 | ||||||||||||||||
| (Cost $13,429,808) | |||||||||||||||||
| John Hancock Collateral Trust (W) | 0.1388(Y) | 1,342,270 | 13,430,221 | ||||||||||||||
| Par value | Value | ||||||||||||||||
| Short-term investments 1.1% | $23,296,000 | ||||||||||||||||
| (Cost $23,296,000) | |||||||||||||||||
| Repurchase agreement 1.1% | 23,296,000 | ||||||||||||||||
| Repurchase Agreement with State Street Corp. dated 10-30-15 at 0.000% to be repurchased at $23,296,000 on 11-2-15, collateralized by $23,615,000 U.S. Treasury Notes, 1.000% due 9-15-17 (valued at $23,763,775, including interest) | 23,296,000 | 23,296,000 | |||||||||||||||
| Total investments (Cost $1,700,490,055)† 100.4% | $2,052,187,213 | ||||||||||||||||
| Other assets and liabilities, net (0.4%) | ($8,660,742 | ) | |||||||||||||||
| Total net assets 100.0% | $2,043,526,471 | ||||||||||||||||
| The percentage shown for each investment category is the total value of the category as a percentage of the net assets of the fund. | |||||||||||||||||
| Key to Security Abbreviations and Legend | |||||||||||||||||
| ADR | American Depositary Receipts | ||||||||||||||||
| (I) | Non-income producing security. | ||||||||||||||||
| (L) | A portion of this security is on loan as of 10-31-15. | ||||||||||||||||
| (W) | Investment is an affiliate of the fund, the advisor and/or subadvisor. This security represents the investment of cash collateral received for securities lending. | ||||||||||||||||
| (Y) | The rate shown is the annualized seven-day yield as of 10-31-15. | ||||||||||||||||
| † | At 10-31-15, the aggregate cost of investment securities for federal income tax purposes was $1,765,103,047. Net unrealized appreciation aggregated $287,084,166, of which $389,862,474 related to appreciated investment securities and $102,778,308 related to depreciated investment securities. | ||||||||||||||||
Financial statements
STATEMENT OF ASSETS AND LIABILITIES 10-31-15
| Assets | ||||||||||||||||||||||||||||||||||||||||
| Investments in unaffiliated issuers, at value (Cost $1,687,060,247) including $13,121,653 of securities loaned | $2,038,756,992 | |||||||||||||||||||||||||||||||||||||||
| Investments in affiliated issuers, at value (Cost $13,429,808) | 13,430,221 | |||||||||||||||||||||||||||||||||||||||
| Total investments, at value (Cost $1,700,490,055) | 2,052,187,213 | |||||||||||||||||||||||||||||||||||||||
| Cash | 710 | |||||||||||||||||||||||||||||||||||||||
| Receivable for investments sold | 3,679,557 | |||||||||||||||||||||||||||||||||||||||
| Receivable for fund shares sold | 3,376,906 | |||||||||||||||||||||||||||||||||||||||
| Dividends and interest receivable | 1,648,508 | |||||||||||||||||||||||||||||||||||||||
| Receivable for securities lending income | 4,432 | |||||||||||||||||||||||||||||||||||||||
| Other receivables and prepaid expenses | 105,660 | |||||||||||||||||||||||||||||||||||||||
| Total assets | 2,061,002,986 | |||||||||||||||||||||||||||||||||||||||
| Liabilities | ||||||||||||||||||||||||||||||||||||||||
| Payable for fund shares repurchased | 2,108,418 | |||||||||||||||||||||||||||||||||||||||
| Payable upon return of securities loaned | 13,429,550 | |||||||||||||||||||||||||||||||||||||||
| Payable to affiliates | ||||||||||||||||||||||||||||||||||||||||
| Accounting and legal services fees | 33,134 | |||||||||||||||||||||||||||||||||||||||
| Transfer agent fees | 199,284 | |||||||||||||||||||||||||||||||||||||||
| Distribution and service fees | 154,950 | |||||||||||||||||||||||||||||||||||||||
| Trustees' fees | 4,706 | |||||||||||||||||||||||||||||||||||||||
| Investment management fees | 1,270,178 | |||||||||||||||||||||||||||||||||||||||
| Other liabilities and accrued expenses | 276,295 | |||||||||||||||||||||||||||||||||||||||
| Total liabilities | 17,476,515 | |||||||||||||||||||||||||||||||||||||||
| Net assets | $2,043,526,471 | |||||||||||||||||||||||||||||||||||||||
| Net assets consist of | ||||||||||||||||||||||||||||||||||||||||
| Paid-in capital | $3,310,559,598 | |||||||||||||||||||||||||||||||||||||||
| Undistributed net investment income | 23,839,553 | |||||||||||||||||||||||||||||||||||||||
| Accumulated net realized gain (loss) on investments and foreign currency transactions | (1,642,569,838 | ) | ||||||||||||||||||||||||||||||||||||||
| Net unrealized appreciation (depreciation) on investments | 351,697,158 | |||||||||||||||||||||||||||||||||||||||
| Net assets | $2,043,526,471 | |||||||||||||||||||||||||||||||||||||||
STATEMENT OF ASSETS AND LIABILITIES (continued)
| Net asset value per share | ||||||||||||||||||
| Based on net asset values and shares outstanding-the fund has an unlimited number of shares authorized with no par value | ||||||||||||||||||
| Class A ($350,610,546 ÷ 13,756,452 shares)1 | $25.49 | |||||||||||||||||
| Class B ($7,723,596 ÷ 308,490 shares)1 | $25.04 | |||||||||||||||||
| Class C ($87,824,253 ÷ 3,509,166 shares)1 | $25.03 | |||||||||||||||||
| Class I ($1,591,174,407 ÷ 62,253,662 shares) | $25.56 | |||||||||||||||||
| Class R1 ($3,489,129 ÷ 136,880 shares) | $25.49 | |||||||||||||||||
| Class R2 ($329,464 ÷ 12,941 shares) | $25.46 | |||||||||||||||||
| Class R3 ($988,417 ÷ 38,903 shares) | $25.41 | |||||||||||||||||
| Class R4 ($56,825 ÷ 2,224 shares) | $25.55 | |||||||||||||||||
| Class R5 ($107,589 ÷ 4,207 shares) | $25.57 | |||||||||||||||||
| Class R6 ($1,222,245 ÷ 47,766 shares) | $25.59 | |||||||||||||||||
| Maximum offering price per share | ||||||||||||||||||
| Class A (net asset value per share ÷ 95%)2 | $26.83 | |||||||||||||||||
| 1 | Redemption price per share is equal to net asset value less any applicable contingent deferred sales charge. | ||||||||||||||||
| 2 | On single retail sales of less than $50,000. On sales of $50,000 or more and on group sales the offering price is reduced. | ||||||||||||||||
STATEMENT OF OPERATIONS For the year ended 10-31-15
| Investment income | ||||||||||||||||||||||||||||||||||||||||
| Dividends | $54,653,014 | |||||||||||||||||||||||||||||||||||||||
| Securities lending | 104,944 | |||||||||||||||||||||||||||||||||||||||
| Less foreign taxes withheld | (493,771 | ) | ||||||||||||||||||||||||||||||||||||||
| Total investment income | 54,264,187 | |||||||||||||||||||||||||||||||||||||||
| Expenses | ||||||||||||||||||||||||||||||||||||||||
| Investment management fees | 18,031,030 | |||||||||||||||||||||||||||||||||||||||
| Distribution and service fees | 2,043,550 | |||||||||||||||||||||||||||||||||||||||
| Accounting and legal services fees | 457,505 | |||||||||||||||||||||||||||||||||||||||
| Transfer agent fees | 2,699,039 | |||||||||||||||||||||||||||||||||||||||
| Trustees' fees | 55,086 | |||||||||||||||||||||||||||||||||||||||
| State registration fees | 205,994 | |||||||||||||||||||||||||||||||||||||||
| Printing and postage | 240,882 | |||||||||||||||||||||||||||||||||||||||
| Professional fees | 160,454 | |||||||||||||||||||||||||||||||||||||||
| Custodian fees | 285,191 | |||||||||||||||||||||||||||||||||||||||
| Registration and filing fees | 24,201 | |||||||||||||||||||||||||||||||||||||||
| Other | 65,335 | |||||||||||||||||||||||||||||||||||||||
| Total expenses | 24,268,267 | |||||||||||||||||||||||||||||||||||||||
| Less expense reductions | (183,989 | ) | ||||||||||||||||||||||||||||||||||||||
| Net expenses | 24,084,278 | |||||||||||||||||||||||||||||||||||||||
| Net investment income | 30,179,909 | |||||||||||||||||||||||||||||||||||||||
| Realized and unrealized gain (loss) | ||||||||||||||||||||||||||||||||||||||||
| Net realized gain (loss) on | ||||||||||||||||||||||||||||||||||||||||
| Investments in unaffiliated issuers and foreign currency transactions | 293,921,455 | |||||||||||||||||||||||||||||||||||||||
| Investments in affiliated issuers | 538 | |||||||||||||||||||||||||||||||||||||||
| 293,921,993 | ||||||||||||||||||||||||||||||||||||||||
| Change in net unrealized appreciation (depreciation) of | ||||||||||||||||||||||||||||||||||||||||
| Investments in unaffiliated issuers | (298,499,489 | ) | ||||||||||||||||||||||||||||||||||||||
| Investments in affiliated issuers | 291 | |||||||||||||||||||||||||||||||||||||||
| (298,499,198 | ) | |||||||||||||||||||||||||||||||||||||||
| Net realized and unrealized loss | (4,577,205 | ) | ||||||||||||||||||||||||||||||||||||||
| Increase in net assets from operations | $25,602,704 | |||||||||||||||||||||||||||||||||||||||
STATEMENTS OF CHANGES IN NET ASSETS
| Year ended 10-31-15 | Year ended 10-31-14 | ||||||||||||||||||||||||||||||||||||||||||||
| Increase (decrease) in net assets | |||||||||||||||||||||||||||||||||||||||||||||
| From operations | |||||||||||||||||||||||||||||||||||||||||||||
| Net investment income | $30,179,909 | $25,464,152 | |||||||||||||||||||||||||||||||||||||||||||
| Net realized gain | 293,921,993 | 170,336,685 | |||||||||||||||||||||||||||||||||||||||||||
| Change in net unrealized appreciation (depreciation) | (298,499,198 | ) | 144,716,657 | ||||||||||||||||||||||||||||||||||||||||||
| Increase in net assets resulting from operations | 25,602,704 | 340,517,494 | |||||||||||||||||||||||||||||||||||||||||||
| Distributions to shareholders | |||||||||||||||||||||||||||||||||||||||||||||
| From net investment income | |||||||||||||||||||||||||||||||||||||||||||||
| Class A | (3,212,030 | ) | (4,109,470 | ) | |||||||||||||||||||||||||||||||||||||||||
| Class B | (13,671 | ) | (20,261 | ) | |||||||||||||||||||||||||||||||||||||||||
| Class C | (123,133 | ) | (117,229 | ) | |||||||||||||||||||||||||||||||||||||||||
| Class I | (22,957,701 | ) | (23,864,080 | ) | |||||||||||||||||||||||||||||||||||||||||
| Class R1 | (32,345 | ) | (29,251 | ) | |||||||||||||||||||||||||||||||||||||||||
| Class R2 | (3,998 | ) | (4,629 | ) | |||||||||||||||||||||||||||||||||||||||||
| Class R3 | (6,808 | ) | (2,759 | ) | |||||||||||||||||||||||||||||||||||||||||
| Class R4 | (632 | ) | (575 | ) | |||||||||||||||||||||||||||||||||||||||||
| Class R5 | (1,438 | ) | (763 | ) | |||||||||||||||||||||||||||||||||||||||||
| Class R6 | (7,858 | ) | (6,189 | ) | |||||||||||||||||||||||||||||||||||||||||
| Total distributions | (26,359,614 | ) | (28,155,206 | ) | |||||||||||||||||||||||||||||||||||||||||
| From fund share transactions | (816,816,932 | ) | (64,376,552 | ) | |||||||||||||||||||||||||||||||||||||||||
| Total increase (decrease) | (817,573,842 | ) | 247,985,736 | ||||||||||||||||||||||||||||||||||||||||||
| Net assets | |||||||||||||||||||||||||||||||||||||||||||||
| Beginning of year | 2,861,100,313 | 2,613,114,577 | |||||||||||||||||||||||||||||||||||||||||||
| End of year | $2,043,526,471 | $2,861,100,313 | |||||||||||||||||||||||||||||||||||||||||||
| Undistributed net investment income | $23,839,553 | $20,019,129 | |||||||||||||||||||||||||||||||||||||||||||
Financial highlights
| Class A Shares Period ended | 10-31-15 | 10-31-14 | 10-31-13 | 10-31-12 | 10-31-11 | ||||||||||||||||||||||||||||||||||||||||||||||||||||||||||||||||||||||||||||||||||||||||||||||||||
| Per share operating performance | |||||||||||||||||||||||||||||||||||||||||||||||||||||||||||||||||||||||||||||||||||||||||||||||||||||||
| Net asset value, beginning of period | $25.82 | $23.12 | $17.02 | $15.86 | $15.64 | ||||||||||||||||||||||||||||||||||||||||||||||||||||||||||||||||||||||||||||||||||||||||||||||||||
| Net investment income1 | 0.28 | 0.18 | 0.20 | 0.20 | 0.10 | ||||||||||||||||||||||||||||||||||||||||||||||||||||||||||||||||||||||||||||||||||||||||||||||||||
| Net realized and unrealized gain (loss) on investments | (0.39 | ) | 2.72 | 6.09 | 1.12 | 0.15 | |||||||||||||||||||||||||||||||||||||||||||||||||||||||||||||||||||||||||||||||||||||||||||||||||
| Total from investment operations | (0.11 | ) | 2.90 | 6.29 | 1.32 | 0.25 | |||||||||||||||||||||||||||||||||||||||||||||||||||||||||||||||||||||||||||||||||||||||||||||||||
| Less distributions | |||||||||||||||||||||||||||||||||||||||||||||||||||||||||||||||||||||||||||||||||||||||||||||||||||||||
| From net investment income | (0.22 | ) | (0.20 | ) | (0.19 | ) | (0.16 | ) | (0.03 | ) | |||||||||||||||||||||||||||||||||||||||||||||||||||||||||||||||||||||||||||||||||||||||||||||
| Net asset value, end of period | $25.49 | $25.82 | $23.12 | $17.02 | $15.86 | ||||||||||||||||||||||||||||||||||||||||||||||||||||||||||||||||||||||||||||||||||||||||||||||||||
| Total return (%)2,3 | (0.42 | ) | 12.64 | 37.32 | 8.45 | 1.59 | |||||||||||||||||||||||||||||||||||||||||||||||||||||||||||||||||||||||||||||||||||||||||||||||||
| Ratios and supplemental data | |||||||||||||||||||||||||||||||||||||||||||||||||||||||||||||||||||||||||||||||||||||||||||||||||||||||
| Net assets, end of period (in millions) | $351 | $384 | $476 | $417 | $557 | ||||||||||||||||||||||||||||||||||||||||||||||||||||||||||||||||||||||||||||||||||||||||||||||||||
| Ratios (as a percentage of average net assets): | |||||||||||||||||||||||||||||||||||||||||||||||||||||||||||||||||||||||||||||||||||||||||||||||||||||||
| Expenses before reductions | 1.19 | 1.19 | 1.25 | 1.31 | 1.30 | ||||||||||||||||||||||||||||||||||||||||||||||||||||||||||||||||||||||||||||||||||||||||||||||||||
| Expenses including reductions | 1.18 | 1.18 | 1.25 | 1.31 | 1.30 | ||||||||||||||||||||||||||||||||||||||||||||||||||||||||||||||||||||||||||||||||||||||||||||||||||
| Net investment income | 1.07 | 0.73 | 1.00 | 1.24 | 0.59 | ||||||||||||||||||||||||||||||||||||||||||||||||||||||||||||||||||||||||||||||||||||||||||||||||||
| Portfolio turnover (%) | 17 | 24 | 30 | 37 | 37 | ||||||||||||||||||||||||||||||||||||||||||||||||||||||||||||||||||||||||||||||||||||||||||||||||||
| 1 | Based on average daily shares outstanding. | ||||||||||||||||||||||||||||||||||||||||||||||||||||||||||||||||||||||||||||||||||
| 2 | Does not reflect the effect of sales charges, if any. | ||||||||||||||||||||||||||||||||||||||||||||||||||||||||||||||||||||||||||||||||||
| 3 | Total returns would have been lower had certain expenses not been reduced during the applicable periods. | ||||||||||||||||||||||||||||||||||||||||||||||||||||||||||||||||||||||||||||||||||
| Class B Shares Period ended | 10-31-15 | 10-31-14 | 10-31-13 | 10-31-12 | 10-31-11 | ||||||||||||||||||||||||||||||||||||||||||||||||||||||||||||||||||||||||||||||||||||||||||||||||||
| Per share operating performance | |||||||||||||||||||||||||||||||||||||||||||||||||||||||||||||||||||||||||||||||||||||||||||||||||||||||
| Net asset value, beginning of period | $25.37 | $22.72 | $16.73 | $15.58 | $15.45 | ||||||||||||||||||||||||||||||||||||||||||||||||||||||||||||||||||||||||||||||||||||||||||||||||||
| Net investment income (loss)1 | 0.08 | — | 2 | 0.07 | 0.08 | (0.03 | ) | ||||||||||||||||||||||||||||||||||||||||||||||||||||||||||||||||||||||||||||||||||||||||||||||||
| Net realized and unrealized gain (loss) on investments | (0.38 | ) | 2.68 | 5.98 | 1.10 | 0.16 | |||||||||||||||||||||||||||||||||||||||||||||||||||||||||||||||||||||||||||||||||||||||||||||||||
| Total from investment operations | (0.30 | ) | 2.68 | 6.05 | 1.18 | 0.13 | |||||||||||||||||||||||||||||||||||||||||||||||||||||||||||||||||||||||||||||||||||||||||||||||||
| Less distributions | |||||||||||||||||||||||||||||||||||||||||||||||||||||||||||||||||||||||||||||||||||||||||||||||||||||||
| From net investment income | (0.03 | ) | (0.03 | ) | (0.06 | ) | (0.03 | ) | — | ||||||||||||||||||||||||||||||||||||||||||||||||||||||||||||||||||||||||||||||||||||||||||||||
| Net asset value, end of period | $25.04 | $25.37 | $22.72 | $16.73 | $15.58 | ||||||||||||||||||||||||||||||||||||||||||||||||||||||||||||||||||||||||||||||||||||||||||||||||||
| Total return (%)3,4 | (1.18 | ) | 11.79 | 36.30 | 7.62 | 0.84 | |||||||||||||||||||||||||||||||||||||||||||||||||||||||||||||||||||||||||||||||||||||||||||||||||
| Ratios and supplemental data | |||||||||||||||||||||||||||||||||||||||||||||||||||||||||||||||||||||||||||||||||||||||||||||||||||||||
| Net assets, end of period (in millions) | $8 | $11 | $18 | $25 | $41 | ||||||||||||||||||||||||||||||||||||||||||||||||||||||||||||||||||||||||||||||||||||||||||||||||||
| Ratios (as a percentage of average net assets): | |||||||||||||||||||||||||||||||||||||||||||||||||||||||||||||||||||||||||||||||||||||||||||||||||||||||
| Expenses before reductions | 1.93 | 1.94 | 2.00 | 2.06 | 2.05 | ||||||||||||||||||||||||||||||||||||||||||||||||||||||||||||||||||||||||||||||||||||||||||||||||||
| Expenses including reductions | 1.93 | 1.93 | 2.00 | 2.06 | 2.05 | ||||||||||||||||||||||||||||||||||||||||||||||||||||||||||||||||||||||||||||||||||||||||||||||||||
| Net investment income (loss) | 0.32 | 0.01 | 0.34 | 0.50 | (0.16 | ) | |||||||||||||||||||||||||||||||||||||||||||||||||||||||||||||||||||||||||||||||||||||||||||||||||
| Portfolio turnover (%) | 17 | 24 | 30 | 37 | 37 | ||||||||||||||||||||||||||||||||||||||||||||||||||||||||||||||||||||||||||||||||||||||||||||||||||
| 1 | Based on average daily shares outstanding. | ||||||||||||||||||||||||||||||||||||||||||||||||||||||||||||||||||||||||||||||||||
| 2 | Less than $0.005 per share. | ||||||||||||||||||||||||||||||||||||||||||||||||||||||||||||||||||||||||||||||||||
| 3 | Does not reflect the effect of sales charges, if any. | ||||||||||||||||||||||||||||||||||||||||||||||||||||||||||||||||||||||||||||||||||
| 4 | Total returns would have been lower had certain expenses not been reduced during the applicable periods. | ||||||||||||||||||||||||||||||||||||||||||||||||||||||||||||||||||||||||||||||||||
| Class C Shares Period ended | 10-31-15 | 10-31-14 | 10-31-13 | 10-31-12 | 10-31-11 | ||||||||||||||||||||||||||||||||||||||||||||||||||||||||||||||||||||||||||||||||||||||||||||||||||
| Per share operating performance | |||||||||||||||||||||||||||||||||||||||||||||||||||||||||||||||||||||||||||||||||||||||||||||||||||||||
| Net asset value, beginning of period | $25.36 | $22.71 | $16.73 | $15.58 | $15.44 | ||||||||||||||||||||||||||||||||||||||||||||||||||||||||||||||||||||||||||||||||||||||||||||||||||
| Net investment income (loss)1 | 0.08 | (0.01 | ) | 0.05 | 0.08 | (0.03 | ) | ||||||||||||||||||||||||||||||||||||||||||||||||||||||||||||||||||||||||||||||||||||||||||||||||
| Net realized and unrealized gain (loss) on investments | (0.38 | ) | 2.69 | 5.99 | 1.10 | 0.17 | |||||||||||||||||||||||||||||||||||||||||||||||||||||||||||||||||||||||||||||||||||||||||||||||||
| Total from investment operations | (0.30 | ) | 2.68 | 6.04 | 1.18 | 0.14 | |||||||||||||||||||||||||||||||||||||||||||||||||||||||||||||||||||||||||||||||||||||||||||||||||
| Less distributions | |||||||||||||||||||||||||||||||||||||||||||||||||||||||||||||||||||||||||||||||||||||||||||||||||||||||
| From net investment income | (0.03 | ) | (0.03 | ) | (0.06 | ) | (0.03 | ) | — | ||||||||||||||||||||||||||||||||||||||||||||||||||||||||||||||||||||||||||||||||||||||||||||||
| Net asset value, end of period | $25.03 | $25.36 | $22.71 | $16.73 | $15.58 | ||||||||||||||||||||||||||||||||||||||||||||||||||||||||||||||||||||||||||||||||||||||||||||||||||
| Total return (%)2,3 | (1.18 | ) | 11.80 | 36.24 | 7.62 | 0.91 | |||||||||||||||||||||||||||||||||||||||||||||||||||||||||||||||||||||||||||||||||||||||||||||||||
| Ratios and supplemental data | |||||||||||||||||||||||||||||||||||||||||||||||||||||||||||||||||||||||||||||||||||||||||||||||||||||||
| Net assets, end of period (in millions) | $88 | $101 | $95 | $81 | $101 | ||||||||||||||||||||||||||||||||||||||||||||||||||||||||||||||||||||||||||||||||||||||||||||||||||
| Ratios (as a percentage of average net assets): | |||||||||||||||||||||||||||||||||||||||||||||||||||||||||||||||||||||||||||||||||||||||||||||||||||||||
| Expenses before reductions | 1.94 | 1.94 | 2.00 | 2.06 | 2.05 | ||||||||||||||||||||||||||||||||||||||||||||||||||||||||||||||||||||||||||||||||||||||||||||||||||
| Expenses including reductions | 1.93 | 1.93 | 2.00 | 2.06 | 2.05 | ||||||||||||||||||||||||||||||||||||||||||||||||||||||||||||||||||||||||||||||||||||||||||||||||||
| Net investment income (loss) | 0.32 | (0.04 | ) | 0.25 | 0.47 | (0.16 | ) | ||||||||||||||||||||||||||||||||||||||||||||||||||||||||||||||||||||||||||||||||||||||||||||||||
| Portfolio turnover (%) | 17 | 24 | 30 | 37 | 37 | ||||||||||||||||||||||||||||||||||||||||||||||||||||||||||||||||||||||||||||||||||||||||||||||||||
| 1 | Based on average daily shares outstanding. | ||||||||||||||||||||||||||||||||||||||||||||||||||||||||||||||||||||||||||||||||||
| 2 | Does not reflect the effect of sales charges, if any. | ||||||||||||||||||||||||||||||||||||||||||||||||||||||||||||||||||||||||||||||||||
| 3 | Total returns would have been lower had certain expenses not been reduced during the applicable periods. | ||||||||||||||||||||||||||||||||||||||||||||||||||||||||||||||||||||||||||||||||||
| Class I Shares Period ended | 10-31-15 | 10-31-14 | 10-31-13 | 10-31-12 | 10-31-11 | ||||||||||||||||||||||||||||||||||||||||||||||||||||||||||||||||||||||||||||||||||||||||||||||||||
| Per share operating performance | |||||||||||||||||||||||||||||||||||||||||||||||||||||||||||||||||||||||||||||||||||||||||||||||||||||||
| Net asset value, beginning of period | $25.90 | $23.19 | $17.07 | $15.93 | $15.70 | ||||||||||||||||||||||||||||||||||||||||||||||||||||||||||||||||||||||||||||||||||||||||||||||||||
| Net investment income1 | 0.35 | 0.24 | 0.25 | 0.26 | 0.16 | ||||||||||||||||||||||||||||||||||||||||||||||||||||||||||||||||||||||||||||||||||||||||||||||||||
| Net realized and unrealized gain (loss) on investments | (0.40 | ) | 2.74 | 6.11 | 1.11 | 0.15 | |||||||||||||||||||||||||||||||||||||||||||||||||||||||||||||||||||||||||||||||||||||||||||||||||
| Total from investment operations | (0.05 | ) | 2.98 | 6.36 | 1.37 | 0.31 | |||||||||||||||||||||||||||||||||||||||||||||||||||||||||||||||||||||||||||||||||||||||||||||||||
| Less distributions | |||||||||||||||||||||||||||||||||||||||||||||||||||||||||||||||||||||||||||||||||||||||||||||||||||||||
| From net investment income | (0.29 | ) | (0.27 | ) | (0.24 | ) | (0.23 | ) | (0.08 | ) | |||||||||||||||||||||||||||||||||||||||||||||||||||||||||||||||||||||||||||||||||||||||||||||
| Net asset value, end of period | $25.56 | $25.90 | $23.19 | $17.07 | $15.93 | ||||||||||||||||||||||||||||||||||||||||||||||||||||||||||||||||||||||||||||||||||||||||||||||||||
| Total return (%)2 | (0.19 | ) | 12.95 | 37.76 | 8.78 | 1.98 | |||||||||||||||||||||||||||||||||||||||||||||||||||||||||||||||||||||||||||||||||||||||||||||||||
| Ratios and supplemental data | |||||||||||||||||||||||||||||||||||||||||||||||||||||||||||||||||||||||||||||||||||||||||||||||||||||||
| Net assets, end of period (in millions) | $1,591 | $2,355 | $2,018 | $982 | $849 | ||||||||||||||||||||||||||||||||||||||||||||||||||||||||||||||||||||||||||||||||||||||||||||||||||
| Ratios (as a percentage of average net assets): | |||||||||||||||||||||||||||||||||||||||||||||||||||||||||||||||||||||||||||||||||||||||||||||||||||||||
| Expenses before reductions | 0.92 | 0.93 | 0.94 | 0.97 | 0.94 | ||||||||||||||||||||||||||||||||||||||||||||||||||||||||||||||||||||||||||||||||||||||||||||||||||
| Expenses including reductions | 0.91 | 0.92 | 0.94 | 0.96 | 0.94 | ||||||||||||||||||||||||||||||||||||||||||||||||||||||||||||||||||||||||||||||||||||||||||||||||||
| Net investment income | 1.34 | 0.97 | 1.24 | 1.55 | 0.95 | ||||||||||||||||||||||||||||||||||||||||||||||||||||||||||||||||||||||||||||||||||||||||||||||||||
| Portfolio turnover (%) | 17 | 24 | 30 | 37 | 37 | ||||||||||||||||||||||||||||||||||||||||||||||||||||||||||||||||||||||||||||||||||||||||||||||||||
| 1 | Based on average daily shares outstanding. | ||||||||||||||||||||||||||||||||||||||||||||||||||||||||||||||||||||||||||||||||||
| 2 | Total returns would have been lower had certain expenses not been reduced during the applicable periods. | ||||||||||||||||||||||||||||||||||||||||||||||||||||||||||||||||||||||||||||||||||
| Class R1 Shares Period ended | 10-31-15 | 10-31-14 | 10-31-13 | 10-31-12 | 10-31-11 | ||||||||||||||||||||||||||||||||||||||||||||||||||||||||||||||||||||||||||||||||||||||||||||||||||
| Per share operating performance | |||||||||||||||||||||||||||||||||||||||||||||||||||||||||||||||||||||||||||||||||||||||||||||||||||||||
| Net asset value, beginning of period | $25.83 | $23.13 | $17.03 | $15.87 | $15.68 | ||||||||||||||||||||||||||||||||||||||||||||||||||||||||||||||||||||||||||||||||||||||||||||||||||
| Net investment income1 | 0.17 | 0.08 | 0.13 | 0.15 | 0.04 | ||||||||||||||||||||||||||||||||||||||||||||||||||||||||||||||||||||||||||||||||||||||||||||||||||
| Net realized and unrealized gain (loss) on investments | (0.38 | ) | 2.73 | 6.10 | 1.11 | 0.15 | |||||||||||||||||||||||||||||||||||||||||||||||||||||||||||||||||||||||||||||||||||||||||||||||||
| Total from investment operations | (0.21 | ) | 2.81 | 6.23 | 1.26 | 0.19 | |||||||||||||||||||||||||||||||||||||||||||||||||||||||||||||||||||||||||||||||||||||||||||||||||
| Less distributions | |||||||||||||||||||||||||||||||||||||||||||||||||||||||||||||||||||||||||||||||||||||||||||||||||||||||
| From net investment income | (0.13 | ) | (0.11 | ) | (0.13 | ) | (0.10 | ) | — | ||||||||||||||||||||||||||||||||||||||||||||||||||||||||||||||||||||||||||||||||||||||||||||||
| Net asset value, end of period | $25.49 | $25.83 | $23.13 | $17.03 | $15.87 | ||||||||||||||||||||||||||||||||||||||||||||||||||||||||||||||||||||||||||||||||||||||||||||||||||
| Total return (%)2 | (0.82 | ) | 12.21 | 36.84 | 8.06 | 1.21 | |||||||||||||||||||||||||||||||||||||||||||||||||||||||||||||||||||||||||||||||||||||||||||||||||
| Ratios and supplemental data | |||||||||||||||||||||||||||||||||||||||||||||||||||||||||||||||||||||||||||||||||||||||||||||||||||||||
| Net assets, end of period (in millions) | $3 | $7 | $6 | $4 | $5 | ||||||||||||||||||||||||||||||||||||||||||||||||||||||||||||||||||||||||||||||||||||||||||||||||||
| Ratios (as a percentage of average net assets): | |||||||||||||||||||||||||||||||||||||||||||||||||||||||||||||||||||||||||||||||||||||||||||||||||||||||
| Expenses before reductions | 1.57 | 1.57 | 1.60 | 1.65 | 1.64 | ||||||||||||||||||||||||||||||||||||||||||||||||||||||||||||||||||||||||||||||||||||||||||||||||||
| Expenses including reductions | 1.57 | 1.57 | 1.60 | 1.65 | 1.64 | ||||||||||||||||||||||||||||||||||||||||||||||||||||||||||||||||||||||||||||||||||||||||||||||||||
| Net investment income | 0.64 | 0.32 | 0.63 | 0.88 | 0.24 | ||||||||||||||||||||||||||||||||||||||||||||||||||||||||||||||||||||||||||||||||||||||||||||||||||
| Portfolio turnover (%) | 17 | 24 | 30 | 37 | 37 | ||||||||||||||||||||||||||||||||||||||||||||||||||||||||||||||||||||||||||||||||||||||||||||||||||
| 1 | Based on average daily shares outstanding. | ||||||||||||||||||||||||||||||||||||||||||||||||||||||||||||||||||||||||||||||||||
| 2 | Total returns would have been lower had certain expenses not been reduced during the applicable periods. | ||||||||||||||||||||||||||||||||||||||||||||||||||||||||||||||||||||||||||||||||||
| Class R2 Shares Period ended | 10-31-15 | 10-31-14 | 10-31-13 | 10-31-12 | 1 | |||||||||||||||||||||||||||||||||||||||||||||||||||||||||||||||||||||||||||||||||||
| Per share operating performance | ||||||||||||||||||||||||||||||||||||||||||||||||||||||||||||||||||||||||||||||||||||||||
| Net asset value, beginning of period | $25.85 | $23.16 | $17.05 | $17.08 | ||||||||||||||||||||||||||||||||||||||||||||||||||||||||||||||||||||||||||||||||||||
| Net investment income2 | 0.26 | 0.17 | 0.18 | 0.13 | ||||||||||||||||||||||||||||||||||||||||||||||||||||||||||||||||||||||||||||||||||||
| Net realized and unrealized gain (loss) on investments | (0.41 | ) | 2.75 | 6.15 | (0.16 | ) | ||||||||||||||||||||||||||||||||||||||||||||||||||||||||||||||||||||||||||||||||||
| Total from investment operations | (0.15 | ) | 2.92 | 6.33 | (0.03 | ) | ||||||||||||||||||||||||||||||||||||||||||||||||||||||||||||||||||||||||||||||||||
| Less distributions | ||||||||||||||||||||||||||||||||||||||||||||||||||||||||||||||||||||||||||||||||||||||||
| From net investment income | (0.24 | ) | (0.23 | ) | (0.22 | ) | — | |||||||||||||||||||||||||||||||||||||||||||||||||||||||||||||||||||||||||||||||||
| Net asset value, end of period | $25.46 | $25.85 | $23.16 | $17.05 | ||||||||||||||||||||||||||||||||||||||||||||||||||||||||||||||||||||||||||||||||||||
| Total return (%)3 | (0.56 | ) | 12.70 | 37.53 | (0.18 | ) 4 | ||||||||||||||||||||||||||||||||||||||||||||||||||||||||||||||||||||||||||||||||||
| Ratios and supplemental data | ||||||||||||||||||||||||||||||||||||||||||||||||||||||||||||||||||||||||||||||||||||||||
| Net assets, end of period (in millions) | — | 5 | — | 5 | — | 5 | — | 5 | ||||||||||||||||||||||||||||||||||||||||||||||||||||||||||||||||||||||||||||||||
| Ratios (as a percentage of average net assets): | ||||||||||||||||||||||||||||||||||||||||||||||||||||||||||||||||||||||||||||||||||||||||
| Expenses before reductions | 1.26 | 1.19 | 1.13 | 1.13 | 6 | |||||||||||||||||||||||||||||||||||||||||||||||||||||||||||||||||||||||||||||||||||
| Expenses including reductions | 1.26 | 1.18 | 1.13 | 1.13 | 6 | |||||||||||||||||||||||||||||||||||||||||||||||||||||||||||||||||||||||||||||||||||
| Net investment income | 0.99 | 0.68 | 0.86 | 1.17 | 6 | |||||||||||||||||||||||||||||||||||||||||||||||||||||||||||||||||||||||||||||||||||
| Portfolio turnover (%) | 17 | 24 | 30 | 37 | 7 | |||||||||||||||||||||||||||||||||||||||||||||||||||||||||||||||||||||||||||||||||||
| 1 | The inception date for Class R2 shares is 3-1-12. | ||||||||||||||||||||||||||||||||||||||||||||||||||||||||||||||||||||||||||||||||||
| 2 | Based on average daily shares outstanding. | ||||||||||||||||||||||||||||||||||||||||||||||||||||||||||||||||||||||||||||||||||
| 3 | Total returns would have been lower had certain expenses not been reduced during the applicable periods. | ||||||||||||||||||||||||||||||||||||||||||||||||||||||||||||||||||||||||||||||||||
| 4 | Not annualized. | ||||||||||||||||||||||||||||||||||||||||||||||||||||||||||||||||||||||||||||||||||
| 5 | Less than $500,000. | ||||||||||||||||||||||||||||||||||||||||||||||||||||||||||||||||||||||||||||||||||
| 6 | Annualized. | ||||||||||||||||||||||||||||||||||||||||||||||||||||||||||||||||||||||||||||||||||
| 7 | The portfolio turnover is shown for the period from 11-1-11 to 10-31-12. | ||||||||||||||||||||||||||||||||||||||||||||||||||||||||||||||||||||||||||||||||||
| Class R3 Shares Period ended | 10-31-15 | 10-31-14 | 10-31-13 | 10-31-12 | 10-31-11 | ||||||||||||||||||||||||||||||||||||||||||||||||||||||||||||||||||||||||||||||||||||||||||||||||||
| Per share operating performance | |||||||||||||||||||||||||||||||||||||||||||||||||||||||||||||||||||||||||||||||||||||||||||||||||||||||
| Net asset value, beginning of period | $25.75 | $23.08 | $17.00 | $15.84 | $15.62 | ||||||||||||||||||||||||||||||||||||||||||||||||||||||||||||||||||||||||||||||||||||||||||||||||||
| Net investment income1 | 0.20 | 0.09 | 0.14 | 0.17 | 0.07 | ||||||||||||||||||||||||||||||||||||||||||||||||||||||||||||||||||||||||||||||||||||||||||||||||||
| Net realized and unrealized gain (loss) on investments | (0.39 | ) | 2.74 | 6.10 | 1.12 | 0.15 | |||||||||||||||||||||||||||||||||||||||||||||||||||||||||||||||||||||||||||||||||||||||||||||||||
| Total from investment operations | (0.19 | ) | 2.83 | 6.24 | 1.29 | 0.22 | |||||||||||||||||||||||||||||||||||||||||||||||||||||||||||||||||||||||||||||||||||||||||||||||||
| Less distributions | |||||||||||||||||||||||||||||||||||||||||||||||||||||||||||||||||||||||||||||||||||||||||||||||||||||||
| From net investment income | (0.15 | ) | (0.16 | ) | (0.16 | ) | (0.13 | ) | — | ||||||||||||||||||||||||||||||||||||||||||||||||||||||||||||||||||||||||||||||||||||||||||||||
| Net asset value, end of period | $25.41 | $25.75 | $23.08 | $17.00 | $15.84 | ||||||||||||||||||||||||||||||||||||||||||||||||||||||||||||||||||||||||||||||||||||||||||||||||||
| Total return (%)2 | (0.73 | ) | 12.34 | 37.01 | 8.28 | 1.41 | |||||||||||||||||||||||||||||||||||||||||||||||||||||||||||||||||||||||||||||||||||||||||||||||||
| Ratios and supplemental data | |||||||||||||||||||||||||||||||||||||||||||||||||||||||||||||||||||||||||||||||||||||||||||||||||||||||
| Net assets, end of period (in millions) | $1 | $1 | — | 3 | — | 3 | — | 3 | |||||||||||||||||||||||||||||||||||||||||||||||||||||||||||||||||||||||||||||||||||||||||||||||
| Ratios (as a percentage of average net assets): | |||||||||||||||||||||||||||||||||||||||||||||||||||||||||||||||||||||||||||||||||||||||||||||||||||||||
| Expenses before reductions | 1.48 | 1.47 | 1.42 | 1.48 | 1.48 | ||||||||||||||||||||||||||||||||||||||||||||||||||||||||||||||||||||||||||||||||||||||||||||||||||
| Expenses including reductions | 1.47 | 1.47 | 1.41 | 1.48 | 1.48 | ||||||||||||||||||||||||||||||||||||||||||||||||||||||||||||||||||||||||||||||||||||||||||||||||||
| Net investment income | 0.78 | 0.37 | 0.65 | 1.01 | 0.44 | ||||||||||||||||||||||||||||||||||||||||||||||||||||||||||||||||||||||||||||||||||||||||||||||||||
| Portfolio turnover (%) | 17 | 24 | 30 | 37 | 37 | ||||||||||||||||||||||||||||||||||||||||||||||||||||||||||||||||||||||||||||||||||||||||||||||||||
| 1 | Based on average daily shares outstanding. | ||||||||||||||||||||||||||||||||||||||||||||||||||||||||||||||||||||||||||||||||||
| 2 | Total returns would have been lower had certain expenses not been reduced during the applicable periods. | ||||||||||||||||||||||||||||||||||||||||||||||||||||||||||||||||||||||||||||||||||
| 3 | Less than $500,000. | ||||||||||||||||||||||||||||||||||||||||||||||||||||||||||||||||||||||||||||||||||
| Class R4 Shares Period ended | 10-31-15 | 10-31-14 | 10-31-13 | 10-31-12 | 10-31-11 | ||||||||||||||||||||||||||||||||||||||||||||||||||||||||||||||||||||||||||||||||||||||||||||||||||
| Per share operating performance | |||||||||||||||||||||||||||||||||||||||||||||||||||||||||||||||||||||||||||||||||||||||||||||||||||||||
| Net asset value, beginning of period | $25.90 | $23.19 | $17.07 | $15.90 | $15.64 | ||||||||||||||||||||||||||||||||||||||||||||||||||||||||||||||||||||||||||||||||||||||||||||||||||
| Net investment income1 | 0.34 | 0.23 | 0.25 | 0.23 | 0.13 | ||||||||||||||||||||||||||||||||||||||||||||||||||||||||||||||||||||||||||||||||||||||||||||||||||
| Net realized and unrealized gain (loss) on investments | (0.41 | ) | 2.74 | 6.10 | 1.13 | 0.15 | |||||||||||||||||||||||||||||||||||||||||||||||||||||||||||||||||||||||||||||||||||||||||||||||||
| Total from investment operations | (0.07 | ) | 2.97 | 6.35 | 1.36 | 0.28 | |||||||||||||||||||||||||||||||||||||||||||||||||||||||||||||||||||||||||||||||||||||||||||||||||
| Less distributions | |||||||||||||||||||||||||||||||||||||||||||||||||||||||||||||||||||||||||||||||||||||||||||||||||||||||
| From net investment income | (0.28 | ) | (0.26 | ) | (0.23 | ) | (0.19 | ) | (0.02 | ) | |||||||||||||||||||||||||||||||||||||||||||||||||||||||||||||||||||||||||||||||||||||||||||||
| Net asset value, end of period | $25.55 | $25.90 | $23.19 | $17.07 | $15.90 | ||||||||||||||||||||||||||||||||||||||||||||||||||||||||||||||||||||||||||||||||||||||||||||||||||
| Total return (%)2 | (0.24 | ) | 12.92 | 37.66 | 8.69 | 1.77 | |||||||||||||||||||||||||||||||||||||||||||||||||||||||||||||||||||||||||||||||||||||||||||||||||
| Ratios and supplemental data | |||||||||||||||||||||||||||||||||||||||||||||||||||||||||||||||||||||||||||||||||||||||||||||||||||||||
| Net assets, end of period (in millions) | — | 3 | — | 3 | — | 3 | — | 3 | — | 3 | |||||||||||||||||||||||||||||||||||||||||||||||||||||||||||||||||||||||||||||||||||||||||||||
| Ratios (as a percentage of average net assets): | |||||||||||||||||||||||||||||||||||||||||||||||||||||||||||||||||||||||||||||||||||||||||||||||||||||||
| Expenses before reductions | 1.08 | 1.07 | 1.10 | 1.13 | 1.15 | ||||||||||||||||||||||||||||||||||||||||||||||||||||||||||||||||||||||||||||||||||||||||||||||||||
| Expenses including reductions | 0.97 | 0.96 | 1.00 | 1.09 | 1.15 | ||||||||||||||||||||||||||||||||||||||||||||||||||||||||||||||||||||||||||||||||||||||||||||||||||
| Net investment income | 1.28 | 0.93 | 1.23 | 1.41 | 0.76 | ||||||||||||||||||||||||||||||||||||||||||||||||||||||||||||||||||||||||||||||||||||||||||||||||||
| Portfolio turnover (%) | 17 | 24 | 30 | 37 | 37 | ||||||||||||||||||||||||||||||||||||||||||||||||||||||||||||||||||||||||||||||||||||||||||||||||||
| 1 | Based on average daily shares outstanding. | ||||||||||||||||||||||||||||||||||||||||||||||||||||||||||||||||||||||||||||||||||
| 2 | Total returns would have been lower had certain expenses not been reduced during the applicable periods. | ||||||||||||||||||||||||||||||||||||||||||||||||||||||||||||||||||||||||||||||||||
| 3 | Less than $500,000. | ||||||||||||||||||||||||||||||||||||||||||||||||||||||||||||||||||||||||||||||||||
| Class R5 Shares Period ended | 10-31-15 | 10-31-14 | 10-31-13 | 10-31-12 | 10-31-11 | ||||||||||||||||||||||||||||||||||||||||||||||||||||||||||||||||||||||||||||||||||||||||||||||||||
| Per share operating performance | |||||||||||||||||||||||||||||||||||||||||||||||||||||||||||||||||||||||||||||||||||||||||||||||||||||||
| Net asset value, beginning of period | $25.92 | $23.22 | $17.09 | $15.94 | $15.67 | ||||||||||||||||||||||||||||||||||||||||||||||||||||||||||||||||||||||||||||||||||||||||||||||||||
| Net investment income1 | 0.37 | 0.25 | 0.28 | 0.27 | 0.17 | ||||||||||||||||||||||||||||||||||||||||||||||||||||||||||||||||||||||||||||||||||||||||||||||||||
| Net realized and unrealized gain (loss) on investments | (0.40 | ) | 2.74 | 6.11 | 1.11 | 0.15 | |||||||||||||||||||||||||||||||||||||||||||||||||||||||||||||||||||||||||||||||||||||||||||||||||
| Total from investment operations | (0.03 | ) | 2.99 | 6.39 | 1.38 | 0.32 | |||||||||||||||||||||||||||||||||||||||||||||||||||||||||||||||||||||||||||||||||||||||||||||||||
| Less distributions | |||||||||||||||||||||||||||||||||||||||||||||||||||||||||||||||||||||||||||||||||||||||||||||||||||||||
| From net investment income | (0.32 | ) | (0.29 | ) | (0.26 | ) | (0.23 | ) | (0.05 | ) | |||||||||||||||||||||||||||||||||||||||||||||||||||||||||||||||||||||||||||||||||||||||||||||
| Net asset value, end of period | $25.57 | $25.92 | $23.22 | $17.09 | $15.94 | ||||||||||||||||||||||||||||||||||||||||||||||||||||||||||||||||||||||||||||||||||||||||||||||||||
| Total return (%)2 | (0.11 | ) | 13.02 | 37.87 | 8.85 | 2.07 | |||||||||||||||||||||||||||||||||||||||||||||||||||||||||||||||||||||||||||||||||||||||||||||||||
| Ratios and supplemental data | |||||||||||||||||||||||||||||||||||||||||||||||||||||||||||||||||||||||||||||||||||||||||||||||||||||||
| Net assets, end of period (in millions) | — | 3 | — | 3 | — | 3 | — | 3 | — | 3 | |||||||||||||||||||||||||||||||||||||||||||||||||||||||||||||||||||||||||||||||||||||||||||||
| Ratios (as a percentage of average net assets): | |||||||||||||||||||||||||||||||||||||||||||||||||||||||||||||||||||||||||||||||||||||||||||||||||||||||
| Expenses before reductions | 0.85 | 0.84 | 0.85 | 0.90 | 0.90 | ||||||||||||||||||||||||||||||||||||||||||||||||||||||||||||||||||||||||||||||||||||||||||||||||||
| Expenses including reductions | 0.84 | 0.83 | 0.85 | 0.90 | 0.90 | ||||||||||||||||||||||||||||||||||||||||||||||||||||||||||||||||||||||||||||||||||||||||||||||||||
| Net investment income | 1.40 | 1.03 | 1.37 | 1.62 | 1.02 | ||||||||||||||||||||||||||||||||||||||||||||||||||||||||||||||||||||||||||||||||||||||||||||||||||
| Portfolio turnover (%) | 17 | 24 | 30 | 37 | 37 | ||||||||||||||||||||||||||||||||||||||||||||||||||||||||||||||||||||||||||||||||||||||||||||||||||
| 1 | Based on average daily shares outstanding. | ||||||||||||||||||||||||||||||||||||||||||||||||||||||||||||||||||||||||||||||||||
| 2 | Total returns would have been lower had certain expenses not been reduced during the applicable periods. | ||||||||||||||||||||||||||||||||||||||||||||||||||||||||||||||||||||||||||||||||||
| 3 | Less than $500,000. | ||||||||||||||||||||||||||||||||||||||||||||||||||||||||||||||||||||||||||||||||||
| Class R6 Shares Period ended | 10-31-15 | 10-31-14 | 10-31-13 | 10-31-12 | 10-31-11 | 1 | |||||||||||||||||||||||||||||||||||||||||||||||||||||||||||||||||||||||||||||||||||||||||||||||||
| Per share operating performance | |||||||||||||||||||||||||||||||||||||||||||||||||||||||||||||||||||||||||||||||||||||||||||||||||||||||
| Net asset value, beginning of period | $25.94 | $23.21 | $17.09 | $15.93 | $15.38 | ||||||||||||||||||||||||||||||||||||||||||||||||||||||||||||||||||||||||||||||||||||||||||||||||||
| Net investment income2 | 0.39 | 0.27 | 0.24 | 0.27 | 0.02 | ||||||||||||||||||||||||||||||||||||||||||||||||||||||||||||||||||||||||||||||||||||||||||||||||||
| Net realized and unrealized gain (loss) on investments | (0.42 | ) | 2.74 | 6.13 | 1.12 | 0.53 | |||||||||||||||||||||||||||||||||||||||||||||||||||||||||||||||||||||||||||||||||||||||||||||||||
| Total from investment operations | (0.03 | ) | 3.01 | 6.37 | 1.39 | 0.55 | |||||||||||||||||||||||||||||||||||||||||||||||||||||||||||||||||||||||||||||||||||||||||||||||||
| Less distributions | |||||||||||||||||||||||||||||||||||||||||||||||||||||||||||||||||||||||||||||||||||||||||||||||||||||||
| From net investment income | (0.32 | ) | (0.28 | ) | (0.25 | ) | (0.23 | ) | — | ||||||||||||||||||||||||||||||||||||||||||||||||||||||||||||||||||||||||||||||||||||||||||||||
| Net asset value, end of period | $25.59 | $25.94 | $23.21 | $17.09 | $15.93 | ||||||||||||||||||||||||||||||||||||||||||||||||||||||||||||||||||||||||||||||||||||||||||||||||||
| Total return (%)3 | (0.09 | ) | 13.11 | 37.80 | 8.93 | 3.58 | 4 | ||||||||||||||||||||||||||||||||||||||||||||||||||||||||||||||||||||||||||||||||||||||||||||||||
| Ratios and supplemental data | |||||||||||||||||||||||||||||||||||||||||||||||||||||||||||||||||||||||||||||||||||||||||||||||||||||||
| Net assets, end of period (in millions) | $1 | $1 | $1 | — | 5 | — | 5 | ||||||||||||||||||||||||||||||||||||||||||||||||||||||||||||||||||||||||||||||||||||||||||||||||
| Ratios (as a percentage of average net assets): | |||||||||||||||||||||||||||||||||||||||||||||||||||||||||||||||||||||||||||||||||||||||||||||||||||||||
| Expenses before reductions | 0.83 | 0.83 | 0.85 | 0.89 | 0.87 | 6 | |||||||||||||||||||||||||||||||||||||||||||||||||||||||||||||||||||||||||||||||||||||||||||||||||
| Expenses including reductions | 0.81 | 0.80 | 0.85 | 0.89 | 0.87 | 6 | |||||||||||||||||||||||||||||||||||||||||||||||||||||||||||||||||||||||||||||||||||||||||||||||||
| Net investment income | 1.51 | 1.08 | 1.13 | 1.61 | 0.90 | 6 | |||||||||||||||||||||||||||||||||||||||||||||||||||||||||||||||||||||||||||||||||||||||||||||||||
| Portfolio turnover (%) | 17 | 24 | 30 | 37 | 37 | 7 | |||||||||||||||||||||||||||||||||||||||||||||||||||||||||||||||||||||||||||||||||||||||||||||||||
| 1 | The inception date for Class R6 shares is 9-1-11. | ||||||||||||||||||||||||||||||||||||||||||||||||||||||||||||||||||||||||||||||||||
| 2 | Based on average daily shares outstanding. | ||||||||||||||||||||||||||||||||||||||||||||||||||||||||||||||||||||||||||||||||||
| 3 | Total returns would have been lower had certain expenses not been reduced during the applicable periods. | ||||||||||||||||||||||||||||||||||||||||||||||||||||||||||||||||||||||||||||||||||
| 4 | Not annualized. | ||||||||||||||||||||||||||||||||||||||||||||||||||||||||||||||||||||||||||||||||||
| 5 | Less than $500,000. | ||||||||||||||||||||||||||||||||||||||||||||||||||||||||||||||||||||||||||||||||||
| 6 | Annualized. | ||||||||||||||||||||||||||||||||||||||||||||||||||||||||||||||||||||||||||||||||||
| 7 | The portfolio turnover is shown for the period from 11-1-10 to 10-31-11. | ||||||||||||||||||||||||||||||||||||||||||||||||||||||||||||||||||||||||||||||||||
Note 1 — Organization
John Hancock Classic Value Fund (the fund) is a series of John Hancock Capital Series (the Trust), an open-end management investment company organized as a Massachusetts business trust and registered under the Investment Company Act of 1940, as amended (the 1940 Act). The investment objective of the fund is to seek long-term growth of capital.
The fund may offer multiple classes of shares. The shares currently offered are detailed in the Statement of assets and liabilities. Class A and Class C shares are offered to all investors. Class B shares are closed to new investors. Class I shares are offered to institutions and certain investors. Class R1, Class R2, Class R3, Class R4, and Class R5 shares are available only to certain retirement plans. Class R6 shares are available only to certain retirement plans, institutions and other investors. Shareholders of each class have exclusive voting rights to matters that affect that class. The distribution and service fees, if any, and transfer agent fees for each class may differ. Class B shares convert to Class A shares eight years after purchase.
Note 2 — Significant accounting policies
The financial statements have been prepared in conformity with accounting principles generally accepted in the United States of America (US GAAP), which require management to make certain estimates and assumptions as of the date of the financial statements. Actual results could differ from those estimates and those differences could be significant. The fund qualifies as an investment company under Topic 946 of Accounting Standards Codification of US GAAP.
Events or transactions occurring after the end of the fiscal period through the date that the financial statements were issued have been evaluated in the preparation of the financial statements. The following summarizes the significant accounting policies of the fund:
Security valuation. Investments are stated at value as of the close of regular trading on the New York Stock Exchange (NYSE), normally at 4:00 p.m., Eastern Time. In order to value the securities, the fund uses the following valuation techniques: Equity securities held by the fund are valued at the last sale price or official closing price on the exchange where the security was acquired or most likely will be sold. In the event there were no sales during the day or closing prices are not available, the securities are valued using the last available bid price. Investments by the fund in open-end mutual funds, including John Hancock Collateral Trust (JHCT), are valued at their respective net asset values each business day. Foreign securities and currencies are valued in U.S. dollars, based on foreign currency exchange rates supplied by an independent pricing vendor. Securities that trade only in the over-the-counter (OTC) market are valued using bid prices. Other portfolio securities and assets, for which reliable market quotations are not readily available, are valued at fair value as determined in good faith by the fund's Pricing Committee following procedures established by the Board of Trustees. The frequency with which these fair valuation procedures are used cannot be predicted and fair value securities may differ significantly from the value that would have been used had a ready market for such securities existed.
The fund uses a three-tier hierarchy to prioritize the pricing assumptions, referred to as inputs, used in valuation techniques to measure fair value. Level 1 includes securities valued using quoted prices in active markets for identical securities. Level 2 includes securities valued using other significant observable inputs. Observable inputs may include quoted prices for similar securities, interest rates, prepayment speeds and credit risk. Prices for securities valued using these inputs are received from independent pricing vendors and brokers and are based on an evaluation of the inputs described. Level 3 includes securities valued using significant unobservable inputs when market prices are not readily available or reliable, including the fund's own assumptions in determining the fair value of investments. Factors used in determining value may include market or issuer specific events or trends, changes in interest rates and credit quality. The inputs or methodology used for valuing securities are not necessarily an indication of the risks associated with investing in those securities. Changes in valuation techniques and related inputs may result in transfers into or out of an assigned level within the disclosure hierarchy.
As of October 31, 2015, all investments are categorized as Level 1 under the hierarchy described above, except repurchase agreements, which are categorized as Level 2.
Repurchase agreements. The fund may enter into repurchase agreements. When the fund enters into a repurchase agreement, it receives collateral that is held in a segregated account by the fund's custodian. The collateral amount is marked-to-market and monitored on a daily basis to ensure that the collateral held is in an amount not less than the principal
29
amount of the repurchase agreement plus any accrued interest. Collateral received by the fund for repurchase agreements is disclosed in the Fund's investments as part of the caption related to the repurchase agreement.
Repurchase agreements are typically governed by the terms and conditions of the Master Repurchase Agreement and/or Global Master Repurchase Agreement (collectively, MRA). Upon an event of default, the non-defaulting party may close out all transactions traded under the MRA and net amounts owed. Absent an event of default, assets and liabilities resulting from repurchase agreements are not offset in the Statement of assets and liabilities. In the event of a default by the counterparty, realization of the collateral proceeds could be delayed, during which time the collateral value may decline or the counterparty may have insufficient assets to pay back claims resulting from close-out of the transactions.
Security transactions and related investment income. Investment security transactions are accounted for on a trade date plus one basis for daily net asset value calculations. However, for financial reporting purposes, investment transactions are reported on trade date. Interest income is accrued as earned. Dividend income is recorded on the ex-date, except for dividends of foreign securities where the dividend may not be known until after the ex-date. In those cases, dividend income, net of withholding taxes, is recorded when the fund becomes aware of the dividends. Foreign taxes are provided for based on the fund's understanding of the tax rules and rates that exist in the foreign markets in which it invests. Gains and losses on securities sold are determined on the basis of identified cost and may include proceeds from litigation.
Securities lending. The fund may lend its securities to earn additional income. The fund receives cash collateral from the borrower in an amount not less than the market value of the loaned securities. The fund will invest its collateral in JHCT, an affiliate of the fund, which has a floating net asset value and is registered with the Securities and Exchange Commission as an investment company. JHCT invests cash received as collateral as part of the securities lending program in short-term money market investments. The fund will receive the benefit of any gains and bear any losses generated by JHCT with respect to the cash collateral.
The fund has the right to recall loaned securities on demand. If a borrower fails to return loaned securities when due, then the lending agent is responsible and indemnifies the fund for the lent securities. The lending agent uses the collateral received from the borrower to purchase replacement securities of the same issue, type, class and series of the loaned securities. If the value of the collateral is less than the purchase cost of replacement securities, the lending agent is responsible for satisfying the shortfall but only to the extent that the shortfall is not due to any decrease in the value of JHCT.
Although the risk of the loss of the securities lent is mitigated by receiving collateral from the borrower and through lending agent indemnification, the fund could experience a delay in recovering securities or could experience a lower than expected return if the borrower fails to return the securities on a timely basis. The fund may receive compensation for lending its securities by retaining a portion of the return on the investment of the collateral and compensation from fees earned from borrowers of the securities.Net income received from JHCT is a component of securities lending income as recorded on the Statement of operations.
Obligations to repay collateral received by the fund are shown on the Statement of assets and liabilities as Payable upon return of securities loaned and are secured by the loaned securities. As of October 31, 2015, the fund loaned common stocks valued at $13,121,653 and received $13,429,550 of cash collateral.
Foreign taxes. The fund may be subject to withholding tax on income and/or capital gains or repatriation taxes imposed by certain countries in which the fund invests. Taxes are accrued based upon investment income, realized gains or unrealized appreciation.
Line of credit. The fund may borrow from banks for temporary or emergency purposes, including meeting redemption requests that otherwise might require the untimely sale of securities. Pursuant to the fund's custodian agreement, the custodian may loan money to funds to make properly authorized payments. The fund is obligated to repay the custodian for any overdraft, including any related costs or expenses. The custodian may have a lien, security interest or security entitlement in any fund property that is not otherwise segregated or pledged, to the extent of any overdraft, and to the maximum extent permitted by law.
30
The fund and other affiliated funds have entered into a syndicated line of credit agreement, with Citibank, N.A. (Citibank) as administrative agent, that enables them to participate in a $750 million unsecured committed line of credit. Prior to June 30, 2015, the fund and other affiliated funds had an agreement with Citibank that enabled them to participate in a $300 million unsecured committed line of credit. A commitment fee, payable at the end of each calendar quarter, based on the average daily unused portion of the effective line of credit, is charged to each participating fund on a pro rata basis and is reflected in other expenses on the Statement of operations. Commitment fees for the year ended October 31, 2015 were $2,899. For the year ended October 31, 2015, the fund had no borrowings under either line of credit.
Expenses. Within the John Hancock group of funds complex, expenses that are directly attributable to an individual fund are allocated to such fund. Expenses that are not readily attributable to a specific fund are allocated among all funds in an equitable manner, taking into consideration, among other things, the nature and type of expense and the fund's relative net assets. Expense estimates are accrued in the period to which they relate and adjustments are made when actual amounts are known.
Class allocations. Income, common expenses and realized and unrealized gains (losses) are determined at the fund level and allocated daily to each class of shares based on the net assets of the class. Class-specific expenses, such as distribution and service fees, if any, and transfer agent fees, are calculated daily for each class, based on the net asset value of the class and the applicable specific expense rates.
Federal income taxes. The fund intends to continue to qualify as a regulated investment company by complying with the applicable provisions of the Internal Revenue Code and will not be subject to federal income tax on taxable income that is distributed to shareholders. Therefore, no federal income tax provision is required.
Under the Regulated Investment Company Modernization Act of 2010, the fund is permitted to carry forward capital losses incurred in taxable years beginning after December 22, 2010 for an unlimited period. Any losses incurred during those taxable years will be required to be utilized prior to the losses incurred in pre-enactment taxable years. As a result of this ordering rule, pre-enactment capital loss carryforwards may be more likely to expire unused. Additionally, post-enactment capital losses that are carried forward will retain their character as either short-term or long-term capital losses rather than being considered all short-term as under previous law.
For federal income tax purposes, as of October 31, 2015, the fund has a capital loss carryforward of $1,577,956,848 available to offset future net realized capital gains. This carryforward expires as follows: October 31, 2016 -- $98,745,186 and October 31, 2017 -- $1,479,211,662.
As of October 31, 2015, the fund had no uncertain tax positions that would require financial statement recognition, derecognition or disclosure. The fund's federal tax returns are subject to examination by the Internal Revenue Service for a period of three years.
Distribution of income and gains. Distributions to shareholders from net investment income and net realized gains, if any, are recorded on the ex-date. The fund generally declares and pays dividends and capital gain distributions, if any, annually.
The tax character of distributions for the years ended October 31, 2015 and 2014 was as follows:
| October 31, 2015 | October 31, 2014 | |
| Ordinary Income | $26,359,614 | $28,155,206 |
Distributions paid by the fund with respect to each class of shares are calculated in the same manner, at the same time and in the same amount, except for the effect of class level expenses that may be applied differently to each class. As of October 31, 2015, the components of distributable earnings on a tax basis consisted of $23,839,553 of undistributed ordinary income.
Such distributions and distributable earnings, on a tax basis, are determined in conformity with income tax regulations, which may differ from US GAAP. Distributions in excess of tax basis earnings and profits, if any, are reported in the fund's financial statements as a return of capital.
31
Capital accounts within the financial statements are adjusted for permanent book-tax differences. These adjustments have no impact on net assets or the results of operations. Temporary book-tax differences, if any, will reverse in a subsequent period. Book-tax differences are primarily attributable to wash sale loss deferrals.
Note 3 — Guarantees and indemnifications
Under the Trust's organizational documents, its Officers and Trustees are indemnified against certain liabilities arising out of the performance of their duties to Trust, including the fund. Additionally, in the normal course of business, the fund enters into contracts with service providers that contain general indemnification clauses. The fund's maximum exposure under these arrangements is unknown, as this would involve future claims that may be made against the fund that have not yet occurred. The risk of material loss from such claims is considered remote.
Note 4 — Fees and transactions with affiliates
John Hancock Advisers, LLC (the Advisor) serves as investment advisor for the fund. John Hancock Funds, LLC (the Distributor), an affiliate of the Advisor, serves as principal underwriter of the fund. The Advisor and the Distributor are indirect, wholly owned subsidiaries of Manulife Financial Corporation (MFC).
Management fee. The fund has an investment management agreement with the Advisor under which the fund pays a monthly management fee to the Advisor, equivalent on an annual basis to the sum of: (a) 0.750% of the first $2.5 billion of the fund's average daily net assets; (b) 0.740% of the next $2.5 billion of the fund's average daily net assets; and (c) 0.730% of the fund's average daily net assets in excess of $5 billion. The Advisor has a subadvisory agreement with Pzena Investment Management, LLC. The fund is not responsible for payment of the subadvisory fees.
The Advisor has contractually agreed to waive a portion of its management fee and/or reimburse expenses for certain funds of the John Hancock funds complex, including the fund (the participating portfolios). This waiver is based upon aggregate net assets of all the participating portfolios. The amount of the reimbursement is calculated daily and allocated among all the participating portfolios in proportion to the daily net assets of each fund. During the year ended October 31, 2015, this waiver amounted to 0.01% of the fund's average net assets. This arrangement may be amended or terminated at any time by the Advisor upon notice to the fund and with the approval of the Board of Trustees.
The Advisor has contractually agreed to waive and/or reimburse all class specific expenses for Class R6 shares of the fund to the extent they exceed 0.00% of average annual net assets, on an annualized basis. The fee waiver and/or reimbursement will continue in effect until February 29, 2016, unless renewed by mutual agreement of the fund and Advisor based upon a determination of that this is appropriate under the circumstances at the time.
Prior to March 1, 2015, the Advisor had contractually agreed to waive and/or reimburse all class specific expenses for Class B shares of the fund, including Rule 12b-1 fees and transfer agency fees and service fees, as applicable, to the extent they exceeded 1.30% of average annual net assets attributable to Class B shares.
For the year ended October 31, 2015, these expense reductions described above amounted to the following:
| Class | Expense reduction | Class | Expense reduction | |
| Class A | $28,602 | Class R3 | $89 | |
| Class B | 749 | Class R4 | 4 | |
| Class C | 7,358 | Class R5 | 8 | |
| Class I | 146,466 | Class R6 | 222 | |
| Class R1 | 401 | Total | $183,931 | |
| Class R2 | 32 |
The investment management fees, including the impact of the waivers and reimbursements as described above, incurred for the year ended October 31, 2015 were equivalent to a net annual effective rate of 0.74% of the fund's average daily net assets.
32
Accounting and legal services. Pursuant to the Accounting and Legal Services Agreement, the fund reimburses the Advisor for all expenses associated with providing the administrative, financial, legal, accounting and recordkeeping services to the fund, including the preparation of all tax returns, periodic reports to shareholders and regulatory reports, among other services. These expenses are allocated to each share class based on its relative net assets at the time the expense was incurred. These accounting and legal services fees incurred for the year ended October 31, 2015 amounted to an annual rate of 0.02% of the fund's average daily net assets.
Distribution and service plans. The fund has a distribution agreement with the Distributor. The fund has adopted distribution and service plans with respect to Class A, Class B, Class C, Class R1, Class R2, Class R3 and Class R4 shares pursuant to Rule 12b-1 under the 1940 Act, to pay the Distributor for services provided as the distributor of shares of the fund. In addition, under a service plan for Class R1, Class R2, Class R3, Class R4 and Class R5 shares, the fund pays for certain other services. The fund may pay up to the following contractual rates of distribution and service fees under these arrangements, expressed as an annual percentage of average daily net assets for each class of the fund's shares:
| Class | Rule 12b-1 fee | Service fee | Class | Rule 12b-1 fee | Service fee | |
| Class A | 0.25% | — | Class R2 | 0.25% | 0.25% | |
| Class B | 1.00% | — | Class R3 | 0.50% | 0.15% | |
| Class C | 1.00% | — | Class R4 | 0.25% | 0.10% | |
| Class R1 | 0.50% | 0.25% | Class R5 | — | 0.05% |
The fund's Distributor has contractually agreed to waive 0.10% of Rule 12b-1 fees for Class R4 shares. The current waiver agreement expires on February 29, 2016, unless renewed by mutual agreement of the fund and the Distributor based upon a determination that this is appropriate under the circumstances at the time. The contractual waiver amounted to $58 for Class R4 shares for the year ended October 31, 2015.
Sales charges. Class A shares are assessed up-front sales charges, which resulted in payments to the Distributor amounting to $613,566 for the year ended October 31, 2015. Of this amount, $102,750 was retained and used for printing prospectuses, advertising, sales literature and other purposes, $502,547 was paid as sales commissions to broker-dealers and $8,269 was paid as sales commissions to sales personnel of Signator Investors, Inc., a broker-dealer affiliate of the Advisor.
Class A, Class B and Class C shares may be subject to contingent deferred sales charges (CDSCs). Certain Class A shares that are acquired through purchases of $1 million or more and are redeemed within one year of purchase are subject to a 1.00% sales charge. Class B shares that are redeemed within six years of purchase are subject to CDSCs, at declining rates, beginning at 5.00%. Class C shares that are redeemed within one year of purchase are subject to a 1.00% CDSC. CDSCs are applied to the lesser of the current market value at the time of redemption or the original purchase cost of the shares being redeemed. Proceeds from CDSCs are used to compensate the Distributor for providing distribution-related services in connection with the sale of these shares. During the year ended October 31, 2015, CDSCs received by the Distributor amounted to $1,334, $7,432, and $8,418 for Class A, Class B, and Class C shares, respectively.
Transfer agent fees. The fund has a transfer agent agreement with John Hancock Signature Services, Inc. (Signature Services), an affiliate of the Advisor. The transfer agent fees paid to Signature Services are determined based on the cost to Signature Services (Signature Services Cost) of providing recordkeeping services. It also includes out-of-pocket expenses, including payments made to third-parties for recordkeeping services provided to their clients who invest in one or more John Hancock funds. In addition, Signature Services Cost may be reduced by certain fees that Signature Services receives in connection with retirement and small accounts. Signature Services Cost is calculated monthly and allocated, as applicable, to five categories of share classes: Retail Share and Institutional Share Classes of Non-Municipal Bond Funds, Class R6 Shares, Retirement Share Classes and Municipal Bond Share Classes. Within each of these categories, the applicable costs are allocated to the affected John Hancock affiliated funds and/or classes, based on the relative average daily net assets.
33
Class level expenses. Class level expenses for the year ended October 31, 2015 were:
| Class | Distribution and service fees | Transfer agent fees |
| Class A | $934,732 | $460,283 |
| Class B | 98,005 | 12,012 |
| Class C | 961,858 | 118,316 |
| Class I | — | 2,107,242 |
| Class R1 | 39,351 | 776 |
| Class R2 | 1,803 | 62 |
| Class R3 | 7,628 | 175 |
| Class R4 | 146 | 9 |
| Class R5 | 27 | 16 |
| Class R6 | — | 148 |
| Total | $2,043,550 | $2,699,039 |
Trustee expenses. The fund compensates each Trustee who is not an employee of the Advisor or its affiliates. The costs of paying Trustee compensation and expenses are allocated to each fund based on its net assets relative to other funds within the John Hancock group of funds complex.
Interfund lending program. Pursuant to an Exemptive Order issued by the SEC, the fund, along with certain other funds advised by the Advisor, may participate in an interfund lending program. This program provides an alternative credit facility allowing the funds to borrow from, or lend money to, other participating affiliated funds. At period end, no interfund loans were outstanding. Interest expense is included in Other expenses on the Statement of operations. The fund's activity in this program during the period for which loans were outstanding was as follows:
| Borrower or lender | Weighted average loan balance | Days outstanding | Weighted average interest rate | Interest income (expense) |
| Borrower | $67,048,964 | 16 | 0.46% | ($13,808) |
| Lender | $13,461,976 | 1 | 0.46% | $172 |
Note 5 — Fund share transactions
Transactions in fund shares for the years ended October 31, 2015 and 2014 were as follows:
| Year ended 10-31-15 | Year ended 10-31-14 | |||||||||||||||||||||||||
| Shares | Amount | Shares | Amount | |||||||||||||||||||||||
| Class A shares | ||||||||||||||||||||||||||
| Sold | 1,328,335 | $34,572,241 | 2,393,476 | $58,359,607 | ||||||||||||||||||||||
| Distributions reinvested | 118,808 | 2,999,916 | 166,923 | 3,917,695 | ||||||||||||||||||||||
| Repurchased | (2,565,981 | ) | (66,932,678 | ) | (8,252,020 | ) | (209,538,636 | ) | ||||||||||||||||||
| Net decrease | (1,118,838 | ) | ($29,360,521 | ) | (5,691,621 | ) | ($147,261,334 | ) | ||||||||||||||||||
| Class B shares | ||||||||||||||||||||||||||
| Sold | 20,709 | $535,917 | 52,852 | $1,296,475 | ||||||||||||||||||||||
| Distributions reinvested | 477 | 11,910 | 732 | 16,985 | ||||||||||||||||||||||
| Repurchased | (157,679 | ) | (4,029,206 | ) | (395,219 | ) | (9,464,994 | ) | ||||||||||||||||||
| Net decrease | (136,493 | ) | ($3,481,379 | ) | (341,635 | ) | ($8,151,534 | ) | ||||||||||||||||||
34
| Year ended 10-31-15 | Year ended 10-31-14 | |||||||||||||||||||||||||
| Shares | Amount | Shares | Amount | |||||||||||||||||||||||
| Class C shares | ||||||||||||||||||||||||||
| Sold | 222,588 | $5,732,134 | 545,108 | $13,266,782 | ||||||||||||||||||||||
| Distributions reinvested | 3,870 | 96,595 | 3,925 | 91,077 | ||||||||||||||||||||||
| Repurchased | (701,053 | ) | (18,058,092 | ) | (728,241 | ) | (17,751,252 | ) | ||||||||||||||||||
| Net decrease | (474,595 | ) | ($12,229,363 | ) | (179,208 | ) | ($4,393,393 | ) | ||||||||||||||||||
| Class I shares | ||||||||||||||||||||||||||
| Sold | 11,974,982 | $313,178,287 | 29,657,292 | $734,896,493 | ||||||||||||||||||||||
| Distributions reinvested | 644,257 | 16,280,369 | 576,503 | 13,536,284 | ||||||||||||||||||||||
| Repurchased | (41,316,915 | ) | (1,098,063,100 | ) | (26,306,871 | ) | (654,126,626 | ) | ||||||||||||||||||
| Net increase (decrease) | (28,697,676 | ) | ($768,604,444 | ) | 3,926,924 | $94,306,151 | ||||||||||||||||||||
| Class R1 shares | ||||||||||||||||||||||||||
| Sold | 28,845 | $759,396 | 61,721 | $1,522,821 | ||||||||||||||||||||||
| Distributions reinvested | 1,050 | 26,611 | 1,043 | 24,573 | ||||||||||||||||||||||
| Repurchased | (163,889 | ) | (4,341,602 | ) | (45,226 | ) | (1,126,366 | ) | ||||||||||||||||||
| Net increase (decrease) | (133,994 | ) | ($3,555,595 | ) | 17,538 | $421,028 | ||||||||||||||||||||
| Class R2 shares | ||||||||||||||||||||||||||
| Sold | 5,282 | $136,601 | 10,770 | $261,314 | ||||||||||||||||||||||
| Distributions reinvested | 91 | 2,294 | 127 | 2,974 | ||||||||||||||||||||||
| Repurchased | (8,720 | ) | (227,908 | ) | (14,328 | ) | (333,734 | ) | ||||||||||||||||||
| Net decrease | (3,347 | ) | ($89,013 | ) | (3,431 | ) | ($69,446 | ) | ||||||||||||||||||
| Class R3 shares | ||||||||||||||||||||||||||
| Sold | 5,217 | $135,867 | 29,406 | $717,630 | ||||||||||||||||||||||
| Distributions reinvested | 256 | 6,470 | 102 | 2,397 | ||||||||||||||||||||||
| Repurchased | (11,060 | ) | (284,416 | ) | (1,708 | ) | (41,670 | ) | ||||||||||||||||||
| Net increase (decrease) | (5,587 | ) | ($142,079 | ) | 27,800 | $678,357 | ||||||||||||||||||||
| Class R5 shares | ||||||||||||||||||||||||||
| Sold | 716 | $18,858 | 1,932 | $48,864 | ||||||||||||||||||||||
| Distributions reinvested | 29 | 733 | 5 | 109 | ||||||||||||||||||||||
| Repurchased | (1,034 | ) | (27,616 | ) | (9 | ) | (239 | ) | ||||||||||||||||||
| Net increase (decrease) | (289 | ) | ($8,025 | ) | 1,928 | $48,734 | ||||||||||||||||||||
| Class R6 shares | ||||||||||||||||||||||||||
| Sold | 51,874 | $1,390,616 | 2,995 | $74,411 | ||||||||||||||||||||||
| Distributions reinvested | 228 | 5,761 | 185 | 4,345 | ||||||||||||||||||||||
| Repurchased | (27,703 | ) | (742,890 | ) | (1,365 | ) | (33,871 | ) | ||||||||||||||||||
| Net increase | 24,399 | $653,487 | 1,815 | $44,885 | ||||||||||||||||||||||
| Total net decrease | (30,546,420 | ) | ($816,816,932 | ) | (2,239,890 | ) | ($64,376,552 | ) | ||||||||||||||||||
There were no transactions in fund shares for the years ended October 31, 2015 and 2014 for Class R4.
Affiliates of the fund owned 100% and 53% of shares of beneficial interest of Class R4 and Class R5, respectively, on October 31, 2015.
Note 6 — Purchase and sale of securities
Purchases and sales of securities, other than short-term investments, amounted to $404,201,808 and $1,194,997,660, respectively, for the year ended October 31, 2015.
35
Note 7 — Industry or sector risk
The fund may invest a large percentage of its assets in one or more particular industries or sectors of the economy. If a large percentage of the fund's assets are economically tied to a single or small number of industries or sectors of the economy, the fund will be less diversified than a more broadly diversified fund, and it may cause the fund to underperform if that industry or sector underperforms. In addition, focusing on a particular industry or sector may make the fund's net assets value more volatile. Further, a fund that invests in particular industries or sectors is particularly susceptible to the impact of market, economic, regulatory and other factors affecting those industries or sectors. Financial services companies can be hurt by economic declines, changes in interest rates and regulatory and market impacts.
36
Report of Independent Registered Public Accounting Firm
To the Board of Trustees of John Hancock Capital Series and Shareholders of John Hancock Classic Value Fund:
In our opinion, the accompanying statement of assets and liabilities, including the fund's investments, and the related statements of operations and of changes in net assets and the financial highlights present fairly, in all material respects, the financial position of John Hancock Classic Value Fund (the "Fund") at October 31, 2015, the results of its operations for the year then ended, the changes in its net assets for each of the two years in the period then ended and the financial highlights for each of the periods indicated, in conformity with accounting principles generally accepted in the United States of America. These financial statements and financial highlights (hereafter referred to as "financial statements") are the responsibility of the Fund's management. Our responsibility is to express an opinion on these financial statements based on our audits. We conducted our audits of these financial statements in accordance with the standards of the Public Company Accounting Oversight Board (United States). Those standards require that we plan and perform the audit to obtain reasonable assurance about whether the financial statements are free of material misstatement. An audit includes examining, on a test basis, evidence supporting the amounts and disclosures in the financial statements, assessing the accounting principles used and significant estimates made by management, and evaluating the overall financial statement presentation. We believe that our audits, which included confirmation of securities at October 31, 2015 by correspondence with the custodian and brokers, provide a reasonable basis for our opinion.
PricewaterhouseCoopers LLP
Boston, Massachusetts
December 18, 2015
37
Unaudited
For federal income tax purposes, the following information is furnished with respect to the distributions of the fund, if any, paid during its taxable year ended October 31, 2015.
The fund reports the maximum amount allowable of its net taxable income as eligible for the corporate dividends-received deduction.
The fund reports the maximum amount allowable of its net taxable income as qualified dividend income as provided in the Jobs and Growth Tax Relief Reconciliation Act of 2003.
Eligible shareholders will be mailed a 2015 Form 1099-DIV in early 2016. This will reflect the tax character of all distributions paid in calendar year 2015.
Please consult a tax advisor regarding the tax consequences of your investment in the fund.
38
Continuation of Investment Advisory and Subadvisory Agreements
Evaluation of Advisory and Subadvisory Agreements by the Board of Trustees
This section describes the evaluation by the Board of Trustees (the Board) of John Hancock Capital Series (the Trust) of the Advisory Agreement (the Advisory Agreement) with John Hancock Advisers, LLC (the Advisor) and the Subadvisory Agreement (the Subadvisory Agreement) with Pzena Investment Management, LLC (the Subadvisor), for John Hancock Classic Value Fund (the fund). The Advisory Agreement and Subadvisory Agreement are collectively referred to as the Agreements. Prior to the June 23-25, 2015 meeting at which the Agreements were approved, the Board also discussed and considered information regarding the proposed continuation of the Agreements at an in-person meeting held on May 21-22, 2015.
Approval of Advisory and Subadvisory Agreements
At in-person meetings held on June 23-25, 2015, the Board, including the Trustees who are not considered to be interested persons of the Trust under the Investment Company Act of 1940, as amended (the 1940 Act) (the Independent Trustees), reapproved for an annual period the continuation of the Advisory Agreement between the Trust and the Advisor and the Subadvisory Agreement between the Advisor and the Subadvisor with respect to the fund.
In considering the Advisory Agreement and the Subadvisory Agreement, the Board received in advance of the meetings a variety of materials relating to the fund, the Advisor and the Subadvisor, including comparative performance, fee and expense information for a peer group of similar funds prepared by an independent third-party provider of mutual fund data, performance information for an applicable benchmark index; and, with respect to the Subadvisor, comparative performance information for comparably managed accounts, as applicable, and other information provided by the Advisor and the Subadvisor regarding the nature, extent and quality of services provided by the Advisor and the Subadvisor under their respective Agreements, as well as information regarding the Advisor's revenues and costs of providing services to the fund and any compensation paid to affiliates of the Advisor. At the meetings at which the renewal of the Advisory Agreement and Subadvisory Agreement are considered, particular focus is given to information concerning fund performance, comparability of fees and total expenses, and profitability. However, the Board notes that the evaluation process with respect to the Advisor and the Subadvisor is an ongoing one. In this regard, the Board also took into account discussions with management and information provided to the Board at prior meetings with respect to the services provided by the Advisor and the Subadvisor to the fund, including quarterly performance reports prepared by management containing reviews of investment results and prior presentations from the Subadvisor with respect to the fund. The Board also considered the nature, quality, and extent of non-advisory services, if any, to be provided to the fund by the Advisor's affiliates, including distribution services.
Throughout the process, the Board asked questions of and requested additional information from management. The Board is assisted by counsel for the Trust and the Independent Trustees are also separately assisted by independent legal counsel throughout the process. The Independent Trustees also received a memorandum from their independent legal counsel discussing the legal standards for their consideration of the proposed continuation of the Agreements and discussed the proposed continuation of the Agreements in private sessions with their independent legal counsel at which no representatives of management were present.
Approval of Advisory Agreement
In approving the Advisory Agreement with respect to the fund, the Board, including the Independent Trustees, considered a variety of factors, including those discussed below. The Board also considered other factors (including conditions and trends prevailing generally in the economy, the securities markets, and the industry) and does not treat any single factor as determinative, and each Trustee may attribute different weights to different factors. The Board's conclusions may be based in part on its consideration of the advisory and subadvisory arrangements in prior years and on the Board's ongoing regular review of fund performance and operations throughout the year.
39
Nature, extent, and quality of services. Among the information received by the Board from the Advisor relating to the nature, extent, and quality of services provided to the fund, the Board reviewed information provided by the Advisor relating to its operations and personnel, descriptions of its organizational and management structure, and information regarding the Advisor's compliance and regulatory history, including its Form ADV. The Board also noted that on a regular basis it receives and reviews information from the Trust's Chief Compliance Officer (CCO) regarding the fund's compliance policies and procedures established pursuant to Rule 38a-1 under the 1940 Act. The Board also considered the Advisor's risk management processes. The Board considered that the Advisor is responsible for the management of the day-to-day operations of the fund, including, but not limited to, general supervision of and coordination of the services provided by the Subadvisor, and is also responsible for monitoring and reviewing the activities of the Subadvisor and other third-party service providers.
In considering the nature, extent, and quality of the services provided by the Advisor, the Trustees also took into account their knowledge of the Advisor's management and the quality of the performance of the Advisor's duties, through Board meetings, discussions and reports during the preceding year and through each Trustee's experience as a Trustee of the Trust and of the other trusts in the John Hancock group of funds complex (the John Hancock Fund Complex).
In the course of their deliberations regarding the Advisory Agreement, the Board considered, among other things:
| (a) | the skills and competency with which the Advisor has in the past managed the Trust's affairs and its subadvisory relationship, the Advisor's oversight and monitoring of the Subadvisor's investment performance and compliance programs, such as the Subadvisor's compliance with fund policies and objectives, review of brokerage matters, including with respect to trade allocation and best execution and the Advisor's timeliness in responding to performance issues; | |
| (b) | the background, qualifications and skills of the Advisor's personnel; | |
| (c) | the Advisor's compliance policies and procedures and its responsiveness to regulatory changes and mutual fund industry developments; | |
| (d) | the Advisor's administrative capabilities, including its ability to supervise the other service providers for the fund; | |
| (e) | the financial condition of the Advisor and whether it has the financial wherewithal to provide a high level and quality of services to the fund; and | |
| (f) | the Advisor's reputation and experience in serving as an investment advisor to the Trust and the benefit to shareholders of investing in funds that are part of a family of funds offering a variety of investments. |
The Board concluded that the Advisor may reasonably be expected to continue to provide a high quality of services under the Advisory Agreement with respect to the fund.
Investment performance. In considering the fund's performance, the Board noted that it reviews at its regularly scheduled meetings information about the fund's performance results. In connection with the consideration of the Advisory Agreement, the Board:
| (a) | reviewed information prepared by management regarding the fund's performance; | |
| (b) | considered the comparative performance of an applicable benchmark index; | |
| (c) | considered the performance of comparable funds, if any, as included in the report prepared by an independent third-party provider of fund data; and | |
| (d) | took into account the Advisor's analysis of the fund's performance and its plans and recommendations regarding the Trust's subadvisory arrangements generally. |
The Board noted that the fund underperformed its benchmark index for the one- and five-year periods ended December 31, 2014 and outperformed its benchmark index for the three-year period ended December 31, 2014. The Board also noted that
40
the fund outperformed its peer group average for the one-, three-, and five-year periods ended December 31, 2014. The Board took into account management's discussion of the fund's performance, including the factors that contributed to the fund's performance for the one- and five-year periods relative to the benchmark. The Board noted the fund's favorable performance relative to the benchmark index for the three-year period and to the peer group for the one-, three- and five-year periods. The Board concluded that the fund's performance has generally been in line with or outperformed the historical performance of comparable funds.
Fees and expenses. The Board reviewed comparative information prepared by an independent third-party provider of mutual fund data, including, among other data, the fund's contractual and net management fees (and subadvisory fees, to the extent available) and total expenses as compared to similarly situated investment companies deemed to be comparable to the fund. The Board considered the fund's ranking within a smaller group of peer funds chosen by the independent third-party provider, as well as the fund's ranking within a broader group of funds. In comparing the fund's contractual and net management fees to those of comparable funds, the Board noted that such fees include both advisory and administrative costs. The Board noted that net management fees and total expenses for the fund are higher than the peer group median.
The Board took into account management's discussion of the fund's expenses. The Board took into account management's discussion with respect to the advisory/subadvisory fee structure, including the amount of the advisory fee retained by the Advisor after payment of the subadvisory fee. The Board also noted that the Advisor pays the subadvisory fee, and that such fees are negotiated at arm's length with respect to the Subadvisor. In addition, the Board took into account that management had agreed to implement an overall fee waiver across the complex, including the fund, which is discussed further below. The Board also noted actions taken over the past several years to reduce the fund's operating expenses. The Board also noted that, in addition, the Advisor is currently waiving fees and/or reimbursing expenses with respect to the fund and that the fund has breakpoints in its contractual management fee schedule that reduces management fees as assets increase. The Board also noted that the fund's distributor, an affiliate of the Advisor, has agreed to waive a portion of its Rule 12b-1 fee for a share class of the fund. The Board reviewed information provided by the Advisor concerning the investment advisory fee charged by the Advisor or one of its advisory affiliates to other clients (including other funds in the John Hancock Fund Complex) having similar investment mandates, if any. The Board considered any differences between the Advisor's and Subadvisor's services to the fund and the services they provide to other comparable clients or funds. The Board concluded that the advisory fee paid with respect to the fund is reasonable.
Profitability/indirect benefits. In considering the costs of the services to be provided and the profits to be realized by the Advisor and its affiliates from the Advisor's relationship with the Trust, the Board:
| (a) | reviewed financial information of the Advisor; | |||||||
| (b) | reviewed and considered information presented by the Advisor regarding the net profitability to the Advisor and its affiliates with respect to the fund; | |||||||
| (c) | received and reviewed profitability information with respect to the John Hancock Fund Complex as a whole; | |||||||
| (d) | received information with respect to the Advisor's allocation methodologies used in preparing the profitability data; | |||||||
| (e) | considered that the John Hancock insurance companies that are affiliates of the Advisor, as shareholders of the Trust directly or through their separate accounts, receive certain tax credits or deductions relating to foreign taxes paid and dividends received by certain funds of the Trust and noted that these tax benefits, which are not available to participants in qualified retirement plans under applicable income tax law, are reflected in the profitability information reviewed by the Board; | |||||||
| (f) | considered that the Advisor also provides administrative services to the fund on a cost basis pursuant to an administrative services agreement; | |||||||
| (g) | noted that affiliates of the Advisor provide transfer agency services and distribution services to the fund, and that the fund's distributor also receives Rule 12b-1 payments to support distribution of the fund; |
41
| (h) | noted that the Advisor also derives reputational and other indirect benefits from providing advisory services to the fund; | |||||||
| (i) | noted that the subadvisory fee for the fund is paid by the Advisor and is negotiated at arm's length; and | |||||||
| (j) | considered that the Advisor should be entitled to earn a reasonable level of profits in exchange for the level of services it provides to the fund and the entrepreneurial risk that it assumes as Advisor. |
Based upon its review, the Board concluded that the level of profitability, if any, of the Advisor and its affiliates from their relationship with the fund was reasonable and not excessive.
Economies of scale. In considering the extent to which economies of scale would be realized as the fund grows and whether fee levels reflect these economies of scale for the benefit of fund shareholders, the Board:
| (a) | considered that the Advisor has contractually agreed to waive a portion of its management fee for certain funds of the John Hancock Fund Complex, including the fund (the participating portfolios) or otherwise reimburse the expenses of the participating portfolios (the reimbursement). This waiver is based upon aggregate net assets of all the participating portfolios. The amount of the reimbursement is calculated daily and allocated among all the participating portfolios in proportion to the daily net assets of each fund; | |
| (b) | reviewed the fund's advisory fee structure and concluded that: (i) the fund's fee structure contains breakpoints at the subadvisory fee level and that such breakpoints are reflected as breakpoints in the advisory fees for the fund; and (ii) although economies of scale cannot be measured with precision, these arrangements permit shareholders of the fund to benefit from economies of scale if the fund grows. The Board also took into account management's discussion of the fund's advisory fee structure; and | |
| (c) | the Board also considered the effect of the fund's growth in size on its performance and fees. The Board also noted that if the fund's assets increase over time, the fund may realize other economies of scale. |
Approval of Subadvisory Agreement
In making its determination with respect to approval of the Subadvisory Agreement, the Board reviewed:
| (1) | information relating to the Subadvisor's business, including current subadvisory services to the Trust (and other funds in the John Hancock Fund Complex); | |
| (2) | the historical and current performance of the fund and comparative performance information relating to an applicable benchmark index; | |
| (3) | the subadvisory fee for the fund, including any breakpoints, and to the extent available, comparable fee information prepared by an independent third party provider of fund data; and | |
| (4) | information relating to the nature and scope of any material relationships and their significance to the Trust's Advisor and Subadvisor. |
Nature, extent, and quality of services. With respect to the services provided by the Subadvisor, the Board received information provided to the Board by the Subadvisor, including the Subadvisor's Form ADV, as well as took into account information presented throughout the past year. The Board considered the Subadvisor's current level of staffing and its overall resources, as well as received information relating to the Subadvisor's compensation program. The Board reviewed the Subadvisor's history and investment experience, as well as information regarding the qualifications, background, and responsibilities of the Subadvisor's investment and compliance personnel who provide services to the fund. The Board also considered, among other things, the Subadvisor's compliance program and any disciplinary history. The Board also considered the Subadvisor's risk assessment and monitoring process. The Board reviewed the Subadvisor's regulatory history, including whether it was involved in any regulatory actions or investigations as well as material litigation, and any settlements and amelioratory actions undertaken, as appropriate. The Board noted that the Advisor conducts regular,
42
periodic reviews of the Subadvisor and its operations, including regarding investment processes and organizational and staffing matters. The Board also noted that the Trust's CCO and his staff conduct regular, periodic compliance reviews with the Subadvisor and present reports to the Independent Trustees regarding the same, which includes evaluating the regulatory compliance systems of the Subadvisor and procedures reasonably designed to assure compliance with the federal securities laws. The Board also took into account the financial condition of the Subadvisor.
The Board considered the Subadvisor's investment process and philosophy. The Board took into account that the Subadvisor's responsibilities include the development and maintenance of an investment program for the fund that is consistent with the fund's investment objective, the selection of investment securities and the placement of orders for the purchase and sale of such securities, as well as the implementation of compliance controls related to performance of these services. The Board also received information with respect to the Subadvisor's brokerage policies and practices, including with respect to best execution and soft dollars.
Subadvisor compensation. In considering the cost of services to be provided by the Subadvisor and the profitability to the Subadvisor of its relationship with the fund, the Board noted that the fees under the Subadvisory Agreement are paid by the Advisor and not the fund.
The Board also relied on the ability of the Advisor to negotiate the Subadvisory Agreement with the Subadvisor, which is not affiliated with the Advisor, and the fees thereunder at arm's length. As a result, the costs of the services to be provided and the profits to be realized by the Subadvisor from its relationship with the Trust were not a material factor in the Board's consideration of the Subadvisory Agreement.
The Board also received information regarding the nature and scope (including their significance to the Advisor and its affiliates and to the Subadvisor) of any material relationships with respect to the Subadvisor, which include arrangements in which the Subadvisor or its affiliates provide advisory, distribution, or management services in connection with financial products sponsored by the Advisor or its affiliates, and may include other registered investment companies, a 529 education savings plan, managed separate accounts and exempt group annuity contracts sold to qualified plans. The Board also received information and took into account any other potential conflicts of interest the Advisor might have in connection with the Subadvisory Agreement.
In addition, the Board considered other potential indirect benefits that the Subadvisor and its affiliates may receive from the Subadvisor's relationship with the fund, such as the opportunity to provide advisory services to additional funds in the John Hancock Fund Complex and reputational benefits.
Subadvisory fees. The Board considered that the fund pays an advisory fee to the Advisor and that, in turn, the Advisor pays a subadvisory fee to the Subadvisor. As noted above, the Board also considered the fund's subadvisory fees as compared to similarly situated investment companies deemed to be comparable to the fund as included in the report prepared by the independent third party provider of fund data, to the extent available. The Board noted that the limited size of the Lipper peer group was not sufficient for comparative purposes. The Board also took into account the subadvisory fees paid by the Advisor to the Subadvisor with respect to the fund and compared them to fees charged by the Subadvisor to manage other subadvised portfolios and portfolios not subject to regulation under the 1940 Act, as applicable.
Subadvisor performance. As noted above, the Board considered the fund's performance as compared to the fund's peer group and the benchmark index and noted that the Board reviews information about the fund's performance results at its regularly scheduled meetings. The Board noted the Advisor's expertise and resources in monitoring the performance, investment style and risk-adjusted performance of the Subadvisor. The Board was mindful of the Advisor's focus on the Subadvisor's performance. The Board also noted the Subadvisor's long-term performance record for similar accounts, as applicable.
The Board's decision to approve the Subadvisory Agreement was based on a number of determinations, including the following:
| (1) | the Subadvisor has extensive experience and demonstrated skills as a manager; |
43
| (2) | the performance of the fund has generally been in line with or outperformed the historical performance of comparable funds; | |||||||
| (3) | the subadvisory fee is reasonable in relation to the level and quality of services being provided; and | |||||||
| (4) | noted that the subadvisory fees are paid by the Advisor not the fund and that the subadvisory fee breakpoints are reflected as breakpoints in the advisory fees for the fund in order to permit shareholders to benefit from economies of scale if the fund grows. | |||||||
| * * * | ||||||||
Based on the Board's evaluation of all factors that the Board deemed to be material, including those factors described above, the Board, including the Independent Trustees, concluded that renewal of the Advisory Agreement and the Subadvisory Agreement would be in the best interest of the fund and its shareholders. Accordingly, the Board, and the Independent Trustees voting separately, approved the Advisory Agreement and Subadvisory Agreement for an additional one-year period.
44
This chart provides information about the Trustees and Officers who oversee your John Hancock fund. Officers elected by the Trustees manage the day-to-day operations of the fund and execute policies formulated by the Trustees.
Independent Trustees
| Name, year of birth Position(s) held with fund Principal occupation(s) and other directorships during past 5 years | Trustee of the Trust since1 | Number of John Hancock funds overseen by Trustee |
| James M. Oates, Born: 1946 | 2012 | 228 |
| Trustee and Chairperson of the Board Managing Director, Wydown Group (financial consulting firm) (since 1994); Chairman and Director, Emerson Investment Management, Inc. (since 2000); Independent Chairman, Hudson Castle Group, Inc. (formerly IBEX Capital Markets, Inc.) (financial services company) (1997-2011); Director, Stifel Financial (since 1996); Director, Investor Financial Services Corporation (1995-2007); Director, Connecticut River Bancorp (1998-2014); Director, Virtus Funds (formerly Phoenix Mutual Funds) (since 1988). Trustee and Chairperson of the Board, John Hancock Collateral Trust and John Hancock Exchange-Traded Fund Trust (since 2015); Trustee and Chairperson of the Board, John Hancock retail funds3 (since 2012); Trustee (2005-2006 and since 2012) and Chairperson of the Board (since 2012), John Hancock Funds III; Trustee (since 2004) and Chairperson of the Board (since 2005), John Hancock Variable Insurance Trust; Trustee and Chairperson of the Board, John Hancock Funds II (since 2005). | ||
| Charles L. Bardelis,2 Born: 1941 | 2012 | 228 |
| Trustee Director, Island Commuter Corp. (marine transport). Trustee, John Hancock Collateral Trust and John Hancock Exchange-Traded Fund Trust (since 2015); Trustee, John Hancock retail funds3 (since 2012); Trustee, John Hancock Funds III (2005-2006 and since 2012); Trustee, John Hancock Variable Insurance Trust (since 1988); Trustee, John Hancock Funds II (since 2005). | ||
| Peter S. Burgess,2 Born: 1942 | 2012 | 228 |
| Trustee Consultant (financial, accounting, and auditing matters) (since 1999); Certified Public Accountant; Partner, Arthur Andersen (independent public accounting firm) (prior to 1999); Director, Lincoln Educational Services Corporation (since 2004); Director, Symetra Financial Corporation (since 2010); Director, PMA Capital Corporation (2004-2010). Trustee, John Hancock Collateral Trust and John Hancock Exchange-Traded Fund Trust (since 2015); Trustee, John Hancock retail funds3 (since 2012); Trustee, John Hancock Funds III (2005-2006 and since 2012); Trustee, John Hancock Variable Insurance Trust and John Hancock Funds II (since 2005). | ||
| William H. Cunningham, Born: 1944 | 2005 | 228 |
| Trustee Professor, University of Texas, Austin, Texas (since 1971); former Chancellor, University of Texas System and former President of the University of Texas, Austin, Texas; Chairman (since 2009) and Director (since 2006), Lincoln National Corporation (insurance); Director, Southwest Airlines (since 2000); former Director, LIN Television (2009-2014). Trustee, John Hancock retail funds3 (since 1986); Trustee, John Hancock Variable Insurance Trust (since 2012); Trustee, John Hancock Funds II (2005-2006 and since 2012); Trustee, John Hancock Collateral Trust and John Hancock Exchange-Traded Fund Trust (since 2015). | ||
| Grace K. Fey, Born: 1946 | 2012 | 228 |
| Trustee Chief Executive Officer, Grace Fey Advisors (since 2007); Director and Executive Vice President, Frontier Capital Management Company (1988-2007); Director, Fiduciary Trust (since 2009). Trustee, John Hancock Collateral Trust and John Hancock Exchange-Traded Fund Trust (since 2015); Trustee, John Hancock retail funds3 (since 2012); Trustee, John Hancock Variable Insurance Trust and John Hancock Funds II (since 2008). | ||
45
Independent Trustees (continued)
| Name, year of birth Position(s) held with fund Principal occupation(s) and other directorships during past 5 years | Trustee of the Trust since1 | Number of John Hancock funds overseen by Trustee |
| Theron S. Hoffman,2 Born: 1947 | 2012 | 228 |
| Trustee Chief Executive Officer, T. Hoffman Associates, LLC (consulting firm) (since 2003); Director, The Todd Organization (consulting firm) (2003-2010); President, Westport Resources Management (investment management consulting firm) (2006-2008); Senior Managing Director, Partner, and Operating Head, Putnam Investments (2000-2003); Executive Vice President, The Thomson Corp. (financial and legal information publishing) (1997-2000). Trustee, John Hancock Collateral Trust and John Hancock Exchange-Traded Fund Trust (since 2015); Trustee, John Hancock retail funds3 (since 2012); Trustee, John Hancock Variable Insurance Trust and John Hancock Funds II (since 2008). | ||
| Deborah C. Jackson, Born: 1952 | 2008 | 228 |
| Trustee President, Cambridge College, Cambridge, Massachusetts (since 2011); Chief Executive Officer, American Red Cross of Massachusetts Bay (2002-2011); Board of Directors of Eastern Bank Corporation (since 2001); Board of Directors of Eastern Bank Charitable Foundation (since 2001); Board of Directors of American Student Assistance Corporation (1996-2009); Board of Directors of Boston Stock Exchange (2002-2008); Board of Directors of Harvard Pilgrim Healthcare (health benefits company) (2007-2011). Trustee, John Hancock retail funds3 (since 2008); Trustee of John Hancock Variable Insurance Trust and John Hancock Funds II (since 2012); Trustee, John Hancock Collateral Trust and John Hancock Exchange-Traded Fund Trust (since 2015). | ||
| Hassell H. McClellan, Born: 1945 | 2012 | 228 |
| Trustee Trustee, Virtus Variable Insurance Trust (formerly Phoenix Edge Series Funds) (since 2008); Director, The Barnes Group (since 2010); Associate Professor, The Wallace E. Carroll School of Management, Boston College (retired 2013). Trustee, John Hancock Collateral Trust and John Hancock Exchange-Traded Fund Trust (since 2015); Trustee, John Hancock retail funds3 (since 2012); Trustee, John Hancock Funds III (2005-2006 and since 2012); Trustee, John Hancock Variable Insurance Trust and John Hancock Funds II (since 2005). | ||
| Steven R. Pruchansky, Born: 1944 | 2005 | 228 |
| Trustee and Vice Chairperson of the Board Chairman and Chief Executive Officer, Greenscapes of Southwest Florida, Inc. (since 2000); Director and President, Greenscapes of Southwest Florida, Inc. (until 2000); Member, Board of Advisors, First American Bank (until 2010); Managing Director, Jon James, LLC (real estate) (since 2000); Partner, Right Funding, LLC (since 2014); Director, First Signature Bank & Trust Company (until 1991); Director, Mast Realty Trust (until 1994); President, Maxwell Building Corp. (until 1991). Trustee (since 1992) and Chairperson of the Board (2011-2012), John Hancock retail funds3; Trustee and Vice Chairperson of the Board, John Hancock retail funds3 John Hancock Variable Insurance Trust, and John Hancock Funds II (since 2012); Trustee, and Vice Chairperson of the Board, John Hancock Collateral Trust and John Hancock Exchange-Traded Fund Trust (since 2015). | ||
46
Independent Trustees (continued)
| Name, year of birth Position(s) held with fund Principal occupation(s) and other directorships during past 5 years | Trustee of the Trust since1 | Number of John Hancock funds overseen by Trustee |
| Gregory A. Russo, Born: 1949 | 2009 | 228 |
| Trustee Director and Audit Committee Chairman (since 2012), and Member, Audit Committee and Finance Committee (since 2011), NCH Healthcare System, Inc. (holding company for multi-entity healthcare system); Director and Member (since 2012) and Finance Committee Chairman (since 2014), The Moorings, Inc. (nonprofit continuing care community); Vice Chairman, Risk & Regulatory Matters, KPMG LLP (KPMG) (2002-2006); Vice Chairman, Industrial Markets, KPMG (1998-2002); Chairman and Treasurer, Westchester County, New York, Chamber of Commerce (1986-1992); Director, Treasurer, and Chairman of Audit and Finance Committees, Putnam Hospital Center (1989-1995); Director and Chairman of Fundraising Campaign, United Way of Westchester and Putnam Counties, New York (1990-1995). Trustee, John Hancock retail funds3 (since 2008); Trustee, John Hancock Variable Insurance Trust and John Hancock Funds II (since 2012); Trustee, John Hancock Collateral Trust and John Hancock Exchange-Traded Fund Trust (since 2015). | ||
Non-Independent Trustees4
| Name, year of birth Position(s) held with fund Principal occupation(s) and other directorships during past 5 years | Trustee of the Trust since1 | Number of John Hancock funds overseen by Trustee |
| James R. Boyle, Born: 1959 | 2015 | 228 |
| Non-Independent Trustee* Chairman, HealthFleet, Inc. (healthcare) (since 2014); Executive Vice President and Chief Executive Officer, U.S. Life Insurance Division of Genworth Financial, Inc. (insurance) (January 2014-July 2014); Senior Executive Vice President, Manulife Financial, President and Chief Executive Officer, John Hancock (1999-2012); Chairman and Director, John Hancock Advisers, LLC, John Hancock Funds, LLC, and John Hancock Investment Management Services, LLC (2005-2010); Trustee, John Hancock Collateral Trust and John Hancock Exchange-Traded Fund Trust (since 2015); Trustee, John Hancock retail funds3 (2005-2010; 2012-2014 and since 2015); Trustee, John Hancock Variable Insurance Trust and John Hancock Funds II (2005-2014 and since 2015). *Effective 3-10-15. | ||
| Craig Bromley, Born: 1966 | 2012 | 228 |
| Non-Independent Trustee President, John Hancock Financial Service (since 2012); Senior Executive Vice President and General Manager, U.S. Division, Manulife Corporation (since 2012); President and Chief Executive Officer, Manulife Insurance Company (Manulife Japan) (2005-2012, including prior positions). Trustee, John Hancock retail funds,3 John Hancock Variable Insurance Trust, and John Hancock Funds II (since 2012); Trustee, John Hancock Collateral Trust and John Hancock Exchange-Traded Fund Trust (since 2015). | ||
| Warren A. Thomson, Born: 1955 | 2012 | 228 |
| Non-Independent Trustee Senior Executive Vice President and Chief Investment Officer, Manulife Financial Corporation and The Manufacturers Life Insurance Company (since 2009); Chairman, Manulife Asset Management (since 2001, including prior positions); Director and Chairman, Manulife Asset Management Limited (since 2006); Director and Chairman, Hancock Natural Resources Group, Inc. (since 2013). Trustee, John Hancock retail funds,3 John Hancock Variable Insurance Trust, and John Hancock Funds II (since 2012); Trustee, John Hancock Collateral Trust and John Hancock Exchange-Traded Fund Trust (since 2015). | ||
47
Principal officers who are not Trustees
| Name, year of birth Position(s) held with fund Principal occupation(s) and other directorships during past 5 years | Officer of the Trust since |
| Andrew G. Arnott, Born: 1971 | 2007 |
| President Senior Vice President, John Hancock Financial Services (since 2009); Director and Executive Vice President, John Hancock Advisers, LLC (since 2005, including prior positions); Director and Executive Vice President, John Hancock Investment Management Services, LLC (since 2006, including prior positions); President, John Hancock Funds, LLC (since 2004, including prior positions); President, John Hancock retail funds,3 John Hancock Variable Insurance Trust, and John Hancock Funds II (since 2007, including prior positions); President, John Hancock Collateral Trust (since 2015); President, John Hancock Exchange-Traded Fund Trust (since 2014). | |
| John J. Danello, Born: 1955 | 2014 |
| Senior Vice President, Secretary, and Chief Legal Officer Vice President and Chief Counsel, John Hancock Wealth Management (since 2005); Senior Vice President (since 2007) and Chief Legal Counsel (2007-2010), John Hancock Funds, LLC and The Berkeley Financial Group, LLC; Senior Vice President (since 2006, including prior positions) and Chief Legal Officer and Secretary (since 2014), John Hancock retail funds 3, John Hancock Funds II and John Hancock Variable Insurance Trust; Senior Vice President, Chief Legal Officer and Secretary (since 2015), John Hancock Collateral Trust and John Hancock Exchange-Traded Fund Trust; Vice President, John Hancock Life & Health Insurance Company (since 2009); Vice President, John Hancock Life Insurance Company (USA) and John Hancock Life Insurance Company of New York (since 2010); and Senior Vice President, Secretary, and Chief Legal Counsel (2007-2014, including prior positions) of John Hancock Advisers, LLC and John Hancock Investment Management Services, LLC. | |
| Francis V. Knox, Jr., Born: 1947 | 2005 |
| Chief Compliance Officer Vice President, John Hancock Financial Services (since 2005); Chief Compliance Officer, John Hancock retail funds,3 John Hancock Variable Insurance Trust, John Hancock Funds II, John Hancock Advisers, LLC, and John Hancock Investment Management Services, LLC (since 2005); Chief Compliance Officer, John Hancock Collateral Trust and John Hancock Exchange-Traded Fund Trust (since 2015). | |
| Charles A. Rizzo, Born: 1957 | 2007 |
| Chief Financial Officer Vice President, John Hancock Financial Services (since 2008); Senior Vice President, John Hancock Advisers, LLC and John Hancock Investment Management Services, LLC (since 2008); Chief Financial Officer, John Hancock retail funds,3 John Hancock Variable Insurance Trust and John Hancock Funds II (since 2007); Chief Financial Officer, John Hancock Collateral Trust and John Hancock Exchange-Traded Fund Trust (since 2015). | |
| Salvatore Schiavone, Born: 1965 | 2010 |
| Treasurer Assistant Vice President, John Hancock Financial Services (since 2007); Vice President, John Hancock Advisers, LLC and John Hancock Investment Management Services, LLC (since 2007); Treasurer, John Hancock retail funds3 (since 2007, including prior positions); Treasurer, John Hancock Variable Insurance Trust and John Hancock Funds II (2007-2009 and since 2010, including prior positions); Treasurer, John Hancock Collateral Trust and John Hancock Exchange-Traded Fund Trust (since 2015). | |
The business address for all Trustees and Officers is 601 Congress Street, Boston, Massachusetts 02210-2805.
The Statement of Additional Information of the fund includes additional information about members of the Board of Trustees of the Trust and is available without charge, upon request, by calling 800-225-5291.
| 1 | Each Trustee holds office until his or her successor is elected and qualified, or until the Trustee's death, retirement, resignation, or removal. Mr. Boyle has served as Trustee at various times prior to the date listed in the table. |
| 2 | Member of the Audit Committee. |
| 3 | "John Hancock retail funds" comprises John Hancock Funds III and 36 other John Hancock funds consisting of 26 series of other John Hancock trusts and 10 closed-end funds. |
| 4 | The Trustee is a Non-Independent Trustee due to current or former positions with the Advisor and certain affiliates. |
48
Trustees James M. Oates, Chairperson Officers Andrew G. Arnott John J. Danello Francis V. Knox, Jr. Charles A. Rizzo Salvatore Schiavone | Investment advisor John Hancock Advisers, LLC Subadvisor Pzena Investment Management, LLC Principal distributor John Hancock Funds, LLC Custodian State Street Bank and Trust Company Transfer agent John Hancock Signature Services, Inc. Legal counsel K&L Gates LLP Independent registered public accounting firm PricewaterhouseCoopers LLP |
*Member of the Audit Committee
†Non-Independent Trustee
#Effective 3-10-15
The fund's proxy voting policies and procedures, as well as the fund proxy voting record for the most recent twelve-month period ended June 30, are available free of charge on the Securities and Exchange Commission (SEC) website at sec.gov or on our website.
The fund's complete list of portfolio holdings, for the first and third fiscal quarters, is filed with the SEC on Form N-Q. The fund's Form N-Q is available on our website and the SEC's website, sec.gov, and can be reviewed and copied (for a fee) at the SEC's Public Reference Room in Washington, DC. Call 800-SEC-0330 to receive information on the operation of the SEC's Public Reference Room.
We make this information on your fund, as well as monthly portfolio holdings, and other fund details available on our website at jhinvestments.com or by calling 800-225-5291.
| You can also contact us: | |||
| 800-225-5291 jhinvestments.com | Regular mail: John Hancock Signature Services, Inc. | Express mail: John Hancock Signature Services, Inc. | |
49
John Hancock family of funds
DOMESTIC EQUITY FUNDS Balanced Blue Chip Growth Classic Value Disciplined Value Disciplined Value Mid Cap Equity Income Fundamental All Cap Core Fundamental Large Cap Core Fundamental Large Cap Value Large Cap Equity New Opportunities Select Growth Small Cap Equity Small Cap Value Small Company Strategic Growth U.S. Equity U.S. Global Leaders Growth Value Equity GLOBAL/INTERNATIONAL FUNDS Disciplined Value International Emerging Markets Emerging Markets Equity Global Equity Global Shareholder Yield Greater China Opportunities International Core International Growth International Small Company International Value Equity | INCOME FUNDS Bond California Tax-Free Income Core High Yield Emerging Markets Debt Floating Rate Income Focused High Yield Global Income Government Income High Yield Municipal Bond Income Investment Grade Bond Money Market Short Duration Credit Opportunities Spectrum Income Strategic Income Opportunities Tax-Free Bond ALTERNATIVE/SPECIALTY FUNDS Absolute Return Currency Alternative Asset Allocation Enduring Assets Financial Industries Global Absolute Return Strategies Global Conservative Absolute Return Global Real Estate Natural Resources Redwood Regional Bank Seaport Technical Opportunities |
The fund's investment objectives, risks, charges, and expenses are included in the prospectus and should be considered carefully before investing. For a prospectus, contact your financial professional, call
John Hancock Investments at 800-225-5291, or visit the fund's website at jhinvestments.com. Please read the prospectus carefully before investing or sending money.
ASSET ALLOCATION PORTFOLIOS Income Allocation Fund Lifestyle Aggressive Portfolio Lifestyle Balanced Portfolio Lifestyle Conservative Portfolio Lifestyle Growth Portfolio Lifestyle Moderate Portfolio Retirement Choices Portfolios (2010-2055) Retirement Living Portfolios (2010-2055) Retirement Living II Portfolios (2010-2055) EXCHANGE-TRADED FUNDS John Hancock Multifactor Consumer Discretionary ETF John Hancock Multifactor Financials ETF John Hancock Multifactor Healthcare ETF John Hancock Multifactor Large Cap ETF John Hancock Multifactor Mid Cap ETF John Hancock Multifactor Technology ETF CLOSED-END FUNDS Financial Opportunities Hedged Equity & Income Income Securities Trust Investors Trust Preferred Income Preferred Income II Preferred Income III Premium Dividend Tax-Advantaged Dividend Income Tax-Advantaged Global Shareholder Yield |
"As an investment firm,
upholding the proud
tradition of John Hancock
comes down to one thing:
putting shareholders
first. We believe that if
our shareholders are
successful, then we will
be successful."
Andrew G. Arnott
President and Chief Executive Officer
John Hancock Investments
John Hancock Multifactor ETF shares are bought and sold at market price (not NAV), and are not individually redeemed
from the fund. Brokerage commissions will reduce returns.
John Hancock ETFs are distributed by Foreside Fund Services, LLC, and are subadvised by Dimensional Fund Advisors LP.
Foreside is not affiliated with John Hancock Funds, LLC or Dimensional Fund Advisors LP.
Dimensional Fund Advisors LP receives compensation from John Hancock in connection with licensing rights to the
John Hancock Dimensional indexes. Dimensional Fund Advisors LP does not sponsor, endorse, or sell, and makes no
representation as to the advisability of investing in, John Hancock Multifactor ETFs.
John Hancock Investments
A trusted brand
John Hancock Investments is a premier asset manager representing
one of America's most trusted brands, with a heritage of financial
stewardship dating back to 1862. Helping our shareholders pursue
their financial goals is at the core of everything we do. It's why we
support the role of professional financial advice and operate with the
highest standards of conduct and integrity.
A better way to invest
We build funds based on investor needs, then search the world to find
proven portfolio teams with specialized expertise in those strategies.
As a manager of managers, we apply vigorous oversight to ensure that
they continue to meet our uncompromising standards and serve the
best interests of our shareholders.
Results for investors
Our unique approach to asset management enables us to provide
a diverse set of investments backed by some of the world's best
managers, along with strong risk-adjusted returns across asset classes.
| | John Hancock Funds, LLC n Member FINRA, SIPC 601 Congress Street n Boston, MA 02210-2805 800-225-5291 n jhinvestments.com | |
| This report is for the information of the shareholders of John Hancock Classic Value Fund. It is not authorized for distribution to prospective investors unless preceded or accompanied by a prospectus. | ||
| MF230730 | 38A 10/15 12/15 | |
ITEM 2. CODE OF ETHICS.
As of the end of the period, October 31, 2015, the registrant has adopted a code of ethics, as defined in Item 2 of Form N-CSR, that applies to its Chief Executive Officer, Chief Financial Officer and Treasurer (respectively, the principal executive officer, the principal financial officer and the principal accounting officer, the “Senior Financial Officers”). A copy of the code of ethics is filed as an exhibit to this Form N-CSR.
ITEM 3. AUDIT COMMITTEE FINANCIAL EXPERT.
Peter S. Burgess is the audit committee financial expert and is “independent”, pursuant to general instructions on Form N-CSR Item 3.
ITEM 4. PRINCIPAL ACCOUNTANT FEES AND SERVICES.
(a) Audit Fees
The aggregate fees billed for professional services rendered by the principal accountant for the audits of the registrant’s annual financial statements or services that are normally provided by the accountant in connection with statutory and regulatory filings or engagements amounted to the following for the fiscal years ended October 31, 2015 and 2014. These fees were billed to the registrant and were approved by the registrant’s audit committee.
Fund | October 31, 2015 | October 31, 2014 |
John Hancock Classic Value Fund | $ 31,208 | $ 30,442 |
John Hancock U.S. Global Leaders Growth Fund | 29,352 | 28,630 |
Total | $ 60,560 | $ 59,072 |
(b) Audit-Related Services
Audit-related service fees for assurance and related services by the principal accountant are billed to the registrant or to the registrant's investment adviser (not including any sub-adviser whose role is primarily portfolio management and is subcontracted with or overseen by another investment adviser), and any entity controlling, controlled by, or under common control with the adviser (“control affiliates”) that provides ongoing services to the registrant. The nature of the services provided was affiliated service provider internal controls reviews.
Fund | October 31, 2015 | October 31, 2014 |
John Hancock Classic Value Fund | $ 594 | $ 557 |
John Hancock U.S. Global Leaders Growth Fund | 594 | 557 |
Total | $ 1,188 | $ 1,114 |
In addition, amounts billed to control affiliates for service provider internal controls reviews were $103,940 and $198,642 for the fiscal years ended October 31, 2015 and 2014, respectively.
(c) Tax Fees
The aggregate fees billed for professional services rendered by the principal accountant for tax compliance, tax advice and tax planning (“tax fees”) amounted to the following for the fiscal years ended October 31, 2015 and 2014. The nature of the services comprising the tax fees was the review of the registrant’s tax returns and tax distribution requirements. These fees were billed to the registrant and were approved by the registrant’s audit committee.
Fund | October 31, 2015 | October 31, 2014 |
John Hancock Classic Value Fund | $ 3,500 | $ 3,450 |
John Hancock U.S. Global Leaders Growth Fund | 3,500 | 3,450 |
Total | $ 7,000 | $ 6,900 |
(d) All Other Fees
Other fees billed for professional services rendered by the principal accountant to the registrant or to the control affiliates for the fiscal years ended October 31, 2015 and 2014 amounted to the following:
Fund | October 31, 2015 | October 31, 2014 |
John Hancock Classic Value Fund | $ 215 | $ 122 |
John Hancock U.S. Global Leaders Growth Fund | 215 | 122 |
Total | $ 430 | $ 244 |
(e)(1) Audit Committee Pre-Approval Policies and Procedures:
The trust’s Audit Committee must pre-approve all audit and non-audit services provided by the independent registered public accounting firm (the “Auditor”) relating to the operations or financial reporting of the funds. Prior to the commencement of any audit or non-audit services to a fund, the Audit Committee reviews the services to determine whether they are appropriate and permissible under applicable law.
The trust’s Audit Committee has adopted policies and procedures to, among other purposes, provide a framework for the Committee’s consideration of audit-related and non-audit services by the Auditor. The policies and procedures require that any audit-related and non-audit service provided by the Auditor and any non-audit service provided by the Auditor to a fund service provider that relates directly to the operations and financial reporting of a fund are subject to approval by the Audit Committee before such service is provided. Audit-related services provided by the Auditor that are expected to exceed $25,000 per instance/per fund are subject to specific pre-approval by the Audit Committee. Tax services provided by the Auditor that are expected to exceed $30,000 per instance/per fund are subject to specific pre-approval by the Audit Committee.
All audit services, as well as the audit-related and non-audit services that are expected to exceed the amounts stated above, must be approved in advance of provision of the service by formal resolution of the Audit Committee. At the regularly scheduled Audit Committee meetings, the Committee reviews a report summarizing the services, including fees, provided by the Auditor.
(e)(2) Services approved pursuant to paragraph (c)(7)(i)(C) of Rule 2-01 of Regulation S-X:
Audit-Related Fees, Tax Fees and All Other Fees:
There were no amounts that were approved by the Audit Committee pursuant to the de minimis exception under Rule 2-01 of Regulation S-X.
(f) According to the registrant’s principal accountant, for the fiscal period ended October 31, 2015, the percentage of hours spent on the audit of the registrant's financial statements for the most recent fiscal year that were attributed to work performed by persons who were not full-time, permanent employees of principal accountant was less than 50%.
(g) The aggregate non-audit fees billed by the registrant's accountant for non- audit services rendered to the registrant and rendered to the registrant's control affiliates for the fiscal years ended October 31, 2015 and 2014 amounted to the following:
Trust | October 31, 2015 | October 31, 2014 |
John Hancock Capital Series | $ 7,129,082 | $ 5,636,068 |
(h) The audit committee of the registrant has considered the non-audit services provided by the registrant’s principal accountant(s) to the control affiliates and has determined that the services that were not pre-approved are compatible with maintaining the principal accountant(s)' independence.
ITEM 5. AUDIT COMMITTEE OF LISTED REGISTRANTS.
The registrant has a separately-designated standing audit committee comprised of independent trustees. The members of the audit committee are as follows:
Peter S. Burgess - Chairman
Charles L. Bardelis
Theron S. Hoffman
ITEM 6. SCHEDULE OF INVESTMENTS.
(a)
Not applicable.
(b)
Not applicable.
ITEM 7. DISCLOSURE OF PROXY VOTING POLICIES AND PROCEDURES FOR CLOSED-END MANAGEMENT INVESTMENT COMPANIES.
Not applicable.
ITEM 8. PORTFOLIO MANAGERS OF CLOSED-END MANAGEMENT INVESTMENT COMPANIES.
Not applicable.
ITEM 9. PURCHASES OF EQUITY SECURITIES BY CLOSED-END MANAGEMENT INVESTMENT COMPANY AND AFFILIATED PURCHASERS.
Not applicable.
ITEM 10. SUBMISSION OF MATTERS TO A VOTE OF SECURITY HOLDERS.
There were no material changes to previously disclosed John Hancock Funds – Governance Committee Charter.
ITEM 11. CONTROLS AND PROCEDURES.
(a) Based upon their evaluation of the registrant's disclosure controls and procedures as conducted within 90 days of the filing date of this Form N-CSR, the registrant's principal executive officer and principal financial officer have concluded that those disclosure controls and procedures provide reasonable assurance that the material information required to be disclosed by the registrant on this report is recorded, processed, summarized and reported within the time periods specified in the Securities and Exchange Commission's rules and forms.
(b) There were no changes in the registrant's internal control over financial reporting that occurred during the registrant's most recent fiscal half-year (the registrant's second fiscal half-year in the case of an annual report) that have materially affected, or are reasonably likely to materially affect, the registrant's internal control over financial reporting.
ITEM 12. EXHIBITS.
(a)(1) Code of Ethics for Senior Financial Officers is attached.
(a)(2) Separate certifications for the registrant's principal executive officer and principal financial officer, as required by Section 302 of the Sarbanes-Oxley Act of 2002 and Rule 30a-2(a) under the Investment Company Act of 1940, are attached.
(b) Separate certifications for the registrant's principal executive officer and principal financial officer, as required by 18 U.S.C. Section 1350, as adopted pursuant to Section 906 of the Sarbanes-Oxley Act of 2002, and Rule 30a-2(b) under the Investment Company Act of 1940, are attached. The certifications furnished pursuant to this paragraph are not deemed to be "filed" for purposes of Section 18 of the Securities Exchange Act of 1934, or otherwise subject to the liability of that section. Such certifications are not deemed to be incorporated by reference into any filing under the Securities Act of 1933 or the Securities Exchange Act of 1934, except to the extent that the Registrant specifically incorporates them by reference.
(c)(1) Submission of Matters to a Vote of Security Holders is attached. See attached “John Hancock Funds – Governance Committee Charter”.
(c)(2) Contact person at the registrant.
SIGNATURES
Pursuant to the requirements of the Securities Exchange Act of 1934 and the Investment Company Act of 1940, the registrant has duly caused this report to be signed on its behalf by the undersigned, thereunto duly authorized.
John Hancock Capital Series
By:
/s/ Andrew Arnott
___________________________
Andrew Arnott
President
Date: December 17, 2015
Pursuant to the requirements of the Securities Exchange Act of 1934 and the Investment Company Act of 1940, this report has been signed below by the following persons on behalf of the registrant and in the capacities and on the dates indicated.
By:
/s/ Andrew Arnott
___________________________
Andrew Arnott
President
Date: December 17, 2015
By:
/s/ Charles A. Rizzo
___________________________
Charles A. Rizzo
Chief Financial Officer
Date: December 17, 2015