UNITED STATES
SECURITIES AND EXCHANGE COMMISSION
Washington, D.C. 20549
FORM N-CSR
CERTIFIED SHAREHOLDER REPORT OF REGISTERED
MANAGEMENT INVESTMENT COMPANIES
Investment Company Act file number 811-1677
John Hancock Capital Series
(Exact name of registrant as specified in charter)
601 Congress Street, Boston, Massachusetts 02210
(Address of principal executive offices) (Zip code)
Salvatore Schiavone
Treasurer
601 Congress Street
Boston, Massachusetts 02210
(Name and address of agent for service) | |
Registrant's telephone number, including area code: 617-663-4497 | |
| Date of fiscal year end: | October 31 |
| Date of reporting period: | October 31, 2017 |
ITEM 1. REPORTS TO STOCKHOLDERS.
John Hancock
U.S. Global Leaders Growth Fund
Annual report 10/31/17


A message to shareholders
Dear shareholder,
Wherever stock investors look today, the markets seem to exhibit undiminished strength, as evidenced by the fact that the Dow Jones Industrial Average, the S&P 500 Index, and the NASDAQ Composite Index reached and then surpassed all-time highs several times during the period. Economic and corporate data has continued to underpin investor optimism. Corporate earnings have generally been solid, with a weaker dollar helping to boost results for U.S.-based multinationals.
While stock markets continue their rise, investors have reason to be vigilant. U.S. stocks haven't experienced a drop of 10% in more than 21 months, and 16 months have passed since the last 5% pullback. This degree of calm in a rising market is rare, and history suggests stormier market conditions could be brewing. As the bull market advances, many stocks are moving deeper into overvalued territory, suggesting that market leaders could be vulnerable to any setbacks.
Given the risks of overvaluation, investors would do well to consider their options for diversification. Maintaining a diversified portfolio of stocks, bonds, and alternatives, alongside a disciplined investment program, is one approach that has stood the test of time. As always, your best resource to prepare for any market condition is your financial advisor, who can help ensure your portfolio is sufficiently diversified to meet your long-term objectives and to withstand the inevitable disappointments that can interrupt any market rise.
On behalf of everyone at John Hancock Investments, I'd like to take this opportunity to welcome new shareholders and to thank existing shareholders for the continued trust you've placed in us.
Sincerely,

Andrew G. Arnott
President and Chief Executive Officer
John Hancock Investments
This commentary reflects the CEO's views, which are subject to change at any time. Investing involves risks, including the potential loss of principal. Diversification does not guarantee a profit or eliminate the risk of a loss. It is not possible to invest directly into an index. For more up-to-date information, please visit our website at jhinvestments.com.
John Hancock
U.S. Global Leaders Growth Fund
Table of contents
| 2 | Your fund at a glance | |
| 4 | Discussion of fund performance | |
| 8 | A look at performance | |
| 10 | Your expenses | |
| 12 | Fund's investments | |
| 14 | Financial statements | |
| 17 | Financial highlights | |
| 23 | Notes to financial statements | |
| 29 | Auditor's report | |
| 30 | Tax information | |
| 31 | Continuation of investment advisory and subadvisory agreements | |
| 37 | Trustees and Officers | |
| 41 | More information |
INVESTMENT OBJECTIVE
The fund seeks long-term growth of capital.
AVERAGE ANNUAL TOTAL RETURNS AS OF 10/31/17 (%)
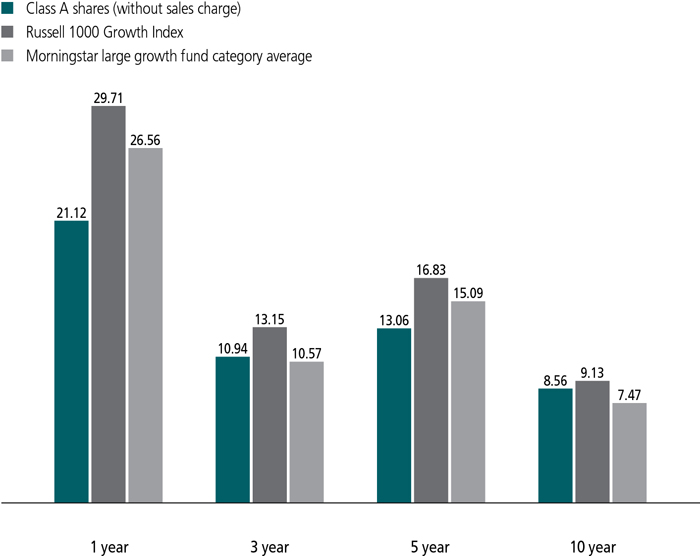
The Russell 1000 Growth Index is an unmanaged index of companies in the Russell 1000 Index (the 1,000 largest U.S. publicly traded companies) with high price-to-book ratios and higher forecasted growth values.
It is not possible to invest directly in an index. Index figures do not reflect expenses or sales charges, which would result in lower returns.
Figures from Morningstar, Inc. include reinvested distributions and do not take into account sales charges. Actual load-adjusted performance is lower.
The past performance shown here reflects reinvested distributions and the beneficial effect of any expense reductions, and does not guarantee future results. Performance of the other share classes will vary based on the difference in the fees and expenses of those classes. Shares will fluctuate in value and, when redeemed, may be worth more or less than their original cost. Current month-end performance may be lower or higher than the performance cited, and can be found at jhinvestments.com or by calling 800-225-5291. For further information on the fund's objectives, risks, and strategy, see the fund's prospectus.
PERFORMANCE HIGHLIGHTS OVER THE LAST TWELVE MONTHS
Outsize gains for stocks
U.S. stocks enjoyed a robust rally as optimism about an improving global economic environment led to stronger corporate earnings growth.
The fund delivered strong absolute performance
The fund delivered a strong return for the period, but trailed the performance of its benchmark, the Russell 1000 Growth Index.
Stock selection and an energy overweight detracted
The fund's underperformance of its benchmark was driven primarily by an overweight position in the energy sector and stock selection in the information technology and consumer discretionary sectors.
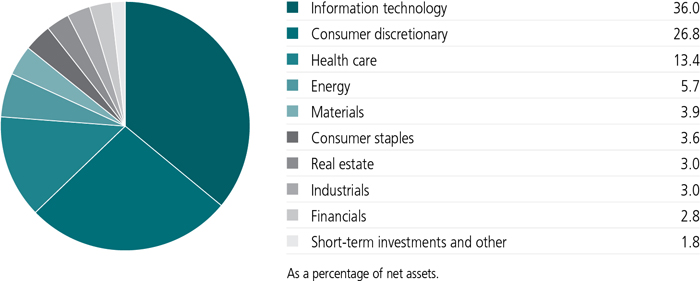
SECTOR COMPOSITION AS OF 10/31/17 (%)
A note about risks
Growth stocks may be more susceptible to earnings disappointments as compared with value stocks, and market values can be more volatile. Large company stocks could fall out of favor. Foreign investing has additional risks, such as currency and market volatility and political and social instability. A portfolio concentrated in one sector or that holds a limited number of securities may fluctuate more than a diversified portfolio. Investments in a non-diversified fund may magnify the fund's losses from adverse events affecting a particular issuer. Please see the fund's prospectus for additional risks.
An interview with Portfolio Manager Gordon M. Marchand, CPA, CFA, CIC, Sustainable Growth Advisers, LP

Gordon M. Marchand, CPA, CFA, CIC
Portfolio Manager
Sustainable Growth Advisors
Can you provide an overview of the U.S. equity market during the 12 months ended October 31, 2017?
The U.S. equity market had a very strong period of performance. The initial catalyst for the stock market rally was the outcome of the 2016 presidential election, as investors reacted with enthusiasm to the pro-business policies expected from the new administration and Congress. These included potentially lower taxes, reduced regulation, and a significant investment in projects to upgrade the country's infrastructure.
With regulatory changes in progress and hope for a tax overhaul on the horizon, U.S. stocks remained on an upward trajectory through the end of the reporting period. Improving economic conditions, both in the United States and globally, contributed to stronger corporate earnings growth, providing an additional catalyst for the market's rally.
For the period, the broad S&P 500 Index returned 23.63%. Growth stocks outperformed as the fund's benchmark, the Russell 1000 Growth Index, returned 29.71%. Market leadership was fairly narrow, led by economically sensitive sectors, such as information technology and industrials, as well as sectors expected to benefit from anticipated regulatory relief, such as financials.
How did the fund perform?
The fund's Class A shares returned a strong 21.12% (excluding sales charges), but trailed the performance of the benchmark. Most of the fund's underperformance occurred late in the reporting period, when the U.S. equity market experienced historically low volatility levels and the narrowest dispersion of individual stock returns in decades. Taken together, these trends indicated a high degree of investor complacency and little differentiation between individual stocks, which presented a headwind for our investment approach.
In addition, we trimmed or sold positions in several less attractively valued stocks with high price momentum, reallocating the capital into stocks that we expect to provide more attractive returns over a three- to five-year time horizon. In a rising market environment characterized by strong price momentum, these decisions weighed on relative performance.
What contributed the most to the fund's underperformance of its benchmark?
Stock selection in the consumer discretionary and information technology sectors detracted the most compared with the index, the most notable being restaurant chain Chipotle Mexican Grill, Inc. Chipotle was one of the top contributors to fund performance during the first half of the reporting period as the company enjoyed a faster-than-expected sales recovery following a high-profile E. coli outbreak in late 2015. However, a norovirus outbreak at one of its restaurants in July led to renewed concerns about food safety. Chipotle confirmed that the isolated outbreak was not the result of foodborne bacteria, but rather because the restaurant's managers failed to follow the company's food safety protocols. Nonetheless, this episode led to heightened concerns about Chipotle's ability to attract customers back, which put downward pressure on the stock. In our view, decisive, corrective actions were taken by the company in this case, and they recently announced they were searching for a new CEO.
Another meaningful detractor was snack food maker Mondelez International, Inc. The unexpected retirement of the company's CEO and weaker-than-expected sales, particularly in North America, weighed on the stock during the reporting period. Our research indicates that the company's efficiency initiatives to enhance its profit margins, the introduction of healthier products, and continued sales strength outside of the United States should be positive catalysts for the stock going forward.
TOP 10 HOLDINGS AS OF 10/31/17 (%)
| salesforce.com, Inc. | 4.3 |
| Facebook, Inc., Class A | 4.2 |
| Visa, Inc., Class A | 4.1 |
| FleetCor Technologies, Inc. | 4.1 |
| NIKE, Inc., Class B | 4.0 |
| The Priceline Group, Inc. | 3.9 |
| Ecolab, Inc. | 3.9 |
| Alphabet, Inc., Class C | 3.7 |
| UnitedHealth Group, Inc. | 3.7 |
| Mondelez International, Inc., Class A | 3.6 |
| TOTAL | 39.5 |
| As a percentage of net assets. | |
| Cash and cash equivalents are not included. | |
Beauty products retailer Ulta Beauty, Inc., a new portfolio holding during the period, was also a significant performance detractor. The stock was penalized for its moderating growth forecast in a challenging environment for the retail industry. We continue to view Ulta as an attractive sustainable growth opportunity as the company continues to gain market share, launch unique new brands, and build its e-commerce offerings to drive future growth.
What fund holdings contributed positively to performance during the period?
One of the top contributors to the fund's absolute return was social media company Facebook, Inc., which continued to benefit from strong user engagement across its key social media platforms and its ability to increase revenues from advertising on those platforms. While the company faces some deceleration in its short-term results due to investments in video content and other initiatives, we continue to have confidence in Facebook's long-term growth opportunities. We trimmed the position on strength early in the period, then subsequently added to it on weakness later in the period.
Another leading contributor was natural foods grocery retailer Whole Foods Market, Inc. The stock rallied sharply after the company agreed to be acquired by Amazon.com, Inc. (another fund holding) in June. We trimmed the fund's position in the stock significantly following the acquisition announcement, and with no competing bids emerging, we sold the remaining shares prior to the acquisition's completion in August.
Other important contributors included two software makers, Autodesk, Inc. and Red Hat, Inc. Autodesk, a new holding during the reporting period, produces AutoCAD, a pioneering design and engineering software platform, but also offers a broad range of media and entertainment software. Consistent with industry trends, the company is transitioning from a conventional license-based revenue model to a software as a service (SaaS) revenue model, which will significantly increase the repeatability of revenues and thereby improve the quality of the business over the long term. The stock rallied during the period as Autodesk announced significant progress toward its new business model.
Red Hat, which provides open-source enterprise software products, has already successfully
converted to an SaaS business model. The company consistently exceeded earnings expectations during the period thanks to robust sales growth and improving profit margins.
What changes did you make to the portfolio during the reporting period?
In addition to Whole Foods, we sold biotechnology firm Amgen, Inc., consumer electronics giant Apple, Inc., household products maker Colgate-Palmolive Company, and railroad operator Kansas City Southern.
Along with Autodesk and Ulta Beauty, we initiated positions in three new investment opportunities. We added two of them early in the period—healthcare services provider UnitedHealth Group, Inc. and intermodal transportation company J.B. Hunt Transport Services, Inc. UnitedHealth is well positioned to benefit from the size and scale of its network, which encompasses an integrated physician system and a pharmacy benefit manager, while J.B. Hunt is a leading transportation and logistics company that should benefit from headwinds facing the long-haul trucking industry.
Off-price apparel and home products retailer The TJX Companies, Inc. was added to the portfolio late in the reporting period. The stock came under pressure amid concerns about Amazon.com's impact on the retail industry, but we believe TJX has unique characteristics that make the company less susceptible to e-commerce competition.
As we reallocate capital toward out-of-favor companies where we see attractive long-term growth potential, we are confident in the ability of our approach to generate returns commensurate with the strong earnings and cash flow growth of our portfolio companies over time.
MANAGED BY
 | George P. Fraise On the fund since 2000 Investing since 1987 |
| | Gordon M. Marchand, CPA, CFA, CIC On the fund since 1995 Investing since 1977 |
 | Robert L. Rohn On the fund since 2003 Investing since 1983 |
![]()
TOTAL RETURNS FOR THE PERIOD ENDED OCTOBER 31, 2017
| Average annual total returns (%) with maximum sales charge | Cumulative total returns (%) with maximum sales charge | ||||||
| 1-year | 5-year | 10-year | 5-year | 10-year | |||
| Class A | 15.06 | 11.91 | 8.00 | 75.52 | 115.92 | ||
| Class B | 15.22 | 11.96 | 7.91 | 75.92 | 114.01 | ||
| Class C | 19.21 | 12.21 | 7.75 | 77.93 | 110.89 | ||
| Class I1 | 21.44 | 13.37 | 8.94 | 87.27 | 135.52 | ||
| Class R21,2 | 20.93 | 12.93 | 8.46 | 83.68 | 125.30 | ||
| Class R61,2 | 21.56 | 13.49 | 8.99 | 88.30 | 136.44 | ||
| Index 1† | 29.71 | 16.83 | 9.13 | 117.63 | 139.64 | ||
| Index 2† | 23.63 | 15.18 | 7.51 | 102.72 | 106.38 | ||
Performance figures assume all distributions have been reinvested. Figures reflect maximum sales charges on Class A shares of 5% and the applicable contingent deferred sales charge (CDSC) on Class B and Class C shares. The Class B shares' CDSC declines annually between years 1 to 6 according to the following schedule: 5%, 4%, 3%, 3%, 2%, 1%. No sales charge will be assessed after the sixth year. Class C shares sold within one year of purchase are subject to a 1% CDSC. Sales charges are not applicable to Class I, Class R2, and Class R6 shares.
The expense ratios of the fund, both net (including any fee waivers and/or expense limitations) and gross (excluding any fee waivers and/or expense limitations), are set forth according to the most recent publicly available prospectus for the fund and may differ from those disclosed in the Financial highlights tables in this report. The expense ratios are as follows:
| Class A | Class B | Class C | Class I | Class R2 | Class R6 | ||
| Gross/Net (%) | 1.18 | 1.93 | 1.93 | 0.92 | 1.32 | 0.82 |
Please refer to the most recent prospectus and annual or semiannual report for more information on expenses and any expense limitation arrangements for each class.
The returns reflect past results and should not be considered indicative of future performance. The return and principal value of an investment will fluctuate so that shares, when redeemed, may be worth more or less than their original cost. Due to market volatility and other factors, the fund's current performance may be higher or lower than the performance shown. For current to the most recent month-end performance data, please call 800-225-5291 or visit the fund's website at jhinvestments.com.
The performance table above and the chart on the next page do not reflect the deduction of taxes that a shareholder would pay on fund distributions or the redemption of fund shares. The fund's performance results reflect any applicable fee waivers or expense reductions, without which the expenses would increase and results would have been less favorable.
| † | Index 1 is the Russell 1000 Growth Index; Index 2 is the S&P 500 Index. |
See the following page for footnotes.
This chart and table show what happened to a hypothetical $10,000 investment in John Hancock U.S. Global Leaders Growth Fund for the share classes and periods indicated, assuming all distributions were reinvested. For comparison, we've shown the same investment in two separate indexes.
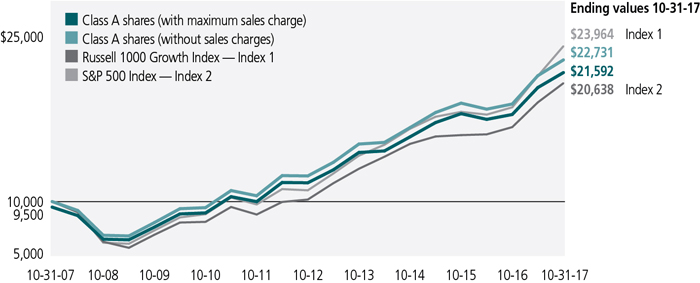
The Russell 1000 Growth Index is an unmanaged index of companies in the Russell 1000 Index (the 1,000 largest U.S. publicly traded companies) with high price-to-book ratios and higher forecasted growth values.
The S&P 500 Index is an unmanaged index that includes 500 widely traded common stocks.
It is not possible to invest directly in an index. Index figures do not reflect expenses or sales charges, which would result in lower returns.
Footnotes related to performance pages
| 1 | For certain types of investors, as described in the fund's prospectus. |
| 2 | Class R2 and Class R6 shares were first offered on 3-1-12 and 9-1-11, respectively. The returns prior to these dates are those of Class A shares that have been recalculated to apply the gross fees and expenses of Class R2 and Class R6 shares, as applicable. |
| 3 | The contingent deferred sales charge is not applicable. |
These examples are intended to help you understand your ongoing operating expenses of investing in the fund so you can compare these costs with the ongoing costs of investing in other mutual funds.
Understanding fund expenses
As a shareholder of the fund, you incur two types of costs:
| • | Transaction costs, which include sales charges (loads) on purchases or redemptions (varies by share class), minimum account fee charge, etc. |
| • | Ongoing operating expenses, including management fees, distribution and service fees (if applicable), and other fund expenses. |
We are presenting only your ongoing operating expenses here.
Actual expenses/actual returns
The first line of each share class in the table on the following page is intended to provide information about the fund's actual ongoing operating expenses, and is based on the fund's actual return. It assumes an account value of $1,000.00 on May 1, 2017, with the same investment held until October 31, 2017.
Together with the value of your account, you may use this information to estimate the operating expenses that you paid over the period. Simply divide your account value at October 31, 2017, by $1,000.00, then multiply it by the "expenses paid" for your share class from the table. For example, for an account value of $8,600.00, the operating expenses should be calculated as follows:
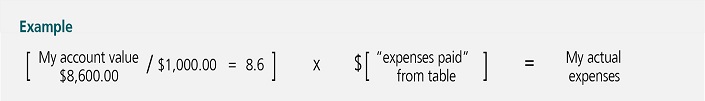
Hypothetical example for comparison purposes
The second line of each share class in the table on the following page allows you to compare the fund's ongoing operating expenses with those of any other fund. It provides an example of the fund's hypothetical account values and hypothetical expenses based on each class's actual expense ratio and an assumed 5% annualized return before expenses (which is not the fund's actual return). It assumes an account value of $1,000.00 on May 1, 2017, with the same investment held until October 31, 2017. Look in any other fund shareholder report to find its hypothetical example and you will be able to compare these expenses. Please remember that these hypothetical account values and expenses may not be used to estimate the actual ending account balance or expenses you paid for the period.
Remember, these examples do not include any transaction costs, therefore, these examples will not help you to determine the relative total costs of owning different funds. If transaction costs were included, your expenses would have been higher. See the prospectus for details regarding transaction costs.
SHAREHOLDER EXPENSE EXAMPLE CHART
| Account value on 5-1-2017 | Ending value on 10-31-2017 | Expenses paid during period ended 10-31-20171 | Annualized expense ratio | ||
| Class A | Actual expenses/actual returns | $1,000.00 | $1,066.50 | $6.04 | 1.16% |
| Hypothetical example for comparison purposes | 1,000.00 | 1,019.40 | 5.90 | 1.16% | |
| Class B | Actual expenses/actual returns | 1,000.00 | 1,062.30 | 9.93 | 1.91% |
| Hypothetical example for comparison purposes | 1,000.00 | 1,015.60 | 9.70 | 1.91% | |
| Class C | Actual expenses/actual returns | 1,000.00 | 1,062.30 | 9.93 | 1.91% |
| Hypothetical example for comparison purposes | 1,000.00 | 1,015.60 | 9.70 | 1.91% | |
| Class I | Actual expenses/actual returns | 1,000.00 | 1,067.80 | 4.69 | 0.90% |
| Hypothetical example for comparison purposes | 1,000.00 | 1,020.70 | 4.58 | 0.90% | |
| Class R2 | Actual expenses/actual returns | 1,000.00 | 1,065.50 | 6.82 | 1.31% |
| Hypothetical example for comparison purposes | 1,000.00 | 1,018.60 | 6.67 | 1.31% | |
| Class R6 | Actual expenses/actual returns | 1,000.00 | 1,068.40 | 4.22 | 0.81% |
| Hypothetical example for comparison purposes | 1,000.00 | 1,021.10 | 4.13 | 0.81% | |
| 1 | Expenses are equal to the annualized expense ratio, multiplied by the average account value over the period, multiplied by 184/365 (to reflect the one-half year period). |
| Fund’s investments |
| Shares | Value | ||||
| Common stocks 98.2% | $1,431,184,976 | ||||
| (Cost $989,041,327) | |||||
| Consumer discretionary 26.8% | 390,572,340 | ||||
| Hotels, restaurants and leisure 6.0% | |||||
| Chipotle Mexican Grill, Inc. (A)(B) | 161,042 | 43,787,320 | |||
| Starbucks Corp. | 787,593 | 43,191,600 | |||
| Internet and direct marketing retail 7.3% | |||||
| Amazon.com, Inc. (A) | 45,144 | 49,896,760 | |||
| The Priceline Group, Inc. (A) | 30,045 | 57,444,838 | |||
| Specialty retail 9.5% | |||||
| Lowe's Companies, Inc. | 624,884 | 49,959,476 | |||
| The TJX Companies, Inc. | 610,688 | 42,626,022 | |||
| Ulta Beauty, Inc. (A) | 227,299 | 45,866,665 | |||
| Textiles, apparel and luxury goods 4.0% | |||||
| NIKE, Inc., Class B | 1,051,094 | 57,799,659 | |||
| Consumer staples 3.6% | 53,103,068 | ||||
| Food products 3.6% | |||||
| Mondelez International, Inc., Class A | 1,281,754 | 53,103,068 | |||
| Energy 5.7% | 83,718,919 | ||||
| Energy equipment and services 5.7% | |||||
| Core Laboratories NV (B) | 417,487 | 41,706,951 | |||
| Schlumberger, Ltd. | 656,437 | 42,011,968 | |||
| Financials 2.8% | 40,680,468 | ||||
| Capital markets 2.8% | |||||
| State Street Corp. | 442,179 | 40,680,468 | |||
| Health care 13.4% | 194,539,096 | ||||
| Biotechnology 3.3% | |||||
| Regeneron Pharmaceuticals, Inc. (A) | 118,435 | 47,684,300 | |||
| Health care providers and services 3.7% | |||||
| UnitedHealth Group, Inc. | 254,254 | 53,449,276 | |||
| Health care technology 3.3% | |||||
| Cerner Corp. (A) | 720,061 | 48,618,519 | |||
| Pharmaceuticals 3.1% | |||||
| Novo Nordisk A/S, ADR (B) | 899,518 | 44,787,001 | |||
| Industrials 3.0% | 43,211,575 | ||||
| Road and rail 3.0% | |||||
| J.B. Hunt Transport Services, Inc. | 406,162 | 43,211,575 | |||
| 12 | JOHN HANCOCK U.S. Global Leaders Growth Fund | ANNUAL REPORT | SEE NOTES TO FINANCIAL STATEMENTS |
| Shares | Value | ||||
| Information technology 36.0% | $524,344,326 | ||||
| Internet software and services 7.9% | |||||
| Alphabet, Inc., Class C (A) | 52,638 | 53,513,896 | |||
| Facebook, Inc., Class A (A) | 343,825 | 61,909,130 | |||
| IT services 13.7% | |||||
| Alliance Data Systems Corp. | 195,360 | 43,707,893 | |||
| Automatic Data Processing, Inc. | 316,883 | 36,840,818 | |||
| FleetCor Technologies, Inc. (A) | 357,210 | 59,036,097 | |||
| Visa, Inc., Class A | 538,643 | 59,239,957 | |||
| Software 14.4% | |||||
| Autodesk, Inc. (A) | 378,478 | 47,294,611 | |||
| Red Hat, Inc. (A) | 437,448 | 52,856,842 | |||
| salesforce.com, Inc. (A) | 606,083 | 62,026,534 | |||
| SAP SE, ADR (B) | 419,602 | 47,918,548 | |||
| Materials 3.9% | 57,171,328 | ||||
| Chemicals 3.9% | |||||
| Ecolab, Inc. | 437,558 | 57,171,328 | |||
| Real estate 3.0% | 43,843,856 | ||||
| Equity real estate investment trusts 3.0% | |||||
| Equinix, Inc. | 94,593 | 43,843,856 | |||
| Yield (%) | Shares | Value | |||
| Securities lending collateral 6.7% | $98,141,028 | ||||
| (Cost $98,140,190) | |||||
| John Hancock Collateral Trust (C) | 1.1946(D) | 9,808,610 | 98,141,028 | ||
| Short-term investments 1.8% | $25,423,054 | ||||
| (Cost $25,423,054) | |||||
| Money market funds 1.8% | 25,423,054 | ||||
| State Street Institutional U.S. Government Money Market Fund, Premier Class | 0.9569(D) | 25,423,054 | 25,423,054 | ||
| Total investments (Cost $1,112,604,571) 106.7% | $1,554,749,058 | ||||
| Other assets and liabilities, net (6.7%) | (97,081,431) | ||||
| Total net assets 100.0% | $1,457,667,627 | ||||
| The percentage shown for each investment category is the total value of the category as a percentage of the net assets of the fund. | |
| Security Abbreviations and Legend | |
| ADR | American Depositary Receipt |
| (A) | Non-income producing security. |
| (B) | A portion of this security is on loan as of 10-31-17. |
| (C) | Investment is an affiliate of the fund, the advisor and/or subadvisor. This security represents the investment of cash collateral received for securities lending. |
| (D) | The rate shown is the annualized seven-day yield as of 10-31-17. |
| SEE NOTES TO FINANCIAL STATEMENTS | ANNUAL REPORT | JOHN HANCOCK U.S. Global Leaders Growth Fund | 13 |
Financial statements
STATEMENT OF ASSETS AND LIABILITIES 10-31-17
| Assets | |||||||||||||||||||
| Unaffiliated investments, at value (Cost $1,014,464,381) including $96,179,846 of securities loaned | $1,456,608,030 | ||||||||||||||||||
| Affiliated investments, at value (Cost $98,140,190) | 98,141,028 | ||||||||||||||||||
| Receivable for fund shares sold | 2,890,632 | ||||||||||||||||||
| Dividends and interest receivable | 689,407 | ||||||||||||||||||
| Receivable for securities lending income | 30,584 | ||||||||||||||||||
| Other receivables and prepaid expenses | 149,923 | ||||||||||||||||||
| Total assets | 1,558,509,604 | ||||||||||||||||||
| Liabilities | |||||||||||||||||||
| Payable for fund shares repurchased | 1,189,230 | ||||||||||||||||||
| Payable upon return of securities loaned | 98,155,132 | ||||||||||||||||||
| Payable to affiliates | |||||||||||||||||||
| Accounting and legal services fees | 22,087 | ||||||||||||||||||
| Transfer agent fees | 136,414 | ||||||||||||||||||
| Distribution and service fees | 225,601 | ||||||||||||||||||
| Trustees' fees | 843 | ||||||||||||||||||
| Investment management fees | 912,458 | ||||||||||||||||||
| Other liabilities and accrued expenses | 200,212 | ||||||||||||||||||
| Total liabilities | 100,841,977 | ||||||||||||||||||
| Net assets | $1,457,667,627 | ||||||||||||||||||
| Net assets consist of | |||||||||||||||||||
| Paid-in capital | $919,267,919 | ||||||||||||||||||
| Accumulated net realized gain (loss) on investments | 96,255,221 | ||||||||||||||||||
| Net unrealized appreciation (depreciation) on investments | 442,144,487 | ||||||||||||||||||
| Net assets | $1,457,667,627 | ||||||||||||||||||
| Net asset value per share | |||||||||||||||||||
| Based on net asset values and shares outstanding-the fund has an unlimited number of shares authorized with no par value | |||||||||||||||||||
| Class A ($577,415,800 ÷ 12,246,976 shares)1 | $47.15 | ||||||||||||||||||
| Class B ($15,566,066 ÷ 383,695 shares)1 | $40.57 | ||||||||||||||||||
| Class C ($102,490,813 ÷ 2,525,170 shares)1 | $40.59 | ||||||||||||||||||
| Class I ($751,076,220 ÷ 14,947,383 shares) | $50.25 | ||||||||||||||||||
| Class R2 ($5,445,123 ÷ 110,040 shares) | $49.48 | ||||||||||||||||||
| Class R6 ($5,673,605 ÷ 112,426 shares) | $50.47 | ||||||||||||||||||
| Maximum offering price per share | |||||||||||||||||||
| Class A (net asset value per share ÷ 95%)2 | $49.63 | ||||||||||||||||||
| 1 | Redemption price per share is equal to net asset value less any applicable contingent deferred sales charge. | ||||||||||||||||
| 2 | On single retail sales of less than $50,000. On sales of $50,000 or more and on group sales the offering price is reduced. | ||||||||||||||||
STATEMENT OF OPERATIONS For the year ended 10-31-17
| Investment income | ||||||||||||||||||||||||
| Dividends | $13,057,210 | |||||||||||||||||||||||
| Securities lending | 575,032 | |||||||||||||||||||||||
| Interest | 232,923 | |||||||||||||||||||||||
| Less foreign taxes withheld | (389,071 | ) | ||||||||||||||||||||||
| Total investment income | 13,476,094 | |||||||||||||||||||||||
| Expenses | ||||||||||||||||||||||||
| Investment management fees | 9,529,997 | |||||||||||||||||||||||
| Distribution and service fees | 2,743,717 | |||||||||||||||||||||||
| Accounting and legal services fees | 303,674 | |||||||||||||||||||||||
| Transfer agent fees | 1,447,470 | |||||||||||||||||||||||
| Trustees' fees | 19,707 | |||||||||||||||||||||||
| State registration fees | 169,302 | |||||||||||||||||||||||
| Printing and postage | 164,342 | |||||||||||||||||||||||
| Professional fees | 67,538 | |||||||||||||||||||||||
| Custodian fees | 150,468 | |||||||||||||||||||||||
| Other | 31,028 | |||||||||||||||||||||||
| Total expenses | 14,627,243 | |||||||||||||||||||||||
| Less expense reductions | (103,605 | ) | ||||||||||||||||||||||
| Net expenses | 14,523,638 | |||||||||||||||||||||||
| Net investment loss | (1,047,544 | ) | ||||||||||||||||||||||
| Realized and unrealized gain (loss) | ||||||||||||||||||||||||
| Net realized gain (loss) on | ||||||||||||||||||||||||
| Unaffiliated investments | 101,006,253 | |||||||||||||||||||||||
| Affiliated investments | (6,970 | ) | ||||||||||||||||||||||
| 100,999,283 | ||||||||||||||||||||||||
| Change in net unrealized appreciation (depreciation) of | ||||||||||||||||||||||||
| Unaffiliated investments | 142,943,267 | |||||||||||||||||||||||
| Affiliated investments | (4,987 | ) | ||||||||||||||||||||||
| 142,938,280 | ||||||||||||||||||||||||
| Net realized and unrealized gain | 243,937,563 | |||||||||||||||||||||||
| Increase in net assets from operations | $242,890,019 | |||||||||||||||||||||||
STATEMENTS OF CHANGES IN NET ASSETS
| Year ended 10-31-17 | Year ended 10-31-16 | ||||||||||||||||||||||||||||||||||||||||||||
| Increase (decrease) in net assets | |||||||||||||||||||||||||||||||||||||||||||||
| From operations | |||||||||||||||||||||||||||||||||||||||||||||
| Net investment loss | ($1,047,544 | ) | ($1,144,529 | ) | |||||||||||||||||||||||||||||||||||||||||
| Net realized gain | 100,999,283 | 55,066,722 | |||||||||||||||||||||||||||||||||||||||||||
| Change in net unrealized appreciation (depreciation) | 142,938,280 | (56,696,388 | ) | ||||||||||||||||||||||||||||||||||||||||||
| Increase (decrease) in net assets resulting from operations | 242,890,019 | (2,774,195 | ) | ||||||||||||||||||||||||||||||||||||||||||
| Distributions to shareholders | |||||||||||||||||||||||||||||||||||||||||||||
| From net investment income | |||||||||||||||||||||||||||||||||||||||||||||
| Class A | — | (611,227 | ) | ||||||||||||||||||||||||||||||||||||||||||
| Class I | — | (649,619 | ) | ||||||||||||||||||||||||||||||||||||||||||
| Class R2 | — | (1,179 | ) | ||||||||||||||||||||||||||||||||||||||||||
| Class R6 | — | (15,106 | ) | ||||||||||||||||||||||||||||||||||||||||||
| From net realized gain | |||||||||||||||||||||||||||||||||||||||||||||
| Class A | (30,348,038 | ) | (39,991,908 | ) | |||||||||||||||||||||||||||||||||||||||||
| Class B | (1,064,374 | ) | (1,624,153 | ) | |||||||||||||||||||||||||||||||||||||||||
| Class C | (6,633,373 | ) | (9,409,465 | ) | |||||||||||||||||||||||||||||||||||||||||
| Class I | (15,554,816 | ) | (17,083,682 | ) | |||||||||||||||||||||||||||||||||||||||||
| Class R2 | (299,904 | ) | (387,928 | ) | |||||||||||||||||||||||||||||||||||||||||
| Class R6 | (253,662 | ) | (311,313 | ) | |||||||||||||||||||||||||||||||||||||||||
| Total distributions | (54,154,167 | ) | (70,085,580 | ) | |||||||||||||||||||||||||||||||||||||||||
| From fund share transactions | 200,952,038 | 14,569,577 | |||||||||||||||||||||||||||||||||||||||||||
| Total increase (decrease) | 389,687,890 | (58,290,198 | ) | ||||||||||||||||||||||||||||||||||||||||||
| Net assets | |||||||||||||||||||||||||||||||||||||||||||||
| Beginning of year | 1,067,979,737 | 1,126,269,935 | |||||||||||||||||||||||||||||||||||||||||||
| End of year | $1,457,667,627 | $1,067,979,737 | |||||||||||||||||||||||||||||||||||||||||||
Financial highlights
| Class A Shares Period ended | 10-31-17 | 10-31-16 | 10-31-15 | 10-31-14 | 10-31-13 | ||||||||||||||||||||||||||||||||||||||||||||||||||||||||||||||||||||||||||||||||||||||||||||||||||
| Per share operating performance | |||||||||||||||||||||||||||||||||||||||||||||||||||||||||||||||||||||||||||||||||||||||||||||||||||||||
| Net asset value, beginning of period | $41.00 | $43.87 | $45.02 | $42.25 | $35.04 | ||||||||||||||||||||||||||||||||||||||||||||||||||||||||||||||||||||||||||||||||||||||||||||||||||
| Net investment income (loss)1 | (0.05 | ) | (0.03 | ) | 0.07 | 0.11 | 0.04 | ||||||||||||||||||||||||||||||||||||||||||||||||||||||||||||||||||||||||||||||||||||||||||||||||
| Net realized and unrealized gain (loss) on investments | 8.31 | (0.13 | ) | 4.98 | 3.90 | 7.96 | |||||||||||||||||||||||||||||||||||||||||||||||||||||||||||||||||||||||||||||||||||||||||||||||||
| Total from investment operations | 8.26 | (0.16 | ) | 5.05 | 4.01 | 8.00 | |||||||||||||||||||||||||||||||||||||||||||||||||||||||||||||||||||||||||||||||||||||||||||||||||
| Less distributions | |||||||||||||||||||||||||||||||||||||||||||||||||||||||||||||||||||||||||||||||||||||||||||||||||||||||
| From net investment income | — | (0.04 | ) | (0.10 | ) | (0.03 | ) | — | |||||||||||||||||||||||||||||||||||||||||||||||||||||||||||||||||||||||||||||||||||||||||||||||
| From net realized gain | (2.11 | ) | (2.67 | ) | (6.10 | ) | (1.21 | ) | (0.79 | ) | |||||||||||||||||||||||||||||||||||||||||||||||||||||||||||||||||||||||||||||||||||||||||||||
| Total distributions | (2.11 | ) | (2.71 | ) | (6.20 | ) | (1.24 | ) | (0.79 | ) | |||||||||||||||||||||||||||||||||||||||||||||||||||||||||||||||||||||||||||||||||||||||||||||
| Net asset value, end of period | $47.15 | $41.00 | $43.87 | $45.02 | $42.25 | ||||||||||||||||||||||||||||||||||||||||||||||||||||||||||||||||||||||||||||||||||||||||||||||||||
| Total return (%)2,3 | 21.12 | (0.42 | ) | 13.19 | 9.74 | 23.30 | |||||||||||||||||||||||||||||||||||||||||||||||||||||||||||||||||||||||||||||||||||||||||||||||||
| Ratios and supplemental data | |||||||||||||||||||||||||||||||||||||||||||||||||||||||||||||||||||||||||||||||||||||||||||||||||||||||
| Net assets, end of period (in millions) | $577 | $608 | $660 | $600 | $697 | ||||||||||||||||||||||||||||||||||||||||||||||||||||||||||||||||||||||||||||||||||||||||||||||||||
| Ratios (as a percentage of average net assets): | |||||||||||||||||||||||||||||||||||||||||||||||||||||||||||||||||||||||||||||||||||||||||||||||||||||||
| Expenses before reductions | 1.17 | 1.18 | 1.18 | 1.19 | 1.23 | ||||||||||||||||||||||||||||||||||||||||||||||||||||||||||||||||||||||||||||||||||||||||||||||||||
| Expenses including reductions | 1.16 | 1.17 | 1.17 | 1.18 | 1.23 | ||||||||||||||||||||||||||||||||||||||||||||||||||||||||||||||||||||||||||||||||||||||||||||||||||
| Net investment income (loss) | (0.12 | ) | (0.07 | ) | 0.16 | 0.27 | 0.10 | ||||||||||||||||||||||||||||||||||||||||||||||||||||||||||||||||||||||||||||||||||||||||||||||||
| Portfolio turnover (%) | 41 | 44 | 30 | 43 | 30 | ||||||||||||||||||||||||||||||||||||||||||||||||||||||||||||||||||||||||||||||||||||||||||||||||||
| 1 | Based on average daily shares outstanding. | ||||||||||||||||||||||||||||||||||||||||||||||||||||||||||||||||||||||||||||||||||
| 2 | Does not reflect the effect of sales charges, if any. | ||||||||||||||||||||||||||||||||||||||||||||||||||||||||||||||||||||||||||||||||||
| 3 | Total returns would have been lower had certain expenses not been reduced during the applicable periods. | ||||||||||||||||||||||||||||||||||||||||||||||||||||||||||||||||||||||||||||||||||
| Class B Shares Period ended | 10-31-17 | 10-31-16 | 10-31-15 | 10-31-14 | 10-31-13 | ||||||||||||||||||||||||||||||||||||||||||||||||||||||||||||||||||||||||||||||||||||||||||||||||||
| Per share operating performance | |||||||||||||||||||||||||||||||||||||||||||||||||||||||||||||||||||||||||||||||||||||||||||||||||||||||
| Net asset value, beginning of period | $35.82 | $38.90 | $40.80 | $38.65 | $32.36 | ||||||||||||||||||||||||||||||||||||||||||||||||||||||||||||||||||||||||||||||||||||||||||||||||||
| Net investment loss1 | (0.32 | ) | (0.29 | ) | (0.22 | ) | (0.19 | ) | (0.22 | ) | |||||||||||||||||||||||||||||||||||||||||||||||||||||||||||||||||||||||||||||||||||||||||||||
| Net realized and unrealized gain (loss) on investments | 7.18 | (0.12 | ) | 4.42 | 3.55 | 7.30 | |||||||||||||||||||||||||||||||||||||||||||||||||||||||||||||||||||||||||||||||||||||||||||||||||
| Total from investment operations | 6.86 | (0.41 | ) | 4.20 | 3.36 | 7.08 | |||||||||||||||||||||||||||||||||||||||||||||||||||||||||||||||||||||||||||||||||||||||||||||||||
| Less distributions | |||||||||||||||||||||||||||||||||||||||||||||||||||||||||||||||||||||||||||||||||||||||||||||||||||||||
| From net realized gain | (2.11 | ) | (2.67 | ) | (6.10 | ) | (1.21 | ) | (0.79 | ) | |||||||||||||||||||||||||||||||||||||||||||||||||||||||||||||||||||||||||||||||||||||||||||||
| Net asset value, end of period | $40.57 | $35.82 | $38.90 | $40.80 | $38.65 | ||||||||||||||||||||||||||||||||||||||||||||||||||||||||||||||||||||||||||||||||||||||||||||||||||
| Total return (%)2,3 | 20.22 | (1.16 | ) | 12.33 | 8.93 | 22.37 | |||||||||||||||||||||||||||||||||||||||||||||||||||||||||||||||||||||||||||||||||||||||||||||||||
| Ratios and supplemental data | |||||||||||||||||||||||||||||||||||||||||||||||||||||||||||||||||||||||||||||||||||||||||||||||||||||||
| Net assets, end of period (in millions) | $16 | $19 | $24 | $27 | $33 | ||||||||||||||||||||||||||||||||||||||||||||||||||||||||||||||||||||||||||||||||||||||||||||||||||
| Ratios (as a percentage of average net assets): | |||||||||||||||||||||||||||||||||||||||||||||||||||||||||||||||||||||||||||||||||||||||||||||||||||||||
| Expenses before reductions | 1.92 | 1.93 | 1.93 | 1.94 | 1.99 | ||||||||||||||||||||||||||||||||||||||||||||||||||||||||||||||||||||||||||||||||||||||||||||||||||
| Expenses including reductions | 1.91 | 1.92 | 1.92 | 1.93 | 1.98 | ||||||||||||||||||||||||||||||||||||||||||||||||||||||||||||||||||||||||||||||||||||||||||||||||||
| Net investment loss | (0.86 | ) | (0.82 | ) | (0.60 | ) | (0.48 | ) | (0.64 | ) | |||||||||||||||||||||||||||||||||||||||||||||||||||||||||||||||||||||||||||||||||||||||||||||
| Portfolio turnover (%) | 41 | 44 | 30 | 43 | 30 | ||||||||||||||||||||||||||||||||||||||||||||||||||||||||||||||||||||||||||||||||||||||||||||||||||
| �� | |||||||||||||||||||||||||||||||||||||||||||||||||||||||||||||||||||||||||||||||||||
| 1 | Based on average daily shares outstanding. | ||||||||||||||||||||||||||||||||||||||||||||||||||||||||||||||||||||||||||||||||||
| 2 | Does not reflect the effect of sales charges, if any. | ||||||||||||||||||||||||||||||||||||||||||||||||||||||||||||||||||||||||||||||||||
| 3 | Total returns would have been lower had certain expenses not been reduced during the applicable periods. | ||||||||||||||||||||||||||||||||||||||||||||||||||||||||||||||||||||||||||||||||||
| �� | |||||||||||||||||||||||||||||||||||||||||||||||||||||||||||||||||||||||||||||||||||||||||||||||||||||||
| Class C Shares Period ended | 10-31-17 | 10-31-16 | 10-31-15 | 10-31-14 | 10-31-13 | ||||||||||||||||||||||||||||||||||||||||||||||||||||||||||||||||||||||||||||||||||||||||||||||||||
| Per share operating performance | |||||||||||||||||||||||||||||||||||||||||||||||||||||||||||||||||||||||||||||||||||||||||||||||||||||||
| Net asset value, beginning of period | $35.84 | $38.92 | $40.81 | $38.66 | $32.37 | ||||||||||||||||||||||||||||||||||||||||||||||||||||||||||||||||||||||||||||||||||||||||||||||||||
| Net investment loss1 | (0.32 | ) | (0.29 | ) | (0.22 | ) | (0.19 | ) | (0.22 | ) | |||||||||||||||||||||||||||||||||||||||||||||||||||||||||||||||||||||||||||||||||||||||||||||
| Net realized and unrealized gain (loss) on investments | 7.18 | (0.12 | ) | 4.43 | 3.55 | 7.30 | |||||||||||||||||||||||||||||||||||||||||||||||||||||||||||||||||||||||||||||||||||||||||||||||||
| Total from investment operations | 6.86 | (0.41 | ) | 4.21 | 3.36 | 7.08 | |||||||||||||||||||||||||||||||||||||||||||||||||||||||||||||||||||||||||||||||||||||||||||||||||
| Less distributions | |||||||||||||||||||||||||||||||||||||||||||||||||||||||||||||||||||||||||||||||||||||||||||||||||||||||
| From net realized gain | (2.11 | ) | (2.67 | ) | (6.10 | ) | (1.21 | ) | (0.79 | ) | |||||||||||||||||||||||||||||||||||||||||||||||||||||||||||||||||||||||||||||||||||||||||||||
| Net asset value, end of period | $40.59 | $35.84 | $38.92 | $40.81 | $38.66 | ||||||||||||||||||||||||||||||||||||||||||||||||||||||||||||||||||||||||||||||||||||||||||||||||||
| Total return (%)2,3 | 20.21 | (1.16 | ) | 12.36 | 8.92 | 22.36 | |||||||||||||||||||||||||||||||||||||||||||||||||||||||||||||||||||||||||||||||||||||||||||||||||
| Ratios and supplemental data | |||||||||||||||||||||||||||||||||||||||||||||||||||||||||||||||||||||||||||||||||||||||||||||||||||||||
| Net assets, end of period (in millions) | $102 | $117 | $136 | $133 | $130 | ||||||||||||||||||||||||||||||||||||||||||||||||||||||||||||||||||||||||||||||||||||||||||||||||||
| Ratios (as a percentage of average net assets): | |||||||||||||||||||||||||||||||||||||||||||||||||||||||||||||||||||||||||||||||||||||||||||||||||||||||
| Expenses before reductions | 1.92 | 1.93 | 1.93 | 1.94 | 1.98 | ||||||||||||||||||||||||||||||||||||||||||||||||||||||||||||||||||||||||||||||||||||||||||||||||||
| Expenses including reductions | 1.91 | 1.92 | 1.92 | 1.93 | 1.98 | ||||||||||||||||||||||||||||||||||||||||||||||||||||||||||||||||||||||||||||||||||||||||||||||||||
| Net investment loss | (0.86 | ) | (0.82 | ) | (0.59 | ) | (0.48 | ) | (0.65 | ) | |||||||||||||||||||||||||||||||||||||||||||||||||||||||||||||||||||||||||||||||||||||||||||||
| Portfolio turnover (%) | 41 | 44 | 30 | 43 | 30 | ||||||||||||||||||||||||||||||||||||||||||||||||||||||||||||||||||||||||||||||||||||||||||||||||||
| 1 | Based on average daily shares outstanding. | ||||||||||||||||||||||||||||||||||||||||||||||||||||||||||||||||||||||||||||||||||
| 2 | Does not reflect the effect of sales charges, if any. | ||||||||||||||||||||||||||||||||||||||||||||||||||||||||||||||||||||||||||||||||||
| 3 | Total returns would have been lower had certain expenses not been reduced during the applicable periods. | ||||||||||||||||||||||||||||||||||||||||||||||||||||||||||||||||||||||||||||||||||
| Class I Shares Period ended | 10-31-17 | 10-31-16 | 10-31-15 | 10-31-14 | 10-31-13 | ||||||||||||||||||||||||||||||||||||||||||||||||||||||||||||||||||||||||||||||||||||||||||||||||||
| Per share operating performance | |||||||||||||||||||||||||||||||||||||||||||||||||||||||||||||||||||||||||||||||||||||||||||||||||||||||
| Net asset value, beginning of period | $43.45 | $46.27 | $47.12 | $44.12 | $36.44 | ||||||||||||||||||||||||||||||||||||||||||||||||||||||||||||||||||||||||||||||||||||||||||||||||||
| Net investment income1 | 0.06 | 0.08 | 0.18 | 0.24 | 0.16 | ||||||||||||||||||||||||||||||||||||||||||||||||||||||||||||||||||||||||||||||||||||||||||||||||||
| Net realized and unrealized gain (loss) on investments | 8.85 | (0.13 | ) | 5.25 | 4.07 | 8.31 | |||||||||||||||||||||||||||||||||||||||||||||||||||||||||||||||||||||||||||||||||||||||||||||||||
| Total from investment operations | 8.91 | (0.05 | ) | 5.43 | 4.31 | 8.47 | |||||||||||||||||||||||||||||||||||||||||||||||||||||||||||||||||||||||||||||||||||||||||||||||||
| Less distributions | |||||||||||||||||||||||||||||||||||||||||||||||||||||||||||||||||||||||||||||||||||||||||||||||||||||||
| From net investment income | — | (0.10 | ) | (0.18 | ) | (0.10 | ) | — | |||||||||||||||||||||||||||||||||||||||||||||||||||||||||||||||||||||||||||||||||||||||||||||||
| From net realized gain | (2.11 | ) | (2.67 | ) | (6.10 | ) | (1.21 | ) | (0.79 | ) | |||||||||||||||||||||||||||||||||||||||||||||||||||||||||||||||||||||||||||||||||||||||||||||
| Total distributions | (2.11 | ) | (2.77 | ) | (6.28 | ) | (1.31 | ) | (0.79 | ) | |||||||||||||||||||||||||||||||||||||||||||||||||||||||||||||||||||||||||||||||||||||||||||||
| Net asset value, end of period | $50.25 | $43.45 | $46.27 | $47.12 | $44.12 | ||||||||||||||||||||||||||||||||||||||||||||||||||||||||||||||||||||||||||||||||||||||||||||||||||
| Total return (%)2 | 21.44 | (0.14 | ) | 13.48 | 10.01 | 23.70 | |||||||||||||||||||||||||||||||||||||||||||||||||||||||||||||||||||||||||||||||||||||||||||||||||
| Ratios and supplemental data | |||||||||||||||||||||||||||||||||||||||||||||||||||||||||||||||||||||||||||||||||||||||||||||||||||||||
| Net assets, end of period (in millions) | $751 | $313 | $293 | $317 | $307 | ||||||||||||||||||||||||||||||||||||||||||||||||||||||||||||||||||||||||||||||||||||||||||||||||||
| Ratios (as a percentage of average net assets): | |||||||||||||||||||||||||||||||||||||||||||||||||||||||||||||||||||||||||||||||||||||||||||||||||||||||
| Expenses before reductions | 0.91 | 0.92 | 0.91 | 0.93 | 0.93 | ||||||||||||||||||||||||||||||||||||||||||||||||||||||||||||||||||||||||||||||||||||||||||||||||||
| Expenses including reductions | 0.90 | 0.91 | 0.91 | 0.92 | 0.93 | ||||||||||||||||||||||||||||||||||||||||||||||||||||||||||||||||||||||||||||||||||||||||||||||||||
| Net investment income | 0.13 | 0.19 | 0.41 | 0.53 | 0.41 | ||||||||||||||||||||||||||||||||||||||||||||||||||||||||||||||||||||||||||||||||||||||||||||||||||
| Portfolio turnover (%) | 41 | 44 | 30 | 43 | 30 | ||||||||||||||||||||||||||||||||||||||||||||||||||||||||||||||||||||||||||||||||||||||||||||||||||
| 1 | Based on average daily shares outstanding. | ||||||||||||||||||||||||||||||||||||||||||||||||||||||||||||||||||||||||||||||||||
| 2 | Total returns would have been lower had certain expenses not been reduced during the applicable periods. | ||||||||||||||||||||||||||||||||||||||||||||||||||||||||||||||||||||||||||||||||||
| Class R2 Shares Period ended | 10-31-17 | 10-31-16 | 10-31-15 | 10-31-14 | 10-31-13 | ||||||||||||||||||||||||||||||||||||||||||||||||||||||||||||||||||||||||||||||||||||||||||||||||||
| Per share operating performance | |||||||||||||||||||||||||||||||||||||||||||||||||||||||||||||||||||||||||||||||||||||||||||||||||||||||
| Net asset value, beginning of period | $42.99 | $45.89 | $46.82 | $43.93 | $36.40 | ||||||||||||||||||||||||||||||||||||||||||||||||||||||||||||||||||||||||||||||||||||||||||||||||||
| Net investment income (loss)1 | (0.12 | ) | (0.09 | ) | (0.05 | ) | 0.06 | (0.04 | ) | ||||||||||||||||||||||||||||||||||||||||||||||||||||||||||||||||||||||||||||||||||||||||||||||
| Net realized and unrealized gain (loss) on investments | 8.72 | (0.13 | ) | 5.27 | 4.06 | 8.36 | |||||||||||||||||||||||||||||||||||||||||||||||||||||||||||||||||||||||||||||||||||||||||||||||||
| Total from investment operations | 8.60 | (0.22 | ) | 5.22 | 4.12 | 8.32 | |||||||||||||||||||||||||||||||||||||||||||||||||||||||||||||||||||||||||||||||||||||||||||||||||
| Less distributions | |||||||||||||||||||||||||||||||||||||||||||||||||||||||||||||||||||||||||||||||||||||||||||||||||||||||
| From net investment income | — | (0.01 | ) | (0.05 | ) | (0.02 | ) | — | |||||||||||||||||||||||||||||||||||||||||||||||||||||||||||||||||||||||||||||||||||||||||||||||
| From net realized gain | (2.11 | ) | (2.67 | ) | (6.10 | ) | (1.21 | ) | (0.79 | ) | |||||||||||||||||||||||||||||||||||||||||||||||||||||||||||||||||||||||||||||||||||||||||||||
| Total distributions | (2.11 | ) | (2.68 | ) | (6.15 | ) | (1.23 | ) | (0.79 | ) | |||||||||||||||||||||||||||||||||||||||||||||||||||||||||||||||||||||||||||||||||||||||||||||
| Net asset value, end of period | $49.48 | $42.99 | $45.89 | $46.82 | $43.93 | ||||||||||||||||||||||||||||||||||||||||||||||||||||||||||||||||||||||||||||||||||||||||||||||||||
| Total return (%)2 | 20.93 | (0.54 | ) | 13.01 | 9.59 | 23.31 | |||||||||||||||||||||||||||||||||||||||||||||||||||||||||||||||||||||||||||||||||||||||||||||||||
| Ratios and supplemental data | |||||||||||||||||||||||||||||||||||||||||||||||||||||||||||||||||||||||||||||||||||||||||||||||||||||||
| Net assets, end of period (in millions) | $5 | $6 | $8 | $34 | $32 | ||||||||||||||||||||||||||||||||||||||||||||||||||||||||||||||||||||||||||||||||||||||||||||||||||
| Ratios (as a percentage of average net assets): | |||||||||||||||||||||||||||||||||||||||||||||||||||||||||||||||||||||||||||||||||||||||||||||||||||||||
| Expenses before reductions | 1.31 | 1.32 | 1.30 | 1.33 | 1.32 | ||||||||||||||||||||||||||||||||||||||||||||||||||||||||||||||||||||||||||||||||||||||||||||||||||
| Expenses including reductions | 1.30 | 1.32 | 1.29 | 1.32 | 1.31 | ||||||||||||||||||||||||||||||||||||||||||||||||||||||||||||||||||||||||||||||||||||||||||||||||||
| Net investment income (loss) | (0.26 | ) | (0.21 | ) | (0.11 | ) | 0.13 | (0.09 | ) | ||||||||||||||||||||||||||||||||||||||||||||||||||||||||||||||||||||||||||||||||||||||||||||||
| Portfolio turnover (%) | 41 | 44 | 30 | 43 | 30 | ||||||||||||||||||||||||||||||||||||||||||||||||||||||||||||||||||||||||||||||||||||||||||||||||||
| 1 | Based on average daily shares outstanding. | ||||||||||||||||||||||||||||||||||||||||||||||||||||||||||||||||||||||||||||||||||
| 2 | Total returns would have been lower had certain expenses not been reduced during the applicable periods. | ||||||||||||||||||||||||||||||||||||||||||||||||||||||||||||||||||||||||||||||||||
| Class R6 Shares Period ended | 10-31-17 | 10-31-16 | 10-31-15 | 10-31-14 | 10-31-13 | ||||||||||||||||||||||||||||||||||||||||||||||||||||||||||||||||||||||||||||||||||||||||||||||||||
| Per share operating performance | |||||||||||||||||||||||||||||||||||||||||||||||||||||||||||||||||||||||||||||||||||||||||||||||||||||||
| Net asset value, beginning of period | $43.59 | $46.39 | $47.23 | $44.19 | $36.46 | ||||||||||||||||||||||||||||||||||||||||||||||||||||||||||||||||||||||||||||||||||||||||||||||||||
| Net investment income1 | 0.11 | 0.13 | 0.24 | 0.28 | 0.18 | ||||||||||||||||||||||||||||||||||||||||||||||||||||||||||||||||||||||||||||||||||||||||||||||||||
| Net realized and unrealized gain (loss) on investments | 8.88 | (0.13 | ) | 5.25 | 4.09 | 8.34 | |||||||||||||||||||||||||||||||||||||||||||||||||||||||||||||||||||||||||||||||||||||||||||||||||
| Total from investment operations | 8.99 | — | 5.49 | 4.37 | 8.52 | ||||||||||||||||||||||||||||||||||||||||||||||||||||||||||||||||||||||||||||||||||||||||||||||||||
| Less distributions | |||||||||||||||||||||||||||||||||||||||||||||||||||||||||||||||||||||||||||||||||||||||||||||||||||||||
| From net investment income | — | (0.13 | ) | (0.23 | ) | (0.12 | ) | — | |||||||||||||||||||||||||||||||||||||||||||||||||||||||||||||||||||||||||||||||||||||||||||||||
| From net realized gain | (2.11 | ) | (2.67 | ) | (6.10 | ) | (1.21 | ) | (0.79 | ) | |||||||||||||||||||||||||||||||||||||||||||||||||||||||||||||||||||||||||||||||||||||||||||||
| Total distributions | (2.11 | ) | (2.80 | ) | (6.33 | ) | (1.33 | ) | (0.79 | ) | |||||||||||||||||||||||||||||||||||||||||||||||||||||||||||||||||||||||||||||||||||||||||||||
| Net asset value, end of period | $50.47 | $43.59 | $46.39 | $47.23 | $44.19 | ||||||||||||||||||||||||||||||||||||||||||||||||||||||||||||||||||||||||||||||||||||||||||||||||||
| Total return (%)2 | 21.56 | (0.03 | ) | 13.61 | 10.15 | 23.83 | |||||||||||||||||||||||||||||||||||||||||||||||||||||||||||||||||||||||||||||||||||||||||||||||||
| Ratios and supplemental data | |||||||||||||||||||||||||||||||||||||||||||||||||||||||||||||||||||||||||||||||||||||||||||||||||||||||
| Net assets, end of period (in millions) | $6 | $5 | $6 | $4 | $4 | ||||||||||||||||||||||||||||||||||||||||||||||||||||||||||||||||||||||||||||||||||||||||||||||||||
| Ratios (as a percentage of average net assets): | |||||||||||||||||||||||||||||||||||||||||||||||||||||||||||||||||||||||||||||||||||||||||||||||||||||||
| Expenses before reductions | 0.82 | 0.82 | 0.82 | 0.83 | 0.84 | ||||||||||||||||||||||||||||||||||||||||||||||||||||||||||||||||||||||||||||||||||||||||||||||||||
| Expenses including reductions | 0.80 | 0.80 | 0.80 | 0.80 | 0.84 | ||||||||||||||||||||||||||||||||||||||||||||||||||||||||||||||||||||||||||||||||||||||||||||||||||
| Net investment income | 0.23 | 0.30 | 0.55 | 0.64 | 0.47 | ||||||||||||||||||||||||||||||||||||||||||||||||||||||||||||||||||||||||||||||||||||||||||||||||||
| Portfolio turnover (%) | 41 | 44 | 30 | 43 | 30 | ||||||||||||||||||||||||||||||||||||||||||||||||||||||||||||||||||||||||||||||||||||||||||||||||||
| 1 | Based on average daily shares outstanding. | ||||||||||||||||||||||||||||||||||||||||||||||||||||||||||||||||||||||||||||||||||
| 2 | Total returns would have been lower had certain expenses not been reduced during the applicable periods. | ||||||||||||||||||||||||||||||||||||||||||||||||||||||||||||||||||||||||||||||||||
Note 1 — Organization
John Hancock U.S. Global Leaders Growth Fund (the fund) is a series of John Hancock Capital Series (the Trust), an open-end management investment company organized as a Massachusetts business trust and registered under the Investment Company Act of 1940, as amended (the 1940 Act). The investment objective of the fund is to seek long-term growth of capital.
The fund may offer multiple classes of shares. The shares currently offered are detailed in the Statement of assets and liabilities. Class A and Class C shares are offered to all investors. Class B shares are closed to new investors. Class I shares are offered to institutions and certain investors. Class R2 shares are available only to certain retirement plans. Class R6 shares are available only to certain retirement plans, institutions and other investors. Shareholders of each class have exclusive voting rights to matters that affect that class. The distribution and service fees, if any, and transfer agent fees for each class may differ. Class B shares convert to Class A shares eight years after purchase.
Note 2 — Significant accounting policies
The financial statements have been prepared in conformity with accounting principles generally accepted in the United States of America (US GAAP), which require management to make certain estimates and assumptions as of the date of the financial statements. Actual results could differ from those estimates and those differences could be significant. The fund qualifies as an investment company under Topic 946 of Accounting Standards Codification of US GAAP.
Events or transactions occurring after the end of the fiscal period through the date that the financial statements were issued have been evaluated in the preparation of the financial statements. The following summarizes the significant accounting policies of the fund:
Security valuation. Investments are stated at value as of the scheduled close of regular trading on the New York Stock Exchange (NYSE), normally at 4:00 p.m., Eastern Time. In case of emergency or other disruption resulting in the NYSE not opening for trading or the NYSE closing at a time other than the regularly scheduled close, the net asset value (NAV) may be determined as of the regularly scheduled close of the NYSE pursuant to the fund's Valuation Policies and Procedures.
In order to value the securities, the fund uses the following valuation techniques: Equity securities held by the fund are typically valued at the last sale price or official closing price on the exchange or principal market where the security trades. In the event there were no sales during the day or closing prices are not available, the securities are valued using the last available bid price. Investments by the fund in open-end mutual funds, including John Hancock Collateral Trust (JHCT), are valued at their respective NAVs each business day.
In certain instances, the Pricing Committee may determine to value equity securities using prices obtained from another exchange or market if trading on the exchange or market on which prices are typically obtained did not open for trading as scheduled, or if trading closed earlier than scheduled, and trading occurred as normal on another exchange or market.
Other portfolio securities and assets, for which reliable market quotations are not readily available, are valued at fair value as determined in good faith by the fund's Pricing Committee following procedures established by the Board of Trustees. The frequency with which these fair valuation procedures are used cannot be predicted and fair value of securities may differ significantly from the value that would have been used had a ready market for such securities existed.
The fund uses a three-tier hierarchy to prioritize the pricing assumptions, referred to as inputs, used in valuation techniques to measure fair value. Level 1 includes securities valued using quoted prices in active markets for identical securities. Level 2 includes securities valued using other significant observable inputs. Observable inputs may include quoted prices for similar securities, interest rates, prepayment speeds and credit risk. Prices for securities valued using these inputs are received from independent pricing vendors and brokers and are based on an evaluation of the inputs described. Level 3 includes securities valued using significant unobservable inputs when market prices are not readily available or reliable, including the fund's own assumptions in determining the fair value of investments. Factors used in determining value may include market or issuer specific events or trends, changes in interest rates and credit quality. The inputs or methodology used for valuing securities are not necessarily an indication of the risks associated with investing in those securities. Changes in valuation techniques and related inputs may result in transfers into or out of an assigned level within the disclosure hierarchy.
As of October 31, 2017, all investments are categorized as Level 1 under the hierarchy described above.
Security transactions and related investment income. Investment security transactions are accounted for on a trade date plus one basis for daily NAV calculations. However, for financial reporting purposes, investment transactions are reported on trade date. Interest income is accrued as earned. Dividend income is recorded on the ex-date, except for dividends of foreign securities where the dividend may not be known until after the ex-date. In those cases, dividend income, net of withholding taxes, is recorded when the fund becomes aware of the dividends. Foreign taxes are provided for based on the fund's understanding of the tax rules and rates that exist in the foreign markets in which it invests. Gains and losses on securities sold are determined on the basis of identified cost and may include proceeds from litigation.
Securities lending. The fund may lend its securities to earn additional income. The fund receives cash collateral from the borrower in an amount not less than the market value of the loaned securities. The fund will invest its collateral in JHCT, an affiliate of the fund, which has a floating NAV and is registered with the Securities and Exchange Commission as an investment company. JHCT invests cash received as collateral as part of the securities lending program in short-term money market investments. The fund will receive the benefit of any gains and bear any losses generated by JHCT with respect to the cash collateral.
The fund has the right to recall loaned securities on demand. If a borrower fails to return loaned securities when due, then the lending agent is responsible and indemnifies the fund for the lent securities. The lending agent uses the collateral received from the borrower to purchase replacement securities of the same issue, type, class and series of the loaned securities. If the value of the collateral is less than the purchase cost of replacement securities, the lending agent is responsible for satisfying the shortfall but only to the extent that the shortfall is not due to any decrease in the value of JHCT.
Although the risk of the loss of the securities lent is mitigated by receiving collateral from the borrower and through lending agent indemnification, the fund could experience a delay in recovering securities or could experience a lower than expected return if the borrower fails to return the securities on a timely basis. The fund receives compensation for lending its securities by retaining a portion of the return on the investment of the collateral and compensation from fees earned from borrowers of the securities. Securities lending income received by the fund is net of fees retained by the securities lending agent. Net income received from JHCT is a component of securities lending income as recorded on the Statement of operations.
Obligations to repay collateral received by the fund are shown on the Statement of assets and liabilities as Payable upon return of securities loaned and are secured by the loaned securities. As of October 31, 2017 the fund loaned common stocks valued at $96,179,846 and received $98,155,132 of cash collateral.
Foreign taxes. The fund may be subject to withholding tax on income and/or capital gains or repatriation taxes imposed by certain countries in which the fund invests. Taxes are accrued based upon investment income, realized gains or unrealized appreciation.
Line of credit. The fund may have the ability to borrow from banks for temporary or emergency purposes, including meeting redemption requests that otherwise might require the untimely sale of securities. Pursuant to the fund's custodian agreement, the custodian may loan money to the fund to make properly authorized payments. The fund is obligated to repay the custodian for any overdraft, including any related costs or expenses. The custodian may have a lien, security interest or security entitlement in any fund property that is not otherwise segregated or pledged, to the extent of any overdraft, and to the maximum extent permitted by law.
Effective June 29, 2017, the fund and other affiliated funds have entered into a syndicated line of credit agreement with Citibank, N.A. as the administrative agent that enables them to participate in a $750 million unsecured committed line of credit. Excluding commitments designated for a certain fund and subject to the needs of all other affiliated funds, the fund can borrow up to an aggregate commitment amount of $500 million, subject to asset coverage and other limitations as specified in the agreement. A commitment fee payable at the end of each calendar quarter, based on the average daily unused portion of the line of credit, is charged to each participating fund based on a combination of fixed and asset based allocations and is reflected in Other expenses on the Statement of operations. Prior to June 29, 2017, the fund had a similar agreement that enabled it to participate in a $1 billion unsecured committed line of credit. For the year ended October 31, 2017, the fund had no borrowings under either line of credit. Commitment fees for the year ended October 31, 2017 were $6,250.
Expenses. Within the John Hancock group of funds complex, expenses that are directly attributable to an individual fund are allocated to such fund. Expenses that are not readily attributable to a specific fund are allocated among all funds in an equitable manner, taking into consideration, among other things, the nature and type of expense and the fund's relative net assets. Expense estimates are accrued in the period to which they relate and adjustments are made when actual amounts are known.
Class allocations. Income, common expenses and realized and unrealized gains (losses) are determined at the fund level and allocated daily to each class of shares based on the net assets of the class. Class-specific expenses, such as distribution and service fees, if any, and transfer agent fees, for all classes, are charged daily at the class level based on the net assets of each class and the specific expense rates applicable to each class.
Federal income taxes. The fund intends to continue to qualify as a regulated investment company by complying with the applicable provisions of the Internal Revenue Code and will not be subject to federal income tax on taxable income that is distributed to shareholders. Therefore, no federal income tax provision is required.
As of October 31, 2017, the fund had no uncertain tax positions that would require financial statement recognition, derecognition or disclosure. The fund's federal tax returns are subject to examination by the Internal Revenue Service for a period of three years.
Distribution of income and gains. Distributions to shareholders from net investment income and net realized gains, if any, are recorded on the ex-date. The fund generally declares and pays dividends and capital gain distributions, if any, annually.
The tax character of distributions for the years ended October 31, 2017 and 2016 was as follows:
| October 31, 2017 | October 31, 2016 | |
| Ordinary income | $9,952,088 | $10,352,368 |
| Long-term capital gains | 44,202,079 | 59,733,212 |
| Total | $54,154,167 | $70,085,580 |
Distributions paid by the fund with respect to each class of shares are calculated in the same manner, at the same time and in the same amount, except for the effect of class level expenses that may be applied differently to each class. As of October 31, 2017, the components of distributable earnings on a tax basis consisted of $41,706,247 of undistributed ordinary income and $58,997,259 of undistributed long-term capital gains.
Such distributions and distributable earnings, on a tax basis, are determined in conformity with income tax regulations, which may differ from US GAAP. Distributions in excess of tax basis earnings and profits, if any, are reported in the fund's financial statements as a return of capital.
Capital accounts within the financial statements are adjusted for permanent book-tax differences. These adjustments have no impact on net assets or the results of operations. Temporary book-tax differences, if any, will reverse in a subsequent period. Book-tax differences are primarily attributable to net operating losses and wash sale loss deferrals.
Note 3 — Guarantees and indemnifications
Under the Trust's organizational documents, its Officers and Trustees are indemnified against certain liabilities arising out of the performance of their duties to the Trust, including the fund. Additionally, in the normal course of business, the fund enters into contracts with service providers that contain general indemnification clauses. The fund's maximum exposure under these arrangements is unknown, as this would involve future claims that may be made against the fund that have not yet occurred. The risk of material loss from such claims is considered remote.
Note 4 — Fees and transactions with affiliates
John Hancock Advisers, LLC (the Advisor) serves as investment advisor for the fund. John Hancock Funds, LLC (the Distributor), an affiliate of the Advisor, serves as principal underwriter of the fund. The Advisor and the Distributor are indirect, wholly owned subsidiaries of Manulife Financial Corporation (MFC).
Management fee. The fund has an investment management agreement with the Advisor under which the fund pays a monthly management fee to the Advisor equivalent on an annual basis to the sum of: (a) 0.75% of the first $500 million of the fund's average daily net assets; (b) 0.73% of the next $500 million of the fund's average daily net assets; (c) 0.71% of the next $1 billion of the fund's average daily net assets; (d) 0.70% of the next $3 billion of the fund's average daily net assets; and (e) 0.65% of the fund's average daily net assets in excess of $5 billion. The Advisor has a subadvisory agreement with Sustainable Growth Advisers, LP. The fund is not responsible for payment of the subadvisory fees.
The Advisor has contractually agreed to waive a portion of its management fee and/or reimburse expenses for certain funds of the John Hancock group of funds complex, including the fund (the participating portfolios). This waiver is based upon aggregate net assets of all the participating portfolios. The amount of the reimbursement is calculated daily and allocated among all the participating portfolios in proportion to the daily net assets of each fund. During the year ended October 31, 2017, this waiver amounted to 0.01% of the fund's average net assets. This arrangement may be amended or terminated at any time by the Advisor upon notice to the fund and with the approval of the Board of Trustees.
Prior to March 1, 2017, the Advisor had contractually agreed to waive and/or reimburse all class-specific expenses for Class R6 shares of the fund to the extent they exceeded 0.00% of average daily net assets.
For the year ended October 31, 2017, the expense reductions described above amounted to the following:
| Class | Expense reduction | Class | Expense reduction | |
| Class A | $45,911 | Class R2 | $480 | |
| Class B | 1,358 | Class R6 | 663 | |
| Class C | 8,695 | Total | $103,605 | |
| Class I | 46,498 |
Expenses waived or reimbursed in the current fiscal period are not subject to recapture in future fiscal periods.
The investment management fees, including the impact of the waivers and reimbursements as described above, incurred for the year ended October 31, 2017 were equivalent to a net annual effective rate of 0.73% of the fund's average daily net assets.
Accounting and legal services. Pursuant to the Accounting and Legal Services Agreement the fund reimburses the Advisor for all expenses associated with providing the administrative, financial, legal, accounting and recordkeeping services to the fund, including the preparation of all tax returns, periodic reports to shareholders and regulatory reports, among other services. These expenses are allocated to each share class based on its relative net assets at the time the expense was incurred. These accounting and legal services fees incurred for the year ended October 31, 2017 amounted to an annual rate of 0.02% of the fund's average daily net assets.
Distribution and service plans. The fund has a distribution agreement with the Distributor. The fund has adopted distribution and service plans with respect to Class A, Class B, Class C and Class R2 shares pursuant to Rule 12b-1 under the 1940 Act, to pay the Distributor for services provided as the distributor of shares of the fund. In addition, under a service plan for Class R2 shares, the fund pays for certain other services. The fund may pay up to the following contractual rates of distribution and service fees under these arrangements, expressed as an annual percentage of average daily net assets for each class of the fund's shares:
| Class | Rule 12b-1 fee | Service fee | Class | Rule 12b-1 fee | Service fee | |
| Class A | 0.25% | — | Class C | 1.00% | — | |
| Class B | 1.00% | — | Class R2 | 0.25% | 0.25% |
Sales charges. Class A shares are assessed up-front sales charges, which resulted in payments to the Distributor amounting to $693,278 for the year ended October 31, 2017. Of this amount, $116,668 was retained and used for printing prospectuses, advertising, sales literature and other purposes, $559,533 was paid as sales commissions to broker-dealers and $17,077 was paid as sales commissions to sales personnel of Signator Investors, Inc., a broker-dealer affiliate of the Advisor.
Class A, Class B and Class C shares may be subject to contingent deferred sales charges (CDSCs). Certain Class A shares that are acquired through purchases of $1 million or more and are redeemed within one year of purchase are subject to a 1.00% sales charge. Class B shares that are redeemed within six years of purchase are subject to CDSCs, at declining rates, beginning at 5.00%. Class C shares that are redeemed within one year of purchase are subject to a 1.00% CDSC. CDSCs are applied to the lesser of the current market value at the time of redemption or the original purchase cost of the shares being redeemed. Proceeds from CDSCs are used to compensate the Distributor for providing distribution-related services in connection with the sale of these shares. During the year ended October 31, 2017, CDSCs received by the Distributor amounted to $3,555, $17,490 and $11,605 for Class A, Class B and Class C shares, respectively.
Transfer agent fees. The John Hancock Group of Funds has a complex-wide transfer agent agreement with John Hancock Signature Services, Inc. (Signature Services), an affiliate of the Advisor. The transfer agent fees paid to Signature Services are
determined based on the cost to Signature Services (Signature Services Cost) of providing recordkeeping services. It also includes out-of-pocket expenses, including payments made to third-parties for recordkeeping services provided to their clients who invest in one or more John Hancock funds. In addition, Signature Services Cost may be reduced by certain fees that Signature Services receives in connection with retirement and small accounts. Signature Services Cost is calculated monthly and allocated, as applicable, to five categories of share classes: Retail Share and Institutional Share Classes of Non-Municipal Bond Funds, Class R6 Shares, Retirement Share Classes and Municipal Bond Share Classes. Within each of these categories, the applicable costs are allocated to the affected John Hancock affiliated funds and/or classes, based on the relative average daily net assets.
Class level expenses. Class level expenses for the year ended October 31, 2017 were:
| Class | Distribution and service fees | Transfer agent fees |
| Class A | $1,446,053 | $677,513 |
| Class B | 171,278 | 20,095 |
| Class C | 1,096,376 | 128,532 |
| Class I | — | 619,741 |
| Class R2 | 30,010 | 858 |
| Class R6 | — | 731 |
| Total | $2,743,717 | $1,447,470 |
Trustee expenses. The fund compensates each Trustee who is not an employee of the Advisor or its affiliates. The costs of paying Trustee compensation and expenses are allocated to the fund based on its net assets relative to other funds within the John Hancock group of funds complex.
Note 5 — Fund share transactions
Transactions in fund shares for the years ended October 31, 2017 and 2016 were as follows:
| Year ended 10-31-17 | Year ended 10-31-16 | |||||||||||||||||||||||||
| Shares | Amount | Shares | Amount | |||||||||||||||||||||||
| Class A shares | ||||||||||||||||||||||||||
| Sold | 1,650,569 | $71,553,086 | 3,451,880 | $138,442,519 | ||||||||||||||||||||||
| Distributions reinvested | 741,848 | 29,399,464 | 941,848 | 38,973,281 | ||||||||||||||||||||||
| Repurchased | (4,975,171 | ) | (211,142,536 | ) | (4,607,926 | ) | (189,841,715 | ) | ||||||||||||||||||
| Net decrease | (2,582,754 | ) | ($110,189,986 | ) | (214,198 | ) | ($12,425,915 | ) | ||||||||||||||||||
| Class B shares | ||||||||||||||||||||||||||
| Sold | 10,974 | $413,702 | 21,655 | $789,512 | ||||||||||||||||||||||
| Distributions reinvested | 28,642 | 982,997 | 40,617 | 1,478,312 | ||||||||||||||||||||||
| Repurchased | (180,095 | ) | (6,728,361 | ) | (161,811 | ) | (5,789,792 | ) | ||||||||||||||||||
| Net decrease | (140,479 | ) | ($5,331,662 | ) | (99,539 | ) | ($3,521,968 | ) | ||||||||||||||||||
| Class C shares | ||||||||||||||||||||||||||
| Sold | 248,122 | $9,281,668 | 484,491 | $17,305,223 | ||||||||||||||||||||||
| Distributions reinvested | 163,819 | 5,625,549 | 208,307 | 7,584,455 | ||||||||||||||||||||||
| Repurchased | (1,150,876 | ) | (43,215,342 | ) | (929,819 | ) | (33,321,999 | ) | ||||||||||||||||||
| Net decrease | (738,935 | ) | ($28,308,125 | ) | (237,021 | ) | ($8,432,321 | ) | ||||||||||||||||||
| Class I shares | ||||||||||||||||||||||||||
| Sold | 12,795,709 | $581,560,007 | 3,154,966 | $137,331,808 | ||||||||||||||||||||||
| Distributions reinvested | 323,792 | 13,644,599 | 341,949 | 14,960,261 | ||||||||||||||||||||||
| Repurchased | (5,369,963 | ) | (248,528,151 | ) | (2,622,121 | ) | (112,272,307 | ) | ||||||||||||||||||
| Net increase | 7,749,538 | $346,676,455 | 874,794 | $40,019,762 | ||||||||||||||||||||||
| Year ended 10-31-17 | Year ended 10-31-16 | |||||||||||||||||||||||||
| Shares | Amount | Shares | Amount | |||||||||||||||||||||||
| Class R2 shares | ||||||||||||||||||||||||||
| Sold | 40,931 | $1,805,950 | 35,125 | $1,459,180 | ||||||||||||||||||||||
| Distributions reinvested | 6,010 | 250,320 | 7,683 | 333,737 | ||||||||||||||||||||||
| Repurchased | (77,570 | ) | (3,526,106 | ) | (69,441 | ) | (3,033,466 | ) | ||||||||||||||||||
| Net decrease | (30,629 | ) | ($1,469,836 | ) | (26,633 | ) | ($1,240,549 | ) | ||||||||||||||||||
| Class R6 shares | ||||||||||||||||||||||||||
| Sold | 27,047 | $1,277,851 | 23,477 | $988,082 | ||||||||||||||||||||||
| Distributions reinvested | 5,998 | 253,662 | 7,444 | 326,419 | ||||||||||||||||||||||
| Repurchased | (43,886 | ) | (1,956,321 | ) | (26,682 | ) | (1,143,933 | ) | ||||||||||||||||||
| Net increase (decrease) | (10,841 | ) | ($424,808 | ) | 4,239 | $170,568 | ||||||||||||||||||||
| Total net increase | 4,245,900 | $200,952,038 | 301,642 | $14,569,577 | ||||||||||||||||||||||
Note 6 — Purchase and sale of securities
Purchases and sales of securities, other than short-term investments, amounted to $659,757,927 and $525,210,699, respectively, for the year ended October 31, 2017.
Note 7 — Industry or sector risk
The fund may invest a large percentage of its assets in one or more particular industries or sectors of the economy. If a large percentage of the fund's assets are economically tied to a single or small number of industries or sectors of the economy, the fund will be less diversified than a more broadly diversified fund, and it may cause the fund to underperform if that industry or sector underperforms. In addition, focusing on a particular industry or sector may make the fund's NAV more volatile. Further, a fund that invests in particular industries or sectors is particularly susceptible to the impact of market, economic, regulatory and other factors affecting those industries or sectors.
Report of Independent Registered Public Accounting Firm
To the Board of Trustees of John Hancock Capital Series and Shareholders of John Hancock U.S. Global Leaders Growth Fund:
In our opinion, the accompanying statement of assets and liabilities, including the fund's investments, and the related statements of operations and of changes in net assets and the financial highlights present fairly, in all material respects, the financial position of the John Hancock U.S. Global Leaders Growth Fund (the "Fund") as of October 31, 2017, the results of its operations for the year then ended, the changes in its net assets for each of the two years in the period then ended and the financial highlights for each of the five years in the period then ended, in conformity with accounting principles generally accepted in the United States of America. These financial statements and financial highlights (hereafter referred to as "financial statements") are the responsibility of the Fund's management. Our responsibility is to express an opinion on these financial statements based on our audits. We conducted our audits of these financial statements in accordance with the standards of the Public Company Accounting Oversight Board (United States). Those standards require that we plan and perform the audit to obtain reasonable assurance about whether the financial statements are free of material misstatement. An audit includes examining, on a test basis, evidence supporting the amounts and disclosures in the financial statements, assessing the accounting principles used and significant estimates made by management, and evaluating the overall financial statement presentation. We believe that our audits, which included confirmation of securities as of October 31, 2017 by correspondence with the custodian, brokers, and transfer agent, provide a reasonable basis for our opinion.
PricewaterhouseCoopers LLP
Boston, Massachusetts
December 15, 2017
Unaudited
For federal income tax purposes, the following information is furnished with respect to the distributions of the fund, if any, paid during its taxable year ended October 31, 2017.
The fund reports the maximum amount allowable of its net taxable income as eligible for the corporate dividends-received deduction.
The fund reports the maximum amount allowable of its net taxable income as qualified dividend income as provided in the Jobs and Growth Tax Relief Reconciliation Act of 2003.
The fund paid $44,202,079 in capital gain dividends.
Eligible shareholders will be mailed a 2017 Form 1099-DIV in early 2018. This will reflect the tax character of all distributions paid in calendar year 2017.
Please consult a tax advisor regarding the tax consequences of your investment in the fund.
Continuation of Investment Advisory and Subadvisory Agreements
Evaluation of Advisory and Subadvisory Agreements by the Board of Trustees
This section describes the evaluation by the Board of Trustees (the Board) of John Hancock Capital Series (the Trust) of the Advisory Agreement (the Advisory Agreement) with John Hancock Advisers, LLC (the Advisor) and the Subadvisory Agreement (the Subadvisory Agreement) with Sustainable Growth Advisers, LP (the Subadvisor), for John Hancock U.S. Global Leaders Growth Fund (the fund). The Advisory Agreement and Subadvisory Agreement are collectively referred to as the Agreements. Prior to the June 19-22, 2017 in-person meeting at which the Agreements were approved, the Board also discussed and considered information regarding the proposed continuation of the Agreements at an in-person meeting held on May 22-24, 2017.
Approval of Advisory and Subadvisory Agreements
At in-person meetings held on June 19-22, 2017, the Board, including the Trustees who are not parties to any Agreement or considered to be interested persons of the Trust under the Investment Company Act of 1940, as amended (the 1940 Act) (the Independent Trustees), reapproved for an annual period the continuation of the Advisory Agreement between the Trust and the Advisor and the Subadvisory Agreement between the Advisor and the Subadvisor with respect to the fund.
In considering the Advisory Agreement and the Subadvisory Agreement, the Board received in advance of the meetings a variety of materials relating to the fund, the Advisor and the Subadvisor, including comparative performance, fee and expense information for a peer group of similar funds prepared by an independent third-party provider of fund data, performance information for an applicable benchmark index; and, with respect to the Subadvisor, comparative performance information for comparably managed accounts, as applicable, and other information provided by the Advisor and the Subadvisor regarding the nature, extent and quality of services provided by the Advisor and the Subadvisor under their respective Agreements, as well as information regarding the Advisor's revenues and costs of providing services to the fund and any compensation paid to affiliates of the Advisor. At the meetings at which the renewal of the Advisory Agreement and Subadvisory Agreement are considered, particular focus is given to information concerning fund performance, comparability of fees and total expenses, and profitability. However, the Board notes that the evaluation process with respect to the Advisor and the Subadvisor is an ongoing one. In this regard, the Board also took into account discussions with management and information provided to the Board (including its various committees) at prior meetings with respect to the services provided by the Advisor and the Subadvisor to the fund, including quarterly performance reports prepared by management containing reviews of investment results and prior presentations from the Subadvisor with respect to the fund. The information received and considered by the Board in connection with the May and June meetings and throughout the year was both written and oral. The Board also considered the nature, quality, and extent of non-advisory services, if any, to be provided to the fund by the Advisor's affiliates, including distribution services. The Board considered the Advisory Agreement and Subadvisory Agreement separately in the course of its review. In doing so, the Board noted the respective roles of the Advisor and Subadvisor in providing services to the fund.
Throughout the process, the Board asked questions of and requested additional information from management. The Board is assisted by counsel for the Trust and the Independent Trustees are also separately assisted by independent legal counsel throughout the process. The Independent Trustees also received a memorandum from their independent legal counsel discussing the legal standards for their consideration of the proposed continuation of the Agreements and discussed the proposed continuation of the Agreements in private sessions with their independent legal counsel at which no representatives of management were present.
Approval of Advisory Agreement
In approving the Advisory Agreement with respect to the fund, the Board, including the Independent Trustees, considered a variety of factors, including those discussed below. The Board also considered other factors (including conditions and trends prevailing generally in the economy, the securities markets, and the industry) and did not treat any single factor as determinative, and each Trustee may have attributed different weights to different factors. The Board's conclusions may be
based in part on its consideration of the advisory and subadvisory arrangements in prior years and on the Board's ongoing regular review of fund performance and operations throughout the year.
Nature, extent, and quality of services. Among the information received by the Board from the Advisor relating to the nature, extent, and quality of services provided to the fund, the Board reviewed information provided by the Advisor relating to its operations and personnel, descriptions of its organizational and management structure, and information regarding the Advisor's compliance and regulatory history, including its Form ADV. The Board also noted that on a regular basis it receives and reviews information from the Trust's Chief Compliance Officer (CCO) regarding the fund's compliance policies and procedures established pursuant to Rule 38a-1 under the 1940 Act. The Board observed that the scope of services provided by the Advisor, and of the undertakings required of the Advisor in connection with those services, including maintaining and monitoring its own and the fund's compliance programs, risk management programs, liquidity management programs and cybersecurity programs, had expanded over time as a result of regulatory, market and other developments. The Board considered that the Advisor is responsible for the management of the day-to-day operations of the fund, including, but not limited to, general supervision of and coordination of the services provided by the Subadvisor, and is also responsible for monitoring and reviewing the activities of the Subadvisor and other third-party service providers. The Board also considered the significant risks assumed by the Advisor in connection with the services provided to the fund including entrepreneurial risk in sponsoring new funds and ongoing risks including investment, operational, enterprise, litigation, regulatory and compliance risks with respect to all funds.
In considering the nature, extent, and quality of the services provided by the Advisor, the Trustees also took into account their knowledge of the Advisor's management and the quality of the performance of the Advisor's duties, through Board meetings, discussions and reports during the preceding year and through each Trustee's experience as a Trustee of the Trust and of the other trusts in the John Hancock group of funds complex (the John Hancock Fund Complex).
In the course of their deliberations regarding the Advisory Agreement, the Board considered, among other things:
| (a) | the skills and competency with which the Advisor has in the past managed the Trust's affairs and its subadvisory relationship, the Advisor's oversight and monitoring of the Subadvisor's investment performance and compliance programs, such as the Subadvisor's compliance with fund policies and objectives, review of brokerage matters, including with respect to trade allocation and best execution and the Advisor's timeliness in responding to performance issues; | |
| (b) | the background, qualifications and skills of the Advisor's personnel; | |
| (c) | the Advisor's compliance policies and procedures and its responsiveness to regulatory changes and fund industry developments; | |
| (d) | the Advisor's administrative capabilities, including its ability to supervise the other service providers for the fund; | |
| (e) | the financial condition of the Advisor and whether it has the financial wherewithal to provide a high level and quality of services to the fund; | |
| (f) | the Advisor's initiatives intended to improve various aspects of the Trust's operations and the investor experience with the fund; and | |
| (g) | the Advisor's reputation and experience in serving as an investment advisor to the Trust and the benefit to shareholders of investing in funds that are part of a family of funds offering a variety of investments. |
The Board concluded that the Advisor may reasonably be expected to continue to provide a high quality of services under the Advisory Agreement with respect to the fund.
Investment performance. In considering the fund's performance, the Board noted that it reviews at its regularly scheduled meetings information about the fund's performance results. In connection with the consideration of the Advisory Agreement, the Board:
| (a) | reviewed information prepared by management regarding the fund's performance; | |
| (b) | considered the comparative performance of an applicable benchmark index; | |
| (c) | considered the performance of comparable funds, if any, as included in the report prepared by an independent third-party provider of fund data; and | |
| (d) | took into account the Advisor's analysis of the fund's performance and its plans and recommendations regarding the Trust's subadvisory arrangements generally. |
The Board noted that while it found the data provided by the independent third-party generally useful it recognized its limitations, including in particular that the data may vary depending on the end date selected and the results of the performance comparisons may vary depending on the selection of the peer group. The Board noted that the fund underperformed its benchmark index for the one-, three-, five- and ten-year periods ended December 31, 2016. The Board also noted that the fund underperformed its peer group average for the one-, three- and five-year periods and outperformed its peer group average for the ten-year period ended December 31, 2016. The Board took into account management's discussion of the fund's performance, including the favorable performance relative to the peer group for the ten-year period. The Board concluded that the fund's performance is being monitored and reasonably addressed, where appropriate.
Fees and expenses. The Board reviewed comparative information prepared by an independent third-party provider of fund data, including, among other data, the fund's contractual and net management fees (and subadvisory fees, to the extent available) and total expenses as compared to similarly situated investment companies deemed to be comparable to the fund in light of the nature, extent and quality of the management and advisory and subadvisory services provided by the Advisor to the Subadvisor. The Board considered the fund's ranking within a smaller group of peer funds chosen by the independent third-party provider, as well as the fund's ranking within a broader group of funds. In comparing the fund's contractual and net management fees to those of comparable funds, the Board noted that such fees include both advisory and administrative costs. The Board noted that net management fees for the fund are higher than the peer group median and net total expenses for the fund are equal to the peer group median.
The Board took into account management's discussion of the fund's expenses. The Board also took into account management's discussion with respect to the overall management fee, the fees of the Subadvisor, including the amount of the advisory fee retained by the Advisor after payment of the subadvisory fee, in each case in light of the services rendered for those amounts and the risks undertaken by the Advisor. The Board also noted that the Advisor pays the subadvisory fee, and that such fees are negotiated at arm's length with respect to the Subadvisor. In addition, the Board took into account that management had agreed to implement an overall fee waiver across the complex, including the fund, which is discussed further below. The Board also noted actions taken over the past several years to reduce the fund's operating expenses. The Board also noted that, in addition, the Advisor is currently waiving fees and/or reimbursing expenses with respect to the fund and that the fund has breakpoints in its contractual management fee schedule that reduces management fees as assets increase. The Board also noted that the fund's distributor, an affiliate of the Advisor, has agreed to waive a portion of its Rule 12b-1 fee for a share class of the fund. The Board reviewed information provided by the Advisor concerning the investment advisory fee charged by the Advisor or one of its advisory affiliates to other clients (including other funds in the John Hancock Fund Complex) having similar investment mandates, if any. The Board considered any differences between the Advisor's and Subadvisor's services to the fund and the services they provide to other comparable clients or funds. The Board concluded that the advisory fee paid with respect to the fund is reasonable in light of the nature, extent and quality of the services provided to the fund under the Advisory Agreement.
Profitability/Fall out benefits. In considering the costs of the services to be provided and the profits to be realized by the Advisor and its affiliates from the Advisor's relationship with the Trust, the Board:
| (a) | reviewed financial information of the Advisor; | |
| (b) | reviewed and considered information presented by the Advisor regarding the net profitability to the Advisor and its affiliates with respect to the fund; | |
| (c) | received and reviewed profitability information with respect to the John Hancock Fund Complex as a whole and with respect to the fund; | |
| (d) | received information with respect to the Advisor's allocation methodologies used in preparing the profitability data and considered that the Advisor hired an independent third-party consultant to provide an analysis of the Advisor's allocation methodologies; | |
| (e) | considered that the John Hancock insurance companies that are affiliates of the Advisor, as shareholders of the Trust directly or through their separate accounts, receive certain tax credits or deductions relating to foreign taxes paid and dividends received by certain funds of the Trust and noted that these tax benefits, which are not available to participants in qualified retirement plans under applicable income tax law, are reflected in the profitability information reviewed by the Board; | |
| (f) | considered that the Advisor also provides administrative services to the fund on a cost basis pursuant to an administrative services agreement; | |
| (g) | noted that affiliates of the Advisor provide transfer agency services and distribution services to the fund, and that the fund's distributor also receives Rule 12b-1 payments to support distribution of the fund; | |
| (h) | noted that the Advisor also derives reputational and other indirect benefits from providing advisory services to the fund; | |
(i) | noted that the subadvisory fee for the fund is paid by the Advisor and is negotiated at arm's length; | |
(j) | considered the Advisor's ongoing costs and expenditures necessary to improve services, meet new regulatory and compliance requirements, and adapt to other challenges impacting the fund industry; and | |
| (k) | considered that the Advisor should be entitled to earn a reasonable level of profits in exchange for the level of services it provides to the fund and the risks that it assumes as Advisor, including entrepreneurial, operational, reputational, litigation and regulatory risk. |
Based upon its review, the Board concluded that the level of profitability, if any, of the Advisor and its affiliates from their relationship with the fund was reasonable and not excessive.
Economies of scale. In considering the extent to which economies of scale would be realized as the fund grows and whether fee levels reflect these economies of scale for the benefit of fund shareholders, the Board:
| (a) | considered that the Advisor has contractually agreed to waive a portion of its management fee for certain funds of the John Hancock Fund Complex, including the fund (the participating portfolios) or otherwise reimburse the expenses of the participating portfolios (the reimbursement). This waiver is based upon aggregate net assets of all the participating portfolios. The amount of the reimbursement is calculated daily and allocated among all the participating portfolios in proportion to the daily net assets of each fund; |
| (b) | reviewed the fund's advisory fee structure and concluded that: (i) the fund's fee structure contains breakpoints at the subadvisory fee level and that such breakpoints are reflected as breakpoints in the advisory fees for the fund; and (ii) although economies of scale cannot be measured with precision, these arrangements permit shareholders of the fund to benefit from economies of scale if the fund grows. The Board also took into account management's discussion of the fund's advisory fee structure; and | |||||||
| (c) | the Board also considered the effect of the fund's growth in size on its performance and fees. The Board also noted that if the fund's assets increase over time, the fund may realize other economies of scale. |
Approval of Subadvisory Agreements
In making its determination with respect to approval of the Subadvisory Agreements, the Board reviewed:
| (1) | information relating to the Subadvisor's business, including current subadvisory services to the Trust (and other funds in the John Hancock Fund Complex); | |
| (2) | the historical and current performance of the fund and comparative performance information relating to an applicable benchmark index and comparable funds; | |
| (3) | the subadvisory fee for the fund, including any breakpoints, and to the extent available, comparable fee information prepared by an independent third party provider of fund data; and | |
| (4) | information relating to the nature and scope of any material relationships and their significance to the Trust's Advisor and Subadvisor. |
Nature, extent, and quality of services. With respect to the services provided by the Subadvisor, the Board received information provided to the Board by the Subadvisor, including the Subadvisor's Form ADV, as well as took into account information presented throughout the past year. The Board considered the Subadvisor's current level of staffing and its overall resources, as well as received information relating to the Subadvisor's compensation program. The Board reviewed the Subadvisor's history and investment experience, as well as information regarding the qualifications, background, and responsibilities of the Subadvisor's investment and compliance personnel who provide services to the fund. The Board also considered, among other things, the Subadvisor's compliance program and any disciplinary history. The Board also considered the Subadvisor's risk assessment and monitoring process. The Board reviewed the Subadvisor's regulatory history, including whether it was involved in any regulatory actions or investigations as well as material litigation, and any settlements and amelioratory actions undertaken, as appropriate. The Board noted that the Advisor conducts regular, periodic reviews of the Subadvisor and its operations, including regarding investment processes and organizational and staffing matters. The Board also noted that the Trust's CCO and his staff conduct regular, periodic compliance reviews with the Subadvisor and present reports to the Independent Trustees regarding the same, which includes evaluating the regulatory compliance systems of the Subadvisor and procedures reasonably designed to assure compliance with the federal securities laws. The Board also took into account the financial condition of the Subadvisor.
The Board considered the Subadvisor's investment process and philosophy. The Board took into account that the Subadvisor's responsibilities include the development and maintenance of an investment program for the fund that is consistent with the fund's investment objective, the selection of investment securities and the placement of orders for the purchase and sale of such securities, as well as the implementation of compliance controls related to performance of these services. The Board also received information with respect to the Subadvisor's brokerage policies and practices, including with respect to best execution and soft dollars.
Subadvisor compensation. In considering the cost of services to be provided by the Subadvisor and the profitability to the Subadvisor of its relationship with the fund, the Board noted that the fees under the Subadvisory Agreement are paid by the Advisor and not the fund.
The Board also relied on the ability of the Advisor to negotiate the Subadvisory Agreement with the Subadvisor, which is not affiliated with the Advisor, and the fees thereunder at arm's length. As a result, the costs of the services to be provided and the profits to be realized by the Subadvisor from its relationship with the Trust were not a material factor in the Board's consideration of the Subadvisory Agreement.
The Board also received information regarding the nature and scope (including their significance to the Advisor and its affiliates and to the Subadvisor) of any material relationships with respect to the Subadvisor, which include arrangements in which the Subadvisor or its affiliates provide advisory, distribution, or management services in connection with financial products sponsored by the Advisor or its affiliates, and may include other registered investment companies, a 529 education savings plan, managed separate accounts and exempt group annuity contracts sold to qualified plans. The Board also received information and took into account any other potential conflicts of interest the Advisor might have in connection with the Subadvisory Agreement.
In addition, the Board considered other potential indirect benefits that the Subadvisor and its affiliates may receive from the Subadvisor's relationship with the fund, such as the opportunity to provide advisory services to additional funds in the John Hancock Fund Complex and reputational benefits.
Subadvisory fees. The Board considered that the fund pays an advisory fee to the Advisor and that, in turn, the Advisor pays a subadvisory fee to the Subadvisor. As noted above, the Board also considered the fund's subadvisory fees as compared to similarly situated investment companies deemed to be comparable to the fund as included in the report prepared by the independent third party provider of fund data, to the extent available. The Board noted that the limited size of the Lipper peer group was not sufficient for comparative purposes. The Board also took into account the subadvisory fees paid by the Advisor to the Subadvisor with respect to the fund and compared them to fees charged by the Subadvisor to manage other subadvised portfolios and portfolios not subject to regulation under the 1940 Act, as applicable.
Subadvisor performance. As noted above, the Board considered the fund's performance as compared to the fund's peer group and the benchmark index and noted that the Board reviews information about the fund's performance results at its regularly scheduled meetings. The Board noted the Advisor's expertise and resources in monitoring the performance, investment style and risk-adjusted performance of the Subadvisor. The Board was mindful of the Advisor's focus on the Subadvisor's performance. The Board also noted the Subadvisor's long-term performance record for similar accounts, as applicable.
The Board's decision to approve the Subadvisory Agreements was based on a number of determinations, including the following:
| (1) | the Subadvisor has extensive experience and demonstrated skills as a manager; | |
| (2) | the performance of the fund is being monitored and reasonably addressed, where appropriate; | |
| (3) | the subadvisory fee is reasonable in relation to the level and quality of services being provided under the Subadvisory Agreement; and | |
| (4) | noted that the subadvisory fees are paid by the Advisor not the fund and that the subadvisory fee breakpoints are reflected as breakpoints in the advisory fees for the fund in order to permit shareholders to benefit from economies of scale if the fund grows. | |
| * * * | ||
Based on the Board's evaluation of all factors that the Board deemed to be material, including those factors described above, the Board, including the Independent Trustees, concluded that renewal of the Advisory Agreement and the Subadvisory Agreement would be in the best interest of the fund and its shareholders. Accordingly, the Board, and the Independent Trustees voting separately, approved the Advisory Agreement and Subadvisory Agreement for an additional one-year period.
This chart provides information about the Trustees and Officers who oversee your John Hancock fund. Officers elected by the Trustees manage the day-to-day operations of the fund and execute policies formulated by the Trustees.
Independent Trustees
| Name, year of birth Position(s) held with Trust Principal occupation(s) and other directorships during past 5 years | Trustee of the Trust since1 | Number of John Hancock funds overseen by Trustee |
| Hassell H. McClellan, Born: 1945 | 2012 | 223 |
| Trustee and Chairperson of the Board Director/Trustee, Virtus Funds (since 2008); Director, The Barnes Group (since 2010); Associate Professor, The Wallace E. Carroll School of Management, Boston College (retired 2013). Trustee (since 2014) and Chairperson of the Board (since 2017), John Hancock Collateral Trust; Trustee (since 2015) and Chairperson of the Board (since 2017), John Hancock Exchange-Traded Fund Trust; Trustee (since 2012) and Chairperson of the Board (since 2017), John Hancock retail funds3; Trustee (2005-2006 and since 2012) and Chairperson of the Board (since 2017), John Hancock Funds III; Trustee (since 2005) and Chairperson of the Board (since 2017), John Hancock Variable Insurance Trust and John Hancock Funds II. | ||
| Charles L. Bardelis,2 Born: 1941 | 2012 | 223 |
| Trustee Director, Island Commuter Corp. (marine transport). Trustee, John Hancock Collateral Trust (since 2014), Trustee, John Hancock Exchange-Traded Fund Trust (since 2015); Trustee, John Hancock retail funds3 (since 2012); Trustee, John Hancock Funds III (2005-2006 and since 2012); Trustee, John Hancock Variable Insurance Trust (since 1988); Trustee, John Hancock Funds II (since 2005). | ||
| Peter S. Burgess,2 Born: 1942 | 2012 | 223 |
| Trustee Consultant (financial, accounting, and auditing matters) (since 1999); Certified Public Accountant; Partner, Arthur Andersen (independent public accounting firm) (prior to 1999); Director, Lincoln Educational Services Corporation (since 2004); Director, Symetra Financial Corporation (2010-2016); Director, PMA Capital Corporation (2004-2010). Trustee, John Hancock Collateral Trust (since 2014); Trustee, John Hancock Exchange-Traded Fund Trust (since 2015); Trustee, John Hancock retail funds3 (since 2012); Trustee, John Hancock Funds III (2005-2006 and since 2012); Trustee, John Hancock Variable Insurance Trust and John Hancock Funds II (since 2005). | ||
| William H. Cunningham, Born: 1944 | 2005 | 223 |
| Trustee Professor, University of Texas, Austin, Texas (since 1971); former Chancellor, University of Texas System and former President of the University of Texas, Austin, Texas; Chairman (since 2009) and Director (since 2006), Lincoln National Corporation (insurance); Director, Southwest Airlines (since 2000); former Director, LIN Television (2009-2014). Trustee, John Hancock retail funds3 (since 1986); Trustee, John Hancock Variable Insurance Trust (since 2012); Trustee, John Hancock Funds II (2005-2006 and since 2012); Trustee, John Hancock Collateral Trust (since 2014); Trustee, John Hancock Exchange-Traded Fund Trust (since 2015). | ||
| Grace K. Fey, Born: 1946 | 2012 | 223 |
| Trustee Chief Executive Officer, Grace Fey Advisors (since 2007); Director and Executive Vice President, Frontier Capital Management Company (1988-2007); Director, Fiduciary Trust (since 2009). Trustee, John Hancock Collateral Trust (since 2014); Trustee, John Hancock Exchange-Traded Fund Trust (since 2015); Trustee, John Hancock retail funds3 (since 2012); Trustee, John Hancock Variable Insurance Trust and John Hancock Funds II (since 2008). | ||
Independent Trustees (continued)
| Name, year of birth Position(s) held with Trust Principal occupation(s) and other directorships during past 5 years | Trustee of the Trust since1 | Number of John Hancock funds overseen by Trustee |
| Theron S. Hoffman,2 Born: 1947 | 2012 | 223 |
| Trustee Chief Executive Officer, T. Hoffman Associates, LLC (consulting firm) (since 2003); Director, The Todd Organization (consulting firm) (2003-2010); President, Westport Resources Management (investment management consulting firm) (2006-2008); Senior Managing Director, Partner, and Operating Head, Putnam Investments (2000-2003); Executive Vice President, The Thomson Corp. (financial and legal information publishing) (1997-2000). Trustee, John Hancock Collateral Trust (since 2014); Trustee, John Hancock Exchange-Traded Fund Trust (since 2015); Trustee, John Hancock retail funds3 (since 2012); Trustee, John Hancock Variable Insurance Trust and John Hancock Funds II (since 2008). | ||
| Deborah C. Jackson, Born: 1952 | 2008 | 223 |
| Trustee President, Cambridge College, Cambridge, Massachusetts (since 2011); Board of Directors, National Association of Corporate Directors/New England (since 2015); Board of Directors, Association of Independent Colleges and Universities of Massachusetts (since 2014); Chief Executive Officer, American Red Cross of Massachusetts Bay (2002-2011); Board of Directors of Eastern Bank Corporation (since 2001); Board of Directors of Eastern Bank Charitable Foundation (since 2001); Board of Directors of American Student Assistance Corporation (1996-2009); Board of Directors of Boston Stock Exchange (2002-2008); Board of Directors of Harvard Pilgrim Healthcare (health benefits company) (2007-2011). Trustee, John Hancock retail funds3 (since 2008); Trustee, John Hancock Variable Insurance Trust and John Hancock Funds II (since 2012); Trustee, John Hancock Collateral Trust (since 2014); and Trustee, John Hancock Exchange-Traded Fund Trust (since 2015). | ||
| James M. Oates, Born: 1946 | 2012 | 223 |
Trustee | ||
| Steven R. Pruchansky, Born: 1944 | 2005 | 223 |
| Trustee and Vice Chairperson of the Board Chairman and Chief Executive Officer, Greenscapes of Southwest Florida, Inc. (since 2000); Director and President, Greenscapes of Southwest Florida, Inc. (until 2000); Member, Board of Advisors, First American Bank (until 2010); Managing Director, Jon James, LLC (real estate) (since 2000); Partner, Right Funding, LLC (since 2014); Director, First Signature Bank & Trust Company (until 1991); Director, Mast Realty Trust (until 1994); President, Maxwell Building Corp. (until 1991). Trustee (since 1992) and Chairperson of the Board (2011-2012), John Hancock retail funds3; Trustee and Vice Chairperson of the Board, John Hancock retail funds3 John Hancock Variable Insurance Trust, and John Hancock Funds II (since 2012); Trustee and Vice Chairperson of the Board, John Hancock Collateral Trust (since 2014); Trustee and Vice Chairperson of the Board, John Hancock Exchange-Traded Fund Trust (since 2015). | ||
Independent Trustees (continued)
| Name, year of birth Position(s) held with Trust Principal occupation(s) and other directorships during past 5 years | Trustee of the Trust since1 | Number of John Hancock funds overseen by Trustee |
| Gregory A. Russo, Born: 1949 | 2009 | 223 |
| Trustee Director and Audit Committee Chairman (since 2012), and Member, Audit Committee and Finance Committee (since 2011), NCH Healthcare System, Inc. (holding company for multi-entity healthcare system); Director and Member (since 2012) and Finance Committee Chairman (since 2014), The Moorings, Inc. (nonprofit continuing care community); Vice Chairman, Risk & Regulatory Matters, KPMG LLP (KPMG) (2002-2006); Vice Chairman, Industrial Markets, KPMG (1998-2002); Chairman and Treasurer, Westchester County, New York, Chamber of Commerce (1986-1992); Director, Treasurer, and Chairman of Audit and Finance Committees, Putnam Hospital Center (1989-1995); Director and Chairman of Fundraising Campaign, United Way of Westchester and Putnam Counties, New York (1990-1995). Trustee, John Hancock retail funds3 (since 2008); Trustee, John Hancock Variable Insurance Trust and John Hancock Funds II (since 2012); Trustee, John Hancock Collateral Trust (since 2014); Trustee, John Hancock Exchange-Traded Fund Trust (since 2015). | ||
Non-Independent Trustees4
| Name, year of birth Position(s) held with Trust Principal occupation(s) and other directorships during past 5 years | Trustee of the Trust since1 | Number of John Hancock funds overseen by Trustee |
| Andrew G. Arnott, Born: 1971 | 2017 | 223 |
President and Trustee | ||
| James R. Boyle, Born: 1959 | 2015 | 223 |
| Non-Independent Trustee Chairman and Chief Executive Officer, Zillion Group, Inc. (formerly HealthFleet, Inc.) (healthcare) (since 2014); Executive Vice President and Chief Executive Officer, U.S. Life Insurance Division of Genworth Financial, Inc. (insurance) (January 2014-July 2014); Senior Executive Vice President, Manulife Financial Corporation, President and Chief Executive Officer, John Hancock (1999-2012); Chairman and Director, John Hancock Advisers, LLC, John Hancock Funds, LLC, and John Hancock Investment Management Services, LLC (2005-2010). Trustee, John Hancock Collateral Trust and John Hancock Exchange-Traded Fund Trust (since 2015); Trustee, John Hancock retail funds3 (2005-2010; 2012-2014 and since 2015); Trustee, John Hancock Variable Insurance Trust and John Hancock Funds II (2005-2014 and since 2015). | ||
| Warren A. Thomson, Born: 1955 | 2012 | 223 |
| Non-Independent Trustee Senior Executive Vice President and Chief Investment Officer, Manulife Financial Corporation and The Manufacturers Life Insurance Company (since 2009); Chairman, Manulife Asset Management (since 2001, including prior positions); Director and Chairman, Manulife Asset Management Limited (since 2006); Director and Chairman, Hancock Natural Resources Group, Inc. (since 2013). Trustee, John Hancock retail funds,3 John Hancock Variable Insurance Trust, and John Hancock Funds II (since 2012); Trustee, John Hancock Collateral Trust (since 2014); Trustee, John Hancock Exchange-Traded Fund Trust (since 2015). | ||
Principal officers who are not Trustees
| Name, year of birth Position(s) held with Trust Principal occupation(s) during past 5 years | Officer of the Trust since |
| John J. Danello, Born: 1955 | 2014 |
| Senior Vice President, Secretary, and Chief Legal Officer Vice President and Chief Counsel, John Hancock Wealth Management (since 2005); Senior Vice President (since 2007) and Chief Legal Counsel (2007-2010), John Hancock Funds, LLC and The Berkeley Financial Group, LLC; Senior Vice President (since 2006, including prior positions) and Chief Legal Officer and Secretary (since 2014), John Hancock retail funds,3 John Hancock Funds II and John Hancock Variable Insurance Trust; Senior Vice President, Secretary and Chief Legal Officer, John Hancock Collateral Trust and John Hancock Exchange-Traded Fund Trust (since 2014); Vice President, John Hancock Life & Health Insurance Company (since 2009); Vice President, John Hancock Life Insurance Company (USA) and John Hancock Life Insurance Company of New York (since 2010); and Senior Vice President, Secretary and Chief Legal Counsel (2007-2014, including prior positions) of John Hancock Advisers, LLC and John Hancock Investment Management Services, LLC. | |
| Francis V. Knox, Jr., Born: 1947 | 2005 |
| Chief Compliance Officer Vice President, John Hancock Financial Services (since 2005); Chief Compliance Officer, John Hancock retail funds,3 John Hancock Variable Insurance Trust, John Hancock Funds II, John Hancock Advisers, LLC, and John Hancock Investment Management Services, LLC (since 2005); Chief Compliance Officer, John Hancock Collateral Trust and John Hancock Exchange-Traded Fund Trust (since 2014). | |
| Charles A. Rizzo, Born: 1957 | 2007 |
| Chief Financial Officer Vice President, John Hancock Financial Services (since 2008); Senior Vice President, John Hancock Advisers, LLC and John Hancock Investment Management Services, LLC (since 2008); Chief Financial Officer, John Hancock retail funds,3 John Hancock Variable Insurance Trust and John Hancock Funds II (since 2007); Chief Financial Officer, John Hancock Collateral Trust and John Hancock Exchange-Traded Fund Trust (since 2014). | |
| Salvatore Schiavone, Born: 1965 | 2010 |
| Treasurer Assistant Vice President, John Hancock Financial Services (since 2007); Vice President, John Hancock Advisers, LLC and John Hancock Investment Management Services, LLC (since 2007); Treasurer, John Hancock retail funds3 (since 2007, including prior positions); Treasurer, John Hancock Variable Insurance Trust and John Hancock Funds II (2007-2009 and since 2010, including prior positions); Treasurer, John Hancock Collateral Trust and John Hancock Exchange-Traded Fund Trust (since 2014). | |
The business address for all Trustees and Officers is 601 Congress Street, Boston, Massachusetts 02210-2805.
The Statement of Additional Information of the fund includes additional information about members of the Board of Trustees of the Trust and is available without charge, upon request, by calling 800-225-5291.
| 1 | Each Trustee holds office until his or her successor is elected and qualified, or until the Trustee's death, retirement, resignation, or removal. Mr. Boyle has served as Trustee at various times prior to the date listed in the table. |
| 2 | Member of the Audit Committee. |
| 3 | "John Hancock retail funds" comprises John Hancock Funds III and 38 other John Hancock funds consisting of 28 series of other John Hancock trusts and 10 closed-end funds. |
| 4 | The Trustee is a Non-Independent Trustee due to current or former positions with the Advisor and certain affiliates. |
Trustees Hassell H. McClellan, Chairperson Officers Andrew G. Arnott John J. Danello Francis V. Knox, Jr. Charles A. Rizzo Salvatore Schiavone | Investment advisor John Hancock Advisers, LLC Subadvisor Sustainable Growth Advisers, LP (SGA) Principal distributor John Hancock Funds, LLC Custodian State Street Bank and Trust Company Transfer agent John Hancock Signature Services, Inc. Legal counsel K&L Gates LLP Independent registered public accounting firm PricewaterhouseCoopers LLP |
*Member of the Audit Committee
†Non-Independent Trustee
#Effective 6-20-17
The fund's proxy voting policies and procedures, as well as the fund proxy voting record for the most recent twelve-month period ended June 30, are available free of charge on the Securities and Exchange Commission (SEC) website at sec.gov or on our website.
The fund's complete list of portfolio holdings, for the first and third fiscal quarters, is filed with the SEC on Form N-Q. The fund's Form N-Q is available on our website and the SEC's website, sec.gov, and can be reviewed and copied (for a fee) at the SEC's Public Reference Room in Washington, DC. Call 800-SEC-0330 to receive information on the operation of the SEC's Public Reference Room.
We make this information on your fund, as well as monthly portfolio holdings, and other fund details available on our website at jhinvestments.com or by calling 800-225-5291.
| You can also contact us: | |||
| 800-225-5291 jhinvestments.com | Regular mail: John Hancock Signature Services, Inc. | Express mail: John Hancock Signature Services, Inc. | |
John Hancock family of funds
DOMESTIC EQUITY FUNDS Balanced Blue Chip Growth Classic Value Disciplined Value Disciplined Value Mid Cap Equity Income Fundamental All Cap Core Fundamental Large Cap Core Fundamental Large Cap Value New Opportunities Small Cap Core Small Cap Value Small Company Strategic Growth U.S. Global Leaders Growth U.S. Growth Value Equity GLOBAL AND INTERNATIONAL EQUITY FUNDS Disciplined Value International Emerging Markets Emerging Markets Equity Fundamental Global Franchise Global Equity Global Shareholder Yield Greater China Opportunities International Growth International Small Company International Value Equity | INCOME FUNDS Bond California Tax-Free Income Emerging Markets Debt Floating Rate Income Global Income Government Income High Yield High Yield Municipal Bond Income Investment Grade Bond Money Market Short Duration Credit Opportunities Spectrum Income Strategic Income Opportunities Tax-Free Bond ALTERNATIVE AND SPECIALTY FUNDS Absolute Return Currency Alternative Asset Allocation Enduring Assets Financial Industries Global Absolute Return Strategies Global Conservative Absolute Return Global Focused Strategies Natural Resources Redwood Regional Bank Seaport Technical Opportunities |
A fund's investment objectives, risks, charges, and expenses should be considered carefully before investing. The prospectus contains this and other important information about the fund. To obtain a prospectus, contact your financial professional, call John Hancock Investments at 800-225-5291, or visit our website at jhinvestments.com. Please read the prospectus carefully before investing or sending money.
ASSET ALLOCATION Income Allocation Fund Multi-Index Lifetime Portfolios Multi-Index Preservation Portfolios Multimanager Lifestyle Portfolios Multimanager Lifetime Portfolios EXCHANGE-TRADED FUNDS John Hancock Multifactor Consumer Discretionary ETF John Hancock Multifactor Consumer Staples ETF John Hancock Multifactor Developed International ETF John Hancock Multifactor Energy ETF John Hancock Multifactor Financials ETF John Hancock Multifactor Healthcare ETF John Hancock Multifactor Industrials ETF John Hancock Multifactor Large Cap ETF John Hancock Multifactor Materials ETF John Hancock Multifactor Mid Cap ETF John Hancock Multifactor Small Cap ETF John Hancock Multifactor Technology ETF John Hancock Multifactor Utilities ETF | ENVIRONMENTAL, SOCIAL, AND GOVERNANCE FUNDS ESG All Cap Core ESG Core Bond ESG International Equity ESG Large Cap Core CLOSED-END FUNDS Financial Opportunities Hedged Equity & Income Income Securities Trust Investors Trust Preferred Income Preferred Income II Preferred Income III Premium Dividend Tax-Advantaged Dividend Income Tax-Advantaged Global Shareholder Yield |
John Hancock Multifactor ETF shares are bought and sold at market price (not NAV), and are not individually redeemed
from the fund. Brokerage commissions will reduce returns.
John Hancock ETFs are distributed by Foreside Fund Services, LLC, and are subadvised by Dimensional Fund Advisors LP.
Foreside is not affiliated with John Hancock Funds, LLC or Dimensional Fund Advisors LP.
Dimensional Fund Advisors LP receives compensation from John Hancock in connection with licensing rights to the
John Hancock Dimensional indexes. Dimensional Fund Advisors LP does not sponsor, endorse, or sell, and makes no
representation as to the advisability of investing in, John Hancock Multifactor ETFs.
John Hancock Investments
A trusted brand
John Hancock Investments is a premier asset manager representing one of
America's most trusted brands, with a heritage of financial stewardship dating
back to 1862. Helping our shareholders pursue their financial goals is at the
core of everything we do. It's why we support the role of professional financial
advice and operate with the highest standards of conduct and integrity.
A better way to invest
We serve investors globally through a unique multimanager approach:
We search the world to find proven portfolio teams with specialized
expertise for every strategy we offer, then we apply robust investment
oversight to ensure they continue to meet our uncompromising standards
and serve the best interests of our shareholders.
Results for investors
Our unique approach to asset management enables us to provide a diverse set
of investments backed by some of the world's best managers, along with strong
risk-adjusted returns across asset classes.

 | John Hancock Funds, LLC n Member FINRA, SIPC 601 Congress Street n Boston, MA 02210-2805 800-225-5291 n jhinvestments.com | |
| This report is for the information of the shareholders of John Hancock U.S. Global Leaders Growth Fund. It is not authorized for distribution to prospective investors unless preceded or accompanied by a prospectus. | ||
| MF410680 | 26A 10/17 12/17 | |
John Hancock
Classic Value Fund
Annual report 10/31/17
A message to shareholders
Dear shareholder,
Wherever stock investors look today, the markets seem to exhibit undiminished strength, as evidenced by the fact that the Dow Jones Industrial Average, the S&P 500 Index, and the NASDAQ Composite Index reached and then surpassed all-time highs several times during the period. Economic and corporate data has continued to underpin investor optimism. Corporate earnings have generally been solid, with a weaker dollar helping to boost results for U.S.-based multinationals.
While stock markets continue their rise, investors have reason to be vigilant. U.S. stocks haven't experienced a drop of 10% in more than 21 months, and 16 months have passed since the last 5% pullback. This degree of calm in a rising market is rare, and history suggests stormier market conditions could be brewing. As the bull market advances, many stocks are moving deeper into overvalued territory, suggesting that market leaders could be vulnerable to any setbacks.
Given the risks of overvaluation, investors would do well to consider their options for diversification. Maintaining a diversified portfolio of stocks, bonds, and alternatives, alongside a disciplined investment program, is one approach that has stood the test of time. As always, your best resource to prepare for any market condition is your financial advisor, who can help ensure your portfolio is sufficiently diversified to meet your long-term objectives and to withstand the inevitable disappointments that can interrupt any market rise.
On behalf of everyone at John Hancock Investments, I'd like to take this opportunity to welcome new shareholders and to thank existing shareholders for the continued trust you've placed in us.
Sincerely,
Andrew G. Arnott
President and Chief Executive Officer
John Hancock Investments
This commentary reflects the CEO's views, which are subject to change at any time. Investing involves risks, including the potential loss of principal. Diversification does not guarantee a profit or eliminate the risk of a loss. It is not possible to invest directly into an index. For more up-to-date information, please visit our website at jhinvestments.com.
John Hancock
Classic Value Fund
Table of contents
| 2 | Your fund at a glance | |
| 4 | Discussion of fund performance | |
| 8 | A look at performance | |
| 10 | Your expenses | |
| 12 | Fund's investments | |
| 15 | Financial statements | |
| 19 | Financial highlights | |
| 29 | Notes to financial statements | |
| 36 | Auditor's report | |
| 37 | Tax information | |
| 38 | Continuation of investment advisory and subadvisory agreements | |
| 44 | Trustees and Officers | |
| 48 | More information |
INVESTMENT OBJECTIVE
The fund seeks long-term growth of capital.
AVERAGE ANNUAL TOTAL RETURNS AS OF 10/31/17 (%)
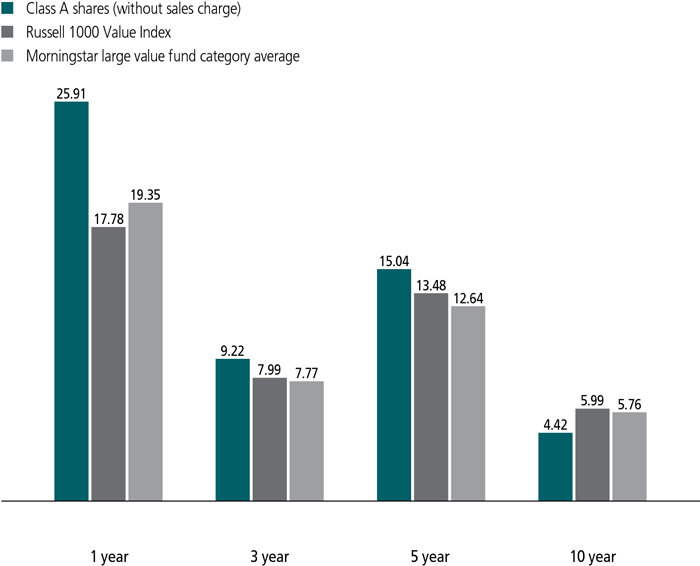
The Russell 1000 Value Index is an unmanaged index containing those securities in the Russell 1000 Index with a less-than-average growth orientation.
It is not possible to invest directly in an index. Index figures do not reflect expenses or sales charges, which would result in lower returns.
Figures from Morningstar, Inc. include reinvested distributions and do not take into account sales charges. Actual load-adjusted performance is lower.
The past performance shown here reflects reinvested distributions and the beneficial effect of any expense reductions, and does not guarantee future results. Performance of the other share classes will vary based on the difference in the fees and expenses of those classes. Shares will fluctuate in value and, when redeemed, may be worth more or less than their original cost. Current month-end performance may be lower or higher than the performance cited, and can be found at jhinvestments.com or by calling 800-225-5291. For further information on the fund's objectives, risks, and strategy, see the fund's prospectus.
PERFORMANCE HIGHLIGHTS OVER THE LAST TWELVE MONTHS
The stock market continued to climb to new highs
U.S. companies and investors reacted positively to President Trump's pro-business agenda and the economy's continued growth, spurring the markets on to new heights.
The fund generated a positive return and outpaced its benchmark
The fund's overweight in the strong-performing financials sector helped it outgain its benchmark, the Russell 1000 Value Index.
Selection in other sectors also benefited
Stock selection in consumer staples, industrials, information technology, and energy was also an important contributor to the fund's outperformance.
SECTOR COMPOSITION AS OF 10/31/17 (%)
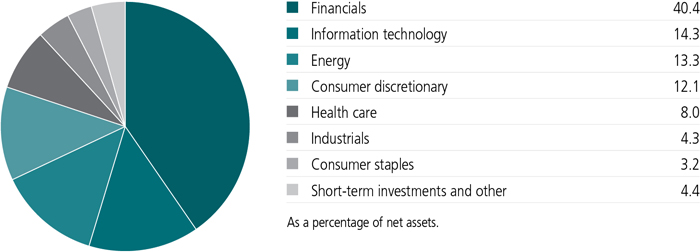
A note about risks
The value of a company's equity securities is subject to changes in the company's financial condition and overall market and economic conditions. The securities of value companies are subject to the risk that the companies may not overcome the adverse business developments or other factors causing their securities to be underpriced or that the market may never come to recognize their fundamental value. Because the fund may focus on particular sectors of the economy, its performance may depend on the performance of those sectors, and investments focused in one sector may fluctuate more widely than investments broadly invested across sectors. Foreign investing has additional risks, such as currency and market volatility and political and social instability. Please see the fund's prospectus for additional risks.

Richard S. Pzena
Portfolio Manager
Pzena Investment Management, LLC

John Flynn
Portfolio Manager
Pzena Investment Management, LLC

Benjamin S. Silver, CFA, CPA
Portfolio Manager
Pzena Investment Management, LLC
How did the markets perform during the 12 months ended October 31, 2017?
The stock markets continued to hit record highs in 2017, with the bull market entering its ninth year. Companies and investors reacted positively to President Trump's pro-business agenda and the U.S. economy's continued growth. Valuation spreads widened and growth stocks outperformed value. Still, the fund's benchmark, the Russell 1000 Value Index, returned a healthy 17.78%, driven largely by the financials sector. Many banks, brokerages, and other financial firms have implemented aggressive self-help measures to improve returns, and strong balance sheets have enabled substantial increases in capital returns to shareholders. Rising interest rates also contributed to investor optimism for the sector. Other economically sensitive areas were top performers, including materials and processing, technology, and industrials. The energy sector lagged, as oil prices hovered between $40 and $55 per barrel; consumer staples and real estate were also relatively weak.
How did the fund perform in this environment?
The fund outperformed its benchmark, due in large part to a significant exposure to financials, which accounted for 40.4% of the portfolio's weight at period end.
What were some of the key contributors?
Specific holdings that topped the list included Morgan Stanley, Bank of America Corp., and Citigroup, Inc. Although we selectively trimmed some positions in the sector as they ran up,
Stock selection in consumer staples, industrials, information technology, and energy was also an important contributor to outperformance. We saw strong contributions from information technology firm Cognizant Technology Solutions Corp., industrial equipment manufacturer Dover Corp., and hotel company Hilton Worldwide Holdings, Inc.
What about detractors?
Holdings that detracted from performance included Canadian oil sands company Cenovus Energy, Inc., global advertising firms Omnicom Group, Inc. and The Interpublic Group of Companies, Inc., and semiconductor manufacturer Intel, Inc. We added to Cenovus, Omnicom, and Interpublic, as we believe our investment thesis remains intact despite near-term headwinds, but sold Intel, as competition at both the low and high ends of the semiconductor market opened the possibility of a destructive price war.
What changes did you make to the fund over the period?
The most significant changes were an increase in healthcare exposure and a decrease in industrial holdings.
In healthcare, controversy broke out across the pharmaceutical supply chain as pricing pressures affected both manufacturers and distributors, and healthcare spending in general garnered more attention. Our investment process led us to add three holdings: Mylan NV, one of the world's largest
TOP 10 HOLDINGS AS OF 10/31/17 (%)
| Citigroup, Inc. | 4.2 |
| Hewlett Packard Enterprise Company | 3.9 |
| Royal Dutch Shell PLC, ADR, Class A | 3.8 |
| Bank of America Corp. | 3.7 |
| Oracle Corp. | 3.7 |
| Cognizant Technology Solutions Corp., Class A | 3.5 |
| Dover Corp. | 3.3 |
| Mylan NV | 3.2 |
| Wal-Mart Stores, Inc. | 3.2 |
| Morgan Stanley | 3.2 |
| TOTAL | 35.7 |
| As a percentage of net assets. | |
| Cash and cash equivalents are not included. | |
Mylan's stock fell as the EpiPen product, historically 20% of earnings, came under scrutiny for aggressive pricing actions. We believe the stock price reaction ignores the value of the generics business, and that even with conservative estimates around the EpiPen franchise, the stock is attractive.
With McKesson, the slowdown in drug price inflation in 2016 depressed margins, which was compounded by the company's aggressive price cuts in response to those of a competitor. Despite the near-term issues, we see a company that has high returns on capital, an important value-added proposition to both its suppliers and customers, and a highly consolidated industry structure with high barriers to entry and a history of disciplined behavior.
Express Scripts presented the opportunity to invest in one of the three largest PBMs that help employers and health plans manage their drug benefit programs. The stock weakened on overall drug price deflation fears as well as on news that its largest customer was suing for breach of contract. After adjusting for the loss of this customer and bringing margins in line with their long-term history, we found the stock to be an attractive addition.
To help fund these purchases, we sold Abbott Laboratories, as it reached fair value, and trimmed Cigna Corp., the leading managed care company, after a strong run.
Industrials valuations rallied over the period, powered by earnings that generally beat expectations and an uptick in top-line growth. We reduced the fund's exposure to the sector as we sold out of Stanley Black & Decker, Inc., a leader in tools, storage solutions, and fasteners, as it reached fair
COUNTRY COMPOSITION AS OF 10/31/17 (%)
| United States | 87.2 |
| Netherlands | 3.8 |
| United Kingdom | 3.0 |
| Canada | 2.2 |
| Switzerland | 2.0 |
| Bermuda | 1.8 |
| TOTAL | 100.0 |
| As a percentage of net assets. |
value, and trimmed Parker-Hannifin Corp., a leading global manufacturer of motion and control technologies, as its stock price surged.
The fund's weight in financials did not change materially. We bought Wells Fargo & Company during the period and sold Regions Financial Corp. Other notable actions included the sales of Microsoft Corp., as its leading position in cloud computing was rewarded by investors, and the office supply company Staples, Inc. when it was sold to a private investment group.
How was the fund positioned at period end?
The fund's largest positions were in the financials, information technology, and energy sectors. Financials continue to be the fund's largest exposure, as we see the businesses in this sector offering the best risk/reward trade-off in the fund's investment universe.
Economic growth around the world appears to have become more synchronous, and, on balance, corporate profits announcements have surprised on the upside. We believe this combination of wide valuation spreads and improving fundamentals continues to provide significant opportunity for value stocks, and we believe the fund can take advantage of some attractive returns in an increasingly pricey market.
MANAGED BY
| | Richard S. Pzena On the fund since 1996 Investing since 1980 |
| | John Flynn On the fund since 2017 Investing since 2000 |
| | Benjamin S. Silver, CFA, CPA On the fund since 2012 Investing since 1991 |
![]()
TOTAL RETURNS FOR THE PERIOD ENDED OCTOBER 31, 2017
| Average annual total returns (%) with maximum sales charge | Cumulative total returns (%) with maximum sales charge | ||||||
| 1-year | 5-year | 10-year | 5-year | 10-year | |||
| Class A | 19.64 | 13.86 | 3.88 | 91.38 | 46.39 | ||
| Class B | 19.96 | 13.94 | 3.79 | 92.02 | 45.12 | ||
| Class C | 23.96 | 14.17 | 3.63 | 93.95 | 42.89 | ||
| Class I1 | 26.24 | 15.35 | 4.75 | 104.24 | 59.06 | ||
| Class R11 | 25.43 | 14.61 | 4.06 | 97.75 | 48.82 | ||
| Class R21,2 | 25.71 | 14.99 | 4.37 | 101.03 | 53.38 | ||
| Class R31,2 | 25.58 | 14.72 | 4.13 | 98.74 | 49.88 | ||
| Class R41,2 | 26.20 | 15.29 | 4.55 | 103.71 | 56.07 | ||
| Class R51,2 | 26.27 | 15.43 | 4.76 | 104.93 | 59.14 | ||
| Class R61,2 | 26.41 | 15.47 | 4.83 | 105.24 | 60.29 | ||
| Index† | 17.78 | 13.48 | 5.99 | 88.17 | 78.93 | ||
Performance figures assume all distributions have been reinvested. Figures reflect maximum sales charges on Class A shares of 5% and the applicable contingent deferred sales charge (CDSC) on Class B and Class C shares. The Class B shares' CDSC declines annually between years 1 to 6 according to the following schedule: 5%, 4%, 3%, 3%, 2%, 1%. No sales charge will be assessed after the sixth year. Class C shares held for less than one year are subject to a 1% CDSC. Sales charges are not applicable to Class I, Class R1, Class R2, Class R3, Class R4, Class R5, and Class R6 shares.
The expense ratios of the fund, both net (including any fee waivers and/or expense limitations) and gross (excluding any fee waivers and/or expense limitations), are set forth according to the most recent publicly available prospectus for the fund and may differ from those disclosed in the Financial highlights tables in this report. Had the contractual fee waivers and expense limitations not been in place, gross expenses would apply. The expense ratios are as follows:
| Class A | Class B | Class C | Class I | Class R1 | Class R2 | Class R3 | Class R4 | Class R5 | Class R6 | |
| Gross (%) | 1.19 | 1.94 | 1.94 | 0.93 | 1.58 | 1.33 | 1.48 | 1.18 | 0.88 | 0.83 |
| Net (%) | 1.19 | 1.94 | 1.94 | 0.93 | 1.58 | 1.33 | 1.48 | 1.08 | 0.88 | 0.83 |
Please refer to the most recent prospectus and annual or semiannual report for more information on expenses and any expense limitation arrangements for each class.
The returns reflect past results and should not be considered indicative of future performance. The return and principal value of an investment will fluctuate so that shares, when redeemed, may be worth more or less than their original cost. Due to market volatility and other factors, the fund's current performance may be higher or lower than the performance shown. For current to the most recent month-end performance data, please call 800-225-5291 or visit the fund's website at jhinvestments.com.
The performance table above and the chart on the next page do not reflect the deduction of taxes that a shareholder would pay on fund distributions or the redemption of fund shares. The fund's performance results reflect any applicable fee waivers or expense reductions, without which the expenses would increase and results would have been less favorable.
| † | Index is the Russell 1000 Value Index. |
See the following page for footnotes.
This chart and table show what happened to a hypothetical $10,000 investment in John Hancock Classic Value Fund for the share classes and periods indicated, assuming all distributions were reinvested. For comparison, we've shown the same investment in the Russell 1000 Value Index.
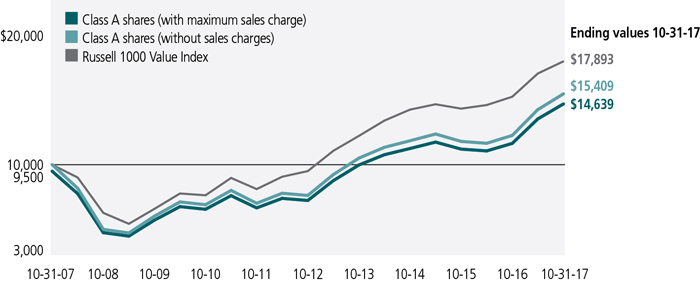
| Start date | With maximum sales charge ($) | Without sales charge ($) | Index ($) | |
| Class B3 | 10-31-07 | 14,512 | 14,512 | 17,893 |
| Class C3 | 10-31-07 | 14,289 | 14,289 | 17,893 |
| Class I1 | 10-31-07 | 15,906 | 15,906 | 17,893 |
| Class R11 | 10-31-07 | 14,882 | 14,882 | 17,893 |
| Class R21,2 | 10-31-07 | 15,338 | 15,338 | 17,893 |
| Class R31,2 | 10-31-07 | 14,988 | 14,988 | 17,893 |
| Class R41,2 | 10-31-07 | 15,607 | 15,607 | 17,893 |
| Class R51,2 | 10-31-07 | 15,914 | 15,914 | 17,893 |
| Class R61,2 | 10-31-07 | 16,029 | 16,029 | 17,893 |
Performance of the classes will vary based on the difference in sales charges paid by shareholders investing in the different classes and the fee structure of those classes.
The Russell 1000 Value Index is an unmanaged index containing those securities in the Russell 1000 Index with a less-than-average growth orientation.
It is not possible to invest directly in an index. Index figures do not reflect expenses or sales charges, which would result in lower returns.
Footnotes related to performance pages
| 1 | For certain types of investors, as described in the fund's prospectus. |
| 2 | Class R2 shares were first offered on 3-1-12; Class R3, Class R4, and Class R5 shares were first offered on 5-22-09; Class R6 shares were first offered on 9-1-11. The returns prior to these dates are those of Class A shares that have been recalculated to apply the gross fees and expenses of Class R2, Class R3, Class R4, Class R5, and Class R6 shares, as applicable. |
| 3 | The contingent deferred sales charge is not applicable. |
These examples are intended to help you understand your ongoing operating expenses of investing in the fund so you can compare these costs with the ongoing costs of investing in other mutual funds.
Understanding fund expenses
As a shareholder of the fund, you incur two types of costs:
| • | Transaction costs, which include sales charges (loads) on purchases or redemptions (varies by share class), minimum account fee charge, etc. |
| • | Ongoing operating expenses, including management fees, distribution and service fees (if applicable), and other fund expenses. |
We are presenting only your ongoing operating expenses here.
Actual expenses/actual returns
The first line of each share class in the table on the following page is intended to provide information about the fund's actual ongoing operating expenses, and is based on the fund's actual return. It assumes an account value of $1,000.00 on May 1, 2017, with the same investment held until October 31, 2017.
Together with the value of your account, you may use this information to estimate the operating expenses that you paid over the period. Simply divide your account value at October 31, 2017, by $1,000.00, then multiply it by the "expenses paid" for your share class from the table. For example, for an account value of $8,600.00, the operating expenses should be calculated as follows:
Hypothetical example for comparison purposes
The second line of each share class in the table on the following page allows you to compare the fund's ongoing operating expenses with those of any other fund. It provides an example of the fund's hypothetical account values and hypothetical expenses based on each class's actual expense ratio and an assumed 5% annualized return before expenses (which is not the fund's actual return). It assumes an account value of $1,000.00 on May 1, 2017, with the same investment held until October 31, 2017. Look in any other fund shareholder report to find its hypothetical example and you will be able to compare these expenses. Please remember that these hypothetical account values and expenses may not be used to estimate the actual ending account balance or expenses you paid for the period.
Remember, these examples do not include any transaction costs, therefore, these examples will not help you to determine the relative total costs of owning different funds. If transaction costs were included, your expenses would have been higher. See the prospectus for details regarding transaction costs.
SHAREHOLDER EXPENSE EXAMPLE CHART
| Account value on 5-1-2017 | Ending value on 10-31-2017 | Expenses paid during period ended 10-31-20171 | Annualized expense ratio | ||
| Class A | Actual expenses/actual returns | $1,000.00 | $1,084.60 | $6.15 | 1.17% |
| Hypothetical example for comparison purposes | 1,000.00 | 1,019.30 | 5.95 | 1.17% | |
| Class B | Actual expenses/actual returns | 1,000.00 | 1,080.40 | 10.07 | 1.92% |
| Hypothetical example for comparison purposes | 1,000.00 | 1,015.50 | 9.75 | 1.92% | |
| Class C | Actual expenses/actual returns | 1,000.00 | 1,080.50 | 10.07 | 1.92% |
| Hypothetical example for comparison purposes | 1,000.00 | 1,015.50 | 9.75 | 1.92% | |
| Class I | Actual expenses/actual returns | 1,000.00 | 1,086.10 | 4.78 | 0.91% |
| Hypothetical example for comparison purposes | 1,000.00 | 1,020.60 | 4.63 | 0.91% | |
| Class R1 | Actual expenses/actual returns | 1,000.00 | 1,082.40 | 8.29 | 1.58% |
| Hypothetical example for comparison purposes | 1,000.00 | 1,017.20 | 8.03 | 1.58% | |
| Class R2 | Actual expenses/actual returns | 1,000.00 | 1,083.70 | 6.93 | 1.32% |
| Hypothetical example for comparison purposes | 1,000.00 | 1,018.60 | 6.72 | 1.32% | |
| Class R3 | Actual expenses/actual returns | 1,000.00 | 1,082.70 | 7.77 | 1.48% |
| Hypothetical example for comparison purposes | 1,000.00 | 1,017.70 | 7.53 | 1.48% | |
| Class R4 | Actual expenses/actual returns | 1,000.00 | 1,085.80 | 5.05 | 0.96% |
| Hypothetical example for comparison purposes | 1,000.00 | 1,020.40 | 4.89 | 0.96% | |
| Class R5 | Actual expenses/actual returns | 1,000.00 | 1,086.00 | 4.57 | 0.87% |
| Hypothetical example for comparison purposes | 1,000.00 | 1,020.80 | 4.43 | 0.87% | |
| Class R6 | Actual expenses/actual returns | 1,000.00 | 1,086.70 | 4.31 | 0.82% |
| Hypothetical example for comparison purposes | 1,000.00 | 1,021.10 | 4.18 | 0.82% | |
| 1 | Expenses are equal to the annualized expense ratio, multiplied by the average account value over the period, multiplied by 184/365 (to reflect the one-half year period). |
| Fund’s investments |
| Shares | Value | ||||
| Common stocks 95.6% | $2,117,222,528 | ||||
| (Cost $1,816,222,441) | |||||
| Consumer discretionary 12.1% | 266,772,027 | ||||
| Automobiles 3.0% | |||||
| Ford Motor Company | 5,476,327 | 67,194,532 | |||
| Hotels, restaurants and leisure 2.2% | |||||
| Hilton Worldwide Holdings, Inc. | 655,334 | 47,367,542 | |||
| Media 6.9% | |||||
| News Corp., Class A | 2,160,052 | 29,506,310 | |||
| Omnicom Group, Inc. | 910,344 | 61,166,013 | |||
| The Interpublic Group of Companies, Inc. | 3,196,760 | 61,537,630 | |||
| Consumer staples 3.2% | 71,496,762 | ||||
| Food and staples retailing 3.2% | |||||
| Wal-Mart Stores, Inc. | 818,884 | 71,496,762 | |||
| Energy 13.3% | 294,561,099 | ||||
| Energy equipment and services 2.1% | |||||
| Halliburton Company | 1,064,410 | 45,492,883 | |||
| Oil, gas and consumable fuels 11.2% | |||||
| BP PLC, ADR | 1,083,645 | 44,071,842 | |||
| Cenovus Energy, Inc. (A) | 4,945,673 | 48,071,942 | |||
| Exxon Mobil Corp. | 508,542 | 42,386,976 | |||
| Murphy Oil Corp. | 1,103,276 | 29,512,633 | |||
| Royal Dutch Shell PLC, ADR, Class A | 1,348,958 | 85,024,823 | |||
| Financials 40.4% | 895,527,104 | ||||
| Banks 13.5% | |||||
| Bank of America Corp. | 2,972,988 | 81,430,141 | |||
| Citigroup, Inc. | 1,252,054 | 92,025,970 | |||
| JPMorgan Chase & Co. | 586,661 | 59,023,963 | |||
| Wells Fargo & Company | 1,196,410 | 67,166,457 | |||
| Capital markets 13.5% | |||||
| Franklin Resources, Inc. | 1,364,649 | 57,492,662 | |||
| Morgan Stanley | 1,429,596 | 71,479,800 | |||
| State Street Corp. | 646,187 | 59,449,204 | |||
| The Goldman Sachs Group, Inc. | 274,028 | 66,446,309 | |||
| UBS Group AG (A)(B) | 2,577,126 | 43,836,913 | |||
| Consumer finance 3.2% | |||||
| Capital One Financial Corp. | 775,281 | 71,465,403 | |||
| Diversified financial services 2.8% | |||||
| Voya Financial, Inc. | 1,562,843 | 62,763,775 | |||
| Insurance 7.4% | |||||
| American International Group, Inc. | 1,034,118 | 66,814,364 | |||
| 12 | JOHN HANCOCK Classic Value Fund | ANNUAL REPORT | SEE NOTES TO FINANCIAL STATEMENTS |
| Shares | Value | ||||
| Financials (continued) | |||||
| Insurance (continued) | |||||
| Axis Capital Holdings, Ltd. | 746,892 | $40,623,456 | |||
| Brighthouse Financial, Inc. (B) | 56,735 | 3,527,782 | |||
| MetLife, Inc. | 970,155 | 51,980,905 | |||
| Health care 8.0% | 176,267,644 | ||||
| Health care providers and services 4.7% | |||||
| Cigna Corp. | 28,250 | 5,571,465 | |||
| Express Scripts Holding Company (B) | 671,456 | 41,153,538 | |||
| McKesson Corp. | 419,951 | 57,902,844 | |||
| Pharmaceuticals 3.3% | |||||
| Mylan NV (B) | 2,006,155 | 71,639,797 | |||
| Industrials 4.3% | 96,115,089 | ||||
| Machinery 4.3% | |||||
| Dover Corp. | 765,185 | 73,067,516 | |||
| Parker-Hannifin Corp. | 126,212 | 23,047,573 | |||
| Information technology 14.3% | 316,482,803 | ||||
| IT services 3.5% | |||||
| Cognizant Technology Solutions Corp., Class A | 1,030,906 | 78,008,657 | |||
| Software 4.7% | |||||
| Micro Focus International PLC, ADR (A)(B) | 631,668 | 22,064,163 | |||
| Oracle Corp. | 1,597,394 | 81,307,355 | |||
| Technology hardware, storage and peripherals 6.1% | |||||
| Hewlett Packard Enterprise Company | 6,237,970 | 86,832,542 | |||
| HP, Inc. | 1,550,226 | 33,407,370 | |||
| Seagate Technology PLC | 402,021 | 14,862,716 | |||
| Yield (%) | Shares | Value | |||
| Securities lending collateral 0.1% | $2,506,393 | ||||
| (Cost $2,506,459) | |||||
| John Hancock Collateral Trust (C) | 1.1946(D) | 250,499 | 2,506,393 | ||
| Par value^ | Value | ||||
| Short-term investments 4.4% | $96,390,000 | ||||
| (Cost $96,390,000) | |||||
| Repurchase agreement 4.4% | 96,390,000 | ||||
| Repurchase Agreement with State Street Corp. dated 10-31-17 at 0.34% to be repurchased at $96,390,910 on 11-1-17, collateralized by $93,460,000 U.S. Treasury Inflation Indexed Notes, 0.125% due 4-15-20 (valued at $98,323,004, including interest) | 96,390,000 | 96,390,000 |
| Total investments (Cost $1,915,118,900) 100.1% | $2,216,118,921 | ||||
| Other assets and liabilities, net (0.1%) | (1,579,337) | ||||
| Total net assets 100.0% | $2,214,539,584 | ||||
| SEE NOTES TO FINANCIAL STATEMENTS | ANNUAL REPORT | JOHN HANCOCK Classic Value Fund | 13 |
| The percentage shown for each investment category is the total value of the category as a percentage of the net assets of the fund. | |
| ^All par values are denominated in U.S. dollars unless otherwise indicated. | |
| Security Abbreviations and Legend | |
| ADR | American Depositary Receipt |
| (A) | A portion of this security is on loan as of 10-31-17. |
| (B) | Non-income producing security. |
| (C) | Investment is an affiliate of the fund, the advisor and/or subadvisor. This security represents the investment of cash collateral received for securities lending. |
| (D) | The rate shown is the annualized seven-day yield as of 10-31-17. |
| 14 | JOHN HANCOCK Classic Value Fund | ANNUAL REPORT | SEE NOTES TO FINANCIAL STATEMENTS |
Financial statements
STATEMENT OF ASSETS AND LIABILITIES 10-31-17
| Assets | ||||||||||||||||||||||||||||||
| Unaffiliated investments, at value (Cost $1,912,612,441) including $2,443,178 of securities loaned | $2,213,612,528 | |||||||||||||||||||||||||||||
| Affiliated investments, at value (Cost $2,506,459) | 2,506,393 | |||||||||||||||||||||||||||||
| Cash | 835 | |||||||||||||||||||||||||||||
| Receivable for fund shares sold | 3,621,244 | |||||||||||||||||||||||||||||
| Dividends and interest receivable | 1,179,759 | |||||||||||||||||||||||||||||
| Receivable for securities lending income | 1,876 | |||||||||||||||||||||||||||||
| Other receivables and prepaid expenses | 217,650 | |||||||||||||||||||||||||||||
| Total assets | 2,221,140,285 | |||||||||||||||||||||||||||||
| Liabilities | ||||||||||||||||||||||||||||||
| Payable for fund shares repurchased | 2,027,125 | |||||||||||||||||||||||||||||
| Payable upon return of securities loaned | 2,506,670 | |||||||||||||||||||||||||||||
| Payable to affiliates | ||||||||||||||||||||||||||||||
| Accounting and legal services fees | 33,883 | |||||||||||||||||||||||||||||
| Transfer agent fees | 204,271 | |||||||||||||||||||||||||||||
| Distribution and service fees | 148,565 | |||||||||||||||||||||||||||||
| Trustees' fees | 1,272 | |||||||||||||||||||||||||||||
| Investment management fees | 1,415,160 | |||||||||||||||||||||||||||||
| Other liabilities and accrued expenses | 263,755 | |||||||||||||||||||||||||||||
| Total liabilities | 6,600,701 | |||||||||||||||||||||||||||||
| Net assets | $2,214,539,584 | |||||||||||||||||||||||||||||
| Net assets consist of | ||||||||||||||||||||||||||||||
| Paid-in capital | $1,902,984,670 | |||||||||||||||||||||||||||||
| Undistributed net investment income | 19,397,004 | |||||||||||||||||||||||||||||
| Accumulated net realized gain (loss) on investments and foreign currency transactions | (8,842,111 | ) | ||||||||||||||||||||||||||||
| Net unrealized appreciation (depreciation) on investments | 301,000,021 | |||||||||||||||||||||||||||||
| Net assets | $2,214,539,584 | |||||||||||||||||||||||||||||
STATEMENT OF ASSETS AND LIABILITIES (continued)
| Net asset value per share | ||||||||||||||||||
| Based on net asset values and shares outstanding-the fund has an unlimited number of shares authorized with no par value | ||||||||||||||||||
| Class A ($354,273,897 ÷ 10,962,786 shares)1 | $32.32 | |||||||||||||||||
| Class B ($4,382,808 ÷ 138,243 shares)1 | $31.70 | |||||||||||||||||
| Class C ($75,401,315 ÷ 2,379,105 shares)1 | $31.69 | |||||||||||||||||
| Class I ($1,767,072,897 ÷ 54,506,633 shares) | $32.42 | |||||||||||||||||
| Class R1 ($3,586,787 ÷ 111,017 shares) | $32.31 | |||||||||||||||||
| Class R2 ($7,159,234 ÷ 222,058 shares) | $32.24 | |||||||||||||||||
| Class R3 ($1,336,917 ÷ 41,521 shares) | $32.20 | |||||||||||||||||
| Class R4 ($72,057 ÷ 2,224 shares) | $32.40 | |||||||||||||||||
| Class R5 ($66,636 ÷ 2,054 shares) | $32.44 | |||||||||||||||||
| Class R6 ($1,187,036 ÷ 36,574 shares) | $32.46 | |||||||||||||||||
| Maximum offering price per share | ||||||||||||||||||
| Class A (net asset value per share ÷ 95%)2 | $34.02 | |||||||||||||||||
| 1 | Redemption price per share is equal to net asset value less any applicable contingent deferred sales charge. | ||||||||||||||||
| 2 | On single retail sales of less than $50,000. On sales of $50,000 or more and on group sales the offering price is reduced. | ||||||||||||||||
STATEMENT OF OPERATIONS For the year ended 10-31-17
| Investment income | ||||||||||||||||||||||||
| Dividends | $38,821,089 | |||||||||||||||||||||||
| Non-cash dividends | 5,441,890 | |||||||||||||||||||||||
| Interest | 138,722 | |||||||||||||||||||||||
| Securities lending | 23,168 | |||||||||||||||||||||||
| Less foreign taxes withheld | (92,229 | ) | ||||||||||||||||||||||
| Total investment income | 44,332,640 | |||||||||||||||||||||||
| Expenses | ||||||||||||||||||||||||
| Investment management fees | 14,669,775 | |||||||||||||||||||||||
| Distribution and service fees | 1,784,813 | |||||||||||||||||||||||
| Accounting and legal services fees | 459,536 | |||||||||||||||||||||||
| Transfer agent fees | 2,124,304 | |||||||||||||||||||||||
| Trustees' fees | 29,121 | |||||||||||||||||||||||
| State registration fees | 201,316 | |||||||||||||||||||||||
| Printing and postage | 191,520 | |||||||||||||||||||||||
| Professional fees | 81,863 | |||||||||||||||||||||||
| Custodian fees | 221,216 | |||||||||||||||||||||||
| Other | 41,027 | |||||||||||||||||||||||
| Total expenses | 19,804,491 | |||||||||||||||||||||||
| Less expense reductions | (155,499 | ) | ||||||||||||||||||||||
| Net expenses | 19,648,992 | |||||||||||||||||||||||
| Net investment income | 24,683,648 | |||||||||||||||||||||||
| Realized and unrealized gain (loss) | ||||||||||||||||||||||||
| Net realized gain (loss) on | ||||||||||||||||||||||||
| Unaffiliated investments and foreign currency transactions | 268,092,034 | |||||||||||||||||||||||
| Affiliated investments | (2,707 | ) | ||||||||||||||||||||||
| 268,089,327 | ||||||||||||||||||||||||
| Change in net unrealized appreciation (depreciation) of | ||||||||||||||||||||||||
| Unaffiliated investments | 126,279,798 | |||||||||||||||||||||||
| Affiliated investments | (126 | ) | ||||||||||||||||||||||
| 126,279,672 | ||||||||||||||||||||||||
| Net realized and unrealized gain | 394,368,999 | |||||||||||||||||||||||
| Increase in net assets from operations | $419,052,647 | |||||||||||||||||||||||
STATEMENTS OF CHANGES IN NET ASSETS
| Year ended 10-31-17 | Year ended 10-31-16 | ||||||||||||||||||||||||||||||||||||||||||||
| Increase (decrease) in net assets | |||||||||||||||||||||||||||||||||||||||||||||
| From operations | |||||||||||||||||||||||||||||||||||||||||||||
| Net investment income | $24,683,648 | $34,582,429 | |||||||||||||||||||||||||||||||||||||||||||
| Net realized gain | 268,089,327 | 194,812,157 | |||||||||||||||||||||||||||||||||||||||||||
| Change in net unrealized appreciation (depreciation) | 126,279,672 | (176,976,809 | ) | ||||||||||||||||||||||||||||||||||||||||||
| Increase in net assets resulting from operations | 419,052,647 | 52,417,777 | |||||||||||||||||||||||||||||||||||||||||||
| Distributions to shareholders | |||||||||||||||||||||||||||||||||||||||||||||
| From net investment income | |||||||||||||||||||||||||||||||||||||||||||||
| Class A | (6,123,008 | ) | (4,673,892 | ) | |||||||||||||||||||||||||||||||||||||||||
| Class B | (69,061 | ) | (44,626 | ) | |||||||||||||||||||||||||||||||||||||||||
| Class C | (1,011,833 | ) | (516,614 | ) | |||||||||||||||||||||||||||||||||||||||||
| Class I | (25,583,802 | ) | (25,462,459 | ) | |||||||||||||||||||||||||||||||||||||||||
| Class R1 | (47,697 | ) | (34,026 | ) | |||||||||||||||||||||||||||||||||||||||||
| Class R2 | (15,242 | ) | (4,242 | ) | |||||||||||||||||||||||||||||||||||||||||
| Class R3 | (16,786 | ) | (10,558 | ) | |||||||||||||||||||||||||||||||||||||||||
| Class R4 | (1,277 | ) | (895 | ) | |||||||||||||||||||||||||||||||||||||||||
| Class R5 | (1,025 | ) | (1,797 | ) | |||||||||||||||||||||||||||||||||||||||||
| Class R6 | (64,570 | ) | (21,271 | ) | |||||||||||||||||||||||||||||||||||||||||
| Total distributions | (32,934,301 | ) | (30,770,380 | ) | |||||||||||||||||||||||||||||||||||||||||
| From fund share transactions | 285,906,812 | (522,659,442 | ) | ||||||||||||||||||||||||||||||||||||||||||
| Total increase (decrease) | 672,025,158 | (501,012,045 | ) | ||||||||||||||||||||||||||||||||||||||||||
| Net assets | |||||||||||||||||||||||||||||||||||||||||||||
| Beginning of year | 1,542,514,426 | 2,043,526,471 | |||||||||||||||||||||||||||||||||||||||||||
| End of year | $2,214,539,584 | $1,542,514,426 | |||||||||||||||||||||||||||||||||||||||||||
| Undistributed net investment income | $19,397,004 | $27,649,713 | |||||||||||||||||||||||||||||||||||||||||||
Financial highlights
| Class A Shares Period ended | 10-31-17 | 10-31-16 | 10-31-15 | 10-31-14 | 10-31-13 | ||||||||||||||||||||||||||||||||||||||||||||||||||||||||||||||||||||||||||||||||||||||||||||||||||
| Per share operating performance | |||||||||||||||||||||||||||||||||||||||||||||||||||||||||||||||||||||||||||||||||||||||||||||||||||||||
| Net asset value, beginning of period | $26.12 | $25.49 | $25.82 | $23.12 | $17.02 | ||||||||||||||||||||||||||||||||||||||||||||||||||||||||||||||||||||||||||||||||||||||||||||||||||
| Net investment income1 | 0.34 | 0.43 | 0.28 | 0.18 | 0.20 | ||||||||||||||||||||||||||||||||||||||||||||||||||||||||||||||||||||||||||||||||||||||||||||||||||
| Net realized and unrealized gain (loss) on investments | 6.38 | 0.54 | (0.39 | ) | 2.72 | 6.09 | |||||||||||||||||||||||||||||||||||||||||||||||||||||||||||||||||||||||||||||||||||||||||||||||||
| Total from investment operations | 6.72 | 0.97 | (0.11 | ) | 2.90 | 6.29 | |||||||||||||||||||||||||||||||||||||||||||||||||||||||||||||||||||||||||||||||||||||||||||||||||
| Less distributions | |||||||||||||||||||||||||||||||||||||||||||||||||||||||||||||||||||||||||||||||||||||||||||||||||||||||
| From net investment income | (0.52 | ) | (0.34 | ) | (0.22 | ) | (0.20 | ) | (0.19 | ) | |||||||||||||||||||||||||||||||||||||||||||||||||||||||||||||||||||||||||||||||||||||||||||||
| Net asset value, end of period | $32.32 | $26.12 | $25.49 | $25.82 | $23.12 | ||||||||||||||||||||||||||||||||||||||||||||||||||||||||||||||||||||||||||||||||||||||||||||||||||
| Total return (%)2,3 | 25.91 | 3.90 | (0.42 | ) | 12.64 | 37.32 | |||||||||||||||||||||||||||||||||||||||||||||||||||||||||||||||||||||||||||||||||||||||||||||||||
| Ratios and supplemental data | |||||||||||||||||||||||||||||||||||||||||||||||||||||||||||||||||||||||||||||||||||||||||||||||||||||||
| Net assets, end of period (in millions) | $354 | $308 | $351 | $384 | $476 | ||||||||||||||||||||||||||||||||||||||||||||||||||||||||||||||||||||||||||||||||||||||||||||||||||
| Ratios (as a percentage of average net assets): | |||||||||||||||||||||||||||||||||||||||||||||||||||||||||||||||||||||||||||||||||||||||||||||||||||||||
| Expenses before reductions | 1.18 | 1.19 | 1.19 | 1.19 | 1.25 | ||||||||||||||||||||||||||||||||||||||||||||||||||||||||||||||||||||||||||||||||||||||||||||||||||
| Expenses including reductions | 1.17 | 1.18 | 1.18 | 1.18 | 1.25 | ||||||||||||||||||||||||||||||||||||||||||||||||||||||||||||||||||||||||||||||||||||||||||||||||||
| Net investment income | 1.12 | 1.76 | 1.07 | 0.73 | 1.00 | ||||||||||||||||||||||||||||||||||||||||||||||||||||||||||||||||||||||||||||||||||||||||||||||||||
| Portfolio turnover (%) | 45 | 21 | 17 | 24 | 30 | ||||||||||||||||||||||||||||||||||||||||||||||||||||||||||||||||||||||||||||||||||||||||||||||||||
| 1 | Based on average daily shares outstanding. | ||||||||||||||||||||||||||||||||||||||||||||||||||||||||||||||||||||||||||||||||||
| 2 | Does not reflect the effect of sales charges, if any. | ||||||||||||||||||||||||||||||||||||||||||||||||||||||||||||||||||||||||||||||||||
| 3 | Total returns would have been lower had certain expenses not been reduced during the applicable periods. | ||||||||||||||||||||||||||||||||||||||||||||||||||||||||||||||||||||||||||||||||||
| Class B Shares Period ended | 10-31-17 | 10-31-16 | 10-31-15 | 10-31-14 | 10-31-13 | ||||||||||||||||||||||||||||||||||||||||||||||||||||||||||||||||||||||||||||||||||||||||||||||||||
| Per share operating performance | |||||||||||||||||||||||||||||||||||||||||||||||||||||||||||||||||||||||||||||||||||||||||||||||||||||||
| Net asset value, beginning of period | $25.66 | $25.04 | $25.37 | $22.72 | $16.73 | ||||||||||||||||||||||||||||||||||||||||||||||||||||||||||||||||||||||||||||||||||||||||||||||||||
| Net investment income1 | 0.12 | 0.25 | 0.08 | — | 2 | 0.07 | |||||||||||||||||||||||||||||||||||||||||||||||||||||||||||||||||||||||||||||||||||||||||||||||||
| Net realized and unrealized gain (loss) on investments | 6.26 | 0.52 | (0.38 | ) | 2.68 | 5.98 | |||||||||||||||||||||||||||||||||||||||||||||||||||||||||||||||||||||||||||||||||||||||||||||||||
| Total from investment operations | 6.38 | 0.77 | (0.30 | ) | 2.68 | 6.05 | |||||||||||||||||||||||||||||||||||||||||||||||||||||||||||||||||||||||||||||||||||||||||||||||||
| Less distributions | |||||||||||||||||||||||||||||||||||||||||||||||||||||||||||||||||||||||||||||||||||||||||||||||||||||||
| From net investment income | (0.34 | ) | (0.15 | ) | (0.03 | ) | (0.03 | ) | (0.06 | ) | |||||||||||||||||||||||||||||||||||||||||||||||||||||||||||||||||||||||||||||||||||||||||||||
| Net asset value, end of period | $31.70 | $25.66 | $25.04 | $25.37 | $22.72 | ||||||||||||||||||||||||||||||||||||||||||||||||||||||||||||||||||||||||||||||||||||||||||||||||||
| Total return (%)3,4 | 24.96 | 3.10 | (1.18 | ) | 11.79 | 36.30 | |||||||||||||||||||||||||||||||||||||||||||||||||||||||||||||||||||||||||||||||||||||||||||||||||
| Ratios and supplemental data | |||||||||||||||||||||||||||||||||||||||||||||||||||||||||||||||||||||||||||||||||||||||||||||||||||||||
| Net assets, end of period (in millions) | $4 | $6 | $8 | $11 | $18 | ||||||||||||||||||||||||||||||||||||||||||||||||||||||||||||||||||||||||||||||||||||||||||||||||||
| Ratios (as a percentage of average net assets): | |||||||||||||||||||||||||||||||||||||||||||||||||||||||||||||||||||||||||||||||||||||||||||||||||||||||
| Expenses before reductions | 1.93 | 1.94 | 1.93 | 1.94 | 2.00 | ||||||||||||||||||||||||||||||||||||||||||||||||||||||||||||||||||||||||||||||||||||||||||||||||||
| Expenses including reductions | 1.92 | 1.93 | 1.93 | 1.93 | 2.00 | ||||||||||||||||||||||||||||||||||||||||||||||||||||||||||||||||||||||||||||||||||||||||||||||||||
| Net investment income | 0.40 | 1.03 | 0.32 | 0.01 | 0.34 | ||||||||||||||||||||||||||||||||||||||||||||||||||||||||||||||||||||||||||||||||||||||||||||||||||
| Portfolio turnover (%) | 45 | 21 | 17 | 24 | 30 | ||||||||||||||||||||||||||||||||||||||||||||||||||||||||||||||||||||||||||||||||||||||||||||||||||
| 1 | Based on average daily shares outstanding. | ||||||||||||||||||||||||||||||||||||||||||||||||||||||||||||||||||||||||||||||||||
| 2 | Less than $0.005 per share. | ||||||||||||||||||||||||||||||||||||||||||||||||||||||||||||||||||||||||||||||||||
| 3 | Does not reflect the effect of sales charges, if any. | ||||||||||||||||||||||||||||||||||||||||||||||||||||||||||||||||||||||||||||||||||
| 4 | Total returns would have been lower had certain expenses not been reduced during the applicable periods. | ||||||||||||||||||||||||||||||||||||||||||||||||||||||||||||||||||||||||||||||||||
| Class C Shares Period ended | 10-31-17 | 10-31-16 | 10-31-15 | 10-31-14 | 10-31-13 | ||||||||||||||||||||||||||||||||||||||||||||||||||||||||||||||||||||||||||||||||||||||||||||||||||
| Per share operating performance | |||||||||||||||||||||||||||||||||||||||||||||||||||||||||||||||||||||||||||||||||||||||||||||||||||||||
| Net asset value, beginning of period | $25.65 | $25.03 | $25.36 | $22.71 | $16.73 | ||||||||||||||||||||||||||||||||||||||||||||||||||||||||||||||||||||||||||||||||||||||||||||||||||
| Net investment income (loss)1 | 0.11 | 0.24 | 0.08 | (0.01 | ) | 0.05 | |||||||||||||||||||||||||||||||||||||||||||||||||||||||||||||||||||||||||||||||||||||||||||||||||
| Net realized and unrealized gain (loss) on investments | 6.27 | 0.53 | (0.38 | ) | 2.69 | 5.99 | |||||||||||||||||||||||||||||||||||||||||||||||||||||||||||||||||||||||||||||||||||||||||||||||||
| Total from investment operations | 6.38 | 0.77 | (0.30 | ) | 2.68 | 6.04 | |||||||||||||||||||||||||||||||||||||||||||||||||||||||||||||||||||||||||||||||||||||||||||||||||
| Less distributions | |||||||||||||||||||||||||||||||||||||||||||||||||||||||||||||||||||||||||||||||||||||||||||||||||||||||
| From net investment income | (0.34 | ) | (0.15 | ) | (0.03 | ) | (0.03 | ) | (0.06 | ) | |||||||||||||||||||||||||||||||||||||||||||||||||||||||||||||||||||||||||||||||||||||||||||||
| Net asset value, end of period | $31.69 | $25.65 | $25.03 | $25.36 | $22.71 | ||||||||||||||||||||||||||||||||||||||||||||||||||||||||||||||||||||||||||||||||||||||||||||||||||
| Total return (%)2,3 | 24.96 | 3.11 | (1.18 | ) | 11.80 | 36.24 | |||||||||||||||||||||||||||||||||||||||||||||||||||||||||||||||||||||||||||||||||||||||||||||||||
| Ratios and supplemental data | |||||||||||||||||||||||||||||||||||||||||||||||||||||||||||||||||||||||||||||||||||||||||||||||||||||||
| Net assets, end of period (in millions) | $75 | $76 | $88 | $101 | $95 | ||||||||||||||||||||||||||||||||||||||||||||||||||||||||||||||||||||||||||||||||||||||||||||||||||
| Ratios (as a percentage of average net assets): | |||||||||||||||||||||||||||||||||||||||||||||||||||||||||||||||||||||||||||||||||||||||||||||||||||||||
| Expenses before reductions | 1.93 | 1.94 | 1.94 | 1.94 | 2.00 | ||||||||||||||||||||||||||||||||||||||||||||||||||||||||||||||||||||||||||||||||||||||||||||||||||
| Expenses including reductions | 1.92 | 1.93 | 1.93 | 1.93 | 2.00 | ||||||||||||||||||||||||||||||||||||||||||||||||||||||||||||||||||||||||||||||||||||||||||||||||||
| Net investment income (loss) | 0.38 | 1.01 | 0.32 | (0.04 | ) | 0.25 | |||||||||||||||||||||||||||||||||||||||||||||||||||||||||||||||||||||||||||||||||||||||||||||||||
| Portfolio turnover (%) | 45 | 21 | 17 | 24 | 30 | ||||||||||||||||||||||||||||||||||||||||||||||||||||||||||||||||||||||||||||||||||||||||||||||||||
| 1 | Based on average daily shares outstanding. | ||||||||||||||||||||||||||||||||||||||||||||||||||||||||||||||||||||||||||||||||||
| 2 | Does not reflect the effect of sales charges, if any. | ||||||||||||||||||||||||||||||||||||||||||||||||||||||||||||||||||||||||||||||||||
| 3 | Total returns would have been lower had certain expenses not been reduced during the applicable periods. | ||||||||||||||||||||||||||||||||||||||||||||||||||||||||||||||||||||||||||||||||||
| Class I Shares Period ended | 10-31-17 | 10-31-16 | 10-31-15 | 10-31-14 | 10-31-13 | ||||||||||||||||||||||||||||||||||||||||||||||||||||||||||||||||||||||||||||||||||||||||||||||||||
| Per share operating performance | |||||||||||||||||||||||||||||||||||||||||||||||||||||||||||||||||||||||||||||||||||||||||||||||||||||||
| Net asset value, beginning of period | $26.19 | $25.56 | $25.90 | $23.19 | $17.07 | ||||||||||||||||||||||||||||||||||||||||||||||||||||||||||||||||||||||||||||||||||||||||||||||||||
| Net investment income1 | 0.41 | 0.51 | 0.35 | 0.24 | 0.25 | ||||||||||||||||||||||||||||||||||||||||||||||||||||||||||||||||||||||||||||||||||||||||||||||||||
| Net realized and unrealized gain (loss) on investments | 6.41 | 0.53 | (0.40 | ) | 2.74 | 6.11 | |||||||||||||||||||||||||||||||||||||||||||||||||||||||||||||||||||||||||||||||||||||||||||||||||
| Total from investment operations | 6.82 | 1.04 | (0.05 | ) | 2.98 | 6.36 | |||||||||||||||||||||||||||||||||||||||||||||||||||||||||||||||||||||||||||||||||||||||||||||||||
| Less distributions | |||||||||||||||||||||||||||||||||||||||||||||||||||||||||||||||||||||||||||||||||||||||||||||||||||||||
| From net investment income | (0.59 | ) | (0.41 | ) | (0.29 | ) | (0.27 | ) | (0.24 | ) | |||||||||||||||||||||||||||||||||||||||||||||||||||||||||||||||||||||||||||||||||||||||||||||
| Net asset value, end of period | $32.42 | $26.19 | $25.56 | $25.90 | $23.19 | ||||||||||||||||||||||||||||||||||||||||||||||||||||||||||||||||||||||||||||||||||||||||||||||||||
| Total return (%)2 | 26.24 | 4.18 | (0.19 | ) | 12.95 | 37.76 | |||||||||||||||||||||||||||||||||||||||||||||||||||||||||||||||||||||||||||||||||||||||||||||||||
| Ratios and supplemental data | |||||||||||||||||||||||||||||||||||||||||||||||||||||||||||||||||||||||||||||||||||||||||||||||||||||||
| Net assets, end of period (in millions) | $1,767 | $1,146 | $1,591 | $2,355 | $2,018 | ||||||||||||||||||||||||||||||||||||||||||||||||||||||||||||||||||||||||||||||||||||||||||||||||||
| Ratios (as a percentage of average net assets): | |||||||||||||||||||||||||||||||||||||||||||||||||||||||||||||||||||||||||||||||||||||||||||||||||||||||
| Expenses before reductions | 0.92 | 0.93 | 0.92 | 0.93 | 0.94 | ||||||||||||||||||||||||||||||||||||||||||||||||||||||||||||||||||||||||||||||||||||||||||||||||||
| Expenses including reductions | 0.91 | 0.92 | 0.91 | 0.92 | 0.94 | ||||||||||||||||||||||||||||||||||||||||||||||||||||||||||||||||||||||||||||||||||||||||||||||||||
| Net investment income | 1.35 | 2.07 | 1.34 | 0.97 | 1.24 | ||||||||||||||||||||||||||||||||||||||||||||||||||||||||||||||||||||||||||||||||||||||||||||||||||
| Portfolio turnover (%) | 45 | 21 | 17 | 24 | 30 | ||||||||||||||||||||||||||||||||||||||||||||||||||||||||||||||||||||||||||||||||||||||||||||||||||
| 1 | Based on average daily shares outstanding. | ||||||||||||||||||||||||||||||||||||||||||||||||||||||||||||||||||||||||||||||||||
| 2 | Total returns would have been lower had certain expenses not been reduced during the applicable periods. | ||||||||||||||||||||||||||||||||||||||||||||||||||||||||||||||||||||||||||||||||||
| Class R1 Shares Period ended | 10-31-17 | 10-31-16 | 10-31-15 | 10-31-14 | 10-31-13 | ||||||||||||||||||||||||||||||||||||||||||||||||||||||||||||||||||||||||||||||||||||||||||||||||||
| Per share operating performance | |||||||||||||||||||||||||||||||||||||||||||||||||||||||||||||||||||||||||||||||||||||||||||||||||||||||
| Net asset value, beginning of period | $26.13 | $25.49 | $25.83 | $23.13 | $17.03 | ||||||||||||||||||||||||||||||||||||||||||||||||||||||||||||||||||||||||||||||||||||||||||||||||||
| Net investment income1 | 0.21 | 0.34 | 0.17 | 0.08 | 0.13 | ||||||||||||||||||||||||||||||||||||||||||||||||||||||||||||||||||||||||||||||||||||||||||||||||||
| Net realized and unrealized gain (loss) on investments | 6.40 | 0.55 | (0.38 | ) | 2.73 | 6.10 | |||||||||||||||||||||||||||||||||||||||||||||||||||||||||||||||||||||||||||||||||||||||||||||||||
| Total from investment operations | 6.61 | 0.89 | (0.21 | ) | 2.81 | 6.23 | |||||||||||||||||||||||||||||||||||||||||||||||||||||||||||||||||||||||||||||||||||||||||||||||||
| Less distributions | |||||||||||||||||||||||||||||||||||||||||||||||||||||||||||||||||||||||||||||||||||||||||||||||||||||||
| From net investment income | (0.43 | ) | (0.25 | ) | (0.13 | ) | (0.11 | ) | (0.13 | ) | |||||||||||||||||||||||||||||||||||||||||||||||||||||||||||||||||||||||||||||||||||||||||||||
| Net asset value, end of period | $32.31 | $26.13 | $25.49 | $25.83 | $23.13 | ||||||||||||||||||||||||||||||||||||||||||||||||||||||||||||||||||||||||||||||||||||||||||||||||||
| Total return (%)2 | 25.43 | 3.53 | (0.82 | ) | 12.21 | 36.84 | |||||||||||||||||||||||||||||||||||||||||||||||||||||||||||||||||||||||||||||||||||||||||||||||||
| Ratios and supplemental data | |||||||||||||||||||||||||||||||||||||||||||||||||||||||||||||||||||||||||||||||||||||||||||||||||||||||
| Net assets, end of period (in millions) | $4 | $3 | $3 | $7 | $6 | ||||||||||||||||||||||||||||||||||||||||||||||||||||||||||||||||||||||||||||||||||||||||||||||||||
| Ratios (as a percentage of average net assets): | |||||||||||||||||||||||||||||||||||||||||||||||||||||||||||||||||||||||||||||||||||||||||||||||||||||||
| Expenses before reductions | 1.57 | 1.55 | 1.57 | 1.57 | 1.60 | ||||||||||||||||||||||||||||||||||||||||||||||||||||||||||||||||||||||||||||||||||||||||||||||||||
| Expenses including reductions | 1.56 | 1.55 | 1.57 | 1.57 | 1.60 | ||||||||||||||||||||||||||||||||||||||||||||||||||||||||||||||||||||||||||||||||||||||||||||||||||
| Net investment income | 0.71 | 1.40 | 0.64 | 0.32 | 0.63 | ||||||||||||||||||||||||||||||||||||||||||||||||||||||||||||||||||||||||||||||||||||||||||||||||||
| Portfolio turnover (%) | 45 | 21 | 17 | 24 | 30 | ||||||||||||||||||||||||||||||||||||||||||||||||||||||||||||||||||||||||||||||||||||||||||||||||||
| 1 | Based on average daily shares outstanding. | ||||||||||||||||||||||||||||||||||||||||||||||||||||||||||||||||||||||||||||||||||
| 2 | Total returns would have been lower had certain expenses not been reduced during the applicable periods. | ||||||||||||||||||||||||||||||||||||||||||||||||||||||||||||||||||||||||||||||||||
| Class R2 Shares Period ended | 10-31-17 | 10-31-16 | 10-31-15 | 10-31-14 | 10-31-13 | ||||||||||||||||||||||||||||||||||||||||||||||||||||||||||||||||||||||||||||||||||||||||||||||||||
| Per share operating performance | |||||||||||||||||||||||||||||||||||||||||||||||||||||||||||||||||||||||||||||||||||||||||||||||||||||||
| Net asset value, beginning of period | $26.07 | $25.46 | $25.85 | $23.16 | $17.05 | ||||||||||||||||||||||||||||||||||||||||||||||||||||||||||||||||||||||||||||||||||||||||||||||||||
| Net investment income1 | 0.25 | 0.36 | 0.26 | 0.17 | 0.18 | ||||||||||||||||||||||||||||||||||||||||||||||||||||||||||||||||||||||||||||||||||||||||||||||||||
| Net realized and unrealized gain (loss) on investments | 6.41 | 0.58 | (0.41 | ) | 2.75 | 6.15 | |||||||||||||||||||||||||||||||||||||||||||||||||||||||||||||||||||||||||||||||||||||||||||||||||
| Total from investment operations | 6.66 | 0.94 | (0.15 | ) | 2.92 | 6.33 | |||||||||||||||||||||||||||||||||||||||||||||||||||||||||||||||||||||||||||||||||||||||||||||||||
| Less distributions | |||||||||||||||||||||||||||||||||||||||||||||||||||||||||||||||||||||||||||||||||||||||||||||||||||||||
| From net investment income | (0.49 | ) | (0.33 | ) | (0.24 | ) | (0.23 | ) | (0.22 | ) | |||||||||||||||||||||||||||||||||||||||||||||||||||||||||||||||||||||||||||||||||||||||||||||
| Net asset value, end of period | $32.24 | $26.07 | $25.46 | $25.85 | $23.16 | ||||||||||||||||||||||||||||||||||||||||||||||||||||||||||||||||||||||||||||||||||||||||||||||||||
| Total return (%)2 | 25.71 | 3.76 | (0.56 | ) | 12.70 | 37.53 | |||||||||||||||||||||||||||||||||||||||||||||||||||||||||||||||||||||||||||||||||||||||||||||||||
| Ratios and supplemental data | |||||||||||||||||||||||||||||||||||||||||||||||||||||||||||||||||||||||||||||||||||||||||||||||||||||||
| Net assets, end of period (in millions) | $7 | $1 | — | 3 | — | 3 | — | 3 | |||||||||||||||||||||||||||||||||||||||||||||||||||||||||||||||||||||||||||||||||||||||||||||||
| Ratios (as a percentage of average net assets): | |||||||||||||||||||||||||||||||||||||||||||||||||||||||||||||||||||||||||||||||||||||||||||||||||||||||
| Expenses before reductions | 1.33 | 1.33 | 1.26 | 1.19 | 1.13 | ||||||||||||||||||||||||||||||||||||||||||||||||||||||||||||||||||||||||||||||||||||||||||||||||||
| Expenses including reductions | 1.32 | 1.32 | 1.26 | 1.18 | 1.13 | ||||||||||||||||||||||||||||||||||||||||||||||||||||||||||||||||||||||||||||||||||||||||||||||||||
| Net investment income | 0.84 | 1.47 | 0.99 | 0.68 | 0.86 | ||||||||||||||||||||||||||||||||||||||||||||||||||||||||||||||||||||||||||||||||||||||||||||||||||
| Portfolio turnover (%) | 45 | 21 | 17 | 24 | 30 | ||||||||||||||||||||||||||||||||||||||||||||||||||||||||||||||||||||||||||||||||||||||||||||||||||
| 1 | Based on average daily shares outstanding. | ||||||||||||||||||||||||||||||||||||||||||||||||||||||||||||||||||||||||||||||||||
| 2 | Total returns would have been lower had certain expenses not been reduced during the applicable periods. | ||||||||||||||||||||||||||||||||||||||||||||||||||||||||||||||||||||||||||||||||||
| 3 | Less than $500,000. | ||||||||||||||||||||||||||||||||||||||||||||||||||||||||||||||||||||||||||||||||||
| Class R3 Shares Period ended | 10-31-17 | 10-31-16 | 10-31-15 | 10-31-14 | 10-31-13 | ||||||||||||||||||||||||||||||||||||||||||||||||||||||||||||||||||||||||||||||||||||||||||||||||||
| Per share operating performance | |||||||||||||||||||||||||||||||||||||||||||||||||||||||||||||||||||||||||||||||||||||||||||||||||||||||
| Net asset value, beginning of period | $26.03 | $25.41 | $25.75 | $23.08 | $17.00 | ||||||||||||||||||||||||||||||||||||||||||||||||||||||||||||||||||||||||||||||||||||||||||||||||||
| Net investment income1 | 0.24 | 0.36 | 0.20 | 0.09 | 0.14 | ||||||||||||||||||||||||||||||||||||||||||||||||||||||||||||||||||||||||||||||||||||||||||||||||||
| Net realized and unrealized gain (loss) on investments | 6.38 | 0.53 | (0.39 | ) | 2.74 | 6.10 | |||||||||||||||||||||||||||||||||||||||||||||||||||||||||||||||||||||||||||||||||||||||||||||||||
| Total from investment operations | 6.62 | 0.89 | (0.19 | ) | 2.83 | 6.24 | |||||||||||||||||||||||||||||||||||||||||||||||||||||||||||||||||||||||||||||||||||||||||||||||||
| Less distributions | |||||||||||||||||||||||||||||||||||||||||||||||||||||||||||||||||||||||||||||||||||||||||||||||||||||||
| From net investment income | (0.45 | ) | (0.27 | ) | (0.15 | ) | (0.16 | ) | (0.16 | ) | |||||||||||||||||||||||||||||||||||||||||||||||||||||||||||||||||||||||||||||||||||||||||||||
| Net asset value, end of period | $32.20 | $26.03 | $25.41 | $25.75 | $23.08 | ||||||||||||||||||||||||||||||||||||||||||||||||||||||||||||||||||||||||||||||||||||||||||||||||||
| Total return (%)2 | 25.58 | 3.57 | (0.73 | ) | 12.34 | 37.01 | |||||||||||||||||||||||||||||||||||||||||||||||||||||||||||||||||||||||||||||||||||||||||||||||||
| Ratios and supplemental data | |||||||||||||||||||||||||||||||||||||||||||||||||||||||||||||||||||||||||||||||||||||||||||||||||||||||
| Net assets, end of period (in millions) | $1 | $1 | $1 | $1 | — | 3 | |||||||||||||||||||||||||||||||||||||||||||||||||||||||||||||||||||||||||||||||||||||||||||||||||
| Ratios (as a percentage of average net assets): | |||||||||||||||||||||||||||||||||||||||||||||||||||||||||||||||||||||||||||||||||||||||||||||||||||||||
| Expenses before reductions | 1.47 | 1.48 | 1.48 | 1.47 | 1.42 | ||||||||||||||||||||||||||||||||||||||||||||||||||||||||||||||||||||||||||||||||||||||||||||||||||
| Expenses including reductions | 1.47 | 1.47 | 1.47 | 1.47 | 1.41 | ||||||||||||||||||||||||||||||||||||||||||||||||||||||||||||||||||||||||||||||||||||||||||||||||||
| Net investment income | 0.79 | 1.48 | 0.78 | 0.37 | 0.65 | ||||||||||||||||||||||||||||||||||||||||||||||||||||||||||||||||||||||||||||||||||||||||||||||||||
| Portfolio turnover (%) | 45 | 21 | 17 | 24 | 30 | ||||||||||||||||||||||||||||||||||||||||||||||||||||||||||||||||||||||||||||||||||||||||||||||||||
| 1 | Based on average daily shares outstanding. | ||||||||||||||||||||||||||||||||||||||||||||||||||||||||||||||||||||||||||||||||||
| 2 | Total returns would have been lower had certain expenses not been reduced during the applicable periods. | ||||||||||||||||||||||||||||||||||||||||||||||||||||||||||||||||||||||||||||||||||
| 3 | Less than $500,000. | ||||||||||||||||||||||||||||||||||||||||||||||||||||||||||||||||||||||||||||||||||
| Class R4 Shares Period ended | 10-31-17 | 10-31-16 | 10-31-15 | 10-31-14 | 10-31-13 | ||||||||||||||||||||||||||||||||||||||||||||||||||||||||||||||||||||||||||||||||||||||||||||||||||
| Per share operating performance | |||||||||||||||||||||||||||||||||||||||||||||||||||||||||||||||||||||||||||||||||||||||||||||||||||||||
| Net asset value, beginning of period | $26.17 | $25.55 | $25.90 | $23.19 | $17.07 | ||||||||||||||||||||||||||||||||||||||||||||||||||||||||||||||||||||||||||||||||||||||||||||||||||
| Net investment income1 | 0.40 | 0.48 | 0.34 | 0.23 | 0.25 | ||||||||||||||||||||||||||||||||||||||||||||||||||||||||||||||||||||||||||||||||||||||||||||||||||
| Net realized and unrealized gain (loss) on investments | 6.40 | 0.54 | (0.41 | ) | 2.74 | 6.10 | |||||||||||||||||||||||||||||||||||||||||||||||||||||||||||||||||||||||||||||||||||||||||||||||||
| Total from investment operations | 6.80 | 1.02 | (0.07 | ) | 2.97 | 6.35 | |||||||||||||||||||||||||||||||||||||||||||||||||||||||||||||||||||||||||||||||||||||||||||||||||
| Less distributions | |||||||||||||||||||||||||||||||||||||||||||||||||||||||||||||||||||||||||||||||||||||||||||||||||||||||
| From net investment income | (0.57 | ) | (0.40 | ) | (0.28 | ) | (0.26 | ) | (0.23 | ) | |||||||||||||||||||||||||||||||||||||||||||||||||||||||||||||||||||||||||||||||||||||||||||||
| Net asset value, end of period | $32.40 | $26.17 | $25.55 | $25.90 | $23.19 | ||||||||||||||||||||||||||||||||||||||||||||||||||||||||||||||||||||||||||||||||||||||||||||||||||
| Total return (%)2 | 26.20 | 4.10 | (0.24 | ) | 12.92 | 37.66 | |||||||||||||||||||||||||||||||||||||||||||||||||||||||||||||||||||||||||||||||||||||||||||||||||
| Ratios and supplemental data | |||||||||||||||||||||||||||||||||||||||||||||||||||||||||||||||||||||||||||||||||||||||||||||||||||||||
| Net assets, end of period (in millions) | — | 3 | — | 3 | — | 3 | — | 3 | — | 3 | |||||||||||||||||||||||||||||||||||||||||||||||||||||||||||||||||||||||||||||||||||||||||||||
| Ratios (as a percentage of average net assets): | |||||||||||||||||||||||||||||||||||||||||||||||||||||||||||||||||||||||||||||||||||||||||||||||||||||||
| Expenses before reductions | 1.08 | 1.08 | 1.08 | 1.07 | 1.10 | ||||||||||||||||||||||||||||||||||||||||||||||||||||||||||||||||||||||||||||||||||||||||||||||||||
| Expenses including reductions | 0.97 | 0.97 | 0.97 | 0.96 | 1.00 | ||||||||||||||||||||||||||||||||||||||||||||||||||||||||||||||||||||||||||||||||||||||||||||||||||
| Net investment income | 1.31 | 1.96 | 1.28 | 0.93 | 1.23 | ||||||||||||||||||||||||||||||||||||||||||||||||||||||||||||||||||||||||||||||||||||||||||||||||||
| Portfolio turnover (%) | 45 | 21 | 17 | 24 | 30 | ||||||||||||||||||||||||||||||||||||||||||||||||||||||||||||||||||||||||||||||||||||||||||||||||||
| 1 | Based on average daily shares outstanding. | ||||||||||||||||||||||||||||||||||||||||||||||||||||||||||||||||||||||||||||||||||
| 2 | Total returns would have been lower had certain expenses not been reduced during the applicable periods. | ||||||||||||||||||||||||||||||||||||||||||||||||||||||||||||||||||||||||||||||||||
| 3 | Less than $500,000. | ||||||||||||||||||||||||||||||||||||||||||||||||||||||||||||||||||||||||||||||||||
| Class R5 Shares Period ended | 10-31-17 | 10-31-16 | 10-31-15 | 10-31-14 | 10-31-13 | ||||||||||||||||||||||||||||||||||||||||||||||||||||||||||||||||||||||||||||||||||||||||||||||||||
| Per share operating performance | |||||||||||||||||||||||||||||||||||||||||||||||||||||||||||||||||||||||||||||||||||||||||||||||||||||||
| Net asset value, beginning of period | $26.21 | $25.57 | $25.92 | $23.22 | $17.09 | ||||||||||||||||||||||||||||||||||||||||||||||||||||||||||||||||||||||||||||||||||||||||||||||||||
| Net investment income1 | 0.43 | 0.54 | 0.37 | 0.25 | 0.28 | ||||||||||||||||||||||||||||||||||||||||||||||||||||||||||||||||||||||||||||||||||||||||||||||||||
| Net realized and unrealized gain (loss) on investments | 6.40 | 0.52 | (0.40 | ) | 2.74 | 6.11 | |||||||||||||||||||||||||||||||||||||||||||||||||||||||||||||||||||||||||||||||||||||||||||||||||
| Total from investment operations | 6.83 | 1.06 | (0.03 | ) | 2.99 | 6.39 | |||||||||||||||||||||||||||||||||||||||||||||||||||||||||||||||||||||||||||||||||||||||||||||||||
| Less distributions | |||||||||||||||||||||||||||||||||||||||||||||||||||||||||||||||||||||||||||||||||||||||||||||||||||||||
| From net investment income | (0.60 | ) | (0.42 | ) | (0.32 | ) | (0.29 | ) | (0.26 | ) | |||||||||||||||||||||||||||||||||||||||||||||||||||||||||||||||||||||||||||||||||||||||||||||
| Net asset value, end of period | $32.44 | $26.21 | $25.57 | $25.92 | $23.22 | ||||||||||||||||||||||||||||||||||||||||||||||||||||||||||||||||||||||||||||||||||||||||||||||||||
| Total return (%)2 | 26.27 | 4.27 | (0.11 | ) | 13.02 | 37.87 | |||||||||||||||||||||||||||||||||||||||||||||||||||||||||||||||||||||||||||||||||||||||||||||||||
| Ratios and supplemental data | |||||||||||||||||||||||||||||||||||||||||||||||||||||||||||||||||||||||||||||||||||||||||||||||||||||||
| Net assets, end of period (in millions) | — | 3 | — | 3 | — | 3 | — | 3 | — | 3 | |||||||||||||||||||||||||||||||||||||||||||||||||||||||||||||||||||||||||||||||||||||||||||||
| Ratios (as a percentage of average net assets): | |||||||||||||||||||||||||||||||||||||||||||||||||||||||||||||||||||||||||||||||||||||||||||||||||||||||
| Expenses before reductions | 0.88 | 0.86 | 0.85 | 0.84 | 0.85 | ||||||||||||||||||||||||||||||||||||||||||||||||||||||||||||||||||||||||||||||||||||||||||||||||||
| Expenses including reductions | 0.87 | 0.86 | 0.84 | 0.83 | 0.85 | ||||||||||||||||||||||||||||||||||||||||||||||||||||||||||||||||||||||||||||||||||||||||||||||||||
| Net investment income | 1.40 | 2.22 | 1.40 | 1.03 | 1.37 | ||||||||||||||||||||||||||||||||||||||||||||||||||||||||||||||||||||||||||||||||||||||||||||||||||
| Portfolio turnover (%) | 45 | 21 | 17 | 24 | 30 | ||||||||||||||||||||||||||||||||||||||||||||||||||||||||||||||||||||||||||||||||||||||||||||||||||
| 1 | Based on average daily shares outstanding. | ||||||||||||||||||||||||||||||||||||||||||||||||||||||||||||||||||||||||||||||||||
| 2 | Total returns would have been lower had certain expenses not been reduced during the applicable periods. | ||||||||||||||||||||||||||||||||||||||||||||||||||||||||||||||||||||||||||||||||||
| 3 | Less than $500,000. | ||||||||||||||||||||||||||||||||||||||||||||||||||||||||||||||||||||||||||||||||||
| Class R6 Shares Period ended | 10-31-17 | 10-31-16 | 10-31-15 | 10-31-14 | 10-31-13 | ||||||||||||||||||||||||||||||||||||||||||||||||||||||||||||||||||||||||||||||||||||||||||||||||||
| Per share operating performance | |||||||||||||||||||||||||||||||||||||||||||||||||||||||||||||||||||||||||||||||||||||||||||||||||||||||
| Net asset value, beginning of period | $26.21 | $25.59 | $25.94 | $23.21 | $17.09 | ||||||||||||||||||||||||||||||||||||||||||||||||||||||||||||||||||||||||||||||||||||||||||||||||||
| Net investment income1 | 0.47 | 0.52 | 0.39 | 0.27 | 0.24 | ||||||||||||||||||||||||||||||||||||||||||||||||||||||||||||||||||||||||||||||||||||||||||||||||||
| Net realized and unrealized gain (loss) on investments | 6.39 | 0.54 | (0.42 | ) | 2.74 | 6.13 | |||||||||||||||||||||||||||||||||||||||||||||||||||||||||||||||||||||||||||||||||||||||||||||||||
| Total from investment operations | 6.86 | 1.06 | (0.03 | ) | 3.01 | 6.37 | |||||||||||||||||||||||||||||||||||||||||||||||||||||||||||||||||||||||||||||||||||||||||||||||||
| Less distributions | |||||||||||||||||||||||||||||||||||||||||||||||||||||||||||||||||||||||||||||||||||||||||||||||||||||||
| From net investment income | (0.61 | ) | (0.44 | ) | (0.32 | ) | (0.28 | ) | (0.25 | ) | |||||||||||||||||||||||||||||||||||||||||||||||||||||||||||||||||||||||||||||||||||||||||||||
| Net asset value, end of period | $32.46 | $26.21 | $25.59 | $25.94 | $23.21 | ||||||||||||||||||||||||||||||||||||||||||||||||||||||||||||||||||||||||||||||||||||||||||||||||||
| Total return (%)2 | 26.41 | 4.26 | (0.09 | ) | 13.11 | 37.80 | |||||||||||||||||||||||||||||||||||||||||||||||||||||||||||||||||||||||||||||||||||||||||||||||||
| Ratios and supplemental data | |||||||||||||||||||||||||||||||||||||||||||||||||||||||||||||||||||||||||||||||||||||||||||||||||||||||
| Net assets, end of period (in millions) | $1 | $1 | $1 | $1 | $1 | ||||||||||||||||||||||||||||||||||||||||||||||||||||||||||||||||||||||||||||||||||||||||||||||||||
| Ratios (as a percentage of average net assets): | |||||||||||||||||||||||||||||||||||||||||||||||||||||||||||||||||||||||||||||||||||||||||||||||||||||||
| Expenses before reductions | 0.83 | 0.83 | 0.83 | 0.83 | 0.85 | ||||||||||||||||||||||||||||||||||||||||||||||||||||||||||||||||||||||||||||||||||||||||||||||||||
| Expenses including reductions | 0.81 | 0.81 | 0.81 | 0.80 | 0.85 | ||||||||||||||||||||||||||||||||||||||||||||||||||||||||||||||||||||||||||||||||||||||||||||||||||
| Net investment income | 1.53 | 2.11 | 1.51 | 1.08 | 1.13 | ||||||||||||||||||||||||||||||||||||||||||||||||||||||||||||||||||||||||||||||||||||||||||||||||||
| Portfolio turnover (%) | 45 | 21 | 17 | 24 | 30 | ||||||||||||||||||||||||||||||||||||||||||||||||||||||||||||||||||||||||||||||||||||||||||||||||||
| 1 | Based on average daily shares outstanding. | ||||||||||||||||||||||||||||||||||||||||||||||||||||||||||||||||||||||||||||||||||
| 2 | Total returns would have been lower had certain expenses not been reduced during the applicable periods. | ||||||||||||||||||||||||||||||||||||||||||||||||||||||||||||||||||||||||||||||||||
Note 1 — Organization
John Hancock Classic Value Fund (the fund) is a series of John Hancock Capital Series (the Trust), an open-end management investment company organized as a Massachusetts business trust and registered under the Investment Company Act of 1940, as amended (the 1940 Act). The investment objective of the fund is to seek long-term growth of capital.
The fund may offer multiple classes of shares. The shares currently offered are detailed in the Statement of assets and liabilities. Class A and Class C are open to all investors. Class B shares are closed to new investors. Class I shares are offered to institutions and certain investors. Class R1, Class R2, Class R3, Class R4 and Class R5 shares are available only to certain retirement plans. Class R6 shares are only available to certain retirement plans, institutions and other investors. Shareholders of each class have exclusive voting rights to matters that affect that class. The distribution and service fees if any, and transfer agent fees for each class may differ. Class B shares convert to Class A shares eight years after purchase.
Note 2 — Significant accounting policies
The financial statements have been prepared in conformity with accounting principles generally accepted in the United States of America (US GAAP), which require management to make certain estimates and assumptions as of the date of the financial statements. Actual results could differ from those estimates and those differences could be significant. The fund qualifies as an investment company under Topic 946 of Accounting Standards Codification of US GAAP.
Events or transactions occurring after the end of the fiscal period through the date that the financial statements were issued have been evaluated in the preparation of the financial statements. The following summarizes the significant accounting policies of the fund:
Security valuation. Investments are stated at value as of the scheduled close of regular trading on the New York Stock Exchange (NYSE), normally at 4:00 p.m., Eastern Time. In case of emergency or other disruption resulting in the NYSE not opening for trading or the NYSE closing at a time other than the regularly scheduled close, the net asset value (NAV) may be determined as of the regularly scheduled close of the NYSE pursuant to the fund's Valuation Policies and Procedures.
In order to value the securities, the fund uses the following valuation techniques: Equity securities held by the fund are typically valued at the last sale price or official closing price on the exchange or principal market where the security trades. In the event there were no sales during the day or closing prices are not available, the securities are valued using the last available bid price. Investments by the fund in open-end mutual funds, including John Hancock Collateral Trust (JHCT), are valued at their respective NAVs each business day. Foreign securities and currencies are valued in U.S. dollars based on foreign currency exchange rates supplied by an independent pricing vendor.
In certain instances, the Pricing Committee may determine to value equity securities using prices obtained from another exchange or market if trading on the exchange or market on which prices are typically obtained did not open for trading as scheduled, or if trading closed earlier than scheduled, and trading occurred as normal on another exchange or market.
Other portfolio securities and assets, for which reliable market quotations are not readily available, are valued at fair value as determined in good faith by the fund's Pricing Committee following procedures established by the Board of Trustees. The frequency with which these fair valuation procedures are used cannot be predicted and fair value of securities may differ significantly from the value that would have been used had a ready market for such securities existed.
The fund uses a three-tier hierarchy to prioritize the pricing assumptions, referred to as inputs, used in valuation techniques to measure fair value. Level 1 includes securities valued using quoted prices in active markets for identical securities. Level 2 includes securities valued using other significant observable inputs. Observable inputs may include quoted prices for similar securities, interest rates, prepayment speeds and credit risk. Prices for securities valued using these inputs are received from independent pricing vendors and brokers and are based on an evaluation of the inputs described. Level 3 includes securities valued using significant unobservable inputs when market prices are not readily available or reliable, including the fund's own assumptions in determining the fair value of investments. Factors used in determining value may include market or issuer specific events or trends, changes in interest rates and credit quality. The inputs or methodology used for valuing securities are not necessarily an indication of the risks associated with investing in those securities. Changes in valuation techniques and related inputs may result in transfers into or out of an assigned level within the disclosure hierarchy.
As of October 31, 2017, all investments are categorized as Level 1 under the hierarchy described above, except repurchase agreements, which are categorized as Level 2.
Repurchase agreements. The fund may enter into repurchase agreements. When the fund enters into a repurchase agreement, it receives collateral that is held in a segregated account by the fund's custodian or for tri-party repurchase agreements, collateral is held at a third-party custodian bank in a segregated account for the benefit of the fund. The collateral amount is marked-to-market and monitored on a daily basis to ensure that the collateral held is in an amount not less than the principal amount of the repurchase agreement plus any accrued interest. Collateral received by the fund for repurchase agreements is disclosed in the Fund's investments as part of the caption related to the repurchase agreement.
Repurchase agreements are typically governed by the terms and conditions of the Master Repurchase Agreement and/or Global Master Repurchase Agreement (collectively, MRA). Upon an event of default, the non-defaulting party may close out all transactions traded under the MRA and net amounts owed. Absent an event of default, assets and liabilities resulting from repurchase agreements are not offset in the Statement of assets and liabilities. In the event of a default by the counterparty, realization of the collateral proceeds could be delayed, during which time the collateral value may decline or the counterparty may have insufficient assets to pay back claims resulting from close-out of the transactions.
Security transactions and related investment income. Investment security transactions are accounted for on a trade date plus one basis for daily NAV calculations. However, for financial reporting purposes, investment transactions are reported on trade date. Interest income is accrued as earned. Interest income includes coupon interest and amortization/accretion of premiums/discounts on debt securities. Debt obligations may be placed in a non-accrual status and related interest income may be reduced by stopping current accruals and writing off interest receivable when the collection of all or a portion of interest has become doubtful. Dividend income is recorded on the ex-date, except for dividends of foreign securities where the dividend may not be known until after the ex-date. In those cases, dividend income, net of withholding taxes, is recorded when the fund becomes aware of the dividends. Foreign taxes are provided for based on the fund's understanding of the tax rules and rates that exist in the foreign markets in which it invests. Gains and losses on securities sold are determined on the basis of identified cost and may include proceeds from litigation.
Securities lending. The fund may lend its securities to earn additional income. The fund receives cash collateral from the borrower in an amount not less than the market value of the loaned securities. The fund will invest its collateral in JHCT, an affiliate of the fund, which has a floating NAV and is registered with the Securities and Exchange Commission as an investment company. JHCT invests cash received as collateral as part of the securities lending program in short-term money market investments. The fund will receive the benefit of any gains and bear any losses generated by JHCT with respect to the cash collateral.
The fund has the right to recall loaned securities on demand. If a borrower fails to return loaned securities when due, then the lending agent is responsible and indemnifies the fund for the lent securities. The lending agent uses the collateral received from the borrower to purchase replacement securities of the same issue, type, class and series of the loaned securities. If the value of the collateral is less than the purchase cost of replacement securities, the lending agent is responsible for satisfying the shortfall but only to the extent that the shortfall is not due to any decrease in the value of JHCT.
Although the risk of the loss of the securities lent is mitigated by receiving collateral from the borrower and through lending agent indemnification, the fund could experience a delay in recovering securities or could experience a lower than expected return if the borrower fails to return the securities on a timely basis. The fund receives compensation for lending its securities by retaining a portion of the return on the investment of the collateral and compensation from fees earned from borrowers of the securities. Securities lending income received by the fund is net of fees retained by the securities lending agent. Net income received from JHCT is a component of securities lending income as recorded on the Statement of operations.
Obligations to repay collateral received by the fund are shown on the Statement of assets and liabilities as Payable upon return of securities loaned and are secured by the loaned securities. As of October 31, 2017, the fund loaned securities valued at $2,443,178 and received $2,506,670 of cash collateral.
Foreign taxes. The fund may be subject to withholding tax on income and/or capital gains or repatriation taxes imposed by certain countries in which the fund invests. Taxes are accrued based upon investment income, realized gains or unrealized appreciation.
Line of credit. The fund may have the ability to borrow from banks for temporary or emergency purposes, including meeting redemption requests that otherwise might require the untimely sale of securities. Pursuant to the fund's custodian agreement, the custodian may loan money to the fund to make properly authorized payments. The fund is obligated to repay the custodian for any overdraft, including any related costs or expenses. The custodian may have a lien, security interest or security entitlement in any fund property that is not otherwise segregated or pledged, to the extent of any overdraft, and to the maximum extent permitted by law.
Effective June 29, 2017, the fund and other affiliated funds have entered into a syndicated line of credit agreement with Citibank, N.A. as the administrative agent that enables them to participate in a $750 million unsecured committed line of credit. Excluding commitments designated for a certain fund and subject to the needs of all other affiliated funds, the fund can borrow up to an aggregate commitment amount of $500 million, subject to asset coverage and other limitations as specified in the agreement. A commitment fee payable at the end of each calendar quarter, based on the average daily unused portion of the line of credit, is charged to each participating fund based on a combination of fixed and asset based allocations and is reflected in Other expenses on the Statement of operations. Prior to June 29, 2017, the fund had a similar agreement that enabled it to participate in a $1 billion unsecured committed line of credit. For the year ended October 31, 2017, the fund had no borrowings under either line of credit. Commitment fees for the year ended October 31, 2017 were $7,918.
Expenses. Within the John Hancock group of funds complex, expenses that are directly attributable to an individual fund are allocated to such fund. Expenses that are not readily attributable to a specific fund are allocated among all funds in an equitable manner, taking into consideration, among other things, the nature and type of expense and the fund's relative net assets. Expense estimates are accrued in the period to which they relate and adjustments are made when actual amounts are known.
Class allocations. Income, common expenses and realized and unrealized gains (losses) are determined at the fund level and allocated daily to each class of shares based on the net assets of the class. Class-specific expenses, such as distribution and service fees, if any, and transfer agent fees, for all classes, are charged daily at the class level based on the net assets of each class and the specific expense rates applicable to each class.
Federal income taxes. The fund intends to continue to qualify as a regulated investment company by complying with the applicable provisions of the Internal Revenue Code and will not be subject to federal income tax on taxable income that is distributed to shareholders. Therefore, no federal income tax provision is required.
Under the Regulated Investment Company Modernization Act of 2010, the fund is permitted to carry forward capital losses incurred in taxable years beginning after December 22, 2010 for an unlimited period. Any losses incurred during those taxable years will be required to be utilized prior to the losses incurred in pre-enactment taxable years. As a result of this ordering rule, pre-enactment capital loss carryforwards may be more likely to expire unused. Additionally, post-enactment capital losses that are carried forward will retain their character as either short-term or long-term capital losses rather than being considered all short-term as under previous law.
As of October 31, 2017, the fund had a capital loss carryforward of $1,170,822,298 that expired unused.
As of October 31, 2017, the fund had no uncertain tax positions that would require financial statement recognition, derecognition or disclosure. The fund's federal tax returns are subject to examination by the Internal Revenue Service for a period of three years.
Distribution of income and gains. Distributions to shareholders from net investment income and net realized gains, if any, are recorded on the ex-date. The fund generally declares and pays dividends and capital gain distributions, if any, annually.
The tax character of distributions for the years ended October 31, 2017 and 2016 was as follows:
| October 31, 2017 | October 31, 2016 | |
| Ordinary income | $32,934,301 | $30,770,380 |
Distributions paid by the fund with respect to each class of shares are calculated in the same manner, at the same time and in the same amount, except for the effect of class level expenses that may be applied differently to each class. As of October 31, 2017, the components of distributable earnings on a tax basis consisted of $19,397,004 of undistributed ordinary income.
Such distributions and distributable earnings, on a tax basis, are determined in conformity with income tax regulations, which may differ from US GAAP. Distributions in excess of tax basis earnings and profits, if any, are reported in the fund's financial statements as a return of capital.
Capital accounts within the financial statements are adjusted for permanent book-tax differences. These adjustments have no impact on net assets or the results of operations. Temporary book-tax differences, if any, will reverse in a subsequent period. Book-tax differences are primarily attributable to wash sale loss deferrals and expiration of capital loss carryforwards.
Note 3 — Guarantees and indemnifications
Under the Trust's organizational documents, its Officers and Trustees are indemnified against certain liabilities arising out of the performance of their duties to the Trust, including the fund. Additionally, in the normal course of business, the fund enters into contracts with service providers that contain general indemnification clauses. The fund's maximum exposure under these arrangements is unknown, as this would involve future claims that may be made against the fund that have not yet occurred. The risk of material loss from such claims is considered remote.
Note 4 — Fees and transactions with affiliates
John Hancock Advisers, LLC (the Advisor) serves as investment advisor for the fund. John Hancock Funds, LLC (the Distributor), an affiliate of the Advisor, serves as principal underwriter of the fund. The Advisor and the Distributor are indirect, wholly owned subsidiaries of Manulife Financial Corporation (MFC).
Management fee. The fund has an investment management agreement with the Advisor under which the fund pays a monthly management fee to the Advisor equivalent on an annual basis to the sum of: (a) 0.750% of the first $2.5 billion of the fund's average daily net assets; (b) 0.740% of the next $2.5 billion of the fund's average daily net assets; and (c) 0.730% of the fund's average daily net assets in excess of $5 billion. The Advisor has a subadvisory agreement with Pzena Investment Management, LLC. The fund is not responsible for payment of the subadvisory fees.
The Advisor has contractually agreed to waive a portion of its management fee and/or reimburse expenses for certain funds of the John Hancock group of funds complex, including the fund (the participating portfolios). This waiver is based upon aggregate net assets of all the participating portfolios. The amount of the reimbursement is calculated daily and allocated among all the participating portfolios in proportion to the daily net assets of each fund. During the year ended October 31, 2017, this waiver amounted to 0.01% of the fund's average net assets. This arrangement may be amended or terminated at any time by the Advisor upon notice to the fund and with the approval of the Board of Trustees.
Prior to March 1, 2017, the Advisor had contractually agreed to waive and/or reimburse all class specific expenses for Class R6 shares of the fund to the extent they exceed 0.00% of average daily net assets.
For the year ended October 31, 2017, these expense reductions described above amounted to the following:
| Class | Expense reduction | Class | Expense reduction | |
| Class A | $27,516 | Class R3 | $98 | |
| Class B | 414 | Class R4 | 5 | |
| Class C | 6,475 | Class R5 | 5 | |
| Class I | 120,125 | Class R6 | 297 | |
| Class R1 | 266 | Total | $155,432 | |
| Class R2 | 231 |
Expenses waived or reimbursed in the current fiscal period are not subject to recapture in future fiscal periods.
The investment management fees incurred for the year ended October 31, 2017 were equivalent to a net annual effective rate of 0.74% of the fund's average daily net assets.
Accounting and legal services. Pursuant to a service agreement, the fund reimburses the Advisor for all expenses associated with providing the administrative, financial, legal, accounting and recordkeeping services to the fund, including the preparation of all tax returns, periodic reports to shareholders and regulatory reports, among other services. These expenses are allocated to each share class based on its relative net assets at the time the expense was incurred. These accounting and legal services fees incurred for the year ended October 31, 2017 amounted to an annual rate of 0.02% of the fund's average daily net assets.
Distribution and service plans. The fund has a distribution agreement with the Distributor. The fund has adopted distribution and service plans with respect to Class A, Class B, Class C, Class R1, Class R2, Class R3 and Class R4 shares pursuant to Rule 12b-1 under the 1940 Act, to pay the Distributor for services provided as the distributor of shares of the fund. In addition, under a service plan for Class R1, Class R2, Class R3, Class R4 and Class R5, the fund pays for certain other services. The fund may pay up to the following contractual rates of distribution and service fees under these arrangements, expressed as an annual percentage of average daily net assets for each class of the fund's shares:
| Class | Rule 12b-1 fee | Service fee | Class | Rule 12b-1 fee | Service fee | |
| Class A | 0.25% | — | Class R2 | 0.25% | 0.25% | |
| Class B | 1.00% | — | Class R3 | 0.50% | 0.15% | |
| Class C | 1.00% | — | Class R4 | 0.25% | 0.10% | |
| Class R1 | 0.50% | 0.25% | Class R5 | — | 0.05% |
The fund's Distributor has contractually agreed to waive 0.10% of Rule12b-1 fees for Class R4 shares. The current waiver agreement expires on February 28, 2018, unless renewed by mutual agreement of the fund and the Distributor based upon a determination that this is appropriate under the circumstances at the time. This contractual waiver amounted to $67 for Class R4 shares for the year ended October 31, 2017.
Sales charges. Class A shares are assessed up-front sales charges, which resulted in payments to the Distributor amounting to $336,202 for the year ended October 31, 2017. Of this amount, $56,027 was retained and used for printing prospectuses, advertising, sales literature and other purposes, $268,978 was paid as sales commissions to broker-dealers and $11,197 was paid as sales commissions to sales personnel of Signator Investors, Inc., a broker-dealer affiliate of the Advisor.
Class A, Class B and Class C shares may be subject to contingent deferred sales charges (CDSCs). Certain Class A shares that are acquired through purchases of $1 million or more and are redeemed within one year of purchase are subject to a 1.00% sales charge. Class B shares that are redeemed within six years of purchase are subject to CDSCs, at declining rates, beginning at 5.00%. Class C shares that are redeemed within one year of purchase are subject to a 1.00% CDSC. CDSCs are applied to the lesser of the current market value at the time of redemption or the original purchase cost of the shares being redeemed. Proceeds from CDSCs are used to compensate the Distributor for providing distribution-related services in connection with the sale of these shares. During the year ended October 31, 2017, CDSCs received by the Distributor amounted to $916, $1,904 and $2,509 for Class A, Class B and Class C shares, respectively.
Transfer agent fees. The John Hancock Group of Funds has a complex-wide transfer agent agreement with John Hancock Signature Services, Inc. (Signature Services), an affiliate of the Advisor. The transfer agent fees paid to Signature Services are determined based on the cost to Signature Services (Signature Services Cost) of providing recordkeeping services. It also includes out-of-pocket expenses, including payments made to third-parties for recordkeeping services provided to their clients who invest in one or more John Hancock funds. In addition, Signature Services Cost may be reduced by certain fees that Signature Services receives in connection with retirement and small accounts. Signature Services Cost is calculated monthly and allocated, as applicable, to five categories of share classes: Retail Share and Institutional Share Classes of Non-Municipal Bond Funds, Class R6 Shares, Retirement Share Classes and Municipal Bond Share Classes. Within each of these categories, the applicable costs are allocated to the affected John Hancock affiliated funds and/or classes, based on the relative average daily net assets.
Class level expenses. Class level expenses for the year ended October 31, 2017 were:
| Class | Distribution and service fees | Transfer agent fees |
| Class A | $867,620 | $406,401 |
| Class B | 52,301 | 6,152 |
| Class C | 817,614 | 95,959 |
| Class I | — | 1,614,425 |
| Class R1 | 24,764 | 476 |
| Class R2 | 14,302 | 388 |
| Class R3 | 8,015 | 175 |
| Class R4 | 168 | 10 |
| Class R5 | 29 | 8 |
| Class R6 | — | 310 |
| Total | $1,784,813 | $2,124,304 |
Trustee expenses. The fund compensates each Trustee who is not an employee of the Advisor or its affiliates. The costs of paying Trustee compensation and expenses are allocated to the fund based on its net assets relative to other funds within the John Hancock group of funds complex.
Note 5 — Fund share transactions
Transactions in fund shares for the years ended October 31, 2017 and 2016 were as follows:
| Year ended 10-31-17 | Year ended 10-31-16 | |||||||||||||||||||||||||
| Shares | Amount | Shares | Amount | |||||||||||||||||||||||
| Class A shares | ||||||||||||||||||||||||||
| Sold | 1,741,170 | $52,263,842 | 990,355 | $24,375,277 | ||||||||||||||||||||||
| Distributions reinvested | 194,622 | 5,762,744 | 178,151 | 4,393,219 | ||||||||||||||||||||||
| Repurchased | (2,780,522 | ) | (83,623,434 | ) | (3,117,442 | ) | (76,606,315 | ) | ||||||||||||||||||
| Net decrease | (844,730 | ) | ($25,596,848 | ) | (1,948,936 | ) | ($47,837,819 | ) | ||||||||||||||||||
| Class B shares | ||||||||||||||||||||||||||
| Sold | 13,322 | $394,186 | 7,060 | $171,397 | ||||||||||||||||||||||
| Distributions reinvested | 2,126 | 62,173 | 1,633 | 39,844 | ||||||||||||||||||||||
| Repurchased | (92,083 | ) | (2,729,048 | ) | (102,305 | ) | (2,445,095 | ) | ||||||||||||||||||
| Net decrease | (76,635 | ) | ($2,272,689 | ) | (93,612 | ) | ($2,233,854 | ) | ||||||||||||||||||
| Class C shares | ||||||||||||||||||||||||||
| Sold | 292,354 | $8,475,115 | 155,509 | $3,706,520 | ||||||||||||||||||||||
| Distributions reinvested | 28,499 | 833,017 | 16,767 | 408,790 | ||||||||||||||||||||||
| Repurchased | (913,769 | ) | (27,079,294 | ) | (709,421 | ) | (17,147,922 | ) | ||||||||||||||||||
| Net decrease | (592,916 | ) | ($17,771,162 | ) | (537,145 | ) | ($13,032,612 | ) | ||||||||||||||||||
| Class I shares | ||||||||||||||||||||||||||
| Sold | 24,224,480 | $734,272,624 | 9,190,449 | $222,756,910 | ||||||||||||||||||||||
| Distributions reinvested | 740,798 | 21,957,249 | 872,976 | 21,536,312 | ||||||||||||||||||||||
| Repurchased | (14,232,178 | ) | (430,352,129 | ) | (28,543,554 | ) | (703,493,654 | ) | ||||||||||||||||||
| Net increase (decrease) | 10,733,100 | $325,877,744 | (18,480,129 | ) | ($459,200,432 | ) | ||||||||||||||||||||
| Year ended 10-31-17 | Year ended 10-31-16 | |||||||||||||||||||||||||
| Shares | Amount | Shares | Amount | |||||||||||||||||||||||
| Class R1 shares | ||||||||||||||||||||||||||
| Sold | 46,404 | $1,403,455 | 25,815 | $612,064 | ||||||||||||||||||||||
| Distributions reinvested | 1,389 | 41,265 | 1,117 | 27,654 | ||||||||||||||||||||||
| Repurchased | (40,644 | ) | (1,239,448 | ) | (59,944 | ) | (1,492,661 | ) | ||||||||||||||||||
| Net increase (decrease) | 7,149 | $205,272 | (33,012 | ) | ($852,943 | ) | ||||||||||||||||||||
| Class R2 shares | ||||||||||||||||||||||||||
| Sold | 261,929 | $8,125,842 | 21,355 | $555,330 | ||||||||||||||||||||||
| Distributions reinvested | 511 | 15,123 | 169 | 4,163 | ||||||||||||||||||||||
| Repurchased | (72,289 | ) | (2,311,603 | ) | (2,558 | ) | (60,039 | ) | ||||||||||||||||||
| Net increase | 190,151 | $5,829,362 | 18,966 | $499,454 | ||||||||||||||||||||||
| Class R3 shares | ||||||||||||||||||||||||||
| Sold | 16,571 | $501,803 | 6,156 | $147,705 | ||||||||||||||||||||||
| Distributions reinvested | 568 | 16,786 | 429 | 10,558 | ||||||||||||||||||||||
| Repurchased | (9,868 | ) | (298,569 | ) | (11,238 | ) | (282,277 | ) | ||||||||||||||||||
| Net increase (decrease) | 7,271 | $220,020 | (4,653 | ) | ($124,014 | ) | ||||||||||||||||||||
| Class R5 shares | ||||||||||||||||||||||||||
| Sold | 455 | $13,864 | 194 | $4,736 | ||||||||||||||||||||||
| Distributions reinvested | 35 | 1,025 | 35 | 852 | ||||||||||||||||||||||
| Repurchased | (366 | ) | (11,071 | ) | (2,506 | ) | (57,736 | ) | ||||||||||||||||||
| Net increase (decrease) | 124 | $3,818 | (2,277 | ) | ($52,148 | ) | ||||||||||||||||||||
| Class R6 shares | ||||||||||||||||||||||||||
| Sold | 77,044 | $2,334,880 | 9,095 | $222,751 | ||||||||||||||||||||||
| Distributions reinvested | 2,179 | 64,570 | 862 | 21,271 | ||||||||||||||||||||||
| Repurchased | (97,493 | ) | (2,988,155 | ) | (2,879 | ) | (69,096 | ) | ||||||||||||||||||
| Net increase (decrease) | (18,270 | ) | ($588,705 | ) | 7,078 | $174,926 | ||||||||||||||||||||
| Total net increase (decrease) | 9,405,244 | $285,906,812 | (21,073,720 | ) | ($522,659,442 | ) | ||||||||||||||||||||
There were no share transactions for Class R4 for the years ended October 31, 2017 and 2016. Affiliates of the fund owned 100% of Class R4 shares on October 31, 2017. Such concentration of shareholders' capital could have a material effect on the fund if such shareholders redeem from the fund.
Note 6 — Purchase and sale of securities
Purchases and sales of securities, other than short-term investments, amounted to $1,036,800,048 and $847,449,687, respectively, for the year ended October 31, 2017.
Note 7 — Industry or sector risk
The fund may invest a large percentage of its assets in one or more particular industries or sectors of the economy. If a large percentage of the fund's assets are economically tied to a single or small number of industries or sectors of the economy, the fund will be less diversified than a more broadly diversified fund, and it may cause the fund to underperform if that industry or sector underperforms. In addition, focusing on a particular industry or sector may make the fund's NAV more volatile. Further, a fund that invests in particular industries or sectors is particularly susceptible to the impact of market, economic, regulatory and other factors affecting those industries or sectors.
Report of Independent Registered Public Accounting Firm
To the Board of Trustees of John Hancock Capital Series and Shareholders of John Hancock Classic Value Fund:
In our opinion, the accompanying statement of assets and liabilities, including the fund's investments, and the related statements of operations and of changes in net assets and the financial highlights present fairly, in all material respects, the financial position of the John Hancock Classic Value Fund (the "Fund") as of October 31, 2017, the results of its operations for the year then ended, the changes in its net assets for each of the two years in the period then ended and the financial highlights for each of the five years in the period then ended, in conformity with accounting principles generally accepted in the United States of America. These financial statements and financial highlights (hereafter referred to as "financial statements") are the responsibility of the Fund's management. Our responsibility is to express an opinion on these financial statements based on our audits. We conducted our audits of these financial statements in accordance with the standards of the Public Company Accounting Oversight Board (United States). Those standards require that we plan and perform the audit to obtain reasonable assurance about whether the financial statements are free of material misstatement. An audit includes examining, on a test basis, evidence supporting the amounts and disclosures in the financial statements, assessing the accounting principles used and significant estimates made by management, and evaluating the overall financial statement presentation. We believe that our audits, which included confirmation of securities as of October 31, 2017 by correspondence with the custodian, brokers, and transfer agent, provide a reasonable basis for our opinion.
PricewaterhouseCoopers LLP
Boston, Massachusetts
December 15, 2017
Unaudited
For federal income tax purposes, the following information is furnished with respect to the distributions of the fund, if any, paid during its taxable year ended October 31, 2017.
The fund reports the maximum amount allowable of its net taxable income as eligible for the corporate dividends-received deduction.
The fund reports the maximum amount allowable of its net taxable income as qualified dividend income as provided in the Jobs and Growth Tax Relief Reconciliation Act of 2003.
Eligible shareholders will be mailed a 2017 Form 1099-DIV in early 2018. This will reflect the tax character of all distributions paid in calendar year 2017.
Please consult a tax advisor regarding the tax consequences of your investment in the fund.
Continuation of Investment Advisory and Subadvisory Agreements
Evaluation of Advisory and Subadvisory Agreements by the Board of Trustees
This section describes the evaluation by the Board of Trustees (the Board) of John Hancock Capital Series (the Trust) of the Advisory Agreement (the Advisory Agreement) with John Hancock Advisers, LLC (the Advisor) and the Subadvisory Agreement (the Subadvisory Agreement) with Pzena Investment Management, LLC (the Subadvisor), for John Hancock Classic Value Fund (the fund). The Advisory Agreement and Subadvisory Agreement are collectively referred to as the Agreements. Prior to the June 19-22, 2017 in-person meeting at which the Agreements were approved, the Board also discussed and considered information regarding the proposed continuation of the Agreements at an in-person meeting held on May 22-24, 2017.
Approval of Advisory and Subadvisory Agreements
At in-person meetings held on June 19-22, 2017, the Board, including the Trustees who are not parties to any Agreement or considered to be interested persons of the Trust under the Investment Company Act of 1940, as amended (the 1940 Act) (the Independent Trustees), reapproved for an annual period the continuation of the Advisory Agreement between the Trust and the Advisor and the Subadvisory Agreement between the Advisor and the Subadvisor with respect to the fund.
In considering the Advisory Agreement and the Subadvisory Agreement, the Board received in advance of the meetings a variety of materials relating to the fund, the Advisor and the Subadvisor, including comparative performance, fee and expense information for a peer group of similar funds prepared by an independent third-party provider of fund data, performance information for an applicable benchmark index; and, with respect to the Subadvisor, comparative performance information for comparably managed accounts, as applicable, and other information provided by the Advisor and the Subadvisor regarding the nature, extent and quality of services provided by the Advisor and the Subadvisor under their respective Agreements, as well as information regarding the Advisor's revenues and costs of providing services to the fund and any compensation paid to affiliates of the Advisor. At the meetings at which the renewal of the Advisory Agreement and Subadvisory Agreement are considered, particular focus is given to information concerning fund performance, comparability of fees and total expenses, and profitability. However, the Board notes that the evaluation process with respect to the Advisor and the Subadvisor is an ongoing one. In this regard, the Board also took into account discussions with management and information provided to the Board (including its various committees) at prior meetings with respect to the services provided by the Advisor and the Subadvisor to the fund, including quarterly performance reports prepared by management containing reviews of investment results and prior presentations from the Subadvisor with respect to the fund. The information received and considered by the Board in connection with the May and June meetings and throughout the year was both written and oral. The Board also considered the nature, quality, and extent of non-advisory services, if any, to be provided to the fund by the Advisor's affiliates, including distribution services. The Board considered the Advisory Agreement and Subadvisory Agreement separately in the course of its review. In doing so, the Board noted the respective roles of the Advisor and Subadvisor in providing services to the fund.
Throughout the process, the Board asked questions of and requested additional information from management. The Board is assisted by counsel for the Trust and the Independent Trustees are also separately assisted by independent legal counsel throughout the process. The Independent Trustees also received a memorandum from their independent legal counsel discussing the legal standards for their consideration of the proposed continuation of the Agreements and discussed the proposed continuation of the Agreements in private sessions with their independent legal counsel at which no representatives of management were present.
Approval of Advisory Agreement
In approving the Advisory Agreement with respect to the fund, the Board, including the Independent Trustees, considered a variety of factors, including those discussed below. The Board also considered other factors (including conditions and trends prevailing generally in the economy, the securities markets, and the industry) and did not treat any single factor as determinative, and each Trustee may have attributed different weights to different factors. The Board's conclusions may be
based in part on its consideration of the advisory and subadvisory arrangements in prior years and on the Board's ongoing regular review of fund performance and operations throughout the year.
Nature, extent, and quality of services. Among the information received by the Board from the Advisor relating to the nature, extent, and quality of services provided to the fund, the Board reviewed information provided by the Advisor relating to its operations and personnel, descriptions of its organizational and management structure, and information regarding the Advisor's compliance and regulatory history, including its Form ADV. The Board also noted that on a regular basis it receives and reviews information from the Trust's Chief Compliance Officer (CCO) regarding the fund's compliance policies and procedures established pursuant to Rule 38a-1 under the 1940 Act. The Board observed that the scope of services provided by the Advisor, and of the undertakings required of the Advisor in connection with those services, including maintaining and monitoring its own and the fund's compliance programs, risk management programs, liquidity management programs and cybersecurity programs, had expanded over time as a result of regulatory, market and other developments. The Board considered that the Advisor is responsible for the management of the day-to-day operations of the fund, including, but not limited to, general supervision of and coordination of the services provided by the Subadvisor, and is also responsible for monitoring and reviewing the activities of the Subadvisor and other third-party service providers. The Board also considered the significant risks assumed by the Advisor in connection with the services provided to the fund including entrepreneurial risk in sponsoring new funds and ongoing risks including investment, operational, enterprise, litigation, regulatory and compliance risk with respect to all funds.
In considering the nature, extent, and quality of the services provided by the Advisor, the Trustees also took into account their knowledge of the Advisor's management and the quality of the performance of the Advisor's duties, through Board meetings, discussions and reports during the preceding year and through each Trustee's experience as a Trustee of the Trust and of the other trusts in the John Hancock group of funds complex (the John Hancock Fund Complex).
In the course of their deliberations regarding the Advisory Agreement, the Board considered, among other things:
| (a) | the skills and competency with which the Advisor has in the past managed the Trust's affairs and its subadvisory relationship, the Advisor's oversight and monitoring of the Subadvisor's investment performance and compliance programs, such as the Subadvisor's compliance with fund policies and objectives, review of brokerage matters, including with respect to trade allocation and best execution and the Advisor's timeliness in responding to performance issues; |
| (b) | the background, qualifications and skills of the Advisor's personnel; |
| (c) | the Advisor's compliance policies and procedures and its responsiveness to regulatory changes and fund industry developments; |
| (d) | the Advisor's administrative capabilities, including its ability to supervise the other service providers for the fund; |
| (e) | the financial condition of the Advisor and whether it has the financial wherewithal to provide a high level and quality of services to the fund |
| (f) | the Advisor's initiatives intended to improve various aspects of the Trust's operations and the investor experience with the fund; and |
| (g) | the Advisor's reputation and experience in serving as an investment advisor to the Trust and the benefit to shareholders of investing in funds that are part of a family of funds offering a variety of investments. |
The Board concluded that the Advisor may reasonably be expected to continue to provide a high quality of services under the Advisory Agreement with respect to the fund.
Investment performance. In considering the fund's performance, the Board noted that it reviews at its regularly scheduled meetings information about the fund's performance results. In connection with the consideration of the Advisory Agreement, the Board:
| (a) | reviewed information prepared by management regarding the fund's performance; |
| (b) | considered the comparative performance of an applicable benchmark index; |
| (c) | considered the performance of comparable funds, if any, as included in the report prepared by an independent third-party provider of fund data; and |
| (d) | took into account the Advisor's analysis of the fund's performance and its plans and recommendations regarding the Trust's subadvisory arrangements generally. |
The Board noted that while it found the data provided by the independent third-party generally useful it recognized its limitations, including in particular that the data may vary depending on the end date selected and the results of the performance comparisons may vary depending on the selection of the peer group. The Board noted that the fund outperformed its benchmark index for the one- and five-year periods and underperformed its benchmark index for the three- and ten-year periods ended December 31, 2016. The Board also noted that the fund outperformed its peer group average for the one-, three- and five-year periods and underperformed its peer group average for the ten-year period ended December 31, 2016. The Board took into account management's discussion of the fund's performance, including the favorable performance relative to the benchmark index for the one- and five-year periods and to the peer group for the one-, three- and five-year periods. The Board concluded that the fund's performance has generally been in line with or outperformed the historical performance of comparable funds and the fund's benchmark index.
Fees and expenses. The Board reviewed comparative information prepared by an independent third-party provider of fund data, including, among other data, the fund's contractual and net management fees (and subadvisory fees, to the extent available) and total expenses as compared to similarly situated investment companies deemed to be comparable to the fund in light of the nature, extent and quality of the management and advisory and subadvisory services provided by the Advisor to the Subadvisor. The Board considered the fund's ranking within a smaller group of peer funds chosen by the independent third-party provider, as well as the fund's ranking within a broader group of funds. In comparing the fund's contractual and net management fees to those of comparable funds, the Board noted that such fees include both advisory and administrative costs. The Board noted that net management fees and net total expenses for the fund are higher than the peer group median.
The Board took into account management's discussion of the fund's expenses. The Board also took into account management's discussion with respect to the overall management fee, the fees of the Subadvisor, including the amount of the advisory fee retained by the Advisor after payment of the subadvisory fee, in each case in light of the services rendered for those amounts and the risks undertaken by the Advisor. The Board also noted that the Advisor pays the subadvisory fee, and that such fees are negotiated at arm's length with respect to the Subadvisor. In addition, the Board took into account that management had agreed to implement an overall fee waiver across the complex, including the fund, which is discussed further below. The Board also noted actions taken over the past several years to reduce the fund's operating expenses. The Board also noted that, in addition, the Advisor is currently waiving fees and/or reimbursing expenses with respect to the fund and that the fund has breakpoints in its contractual management fee schedule that reduces management fees as assets increase. The Board also noted that the fund's distributor, an affiliate of the Advisor, has agreed to waive a portion of its Rule 12b-1 fee for a share class of the fund. The Board reviewed information provided by the Advisor concerning the investment advisory fee charged by the Advisor or one of its advisory affiliates to other clients (including other funds in the John Hancock Fund Complex) having similar investment mandates, if any. The Board considered any differences between the Advisor's and Subadvisor's services to the fund and the services they provide to other comparable clients or funds. The Board concluded that the advisory fee paid with respect to the fund is reasonable in light of the nature, extent and quality of the services provided to the fund under the Advisory Agreement.
Profitability/Fall out benefits. In considering the costs of the services to be provided and the profits to be realized by the Advisor and its affiliates from the Advisor's relationship with the Trust, the Board:
| (a) | reviewed financial information of the Advisor; |
| (b) | reviewed and considered information presented by the Advisor regarding the net profitability to the Advisor and its affiliates with respect to the fund; |
| (c) | received and reviewed profitability information with respect to the John Hancock Fund Complex as a whole and with respect to the fund; |
| (d) | received information with respect to the Advisor's allocation methodologies used in preparing the profitability data and considered that the Advisor hired an independent third-party consultant to provide an analysis of the Advisor's allocation methodologies; |
| (e) | considered that the John Hancock insurance companies that are affiliates of the Advisor, as shareholders of the Trust directly or through their separate accounts, receive certain tax credits or deductions relating to foreign taxes paid and dividends received by certain funds of the Trust and noted that these tax benefits, which are not available to participants in qualified retirement plans under applicable income tax law, are reflected in the profitability information reviewed by the Board; |
| (f) | considered that the Advisor also provides administrative services to the fund on a cost basis pursuant to an administrative services agreement; |
| (g) | noted that affiliates of the Advisor provide transfer agency services and distribution services to the fund, and that the fund's distributor also receives Rule 12b-1 payments to support distribution of the fund; |
| (h) | noted that the Advisor also derives reputational and other indirect benefits from providing advisory services to the fund; |
| (i) | noted that the subadvisory fee for the fund is paid by the Advisor and is negotiated at arm's length; |
| (j) | considered the Advisor's ongoing costs and expenditures necessary to improve services, meet new regulatory and compliance requirements, and adapt to other challenges impacting the fund industry; and |
| (k) | considered that the Advisor should be entitled to earn a reasonable level of profits in exchange for the level of services it provides to the fund and the risks it assumes as Advisor, including entrepreneurial, operational, reputational, litigation and regulatory risk. |
Based upon its review, the Board concluded that the level of profitability, if any, of the Advisor and its affiliates from their relationship with the fund was reasonable and not excessive.
Economies of scale. In considering the extent to which economies of scale would be realized as the fund grows and whether fee levels reflect these economies of scale for the benefit of fund shareholders, the Board:
| (a) | considered that the Advisor has contractually agreed to waive a portion of its management fee for certain funds of the John Hancock Fund Complex, including the fund (the participating portfolios) or otherwise reimburse the expenses of the participating portfolios (the reimbursement). This waiver is based upon aggregate net assets of all the participating portfolios. The amount of the reimbursement is calculated daily and allocated among all the participating portfolios in proportion to the daily net assets of each fund; |
| (b) | reviewed the fund's advisory fee structure and concluded that: (i) the fund's fee structure contains breakpoints at the subadvisory fee level and that such breakpoints are reflected as breakpoints in the advisory fees for the fund; and (ii) although economies of scale cannot be measured with precision, these arrangements permit shareholders of the fund to benefit from economies of scale if the fund grows. The Board also took into account management's discussion of the fund's advisory fee structure; and |
| (c) | the Board also considered the effect of the fund's growth in size on its performance and fees. The Board also noted that if the fund's assets increase over time, the fund may realize other economies of scale. |
Approval of Subadvisory Agreements
In making its determination with respect to approval of the Subadvisory Agreements, the Board reviewed:
| (1) | information relating to the Subadvisor's business, including current subadvisory services to the Trust (and other funds in the John Hancock Fund Complex); |
| (2) | the historical and current performance of the fund and comparative performance information relating to an applicable benchmark index and comparable funds; |
| (3) | the subadvisory fee for the fund, including any breakpoints, and to the extent available, comparable fee information prepared by an independent third party provider of fund data; and |
| (4) | information relating to the nature and scope of any material relationships and their significance to the Trust's Advisor and Subadvisor. |
Nature, extent, and quality of services. With respect to the services provided by the Subadvisor, the Board received information provided to the Board by the Subadvisor, including the Subadvisor's Form ADV, as well as took into account information presented throughout the past year. The Board considered the Subadvisor's current level of staffing and its overall resources, as well as received information relating to the Subadvisor's compensation program. The Board reviewed the Subadvisor's history and investment experience, as well as information regarding the qualifications, background, and responsibilities of the Subadvisor's investment and compliance personnel who provide services to the fund. The Board also considered, among other things, the Subadvisor's compliance program and any disciplinary history. The Board also considered the Subadvisor's risk assessment and monitoring process. The Board reviewed the Subadvisor's regulatory history, including whether it was involved in any regulatory actions or investigations as well as material litigation, and any settlements and amelioratory actions undertaken, as appropriate. The Board noted that the Advisor conducts regular, periodic reviews of the Subadvisor and its operations, including regarding investment processes and organizational and staffing matters. The Board also noted that the Trust's CCO and his staff conduct regular, periodic compliance reviews with the Subadvisor and present reports to the Independent Trustees regarding the same, which includes evaluating the regulatory compliance systems of the Subadvisor and procedures reasonably designed to assure compliance with the federal securities laws. The Board also took into account the financial condition of the Subadvisor.
The Board considered the Subadvisor's investment process and philosophy. The Board took into account that the Subadvisor's responsibilities include the development and maintenance of an investment program for the fund that is consistent with the fund's investment objective, the selection of investment securities and the placement of orders for the purchase and sale of such securities, as well as the implementation of compliance controls related to performance of these services. The Board also received information with respect to the Subadvisor's brokerage policies and practices, including with respect to best execution and soft dollars.
Subadvisor compensation. In considering the cost of services to be provided by the Subadvisor and the profitability to the Subadvisor of its relationship with the fund, the Board noted that the fees under the Subadvisory Agreement are paid by the Advisor and not the fund.
The Board also relied on the ability of the Advisor to negotiate the Subadvisory Agreement with the Subadvisor, which is not affiliated with the Advisor, and the fees thereunder at arm's length. As a result, the costs of the services to be provided and the profits to be realized by the Subadvisor from its relationship with the Trust were not a material factor in the Board's consideration of the Subadvisory Agreement.
The Board also received information regarding the nature and scope (including their significance to the Advisor and its affiliates and to the Subadvisor) of any material relationships with respect to the Subadvisor, which include arrangements in which the Subadvisor or its affiliates provide advisory, distribution, or management services in connection with financial products sponsored by the Advisor or its affiliates, and may include other registered investment companies, a 529 education savings plan, managed separate accounts and exempt group annuity contracts sold to qualified plans. The Board also
received information and took into account any other potential conflicts of interest the Advisor might have in connection with the Subadvisory Agreement.
In addition, the Board considered other potential indirect benefits that the Subadvisor and its affiliates may receive from the Subadvisor's relationship with the fund, such as the opportunity to provide advisory services to additional funds in the John Hancock Fund Complex and reputational benefits.
Subadvisory fees. The Board considered that the fund pays an advisory fee to the Advisor and that, in turn, the Advisor pays a subadvisory fee to the Subadvisor. As noted above, the Board also considered the fund's subadvisory fees as compared to similarly situated investment companies deemed to be comparable to the fund as included in the report prepared by the independent third party provider of fund data, to the extent available. The Board noted that the limited size of the Lipper peer group was not sufficient for comparative purposes. The Board also took into account the subadvisory fees paid by the Advisor to the Subadvisor with respect to the fund and compared them to fees charged by the Subadvisor to manage other subadvised portfolios and portfolios not subject to regulation under the 1940 Act, as applicable.
Subadvisor performance. As noted above, the Board considered the fund's performance as compared to the fund's peer group and the benchmark index and noted that the Board reviews information about the fund's performance results at its regularly scheduled meetings. The Board noted the Advisor's expertise and resources in monitoring the performance, investment style and risk-adjusted performance of the Subadvisor. The Board was mindful of the Advisor's focus on the Subadvisor's performance. The Board also noted the Subadvisor's long-term performance record for similar accounts, as applicable.
The Board's decision to approve the Subadvisory Agreements was based on a number of determinations, including the following:
| (1) | the Subadvisor has extensive experience and demonstrated skills as a manager; |
| (2) | the performance of the fund has generally been in line with or outperformed the historical performance of comparable funds and the fund's benchmark index; |
| (3) | the subadvisory fee is reasonable in relation to the level and quality of services being provided under the Subadvisory Agreement; and |
| (4) | noted that the subadvisory fees are paid by the Advisor not the fund and that the subadvisory fee breakpoints are reflected as breakpoints in the advisory fees for the fund in order to permit shareholders to benefit from economies of scale if the fund grows. |
* * *
Based on the Board's evaluation of all factors that the Board deemed to be material, including those factors described above, the Board, including the Independent Trustees, concluded that renewal of the Advisory Agreement and the Subadvisory Agreement would be in the best interest of the fund and its shareholders. Accordingly, the Board, and the Independent Trustees voting separately, approved the Advisory Agreement and Subadvisory Agreement for an additional one-year period.
This chart provides information about the Trustees and Officers who oversee your John Hancock fund. Officers elected by the Trustees manage the day-to-day operations of the fund and execute policies formulated by the Trustees.
Independent Trustees
| Name, year of birth Position(s) held with Trust Principal occupation(s) and other directorships during past 5 years | Trustee of the Trust since1 | Number of John Hancock funds overseen by Trustee |
| Hassell H. McClellan, Born: 1945 | 2012 | 223 |
| Trustee and Chairperson of the Board Director/Trustee, Virtus Funds (since 2008); Director, The Barnes Group (since 2010); Associate Professor, The Wallace E. Carroll School of Management, Boston College (retired 2013). Trustee (since 2014) and Chairperson of the Board (since 2017), John Hancock Collateral Trust; Trustee (since 2015) and Chairperson of the Board (since 2017), John Hancock Exchange-Traded Fund Trust; Trustee (since 2012) and Chairperson of the Board (since 2017), John Hancock retail funds3; Trustee (2005-2006 and since 2012) and Chairperson of the Board (since 2017), John Hancock Funds III; Trustee (since 2005) and Chairperson of the Board (since 2017), John Hancock Variable Insurance Trust and John Hancock Funds II. | ||
| Charles L. Bardelis,2 Born: 1941 | 2012 | 223 |
| Trustee Director, Island Commuter Corp. (marine transport). Trustee, John Hancock Collateral Trust (since 2014), Trustee, John Hancock Exchange-Traded Fund Trust (since 2015); Trustee, John Hancock retail funds3 (since 2012); Trustee, John Hancock Funds III (2005-2006 and since 2012); Trustee, John Hancock Variable Insurance Trust (since 1988); Trustee, John Hancock Funds II (since 2005). | ||
| Peter S. Burgess,2 Born: 1942 | 2012 | 223 |
| Trustee Consultant (financial, accounting, and auditing matters) (since 1999); Certified Public Accountant; Partner, Arthur Andersen (independent public accounting firm) (prior to 1999); Director, Lincoln Educational Services Corporation (since 2004); Director, Symetra Financial Corporation (2010-2016); Director, PMA Capital Corporation (2004-2010). Trustee, John Hancock Collateral Trust (since 2014); Trustee, John Hancock Exchange-Traded Fund Trust (since 2015); Trustee, John Hancock retail funds3 (since 2012); Trustee, John Hancock Funds III (2005-2006 and since 2012); Trustee, John Hancock Variable Insurance Trust and John Hancock Funds II (since 2005). | ||
| William H. Cunningham, Born: 1944 | 2005 | 223 |
| Trustee Professor, University of Texas, Austin, Texas (since 1971); former Chancellor, University of Texas System and former President of the University of Texas, Austin, Texas; Chairman (since 2009) and Director (since 2006), Lincoln National Corporation (insurance); Director, Southwest Airlines (since 2000); former Director, LIN Television (2009-2014). Trustee, John Hancock retail funds3 (since 1986); Trustee, John Hancock Variable Insurance Trust (since 2012); Trustee, John Hancock Funds II (2005-2006 and since 2012); Trustee, John Hancock Collateral Trust (since 2014); Trustee, John Hancock Exchange-Traded Fund Trust (since 2015). | ||
| Grace K. Fey, Born: 1946 | 2012 | 223 |
| Trustee Chief Executive Officer, Grace Fey Advisors (since 2007); Director and Executive Vice President, Frontier Capital Management Company (1988-2007); Director, Fiduciary Trust (since 2009). Trustee, John Hancock Collateral Trust (since 2014); Trustee, John Hancock Exchange-Traded Fund Trust (since 2015); Trustee, John Hancock retail funds3 (since 2012); Trustee, John Hancock Variable Insurance Trust and John Hancock Funds II (since 2008). | ||
Independent Trustees (continued)
| Name, year of birth Position(s) held with Trust Principal occupation(s) and other directorships during past 5 years | Trustee of the Trust since1 | Number of John Hancock funds overseen by Trustee |
| Theron S. Hoffman,2 Born: 1947 | 2012 | 223 |
| Trustee Chief Executive Officer, T. Hoffman Associates, LLC (consulting firm) (since 2003); Director, The Todd Organization (consulting firm) (2003-2010); President, Westport Resources Management (investment management consulting firm) (2006-2008); Senior Managing Director, Partner, and Operating Head, Putnam Investments (2000-2003); Executive Vice President, The Thomson Corp. (financial and legal information publishing) (1997-2000). Trustee, John Hancock Collateral Trust (since 2014); Trustee, John Hancock Exchange-Traded Fund Trust (since 2015); Trustee, John Hancock retail funds3 (since 2012); Trustee, John Hancock Variable Insurance Trust and John Hancock Funds II (since 2008). | ||
| Deborah C. Jackson, Born: 1952 | 2008 | 223 |
| Trustee President, Cambridge College, Cambridge, Massachusetts (since 2011); Board of Directors, National Association of Corporate Directors/New England (since 2015); Board of Directors, Association of Independent Colleges and Universities of Massachusetts (since 2014); Chief Executive Officer, American Red Cross of Massachusetts Bay (2002-2011); Board of Directors of Eastern Bank Corporation (since 2001); Board of Directors of Eastern Bank Charitable Foundation (since 2001); Board of Directors of American Student Assistance Corporation (1996-2009); Board of Directors of Boston Stock Exchange (2002-2008); Board of Directors of Harvard Pilgrim Healthcare (health benefits company) (2007-2011). Trustee, John Hancock retail funds3 (since 2008); Trustee, John Hancock Variable Insurance Trust and John Hancock Funds II (since 2012); Trustee, John Hancock Collateral Trust (since 2014); and Trustee, John Hancock Exchange-Traded Fund Trust (since 2015). | ||
| James M. Oates, Born: 1946 | 2012 | 223 |
Trustee | ||
| Steven R. Pruchansky, Born: 1944 | 2005 | 223 |
| Trustee and Vice Chairperson of the Board Chairman and Chief Executive Officer, Greenscapes of Southwest Florida, Inc. (since 2000); Director and President, Greenscapes of Southwest Florida, Inc. (until 2000); Member, Board of Advisors, First American Bank (until 2010); Managing Director, Jon James, LLC (real estate) (since 2000); Partner, Right Funding, LLC (since 2014); Director, First Signature Bank & Trust Company (until 1991); Director, Mast Realty Trust (until 1994); President, Maxwell Building Corp. (until 1991). Trustee (since 1992) and Chairperson of the Board (2011-2012), John Hancock retail funds3; Trustee and Vice Chairperson of the Board, John Hancock retail funds3 John Hancock Variable Insurance Trust, and John Hancock Funds II (since 2012); Trustee and Vice Chairperson of the Board, John Hancock Collateral Trust (since 2014); Trustee and Vice Chairperson of the Board, John Hancock Exchange-Traded Fund Trust (since 2015). | ||
Independent Trustees (continued)
| Name, year of birth Position(s) held with Trust Principal occupation(s) and other directorships during past 5 years | Trustee of the Trust since1 | Number of John Hancock funds overseen by Trustee |
| Gregory A. Russo, Born: 1949 | 2009 | 223 |
| Trustee Director and Audit Committee Chairman (since 2012), and Member, Audit Committee and Finance Committee (since 2011), NCH Healthcare System, Inc. (holding company for multi-entity healthcare system); Director and Member (since 2012) and Finance Committee Chairman (since 2014), The Moorings, Inc. (nonprofit continuing care community); Vice Chairman, Risk & Regulatory Matters, KPMG LLP (KPMG) (2002-2006); Vice Chairman, Industrial Markets, KPMG (1998-2002); Chairman and Treasurer, Westchester County, New York, Chamber of Commerce (1986-1992); Director, Treasurer, and Chairman of Audit and Finance Committees, Putnam Hospital Center (1989-1995); Director and Chairman of Fundraising Campaign, United Way of Westchester and Putnam Counties, New York (1990-1995). Trustee, John Hancock retail funds3 (since 2008); Trustee, John Hancock Variable Insurance Trust and John Hancock Funds II (since 2012); Trustee, John Hancock Collateral Trust (since 2014); Trustee, John Hancock Exchange-Traded Fund Trust (since 2015). | ||
Non-Independent Trustees4
| Name, year of birth Position(s) held with Trust Principal occupation(s) and other directorships during past 5 years | Trustee of the Trust since1 | Number of John Hancock funds overseen by Trustee |
| Andrew G. Arnott, Born: 1971 | 2017 | 223 |
President and Trustee | ||
| James R. Boyle, Born: 1959 | 2015 | 223 |
| Non-Independent Trustee Chairman and Chief Executive Officer, Zillion Group, Inc. (formerly HealthFleet, Inc.) (healthcare) (since 2014); Executive Vice President and Chief Executive Officer, U.S. Life Insurance Division of Genworth Financial, Inc. (insurance) (January 2014-July 2014); Senior Executive Vice President, Manulife Financial Corporation, President and Chief Executive Officer, John Hancock (1999-2012); Chairman and Director, John Hancock Advisers, LLC, John Hancock Funds, LLC, and John Hancock Investment Management Services, LLC (2005-2010). Trustee, John Hancock Collateral Trust and John Hancock Exchange-Traded Fund Trust (since 2015); Trustee, John Hancock retail funds3 (2005-2010; 2012-2014 and since 2015); Trustee, John Hancock Variable Insurance Trust and John Hancock Funds II (2005-2014 and since 2015). | ||
| Warren A. Thomson, Born: 1955 | 2012 | 223 |
| Non-Independent Trustee Senior Executive Vice President and Chief Investment Officer, Manulife Financial Corporation and The Manufacturers Life Insurance Company (since 2009); Chairman, Manulife Asset Management (since 2001, including prior positions); Director and Chairman, Manulife Asset Management Limited (since 2006); Director and Chairman, Hancock Natural Resources Group, Inc. (since 2013). Trustee, John Hancock retail funds,3 John Hancock Variable Insurance Trust, and John Hancock Funds II (since 2012); Trustee, John Hancock Collateral Trust (since 2014); Trustee, John Hancock Exchange-Traded Fund Trust (since 2015). | ||
Principal officers who are not Trustees
| Name, year of birth Position(s) held with Trust Principal occupation(s) during past 5 years | Officer of the Trust since |
| John J. Danello, Born: 1955 | 2014 |
| Senior Vice President, Secretary, and Chief Legal Officer Vice President and Chief Counsel, John Hancock Wealth Management (since 2005); Senior Vice President (since 2007) and Chief Legal Counsel (2007-2010), John Hancock Funds, LLC and The Berkeley Financial Group, LLC; Senior Vice President (since 2006, including prior positions) and Chief Legal Officer and Secretary (since 2014), John Hancock retail funds,3 John Hancock Funds II and John Hancock Variable Insurance Trust; Senior Vice President, Secretary and Chief Legal Officer, John Hancock Collateral Trust and John Hancock Exchange-Traded Fund Trust (since 2014); Vice President, John Hancock Life & Health Insurance Company (since 2009); Vice President, John Hancock Life Insurance Company (USA) and John Hancock Life Insurance Company of New York (since 2010); and Senior Vice President, Secretary and Chief Legal Counsel (2007-2014, including prior positions) of John Hancock Advisers, LLC and John Hancock Investment Management Services, LLC. | |
| Francis V. Knox, Jr., Born: 1947 | 2005 |
| Chief Compliance Officer Vice President, John Hancock Financial Services (since 2005); Chief Compliance Officer, John Hancock retail funds,3 John Hancock Variable Insurance Trust, John Hancock Funds II, John Hancock Advisers, LLC, and John Hancock Investment Management Services, LLC (since 2005); Chief Compliance Officer, John Hancock Collateral Trust and John Hancock Exchange-Traded Fund Trust (since 2014). | |
| Charles A. Rizzo, Born: 1957 | 2007 |
| Chief Financial Officer Vice President, John Hancock Financial Services (since 2008); Senior Vice President, John Hancock Advisers, LLC and John Hancock Investment Management Services, LLC (since 2008); Chief Financial Officer, John Hancock retail funds,3 John Hancock Variable Insurance Trust and John Hancock Funds II (since 2007); Chief Financial Officer, John Hancock Collateral Trust and John Hancock Exchange-Traded Fund Trust (since 2014). | |
| Salvatore Schiavone, Born: 1965 | 2010 |
| Treasurer Assistant Vice President, John Hancock Financial Services (since 2007); Vice President, John Hancock Advisers, LLC and John Hancock Investment Management Services, LLC (since 2007); Treasurer, John Hancock retail funds3 (since 2007, including prior positions); Treasurer, John Hancock Variable Insurance Trust and John Hancock Funds II (2007-2009 and since 2010, including prior positions); Treasurer, John Hancock Collateral Trust and John Hancock Exchange-Traded Fund Trust (since 2014). | |
The business address for all Trustees and Officers is 601 Congress Street, Boston, Massachusetts 02210-2805.
The Statement of Additional Information of the fund includes additional information about members of the Board of Trustees of the Trust and is available without charge, upon request, by calling 800-225-5291.
| 1 | Each Trustee holds office until his or her successor is elected and qualified, or until the Trustee's death, retirement, resignation, or removal. Mr. Boyle has served as Trustee at various times prior to the date listed in the table. |
| 2 | Member of the Audit Committee. |
| 3 | "John Hancock retail funds" comprises John Hancock Funds III and 38 other John Hancock funds consisting of 28 series of other John Hancock trusts and 10 closed-end funds. |
| 4 | The Trustee is a Non-Independent Trustee due to current or former positions with the Advisor and certain affiliates. |
Trustees Hassell H. McClellan, Chairperson Officers Andrew G. Arnott John J. Danello Francis V. Knox, Jr. Charles A. Rizzo Salvatore Schiavone | Investment advisor John Hancock Advisers, LLC Subadvisor Pzena Investment Management, LLC Principal distributor John Hancock Funds, LLC Custodian State Street Bank and Trust Company Transfer agent John Hancock Signature Services, Inc. Legal counsel K&L Gates LLP Independent registered public accounting firm PricewaterhouseCoopers LLP |
*Member of the Audit Committee
†Non-Independent Trustee
#Effective 6-20-17
The fund's proxy voting policies and procedures, as well as the fund proxy voting record for the most recent twelve-month period ended June 30, are available free of charge on the Securities and Exchange Commission (SEC) website at sec.gov or on our website.
The fund's complete list of portfolio holdings, for the first and third fiscal quarters, is filed with the SEC on Form N-Q. The fund's Form N-Q is available on our website and the SEC's website, sec.gov, and can be reviewed and copied (for a fee) at the SEC's Public Reference Room in Washington, DC. Call 800-SEC-0330 to receive information on the operation of the SEC's Public Reference Room.
We make this information on your fund, as well as monthly portfolio holdings, and other fund details available on our website at jhinvestments.com or by calling 800-225-5291.
| You can also contact us: | |||
| 800-225-5291 jhinvestments.com | Regular mail: John Hancock Signature Services, Inc. | Express mail: John Hancock Signature Services, Inc. | |
John Hancock family of funds
DOMESTIC EQUITY FUNDS Balanced Blue Chip Growth Classic Value Disciplined Value Disciplined Value Mid Cap Equity Income Fundamental All Cap Core Fundamental Large Cap Core Fundamental Large Cap Value New Opportunities Small Cap Core Small Cap Value Small Company Strategic Growth U.S. Global Leaders Growth U.S. Growth Value Equity GLOBAL AND INTERNATIONAL EQUITY FUNDS Disciplined Value International Emerging Markets Emerging Markets Equity Fundamental Global Franchise Global Equity Global Shareholder Yield Greater China Opportunities International Growth International Small Company International Value Equity | INCOME FUNDS Bond California Tax-Free Income Emerging Markets Debt Floating Rate Income Global Income Government Income High Yield High Yield Municipal Bond Income Investment Grade Bond Money Market Short Duration Credit Opportunities Spectrum Income Strategic Income Opportunities Tax-Free Bond ALTERNATIVE AND SPECIALTY FUNDS Absolute Return Currency Alternative Asset Allocation Enduring Assets Financial Industries Global Absolute Return Strategies Global Conservative Absolute Return Global Focused Strategies Natural Resources Redwood Regional Bank Seaport Technical Opportunities |
A fund's investment objectives, risks, charges, and expenses should be considered carefully before investing. The prospectus contains this and other important information about the fund. To obtain a prospectus, contact your financial professional, call John Hancock Investments at 800-225-5291, or visit our website at jhinvestments.com. Please read the prospectus carefully before investing or sending money.
ASSET ALLOCATION Income Allocation Fund Multi-Index Lifetime Portfolios Multi-Index Preservation Portfolios Multimanager Lifestyle Portfolios Multimanager Lifetime Portfolios EXCHANGE-TRADED FUNDS John Hancock Multifactor Consumer Discretionary ETF John Hancock Multifactor Consumer Staples ETF John Hancock Multifactor Developed International ETF John Hancock Multifactor Energy ETF John Hancock Multifactor Financials ETF John Hancock Multifactor Healthcare ETF John Hancock Multifactor Industrials ETF John Hancock Multifactor Large Cap ETF John Hancock Multifactor Materials ETF John Hancock Multifactor Mid Cap ETF John Hancock Multifactor Small Cap ETF John Hancock Multifactor Technology ETF John Hancock Multifactor Utilities ETF | ENVIRONMENTAL, SOCIAL, AND GOVERNANCE FUNDS ESG All Cap Core ESG Core Bond ESG International Equity ESG Large Cap Core CLOSED-END FUNDS Financial Opportunities Hedged Equity & Income Income Securities Trust Investors Trust Preferred Income Preferred Income II Preferred Income III Premium Dividend Tax-Advantaged Dividend Income Tax-Advantaged Global Shareholder Yield |
John Hancock Multifactor ETF shares are bought and sold at market price (not NAV), and are not individually redeemed
from the fund. Brokerage commissions will reduce returns.
John Hancock ETFs are distributed by Foreside Fund Services, LLC, and are subadvised by Dimensional Fund Advisors LP.
Foreside is not affiliated with John Hancock Funds, LLC or Dimensional Fund Advisors LP.
Dimensional Fund Advisors LP receives compensation from John Hancock in connection with licensing rights to the
John Hancock Dimensional indexes. Dimensional Fund Advisors LP does not sponsor, endorse, or sell, and makes no
representation as to the advisability of investing in, John Hancock Multifactor ETFs.
John Hancock Investments
A trusted brand
John Hancock Investments is a premier asset manager representing one of
America's most trusted brands, with a heritage of financial stewardship dating
back to 1862. Helping our shareholders pursue their financial goals is at the
core of everything we do. It's why we support the role of professional financial
advice and operate with the highest standards of conduct and integrity.
A better way to invest
We serve investors globally through a unique multimanager approach:
We search the world to find proven portfolio teams with specialized
expertise for every strategy we offer, then we apply robust investment
oversight to ensure they continue to meet our uncompromising standards
and serve the best interests of our shareholders.
Results for investors
Our unique approach to asset management enables us to provide a diverse set
of investments backed by some of the world's best managers, along with strong
risk-adjusted returns across asset classes.
| | John Hancock Funds, LLC n Member FINRA, SIPC 601 Congress Street n Boston, MA 02210-2805 800-225-5291 n jhinvestments.com | |
| This report is for the information of the shareholders of John Hancock Classic Value Fund. It is not authorized for distribution to prospective investors unless preceded or accompanied by a prospectus. | ||
| MF410660 | 38A 10/17 12/17 | |
ITEM 2. CODE OF ETHICS.
As of the end of the period, October 31, 2017, the registrant has adopted a code of ethics, as defined in Item 2 of Form N-CSR, that applies to its Chief Executive Officer, Chief Financial Officer and Treasurer (respectively, the principal executive officer, the principal financial officer and the principal accounting officer, the “Senior Financial Officers”). A copy of the code of ethics is filed as an exhibit to this Form N-CSR.
ITEM 3. AUDIT COMMITTEE FINANCIAL EXPERT.
Peter S. Burgess is the audit committee financial expert and is “independent”, pursuant to general instructions on Form N-CSR Item 3.
ITEM 4. PRINCIPAL ACCOUNTANT FEES AND SERVICES.
(a) Audit Fees
The aggregate fees billed for professional services rendered by the principal accountant for the audits of the registrant’s annual financial statements or services that are normally provided by the accountant in connection with statutory and regulatory filings or engagements amounted to the following for the fiscal years ended October 31, 2017 and 2016. These fees were billed to the registrant and were approved by the registrant’s audit committee.
| Fund | October 31, 2017 | October 31, 2016 |
| John Hancock Classic Value Fund | $32,737 | $ 31,968 |
| John Hancock U.S. Global Leaders Growth Fund | 30,768 | 30,056 |
| Total | $63,505 | $ 62,024 |
(b) Audit-Related Services
Audit-related service fees for assurance and related services by the principal accountant are billed to the registrant or to the registrant's investment adviser (not including any sub-adviser whose role is primarily portfolio management and is subcontracted with or overseen by another investment adviser), and any entity controlling, controlled by, or under common control with the adviser (“control affiliates”) that provides ongoing services to the registrant. The nature of the services provided was affiliated service provider internal controls reviews.
| Fund | October 31, 2017 | October 31, 2016 |
| John Hancock Classic Value Fund | $524 | $ 427 |
| John Hancock U.S. Global Leaders Growth Fund | 524 | 427 |
| Total | $1,048 | $ 854 |
In addition, amounts billed to control affiliates for service provider internal controls reviews were $106,517 and $103,474 for the fiscal years ended October 31, 2017 and 2016, respectively.
(c) Tax Fees
The aggregate fees billed for professional services rendered by the principal accountant for tax compliance, tax advice and tax planning (“tax fees”) amounted to the following for the fiscal years ended October 31, 2017 and 2016. The nature of the services comprising the tax fees was the review of the registrant’s tax returns and tax distribution requirements. These fees were billed to the registrant and were approved by the registrant’s audit committee.
| Fund | October 31, 2017 | October 31, 2016 |
| John Hancock Classic Value Fund | $3,850 | $ 3,647 |
| John Hancock U.S. Global Leaders Growth Fund | 3,725 | 3,647 |
| Total | $7,575 | $ 7,294 |
(d) All Other Fees
Other fees billed for professional services rendered by the principal accountant to the registrant or to the control affiliates for the fiscal years ended October 31, 2017 and 2016 amounted to the following:
| Fund | October 31, 2017 | October 31, 2016 |
| John Hancock Classic Value Fund | $839 | $ 109 |
| John Hancock U.S. Global Leaders Growth Fund | 839 | 109 |
| Total | $1,678 | $ 218 |
(e)(1) Audit Committee Pre-Approval Policies and Procedures:
The trust’s Audit Committee must pre-approve all audit and non-audit services provided by the independent registered public accounting firm (the “Auditor”) relating to the operations or financial reporting of the funds. Prior to the commencement of any audit or non-audit services to a fund, the Audit Committee reviews the services to determine whether they are appropriate and permissible under applicable law.
The trust’s Audit Committee has adopted policies and procedures to, among other purposes, provide a framework for the Committee’s consideration of audit-related and non-audit services by the Auditor. The policies and procedures require that any audit-related and non-audit service provided by the Auditor and any non-audit service provided by the Auditor to a fund service provider that relates directly to the operations and financial reporting of a fund are subject to approval by the Audit Committee before such service is provided. Audit-related services provided by the Auditor that are expected to exceed $25,000 per instance/per fund are subject to specific pre-approval by the Audit Committee. Tax services provided by the Auditor that are expected to exceed $30,000 per instance/per fund are subject to specific pre-approval by the Audit Committee.
All audit services, as well as the audit-related and non-audit services that are expected to exceed the amounts stated above, must be approved in advance of provision of the service by formal resolution of the Audit Committee. At the regularly scheduled Audit Committee meetings, the Committee reviews a report summarizing the services, including fees, provided by the Auditor.
(e)(2) Services approved pursuant to paragraph (c)(7)(i)(C) of Rule 2-01 of Regulation S-X:
Audit-Related Fees, Tax Fees and All Other Fees:
There were no amounts that were approved by the Audit Committee pursuant to the de minimis exception under Rule 2-01 of Regulation S-X.
(f) According to the registrant’s principal accountant, for the fiscal period ended October 31, 2017, the percentage of hours spent on the audit of the registrant's financial statements for the most recent fiscal year that were attributed to work performed by persons who were not full-time, permanent employees of principal accountant was less than 50%.
(g) The aggregate non-audit fees billed by the registrant's accountant for non-audit services rendered to the registrant and rendered to the registrant's control affiliates for the fiscal years ended October 31, 2017 and 2016 amounted to the following:
| Trust | October 31, 2017 | October 31, 2016 |
| John Hancock Capital Series | $8,888,919 | $ 4,593,942 |
(h) The audit committee of the registrant has considered the non-audit services provided by the registrant’s principal accountant(s) to the control affiliates and has determined that the services that were not pre-approved are compatible with maintaining the principal accountant(s)' independence.
ITEM 5. AUDIT COMMITTEE OF LISTED REGISTRANTS.
The registrant has a separately-designated standing audit committee comprised of independent trustees. The members of the audit committee are as follows:
Peter S. Burgess - Chairman
Charles L. Bardelis
Theron S. Hoffman
ITEM 6. SCHEDULE OF INVESTMENTS.
(a) Not applicable.
(b) Not applicable.
ITEM 7. DISCLOSURE OF PROXY VOTING POLICIES AND PROCEDURES FOR CLOSED-END MANAGEMENT INVESTMENT COMPANIES.
Not applicable.
ITEM 8. PORTFOLIO MANAGERS OF CLOSED-END MANAGEMENT INVESTMENT COMPANIES.
Not applicable.
ITEM 9. PURCHASES OF EQUITY SECURITIES BY CLOSED-END MANAGEMENT INVESTMENT COMPANY AND AFFILIATED PURCHASERS.
Not applicable.
ITEM 10. SUBMISSION OF MATTERS TO A VOTE OF SECURITY HOLDERS.
There were no material changes to previously disclosed John Hancock Funds – Nominating and Governance Committee Charter.
ITEM 11. CONTROLS AND PROCEDURES.
(a) Based upon their evaluation of the registrant's disclosure controls and procedures as conducted within 90 days of the filing date of this Form N-CSR, the registrant's principal executive officer and principal financial officer have concluded that those disclosure controls and procedures provide reasonable assurance that the material information required to be disclosed by the registrant on this report is recorded, processed, summarized and reported within the time periods specified in the Securities and Exchange Commission's rules and forms.
(b) There were no changes in the registrant's internal control over financial reporting that occurred during the registrant's most recent fiscal half-year (the registrant's second fiscal half-year in the case of an annual report) that have materially affected, or are reasonably likely to materially affect, the registrant's internal control over financial reporting.
ITEM 12. DISCLOSURE OF SECURITIES LENDING ACTIVITIES FOR CLOSED-END MANAGEMENT INVESTMENT COMPANIES.
Not applicable.
ITEM 13. EXHIBITS.
(a)(1) Code of Ethics for Senior Financial Officers is attached.
(a)(2) Separate certifications for the registrant's principal executive officer and principal financial officer, as required by Section 302 of the Sarbanes-Oxley Act of 2002 and Rule 30a-2(a) under the Investment Company Act of 1940, are attached.
(b) Separate certifications for the registrant's principal executive officer and principal financial officer, as required by 18 U.S.C. Section 1350, as adopted pursuant to Section 906 of the Sarbanes-Oxley Act of 2002, and Rule 30a-2(b) under the Investment Company Act of 1940, are attached. The certifications furnished pursuant to this paragraph are not deemed to be "filed" for purposes of Section 18 of the Securities Exchange Act of 1934, or otherwise subject to the liability of that section. Such certifications are not deemed to be incorporated by reference into any filing under the Securities Act of 1933 or the Securities Exchange Act of 1934, except to the extent that the Registrant specifically incorporates them by reference.
(c)(1) Submission of Matters to a Vote of Security Holders is attached. See attached “John Hancock Funds – Nominating and Governance Committee Charter”.
SIGNATURES
Pursuant to the requirements of the Securities Exchange Act of 1934 and the Investment Company Act of 1940, the registrant has duly caused this report to be signed on its behalf by the undersigned, thereunto duly authorized.
John Hancock Capital Series
| By: | /s/ Andrew Arnott |
| Andrew Arnott | |
| President | |
| Date: | December 19, 2017 |
Pursuant to the requirements of the Securities Exchange Act of 1934 and the Investment Company Act of 1940, this report has been signed below by the following persons on behalf of the registrant and in the capacities and on the dates indicated.
| By: | /s/ Andrew Arnott |
| Andrew Arnott | |
| President | |
| Date: | December 19, 2017 |
| By: | /s/ Charles A. Rizzo |
| Charles A. Rizzo | |
| Chief Financial Officer | |
| Date: | December 19, 2017 |