 Second Quarter 2006 Review August 1, 2006 Second Quarter 2006 Review August 1, 2006 John V. Faraci Chairman & CEO Marianne M. Parrs Executive VP & CFO John V. Faraci Chairman & CEO Marianne M. Parrs Executive VP & CFO Exhibit 99.2 |
 2 Forward-Looking Statements These slides contain forward-looking statements. These statements reflect management's current views and are subject to risks and uncertainties that could cause actual results to differ materially from those expressed or implied in these statements. Factors that could cause actual results to differ relate to: (i) the execution of sale transactions currently under contract and the realization of anticipated sales proceeds thereunder, including the ability to successfully consummate the transactions without a material purchase price adjustment, the successful fulfillment (or waiver) of all conditions set forth in the sale agreements, the successful closing of the transactions within the estimated timeframes, and the ability to monetize the non-cash portion of the sale proceeds; (ii) the ability of the Company to accomplish the transformation plan, including the ability to realize anticipated profit improvement from the plan and the ability to successfully negotiate satisfactory sale terms for assets that are being evaluated for sale but are not currently under contract; and (iii) the effect of economic and industry conditions on the Company generally, and on the market price of the Company’s stock, including unanticipated events (in type, scope or magnitude) that would have a material adverse impact upon the Company’s liquidity or results of operations. We undertake no obligation to publicly update any forward-looking statements, whether as a result of new information, future events or otherwise. These and other factors that could cause or contribute to actual results differing materially from such forward looking statements are discussed in greater detail in the Company's Securities and Exchange Commission filings. |
 3 During the course of this presentation, certain non- U.S. GAAP financial information will be presented. A reconciliation of those numbers to U.S. GAAP financial measures is available on the company’s website at www.internationalpaper.com under Investors. Statements Relating to Non-GAAP Financial Measures |
 4 Agenda Second Quarter 2006 Review Third Quarter 2006 Outlook Transformation Plan Update Second Quarter 2006 Review Third Quarter 2006 Outlook Transformation Plan Update |
 5 Second Quarter 2006 Summary Solid second quarter, strong revenue Improving IP paper and packaging pricing Comparable volume to first quarter 2006 Strong manufacturing operations Lower raw material costs / higher freight costs Lower land sales / higher tax rate Coated Papers included in continuing operations Solid second quarter, strong revenue Improving IP paper and packaging pricing Comparable volume to first quarter 2006 Strong manufacturing operations Lower raw material costs / higher freight costs Lower land sales / higher tax rate Coated Papers included in continuing operations |
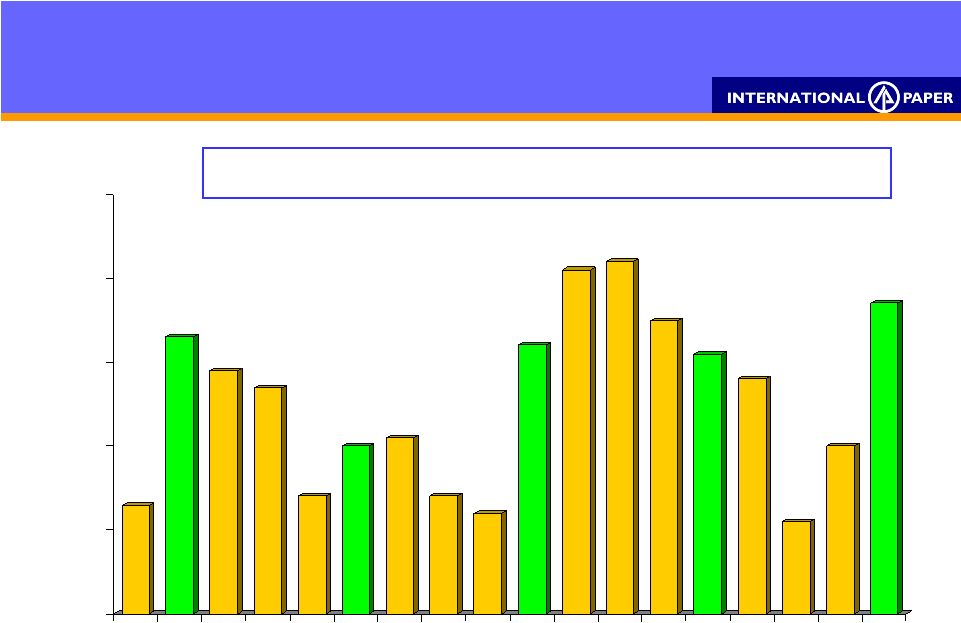 6 0.00 0.10 0.20 0.30 0.40 0.50 1Q 2Q 3Q 4Q 1Q 2Q 3Q 4Q 1Q 2Q 3Q 4Q 1Q 2Q 3Q 4Q 1Q 2Q 0.00 0.10 0.20 0.30 0.40 0.50 1Q 2Q 3Q 4Q 1Q 2Q 3Q 4Q 1Q 2Q 3Q 4Q 1Q 2Q 3Q 4Q 1Q 2Q 2002 2003 2004 2005 2006 .13 .33 .27 .29 .14 .20 .21 .14 .12 .41 .32 .42 .35 .31 .28 .11 .20 .41 Diluted EPS from Continuing Operations and Before Special Items Best second quarter EPS results since 2000 $/Share * A reconciliation to GAAP EPS is available at www.internationalpaper.com under Investors |
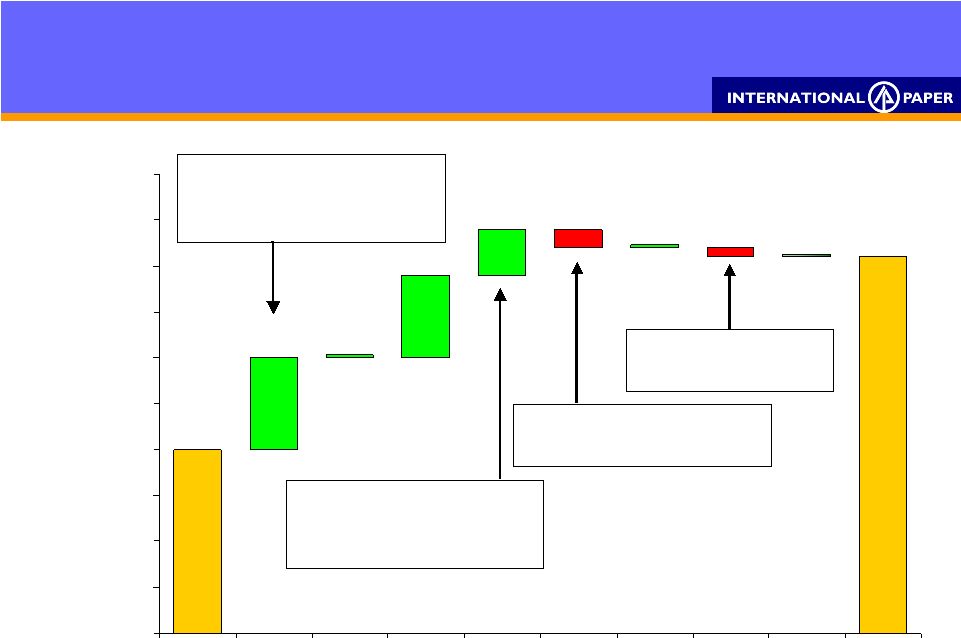 7 $0.00 $0.05 $0.10 $0.15 $0.20 $0.25 $0.30 $0.35 $0.40 $0.45 $0.50 1Q'06 Price Volume / Downtime Cost / Mix Materials / Freight Land Sales Corporate Items Tax Other 2Q'06 EPS $ / Share Energy $0.04 Wood Cost $0.02 Freight ($0.01) Packaging $0.05 Papers $0.07 Wood Products ($0.02) 1Q06 Tax rate 30% 2Q06 Tax rate 34% IP Realty ($0.02) Land Sales $0.00 2Q’06 vs. 1Q’06 EPS from cont. ops before special items $.20 $.10 $.05 $.00 $.41 $.00 ($.02) $.00 $.09 ($.01) |
 8 $0.00 $0.10 $0.20 $0.30 $0.40 $0.50 $0.60 $0.70 $0.80 $0.90 $1.00 6M'05 Price Volume / Downtime Cost / Mix Materials / Freight Land Sales Corporate Items Interest Tax Other 6M'06 EPS $ / Share Packaging $0.03 Papers $0.10 Wood Products ($0.05) 2006 Tax rate 33% 2005 Tax rate 26% 6M’06 vs. 6M’05 EPS from cont. ops before special items $.67 $.08 ($.30) $.16 ($.04) ($.06) $.07 ($.08) $.05 $.05 $.60 Energy ($0.13) Freight ($0.08) Wood Cost ($0.02) Other ($0.07) Land Sales $0.09 IP Realty ($0.02) |
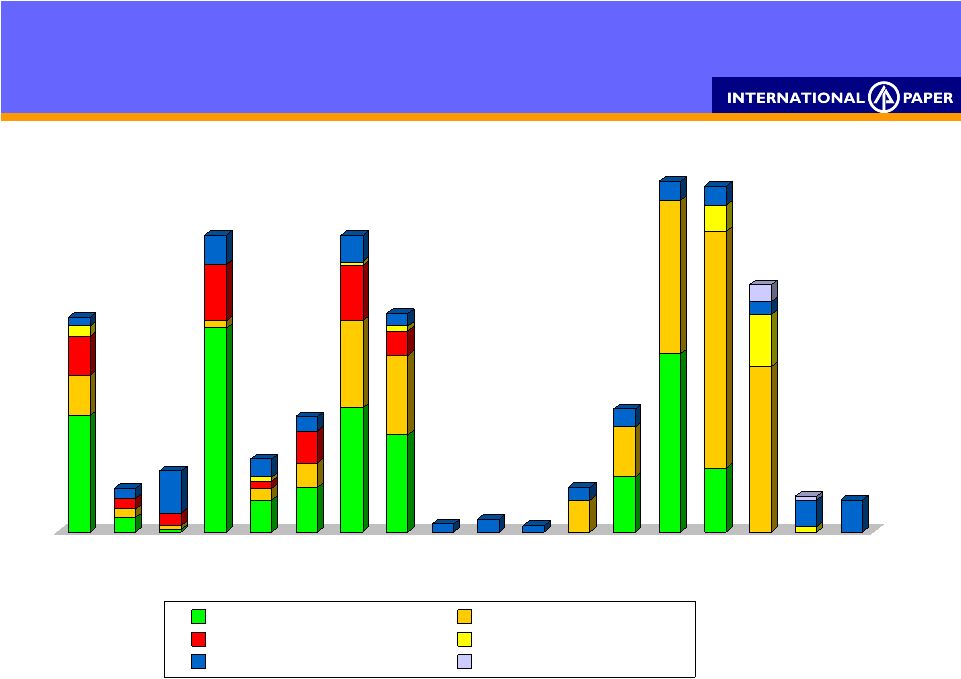
 9 Raw Material & Freight Costs EBIT impact 6M’06 vs. 6M’05 Total of $220 million or $0.30 per share negative impact in 6M’06 versus 6M’05 (120) (100) (80) (60) (40) (20) 0 (120) (100) (80) (60) (40) (20) 0 Energy Wood Chemicals EBIT ($MM) (94) (13) (36) (57) Non- U.S. Freight (20) |
 10 Printing Papers $1,915 254 Sales Earnings 2Q’06 1Q’06 $ Millions $ Millions $ 1,895 128 2 U.S. operations only 3 Europe is average commodity cut-size price, excluding Russia Average IP realization (includes the impact of mix across all grades) Uncoated Pulp Europe (uncoated) Volume Realizations/ton 2Q’06 Change vs 1Q’06: 2Q’06 Change vs 1Q’06: (2)% 2% (10)% $60 $25 €20 1 Includes a $31 million benefit from the elimination of Coated Paper’s depreciation expense 2 3 1 2 |
 11 Industrial Packaging Average IP realization (includes the impact of mix across all grades) $ 1,240 100 Sales Earnings 2Q’06 1Q’06 $ Millions $ Millions $ 1,170 38 Containerboard U.S. Container $50 $35 Volume Realizations/ton 2Q’06 Change vs 1Q’06: 2Q’06 Change vs 1Q’06: (12%) 3% 1 U .S. operations only 1 |
 12 Consumer Packaging Average IP realization (includes the impact of mix across all grades) $ 795 41 Sales Earnings 2Q’06 1Q’06 $ Millions $ Millions $ 775 35 Coated Paperboard Flat Volume Realizations/ton 2Q’06 Change vs 1Q’06: 2Q’06 Change vs 1Q’06: 3% Converting Businesses Sales Revenue 4% 2 U.S. operations only 1 Includes a charge of $8 million for Shorewood Packaging asset write-off 2 1 |
 13 Distribution $ 1,690 36 Sales Earnings 2Q’06 1Q’06 $ Millions $ Millions $ 1,650 27 xpedx reported record earnings for month, quarter and six-month period Revenues improved 8% vs. second quarter 2005 Expenses down, margins up |
 14 Forest Products Average IP realization (includes the impact of mix across all grades) $ 595 184 Sales Earnings 2Q’06 1Q’06 $ Millions Lumber (mbf) Plywood (msf) ($15) ($5) Volume Realizations/unit $ 630 226 2Q’06 Change vs 1Q’06: 2Q’06 Change vs 1Q’06: 6% 3% 1 U.S. operations only 1 |
 15 Special Items – After Tax • Transformation Plan Costs & Other (70) • Divestitures Gain on Conservation Tracts 39 Estimated Loss on Coated Paper Sale (53) Special Items Total (84) ($0.17) Discontinued Operations (Kraft Papers) • Earnings 9 • Estimated Loss on Sale (10) Discontinued Operations Total (1) $0.00 Special Items – After Tax • Transformation Plan Costs & Other (70) • Divestitures Gain on Conservation Tracts 39 Estimated Loss on Coated Paper Sale (53) Special Items Total (84) ($0.17) Discontinued Operations (Kraft Papers) • Earnings 9 • Estimated Loss on Sale (10) Discontinued Operations Total (1) $0.00 $MM EPS Special Items & Discontinued Operations – 2Q’06 |
 16 Earnings from Continuing Operations and Before Special Items $0.41 Special Items (0.17) Earnings from Continuing Operations 0.24 Discontinued Operations 0.00 Net Earnings $0.24 Earnings from Continuing Operations and Before Special Items $0.41 Special Items (0.17) Earnings from Continuing Operations 0.24 Discontinued Operations 0.00 Net Earnings $0.24 Reconciliation to 2Q’06 Diluted Earnings Per Share Diluted EPS |
 17 Third Quarter 2006 Outlook Volume – Continued solid, inventories in good shape Implementing IP’s previously announced price increases in paper and packaging Continued progress in improving operations Costs remain high, outlook mixed Volume – Continued solid, inventories in good shape Implementing IP’s previously announced price increases in paper and packaging Continued progress in improving operations Costs remain high, outlook mixed |
 18 Transformation Plan Update Continued focus on improving our key platform operations Communicated details on returning value to shareholders on July 13, 2006 • Board authorized up to $3 billion share repurchase • Plan to spend $6-7 billion to strengthen balance sheet • Disciplined approach to strategic opportunities for selective reinvestment Divestment program on track Continued focus on improving our key platform operations Communicated details on returning value to shareholders on July 13, 2006 • Board authorized up to $3 billion share repurchase • Plan to spend $6-7 billion to strengthen balance sheet • Disciplined approach to strategic opportunities for selective reinvestment Divestment program on track Second Quarter 2006 |
 19 Carter Holt Harvey Forestlands Coated Papers Beverage Packaging Kraft Papers Wood Products Arizona Chemical Consider Strategic Options Distribute Sales Book Evaluate Final Bids Sales Agreement Announced Close on Sale - Phase completed 5.7 MM acres Inpacel (Brazil) Proceeds $1.1B $6.6B* *Estimated proceeds to be received in 3Q’06 and 4Q’06 $1.4B $0.2B Could reach decisions regarding these assets within the next 90 days Sales Agreed To Date $9.3B Transformation Plan Update Divestments status as of August 1, 2006 |
 20 Q & A Q & A |
 21 Appendix Appendix |
 22 Capital Spending Depreciation & Amort. Net Interest Expense Corporate Items Effective Tax Rate Capital Spending Depreciation & Amort. Net Interest Expense Corporate Items Effective Tax Rate $ 1.2 B $ 1.2-1.3 B $ 600 MM $ 700-750 MM 33% 2006 Est. Key Financial Statistics $ 1.2 B $ 1.4 B $ 650 MM $ 595 MM 27% 2005 $ 1.2 B $ 1.4 B $ 710 MM $ 470 MM 26% 2004 1 Excludes Carter Holt Harvey results 2 Includes impact of all businesses except Coated Papers and Kraft Papers for entire year 3 Before special items Updated as of August 1, 2006 1 1 3 3 2 |
 23 1Q 2Q 3Q 4Q 1Q 2Q 3Q 4Q 1Q 2Q 3Q 4Q 1Q 2Q 3Q 4Q 1Q 2Q Containerboard Uncoated Papers Pulp Coated Paperboard European Papers Coated Papers *Includes indefinitely closed uncoated papers capacity at Pensacola, FL, Bastrop, LA and Jay, ME in 2Q05 (72,000 tons), 3Q05 (108,000 tons) and 4Q’05 (108,000 tons). Permanently closed at end of 4Q’05. 168 44 49 232 Lack of Order Downtime 59 90 236 173 5 10 5 35 95 M Short Tons 2002 2003 2004 2005 274* 270* 194* 28 2006 25 |
 24 Earnings by Industry Segment Earnings by Industry Segment Printing Papers $215 $128 $156 Industrial Packaging 100 38 84 Consumer Packaging 49 35 53 Distribution 36 27 18 Forest Products 184 226 205 Other Businesses 16 10 7 Operating Profit 600 464 523 Interest Expense (148) (148) (166) Minority Interest 2 3 2 Corporate Items, net (174) (176) (133) Earnings from continuing operations before income taxes, minority interest & special items $280 $143 $226 Earnings by Industry Segment Printing Papers $215 $128 $156 Industrial Packaging 100 38 84 Consumer Packaging 49 35 53 Distribution 36 27 18 Forest Products 184 226 205 Other Businesses 16 10 7 Operating Profit 600 464 523 Interest Expense (148) (148) (166) Minority Interest 2 3 2 Corporate Items, net (174) (176) (133) Earnings from continuing operations before income taxes, minority interest & special items $280 $143 $226 $ Millions 1Q’06* 1Q’06* 2Q’05* 2Q’05* 2Q’06 2Q’06 Before special items & Coated Papers depreciation expense *Industry segment information has been reclassified to conform with minor changes in 2006 organizational structure as well as to reflect the Kraft Papers business as a discontinued operation and Coated Papers as a continuing operation. |
 25 Before Special Items Q1 143 (44) (4) 95 30% 486.3 0.20 Q2 311 (106) (5) 200 34% 487.2 0.41 Special Items Q1 (1,310) 36 - (1,274) 3% 486.3 (2.62) Q2 (129) 45 - (84) 35% 487.2 (0.17) Earnings from Continuing Operations Q1 (1,167) (8) (4) (1,179) (1%) 486.3 (2.42) Q2 182 (61) (5) 116 34% 487.2 0.24 2006 Earnings from Continuing Operations Pre-Tax Tax MI Net ETR Average Diluted Shares EPS $ MM MM Shares $/Share $ MM $ MM $ MM MI – Minority Interest; Net – Net Income; ETR – Effective Tax Rate; EPS – Earnings per Share; NM – Not Meaningful 1 A reconciliation to GAAP EPS is available at www.internationalpaper.com under Investor Information 2 Assuming dilution 2 1 |
 26 * U.S. only Average IP realization (includes the impact of mix across all grades) Average Sales Realizations (Preliminary) Forest Products $/ton Packaging $/ton Printing Papers Segments* 300 369 721 437 499 803 1Q’06 Average Sales Realizations 300 406 726 450 496 813 2Q’05 285 347 772 502 528 885 Jun 06 Plywood, $/MSF Lumber, $/MBF Corrugated boxes Containerboard Pulp Uncoated Grades 293 372 754 489 525 862 2Q’06 309 416 721 442 475 810 Jun 05 |
 27 Forest Resources Earnings Sources – Gross Margin • Forestland Sales $101 $103 $67 • Harvest & Recreational Income 61 72 62 Forestland Expenses (31) (30) (39) Land Utilization (real estate), Net of Expenses 29 45 39 Total EBIT $160 $190 $129 Earnings Sources – Gross Margin • Forestland Sales $101 $103 $67 • Harvest & Recreational Income 61 72 62 Forestland Expenses (31) (30) (39) Land Utilization (real estate), Net of Expenses 29 45 39 Total EBIT $160 $190 $129 $ Millions 1Q’06 1Q’06 2Q’05 2Q’05 2Q’06 2Q’06 1 Excludes U.S. forestlands identified for sale as part of transformation plan 1 |
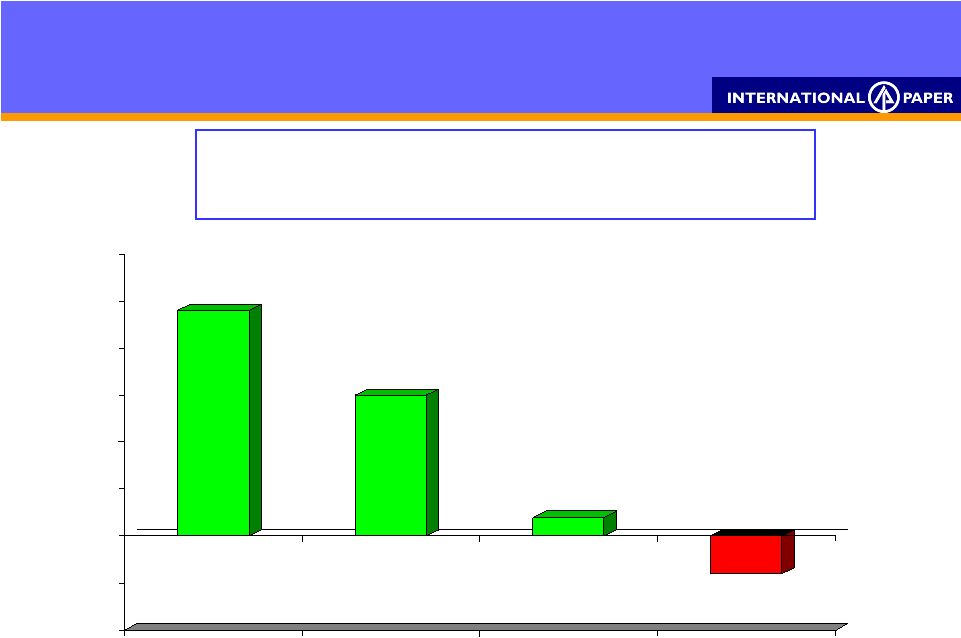 28 Raw Material & Freight Costs EBIT impact 2Q’06 vs. 1Q’06 Total of $37 million or $0.05 per share positive impact in 2Q’06 versus 1Q’06 (10) (5) 0 5 10 15 20 25 30 (10) (5) 0 5 10 15 20 25 30 Energy Wood Other EBIT ($MM) 24 15 2 (4) Freight |
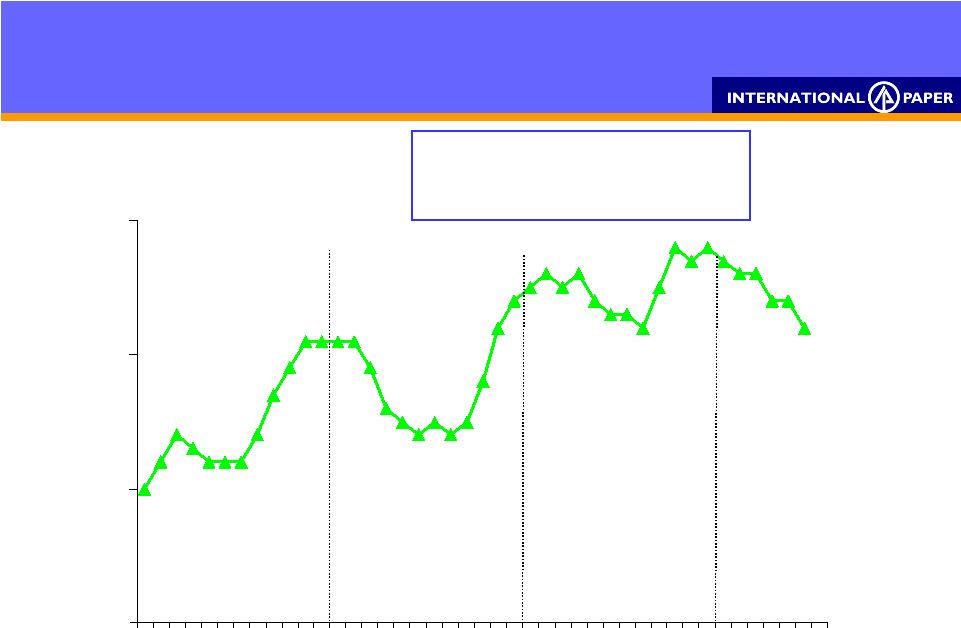
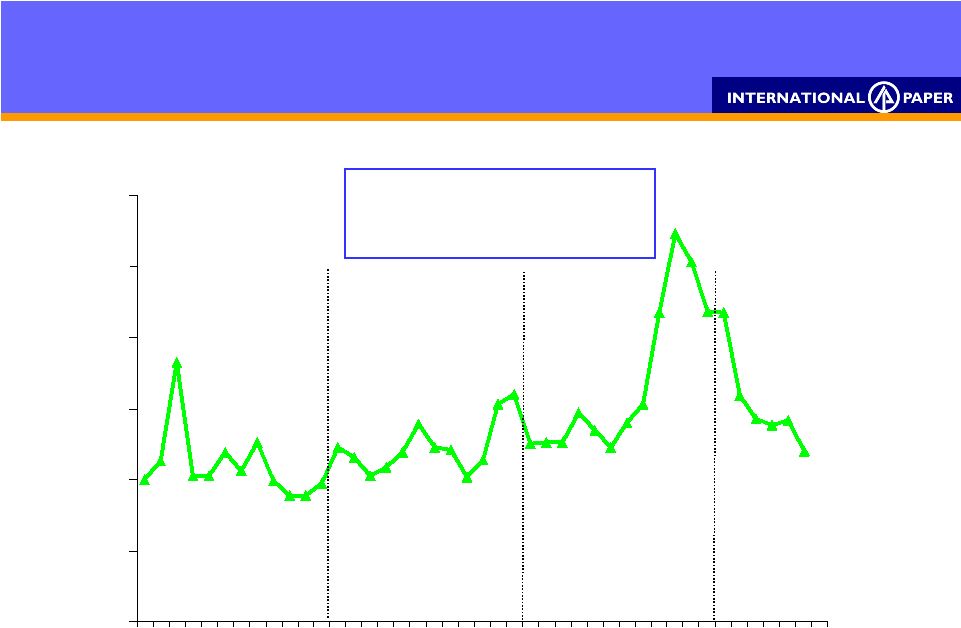 29 0 50 100 150 200 250 300 Jan Apr July Oct Jan Apr July Oct Jan Apr July Oct Jan Apr July Index: Jan 2003 Natural Gas Costs = 100 2003 2004 Natural gas costs peaked in October Natural Gas Costs 2005 Trended lower in 2Q’06 2006 * U.S. pulp & paper mills average |
 30 90 100 110 120 Jan Apr July Oct Jan Apr July Oct Jan Apr July Oct Jan Apr July U.S. Mill Wood Costs Index: Jan 2003 Wood Costs = 100 2003 2004 * Delivered cost to U.S. pulp & paper mills Trended lower in 2Q’06 2005 U.S. mill wood costs decreased in 2Q’06 2006 |
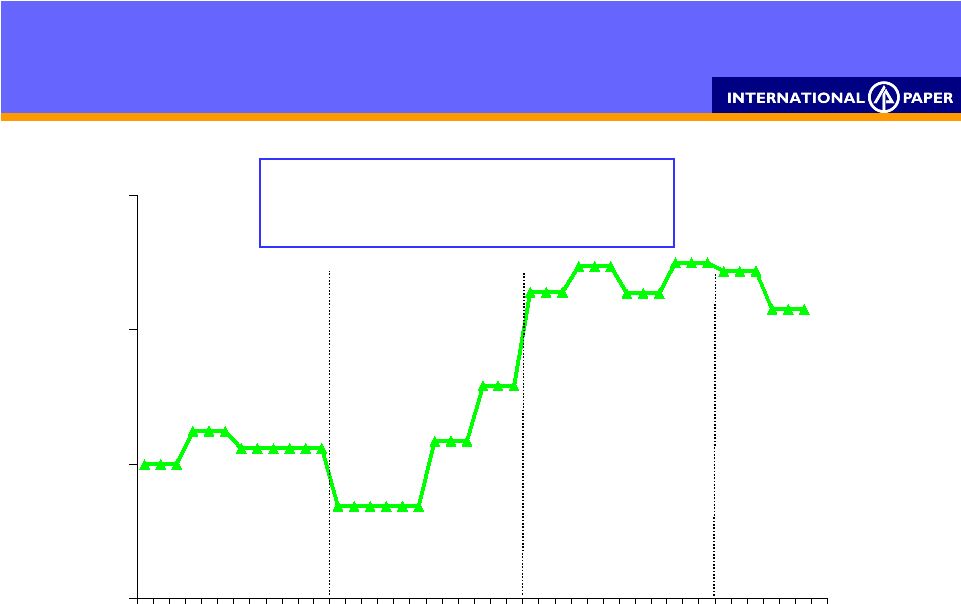 31 0 100 200 300 Jan Apr July Oct Jan Apr July Oct Jan Apr July Oct Jan Apr July Index: Jan 2003 Caustic Soda Costs = 100 2003 2004 Caustic soda costs remain historically high Caustic Soda Costs 2005 Trended lower in 2Q’06 2006 * Delivered cost to U.S. facilities |
 32 Global Consumption Key input indicative annual purchase levels Natural Gas MMbtu 37,000,000 16,000,000 # 6 Fuel Oil BBL 5,000,000 440,000 Coal Tons 1,600,000 230,000 Wood Tons 65,000,000 5,700,000 OCC Tons 600,000 310,000 Caustic Soda Tons 315,000 60,000 Sodium Chlorate Tons 290,000 40,000 LD Polyethylene Tons 100,000 - Latex Tons 41,000 4,000 Energy Energy Fiber Fiber Chemicals Chemicals Units Units U.S. U.S. Non- U.S. Non- U.S. 3 Old corrugated containers 1 2006 Run Rate 2 Includes Coated Papers business 3 2 1 |
 33 |