 Fourth Quarter and Full Year 2009 Review February 3, 2010 Fourth Quarter and Full Year 2009 Review February 3, 2010 John V. Faraci Chairman & Chief Executive Officer Tim S. Nicholls Senior Vice President & Chief Financial Officer Exhibit 99.2 |
 2 Forward-Looking Statements Forward-Looking Statements These slides and statements made during this presentation contain forward-looking statements. These statements reflect management's current views and are subject to risks and uncertainties that could cause actual results to differ materially from those expressed or implied in these statements. Factors which could cause actual results to differ relate to: (i) increases in interest rates; (ii) industry conditions, including but not limited to changes in the cost or availability of raw materials, energy and transportation costs, competition we face, cyclicality and changes in consumer preferences, demand and pricing for our products; (iii) global economic conditions and political changes, including but not limited to the impairment of financial institutions, changes in currency exchange rates, credit ratings issued by recognized credit rating organizations, the amount of our future pension funding obligation and changes in pension and health care costs; (iv) unanticipated expenditures related to the cost of compliance with environmental and other governmental regulations and to actual or potential litigation; and (v) whether we experience a material disruption at one of our manufacturing facilities and risks inherent in conducting business through a joint venture. We undertake no obligation to publicly update any forward-looking statements, whether as a result of new information, future events or otherwise. These and other factors that could cause or contribute to actual results differing materially from such forward looking statements are discussed in greater detail in the company's Securities and Exchange Commission filings. |
 3 Statements Relating to Non-GAAP Financial Measures Statements Relating to Non-GAAP Financial Measures During the course of this presentation, certain non-U.S. GAAP financial information will be presented. A reconciliation of those numbers to U.S. GAAP financial measures is available on the company’s website at internationalpaper.com under Investors. |
 4 IP Delivers Solid Full-Year Results Despite Challenging Economic Environment IP Delivers Solid Full-Year Results Despite Challenging Economic Environment $2.2 B Free Cash Flow 1 $4.3 B Balance Sheet Improvement $3.1 B Debt Reduction $400 MM Unfunded Pension Obligation Reduction $800 MM Cash Balance Increase 2.6 MM Ton Excess Capacity Reduction $500 MM Industrial Packaging Synergies $500 MM Overhead Cost Reduction 1 Cash provided by continuing operations less capital expenditures, excluding cash received from alternative fuel credits of $1.7 B and cash received under European accounts receivable securitization of $0.2 B |
 5 Responding to the Economic Contraction Decisive Actions in 2009 Responding to the Economic Contraction Decisive Actions in 2009 NA Containerboard 1.8 MM tons (16%) LOO 1.4 MM tons (13%) closed NA Uncoated Freesheet 405 M tons (13%) LOO 600 M tons (19%) to close in 2009/10 NA Coated Paperboard 300 M tons (16%) LOO 140 M tons (7%) closed Capacity Management Integration Synergies Cost Reduction Balance Sheet $500 MM Overhead Reduction Hourly Headcount Reduction Salaried Position Eliminations Systematic, Not Episodic $500 MM Integration Synergies Salaried Headcount Reduction Mill & Box Plants Optimization Box Margins Improvement Mill Freight Reduction Box Plant Rationalization $300 MM Incremental Synergies $3.1 B Debt Reduction $800 MM Cash Increase $2.75 B Debt Refinanced $1.5 B Corporate Revolver Extension $1 B AR Securitization Extension $450 MM Capex Reduction |
 6 Debt Reduction Progress $3.7 Billion Reduction since Acquisition Debt Reduction Progress $3.7 Billion Reduction since Acquisition 1 Excludes the debt repayment of $1 B from the proceeds of our May bond issuance: $1 B 9.375% notes due 2019 2 Excludes the debt repayment of $1 B from the proceeds of our August bond issuance: $1 B 7.5% notes due 2021 3 Excludes the debt repayment of $750 MM from the proceeds of our November bond issuance: $750 MM 7.3% notes due 2039 |
 7 2009 Full-Year Results Record Free Cash Flow 2009 Full-Year Results Record Free Cash Flow 1 Earnings from continuing operations before special items 2 Cash provided by continuing operations less capital expenditures before dividends; 2009 excludes cash received from alternative fuel credits of $1.7 B and cash received under European accounts receivable securitization of $0.2 B $ Billion 2008 2009 Sales $24.8 $23.4 EBITDA 1 $3.0 $2.8 Year-End Debt $12.1 $9.0 Cash Balance $1.1 $1.9 Free Cash Flow 2 $0.6 $1.7 $2.2 2007 2008 2009 |
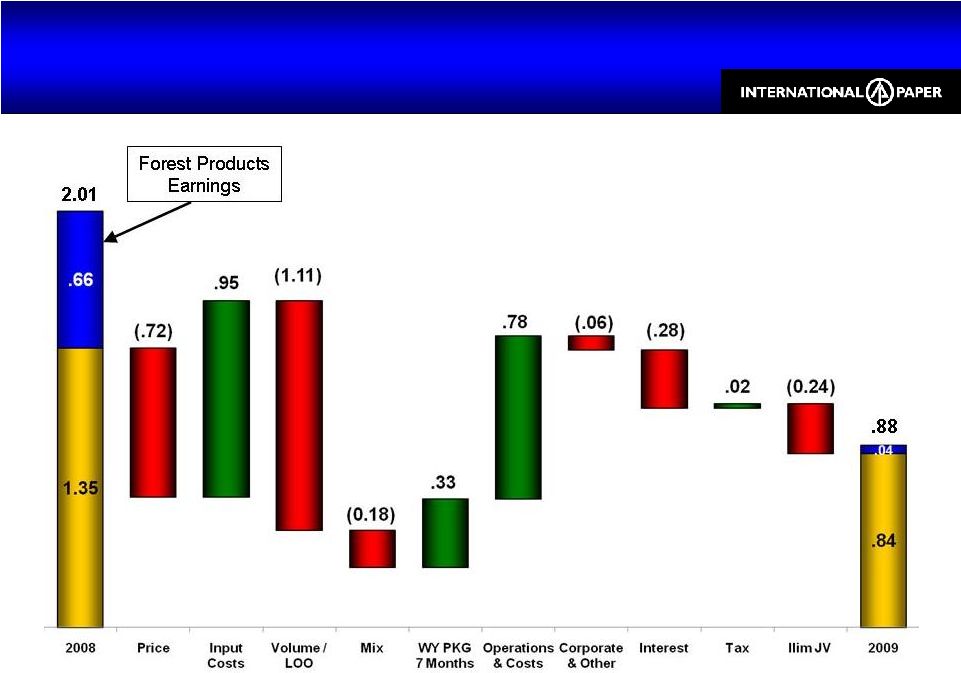 8 Earnings from continuing operations before special items 2009 Earnings per Share Weak Demand, Input Cost Relief, Strong Operations 2009 Earnings per Share Weak Demand, Input Cost Relief, Strong Operations |
 9 Improving Earnings Quality Replaced Land Sales Earnings Improving Earnings Quality Replaced Land Sales Earnings EBIT before special items including discontinued operations; Forest Products EBIT excludes Wood Products Earnings as reported in the 10-K for each year at time of filing Forest Products EBIT ($B) $0.6 $0.5 $0.7 $0.7 $0.5 $0.4 < $0.1 |
 10 Fourth Quarter 2009 Strong Free Cash Flow & Debt Reduction Fourth Quarter 2009 Strong Free Cash Flow & Debt Reduction $500 MM Free Cash Flow 1 $600 MM Debt Reduction $200 MM Cash Increase $36 MM Input Cost Inflation Earnings from continuing operations before special items • 1 Cash provided by continuing operations less capital expenditures, excluding cash received from alternative fuel mixture credits |
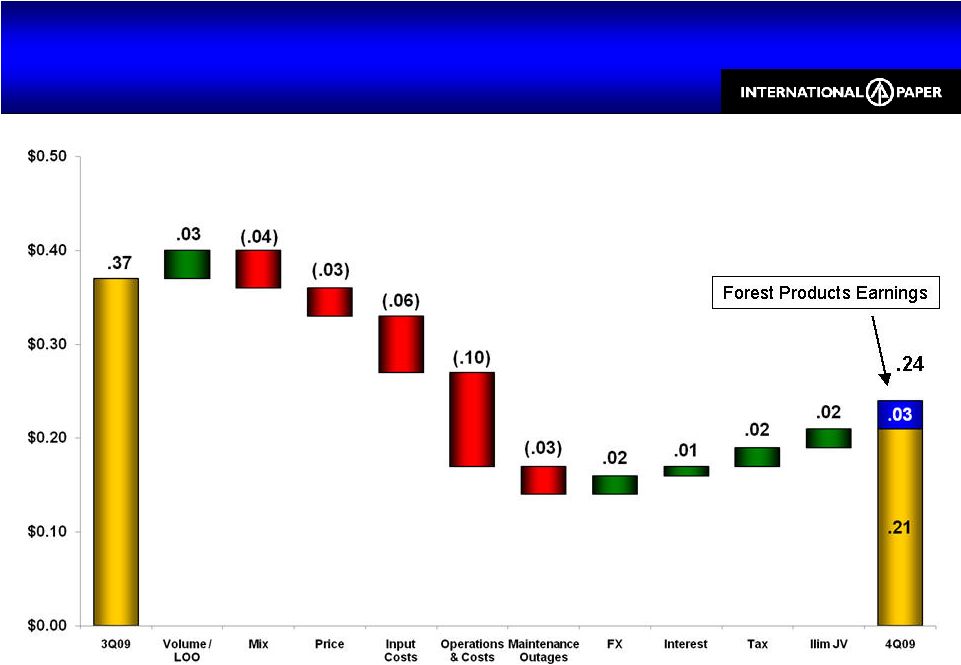 11 Earnings before special items 4Q09 vs. 3Q09 EPS Stable Volumes, Rising Input Costs, Weather-Impacted Operations 4Q09 vs. 3Q09 EPS Stable Volumes, Rising Input Costs, Weather-Impacted Operations |
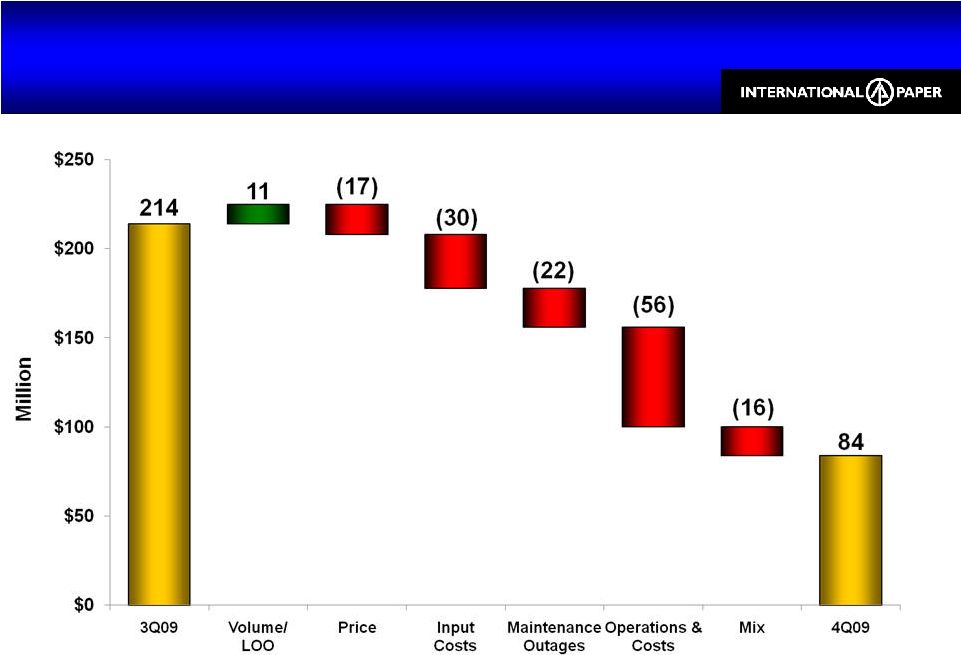 12 Industrial Packaging Earnings 4Q09 vs. 3Q09 Industrial Packaging Earnings 4Q09 vs. 3Q09 Earnings before special items |
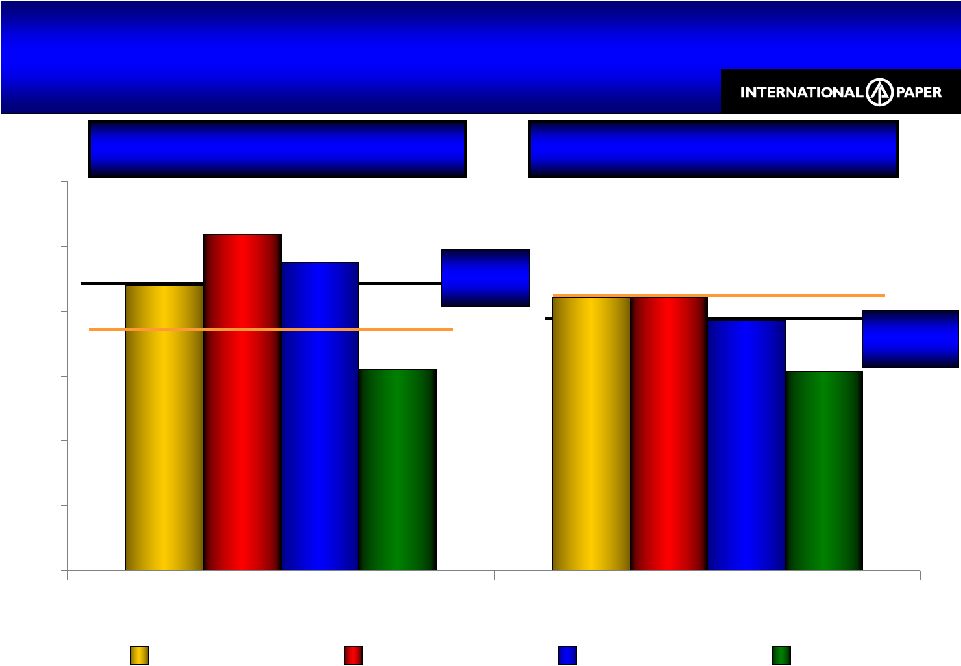 13 N.A. Industrial Packaging Relative EBITDA Margins Industry-Leading Margins Despite LOO Costs N.A. Industrial Packaging Relative EBITDA Margins Industry-Leading Margins Despite LOO Costs IP EBITDA margins based on North American Industrial Packaging operating profit before special items Competitor EBITDA margin estimates obtained from public filings and IP analysis 2009 17.5% 2008 16.5% 20.7% 16.9% 19.0% 15.4% 12.4% 12.3% 17.6% 16.9% 0% 4% 8% 12% 16% 20% 24% IP Competitor A 1Q09 2Q09 3Q09 4Q09 2008 15.2% IP 2009 margins reflect 2.1 MM tons (19% of capacity) of downtime Competitor A 2009 margins reflect 200 M tons (8% of capacity) of downtime 2009 15.3% |
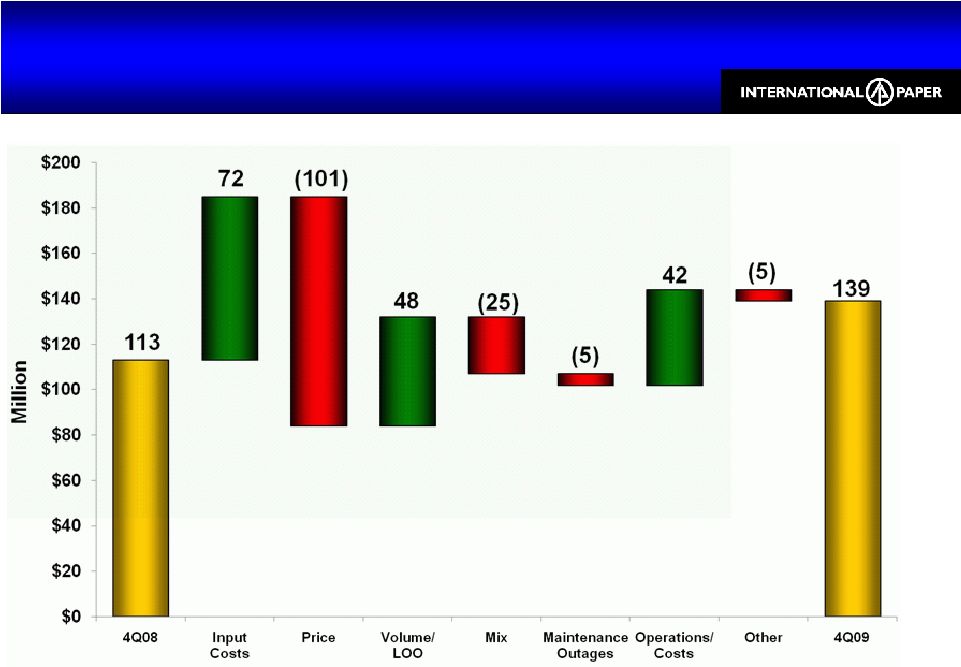
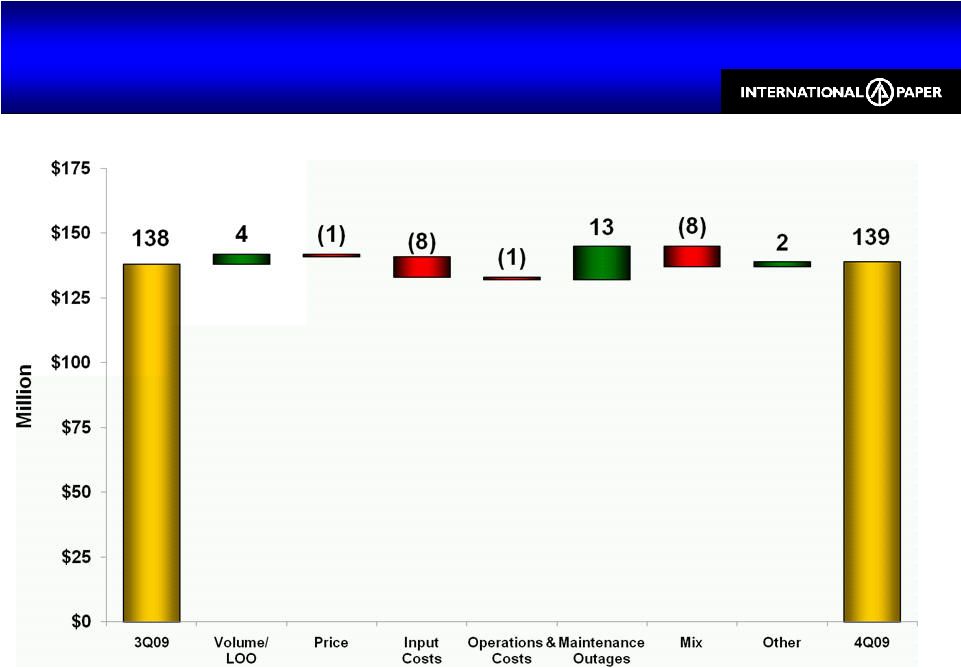 14 Printing Papers Earnings 4Q09 vs. 3Q09 Printing Papers Earnings 4Q09 vs. 3Q09 Earnings before special items |
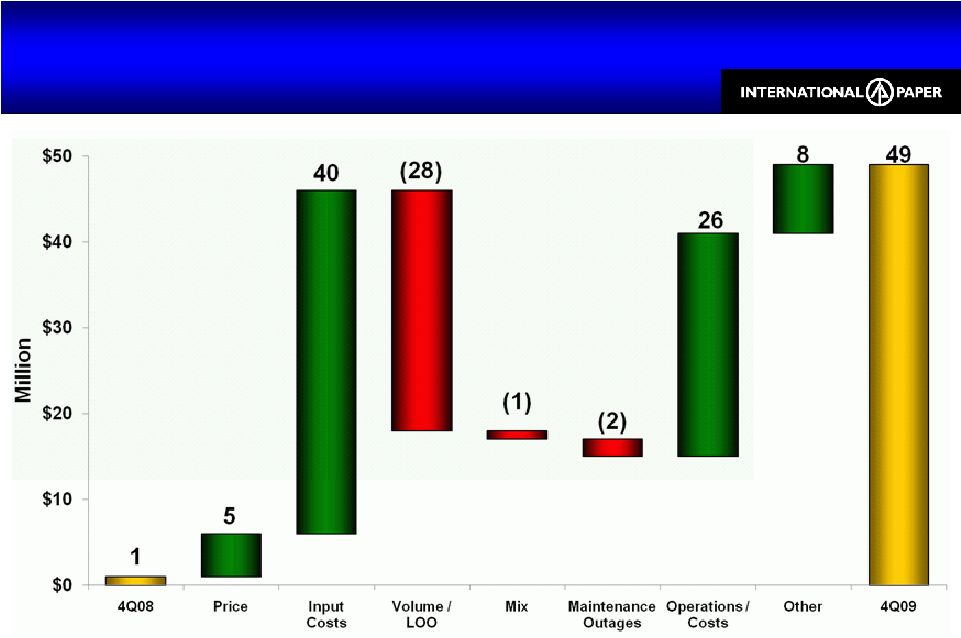
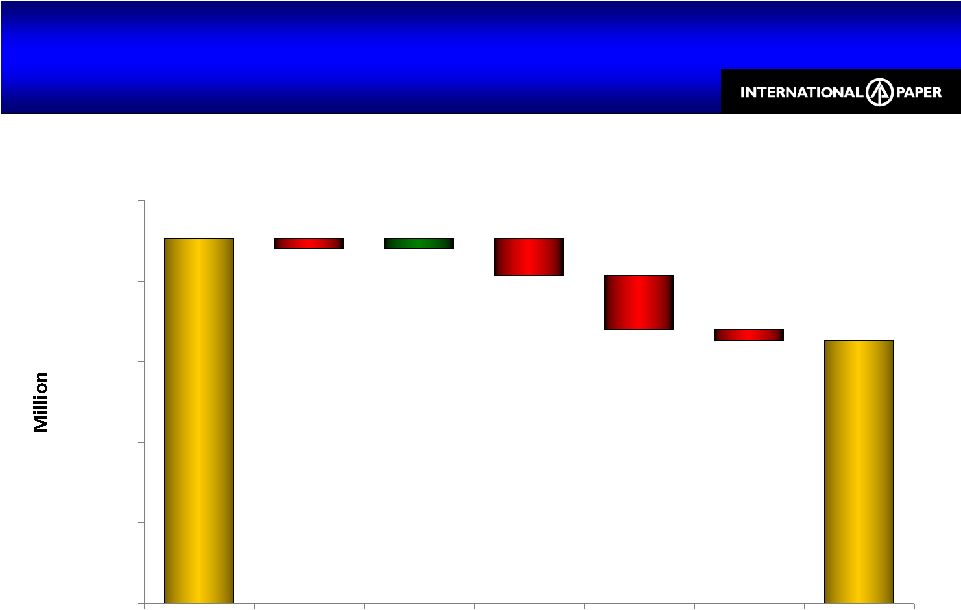 15 Consumer Packaging Earnings 4Q09 vs. 3Q09 Consumer Packaging Earnings 4Q09 vs. 3Q09 Earnings before special items 68 49 (2) (7) (10) (2) 2 $0 $15 $30 $45 $60 $75 3Q09 Price Input Costs Operations & Costs Maintenance Outages Mix 4Q09 |
 16 $ Million 4Q08 3Q09 4Q09 Sales $1,940 $1,665 $1,675 Earnings $26 $21 $31 xpedx xpedx 4Q09 earnings include a $17 MM favorable LIFO adjustment Paper prices stabilized as the quarter progressed 4Q08 and 3Q09 earnings include $6 MM unfavorable and $3 MM favorable LIFO inventory valuation adjustments respectively |
 17 $ Million 4Q08 3Q09 4Q09 Sales $215 $275 $300 Earnings $44 $36 $33 EBITDA Margin 32% 25% 23% IP Brazil results are reported in the Printing Papers segment 4Q09 vs. 3Q09 4Q09 vs. 4Q08 Business Volume Price / Ton Volume Price / Ton Uncoated Freesheet 7% ($29) 44% ($172) Domestic (5%) ($43) (7%) ($70) Export 16% ($19) 134% ($244) IP Brazil |
 18 $ Million 4Q08 3Q09 4Q09 Sales (100%) $530 $305 $350 Earnings (IP Share) $0 $0 $6 Ilim’s results are reported on a one-quarter lag IP’s shares of Ilim’s 4Q08, 3Q09 & 4Q09 earnings includes an after-tax foreign exchange loss of $11 MM, and after-tax foreign exchange gains of $10 MM and $2 MM, respectively 4Q09 vs. 3Q09 4Q09 vs. 4Q08 Business Volume Price / Ton Volume Price / Ton Pulp 0% $65 (7%) ($213) Containerboard 10% $18 15% ($189) IP received a $51 MM dividend from Ilim in 4Q09 Ilim Joint Venture |
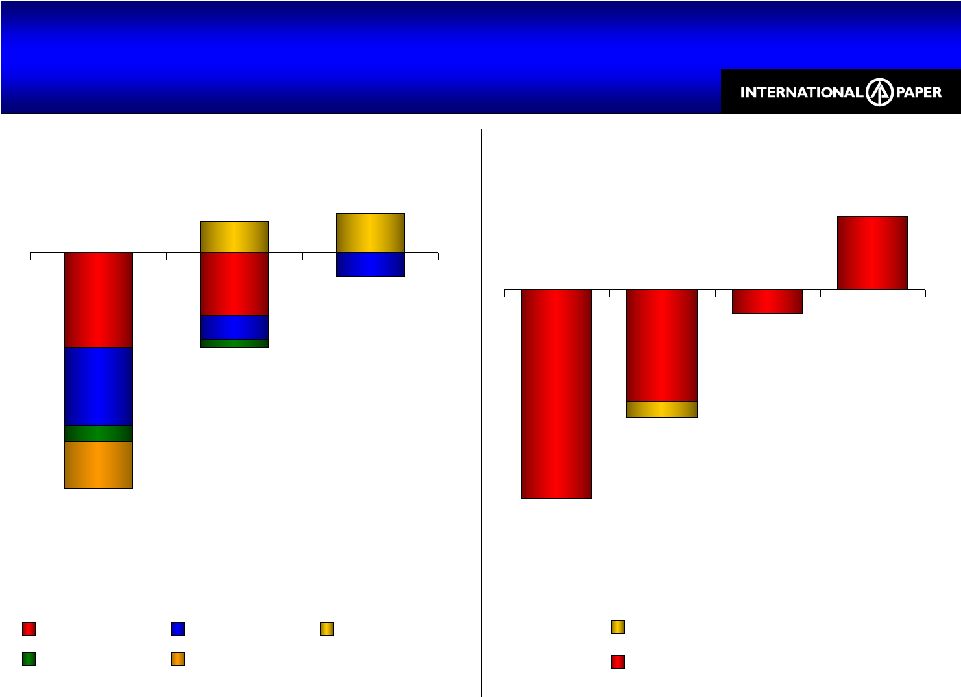 19 Global Input Costs by Segment $36 MM, or $0.06/Share Unfavorable vs. 3Q09 Global Input Costs by Segment $36 MM, or $0.06/Share Unfavorable vs. 3Q09 By Business By Input Type ($30) ($8) $2 Industrial Packaging Printing Papers Consumer Packaging Fiber Energy Chemicals Freight OCC ($26) ($16) ($3) $9 Fiber Energy Freight Chemicals Outside North America North America |
 20 Positives Improved N.A. Exports Printing Papers Results Quarter-End Price Momentum Further Cost Reduction Continued Debt Reduction Offsets Increasing Fiber Costs Isolated Operating Issues Ongoing LOO Downtime Costs Fourth Quarter Summary |
 21 Input Cost Inflation Input Costs Ahead of Price Increases Input Cost Inflation Input Costs Ahead of Price Increases Previously Announced IP Price Increases Business Increase per Ton IP Capacity (MM Tons) N. A. Industrial Packaging $50 10.0 N. A. Uncoated Freesheet $40 2.6 N. A. Coated Paperboard $40 1.8 Global Pulp $30 - $40 3.0 Brazil Export Cut-Size $50 .4 European Cut-Size €30 - €40 .4 Russian Cut-Size $30 .3 Sun Coated Paperboard $25 .9 ($36) ($120) ($120) ($100) ($80) ($60) ($40) ($20) $0 4Q09 1Q10 Wood OCC Natural Gas Other |
 22 From 4Q09 to 1H10 Cost Increases Precede Price Increases From 4Q09 to 1H10 Cost Increases Precede Price Increases Input Cost Inflection Isolated Operating Issues Input Cost Escalation Higher Maintenance Outages Input Cost Stabilization Price Increase Realization 1Q 2Q 4Q |
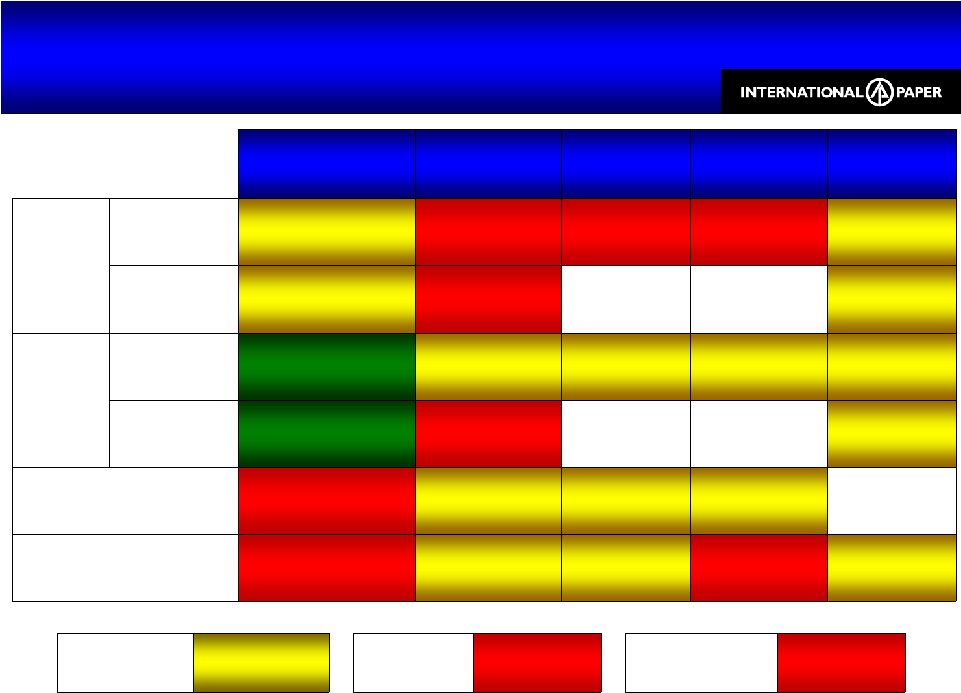 23 First Quarter Outlook Changes from 4Q09 First Quarter Outlook Changes from 4Q09 North America Europe Brazil Russia - Svetogorsk Asia Volume Paper Slight Increase Slight Decrease Decrease Decrease Flat Packaging Slight Increase Seasonal Decrease Stable Pricing Paper Ramping Up Flat Slight Increase Flat Slight Increase Packaging Ramping Up Margin Squeeze Slight Increase Maintenance Outages ~$25MM Increase Flat Flat Flat Input & Freight Costs ~$120MM Increase Increasing Increasing Increasing Pulp Increasing xpedx Seasonal Decrease Ilim Decrease Corporate Expense Increase |
 24 2010 Priorities 2010 Priorities Regain momentum after 1Q input cost squeeze Increase margins and ROI Capture benefits of higher operating rates Build on operating performance Balanced use of cash |
 25 Appendix Investor Relations Contacts Thomas A. Cleves 901-419-7566 Emily Nix 901-419-4987 Media Contact Kathleen Bark 901-419-4333 |
 26 4Q09 Financial Snapshot 4Q09 Financial Snapshot 4Q08 3Q09 4Q09 Sales ($B) $6.5 $5.9 $6.0 EBITDA ($MM) $671 $780 $669 Free Cash Flow 1 ($MM) $443 $605 $530 Debt ($B) $12.1 $9.6 $9.0 Cash Balance ($B) $1.1 $1.7 $1.9 • Earnings from continuing operations before special items • 1 Cash provided by continuing operations less capital expenditures, excluding cash received from alternative fuel credits of $0.5 B in 3Q09, $0.4 B in 4Q09 and cash received under European accounts receivable securitization of $0.2 B in 3Q09 |
 27 $ Million 2008 2009 2010 Estimate Capital Spending $1,002 $534 $800 Depreciation & Amortization $1,347 $1,472 $1,450 1 Net Interest Expense $492 $669 $620 - $640 Corporate Items 2 $103 $181 $200 - $225 Effective Tax Rate 2 31.5% 30% 30-32% 1 Estimated depreciation may be impacted by lack-of-order downtime 2 Before special items and excluding Ilim Key Financial Statistics Key Financial Statistics |
 28 Free Cash Flow 2009 Free Cash Flow 2009 $ Million 2007 2008 1Q09 2Q09 3Q09 4Q09 2009 Cash from Operations $1,887 $2,669 $649 $707 $713* $697 $2,766* Cash Received from Alternative Fuel Mixture Tax Credits $0 $0 $145 $688 $463 $388 $1,684 Cash Provided by Continuing Operations $1,887 $2,669 $794 $1,395 $1,381 $1,085 $4,655 Less Capital Investment ($1,288) ($1,002) ($128) ($131) ($108) ($167) ($534) Free Cash Flow $599 $1,667 $666 $1,264 $1,273 $918 $4,121 Free Cash Flow Excluding AFMTC & European AR Cash $599 $1,667 $521 $576 $605 $530 $2,232 * Excludes $205 MM cash received under European accounts receivable securitization in 3Q09 |
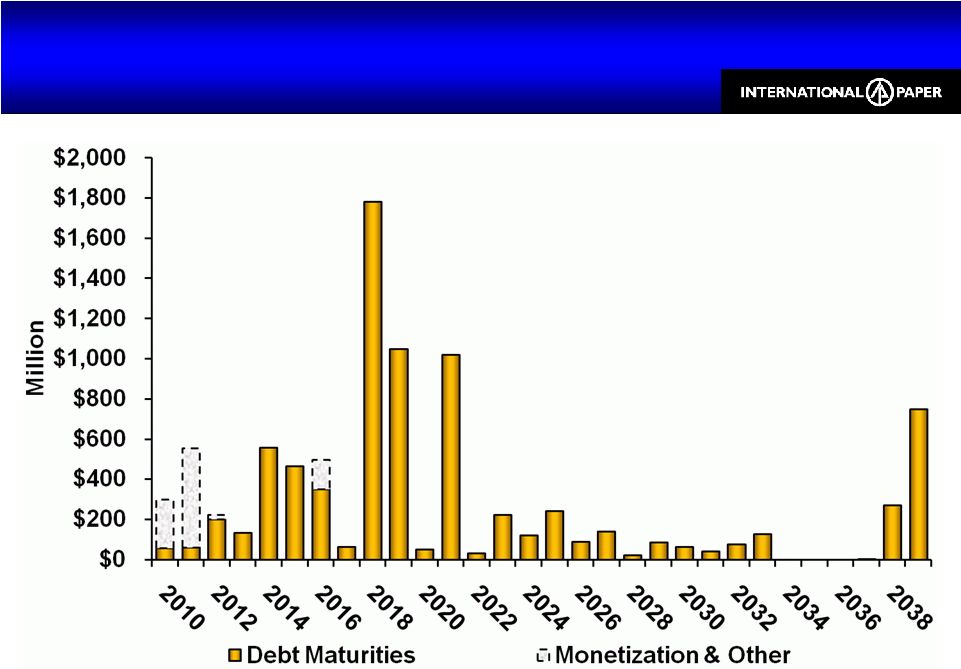 29 Monetization & Other: Intend to rollover or refinance timber monetization debt, Sun JV debt and other foreign subsidiary debt Debt Maturity Profile Maturities as of Year-End Debt Maturity Profile Maturities as of Year-End |
 30 Cash & Committed Facilities $4.4 Billion Cash & Committed Facilities $4.4 Billion Maturity Facility Cost Quarter-End Cash - $1.9 B - $1 B 1 Accounts Receivables Program JAN 2011 Zero Drawn CP Rate 2 + 100 bps $1.5 B Corporate Revolver NOV 2012 Zero Drawn LIBOR + 300 bps Total Cash & Committed Facilities $4.4 B - Cost includes commitment fees 1 $816 MM available at quarter-end based on eligible receivable balances 2 Conduit’s rate |
 31 Debt Covenants & Credit Ratings Debt Covenants & Credit Ratings Covenant Year-end Actual Maximum Debt-to-Total Capital 60% 43.3% Minimum Consolidated Net Worth $9 B $11.8 B Rating Outlook Standard & Poor’s BBB Negative Moody’s Baa3 Negative |
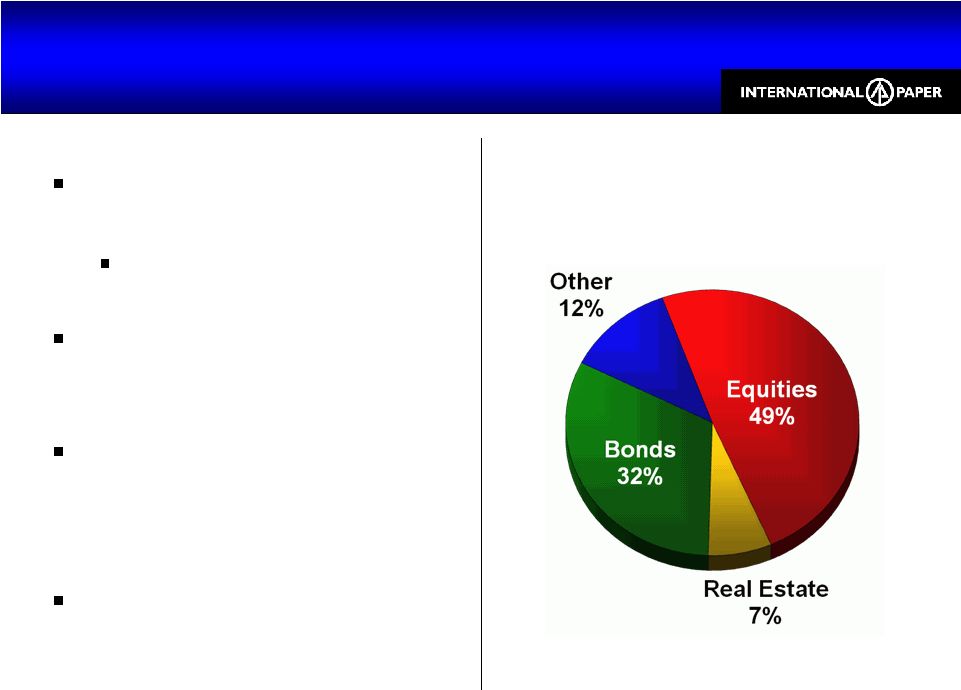 32 Pension Update Pension Update Market value of assets increased to $6.8 B 23.8% return in 2009 Benefits obligation increased to $9.5 B 1 Unfunded obligation declined from $3.2 B to $2.8 B 1 No cash contribution required in 2010 1 US GAAP basis 2009 Year-End Portfolio |
 33 Pension Plan Pension Plan Key Variables 2008 2009 2010E Assumed Rate of Return 8.5% 8.25% 8.25% Discount Rate 6.2% 6.0% 5.8% * Non-cash expense for U.S. plans only Pension expense reflects service cost, interest cost, amortization of actuarial losses and expected return on plan assets Average Annualized Returns 2009 23.8% Past Five Years 5.9% Past Ten Years 5.6% Portfolio Asset Allocation at 12-31-09 Target Actual Equity 40% - 51% 49% Bonds 30% - 40% 32% Real Estate 7% – 13% 7% Other 9% - 18% 12% |
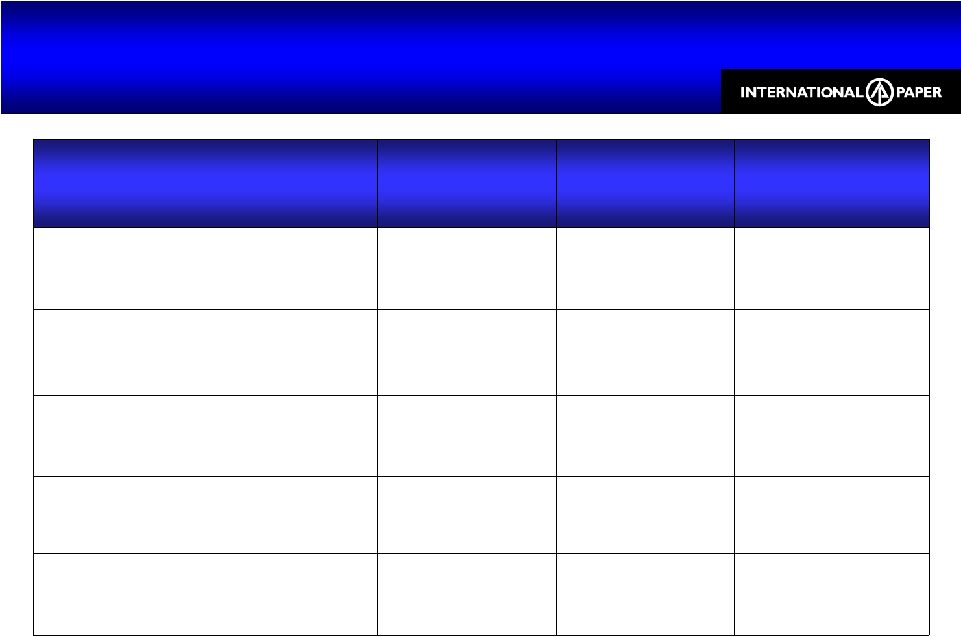
 34 Capacity Management Summary Permanent Capacity Reductions in 2009 Capacity Management Summary Permanent Capacity Reductions in 2009 Mill Products Annual Capacity (Tons) % of IP Global Capacity Closure Date Franklin, VA Uncoated Freesheet 600,000 1 12% Spring 2010 Coated Paperboard 140,000 4% December 2009 Albany, OR Containerboard 580,000 12% December 2009 Pineville, LA Containerboard 390,000 Valliant, OK Containerboard 430,000 2 Etienne, France Containerboard 200,000 2% November 2009 Inverurie, Scotland Uncoated Freesheet 275,000 5% March 2009 • 1 Does not include 150,000-ton capacity of #3 machine previously closed in November 2008 • 2 Capacity of #3 machine previously indefinitely idled in November 2008 |
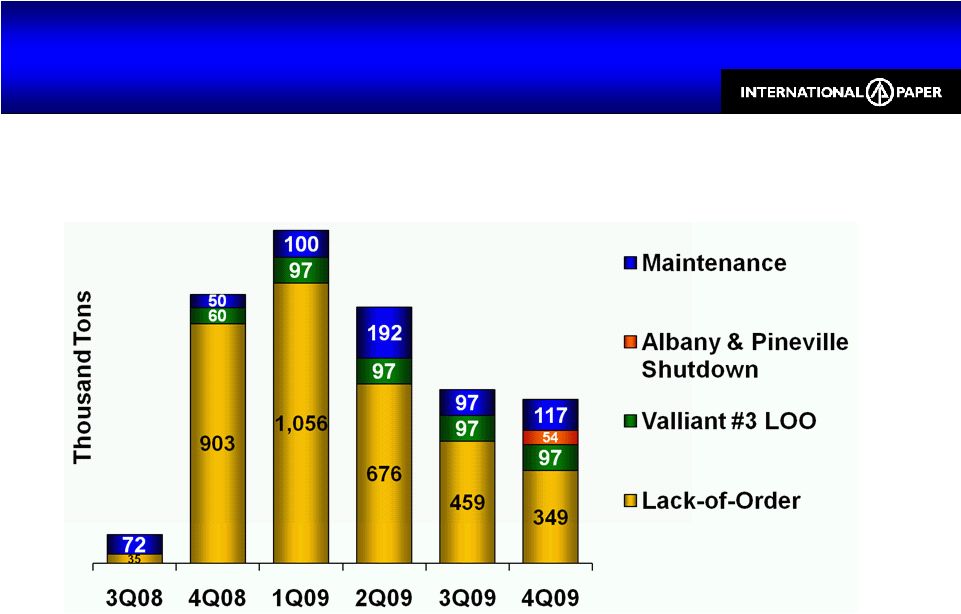 35 N.A. Lack of Order & Maintenance Downtime 14% of Capacity in 4Q, 20% for the Year N.A. Lack of Order & Maintenance Downtime 14% of Capacity in 4Q, 20% for the Year Lack-of-order & maintenance downtime for North American Containerboard, Uncoated Papers, Market Pulp, & Coated Paperboard. See the following slide for detail by business. 2009 LOO downtime excludes capacity from mills or machines that have been permanently shutdown (Franklin #3 - 32,000 tons and Louisiana mill - 120,000 tons) as of December 31, 2009 107 1,013 1,253 965 653 617 |
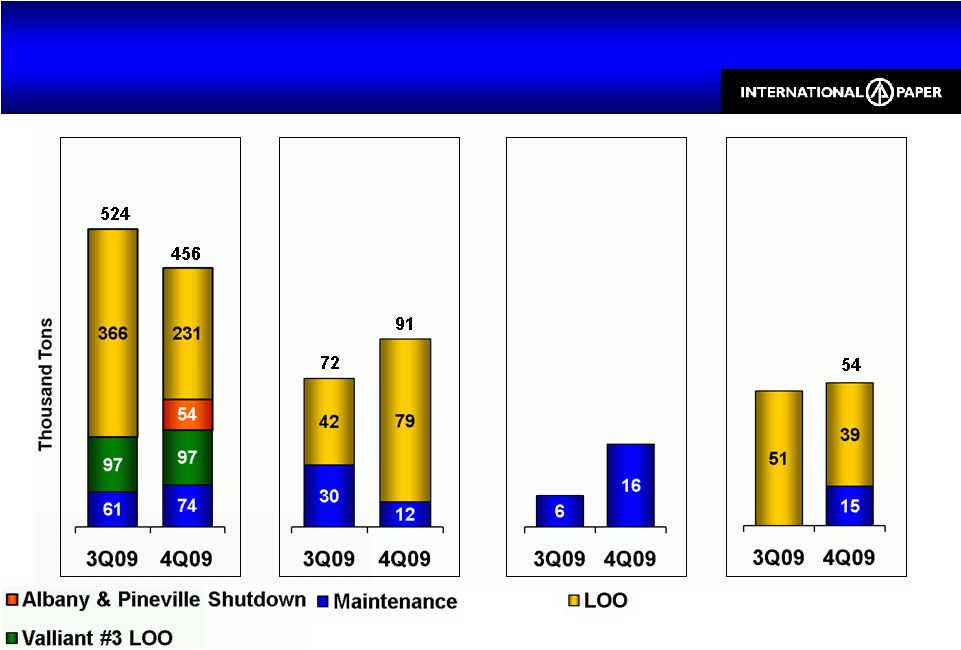 36 N.A. Lack of Order & Maintenance Downtime N.A. Lack of Order & Maintenance Downtime Containerboard Uncoated Papers Market Pulp Coated Paperboard LOO downtime excludes capacity from mills or machines that have been permanently shutdown (Franklin #3 - 32,000 tons and Louisiana mill - 120,000 tons) as of December 31, 2009 |
 37 $ Million 4Q09 1Q10E 2009 2010E Industrial Packaging $26 $70 $120 $140 North America $32 $25 $118 $125 Europe 0 0 $39 $40 Brazil 0 0 $7 $5 Printing Papers Total $32 $25 $164 $170 Consumer Packaging $16 $5 $41 $40 Total Impact $74 $100 $325 $350 Dollar impact of planned maintenance outages are estimates and subject to change Maintenance Outages Expenses Maintenance Outages Expenses ~70% of 2010 outage expense planned for 1H10 |
 38 Forest Products 4Q09 vs. 3Q09 Forest Products 4Q09 vs. 3Q09 4Q08 3Q09 4Q09 Sales ($ MM) $65 $5 $25 Earnings ($ MM) $38 $2 $18 Acres Sold 30,000 3,200 7,700 1 Price / Acre $2,106 $1,994 $2,655 1 1 4Q09 figures exclude a 17,000-acre sale of a partnership interest at $369 per acre. The previously announced agreement to sell 143,000 acres of timberland has expired in accordance with its terms and will not be completed. |
 39 4Q09 vs. 3Q09 4Q09 vs. 4Q08 Business Volume Price / Ton Volume Price / Ton N.A. Container (4%) ($14) (5%) ($65) European Container 2% (€23) (8%) (€81) Industrial Packaging Industrial Packaging |
 40 Average IP price realization (includes the impact of mix across all grades) 4Q09 vs. 3Q09 4Q09 vs. 4Q08 Business Volume Price / Ton Volume Price / Ton N.A. Paper (3%) ($11) (1%) ($82) N.A. Pulp (3%) $37 (1%) ($27) European Paper 9% (€15) (8%) (€105) Printing Papers Printing Papers |
 41 Average IP price realization (includes the impact of mix across all grades) 4Q09 vs. 3Q09 4Q09 vs. 4Q08 Volume Price/Ton Volume Price/Ton U.S. Coated Paperboard (5%) ($10) (19%) ($3) Revenue Price Revenue Price Converting Businesses (4%) NA (10%) NA Consumer Packaging Consumer Packaging |
 42 Special Items Pre-Tax from Continuing Operations Special Items Pre-Tax from Continuing Operations Special Items Pre-Tax ($Million) 4Q08 3Q09 4Q09 Industrial Packaging Alternative Fuel Mixture Credits $221 $212 Facility & Machine Closure Costs ($8) ($7) ($670) Integration Costs ($26) ($18) ($15) Other ($2) Printing Papers Alternative Fuel Mixture Credits $226 $221 Facility Closure Costs ($153) ($1) ($223) Consumer Packaging Alternative Fuel Mixture Credits $78 $83 Facility Closure Costs ($67) Reorganization ($4) ($2) ($2) xpedx Reorganization ($5) Corporate Impairments of Goodwill ($1,777) Restructuring & Other Charges ($53) ($141) ($82) Total Special Items Pre-Tax ($2,021) $356 ($550) |
 43 Special Items Net of Taxes from Continuing Operations Special Items Net of Taxes from Continuing Operations 4Q09 2009 $ Million EPS $ Million EPS Earnings Before Special Items $101 $0.24 $378 $0.88 Special Items Net of Taxes: Alternative Fuel Mixture Credits $469 $1,413 North American Mill Shutdowns ($525) ($525) Machine Shutdown – Valliant PM#3 ($50) ($50) Etienne Mill Shutdown ($17) ($87) Inverurie Mill Shutdown ($28) Tax Adjustments ($15) ($165) Debt Extinguishment Costs ($35) ($113) Overhead Reduction Initiative ($15) ($92) Integration Costs ($10) ($54) Other ($4) ($14) Total Special Items Net of Taxes ($202) ($0.48) $285 $0.67 Net Earnings ($101) ($0.24) $663 $1.55 |
 44 4Q09 EBITDA before Special Items 4Q09 EBITDA before Special Items Operating Profit $ Million D & A $ Million Tons Thousand EBITDA per Ton EBITDA Margin Industrial Packaging North America 1 $68 $162 2,502 $92 13.1% Europe $17 $9 256 $102 9.9% Printing Papers North America 2 $70 $58 754 $170 18.4% Western Europe 3 $0 $2 74 $27 1.2% Eastern Europe & Russia 3 $46 $16 256 $242 30.0% Brazil $33 $35 311 $219 22.6% U.S. Market Pulp ($11) $9 292 ($7) (1.2%) Consumer Packaging U.S. Coated Paperboard $22 $33 310 $177 16.5% 1 Excludes Recycling & Bag businesses; includes Saturating Kraft business 2 Includes Bleached Kraft business 3 Excludes Market Pulp |
 45 Operating Profits by Industry Segment from Continuing Operations Operating Profits by Industry Segment from Continuing Operations $ Million 4Q08 3Q09 4Q09 2008 2009 Industrial Packaging $145 $214 $84 $482 $741 Printing Papers $113 $138 $139 $734 $464 Consumer Packaging $1 $68 $49 $47 $177 Distribution $26 $21 $31 $103 $55 Forest Products $38 $2 $18 $409 $25 Operating Profit $323 $443 $321 $1,775 $1,462 Net Interest Expense ($186) ($169) ($163) ($492) ($669) Noncontrolling Interest / Equity Earnings Adjustment ($13) $5 $4 ($2) $23 Corporate Items ($21) ($46) ($40) ($103) ($181) Special Items ($2,021) $356 ($550) ($2,331) $564 Earnings from continuing operations before income taxes, equity earnings & noncontrolling interest ($1,918) $589 ($428) ($1,153) $1,199 Equity Earnings, net of taxes - Ilim $0 $0 $6 $54 ($50) |
 46 Geographic Business Segment Operating Results from Continuing Operations Geographic Business Segment Operating Results from Continuing Operations Excludes Forest Products $ Million Sales 4Q08 3Q09 4Q09 2008 2009 Industrial Packaging North American $2,125 $1,890 $1,855 $6,170 $7,585 European $255 $240 $260 $1,170 $980 Asian $75 $100 $95 $350 $325 Printing Papers North American $765 $725 $700 $3,435 $2,815 European $350 $300 $340 $1,655 $1,280 Brazilian $215 $275 $300 $950 $960 U.S. Market Pulp $170 $155 $160 $750 $575 Asian $5 $15 $25 $20 $50 Consumer Packaging North American $635 $565 $540 $2,505 $2,200 European $70 $80 $85 $300 $315 Asian $95 $145 $160 $390 $545 Distribution $1,940 $1,665 $1,675 $7,970 $6,525 |
 47 Geographic Business Segment Operating Results from Continuing Operations before Special Items Geographic Business Segment Operating Results from Continuing Operations before Special Items Excludes Forest Products $ Million Operating Profit 4Q08 3Q09 4Q09 2008 2009 Industrial Packaging North American $130 $201 $68 $414 $685 European $15 $14 $17 $64 $57 Asian $0 $0 ($1) $4 ($1) Printing Papers North American $73 $92 $70 $435 $307 European $36 $28 $46 $146 $115 Brazilian $44 $36 $33 $186 $112 U.S. Market Pulp ($39) ($18) ($11) ($33) ($71) Asian ($1) $0 $1 $0 $1 Consumer Packaging North American $16 $44 $22 $38 $87 European $5 $17 $21 $22 $66 Asian ($20) $7 $6 ($13) $24 Distribution $26 $21 $31 $103 $55 |
 48 Pre-Tax $MM Tax $MM Non- controlling Interest $MM Equity Earnings Net Income $MM Estimated Tax Rate Average Shares 1 MM Diluted EPS 2 Before Special Items 1Q08 $239 ($75) ($5) $16 $175 32% 423 $0.41 2Q08 $312 ($100) ($7) $30 $235 33% 423 $0.56 3Q08 $524 ($170) ($3) $5 $356 33% 423 $0.84 4Q08 $103 ($24) $12 ($2) $89 23% 421 $0.21 2008 $1,178 ($369) ($3) $49 $855 32% 421 $2.01 Special Items 1Q08 ($41) $16 $0 $0 ($25) 39% 423 ($0.06) 2Q08 ($10) $3 $0 $0 ($7) 30% 423 ($0.02) 3Q08 ($259) $52 $0 $0 ($207) 20% 423 ($0.49) 4Q08 ($2,021) $136 $0 $0 ($1,885) 7% 421 ($4.47) 2008 ($2,331) $207 $0 $0 ($2,124) 9% 421 ($5.03) Earnings from Continuing Operations 1Q08 $198 ($59) ($5) $16 $150 30% 423 $0.35 2Q08 $302 ($97) ($7) $30 $228 32% 423 $0.54 3Q08 $265 ($118) ($3) $5 $149 45% 423 $0.35 4Q08 ($1,918) $112 $12 ($2) ($1,796) 6% 421 ($4.26) 2008 ($1,153) ($162) ($3) $49 ($1,269) (14%) 421 ($3.02) 2008 Earnings from Continuing Operations 2008 Earnings from Continuing Operations 1 Assuming dilution 2 A reconciliation to GAAP EPS is available at www.internationalpaper.com under the Investors tab at Webcasts and Presentations |
 49 1 Assuming dilution 2 A reconciliation to GAAP EPS is available at www.internationalpaper.com under the Investors tab at Webcasts and Presentations Pre-Tax $MM Tax $MM Non- controlling Interest $MM Equity Earnings Net Income $MM Estimated Tax Rate Average Shares 1 MM Diluted EPS 2 Before Special Items 1Q09 $97 ($32) ($4) ($27) $34 33% 423 $0.08 2Q09 $183 ($61) ($4) ($32) $86 33% 425 $0.20 3Q09 $233 ($70) ($6) $0 $157 30% 429 $0.37 4Q09 $122 ($27) ($4) $10 $101 22% 427 $0.24 2009 $635 ($190) ($18) ($49) $378 30% 428 $0.88 Special Items 1Q09 $421 ($198) $0 $0 $223 47% 423 $0.53 2Q09 $337 ($287) $0 $0 $50 85% 425 $0.12 3Q09 $356 ($142) $0 $0 $214 40% 429 $0.50 4Q09 ($550) $348 $0 $0 ($202) 63% 427 ($0.48) 2009 $564 ($279) $0 $0 $285 49% 428 $0.67 Earnings 1Q09 $518 ($230) ($4) ($27) $257 44% 423 $0.61 2Q09 $520 ($348) ($4) ($32) $136 67% 425 $0.32 3Q09 $589 ($212) ($6) $0 $371 36% 429 $0.87 4Q09 ($428) $321 ($4) $10 ($101) 75% 427 ($0.24) 2009 $1,199 ($469) ($18) ($49) $663 39% 428 $1.55 2009 Earnings from Continuing Operations 2009 Earnings from Continuing Operations |
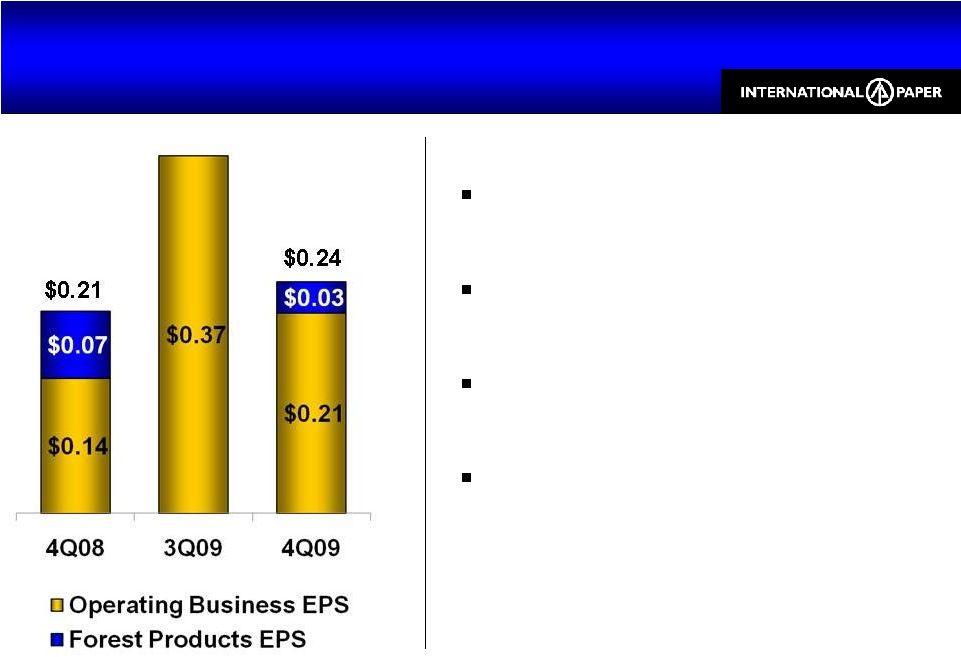
 50 Earnings from continuing operations before special items 4Q09 vs. 4Q08 EPS 4Q09 vs. 4Q08 EPS Forest Products Earnings |
 51 Industrial Packaging Earnings 4Q09 vs. 4Q08 Industrial Packaging Earnings 4Q09 vs. 4Q08 Earnings before special items |
 52 Printing Papers Earnings 4Q09 vs. 4Q08 Printing Papers Earnings 4Q09 vs. 4Q08 Earnings before special items |
 53 Consumer Packaging Earnings 4Q09 vs. 4Q08 Consumer Packaging Earnings 4Q09 vs. 4Q08 Earnings before special items |
 54 Total Cash Cost Components 2009 Total Cash Cost Components 2009 North American Mills Only |
 55 Global Input & Freight Costs by Input $212 MM, or $0.39/Share Favorable vs. 4Q08 Global Input & Freight Costs by Input $212 MM, or $0.39/Share Favorable vs. 4Q08 Input costs for continuing businesses 103 37 37 35 ($5) $10 $25 $40 $55 $70 $85 $100 Chemicals Energy Fiber Freight North America Outside North America |
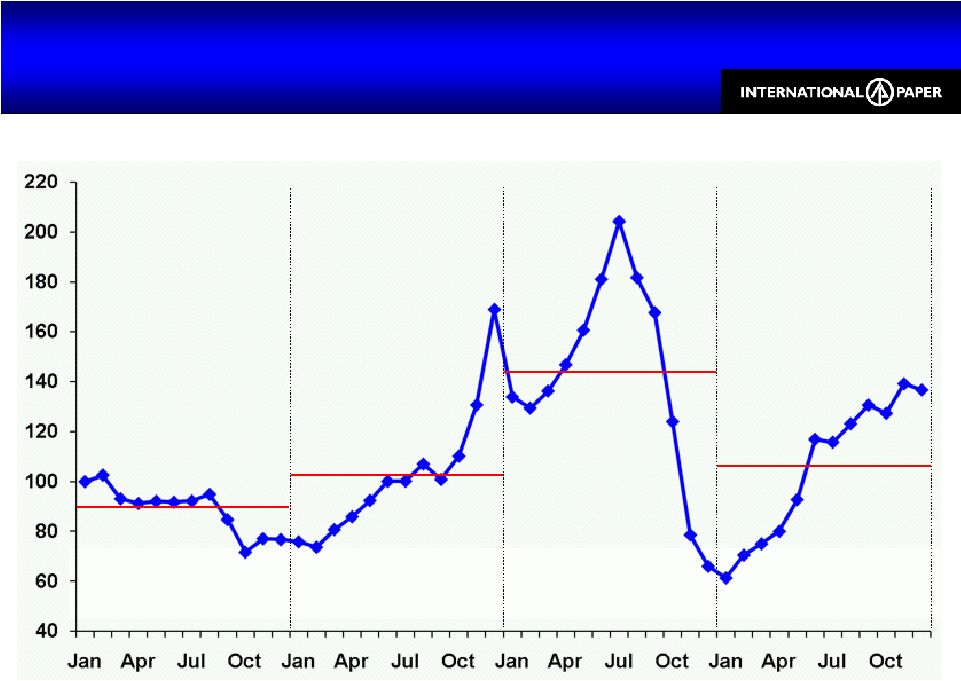
 56 NYMEX Natural Gas closing prices Index: Jan 2005 Natural Gas Costs = 100 Natural Gas Costs 23% Increase vs. 3Q09 Average Cost Natural Gas Costs 23% Increase vs. 3Q09 Average Cost 2005 2006 2007 2008 2009 |
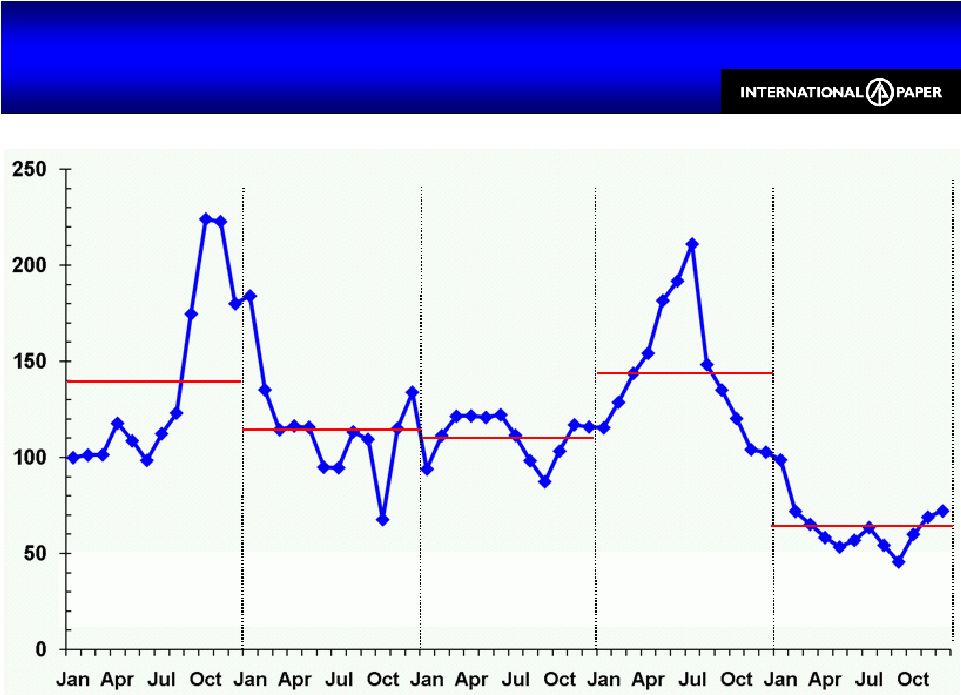
 57 U.S. Mill Wood Costs 5% Increase vs. 3Q09 Average Cost U.S. Mill Wood Costs 5% Increase vs. 3Q09 Average Cost Index: Jan 2005 Wood Costs = 100 Delivered cost to U.S. facilities 2005 2006 2007 2009 2008 |
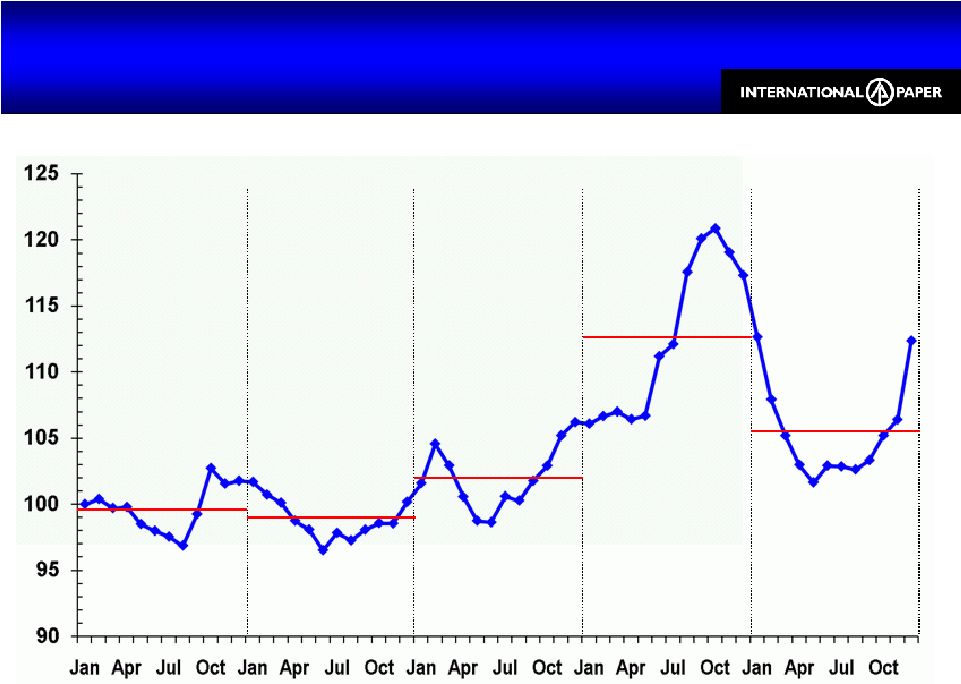
 58 Index: Jan 2005 OCC Costs = 100 U.S. Old Corrugated Containers Costs 1% Increase vs. 3Q09 Average Cost U.S. Old Corrugated Containers Costs 1% Increase vs. 3Q09 Average Cost 2005-2007 represents WY PKG delivered costs; 2008-2009 represents delivered costs to the integrated system 2005 2006 2007 2008 2009 |
 59 Index: Jan 2006 Fuel Oil Costs = 100 U.S. Fuel Oil 9% Increase vs. 3Q09 Average Cost U.S. Fuel Oil 9% Increase vs. 3Q09 Average Cost WTI Crude prices 2006 2007 2008 2009 |
 60 U.S. Chemical Composite Index 5% Decrease vs. 3Q09 Average Cost U.S. Chemical Composite Index 5% Decrease vs. 3Q09 Average Cost Delivered cost to U.S. facilities; includes Caustic Soda, Sodium Chlorate, Starch and Sulfuric Acid 2005 - 2008 excludes WY PKG Index: 1Q05 Chemical Composite= 100 2005 2006 2007 2009 2008 |
 61 2010 Global Consumption Annual Purchase Estimates for Key Inputs 2010 Global Consumption Annual Purchase Estimates for Key Inputs Does not include Asian or Ilim consumption Estimates are based on normal operations and may be impacted by downtime Commodity U. S. Non – U. S. Energy Natural Gas (MM BTUs) 42,000,000 13,000,000 Fuel Oil (Barrels) 1,500,000 500,000 Coal (Tons) 860,000 260,000 Fiber Wood (Tons) 44,200,000 8,800,000 Old Corrugated Containers (Tons) 3,000,000 310,000 Chemicals Caustic Soda (Tons) 250,000 70,000 Starch (Tons) 394,000 96,000 Sodium Chlorate (Tons) 180,000 40,000 LD Polyethylene (Tons) 39,000 - Latex (Tons) 22,000 4,000 |