UNITED STATES
SECURITIES AND EXCHANGE COMMISSION
Washington, D.C. 20549
FORM N-CSR
Certified Shareholder Report of
Registered Management Investment Companies
Investment Company Act File Number: 811-00116
The Investment Company of America
(Exact Name of Registrant as Specified in Charter)
333 South Hope Street
Los Angeles, California 90071
(Address of Principal Executive Offices)
Registrant's telephone number, including area code: (213) 486-9200
Date of fiscal year end: December 31
Date of reporting period: June 30, 2017
Laurie D. Neat
The Investment Company of America
333 South Hope Street
Los Angeles, California 90071
(Name and Address of Agent for Service)
ITEM 1 – Reports to Stockholders
 | ICA The Investment Company of America®
Semi-annual report |

We believe high-
conviction investing
and diverse
perspectives lead
to better results.
ICA seeks to achieve long-term growth of capital and income.
The Investment Company of America is one of more than 40 funds offered by one of the nation’s largest mutual fund families, American Funds, from Capital Group. For more than 85 years, Capital has invested with a long-term focus based on thorough research and attention to risk.
Fund results shown in this report, unless otherwise indicated, are for Class A shares at net asset value. If a sales charge (maximum 5.75%) had been deducted, the results would have been lower. Results are for past periods and are not predictive of results for future periods. Current and future results may be lower or higher than those shown. Share prices and returns will vary, so investors may lose money. Investing for short periods makes losses more likely. Investments are not FDIC-insured, nor are they deposits of or guaranteed by a bank or any other entity, so they may lose value. For current information and month-end results, visit americanfunds.com.
Here are the average annual total returns on a $1,000 investment with all distributions reinvested for periods ended June 30, 2017:
| Class A shares | 1 year | 5 years | 10 years |
| Reflecting 5.75% maximum sales charge | 9.10% | 12.76% | 5.77% |
The total annual fund operating expense ratio was 0.59% for Class A shares as of the prospectus dated April 7, 2017.
For other share class results, visit americanfunds.com and americanfundsretirement.com.
Investment results assume all distributions are reinvested and reflect applicable fees and expenses. When applicable, investment results reflect fee waivers, without which results would have been lower. Visit americanfunds.com for more information.
The fund’s 30-day yield for Class A shares as of July 31, 2017, reflecting the 5.75% maximum sales charge and calculated in accordance with the U.S. Securities and Exchange Commission formula, was 1.72%.
Investing outside the United States may be subject to risks, such as currency fluctuations, political instability, differing securities regulations and periods of illiquidity. Global diversification can help reduce these risks. Refer to the fund prospectus and the Risk Factors section of this report for more information on these and other risks associated with investing in the fund.
Fellow investors:
The U.S. stock market rallied and key market indexes reached record highs led by strong corporate earnings and steady economic expansion. The Investment Company of America rose 8.20% for the six-month period ended June 30, 2017, with distributions reinvested. In comparison, the unmanaged Standard & Poor’s 500 Composite Index (a market capitalization-weighted index based on the results of approximately 500 widely held common stocks) returned 9.34% during the same time period.
For the 20 years ended June 30, 2017, ICA posted an average annual total return of 7.94% with distributions reinvested, compared with 7.15% by the S&P 500. Over its more than 83-year history, ICA has had an average annual total return of 12.13% with distributions reinvested, compared with 10.85% by the S&P 500.
U.S. growth is slow, but steady
The U.S. economy continued to grow at a modest pace. Although wage gains were sluggish and consumer spending mixed, most economic signals have been generally positive led by improvements in industrial production and unemployment figures. Gross domestic product growth has been positive, which is essentially good news, even though gains have been slower than what investors might have hoped for after the U.S. presidential election.
Results at a glance
For the six months ended June 30, 2017, with all distributions reinvested
| Standard & | Lipper | |||||||||||
| ICA | Poor’s 500 Composite | Growth & Income | ||||||||||
| (Class A shares) | Index* | Funds Index† | ||||||||||
| Income return | 0.83 | % | 1.07 | % | n/a | |||||||
| Capital return | 7.37 | % | 8.27 | % | n/a | |||||||
| Total return | 8.20 | % | 9.34 | % | 8.94 | % | ||||||
| * | Source: S&P Dow Jones Indices LLC. The S&P 500 is unmanaged and, therefore, has no expenses. Investors cannot invest directly in an index. |
| † | Source: Thomson Reuters Lipper. Lipper indexes track the largest mutual funds (no more than 30), represented by one share class per fund, in the corresponding Lipper category. |
| The Investment Company of America | 1 |
Growth-oriented stocks led gains, outpacing those in more defensive companies amid continued evidence of a broad-based global economic recovery. Market volatility in the current environment has remained subdued, despite geopolitical challenges such as the conflict in Syria and nuclear tensions in North Korea, and political uncertainty ahead of pivotal elections in Europe. It is worth noting that negative headlines do not necessarily translate to poor stock market performance, and U.S. equities have validated that axiom recently, shrugging off geopolitical concerns and political uncertainty.
The U.S. Federal Reserve increased short-term interest rates by a quarter percentage point in both March and June, lending credence to the case for continued growth and economic stability. These rate hikes are steps toward normalization after central banks have pursued accommodative monetary policies focused on healing stresses in the global financial system caused by the 2008 financial crisis. In addition to tightening monetary policy, the U.S. Federal Reserve also indicated its plan to unwind its balance sheet.
ICA’s portfolio in review
Strong stock selection was beneficial among our consumer discretionary, health care and industrials holdings. Investments in cyclical and defensive sectors contributed to the fund’s returns. The fund’s second-largest equity holding, Philip Morris International, was among the top contributors, as it rose 28.37% and reached record highs. The fund’s largest equity holding, AbbVie, rose 15.79% as the company reported strong first-quarter earnings on the back of strong sales of its rheumatoid arthritis drug, Humira. Select investments in the information technology sector also boosted the fund’s results. Samsung Electronics rose 40.61% on strong earnings from its memory chips business and its plans to pay dividends and retire Treasury shares. Broadcom advanced 31.84% based on growing demand for its communication chips used in smartphones.
Detracting from results was Kroger as the company’s stock price plunged 32.43%. Kroger cut earnings guidance due to expectations of increased competition. Verizon Communications also hindered results as the company reported first-quarter earnings that missed analyst expectations. Lack of investment in some low-yield information technology stocks was a drag on relative returns. Investments in the energy sector also hindered returns as the price of oil declined amid concerns of oversupply.
The fund’s cash position (which includes short-term securities and other assets less liabilities) of approximately 8.4% of assets at the end of the period is at a reasonable level for ICA given current market conditions. As a naturally defensive holding, cash
| 2 | The Investment Company of America |
provides protection during market volatility and downturns. Cash also provides portfolio managers the flexibility to easily finance additional or new investments.
We remain focused on the long term
In today’s uncertain political environment, the underlying economic reality is generally positive. The U.S. is likely to continue growing at a moderate pace, even as other countries experience sluggish growth. Valuations are richer in the U.S. than in other parts of the world given its faster growth and high level of innovation. In addition, U.S. indexes comprise a greater proportion of technology companies that tend to have higher price-to-earning multiples and a lower proportion of financial companies that tend to have lower multiples.
There is continuing anxiety about whether the U.S. administration can deliver on fiscal stimulus, health care reform and tax cuts. As a result, there may be volatility in the coming months. This is not to be feared, as dislocations in the stock market could present opportunities for long-term investors. Increased volatility may provide us with an opportunity to invest in quality companies with more favorable valuations for the long run. So, we remind our investors to keep their long-term plan in mind, especially during times of uncertainty.
We continue to seek to invest for the long term with our time-tested approach. As valuations have gone up, that may mean we are entering a moderate-to-low return environment going forward. We continue to conduct fundamental research, with a long-term horizon and an eye toward valuation and risk. We remain optimistic that our robust investment process, and our ability to identify solid companies at good valuations based on bottom-up analysis, can serve our investors well in the long run.
We thank you for your confidence in our investment philosophy and look forward to reporting to you again in six months.
Cordially,
 |  |
| James B. Lovelace Vice Chairman | Donald D. O’Neal President |
August 10, 2017
For current information about the fund, visit americanfunds.com.
| The Investment Company of America | 3 |
| Summary investment portfolio June 30, 2017 | unaudited |
| Industry sector diversification | Percent of net assets |
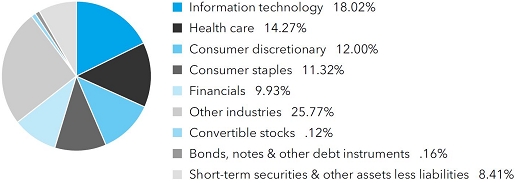
| Common stocks 91.31% | Shares | Value (000) | ||||||
| Energy 7.26% | ||||||||
| Canadian Natural Resources, Ltd. | 17,555,082 | $ | 506,563 | |||||
| EOG Resources, Inc. | 8,746,200 | 791,706 | ||||||
| Exxon Mobil Corp. | 6,900,835 | 557,104 | ||||||
| Other securities | 4,454,083 | |||||||
| 6,309,456 | ||||||||
| Materials 3.67% | ||||||||
| Dow Chemical Co. | 11,475,000 | 723,728 | ||||||
| Freeport-McMoRan Inc.1 | 53,517,060 | 642,740 | ||||||
| Vale SA, Class A, preferred nominative | 15,319,100 | 124,434 | ||||||
| Vale SA, Class A, preferred nominative (ADR) | 51,663,730 | 421,059 | ||||||
| Other securities | 1,279,198 | |||||||
| 3,191,159 | ||||||||
| Industrials 8.54% | ||||||||
| Boeing Co. | 2,700,000 | 533,925 | ||||||
| CSX Corp. | 21,072,002 | 1,149,688 | ||||||
| General Dynamics Corp. | 6,361,200 | 1,260,154 | ||||||
| General Electric Co. | 33,729,000 | 911,020 | ||||||
| Illinois Tool Works Inc. | 5,450,000 | 780,713 | ||||||
| Union Pacific Corp. | 9,371,337 | 1,020,632 | ||||||
| Other securities | 1,766,546 | |||||||
| 7,422,678 | ||||||||
| Consumer discretionary 12.00% | ||||||||
| Amazon.com, Inc.1 | 2,055,600 | 1,989,821 | ||||||
| Home Depot, Inc. | 6,620,000 | 1,015,508 | ||||||
| Las Vegas Sands Corp. | 18,738,000 | 1,197,171 | ||||||
| McDonald’s Corp. | 4,200,000 | 643,272 | ||||||
| Twenty-First Century Fox, Inc., Class A | 28,408,215 | 805,089 | ||||||
| Other securities | 4,780,799 | |||||||
| 10,431,660 | ||||||||
| 4 | The Investment Company of America |
| Value | ||||||||
| Shares | (000) | |||||||
| Consumer staples 11.32% | ||||||||
| Altria Group, Inc. | 20,455,000 | $ | 1,523,284 | |||||
| Coca-Cola Co. | 15,163,000 | 680,061 | ||||||
| Kellogg Co. | 7,820,200 | 543,191 | ||||||
| Kraft Heinz Co. | 6,124,722 | 524,521 | ||||||
| Nestlé SA | 5,750,971 | 500,489 | ||||||
| PepsiCo, Inc. | 4,420,000 | 510,466 | ||||||
| Philip Morris International Inc. | 19,314,441 | 2,268,481 | ||||||
| Other securities | 3,287,732 | |||||||
| 9,838,225 | ||||||||
| Health care 14.27% | ||||||||
| Abbott Laboratories | 12,470,090 | 606,171 | ||||||
| AbbVie Inc. | 57,880,449 | 4,196,911 | ||||||
| Amgen Inc. | 12,231,463 | 2,106,625 | ||||||
| Medtronic PLC | 9,282,000 | 823,777 | ||||||
| Stryker Corp. | 6,280,865 | 871,658 | ||||||
| UnitedHealth Group Inc. | 5,495,997 | 1,019,068 | ||||||
| Other securities | 2,777,150 | |||||||
| 12,401,360 | ||||||||
| Financials 9.93% | ||||||||
| American International Group, Inc. | 16,198,200 | 1,012,711 | ||||||
| Berkshire Hathaway Inc., Class B1 | 5,050,000 | 855,319 | ||||||
| Charles Schwab Corp. | 2,387,809 | 102,580 | ||||||
| Citigroup Inc. | 9,672,000 | 646,863 | ||||||
| JPMorgan Chase & Co. | 11,362,000 | 1,038,487 | ||||||
| Prudential Financial, Inc. | 6,348,178 | 686,492 | ||||||
| Wells Fargo & Co. | 19,298,900 | 1,069,352 | ||||||
| Other securities | 3,216,022 | |||||||
| 8,627,826 | ||||||||
| Information technology 18.02% | ||||||||
| Accenture PLC, Class A | 9,595,000 | 1,186,710 | ||||||
| Alphabet Inc., Class A1 | 951,030 | 884,153 | ||||||
| Alphabet Inc., Class C1 | 1,030,859 | 936,772 | ||||||
| Apple Inc. | 10,355,561 | 1,491,408 | ||||||
| Broadcom Ltd. | 3,829,079 | 892,367 | ||||||
| Intel Corp. | 38,178,000 | 1,288,126 | ||||||
| Microsoft Corp. | 22,345,100 | 1,540,248 | ||||||
| Oracle Corp. | 37,432,300 | 1,876,855 | ||||||
| Samsung Electronics Co., Ltd. | 642,029 | 1,333,831 | ||||||
| Texas Instruments Inc. | 18,010,773 | 1,385,569 | ||||||
| Western Union Co.2 | 35,700,000 | 680,085 | ||||||
| Other securities | 2,165,509 | |||||||
| 15,661,633 | ||||||||
| Telecommunication services 3.74% | ||||||||
| Verizon Communications Inc. | 50,399,795 | 2,250,855 | ||||||
| Other securities | 1,000,129 | |||||||
| 3,250,984 | ||||||||
| The Investment Company of America | 5 |
| Common stocks (continued) | Shares | Value (000) | ||||||
| Utilities 2.10% | ||||||||
| Dominion Energy, Inc. | 7,723,824 | $ | 591,877 | |||||
| Other securities | 1,238,534 | |||||||
| 1,830,411 | ||||||||
| Real estate 0.16% | ||||||||
| Other securities | 136,756 | |||||||
| Miscellaneous 0.30% | ||||||||
| Other common stocks in initial period of acquisition | 262,763 | |||||||
| Total common stocks (cost: $51,245,512,000) | 79,364,911 | |||||||
| Convertible stocks 0.12% | ||||||||
| Energy 0.12% | ||||||||
| Other securities | 102,991 | |||||||
| Total convertible stocks (cost: $144,999,000) | 102,991 | |||||||
| Bonds, notes & other debt instruments 0.16% | Principal amount (000) | |||||||
| U.S. Treasury bonds & notes 0.16% | ||||||||
| U.S. Treasury 1.625% 2026 | $ | 149,700 | 141,955 | |||||
| Total bonds, notes & other debt instruments (cost: $150,494,000) | 141,955 | |||||||
| Short-term securities 8.36% | ||||||||
| Apple Inc. 0.89%–0.95% due 7/18/2017–7/24/20173 | 215,000 | 214,865 | ||||||
| Federal Home Loan Bank 0.64%–1.08% due 7/3/2017–12/6/2017 | 3,114,063 | 3,110,600 | ||||||
| Jupiter Securitization Co., LLC 0.95% due 7/3/20173 | 45,000 | 44,996 | ||||||
| Microsoft Corp. 0.94%–1.04% due 7/17/2017–8/15/20173 | 186,750 | 186,584 | ||||||
| U.S. Treasury Bills 0.62%–1.10% due 7/6/2017–12/7/2017 | 1,462,300 | 1,460,227 | ||||||
| Other securities | 2,247,102 | |||||||
| Total short-term securities (cost: $7,264,300,000) | 7,264,374 | |||||||
| Total investment securities 99.95% (cost: $58,805,305,000) | 86,874,231 | |||||||
| Other assets less liabilities 0.05% | 43,855 | |||||||
| Net assets 100.00% | $ | 86,918,086 | ||||||
This summary investment portfolio is designed to streamline the report and help investors better focus on the fund’s principal holdings. See the inside back cover for details on how to obtain a complete schedule of portfolio holdings.
As permitted by U.S. Securities and Exchange Commission regulations, “Miscellaneous” securities include holdings in their first year of acquisition that have not previously been publicly disclosed.
“Other securities” includes all issues that are not disclosed separately in the summary investment portfolio.
| 6 | The Investment Company of America |
Investments in affiliates
A company is an affiliate of the fund under the Investment Company Act of 1940 if the fund’s holdings in that company represent 5% or more of the outstanding voting shares. The value of the fund’s affiliated-company holdings is either shown in the summary investment portfolio or included in the value of “Other securities” under the respective industry sectors. Further details on such holdings and related transactions during the six months ended June 30, 2017, appear below.
| Beginning | Ending | |||||||||||||||
| shares | Additions | Reductions | shares | |||||||||||||
| Western Union Co. | 35,700,000 | — | — | 35,700,000 | ||||||||||||
| Avon Products, Inc.1 | 25,493,441 | — | — | 25,493,441 | ||||||||||||
| Freeport-McMoRan Inc.1,4 | 71,019,145 | — | 17,502,085 | 53,517,060 | ||||||||||||
| Net unrealized | Value of | |||||||||||||||
| Net realized | (depreciation) | Dividend | affiliates at | |||||||||||||
| loss | appreciation | income | 6/30/2017 | |||||||||||||
| (000) | (000) | (000) | (000) | |||||||||||||
| Western Union Co. | $ | — | $ | (95,319 | ) | $ | 12,495 | $ | 680,085 | |||||||
| Avon Products, Inc.1 | — | (31,612 | ) | — | 96,875 | |||||||||||
| Freeport-McMoRan Inc.1,4 | (91,226 | ) | 34,684 | — | — | |||||||||||
| $ | (91,226 | ) | $ | (92,247 | ) | $ | 12,495 | $ | 776,960 | |||||||
The following footnotes apply to either the individual securities noted or one or more of the securities aggregated and listed as a single line item.
| 1 | Security did not produce income during the last 12 months. |
| 2 | Represents an affiliated company as defined under the Investment Company Act of 1940. |
| 3 | Acquired in a transaction exempt from registration under Section 4(2) of the Securities Act of 1933. May be resold in the U.S. in transactions exempt from registration, normally to qualified institutional buyers. The total value of all such securities, including those in “Other securities,” was $1,772,083,000, which represented 2.04% of the net assets of the fund. |
| 4 | Unaffiliated issuer at 6/30/2017. |
Key to abbreviation
ADR = American Depositary Receipts
See Notes to Financial Statements
| The Investment Company of America | 7 |
| Financial statements | |
| Statement of assets and liabilities at June 30, 2017 | unaudited (dollars in thousands) |
| Assets: | ||||||||
| Investment securities, at value: | ||||||||
| Unaffiliated issuers (cost: $58,090,860) | $ | 86,097,271 | ||||||
| Affiliated issuers (cost: $714,445) | 776,960 | $ | 86,874,231 | |||||
| Cash | 155,282 | |||||||
| Cash denominated in currencies other than U.S. dollars (cost: $9,099) | 9,079 | |||||||
| Receivables for: | ||||||||
| Sales of investments | 192,706 | |||||||
| Sales of fund’s shares | 104,581 | |||||||
| Dividends and interest | 108,833 | |||||||
| Other | 686 | 406,806 | ||||||
| 87,445,398 | ||||||||
| Liabilities: | ||||||||
| Payables for: | ||||||||
| Purchases of investments | 391,626 | |||||||
| Repurchases of fund’s shares | 89,295 | |||||||
| Investment advisory services | 16,866 | |||||||
| Services provided by related parties | 19,265 | |||||||
| Trustees’ deferred compensation | 7,452 | |||||||
| Other | 2,808 | 527,312 | ||||||
| Net assets at June 30, 2017 | $ | 86,918,086 | ||||||
| Net assets consist of: | ||||||||
| Capital paid in on shares of beneficial interest | $ | 56,203,512 | ||||||
| Undistributed net investment income | 437,418 | |||||||
| Undistributed net realized gain | 2,207,566 | |||||||
| Net unrealized appreciation | 28,069,590 | |||||||
| Net assets at June 30, 2017 | $ | 86,918,086 |
See Notes to Financial Statements
| 8 | The Investment Company of America |
(dollars and shares in thousands, except per-share amounts)
Shares of beneficial interest issued and outstanding (no stated par value) —
unlimited shares authorized (2,235,674 total shares outstanding)
| Net assets | Shares outstanding | Net asset value per share | ||||||||||
| Class A | $ | 60,515,332 | 1,555,687 | $ | 38.90 | |||||||
| Class C | 1,759,747 | 45,675 | 38.53 | |||||||||
| Class T | 10 | — | * | 38.90 | ||||||||
| Class F-1 | 2,091,944 | 53,903 | 38.81 | |||||||||
| Class F-2 | 3,925,070 | 100,942 | 38.88 | |||||||||
| Class F-3 | 2,046,833 | 52,637 | 38.89 | |||||||||
| Class 529-A | 2,526,061 | 65,083 | 38.81 | |||||||||
| Class 529-C | 531,289 | 13,735 | 38.68 | |||||||||
| Class 529-E | 88,990 | 2,300 | 38.70 | |||||||||
| Class 529-T | 10 | — | * | 38.90 | ||||||||
| Class 529-F-1 | 75,632 | 1,951 | 38.77 | |||||||||
| Class R-1 | 86,382 | 2,237 | 38.61 | |||||||||
| Class R-2 | 666,648 | 17,242 | 38.66 | |||||||||
| Class R-2E | 29,186 | 752 | 38.80 | |||||||||
| Class R-3 | 978,446 | 25,240 | 38.77 | |||||||||
| Class R-4 | 1,634,971 | 42,140 | 38.80 | |||||||||
| Class R-5E | 2,681 | 69 | 38.88 | |||||||||
| Class R-5 | 287,986 | 7,405 | 38.89 | |||||||||
| Class R-6 | 9,670,868 | 248,676 | 38.89 | |||||||||
| * | Amount less than one thousand. |
See Notes to Financial Statements
| The Investment Company of America | 9 |
| Statement of operations for the six months ended June 30, 2017 | unaudited (dollars in thousands) |
| Investment income: | ||||||||
| Income: | ||||||||
| Dividends (net of non-U.S. taxes of $20,590; also includes $12,495 from affiliates) | $ | 987,938 | ||||||
| Interest | 27,598 | $ | 1,015,536 | |||||
| Fees and expenses*: | ||||||||
| Investment advisory services | 98,872 | |||||||
| Distribution services | 93,067 | |||||||
| Transfer agent services | 34,194 | |||||||
| Administrative services | 8,950 | |||||||
| Reports to shareholders | 1,760 | |||||||
| Registration statement and prospectus | 1,487 | |||||||
| Trustees’ compensation | 829 | |||||||
| Auditing and legal | 57 | |||||||
| Custodian | 809 | |||||||
| Other | 1,192 | 241,217 | ||||||
| Net investment income | 774,319 | |||||||
| Net realized gain and unrealized appreciation: | ||||||||
| Net realized gain (loss) on: | ||||||||
| Investments: | ||||||||
| Unaffiliated issuers | �� | 1,957,680 | ||||||
| Affiliated issuers | (91,226 | ) | ||||||
| Forward currency contracts | (846 | ) | ||||||
| Currency transactions | (2,777 | ) | 1,862,831 | |||||
| Net unrealized appreciation (depreciation) on: | ||||||||
| Investments: | ||||||||
| Unffiliated issuers | 4,024,266 | |||||||
| Affiliated issuers | (92,247 | ) | ||||||
| Forward currency contracts | (1,491 | ) | ||||||
| Currency translations | 819 | 3,931,347 | ||||||
| Net realized gain and unrealized appreciation | 5,794,178 | |||||||
| Net increase in net assets resulting from operations | $ | 6,568,497 |
| * | Additional information related to class-specific fees and expenses is included in the Notes to Financial Statements. |
See Notes to Financial Statements
| 10 | The Investment Company of America |
| Statements of changes in net assets | |
| (dollars in thousands) |
| Six months ended June 30, 2017* | Year ended December 31, 2016 | |||||||
| Operations: | ||||||||
| Net investment income | $ | 774,319 | $ | 1,391,772 | ||||
| Net realized gain | 1,862,831 | 2,893,324 | ||||||
| Net unrealized appreciation | 3,931,347 | 6,038,291 | ||||||
| Net increase in net assets resulting from operations | 6,568,497 | 10,323,387 | ||||||
| Dividends and distributions paid to shareholders: | ||||||||
| Dividends from net investment income | (664,384 | ) | (1,456,141 | ) | ||||
| Distributions from net realized gain on investments | — | (2,762,984 | ) | |||||
| Total dividends and distributions paid to shareholders | (664,384 | ) | (4,219,125 | ) | ||||
| Net capital share transactions | 1,050,036 | 1,970,385 | ||||||
| Total increase in net assets | 6,954,149 | 8,074,647 | ||||||
| Net assets: | ||||||||
| Beginning of period | 79,963,937 | 71,889,290 | ||||||
| End of period (including undistributed net investment income: $437,418 and $327,483, respectively) | $ | 86,918,086 | $ | 79,963,937 | ||||
| * | Unaudited. |
See Notes to Financial Statements
| The Investment Company of America | 11 |
| Notes to financial statements | unaudited |
1. Organization
The Investment Company of America (the “fund”) is registered under the Investment Company Act of 1940 as an open-end, diversified management investment company. The fund seeks long-term growth of capital and income.
The fund has 19 share classes consisting of six retail share classes (Classes A, C, T, F-1, F-2 and F-3), five 529 college savings plan share classes (Classes 529-A, 529-C, 529-E, 529-T and 529-F-1) and eight retirement plan share classes (Classes R-1, R-2, R-2E, R-3, R-4, R-5E, R-5 and R-6). The 529 college savings plan share classes can be used to save for college education. The retirement plan share classes are generally offered only through eligible employer-sponsored retirement plans. The fund’s share classes are described further in the following table:
| Share class | Initial sales charge | Contingent deferred sales charge upon redemption | Conversion feature | ||||
| Classes A and 529-A | Up to 5.75% | None (except 1% for certain redemptions within one year of purchase without an initial sales charge) | None | ||||
| Class C | None | 1% for redemptions within one year of purchase | Class C converts to Class F-1 after 10 years | ||||
| Class 529-C | None | 1% for redemptions within one year of purchase | None | ||||
| Class 529-E | None | None | None | ||||
| Classes T and 529-T* | Up to 2.50% | None | None | ||||
| Classes F-1, F-2, F-3 and 529-F-1 | None | None | None | ||||
| Classes R-1, R-2, R-2E, R-3, R-4, R-5E, R-5 and R-6 | None | None | None |
| * | Class T and 529-T shares are not available for purchase. |
Holders of all share classes have equal pro rata rights to the assets, dividends and liquidation proceeds of the fund. Each share class has identical voting rights, except for the exclusive right to vote on matters affecting only its class. Share classes have different fees and expenses (“class-specific fees and expenses”), primarily due to different arrangements for distribution, transfer agent and administrative services. Differences in class-specific fees and expenses will result in differences in net investment income and, therefore, the payment of different per-share dividends by each share class.
2. Significant accounting policies
The fund is an investment company that applies the accounting and reporting guidance issued in Topic 946 by the U.S. Financial Accounting Standards Board. The fund’s financial statements have been prepared to comply with U.S. generally accepted accounting principles (“U.S. GAAP”). These principles require the fund’s investment adviser to make
| 12 | The Investment Company of America |
estimates and assumptions that affect reported amounts and disclosures. Actual results could differ from those estimates. Subsequent events, if any, have been evaluated through the date of issuance in the preparation of the financial statements. The fund follows the significant accounting policies described in this section, as well as the valuation policies described in the next section on valuation.
Cash — Cash includes amounts held in an interest bearing deposit facility.
Security transactions and related investment income — Security transactions are recorded by the fund as of the date the trades are executed with brokers. Realized gains and losses from security transactions are determined based on the specific identified cost of the securities. In the event a security is purchased with a delayed payment date, the fund will segregate liquid assets sufficient to meet its payment obligations. Dividend income is recognized on the ex-dividend date and interest income is recognized on an accrual basis. Market discounts, premiums and original issue discounts on fixed-income securities are amortized daily over the expected life of the security.
Class allocations — Income, fees and expenses (other than class-specific fees and expenses) and realized and unrealized gains and losses are allocated daily among the various share classes based on their relative net assets. Class-specific fees and expenses, such as distribution, transfer agent and administrative services, are charged directly to the respective share class.
Dividends and distributions to shareholders — Dividends and distributions to shareholders are recorded on the ex-dividend date.
Currency translation — Assets and liabilities, including investment securities, denominated in currencies other than U.S. dollars are translated into U.S. dollars at the exchange rates supplied by one or more pricing vendors on the valuation date. Purchases and sales of investment securities and income and expenses are translated into U.S. dollars at the exchange rates on the dates of such transactions. The effects of changes in exchange rates on investment securities are included with the net realized gain or loss and net unrealized appreciation or depreciation on investments in the fund’s statement of operations. The realized gain or loss and unrealized appreciation or depreciation resulting from all other transactions denominated in currencies other than U.S. dollars are disclosed separately.
3. Valuation
Capital Research and Management Company (“CRMC”), the fund’s investment adviser, values the fund’s investments at fair value as defined by U.S. GAAP. The net asset value of each share class of the fund is generally determined as of approximately 4:00 p.m. New York time each day the New York Stock Exchange is open.
| The Investment Company of America | 13 |
Methods and inputs — The fund’s investment adviser uses the following methods and inputs to establish the fair value of the fund’s assets and liabilities. Use of particular methods and inputs may vary over time based on availability and relevance as market and economic conditions evolve.
Equity securities are generally valued at the official closing price of, or the last reported sale price on, the exchange or market on which such securities are traded, as of the close of business on the day the securities are being valued or, lacking any sales, at the last available bid price. Prices for each security are taken from the principal exchange or market on which the security trades.
Fixed-income securities, including short-term securities, are generally valued at prices obtained from one or more pricing vendors. Vendors value such securities based on one or more of the inputs described in the following table. The table provides examples of inputs that are commonly relevant for valuing particular classes of fixed-income securities in which the fund is authorized to invest. However, these classifications are not exclusive, and any of the inputs may be used to value any other class of fixed-income security.
| Fixed-income class | Examples of standard inputs | |
| All | Benchmark yields, transactions, bids, offers, quotations from dealers and trading systems, new issues, spreads and other relationships observed in the markets among comparable securities; and proprietary pricing models such as yield measures calculated using factors such as cash flows, financial or collateral performance and other reference data (collectively referred to as “standard inputs”) | |
| Corporate bonds & notes; convertible securities | Standard inputs and underlying equity of the issuer | |
| Bonds & notes of governments & government agencies | Standard inputs and interest rate volatilities | |
| Mortgage-backed; asset-backed obligations | Standard inputs and cash flows, prepayment information, default rates, delinquency and loss assumptions, collateral characteristics, credit enhancements and specific deal information |
When the fund’s investment adviser deems it appropriate to do so (such as when vendor prices are unavailable or deemed to be not representative), fixed-income securities will be valued in good faith at the mean quoted bid and ask prices that are reasonably and timely available (or bid prices, if ask prices are not available) or at prices for securities of comparable maturity, quality and type.
Securities with both fixed-income and equity characteristics, or equity securities traded principally among fixed-income dealers, are generally valued in the manner described for either equity or fixed-income securities, depending on which method is deemed most appropriate by the fund’s investment adviser. Forward currency contracts are valued at the mean of representative quoted bid and ask prices, generally based on prices supplied by one or more pricing vendors.
| 14 | The Investment Company of America |
Securities and other assets for which representative market quotations are not readily available or are considered unreliable by the fund’s investment adviser are fair valued as determined in good faith under fair valuation guidelines adopted by authority of the fund’s board of trustees as further described. The investment adviser follows fair valuation guidelines, consistent with U.S. Securities and Exchange Commission rules and guidance, to consider relevant principles and factors when making fair value determinations. The investment adviser considers relevant indications of value that are reasonably and timely available to it in determining the fair value to be assigned to a particular security, such as the type and cost of the security; contractual or legal restrictions on resale of the security; relevant financial or business developments of the issuer; actively traded similar or related securities; conversion or exchange rights on the security; related corporate actions; significant events occurring after the close of trading in the security; and changes in overall market conditions. In addition, the closing prices of equity securities that trade in markets outside U.S. time zones may be adjusted to reflect significant events that occur after the close of local trading but before the net asset value of each share class of the fund is determined. Fair valuations and valuations of investments that are not actively trading involve judgment and may differ materially from valuations that would have been used had greater market activity occurred.
Processes and structure — The fund’s board of trustees has delegated authority to the fund’s investment adviser to make fair value determinations, subject to board oversight. The investment adviser has established a Joint Fair Valuation Committee (the “Fair Valuation Committee”) to administer, implement and oversee the fair valuation process, and to make fair value decisions. The Fair Valuation Committee regularly reviews its own fair value decisions, as well as decisions made under its standing instructions to the investment adviser’s valuation teams. The Fair Valuation Committee reviews changes in fair value measurements from period to period and may, as deemed appropriate, update the fair valuation guidelines to better reflect the results of back testing and address new or evolving issues. The Fair Valuation Committee reports any changes to the fair valuation guidelines to the board of trustees with supplemental information to support the changes. The fund’s board and audit committee also regularly review reports that describe fair value determinations and methods.
The fund’s investment adviser has also established a Fixed-Income Pricing Review Group to administer and oversee the fixed-income valuation process, including the use of fixed-income pricing vendors. This group regularly reviews pricing vendor information and market data. Pricing decisions, processes and controls over security valuation are also subject to additional internal reviews, including an annual control self-evaluation program facilitated by the investment adviser’s compliance group.
Classifications — The fund’s investment adviser classifies the fund’s assets and liabilities into three levels based on the inputs used to value the assets or liabilities. Level 1 values are based on quoted prices in active markets for identical securities. Level 2 values are based on significant observable market inputs, such as quoted prices for similar securities and quoted prices in inactive markets. Certain securities trading outside the U.S. may transfer between Level 1 and Level 2 due to valuation adjustments resulting from
| The Investment Company of America | 15 |
significant market movements following the close of local trading. Level 3 values are based on significant unobservable inputs that reflect the investment adviser’s determination of assumptions that market participants might reasonably use in valuing the securities. The valuation levels are not necessarily an indication of the risk or liquidity associated with the underlying investment. For example, U.S. government securities are reflected as Level 2 because the inputs used to determine fair value may not always be quoted prices in an active market. The following table presents the fund’s valuation levels as of June 30, 2017 (dollars in thousands):
| Investment securities | ||||||||||||||||
| Level 1* | Level 2 | Level 3 | Total | |||||||||||||
| Assets: | ||||||||||||||||
| Common stocks: | ||||||||||||||||
| Energy | $ | 6,309,456 | $ | — | $ | — | $ | 6,309,456 | ||||||||
| Materials | 3,191,159 | — | — | 3,191,159 | ||||||||||||
| Industrials | 7,422,678 | — | — | 7,422,678 | ||||||||||||
| Consumer discretionary | 10,431,660 | — | — | 10,431,660 | ||||||||||||
| Consumer staples | 9,838,225 | — | — | 9,838,225 | ||||||||||||
| Health care | 12,401,360 | — | — | 12,401,360 | ||||||||||||
| Financials | 8,627,826 | — | — | 8,627,826 | ||||||||||||
| Information technology | 15,661,633 | — | — | 15,661,633 | ||||||||||||
| Telecommunication services | 3,250,984 | — | — | 3,250,984 | ||||||||||||
| Utilities | 1,830,411 | — | — | 1,830,411 | ||||||||||||
| Real estate | 136,756 | — | — | 136,756 | ||||||||||||
| Miscellaneous | 262,763 | — | — | 262,763 | ||||||||||||
| Convertible stocks | 102,991 | — | — | 102,991 | ||||||||||||
| Bonds, notes & other debt instruments | — | 141,955 | — | 141,955 | ||||||||||||
| Short-term securities | — | 7,264,374 | — | 7,264,374 | ||||||||||||
| Total | $ | 79,467,902 | $ | 7,406,329 | $ | — | $ | 86,874,231 | ||||||||
| * | Securities with a value of $6,591,599,000, which represented 7.58% of the net assets of the fund, transferred from Level 2 to Level 1 since the prior fiscal year-end, primarily due to a lack of significant market movements following the close of local trading. |
4. Risk factors
Investing in the fund may involve certain risks including, but not limited to, those described below.
Market conditions — The prices of, and the income generated by, the common stocks and other securities held by the fund may decline — sometimes rapidly or unpredictably — due to various factors, including events or conditions affecting the general economy or particular industries; overall market changes; local, regional or global political, social or economic instability; governmental or governmental agency responses to economic conditions; and currency exchange rate, interest rate and commodity price fluctuations.
| 16 | The Investment Company of America |
Issuer risks — The prices of, and the income generated by, securities held by the fund may decline in response to various factors directly related to the issuers of such securities, including reduced demand for an issuer’s goods or services, poor management performance and strategic initiatives such as mergers, acquisitions or dispositions and the market response to any such initiatives.
Investing in income-oriented stocks — Income provided by the fund may be reduced by changes in the dividend policies of, and the capital resources available for dividend payments at, the companies in which the fund invests.
Investing in growth-oriented stocks — Growth-oriented common stocks and other equity-type securities (such as preferred stocks, convertible preferred stocks and convertible bonds) may involve larger price swings and greater potential for loss than other types of investments.
Investing outside the U.S. — Securities of issuers domiciled outside the U.S., or with significant operations or revenues outside the U.S., may lose value because of adverse political, social, economic or market developments (including social instability, regional conflicts, terrorism and war) in the countries or regions in which the issuers operate or generate revenue. These securities may also lose value due to changes in foreign currency exchange rates against the U.S. dollar and/or currencies of other countries. Issuers of these securities may be more susceptible to actions of foreign governments, such as the imposition of price controls or punitive taxes, that could adversely impact the value of these securities. Securities markets in certain countries may be more volatile and/or less liquid than those in the U.S. Investments outside the U.S. may also be subject to different accounting practices and different regulatory, legal and reporting standards and practices, and may be more difficult to value, than those in the U.S. In addition, the value of investments outside the U.S. may be reduced by foreign taxes, including foreign withholding taxes on interest and dividends. Further, there may be increased risks of delayed settlement of securities purchased or sold by the fund. The risks of investing outside the U.S. may be heightened in connection with investments in emerging markets.
Management — The investment adviser to the fund actively manages the fund’s investments. Consequently, the fund is subject to the risk that the methods and analyses employed by the investment adviser in this process may not produce the desired results. This could cause the fund to lose value or its investment results to lag relevant benchmarks or other funds with similar objectives.
5. Certain investment techniques
Forward currency contracts — The fund has entered into forward currency contracts, which represent agreements to exchange currencies on specific future dates at predetermined rates. The fund’s investment adviser uses forward currency contracts to manage the fund’s exposure to changes in exchange rates. Upon entering into these contracts, risks may arise from the potential inability of counterparties to meet the terms of their contracts and from possible movements in exchange rates.
| The Investment Company of America | 17 |
On a daily basis, the fund’s investment adviser values forward currency contracts and records unrealized appreciation or depreciation for open forward currency contracts in the fund’s statement of assets and liabilities. Realized gains or losses are recorded at the time the forward currency contract is closed or offset by another contract with the same broker for the same settlement date and currency.
Closed forward currency contracts that have not reached their settlement date are included in the respective receivables or payables for closed forward currency contracts in the fund’s statement of assets and liabilities. Net realized gains or losses from closed forward currency contracts and net unrealized appreciation or depreciation from open forward currency contracts are recorded in the fund’s statement of operations. As of June 30, 2017, the fund did not have any open forward currency contracts. The average month-end notional amount of open forward currency contracts while held was $125,580,000.
| Net realized loss | Net unrealized depreciation | |||||||||
| Contract | Risk type | Location on statement of operations | Value | Location on statement of operations | Value | |||||
| Forward currency | Currency | Net realized loss on forward currency contracts | $(846) | Net unrealized depreciation on forward currency contracts | $(1,491) | |||||
6. Taxation and distributions
Federal income taxation — The fund complies with the requirements under Subchapter M of the Internal Revenue Code applicable to mutual funds and intends to distribute substantially all of its net taxable income and net capital gains each year. The fund is not subject to income taxes to the extent such distributions are made. Therefore, no federal income tax provision is required.
As of and during the period ended June 30, 2017, the fund did not have a liability for any unrecognized tax benefits. The fund recognizes interest and penalties, if any, related to unrecognized tax benefits as income tax expense in the statement of operations. During the period, the fund did not incur any interest or penalties.
The fund is not subject to examination by U.S. federal tax authorities for tax years before 2013 and by state tax authorities for tax years before 2012.
Non-U.S. taxation — Dividend and interest income are recorded net of non-U.S. taxes paid. The fund may file withholding tax reclaims in certain jurisdictions to recover a portion of amounts previously withheld. As a result of rulings from European courts, the fund filed for additional reclaims related to prior years. These reclaims are recorded when the amount is known and there are no significant uncertainties on collectability. Gains realized by the fund on the sale of securities in certain countries, if any, may be subject to non-U.S. taxes. If applicable, the fund records an estimated deferred tax liability based on unrealized gains to provide for potential non-U.S. taxes payable upon the sale of these securities.
| 18 | The Investment Company of America |
Distributions — Distributions paid to shareholders are based on net investment income and net realized gains determined on a tax basis, which may differ from net investment income and net realized gains for financial reporting purposes. These differences are due primarily to different treatment for items such as currency gains and losses; short-term capital gains and losses; and income on certain investments. The fiscal year in which amounts are distributed may differ from the year in which the net investment income and net realized gains are recorded by the fund for financial reporting purposes.
The components of distributable earnings on a tax basis are reported as of the fund’s most recent year-end. As of December 31, 2016, the components of distributable earnings on a tax basis were as follows (dollars in thousands):
| Undistributed ordinary income | $334,653 |
As of June 30, 2017, the tax basis unrealized appreciation (depreciation) and cost of investment securities were as follows (dollars in thousands):
| Gross unrealized appreciation on investment securities | $29,861,024 | ||
| Gross unrealized depreciation on investment securities | (1,434,184 | ) | |
| Net unrealized appreciation on investment securities | 28,426,840 | ||
| Cost of investment securities | 58,447,391 |
| The Investment Company of America | 19 |
The tax character of distributions paid to shareholders was as follows (dollars in thousands):
| Six months ended June 30, 2017 | Year ended December 31, 2016 | |||||||||||||||||||||||
| Total | ||||||||||||||||||||||||
| Total | dividends and | |||||||||||||||||||||||
| Ordinary | Long-term | dividends | Ordinary | Long-term | distributions | |||||||||||||||||||
| Share class | income | capital gains | paid | income | capital gains | paid | ||||||||||||||||||
| Class A | $ | 471,492 | $ | — | $ | 471,492 | $ | 1,088,281 | $ | 2,022,348 | $ | 3,110,629 | ||||||||||||
| Class B1 | — | — | — | 713 | 1,418 | 2,131 | ||||||||||||||||||
| Class C | 6,823 | — | 6,823 | 18,879 | 59,383 | 78,262 | ||||||||||||||||||
| Class T2 | — | 3 | — | — | 3 | |||||||||||||||||||
| Class F-1 | 15,276 | — | 15,276 | 37,434 | 68,861 | 106,295 | ||||||||||||||||||
| Class F-2 | 38,436 | — | 38,436 | 70,153 | 147,599 | 217,752 | ||||||||||||||||||
| Class F-34 | 9,193 | — | 9,193 | |||||||||||||||||||||
| Class 529-A | 18,429 | — | 18,429 | 41,156 | 81,201 | 122,357 | ||||||||||||||||||
| Class 529-B1 | — | 3 | — | — | 3 | 95 | 220 | 315 | ||||||||||||||||
| Class 529-C | 1,925 | — | 1,925 | 5,213 | 17,504 | 22,717 | ||||||||||||||||||
| Class 529-E | 552 | — | 552 | 1,293 | 2,910 | 4,203 | ||||||||||||||||||
| Class 529-T2 | — | 3 | — | — | 3 | |||||||||||||||||||
| Class 529-F-1 | 633 | — | 633 | 1,364 | 2,437 | 3,801 | ||||||||||||||||||
| Class R-1 | 329 | — | 329 | 945 | 2,971 | 3,916 | ||||||||||||||||||
| Class R-2 | 2,537 | — | 2,537 | 7,203 | 22,729 | 29,932 | ||||||||||||||||||
| Class R-2E | 142 | — | 142 | 159 | 535 | 694 | ||||||||||||||||||
| Class R-3 | 5,979 | — | 5,979 | 14,290 | 33,001 | 47,291 | ||||||||||||||||||
| Class R-4 | 12,063 | — | 12,063 | 22,334 | 52,454 | 74,788 | ||||||||||||||||||
| Class R-5E | 23 | — | 23 | 19 | 92 | 111 | ||||||||||||||||||
| Class R-5 | 2,509 | — | 2,509 | 12,206 | 9,024 | 21,230 | ||||||||||||||||||
| Class R-6 | 78,043 | — | 78,043 | 134,404 | 238,297 | 372,701 | ||||||||||||||||||
| Total | $ | 664,384 | $ | — | $ | 664,384 | $ | 1,456,141 | $ | 2,762,984 | $ | 4,219,125 | ||||||||||||
| 1 | Class B and 529-B shares were fully liquidated on May 5, 2017. |
| 2 | Class T and 529-T shares began investment operations on April 7, 2017. |
| 3 | Amount less than one thousand. |
| 4 | Class F-3 shares began investment operations on January 27, 2017. |
7. Fees and transactions with related parties
CRMC, the fund’s investment adviser, is the parent company of American Funds Distributors,® Inc. (“AFD”), the principal underwriter of the fund’s shares, and American Funds Service Company® (“AFS”), the fund’s transfer agent. CRMC, AFD and AFS are considered related parties to the fund.
Investment advisory services — The fund has an investment advisory and service agreement with CRMC that provides for monthly fees accrued daily. These fees are based on a series of decreasing annual rates beginning with 0.390% on the first $1 billion of
| 20 | The Investment Company of America |
daily net assets and decreasing to 0.219% on such assets in excess of $89 billion. For the six months ended June 30, 2017, the investment advisory services fee was $98,872,000, which was equivalent to an annualized rate of 0.236% of average daily net assets.
Class-specific fees and expenses — Expenses that are specific to individual share classes are accrued directly to the respective share class. The principal class-specific fees and expenses are further described below:
Distribution services — The fund has plans of distribution for all share classes, except Class F-2, F-3, R-5E, R-5 and R-6 shares. Under the plans, the board of trustees approves certain categories of expenses that are used to finance activities primarily intended to sell fund shares and service existing accounts. The plans provide for payments, based on an annualized percentage of average daily net assets, ranging from 0.25% to 1.00% as noted in this section. In some cases, the board of trustees has limited the amounts that may be paid to less than the maximum allowed by the plans. All share classes with a plan may use up to 0.25% of average daily net assets to pay service fees, or to compensate AFD for paying service fees, to firms that have entered into agreements with AFD to provide certain shareholder services. The remaining amounts available to be paid under each plan are paid to dealers to compensate them for their sales activities.
For Class A and 529-A shares, distribution-related expenses include the reimbursement of dealer and wholesaler commissions paid by AFD for certain shares sold without a sales charge. These share classes reimburse AFD for amounts billed within the prior 15 months but only to the extent that the overall annual expense limit of 0.25% is not exceeded. As of June 30, 2017, there were no unreimbursed expenses subject to reimbursement for Class A or 529-A shares.
| Share class | Currently approved limits | Plan limits | |||||||
| Class A | 0.25 | % | 0.25 | % | |||||
| Class 529-A | 0.25 | 0.50 | |||||||
| Classes C, 529-C and R-1 | 1.00 | 1.00 | |||||||
| Class R-2 | 0.75 | 1.00 | |||||||
| Class R-2E | 0.60 | 0.85 | |||||||
| Classes 529-E and R-3 | 0.50 | 0.75 | |||||||
| Classes T, F-1, 529-T, 529-F-1 and R-4 | 0.25 | 0.50 | |||||||
Transfer agent services — The fund has a shareholder services agreement with AFS under which the fund compensates AFS for providing transfer agent services to each of the fund’s share classes. These services include recordkeeping, shareholder communications and transaction processing. In addition, the fund reimburses AFS for amounts paid to third parties for performing transfer agent services on behalf of fund shareholders.
| The Investment Company of America | 21 |
Administrative services — The fund has an administrative services agreement with CRMC under which the fund compensates CRMC for providing administrative services to Class A, C, T, F, 529 and R shares. These services include, but are not limited to, coordinating, monitoring, assisting and overseeing third parties that provide services to fund shareholders. Under the agreement, Class A shares pay an annual fee of 0.01% and Class C, T, F, 529 and R shares pay an annual fee of 0.05% of their respective average daily net assets.
529 plan services — Each 529 share class is subject to service fees to compensate the Virginia College Savings Plan (“Virginia529”) for its oversight and administration of the 529 college savings plan. The quarterly fee is based on a series of decreasing annual rates beginning with 0.10% on the first $20 billion of the net assets invested in the Class 529 shares of the American Funds and decreasing to 0.03% on such assets in excess of $100 billion. The fee for any given calendar quarter is accrued and calculated on the basis of the average net assets of Class 529 shares of the American Funds for the last month of the prior calendar quarter. The fee is included in other expenses in the fund’s statement of operations. Virginia529 is not considered a related party to the fund.
| 22 | The Investment Company of America |
For the six months ended June 30, 2017, class-specific expenses under the agreements were as follows (dollars in thousands):
| Distribution | Transfer agent | Administrative | 529 plan | |||||||||||||
| Share class | services | services | services | services | ||||||||||||
| Class A | $68,851 | $25,541 | $2,994 | Not applicable | ||||||||||||
| Class B1 | 63 | 10 | Not applicable | Not applicable | ||||||||||||
| Class C | 8,678 | 781 | 436 | Not applicable | ||||||||||||
| Class T2 | — | — | 3 | — | 3 | Not applicable | ||||||||||
| Class F-1 | 2,559 | 1,359 | 514 | Not applicable | ||||||||||||
| Class F-2 | Not applicable | 2,467 | 1,105 | Not applicable | ||||||||||||
| Class F-34 | Not applicable | 38 | 189 | Not applicable | ||||||||||||
| Class 529-A | 2,735 | 904 | 613 | $831 | ||||||||||||
| Class 529-B | 8 | 2 | — | 3 | 1 | |||||||||||
| Class 529-C | 2,566 | 210 | 130 | 177 | ||||||||||||
| Class 529-E | 216 | 18 | 22 | 29 | ||||||||||||
| Class 529-T2 | — | — | 3 | — | 3 | — | 3 | |||||||||
| Class 529-F-1 | — | 27 | 18 | 25 | ||||||||||||
| Class R-1 | 432 | 44 | 22 | Not applicable | ||||||||||||
| Class R-2 | 2,470 | 1,175 | 166 | Not applicable | ||||||||||||
| Class R-2E | 69 | 21 | 6 | Not applicable | ||||||||||||
| Class R-3 | 2,429 | 739 | 244 | Not applicable | ||||||||||||
| Class R-4 | 1,991 | 786 | 399 | Not applicable | ||||||||||||
| Class R-5E | Not applicable | 2 | 1 | Not applicable | ||||||||||||
| Class R-5 | Not applicable | 70 | 69 | Not applicable | ||||||||||||
| Class R-6 | Not applicable | — | 2,022 | Not applicable | ||||||||||||
| Total class-specific expenses | $93,067 | $34,194 | $8,950 | $1,063 | ||||||||||||
| 1 | Class B and 529-B shares were fully liquidated on May 5, 2017. | |
| 2 | Class T and 529-T shares began investment operations on April 7, 2017. | |
| �� | 3 | Amount less than one thousand. |
| 4 | Class F-3 shares began investment operations on January 27, 2017. |
Trustees’ deferred compensation — Trustees who are unaffiliated with CRMC may elect to defer the cash payment of part or all of their compensation. These deferred amounts, which remain as liabilities of the fund, are treated as if invested in shares of the fund or other American Funds. These amounts represent general, unsecured liabilities of the fund and vary according to the total returns of the selected funds. Trustees’ compensation of $829,000 in the fund’s statement of operations reflects $217,000 in current fees (either paid in cash or deferred) and a net increase of $612,000 in the value of the deferred amounts.
Affiliated officers and trustees — Officers and certain trustees of the fund are or may be considered to be affiliated with CRMC, AFD and AFS. No affiliated officers or trustees received any compensation directly from the fund.
Security transactions with related funds — The fund may purchase from, or sell securities to, other funds managed by CRMC (or funds managed by certain affiliates of CRMC) under procedures adopted by the fund’s board of trustees. The funds involved in such transactions are considered related by virtue of having a common investment adviser (or
| The Investment Company of America | 23 |
affiliated investment advisers), common trustees and/or common officers. When such transactions occur, each transaction is executed at the current market price of the security and no brokerage commissions or fees are paid in accordance with Rule 17a-7 of the 1940 Act.
Interfund lending — Pursuant to an exemptive order issued by the SEC, the fund, along with other CRMC-managed funds (or funds managed by certain affiliates of CRMC), may participate in an interfund lending program. The program provides an alternate credit facility that permits the funds to lend or borrow cash for temporary purposes directly to or from one another, subject to the conditions of the exemptive order. The fund did not lend or borrow cash through the interfund lending program at any time during the six months ended June 30, 2017.
8. Warrants
As of June 30, 2017, the fund had warrants outstanding which may be exercised at any time for the purchase of 818,231 Class A shares at approximately $5.24 per share. If these warrants had been exercised as of June 30, 2017, the net asset value of each share class would have been reduced by less than $0.02 per share. No warrants were exercised during the six months ended June 30, 2017, or the prior fiscal year ended December 31, 2016.
| 24 | The Investment Company of America |
9. Capital share transactions
Capital share transactions in the fund were as follows (dollars and shares in thousands):
| Reinvestments of | Net (decrease) | |||||||||||||||||||||||||||||||
| Sales1 | dividends | Repurchases1 | increase | |||||||||||||||||||||||||||||
| Share class | Amount | Shares | Amount | Shares | Amount | Shares | Amount | Shares | ||||||||||||||||||||||||
| Six months ended June 30, 2017 | ||||||||||||||||||||||||||||||||
| Class A | $ | 1,845,174 | 48,560 | $ | 456,608 | 11,806 | $ | (4,449,360 | ) | (116,725 | ) | $ | (2,147,578 | ) | (56,359 | ) | ||||||||||||||||
| Class B2 | 57 | 2 | — | — | (42,509 | ) | (1,128 | ) | (42,452 | ) | (1,126 | ) | ||||||||||||||||||||
| Class C | 180,225 | 4,788 | 6,743 | 176 | (261,063 | ) | (6,928 | ) | (74,095 | ) | (1,964 | ) | ||||||||||||||||||||
| Class T3 | 10 | — | 4 | — | — | — | — | 10 | — | 4 | ||||||||||||||||||||||
| Class F-1 | 208,766 | 5,509 | 14,896 | 386 | (249,674 | ) | (6,559 | ) | (26,012 | ) | (664 | ) | ||||||||||||||||||||
| Class F-2 | 1,583,178 | 41,633 | 35,214 | 912 | (2,367,257 | ) | (61,961 | ) | (748,865 | ) | (19,416 | ) | ||||||||||||||||||||
| Class F-35 | 2,099,708 | 54,800 | 8,926 | 229 | (92,613 | ) | (2,392 | ) | 2,016,021 | 52,637 | ||||||||||||||||||||||
| Class 529-A | 117,222 | 3,096 | 18,425 | 477 | (133,932 | ) | (3,532 | ) | 1,715 | 41 | ||||||||||||||||||||||
| Class 529-B2 | 13 | — | 4 | — | 4 | — | 4 | (6,604 | ) | (175 | ) | (6,591 | ) | (175 | ) | |||||||||||||||||
| Class 529-C | 24,291 | 644 | 1,923 | 50 | (36,358 | ) | (962 | ) | (10,144 | ) | (268 | ) | ||||||||||||||||||||
| Class 529-E | 3,764 | 100 | 552 | 14 | (5,343 | ) | (141 | ) | (1,027 | ) | (27 | ) | ||||||||||||||||||||
| Class 529-T3 | 10 | — | 4 | — | 4 | — | 4 | — | — | 10 | — | 4 | ||||||||||||||||||||
| Class 529-F-1 | 8,787 | 231 | 633 | 17 | (9,029 | ) | (238 | ) | 391 | 10 | ||||||||||||||||||||||
| Class R-1 | 6,338 | 169 | 328 | 9 | (11,295 | ) | (300 | ) | (4,629 | ) | (122 | ) | ||||||||||||||||||||
| Class R-2 | 89,627 | 2,374 | 2,536 | 66 | (126,190 | ) | (3,341 | ) | (34,027 | ) | (901 | ) | ||||||||||||||||||||
| Class R-2E | 13,378 | 353 | 142 | 4 | (1,422 | ) | (37 | ) | 12,098 | 320 | ||||||||||||||||||||||
| Class R-3 | 128,452 | 3,398 | 5,976 | 155 | (175,890 | ) | (4,642 | ) | (41,462 | ) | (1,089 | ) | ||||||||||||||||||||
| Class R-4 | 197,509 | 5,220 | 12,054 | 312 | (205,659 | ) | (5,416 | ) | 3,904 | 116 | ||||||||||||||||||||||
| Class R-5E | 63 | 1 | 23 | 1 | (305 | ) | (8 | ) | (219 | ) | (6 | ) | ||||||||||||||||||||
| Class R-5 | 57,084 | 1,496 | 2,506 | 65 | (52,509 | ) | (1,378 | ) | 7,081 | 183 | ||||||||||||||||||||||
| Class R-6 | 2,252,489 | 58,877 | 78,043 | 2,017 | (184,625 | ) | (4,840 | ) | 2,145,907 | 56,054 | ||||||||||||||||||||||
| Total net increase (decrease) | $ | 8,816,145 | 231,251 | $ | 645,528 | 16,696 | $ | (8,411,637 | ) | (220,703 | ) | $ | 1,050,036 | 27,244 | ||||||||||||||||||
See page 26 for footnotes.
| The Investment Company of America | 25 |
| Reinvestments of | Net (decrease) | |||||||||||||||||||||||||||||||
| Sales1 | dividends | Repurchases1 | increase | |||||||||||||||||||||||||||||
| Share class | Amount | Shares | Amount | Shares | Amount | Shares | Amount | Shares | ||||||||||||||||||||||||
| Year ended December 31, 2016 | ||||||||||||||||||||||||||||||||
| Class A | $ | 3,130,470 | 89,151 | $ | 3,021,559 | 83,552 | $ | (7,085,990 | ) | (200,596 | ) | $ | (933,961 | ) | (27,893 | ) | ||||||||||||||||
| Class B | 1,073 | 31 | 2,122 | 59 | (126,874 | ) | (3,647 | ) | (123,679 | ) | (3,557 | ) | ||||||||||||||||||||
| Class C | 296,294 | 8,513 | 77,384 | 2,152 | (432,638 | ) | (12,466 | ) | (58,960 | ) | (1,801 | ) | ||||||||||||||||||||
| Class F-1 | 366,869 | 10,528 | 103,809 | 2,880 | (1,127,014 | ) | (32,676 | ) | (656,336 | ) | (19,268 | ) | ||||||||||||||||||||
| Class F-2 | 2,842,236 | 80,184 | 199,219 | 5,496 | (848,535 | ) | (23,771 | ) | 2,192,920 | 61,909 | ||||||||||||||||||||||
| Class 529-A | 206,104 | 5,874 | 122,314 | 3,388 | (291,003 | ) | (8,256 | ) | 37,415 | 1,006 | ||||||||||||||||||||||
| Class 529-B | 228 | 7 | 315 | 9 | (20,144 | ) | (578 | ) | (19,601 | ) | (562 | ) | ||||||||||||||||||||
| Class 529-C | 45,532 | 1,303 | 22,713 | 629 | (78,386 | ) | (2,237 | ) | (10,141 | ) | (305 | ) | ||||||||||||||||||||
| Class 529-E | 7,067 | 202 | 4,203 | 117 | (11,962 | ) | (341 | ) | (692 | ) | (22 | ) | ||||||||||||||||||||
| Class 529-F-1 | 14,690 | 419 | 3,800 | 105 | (14,431 | ) | (408 | ) | 4,059 | 116 | ||||||||||||||||||||||
| Class R-1 | 12,272 | 351 | 3,912 | 109 | (20,668 | ) | (593 | ) | (4,484 | ) | (133 | ) | ||||||||||||||||||||
| Class R-2 | 136,587 | 3,913 | 29,914 | 829 | (201,039 | ) | (5,788 | ) | (34,538 | ) | (1,046 | ) | ||||||||||||||||||||
| Class R-2E | 15,306 | 441 | 694 | 19 | (1,663 | ) | (48 | ) | 14,337 | 412 | ||||||||||||||||||||||
| Class R-3 | 194,517 | 5,553 | 47,246 | 1,308 | (224,270 | ) | (6,401 | ) | 17,493 | 460 | ||||||||||||||||||||||
| Class R-4 | 596,687 | 16,903 | 74,711 | 2,066 | (226,252 | ) | (6,476 | ) | 445,146 | 12,493 | ||||||||||||||||||||||
| Class R-5E | 2,601 | 72 | 111 | 3 | (29 | ) | — | 4 | 2,683 | 75 | ||||||||||||||||||||||
| Class R-5 | 106,278 | 3,025 | 21,219 | 594 | (672,058 | ) | (19,021 | ) | (544,561 | ) | (15,402 | ) | ||||||||||||||||||||
| Class R-6 | 1,545,651 | 43,968 | 372,701 | 10,305 | (275,067 | ) | (7,787 | ) | 1,643,285 | 46,486 | ||||||||||||||||||||||
| Total net increase (decrease) | $ | 9,520,462 | 270,438 | $ | 4,107,946 | 113,620 | $ | (11,658,023 | ) | (331,090 | ) | $ | 1,970,385 | 52,968 | ||||||||||||||||||
| 1 | Includes exchanges between share classes of the fund. |
| 2 | Class B and 529-B shares were fully liquidated on May 5, 2017. |
| 3 | Class T and 529-T shares began investment operations on April 7, 2017. |
| 4 | Amount less than one thousand. |
| 5 | Class F-3 shares began investment operations on January 27, 2017. |
| 26 | The Investment Company of America |
10. Investment transactions
The fund made purchases and sales of investment securities, excluding short-term securities and U.S. government obligations, if any, of $11,927,453,000 and $11,301,530,000, respectively, during the six months ended June 30, 2017.
| The Investment Company of America | 27 |
Financial highlights
| Income (loss) from investment operations1 | ||||||||||||||||
| Net asset | Net gains (losses) | |||||||||||||||
| value, | Net | on securities (both | Total from | |||||||||||||
| beginning | investment | realized and | investment | |||||||||||||
| of period | income2 | unrealized) | operations | |||||||||||||
| Class A: | ||||||||||||||||
| Six months ended 6/30/20174,5 | $ | 36.23 | $ | .35 | $ | 2.62 | $ | 2.97 | ||||||||
| Year ended 12/31/2016 | 33.37 | .65 | 4.20 | 4.85 | ||||||||||||
| Year ended 12/31/2015 | 37.08 | .66 | (1.24 | ) | (.58 | ) | ||||||||||
| Year ended 12/31/2014 | 36.70 | .85 | 3.60 | 4.45 | ||||||||||||
| Year ended 12/31/2013 | 30.16 | .61 | 9.07 | 9.68 | ||||||||||||
| Year ended 12/31/2012 | 27.09 | .60 | 3.61 | 4.21 | ||||||||||||
| Class C: | ||||||||||||||||
| Six months ended 6/30/20174,5 | 35.89 | .19 | 2.60 | 2.79 | ||||||||||||
| Year ended 12/31/2016 | 33.08 | .37 | 4.14 | 4.51 | ||||||||||||
| Year ended 12/31/2015 | 36.77 | .36 | (1.22 | ) | (.86 | ) | ||||||||||
| Year ended 12/31/2014 | 36.42 | .54 | 3.56 | 4.10 | ||||||||||||
| Year ended 12/31/2013 | 29.95 | .33 | 9.00 | 9.33 | ||||||||||||
| Year ended 12/31/2012 | 26.90 | .36 | 3.59 | 3.95 | ||||||||||||
| Class T: | ||||||||||||||||
| Period from 4/7/2017 to 6/30/20174,5,8 | 38.08 | .18 | .81 | .99 | ||||||||||||
| Class F-1: | ||||||||||||||||
| Six months ended 6/30/20174,5 | 36.15 | .33 | 2.61 | 2.94 | ||||||||||||
| Year ended 12/31/2016 | 33.30 | .62 | 4.18 | 4.80 | ||||||||||||
| Year ended 12/31/2015 | 37.01 | .62 | (1.23 | ) | (.61 | ) | ||||||||||
| Year ended 12/31/2014 | 36.63 | .82 | 3.59 | 4.41 | ||||||||||||
| Year ended 12/31/2013 | 30.11 | .58 | 9.06 | 9.64 | ||||||||||||
| Year ended 12/31/2012 | 27.04 | .58 | 3.62 | 4.20 | ||||||||||||
| Class F-2: | ||||||||||||||||
| Six months ended 6/30/20174,5 | 36.21 | .38 | 2.62 | 3.00 | ||||||||||||
| Year ended 12/31/2016 | 33.36 | .71 | 4.19 | 4.90 | ||||||||||||
| Year ended 12/31/2015 | 37.07 | .72 | (1.23 | ) | (.51 | ) | ||||||||||
| Year ended 12/31/2014 | 36.69 | .90 | 3.62 | 4.52 | ||||||||||||
| Year ended 12/31/2013 | 30.15 | .68 | 9.07 | 9.75 | ||||||||||||
| Year ended 12/31/2012 | 27.08 | .67 | 3.61 | 4.28 | ||||||||||||
| Class F-3: | ||||||||||||||||
| Period from 1/27/2017 to 6/30/20174,5,11 | 37.51 | .35 | 1.39 | 1.74 | ||||||||||||
| 28 | The Investment Company of America |
| Dividends and distributions | ||||||||||||||||||||||||||||||
| Dividends | Total | Ratio of | Ratio of net | |||||||||||||||||||||||||||
| (from net | Distributions | dividends | Net asset | Net assets, | expenses | income | ||||||||||||||||||||||||
| investment | (from capital | and | value, end | Total | end of period | to average | to average | |||||||||||||||||||||||
| income) | gains) | distributions | of period | return3 | (in millions) | net assets | net assets2 | |||||||||||||||||||||||
| $ | (.30 | ) | $ | — | $ | (.30 | ) | $ | 38.90 | 8.20 | %6 | $ | 60,515 | .57 | %7 | 1.85 | %7 | |||||||||||||
| (.69 | ) | (1.30 | ) | (1.99 | ) | 36.23 | 14.59 | 58,402 | .59 | 1.86 | ||||||||||||||||||||
| (.62 | ) | (2.51 | ) | (3.13 | ) | 33.37 | (1.44 | ) | 54,725 | .58 | 1.79 | |||||||||||||||||||
| (.73 | ) | (3.34 | ) | (4.07 | ) | 37.08 | 12.09 | 58,430 | .59 | 2.21 | ||||||||||||||||||||
| (.63 | ) | (2.51 | ) | (3.14 | ) | 36.70 | 32.42 | 55,032 | .61 | 1.76 | ||||||||||||||||||||
| (.72 | ) | (.42 | ) | (1.14 | ) | 30.16 | 15.60 | 44,501 | .62 | 2.02 | ||||||||||||||||||||
| (.15 | ) | — | (.15 | ) | 38.53 | 7.77 | 6 | 1,760 | 1.38 | 7 | 1.04 | 7 | ||||||||||||||||||
| (.40 | ) | (1.30 | ) | (1.70 | ) | 35.89 | 13.70 | 1,710 | 1.39 | 1.06 | ||||||||||||||||||||
| (.32 | ) | (2.51 | ) | (2.83 | ) | 33.08 | (2.24 | ) | 1,635 | 1.39 | .98 | |||||||||||||||||||
| (.41 | ) | (3.34 | ) | (3.75 | ) | 36.77 | 11.20 | 1,774 | 1.39 | 1.41 | ||||||||||||||||||||
| (.35 | ) | (2.51 | ) | (2.86 | ) | 36.42 | 31.36 | 1,791 | 1.41 | .95 | ||||||||||||||||||||
| (.48 | ) | (.42 | ) | (.90 | ) | 29.95 | 14.70 | 1,620 | 1.43 | 1.21 | ||||||||||||||||||||
| (.17 | ) | — | (.17 | ) | 38.90 | 2.60 | 6,9 | — | 10 | .09 | 6,9 | .48 | 6,9 | |||||||||||||||||
| (.28 | ) | — | (.28 | ) | 38.81 | 8.14 | 6 | 2,092 | .68 | 7 | 1.75 | 7 | ||||||||||||||||||
| (.65 | ) | (1.30 | ) | (1.95 | ) | 36.15 | 14.48 | 1,972 | .69 | 1.78 | ||||||||||||||||||||
| (.59 | ) | (2.51 | ) | (3.10 | ) | 33.30 | (1.53 | ) | 2,459 | .67 | 1.70 | |||||||||||||||||||
| (.69 | ) | (3.34 | ) | (4.03 | ) | 37.01 | 12.02 | 2,518 | .67 | 2.13 | ||||||||||||||||||||
| (.61 | ) | (2.51 | ) | (3.12 | ) | 36.63 | 32.32 | 2,366 | .68 | 1.68 | ||||||||||||||||||||
| (.71 | ) | (.42 | ) | (1.13 | ) | 30.11 | 15.58 | 1,842 | .67 | 1.98 | ||||||||||||||||||||
| (.33 | ) | — | (.33 | ) | 38.88 | 8.30 | 6 | 3,925 | .41 | 7 | 2.02 | 7 | ||||||||||||||||||
| (.75 | ) | (1.30 | ) | (2.05 | ) | 36.21 | 14.78 | 4,359 | .41 | 2.02 | ||||||||||||||||||||
| (.69 | ) | (2.51 | ) | (3.20 | ) | 33.36 | (1.26 | ) | 1,950 | .41 | 1.97 | |||||||||||||||||||
| (.80 | ) | (3.34 | ) | (4.14 | ) | 37.07 | 12.31 | 1,762 | .39 | 2.32 | ||||||||||||||||||||
| (.70 | ) | (2.51 | ) | (3.21 | ) | 36.69 | 32.69 | 1,107 | .41 | 1.96 | ||||||||||||||||||||
| (.79 | ) | (.42 | ) | (1.21 | ) | 30.15 | 15.86 | 770 | .40 | 2.25 | ||||||||||||||||||||
| (.36 | ) | — | (.36 | ) | 38.89 | 4.64 | 6 | 2,047 | .13 | 6 | .91 | 6 | ||||||||||||||||||
See page 35 for footnotes.
| The Investment Company of America | 29 |
Financial highlights (continued)
| Income (loss) from investment operations1 | ||||||||||||||||
| Net asset | Net gains (losses) | |||||||||||||||
| value, | Net | on securities (both | Total from | |||||||||||||
| beginning | investment | realized and | investment | |||||||||||||
| of period | income2 | unrealized) | operations | |||||||||||||
| Class 529-A: | ||||||||||||||||
| Six months ended 6/30/20174,5 | $ | 36.15 | $ | .33 | $ | 2.61 | $ | 2.94 | ||||||||
| Year ended 12/31/2016 | 33.30 | .62 | 4.18 | 4.80 | ||||||||||||
| Year ended 12/31/2015 | 37.01 | .62 | (1.24 | ) | (.62 | ) | ||||||||||
| Year ended 12/31/2014 | 36.64 | .81 | 3.58 | 4.39 | ||||||||||||
| Year ended 12/31/2013 | 30.11 | .57 | 9.07 | 9.64 | ||||||||||||
| Year ended 12/31/2012 | 27.05 | .57 | 3.60 | 4.17 | ||||||||||||
| Class 529-C: | ||||||||||||||||
| Six months ended 6/30/20174,5 | 36.03 | .19 | 2.60 | 2.79 | ||||||||||||
| Year ended 12/31/2016 | 33.20 | .35 | 4.16 | 4.51 | ||||||||||||
| Year ended 12/31/2015 | 36.90 | .33 | (1.22 | ) | (.89 | ) | ||||||||||
| Year ended 12/31/2014 | 36.54 | .51 | 3.58 | 4.09 | ||||||||||||
| Year ended 12/31/2013 | 30.04 | .30 | 9.04 | 9.34 | ||||||||||||
| Year ended 12/31/2012 | 26.99 | .34 | 3.59 | 3.93 | ||||||||||||
| Class 529-E: | ||||||||||||||||
| Six months ended 6/30/20174,5 | 36.04 | .29 | 2.61 | 2.90 | ||||||||||||
| Year ended 12/31/2016 | 33.21 | .53 | 4.17 | 4.70 | ||||||||||||
| Year ended 12/31/2015 | 36.91 | .53 | (1.23 | ) | (.70 | ) | ||||||||||
| Year ended 12/31/2014 | 36.55 | .71 | 3.58 | 4.29 | ||||||||||||
| Year ended 12/31/2013 | 30.05 | .49 | 9.03 | 9.52 | ||||||||||||
| Year ended 12/31/2012 | 26.99 | .49 | 3.61 | 4.10 | ||||||||||||
| Class 529-T: | ||||||||||||||||
| Period from 4/7/2017 to 6/30/20174,5,8 | 38.08 | .18 | .81 | .99 | ||||||||||||
| Class 529-F-1: | ||||||||||||||||
| Six months ended 6/30/20174,5 | 36.11 | .37 | 2.62 | 2.99 | ||||||||||||
| Year ended 12/31/2016 | 33.27 | .70 | 4.17 | 4.87 | ||||||||||||
| Year ended 12/31/2015 | 36.98 | .70 | (1.24 | ) | (.54 | ) | ||||||||||
| Year ended 12/31/2014 | 36.61 | .89 | 3.59 | 4.48 | ||||||||||||
| Year ended 12/31/2013 | 30.09 | .65 | 9.05 | 9.70 | ||||||||||||
| Year ended 12/31/2012 | 27.03 | .63 | 3.61 | 4.24 | ||||||||||||
| Class R-1: | ||||||||||||||||
| Six months ended 6/30/20174,5 | 35.97 | .19 | 2.59 | 2.78 | ||||||||||||
| Year ended 12/31/2016 | 33.15 | .37 | 4.15 | 4.52 | ||||||||||||
| Year ended 12/31/2015 | 36.84 | .35 | (1.21 | ) | (.86 | ) | ||||||||||
| Year ended 12/31/2014 | 36.49 | .54 | 3.56 | 4.10 | ||||||||||||
| Year ended 12/31/2013 | 30.01 | .33 | 9.01 | 9.34 | ||||||||||||
| Year ended 12/31/2012 | 26.95 | .36 | 3.60 | 3.96 | ||||||||||||
| 30 | The Investment Company of America |
| Dividends and distributions | ||||||||||||||||||||||||||||||
| Dividends | Total | Ratio of | Ratio of net | |||||||||||||||||||||||||||
| (from net | Distributions | dividends | Net asset | Net assets, | expenses | income | ||||||||||||||||||||||||
| investment | (from capital | and | value, end | Total | end of period | to average | to average | |||||||||||||||||||||||
| income) | gains) | distributions | of period | return3 | (in millions) | net assets | net assets2 | |||||||||||||||||||||||
| $ | (.28 | ) | $ | — | $ | (.28 | ) | $ | 38.81 | 8.15 | %6 | $ | 2,526 | .66 | %7 | 1.76 | %7 | |||||||||||||
| (.65 | ) | (1.30 | ) | (1.95 | ) | 36.15 | 14.49 | 2,351 | .68 | 1.77 | ||||||||||||||||||||
| (.58 | ) | (2.51 | ) | (3.09 | ) | 33.30 | (1.55 | ) | 2,132 | .69 | 1.68 | |||||||||||||||||||
| (.68 | ) | (3.34 | ) | (4.02 | ) | 37.01 | 11.97 | 2,234 | .69 | 2.10 | ||||||||||||||||||||
| (.60 | ) | (2.51 | ) | (3.11 | ) | 36.64 | 32.32 | 2,030 | .71 | 1.66 | ||||||||||||||||||||
| (.69 | ) | (.42 | ) | (1.11 | ) | 30.11 | 15.47 | 1,562 | .72 | 1.93 | ||||||||||||||||||||
| (.14 | ) | — | (.14 | ) | 38.68 | 7.74 | 6 | 531 | 1.43 | 7 | .99 | 7 | ||||||||||||||||||
| (.38 | ) | (1.30 | ) | (1.68 | ) | 36.03 | 13.61 | 504 | 1.45 | 1.00 | ||||||||||||||||||||
| (.30 | ) | (2.51 | ) | (2.81 | ) | 33.20 | (2.31 | ) | 475 | 1.46 | .91 | |||||||||||||||||||
| (.39 | ) | (3.34 | ) | (3.73 | ) | 36.90 | 11.13 | 509 | 1.46 | 1.33 | ||||||||||||||||||||
| (.33 | ) | (2.51 | ) | (2.84 | ) | 36.54 | 31.29 | 471 | 1.49 | .88 | ||||||||||||||||||||
| (.46 | ) | (.42 | ) | (.88 | ) | 30.04 | 14.59 | 372 | 1.50 | 1.14 | ||||||||||||||||||||
| (.24 | ) | — | (.24 | ) | 38.70 | 8.05 | 6 | 89 | .90 | 7 | 1.52 | 7 | ||||||||||||||||||
| (.57 | ) | (1.30 | ) | (1.87 | ) | 36.04 | 14.20 | 84 | .92 | 1.53 | ||||||||||||||||||||
| (.49 | ) | (2.51 | ) | (3.00 | ) | 33.21 | (1.77 | ) | 78 | .93 | 1.44 | |||||||||||||||||||
| (.59 | ) | (3.34 | ) | (3.93 | ) | 36.91 | 11.70 | 82 | .93 | 1.86 | ||||||||||||||||||||
| (.51 | ) | (2.51 | ) | (3.02 | ) | 36.55 | 31.96 | 77 | .95 | 1.41 | ||||||||||||||||||||
| (.62 | ) | (.42 | ) | (1.04 | ) | 30.05 | 15.23 | 61 | .97 | 1.68 | ||||||||||||||||||||
| (.17 | ) | — | (.17 | ) | 38.90 | 2.59 | 6,9 | — | 10 | .10 | 6,9 | .47 | 6,9 | |||||||||||||||||
| (.33 | ) | — | (.33 | ) | 38.77 | 8.28 | 6 | 76 | .44 | 7 | 1.99 | 7 | ||||||||||||||||||
| (.73 | ) | (1.30 | ) | (2.03 | ) | 36.11 | 14.73 | 70 | .46 | 1.99 | ||||||||||||||||||||
| (.66 | ) | (2.51 | ) | (3.17 | ) | 33.27 | (1.32 | ) | 61 | .47 | 1.91 | |||||||||||||||||||
| (.77 | ) | (3.34 | ) | (4.11 | ) | 36.98 | 12.23 | 61 | .46 | 2.32 | ||||||||||||||||||||
| (.67 | ) | (2.51 | ) | (3.18 | ) | 36.61 | 32.59 | 51 | .49 | 1.88 | ||||||||||||||||||||
| (.76 | ) | (.42 | ) | (1.18 | ) | 30.09 | 15.74 | 37 | .50 | 2.15 | ||||||||||||||||||||
| (.14 | ) | — | (.14 | ) | 38.61 | 7.74 | 6 | 86 | 1.40 | 7 | 1.03 | 7 | ||||||||||||||||||
| (.40 | ) | (1.30 | ) | (1.70 | ) | 35.97 | 13.66 | 85 | 1.40 | 1.05 | ||||||||||||||||||||
| (.32 | ) | (2.51 | ) | (2.83 | ) | 33.15 | (2.22 | ) | 83 | 1.40 | .97 | |||||||||||||||||||
| (.41 | ) | (3.34 | ) | (3.75 | ) | 36.84 | 11.19 | 94 | 1.40 | 1.40 | ||||||||||||||||||||
| (.35 | ) | (2.51 | ) | (2.86 | ) | 36.49 | 31.36 | 87 | 1.40 | .96 | ||||||||||||||||||||
| (.48 | ) | (.42 | ) | (.90 | ) | 30.01 | 14.74 | 73 | 1.41 | 1.23 | ||||||||||||||||||||
See page 35 for footnotes.
| The Investment Company of America | 31 |
Financial highlights (continued)
| Income (loss) from investment operations1 | ||||||||||||||||
| Net asset | Net gains (losses) | |||||||||||||||
| value, | Net | on securities (both | Total from | |||||||||||||
| beginning | investment | realized and | investment | |||||||||||||
| of period | income2 | unrealized) | operations | |||||||||||||
| Class R-2: | ||||||||||||||||
| Six months ended 6/30/20174,5 | $ | 36.01 | $ | .19 | $ | 2.60 | $ | 2.79 | ||||||||
| Year ended 12/31/2016 | 33.18 | .37 | 4.16 | 4.53 | ||||||||||||
| Year ended 12/31/2015 | 36.88 | .37 | (1.23 | ) | (.86 | ) | ||||||||||
| Year ended 12/31/2014 | 36.53 | .55 | 3.56 | 4.11 | ||||||||||||
| Year ended 12/31/2013 | 30.03 | .34 | 9.04 | 9.38 | ||||||||||||
| Year ended 12/31/2012 | 26.98 | .37 | 3.59 | 3.96 | ||||||||||||
| Class R-2E: | ||||||||||||||||
| Six months ended 6/30/20174,5 | 36.15 | .26 | 2.61 | 2.87 | ||||||||||||
| Year ended 12/31/2016 | 33.33 | .47 | 4.19 | 4.66 | ||||||||||||
| Year ended 12/31/2015 | 37.06 | .51 | (1.23 | ) | (.72 | ) | ||||||||||
| Period from 8/29/2014 to 12/31/20144,12 | 40.36 | .25 | .25 | .50 | ||||||||||||
| Class R-3: | ||||||||||||||||
| Six months ended 6/30/20174,5 | 36.11 | .28 | 2.61 | 2.89 | ||||||||||||
| Year ended 12/31/2016 | 33.27 | .52 | 4.18 | 4.70 | ||||||||||||
| Year ended 12/31/2015 | 36.97 | .52 | (1.23 | ) | (.71 | ) | ||||||||||
| Year ended 12/31/2014 | 36.60 | .71 | 3.58 | 4.29 | ||||||||||||
| Year ended 12/31/2013 | 30.09 | .48 | 9.05 | 9.53 | ||||||||||||
| Year ended 12/31/2012 | 27.03 | .49 | 3.60 | 4.09 | ||||||||||||
| Class R-4: | ||||||||||||||||
| Six months ended 6/30/20174,5 | 36.14 | .34 | 2.61 | 2.95 | ||||||||||||
| Year ended 12/31/2016 | 33.29 | .63 | 4.19 | 4.82 | ||||||||||||
| Year ended 12/31/2015 | 37.00 | .63 | (1.23 | ) | (.60 | ) | ||||||||||
| Year ended 12/31/2014 | 36.63 | .83 | 3.58 | 4.41 | ||||||||||||
| Year ended 12/31/2013 | 30.11 | .59 | 9.06 | 9.65 | ||||||||||||
| Year ended 12/31/2012 | 27.04 | .59 | 3.61 | 4.20 | ||||||||||||
| Class R-5E: | ||||||||||||||||
| Six months ended 6/30/20174,5 | 36.20 | .38 | 2.62 | 3.00 | ||||||||||||
| Year ended 12/31/2016 | 33.36 | .62 | 4.24 | 4.86 | ||||||||||||
| Period from 11/20/2015 to 12/31/20154,13 | 36.83 | .07 | (1.08 | ) | (1.01 | ) | ||||||||||
| Class R-5: | ||||||||||||||||
| Six months ended 6/30/20174,5 | 36.22 | .39 | 2.62 | 3.01 | ||||||||||||
| Year ended 12/31/2016 | 33.36 | .74 | 4.18 | 4.92 | ||||||||||||
| Year ended 12/31/2015 | 37.07 | .74 | (1.23 | ) | (.49 | ) | ||||||||||
| Year ended 12/31/2014 | 36.69 | .96 | 3.58 | 4.54 | ||||||||||||
| Year ended 12/31/2013 | 30.15 | .70 | 9.07 | 9.77 | ||||||||||||
| Year ended 12/31/2012 | 27.08 | .68 | 3.61 | 4.29 | ||||||||||||
| 32 | The Investment Company of America |
| Dividends and distributions | ||||||||||||||||||||||||||||||
| Dividends | Total | Ratio of | Ratio of net | |||||||||||||||||||||||||||
| (from net | Distributions | dividends | Net asset | Net assets, | expenses | income | ||||||||||||||||||||||||
| investment | (from capital | and | value, end | Total | end of period | to average | to average | |||||||||||||||||||||||
| income) | gains) | distributions | of period | return3 | (in millions) | net assets | net assets2 | |||||||||||||||||||||||
| $ | (.14 | ) | $ | — | $ | (.14 | ) | $ | 38.66 | 7.76 | %6 | $ | 667 | 1.40 | %7 | 1.03 | %7 | |||||||||||||
| (.40 | ) | (1.30 | ) | (1.70 | ) | 36.01 | 13.68 | 653 | 1.39 | 1.06 | ||||||||||||||||||||
| (.33 | ) | (2.51 | ) | (2.84 | ) | 33.18 | (2.21 | ) | 637 | 1.36 | 1.01 | |||||||||||||||||||
| (.42 | ) | (3.34 | ) | (3.76 | ) | 36.88 | 11.20 | 722 | 1.37 | 1.43 | ||||||||||||||||||||
| (.37 | ) | (2.51 | ) | (2.88 | ) | 36.53 | 31.45 | 698 | 1.36 | 1.00 | ||||||||||||||||||||
| (.49 | ) | (.42 | ) | (.91 | ) | 30.03 | 14.70 | 584 | 1.40 | 1.25 | ||||||||||||||||||||
| (.22 | ) | — | (.22 | ) | 38.80 | 7.93 | 6 | 29 | 1.09 | 7 | 1.37 | 7 | ||||||||||||||||||
| (.54 | ) | (1.30 | ) | (1.84 | ) | 36.15 | 14.03 | 16 | 1.09 | 1.32 | ||||||||||||||||||||
| (.50 | ) | (2.51 | ) | (3.01 | ) | 33.33 | (1.83 | ) | 1 | 1.04 | 1.48 | |||||||||||||||||||
| (.46 | ) | (3.34 | ) | (3.80 | ) | 37.06 | 1.08 | 6,9 | — | 10 | .23 | 6,9 | .62 | 6,9 | ||||||||||||||||
| (.23 | ) | — | (.23 | ) | 38.77 | 8.01 | 6 | 978 | .95 | 7 | 1.48 | 7 | ||||||||||||||||||
| (.56 | ) | (1.30 | ) | (1.86 | ) | 36.11 | 14.17 | 951 | .95 | 1.50 | ||||||||||||||||||||
| (.48 | ) | (2.51 | ) | (2.99 | ) | 33.27 | (1.79 | ) | 860 | .95 | 1.41 | |||||||||||||||||||
| (.58 | ) | (3.34 | ) | (3.92 | ) | 36.97 | 11.68 | 936 | .96 | 1.83 | ||||||||||||||||||||
| (.51 | ) | (2.51 | ) | (3.02 | ) | 36.60 | 31.94 | 912 | .96 | 1.40 | ||||||||||||||||||||
| (.61 | ) | (.42 | ) | (1.03 | ) | 30.09 | 15.19 | 743 | .98 | 1.67 | ||||||||||||||||||||
| (.29 | ) | — | (.29 | ) | 38.80 | 8.16 | 6 | 1,635 | .65 | 7 | 1.78 | 7 | ||||||||||||||||||
| (.67 | ) | (1.30 | ) | (1.97 | ) | 36.14 | 14.55 | 1,518 | .64 | 1.80 | ||||||||||||||||||||
| (.60 | ) | (2.51 | ) | (3.11 | ) | 33.29 | (1.50 | ) | 983 | .64 | 1.73 | |||||||||||||||||||
| (.70 | ) | (3.34 | ) | (4.04 | ) | 37.00 | 12.02 | 998 | .65 | 2.15 | ||||||||||||||||||||
| (.62 | ) | (2.51 | ) | (3.13 | ) | 36.63 | 32.37 | 909 | .65 | 1.72 | ||||||||||||||||||||
| (.71 | ) | (.42 | ) | (1.13 | ) | 30.11 | 15.60 | 705 | .65 | 2.00 | ||||||||||||||||||||
| (.32 | ) | — | (.32 | ) | 38.88 | 8.30 | 6 | 3 | .43 | 7 | 1.99 | 7 | ||||||||||||||||||
| (.72 | ) | (1.30 | ) | (2.02 | ) | 36.20 | 14.69 | 3 | .43 | 1.71 | ||||||||||||||||||||
| (.21 | ) | (2.25 | ) | (2.46 | ) | 33.36 | (2.64 | )6 | — | 10 | .05 | 6 | .20 | 6 | ||||||||||||||||
| (.34 | ) | — | (.34 | ) | 38.89 | 8.32 | 6 | 288 | .35 | 7 | 2.08 | 7 | ||||||||||||||||||
| (.76 | ) | (1.30 | ) | (2.06 | ) | 36.22 | 14.85 | 262 | .35 | 2.12 | ||||||||||||||||||||
| (.71 | ) | (2.51 | ) | (3.22 | ) | 33.36 | (1.20 | ) | 755 | .35 | 2.02 | |||||||||||||||||||
| (.82 | ) | (3.34 | ) | (4.16 | ) | 37.07 | 12.36 | 820 | .35 | 2.50 | ||||||||||||||||||||
| (.72 | ) | (2.51 | ) | (3.23 | ) | 36.69 | 32.77 | 854 | .35 | 2.02 | ||||||||||||||||||||
| (.80 | ) | (.42 | ) | (1.22 | ) | 30.15 | 15.92 | 697 | .35 | 2.28 | ||||||||||||||||||||
See page 35 for footnotes.
| The Investment Company of America | 33 |
Financial highlights (continued)
| Income (loss) from investment operations1 | ||||||||||||||||
| Net asset | Net gains (losses) | |||||||||||||||
| value, | Net | on securities (both | Total from | |||||||||||||
| beginning | investment | realized and | investment | |||||||||||||
| of period | income2 | unrealized) | operations | |||||||||||||
| Class R-6: | ||||||||||||||||
| Six months ended 6/30/20174,5 | $ | 36.22 | $ | .40 | $ | 2.62 | $ | 3.02 | ||||||||
| Year ended 12/31/2016 | 33.36 | .75 | 4.20 | 4.95 | ||||||||||||
| Year ended 12/31/2015 | 37.07 | .76 | (1.24 | ) | (.48 | ) | ||||||||||
| Year ended 12/31/2014 | 36.69 | .95 | 3.61 | 4.56 | ||||||||||||
| Year ended 12/31/2013 | 30.15 | .71 | 9.08 | 9.79 | ||||||||||||
| Year ended 12/31/2012 | 27.08 | .69 | 3.62 | 4.31 | ||||||||||||
| Six months ended | Year ended December 31 | ||||||||||
| June 30, 20174,5,6 | 2016 | 2015 | 2014 | 2013 | 2012 | ||||||
| Portfolio turnover rate for all share classes | 15% | 25% | 30% | 29% | 24% | 21% | |||||
See Notes to Financial Statements
| 34 | The Investment Company of America |
| Dividends and distributions | ||||||||||||||||||||||||||||||
| Dividends | Total | Ratio of | Ratio of net | |||||||||||||||||||||||||||
| (from net | Distributions | dividends | Net asset | Net assets, | expenses | income | ||||||||||||||||||||||||
| investment | (from capital | and | value, end | Total | end of period | to average | to average | |||||||||||||||||||||||
| income) | gains) | distributions | of period | return3 | (in millions) | net assets | net assets2 | |||||||||||||||||||||||
| $ | (.35 | ) | $ | — | $ | (.35 | ) | $ | 38.89 | 8.36 | %6 | $ | 9,671 | .30 | %7 | 2.14 | %7 | |||||||||||||
| (.79 | ) | (1.30 | ) | (2.09 | ) | 36.22 | 14.92 | 6,977 | .30 | 2.14 | ||||||||||||||||||||
| (.72 | ) | (2.51 | ) | (3.23 | ) | 33.36 | (1.15 | ) | 4,875 | .30 | 2.08 | |||||||||||||||||||
| (.84 | ) | (3.34 | ) | (4.18 | ) | 37.07 | 12.41 | 4,160 | .30 | 2.45 | ||||||||||||||||||||
| (.74 | ) | (2.51 | ) | (3.25 | ) | 36.69 | 32.84 | 3,005 | .30 | 2.07 | ||||||||||||||||||||
| (.82 | ) | (.42 | ) | (1.24 | ) | 30.15 | 15.98 | 2,995 | .30 | 2.34 | ||||||||||||||||||||
| 1 | Based on average shares outstanding. |
| 2 | For the year ended December 31, 2014, this column reflects the impact of a corporate action event that resulted in a one-time increase to net investment income. If the corporate action event had not occurred, the Class A net investment income per share and ratio of net income to average net assets would have been lower by $.20 and .52 percentage points, respectively. The impact to the other share classes would have been similar. |
| 3 | Total returns exclude any applicable sales charges, including contingent deferred sales charges. |
| 4 | Based on operations for the period shown and, accordingly, is not representative of a full year. |
| 5 | Unaudited. |
| 6 | Not annualized. |
| 7 | Annualized. |
| 8 | Class T and 529-T shares began investment operations on April 7, 2017. |
| 9 | All or a significant portion of assets in this class consisted of seed capital invested by CRMC and/or its affiliates. Fees for distribution services are not charged or accrued on these seed capital assets. If such fees were paid by the fund on seed capital assets, fund expenses would have been higher and net income and total return would have been lower. |
| 10 | Amount less than $1 million. |
| 11 | Class F-3 shares began investment operations on January 27, 2017. |
| 12 | Class R-2E shares began investment operations on August 29, 2014. |
| 13 | Class R-5E shares began investment operations on November 20, 2015. |
| The Investment Company of America | 35 |
| Expense example | unaudited |
As a fund shareholder, you incur two types of costs: (1) transaction costs, such as initial sales charges on purchase payments and contingent deferred sales charges on redemptions (loads), and (2) ongoing costs, including management fees, distribution and service (12b-1) fees, and other expenses. This example is intended to help you understand your ongoing costs (in dollars) of investing in the fund so you can compare these costs with the ongoing costs of investing in other mutual funds. The example is based on an investment of $1,000 invested at the beginning of the period and held for the entire six-month period (January 1, 2017, through June 30, 2017).
Actual expenses:
The first line of each share class in the table on the following page provides information about actual account values and actual expenses. You may use the information in this line, together with the amount you invested, to estimate the expenses that you paid over the period. Simply divide your account value by $1,000 (for example, an $8,600 account value divided by $1,000 = 8.6), then multiply the result by the number in the first line under the heading titled “Expenses paid during period” to estimate the expenses you paid on your account during this period.
Hypothetical example for comparison purposes:
The second line of each share class in the table on the following page provides information about hypothetical account values and hypothetical expenses based on the actual expense ratio for the share class and an assumed rate of return of 5.00% per year before expenses, which is not the actual return of the share class. The hypothetical account values and expenses may not be used to estimate the actual ending account balance or expenses you paid for the period. You may use this information to compare the ongoing costs of investing in the fund and other funds. To do so, compare this 5.00% hypothetical example with the 5.00% hypothetical examples that appear in the shareholder reports of the other funds.
Notes:
Retirement plan participants may be subject to certain fees charged by the plan sponsor, and Class F-1, F-2, F-3 and 529-F-1 shareholders may be subject to fees charged by financial intermediaries, typically ranging from 0.75% to 1.50% of assets annually depending on services offered. You can estimate the impact of these fees by adding the amount of the fees to the total estimated expenses you paid on your account during the period as calculated above. In addition, your ending account value would be lower by the amount of these fees.
Note that the expenses shown in the table on the following page are meant to highlight your ongoing costs only and do not reflect any transactional costs, such as sales charges (loads). Therefore, the second line of each share class in the table is useful in comparing ongoing costs only and will not help you determine the relative total costs of owning different funds. In addition, if these transactional costs were included, your costs would have been higher.
| 36 | The Investment Company of America |
| Beginning account value 1/1/2017 | Ending account value 6/30/2017 | Expenses paid during period1 | Annualized expense ratio | |||||||||||||
| Class A - actual return | $ | 1,000.00 | $ | 1,082.04 | $ | 2.94 | .57 | % | ||||||||
| Class A - assumed 5% return | 1,000.00 | 1,021.97 | 2.86 | .57 | ||||||||||||
| Class C - actual return | 1,000.00 | 1,077.72 | 7.11 | 1.38 | ||||||||||||
| Class C - assumed 5% return | 1,000.00 | 1,017.95 | 6.90 | 1.38 | ||||||||||||
| Class T - actual return2 | 1,000.00 | 1,025.99 | .93 | .40 | ||||||||||||
| Class T - assumed 5% return2 | 1,000.00 | 1,022.81 | 2.01 | .40 | ||||||||||||
| Class F-1 - actual return | 1,000.00 | 1,081.44 | 3.51 | .68 | ||||||||||||
| Class F-1 - assumed 5% return | 1,000.00 | 1,021.42 | 3.41 | .68 | ||||||||||||
| Class F-2 - actual return | 1,000.00 | 1,082.96 | 2.12 | .41 | ||||||||||||
| Class F-2 - assumed 5% return | 1,000.00 | 1,022.76 | 2.06 | .41 | ||||||||||||
| Class F-3 - actual return3 | 1,000.00 | 1,046.37 | 1.34 | .31 | ||||||||||||
| Class F-3 - assumed 5% return3 | 1,000.00 | 1,023.26 | 1.56 | .31 | ||||||||||||
| Class 529-A - actual return | 1,000.00 | 1,081.48 | 3.41 | .66 | ||||||||||||
| Class 529-A - assumed 5% return | 1,000.00 | 1,021.52 | 3.31 | .66 | ||||||||||||
| Class 529-C - actual return | 1,000.00 | 1,077.43 | 7.37 | 1.43 | ||||||||||||
| Class 529-C - assumed 5% return | 1,000.00 | 1,017.70 | 7.15 | 1.43 | ||||||||||||
| Class 529-E - actual return | 1,000.00 | 1,080.47 | 4.64 | .90 | ||||||||||||
| Class 529-E - assumed 5% return | 1,000.00 | 1,020.33 | 4.51 | .90 | ||||||||||||
| Class 529-T - actual return2 | 1,000.00 | 1,025.87 | 1.00 | .43 | ||||||||||||
| Class 529-T - assumed 5% return2 | 1,000.00 | 1,022.66 | 2.16 | .43 | ||||||||||||
| Class 529-F-1 - actual return | 1,000.00 | 1,082.77 | 2.27 | .44 | ||||||||||||
| Class 529-F-1 - assumed 5% return | 1,000.00 | 1,022.61 | 2.21 | .44 | ||||||||||||
| Class R-1 - actual return | 1,000.00 | 1,077.41 | 7.21 | 1.40 | ||||||||||||
| Class R-1 - assumed 5% return | 1,000.00 | 1,017.85 | 7.00 | 1.40 | ||||||||||||
| Class R-2 - actual return | 1,000.00 | 1,077.65 | 7.21 | 1.40 | ||||||||||||
| Class R-2 - assumed 5% return | 1,000.00 | 1,017.85 | 7.00 | 1.40 | ||||||||||||
| Class R-2E - actual return | 1,000.00 | 1,079.34 | 5.62 | 1.09 | ||||||||||||
| Class R-2E - assumed 5% return | 1,000.00 | 1,019.39 | 5.46 | 1.09 | ||||||||||||
| Class R-3 - actual return | 1,000.00 | 1,080.09 | 4.90 | .95 | ||||||||||||
| Class R-3 - assumed 5% return | 1,000.00 | 1,020.08 | 4.76 | .95 | ||||||||||||
| Class R-4 - actual return | 1,000.00 | 1,081.59 | 3.35 | .65 | ||||||||||||
| Class R-4 - assumed 5% return | 1,000.00 | 1,021.57 | 3.26 | .65 | ||||||||||||
| Class R-5E - actual return | 1,000.00 | 1,083.04 | 2.22 | .43 | ||||||||||||
| Class R-5E - assumed 5% return | 1,000.00 | 1,022.66 | 2.16 | .43 | ||||||||||||
| Class R-5 - actual return | 1,000.00 | 1,083.24 | 1.81 | .35 | ||||||||||||
| Class R-5 - assumed 5% return | 1,000.00 | 1,023.06 | 1.76 | .35 | ||||||||||||
| Class R-6 - actual return | 1,000.00 | 1,083.55 | 1.55 | .30 | ||||||||||||
| Class R-6 - assumed 5% return | 1,000.00 | 1,023.31 | 1.51 | .30 | ||||||||||||
See page 38 for footnotes.
| The Investment Company of America | 37 |
| 1 | The “expenses paid during period” are equal to the “annualized expense ratio,” multiplied by the average account value over the period, multiplied by the number of days in the period, and divided by 365 (to reflect the one-half year period). |
| 2 | The period for the “annualized expense ratio” and “actual return” line is based on the number of days since the share class began investment operations on April 7, 2017. The “assumed 5% return” line is based on 181 days. |
| 3 | The period for the “annualized expense ratio” and “actual return” line is based on the number of days since the share class began investment operations on January 27, 2017. The “assumed 5% return” line is based on 181 days. |
| 38 | The Investment Company of America |
Approval of Investment Advisory and Service Agreement
The Investment Company of America’s board has approved the fund’s Investment Advisory and Service Agreement (the “agreement”) with Capital Research and Management Company (“CRMC”) for an additional one-year term through April 30, 2018. The board approved the agreement following the recommendation of the fund’s Contracts Committee (the “committee”), which is composed of all of the fund’s independent board members. The board and the committee determined that the fund’s advisory fee structure was fair and reasonable in relation to the services provided, and that approving the agreement was in the best interests of the fund and its shareholders.
In reaching this decision, the board and the committee took into account information furnished to them throughout the year and otherwise provided to them, as well as information prepared specifically in connection with their review of the agreement, and were advised by their independent counsel. They considered the following factors, among others, but did not identify any single issue or particular piece of information that, in isolation, was the controlling factor, and each board and committee member did not necessarily attribute the same weight to each factor.
1. Nature, extent and quality of services
The board and the committee considered the depth and quality of CRMC’s investment management process, including its global research capabilities; the experience, capability and integrity of its senior management and other personnel; the low turnover rates of its key personnel; the overall financial strength and stability of CRMC and the Capital Group organization; and the ongoing evolution of CRMC’s organizational structure designed to maintain and strengthen these qualities. The board and the committee also considered the nature, extent and quality of administrative, compliance and shareholder services provided by CRMC to the fund under the agreement and other agreements, as well as the benefits to fund shareholders from investing in a fund that is part of a large family of funds. The board and the committee concluded that the nature, extent and quality of the services provided by CRMC have benefited and should continue to benefit the fund and its shareholders.
2. Investment results
The board and the committee considered the investment results of the fund in light of its objectives of achieving long-term growth of capital and income. They compared the fund’s investment results with those of other funds (including funds that currently form the basis of the Lipper index for the category in which the fund is included), and data such as relevant market and fund indexes, over various periods through September 30, 2016. This report, including the letter to shareholders and related
| The Investment Company of America | 39 |
disclosures, contains certain information about the fund’s investment results. The board and the committee reviewed the fund’s investment results measured against various indexes, including the Lipper Growth and Income Funds Index, the Lipper Large-Cap Core Funds Index and the S&P 500 Index. They noted that the investment results of the fund generally compared favorably to the results of the two Lipper indexes for the 20-year, 10-year, 5-year and year-to-date periods, and favorably to the results of the S&P 500 Index for the fund’s lifetime period and 20-year period and mixed for shorter periods. The board and the committee concluded that the fund’s investment results have been satisfactory for renewal of the agreement, and that CRMC’s record in managing the fund indicated that its continued management should benefit the fund and its shareholders.
3. Advisory fees and total expenses
The board and the committee compared the advisory fees and total expense levels of the fund to those of other relevant funds. They observed that the fund’s advisory fees and expenses generally compared favorably to those of other similar funds included in the Lipper Growth and Income Funds category. The board and the committee also considered the breakpoint discounts in the fund’s advisory fee structure that reduce the level of fees charged by CRMC to the fund as fund assets increase. In addition, they reviewed information regarding the effective advisory fees charged to non-mutual fund clients by CRMC and its affiliates. They noted that, to the extent there were differences between the advisory fees paid by the fund and the advisory fees paid by those clients, the differences appropriately reflected the investment, operational, regulatory and market differences between advising the fund and the other clients. The board and the committee concluded that the fund’s cost structure was fair and reasonable in relation to the services provided, and that the fund’s shareholders receive reasonable value in return for the advisory fees and other amounts paid to CRMC by the fund.
4. Ancillary benefits
The board and the committee considered a variety of other benefits that CRMC and its affiliates receive as a result of CRMC’s relationship with the fund and other American Funds, including fees for administrative services provided to certain share classes; fees paid to CRMC’s affiliated transfer agent; sales charges and distribution fees received and retained by the fund’s principal underwriter, an affiliate of CRMC; and possible ancillary benefits to CRMC and its institutional management affiliates in managing other investment vehicles. The board and the committee reviewed CRMC’s portfolio trading practices, noting the benefits CRMC receives from the research obtained with commissions from portfolio transactions made on behalf of the fund. The board and the committee took these ancillary benefits into account in evaluating the reasonableness of the advisory fees and other amounts paid to CRMC by the fund.
| 40 | The Investment Company of America |
5. Adviser financial information
The board and the committee reviewed information regarding CRMC’s costs of providing services to the American Funds, including personnel, systems and resources of investment, compliance, trading, accounting and other administrative operations. They considered CRMC’s costs and related cost allocation methodology as well as its willingness to invest in technology, infrastructure and staff to maintain and expand services and capabilities, respond to industry and regulatory developments, and attract and retain qualified personnel. They noted information regarding the compensation structure for CRMC’s investment professionals. The board and the committee also compared CRMC’s profitability and compensation data to the reported results and data of several large, publicly held investment management companies. The board and the committee noted the competitiveness and cyclicality of both the mutual fund industry and the capital markets, and the importance in that environment of CRMC’s long-term profitability for maintaining its independence, company culture and management continuity. They further considered the breakpoint discounts in the fund’s advisory fee structure. The board and the committee concluded that the fund’s advisory fee structure reflected a reasonable sharing of benefits between CRMC and the fund’s shareholders.
| The Investment Company of America | 41 |
This page was intentionally left blank.
| 42 | The Investment Company of America |
This page was intentionally left blank.
| The Investment Company of America | 43 |
Offices of the fund and of the investment adviser
Capital Research and Management Company
333 South Hope Street
Los Angeles, CA 90071-1406
6455 Irvine Center Drive
Irvine, CA 92618-4518
Transfer agent for shareholder accounts
American Funds Service Company
(Write to the address near you.)
P.O. Box 6007
Indianapolis, IN 46206-6007
P.O. Box 2280
Norfolk, VA 23501-2280
Custodian of assets
JPMorgan Chase Bank
270 Park Avenue
New York, NY 10017-2070
Counsel
O’Melveny & Myers LLP
400 South Hope Street
Los Angeles, CA 90071-2899
Independent registered public accounting firm
Deloitte & Touche LLP
695 Town Center Drive
Suite 1200
Costa Mesa, CA 92626-7188
Principal underwriter
American Funds Distributors, Inc.
333 South Hope Street
Los Angeles, CA 90071-1406
| 44 | The Investment Company of America |
Investors should carefully consider investment objectives, risks, charges and expenses. This and other important information is contained in the fund prospectus and summary prospectus, which can be obtained from your financial professional and should be read carefully before investing. You may also call American Funds Service Company (AFS) at (800) 421-4225 or visit the American Funds website at americanfunds.com. Securities offered through American Funds Distributors, Inc.
“American Funds Proxy Voting Procedures and Principles” — which describes how we vote proxies relating to portfolio securities — is available on the American Funds website or upon request by calling AFS. The fund files its proxy voting record with the U.S. Securities and Exchange Commission (SEC) for the 12 months ended June 30 by August 31. The proxy voting record is available free of charge on the SEC website at sec.gov and on the American Funds website.
A complete June 30, 2017, portfolio of The Investment Company of America’s investments is available free of charge by calling AFS or visiting the SEC website (where it is part of Form N-CSR).
The Investment Company of America files a complete list of its portfolio holdings with the SEC for the first and third quarters of each fiscal year on Form N-Q. This filing is available free of charge on the SEC website. You may also review or, for a fee, copy this filing at the SEC’s Public Reference Room in Washington, D.C. Additional information regarding the operation of the Public Reference Room may be obtained by calling the SEC’s Office of Investor Education and Advocacy at (800) SEC-0330. Additionally, the list of portfolio holdings is available by calling AFS.
This report is for the information of shareholders of The Investment Company of America, but it also may be used as sales literature when preceded or accompanied by the current prospectus or summary prospectus, which gives details about charges, expenses, investment objectives and operating policies of the fund. If used as sales material after September 30, 2017, this report must be accompanied by an American Funds statistical update for the most recently completed calendar quarter.
Standard & Poor’s 500 Composite Index is a product of S&P Dow Jones Indices LLC and/or its affiliates and has been licensed for use by Capital Group. Copyright © 2017 S&P Dow Jones Indices LLC, a division of S&P Global, and/or its affiliates. All rights reserved. Redistribution or reproduction in whole or in part are prohibited without written permission of S&P Dow Jones Indices LLC.
American Funds from Capital Group
The Capital AdvantageSM
Since 1931, American Funds, part of Capital Group, has helped investors pursue long-term investment success. Our consistent approach — in combination with The Capital SystemSM — has resulted in a superior long-term track record.
| Aligned with investor success | |
| We base our decisions on a long-term perspective, which we believe aligns our goals with the interests of our clients. Our portfolio managers average 27 years of investment experience, including 21 years at our company, reflecting a career commitment to our long-term approach.1 | |
| The Capital System | |
| The Capital System combines individual accountability with teamwork. Funds using The Capital System are divided into portions that are managed independently by investment professionals with diverse backgrounds, ages and investment approaches. An extensive global research effort is the backbone of our system. | |
| American Funds’ superior long-term track record | |
| Equity funds have beaten their Lipper peer indexes in 93% of 10-year periods and 98% of 20-year periods. Fixed income funds have beaten their Lipper indexes in 80% of 10-year periods and 80% of 20-year periods.2 Fund management fees have been among the lowest in the industry.3 |
| 1 | Portfolio manager experience as of December 31, 2016. | |
| 2 | Based on Class F-2 share results for rolling periods through December 31, 2016. Periods covered are the shorter of the fund’s lifetime or since the comparable Lipper index inception date (except Capital Income Builder and SMALLCAP World Fund, for which the Lipper average was used). Expenses differ for each share class, so results will vary. Class F-2 shares were first offered on August 1, 2008. Class F-2 share results prior to the date of first sale are hypothetical based on Class A share results without a sales charge, adjusted for typical estimated expenses. Results for certain funds with an inception date after August 1, 2008, also include hypothetical returns because those funds’ Class F-2 shares sold after the funds’ date of first offering. Please see americanfunds.com for more information on specific expense adjustments and the actual dates of first sale. | |
| 3 | On average, our management fees were in the lowest quintile 73% of the time, based on the 20-year period ended December 31, 2016, versus comparable Lipper categories, excluding funds of funds. |

ITEM 2 – Code of Ethics
Not applicable for filing of semi-annual reports to shareholders.
ITEM 3 – Audit Committee Financial Expert
Not applicable for filing of semi-annual reports to shareholders.
ITEM 4 – Principal Accountant Fees and Services
Not applicable for filing of semi-annual reports to shareholders.
ITEM 5 – Audit Committee of Listed Registrants
Not applicable to this Registrant, insofar as the Registrant is not a listed issuer as defined in Rule 10A-3 under the Securities Exchange Act of 1934.
ITEM 6 – Schedule of Investments

The Investment Company of America®
Investment portfolio
June 30, 2017
unaudited
| Common stocks91.31% Energy7.26% | Shares | Value (000) |
| Apache Corp. | 2,850,000 | $136,600 |
| BP PLC | 26,748,508 | 154,265 |
| Canadian Natural Resources, Ltd. | 17,555,082 | 506,563 |
| Chesapeake Energy Corp.1 | 20,000,000 | 99,400 |
| Chevron Corp. | 4,500,000 | 469,485 |
| Concho Resources Inc.1 | 3,271,000 | 397,525 |
| ConocoPhillips | 6,403,000 | 281,476 |
| Enbridge Inc. | 1,937,272 | 77,123 |
| Eni SpA | 11,785,561 | 177,145 |
| EOG Resources, Inc. | 8,746,200 | 791,706 |
| Exxon Mobil Corp. | 6,900,835 | 557,104 |
| Halliburton Co. | 7,900,000 | 337,409 |
| Kinder Morgan, Inc. | 5,875,000 | 112,565 |
| Noble Energy, Inc. | 13,233,159 | 374,498 |
| Plains GP Holdings, LP, Class A | 7,022,431 | 183,707 |
| Range Resources Corp. | 2,992,000 | 69,325 |
| Royal Dutch Shell PLC, Class A | 2,033,011 | 53,885 |
| Royal Dutch Shell PLC, Class A (ADR) | 2,076,138 | 110,430 |
| Royal Dutch Shell PLC, Class B | 8,807,417 | 236,594 |
| Schlumberger Ltd. | 5,115,000 | 336,772 |
| Southwestern Energy Co.1 | 5,777,540 | 35,127 |
| Suncor Energy Inc. | 11,216,292 | 327,718 |
| TOTAL SA | 9,770,506 | 483,034 |
| 6,309,456 | ||
| Materials3.67% | ||
| Agrium Inc. | 1,300,000 | 117,820 |
| Barrick Gold Corp. | 1,725,000 | 27,445 |
| BHP Billiton PLC | 8,507,000 | 130,300 |
| Dow Chemical Co. | 11,475,000 | 723,728 |
| Freeport-McMoRan Inc.1 | 53,517,060 | 642,740 |
| Glencore PLC | 16,541,000 | 61,874 |
| International Flavors & Fragrances Inc. | 1,824,353 | 246,288 |
| Monsanto Co. | 489,000 | 57,878 |
| Praxair, Inc. | 3,753,300 | 497,500 |
| Rio Tinto PLC | 2,627,000 | 110,926 |
| Vale SA, Class A, preferred nominative | 15,319,100 | 124,434 |
| Vale SA, Class A, preferred nominative (ADR) | 51,663,730 | 421,059 |
| Vale SA, ordinary nominative (ADR) | 3,333,343 | 29,167 |
| 3,191,159 | ||
| Industrials8.54% | ||
| 3M Co. | 425,000 | 88,481 |
| Airbus SE, non-registered shares | 1,450,000 | 119,240 |
| BAE Systems PLC | 13,495,540 | 111,352 |
| Boeing Co. | 2,700,000 | 533,925 |
| C.H. Robinson Worldwide, Inc. | 707,000 | 48,557 |
The Investment Company of America — Page 1 of 6
unaudited
| Common stocks Industrials (continued) | Shares | Value (000) |
| CSX Corp. | 21,072,002 | $1,149,688 |
| Cummins Inc. | 1,391,000 | 225,648 |
| General Dynamics Corp. | 6,361,200 | 1,260,154 |
| General Electric Co. | 33,729,000 | 911,020 |
| Illinois Tool Works Inc. | 5,450,000 | 780,713 |
| Johnson Controls International PLC | 1,463,000 | 63,436 |
| Lockheed Martin Corp. | 1,250,000 | 347,013 |
| Nielsen Holdings PLC | 7,502,000 | 290,027 |
| Union Pacific Corp. | 9,371,337 | 1,020,632 |
| United Technologies Corp. | 3,871,852 | 472,792 |
| 7,422,678 | ||
| Consumer discretionary12.00% | ||
| Amazon.com, Inc.1 | 2,055,600 | 1,989,821 |
| Comcast Corp., Class A | 10,493,034 | 408,389 |
| General Motors Co. | 10,620,173 | 370,963 |
| Harley-Davidson, Inc. | 4,531,930 | 244,815 |
| Hasbro, Inc. | 2,245,000 | 250,340 |
| Home Depot, Inc. | 6,620,000 | 1,015,508 |
| Kering SA | 397,000 | 135,214 |
| Las Vegas Sands Corp. | 18,738,000 | 1,197,171 |
| Marriott International, Inc., Class A | 2,236,700 | 224,363 |
| McDonald’s Corp. | 4,200,000 | 643,272 |
| Netflix, Inc.1 | 2,052,800 | 306,709 |
| NIKE, Inc., Class B | 4,922,400 | 290,422 |
| Omnicom Group Inc. | 1,800,000 | 149,220 |
| Priceline Group Inc.1 | 239,204 | 447,436 |
| Sony Corp. | 1,925,000 | 73,354 |
| Time Warner Inc. | 4,607,932 | 462,682 |
| TJX Companies, Inc. | 1,800,000 | 129,906 |
| Toyota Motor Corp. | 4,000,000 | 209,575 |
| Twenty-First Century Fox, Inc., Class A | 28,408,215 | 805,089 |
| Viacom Inc., Class B | 13,525,760 | 454,060 |
| WPP PLC | 4,300,000 | 90,393 |
| Wyndham Worldwide Corp. | 2,423,000 | 243,293 |
| Yum China Holdings, Inc.1 | 2,154,000 | 84,932 |
| YUM! Brands, Inc. | 2,775,672 | 204,733 |
| 10,431,660 | ||
| Consumer staples11.32% | ||
| Altria Group, Inc. | 20,455,000 | 1,523,284 |
| Avon Products, Inc.1,2 | 25,493,441 | 96,875 |
| British American Tobacco PLC | 5,706,400 | 389,007 |
| Coca-Cola Co. | 15,163,000 | 680,061 |
| Conagra Brands, Inc. | 5,521,100 | 197,434 |
| Costco Wholesale Corp. | 1,100,000 | 175,923 |
| CVS Health Corp. | 1,900,000 | 152,874 |
| Imperial Brands PLC | 10,518,375 | 472,433 |
| Kellogg Co. | 7,820,200 | 543,191 |
| Kimberly-Clark Corp. | 2,035,900 | 262,855 |
| Kraft Heinz Co. | 6,124,722 | 524,521 |
| Kroger Co. | 20,146,500 | 469,816 |
| Lamb Weston Holdings, Inc. | 3,940,013 | 173,518 |
| Mondelez International, Inc. | 9,875,000 | 426,501 |
| Nestlé SA | 5,750,971 | 500,489 |
The Investment Company of America — Page 2 of 6
unaudited
| Common stocks Consumer staples (continued) | Shares | Value (000) |
| PepsiCo, Inc. | 4,420,000 | $510,466 |
| Philip Morris International Inc. | 19,314,441 | 2,268,481 |
| Procter & Gamble Co. | 2,513,000 | 219,008 |
| Reynolds American Inc. | 3,866,664 | 251,488 |
| 9,838,225 | ||
| Health care14.27% | ||
| Abbott Laboratories | 12,470,090 | 606,171 |
| AbbVie Inc. | 57,880,449 | 4,196,911 |
| Amgen Inc. | 12,231,463 | 2,106,625 |
| Danaher Corp. | 1,500,000 | 126,585 |
| Express Scripts Holding Co.1 | 2,317,357 | 147,940 |
| Gilead Sciences, Inc. | 4,234,588 | 299,724 |
| Humana Inc. | 1,125,000 | 270,698 |
| Illumina, Inc.1 | 1,422,900 | 246,902 |
| Johnson & Johnson | 600,000 | 79,374 |
| McKesson Corp. | 155,400 | 25,570 |
| Medtronic PLC | 9,282,000 | 823,777 |
| Merck & Co., Inc. | 2,800,000 | 179,452 |
| Novartis AG | 2,000,000 | 166,441 |
| Perrigo Co. PLC | 3,056,000 | 230,789 |
| Stryker Corp. | 6,280,865 | 871,658 |
| Takeda Pharmaceutical Co. Ltd. | 7,690,000 | 390,329 |
| Teva Pharmaceutical Industries Ltd. (ADR) | 7,822,700 | 259,870 |
| Thermo Fisher Scientific Inc. | 2,026,000 | 353,476 |
| UnitedHealth Group Inc. | 5,495,997 | 1,019,068 |
| 12,401,360 | ||
| Financials9.93% | ||
| AIA Group Ltd. | 9,900,000 | 72,341 |
| American International Group, Inc. | 16,198,200 | 1,012,711 |
| Bank of Montreal | 2,343,478 | 172,074 |
| Barclays PLC | 74,544,411 | 196,851 |
| BB&T Corp. | 2,416,000 | 109,711 |
| Berkshire Hathaway Inc., Class B1 | 5,050,000 | 855,319 |
| BNP Paribas SA | 3,483,289 | 250,880 |
| Capital One Financial Corp. | 2,100,000 | 173,502 |
| Charles Schwab Corp. | 2,387,809 | 102,580 |
| Citigroup Inc. | 9,672,000 | 646,863 |
| Fairfax Financial Holdings Ltd., subordinate voting (CAD denominated) | 127,800 | 55,386 |
| HSBC Holdings PLC (ADR) | 1,549,479 | 71,880 |
| HSBC Holdings PLC (GBP denominated) | 4,933,118 | 45,728 |
| JPMorgan Chase & Co. | 11,362,000 | 1,038,487 |
| KeyCorp | 6,157,000 | 115,382 |
| M&T Bank Corp. | 927,036 | 150,134 |
| Marsh & McLennan Companies, Inc. | 2,500,000 | 194,900 |
| PNC Financial Services Group, Inc. | 2,443,000 | 305,057 |
| Progressive Corp. | 6,800,000 | 299,812 |
| Prudential Financial, Inc. | 6,348,178 | 686,492 |
| Prudential PLC | 2,000,000 | 45,872 |
| Société Générale | 3,915,000 | 210,653 |
| U.S. Bancorp | 6,400,000 | 332,288 |
| UBS Group AG | 9,165,000 | 155,219 |
The Investment Company of America — Page 3 of 6
unaudited
| Common stocks Financials (continued) | Shares | Value (000) |
| Wells Fargo & Co. | 19,298,900 | $1,069,352 |
| Willis Towers Watson PLC | 1,776,101 | 258,352 |
| 8,627,826 | ||
| Information technology18.02% | ||
| Accenture PLC, Class A | 9,595,000 | 1,186,710 |
| Alphabet Inc., Class A1 | 951,030 | 884,153 |
| Alphabet Inc., Class C1 | 1,030,859 | 936,772 |
| Amphenol Corp., Class A | 935,000 | 69,022 |
| Apple Inc. | 10,355,561 | 1,491,408 |
| ASML Holding NV | 2,718,773 | 354,309 |
| Broadcom Ltd. | 3,829,079 | 892,367 |
| Cisco Systems, Inc. | 5,400,000 | 169,020 |
| Intel Corp. | 38,178,000 | 1,288,126 |
| International Business Machines Corp. | 1,100,000 | 169,213 |
| MasterCard Inc., Class A | 1,000,000 | 121,450 |
| Microsoft Corp. | 22,345,100 | 1,540,248 |
| Motorola Solutions, Inc. | 858,430 | 74,460 |
| Oracle Corp. | 37,432,300 | 1,876,855 |
| salesforce.com, inc.1 | 1,895,000 | 164,107 |
| Samsung Electronics Co., Ltd. | 642,029 | 1,333,831 |
| Skyworks Solutions, Inc. | 3,798,000 | 364,418 |
| Symantec Corp. | 6,473,000 | 182,862 |
| Taiwan Semiconductor Manufacturing Co., Ltd. | 14,400,000 | 98,698 |
| Texas Instruments Inc. | 18,010,773 | 1,385,569 |
| Visa Inc., Class A | 1,500,000 | 140,670 |
| Western Union Co.2 | 35,700,000 | 680,085 |
| Xilinx, Inc. | 4,000,000 | 257,280 |
| 15,661,633 | ||
| Telecommunication services3.74% | ||
| AT&T Inc. | 12,432,734 | 469,087 |
| BT Group PLC | 25,895,000 | 99,410 |
| CenturyLink, Inc. | 9,250,505 | 220,902 |
| SoftBank Group Corp. | 1,017,000 | 82,255 |
| Verizon Communications Inc. | 50,399,795 | 2,250,855 |
| Vodafone Group PLC | 45,300,000 | 128,475 |
| 3,250,984 | ||
| Utilities2.10% | ||
| American Electric Power Co., Inc. | 4,014,088 | 278,859 |
| Dominion Energy, Inc. | 7,723,824 | 591,877 |
| Duke Energy Corp. | 1,590,000 | 132,908 |
| Exelon Corp. | 11,700,000 | 422,019 |
| NextEra Energy, Inc. | 300,000 | 42,039 |
| Power Assets Holdings Ltd. | 14,000,000 | 123,638 |
| Sempra Energy | 846,400 | 95,431 |
| Southern Co. | 3,000,000 | 143,640 |
| 1,830,411 | ||
| Real estate0.16% | ||
| Crown Castle International Corp. REIT | 1,365,100 | 136,756 |
The Investment Company of America — Page 4 of 6
unaudited
| Common stocks Miscellaneous0.30% | Shares | Value (000) |
| Other common stocks in initial period of acquisition | $262,763 | |
| Total common stocks (cost: $51,245,512,000) | 79,364,911 | |
| Convertible stocks0.12% Energy0.12% | ||
| Kinder Morgan Inc., Series A, depository share, convertible preferred 2018 | 1,200,000 | 52,656 |
| Southwestern Energy Co., Series B, 6.25% convertible preferred 2018 | 3,450,000 | 50,335 |
| Total convertible stocks (cost: $144,999,000) | 102,991 | |
| Bonds, notes & other debt instruments0.16% U.S. Treasury bonds & notes0.16% U.S. Treasury0.16% | Principal?amount (000) | |
| U.S. Treasury 1.625% 2026 | $149,700 | 141,955 |
| Total bonds, notes & other debt instruments (cost: $150,494,000) | 141,955 | |
| Short-term securities8.36% | ||
| Apple Inc. 0.89%–0.95% due 7/18/2017–7/24/20173 | 215,000 | 214,865 |
| Bank of New York Mellon Corp. 1.07% due 9/12/2017 | 95,000 | 94,764 |
| CAFCO, LLC 1.18%–1.28% due 9/8/2017–10/3/20173 | 145,300 | 144,889 |
| Chevron Corp. 1.02% due 7/11/20173 | 50,000 | 49,984 |
| Ciesco LLC 1.32% due 11/15/20173 | 25,000 | 24,869 |
| Cisco Systems, Inc. 0.95%–1.19% due 7/12/2017–9/13/20173 | 115,000 | 114,862 |
| Citibank, N.A. 1.10% due 8/7/2017 | 50,000 | 49,995 |
| Coca-Cola Co. 0.95%–1.19% due 7/19/2017–10/17/20173 | 181,100 | 180,771 |
| Eli Lilly and Co. 1.10% due 7/18/20173 | 75,000 | 74,960 |
| Emerson Electric Co. 1.08% due 8/3/20173 | 33,250 | 33,215 |
| ExxonMobil Corp. 1.13%–1.14% due 9/11/2017–9/18/2017 | 155,000 | 154,623 |
| Fannie Mae 0.78% due 7/24/2017 | 38,800 | 38,781 |
| Federal Farm Credit Banks 1.21%–1.22% due 3/15/2018–4/13/2018 | 90,000 | 89,187 |
| Federal Home Loan Bank 0.64%–1.08% due 7/3/2017–12/6/2017 | 3,114,063 | 3,110,600 |
| Freddie Mac 0.94%–1.08% due 9/7/2017–11/3/2017 | 275,000 | 274,218 |
| John Deere Financial Inc. 1.15% due 7/26/20173 | 30,000 | 29,976 |
| Jupiter Securitization Co., LLC 0.95% due 7/3/20173 | 45,000 | 44,996 |
| Microsoft Corp. 0.94%–1.04% due 7/17/2017–8/15/20173 | 186,750 | 186,584 |
| Paccar Financial Corp. 0.90%–1.12% due 7/5/2017–7/27/2017 | 50,000 | 49,981 |
| PepsiCo Inc. 1.10% due 7/21/2017–8/18/20173 | 100,000 | 99,891 |
| Pfizer Inc. 1.02%–1.16% due 7/17/2017–9/18/20173 | 175,000 | 174,712 |
| Private Export Funding Corp. 1.08%–1.34% due 9/5/2017–11/17/20173 | 90,000 | 89,687 |
| Prudential Funding, LLC 1.10% due 7/17/2017 | 40,000 | 39,979 |
| Qualcomm Inc. 1.12% due 8/15/20173 | 50,000 | 49,926 |
| Regents of the University of California 1.20% due 9/13/2017 | 30,000 | 29,926 |
| Simon Property Group, L.P. 1.16% due 8/7/20173 | 15,500 | 15,481 |
| U.S. Bank, N.A. 1.20%–1.21% due 10/16/2017–10/24/2017 | 100,000 | 100,010 |
| U.S. Treasury Bills 0.62%–1.10% due 7/6/2017–12/7/2017 | 1,462,300 | 1,460,227 |
The Investment Company of America — Page 5 of 6
unaudited
| Short-term securities | Principal?amount (000) | Value (000) |
| United Parcel Service Inc. 1.08% due 7/5/20173 | $25,000 | $24,996 |
| Wal-Mart Stores, Inc. 0.88%–1.11% due 7/3/2017–7/24/20173 | 217,531 | 217,419 |
| Total short-term securities (cost: $7,264,300,000) | 7,264,374 | |
| Total investment securities 99.95% (cost: $58,805,305,000) | 86,874,231 | |
| Other assets less liabilities 0.05% | 43,855 | |
| Net assets 100.00% | $86,918,086 |
As permitted by U.S. Securities and Exchange Commission regulations, “Miscellaneous” securities include holdings in their first year of acquisition that have not previously been publicly disclosed.
The following footnotes apply to either the individual securities noted or one or more of the securities aggregated and listed as a single line item.
| 1 | Security did not produce income during the last 12 months. |
| 2 | Represents an affiliated company as defined under the Investment Company Act of 1940. |
| 3 | Acquired in a transaction exempt from registration under Section 4(2) of the Securities Act of 1933. May be resold in the U.S. in transactions exempt from registration, normally to qualified institutional buyers. The total value of all such securities was $1,772,083,000, which represented 2.04% of the net assets of the fund. |
| Key to abbreviations |
| ADR = American Depositary Receipts |
| CAD = Canadian dollars |
| GBP = British pounds |
Additional financial disclosures are included in the fund’s current shareholder report and should be read in conjunction with this report.
Investments are not FDIC-insured, nor are they deposits of or guaranteed by a bank or any other entity, so they may lose value.
Investors should carefully consider investment objectives, risks, charges and expenses. This and other important information is contained in the fund prospectus and summary prospectus, which can be obtained from your financial professional and should be read carefully before investing. You may also call American Funds Service Company (AFS) at (800) 421-4225 or visit the American Funds website at americanfunds.com. Securities offered through American Funds Distributors, Inc.
| MFGEFPX-004-0817O-S60717 | The Investment Company of America — Page 6 of 6 |
ITEM 7 – Disclosure of Proxy Voting Policies and Procedures for Closed-End Management Investment Companies
Not applicable to this Registrant, insofar as the Registrant is not a closed-end management investment company.
ITEM 8 – Portfolio Managers of Closed-End Management Investment Companies
Not applicable to this Registrant, insofar as the Registrant is not a closed-end management investment company.
ITEM 9 – Purchases of Equity Securities by Closed-End Management Investment Company and Affiliated Purchasers
Not applicable to this Registrant, insofar as the Registrant is not a closed-end management investment company.
ITEM 10 – Submission of Matters to a Vote of Security Holders
There have been no material changes to the procedures by which shareholders may recommend nominees to the Registrant’s board of trustees since the Registrant last submitted a proxy statement to its shareholders. The procedures are as follows. The Registrant has a nominating and governance committee comprised solely of persons who are not considered ‘‘interested persons’’ of the Registrant within the meaning of the Investment Company Act of 1940, as amended. The committee periodically reviews such issues as the board’s composition, responsibilities, committees, compensation and other relevant issues, and recommends any appropriate changes to the full board of trustees. While the committee normally is able to identify from its own resources an ample number of qualified candidates, it will consider shareholder suggestions of persons to be considered as nominees to fill future vacancies on the board. Such suggestions must be sent in writing to the nominating and governance committee of the Registrant, c/o the Registrant’s Secretary, and must be accompanied by complete biographical and occupational data on the prospective nominee, along with a written consent of the prospective nominee for consideration of his or her name by the nominating and governance committee.
ITEM 11 – Controls and Procedures
| (a) | The Registrant’s Principal Executive Officer and Principal Financial Officer have concluded, based on their evaluation of the Registrant’s disclosure controls and procedures (as such term is defined in Rule 30a-3 under the Investment Company Act of 1940), that such controls and procedures are adequate and reasonably designed to achieve the purposes described in paragraph (c) of such rule. |
| (b) | There were no changes in the Registrant’s internal controls over financial reporting (as defined in Rule 30a-3(d) under the Investment Company Act of 1940) that occurred during the Registrant’s second fiscal quarter of the period covered by this report that has materially affected, or is reasonably likely to materially affect, the Registrant’s internal control over financial reporting. |
ITEM 12 – Exhibits
| (a)(1) | Not applicable for filing of semi-annual reports to shareholders. |
| (a)(2) | The certifications required by Rule 30a-2 of the Investment Company Act of 1940 and Sections 302 and 906 of the Sarbanes-Oxley Act of 2002 are attached as exhibits hereto. |
SIGNATURES
Pursuant to the requirements of the Securities Exchange Act of 1934 and the Investment Company Act of 1940, the Registrant has duly caused this report to be signed on its behalf by the undersigned, thereunto duly authorized.
| THE INVESTMENT COMPANY OF AMERICA | |
| By /s/ James B. Lovelace | |
James B. Lovelace, Vice Chairman and Principal Executive Officer | |
| Date: August 31, 2017 |
Pursuant to the requirements of the Securities Exchange Act of 1934 and the Investment Company Act of 1940, this report has been signed below by the following persons on behalf of the Registrant and in the capacities and on the dates indicated.
| By /s/ James B. Lovelace |
James B. Lovelace, Vice Chairman and Principal Executive Officer |
| Date: August 31, 2017 |
| By /s/ Brian D. Bullard |
Brian D. Bullard, Treasurer and Principal Financial Officer |
| Date: August 31, 2017 |