UNITED STATES
SECURITIES AND EXCHANGE COMMISSION
Washington, D.C. 20549
FORM N-CSR
CERTIFIED SHAREHOLDER REPORT
OF
REGISTERED MANAGEMENT INVESTMENT COMPANIES
Investment Company Act file number: 811-01027
| Name of Registrant: | Vanguard World Fund |
| Address of Registrant: | P.O. Box 2600 |
| Valley Forge, PA 19482 |
| Name and address of agent for service: | Anne E. Robinson, Esquire |
| P.O. Box 876 | |
| Valley Forge, PA 19482 |
Registrant’s telephone number, including area code: (610) 669-1000
Date of fiscal year end: August 31
Date of reporting period: September 1, 2022—August 31, 2023
Item 1: Reports to Shareholders

Your Fund’s Performance at a Glance | 1 |
Advisors' Report | 2 |
About Your Fund’s Expenses | 6 |
Performance Summary | 8 |
Financial Statements | 10 |
Trustees Approve Advisory Arrangement | 27 |
Liquidity Risk Management | 29 |
| • | Vanguard U.S. Growth Fund returned 20.19% for Investor Shares and 20.30% for Admiral Shares for the 12 months ended August 31, 2023. The fund’s benchmark returned 21.94%. |
| • | Early in the period, inflation in many developed markets began to ease off multidecade highs but remained stubbornly high in some sectors, including services, which felt the effects of a tight labor market. While aggressive interest rate hikes by many major central banks including the Federal Reserve fanned fears of recession, the economy proved more resilient than expected. |
| • | Growth stocks outperformed value stocks for the period, while large-capitalization stocks outperformed small-caps. While both U.S. and international stocks generally posted robust gains, domestic issues outperformed. |
| • | Eight of the fund’s sectors posted gains. The greatest contributor was information technology as a result of security selection. Other contributors included health care and communication services. Real estate and consumer staples posted slightly negative returns but were neutral contributors to relative performance. |
| Average Annual Total Returns Periods Ended August 31, 2023 | |||
| One Year | Three Years | Five Years | |
| Stocks | |||
| Russell 1000 Index (Large-caps) | 15.40% | 9.93% | 10.77% |
| Russell 2000 Index (Small-caps) | 4.65 | 8.12 | 3.14 |
| Russell 3000 Index (Broad U.S. market) | 14.76 | 9.81 | 10.25 |
| FTSE All-World ex US Index (International) | 12.02 | 4.49 | 3.74 |
| Bonds | |||
| Bloomberg U.S. Aggregate Float Adjusted Index (Broad taxable market) | -1.05% | -4.40% | 0.55% |
| Bloomberg Municipal Bond Index (Broad tax-exempt market) | 1.70 | -1.32 | 1.52 |
| FTSE Three-Month U.S. Treasury Bill Index | 4.44 | 1.63 | 1.68 |
| CPI | |||
| Consumer Price Index | 3.67% | 5.71% | 4.02% |
| Fund Assets Managed | |||
| Investment Advisor | % | $ Million | Investment Strategy |
| Wellington Management Company LLP | 49 | 18,636 | Employs proprietary fundamental research and a rigorous valuation discipline in an effort to invest in high-quality, large-cap, sustainable-growth companies. The investment approach is based on the belief that stock prices often overreact to short-term trends and that bottom-up, intensive research focused on longer-term fundamentals can be used to identify stocks that will outperform the market over time. |
| Jennison Associates LLC | 31 | 11,457 | Uses a research-driven, bottom-up fundamental investment approach to identify and invest in companies with sustainable competitive advantages that we believe can create long-term growth in economic value and generate superior returns for shareholders. |
| Baillie Gifford Overseas Ltd. | 19 | 7,333 | Uses an active, bottom-up approach to identify exceptional growth companies and own them for long periods. Such companies have special cultures, address large market opportunities, and enjoy sustainable competitive advantages. This approach is based on the belief that these factors drive long-term returns, and a long investment horizon enables the inherent asymmetry of equity market returns to be captured. |
| Cash Investments | 1 | 467 | These short-term reserves are invested by Vanguard in equity index products to simulate investment in stocks. Each advisor may also maintain a modest cash position. |
| • | Based on actual fund return. This section helps you to estimate the actual expenses that you paid over the period. The ”Ending Account Value“ shown is derived from the fund‘s actual return, and the third column shows the dollar amount that would have been paid by an investor who started with $1,000 in the fund. You may use the information here, together with the amount you invested, to estimate the expenses that you paid over the period. |
| • | Based on hypothetical 5% yearly return. This section is intended to help you compare your fund‘s costs with those of other mutual funds. It assumes that the fund had a yearly return of 5% before expenses, but that the expense ratio is unchanged. In this case—because the return used is not the fund’s actual return—the results do not apply to your investment. The example is useful in making comparisons because the Securities and Exchange Commission requires all mutual funds to calculate expenses based on a 5% return. You can assess your fund’s costs by comparing this hypothetical example with the hypothetical examples that appear in shareholder reports of other funds. |
| Six Months Ended August 31, 2023 | |||
| Beginning Account Value 2/28/2023 | Ending Account Value 8/31/2023 | Expenses Paid During Period | |
| Based on Actual Fund Return | |||
| U.S. Growth Fund | |||
| Investor Shares | $1,000.00 | $1,227.30 | $1.68 |
| Admiral™ Shares | 1,000.00 | 1,227.90 | 1.12 |
| Based on Hypothetical 5% Yearly Return | |||
| U.S. Growth Fund | |||
| Investor Shares | $1,000.00 | $1,023.69 | $1.53 |
| Admiral Shares | 1,000.00 | 1,024.20 | 1.02 |

| Average Annual Total Returns Periods Ended August 31, 2023 | |||||
| One Year | Five Years | Ten Years | Final Value of a $10,000 Investment | ||
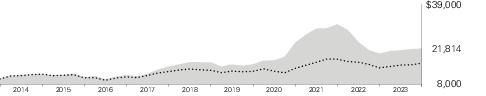
 | U.S. Growth Fund Investor Shares | 20.19% | 10.19% | 13.67% | $36,026 |
 | Russell 1000 Growth Index | 21.94 | 13.81 | 15.63 | 42,713 |
 | Dow Jones U.S. Total Stock Market Float Adjusted Index | 14.75 | 10.12 | 12.14 | 31,461 |
| One Year | Five Years | Ten Years | Final Value of a $50,000 Investment | ||
| U.S. Growth Fund Admiral Shares | 20.30% | 10.29% | 13.80% | $182,192 | |
| Russell 1000 Growth Index | 21.94 | 13.81 | 15.63 | 213,567 | |
| Dow Jones U.S. Total Stock Market Float Adjusted Index | 14.75 | 10.12 | 12.14 | 157,306 | |
| Communication Services | 13.4% |
| Consumer Discretionary | 19.5 |
| Consumer Staples | 1.7 |
| Energy | 0.4 |
| Financials | 10.4 |
| Health Care | 11.0 |
| Industrials | 4.0 |
| Information Technology | 37.5 |
| Materials | 0.1 |
| Real Estate | 2.0 |
| Shares | Market Value• ($000) | ||
| Common Stocks (97.3%) | |||
| Communication Services (13.0%) | |||
| * | Alphabet Inc. Class C | 12,342,047 | 1,695,180 |
| * | Meta Platforms Inc. Class A | 3,699,823 | 1,094,741 |
| * | Trade Desk Inc. Class A | 8,924,068 | 714,193 |
| * | Netflix Inc. | 1,254,649 | 544,116 |
| * | Alphabet Inc. Class A | 2,470,423 | 336,398 |
| * | ZoomInfo Technologies Inc. | 8,838,619 | 159,272 |
| * | Roku Inc. | 1,556,488 | 126,387 |
| * | Pinterest Inc. Class A | 4,064,136 | 111,723 |
| * | Roblox Corp. Class A | 3,643,814 | 103,083 |
| * | Snap Inc. Class A | 5,060,705 | 52,378 |
| 4,937,471 | |||
| Consumer Discretionary (18.9%) | |||
| * | Amazon.com Inc. | 19,946,503 | 2,752,817 |
| * | Tesla Inc. | 4,118,517 | 1,062,907 |
| * | MercadoLibre Inc. | 303,970 | 417,156 |
| * | Airbnb Inc. Class A | 2,849,902 | 374,905 |
| * | Lululemon Athletica Inc. | 798,643 | 304,491 |
| LVMH Moet Hennessy Louis Vuitton SE | 310,336 | 262,438 | |
| TJX Cos. Inc. | 2,746,416 | 253,988 | |
| * | DoorDash Inc. Class A | 2,938,268 | 247,196 |
| * | Duolingo Inc. | 1,339,382 | 197,103 |
| Hilton Worldwide Holdings Inc. | 1,235,140 | 183,604 | |
| NIKE Inc. Class B | 1,518,099 | 154,406 | |
| * | Wayfair Inc. Class A | 2,230,483 | 154,149 |
| Marriott International Inc. Class A | 582,585 | 118,562 | |
| Home Depot Inc. | 337,294 | 111,408 | |
| * | Chipotle Mexican Grill Inc. | 50,185 | 96,688 |
| * | Chewy Inc. Class A | 3,835,660 | 91,979 |
| *,1 | Mobileye Global Inc. Class A | 2,554,460 | 90,709 |
| * | Sweetgreen Inc. Class A | 5,895,814 | 84,664 |
| * | Coursera Inc. | 4,859,454 | 84,506 |
| * | Ulta Beauty Inc. | 90,184 | 37,429 |
| * | Rivian Automotive Inc. Class A | 1,612,154 | 36,644 |
| * | Chegg Inc. | 3,068,126 | 31,326 |
| 7,149,075 | |||
| Shares | Market Value• ($000) | ||
| Consumer Staples (1.7%) | |||
| Costco Wholesale Corp. | 427,432 | 234,780 | |
| Constellation Brands Inc. Class A | 688,741 | 179,458 | |
| L'Oreal SA (XPAR) | 253,303 | 111,259 | |
| Estee Lauder Cos. Inc. Class A | 486,315 | 78,068 | |
| *,1 | Oddity Tech Ltd. Class A | 711,552 | 29,594 |
| 633,159 | |||
| Energy (0.4%) | |||
| Schlumberger NV | 2,302,581 | 135,760 | |
| Financials (10.1%) | |||
| Mastercard Inc. Class A | 2,834,539 | 1,169,644 | |
| Visa Inc. Class A | 2,470,651 | 606,989 | |
| * | FleetCor Technologies Inc. | 1,188,547 | 322,964 |
| S&P Global Inc. | 696,710 | 272,316 | |
| Progressive Corp. | 1,838,037 | 245,323 | |
| American Express Co. | 1,288,004 | 203,492 | |
| Blackstone Inc. | 1,859,260 | 197,769 | |
| MSCI Inc. | 353,620 | 192,235 | |
| Global Payments Inc. | 1,406,829 | 178,231 | |
| Marsh & McLennan Cos. Inc. | 852,378 | 166,205 | |
| Ares Management Corp. Class A | 959,939 | 99,296 | |
| *,1 | Affirm Holdings Inc. | 3,158,994 | 65,739 |
| MarketAxess Holdings Inc. | 186,261 | 44,876 | |
| *,1 | Lemonade Inc. | 2,076,619 | 28,574 |
| *,2 | Adyen NV | 30,328 | 25,325 |
| 3,818,978 | |||
| Health Care (10.7%) | |||
| Eli Lilly & Co. | 1,128,857 | 625,613 | |
| UnitedHealth Group Inc. | 1,195,655 | 569,825 | |
| * | Moderna Inc. | 2,741,956 | 310,033 |
| Zoetis Inc. | 1,402,180 | 267,129 | |
| Novo Nordisk A/S ADR | 1,309,262 | 243,025 | |
| * | Vertex Pharmaceuticals Inc. | 661,374 | 230,383 |
| Danaher Corp. | 782,411 | 207,339 | |
| * | Intuitive Surgical Inc. | 646,241 | 202,067 |
| * | Alnylam Pharmaceuticals Inc. | 965,767 | 191,048 |
| * | Boston Scientific Corp. | 3,261,129 | 175,905 |
| Stryker Corp. | 569,393 | 161,451 | |
| AstraZeneca plc ADR | 2,263,208 | 153,491 | |
| * | Align Technology Inc. | 334,982 | 123,990 |
| Shares | Market Value• ($000) | ||
| * | Illumina Inc. | 668,388 | 110,431 |
| * | Penumbra Inc. | 329,601 | 87,179 |
| * | Denali Therapeutics Inc. | 3,654,850 | 84,391 |
| * | Mettler-Toledo International Inc. | 64,163 | 77,861 |
| * | 10X Genomics Inc. Class A | 1,351,761 | 70,089 |
| * | Doximity Inc. Class A | 2,291,617 | 54,632 |
| * | Insulet Corp. | 236,383 | 45,317 |
| * | Novocure Ltd. | 1,820,759 | 40,166 |
| * | Recursion Pharmaceuticals Inc. Class A | 3,591,730 | 31,248 |
| *,1 | Sana Biotechnology Inc. | 1,840,066 | 9,844 |
| *,3 | ABIOMED Inc. CVR | 718,252 | 733 |
| 4,073,190 | |||
| Industrials (3.9%) | |||
| * | Uber Technologies Inc. | 11,585,330 | 547,175 |
| TransUnion | 3,183,559 | 258,569 | |
| Watsco Inc. | 609,713 | 222,271 | |
| * | Copart Inc. | 3,490,733 | 156,490 |
| General Dynamics Corp. | 573,439 | 129,964 | |
| Airbus SE ADR | 3,127,361 | 114,680 | |
| IDEX Corp. | 204,672 | 46,338 | |
| 1,475,487 | |||
| Information Technology (36.5%) | |||
| Microsoft Corp. | 9,310,355 | 3,051,562 | |
| Apple Inc. | 14,664,254 | 2,754,973 | |
| NVIDIA Corp. | 5,493,123 | 2,711,131 | |
| * | Shopify Inc. Class A (XTSE) | 9,912,562 | 659,086 |
| * | Adobe Inc. | 767,980 | 429,562 |
| * | Salesforce Inc. | 1,556,449 | 344,691 |
| * | Advanced Micro Devices Inc. | 2,974,278 | 314,441 |
| * | Cadence Design Systems Inc. | 1,227,287 | 295,089 |
| * | Snowflake Inc. Class A | 1,751,890 | 274,784 |
| * | Workday Inc. Class A | 979,350 | 239,451 |
| * | ServiceNow Inc. | 370,714 | 218,288 |
| Monolithic Power Systems Inc. | 390,617 | 203,594 | |
| * | Atlassian Corp. Ltd. Class A | 989,422 | 201,901 |
| * | Cloudflare Inc. Class A | 3,101,025 | 201,660 |
| Microchip Technology Inc. | 2,265,365 | 185,398 | |
| * | MongoDB Inc. | 470,965 | 179,579 |
| Intuit Inc. | 301,379 | 163,290 | |
| ASML Holding NV GDR (Registered) | 236,711 | 156,355 | |
| Broadcom Inc. | 166,277 | 153,455 | |
| * | Datadog Inc. Class A | 1,536,431 | 148,235 |
| * | Okta Inc. | 1,677,562 | 140,093 |
| * | Twilio Inc. Class A | 1,944,690 | 123,896 |
| * | HubSpot Inc. | 211,101 | 115,371 |
| * | ANSYS Inc. | 353,305 | 112,658 |
| * | Zoom Video Communications Inc. Class A | 1,326,918 | 94,251 |
| * | Crowdstrike Holdings Inc. Class A | 526,059 | 85,763 |
| * | HashiCorp Inc. Class A | 2,829,400 | 82,505 |
| * | VeriSign Inc. | 349,638 | 72,651 |
| Micron Technology Inc. | 816,805 | 57,127 | |
| * | Samsara Inc. Class A | 1,999,522 | 54,707 |
| Shares | Market Value• ($000) | ||
| * | Sprout Social Inc. Class A | 211,329 | 11,315 |
| 13,836,862 | |||
| Materials (0.1%) | |||
| *,1 | Ginkgo Bioworks Holdings Inc. | 18,631,948 | 43,599 |
| Real Estate (2.0%) | |||
| * | CoStar Group Inc. | 3,223,352 | 264,283 |
| American Tower Corp. | 887,345 | 160,893 | |
| Equinix Inc. | 196,009 | 153,157 | |
| Welltower Inc. | 1,639,378 | 135,872 | |
| * | Redfin Corp. | 4,175,587 | 39,752 |
| 753,957 | |||
| Total Common Stocks (Cost $22,596,302) | 36,857,538 | ||
| Preferred Stock (0.1%) | |||
| 2 | Dr. Ing Hc F Porsche AG (Cost $45,922) | 567,894 | 62,633 |
| Temporary Cash Investments (3.0%) | |||
| Money Market Fund (1.8%) | |||
| 4,5 | Vanguard Market Liquidity Fund, 5.384% | 6,756,869 | 675,619 |
| Face Amount ($000) | |||
| Repurchase Agreements (1.2%) | |||
| Bank of America Securities, LLC 5.300%, 9/1/23 (Dated 8/31/23, Repurchase Value $218,632,000, collateralized by United States Treasury Note/Bond 0.625%–4.125%, 9/30/27–12/31/27, with a value of $222,972,000) | 218,600 | 218,600 | |
| Face Amount ($000) | Market Value• ($000) | ||
| Societe Generale 5.280%, 9/1/23 (Dated 8/31/23, Repurchase Value $227,633,000, collateralized by Ginnie Mae 6.500%, 12/20/52, with a value of $232,152,000) | 227,600 | 227,600 | |
| 446,200 | |||
| Total Temporary Cash Investments (Cost $1,121,706) | 1,121,819 | ||
| Total Investments (100.4%) (Cost $23,763,930) | 38,041,990 | ||
| Other Assets and Liabilities—Net (-0.4%) | (149,068) | ||
| Net Assets (100%) | 37,892,922 | ||
| Cost is in $000. | |||
| • | See Note A in Notes to Financial Statements. |
| * | Non-income-producing security. |
| 1 | Includes partial security positions on loan to broker-dealers. The total value of securities on loan is $94,388,000. |
| 2 | Security exempt from registration under Rule 144A of the Securities Act of 1933. Such securities may be sold in transactions exempt from registration, normally to qualified institutional buyers. At August 31, 2023, the aggregate value was $87,958,000, representing 0.2% of net assets. |
| 3 | Security value determined using significant unobservable inputs. |
| 4 | Affiliated money market fund available only to Vanguard funds and certain trusts and accounts managed by Vanguard. Rate shown is the 7-day yield. |
| 5 | Collateral of $106,692,000 was received for securities on loan. |
| ADR—American Depositary Receipt. | |
| CVR—Contingent Value Rights. | |
| GDR—Global Depositary Receipt. |
| Futures Contracts | ||||
| ($000) | ||||
| Expiration | Number of Long (Short) Contracts | Notional Amount | Value and Unrealized Appreciation (Depreciation) | |
| Long Futures Contracts | ||||
| E-mini S&P 500 Index | September 2023 | 1,831 | 413,440 | 5,166 |
| E-mini S&P Mid-Cap 400 Index | September 2023 | 222 | 58,801 | 1,798 |
| 6,964 | ||||
| ($000s, except shares, footnotes, and per-share amounts) | Amount |
| Assets | |
| Investments in Securities, at Value1 | |
| Unaffiliated Issuers (Cost $23,088,424) | 37,366,371 |
| Affiliated Issuers (Cost $675,506) | 675,619 |
| Total Investments in Securities | 38,041,990 |
| Investment in Vanguard | 1,288 |
| Cash | 8,112 |
| Cash Collateral Pledged—Futures Contracts | 24,446 |
| Foreign Currency, at Value (Cost $646) | 640 |
| Receivables for Investment Securities Sold | 264 |
| Receivables for Accrued Income | 18,683 |
| Receivables for Capital Shares Issued | 7,052 |
| Total Assets | 38,102,475 |
| Liabilities | |
| Payables for Investment Securities Purchased | 65,985 |
| Collateral for Securities on Loan | 106,692 |
| Payables to Investment Advisor | 8,206 |
| Payables for Capital Shares Redeemed | 25,300 |
| Payables to Vanguard | 2,571 |
| Variation Margin Payable—Futures Contracts | 799 |
| Total Liabilities | 209,553 |
| Net Assets | 37,892,922 |
| 1 Includes $94,388,000 of securities on loan. | |
| At August 31, 2023, net assets consisted of: | |
| Paid-in Capital | 24,715,984 |
| Total Distributable Earnings (Loss) | 13,176,938 |
| Net Assets | 37,892,922 |
| Investor Shares—Net Assets | |
| Applicable to 166,836,878 outstanding $.001 par value shares of beneficial interest (unlimited authorization) | 8,709,894 |
| Net Asset Value Per Share—Investor Shares | $52.21 |
| Admiral Shares—Net Assets | |
| Applicable to 215,675,648 outstanding $.001 par value shares of beneficial interest (unlimited authorization) | 29,183,028 |
| Net Asset Value Per Share—Admiral Shares | $135.31 |
| Year Ended August 31, 2023 | |
| ($000) | |
| Investment Income | |
| Income | |
| Dividends1 | 190,310 |
| Interest2 | 36,000 |
| Securities Lending—Net | 3,803 |
| Total Income | 230,113 |
| Expenses | |
| Investment Advisory Fees—Note B | |
| Basic Fee | 46,011 |
| Performance Adjustment | (22,067) |
| The Vanguard Group—Note C | |
| Management and Administrative—Investor Shares | 17,116 |
| Management and Administrative—Admiral Shares | 31,578 |
| Marketing and Distribution—Investor Shares | 431 |
| Marketing and Distribution—Admiral Shares | 1,291 |
| Custodian Fees | 170 |
| Auditing Fees | 47 |
| Shareholders’ Reports—Investor Shares | 198 |
| Shareholders’ Reports—Admiral Shares | 194 |
| Trustees’ Fees and Expenses | 18 |
| Other Expenses | 157 |
| Total Expenses | 75,144 |
| Expenses Paid Indirectly | (280) |
| Net Expenses | 74,864 |
| Net Investment Income | 155,249 |
| Realized Net Gain (Loss) | |
| Investment Securities Sold2 | (432,202) |
| Futures Contracts | 32,003 |
| Foreign Currencies | (751) |
| Realized Net Gain (Loss) | (400,950) |
| Change in Unrealized Appreciation (Depreciation) | |
| Investment Securities2 | 6,808,857 |
| Futures Contracts | 18,828 |
| Foreign Currencies | 91 |
| Change in Unrealized Appreciation (Depreciation) | 6,827,776 |
| Net Increase (Decrease) in Net Assets Resulting from Operations | 6,582,075 |
| 1 | Dividends are net of foreign withholding taxes of $594,000. |
| 2 | Interest income, realized net gain (loss), capital gain distributions received, and change in unrealized appreciation (depreciation) from an affiliated company of the fund were $22,903,000, $51,000, $2,000, and $9,000, respectively. Purchases and sales are for temporary cash investment purposes. |
| Year Ended August 31, | ||
| 2023 ($000) | 2022 ($000) | |
| Increase (Decrease) in Net Assets | ||
| Operations | ||
| Net Investment Income | 155,249 | 91,273 |
| Realized Net Gain (Loss) | (400,950) | (336,634) |
| Change in Unrealized Appreciation (Depreciation) | 6,827,776 | (18,791,793) |
| Net Increase (Decrease) in Net Assets Resulting from Operations | 6,582,075 | (19,037,154) |
| Distributions | ||
| Investor Shares | (25,805) | (1,376,782) |
| Admiral Shares | (113,199) | (4,883,411) |
| Total Distributions | (139,004) | (6,260,193) |
| Capital Share Transactions | ||
| Investor Shares | (711,024) | 131,521 |
| Admiral Shares | (2,320,731) | 4,702,896 |
| Net Increase (Decrease) from Capital Share Transactions | (3,031,755) | 4,834,417 |
| Total Increase (Decrease) | 3,411,316 | (20,462,930) |
| Net Assets | ||
| Beginning of Period | 34,481,606 | 54,944,536 |
| End of Period | 37,892,922 | 34,481,606 |
| Investor Shares | |||||
| For a Share Outstanding Throughout Each Period | Year Ended August 31, | ||||
| 2023 | 2022 | 2021 | 2020 | 2019 | |
| Net Asset Value, Beginning of Period | $43.59 | $76.41 | $62.28 | $41.02 | $43.31 |
| Investment Operations | |||||
| Net Investment Income (Loss)1 | .169 | .074 | (.013) | .113 | .176 |
| Net Realized and Unrealized Gain (Loss) on Investments | 8.595 | (24.184) | 16.700 | 22.856 | .771 |
| Total from Investment Operations | 8.764 | (24.110) | 16.687 | 22.969 | .947 |
| Distributions | |||||
| Dividends from Net Investment Income | (.144) | (.001) | (.019) | (.119) | (.132) |
| Distributions from Realized Capital Gains | — | (8.709) | (2.538) | (1.590) | (3.105) |
| Total Distributions | (.144) | (8.710) | (2.557) | (1.709) | (3.237) |
| Net Asset Value, End of Period | $52.21 | $43.59 | $76.41 | $62.28 | $41.02 |
| Total Return2 | 20.19% | -35.32% | 27.52% | 58.01% | 3.70% |
| Ratios/Supplemental Data | |||||
| Net Assets, End of Period (Millions) | $8,710 | $7,935 | $13,405 | $12,410 | $8,819 |
| Ratio of Total Expenses to Average Net Assets3 | 0.30%4 | 0.33%4 | 0.38% | 0.38% | 0.39% |
| Ratio of Net Investment Income (Loss) to Average Net Assets | 0.38% | 0.13% | (0.02%) | 0.25% | 0.44% |
| Portfolio Turnover Rate | 37% | 23% | 41% | 38% | 41% |
| 1 | Calculated based on average shares outstanding. |
| 2 | Total returns do not include account service fees that may have applied in the periods shown. Fund prospectuses provide information about any applicable account service fees. |
| 3 | Includes performance-based investment advisory fee increases (decreases) of (0.06%), (0.02%), 0.03%, 0.02%, and 0.01%. |
| 4 | The ratio of expenses to average net assets for the period net of reduction from broker commission abatement arrangements was 0.30% and 0.33%, respectively. |
| Admiral Shares | |||||
| For a Share Outstanding Throughout Each Period | Year Ended August 31, | ||||
| 2023 | 2022 | 2021 | 2020 | 2019 | |
| Net Asset Value, Beginning of Period | $112.99 | $198.03 | $161.42 | $106.30 | $112.28 |
| Investment Operations | |||||
| Net Investment Income1 | .552 | .338 | .138 | .410 | .572 |
| Net Realized and Unrealized Gain (Loss) on Investments | 22.260 | (62.667) | 43.277 | 59.231 | 1.963 |
| Total from Investment Operations | 22.812 | (62.329) | 43.415 | 59.641 | 2.535 |
| Distributions | |||||
| Dividends from Net Investment Income | (.492) | (.135) | (.224) | (.401) | (.464) |
| Distributions from Realized Capital Gains | — | (22.576) | (6.581) | (4.120) | (8.051) |
| Total Distributions | (.492) | (22.711) | (6.805) | (4.521) | (8.515) |
| Net Asset Value, End of Period | $135.31 | $112.99 | $198.03 | $161.42 | $106.30 |
| Total Return2 | 20.30% | -35.26% | 27.64% | 58.17% | 3.80% |
| Ratios/Supplemental Data | |||||
| Net Assets, End of Period (Millions) | $29,183 | $26,547 | $41,539 | $27,860 | $17,060 |
| Ratio of Total Expenses to Average Net Assets3 | 0.20%4 | 0.23%4 | 0.28% | 0.28% | 0.28% |
| Ratio of Net Investment Income to Average Net Assets | 0.48% | 0.23% | 0.08% | 0.35% | 0.55% |
| Portfolio Turnover Rate | 37% | 23% | 41% | 38% | 41% |
| 1 | Calculated based on average shares outstanding. |
| 2 | Total returns do not include account service fees that may have applied in the periods shown. Fund prospectuses provide information about any applicable account service fees. |
| 3 | Includes performance-based investment advisory fee increases (decreases) of (0.06%), (0.02%), 0.03%, 0.02%, and 0.01%. |
| 4 | The ratio of expenses to average net assets for the period net of reduction from broker commission abatement arrangements was 0.20% and 0.23%, respectively. |
| A. | The following significant accounting policies conform to generally accepted accounting principles for U.S. investment companies. The fund consistently follows such policies in preparing its financial statements. |
| B. | The investment advisory firms Wellington Management Company llp, Jennison Associates LLC, and Baillie Gifford Overseas Ltd., each provide investment advisory services to a portion of the fund for a fee calculated at an annual percentage rate of average net assets managed by the advisor. The basic fees of Wellington Management Company llp and Jennison Associates LLC are subject to quarterly adjustments based on performance relative to the Russell 1000 Growth Index for the preceding three years. The basic fee of Baillie Gifford Overseas Ltd. is subject to quarterly adjustments based on performance relative to the S&P 500 Index for the preceding three years. |
| C. | In accordance with the terms of a Funds' Service Agreement (the “FSA”) between Vanguard and the fund, Vanguard furnishes to the fund corporate management, administrative, marketing, distribution and cash management services at Vanguard’s cost of operations (as defined by the FSA). These costs of operations are allocated to the fund based on methods and guidelines approved by the board of trustees and are generally settled twice a month. |
| D. | The fund has asked its investment advisors to direct certain security trades, subject to obtaining the best price and execution, to brokers who have agreed to rebate to the fund part of the commissions generated. Such rebates are used solely to reduce the fund’s management and administrative expenses. For the year ended August 31, 2023, these arrangements reduced the fund’s expenses by $280,000 (an annual rate of less than 0.01% of average net assets). |
| E. | Various inputs may be used to determine the value of the fund’s investments and derivatives. These inputs are summarized in three broad levels for financial statement purposes. The inputs or methodologies used to value securities are not necessarily an indication of the risk associated with investing in those securities. |
| Level 1 ($000) | Level 2 ($000) | Level 3 ($000) | Total ($000) | |
| Investments | ||||
| Assets | ||||
| Common Stocks | 36,457,783 | 399,022 | 733 | 36,857,538 |
| Preferred Stock | — | 62,633 | — | 62,633 |
| Temporary Cash Investments | 675,619 | 446,200 | — | 1,121,819 |
| Total | 37,133,402 | 907,855 | 733 | 38,041,990 |
| Derivative Financial Instruments | ||||
| Assets | ||||
| Futures Contracts1 | 6,964 | — | — | 6,964 |
| 1 | Includes cumulative appreciation (depreciation) on futures contracts and centrally cleared swaps, if any, as reported in the Schedule of Investments. Only current day’s variation margin is reported within the Statement of Assets and Liabilities. |
| F. | Permanent differences between book-basis and tax-basis components of net assets are reclassified among capital accounts in the financial statements to reflect their tax character. These reclassifications have no effect on net assets or net asset value per share. As of period end, permanent differences primarily attributable to the accounting for applicable foreign currency transactions were reclassified between the individual components of total distributable earnings (loss). |
| Amount ($000) | |
| Undistributed Ordinary Income | 97,182 |
| Undistributed Long-Term Gains | — |
| Net Unrealized Gains (Losses) | 13,952,981 |
| Capital Loss Carryforwards | (873,225) |
| Qualified Late-Year Losses | — |
| Other Temporary Differences | — |
| Total | 13,176,938 |
| Year Ended August 31, | ||
| 2023 Amount ($000) | 2022 Amount ($000) | |
| Ordinary Income* | 139,004 | 1,153,596 |
| Long-Term Capital Gains | — | 5,106,597 |
| Total | 139,004 | 6,260,193 |
| * | Includes short-term capital gains, if any. |
| Amount ($000) | |
| Tax Cost | 24,089,016 |
| Gross Unrealized Appreciation | 17,537,317 |
| Gross Unrealized Depreciation | (3,584,343) |
| Net Unrealized Appreciation (Depreciation) | 13,952,974 |
| G. | During the year ended August 31, 2023, the fund purchased $12,504,343,000 of investment securities and sold $15,358,338,000 of investment securities, other than temporary cash investments. |
| H. | Capital share transactions for each class of shares were: |
| Year Ended August 31, | |||||
| 2023 | 2022 | ||||
| Amount ($000) | Shares (000) | Amount ($000) | Shares (000) | ||
| Investor Shares | |||||
| Issued | 592,236 | 13,160 | 1,523,268 | 28,740 | |
| Issued in Lieu of Cash Distributions | 25,011 | 599 | 1,326,967 | 20,374 | |
| Redeemed | (1,328,271) | (28,956) | (2,718,714) | (42,517) | |
| Net Increase (Decrease)—Investor Shares | (711,024) | (15,197) | 131,521 | 6,597 | |
| Admiral Shares | |||||
| Issued | 2,081,981 | 17,879 | 5,943,274 | 38,050 | |
| Issued in Lieu of Cash Distributions | 105,916 | 980 | 4,578,807 | 27,142 | |
| Redeemed | (4,508,628) | (38,120) | (5,819,185) | (40,021) | |
| Net Increase (Decrease)—Admiral Shares | (2,320,731) | (19,261) | 4,702,896 | 25,171 | |
| I. | Significant market disruptions, such as those caused by pandemics (e.g., COVID-19 pandemic), natural or environmental disasters, war (e.g., Russia’s invasion of Ukraine), acts of terrorism, or other events, can adversely affect local and global markets and normal market operations. Any such disruptions could have an adverse impact on the value of the fund’s investments and fund performance. |
| J. | Management has determined that no events or transactions occurred subsequent to August 31, 2023, that would require recognition or disclosure in these financial statements. |
Philadelphia, Pennsylvania
October 19, 2023
| Matthew Benchener | Thomas M. Rampulla |
| Joseph Brennan | Karin A. Risi |
| Mortimer J. Buckley | Anne E. Robinson |
| Gregory Davis | Michael Rollings |
| John James | Nitin Tandon |
| Chris D. Mclsaac | Lauren Valente |

All rights reserved.
Vanguard Marketing Corporation, Distributor.

Your Fund’s Performance at a Glance | 1 |
Advisors' Report | 2 |
About Your Fund’s Expenses | 6 |
Performance Summary | 8 |
Financial Statements | 10 |
Liquidity Risk Management | 29 |
| • | For the 12 months ended August 31, 2023, Vanguard International Growth Fund returned 9.82% for Investor Shares and 9.92% for Admiral Shares, lagging the 11.89% return of the benchmark index. |
| • | Early in the period, inflation in many developed markets began to ease off multidecade highs but remained stubbornly high in some sectors—including services, which felt the effects of tight labor markets. While aggressive interest rate hikes by many major central banks fanned fears of recession, the global economy proved more resilient than expected. |
| • | Relative to the benchmark, the fund’s stock selection in information technology, communication services, and consumer staples contributed to outperformance. However, it wasn’t enough to offset the lagging performance of the fund’s stock selection in health care, financials, and industrials. |
| • | By region, the fund’s overweighting in the U.S. relative to the benchmark boosted performance, while the fund’s stock selection in Japan, Europe, and China hindered relative returns. |
| Average Annual Total Returns Periods Ended August 31, 2023 | |||
| One Year | Three Years | Five Years | |
| Stocks | |||
| Russell 1000 Index (Large-caps) | 15.40% | 9.93% | 10.77% |
| Russell 2000 Index (Small-caps) | 4.65 | 8.12 | 3.14 |
| Russell 3000 Index (Broad U.S. market) | 14.76 | 9.81 | 10.25 |
| FTSE All-World ex US Index (International) | 12.02 | 4.49 | 3.74 |
| Bonds | |||
| Bloomberg U.S. Aggregate Float Adjusted Index (Broad taxable market) | -1.05% | -4.40% | 0.55% |
| Bloomberg Municipal Bond Index (Broad tax-exempt market) | 1.70 | -1.32 | 1.52 |
| FTSE Three-Month U.S. Treasury Bill Index | 4.44 | 1.63 | 1.68 |
| CPI | |||
| Consumer Price Index | 3.67% | 5.71% | 4.02% |
| Fund Assets Managed | |||
| Investment Advisor | % | $ Million | Investment Strategy |
| Baillie Gifford Overseas Ltd. | 68 | 29,525 | The advisor seeks stocks that can generate above-average growth in earnings and cash flow, producing a bottom-up, stock-driven approach to country and asset allocation. An in-depth view on each company is measured against the consensus view, leading to discrepancies and potential opportunities to add value. |
| Schroder Investment Management North America Inc. | 31 | 13,530 | Equity analysts located around the world and an international team of global sector specialists help to identify reasonably priced companies with strong growth prospects and a sustainable competitive advantage. |
| Cash Investments | 1 | 478 | These short-term reserves are invested by Vanguard in equity index products to simulate investment in stocks. Each advisor may also maintain a modest cash position. |
| • | Based on actual fund return. This section helps you to estimate the actual expenses that you paid over the period. The ”Ending Account Value“ shown is derived from the fund‘s actual return, and the third column shows the dollar amount that would have been paid by an investor who started with $1,000 in the fund. You may use the information here, together with the amount you invested, to estimate the expenses that you paid over the period. |
| • | Based on hypothetical 5% yearly return. This section is intended to help you compare your fund‘s costs with those of other mutual funds. It assumes that the fund had a yearly return of 5% before expenses, but that the expense ratio is unchanged. In this case—because the return used is not the fund’s actual return—the results do not apply to your investment. The example is useful in making comparisons because the Securities and Exchange Commission requires all mutual funds to calculate expenses based on a 5% return. You can assess your fund’s costs by comparing this hypothetical example with the hypothetical examples that appear in shareholder reports of other funds. |
| Six Months Ended August 31, 2023 | |||
| Beginning Account Value 2/28/2023 | Ending Account Value 8/31/2023 | Expenses Paid During Period | |
| Based on Actual Fund Return | |||
| International Growth Fund | |||
| Investor Shares | $1,000.00 | $1,031.00 | $1.95 |
| Admiral™ Shares | 1,000.00 | 1,031.30 | 1.38 |
| Based on Hypothetical 5% Yearly Return | |||
| International Growth Fund | |||
| Investor Shares | $1,000.00 | $1,023.29 | $1.94 |
| Admiral Shares | 1,000.00 | 1,023.84 | 1.38 |
| Average Annual Total Returns Periods Ended August 31, 2023 | |||||
| One Year | Five Years | Ten Years | Final Value of a $10,000 Investment | ||
 | International Growth Fund Investor Shares | 9.82% | 5.82% | 8.11% | $21,814 |
 | MSCI All Country World Index ex USA Net | 11.89 | 3.33 | 4.38 | 15,350 |
| One Year | Five Years | Ten Years | Final Value of a $50,000 Investment | ||
| International Growth Fund Admiral Shares | 9.92% | 5.93% | 8.24% | $110,395 | |
| MSCI All Country World Index ex USA Net | 11.89 | 3.33 | 4.38 | 76,749 | |
| United States | 15.6% |
| China | 10.5 |
| Netherlands | 9.0 |
| United Kingdom | 7.9 |
| Japan | 7.4 |
| France | 7.2 |
| Germany | 6.4 |
| Sweden | 5.2 |
| Denmark | 4.9 |
| Belgium | 4.1 |
| Switzerland | 3.3 |
| Taiwan | 3.0 |
| Italy | 2.9 |
| Hong Kong | 2.1 |
| South Korea | 1.9 |
| India | 1.8 |
| Brazil | 1.4 |
| Spain | 1.0 |
| Other | 4.4 |
| Shares | Market Value• ($000) | ||
| Common Stocks (96.8%) | |||
| Australia (0.9%) | |||
| WiseTech Global Ltd. | 8,981,963 | 402,920 | |
| Austria (0.4%) | |||
| Erste Group Bank AG | 5,202,412 | 185,590 | |
| Belgium (4.1%) | |||
| * | Argenx SE | 2,579,297 | 1,296,314 |
| Umicore SA | 12,319,461 | 326,444 | |
| UCB SA | 1,575,407 | 141,310 | |
| 1,764,068 | |||
| Brazil (1.4%) | |||
| * | NU Holdings Ltd. Class A | 51,727,593 | 354,334 |
| B3 SA - Brasil Bolsa Balcao | 54,611,441 | 142,593 | |
| Raia Drogasil SA | 21,209,451 | 117,696 | |
| 614,623 | |||
| Canada (0.8%) | |||
| Toronto-Dominion Bank | 3,336,894 | 203,543 | |
| Canadian National Railway Co. | 1,438,586 | 162,043 | |
| 365,586 | |||
| China (10.3%) | |||
| Tencent Holdings Ltd. | 31,231,200 | 1,294,232 | |
| *,1 | Meituan Class B | 47,849,968 | 791,877 |
| * | PDD Holdings Inc. ADR | 4,875,928 | 482,571 |
| * | Alibaba Group Holding Ltd. | 39,236,432 | 455,384 |
| *,2 | NIO Inc. ADR | 38,610,070 | 396,525 |
| * | Baidu Inc. ADR | 1,951,652 | 278,754 |
| *,1 | Wuxi Biologics Cayman Inc. | 39,421,000 | 222,240 |
| Shenzhen Inovance Technology Co. Ltd. Class A | 14,662,314 | 137,431 | |
| * | Contemporary Amperex Technology Co. Ltd. Class A | 3,934,959 | 127,599 |
| 1 | Ganfeng Lithium Co. Ltd. Class H | 18,796,200 | 89,782 |
| Shares | Market Value• ($000) | ||
| * | Full Truck Alliance Co. Ltd. ADR | 12,227,700 | 81,926 |
| JD.com Inc. Class A | 4,777,289 | 79,342 | |
| * | BYD Co. Ltd. Class H | 2,021,500 | 63,497 |
| 4,501,160 | |||
| Denmark (4.8%) | |||
| * | Genmab A/S | 2,449,802 | 938,606 |
| * | Vestas Wind Systems A/S | 29,436,532 | 680,134 |
| Novo Nordisk A/S Class B | 1,692,084 | 312,111 | |
| * | Ambu A/S Class B | 13,769,955 | 166,401 |
| 2,097,252 | |||
| France (7.1%) | |||
| Kering SA | 2,161,368 | 1,155,749 | |
| L'Oreal SA (XPAR) | 1,564,175 | 687,036 | |
| Schneider Electric SE | 2,378,550 | 407,703 | |
| Sanofi | 2,518,315 | 268,211 | |
| TotalEnergies SE | 2,736,293 | 171,645 | |
| EssilorLuxottica SA | 808,714 | 152,003 | |
| Carrefour SA | 6,843,390 | 130,803 | |
| Legrand SA | 1,155,671 | 113,856 | |
| 3,087,006 | |||
| Germany (4.7%) | |||
| *,1 | Zalando SE | 12,213,116 | 379,651 |
| *,1 | Delivery Hero SE | 9,609,839 | 350,544 |
| *,3 | HelloFresh SE | 10,336,074 | 333,112 |
| SAP SE | 2,227,763 | 310,783 | |
| Bayerische Motoren Werke AG (XETR) | 2,535,539 | 266,686 | |
| Infineon Technologies AG | 6,136,884 | 219,306 | |
| Siemens AG (Registered) | 1,138,442 | 171,029 | |
| *,2,3 | Jumia Technologies AG ADR | 6,724,836 | 20,645 |
| 2,051,756 | |||
| Hong Kong (2.1%) | |||
| AIA Group Ltd. | 69,844,800 | 631,974 | |
| Hong Kong Exchanges & Clearing Ltd. | 3,985,030 | 154,453 | |
| Shares | Market Value• ($000) | ||
| BOC Hong Kong Holdings Ltd. | 42,037,000 | 116,791 | |
| 903,218 | |||
| India (1.7%) | |||
| HDFC Bank Ltd. | 33,779,249 | 639,643 | |
| Larsen & Toubro Ltd. | 2,941,467 | 95,972 | |
| *,4,5 | ANI Technologies Private Ltd. PP (Acquired 12/1/15, Cost $5,969) | 166,185 | 18,759 |
| 754,374 | |||
| Indonesia (0.4%) | |||
| Bank Central Asia Tbk PT | 264,795,600 | 159,409 | |
| Israel (0.9%) | |||
| *,3 | Wix.com Ltd. | 4,006,720 | 395,744 |
| Italy (2.9%) | |||
| Ferrari NV | 2,899,825 | 919,425 | |
| FinecoBank Banca Fineco SpA | 12,538,095 | 171,363 | |
| Prysmian SpA | 4,145,038 | 169,352 | |
| 1,260,140 | |||
| Japan (7.3%) | |||
| Nidec Corp. | 10,240,000 | 532,833 | |
| M3 Inc. | 23,057,700 | 459,605 | |
| SMC Corp. | 849,200 | 412,814 | |
| Mitsubishi UFJ Financial Group Inc. | 39,392,500 | 314,261 | |
| Sony Group Corp. | 2,846,200 | 236,783 | |
| Bridgestone Corp. | 4,716,000 | 183,102 | |
| KDDI Corp. | 5,708,900 | 169,711 | |
| Recruit Holdings Co. Ltd. | 4,599,000 | 163,828 | |
| Kubota Corp. | 7,442,500 | 119,776 | |
| Terumo Corp. | 3,527,400 | 106,730 | |
| SBI Holdings Inc. | 4,470,400 | 91,245 | |
| Murata Manufacturing Co. Ltd. | 1,626,700 | 91,003 | |
| Sekisui Chemical Co. Ltd. | 5,604,800 | 85,963 | |
| FUJIFILM Holdings Corp. | 1,316,600 | 77,806 | |
| Daikin Industries Ltd. | 378,400 | 65,410 | |
| MISUMI Group Inc. | 2,549,100 | 44,404 | |
| 3,155,274 | |||
| Netherlands (8.8%) | |||
| ASML Holding NV | 3,360,208 | 2,209,432 | |
| *,1 | Adyen NV | 1,032,211 | 861,919 |
| EXOR NV | 7,791,309 | 689,508 | |
| Universal Music Group NV | 3,501,597 | 86,816 | |
| 3,847,675 | |||
| Norway (0.7%) | |||
| DNB Bank ASA | 7,480,595 | 147,866 | |
| *,1,2 | AutoStore Holdings Ltd. | 85,404,717 | 145,800 |
| 293,666 | |||
| Shares | Market Value• ($000) | ||
| Singapore (0.2%) | |||
| * | Sea Ltd. ADR | 2,479,980 | 93,322 |
| South Korea (1.9%) | |||
| Samsung Electronics Co. Ltd. (XKRX) | 7,534,894 | 381,086 | |
| * | Coupang Inc. | 15,030,499 | 285,279 |
| Samsung SDI Co. Ltd. (XKRX) | 336,872 | 156,242 | |
| 822,607 | |||
| Spain (0.9%) | |||
| Banco Bilbao Vizcaya Argentaria SA | 27,532,523 | 217,229 | |
| Iberdrola SA (XMAD) | 15,969,777 | 189,445 | |
| 406,674 | |||
| Sweden (5.1%) | |||
| * | Spotify Technology SA | 8,166,108 | 1,257,336 |
| Atlas Copco AB Class A | 47,384,892 | 626,486 | |
| * | Kinnevik AB Class B | 15,093,719 | 177,234 |
| Svenska Handelsbanken AB Class A | 14,784,512 | 123,363 | |
| Nibe Industrier AB Class B | 5,938,300 | 44,448 | |
| 2,228,867 | |||
| Switzerland (3.2%) | |||
| Roche Holding AG | 1,094,929 | 321,349 | |
| 1 | VAT Group AG | 638,714 | 255,260 |
| Lonza Group AG (Registered) | 328,379 | 181,131 | |
| Temenos AG (Registered) | 2,177,560 | 172,585 | |
| Alcon Inc. | 2,002,961 | 167,166 | |
| Cie Financiere Richemont SA Class A (Registered) | 1,155,621 | 163,915 | |
| Chocoladefabriken Lindt & Spruengli AG | 11,249 | 134,457 | |
| 1,395,863 | |||
| Taiwan (3.0%) | |||
| Taiwan Semiconductor Manufacturing Co. Ltd. (XTAI) | 74,626,000 | 1,282,295 | |
| United Kingdom (7.8%) | |||
| *,3 | Ocado Group plc | 47,079,148 | 518,583 |
| Shell plc (XETR) | 11,500,265 | 356,495 | |
| * | Wise plc Class A | 34,223,559 | 277,022 |
| *,3,4,5 | Brandtech Group Class A1 PP (Acquired 9/23/15, Cost $44,800) | 33,633,606 | 267,387 |
| AstraZeneca plc | 1,902,412 | 255,537 | |
| Unilever plc (XLON) | 4,406,960 | 225,060 | |
| Reckitt Benckiser Group plc | 2,716,397 | 196,031 | |
| Shell plc | 5,620,152 | 174,082 | |
| Shares | Market Value• ($000) | ||
| RELX plc | 4,823,424 | 157,218 | |
| Burberry Group plc | 5,465,301 | 150,895 | |
| GSK plc | 8,223,945 | 144,050 | |
| Diageo plc | 3,304,484 | 135,329 | |
| National Grid plc | 9,930,135 | 123,952 | |
| Bunzl plc | 3,079,316 | 110,267 | |
| Rio Tinto plc | 1,626,300 | 100,155 | |
| Whitbread plc | 2,154,152 | 93,692 | |
| HSBC Holdings plc | 12,268,371 | 90,506 | |
| 3,376,261 | |||
| United States (15.4%) | |||
| * | MercadoLibre Inc. | 1,885,026 | 2,586,934 |
| * | Moderna Inc. | 9,417,081 | 1,064,789 |
| NVIDIA Corp. | 1,758,538 | 867,927 | |
| * | Tesla Inc. | 2,765,637 | 713,756 |
| * | Illumina Inc. | 3,221,940 | 532,329 |
| * | Elastic NV | 4,896,014 | 302,965 |
| *,2 | Mobileye Global Inc. Class A | 5,227,537 | 185,630 |
| * | Booking Holdings Inc. | 57,298 | 177,912 |
| * | Lululemon Athletica Inc. | 381,167 | 145,324 |
| * | SolarEdge Technologies Inc. | 514,395 | 83,625 |
| *,2 | Oatly Group AB ADR | 22,087,214 | 27,167 |
| 6,688,358 | |||
| Total Common Stocks (Cost $32,026,745) | 42,133,708 | ||
| Preferred Stocks (1.5%) | |||
| Sartorius AG | 1,380,973 | 564,716 | |
| 1,2 | Dr. Ing Hc F Porsche AG | 940,146 | 103,689 |
| Total Preferred Stocks (Cost $887,517) | 668,405 | ||
| Shares | Market Value• ($000) | ||
| Temporary Cash Investments (1.8%) | |||
| Money Market Fund (1.8%) | |||
| 6,7 | Vanguard Market Liquidity Fund, 5.384% (Cost $789,685) | 7,898,237 | 789,745 |
| Total Investments (100.1%) (Cost $33,703,947) | 43,591,858 | ||
| Other Assets and Liabilities—Net (-0.1%) | (58,374) | ||
| Net Assets (100%) | 43,533,484 | ||
| Cost is in $000. | |||
| • | See Note A in Notes to Financial Statements. |
| * | Non-income-producing security. |
| 1 | Security exempt from registration under Rule 144A of the Securities Act of 1933. Such securities may be sold in transactions exempt from registration, normally to qualified institutional buyers. At August 31, 2023, the aggregate value was $3,200,762,000, representing 7.4% of net assets. |
| 2 | Includes partial security positions on loan to broker-dealers. The total value of securities on loan is $106,722,000. |
| 3 | Considered an affiliated company of the fund as the fund owns more than 5% of the outstanding voting securities of such company. |
| 4 | Restricted securities totaling $286,146,000, representing 0.7% of net assets. |
| 5 | Security value determined using significant unobservable inputs. |
| 6 | Affiliated money market fund available only to Vanguard funds and certain trusts and accounts managed by Vanguard. Rate shown is the 7-day yield. |
| 7 | Collateral of $126,718,000 was received for securities on loan. |
| ADR—American Depositary Receipt. | |
| PP—Private Placement. |
| Futures Contracts | ||||
| ($000) | ||||
| Expiration | Number of Long (Short) Contracts | Notional Amount | Value and Unrealized Appreciation (Depreciation) | |
| Long Futures Contracts | ||||
| MSCI EAFE Index | September 2023 | 3,400 | 358,581 | (3,315) |
| MSCI Emerging Markets Index | September 2023 | 3,076 | 150,616 | (2,769) |
| (6,084) | ||||
| ($000s, except shares, footnotes, and per-share amounts) | Amount |
| Assets | |
| Investments in Securities, at Value1 | |
| Unaffiliated Issuers (Cost $31,585,446) | 41,266,642 |
| Affiliated Issuers (Cost $2,118,501) | 2,325,216 |
| Total Investments in Securities | 43,591,858 |
| Investment in Vanguard | 1,556 |
| Cash | 10,143 |
| Cash Collateral Pledged—Futures Contracts | 15,289 |
| Foreign Currency, at Value (Cost $23,105) | 22,342 |
| Receivables for Investment Securities Sold | 35,368 |
| Receivables for Accrued Income | 100,789 |
| Receivables for Capital Shares Issued | 14,274 |
| Other Assets | 421 |
| Total Assets | 43,792,040 |
| Liabilities | |
| Payables for Investment Securities Purchased | 66,005 |
| Collateral for Securities on Loan | 126,718 |
| Payables to Investment Advisor | 12,305 |
| Payables for Capital Shares Redeemed | 22,112 |
| Payables to Vanguard | 5,573 |
| Variation Margin Payable—Futures Contracts | 3,800 |
| Deferred Foreign Capital Gains Taxes | 22,043 |
| Total Liabilities | 258,556 |
| Net Assets | 43,533,484 |
| 1 Includes $106,722,000 of securities on loan. | |
| At August 31, 2023, net assets consisted of: | |
| Paid-in Capital | 33,104,084 |
| Total Distributable Earnings (Loss) | 10,429,400 |
| Net Assets | 43,533,484 |
| Investor Shares—Net Assets | |
| Applicable to 202,775,216 outstanding $.001 par value shares of beneficial interest (unlimited authorization) | 6,340,149 |
| Net Asset Value Per Share—Investor Shares | $31.27 |
| Admiral Shares—Net Assets | |
| Applicable to 373,903,878 outstanding $.001 par value shares of beneficial interest (unlimited authorization) | 37,193,335 |
| Net Asset Value Per Share—Admiral Shares | $99.47 |
| Year Ended August 31, 2023 | |
| ($000) | |
| Investment Income | |
| Income | |
| Dividends—Unaffiliated Issuers1 | 491,042 |
| Dividends—Affiliated Issuers2 | 7,552 |
| Non-Cash Dividends | 91,567 |
| Interest—Unaffiliated Issuers | 641 |
| Interest—Affiliated Issuers | 26,595 |
| Securities Lending—Net | 4,747 |
| Total Income | 622,144 |
| Expenses | |
| Investment Advisory Fees—Note B | |
| Basic Fee | 61,219 |
| Performance Adjustment | 4,978 |
| The Vanguard Group—Note C | |
| Management and Administrative—Investor Shares | 15,438 |
| Management and Administrative—Admiral Shares | 50,169 |
| Marketing and Distribution—Investor Shares | 341 |
| Marketing and Distribution—Admiral Shares | 1,841 |
| Custodian Fees | 3,339 |
| Auditing Fees | 44 |
| Shareholders’ Reports—Investor Shares | 167 |
| Shareholders’ Reports—Admiral Shares | 366 |
| Trustees’ Fees and Expenses | 22 |
| Other Expenses | 4,307 |
| Total Expenses | 142,231 |
| Net Investment Income | 479,913 |
| Realized Net Gain (Loss) | |
| Capital Gains Distributions Received – Affiliated Issuers | 1 |
| Investment Securities Sold—Unaffiliated Issuers | 977,386 |
| Investment Securities Sold—Affiliated Issuers | (255,029) |
| Futures Contracts | 41,348 |
| Foreign Currencies | 677 |
| Realized Net Gain (Loss) | 764,383 |
| Statement of Operations (continued) | |
| Year Ended August 31, 2023 | |
| ($000) | |
| Change in Unrealized Appreciation (Depreciation) | |
| Investment Securities—Unaffiliated Issuers3 | 2,180,339 |
| Investment Securities—Affiliated Issuers | 581,215 |
| Futures Contracts | 2,309 |
| Foreign Currencies | 5,790 |
| Change in Unrealized Appreciation (Depreciation) | 2,769,653 |
| Net Increase (Decrease) in Net Assets Resulting from Operations | 4,013,949 |
| 1 | Dividends include foreign tax reclaims of $19,179,000 and are net of foreign withholding taxes of $49,271,000. |
| 2 | Dividends are net of foreign withholding taxes of $3,236,000. |
| 3 | The change in unrealized appreciation (depreciation) is net of the change in deferred foreign capital gains taxes of $11,953,000. |
| Year Ended August 31, | ||
| 2023 ($000) | 2022 ($000) | |
| Increase (Decrease) in Net Assets | ||
| Operations | ||
| Net Investment Income | 479,913 | 566,924 |
| Realized Net Gain (Loss) | 764,383 | 2,364,831 |
| Change in Unrealized Appreciation (Depreciation) | 2,769,653 | (28,757,006) |
| Net Increase (Decrease) in Net Assets Resulting from Operations | 4,013,949 | (25,825,251) |
| Distributions | ||
| Investor Shares | (395,795) | (1,151,429) |
| Admiral Shares | (2,317,351) | (7,014,600) |
| Total Distributions | (2,713,146) | (8,166,029) |
| Capital Share Transactions | ||
| Investor Shares | (97,479) | (158,025) |
| Admiral Shares | (347,462) | 3,238,161 |
| Net Increase (Decrease) from Capital Share Transactions | (444,941) | 3,080,136 |
| Total Increase (Decrease) | 855,862 | (30,911,144) |
| Net Assets | ||
| Beginning of Period | 42,677,622 | 73,588,766 |
| End of Period | 43,533,484 | 42,677,622 |
| Investor Shares | |||||
| For a Share Outstanding Throughout Each Period | Year Ended August 31, | ||||
| 2023 | 2022 | 2021 | 2020 | 2019 | |
| Net Asset Value, Beginning of Period | $30.33 | $54.50 | $42.94 | $28.30 | $31.23 |
| Investment Operations | |||||
| Net Investment Income1 | .313 | .362 | .374 | .238 | .342 |
| Net Realized and Unrealized Gain (Loss) on Investments | 2.588 | (18.463) | 12.336 | 14.791 | (1.941) |
| Total from Investment Operations | 2.901 | (18.101) | 12.710 | 15.029 | (1.599) |
| Distributions | |||||
| Dividends from Net Investment Income | (.390) | (.407) | (.106) | (.389) | (.403) |
| Distributions from Realized Capital Gains | (1.571) | (5.662) | (1.044) | — | (.928) |
| Total Distributions | (1.961) | (6.069) | (1.150) | (.389) | (1.331) |
| Net Asset Value, End of Period | $31.27 | $30.33 | $54.50 | $42.94 | $28.30 |
| Total Return2 | 9.82% | -36.53% | 29.89% | 53.60% | -4.58% |
| Ratios/Supplemental Data | |||||
| Net Assets, End of Period (Millions) | $6,340 | $6,243 | $11,247 | $9,658 | $7,056 |
| Ratio of Total Expenses to Average Net Assets3 | 0.42% | 0.45%4 | 0.43% | 0.44% | 0.43% |
| Ratio of Net Investment Income to Average Net Assets | 1.02% | 0.91% | 0.75% | 0.74% | 1.23% |
| Portfolio Turnover Rate | 14% | 15% | 25% | 20% | 13% |
| 1 | Calculated based on average shares outstanding. |
| 2 | Total returns do not include account service fees that may have applied in the periods shown. Fund prospectuses provide information about any applicable account service fees. |
| 3 | Includes performance-based investment advisory fee increases (decreases) of 0.01%, 0.04%, 0.03%, 0.04%, and 0.03%. |
| 4 | The ratio of expenses to average net assets for the period net of reduction from broker commission abatement arrangements was 0.45%. |
| Admiral Shares | |||||
| For a Share Outstanding Throughout Each Period | Year Ended August 31, | ||||
| 2023 | 2022 | 2021 | 2020 | 2019 | |
| Net Asset Value, Beginning of Period | $96.50 | $173.47 | $136.68 | $90.05 | $99.45 |
| Investment Operations | |||||
| Net Investment Income1 | 1.101 | 1.290 | 1.367 | .863 | 1.203 |
| Net Realized and Unrealized Gain (Loss) on Investments | 8.228 | (58.729) | 39.246 | 47.105 | (6.230) |
| Total from Investment Operations | 9.329 | (57.439) | 40.613 | 47.968 | (5.027) |
| Distributions | |||||
| Dividends from Net Investment Income | (1.358) | (1.502) | (.497) | (1.338) | (1.418) |
| Distributions from Realized Capital Gains | (5.001) | (18.029) | (3.326) | — | (2.955) |
| Total Distributions | (6.359) | (19.531) | (3.823) | (1.338) | (4.373) |
| Net Asset Value, End of Period | $99.47 | $96.50 | $173.47 | $136.68 | $90.05 |
| Total Return2 | 9.92% | -36.46% | 30.01% | 53.81% | -4.50% |
| Ratios/Supplemental Data | |||||
| Net Assets, End of Period (Millions) | $37,193 | $36,435 | $62,342 | $46,906 | $28,549 |
| Ratio of Total Expenses to Average Net Assets3 | 0.31% | 0.34%4 | 0.32% | 0.33% | 0.32% |
| Ratio of Net Investment Income to Average Net Assets | 1.13% | 1.02% | 0.86% | 0.83% | 1.34% |
| Portfolio Turnover Rate | 14% | 15% | 25% | 20% | 13% |
| 1 | Calculated based on average shares outstanding. |
| 2 | Total returns do not include account service fees that may have applied in the periods shown. Fund prospectuses provide information about any applicable account service fees. |
| 3 | Includes performance-based investment advisory fee increases (decreases) of 0.01%, 0.04%, 0.03%, 0.04%, and 0.03%. |
| 4 | The ratio of expenses to average net assets for the period net of reduction from broker commission abatement arrangements was 0.34%. |
| A. | The following significant accounting policies conform to generally accepted accounting principles for U.S. investment companies. The fund consistently follows such policies in preparing its financial statements. |
| B. | The investment advisory firms Baillie Gifford Overseas Ltd. and Schroder Investment Management North America Inc. each provide investment advisory services to a portion of the fund for a fee calculated at an annual percentage rate of average net assets managed by the |
| C. | In accordance with the terms of a Funds' Service Agreement (the “FSA”) between Vanguard and the fund, Vanguard furnishes to the fund investment advisory, corporate management, administrative, marketing, and distribution services at Vanguard’s cost of operations (as defined by the FSA). These costs of operations are allocated to the fund based on methods and guidelines approved by the board of trustees and are generally settled twice a month. |
| D. | Various inputs may be used to determine the value of the fund’s investments and derivatives. These inputs are summarized in three broad levels for financial statement purposes. The inputs or methodologies used to value securities are not necessarily an indication of the risk associated with investing in those securities. |
| Level 1 ($000) | Level 2 ($000) | Level 3 ($000) | Total ($000) | |
| Investments | ||||
| Assets | ||||
| Common Stocks—North and South America | 7,668,567 | — | — | 7,668,567 |
| Common Stocks—Other | 3,292,102 | 30,886,893 | 286,146 | 34,465,141 |
| Preferred Stocks | — | 668,405 | — | 668,405 |
| Temporary Cash Investments | 789,745 | — | — | 789,745 |
| Total | 11,750,414 | 31,555,298 | 286,146 | 43,591,858 |
| Derivative Financial Instruments | ||||
| Liabilities | ||||
| Futures Contracts1 | 6,084 | — | — | 6,084 |
| 1 | Includes cumulative appreciation (depreciation) on futures contracts and centrally cleared swaps, if any, as reported in the Schedule of Investments. Only current day’s variation margin is reported within the Statement of Assets and Liabilities. |
| E. | Permanent differences between book-basis and tax-basis components of net assets are reclassified among capital accounts in the financial statements to reflect their tax character. These reclassifications have no effect on net assets or net asset value per share. As of period end, permanent differences primarily attributable to the accounting for applicable foreign currency transactions, passive foreign investment companies, and distributions in connection with fund share redemptions were reclassified between the following accounts: |
| Amount ($000) | |
| Paid-in Capital | 27,577 |
| Total Distributable Earnings (Loss) | (27,577) |
| Amount ($000) | |
| Undistributed Ordinary Income | 406,698 |
| Undistributed Long-Term Gains | 352,696 |
| Net Unrealized Gains (Losses) | 9,654,412 |
| Capital Loss Carryforwards | — |
| Qualified Late-Year Losses | — |
| Other Temporary Differences | 15,594 |
| Total | 10,429,400 |
| Year Ended August 31, | ||
| 2023 Amount ($000) | 2022 Amount ($000) | |
| Ordinary Income* | 573,470 | 1,220,131 |
| Long-Term Capital Gains | 2,139,676 | 6,945,898 |
| Total | 2,713,146 | 8,166,029 |
| * | Includes short-term capital gains, if any. |
| Amount ($000) | |
| Tax Cost | 33,915,007 |
| Gross Unrealized Appreciation | 15,744,333 |
| Gross Unrealized Depreciation | (6,067,482) |
| Net Unrealized Appreciation (Depreciation) | 9,676,851 |
| F. | During the year ended August 31, 2023, the fund purchased $5,811,820,000 of investment securities and sold $8,560,285,000 of investment securities, other than temporary cash investments. |
| G. | Capital share transactions for each class of shares were: |
| Year Ended August 31, | |||||
| 2023 | 2022 | ||||
| Amount ($000) | Shares (000) | Amount ($000) | Shares (000) | ||
| Investor Shares | |||||
| Issued | 426,955 | 13,831 | 959,453 | 24,871 | |
| Issued in Lieu of Cash Distributions | 380,809 | 12,647 | 1,096,647 | 25,374 | |
| Redeemed | (905,243) | (29,538) | (2,214,125) | (50,772) | |
| Net Increase (Decrease)—Investor Shares | (97,479) | (3,060) | (158,025) | (527) | |
| Year Ended August 31, | |||||
| 2023 | 2022 | ||||
| Amount ($000) | Shares (000) | Amount ($000) | Shares (000) | ||
| Admiral Shares | |||||
| Issued | 4,499,299 | 46,038 | 7,087,254 | 55,305 | |
| Issued in Lieu of Cash Distributions | 2,093,359 | 21,868 | 6,273,065 | 45,655 | |
| Redeemed | (6,940,120) | (71,557) | (10,122,158) | (82,784) | |
| Net Increase (Decrease)—Admiral Shares | (347,462) | (3,651) | 3,238,161 | 18,176 | |
| H. | Certain of the fund’s investments are in companies that are considered to be affiliated companies of the fund because the fund owns more than 5% of the outstanding voting securities of the company or the issuer is another member of The Vanguard Group. Transactions during the period in securities of these companies were as follows: |
| Current Period Transactions | ||||||||
| Aug. 31, 2022 Market Value ($000) | Purchases at Cost ($000) | Proceeds from Securities Sold ($000) | Realized Net Gain (Loss) ($000) | Change in Unrealized App. (Dep.) ($000) | Income ($000) | Capital Gain Distributions Received ($000) | Aug. 31, 2023 Market Value ($000) | |
| Brandtech Group Class A | 273,441 | — | — | — | (6,054) | — | — | 267,387 |
| Elastic NV | NA1 | 172,343 | — | — | (57,310) | — | — | NA2 |
| HelloFresh SE | 246,784 | — | — | — | 86,328 | — | — | 333,112 |
| Home24 SE | 5,957 | — | 17,035 | (76,677) | 87,755 | — | — | — |
| Jumia Technologies AG ADR | 49,697 | — | — | — | (29,052) | — | — | 20,645 |
| Meli Kaszek Pioneer Corp. Class A | 18,753 | — | 19,462 | 615 | 94 | — | — | — |
| Ocado Group plc | 395,659 | — | — | — | 122,924 | — | — | 518,583 |
| Umicore SA | 476,466 | — | 86,814 | (4,860) | (58,348) | 7,552 | — | NA2 |
| Vanguard Market Liquidity Fund | 669,750 | NA3 | NA3 | 145 | (26) | 26,595 | 1 | 789,745 |
| Wix.com Ltd. | 261,448 | — | 10,300 | (26,319) | 170,915 | — | — | 395,744 |
| Zalando SE | 338,543 | — | 74,948 | (147,933) | 263,989 | — | — | NA2 |
| Total | 2,736,498 | 172,343 | 208,559 | (255,029) | 581,215 | 34,147 | 1 | 2,325,216 |
| 1 | Not applicable—at August 31, 2022, the issuer was not an affiliated company of the fund. |
| 2 | Not applicable—at August 31, 2023, the security was still held, but the issuer was no longer an affiliated company of the fund. |
| 3 | Not applicable—purchases and sales are for temporary cash investment purposes. |
| I. | Significant market disruptions, such as those caused by pandemics (e.g., COVID-19 pandemic), natural or environmental disasters, war (e.g., Russia’s invasion of Ukraine), acts of terrorism, or other events, can adversely affect local and global markets and normal market operations. Any such disruptions could have an adverse impact on the value of the fund’s investments and fund performance. |
| J. | Management has determined that no events or transactions occurred subsequent to August 31, 2023, that would require recognition or disclosure in these financial statements. |
Philadelphia, Pennsylvania
October 19, 2023
| Matthew Benchener | Thomas M. Rampulla |
| Joseph Brennan | Karin A. Risi |
| Mortimer J. Buckley | Anne E. Robinson |
| Gregory Davis | Michael Rollings |
| John James | Nitin Tandon |
| Chris D. Mclsaac | Lauren Valente |

All rights reserved.
Vanguard Marketing Corporation, Distributor.

Your Fund’s Performance at a Glance | 1 |
About Your Fund’s Expenses | 2 |
Performance Summary | 4 |
Financial Statements | 6 |
Trustees Approve Advisory Arrangement | 25 |
Liquidity Risk Management | 27 |
| • | For the 12 months ended August 31, 2023, Vanguard FTSE Social Index Fund returned 16.74% for Admiral Shares and 16.71% for Institutional Shares. Those results were roughly in line with the 16.88% return of its expense-free benchmark. |
| • | Early in the period, inflation in many developed markets began to ease off multidecade highs but remained stubbornly high in some sectors—including services, which felt the effects of a tight labor market. While aggressive interest rate hikes by many major central banks including the Federal Reserve fanned fears of recession, the economy proved more resilient than expected. |
| • | For the fund’s benchmark index, industry sector performance varied greatly over the period. Six sectors advanced roughly 10% or more. Technology was the standout, rising more than 30%. Industrials and basic materials were also high up on the leaderboard. Energy, real estate, and utilities, all of which represented small slices of the index, posted declines. |
| Average Annual Total Returns Periods Ended August 31, 2023 | |||
| One Year | Three Years | Five Years | |
| Stocks | |||
| Russell 1000 Index (Large-caps) | 15.40% | 9.93% | 10.77% |
| Russell 2000 Index (Small-caps) | 4.65 | 8.12 | 3.14 |
| Russell 3000 Index (Broad U.S. market) | 14.76 | 9.81 | 10.25 |
| FTSE All-World ex US Index (International) | 12.02 | 4.49 | 3.74 |
| Bonds | |||
| Bloomberg U.S. Aggregate Float Adjusted Index (Broad taxable market) | -1.05% | -4.40% | 0.55% |
| Bloomberg Municipal Bond Index (Broad tax-exempt market) | 1.70 | -1.32 | 1.52 |
| FTSE Three-Month U.S. Treasury Bill Index | 4.44 | 1.63 | 1.68 |
| CPI | |||
| Consumer Price Index | 3.67% | 5.71% | 4.02% |
| • | Based on actual fund return. This section helps you to estimate the actual expenses that you paid over the period. The ”Ending Account Value“ shown is derived from the fund‘s actual return, and the third column shows the dollar amount that would have been paid by an investor who started with $1,000 in the fund. You may use the information here, together with the amount you invested, to estimate the expenses that you paid over the period. |
| • | Based on hypothetical 5% yearly return. This section is intended to help you compare your fund‘s costs with those of other mutual funds. It assumes that the fund had a yearly return of 5% before expenses, but that the expense ratio is unchanged. In this case—because the return used is not the fund’s actual return—the results do not apply to your investment. The example is useful in making comparisons because the Securities and Exchange Commission requires all mutual funds to calculate expenses based on a 5% return. You can assess your fund’s costs by comparing this hypothetical example with the hypothetical examples that appear in shareholder reports of other funds. |
| Six Months Ended August 31, 2023 | |||
| Beginning Account Value 2/28/2023 | Ending Account Value 8/31/2023 | Expenses Paid During Period | |
| Based on Actual Fund Return | |||
| FTSE Social Index Fund | |||
| Admiral™ Shares | $1,000.00 | $1,162.70 | $0.76 |
| Institutional Shares | 1,000.00 | 1,162.60 | 0.65 |
| Based on Hypothetical 5% Yearly Return | |||
| FTSE Social Index Fund | �� | ||
| Admiral Shares | $1,000.00 | $1,024.50 | $0.71 |
| Institutional Shares | 1,000.00 | 1,024.60 | 0.61 |
| Average Annual Total Returns Periods Ended August 31, 2023 | |||||
| One Year | Five Years | Ten Years | Final Value of a $5,000,000 Investment | ||
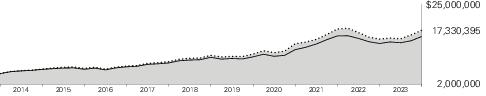
 | FTSE Social Index Fund Institutional Shares | 16.71% | 11.16% | 13.24% | $17,330,395 |
 | FTSE4Good US Select Index | 16.88 | 11.26 | 13.35 | 17,512,924 |
 | Dow Jones U.S. Total Stock Market Float Adjusted Index | 14.75 | 10.12 | 12.14 | 15,730,560 |
| One Year | Since Inception (2/7/2019) | Final Value of a $10,000 Investment | ||
| FTSE Social Index Fund Admiral Shares | 16.74% | 13.73% | $17,982 | |
| FTSE4Good US Select Index | 16.88 | 13.87 | 18,083 | |
| Dow Jones U.S. Total Stock Market Float Adjusted Index | 14.75 | 12.82 | 17,339 | |
| Basic Materials | 1.6% |
| Consumer Discretionary | 16.2 |
| Consumer Staples | 5.3 |
| Energy | 0.1 |
| Financials | 9.3 |
| Health Care | 14.1 |
| Industrials | 9.7 |
| Real Estate | 2.8 |
| Technology | 37.7 |
| Telecommunications | 2.8 |
| Utilities | 0.4 |
| Shares | Market Value• ($000) | ||
| Common Stocks (99.8%) | |||
| Basic Materials (1.6%) | |||
| Linde plc | 240,897 | 93,237 | |
| Air Products and Chemicals Inc. | 108,807 | 32,151 | |
| Nucor Corp. | 123,769 | 21,301 | |
| Fastenal Co. | 278,574 | 16,040 | |
| Newmont Corp. | 392,481 | 15,472 | |
| LyondellBasell Industries NV Class A | 126,620 | 12,506 | |
| Albemarle Corp. | 57,132 | 11,353 | |
| International Flavors & Fragrances Inc. | 124,482 | 8,770 | |
| Steel Dynamics Inc. | 78,300 | 8,346 | |
| Avery Dennison Corp. | 39,625 | 7,465 | |
| CF Industries Holdings Inc. | 95,239 | 7,340 | |
| Mosaic Co. | 161,800 | 6,286 | |
| International Paper Co. | 169,479 | 5,918 | |
| FMC Corp. | 61,480 | 5,301 | |
| Westlake Corp. | 15,800 | 2,069 | |
| 253,555 | |||
| Consumer Discretionary (16.2%) | |||
| * | Amazon.com Inc. | 4,425,040 | 610,700 |
| * | Tesla Inc. | 1,355,262 | 349,766 |
| Home Depot Inc. | 497,471 | 164,315 | |
| Costco Wholesale Corp. | 217,545 | 119,493 | |
| McDonald's Corp. | 358,066 | 100,670 | |
| * | Netflix Inc. | 215,503 | 93,459 |
| * | Walt Disney Co. | 897,704 | 75,120 |
| Lowe's Cos. Inc. | 292,884 | 67,504 | |
| NIKE Inc. Class B | 584,602 | 59,460 | |
| * | Booking Holdings Inc. | 18,281 | 56,763 |
| Starbucks Corp. | 554,491 | 54,030 | |
| TJX Cos. Inc. | 566,228 | 52,365 | |
| * | Uber Technologies Inc. | 953,995 | 45,057 |
| Activision Blizzard Inc. | 382,318 | 35,169 | |
| * | MercadoLibre Inc. | 22,664 | 31,103 |
| Target Corp. | 225,796 | 28,574 | |
| * | O'Reilly Automotive Inc. | 29,974 | 28,167 |
| * | Airbnb Inc. Class A | 199,000 | 26,178 |
| * | Chipotle Mexican Grill Inc. | 13,500 | 26,010 |
| Marriott International Inc. Class A | 124,100 | 25,256 | |
| Ford Motor Co. | 1,928,486 | 23,393 | |
| * | AutoZone Inc. | 9,004 | 22,792 |
| * | Lululemon Athletica Inc. | 54,711 | 20,859 |
| Ross Stores Inc. | 165,329 | 20,139 | |
| Shares | Market Value• ($000) | ||
| * | Copart Inc. | 422,330 | 18,933 |
| Hilton Worldwide Holdings Inc. | 125,510 | 18,657 | |
| Estee Lauder Cos. Inc. Class A | 113,202 | 18,172 | |
| Yum! Brands Inc. | 138,480 | 17,917 | |
| * | Trade Desk Inc. Class A | 216,800 | 17,351 |
| Electronic Arts Inc. | 134,997 | 16,197 | |
| Dollar General Corp. | 108,277 | 14,996 | |
| Lennar Corp. Class A | 121,744 | 14,498 | |
| * | Warner Bros Discovery Inc. | 1,075,922 | 14,138 |
| * | Aptiv plc | 132,184 | 13,410 |
| * | Dollar Tree Inc. | 101,778 | 12,454 |
| Tractor Supply Co. | 54,338 | 11,873 | |
| eBay Inc. | 261,465 | 11,708 | |
| * | Take-Two Interactive Software Inc. | 80,484 | 11,445 |
| * | Royal Caribbean Cruises Ltd. | 114,210 | 11,300 |
| Genuine Parts Co. | 68,464 | 10,525 | |
| * | Spotify Technology SA | 68,313 | 10,518 |
| * | Ulta Beauty Inc. | 24,467 | 10,155 |
| * | Coupang Inc. | 535,000 | 10,154 |
| * | NVR Inc. | 1,437 | 9,164 |
| PulteGroup Inc. | 108,080 | 8,869 | |
| Garmin Ltd. | 75,307 | 7,984 | |
| Omnicom Group Inc. | 96,088 | 7,784 | |
| * | Carnival Corp. | 485,982 | 7,688 |
| * | Expedia Group Inc. | 70,069 | 7,595 |
| Best Buy Co. Inc. | 94,965 | 7,260 | |
| LKQ Corp. | 130,074 | 6,833 | |
| Pool Corp. | 18,500 | 6,764 | |
| Domino's Pizza Inc. | 17,300 | 6,702 | |
| * | Live Nation Entertainment Inc. | 76,324 | 6,452 |
| * | Roblox Corp. Class A | 224,175 | 6,342 |
| * | CarMax Inc. | 77,588 | 6,337 |
| Interpublic Group of Cos. Inc. | 189,413 | 6,177 | |
| * | Rivian Automotive Inc. Class A | 253,605 | 5,764 |
| * | Burlington Stores Inc. | 31,536 | 5,117 |
| Fox Corp. Class A | 143,414 | 4,741 | |
| BorgWarner Inc. (XNYS) | 113,282 | 4,616 | |
| Hasbro Inc. | 63,340 | 4,560 | |
| Aramark | 122,019 | 4,537 | |
| News Corp. Class A | 206,400 | 4,436 | |
| * | Etsy Inc. | 60,044 | 4,417 |
| Vail Resorts Inc. | 19,500 | 4,413 |
| Shares | Market Value• ($000) | ||
| Rollins Inc. | 108,195 | 4,281 | |
| Paramount Global Inc. Class B | 281,407 | 4,246 | |
| Bath & Body Works Inc. | 111,680 | 4,118 | |
| Lear Corp. | 28,456 | 4,100 | |
| Autoliv Inc. | 41,945 | 4,094 | |
| Gentex Corp. | 117,010 | 3,822 | |
| Whirlpool Corp. | 26,588 | 3,721 | |
| Delta Air Lines Inc. | 78,621 | 3,371 | |
| VF Corp. | 170,397 | 3,367 | |
| Southwest Airlines Co. | 72,167 | 2,280 | |
| *,1 | Lucid Group Inc. | 360,673 | 2,265 |
| * | United Airlines Holdings Inc. | 40,051 | 1,995 |
| Advance Auto Parts Inc. | 28,825 | 1,984 | |
| Fox Corp. Class B | 64,272 | 1,962 | |
| * | Liberty Media Corp. - Liberty SiriusXM Class C | 73,000 | 1,784 |
| 1 | Sirius XM Holdings Inc. | 319,070 | 1,404 |
| * | American Airlines Group Inc. | 80,894 | 1,192 |
| News Corp. Class B | 52,100 | 1,146 | |
| * | Liberty Media Corp.-Liberty SiriusXM Class A | 38,000 | 913 |
| Lennar Corp. Class B | 7,655 | 816 | |
| * | Phinia Inc. | 22,656 | 630 |
| 2,598,786 | |||
| Consumer Staples (5.3%) | |||
| Procter & Gamble Co. | 1,155,634 | 178,360 | |
| PepsiCo Inc. | 676,605 | 120,382 | |
| Coca-Cola Co. | 1,910,565 | 114,309 | |
| Mondelez International Inc. Class A | 667,209 | 47,545 | |
| CVS Health Corp. | 629,737 | 41,040 | |
| Colgate-Palmolive Co. | 402,678 | 29,585 | |
| McKesson Corp. | 67,276 | 27,739 | |
| Kimberly-Clark Corp. | 165,642 | 21,340 | |
| Archer-Daniels-Midland Co. | 266,800 | 21,157 | |
| * | Monster Beverage Corp. | 366,682 | 21,051 |
| General Mills Inc. | 289,019 | 19,555 | |
| Corteva Inc. | 350,930 | 17,725 | |
| Sysco Corp. | 250,360 | 17,438 | |
| Keurig Dr Pepper Inc. | 469,626 | 15,803 | |
| Hershey Co. | 72,592 | 15,597 | |
| Kroger Co. | 321,742 | 14,926 | |
| Cencora Inc. | 80,974 | 14,250 | |
| Kraft Heinz Co. | 392,549 | 12,989 | |
| Church & Dwight Co. Inc. | 119,241 | 11,539 | |
| McCormick & Co. Inc. | 124,268 | 10,200 | |
| Clorox Co. | 61,341 | 9,597 | |
| Walgreens Boots Alliance Inc. | 349,868 | 8,855 | |
| Bunge Ltd. | 72,799 | 8,322 | |
| Kellogg Co. | 126,735 | 7,733 | |
| J M Smucker Co. | 50,284 | 7,289 | |
| Tyson Foods Inc. Class A | 135,407 | 7,213 | |
| Conagra Brands Inc. | 232,220 | 6,939 | |
| Lamb Weston Holdings Inc. | 71,058 | 6,922 | |
| Coca-Cola Europacific Partners plc | 99,200 | 6,360 | |
| Hormel Foods Corp. | 140,970 | 5,440 | |
| Shares | Market Value• ($000) | ||
| Campbell Soup Co. | 94,548 | 3,943 | |
| 851,143 | |||
| Energy (0.2%) | |||
| * | First Solar Inc. | 51,900 | 9,815 |
| * | Enphase Energy Inc. | 64,892 | 8,211 |
| * | SolarEdge Technologies Inc. | 27,185 | 4,419 |
| *,1 | Plug Power Inc. | 252,682 | 2,138 |
| 24,583 | |||
| Financials (9.3%) | |||
| JPMorgan Chase & Co. | 1,435,459 | 210,051 | |
| Bank of America Corp. | 3,422,123 | 98,112 | |
| S&P Global Inc. | 157,287 | 61,477 | |
| Goldman Sachs Group Inc. | 158,725 | 52,016 | |
| BlackRock Inc. | 73,040 | 51,167 | |
| Morgan Stanley | 590,807 | 50,307 | |
| Marsh & McLennan Cos. Inc. | 242,697 | 47,323 | |
| Charles Schwab Corp. | 728,988 | 43,120 | |
| Chubb Ltd. | 202,159 | 40,608 | |
| Citigroup Inc. | 956,945 | 39,512 | |
| Progressive Corp. | 286,769 | 38,275 | |
| Blackstone Inc. | 346,605 | 36,868 | |
| CME Group Inc. | 176,136 | 35,699 | |
| Aon plc Class A (XNYS) | 99,274 | 33,097 | |
| Intercontinental Exchange Inc. | 271,954 | 32,088 | |
| US Bancorp | 752,637 | 27,494 | |
| Moody's Corp. | 77,972 | 26,261 | |
| Arthur J Gallagher & Co. | 104,164 | 24,008 | |
| PNC Financial Services Group Inc. | 195,616 | 23,617 | |
| Apollo Global Management Inc. | 256,700 | 22,420 | |
| Aflac Inc. | 297,091 | 22,154 | |
| American International Group Inc. | 361,013 | 21,126 | |
| MSCI Inc. | 38,214 | 20,774 | |
| KKR & Co. Inc. | 322,699 | 20,269 | |
| MetLife Inc. | 318,426 | 20,169 | |
| Truist Financial Corp. | 652,715 | 19,940 | |
| Travelers Cos. Inc. | 113,633 | 18,321 | |
| Ameriprise Financial Inc. | 51,804 | 17,488 | |
| Bank of New York Mellon Corp. | 389,280 | 17,467 | |
| Prudential Financial Inc. | 179,073 | 16,953 | |
| Allstate Corp. | 129,422 | 13,953 | |
| * | Arch Capital Group Ltd. | 174,642 | 13,423 |
| T Rowe Price Group Inc. | 107,602 | 12,076 | |
| State Street Corp. | 162,830 | 11,193 | |
| Discover Financial Services | 123,669 | 11,139 | |
| Willis Towers Watson plc | 52,088 | 10,770 | |
| Broadridge Financial Solutions Inc. | 57,402 | 10,689 | |
| Hartford Financial Services Group Inc. | 148,524 | 10,667 | |
| M&T Bank Corp. | 81,049 | 10,135 | |
| Raymond James Financial Inc. | 95,539 | 9,992 | |
| * | Markel Group Inc. | 6,542 | 9,675 |
| Principal Financial Group Inc. | 117,947 | 9,166 | |
| Fifth Third Bancorp | 333,028 | 8,842 | |
| LPL Financial Holdings Inc. | 38,200 | 8,809 | |
| Shares | Market Value• ($000) | ||
| Nasdaq Inc. | 167,563 | 8,794 | |
| Brown & Brown Inc. | 115,540 | 8,562 | |
| Regions Financial Corp. | 455,283 | 8,350 | |
| FactSet Research Systems Inc. | 18,857 | 8,229 | |
| Huntington Bancshares Inc. | 721,272 | 7,999 | |
| Cincinnati Financial Corp. | 74,856 | 7,919 | |
| Cboe Global Markets Inc. | 51,755 | 7,748 | |
| Northern Trust Corp. | 99,789 | 7,591 | |
| Everest Group Ltd. | 20,648 | 7,447 | |
| Citizens Financial Group Inc. | 234,969 | 6,610 | |
| W R Berkley Corp. | 103,747 | 6,418 | |
| Loews Corp. | 92,300 | 5,731 | |
| Fidelity National Financial Inc. | 133,713 | 5,536 | |
| KeyCorp | 454,918 | 5,154 | |
| Equitable Holdings Inc. | 173,921 | 5,009 | |
| Annaly Capital Management Inc. | 240,428 | 4,873 | |
| Globe Life Inc. | 43,108 | 4,810 | |
| Credicorp Ltd. | 33,170 | 4,691 | |
| RenaissanceRe Holdings Ltd. | 23,893 | 4,489 | |
| MarketAxess Holdings Inc. | 18,064 | 4,352 | |
| Franklin Resources Inc. | 138,174 | 3,695 | |
| Ally Financial Inc. | 131,713 | 3,647 | |
| Assurant Inc. | 25,632 | 3,571 | |
| Voya Financial Inc. | 47,608 | 3,317 | |
| Comerica Inc. | 63,804 | 3,070 | |
| SEI Investments Co. | 49,191 | 3,053 | |
| AGNC Investment Corp. | 279,110 | 2,766 | |
| Commerce Bancshares Inc. | 55,899 | 2,744 | |
| Zions Bancorp NA | 71,546 | 2,540 | |
| CNA Financial Corp. | 12,300 | 484 | |
| 1,497,909 | |||
| Health Care (14.0%) | |||
| Eli Lilly & Co. | 415,535 | 230,289 | |
| UnitedHealth Group Inc. | 456,401 | 217,512 | |
| Merck & Co. Inc. | 1,247,298 | 135,930 | |
| AbbVie Inc. | 866,774 | 127,381 | |
| Thermo Fisher Scientific Inc. | 189,480 | 105,559 | |
| Pfizer Inc. | 2,776,623 | 98,237 | |
| Abbott Laboratories | 850,948 | 87,563 | |
| Danaher Corp. | 322,836 | 85,551 | |
| Amgen Inc. | 262,515 | 67,293 | |
| Bristol-Myers Squibb Co. | 1,032,017 | 63,624 | |
| * | Intuitive Surgical Inc. | 172,012 | 53,785 |
| Medtronic plc | 653,451 | 53,256 | |
| Elevance Health Inc. | 116,449 | 51,472 | |
| Stryker Corp. | 174,147 | 49,379 | |
| Gilead Sciences Inc. | 614,700 | 47,012 | |
| * | Vertex Pharmaceuticals Inc. | 126,362 | 44,017 |
| Zoetis Inc. | 226,992 | 43,244 | |
| * | Regeneron Pharmaceuticals Inc. | 50,784 | 41,972 |
| Cigna Group | 143,232 | 39,569 | |
| Becton Dickinson & Co. | 138,990 | 38,841 | |
| * | Boston Scientific Corp. | 704,406 | 37,996 |
| Humana Inc. | 61,450 | 28,367 | |
| HCA Healthcare Inc. | 100,490 | 27,866 | |
| Shares | Market Value• ($000) | ||
| * | Edwards Lifesciences Corp. | 297,996 | 22,788 |
| * | IDEXX Laboratories Inc. | 40,240 | 20,579 |
| * | IQVIA Holdings Inc. | 91,938 | 20,468 |
| * | DexCom Inc. | 190,060 | 19,192 |
| * | Biogen Inc. | 71,036 | 18,992 |
| * | Moderna Inc. | 165,759 | 18,742 |
| Agilent Technologies Inc. | 145,614 | 17,629 | |
| * | Centene Corp. | 270,034 | 16,648 |
| West Pharmaceutical Services Inc. | 36,485 | 14,846 | |
| * | Veeva Systems Inc. Class A | 70,670 | 14,749 |
| * | Seagen Inc. | 68,477 | 14,111 |
| * | Align Technology Inc. | 37,305 | 13,808 |
| GE Healthcare Inc. | 190,500 | 13,421 | |
| * | Illumina Inc. | 78,018 | 12,890 |
| * | Horizon Therapeutics plc | 109,296 | 12,322 |
| Zimmer Biomet Holdings Inc. | 102,456 | 12,205 | |
| * | Alnylam Pharmaceuticals Inc. | 60,405 | 11,949 |
| ResMed Inc. | 71,637 | 11,433 | |
| STERIS plc | 48,386 | 11,109 | |
| Cardinal Health Inc. | 125,913 | 10,996 | |
| * | ICON plc | 39,770 | 10,338 |
| Baxter International Inc. | 246,645 | 10,014 | |
| Laboratory Corp. of America Holdings | 43,162 | 8,982 | |
| * | Hologic Inc. | 118,573 | 8,862 |
| Cooper Cos. Inc. | 23,704 | 8,770 | |
| * | Molina Healthcare Inc. | 28,185 | 8,741 |
| * | BioMarin Pharmaceutical Inc. | 91,339 | 8,347 |
| * | Exact Sciences Corp. | 87,034 | 7,282 |
| Revvity Inc. | 61,692 | 7,220 | |
| Quest Diagnostics Inc. | 54,568 | 7,176 | |
| * | Avantor Inc. | 329,524 | 7,134 |
| * | Insulet Corp. | 33,950 | 6,509 |
| Viatris Inc. | 583,883 | 6,277 | |
| Bio-Techne Corp. | 75,840 | 5,946 | |
| * | Incyte Corp. | 89,711 | 5,789 |
| Royalty Pharma plc Class A | 180,680 | 5,388 | |
| * | Charles River Laboratories International Inc. | 24,885 | 5,147 |
| * | Henry Schein Inc. | 63,691 | 4,875 |
| Teleflex Inc. | 22,885 | 4,869 | |
| * | Catalent Inc. | 87,700 | 4,382 |
| * | Jazz Pharmaceuticals plc | 29,794 | 4,271 |
| * | Bio-Rad Laboratories Inc. Class A | 10,286 | 4,116 |
| Universal Health Services Inc. Class B | 29,507 | 3,975 | |
| DENTSPLY SIRONA Inc. | 102,799 | 3,813 | |
| * | Elanco Animal Health Inc. (XNYS) | 238,537 | 2,910 |
| Organon & Co. | 125,524 | 2,756 | |
| * | DaVita Inc. | 26,447 | 2,709 |
| * | Masimo Corp. | 23,028 | 2,632 |
| * | Fortrea Holdings Inc. | 42,762 | 1,178 |
| * | Novocure Ltd. | 51,458 | 1,135 |
| 2,256,135 | |||
| Industrials (9.6%) | |||
| Visa Inc. Class A | 795,201 | 195,365 | |
| Mastercard Inc. Class A | 411,744 | 169,902 | |
| Shares | Market Value• ($000) | ||
| Accenture plc Class A | 310,569 | 100,553 | |
| Caterpillar Inc. | 253,486 | 71,263 | |
| Union Pacific Corp. | 299,056 | 65,963 | |
| United Parcel Service Inc. Class B (XNYS) | 356,150 | 60,332 | |
| Deere & Co. | 134,049 | 55,086 | |
| Automatic Data Processing Inc. | 203,331 | 51,770 | |
| American Express Co. | 290,255 | 45,857 | |
| Illinois Tool Works Inc. | 148,919 | 36,835 | |
| * | Fiserv Inc. | 301,633 | 36,615 |
| * | PayPal Holdings Inc. | 550,627 | 34,420 |
| Sherwin-Williams Co. | 116,712 | 31,713 | |
| CSX Corp. | 995,779 | 30,073 | |
| FedEx Corp. | 113,878 | 29,724 | |
| Carrier Global Corp. | 409,100 | 23,503 | |
| Trane Technologies plc | 111,130 | 22,811 | |
| Cintas Corp. | 42,272 | 21,312 | |
| PACCAR Inc. | 253,350 | 20,848 | |
| Old Dominion Freight Line Inc. | 48,558 | 20,752 | |
| Johnson Controls International plc | 337,814 | 19,951 | |
| Paychex Inc. | 158,620 | 19,388 | |
| Capital One Financial Corp. | 187,760 | 19,225 | |
| Rockwell Automation Inc. | 56,778 | 17,719 | |
| DuPont de Nemours Inc. | 226,434 | 17,411 | |
| Otis Worldwide Corp. | 201,700 | 17,255 | |
| Verisk Analytics Inc. | 70,360 | 17,043 | |
| Fidelity National Information Services Inc. | 293,606 | 16,401 | |
| Global Payments Inc. | 128,934 | 16,335 | |
| * | Block Inc. (XNYS) | 266,675 | 15,374 |
| Vulcan Materials Co. | 65,676 | 14,334 | |
| Ingersoll Rand Inc. (XYNS) | 197,586 | 13,754 | |
| Martin Marietta Materials Inc. | 30,175 | 13,470 | |
| * | Mettler-Toledo International Inc. | 10,673 | 12,951 |
| Equifax Inc. | 60,370 | 12,478 | |
| * | Keysight Technologies Inc. | 87,631 | 11,681 |
| * | Fair Isaac Corp. | 11,979 | 10,836 |
| Dover Corp. | 67,947 | 10,077 | |
| Westinghouse Air Brake Technologies Corp. | 89,101 | 10,026 | |
| * | FleetCor Technologies Inc. | 35,051 | 9,524 |
| Expeditors International of Washington Inc. | 74,986 | 8,752 | |
| IDEX Corp. | 36,885 | 8,351 | |
| * | Waters Corp. | 28,609 | 8,033 |
| TransUnion | 94,040 | 7,638 | |
| JB Hunt Transport Services Inc. | 40,651 | 7,637 | |
| Stanley Black & Decker Inc. | 74,804 | 7,060 | |
| * | Zebra Technologies Corp. Class A | 25,064 | 6,893 |
| Snap-on Inc. | 25,404 | 6,824 | |
| Synchrony Financial | 207,753 | 6,706 | |
| Packaging Corp. of America | 44,120 | 6,578 | |
| * | Trimble Inc. | 119,950 | 6,572 |
| Shares | Market Value• ($000) | ||
| Masco Corp. | 109,145 | 6,441 | |
| * | Bill Holdings Inc. | 50,180 | 5,786 |
| Jack Henry & Associates Inc. | 35,514 | 5,568 | |
| CH Robinson Worldwide Inc. | 56,197 | 5,082 | |
| Allegion plc | 43,845 | 4,990 | |
| Fortune Brands Innovations Inc. | 66,158 | 4,566 | |
| Westrock Co. | 123,595 | 4,043 | |
| Robert Half Inc. | 51,207 | 3,787 | |
| * | Generac Holdings Inc. | 30,000 | 3,564 |
| * | Mohawk Industries Inc. | 25,764 | 2,612 |
| 1,547,413 | |||
| Real Estate (2.8%) | |||
| Prologis Inc. | 452,667 | 56,221 | |
| American Tower Corp. | 228,399 | 41,413 | |
| Equinix Inc. | 45,875 | 35,846 | |
| Crown Castle Inc. | 212,721 | 21,378 | |
| Public Storage | 77,114 | 21,313 | |
| Welltower Inc. | 244,530 | 20,267 | |
| Digital Realty Trust Inc. | 143,114 | 18,851 | |
| Realty Income Corp. | 330,106 | 18,499 | |
| Simon Property Group Inc. | 159,795 | 18,135 | |
| * | CoStar Group Inc. | 199,120 | 16,326 |
| Extra Space Storage Inc. | 103,755 | 13,351 | |
| * | CBRE Group Inc. Class A | 151,046 | 12,846 |
| AvalonBay Communities Inc. | 68,220 | 12,540 | |
| Equity Residential | 182,109 | 11,806 | |
| SBA Communications Corp. | 52,535 | 11,796 | |
| Invitation Homes Inc. | 298,293 | 10,169 | |
| Alexandria Real Estate Equities Inc. | 83,786 | 9,748 | |
| Iron Mountain Inc. | 141,449 | 8,988 | |
| Ventas Inc. | 195,064 | 8,520 | |
| Mid-America Apartment Communities Inc. | 56,696 | 8,234 | |
| Essex Property Trust Inc. | 31,757 | 7,571 | |
| Sun Communities Inc. | 59,914 | 7,335 | |
| WP Carey Inc. | 103,282 | 6,718 | |
| UDR Inc. | 159,456 | 6,362 | |
| Equity LifeStyle Properties Inc. | 86,639 | 5,801 | |
| Kimco Realty Corp. | 293,964 | 5,568 | |
| Regency Centers Corp. | 88,627 | 5,513 | |
| Host Hotels & Resorts Inc. | 348,175 | 5,498 | |
| Healthpeak Properties Inc. | 266,400 | 5,483 | |
| Boston Properties Inc. | 76,507 | 5,108 | |
| * | Zillow Group Inc. Class C | 76,217 | 3,975 |
| Federal Realty Investment Trust | 39,279 | 3,847 | |
| * | Zillow Group Inc. Class A | 26,150 | 1,332 |
| 446,358 | |||
| Technology (37.6%) | |||
| Apple Inc. | 7,328,723 | 1,376,847 | |
| Microsoft Corp. | 3,654,937 | 1,197,942 | |
| NVIDIA Corp. | 1,167,005 | 575,975 | |
| * | Alphabet Inc. Class A | 2,922,195 | 397,915 |
| * | Alphabet Inc. Class C | 2,525,945 | 346,938 |
| * | Meta Platforms Inc. Class A | 1,086,477 | 321,478 |
| Broadcom Inc. | 200,467 | 185,009 | |
| Shares | Market Value• ($000) | ||
| * | Adobe Inc. | 225,149 | 125,935 |
| * | Salesforce Inc. | 465,090 | 102,999 |
| Oracle Corp. | 746,899 | 89,919 | |
| * | Advanced Micro Devices Inc. | 788,023 | 83,310 |
| Texas Instruments Inc. | 446,134 | 74,977 | |
| Intuit Inc. | 134,100 | 72,657 | |
| Intel Corp. | 2,049,606 | 72,023 | |
| Applied Materials Inc. | 415,365 | 63,451 | |
| QUALCOMM Inc. | 547,883 | 62,749 | |
| * | ServiceNow Inc. | 100,024 | 58,897 |
| Lam Research Corp. | 65,799 | 46,217 | |
| Micron Technology Inc. | 536,057 | 37,492 | |
| * | Palo Alto Networks Inc. | 146,295 | 35,594 |
| * | Synopsys Inc. | 74,535 | 34,203 |
| KLA Corp. | 67,271 | 33,761 | |
| * | Cadence Design Systems Inc. | 132,800 | 31,930 |
| NXP Semiconductors NV | 127,183 | 26,164 | |
| Marvell Technology Inc. | 419,689 | 24,447 | |
| * | Snowflake Inc. Class A | 152,210 | 23,874 |
| * | Workday Inc. Class A | 97,587 | 23,860 |
| * | Autodesk Inc. | 105,787 | 23,478 |
| Microchip Technology Inc. | 264,294 | 21,630 | |
| * | ON Semiconductor Corp. | 211,980 | 20,872 |
| * | Fortinet Inc. | 322,605 | 19,424 |
| Cognizant Technology Solutions Corp. Class A | 251,672 | 18,022 | |
| * | VMware Inc. Class A | 105,049 | 17,730 |
| * | Crowdstrike Holdings Inc. Class A | 104,084 | 16,969 |
| * | Atlassian Corp. Ltd. Class A | 71,400 | 14,570 |
| CDW Corp. | 66,800 | 14,105 | |
| * | Palantir Technologies Inc. Class A | 914,535 | 13,700 |
| * | Gartner Inc. | 37,428 | 13,088 |
| * | Datadog Inc. Class A | 133,198 | 12,851 |
| HP Inc. | 427,666 | 12,706 | |
| * | DoorDash Inc. Class A | 147,225 | 12,386 |
| * | MongoDB Inc. | 32,095 | 12,238 |
| Corning Inc. | 371,690 | 12,199 | |
| * | HubSpot Inc. | 22,304 | 12,190 |
| Monolithic Power Systems Inc. | 22,157 | 11,548 | |
| Hewlett Packard Enterprise Co. | 632,967 | 10,754 | |
| * | Splunk Inc. | 78,502 | 9,519 |
| * | VeriSign Inc. | 44,107 | 9,165 |
| * | Cloudflare Inc. Class A | 140,488 | 9,136 |
| * | Zoom Video Communications Inc. Class A | 120,356 | 8,549 |
| Skyworks Solutions Inc. | 77,597 | 8,438 | |
| * | Tyler Technologies Inc. | 21,064 | 8,392 |
| * | PTC Inc. | 56,157 | 8,265 |
| Teradyne Inc. | 76,455 | 8,247 | |
| NetApp Inc. | 104,265 | 7,997 | |
| * | Akamai Technologies Inc. | 75,927 | 7,979 |
| * | Pinterest Inc. Class A | 289,663 | 7,963 |
| Paycom Software Inc. | 25,385 | 7,484 | |
| * | EPAM Systems Inc. | 27,064 | 7,009 |
| * | Western Digital Corp. | 155,623 | 7,003 |
| Seagate Technology Holdings plc | 94,174 | 6,667 | |
| * | Zscaler Inc. | 42,653 | 6,656 |
| Shares | Market Value• ($000) | ||
| * | Match Group Inc. | 137,200 | 6,431 |
| * | Check Point Software Technologies Ltd. | 45,828 | 6,168 |
| * | Okta Inc. | 73,093 | 6,104 |
| * | Flex Ltd. | 221,200 | 6,103 |
| SS&C Technologies Holdings Inc. | 105,500 | 6,058 | |
| Gen Digital Inc. (XNGS) | 272,969 | 5,528 | |
| * | GoDaddy Inc. Class A | 74,855 | 5,428 |
| * | Twilio Inc. Class A | 82,865 | 5,279 |
| * | Qorvo Inc. | 48,600 | 5,219 |
| * | Unity Software Inc. | 140,400 | 5,205 |
| * | Ceridian HCM Holding Inc. | 71,729 | 5,202 |
| Amdocs Ltd. | 58,080 | 5,181 | |
| * | DocuSign Inc. | 98,531 | 4,956 |
| * | F5 Inc. | 29,395 | 4,811 |
| * | Arrow Electronics Inc. | 27,888 | 3,721 |
| * | UiPath Inc. Class A | 184,335 | 2,914 |
| * | ZoomInfo Technologies Inc. | 151,700 | 2,734 |
| *,1 | GLOBALFOUNDRIES Inc. | 38,200 | 2,111 |
| *,2 | Yandex NV Class A | 149,782 | — |
| 6,034,645 | |||
| Telecommunications (2.8%) | |||
| Cisco Systems Inc. | 2,012,783 | 115,433 | |
| Comcast Corp. Class A | 2,028,906 | 94,872 | |
| Verizon Communications Inc. | 2,070,113 | 72,413 | |
| AT&T Inc. | 3,519,703 | 52,057 | |
| * | T-Mobile US Inc. | 266,456 | 36,305 |
| * | Arista Networks Inc. | 123,353 | 24,082 |
| Motorola Solutions Inc. | 81,230 | 23,034 | |
| * | Charter Communications Inc. Class A | 50,576 | 22,158 |
| Juniper Networks Inc. | 155,390 | 4,525 | |
| * | Liberty Global plc Class C | 124,600 | 2,472 |
| * | Liberty Global plc Class A | 76,365 | 1,408 |
| Ubiquiti Inc. | 2,000 | 350 | |
| 449,109 | |||
| Utilities (0.4%) | |||
| Waste Management Inc. | 199,602 | 31,293 | |
| Republic Services Inc. | 100,789 | 14,527 | |
| American Water Works Co. Inc. | 95,215 | 13,210 | |
| Atmos Energy Corp. | 70,350 | 8,157 | |
| 67,187 | |||
| Total Common Stocks (Cost $9,698,571) | 16,026,823 | ||
| Shares | Market Value• ($000) | ||
| Temporary Cash Investments (0.1%) | |||
| Money Market Fund (0.1%) | |||
| 3,4 | Vanguard Market Liquidity Fund, 5.384% (Cost $22,176) | 221,794 | 22,177 |
| Total Investments (99.9%) (Cost $9,720,747) | 16,049,000 | ||
| Other Assets and Liabilities—Net (0.1%) | 10,756 | ||
| Net Assets (100%) | 16,059,756 | ||
| Cost is in $000. | |||
| • | See Note A in Notes to Financial Statements. |
| * | Non-income-producing security. |
| 1 | Includes partial security positions on loan to broker-dealers. The total value of securities on loan is $5,258,000. |
| 2 | Security value determined using significant unobservable inputs. |
| 3 | Affiliated money market fund available only to Vanguard funds and certain trusts and accounts managed by Vanguard. Rate shown is the 7-day yield. |
| 4 | Collateral of $5,600,000 was received for securities on loan. |
| Futures Contracts | ||||
| ($000) | ||||
| Expiration | Number of Long (Short) Contracts | Notional Amount | Value and Unrealized Appreciation (Depreciation) | |
| Long Futures Contracts | ||||
| E-mini S&P 500 Index | September 2023 | 154 | 34,773 | 151 |
| ($000s, except shares, footnotes, and per-share amounts) | Amount |
| Assets | |
| Investments in Securities, at Value1 | |
| Unaffiliated Issuers (Cost $9,698,571) | 16,026,823 |
| Affiliated Issuers (Cost $22,176) | 22,177 |
| Total Investments in Securities | 16,049,000 |
| Investment in Vanguard | 537 |
| Cash Collateral Pledged—Futures Contracts | 1,390 |
| Receivables for Investment Securities Sold | 426 |
| Receivables for Accrued Income | 16,594 |
| Receivables for Capital Shares Issued | 8,539 |
| Variation Margin Receivable—Futures Contracts | 295 |
| Total Assets | 16,076,781 |
| Liabilities | |
| Due to Custodian | 403 |
| Payables for Investment Securities Purchased | 112 |
| Collateral for Securities on Loan | 5,600 |
| Payables for Capital Shares Redeemed | 10,015 |
| Payables to Vanguard | 895 |
| Total Liabilities | 17,025 |
| Net Assets | 16,059,756 |
| 1 Includes $5,258,000 of securities on loan. | |
| At August 31, 2023, net assets consisted of: | |
| Paid-in Capital | 10,400,892 |
| Total Distributable Earnings (Loss) | 5,658,864 |
| Net Assets | 16,059,756 |
| Admiral Shares—Net Assets | |
| Applicable to 200,416,395 outstanding $.001 par value shares of beneficial interest (unlimited authorization) | 8,489,296 |
| Net Asset Value Per Share—Admiral Shares | $42.36 |
| Institutional Shares—Net Assets | |
| Applicable to 248,277,217 outstanding $.001 par value shares of beneficial interest (unlimited authorization) | 7,570,460 |
| Net Asset Value Per Share—Institutional Shares | $30.49 |
| Year Ended August 31, 2023 | |
| ($000) | |
| Investment Income | |
| Income | |
| Dividends1 | 201,675 |
| Interest2 | 856 |
| Securities Lending—Net | 776 |
| Total Income | 203,307 |
| Expenses | |
| The Vanguard Group—Note B | |
| Investment Advisory Services | 302 |
| Management and Administrative—Admiral Shares | 9,818 |
| Management and Administrative—Institutional Shares | 7,137 |
| Marketing and Distribution—Admiral Shares | 426 |
| Marketing and Distribution—Institutional Shares | 230 |
| Custodian Fees | 171 |
| Auditing Fees | 30 |
| Shareholders’ Reports—Admiral Shares | 115 |
| Shareholders’ Reports—Institutional Shares | 94 |
| Trustees’ Fees and Expenses | 7 |
| Other Expenses | 22 |
| Total Expenses | 18,352 |
| Expenses Paid Indirectly | (2) |
| Net Expenses | 18,350 |
| Net Investment Income | 184,957 |
| Realized Net Gain (Loss) | |
| Investment Securities Sold2,3 | (168,541) |
| Futures Contracts | 2,213 |
| Realized Net Gain (Loss) | (166,328) |
| Change in Unrealized Appreciation (Depreciation) | |
| Investment Securities2 | 2,253,864 |
| Futures Contracts | 934 |
| Change in Unrealized Appreciation (Depreciation) | 2,254,798 |
| Net Increase (Decrease) in Net Assets Resulting from Operations | 2,273,427 |
| 1 | Dividends are net of foreign withholding taxes of $69,000. |
| 2 | Interest income, realized net gain (loss), and change in unrealized appreciation (depreciation) from an affiliated company of the fund were $803,000, $1,000, and ($3,000), respectively. Purchases and sales are for temporary cash investment purposes. |
| 3 | Includes $7,410,000 of net gain (loss) resulting from in-kind redemptions. |
| Year Ended August 31, | ||
| 2023 ($000) | 2022 ($000) | |
| Increase (Decrease) in Net Assets | ||
| Operations | ||
| Net Investment Income | 184,957 | 169,201 |
| Realized Net Gain (Loss) | (166,328) | (10,874) |
| Change in Unrealized Appreciation (Depreciation) | 2,254,798 | (2,815,282) |
| Net Increase (Decrease) in Net Assets Resulting from Operations | 2,273,427 | (2,656,955) |
| Distributions | ||
| Admiral Shares | (95,885) | (90,342) |
| Institutional Shares | (81,511) | (71,904) |
| Total Distributions | (177,396) | (162,246) |
| Capital Share Transactions | ||
| Admiral Shares | (143,211) | 515,627 |
| Institutional Shares | 602,768 | 604,756 |
| Net Increase (Decrease) from Capital Share Transactions | 459,557 | 1,120,383 |
| Total Increase (Decrease) | 2,555,588 | (1,698,818) |
| Net Assets | ||
| Beginning of Period | 13,504,168 | 15,202,986 |
| End of Period | 16,059,756 | 13,504,168 |
| Admiral Shares | |||||
| For a Share Outstanding Throughout Each Period | February 7, 20191 to August 31, 2019 | Year Ended August 31, | |||
| 2023 | 2022 | 2021 | 2020 | ||
| Net Asset Value, Beginning of Period | $36.76 | $44.39 | $34.27 | $27.27 | $25.00 |
| Investment Operations | |||||
| Net Investment Income2 | .494 | .464 | .432 | .465 | .273 |
| Net Realized and Unrealized Gain (Loss) on Investments | 5.583 | (7.647) | 10.110 | 6.996 | 2.183 |
| Total from Investment Operations | 6.077 | (7.183) | 10.542 | 7.461 | 2.456 |
| Distributions | |||||
| Dividends from Net Investment Income | (.477) | (.447) | (.422) | (.461) | (.186) |
| Distributions from Realized Capital Gains | — | — | — | — | — |
| Total Distributions | (.477) | (.447) | (.422) | (.461) | (.186) |
| Net Asset Value, End of Period | $42.36 | $36.76 | $44.39 | $34.27 | $27.27 |
| Total Return3 | 16.74% | -16.28% | 31.04% | 27.83% | 9.85% |
| Ratios/Supplemental Data | |||||
| Net Assets, End of Period (Millions) | $8,489 | $7,512 | $8,573 | $5,305 | $3,478 |
| Ratio of Total Expenses to Average Net Assets | 0.14%4 | 0.14% | 0.14% | 0.14% | 0.14%5 |
| Ratio of Net Investment Income to Average Net Assets | 1.31% | 1.12% | 1.13% | 1.60% | 1.79%5 |
| Portfolio Turnover Rate | 5%6 | 8%6 | 4%6 | 18% | 11%6,7 |
| 1 | Inception. |
| 2 | Calculated based on average shares outstanding. |
| 3 | Total returns do not include account service fees that may have applied in the periods shown. Fund prospectuses provide information about any applicable account service fees. |
| 4 | The ratio of expenses to average net assets for the period net of reduction from custody fee offset arrangements was 0.14%. |
| 5 | Annualized. |
| 6 | Excludes the value of portfolio securities received or delivered as a result of in-kind purchases or redemptions of the fund’s capital shares. |
| 7 | Reflects the fund’s portfolio turnover for the fiscal year ended August 31, 2019. |
| Institutional Shares | |||||
| For a Share Outstanding Throughout Each Period | Year Ended August 31, | ||||
| 2023 | 2022 | 2021 | 2020 | 2019 | |
| Net Asset Value, Beginning of Period | $26.47 | $31.96 | $24.67 | $19.63 | $19.28 |
| Investment Operations | |||||
| Net Investment Income1 | .362 | .340 | .317 | .339 | .314 |
| Net Realized and Unrealized Gain (Loss) on Investments | 4.007 | (5.502) | 7.282 | 5.037 | .351 |
| Total from Investment Operations | 4.369 | (5.162) | 7.599 | 5.376 | .665 |
| Distributions | |||||
| Dividends from Net Investment Income | (.349) | (.328) | (.309) | (.336) | (.315) |
| Distributions from Realized Capital Gains | — | — | — | — | — |
| Total Distributions | (.349) | (.328) | (.309) | (.336) | (.315) |
| Net Asset Value, End of Period | $30.49 | $26.47 | $31.96 | $24.67 | $19.63 |
| Total Return | 16.71% | -16.25% | 31.09% | 27.86% | 3.58% |
| Ratios/Supplemental Data | |||||
| Net Assets, End of Period (Millions) | $7,570 | $5,993 | $6,630 | $4,003 | $2,701 |
| Ratio of Total Expenses to Average Net Assets | 0.12%2 | 0.12% | 0.12% | 0.12% | 0.12% |
| Ratio of Net Investment Income to Average Net Assets | 1.33% | 1.14% | 1.15% | 1.62% | 1.49% |
| Portfolio Turnover Rate | 5%3 | 8%3 | 4%3 | 18% | 11%3 |
| 1 | Calculated based on average shares outstanding. |
| 2 | The ratio of expenses to average net assets for the period net of reduction from custody fee offset arrangements was 0.12%. |
| 3 | Excludes the value of portfolio securities received or delivered as a result of in-kind purchases or redemptions of the fund’s capital shares. |
| A. | The following significant accounting policies conform to generally accepted accounting principles for U.S. investment companies. The fund consistently follows such policies in preparing its financial statements. |
| B. | In accordance with the terms of a Funds' Service Agreement (the “FSA”) between Vanguard and the fund, Vanguard furnishes to the fund investment advisory, corporate management, administrative, marketing, and distribution services at Vanguard’s cost of operations (as defined by the FSA). These costs of operations are allocated to the fund based on methods and guidelines approved by the board of trustees and are generally settled twice a month. |
| C. | The fund’s custodian bank has agreed to reduce its fees when the fund maintains cash on deposit in the non-interest-bearing custody account. For the year ended August 31, 2023, custodian fee offset arrangements reduced the fund’s expenses by $2,000 (an annual rate of less than 0.01% of average net assets). |
| D. | Various inputs may be used to determine the value of the fund’s investments and derivatives. These inputs are summarized in three broad levels for financial statement purposes. The inputs or methodologies used to value securities are not necessarily an indication of the risk associated with investing in those securities. |
| Level 1 ($000) | Level 2 ($000) | Level 3 ($000) | Total ($000) | |
| Investments | ||||
| Assets | ||||
| Common Stocks | 16,026,823 | — | — | 16,026,823 |
| Temporary Cash Investments | 22,177 | — | — | 22,177 |
| Total | 16,049,000 | — | — | 16,049,000 |
| Derivative Financial Instruments | ||||
| Assets | ||||
| Futures Contracts1 | 151 | — | — | 151 |
| 1 | Includes cumulative appreciation (depreciation) on futures contracts and centrally cleared swaps, if any, as reported in the Schedule of Investments. Only current day’s variation margin is reported within the Statement of Assets and Liabilities. |
| E. | Permanent differences between book-basis and tax-basis components of net assets are reclassified among capital accounts in the financial statements to reflect their tax character. These reclassifications have no effect on net assets or net asset value per share. As of period end, permanent differences primarily attributable to the accounting for applicable in-kind redemptions were reclassified between the following accounts: |
| Amount ($000) | |
| Paid-in Capital | 7,362 |
| Total Distributable Earnings (Loss) | (7,362) |
| Amount ($000) | |
| Undistributed Ordinary Income | 44,096 |
| Undistributed Long-Term Gains | — |
| Net Unrealized Gains (Losses) | 6,224,439 |
| Capital Loss Carryforwards | (609,671) |
| Qualified Late-Year Losses | — |
| Other Temporary Differences | — |
| Total | 5,658,864 |
| Year Ended August 31, | ||
| 2023 Amount ($000) | 2022 Amount ($000) | |
| Ordinary Income* | 177,396 | 162,246 |
| Long-Term Capital Gains | — | — |
| Total | 177,396 | 162,246 |
| * | Includes short-term capital gains, if any. |
| Amount ($000) | |
| Tax Cost | 9,824,561 |
| Gross Unrealized Appreciation | 6,981,599 |
| Gross Unrealized Depreciation | (757,160) |
| Net Unrealized Appreciation (Depreciation) | 6,224,439 |
| F. | During the year ended August 31, 2023, the fund purchased $1,252,936,000 of investment securities and sold $765,361,000 of investment securities, other than temporary cash investments. Purchases and sales include $0 and $18,963,000, respectively, in connection with in-kind purchases and redemptions of the fund's capital shares. |
| G. | Capital share transactions for each class of shares were: |
| Year Ended August 31, | |||||
| 2023 | 2022 | ||||
| Amount ($000) | Shares (000) | Amount ($000) | Shares (000) | ||
| Admiral Shares | |||||
| Issued | 1,332,404 | 35,434 | 2,331,265 | 55,224 | |
| Issued in Lieu of Cash Distributions | 83,378 | 2,266 | 78,683 | 1,922 | |
| Redeemed | (1,558,993) | (41,603) | (1,894,321) | (45,939) | |
| Net Increase (Decrease)—Admiral Shares | (143,211) | (3,903) | 515,627 | 11,207 | |
| Institutional Shares | |||||
| Issued | 1,105,824 | 40,369 | 1,604,543 | 52,921 | |
| Issued in Lieu of Cash Distributions | 80,161 | 3,020 | 70,377 | 2,386 | |
| Redeemed | (583,217) | (21,539) | (1,070,164) | (36,334) | |
| Net Increase (Decrease)—Institutional Shares | 602,768 | 21,850 | 604,756 | 18,973 | |
| H. | Significant market disruptions, such as those caused by pandemics (e.g., COVID-19 pandemic), natural or environmental disasters, war (e.g., Russia’s invasion of Ukraine), acts of terrorism, or other events, can adversely affect local and global markets and normal market operations. Any such disruptions could have an adverse impact on the value of the fund’s investments and fund performance. |
| I. | Management has determined that no events or transactions occurred subsequent to August 31, 2023, that would require recognition or disclosure in these financial statements. |
Philadelphia, Pennsylvania
October 18, 2023
| Matthew Benchener | Thomas M. Rampulla |
| Joseph Brennan | Karin A. Risi |
| Mortimer J. Buckley | Anne E. Robinson |
| Gregory Davis | Michael Rollings |
| John James | Nitin Tandon |
| Chris D. Mclsaac | Lauren Valente |

All rights reserved.
Vanguard Marketing Corporation, Distributor.

| Vanguard Communication Services Index Fund |
| Vanguard Consumer Discretionary Index Fund |
| Vanguard Consumer Staples Index Fund |
| Vanguard Energy Index Fund |
| Vanguard Financials Index Fund |
| Vanguard Health Care Index Fund |
| Vanguard Industrials Index Fund |
| Vanguard Information Technology Index Fund |
| Vanguard Materials Index Fund |
| Vanguard Utilities Index Fund |
Your Fund’s Performance at a Glance | 1 |
About Your Fund’s Expenses | 2 |
Communication Services Index Fund | 5 |
Consumer Discretionary Index Fund | 17 |
Consumer Staples Index Fund | 30 |
Energy Index Fund | 42 |
Financials Index Fund | 54 |
Health Care Index Fund | 68 |
Industrials Index Fund | 83 |
Information Technology Index Fund | 97 |
Materials Index Fund | 110 |
Utilities Index Fund | 122 |
Trustees Approve Advisory Arrangements | 136 |
Liquidity Risk Management | 137 |

| • | For the 12 months ended August 31, 2023, returns for the Vanguard U.S. Sector Index Funds ranged from about –13% to more than 28%. All 10 funds closely tracked their target indexes. |
| • | Early in the period, inflation in many developed markets began to ease off multidecade highs but remained stubbornly high in some sectors—including services, which felt the effects of a tight labor market. While aggressive interest rate hikes by many major central banks, including the Federal Reserve, fanned fears of recession, the economy proved more resilient than expected. |
| • | Returns were strongest for Vanguard Information Technology Index (+28.47%) and Industrials Index (+19.99%) Funds. At the low end were Vanguard Utilities Index (–12.73%), Consumer Staples Index (+4.65%), and Financials Index (+5.27%) Funds. (Returns listed are for Admiral Shares.) |
| Average Annual Total Returns Periods Ended August 31, 2023 | |||
| One Year | Three Years | Five Years | |
| Stocks | |||
| Russell 1000 Index (Large-caps) | 15.40% | 9.93% | 10.77% |
| Russell 2000 Index (Small-caps) | 4.65 | 8.12 | 3.14 |
| Russell 3000 Index (Broad U.S. market) | 14.76 | 9.81 | 10.25 |
| FTSE All-World ex US Index (International) | 12.02 | 4.49 | 3.74 |
| Bonds | |||
| Bloomberg U.S. Aggregate Float Adjusted Index (Broad taxable market) | -1.05% | -4.40% | 0.55% |
| Bloomberg Municipal Bond Index (Broad tax-exempt market) | 1.70 | -1.32 | 1.52 |
| FTSE Three-Month U.S. Treasury Bill Index | 4.44 | 1.63 | 1.68 |
| CPI | |||
| Consumer Price Index | 3.67% | 5.71% | 4.02% |
| • | Based on actual fund return. This section helps you to estimate the actual expenses that you paid over the period. The ”Ending Account Value“ shown is derived from the fund‘s actual return, and the third column shows the dollar amount that would have been paid by an investor who started with $1,000 in the fund. You may use the information here, together with the amount you invested, to estimate the expenses that you paid over the period. |
| • | Based on hypothetical 5% yearly return. This section is intended to help you compare your fund‘s costs with those of other mutual funds. It assumes that the fund had a yearly return of 5% before expenses, but that the expense ratio is unchanged. In this case—because the return used is not the fund’s actual return—the results do not apply to your investment. The example is useful in making comparisons because the Securities and Exchange Commission requires all mutual funds to calculate expenses based on a 5% return. You can assess your fund’s costs by comparing this hypothetical example with the hypothetical examples that appear in shareholder reports of other funds. |
| Six Months Ended August 31, 2023 | |||
| Beginning Account Value 2/28/2023 | Ending Account Value 8/31/2023 | Expenses Paid During Period | |
| Based on Actual Fund Return | |||
| Communication Services Index Fund | |||
| ETF Shares | $1,000.00 | $1,211.10 | $0.56 |
| Admiral™ Shares | 1,000.00 | 1,210.90 | 0.56 |
| Consumer Discretionary Index Fund | |||
| ETF Shares | $1,000.00 | $1,165.20 | $0.55 |
| Admiral Shares | 1,000.00 | 1,165.10 | 0.55 |
| Consumer Staples Index Fund | |||
| ETF Shares | $1,000.00 | $1,040.50 | $0.51 |
| Admiral Shares | 1,000.00 | 1,040.60 | 0.51 |
| Energy Index Fund | |||
| ETF Shares | $1,000.00 | $1,087.90 | $0.53 |
| Admiral Shares | 1,000.00 | 1,087.90 | 0.53 |
| Financials Index Fund | |||
| ETF Shares | $1,000.00 | $966.40 | $0.50 |
| Admiral Shares | 1,000.00 | 966.40 | 0.50 |
| Health Care Index Fund | |||
| ETF Shares | $1,000.00 | $1,047.30 | $0.52 |
| Admiral Shares | 1,000.00 | 1,047.30 | 0.52 |
| Industrials Index Fund | |||
| ETF Shares | $1,000.00 | $1,089.60 | $0.53 |
| Admiral Shares | 1,000.00 | 1,089.70 | 0.53 |
| Information Technology Index Fund | |||
| ETF Shares | $1,000.00 | $1,267.80 | $0.57 |
| Admiral Shares | 1,000.00 | 1,267.80 | 0.57 |
| Materials Index Fund | |||
| ETF Shares | $1,000.00 | $1,015.30 | $0.51 |
| Admiral Shares | 1,000.00 | 1,015.50 | 0.51 |
| Utilities Index Fund | |||
| ETF Shares | $1,000.00 | $973.80 | $0.50 |
| Admiral Shares | 1,000.00 | 974.10 | 0.50 |
| Six Months Ended August 31, 2023 | |||
| Beginning Account Value 2/28/2023 | Ending Account Value 8/31/2023 | Expenses Paid During Period | |
| Based on Hypothetical 5% Yearly Return | |||
| Communication Services Index Fund | |||
| ETF Shares | $1,000.00 | $1,024.70 | $0.51 |
| Admiral Shares | 1,000.00 | 1,024.70 | 0.51 |
| Consumer Discretionary Index Fund | |||
| ETF Shares | $1,000.00 | $1,024.70 | $0.51 |
| Admiral Shares | 1,000.00 | 1,024.70 | 0.51 |
| Consumer Staples Index Fund | |||
| ETF Shares | $1,000.00 | $1,024.70 | $0.51 |
| Admiral Shares | 1,000.00 | 1,024.70 | 0.51 |
| Energy Index Fund | |||
| ETF Shares | $1,000.00 | $1,024.70 | $0.51 |
| Admiral Shares | 1,000.00 | 1,024.70 | 0.51 |
| Financials Index Fund | |||
| ETF Shares | $1,000.00 | $1,024.70 | $0.51 |
| Admiral Shares | 1,000.00 | 1,024.70 | 0.51 |
| Health Care Index Fund | |||
| ETF Shares | $1,000.00 | $1,024.70 | $0.51 |
| Admiral Shares | 1,000.00 | 1,024.70 | 0.51 |
| Industrials Index Fund | |||
| ETF Shares | $1,000.00 | $1,024.70 | $0.51 |
| Admiral Shares | 1,000.00 | 1,024.70 | 0.51 |
| Information Technology Index Fund | |||
| ETF Shares | $1,000.00 | $1,024.70 | $0.51 |
| Admiral Shares | 1,000.00 | 1,024.70 | 0.51 |
| Materials Index Fund | |||
| ETF Shares | $1,000.00 | $1,024.70 | $0.51 |
| Admiral Shares | 1,000.00 | 1,024.70 | 0.51 |
| Utilities Index Fund | |||
| ETF Shares | $1,000.00 | $1,024.70 | $0.51 |
| Admiral Shares | 1,000.00 | 1,024.70 | 0.51 |

| Average Annual Total Returns Periods Ended August 31, 2023 | |||||
| One Year | Five Years | Ten Years | Final Value of a $10,000 Investment | ||
 | Communication Services Index Fund ETF Shares Net Asset Value | 17.46% | 5.73% | 5.81% | $17,582 |
| Communication Services Index Fund ETF Shares Market Price | 17.53 | 5.74 | 5.81 | 17,594 | |
 | Communication Services Spliced Index | 17.28 | 5.73 | 5.79 | 17,561 |
 | MSCI US Investable Market 2500 Index | 15.01 | 10.39 | 12.34 | 32,022 |
| One Year | Five Years | Ten Years | Final Value of a $100,000 Investment | ||
| Communication Services Index Fund Admiral Shares | 17.44% | 5.73% | 5.82% | $176,008 | |
| Communication Services Spliced Index | 17.28 | 5.73 | 5.79 | 175,614 | |
| MSCI US Investable Market 2500 Index | 15.01 | 10.39 | 12.34 | 320,217 | |
| One Year | Five Years | Ten Years | |
| Communication Services Index Fund ETF Shares Market Price | 17.53% | 32.22% | 75.94% |
| Communication Services Index Fund ETF Shares Net Asset Value | 17.46 | 32.13 | 75.82 |
| Communication Services Spliced Index | 17.28 | 32.12 | 75.61 |
| Diversified Telecommunication Services | 10.7% |
| Entertainment | 21.1 |
| Interactive Media & Services | 47.8 |
| Media | 17.1 |
| Wireless Telecommunication Services | 3.3 |
| Shares | Market Value• ($000) | ||
| Common Stocks (99.8%) | |||
| Diversified Telecommunication Services (10.7%) | |||
| Verizon Communications Inc. | 4,494,024 | 157,201 | |
| AT&T Inc. | 7,867,048 | 116,354 | |
| * | Liberty Global plc Class C | 978,753 | 19,419 |
| Iridium Communications Inc. | 331,028 | 16,204 | |
| Cogent Communications Holdings Inc. | 173,420 | 12,240 | |
| * | Liberty Global plc Class A | 648,549 | 11,959 |
| * | Frontier Communications Parent Inc. | 734,086 | 11,760 |
| * | Lumen Technologies Inc. | 4,006,430 | 6,370 |
| * | Liberty Latin America Ltd. Class C | 611,071 | 5,475 |
| * | Radius Global Infrastructure Inc. Class A (XNMS) | 298,267 | 4,450 |
| * | Globalstar Inc. | 2,892,884 | 4,166 |
| * | EchoStar Corp. Class A | 136,693 | 2,376 |
| * | Anterix Inc. | 53,134 | 1,758 |
| * | IDT Corp. Class B | 71,878 | 1,681 |
| ATN International Inc. | 44,095 | 1,582 | |
| * | Bandwidth Inc. Class A | 94,325 | 1,355 |
| * | Liberty Latin America Ltd. Class A | 140,738 | 1,258 |
| * | Consolidated Communications Holdings Inc. | 302,314 | 1,194 |
| * | Charge Enterprises Inc. | 466,400 | 253 |
| 377,055 | |||
| Entertainment (21.0%) | |||
| * | Netflix Inc. | 378,396 | 164,103 |
| * | Walt Disney Co. | 1,798,758 | 150,520 |
| Activision Blizzard Inc. | 960,575 | 88,363 | |
| Electronic Arts Inc. | 388,324 | 46,591 | |
| * | Warner Bros Discovery Inc. | 3,350,967 | 44,032 |
| * | Take-Two Interactive Software Inc. | 267,963 | 38,104 |
| * | Roku Inc. | 366,162 | 29,732 |
| * | Liberty Media Corp.-Liberty Formula One Class C | 385,814 | 26,540 |
| * | Live Nation Entertainment Inc. | 312,671 | 26,430 |
| * | Roblox Corp. Class A | 789,949 | 22,348 |
| World Wrestling Entertainment Inc. Class A | 172,181 | 16,624 | |
| Warner Music Group Corp. Class A | 494,938 | 16,481 | |
| * | Endeavor Group Holdings Inc. Class A | 636,341 | 13,929 |
| Madison Square Garden Sports Corp. | 61,790 | 10,999 | |
| * | Cinemark Holdings Inc. | 436,477 | 7,106 |
| *,1 | AMC Entertainment Holdings Inc. Class A | 561,194 | 7,043 |
| Shares | Market Value• ($000) | ||
| * | Atlanta Braves Holdings Inc. Class C | 180,281 | 6,642 |
| * | Liberty Media Corp.-Liberty Live Class C | 193,155 | 6,500 |
| * | Madison Square Garden Entertainment Corp. | 123,281 | 3,956 |
| * | Imax Corp. | 185,009 | 3,539 |
| * | Sphere Entertainment Co. | 93,912 | 3,293 |
| * | Lions Gate Entertainment Corp. Class B | 408,793 | 3,046 |
| * | Lions Gate Entertainment Corp. Class A | 330,705 | 2,619 |
| * | Liberty Media Corp.-Liberty Live Class A | 73,493 | 2,448 |
| Marcus Corp. | 93,071 | 1,414 | |
| * | Atlanta Braves Holdings Inc. Class A | 27,501 | 1,151 |
| * | Vivid Seats Inc. Class A | 153,216 | 1,112 |
| * | Skillz Inc. | 53,048 | 434 |
| 745,099 | |||
| Interactive Media & Services (47.7%) | |||
| * | Meta Platforms Inc. Class A | 2,295,930 | 679,343 |
| * | Alphabet Inc. Class A | 3,306,314 | 450,221 |
| * | Alphabet Inc. Class C | 2,698,015 | 370,572 |
| * | Match Group Inc. | 681,053 | 31,921 |
| * | Pinterest Inc. Class A | 1,156,991 | 31,806 |
| * | Snap Inc. Class A | 2,310,789 | 23,917 |
| * | IAC Inc. | 295,597 | 16,355 |
| * | ZoomInfo Technologies Inc. | 830,368 | 14,963 |
| * | Ziff Davis Inc. | 188,647 | 12,573 |
| * | Yelp Inc. | 260,911 | 11,180 |
| * | TripAdvisor Inc. | 438,500 | 6,626 |
| * | Bumble Inc. Class A | 384,210 | 6,447 |
| * | Cargurus Inc. | 330,118 | 5,978 |
| * | Cars.com Inc. | 252,867 | 4,726 |
| * | ZipRecruiter Inc. Class A | 281,848 | 4,281 |
| Shutterstock Inc. | 100,679 | 4,240 | |
| * | Eventbrite Inc. Class A | 328,548 | 3,328 |
| *,1 | fuboTV Inc. | 1,163,644 | 2,723 |
| * | Vimeo Inc. | 591,945 | 2,356 |
| * | QuinStreet Inc. | 205,112 | 2,031 |
| * | Nextdoor Holdings Inc. | 444,455 | 965 |
| * | Outbrain Inc. | 142,804 | 815 |
| * | Angi Inc. | 320,478 | 788 |
| * | Mediaalpha Inc. Class A | 82,282 | 690 |
| * | System1 Inc. | 89,591 | 160 |
| 1,689,005 | |||
| Media (17.1%) | |||
| Comcast Corp. Class A | 3,368,749 | 157,523 | |
| * | Charter Communications Inc. Class A | 145,022 | 63,537 |
| * | Trade Desk Inc. Class A | 633,241 | 50,678 |
| Omnicom Group Inc. | 347,940 | 28,187 | |
| Interpublic Group of Cos. Inc. | 744,326 | 24,272 | |
| Shares | Market Value• ($000) | ||
| * | Liberty Broadband Corp. Class C | 253,531 | 23,720 |
| Fox Corp. Class A | 704,778 | 23,300 | |
| News Corp. Class A | 1,059,074 | 22,759 | |
| New York Times Co. Class A | 503,297 | 22,281 | |
| Nexstar Media Group Inc. | 116,703 | 18,999 | |
| Paramount Global Inc. Class B | 1,167,675 | 17,620 | |
| Fox Corp. Class B | 563,989 | 17,213 | |
| * | Liberty Media Corp. - Liberty SiriusXM Class C | 619,530 | 15,141 |
| TEGNA Inc. | 763,506 | 12,621 | |
| Cable One Inc. | 18,143 | 11,803 | |
| 1 | Sirius XM Holdings Inc. | 2,436,491 | 10,721 |
| News Corp. Class B | 472,720 | 10,400 | |
| * | Liberty Broadband Corp. Class A | 100,156 | 9,379 |
| * | Liberty Media Corp.-Liberty SiriusXM Class A | 294,634 | 7,080 |
| John Wiley & Sons Inc. Class A | 175,439 | 6,519 | |
| * | DISH Network Corp. Class A | 999,520 | 5,997 |
| Scholastic Corp. | 112,694 | 4,897 | |
| * | Magnite Inc. | 460,008 | 3,795 |
| * | Integral Ad Science Holding Corp. | 216,040 | 3,083 |
| * | TechTarget Inc. | 106,367 | 3,058 |
| * | Thryv Holdings Inc. | 131,906 | 2,690 |
| Gray Television Inc. | 329,851 | 2,659 | |
| * | Altice USA Inc. Class A | 862,495 | 2,648 |
| * | PubMatic Inc. Class A | 153,230 | 2,130 |
| * | Stagwell Inc. | 365,251 | 1,991 |
| * | Cardlytics Inc. | 115,051 | 1,917 |
| * | EW Scripps Co. Class A | 231,391 | 1,768 |
| * | Boston Omaha Corp. Class A | 96,458 | 1,705 |
| * | Clear Channel Outdoor Holdings Inc. | 1,155,797 | 1,676 |
| * | WideOpenWest Inc. | 202,854 | 1,643 |
| * | Gannett Co. Inc. | 564,694 | 1,643 |
| Sinclair Inc. | 125,371 | 1,582 | |
| * | iHeartMedia Inc. Class A | 389,172 | 1,405 |
| * | AMC Networks Inc. Class A | 108,543 | 1,263 |
| * | Quotient Technology Inc. | 314,721 | 1,256 |
| * | Advantage Solutions Inc. | 387,576 | 1,085 |
| 603,644 | |||
| Other (0.0%)2 | |||
| *,3 | GCI Liberty Inc. | 188,049 | — |
| Wireless Telecommunication Services (3.3%) | |||
| * | T-Mobile US Inc. | 725,653 | 98,870 |
| Telephone and Data Systems Inc. | 398,405 | 8,562 | |
| Shenandoah Telecommunications Co. | 190,367 | 4,329 | |
| Shares | Market Value• ($000) | ||
| * | Gogo Inc. | 256,353 | 2,909 |
| * | United States Cellular Corp. | 61,952 | 2,842 |
| 117,512 | |||
| Total Common Stocks (Cost $3,942,048) | 3,532,315 | ||
| Temporary Cash Investments (0.5%) | |||
| Money Market Fund (0.5%) | |||
| 4,5 | Vanguard Market Liquidity Fund, 5.384% (Cost $16,846) | 168,526 | 16,851 |
| Total Investments (100.3%) (Cost $3,958,894) | 3,549,166 | ||
| Other Assets and Liabilities—Net (-0.3%) | (10,211) | ||
| Net Assets (100.0%) | 3,538,955 | ||
| Cost is in $000. | |||
| • | See Note A in Notes to Financial Statements. |
| * | Non-income-producing security. |
| 1 | Includes partial security positions on loan to broker-dealers. The total value of securities on loan is $10,194,000. |
| 2 | “Other” represents securities that are not classified by the fund’s benchmark index. |
| 3 | Security value determined using significant unobservable inputs. |
| 4 | Affiliated money market fund available only to Vanguard funds and certain trusts and accounts managed by Vanguard. Rate shown is the 7-day yield. |
| 5 | Collateral of $11,297,000 was received for securities on loan, of which $11,239,000 is held in Vanguard Market Liquidity Fund and $58,000 is held in cash. |
| Over-the-Counter Total Return Swaps | ||||||
| Reference Entity | Termination Date | Counterparty | Notional Amount ($000) | Floating Interest Rate Received (Paid)1 (%) | Value and Unrealized Appreciation ($000) | Value and Unrealized (Depreciation) ($000) |
| Paramount Global Class B | 8/30/24 | BANA | 2,490 | (5.320) | — | — |
| Sirius XM Holdings Inc. | 1/31/24 | GSI | 3,061 | (5.320) | — | (193) |
| — | (193) | |||||
| 1 | Based on Overnight Bank Funding Rate as of the most recent reset date. Floating interest payment received/paid monthly. |
| BANA—Bank of America, N.A. | |
| GSI—Goldman Sachs International. |
| ($000s, except shares, footnotes, and per-share amounts) | Amount |
| Assets | |
| Investments in Securities, at Value1 | |
| Unaffiliated Issuers (Cost $3,942,048) | 3,532,315 |
| Affiliated Issuers (Cost $16,846) | 16,851 |
| Total Investments in Securities | 3,549,166 |
| Investment in Vanguard | 118 |
| Cash | 58 |
| Cash Collateral Pledged—Over-the-Counter Swap Contracts | 450 |
| Receivables for Investment Securities Sold | 28,038 |
| Receivables for Accrued Income | 1,050 |
| Receivables for Capital Shares Issued | 192 |
| Total Assets | 3,579,072 |
| Liabilities | |
| Due to Custodian | 77 |
| Payables for Investment Securities Purchased | 28,261 |
| Collateral for Securities on Loan | 11,297 |
| Payables for Capital Shares Redeemed | 139 |
| Payables to Vanguard | 150 |
| Unrealized Depreciation—Over-the-Counter Swap Contracts | 193 |
| Total Liabilities | 40,117 |
| Net Assets | 3,538,955 |
| 1 Includes $10,194,000 of securities on loan. | |
| At August 31, 2023, net assets consisted of: | |
| Paid-in Capital | 4,529,100 |
| Total Distributable Earnings (Loss) | (990,145) |
| Net Assets | 3,538,955 |
| ETF Shares—Net Assets | |
| Applicable to 31,295,890 outstanding $.001 par value shares of beneficial interest (unlimited authorization) | 3,424,050 |
| Net Asset Value Per Share—ETF Shares | $109.41 |
| Admiral Shares—Net Assets | |
| Applicable to 2,060,928 outstanding $.001 par value shares of beneficial interest (unlimited authorization) | 114,905 |
| Net Asset Value Per Share—Admiral Shares | $55.75 |
| Year Ended August 31, 2023 | |
| ($000) | |
| Investment Income | |
| Income | |
| Dividends | 28,549 |
| Interest1 | 235 |
| Securities Lending—Net | 7,683 |
| Total Income | 36,467 |
| Expenses | |
| The Vanguard Group—Note B | |
| Investment Advisory Services | 67 |
| Management and Administrative— ETF Shares | 2,285 |
| Management and Administrative— Admiral Shares | 72 |
| Marketing and Distribution— ETF Shares | 157 |
| Marketing and Distribution— Admiral Shares | 5 |
| Custodian Fees | 1 |
| Auditing Fees | 30 |
| Shareholders’ Reports—ETF Shares | 159 |
| Shareholders’ Reports—Admiral Shares | 1 |
| Trustees’ Fees and Expenses | 1 |
| Other Expenses | 49 |
| Total Expenses | 2,827 |
| Expenses Paid Indirectly | (2) |
| Net Expenses | 2,825 |
| Net Investment Income | 33,642 |
| Realized Net Gain (Loss) | |
| Investment Securities Sold1,2 | (29,549) |
| Swap Contracts | (2,804) |
| Realized Net Gain (Loss) | (32,353) |
| Change in Unrealized Appreciation (Depreciation) | |
| Investment Securities1 | 458,340 |
| Swap Contracts | 239 |
| Change in Unrealized Appreciation (Depreciation) | 458,579 |
| Net Increase (Decrease) in Net Assets Resulting from Operations | 459,868 |
| 1 | Interest income, realized net gain (loss), capital gain distributions received, and change in unrealized appreciation (depreciation) from an affiliated company of the fund were $235,000, $1,000, less than $1,000, and $2,000, respectively. Purchases and sales are for temporary cash investment purposes. |
| 2 | Includes $97,001,000 of net gain (loss) resulting from in-kind redemptions. |
| Year Ended August 31, | ||
| 2023 ($000) | 2022 ($000) | |
| Increase (Decrease) in Net Assets | ||
| Operations | ||
| Net Investment Income | 33,642 | 35,113 |
| Realized Net Gain (Loss) | (32,353) | 301,906 |
| Change in Unrealized Appreciation (Depreciation) | 458,579 | (2,110,443) |
| Net Increase (Decrease) in Net Assets Resulting from Operations | 459,868 | (1,773,424) |
| Distributions | ||
| ETF Shares | (27,514) | (36,456) |
| Admiral Shares | (839) | (937) |
| Total Distributions | (28,353) | (37,393) |
| Capital Share Transactions | ||
| ETF Shares | 290,125 | (303,025) |
| Admiral Shares | 29,898 | (10,410) |
| Net Increase (Decrease) from Capital Share Transactions | 320,023 | (313,435) |
| Total Increase (Decrease) | 751,538 | (2,124,252) |
| Net Assets | ||
| Beginning of Period | 2,787,417 | 4,911,669 |
| End of Period | 3,538,955 | 2,787,417 |
| ETF Shares | |||||
| For a Share Outstanding Throughout Each Period | Year Ended August 31, | ||||
| 2023 | 2022 | 2021 | 2020 | 2019 | |
| Net Asset Value, Beginning of Period | $94.12 | $149.87 | $108.04 | $87.24 | $86.83 |
| Investment Operations | |||||
| Net Investment Income1 | 1.128 | 1.110 | 1.018 | 1.005 | .917 |
| Net Realized and Unrealized Gain (Loss) on Investments | 15.127 | (55.695) | 41.708 | 20.743 | .316 |
| Total from Investment Operations | 16.255 | (54.585) | 42.726 | 21.748 | 1.233 |
| Distributions | |||||
| Dividends from Net Investment Income | (.965) | (1.165) | (.896) | (.948) | (.823) |
| Distributions from Realized Capital Gains | — | — | — | — | — |
| Total Distributions | (.965) | (1.165) | (.896) | (.948) | (.823) |
| Net Asset Value, End of Period | $109.41 | $94.12 | $149.87 | $108.04 | $87.24 |
| Total Return | 17.46% | -36.61% | 39.75% | 25.15% | 1.47% |
| Ratios/Supplemental Data | |||||
| Net Assets, End of Period (Millions) | $3,424 | $2,717 | $4,787 | $2,914 | $2,016 |
| Ratio of Total Expenses to Average Net Assets | 0.10%2 | 0.10% | 0.10% | 0.10% | 0.10% |
| Ratio of Net Investment Income to Average Net Assets | 1.19% | 0.92% | 0.80% | 1.09% | 1.09% |
| Portfolio Turnover Rate3 | 15% | 16% | 15% | 15% | 33% |
| 1 | Calculated based on average shares outstanding. |
| 2 | The ratio of expenses to average net assets for the period net of reduction from custody fee offset arrangements was 0.10%. |
| 3 | Excludes the value of portfolio securities received or delivered as a result of in-kind purchases or redemptions of the fund’s capital shares, including ETF Creation Units. |
| Admiral Shares | |||||
| For a Share Outstanding Throughout Each Period | Year Ended August 31, | ||||
| 2023 | 2022 | 2021 | 2020 | 2019 | |
| Net Asset Value, Beginning of Period | $47.97 | $76.38 | $55.06 | $44.46 | $44.25 |
| Investment Operations | |||||
| Net Investment Income1 | .591 | .572 | .519 | .512 | .470 |
| Net Realized and Unrealized Gain (Loss) on Investments | 7.682 | (28.388) | 21.259 | 10.571 | .157 |
| Total from Investment Operations | 8.273 | (27.816) | 21.778 | 11.083 | .627 |
| Distributions | |||||
| Dividends from Net Investment Income | (.493) | (.594) | (.458) | (.483) | (.417) |
| Distributions from Realized Capital Gains | — | — | — | — | — |
| Total Distributions | (.493) | (.594) | (.458) | (.483) | (.417) |
| Net Asset Value, End of Period | $55.75 | $47.97 | $76.38 | $55.06 | $44.46 |
| Total Return2 | 17.44% | -36.61% | 39.76% | 25.16% | 1.46% |
| Ratios/Supplemental Data | |||||
| Net Assets, End of Period (Millions) | $115 | $70 | $124 | $67 | $50 |
| Ratio of Total Expenses to Average Net Assets | 0.10%3 | 0.10% | 0.10% | 0.10% | 0.10% |
| Ratio of Net Investment Income to Average Net Assets | 1.21% | 0.93% | 0.79% | 1.10% | 1.09% |
| Portfolio Turnover Rate4 | 15% | 16% | 15% | 15% | 33% |
| 1 | Calculated based on average shares outstanding. |
| 2 | Total returns do not include account service fees that may have applied in the periods shown. Fund prospectuses provide information about any applicable account service fees. |
| 3 | The ratio of expenses to average net assets for the period net of reduction from custody fee offset arrangements was 0.10%. |
| 4 | Excludes the value of portfolio securities received or delivered as a result of in-kind purchases or redemptions of the fund’s capital shares, including ETF Creation Units. |
| A. | The following significant accounting policies conform to generally accepted accounting principles for U.S. investment companies. The fund consistently follows such policies in preparing its financial statements. |
| B. | In accordance with the terms of a Funds' Service Agreement (the “FSA”) between Vanguard and the fund, Vanguard furnishes to the fund investment advisory, corporate management, administrative, marketing, and distribution services at Vanguard’s cost of operations (as defined by the FSA). These costs of operations are allocated to the fund based on methods and guidelines approved by the board of trustees and are generally settled twice a month. |
| C. | The fund’s custodian bank has agreed to reduce its fees when the fund maintains cash on deposit in the non-interest-bearing custody account. For the year ended August 31, 2023, custodian fee offset arrangements reduced the fund’s expenses by $2,000 (an annual rate of less than 0.01% of average net assets). |
| D. | Various inputs may be used to determine the value of the fund’s investments and derivatives. These inputs are summarized in three broad levels for financial statement purposes. The inputs or methodologies used to value securities are not necessarily an indication of the risk associated with investing in those securities. |
| Level 1 ($000) | Level 2 ($000) | Level 3 ($000) | Total ($000) | |
| Investments | ||||
| Assets | ||||
| Common Stocks | 3,532,315 | — | — | 3,532,315 |
| Temporary Cash Investments | 16,851 | — | — | 16,851 |
| Total | 3,549,166 | — | — | 3,549,166 |
| Derivative Financial Instruments | ||||
| Liabilities | ||||
| Swap Contracts | — | 193 | — | 193 |
| E. | Permanent differences between book-basis and tax-basis components of net assets are reclassified among capital accounts in the financial statements to reflect their tax character. These reclassifications have no effect on net assets or net asset value per share. As of period end, permanent differences primarily attributable to the accounting for applicable in-kind redemptions and swap agreements were reclassified between the following accounts: |
| Amount ($000) | |
| Paid-in Capital | 96,543 |
| Total Distributable Earnings (Loss) | (96,543) |
| Amount ($000) | |
| Undistributed Ordinary Income | 8,325 |
| Undistributed Long-Term Gains | — |
| Net Unrealized Gains (Losses) | (441,840) |
| Capital Loss Carryforwards | (556,630) |
| Qualified Late-Year Losses | — |
| Other Temporary Differences | — |
| Total | (990,145) |
| Year Ended August 31, | ||
| 2023 Amount ($000) | 2022 Amount ($000) | |
| Ordinary Income* | 28,353 | 37,393 |
| Long-Term Capital Gains | — | — |
| Total | 28,353 | 37,393 |
| * | Includes short-term capital gains, if any. |
| Amount ($000) | |
| Tax Cost | 3,991,006 |
| Gross Unrealized Appreciation | 370,661 |
| Gross Unrealized Depreciation | (812,501) |
| Net Unrealized Appreciation (Depreciation) | (441,840) |
| F. | During the year ended August 31, 2023, the fund purchased $1,602,546,000 of investment securities and sold $1,279,434,000 of investment securities, other than temporary cash investments. Purchases and sales include $1,113,576,000 and $841,376,000, respectively, in connection with in-kind purchases and redemptions of the fund's capital shares. |
| G. | Capital share transactions for each class of shares were: |
| Year Ended August 31, | |||||
| 2023 | 2022 | ||||
| Amount ($000) | Shares (000) | Amount ($000) | Shares (000) | ||
| ETF Shares | |||||
| Issued | 1,133,331 | 11,775 | 1,584,130 | 13,653 | |
| Issued in Lieu of Cash Distributions | — | — | — | — | |
| Redeemed | (843,206) | (9,350) | (1,887,155) | (16,725) | |
| Net Increase (Decrease)—ETF Shares | 290,125 | 2,425 | (303,025) | (3,072) | |
| Admiral Shares | |||||
| Issued | 74,117 | 1,497 | 39,208 | 630 | |
| Issued in Lieu of Cash Distributions | 687 | 14 | 787 | 12 | |
| Redeemed | (44,906) | (909) | (50,405) | (809) | |
| Net Increase (Decrease)—Admiral Shares | 29,898 | 602 | (10,410) | (167) | |
| H. | Significant market disruptions, such as those caused by pandemics (e.g., COVID-19 pandemic), natural or environmental disasters, war (e.g., Russia’s invasion of Ukraine), acts of terrorism, or other events, can adversely affect local and global markets and normal market operations. Any such disruptions could have an adverse impact on the value of the fund’s investments and fund performance. |
| I. | Management has determined that no events or transactions occurred subsequent to August 31, 2023, that would require recognition or disclosure in these financial statements. |

| Average Annual Total Returns Periods Ended August 31, 2023 | |||||
| One Year | Five Years | Ten Years | Final Value of a $10,000 Investment | ||
| Consumer Discretionary Index Fund ETF Shares Net Asset Value | 12.75% | 11.04% | 13.36% | $35,036 |
| Consumer Discretionary Index Fund ETF Shares Market Price | 12.78 | 11.03 | 13.36 | 35,035 | |
| Consumer Discretionary Spliced Index | 12.82 | 11.11 | 13.44 | 35,302 |
| MSCI US Investable Market 2500 Index | 15.01 | 10.39 | 12.34 | 32,022 |
| One Year | Five Years | Ten Years | Final Value of a $100,000 Investment | ||
| Consumer Discretionary Index Fund Admiral Shares | 12.75% | 11.04% | 13.36% | $350,509 | |
| Consumer Discretionary Spliced Index | 12.82 | 11.11 | 13.44 | 353,018 | |
| MSCI US Investable Market 2500 Index | 15.01 | 10.39 | 12.34 | 320,217 | |
| One Year | Five Years | Ten Years | |
| Consumer Discretionary Index Fund ETF Shares Market Price | 12.78% | 68.76% | 250.35% |
| Consumer Discretionary Index Fund ETF Shares Net Asset Value | 12.75 | 68.78 | 250.36 |
| Consumer Discretionary Spliced Index | 12.82 | 69.35 | 253.02 |
| Automobile Components | 2.4% |
| Automobiles | 17.8 |
| Broadline Retail | 24.6 |
| Distributors | 1.1 |
| Diversified Consumer Services | 1.3 |
| Hotels, Restaurants & Leisure | 20.9 |
| Household Durables | 4.9 |
| Leisure Products | 1.1 |
| Specialty Retail | 20.6 |
| Textiles, Apparel & Luxury Goods | 5.3 |
| Shares | Market Value• ($000) | ||
| Common Stocks (99.8%) | |||
| Automobile Components (2.4%) | |||
| * | Aptiv plc | 341,442 | 34,639 |
| BorgWarner Inc. (XNYS) | 293,878 | 11,976 | |
| Lear Corp. | 74,525 | 10,738 | |
| Autoliv Inc. | 103,493 | 10,101 | |
| Gentex Corp. | 297,212 | 9,707 | |
| * | Fox Factory Holding Corp. | 56,195 | 6,227 |
| * | Visteon Corp. | 38,245 | 5,326 |
| * | Adient plc | 129,172 | 5,060 |
| * | Goodyear Tire & Rubber Co. | 386,527 | 4,990 |
| LCI Industries | 35,203 | 4,410 | |
| * | Modine Manufacturing Co. | 79,765 | 3,796 |
| * | QuantumScape Corp. | 467,438 | 3,338 |
| * | Dorman Products Inc. | 39,609 | 3,268 |
| Dana Inc. | 195,449 | 3,149 | |
| * | Gentherm Inc. | 49,960 | 3,008 |
| * | XPEL Inc. | 34,090 | 2,840 |
| Patrick Industries Inc. | 33,309 | 2,786 | |
| *,1 | Luminar Technologies Inc. | 411,784 | 2,372 |
| * | Phinia Inc. | 80,960 | 2,251 |
| * | American Axle & Manufacturing Holdings Inc. | 229,176 | 1,730 |
| Standard Motor Products Inc. | 41,084 | 1,521 | |
| * | Stoneridge Inc. | 63,690 | 1,309 |
| * | Holley Inc. | 190,120 | 1,084 |
| *,1 | Solid Power Inc. | 476,179 | 1,009 |
| 136,635 | |||
| Automobiles (17.8%) | |||
| * | Tesla Inc. | 3,376,430 | 871,389 |
| Ford Motor Co. | 4,703,318 | 57,051 | |
| General Motors Co. | 1,664,186 | 55,767 | |
| * | Rivian Automotive Inc. Class A | 802,344 | 18,237 |
| *,1 | Lucid Group Inc. | 1,179,807 | 7,409 |
| Thor Industries Inc. | 66,135 | 6,932 | |
| Harley-Davidson Inc. | 181,097 | 6,112 | |
| Winnebago Industries Inc. | 45,822 | 2,972 | |
| *,1 | Fisker Inc. | 340,565 | 1,999 |
| *,1 | Canoo Inc. | 1,885,019 | 1,117 |
| *,1 | Workhorse Group Inc. | 996,855 | 786 |
| *,1 | Faraday Future Intelligent Electric Inc. | 59,076 | 445 |
| 1,030,216 | |||
| Broadline Retail (24.5%) | |||
| * | Amazon.com Inc. | 9,358,971 | 1,291,632 |
| * | MercadoLibre Inc. | 47,179 | 64,747 |
| eBay Inc. | 647,840 | 29,010 | |
| * | Etsy Inc. | 154,943 | 11,399 |
| * | Ollie's Bargain Outlet Holdings Inc. | 81,999 | 6,320 |
| Macy's Inc. | 366,739 | 4,485 | |
| Kohl's Corp. | 154,433 | 4,114 | |
| Nordstrom Inc. | 158,598 | 2,572 | |
| Dillard's Inc. Class A | 6,388 | 2,205 | |
| Shares | Market Value• ($000) | ||
| *,1 | Groupon Inc. | 94,943 | 1,174 |
| * | Qurate Retail Inc. Series A | 1,305,257 | 1,012 |
| Big Lots Inc. | 132,123 | 819 | |
| *,1 | ContextLogic Inc. Class A | 94,803 | 508 |
| 1,419,997 | |||
| Distributors (1.1%) | |||
| Genuine Parts Co. | 170,493 | 26,210 | |
| Pool Corp. | 48,063 | 17,572 | |
| LKQ Corp. | 328,769 | 17,270 | |
| 61,052 | |||
| Diversified Consumer Services (1.3%) | |||
| Service Corp. International | 190,353 | 12,013 | |
| H&R Block Inc. | 196,976 | 7,875 | |
| * | Bright Horizons Family Solutions Inc. | 75,476 | 7,126 |
| * | Duolingo Inc. | 40,067 | 5,896 |
| * | Grand Canyon Education Inc. | 42,218 | 4,950 |
| * | Frontdoor Inc. | 116,834 | 3,835 |
| Graham Holdings Co. Class B | 5,385 | 3,157 | |
| * | Adtalem Global Education Inc. | 66,978 | 2,937 |
| Laureate Education Inc. | 204,011 | 2,842 | |
| * | Stride Inc. | 64,522 | 2,742 |
| * | Coursera Inc. | 156,391 | 2,720 |
| Strategic Education Inc. | 34,591 | 2,681 | |
| ADT Inc. | 361,021 | 2,318 | |
| * | Chegg Inc. | 199,974 | 2,042 |
| Perdoceo Education Corp. | 120,502 | 1,997 | |
| * | OneSpaWorld Holdings Ltd. | 165,322 | 1,891 |
| * | WW International Inc. | 158,520 | 1,539 |
| * | Rover Group Inc. | 225,892 | 1,529 |
| * | Mister Car Wash Inc. | 209,604 | 1,518 |
| * | Udemy Inc. | 139,327 | 1,443 |
| *,1 | European Wax Center Inc. Class A | 79,634 | 1,382 |
| Carriage Services Inc. | 37,621 | 1,160 | |
| * | 2U Inc. | 316,637 | 1,004 |
| * | Beachbody Co. Inc. | 526,460 | 215 |
| 76,812 | |||
| Hotels, Restaurants & Leisure (20.8%) | |||
| McDonald's Corp. | 865,712 | 243,395 | |
| * | Booking Holdings Inc. | 44,679 | 138,730 |
| Starbucks Corp. | 1,363,237 | 132,834 | |
| * | Airbnb Inc. Class A | 493,094 | 64,867 |
| Marriott International Inc. Class A | 312,975 | 63,694 | |
| * | Chipotle Mexican Grill Inc. | 32,984 | 63,548 |
| Hilton Worldwide Holdings Inc. | 317,451 | 47,189 | |
| Yum! Brands Inc. | 336,365 | 43,519 | |
| * | Royal Caribbean Cruises Ltd. | 278,841 | 27,589 |
| * | DoorDash Inc. Class A | 307,872 | 25,901 |
| Las Vegas Sands Corp. | 419,173 | 22,996 | |
| Darden Restaurants Inc. | 147,277 | 22,903 | |
| * | Carnival Corp. | 1,233,381 | 19,512 |
| Shares | Market Value• ($000) | ||
| * | Expedia Group Inc. | 179,465 | 19,452 |
| Domino's Pizza Inc. | 43,532 | 16,864 | |
| MGM Resorts International | 363,375 | 15,981 | |
| * | DraftKings Inc. Class A | 516,285 | 15,308 |
| * | Caesars Entertainment Inc. | 267,449 | 14,779 |
| Wynn Resorts Ltd. | 128,143 | 12,991 | |
| Aramark | 310,943 | 11,561 | |
| Vail Resorts Inc. | 50,647 | 11,462 | |
| Churchill Downs Inc. | 85,036 | 10,653 | |
| * | Norwegian Cruise Line Holdings Ltd. | 540,788 | 8,961 |
| * | Light & Wonder Inc. | 116,745 | 8,951 |
| Texas Roadhouse Inc. | 85,662 | 8,917 | |
| Wyndham Hotels & Resorts Inc. | 110,670 | 8,343 | |
| Hyatt Hotels Corp. Class A | 61,246 | 6,885 | |
| * | Planet Fitness Inc. Class A | 111,690 | 6,791 |
| Boyd Gaming Corp. | 99,841 | 6,676 | |
| Wingstop Inc. | 39,481 | 6,342 | |
| Choice Hotels International Inc. | 44,309 | 5,623 | |
| Marriott Vacations Worldwide Corp. | 47,411 | 5,153 | |
| * | Penn Entertainment Inc. | 210,871 | 4,996 |
| Wendy's Co. | 243,526 | 4,819 | |
| * | Hilton Grand Vacations Inc. | 107,541 | 4,702 |
| Travel & Leisure Co. | 106,972 | 4,300 | |
| * | Shake Shack Inc. Class A | 53,817 | 3,767 |
| Papa John's International Inc. | 47,399 | 3,588 | |
| Bloomin' Brands Inc. | 127,058 | 3,565 | |
| Red Rock Resorts Inc. Class A | 74,072 | 3,254 | |
| * | SeaWorld Entertainment Inc. | 58,602 | 2,854 |
| * | Six Flags Entertainment Corp. | 113,379 | 2,603 |
| Cracker Barrel Old Country Store Inc. | 31,488 | 2,596 | |
| Jack in the Box Inc. | 32,259 | 2,593 | |
| Cheesecake Factory Inc. | 78,298 | 2,494 | |
| * | Dave & Buster's Entertainment Inc. | 61,859 | 2,429 |
| * | Sabre Corp. | 485,089 | 2,425 |
| * | Brinker International Inc. | 71,880 | 2,353 |
| * | Sweetgreen Inc. Class A | 156,858 | 2,253 |
| * | Everi Holdings Inc. | 154,303 | 2,231 |
| *,1 | Dutch Bros Inc. Class A | 70,019 | 2,073 |
| * | Life Time Group Holdings Inc. | 108,630 | 1,868 |
| Krispy Kreme Inc. | 139,374 | 1,866 | |
| Monarch Casino & Resort Inc. | 26,925 | 1,815 | |
| * | Portillo's Inc. Class A | 90,993 | 1,669 |
| Dine Brands Global Inc. | 29,802 | 1,633 | |
| * | Playa Hotels & Resorts NV | 216,093 | 1,612 |
| Golden Entertainment Inc. | 44,118 | 1,606 | |
| * | Accel Entertainment Inc. | 131,588 | 1,565 |
| Shares | Market Value• ($000) | ||
| * | Chuy's Holdings Inc. | 38,989 | 1,486 |
| * | BJ's Restaurants Inc. | 49,716 | 1,462 |
| * | Target Hospitality Corp. | 84,710 | 1,347 |
| * | Bally's Corp. | 79,909 | 1,327 |
| * | First Watch Restaurant Group Inc. | 68,434 | 1,308 |
| RCI Hospitality Holdings Inc. | 19,998 | 1,305 | |
| * | Denny's Corp. | 135,199 | 1,288 |
| * | Bowlero Corp. | 116,180 | 1,278 |
| * | Kura Sushi USA Inc. Class A | 14,009 | 1,224 |
| * | Lindblad Expeditions Holdings Inc. | 108,872 | 985 |
| * | Soho House & Co. Inc. | 137,338 | 934 |
| *,1 | Sonder Holdings Inc. | 731,810 | 366 |
| * | Vacasa Inc. Class A | 502,609 | 303 |
| * | F45 Training Holdings Inc. | 76,141 | 4 |
| 1,206,516 | |||
| Household Durables (4.9%) | |||
| DR Horton Inc. | 375,919 | 44,742 | |
| Lennar Corp. Class A | 304,389 | 36,250 | |
| * | NVR Inc. | 3,951 | 25,197 |
| PulteGroup Inc. | 272,505 | 22,362 | |
| Garmin Ltd. | 187,508 | 19,880 | |
| * | TopBuild Corp. | 39,888 | 11,571 |
| Toll Brothers Inc. | 138,139 | 11,318 | |
| Tempur Sealy International Inc. | 219,106 | 10,237 | |
| Whirlpool Corp. | 69,658 | 9,749 | |
| * | Mohawk Industries Inc. | 70,738 | 7,172 |
| Meritage Homes Corp. | 48,450 | 6,736 | |
| * | Taylor Morrison Home Corp. | 137,262 | 6,506 |
| Newell Brands Inc. | 529,513 | 5,602 | |
| KB Home | 109,036 | 5,539 | |
| * | Skyline Champion Corp. | 74,439 | 5,305 |
| Leggett & Platt Inc. | 181,327 | 5,113 | |
| Installed Building Products Inc. | 33,107 | 4,792 | |
| * | Tri Pointe Homes Inc. | 140,561 | 4,371 |
| MDC Holdings Inc. | 88,023 | 4,177 | |
| * | Helen of Troy Ltd. | 33,873 | 4,164 |
| * | M/I Homes Inc. | 40,035 | 3,931 |
| * | LGI Homes Inc. | 30,716 | ��� 3,781 |
| * | Cavco Industries Inc. | 11,679 | 3,264 |
| Century Communities Inc. | 43,421 | 3,224 | |
| * | Sonos Inc. | 191,944 | 2,645 |
| * | Green Brick Partners Inc. | 46,074 | 2,279 |
| La-Z-Boy Inc. | 72,805 | 2,246 | |
| * | iRobot Corp. | 48,752 | 1,896 |
| * | Beazer Homes USA Inc. | 56,555 | 1,658 |
| *,1 | Dream Finders Homes Inc. Class A | 53,087 | 1,530 |
| Ethan Allen Interiors Inc. | 48,094 | 1,509 | |
| * | GoPro Inc. Class A | 327,937 | 1,192 |
| * | Vizio Holding Corp. Class A | 183,644 | 1,054 |
| * | Lovesac Co. | 45,335 | 1,039 |
| Cricut Inc. Class A | 104,468 | 988 | |
| * | Traeger Inc. | 210,499 | 941 |
| * | Tupperware Brands Corp. | 188,830 | 470 |
| 284,430 | |||
| Leisure Products (1.1%) | |||
| Hasbro Inc. | 166,217 | 11,968 | |
| * | Mattel Inc. | 450,155 | 9,975 |
| Polaris Inc. | 69,844 | 7,829 | |
| Brunswick Corp. | 91,770 | 7,261 | |
| * | YETI Holdings Inc. | 116,580 | 5,823 |
| Shares | Market Value• ($000) | ||
| * | Topgolf Callaway Brands Corp. | 215,991 | 3,767 |
| * | Peloton Interactive Inc. Class A | 471,184 | 3,006 |
| Acushnet Holdings Corp. | 51,253 | 3,001 | |
| * | Vista Outdoor Inc. | 90,975 | 2,661 |
| * | Malibu Boats Inc. Class A | 36,523 | 1,774 |
| Sturm Ruger & Co. Inc. | 33,546 | 1,730 | |
| Smith & Wesson Brands Inc. | 105,816 | 1,242 | |
| * | Funko Inc. Class A | 146,957 | 1,024 |
| Johnson Outdoors Inc. Class A | 18,269 | 1,021 | |
| *,1 | AMMO Inc. | 431,028 | 987 |
| * | Solo Brands Inc. Class A | 148,470 | 830 |
| Clarus Corp. | 110,021 | 791 | |
| * | Latham Group Inc. | 189,935 | 703 |
| 65,393 | |||
| Specialty Retail (20.6%) | |||
| Home Depot Inc. | 1,191,022 | 393,395 | |
| Lowe's Cos. Inc. | 707,337 | 163,027 | |
| TJX Cos. Inc. | 1,368,443 | 126,554 | |
| * | O'Reilly Automotive Inc. | 73,264 | 68,846 |
| * | AutoZone Inc. | 21,922 | 55,492 |
| Ross Stores Inc. | 408,738 | 49,788 | |
| Tractor Supply Co. | 132,648 | 28,984 | |
| * | Ulta Beauty Inc. | 60,373 | 25,057 |
| Best Buy Co. Inc. | 240,691 | 18,401 | |
| * | CarMax Inc. | 195,294 | 15,952 |
| * | Burlington Stores Inc. | 80,612 | 13,080 |
| * | Floor & Decor Holdings Inc. Class A | 126,150 | 12,577 |
| * | Five Below Inc. | 69,250 | 11,908 |
| Williams-Sonoma Inc. | 81,603 | 11,522 | |
| Lithia Motors Inc. | 34,762 | 10,707 | |
| Bath & Body Works Inc. | 275,288 | 10,150 | |
| Dick's Sporting Goods Inc. | 78,637 | 9,149 | |
| * | RH | 24,097 | 8,800 |
| Murphy USA Inc. | 26,599 | 8,449 | |
| *,1 | Carvana Co. | 148,199 | 7,462 |
| * | Wayfair Inc. Class A | 103,089 | 7,124 |
| *,1 | GameStop Corp. Class A | 359,684 | 6,672 |
| * | AutoNation Inc. | 42,227 | 6,633 |
| Valvoline Inc. | 175,382 | 6,040 | |
| * | Asbury Automotive Group Inc. | 25,886 | 5,954 |
| Academy Sports & Outdoors Inc. | 102,141 | 5,574 | |
| Advance Auto Parts Inc. | 79,905 | 5,499 | |
| Penske Automotive Group Inc. | 32,791 | 5,388 | |
| Group 1 Automotive Inc. | 19,285 | 5,099 | |
| Signet Jewelers Ltd. | 59,966 | 4,497 | |
| American Eagle Outfitters Inc. | 262,854 | 4,458 | |
| * | Abercrombie & Fitch Co. Class A | 77,930 | 4,189 |
| * | Boot Barn Holdings Inc. | 42,526 | 3,902 |
| * | Chewy Inc. Class A | 161,305 | 3,868 |
| Gap Inc. | 325,086 | 3,764 | |
| * | Urban Outfitters Inc. | 89,619 | 2,976 |
| * | ODP Corp. | 54,781 | 2,702 |
| Foot Locker Inc. | 126,926 | 2,490 | |
| Upbound Group Inc. | 78,621 | 2,407 | |
| * | National Vision Holdings Inc. | 127,313 | 2,331 |
| * | Victoria's Secret & Co. | 114,932 | 2,204 |
| * | Overstock.com Inc. | 80,300 | 2,097 |
| Winmark Corp. | 5,309 | 2,020 | |
| Shares | Market Value• ($000) | ||
| * | Sally Beauty Holdings Inc. | 192,493 | 1,956 |
| Buckle Inc. | 53,201 | 1,944 | |
| * | Leslie's Inc. | 305,872 | 1,915 |
| Caleres Inc. | 65,537 | 1,879 | |
| Camping World Holdings Inc. Class A | 75,658 | 1,871 | |
| Monro Inc. | 56,558 | 1,852 | |
| * | Warby Parker Inc. Class A | 138,987 | 1,669 |
| Sonic Automotive Inc. Class A | 30,770 | 1,641 | |
| Guess? Inc. | 66,341 | 1,596 | |
| * | America's Car-Mart Inc. | 13,415 | 1,493 |
| * | MarineMax Inc. | 44,533 | 1,482 |
| Hibbett Inc. | 30,563 | 1,415 | |
| * | Sleep Number Corp. | 54,787 | 1,401 |
| * | Chico's FAS Inc. | 271,787 | 1,394 |
| Designer Brands Inc. Class A | 128,393 | 1,349 | |
| * | Revolve Group Inc. | 90,796 | 1,330 |
| * | Arhaus Inc. | 128,472 | 1,272 |
| * | Genesco Inc. | 35,957 | 1,233 |
| Arko Corp. | 159,581 | 1,202 | |
| Haverty Furniture Cos. Inc. | 36,400 | 1,139 | |
| *,1 | Stitch Fix Inc. Class A | 258,298 | 1,134 |
| *,1 | EVgo Inc. | 277,722 | 1,116 |
| Shoe Carnival Inc. | 48,189 | 1,115 | |
| Aaron's Co. Inc. | 89,229 | 1,077 | |
| * | Zumiez Inc. | 55,457 | 1,053 |
| * | Petco Health & Wellness Co. Inc. | 206,662 | 1,052 |
| * | ThredUP Inc. Class A | 262,295 | 1,044 |
| * | Children's Place Inc. | 37,666 | 999 |
| *,1 | OneWater Marine Inc. Class A | 37,052 | 967 |
| PetMed Express Inc. | 82,765 | 933 | |
| * | 1-800-Flowers.com Inc. Class A | 122,399 | 922 |
| * | BARK Inc. | 506,047 | 810 |
| *,1 | Sportsman's Warehouse Holdings Inc. | 145,087 | 698 |
| * | Lands' End Inc. | 61,272 | 472 |
| * | Conn's Inc. | 79,696 | 333 |
| 1,191,946 | |||
| Textiles, Apparel & Luxury Goods (5.3%) | |||
| NIKE Inc. Class B | 1,463,599 | 148,863 | |
| * | Lululemon Athletica Inc. | 138,733 | 52,893 |
| * | Deckers Outdoor Corp. | 32,154 | 17,012 |
| Tapestry Inc. | 293,807 | 9,790 | |
| * | Skechers USA Inc. Class A | 171,738 | 8,640 |
| * | Capri Holdings Ltd. | 160,192 | 8,409 |
| VF Corp. | 422,857 | 8,356 | |
| * | Crocs Inc. | 79,999 | 7,787 |
| PVH Corp. | 82,265 | 6,877 | |
| Ralph Lauren Corp. | 53,434 | 6,232 | |
| Columbia Sportswear Co. | 52,799 | 3,872 | |
| Carter's Inc. | 53,933 | 3,860 | |
| Steven Madden Ltd. | 104,525 | 3,606 | |
| Kontoor Brands Inc. | 72,988 | 3,342 | |
| Hanesbrands Inc. | 537,120 | 2,820 | |
| Oxford Industries Inc. | 25,090 | 2,534 | |
| * | Under Armour Inc. Class A | 314,048 | 2,399 |
| * | Under Armour Inc. Class C | 331,431 | 2,284 |
| Levi Strauss & Co. Class A | 158,945 | 2,189 | |
| * | G-III Apparel Group Ltd. | 81,322 | 1,614 |
| * | Figs Inc. Class A | 252,019 | 1,557 |
| Wolverine World Wide Inc. | 173,875 | 1,405 | |
| Movado Group Inc. | 43,003 | 1,176 | |
| Shares | Market Value• ($000) | ||
| * | Allbirds Inc. Class A | 458,129 | 591 |
| * | Fossil Group Inc. | 227,276 | 482 |
| *,1 | PLBY Group Inc. | 262,628 | 341 |
| 308,931 | |||
| Total Common Stocks (Cost $5,324,547) | 5,781,928 | ||
| Shares | Market Value• ($000) | ||
| Temporary Cash Investments (0.6%) | |||
| Money Market Fund (0.6%) | |||
| 2,3 | Vanguard Market Liquidity Fund, 5.384% (Cost $34,221) | 342,314 | 34,228 |
| Total Investments (100.4%) (Cost $5,358,768) | 5,816,156 | ||
| Other Assets and Liabilities—Net (-0.4%) | (21,123) | ||
| Net Assets (100.0%) | 5,795,033 | ||
| Cost is in $000. | |||
| • | See Note A in Notes to Financial Statements. |
| * | Non-income-producing security. |
| 1 | Includes partial security positions on loan to broker-dealers. The total value of securities on loan is $22,269,000. |
| 2 | Affiliated money market fund available only to Vanguard funds and certain trusts and accounts managed by Vanguard. Rate shown is the 7-day yield. |
| 3 | Collateral of $24,675,000 was received for securities on loan. |
| Over-the-Counter Total Return Swaps | ||||||
| Reference Entity | Termination Date | Counterparty | Notional Amount ($000) | Floating Interest Rate Received (Paid)1 (%) | Value and Unrealized Appreciation ($000) | Value and Unrealized (Depreciation) ($000) |
| MercadoLibre Inc. | 8/30/24 | BANA | 9,332 | (5.320) | — | — |
| 1 | Based on Overnight Bank Funding Rate as of the most recent reset date. Floating interest payment received/paid monthly. |
| BANA—Bank of America, N.A. |
| ($000s, except shares, footnotes, and per-share amounts) | Amount |
| Assets | |
| Investments in Securities, at Value1 | |
| Unaffiliated Issuers (Cost $5,324,547) | 5,781,928 |
| Affiliated Issuers (Cost $34,221) | 34,228 |
| Total Investments in Securities | 5,816,156 |
| Investment in Vanguard | 192 |
| Cash | 301 |
| Receivables for Investment Securities Sold | 98,197 |
| Receivables for Accrued Income | 5,996 |
| Receivables for Capital Shares Issued | 82 |
| Unrealized Appreciation—Over-the-Counter Swap Contracts | — |
| Total Assets | 5,920,924 |
| Liabilities | |
| Payables for Investment Securities Purchased | 100,934 |
| Collateral for Securities on Loan | 24,675 |
| Payables for Capital Shares Redeemed | 35 |
| Payables to Vanguard | 247 |
| Total Liabilities | 125,891 |
| Net Assets | 5,795,033 |
| 1 Includes $22,269,000 of securities on loan. | |
| At August 31, 2023, net assets consisted of: | |
| Paid-in Capital | 5,828,793 |
| Total Distributable Earnings (Loss) | (33,760) |
| Net Assets | 5,795,033 |
| ETF Shares—Net Assets | |
| Applicable to 18,082,597 outstanding $.001 par value shares of beneficial interest (unlimited authorization) | 5,186,936 |
| Net Asset Value Per Share—ETF Shares | $286.85 |
| Admiral Shares—Net Assets | |
| Applicable to 4,095,629 outstanding $.001 par value shares of beneficial interest (unlimited authorization) | 608,097 |
| Net Asset Value Per Share—Admiral Shares | $148.47 |
| Year Ended August 31, 2023 | |
| ($000) | |
| Investment Income | |
| Income | |
| Dividends | 50,262 |
| Interest1 | 263 |
| Securities Lending—Net | 2,095 |
| Total Income | 52,620 |
| Expenses | |
| The Vanguard Group—Note B | |
| Investment Advisory Services | 114 |
| Management and Administrative— ETF Shares | 3,780 |
| Management and Administrative— Admiral Shares | 455 |
| Marketing and Distribution— ETF Shares | 228 |
| Marketing and Distribution— Admiral Shares | 29 |
| Custodian Fees | 21 |
| Auditing Fees | 30 |
| Shareholders’ Reports—ETF Shares | 161 |
| Shareholders’ Reports—Admiral Shares | 6 |
| Trustees’ Fees and Expenses | 3 |
| Other Expenses | 23 |
| Total Expenses | 4,850 |
| Expenses Paid Indirectly | (2) |
| Net Expenses | 4,848 |
| Net Investment Income | 47,772 |
| Realized Net Gain (Loss) | |
| Investment Securities Sold1,2 | 62,684 |
| Swap Contracts | 3,171 |
| Realized Net Gain (Loss) | 65,855 |
| Change in Unrealized Appreciation (Depreciation) | |
| Investment Securities1 | 437,352 |
| Swap Contracts | — |
| Change in Unrealized Appreciation (Depreciation) | 437,352 |
| Net Increase (Decrease) in Net Assets Resulting from Operations | 550,979 |
| 1 | Interest income, realized net gain (loss), capital gain distributions received, and change in unrealized appreciation (depreciation) from an affiliated company of the fund were $263,000, $3,000, less than $1,000, and $5,000, respectively. Purchases and sales are for temporary cash investment purposes. |
| 2 | Includes $215,606,000 of net gain (loss) resulting from in-kind redemptions. |
| Year Ended August 31, | ||
| 2023 ($000) | 2022 ($000) | |
| Increase (Decrease) in Net Assets | ||
| Operations | ||
| Net Investment Income | 47,772 | 52,090 |
| Realized Net Gain (Loss) | 65,855 | 927,803 |
| Change in Unrealized Appreciation (Depreciation) | 437,352 | (2,398,610) |
| Net Increase (Decrease) in Net Assets Resulting from Operations | 550,979 | (1,418,717) |
| Distributions | ||
| ETF Shares | (42,420) | (64,707) |
| Admiral Shares | (4,965) | (7,212) |
| Total Distributions | (47,385) | (71,919) |
| Capital Share Transactions | ||
| ETF Shares | 104,338 | (678,371) |
| Admiral Shares | 25,960 | (80,670) |
| Net Increase (Decrease) from Capital Share Transactions | 130,298 | (759,041) |
| Total Increase (Decrease) | 633,892 | (2,249,677) |
| Net Assets | ||
| Beginning of Period | 5,161,141 | 7,410,818 |
| End of Period | 5,795,033 | 5,161,141 |
| ETF Shares | |||||
| For a Share Outstanding Throughout Each Period | Year Ended August 31, | ||||
| 2023 | 2022 | 2021 | 2020 | 2019 | |
| Net Asset Value, Beginning of Period | $256.97 | $320.99 | $246.86 | $178.51 | $180.85 |
| Investment Operations | |||||
| Net Investment Income1 | 2.493 | 2.329 | 1.724 | 1.998 | 2.052 |
| Net Realized and Unrealized Gain (Loss) on Investments | 29.853 | (63.227) | 76.697 | 68.603 | (2.391) |
| Total from Investment Operations | 32.346 | (60.898) | 78.421 | 70.601 | (.339) |
| Distributions | |||||
| Dividends from Net Investment Income | (2.466) | (3.122) | (4.291) | (2.251) | (2.001) |
| Distributions from Realized Capital Gains | — | — | — | — | — |
| Total Distributions | (2.466) | (3.122) | (4.291) | (2.251) | (2.001) |
| Net Asset Value, End of Period | $286.85 | $256.97 | $320.99 | $246.86 | $178.51 |
| Total Return | 12.75% | -19.11% | 32.39% | 39.98% | -0.14% |
| Ratios/Supplemental Data | |||||
| Net Assets, End of Period (Millions) | $5,187 | $4,638 | $6,658 | $4,026 | $3,049 |
| Ratio of Total Expenses to Average Net Assets | 0.10%2 | 0.10% | 0.10% | 0.10% | 0.10% |
| Ratio of Net Investment Income to Average Net Assets | 0.99% | 0.78% | 0.60% | 1.06% | 1.20% |
| Portfolio Turnover Rate3 | 11% | 9% | 8% | 10% | 9% |
| 1 | Calculated based on average shares outstanding. |
| 2 | The ratio of expenses to average net assets for the period net of reduction from custody fee offset arrangements was 0.10%. |
| 3 | Excludes the value of portfolio securities received or delivered as a result of in-kind purchases or redemptions of the fund’s capital shares, including ETF Creation Units. |
| Admiral Shares | |||||
| For a Share Outstanding Throughout Each Period | Year Ended August 31, | ||||
| 2023 | 2022 | 2021 | 2020 | 2019 | |
| Net Asset Value, Beginning of Period | $133.01 | $166.15 | $127.78 | $92.40 | $93.61 |
| Investment Operations | |||||
| Net Investment Income1 | 1.287 | 1.211 | .889 | 1.033 | 1.058 |
| Net Realized and Unrealized Gain (Loss) on Investments | 15.450 | (32.737) | 39.704 | 35.512 | (1.232) |
| Total from Investment Operations | 16.737 | (31.526) | 40.593 | 36.545 | (.174) |
| Distributions | |||||
| Dividends from Net Investment Income | (1.277) | (1.614) | (2.223) | (1.165) | (1.036) |
| Distributions from Realized Capital Gains | — | — | — | — | — |
| Total Distributions | (1.277) | (1.614) | (2.223) | (1.165) | (1.036) |
| Net Asset Value, End of Period | $148.47 | $133.01 | $166.15 | $127.78 | $92.40 |
| Total Return2 | 12.75% | -19.11% | 32.39% | 40.01% | -0.14% |
| Ratios/Supplemental Data | |||||
| Net Assets, End of Period (Millions) | $608 | $523 | $753 | $437 | $321 |
| Ratio of Total Expenses to Average Net Assets | 0.10%3 | 0.10% | 0.10% | 0.10% | 0.10% |
| Ratio of Net Investment Income to Average Net Assets | 0.98% | 0.79% | 0.60% | 1.06% | 1.20% |
| Portfolio Turnover Rate4 | 11% | 9% | 8% | 10% | 9% |
| 1 | Calculated based on average shares outstanding. |
| 2 | Total returns do not include account service fees that may have applied in the periods shown. Fund prospectuses provide information about any applicable account service fees. |
| 3 | The ratio of expenses to average net assets for the period net of reduction from custody fee offset arrangements was 0.10%. |
| 4 | Excludes the value of portfolio securities received or delivered as a result of in-kind purchases or redemptions of the fund’s capital shares, including ETF Creation Units. |
| A. | The following significant accounting policies conform to generally accepted accounting principles for U.S. investment companies. The fund consistently follows such policies in preparing its financial statements. |
| B. | In accordance with the terms of a Funds' Service Agreement (the “FSA”) between Vanguard and the fund, Vanguard furnishes to the fund investment advisory, corporate management, administrative, marketing, and distribution services at Vanguard’s cost of operations (as defined by the FSA). These costs of operations are allocated to the fund based on methods and guidelines approved by the board of trustees and are generally settled twice a month. |
| C. | The fund’s custodian bank has agreed to reduce its fees when the fund maintains cash on deposit in the non-interest-bearing custody account. For the year ended August 31, 2023, custodian fee offset arrangements reduced the fund’s expenses by $2,000 (an annual rate of less than 0.01% of average net assets). |
| D. | Various inputs may be used to determine the value of the fund’s investments and derivatives. These inputs are summarized in three broad levels for financial statement purposes. The inputs or methodologies used to value securities are not necessarily an indication of the risk associated with investing in those securities. |
| Level 1 ($000) | Level 2 ($000) | Level 3 ($000) | Total ($000) | |
| Investments | ||||
| Assets | ||||
| Common Stocks | 5,781,928 | — | — | 5,781,928 |
| Temporary Cash Investments | 34,228 | — | — | 34,228 |
| Total | 5,816,156 | — | — | 5,816,156 |
| Derivative Financial Instruments | ||||
| Assets | ||||
| Swap Contracts | — | — | — | — |
| E. | Permanent differences between book-basis and tax-basis components of net assets are reclassified among capital accounts in the financial statements to reflect their tax character. These reclassifications have no effect on net assets or net asset value per share. As of period end, permanent differences primarily attributable to the accounting for applicable in-kind redemptions and swap agreements were reclassified between the following accounts: |
| Amount ($000) | |
| Paid-in Capital | 215,465 |
| Total Distributable Earnings (Loss) | (215,465) |
| Amount ($000) | |
| Undistributed Ordinary Income | 12,725 |
| Undistributed Long-Term Gains | — |
| Net Unrealized Gains (Losses) | 440,142 |
| Capital Loss Carryforwards | (486,627) |
| Qualified Late-Year Losses | — |
| Other Temporary Differences | — |
| Total | (33,760) |
| Year Ended August 31, | ||
| 2023 Amount ($000) | 2022 Amount ($000) | |
| Ordinary Income* | 47,385 | 71,919 |
| Long-Term Capital Gains | — | — |
| Total | 47,385 | 71,919 |
| * | Includes short-term capital gains, if any. |
| Amount ($000) | |
| Tax Cost | 5,376,016 |
| Gross Unrealized Appreciation | 969,783 |
| Gross Unrealized Depreciation | (529,641) |
| Net Unrealized Appreciation (Depreciation) | 440,142 |
| F. | During the year ended August 31, 2023, the fund purchased $1,466,259,000 of investment securities and sold $1,338,909,000 of investment securities, other than temporary cash investments. Purchases and sales include $926,911,000 and $819,248,000, respectively, in connection with in-kind purchases and redemptions of the fund's capital shares. |
| G. | Capital share transactions for each class of shares were: |
| Year Ended August 31, | |||||
| 2023 | 2022 | ||||
| Amount ($000) | Shares (000) | Amount ($000) | Shares (000) | ||
| ETF Shares | |||||
| Issued | 947,780 | 3,535 | 1,566,104 | 5,181 | |
| Issued in Lieu of Cash Distributions | — | — | — | — | |
| Redeemed | (843,442) | (3,500) | (2,244,475) | (7,875) | |
| Net Increase (Decrease)—ETF Shares | 104,338 | 35 | (678,371) | (2,694) | |
| Admiral Shares | |||||
| Issued | 154,826 | 1,153 | 200,157 | 1,252 | |
| Issued in Lieu of Cash Distributions | 4,229 | 33 | 6,292 | 40 | |
| Redeemed | (133,095) | (1,026) | (287,119) | (1,886) | |
| Net Increase (Decrease)—Admiral Shares | 25,960 | 160 | (80,670) | (594) | |
| H. | Significant market disruptions, such as those caused by pandemics (e.g., COVID-19 pandemic), natural or environmental disasters, war (e.g., Russia’s invasion of Ukraine), acts of terrorism, or other events, can adversely affect local and global markets and normal market operations. Any such disruptions could have an adverse impact on the value of the fund’s investments and fund performance. |
| I. | Management has determined that no events or transactions occurred subsequent to August 31, 2023, that would require recognition or disclosure in these financial statements. |

| Average Annual Total Returns Periods Ended August 31, 2023 | |||||
| One Year | Five Years | Ten Years | Final Value of a $10,000 Investment | ||
| Consumer Staples Index Fund ETF Shares Net Asset Value | 4.65% | 9.24% | 9.31% | $24,352 |
| Consumer Staples Index Fund ETF Shares Market Price | 4.65 | 9.25 | 9.31 | 24,363 | |
| MSCI US Investable Market Consumer Staples 25/50 Index | 4.69 | 9.34 | 9.41 | 24,579 |
| MSCI US Investable Market 2500 Index | 15.01 | 10.39 | 12.34 | 32,022 |
| One Year | Five Years | Ten Years | Final Value of a $100,000 Investment | ||
| Consumer Staples Index Fund Admiral Shares | 4.65% | 9.26% | 9.32% | $243,807 | |
| MSCI US Investable Market Consumer Staples 25/50 Index | 4.69 | 9.34 | 9.41 | 245,792 | |
| MSCI US Investable Market 2500 Index | 15.01 | 10.39 | 12.34 | 320,217 | |
| One Year | Five Years | Ten Years | |
| Consumer Staples Index Fund ETF Shares Market Price | 4.65% | 55.61% | 143.63% |
| Consumer Staples Index Fund ETF Shares Net Asset Value | 4.65 | 55.57 | 143.52 |
| MSCI US Investable Market Consumer Staples 25/50 Index | 4.69 | 56.27 | 145.79 |
| Beverages | 23.8% |
| Consumer Staples Distribution & Retail | 26.4 |
| Food Products | 18.5 |
| Household Products | 19.2 |
| Personal Care Products | 4.2 |
| Tobacco | 7.9 |
| Shares | Market Value• ($000) | ||
| Common Stocks (99.7%) | |||
| Beverages (23.7%) | |||
| Coca-Cola Co. | 11,252,097 | 673,213 | |
| PepsiCo Inc. | 3,766,889 | 670,205 | |
| * | Monster Beverage Corp. | 2,515,073 | 144,390 |
| Constellation Brands Inc. Class A | 536,367 | 139,756 | |
| Keurig Dr Pepper Inc. | 2,697,689 | 90,777 | |
| Brown-Forman Corp. Class B | 1,049,319 | 69,391 | |
| Molson Coors Beverage Co. Class B | 681,626 | 43,276 | |
| * | Celsius Holdings Inc. | 176,529 | 34,607 |
| * | Boston Beer Co. Inc. Class A | 48,776 | 17,824 |
| Coca-Cola Consolidated Inc. | 24,725 | 17,280 | |
| MGP Ingredients Inc. | 103,783 | 12,444 | |
| * | National Beverage Corp. | 190,453 | 9,772 |
| * | Duckhorn Portfolio Inc. | 489,300 | 6,087 |
| * | Vita Coco Co. Inc. | 180,972 | 5,120 |
| *,1 | Vintage Wine Estates Inc. | 407,856 | 339 |
| 1,934,481 | |||
| Consumer Staples Distribution & Retail (26.3%) | |||
| Costco Wholesale Corp. | 1,210,992 | 665,174 | |
| Walmart Inc. | 4,033,034 | 655,812 | |
| Target Corp. | 1,211,916 | 153,368 | |
| Sysco Corp. | 1,643,898 | 114,497 | |
| Kroger Co. | 2,218,411 | 102,912 | |
| Dollar General Corp. | 516,970 | 71,600 | |
| Walgreens Boots Alliance Inc. | 2,450,337 | 62,018 | |
| * | Dollar Tree Inc. | 483,323 | 59,139 |
| * | Performance Food Group Co. | 587,688 | 36,513 |
| Casey's General Stores Inc. | 141,432 | 34,567 | |
| * | BJ's Wholesale Club Holdings Inc. | 499,455 | 33,658 |
| * | US Foods Holding Corp. | 790,986 | 31,980 |
| Albertsons Cos. Inc. Class A | 1,186,910 | 26,587 | |
| * | Sprouts Farmers Market Inc. | 486,546 | 19,846 |
| * | Grocery Outlet Holding Corp. | 487,273 | 15,032 |
| PriceSmart Inc. | 165,879 | 13,184 | |
| Andersons Inc. | 252,719 | 12,980 | |
| Weis Markets Inc. | 144,466 | 9,372 | |
| Ingles Markets Inc. Class A | 119,007 | 9,298 | |
| * | Chefs' Warehouse Inc. | 294,241 | 8,398 |
| * | United Natural Foods Inc. | 374,674 | 7,542 |
| SpartanNash Co. | 343,284 | 7,470 | |
| 2,150,947 | |||
| Shares | Market Value• ($000) | ||
| Food Products (18.4%) | |||
| Mondelez International Inc. Class A | 4,268,075 | 304,143 | |
| Archer-Daniels-Midland Co. | 1,763,122 | 139,816 | |
| General Mills Inc. | 1,874,944 | 126,859 | |
| Hershey Co. | 475,441 | 102,153 | |
| Kraft Heinz Co. | 2,181,225 | 72,177 | |
| McCormick & Co. Inc. | 840,073 | 68,953 | |
| Bunge Ltd. | 528,946 | 60,469 | |
| Kellogg Co. | 924,312 | 56,402 | |
| J M Smucker Co. | 368,247 | 53,377 | |
| Tyson Foods Inc. Class A | 1,001,038 | 53,325 | |
| Conagra Brands Inc. | 1,637,369 | 48,925 | |
| Lamb Weston Holdings Inc. | 501,607 | 48,862 | |
| Hormel Foods Corp. | 1,080,390 | 41,692 | |
| * | Darling Ingredients Inc. | 586,556 | 36,226 |
| Campbell Soup Co. | 715,260 | 29,826 | |
| Ingredion Inc. | 257,620 | 26,512 | |
| * | Post Holdings Inc. | 234,544 | 21,041 |
| Flowers Foods Inc. | 855,813 | 20,163 | |
| * | Hostess Brands Inc. | 649,713 | 18,504 |
| * | Freshpet Inc. | 242,668 | 18,324 |
| * | Simply Good Foods Co. | 453,930 | 16,378 |
| Lancaster Colony Corp. | 88,997 | 14,701 | |
| J & J Snack Foods Corp. | 86,480 | 14,021 | |
| * | TreeHouse Foods Inc. | 276,844 | 12,879 |
| Cal-Maine Foods Inc. | 254,466 | 12,161 | |
| * | Pilgrim's Pride Corp. | 373,081 | 9,387 |
| Utz Brands Inc. | 582,234 | 8,990 | |
| Fresh Del Monte Produce Inc. | 349,648 | 8,933 | |
| * | Sovos Brands Inc. | 393,797 | 8,821 |
| 1 | B&G Foods Inc. | 655,396 | 8,382 |
| John B Sanfilippo & Son Inc. | 82,595 | 8,288 | |
| *,1 | Beyond Meat Inc. | 593,481 | 7,003 |
| Calavo Growers Inc. | 205,352 | 6,768 | |
| Tootsie Roll Industries Inc. | 198,495 | 6,382 | |
| * | Hain Celestial Group Inc. | 559,444 | 5,924 |
| * | Mission Produce Inc. | 513,457 | 4,888 |
| * | Vital Farms Inc. | 264,266 | 3,113 |
| *,1 | Benson Hill Inc. | 1,482,361 | 947 |
| 1,505,715 | |||
| Household Products (19.2%) | |||
| Procter & Gamble Co. | 6,673,722 | 1,030,022 | |
| Colgate-Palmolive Co. | 2,505,939 | 184,111 | |
| Kimberly-Clark Corp. | 1,079,316 | 139,048 | |
| Church & Dwight Co. Inc. | 814,784 | 78,847 | |
| Clorox Co. | 356,607 | 55,791 | |
| Spectrum Brands Holdings Inc. | 211,066 | 17,555 | |
| WD-40 Co. | 73,745 | 15,846 | |
| Energizer Holdings Inc. | 385,888 | 13,255 | |
| * | Central Garden & Pet Co. Class A | 304,657 | 12,430 |
| Shares | Market Value• ($000) | ||
| Reynolds Consumer Products Inc. | 412,860 | 11,267 | |
| * | Central Garden & Pet Co. | 112,703 | 4,975 |
| 1,563,147 | |||
| Personal Care Products (4.2%) | |||
| Estee Lauder Cos. Inc. Class A | 742,697 | 119,225 | |
| Kenvue Inc. | 3,596,127 | 82,891 | |
| * | elf Beauty Inc. | 224,353 | 31,120 |
| * | BellRing Brands Inc. | 584,980 | 24,277 |
| * | Coty Inc. Class A | 1,726,603 | 19,959 |
| Inter Parfums Inc. | 105,235 | 14,704 | |
| Edgewell Personal Care Co. | 291,482 | 11,240 | |
| * | Herbalife Ltd. | 652,686 | 9,803 |
| * | USANA Health Sciences Inc. | 131,962 | 8,484 |
| Nu Skin Enterprises Inc. Class A | 306,787 | 7,329 | |
| Medifast Inc. | 85,988 | 7,252 | |
| * | Beauty Health Co. | 845,551 | 5,209 |
| *,1 | Veru Inc. | 761,130 | 792 |
| * | Olaplex Holdings Inc. | 29,389 | 80 |
| 342,365 | |||
| Tobacco (7.9%) | |||
| Philip Morris International Inc. | 3,872,359 | 371,979 | |
| Altria Group Inc. | 5,623,773 | 248,683 | |
| Vector Group Ltd. | 964,744 | 10,332 | |
| Universal Corp. | 192,051 | 9,146 | |
| Turning Point Brands Inc. | 195,141 | 4,804 | |
| 644,944 | |||
| Total Common Stocks (Cost $7,468,573) | 8,141,599 | ||
| Temporary Cash Investments (0.3%) | |||
| Money Market Fund (0.3%) | |||
| 2,3 | Vanguard Market Liquidity Fund, 5.384% (Cost $24,139) | 241,455 | 24,143 |
| Total Investments (100.0%) (Cost $7,492,712) | 8,165,742 | ||
| Other Assets and Liabilities—Net (0.0%) | (1,628) | ||
| Net Assets (100.0%) | 8,164,114 | ||
| Cost is in $000. | |||
| • | See Note A in Notes to Financial Statements. |
| * | Non-income-producing security. |
| 1 | Includes partial security positions on loan to broker-dealers. The total value of securities on loan is $8,547,000. |
| 2 | Affiliated money market fund available only to Vanguard funds and certain trusts and accounts managed by Vanguard. Rate shown is the 7-day yield. |
| 3 | Collateral of $10,020,000 was received for securities on loan, of which $10,017,000 is held in Vanguard Market Liquidity Fund and $3,000 is held in cash. |
| Over-the-Counter Total Return Swaps | ||||||
| Reference Entity | Termination Date | Counterparty | Notional Amount ($000) | Floating Interest Rate Received (Paid)1 (%) | Value and Unrealized Appreciation ($000) | Value and Unrealized (Depreciation) ($000) |
| Clorox Co. | 8/30/24 | BANA | 9,387 | (5.320) | — | — |
| Kraft Heinz Co. | 8/30/24 | BANA | 12,243 | (5.320) | — | — |
| — | — | |||||
| 1 | Based on Overnight Bank Funding Rate as of the most recent reset date. Floating interest payment received/paid monthly. |
| BANA—Bank of America, N.A. |
| ($000s, except shares, footnotes, and per-share amounts) | Amount |
| Assets | |
| Investments in Securities, at Value1 | |
| Unaffiliated Issuers (Cost $7,468,573) | 8,141,599 |
| Affiliated Issuers (Cost $24,139) | 24,143 |
| Total Investments in Securities | 8,165,742 |
| Investment in Vanguard | 281 |
| Cash | 3 |
| Cash Collateral Pledged—Over-the-Counter Swap Contracts | 1,080 |
| Receivables for Investment Securities Sold | 10,433 |
| Receivables for Accrued Income | 18,280 |
| Receivables for Capital Shares Issued | 545 |
| Unrealized Appreciation—Over-the-Counter Swap Contracts | — |
| Total Assets | 8,196,364 |
| Liabilities | |
| Due to Custodian | 822 |
| Payables for Investment Securities Purchased | 20,572 |
| Collateral for Securities on Loan | 10,020 |
| Payables for Capital Shares Redeemed | 478 |
| Payables to Vanguard | 358 |
| Total Liabilities | 32,250 |
| Net Assets | 8,164,114 |
| 1 Includes $8,547,000 of securities on loan. | |
| At August 31, 2023, net assets consisted of: | |
| Paid-in Capital | 7,790,741 |
| Total Distributable Earnings (Loss) | 373,373 |
| Net Assets | 8,164,114 |
| ETF Shares—Net Assets | |
| Applicable to 36,067,647 outstanding $.001 par value shares of beneficial interest (unlimited authorization) | 6,940,279 |
| Net Asset Value Per Share—ETF Shares | $192.42 |
| Admiral Shares—Net Assets | |
| Applicable to 12,898,925 outstanding $.001 par value shares of beneficial interest (unlimited authorization) | 1,223,835 |
| Net Asset Value Per Share—Admiral Shares | $94.88 |
| Year Ended August 31, 2023 | |
| ($000) | |
| Investment Income | |
| Income | |
| Dividends | 207,002 |
| Interest1 | 496 |
| Securities Lending—Net | 5,385 |
| Total Income | 212,883 |
| Expenses | |
| The Vanguard Group—Note B | |
| Investment Advisory Services | 187 |
| Management and Administrative— ETF Shares | 5,872 |
| Management and Administrative— Admiral Shares | 1,096 |
| Marketing and Distribution— ETF Shares | 316 |
| Marketing and Distribution— Admiral Shares | 69 |
| Custodian Fees | 80 |
| Auditing Fees | 30 |
| Shareholders’ Reports—ETF Shares | 287 |
| Shareholders’ Reports—Admiral Shares | 21 |
| Trustees’ Fees and Expenses | 4 |
| Other Expenses | 22 |
| Total Expenses | 7,984 |
| Expenses Paid Indirectly | (3) |
| Net Expenses | 7,981 |
| Net Investment Income | 204,902 |
| Realized Net Gain (Loss) | |
| Investment Securities Sold1,2 | 229,160 |
| Swap Contracts | (2,277) |
| Realized Net Gain (Loss) | 226,883 |
| Change in Unrealized Appreciation (Depreciation) | |
| Investment Securities1 | (95,399) |
| Swap Contracts | (71) |
| Change in Unrealized Appreciation (Depreciation) | (95,470) |
| Net Increase (Decrease) in Net Assets Resulting from Operations | 336,315 |
| 1 | Interest income, realized net gain (loss), and change in unrealized appreciation (depreciation) from an affiliated company of the fund were $495,000, $9,000, and $2,000, respectively. Purchases and sales are for temporary cash investment purposes. |
| 2 | Includes $343,788,000 of net gain (loss) resulting from in-kind redemptions. |
| Year Ended August 31, | ||
| 2023 ($000) | 2022 ($000) | |
| Increase (Decrease) in Net Assets | ||
| Operations | ||
| Net Investment Income | 204,902 | 171,173 |
| Realized Net Gain (Loss) | 226,883 | 423,016 |
| Change in Unrealized Appreciation (Depreciation) | (95,470) | (412,612) |
| Net Increase (Decrease) in Net Assets Resulting from Operations | 336,315 | 181,577 |
| Distributions | ||
| ETF Shares | (169,896) | (141,845) |
| Admiral Shares | (30,958) | (22,409) |
| Total Distributions | (200,854) | (164,254) |
| Capital Share Transactions | ||
| ETF Shares | 81,812 | 813,055 |
| Admiral Shares | (25,525) | 387,987 |
| Net Increase (Decrease) from Capital Share Transactions | 56,287 | 1,201,042 |
| Total Increase (Decrease) | 191,748 | 1,218,365 |
| Net Assets | ||
| Beginning of Period | 7,972,366 | 6,754,001 |
| End of Period | 8,164,114 | 7,972,366 |
| ETF Shares | |||||
| For a Share Outstanding Throughout Each Period | Year Ended August 31, | ||||
| 2023 | 2022 | 2021 | 2020 | 2019 | |
| Net Asset Value, Beginning of Period | $188.63 | $187.61 | $167.31 | $154.72 | $140.13 |
| Investment Operations | |||||
| Net Investment Income1 | 4.909 | 4.356 | 4.385 | 3.992 | 3.896 |
| Net Realized and Unrealized Gain (Loss) on Investments | 3.705 | .907 | 20.341 | 12.658 | 14.346 |
| Total from Investment Operations | 8.614 | 5.263 | 24.726 | 16.650 | 18.242 |
| Distributions | |||||
| Dividends from Net Investment Income | (4.824) | (4.243) | (4.427) | (4.060) | (3.652) |
| Distributions from Realized Capital Gains | — | — | — | — | — |
| Total Distributions | (4.824) | (4.243) | (4.427) | (4.060) | (3.652) |
| Net Asset Value, End of Period | $192.42 | $188.63 | $187.61 | $167.31 | $154.72 |
| Total Return | 4.65% | 2.83% | 15.01% | 11.01% | 13.24% |
| Ratios/Supplemental Data | |||||
| Net Assets, End of Period (Millions) | $6,940 | $6,747 | $5,908 | $5,712 | $5,296 |
| Ratio of Total Expenses to Average Net Assets | 0.10%2 | 0.10% | 0.10% | 0.10% | 0.10% |
| Ratio of Net Investment Income to Average Net Assets | 2.57% | 2.27% | 2.50% | 2.58% | 2.71% |
| Portfolio Turnover Rate3 | 9% | 5% | 8% | 3% | 6% |
| 1 | Calculated based on average shares outstanding. |
| 2 | The ratio of expenses to average net assets for the period net of reduction from custody fee offset arrangements was 0.10%. |
| 3 | Excludes the value of portfolio securities received or delivered as a result of in-kind purchases or redemptions of the fund’s capital shares, including ETF Creation Units. |
| Admiral Shares | |||||
| For a Share Outstanding Throughout Each Period | Year Ended August 31, | ||||
| 2023 | 2022 | 2021 | 2020 | 2019 | |
| Net Asset Value, Beginning of Period | $93.01 | $92.51 | $82.50 | $76.29 | $69.09 |
| Investment Operations | |||||
| Net Investment Income1 | 2.416 | 2.147 | 2.160 | 1.973 | 1.923 |
| Net Realized and Unrealized Gain (Loss) on Investments | 1.831 | .448 | 10.032 | 6.239 | 7.076 |
| Total from Investment Operations | 4.247 | 2.595 | 12.192 | 8.212 | 8.999 |
| Distributions | |||||
| Dividends from Net Investment Income | (2.377) | (2.095) | (2.183) | (2.002) | (1.799) |
| Distributions from Realized Capital Gains | — | — | — | — | — |
| Total Distributions | (2.377) | (2.095) | (2.183) | (2.002) | (1.799) |
| Net Asset Value, End of Period | $94.88 | $93.01 | $92.51 | $82.50 | $76.29 |
| Total Return2 | 4.65% | 2.85% | 15.04% | 11.03% | 13.24% |
| Ratios/Supplemental Data | |||||
| Net Assets, End of Period (Millions) | $1,224 | $1,225 | $846 | $791 | $710 |
| Ratio of Total Expenses to Average Net Assets | 0.10%3 | 0.10% | 0.10% | 0.10% | 0.10% |
| Ratio of Net Investment Income to Average Net Assets | 2.56% | 2.27% | 2.50% | 2.59% | 2.71% |
| Portfolio Turnover Rate4 | 9% | 5% | 8% | 3% | 6% |
| 1 | Calculated based on average shares outstanding. |
| 2 | Total returns do not include account service fees that may have applied in the periods shown. Fund prospectuses provide information about any applicable account service fees. |
| 3 | The ratio of expenses to average net assets for the period net of reduction from custody fee offset arrangements was 0.10%. |
| 4 | Excludes the value of portfolio securities received or delivered as a result of in-kind purchases or redemptions of the fund’s capital shares, including ETF Creation Units. |
| A. | The following significant accounting policies conform to generally accepted accounting principles for U.S. investment companies. The fund consistently follows such policies in preparing its financial statements. |
| B. | In accordance with the terms of a Funds' Service Agreement (the “FSA”) between Vanguard and the fund, Vanguard furnishes to the fund investment advisory, corporate management, administrative, marketing, and distribution services at Vanguard’s cost of operations (as defined by the FSA). These costs of operations are allocated to the fund based on methods and guidelines approved by the board of trustees and are generally settled twice a month. |
| C. | The fund’s custodian bank has agreed to reduce its fees when the fund maintains cash on deposit in the non-interest-bearing custody account. For the year ended August 31, 2023, custodian fee offset arrangements reduced the fund’s expenses by $3,000 (an annual rate of less than 0.01% of average net assets). |
| D. | Various inputs may be used to determine the value of the fund’s investments and derivatives. These inputs are summarized in three broad levels for financial statement purposes. The inputs or methodologies used to value securities are not necessarily an indication of the risk associated with investing in those securities. |
| Level 1 ($000) | Level 2 ($000) | Level 3 ($000) | Total ($000) | |
| Investments | ||||
| Assets | ||||
| Common Stocks | 8,141,599 | — | — | 8,141,599 |
| Temporary Cash Investments | 24,143 | — | — | 24,143 |
| Total | 8,165,742 | — | — | 8,165,742 |
| Derivative Financial Instruments | ||||
| Assets | ||||
| Swap Contracts | — | — | — | — |
| E. | Permanent differences between book-basis and tax-basis components of net assets are reclassified among capital accounts in the financial statements to reflect their tax character. These reclassifications have no effect on net assets or net asset value per share. As of period end, permanent differences primarily attributable to the accounting for applicable in-kind redemptions and swap agreements were reclassified between the following accounts: |
| Amount ($000) | |
| Paid-in Capital | 343,452 |
| Total Distributable Earnings (Loss) | (343,452) |
| Amount ($000) | |
| Undistributed Ordinary Income | 32,466 |
| Undistributed Long-Term Gains | — |
| Net Unrealized Gains (Losses) | 666,145 |
| Capital Loss Carryforwards | (325,238) |
| Qualified Late-Year Losses | — |
| Other Temporary Differences | — |
| Total | 373,373 |
| Year Ended August 31, | ||
| 2023 Amount ($000) | 2022 Amount ($000) | |
| Ordinary Income* | 200,854 | 164,254 |
| Long-Term Capital Gains | — | — |
| Total | 200,854 | 164,254 |
| * | Includes short-term capital gains, if any. |
| Amount ($000) | |
| Tax Cost | 7,499,597 |
| Gross Unrealized Appreciation | 1,232,212 |
| Gross Unrealized Depreciation | (566,067) |
| Net Unrealized Appreciation (Depreciation) | 666,145 |
| F. | During the year ended August 31, 2023, the fund purchased $1,837,807,000 of investment securities and sold $1,794,046,000 of investment securities, other than temporary cash investments. Purchases and sales include $1,096,679,000 and $1,102,029,000, respectively, in connection with in-kind purchases and redemptions of the fund's capital shares. |
| G. | Capital share transactions for each class of shares were: |
| Year Ended August 31, | |||||
| 2023 | 2022 | ||||
| Amount ($000) | Shares (000) | Amount ($000) | Shares (000) | ||
| ETF Shares | |||||
| Issued | 1,190,077 | 6,226 | 2,200,339 | 11,477 | |
| Issued in Lieu of Cash Distributions | — | — | — | — | |
| Redeemed | (1,108,265) | (5,925) | (1,387,284) | (7,200) | |
| Net Increase (Decrease)—ETF Shares | 81,812 | 301 | 813,055 | 4,277 | |
| Admiral Shares | |||||
| Issued | 326,126 | 3,468 | 636,063 | 6,644 | |
| Issued in Lieu of Cash Distributions | 27,369 | 295 | 18,698 | 204 | |
| Redeemed | (379,020) | (4,040) | (266,774) | (2,818) | |
| Net Increase (Decrease)—Admiral Shares | (25,525) | (277) | 387,987 | 4,030 | |
| H. | Significant market disruptions, such as those caused by pandemics (e.g., COVID-19 pandemic), natural or environmental disasters, war (e.g., Russia’s invasion of Ukraine), acts of terrorism, or other events, can adversely affect local and global markets and normal market operations. Any such disruptions could have an adverse impact on the value of the fund’s investments and fund performance. |
| I. | Management has determined that no events or transactions occurred subsequent to August 31, 2023, that would require recognition or disclosure in these financial statements. |

| Average Annual Total Returns Periods Ended August 31, 2023 | |||||
| One Year | Five Years | Ten Years | Final Value of a $10,000 Investment | ||
| Energy Index Fund ETF Shares Net Asset Value | 14.51% | 8.10% | 4.13% | $14,992 |
| Energy Index Fund ETF Shares Market Price | 14.50 | 8.11 | 4.13 | 14,992 | |
| MSCI US Investable Market Energy 25/50 Index | 14.72 | 8.22 | 4.27 | 15,197 |
| MSCI US Investable Market 2500 Index | 15.01 | 10.39 | 12.34 | 32,022 |
| One Year | Five Years | Ten Years | Final Value of a $100,000 Investment | ||
| Energy Index Fund Admiral Shares | 14.58% | 8.15% | 4.16% | $150,288 | |
| MSCI US Investable Market Energy 25/50 Index | 14.72 | 8.22 | 4.27 | 151,969 | |
| MSCI US Investable Market 2500 Index | 15.01 | 10.39 | 12.34 | 320,217 | |
| One Year | Five Years | Ten Years | |
| Energy Index Fund ETF Shares Market Price | 14.50% | 47.67% | 49.92% |
| Energy Index Fund ETF Shares Net Asset Value | 14.51 | 47.64 | 49.92 |
| MSCI US Investable Market Energy 25/50 Index | 14.72 | 48.43 | 51.97 |
| Coal & Consumable Fuels | 0.4% |
| Integrated Oil & Gas | 39.9 |
| Oil & Gas Drilling | 1.3 |
| Oil & Gas Equipment & Services | 10.7 |
| Oil & Gas Exploration & Production | 28.7 |
| Oil & Gas Refining & Marketing | 9.3 |
| Oil & Gas Storage & Transportation | 9.7 |
| Shares | Market Value• ($000) | ||
| Common Stocks (99.6%) | |||
| Coal & Consumable Fuels (0.4%) | |||
| CONSOL Energy Inc. | 177,812 | 15,299 | |
| Peabody Energy Corp. | 682,717 | 14,733 | |
| *,1 | Uranium Energy Corp. | 1,880,123 | 8,122 |
| * | Centrus Energy Corp. Class A | 65,767 | 3,121 |
| Enviva Inc. | 142,002 | 1,307 | |
| 42,582 | |||
| Integrated Oil & Gas (39.7%) | |||
| Exxon Mobil Corp. | 21,175,341 | 2,354,486 | |
| Chevron Corp. | 9,503,985 | 1,531,092 | |
| Occidental Petroleum Corp. | 3,503,413 | 219,979 | |
| 4,105,557 | |||
| Oil & Gas Drilling (1.3%) | |||
| * | Transocean Ltd. (XNYS) | 3,612,372 | 29,549 |
| Noble Corp. plc | 544,462 | 28,715 | |
| * | Valaris Ltd. | 334,601 | 25,202 |
| Helmerich & Payne Inc. | 537,009 | 21,475 | |
| Patterson-UTI Energy Inc. | 955,130 | 13,505 | |
| * | Diamond Offshore Drilling Inc. | 531,310 | 7,901 |
| * | Nabors Industries Ltd. (XNYS) | 47,507 | 5,259 |
| 131,606 | |||
| Oil & Gas Equipment & Services (10.7%) | |||
| Schlumberger NV | 7,466,353 | 440,216 | |
| Baker Hughes Co. | 5,303,031 | 191,917 | |
| Halliburton Co. | 4,725,888 | 182,514 | |
| TechnipFMC plc | 2,312,949 | 44,039 | |
| NOV Inc. | 2,062,337 | 43,577 | |
| ChampionX Corp. | 1,036,975 | 37,425 | |
| * | Weatherford International plc | 358,549 | 31,739 |
| Cactus Inc. Class A | 337,746 | 18,015 | |
| * | Tidewater Inc. | 253,313 | 16,473 |
| Liberty Energy Inc. | 848,597 | 13,535 | |
| * | NexTier Oilfield Solutions Inc. | 1,184,564 | 12,568 |
| * | Oceaneering International Inc. | 528,252 | 12,039 |
| * | Expro Group Holdings NV | 483,895 | 11,376 |
| Archrock Inc. | 739,259 | 9,455 | |
| * | Helix Energy Solutions Group Inc. | 754,455 | 7,650 |
| Core Laboratories Inc. | 244,611 | 5,881 | |
| * | US Silica Holdings Inc. | 403,963 | 4,981 |
| * | Dril-Quip Inc. | 170,171 | 4,693 |
| * | ProPetro Holding Corp. | 453,034 | 4,367 |
| RPC Inc. | 453,678 | 3,625 | |
| Select Water Solutions Inc. | 442,732 | 3,564 | |
| * | DMC Global Inc. | 103,337 | 2,482 |
| * | Bristow Group Inc. | 88,082 | 2,440 |
| Shares | Market Value• ($000) | ||
| * | ProFrac Holding Corp. Class A | 100,008 | 1,100 |
| 1,105,671 | |||
| Oil & Gas Exploration & Production (28.5%) | |||
| ConocoPhillips | 6,338,682 | 754,493 | |
| EOG Resources Inc. | 3,063,659 | 394,048 | |
| Pioneer Natural Resources Co. | 1,224,375 | 291,316 | |
| Hess Corp. | 1,247,578 | 192,751 | |
| Devon Energy Corp. | 3,361,360 | 171,732 | |
| Diamondback Energy Inc. | 901,159 | 136,778 | |
| Coterra Energy Inc. | 3,967,610 | 111,847 | |
| Marathon Oil Corp. | 3,235,054 | 85,244 | |
| APA Corp. | 1,616,479 | 70,866 | |
| EQT Corp. | 1,594,356 | 68,908 | |
| Ovintiv Inc. (XNYS) | 1,302,557 | 61,168 | |
| Texas Pacific Land Corp. | 32,234 | 60,753 | |
| Chesapeake Energy Corp. | 596,013 | 52,574 | |
| * | Antero Resources Corp. | 1,493,501 | 41,325 |
| Range Resources Corp. | 1,263,866 | 40,924 | |
| * | Southwestern Energy Co. | 5,768,228 | 39,109 |
| Matador Resources Co. | 593,059 | 37,659 | |
| Murphy Oil Corp. | 776,676 | 35,261 | |
| Chord Energy Corp. | 217,615 | 35,145 | |
| SM Energy Co. | 631,049 | 26,700 | |
| * | Denbury Inc. | 262,475 | 24,037 |
| Civitas Resources Inc. | 273,698 | 22,503 | |
| Magnolia Oil & Gas Corp. Class A | 945,623 | 21,560 | |
| * | CNX Resources Corp. | 867,945 | 19,399 |
| Permian Resources Corp. | 1,315,883 | 18,659 | |
| * | Kosmos Energy Ltd. | 2,411,274 | 17,554 |
| Northern Oil and Gas Inc. | 413,745 | 17,307 | |
| California Resources Corp. | 277,374 | 15,489 | |
| * | Talos Energy Inc. | 658,237 | 11,335 |
| * | Callon Petroleum Co. | 285,755 | 11,210 |
| Sitio Royalties Corp. Class A | 401,621 | 10,201 | |
| Viper Energy Partners LP | 339,777 | 9,453 | |
| * | Gulfport Energy Corp. | 58,229 | 6,871 |
| 1 | Comstock Resources Inc. | 509,124 | 6,242 |
| * | Earthstone Energy Inc. Class A | 278,340 | 5,673 |
| * | Vital Energy Inc. | 87,742 | 5,290 |
| Kimbell Royalty Partners LP | 340,622 | 5,229 | |
| 1 | Crescent Energy Co. Class A | 318,562 | 4,342 |
| *,1 | Tellurian Inc. | 2,802,777 | 3,139 |
| Berry Corp. | 363,613 | 3,116 | |
| Vitesse Energy Inc. | 128,287 | 2,981 | |
| Shares | Market Value• ($000) | ||
| * | W&T Offshore Inc. | 537,382 | 2,192 |
| 2,952,383 | |||
| Oil & Gas Refining & Marketing (9.3%) | |||
| Marathon Petroleum Corp. | 2,222,516 | 317,309 | |
| Phillips 66 | 2,403,645 | 274,400 | |
| Valero Energy Corp. | 1,893,723 | 245,995 | |
| HF Sinclair Corp. | 805,842 | 44,394 | |
| PBF Energy Inc. Class A | 594,288 | 27,866 | |
| * | Par Pacific Holdings Inc. | 303,982 | 10,442 |
| Delek US Holdings Inc. | 344,563 | 8,872 | |
| * | Green Plains Inc. | 280,768 | 8,715 |
| World Kinect Corp. | 325,687 | 7,133 | |
| CVR Energy Inc. | 158,090 | 5,169 | |
| * | Clean Energy Fuels Corp. | 934,773 | 3,982 |
| * | REX American Resources Corp. | 82,067 | 3,241 |
| *,1 | Vertex Energy Inc. | 439,866 | 1,865 |
| *,1 | Gevo Inc. | 1,243,482 | 1,629 |
| 961,012 | |||
| Oil & Gas Storage & Transportation (9.7%) | |||
| Williams Cos. Inc. | 6,381,212 | 220,343 | |
| Cheniere Energy Inc. | 1,272,686 | 207,702 | |
| Kinder Morgan Inc. | 10,565,962 | 181,946 | |
| ONEOK Inc. | 2,343,798 | 152,815 | |
| Targa Resources Corp. | 1,124,711 | 97,006 | |
| DTE Midstream LLC | 507,337 | 26,529 | |
| Antero Midstream Corp. | 1,883,388 | 22,827 | |
| Equitrans Midstream Corp. | 2,267,673 | 21,770 | |
| * | EnLink Midstream LLC | 1,343,546 | 16,714 |
| *,1 | Plains GP Holdings LP Class A | 1,019,115 | 16,346 |
| Hess Midstream LP Class A | 350,472 | 10,129 | |
| New Fortress Energy Inc. | 322,454 | 10,009 | |
| International Seaways Inc. | 179,295 | 7,704 | |
| 1 | Kinetik Holdings Inc. | 95,560 | 3,355 |
| * | NextDecade Corp. | 314,693 | 1,910 |
| Excelerate Energy Inc. Class A | 96,327 | 1,792 | |
| 998,897 | |||
| Total Common Stocks (Cost $8,547,885) | 10,297,708 | ||
| Shares | Market Value• ($000) | ||
| Temporary Cash Investments (0.2%) | |||
| Money Market Fund (0.2%) | |||
| 2,3 | Vanguard Market Liquidity Fund, 5.384% (Cost $22,287) | 222,918 | 22,290 |
| Total Investments (99.8%) (Cost $8,570,172) | 10,319,998 | ||
| Other Assets and Liabilities—Net (0.2%) | 20,294 | ||
| Net Assets (100.0%) | 10,340,292 | ||
| Cost is in $000. | |||
| • | See Note A in Notes to Financial Statements. |
| * | Non-income-producing security. |
| 1 | Includes partial security positions on loan to broker-dealers. The total value of securities on loan is $18,515,000. |
| 2 | Affiliated money market fund available only to Vanguard funds and certain trusts and accounts managed by Vanguard. Rate shown is the 7-day yield. |
| 3 | Collateral of $22,175,000 was received for securities on loan. |
| Over-the-Counter Total Return Swaps | ||||||
| Reference Entity | Termination Date | Counterparty | Notional Amount ($000) | Floating Interest Rate Received (Paid)1 (%) | Value and Unrealized Appreciation ($000) | Value and Unrealized (Depreciation) ($000) |
| EQT Corp. | 8/30/24 | BANA | 12,966 | (5.320) | — | — |
| Hess Corp. | 1/31/24 | GSI | 31,114 | (5.320) | — | (288) |
| — | (288) | |||||
| 1 | Based on Overnight Bank Funding Rate as of the most recent reset date. Floating interest payment received/paid monthly. |
| BANA—Bank of America, N.A. | |
| GSI—Goldman Sachs International. |
| ($000s, except shares, footnotes, and per-share amounts) | Amount |
| Assets | |
| Investments in Securities, at Value1 | |
| Unaffiliated Issuers (Cost $8,547,885) | 10,297,708 |
| Affiliated Issuers (Cost $22,287) | 22,290 |
| Total Investments in Securities | 10,319,998 |
| Investment in Vanguard | 335 |
| Cash Collateral Pledged—Over-the-Counter Swap Contracts | 500 |
| Receivables for Investment Securities Sold | 213,894 |
| Receivables for Accrued Income | 43,977 |
| Receivables for Capital Shares Issued | 876 |
| Total Assets | 10,579,580 |
| Liabilities | |
| Due to Custodian | 4,165 |
| Payables for Investment Securities Purchased | 206,321 |
| Collateral for Securities on Loan | 22,175 |
| Payables for Capital Shares Redeemed | 5,890 |
| Payables to Vanguard | 449 |
| Unrealized Depreciation—Over-the-Counter Swap Contracts | 288 |
| Total Liabilities | 239,288 |
| Net Assets | 10,340,292 |
| 1 Includes $18,515,000 of securities on loan. | |
| At August 31, 2023, net assets consisted of: | |
| Paid-in Capital | 10,023,769 |
| Total Distributable Earnings (Loss) | 316,523 |
| Net Assets | 10,340,292 |
| ETF Shares—Net Assets | |
| Applicable to 67,726,867 outstanding $.001 par value shares of beneficial interest (unlimited authorization) | 8,440,003 |
| Net Asset Value Per Share—ETF Shares | $124.62 |
| Admiral Shares—Net Assets | |
| Applicable to 30,524,869 outstanding $.001 par value shares of beneficial interest (unlimited authorization) | 1,900,289 |
| Net Asset Value Per Share—Admiral Shares | $62.25 |
| Year Ended August 31, 2023 | |
| ($000) | |
| Investment Income | |
| Income | |
| Dividends1 | 365,323 |
| Interest2 | 1,131 |
| Securities Lending—Net | 358 |
| Total Income | 366,812 |
| Expenses | |
| The Vanguard Group—Note B | |
| Investment Advisory Services | 233 |
| Management and Administrative— ETF Shares | 6,971 |
| Management and Administrative— Admiral Shares | 1,781 |
| Marketing and Distribution— ETF Shares | 423 |
| Marketing and Distribution— Admiral Shares | 109 |
| Custodian Fees | 71 |
| Auditing Fees | 30 |
| Shareholders’ Reports—ETF Shares | 321 |
| Shareholders’ Reports—Admiral Shares | 19 |
| Trustees’ Fees and Expenses | 5 |
| Other Expenses | 22 |
| Total Expenses | 9,985 |
| Expenses Paid Indirectly | (24) |
| Net Expenses | 9,961 |
| Net Investment Income | 356,851 |
| Realized Net Gain (Loss) | |
| Investment Securities Sold2,3 | 703,820 |
| Futures Contracts | 13 |
| Swap Contracts | 10,594 |
| Realized Net Gain (Loss) | 714,427 |
| Change in Unrealized Appreciation (Depreciation) | |
| Investment Securities2 | 240,694 |
| Swap Contracts | (3,096) |
| Change in Unrealized Appreciation (Depreciation) | 237,598 |
| Net Increase (Decrease) in Net Assets Resulting from Operations | 1,308,876 |
| 1 | Dividends are net of foreign withholding taxes of $1,000. |
| 2 | Interest income, realized net gain (loss), capital gain distributions received, and change in unrealized appreciation (depreciation) from an affiliated company of the fund were $1,131,000, $10,000, less than $1,000, and $2,000, respectively. Purchases and sales are for temporary cash investment purposes. |
| 3 | Includes $852,247,000 of net gain (loss) resulting from in-kind redemptions. |
| Year Ended August 31, | ||
| 2023 ($000) | 2022 ($000) | |
| Increase (Decrease) in Net Assets | ||
| Operations | ||
| Net Investment Income | 356,851 | 329,927 |
| Realized Net Gain (Loss) | 714,427 | 1,348,925 |
| Change in Unrealized Appreciation (Depreciation) | 237,598 | 2,695,802 |
| Net Increase (Decrease) in Net Assets Resulting from Operations | 1,308,876 | 4,374,654 |
| Distributions | ||
| ETF Shares | (311,564) | (276,138) |
| Admiral Shares | (77,509) | (61,049) |
| Total Distributions | (389,073) | (337,187) |
| Capital Share Transactions | ||
| ETF Shares | (162,937) | (248,367) |
| Admiral Shares | (222,832) | 111,245 |
| Net Increase (Decrease) from Capital Share Transactions | (385,769) | (137,122) |
| Total Increase (Decrease) | 534,034 | 3,900,345 |
| Net Assets | ||
| Beginning of Period | 9,806,258 | 5,905,913 |
| End of Period | 10,340,292 | 9,806,258 |
| ETF Shares | |||||
| For a Share Outstanding Throughout Each Period | Year Ended August 31, | ||||
| 2023 | 2022 | 2021 | 2020 | 2019 | |
| Net Asset Value, Beginning of Period | $113.45 | $67.99 | $47.90 | $75.75 | $103.13 |
| Investment Operations | |||||
| Net Investment Income1 | 4.205 | 3.625 | 2.802 | 2.957 | 2.769 |
| Net Realized and Unrealized Gain (Loss) on Investments | 11.554 | 45.526 | 19.789 | (28.064) | (27.449) |
| Total from Investment Operations | 15.759 | 49.151 | 22.591 | (25.107) | (24.680) |
| Distributions | |||||
| Dividends from Net Investment Income | (4.589) | (3.691) | (2.501) | (2.743) | (2.700) |
| Distributions from Realized Capital Gains | — | — | — | — | — |
| Total Distributions | (4.589) | (3.691) | (2.501) | (2.743) | (2.700) |
| Net Asset Value, End of Period | $124.62 | $113.45 | $67.99 | $47.90 | $75.75 |
| Total Return | 14.51% | 74.07% | 48.07% | -33.87% | -24.34% |
| Ratios/Supplemental Data | |||||
| Net Assets, End of Period (Millions) | $8,440 | $7,862 | $4,806 | $2,720 | $3,029 |
| Ratio of Total Expenses to Average Net Assets | 0.10%2 | 0.10% | 0.10% | 0.10% | 0.10% |
| Ratio of Net Investment Income to Average Net Assets | 3.58% | 3.80% | 4.54% | 4.91% | 3.15% |
| Portfolio Turnover Rate3 | 9% | 6% | 5% | 8% | 7% |
| 1 | Calculated based on average shares outstanding. |
| 2 | The ratio of expenses to average net assets for the period net of reduction from custody fee offset arrangements was 0.10%. |
| 3 | Excludes the value of portfolio securities received or delivered as a result of in-kind purchases or redemptions of the fund’s capital shares, including ETF Creation Units. |
| Admiral Shares | |||||
| For a Share Outstanding Throughout Each Period | Year Ended August 31, | ||||
| 2023 | 2022 | 2021 | 2020 | 2019 | |
| Net Asset Value, Beginning of Period | $56.67 | $33.97 | $23.93 | $37.84 | $51.52 |
| Investment Operations | |||||
| Net Investment Income1 | 2.095 | 1.829 | 1.435 | 1.461 | 1.388 |
| Net Realized and Unrealized Gain (Loss) on Investments | 5.777 | 22.715 | 9.855 | (14.001) | (13.720) |
| Total from Investment Operations | 7.872 | 24.544 | 11.290 | (12.540) | (12.332) |
| Distributions | |||||
| Dividends from Net Investment Income | (2.292) | (1.844) | (1.250) | (1.370) | (1.348) |
| Distributions from Realized Capital Gains | — | — | — | — | — |
| Total Distributions | (2.292) | (1.844) | (1.250) | (1.370) | (1.348) |
| Net Asset Value, End of Period | $62.25 | $56.67 | $33.97 | $23.93 | $37.84 |
| Total Return2 | 14.58% | 73.97% | 48.18% | -33.82% | -24.33% |
| Ratios/Supplemental Data | |||||
| Net Assets, End of Period (Millions) | $1,900 | $1,944 | $1,100 | $407 | $468 |
| Ratio of Total Expenses to Average Net Assets | 0.10%3 | 0.10% | 0.10% | 0.10% | 0.10% |
| Ratio of Net Investment Income to Average Net Assets | 3.57% | 3.83% | 4.52% | 4.84% | 3.15% |
| Portfolio Turnover Rate4 | 9% | 6% | 5% | 8% | 7% |
| 1 | Calculated based on average shares outstanding. |
| 2 | Total returns do not include account service fees that may have applied in the periods shown. Fund prospectuses provide information about any applicable account service fees. |
| 3 | The ratio of expenses to average net assets for the period net of reduction from custody fee offset arrangements was 0.10%. |
| 4 | Excludes the value of portfolio securities received or delivered as a result of in-kind purchases or redemptions of the fund’s capital shares, including ETF Creation Units. |
| A. | The following significant accounting policies conform to generally accepted accounting principles for U.S. investment companies. The fund consistently follows such policies in preparing its financial statements. |
| B. | In accordance with the terms of a Funds' Service Agreement (the “FSA”) between Vanguard and the fund, Vanguard furnishes to the fund investment advisory, corporate management, administrative, marketing, and distribution services at Vanguard’s cost of operations (as defined by the FSA). These costs of operations are allocated to the fund based on methods and guidelines approved by the board of trustees and are generally settled twice a month. |
| C. | The fund’s custodian bank has agreed to reduce its fees when the fund maintains cash on deposit in the non-interest-bearing custody account. For the year ended August 31, 2023, custodian fee offset arrangements reduced the fund’s expenses by $24,000 (an annual rate of less than 0.01% of average net assets). |
| D. | Various inputs may be used to determine the value of the fund’s investments and derivatives. These inputs are summarized in three broad levels for financial statement purposes. The inputs or methodologies used to value securities are not necessarily an indication of the risk associated with investing in those securities. |
| Level 1 ($000) | Level 2 ($000) | Level 3 ($000) | Total ($000) | |
| Investments | ||||
| Assets | ||||
| Common Stocks | 10,297,708 | — | — | 10,297,708 |
| Temporary Cash Investments | 22,290 | — | — | 22,290 |
| Total | 10,319,998 | — | — | 10,319,998 |
| Derivative Financial Instruments | ||||
| Liabilities | ||||
| Swap Contracts | — | 288 | — | 288 |
| E. | Permanent differences between book-basis and tax-basis components of net assets are reclassified among capital accounts in the financial statements to reflect their tax character. These reclassifications have no effect on net assets or net asset value per share. As of period end, permanent differences primarily attributable to the accounting for applicable in-kind redemptions and swap agreements were reclassified between the following accounts: |
| Amount ($000) | |
| Paid-in Capital | 851,827 |
| Total Distributable Earnings (Loss) | (851,827) |
| Amount ($000) | |
| Undistributed Ordinary Income | 62,476 |
| Undistributed Long-Term Gains | — |
| Net Unrealized Gains (Losses) | 1,701,204 |
| Capital Loss Carryforwards | (1,447,157) |
| Qualified Late-Year Losses | — |
| Other Temporary Differences | — |
| Total | 316,523 |
| Year Ended August 31, | ||
| 2023 Amount ($000) | 2022 Amount ($000) | |
| Ordinary Income* | 389,073 | 337,187 |
| Long-Term Capital Gains | — | — |
| Total | 389,073 | 337,187 |
| * | Includes short-term capital gains, if any. |
| Amount ($000) | |
| Tax Cost | 8,618,794 |
| Gross Unrealized Appreciation | 2,221,612 |
| Gross Unrealized Depreciation | (520,408) |
| Net Unrealized Appreciation (Depreciation) | 1,701,204 |
| F. | During the year ended August 31, 2023, the fund purchased $2,602,688,000 of investment securities and sold $3,009,302,000 of investment securities, other than temporary cash investments. Purchases and sales include $1,563,037,000 and $2,125,458,000, respectively, in connection with in-kind purchases and redemptions of the fund's capital shares. |
| G. | Capital share transactions for each class of shares were: |
| Year Ended August 31, | |||||
| 2023 | 2022 | ||||
| Amount ($000) | Shares (000) | Amount ($000) | Shares (000) | ||
| ETF Shares | |||||
| Issued | 1,972,280 | 16,850 | 3,288,003 | 35,250 | |
| Issued in Lieu of Cash Distributions | — | — | — | — | |
| Redeemed | (2,135,217) | (18,425) | (3,536,370) | (36,625) | |
| Net Increase (Decrease)—ETF Shares | (162,937) | (1,575) | (248,367) | (1,375) | |
| Admiral Shares | |||||
| Issued | 706,787 | 12,005 | 1,232,945 | 24,911 | |
| Issued in Lieu of Cash Distributions | 68,739 | 1,272 | 54,811 | 1,248 | |
| Redeemed | (998,358) | (17,057) | (1,176,511) | (24,249) | |
| Net Increase (Decrease)—Admiral Shares | (222,832) | (3,780) | 111,245 | 1,910 | |
| H. | Significant market disruptions, such as those caused by pandemics (e.g., COVID-19 pandemic), natural or environmental disasters, war (e.g., Russia’s invasion of Ukraine), acts of terrorism, or other events, can adversely affect local and global markets and normal market operations. Any such disruptions could have an adverse impact on the value of the fund’s investments and fund performance. |
| I. | Management has determined that no events or transactions occurred subsequent to August 31, 2023, that would require recognition or disclosure in these financial statements. |

| Average Annual Total Returns Periods Ended August 31, 2023 | |||||
| One Year | Five Years | Ten Years | Final Value of a $10,000 Investment | ||
| Financials Index Fund ETF Shares Net Asset Value | 5.27% | 5.52% | 9.98% | $25,889 |
| Financials Index Fund ETF Shares Market Price | 5.27 | 5.53 | 9.99 | 25,903 | |
| MSCI US Investable Market Financials 25/50 Index | 5.32 | 5.61 | 10.08 | 26,118 |
| MSCI US Investable Market 2500 Index | 15.01 | 10.39 | 12.34 | 32,022 |
| One Year | Five Years | Ten Years | Final Value of a $100,000 Investment | ||
| Financials Index Fund Admiral Shares | 5.27% | 5.54% | 9.99% | $259,053 | |
| MSCI US Investable Market Financials 25/50 Index | 5.32 | 5.61 | 10.08 | 261,182 | |
| MSCI US Investable Market 2500 Index | 15.01 | 10.39 | 12.34 | 320,217 | |
| One Year | Five Years | Ten Years | |
| Financials Index Fund ETF Shares Market Price | 5.27% | 30.87% | 159.03% |
| Financials Index Fund ETF Shares Net Asset Value | 5.27 | 30.84 | 158.89 |
| MSCI US Investable Market Financials 25/50 Index | 5.32 | 31.40 | 161.18 |
| Banks | 25.6% |
| Capital Markets | 23.4 |
| Consumer Finance | 4.0 |
| Financial Services | 28.7 |
| Insurance | 17.3 |
| Mortgage Real Estate Investment Trusts (REITs) | 1.0 |
| Shares | Market Value• ($000) | ||
| Common Stocks (99.0%) | |||
| Banks (25.3%) | |||
| JPMorgan Chase & Co. | 4,943,547 | 723,389 | |
| Bank of America Corp. | 12,133,613 | 347,871 | |
| Wells Fargo & Co. | 6,204,937 | 256,202 | |
| Citigroup Inc. | 3,294,048 | 136,011 | |
| US Bancorp | 2,593,997 | 94,759 | |
| PNC Financial Services Group Inc. | 675,425 | 81,544 | |
| Truist Financial Corp. | 2,254,111 | 68,863 | |
| M&T Bank Corp. | 280,906 | 35,127 | |
| Fifth Third Bancorp | 1,153,299 | 30,620 | |
| Regions Financial Corp. | 1,590,303 | 29,166 | |
| Huntington Bancshares Inc. | 2,439,913 | 27,059 | |
| First Citizens BancShares Inc. Class A | 18,261 | 24,842 | |
| Citizens Financial Group Inc. | 818,864 | 23,035 | |
| KeyCorp | 1,579,902 | 17,900 | |
| New York Community Bancorp Inc. | 1,219,556 | 14,976 | |
| East West Bancorp Inc. | 239,119 | 13,233 | |
| Webster Financial Corp. | 295,170 | 12,518 | |
| First Horizon Corp. | 896,186 | 11,247 | |
| Comerica Inc. | 222,105 | 10,685 | |
| Commerce Bancshares Inc. | 200,445 | 9,840 | |
| Cullen/Frost Bankers Inc. | 103,612 | 9,794 | |
| SouthState Corp. | 128,176 | 9,267 | |
| Prosperity Bancshares Inc. | 158,844 | 9,024 | |
| Zions Bancorp NA | 250,320 | 8,886 | |
| Western Alliance Bancorp | 176,051 | 8,804 | |
| Pinnacle Financial Partners Inc. | 129,563 | 8,624 | |
| Popular Inc. | 121,706 | 8,310 | |
| Wintrust Financial Corp. | 103,498 | 8,032 | |
| Synovus Financial Corp. | 247,015 | 7,648 | |
| Old National Bancorp | 494,862 | 7,552 | |
| Bank OZK | 183,651 | 7,377 | |
| Home BancShares Inc. | 327,410 | 7,262 | |
| Columbia Banking System Inc. | 352,428 | 7,218 | |
| FNB Corp. | 611,138 | 7,108 | |
| Cadence Bank | 308,199 | 7,052 | |
| United Bankshares Inc. | 228,339 | 6,868 | |
| Valley National Bancorp | 729,886 | 6,700 | |
| First Financial Bankshares Inc. | 229,238 | 6,584 | |
| Hancock Whitney Corp. | 146,914 | 6,060 | |
| Glacier Bancorp Inc. | 187,664 | 5,669 | |
| United Community Banks Inc. | 199,496 | 5,386 | |
| * | Texas Capital Bancshares Inc. | 81,612 | 5,096 |
| UMB Financial Corp. | 77,819 | 4,919 | |
| ServisFirst Bancshares Inc. | 87,340 | 4,895 | |
| Shares | Market Value• ($000) | ||
| Ameris Bancorp | 111,567 | 4,546 | |
| Associated Banc-Corp. | 255,587 | 4,429 | |
| Community Bank System Inc. | 91,134 | 4,333 | |
| International Bancshares Corp. | 94,561 | 4,234 | |
| BOK Financial Corp. | 50,707 | 4,214 | |
| First BanCorp (XNYS) | 303,944 | 4,213 | |
| Cathay General Bancorp | 116,361 | 4,146 | |
| CVB Financial Corp. | 235,571 | 4,113 | |
| First Hawaiian Inc. | 216,274 | 4,090 | |
| WSFS Financial Corp. | 103,795 | 4,079 | |
| Independent Bank Corp. (XNGS) | 75,175 | 4,061 | |
| First Interstate BancSystem Inc. Class A | 149,979 | 3,886 | |
| Simmons First National Corp. Class A | 215,361 | 3,838 | |
| * | Axos Financial Inc. | 89,013 | 3,836 |
| Fulton Financial Corp. | 282,526 | 3,766 | |
| Atlantic Union Bankshares Corp. | 126,778 | 3,764 | |
| Pacific Premier Bancorp Inc. | 162,001 | 3,729 | |
| Bank of Hawaii Corp. | 67,317 | 3,618 | |
| Eastern Bankshares Inc. | 268,276 | 3,611 | |
| BancFirst Corp. | 36,158 | 3,456 | |
| * | Bancorp Inc. | 93,640 | 3,438 |
| Seacoast Banking Corp. of Florida | 143,207 | 3,381 | |
| First Financial Bancorp | 161,070 | 3,347 | |
| BankUnited Inc. | 125,930 | 3,306 | |
| Washington Federal Inc. | 111,386 | 3,027 | |
| First Merchants Corp. | 100,741 | 3,006 | |
| Towne Bank | 118,719 | 2,802 | |
| Park National Corp. | 27,462 | 2,795 | |
| NBT Bancorp Inc. | 79,558 | 2,738 | |
| Independent Bank Group Inc. | 62,887 | 2,654 | |
| Renasant Corp. | 94,737 | 2,638 | |
| WesBanco Inc. | 100,155 | 2,540 | |
| Banner Corp. | 57,886 | 2,521 | |
| Hilltop Holdings Inc. | 81,972 | 2,491 | |
| Enterprise Financial Services Corp. | 63,075 | 2,442 | |
| OFG Bancorp | 80,686 | 2,433 | |
| * | Triumph Financial Inc. | 37,334 | 2,398 |
| Northwest Bancshares Inc. | 215,040 | 2,365 | |
| City Holding Co. | 25,137 | 2,297 | |
| Lakeland Financial Corp. | 43,910 | 2,289 | |
| First Commonwealth Financial Corp. | 174,509 | 2,281 | |
| Trustmark Corp. | 98,207 | 2,263 | |
| Pathward Financial Inc. | 44,565 | 2,196 | |
| Stock Yards Bancorp Inc. | 46,876 | 2,147 | |
| Heartland Financial USA Inc. | 68,189 | 2,089 | |
| First Bancorp (XNGS) | 69,020 | 2,046 | |
| Westamerica BanCorp | 45,486 | 2,003 |
| Shares | Market Value• ($000) | ||
| Provident Financial Services Inc. | 121,121 | 1,996 | |
| Hope Bancorp Inc. | 202,715 | 1,960 | |
| FB Financial Corp. | 63,201 | 1,920 | |
| S&T Bancorp Inc. | 66,083 | 1,872 | |
| TriCo Bancshares | 53,549 | 1,839 | |
| Live Oak Bancshares Inc. | 55,949 | 1,809 | |
| First Busey Corp. | 88,926 | 1,796 | |
| * | Customers Bancorp Inc. | 50,682 | 1,781 |
| Veritex Holdings Inc. | 91,518 | 1,721 | |
| Nicolet Bankshares Inc. | 22,273 | 1,689 | |
| OceanFirst Financial Corp. | 100,135 | 1,689 | |
| Stellar Bancorp Inc. | 76,174 | 1,620 | |
| National Bank Holdings Corp. Class A | 50,829 | 1,603 | |
| PacWest Bancorp | 199,598 | 1,587 | |
| Sandy Spring Bancorp Inc. | 71,234 | 1,584 | |
| Berkshire Hills Bancorp Inc. | 75,275 | 1,573 | |
| Origin Bancorp Inc. | 49,462 | 1,518 | |
| Southside Bancshares Inc. | 50,179 | 1,510 | |
| QCR Holdings Inc. | 28,371 | 1,488 | |
| Preferred Bank | 23,433 | 1,455 | |
| German American Bancorp Inc. | 49,845 | 1,442 | |
| Brookline Bancorp Inc. | 150,457 | 1,440 | |
| Lakeland Bancorp Inc. | 104,241 | 1,408 | |
| 1st Source Corp. | 31,339 | 1,401 | |
| Peoples Bancorp Inc. | 52,482 | 1,352 | |
| First Bancshares Inc. | 46,637 | 1,324 | |
| Eagle Bancorp Inc. | 52,812 | 1,271 | |
| Dime Community Bancshares Inc. | 59,062 | 1,259 | |
| Capitol Federal Financial Inc. | 218,794 | 1,241 | |
| ConnectOne Bancorp Inc. | 62,912 | 1,203 | |
| Premier Financial Corp. | 60,185 | 1,134 | |
| Banc of California Inc. | 89,450 | 1,121 | |
| Tompkins Financial Corp. | 21,107 | 1,096 | |
| Heritage Financial Corp. | 59,396 | 1,023 | |
| * | Columbia Financial Inc. | 54,704 | 939 |
| Community Trust Bancorp Inc. | 25,940 | 921 | |
| TrustCo Bank Corp. NY | 32,144 | 915 | |
| Heritage Commerce Corp. | 103,200 | 895 | |
| Hanmi Financial Corp. | 51,598 | 894 | |
| Univest Financial Corp. | 49,599 | 892 | |
| * | Coastal Financial Corp. | 20,035 | 883 |
| Byline Bancorp Inc. | 41,404 | 877 | |
| First Mid Bancshares Inc. | 31,251 | 874 | |
| First Community Bankshares Inc. | 28,163 | 871 | |
| Mercantile Bank Corp. | 25,832 | 862 | |
| Amerant Bancorp Inc. | 45,035 | 845 | |
| Great Southern Bancorp Inc. | 16,599 | 838 |
| Shares | Market Value• ($000) | ||
| Horizon Bancorp Inc. | 73,730 | 825 | |
| Camden National Corp. | 24,674 | 809 | |
| Washington Trust Bancorp Inc. | 28,663 | 803 | |
| Midland States Bancorp Inc. | 35,773 | 794 | |
| * | CrossFirst Bankshares Inc. | 73,832 | 794 |
| Central Pacific Financial Corp. | 45,655 | 775 | |
| Kearny Financial Corp. | 102,838 | 762 | |
| * | Metropolitan Bank Holding Corp. | 19,059 | 759 |
| Northfield Bancorp Inc. | 71,041 | 749 | |
| Peapack-Gladstone Financial Corp. | 27,133 | 740 | |
| HarborOne Bancorp Inc. | 73,364 | 731 | |
| Southern Missouri Bancorp Inc. | 17,098 | 723 | |
| First Financial Corp. | 19,300 | 709 | |
| Cambridge Bancorp | 13,281 | 707 | |
| First Foundation Inc. | 85,927 | 675 | |
| Flushing Financial Corp. | 43,311 | 612 | |
| * | Carter Bankshares Inc. | 40,439 | 579 |
| SmartFinancial Inc. | 24,287 | 553 | |
| Hingham Institution for Savings | 2,767 | 551 | |
| Amalgamated Financial Corp. | 28,394 | 509 | |
| Arrow Financial Corp. | 27,943 | 492 | |
| Bank of Marin Bancorp | 24,357 | 458 | |
| Capstar Financial Holdings Inc. | 31,066 | 406 | |
| HomeStreet Inc. | 25,820 | 244 | |
| 2,371,907 | |||
| Capital Markets (23.2%) | |||
| S&P Global Inc. | 554,895 | 216,886 | |
| Goldman Sachs Group Inc. | 562,503 | 184,338 | |
| Morgan Stanley | 2,119,280 | 180,457 | |
| BlackRock Inc. | 253,388 | 177,508 | |
| Charles Schwab Corp. | 2,543,946 | 150,474 | |
| Blackstone Inc. | 1,194,605 | 127,070 | |
| CME Group Inc. | 608,557 | 123,342 | |
| Intercontinental Exchange Inc. | 946,085 | 111,629 | |
| Moody's Corp. | 279,478 | 94,128 | |
| MSCI Inc. | 135,483 | 73,651 | |
| KKR & Co. Inc. | 1,022,523 | 64,225 | |
| Ameriprise Financial Inc. | 176,334 | 59,527 | |
| Bank of New York Mellon Corp. | 1,318,525 | 59,162 | |
| T Rowe Price Group Inc. | 379,548 | 42,597 | |
| State Street Corp. | 564,856 | 38,828 | |
| Raymond James Financial Inc. | 340,133 | 35,574 | |
| Nasdaq Inc. | 580,498 | 30,465 | |
| LPL Financial Holdings Inc. | 131,223 | 30,259 | |
| FactSet Research Systems Inc. | 64,648 | 28,213 | |
| Ares Management Corp. Class A | 271,408 | 28,074 | |
| Cboe Global Markets Inc. | 178,904 | 26,784 | |
| Northern Trust Corp. | 352,061 | 26,781 | |
| * | Coinbase Global Inc. Class A | 284,245 | 22,626 |
| Tradeweb Markets Inc. Class A | 184,107 | 15,912 | |
| Interactive Brokers Group Inc. Class A | 174,288 | 15,874 | |
| Shares | Market Value• ($000) | ||
| MarketAxess Holdings Inc. | 63,653 | 15,336 | |
| Franklin Resources Inc. | 507,907 | 13,581 | |
| SEI Investments Co. | 191,589 | 11,890 | |
| Carlyle Group Inc. | 367,526 | 11,889 | |
| Stifel Financial Corp. | 178,975 | 11,637 | |
| Morningstar Inc. | 43,312 | 10,077 | |
| Jefferies Financial Group Inc. | 279,877 | 9,989 | |
| Invesco Ltd. | 582,489 | 9,273 | |
| Houlihan Lokey Inc. | 85,581 | 9,015 | |
| Evercore Inc. Class A | 61,428 | 8,603 | |
| Affiliated Managers Group Inc. | 61,196 | 8,201 | |
| * | Robinhood Markets Inc. Class A | 720,866 | 7,850 |
| Blue Owl Capital Inc. | 603,064 | 7,207 | |
| Janus Henderson Group plc | 224,200 | 6,159 | |
| Moelis & Co. Class A | 112,438 | 5,331 | |
| *,1 | Focus Financial Partners Inc. Class A | 100,249 | 5,313 |
| Hamilton Lane Inc. Class A | 55,400 | 5,141 | |
| Federated Hermes Inc. | 143,494 | 4,988 | |
| Piper Sandler Cos. | 30,153 | 4,492 | |
| Artisan Partners Asset Management Inc. Class A | 114,815 | 4,411 | |
| PJT Partners Inc. Class A | 39,900 | 3,152 | |
| *,2 | Freedom Holding Corp. | 30,296 | 2,979 |
| Cohen & Steers Inc. | 45,636 | 2,975 | |
| * | StoneX Group Inc. | 31,450 | 2,952 |
| Virtu Financial Inc. Class A | 152,439 | 2,857 | |
| StepStone Group Inc. Class A | 90,072 | 2,780 | |
| BGC Group Inc. Class A | 545,532 | 2,695 | |
| Virtus Investment Partners Inc. | 12,425 | 2,573 | |
| TPG Inc. | 90,383 | 2,542 | |
| * | Donnelley Financial Solutions Inc. | 42,115 | 2,075 |
| Victory Capital Holdings Inc. Class A | 44,937 | 1,547 | |
| B Riley Financial Inc. | 29,155 | 1,493 | |
| WisdomTree Inc. | 189,406 | 1,383 | |
| * | Avantax Inc. | 60,073 | 1,257 |
| Brightsphere Investment Group Inc. | 54,801 | 1,135 | |
| * | Open Lending Corp. Class A | 132,340 | 1,092 |
| P10 Inc. Class A | 76,145 | 918 | |
| Diamond Hill Investment Group Inc. | 5,121 | 864 | |
| Perella Weinberg Partners | 68,155 | 718 | |
| Bridge Investment Group Holdings Inc. Class A | 49,669 | 501 | |
| Associated Capital Group Inc. Class A | 4,870 | 177 | |
| 2,173,432 | |||
| Consumer Finance (4.0%) | |||
| American Express Co. | 1,068,699 | 168,844 | |
| Capital One Financial Corp. | 646,392 | 66,184 | |
| Discover Financial Services | 430,005 | 38,731 | |
| Synchrony Financial | 724,490 | 23,386 | |
| * | SoFi Technologies Inc. | 1,513,807 | 13,110 |
| Ally Financial Inc. | 458,001 | 12,682 | |
| Shares | Market Value• ($000) | ||
| OneMain Holdings Inc. | 194,753 | 8,084 | |
| FirstCash Holdings Inc. | 65,112 | 5,816 | |
| *,2 | Credit Acceptance Corp. | 10,882 | 5,460 |
| SLM Corp. | 366,928 | 5,225 | |
| *,2 | Upstart Holdings Inc. | 118,587 | 3,815 |
| Bread Financial Holdings Inc. | 84,910 | 3,191 | |
| Navient Corp. | 161,000 | 2,842 | |
| * | PROG Holdings Inc. | 80,094 | 2,747 |
| * | Enova International Inc. | 53,237 | 2,686 |
| Nelnet Inc. Class A | 24,657 | 2,265 | |
| * | Encore Capital Group Inc. | 39,537 | 1,853 |
| * | PRA Group Inc. | 66,069 | 1,287 |
| * | LendingClub Corp. | 180,216 | 1,254 |
| * | Green Dot Corp. Class A | 79,281 | 1,176 |
| * | World Acceptance Corp. | 5,693 | 767 |
| * | NerdWallet Inc. Class A | 57,261 | 515 |
| * | LendingTree Inc. | 19,243 | 364 |
| * | Curo Group Holdings Corp. | 37,634 | 41 |
| 372,325 | |||
| Financial Services (28.4%) | |||
| * | Berkshire Hathaway Inc. Class B | 2,192,279 | 789,659 |
| Visa Inc. Class A | 2,437,422 | 598,826 | |
| Mastercard Inc. Class A | 1,431,588 | 590,730 | |
| * | Fiserv Inc. | 1,044,423 | 126,782 |
| * | PayPal Holdings Inc. | 1,793,199 | 112,093 |
| Apollo Global Management Inc. | 672,220 | 58,712 | |
| Global Payments Inc. | 443,400 | 56,174 | |
| Fidelity National Information Services Inc. | 1,002,937 | 56,024 | |
| * | Block Inc. (XNYS) | 921,417 | 53,120 |
| * | FleetCor Technologies Inc. | 118,518 | 32,205 |
| Jack Henry & Associates Inc. | 123,330 | 19,336 | |
| Equitable Holdings Inc. | 604,011 | 17,395 | |
| * | WEX Inc. | 72,441 | 14,211 |
| Voya Financial Inc. | 166,211 | 11,582 | |
| * | Toast Inc. Class A | 522,315 | 11,580 |
| Essent Group Ltd. | 181,015 | 9,090 | |
| MGIC Investment Corp. | 485,674 | 8,538 | |
| Western Union Co. | 634,388 | 7,835 | |
| Radian Group Inc. | 265,332 | 7,185 | |
| * | Affirm Holdings Inc. | 341,225 | 7,101 |
| * | Euronet Worldwide Inc. | 79,597 | 6,954 |
| * | Mr Cooper Group Inc. | 109,136 | 6,184 |
| * | Remitly Global Inc. | 210,365 | 5,291 |
| PennyMac Financial Services Inc. | 71,938 | 5,163 | |
| * | Flywire Corp. | 146,171 | 5,055 |
| * | Shift4 Payments Inc. Class A | 87,057 | 4,944 |
| Jackson Financial Inc. Class A | 125,710 | 4,727 | |
| Walker & Dunlop Inc. | 53,573 | 4,572 | |
| EVERTEC Inc. | 110,096 | 4,356 | |
| * | Marqeta Inc. Class A | 655,359 | 4,030 |
| * | NMI Holdings Inc. Class A | 134,214 | 3,841 |
| * | Payoneer Global Inc. | 455,672 | 2,821 |
| * | AvidXchange Holdings Inc. | 254,836 | 2,620 |
| Federal Agricultural Mortgage Corp. Class C | 15,526 | 2,613 | |
| * | Cannae Holdings Inc. | 122,530 | 2,405 |
| Shares | Market Value• ($000) | ||
| Compass Diversified Holdings | 109,772 | 2,267 | |
| *,2 | Rocket Cos. Inc. Class A | 190,063 | 2,030 |
| * | Repay Holdings Corp. | 130,208 | 1,200 |
| A-Mark Precious Metals Inc. | 31,812 | 1,085 | |
| * | International Money Express Inc. | 60,755 | 1,051 |
| * | I3 Verticals Inc. Class A | 39,274 | 929 |
| Merchants Bancorp | 29,164 | 851 | |
| Cass Information Systems Inc. | 22,110 | 848 | |
| * | Paymentus Holdings Inc. Class A | 28,693 | 432 |
| 2,664,447 | |||
| Insurance (17.1%) | |||
| Marsh & McLennan Cos. Inc. | 836,732 | 163,154 | |
| Chubb Ltd. | 700,574 | 140,724 | |
| Progressive Corp. | 990,097 | 132,148 | |
| Aon plc Class A (XNYS) | 345,479 | 115,179 | |
| Arthur J Gallagher & Co. | 362,365 | 83,518 | |
| Aflac Inc. | 971,171 | 72,420 | |
| American International Group Inc. | 1,224,765 | 71,673 | |
| MetLife Inc. | 1,101,450 | 69,766 | |
| Travelers Cos. Inc. | 390,791 | 63,007 | |
| Prudential Financial Inc. | 617,947 | 58,501 | |
| Allstate Corp. | 444,520 | 47,924 | |
| Hartford Financial Services Group Inc. | 525,272 | 37,725 | |
| Willis Towers Watson plc | 180,037 | 37,225 | |
| Principal Financial Group Inc. | 410,157 | 31,873 | |
| * | Markel Group Inc. | 21,438 | 31,705 |
| Brown & Brown Inc. | 407,892 | 30,225 | |
| Cincinnati Financial Corp. | 266,026 | 28,143 | |
| * | Arch Capital Group Ltd. | 355,590 | 27,331 |
| Everest Group Ltd. | 72,443 | 26,129 | |
| W R Berkley Corp. | 353,603 | 21,874 | |
| Loews Corp. | 328,447 | 20,393 | |
| Fidelity National Financial Inc. | 437,207 | 18,100 | |
| Globe Life Inc. | 153,913 | 17,172 | |
| Unum Group | 334,183 | 16,439 | |
| RenaissanceRe Holdings Ltd. | 86,435 | 16,240 | |
| Reinsurance Group of America Inc. | 112,603 | 15,609 | |
| Kinsale Capital Group Inc. | 37,214 | 14,835 | |
| American Financial Group Inc. | 122,454 | 14,195 | |
| Old Republic International Corp. | 468,850 | 12,823 | |
| Assurant Inc. | 89,758 | 12,506 | |
| Primerica Inc. | 61,396 | 12,338 | |
| Erie Indemnity Co. Class A | 43,053 | 12,000 | |
| First American Financial Corp. | 174,842 | 10,784 | |
| Selective Insurance Group Inc. | 102,467 | 10,166 | |
| RLI Corp. | 69,187 | 9,100 | |
| * | Ryan Specialty Holdings Inc. | 164,746 | 8,031 |
| Shares | Market Value• ($000) | ||
| Axis Capital Holdings Ltd. | 136,723 | 7,501 | |
| Lincoln National Corp. | 286,882 | 7,361 | |
| White Mountains Insurance Group Ltd. | 4,336 | 6,889 | |
| Hanover Insurance Group Inc. | 60,277 | 6,433 | |
| American Equity Investment Life Holding Co. | 105,185 | 5,646 | |
| Assured Guaranty Ltd. | 95,275 | 5,606 | |
| * | Brighthouse Financial Inc. | 112,537 | 5,589 |
| Kemper Corp. | 108,179 | 5,081 | |
| * | Enstar Group Ltd. | 18,925 | 4,794 |
| * | Genworth Financial Inc. Class A | 806,582 | 4,670 |
| CNO Financial Group Inc. | 194,164 | 4,543 | |
| * | BRP Group Inc. Class A | 108,442 | 2,884 |
| * | Goosehead Insurance Inc. Class A | 36,977 | 2,583 |
| * | Palomar Holdings Inc. | 42,034 | 2,144 |
| Stewart Information Services Corp. | 46,241 | 2,142 | |
| Horace Mann Educators Corp. | 68,981 | 1,977 | |
| *,2 | Trupanion Inc. | 62,494 | 1,858 |
| Employers Holdings Inc. | 45,731 | 1,794 | |
| Safety Insurance Group Inc. | 25,314 | 1,743 | |
| National Western Life Group Inc. Class A | 3,760 | 1,709 | |
| AMERISAFE Inc. | 32,546 | 1,686 | |
| Argo Group International Holdings Ltd. | 56,284 | 1,674 | |
| * | SiriusPoint Ltd. | 150,908 | 1,669 |
| ProAssurance Corp. | 91,249 | 1,613 | |
| * | Oscar Health Inc. Class A | 216,625 | 1,358 |
| Mercury General Corp. | 46,728 | 1,337 | |
| *,2 | Lemonade Inc. | 87,805 | 1,208 |
| James River Group Holdings Ltd. | 63,457 | 924 | |
| United Fire Group Inc. | 35,979 | 711 | |
| * | MBIA Inc. | 83,844 | 662 |
| HCI Group Inc. | 10,094 | 538 | |
| Donegal Group Inc. Class A | 27,649 | 404 | |
| * | Hagerty Inc. Class A | 42,093 | 385 |
| * | Hippo Holdings Inc. | 20,549 | 205 |
| 1,608,296 | |||
| Mortgage Real Estate Investment Trusts (REITs) (1.0%) | |||
| Annaly Capital Management Inc. | 835,197 | 16,929 | |
| Starwood Property Trust Inc. | 527,457 | 10,776 | |
| AGNC Investment Corp. | 1,007,541 | 9,985 | |
| Rithm Capital Corp. | 818,284 | 8,437 | |
| Blackstone Mortgage Trust Inc. Class A | 276,966 | 6,099 | |
| Arbor Realty Trust Inc. | 306,028 | 4,884 | |
| Hannon Armstrong Sustainable Infrastructure Capital Inc. | 177,212 | 3,964 | |
| Ready Capital Corp. | 269,420 | 2,942 | |
| Shares | Market Value• ($000) | ||
| Apollo Commercial Real Estate Finance Inc. | 226,839 | 2,477 | |
| Chimera Investment Corp. | 392,420 | 2,374 | |
| Two Harbors Investment Corp. | 163,441 | 2,251 | |
| Claros Mortgage Trust Inc. | 188,728 | 2,150 | |
| Ladder Capital Corp. | 192,618 | 2,111 | |
| PennyMac Mortgage Investment Trust | 150,259 | 2,015 | |
| Franklin BSP Realty Trust Inc. REIT | 140,112 | 1,981 | |
| MFA Financial Inc. REIT | 172,362 | 1,889 | |
| ARMOUR Residential REIT Inc. | 325,869 | 1,600 | |
| BrightSpire Capital Inc. | 222,344 | 1,548 | |
| Redwood Trust Inc. | 192,677 | 1,543 | |
| New York Mortgage Trust Inc. | 154,551 | 1,471 | |
| Ellington Financial Inc. | 109,048 | 1,458 | |
| KKR Real Estate Finance Trust Inc. | 99,466 | 1,244 | |
| Dynex Capital Inc. | 90,069 | 1,167 | |
| Ares Commercial Real Estate Corp. | 83,261 | 862 | |
| Invesco Mortgage Capital Inc. REIT | 70,383 | 792 | |
| Orchid Island Capital Inc. | 75,158 | 721 | |
| TPG RE Finance Trust Inc. | 91,608 | 689 | |
| Granite Point Mortgage Trust Inc. | 89,313 | 477 | |
| 94,836 | |||
| Total Common Stocks (Cost $8,988,368) | 9,285,243 | ||
| Temporary Cash Investments (1.0%) | |||
| Money Market Fund (1.0%) | |||
| 3,4 | Vanguard Market Liquidity Fund, 5.384% (Cost $93,130) | 931,554 | 93,146 |
| Total Investments (100.0%) (Cost $9,081,498) | 9,378,389 | ||
| Other Assets and Liabilities—Net (0.0%) | (3,730) | ||
| Net Assets (100.0%) | 9,374,659 | ||
| Cost is in $000. | |||
| • | See Note A in Notes to Financial Statements. |
| * | Non-income-producing security. |
| 1 | Security value determined using significant unobservable inputs. |
| 2 | Includes partial security positions on loan to broker-dealers. The total value of securities on loan is $8,279,000. |
| 3 | Affiliated money market fund available only to Vanguard funds and certain trusts and accounts managed by Vanguard. Rate shown is the 7-day yield. |
| 4 | Collateral of $8,717,000 was received for securities on loan. |
| REIT—Real Estate Investment Trust. |
| Over-the-Counter Total Return Swaps | ||||||
| Reference Entity | Termination Date | Counterparty | Notional Amount ($000) | Floating Interest Rate Received (Paid)1 (%) | Value and Unrealized Appreciation ($000) | Value and Unrealized (Depreciation) ($000) |
| Arch Capital Group Ltd. | 8/30/24 | BANA | 21,137 | (5.320) | — | — |
| Visa Inc. Class A | 8/30/24 | BANA | 73,704 | (5.220) | — | — |
| — | — | |||||
| 1 | Based on Overnight Bank Funding Rate as of the most recent reset date. Floating interest payment received/paid monthly. |
| BANA—Bank of America, N.A. |
| ($000s, except shares, footnotes, and per-share amounts) | Amount |
| Assets | |
| Investments in Securities, at Value1 | |
| Unaffiliated Issuers (Cost $8,988,368) | 9,285,243 |
| Affiliated Issuers (Cost $93,130) | 93,146 |
| Total Investments in Securities | 9,378,389 |
| Investment in Vanguard | 320 |
| Receivables for Investment Securities Sold | 26,510 |
| Receivables for Accrued Income | 16,319 |
| Receivables for Capital Shares Issued | 211 |
| Unrealized Appreciation—Over-the-Counter Swap Contracts | — |
| Total Assets | 9,421,749 |
| Liabilities | |
| Due to Custodian | 2,517 |
| Payables for Investment Securities Purchased | 34,797 |
| Collateral for Securities on Loan | 8,717 |
| Payables for Capital Shares Redeemed | 652 |
| Payables to Vanguard | 407 |
| Total Liabilities | 47,090 |
| Net Assets | 9,374,659 |
| 1 Includes $8,279,000 of securities on loan. | |
| At August 31, 2023, net assets consisted of: | |
| Paid-in Capital | 10,021,823 |
| Total Distributable Earnings (Loss) | (647,164) |
| Net Assets | 9,374,659 |
| ETF Shares—Net Assets | |
| Applicable to 104,331,037 outstanding $.001 par value shares of beneficial interest (unlimited authorization) | 8,710,851 |
| Net Asset Value Per Share—ETF Shares | $83.49 |
| Admiral Shares—Net Assets | |
| Applicable to 15,864,002 outstanding $.001 par value shares of beneficial interest (unlimited authorization) | 663,808 |
| Net Asset Value Per Share—Admiral Shares | $41.84 |
| Year Ended August 31, 2023 | |
| ($000) | |
| Investment Income | |
| Income | |
| Dividends | 219,186 |
| Interest1 | 1,278 |
| Securities Lending—Net | 1,956 |
| Total Income | 222,420 |
| Expenses | |
| The Vanguard Group—Note B | |
| Investment Advisory Services | 216 |
| Management and Administrative— ETF Shares | 7,346 |
| Management and Administrative— Admiral Shares | 631 |
| Marketing and Distribution— ETF Shares | 445 |
| Marketing and Distribution— Admiral Shares | 39 |
| Auditing Fees | 31 |
| Shareholders’ Reports—ETF Shares | 367 |
| Shareholders’ Reports—Admiral Shares | 14 |
| Trustees’ Fees and Expenses | 5 |
| Other Expenses | 22 |
| Total Expenses | 9,116 |
| Net Investment Income | 213,304 |
| Realized Net Gain (Loss) | |
| Investment Securities Sold1,2 | (237,491) |
| Swap Contracts | 12,687 |
| Realized Net Gain (Loss) | (224,804) |
| Change in Unrealized Appreciation (Depreciation) | |
| Investment Securities1 | 437,385 |
| Swap Contracts | — |
| Change in Unrealized Appreciation (Depreciation) | 437,385 |
| Net Increase (Decrease) in Net Assets Resulting from Operations | 425,885 |
| 1 | Interest income, realized net gain (loss), capital gain distributions received, and change in unrealized appreciation (depreciation) from an affiliated company of the fund were $1,278,000, $9,000, less than $1,000, and $13,000, respectively. Purchases and sales are for temporary cash investment purposes. |
| 2 | Includes $514,039,000 of net gain (loss) resulting from in-kind redemptions. |
| Year Ended August 31, | ||
| 2023 ($000) | 2022 ($000) | |
| Increase (Decrease) in Net Assets | ||
| Operations | ||
| Net Investment Income | 213,304 | 235,116 |
| Realized Net Gain (Loss) | (224,804) | 983,234 |
| Change in Unrealized Appreciation (Depreciation) | 437,385 | (2,794,528) |
| Net Increase (Decrease) in Net Assets Resulting from Operations | 425,885 | (1,576,178) |
| Distributions | ||
| ETF Shares | (200,453) | (223,491) |
| Admiral Shares | (16,982) | (16,712) |
| Total Distributions | (217,435) | (240,203) |
| Capital Share Transactions | ||
| ETF Shares | (155,821) | (585,784) |
| Admiral Shares | (75,505) | 31,828 |
| Net Increase (Decrease) from Capital Share Transactions | (231,326) | (553,956) |
| Total Increase (Decrease) | (22,876) | (2,370,337) |
| Net Assets | ||
| Beginning of Period | 9,397,535 | 11,767,872 |
| End of Period | 9,374,659 | 9,397,535 |
| ETF Shares | |||||
| For a Share Outstanding Throughout Each Period | Year Ended August 31, | ||||
| 2023 | 2022 | 2021 | 2020 | 2019 | |
| Net Asset Value, Beginning of Period | $81.31 | $94.79 | $61.18 | $67.31 | $71.60 |
| Investment Operations | |||||
| Net Investment Income1 | 1.924 | 1.852 | 1.676 | 1.652 | 1.539 |
| Net Realized and Unrealized Gain (Loss) on Investments | 2.219 | (13.457) | 33.519 | (6.081) | (4.338) |
| Total from Investment Operations | 4.143 | (11.605) | 35.195 | (4.429) | (2.799) |
| Distributions | |||||
| Dividends from Net Investment Income | (1.963) | (1.875) | (1.585) | (1.701) | (1.491) |
| Distributions from Realized Capital Gains | — | — | — | — | — |
| Total Distributions | (1.963) | (1.875) | (1.585) | (1.701) | (1.491) |
| Net Asset Value, End of Period | $83.49 | $81.31 | $94.79 | $61.18 | $67.31 |
| Total Return | 5.27% | -12.43% | 58.26% | -6.73% | -3.85% |
| Ratios/Supplemental Data | |||||
| Net Assets, End of Period (Millions) | $8,711 | $8,676 | $10,946 | $6,140 | $7,222 |
| Ratio of Total Expenses to Average Net Assets | 0.10% | 0.10% | 0.10% | 0.10% | 0.10% |
| Ratio of Net Investment Income to Average Net Assets | 2.34% | 2.03% | 2.09% | 2.53% | 2.30% |
| Portfolio Turnover Rate2 | 20% | 6% | 4% | 5% | 5% |
| 1 | Calculated based on average shares outstanding. |
| 2 | Excludes the value of portfolio securities received or delivered as a result of in-kind purchases or redemptions of the fund’s capital shares, including ETF Creation Units. |
| Admiral Shares | |||||
| For a Share Outstanding Throughout Each Period | Year Ended August 31, | ||||
| 2023 | 2022 | 2021 | 2020 | 2019 | |
| Net Asset Value, Beginning of Period | $40.75 | $47.51 | $30.66 | $33.73 | $35.88 |
| Investment Operations | |||||
| Net Investment Income1 | .962 | .931 | .841 | .828 | .771 |
| Net Realized and Unrealized Gain (Loss) on Investments | 1.112 | (6.751) | 16.803 | (3.046) | (2.174) |
| Total from Investment Operations | 2.074 | (5.820) | 17.644 | (2.218) | (1.403) |
| Distributions | |||||
| Dividends from Net Investment Income | (.984) | (.940) | (.794) | (.852) | (.747) |
| Distributions from Realized Capital Gains | — | — | — | — | — |
| Total Distributions | (.984) | (.940) | (.794) | (.852) | (.747) |
| Net Asset Value, End of Period | $41.84 | $40.75 | $47.51 | $30.66 | $33.73 |
| Total Return2 | 5.27% | -12.43% | 58.32% | -6.70% | -3.87% |
| Ratios/Supplemental Data | |||||
| Net Assets, End of Period (Millions) | $664 | $721 | $822 | $432 | $490 |
| Ratio of Total Expenses to Average Net Assets | 0.10% | 0.10% | 0.10% | 0.10% | 0.10% |
| Ratio of Net Investment Income to Average Net Assets | 2.34% | 2.05% | 2.09% | 2.53% | 2.30% |
| Portfolio Turnover Rate3 | 20% | 6% | 4% | 5% | 5% |
| 1 | Calculated based on average shares outstanding. |
| 2 | Total returns do not include account service fees that may have applied in the periods shown. Fund prospectuses provide information about any applicable account service fees. |
| 3 | Excludes the value of portfolio securities received or delivered as a result of in-kind purchases or redemptions of the fund’s capital shares, including ETF Creation Units. |
| A. | The following significant accounting policies conform to generally accepted accounting principles for U.S. investment companies. The fund consistently follows such policies in preparing its financial statements. |
| B. | In accordance with the terms of a Funds' Service Agreement (the “FSA”) between Vanguard and the fund, Vanguard furnishes to the fund investment advisory, corporate management, administrative, marketing, and distribution services at Vanguard’s cost of operations (as defined by the FSA). These costs of operations are allocated to the fund based on methods and guidelines approved by the board of trustees and are generally settled twice a month. |
| C. | Various inputs may be used to determine the value of the fund’s investments and derivatives. These inputs are summarized in three broad levels for financial statement purposes. The inputs or methodologies used to value securities are not necessarily an indication of the risk associated with investing in those securities. |
| Level 1 ($000) | Level 2 ($000) | Level 3 ($000) | Total ($000) | |
| Investments | ||||
| Assets | ||||
| Common Stocks | 9,279,930 | — | 5,313 | 9,285,243 |
| Temporary Cash Investments | 93,146 | — | — | 93,146 |
| Total | 9,373,076 | — | 5,313 | 9,378,389 |
| Derivative Financial Instruments | ||||
| Assets | ||||
| Swap Contracts | — | — | — | — |
| D. | Permanent differences between book-basis and tax-basis components of net assets are reclassified among capital accounts in the financial statements to reflect their tax character. These reclassifications have no effect on net assets or net asset value per share. As of period end, permanent differences primarily attributable to the accounting for applicable in-kind redemptions and swap agreements were reclassified between the following accounts: |
| Amount ($000) | |
| Paid-in Capital | 513,899 |
| Total Distributable Earnings (Loss) | (513,899) |
| Amount ($000) | |
| Undistributed Ordinary Income | 50,290 |
| Undistributed Long-Term Gains | — |
| Net Unrealized Gains (Losses) | 288,795 |
| Capital Loss Carryforwards | (986,249) |
| Qualified Late-Year Losses | — |
| Other Temporary Differences | — |
| Total | (647,164) |
| Year Ended August 31, | ||
| 2023 Amount ($000) | 2022 Amount ($000) | |
| Ordinary Income* | 217,435 | 240,203 |
| Long-Term Capital Gains | — | — |
| Total | 217,435 | 240,203 |
| * | Includes short-term capital gains, if any. |
| Amount ($000) | |
| Tax Cost | 9,089,594 |
| Gross Unrealized Appreciation | 1,068,362 |
| Gross Unrealized Depreciation | (779,567) |
| Net Unrealized Appreciation (Depreciation) | 288,795 |
| E. | During the year ended August 31, 2023, the fund purchased $3,931,958,000 of investment securities and sold $4,222,713,000 of investment securities, other than temporary cash investments. Purchases and sales include $2,118,271,000 and $2,320,011,000, respectively, in connection with in-kind purchases and redemptions of the fund's capital shares. |
| F. | Capital share transactions for each class of shares were: |
| Year Ended August 31, | |||||
| 2023 | 2022 | ||||
| Amount ($000) | Shares (000) | Amount ($000) | Shares (000) | ||
| ETF Shares | |||||
| Issued | 2,179,191 | 26,823 | 2,918,740 | 30,807 | |
| Issued in Lieu of Cash Distributions | — | — | — | — | |
| Redeemed | (2,335,012) | (29,200) | (3,504,524) | (39,575) | |
| Net Increase (Decrease)—ETF Shares | (155,821) | (2,377) | (585,784) | (8,768) | |
| Admiral Shares | |||||
| Issued | 185,881 | 4,558 | 407,610 | 8,635 | |
| Issued in Lieu of Cash Distributions | 14,096 | 359 | 14,052 | 311 | |
| Redeemed | (275,482) | (6,754) | (389,834) | (8,546) | |
| Net Increase (Decrease)—Admiral Shares | (75,505) | (1,837) | 31,828 | 400 | |
| G. | Significant market disruptions, such as those caused by pandemics (e.g., COVID-19 pandemic), natural or environmental disasters, war (e.g., Russia’s invasion of Ukraine), acts of terrorism, or other events, can adversely affect local and global markets and normal market operations. Any such disruptions could have an adverse impact on the value of the fund’s investments and fund performance. |
| H. | Management has determined that no events or transactions occurred subsequent to August 31, 2023, that would require recognition or disclosure in these financial statements. |

| Average Annual Total Returns Periods Ended August 31, 2023 | |||||
| One Year | Five Years | Ten Years | Final Value of a $10,000 Investment | ||
| Health Care Index Fund ETF Shares Net Asset Value | 7.07% | 8.24% | 12.09% | $31,315 |
| Health Care Index Fund ETF Shares Market Price | 7.07 | 8.25 | 12.10 | 31,326 | |
| MSCI US Investable Market Health Care 25/50 Index | 7.16 | 8.32 | 12.17 | 31,520 |
| MSCI US Investable Market 2500 Index | 15.01 | 10.39 | 12.34 | 32,022 |
| One Year | Five Years | Ten Years | Final Value of a $100,000 Investment | ||
| Health Care Index Fund Admiral Shares | 7.08% | 8.26% | 12.10% | $313,423 | |
| MSCI US Investable Market Health Care 25/50 Index | 7.16 | 8.32 | 12.17 | 315,202 | |
| MSCI US Investable Market 2500 Index | 15.01 | 10.39 | 12.34 | 320,217 | |
| One Year | Five Years | Ten Years | |
| Health Care Index Fund ETF Shares Market Price | 7.07% | 48.61% | 213.26% |
| Health Care Index Fund ETF Shares Net Asset Value | 7.07 | 48.60 | 213.15 |
| MSCI US Investable Market Health Care 25/50 Index | 7.16 | 49.13 | 215.20 |
| Biotechnology | 18.7% |
| Health Care Equipment & Supplies | 19.6 |
| Health Care Providers & Services | 20.2 |
| Health Care Technology | 0.9 |
| Life Sciences Tools & Services | 12.0 |
| Pharmaceuticals | 28.6 |
| Shares | Market Value• ($000) | ||
| Common Stocks (99.8%) | |||
| Biotechnology (18.7%) | |||
| AbbVie Inc. | 6,125,664 | 900,228 | |
| Amgen Inc. | 1,855,289 | 475,585 | |
| Gilead Sciences Inc. | 4,330,558 | 331,201 | |
| * | Vertex Pharmaceuticals Inc. | 894,130 | 311,461 |
| * | Regeneron Pharmaceuticals Inc. | 374,578 | 309,585 |
| * | Biogen Inc. | 502,384 | 134,317 |
| * | Moderna Inc. | 1,124,840 | 127,186 |
| * | Seagen Inc. | 488,167 | 100,597 |
| * | Horizon Therapeutics plc | 754,966 | 85,115 |
| * | Alnylam Pharmaceuticals Inc. | 407,164 | 80,545 |
| * | BioMarin Pharmaceutical Inc. | 651,317 | 59,517 |
| * | Exact Sciences Corp. | 625,971 | 52,375 |
| * | Incyte Corp. | 658,363 | 42,484 |
| * | Neurocrine Biosciences Inc. | 338,736 | 36,885 |
| * | United Therapeutics Corp. | 162,504 | 36,459 |
| * | Sarepta Therapeutics Inc. | 275,098 | 33,290 |
| * | Exelixis Inc. | 1,017,732 | 22,787 |
| * | Natera Inc. | 377,287 | 22,158 |
| * | Karuna Therapeutics Inc. | 110,581 | 20,763 |
| * | Halozyme Therapeutics Inc. | 456,798 | 19,441 |
| * | Ionis Pharmaceuticals Inc. | 446,151 | 17,966 |
| * | Alkermes plc | 519,222 | 15,156 |
| *,1 | CRISPR Therapeutics AG | 260,206 | 13,013 |
| * | Vaxcyte Inc. | 244,124 | 12,675 |
| * | ImmunoGen Inc. | 757,931 | 12,006 |
| * | Apellis Pharmaceuticals Inc. | 283,239 | 11,956 |
| * | Cytokinetics Inc. | 315,280 | 11,016 |
| * | Blueprint Medicines Corp. | 210,170 | 10,479 |
| * | Insmed Inc. | 473,328 | 10,361 |
| * | Intellia Therapeutics Inc. | 276,097 | 10,348 |
| * | ACADIA Pharmaceuticals Inc. | 367,155 | 9,921 |
| * | Arrowhead Pharmaceuticals Inc. | 352,891 | 9,754 |
| * | Amicus Therapeutics Inc. | 742,468 | 9,518 |
| * | Bridgebio Pharma Inc. | 306,731 | 9,174 |
| * | PTC Therapeutics Inc. | 231,506 | 9,144 |
| * | Ultragenyx Pharmaceutical Inc. | 246,194 | 9,057 |
| * | Denali Therapeutics Inc. | 381,016 | 8,798 |
| * | REVOLUTION Medicines Inc. | 257,842 | 8,759 |
| * | Krystal Biotech Inc. | 62,175 | 7,740 |
| * | Akero Therapeutics Inc. | 154,024 | 7,644 |
| * | Prothena Corp. plc | 137,323 | 7,253 |
| Shares | Market Value• ($000) | ||
| * | Xenon Pharmaceuticals Inc. | 176,112 | 6,865 |
| * | Veracyte Inc. | 251,620 | 6,643 |
| * | Mirati Therapeutics Inc. | 177,035 | 6,586 |
| * | Dynavax Technologies Corp. | 445,461 | 6,397 |
| * | Madrigal Pharmaceuticals Inc. | 34,923 | 6,286 |
| * | Agios Pharmaceuticals Inc. | 193,516 | 5,308 |
| * | Beam Therapeutics Inc. | 225,446 | 5,226 |
| * | Cerevel Therapeutics Holdings Inc. | 218,772 | 5,185 |
| * | Morphic Holding Inc. | 94,110 | 5,184 |
| * | TG Therapeutics Inc. | 493,208 | 5,164 |
| * | Vericel Corp. | 156,389 | 5,134 |
| * | Myriad Genetics Inc. | 282,833 | 5,049 |
| * | Catalyst Pharmaceuticals Inc. | 351,557 | 4,936 |
| * | Iovance Biotherapeutics Inc. | 773,992 | 4,675 |
| * | BioCryst Pharmaceuticals Inc. | 655,535 | 4,661 |
| * | Immunovant Inc. | 204,001 | 4,633 |
| * | Zentalis Pharmaceuticals Inc. | 171,454 | 4,554 |
| * | Twist Bioscience Corp. | 199,631 | 4,390 |
| * | Viking Therapeutics Inc. | 312,029 | 4,309 |
| * | Aurinia Pharmaceuticals Inc. | 472,176 | 4,283 |
| * | Ironwood Pharmaceuticals Inc. | 484,783 | 4,266 |
| * | MannKind Corp. | 917,241 | 4,228 |
| * | Xencor Inc. | 189,389 | 4,163 |
| *,1 | Rhythm Pharmaceuticals Inc. | 158,716 | 4,128 |
| * | Recursion Pharmaceuticals Inc. Class A | 451,349 | 3,927 |
| * | Celldex Therapeutics Inc. | 139,126 | 3,882 |
| * | Vir Biotechnology Inc. | 304,051 | 3,849 |
| * | Sage Therapeutics Inc. | 187,805 | 3,756 |
| * | Biohaven Ltd. | 201,113 | 3,678 |
| * | Arcellx Inc. | 100,012 | 3,584 |
| * | Syndax Pharmaceuticals Inc. | 189,873 | 3,515 |
| * | Arcus Biosciences Inc. | 165,216 | 3,387 |
| * | SpringWorks Therapeutics Inc. | 119,265 | 3,361 |
| * | Travere Therapeutics Inc. | 233,736 | 3,338 |
| * | Merus NV | 146,936 | 3,287 |
| * | Nuvalent Inc. Class A | 71,227 | 3,246 |
| * | Protagonist Therapeutics Inc. | 159,039 | 3,152 |
| * | Rocket Pharmaceuticals Inc. | 195,891 | 3,066 |
| * | 89bio Inc. | 176,882 | 3,032 |
| * | MiMedx Group Inc. | 401,469 | 2,979 |
| * | Relay Therapeutics Inc. | 273,334 | 2,793 |
| * | ADMA Biologics Inc. | 693,524 | 2,670 |
| Shares | Market Value• ($000) | ||
| * | Avid Bioservices Inc. | 218,475 | 2,578 |
| * | Arcturus Therapeutics Holdings Inc. | 83,798 | 2,543 |
| * | Keros Therapeutics Inc. | 71,993 | 2,528 |
| * | Editas Medicine Inc. | 282,684 | 2,519 |
| * | Replimune Group Inc. | 120,525 | 2,461 |
| * | REGENXBIO Inc. | 136,216 | 2,411 |
| * | Kymera Therapeutics Inc. | 125,057 | 2,386 |
| * | Cogent Biosciences Inc. | 190,461 | 2,326 |
| * | Novavax Inc. | 285,234 | 2,282 |
| * | Crinetics Pharmaceuticals Inc. | 130,893 | 2,267 |
| *,1 | Anavex Life Sciences Corp. | 283,952 | 2,243 |
| * | Day One Biopharmaceuticals Inc. | 150,950 | 2,036 |
| * | Inhibrx Inc. | 91,034 | 1,948 |
| * | Verve Therapeutics Inc. | 151,065 | 1,944 |
| * | Kura Oncology Inc. | 193,363 | 1,920 |
| * | Deciphera Pharmaceuticals Inc. | 136,536 | 1,917 |
| * | Viridian Therapeutics Inc. | 105,024 | 1,908 |
| * | EQRx Inc. | 762,522 | 1,746 |
| * | Point Biopharma Global Inc. | 218,503 | 1,739 |
| * | CareDx Inc. | 184,689 | 1,719 |
| * | Kiniksa Pharmaceuticals Ltd. Class A | 96,425 | 1,661 |
| * | Sana Biotechnology Inc. | 299,527 | 1,602 |
| * | Coherus Biosciences Inc. | 298,281 | 1,590 |
| Agenus Inc. | 1,095,384 | 1,512 | |
| * | Avidity Biosciences Inc. | 197,124 | 1,490 |
| * | Rapt Therapeutics Inc. | 77,732 | 1,485 |
| * | Disc Medicine Inc. | 27,430 | 1,452 |
| * | UniQure NV | 157,735 | 1,374 |
| * | Arcutis Biotherapeutics Inc. | 160,531 | 1,371 |
| * | Biomea Fusion Inc. | 79,670 | 1,344 |
| * | Intercept Pharmaceuticals Inc. | 122,464 | 1,326 |
| * | Seres Therapeutics Inc. | 359,653 | 1,241 |
| * | Aldeyra Therapeutics Inc. | 162,326 | 1,211 |
| * | Allogene Therapeutics Inc. | 310,544 | 1,208 |
| * | AnaptysBio Inc. | 60,031 | 1,181 |
| * | Alector Inc. | 215,811 | 1,176 |
| * | Nurix Therapeutics Inc. | 133,993 | 1,139 |
| * | Vanda Pharmaceuticals Inc. | 201,072 | 1,044 |
| *,1 | Lyell Immunopharma Inc. | 432,983 | 1,035 |
| * | Tango Therapeutics Inc. | 158,143 | 1,026 |
| * | Enanta Pharmaceuticals Inc. | 68,919 | 1,023 |
| * | iTeos Therapeutics Inc. | 80,479 | 971 |
| * | Humacyte Inc. | 234,119 | 897 |
| Shares | Market Value• ($000) | ||
| *,1 | Monte Rosa Therapeutics Inc. | 145,616 | 855 |
| * | MeiraGTx Holdings plc | 135,041 | 849 |
| * | 2seventy bio Inc. | 156,854 | 814 |
| * | MacroGenics Inc. | 170,528 | 795 |
| * | Erasca Inc. | 290,292 | 752 |
| * | Emergent BioSolutions Inc. | 155,889 | 731 |
| *,1 | ImmunityBio Inc. | 453,833 | 731 |
| * | Organogenesis Holdings Inc. | 250,404 | 701 |
| * | Eagle Pharmaceuticals Inc. | 41,140 | 697 |
| * | Fate Therapeutics Inc. | 269,422 | 676 |
| * | Cullinan Oncology Inc. | 61,187 | 633 |
| * | PMV Pharmaceuticals Inc. | 87,221 | 630 |
| * | Repare Therapeutics Inc. | 64,503 | 630 |
| * | Y-mAbs Therapeutics Inc. | 121,204 | 614 |
| *,1 | Entrada Therapeutics Inc. | 41,403 | 609 |
| *,2 | PDL BioPharma Inc. | 311,327 | 582 |
| * | HilleVax Inc. | 41,035 | 547 |
| * | Heron Therapeutics Inc. | 331,881 | 544 |
| *,1 | Aerovate Therapeutics Inc. | 33,696 | 535 |
| * | Sangamo Therapeutics Inc. | 535,107 | 519 |
| * | Foghorn Therapeutics Inc. | 63,141 | 478 |
| *,1 | Vaxart Inc. | 540,444 | 445 |
| * | Altimmune Inc. | 170,005 | 430 |
| * | Inovio Pharmaceuticals Inc. | 939,731 | 423 |
| * | Atara Biotherapeutics Inc. | 281,858 | 412 |
| *,1 | Janux Therapeutics Inc. | 36,263 | 399 |
| * | Stoke Therapeutics Inc. | 68,923 | 387 |
| *,1 | Ocugen Inc. | 853,027 | 368 |
| * | IGM Biosciences Inc. | 46,538 | 333 |
| * | FibroGen Inc. | 309,357 | 297 |
| * | Gossamer Bio Inc. | 246,696 | 257 |
| * | ALX Oncology Holdings Inc. | 54,831 | 234 |
| * | Century Therapeutics Inc. | 72,121 | 179 |
| * | Adicet Bio Inc. | 68,238 | 136 |
| *,2 | Prevail Therapeutics Inc. CVR | 78 | — |
| 3,697,474 | |||
| Health Care Equipment & Supplies (19.5%) | |||
| Abbott Laboratories | 6,037,836 | 621,293 | |
| * | Intuitive Surgical Inc. | 1,216,499 | 380,375 |
| Medtronic plc | 4,619,252 | 376,469 | |
| Stryker Corp. | 1,186,237 | 336,358 | |
| * | Boston Scientific Corp. | 4,991,943 | 269,265 |
| Becton Dickinson & Co. | 946,138 | 264,398 | |
| * | Edwards Lifesciences Corp. | 2,104,621 | 160,940 |
| * | IDEXX Laboratories Inc. | 288,167 | 147,372 |
| * | DexCom Inc. | 1,345,769 | 135,896 |
| GE Healthcare Inc. | 1,420,652 | 100,085 | |
| * | Align Technology Inc. | 252,310 | 93,390 |
| Zimmer Biomet Holdings Inc. | 724,794 | 86,337 | |
| ResMed Inc. | 510,051 | 81,399 | |
| STERIS plc | 342,467 | 78,627 | |
| Baxter International Inc. | 1,754,683 | 71,240 | |
| * | Hologic Inc. | 854,178 | 63,841 |
| Cooper Cos. Inc. | 171,848 | 63,582 | |
| Shares | Market Value• ($000) | ||
| * | Insulet Corp. | 241,894 | 46,374 |
| Teleflex Inc. | 163,136 | 34,706 | |
| * | Penumbra Inc. | 126,160 | 33,369 |
| * | Shockwave Medical Inc. | 127,250 | 28,045 |
| DENTSPLY SIRONA Inc. | 737,906 | 27,369 | |
| * | Inspire Medical Systems Inc. | 101,359 | 22,996 |
| * | Globus Medical Inc. Class A | 407,156 | 22,027 |
| * | Envista Holdings Corp. | 567,931 | 18,185 |
| * | Masimo Corp. | 155,574 | 17,779 |
| * | Neogen Corp. | 712,693 | 16,477 |
| * | Lantheus Holdings Inc. | 237,351 | 16,244 |
| * | Haemonetics Corp. | 175,456 | 15,744 |
| * | QuidelOrtho Corp. | 173,758 | 14,311 |
| * | Merit Medical Systems Inc. | 199,680 | 13,035 |
| * | Glaukos Corp. | 159,115 | 11,956 |
| * | Inari Medical Inc. | 178,787 | 11,911 |
| CONMED Corp. | 105,866 | 11,800 | |
| * | iRhythm Technologies Inc. | 106,044 | 10,962 |
| * | Integra LifeSciences Holdings Corp. | 255,403 | 10,865 |
| * | LivaNova plc | 186,429 | 10,356 |
| * | ICU Medical Inc. | 70,893 | 10,282 |
| * | Axonics Inc. | 175,079 | 10,032 |
| * | Integer Holdings Corp. | 115,686 | 9,869 |
| * | Enovis Corp. | 170,615 | 9,561 |
| * | Omnicell Inc. | 156,972 | 8,925 |
| * | Novocure Ltd. | 350,744 | 7,737 |
| * | AtriCure Inc. | 164,459 | 7,425 |
| * | TransMedics Group Inc. | 112,758 | 7,400 |
| * | STAAR Surgical Co. | 142,248 | 6,168 |
| * | Tandem Diabetes Care Inc. | 225,079 | 6,158 |
| *,1 | PROCEPT BioRobotics Corp. | 132,354 | 4,515 |
| * | Alphatec Holdings Inc. | 267,715 | 4,377 |
| LeMaitre Vascular Inc. | 68,715 | 3,972 | |
| Embecta Corp. | 198,558 | 3,640 | |
| * | Establishment Labs Holdings Inc. | 58,297 | 3,519 |
| * | Avanos Medical Inc. | 161,124 | 3,390 |
| * | SI-BONE Inc. | 120,991 | 2,768 |
| * | Varex Imaging Corp. | 140,496 | 2,764 |
| * | Silk Road Medical Inc. | 134,993 | 2,608 |
| * | Orthofix Medical Inc. | 120,047 | 2,540 |
| * | Treace Medical Concepts Inc. | 159,998 | 2,488 |
| * | Nevro Corp. | 123,823 | 2,481 |
| * | OrthoPediatrics Corp. | 61,095 | 2,335 |
| Atrion Corp. | 4,931 | 2,293 | |
| * | Outset Medical Inc. | 162,768 | 2,215 |
| * | Artivion Inc. | 127,643 | 2,160 |
| * | RxSight Inc. | 70,686 | 2,051 |
| * | Surmodics Inc. | 49,469 | 1,821 |
| * | OraSure Technologies Inc. | 254,598 | 1,645 |
| * | Paragon 28 Inc. | 114,061 | 1,635 |
| * | Pulmonx Corp. | 124,375 | 1,301 |
| * | Cerus Corp. | 637,815 | 1,206 |
| * | Zimvie Inc. | 91,488 | 1,080 |
| * | AngioDynamics Inc. | 133,358 | 1,071 |
| * | Butterfly Network Inc. | 527,595 | 934 |
| *,1 | Senseonics Holdings Inc. | 1,500,698 | 763 |
| * | Cutera Inc. | 48,150 | 548 |
| * | Inogen Inc. | 80,535 | 500 |
| 3,871,555 |
| Shares | Market Value• ($000) | ||
| Health Care Providers & Services (20.2%) | |||
| UnitedHealth Group Inc. | 3,232,596 | 1,540,591 | |
| Elevance Health Inc. | 823,023 | 363,784 | |
| CVS Health Corp. | 4,450,899 | 290,065 | |
| Cigna Group | 1,027,210 | 283,777 | |
| Humana Inc. | 433,785 | 200,248 | |
| HCA Healthcare Inc. | 716,631 | 198,722 | |
| McKesson Corp. | 470,547 | 194,016 | |
| * | Centene Corp. | 1,905,131 | 117,451 |
| Cencora Inc. | 596,967 | 105,054 | |
| Cardinal Health Inc. | 883,748 | 77,178 | |
| Laboratory Corp. of America Holdings | 307,471 | 63,985 | |
| * | Molina Healthcare Inc. | 202,348 | 62,752 |
| Quest Diagnostics Inc. | 388,667 | 51,110 | |
| * | Henry Schein Inc. | 454,760 | 34,807 |
| Universal Health Services Inc. Class B | 218,402 | 29,419 | |
| Chemed Corp. | 52,146 | 26,670 | |
| Encompass Health Corp. | 348,166 | 24,734 | |
| * | Tenet Healthcare Corp. | 318,319 | 24,689 |
| * | Acadia Healthcare Co. Inc. | 319,661 | 24,646 |
| * | Option Care Health Inc. | 624,556 | 21,753 |
| * | HealthEquity Inc. | 296,969 | 20,060 |
| Ensign Group Inc. | 194,306 | 19,473 | |
| * | DaVita Inc. | 188,797 | 19,337 |
| * | agilon health Inc. | 1,053,902 | 18,675 |
| * | Guardant Health Inc. | 386,841 | 15,118 |
| * | AMN Healthcare Services Inc. | 137,745 | 12,174 |
| Select Medical Holdings Corp. | 374,845 | 10,949 | |
| * | Amedisys Inc. | 113,309 | 10,623 |
| * | Progyny Inc. | 279,169 | 10,424 |
| * | R1 RCM Inc. | 582,358 | 10,040 |
| Patterson Cos. Inc. | 297,805 | 8,946 | |
| Premier Inc. Class A | 413,429 | 8,901 | |
| * | Surgery Partners Inc. | 241,646 | 8,762 |
| * | Privia Health Group Inc. | 321,582 | 8,442 |
| * | CorVel Corp. | 32,698 | 7,077 |
| * | RadNet Inc. | 209,503 | 6,999 |
| * | NeoGenomics Inc. | 442,347 | 6,648 |
| * | Apollo Medical Holdings Inc. | 149,366 | 5,655 |
| US Physical Therapy Inc. | 51,042 | 5,147 | |
| * | Addus HomeCare Corp. | 56,155 | 4,925 |
| * | Owens & Minor Inc. | 251,306 | 4,247 |
| * | Pediatrix Medical Group Inc. | 277,571 | 3,922 |
| * | AdaptHealth Corp. | 280,067 | 3,341 |
| * | Hims & Hers Health Inc. | 488,990 | 3,281 |
| * | Accolade Inc. | 236,808 | 3,195 |
| National HealthCare Corp. | 47,697 | 3,146 | |
| * | Cross Country Healthcare Inc. | 118,643 | 3,056 |
| * | DocGo Inc. | 323,814 | 2,898 |
| * | OPKO Health Inc. | 1,473,160 | 2,696 |
| * | Brookdale Senior Living Inc. | 551,993 | 2,346 |
| * | Fulgent Genetics Inc. | 67,168 | 2,200 |
| * | Enhabit Inc. | 164,867 | 2,112 |
| * | Alignment Healthcare Inc. | 357,194 | 2,086 |
| * | PetIQ Inc. | 96,238 | 1,836 |
| * | Castle Biosciences Inc. | 87,909 | 1,752 |
| *,1 | Clover Health Investments Corp. | 1,240,143 | 1,625 |
| Shares | Market Value• ($000) | ||
| * | Community Health Systems Inc. | 450,886 | 1,524 |
| * | ModivCare Inc. | 44,241 | 1,420 |
| * | Agiliti Inc. | 139,208 | 1,343 |
| * | Pennant Group Inc. | 97,906 | 1,173 |
| * | 23andMe Holding Co. Class A | 900,952 | 991 |
| *,1 | Invitae Corp. | 868,605 | 803 |
| * | Joint Corp. | 50,064 | 465 |
| * | CareMax Inc. | 208,072 | 464 |
| * | Aveanna Healthcare Holdings Inc. | 182,287 | 262 |
| *,1 | Cano Health Inc. | 732,986 | 227 |
| 4,006,237 | |||
| Health Care Technology (0.9%) | |||
| * | Veeva Systems Inc. Class A | 505,680 | 105,535 |
| * | Teladoc Health Inc. | 567,944 | 12,858 |
| * | Evolent Health Inc. Class A | 371,931 | 9,488 |
| * | Doximity Inc. Class A | 380,192 | 9,064 |
| * | Schrodinger Inc. | 216,702 | 7,994 |
| * | Certara Inc. | 414,991 | 6,706 |
| * | Veradigm Inc. | 378,915 | 5,070 |
| * | Phreesia Inc. | 177,511 | 5,054 |
| * | NextGen Healthcare Inc. | 182,099 | 3,316 |
| Simulations Plus Inc. | 55,640 | 2,476 | |
| * | Health Catalyst Inc. | 193,360 | 2,260 |
| HealthStream Inc. | 84,591 | 1,779 | |
| * | GoodRx Holdings Inc. Class A | 260,228 | 1,699 |
| * | Multiplan Corp. | 921,904 | 1,577 |
| * | Definitive Healthcare Corp. | 154,356 | 1,451 |
| * | American Well Corp. Class A | 745,163 | 1,058 |
| * | Sharecare Inc. | 1,059,414 | 1,004 |
| * | OptimizeRx Corp. | 59,326 | 506 |
| 178,895 | |||
| Life Sciences Tools & Services (12.0%) | |||
| Thermo Fisher Scientific Inc. | 1,339,272 | 746,109 | |
| Danaher Corp. | 2,433,944 | 644,995 | |
| * | IQVIA Holdings Inc. | 644,178 | 143,413 |
| Agilent Technologies Inc. | 1,025,432 | 124,149 | |
| West Pharmaceutical Services Inc. | 257,757 | 104,881 | |
| * | Illumina Inc. | 548,765 | 90,667 |
| * | Mettler-Toledo International Inc. | 68,469 | 83,086 |
| * | Waters Corp. | 204,963 | 57,554 |
| Revvity Inc. | 435,394 | 50,954 | |
| * | Avantor Inc. | 2,343,344 | 50,733 |
| Bio-Techne Corp. | 546,419 | 42,839 | |
| * | Charles River Laboratories International Inc. | 177,818 | 36,776 |
| * | Repligen Corp. | 183,670 | 31,942 |
| * | Bio-Rad Laboratories Inc. Class A | 76,649 | 30,675 |
| Bruker Corp. | 356,545 | 23,389 | |
| * | Medpace Holdings Inc. | 84,658 | 22,881 |
| * | Syneos Health Inc. | 360,350 | 15,398 |
| * | 10X Genomics Inc. Class A | 289,807 | 15,027 |
| * | Azenta Inc. | 226,440 | 12,778 |
| * | Pacific Biosciences of California Inc. | 826,571 | 9,324 |
| * | Fortrea Holdings Inc. | 307,884 | 8,482 |
| Shares | Market Value• ($000) | ||
| * | Sotera Health Co. | 343,242 | 5,540 |
| * | Maravai LifeSciences Holdings Inc. Class A | 388,293 | 4,015 |
| * | Quanterix Corp. | 123,662 | 3,314 |
| Mesa Laboratories Inc. | 18,648 | 2,673 | |
| * | Adaptive Biotechnologies Corp. | 353,197 | 2,391 |
| * | Cytek Biosciences Inc. | 306,843 | 2,332 |
| * | CryoPort Inc. | 158,670 | 2,237 |
| * | OmniAb Inc. | 299,118 | 1,735 |
| * | BioLife Solutions Inc. | 121,151 | 1,600 |
| * | SomaLogic Inc. | 553,980 | 1,224 |
| * | MaxCyte Inc. | 303,398 | 1,111 |
| * | Quantum-Si Inc. | 351,207 | 822 |
| * | Nautilus Biotechnology Inc. | 129,056 | 417 |
| * | NanoString Technologies Inc. | 162,609 | 416 |
| * | Seer Inc. | 155,413 | 409 |
| *,1 | Bionano Genomics Inc. | 103,619 | 400 |
| * | Codexis Inc. | 229,086 | 399 |
| * | Akoya Biosciences Inc. | 68,278 | 355 |
| *,2 | OmniAb Inc. 12.5 Earnout | 22,076 | — |
| *,2 | OmniAb Inc. 15 Earnout | 22,076 | — |
| 2,377,442 | |||
| Other (0.0%)3 | |||
| *,2 | Chinook Therapeutics Inc. CVR | 784 | — |
| Personal Care Products (0.0%) | |||
| Kenvue Inc. | 1 | — | |
| Pharmaceuticals (28.5%) | |||
| Eli Lilly & Co. | 2,801,537 | 1,552,612 | |
| Johnson & Johnson | 8,359,854 | 1,351,621 | |
| Merck & Co. Inc. | 8,810,063 | 960,121 | |
| Pfizer Inc. | 19,600,304 | 693,459 | |
| Bristol-Myers Squibb Co. | 7,294,215 | 449,688 | |
| Zoetis Inc. | 1,604,315 | 305,638 | |
| Viatris Inc. | 4,163,089 | 44,753 | |
| Royalty Pharma plc Class A | 1,322,085 | 39,424 | |
| * | Jazz Pharmaceuticals plc | 222,484 | 31,895 |
| * | Catalent Inc. | 625,628 | 31,263 |
| * | Elanco Animal Health Inc. (XNYS) | 1,709,277 | 20,853 |
| Organon & Co. | 885,473 | 19,445 | |
| * | Intra-Cellular Therapies Inc. | 299,901 | 16,650 |
| Perrigo Co. plc | 470,164 | 16,456 | |
| * | Reata Pharmaceuticals Inc. Class A | 86,071 | 14,546 |
| * | Prestige Consumer Healthcare Inc. | 171,996 | 10,032 |
| * | Corcept Therapeutics Inc. | 299,241 | 9,794 |
| *,1 | Axsome Therapeutics Inc. | 113,314 | 9,156 |
| * | Amphastar Pharmaceuticals Inc. | 134,166 | 7,152 |
| *,1 | Tilray Brands Inc. | 2,303,916 | 6,820 |
| * | Supernus Pharmaceuticals Inc. | 189,430 | 6,031 |
| * | Pacira BioSciences Inc. | 160,150 | 5,653 |
| * | Revance Therapeutics Inc. | 290,760 | 5,126 |
| * | Ventyx Biosciences Inc. | 142,472 | 4,773 |
| Shares | Market Value• ($000) | ||
| * | Harmony Biosciences Holdings Inc. | 125,056 | 4,533 |
| * | Arvinas Inc. | 156,960 | 4,428 |
| * | Ligand Pharmaceuticals Inc. | 57,012 | 3,750 |
| *,1 | Cassava Sciences Inc. | 137,829 | 2,890 |
| * | Collegium Pharmaceutical Inc. | 119,795 | 2,806 |
| * | Innoviva Inc. | 204,719 | 2,610 |
| * | Pliant Therapeutics Inc. | 144,000 | 2,431 |
| * | Amylyx Pharmaceuticals Inc. | 104,066 | 2,244 |
| *,1 | Theravance Biopharma Inc. | 169,668 | 1,615 |
| * | Harrow Health Inc. | 103,807 | 1,575 |
| * | Amneal Pharmaceuticals Inc. | 372,898 | 1,525 |
| * | Tarsus Pharmaceuticals Inc. | 79,304 | 1,389 |
| * | Phathom Pharmaceuticals Inc. | 95,190 | 1,370 |
| * | Aclaris Therapeutics Inc. | 173,220 | 1,296 |
| * | Liquidia Corp. | 156,856 | 1,078 |
| Phibro Animal Health Corp. Class A | 70,019 | 977 | |
| * | Atea Pharmaceuticals Inc. | 230,570 | 775 |
| * | Fulcrum Therapeutics Inc. | 138,749 | 767 |
| *,1 | ATAI Life Sciences NV | 443,729 | 679 |
| * | Nuvation Bio Inc. | 410,355 | 673 |
| SIGA Technologies Inc. | 137,601 | 632 | |
| * | Terns Pharmaceuticals Inc. | 108,062 | 569 |
| *,4 | Scilex Holding Co. (Acquired 1/6/23, Cost $2,304) | 219,844 | 568 |
| * | Nektar Therapeutics | 654,006 | 389 |
| * | Cara Therapeutics Inc. | 144,272 | 371 |
| * | NGM Biopharmaceuticals Inc. | 156,131 | 295 |
| 5,655,196 | |||
| Total Common Stocks (Cost $16,508,744) | 19,786,799 | ||
| Warrants (0.0%) | |||
| * | Geron Corp. Exp. 12/31/25 (Cost $0) | 152,449 | 86 |
| * | Advaxis Inc. Exp. 9/11/24 (Cost $0) | 7,710 | — |
| Total Warrants (Cost $0) | 86 | ||
| Shares | Market Value• ($000) | ||
| Temporary Cash Investments (0.2%) | |||
| Money Market Fund (0.2%) | |||
| 5,6 | Vanguard Market Liquidity Fund, 5.384% (Cost $34,006) | 340,192 | 34,016 |
| Total Investments (100.0%) (Cost $16,542,750) | 19,820,901 | ||
| Other Assets and Liabilities—Net (0.0%) | (7,930) | ||
| Net Assets (100.0%) | 19,812,971 | ||
| Cost is in $000. | |||
| • | See Note A in Notes to Financial Statements. |
| * | Non-income-producing security. |
| 1 | Includes partial security positions on loan to broker-dealers. The total value of securities on loan is $27,805,000. |
| 2 | Security value determined using significant unobservable inputs. |
| 3 | “Other” represents securities that are not classified by the fund’s benchmark index. |
| 4 | Restricted securities totaling $568,000, representing 0.0% of net assets. |
| 5 | Affiliated money market fund available only to Vanguard funds and certain trusts and accounts managed by Vanguard. Rate shown is the 7-day yield. |
| 6 | Collateral of $31,951,000 was received for securities on loan. |
| CVR—Contingent Value Rights. |
| Over-the-Counter Total Return Swaps | ||||||
| Reference Entity | Termination Date | Counterparty | Notional Amount ($000) | Floating Interest Rate Received (Paid)1 (%) | Value and Unrealized Appreciation ($000) | Value and Unrealized (Depreciation) ($000) |
| Alnylam Pharmaceuticals Inc. | 8/30/24 | BANA | 4,946 | (5.320) | — | — |
| Becton Dickinson & Co. | 1/31/24 | CITNA | 11,178 | (5.327) | — | (51) |
| Mettler-Toledo International Inc. | 1/31/24 | CITNA | 9,708 | (5.327) | — | (46) |
| — | (97) | |||||
| 1 | Based on Overnight Bank Funding Rate as of the most recent reset date. Floating interest payment received/paid monthly. |
| BANA—Bank of America, N.A. | |
| CITNA—Citibank, N.A. |
| ($000s, except shares, footnotes, and per-share amounts) | Amount |
| Assets | |
| Investments in Securities, at Value1 | |
| Unaffiliated Issuers (Cost $16,508,744) | 19,786,885 |
| Affiliated Issuers (Cost $34,006) | 34,016 |
| Total Investments in Securities | 19,820,901 |
| Investment in Vanguard | 663 |
| Cash | 491 |
| Cash Collateral Pledged—Over-the-Counter Swap Contracts | 580 |
| Receivables for Investment Securities Sold | 46,368 |
| Receivables for Accrued Income | 28,581 |
| Receivables for Capital Shares Issued | 887 |
| Total Assets | 19,898,471 |
| Liabilities | |
| Payables for Investment Securities Purchased | 39,363 |
| Collateral for Securities on Loan | 31,951 |
| Payables for Capital Shares Redeemed | 13,213 |
| Payables to Vanguard | 876 |
| Unrealized Depreciation—Over-the-Counter Swap Contracts | 97 |
| Total Liabilities | 85,500 |
| Net Assets | 19,812,971 |
| 1 Includes $27,805,000 of securities on loan. | |
| At August 31, 2023, net assets consisted of: | |
| Paid-in Capital | 17,165,445 |
| Total Distributable Earnings (Loss) | 2,647,526 |
| Net Assets | 19,812,971 |
| ETF Shares—Net Assets | |
| Applicable to 69,449,295 outstanding $.001 par value shares of beneficial interest (unlimited authorization) | 16,975,629 |
| Net Asset Value Per Share—ETF Shares | $244.43 |
| Admiral Shares—Net Assets | |
| Applicable to 23,205,321 outstanding $.001 par value shares of beneficial interest (unlimited authorization) | 2,837,342 |
| Net Asset Value Per Share—Admiral Shares | $122.27 |
| Year Ended August 31, 2023 | |
| ($000) | |
| Investment Income | |
| Income | |
| Dividends | 296,047 |
| Interest1 | 387 |
| Securities Lending—Net | 1,577 |
| Total Income | 298,011 |
| Expenses | |
| The Vanguard Group—Note B | |
| Investment Advisory Services | 462 |
| Management and Administrative— ETF Shares | 15,114 |
| Management and Administrative— Admiral Shares | 2,619 |
| Marketing and Distribution— ETF Shares | 703 |
| Marketing and Distribution— Admiral Shares | 133 |
| Custodian Fees | 123 |
| Auditing Fees | 30 |
| Shareholders’ Reports—ETF Shares | 460 |
| Shareholders’ Reports—Admiral Shares | 29 |
| Trustees’ Fees and Expenses | 10 |
| Other Expenses | 23 |
| Total Expenses | 19,706 |
| Expenses Paid Indirectly | (10) |
| Net Expenses | 19,696 |
| Net Investment Income | 278,315 |
| Realized Net Gain (Loss) | |
| Investment Securities Sold1,2 | 726,733 |
| Swap Contracts | 1,994 |
| Realized Net Gain (Loss) | 728,727 |
| Change in Unrealized Appreciation (Depreciation) | |
| Investment Securities1 | 315,263 |
| Swap Contracts | (97) |
| Change in Unrealized Appreciation (Depreciation) | 315,166 |
| Net Increase (Decrease) in Net Assets Resulting from Operations | 1,322,208 |
| 1 | Interest income, realized net gain (loss), and change in unrealized appreciation (depreciation) from an affiliated company of the fund were $386,000, $7,000, and $4,000, respectively. Purchases and sales are for temporary cash investment purposes. |
| 2 | Includes $825,573,000 of net gain (loss) resulting from in-kind redemptions. |
| Year Ended August 31, | ||
| 2023 ($000) | 2022 ($000) | |
| Increase (Decrease) in Net Assets | ||
| Operations | ||
| Net Investment Income | 278,315 | 246,701 |
| Realized Net Gain (Loss) | 728,727 | 1,162,200 |
| Change in Unrealized Appreciation (Depreciation) | 315,166 | (3,600,457) |
| Net Increase (Decrease) in Net Assets Resulting from Operations | 1,322,208 | (2,191,556) |
| Distributions | ||
| ETF Shares | (238,117) | (212,391) |
| Admiral Shares | (40,777) | (36,855) |
| Total Distributions | (278,894) | (249,246) |
| Capital Share Transactions | ||
| ETF Shares | 255,391 | 1,015,966 |
| Admiral Shares | (58,051) | 131,473 |
| Net Increase (Decrease) from Capital Share Transactions | 197,340 | 1,147,439 |
| Total Increase (Decrease) | 1,240,654 | (1,293,363) |
| Net Assets | ||
| Beginning of Period | 18,572,317 | 19,865,680 |
| End of Period | 19,812,971 | 18,572,317 |
| ETF Shares | |||||
| For a Share Outstanding Throughout Each Period | Year Ended August 31, | ||||
| 2023 | 2022 | 2021 | 2020 | 2019 | |
| Net Asset Value, Beginning of Period | $231.59 | $262.41 | $207.65 | $169.74 | $177.07 |
| Investment Operations | |||||
| Net Investment Income1 | 3.418 | 3.157 | 2.893 | 2.702 | 3.6002 |
| Net Realized and Unrealized Gain (Loss) on Investments | 12.859 | (30.771) | 54.714 | 37.758 | (7.457) |
| Total from Investment Operations | 16.277 | (27.614) | 57.607 | 40.460 | (3.857) |
| Distributions | |||||
| Dividends from Net Investment Income | (3.437) | (3.206) | (2.846) | (2.550) | (3.473) |
| Distributions from Realized Capital Gains | — | — | — | — | — |
| Total Distributions | (3.437) | (3.206) | (2.846) | (2.550) | (3.473) |
| Net Asset Value, End of Period | $244.43 | $231.59 | $262.41 | $207.65 | $169.74 |
| Total Return | 7.07% | -10.60% | 27.99% | 24.05% | -2.22% |
| Ratios/Supplemental Data | |||||
| Net Assets, End of Period (Millions) | $16,976 | $15,829 | $16,894 | $11,724 | $8,899 |
| Ratio of Total Expenses to Average Net Assets | 0.10%3 | 0.10% | 0.10% | 0.10% | 0.10% |
| Ratio of Net Investment Income to Average Net Assets | 1.41% | 1.27% | 1.25% | 1.45% | 2.12%2 |
| Portfolio Turnover Rate4 | 4% | 3% | 5% | 7% | 5% |
| 1 | Calculated based on average shares outstanding. |
| 2 | Net investment income per share and the ratio of net investment income to average net assets include $1.132 and 0.67%, respectively, resulting from a cash payment received in connection with the merger of Cigna Corp. and Express Scripts Holding Co. in December 2018. |
| 3 | The ratio of expenses to average net assets for the period net of reduction from custody fee offset arrangements was 0.10%. |
| 4 | Excludes the value of portfolio securities received or delivered as a result of in-kind purchases or redemptions of the fund’s capital shares, including ETF Creation Units. |
| Admiral Shares | |||||
| For a Share Outstanding Throughout Each Period | Year Ended August 31, | ||||
| 2023 | 2022 | 2021 | 2020 | 2019 | |
| Net Asset Value, Beginning of Period | $115.84 | $131.26 | $103.87 | $84.91 | $88.57 |
| Investment Operations | |||||
| Net Investment Income1 | 1.711 | 1.583 | 1.450 | 1.351 | 1.8042 |
| Net Realized and Unrealized Gain (Loss) on Investments | 6.438 | (15.400) | 27.365 | 18.884 | (3.727) |
| Total from Investment Operations | 8.149 | (13.817) | 28.815 | 20.235 | (1.923) |
| Distributions | |||||
| Dividends from Net Investment Income | (1.719) | (1.603) | (1.425) | (1.275) | (1.737) |
| Distributions from Realized Capital Gains | — | — | — | — | — |
| Total Distributions | (1.719) | (1.603) | (1.425) | (1.275) | (1.737) |
| Net Asset Value, End of Period | $122.27 | $115.84 | $131.26 | $103.87 | $84.91 |
| Total Return3 | 7.08% | -10.59% | 28.01% | 24.06% | -2.21% |
| Ratios/Supplemental Data | |||||
| Net Assets, End of Period (Millions) | $2,837 | $2,744 | $2,972 | $1,676 | $1,316 |
| Ratio of Total Expenses to Average Net Assets | 0.10%4 | 0.10% | 0.10% | 0.10% | 0.10% |
| Ratio of Net Investment Income to Average Net Assets | 1.41% | 1.28% | 1.25% | 1.45% | 2.12%2 |
| Portfolio Turnover Rate5 | 4% | 3% | 5% | 7% | 5% |
| 1 | Calculated based on average shares outstanding. |
| 2 | Net investment income per share and the ratio of net investment income to average net assets include $.566 and 0.67%, respectively, resulting from a cash payment received in connection with the merger of Cigna Corp. and Express Scripts Holding Co. in December 2018. |
| 3 | Total returns do not include account service fees that may have applied in the periods shown. Fund prospectuses provide information about any applicable account service fees. |
| 4 | The ratio of expenses to average net assets for the period net of reduction from custody fee offset arrangements was 0.10%. |
| 5 | Excludes the value of portfolio securities received or delivered as a result of in-kind purchases or redemptions of the fund’s capital shares, including ETF Creation Units. |
| A. | The following significant accounting policies conform to generally accepted accounting principles for U.S. investment companies. The fund consistently follows such policies in preparing its financial statements. |
| B. | In accordance with the terms of a Funds' Service Agreement (the “FSA”) between Vanguard and the fund, Vanguard furnishes to the fund investment advisory, corporate management, administrative, marketing, and distribution services at Vanguard’s cost of operations (as defined by the FSA). These costs of operations are allocated to the fund based on methods and guidelines approved by the board of trustees and are generally settled twice a month. |
| C. | The fund’s custodian bank has agreed to reduce its fees when the fund maintains cash on deposit in the non-interest-bearing custody account. For the year ended August 31, 2023, custodian fee offset arrangements reduced the fund’s expenses by $10,000 (an annual rate of less than 0.01% of average net assets). |
| D. | Various inputs may be used to determine the value of the fund’s investments and derivatives. These inputs are summarized in three broad levels for financial statement purposes. The inputs or methodologies used to value securities are not necessarily an indication of the risk associated with investing in those securities. |
| Level 1 ($000) | Level 2 ($000) | Level 3 ($000) | Total ($000) | |
| Investments | ||||
| Assets | ||||
| Common Stocks | 19,785,649 | 568 | 582 | 19,786,799 |
| Warrants | — | 86 | — | 86 |
| Temporary Cash Investments | 34,016 | — | — | 34,016 |
| Total | 19,819,665 | 654 | 582 | 19,820,901 |
| Derivative Financial Instruments | ||||
| Liabilities | ||||
| Swap Contracts | — | 97 | — | 97 |
| E. | Permanent differences between book-basis and tax-basis components of net assets are reclassified among capital accounts in the financial statements to reflect their tax character. These reclassifications have no effect on net assets or net asset value per share. As of period end, permanent differences primarily attributable to the accounting for applicable in-kind redemptions, passive foreign investment companies, and swap agreements were reclassified between the following accounts: |
| Amount ($000) | |
| Paid-in Capital | 824,988 |
| Total Distributable Earnings (Loss) | (824,988) |
| Amount ($000) | |
| Undistributed Ordinary Income | 48,792 |
| Undistributed Long-Term Gains | — |
| Net Unrealized Gains (Losses) | 3,229,106 |
| Capital Loss Carryforwards | (630,372) |
| Qualified Late-Year Losses | — |
| Other Temporary Differences | — |
| Total | 2,647,526 |
| Year Ended August 31, | ||
| 2023 Amount ($000) | 2022 Amount ($000) | |
| Ordinary Income* | 278,894 | 249,246 |
| Long-Term Capital Gains | — | — |
| Total | 278,894 | 249,246 |
| * | Includes short-term capital gains, if any. |
| Amount ($000) | |
| Tax Cost | 16,591,795 |
| Gross Unrealized Appreciation | 4,993,338 |
| Gross Unrealized Depreciation | (1,764,232) |
| Net Unrealized Appreciation (Depreciation) | 3,229,106 |
| F. | During the year ended August 31, 2023, the fund purchased $2,607,710,000 of investment securities and sold $2,413,643,000 of investment securities, other than temporary cash investments. Purchases and sales include $1,734,249,000 and $1,615,081,000, respectively, in connection with in-kind purchases and redemptions of the fund's capital shares. |
| G. | Capital share transactions for each class of shares were: |
| Year Ended August 31, | |||||
| 2023 | 2022 | ||||
| Amount ($000) | Shares (000) | Amount ($000) | Shares (000) | ||
| ETF Shares | |||||
| Issued | 1,883,291 | 7,825 | 3,682,327 | 14,971 | |
| Issued in Lieu of Cash Distributions | — | — | — | — | |
| Redeemed | (1,627,900) | (6,725) | (2,666,361) | (11,000) | |
| Net Increase (Decrease)—ETF Shares | 255,391 | 1,100 | 1,015,966 | 3,971 | |
| Admiral Shares | |||||
| Issued | 391,651 | 3,228 | 548,361 | 4,414 | |
| Issued in Lieu of Cash Distributions | 34,825 | 293 | 31,635 | 257 | |
| Redeemed | (484,527) | (4,001) | (448,523) | (3,629) | |
| Net Increase (Decrease)—Admiral Shares | (58,051) | (480) | 131,473 | 1,042 | |
| H. | Significant market disruptions, such as those caused by pandemics (e.g., COVID-19 pandemic), natural or environmental disasters, war (e.g., Russia’s invasion of Ukraine), acts of terrorism, or other events, can adversely affect local and global markets and normal market operations. Any such disruptions could have an adverse impact on the value of the fund’s investments and fund performance. |
| I. | Management has determined that no events or transactions occurred subsequent to August 31, 2023, that would require recognition or disclosure in these financial statements. |

| Average Annual Total Returns Periods Ended August 31, 2023 | |||||
| One Year | Five Years | Ten Years | Final Value of a $10,000 Investment | ||
| Industrials Index Fund ETF Shares Net Asset Value | 19.99% | 8.95% | 11.31% | $29,190 |
| Industrials Index Fund ETF Shares Market Price | 20.01 | 8.96 | 11.31 | 29,203 | |
| MSCI US Investable Market Industrials 25/50 Index | 20.09 | 9.06 | 11.41 | 29,467 |
| MSCI US Investable Market 2500 Index | 15.01 | 10.39 | 12.34 | 32,022 |
| One Year | Five Years | Ten Years | Final Value of a $100,000 Investment | ||
| Industrials Index Fund Admiral Shares | 19.99% | 8.96% | 11.32% | $292,141 | |
| MSCI US Investable Market Industrials 25/50 Index | 20.09 | 9.06 | 11.41 | 294,671 | |
| MSCI US Investable Market 2500 Index | 15.01 | 10.39 | 12.34 | 320,217 | |
| One Year | Five Years | Ten Years | |
| Industrials Index Fund ETF Shares Market Price | 20.01% | 53.57% | 192.03% |
| Industrials Index Fund ETF Shares Net Asset Value | 19.99 | 53.53 | 191.90 |
| MSCI US Investable Market Industrials 25/50 Index | 20.09 | 54.30 | 194.67 |
| Aerospace & Defense | 15.7% |
| Air Freight & Logistics | 5.2 |
| Building Products | 7.0 |
| Commercial Services & Supplies | 6.7 |
| Construction & Engineering | 2.6 |
| Electrical Equipment | 7.6 |
| Ground Transportation | 10.5 |
| Industrial Conglomerates | 7.1 |
| Machinery | 20.2 |
| Marine Transportation | 0.2 |
| Passenger Airlines | 2.1 |
| Professional Services | 10.1 |
| Trading Companies & Distributors | 5.0 |
| Shares | Market Value• ($000) | ||
| Common Stocks (99.9%) | |||
| Aerospace & Defense (15.7%) | |||
| * | Boeing Co. | 625,712 | 140,178 |
| RTX Corp. | 1,599,811 | 137,648 | |
| Lockheed Martin Corp. | 249,422 | 111,828 | |
| Northrop Grumman Corp. | 157,919 | 68,393 | |
| General Dynamics Corp. | 255,280 | 57,857 | |
| * | TransDigm Group Inc. | 60,186 | 54,399 |
| L3Harris Technologies Inc. | 207,620 | 36,975 | |
| Howmet Aerospace Inc. | 429,535 | 21,249 | |
| Textron Inc. | 220,653 | 17,147 | |
| * | Axon Enterprise Inc. | 76,788 | 16,349 |
| HEICO Corp. Class A | 80,262 | 10,870 | |
| Huntington Ingalls Industries Inc. | 43,650 | 9,617 | |
| Curtiss-Wright Corp. | 41,939 | 8,723 | |
| HEICO Corp. | 48,489 | 8,181 | |
| Woodward Inc. | 62,405 | 8,073 | |
| BWX Technologies Inc. | 99,903 | 7,369 | |
| Hexcel Corp. | 92,285 | 6,764 | |
| Moog Inc. Class A | 31,403 | 3,648 | |
| * | AeroVironment Inc. | 28,699 | 2,785 |
| * | Parsons Corp. | 45,916 | 2,618 |
| Spirit AeroSystems Holdings Inc. Class A | 115,128 | 2,455 | |
| * | Mercury Systems Inc. | 57,385 | 2,252 |
| * | Kratos Defense & Security Solutions Inc. | 139,734 | 2,248 |
| * | AAR Corp. | 36,113 | 2,225 |
| *,1 | Rocket Lab USA Inc. | 263,487 | 1,663 |
| *,1 | Archer Aviation Inc. Class A | 141,683 | 988 |
| * | Leonardo DRS Inc. | 56,568 | 968 |
| * | V2X Inc. | 13,804 | 694 |
| *,1 | Virgin Galactic Holdings Inc. | 273,910 | 690 |
| * | Triumph Group Inc. | 70,548 | 664 |
| * | Ducommun Inc. | 13,903 | 632 |
| Kaman Corp. | 27,465 | 616 | |
| Cadre Holdings Inc. | 20,612 | 545 | |
| National Presto Industries Inc. | 5,680 | 425 | |
| * | Aersale Corp. | 28,167 | 417 |
| *,1 | Astra Space Inc. | 206,735 | 53 |
| 748,206 | |||
| Air Freight & Logistics (5.2%) | |||
| United Parcel Service Inc. Class B (XNYS) | 793,435 | 134,408 | |
| FedEx Corp. | 261,453 | 68,244 | |
| Expeditors International of Washington Inc. | 167,130 | 19,506 | |
| CH Robinson Worldwide Inc. | 127,791 | 11,556 | |
| * | GXO Logistics Inc. | 130,137 | 8,325 |
| * | Hub Group Inc. Class A | 35,907 | 2,802 |
| Forward Air Corp. | 28,417 | 2,012 | |
| * | Air Transport Services Group Inc. | 62,272 | 1,343 |
| 248,196 | |||
| Shares | Market Value• ($000) | ||
| Building Products (7.0%) | |||
| Carrier Global Corp. | 914,662 | 52,547 | |
| Trane Technologies plc | 249,678 | 51,249 | |
| Johnson Controls International plc | 751,375 | 44,376 | |
| * | Builders FirstSource Inc. | 140,194 | 20,334 |
| Carlisle Cos. Inc. | 55,744 | 14,662 | |
| Masco Corp. | 247,615 | 14,612 | |
| Owens Corning | 98,556 | 14,183 | |
| Lennox International Inc. | 34,954 | 13,171 | |
| Allegion plc | 96,216 | 10,950 | |
| Advanced Drainage Systems Inc. | 78,106 | 10,010 | |
| A O Smith Corp. | 136,215 | 9,876 | |
| Fortune Brands Innovations Inc. | 138,630 | 9,568 | |
| * | Trex Co. Inc. | 119,148 | 8,504 |
| Simpson Manufacturing Co. Inc. | 46,601 | 7,445 | |
| UFP Industries Inc. | 67,929 | 7,088 | |
| * | AZEK Co. Inc. | 148,649 | 5,056 |
| Zurn Elkay Water Solutions Corp. | 162,337 | 4,808 | |
| AAON Inc. | 75,581 | 4,766 | |
| Armstrong World Industries Inc. | 49,370 | 3,781 | |
| CSW Industrials Inc. | 17,000 | 3,054 | |
| * | Resideo Technologies Inc. | 160,800 | 2,711 |
| * | Gibraltar Industries Inc. | 33,267 | 2,496 |
| * | Hayward Holdings Inc. | 162,683 | 2,408 |
| * | Masonite International Corp. | 22,879 | 2,350 |
| Griffon Corp. | 47,201 | 1,976 | |
| * | PGT Innovations Inc. | 64,272 | 1,812 |
| * | Masterbrand Inc. | 141,386 | 1,811 |
| * | American Woodmark Corp. | 18,073 | 1,404 |
| * | JELD-WEN Holding Inc. | 92,345 | 1,393 |
| AZZ Inc. | 27,556 | 1,353 | |
| Apogee Enterprises Inc. | 24,068 | 1,214 | |
| * | Janus International Group Inc. | 104,498 | 1,196 |
| Quanex Building Products Corp. | 36,047 | 973 | |
| Insteel Industries Inc. | 21,113 | 734 | |
| 333,871 | |||
| Commercial Services & Supplies (6.7%) | |||
| Waste Management Inc. | 445,284 | 69,812 | |
| Cintas Corp. | 100,243 | 50,540 | |
| * | Copart Inc. | 941,088 | 42,189 |
| Waste Connections Inc. (XTSE) | 282,066 | 38,640 | |
| Republic Services Inc. | 242,476 | 34,948 | |
| Rollins Inc. | 269,754 | 10,674 | |
| * | Clean Harbors Inc. | 56,231 | 9,522 |
| Tetra Tech Inc. | 58,229 | 9,162 | |
| MSA Safety Inc. | 40,763 | 7,447 | |
| * | Casella Waste Systems Inc. Class A | 61,396 | 4,836 |
| * | Stericycle Inc. | 100,892 | 4,460 |
| Shares | Market Value• ($000) | ||
| Brink's Co. | 50,810 | 3,852 | |
| ABM Industries Inc. | 72,403 | 3,289 | |
| UniFirst Corp. | 16,565 | 2,918 | |
| Brady Corp. Class A | 50,067 | 2,525 | |
| * | ACV Auctions Inc. Class A | 141,853 | 2,385 |
| * | OPENLANE Inc. | 119,797 | 1,870 |
| HNI Corp. | 51,201 | 1,677 | |
| MillerKnoll Inc. | 83,458 | 1,594 | |
| Matthews International Corp. Class A | 31,830 | 1,343 | |
| * | CoreCivic Inc. | 124,494 | 1,340 |
| * | Cimpress plc | 18,894 | 1,221 |
| * | Montrose Environmental Group Inc. | 31,497 | 1,211 |
| * | Driven Brands Holdings Inc. | 72,664 | 1,094 |
| * | GEO Group Inc. | 138,764 | 1,005 |
| Deluxe Corp. | 47,006 | 950 | |
| Healthcare Services Group Inc. | 80,782 | 933 | |
| * | Heritage-Crystal Clean Inc. | 18,669 | 842 |
| * | SP Plus Corp. | 21,300 | 834 |
| Steelcase Inc. Class A | 91,444 | 829 | |
| VSE Corp. | 14,186 | 805 | |
| * | Viad Corp. | 23,202 | 659 |
| Interface Inc. | 62,576 | 646 | |
| * | Enviri Corp. | 86,325 | 643 |
| Pitney Bowes Inc. | 173,649 | 571 | |
| ACCO Brands Corp. | 103,207 | 550 | |
| * | Liquidity Services Inc. | 24,615 | 449 |
| * | BrightView Holdings Inc. | 45,803 | 379 |
| 318,644 | |||
| Construction & Engineering (2.6%) | |||
| Quanta Services Inc. | 159,087 | 33,388 | |
| AECOM | 144,423 | 12,673 | |
| EMCOR Group Inc. | 51,998 | 11,661 | |
| * | WillScot Mobile Mini Holdings Corp. | 221,353 | 9,080 |
| Comfort Systems USA Inc. | 39,103 | 7,217 | |
| * | MasTec Inc. | 68,959 | 6,861 |
| Valmont Industries Inc. | 23,042 | 5,841 | |
| * | Fluor Corp. | 156,745 | 5,484 |
| * | API Group Corp. | 179,824 | 5,062 |
| MDU Resources Group Inc. | 211,972 | 4,316 | |
| Arcosa Inc. | 52,843 | 4,133 | |
| * | Dycom Industries Inc. | 32,130 | 3,211 |
| * | Sterling Infrastructure Inc. | 33,687 | 2,788 |
| * | MYR Group Inc. | 18,286 | 2,598 |
| Primoris Services Corp. | 58,526 | 2,070 | |
| Granite Construction Inc. | 48,107 | 1,986 | |
| * | Construction Partners Inc. Class A | 45,645 | 1,586 |
| * | Ameresco Inc. Class A | 35,581 | 1,547 |
| * | IES Holdings Inc. | 8,811 | 661 |
| * | Great Lakes Dredge & Dock Corp. | 72,070 | 636 |
| Argan Inc. | 14,751 | 627 | |
| Shares | Market Value• ($000) | ||
| * | Tutor Perini Corp. | 47,312 | 421 |
| 123,847 | |||
| Electrical Equipment (7.6%) | |||
| Eaton Corp. plc | 436,424 | 100,539 | |
| Emerson Electric Co. | 625,669 | 61,472 | |
| AMETEK Inc. | 252,411 | 40,262 | |
| Rockwell Automation Inc. | 125,906 | 39,293 | |
| Hubbell Inc. | 58,646 | 19,121 | |
| Vertiv Holdings Co. | 332,339 | 13,091 | |
| Regal Rexnord Corp. | 72,826 | 11,812 | |
| nVent Electric plc | 181,407 | 10,257 | |
| * | Generac Holdings Inc. | 68,055 | 8,086 |
| * | Atkore Inc. | 42,197 | 6,497 |
| Sensata Technologies Holding plc | 167,230 | 6,291 | |
| Acuity Brands Inc. | 34,145 | 5,507 | |
| *,1 | Plug Power Inc. | 591,742 | 5,006 |
| EnerSys | 44,779 | 4,701 | |
| * | Array Technologies Inc. | 164,938 | 4,102 |
| * | Sunrun Inc. | 235,196 | 3,676 |
| * | Shoals Technologies Group Inc. Class A | 185,971 | 3,660 |
| Encore Wire Corp. | 19,235 | 3,170 | |
| *,1 | Bloom Energy Corp. Class A | 200,850 | 3,011 |
| *,1 | ChargePoint Holdings Inc. | 329,078 | 2,356 |
| *,1 | Enovix Corp. | 138,524 | 1,909 |
| * | Vicor Corp. | 24,977 | 1,693 |
| * | Fluence Energy Inc. | 44,576 | 1,174 |
| * | Thermon Group Holdings Inc. | 36,427 | 1,001 |
| *,1 | Stem Inc. | 159,490 | 812 |
| GrafTech International Ltd. | 222,812 | 789 | |
| *,1 | FREYR Battery SA | 113,807 | 709 |
| *,1 | SunPower Corp. | 94,955 | 680 |
| *,1 | FuelCell Energy Inc. | 440,731 | 617 |
| *,1 | Energy Vault Holdings Inc. | 78,137 | 249 |
| *,1 | Blink Charging Co. | 62,319 | 245 |
| * | TPI Composites Inc. | 46,010 | 232 |
| * | SES AI Corp. | 101,306 | 214 |
| *,1 | NuScale Power Corp. | 31,619 | 189 |
| * | ESS Tech Inc. | 61,192 | 87 |
| 362,510 | |||
| Ground Transportation (10.5%) | |||
| Union Pacific Corp. | 667,389 | 147,206 | |
| * | Uber Technologies Inc. | 1,994,423 | 94,197 |
| CSX Corp. | 2,243,100 | 67,742 | |
| Norfolk Southern Corp. | 249,280 | 51,105 | |
| Old Dominion Freight Line Inc. | 108,106 | 46,201 | |
| JB Hunt Transport Services Inc. | 90,686 | 17,038 | |
| * | Saia Inc. | 29,031 | 12,373 |
| Knight-Swift Transportation Holdings Inc. | 176,009 | 9,649 | |
| * | XPO Inc. | 126,737 | 9,458 |
| Landstar System Inc. | 39,364 | 7,472 | |
| U-Haul Holding Co. | 106,167 | 5,652 | |
| Ryder System Inc. | 50,899 | 5,125 | |
| * | Avis Budget Group Inc. | 23,949 | 5,110 |
| * | Lyft Inc. Class A | 364,853 | 4,298 |
| ArcBest Corp. | 26,214 | 2,768 | |
| Werner Enterprises Inc. | 65,916 | 2,743 | |
| * | Hertz Global Holdings Inc. | 155,254 | 2,632 |
| * | RXO Inc. | 128,127 | 2,317 |
| Schneider National Inc. Class B | 57,123 | 1,651 | |
| Marten Transport Ltd. | 66,721 | 1,401 | |
| Shares | Market Value• ($000) | ||
| Heartland Express Inc. | 51,541 | 778 | |
| Universal Logistics Holdings Inc. | 9,107 | 247 | |
| * | Daseke Inc. | 41,356 | 219 |
| * | TuSimple Holdings Inc. Class A | 137,559 | 172 |
| * | PAM Transportation Services Inc. | 7,255 | 167 |
| 497,721 | |||
| Industrial Conglomerates (7.1%) | |||
| Honeywell International Inc. | 728,746 | 136,961 | |
| General Electric Co. | 1,192,209 | 136,460 | |
| 3M Co. | 604,508 | 64,483 | |
| 337,904 | |||
| Machinery (20.2%) | |||
| Caterpillar Inc. | 564,197 | 158,613 | |
| Deere & Co. | 304,931 | 125,308 | |
| Illinois Tool Works Inc. | 310,669 | 76,844 | |
| Parker-Hannifin Corp. | 140,556 | 58,598 | |
| PACCAR Inc. | 572,172 | 47,084 | |
| Otis Worldwide Corp. | 452,550 | 38,716 | |
| Cummins Inc. | 155,104 | 35,680 | |
| Ingersoll Rand Inc. (XYNS) | 443,430 | 30,867 | |
| Fortive Corp. | 387,354 | 30,543 | |
| Xylem Inc. | 261,936 | 27,121 | |
| Dover Corp. | 152,978 | 22,687 | |
| Westinghouse Air Brake Technologies Corp. | 197,163 | 22,185 | |
| IDEX Corp. | 82,670 | 18,717 | |
| Stanley Black & Decker Inc. | 167,577 | 15,816 | |
| Snap-on Inc. | 57,887 | 15,548 | |
| Graco Inc. | 184,120 | 14,534 | |
| Nordson Corp. | 56,088 | 13,693 | |
| Pentair plc | 180,563 | 12,686 | |
| Lincoln Electric Holdings Inc. | 63,229 | 12,169 | |
| Toro Co. | 113,626 | 11,626 | |
| ITT Inc. | 90,133 | 9,219 | |
| AGCO Corp. | 69,638 | 9,020 | |
| * | Middleby Corp. | 58,552 | 8,525 |
| Donaldson Co. Inc. | 132,477 | 8,461 | |
| * | Chart Industries Inc. | 45,958 | 8,299 |
| Oshkosh Corp. | 71,455 | 7,419 | |
| * | RBC Bearings Inc. | 31,756 | 7,321 |
| Allison Transmission Holdings Inc. | 99,544 | 6,017 | |
| Flowserve Corp. | 144,653 | 5,724 | |
| Watts Water Technologies Inc. Class A | 30,004 | 5,664 | |
| Timken Co. | 71,307 | 5,449 | |
| Crane Co. | 52,830 | 4,814 | |
| Mueller Industries Inc. | 59,336 | 4,578 | |
| Esab Corp. | 62,714 | 4,526 | |
| Terex Corp. | 74,117 | 4,492 | |
| Franklin Electric Co. Inc. | 42,921 | 4,151 | |
| Federal Signal Corp. | 66,727 | 4,067 | |
| * | SPX Technologies Inc. | 49,683 | 3,926 |
| John Bean Technologies Corp. | 34,742 | 3,819 | |
| Hillenbrand Inc. | 76,285 | 3,695 | |
| Albany International Corp. Class A | 34,127 | 3,164 | |
| ESCO Technologies Inc. | 28,286 | 3,027 | |
| EnPro Industries Inc. | 21,749 | 2,966 | |
| Kadant Inc. | 12,804 | 2,814 | |
| Mueller Water Products Inc. Class A | 171,441 | 2,421 | |
| Shares | Market Value• ($000) | ||
| Kennametal Inc. | 83,038 | 2,198 | |
| Trinity Industries Inc. | 84,635 | 2,122 | |
| * | Gates Industrial Corp. plc | 171,558 | 2,107 |
| Barnes Group Inc. | 52,846 | 2,077 | |
| Helios Technologies Inc. | 35,823 | 2,073 | |
| Alamo Group Inc. | 11,867 | 2,037 | |
| Standex International Corp. | 13,014 | 1,999 | |
| * | Hillman Solutions Corp. | 213,885 | 1,936 |
| * | Energy Recovery Inc. | 61,677 | 1,676 |
| Enerpac Tool Group Corp. | 61,124 | 1,602 | |
| Tennant Co. | 19,144 | 1,578 | |
| Lindsay Corp. | 12,153 | 1,508 | |
| Greenbrier Cos. Inc. | 33,808 | 1,439 | |
| Astec Industries Inc. | 25,103 | 1,376 | |
| Columbus McKinnon Corp. | 31,736 | 1,196 | |
| Wabash National Corp. | 51,849 | 1,169 | |
| * | CIRCOR International Inc. | 19,916 | 1,109 |
| * | 3D Systems Corp. | 146,625 | 925 |
| * | Proto Labs Inc. | 28,474 | 840 |
| Gorman-Rupp Co. | 25,663 | 825 | |
| Douglas Dynamics Inc. | 24,870 | 753 | |
| *,1 | Nikola Corp. | 627,878 | 741 |
| *,1 | Symbotic Inc. | 16,976 | 709 |
| * | Manitowoc Co. Inc. | 38,245 | 647 |
| Shyft Group Inc. | 35,950 | 564 | |
| * | Blue Bird Corp. | 23,048 | 504 |
| Hyster-Yale Materials Handling Inc. | 10,163 | 464 | |
| * | Desktop Metal Inc. Class A | 247,640 | 446 |
| REV Group Inc. | 32,637 | 443 | |
| Luxfer Holdings plc | 29,316 | 353 | |
| *,1 | Microvast Holdings Inc. | 102,165 | 228 |
| *,1 | Velo3D Inc. | 109,486 | 173 |
| * | Hyliion Holdings Corp. | 135,185 | 165 |
| * | Markforged Holding Corp. | 125,485 | 164 |
| *,1 | Hyzon Motors Inc. | 85,324 | 108 |
| 960,867 | |||
| Marine Transportation (0.2%) | |||
| * | Kirby Corp. | 65,704 | 5,442 |
| Matson Inc. | 39,133 | 3,439 | |
| Genco Shipping & Trading Ltd. | 46,113 | 631 | |
| 1 | Eagle Bulk Shipping Inc. | 7,192 | 315 |
| 9,827 | |||
| Passenger Airlines (2.0%) | |||
| Delta Air Lines Inc. | 705,729 | 30,262 | |
| Southwest Airlines Co. | 650,872 | 20,568 | |
| * | United Airlines Holdings Inc. | 358,773 | 17,870 |
| * | American Airlines Group Inc. | 714,224 | 10,520 |
| * | Alaska Air Group Inc. | 140,036 | 5,877 |
| * | Joby Aviation Inc. | 378,880 | 2,823 |
| * | SkyWest Inc. | 48,595 | 2,192 |
| * | JetBlue Airways Corp. | 360,389 | 2,133 |
| Spirit Airlines Inc. | 120,162 | 1,983 | |
| Allegiant Travel Co. | 17,143 | 1,523 | |
| * | Sun Country Airlines Holdings Inc. | 46,174 | 688 |
| * | Hawaiian Holdings Inc. | 56,085 | 481 |
| * | Frontier Group Holdings Inc. | 46,551 | 292 |
| * | Blade Air Mobility Inc. | 52,739 | 168 |
| *,1 | Wheels Up Experience Inc. | 18,252 | 35 |
| 97,415 | |||
| Shares | Market Value• ($000) | ||
| Professional Services (10.1%) | |||
| Automatic Data Processing Inc. | 452,309 | 115,162 | |
| Paychex Inc. | 355,754 | 43,484 | |
| Verisk Analytics Inc. | 158,597 | 38,415 | |
| Equifax Inc. | 134,167 | 27,732 | |
| Broadridge Financial Solutions Inc. | 129,050 | 24,030 | |
| Jacobs Solutions Inc. | 138,745 | 18,706 | |
| TransUnion | 211,395 | 17,169 | |
| Paycom Software Inc. | 56,988 | 16,802 | |
| Booz Allen Hamilton Holding Corp. | 143,265 | 16,233 | |
| SS&C Technologies Holdings Inc. | 245,396 | 14,091 | |
| Leidos Holdings Inc. | 142,556 | 13,901 | |
| * | Ceridian HCM Holding Inc. | 161,150 | 11,687 |
| * | Paylocity Holding Corp. | 48,858 | 9,796 |
| KBR Inc. | 148,438 | 9,132 | |
| Robert Half Inc. | 117,991 | 8,727 | |
| * | CACI International Inc. Class A | 24,919 | 8,174 |
| * | FTI Consulting Inc. | 37,187 | 6,910 |
| Science Applications International Corp. | 58,680 | 6,904 | |
| Maximus Inc. | 66,511 | 5,375 | |
| * | ExlService Holdings Inc. | 182,176 | 5,325 |
| Exponent Inc. | 55,501 | 4,987 | |
| * | ASGN Inc. | 53,963 | 4,434 |
| ManpowerGroup Inc. | 55,184 | 4,352 | |
| *,1 | TriNet Group Inc. | 38,967 | 4,323 |
| Insperity Inc. | 39,761 | 4,029 | |
| Concentrix Corp. | 48,573 | 3,878 | |
| Korn Ferry | 57,100 | 2,911 | |
| * | CBIZ Inc. | 49,294 | 2,766 |
| ICF International Inc. | 20,481 | 2,766 | |
| * | Clarivate plc | 370,210 | 2,751 |
| * | Alight Inc. Class A | 354,162 | 2,706 |
| Dun & Bradstreet Holdings Inc. | 240,553 | 2,622 | |
| * | Verra Mobility Corp. | 131,595 | 2,341 |
| * | Huron Consulting Group Inc. | 21,144 | 2,113 |
| * | Upwork Inc. | 131,520 | 1,948 |
| CSG Systems International Inc. | 34,667 | 1,883 | |
| * | Paycor HCM Inc. | 68,100 | 1,598 |
| * | NV5 Global Inc. | 15,560 | 1,584 |
| Kforce Inc. | 20,968 | 1,314 | |
| * | LegalZoom.Com Inc. | 82,806 | 945 |
| CRA International Inc. | 7,589 | 824 | |
| First Advantage Corp. | 56,032 | 782 | |
| Barrett Business Services Inc. | 7,456 | 713 | |
| *,1 | Planet Labs PBC | 206,743 | 672 |
| Kelly Services Inc. Class A | 35,355 | 654 | |
| TTEC Holdings Inc. | 20,499 | 610 | |
| Heidrick & Struggles International Inc. | 21,784 | 577 | |
| * | Conduent Inc. | 178,203 | 560 |
| * | Franklin Covey Co. | 13,008 | 555 |
| Resources Connection Inc. | 34,716 | 538 | |
| * | TrueBlue Inc. | 34,801 | 526 |
| * | Forrester Research Inc. | 12,559 | 385 |
| * | Sterling Check Corp. | 26,179 | 365 |
| * | TaskUS Inc. Class A | 29,926 | 296 |
| * | Hireright Holdings Corp. | 20,651 | 216 |
| * | Skillsoft Corp. | 93,691 | 123 |
| 482,402 | |||
| Shares | Market Value• ($000) | ||
| Trading Companies & Distributors (5.0%) | |||
| Ferguson plc | 224,040 | 36,196 | |
| Fastenal Co. | 625,870 | 36,038 | |
| United Rentals Inc. | 75,194 | 35,833 | |
| WW Grainger Inc. | 49,458 | 35,320 | |
| Watsco Inc. | 36,568 | 13,331 | |
| * | SiteOne Landscape Supply Inc. | 49,168 | 8,417 |
| WESCO International Inc. | 50,429 | 8,162 | |
| Applied Industrial Technologies Inc. | 42,222 | 6,518 | |
| MSC Industrial Direct Co. Inc. Class A | 51,757 | 5,282 | |
| Triton International Ltd. | 60,358 | 5,065 | |
| Boise Cascade Co. | 43,209 | 4,726 | |
| Air Lease Corp. | 115,114 | 4,692 | |
| * | Beacon Roofing Supply Inc. | 55,518 | 4,433 |
| GATX Corp. | 36,735 | 4,340 | |
| Herc Holdings Inc. | 31,199 | 4,060 | |
| FTAI Aviation Ltd. | 108,866 | 4,024 | |
| * | Core & Main Inc. Class A | 99,928 | 3,282 |
| * | GMS Inc. | 42,414 | 2,941 |
| Rush Enterprises Inc. Class A | 68,968 | 2,856 | |
| McGrath RentCorp. | 26,737 | 2,703 | |
| Veritiv Corp. | 14,093 | 2,372 | |
| H&E Equipment Services Inc. | 33,896 | 1,536 | |
| * | NOW Inc. | 117,276 | 1,310 |
| * | MRC Global Inc. | 91,444 | 852 |
| *,1 | Xometry Inc. Class A | 41,575 | 792 |
| Global Industrial Co. | 21,096 | 714 | |
| * | Titan Machinery Inc. | 22,160 | 687 |
| * | DXP Enterprises Inc. | 16,227 | 577 |
| Alta Equipment Group Inc. | 19,271 | 274 | |
| 237,333 | |||
| Total Common Stocks (Cost $4,358,086) | 4,758,743 | ||
| Temporary Cash Investments (0.4%) | |||
| Money Market Fund (0.4%) | |||
| 2,3 | Vanguard Market Liquidity Fund, 5.384% (Cost $19,574) | 195,786 | 19,576 |
| Total Investments (100.3%) (Cost $4,377,660) | 4,778,319 | ||
| Other Assets and Liabilities—Net (-0.3%) | (13,885) | ||
| Net Assets (100.0%) | 4,764,434 | ||
| Cost is in $000. | |||
| • | See Note A in Notes to Financial Statements. |
| * | Non-income-producing security. |
| 1 | Includes partial security positions on loan to broker-dealers. The total value of securities on loan is $15,922,000. |
| 2 | Affiliated money market fund available only to Vanguard funds and certain trusts and accounts managed by Vanguard. Rate shown is the 7-day yield. |
| 3 | Collateral of $17,662,000 was received for securities on loan. |
| Over-the-Counter Total Return Swaps | ||||||
| Reference Entity | Termination Date | Counterparty | Notional Amount ($000) | Floating Interest Rate Received (Paid)1 (%) | Value and Unrealized Appreciation ($000) | Value and Unrealized (Depreciation) ($000) |
| Illinois Tool Works Inc. | 1/31/24 | CITNA | 5,442 | (5.327) | — | (27) |
| 1 | Based on Overnight Bank Funding Rate as of the most recent reset date. Floating interest payment received/paid monthly. |
| CITNA—Citibank, N.A. |
| ($000s, except shares, footnotes, and per-share amounts) | Amount |
| Assets | |
| Investments in Securities, at Value1 | |
| Unaffiliated Issuers (Cost $4,358,086) | 4,758,743 |
| Affiliated Issuers (Cost $19,574) | 19,576 |
| Total Investments in Securities | 4,778,319 |
| Investment in Vanguard | 160 |
| Cash Collateral Pledged—Over-the-Counter Swap Contracts | 580 |
| Receivables for Investment Securities Sold | 13,880 |
| Receivables for Accrued Income | 7,695 |
| Receivables for Capital Shares Issued | 185 |
| Total Assets | 4,800,819 |
| Liabilities | |
| Due to Custodian | 3,055 |
| Payables for Investment Securities Purchased | 15,132 |
| Collateral for Securities on Loan | 17,662 |
| Payables for Capital Shares Redeemed | 306 |
| Payables to Vanguard | 203 |
| Unrealized Depreciation—Over-the-Counter Swap Contracts | 27 |
| Total Liabilities | 36,385 |
| Net Assets | 4,764,434 |
| 1 Includes $15,922,000 of securities on loan. | |
| At August 31, 2023, net assets consisted of: | |
| Paid-in Capital | 4,613,700 |
| Total Distributable Earnings (Loss) | 150,734 |
| Net Assets | 4,764,434 |
| ETF Shares—Net Assets | |
| Applicable to 21,644,050 outstanding $.001 par value shares of beneficial interest (unlimited authorization) | 4,493,104 |
| Net Asset Value Per Share—ETF Shares | $207.59 |
| Admiral Shares—Net Assets | |
| Applicable to 2,544,103 outstanding $.001 par value shares of beneficial interest (unlimited authorization) | 271,330 |
| Net Asset Value Per Share—Admiral Shares | $106.65 |
| Year Ended August 31, 2023 | |
| ($000) | |
| Investment Income | |
| Income | |
| Dividends1 | 63,456 |
| Interest2 | 149 |
| Securities Lending—Net | 737 |
| Total Income | 64,342 |
| Expenses | |
| The Vanguard Group—Note B | |
| Investment Advisory Services | 96 |
| Management and Administrative— ETF Shares | 3,267 |
| Management and Administrative— Admiral Shares | 200 |
| Marketing and Distribution— ETF Shares | 192 |
| Marketing and Distribution— Admiral Shares | 13 |
| Custodian Fees | 36 |
| Auditing Fees | 30 |
| Shareholders’ Reports—ETF Shares | 165 |
| Shareholders’ Reports—Admiral Shares | 5 |
| Trustees’ Fees and Expenses | 2 |
| Other Expenses | 23 |
| Total Expenses | 4,029 |
| Net Investment Income | 60,313 |
| Realized Net Gain (Loss) | |
| Investment Securities Sold2,3 | 32,761 |
| Swap Contracts | (695) |
| Foreign Currencies | (1) |
| Realized Net Gain (Loss) | 32,065 |
| Change in Unrealized Appreciation (Depreciation) | |
| Investment Securities2 | 626,415 |
| Swap Contracts | (101) |
| Change in Unrealized Appreciation (Depreciation) | 626,314 |
| Net Increase (Decrease) in Net Assets Resulting from Operations | 718,692 |
| 1 | Dividends are net of foreign withholding taxes of $41,000. |
| 2 | Interest income, realized net gain (loss), capital gain distributions received, and change in unrealized appreciation (depreciation) from an affiliated company of the fund were $148,000, $2,000, less than $1,000, and $1,000, respectively. Purchases and sales are for temporary cash investment purposes. |
| 3 | Includes $151,871,000 of net gain (loss) resulting from in-kind redemptions. |
| Year Ended August 31, | ||
| 2023 ($000) | 2022 ($000) | |
| Increase (Decrease) in Net Assets | ||
| Operations | ||
| Net Investment Income | 60,313 | 61,443 |
| Realized Net Gain (Loss) | 32,065 | 686,904 |
| Change in Unrealized Appreciation (Depreciation) | 626,314 | (1,300,943) |
| Net Increase (Decrease) in Net Assets Resulting from Operations | 718,692 | (552,596) |
| Distributions | ||
| ETF Shares | (57,205) | (60,577) |
| Admiral Shares | (3,409) | (3,978) |
| Total Distributions | (60,614) | (64,555) |
| Capital Share Transactions | ||
| ETF Shares | 411,493 | (1,397,561) |
| Admiral Shares | 8,914 | (109,475) |
| Net Increase (Decrease) from Capital Share Transactions | 420,407 | (1,507,036) |
| Total Increase (Decrease) | 1,078,485 | (2,124,187) |
| Net Assets | ||
| Beginning of Period | 3,685,949 | 5,810,136 |
| End of Period | 4,764,434 | 3,685,949 |
| ETF Shares | |||||
| For a Share Outstanding Throughout Each Period | Year Ended August 31, | ||||
| 2023 | 2022 | 2021 | 2020 | 2019 | |
| Net Asset Value, Beginning of Period | $175.75 | $199.27 | $146.89 | $142.53 | $146.12 |
| Investment Operations | |||||
| Net Investment Income1 | 2.829 | 2.432 | 2.264 | 2.366 | 2.597 |
| Net Realized and Unrealized Gain (Loss) on Investments | 31.869 | (23.486) | 52.318 | 4.554 | (3.754) |
| Total from Investment Operations | 34.698 | (21.054) | 54.582 | 6.920 | (1.157) |
| Distributions | |||||
| Dividends from Net Investment Income | (2.858) | (2.466) | (2.202) | (2.560) | (2.433) |
| Distributions from Realized Capital Gains | — | — | — | — | — |
| Total Distributions | (2.858) | (2.466) | (2.202) | (2.560) | (2.433) |
| Net Asset Value, End of Period | $207.59 | $175.75 | $199.27 | $146.89 | $142.53 |
| Total Return | 19.99% | -10.62% | 37.41% | 4.96% | -0.73% |
| Ratios/Supplemental Data | |||||
| Net Assets, End of Period (Millions) | $4,493 | $3,461 | $5,438 | $3,090 | $3,457 |
| Ratio of Total Expenses to Average Net Assets | 0.10% | 0.10% | 0.10% | 0.10% | 0.10% |
| Ratio of Net Investment Income to Average Net Assets | 1.50% | 1.29% | 1.25% | 1.69% | 1.87% |
| Portfolio Turnover Rate2 | 10% | 4% | 5% | 4% | 4% |
| 1 | Calculated based on average shares outstanding. |
| 2 | Excludes the value of portfolio securities received or delivered as a result of in-kind purchases or redemptions of the fund’s capital shares, including ETF Creation Units. |
| Admiral Shares | |||||
| For a Share Outstanding Throughout Each Period | Year Ended August 31, | ||||
| 2023 | 2022 | 2021 | 2020 | 2019 | |
| Net Asset Value, Beginning of Period | $90.29 | $102.37 | $75.46 | $73.22 | $75.07 |
| Investment Operations | |||||
| Net Investment Income1 | 1.451 | 1.240 | 1.162 | 1.221 | 1.340 |
| Net Realized and Unrealized Gain (Loss) on Investments | 16.376 | (12.056) | 26.880 | 2.336 | (1.941) |
| Total from Investment Operations | 17.827 | (10.816) | 28.042 | 3.557 | (.601) |
| Distributions | |||||
| Dividends from Net Investment Income | (1.467) | (1.264) | (1.132) | (1.317) | (1.249) |
| Distributions from Realized Capital Gains | — | — | — | — | — |
| Total Distributions | (1.467) | (1.264) | (1.132) | (1.317) | (1.249) |
| Net Asset Value, End of Period | $106.65 | $90.29 | $102.37 | $75.46 | $73.22 |
| Total Return2 | 19.99% | -10.62% | 37.43% | 4.98% | -0.75% |
| Ratios/Supplemental Data | |||||
| Net Assets, End of Period (Millions) | $271 | $225 | $372 | $210 | $202 |
| Ratio of Total Expenses to Average Net Assets | 0.10% | 0.10% | 0.10% | 0.10% | 0.10% |
| Ratio of Net Investment Income to Average Net Assets | 1.49% | 1.27% | 1.25% | 1.71% | 1.87% |
| Portfolio Turnover Rate3 | 10% | 4% | 5% | 4% | 4% |
| 1 | Calculated based on average shares outstanding. |
| 2 | Total returns do not include account service fees that may have applied in the periods shown. Fund prospectuses provide information about any applicable account service fees. |
| 3 | Excludes the value of portfolio securities received or delivered as a result of in-kind purchases or redemptions of the fund’s capital shares. |
| A. | The following significant accounting policies conform to generally accepted accounting principles for U.S. investment companies. The fund consistently follows such policies in preparing its financial statements. |
| B. | In accordance with the terms of a Funds' Service Agreement (the “FSA”) between Vanguard and the fund, Vanguard furnishes to the fund investment advisory, corporate management, administrative, marketing, and distribution services at Vanguard’s cost of operations (as defined by the FSA). These costs of operations are allocated to the fund based on methods and guidelines approved by the board of trustees and are generally settled twice a month. |
| C. | Various inputs may be used to determine the value of the fund’s investments and derivatives. These inputs are summarized in three broad levels for financial statement purposes. The inputs or methodologies used to value securities are not necessarily an indication of the risk associated with investing in those securities. |
| Level 1 ($000) | Level 2 ($000) | Level 3 ($000) | Total ($000) | |
| Investments | ||||
| Assets | ||||
| Common Stocks | 4,758,743 | — | — | 4,758,743 |
| Temporary Cash Investments | 19,576 | — | — | 19,576 |
| Total | 4,778,319 | — | — | 4,778,319 |
| Derivative Financial Instruments | ||||
| Liabilities | ||||
| Swap Contracts | — | 27 | — | 27 |
| D. | Permanent differences between book-basis and tax-basis components of net assets are reclassified among capital accounts in the financial statements to reflect their tax character. These reclassifications have no effect on net assets or net asset value per share. As of period end, permanent differences primarily attributable to the accounting for applicable in-kind redemptions, foreign currency transactions, passive foreign investment companies, and swap agreements were reclassified between the following accounts: |
| Amount ($000) | |
| Paid-in Capital | 151,769 |
| Total Distributable Earnings (Loss) | (151,769) |
| Amount ($000) | |
| Undistributed Ordinary Income | 13,777 |
| Undistributed Long-Term Gains | — |
| Net Unrealized Gains (Losses) | 390,205 |
| Capital Loss Carryforwards | (253,248) |
| Qualified Late-Year Losses | — |
| Other Temporary Differences | — |
| Total | 150,734 |
| Year Ended August 31, | ||
| 2023 Amount ($000) | 2022 Amount ($000) | |
| Ordinary Income* | 60,614 | 64,555 |
| Long-Term Capital Gains | — | — |
| Total | 60,614 | 64,555 |
| * | Includes short-term capital gains, if any. |
| Amount ($000) | |
| Tax Cost | 4,388,112 |
| Gross Unrealized Appreciation | 800,618 |
| Gross Unrealized Depreciation | (410,413) |
| Net Unrealized Appreciation (Depreciation) | 390,205 |
| E. | During the year ended August 31, 2023, the fund purchased $1,335,672,000 of investment securities and sold $914,370,000 of investment securities, other than temporary cash investments. Purchases and sales include $887,970,000 and $523,096,000, respectively, in connection with in-kind purchases and redemptions of the fund's capital shares. |
| F. | Capital share transactions for each class of shares were: |
| Year Ended August 31, | |||||
| 2023 | 2022 | ||||
| Amount ($000) | Shares (000) | Amount ($000) | Shares (000) | ||
| ETF Shares | |||||
| Issued | 930,187 | 4,752 | 858,213 | 4,528 | |
| Issued in Lieu of Cash Distributions | — | — | — | — | |
| Redeemed | (518,694) | (2,800) | (2,255,774) | (12,125) | |
| Net Increase (Decrease)—ETF Shares | 411,493 | 1,952 | (1,397,561) | (7,597) | |
| Admiral Shares | |||||
| Issued | 91,744 | 925 | 89,996 | 911 | |
| Issued in Lieu of Cash Distributions | 2,908 | 31 | 3,384 | 35 | |
| Redeemed | (85,738) | (905) | (202,855) | (2,091) | |
| Net Increase (Decrease)—Admiral Shares | 8,914 | 51 | (109,475) | (1,145) | |
| G. | Significant market disruptions, such as those caused by pandemics (e.g., COVID-19 pandemic), natural or environmental disasters, war (e.g., Russia’s invasion of Ukraine), acts of terrorism, or other events, can adversely affect local and global markets and normal market operations. Any such disruptions could have an adverse impact on the value of the fund’s investments and fund performance. |
| H. | Management has determined that no events or transactions occurred subsequent to August 31, 2023, that would require recognition or disclosure in these financial statements. |

| Average Annual Total Returns Periods Ended August 31, 2023 | |||||
| One Year | Five Years | Ten Years | Final Value of a $10,000 Investment | ||
| Information Technology Index Fund ETF Shares Net Asset Value | 28.47% | 18.16% | 20.44% | $64,210 |
| Information Technology Index Fund ETF Shares Market Price | 28.56 | 18.18 | 20.44 | 64,216 | |
| Information Technology Spliced Index | 28.58 | 18.30 | 20.57 | 64,929 |
| MSCI US Investable Market 2500 Index | 15.01 | 10.39 | 12.34 | 32,022 |
| One Year | Five Years | Ten Years | Final Value of a $100,000 Investment | ||
| Information Technology Index Fund Admiral Shares | 28.47% | 18.17% | 20.45% | $642,718 | |
| Information Technology Spliced Index | 28.58 | 18.30 | 20.57 | 649,295 | |
| MSCI US Investable Market 2500 Index | 15.01 | 10.39 | 12.34 | 320,217 | |
| One Year | Five Years | Ten Years | |
| Information Technology Index Fund ETF Shares Market Price | 28.56% | 130.49% | 542.16% |
| Information Technology Index Fund ETF Shares Net Asset Value | 28.47 | 130.34 | 542.10 |
| Information Technology Spliced Index | 28.58 | 131.73 | 549.29 |
| Communications Equipment | 3.8% |
| Electronic Equipment, Instruments & Components | 4.8 |
| IT Services | 5.8 |
| Semiconductors & Semiconductor Equipment | 24.5 |
| Software | 37.7 |
| Technology Hardware, Storage & Peripherals | 23.4 |
| Shares | Market Value• ($000) | ||
| Common Stocks (99.8%) | |||
| Communications Equipment (3.8%) | |||
| Cisco Systems Inc. | 22,081,618 | 1,266,381 | |
| * | Arista Networks Inc. | 1,501,322 | 293,103 |
| Motorola Solutions Inc. | 963,990 | 273,359 | |
| * | F5 Inc. | 460,408 | 75,350 |
| Juniper Networks Inc. | 2,485,731 | 72,385 | |
| * | Ciena Corp. | 1,325,385 | 66,243 |
| * | Lumentum Holdings Inc. | 816,776 | 44,212 |
| * | Extreme Networks Inc. | 1,472,017 | 40,407 |
| * | Calix Inc. | 865,493 | 40,254 |
| * | Viavi Solutions Inc. | 3,356,069 | 35,071 |
| * | NetScout Systems Inc. | 1,172,465 | 33,568 |
| * | ViaSat Inc. | 1,128,601 | 31,307 |
| * | Digi International Inc. | 756,266 | 25,244 |
| * | Harmonic Inc. | 2,230,467 | 23,821 |
| * | Infinera Corp. | 4,281,270 | 20,036 |
| * | CommScope Holding Co. Inc. | 4,422,947 | 14,773 |
| Adtran Holdings Inc. | 1,575,469 | 13,470 | |
| * | Clearfield Inc. | 289,570 | 10,178 |
| * | NETGEAR Inc. | 581,857 | 7,669 |
| * | Ribbon Communications Inc. | 1,966,455 | 5,821 |
| * | Casa Systems Inc. | 752,309 | 730 |
| 2,393,382 | |||
| Electronic Equipment, Instruments & Components (4.7%) | |||
| Amphenol Corp. Class A | 3,397,551 | 300,276 | |
| TE Connectivity Ltd. | 1,833,772 | 242,773 | |
| CDW Corp. | 820,461 | 173,240 | |
| Corning Inc. | 4,947,507 | 162,377 | |
| * | Keysight Technologies Inc. | 1,111,072 | 148,106 |
| * | Teledyne Technologies Inc. | 302,741 | 126,637 |
| Jabil Inc. | 905,170 | 103,569 | |
| * | Zebra Technologies Corp. Class A | 353,813 | 97,302 |
| * | Trimble Inc. | 1,724,312 | 94,475 |
| * | Flex Ltd. | 3,189,611 | 88,001 |
| Cognex Corp. | 1,385,886 | 65,247 | |
| National Instruments Corp. | 1,075,579 | 64,104 | |
| * | Arrow Electronics Inc. | 475,632 | 63,464 |
| * | Fabrinet | 380,813 | 61,223 |
| Littelfuse Inc. | 215,194 | 57,474 | |
| * | Novanta Inc. | 335,263 | 55,982 |
| * | Coherent Corp. | 1,354,565 | 50,972 |
| TD SYNNEX Corp. | 498,368 | 50,709 | |
| Vontier Corp. | 1,570,199 | 49,320 | |
| Badger Meter Inc. | 292,641 | 48,602 | |
| * | Insight Enterprises Inc. | 297,118 | 47,566 |
| Avnet Inc. | 934,480 | 47,425 | |
| Advanced Energy Industries Inc. | 393,553 | 46,467 | |
| Belden Inc. | 482,333 | 45,291 | |
| * | IPG Photonics Corp. | 385,269 | 41,748 |
| Vishay Intertechnology Inc. | 1,504,980 | 41,297 | |
| Shares | Market Value• ($000) | ||
| * | Sanmina Corp. | 714,492 | 39,797 |
| * | Itron Inc. | 569,626 | 38,968 |
| * | Plexus Corp. | 372,957 | 37,874 |
| Crane NXT Co. | 628,556 | 37,311 | |
| * | OSI Systems Inc. | 271,717 | 37,049 |
| * | Rogers Corp. | 245,581 | 35,489 |
| * | ePlus Inc. | 500,029 | 33,192 |
| * | Mirion Technologies Inc. | 3,674,787 | 31,383 |
| * | TTM Technologies Inc. | 2,047,520 | 30,508 |
| * | Knowles Corp. | 1,837,818 | 29,460 |
| CTS Corp. | 631,877 | 28,213 | |
| * | PAR Technology Corp. | 577,888 | 25,127 |
| Methode Electronics Inc. | 748,059 | 24,125 | |
| Benchmark Electronics Inc. | 751,511 | 19,344 | |
| * | Arlo Technologies Inc. | 1,930,405 | 18,860 |
| Napco Security Technologies Inc. | 697,885 | 17,294 | |
| * | ScanSource Inc. | 525,335 | 17,220 |
| *,1 | Lightwave Logic Inc. | 2,291,921 | 14,462 |
| PC Connection Inc. | 249,475 | 13,252 | |
| * | Evolv Technologies Holdings Inc. | 1,721,637 | 12,034 |
| *,1 | SmartRent Inc. | 3,364,662 | 11,440 |
| * | nLight Inc. | 918,288 | 10,478 |
| *,1 | MicroVision Inc. | 3,722,468 | 9,381 |
| * | FARO Technologies Inc. | 398,186 | 6,315 |
| *,1 | Ouster Inc. | 654,537 | 3,685 |
| * | 908 Devices Inc. | 456,940 | 3,285 |
| * | Aeva Technologies Inc. | 1,623,042 | 1,530 |
| *,1 | Focus Universal Inc. | 575,898 | 1,065 |
| 2,961,788 | |||
| IT Services (5.8%) | |||
| Accenture plc Class A | 3,408,865 | 1,103,688 | |
| International Business Machines Corp. | 4,942,877 | 725,763 | |
| * | Snowflake Inc. Class A | 1,520,156 | 238,437 |
| Cognizant Technology Solutions Corp. Class A | 2,997,194 | 214,629 | |
| * | Gartner Inc. | 483,303 | 169,001 |
| * | MongoDB Inc. | 433,797 | 165,407 |
| * | VeriSign Inc. | 603,386 | 125,378 |
| * | Cloudflare Inc. Class A | 1,827,628 | 118,851 |
| * | Akamai Technologies Inc. | 1,022,361 | 107,440 |
| * | EPAM Systems Inc. | 397,272 | 102,890 |
| * | Okta Inc. | 1,120,723 | 93,592 |
| * | Twilio Inc. Class A | 1,271,770 | 81,025 |
| * | GoDaddy Inc. Class A | 1,085,476 | 78,708 |
| * | DXC Technology Co. | 2,196,936 | 45,564 |
| * | Kyndryl Holdings Inc. | 2,598,542 | 43,863 |
| * | Fastly Inc. Class A | 1,771,913 | 42,154 |
| * | Perficient Inc. | 554,540 | 35,374 |
| * | Squarespace Inc. Class A | 920,210 | 27,744 |
| *,1 | DigitalOcean Holdings Inc. | 963,448 | 26,061 |
| Shares | Market Value• ($000) | ||
| * | BigCommerce Holdings Inc. Series 1 | 1,335,786 | 14,159 |
| * | Grid Dynamics Holdings Inc. | 1,184,357 | 13,774 |
| Hackett Group Inc. | 487,544 | 11,491 | |
| * | Thoughtworks Holding Inc. | 2,006,659 | 9,973 |
| * | Unisys Corp. | 1,435,559 | 5,785 |
| *,1 | Tucows Inc. Class A | 191,736 | 4,535 |
| * | Rackspace Technology Inc. | 1,182,507 | 2,956 |
| 3,608,242 | |||
| Semiconductors & Semiconductor Equipment (24.4%) | |||
| NVIDIA Corp. | 8,285,388 | 4,089,253 | |
| Broadcom Inc. | 2,239,596 | 2,066,901 | |
| * | Advanced Micro Devices Inc. | 8,696,417 | 919,385 |
| Texas Instruments Inc. | 4,917,064 | 826,362 | |
| Intel Corp. | 22,660,143 | 796,277 | |
| Applied Materials Inc. | 4,605,599 | 703,551 | |
| QUALCOMM Inc. | 6,073,089 | 695,551 | |
| Lam Research Corp. | 741,429 | 520,780 | |
| Analog Devices Inc. | 2,768,446 | 503,248 | |
| Micron Technology Inc. | 6,120,497 | 428,068 | |
| KLA Corp. | 769,061 | 385,969 | |
| NXP Semiconductors NV | 1,479,144 | 304,290 | |
| Marvell Technology Inc. | 4,902,567 | 285,575 | |
| Microchip Technology Inc. | 3,144,573 | 257,352 | |
| * | ON Semiconductor Corp. | 2,514,710 | 247,598 |
| Monolithic Power Systems Inc. | 281,910 | 146,934 | |
| * | First Solar Inc. | 656,799 | 124,214 |
| Skyworks Solutions Inc. | 1,045,780 | 113,718 | |
| * | Enphase Energy Inc. | 892,439 | 112,920 |
| Teradyne Inc. | 1,032,742 | 111,402 | |
| Entegris Inc. | 1,014,930 | 102,782 | |
| * | Lattice Semiconductor Corp. | 968,318 | 94,179 |
| * | Qorvo Inc. | 739,750 | 79,442 |
| * | SolarEdge Technologies Inc. | 432,720 | 70,347 |
| * | Onto Innovation Inc. | 451,921 | 62,808 |
| Universal Display Corp. | 381,887 | 62,080 | |
| * | Axcelis Technologies Inc. | 301,549 | 57,943 |
| * | Rambus Inc. | 986,997 | 55,736 |
| * | Wolfspeed Inc. | 1,153,482 | 55,160 |
| MKS Instruments Inc. | 549,301 | 55,056 | |
| * | MACOM Technology Solutions Holdings Inc. | 604,556 | 51,121 |
| Power Integrations Inc. | 571,822 | 48,044 | |
| * | Cirrus Logic Inc. | 568,022 | 46,601 |
| * | Silicon Laboratories Inc. | 331,155 | 44,660 |
| * | Diodes Inc. | 511,878 | 41,897 |
| Amkor Technology Inc. | 1,446,522 | 40,445 | |
| * | Synaptics Inc. | 459,077 | 40,188 |
| * | FormFactor Inc. | 1,131,271 | 39,956 |
| Shares | Market Value• ($000) | ||
| Kulicke & Soffa Industries Inc. | 732,490 | 37,892 | |
| * | Allegro MicroSystems Inc. | 976,553 | 37,353 |
| * | Sitime Corp. | 262,019 | 34,767 |
| * | Credo Technology Group Holding Ltd. | 2,079,185 | 34,223 |
| * | Cohu Inc. | 872,170 | 32,610 |
| * | MaxLinear Inc. | 1,373,547 | 32,278 |
| * | Ambarella Inc. | 516,294 | 32,088 |
| * | Ultra Clean Holdings Inc. | 905,015 | 31,820 |
| * | Impinj Inc. | 477,511 | 31,788 |
| * | Semtech Corp. | 1,209,804 | 31,636 |
| * | Photronics Inc. | 1,305,119 | 31,010 |
| * | Veeco Instruments Inc. | 1,045,882 | 30,529 |
| * | SMART Global Holdings Inc. | 1,055,767 | 27,270 |
| * | PDF Solutions Inc. | 638,561 | 23,205 |
| *,1 | Navitas Semiconductor Corp. | 2,545,005 | 22,472 |
| * | Ichor Holdings Ltd. | 612,619 | 22,440 |
| * | indie Semiconductor Inc. Class A | 2,522,643 | 16,902 |
| * | ACM Research Inc. Class A | 926,013 | 16,261 |
| * | Alpha & Omega Semiconductor Ltd. | 492,680 | 15,544 |
| * | CEVA Inc. | 469,033 | 10,891 |
| * | Magnachip Semiconductor Corp. | 889,888 | 7,315 |
| 15,248,087 | |||
| Software (37.7%) | |||
| Microsoft Corp. | 31,571,290 | 10,347,806 | |
| * | Adobe Inc. | 2,478,503 | 1,386,326 |
| * | Salesforce Inc. | 5,388,317 | 1,193,297 |
| Oracle Corp. | 8,775,752 | 1,056,513 | |
| Intuit Inc. | 1,523,860 | 825,643 | |
| * | ServiceNow Inc. | 1,113,814 | 655,847 |
| * | Synopsys Inc. | 852,889 | 391,382 |
| * | Palo Alto Networks Inc. | 1,554,383 | 378,181 |
| * | Cadence Design Systems Inc. | 1,535,958 | 369,306 |
| Roper Technologies Inc. | 607,496 | 303,177 | |
| * | Workday Inc. Class A | 1,183,404 | 289,342 |
| * | Autodesk Inc. | 1,236,254 | 274,374 |
| * | Fortinet Inc. | 3,898,684 | 234,740 |
| * | VMware Inc. Class A | 1,384,028 | 233,596 |
| * | Crowdstrike Holdings Inc. Class A | 1,325,392 | 216,079 |
| * | Atlassian Corp. Ltd. Class A | 920,856 | 187,910 |
| * | ANSYS Inc. | 531,468 | 169,469 |
| * | Palantir Technologies Inc. Class A | 11,080,819 | 165,991 |
| * | HubSpot Inc. | 292,588 | 159,905 |
| * | Datadog Inc. Class A | 1,561,252 | 150,630 |
| * | Fair Isaac Corp. | 157,922 | 142,855 |
| * | Splunk Inc. | 1,053,678 | 127,769 |
| * | Zoom Video Communications Inc. Class A | 1,585,949 | 112,650 |
| * | Tyler Technologies Inc. | 280,009 | 111,564 |
| * | PTC Inc. | 749,702 | 110,334 |
| * | Zscaler Inc. | 616,406 | 96,190 |
| * | Manhattan Associates Inc. | 445,263 | 90,219 |
| * | Black Knight Inc. | 1,149,562 | 87,091 |
| * | Dynatrace Inc. | 1,790,523 | 86,303 |
| Shares | Market Value• ($000) | ||
| Gen Digital Inc. (XNGS) | 4,104,552 | 83,117 | |
| * | Bill Holdings Inc. | 709,906 | 81,852 |
| Bentley Systems Inc. Class B | 1,593,455 | 79,529 | |
| * | DocuSign Inc. | 1,527,891 | 76,853 |
| * | Unity Software Inc. | 1,838,645 | 68,159 |
| * | AppLovin Corp. Class A | 1,476,254 | 63,804 |
| * | Nutanix Inc. Class A | 1,958,371 | 60,905 |
| * | Dropbox Inc. Class A | 2,190,100 | 60,863 |
| * | SPS Commerce Inc. | 320,862 | 59,722 |
| * | Guidewire Software Inc. | 685,573 | 59,254 |
| * | Workiva Inc. | 488,149 | 54,600 |
| * | Qualys Inc. | 347,393 | 54,072 |
| * | Procore Technologies Inc. | 799,009 | 53,973 |
| * | UiPath Inc. Class A | 3,357,436 | 53,081 |
| * | Aspen Technology Inc. | 268,340 | 52,058 |
| * | Smartsheet Inc. Class A | 1,225,023 | 51,120 |
| * | Confluent Inc. Class A | 1,543,554 | 51,076 |
| * | Five9 Inc. | 688,154 | 49,802 |
| * | Tenable Holdings Inc. | 1,096,094 | 49,730 |
| Dolby Laboratories Inc. Class A | 571,556 | 48,279 | |
| * | Elastic NV | 776,139 | 48,028 |
| * | Teradata Corp. | 1,037,907 | 48,024 |
| * | New Relic Inc. | 557,922 | 47,485 |
| * | Samsara Inc. Class A | 1,735,291 | 47,478 |
| * | NCR Corp. | 1,447,653 | 44,530 |
| *,1 | MicroStrategy Inc. Class A | 123,946 | 44,314 |
| * | Altair Engineering Inc. Class A | 642,412 | 42,708 |
| * | Varonis Systems Inc. | 1,322,435 | 42,225 |
| * | DoubleVerify Holdings Inc. | 1,243,828 | 42,054 |
| * | Appfolio Inc. Class A | 218,015 | 42,027 |
| * | Blackline Inc. | 696,417 | 41,827 |
| * | Gitlab Inc. Class A | 881,493 | 41,756 |
| * | SentinelOne Inc. Class A | 2,509,769 | 41,737 |
| * | Blackbaud Inc. | 531,302 | 40,437 |
| * | Rapid7 Inc. | 798,936 | 40,258 |
| * | Box Inc. Class A | 1,496,534 | 39,628 |
| * | Freshworks Inc. Class A | 1,804,457 | 39,464 |
| * | Sprout Social Inc. Class A | 736,703 | 39,443 |
| * | Aurora Innovation Inc. | 12,374,908 | 39,228 |
| * | ACI Worldwide Inc. | 1,549,886 | 37,631 |
| * | Alarm.com Holdings Inc. | 636,823 | 37,299 |
| *,1 | C3.ai Inc. Class A | 1,198,497 | 37,177 |
| * | HashiCorp Inc. Class A | 1,274,890 | 37,176 |
| * | CommVault Systems Inc. | 543,974 | 37,159 |
| Progress Software Corp. | 602,658 | 36,666 | |
| * | RingCentral Inc. Class A | 1,181,841 | 36,554 |
| *,1 | Marathon Digital Holdings Inc. | 2,897,856 | 36,426 |
| InterDigital Inc. | 414,737 | 35,962 | |
| * | PagerDuty Inc. | 1,388,780 | 35,775 |
| * | Braze Inc. Class A | 752,380 | 34,805 |
| Pegasystems Inc. | 698,477 | 34,686 | |
| * | LiveRamp Holdings Inc. | 1,070,532 | 34,621 |
| * | Envestnet Inc. | 632,407 | 34,548 |
| * | JFrog Ltd. | 1,195,203 | 34,290 |
| *,1 | Riot Platforms Inc. | 3,000,641 | 34,057 |
| * | Q2 Holdings Inc. | 985,194 | 33,901 |
| * | nCino Inc. | 1,030,498 | 33,873 |
| * | Verint Systems Inc. | 1,022,548 | 33,120 |
| * | Alteryx Inc. Class A | 1,098,584 | 32,430 |
| * | Asana Inc. Class A | 1,502,020 | 32,278 |
| Shares | Market Value• ($000) | ||
| * | Appian Corp. Class A | 648,119 | 31,563 |
| * | Sprinklr Inc. Class A | 2,075,310 | 31,399 |
| * | Agilysys Inc. | 442,111 | 31,189 |
| * | PROS Holdings Inc. | 853,349 | 30,601 |
| Clear Secure Inc. Class A | 1,386,536 | 30,143 | |
| * | Clearwater Analytics Holdings Inc. Class A | 1,659,009 | 30,111 |
| * | PowerSchool Holdings Inc. Class A | 1,202,777 | 26,605 |
| * | Zeta Global Holdings Corp. Class A | 3,045,954 | 24,764 |
| * | Zuora Inc. Class A | 2,586,242 | 23,561 |
| * | Vertex Inc. Class A | 1,022,201 | 22,887 |
| Adeia Inc. | 2,242,908 | 22,564 | |
| * | Cerence Inc. | 849,973 | 22,184 |
| A10 Networks Inc. | 1,482,448 | 22,074 | |
| * | Everbridge Inc. | 854,890 | 21,210 |
| * | Intapp Inc. | 566,982 | 20,757 |
| * | Model N Inc. | 763,397 | 20,612 |
| * | Yext Inc. | 2,223,348 | 19,477 |
| * | Digital Turbine Inc. | 2,107,792 | 18,780 |
| * | EngageSmart Inc. | 1,054,877 | 18,682 |
| * | E2open Parent Holdings Inc. | 3,833,802 | 18,517 |
| * | N-Able Inc. | 1,343,467 | 17,962 |
| * | Jamf Holding Corp. | 1,045,540 | 17,628 |
| * | Informatica Inc. Class A | 765,986 | 16,047 |
| * | Alkami Technology Inc. | 881,118 | 15,349 |
| * | Matterport Inc. | 5,294,191 | 14,188 |
| * | Amplitude Inc. Class A | 1,191,534 | 13,917 |
| * | AvePoint Inc. | 1,984,719 | 13,774 |
| * | Olo Inc. Class A | 2,092,440 | 13,496 |
| * | Consensus Cloud Solutions Inc. | 393,849 | 12,576 |
| * | SolarWinds Corp. | 1,035,122 | 11,024 |
| * | Couchbase Inc. | 635,996 | 10,876 |
| * | Xperi Inc. | 891,541 | 10,520 |
| * | Mitek Systems Inc. | 895,358 | 10,001 |
| *,1 | Digimarc Corp. | 300,064 | 9,824 |
| Ebix Inc. | 521,298 | 8,706 | |
| *,1 | SoundHound AI Inc. Class A | 3,371,687 | 8,497 |
| * | OneSpan Inc. | 672,817 | 8,242 |
| American Software Inc. Class A | 682,233 | 7,866 | |
| * | MeridianLink Inc. | 425,113 | 7,529 |
| * | Domo Inc. Class B | 654,577 | 6,978 |
| * | 8x8 Inc. | 2,085,305 | 6,777 |
| * | LivePerson Inc. | 1,517,032 | 6,372 |
| *,1 | SEMrush Holdings Inc. Class A | 624,022 | 5,897 |
| * | Weave Communications Inc. | 492,479 | 5,028 |
| * | CS Disco Inc. | 496,841 | 4,720 |
| *,1 | Terawulf Inc. | 2,235,261 | 4,672 |
| ON24 Inc. | 658,373 | 4,516 | |
| * | Enfusion Inc. Class A | 474,840 | 4,055 |
| *,1 | Cipher Mining Inc. | 1,010,046 | 3,222 |
| * | Expensify Inc. Class A | 688,791 | 2,955 |
| * | Rimini Street Inc. | 1,183,894 | 2,865 |
| * | Telos Corp. | 1,097,016 | 2,863 |
| * | WM Technology Inc. | 1,650,734 | 2,509 |
| * | Upland Software Inc. | 644,219 | 2,287 |
| *,1 | Veritone Inc. | 731,055 | 2,244 |
| * | SecureWorks Corp. Class A | 257,171 | 1,775 |
| *,1 | Porch Group Inc. | 1,830,941 | 1,547 |
| * | ForgeRock Inc. Class A | 1,860 | 43 |
| 23,506,450 |
| Shares | Market Value• ($000) | ||
| Technology Hardware, Storage & Peripherals (23.4%) | |||
| Apple Inc. | 72,536,988 | 13,627,524 | |
| HP Inc. | 5,385,293 | 159,997 | |
| Hewlett Packard Enterprise Co. | 8,107,533 | 137,747 | |
| NetApp Inc. | 1,409,320 | 108,095 | |
| * | Western Digital Corp. | 2,234,127 | 100,536 |
| Dell Technologies Inc. Class C | 1,743,755 | 98,069 | |
| Seagate Technology Holdings plc | 1,320,266 | 93,462 | |
| * | Super Micro Computer Inc. | 336,670 | 92,611 |
| * | Pure Storage Inc. Class A | 2,133,341 | 78,059 |
| *,1 | IonQ Inc. | 2,493,973 | 42,871 |
| Xerox Holdings Corp. | 2,054,914 | 32,653 | |
| * | Avid Technology Inc. | 740,637 | 19,745 |
| * | Corsair Gaming Inc. | 968,112 | 15,219 |
| *,1 | CPI Card Group Inc. | 88,794 | 1,835 |
| 14,608,423 | |||
| Total Common Stocks (Cost $46,013,855) | 62,326,372 | ||
| Shares | Market Value• ($000) | ||
| Temporary Cash Investments (0.4%) | |||
| Money Market Fund (0.4%) | |||
| 2,3 | Vanguard Market Liquidity Fund, 5.384% (Cost $249,112) | 2,491,813 | 249,156 |
| Total Investments (100.2%) (Cost $46,262,967) | 62,575,528 | ||
| Other Assets and Liabilities—Net (-0.2%) | (139,594) | ||
| Net Assets (100.0%) | 62,435,934 | ||
| Cost is in $000. | |||
| • | See Note A in Notes to Financial Statements. |
| * | Non-income-producing security. |
| 1 | Includes partial security positions on loan to broker-dealers. The total value of securities on loan is $142,994,000. |
| 2 | Affiliated money market fund available only to Vanguard funds and certain trusts and accounts managed by Vanguard. Rate shown is the 7-day yield. |
| 3 | Collateral of $158,224,000 was received for securities on loan, of which $158,171,000 is held in Vanguard Market Liquidity Fund and $53,000 is held in cash. |
| Futures Contracts | ||||
| ($000) | ||||
| Expiration | Number of Long (Short) Contracts | Notional Amount | Value and Unrealized Appreciation (Depreciation) | |
| Long Futures Contracts | ||||
| E-mini NASDAQ 100 Index | September 2023 | 227 | 70,545 | 1,902 |
| Over-the-Counter Total Return Swaps | ||||||
| Reference Entity | Termination Date | Counterparty | Notional Amount ($000) | Floating Interest Rate Received (Paid)1 (%) | Value and Unrealized Appreciation ($000) | Value and Unrealized (Depreciation) ($000) |
| Palo Alto Networks Inc. | 8/30/24 | BANA | 36,495 | (5.320) | — | — |
| 1 | Based on Overnight Bank Funding Rate as of the most recent reset date. Floating interest payment received/paid monthly. |
| BANA—Bank of America, N.A. |
| ($000s, except shares, footnotes, and per-share amounts) | Amount |
| Assets | |
| Investments in Securities, at Value1 | |
| Unaffiliated Issuers (Cost $46,013,855) | 62,326,372 |
| Affiliated Issuers (Cost $249,112) | 249,156 |
| Total Investments in Securities | 62,575,528 |
| Investment in Vanguard | 2,081 |
| Cash | 53 |
| Cash Collateral Pledged—Futures Contracts | 5,990 |
| Cash Collateral Pledged—Over-the-Counter Swap Contracts | 1,980 |
| Receivables for Investment Securities Sold | 1,772,488 |
| Receivables for Accrued Income | 51,369 |
| Receivables for Capital Shares Issued | 9,698 |
| Variation Margin Receivable—Futures Contracts | 271 |
| Unrealized Appreciation—Over-the-Counter Swap Contracts | — |
| Total Assets | 64,419,458 |
| Liabilities | |
| Due to Custodian | 4,273 |
| Payables for Investment Securities Purchased | 1,770,971 |
| Collateral for Securities on Loan | 158,224 |
| Payables for Capital Shares Redeemed | 47,435 |
| Payables to Vanguard | 2,621 |
| Total Liabilities | 1,983,524 |
| Net Assets | 62,435,934 |
| 1 Includes $142,994,000 of securities on loan. | |
| At August 31, 2023, net assets consisted of: | |
| Paid-in Capital | 48,450,941 |
| Total Distributable Earnings (Loss) | 13,984,993 |
| Net Assets | 62,435,934 |
| ETF Shares—Net Assets | |
| Applicable to 120,619,432 outstanding $.001 par value shares of beneficial interest (unlimited authorization) | 53,652,722 |
| Net Asset Value Per Share—ETF Shares | $444.81 |
| Admiral Shares—Net Assets | |
| Applicable to 38,563,467 outstanding $.001 par value shares of beneficial interest (unlimited authorization) | 8,783,212 |
| Net Asset Value Per Share—Admiral Shares | $227.76 |
| Year Ended August 31, 2023 | |
| ($000) | |
| Investment Income | |
| Income | |
| Dividends1 | 470,521 |
| Interest2 | 6,109 |
| Securities Lending—Net | 7,217 |
| Total Income | 483,847 |
| Expenses | |
| The Vanguard Group—Note B | |
| Investment Advisory Services | 1,224 |
| Management and Administrative— ETF Shares | 40,828 |
| Management and Administrative— Admiral Shares | 6,138 |
| Marketing and Distribution— ETF Shares | 2,129 |
| Marketing and Distribution— Admiral Shares | 375 |
| Custodian Fees | 147 |
| Auditing Fees | 30 |
| Shareholders’ Reports—ETF Shares | 931 |
| Shareholders’ Reports—Admiral Shares | 38 |
| Trustees’ Fees and Expenses | 27 |
| Other Expenses | 22 |
| Total Expenses | 51,889 |
| Expenses Paid Indirectly | (12) |
| Net Expenses | 51,877 |
| Net Investment Income | 431,970 |
| Realized Net Gain (Loss) | |
| Investment Securities Sold2,3 | 7,712,419 |
| Futures Contracts | 10,468 |
| Swap Contracts | 11,355 |
| Realized Net Gain (Loss) | 7,734,242 |
| Change in Unrealized Appreciation (Depreciation) | |
| Investment Securities2 | 5,501,548 |
| Futures Contracts | 3,012 |
| Swap Contracts | — |
| Change in Unrealized Appreciation (Depreciation) | 5,504,560 |
| Net Increase (Decrease) in Net Assets Resulting from Operations | 13,670,772 |
| 1 | Dividends are net of foreign withholding taxes of $738,000. |
| 2 | Interest income, realized net gain (loss), capital gain distributions received, and change in unrealized appreciation (depreciation) from an affiliated company of the fund were $5,962,000, ($8,000), less than $1,000, and $19,000, respectively. Purchases and sales are for temporary cash investment purposes. |
| 3 | Includes $9,049,814,000 of net gain (loss) resulting from in-kind redemptions. |
| Year Ended August 31, | ||
| 2023 ($000) | 2022 ($000) | |
| Increase (Decrease) in Net Assets | ||
| Operations | ||
| Net Investment Income | 431,970 | 419,743 |
| Realized Net Gain (Loss) | 7,734,242 | 6,476,344 |
| Change in Unrealized Appreciation (Depreciation) | 5,504,560 | (17,436,415) |
| Net Increase (Decrease) in Net Assets Resulting from Operations | 13,670,772 | (10,540,328) |
| Distributions | ||
| ETF Shares | (377,208) | (362,859) |
| Admiral Shares | (55,088) | (51,539) |
| Total Distributions | (432,296) | (414,398) |
| Capital Share Transactions | ||
| ETF Shares | (1,393,287) | 1,913,376 |
| Admiral Shares | 1,038,391 | 54,602 |
| Net Increase (Decrease) from Capital Share Transactions | (354,896) | 1,967,978 |
| Total Increase (Decrease) | 12,883,580 | (8,986,748) |
| Net Assets | ||
| Beginning of Period | 49,552,354 | 58,539,102 |
| End of Period | 62,435,934 | 49,552,354 |
| ETF Shares | |||||
| For a Share Outstanding Throughout Each Period | Year Ended August 31, | ||||
| 2023 | 2022 | 2021 | 2020 | 2019 | |
| Net Asset Value, Beginning of Period | $349.23 | $426.48 | $328.54 | $213.66 | $202.82 |
| Investment Operations | |||||
| Net Investment Income1 | 3.090 | 3.003 | 2.634 | 2.926 | 2.572 |
| Net Realized and Unrealized Gain (Loss) on Investments | 95.573 | (77.272) | 97.919 | 114.955 | 10.792 |
| Total from Investment Operations | 98.663 | (74.269) | 100.553 | 117.881 | 13.364 |
| Distributions | |||||
| Dividends from Net Investment Income | (3.083) | (2.981) | (2.613) | (3.001) | (2.524) |
| Distributions from Realized Capital Gains | — | — | — | — | — |
| Total Distributions | (3.083) | (2.981) | (2.613) | (3.001) | (2.524) |
| Net Asset Value, End of Period | $444.81 | $349.23 | $426.48 | $328.54 | $213.66 |
| Total Return | 28.47% | -17.50% | 30.80% | 55.72% | 6.70% |
| Ratios/Supplemental Data | |||||
| Net Assets, End of Period (Millions) | $53,653 | $43,558 | $51,238 | $38,711 | $20,738 |
| Ratio of Total Expenses to Average Net Assets | 0.10%2 | 0.10%2 | 0.10% | 0.10% | 0.10% |
| Ratio of Net Investment Income to Average Net Assets | 0.83% | 0.76% | 0.73% | 1.17% | 1.32% |
| Portfolio Turnover Rate3 | 15% | 6% | 4% | 5% | 5% |
| 1 | Calculated based on average shares outstanding. |
| 2 | The ratio of expenses to average net assets for the period net of reduction from custody fee offset arrangements was 0.10%. |
| 3 | Excludes the value of portfolio securities received or delivered as a result of in-kind purchases or redemptions of the fund’s capital shares, including ETF Creation Units. |
| Admiral Shares | |||||
| For a Share Outstanding Throughout Each Period | Year Ended August 31, | ||||
| 2023 | 2022 | 2021 | 2020 | 2019 | |
| Net Asset Value, Beginning of Period | $178.82 | $218.38 | $168.23 | $109.40 | $103.86 |
| Investment Operations | |||||
| Net Investment Income1 | 1.591 | 1.538 | 1.353 | 1.504 | 1.326 |
| Net Realized and Unrealized Gain (Loss) on Investments | 48.931 | (39.572) | 50.136 | 58.864 | 5.509 |
| Total from Investment Operations | 50.522 | (38.034) | 51.489 | 60.368 | 6.835 |
| Distributions | |||||
| Dividends from Net Investment Income | (1.582) | (1.526) | (1.339) | (1.538) | (1.295) |
| Distributions from Realized Capital Gains | — | — | — | — | — |
| Total Distributions | (1.582) | (1.526) | (1.339) | (1.538) | (1.295) |
| Net Asset Value, End of Period | $227.76 | $178.82 | $218.38 | $168.23 | $109.40 |
| Total Return2 | 28.47% | -17.50% | 30.81% | 55.78% | 6.70% |
| Ratios/Supplemental Data | |||||
| Net Assets, End of Period (Millions) | $8,783 | $5,994 | $7,301 | $5,149 | $2,470 |
| Ratio of Total Expenses to Average Net Assets | 0.10%3 | 0.10%3 | 0.10% | 0.10% | 0.10% |
| Ratio of Net Investment Income to Average Net Assets | 0.83% | 0.75% | 0.73% | 1.17% | 1.32% |
| Portfolio Turnover Rate4 | 15% | 6% | 4% | 5% | 5% |
| 1 | Calculated based on average shares outstanding. |
| 2 | Total returns do not include account service fees that may have applied in the periods shown. Fund prospectuses provide information about any applicable account service fees. |
| 3 | The ratio of expenses to average net assets for the period net of reduction from custody fee offset arrangements was 0.10%. |
| 4 | Excludes the value of portfolio securities received or delivered as a result of in-kind purchases or redemptions of the fund’s capital shares, including ETF Creation Units. |
| A. | The following significant accounting policies conform to generally accepted accounting principles for U.S. investment companies. The fund consistently follows such policies in preparing its financial statements. |
| B. | In accordance with the terms of a Funds' Service Agreement (the “FSA”) between Vanguard and the fund, Vanguard furnishes to the fund investment advisory, corporate management, administrative, marketing, and distribution services at Vanguard’s cost of operations (as defined by the FSA). These costs of operations are allocated to the fund based on methods and guidelines approved by the board of trustees and are generally settled twice a month. |
| C. | The fund’s custodian bank has agreed to reduce its fees when the fund maintains cash on deposit in the non-interest-bearing custody account. For the year ended August 31, 2023, custodian fee offset arrangements reduced the fund’s expenses by $12,000 (an annual rate of less than 0.01% of average net assets). |
| D. | Various inputs may be used to determine the value of the fund’s investments and derivatives. These inputs are summarized in three broad levels for financial statement purposes. The inputs or methodologies used to value securities are not necessarily an indication of the risk associated with investing in those securities. |
| Level 1 ($000) | Level 2 ($000) | Level 3 ($000) | Total ($000) | |
| Investments | ||||
| Assets | ||||
| Common Stocks | 62,326,372 | — | — | 62,326,372 |
| Temporary Cash Investments | 249,156 | — | — | 249,156 |
| Total | 62,575,528 | — | — | 62,575,528 |
| Derivative Financial Instruments | ||||
| Assets | ||||
| Futures Contracts1 | 1,902 | — | — | 1,902 |
| Swap Contracts | — | — | — | — |
| Total | 1,902 | — | — | 1,902 |
| 1 | Includes cumulative appreciation (depreciation) on futures contracts and centrally cleared swaps, if any, as reported in the Schedule of Investments. Only current day’s variation margin is reported within the Statement of Assets and Liabilities. |
| E. | Permanent differences between book-basis and tax-basis components of net assets are reclassified among capital accounts in the financial statements to reflect their tax character. These reclassifications have no effect on net assets or net asset value per share. As of period end, permanent differences primarily attributable to the accounting for applicable in-kind redemptions and swap agreements were reclassified between the following accounts: |
| Amount ($000) | |
| Paid-in Capital | 9,047,793 |
| Total Distributable Earnings (Loss) | (9,047,793) |
| Amount ($000) | |
| Undistributed Ordinary Income | 108,152 |
| Undistributed Long-Term Gains | — |
| Net Unrealized Gains (Losses) | 16,156,230 |
| Capital Loss Carryforwards | (2,279,389) |
| Qualified Late-Year Losses | — |
| Other Temporary Differences | — |
| Total | 13,984,993 |
| Year Ended August 31, | ||
| 2023 Amount ($000) | 2022 Amount ($000) | |
| Ordinary Income* | 432,296 | 414,398 |
| Long-Term Capital Gains | — | — |
| Total | 432,296 | 414,398 |
| * | Includes short-term capital gains, if any. |
| Amount ($000) | |
| Tax Cost | 46,419,298 |
| Gross Unrealized Appreciation | 18,388,541 |
| Gross Unrealized Depreciation | (2,232,311) |
| Net Unrealized Appreciation (Depreciation) | 16,156,230 |
| F. | During the year ended August 31, 2023, the fund purchased $25,457,018,000 of investment securities and sold $25,795,504,000 of investment securities, other than temporary cash investments. Purchases and sales include $16,403,899,000 and $17,750,262,000, respectively, in connection with in-kind purchases and redemptions of the fund's capital shares. |
| G. | Capital share transactions for each class of shares were: |
| Year Ended August 31, | |||||
| 2023 | 2022 | ||||
| Amount ($000) | Shares (000) | Amount ($000) | Shares (000) | ||
| ETF Shares | |||||
| Issued | 16,506,313 | 41,443 | 12,984,660 | 32,734 | |
| Issued in Lieu of Cash Distributions | — | — | — | — | |
| Redeemed | (17,899,600) | (45,550) | (11,071,284) | (28,150) | |
| Net Increase (Decrease)—ETF Shares | (1,393,287) | (4,107) | 1,913,376 | 4,584 | |
| Admiral Shares | |||||
| Issued | 2,150,542 | 10,897 | 1,802,529 | 8,692 | |
| Issued in Lieu of Cash Distributions | 50,075 | 271 | 46,814 | 229 | |
| Redeemed | (1,162,226) | (6,126) | (1,794,741) | (8,834) | |
| Net Increase (Decrease)—Admiral Shares | 1,038,391 | 5,042 | 54,602 | 87 | |
| H. | Significant market disruptions, such as those caused by pandemics (e.g., COVID-19 pandemic), natural or environmental disasters, war (e.g., Russia’s invasion of Ukraine), acts of terrorism, or other events, can adversely affect local and global markets and normal market operations. Any such disruptions could have an adverse impact on the value of the fund’s investments and fund performance. |
| I. | Management has determined that no events or transactions occurred subsequent to August 31, 2023, that would require recognition or disclosure in these financial statements. |

| Average Annual Total Returns Periods Ended August 31, 2023 | |||||
| One Year | Five Years | Ten Years | Final Value of a $10,000 Investment | ||
| Materials Index Fund ETF Shares Net Asset Value | 12.09% | 8.37% | 9.37% | $24,485 |
| Materials Index Fund ETF Shares Market Price | 12.09 | 8.37 | 9.37 | 24,481 | |
| MSCI US Investable Market Materials 25/50 Index | 12.20 | 8.49 | 9.46 | 24,696 |
| MSCI US Investable Market 2500 Index | 15.01 | 10.39 | 12.34 | 32,022 |
| One Year | Five Years | Ten Years | Final Value of a $100,000 Investment | ||
| Materials Index Fund Admiral Shares | 12.10% | 8.38% | 9.37% | $244,980 | |
| MSCI US Investable Market Materials 25/50 Index | 12.20 | 8.49 | 9.46 | 246,961 | |
| MSCI US Investable Market 2500 Index | 15.01 | 10.39 | 12.34 | 320,217 | |
| One Year | Five Years | Ten Years | |
| Materials Index Fund ETF Shares Market Price | 12.09% | 49.48% | 144.81% |
| Materials Index Fund ETF Shares Net Asset Value | 12.09 | 49.47 | 144.85 |
| MSCI US Investable Market Materials 25/50 Index | 12.20 | 50.27 | 146.96 |
| Chemicals | 62.5% |
| Construction Materials | 5.9 |
| Containers & Packaging | 11.5 |
| Metals & Mining | 19.6 |
| Paper & Forest Products | 0.5 |
| Shares | Market Value• ($000) | ||
| Common Stocks (99.6%) | |||
| Chemicals (62.2%) | |||
| Linde plc | 1,697,690 | 657,074 | |
| Sherwin-Williams Co. | 849,527 | 230,833 | |
| Air Products and Chemicals Inc. | 770,218 | 227,592 | |
| Ecolab Inc. | 888,546 | 163,324 | |
| Dow Inc. | 2,452,673 | 133,818 | |
| Corteva Inc. | 2,464,961 | 124,505 | |
| DuPont de Nemours Inc. | 1,591,663 | 122,383 | |
| PPG Industries Inc. | 816,309 | 115,720 | |
| LyondellBasell Industries NV Class A | 902,331 | 89,123 | |
| Albemarle Corp. | 359,865 | 71,509 | |
| International Flavors & Fragrances Inc. | 884,564 | 62,318 | |
| CF Industries Holdings Inc. | 675,887 | 52,091 | |
| Celanese Corp. | 358,360 | 45,282 | |
| Mosaic Co. | 1,151,603 | 44,740 | |
| RPM International Inc. | 447,002 | 44,584 | |
| FMC Corp. | 433,593 | 37,389 | |
| Eastman Chemical Co. | 413,178 | 35,124 | |
| Olin Corp. | 425,841 | 24,707 | |
| * | Axalta Coating Systems Ltd. | 768,169 | 21,739 |
| Chemours Co. | 517,217 | 17,596 | |
| Westlake Corp. | 132,841 | 17,400 | |
| Huntsman Corp. | 596,902 | 16,636 | |
| Element Solutions Inc. | 795,250 | 16,398 | |
| Balchem Corp. | 111,744 | 15,700 | |
| Ashland Inc. | 173,942 | 15,069 | |
| Cabot Corp. | 194,468 | 14,091 | |
| HB Fuller Co. | 186,990 | 13,562 | |
| * | Livent Corp. | 623,815 | 13,393 |
| Avient Corp. | 300,013 | 12,034 | |
| NewMarket Corp. | 25,046 | 11,763 | |
| Innospec Inc. | 86,121 | 9,251 | |
| Sensient Technologies Corp. | 146,641 | 9,035 | |
| *,1 | Ginkgo Bioworks Holdings Inc. | 3,583,446 | 8,385 |
| Scotts Miracle-Gro Co. | 145,903 | 8,267 | |
| Quaker Chemical Corp. | 43,703 | 7,756 | |
| Minerals Technologies Inc. | 113,029 | 6,906 | |
| Stepan Co. | 77,392 | 6,754 | |
| * | Ingevity Corp. | 119,378 | 6,433 |
| Tronox Holdings plc | 406,693 | 5,547 | |
| Orion SA | 203,597 | 4,605 | |
| Hawkins Inc. | 69,718 | 4,336 | |
| * | Ecovyst Inc. | 363,430 | 3,722 |
| Chase Corp. | 27,936 | 3,534 | |
| AdvanSix Inc. | 95,924 | 3,173 | |
| Mativ Holdings Inc. | 189,547 | 3,109 | |
| * | Perimeter Solutions SA | 516,122 | 3,050 |
| *,1 | PureCycle Technologies Inc. | 310,898 | 2,776 |
| Shares | Market Value• ($000) | ||
| Koppers Holdings Inc. | 71,781 | 2,748 | |
| * | LSB Industries Inc. | 184,375 | 1,866 |
| * | Aspen Aerogels Inc. | 182,083 | 1,109 |
| * | Intrepid Potash Inc. | 38,735 | 1,039 |
| Trinseo plc | 96,036 | 1,011 | |
| Kronos Worldwide Inc. | 80,003 | 672 | |
| *,1 | Danimer Scientific Inc. | 334,620 | 652 |
| *,1 | Origin Materials Inc. | 399,664 | 548 |
| 2,573,781 | |||
| Construction Materials (5.9%) | |||
| Vulcan Materials Co. | 461,333 | 100,686 | |
| Martin Marietta Materials Inc. | 214,854 | 95,913 | |
| Eagle Materials Inc. | 123,119 | 23,309 | |
| * | Summit Materials Inc. Class A | 412,305 | 15,424 |
| * | Knife River Corp. | 167,132 | 8,601 |
| 243,933 | |||
| Containers & Packaging (11.5%) | |||
| Ball Corp. | 1,090,671 | 59,387 | |
| Avery Dennison Corp. | 279,908 | 52,729 | |
| Amcor plc | 5,101,865 | 49,692 | |
| Packaging Corp. of America | 311,822 | 46,493 | |
| International Paper Co. | 1,143,237 | 39,922 | |
| Crown Holdings Inc. | 416,425 | 38,586 | |
| AptarGroup Inc. | 227,164 | 30,113 | |
| Westrock Co. | 888,161 | 29,052 | |
| Berry Global Group Inc. | 413,292 | 27,004 | |
| Graphic Packaging Holding Co. | 1,064,932 | 23,684 | |
| Sonoco Products Co. | 339,621 | 19,511 | |
| Sealed Air Corp. | 500,664 | 18,554 | |
| Silgan Holdings Inc. | 305,912 | 13,806 | |
| * | O-I Glass Inc. | 538,407 | 10,693 |
| Greif Inc. Class A | 88,079 | 6,394 | |
| TriMas Corp. | 144,400 | 3,783 | |
| Myers Industries Inc. | 108,946 | 2,049 | |
| Pactiv Evergreen Inc. | 156,953 | 1,290 | |
| * | Ranpak Holdings Corp. | 151,297 | 958 |
| 473,700 | |||
| Metals & Mining (19.5%) | |||
| Freeport-McMoRan Inc. | 4,969,998 | 198,353 | |
| Nucor Corp. | 871,121 | 149,920 | |
| Newmont Corp. | 2,755,798 | 108,634 | |
| Steel Dynamics Inc. | 556,816 | 59,351 | |
| Reliance Steel & Aluminum Co. | 203,869 | 58,095 | |
| * | Cleveland-Cliffs Inc. | 1,786,081 | 27,309 |
| Royal Gold Inc. | 227,750 | 25,528 | |
| Commercial Metals Co. | 404,996 | 22,797 | |
| * | ATI Inc. | 445,759 | 20,206 |
| Alcoa Corp. | 618,655 | 18,609 | |
| United States Steel Corp. | 573,285 | 17,823 | |
| Carpenter Technology Corp. | 168,242 | 10,537 | |
| Shares | Market Value• ($000) | ||
| Alpha Metallurgical Resources Inc. | 45,246 | 9,178 | |
| Hecla Mining Co. | 2,034,049 | 8,929 | |
| Worthington Industries Inc. | 112,141 | 8,441 | |
| Arch Resources Inc. | 61,347 | 8,012 | |
| Materion Corp. | 71,567 | 7,786 | |
| * | MP Materials Corp. | 370,213 | 7,752 |
| Warrior Met Coal Inc. | 180,523 | 7,141 | |
| Kaiser Aluminum Corp. | 55,450 | 4,210 | |
| Compass Minerals International Inc. | 121,036 | 3,649 | |
| Ryerson Holding Corp. | 107,875 | 3,359 | |
| *,1 | Ivanhoe Electric Inc. | 197,427 | 3,086 |
| * | TimkenSteel Corp. | 136,394 | 2,988 |
| Schnitzer Steel Industries Inc. Class A | 89,406 | 2,968 | |
| * | Piedmont Lithium Inc. | 62,953 | 2,818 |
| * | Coeur Mining Inc. | 1,152,160 | 2,777 |
| SunCoke Energy Inc. | 291,068 | 2,707 | |
| * | Century Aluminum Co. | 191,348 | 1,424 |
| Ramaco Resources Inc. Class A | 99,873 | 783 | |
| *,1 | 5e Advanced Materials Inc. | 106,872 | 274 |
| 805,444 | |||
| Paper & Forest Products (0.5%) | |||
| Louisiana-Pacific Corp. | 225,027 | 14,060 | |
| Sylvamo Corp. | 133,225 | 5,565 | |
| Mercer International Inc. | 137,101 | 1,246 | |
| 20,871 | |||
| Total Common Stocks (Cost $3,945,399) | 4,117,729 | ||
| Temporary Cash Investments (0.6%) | |||
| Money Market Fund (0.6%) | |||
| 2,3 | Vanguard Market Liquidity Fund, 5.384% (Cost $25,870) | 258,748 | 25,872 |
| Total Investments (100.2%) (Cost $3,971,269) | 4,143,601 | ||
| Other Assets and Liabilities—Net (-0.2%) | (8,488) | ||
| Net Assets (100.0%) | 4,135,113 | ||
| Cost is in $000. | |||
| • | See Note A in Notes to Financial Statements. |
| * | Non-income-producing security. |
| 1 | Includes partial security positions on loan to broker-dealers. The total value of securities on loan is $5,229,000. |
| 2 | Affiliated money market fund available only to Vanguard funds and certain trusts and accounts managed by Vanguard. Rate shown is the 7-day yield. |
| 3 | Collateral of $6,570,000 was received for securities on loan. |
| Over-the-Counter Total Return Swaps | ||||||
| Reference Entity | Termination Date | Counterparty | Notional Amount ($000) | Floating Interest Rate Received (Paid)1 (%) | Value and Unrealized Appreciation ($000) | Value and Unrealized (Depreciation) ($000) |
| Albemarle Corp. | 1/31/24 | CITNA | 9,339 | (5.326) | — | (42) |
| United States Steel Corp. | 8/30/24 | BANA | 6,591 | (5.320) | — | — |
| — | (42) | |||||
| 1 | Based on Overnight Bank Funding Rate as of the most recent reset date. Floating interest payment received/paid monthly. |
| BANA—Bank of America, N.A. | |
| CITNA—Citibank, N.A. |
| ($000s, except shares, footnotes, and per-share amounts) | Amount |
| Assets | |
| Investments in Securities, at Value1 | |
| Unaffiliated Issuers (Cost $3,945,399) | 4,117,729 |
| Affiliated Issuers (Cost $25,870) | 25,872 |
| Total Investments in Securities | 4,143,601 |
| Investment in Vanguard | 141 |
| Cash | 1,014 |
| Cash Collateral Pledged—Over-the-Counter Swap Contracts | 980 |
| Receivables for Investment Securities Sold | 7,428 |
| Receivables for Accrued Income | 7,709 |
| Receivables for Capital Shares Issued | 424 |
| Total Assets | 4,161,297 |
| Liabilities | |
| Payables for Investment Securities Purchased | 18,936 |
| Collateral for Securities on Loan | 6,570 |
| Payables for Capital Shares Redeemed | 459 |
| Payables to Vanguard | 177 |
| Unrealized Depreciation—Over-the-Counter Swap Contracts | 42 |
| Total Liabilities | 26,184 |
| Net Assets | 4,135,113 |
| 1 Includes $5,229,000 of securities on loan. | |
| At August 31, 2023, net assets consisted of: | |
| Paid-in Capital | 4,129,140 |
| Total Distributable Earnings (Loss) | 5,973 |
| Net Assets | 4,135,113 |
| ETF Shares—Net Assets | |
| Applicable to 16,814,091 outstanding $.001 par value shares of beneficial interest (unlimited authorization) | 3,070,389 |
| Net Asset Value Per Share—ETF Shares | $182.61 |
| Admiral Shares—Net Assets | |
| Applicable to 11,443,919 outstanding $.001 par value shares of beneficial interest (unlimited authorization) | 1,064,724 |
| Net Asset Value Per Share—Admiral Shares | $93.04 |
| Year Ended August 31, 2023 | |
| ($000) | |
| Investment Income | |
| Income | |
| Dividends1 | 75,937 |
| Interest2 | 150 |
| Securities Lending—Net | 449 |
| Total Income | 76,536 |
| Expenses | |
| The Vanguard Group—Note B | |
| Investment Advisory Services | 90 |
| Management and Administrative— ETF Shares | 2,393 |
| Management and Administrative— Admiral Shares | 901 |
| Marketing and Distribution— ETF Shares | 142 |
| Marketing and Distribution— Admiral Shares | 57 |
| Custodian Fees | 46 |
| Auditing Fees | 30 |
| Shareholders’ Reports—ETF Shares | 195 |
| Shareholders’ Reports—Admiral Shares | 13 |
| Trustees’ Fees and Expenses | 2 |
| Other Expenses | 22 |
| Total Expenses | 3,891 |
| Expenses Paid Indirectly | (2) |
| Net Expenses | 3,889 |
| Net Investment Income | 72,647 |
| Realized Net Gain (Loss) | |
| Investment Securities Sold2,3 | 98,597 |
| Futures Contracts | 22 |
| Swap Contracts | 1,120 |
| Realized Net Gain (Loss) | 99,739 |
| Change in Unrealized Appreciation (Depreciation) | |
| Investment Securities2 | 247,732 |
| Swap Contracts | (42) |
| Change in Unrealized Appreciation (Depreciation) | 247,690 |
| Net Increase (Decrease) in Net Assets Resulting from Operations | 420,076 |
| 1 | Dividends are net of foreign withholding taxes of $3,000. |
| 2 | Interest income, realized net gain (loss), and change in unrealized appreciation (depreciation) from an affiliated company of the fund were $150,000, less than $1,000, and $2,000, respectively. Purchases and sales are for temporary cash investment purposes. |
| 3 | Includes $142,531,000 of net gain (loss) resulting from in-kind redemptions. |
| Year Ended August 31, | ||
| 2023 ($000) | 2022 ($000) | |
| Increase (Decrease) in Net Assets | ||
| Operations | ||
| Net Investment Income | 72,647 | 84,474 |
| Realized Net Gain (Loss) | 99,739 | 315,519 |
| Change in Unrealized Appreciation (Depreciation) | 247,690 | (886,777) |
| Net Increase (Decrease) in Net Assets Resulting from Operations | 420,076 | (486,784) |
| Distributions | ||
| ETF Shares | (53,383) | (66,907) |
| Admiral Shares | (19,101) | (19,170) |
| Total Distributions | (72,484) | (86,077) |
| Capital Share Transactions | ||
| ETF Shares | (71,615) | (590,097) |
| Admiral Shares | (24,601) | 44,413 |
| Net Increase (Decrease) from Capital Share Transactions | (96,216) | (545,684) |
| Total Increase (Decrease) | 251,376 | (1,118,545) |
| Net Assets | ||
| Beginning of Period | 3,883,737 | 5,002,282 |
| End of Period | 4,135,113 | 3,883,737 |
| ETF Shares | |||||
| For a Share Outstanding Throughout Each Period | Year Ended August 31, | ||||
| 2023 | 2022 | 2021 | 2020 | 2019 | |
| Net Asset Value, Beginning of Period | $166.09 | $187.02 | $134.84 | $122.80 | $134.33 |
| Investment Operations | |||||
| Net Investment Income1 | 3.253 | 3.213 | 2.801 | 2.522 | 2.501 |
| Net Realized and Unrealized Gain (Loss) on Investments | 16.513 | (20.893) | 52.014 | 12.053 | (11.541) |
| Total from Investment Operations | 19.766 | (17.680) | 54.815 | 14.575 | (9.040) |
| Distributions | |||||
| Dividends from Net Investment Income | (3.246) | (3.250) | (2.635) | (2.535) | (2.490) |
| Distributions from Realized Capital Gains | — | — | — | — | — |
| Total Distributions | (3.246) | (3.250) | (2.635) | (2.535) | (2.490) |
| Net Asset Value, End of Period | $182.61 | $166.09 | $187.02 | $134.84 | $122.80 |
| Total Return | 12.09% | -9.55% | 41.00% | 12.12% | -6.73% |
| Ratios/Supplemental Data | |||||
| Net Assets, End of Period (Millions) | $3,070 | $2,889 | $3,924 | $1,676 | $1,921 |
| Ratio of Total Expenses to Average Net Assets | 0.10%2 | 0.10% | 0.10% | 0.10% | 0.10% |
| Ratio of Net Investment Income to Average Net Assets | 1.87% | 1.76% | 1.66% | 2.05% | 2.04% |
| Portfolio Turnover Rate3 | 5% | 4% | 5% | 4% | 4% |
| 1 | Calculated based on average shares outstanding. |
| 2 | The ratio of expenses to average net assets for the period net of reduction from custody fee offset arrangements was 0.10%. |
| 3 | Excludes the value of portfolio securities received or delivered as a result of in-kind purchases or redemptions of the fund’s capital shares, including ETF Creation Units. |
| Admiral Shares | |||||
| For a Share Outstanding Throughout Each Period | Year Ended August 31, | ||||
| 2023 | 2022 | 2021 | 2020 | 2019 | |
| Net Asset Value, Beginning of Period | $84.62 | $95.29 | $68.70 | $62.57 | $68.45 |
| Investment Operations | |||||
| Net Investment Income1 | 1.654 | 1.652 | 1.424 | 1.294 | 1.282 |
| Net Realized and Unrealized Gain (Loss) on Investments | 8.420 | (10.665) | 26.507 | 6.130 | (5.892) |
| Total from Investment Operations | 10.074 | (9.013) | 27.931 | 7.424 | (4.610) |
| Distributions | |||||
| Dividends from Net Investment Income | (1.654) | (1.657) | (1.341) | (1.294) | (1.270) |
| Distributions from Realized Capital Gains | — | — | — | — | — |
| Total Distributions | (1.654) | (1.657) | (1.341) | (1.294) | (1.270) |
| Net Asset Value, End of Period | $93.04 | $84.62 | $95.29 | $68.70 | $62.57 |
| Total Return2 | 12.10% | -9.56% | 41.04% | 12.14% | -6.74% |
| Ratios/Supplemental Data | |||||
| Net Assets, End of Period (Millions) | $1,065 | $994 | $1,078 | $583 | $482 |
| Ratio of Total Expenses to Average Net Assets | 0.10%3 | 0.10% | 0.10% | 0.10% | 0.10% |
| Ratio of Net Investment Income to Average Net Assets | 1.86% | 1.78% | 1.67% | 2.08% | 2.04% |
| Portfolio Turnover Rate4 | 5% | 4% | 5% | 4% | 4% |
| 1 | Calculated based on average shares outstanding. |
| 2 | Total returns do not include account service fees that may have applied in the periods shown. Fund prospectuses provide information about any applicable account service fees. |
| 3 | The ratio of expenses to average net assets for the period net of reduction from custody fee offset arrangements was 0.10%. |
| 4 | Excludes the value of portfolio securities received or delivered as a result of in-kind purchases or redemptions of the fund’s capital shares, including ETF Creation Units. |
| A. | The following significant accounting policies conform to generally accepted accounting principles for U.S. investment companies. The fund consistently follows such policies in preparing its financial statements. |
| B. | In accordance with the terms of a Funds' Service Agreement (the “FSA”) between Vanguard and the fund, Vanguard furnishes to the fund investment advisory, corporate management, administrative, marketing, and distribution services at Vanguard’s cost of operations (as defined by the FSA). These costs of operations are allocated to the fund based on methods and guidelines approved by the board of trustees and are generally settled twice a month. |
| C. | The fund’s custodian bank has agreed to reduce its fees when the fund maintains cash on deposit in the non-interest-bearing custody account. For the year ended August 31, 2023, custodian fee offset arrangements reduced the fund’s expenses by $2,000 (an annual rate of less than 0.01% of average net assets). |
| D. | Various inputs may be used to determine the value of the fund’s investments and derivatives. These inputs are summarized in three broad levels for financial statement purposes. The inputs or methodologies used to value securities are not necessarily an indication of the risk associated with investing in those securities. |
| Level 1 ($000) | Level 2 ($000) | Level 3 ($000) | Total ($000) | |
| Investments | ||||
| Assets | ||||
| Common Stocks | 4,117,729 | — | — | 4,117,729 |
| Temporary Cash Investments | 25,872 | — | — | 25,872 |
| Total | 4,143,601 | — | — | 4,143,601 |
| Derivative Financial Instruments | ||||
| Liabilities | ||||
| Swap Contracts | — | 42 | — | 42 |
| E. | Permanent differences between book-basis and tax-basis components of net assets are reclassified among capital accounts in the financial statements to reflect their tax character. These reclassifications have no effect on net assets or net asset value per share. As of period end, permanent differences primarily attributable to the accounting for applicable in-kind redemptions and swap agreements were reclassified between the following accounts: |
| Amount ($000) | |
| Paid-in Capital | 141,403 |
| Total Distributable Earnings (Loss) | (141,403) |
| Amount ($000) | |
| Undistributed Ordinary Income | 13,837 |
| Undistributed Long-Term Gains | — |
| Net Unrealized Gains (Losses) | 160,422 |
| Capital Loss Carryforwards | (168,286) |
| Qualified Late-Year Losses | — |
| Other Temporary Differences | — |
| Total | 5,973 |
| Year Ended August 31, | ||
| 2023 Amount ($000) | 2022 Amount ($000) | |
| Ordinary Income* | 72,484 | 86,077 |
| Long-Term Capital Gains | — | — |
| Total | 72,484 | 86,077 |
| * | Includes short-term capital gains, if any. |
| Amount ($000) | |
| Tax Cost | 3,983,178 |
| Gross Unrealized Appreciation | 621,289 |
| Gross Unrealized Depreciation | (460,867) |
| Net Unrealized Appreciation (Depreciation) | 160,422 |
| F. | During the year ended August 31, 2023, the fund purchased $673,186,000 of investment securities and sold $779,804,000 of investment securities, other than temporary cash investments. Purchases and sales include $467,915,000 and $558,688,000, respectively, in connection with in-kind purchases and redemptions of the fund's capital shares. |
| G. | Capital share transactions for each class of shares were: |
| Year Ended August 31, | |||||
| 2023 | 2022 | ||||
| Amount ($000) | Shares (000) | Amount ($000) | Shares (000) | ||
| ETF Shares | |||||
| Issued | 492,462 | 2,743 | 524,091 | 2,812 | |
| Issued in Lieu of Cash Distributions | — | — | — | — | |
| Redeemed | (564,077) | (3,325) | (1,114,188) | (6,400) | |
| Net Increase (Decrease)—ETF Shares | (71,615) | (582) | (590,097) | (3,588) | |
| Admiral Shares | |||||
| Issued | 237,053 | 2,655 | 305,754 | 3,264 | |
| Issued in Lieu of Cash Distributions | 17,073 | 200 | 17,067 | 189 | |
| Redeemed | (278,727) | (3,163) | (278,408) | (3,013) | |
| Net Increase (Decrease)—Admiral Shares | (24,601) | (308) | 44,413 | 440 | |
| H. | Significant market disruptions, such as those caused by pandemics (e.g., COVID-19 pandemic), natural or environmental disasters, war (e.g., Russia’s invasion of Ukraine), acts of terrorism, or other events, can adversely affect local and global markets and normal market operations. Any such disruptions could have an adverse impact on the value of the fund’s investments and fund performance. |
| I. | Management has determined that no events or transactions occurred subsequent to August 31, 2023, that would require recognition or disclosure in these financial statements. |

| Average Annual Total Returns Periods Ended August 31, 2023 | |||||
| One Year | Five Years | Ten Years | Final Value of a $10,000 Investment | ||
| Utilities Index Fund ETF Shares Net Asset Value | -12.75% | 5.91% | 8.75% | $23,139 |
| Utilities Index Fund ETF Shares Market Price | -12.76 | 5.91 | 8.75 | 23,142 | |
| MSCI US Investable Market Utilities 25/50 Index | -12.65 | 6.03 | 8.86 | 23,373 |
| MSCI US Investable Market 2500 Index | 15.01 | 10.39 | 12.34 | 32,022 |
| One Year | Five Years | Ten Years | Final Value of a $100,000 Investment | ||
| Utilities Index Fund Admiral Shares | -12.73% | 5.94% | 8.77% | $231,735 | |
| MSCI US Investable Market Utilities 25/50 Index | -12.65 | 6.03 | 8.86 | 233,729 | |
| MSCI US Investable Market 2500 Index | 15.01 | 10.39 | 12.34 | 320,217 | |
| One Year | Five Years | Ten Years | |
| Utilities Index Fund ETF Shares Market Price | -12.76% | 33.27% | 131.42% |
| Utilities Index Fund ETF Shares Net Asset Value | -12.75 | 33.27 | 131.39 |
| MSCI US Investable Market Utilities 25/50 Index | -12.65 | 34.04 | 133.73 |
| Electric Utilities | 61.5% |
| Gas Utilities | 4.4 |
| Independent Power and Renewable Electricity Producers | 3.5 |
| Multi-Utilities | 26.1 |
| Water Utilities | 4.5 |
| Shares | Market Value• ($000) | ||
| Common Stocks (99.6%) | |||
| Electric Utilities (61.2%) | |||
| NextEra Energy Inc. | 12,754,254 | 851,984 | |
| Southern Co. | 6,873,074 | 465,513 | |
| Duke Energy Corp. | 4,857,587 | 431,354 | |
| American Electric Power Co. Inc. | 3,244,805 | 254,393 | |
| Exelon Corp. | 6,268,943 | 251,510 | |
| Constellation Energy Corp. | 2,044,848 | 212,992 | |
| Xcel Energy Inc. | 3,468,966 | 198,182 | |
| * | PG&E Corp. | 10,850,870 | 176,869 |
| Edison International | 2,413,992 | 166,203 | |
| Eversource Energy | 2,198,762 | 140,325 | |
| Entergy Corp. | 1,332,748 | 126,944 | |
| FirstEnergy Corp. | 3,430,055 | 123,722 | |
| PPL Corp. | 4,645,557 | 115,767 | |
| Evergy Inc. | 1,447,675 | 79,579 | |
| Alliant Energy Corp. | 1,584,397 | 79,489 | |
| Pinnacle West Capital Corp. | 713,968 | 55,168 | |
| NRG Energy Inc. | 1,451,456 | 54,502 | |
| OGE Energy Corp. | 1,262,719 | 42,996 | |
| IDACORP Inc. | 319,065 | 30,579 | |
| Portland General Electric Co. | 608,671 | 26,696 | |
| PNM Resources Inc. | 513,930 | 22,772 | |
| ALLETE Inc. | 361,610 | 19,853 | |
| Otter Tail Corp. | 236,653 | 19,493 | |
| Avangrid Inc. | 487,999 | 16,836 | |
| MGE Energy Inc. | 227,865 | 16,504 | |
| Hawaiian Electric Industries Inc. | 692,622 | 9,711 | |
| 3,989,936 | |||
| Gas Utilities (4.4%) | |||
| Atmos Energy Corp. | 910,617 | 105,586 | |
| UGI Corp. | 1,320,055 | 33,239 | |
| National Fuel Gas Co. | 549,378 | 29,524 | |
| Shares | Market Value• ($000) | ||
| Southwest Gas Holdings Inc. | 449,713 | 27,851 | |
| New Jersey Resources Corp. | 611,645 | 25,793 | |
| ONE Gas Inc. | 349,199 | 25,307 | |
| Spire Inc. | 342,185 | 19,987 | |
| Chesapeake Utilities Corp. | 112,208 | 12,354 | |
| Northwest Natural Holding Co. | 227,048 | 8,918 | |
| 288,559 | |||
| Independent Power and Renewable Electricity Producers (3.5%) | |||
| AES Corp. | 4,219,008 | 75,647 | |
| Vistra Corp. | 2,116,284 | 66,494 | |
| NextEra Energy Partners LP | 560,062 | 27,936 | |
| Ormat Technologies Inc. (XNYS) | 338,871 | 25,734 | |
| Clearway Energy Inc. Class C | 515,212 | 12,762 | |
| * | Sunnova Energy International Inc. | 659,331 | 9,171 |
| Clearway Energy Inc. Class A | 212,035 | 4,970 | |
| * | Montauk Renewables Inc. | 317,788 | 3,035 |
| * | Altus Power Inc. | 398,667 | 2,575 |
| 228,324 | |||
| Multi-Utilities (26.0%) | |||
| Sempra Energy (XNYS) | 3,966,701 | 278,542 | |
| Dominion Energy Inc. | 5,269,176 | 255,766 | |
| Consolidated Edison Inc. | 2,184,269 | 194,313 | |
| Public Service Enterprise Group Inc. | 3,145,071 | 192,101 | |
| WEC Energy Group Inc. | 1,988,236 | 167,250 | |
| DTE Energy Co. | 1,299,127 | 134,304 | |
| Ameren Corp. | 1,555,255 | 123,285 | |
| CenterPoint Energy Inc. | 3,977,421 | 110,930 | |
| CMS Energy Corp. | 1,838,308 | 103,295 | |
| Shares | Market Value• ($000) | ||
| NiSource Inc. | 2,603,741 | 69,676 | |
| Black Hills Corp. | 421,607 | 23,188 | |
| NorthWestern Corp. | 377,112 | 19,006 | |
| Avista Corp. | 477,214 | 15,886 | |
| Unitil Corp. | 101,794 | 4,970 | |
| 1,692,512 | |||
| Water Utilities (4.5%) | |||
| American Water Works Co. Inc. | 1,226,865 | 170,215 | |
| Essential Utilities Inc. | 1,583,086 | 58,416 | |
| American States Water Co. | 233,250 | 19,642 | |
| California Water Service Group | 352,567 | 17,716 | |
| SJW Group | 187,988 | 12,362 | |
| Middlesex Water Co. | 111,541 | 8,395 | |
| York Water Co. | 90,352 | 3,681 | |
| 290,427 | |||
| Total Common Stocks (Cost $6,794,229) | 6,489,758 | ||
| Temporary Cash Investments (0.0%) | |||
| Money Market Fund (0.0%) | |||
| 1 | Vanguard Market Liquidity Fund, 5.384% (Cost $2,211) | 22,111 | 2,211 |
| Total Investments (99.6%) (Cost $6,796,440) | 6,491,969 | ||
| Other Assets and Liabilities—Net (0.4%) | 24,066 | ||
| Net Assets (100.0%) | 6,516,035 | ||
| Cost is in $000. | |||
| • | See Note A in Notes to Financial Statements. |
| * | Non-income-producing security. |
| 1 | Affiliated money market fund available only to Vanguard funds and certain trusts and accounts managed by Vanguard. Rate shown is the 7-day yield. |
| Over-the-Counter Total Return Swaps | ||||||
| Reference Entity | Termination Date | Counterparty | Notional Amount ($000) | Floating Interest Rate Received (Paid)1 (%) | Value and Unrealized Appreciation ($000) | Value and Unrealized (Depreciation) ($000) |
| Ameren Corp. | 1/31/24 | GSI | 7,876 | (5.320) | 32 | — |
| PG&E Corp. | 8/30/24 | BANA | 17,930 | (5.320) | — | — |
| 32 | — | |||||
| 1 | Based on Overnight Bank Funding Rate as of the most recent reset date. Floating interest payment received/paid monthly. |
| BANA—Bank of America, N.A. | |
| GSI—Goldman Sachs International. |
| ($000s, except shares, footnotes, and per-share amounts) | Amount |
| Assets | |
| Investments in Securities, at Value | |
| Unaffiliated Issuers (Cost $6,794,229) | 6,489,758 |
| Affiliated Issuers (Cost $2,211) | 2,211 |
| Total Investments in Securities | 6,491,969 |
| Investment in Vanguard | 232 |
| Cash Collateral Pledged—Over-the-Counter Swap Contracts | 1,090 |
| Receivables for Investment Securities Sold | 13,939 |
| Receivables for Accrued Income | 37,701 |
| Receivables for Capital Shares Issued | 532 |
| Unrealized Appreciation—Over-the-Counter Swap Contracts | 32 |
| Total Assets | 6,545,495 |
| Liabilities | |
| Due to Custodian | 10,182 |
| Payables for Investment Securities Purchased | 18,142 |
| Payables for Capital Shares Redeemed | 848 |
| Payables to Vanguard | 288 |
| Total Liabilities | 29,460 |
| Net Assets | 6,516,035 |
| At August 31, 2023, net assets consisted of: | |
| Paid-in Capital | 7,028,118 |
| Total Distributable Earnings (Loss) | (512,083) |
| Net Assets | 6,516,035 |
| ETF Shares—Net Assets | |
| Applicable to 37,169,086 outstanding $.001 par value shares of beneficial interest (unlimited authorization) | 5,070,840 |
| Net Asset Value Per Share—ETF Shares | $136.43 |
| Admiral Shares—Net Assets | |
| Applicable to 21,114,297 outstanding $.001 par value shares of beneficial interest (unlimited authorization) | 1,445,195 |
| Net Asset Value Per Share—Admiral Shares | $68.45 |
| Year Ended August 31, 2023 | |
| ($000) | |
| Investment Income | |
| Income | |
| Dividends | 232,731 |
| Interest1 | 626 |
| Securities Lending—Net | 44 |
| Total Income | 233,401 |
| Expenses | |
| The Vanguard Group—Note B | |
| Investment Advisory Services | 164 |
| Management and Administrative— ETF Shares | 4,729 |
| Management and Administrative— Admiral Shares | 1,499 |
| Marketing and Distribution— ETF Shares | 261 |
| Marketing and Distribution— Admiral Shares | 88 |
| Custodian Fees | 77 |
| Auditing Fees | 30 |
| Shareholders’ Reports—ETF Shares | 222 |
| Shareholders’ Reports—Admiral Shares | 20 |
| Trustees’ Fees and Expenses | 4 |
| Other Expenses | 22 |
| Total Expenses | 7,116 |
| Expenses Paid Indirectly | (3) |
| Net Expenses | 7,113 |
| Net Investment Income | 226,288 |
| Realized Net Gain (Loss) | |
| Investment Securities Sold1,2 | 108,337 |
| Swap Contracts | 1,728 |
| Realized Net Gain (Loss) | 110,065 |
| Change in Unrealized Appreciation (Depreciation) | |
| Investment Securities1 | (1,338,510) |
| Swap Contracts | 379 |
| Change in Unrealized Appreciation (Depreciation) | (1,338,131) |
| Net Increase (Decrease) in Net Assets Resulting from Operations | (1,001,778) |
| 1 | Interest income, realized net gain (loss), capital gain distributions received, and change in unrealized appreciation (depreciation) from an affiliated company of the fund were $626,000, $4,000, less than $1,000, and $1,000, respectively. Purchases and sales are for temporary cash investment purposes. |
| 2 | Includes $164,292,000 of net gain (loss) resulting from in-kind redemptions. |
| Year Ended August 31, | ||
| 2023 ($000) | 2022 ($000) | |
| Increase (Decrease) in Net Assets | ||
| Operations | ||
| Net Investment Income | 226,288 | 209,358 |
| Realized Net Gain (Loss) | 110,065 | 374,119 |
| Change in Unrealized Appreciation (Depreciation) | (1,338,131) | 173,877 |
| Net Increase (Decrease) in Net Assets Resulting from Operations | (1,001,778) | 757,354 |
| Distributions | ||
| ETF Shares | (174,158) | (157,667) |
| Admiral Shares | (53,913) | (47,893) |
| Total Distributions | (228,071) | (205,560) |
| Capital Share Transactions | ||
| ETF Shares | (13,355) | 486,753 |
| Admiral Shares | (147,955) | 161,161 |
| Net Increase (Decrease) from Capital Share Transactions | (161,310) | 647,914 |
| Total Increase (Decrease) | (1,391,159) | 1,199,708 |
| Net Assets | ||
| Beginning of Period | 7,907,194 | 6,707,486 |
| End of Period | 6,516,035 | 7,907,194 |
| ETF Shares | |||||
| For a Share Outstanding Throughout Each Period | Year Ended August 31, | ||||
| 2023 | 2022 | 2021 | 2020 | 2019 | |
| Net Asset Value, Beginning of Period | $161.46 | $149.52 | $129.35 | $139.09 | $119.32 |
| Investment Operations | |||||
| Net Investment Income1 | 4.708 | 4.393 | 4.310 | 4.306 | 4.087 |
| Net Realized and Unrealized Gain (Loss) on Investments | (25.005) | 11.897 | 20.048 | (9.802) | 19.562 |
| Total from Investment Operations | (20.297) | 16.290 | 24.358 | (5.496) | 23.649 |
| Distributions | |||||
| Dividends from Net Investment Income | (4.733) | (4.350) | (4.188) | (4.244) | (3.879) |
| Distributions from Realized Capital Gains | — | — | — | — | — |
| Total Distributions | (4.733) | (4.350) | (4.188) | (4.244) | (3.879) |
| Net Asset Value, End of Period | $136.43 | $161.46 | $149.52 | $129.35 | $139.09 |
| Total Return | -12.75% | 11.18% | 19.19% | -4.08% | 20.17% |
| Ratios/Supplemental Data | |||||
| Net Assets, End of Period (Millions) | $5,071 | $6,030 | $5,126 | $4,014 | $4,107 |
| Ratio of Total Expenses to Average Net Assets | 0.10%2 | 0.10% | 0.10% | 0.10% | 0.10% |
| Ratio of Net Investment Income to Average Net Assets | 3.19% | 2.87% | 3.09% | 3.18% | 3.22% |
| Portfolio Turnover Rate3 | 4% | 3% | 6% | 5% | 4% |
| 1 | Calculated based on average shares outstanding. |
| 2 | The ratio of expenses to average net assets for the period net of reduction from custody fee offset arrangements was 0.10%. |
| 3 | Excludes the value of portfolio securities received or delivered as a result of in-kind purchases or redemptions of the fund’s capital shares, including ETF Creation Units. |
| Admiral Shares | |||||
| For a Share Outstanding Throughout Each Period | Year Ended August 31, | ||||
| 2023 | 2022 | 2021 | 2020 | 2019 | |
| Net Asset Value, Beginning of Period | $81.00 | $75.01 | $64.89 | $69.78 | $59.86 |
| Investment Operations | |||||
| Net Investment Income1 | 2.351 | 2.212 | 2.166 | 2.163 | 2.038 |
| Net Realized and Unrealized Gain (Loss) on Investments | (12.527) | 5.961 | 10.055 | (4.924) | 9.828 |
| Total from Investment Operations | (10.176) | 8.173 | 12.221 | (2.761) | 11.866 |
| Distributions | |||||
| Dividends from Net Investment Income | (2.374) | (2.183) | (2.101) | (2.129) | (1.946) |
| Distributions from Realized Capital Gains | — | — | — | — | — |
| Total Distributions | (2.374) | (2.183) | (2.101) | (2.129) | (1.946) |
| Net Asset Value, End of Period | $68.45 | $81.00 | $75.01 | $64.89 | $69.78 |
| Total Return2 | -12.73% | 11.22% | 19.22% | -4.05% | 20.19% |
| Ratios/Supplemental Data | |||||
| Net Assets, End of Period (Millions) | $1,445 | $1,877 | $1,582 | $1,281 | $1,266 |
| Ratio of Total Expenses to Average Net Assets | 0.10%3 | 0.10% | 0.10% | 0.10% | 0.10% |
| Ratio of Net Investment Income to Average Net Assets | 3.17% | 2.88% | 3.10% | 3.18% | 3.22% |
| Portfolio Turnover Rate4 | 4% | 3% | 6% | 5% | 4% |
| 1 | Calculated based on average shares outstanding. |
| 2 | Total returns do not include account service fees that may have applied in the periods shown. Fund prospectuses provide information about any applicable account service fees. |
| 3 | The ratio of expenses to average net assets for the period net of reduction from custody fee offset arrangements was 0.10%. |
| 4 | Excludes the value of portfolio securities received or delivered as a result of in-kind purchases or redemptions of the fund’s capital shares, including ETF Creation Units. |
| A. | The following significant accounting policies conform to generally accepted accounting principles for U.S. investment companies. The fund consistently follows such policies in preparing its financial statements. |
| B. | In accordance with the terms of a Funds' Service Agreement (the “FSA”) between Vanguard and the fund, Vanguard furnishes to the fund investment advisory, corporate management, administrative, marketing, and distribution services at Vanguard’s cost of operations (as defined by the FSA). These costs of operations are allocated to the fund based on methods and guidelines approved by the board of trustees and are generally settled twice a month. |
| C. | The fund’s custodian bank has agreed to reduce its fees when the fund maintains cash on deposit in the non-interest-bearing custody account. For the year ended August 31, 2023, custodian fee offset arrangements reduced the fund’s expenses by $3,000 (an annual rate of less than 0.01% of average net assets). |
| D. | Various inputs may be used to determine the value of the fund’s investments and derivatives. These inputs are summarized in three broad levels for financial statement purposes. The inputs or methodologies used to value securities are not necessarily an indication of the risk associated with investing in those securities. |
| Level 1 ($000) | Level 2 ($000) | Level 3 ($000) | Total ($000) | |
| Investments | ||||
| Assets | ||||
| Common Stocks | 6,489,758 | — | — | 6,489,758 |
| Temporary Cash Investments | 2,211 | — | — | 2,211 |
| Total | 6,491,969 | — | — | 6,491,969 |
| Derivative Financial Instruments | ||||
| Assets | ||||
| Swap Contracts | — | 32 | — | 32 |
| E. | Permanent differences between book-basis and tax-basis components of net assets are reclassified among capital accounts in the financial statements to reflect their tax character. These reclassifications have no effect on net assets or net asset value per share. As of period end, permanent differences primarily attributable to the accounting for applicable in-kind redemptions and swap agreements were reclassified between the following accounts: |
| Amount ($000) | |
| Paid-in Capital | 164,214 |
| Total Distributable Earnings (Loss) | (164,214) |
| Amount ($000) | |
| Undistributed Ordinary Income | 47,859 |
| Undistributed Long-Term Gains | — |
| Net Unrealized Gains (Losses) | (321,129) |
| Capital Loss Carryforwards | (238,813) |
| Qualified Late-Year Losses | — |
| Other Temporary Differences | — |
| Total | (512,083) |
| Year Ended August 31, | ||
| 2023 Amount ($000) | 2022 Amount ($000) | |
| Ordinary Income* | 228,071 | 205,560 |
| Long-Term Capital Gains | — | — |
| Total | 228,071 | 205,560 |
| * | Includes short-term capital gains, if any. |
| Amount ($000) | |
| Tax Cost | 6,813,099 |
| Gross Unrealized Appreciation | 411,899 |
| Gross Unrealized Depreciation | (733,028) |
| Net Unrealized Appreciation (Depreciation) | (321,129) |
| F. | During the year ended August 31, 2023, the fund purchased $1,074,266,000 of investment securities and sold $1,236,950,000 of investment securities, other than temporary cash investments. Purchases and sales include $788,158,000 and $802,970,000, respectively, in connection with in-kind purchases and redemptions of the fund's capital shares. |
| G. | Capital share transactions for each class of shares were: |
| Year Ended August 31, | |||||
| 2023 | 2022 | ||||
| Amount ($000) | Shares (000) | Amount ($000) | Shares (000) | ||
| ETF Shares | |||||
| Issued | 791,370 | 5,346 | 1,904,515 | 12,392 | |
| Issued in Lieu of Cash Distributions | — | — | — | — | |
| Redeemed | (804,725) | (5,525) | (1,417,762) | (9,325) | |
| Net Increase (Decrease)—ETF Shares | (13,355) | (179) | 486,753 | 3,067 | |
| Admiral Shares | |||||
| Issued | 269,479 | 3,578 | 493,216 | 6,363 | |
| Issued in Lieu of Cash Distributions | 41,299 | 562 | 35,820 | 486 | |
| Redeemed | (458,733) | (6,200) | (367,875) | (4,761) | |
| Net Increase (Decrease)—Admiral Shares | (147,955) | (2,060) | 161,161 | 2,088 | |
| H. | Significant market disruptions, such as those caused by pandemics (e.g., COVID-19 pandemic), natural or environmental disasters, war (e.g., Russia’s invasion of Ukraine), acts of terrorism, or other events, can adversely affect local and global markets and normal market operations. Any such disruptions could have an adverse impact on the value of the fund’s investments and fund performance. |
| I. | Management has determined that no events or transactions occurred subsequent to August 31, 2023, that would require recognition or disclosure in these financial statements. |
Philadelphia, Pennsylvania
October 19, 2023
| Fund | Percentage |
| Communication Services Index Fund | 89.8% |
| Consumer Discretionary Index Fund | 96.9 |
| Consumer Staples Index Fund | 100.0 |
| Energy Index Fund | 97.0 |
| Financials Index Fund | 90.1 |
| Health Care Index Fund | 100.0 |
| Industrials Index Fund | 96.9 |
| Information Technology Index Fund | 100.0 |
| Materials Index Fund | 82.0 |
| Utilities Index Fund | 100.0 |
| Fund | ($000) |
| Communication Services Index Fund | 25,650 |
| Consumer Discretionary Index Fund | 46,179 |
| Consumer Staples Index Fund | 200,854 |
| Energy Index Fund | 379,296 |
| Financials Index Fund | 212,758 |
| Health Care Index Fund | 278,894 |
| Industrials Index Fund | 60,614 |
| Information Technology Index Fund | 432,295 |
| Materials Index Fund | 72,485 |
| Utilities Index Fund | 228,071 |
| Fund | ($000) |
| Communication Services Index Fund | 73 |
| Consumer Discretionary Index Fund | 81 |
| Consumer Staples Index Fund | 161 |
| Energy Index Fund | 372 |
| Financials Index Fund | 415 |
| Health Care Index Fund | 122 |
| Industrials Index Fund | 47 |
| Information Technology Index Fund | 1,800 |
| Materials Index Fund | 48 |
| Utilities Index Fund | 205 |
| Fund | ($000) |
| Communication Services Index Fund | — |
| Consumer Discretionary Index Fund | — |
| Consumer Staples Index Fund | — |
| Energy Index Fund | — |
| Financials Index Fund | 3,423 |
| Health Care Index Fund | — |
| Industrials Index Fund | — |
| Information Technology Index Fund | — |
| Materials Index Fund | — |
| Utilities Index Fund | — |
| Matthew Benchener | Thomas M. Rampulla |
| Joseph Brennan | Karin A. Risi |
| Mortimer J. Buckley | Anne E. Robinson |
| Gregory Davis | Michael Rollings |
| John James | Nitin Tandon |
| Chris D. Mclsaac | Lauren Valente |

All rights reserved.
Vanguard Marketing Corporation, Distributor.

| 1 | |
| 2 | |
| 4 | |
| 7 | |
| 24 | |
| 26 |
| • | Vanguard Extended Duration Treasury Index Fund returned –16.25% for Institutional Shares, –16.24% for Institutional Plus Shares, and –15.83% for ETF Shares (based on net asset value) for the 12 months ended August 31, 2023. The fund’s benchmark index returned –15.67%. |
| • | Early in the period, inflation in many developed markets began to ease off multidecade highs but remained stubbornly high in some sectors—including services, which felt the effects of a tight labor market. While aggressive interest rate hikes by many major central banks including the Federal Reserve fanned fears of recession and weighed on bond prices, the economy proved more resilient than expected. |
| • | The yield of the 30-year U.S. Treasury bond rose from 3.29% to 4.21% during the period. Long-term corporates underperformed short-term Treasuries but outperformed long-term Treasuries. |
| • | Because the fund invests in zero-coupon U.S. Treasuries with maturities ranging from 20 to 30 years and the prices of such securities are very sensitive to interest rate changes, its interest rate risk is extremely high. As a result, the fund may exhibit substantial short-term volatility and is best used by long-term investors. |
| Average Annual Total Returns Periods Ended August 31, 2023 | |||
| One Year | Three Years | Five Years | |
| Stocks | |||
| Russell 1000 Index (Large-caps) | 15.40% | 9.93% | 10.77% |
| Russell 2000 Index (Small-caps) | 4.65 | 8.12 | 3.14 |
| Russell 3000 Index (Broad U.S. market) | 14.76 | 9.81 | 10.25 |
| FTSE All-World ex US Index (International) | 12.02 | 4.49 | 3.74 |
| Bonds | |||
| Bloomberg U.S. Aggregate Float Adjusted Index (Broad taxable market) | -1.05% | -4.40% | 0.55% |
| Bloomberg Municipal Bond Index (Broad tax-exempt market) | 1.70 | -1.32 | 1.52 |
| FTSE Three-Month U.S. Treasury Bill Index | 4.44 | 1.63 | 1.68 |
| CPI | |||
| Consumer Price Index | 3.67% | 5.71% | 4.02% |
| • | Based on actual fund return. This section helps you to estimate the actual expenses that you paid over the period. The ”Ending Account Value“ shown is derived from the fund’s actual return, and the third column shows the dollar amount that would have been paid by an investor who started with $1,000 in the fund. You may use the information here, together with the amount you invested, to estimate the expenses that you paid over the period. |
| • | Based on hypothetical 5% yearly return. This section is intended to help you compare your fund‘s costs with those of other mutual funds. It assumes that the fund had a yearly return of 5% before expenses, but that the expense ratio is unchanged. In this case—because the return used is not the fund’s actual return—the results do not apply to your investment. The example is useful in making comparisons because the Securities and Exchange Commission requires all mutual funds to calculate expenses based on a 5% return. You can assess your fund’s costs by comparing this hypothetical example with the hypothetical examples that appear in shareholder reports of other funds. |
| Six Months Ended August 31, 2023 | |||
| Beginning Account Value 2/28/2023 | Ending Account Value 8/31/2023 | Expenses Paid During Period | |
| Based on Actual Fund Return | |||
| Extended Duration Treasury Index Fund | |||
| ETF Shares | $1,000.00 | $937.50 | $0.29 |
| Institutional Shares | 1,000.00 | 937.40 | 0.29 |
| Institutional Plus Shares | 1,000.00 | 937.60 | 0.20 |
| Based on Hypothetical 5% Yearly Return | |||
| Extended Duration Treasury Index Fund | |||
| ETF Shares | $1,000.00 | $1,024.90 | $0.31 |
| Institutional Shares | 1,000.00 | 1,024.90 | 0.31 |
| Institutional Plus Shares | 1,000.00 | 1,025.00 | 0.20 |
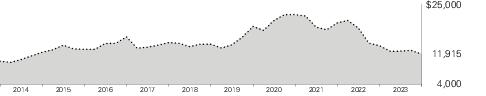
| Average Annual Total Returns Periods Ended August 31, 2023 | |||||
| One Year | Five Years | Ten Years | Final Value of a $10,000 Investment | ||
 | Extended Duration Treasury Index Fund ETF Shares Net Asset Value | -15.83% | -3.89% | 1.77% | $11,915 |
| Extended Duration Treasury Index Fund ETF Shares Market Price | -15.63 | -3.88 | 1.77 | 11,916 | |
 | Bloomberg U.S. Treasury STRIPS 20–30 Year Equal Par Bond Index | -15.67 | -3.92 | 1.74 | 11,883 |
| One Year | Five Years | Ten Years | Final Value of a $5,000,000 Investment | ||
| Extended Duration Treasury Index Fund Institutional Shares | -16.25% | -3.99% | 1.73% | $5,933,695 | |
| Bloomberg U.S. Treasury STRIPS 20–30 Year Equal Par Bond Index | -15.67 | -3.92 | 1.74 | 5,941,267 | |
| Average Annual Total Returns Periods Ended August 31, 2023 | |||||
| One Year | Five Years | Ten Years | Final Value of a $100,000,000 Investment | ||
| Extended Duration Treasury Index Fund Institutional Plus Shares | -16.24% | -3.97% | 1.75% | $118,943,690 | |
| Bloomberg U.S. Treasury STRIPS 20–30 Year Equal Par Bond Index | -15.67 | -3.92 | 1.74 | 118,825,340 | |
| Cumulative Returns of ETF Shares: August 31, 2013, Through August 31, 2023 | |||
| One Year | Five Years | Ten Years | |
| Extended Duration Treasury Index Fund ETF Shares Market Price | -15.63% | -17.97% | 19.16% |
| Extended Duration Treasury Index Fund ETF Shares Net Asset Value | -15.83 | -18.00 | 19.15 |
| Bloomberg U.S. Treasury STRIPS 20–30 Year Equal Par Bond Index | -15.67 | -18.13 | 18.83 |
| 15 - 20 Years | 0.5% |
| 20 - 25 Years | 51.6 |
| 25 - 30 Years | 47.9 |
| Coupon | Maturity Date | Face Amount ($000) | Market Value• ($000) | |||
| U.S. Government and Agency Obligations (100.0%) | ||||||
| U.S. Government Securities (100.0%) | ||||||
| United States Treasury Strip Coupon | 0.000% | 8/15/43 | 39,401 | 15,782 | ||
| United States Treasury Strip Coupon | 0.000% | 11/15/43 | 128,561 | 51,003 | ||
| United States Treasury Strip Coupon | 0.000% | 2/15/44 | 130,464 | 51,278 | ||
| United States Treasury Strip Coupon | 0.000% | 5/15/44 | 124,715 | 48,561 | ||
| United States Treasury Strip Coupon | 0.000% | 8/15/44 | 149,378 | 57,604 | ||
| United States Treasury Strip Coupon | 0.000% | 11/15/44 | 86,650 | 33,001 | ||
| United States Treasury Strip Coupon | 0.000% | 2/15/45 | 117,743 | 44,319 | ||
| United States Treasury Strip Coupon | 0.000% | 5/15/45 | 126,451 | 47,212 | ||
| United States Treasury Strip Coupon | 0.000% | 8/15/45 | 116,482 | 43,026 | ||
| United States Treasury Strip Coupon | 0.000% | 11/15/45 | 160,998 | 58,840 | ||
| United States Treasury Strip Coupon | 0.000% | 2/15/46 | 123,379 | 44,609 | ||
| United States Treasury Strip Coupon | 0.000% | 5/15/46 | 97,867 | 35,026 | ||
| United States Treasury Strip Coupon | 0.000% | 8/15/46 | 94,379 | 33,468 | ||
| United States Treasury Strip Coupon | 0.000% | 11/15/46 | 89,023 | 31,255 | ||
| United States Treasury Strip Coupon | 0.000% | 2/15/47 | 156,449 | 54,439 | ||
| United States Treasury Strip Coupon | 0.000% | 5/15/47 | 105,242 | 36,292 | ||
| United States Treasury Strip Coupon | 0.000% | 8/15/47 | 120,779 | 41,244 | ||
| United States Treasury Strip Coupon | 0.000% | 11/15/47 | 124,025 | 41,955 | ||
| United States Treasury Strip Coupon | 0.000% | 2/15/48 | 123,243 | 41,392 | ||
| United States Treasury Strip Coupon | 0.000% | 5/15/48 | 82,461 | 27,444 | ||
| United States Treasury Strip Coupon | 0.000% | 8/15/48 | 107,965 | 35,645 | ||
| United States Treasury Strip Coupon | 0.000% | 11/15/48 | 118,002 | 38,618 | ||
| United States Treasury Strip Coupon | 0.000% | 2/15/49 | 125,196 | 40,601 | ||
| United States Treasury Strip Coupon | 0.000% | 5/15/49 | 89,873 | 28,998 | ||
| United States Treasury Strip Coupon | 0.000% | 8/15/49 | 176,437 | 56,611 | ||
| United States Treasury Strip Coupon | 0.000% | 11/15/49 | 184,399 | 58,936 | ||
| United States Treasury Strip Coupon | 0.000% | 2/15/50 | 106,208 | 33,721 | ||
| United States Treasury Strip Coupon | 0.000% | 5/15/50 | 96,623 | 30,534 | ||
| United States Treasury Strip Coupon | 0.000% | 8/15/50 | 209,637 | 65,855 | ||
| United States Treasury Strip Coupon | 0.000% | 11/15/50 | 117,554 | 36,726 | ||
| United States Treasury Strip Coupon | 0.000% | 2/15/51 | 208,147 | 64,412 | ||
| United States Treasury Strip Coupon | 0.000% | 5/15/51 | 102,819 | 31,537 | ||
| United States Treasury Strip Coupon | 0.000% | 8/15/51 | 115,644 | 35,434 | ||
| United States Treasury Strip Coupon | 0.000% | 11/15/51 | 197,535 | 60,356 | ||
| United States Treasury Strip Coupon | 0.000% | 2/15/52 | 134,712 | 41,066 | ||
| United States Treasury Strip Coupon | 0.000% | 5/15/52 | 138,620 | ��� 42,236 | ||
| United States Treasury Strip Coupon | 0.000% | 8/15/52 | 129,351 | 39,331 | ||
| United States Treasury Strip Coupon | 0.000% | 11/15/52 | 51,941 | 15,793 | ||
| United States Treasury Strip Coupon | 0.000% | 2/15/53 | 8,357 | 2,520 | ||
| Coupon | Maturity Date | Face Amount ($000) | Market Value• ($000) | |||
| United States Treasury Strip Coupon | 0.000% | 5/15/53 | 6,699 | 2,008 | ||
| United States Treasury Strip Coupon | 0.000% | 8/15/53 | 2,341 | 708 | ||
| United States Treasury Strip Principal | 0.000% | 11/15/43 | 88,926 | 36,543 | ||
| United States Treasury Strip Principal | 0.000% | 2/15/44 | 116,681 | 47,411 | ||
| United States Treasury Strip Principal | 0.000% | 5/15/44 | 108,866 | 43,768 | ||
| United States Treasury Strip Principal | 0.000% | 8/15/44 | 179,914 | 71,544 | ||
| United States Treasury Strip Principal | 0.000% | 11/15/44 | 95,795 | 37,719 | ||
| United States Treasury Strip Principal | 0.000% | 2/15/45 | 53,930 | 20,995 | ||
| United States Treasury Strip Principal | 0.000% | 5/15/45 | 100,230 | 38,581 | ||
| United States Treasury Strip Principal | 0.000% | 8/15/45 | 165,113 | 62,846 | ||
| United States Treasury Strip Principal | 0.000% | 11/15/45 | 117,792 | 44,420 | ||
| United States Treasury Strip Principal | 0.000% | 2/15/46 | 52,283 | 19,512 | ||
| United States Treasury Strip Principal | 0.000% | 5/15/46 | 53,084 | 19,641 | ||
| United States Treasury Strip Principal | 0.000% | 8/15/46 | 139,251 | 51,012 | ||
| United States Treasury Strip Principal | 0.000% | 11/15/46 | 137,856 | 50,070 | ||
| United States Treasury Strip Principal | 0.000% | 2/15/47 | 73,564 | 26,483 | ||
| United States Treasury Strip Principal | 0.000% | 5/15/47 | 62,374 | 22,284 | ||
| United States Treasury Strip Principal | 0.000% | 8/15/47 | 63,371 | 22,432 | ||
| United States Treasury Strip Principal | 0.000% | 11/15/47 | 123,859 | 43,457 | ||
| United States Treasury Strip Principal | 0.000% | 2/15/48 | 129,051 | 44,916 | ||
| United States Treasury Strip Principal | 0.000% | 5/15/48 | 111,165 | 38,387 | ||
| United States Treasury Strip Principal | 0.000% | 8/15/48 | 98,098 | 33,668 | ||
| United States Treasury Strip Principal | 0.000% | 11/15/48 | 81,156 | 27,631 | ||
| United States Treasury Strip Principal | 0.000% | 2/15/49 | 121,237 | 41,041 | ||
| United States Treasury Strip Principal | 0.000% | 5/15/49 | 68,013 | 22,880 | ||
| United States Treasury Strip Principal | 0.000% | 8/15/49 | 126,044 | 42,225 | ||
| United States Treasury Strip Principal | 0.000% | 11/15/49 | 79,661 | 26,525 | ||
| United States Treasury Strip Principal | 0.000% | 2/15/50 | 125,266 | 41,348 | ||
| United States Treasury Strip Principal | 0.000% | 5/15/50 | 82,705 | 27,092 | ||
| United States Treasury Strip Principal | 0.000% | 8/15/50 | 195,200 | 63,379 | ||
| United States Treasury Strip Principal | 0.000% | 11/15/50 | 82,350 | 26,551 | ||
| United States Treasury Strip Principal | 0.000% | 2/15/51 | 146,619 | 46,941 | ||
| United States Treasury Strip Principal | 0.000% | 5/15/51 | 106,228 | 33,744 | ||
| United States Treasury Strip Principal | 0.000% | 8/15/51 | 116,750 | 36,804 | ||
| United States Treasury Strip Principal | 0.000% | 11/15/51 | 118,045 | 37,073 | ||
| United States Treasury Strip Principal | 0.000% | 2/15/52 | 145,079 | 45,292 | ||
| United States Treasury Strip Principal | 0.000% | 5/15/52 | 150,971 | 46,954 | ||
| United States Treasury Strip Principal | 0.000% | 8/15/52 | 151,634 | 46,924 | ||
| United States Treasury Strip Principal | 0.000% | 11/15/52 | 150,640 | 47,040 | ||
| United States Treasury Strip Principal | 0.000% | 2/15/53 | 149,588 | 45,858 | ||
| United States Treasury Strip Principal | 0.000% | 5/15/53 | 136,620 | 41,637 | ||
| United States Treasury Strip Principal | 0.000% | 8/15/53 | 136,123 | 41,294 | ||
| Total U.S. Government and Agency Obligations (Cost $4,174,880) | 3,163,318 | |||||
| Coupon | Shares | Market Value• ($000) | ||||
| Temporary Cash Investments (0.0%) | ||||||
| Money Market Fund (0.0%) | ||||||
| 1 | Vanguard Market Liquidity Fund (Cost $267) | 5.384% | 2,667 | 267 | ||
| Total Investments (100.0%) (Cost $4,175,147) | 3,163,585 | |||||
| Other Assets and Liabilities—Net (0.0%) | (1,351) | |||||
| Net Assets (100%) | 3,162,234 | |||||
| Cost is in $000. |
| • | See Note A in Notes to Financial Statements. |
| 1 | Affiliated money market fund available only to Vanguard funds and certain trusts and accounts managed by Vanguard. Rate shown is the 7-day yield. |
| ($000s, except shares, footnotes, and per-share amounts) | Amount |
| Assets | |
| Investments in Securities, at Value | |
| Unaffiliated Issuers (Cost $4,174,880) | 3,163,318 |
| Affiliated Issuers (Cost $267) | 267 |
| Total Investments in Securities | 3,163,585 |
| Investment in Vanguard | 100 |
| Cash Collateral Received for ETF Capital Activity | 10,566 |
| Receivables for Investment Securities Sold | 90,459 |
| Receivables for Accrued Income | 1 |
| Receivables for Capital Shares Issued | 16 |
| Total Assets | 3,264,727 |
| Liabilities | |
| Due to Custodian | 851 |
| Payables for Investment Securities Purchased | 90,679 |
| Collateral for ETF Capital Activity | 10,566 |
| Payables for Capital Shares Redeemed | 320 |
| Payables to Vanguard | 77 |
| Total Liabilities | 102,493 |
| Net Assets | 3,162,234 |
| Statement of Assets and Liabilities (continued) | |
| At August 31, 2023, net assets consisted of: | |
| ($000s, except shares, footnotes, and per-share amounts) | Amount |
| Paid-in Capital | 4,548,232 |
| Total Distributable Earnings (Loss) | (1,385,998) |
| Net Assets | 3,162,234 |
| ETF Shares—Net Assets | |
| Applicable to 30,000,000 outstanding $.001 par value shares of beneficial interest (unlimited authorization) | 2,355,627 |
| Net Asset Value Per Share—ETF Shares | $78.52 |
| Institutional Shares—Net Assets | |
| Applicable to 24,650,535 outstanding $.001 par value shares of beneficial interest (unlimited authorization) | 584,744 |
| Net Asset Value Per Share—Institutional Shares | $23.72 |
| Institutional Plus Shares—Net Assets | |
| Applicable to 3,725,680 outstanding $.001 par value shares of beneficial interest (unlimited authorization) | 221,863 |
| Net Asset Value Per Share—Institutional Plus Shares | $59.55 |
| Year Ended August 31, 2023 | |
| ($000) | |
| Investment Income | |
| Income | |
| Interest1 | 91,583 |
| Total Income | 91,583 |
| Expenses | |
| The Vanguard Group—Note B | |
| Investment Advisory Services | 55 |
| Management and Administrative—ETF Shares | 758 |
| Management and Administrative—Institutional Shares | 295 |
| Management and Administrative—Institutional Plus Shares | 78 |
| Marketing and Distribution—ETF Shares | 100 |
| Marketing and Distribution—Institutional Shares | 19 |
| Marketing and Distribution—Institutional Plus Shares | 4 |
| Custodian Fees | 34 |
| Auditing Fees | 33 |
| Shareholders’ Reports—ETF Shares | 81 |
| Shareholders’ Reports—Institutional Shares | — |
| Shareholders’ Reports—Institutional Plus Shares | — |
| Trustees’ Fees and Expenses | 1 |
| Other Expenses | 20 |
| Total Expenses | 1,478 |
| Expenses Paid Indirectly | (3) |
| Net Expenses | 1,475 |
| Net Investment Income | 90,108 |
| Realized Net Gain (Loss) on Investment Securities Sold1,2 | (287,157) |
| Change in Unrealized Appreciation (Depreciation) of Investment Securities1 | (241,159) |
| Net Increase (Decrease) in Net Assets Resulting from Operations | (438,208) |
| 1 | Interest income, realized net gain (loss), capital gain distributions received, and change in unrealized appreciation (depreciation) from an affiliated company of the fund were $45,000, ($2,000), less than $1,000, and less than $1,000, respectively. Purchases and sales are for temporary cash investment purposes. |
| 2 | Includes ($1,474,000) of net gain (loss) resulting from in-kind redemptions. |
| Year Ended August 31, | ||
| 2023 ($000) | 2022 ($000) | |
| Increase (Decrease) in Net Assets | ||
| Operations | ||
| Net Investment Income | 90,108 | 54,800 |
| Realized Net Gain (Loss) | (287,157) | (64,318) |
| Change in Unrealized Appreciation (Depreciation) | (241,159) | (838,872) |
| Net Increase (Decrease) in Net Assets Resulting from Operations | (438,208) | (848,390) |
| Distributions | ||
| ETF Shares | (54,931) | (28,243) |
| Institutional Shares | (18,180) | (15,042) |
| Institutional Plus Shares | (7,725) | (9,537) |
| Total Distributions | (80,836) | (52,822) |
| Capital Share Transactions | ||
| ETF Shares | 1,396,402 | 534,037 |
| Institutional Shares | 78,790 | 83,248 |
| Institutional Plus Shares | 7,725 | (88,387) |
| Net Increase (Decrease) from Capital Share Transactions | 1,482,917 | 528,898 |
| Total Increase (Decrease) | 963,873 | (372,314) |
| Net Assets | ||
| Beginning of Period | 2,198,361 | 2,570,675 |
| End of Period | 3,162,234 | 2,198,361 |
| ETF Shares | |||||
| For a Share Outstanding Throughout Each Period | Year Ended August 31, | ||||
| 2023 | 2022 | 2021 | 2020 | 2019 | |
| Net Asset Value, Beginning of Period | $96.31 | $140.69 | $163.11 | $146.43 | $113.39 |
| Investment Operations | |||||
| Net Investment Income1 | 3.033 | 2.769 | 2.795 | 3.146 | 3.347 |
| Net Realized and Unrealized Gain (Loss) on Investments2 | (18.048) | (44.418) | (17.061) | 18.113 | 32.972 |
| Total from Investment Operations | (15.015) | (41.649) | (14.266) | 21.259 | 36.319 |
| Distributions | |||||
| Dividends from Net Investment Income | (2.775) | (2.731) | (2.820) | (3.329) | (3.279) |
| Distributions from Realized Capital Gains | — | — | (5.334) | (1.250) | — |
| Total Distributions | (2.775) | (2.731) | (8.154) | (4.579) | (3.279) |
| Net Asset Value, End of Period | $78.52 | $96.31 | $140.69 | $163.11 | $146.43 |
| Total Return | -15.83% | -30.00% | -8.94% | 14.98% | 32.92% |
| Ratios/Supplemental Data | |||||
| Net Assets, End of Period (Millions) | $2,356 | $1,312 | $1,277 | $1,810 | $1,333 |
| Ratio of Total Expenses to Average Net Assets | 0.06%3 | 0.06%3 | 0.06% | 0.07% | 0.07% |
| Ratio of Net Investment Income to Average Net Assets | 3.56% | 2.33% | 1.93% | 2.06% | 2.87% |
| Portfolio Turnover Rate4 | 24% | 15% | 23% | 17% | 20% |
| 1 | Calculated based on average shares outstanding. |
| 2 | Includes increases from purchase fees of $.03, $.03, $.07, $.07, and $.04. |
| 3 | The ratio of expenses to average net assets for the period net of reduction from custody fee offset arrangements was 0.06%. |
| 4 | Excludes the value of portfolio securities received or delivered as a result of in-kind purchases or redemptions of the fund’s capital shares, including ETF Creation Units. |
| Institutional Shares | |||||
| For a Share Outstanding Throughout Each Period | Year Ended August 31, | ||||
| 2023 | 2022 | 2021 | 2020 | 2019 | |
| Net Asset Value, Beginning of Period | $29.09 | $42.50 | $49.27 | $44.24 | $34.25 |
| Investment Operations | |||||
| Net Investment Income1 | .911 | .835 | .842 | .959 | 1.015 |
| Net Realized and Unrealized Gain (Loss) on Investments2 | (5.444) | (13.425) | (5.143) | 5.459 | 9.967 |
| Total from Investment Operations | (4.533) | (12.590) | (4.301) | 6.418 | 10.982 |
| Distributions | |||||
| Dividends from Net Investment Income | (.837) | (.820) | (.857) | (1.010) | (.992) |
| Distributions from Realized Capital Gains | — | — | (1.612) | (.378) | — |
| Total Distributions | (.837) | (.820) | (2.469) | (1.388) | (.992) |
| Net Asset Value, End of Period | $23.72 | $29.09 | $42.50 | $49.27 | $44.24 |
| Total Return3 | -15.83% | -30.01% | -8.95% | 14.98% | 32.94% |
| Ratios/Supplemental Data | |||||
| Net Assets, End of Period (Millions) | $585 | $623 | $789 | $889 | $862 |
| Ratio of Total Expenses to Average Net Assets | 0.06%4 | 0.06%4 | 0.06% | 0.06% | 0.06% |
| Ratio of Net Investment Income to Average Net Assets | 3.52% | 2.29% | 1.96% | 2.10% | 2.88% |
| Portfolio Turnover Rate5 | 24% | 15% | 23% | 17% | 20% |
| 1 | Calculated based on average shares outstanding. |
| 2 | Includes increases from purchase fees of $.00, $.00, $.02, $.02, and $.01. |
| 3 | Total returns do not include transaction fees that may have applied in the periods shown. Fund prospectuses provide information about any applicable transaction fees. |
| 4 | The ratio of expenses to average net assets for the period net of reduction from custody fee offset arrangements was 0.06%. |
| 5 | Excludes the value of portfolio securities received or delivered as a result of in-kind purchases or redemptions of the fund’s capital shares, including ETF Creation Units. |
| Institutional Plus Shares | |||||
| For a Share Outstanding Throughout Each Period | Year Ended August 31, | ||||
| 2023 | 2022 | 2021 | 2020 | 2019 | |
| Net Asset Value, Beginning of Period | $73.04 | $106.68 | $123.70 | $111.06 | $85.99 |
| Investment Operations | |||||
| Net Investment Income1 | 2.297 | 2.114 | 2.140 | 2.432 | 2.564 |
| Net Realized and Unrealized Gain (Loss) on Investments2 | (13.672) | (33.676) | (12.941) | 13.716 | 25.015 |
| Total from Investment Operations | (11.375) | (31.562) | (10.801) | 16.148 | 27.579 |
| Distributions | |||||
| Dividends from Net Investment Income | (2.115) | (2.078) | (2.173) | (2.560) | (2.509) |
| Distributions from Realized Capital Gains | — | — | (4.046) | (.948) | — |
| Total Distributions | (2.115) | (2.078) | (6.219) | (3.508) | (2.509) |
| Net Asset Value, End of Period | $59.55 | $73.04 | $106.68 | $123.70 | $111.06 |
| Total Return3 | -15.82% | -29.98% | -8.95% | 15.02% | 32.95% |
| Ratios/Supplemental Data | |||||
| Net Assets, End of Period (Millions) | $222 | $264 | $505 | $689 | $780 |
| Ratio of Total Expenses to Average Net Assets | 0.04%4 | 0.04%4 | 0.04% | 0.04% | 0.04% |
| Ratio of Net Investment Income to Average Net Assets | 3.54% | 2.29% | 1.96% | 2.12% | 2.90% |
| Portfolio Turnover Rate5 | 24% | 15% | 23% | 17% | 20% |
| 1 | Calculated based on average shares outstanding. |
| 2 | Includes increases from purchase fees of $.02, $.02, $.05, $.05, and $.03. |
| 3 | Total returns do not include transaction fees that may have applied in the periods shown. Fund prospectuses provide information about any applicable transaction fees. |
| 4 | The ratio of expenses to average net assets for the period net of reduction from custody fee offset arrangements was 0.04%. |
| 5 | Excludes the value of portfolio securities received or delivered as a result of in-kind purchases or redemptions of the fund’s capital shares, including ETF Creation Units. |
| Level 1 ($000) | Level 2 ($000) | Level 3 ($000) | Total ($000) | |
| Investments | ||||
| Assets | ||||
| U.S. Government and Agency Obligations | — | 3,163,318 | — | 3,163,318 |
| Temporary Cash Investments | 267 | — | — | 267 |
| Total | 267 | 3,163,318 | — | 3,163,585 |
| Amount ($000) | |
| Paid-in Capital | (1,474) |
| Total Distributable Earnings (Loss) | 1,474 |
| Amount ($000) | |
| Undistributed Ordinary Income | 19,869 |
| Undistributed Long-Term Gains | — |
| Net Unrealized Gains (Losses) | (1,017,056) |
| Capital Loss Carryforwards | (388,811) |
| Qualified Late-Year Losses | — |
| Other Temporary Differences | — |
| Total | (1,385,998) |
| Year Ended August 31, | ||
| 2023 Amount ($000) | 2022 Amount ($000) | |
| Ordinary Income* | 80,836 | 52,822 |
| Long-Term Capital Gains | — | — |
| Total | 80,836 | 52,822 |
| * | Includes short-term capital gains, if any. |
| Amount ($000) | |
| Tax Cost | 4,180,641 |
| Gross Unrealized Appreciation | 4,910 |
| Gross Unrealized Depreciation | (1,021,966) |
| Net Unrealized Appreciation (Depreciation) | (1,017,056) |
| Year Ended August 31, | |||||
| 2023 | 2022 | ||||
| Amount ($000) | Shares (000) | Amount ($000) | Shares (000) | ||
| ETF Shares | |||||
| Issued1 | 1,607,800 | 18,950 | 1,370,500 | 11,325 | |
| Issued in Lieu of Cash Distributions | — | — | — | — | |
| Redeemed | (211,398) | (2,575) | (836,463) | (6,775) | |
| Net Increase (Decrease)—ETF Shares | 1,396,402 | 16,375 | 534,037 | 4,550 | |
| Institutional Shares | |||||
| Issued1 | 159,637 | 6,318 | 131,583 | 4,011 | |
| Issued in Lieu of Cash Distributions | 17,611 | 671 | 15,013 | 411 | |
| Redeemed | (98,458) | (3,736) | (63,348) | (1,583) | |
| Net Increase (Decrease)—Institutional Shares | 78,790 | 3,253 | 83,248 | 2,839 | |
| Institutional Plus Shares | |||||
| Issued1 | — | — | — | — | |
| Issued in Lieu of Cash Distributions | 7,725 | 118 | 9,537 | 103 | |
| Redeemed | — | — | (97,924) | (1,231) | |
| Net Increase (Decrease)—Institutional Plus Shares | 7,725 | 118 | (88,387) | (1,128) | |
| 1 | Includes purchase fees for fiscal 2023 and 2022 of $791,000 and $535,000, respectively (fund totals). |
Philadelphia, Pennsylvania
October 18, 2023
| Matthew Benchener | Thomas M. Rampulla |
| Joseph Brennan | Karin A. Risi |
| Mortimer J. Buckley | Anne E. Robinson |
| Gregory Davis | Michael Rollings |
| John James | Nitin Tandon |
| Chris D. McIsaac | Lauren Valente |

Who Are Deaf or Hard of Hearing > 800-749-7273
All rights reserved.
Vanguard Marketing Corporation, Distributor.

| Vanguard Mega Cap Index Fund |
| Vanguard Mega Cap Growth Index Fund |
| Vanguard Mega Cap Value Index Fund |
Your Fund’s Performance at a Glance | 1 |
About Your Fund’s Expenses | 2 |
Mega Cap Index Fund | 4 |
Mega Cap Growth Index Fund | 21 |
Mega Cap Value Index Fund | 37 |
Trustees Approve Advisory Arrangements | 57 |
Liquidity Risk Management | 59 |
| • | For the 12 months ended August 31, 2023, returns for the three Vanguard Mega Cap Index Funds ranged from 10.53% for ETF Shares of Vanguard Mega Cap Value Index Fund to 24.41% for Institutional Shares of Vanguard Mega Cap Growth Index Fund. (Returns for ETF Shares are based on net asset value.) Each fund closely tracked its target index. |
| • | Early in the period, inflation in many developed markets began to ease off multidecade highs but remained stubbornly high in some sectors—including services, which felt the effects of tight labor markets. While aggressive interest rate hikes by many major central banks fanned fears of recession, the global economy proved more resilient than expected. |
| • | Large-capitalization stocks outperformed their small- and mid-cap counterparts for the period. Value and growth stocks both posted positive returns, but growth significantly outperformed value. |
| • | The majority of sectors across all three funds posted positive returns. Technology was the top contributor for each fund. Financials and industrials also boosted returns of the Mega Cap Value Index Fund. |
| Average Annual Total Returns Periods Ended August 31, 2023 | |||
| One Year | Three Years | Five Years | |
| Stocks | |||
| Russell 1000 Index (Large-caps) | 15.40% | 9.93% | 10.77% |
| Russell 2000 Index (Small-caps) | 4.65 | 8.12 | 3.14 |
| Russell 3000 Index (Broad U.S. market) | 14.76 | 9.81 | 10.25 |
| FTSE All-World ex US Index (International) | 12.02 | 4.49 | 3.74 |
| Bonds | |||
| Bloomberg U.S. Aggregate Float Adjusted Index (Broad taxable market) | -1.05% | -4.40% | 0.55% |
| Bloomberg Municipal Bond Index (Broad tax-exempt market) | 1.70 | -1.32 | 1.52 |
| FTSE Three-Month U.S. Treasury Bill Index | 4.44 | 1.63 | 1.68 |
| CPI | |||
| Consumer Price Index | 3.67% | 5.71% | 4.02% |
| • | Based on actual fund return. This section helps you to estimate the actual expenses that you paid over the period. The ”Ending Account Value“ shown is derived from the fund‘s actual return, and the third column shows the dollar amount that would have been paid by an investor who started with $1,000 in the fund. You may use the information here, together with the amount you invested, to estimate the expenses that you paid over the period. |
| • | Based on hypothetical 5% yearly return. This section is intended to help you compare your fund‘s costs with those of other mutual funds. It assumes that the fund had a yearly return of 5% before expenses, but that the expense ratio is unchanged. In this case—because the return used is not the fund’s actual return—the results do not apply to your investment. The example is useful in making comparisons because the Securities and Exchange Commission requires all mutual funds to calculate expenses based on a 5% return. You can assess your fund’s costs by comparing this hypothetical example with the hypothetical examples that appear in shareholder reports of other funds. |
| Six Months Ended August 31, 2023 | |||
| Beginning Account Value 2/28/2023 | Ending Account Value 8/31/2023 | Expenses Paid During Period | |
| Based on Actual Fund Return | |||
| Mega Cap Index Fund | |||
| ETF Shares | $1,000.00 | $1,171.80 | $0.38 |
| Institutional Shares | 1,000.00 | 1,171.80 | 0.33 |
| Mega Cap Growth Index Fund | |||
| ETF Shares | $1,000.00 | $1,287.60 | $0.40 |
| Institutional Shares | 1,000.00 | 1,287.60 | 0.35 |
| Mega Cap Value Index Fund | |||
| ETF Shares | $1,000.00 | $1,050.30 | $0.36 |
| Institutional Shares | 1,000.00 | 1,050.30 | 0.31 |
| Based on Hypothetical 5% Yearly Return | |||
| Mega Cap Index Fund | |||
| ETF Shares | $1,000.00 | $1,024.85 | $0.36 |
| Institutional Shares | 1,000.00 | 1,024.90 | 0.31 |
| Mega Cap Growth Index Fund | |||
| ETF Shares | $1,000.00 | $1,024.85 | $0.36 |
| Institutional Shares | 1,000.00 | 1,024.90 | 0.31 |
| Mega Cap Value Index Fund | |||
| ETF Shares | $1,000.00 | $1,024.85 | $0.36 |
| Institutional Shares | 1,000.00 | 1,024.90 | 0.31 |

| Average Annual Total Returns Periods Ended August 31, 2023 | |||||
| One Year | Five Years | Ten Years | Final Value of a $10,000 Investment | ||
 | Mega Cap Index Fund ETF Shares Net Asset Value | 17.79% | 11.62% | 13.13% | $34,338 |
| Mega Cap Index Fund ETF Shares Market Price | 17.85 | 11.63 | 13.14 | 34,358 | |
 | CRSP US Mega Cap Index | 17.88 | 11.68 | 13.20 | 34,545 |
 | Dow Jones U.S. Total Stock Market Float Adjusted Index | 14.75 | 10.12 | 12.14 | 31,461 |
| One Year | Five Years | Ten Years | Final Value of a $5,000,000 Investment | ||
| Mega Cap Index Fund Institutional Shares | 17.81% | 11.64% | 13.15% | $17,199,142 | |
| CRSP US Mega Cap Index | 17.88 | 11.68 | 13.20 | 17,272,378 | |
| Dow Jones U.S. Total Stock Market Float Adjusted Index | 14.75 | 10.12 | 12.14 | 15,730,560 | |
| One Year | Five Years | Ten Years | |
| Mega Cap Index Fund ETF Shares Market Price | 17.85% | 73.34% | 243.58% |
| Mega Cap Index Fund ETF Shares Net Asset Value | 17.79 | 73.27 | 243.38 |
| CRSP US Mega Cap Index | 17.88 | 73.76 | 245.45 |
| Basic Materials | 1.3% |
| Consumer Discretionary | 14.4 |
| Consumer Staples | 5.4 |
| Energy | 4.2 |
| Financials | 9.3 |
| Health Care | 13.1 |
| Industrials | 10.7 |
| Real Estate | 1.2 |
| Technology | 36.2 |
| Telecommunications | 2.4 |
| Utilities | 1.8 |
| Shares | Market Value• ($000) | ||
| Common Stocks (99.7%) | |||
| Basic Materials (1.3%) | |||
| Linde plc | 67,468 | 26,113 | |
| Air Products and Chemicals Inc. | 30,516 | 9,017 | |
| Freeport-McMoRan Inc. | 197,108 | 7,867 | |
| Ecolab Inc. | 35,274 | 6,484 | |
| Dow Inc. | 97,295 | 5,308 | |
| Newmont Corp. | 109,266 | 4,307 | |
| 59,096 | |||
| Consumer Discretionary (14.3%) | |||
| * | Amazon.com Inc. | 1,199,668 | 165,566 |
| * | Tesla Inc. | 370,589 | 95,642 |
| Home Depot Inc. | 138,311 | 45,684 | |
| Costco Wholesale Corp. | 61,020 | 33,517 | |
| Walmart Inc. | 203,990 | 33,171 | |
| McDonald's Corp. | 100,412 | 28,231 | |
| * | Netflix Inc. | 61,133 | 26,512 |
| * | Walt Disney Co. | 251,319 | 21,030 |
| Lowe's Cos. Inc. | 81,410 | 18,763 | |
| NIKE Inc. Class B | 169,524 | 17,242 | |
| * | Booking Holdings Inc. | 5,081 | 15,777 |
| Starbucks Corp. | 157,649 | 15,361 | |
| TJX Cos. Inc. | 158,370 | 14,646 | |
| * | Uber Technologies Inc. | 264,445 | 12,490 |
| Activision Blizzard Inc. | 102,751 | 9,452 | |
| Target Corp. | 63,493 | 8,035 | |
| * | O'Reilly Automotive Inc. | 8,397 | 7,891 |
| Marriott International Inc. Class A | 35,517 | 7,228 | |
| * | Airbnb Inc. Class A | 51,084 | 6,720 |
| Ford Motor Co. | 540,543 | 6,557 | |
| * | Lululemon Athletica Inc. | 15,975 | 6,091 |
| General Motors Co. | 181,613 | 6,086 | |
| Ross Stores Inc. | 47,046 | 5,731 | |
| Yum! Brands Inc. | 38,481 | 4,979 | |
| Estee Lauder Cos. Inc. Class A | 28,706 | 4,608 | |
| Electronic Arts Inc. | 37,481 | 4,497 | |
| Dollar General Corp. | 30,183 | 4,180 | |
| * | Chipotle Mexican Grill Inc. | 1,875 | 3,612 |
| * | AutoZone Inc. | 1,304 | 3,301 |
| Hilton Worldwide Holdings Inc. | 18,155 | 2,699 | |
| Las Vegas Sands Corp. | 23,707 | 1,300 | |
| 636,599 | |||
| Shares | Market Value• ($000) | ||
| Consumer Staples (5.4%) | |||
| Procter & Gamble Co. | 324,189 | 50,035 | |
| PepsiCo Inc. | 189,447 | 33,707 | |
| Coca-Cola Co. | 535,321 | 32,028 | |
| Philip Morris International Inc. | 213,491 | 20,508 | |
| Mondelez International Inc. Class A | 187,262 | 13,344 | |
| CVS Health Corp. | 176,347 | 11,493 | |
| Altria Group Inc. | 245,507 | 10,856 | |
| Colgate-Palmolive Co. | 114,156 | 8,387 | |
| McKesson Corp. | 18,675 | 7,700 | |
| Kimberly-Clark Corp. | 46,465 | 5,986 | |
| Constellation Brands Inc. Class A | 22,691 | 5,912 | |
| * | Monster Beverage Corp. | 100,758 | 5,785 |
| General Mills Inc. | 80,895 | 5,473 | |
| Kenvue Inc. | 236,940 | 5,462 | |
| Sysco Corp. | 69,695 | 4,854 | |
| Keurig Dr Pepper Inc. | 135,063 | 4,545 | |
| Hershey Co. | 20,241 | 4,349 | |
| Kraft Heinz Co. | 109,740 | 3,631 | |
| Archer-Daniels-Midland Co. | 37,403 | 2,966 | |
| Brown-Forman Corp. Class B | 21,293 | 1,408 | |
| Walgreens Boots Alliance Inc. | 50,485 | 1,278 | |
| Brown-Forman Corp. Class A | 3,540 | 238 | |
| 239,945 | |||
| Energy (4.2%) | |||
| Exxon Mobil Corp. | 556,092 | 61,832 | |
| Chevron Corp. | 249,274 | 40,158 | |
| ConocoPhillips | 166,658 | 19,837 | |
| Schlumberger NV | 196,110 | 11,563 | |
| EOG Resources Inc. | 80,407 | 10,342 | |
| Marathon Petroleum Corp. | 58,339 | 8,329 | |
| Pioneer Natural Resources Co. | 32,112 | 7,640 | |
| Phillips 66 | 63,316 | 7,228 | |
| Valero Energy Corp. | 49,702 | 6,456 | |
| Occidental Petroleum Corp. | 91,971 | 5,775 | |
| Kinder Morgan Inc. | 262,436 | 4,519 | |
| Williams Cos. Inc. | 84,143 | 2,906 | |
| 186,585 | |||
| Financials (9.3%) | |||
| * | Berkshire Hathaway Inc. Class B | 232,384 | 83,705 |
| JPMorgan Chase & Co. | 401,970 | 58,820 | |
| Shares | Market Value• ($000) | ||
| Bank of America Corp. | 931,354 | 26,702 | |
| Wells Fargo & Co. | 516,241 | 21,316 | |
| S&P Global Inc. | 44,096 | 17,235 | |
| Goldman Sachs Group Inc. | 45,740 | 14,990 | |
| Morgan Stanley | 172,270 | 14,669 | |
| Marsh & McLennan Cos. Inc. | 68,118 | 13,282 | |
| BlackRock Inc. | 17,522 | 12,275 | |
| Charles Schwab Corp. | 206,888 | 12,237 | |
| Chubb Ltd. | 56,894 | 11,428 | |
| Progressive Corp. | 80,522 | 10,747 | |
| Citigroup Inc. | 254,464 | 10,507 | |
| Blackstone Inc. | 97,135 | 10,332 | |
| CME Group Inc. | 49,474 | 10,027 | |
| Intercontinental Exchange Inc. | 76,973 | 9,082 | |
| Aon plc Class A (XNYS) | 26,733 | 8,913 | |
| US Bancorp | 211,011 | 7,708 | |
| Moody's Corp. | 21,491 | 7,238 | |
| * | Berkshire Hathaway Inc. Class A | 13 | 7,107 |
| PNC Financial Services Group Inc. | 54,809 | 6,617 | |
| Truist Financial Corp. | 183,310 | 5,600 | |
| KKR & Co. Inc. | 89,050 | 5,593 | |
| Aflac Inc. | 74,787 | 5,577 | |
| Travelers Cos. Inc. | 31,726 | 5,115 | |
| MetLife Inc. | 78,839 | 4,994 | |
| Bank of New York Mellon Corp. | 103,142 | 4,628 | |
| American International Group Inc. | 49,811 | 2,915 | |
| Prudential Financial Inc. | 25,188 | 2,385 | |
| Allstate Corp. | 18,147 | 1,957 | |
| 413,701 | |||
| Health Care (13.0%) | |||
| Eli Lilly & Co. | 117,521 | 65,130 | |
| UnitedHealth Group Inc. | 128,040 | 61,021 | |
| Johnson & Johnson | 331,186 | 53,546 | |
| Merck & Co. Inc. | 348,971 | 38,031 | |
| AbbVie Inc. | 242,694 | 35,666 | |
| �� | Thermo Fisher Scientific Inc. | 53,065 | 29,563 |
| Pfizer Inc. | 776,482 | 27,472 | |
| Abbott Laboratories | 239,163 | 24,610 | |
| Danaher Corp. | 91,366 | 24,212 | |
| Amgen Inc. | 73,492 | 18,839 | |
| Bristol-Myers Squibb Co. | 288,982 | 17,816 | |
| * | Intuitive Surgical Inc. | 48,165 | 15,060 |
| Medtronic plc | 183,023 | 14,916 | |
| Elevance Health Inc. | 32,571 | 14,397 | |
| Stryker Corp. | 47,028 | 13,335 | |
| Gilead Sciences Inc. | 171,759 | 13,136 | |
| * | Vertex Pharmaceuticals Inc. | 35,436 | 12,344 |
| * | Regeneron Pharmaceuticals Inc. | 14,134 | 11,682 |
| Cigna Group | 40,726 | 11,251 | |
| Becton Dickinson & Co. | 39,081 | 10,921 | |
| Zoetis Inc. | 57,306 | 10,917 | |
| * | Boston Scientific Corp. | 201,055 | 10,845 |
| Humana Inc. | 17,190 | 7,936 | |
| HCA Healthcare Inc. | 28,353 | 7,862 | |
| * | Edwards Lifesciences Corp. | 83,460 | 6,382 |
| * | Biogen Inc. | 19,887 | 5,317 |
| * | Moderna Inc. | 44,568 | 5,039 |
| Agilent Technologies Inc. | 40,624 | 4,918 | |
| * | IDEXX Laboratories Inc. | 5,745 | 2,938 |
| Shares | Market Value• ($000) | ||
| GE Healthcare Inc. | 26,423 | 1,862 | |
| * | Illumina Inc. | 10,937 | 1,807 |
| 578,771 | |||
| Industrials (10.7%) | |||
| Visa Inc. Class A | 222,502 | 54,664 | |
| Mastercard Inc. Class A | 116,338 | 48,006 | |
| Accenture plc Class A | 86,905 | 28,137 | |
| Caterpillar Inc. | 70,904 | 19,933 | |
| * | Boeing Co. | 82,732 | 18,534 |
| Union Pacific Corp. | 83,859 | 18,497 | |
| RTX Corp. | 200,956 | 17,290 | |
| Honeywell International Inc. | 91,546 | 17,205 | |
| General Electric Co. | 149,762 | 17,142 | |
| United Parcel Service Inc. Class B (XNYS) | 99,677 | 16,885 | |
| Lockheed Martin Corp. | 34,851 | 15,625 | |
| Deere & Co. | 36,684 | 15,075 | |
| Automatic Data Processing Inc. | 56,791 | 14,460 | |
| Eaton Corp. plc | 54,837 | 12,633 | |
| American Express Co. | 76,712 | 12,120 | |
| * | Fiserv Inc. | 80,588 | 9,783 |
| * | PayPal Holdings Inc. | 153,477 | 9,594 |
| Illinois Tool Works Inc. | 35,551 | 8,794 | |
| Sherwin-Williams Co. | 31,889 | 8,665 | |
| CSX Corp. | 279,591 | 8,444 | |
| Northrop Grumman Corp. | 18,824 | 8,152 | |
| FedEx Corp. | 31,070 | 8,110 | |
| 3M Co. | 75,873 | 8,093 | |
| Emerson Electric Co. | 78,437 | 7,706 | |
| General Dynamics Corp. | 33,908 | 7,685 | |
| Parker-Hannifin Corp. | 17,678 | 7,370 | |
| Trane Technologies plc | 31,372 | 6,439 | |
| Norfolk Southern Corp. | 31,344 | 6,426 | |
| Johnson Controls International plc | 94,386 | 5,574 | |
| Paychex Inc. | 44,640 | 5,456 | |
| Capital One Financial Corp. | 49,878 | 5,107 | |
| L3Harris Technologies Inc. | 26,087 | 4,646 | |
| PPG Industries Inc. | 32,351 | 4,586 | |
| Fidelity National Information Services Inc. | 81,573 | 4,557 | |
| * | Block Inc. (XNYS) | 74,878 | 4,317 |
| Otis Worldwide Corp. | 28,324 | 2,423 | |
| Cummins Inc. | 9,718 | 2,236 | |
| DuPont de Nemours Inc. | 28,388 | 2,183 | |
| 472,552 | |||
| Real Estate (1.2%) | |||
| Prologis Inc. | 127,020 | 15,776 | |
| American Tower Corp. | 64,133 | 11,629 | |
| Equinix Inc. | 12,901 | 10,081 | |
| Public Storage | 21,787 | 6,021 | |
| Crown Castle Inc. | 59,624 | 5,992 | |
| Simon Property Group Inc. | 21,351 | 2,423 | |
| 51,922 | |||
| Technology (36.1%) | |||
| Apple Inc. | 2,055,378 | 386,144 | |
| Microsoft Corp. | 1,022,748 | 335,216 | |
| NVIDIA Corp. | 323,154 | 159,493 | |
| * | Alphabet Inc. Class A | 815,074 | 110,989 |
| * | Alphabet Inc. Class C | 688,920 | 94,623 |
| * | Meta Platforms Inc. Class A | 304,264 | 90,029 |
| Broadcom Inc. | 57,298 | 52,880 | |
| * | Adobe Inc. | 63,113 | 35,301 |
| * | Salesforce Inc. | 130,635 | 28,930 |
| Oracle Corp. | 204,240 | 24,588 | |
| Shares | Market Value• ($000) | ||
| * | Advanced Micro Devices Inc. | 221,546 | 23,422 |
| Texas Instruments Inc. | 124,809 | 20,975 | |
| Intel Corp. | 573,676 | 20,159 | |
| Intuit Inc. | 36,645 | 19,855 | |
| International Business Machines Corp. | 124,914 | 18,341 | |
| Applied Materials Inc. | 116,249 | 17,758 | |
| QUALCOMM Inc. | 153,259 | 17,553 | |
| * | ServiceNow Inc. | 28,067 | 16,527 |
| Lam Research Corp. | 18,499 | 12,994 | |
| Analog Devices Inc. | 68,969 | 12,537 | |
| Micron Technology Inc. | 150,579 | 10,531 | |
| * | Palo Alto Networks Inc. | 42,019 | 10,223 |
| * | Synopsys Inc. | 20,907 | 9,594 |
| KLA Corp. | 18,816 | 9,443 | |
| * | Cadence Design Systems Inc. | 37,502 | 9,017 |
| Roper Technologies Inc. | 14,695 | 7,334 | |
| * | Workday Inc. Class A | 28,042 | 6,856 |
| * | Autodesk Inc. | 29,539 | 6,556 |
| * | Snowflake Inc. Class A | 37,998 | 5,960 |
| TE Connectivity Ltd. | 43,441 | 5,751 | |
| * | VMware Inc. Class A | 32,395 | 5,468 |
| Cognizant Technology Solutions Corp. Class A | 69,919 | 5,007 | |
| * | Crowdstrike Holdings Inc. Class A | 29,310 | 4,778 |
| Marvell Technology Inc. | 58,955 | 3,434 | |
| * | Fortinet Inc. | 45,934 | 2,766 |
| Dell Technologies Inc. Class C | 33,424 | 1,880 | |
| HP Inc. | 61,047 | 1,814 | |
| 1,604,726 | |||
| Telecommunications (2.4%) | |||
| Cisco Systems Inc. | 504,624 | 28,940 | |
| Comcast Corp. Class A | 572,113 | 26,752 | |
| Verizon Communications Inc. | 520,389 | 18,203 | |
| AT&T Inc. | 983,233 | 14,542 | |
| * | T-Mobile US Inc. | 82,551 | 11,248 |
| Shares | Market Value• ($000) | ||
| * | Charter Communications Inc. Class A | 13,456 | 5,895 |
| 105,580 | |||
| Utilities (1.8%) | |||
| NextEra Energy Inc. | 278,341 | 18,593 | |
| Southern Co. | 150,085 | 10,165 | |
| Duke Energy Corp. | 106,025 | 9,415 | |
| Waste Management Inc. | 56,071 | 8,791 | |
| Sempra Energy (XNYS) | 86,636 | 6,084 | |
| Dominion Energy Inc. | 115,015 | 5,583 | |
| American Electric Power Co. Inc. | 70,832 | 5,553 | |
| Exelon Corp. | 136,742 | 5,486 | |
| Xcel Energy Inc. | 75,696 | 4,325 | |
| Republic Services Inc. | 28,224 | 4,068 | |
| Public Service Enterprise Group Inc. | 34,348 | 2,098 | |
| 80,161 | |||
| Total Common Stocks (Cost $3,025,269) | 4,429,638 | ||
| Temporary Cash Investments (0.1%) | |||
| Money Market Fund (0.1%) | |||
| 1 | Vanguard Market Liquidity Fund, 5.384% (Cost $3,258) | 32,595 | 3,259 |
| Total Investments (99.8%) (Cost $3,028,527) | 4,432,897 | ||
| Other Assets and Liabilities—Net (0.2%) | 7,371 | ||
| Net Assets (100%) | 4,440,268 | ||
| Cost is in $000. | |||
| • | See Note A in Notes to Financial Statements. |
| * | Non-income-producing security. |
| 1 | Affiliated money market fund available only to Vanguard funds and certain trusts and accounts managed by Vanguard. Rate shown is the 7-day yield. |
| Futures Contracts | ||||
| ($000) | ||||
| Expiration | Number of Long (Short) Contracts | Notional Amount | Value and Unrealized Appreciation (Depreciation) | |
| Long Futures Contracts | ||||
| E-mini S&P 500 Index | September 2023 | 47 | 10,613 | 80 |
| ($000s, except shares, footnotes, and per-share amounts) | Amount |
| Assets | |
| Investments in Securities, at Value | |
| Unaffiliated Issuers (Cost $3,025,269) | 4,429,638 |
| Affiliated Issuers (Cost $3,258) | 3,259 |
| Total Investments in Securities | 4,432,897 |
| Investment in Vanguard | 148 |
| Cash | 8 |
| Cash Collateral Pledged—Futures Contracts | 465 |
| Receivables for Accrued Income | 6,932 |
| Receivables for Capital Shares Issued | 30 |
| Total Assets | 4,440,480 |
| Liabilities | |
| Payables for Investment Securities Purchased | 35 |
| Payables for Capital Shares Redeemed | 29 |
| Payables to Vanguard | 132 |
| Variation Margin Payable—Futures Contracts | 16 |
| Total Liabilities | 212 |
| Net Assets | 4,440,268 |
| At August 31, 2023, net assets consisted of: | |
| Paid-in Capital | 3,170,829 |
| Total Distributable Earnings (Loss) | 1,269,439 |
| Net Assets | 4,440,268 |
| ETF Shares—Net Assets | |
| Applicable to 26,525,000 outstanding $.001 par value shares of beneficial interest (unlimited authorization) | 4,237,102 |
| Net Asset Value Per Share—ETF Shares | $159.74 |
| Institutional Shares—Net Assets | |
| Applicable to 645,052 outstanding $.001 par value shares of beneficial interest (unlimited authorization) | 203,166 |
| Net Asset Value Per Share—Institutional Shares | $314.96 |
| Year Ended August 31, 2023 | |
| ($000) | |
| Investment Income | |
| Income | |
| Dividends | 65,133 |
| Interest1 | 515 |
| Securities Lending—Net | 24 |
| Total Income | 65,672 |
| Expenses | |
| The Vanguard Group—Note B | |
| Investment Advisory Services | 94 |
| Management and Administrative—ETF Shares | 2,195 |
| Management and Administrative—Institutional Shares | 95 |
| Marketing and Distribution—ETF Shares | 140 |
| Marketing and Distribution—Institutional Shares | 5 |
| Custodian Fees | 32 |
| Auditing Fees | 30 |
| Shareholders’ Reports—ETF Shares | 132 |
| Shareholders’ Reports—Institutional Shares | — |
| Trustees’ Fees and Expenses | 2 |
| Other Expenses | 22 |
| Total Expenses | 2,747 |
| Expenses Paid Indirectly | (1) |
| Net Expenses | 2,746 |
| Net Investment Income | 62,926 |
| Realized Net Gain (Loss) | |
| Investment Securities Sold1,2 | 174,487 |
| Futures Contracts | 2 |
| Realized Net Gain (Loss) | 174,489 |
| Change in Unrealized Appreciation (Depreciation) | |
| Investment Securities1 | 428,368 |
| Futures Contracts | 79 |
| Change in Unrealized Appreciation (Depreciation) | 428,447 |
| Net Increase (Decrease) in Net Assets Resulting from Operations | 665,862 |
| 1 | Interest income, realized net gain (loss), capital gain distributions received, and change in unrealized appreciation (depreciation) from an affiliated company of the fund were $484,000, $8,000, less than $1,000, and ($1,000), respectively. Purchases and sales are for temporary cash investment purposes. |
| 2 | Includes $220,884,000 of net gain (loss) resulting from in-kind redemptions. |
| Year Ended August 31, | ||
| 2023 ($000) | 2022 ($000) | |
| Increase (Decrease) in Net Assets | ||
| Operations | ||
| Net Investment Income | 62,926 | 59,135 |
| Realized Net Gain (Loss) | 174,489 | 332,118 |
| Change in Unrealized Appreciation (Depreciation) | 428,447 | (990,069) |
| Net Increase (Decrease) in Net Assets Resulting from Operations | 665,862 | (598,816) |
| Distributions | ||
| ETF Shares | (59,377) | (55,014) |
| Institutional Shares | (2,876) | (2,467) |
| Total Distributions | (62,253) | (57,481) |
| Capital Share Transactions | ||
| ETF Shares | (39,050) | 41,621 |
| Institutional Shares | (2,982) | 15,237 |
| Net Increase (Decrease) from Capital Share Transactions | (42,032) | 56,858 |
| Total Increase (Decrease) | 561,577 | (599,439) |
| Net Assets | ||
| Beginning of Period | 3,878,691 | 4,478,130 |
| End of Period | 4,440,268 | 3,878,691 |
| ETF Shares | |||||
| For a Share Outstanding Throughout Each Period | Year Ended August 31, | ||||
| 2023 | 2022 | 2021 | 2020 | 2019 | |
| Net Asset Value, Beginning of Period | $137.84 | $160.74 | $125.47 | $101.36 | $100.26 |
| Investment Operations | |||||
| Net Investment Income1 | 2.268 | 2.109 | 1.961 | 1.992 | 2.045 |
| Net Realized and Unrealized Gain (Loss) on Investments | 21.869 | (22.957) | 35.218 | 24.065 | 1.052 |
| Total from Investment Operations | 24.137 | (20.848) | 37.179 | 26.057 | 3.097 |
| Distributions | |||||
| Dividends from Net Investment Income | (2.237) | (2.052) | (1.908) | (1.947) | (1.997) |
| Distributions from Realized Capital Gains | — | — | — | — | — |
| Total Distributions | (2.237) | (2.052) | (1.908) | (1.947) | (1.997) |
| Net Asset Value, End of Period | $159.74 | $137.84 | $160.74 | $125.47 | $101.36 |
| Total Return | 17.79% | -13.09% | 29.94% | 26.14% | 3.26% |
| Ratios/Supplemental Data | |||||
| Net Assets, End of Period (Millions) | $4,237 | $3,701 | $4,288 | $3,036 | $1,944 |
| Ratio of Total Expenses to Average Net Assets | 0.07%2 | 0.07% | 0.07% | 0.07% | 0.07% |
| Ratio of Net Investment Income to Average Net Assets | 1.59% | 1.38% | 1.41% | 1.85% | 2.10% |
| Portfolio Turnover Rate3 | 2% | 3% | 5% | 4% | 4% |
| 1 | Calculated based on average shares outstanding. |
| 2 | The ratio of expenses to average net assets for the period net of reduction from custody fee offset arrangements was 0.07%. |
| 3 | Excludes the value of portfolio securities received or delivered as a result of in-kind purchases or redemptions of the fund’s capital shares, including ETF Creation Units. |
| Institutional Shares | |||||
| For a Share Outstanding Throughout Each Period | Year Ended August 31, | ||||
| 2023 | 2022 | 2021 | 2020 | 2019 | |
| Net Asset Value, Beginning of Period | $271.77 | $316.94 | $247.38 | $199.84 | $197.68 |
| Investment Operations | |||||
| Net Investment Income1 | 4.499 | 4.199 | 3.882 | 3.943 | 4.053 |
| Net Realized and Unrealized Gain (Loss) on Investments | 43.129 | (45.292) | 69.463 | 47.454 | 2.062 |
| Total from Investment Operations | 47.628 | (41.093) | 73.345 | 51.397 | 6.115 |
| Distributions | |||||
| Dividends from Net Investment Income | (4.438) | (4.077) | (3.785) | (3.857) | (3.955) |
| Distributions from Realized Capital Gains | — | — | — | — | — |
| Total Distributions | (4.438) | (4.077) | (3.785) | (3.857) | (3.955) |
| Net Asset Value, End of Period | $314.96 | $271.77 | $316.94 | $247.38 | $199.84 |
| Total Return | 17.81% | -13.07% | 29.97% | 26.19% | 3.25% |
| Ratios/Supplemental Data | |||||
| Net Assets, End of Period (Millions) | $203 | $178 | $190 | $180 | $150 |
| Ratio of Total Expenses to Average Net Assets | 0.06%2 | 0.06% | 0.06% | 0.06% | 0.06% |
| Ratio of Net Investment Income to Average Net Assets | 1.60% | 1.40% | 1.42% | 1.86% | 2.11% |
| Portfolio Turnover Rate3 | 2% | 3% | 5% | 4% | 4% |
| 1 | Calculated based on average shares outstanding. |
| 2 | The ratio of expenses to average net assets for the period net of reduction from custody fee offset arrangements was 0.06%. |
| 3 | Excludes the value of portfolio securities received or delivered as a result of in-kind purchases or redemptions of the fund’s capital shares, including ETF Creation Units. |
| A. | The following significant accounting policies conform to generally accepted accounting principles for U.S. investment companies. The fund consistently follows such policies in preparing its financial statements. |
| B. | In accordance with the terms of a Funds' Service Agreement (the “FSA”) between Vanguard and the fund, Vanguard furnishes to the fund investment advisory, corporate management, administrative, marketing, and distribution services at Vanguard’s cost of operations (as defined by the FSA). These costs of operations are allocated to the fund based on methods and guidelines approved by the board of trustees and are generally settled twice a month. |
| C. | The fund’s custodian bank has agreed to reduce its fees when the fund maintains cash on deposit in the non-interest-bearing custody account. For the year ended August 31, 2023, custodian fee offset arrangements reduced the fund’s expenses by $1,000 (an annual rate of less than 0.01% of average net assets). |
| D. | Various inputs may be used to determine the value of the fund’s investments and derivatives. These inputs are summarized in three broad levels for financial statement purposes. The inputs or methodologies used to value securities are not necessarily an indication of the risk associated with investing in those securities. |
| E. | Permanent differences between book-basis and tax-basis components of net assets are reclassified among capital accounts in the financial statements to reflect their tax character. These reclassifications have no effect on net assets or net asset value per share. As of period end, permanent differences primarily attributable to the accounting for applicable in-kind redemptions were reclassified between the following accounts: |
| Amount ($000) | |
| Paid-in Capital | 220,893 |
| Total Distributable Earnings (Loss) | (220,893) |
| Amount ($000) | |
| Undistributed Ordinary Income | 13,428 |
| Undistributed Long-Term Gains | — |
| Net Unrealized Gains (Losses) | 1,404,061 |
| Capital Loss Carryforwards | (148,050) |
| Qualified Late-Year Losses | — |
| Other Temporary Differences | — |
| Total | 1,269,439 |
| Year Ended August 31, | ||
| 2023 Amount ($000) | 2022 Amount ($000) | |
| Ordinary Income* | 62,253 | 57,481 |
| Long-Term Capital Gains | — | — |
| Total | 62,253 | 57,481 |
| * | Includes short-term capital gains, if any. |
| Amount ($000) | |
| Tax Cost | 3,028,836 |
| Gross Unrealized Appreciation | 1,553,851 |
| Gross Unrealized Depreciation | (149,790) |
| Net Unrealized Appreciation (Depreciation) | 1,404,061 |
| F. | During the year ended August 31, 2023, the fund purchased $427,126,000 of investment securities and sold $454,457,000 of investment securities, other than temporary cash investments. Purchases and sales include $311,430,000 and $360,492,000, respectively, in connection with in-kind purchases and redemptions of the fund's capital shares. |
| G. | Capital share transactions for each class of shares were: |
| Year Ended August 31, | |||||
| 2023 | 2022 | ||||
| Amount ($000) | Shares (000) | Amount ($000) | Shares (000) | ||
| ETF Shares | |||||
| Issued | 321,852 | 2,250 | 623,865 | 4,075 | |
| Issued in Lieu of Cash Distributions | — | — | — | — | |
| Redeemed | (360,902) | (2,575) | (582,244) | (3,900) | |
| Net Increase (Decrease)—ETF Shares | (39,050) | (325) | 41,621 | 175 | |
| Institutional Shares | |||||
| Issued | 20,931 | 74 | 25,422 | 87 | |
| Issued in Lieu of Cash Distributions | 2,865 | 10 | 2,465 | 8 | |
| Redeemed | (26,778) | (93) | (12,650) | (41) | |
| Net Increase (Decrease)—Institutional Shares | (2,982) | (9) | 15,237 | 54 | |
| H. | Significant market disruptions, such as those caused by pandemics (e.g., COVID-19 pandemic), natural or environmental disasters, war (e.g., Russia’s invasion of Ukraine), acts of terrorism, or other events, can adversely affect local and global markets and normal market operations. Any such disruptions could have an adverse impact on the value of the fund’s investments and fund performance. |
| I. | Management has determined that no events or transactions occurred subsequent to August 31, 2023, that would require recognition or disclosure in these financial statements. |
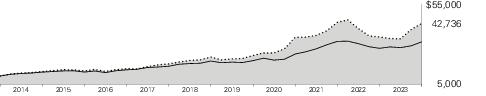
| Average Annual Total Returns Periods Ended August 31, 2023 | |||||
| One Year | Five Years | Ten Years | Final Value of a $10,000 Investment | ||
| Mega Cap Growth Index Fund ETF Shares Net Asset Value | 24.39% | 14.35% | 15.63% | $42,736 |
| Mega Cap Growth Index Fund ETF Shares Market Price | 24.48 | 14.36 | 15.64 | 42,755 | |
| CRSP US Mega Cap Growth Index | 24.48 | 14.42 | 15.71 | 43,014 |
| Dow Jones U.S. Total Stock Market Float Adjusted Index | 14.75 | 10.12 | 12.14 | 31,461 |
| One Year | Five Years | Ten Years | Final Value of a $5,000,000 Investment | ||
| Mega Cap Growth Index Fund Institutional Shares | 24.41% | 14.37% | 15.65% | $21,395,223 | |
| CRSP US Mega Cap Growth Index | 24.48 | 14.42 | 15.71 | 21,506,977 | |
| Dow Jones U.S. Total Stock Market Float Adjusted Index | 14.75 | 10.12 | 12.14 | 15,730,560 | |
| One Year | Five Years | Ten Years | |
| Mega Cap Growth Index Fund ETF Shares Market Price | 24.48% | 95.61% | 327.55% |
| Mega Cap Growth Index Fund ETF Shares Net Asset Value | 24.39 | 95.52 | 327.36 |
| CRSP US Mega Cap Growth Index | 24.48 | 96.11 | 330.14 |
| Basic Materials | 1.3% |
| Consumer Discretionary | 22.6 |
| Consumer Staples | 0.7 |
| Energy | 0.5 |
| Financials | 1.5 |
| Health Care | 7.8 |
| Industrials | 7.8 |
| Real Estate | 1.2 |
| Technology | 55.9 |
| Telecommunications | 0.7 |
| Shares | Market Value• ($000) | ||
| Common Stocks (99.8%) | |||
| Basic Materials (1.3%) | |||
| Linde plc | 386,380 | 149,544 | |
| Ecolab Inc. | 205,071 | 37,694 | |
| 187,238 | |||
| Consumer Discretionary (22.5%) | |||
| * | Amazon.com Inc. | 6,843,627 | 944,489 |
| * | Tesla Inc. | 2,115,560 | 545,984 |
| Home Depot Inc. | 790,749 | 261,184 | |
| Costco Wholesale Corp. | 349,073 | 191,739 | |
| McDonald's Corp. | 574,923 | 161,640 | |
| * | Netflix Inc. | 350,358 | 151,943 |
| * | Walt Disney Co. | 1,440,584 | 120,548 |
| NIKE Inc. Class B | 972,643 | 98,927 | |
| * | Booking Holdings Inc. | 29,251 | 90,825 |
| Starbucks Corp. | 905,963 | 88,277 | |
| TJX Cos. Inc. | 911,871 | 84,330 | |
| * | Uber Technologies Inc. | 1,525,350 | 72,042 |
| Lowe's Cos. Inc. | 236,010 | 54,396 | |
| * | O'Reilly Automotive Inc. | 48,507 | 45,582 |
| Marriott International Inc. Class A | 206,251 | 41,974 | |
| * | Airbnb Inc. Class A | 297,050 | 39,077 |
| * | Lululemon Athletica Inc. | 93,020 | 35,465 |
| Ross Stores Inc. | 274,989 | 33,496 | |
| Yum! Brands Inc. | 224,853 | 29,091 | |
| Activision Blizzard Inc. | 301,621 | 27,746 | |
| Estee Lauder Cos. Inc. Class A | 167,375 | 26,869 | |
| Dollar General Corp. | 176,135 | 24,395 | |
| * | Chipotle Mexican Grill Inc. | 11,154 | 21,490 |
| * | AutoZone Inc. | 7,522 | 19,041 |
| Hilton Worldwide Holdings Inc. | 108,770 | 16,169 | |
| Electronic Arts Inc. | 112,737 | 13,526 | |
| Las Vegas Sands Corp. | 146,884 | 8,058 | |
| 3,248,303 | |||
| Consumer Staples (0.7%) | |||
| * | Monster Beverage Corp. | 586,450 | 33,668 |
| Hershey Co. | 118,258 | 25,409 | |
| Colgate-Palmolive Co. | 334,556 | 24,580 | |
| Brown-Forman Corp. Class B | 131,028 | 8,665 | |
| Brown-Forman Corp. Class A | 21,866 | 1,470 | |
| 93,792 | |||
| Shares | Market Value• ($000) | ||
| Energy (0.5%) | |||
| Pioneer Natural Resources Co. | 186,707 | 44,423 | |
| Schlumberger NV | 574,007 | 33,844 | |
| 78,267 | |||
| Financials (1.6%) | |||
| S&P Global Inc. | 253,382 | 99,037 | |
| Aon plc Class A (XNYS) | 154,417 | 51,481 | |
| Moody's Corp. | 124,469 | 41,921 | |
| Blackstone Inc. | 285,407 | 30,359 | |
| 222,798 | |||
| Health Care (7.8%) | |||
| Eli Lilly & Co. | 671,513 | 372,152 | |
| Thermo Fisher Scientific Inc. | 303,804 | 169,249 | |
| * | Intuitive Surgical Inc. | 277,051 | 86,628 |
| * | Vertex Pharmaceuticals Inc. | 204,060 | 71,082 |
| Danaher Corp. | 263,376 | 69,795 | |
| * | Regeneron Pharmaceuticals Inc. | 81,329 | 67,218 |
| Zoetis Inc. | 330,276 | 62,921 | |
| * | Boston Scientific Corp. | 1,159,778 | 62,558 |
| Stryker Corp. | 136,533 | 38,714 | |
| * | Edwards Lifesciences Corp. | 483,636 | 36,984 |
| * | Moderna Inc. | 259,549 | 29,347 |
| Agilent Technologies Inc. | 237,365 | 28,738 | |
| * | IDEXX Laboratories Inc. | 34,055 | 17,416 |
| * | Illumina Inc. | 65,540 | 10,829 |
| 1,123,631 | |||
| Industrials (7.7%) | |||
| Visa Inc. Class A | 1,271,886 | 312,477 | |
| Mastercard Inc. Class A | 665,357 | 274,553 | |
| Accenture plc Class A | 497,480 | 161,069 | |
| * | Boeing Co. | 475,016 | 106,418 |
| * | Fiserv Inc. | 466,011 | 56,569 |
| * | PayPal Holdings Inc. | 885,965 | 55,382 |
| Sherwin-Williams Co. | 184,905 | 50,242 | |
| Automatic Data Processing Inc. | 165,294 | 42,085 | |
| Paychex Inc. | 260,836 | 31,882 | |
| * | Block Inc. (XNYS) | 437,946 | 25,248 |
| Global Payments Inc. | 229 | 29 | |
| 1,115,954 | |||
| Real Estate (1.2%) | |||
| American Tower Corp. | 369,117 | 66,928 | |
| Equinix Inc. | 74,223 | 57,997 | |
| Shares | Market Value• ($000) | ||
| Public Storage | 126,489 | 34,959 | |
| Crown Castle Inc. | 176,637 | 17,752 | |
| 177,636 | |||
| Technology (55.8%) | |||
| Apple Inc. | 11,719,621 | 2,201,765 | |
| Microsoft Corp. | 5,831,940 | 1,911,477 | |
| NVIDIA Corp. | 1,677,336 | 827,849 | |
| * | Alphabet Inc. Class A | 4,661,204 | 634,716 |
| * | Alphabet Inc. Class C | 3,917,457 | 538,063 |
| * | Meta Platforms Inc. Class A | 1,737,047 | 513,975 |
| * | Adobe Inc. | 361,264 | 202,069 |
| * | Salesforce Inc. | 748,152 | 165,686 |
| * | Advanced Micro Devices Inc. | 1,268,674 | 134,124 |
| Texas Instruments Inc. | 715,658 | 120,273 | |
| Intuit Inc. | 210,214 | 113,896 | |
| Applied Materials Inc. | 667,914 | 102,031 | |
| * | ServiceNow Inc. | 161,003 | 94,803 |
| Lam Research Corp. | 106,489 | 74,798 | |
| * | Palo Alto Networks Inc. | 243,114 | 59,150 |
| * | Synopsys Inc. | 120,923 | 55,490 |
| KLA Corp. | 109,151 | 54,780 | |
| * | Cadence Design Systems Inc. | 216,656 | 52,093 |
| * | Workday Inc. Class A | 163,276 | 39,921 |
| * | Autodesk Inc. | 171,841 | 38,138 |
| * | Snowflake Inc. Class A | 220,618 | 34,604 |
| * | Crowdstrike Holdings Inc. Class A | 171,621 | 27,979 |
| Marvell Technology Inc. | 347,727 | 20,255 | |
| * | Fortinet Inc. | 272,133 | 16,385 |
| Shares | Market Value• ($000) | ||
| Roper Technologies Inc. | 92 | 46 | |
| 8,034,366 | |||
| Telecommunications (0.7%) | |||
| * | T-Mobile US Inc. | 475,884 | 64,839 |
| * | Charter Communications Inc. Class A | 78,900 | 34,568 |
| 99,407 | |||
| Total Common Stocks (Cost $10,898,622) | 14,381,392 | ||
| Temporary Cash Investments (0.1%) | |||
| Money Market Fund (0.1%) | |||
| 1 | Vanguard Market Liquidity Fund, 5.384% (Cost $15,083) | 150,859 | 15,084 |
| Total Investments (99.9%) (Cost $10,913,705) | 14,396,476 | ||
| Other Assets and Liabilities—Net (0.1%) | 11,340 | ||
| Net Assets (100%) | 14,407,816 | ||
| Cost is in $000. | |||
| • | See Note A in Notes to Financial Statements. |
| * | Non-income-producing security. |
| 1 | Affiliated money market fund available only to Vanguard funds and certain trusts and accounts managed by Vanguard. Rate shown is the 7-day yield. |
| Futures Contracts | ||||
| ($000) | ||||
| Expiration | Number of Long (Short) Contracts | Notional Amount | Value and Unrealized Appreciation (Depreciation) | |
| Long Futures Contracts | ||||
| E-mini NASDAQ 100 Index | September 2023 | 75 | 23,308 | 637 |
| E-mini S&P 500 Index | September 2023 | 10 | 2,258 | 28 |
| 665 | ||||
| ($000s, except shares, footnotes, and per-share amounts) | Amount |
| Assets | |
| Investments in Securities, at Value | |
| Unaffiliated Issuers (Cost $10,898,622) | 14,381,392 |
| Affiliated Issuers (Cost $15,083) | 15,084 |
| Total Investments in Securities | 14,396,476 |
| Investment in Vanguard | 478 |
| Cash Collateral Pledged—Futures Contracts | 1,375 |
| Receivables for Accrued Income | 9,911 |
| Receivables for Capital Shares Issued | 3 |
| Variation Margin Receivable—Futures Contracts | 52 |
| Total Assets | 14,408,295 |
| Liabilities | |
| Payables for Investment Securities Purchased | 53 |
| Payables to Vanguard | 426 |
| Total Liabilities | 479 |
| Net Assets | 14,407,816 |
| At August 31, 2023, net assets consisted of: | |
| Paid-in Capital | 11,814,119 |
| Total Distributable Earnings (Loss) | 2,593,697 |
| Net Assets | 14,407,816 |
| ETF Shares—Net Assets | |
| Applicable to 59,589,192 outstanding $.001 par value shares of beneficial interest (unlimited authorization) | 14,376,122 |
| Net Asset Value Per Share—ETF Shares | $241.25 |
| Institutional Shares—Net Assets | |
| Applicable to 66,136 outstanding $.001 par value shares of beneficial interest (unlimited authorization) | 31,694 |
| Net Asset Value Per Share—Institutional Shares | $479.23 |
| Year Ended August 31, 2023 | |
| ($000) | |
| Investment Income | |
| Income | |
| Dividends | 79,205 |
| Interest1 | 435 |
| Securities Lending—Net | 1 |
| Total Income | 79,641 |
| Expenses | |
| The Vanguard Group—Note B | |
| Investment Advisory Services | 276 |
| Management and Administrative—ETF Shares | 6,827 |
| Management and Administrative—Institutional Shares | 13 |
| Marketing and Distribution—ETF Shares | 554 |
| Marketing and Distribution—Institutional Shares | 1 |
| Custodian Fees | 22 |
| Auditing Fees | 30 |
| Shareholders’ Reports—ETF Shares | 340 |
| Shareholders’ Reports—Institutional Shares | — |
| Trustees’ Fees and Expenses | 6 |
| Other Expenses | 22 |
| Total Expenses | 8,091 |
| Expenses Paid Indirectly | (3) |
| Net Expenses | 8,088 |
| Net Investment Income | 71,553 |
| Realized Net Gain (Loss) | |
| Investment Securities Sold1,2 | 708,840 |
| Futures Contracts | 1,929 |
| Realized Net Gain (Loss) | 710,769 |
| Change in Unrealized Appreciation (Depreciation) | |
| Investment Securities1 | 1,954,146 |
| Futures Contracts | 1,178 |
| Change in Unrealized Appreciation (Depreciation) | 1,955,324 |
| Net Increase (Decrease) in Net Assets Resulting from Operations | 2,737,646 |
| 1 | Interest income, realized net gain (loss), capital gain distributions received, and change in unrealized appreciation (depreciation) from an affiliated company of the fund were $405,000, $6,000, less than $1,000, and less than $1,000, respectively. Purchases and sales are for temporary cash investment purposes. |
| 2 | Includes $1,119,078,000 of net gain (loss) resulting from in-kind redemptions. |
| Year Ended August 31, | ||
| 2023 ($000) | 2022 ($000) | |
| Increase (Decrease) in Net Assets | ||
| Operations | ||
| Net Investment Income | 71,553 | 63,434 |
| Realized Net Gain (Loss) | 710,769 | 858,787 |
| Change in Unrealized Appreciation (Depreciation) | 1,955,324 | (3,910,393) |
| Net Increase (Decrease) in Net Assets Resulting from Operations | 2,737,646 | (2,988,172) |
| Distributions | ||
| ETF Shares | (70,975) | (57,769) |
| Institutional Shares | (170) | (185) |
| Total Distributions | (71,145) | (57,954) |
| Capital Share Transactions | ||
| ETF Shares | 547,536 | 1,490,053 |
| Institutional Shares | (1,174) | (9,451) |
| Net Increase (Decrease) from Capital Share Transactions | 546,362 | 1,480,602 |
| Total Increase (Decrease) | 3,212,863 | (1,565,524) |
| Net Assets | ||
| Beginning of Period | 11,194,953 | 12,760,477 |
| End of Period | 14,407,816 | 11,194,953 |
| ETF Shares | |||||
| For a Share Outstanding Throughout Each Period | Year Ended August 31, | ||||
| 2023 | 2022 | 2021 | 2020 | 2019 | |
| Net Asset Value, Beginning of Period | $195.20 | $248.50 | $196.25 | $132.22 | $127.79 |
| Investment Operations | |||||
| Net Investment Income1 | 1.248 | 1.151 | 1.220 | 1.358 | 1.588 |
| Net Realized and Unrealized Gain (Loss) on Investments | 46.044 | (53.389) | 52.279 | 64.007 | 3.860 |
| Total from Investment Operations | 47.292 | (52.238) | 53.499 | 65.365 | 5.448 |
| Distributions | |||||
| Dividends from Net Investment Income | (1.242) | (1.062) | (1.249) | (1.335) | (1.018) |
| Distributions from Realized Capital Gains | — | — | — | — | — |
| Total Distributions | (1.242) | (1.062) | (1.249) | (1.335) | (1.018) |
| Net Asset Value, End of Period | $241.25 | $195.20 | $248.50 | $196.25 | $132.22 |
| Total Return | 24.39% | -21.08% | 27.41% | 49.84% | 4.32% |
| Ratios/Supplemental Data | |||||
| Net Assets, End of Period (Millions) | $14,376 | $11,168 | $12,714 | $10,193 | $4,388 |
| Ratio of Total Expenses to Average Net Assets | 0.07%2 | 0.07% | 0.07% | 0.07% | 0.07% |
| Ratio of Net Investment Income to Average Net Assets | 0.62% | 0.51% | 0.58% | 0.90% | 1.30% |
| Portfolio Turnover Rate3 | 7% | 5% | 8% | 6% | 14% |
| 1 | Calculated based on average shares outstanding. |
| 2 | The ratio of expenses to average net assets for the period net of reduction from custody fee offset arrangements was 0.07%. |
| 3 | Excludes the value of portfolio securities received or delivered as a result of in-kind purchases or redemptions of the fund’s capital shares, including ETF Creation Units. |
| Institutional Shares | |||||
| For a Share Outstanding Throughout Each Period | Year Ended August 31, | ||||
| 2023 | 2022 | 2021 | 2020 | 2019 | |
| Net Asset Value, Beginning of Period | $387.74 | $493.61 | $389.78 | $262.63 | $253.80 |
| Investment Operations | |||||
| Net Investment Income1 | 2.517 | 2.279 | 2.498 | 2.707 | 3.184 |
| Net Realized and Unrealized Gain (Loss) on Investments | 91.475 | (106.001) | 103.822 | 127.126 | 7.684 |
| Total from Investment Operations | 93.992 | (103.722) | 106.320 | 129.833 | 10.868 |
| Distributions | |||||
| Dividends from Net Investment Income | (2.502) | (2.148) | (2.489) | (2.683) | (2.038) |
| Distributions from Realized Capital Gains | — | — | — | — | — |
| Total Distributions | (2.502) | (2.148) | (2.489) | (2.683) | (2.038) |
| Net Asset Value, End of Period | $479.23 | $387.74 | $493.61 | $389.78 | $262.63 |
| Total Return | 24.41% | -21.07% | 27.43% | 49.87% | 4.34% |
| Ratios/Supplemental Data | |||||
| Net Assets, End of Period (Millions) | $32 | $27 | $46 | $81 | $43 |
| Ratio of Total Expenses to Average Net Assets | 0.06%2 | 0.06% | 0.06% | 0.06% | 0.06% |
| Ratio of Net Investment Income to Average Net Assets | 0.63% | 0.50% | 0.62% | 0.91% | 1.31% |
| Portfolio Turnover Rate3 | 7% | 5% | 8% | 6% | 14% |
| 1 | Calculated based on average shares outstanding. |
| 2 | The ratio of expenses to average net assets for the period net of reduction from custody fee offset arrangements was 0.06%. |
| 3 | Excludes the value of portfolio securities received or delivered as a result of in-kind purchases or redemptions of the fund’s capital shares, including ETF Creation Units. |
| A. | The following significant accounting policies conform to generally accepted accounting principles for U.S. investment companies. The fund consistently follows such policies in preparing its financial statements. |
| B. | In accordance with the terms of a Funds' Service Agreement (the “FSA”) between Vanguard and the fund, Vanguard furnishes to the fund investment advisory, corporate management, administrative, marketing, and distribution services at Vanguard’s cost of operations (as defined by the FSA). These costs of operations are allocated to the fund based on methods and guidelines approved by the board of trustees and are generally settled twice a month. |
| C. | The fund’s custodian bank has agreed to reduce its fees when the fund maintains cash on deposit in the non-interest-bearing custody account. For the year ended August 31, 2023, custodian fee offset arrangements reduced the fund’s expenses by $3,000 (an annual rate of less than 0.01% of average net assets). |
| D. | Various inputs may be used to determine the value of the fund’s investments and derivatives. These inputs are summarized in three broad levels for financial statement purposes. The inputs or methodologies used to value securities are not necessarily an indication of the risk associated with investing in those securities. |
| E. | Permanent differences between book-basis and tax-basis components of net assets are reclassified among capital accounts in the financial statements to reflect their tax character. These reclassifications have no effect on net assets or net asset value per share. As of period end, permanent differences primarily attributable to the accounting for applicable in-kind redemptions were reclassified between the following accounts: |
| Amount ($000) | |
| Paid-in Capital | 1,119,009 |
| Total Distributable Earnings (Loss) | (1,119,009) |
| Amount ($000) | |
| Undistributed Ordinary Income | 17,173 |
| Undistributed Long-Term Gains | — |
| Net Unrealized Gains (Losses) | 3,480,071 |
| Capital Loss Carryforwards | (903,547) |
| Qualified Late-Year Losses | — |
| Other Temporary Differences | — |
| Total | 2,593,697 |
| Year Ended August 31, | ||
| 2023 Amount ($000) | 2022 Amount ($000) | |
| Ordinary Income* | 71,145 | 57,954 |
| Long-Term Capital Gains | — | — |
| Total | 71,145 | 57,954 |
| * | Includes short-term capital gains, if any. |
| Amount ($000) | |
| Tax Cost | 10,916,404 |
| Gross Unrealized Appreciation | 3,963,193 |
| Gross Unrealized Depreciation | (483,122) |
| Net Unrealized Appreciation (Depreciation) | 3,480,071 |
| F. | During the year ended August 31, 2023, the fund purchased $3,609,598,000 of investment securities and sold $3,066,033,000 of investment securities, other than temporary cash investments. Purchases and sales include $2,796,481,000 and $2,257,397,000, respectively, in connection with in-kind purchases and redemptions of the fund's capital shares. |
| G. | Capital share transactions for each class of shares were: |
| Year Ended August 31, | |||||
| 2023 | 2022 | ||||
| Amount ($000) | Shares (000) | Amount ($000) | Shares (000) | ||
| ETF Shares | |||||
| Issued | 2,798,222 | 13,950 | 3,516,757 | 15,200 | |
| Issued in Lieu of Cash Distributions | — | — | — | — | |
| Redeemed | (2,250,686) | (11,575) | (2,026,704) | (9,150) | |
| Net Increase (Decrease)—ETF Shares | 547,536 | 2,375 | 1,490,053 | 6,050 | |
| Institutional Shares | |||||
| Issued | 1,823 | 5 | 1,938 | 5 | |
| Issued in Lieu of Cash Distributions | 170 | — | 184 | — | |
| Redeemed | (3,167) | (8) | (11,573) | (29) | |
| Net Increase (Decrease)—Institutional Shares | (1,174) | (3) | (9,451) | (24) | |
| H. | Significant market disruptions, such as those caused by pandemics (e.g., COVID-19 pandemic), natural or environmental disasters, war (e.g., Russia’s invasion of Ukraine), acts of terrorism, or other events, can adversely affect local and global markets and normal market operations. Any such disruptions could have an adverse impact on the value of the fund’s investments and fund performance. |
| I. | Management has determined that no events or transactions occurred subsequent to August 31, 2023, that would require recognition or disclosure in these financial statements. |

| Average Annual Total Returns Periods Ended August 31, 2023 | |||||
| One Year | Five Years | Ten Years | Final Value of a $10,000 Investment | ||
| Mega Cap Value Index Fund ETF Shares Net Asset Value | 10.53% | 8.48% | 10.61% | $27,406 |
| Mega Cap Value Index Fund ETF Shares Market Price | 10.56 | 8.48 | 10.62 | 27,426 | |
| CRSP US Mega Cap Value Index | 10.59 | 8.54 | 10.67 | 27,563 |
| Dow Jones U.S. Total Stock Market Float Adjusted Index | 14.75 | 10.12 | 12.14 | 31,461 |
| One Year | Five Years | Ten Years | Final Value of a $5,000,000 Investment | ||
| Mega Cap Value Index Fund Institutional Shares | 10.55% | 8.50% | 10.63% | $13,730,937 | |
| CRSP US Mega Cap Value Index | 10.59 | 8.54 | 10.67 | 13,781,292 | |
| Dow Jones U.S. Total Stock Market Float Adjusted Index | 14.75 | 10.12 | 12.14 | 15,730,560 | |
| One Year | Five Years | Ten Years | |
| Mega Cap Value Index Fund ETF Shares Market Price | 10.56% | 50.23% | 174.26% |
| Mega Cap Value Index Fund ETF Shares Net Asset Value | 10.53 | 50.21 | 174.06 |
| CRSP US Mega Cap Value Index | 10.59 | 50.62 | 175.63 |
| Basic Materials | 1.4% |
| Consumer Discretionary | 3.7 |
| Consumer Staples | 11.8 |
| Energy | 9.1 |
| Financials | 19.6 |
| Health Care | 20.2 |
| Industrials | 14.6 |
| Real Estate | 1.1 |
| Technology | 9.7 |
| Telecommunications | 4.6 |
| Utilities | 4.2 |
| Shares | Market Value• ($000) | ||
| Common Stocks (99.9%) | |||
| Basic Materials (1.4%) | |||
| Air Products and Chemicals Inc. | 98,955 | 29,240 | |
| Freeport-McMoRan Inc. | 638,368 | 25,477 | |
| Dow Inc. | 315,682 | 17,224 | |
| Newmont Corp. | 353,185 | 13,923 | |
| 85,864 | |||
| Consumer Discretionary (3.7%) | |||
| Walmart Inc. | 660,319 | 107,374 | |
| Lowe's Cos. Inc. | 131,814 | 30,381 | |
| Target Corp. | 205,629 | 26,022 | |
| Ford Motor Co. | 1,751,260 | 21,243 | |
| General Motors Co. | 586,909 | 19,667 | |
| Activision Blizzard Inc. | 165,963 | 15,267 | |
| Electronic Arts Inc. | 60,643 | 7,276 | |
| 227,230 | |||
| Consumer Staples (11.8%) | |||
| Procter & Gamble Co. | 1,049,151 | 161,926 | |
| PepsiCo Inc. | 613,212 | 109,103 | |
| Coca-Cola Co. | 1,732,466 | 103,653 | |
| Philip Morris International Inc. | 691,074 | 66,385 | |
| Mondelez International Inc. Class A | 606,505 | 43,220 | |
| CVS Health Corp. | 570,927 | 37,207 | |
| Altria Group Inc. | 794,868 | 35,149 | |
| McKesson Corp. | 60,311 | 24,867 | |
| Kimberly-Clark Corp. | 150,062 | 19,333 | |
| Constellation Brands Inc. Class A | 73,499 | 19,151 | |
| Kenvue Inc. | 767,656 | 17,694 | |
| General Mills Inc. | 261,063 | 17,664 | |
| Sysco Corp. | 225,248 | 15,689 | |
| Keurig Dr Pepper Inc. | 436,750 | 14,697 | |
| Colgate-Palmolive Co. | 185,034 | 13,594 | |
| Kraft Heinz Co. | 354,530 | 11,731 | |
| Archer-Daniels-Midland Co. | 121,049 | 9,599 | |
| Walgreens Boots Alliance Inc. | 163,491 | 4,138 | |
| 724,800 | |||
| Energy (9.1%) | |||
| Exxon Mobil Corp. | 1,799,737 | 200,113 | |
| Chevron Corp. | 806,699 | 129,959 | |
| ConocoPhillips | 539,559 | 64,224 | |
| EOG Resources Inc. | 260,445 | 33,498 | |
| Marathon Petroleum Corp. | 188,929 | 26,973 | |
| Phillips 66 | 205,370 | 23,445 | |
| Shares | Market Value• ($000) | ||
| Valero Energy Corp. | 161,145 | 20,933 | |
| Schlumberger NV | 316,723 | 18,674 | |
| Occidental Petroleum Corp. | 297,249 | 18,664 | |
| Kinder Morgan Inc. | 846,760 | 14,581 | |
| Williams Cos. Inc. | 270,768 | 9,350 | |
| 560,414 | |||
| Financials (19.6%) | |||
| * | Berkshire Hathaway Inc. Class B | 690,216 | 248,616 |
| JPMorgan Chase & Co. | 1,300,822 | 190,349 | |
| Bank of America Corp. | 3,015,373 | 86,451 | |
| Wells Fargo & Co. | 1,670,300 | 68,967 | |
| Goldman Sachs Group Inc. | 147,992 | 48,498 | |
| Morgan Stanley | 557,595 | 47,479 | |
| * | Berkshire Hathaway Inc. Class A | 82 | 44,831 |
| Marsh & McLennan Cos. Inc. | 220,295 | 42,955 | |
| BlackRock Inc. | 56,666 | 39,697 | |
| Charles Schwab Corp. | 669,501 | 39,601 | |
| Chubb Ltd. | 184,350 | 37,030 | |
| Progressive Corp. | 260,615 | 34,784 | |
| Citigroup Inc. | 823,368 | 33,997 | |
| CME Group Inc. | 160,185 | 32,466 | |
| Intercontinental Exchange Inc. | 249,298 | 29,415 | |
| US Bancorp | 683,032 | 24,951 | |
| KKR & Co. Inc. | 288,612 | 18,128 | |
| Truist Financial Corp. | 592,018 | 18,086 | |
| Aflac Inc. | 242,378 | 18,074 | |
| PNC Financial Services Group Inc. | 140,927 | 17,014 | |
| Blackstone Inc. | 156,921 | 16,692 | |
| Travelers Cos. Inc. | 102,943 | 16,598 | |
| MetLife Inc. | 255,210 | 16,165 | |
| Bank of New York Mellon Corp. | 333,045 | 14,944 | |
| American International Group Inc. | 160,787 | 9,409 | |
| Prudential Financial Inc. | 81,158 | 7,683 | |
| Allstate Corp. | 58,459 | 6,303 | |
| 1,209,183 | |||
| Health Care (20.1%) | |||
| UnitedHealth Group Inc. | 414,479 | 197,532 | |
| Johnson & Johnson | 1,071,925 | 173,309 | |
| Merck & Co. Inc. | 1,129,506 | 123,094 | |
| AbbVie Inc. | 785,465 | 115,432 | |
| Pfizer Inc. | 2,513,225 | 88,918 | |
| Abbott Laboratories | 774,105 | 79,656 | |
| Shares | Market Value• ($000) | ||
| Amgen Inc. | 237,837 | 60,967 | |
| Bristol-Myers Squibb Co. | 935,313 | 57,662 | |
| Medtronic plc | 592,241 | 48,268 | |
| Elevance Health Inc. | 105,500 | 46,632 | |
| Gilead Sciences Inc. | 555,990 | 42,522 | |
| Danaher Corp. | 147,802 | 39,168 | |
| Cigna Group | 131,771 | 36,403 | |
| Becton Dickinson & Co. | 126,531 | 35,359 | |
| Humana Inc. | 55,619 | 25,675 | |
| HCA Healthcare Inc. | 91,766 | 25,447 | |
| Stryker Corp. | 76,076 | 21,571 | |
| * | Biogen Inc. | 64,330 | 17,199 |
| GE Healthcare Inc. | 85,906 | 6,052 | |
| 1,240,866 | |||
| Industrials (14.6%) | |||
| Caterpillar Inc. | 229,406 | 64,493 | |
| Union Pacific Corp. | 271,359 | 59,854 | |
| RTX Corp. | 650,571 | 55,975 | |
| Honeywell International Inc. | 296,333 | 55,693 | |
| General Electric Co. | 484,610 | 55,469 | |
| United Parcel Service Inc. Class B (XNYS) | 322,645 | 54,656 | |
| Lockheed Martin Corp. | 112,730 | 50,543 | |
| Deere & Co. | 118,745 | 48,797 | |
| Eaton Corp. plc | 177,419 | 40,872 | |
| American Express Co. | 248,268 | 39,224 | |
| Illinois Tool Works Inc. | 115,004 | 28,446 | |
| CSX Corp. | 905,922 | 27,359 | |
| Northrop Grumman Corp. | 60,840 | 26,349 | |
| FedEx Corp. | 100,725 | 26,291 | |
| 3M Co. | 245,825 | 26,222 | |
| Emerson Electric Co. | 254,518 | 25,006 | |
| General Dynamics Corp. | 109,998 | 24,930 | |
| Parker-Hannifin Corp. | 57,125 | 23,815 | |
| Automatic Data Processing Inc. | 91,847 | 23,385 | |
| Trane Technologies plc | 101,629 | 20,860 | |
| Norfolk Southern Corp. | 101,219 | 20,751 | |
| Johnson Controls International plc | 304,864 | 18,005 | |
| Capital One Financial Corp. | 161,158 | 16,501 | |
| L3Harris Technologies Inc. | 84,206 | 14,996 | |
| PPG Industries Inc. | 104,933 | 14,875 | |
| Fidelity National Information Services Inc. | 263,194 | 14,702 | |
| Otis Worldwide Corp. | 91,952 | 7,867 | |
| Cummins Inc. | 31,443 | 7,233 | |
| DuPont de Nemours Inc. | 91,852 | 7,063 | |
| 900,232 | |||
| Real Estate (1.1%) | |||
| Prologis Inc. | 411,212 | 51,073 | |
| Crown Castle Inc. | 96,378 | 9,686 | |
| Simon Property Group Inc. | 69,083 | 7,840 | |
| 68,599 | |||
| Technology (9.7%) | |||
| Broadcom Inc. | 185,545 | 171,238 | |
| Oracle Corp. | 661,112 | 79,591 | |
| Shares | Market Value• ($000) | ||
| Intel Corp. | 1,856,790 | 65,248 | |
| International Business Machines Corp. | 404,342 | 59,370 | |
| QUALCOMM Inc. | 495,900 | 56,795 | |
| Analog Devices Inc. | 223,231 | 40,579 | |
| Micron Technology Inc. | 487,375 | 34,087 | |
| Roper Technologies Inc. | 47,394 | 23,652 | |
| TE Connectivity Ltd. | 140,562 | 18,609 | |
| * | VMware Inc. Class A | 104,720 | 17,675 |
| Cognizant Technology Solutions Corp. Class A | 225,529 | 16,150 | |
| Dell Technologies Inc. Class C | 108,132 | 6,081 | |
| HP Inc. | 196,680 | 5,843 | |
| 594,918 | |||
| Telecommunications (4.6%) | |||
| Cisco Systems Inc. | 1,632,762 | 93,639 | |
| Comcast Corp. Class A | 1,851,700 | 86,585 | |
| Verizon Communications Inc. | 1,684,323 | 58,918 | |
| AT&T Inc. | 3,182,930 | 47,076 | |
| 286,218 | |||
| Utilities (4.2%) | |||
| NextEra Energy Inc. | 900,777 | 60,172 | |
| Southern Co. | 486,049 | 32,920 | |
| Duke Energy Corp. | 343,182 | 30,475 | |
| Waste Management Inc. | 181,162 | 28,403 | |
| Sempra Energy (XNYS) | 280,541 | 19,700 | |
| Dominion Energy Inc. | 371,808 | 18,047 | |
| American Electric Power Co. Inc. | 229,482 | 17,991 | |
| Exelon Corp. | 442,226 | 17,742 | |
| Xcel Energy Inc. | 244,515 | 13,969 | |
| Republic Services Inc. | 91,368 | 13,169 | |
| Public Service Enterprise Group Inc. | 111,016 | 6,781 | |
| 259,369 | |||
| Total Common Stocks (Cost $5,339,183) | 6,157,693 | ||
| Temporary Cash Investments (0.0%) | |||
| Money Market Fund (0.0%) | |||
| 1 | Vanguard Market Liquidity Fund, 5.384% (Cost $15) | 152 | 15 |
| Total Investments (99.9%) (Cost $5,339,198) | 6,157,708 | ||
| Other Assets and Liabilities—Net (0.1%) | 8,144 | ||
| Net Assets (100%) | 6,165,852 | ||
| Cost is in $000. | |||
| • | See Note A in Notes to Financial Statements. |
| * | Non-income-producing security. |
| 1 | Affiliated money market fund available only to Vanguard funds and certain trusts and accounts managed by Vanguard. Rate shown is the 7-day yield. |
| Futures Contracts | ||||
| ($000) | ||||
| Expiration | Number of Long (Short) Contracts | Notional Amount | Value and Unrealized Appreciation (Depreciation) | |
| Long Futures Contracts | ||||
| E-mini S&P 500 Index | September 2023 | 16 | 3,613 | 29 |
| Over-the-Counter Total Return Swaps | ||||||
| Reference Entity | Termination Date | Counterparty | Notional Amount ($000) | Floating Interest Rate Received (Paid)1 (%) | Value and Unrealized Appreciation ($000) | Value and Unrealized (Depreciation) ($000) |
| PNC Financial Services Group Inc. | 1/31/24 | CITNA | 4,467 | (5.326) | — | (21) |
| 1 | Based on Overnight Bank Funding Rate as of the most recent reset date. Floating interest payment received/paid monthly. |
| CITNA—Citibank, N.A. |
| ($000s, except shares, footnotes, and per-share amounts) | Amount |
| Assets | |
| Investments in Securities, at Value | |
| Unaffiliated Issuers (Cost $5,339,183) | 6,157,693 |
| Affiliated Issuers (Cost $15) | 15 |
| Total Investments in Securities | 6,157,708 |
| Investment in Vanguard | 207 |
| Cash | 517 |
| Cash Collateral Pledged—Futures Contracts | 460 |
| Cash Collateral Pledged—Over-the-Counter Swap Contracts | 590 |
| Receivables for Investment Securities Sold | 186 |
| Receivables for Accrued Income | 16,833 |
| Receivables for Capital Shares Issued | 3 |
| Variation Margin Receivable—Futures Contracts | 66 |
| Total Assets | 6,176,570 |
| Liabilities | |
| Payables for Investment Securities Purchased | 10,307 |
| Payables for Capital Shares Redeemed | 202 |
| Payables to Vanguard | 188 |
| Unrealized Depreciation—Over-the-Counter Swap Contracts | 21 |
| Total Liabilities | 10,718 |
| Net Assets | 6,165,852 |
| At August 31, 2023, net assets consisted of: | |
| Paid-in Capital | 5,543,289 |
| Total Distributable Earnings (Loss) | 622,563 |
| Net Assets | 6,165,852 |
| ETF Shares—Net Assets | |
| Applicable to 57,515,803 outstanding $.001 par value shares of beneficial interest (unlimited authorization) | 6,048,152 |
| Net Asset Value Per Share—ETF Shares | $105.16 |
| Institutional Shares—Net Assets | |
| Applicable to 564,435 outstanding $.001 par value shares of beneficial interest (unlimited authorization) | 117,700 |
| Net Asset Value Per Share—Institutional Shares | $208.53 |
| Year Ended August 31, 2023 | |
| ($000) | |
| Investment Income | |
| Income | |
| Dividends | 162,803 |
| Interest1 | 93 |
| Securities Lending—Net | 77 |
| Total Income | 162,973 |
| Expenses | |
| The Vanguard Group—Note B | |
| Investment Advisory Services | 142 |
| Management and Administrative—ETF Shares | 3,264 |
| Management and Administrative—Institutional Shares | 53 |
| Marketing and Distribution—ETF Shares | 280 |
| Marketing and Distribution—Institutional Shares | 3 |
| Custodian Fees | 163 |
| Auditing Fees | 30 |
| Shareholders’ Reports—ETF Shares | 203 |
| Shareholders’ Reports—Institutional Shares | 2 |
| Trustees’ Fees and Expenses | 3 |
| Other Expenses | 22 |
| Total Expenses | 4,165 |
| Expenses Paid Indirectly | (5) |
| Net Expenses | 4,160 |
| Net Investment Income | 158,813 |
| Realized Net Gain (Loss) | |
| Investment Securities Sold1,2 | 334,005 |
| Futures Contracts | (804) |
| Swap Contracts | (494) |
| Realized Net Gain (Loss) | 332,707 |
| Change in Unrealized Appreciation (Depreciation) | |
| Investment Securities1 | 91,988 |
| Futures Contracts | 207 |
| Swap Contracts | (21) |
| Change in Unrealized Appreciation (Depreciation) | 92,174 |
| Net Increase (Decrease) in Net Assets Resulting from Operations | 583,694 |
| 1 | Interest income, realized net gain (loss), capital gain distributions received, and change in unrealized appreciation (depreciation) from an affiliated company of the fund were $80,000, $5,000, less than $1,000, and less than $1,000, respectively. Purchases and sales are for temporary cash investment purposes. |
| 2 | Includes $415,440,000 of net gain (loss) resulting from in-kind redemptions. |
| Year Ended August 31, | ||
| 2023 ($000) | 2022 ($000) | |
| Increase (Decrease) in Net Assets | ||
| Operations | ||
| Net Investment Income | 158,813 | 128,925 |
| Realized Net Gain (Loss) | 332,707 | 246,304 |
| Change in Unrealized Appreciation (Depreciation) | 92,174 | (553,302) |
| Net Increase (Decrease) in Net Assets Resulting from Operations | 583,694 | (178,073) |
| Distributions | ||
| ETF Shares | (150,757) | (119,211) |
| Institutional Shares | (3,074) | (3,022) |
| Total Distributions | (153,831) | (122,233) |
| Capital Share Transactions | ||
| ETF Shares | 40,766 | 1,294,327 |
| Institutional Shares | (6,629) | (6,904) |
| Net Increase (Decrease) from Capital Share Transactions | 34,137 | 1,287,423 |
| Total Increase (Decrease) | 464,000 | 987,117 |
| Net Assets | ||
| Beginning of Period | 5,701,852 | 4,714,735 |
| End of Period | 6,165,852 | 5,701,852 |
| ETF Shares | |||||
| For a Share Outstanding Throughout Each Period | Year Ended August 31, | ||||
| 2023 | 2022 | 2021 | 2020 | 2019 | |
| Net Asset Value, Beginning of Period | $97.72 | $102.64 | $78.96 | $78.94 | $79.89 |
| Investment Operations | |||||
| Net Investment Income1 | 2.709 | 2.519 | 2.271 | 2.271 | 2.261 |
| Net Realized and Unrealized Gain (Loss) on Investments | 7.364 | (5.016) | 23.557 | (.044) | (1.027) |
| Total from Investment Operations | 10.073 | (2.497) | 25.828 | 2.227 | 1.234 |
| Distributions | |||||
| Dividends from Net Investment Income | (2.633) | (2.423) | (2.148) | (2.207) | (2.184) |
| Distributions from Realized Capital Gains | — | — | — | — | — |
| Total Distributions | (2.633) | (2.423) | (2.148) | (2.207) | (2.184) |
| Net Asset Value, End of Period | $105.16 | $97.72 | $102.64 | $78.96 | $78.94 |
| Total Return | 10.53% | -2.51% | 33.17% | 2.94% | 1.69% |
| Ratios/Supplemental Data | |||||
| Net Assets, End of Period (Millions) | $6,048 | $5,586 | $4,587 | $3,017 | $2,448 |
| Ratio of Total Expenses to Average Net Assets | 0.07%2 | 0.07% | 0.07% | 0.07% | 0.07% |
| Ratio of Net Investment Income to Average Net Assets | 2.66% | 2.45% | 2.47% | 2.90% | 2.90% |
| Portfolio Turnover Rate3 | 7% | 8% | 11% | 9% | 10% |
| 1 | Calculated based on average shares outstanding. |
| 2 | The ratio of expenses to average net assets for the period net of reduction from custody fee offset arrangements was 0.07%. |
| 3 | Excludes the value of portfolio securities received or delivered as a result of in-kind purchases or redemptions of the fund’s capital shares, including ETF Creation Units. |
| Institutional Shares | |||||
| For a Share Outstanding Throughout Each Period | Year Ended August 31, | ||||
| 2023 | 2022 | 2021 | 2020 | 2019 | |
| Net Asset Value, Beginning of Period | $193.77 | $203.54 | $156.56 | $156.53 | $158.41 |
| Investment Operations | |||||
| Net Investment Income1 | 5.384 | 4.999 | 4.492 | 4.522 | 4.467 |
| Net Realized and Unrealized Gain (Loss) on Investments | 14.615 | (9.947) | 46.761 | (.102) | (2.002) |
| Total from Investment Operations | 19.999 | (4.948) | 51.253 | 4.420 | 2.465 |
| Distributions | |||||
| Dividends from Net Investment Income | (5.239) | (4.822) | (4.274) | (4.390) | (4.345) |
| Distributions from Realized Capital Gains | — | — | — | — | — |
| Total Distributions | (5.239) | (4.822) | (4.274) | (4.390) | (4.345) |
| Net Asset Value, End of Period | $208.53 | $193.77 | $203.54 | $156.56 | $156.53 |
| Total Return | 10.55% | -2.49% | 33.22% | 3.00% | 1.68% |
| Ratios/Supplemental Data | |||||
| Net Assets, End of Period (Millions) | $118 | $116 | $128 | $117 | $134 |
| Ratio of Total Expenses to Average Net Assets | 0.06%2 | 0.06% | 0.06% | 0.06% | 0.06% |
| Ratio of Net Investment Income to Average Net Assets | 2.67% | 2.45% | 2.49% | 2.89% | 2.91% |
| Portfolio Turnover Rate3 | 7% | 8% | 11% | 9% | 10% |
| 1 | Calculated based on average shares outstanding. |
| 2 | The ratio of expenses to average net assets for the period net of reduction from custody fee offset arrangements was 0.06%. |
| 3 | Excludes the value of portfolio securities received or delivered as a result of in-kind purchases or redemptions of the fund’s capital shares, including ETF Creation Units. |
| A. | The following significant accounting policies conform to generally accepted accounting principles for U.S. investment companies. The fund consistently follows such policies in preparing its financial statements. |
| B. | In accordance with the terms of a Funds' Service Agreement (the “FSA”) between Vanguard and the fund, Vanguard furnishes to the fund investment advisory, corporate management, administrative, marketing, and distribution services at Vanguard’s cost of operations (as defined by the FSA). These costs of operations are allocated to the fund based on methods and guidelines approved by the board of trustees and are generally settled twice a month. |
| C. | The fund’s custodian bank has agreed to reduce its fees when the fund maintains cash on deposit in the non-interest-bearing custody account. For the year ended August 31, 2023, custodian fee offset arrangements reduced the fund’s expenses by $5,000 (an annual rate of less than 0.01% of average net assets). |
| D. | Various inputs may be used to determine the value of the fund’s investments and derivatives. These inputs are summarized in three broad levels for financial statement purposes. The inputs or methodologies used to value securities are not necessarily an indication of the risk associated with investing in those securities. |
| Level 1 ($000) | Level 2 ($000) | Level 3 ($000) | Total ($000) | |
| Investments | ||||
| Assets | ||||
| Common Stocks | 6,157,693 | — | — | 6,157,693 |
| Temporary Cash Investments | 15 | — | — | 15 |
| Total | 6,157,708 | — | — | 6,157,708 |
| Derivative Financial Instruments | ||||
| Assets | ||||
| Futures Contracts1 | 29 | — | — | 29 |
| Liabilities | ||||
| Swap Contracts | — | 21 | — | 21 |
| 1 | Includes cumulative appreciation (depreciation) on futures contracts and centrally cleared swaps, if any, as reported in the Schedule of Investments. Only current day’s variation margin is reported within the Statement of Assets and Liabilities. |
| E. | Permanent differences between book-basis and tax-basis components of net assets are reclassified among capital accounts in the financial statements to reflect their tax character. These reclassifications have no effect on net assets or net asset value per share. As of period end, permanent differences primarily attributable to the accounting for applicable in-kind redemptions and swap agreements were reclassified between the following accounts: |
| Amount ($000) | |
| Paid-in Capital | 415,388 |
| Total Distributable Earnings (Loss) | (415,388) |
| Amount ($000) | |
| Undistributed Ordinary Income | 33,287 |
| Undistributed Long-Term Gains | — |
| Net Unrealized Gains (Losses) | 813,331 |
| Capital Loss Carryforwards | (224,055) |
| Qualified Late-Year Losses | — |
| Other Temporary Differences | — |
| Total | 622,563 |
| Year Ended August 31, | ||
| 2023 Amount ($000) | 2022 Amount ($000) | |
| Ordinary Income* | 153,831 | 122,233 |
| Long-Term Capital Gains | — | — |
| Total | 153,831 | 122,233 |
| * | Includes short-term capital gains, if any. |
| Amount ($000) | |
| Tax Cost | 5,344,377 |
| Gross Unrealized Appreciation | 1,112,907 |
| Gross Unrealized Depreciation | (299,576) |
| Net Unrealized Appreciation (Depreciation) | 813,331 |
| F. | During the year ended August 31, 2023, the fund purchased $1,430,977,000 of investment securities and sold $1,397,847,000 of investment securities, other than temporary cash investments. Purchases and sales include $1,009,786,000 and $974,785,000, respectively, in connection with in-kind purchases and redemptions of the fund's capital shares. |
| G. | Capital share transactions for each class of shares were: |
| Year Ended August 31, | |||||
| 2023 | 2022 | ||||
| Amount ($000) | Shares (000) | Amount ($000) | Shares (000) | ||
| ETF Shares | |||||
| Issued | 1,012,888 | 9,975 | 1,983,469 | 19,305 | |
| Issued in Lieu of Cash Distributions | — | — | — | — | |
| Redeemed | (972,122) | (9,625) | (689,142) | (6,825) | |
| Net Increase (Decrease)—ETF Shares | 40,766 | 350 | 1,294,327 | 12,480 | |
| Year Ended August 31, | |||||
| 2023 | 2022 | ||||
| Amount ($000) | Shares (000) | Amount ($000) | Shares (000) | ||
| Institutional Shares | |||||
| Issued | 9,754 | 47 | 12,673 | 62 | |
| Issued in Lieu of Cash Distributions | 935 | 5 | 939 | 5 | |
| Redeemed | (17,318) | (86) | (20,516) | (99) | |
| Net Increase (Decrease)—Institutional Shares | (6,629) | (34) | (6,904) | (32) | |
| H. | Significant market disruptions, such as those caused by pandemics (e.g., COVID-19 pandemic), natural or environmental disasters, war (e.g., Russia’s invasion of Ukraine), acts of terrorism, or other events, can adversely affect local and global markets and normal market operations. Any such disruptions could have an adverse impact on the value of the fund’s investments and fund performance. |
| I. | Management has determined that no events or transactions occurred subsequent to August 31, 2023, that would require recognition or disclosure in these financial statements. |
Philadelphia, Pennsylvania
October 18, 2023
| Fund | Percentage |
| Mega Cap Index Fund | 98.0% |
| Mega Cap Growth Index Fund | 98.3 |
| Mega Cap Value Index Fund | 99.0 |
| Fund | ($000) |
| Mega Cap Index Fund | 62,253 |
| Mega Cap Growth Index Fund | 71,145 |
| Mega Cap Value Index Fund | 153,831 |
| Fund | ($000) |
| Mega Cap Index Fund | 156 |
| Mega Cap Growth Index Fund | 123 |
| Mega Cap Value Index Fund | 26 |
| Matthew Benchener | Thomas M. Rampulla |
| Joseph Brennan | Karin A. Risi |
| Mortimer J. Buckley | Anne E. Robinson |
| Gregory Davis | Michael Rollings |
| John James | Nitin Tandon |
| Chris D. Mclsaac | Lauren Valente |

All rights reserved.
Vanguard Marketing Corporation, Distributor.

| 1 | |
| 2 | |
| 5 | |
| 7 | |
| 9 | |
| 45 |
| • | For the 12 months ended August 31, 2023, Vanguard Global Wellington Fund returned 10.18% for Investor Shares and 10.32% for Admiral Shares. Its composite benchmark returned 10.74%. |
| • | Early in the period, inflation in many developed markets began to ease off multidecade highs but remained stubbornly high in some sectors—including services, which felt the effects of a tight labor market. While aggressive interest rate hikes by many major central banks fanned fears of recession and weighed on bond prices, the global economy proved more resilient than expected. |
| • | In the equity portion of the fund, financials and consumer discretionary contributed most to the fund’s performance relative to its benchmark. By region, Europe contributed most to relative performance, with France the top-contributing country. |
| • | In the fixed income portion of the fund, an underweight credit spread duration stance versus the benchmark and an overweight allocation to securitized sectors held back returns. On the other side of the ledger, security selection was positive, particularly within investment-grade industrials, sovereigns, and supranationals. The fund’s shorter duration compared with that of the benchmark and its yield curve positioning also helped. |
| Average Annual Total Returns Periods Ended August 31, 2023 | |||
| One Year | Three Years | Five Years | |
| Stocks | |||
| Russell 1000 Index (Large-caps) | 15.40% | 9.93% | 10.77% |
| Russell 2000 Index (Small-caps) | 4.65 | 8.12 | 3.14 |
| Russell 3000 Index (Broad U.S. market) | 14.76 | 9.81 | 10.25 |
| FTSE All-World ex US Index (International) | 12.02 | 4.49 | 3.74 |
| Bonds | |||
| Bloomberg U.S. Aggregate Float Adjusted Index (Broad taxable market) | -1.05% | -4.40% | 0.55% |
| Bloomberg Municipal Bond Index (Broad tax-exempt market) | 1.70 | -1.32 | 1.52 |
| FTSE Three-Month U.S. Treasury Bill Index | 4.44 | 1.63 | 1.68 |
| CPI | |||
| Consumer Price Index | 3.67% | 5.71% | 4.02% |
Equity Portfolio Manager
Fixed Income Portfolio Manager
| • | Based on actual fund return. This section helps you to estimate the actual expenses that you paid over the period. The ”Ending Account Value“ shown is derived from the fund’s actual return, and the third column shows the dollar amount that would have been paid by an investor who started with $1,000 in the fund. You may use the information here, together with the amount you invested, to estimate the expenses that you paid over the period. |
| • | Based on hypothetical 5% yearly return. This section is intended to help you compare your fund‘s costs with those of other mutual funds. It assumes that the fund had a yearly return of 5% before expenses, but that the expense ratio is unchanged. In this case—because the return used is not the fund’s actual return—the results do not apply to your investment. The example is useful in making comparisons because the Securities and Exchange Commission requires all mutual funds to calculate expenses based on a 5% return. You can assess your fund’s costs by comparing this hypothetical example with the hypothetical examples that appear in shareholder reports of other funds. |
| Six Months Ended August 31, 2023 | |||
| Beginning Account Value 2/28/2023 | Ending Account Value 8/31/2023 | Expenses Paid During Period | |
| Based on Actual Fund Return | |||
| Global Wellington Fund | |||
| Investor Shares | $1,000.00 | $1,048.70 | $2.53 |
| Admiral™ Shares | 1,000.00 | 1,049.30 | 1.86 |
| Based on Hypothetical 5% Yearly Return | |||
| Global Wellington Fund | |||
| Investor Shares | $1,000.00 | $1,022.73 | $2.50 |
| Admiral Shares | 1,000.00 | 1,023.39 | 1.84 |
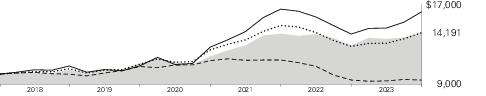
| Average Annual Total Returns Periods Ended August 31, 2023 | |||||
| One Year | Five Years | Since Inception (11/2/2017) | Final Value of a $10,000 Investment | ||
 | Global Wellington Fund Investor Shares | 10.18% | 6.44% | 6.19% | $14,191 |
 | Global Wellington Composite Index | 10.74 | 6.11 | 6.14 | 14,155 |
 | Bloomberg Global Aggregate Bond Index | -0.09 | -1.21 | -1.07 | 9,393 |
 | FTSE Developed Net Tax Index | 15.98 | 8.52 | 8.70 | 16,264 |
| One Year | Five Years | Since Inception (11/2/2017) | Final Value of a $50,000 Investment | ||
| Global Wellington Fund Admiral Shares | 10.32% | 6.56% | 6.31% | $71,435 | |
| Global Wellington Composite Index | 10.74 | 6.11 | 6.14 | 70,776 | |
| Bloomberg Global Aggregate Bond Index | -0.09 | -1.21 | -1.07 | 46,967 | |
| FTSE Developed Net Tax Index | 15.98 | 8.52 | 8.70 | 81,321 | |
| United States | 59.8% |
| Japan | 8.1 |
| France | 7.9 |
| United Kingdom | 5.9 |
| Switzerland | 3.5 |
| Supranational | 1.9 |
| Sweden | 1.5 |
| Spain | 1.1 |
| Germany | 1.0 |
| South Korea | 1.0 |
| Finland | 1.0 |
| Other | 7.3 |
| Shares | Market Value• ($000) | |||||
| Common Stocks (65.2%) | ||||||
| Austria (0.7%) | ||||||
| Erste Group Bank AG | 408,460 | 14,571 | ||||
| Finland (0.9%) | ||||||
| Nokia OYJ | 4,725,054 | 18,896 | ||||
| France (5.3%) | ||||||
| TotalEnergies SE | 518,525 | 32,527 | ||||
| Arkema SA | 185,458 | 19,380 | ||||
| Engie SA | 1,132,363 | 18,236 | ||||
| BNP Paribas SA | 201,627 | 13,039 | ||||
| Schneider Electric SE | 72,385 | 12,407 | ||||
| Vinci SA | 52,712 | 5,871 | ||||
| Safran SA | 35,123 | 5,629 | ||||
| 107,089 | ||||||
| Germany (0.6%) | ||||||
| Daimler Truck Holding AG | 356,041 | 12,528 | ||||
| Hong Kong (0.9%) | ||||||
| AIA Group Ltd. | 1,954,200 | 17,682 | ||||
| Japan (7.1%) | ||||||
| Mitsubishi UFJ Financial Group Inc. | 2,899,122 | 23,128 | ||||
| Nippon Telegraph & Telephone Corp. | 19,390,400 | 22,389 | ||||
| Isuzu Motors Ltd. | 1,497,214 | 19,167 | ||||
| Tokio Marine Holdings Inc. | 835,791 | 18,445 | ||||
| Honda Motor Co. Ltd. | 464,600 | 15,014 | ||||
| Mitsubishi Estate Co. Ltd. | 1,031,600 | 13,139 | ||||
| Marui Group Co. Ltd. | 546,965 | 9,467 | ||||
| Resona Holdings Inc. | 1,575,700 | 8,347 | ||||
| BIPROGY Inc. | 313,300 | 8,109 | ||||
| Astellas Pharma Inc. | 306,400 | 4,636 | ||||
| 141,841 | ||||||
| Netherlands (0.6%) | ||||||
| Shell plc | 374,631 | 11,455 | ||||
| South Korea (1.0%) | ||||||
| Samsung Electronics Co. Ltd. | 392,796 | 19,866 | ||||
| Spain (0.6%) | ||||||
| CaixaBank SA | 1,960,189 | 7,939 | ||||
| Iberdrola SA | 306,794 | 3,640 | ||||
| 11,579 | ||||||
| Shares | Market Value• ($000) | |||||
| Sweden (1.4%) | ||||||
| Autoliv Inc. | 247,871 | 24,192 | ||||
| Alfa Laval AB | 134,155 | 4,710 | ||||
| 28,902 | ||||||
| Switzerland (2.8%) | ||||||
| Novartis AG (Registered) | 297,585 | 29,950 | ||||
| Nestle SA (Registered) | 143,798 | 17,290 | ||||
| Zurich Insurance Group AG | 19,859 | 9,312 | ||||
| 56,552 | ||||||
| Taiwan (0.7%) | ||||||
| Taiwan Semiconductor Manufacturing Co. Ltd. | 842,175 | 14,471 | ||||
| United Kingdom (4.5%) | ||||||
| AstraZeneca plc ADR | 451,231 | 30,602 | ||||
| Unilever plc | 372,008 | 18,998 | ||||
| BAE Systems plc | 1,225,942 | 15,604 | ||||
| WPP plc | 1,205,568 | 11,686 | ||||
| Rotork plc | 2,722,274 | 10,346 | ||||
| Derwent London plc | 86,546 | 2,035 | ||||
| 89,271 | ||||||
| United States (38.1%) | ||||||
| Microsoft Corp. | 126,367 | 41,418 | ||||
| Chubb Ltd. | 165,828 | 33,310 | ||||
| Cisco Systems Inc. | 547,638 | 31,407 | ||||
| Johnson & Johnson | 182,541 | 29,513 | ||||
| UnitedHealth Group Inc. | 55,986 | 26,682 | ||||
| * | Alphabet Inc. Class A | 193,058 | 26,289 | |||
| Accenture plc Class A | 77,102 | 24,963 | ||||
| Northrop Grumman Corp. | 56,192 | 24,336 | ||||
| Home Depot Inc. | 71,245 | 23,532 | ||||
| United Parcel Service Inc. Class B | 138,423 | 23,449 | ||||
| JPMorgan Chase & Co. | 155,396 | 22,739 | ||||
| Duke Energy Corp. | 255,107 | 22,654 | ||||
| Merck & Co. Inc. | 207,338 | 22,596 | ||||
| Exelon Corp. | 558,640 | 22,413 | ||||
| Texas Instruments Inc. | 127,995 | 21,511 | ||||
| Colgate-Palmolive Co. | 287,185 | 21,099 | ||||
| Deere & Co. | 44,262 | 18,189 | ||||
| American Express Co. | 111,041 | 17,543 | ||||
| Coterra Energy Inc. | 601,983 | 16,970 | ||||
| General Dynamics Corp. | 71,719 | 16,254 | ||||
| BlackRock Inc. | 23,062 | 16,156 | ||||
| TJX Cos. Inc. | 173,734 | 16,067 | ||||
| Medtronic plc | 194,754 | 15,872 | ||||
| Sempra | 219,600 | 15,420 | ||||
| Gilead Sciences Inc. | 197,920 | 15,137 | ||||
| PNC Financial Services Group Inc. | 122,573 | 14,798 | ||||
| Union Pacific Corp. | 64,727 | 14,277 | ||||
| Pfizer Inc. | 403,130 | 14,263 | ||||
| Intel Corp. | 398,085 | 13,989 | ||||
| LyondellBasell Industries NV Class A | 137,234 | 13,555 | ||||
| Visa Inc. Class A | 54,097 | 13,291 | ||||
| General Motors Co. | 390,701 | 13,092 | ||||
| Marsh & McLennan Cos. Inc. | 67,131 | 13,090 | ||||
| Bank of America Corp. | 453,311 | 12,996 | ||||
| Shares | Market Value• ($000) | |||||
| Kenvue Inc. | 427,706 | 9,859 | ||||
| Mondelez International Inc. Class A | 137,868 | 9,824 | ||||
| * | Walt Disney Co. | 105,013 | 8,788 | |||
| Honeywell International Inc. | 45,065 | 8,470 | ||||
| Eli Lilly & Co. | 12,005 | 6,653 | ||||
| American Tower Corp. | 36,182 | 6,561 | ||||
| Caterpillar Inc. | 21,532 | 6,053 | ||||
| PepsiCo Inc. | 29,205 | 5,196 | ||||
| Pioneer Natural Resources Co. | 19,131 | 4,552 | ||||
| Comcast Corp. Class A | 84,344 | 3,944 | ||||
| KLA Corp. | 6,873 | 3,449 | ||||
| Linde plc | 7,712 | 2,972 | ||||
| 765,191 | ||||||
| Total Common Stocks (Cost $1,057,125) | 1,309,894 | |||||
| Coupon | Maturity Date | Face Amount ($000) | ||||
| U.S. Government and Agency Obligations (6.5%) | ||||||
| 1,2 | Fannie Mae REMICS | 2.000% | 9/25/40 | 19 | 18 | |
| 1,2 | Fannie Mae REMICS | 2.500% | 5/25/45 | 199 | 178 | |
| 1,2 | Fannie Mae REMICS | 3.000% | 3/25/45–2/25/49 | 1,704 | 1,458 | |
| 1,2 | Fannie Mae REMICS | 3.500% | 6/25/44 | ��74 | 70 | |
| 1,2 | Freddie Mac REMICS | 1.750% | 9/15/42 | 503 | 458 | |
| 1,2 | Freddie Mac REMICS | 2.000% | 7/25/50 | 1,169 | 1,003 | |
| 1,2 | Freddie Mac REMICS | 4.000% | 12/15/39–9/15/41 | 1,167 | 1,114 | |
| 1 | Ginnie Mae II Pool | 2.000% | 1/20/51–11/20/51 | 1,274 | 1,050 | |
| 1 | Ginnie Mae II Pool | 2.500% | 3/20/51–12/20/52 | 2,018 | 1,717 | |
| 1 | Ginnie Mae II Pool | 3.000% | 11/20/49–3/20/52 | 2,273 | 2,002 | |
| 1 | Ginnie Mae II Pool | 3.500% | 1/20/52–7/20/52 | 3,133 | 2,843 | |
| 1 | Ginnie Mae II Pool | 4.000% | 8/20/52 | 1,522 | 1,418 | |
| 1 | Ginnie Mae REMICS | 2.750% | 9/20/44 | 59 | 56 | |
| 1,2 | UMBS Pool | 2.000% | 4/01/36–5/01/51 | 8,447 | 6,981 | |
| 1,2 | UMBS Pool | 2.500% | 5/01/51–11/01/51 | 1,188 | 1,002 | |
| 1,2 | UMBS Pool | 3.000% | 10/1/51 | 2,290 | 1,992 | |
| 1,2 | UMBS Pool | 3.500% | 7/1/51 | 2,163 | 1,956 | |
| 1,2 | UMBS Pool | 4.000% | 8/01/52–10/01/52 | 2,232 | 2,063 | |
| 1,2 | UMBS Pool | 4.500% | 9/01/37–9/01/52 | 10,045 | 9,722 | |
| 1,2,3 | UMBS Pool | 5.000% | 10/01/52–9/25/53 | 15,486 | 15,021 | |
| 1,2 | UMBS Pool | 5.500% | 1/1/53 | 644 | 636 | |
| United States Treasury Note/Bond | 0.375% | 1/31/26 | 285 | 257 | ||
| United States Treasury Note/Bond | 0.875% | 9/30/26 | 75 | 67 | ||
| United States Treasury Note/Bond | 1.125% | 1/15/25 | 1,257 | 1,190 | ||
| 4 | United States Treasury Note/Bond | 2.000% | 11/15/41 | 4,773 | 3,338 | |
| United States Treasury Note/Bond | 2.375% | 2/15/42 | 288 | 214 | ||
| United States Treasury Note/Bond | 2.625% | 4/15/25 | 1,015 | 977 | ||
| United States Treasury Note/Bond | 3.250% | 5/15/42 | 904 | 772 | ||
| United States Treasury Note/Bond | 3.375% | 5/15/33 | 1,784 | 1,681 | ||
| United States Treasury Note/Bond | 3.500% | 4/30/28–2/15/33 | 123 | 119 | ||
| United States Treasury Note/Bond | 3.625% | 5/15/26–5/15/53 | 9,667 | 8,860 | ||
| United States Treasury Note/Bond | 3.750% | 5/31/30 | 102 | 99 | ||
| United States Treasury Note/Bond | 3.875% | 8/15/33–5/15/43 | 11,333 | 10,811 | ||
| United States Treasury Note/Bond | 4.000% | 12/15/25–11/15/52 | 15,348 | 15,065 | ||
| United States Treasury Note/Bond | 4.125% | 6/15/26–8/15/53 | 6,303 | 6,249 | ||
| Coupon | Maturity Date | Face Amount ($000) | Market Value• ($000) | |||
| United States Treasury Note/Bond | 4.250% | 5/31/25–10/15/25 | 9,000 | 8,892 | ||
| United States Treasury Note/Bond | 4.375% | 8/15/26–8/15/43 | 9,529 | 9,491 | ||
| United States Treasury Note/Bond | 4.625% | 2/28/25–3/15/26 | 9,138 | 9,097 | ||
| Total U.S. Government and Agency Obligations (Cost $134,521) | 129,937 | |||||
| Asset-Backed/Commercial Mortgage-Backed Securities (1.1%) | ||||||
| Bermuda (0.0%) | ||||||
| 1,5 | Start II Ltd. Series 2019-1 | 4.089% | 3/15/44 | 114 | 101 | |
| Cayman Islands (0.0%) | ||||||
| 1,5 | Horizon Aircraft Finance II Ltd. Series 2019-1 | 3.721% | 7/15/39 | 187 | 161 | |
| United States (1.1%) | ||||||
| 1,5 | Aaset Trust Series 2019-1 | 3.844% | 5/15/39 | 92 | 68 | |
| 1,5 | Aligned Data Centers Issuer LLC Series 2021-1A | 1.937% | 8/15/46 | 1,260 | 1,111 | |
| 1,5,6 | BX Trust Series 2021-ARIA, TSFR1M + 1.411% | 6.721% | 10/15/36 | 1,290 | 1,245 | |
| 1,5 | Castlelake Aircraft Structured Trust Series 2019-1A | 3.967% | 4/15/39 | 159 | 142 | |
| 1,5 | CF Hippolyta Issuer LLC Series 2020-1 | 1.690% | 7/15/60 | 365 | 331 | |
| 1,5 | CF Hippolyta Issuer LLC Series 2021-1A | 1.530% | 3/15/61 | 1,042 | 914 | |
| 1,5 | CF Hippolyta Issuer LLC Series 2022-1A | 5.970% | 8/15/62 | 459 | 450 | |
| 1,5,6 | Connecticut Avenue Securities Trust Series 2021-R01, SOFR30A + 1.550% | 6.838% | 10/25/41 | 250 | 247 | |
| 1,2 | Fannie Mae-Aces Series 2021-M2S | 2.386% | 10/25/36 | 649 | 499 | |
| 1,2 | Freddie Mac Multifamily Structured Pass-Through Certificates Series K142 | 2.400% | 3/25/32 | 1,600 | 1,334 | |
| 1,2 | Freddie Mac Multifamily Structured Pass-Through Certificates Series K156 | 4.430% | 2/25/33 | 1,365 | 1,326 | |
| 1,2,5,6 | Freddie Mac STACR REMICS Trust Series 2020-DNA5, SOFR30A + 2.800% | 8.088% | 10/25/50 | 289 | 293 | |
| 1,5 | Home Partners of America Trust Series 2021-2 | 2.302% | 12/17/26 | 1,170 | 1,027 | |
| 1,5 | Kubota Credit Owner Trust Series 2023-2A | 5.280% | 1/18/28 | 1,335 | 1,333 | |
| 1,5 | Navient Private Education Refi Loan Trust Series 2023-A | 5.510% | 10/15/71 | 1,667 | 1,657 | |
| 1,5 | New Economy Assets Phase 1 Sponsor LLC Series 2021-1 | 1.910% | 10/20/61 | 2,015 | 1,739 | |
| 1,5 | New Economy Assets Phase 1 Sponsor LLC Series 2021-1 | 2.410% | 10/20/61 | 425 | 356 | |
| 1 | Seasoned Credit Risk Transfer Trust Series 2019-3 | 3.500% | 10/25/58 | 118 | 113 | |
| 1,5,6 | SREIT Trust Series 2021-MFP, TSFR1M + 1.194% | 6.505% | 11/15/38 | 1,550 | 1,517 | |
| 1,5 | Stack Infrastructure Issuer LLC Series 2023-2A | 5.900% | 7/25/48 | 2,950 | 2,875 | |
| 1,5 | Towd Point Mortgage Trust Series 2018-1 | 3.000% | 1/25/58 | 59 | 56 | |
| 1,5 | Wheels Fleet Lease Funding LLC Series 2023-1A | 5.800% | 4/18/38 | 2,595 | 2,584 | |
| 21,217 | ||||||
| Total Asset-Backed/Commercial Mortgage-Backed Securities (Cost $22,383) | 21,479 | |||||
| Corporate Bonds (19.8%) | ||||||
| Belgium (0.2%) | ||||||
| 1,7 | Anheuser-Busch InBev SA/NV | 1.650% | 3/28/31 | 635 | 598 | |
| 1,7 | Anheuser-Busch InBev SA/NV | 2.750% | 3/17/36 | 1,350 | 1,290 | |
| Anheuser-Busch InBev Worldwide Inc. | 4.600% | 4/15/48 | 124 | 112 | ||
| Coupon | Maturity Date | Face Amount ($000) | Market Value• ($000) | |||
| Anheuser-Busch InBev Worldwide Inc. | 5.550% | 1/23/49 | 760 | 778 | ||
| Anheuser-Busch InBev Worldwide Inc. | 4.500% | 6/1/50 | 963 | 857 | ||
| 5 | KBC Group NV | 5.796% | 1/19/29 | 255 | 253 | |
| 3,888 | ||||||
| Bermuda (0.1%) | ||||||
| 5 | Bacardi Ltd. | 5.250% | 1/15/29 | 500 | 492 | |
| 5 | Bacardi Ltd. | 5.900% | 6/15/43 | 1,644 | 1,620 | |
| 2,112 | ||||||
| Canada (0.3%) | ||||||
| 8 | Bank of Montreal | 2.850% | 3/6/24 | 3,185 | 2,325 | |
| 8 | Emera Inc. | 4.838% | 5/2/30 | 3,000 | 2,138 | |
| Fortis Inc. | 3.055% | 10/4/26 | 775 | 719 | ||
| TransCanada PipeLines Ltd. | 4.875% | 1/15/26 | 400 | 395 | ||
| 5,577 | ||||||
| Denmark (0.5%) | ||||||
| 1,7 | Danfoss Finance II BV | 4.125% | 12/2/29 | 2,585 | 2,811 | |
| 7 | Danske Bank A/S | 0.500% | 8/27/25 | 1,180 | 1,229 | |
| 5 | Danske Bank A/S | 6.466% | 1/9/26 | 2,900 | 2,903 | |
| 5 | Danske Bank A/S | 1.621% | 9/11/26 | 1,320 | 1,201 | |
| 1,9 | Danske Bank A/S | 2.250% | 1/14/28 | 1,440 | 1,573 | |
| 9,717 | ||||||
| France (2.3%) | ||||||
| 1,7 | Banque Federative du Credit Mutuel SA | 4.375% | ��� 5/2/30 | 700 | 754 | |
| 7 | Banque Federative du Credit Mutuel SA | 3.875% | 6/16/32 | 3,000 | 3,070 | |
| 1,7 | BNP Paribas Home Loan SFH SA | 3.000% | 5/25/28 | 2,600 | 2,780 | |
| 5 | BNP Paribas SA | 2.819% | 11/19/25 | 470 | 451 | |
| 5 | BNP Paribas SA | 2.219% | 6/9/26 | 1,095 | 1,020 | |
| 1,7 | BNP Paribas SA | 0.125% | 9/4/26 | 600 | 584 | |
| 5 | BNP Paribas SA | 5.335% | 6/12/29 | 2,845 | 2,803 | |
| 5 | BNP Paribas SA | 2.159% | 9/15/29 | 1,800 | 1,504 | |
| 1,7 | BNP Paribas SA | 1.125% | 1/15/32 | 800 | 748 | |
| 1,9 | BNP Paribas SA | 5.750% | 6/13/32 | 1,100 | 1,328 | |
| 1,7 | BPCE SA | 0.500% | 9/15/27 | 3,700 | 3,566 | |
| 5 | BPCE SA | 3.250% | 1/11/28 | 525 | 476 | |
| 5 | BPCE SA | 2.277% | 1/20/32 | 1,100 | 850 | |
| 1,7 | BPCE SA | 1.750% | 2/2/34 | 1,600 | 1,432 | |
| 7 | BPCE SFH SA | 3.000% | 10/17/29 | 1,200 | 1,280 | |
| 7 | Cie de Financement Foncier SA | 0.010% | 7/15/26 | 1,600 | 1,573 | |
| 1,7 | Cie de Financement Foncier SA | 0.875% | 9/11/28 | 2,300 | 2,214 | |
| 7 | Credit Agricole SA | 1.875% | 4/22/27 | 3,300 | 3,358 | |
| 5 | Credit Agricole SA | 5.514% | 7/5/33 | 1,205 | 1,200 | |
| 1,7 | Credit Agricole SA | 3.875% | 11/28/34 | 1,000 | 1,054 | |
| 5 | Danone SA | 2.947% | 11/2/26 | 555 | 519 | |
| 1,7 | Engie SA | 0.375% | 6/11/27 | 2,300 | 2,207 | |
| 1,7 | Engie SA | 4.000% | 1/11/35 | 3,300 | 3,535 | |
| 1,7 | Engie SA | 2.000% | 9/28/37 | 1,300 | 1,079 | |
| 1,7 | Orange SA | 1.000% | 5/12/25 | 1,300 | 1,346 | |
| 1,7 | RCI Banque SA | 1.375% | 3/8/24 | 1,400 | 1,497 | |
| 1,9 | Societe Generale SA | 1.250% | 12/7/27 | 2,300 | 2,362 | |
| 7 | Societe Generale SFH SA | 0.750% | 1/29/27 | 1,500 | 1,488 | |
| 1,7 | Suez SACA | 2.875% | 5/24/34 | 1,100 | 1,046 | |
| 47,124 | ||||||
| Germany (0.3%) | ||||||
| 5 | Bayer US Finance LLC | 3.375% | 10/8/24 | 770 | 748 | |
| Coupon | Maturity Date | Face Amount ($000) | Market Value• ($000) | |||
| 5 | Bayer US Finance II LLC | 4.250% | 12/15/25 | 1,000 | 968 | |
| 5 | Daimler Truck Finance North America LLC | 5.150% | 1/16/26 | 580 | 576 | |
| 5 | Daimler Truck Finance North America LLC | 5.125% | 1/19/28 | 185 | 183 | |
| 1,9 | E.ON International Finance BV | 6.250% | 6/3/30 | 295 | 383 | |
| 1,9 | E.ON International Finance BV | 6.375% | 6/7/32 | 1,645 | 2,159 | |
| 7 | Wintershall Dea Finance BV | 1.823% | 9/25/31 | 1,900 | 1,630 | |
| 6,647 | ||||||
| Ireland (0.0%) | ||||||
| 5 | Avolon Holdings Funding Ltd. | 2.125% | 2/21/26 | 642 | 577 | |
| Italy (0.5%) | ||||||
| 7 | Autostrade per l'Italia SpA | 2.000% | 12/4/28 | 6,455 | 6,132 | |
| 7 | Autostrade per l'Italia SpA | 2.000% | 1/15/30 | 800 | 731 | |
| 7 | Intesa Sanpaolo SpA | 1.125% | 6/16/27 | 1,900 | 1,885 | |
| 7 | Intesa Sanpaolo SpA | 1.125% | 10/4/27 | 1,320 | 1,301 | |
| 10,049 | ||||||
| Japan (0.0%) | ||||||
| 5 | NTT Finance Corp. | 1.162% | 4/3/26 | 1,180 | 1,064 | |
| Luxembourg (0.1%) | ||||||
| 5 | JAB Holdings BV | 2.200% | 11/23/30 | 430 | 337 | |
| 5 | JAB Holdings BV | 3.750% | 5/28/51 | 805 | 526 | |
| 5 | JAB Holdings BV | 4.500% | 4/8/52 | 875 | 653 | |
| 1,516 | ||||||
| Mexico (0.0%) | ||||||
| America Movil SAB de CV | 3.625% | 4/22/29 | 275 | 252 | ||
| America Movil SAB de CV | 6.375% | 3/1/35 | 350 | 377 | ||
| 629 | ||||||
| Netherlands (0.3%) | ||||||
| 1,9 | Cooperatieve Rabobank UA | 4.625% | 5/23/29 | 100 | 114 | |
| 1,7 | Cooperatieve Rabobank UA | 0.010% | 7/2/30 | 1,900 | 1,664 | |
| 7 | ING Groep NV | 0.250% | 2/18/29 | 1,100 | 988 | |
| 7 | ING Groep NV | 0.250% | 2/1/30 | 1,200 | 1,041 | |
| 1,7 | Koninklijke KPN NV | 0.875% | 11/15/33 | 1,100 | 903 | |
| Shell International Finance BV | 4.000% | 5/10/46 | 300 | 246 | ||
| Shell International Finance BV | 3.000% | 11/26/51 | 1,215 | 814 | ||
| 5,770 | ||||||
| Norway (0.3%) | ||||||
| 1,7 | Aker BP ASA | 1.125% | 5/12/29 | 1,290 | 1,173 | |
| 5 | Aker BP ASA | 3.750% | 1/15/30 | 3,543 | 3,135 | |
| 5 | Aker BP ASA | 4.000% | 1/15/31 | 1,090 | 961 | |
| 5 | Var Energi ASA | 8.000% | 11/15/32 | 1,675 | 1,789 | |
| 7,058 | ||||||
| Portugal (0.1%) | ||||||
| 1,7 | EDP Finance BV | 1.875% | 9/21/29 | 2,000 | 1,949 | |
| Saudi Arabia (0.2%) | ||||||
| 5 | EIG Pearl Holdings Sarl | 3.545% | 8/31/36 | 3,336 | 2,773 | |
| 5 | Greensaif Pipelines Bidco Sarl | 6.129% | 2/23/38 | 1,290 | 1,294 | |
| 5 | Greensaif Pipelines Bidco Sarl | 6.510% | 2/23/42 | 975 | 985 | |
| 5,052 | ||||||
| South Africa (0.1%) | ||||||
| 1,7 | Anglo American Capital plc | 4.750% | 9/21/32 | 2,325 | 2,488 | |
| Coupon | Maturity Date | Face Amount ($000) | Market Value• ($000) | |||
| Spain (0.5%) | ||||||
| 1,7 | Banco de Sabadell SA | 3.500% | 8/28/26 | 4,000 | 4,321 | |
| 1,7 | CaixaBank SA | 5.375% | 11/14/30 | 2,400 | 2,680 | |
| 1,7 | Iberdrola Finanzas SA | 1.250% | 10/28/26 | 1,300 | 1,320 | |
| Telefonica Emisiones SA | 4.665% | 3/6/38 | 1,055 | 873 | ||
| 9,194 | ||||||
| Switzerland (0.6%) | ||||||
| 5 | Alcon Finance Corp. | 3.000% | 9/23/29 | 5,400 | 4,736 | |
| 5 | Alcon Finance Corp. | 5.750% | 12/6/52 | 200 | 203 | |
| Credit Suisse AG | 7.500% | 2/15/28 | 3,654 | 3,908 | ||
| 7 | Sika Capital BV | 1.500% | 4/29/31 | 1,825 | 1,680 | |
| 1,7 | UBS Group AG | 1.250% | 7/17/25 | 675 | 711 | |
| 11,238 | ||||||
| United Arab Emirates (0.3%) | ||||||
| 5 | DAE Funding LLC | 1.550% | 8/1/24 | 1,915 | 1,827 | |
| 5 | Galaxy Pipeline Assets Bidco Ltd. | 2.160% | 3/31/34 | 4,045 | 3,404 | |
| 5,231 | ||||||
| United Kingdom (1.3%) | ||||||
| 5 | Ashtead Capital Inc. | 2.450% | 8/12/31 | 2,368 | 1,852 | |
| 5 | Ashtead Capital Inc. | 5.500% | 8/11/32 | 600 | 572 | |
| 5 | Ashtead Capital Inc. | 5.550% | 5/30/33 | 385 | 369 | |
| 5 | Ashtead Capital Inc. | 5.950% | 10/15/33 | 630 | 619 | |
| AstraZeneca plc | 4.000% | 1/17/29 | 755 | 724 | ||
| 1,7 | Barclays plc | 5.262% | 1/29/34 | 680 | 737 | |
| BAT Capital Corp. | 6.343% | 8/2/30 | 1,195 | 1,203 | ||
| 1,8 | BP Capital Markets plc | 3.470% | 5/15/25 | 1,350 | 967 | |
| 1,7 | Diageo Finance plc | 2.500% | 3/27/32 | 1,635 | 1,639 | |
| 1,9 | Heathrow Funding Ltd. | 2.750% | 10/13/29 | 1,505 | 1,585 | |
| 1 | HSBC Holdings plc | 4.041% | 3/13/28 | 1,160 | 1,089 | |
| HSBC Holdings plc | 7.390% | 11/3/28 | 1,451 | 1,524 | ||
| 1,9 | National Grid Electricity Transmission plc | 2.000% | 9/16/38 | 1,145 | 886 | |
| 1,9 | National Grid Electricity Transmission plc | 2.000% | 4/17/40 | 890 | 664 | |
| 1,7 | National Grid plc | 0.163% | 1/20/28 | 1,700 | 1,566 | |
| 1,7 | NatWest Group plc | 1.750% | 3/2/26 | 3,125 | 3,247 | |
| 1,7 | NatWest Group plc | 0.780% | 2/26/30 | 330 | 290 | |
| Santander UK Group Holdings plc | 1.089% | 3/15/25 | 3,210 | 3,111 | ||
| 1,9 | Scottish Hydro Electric Transmission plc | 2.250% | 9/27/35 | 985 | 875 | |
| 1,7 | SSE plc | 1.750% | 4/16/30 | 885 | 839 | |
| 5 | Standard Chartered plc | 0.991% | 1/12/25 | 815 | 798 | |
| 25,156 | ||||||
| United States (11.8%) | ||||||
| AbbVie Inc. | 4.050% | 11/21/39 | 1,297 | 1,112 | ||
| Activision Blizzard Inc. | 4.500% | 6/15/47 | 1,164 | 1,069 | ||
| 1 | Alabama Power Co. | 4.300% | 7/15/48 | 255 | 210 | |
| Allstate Corp. | 5.250% | 3/30/33 | 515 | 504 | ||
| American Electric Power Co. Inc. | 3.200% | 11/13/27 | 950 | 880 | ||
| American Express Co. | 5.043% | 5/1/34 | 5,399 | 5,188 | ||
| American International Group Inc. | 3.400% | 6/30/30 | 2,387 | 2,103 | ||
| American International Group Inc. | 4.750% | 4/1/48 | 45 | 40 | ||
| American International Group Inc. | 4.375% | 6/30/50 | 570 | 472 | ||
| 5 | American Transmission Systems Inc. | 2.650% | 1/15/32 | 1,070 | 877 | |
| Arizona Public Service Co. | 4.350% | 11/15/45 | 1,010 | 805 | ||
| AT&T Inc. | 4.750% | 5/15/46 | 2,995 | 2,491 | ||
| 5 | Athene Global Funding | 1.450% | 1/8/26 | 2,913 | 2,597 | |
| Coupon | Maturity Date | Face Amount ($000) | Market Value• ($000) | |||
| 5 | Athene Global Funding | 2.500% | 3/24/28 | 2,555 | 2,183 | |
| 1,7 | Bank of America Corp. | 1.102% | 5/24/32 | 1,575 | 1,361 | |
| Bank of America Corp. | 2.482% | 9/21/36 | 3,585 | 2,725 | ||
| Bank of America Corp. | 3.311% | 4/22/42 | 1,100 | 823 | ||
| 1 | Bank of New York Mellon Corp. | 4.967% | 4/26/34 | 2,687 | 2,580 | |
| 7 | Becton Dickinson Euro Finance Sarl | 0.334% | 8/13/28 | 1,600 | 1,473 | |
| 1 | Bon Secours Mercy Health Inc. | 3.555% | 8/1/27 | 410 | 379 | |
| 1 | Bon Secours Mercy Health Inc. | 4.302% | 7/1/28 | 140 | 134 | |
| 1 | Bon Secours Mercy Health Inc. | 2.095% | 6/1/31 | 415 | 331 | |
| 7 | Booking Holdings Inc. | 4.500% | 11/15/31 | 2,065 | 2,309 | |
| 7 | Booking Holdings Inc. | 4.125% | 5/12/33 | 1,885 | 2,044 | |
| 5 | Boston Gas Co. | 3.001% | 8/1/29 | 130 | 112 | |
| BP Capital Markets America Inc. | 4.812% | 2/13/33 | 559 | 541 | ||
| BP Capital Markets America Inc. | 2.939% | 6/4/51 | 1,930 | 1,262 | ||
| Brixmor Operating Partnership LP | 2.500% | 8/16/31 | 805 | 633 | ||
| 5 | Broadcom Inc. | 3.469% | 4/15/34 | 6,144 | 5,019 | |
| 5 | Brooklyn Union Gas Co. | 4.273% | 3/15/48 | 965 | 712 | |
| Capital One Financial Corp. | 6.312% | 6/8/29 | 2,613 | 2,612 | ||
| Capital One Financial Corp. | 6.377% | 6/8/34 | 4,007 | 3,958 | ||
| Celanese US Holdings LLC | 6.350% | 11/15/28 | 1,330 | 1,334 | ||
| CenterPoint Energy Resources Corp. | 5.250% | 3/1/28 | 2,147 | 2,144 | ||
| Charles Schwab Corp. | 6.136% | 8/24/34 | 2,782 | 2,831 | ||
| Charter Communications Operating LLC | 2.250% | 1/15/29 | 215 | 178 | ||
| Charter Communications Operating LLC | 5.050% | 3/30/29 | 595 | 566 | ||
| Charter Communications Operating LLC | 6.384% | 10/23/35 | 355 | 344 | ||
| Charter Communications Operating LLC | 3.700% | 4/1/51 | 610 | 378 | ||
| Cheniere Energy Partners LP | 4.500% | 10/1/29 | 2,869 | 2,649 | ||
| Cheniere Energy Partners LP | 4.000% | 3/1/31 | 3,556 | 3,136 | ||
| Cigna Group | 4.375% | 10/15/28 | 420 | 404 | ||
| Cigna Group | 2.400% | 3/15/30 | 310 | 261 | ||
| Citigroup Inc. | 4.600% | 3/9/26 | 535 | 521 | ||
| Cleco Corporate Holdings LLC | 3.375% | 9/15/29 | 325 | 275 | ||
| 5 | Columbia Pipelines Operating Co. LLC | 5.927% | 8/15/30 | 435 | 439 | |
| 5 | Columbia Pipelines Operating Co. LLC | 6.497% | 8/15/43 | 781 | 792 | |
| Comcast Corp. | 3.950% | 10/15/25 | 250 | 243 | ||
| 7 | Comcast Corp. | 0.000% | 9/14/26 | 3,225 | 3,134 | |
| Comcast Corp. | 3.250% | 11/1/39 | 659 | 507 | ||
| Comcast Corp. | 4.000% | 3/1/48 | 40 | 32 | ||
| Comcast Corp. | 3.999% | 11/1/49 | 120 | 96 | ||
| Comcast Corp. | 2.887% | 11/1/51 | 1,417 | 905 | ||
| Comcast Corp. | 4.049% | 11/1/52 | 11 | 9 | ||
| Comcast Corp. | 2.937% | 11/1/56 | 190 | 118 | ||
| Comcast Corp. | 2.650% | 8/15/62 | 25 | 14 | ||
| Comcast Corp. | 2.987% | 11/1/63 | 11 | 7 | ||
| Commonwealth Edison Co. | 3.650% | 6/15/46 | 35 | 26 | ||
| Commonwealth Edison Co. | 4.000% | 3/1/48 | 245 | 197 | ||
| 1 | Consolidated Edison Co. of New York Inc. | 6.300% | 8/15/37 | 75 | 79 | |
| Consolidated Edison Co. of New York Inc. | 3.200% | 12/1/51 | 990 | 663 | ||
| Consolidated Edison Co. of New York Inc. | 4.625% | 12/1/54 | 290 | 246 | ||
| Consolidated Edison Co. of New York Inc. | 4.500% | 5/15/58 | 150 | 122 | ||
| Corebridge Financial Inc. | 4.350% | 4/5/42 | 2,189 | 1,734 | ||
| 5 | Corebridge Global Funding | 5.750% | 7/2/26 | 1,230 | 1,223 | |
| 5 | Cox Communications Inc. | 3.500% | 8/15/27 | 2,665 | 2,470 | |
| 5 | Cox Communications Inc. | 4.800% | 2/1/35 | 100 | 90 | |
| CubeSmart LP | 2.250% | 12/15/28 | 995 | 844 | ||
| Coupon | Maturity Date | Face Amount ($000) | Market Value• ($000) | |||
| CVS Health Corp. | 2.875% | 6/1/26 | 1,455 | 1,363 | ||
| CVS Health Corp. | 4.300% | 3/25/28 | 113 | 109 | ||
| CVS Health Corp. | 4.125% | 4/1/40 | 235 | 191 | ||
| CVS Health Corp. | 5.050% | 3/25/48 | 125 | 110 | ||
| Dignity Health | 3.812% | 11/1/24 | 594 | 580 | ||
| Discover Financial Services | 4.100% | 2/9/27 | 3,294 | 3,055 | ||
| Discovery Communications LLC | 4.125% | 5/15/29 | 186 | 171 | ||
| Discovery Communications LLC | 3.625% | 5/15/30 | 995 | 873 | ||
| Discovery Communications LLC | 4.000% | 9/15/55 | 1,172 | 764 | ||
| 1 | Dominion Energy Inc. | 3.375% | 4/1/30 | 259 | 229 | |
| Dominion Energy Inc. | 5.375% | 11/15/32 | 2,853 | 2,809 | ||
| 1 | Dominion Energy Inc. | 4.900% | 8/1/41 | 733 | 644 | |
| 1 | Dominion Energy Inc. | 4.850% | 8/15/52 | 391 | 333 | |
| Dominion Energy South Carolina Inc. | 6.625% | 2/1/32 | 156 | 170 | ||
| Dominion Energy South Carolina Inc. | 5.300% | 5/15/33 | 113 | 113 | ||
| Dominion Energy South Carolina Inc. | 5.450% | 2/1/41 | 300 | 290 | ||
| Dominion Energy South Carolina Inc. | 4.600% | 6/15/43 | 230 | 203 | ||
| Duke Energy Corp. | 2.550% | 6/15/31 | 900 | 734 | ||
| Duke Energy Progress LLC | 3.400% | 4/1/32 | 475 | 416 | ||
| 1 | Eastern Gas Transmission & Storage Inc. | 4.600% | 12/15/44 | 660 | 541 | |
| Eaton Corp. | 4.150% | 3/15/33 | 680 | 640 | ||
| Eaton Corp. | 4.700% | 8/23/52 | 145 | 135 | ||
| Energy Transfer LP | 4.900% | 3/15/35 | 1,075 | 981 | ||
| 5 | Equitable Financial Life Global Funding | 1.400% | 7/7/25 | 150 | 138 | |
| 5 | Equitable Financial Life Global Funding | 1.300% | 7/12/26 | 1,020 | 894 | |
| 5 | Equitable Financial Life Global Funding | 1.400% | 8/27/27 | 825 | 702 | |
| 5 | ERAC USA Finance LLC | 3.300% | 12/1/26 | 300 | 280 | |
| 5 | ERAC USA Finance LLC | 4.900% | 5/1/33 | 1,967 | 1,920 | |
| 5 | ERAC USA Finance LLC | 4.500% | 2/15/45 | 455 | 385 | |
| 5 | ERAC USA Finance LLC | 5.400% | 5/1/53 | 737 | 720 | |
| Estee Lauder Cos. Inc. | 5.150% | 5/15/53 | 1,734 | 1,680 | ||
| Evergy Kansas Central Inc. | 3.250% | 9/1/49 | 235 | 161 | ||
| 1 | Evergy Metro Inc. | 2.250% | 6/1/30 | 245 | 203 | |
| Eversource Energy | 5.450% | 3/1/28 | 850 | 853 | ||
| Eversource Energy | 5.125% | 5/15/33 | 1,255 | 1,214 | ||
| Extra Space Storage LP | 5.500% | 7/1/30 | 1,944 | 1,927 | ||
| Exxon Mobil Corp. | 2.275% | 8/16/26 | 1,075 | 1,001 | ||
| Exxon Mobil Corp. | 2.610% | 10/15/30 | 190 | 165 | ||
| Florida Power & Light Co. | 5.050% | 4/1/28 | 245 | 246 | ||
| 7 | General Mills Inc. | 3.907% | 4/13/29 | 1,470 | 1,592 | |
| 5 | Genting New York LLC | 3.300% | 2/15/26 | 1,668 | 1,491 | |
| Georgia Power Co. | 4.700% | 5/15/32 | 3,021 | 2,880 | ||
| Georgia Power Co. | 4.300% | 3/15/42 | 2,164 | 1,810 | ||
| Georgia Power Co. | 5.125% | 5/15/52 | 434 | 403 | ||
| Goldman Sachs Group Inc. | 5.700% | 11/1/24 | 2,773 | 2,768 | ||
| 1 | Goldman Sachs Group Inc. | 3.272% | 9/29/25 | 1,375 | 1,334 | |
| Goldman Sachs Group Inc. | 1.431% | 3/9/27 | 3,610 | 3,236 | ||
| Goldman Sachs Group Inc. | 2.615% | 4/22/32 | 885 | 716 | ||
| Goldman Sachs Group Inc. | 2.383% | 7/21/32 | 960 | 758 | ||
| 5 | Gray Oak Pipeline LLC | 2.600% | 10/15/25 | 436 | 403 | |
| 5 | Gray Oak Pipeline LLC | 3.450% | 10/15/27 | 70 | 63 | |
| Healthpeak OP LLC | 3.500% | 7/15/29 | 335 | 301 | ||
| HEICO Corp. | 5.250% | 8/1/28 | 355 | 352 | ||
| HEICO Corp. | 5.350% | 8/1/33 | 3,385 | 3,354 | ||
| Hess Corp. | 7.300% | 8/15/31 | 1,120 | 1,221 | ||
| Coupon | Maturity Date | Face Amount ($000) | Market Value• ($000) | |||
| Home Depot Inc. | 3.300% | 4/15/40 | 2,190 | 1,729 | ||
| Honeywell International Inc. | 4.250% | 1/15/29 | 570 | 554 | ||
| 7 | Honeywell International Inc. | 3.750% | 5/17/32 | 975 | 1,034 | |
| 7 | Honeywell International Inc. | 4.125% | 11/2/34 | 1,650 | 1,781 | |
| Intercontinental Exchange Inc. | 4.350% | 6/15/29 | 5,818 | 5,577 | ||
| Intercontinental Exchange Inc. | 4.950% | 6/15/52 | 355 | 331 | ||
| International Business Machines Corp. | 3.300% | 5/15/26 | 550 | 524 | ||
| 5 | ITC Holdings Corp. | 4.950% | 9/22/27 | 530 | 522 | |
| 1 | John Deere Capital Corp. | 3.450% | 3/13/25 | 985 | 960 | |
| JPMorgan Chase & Co. | 2.947% | 2/24/28 | 3,750 | 3,439 | ||
| JPMorgan Chase & Co. | 5.350% | 6/1/34 | 975 | 964 | ||
| 1 | JPMorgan Chase & Co. | 3.964% | 11/15/48 | 975 | 773 | |
| 1 | Kaiser Foundation Hospitals | 2.810% | 6/1/41 | 1,200 | 852 | |
| Kaiser Foundation Hospitals | 4.875% | 4/1/42 | 650 | 611 | ||
| 5 | Kenvue Inc. | 5.050% | 3/22/53 | 1,581 | 1,547 | |
| 5 | KeySpan Gas East Corp. | 2.742% | 8/15/26 | 400 | 366 | |
| 5 | Liberty Mutual Group Inc. | 4.569% | 2/1/29 | 5,534 | 5,339 | |
| 5 | LKQ Corp. | 5.750% | 6/15/28 | 525 | 521 | |
| Manufacturers & Traders Trust Co. | 4.700% | 1/27/28 | 1,066 | 995 | ||
| Marsh & McLennan Cos. Inc. | 4.375% | 3/15/29 | 1,010 | 977 | ||
| 5 | Massachusetts Mutual Life Insurance Co. | 3.375% | 4/15/50 | 550 | 381 | |
| 1,7 | McDonald's Corp. | 4.250% | 3/7/35 | 1,640 | 1,805 | |
| Memorial Sloan-Kettering Cancer Center | 4.125% | 7/1/52 | 150 | 125 | ||
| Merck & Co. Inc. | 5.000% | 5/17/53 | 1,219 | 1,189 | ||
| MetLife Inc. | 5.375% | 7/15/33 | 2,945 | 2,931 | ||
| 5 | Metropolitan Edison Co. | 5.200% | 4/1/28 | 80 | 79 | |
| Microchip Technology Inc. | 0.972% | 2/15/24 | 1,630 | 1,593 | ||
| Microsoft Corp. | 2.921% | 3/17/52 | 1,125 | 797 | ||
| MidAmerican Energy Co. | 4.250% | 5/1/46 | 10 | 8 | ||
| 1,7 | Mondelez International Holdings Netherlands BV | 0.875% | 10/1/31 | 775 | 677 | |
| 1,7 | Mondelez International Holdings Netherlands BV | 0.625% | 9/9/32 | 273 | 227 | |
| 7 | Mondelez International Inc. | 0.250% | 3/17/28 | 975 | 913 | |
| 1 | Morgan Stanley | 3.125% | 7/27/26 | 1,850 | 1,732 | |
| 1 | Morgan Stanley | 3.772% | 1/24/29 | 570 | 528 | |
| 7 | Morgan Stanley | 0.497% | 2/7/31 | 1,050 | 893 | |
| 1 | Morgan Stanley | 2.511% | 10/20/32 | 4,650 | 3,705 | |
| Morgan Stanley | 5.948% | 1/19/38 | 1,433 | 1,394 | ||
| Nasdaq Inc. | 5.550% | 2/15/34 | 715 | 712 | ||
| Nasdaq Inc. | 5.950% | 8/15/53 | 195 | 193 | ||
| Nasdaq Inc. | 6.100% | 6/28/63 | 180 | 178 | ||
| NextEra Energy Capital Holdings Inc. | 6.051% | 3/1/25 | 220 | 221 | ||
| NextEra Energy Capital Holdings Inc. | 5.749% | 9/1/25 | 730 | 732 | ||
| NiSource Inc. | 5.250% | 3/30/28 | 485 | 483 | ||
| NNN REIT Inc. | 3.900% | 6/15/24 | 805 | 791 | ||
| 5 | Northwestern Mutual Life Insurance Co. | 3.850% | 9/30/47 | 230 | 173 | |
| 5 | Northwestern Mutual Life Insurance Co. | 3.625% | 9/30/59 | 36 | 24 | |
| Occidental Petroleum Corp. | 7.875% | 9/15/31 | 1,988 | 2,204 | ||
| Occidental Petroleum Corp. | 6.200% | 3/15/40 | 2,200 | 2,169 | ||
| 5 | Oglethorpe Power Corp. | 6.191% | 1/1/31 | 210 | 216 | |
| Oglethorpe Power Corp. | 5.050% | 10/1/48 | 161 | 139 | ||
| ONEOK Inc. | 5.650% | 11/1/28 | 800 | 801 | ||
| Oracle Corp. | 3.400% | 7/8/24 | 575 | 564 | ||
| Oracle Corp. | 3.650% | 3/25/41 | 1,222 | 922 | ||
| Oracle Corp. | 4.500% | 7/8/44 | 891 | 730 | ||
| Coupon | Maturity Date | Face Amount ($000) | Market Value• ($000) | |||
| Oracle Corp. | 3.950% | 3/25/51 | 1,025 | 747 | ||
| Pacific Gas & Electric Co. | 4.550% | 7/1/30 | 1,795 | 1,613 | ||
| Pacific Gas & Electric Co. | 4.500% | 7/1/40 | 3,244 | 2,503 | ||
| Pacific Gas & Electric Co. | 6.700% | 4/1/53 | 1,628 | 1,584 | ||
| 5 | Pennsylvania Electric Co. | 5.150% | 3/30/26 | 65 | 64 | |
| 5 | Pennsylvania Electric Co. | 3.250% | 3/15/28 | 1,604 | 1,461 | |
| 5 | Pennsylvania Electric Co. | 3.600% | 6/1/29 | 208 | 189 | |
| 5 | Penske Truck Leasing Co. LP | 3.950% | 3/10/25 | 1,120 | 1,083 | |
| 5 | Penske Truck Leasing Co. LP | 4.000% | 7/15/25 | 180 | 173 | |
| 5 | Penske Truck Leasing Co. LP | 5.875% | 11/15/27 | 4,026 | 4,004 | |
| Pfizer Investment Enterprises Pte. Ltd. | 5.110% | 5/19/43 | 2,292 | 2,231 | ||
| Philip Morris International Inc. | 5.125% | 11/17/27 | 795 | 793 | ||
| Piedmont Natural Gas Co. Inc. | 5.050% | 5/15/52 | 665 | 586 | ||
| Progressive Corp. | 3.950% | 3/26/50 | 1,213 | 970 | ||
| 1 | Providence St. Joseph Health Obligated Group | 3.930% | 10/1/48 | 225 | 168 | |
| 1 | Prudential Financial Inc. | 3.700% | 3/13/51 | 1,510 | 1,125 | |
| Public Storage Operating Co. | 5.125% | 1/15/29 | 380 | 379 | ||
| Public Storage Operating Co. | 5.100% | 8/1/33 | 555 | 550 | ||
| Public Storage Operating Co. | 5.350% | 8/1/53 | 155 | 151 | ||
| Realty Income Corp. | 2.200% | 6/15/28 | 285 | 247 | ||
| Realty Income Corp. | 3.100% | 12/15/29 | 830 | 734 | ||
| 7 | Realty Income Corp. | 4.875% | 7/6/30 | 3,250 | 3,530 | |
| Realty Income Corp. | 2.850% | 12/15/32 | 120 | 97 | ||
| Realty Income Corp. | 4.900% | 7/15/33 | 1,474 | 1,399 | ||
| RTX Corp. | 3.950% | 8/16/25 | 285 | 277 | ||
| RTX Corp. | 4.450% | 11/16/38 | 725 | 642 | ||
| 1 | San Diego Gas & Electric Co. | 4.100% | 6/15/49 | 261 | 207 | |
| 5 | SBA Tower Trust | 1.884% | 1/15/26 | 245 | 222 | |
| 5 | SBA Tower Trust | 1.631% | 11/15/26 | 2,265 | 1,958 | |
| 1 | SCE Recovery Funding LLC | 0.861% | 11/15/31 | 327 | 274 | |
| 1 | SCE Recovery Funding LLC | 1.942% | 5/15/38 | 165 | 117 | |
| 1 | SCE Recovery Funding LLC | 2.510% | 11/15/43 | 95 | 62 | |
| Sierra Pacific Power Co. | 2.600% | 5/1/26 | 149 | 139 | ||
| 1 | Southern California Edison Co. | 3.700% | 8/1/25 | 30 | 29 | |
| 1 | Southern California Edison Co. | 2.950% | 2/1/51 | 790 | 501 | |
| Southern California Edison Co. | 5.875% | 12/1/53 | 812 | 808 | ||
| Southern Co. | 4.400% | 7/1/46 | 5 | 4 | ||
| 1 | SSM Health Care Corp. | 3.823% | 6/1/27 | 320 | 304 | |
| 1 | Sutter Health | 2.294% | 8/15/30 | 360 | 298 | |
| 5 | Texas Electric Market Stabilization Funding N LLC | 4.265% | 8/1/34 | 1,510 | 1,428 | |
| T-Mobile USA Inc. | 2.050% | 2/15/28 | 1,975 | 1,724 | ||
| T-Mobile USA Inc. | 2.700% | 3/15/32 | 2,160 | 1,756 | ||
| T-Mobile USA Inc. | 5.750% | 1/15/54 | 767 | 758 | ||
| Toledo Hospital | 5.750% | 11/15/38 | 205 | 198 | ||
| Trane Technologies Financing Ltd. | 5.250% | 3/3/33 | 725 | 724 | ||
| 1 | United Airlines Pass-Through Trust Class B Series 2018-1 | 4.600% | 3/1/26 | 41 | 39 | |
| UnitedHealth Group Inc. | 3.850% | 6/15/28 | 820 | 785 | ||
| UnitedHealth Group Inc. | 2.000% | 5/15/30 | 240 | 200 | ||
| UnitedHealth Group Inc. | 4.200% | 5/15/32 | 495 | 467 | ||
| UnitedHealth Group Inc. | 4.625% | 7/15/35 | 75 | 73 | ||
| UnitedHealth Group Inc. | 4.200% | 1/15/47 | 65 | 55 | ||
| UnitedHealth Group Inc. | 4.750% | 5/15/52 | 90 | 82 | ||
| UnitedHealth Group Inc. | 5.050% | 4/15/53 | 1,643 | 1,568 | ||
| Coupon | Maturity Date | Face Amount ($000) | Market Value• ($000) | |||
| Verizon Communications Inc. | 1.680% | 10/30/30 | 307 | 240 | ||
| 5 | VICI Properties LP | 4.125% | 8/15/30 | 515 | 450 | |
| 1,8 | Walt Disney Co. | 3.057% | 3/30/27 | 2,350 | 1,594 | |
| Warnermedia Holdings Inc. | 4.054% | 3/15/29 | 1,051 | 966 | ||
| 1,8 | Wells Fargo & Co. | 2.975% | 5/19/26 | 625 | 432 | |
| 1 | Wells Fargo & Co. | 2.879% | 10/30/30 | 435 | 372 | |
| 1 | Wells Fargo & Co. | 4.611% | 4/25/53 | 1,874 | 1,585 | |
| 236,519 | ||||||
| Total Corporate Bonds (Cost $423,977) | 398,555 | |||||
| Sovereign Bonds (3.9%) | ||||||
| Australia (0.3%) | ||||||
| 1,10 | Commonwealth of Australia | 2.750% | 11/21/27 | 135 | 84 | |
| 1,10 | Commonwealth of Australia | 2.250% | 5/21/28 | 1,195 | 724 | |
| 1,10 | Commonwealth of Australia | 1.000% | 11/21/31 | 3,200 | 1,646 | |
| 1,10 | Commonwealth of Australia | 4.500% | 4/21/33 | 2,850 | 1,919 | |
| 1,7 | NBN Co. Ltd. | 4.375% | 3/15/33 | 1,950 | 2,131 | |
| 6,504 | ||||||
| Bermuda (0.0%) | ||||||
| 1,5 | Bermuda | 2.375% | 8/20/30 | 200 | 164 | |
| 1,5 | Bermuda | 3.375% | 8/20/50 | 200 | 133 | |
| 297 | ||||||
| Bulgaria (0.0%) | ||||||
| 5,7 | Republic of Bulgaria | 4.500% | 1/27/33 | 245 | 263 | |
| Canada (0.5%) | ||||||
| 8 | Canadian Government Bond | 0.750% | 10/1/24 | 1,395 | 988 | |
| 8 | Canadian Government Bond | 2.750% | 9/1/27 | 1,700 | 1,199 | |
| 8 | Canadian Government Bond | 1.500% | 6/1/31 | 350 | 222 | |
| 8 | Canadian Government Bond | 2.000% | 12/1/51 | 250 | 138 | |
| 8 | Canadian Government Bond | 1.750% | 12/1/53 | 600 | 307 | |
| 8 | City of Montreal | 3.150% | 12/1/36 | 750 | 472 | |
| 8 | City of Montreal | 3.500% | 12/1/38 | 410 | 263 | |
| 8 | City of Montreal | 2.400% | 12/1/41 | 1,000 | 530 | |
| 8 | City of Toronto | 3.200% | 8/1/48 | 1,000 | 579 | |
| 8 | Municipal Finance Authority of British Columbia | 4.950% | 12/1/27 | 2,200 | 1,663 | |
| 8 | Province of Ontario | 2.900% | 6/2/28 | 1,910 | 1,330 | |
| 1,11 | Province of Ontario | 0.250% | 6/28/29 | 985 | 1,029 | |
| 8 | Regional Municipality of York | 2.150% | 6/22/31 | 800 | 506 | |
| 9,226 | ||||||
| Chile (0.0%) | ||||||
| 1 | Corp. Nacional del Cobre de Chile | 3.625% | 8/1/27 | 650 | 604 | |
| Germany (0.1%) | ||||||
| 7 | Federal Republic of Germany | 3.250% | 7/4/42 | 490 | 580 | |
| 7 | Federal Republic of Germany | 1.250% | 8/15/48 | 640 | 529 | |
| 1,109 | ||||||
| Japan (0.8%) | ||||||
| 1,12 | Japan | 0.000% | 11/10/23 | 2,072,300 | 14,245 | |
| 1,12 | Japan | 0.700% | 6/20/51 | 117,800 | 650 | |
| 1,12 | Japan | 0.700% | 9/20/51 | 59,400 | 327 | |
| 15,222 | ||||||
| Coupon | Maturity Date | Face Amount ($000) | Market Value• ($000) | |||
| Norway (0.1%) | ||||||
| Equinor ASA | 3.000% | 4/6/27 | 1,545 | 1,446 | ||
| Qatar (0.0%) | ||||||
| 1,5 | State of Qatar | 5.103% | 4/23/48 | 255 | 245 | |
| 1,5 | State of Qatar | 4.400% | 4/16/50 | 780 | 687 | |
| 932 | ||||||
| Romania (0.0%) | ||||||
| 1,5,7 | Republic of Romania | 2.000% | 4/14/33 | 737 | 567 | |
| 1,7 | Republic of Romania | 2.625% | 12/2/40 | 525 | 349 | |
| 916 | ||||||
| Saudi Arabia (0.1%) | ||||||
| 1,5 | Kingdom of Saudi Arabia | 5.000% | 1/18/53 | 765 | 680 | |
| 1,5 | Saudi Arabian Oil Co. | 2.875% | 4/16/24 | 500 | 490 | |
| 1,5 | Saudi Arabian Oil Co. | 3.500% | 4/16/29 | 680 | 623 | |
| 1,793 | ||||||
| Singapore (0.0%) | ||||||
| 1,5 | Temasek Financial I Ltd. | 3.625% | 8/1/28 | 510 | 488 | |
| Spain (0.1%) | ||||||
| 5,7 | Kingdom of Spain | 0.600% | 10/31/29 | 1,050 | 976 | |
| Supranational (1.9%) | ||||||
| 1,7,13 | European Financial Stability Facility | 0.875% | 7/26/27 | 11,060 | 11,035 | |
| 1,7,13 | European Financial Stability Facility | 2.375% | 4/11/28 | 6,050 | 6,366 | |
| 1,7,13 | European Financial Stability Facility | 2.875% | 2/16/33 | 3,415 | 3,638 | |
| 1,7 | European Investment Bank | 2.875% | 1/12/33 | 2,215 | 2,365 | |
| 1,7 | European Investment Bank | 3.000% | 10/14/33 | 1,705 | 1,840 | |
| 7 | European Stability Mechanism | 0.000% | 12/15/26 | 1,425 | 1,398 | |
| 1,7 | European Union | 0.000% | 7/4/31 | 4,160 | 3,579 | |
| 1,7 | European Union | 1.000% | 7/6/32 | 3,300 | 3,022 | |
| 1,7 | European Union | 0.000% | 7/4/35 | 1,740 | 1,300 | |
| 1,7 | European Union | 0.200% | 6/4/36 | 4,110 | 3,042 | |
| 37,585 | ||||||
| United Kingdom (0.0%) | ||||||
| 9 | United Kingdom | 0.625% | 10/22/50 | 430 | 213 | |
| Total Sovereign Bonds (Cost $84,290) | 77,574 | |||||
| Taxable Municipal Bonds (0.7%) | ||||||
| United States (0.7%) | ||||||
| Broward County FL Airport System Revenue | 3.477% | 10/1/43 | 100 | 80 | ||
| Chicago IL Transit Authority Sales & Transfer Tax Receipts Revenue | 6.899% | 12/1/40 | 350 | 392 | ||
| Connecticut GO | 5.770% | 3/15/25 | 275 | 276 | ||
| Dallas-Fort Worth TX International Airport Revenue | 3.089% | 11/1/40 | 90 | 70 | ||
| Dallas-Fort Worth TX International Airport Revenue | 4.087% | 11/1/51 | 55 | 47 | ||
| Dallas-Fort Worth TX International Airport Revenue | 4.507% | 11/1/51 | 355 | 318 | ||
| Georgia Municipal Electric Power Authority Revenue | 6.637% | 4/1/57 | 834 | 931 | ||
| Golden State Tobacco Securitization Corp. California Revenue | 2.746% | 6/1/34 | 35 | 28 | ||
| Golden State Tobacco Securitization Corp. California Revenue | 3.293% | 6/1/42 | 65 | 48 | ||
| Coupon | Maturity Date | Face Amount ($000) | Market Value• ($000) | |||
| Golden State Tobacco Securitization Corp. California Revenue | 3.000% | 6/1/46 | 130 | 119 | ||
| Grand Parkway Transportation Corp. Texas System Toll Revenue | 3.236% | 10/1/52 | 290 | 205 | ||
| Illinois GO | 5.100% | 6/1/33 | 5,010 | 4,861 | ||
| 14 | Kansas Development Finance Authority Revenue | 2.774% | 5/1/51 | 475 | 330 | |
| 15 | Kansas Development Finance Authority Revenue (Employees Retirement System) | 5.371% | 5/1/26 | 325 | 323 | |
| Massachusetts School Building Authority Dedicated Sales Tax Revenue | 3.395% | 10/15/40 | 175 | 141 | ||
| New York Metropolitan Transportation Authority Revenue (Build America Bonds) | 6.200% | 11/15/26 | 15 | 15 | ||
| New York Metropolitan Transportation Authority Revenue (Build America Bonds) | 6.668% | 11/15/39 | 170 | 183 | ||
| New York Metropolitan Transportation Authority Revenue (Build America Bonds) | 6.814% | 11/15/40 | 805 | 871 | ||
| 16 | Philadelphia PA Authority for Industrial Development Revenue | 6.550% | 10/15/28 | 635 | 665 | |
| Port Authority of New York & New Jersey Revenue | 5.647% | 11/1/40 | 1,870 | 1,956 | ||
| Port Authority of New York & New Jersey Revenue | 4.458% | 10/1/62 | 205 | 182 | ||
| Texas Natural Gas Securitization Finance Corp. Revenue (Winter Storm Uri) | 5.102% | 4/1/35 | 980 | 978 | ||
| Texas Natural Gas Securitization Finance Corp. Revenue (Winter Storm Uri) | 5.169% | 4/1/41 | 745 | 742 | ||
| Total Taxable Municipal Bonds (Cost $15,371) | 13,761 | |||||
| Coupon | Shares | Market Value• ($000) | ||||
| Temporary Cash Investments (2.6%) | ||||||
| Money Market Fund (2.6%) | ||||||
| 17 | Vanguard Market Liquidity Fund (Cost $51,626) | 5.384% | 516,509 | 51,645 | ||
| Total Investments (99.8%) (Cost $1,789,293) | 2,002,845 | |||||
| Other Assets and Liabilities—Net (0.2%) | 4,596 | |||||
| Net Assets (100%) | 2,007,441 | |||||
| Cost is in $000. |
| • | See Note A in Notes to Financial Statements. |
| * | Non-income-producing security. |
| 1 | The average or expected maturity is shorter than the final maturity shown because of the possibility of interim principal payments and prepayments or the possibility of the issue being called. |
| 2 | The issuer was placed under federal conservatorship in September 2008; since that time, its daily operations have been managed by the Federal Housing Finance Agency and it receives capital from the U.S. Treasury, as needed to maintain a positive net worth, in exchange for senior preferred stock. |
| 3 | Includes securities purchased on a when-issued or delayed-delivery basis for which the fund has not taken delivery as of August 31, 2023. |
| 4 | Securities with a value of $1,258,000 have been segregated as initial margin for open futures contracts. |
| 5 | Security exempt from registration under Rule 144A of the Securities Act of 1933. Such securities may be sold in transactions exempt from registration, normally to qualified institutional buyers. At August 31, 2023, the aggregate value was $113,474,000, representing 5.7% of net assets. |
| 6 | Variable-rate security; rate shown is effective rate at period end. Certain variable-rate securities are not based on a published reference rate and spread but are determined by the issuer or agent based on current market conditions. |
| 7 | Face amount denominated in euro. |
| 8 | Face amount denominated in Canadian dollars. |
| 9 | Face amount denominated in British pounds. |
| 10 | Face amount denominated in Australian dollars. |
| 11 | Face amount denominated in Swiss francs. |
| 12 | Face amount denominated in Japanese yen. |
| 13 | Guaranteed by the Government of Luxembourg. |
| 14 | Scheduled principal and interest payments are guaranteed by Build America Mutual Assurance Co. |
| 15 | Scheduled principal and interest payments are guaranteed by Assured Guaranty Municipal Corp. |
| 16 | Scheduled principal and interest payments are guaranteed by National Public Finance Guarantee Corp. |
| 17 | Affiliated money market fund available only to Vanguard funds and certain trusts and accounts managed by Vanguard. Rate shown is the 7-day yield. |
| ADR—American Depositary Receipt. | |
| GO—General Obligation Bond. | |
| REIT—Real Estate Investment Trust. | |
| REMICS—Real Estate Mortgage Investment Conduits. | |
| SOFR30A—30 Day Average Secured Overnight Financing Rate. | |
| TSFR1M—CME Term Secured Overnight Financing Rate 1-Month. | |
| UMBS—Uniform Mortgage-Backed Securities. |
| Futures Contracts | ||||
| ($000) | ||||
| Expiration | Number of Long (Short) Contracts | Notional Amount | Value and Unrealized Appreciation (Depreciation) | |
| Long Futures Contracts | ||||
| 2-Year U.S. Treasury Note | December 2023 | 10 | 2,038 | 6 |
| 5-Year U.S. Treasury Note | December 2023 | 10 | 1,069 | 8 |
| 10-Year U.S. Treasury Note | December 2023 | 25 | 2,776 | 24 |
| Euro-Buxl | September 2023 | 37 | 5,368 | (70) |
| Euro-OAT | September 2023 | 11 | 1,526 | (5) |
| Euro-Schatz | September 2023 | 223 | 25,419 | (72) |
| Long Gilt | December 2023 | 58 | 7,022 | 61 |
| (48) | ||||
| Short Futures Contracts | ||||
| AUD 10-Year Treasury Bond | September 2023 | (17) | (1,280) | (5) |
| Euro-Bobl | September 2023 | (48) | (6,043) | (35) |
| Euro-Bund | September 2023 | (151) | (21,808) | 102 |
| Ultra 10-Year U.S. Treasury Note | December 2023 | (181) | (21,016) | (225) |
| (163) | ||||
| (211) | ||||
| Forward Currency Contracts | |||||||
| Contract Settlement Date | Contract Amount (000) | Unrealized Appreciation ($000) | Unrealized (Depreciation) ($000) | ||||
| Counterparty | Receive | Deliver | |||||
| JPMorgan Chase Bank, N.A. | 9/29/23 | EUR | 1,755 | USD | 1,912 | — | (7) |
| JPMorgan Chase Bank, N.A. | 9/29/23 | GBP | 2 | USD | 3 | — | — |
| JPMorgan Chase Bank, N.A. | 9/29/23 | USD | 7,406 | AUD | 11,517 | — | (63) |
| JPMorgan Chase Bank, N.A. | 9/29/23 | USD | 15,407 | CAD | 20,886 | — | (56) |
| JPMorgan Chase Bank, N.A. | 9/29/23 | AUD | 900 | CAD | 785 | 2 | — |
| Goldman Sachs International | 9/29/23 | USD | 1,025 | CHF | 899 | 5 | — |
| JPMorgan Chase Bank, N.A. | 9/29/23 | USD | 144,774 | EUR | 133,190 | 182 | — |
| JPMorgan Chase Bank, N.A. | 9/29/23 | GBP | 2,921 | EUR | 3,416 | — | (8) |
| JPMorgan Chase Bank, N.A. | 9/29/23 | USD | 21,770 | GBP | 17,133 | 63 | — |
| Forward Currency Contracts (continued) | |||||||
| Contract Settlement Date | Contract Amount (000) | Unrealized Appreciation ($000) | Unrealized (Depreciation) ($000) | ||||
| Counterparty | Receive | Deliver | |||||
| JPMorgan Chase Bank, N.A. | 9/29/23 | USD | 11,508 | JPY | 1,663,573 | 30 | — |
| JPMorgan Chase Bank, N.A. | 9/29/23 | AUD | 3,926 | JPY | 366,900 | 15 | — |
| JPMorgan Chase Bank, N.A. | 9/29/23 | GBP | 1,169 | JPY | 214,694 | — | — |
| Goldman Sachs International | 9/29/23 | USD | 3 | SEK | 30 | — | — |
| 297 | (134) | ||||||
| AUD—Australian dollar. |
| CAD—Canadian dollar. |
| CHF—Swiss franc. |
| EUR—euro. |
| GBP—British pound. |
| JPY—Japanese yen. |
| SEK—Swedish krona. |
| USD—U.S. dollar. |
| ($000s, except shares, footnotes, and per-share amounts) | Amount |
| Assets | |
| Investments in Securities, at Value | |
| Unaffiliated Issuers (Cost $1,737,667) | 1,951,200 |
| Affiliated Issuers (Cost $51,626) | 51,645 |
| Total Investments in Securities | 2,002,845 |
| Investment in Vanguard | 67 |
| Foreign Currency, at Value (Cost $4,628) | 4,621 |
| Receivables for Investment Securities Sold | 11,449 |
| Receivables for Accrued Income | 11,336 |
| Receivables for Capital Shares Issued | 1,264 |
| Unrealized Appreciation—Forward Currency Contracts | 297 |
| Total Assets | 2,031,879 |
| Liabilities | |
| Due to Custodian | 5 |
| Payables for Investment Securities Purchased | 22,013 |
| Payables for Capital Shares Redeemed | 1,047 |
| Payables to Investment Advisor | 943 |
| Payables to Vanguard | 259 |
| Variation Margin Payable—Futures Contracts | 37 |
| Unrealized Depreciation—Forward Currency Contracts | 134 |
| Total Liabilities | 24,438 |
| Net Assets | 2,007,441 |
| Statement of Assets and Liabilities (continued) | |
| At August 31, 2023, net assets consisted of: | |
| ($000s, except shares, footnotes, and per-share amounts) | Amount |
| Paid-in Capital | 1,802,062 |
| Total Distributable Earnings (Loss) | 205,379 |
| Net Assets | 2,007,441 |
| Investor Shares—Net Assets | |
| Applicable to 10,142,403 outstanding $.001 par value shares of beneficial interest (unlimited authorization) | 246,866 |
| Net Asset Value Per Share—Investor Shares | $24.34 |
| Admiral Shares—Net Assets | |
| Applicable to 57,857,476 outstanding $.001 par value shares of beneficial interest (unlimited authorization) | 1,760,575 |
| Net Asset Value Per Share—Admiral Shares | $30.43 |
| Year Ended August 31, 2023 | |
| ($000) | |
| Investment Income | |
| Income | |
| Dividends1 | 35,585 |
| Interest2 | 23,587 |
| Securities Lending—Net | 12 |
| Total Income | 59,184 |
| Expenses | |
| Investment Advisory Fees—Note B | |
| Basic Fee | 2,810 |
| Performance Adjustment | 747 |
| The Vanguard Group—Note C | |
| Management and Administrative—Investor Shares | 655 |
| Management and Administrative—Admiral Shares | 2,579 |
| Marketing and Distribution—Investor Shares | 17 |
| Marketing and Distribution—Admiral Shares | 87 |
| Custodian Fees | 53 |
| Auditing Fees | 37 |
| Shareholders’ Reports—Investor Shares | 19 |
| Shareholders’ Reports—Admiral Shares | 31 |
| Trustees’ Fees and Expenses | 1 |
| Other Expenses | 120 |
| Total Expenses | 7,156 |
| Expenses Paid Indirectly | (10) |
| Net Expenses | 7,146 |
| Net Investment Income | 52,038 |
| Realized Net Gain (Loss) | |
| Investment Securities Sold2 | (15,854) |
| Futures Contracts | 2,152 |
| Swap Contracts | (55) |
| Forward Currency Contracts | (5,439) |
| Foreign Currencies | 936 |
| Realized Net Gain (Loss) | (18,260) |
| Statement of Operations (continued) | |
| Year Ended August 31, 2023 | |
| ($000) | |
| Change in Unrealized Appreciation (Depreciation) | |
| Investment Securities2 | 145,804 |
| Futures Contracts | 101 |
| Forward Currency Contracts | 257 |
| Foreign Currencies | 281 |
| Change in Unrealized Appreciation (Depreciation) | 146,443 |
| Net Increase (Decrease) in Net Assets Resulting from Operations | 180,221 |
| 1 | Dividends are net of foreign withholding taxes of $2,061,000. |
| 2 | Interest income, realized net gain (loss), capital gain distributions received, and change in unrealized appreciation (depreciation) from an affiliated company of the fund were $2,825,000, $7,000, less than $1,000, and $7,000, respectively. Purchases and sales are for temporary cash investment purposes. |
| Year Ended August 31, | ||
| 2023 ($000) | 2022 ($000) | |
| Increase (Decrease) in Net Assets | ||
| Operations | ||
| Net Investment Income | 52,038 | 44,311 |
| Realized Net Gain (Loss) | (18,260) | 42,890 |
| Change in Unrealized Appreciation (Depreciation) | 146,443 | (251,547) |
| Net Increase (Decrease) in Net Assets Resulting from Operations | 180,221 | (164,346) |
| Distributions | ||
| Investor Shares | (10,955) | (7,906) |
| Admiral Shares | (78,051) | (56,296) |
| Total Distributions | (89,006) | (64,202) |
| Capital Share Transactions | ||
| Investor Shares | 9,516 | 7,961 |
| Admiral Shares | 117,762 | 185,242 |
| Net Increase (Decrease) from Capital Share Transactions | 127,278 | 193,203 |
| Total Increase (Decrease) | 218,493 | (35,345) |
| Net Assets | ||
| Beginning of Period | 1,788,948 | 1,824,293 |
| End of Period | 2,007,441 | 1,788,948 |
| Investor Shares | |||||
| For a Share Outstanding Throughout Each Period | Year Ended August 31, | ||||
| 2023 | 2022 | 2021 | 2020 | 2019 | |
| Net Asset Value, Beginning of Period | $23.18 | $26.18 | $22.29 | $21.41 | $20.51 |
| Investment Operations | |||||
| Net Investment Income1 | .630 | .566 | .410 | .430 | .443 |
| Net Realized and Unrealized Gain (Loss) on Investments | 1.659 | (2.711) | 3.871 | .874 | .920 |
| Total from Investment Operations | 2.289 | (2.145) | 4.281 | 1.304 | 1.363 |
| Distributions | |||||
| Dividends from Net Investment Income | (.560) | (.446) | (.391) | (.389) | (.426) |
| Distributions from Realized Capital Gains | (.569) | (.409) | — | (.035) | (.037) |
| Total Distributions | (1.129) | (.855) | (.391) | (.424) | (.463) |
| Net Asset Value, End of Period | $24.34 | $23.18 | $26.18 | $22.29 | $21.41 |
| Total Return2 | 10.18% | -8.43% | 19.36% | 6.22% | 6.80% |
| Ratios/Supplemental Data | |||||
| Net Assets, End of Period (Millions) | $247 | $226 | $247 | $181 | $176 |
| Ratio of Total Expenses to Average Net Assets3 | 0.50%4 | 0.45%4 | 0.42% | 0.44% | 0.46% |
| Ratio of Net Investment Income to Average Net Assets | 2.66% | 2.26% | 1.68% | 2.01% | 2.19% |
| Portfolio Turnover Rate | 93%5 | 77%5 | 68%5 | 58%5 | 54% |
| 1 | Calculated based on average shares outstanding. |
| 2 | Total returns do not include account service fees that may have applied in the periods shown. Fund prospectuses provide information about any applicable account service fees. |
| 3 | Includes performance-based investment advisory fee increases (decreases) of 0.04%, (0.01%), (0.03%), (0.01%), and 0.01%. |
| 4 | The ratio of expenses to average net assets for the period net of reduction from custody fee offset arrangements was 0.50% and 0.44%, respectively. |
| 5 | Includes 15%, 15%, 20%, and 10%, respectively, attributable to mortgage-dollar-roll activity. |
| Admiral Shares | |||||
| For a Share Outstanding Throughout Each Period | Year Ended August 31, | ||||
| 2023 | 2022 | 2021 | 2020 | 2019 | |
| Net Asset Value, Beginning of Period | $28.98 | $32.74 | $27.87 | $26.76 | $25.65 |
| Investment Operations | |||||
| Net Investment Income1 | .827 | .750 | .554 | .564 | .583 |
| Net Realized and Unrealized Gain (Loss) on Investments | 2.072 | (3.398) | 4.842 | 1.104 | 1.132 |
| Total from Investment Operations | 2.899 | (2.648) | 5.396 | 1.668 | 1.715 |
| Distributions | |||||
| Dividends from Net Investment Income | (.738) | (.601) | (.526) | (.514) | (.559) |
| Distributions from Realized Capital Gains | (.711) | (.511) | — | (.044) | (.046) |
| Total Distributions | (1.449) | (1.112) | (.526) | (.558) | (.605) |
| Net Asset Value, End of Period | $30.43 | $28.98 | $32.74 | $27.87 | $26.76 |
| Total Return2 | 10.32% | -8.33% | 19.53% | 6.38% | 6.85% |
| Ratios/Supplemental Data | |||||
| Net Assets, End of Period (Millions) | $1,761 | $1,563 | $1,577 | $1,129 | $826 |
| Ratio of Total Expenses to Average Net Assets3 | 0.37%4 | 0.32%4 | 0.29% | 0.34% | 0.36% |
| Ratio of Net Investment Income to Average Net Assets | 2.79% | 2.39% | 1.81% | 2.11% | 2.29% |
| Portfolio Turnover Rate | 93%5 | 77%5 | 68%5 | 58%5 | 54% |
| 1 | Calculated based on average shares outstanding. |
| 2 | Total returns do not include account service fees that may have applied in the periods shown. Fund prospectuses provide information about any applicable account service fees. |
| 3 | Includes performance-based investment advisory fee increases (decreases) of 0.04%, (0.01%), (0.03%), (0.01%), and 0.01%. |
| 4 | The ratio of expenses to average net assets for the period net of reduction from custody fee offset arrangements was 0.37% and 0.32%, respectively. |
| 5 | Includes 15%, 15%, 20%, and 10%, respectively, attributable to mortgage-dollar-roll activity. |
| Level 1 ($000) | Level 2 ($000) | Level 3 ($000) | Total ($000) | |
| Investments | ||||
| Assets | ||||
| Common Stocks—North and South America | 762,219 | 2,972 | — | 765,191 |
| Common Stocks—Other | 54,794 | 489,909 | — | 544,703 |
| U.S. Government and Agency Obligations | — | 129,937 | — | 129,937 |
| Asset-Backed/Commercial Mortgage-Backed Securities | — | 21,479 | — | 21,479 |
| Corporate Bonds | — | 398,555 | — | 398,555 |
| Sovereign Bonds | — | 77,574 | — | 77,574 |
| Taxable Municipal Bonds | — | 13,761 | — | 13,761 |
| Temporary Cash Investments | 51,645 | — | — | 51,645 |
| Total | 868,658 | 1,134,187 | — | 2,002,845 |
| Derivative Financial Instruments | ||||
| Assets | ||||
| Futures Contracts1 | 201 | — | — | 201 |
| Forward Currency Contracts | — | 297 | — | 297 |
| Total | 201 | 297 | — | 498 |
| Liabilities | ||||
| Futures Contracts1 | 412 | — | — | 412 |
| Level 1 ($000) | Level 2 ($000) | Level 3 ($000) | Total ($000) | |
| Derivative Financial Instruments | ||||
| Forward Currency Contracts | — | 134 | — | 134 |
| Total | 412 | 134 | — | 546 |
| 1 | Includes cumulative appreciation (depreciation) on futures contracts and centrally cleared swaps, if any, as reported in the Schedule of Investments. Only current day’s variation margin is reported within the Statement of Assets and Liabilities. |
| Statement of Assets and Liabilities | Interest Rate Contracts ($000) | Foreign Exchange Contracts ($000) | Total ($000) |
| Unrealized Appreciation—Futures Contracts1 | 201 | — | 201 |
| Unrealized Appreciation—Forward Currency Contracts | — | 297 | 297 |
| Total Assets | 201 | 297 | 498 |
| Unrealized Depreciation—Futures Contracts1 | 412 | — | 412 |
| Unrealized Depreciation—Forward Currency Contracts | — | 134 | 134 |
| Total Liabilities | 412 | 134 | 546 |
| 1 | Includes cumulative appreciation (depreciation) on futures contracts and centrally cleared swaps, if any, as reported in the Schedule of Investments. Only current day’s variation margin is reported within the Statement of Assets and Liabilities. |
| Realized Net Gain (Loss) on Derivatives | Interest Rate Contracts ($000) | Foreign Exchange Contracts ($000) | Credit Contracts ($000) | Total ($000) |
| Futures Contracts | 2,152 | — | — | 2,152 |
| Swap Contracts | — | — | (55) | (55) |
| Forward Currency Contracts | — | (5,439) | — | (5,439) |
| Realized Net Gain (Loss) on Derivatives | 2,152 | (5,439) | (55) | (3,342) |
| Change in Unrealized Appreciation (Depreciation) on Derivatives | ||||
| Futures Contracts | 101 | — | — | 101 |
| Forward Currency Contracts | — | 257 | — | 257 |
| Change in Unrealized Appreciation (Depreciation) on Derivatives | 101 | 257 | — | 358 |
| Amount ($000) | |
| Undistributed Ordinary Income | 9,525 |
| Undistributed Long-Term Gains | — |
| Net Unrealized Gains (Losses) | 210,943 |
| Capital Loss Carryforwards | (15,089) |
| Qualified Late-Year Losses | — |
| Other Temporary Differences | — |
| Total | 205,379 |
| Year Ended August 31, | ||
| 2023 Amount ($000) | 2022 Amount ($000) | |
| Ordinary Income* | 46,097 | 45,900 |
| Long-Term Capital Gains | 42,909 | 18,302 |
| Total | 89,006 | 64,202 |
| * | Includes short-term capital gains, if any. |
| Amount ($000) | |
| Tax Cost | 1,792,001 |
| Gross Unrealized Appreciation | 284,988 |
| Gross Unrealized Depreciation | (74,144) |
| Net Unrealized Appreciation (Depreciation) | 210,844 |
| Year Ended August 31, | |||||
| 2023 | 2022 | ||||
| Amount ($000) | Shares (000) | Amount ($000) | Shares (000) | ||
| Investor Shares | |||||
| Issued | 60,560 | 2,543 | 82,726 | 3,263 | |
| Issued in Lieu of Cash Distributions | 9,722 | 418 | 7,053 | 279 | |
| Redeemed | (60,766) | (2,570) | (81,818) | (3,241) | |
| Net Increase (Decrease)—Investor Shares | 9,516 | 391 | 7,961 | 301 | |
| Admiral Shares | |||||
| Issued | 365,250 | 12,306 | 428,463 | 13,556 | |
| Issued in Lieu of Cash Distributions | 68,549 | 2,361 | 49,306 | 1,564 | |
| Redeemed | (316,037) | (10,739) | (292,527) | (9,361) | |
| Net Increase (Decrease)—Admiral Shares | 117,762 | 3,928 | 185,242 | 5,759 | |
Philadelphia, Pennsylvania
October 19, 2023
| Matthew Benchener | Thomas M. Rampulla |
| Joseph Brennan | Karin A. Risi |
| Mortimer J. Buckley | Anne E. Robinson |
| Gregory Davis | Michael Rollings |
| John James | Nitin Tandon |
| Chris D. McIsaac | Lauren Valente |

Who Are Deaf or Hard of Hearing > 800-749-7273
All rights reserved.
Vanguard Marketing Corporation, Distributor.

| 1 | |
| 2 | |
| 6 | |
| 8 | |
| 11 | |
| 46 |
| • | For the 12 months ended August 31, 2023, Vanguard Global Wellesley Income Fund returned 5.20% for Investor Shares and 5.33% for Admiral Shares, slightly exceeding the 5.05% return of the composite benchmark index. |
| • | Early in the period, inflation in many developed markets began to ease off multidecade highs but remained stubbornly high in some sectors—including services, which felt the effects of a tight labor market. While aggressive interest rate hikes by major central banks fanned fears of recession and weighed on bond prices, the economy proved more resilient than expected. |
| • | The fund’s stock portfolio outperformed that of the benchmark. By sector, the biggest boost to relative returns was attributable to stock selection in consumer discretionary and financials. By region, both the larger allocation to Europe and the stock selection within Europe bolstered relative performance. |
| • | In the fixed income portion of the fund, an underweight credit spread duration stance versus the benchmark and an overweight allocation to securitized sectors held back returns. On the other side of the ledger, security selection was positive, particularly in investment-grade industrials, sovereigns, and supranationals. The fund’s shorter duration compared with that of the benchmark and its yield curve positioning also helped. |
| • | The fund regularly uses derivatives to hedge portfolio risks. Its holdings of forward currency contracts and futures had a negative impact on performance over the period. |
| Average Annual Total Returns Periods Ended August 31, 2023 | |||
| One Year | Three Years | Five Years | |
| Stocks | |||
| Russell 1000 Index (Large-caps) | 15.40% | 9.93% | 10.77% |
| Russell 2000 Index (Small-caps) | 4.65 | 8.12 | 3.14 |
| Russell 3000 Index (Broad U.S. market) | 14.76 | 9.81 | 10.25 |
| FTSE All-World ex US Index (International) | 12.02 | 4.49 | 3.74 |
| Bonds | |||
| Bloomberg U.S. Aggregate Float Adjusted Index (Broad taxable market) | -1.05% | -4.40% | 0.55% |
| Bloomberg Municipal Bond Index (Broad tax-exempt market) | 1.70 | -1.32 | 1.52 |
| FTSE Three-Month U.S. Treasury Bill Index | 4.44 | 1.63 | 1.68 |
| CPI | |||
| Consumer Price Index | 3.67% | 5.71% | 4.02% |
Fixed Income Portfolio Manager
Equity Portfolio Manager
| • | Based on actual fund return. This section helps you to estimate the actual expenses that you paid over the period. The ”Ending Account Value“ shown is derived from the fund’s actual return, and the third column shows the dollar amount that would have been paid by an investor who started with $1,000 in the fund. You may use the information here, together with the amount you invested, to estimate the expenses that you paid over the period. |
| • | Based on hypothetical 5% yearly return. This section is intended to help you compare your fund‘s costs with those of other mutual funds. It assumes that the fund had a yearly return of 5% before expenses, but that the expense ratio is unchanged. In this case—because the return used is not the fund’s actual return—the results do not apply to your investment. The example is useful in making comparisons because the Securities and Exchange Commission requires all mutual funds to calculate expenses based on a 5% return. You can assess your fund’s costs by comparing this hypothetical example with the hypothetical examples that appear in shareholder reports of other funds. |
| Six Months Ended August 31, 2023 | |||
| Beginning Account Value 2/28/2023 | Ending Account Value 8/31/2023 | Expenses Paid During Period | |
| Based on Actual Fund Return | |||
| Global Wellesley Income Fund | |||
| Investor Shares | $1,000.00 | $1,021.20 | $2.19 |
| Admiral™ Shares | 1,000.00 | 1,022.20 | 1.53 |
| Based on Hypothetical 5% Yearly Return | |||
| Global Wellesley Income Fund | |||
| Investor Shares | $1,000.00 | $1,023.04 | $2.19 |
| Admiral Shares | 1,000.00 | 1,023.69 | 1.53 |
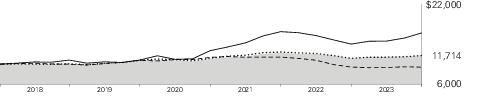
| Average Annual Total Returns Periods Ended August 31, 2023 | |||||
| One Year | Five Years | Since Inception (11/2/2017) | Final Value of a $10,000 Investment | ||
 | Global Wellesley Income Fund Investor Shares | 5.20% | 3.03% | 2.75% | $11,714 |
 | Global Wellesley Income Composite Index | 5.05 | 3.11 | 2.77 | 11,723 |
 | Bloomberg Global Aggregate Bond Index | -0.09 | -1.21 | -1.07 | 9,393 |
 | FTSE Developed Net Tax Index | 15.98 | 8.52 | 8.70 | 16,264 |
| Average Annual Total Returns Periods Ended August 31, 2023 | |||||
| One Year | Five Years | Since Inception (11/2/2017) | Final Value of a $50,000 Investment | ||
| Global Wellesley Income Fund Admiral Shares | 5.33% | 3.16% | 2.87% | $58,965 | |
| Global Wellesley Income Composite Index | 5.05 | 3.11 | 2.77 | 58,617 | |
| Bloomberg Global Aggregate Bond Index | -0.09 | -1.21 | -1.07 | 46,967 | |
| FTSE Developed Net Tax Index | 15.98 | 8.52 | 8.70 | 81,321 | |
| United States | 53.7% |
| France | 9.2 |
| United Kingdom | 7.2 |
| Japan | 4.4 |
| Supranational | 3.8 |
| Canada | 3.6 |
| Switzerland | 3.1 |
| Norway | 2.0 |
| Italy | 1.8 |
| Spain | 1.6 |
| Australia | 1.3 |
| Germany | 1.2 |
| Hong Kong | 1.2 |
| Netherlands | 1.1 |
| Denmark | 1.0 |
| Other | 3.8 |
| Shares | Market Value• ($000) | |||||
| Common Stocks (37.2%) | ||||||
| Australia (0.6%) | ||||||
| Rio Tinto plc | 54,137 | 3,334 | ||||
| Canada (2.0%) | ||||||
| Bank of Nova Scotia | 95,069 | 4,511 | ||||
| Royal Bank of Canada | 39,267 | 3,538 | ||||
| Enbridge Inc. | 81,778 | 2,871 | ||||
| 10,920 | ||||||
| China (0.4%) | ||||||
| ENN Energy Holdings Ltd. | 253,100 | 1,986 | ||||
| France (3.8%) | ||||||
| TotalEnergies SE | 111,958 | 7,023 | ||||
| AXA SA | 169,517 | 5,093 | ||||
| Engie SA | 266,109 | 4,285 | ||||
| Bureau Veritas SA | 157,862 | 4,229 | ||||
| 20,630 | ||||||
| Hong Kong (1.2%) | ||||||
| AIA Group Ltd. | 459,400 | 4,157 | ||||
| * | Sands China Ltd. | 649,200 | 2,196 | |||
| 6,353 | ||||||
| Italy (0.8%) | ||||||
| FinecoBank Banca Fineco SpA | 313,532 | 4,285 | ||||
| Japan (2.7%) | ||||||
| Mitsubishi UFJ Financial Group Inc. | 506,400 | 4,040 | ||||
| Isuzu Motors Ltd. | 281,300 | 3,601 | ||||
| Tokio Marine Holdings Inc. | 153,700 | 3,392 | ||||
| KDDI Corp. | 111,100 | 3,303 | ||||
| 14,336 | ||||||
| Netherlands (0.5%) | ||||||
| Koninklijke KPN NV | 742,927 | 2,600 | ||||
| Norway (1.5%) | ||||||
| Equinor ASA | 138,426 | 4,251 | ||||
| DNB Bank ASA | 193,065 | 3,816 | ||||
| 8,067 | ||||||
| Spain (0.6%) | ||||||
| Industria de Diseno Textil SA | 84,280 | 3,229 | ||||
| Shares | Market Value• ($000) | |||||
| Switzerland (2.0%) | ||||||
| Novartis AG (Registered) | 52,894 | 5,324 | ||||
| UBS Group AG (Registered) | 194,334 | 5,147 | ||||
| 10,471 | ||||||
| Taiwan (0.6%) | ||||||
| Taiwan Semiconductor Manufacturing Co. Ltd. | 185,000 | 3,179 | ||||
| United Kingdom (4.5%) | ||||||
| AstraZeneca plc | 38,907 | 5,226 | ||||
| BAE Systems plc | 393,258 | 5,005 | ||||
| National Grid plc | 311,119 | 3,884 | ||||
| HSBC Holdings plc | 524,261 | 3,868 | ||||
| Unilever plc | 68,337 | 3,490 | ||||
| WPP plc | 274,226 | 2,658 | ||||
| 24,131 | ||||||
| United States (16.0%) | ||||||
| Philip Morris International Inc. | 59,682 | 5,733 | ||||
| Merck & Co. Inc. | 52,228 | 5,692 | ||||
| Cisco Systems Inc. | 88,556 | 5,079 | ||||
| Pfizer Inc. | 139,720 | 4,943 | ||||
| Johnson & Johnson | 29,424 | 4,757 | ||||
| Home Depot Inc. | 13,200 | 4,360 | ||||
| Elevance Health Inc. | 9,417 | 4,162 | ||||
| Coterra Energy Inc. | 146,504 | 4,130 | ||||
| Ares Management Corp. Class A | 39,813 | 4,118 | ||||
| Exelon Corp. | 98,995 | 3,972 | ||||
| Duke Energy Corp. | 43,254 | 3,841 | ||||
| Lockheed Martin Corp. | 8,109 | 3,636 | ||||
| Texas Instruments Inc. | 21,098 | 3,546 | ||||
| Johnson Controls International plc | 59,560 | 3,518 | ||||
| Crown Castle Inc. | 34,783 | 3,496 | ||||
| Microsoft Corp. | 9,893 | 3,242 | ||||
| Bank of America Corp. | 104,928 | 3,008 | ||||
| TJX Cos. Inc. | 32,373 | 2,994 | ||||
| QUALCOMM Inc. | 25,940 | 2,971 | ||||
| Kenvue Inc. | 128,900 | 2,971 | ||||
| Edison International | 40,699 | 2,802 | ||||
| Kellogg Co. | 40,683 | 2,482 | ||||
| 85,453 | ||||||
| Total Common Stocks (Cost $165,610) | 198,974 | |||||
| Coupon | Maturity Date | Face Amount ($000) | ||||
| U.S. Government and Agency Obligations (10.0%) | ||||||
| 1,2 | Fannie Mae REMICS | 2.000% | 9/25/40 | 23 | 22 | |
| 1,2 | Fannie Mae REMICS | 2.500% | 5/25/45 | 239 | 214 | |
| 1,2 | Fannie Mae REMICS | 3.000% | 2/25/49 | 58 | 55 | |
| 1,2 | Fannie Mae REMICS | 3.500% | 6/25/44 | 87 | 83 | |
| 1,2 | Freddie Mac REMICS | 1.750% | 9/15/42 | 591 | 539 | |
| 1,2 | Freddie Mac REMICS | 2.000% | 7/25/50 | 655 | 562 | |
| 1,2 | Freddie Mac REMICS | 3.500% | 11/15/40 | 1 | 1 | |
| 1,2 | Freddie Mac REMICS | 4.000% | 12/15/39–9/15/41 | 926 | 886 | |
| Coupon | Maturity Date | Face Amount ($000) | Market Value• ($000) | |||
| 1 | Ginnie Mae II Pool | 2.000% | 1/20/51–11/20/51 | 745 | 613 | |
| 1 | Ginnie Mae II Pool | 2.500% | 3/20/51–12/20/52 | 1,177 | 1,001 | |
| 1 | Ginnie Mae II Pool | 3.000% | 11/20/49–3/20/52 | 1,137 | 1,001 | |
| 1 | Ginnie Mae II Pool | 3.500% | 1/20/52–7/20/52 | 1,573 | 1,428 | |
| 1 | Ginnie Mae II Pool | 4.000% | 8/20/52 | 835 | 777 | |
| 1 | Ginnie Mae II Pool | 5.000% | 9/20/52 | 634 | 618 | |
| 1 | Ginnie Mae REMICS | 2.750% | 9/20/44 | 70 | 66 | |
| 1,2 | UMBS Pool | 2.000% | 4/01/36–5/01/51 | 4,371 | 3,618 | |
| 1,2 | UMBS Pool | 2.500% | 8/01/51–11/01/51 | 648 | 549 | |
| 1,2 | UMBS Pool | 3.000% | 10/1/51 | 1,244 | 1,082 | |
| 1,2 | UMBS Pool | 3.500% | 7/1/51 | 1,191 | 1,077 | |
| 1,2 | UMBS Pool | 4.000% | 8/01/52–10/01/52 | 1,074 | 993 | |
| 1,2 | UMBS Pool | 4.500% | 9/01/37–9/01/52 | 4,929 | 4,771 | |
| 1,2,3 | UMBS Pool | 5.000% | 10/01/52–9/25/53 | 7,030 | 6,819 | |
| 1,2 | UMBS Pool | 5.500% | 1/1/53 | 337 | 333 | |
| United States Treasury Note/Bond | 1.125% | 10/31/26 | 145 | 131 | ||
| United States Treasury Note/Bond | 1.250% | 11/30/26 | 114 | 103 | ||
| United States Treasury Note/Bond | 1.750% | 8/15/41 | 670 | 450 | ||
| United States Treasury Note/Bond | 2.000% | 11/15/41 | 1,024 | 716 | ||
| United States Treasury Note/Bond | 2.375% | 2/15/42 | 1,230 | 915 | ||
| United States Treasury Note/Bond | 2.625% | 5/31/27 | 10 | 9 | ||
| United States Treasury Note/Bond | 3.250% | 5/15/42 | 170 | 145 | ||
| United States Treasury Note/Bond | 3.375% | 5/15/33–8/15/42 | 2,094 | 1,956 | ||
| United States Treasury Note/Bond | 3.625% | 5/15/26–5/15/53 | 4,623 | 4,247 | ||
| United States Treasury Note/Bond | 3.875% | 8/15/33–5/15/43 | 3,244 | 3,060 | ||
| United States Treasury Note/Bond | 4.000% | 2/15/26–11/15/52 | 2,223 | 2,152 | ||
| United States Treasury Note/Bond | 4.125% | 8/15/53 | 1,021 | 1,007 | ||
| 4 | United States Treasury Note/Bond | 4.250% | 9/30/24–5/31/25 | 6,428 | 6,350 | |
| United States Treasury Note/Bond | 4.375% | 8/15/26–8/15/43 | 4,025 | 4,010 | ||
| United States Treasury Note/Bond | 4.500% | 7/15/26 | 340 | 339 | ||
| United States Treasury Note/Bond | 4.625% | 3/15/26 | 624 | 623 | ||
| Total U.S. Government and Agency Obligations (Cost $55,617) | 53,321 | |||||
| Asset-Backed/Commercial Mortgage-Backed Securities (2.2%) | ||||||
| Bermuda (0.0%) | ||||||
| 1,5 | Start II Ltd. Series 2019-1 | 4.089% | 3/15/44 | 114 | 101 | |
| United States (2.2%) | ||||||
| 1,5 | Aligned Data Centers Issuer LLC Series 2021-1A | 1.937% | 8/15/46 | 740 | 653 | |
| 1,5,6 | BX Trust Series 2021-ARIA, TSFR1M + 1.411% | 6.721% | 10/15/36 | 770 | 743 | |
| 1,5 | Castlelake Aircraft Structured Trust Series 2019-1A | 3.967% | 4/15/39 | 148 | 131 | |
| 1,5 | CF Hippolyta Issuer LLC Series 2020-1 | 1.690% | 7/15/60 | 169 | 153 | |
| 1,5 | CF Hippolyta Issuer LLC Series 2021-1A | 1.530% | 3/15/61 | 547 | 480 | |
| 1,5 | CF Hippolyta Issuer LLC Series 2022-1A | 5.970% | 8/15/62 | 244 | 239 | |
| 1,5,6 | Connecticut Avenue Securities Trust Series 2021-R01, SOFR30A + 1.550% | 6.838% | 10/25/41 | 145 | 143 | |
| 1,2 | Fannie Mae-Aces Series 2021-M2S | 2.386% | 10/25/36 | 364 | 280 | |
| 1,2 | Freddie Mac Multifamily Structured Pass-Through Certificates Series K142 | 2.400% | 3/25/32 | 820 | 684 | |
| 1,2 | Freddie Mac Multifamily Structured Pass-Through Certificates Series K156 | 4.430% | 2/25/33 | 710 | 690 | |
| 1,2,5,6 | Freddie Mac STACR REMICS Trust Series 2020-DNA5, SOFR30A + 2.800% | 8.088% | 10/25/50 | 169 | 171 | |
| 1,5 | Home Partners of America Trust Series 2021-2 | 2.302% | 12/17/26 | 683 | 600 | |
| 1,5 | Kubota Credit Owner Trust Series 2023-2A | 5.280% | 1/18/28 | 685 | 684 | |
| Coupon | Maturity Date | Face Amount ($000) | Market Value• ($000) | |||
| 1,5 | Navient Private Education Refi Loan Trust Series 2023-A | 5.510% | 10/15/71 | 867 | 863 | |
| 1,5 | New Economy Assets Phase 1 Sponsor LLC Series 2021-1 | 1.910% | 10/20/61 | 975 | 842 | |
| 1,5 | New Economy Assets Phase 1 Sponsor LLC Series 2021-1 | 2.410% | 10/20/61 | 245 | 205 | |
| 1 | Seasoned Credit Risk Transfer Trust Series 2019-3 | 3.500% | 10/25/58 | 150 | 143 | |
| 1,5,6 | SREIT Trust Series 2021-MFP, TSFR1M + 1.194% | 6.505% | 11/15/38 | 875 | 856 | |
| 1,5 | Stack Infrastructure Issuer LLC Series 2023-2A | 5.900% | 7/25/48 | 1,520 | 1,481 | |
| 1,5 | Towd Point Mortgage Trust Series 2018-1 | 3.000% | 1/25/58 | 64 | 61 | |
| 1,5 | Wheels Fleet Lease Funding LLC Series 2023-1A | 5.800% | 4/18/38 | 1,425 | 1,419 | |
| 11,521 | ||||||
| Total Asset-Backed/Commercial Mortgage-Backed Securities (Cost $12,122) | 11,622 | |||||
| Corporate Bonds (39.8%) | ||||||
| Belgium (0.4%) | ||||||
| 1,7 | Anheuser-Busch InBev SA/NV | 1.650% | 3/28/31 | 355 | 334 | |
| 1,7 | Anheuser-Busch InBev SA/NV | 2.750% | 3/17/36 | 725 | 693 | |
| Anheuser-Busch InBev Worldwide Inc. | 4.500% | 6/1/50 | 949 | 845 | ||
| 5 | KBC Group NV | 5.796% | 1/19/29 | 200 | 198 | |
| 2,070 | ||||||
| Bermuda (0.2%) | ||||||
| 5 | Bacardi Ltd. | 5.250% | 1/15/29 | 270 | 266 | |
| 5 | Bacardi Ltd. | 5.900% | 6/15/43 | 821 | 809 | |
| 1,075 | ||||||
| Canada (0.6%) | ||||||
| 8 | Bank of Montreal | 2.850% | 3/6/24 | 1,890 | 1,379 | |
| 8 | Emera Inc. | 4.838% | 5/2/30 | 1,560 | 1,112 | |
| Fortis Inc. | 3.055% | 10/4/26 | 625 | 580 | ||
| 3,071 | ||||||
| Denmark (0.9%) | ||||||
| 1,7 | Danfoss Finance II BV | 4.125% | 12/2/29 | 1,330 | 1,446 | |
| 7 | Danske Bank A/S | 0.500% | 8/27/25 | 610 | 636 | |
| 5 | Danske Bank A/S | 6.466% | 1/9/26 | 1,550 | 1,552 | |
| 5 | Danske Bank A/S | 1.621% | 9/11/26 | 875 | 796 | |
| 1,9 | Danske Bank A/S | 2.250% | 1/14/28 | 560 | 611 | |
| 5,041 | ||||||
| France (5.2%) | ||||||
| 1,7 | Banque Federative du Credit Mutuel SA | 4.375% | 5/2/30 | 500 | 539 | |
| 7 | Banque Federative du Credit Mutuel SA | 3.875% | 6/16/32 | 1,500 | 1,535 | |
| 1,7 | BNP Paribas Home Loan SFH SA | 3.000% | 5/25/28 | 1,400 | 1,497 | |
| 5 | BNP Paribas SA | 2.819% | 11/19/25 | 360 | 345 | |
| 5 | BNP Paribas SA | 2.219% | 6/9/26 | 770 | 718 | |
| 1,7 | BNP Paribas SA | 0.125% | 9/4/26 | 400 | 389 | |
| 5 | BNP Paribas SA | 2.591% | 1/20/28 | 1,145 | 1,029 | |
| 5 | BNP Paribas SA | 5.335% | 6/12/29 | 1,490 | 1,468 | |
| 1,7 | BNP Paribas SA | 1.125% | 1/15/32 | 400 | 374 | |
| 1,9 | BNP Paribas SA | 5.750% | 6/13/32 | 600 | 724 | |
| 1,7 | BPCE SA | 0.500% | 9/15/27 | 1,900 | 1,831 | |
| 5 | BPCE SA | 3.250% | 1/11/28 | 500 | 453 | |
| 5 | BPCE SA | 2.277% | 1/20/32 | 760 | 587 | |
| Coupon | Maturity Date | Face Amount ($000) | Market Value• ($000) | |||
| 1,7 | BPCE SA | 1.750% | 2/2/34 | 900 | 806 | |
| 7 | BPCE SFH SA | 3.000% | 10/17/29 | 1,300 | 1,387 | |
| 7 | Cie de Financement Foncier SA | 0.010% | 7/15/26 | 800 | 786 | |
| 1,7 | Cie de Financement Foncier SA | 0.875% | 9/11/28 | 1,200 | 1,155 | |
| 7 | Credit Agricole SA | 1.875% | 4/22/27 | 1,700 | 1,730 | |
| 9 | Credit Agricole SA | 5.750% | 11/29/27 | 900 | 1,115 | |
| 5 | Credit Agricole SA | 5.514% | 7/5/33 | 650 | 647 | |
| 1,7 | Credit Agricole SA | 3.875% | 11/28/34 | 200 | 211 | |
| 5 | Danone SA | 2.947% | 11/2/26 | 285 | 266 | |
| 1,7 | Engie SA | 0.375% | 6/11/27 | 1,300 | 1,247 | |
| 1,7 | Engie SA | 4.000% | 1/11/35 | 1,700 | 1,821 | |
| 1,7 | Engie SA | 2.000% | 9/28/37 | 700 | 581 | |
| 1,7 | Orange SA | 1.000% | 5/12/25 | 1,200 | 1,243 | |
| 1,7 | RCI Banque SA | 1.375% | 3/8/24 | 575 | 615 | |
| 1,9 | Societe Generale SA | 1.250% | 12/7/27 | 1,200 | 1,233 | |
| 7 | Societe Generale SFH SA | 0.750% | 1/29/27 | 800 | 793 | |
| 1,7 | Suez SACA | 2.875% | 5/24/34 | 600 | 571 | |
| 27,696 | ||||||
| Germany (0.7%) | ||||||
| 5 | Bayer US Finance LLC | 3.375% | 10/8/24 | 765 | 744 | |
| 5 | Bayer US Finance II LLC | 4.250% | 12/15/25 | 660 | 639 | |
| 5 | Daimler Truck Finance North America LLC | 5.150% | 1/16/26 | 310 | 308 | |
| 5 | Daimler Truck Finance North America LLC | 5.125% | 1/19/28 | 150 | 148 | |
| 1,9 | E.ON International Finance BV | 6.250% | 6/3/30 | 155 | 201 | |
| 1,9 | E.ON International Finance BV | 6.375% | 6/7/32 | 855 | 1,122 | |
| 7 | Wintershall Dea Finance BV | 1.823% | 9/25/31 | 1,000 | 858 | |
| 4,020 | ||||||
| Ireland (0.0%) | ||||||
| 5 | Avolon Holdings Funding Ltd. | 2.125% | 2/21/26 | 178 | 160 | |
| Italy (1.0%) | ||||||
| 7 | Autostrade per l'Italia SpA | 2.000% | 12/4/28 | 3,475 | 3,301 | |
| 7 | Autostrade per l'Italia SpA | 2.000% | 1/15/30 | 420 | 384 | |
| 7 | Intesa Sanpaolo SpA | 1.125% | 6/16/27 | 1,000 | 992 | |
| 7 | Intesa Sanpaolo SpA | 1.125% | 10/4/27 | 680 | 670 | |
| 5,347 | ||||||
| Japan (0.1%) | ||||||
| 5 | NTT Finance Corp. | 1.162% | 4/3/26 | 700 | 631 | |
| Luxembourg (0.2%) | ||||||
| 5 | JAB Holdings BV | 2.200% | 11/23/30 | 260 | 204 | |
| 5 | JAB Holdings BV | 3.750% | 5/28/51 | 500 | 327 | |
| 5 | JAB Holdings BV | 4.500% | 4/8/52 | 445 | 332 | |
| 863 | ||||||
| Netherlands (0.6%) | ||||||
| 1,9 | Cooperatieve Rabobank UA | 4.625% | 5/23/29 | 100 | 114 | |
| 1,7 | Cooperatieve Rabobank UA | 0.010% | 7/2/30 | 1,100 | 963 | |
| 7 | ING Groep NV | 0.250% | 2/18/29 | 600 | 539 | |
| 7 | ING Groep NV | 0.250% | 2/1/30 | 600 | 521 | |
| 1,7 | Koninklijke KPN NV | 0.875% | 11/15/33 | 500 | 410 | |
| Shell International Finance BV | 4.000% | 5/10/46 | 275 | 226 | ||
| Shell International Finance BV | 3.000% | 11/26/51 | 340 | 228 | ||
| 3,001 | ||||||
| Norway (0.4%) | ||||||
| 1,7 | Aker BP ASA | 1.125% | 5/12/29 | 750 | 682 | |
| Coupon | Maturity Date | Face Amount ($000) | Market Value• ($000) | |||
| 5 | Aker BP ASA | 4.000% | 1/15/31 | 725 | 639 | |
| 5 | Var Energi ASA | 8.000% | 11/15/32 | 900 | 961 | |
| 2,282 | ||||||
| Portugal (0.2%) | ||||||
| 1,7 | EDP Finance BV | 1.875% | 9/21/29 | 1,100 | 1,072 | |
| Saudi Arabia (0.5%) | ||||||
| 5 | EIG Pearl Holdings Sarl | 3.545% | 8/31/36 | 1,565 | 1,301 | |
| 5 | Greensaif Pipelines Bidco Sarl | 6.129% | 2/23/38 | 675 | 677 | |
| 5 | Greensaif Pipelines Bidco Sarl | 6.510% | 2/23/42 | 510 | 515 | |
| 2,493 | ||||||
| South Africa (0.2%) | ||||||
| 1,7 | Anglo American Capital plc | 4.750% | 9/21/32 | 1,250 | 1,337 | |
| Spain (0.8%) | ||||||
| 1,7 | Banco de Sabadell SA | 3.500% | 8/28/26 | 2,100 | 2,269 | |
| 1,7 | CaixaBank SA | 5.375% | 11/14/30 | 1,200 | 1,340 | |
| Telefonica Emisiones SA | 4.665% | 3/6/38 | 845 | 699 | ||
| 4,308 | ||||||
| Switzerland (1.1%) | ||||||
| 5 | Alcon Finance Corp. | 3.000% | 9/23/29 | 2,965 | 2,601 | |
| Credit Suisse AG | 7.500% | 2/15/28 | 1,816 | 1,942 | ||
| 7 | Sika Capital BV | 1.500% | 4/29/31 | 955 | 879 | |
| 1,7 | UBS Group AG | 1.250% | 7/17/25 | 600 | 632 | |
| 6,054 | ||||||
| United Arab Emirates (0.6%) | ||||||
| 5 | DAE Funding LLC | 1.550% | 8/1/24 | 1,125 | 1,074 | |
| 5 | Galaxy Pipeline Assets Bidco Ltd. | 2.160% | 3/31/34 | 2,324 | 1,956 | |
| 3,030 | ||||||
| United Kingdom (2.4%) | ||||||
| 5 | Ashtead Capital Inc. | 2.450% | 8/12/31 | 1,212 | 948 | |
| 5 | Ashtead Capital Inc. | 5.500% | 8/11/32 | 300 | 286 | |
| 5 | Ashtead Capital Inc. | 5.550% | 5/30/33 | 205 | 196 | |
| 5 | Ashtead Capital Inc. | 5.950% | 10/15/33 | 325 | 319 | |
| AstraZeneca plc | 4.000% | 1/17/29 | 720 | 690 | ||
| 1,7 | Barclays plc | 5.262% | 1/29/34 | 355 | 385 | |
| BAT Capital Corp. | 6.343% | 8/2/30 | 615 | 619 | ||
| 1,8 | BP Capital Markets plc | 3.470% | 5/15/25 | 1,325 | 949 | |
| 7 | BP Capital Markets plc | 1.104% | 11/15/34 | 525 | 415 | |
| 1,7 | Diageo Finance plc | 2.500% | 3/27/32 | 885 | 887 | |
| 1,9 | Heathrow Funding Ltd. | 2.750% | 10/13/29 | 790 | 832 | |
| HSBC Holdings plc | 7.390% | 11/3/28 | 454 | 477 | ||
| 1,9 | National Grid Electricity Transmission plc | 2.000% | 9/16/38 | 635 | 491 | |
| 1,9 | National Grid Electricity Transmission plc | 2.000% | 4/17/40 | 480 | 358 | |
| 1,7 | National Grid plc | 0.163% | 1/20/28 | 925 | 852 | |
| 1,7 | NatWest Group plc | 1.750% | 3/2/26 | 970 | 1,008 | |
| Santander UK Group Holdings plc | 1.089% | 3/15/25 | 1,725 | 1,672 | ||
| 1,9 | Scottish Hydro Electric Transmission plc | 2.250% | 9/27/35 | 535 | 475 | |
| 1,7 | SSE plc | 1.750% | 4/16/30 | 490 | 465 | |
| 5 | Standard Chartered plc | 0.991% | 1/12/25 | 530 | 519 | |
| 12,843 | ||||||
| United States (23.7%) | ||||||
| AbbVie Inc. | 4.050% | 11/21/39 | 667 | 572 | ||
| Activision Blizzard Inc. | 4.500% | 6/15/47 | 581 | 534 | ||
| Coupon | Maturity Date | Face Amount ($000) | Market Value• ($000) | |||
| 1 | Alabama Power Co. | 4.300% | 7/15/48 | 275 | 226 | |
| Allstate Corp. | 5.250% | 3/30/33 | 270 | 264 | ||
| American Express Co. | 5.043% | 5/1/34 | 2,808 | 2,698 | ||
| American International Group Inc. | 3.400% | 6/30/30 | 1,949 | 1,717 | ||
| 5 | American Transmission Systems Inc. | 2.650% | 1/15/32 | 605 | 496 | |
| Arizona Public Service Co. | 4.350% | 11/15/45 | 520 | 414 | ||
| AT&T Inc. | 4.750% | 5/15/46 | 995 | 827 | ||
| AT&T Inc. | 3.500% | 9/15/53 | 577 | 380 | ||
| 5 | Athene Global Funding | 1.450% | 1/8/26 | 1,481 | 1,321 | |
| 5 | Athene Global Funding | 2.500% | 3/24/28 | 1,475 | 1,260 | |
| 1 | Bank of America Corp. | 3.593% | 7/21/28 | 1,090 | 1,014 | |
| Bank of America Corp. | 5.202% | 4/25/29 | 1,050 | 1,034 | ||
| Bank of America Corp. | 2.687% | 4/22/32 | 745 | 609 | ||
| 1,7 | Bank of America Corp. | 1.102% | 5/24/32 | 850 | 735 | |
| Bank of America Corp. | 3.311% | 4/22/42 | 625 | 468 | ||
| 1 | Bank of New York Mellon Corp. | 4.967% | 4/26/34 | 1,402 | 1,346 | |
| 7 | Becton Dickinson Euro Finance Sarl | 0.334% | 8/13/28 | 875 | 806 | |
| 1 | Bon Secours Mercy Health Inc. | 3.555% | 8/1/27 | 535 | 494 | |
| 1 | Bon Secours Mercy Health Inc. | 2.095% | 6/1/31 | 275 | 219 | |
| 7 | Booking Holdings Inc. | 4.500% | 11/15/31 | 1,085 | 1,213 | |
| 7 | Booking Holdings Inc. | 4.125% | 5/12/33 | 985 | 1,068 | |
| 5 | Boston Gas Co. | 3.001% | 8/1/29 | 105 | 90 | |
| BP Capital Markets America Inc. | 3.001% | 3/17/52 | 1,115 | 732 | ||
| 5 | Broadcom Inc. | 3.469% | 4/15/34 | 1,587 | 1,296 | |
| 5 | Brooklyn Union Gas Co. | 4.273% | 3/15/48 | 760 | 560 | |
| Capital One Financial Corp. | 6.312% | 6/8/29 | 1,369 | 1,368 | ||
| Capital One Financial Corp. | 6.377% | 6/8/34 | 2,046 | 2,021 | ||
| Celanese US Holdings LLC | 6.350% | 11/15/28 | 665 | 667 | ||
| CenterPoint Energy Resources Corp. | 5.250% | 3/1/28 | 1,120 | 1,118 | ||
| Charles Schwab Corp. | 6.136% | 8/24/34 | 1,430 | 1,455 | ||
| Charter Communications Operating LLC | 2.250% | 1/15/29 | 65 | 54 | ||
| Charter Communications Operating LLC | 5.050% | 3/30/29 | 435 | 414 | ||
| Charter Communications Operating LLC | 6.384% | 10/23/35 | 305 | 296 | ||
| Charter Communications Operating LLC | 3.700% | 4/1/51 | 40 | 25 | ||
| Cheniere Energy Partners LP | 4.500% | 10/1/29 | 1,545 | 1,426 | ||
| Cheniere Energy Partners LP | 4.000% | 3/1/31 | 1,856 | 1,637 | ||
| Cigna Group | 4.375% | 10/15/28 | 435 | 419 | ||
| Cigna Group | 2.400% | 3/15/30 | 220 | 185 | ||
| Cleco Corporate Holdings LLC | 3.375% | 9/15/29 | 270 | 229 | ||
| 5 | Columbia Pipelines Operating Co. LLC | 5.927% | 8/15/30 | 225 | 227 | |
| 5 | Columbia Pipelines Operating Co. LLC | 6.497% | 8/15/43 | 402 | 408 | |
| Comcast Corp. | 3.950% | 10/15/25 | 255 | 248 | ||
| Comcast Corp. | 3.250% | 11/1/39 | 355 | 273 | ||
| Comcast Corp. | 4.000% | 3/1/48 | 20 | 16 | ||
| Comcast Corp. | 2.887% | 11/1/51 | 961 | 614 | ||
| Comcast Corp. | 4.049% | 11/1/52 | 6 | 5 | ||
| Comcast Corp. | 2.650% | 8/15/62 | 130 | 74 | ||
| Comcast Corp. | 2.987% | 11/1/63 | 4 | 2 | ||
| Consolidated Edison Co. of New York Inc. | 4.500% | 5/15/58 | 100 | 82 | ||
| Corebridge Financial Inc. | 4.350% | 4/5/42 | 1,178 | 933 | ||
| 5 | Corebridge Global Funding | 5.750% | 7/2/26 | 665 | 661 | |
| 5 | Cox Communications Inc. | 3.500% | 8/15/27 | 1,255 | 1,163 | |
| CVS Health Corp. | 2.875% | 6/1/26 | 1,000 | 936 | ||
| CVS Health Corp. | 4.300% | 3/25/28 | 96 | 92 | ||
| Dignity Health | 3.812% | 11/1/24 | 659 | 643 | ||
| Coupon | Maturity Date | Face Amount ($000) | Market Value• ($000) | |||
| Discover Financial Services | 4.100% | 2/9/27 | 1,773 | 1,644 | ||
| Discovery Communications LLC | 3.625% | 5/15/30 | 565 | 496 | ||
| Discovery Communications LLC | 4.000% | 9/15/55 | 401 | 261 | ||
| 1 | Dominion Energy Inc. | 3.375% | 4/1/30 | 92 | 81 | |
| Dominion Energy Inc. | 5.375% | 11/15/32 | 1,008 | 992 | ||
| 1 | Dominion Energy Inc. | 4.900% | 8/1/41 | 583 | 513 | |
| Dominion Energy South Carolina Inc. | 6.625% | 2/1/32 | 156 | 170 | ||
| Dominion Energy South Carolina Inc. | 5.300% | 5/15/33 | 129 | 130 | ||
| Dominion Energy South Carolina Inc. | 5.450% | 2/1/41 | 250 | 242 | ||
| Dominion Energy South Carolina Inc. | 4.600% | 6/15/43 | 280 | 247 | ||
| Duke Energy Corp. | 2.550% | 6/15/31 | 530 | 433 | ||
| Duke Energy Progress LLC | 3.400% | 4/1/32 | 185 | 162 | ||
| Duke Energy Progress LLC | 4.200% | 8/15/45 | 350 | 283 | ||
| 1 | Eastern Gas Transmission & Storage Inc. | 4.600% | 12/15/44 | 625 | 513 | |
| Eaton Corp. | 4.150% | 3/15/33 | 380 | 358 | ||
| Eaton Corp. | 4.700% | 8/23/52 | 80 | 74 | ||
| Energy Transfer LP | 4.900% | 3/15/35 | 975 | 890 | ||
| 5 | Equitable Financial Life Global Funding | 1.400% | 7/7/25 | 100 | 92 | |
| 5 | Equitable Financial Life Global Funding | 1.300% | 7/12/26 | 600 | 526 | |
| 5 | Equitable Financial Life Global Funding | 1.400% | 8/27/27 | 565 | 481 | |
| 5 | ERAC USA Finance LLC | 3.300% | 12/1/26 | 235 | 219 | |
| 5 | ERAC USA Finance LLC | 4.900% | 5/1/33 | 1,025 | 1,000 | |
| 5 | ERAC USA Finance LLC | 4.500% | 2/15/45 | 295 | 250 | |
| 5 | ERAC USA Finance LLC | 5.400% | 5/1/53 | 383 | 374 | |
| Estee Lauder Cos. Inc. | 5.150% | 5/15/53 | 691 | 670 | ||
| 1 | Evergy Metro Inc. | 2.250% | 6/1/30 | 180 | 149 | |
| Eversource Energy | 5.450% | 3/1/28 | 440 | 442 | ||
| Eversource Energy | 5.125% | 5/15/33 | 655 | 634 | ||
| Extra Space Storage LP | 5.500% | 7/1/30 | 1,059 | 1,050 | ||
| Exxon Mobil Corp. | 2.275% | 8/16/26 | 865 | 806 | ||
| Florida Power & Light Co. | 5.050% | 4/1/28 | 125 | 126 | ||
| 7 | General Mills Inc. | 3.907% | 4/13/29 | 765 | 829 | |
| 5 | Genting New York LLC | 3.300% | 2/15/26 | 1,002 | 896 | |
| Georgia Power Co. | 4.700% | 5/15/32 | 1,510 | 1,439 | ||
| Georgia Power Co. | 4.300% | 3/15/42 | 500 | 418 | ||
| 1 | Georgia Power Co. | 3.700% | 1/30/50 | 35 | 26 | |
| Georgia Power Co. | 5.125% | 5/15/52 | 700 | 650 | ||
| Goldman Sachs Group Inc. | 5.700% | 11/1/24 | 1,502 | 1,499 | ||
| 1 | Goldman Sachs Group Inc. | 3.272% | 9/29/25 | 705 | 684 | |
| Goldman Sachs Group Inc. | 1.431% | 3/9/27 | 1,310 | 1,174 | ||
| 1 | Goldman Sachs Group Inc. | 3.814% | 4/23/29 | 235 | 217 | |
| 1 | Goldman Sachs Group Inc. | 4.223% | 5/1/29 | 285 | 268 | |
| Goldman Sachs Group Inc. | 2.650% | 10/21/32 | 1,055 | 847 | ||
| 5 | Gray Oak Pipeline LLC | 2.600% | 10/15/25 | 291 | 269 | |
| 5 | Gray Oak Pipeline LLC | 3.450% | 10/15/27 | 45 | 40 | |
| HEICO Corp. | 5.250% | 8/1/28 | 185 | 183 | ||
| HEICO Corp. | 5.350% | 8/1/33 | 1,740 | 1,724 | ||
| Hess Corp. | 4.300% | 4/1/27 | 810 | 779 | ||
| Hess Corp. | 7.300% | 8/15/31 | 590 | 643 | ||
| Home Depot Inc. | 3.300% | 4/15/40 | 1,179 | 931 | ||
| Honeywell International Inc. | 4.250% | 1/15/29 | 295 | 287 | ||
| 7 | Honeywell International Inc. | 3.750% | 5/17/32 | 510 | 541 | |
| 7 | Honeywell International Inc. | 4.125% | 11/2/34 | 860 | 928 | |
| Intercontinental Exchange Inc. | 4.350% | 6/15/29 | 3,172 | 3,040 | ||
| 5 | ITC Holdings Corp. | 4.950% | 9/22/27 | 295 | 290 | |
| Coupon | Maturity Date | Face Amount ($000) | Market Value• ($000) | |||
| JPMorgan Chase & Co. | 0.563% | 2/16/25 | 1,735 | 1,691 | ||
| JPMorgan Chase & Co. | 4.912% | 7/25/33 | 1,726 | 1,658 | ||
| 1 | JPMorgan Chase & Co. | 3.964% | 11/15/48 | 500 | 396 | |
| 1 | Kaiser Foundation Hospitals | 2.810% | 6/1/41 | 710 | 504 | |
| Kaiser Foundation Hospitals | 4.875% | 4/1/42 | 235 | 221 | ||
| 5 | Kenvue Inc. | 5.050% | 3/22/53 | 617 | 604 | |
| 5 | KeySpan Gas East Corp. | 2.742% | 8/15/26 | 500 | 458 | |
| Kroger Co. | 4.450% | 2/1/47 | 220 | 183 | ||
| 5 | Liberty Mutual Group Inc. | 4.569% | 2/1/29 | 2,961 | 2,857 | |
| 5 | LKQ Corp. | 5.750% | 6/15/28 | 275 | 273 | |
| Manufacturers & Traders Trust Co. | 4.700% | 1/27/28 | 539 | 503 | ||
| Marathon Oil Corp. | 6.600% | 10/1/37 | 820 | 825 | ||
| Marsh & McLennan Cos. Inc. | 4.375% | 3/15/29 | 705 | 682 | ||
| 5 | Massachusetts Mutual Life Insurance Co. | 3.375% | 4/15/50 | 140 | 97 | |
| 1,7 | McDonald's Corp. | 4.250% | 3/7/35 | 810 | 891 | |
| Merck & Co. Inc. | 5.000% | 5/17/53 | 656 | 640 | ||
| MetLife Inc. | 5.375% | 7/15/33 | 1,585 | 1,577 | ||
| 5 | Metropolitan Edison Co. | 5.200% | 4/1/28 | 40 | 40 | |
| Microchip Technology Inc. | 0.972% | 2/15/24 | 1,080 | 1,055 | ||
| Microsoft Corp. | 2.921% | 3/17/52 | 650 | 461 | ||
| 1,7 | Mondelez International Holdings Netherlands BV | 0.625% | 9/9/32 | 155 | 129 | |
| 7 | Mondelez International Inc. | 0.250% | 3/17/28 | 605 | 566 | |
| 1 | Morgan Stanley | 0.864% | 10/21/25 | 1,230 | 1,157 | |
| 1 | Morgan Stanley | 3.125% | 7/27/26 | 2,100 | 1,966 | |
| 1 | Morgan Stanley | 3.772% | 1/24/29 | 175 | 162 | |
| 7 | Morgan Stanley | 0.497% | 2/7/31 | 675 | 574 | |
| 1 | Morgan Stanley | 2.511% | 10/20/32 | 2,170 | 1,729 | |
| 1 | Morgan Stanley | 5.250% | 4/21/34 | 981 | 952 | |
| Nasdaq Inc. | 5.550% | 2/15/34 | 385 | 384 | ||
| Nasdaq Inc. | 5.950% | 8/15/53 | 105 | 104 | ||
| Nasdaq Inc. | 6.100% | 6/28/63 | 95 | 94 | ||
| NextEra Energy Capital Holdings Inc. | 6.051% | 3/1/25 | 115 | 115 | ||
| NextEra Energy Capital Holdings Inc. | 5.749% | 9/1/25 | 375 | 376 | ||
| NiSource Inc. | 5.250% | 3/30/28 | 255 | 254 | ||
| NNN REIT Inc. | 3.900% | 6/15/24 | 400 | 393 | ||
| 5 | Northwestern Mutual Life Insurance Co. | 3.850% | 9/30/47 | 280 | 211 | |
| 5 | Northwestern Mutual Life Insurance Co. | 3.625% | 9/30/59 | 12 | 8 | |
| Occidental Petroleum Corp. | 6.200% | 3/15/40 | 1,817 | 1,792 | ||
| 5 | Oglethorpe Power Corp. | 6.191% | 1/1/31 | 285 | 294 | |
| Oglethorpe Power Corp. | 4.550% | 6/1/44 | 20 | 16 | ||
| Oglethorpe Power Corp. | 4.250% | 4/1/46 | 81 | 60 | ||
| ONEOK Inc. | 5.650% | 11/1/28 | 410 | 411 | ||
| Oracle Corp. | 3.650% | 3/25/41 | 1,350 | 1,018 | ||
| Oracle Corp. | 4.500% | 7/8/44 | 480 | 393 | ||
| Pacific Gas & Electric Co. | 4.550% | 7/1/30 | 923 | 829 | ||
| Pacific Gas & Electric Co. | 4.500% | 7/1/40 | 1,724 | 1,330 | ||
| Pacific Gas & Electric Co. | 6.750% | 1/15/53 | 473 | 460 | ||
| Pacific Gas & Electric Co. | 6.700% | 4/1/53 | 240 | 233 | ||
| 5 | Pennsylvania Electric Co. | 5.150% | 3/30/26 | 35 | 34 | |
| 5 | Pennsylvania Electric Co. | 3.600% | 6/1/29 | 124 | 113 | |
| 5 | Penske Truck Leasing Co. LP | 3.950% | 3/10/25 | 740 | 716 | |
| 5 | Penske Truck Leasing Co. LP | 4.000% | 7/15/25 | 140 | 135 | |
| 5 | Penske Truck Leasing Co. LP | 5.700% | 2/1/28 | 205 | 203 | |
| 5 | Penske Truck Leasing Co. LP | 5.550% | 5/1/28 | 815 | 799 | |
| 5 | Penske Truck Leasing Co. LP | 6.200% | 6/15/30 | 890 | 893 | |
| Coupon | Maturity Date | Face Amount ($000) | Market Value• ($000) | |||
| Pfizer Investment Enterprises Pte. Ltd. | 5.110% | 5/19/43 | 1,196 | 1,164 | ||
| Philip Morris International Inc. | 5.125% | 11/17/27 | 420 | 419 | ||
| Piedmont Natural Gas Co. Inc. | 5.050% | 5/15/52 | 360 | 317 | ||
| Progressive Corp. | 3.950% | 3/26/50 | 648 | 518 | ||
| 1 | Providence St. Joseph Health Obligated Group | 3.930% | 10/1/48 | 245 | 182 | |
| 1 | Prudential Financial Inc. | 3.700% | 3/13/51 | 830 | 619 | |
| Public Storage Operating Co. | 5.125% | 1/15/29 | 195 | 195 | ||
| Public Storage Operating Co. | 5.100% | 8/1/33 | 285 | 283 | ||
| Public Storage Operating Co. | 5.350% | 8/1/53 | 80 | 78 | ||
| QUALCOMM Inc. | 4.250% | 5/20/32 | 600 | 576 | ||
| QUALCOMM Inc. | 4.500% | 5/20/52 | 160 | 139 | ||
| Realty Income Corp. | 2.200% | 6/15/28 | 185 | 161 | ||
| Realty Income Corp. | 3.100% | 12/15/29 | 550 | 486 | ||
| 7 | Realty Income Corp. | 4.875% | 7/6/30 | 1,750 | 1,901 | |
| Realty Income Corp. | 2.850% | 12/15/32 | 80 | 65 | ||
| Realty Income Corp. | 4.900% | 7/15/33 | 607 | 576 | ||
| RTX Corp. | 3.950% | 8/16/25 | 310 | 301 | ||
| RTX Corp. | 4.450% | 11/16/38 | 550 | 487 | ||
| 1 | San Diego Gas & Electric Co. | 4.100% | 6/15/49 | 174 | 138 | |
| 5 | SBA Tower Trust | 1.884% | 1/15/26 | 110 | 100 | |
| 5 | SBA Tower Trust | 1.631% | 11/15/26 | 615 | 532 | |
| 1 | SCE Recovery Funding LLC | 0.861% | 11/15/31 | 205 | 171 | |
| 1 | SCE Recovery Funding LLC | 1.942% | 5/15/38 | 105 | 74 | |
| 1 | SCE Recovery Funding LLC | 2.510% | 11/15/43 | 60 | 39 | |
| Sierra Pacific Power Co. | 2.600% | 5/1/26 | 180 | 168 | ||
| 1 | Southern California Edison Co. | 3.700% | 8/1/25 | 30 | 29 | |
| 1 | Southern California Edison Co. | 2.950% | 2/1/51 | 515 | 327 | |
| Southern California Edison Co. | 5.875% | 12/1/53 | 359 | 357 | ||
| 1 | SSM Health Care Corp. | 3.823% | 6/1/27 | 380 | 361 | |
| 5 | Texas Electric Market Stabilization Funding N LLC | 4.265% | 8/1/34 | 823 | 778 | |
| T-Mobile USA Inc. | 2.700% | 3/15/32 | 1,155 | 939 | ||
| T-Mobile USA Inc. | 5.750% | 1/15/54 | 717 | 708 | ||
| Toledo Hospital | 5.750% | 11/15/38 | 150 | 145 | ||
| Trane Technologies Financing Ltd. | 5.250% | 3/3/33 | 385 | 384 | ||
| 1 | United Airlines Pass-Through Trust Class B Series 2018-1 | 4.600% | 3/1/26 | 44 | 41 | |
| UnitedHealth Group Inc. | 3.850% | 6/15/28 | 415 | 397 | ||
| UnitedHealth Group Inc. | 2.000% | 5/15/30 | 215 | 179 | ||
| UnitedHealth Group Inc. | 4.200% | 5/15/32 | 260 | 246 | ||
| UnitedHealth Group Inc. | 4.625% | 7/15/35 | 90 | 87 | ||
| UnitedHealth Group Inc. | 4.750% | 5/15/52 | 50 | 46 | ||
| UnitedHealth Group Inc. | 5.050% | 4/15/53 | 857 | 818 | ||
| 5 | VICI Properties LP | 4.125% | 8/15/30 | 285 | 249 | |
| 1,8 | Walt Disney Co. | 3.057% | 3/30/27 | 1,225 | 831 | |
| Warnermedia Holdings Inc. | 4.054% | 3/15/29 | 1,160 | 1,066 | ||
| 1,8 | Wells Fargo & Co. | 2.975% | 5/19/26 | 600 | 415 | |
| 1 | Wells Fargo & Co. | 4.611% | 4/25/53 | 1,097 | 928 | |
| 126,533 | ||||||
| Total Corporate Bonds (Cost $226,154) | 212,927 | |||||
| Sovereign Bonds (8.2%) | ||||||
| Australia (0.7%) | ||||||
| 1,10 | Commonwealth of Australia | 2.750% | 11/21/27 | 160 | 100 | |
| 1,10 | Commonwealth of Australia | 2.250% | 5/21/28 | 870 | 527 | |
| Coupon | Maturity Date | Face Amount ($000) | Market Value• ($000) | |||
| 1,10 | Commonwealth of Australia | 1.000% | 11/21/31 | 955 | 491 | |
| 1,10 | Commonwealth of Australia | 4.500% | 4/21/33 | 1,960 | 1,320 | |
| 1,7 | NBN Co. Ltd. | 4.375% | 3/15/33 | 1,050 | 1,147 | |
| 3,585 | ||||||
| Bermuda (0.0%) | ||||||
| 1,5 | Bermuda | 2.375% | 8/20/30 | 200 | 164 | |
| Bulgaria (0.0%) | ||||||
| 5,7 | Republic of Bulgaria | 4.500% | 1/27/33 | 145 | 156 | |
| Canada (1.0%) | ||||||
| 8 | Canadian Government Bond | 1.000% | 9/1/26 | 1,065 | 717 | |
| 8 | Canadian Government Bond | 2.750% | 9/1/27 | 1,100 | 776 | |
| 8 | City of Montreal | 3.500% | 12/1/38 | 910 | 583 | |
| 8 | City of Toronto | 3.200% | 8/1/48 | 1,000 | 579 | |
| 8 | Municipal Finance Authority of British Columbia | 4.950% | 12/1/27 | 600 | 454 | |
| 8 | Province of Ontario | 2.900% | 6/2/28 | 815 | 567 | |
| 1,11 | Province of Ontario | 0.250% | 6/28/29 | 1,075 | 1,124 | |
| 8 | Regional Municipality of York | 2.150% | 6/22/31 | 500 | 316 | |
| 5,116 | ||||||
| Chile (0.1%) | ||||||
| 1 | Corp. Nacional del Cobre de Chile | 3.625% | 8/1/27 | 800 | 743 | |
| Germany (0.4%) | ||||||
| 1,7 | Federal Republic of Germany | 2.200% | 4/13/28 | 1,480 | 1,585 | |
| 7 | Federal Republic of Germany | 3.250% | 7/4/42 | 250 | 296 | |
| 7 | Federal Republic of Germany | 1.250% | 8/15/48 | 550 | 454 | |
| 2,335 | ||||||
| Japan (1.5%) | ||||||
| 1,12 | Japan | 0.000% | 11/10/23 | 1,129,700 | 7,766 | |
| 1,12 | Japan | 0.700% | 6/20/51 | 80,700 | 445 | |
| 8,211 | ||||||
| Qatar (0.1%) | ||||||
| 1,5 | State of Qatar | 5.103% | 4/23/48 | 285 | 274 | |
| 1,5 | State of Qatar | 4.400% | 4/16/50 | 205 | 180 | |
| 454 | ||||||
| Romania (0.1%) | ||||||
| 1,5,7 | Republic of Romania | 2.000% | 4/14/33 | 412 | 317 | |
| 1,7 | Republic of Romania | 2.625% | 12/2/40 | 280 | 186 | |
| 503 | ||||||
| Saudi Arabia (0.2%) | ||||||
| 1,5 | Kingdom of Saudi Arabia | 5.000% | 1/18/53 | 405 | 360 | |
| 1,5 | Saudi Arabian Oil Co. | 3.500% | 4/16/29 | 585 | 536 | |
| 896 | ||||||
| Spain (0.1%) | ||||||
| 5,7 | Kingdom of Spain | 0.600% | 10/31/29 | 775 | 720 | |
| Supranational (3.8%) | ||||||
| 1,7,13 | European Financial Stability Facility | 0.875% | 7/26/27 | 5,485 | 5,473 | |
| 1,7,13 | European Financial Stability Facility | 2.375% | 4/11/28 | 3,100 | 3,262 | |
| 1,7,13 | European Financial Stability Facility | 2.875% | 2/16/33 | 1,780 | 1,896 | |
| 1,7 | European Investment Bank | 2.875% | 1/12/33 | 1,070 | 1,143 | |
| 1,7 | European Investment Bank | 3.000% | 10/14/33 | 1,035 | 1,117 | |
| 7 | European Stability Mechanism | 0.000% | 12/16/24 | 525 | 545 | |
| 7 | European Stability Mechanism | 0.000% | 12/15/26 | 775 | 760 | |
| Coupon | Maturity Date | Face Amount ($000) | Market Value• ($000) | |||
| 1,7 | European Union | 0.000% | 7/4/31 | 2,310 | 1,987 | |
| 1,7 | European Union | 1.000% | 7/6/32 | 1,475 | 1,351 | |
| 1,7 | European Union | 0.000% | 7/4/35 | 865 | 646 | |
| 1,7 | European Union | 0.200% | 6/4/36 | 2,475 | 1,832 | |
| 20,012 | ||||||
| United Kingdom (0.2%) | ||||||
| 9 | United Kingdom | 1.250% | 7/22/27 | 1,040 | 1,167 | |
| Total Sovereign Bonds (Cost $47,598) | 44,062 | |||||
| Taxable Municipal Bonds (1.2%) | ||||||
| United States (1.2%) | ||||||
| Broward County FL Airport System Revenue | 3.477% | 10/1/43 | 80 | 64 | ||
| Chicago IL Transit Authority Sales & Transfer Tax Receipts Revenue | 6.899% | 12/1/40 | 35 | 40 | ||
| Connecticut GO | 5.770% | 3/15/25 | 250 | 251 | ||
| Dallas-Fort Worth TX International Airport Revenue | 3.089% | 11/1/40 | 60 | 47 | ||
| Dallas-Fort Worth TX International Airport Revenue | 4.087% | 11/1/51 | 30 | 25 | ||
| Dallas-Fort Worth TX International Airport Revenue | 4.507% | 11/1/51 | 195 | 175 | ||
| Georgia Municipal Electric Power Authority Revenue | 6.637% | 4/1/57 | 525 | 586 | ||
| Golden State Tobacco Securitization Corp. California Revenue | 2.746% | 6/1/34 | 20 | 16 | ||
| Golden State Tobacco Securitization Corp. California Revenue | 3.293% | 6/1/42 | 40 | 29 | ||
| Golden State Tobacco Securitization Corp. California Revenue | 3.000% | 6/1/46 | 75 | 69 | ||
| Grand Parkway Transportation Corp. Texas System Toll Revenue | 3.236% | 10/1/52 | 210 | 148 | ||
| Illinois GO | 5.100% | 6/1/33 | 2,660 | 2,581 | ||
| 14 | Kansas Development Finance Authority Revenue (Employees Retirement System) | 5.371% | 5/1/26 | 410 | 407 | |
| New York Metropolitan Transportation Authority Revenue (Build America Bonds) | 6.200% | 11/15/26 | 15 | 15 | ||
| New York Metropolitan Transportation Authority Revenue (Build America Bonds) | 6.668% | 11/15/39 | 155 | 167 | ||
| New York Metropolitan Transportation Authority Revenue (Build America Bonds) | 6.814% | 11/15/40 | 380 | 411 | ||
| 15 | Philadelphia PA Authority for Industrial Development Revenue | 6.550% | 10/15/28 | 525 | 550 | |
| Port Authority of New York & New Jersey Revenue | 3.175% | 7/15/60 | 160 | 105 | ||
| Texas Natural Gas Securitization Finance Corp. Revenue (Winter Storm Uri) | 5.102% | 4/1/35 | 515 | 514 | ||
| Texas Natural Gas Securitization Finance Corp. Revenue (Winter Storm Uri) | 5.169% | 4/1/41 | 390 | 389 | ||
| Total Taxable Municipal Bonds (Cost $7,348) | 6,589 | |||||
| Coupon | Shares | Market Value• ($000) | ||||
| Temporary Cash Investments (1.0%) | ||||||
| Money Market Fund (1.0%) | ||||||
| 16 | Vanguard Market Liquidity Fund (Cost $5,192) | 5.384% | 51,936 | 5,193 | ||
| Total Investments (99.6%) (Cost $519,641) | 532,688 | |||||
| Other Assets and Liabilities—Net (0.4%) | 2,219 | |||||
| Net Assets (100%) | 534,907 | |||||
| Cost is in $000. |
| • | See Note A in Notes to Financial Statements. |
| * | Non-income-producing security. |
| 1 | The average or expected maturity is shorter than the final maturity shown because of the possibility of interim principal payments and prepayments or the possibility of the issue being called. |
| 2 | The issuer was placed under federal conservatorship in September 2008; since that time, its daily operations have been managed by the Federal Housing Finance Agency and it receives capital from the U.S. Treasury, as needed to maintain a positive net worth, in exchange for senior preferred stock. |
| 3 | Includes securities purchased on a when-issued or delayed-delivery basis for which the fund has not taken delivery as of August 31, 2023. |
| 4 | Securities with a value of $595,000 have been segregated as initial margin for open futures contracts. |
| 5 | Security exempt from registration under Rule 144A of the Securities Act of 1933. Such securities may be sold in transactions exempt from registration, normally to qualified institutional buyers. At August 31, 2023, the aggregate value was $58,464,000, representing 10.9% of net assets. |
| 6 | Variable-rate security; rate shown is effective rate at period end. Certain variable-rate securities are not based on a published reference rate and spread but are determined by the issuer or agent based on current market conditions. |
| 7 | Face amount denominated in euro. |
| 8 | Face amount denominated in Canadian dollars. |
| 9 | Face amount denominated in British pounds. |
| 10 | Face amount denominated in Australian dollars. |
| 11 | Face amount denominated in Swiss francs. |
| 12 | Face amount denominated in Japanese yen. |
| 13 | Guaranteed by the Government of Luxembourg. |
| 14 | Scheduled principal and interest payments are guaranteed by Assured Guaranty Municipal Corp. |
| 15 | Scheduled principal and interest payments are guaranteed by National Public Finance Guarantee Corp. |
| 16 | Affiliated money market fund available only to Vanguard funds and certain trusts and accounts managed by Vanguard. Rate shown is the 7-day yield. |
| GO—General Obligation Bond. | |
| REIT—Real Estate Investment Trust. | |
| REMICS—Real Estate Mortgage Investment Conduits. | |
| SOFR30A—30 Day Average Secured Overnight Financing Rate. | |
| TSFR1M—CME Term Secured Overnight Financing Rate 1-Month. | |
| UMBS—Uniform Mortgage-Backed Securities. |
| Futures Contracts | ||||
| ($000) | ||||
| Expiration | Number of Long (Short) Contracts | Notional Amount | Value and Unrealized Appreciation (Depreciation) | |
| Long Futures Contracts | ||||
| 2-Year U.S. Treasury Note | December 2023 | 31 | 6,318 | 20 |
| 5-Year U.S. Treasury Note | December 2023 | 54 | 5,774 | 35 |
| Euro-Buxl | September 2023 | 19 | 2,757 | (38) |
| Euro-OAT | September 2023 | 6 | 832 | (3) |
| Euro-Schatz | September 2023 | 99 | 11,285 | (38) |
| Long Gilt | December 2023 | 23 | 2,784 | 26 |
| 2 | ||||
| Short Futures Contracts | ||||
| AUD 10-Year Treasury Bond | September 2023 | (11) | (828) | (3) |
| Euro-Bobl | September 2023 | (33) | (4,155) | (18) |
| Euro-Bund | September 2023 | (88) | (12,709) | 60 |
| Ultra 10-Year U.S. Treasury Note | December 2023 | (82) | (9,521) | (102) |
| (63) | ||||
| (61) | ||||
| Forward Currency Contracts | |||||||
| Contract Settlement Date | Contract Amount (000) | Unrealized Appreciation ($000) | Unrealized (Depreciation) ($000) | ||||
| Counterparty | Receive | Deliver | |||||
| Bank of America, N.A. | 9/29/23 | GBP | 1,572 | USD | 1,997 | — | (6) |
| JPMorgan Chase Bank, N.A. | 9/29/23 | USD | 5,021 | AUD | 7,807 | — | (42) |
| JPMorgan Chase Bank, N.A. | 9/29/23 | USD | 8,946 | CAD | 12,128 | — | (33) |
| Goldman Sachs International | 9/29/23 | USD | 1,137 | CHF | 997 | 5 | — |
| JPMorgan Chase Bank, N.A. | 9/29/23 | USD | 78,071 | EUR | 71,824 | 98 | — |
| JPMorgan Chase Bank, N.A. | 9/29/23 | USD | 10,527 | GBP | 8,285 | 31 | — |
| JPMorgan Chase Bank, N.A. | 9/29/23 | AUD | 1,970 | GBP | 1,004 | 6 | — |
| JPMorgan Chase Bank, N.A. | 9/29/23 | EUR | 285 | GBP | 244 | 1 | — |
| JPMorgan Chase Bank, N.A. | 9/29/23 | USD | 6,432 | JPY | 929,857 | 17 | — |
| Forward Currency Contracts (continued) | |||||||
| Contract Settlement Date | Contract Amount (000) | Unrealized Appreciation ($000) | Unrealized (Depreciation) ($000) | ||||
| Counterparty | Receive | Deliver | |||||
| JPMorgan Chase Bank, N.A. | 9/29/23 | AUD | 2,241 | JPY | 209,400 | 8 | — |
| JPMorgan Chase Bank, N.A. | 9/29/23 | GBP | 354 | JPY | 65,000 | — | — |
| 166 | (81) | ||||||
| AUD—Australian dollar. |
| CAD—Canadian dollar. |
| CHF—Swiss franc. |
| EUR—euro. |
| GBP—British pound. |
| JPY—Japanese yen. |
| USD—U.S. dollar. |
| ($000s, except shares, footnotes, and per-share amounts) | Amount |
| Assets | |
| Investments in Securities, at Value | |
| Unaffiliated Issuers (Cost $514,449) | 527,495 |
| Affiliated Issuers (Cost $5,192) | 5,193 |
| Total Investments in Securities | 532,688 |
| Investment in Vanguard | 18 |
| Cash | 1 |
| Foreign Currency, at Value (Cost $1,183) | 1,186 |
| Receivables for Investment Securities Sold | 3,142 |
| Receivables for Accrued Income | 4,473 |
| Receivables for Capital Shares Issued | 100 |
| Unrealized Appreciation—Forward Currency Contracts | 166 |
| Total Assets | 541,774 |
| Liabilities | |
| Payables for Investment Securities Purchased | 6,465 |
| Payables for Capital Shares Redeemed | 29 |
| Payables to Investment Advisor | 178 |
| Payables to Vanguard | 73 |
| Variation Margin Payable—Futures Contracts | 41 |
| Unrealized Depreciation—Forward Currency Contracts | 81 |
| Total Liabilities | 6,867 |
| Net Assets | 534,907 |
| Statement of Assets and Liabilities (continued) | |
| At August 31, 2023, net assets consisted of: | |
| ($000s, except shares, footnotes, and per-share amounts) | Amount |
| Paid-in Capital | 541,033 |
| Total Distributable Earnings (Loss) | (6,126) |
| Net Assets | 534,907 |
| Investor Shares—Net Assets | |
| Applicable to 3,976,667 outstanding $.001 par value shares of beneficial interest (unlimited authorization) | 81,052 |
| Net Asset Value Per Share—Investor Shares | $20.38 |
| Admiral Shares—Net Assets | |
| Applicable to 17,811,186 outstanding $.001 par value shares of beneficial interest (unlimited authorization) | 453,855 |
| Net Asset Value Per Share—Admiral Shares | $25.48 |
| Year Ended August 31, 2023 | |
| ($000) | |
| Investment Income | |
| Income | |
| Dividends1 | 7,279 |
| Interest2 | 11,947 |
| Securities Lending—Net | 24 |
| Total Income | 19,250 |
| Expenses | |
| Investment Advisory Fees—Note B | |
| Basic Fee | 634 |
| Performance Adjustment | 89 |
| The Vanguard Group—Note C | |
| Management and Administrative—Investor Shares | 213 |
| Management and Administrative—Admiral Shares | 650 |
| Marketing and Distribution—Investor Shares | 6 |
| Marketing and Distribution—Admiral Shares | 23 |
| Custodian Fees | 34 |
| Auditing Fees | 34 |
| Shareholders’ Reports—Investor Shares | 15 |
| Shareholders’ Reports—Admiral Shares | 15 |
| Trustees’ Fees and Expenses | — |
| Other Expenses | 46 |
| Total Expenses | 1,759 |
| Expenses Paid Indirectly | (2) |
| Net Expenses | 1,757 |
| Net Investment Income | 17,493 |
| Realized Net Gain (Loss) | |
| Investment Securities Sold2 | (21,962) |
| Futures Contracts | 1,177 |
| Swap Contracts | (28) |
| Forward Currency Contracts | (3,187) |
| Foreign Currencies | 368 |
| Realized Net Gain (Loss) | (23,632) |
| Statement of Operations (continued) | |
| Year Ended August 31, 2023 | |
| ($000) | |
| Change in Unrealized Appreciation (Depreciation) | |
| Investment Securities2 | 32,032 |
| Futures Contracts | 31 |
| Forward Currency Contracts | 182 |
| Foreign Currencies | 102 |
| Change in Unrealized Appreciation (Depreciation) | 32,347 |
| Net Increase (Decrease) in Net Assets Resulting from Operations | 26,208 |
| 1 | Dividends are net of foreign withholding taxes of $631,000. |
| 2 | Interest income, realized net gain (loss), capital gain distributions received, and change in unrealized appreciation (depreciation) from an affiliated company of the fund were $887,000, $4,000, less than $1,000, and less than $1,000, respectively. Purchases and sales are for temporary cash investment purposes. |
| Year Ended August 31, | ||
| 2023 ($000) | 2022 ($000) | |
| Increase (Decrease) in Net Assets | ||
| Operations | ||
| Net Investment Income | 17,493 | 13,145 |
| Realized Net Gain (Loss) | (23,632) | 8,501 |
| Change in Unrealized Appreciation (Depreciation) | 32,347 | (73,665) |
| Net Increase (Decrease) in Net Assets Resulting from Operations | 26,208 | (52,019) |
| Distributions | ||
| Investor Shares | (1,869) | (1,799) |
| Admiral Shares | (10,739) | (10,522) |
| Total Distributions | (12,608) | (12,321) |
| Capital Share Transactions | ||
| Investor Shares | (2,531) | (48) |
| Admiral Shares | (3,545) | 12,787 |
| Net Increase (Decrease) from Capital Share Transactions | (6,076) | 12,739 |
| Total Increase (Decrease) | 7,524 | (51,601) |
| Net Assets | ||
| Beginning of Period | 527,383 | 578,984 |
| End of Period | 534,907 | 527,383 |
| Investor Shares | |||||
| For a Share Outstanding Throughout Each Period | Year Ended August 31, | ||||
| 2023 | 2022 | 2021 | 2020 | 2019 | |
| Net Asset Value, Beginning of Period | $19.82 | $22.22 | $20.42 | $20.16 | $19.87 |
| Investment Operations | |||||
| Net Investment Income1 | .645 | .474 | .446 | .453 | .513 |
| Net Realized and Unrealized Gain (Loss) on Investments | .375 | (2.430) | 1.747 | .263 | .529 |
| Total from Investment Operations | 1.020 | (1.956) | 2.193 | .716 | 1.042 |
| Distributions | |||||
| Dividends from Net Investment Income | (.460) | (.444) | (.393) | (.456) | (.473) |
| Distributions from Realized Capital Gains | — | — | — | — | (.279) |
| Total Distributions | (.460) | (.444) | (.393) | (.456) | (.752) |
| Net Asset Value, End of Period | $20.38 | $19.82 | $22.22 | $20.42 | $20.16 |
| Total Return2 | 5.20% | -8.94% | 10.83% | 3.66% | 5.50% |
| Ratios/Supplemental Data | |||||
| Net Assets, End of Period (Millions) | $81 | $81 | $91 | $81 | $85 |
| Ratio of Total Expenses to Average Net Assets3 | 0.44%4 | 0.42%4 | 0.41% | 0.41% | 0.42% |
| Ratio of Net Investment Income to Average Net Assets | 3.20% | 2.23% | 2.09% | 2.27% | 2.63% |
| Portfolio Turnover Rate | 150%5 | 119%5 | 99%5 | 72%5 | 90% |
| 1 | Calculated based on average shares outstanding. |
| 2 | Total returns do not include account service fees that may have applied in the periods shown. Fund prospectuses provide information about any applicable account service fees. |
| 3 | Includes performance-based investment advisory fee increases (decreases) of 0.02%, 0.00%, (0.01%), (0.01%), and (0.01%). |
| 4 | The ratio of expenses to average net assets for the period net of reduction from custody fee offset arrangements was 0.44% and 0.42%, respectively. |
| 5 | Includes 28%, 27%, 33%, and 1%, respectively, attributable to mortgage-dollar-roll activity. |
| Admiral Shares | |||||
| For a Share Outstanding Throughout Each Period | Year Ended August 31, | ||||
| 2023 | 2022 | 2021 | 2020 | 2019 | |
| Net Asset Value, Beginning of Period | $24.78 | $27.78 | $25.53 | $25.20 | $24.84 |
| Investment Operations | |||||
| Net Investment Income1 | .839 | .627 | .594 | .592 | .666 |
| Net Realized and Unrealized Gain (Loss) on Investments | .468 | (3.035) | 2.178 | .334 | .658 |
| Total from Investment Operations | 1.307 | (2.408) | 2.772 | .926 | 1.324 |
| Distributions | |||||
| Dividends from Net Investment Income | (.607) | (.592) | (.522) | (.596) | (.616) |
| Distributions from Realized Capital Gains | — | — | — | — | (.348) |
| Total Distributions | (.607) | (.592) | (.522) | (.596) | (.964) |
| Net Asset Value, End of Period | $25.48 | $24.78 | $27.78 | $25.53 | $25.20 |
| Total Return2 | 5.33% | -8.81% | 10.96% | 3.79% | 5.60% |
| Ratios/Supplemental Data | |||||
| Net Assets, End of Period (Millions) | $454 | $446 | $488 | $389 | $379 |
| Ratio of Total Expenses to Average Net Assets3 | 0.31%4 | 0.29%4 | 0.28% | 0.31% | 0.32% |
| Ratio of Net Investment Income to Average Net Assets | 3.33% | 2.36% | 2.22% | 2.37% | 2.73% |
| Portfolio Turnover Rate | 150%5 | 119%5 | 99%5 | 72%5 | 90% |
| 1 | Calculated based on average shares outstanding. |
| 2 | Total returns do not include account service fees that may have applied in the periods shown. Fund prospectuses provide information about any applicable account service fees. |
| 3 | Includes performance-based investment advisory fee increases (decreases) of 0.02%, 0.00%, (0.01%), (0.01%), and (0.01%). |
| 4 | The ratio of expenses to average net assets for the period net of reduction from custody fee offset arrangements was 0.31% and 0.29%, respectively. |
| 5 | Includes 28%, 27%, 33%, and 1%, respectively, attributable to mortgage-dollar-roll activity. |
| Level 1 ($000) | Level 2 ($000) | Level 3 ($000) | Total ($000) | |
| Investments | ||||
| Assets | ||||
| Common Stocks—North and South America | 96,373 | — | — | 96,373 |
| Common Stocks—Other | — | 102,601 | — | 102,601 |
| U.S. Government and Agency Obligations | — | 53,321 | — | 53,321 |
| Asset-Backed/Commercial Mortgage-Backed Securities | — | 11,622 | — | 11,622 |
| Corporate Bonds | — | 212,927 | — | 212,927 |
| Sovereign Bonds | — | 44,062 | — | 44,062 |
| Taxable Municipal Bonds | — | 6,589 | — | 6,589 |
| Temporary Cash Investments | 5,193 | — | — | 5,193 |
| Total | 101,566 | 431,122 | — | 532,688 |
| Derivative Financial Instruments | ||||
| Assets | ||||
| Futures Contracts1 | 141 | — | — | 141 |
| Forward Currency Contracts | — | 166 | — | 166 |
| Total | 141 | 166 | — | 307 |
| Liabilities | ||||
| Futures Contracts1 | 202 | — | — | 202 |
| Forward Currency Contracts | — | 81 | — | 81 |
| Total | 202 | 81 | — | 283 |
| 1 | Includes cumulative appreciation (depreciation) on futures contracts and centrally cleared swaps, if any, as reported in the Schedule of Investments. Only current day’s variation margin is reported within the Statement of Assets and Liabilities. |
| Statement of Assets and Liabilities | Interest Rate Contracts ($000) | Foreign Exchange Contracts ($000) | Total ($000) |
| Unrealized Appreciation—Futures Contracts1 | 141 | — | 141 |
| Unrealized Appreciation—Forward Currency Contracts | — | 166 | 166 |
| Total Assets | 141 | 166 | 307 |
| Unrealized Depreciation—Futures Contracts1 | 202 | — | 202 |
| Unrealized Depreciation—Forward Currency Contracts | — | 81 | 81 |
| Total Liabilities | 202 | 81 | 283 |
| 1 | Includes cumulative appreciation (depreciation) on futures contracts and centrally cleared swaps, if any, as reported in the Schedule of Investments. Only current day’s variation margin is reported within the Statement of Assets and Liabilities. |
| Realized Net Gain (Loss) on Derivatives | Interest Rate Contracts ($000) | Foreign Exchange Contracts ($000) | Credit Contracts ($000) | Total ($000) |
| Futures Contracts | 1,177 | — | — | 1,177 |
| Swap Contracts | — | — | (28) | (28) |
| Forward Currency Contracts | — | (3,187) | — | (3,187) |
| Realized Net Gain (Loss) on Derivatives | 1,177 | (3,187) | (28) | (2,038) |
| Change in Unrealized Appreciation (Depreciation) on Derivatives | ||||
| Futures Contracts | 31 | — | — | 31 |
| Forward Currency Contracts | — | 182 | — | 182 |
| Change in Unrealized Appreciation (Depreciation) on Derivatives | 31 | 182 | — | 213 |
| Amount ($000) | |
| Undistributed Ordinary Income | 2,598 |
| Undistributed Long-Term Gains | — |
| Net Unrealized Gains (Losses) | 12,807 |
| Capital Loss Carryforwards | (21,531) |
| Qualified Late-Year Losses | — |
| Other Temporary Differences | — |
| Total | (6,126) |
| Year Ended August 31, | ||
| 2023 Amount ($000) | 2022 Amount ($000) | |
| Ordinary Income* | 12,608 | 12,321 |
| Long-Term Capital Gains | — | — |
| Total | 12,608 | 12,321 |
| * | Includes short-term capital gains, if any. |
| Amount ($000) | |
| Tax Cost | 519,919 |
| Gross Unrealized Appreciation | 39,321 |
| Gross Unrealized Depreciation | (26,555) |
| Net Unrealized Appreciation (Depreciation) | 12,766 |
| Year Ended August 31, | |||||
| 2023 | 2022 | ||||
| Amount ($000) | Shares (000) | Amount ($000) | Shares (000) | ||
| Investor Shares | |||||
| Issued | 19,504 | 962 | 32,516 | 1,511 | |
| Issued in Lieu of Cash Distributions | 1,601 | 80 | 1,541 | 72 | |
| Redeemed | (23,636) | (1,168) | (34,105) | (1,597) | |
| Net Increase (Decrease)—Investor Shares | (2,531) | (126) | (48) | (14) | |
| Admiral Shares | |||||
| Issued | 98,558 | 3,890 | 142,004 | 5,302 | |
| Issued in Lieu of Cash Distributions | 8,446 | 336 | 8,418 | 315 | |
| Redeemed | (110,549) | (4,412) | (137,635) | (5,166) | |
| Net Increase (Decrease)—Admiral Shares | (3,545) | (186) | 12,787 | 451 | |
Philadelphia, Pennsylvania
October 19, 2023
| Matthew Benchener | Thomas M. Rampulla |
| Joseph Brennan | Karin A. Risi |
| Mortimer J. Buckley | Anne E. Robinson |
| Gregory Davis | Michael Rollings |
| John James | Nitin Tandon |
| Chris D. McIsaac | Lauren Valente |

Who Are Deaf or Hard of Hearing > 800-749-7273
All rights reserved.
Vanguard Marketing Corporation, Distributor.

| 1 | |
| 2 | |
| 4 | |
| 7 | |
| 37 | |
| 39 |
| • | For the 12 months ended August 31, 2023, Vanguard ESG U.S. Stock ETF returned 15.82% (based on net asset value), roughly in line with the 15.91% return of its expense-free benchmark. |
| • | Early in the period, inflation in many developed markets began to ease off multidecade highs but remained stubbornly high in some sectors—including services, which felt the effects of a tight labor market. While aggressive interest rate hikes by many major central banks including the Federal Reserve fanned fears of recession, the economy proved more resilient than expected. |
| • | For the fund’s benchmark index, eight of 11 industry sectors recorded gains. Technology was the standout among them, rising more than 30%. Industrials and basic materials also contributed to performance. Real estate, energy, and utilities, all of which represented small slices of the index, posted declines. |
| Average Annual Total Returns Periods Ended August 31, 2023 | |||
| One Year | Three Years | Five Years | |
| Stocks | |||
| Russell 1000 Index (Large-caps) | 15.40% | 9.93% | 10.77% |
| Russell 2000 Index (Small-caps) | 4.65 | 8.12 | 3.14 |
| Russell 3000 Index (Broad U.S. market) | 14.76 | 9.81 | 10.25 |
| FTSE All-World ex US Index (International) | 12.02 | 4.49 | 3.74 |
| Bonds | |||
| Bloomberg U.S. Aggregate Float Adjusted Index (Broad taxable market) | -1.05% | -4.40% | 0.55% |
| Bloomberg Municipal Bond Index (Broad tax-exempt market) | 1.70 | -1.32 | 1.52 |
| FTSE Three-Month U.S. Treasury Bill Index | 4.44 | 1.63 | 1.68 |
| CPI | |||
| Consumer Price Index | 3.67% | 5.71% | 4.02% |
| • | Based on actual fund return. This section helps you to estimate the actual expenses that you paid over the period. The ”Ending Account Value“ shown is derived from the fund’s actual return, and the third column shows the dollar amount that would have been paid by an investor who started with $1,000 in the fund. You may use the information here, together with the amount you invested, to estimate the expenses that you paid over the period. |
| • | Based on hypothetical 5% yearly return. This section is intended to help you compare your fund‘s costs with those of other mutual funds. It assumes that the fund had a yearly return of 5% before expenses, but that the expense ratio is unchanged. In this case—because the return used is not the fund’s actual return—the results do not apply to your investment. The example is useful in making comparisons because the Securities and Exchange Commission requires all mutual funds to calculate expenses based on a 5% return. You can assess your fund’s costs by comparing this hypothetical example with the hypothetical examples that appear in shareholder reports of other funds. |
| Six Months Ended August 31, 2023 | |||
| ESG U.S. Stock ETF | Beginning Account Value 2/28/2023 | Ending Account Value 8/31/2023 | Expenses Paid During Period |
| Based on Actual Fund Return | $1,000.00 | $1,148.80 | $0.49 |
| Based on Hypothetical 5% Yearly Return | 1,000.00 | 1,024.75 | 0.46 |
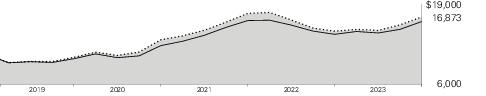
| Average Annual Total Returns Periods Ended August 31, 2023 | ||||
| One Year | Since Inception (9/18/2018) | Final Value of a $10,000 Investment | ||
 | ESG U.S. Stock ETF Net Asset Value | 15.82% | 11.15% | $16,873 |
| ESG U.S. Stock ETF Market Price | 15.83 | 11.15 | 16,875 | |
 | FTSE US All Cap Choice Index | 15.91 | 11.25 | 16,952 |
 | Dow Jones U.S. Total Stock Market Float Adjusted Index | 14.75 | 10.23 | 16,198 |
| Cumulative Returns of ETF Shares: September 18, 2018, Through August 31, 2023 | ||
| One Year | Since Inception (9/18/2018) | |
| ESG U.S. Stock ETF Market Price | 15.83% | 68.75% |
| ESG U.S. Stock ETF Net Asset Value | 15.82 | 68.73 |
| FTSE US All Cap Choice Index | 15.91 | 69.52 |
| Basic Materials | 1.7% |
| Consumer Discretionary | 16.2 |
| Consumer Staples | 5.1 |
| Energy | 0.2 |
| Financials | 10.0 |
| Health Care | 14.0 |
| Industrials | 10.8 |
| Real Estate | 3.3 |
| Technology | 35.5 |
| Telecommunications | 2.7 |
| Utilities | 0.5 |
| Shares | Market Value• ($000) | |||||
| Common Stocks (99.6%) | ||||||
| Basic Materials (1.7%) | ||||||
| Linde plc | 91,891 | 35,566 | ||||
| Air Products and Chemicals Inc. | 41,504 | 12,264 | ||||
| Nucor Corp. | 47,114 | 8,108 | ||||
| Fastenal Co. | 106,860 | 6,153 | ||||
| Newmont Corp. | 149,023 | 5,875 | ||||
| LyondellBasell Industries NV Class A | 48,190 | 4,760 | ||||
| Albemarle Corp. | 21,977 | 4,367 | ||||
| International Flavors & Fragrances Inc. | 47,813 | 3,368 | ||||
| Steel Dynamics Inc. | 30,023 | 3,200 | ||||
| Reliance Steel & Aluminum Co. | 10,948 | 3,120 | ||||
| Avery Dennison Corp. | 15,266 | 2,876 | ||||
| CF Industries Holdings Inc. | 36,662 | 2,826 | ||||
| Mosaic Co. | 61,749 | 2,399 | ||||
| International Paper Co. | 64,406 | 2,249 | ||||
| FMC Corp. | 23,605 | 2,035 | ||||
| Royal Gold Inc. | 12,258 | 1,374 | ||||
| United States Steel Corp. | 42,049 | 1,307 | ||||
| UFP Industries Inc. | 11,182 | 1,167 | ||||
| Valvoline Inc. | 32,234 | 1,110 | ||||
| Huntsman Corp. | 31,629 | 882 | ||||
| Element Solutions Inc. | 42,409 | 874 | ||||
| Balchem Corp. | 5,923 | 832 | ||||
| Ashland Inc. | 9,502 | 823 | ||||
| Westlake Corp. | 6,156 | 806 | ||||
| Boise Cascade Co. | 7,341 | 803 | ||||
| Cabot Corp. | 10,363 | 751 | ||||
| * | Livent Corp. | 33,471 | 719 | |||
| Avient Corp. | 16,987 | 681 | ||||
| NewMarket Corp. | 1,114 | 523 | ||||
| Hecla Mining Co. | 116,031 | 509 | ||||
| Innospec Inc. | 4,598 | 494 | ||||
| Sensient Technologies Corp. | 7,874 | 485 | ||||
| Quaker Chemical Corp. | 2,566 | 455 | ||||
| Scotts Miracle-Gro Co. | 7,594 | 430 | ||||
| * | Constellium SE Class A | 23,500 | 423 | |||
| Shares | Market Value• ($000) | |||||
| * | MP Materials Corp. | 20,046 | 420 | |||
| * | Ingevity Corp. | 6,981 | 376 | |||
| Minerals Technologies Inc. | 6,132 | 375 | ||||
| Stepan Co. | 4,018 | 351 | ||||
| Tronox Holdings plc | 21,815 | 298 | ||||
| Sylvamo Corp. | 6,297 | 263 | ||||
| Orion SA | 11,141 | 252 | ||||
| Kaiser Aluminum Corp. | 2,930 | 222 | ||||
| Compass Minerals International Inc. | 6,328 | 191 | ||||
| * | Piedmont Lithium Inc. | 3,323 | 149 | |||
| * | Coeur Mining Inc. | 51,619 | 124 | |||
| * | Century Aluminum Co. | 10,032 | 75 | |||
| 117,710 | ||||||
| Consumer Discretionary (16.1%) | ||||||
| * | Amazon.com Inc. | 1,689,058 | 233,107 | |||
| * | Tesla Inc. | 517,255 | 133,493 | |||
| Home Depot Inc. | 189,914 | 62,729 | ||||
| Costco Wholesale Corp. | 83,094 | 45,642 | ||||
| McDonald's Corp. | 136,738 | 38,444 | ||||
| * | Netflix Inc. | 82,329 | 35,704 | |||
| * | Walt Disney Co. | 342,800 | 28,686 | |||
| Lowe's Cos. Inc. | 111,933 | 25,798 | ||||
| NIKE Inc. Class B | 222,772 | 22,658 | ||||
| * | Booking Holdings Inc. | 6,958 | 21,605 | |||
| Starbucks Corp. | 211,610 | 20,619 | ||||
| TJX Cos. Inc. | 215,966 | 19,973 | ||||
| * | Uber Technologies Inc. | 363,610 | 17,173 | |||
| Activision Blizzard Inc. | 145,729 | 13,406 | ||||
| * | MercadoLibre Inc. | 8,728 | 11,978 | |||
| Target Corp. | 86,221 | 10,911 | ||||
| * | O'Reilly Automotive Inc. | 11,489 | 10,796 | |||
| * | Airbnb Inc. Class A | 75,995 | 9,997 | |||
| * | Chipotle Mexican Grill Inc. Class A | 5,166 | 9,953 | |||
| Marriott International Inc. Class A | 47,334 | 9,633 | ||||
| Ford Motor Co. | 735,150 | 8,917 | ||||
| * | AutoZone Inc. | 3,419 | 8,655 | |||
| * | Lululemon Athletica Inc. | 20,914 | 7,974 | |||
| Ross Stores Inc. | 62,978 | 7,671 | ||||
| * | Copart Inc. | 161,418 | 7,236 | |||
| Shares | Market Value• ($000) | |||||
| Hilton Worldwide Holdings Inc. | 48,336 | 7,185 | ||||
| Estee Lauder Cos. Inc. Class A | 43,108 | 6,920 | ||||
| Yum! Brands Inc. | 52,347 | 6,773 | ||||
| * | Trade Desk Inc. Class A | 82,299 | 6,586 | |||
| Electronic Arts Inc. | 51,305 | 6,156 | ||||
| Lennar Corp. Class A | 48,304 | 5,753 | ||||
| Dollar General Corp. | 41,093 | 5,691 | ||||
| * | Warner Bros Discovery Inc. | 413,266 | 5,430 | |||
| * | Aptiv plc | 50,685 | 5,142 | |||
| * | Dollar Tree Inc. | 39,152 | 4,791 | |||
| eBay Inc. | 100,125 | 4,484 | ||||
| Tractor Supply Co. | 20,393 | 4,456 | ||||
| * | Take-Two Interactive Software Inc. | 31,017 | 4,411 | |||
| * | Royal Caribbean Cruises Ltd. | 43,878 | 4,341 | |||
| Genuine Parts Co. | 26,451 | 4,066 | ||||
| * | Spotify Technology SA | 26,279 | 4,046 | |||
| * | Ulta Beauty Inc. | 9,421 | 3,910 | |||
| * | Coupang Inc. Class A | 205,154 | 3,894 | |||
| * | NVR Inc. | 550 | 3,508 | |||
| PulteGroup Inc. | 41,525 | 3,408 | ||||
| Garmin Ltd. | 28,876 | 3,061 | ||||
| Omnicom Group Inc. | 36,876 | 2,987 | ||||
| * | Carnival Corp. | 187,785 | 2,971 | |||
| * | Expedia Group Inc. | 26,931 | 2,919 | |||
| Best Buy Co. Inc. | 36,205 | 2,768 | ||||
| * | Liberty Media Corp.-Liberty Formula One Class C | 38,800 | 2,669 | |||
| * | Deckers Outdoor Corp. | 4,975 | 2,632 | |||
| LKQ Corp. | 49,947 | 2,624 | ||||
| Pool Corp. | 7,102 | 2,597 | ||||
| Domino's Pizza Inc. | 6,607 | 2,560 | ||||
| * | Live Nation Entertainment Inc. | 29,225 | 2,470 | |||
| * | ROBLOX Corp. Class A | 86,063 | 2,435 | |||
| * | CarMax Inc. | 29,590 | 2,417 | |||
| Interpublic Group of Cos. Inc. | 72,669 | 2,370 | ||||
| * | Rivian Automotive Inc. Class A | 97,557 | 2,217 | |||
| Fox Corp. Class A | 65,860 | 2,177 | ||||
| * | Grab Holdings Ltd. Class A | 550,071 | 2,074 | |||
| News Corp. Class A | 93,122 | 2,001 | ||||
| * | Burlington Stores Inc. | 12,198 | 1,979 | |||
| * | Floor & Decor Holdings Inc. Class A | 19,361 | 1,930 | |||
| BorgWarner Inc. | 43,759 | 1,783 | ||||
| Hasbro Inc. | 24,630 | 1,773 | ||||
| Service Corp. International | 28,061 | 1,771 | ||||
| * | Five Below Inc. | 10,216 | 1,757 | |||
| Williams-Sonoma Inc. | 12,398 | 1,751 | ||||
| Aramark | 47,072 | 1,750 | ||||
| Shares | Market Value• ($000) | |||||
| Vail Resorts Inc. | 7,491 | 1,695 | ||||
| Toll Brothers Inc. | 20,659 | 1,693 | ||||
| * | BJ's Wholesale Club Holdings Inc. | 25,122 | 1,693 | |||
| * | Etsy Inc. | 22,775 | 1,676 | |||
| Rollins Inc. | 41,279 | 1,633 | ||||
| Paramount Global Class B | 108,109 | 1,631 | ||||
| Lear Corp. | 11,002 | 1,585 | ||||
| Bath & Body Works Inc. | 42,934 | 1,583 | ||||
| Lithia Motors Inc. Class A | 5,136 | 1,582 | ||||
| Autoliv Inc. | 16,178 | 1,579 | ||||
| Tapestry Inc. | 44,250 | 1,474 | ||||
| Tempur Sealy International Inc. | 31,158 | 1,456 | ||||
| Gentex Corp. | 44,101 | 1,440 | ||||
| * | SiteOne Landscape Supply Inc. | 8,356 | 1,430 | |||
| Whirlpool Corp. | 9,976 | 1,396 | ||||
| New York Times Co. Class A | 30,444 | 1,348 | ||||
| * | Skechers USA Inc. Class A | 26,332 | 1,325 | |||
| * | Norwegian Cruise Line Holdings Ltd. | 78,602 | 1,302 | |||
| Delta Air Lines Inc. | 30,246 | 1,297 | ||||
| VF Corp. | 65,562 | 1,296 | ||||
| * | elf Beauty Inc. | 9,119 | 1,265 | |||
| * | Capri Holdings Ltd. | 22,988 | 1,207 | |||
| Murphy USA Inc. | 3,732 | 1,185 | ||||
| Wyndham Hotels & Resorts Inc. | 15,398 | 1,161 | ||||
| H&R Block Inc. | 28,580 | 1,143 | ||||
| * | On Holding AG Class A | 39,606 | 1,142 | |||
| * | RH | 3,069 | 1,121 | |||
| * | Crocs Inc. | 11,332 | 1,103 | |||
| Nexstar Media Group Inc. Class A | 6,343 | 1,033 | ||||
| * | Wayfair Inc. Class A | 14,799 | 1,023 | |||
| Thor Industries Inc. | 9,731 | 1,020 | ||||
| * | Bright Horizons Family Solutions Inc. | 10,771 | 1,017 | |||
| Hyatt Hotels Corp. Class A | 8,884 | 999 | ||||
| PVH Corp. | 11,787 | 985 | ||||
| U-Haul Holding Co. | 17,998 | 970 | ||||
| * | Planet Fitness Inc. Class A | 15,669 | 953 | |||
| * | Asbury Automotive Group Inc. | 4,103 | 944 | |||
| Meritage Homes Corp. | 6,755 | 939 | ||||
| *,1 | GameStop Corp. Class A | 50,392 | 935 | |||
| * | Taylor Morrison Home Corp. Class A | 19,561 | 927 | |||
| Wingstop Inc. | 5,640 | 906 | ||||
| * | Ollie's Bargain Outlet Holdings Inc. | 11,738 | 905 | |||
| Ralph Lauren Corp. Class A | 7,642 | 891 | ||||
| * | AutoNation Inc. | 5,662 | 889 | |||
| Southwest Airlines Co. | 27,948 | 883 | ||||
| *,1 | Lucid Group Inc. | 140,484 | 882 | |||
| Shares | Market Value• ($000) | |||||
| * | Fox Factory Holding Corp. | 7,889 | 874 | |||
| Harley-Davidson Inc. | 25,207 | 851 | ||||
| * | Avis Budget Group Inc. | 3,806 | 812 | |||
| * | YETI Holdings Inc. | 16,161 | 807 | |||
| * | Duolingo Inc. Class A | 5,330 | 784 | |||
| World Wrestling Entertainment Inc. Class A | 8,090 | 781 | ||||
| Advance Auto Parts Inc. | 11,093 | 763 | ||||
| * | United Airlines Holdings Inc. | 15,299 | 762 | |||
| * | Coty Inc. Class A | 65,785 | 760 | |||
| Marriott Vacations Worldwide Corp. | 6,981 | 759 | ||||
| * | Liberty Media Corp.-Liberty SiriusXM Class A | 31,380 | 754 | |||
| Newell Brands Inc. | 70,859 | 750 | ||||
| KB Home | 14,161 | 719 | ||||
| * | Visteon Corp. | 5,158 | 718 | |||
| * | Skyline Champion Corp. | 9,909 | 706 | |||
| Leggett & Platt Inc. | 24,961 | 704 | ||||
| Group 1 Automotive Inc. | 2,645 | 699 | ||||
| * | Adient plc | 17,712 | 694 | |||
| Choice Hotels International Inc. | 5,416 | 687 | ||||
| TEGNA Inc. | 41,575 | 687 | ||||
| * | Goodyear Tire & Rubber Co. | 52,225 | 674 | |||
| * | Grand Canyon Education Inc. | 5,723 | 671 | |||
| * | Lyft Inc. Class A | 55,077 | 649 | |||
| * | Hilton Grand Vacations Inc. | 14,623 | 639 | |||
| Wendy's Co. | 31,968 | 633 | ||||
| Madison Square Garden Sports Corp. | 3,517 | 626 | ||||
| Signet Jewelers Ltd. | 8,306 | 623 | ||||
| Macy's Inc. | 50,579 | 619 | ||||
| Penske Automotive Group Inc. | 3,670 | 603 | ||||
| LCI Industries | 4,647 | 582 | ||||
| * | Tri Pointe Homes Inc. | 18,706 | 582 | |||
| American Eagle Outfitters Inc. | 34,133 | 579 | ||||
| Kohl's Corp. | 20,637 | 550 | ||||
| * | Helen of Troy Ltd. | 4,428 | 544 | |||
| Travel + Leisure Co. | 13,455 | 541 | ||||
| MDC Holdings Inc. | 10,898 | 517 | ||||
| Carter's Inc. | 7,063 | 506 | ||||
| * | Boot Barn Holdings Inc. | 5,496 | 504 | |||
| * | Frontdoor Inc. | 15,296 | 502 | |||
| Steven Madden Ltd. | 14,470 | 499 | ||||
| 1 | Sirius XM Holdings Inc. | 113,047 | 497 | |||
| * | Shake Shack Inc. Class A | 7,041 | 493 | |||
| Columbia Sportswear Co. | 6,706 | 492 | ||||
| * | Abercrombie & Fitch Co. Class A | 9,006 | 484 | |||
| Shares | Market Value• ($000) | |||||
| Rush Enterprises Inc. Class A | 11,677 | 484 | ||||
| Kontoor Brands Inc. | 10,263 | 470 | ||||
| * | LGI Homes Inc. | 3,821 | 470 | |||
| Inter Parfums Inc. | 3,295 | 460 | ||||
| Papa John's International Inc. | 6,054 | 458 | ||||
| * | Topgolf Callaway Brands Corp. | 26,117 | 456 | |||
| * | Cavco Industries Inc. | 1,632 | 456 | |||
| * | Coursera Inc. | 26,200 | 456 | |||
| * | American Airlines Group Inc. | 30,262 | 446 | |||
| Fox Corp. Class B | 13,912 | 425 | ||||
| Gap Inc. | 36,535 | 423 | ||||
| * | QuantumScape Corp. Class A | 58,147 | 415 | |||
| * | Dorman Products Inc. | 4,913 | 405 | |||
| * | Urban Outfitters Inc. | 11,827 | 393 | |||
| Century Communities Inc. | 5,200 | 386 | ||||
| Dana Inc. | 23,867 | 385 | ||||
| PriceSmart Inc. | 4,779 | 380 | ||||
| Graham Holdings Co. Class B | 635 | 372 | ||||
| * | Gentherm Inc. | 6,142 | 370 | |||
| * | Adtalem Global Education Inc. | 8,368 | 367 | |||
| * | Peloton Interactive Inc. Class A | 57,540 | 367 | |||
| Acushnet Holdings Corp. | 6,165 | 361 | ||||
| * | SeaWorld Entertainment Inc. | 7,374 | 359 | |||
| Winnebago Industries Inc. | 5,524 | 358 | ||||
| Laureate Education Inc. | 24,800 | 345 | ||||
| Hanesbrands Inc. | 64,935 | 341 | ||||
| Nordstrom Inc. | 20,868 | 338 | ||||
| Cracker Barrel Old Country Store Inc. | 4,091 | 337 | ||||
| * | Cinemark Holdings Inc. | 20,200 | 329 | |||
| * | Sonos Inc. | 23,785 | 328 | |||
| Strategic Education Inc. | 4,161 | 322 | ||||
| * | PROG Holdings Inc. | 9,306 | 319 | |||
| * | Six Flags Entertainment Corp. | 13,849 | 318 | |||
| * | SharkNinja Inc. | 9,100 | 318 | |||
| * | OPENLANE Inc. | 19,969 | 312 | |||
| Jack in the Box Inc. | 3,857 | 310 | ||||
| * | Central Garden & Pet Co. Class A | 7,582 | 309 | |||
| * | Atlanta Braves Holdings Inc. Class C | 8,232 | 303 | |||
| * | Sabre Corp. | 60,230 | 301 | |||
| John Wiley & Sons Inc. Class A | 8,055 | 299 | ||||
| Foot Locker Inc. | 15,063 | 296 | ||||
| * | ODP Corp. | 5,906 | 291 | |||
| * | Victoria's Secret & Co. | 15,101 | 290 | |||
| Shares | Market Value• ($000) | |||||
| Upbound Group Inc. | 9,448 | 289 | ||||
| * | TripAdvisor Inc. | 19,033 | 288 | |||
| * | Liberty Media Corp.-Liberty SiriusXM | 11,730 | 287 | |||
| HNI Corp. | 8,553 | 280 | ||||
| Oxford Industries Inc. | 2,741 | 277 | ||||
| * | National Vision Holdings Inc. | 14,697 | 269 | |||
| MillerKnoll Inc. | 14,018 | 268 | ||||
| *,1 | Luminar Technologies Inc. Class A | 46,418 | 267 | |||
| * | Liberty Media Corp.-Liberty Live Class A | 8,011 | 267 | |||
| * | Brinker International Inc. | 8,100 | 265 | |||
| * | PowerSchool Holdings Inc. Class A | 12,000 | 265 | |||
| * | Madison Square Garden Entertainment Corp. Class A | 8,100 | 260 | |||
| * | Alaska Air Group Inc. | 5,965 | 250 | |||
| La-Z-Boy Inc. | 8,038 | 248 | ||||
| * | Phinia Inc. | 8,785 | 244 | |||
| Dillard's Inc. Class A | 700 | 242 | ||||
| Scholastic Corp. | 5,551 | 241 | ||||
| Matthews International Corp. Class A | 5,638 | 238 | ||||
| * | Chegg Inc. | 23,246 | 237 | |||
| Krispy Kreme Inc. | 17,600 | 236 | ||||
| * | Under Armour Inc. Class A | 30,778 | 235 | |||
| * | Under Armour Inc. Class C | 31,379 | 216 | |||
| * | Overstock.com Inc. | 7,877 | 206 | |||
| Buckle Inc. | 5,569 | 204 | ||||
| * | Leslie's Inc. | 32,628 | 204 | |||
| * | Sally Beauty Holdings Inc. | 19,944 | 203 | |||
| * | iRobot Corp. | 4,968 | 193 | |||
| *,1 | Fisker Inc. Class A | 32,698 | 192 | |||
| Monro Inc. | 5,761 | 189 | ||||
| * | Driven Brands Holdings Inc. | 11,600 | 175 | |||
| *,1 | Farfetch Ltd. Class A | 60,858 | 173 | |||
| * | Sphere Entertainment Co. | 4,800 | 168 | |||
| * | IMAX Corp. | 8,688 | 166 | |||
| * | Lions Gate Entertainment Corp. Class B | 21,472 | 160 | |||
| * | American Axle & Manufacturing Holdings Inc. | 20,865 | 158 | |||
| * | G-III Apparel Group Ltd. | 7,885 | 157 | |||
| * | Liberty Media Corp.-Liberty Live Class C | 4,587 | 154 | |||
| Dine Brands Global Inc. | 2,764 | 151 | ||||
| * | Figs Inc. Class A | 24,212 | 150 | |||
| Steelcase Inc. Class A | 16,101 | 146 | ||||
| Guess? Inc. | 5,738 | 138 | ||||
| *,1 | AMC Entertainment Holdings Inc. Class A | 11,006 | 138 | |||
| Gray Television Inc. | 14,975 | 121 | ||||
| Shares | Market Value• ($000) | |||||
| Wolverine World Wide Inc. | 14,380 | 116 | ||||
| * | Mister Car Wash Inc. | 15,000 | 109 | |||
| * | Liberty Media Corp.-Liberty Formula One Class A | 1,581 | 96 | |||
| Sinclair Inc. | 7,500 | 95 | ||||
| * | JetBlue Airways Corp. | 15,321 | 91 | |||
| * | Lions Gate Entertainment Corp. Class A | 11,396 | 90 | |||
| Spirit Airlines Inc. | 5,056 | 83 | ||||
| * | EW Scripps Co. Class A | 10,870 | 83 | |||
| * | iHeartMedia Inc. Class A | 22,306 | 81 | |||
| Allegiant Travel Co. | 883 | 78 | ||||
| * | Petco Health & Wellness Co. Inc. Class A | 15,400 | 78 | |||
| * | Atlanta Braves Holdings Inc. Class A | 1,835 | 77 | |||
| Lennar Corp. Class B | 614 | 66 | ||||
| * | Qurate Retail Inc. Class A | 62,576 | 49 | |||
| * | Playtika Holding Corp. | 4,718 | 46 | |||
| News Corp. Class B | 400 | 9 | ||||
| 1,095,764 | ||||||
| Consumer Staples (5.1%) | ||||||
| Procter & Gamble Co. | 441,402 | 68,126 | ||||
| PepsiCo Inc. | 258,106 | 45,922 | ||||
| Coca-Cola Co. | 730,005 | 43,676 | ||||
| Mondelez International Inc. Class A | 254,973 | 18,169 | ||||
| CVS Health Corp. | 240,063 | 15,645 | ||||
| Colgate-Palmolive Co. | 154,171 | 11,327 | ||||
| McKesson Corp. | 25,666 | 10,583 | ||||
| Kimberly-Clark Corp. | 63,152 | 8,136 | ||||
| Archer-Daniels-Midland Co. | 101,545 | 8,052 | ||||
| * | Monster Beverage Corp. | 139,307 | 7,998 | |||
| General Mills Inc. | 109,885 | 7,435 | ||||
| Corteva Inc. | 134,160 | 6,776 | ||||
| Sysco Corp. | 95,311 | 6,638 | ||||
| Keurig Dr Pepper Inc. | 178,681 | 6,013 | ||||
| Hershey Co. | 27,693 | 5,950 | ||||
| Kroger Co. | 121,571 | 5,640 | ||||
| Cencora Inc. | 30,912 | 5,440 | ||||
| Kraft Heinz Co. | 150,274 | 4,973 | ||||
| Church & Dwight Co. Inc. | 45,529 | 4,406 | ||||
| McCormick & Co. Inc. (Non-Voting) | 47,022 | 3,859 | ||||
| Clorox Co. | 23,126 | 3,618 | ||||
| Walgreens Boots Alliance Inc. | 134,550 | 3,405 | ||||
| Bunge Ltd. | 27,955 | 3,196 | ||||
| Kellogg Co. | 48,898 | 2,984 | ||||
| J M Smucker Co. | 19,385 | 2,810 | ||||
| Tyson Foods Inc. Class A | 52,210 | 2,781 | ||||
| Conagra Brands Inc. | 88,276 | 2,638 | ||||
| Lamb Weston Holdings Inc. | 27,064 | 2,636 | ||||
| Shares | Market Value• ($000) | |||||
| Coca-Cola Europacific Partners plc | 37,856 | 2,427 | ||||
| Hormel Foods Corp. | 53,741 | 2,074 | ||||
| * | Celsius Holdings Inc. | 10,351 | 2,029 | |||
| * | Darling Ingredients Inc. | 29,989 | 1,852 | |||
| Albertsons Cos. Inc. Class A | 77,582 | 1,738 | ||||
| * | US Foods Holding Corp. | 42,385 | 1,714 | |||
| Campbell Soup Co. | 36,371 | 1,517 | ||||
| Ingredion Inc. | 12,246 | 1,260 | ||||
| * | BellRing Brands Inc. | 24,953 | 1,035 | |||
| * | Post Holdings Inc. | 10,152 | 911 | |||
| Flowers Foods Inc. | 35,133 | 828 | ||||
| * | Sprouts Farmers Market Inc. | 19,829 | 809 | |||
| * | Hostess Brands Inc. Class A | 24,986 | 712 | |||
| Coca-Cola Consolidated Inc. | 932 | 651 | ||||
| * | Freshpet Inc. | 8,501 | 642 | |||
| Spectrum Brands Holdings Inc. | 7,468 | 621 | ||||
| * | Simply Good Foods Co. | 16,603 | 599 | |||
| Lancaster Colony Corp. | 3,590 | 593 | ||||
| WD-40 Co. | 2,584 | 555 | ||||
| * | Grocery Outlet Holding Corp. | 16,673 | 514 | |||
| * | Nomad Foods Ltd. | 26,219 | 481 | |||
| Energizer Holdings Inc. | 13,322 | 458 | ||||
| J & J Snack Foods Corp. | 2,824 | 458 | ||||
| * | TreeHouse Foods Inc. | 9,539 | 444 | |||
| Edgewell Personal Care Co. | 9,563 | 369 | ||||
| Cal-Maine Foods Inc. | 7,079 | 338 | ||||
| Reynolds Consumer Products Inc. | 10,200 | 278 | ||||
| * | Herbalife Ltd. | 18,353 | 276 | |||
| * | National Beverage Corp. | 4,386 | 225 | |||
| * | United Natural Foods Inc. | 11,012 | 222 | |||
| Nu Skin Enterprises Inc. Class A | 9,151 | 219 | ||||
| Weis Markets Inc. | 3,028 | 196 | ||||
| * | Hain Celestial Group Inc. | 16,590 | 176 | |||
| Medifast Inc. | 2,065 | 174 | ||||
| B&G Foods Inc. | 13,155 | 168 | ||||
| Fresh Del Monte Produce Inc. | 5,591 | 143 | ||||
| *,1 | Beyond Meat Inc. | 11,612 | 137 | |||
| * | USANA Health Sciences Inc. | 2,122 | 136 | |||
| * | Beauty Health Co. | 16,136 | 99 | |||
| * | Olaplex Holdings Inc. | 23,100 | 63 | |||
| 346,973 | ||||||
| Energy (0.2%) | ||||||
| * | First Solar Inc. | 19,925 | 3,768 | |||
| * | Enphase Energy Inc. | 24,913 | 3,152 | |||
| Shares | Market Value• ($000) | |||||
| * | SolarEdge Technologies Inc. | 10,536 | 1,713 | |||
| *,1 | Plug Power Inc. | 97,343 | 824 | |||
| Arcosa Inc. | 9,044 | 707 | ||||
| * | Array Technologies Inc. | 28,095 | 699 | |||
| *,1 | ChargePoint Holdings Inc. | 54,948 | 393 | |||
| * | Ameresco Inc. Class A | 5,906 | 257 | |||
| *,1 | Stem Inc. | 26,806 | 137 | |||
| *,1 | SunPower Corp. | 15,271 | 109 | |||
| * | FuelCell Energy Inc. | 75,690 | 106 | |||
| Enviva Inc. | 5,700 | 52 | ||||
| 11,917 | ||||||
| Financials (10.0%) | ||||||
| JPMorgan Chase & Co. | 548,083 | 80,201 | ||||
| Bank of America Corp. | 1,304,974 | 37,414 | ||||
| S&P Global Inc. | 60,152 | 23,511 | ||||
| Goldman Sachs Group Inc. | 60,603 | 19,860 | ||||
| BlackRock Inc. | 27,881 | 19,532 | ||||
| Morgan Stanley | 225,238 | 19,179 | ||||
| Marsh & McLennan Cos. Inc. | 92,613 | 18,059 | ||||
| Charles Schwab Corp. | 277,806 | 16,432 | ||||
| Chubb Ltd. | 77,111 | 15,489 | ||||
| Citigroup Inc. | 364,647 | 15,056 | ||||
| Progressive Corp. | 109,549 | 14,621 | ||||
| Blackstone Inc. | 132,303 | 14,073 | ||||
| CME Group Inc. | 67,354 | 13,651 | ||||
| Aon plc Class A | 37,897 | 12,634 | ||||
| Intercontinental Exchange Inc. | 103,593 | 12,223 | ||||
| US Bancorp | 286,600 | 10,469 | ||||
| Moody's Corp. | 29,773 | 10,028 | ||||
| Arthur J Gallagher & Co. | 39,630 | 9,134 | ||||
| PNC Financial Services Group Inc. | 74,440 | 8,987 | ||||
| Apollo Global Management Inc. | 97,834 | 8,545 | ||||
| Aflac Inc. | 112,516 | 8,390 | ||||
| American International Group Inc. | 137,257 | 8,032 | ||||
| MSCI Inc. Class A | 14,606 | 7,940 | ||||
| MetLife Inc. | 121,067 | 7,668 | ||||
| KKR & Co. Inc. | 121,192 | 7,612 | ||||
| Truist Financial Corp. | 247,549 | 7,563 | ||||
| Travelers Cos. Inc. | 43,156 | 6,958 | ||||
| Ameriprise Financial Inc. | 19,697 | 6,649 | ||||
| Bank of New York Mellon Corp. | 147,638 | 6,624 | ||||
| Prudential Financial Inc. | 69,092 | 6,541 | ||||
| Allstate Corp. | 48,992 | 5,282 | ||||
| * | Arch Capital Group Ltd. | 67,350 | 5,176 | |||
| T. Rowe Price Group Inc. | 41,221 | 4,626 | ||||
| State Street Corp. | 62,412 | 4,290 | ||||
| Discover Financial Services | 47,295 | 4,260 | ||||
| Willis Towers Watson plc | 19,887 | 4,112 | ||||
| Shares | Market Value• ($000) | |||||
| Hartford Financial Services Group Inc. | 56,821 | 4,081 | ||||
| Broadridge Financial Solutions Inc. | 21,903 | 4,079 | ||||
| M&T Bank Corp. | 30,854 | 3,858 | ||||
| Raymond James Financial Inc. | 36,481 | 3,816 | ||||
| * | Markel Group Inc. | 2,479 | 3,666 | |||
| Principal Financial Group Inc. | 45,371 | 3,526 | ||||
| Fifth Third Bancorp | 127,743 | 3,392 | ||||
| Nasdaq Inc. | 64,461 | 3,383 | ||||
| LPL Financial Holdings Inc. | 14,575 | 3,361 | ||||
| Brown & Brown Inc. | 44,279 | 3,281 | ||||
| Regions Financial Corp. | 175,303 | 3,215 | ||||
| FactSet Research Systems Inc. | 7,279 | 3,177 | ||||
| Ares Management Corp. Class A | 30,125 | 3,116 | ||||
| Cincinnati Financial Corp. | 28,782 | 3,045 | ||||
| Huntington Bancshares Inc. | 269,107 | 2,984 | ||||
| Cboe Global Markets Inc. | 19,779 | 2,961 | ||||
| Northern Trust Corp. | 38,510 | 2,929 | ||||
| Everest Group Ltd. | 7,988 | 2,881 | ||||
| First Citizens BancShares Inc. Class A | 2,054 | 2,794 | ||||
| Citizens Financial Group Inc. | 89,263 | 2,511 | ||||
| * | Coinbase Global Inc. Class A | 31,239 | 2,487 | |||
| W R Berkley Corp. | 39,776 | 2,461 | ||||
| Loews Corp. | 35,106 | 2,180 | ||||
| Fidelity National Financial Inc. | 48,763 | 2,019 | ||||
| KeyCorp | 174,265 | 1,974 | ||||
| Equitable Holdings Inc. | 66,414 | 1,913 | ||||
| Annaly Capital Management Inc. | 92,291 | 1,871 | ||||
| Globe Life Inc. | 16,755 | 1,869 | ||||
| Tradeweb Markets Inc. Class A | 21,443 | 1,853 | ||||
| Unum Group | 37,139 | 1,827 | ||||
| Credicorp Ltd. | 12,777 | 1,807 | ||||
| Reinsurance Group of America Inc. | 12,560 | 1,741 | ||||
| RenaissanceRe Holdings Ltd. | 9,189 | 1,726 | ||||
| Interactive Brokers Group Inc. Class A | 18,506 | 1,686 | ||||
| MarketAxess Holdings Inc. | 6,988 | 1,684 | ||||
| New York Community Bancorp Inc. | 132,868 | 1,632 | ||||
| Kinsale Capital Group Inc. | 4,062 | 1,619 | ||||
| * | XP Inc. Class A | 62,892 | 1,594 | |||
| American Financial Group Inc. | 13,557 | 1,572 | ||||
| Shares | Market Value• ($000) | |||||
| * | SoFi Technologies Inc. | 172,244 | 1,492 | |||
| East West Bancorp Inc. | 26,521 | 1,468 | ||||
| Franklin Resources Inc. | 53,522 | 1,431 | ||||
| Ally Financial Inc. | 50,444 | 1,397 | ||||
| Assurant Inc. | 10,014 | 1,395 | ||||
| Webster Financial Corp. | 32,384 | 1,373 | ||||
| Primerica Inc. | 6,821 | 1,371 | ||||
| Old Republic International Corp. | 49,831 | 1,363 | ||||
| * | Robinhood Markets Inc. Class A | 124,873 | 1,360 | |||
| Voya Financial Inc. | 18,223 | 1,270 | ||||
| First Horizon Corp. | 99,158 | 1,244 | ||||
| Stifel Financial Corp. | 19,107 | 1,242 | ||||
| SEI Investments Co. | 19,266 | 1,196 | ||||
| Comerica Inc. | 24,485 | 1,178 | ||||
| First American Financial Corp. | 18,912 | 1,166 | ||||
| Starwood Property Trust Inc. | 54,786 | 1,119 | ||||
| Invesco Ltd. | 70,016 | 1,115 | ||||
| Selective Insurance Group Inc. | 11,135 | 1,105 | ||||
| AGNC Investment Corp. | 107,236 | 1,062 | ||||
| Commerce Bancshares Inc. | 21,268 | 1,044 | ||||
| Cullen/Frost Bankers Inc. | 10,916 | 1,032 | ||||
| SouthState Corp. | 13,953 | 1,009 | ||||
| Houlihan Lokey Inc. Class A | 9,481 | 999 | ||||
| Western Alliance Bancorp | 19,751 | 988 | ||||
| Zions Bancorp NA | 27,593 | 980 | ||||
| Essent Group Ltd. | 19,516 | 980 | ||||
| MGIC Investment Corp. | 55,384 | 974 | ||||
| RLI Corp. | 7,318 | 962 | ||||
| Evercore Inc. Class A | 6,844 | 958 | ||||
| Pinnacle Financial Partners Inc. | 14,052 | 935 | ||||
| Prosperity Bancshares Inc. | 16,370 | 930 | ||||
| Rithm Capital Corp. | 88,100 | 908 | ||||
| Popular Inc. | 13,153 | 898 | ||||
| OneMain Holdings Inc. | 21,584 | 896 | ||||
| Affiliated Managers Group Inc. | 6,525 | 874 | ||||
| Wintrust Financial Corp. | 11,209 | 870 | ||||
| * | Ryan Specialty Holdings Inc. Class A | 17,289 | 843 | |||
| Bank OZK | 20,954 | 842 | ||||
| Synovus Financial Corp. | 26,975 | 835 | ||||
| Old National Bancorp | 54,382 | 830 | ||||
| Lincoln National Corp. | 31,899 | 819 | ||||
| Axis Capital Holdings Ltd. | 14,636 | 803 | ||||
| Columbia Banking System Inc. | 38,850 | 796 | ||||
| Radian Group Inc. | 29,361 | 795 | ||||
| Shares | Market Value• ($000) | |||||
| American Equity Investment Life Holding Co. | 14,693 | 789 | ||||
| Home BancShares Inc. | 35,087 | 778 | ||||
| Cadence Bank | 33,976 | 777 | ||||
| FNB Corp. | 66,695 | 776 | ||||
| Valley National Bancorp | 79,928 | 734 | ||||
| * | Mr Cooper Group Inc. | 12,953 | 734 | |||
| United Bankshares Inc. | 24,210 | 728 | ||||
| White Mountains Insurance Group Ltd. | 450 | 715 | ||||
| Lazard Ltd. Class A | 20,590 | 715 | ||||
| Blackstone Mortgage Trust Inc. Class A | 32,189 | 709 | ||||
| Hanover Insurance Group Inc. | 6,629 | 707 | ||||
| Janus Henderson Group plc | 25,475 | 700 | ||||
| First Financial Bankshares Inc. | 24,113 | 692 | ||||
| Hancock Whitney Corp. | 16,104 | 664 | ||||
| SLM Corp. | 44,931 | 640 | ||||
| Assured Guaranty Ltd. | 10,867 | 639 | ||||
| * | Brighthouse Financial Inc. | 12,756 | 633 | |||
| Hamilton Lane Inc. Class A | 6,731 | 625 | ||||
| Glacier Bancorp Inc. | 20,664 | 624 | ||||
| Jackson Financial Inc. Class A | 16,106 | 606 | ||||
| * | Credit Acceptance Corp. | 1,200 | 602 | |||
| United Community Banks Inc. | 22,303 | 602 | ||||
| * | Enstar Group Ltd. | 2,352 | 596 | |||
| *,2 | Focus Financial Partners Inc. Class A | 10,786 | 572 | |||
| 1 | Arbor Realty Trust Inc. | 35,485 | 566 | |||
| * | Texas Capital Bancshares Inc. | 9,014 | 563 | |||
| Moelis & Co. Class A | 11,836 | 561 | ||||
| Kemper Corp. | 11,909 | 559 | ||||
| * | Genworth Financial Inc. Class A | 91,745 | 531 | |||
| ServisFirst Bancshares Inc. | 9,434 | 529 | ||||
| UMB Financial Corp. | 8,235 | 521 | ||||
| Ameris Bancorp | 12,410 | 506 | ||||
| CNO Financial Group Inc. | 21,157 | 495 | ||||
| Walker & Dunlop Inc. | 5,753 | 491 | ||||
| Piper Sandler Cos. | 3,278 | 488 | ||||
| Associated Banc-Corp | 28,027 | 486 | ||||
| Corebridge Financial Inc. | 27,025 | 482 | ||||
| Community Bank System Inc. | 9,973 | 474 | ||||
| First Bancorp | 33,741 | 468 | ||||
| Cathay General Bancorp | 13,006 | 463 | ||||
| Independent Bank Corp. | 8,578 | 463 | ||||
| * | Axos Financial Inc. | 10,730 | 462 | |||
| First Hawaiian Inc. | 24,169 | 457 | ||||
| BOK Financial Corp. | 5,458 | 454 | ||||
| Shares | Market Value• ($000) | |||||
| WSFS Financial Corp. | 11,493 | 452 | ||||
| International Bancshares Corp. | 10,050 | 450 | ||||
| Artisan Partners Asset Management Inc. Class A | 11,348 | 436 | ||||
| * | NMI Holdings Inc. Class A | 15,190 | 435 | |||
| CVB Financial Corp. | 24,619 | 430 | ||||
| *,1 | Upstart Holdings Inc. | 13,291 | 428 | |||
| First Interstate BancSystem Inc. Class A | 16,500 | 427 | ||||
| BancFirst Corp. | 4,386 | 419 | ||||
| Atlantic Union Bankshares Corp. | 14,087 | 418 | ||||
| Simmons First National Corp. Class A | 22,957 | 409 | ||||
| Pacific Premier Bancorp Inc. | 17,723 | 408 | ||||
| Fulton Financial Corp. | 30,381 | 405 | ||||
| Bank of Hawaii Corp. | 7,267 | 391 | ||||
| Eastern Bankshares Inc. | 28,552 | 384 | ||||
| Seacoast Banking Corp. of Florida | 16,000 | 378 | ||||
| BankUnited Inc. | 14,034 | 368 | ||||
| First Financial Bancorp | 17,408 | 362 | ||||
| PennyMac Financial Services Inc. | 4,997 | 359 | ||||
| Navient Corp. | 18,872 | 333 | ||||
| Virtu Financial Inc. Class A | 17,747 | 333 | ||||
| Washington Federal Inc. | 11,951 | 325 | ||||
| First Merchants Corp. | 10,807 | 322 | ||||
| Towne Bank | 13,087 | 309 | ||||
| Cohen & Steers Inc. | 4,721 | 308 | ||||
| *,1 | Freedom Holding Corp. | 3,000 | 295 | |||
| NBT Bancorp Inc. | 8,535 | 294 | ||||
| Renasant Corp. | 10,334 | 288 | ||||
| BGC Group Inc. Class A | 58,309 | 288 | ||||
| Banner Corp. | 6,425 | 280 | ||||
| Hilltop Holdings Inc. | 9,170 | 279 | ||||
| Independent Bank Group Inc. | 6,564 | 277 | ||||
| * | Triumph Financial Inc. | 4,300 | 276 | |||
| Park National Corp. | 2,700 | 275 | ||||
| Virtus Investment Partners Inc. | 1,324 | 274 | ||||
| Bank of NT Butterfield & Son Ltd. | 9,305 | 271 | ||||
| Trustmark Corp. | 11,705 | 270 | ||||
| WesBanco Inc. | 10,617 | 269 | ||||
| Chimera Investment Corp. | 43,521 | 263 | ||||
| First Commonwealth Financial Corp. | 19,159 | 250 | ||||
| Northwest Bancshares Inc. | 22,721 | 250 | ||||
| City Holding Co. | 2,726 | 249 | ||||
| Nelnet Inc. Class A | 2,713 | 249 | ||||
| Two Harbors Investment Corp. | 17,875 | 246 | ||||
| Stock Yards Bancorp Inc. | 5,292 | 242 | ||||
| Shares | Market Value• ($000) | |||||
| Heartland Financial USA Inc. | 7,624 | 234 | ||||
| Ladder Capital Corp. Class A | 21,300 | 233 | ||||
| * | Palomar Holdings Inc. | 4,500 | 230 | |||
| PennyMac Mortgage Investment Trust | 16,825 | 226 | ||||
| Provident Financial Services Inc. | 13,628 | 225 | ||||
| Horace Mann Educators Corp. | 7,644 | 219 | ||||
| * | Trupanion Inc. | 7,231 | 215 | |||
| Westamerica Bancorp | 4,858 | 214 | ||||
| Hope Bancorp Inc. | 21,821 | 211 | ||||
| ARMOUR Residential REIT Inc. | 42,454 | 208 | ||||
| MFA Financial Inc. | 19,023 | 208 | ||||
| S&T Bancorp Inc. | 7,235 | 205 | ||||
| CNA Financial Corp. | 5,134 | 202 | ||||
| * | Encore Capital Group Inc. | 4,275 | 200 | |||
| Live Oak Bancshares Inc. | 6,200 | 200 | ||||
| Employers Holdings Inc. | 5,084 | 199 | ||||
| BrightSpire Capital Inc. Class A | 27,342 | 190 | ||||
| * | SiriusPoint Ltd. | 17,039 | 188 | |||
| Sandy Spring Bancorp Inc. | 8,288 | 184 | ||||
| WisdomTree Inc. | 25,028 | 183 | ||||
| Safety Insurance Group Inc. | 2,608 | 180 | ||||
| ProAssurance Corp. | 9,985 | 177 | ||||
| PacWest Bancorp | 21,847 | 174 | ||||
| Argo Group International Holdings Ltd. | 5,838 | 174 | ||||
| Berkshire Hills Bancorp Inc. | 8,085 | 169 | ||||
| Redwood Trust Inc. | 20,905 | 167 | ||||
| * | Open Lending Corp. | 20,112 | 166 | |||
| Brookline Bancorp Inc. | 15,653 | 150 | ||||
| * | PRA Group Inc. | 7,236 | 141 | |||
| 1st Source Corp. | 3,126 | 140 | ||||
| Capitol Federal Financial Inc. | 24,023 | 136 | ||||
| Eagle Bancorp Inc. | 5,651 | 136 | ||||
| TFS Financial Corp. | 9,336 | 127 | ||||
| Brightsphere Investment Group Inc. | 6,093 | 126 | ||||
| * | Avantax Inc. | 5,924 | 124 | |||
| * | Lemonade Inc. | 8,700 | 120 | |||
| * | Columbia Financial Inc. | 6,104 | 105 | |||
| Community Trust Bancorp Inc. | 2,920 | 104 | ||||
| F&G Annuities & Life Inc. | 3,329 | 94 | ||||
| Washington Trust Bancorp Inc. | 3,131 | 88 | ||||
| Shares | Market Value• ($000) | |||||
| Kearny Financial Corp. | 11,041 | 82 | ||||
| Republic Bancorp Inc. Class A | 1,648 | 73 | ||||
| 677,716 | ||||||
| Health Care (13.9%) | ||||||
| Eli Lilly & Co. | 158,627 | 87,911 | ||||
| UnitedHealth Group Inc. | 174,224 | 83,032 | ||||
| Merck & Co. Inc. | 476,206 | 51,897 | ||||
| AbbVie Inc. | 330,887 | 48,627 | ||||
| Thermo Fisher Scientific Inc. | 72,344 | 40,303 | ||||
| Pfizer Inc. | 1,059,303 | 37,478 | ||||
| Abbott Laboratories | 324,626 | 33,404 | ||||
| Danaher Corp. | 123,333 | 32,683 | ||||
| Amgen Inc. | 100,216 | 25,689 | ||||
| Bristol-Myers Squibb Co. | 394,214 | 24,303 | ||||
| * | Intuitive Surgical Inc. | 65,476 | 20,473 | |||
| Medtronic plc | 249,068 | 20,299 | ||||
| Elevance Health Inc. | 44,399 | 19,625 | ||||
| Stryker Corp. | 66,673 | 18,905 | ||||
| Gilead Sciences Inc. | 234,440 | 17,930 | ||||
| * | Vertex Pharmaceuticals Inc. | 48,282 | 16,819 | |||
| Zoetis Inc. Class A | 86,888 | 16,553 | ||||
| * | Regeneron Pharmaceuticals Inc. | 19,436 | 16,064 | |||
| Cigna Group | 54,765 | 15,129 | ||||
| Becton Dickinson & Co. | 52,983 | 14,806 | ||||
| * | Boston Scientific Corp. | 269,429 | 14,533 | |||
| Humana Inc. | 23,417 | 10,810 | ||||
| HCA Healthcare Inc. | 38,317 | 10,625 | ||||
| * | Edwards Lifesciences Corp. | 113,034 | 8,644 | |||
| * | IDEXX Laboratories Inc. | 15,375 | 7,863 | |||
| * | IQVIA Holdings Inc. | 34,538 | 7,689 | |||
| * | Dexcom Inc. | 72,288 | 7,300 | |||
| * | Biogen Inc. | 27,083 | 7,241 | |||
| * | Moderna Inc. | 63,069 | 7,131 | |||
| Agilent Technologies Inc. | 55,469 | 6,716 | ||||
| * | Centene Corp. | 102,732 | 6,333 | |||
| * | Veeva Systems Inc. Class A | 27,153 | 5,667 | |||
| West Pharmaceutical Services Inc. | 13,858 | 5,639 | ||||
| * | Seagen Inc. | 26,292 | 5,418 | |||
| * | Align Technology Inc. | 14,329 | 5,304 | |||
| GE HealthCare Technologies Inc. | 72,959 | 5,140 | ||||
| * | Illumina Inc. | 29,495 | 4,873 | |||
| * | Horizon Therapeutics plc | 42,212 | 4,759 | |||
| Zimmer Biomet Holdings Inc. | 39,345 | 4,687 | ||||
| * | Alnylam Pharmaceuticals Inc. | 23,069 | 4,564 | |||
| ResMed Inc. | 27,061 | 4,319 | ||||
| STERIS plc | 18,465 | 4,239 | ||||
| Shares | Market Value• ($000) | |||||
| Cardinal Health Inc. | 48,258 | 4,214 | ||||
| * | ICON plc | 15,339 | 3,987 | |||
| Baxter International Inc. | 94,424 | 3,834 | ||||
| Laboratory Corp. of America Holdings | 16,592 | 3,453 | ||||
| * | Hologic Inc. | 45,590 | 3,407 | |||
| * | Molina Healthcare Inc. | 10,908 | 3,383 | |||
| Cooper Cos. Inc. | 9,088 | 3,362 | ||||
| * | BioMarin Pharmaceutical Inc. | 35,287 | 3,225 | |||
| * | Exact Sciences Corp. | 33,488 | 2,802 | |||
| Quest Diagnostics Inc. | 21,239 | 2,793 | ||||
| Revvity Inc. | 23,679 | 2,771 | ||||
| * | Avantor Inc. | 126,374 | 2,736 | |||
| * | Insulet Corp. | 12,884 | 2,470 | |||
| Viatris Inc. | 220,335 | 2,369 | ||||
| Bio-Techne Corp. | 29,167 | 2,287 | ||||
| * | Incyte Corp. | 34,211 | 2,208 | |||
| Royalty Pharma plc Class A | 69,757 | 2,080 | ||||
| * | Sarepta Therapeutics Inc. | 16,816 | 2,035 | |||
| * | Charles River Laboratories International Inc. | 9,494 | 1,964 | |||
| * | Neurocrine Biosciences Inc. | 18,011 | 1,961 | |||
| * | United Therapeutics Corp. | 8,385 | 1,881 | |||
| Teleflex Inc. | 8,820 | 1,876 | ||||
| * | Henry Schein Inc. | 24,498 | 1,875 | |||
| * | Penumbra Inc. | 6,888 | 1,822 | |||
| * | Repligen Corp. | 10,321 | 1,795 | |||
| * | Catalent Inc. | 33,572 | 1,678 | |||
| * | Jazz Pharmaceuticals plc | 11,555 | 1,657 | |||
| * | Bio-Rad Laboratories Inc. Class A | 3,996 | 1,599 | |||
| * | Shockwave Medical Inc. | 6,846 | 1,509 | |||
| Universal Health Services Inc. Class B | 11,145 | 1,501 | ||||
| DENTSPLY SIRONA Inc. | 40,193 | 1,491 | ||||
| * | Tenet Healthcare Corp. | 19,001 | 1,474 | |||
| Chemed Corp. | 2,691 | 1,376 | ||||
| * | Exelixis Inc. | 59,983 | 1,343 | |||
| Bruker Corp. | 20,124 | 1,320 | ||||
| Encompass Health Corp. | 18,360 | 1,304 | ||||
| * | Acadia Healthcare Co. Inc. | 16,682 | 1,286 | |||
| * | Karuna Therapeutics Inc. | 6,739 | 1,265 | |||
| * | Inspire Medical Systems Inc. | 5,334 | 1,210 | |||
| * | Globus Medical Inc. Class A | 22,183 | 1,200 | |||
| * | Medpace Holdings Inc. | 4,353 | 1,176 | |||
| * | Natera Inc. | 19,594 | 1,151 | |||
| * | Elanco Animal Health Inc. | 92,620 | 1,130 | |||
| * | Option Care Health Inc. | 31,157 | 1,085 | |||
| * | DaVita Inc. | 10,422 | 1,067 | |||
| * | Ionis Pharmaceuticals Inc. | 26,456 | 1,065 | |||
| * | Halozyme Therapeutics Inc. | 24,779 | 1,055 | |||
| Shares | Market Value• ($000) | |||||
| * | HealthEquity Inc. | 15,489 | 1,046 | |||
| Organon & Co. | 47,641 | 1,046 | ||||
| * | Masimo Corp. | 8,896 | 1,017 | |||
| Ensign Group Inc. | 10,052 | 1,007 | ||||
| * | Envista Holdings Corp. | 30,504 | 977 | |||
| * | Intra-Cellular Therapies Inc. | 17,085 | 949 | |||
| * | Neogen Corp. | 40,427 | 935 | |||
| * | agilon health Inc. | 51,949 | 921 | |||
| * | 10X Genomics Inc. Class A | 17,278 | 896 | |||
| * | Vaxcyte Inc. | 17,178 | 892 | |||
| * | Alkermes plc | 30,472 | 889 | |||
| Perrigo Co. plc | 25,228 | 883 | ||||
| * | Lantheus Holdings Inc. | 12,732 | 871 | |||
| * | Reata Pharmaceuticals Inc. Class A | 5,114 | 864 | |||
| * | Haemonetics Corp. | 9,335 | 838 | |||
| * | QuidelOrtho Corp. | 10,012 | 825 | |||
| * | Syneos Health Inc. | 19,254 | 823 | |||
| * | Guardant Health Inc. | 20,468 | 800 | |||
| * | Apellis Pharmaceuticals Inc. | 18,822 | 794 | |||
| * | Azenta Inc. | 12,834 | 724 | |||
| * | CRISPR Therapeutics AG | 14,396 | 720 | |||
| * | Teladoc Health Inc. | 30,306 | 686 | |||
| * | Ginkgo Bioworks Holdings Inc. Class A | 290,975 | 681 | |||
| * | Merit Medical Systems Inc. | 10,423 | 680 | |||
| * | Inari Medical Inc. | 10,102 | 673 | |||
| * | Amicus Therapeutics Inc. | 51,607 | 662 | |||
| CONMED Corp. | 5,924 | 660 | ||||
| * | REVOLUTION Medicines Inc. | 19,164 | 651 | |||
| * | Glaukos Corp. | 8,541 | 642 | |||
| * | Intellia Therapeutics Inc. | 16,891 | 633 | |||
| * | Cytokinetics Inc. | 17,688 | 618 | |||
| * | ACADIA Pharmaceuticals Inc. | 22,472 | 607 | |||
| * | Bridgebio Pharma Inc. | 19,712 | 590 | |||
| * | iRhythm Technologies Inc. | 5,618 | 581 | |||
| * | Integra LifeSciences Holdings Corp. | 13,637 | 580 | |||
| Select Medical Holdings Corp. | 19,548 | 571 | ||||
| * | Inmode Ltd. | 14,542 | 568 | |||
| * | Amedisys Inc. | 5,994 | 562 | |||
| * | Blueprint Medicines Corp. | 11,229 | 560 | |||
| * | LivaNova plc | 10,009 | 556 | |||
| * | Insmed Inc. | 25,393 | 556 | |||
| * | ICU Medical Inc. | 3,750 | 544 | |||
| * | Prestige Consumer Healthcare Inc. | 9,277 | 541 | |||
| * | Corcept Therapeutics Inc. | 16,244 | 532 | |||
| * | Integer Holdings Corp. | 6,206 | 529 | |||
| * | Progyny Inc. | 14,139 | 528 | |||
| * | Arrowhead Pharmaceuticals Inc. | 19,081 | 527 | |||
| Shares | Market Value• ($000) | |||||
| * | Axonics Inc. | 9,167 | 525 | |||
| * | Evolent Health Inc. Class A | 20,542 | 524 | |||
| * | Pacific Biosciences of California Inc. | 46,128 | 520 | |||
| * | PTC Therapeutics Inc. | 13,151 | 519 | |||
| * | Denali Therapeutics Inc. | 22,417 | 518 | |||
| * | Doximity Inc. Class A | 20,956 | 500 | |||
| Patterson Cos. Inc. | 16,257 | 488 | ||||
| * | R1 RCM Inc. | 28,165 | 486 | |||
| * | Axsome Therapeutics Inc. | 5,972 | 483 | |||
| Premier Inc. Class A | 22,182 | 478 | ||||
| * | Omnicell Inc. | 8,329 | 474 | |||
| * | Madrigal Pharmaceuticals Inc. | 2,588 | 466 | |||
| * | Ultragenyx Pharmaceutical Inc. | 12,532 | 461 | |||
| * | Surgery Partners Inc. | 12,706 | 461 | |||
| * | Fortrea Holdings Inc. | 16,565 | 456 | |||
| * | Xenon Pharmaceuticals Inc. | 11,417 | 445 | |||
| * | Novocure Ltd. | 19,435 | 429 | |||
| * | Akero Therapeutics Inc. | 8,400 | 417 | |||
| * | STAAR Surgical Co. | 8,986 | 390 | |||
| * | Prothena Corp. plc | 7,363 | 389 | |||
| * | AtriCure Inc. | 8,469 | 382 | |||
| * | CorVel Corp. | 1,643 | 356 | |||
| * | NeoGenomics Inc. | 23,569 | 354 | |||
| * | Certara Inc. | 21,782 | 352 | |||
| * | Veracyte Inc. | 13,302 | 351 | |||
| * | Privia Health Group Inc. | 12,695 | 333 | |||
| * | Tandem Diabetes Care Inc. | 11,907 | 326 | |||
| * | SpringWorks Therapeutics Inc. | 11,100 | 313 | |||
| * | Mirati Therapeutics Inc. | 8,348 | 311 | |||
| * | Sotera Health Co. | 18,430 | 297 | |||
| * | Supernus Pharmaceuticals Inc. | 9,199 | 293 | |||
| * | Pacira BioSciences Inc. | 8,285 | 292 | |||
| * | Agios Pharmaceuticals Inc. | 10,088 | 277 | |||
| * | Beam Therapeutics Inc. | 11,849 | 275 | |||
| * | Myriad Genetics Inc. | 14,962 | 267 | |||
| * | Phreesia Inc. | 9,200 | 262 | |||
| * | TG Therapeutics Inc. | 24,886 | 261 | |||
| * | Arvinas Inc. | 8,984 | 253 | |||
| * | Cerevel Therapeutics Holdings Inc. | 10,612 | 251 | |||
| * | BioCryst Pharmaceuticals Inc. | 34,441 | 245 | |||
| * | Harmony Biosciences Holdings Inc. | 6,700 | 243 | |||
| * | Iovance Biotherapeutics Inc. | 39,658 | 240 | |||
| * | Xencor Inc. | 10,589 | 233 | |||
| * | Owens & Minor Inc. | 13,655 | 231 | |||
| * | Zentalis Pharmaceuticals Inc. | 8,712 | 231 | |||
| * | Twist Bioscience Corp. | 10,447 | 230 | |||
| Shares | Market Value• ($000) | |||||
| * | Aurinia Pharmaceuticals Inc. | 25,060 | 227 | |||
| * | Ironwood Pharmaceuticals Inc. Class A | 25,628 | 226 | |||
| * | Recursion Pharmaceuticals Inc. Class A | 25,730 | 224 | |||
| * | Pediatrix Medical Group Inc. | 15,418 | 218 | |||
| * | Biohaven Ltd. | 11,703 | 214 | |||
| * | Maravai LifeSciences Holdings Inc. Class A | 20,550 | 212 | |||
| * | Vir Biotechnology Inc. | 15,875 | 201 | |||
| * | Amylyx Pharmaceuticals Inc. | 9,300 | 201 | |||
| * | Arcus Biosciences Inc. | 9,512 | 195 | |||
| Embecta Corp. | 10,652 | 195 | ||||
| * | Sage Therapeutics Inc. | 9,724 | 194 | |||
| * | NextGen Healthcare Inc. | 10,104 | 184 | |||
| * | Ligand Pharmaceuticals Inc. | 2,774 | 182 | |||
| * | Avanos Medical Inc. | 8,522 | 179 | |||
| * | Rocket Pharmaceuticals Inc. | 10,400 | 163 | |||
| * | Relay Therapeutics Inc. | 15,718 | 161 | |||
| * | AdaptHealth Corp. Class A | 13,400 | 160 | |||
| Healthcare Services Group Inc. | 13,674 | 158 | ||||
| * | Innoviva Inc. | 11,612 | 148 | |||
| *,1 | Cassava Sciences Inc. | 7,026 | 147 | |||
| * | OPKO Health Inc. | 76,136 | 139 | |||
| * | Adaptive Biotechnologies Corp. | 20,606 | 139 | |||
| * | Varex Imaging Corp. | 7,088 | 139 | |||
| * | Kymera Therapeutics Inc. | 7,106 | 136 | |||
| * | REGENXBIO Inc. | 7,439 | 132 | |||
| * | Fulgent Genetics Inc. | 4,000 | 131 | |||
| * | Nevro Corp. | 6,466 | 130 | |||
| *,1 | Novavax Inc. | 16,169 | 129 | |||
| * | Multiplan Corp. | 70,850 | 121 | |||
| * | Theravance Biopharma Inc. | 12,406 | 118 | |||
| * | Enhabit Inc. | 9,123 | 117 | |||
| * | Editas Medicine Inc. | 12,906 | 115 | |||
| * | Alignment Healthcare Inc. | 18,206 | 106 | |||
| *,1 | CureVac NV | 11,912 | 106 | |||
| * | Sana Biotechnology Inc. | 17,500 | 94 | |||
| * | CareDx Inc. | 9,492 | 88 | |||
| * | uniQure NV | 8,200 | 71 | |||
| * | Alector Inc. | 11,500 | 63 | |||
| * | Taro Pharmaceutical Industries Ltd. | 1,552 | 61 | |||
| * | American Well Corp. Class A | 41,400 | 59 | |||
| * | Allogene Therapeutics Inc. | 14,600 | 57 | |||
| * | Enanta Pharmaceuticals Inc. | 3,742 | 56 | |||
| Shares | Market Value• ($000) | |||||
| * | Fate Therapeutics Inc. | 15,328 | 38 | |||
| *,3 | Scilex Holding Co. (Acquired 1/23/23, Cost $126) | 12,014 | 31 | |||
| * | FibroGen Inc. | 16,106 | 15 | |||
| *,2 | OmniAb Inc. 12.5 Earnout | 1,051 | — | |||
| *,2 | OmniAb Inc. 15 Earnout | 1,051 | — | |||
| 944,259 | ||||||
| Industrials (10.8%) | ||||||
| Visa Inc. Class A | 303,511 | 74,567 | ||||
| Mastercard Inc. Class A | 157,243 | 64,885 | ||||
| Accenture plc Class A | 118,401 | 38,335 | ||||
| Caterpillar Inc. | 96,806 | 27,215 | ||||
| Union Pacific Corp. | 114,309 | 25,213 | ||||
| United Parcel Service Inc. Class B | 135,663 | 22,981 | ||||
| Deere & Co. | 51,213 | 21,045 | ||||
| Automatic Data Processing Inc. | 77,518 | 19,737 | ||||
| American Express Co. | 110,885 | 17,519 | ||||
| Illinois Tool Works Inc. | 56,816 | 14,053 | ||||
| * | Fiserv Inc. | 115,169 | 13,980 | |||
| * | PayPal Holdings Inc. | 210,524 | 13,160 | |||
| Sherwin-Williams Co. | 44,568 | 12,110 | ||||
| CSX Corp. | 381,023 | 11,507 | ||||
| FedEx Corp. | 43,438 | 11,338 | ||||
| Carrier Global Corp. | 155,376 | 8,926 | ||||
| Trane Technologies plc | 42,739 | 8,773 | ||||
| Cintas Corp. | 16,272 | 8,204 | ||||
| PACCAR Inc. | 96,038 | 7,903 | ||||
| Old Dominion Freight Line Inc. | 18,432 | 7,877 | ||||
| Johnson Controls International plc | 128,257 | 7,575 | ||||
| Paychex Inc. | 60,482 | 7,393 | ||||
| Capital One Financial Corp. | 70,836 | 7,253 | ||||
| Rockwell Automation Inc. | 21,581 | 6,735 | ||||
| Otis Worldwide Corp. | 77,384 | 6,620 | ||||
| DuPont de Nemours Inc. | 86,020 | 6,614 | ||||
| Verisk Analytics Inc. Class A | 26,764 | 6,483 | ||||
| Fidelity National Information Services Inc. | 111,304 | 6,217 | ||||
| Global Payments Inc. | 48,992 | 6,207 | ||||
| * | Block Inc. Class A | 101,671 | 5,861 | |||
| Vulcan Materials Co. | 24,772 | 5,406 | ||||
| Ingersoll Rand Inc. | 76,139 | 5,300 | ||||
| Martin Marietta Materials Inc. | 11,481 | 5,125 | ||||
| * | Mettler-Toledo International Inc. | 4,029 | 4,889 | |||
| Equifax Inc. | 22,755 | 4,703 | ||||
| * | Keysight Technologies Inc. | 33,230 | 4,430 | |||
| * | Fair Isaac Corp. | 4,557 | 4,122 | |||
| Dover Corp. | 25,809 | 3,827 | ||||
| Shares | Market Value• ($000) | |||||
| Westinghouse Air Brake Technologies Corp. | 33,282 | 3,745 | ||||
| * | FleetCor Technologies Inc. | 13,508 | 3,671 | |||
| * | Builders FirstSource Inc. | 23,753 | 3,445 | |||
| Expeditors International of Washington Inc. | 28,660 | 3,345 | ||||
| IDEX Corp. | 14,252 | 3,227 | ||||
| * | Waters Corp. | 11,043 | 3,101 | |||
| * | NU Holdings Ltd. Class A | 431,940 | 2,959 | |||
| TransUnion | 36,124 | 2,934 | ||||
| JB Hunt Transport Services Inc. | 15,443 | 2,901 | ||||
| * | Axon Enterprise Inc. | 13,006 | 2,769 | |||
| Stanley Black & Decker Inc. | 28,773 | 2,716 | ||||
| * | Zebra Technologies Corp. Class A | 9,665 | 2,658 | |||
| Nordson Corp. | 10,743 | 2,623 | ||||
| Snap-on Inc. | 9,688 | 2,602 | ||||
| Synchrony Financial | 79,319 | 2,560 | ||||
| * | Trimble Inc. | 46,124 | 2,527 | |||
| Masco Corp. | 42,276 | 2,495 | ||||
| Graco Inc. | 31,440 | 2,482 | ||||
| Carlisle Cos. Inc. | 9,374 | 2,466 | ||||
| Packaging Corp. of America | 16,471 | 2,456 | ||||
| Owens Corning | 16,859 | 2,426 | ||||
| RPM International Inc. | 23,941 | 2,388 | ||||
| Lennox International Inc. | 6,035 | 2,274 | ||||
| Watsco Inc. | 6,163 | 2,247 | ||||
| * | BILL Holdings Inc. | 19,288 | 2,224 | |||
| Jack Henry & Associates Inc. | 13,574 | 2,128 | ||||
| * | Saia Inc. | 4,978 | 2,122 | |||
| Toro Co. | 19,541 | 1,999 | ||||
| Regal Rexnord Corp. | 12,234 | 1,984 | ||||
| CH Robinson Worldwide Inc. | 21,787 | 1,970 | ||||
| Allegion plc | 16,423 | 1,869 | ||||
| * | AerCap Holdings NV | 29,800 | 1,833 | |||
| Crown Holdings Inc. | 19,774 | 1,832 | ||||
| nVent Electric plc | 30,965 | 1,751 | ||||
| * | TopBuild Corp. | 5,949 | 1,726 | |||
| Fortune Brands Innovations Inc. | 23,953 | 1,653 | ||||
| A O Smith Corp. | 22,541 | 1,634 | ||||
| AptarGroup Inc. | 12,323 | 1,634 | ||||
| Knight-Swift Transportation Holdings Inc. Class A | 29,276 | 1,605 | ||||
| * | WEX Inc. | 8,179 | 1,605 | |||
| * | XPO Inc. | 21,412 | 1,598 | |||
| * | Paylocity Holding Corp. | 7,929 | 1,590 | |||
| Westrock Co. | 47,571 | 1,556 | ||||
| Cognex Corp. | 32,530 | 1,532 | ||||
| * | WillScot Mobile Mini Holdings Corp. | 36,808 | 1,510 | |||
| AGCO Corp. | 11,597 | 1,502 | ||||
| Shares | Market Value• ($000) | |||||
| Advanced Drainage Systems Inc. | 11,631 | 1,491 | ||||
| Berry Global Group Inc. | 22,801 | 1,490 | ||||
| * | Trex Co. Inc. | 20,637 | 1,473 | |||
| Robert Half Inc. | 19,858 | 1,469 | ||||
| Donaldson Co. Inc. | 22,810 | 1,457 | ||||
| * | Middleby Corp. | 10,007 | 1,457 | |||
| * | Chart Industries Inc. | 7,923 | 1,431 | |||
| * | GXO Logistics Inc. | 21,972 | 1,406 | |||
| * | Generac Holdings Inc. | 11,656 | 1,385 | |||
| WESCO International Inc. | 8,344 | 1,350 | ||||
| Simpson Manufacturing Co. Inc. | 8,003 | 1,279 | ||||
| Graphic Packaging Holding Co. | 57,355 | 1,276 | ||||
| Eagle Materials Inc. | 6,710 | 1,270 | ||||
| MSA Safety Inc. | 6,924 | 1,265 | ||||
| Landstar System Inc. | 6,659 | 1,264 | ||||
| MKS Instruments Inc. | 12,520 | 1,255 | ||||
| Genpact Ltd. | 33,449 | 1,249 | ||||
| Comfort Systems USA Inc. | 6,612 | 1,220 | ||||
| Littelfuse Inc. | 4,525 | 1,209 | ||||
| * | FTI Consulting Inc. | 6,367 | 1,183 | |||
| * | Axalta Coating Systems Ltd. | 41,319 | 1,169 | |||
| * | MasTec Inc. | 11,403 | 1,134 | |||
| * | Atkore Inc. | 7,297 | 1,124 | |||
| Applied Industrial Technologies Inc. | 7,134 | 1,101 | ||||
| * | API Group Corp. | 38,535 | 1,085 | |||
| Brunswick Corp. | 13,537 | 1,071 | ||||
| Sonoco Products Co. | 18,284 | 1,050 | ||||
| Sealed Air Corp. | 27,303 | 1,012 | ||||
| * | Mohawk Industries Inc. | 9,891 | 1,003 | |||
| Valmont Industries Inc. | 3,918 | 993 | ||||
| Watts Water Technologies Inc. Class A | 5,148 | 972 | ||||
| Acuity Brands Inc. | 5,989 | 966 | ||||
| Vontier Corp. | 29,740 | 934 | ||||
| * | Kirby Corp. | 11,247 | 932 | |||
| Maximus Inc. | 11,299 | 913 | ||||
| Badger Meter Inc. | 5,439 | 903 | ||||
| * | ExlService Holdings Inc. | 30,360 | 887 | |||
| MSC Industrial Direct Co. Inc. Class A | 8,630 | 881 | ||||
| * | Affirm Holdings Inc. Class A | 41,667 | 867 | |||
| Western Union Co. | 69,905 | 863 | ||||
| Triton International Ltd. | 10,070 | 845 | ||||
| Ryder System Inc. | 8,305 | 836 | ||||
| * | Summit Materials Inc. Class A | 22,258 | 833 | |||
| Franklin Electric Co. Inc. | 8,591 | 831 | ||||
| Zurn Elkay Water Solutions Corp. | 27,995 | 829 | ||||
| * | Beacon Roofing Supply Inc. | 10,038 | 802 | |||
| Shares | Market Value• ($000) | |||||
| Air Lease Corp. Class A | 19,481 | 794 | ||||
| * | AZEK Co. Inc. Class A | 23,338 | 794 | |||
| * | Euronet Worldwide Inc. | 8,894 | 777 | |||
| AAON Inc. | 12,299 | 776 | ||||
| GATX Corp. | 6,503 | 768 | ||||
| * | TriNet Group Inc. | 6,925 | 768 | |||
| Louisiana-Pacific Corp. | 12,143 | 759 | ||||
| Terex Corp. | 12,476 | 756 | ||||
| * | ASGN Inc. | 9,156 | 752 | |||
| ManpowerGroup Inc. | 9,466 | 747 | ||||
| Belden Inc. | 7,954 | 747 | ||||
| HB Fuller Co. | 10,042 | 728 | ||||
| Silgan Holdings Inc. | 15,400 | 695 | ||||
| Herc Holdings Inc. | 5,275 | 686 | ||||
| Federal Signal Corp. | 11,150 | 680 | ||||
| Insperity Inc. | 6,656 | 674 | ||||
| * | AMN Healthcare Services Inc. | 7,415 | 655 | |||
| John Bean Technologies Corp. | 5,924 | 651 | ||||
| Armstrong World Industries Inc. | 8,482 | 650 | ||||
| * | SPX Technologies Inc. | 8,111 | 641 | |||
| Brink's Co. | 8,433 | 639 | ||||
| Installed Building Products Inc. | 4,417 | 639 | ||||
| * | StoneCo Ltd. Class A | 51,539 | 632 | |||
| Hillenbrand Inc. | 12,955 | 628 | ||||
| * | Flywire Corp. | 17,880 | 618 | |||
| * | Shift4 Payments Inc. Class A | 10,439 | 593 | |||
| * | Itron Inc. | 8,482 | 580 | |||
| * | Marqeta Inc. Class A | 94,248 | 580 | |||
| * | O-I Glass Inc. | 28,636 | 569 | |||
| * | Alight Inc. Class A | 71,842 | 549 | |||
| * | Dycom Industries Inc. | 5,426 | 542 | |||
| Scorpio Tankers Inc. | 10,124 | 511 | ||||
| * | ACI Worldwide Inc. | 20,836 | 506 | |||
| * | Bloom Energy Corp. Class A | 33,684 | 505 | |||
| Korn Ferry | 9,743 | 497 | ||||
| UniFirst Corp. | 2,814 | 496 | ||||
| Werner Enterprises Inc. | 11,888 | 495 | ||||
| * | CBIZ Inc. | 8,822 | 495 | |||
| * | Core & Main Inc. Class A | 14,962 | 491 | |||
| Encore Wire Corp. | 2,965 | 489 | ||||
| ArcBest Corp. | 4,500 | 475 | ||||
| * | Hub Group Inc. Class A | 6,052 | 472 | |||
| * | Verra Mobility Corp. Class A | 26,101 | 464 | |||
| Kadant Inc. | 2,104 | 462 | ||||
| McGrath RentCorp | 4,510 | 456 | ||||
| EVERTEC Inc. | 11,267 | 446 | ||||
| * | Gibraltar Industries Inc. | 5,806 | 436 | |||
| * | Masonite International Corp. | 4,078 | 419 | |||
| Shares | Market Value• ($000) | |||||
| * | Dlocal Ltd. Class A | 19,268 | 413 | |||
| * | OSI Systems Inc. | 2,959 | 403 | |||
| * | RXO Inc. | 21,118 | 382 | |||
| Trinity Industries Inc. | 15,180 | 381 | ||||
| * | Hayward Holdings Inc. | 24,842 | 368 | |||
| * | Huron Consulting Group Inc. | 3,676 | 367 | |||
| Forward Air Corp. | 5,066 | 359 | ||||
| *,1 | Enovix Corp. | 25,574 | 352 | |||
| Bread Financial Holdings Inc. | 9,312 | 350 | ||||
| Helios Technologies Inc. | 5,999 | 347 | ||||
| Primoris Services Corp. | 9,814 | 347 | ||||
| Griffon Corp. | 8,100 | 339 | ||||
| Granite Construction Inc. | 8,197 | 338 | ||||
| * | Pagseguro Digital Ltd. Class A | 37,341 | 335 | |||
| * | Masterbrand Inc. | 24,207 | 310 | |||
| Schneider National Inc. Class B | 10,054 | 291 | ||||
| Tennant Co. | 3,447 | 284 | ||||
| * | Gates Industrial Corp. plc | 22,607 | 278 | |||
| H&E Equipment Services Inc. | 5,959 | 270 | ||||
| Lindsay Corp. | 2,028 | 252 | ||||
| ADT Inc. | 39,028 | 251 | ||||
| Greenbrier Cos. Inc. | 5,862 | 249 | ||||
| SFL Corp. Ltd. | 21,319 | 241 | ||||
| * | American Woodmark Corp. | 3,062 | 238 | |||
| * | JELD-WEN Holding Inc. | 15,738 | 237 | |||
| Astec Industries Inc. | 4,260 | 234 | ||||
| * | Cimpress plc | 3,328 | 215 | |||
| Apogee Enterprises Inc. | 4,145 | 209 | ||||
| * | Kornit Digital Ltd. | 9,294 | 207 | |||
| * | Legalzoom.com Inc. | 17,900 | 204 | |||
| TriMas Corp. | 7,762 | 203 | ||||
| 1 | ZIM Integrated Shipping Services Ltd. | 15,300 | 185 | |||
| Golden Ocean Group Ltd. | 22,800 | 167 | ||||
| Deluxe Corp. | 8,064 | 163 | ||||
| 1 | Star Bulk Carriers Corp. | 9,200 | 162 | |||
| * | Proto Labs Inc. | 5,100 | 150 | |||
| Matson Inc. | 1,519 | 133 | ||||
| * | Green Dot Corp. Class A | 8,701 | 129 | |||
| Heartland Express Inc. | 8,511 | 128 | ||||
| * | CryoPort Inc. | 8,100 | 114 | |||
| * | Virgin Galactic Holdings Inc. | 44,736 | 113 | |||
| TTEC Holdings Inc. | 3,470 | 103 | ||||
| Ardagh Metal Packaging SA | 27,700 | 99 | ||||
| * | TrueBlue Inc. | 5,941 | 90 | |||
| Trinseo plc | 6,543 | 69 | ||||
| * | Forrester Research Inc. | 2,169 | 66 | |||
| 731,984 | ||||||
| Shares | Market Value• ($000) | |||||
| Real Estate (3.3%) | ||||||
| Prologis Inc. | 172,761 | 21,457 | ||||
| American Tower Corp. | 87,387 | 15,845 | ||||
| Equinix Inc. | 17,461 | 13,644 | ||||
| Crown Castle Inc. | 80,980 | 8,138 | ||||
| Public Storage | 29,313 | 8,102 | ||||
| Welltower Inc. | 93,179 | 7,723 | ||||
| Digital Realty Trust Inc. | 54,519 | 7,181 | ||||
| Realty Income Corp. | 124,036 | 6,951 | ||||
| Simon Property Group Inc. | 60,596 | 6,877 | ||||
| * | CoStar Group Inc. | 75,661 | 6,203 | |||
| Extra Space Storage Inc. | 38,931 | 5,010 | ||||
| * | CBRE Group Inc. Class A | 58,223 | 4,952 | |||
| AvalonBay Communities Inc. | 26,195 | 4,815 | ||||
| SBA Communications Corp. Class A | 20,272 | 4,552 | ||||
| Equity Residential | 69,453 | 4,503 | ||||
| Invitation Homes Inc. | 114,449 | 3,902 | ||||
| Alexandria Real Estate Equities Inc. | 32,268 | 3,754 | ||||
| Iron Mountain Inc. | 54,110 | 3,438 | ||||
| Ventas Inc. | 74,846 | 3,269 | ||||
| Mid-America Apartment Communities Inc. | 21,949 | 3,188 | ||||
| Essex Property Trust Inc. | 12,044 | 2,871 | ||||
| Sun Communities Inc. | 22,815 | 2,793 | ||||
| WP Carey Inc. | 40,003 | 2,602 | ||||
| UDR Inc. | 61,399 | 2,450 | ||||
| American Homes 4 Rent Class A | 62,528 | 2,253 | ||||
| Equity LifeStyle Properties Inc. | 33,245 | 2,226 | ||||
| Kimco Realty Corp. | 113,256 | 2,145 | ||||
| Healthpeak Properties Inc. | 102,478 | 2,109 | ||||
| Regency Centers Corp. | 33,845 | 2,105 | ||||
| Host Hotels & Resorts Inc. | 132,733 | 2,096 | ||||
| Camden Property Trust | 19,425 | 2,091 | ||||
| Rexford Industrial Realty Inc. | 37,955 | 2,029 | ||||
| Boston Properties Inc. | 29,452 | 1,967 | ||||
| CubeSmart | 41,888 | 1,747 | ||||
| Americold Realty Trust Inc. | 50,365 | 1,695 | ||||
| * | Jones Lang LaSalle Inc. | 8,969 | 1,550 | |||
| * | Zillow Group Inc. Class C | 29,057 | 1,516 | |||
| Lamar Advertising Co. Class A | 16,205 | 1,478 | ||||
| EastGroup Properties Inc. | 8,217 | 1,476 | ||||
| Federal Realty Investment Trust | 15,061 | 1,475 | ||||
| Omega Healthcare Investors Inc. | 44,009 | 1,400 | ||||
| NNN REIT Inc. | 33,945 | 1,337 | ||||
| First Industrial Realty Trust Inc. | 24,668 | 1,281 | ||||
| Healthcare Realty Trust Inc. Class A | 71,063 | 1,245 | ||||
| Shares | Market Value• ($000) | |||||
| Brixmor Property Group Inc. | 55,878 | 1,228 | ||||
| STAG Industrial Inc. | 33,582 | 1,227 | ||||
| Agree Realty Corp. | 16,369 | 1,012 | ||||
| Spirit Realty Capital Inc. | 26,043 | 1,006 | ||||
| Apartment Income REIT Corp. Class A | 28,005 | 954 | ||||
| Terreno Realty Corp. | 15,045 | 916 | ||||
| Kite Realty Group Trust | 40,557 | 915 | ||||
| Ryman Hospitality Properties Inc. | 10,723 | 912 | ||||
| Rayonier Inc. | 27,324 | 817 | ||||
| Kilroy Realty Corp. | 21,832 | 807 | ||||
| 1 | Medical Properties Trust Inc. | 111,216 | 803 | |||
| Vornado Realty Trust | 33,248 | 799 | ||||
| Phillips Edison & Co. Inc. | 21,863 | 740 | ||||
| Independence Realty Trust Inc. | 41,815 | 704 | ||||
| PotlatchDeltic Corp. | 14,823 | 701 | ||||
| Essential Properties Realty Trust Inc. | 28,955 | 695 | ||||
| Cousins Properties Inc. | 28,506 | 670 | ||||
| EPR Properties | 13,912 | 623 | ||||
| Apple Hospitality REIT Inc. | 40,239 | 604 | ||||
| Physicians Realty Trust | 42,409 | 590 | ||||
| Broadstone Net Lease Inc. | 36,287 | 587 | ||||
| Sabra Health Care REIT Inc. | 43,900 | 550 | ||||
| Corporate Office Properties Trust | 21,168 | 548 | ||||
| Park Hotels & Resorts Inc. | 41,937 | 538 | ||||
| DigitalBridge Group Inc. | 29,508 | 514 | ||||
| LXP Industrial Trust | 50,942 | 500 | ||||
| * | Zillow Group Inc. Class A | 9,584 | 488 | |||
| * | Howard Hughes Holdings Inc. | 6,120 | 481 | |||
| SITE Centers Corp. | 35,659 | 476 | ||||
| National Storage Affiliates Trust | 14,177 | 476 | ||||
| Macerich Co. | 40,055 | 468 | ||||
| Highwoods Properties Inc. | 19,612 | 467 | ||||
| SL Green Realty Corp. | 11,887 | 467 | ||||
| Innovative Industrial Properties Inc. | 5,185 | 453 | ||||
| Douglas Emmett Inc. | 31,943 | 437 | ||||
| Tanger Factory Outlet Centers Inc. | 18,800 | 437 | ||||
| Hannon Armstrong Sustainable Infrastructure Capital Inc. | 18,617 | 416 | ||||
| National Health Investors Inc. | 7,833 | 400 | ||||
| St. Joe Co. | 6,311 | 390 | ||||
| Four Corners Property Trust Inc. | 15,474 | 389 | ||||
| Equity Commonwealth | 19,510 | 371 | ||||
| Shares | Market Value• ($000) | |||||
| CareTrust REIT Inc. | 18,431 | 371 | ||||
| Kennedy-Wilson Holdings Inc. | 22,184 | 354 | ||||
| Urban Edge Properties | 21,660 | 354 | ||||
| Sunstone Hotel Investors Inc. | 39,277 | 353 | ||||
| Pebblebrook Hotel Trust | 24,310 | 352 | ||||
| * | Opendoor Technologies Inc. | 89,975 | 351 | |||
| JBG SMITH Properties | 20,199 | 317 | ||||
| DiamondRock Hospitality Co. | 38,909 | 314 | ||||
| Outfront Media Inc. | 27,414 | 311 | ||||
| Retail Opportunity Investments Corp. | 22,900 | 308 | ||||
| RLJ Lodging Trust | 29,929 | 299 | ||||
| * | Veris Residential Inc. | 15,914 | 296 | |||
| * | Cushman & Wakefield plc | 29,300 | 269 | |||
| Acadia Realty Trust | 17,518 | 261 | ||||
| Elme Communities | 16,643 | 256 | ||||
| eXp World Holdings Inc. | 13,200 | 254 | ||||
| Xenia Hotels & Resorts Inc. | 21,138 | 249 | ||||
| Alexander & Baldwin Inc. | 13,599 | 245 | ||||
| LTC Properties Inc. | 7,353 | 242 | ||||
| Uniti Group Inc. | 44,198 | 237 | ||||
| Getty Realty Corp. | 7,813 | 235 | ||||
| Global Net Lease Inc. | 19,342 | 220 | ||||
| Empire State Realty Trust Inc. Class A | 24,900 | 217 | ||||
| Apartment Investment & Management Co. Class A | 27,900 | 212 | ||||
| American Assets Trust Inc. | 9,328 | 200 | ||||
| Paramount Group Inc. | 35,404 | 182 | ||||
| Centerspace | 2,789 | 181 | ||||
| Hudson Pacific Properties Inc. | 26,082 | 178 | ||||
| Newmark Group Inc. Class A | 24,936 | 177 | ||||
| RPT Realty | 15,423 | 175 | ||||
| Marcus & Millichap Inc. | 4,757 | 158 | ||||
| Piedmont Office Realty Trust Inc. Class A | 22,871 | 157 | ||||
| Brandywine Realty Trust | 31,193 | 156 | ||||
| * | Anywhere Real Estate Inc. | 19,737 | 129 | |||
| Universal Health Realty Income Trust | 2,431 | 113 | ||||
| Summit Hotel Properties Inc. | 19,124 | 111 | ||||
| Saul Centers Inc. | 2,184 | 82 | ||||
| * | Star Holdings | 3,121 | 42 | |||
| * | WeWork Inc. Class A | 39,708 | 5 | |||
| 224,940 | ||||||
| Technology (35.3%) | ||||||
| Apple Inc. | 2,797,792 | 525,621 | ||||
| Microsoft Corp. | 1,395,251 | 457,308 | ||||
| NVIDIA Corp. | 445,449 | 219,851 | ||||
| Shares | Market Value• ($000) | |||||
| * | Alphabet Inc. Class C | 1,035,830 | 142,271 | |||
| * | Alphabet Inc. Class A | 1,043,520 | 142,096 | |||
| * | Meta Platforms Inc. Class A | 414,725 | 122,713 | |||
| Broadcom Inc. | 76,520 | 70,620 | ||||
| * | Adobe Inc. | 85,902 | 48,048 | |||
| * | Salesforce Inc. | 177,465 | 39,301 | |||
| Oracle Corp. | 285,026 | 34,314 | ||||
| * | Advanced Micro Devices Inc. | 300,584 | 31,778 | |||
| Texas Instruments Inc. | 170,326 | 28,625 | ||||
| Intuit Inc. | 51,218 | 27,750 | ||||
| Intel Corp. | 782,827 | 27,509 | ||||
| Applied Materials Inc. | 158,009 | 24,137 | ||||
| QUALCOMM Inc. | 209,180 | 23,957 | ||||
| * | ServiceNow Inc. | 38,146 | 22,462 | |||
| Lam Research Corp. | 25,150 | 17,665 | ||||
| Micron Technology Inc. | 204,876 | 14,329 | ||||
| * | Palo Alto Networks Inc. | 55,840 | 13,586 | |||
| * | Synopsys Inc. | 28,460 | 13,060 | |||
| KLA Corp. | 25,685 | 12,891 | ||||
| * | Cadence Design Systems Inc. | 50,644 | 12,177 | |||
| NXP Semiconductors NV | 48,540 | 9,986 | ||||
| Marvell Technology Inc. | 160,319 | 9,339 | ||||
| * | Snowflake Inc. Class A | 58,192 | 9,127 | |||
| * | Workday Inc. Class A | 37,141 | 9,081 | |||
| * | Autodesk Inc. | 40,361 | 8,958 | |||
| Microchip Technology Inc. | 100,892 | 8,257 | ||||
| * | ON Semiconductor Corp. | 80,666 | 7,942 | |||
| * | Fortinet Inc. | 123,158 | 7,415 | |||
| Cognizant Technology Solutions Corp. Class A | 95,067 | 6,808 | ||||
| * | VMware Inc. Class A | 40,308 | 6,803 | |||
| * | Crowdstrike Holdings Inc. Class A | 39,504 | 6,440 | |||
| * | Atlassian Corp. Class A | 27,303 | 5,571 | |||
| CDW Corp. | 25,326 | 5,348 | ||||
| * | Palantir Technologies Inc. Class A | 351,157 | 5,260 | |||
| * | Gartner Inc. | 14,340 | 5,014 | |||
| * | Datadog Inc. Class A | 51,202 | 4,940 | |||
| HP Inc. | 161,963 | 4,812 | ||||
| * | DoorDash Inc. Class A | 56,654 | 4,766 | |||
| * | MongoDB Inc. Class A | 12,391 | 4,725 | |||
| * | HubSpot Inc. | 8,600 | 4,700 | |||
| Corning Inc. | 142,574 | 4,679 | ||||
| Monolithic Power Systems Inc. | 8,476 | 4,418 | ||||
| Hewlett Packard Enterprise Co. | 241,203 | 4,098 | ||||
| * | Splunk Inc. | 29,830 | 3,617 | |||
| * | Cloudflare Inc. Class A | 54,041 | 3,514 | |||
| * | VeriSign Inc. | 16,893 | 3,510 | |||
| * | Zoom Video Communications Inc. Class A | 46,067 | 3,272 | |||
| Shares | Market Value• ($000) | |||||
| Skyworks Solutions Inc. | 29,814 | 3,242 | ||||
| Teradyne Inc. | 29,392 | 3,171 | ||||
| * | PTC Inc. | 21,428 | 3,154 | |||
| * | Tyler Technologies Inc. | 7,892 | 3,144 | |||
| NetApp Inc. | 39,903 | 3,061 | ||||
| * | Pinterest Inc. Class A | 111,340 | 3,061 | |||
| * | Akamai Technologies Inc. | 29,088 | 3,057 | |||
| Paycom Software Inc. | 9,748 | 2,874 | ||||
| Entegris Inc. | 27,792 | 2,815 | ||||
| Jabil Inc. | 24,431 | 2,795 | ||||
| * | Western Digital Corp. | 59,623 | 2,683 | |||
| * | EPAM Systems Inc. | 10,333 | 2,676 | |||
| Seagate Technology Holdings plc | 36,197 | 2,562 | ||||
| * | Zscaler Inc. | 16,405 | 2,560 | |||
| Vertiv Holdings Co. Class A | 64,240 | 2,530 | ||||
| * | Lattice Semiconductor Corp. | 25,468 | 2,477 | |||
| * | Match Group Inc. | 52,217 | 2,447 | |||
| * | Super Micro Computer Inc. | 8,723 | 2,400 | |||
| * | Okta Inc. Class A | 28,337 | 2,366 | |||
| * | Check Point Software Technologies Ltd. | 17,557 | 2,363 | |||
| * | Manhattan Associates Inc. | 11,602 | 2,351 | |||
| * | Flex Ltd. | 84,326 | 2,327 | |||
| SS&C Technologies Holdings Inc. | 40,311 | 2,315 | ||||
| * | Black Knight Inc. | 29,203 | 2,212 | |||
| * | GoDaddy Inc. Class A | 29,310 | 2,125 | |||
| Gen Digital Inc. | 102,924 | 2,084 | ||||
| * | Twilio Inc. Class A | 31,682 | 2,018 | |||
| * | Ceridian HCM Holding Inc. | 27,719 | 2,010 | |||
| * | Qorvo Inc. | 18,654 | 2,003 | |||
| * | Unity Software Inc. | 53,913 | 1,999 | |||
| Amdocs Ltd. | 22,225 | 1,983 | ||||
| * | Dynatrace Inc. | 40,625 | 1,958 | |||
| * | Pure Storage Inc. Class A | 53,480 | 1,957 | |||
| * | DocuSign Inc. Class A | 38,112 | 1,917 | |||
| * | AppLovin Corp. Class A | 43,801 | 1,893 | |||
| * | F5 Inc. | 11,097 | 1,816 | |||
| * | Globant SA | 7,687 | 1,572 | |||
| * | Toast Inc. Class A | 66,381 | 1,472 | |||
| National Instruments Corp. | 24,514 | 1,461 | ||||
| * | Arrow Electronics Inc. | 10,924 | 1,458 | |||
| Universal Display Corp. | 8,756 | 1,423 | ||||
| * | Dropbox Inc. Class A | 50,415 | 1,401 | |||
| * | Nutanix Inc. Class A | 43,030 | 1,338 | |||
| * | Guidewire Software Inc. | 15,393 | 1,330 | |||
| * | Onto Innovation Inc. | 9,221 | 1,282 | |||
| * | SPS Commerce Inc. | 6,718 | 1,250 | |||
| * | CyberArk Software Ltd. | 7,526 | 1,250 | |||
| * | Axcelis Technologies Inc. | 6,116 | 1,175 | |||
| * | Confluent Inc. Class A | 34,844 | 1,153 | |||
| * | Rambus Inc. | 19,948 | 1,126 | |||
| * | UiPath Inc. Class A | 70,825 | 1,120 | |||
| * | Fabrinet | 6,882 | 1,106 | |||
| Shares | Market Value• ($000) | |||||
| * | Wolfspeed Inc. | 23,107 | 1,105 | |||
| * | Novanta Inc. | 6,604 | 1,103 | |||
| * | ZoomInfo Technologies Inc. Class A | 58,662 | 1,057 | |||
| * | Qualys Inc. | 6,677 | 1,039 | |||
| * | Wix.com Ltd. | 10,366 | 1,024 | |||
| * | Procore Technologies Inc. | 14,807 | 1,000 | |||
| * | Smartsheet Inc. Class A | 23,904 | 998 | |||
| * | Workiva Inc. Class A | 8,840 | 989 | |||
| * | Aspen Technology Inc. | 5,095 | 988 | |||
| * | Five9 Inc. | 13,162 | 953 | |||
| * | Tenable Holdings Inc. | 20,933 | 950 | |||
| Dolby Laboratories Inc. Class A | 11,101 | 938 | ||||
| * | Elastic NV | 14,493 | 897 | |||
| * | DXC Technology Co. | 43,167 | 895 | |||
| * | Teradata Corp. | 19,218 | 889 | |||
| Power Integrations Inc. | 10,559 | 887 | ||||
| Avnet Inc. | 17,034 | 865 | ||||
| * | New Relic Inc. | 9,994 | 851 | |||
| * | Cirrus Logic Inc. | 10,271 | 843 | |||
| * | Insight Enterprises Inc. | 5,248 | 840 | |||
| Advanced Energy Industries Inc. | 7,015 | 828 | ||||
| * | Monday.com Ltd. | 4,578 | 812 | |||
| *,1 | GLOBALFOUNDRIES Inc. | 14,670 | 811 | |||
| * | Silicon Laboratories Inc. | 5,881 | 793 | |||
| * | DoubleVerify Holdings Inc. | 23,441 | 793 | |||
| TD SYNNEX Corp. | 7,706 | 784 | ||||
| * | NCR Corp. | 24,039 | 739 | |||
| * | MicroStrategy Inc. Class A | 2,055 | 735 | |||
| * | Appfolio Inc. Class A | 3,633 | 700 | |||
| * | Box Inc. Class A | 26,040 | 690 | |||
| * | Global-e Online Ltd. | 17,244 | 683 | |||
| * | Diodes Inc. | 8,334 | 682 | |||
| * | Freshworks Inc. Class A | 30,576 | 669 | |||
| Vishay Intertechnology Inc. | 24,293 | 667 | ||||
| * | Clarivate plc | 88,840 | 660 | |||
| * | Synaptics Inc. | 7,413 | 649 | |||
| * | Altair Engineering Inc. Class A | 9,664 | 642 | |||
| * | Varonis Systems Inc. Class B | 19,926 | 636 | |||
| Concentrix Corp. | 7,965 | 636 | ||||
| * | BlackLine Inc. | 10,359 | 622 | |||
| * | SentinelOne Inc. Class A | 35,855 | 596 | |||
| * | Blackbaud Inc. | 7,784 | 592 | |||
| Dun & Bradstreet Holdings Inc. | 53,446 | 583 | ||||
| * | CommVault Systems Inc. | 8,393 | 573 | |||
| * | Ziff Davis Inc. | 8,531 | 569 | |||
| * | Rapid7 Inc. | 11,006 | 555 | |||
| * | Yelp Inc. Class A | 12,652 | 542 | |||
| Kulicke & Soffa Industries Inc. | 10,326 | 534 | ||||
| * | Alarm.com Holdings Inc. | 8,992 | 527 | |||
| Shares | Market Value• ($000) | |||||
| Amkor Technology Inc. | 18,824 | 526 | ||||
| * | IonQ Inc. | 29,861 | 513 | |||
| * | FormFactor Inc. | 14,277 | 504 | |||
| * | Fastly Inc. Class A | 21,000 | 500 | |||
| * | RingCentral Inc. Class A | 16,048 | 496 | |||
| * | Envestnet Inc. | 9,071 | 496 | |||
| Progress Software Corp. | 7,966 | 485 | ||||
| * | Allegro MicroSystems Inc. | 12,400 | 474 | |||
| * | Sprout Social Inc. Class A | 8,661 | 464 | |||
| * | Rogers Corp. | 3,117 | 450 | |||
| * | Gitlab Inc. Class A | 9,506 | 450 | |||
| * | Ambarella Inc. | 6,931 | 431 | |||
| * | nCino Inc. | 12,900 | 424 | |||
| * | PagerDuty Inc. | 16,018 | 413 | |||
| * | CCC Intelligent Solutions Holdings Inc. | 38,100 | 408 | |||
| * | Perficient Inc. | 6,314 | 403 | |||
| * | SiTime Corp. | 3,013 | 400 | |||
| * | Verint Systems Inc. | 11,999 | 389 | |||
| Pegasystems Inc. | 7,742 | 384 | ||||
| * | LiveRamp Holdings Inc. | 11,747 | 380 | |||
| * | Schrodinger Inc. | 10,132 | 374 | |||
| * | Appian Corp. Class A | 7,455 | 363 | |||
| * | NetScout Systems Inc. | 12,651 | 362 | |||
| * | Q2 Holdings Inc. | 10,424 | 359 | |||
| * | JFrog Ltd. | 12,400 | 356 | |||
| *,1 | C3.ai Inc. Class A | 11,200 | 347 | |||
| * | Cargurus Inc. Class A | 18,925 | 343 | |||
| Clear Secure Inc. Class A | 15,700 | 341 | ||||
| Xerox Holdings Corp. | 21,168 | 336 | ||||
| * | Upwork Inc. | 22,413 | 332 | |||
| * | Alteryx Inc. Class A | 11,209 | 331 | |||
| * | MaxLinear Inc. Class A | 13,425 | 316 | |||
| CSG Systems International Inc. | 5,801 | 315 | ||||
| * | Bumble Inc. Class A | 18,543 | 311 | |||
| * | DigitalOcean Holdings Inc. | 11,398 | 308 | |||
| * | Semtech Corp. | 11,703 | 306 | |||
| * | Asana Inc. Class A | 13,651 | 293 | |||
| * | PROS Holdings Inc. | 7,668 | 275 | |||
| * | Veradigm Inc. | 20,086 | 269 | |||
| * | Impinj Inc. | 4,000 | 266 | |||
| CTS Corp. | 5,938 | 265 | ||||
| * | Paycor HCM Inc. | 11,300 | 265 | |||
| Methode Electronics Inc. | 6,600 | 213 | ||||
| * | Jamf Holding Corp. | 12,306 | 208 | |||
| * | Magnite Inc. | 24,506 | 202 | |||
| * | Cerence Inc. | 7,656 | 200 | |||
| Adeia Inc. | 19,400 | 195 | ||||
| Shutterstock Inc. | 4,458 | 188 | ||||
| * | Everbridge Inc. | 7,400 | 184 | |||
| * | Yext Inc. | 21,047 | 184 | |||
| * | Stratasys Ltd. | 12,376 | 182 | |||
| * | E2open Parent Holdings Inc. | 37,524 | 181 | |||
| * | N-able Inc. | 12,937 | 173 | |||
| Shares | Market Value• ($000) | |||||
| * | Fiverr International Ltd. | 5,753 | 162 | |||
| * | Digital Turbine Inc. | 17,342 | 155 | |||
| * | ScanSource Inc. | 4,696 | 154 | |||
| * | 3D Systems Corp. | 23,663 | 149 | |||
| * | TechTarget Inc. | 5,000 | 144 | |||
| * | BigCommerce Holdings Inc. | 12,000 | 127 | |||
| * | Matterport Inc. | 42,900 | 115 | |||
| * | Consensus Cloud Solutions Inc. | 3,507 | 112 | |||
| * | SolarWinds Corp. | 8,638 | 92 | |||
| * | Thoughtworks Holding Inc. | 16,600 | 83 | |||
| * | LivePerson Inc. | 13,006 | 55 | |||
| *,2 | Yandex NV Class A | 54,882 | — | |||
| 2,401,686 | ||||||
| Telecommunications (2.7%) | ||||||
| Cisco Systems Inc. | 768,828 | 44,092 | ||||
| Comcast Corp. Class A | 775,106 | 36,244 | ||||
| Verizon Communications Inc. | 789,009 | 27,600 | ||||
| AT&T Inc. | 1,344,123 | 19,880 | ||||
| * | T-Mobile US Inc. | 101,835 | 13,875 | |||
| * | Arista Networks Inc. | 46,971 | 9,170 | |||
| Motorola Solutions Inc. | 30,887 | 8,759 | ||||
| * | Charter Communications Inc. Class A | 19,238 | 8,429 | |||
| * | Roku Inc. Class A | 22,807 | 1,852 | |||
| Juniper Networks Inc. | 59,856 | 1,743 | ||||
| * | Ciena Corp. | 27,577 | 1,378 | |||
| * | Liberty Global plc Class C | 41,751 | 828 | |||
| * | Frontier Communications Parent Inc. | 45,927 | 736 | |||
| * | Lumentum Holdings Inc. | 12,815 | 694 | |||
| Cable One Inc. | 1,016 | 661 | ||||
| * | Extreme Networks Inc. | 23,382 | 642 | |||
| * | Liberty Global plc Class A | 34,610 | 638 | |||
| Cogent Communications Holdings Inc. | 8,012 | 565 | ||||
| * | Calix Inc. | 10,741 | 500 | |||
| * | Viavi Solutions Inc. | 41,844 | 437 | |||
| InterDigital Inc. | 4,755 | 412 | ||||
| Telephone & Data Systems Inc. | 18,869 | 405 | ||||
| * | Lumen Technologies Inc. | 192,655 | 306 | |||
| * | DISH Network Corp. Class A | 46,642 | 280 | |||
| * | Liberty Latin America Ltd. Class C | 26,282 | 235 | |||
| Shenandoah Telecommunications Co. | 8,900 | 202 | ||||
| Ubiquiti Inc. | 800 | 140 | ||||
| * | CommScope Holding Co. Inc. | 37,903 | 127 | |||
| * | Liberty Latin America Ltd. Class A | 7,448 | 67 | |||
| 180,897 | ||||||
| Shares | Market Value• ($000) | |||||
| Utilities (0.5%) | ||||||
| Waste Management Inc. | 76,178 | 11,943 | ||||
| Republic Services Inc. Class A | 38,729 | 5,582 | ||||
| American Water Works Co. Inc. | 36,663 | 5,087 | ||||
| Atmos Energy Corp. | 27,320 | 3,168 | ||||
| Essential Utilities Inc. | 45,604 | 1,683 | ||||
| * | Clean Harbors Inc. | 9,569 | 1,620 | |||
| * | Casella Waste Systems Inc. Class A | 10,341 | 814 | |||
| * | Stericycle Inc. | 17,216 | 761 | |||
| New Jersey Resources Corp. | 17,906 | 755 | ||||
| Ormat Technologies Inc. | 9,763 | 741 | ||||
| ONE Gas Inc. | 9,976 | 723 | ||||
| Southwest Gas Holdings Inc. | 11,524 | 714 | ||||
| * | Sunrun Inc. | 39,102 | 611 | |||
| Spire Inc. | 9,583 | 560 | ||||
| California Water Service Group | 10,244 | 515 | ||||
| SJW Group | 5,868 | 386 | ||||
| * | Sunnova Energy International Inc. | 18,306 | 255 | |||
| Northwest Natural Holding Co. | 6,400 | 251 | ||||
| 36,169 | ||||||
| Total Common Stocks (Cost $6,034,436) | 6,770,015 | |||||
| Shares | Market Value• ($000) | |||||
| Temporary Cash Investments (0.4%) | ||||||
| Money Market Fund (0.4%) | ||||||
| 4,5 | Vanguard Market Liquidity Fund, 5.384% (Cost $29,398) | 294,044 | 29,401 | |||
| Total Investments (100.0%) (Cost $6,063,834) | 6,799,416 | |||||
| Other Assets and Liabilities—Net (0.0%) | (72) | |||||
| Net Assets (100%) | 6,799,344 | |||||
| Cost is in $000. |
| • | See Note A in Notes to Financial Statements. |
| * | Non-income-producing security. |
| 1 | Includes partial security positions on loan to broker-dealers. The total value of securities on loan is $7,659,000. |
| 2 | Security value determined using significant unobservable inputs. |
| 3 | Restricted securities totaling $31,000, representing 0.0% of net assets. |
| 4 | Affiliated money market fund available only to Vanguard funds and certain trusts and accounts managed by Vanguard. Rate shown is the 7-day yield. |
| 5 | Collateral of $8,270,000 was received for securities on loan, of which $8,269,000 is held in Vanguard Market Liquidity Fund and $1,000 is held in cash. |
| REIT—Real Estate Investment Trust. |
| Futures Contracts | ||||
| ($000) | ||||
| Expiration | Number of Long (Short) Contracts | Notional Amount | Value and Unrealized Appreciation (Depreciation) | |
| Long Futures Contracts | ||||
| E-mini S&P 500 Index | September 2023 | 133 | 30,031 | 486 |
| ($000s, except shares, footnotes, and per-share amounts) | Amount |
| Assets | |
| Investments in Securities, at Value1 | |
| Unaffiliated Issuers (Cost $6,034,436) | 6,770,015 |
| Affiliated Issuers (Cost $29,398) | 29,401 |
| Total Investments in Securities | 6,799,416 |
| Investment in Vanguard | 229 |
| Cash | 1 |
| Cash Collateral Pledged—Futures Contracts | 1,493 |
| Receivables for Investment Securities Sold | 465 |
| Receivables for Accrued Income | 6,903 |
| Total Assets | 6,808,507 |
| Liabilities | |
| Due to Custodian | 66 |
| Payables for Investment Securities Purchased | 499 |
| Collateral for Securities on Loan | 8,270 |
| Payables for Capital Shares Redeemed | 13 |
| Payables to Vanguard | 261 |
| Variation Margin Payable—Futures Contracts | 54 |
| Total Liabilities | 9,163 |
| Net Assets | 6,799,344 |
| 1 Includes $7,659,000 of securities on loan. | |
| At August 31, 2023, net assets consisted of: | |
| Paid-in Capital | 6,201,842 |
| Total Distributable Earnings (Loss) | 597,502 |
| Net Assets | 6,799,344 |
| Net Assets | |
| Applicable to 85,500,000 outstanding $.001 par value shares of beneficial interest (unlimited authorization) | 6,799,344 |
| Net Asset Value Per Share | $79.52 |
| Year Ended August 31, 2023 | |
| ($000) | |
| Investment Income | |
| Income | |
| Dividends1 | 87,246 |
| Interest2 | 682 |
| Securities Lending—Net | 1,275 |
| Total Income | 89,203 |
| Expenses | |
| The Vanguard Group—Note B | |
| Investment Advisory Services | 145 |
| Management and Administrative | 4,809 |
| Marketing and Distribution | 308 |
| Custodian Fees | 29 |
| Auditing Fees | 33 |
| Shareholders’ Reports | 122 |
| Trustees’ Fees and Expenses | 3 |
| Other Expenses | 17 |
| Total Expenses | 5,466 |
| Net Investment Income | 83,737 |
| Realized Net Gain (Loss) | |
| Investment Securities Sold2,3 | 92,084 |
| Futures Contracts | 751 |
| Realized Net Gain (Loss) | 92,835 |
| Change in Unrealized Appreciation (Depreciation) | |
| Investment Securities2 | 754,528 |
| Futures Contracts | 1,064 |
| Change in Unrealized Appreciation (Depreciation) | 755,592 |
| Net Increase (Decrease) in Net Assets Resulting from Operations | 932,164 |
| 1 | Dividends are net of foreign withholding taxes of $69,000. |
| 2 | Interest income, realized net gain (loss), capital gain distributions received, and change in unrealized appreciation (depreciation) from an affiliated company of the fund were $642,000, $1,000, less than $1,000, and $2,000, respectively. Purchases and sales are for temporary cash investment purposes. |
| 3 | Includes $151,415,000 of net gain (loss) resulting from in-kind redemptions. |
| Year Ended August 31, | ||
| 2023 ($000) | 2022 ($000) | |
| Increase (Decrease) in Net Assets | ||
| Operations | ||
| Net Investment Income | 83,737 | 69,924 |
| Realized Net Gain (Loss) | 92,835 | 21,517 |
| Change in Unrealized Appreciation (Depreciation) | 755,592 | (1,199,724) |
| Net Increase (Decrease) in Net Assets Resulting from Operations | 932,164 | (1,108,283) |
| Distributions | ||
| Total Distributions | (80,651) | (64,814) |
| Capital Share Transactions | ||
| Issued | 464,375 | 2,042,647 |
| Issued in Lieu of Cash Distributions | — | — |
| Redeemed | (416,802) | (228,692) |
| Net Increase (Decrease) from Capital Share Transactions | 47,573 | 1,813,955 |
| Total Increase (Decrease) | 899,086 | 640,858 |
| Net Assets | ||
| Beginning of Period | 5,900,258 | 5,259,400 |
| End of Period | 6,799,344 | 5,900,258 |
| For a Share Outstanding Throughout Each Period | Year Ended August 31, | September 18, 20181 to August 31, 2019 | |||
| 2023 | 2022 | 2021 | 2020 | ||
| Net Asset Value, Beginning of Period | $69.60 | $84.42 | $64.47 | $51.25 | $50.00 |
| Investment Operations | |||||
| Net Investment Income2 | .983 | .921 | .873 | .846 | .792 |
| Net Realized and Unrealized Gain (Loss) on Investments | 9.884 | (14.856) | 19.844 | 13.146 | .868 |
| Total from Investment Operations | 10.867 | (13.935) | 20.717 | 13.992 | 1.660 |
| Distributions | |||||
| Dividends from Net Investment Income | (.947) | (.885) | (.767) | (.772) | (.410) |
| Distributions from Realized Capital Gains | — | — | — | — | — |
| Total Distributions | (.947) | (.885) | (.767) | (.772) | (.410) |
| Net Asset Value, End of Period | $79.52 | $69.60 | $84.42 | $64.47 | $51.25 |
| Total Return | 15.82% | -16.61% | 32.41% | 27.60% | 3.40% |
| Ratios/Supplemental Data | |||||
| Net Assets, End of Period (Millions) | $6,799 | $5,900 | $5,259 | $1,974 | $595 |
| Ratio of Total Expenses to Average Net Assets | 0.09% | 0.09% | 0.09% | 0.12% | 0.12%3 |
| Ratio of Net Investment Income to Average Net Assets | 1.38% | 1.18% | 1.18% | 1.54% | 1.67%3 |
| Portfolio Turnover Rate4 | 3% | 7% | 6% | 6% | 6% |
| 1 | Inception. |
| 2 | Calculated based on average shares outstanding. |
| 3 | Annualized. |
| 4 | Excludes the value of portfolio securities received or delivered as a result of in-kind purchases or redemptions of the fund’s capital shares, including ETF Creation Units. |
| Level 1 ($000) | Level 2 ($000) | Level 3 ($000) | Total ($000) | |
| Investments | ||||
| Assets | ||||
| Common Stocks | 6,767,328 | 2,115 | 572 | 6,770,015 |
| Temporary Cash Investments | 29,401 | — | — | 29,401 |
| Total | 6,796,729 | 2,115 | 572 | 6,799,416 |
| Derivative Financial Instruments | ||||
| Assets | ||||
| Futures Contracts1 | 486 | — | — | 486 |
| 1 | Includes cumulative appreciation (depreciation) on futures contracts and centrally cleared swaps, if any, as reported in the Schedule of Investments. Only current day’s variation margin is reported within the Statement of Assets and Liabilities. |
| Amount ($000) | |
| Paid-in Capital | 151,407 |
| Total Distributable Earnings (Loss) | (151,407) |
| Amount ($000) | |
| Undistributed Ordinary Income | 20,811 |
| Undistributed Long-Term Gains | — |
| Net Unrealized Gains (Losses) | 732,922 |
| Capital Loss Carryforwards | (156,231) |
| Qualified Late-Year Losses | — |
| Other Temporary Differences | — |
| Total | 597,502 |
| Year Ended August 31, | ||
| 2023 Amount ($000) | 2022 Amount ($000) | |
| Ordinary Income* | 80,651 | 64,814 |
| Long-Term Capital Gains | — | — |
| Total | 80,651 | 64,814 |
| * | Includes short-term capital gains, if any. |
| Amount ($000) | |
| Tax Cost | 6,066,494 |
| Gross Unrealized Appreciation | 1,331,747 |
| Gross Unrealized Depreciation | (598,825) |
| Net Unrealized Appreciation (Depreciation) | 732,922 |
| Year Ended August 31, | |||
| 2023 Shares (000) | 2022 Shares (000) | ||
| Issued | 6,625 | 25,425 | |
| Issued in Lieu of Cash Distributions | — | — | |
| Redeemed | (5,900) | (2,950) | |
| Net Increase (Decrease) in Shares Outstanding | 725 | 22,475 | |
Philadelphia, Pennsylvania
October 18, 2023
| Matthew Benchener | Thomas M. Rampulla |
| Joseph Brennan | Karin A. Risi |
| Mortimer J. Buckley | Anne E. Robinson |
| Gregory Davis | Michael Rollings |
| John James | Nitin Tandon |
| Chris D. McIsaac | Lauren Valente |

Who Are Deaf or Hard of Hearing > 800-749-7273
All rights reserved.
Vanguard Marketing Corporation, Distributor.

| 1 | |
| 2 | |
| 4 | |
| 7 | |
| 100 | |
| 102 |
| • | For the 12 months ended August 31, 2023, Vanguard ESG International Stock ETF returned 11.36% (based on net asset value), roughly in line with the 10.97% return of its expense-free benchmark. |
| • | Early in the period, inflation in many developed markets began to ease off multidecade highs but remained stubbornly high in some sectors, including services, which felt the effects of tight labor markets. While aggressive interest rate hikes by many major central banks fanned fears of recession, the global economy proved more resilient than expected. |
| • | By market region, Europe added the most to performance. Italy, Spain, Denmark, and Germany all posted gains of 30% or more. Japan, the largest constituent in the index, also outperformed the index with a return of about 14%. Emerging markets as a whole returned a little more than 2%. |
| • | For the fund’s benchmark index, eight industry sectors recorded gains. Technology was the standout among them, rising more than 18%. Consumer discretionary and financials were also high up on the leaderboard. Energy, real estate, and utilities, all of which represented relatively small slices of the index, posted declines. |
| Average Annual Total Returns Periods Ended August 31, 2023 | |||
| One Year | Three Years | Five Years | |
| Stocks | |||
| Russell 1000 Index (Large-caps) | 15.40% | 9.93% | 10.77% |
| Russell 2000 Index (Small-caps) | 4.65 | 8.12 | 3.14 |
| Russell 3000 Index (Broad U.S. market) | 14.76 | 9.81 | 10.25 |
| FTSE All-World ex US Index (International) | 12.02 | 4.49 | 3.74 |
| Bonds | |||
| Bloomberg U.S. Aggregate Float Adjusted Index (Broad taxable market) | -1.05% | -4.40% | 0.55% |
| Bloomberg Municipal Bond Index (Broad tax-exempt market) | 1.70 | -1.32 | 1.52 |
| FTSE Three-Month U.S. Treasury Bill Index | 4.44 | 1.63 | 1.68 |
| CPI | |||
| Consumer Price Index | 3.67% | 5.71% | 4.02% |
| • | Based on actual fund return. This section helps you to estimate the actual expenses that you paid over the period. The ”Ending Account Value“ shown is derived from the fund’s actual return, and the third column shows the dollar amount that would have been paid by an investor who started with $1,000 in the fund. You may use the information here, together with the amount you invested, to estimate the expenses that you paid over the period. |
| • | Based on hypothetical 5% yearly return. This section is intended to help you compare your fund‘s costs with those of other mutual funds. It assumes that the fund had a yearly return of 5% before expenses, but that the expense ratio is unchanged. In this case—because the return used is not the fund’s actual return—the results do not apply to your investment. The example is useful in making comparisons because the Securities and Exchange Commission requires all mutual funds to calculate expenses based on a 5% return. You can assess your fund’s costs by comparing this hypothetical example with the hypothetical examples that appear in shareholder reports of other funds. |
| Six Months Ended August 31, 2023 | |||
| ESG International Stock ETF | Beginning Account Value 2/28/2023 | Ending Account Value 8/31/2023 | Expenses Paid During Period |
| Based on Actual Fund Return | $1,000.00 | $1,044.20 | $0.62 |
| Based on Hypothetical 5% Yearly Return | 1,000.00 | 1,024.60 | 0.61 |
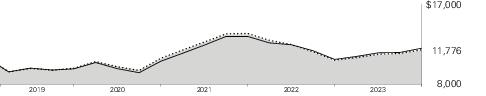
| Average Annual Total Returns Periods Ended August 31, 2023 | ||||
| One Year | Since Inception (9/18/2018) | Final Value of a $10,000 Investment | ||
 | ESG International Stock ETF Net Asset Value | 11.36% | 3.36% | $11,776 |
| ESG International Stock ETF Market Price | 11.41 | 3.36 | 11,775 | |
 | FTSE Global All Cap ex US Choice Index | 10.97 | 3.51 | 11,860 |
 | FTSE Global All Cap ex US Index | 11.73 | 3.83 | 12,044 |
| Cumulative Returns of ETF Shares: September 18, 2018, Through August 31, 2023 | ||
| One Year | Since Inception (9/18/2018) | |
| ESG International Stock ETF Market Price | 11.41% | 17.75% |
| ESG International Stock ETF Net Asset Value | 11.36 | 17.76 |
| FTSE Global All Cap ex US Choice Index | 10.97 | 18.60 |
| Japan | 17.5% |
| United Kingdom | 7.9 |
| China | 7.5 |
| Switzerland | 6.8 |
| Canada | 6.5 |
| Taiwan | 6.0 |
| Germany | 5.2 |
| Australia | 4.9 |
| France | 4.5 |
| India | 4.4 |
| South Korea | 4.0 |
| Netherlands | 3.2 |
| Denmark | 2.4 |
| Sweden | 2.1 |
| Italy | 1.7 |
| Hong Kong | 1.6 |
| Spain | 1.4 |
| Brazil | 1.3 |
| Singapore | 1.0 |
| South Africa | 1.0 |
| Mexico | 1.0 |
| Other | 8.1 |
| Shares | Market Value• ($000) | |||||
| Common Stocks (98.6%) | ||||||
| Australia (4.8%) | ||||||
| Commonwealth Bank of Australia | 279,657 | 18,423 | ||||
| CSL Ltd. | 79,967 | 14,122 | ||||
| National Australia Bank Ltd. | 522,131 | 9,731 | ||||
| Westpac Banking Corp. | 580,596 | 8,214 | ||||
| ANZ Group Holdings Ltd. | 501,033 | 8,180 | ||||
| Macquarie Group Ltd. | 59,518 | 6,805 | ||||
| Wesfarmers Ltd. | 185,667 | 6,462 | ||||
| Goodman Group | 317,801 | 4,788 | ||||
| Transurban Group | 505,352 | 4,327 | ||||
| Fortescue Metals Group Ltd. | 266,839 | 3,674 | ||||
| Amcor plc | 250,044 | 2,438 | ||||
| QBE Insurance Group Ltd. | 251,947 | 2,430 | ||||
| Newcrest Mining Ltd. (XASX) | 145,416 | 2,424 | ||||
| Brambles Ltd. | 240,250 | 2,327 | ||||
| * | James Hardie Industries plc | 75,518 | 2,270 | |||
| Cochlear Ltd. | 11,278 | 1,980 | ||||
| Suncorp Group Ltd. | 221,126 | 1,939 | ||||
| Telstra Group Ltd. | 698,623 | 1,812 | ||||
| * | Xero Ltd. | 21,418 | 1,734 | |||
| Scentre Group | 932,911 | 1,654 | ||||
| Insurance Australia Group Ltd. | 424,432 | 1,593 | ||||
| Sonic Healthcare Ltd. | 76,214 | 1,584 | ||||
| Computershare Ltd. | 92,285 | 1,500 | ||||
| Northern Star Resources Ltd. | 191,335 | 1,466 | ||||
| Pilbara Minerals Ltd. | 475,196 | 1,425 | ||||
| Mineral Resources Ltd. | 28,012 | 1,286 | ||||
| ASX Ltd. | 33,657 | 1,253 | ||||
| Stockland | 442,771 | 1,209 | ||||
| WiseTech Global Ltd. | 26,332 | 1,181 | ||||
| Medibank Pvt Ltd. | 488,808 | 1,156 | ||||
| Mirvac Group | 741,032 | 1,155 | ||||
| carsales.com Ltd. | 62,087 | 1,155 | ||||
| BlueScope Steel Ltd. | 82,280 | 1,112 | ||||
| Dexus | 207,420 | 1,036 | ||||
| Shares | Market Value• ($000) | |||||
| Ramsay Health Care Ltd. | 30,676 | 1,018 | ||||
| GPT Group | 372,156 | 1,008 | ||||
| Atlas Arteria Ltd. | 249,589 | 981 | ||||
| IGO Ltd. | 107,810 | 962 | ||||
| SEEK Ltd. | 64,106 | 957 | ||||
| Vicinity Ltd. | 748,042 | 902 | ||||
| Orica Ltd. | 88,523 | 897 | ||||
| REA Group Ltd. | 8,101 | 864 | ||||
| * | NEXTDC Ltd. | 93,735 | 819 | |||
| * | Lynas Rare Earths Ltd. | 161,671 | 746 | |||
| Steadfast Group Ltd. | 204,338 | 744 | ||||
| Bendigo & Adelaide Bank Ltd. | 114,414 | 701 | ||||
| Evolution Mining Ltd. | 289,746 | 692 | ||||
| JB Hi-Fi Ltd. | 23,433 | 691 | ||||
| IDP Education Ltd. | 43,440 | 691 | ||||
| Incitec Pivot Ltd. | 359,276 | 678 | ||||
| Lendlease Corp. Ltd. | 125,538 | 632 | ||||
| Aurizon Holdings Ltd. | 267,360 | 630 | ||||
| Charter Hall Group | 88,546 | 618 | ||||
| Bank of Queensland Ltd. | 144,068 | 535 | ||||
| Cleanaway Waste Management Ltd. | 311,825 | 528 | ||||
| Altium Ltd. | 16,869 | 527 | ||||
| * | Liontown Resources Ltd. | 288,146 | 504 | |||
| * | Qantas Airways Ltd. | 127,832 | 487 | |||
| Qube Holdings Ltd. | 243,187 | 482 | ||||
| Challenger Ltd. | 106,810 | 468 | ||||
| nib holdings Ltd. | 80,923 | 435 | ||||
| Iluka Resources Ltd. | 74,990 | 411 | ||||
| AMP Ltd. | 486,748 | 397 | ||||
| Downer EDI Ltd. | 139,875 | 386 | ||||
| Reece Ltd. | 29,269 | 385 | ||||
| 1 | Orora Ltd. | 164,176 | 382 | |||
| Breville Group Ltd. | 23,294 | 369 | ||||
| * | Flight Centre Travel Group Ltd. | 26,599 | 362 | |||
| Domino's Pizza Enterprises Ltd. | 10,312 | 359 | ||||
| * | Sandfire Resources Ltd. | 82,303 | 353 | |||
| Technology One Ltd. | 34,925 | 347 | ||||
| Super Retail Group Ltd. | 41,132 | 344 | ||||
| * | Alumina Ltd. | 492,116 | 342 | |||
| Shares | Market Value• ($000) | |||||
| Nine Entertainment Co. Holdings Ltd. | 257,801 | 342 | ||||
| Eagers Automotive Ltd. | 30,261 | 312 | ||||
| * | Webjet Ltd. | 68,597 | 309 | |||
| Reliance Worldwide Corp. Ltd. | 108,864 | 293 | ||||
| Champion Iron Ltd. | 73,303 | 286 | ||||
| Pro Medicus Ltd. | 5,910 | 280 | ||||
| Perpetual Ltd. | 20,323 | 276 | ||||
| National Storage REIT | 184,602 | 276 | ||||
| Ansell Ltd. | 16,968 | 259 | ||||
| Perseus Mining Ltd. | 200,727 | 243 | ||||
| Data#3 Ltd. | 46,746 | 224 | ||||
| ARB Corp. Ltd. | 10,182 | 222 | ||||
| Credit Corp. Group Ltd. | 15,994 | 220 | ||||
| InvoCare Ltd. | 27,100 | 220 | ||||
| Bapcor Ltd. | 50,812 | 218 | ||||
| Harvey Norman Holdings Ltd. | 81,899 | 214 | ||||
| Sims Ltd. | 21,298 | 210 | ||||
| * | Megaport Ltd. | 26,459 | 205 | |||
| * | PEXA Group Ltd. | 27,052 | 201 | |||
| Charter Hall Long Wale REIT | 84,150 | 192 | ||||
| * | Telix Pharmaceuticals Ltd. | 26,210 | 188 | |||
| CSR Ltd. | 49,255 | 187 | ||||
| * | De Grey Mining Ltd. | 203,822 | 187 | |||
| Corporate Travel Management Ltd. | 15,477 | 186 | ||||
| AUB Group Ltd. | 9,349 | 186 | ||||
| Gold Road Resources Ltd. | 157,439 | 179 | ||||
| Domain Holdings Australia Ltd. | 70,255 | 174 | ||||
| Region RE Ltd. | 123,093 | 172 | ||||
| * | Boral Ltd. | 54,758 | 167 | |||
| EVT Ltd. | 21,129 | 166 | ||||
| * | Bellevue Gold Ltd. | 150,340 | 164 | |||
| TPG Telecom Ltd. | 44,717 | 163 | ||||
| GrainCorp Ltd. Class A | 34,469 | 162 | ||||
| HUB24 Ltd. | 7,789 | 162 | ||||
| Brickworks Ltd. | 9,006 | 159 | ||||
| Nufarm Ltd. | 46,719 | 156 | ||||
| *,2 | Life360 Inc. | 25,790 | 155 | |||
| Premier Investments Ltd. | 9,311 | 154 | ||||
| GDI Property Group Partnership | 366,675 | 152 | ||||
| * | Neuren Pharmaceuticals Ltd. | 18,249 | 148 | |||
| * | Capricorn Metals Ltd. | 49,645 | 145 | |||
| * | Chalice Mining Ltd. | 62,487 | 143 | |||
| Ramelius Resources Ltd. | 160,574 | 142 | ||||
| Healius Ltd. | 77,595 | 140 | ||||
| Lifestyle Communities Ltd. | 12,338 | 138 | ||||
| Ingenia Communities Group | 50,136 | 135 | ||||
| IRESS Ltd. | 31,279 | 129 | ||||
| Deterra Royalties Ltd. | 44,607 | 128 | ||||
| Shares | Market Value• ($000) | |||||
| Insignia Financial Ltd. | 74,554 | 125 | ||||
| GUD Holdings Ltd. | 15,533 | 122 | ||||
| HMC Capital Ltd. | 33,403 | 116 | ||||
| Helia Group Ltd. | 44,810 | 112 | ||||
| * | West African Resources Ltd. | 201,913 | 111 | |||
| Costa Group Holdings Ltd. | 58,502 | 108 | ||||
| *,1 | Leo Lithium Ltd. | 145,596 | 108 | |||
| Lovisa Holdings Ltd. | 7,385 | 107 | ||||
| Nickel Industries Ltd. | 209,230 | 107 | ||||
| Regis Resources Ltd. | 101,994 | 106 | ||||
| Centuria Capital Group | 111,358 | 106 | ||||
| Monadelphous Group Ltd. | 11,148 | 105 | ||||
| IPH Ltd. | 20,867 | 103 | ||||
| Waypoint REIT Ltd. | 63,208 | 102 | ||||
| �� | Johns Lyng Group Ltd. | 24,635 | 102 | |||
| * | SiteMinder Ltd. | 32,433 | 102 | |||
| Magellan Financial Group Ltd. | 17,186 | 99 | ||||
| Kelsian Group Ltd. | 24,353 | 99 | ||||
| Adbri Ltd. | 68,572 | 98 | ||||
| Netwealth Group Ltd. | 9,630 | 93 | ||||
| * | PolyNovo Ltd. | 93,871 | 90 | |||
| * | Nanosonics Ltd. | 32,627 | 88 | |||
| Newcrest Mining Ltd. (XTSE) | 5,301 | 88 | ||||
| * | Resolute Mining Ltd. | 365,628 | 87 | |||
| 1 | NRW Holdings Ltd. | 48,672 | 87 | |||
| * | Silver Lake Resources Ltd. | 137,522 | 87 | |||
| GQG Partners Inc. | 82,172 | 82 | ||||
| Collins Foods Ltd. | 12,729 | 81 | ||||
| Clinuvel Pharmaceuticals Ltd. | 6,454 | 80 | ||||
| * | Temple & Webster Group Ltd. | 17,109 | 80 | |||
| Arena REIT | 32,118 | 77 | ||||
| * | Sayona Mining Ltd. | 1,094,334 | 77 | |||
| * | Westgold Resources Ltd. | 72,561 | 76 | |||
| Imdex Ltd. | 69,503 | 73 | ||||
| Elders Ltd. | 17,352 | 72 | ||||
| Platinum Asset Management Ltd. | 75,038 | 69 | ||||
| Estia Health Ltd. | 35,029 | 69 | ||||
| * | Calix Ltd. | 27,741 | 69 | |||
| Inghams Group Ltd. | 29,955 | 67 | ||||
| * | Audinate Group Ltd. | 7,468 | 67 | |||
| Accent Group Ltd. | 49,592 | 66 | ||||
| Sigma Healthcare Ltd. | 125,266 | 65 | ||||
| Vulcan Steel Ltd. | 12,759 | 65 | ||||
| * | Perenti Ltd. | 93,452 | 64 | |||
| * | Macquarie Technology Group Ltd. | 1,451 | 63 | |||
| Pinnacle Investment Management Group Ltd. | 10,358 | 62 | ||||
| Bega Cheese Ltd. | 31,399 | 61 | ||||
| oOh!media Ltd. | 64,438 | 61 | ||||
| Shares | Market Value• ($000) | |||||
| Hansen Technologies Ltd. | 16,814 | 60 | ||||
| Charter Hall Retail REIT | 26,043 | 59 | ||||
| Nick Scali Ltd. | 7,198 | 58 | ||||
| * | FleetPartners Group Ltd. | 30,424 | 58 | |||
| Link Administration Holdings Ltd. | 65,491 | 57 | ||||
| Infomedia Ltd. | 52,246 | 57 | ||||
| Hotel Property Investments Ltd. | 28,618 | 56 | ||||
| * | Omni Bridgeway Ltd. | 41,479 | 56 | |||
| * | ioneer Ltd. | 350,440 | 54 | |||
| APM Human Services International Ltd. | 45,498 | 54 | ||||
| Service Stream Ltd. | 91,961 | 53 | ||||
| McMillan Shakespeare Ltd. | 4,540 | 52 | ||||
| * | Tietto Minerals Ltd. | 164,874 | 52 | |||
| * | Nuix Ltd. | 51,812 | 50 | |||
| Baby Bunting Group Ltd. | 34,679 | 49 | ||||
| * | Judo Capital Holdings Ltd. | 79,207 | 47 | |||
| * | Syrah Resources Ltd. | 122,456 | 46 | |||
| * | Tyro Payments Ltd. | 50,654 | 46 | |||
| Oceania Healthcare Ltd. | 101,609 | 46 | ||||
| *,1 | AVZ Minerals Ltd. | 358,175 | 45 | |||
| Myer Holdings Ltd. | 102,436 | 44 | ||||
| SmartGroup Corp. Ltd. | 7,607 | 42 | ||||
| * | Alkane Resources Ltd. | 96,939 | 42 | |||
| * | Imugene Ltd. | 915,985 | 40 | |||
| * | OFX Group Ltd. | 33,880 | 38 | |||
| Select Harvests Ltd. | 13,463 | 37 | ||||
| * | Kogan.com Ltd. | 10,546 | 37 | |||
| * | Vulcan Energy Resources Ltd. | 16,396 | 36 | |||
| GWA Group Ltd. | 28,131 | 35 | ||||
| Emeco Holdings Ltd. | 81,576 | 35 | ||||
| Mayne Pharma Group Ltd. | 14,939 | 35 | ||||
| * | Aussie Broadband Ltd. | 15,404 | 35 | |||
| G8 Education Ltd. | 46,012 | 34 | ||||
| Regis Healthcare Ltd. | 20,849 | 34 | ||||
| * | Superloop Ltd. | 75,487 | 34 | |||
| *,3 | Lake Resources NL | 230,973 | 33 | |||
| * | Seven West Media Ltd. | 166,120 | 32 | |||
| * | EML Payments Ltd. | 43,095 | 32 | |||
| Integral Diagnostics Ltd. | 16,490 | 32 | ||||
| Cedar Woods Properties Ltd. | 8,900 | 31 | ||||
| Australian Ethical Investment Ltd. | 10,797 | 31 | ||||
| PWR Holdings Ltd. | 4,495 | 31 | ||||
| *,3 | Mesoblast Ltd. | 92,240 | 30 | |||
| MyState Ltd. | 13,978 | 30 | ||||
| * | Argosy Minerals Ltd. | 181,256 | 30 | |||
| Bravura Solutions Ltd. | 55,130 | 27 | ||||
| *,3 | Zip Co. Ltd. | 133,731 | 27 | |||
| *,3 | BrainChip Holdings Ltd. | 130,435 | 27 | |||
| * | Abacus Storage King | 33,633 | 27 | |||
| * | Praemium Ltd. | 55,192 | 26 | |||
| Shares | Market Value• ($000) | |||||
| * | Australian Agricultural Co. Ltd. | 26,373 | 25 | |||
| * | Mount Gibson Iron Ltd. | 86,412 | 25 | |||
| * | Neometals Ltd. | 75,493 | 25 | |||
| * | Ardent Leisure Group Ltd. | 67,417 | 24 | |||
| Solvar Ltd. | 28,545 | 24 | ||||
| Abacus Group | 30,860 | 24 | ||||
| *,3 | Novonix Ltd. | 36,080 | 23 | |||
| 29Metals Ltd. (XASX) | 37,737 | 21 | ||||
| * | Opthea Ltd. | 75,888 | 21 | |||
| Australian Clinical Labs Ltd. | 10,261 | 20 | ||||
| Cromwell Property Group | 61,810 | 19 | ||||
| * | St. Barbara Ltd. | 148,272 | 19 | |||
| * | Aurelia Metals Ltd. | 272,344 | 16 | |||
| * | Appen Ltd. | 15,792 | 16 | |||
| * | Paradigm Biopharmaceuticals Ltd. | 39,491 | 16 | |||
| Australian Finance Group Ltd. | 13,403 | 14 | ||||
| * | Fineos Corp. Ltd. | 9,886 | 13 | |||
| * | Australian Strategic Materials Ltd. | 10,534 | 12 | |||
| * | Jervois Global Ltd. | 380,965 | 12 | |||
| SG Fleet Group Ltd. | 6,490 | 11 | ||||
| * | Incannex Healthcare Ltd. | 207,332 | 11 | |||
| Jupiter Mines Ltd. | 74,019 | 10 | ||||
| * | 29Metals Ltd. | 17,153 | 10 | |||
| * | Bubs Australia Ltd. | 75,873 | 9 | |||
| Growthpoint Properties Australia Ltd. | 4,631 | 8 | ||||
| Dicker Data Ltd. | 1,282 | 8 | ||||
| Southern Cross Media Group Ltd. | 13,677 | 7 | ||||
| * | Navigator Global Investments Ltd. | 7,694 | 7 | |||
| * | Andromeda Metals Ltd. | 324,268 | 6 | |||
| Humm Group Ltd. | 18,121 | 5 | ||||
| * | Starpharma Holdings Ltd. Class A | 37,635 | 4 | |||
| *,1 | AMA Group Ltd. | 35,873 | 3 | |||
| * | Pact Group Holdings Ltd. | 2,475 | 1 | |||
| 163,680 | ||||||
| Austria (0.2%) | ||||||
| Erste Group Bank AG | 56,902 | 2,030 | ||||
| 2 | BAWAG Group AG | 15,091 | 711 | |||
| ANDRITZ AG | 10,657 | 566 | ||||
| Wienerberger AG | 20,343 | 560 | ||||
| * | Raiffeisen Bank International AG | 23,677 | 340 | |||
| Oesterreichische Post AG | 5,524 | 190 | ||||
| 3 | AT&S Austria Technologie & Systemtechnik AG | 4,104 | 146 | |||
| *,3 | Lenzing AG | 3,024 | 143 | |||
| Shares | Market Value• ($000) | |||||
| CA Immobilien Anlagen AG | 4,074 | 135 | ||||
| UNIQA Insurance Group AG | 16,104 | 130 | ||||
| Vienna Insurance Group AG Wiener Versicherung Gruppe | 3,955 | 106 | ||||
| DO & CO AG | 852 | 99 | ||||
| Telekom Austria AG Class A | 12,522 | 94 | ||||
| * | IMMOFINANZ AG | 4,805 | 92 | |||
| Strabag SE | 1,095 | 47 | ||||
| Palfinger AG | 963 | 26 | ||||
| Porr AG | 657 | 9 | ||||
| Agrana Beteiligungs AG | 168 | 3 | ||||
| 5,427 | ||||||
| Belgium (0.6%) | ||||||
| * | Argenx SE | 9,617 | 4,833 | |||
| KBC Group NV | 41,483 | 2,722 | ||||
| UCB SA | 20,803 | 1,866 | ||||
| Solvay SA | 12,823 | 1,485 | ||||
| Ageas SA/NV | 30,584 | 1,216 | ||||
| Groupe Bruxelles Lambert NV | 14,265 | 1,149 | ||||
| Elia Group SA/NV | 7,212 | 831 | ||||
| Warehouses De Pauw CVA | 27,331 | 781 | ||||
| Ackermans & van Haaren NV | 4,828 | 760 | ||||
| Aedifica SA | 10,287 | 689 | ||||
| Sofina SA | 2,439 | 548 | ||||
| D'ieteren Group | 3,331 | 544 | ||||
| Lotus Bakeries NV | 62 | 489 | ||||
| Cofinimmo SA | 6,111 | 476 | ||||
| Euronav NV | 21,758 | 379 | ||||
| KBC Ancora | 8,453 | 375 | ||||
| Etablissements Franz Colruyt NV | 7,595 | 290 | ||||
| Melexis NV | 2,735 | 258 | ||||
| Bekaert SA | 4,289 | 203 | ||||
| Xior Student Housing NV | 6,903 | 202 | ||||
| Proximus SADP | 25,171 | 190 | ||||
| Barco NV | 8,369 | 180 | ||||
| Montea NV | 1,805 | 145 | ||||
| VGP NV | 1,391 | 145 | ||||
| Shurgard Self Storage Ltd. | 3,065 | 141 | ||||
| Fagron | 7,403 | 132 | ||||
| Gimv NV | 2,791 | 128 | ||||
| Deme Group NV | 677 | 79 | ||||
| * | Ontex Group NV | 8,272 | 67 | |||
| Kinepolis Group NV | 1,404 | 67 | ||||
| bpost SA | 12,398 | 58 | ||||
| * | AGFA-Gevaert NV | 25,005 | 57 | |||
| Retail Estates NV | 838 | 52 | ||||
| Wereldhave Belgium Comm VA | 768 | 39 | ||||
| Econocom Group SA/NV | 12,005 | 36 | ||||
| Shares | Market Value• ($000) | |||||
| Telenet Group Holding NV | 833 | 19 | ||||
| Van de Velde NV | 515 | 19 | ||||
| 21,650 | ||||||
| Brazil (0.9%) | ||||||
| B3 SA - Brasil Bolsa Balcao | 961,730 | 2,511 | ||||
| WEG SA | 244,262 | 1,770 | ||||
| Localiza Rent a Car SA | 137,136 | 1,752 | ||||
| Banco do Brasil SA | 140,204 | 1,334 | ||||
| Banco BTG Pactual SA | 190,200 | 1,247 | ||||
| Suzano SA | 117,825 | 1,193 | ||||
| Raia Drogasil SA | 177,860 | 987 | ||||
| Equatorial Energia SA | 150,977 | 965 | ||||
| Rumo SA | 196,579 | 887 | ||||
| Banco Bradesco SA | 298,735 | 799 | ||||
| 2 | Rede D'Or Sao Luiz SA | 127,830 | 740 | |||
| Itau Unibanco Holding SA | 148,500 | 699 | ||||
| BB Seguridade Participacoes SA | 111,200 | 682 | ||||
| *,2 | Hapvida Participacoes e Investimentos SA | 777,874 | 669 | |||
| Cia de Saneamento Basico do Estado de Sao Paulo SABESP | 52,630 | 616 | ||||
| Klabin SA | 125,900 | 579 | ||||
| Telefonica Brasil SA | 69,000 | 576 | ||||
| Sendas Distribuidora SA | 220,139 | 516 | ||||
| Lojas Renner SA | 152,542 | 494 | ||||
| CCR SA | 192,758 | 485 | ||||
| * | Natura & Co. Holding SA | 156,287 | 479 | |||
| Hypera SA | 59,700 | 470 | ||||
| TOTVS SA | 69,988 | 392 | ||||
| * | BRF SA | 212,863 | 389 | |||
| Cia Energetica de Minas Gerais | 97,563 | 388 | ||||
| Energisa SA | 40,300 | 375 | ||||
| TIM SA | 115,300 | 336 | ||||
| Transmissora Alianca de Energia Eletrica SA | 48,000 | 332 | ||||
| Aliansce Sonae Shopping Centers SA | 72,180 | 332 | ||||
| Banco Santander Brasil SA | 56,032 | 307 | ||||
| 2 | GPS Participacoes e Empreendimentos SA | 77,500 | 289 | |||
| * | Magazine Luiza SA | 496,916 | 277 | |||
| Cia Siderurgica Nacional SA | 96,334 | 236 | ||||
| Sao Martinho SA | 31,500 | 230 | ||||
| Cia de Saneamento do Parana | 49,500 | 226 | ||||
| Tres Tentos Agroindustrial SA | 83,800 | 225 | ||||
| Santos Brasil Participacoes SA | 123,581 | 215 | ||||
| Fleury SA | 69,999 | 209 | ||||
| Alupar Investimento SA | 35,376 | 202 | ||||
| YDUQS Participacoes SA | 48,200 | 198 | ||||
| Shares | Market Value• ($000) | |||||
| M Dias Branco SA | 25,000 | 188 | ||||
| Atacadao SA | 84,300 | 175 | ||||
| * | Multiplan Empreendimentos Imobiliarios SA | 34,700 | 173 | |||
| * | Porto Seguro SA | 32,200 | 170 | |||
| * | Cogna Educacao SA | 276,700 | 163 | |||
| Auren Energia SA | 58,032 | 159 | ||||
| Cyrela Brazil Realty SA Empreendimentos e Participacoes | 34,200 | 155 | ||||
| Cia de Saneamento de Minas Gerais Copasa MG | 40,200 | 145 | ||||
| Arezzo Industria e Comercio SA | 9,500 | 136 | ||||
| SLC Agricola SA | 16,610 | 135 | ||||
| Vamos Locacao de Caminhoes Maquinas e Equipamentos SA | 54,093 | 128 | ||||
| Fras-Le SA | 44,500 | 123 | ||||
| * | Omega Energia SA | 60,353 | 122 | |||
| * | IRB-Brasil Resseguros SA | 13,936 | 121 | |||
| Cielo SA | 158,700 | 119 | ||||
| Mahle Metal Leve SA | 12,100 | 117 | ||||
| * | Grupo Mateus SA | 85,700 | 116 | |||
| SIMPAR SA | 58,300 | 115 | ||||
| * | AES Brasil Energia SA | 48,377 | 108 | |||
| MRV Engenharia e Participacoes SA | 45,800 | 105 | ||||
| 2 | Locaweb Servicos de Internet SA | 69,900 | 100 | |||
| Grupo De Moda Soma SA | 65,888 | 100 | ||||
| * | Hidrovias do Brasil SA | 121,500 | 97 | |||
| Vulcabras Azaleia SA | 24,400 | 97 | ||||
| EcoRodovias Infraestrutura e Logistica SA | 63,100 | 96 | ||||
| Odontoprev SA | 44,610 | 93 | ||||
| Direcional Engenharia SA | 21,877 | 89 | ||||
| JHSF Participacoes SA | 92,000 | 89 | ||||
| Dexco SA | 55,418 | 89 | ||||
| CM Hospitalar SA | 23,000 | 89 | ||||
| Iguatemi SA | 20,512 | 85 | ||||
| Mills Estruturas e Servicos de Engenharia SA | 32,200 | 82 | ||||
| Movida Participacoes SA | 30,400 | 76 | ||||
| Vivara Participacoes SA | 13,800 | 76 | ||||
| Grendene SA | 53,800 | 74 | ||||
| Camil Alimentos SA | 43,400 | 74 | ||||
| Marfrig Global Foods SA | 48,705 | 73 | ||||
| * | Smartfit Escola de Ginastica e Danca SA | 17,300 | 72 | |||
| Wilson Sons Holdings Brasil SA | 28,300 | 72 | ||||
| * | Oncoclinicas do Brasil Servicos Medicos SA | 28,700 | 70 | |||
| Shares | Market Value• ($000) | |||||
| Pet Center Comercio e Participacoes SA | 62,300 | 69 | ||||
| Intelbras SA Industria de Telecomunicacao Eletronica Brasileira | 15,600 | 69 | ||||
| Minerva SA | 39,707 | 67 | ||||
| * | Log-in Logistica Intermodal SA | 8,300 | 67 | |||
| Ez Tec Empreendimentos e Participacoes SA | 14,200 | 63 | ||||
| * | Via SA | 236,200 | 61 | |||
| * | Zamp SA | 54,706 | 61 | |||
| LOG Commercial Properties e Participacoes SA | 15,667 | 59 | ||||
| Caixa Seguridade Participacoes SA | 26,100 | 57 | ||||
| BrasilAgro - Co. Brasileira de Propriedades Agricolas | 10,900 | 52 | ||||
| Iochpe Maxion SA | 16,900 | 47 | ||||
| Tupy SA | 8,800 | 46 | ||||
| * | Anima Holding SA | 62,413 | 46 | |||
| * | Lojas Quero Quero SA | 44,000 | 43 | |||
| Usinas Siderurgicas de Minas Gerais SA Usiminas | 30,700 | 43 | ||||
| Hospital Mater Dei SA | 21,700 | 42 | ||||
| CSN Mineracao SA | 44,600 | 39 | ||||
| Empreendimentos Pague Menos SA | 47,279 | 37 | ||||
| Wiz Co. | 31,400 | 37 | ||||
| * | Multilaser Industrial SA | 58,000 | 36 | |||
| * | Guararapes Confeccoes SA | 26,100 | 33 | |||
| Ambipar Participacoes e Empreendimentos SA | 7,800 | 33 | ||||
| Blau Farmaceutica SA | 9,300 | 33 | ||||
| * | CVC Brasil Operadora e Agencia de Viagens SA | 63,210 | 32 | |||
| Grupo SBF SA | 22,200 | 32 | ||||
| Armac Locacao Logistica E Servicos SA | 12,400 | 32 | ||||
| * | Infracommerce CXAAS SA | 80,894 | 31 | |||
| Bradespar SA | 6,300 | 27 | ||||
| * | Cia Brasileira de Distribuicao | 22,800 | 23 | |||
| BRPR Corporate Offices Fundo de Investimento Imobiliario | 1,637 | 22 | ||||
| *,2 | Meliuz SA | 13,300 | 18 | |||
| Qualicorp Consultoria e Corretora de Seguros SA | 24,900 | 17 | ||||
| Cia Brasileira de Aluminio | 19,100 | 17 | ||||
| BR Properties SA | 65 | 5 | ||||
| 31,470 | ||||||
| Shares | Market Value• ($000) | |||||
| Canada (6.5%) | ||||||
| Royal Bank of Canada | 229,119 | 20,643 | ||||
| Toronto-Dominion Bank | 301,126 | 18,368 | ||||
| Canadian Pacific Kansas City Ltd. | 154,151 | 12,237 | ||||
| * | Shopify Inc. Class A (XNYS) | 182,038 | 12,110 | |||
| Canadian National Railway Co. | 98,747 | 11,123 | ||||
| Bank of Montreal | 116,015 | 9,992 | ||||
| Bank of Nova Scotia | 196,788 | 9,338 | ||||
| Waste Connections Inc. | 43,099 | 5,909 | ||||
| Canadian Imperial Bank of Commerce | 142,948 | 5,664 | ||||
| Manulife Financial Corp. | 305,544 | 5,649 | ||||
| Nutrien Ltd. | 83,249 | 5,273 | ||||
| Sun Life Financial Inc. | 94,735 | 4,621 | ||||
| Franco-Nevada Corp. | 31,872 | 4,592 | ||||
| Intact Financial Corp. | 28,630 | 4,036 | ||||
| National Bank of Canada | 54,096 | 3,770 | ||||
| * | CGI Inc. | 36,156 | 3,770 | |||
| Thomson Reuters Corp. | 29,154 | 3,754 | ||||
| Agnico Eagle Mines Ltd. | 76,348 | 3,707 | ||||
| Restaurant Brands International Inc. | 51,791 | 3,597 | ||||
| Wheaton Precious Metals Corp. | 75,729 | 3,303 | ||||
| Dollarama Inc. | 46,477 | 3,013 | ||||
| Fairfax Financial Holdings Ltd. | 3,464 | 2,857 | ||||
| 3 | Magna International Inc. | 44,743 | 2,632 | |||
| First Quantum Minerals Ltd. | 92,956 | 2,497 | ||||
| Loblaw Cos. Ltd. | 26,177 | 2,273 | ||||
| BCE Inc. | 47,276 | 2,003 | ||||
| TFI International Inc. | 13,821 | 1,883 | ||||
| RB Global Inc. | 30,267 | 1,872 | ||||
| Metro Inc. Class A | 35,664 | 1,838 | ||||
| Open Text Corp. | 45,382 | 1,829 | ||||
| 2 | Hydro One Ltd. | 52,362 | 1,361 | |||
| George Weston Ltd. | 12,106 | 1,343 | ||||
| TELUS Corp. | 72,298 | 1,270 | ||||
| Canadian Apartment Properties REIT | 34,435 | 1,235 | ||||
| Toromont Industries Ltd. | 14,784 | 1,213 | ||||
| 3 | Great-West Lifeco Inc. | 39,375 | 1,131 | |||
| * | Descartes Systems Group Inc. | 14,526 | 1,089 | |||
| Kinross Gold Corp. | 208,755 | 1,060 | ||||
| West Fraser Timber Co. Ltd. | 13,726 | 1,038 | ||||
| Element Fleet Management Corp. | 67,251 | 1,034 | ||||
| iA Financial Corp. Inc. | 16,482 | 1,034 | ||||
| FirstService Corp. | 6,743 | 1,020 | ||||
| 3 | RioCan REIT | 66,007 | 943 | |||
| Gildan Activewear Inc. | 31,067 | 927 | ||||
| Saputo Inc. | 42,427 | 917 | ||||
| Lundin Mining Corp. | 117,702 | 913 | ||||
| TMX Group Ltd. | 40,580 | 898 | ||||
| Alamos Gold Inc. Class A | 69,010 | 888 | ||||
| Shares | Market Value• ($000) | |||||
| * | Ivanhoe Mines Ltd. Class A | 96,305 | 857 | |||
| GFL Environmental Inc. (XTSE) | 26,107 | 846 | ||||
| Finning International Inc. | 25,054 | 787 | ||||
| 3 | Brookfield Infrastructure Corp. Class A | 18,102 | 704 | |||
| 3 | Granite REIT | 11,733 | 654 | |||
| Choice Properties REIT | 66,473 | 645 | ||||
| * | Kinaxis Inc. | 5,069 | 625 | |||
| Onex Corp. | 9,962 | 615 | ||||
| Colliers International Group Inc. | 5,008 | 579 | ||||
| B2Gold Corp. | 187,337 | 577 | ||||
| Boyd Group Services Inc. | 3,134 | 565 | ||||
| * | Air Canada | 32,929 | 556 | |||
| SSR Mining Inc. | 36,474 | 541 | ||||
| First Capital REIT | 53,238 | 541 | ||||
| Boardwalk REIT | 10,324 | 522 | ||||
| * | BlackBerry Ltd. | 90,195 | 503 | |||
| Premium Brands Holdings Corp. Class A | 6,335 | 487 | ||||
| SmartCentres REIT | 27,304 | 486 | ||||
| BRP Inc. | 6,256 | 478 | ||||
| H&R REIT | 59,836 | 458 | ||||
| * | Shopify Inc. Class A (XTSE) | 6,844 | 455 | |||
| * | Bausch Health Cos. Inc. | 53,296 | 445 | |||
| Stella-Jones Inc. | 8,311 | 403 | ||||
| CI Financial Corp. | 31,079 | 399 | ||||
| Primo Water Corp. | 26,016 | 397 | ||||
| Canadian Western Bank | 20,195 | 393 | ||||
| Chartwell Retirement Residences | 50,807 | 386 | ||||
| * | Celestica Inc. | 15,839 | 369 | |||
| �� | Methanex Corp. | 8,435 | 359 | |||
| * | Lightspeed Commerce Inc. | 21,578 | 352 | |||
| Osisko Gold Royalties Ltd. (XTSE) | 25,999 | 347 | ||||
| Dream Industrial REIT | 33,864 | 346 | ||||
| Linamar Corp. | 6,420 | 337 | ||||
| Tricon Residential Inc. | 38,778 | 329 | ||||
| * | Capstone Copper Corp. | 70,152 | 327 | |||
| Definity Financial Corp. | 11,640 | 320 | ||||
| Laurentian Bank of Canada | 11,561 | 314 | ||||
| Quebecor Inc. Class B | 12,625 | 289 | ||||
| Innergex Renewable Energy Inc. | 29,970 | 286 | ||||
| * | Eldorado Gold Corp. | 28,302 | 270 | |||
| First Majestic Silver Corp. | 42,517 | 261 | ||||
| * | Lithium Americas Corp. | 14,225 | 261 | |||
| * | Aritzia Inc. | 13,983 | 257 | |||
| Boralex Inc. Class A | 10,175 | 247 | ||||
| Hudbay Minerals Inc. | 48,994 | 244 | ||||
| OceanaGold Corp. | 110,605 | 239 | ||||
| 3 | Russel Metals Inc. | 7,942 | 236 | |||
| Home Capital Group Inc. Class B | 7,115 | 233 | ||||
| Shares | Market Value• ($000) | |||||
| Maple Leaf Foods Inc. | 10,553 | 227 | ||||
| Lundin Gold Inc. | 18,898 | 227 | ||||
| IGM Financial Inc. | 7,611 | 217 | ||||
| Cascades Inc. | 22,753 | 214 | ||||
| * | IAMGOLD Corp. | 85,888 | 213 | |||
| 3 | Artis REIT | 40,464 | 210 | |||
| * | Equinox Gold Corp. | 41,311 | 208 | |||
| Primaris REIT | 20,999 | 208 | ||||
| Centerra Gold Inc. | 34,244 | 205 | ||||
| 2 | Nuvei Corp. | 10,326 | 186 | |||
| NorthWest Healthcare Properties REIT | 34,462 | 174 | ||||
| * | Novagold Resources Inc. | 41,492 | 172 | |||
| North West Co. Inc. | 7,625 | 172 | ||||
| Superior Plus Corp. | 22,502 | 170 | ||||
| Cargojet Inc. | 2,180 | 155 | ||||
| * | Torex Gold Resources Inc. | 13,218 | 153 | |||
| * | Ballard Power Systems Inc. | 36,402 | 153 | |||
| Enghouse Systems Ltd. | 6,219 | 141 | ||||
| * | Canada Goose Holdings Inc. | 7,896 | 124 | |||
| Westshore Terminals Investment Corp. | 5,700 | 123 | ||||
| * | Canfor Corp. | 7,130 | 110 | |||
| GFL Environmental Inc. | 3,333 | 108 | ||||
| Mullen Group Ltd. | 9,776 | 103 | ||||
| Transcontinental Inc. Class A | 8,395 | 82 | ||||
| Winpak Ltd. | 2,273 | 67 | ||||
| Dye & Durham Ltd. | 3,941 | 53 | ||||
| Osisko Gold Royalties Ltd. | 2,950 | 39 | ||||
| Cogeco Communications Inc. | 300 | 15 | ||||
| First National Financial Corp. | 384 | 11 | ||||
| 218,834 | ||||||
| Chile (0.1%) | ||||||
| Banco de Chile | 7,050,726 | 769 | ||||
| Banco Santander Chile | 9,674,923 | 463 | ||||
| Cencosud SA | 190,545 | 408 | ||||
| Sociedad Quimica y Minera de Chile SA ADR | 6,122 | 383 | ||||
| Empresas CMPC SA | 177,691 | 323 | ||||
| Falabella SA | 124,894 | 308 | ||||
| Banco de Credito e Inversiones SA | 8,621 | 248 | ||||
| Cia Sud Americana de Vapores SA | 2,906,540 | 194 | ||||
| Parque Arauco SA | 127,417 | 189 | ||||
| Banco Itau Chile SA | 13,395 | 147 | ||||
| SMU SA | 775,148 | 144 | ||||
| Aguas Andinas SA Class A | 389,042 | 133 | ||||
| Inversiones Aguas Metropolitanas SA | 151,407 | 123 | ||||
| Cencosud Shopping SA | 66,503 | 111 | ||||
| CAP SA | 15,639 | 110 | ||||
| Shares | Market Value• ($000) | |||||
| SONDA SA | 206,981 | 104 | ||||
| Empresa Nacional de Telecomunicaciones SA | 25,073 | 94 | ||||
| Inversiones La Construccion SA | 13,884 | 88 | ||||
| Sociedad de Inversiones Oro Blanco SA | 7,537,247 | 61 | ||||
| Ripley Corp. SA | 158,688 | 35 | ||||
| Plaza SA | 20,224 | 31 | ||||
| 4,466 | ||||||
| China (7.4%) | ||||||
| * | Alibaba Group Holding Ltd. | 2,868,100 | 33,288 | |||
| *,2 | Meituan Class B | 891,055 | 14,746 | |||
| China Construction Bank Corp. Class H | 15,471,000 | 8,278 | ||||
| * | PDD Holdings Inc. ADR | 72,586 | 7,184 | |||
| JD.com Inc. Class A | 393,203 | 6,530 | ||||
| NetEase Inc. | 305,115 | 6,321 | ||||
| Industrial & Commercial Bank of China Ltd. Class H | 13,354,000 | 6,123 | ||||
| Ping An Insurance Group Co. of China Ltd. Class H | 994,000 | 5,951 | ||||
| *,2 | Xiaomi Corp. Class B | 2,466,000 | 3,887 | |||
| * | Li Auto Inc. Class A | 176,336 | 3,671 | |||
| Bank of China Ltd. Class H | 10,784,000 | 3,655 | ||||
| *,2 | Kuaishou Technology | 437,100 | 3,578 | |||
| Yum China Holdings Inc. (XHKG) | 65,950 | 3,506 | ||||
| * | Trip.com Group Ltd. | 88,748 | 3,495 | |||
| *,2 | Wuxi Biologics Cayman Inc. | 595,237 | 3,356 | |||
| China Merchants Bank Co. Ltd. Class H | 709,000 | 2,808 | ||||
| ANTA Sports Products Ltd. | 210,200 | 2,370 | ||||
| * | NIO Inc. ADR | 201,255 | 2,067 | |||
| China Resources Land Ltd. | 456,000 | 1,927 | ||||
| China Life Insurance Co. Ltd. Class H | 1,248,000 | 1,892 | ||||
| * | KE Holdings Inc. ADR | 106,689 | 1,835 | |||
| ZTO Express Cayman Inc. | 73,893 | 1,834 | ||||
| China Mengniu Dairy Co. Ltd. | 537,120 | 1,806 | ||||
| Li Ning Co. Ltd. | 376,678 | 1,780 | ||||
| * | BeiGene Ltd. | 105,800 | 1,697 | |||
| 2 | Nongfu Spring Co. Ltd. Class H | 296,200 | 1,664 | |||
| * | XPeng Inc. Class A | 181,500 | 1,631 | |||
| Contemporary Amperex Technology Co. Ltd. Class A | 50,263 | 1,630 | ||||
| * | H World Group Ltd. ADR | 36,070 | 1,453 | |||
| China Overseas Land & Investment Ltd. | 669,500 | 1,411 | ||||
| Shares | Market Value• ($000) | |||||
| Shenzhou International Group Holdings Ltd. | 132,184 | 1,354 | ||||
| Agricultural Bank of China Ltd. Class A | 2,806,600 | 1,332 | ||||
| PICC Property & Casualty Co. Ltd. Class H | 1,146,000 | 1,318 | ||||
| * | New Oriental Education & Technology Group Inc. | 229,890 | 1,247 | |||
| Geely Automobile Holdings Ltd. | 940,900 | 1,168 | ||||
| Ping An Insurance Group Co. of China Ltd. Class A | 172,400 | 1,156 | ||||
| CSPC Pharmaceutical Group Ltd. | 1,481,280 | 1,113 | ||||
| *,2 | Innovent Biologics Inc. | 236,500 | 1,058 | |||
| Haier Smart Home Co. Ltd. Class A | 324,100 | 1,045 | ||||
| ENN Energy Holdings Ltd. | 131,300 | 1,030 | ||||
| Agricultural Bank of China Ltd. Class H | 2,884,000 | 989 | ||||
| * | Vipshop Holdings Ltd. ADR | 60,935 | 962 | |||
| *,2 | JD Health International Inc. | 170,750 | 921 | |||
| 2 | Postal Savings Bank of China Co. Ltd. Class H | 1,863,000 | 919 | |||
| Sunny Optical Technology Group Co. Ltd. | 112,000 | 914 | ||||
| Bank of China Ltd. Class A | 1,763,100 | 907 | ||||
| China Yangtze Power Co. Ltd. Class A | 266,900 | 808 | ||||
| 2 | China Tower Corp. Ltd. Class H | 8,276,000 | 801 | |||
| * | Kanzhun Ltd. ADR | 52,544 | 778 | |||
| China Pacific Insurance Group Co. Ltd. Class H | 337,200 | 771 | ||||
| China Merchants Bank Co. Ltd. Class A | 176,100 | 764 | ||||
| CITIC Securities Co. Ltd. Class H | 389,537 | 761 | ||||
| * | Full Truck Alliance Co. Ltd. ADR | 108,222 | 725 | |||
| Sino Biopharmaceutical Ltd. | 1,804,000 | 685 | ||||
| 2 | Longfor Group Holdings Ltd. | 322,800 | 681 | |||
| * | Kingdee International Software Group Co. Ltd. | 440,000 | 680 | |||
| Sinopharm Group Co. Ltd. Class H | 221,300 | 642 | ||||
| China Pacific Insurance Group Co. Ltd. Class A | 165,900 | 632 | ||||
| Xinyi Solar Holdings Ltd. | 738,000 | 616 | ||||
| Shares | Market Value• ($000) | |||||
| Bank of Communications Co. Ltd. Class H | 1,074,000 | 615 | ||||
| * | Bilibili Inc. | 39,483 | 597 | |||
| Kingsoft Corp. Ltd. | 148,600 | 592 | ||||
| COSCO SHIPPING Holdings Co. Ltd. Class H | 572,400 | 587 | ||||
| GCL Technology Holdings Ltd. | 3,355,000 | 581 | ||||
| China Gas Holdings Ltd. | 557,633 | 569 | ||||
| 2 | WuXi AppTec Co. Ltd. Class H | 50,536 | 554 | |||
| * | Alibaba Health Information Technology Ltd. | 926,000 | 547 | |||
| * | TAL Education Group ADR | 75,854 | 535 | |||
| ZTE Corp. Class H | 165,800 | 534 | ||||
| People's Insurance Co. Group of China Ltd. Class H | 1,554,000 | 529 | ||||
| 2 | China International Capital Corp. Ltd. Class H | 274,800 | 528 | |||
| Yangzijiang Shipbuilding Holdings Ltd. | 412,700 | 516 | ||||
| Tingyi Cayman Islands Holding Corp. | 344,000 | 505 | ||||
| *,2 | SenseTime Group Inc. Class B | 2,524,000 | 501 | |||
| China CITIC Bank Corp. Ltd. Class H | 1,123,000 | 500 | ||||
| Hengan International Group Co. Ltd. | 134,000 | 497 | ||||
| Shenzhen Mindray Bio-Medical Electronics Co. Ltd. Class A | 13,182 | 489 | ||||
| China Tourism Group Duty Free Corp. Ltd. Class A | 32,020 | 479 | ||||
| Industrial Bank Co. Ltd. Class A | 216,800 | 470 | ||||
| * | Tongcheng Travel Holdings Ltd. | 207,200 | 464 | |||
| Bank of Communications Co. Ltd. Class A | 583,600 | 444 | ||||
| New China Life Insurance Co. Ltd. Class H | 174,900 | 438 | ||||
| Foxconn Industrial Internet Co. Ltd. Class A | 143,900 | 432 | ||||
| China Resources Gas Group Ltd. | 153,600 | 431 | ||||
| Industrial & Commercial Bank of China Ltd. Class A | 678,900 | 430 | ||||
| Wanhua Chemical Group Co. Ltd. Class A | 33,372 | 429 | ||||
| Shares | Market Value• ($000) | |||||
| China National Building Material Co. Ltd. Class H | 840,000 | 427 | ||||
| China Hongqiao Group Ltd. | 428,500 | 427 | ||||
| 2 | Fuyao Glass Industry Group Co. Ltd. Class H | 92,400 | 418 | |||
| 3 | Country Garden Services Holdings Co. Ltd. | 358,646 | 417 | |||
| Haier Smart Home Co. Ltd. Class H | 133,200 | 413 | ||||
| * | Zai Lab Ltd. | 155,370 | 405 | |||
| Haitong Securities Co. Ltd. Class H | 651,200 | 404 | ||||
| WuXi AppTec Co. Ltd. Class A | 35,164 | 394 | ||||
| Shandong Weigao Group Medical Polymer Co. Ltd. Class H | 395,200 | 393 | ||||
| 2 | China Resources Mixc Lifestyle Services Ltd. | 90,800 | 392 | |||
| China Vanke Co. Ltd. Class H | 331,200 | 386 | ||||
| China Medical System Holdings Ltd. | 267,000 | 385 | ||||
| 2 | CSC Financial Co. Ltd. Class H | 356,000 | 379 | |||
| 2 | Pop Mart International Group Ltd. | 116,600 | 379 | |||
| Jiangsu Hengrui Pharmaceuticals Co. Ltd. Class A | 65,800 | 378 | ||||
| CITIC Securities Co. Ltd. Class A | 121,645 | 371 | ||||
| *,2 | JD Logistics Inc. | 276,400 | 368 | |||
| Yuexiu Property Co. Ltd. | 296,280 | 367 | ||||
| Weichai Power Co. Ltd. Class H | 281,000 | 364 | ||||
| *,2 | ZhongAn Online P&C Insurance Co. Ltd. Class H | 122,800 | 364 | |||
| * | MINISO Group Holding Ltd. ADR | 13,882 | 360 | |||
| * | Genscript Biotech Corp. | 154,000 | 359 | |||
| 2 | Topsports International Holdings Ltd. | 440,000 | 358 | |||
| *,2 | Akeso Inc. | 80,000 | 351 | |||
| Great Wall Motor Co. Ltd. Class A | 96,000 | 344 | ||||
| Luxshare Precision Industry Co. Ltd. Class A | 75,899 | 343 | ||||
| Zhuzhou CRRC Times Electric Co. Ltd. Class H | 98,200 | 342 | ||||
| *,2 | East Buy Holding Ltd. | 66,500 | 337 | |||
| Kingboard Holdings Ltd. | 148,000 | 336 | ||||
| China Galaxy Securities Co. Ltd. Class H | 619,000 | 333 | ||||
| Shares | Market Value• ($000) | |||||
| CRRC Corp. Ltd. Class A | 395,300 | 322 | ||||
| Minth Group Ltd. | 108,000 | 321 | ||||
| China Minsheng Banking Corp. Ltd. Class H | 977,000 | 314 | ||||
| China Taiping Insurance Holdings Co. Ltd. | 296,600 | 312 | ||||
| Muyuan Foods Co. Ltd. Class A | 55,912 | 311 | ||||
| 2 | Yadea Group Holdings Ltd. | 162,000 | 311 | |||
| 2 | Huatai Securities Co. Ltd. Class H | 232,400 | 306 | |||
| LONGi Green Energy Technology Co. Ltd. Class A | 83,932 | 306 | ||||
| SF Holding Co. Ltd. Class A | 51,100 | 305 | ||||
| CMOC Group Ltd. Class A | 385,700 | 303 | ||||
| 2 | Hygeia Healthcare Holdings Co. Ltd. | 59,745 | 302 | |||
| 2 | Ganfeng Lithium Group Co. Ltd. Class H | 63,000 | 301 | |||
| Ping An Bank Co. Ltd. Class A | 196,800 | 300 | ||||
| China Everbright Bank Co. Ltd. Class H | 1,004,000 | 289 | ||||
| Foshan Haitian Flavouring & Food Co. Ltd. Class A | 53,760 | 289 | ||||
| C&D International Investment Group Ltd. | 112,000 | 285 | ||||
| Shanghai Pudong Development Bank Co. Ltd. Class A | 295,300 | 283 | ||||
| TravelSky Technology Ltd. Class H | 156,000 | 279 | ||||
| Beijing Kingsoft Office Software Inc. Class A | 5,137 | 278 | ||||
| 2 | Guotai Junan Securities Co. Ltd. Class H | 228,800 | 268 | |||
| Autohome Inc. ADR | 9,228 | 267 | ||||
| China Conch Venture Holdings Ltd. | 269,500 | 265 | ||||
| Jiangxi Copper Co. Ltd. Class H | 168,000 | 262 | ||||
| * | Microport Scientific Corp. | 151,300 | 259 | |||
| Great Wall Motor Co. Ltd. Class H | 217,500 | 258 | ||||
| China CITIC Bank Corp. Ltd. Class A | 340,800 | 256 | ||||
| Shenzhen Inovance Technology Co. Ltd. Class A | 27,000 | 253 | ||||
| 2 | 3SBio Inc. | 302,500 | 253 | |||
| China Minsheng Banking Corp. Ltd. Class A | 477,700 | 248 | ||||
| Shares | Market Value• ($000) | |||||
| Aier Eye Hospital Group Co. Ltd. Class A | 99,448 | 246 | ||||
| *,3 | Country Garden Holdings Co. Ltd. | 2,160,000 | 245 | |||
| GF Securities Co. Ltd. Class A | 118,500 | 245 | ||||
| China Overseas Property Holdings Ltd. | 205,000 | 245 | ||||
| Weichai Power Co. Ltd. Class A | 149,000 | 241 | ||||
| Fuyao Glass Industry Group Co. Ltd. Class A | 46,000 | 240 | ||||
| Zhaojin Mining Industry Co. Ltd. Class H | 171,000 | 239 | ||||
| * | HUTCHMED China Ltd. | 77,500 | 238 | |||
| Poly Developments & Holdings Group Co. Ltd. Class A | 122,600 | 236 | ||||
| Zhangzhou Pientzehuang Pharmaceutical Co. Ltd. Class A | 6,200 | 235 | ||||
| Zhejiang Expressway Co. Ltd. Class H | 312,000 | 233 | ||||
| JOYY Inc. ADR | 6,748 | 232 | ||||
| Far East Horizon Ltd. | 336,000 | 230 | ||||
| * | GDS Holdings Ltd. Class A | 154,541 | 229 | |||
| CRRC Corp. Ltd. Class H | 459,000 | 226 | ||||
| 2 | Jiumaojiu International Holdings Ltd. | 141,000 | 226 | |||
| Shandong Gold Mining Co. Ltd. Class A | 62,660 | 224 | ||||
| NAURA Technology Group Co. Ltd. Class A | 6,006 | 223 | ||||
| *,3 | Canadian Solar Inc. | 7,929 | 222 | |||
| Sungrow Power Supply Co. Ltd. Class A | 16,218 | 222 | ||||
| Zoomlion Heavy Industry Science & Technology Co. Ltd. Class H | 463,800 | 221 | ||||
| BOE Technology Group Co. Ltd. Class A | 398,100 | 219 | ||||
| Sany Heavy Equipment International Holdings Co. Ltd. | 140,000 | 218 | ||||
| Hello Group Inc. ADR | 25,303 | 218 | ||||
| * | JinkoSolar Holding Co. Ltd. ADR | 6,437 | 216 | |||
| Inner Mongolia Yili Industrial Group Co. Ltd. Class A | 60,600 | 216 | ||||
| *,2 | Ping An Healthcare & Technology Co. Ltd. | 86,230 | 215 | |||
| China Cinda Asset Management Co. Ltd. Class H | 2,192,000 | 215 | ||||
| Bosideng International Holdings Ltd. | 544,000 | 213 | ||||
| Shares | Market Value• ($000) | |||||
| Xtep International Holdings Ltd. | 212,000 | 210 | ||||
| China United Network Communications Ltd. Class A | 293,300 | 210 | ||||
| 2 | China Resources Pharmaceutical Group Ltd. | 311,000 | 208 | |||
| Shanghai Pharmaceuticals Holding Co. Ltd. Class H | 126,700 | 208 | ||||
| Tongwei Co. Ltd. Class A | 47,208 | 208 | ||||
| * | Chindata Group Holdings Ltd. ADR | 24,842 | 208 | |||
| China Vanke Co. Ltd. Class A | 110,700 | 207 | ||||
| Beijing Enterprises Water Group Ltd. | 878,000 | 202 | ||||
| Shanghai Fosun Pharmaceutical Group Co. Ltd. Class H | 86,000 | 202 | ||||
| China Everbright Environment Group Ltd. | 544,000 | 198 | ||||
| Haitong Securities Co. Ltd. Class A | 143,700 | 194 | ||||
| Haitian International Holdings Ltd. | 90,000 | 193 | ||||
| SAIC Motor Corp. Ltd. Class A | 97,700 | 193 | ||||
| Guangzhou Automobile Group Co. Ltd. Class H | 364,000 | 192 | ||||
| 2 | Hansoh Pharmaceutical Group Co. Ltd. | 148,000 | 192 | |||
| Iflytek Co. Ltd. Class A | 25,100 | 189 | ||||
| Sinotruk Hong Kong Ltd. | 101,500 | 188 | ||||
| CMOC Group Ltd. Class H | 309,000 | 184 | ||||
| * | Air China Ltd. Class A | 154,300 | 183 | |||
| *,2 | Weimob Inc. | 350,000 | 183 | |||
| * | China Ruyi Holdings Ltd. | 680,000 | 180 | |||
| COSCO SHIPPING Ports Ltd. | 290,000 | 179 | ||||
| Fu Shou Yuan International Group Ltd. | 241,000 | 179 | ||||
| Flat Glass Group Co. Ltd. Class A | 42,100 | 178 | ||||
| Hangzhou Tigermed Consulting Co. Ltd. Class A | 19,400 | 177 | ||||
| *,2 | Hua Hong Semiconductor Ltd. | 66,757 | 174 | |||
| Shenzhen Transsion Holdings Co. Ltd. Class A | 8,643 | 174 | ||||
| Chongqing Zhifei Biological Products Co. Ltd. Class A | 28,600 | 173 | ||||
| Shares | Market Value• ($000) | |||||
| China Communications Services Corp. Ltd. Class H | 380,000 | 171 | ||||
| * | China Southern Airlines Co. Ltd. Class A | 197,500 | 171 | |||
| Shenzhen International Holdings Ltd. | 238,500 | 170 | ||||
| FinVolution Group ADR | 33,549 | 168 | ||||
| COSCO SHIPPING Holdings Co. Ltd. Class A | 124,180 | 167 | ||||
| Sany Heavy Industry Co. Ltd. Class A | 78,000 | 166 | ||||
| Hisense Home Appliances Group Co. Ltd. Class H | 62,000 | 164 | ||||
| Huatai Securities Co. Ltd. Class A | 74,500 | 163 | ||||
| *,2 | Keymed Biosciences Inc. | 24,000 | 163 | |||
| Greentown China Holdings Ltd. | 136,500 | 162 | ||||
| Grand Pharmaceutical Group Ltd. | 311,500 | 161 | ||||
| GF Securities Co. Ltd. Class H | 111,400 | 159 | ||||
| Guangzhou Baiyunshan Pharmaceutical Holdings Co. Ltd. Class H | 56,000 | 157 | ||||
| Chongqing Changan Automobile Co. Ltd. Class A | 89,718 | 155 | ||||
| Shoucheng Holdings Ltd. | 663,600 | 155 | ||||
| Dongyue Group Ltd. | 180,000 | 154 | ||||
| TCL Zhonghuan Renewable Energy Technology Co. Ltd. Class A | 43,750 | 154 | ||||
| China Traditional Chinese Medicine Holdings Co. Ltd. | 390,000 | 152 | ||||
| Hangzhou Steam Turbine Power Group Co. Ltd. Class B | 143,237 | 152 | ||||
| *,2 | Luye Pharma Group Ltd. | 411,000 | 151 | |||
| Jiangsu Expressway Co. Ltd. Class H | 166,000 | 150 | ||||
| Focus Media Information Technology Co. Ltd. Class A | 141,800 | 150 | ||||
| Shanghai Fosun Pharmaceutical Group Co. Ltd. Class A | 39,300 | 150 | ||||
| Canvest Environmental Protection Group Co. Ltd. | 281,000 | 150 | ||||
| * | Advanced Micro-Fabrication Equipment Inc. China Class A | 6,958 | 146 | |||
| Shares | Market Value• ($000) | |||||
| 2 | China Tourism Group Duty Free Corp. Ltd. Class H | 10,900 | 146 | |||
| Yihai International Holding Ltd. | 77,000 | 144 | ||||
| China Jinmao Holdings Group Ltd. | 1,010,000 | 143 | ||||
| * | EHang Holdings Ltd. ADR | 7,225 | 143 | |||
| * | Qinghai Salt Lake Industry Co. Ltd. Class A | 57,500 | 141 | |||
| 1,2 | Dali Foods Group Co. Ltd. | 292,500 | 140 | |||
| JA Solar Technology Co. Ltd. Class A | 36,639 | 140 | ||||
| Lufax Holding Ltd. ADR | 115,893 | 140 | ||||
| Eve Energy Co. Ltd. Class A | 20,300 | 138 | ||||
| 2 | Orient Securities Co. Ltd. Class H | 247,600 | 137 | |||
| Nine Dragons Paper Holdings Ltd. | 245,000 | 136 | ||||
| China Merchants Shekou Industrial Zone Holdings Co. Ltd. Class A | 72,200 | 135 | ||||
| 2 | Shandong Gold Mining Co. Ltd. Class H | 67,100 | 135 | |||
| * | Beijing Capital International Airport Co. Ltd. Class H | 256,000 | 134 | |||
| Yum China Holdings Inc. | 2,493 | 134 | ||||
| * | Lifetech Scientific Corp. | 432,000 | 134 | |||
| Pharmaron Beijing Co. Ltd. Class A | 32,820 | 134 | ||||
| Kingboard Laminates Holdings Ltd. | 160,500 | 133 | ||||
| * | Alibaba Pictures Group Ltd. | 2,010,000 | 133 | |||
| Fufeng Group Ltd. | 250,000 | 133 | ||||
| Consun Pharmaceutical Group Ltd. | 202,000 | 133 | ||||
| Uni-President China Holdings Ltd. | 179,000 | 132 | ||||
| China Merchants Securities Co. Ltd. Class A | 66,620 | 130 | ||||
| Guangzhou Automobile Group Co. Ltd. Class A | 93,700 | 130 | ||||
| Bank of Shanghai Co. Ltd. Class A | 158,000 | 129 | ||||
| China Education Group Holdings Ltd. | 151,000 | 128 | ||||
| Tianqi Lithium Corp. Class A | 15,916 | 126 | ||||
| *,2 | New Horizon Health Ltd. | 56,500 | 125 | |||
| Tianqi Lithium Corp. Class H | 22,400 | 123 | ||||
| Huaxia Bank Co. Ltd. Class A | 160,400 | 122 | ||||
| Shares | Market Value• ($000) | |||||
| * | Air China Ltd. Class H | 164,000 | 121 | |||
| Chongqing Rural Commercial Bank Co. Ltd. Class H | 343,000 | 121 | ||||
| * | Shanghai International Airport Co. Ltd. Class A | 22,376 | 121 | |||
| *,2 | Remegen Co. Ltd. Class H | 26,000 | 121 | |||
| Chongqing Changan Automobile Co. Ltd. Class B | 275,392 | 120 | ||||
| JCET Group Co. Ltd. Class A | 26,900 | 120 | ||||
| *,2 | Jinxin Fertility Group Ltd. | 237,000 | 119 | |||
| China Resources Cement Holdings Ltd. | 354,000 | 117 | ||||
| ZTE Corp. Class A | 23,900 | 116 | ||||
| Tianneng Power International Ltd. | 108,000 | 115 | ||||
| Ganfeng Lithium Group Co. Ltd. Class A | 17,694 | 115 | ||||
| China Construction Bank Corp. Class A | 139,600 | 115 | ||||
| *,2 | Alphamab Oncology | 105,000 | 115 | |||
| China Nonferrous Mining Corp. Ltd. | 213,000 | 115 | ||||
| * | Unigroup Guoxin Microelectronics Co. Ltd. Class A | 8,959 | 114 | |||
| Will Semiconductor Co. Ltd. Shanghai Class A | 9,045 | 114 | ||||
| Imeik Technology Development Co. Ltd. Class A | 1,900 | 114 | ||||
| * | Xinte Energy Co. Ltd. Class H | 64,400 | 114 | |||
| SSY Group Ltd. | 212,000 | 113 | ||||
| 2 | Meitu Inc. | 292,000 | 112 | |||
| Shenwan Hongyuan Group Co. Ltd. Class A | �� 186,400 | 111 | ||||
| Zhejiang Jingsheng Mechanical & Electrical Co. Ltd. Class A | 14,400 | 111 | ||||
| China Water Affairs Group Ltd. | 144,000 | 110 | ||||
| Central China Securities Co. Ltd. Class H | 698,000 | 110 | ||||
| Trina Solar Co. Ltd. Class A | 23,655 | 110 | ||||
| 2 | BAIC Motor Corp. Ltd. Class H | 392,500 | 109 | |||
| Everbright Securities Co. Ltd. Class A | 46,500 | 109 | ||||
| China Suntien Green Energy Corp. Ltd. Class H | 308,000 | 108 | ||||
| * | Gushengtang Holdings Ltd. | 20,300 | 108 | |||
| China Everbright Bank Co. Ltd. Class A | 253,300 | 105 | ||||
| Shares | Market Value• ($000) | |||||
| * | Golden Solar New Energy Technology Holdings Ltd. | 122,000 | 105 | |||
| Yangzijiang Financial Holding Ltd. | 389,200 | 105 | ||||
| Yuexiu REIT | 541,206 | 101 | ||||
| Guangdong Haid Group Co. Ltd. Class A | 15,200 | 101 | ||||
| Jiangxi Copper Co. Ltd. Class A | 39,000 | 101 | ||||
| * | Kingsoft Cloud Holdings Ltd. ADR | 17,554 | 100 | |||
| Hundsun Technologies Inc. Class A | 20,080 | 99 | ||||
| Yonyou Network Technology Co. Ltd. Class A | 39,600 | 99 | ||||
| * | Guangshen Railway Co. Ltd. Class H | 426,000 | 98 | |||
| *,2 | InnoCare Pharma Ltd. | 115,000 | 97 | |||
| Sinopec Engineering Group Co. Ltd. Class H | 208,500 | 96 | ||||
| Inspur Electronic Information Industry Co. Ltd. Class A | 17,800 | 95 | ||||
| * | XD Inc. | 43,000 | 95 | |||
| *,2 | China Huarong Asset Management Co. Ltd. Class H | 2,034,000 | 93 | |||
| Zhejiang Huayou Cobalt Co. Ltd. Class A | 16,900 | 93 | ||||
| Citic Pacific Special Steel Group Co. Ltd. Class A | 48,000 | 93 | ||||
| * | Hopson Development Holdings Ltd. | 152,474 | 93 | |||
| Noah Holdings Ltd. ADR | 6,639 | 92 | ||||
| China Resources Medical Holdings Co. Ltd. | 124,500 | 92 | ||||
| Jiangsu Expressway Co. Ltd. Class A | 68,400 | 91 | ||||
| Jiangsu Jiangyin Rural Commercial Bank Co. Ltd. Class A | 175,900 | 90 | ||||
| * | China Eastern Airlines Corp. Ltd. Class H | 252,000 | 89 | |||
| Towngas Smart Energy Co. Ltd. | 211,000 | 89 | ||||
| Sinotrans Ltd. Class A | 114,000 | 89 | ||||
| * | Huangshan Tourism Development Co. Ltd. Class B | 122,860 | 88 | |||
| Vinda International Holdings Ltd. | 38,000 | 88 | ||||
| *,2 | Shanghai Junshi Biosciences Co. Ltd. Class H | 32,400 | 88 | |||
| Poly Property Services Co. Ltd. Class H | 19,000 | 88 | ||||
| Shares | Market Value• ($000) | |||||
| 2 | China New Higher Education Group Ltd. | 278,000 | 88 | |||
| Beijing Tongrentang Co. Ltd. Class A | 11,300 | 87 | ||||
| * | Seazen Group Ltd. | 444,567 | 87 | |||
| People.cn Co. Ltd. Class A | 15,200 | 87 | ||||
| Montage Technology Co. Ltd. Class A | 12,362 | 87 | ||||
| *,2 | China Bohai Bank Co. Ltd. Class H | 561,500 | 87 | |||
| Maxscend Microelectronics Co. Ltd. Class A | 5,040 | 86 | ||||
| 2 | Legend Holdings Corp. Class H | 95,500 | 85 | |||
| Shanghai Pharmaceuticals Holding Co. Ltd. Class A | 34,600 | 85 | ||||
| Guangzhou Tinci Materials Technology Co. Ltd. Class A | 18,600 | 84 | ||||
| China Risun Group Ltd. | 189,000 | 84 | ||||
| * | Shanghai MicroPort MedBot Group Co. Ltd. | 35,500 | 84 | |||
| * | Shanghai Zhenhua Heavy Industries Co. Ltd. Class B | 373,500 | 83 | |||
| *,2 | Bairong Inc. Class B | 68,000 | 83 | |||
| China Resources Microelectronics Ltd. Class A | 10,366 | 83 | ||||
| Skyworth Group Ltd. | 225,111 | 82 | ||||
| Huadong Medicine Co. Ltd. Class A | 15,700 | 82 | ||||
| Jiangxi Lianchuang Optoelectronic Science & Technology Co. Ltd. Class A | 17,500 | 82 | ||||
| *,1 | CIFI Holdings Group Co. Ltd. | 840,800 | 81 | |||
| PAX Global Technology Ltd. | 107,000 | 81 | ||||
| 2 | Red Star Macalline Group Corp. Ltd. Class H | 234,200 | 81 | |||
| *,2 | A-Living Smart City Services Co. Ltd. | 125,500 | 80 | |||
| * | COFCO Joycome Foods Ltd. | 344,000 | 80 | |||
| Lens Technology Co. Ltd. Class A | 47,600 | 80 | ||||
| * | Wingtech Technology Co. Ltd. Class A | 12,600 | 80 | |||
| 2 | AsiaInfo Technologies Ltd. | 66,000 | 80 | |||
| China Yongda Automobiles Services Holdings Ltd. | 178,500 | 79 | ||||
| Shares | Market Value• ($000) | |||||
| * | LexinFintech Holdings Ltd. ADR | 30,649 | 79 | |||
| C&D Property Management Group Co. Ltd. | 172,000 | 79 | ||||
| China Everbright Ltd. | 134,000 | 78 | ||||
| Anhui Expressway Co. Ltd. Class H | 80,000 | 78 | ||||
| Poly Property Group Co. Ltd. | 334,000 | 78 | ||||
| Digital China Holdings Ltd. | 242,000 | 78 | ||||
| 2 | China Merchants Securities Co. Ltd. Class H | 84,660 | 78 | |||
| Suzhou Dongshan Precision Manufacturing Co. Ltd. Class A | 30,200 | 78 | ||||
| Goldwind Science & Technology Co. Ltd. Class A | 59,100 | 77 | ||||
| *,2 | Ascentage Pharma Group International | 25,200 | 77 | |||
| 2 | Shenwan Hongyuan Group Co. Ltd. Class H | 394,400 | 77 | |||
| Yunnan Baiyao Group Co. Ltd. Class A | 10,100 | 76 | ||||
| Zhongyu Energy Holdings Ltd. | 109,000 | 76 | ||||
| NetDragon Websoft Holdings Ltd. | 38,500 | 75 | ||||
| China Lesso Group Holdings Ltd. | 136,000 | 75 | ||||
| Yunnan Aluminium Co. Ltd. Class A | 38,000 | 75 | ||||
| Jiangsu Zhongtian Technology Co. Ltd. Class A | 37,400 | 75 | ||||
| *,2 | Peijia Medical Ltd. | 81,000 | 75 | |||
| * | Tuya Inc. ADR | 40,534 | 75 | |||
| Shanghai Fudan Microelectronics Group Co. Ltd. Class A | 10,400 | 75 | ||||
| Tong Ren Tang Technologies Co. Ltd. Class H | 93,000 | 74 | ||||
| Changchun High & New Technology Industry Group Inc. Class A | 3,900 | 74 | ||||
| GoerTek Inc. Class A | 35,400 | 74 | ||||
| Guangzhou Restaurant Group Co. Ltd. Class A | 22,000 | 74 | ||||
| Sinoma International Engineering Co. Class A | 46,000 | 74 | ||||
| Guangdong Great River Smarter Logistics Co. Ltd. Class A | 24,500 | 74 | ||||
| Flat Glass Group Co. Ltd. Class H | 30,000 | 74 | ||||
| Shares | Market Value• ($000) | |||||
| Yihai Kerry Arawana Holdings Co. Ltd. Class A | 15,200 | 74 | ||||
| *,2,3 | Haichang Ocean Park Holdings Ltd. | 573,000 | 74 | |||
| Lonking Holdings Ltd. | 408,000 | 73 | ||||
| 3 | Shanghai Fudan Microelectronics Group Co. Ltd. Class H | 30,000 | 72 | |||
| * | Gaotu Techedu Inc. ADR | 25,119 | 72 | |||
| Postal Savings Bank of China Co. Ltd. Class A | 108,700 | 72 | ||||
| * | China Southern Airlines Co. Ltd. Class H | 134,000 | 71 | |||
| Chaozhou Three-Circle Group Co. Ltd. Class A | 16,100 | 71 | ||||
| Henan Shuanghui Investment & Development Co. Ltd. Class A | 19,400 | 71 | ||||
| Shengyi Technology Co. Ltd. Class A | 34,700 | 71 | ||||
| China Overseas Grand Oceans Group Ltd. | 178,000 | 70 | ||||
| China BlueChemical Ltd. Class H | 280,000 | 70 | ||||
| Bethel Automotive Safety Systems Co. Ltd. Class A | 6,800 | 70 | ||||
| Sun Art Retail Group Ltd. | 295,000 | 69 | ||||
| * | Vnet Group Inc. ADR | 18,360 | 69 | |||
| Shanghai Lujiazui Finance & Trade Zone Development Co. Ltd. Class A | 50,200 | 69 | ||||
| Shanghai Pudong Construction Co. Ltd. Class A | 74,100 | 69 | ||||
| Western Region Gold Co. Ltd. Class A | 35,600 | 69 | ||||
| Xinyi Energy Holdings Ltd. | 316,800 | 69 | ||||
| Sichuan Expressway Co. Ltd. Class H | 224,000 | 67 | ||||
| China Resources Sanjiu Medical & Pharmaceutical Co. Ltd. Class A | 10,200 | 67 | ||||
| Hisense Home Appliances Group Co. Ltd. Class A | 20,000 | 67 | ||||
| Concord New Energy Group Ltd. | 820,000 | 67 | ||||
| 2 | Genertec Universal Medical Group Co. Ltd. | 128,500 | 67 | |||
| China Reinsurance Group Corp. Class H | 1,035,000 | 67 | ||||
| *,2 | Ocumension Therapeutics | 63,500 | 67 | |||
| CPMC Holdings Ltd. | 89,000 | 66 | ||||
| Shares | Market Value• ($000) | |||||
| * | Wuxi Taiji Industry Co. Ltd. Class A | 70,900 | 66 | |||
| * | Yeahka Ltd. | 33,200 | 66 | |||
| * | China Conch Environment Protection Holdings Ltd. | 262,500 | 66 | |||
| Orient Securities Co. Ltd. Class A | 47,532 | 65 | ||||
| Guotai Junan Securities Co. Ltd. Class A | 32,400 | 65 | ||||
| *,1,2 | China Renaissance Holdings Ltd. | 70,200 | 65 | |||
| Tiangong International Co. Ltd. | 188,000 | 64 | ||||
| Yintai Gold Co. Ltd. Class A | 32,800 | 64 | ||||
| Suzhou TFC Optical Communication Co. Ltd. Class A | 5,500 | 64 | ||||
| 2 | Blue Moon Group Holdings Ltd. | 137,500 | 64 | |||
| WUS Printed Circuit Kunshan Co. Ltd. Class A | 21,840 | 63 | ||||
| Zhejiang NHU Co. Ltd. Class A | 28,256 | 63 | ||||
| * | TCL Technology Group Corp. Class A | 111,320 | 63 | |||
| *,2 | CARsgen Therapeutics Holdings Ltd. | 53,500 | 63 | |||
| Yuexiu Transport Infrastructure Ltd. | 120,000 | 62 | ||||
| * | Zhejiang Century Huatong Group Co. Ltd. Class A | 83,400 | 62 | |||
| * | Dada Nexus Ltd. ADR | 11,215 | 61 | |||
| China Oriental Group Co. Ltd. | 390,000 | 60 | ||||
| *,2 | Zhou Hei Ya International Holdings Co. Ltd. | 171,000 | 60 | |||
| 37 Interactive Entertainment Network Technology Group Co. Ltd. Class A | 17,400 | 59 | ||||
| COSCO SHIPPING Development Co. Ltd. Class A | 177,900 | 58 | ||||
| 2 | Xiabuxiabu Catering Management China Holdings Co. Ltd. | 119,000 | 58 | |||
| *,2 | Maoyan Entertainment | 42,000 | 58 | |||
| Shanghai Mechanical & Electrical Industry Co. Ltd. Class B | 57,700 | 57 | ||||
| Beijing New Building Materials plc Class A | 13,800 | 57 | ||||
| BOE Varitronix Ltd. | 59,000 | 57 | ||||
| Lee & Man Paper Manufacturing Ltd. | 192,000 | 56 | ||||
| Shares | Market Value• ($000) | |||||
| China Shineway Pharmaceutical Group Ltd. | 57,000 | 56 | ||||
| 3 | Greentown Service Group Co. Ltd. | 120,000 | 56 | |||
| LB Group Co. Ltd. Class A | 22,600 | 56 | ||||
| Zhejiang Hailiang Co. Ltd. Class A | 35,700 | 56 | ||||
| Sieyuan Electric Co. Ltd. Class A | 7,900 | 55 | ||||
| Walvax Biotechnology Co. Ltd. Class A | 17,000 | 55 | ||||
| *,2 | YiChang HEC ChangJiang Pharmaceutical Co. Ltd. Class H | 68,400 | 55 | |||
| Beibuwan Port Co. Ltd. Class A | 51,190 | 55 | ||||
| Shandong Nanshan Aluminum Co. Ltd. Class A | 128,400 | 55 | ||||
| China Foods Ltd. | 146,000 | 54 | ||||
| China Greatwall Technology Group Co. Ltd. Class A | 36,500 | 54 | ||||
| 2 | China Railway Signal & Communication Corp. Ltd. Class H | 162,000 | 54 | |||
| China Galaxy Securities Co. Ltd. Class A | 33,800 | 54 | ||||
| China Meidong Auto Holdings Ltd. | 72,000 | 54 | ||||
| 2 | Simcere Pharmaceutical Group Ltd. | 69,000 | 54 | |||
| Ninestar Corp. Class A | 13,800 | 53 | ||||
| Industrial Securities Co. Ltd. Class A | 59,880 | 53 | ||||
| * | Pangang Group Vanadium Titanium & Resources Co. Ltd. Class A | 103,900 | 53 | |||
| Universal Scientific Industrial Shanghai Co. Ltd. Class A | 26,100 | 53 | ||||
| China Railway Signal & Communication Corp. Ltd. Class A | 68,875 | 53 | ||||
| * | Ming Yuan Cloud Group Holdings Ltd. | 106,000 | 53 | |||
| * | Yatsen Holding Ltd. ADR | 51,964 | 53 | |||
| Shanghai Sinyang Semiconductor Materials Co. Ltd. Class A | 10,200 | 52 | ||||
| * | Amlogic Shanghai Co. Ltd. Class A | 4,360 | 52 | |||
| * | Tongdao Liepin Group | 53,600 | 51 | |||
| TCL Electronics Holdings Ltd. | 128,000 | 50 | ||||
| Sinotrans Ltd. Class H | 123,000 | 50 | ||||
| Shares | Market Value• ($000) | |||||
| Shaanxi International Trust Co. Ltd. Class A | 118,700 | 50 | ||||
| YGSOFT Inc. Class A | 55,440 | 50 | ||||
| 2 | AK Medical Holdings Ltd. | 62,000 | 50 | |||
| Eoptolink Technology Inc. Ltd. Class A | 7,980 | 50 | ||||
| *,2 | Yidu Tech Inc. | 97,800 | 50 | |||
| Bank of Chongqing Co. Ltd. Class A | 46,700 | 50 | ||||
| *,2 | Microport Cardioflow Medtech Corp. | 211,000 | 50 | |||
| *,2 | Arrail Group Ltd. | 49,000 | 50 | |||
| Sihuan Pharmaceutical Holdings Group Ltd. | 595,000 | 49 | ||||
| Lingyi iTech Guangdong Co. Class A | 58,900 | 49 | ||||
| 2 | Everbright Securities Co. Ltd. Class H | 66,632 | 49 | |||
| Bank of Chongqing Co. Ltd. Class H | 95,000 | 49 | ||||
| * | Seazen Holdings Co. Ltd. Class A | 24,500 | 49 | |||
| Ming Yang Smart Energy Group Ltd. Class A | 23,800 | 49 | ||||
| * | China Eastern Airlines Corp. Ltd. Class A | 82,000 | 49 | |||
| Shanghai Jinjiang International Hotels Co. Ltd. Class A | 9,200 | 49 | ||||
| * | Skshu Paint Co. Ltd. Class A | 4,732 | 49 | |||
| Chongqing Water Group Co. Ltd. Class A | 63,700 | 48 | ||||
| Huagong Tech Co. Ltd. Class A | 11,200 | 48 | ||||
| COFCO Capital Holdings Co. Ltd. Class A | 45,800 | 48 | ||||
| 2 | Angelalign Technology Inc. | 7,200 | 48 | |||
| * | Canaan Inc. ADR | 23,797 | 48 | |||
| Shenzhen Investment Ltd. | 266,000 | 47 | ||||
| China Lilang Ltd. | 95,000 | 47 | ||||
| Changzhou Xingyu Automotive Lighting Systems Co. Ltd. Class A | 2,300 | 47 | ||||
| * | Jinke Smart Services Group Co. Ltd. Class H | 35,700 | 47 | |||
| CNGR Advanced Material Co. Ltd. Class A | 6,300 | 47 | ||||
| Chervon Holdings Ltd. | 14,200 | 47 | ||||
| First Tractor Co. Ltd. Class H | 90,000 | 46 | ||||
| GEM Co. Ltd. Class A | 53,900 | 46 | ||||
| Zhejiang Weixing New Building Materials Co. Ltd. Class A | 16,600 | 46 | ||||
| Shares | Market Value• ($000) | |||||
| *,2 | Hope Education Group Co. Ltd. | 706,000 | 46 | |||
| Shanghai Jinqiao Export Processing Zone Development Co. Ltd. Class A | 26,300 | 46 | ||||
| * | Beijing Bei Mo Gao Ke Friction Material Co. Ltd. Class A | 8,710 | 46 | |||
| *,2 | Mobvista Inc. | 101,000 | 46 | |||
| BOE Technology Group Co. Ltd. Class B | 122,100 | 45 | ||||
| * | Sohu.com Ltd. ADR | 4,291 | 45 | |||
| Angang Steel Co. Ltd. Class A | 118,000 | 45 | ||||
| Xiamen C & D Inc. Class A | 29,900 | 45 | ||||
| Zhejiang Juhua Co. Ltd. Class A | 20,100 | 45 | ||||
| Grinm Advanced Materials Co. Ltd. Class A | 26,600 | 45 | ||||
| Jiangsu Jiejie Microelectronics Co. Ltd. Class A | 18,800 | 45 | ||||
| * | Yanlord Land Group Ltd. | 88,100 | 44 | |||
| Perfect World Co. Ltd. Class A | 23,000 | 44 | ||||
| Guangzhou Kingmed Diagnostics Group Co. Ltd. Class A | 5,400 | 44 | ||||
| 2 | Yangtze Optical Fibre & Cable Joint Stock Ltd. Co. Class H | 31,500 | 44 | |||
| DeHua TB New Decoration Materials Co. Ltd. Class A | 30,200 | 44 | ||||
| Shenzhen SED Industry Co. Ltd. Class A | 11,800 | 44 | ||||
| Shui On Land Ltd. | 446,000 | 43 | ||||
| Gemdale Corp. Class A | 43,900 | 43 | ||||
| Shenzhen Kaifa Technology Co. Ltd. Class A | 17,500 | 43 | ||||
| Wellhope Foods Co. Ltd. Class A | 35,500 | 43 | ||||
| Humanwell Healthcare Group Co. Ltd. Class A | 13,300 | 43 | ||||
| Ginlong Technologies Co. Ltd. Class A | 4,200 | 43 | ||||
| 1 | CIFI Ever Sunshine Services Group Ltd. | 110,000 | 43 | |||
| * | DingDong Cayman Ltd. ADR | 20,902 | 43 | |||
| Xingda International Holdings Ltd. | 228,360 | 42 | ||||
| Goldwind Science & Technology Co. Ltd. | 79,600 | 42 | ||||
| * | New Hope Liuhe Co. Ltd. Class A | 26,300 | 42 | |||
| Livzon Pharmaceutical Group Inc. Class H | 13,300 | 42 | ||||
| Shares | Market Value• ($000) | |||||
| MLS Co. Ltd. Class A | 34,200 | 42 | ||||
| Asymchem Laboratories Tianjin Co. Ltd. Class A | 2,300 | 42 | ||||
| *,2,3 | CanSino Biologics Inc. Class H | 14,400 | 42 | |||
| CSG Holding Co. Ltd. Class B | 129,900 | 41 | ||||
| * | Kingnet Network Co. Ltd. Class A | 19,700 | 41 | |||
| Wens Foodstuffs Group Co. Ltd. Class A | 18,000 | 41 | ||||
| B-Soft Co. Ltd. Class A | 45,260 | 41 | ||||
| Hubei Feilihua Quartz Glass Co. Ltd. Class A | 6,324 | 41 | ||||
| Ningbo Orient Wires & Cables Co. Ltd. Class A | 8,100 | 41 | ||||
| Gemdale Properties & Investment Corp. Ltd. | 924,000 | 40 | ||||
| * | Unisplendour Corp. Ltd. Class A | 10,960 | 40 | |||
| Lepu Medical Technology Beijing Co. Ltd. Class A | 17,800 | 40 | ||||
| Guoyuan Securities Co. Ltd. Class A | 41,700 | 40 | ||||
| Livzon Pharmaceutical Group Inc. Class A | 8,500 | 40 | ||||
| China International Marine Containers Group Co. Ltd. Class A | 41,450 | 40 | ||||
| CQ Pharmaceutical Holding Co. Ltd. Class A | 52,800 | 40 | ||||
| Gaona Aero Material Co. Ltd. Class A | 11,680 | 40 | ||||
| * | Cosmopolitan International Holdings Ltd. | 270,000 | 40 | |||
| 2 | Linklogis Inc. Class B | 176,500 | 40 | |||
| Hangcha Group Co. Ltd. Class A | 12,600 | 40 | ||||
| Sunresin New Materials Co. Ltd. Class A | 4,800 | 40 | ||||
| * | CMGE Technology Group Ltd. | 218,000 | 40 | |||
| Xinjiang Daqo New Energy Co. Ltd. Class A | 6,988 | 40 | ||||
| Sinofert Holdings Ltd. | 316,000 | 39 | ||||
| * | China TransInfo Technology Co. Ltd. Class A | 22,600 | 39 | |||
| Caitong Securities Co. Ltd. Class A | 35,800 | 39 | ||||
| JNBY Design Ltd. | 37,500 | 39 | ||||
| Beijing United Information Technology Co. Ltd. Class A | 7,830 | 39 | ||||
| Shanghai Zhonggu Logistics Co. Ltd. Class A | 30,192 | 39 | ||||
| Shares | Market Value• ($000) | |||||
| Tian Lun Gas Holdings Ltd. | 73,000 | 38 | ||||
| * | Topchoice Medical Corp. Class A | 3,004 | 38 | |||
| Anjoy Foods Group Co. Ltd. Class A | 2,100 | 38 | ||||
| * | China Railway Materials Co. Ltd. Class A | 102,600 | 38 | |||
| Rongsheng Petrochemical Co. Ltd. Class A | 22,100 | 37 | ||||
| Changjiang Securities Co. Ltd. Class A | 45,300 | 37 | ||||
| * | Shenzhen Overseas Chinese Town Co. Ltd. Class A | 62,100 | 37 | |||
| New China Life Insurance Co. Ltd. Class A | 6,600 | 37 | ||||
| Liaoning Port Co. Ltd. Class A | 169,500 | 37 | ||||
| Taiji Computer Corp. Ltd. Class A | 7,400 | 37 | ||||
| * | DouYu International Holdings Ltd. ADR | 36,721 | 37 | |||
| Shanghai Liangxin Electrical Co. Ltd. Class A | 23,700 | 37 | ||||
| Shenzhen Dynanonic Co. Ltd. Class A | 2,880 | 37 | ||||
| Comba Telecom Systems Holdings Ltd. | 264,000 | 36 | ||||
| * | Guangzhou R&F Properties Co. Ltd. Class H | 237,600 | 36 | |||
| China Modern Dairy Holdings Ltd. | 383,000 | 36 | ||||
| * | Bluefocus Intelligent Communications Group Co. Ltd. Class A | 29,400 | 36 | |||
| Yantai Dongcheng Pharmaceutical Co. Ltd. Class A | 18,700 | 36 | ||||
| *,2 | Venus MedTech Hangzhou Inc. Class H | 51,000 | 36 | |||
| Joinn Laboratories China Co. Ltd. Class A | 10,897 | 36 | ||||
| Chongqing Sanfeng Environment Group Corp. Ltd. Class A | 35,200 | 36 | ||||
| Shanghai Chlor-Alkali Chemical Co. Ltd. Class B | 74,700 | 35 | ||||
| COSCO SHIPPING Development Co. Ltd. Class H | 320,000 | 35 | ||||
| * | China South City Holdings Ltd. | 598,000 | 35 | |||
| CSC Financial Co. Ltd. Class A | 9,800 | 35 | ||||
| Shares | Market Value• ($000) | |||||
| Health & Happiness H&H International Holdings Ltd. | 26,500 | 35 | ||||
| Foran Energy Group Co. Ltd. Class A | 20,600 | 35 | ||||
| Shanghai International Port Group Co. Ltd. Class A | 50,500 | 35 | ||||
| Tianjin Capital Environmental Protection Group Co. Ltd. Class A | 42,700 | 35 | ||||
| China Jushi Co. Ltd. Class A | 18,144 | 35 | ||||
| Hongfa Technology Co. Ltd. Class A | 7,280 | 35 | ||||
| Cheng De Lolo Co. Ltd. Class A | 30,000 | 35 | ||||
| Xinhua Winshare Publishing & Media Co. Ltd. Class A | 18,200 | 35 | ||||
| *,2 | Ascletis Pharma Inc. | 125,000 | 35 | |||
| * | LVGEM China Real Estate Investment Co. Ltd. | 164,000 | 35 | |||
| Shenzhen Expressway Corp. Ltd. Class A | 27,700 | 35 | ||||
| * | Luoxin Pharmaceuticals Group Stock Co. Ltd. Class A | 46,400 | 35 | |||
| 2,3 | Sunac Services Holdings Ltd. | 113,000 | 35 | |||
| Kangji Medical Holdings Ltd. | 39,500 | 35 | ||||
| China Automotive Engineering Research Institute Co. Ltd. Class A | 12,000 | 35 | ||||
| Shenzhen Expressway Corp. Ltd. Class H | 42,000 | 34 | ||||
| *,1,2 | Redco Properties Group Ltd. | 202,000 | 34 | |||
| Accelink Technologies Co. Ltd. Class A | 8,800 | 34 | ||||
| Jiangsu Nhwa Pharmaceutical Co. Ltd. Class A | 9,400 | 34 | ||||
| Three's Co. Media Group Co. Ltd. Class A | 3,216 | 34 | ||||
| * | Hainan Meilan International Airport Co. Ltd. Class H | 35,000 | 34 | |||
| Guangdong Provincial Expressway Development Co. Ltd. Class B | 44,700 | 33 | ||||
| Shanghai Lujiazui Finance & Trade Zone Development Co. Ltd. Class B | 80,800 | 33 | ||||
| Shares | Market Value• ($000) | |||||
| Shandong Himile Mechanical Science & Technology Co. Ltd. Class A | 7,000 | 33 | ||||
| DHC Software Co. Ltd. Class A | 35,800 | 33 | ||||
| Huayu Automotive Systems Co. Ltd. Class A | 12,900 | 33 | ||||
| Hubei Dinglong Co. Ltd. Class A | 11,300 | 33 | ||||
| Hangjin Technology Co. Ltd. Class A | 7,800 | 33 | ||||
| First Capital Securities Co. Ltd. Class A | 39,600 | 33 | ||||
| Victory Giant Technology Huizhou Co. Ltd. Class A | 11,000 | 33 | ||||
| Henan Yuguang Gold & Lead Co. Ltd. Class A | 34,100 | 33 | ||||
| * | Guangzhou Great Power Energy & Technology Co. Ltd. Class A | 6,700 | 33 | |||
| Anji Microelectronics Technology Shanghai Co. Ltd. Class A | 1,549 | 33 | ||||
| Raytron Technology Co. Ltd. Class A | 4,763 | 33 | ||||
| * | Shanghai Junshi Biosciences Co. Ltd. Class A | 6,375 | 33 | |||
| Ningbo Ronbay New Energy Technology Co. Ltd. Class A | 4,709 | 33 | ||||
| GCL Energy Technology Co. Ltd. Class A | 19,800 | 33 | ||||
| INESA Intelligent Tech Inc. Class B | 50,600 | 32 | ||||
| * | Meinian Onehealth Healthcare Holdings Co. Ltd. Class A | 33,900 | 32 | |||
| Changchun Faway Automobile Components Co. Ltd. Class A | 26,600 | 32 | ||||
| * | China Tianying Inc. Class A | 45,200 | 32 | |||
| Wuhan Jingce Electronic Group Co. Ltd. Class A | 2,600 | 32 | ||||
| Risen Energy Co. Ltd. Class A | 11,800 | 32 | ||||
| China Tungsten & Hightech Materials Co. Ltd. Class A | 24,830 | 32 | ||||
| *,1 | China Dili Group | 378,000 | 32 | |||
| AIMA Technology Group Co. Ltd. Class A | 8,250 | 32 | ||||
| * | Zhuguang Holdings Group Co. Ltd. | 486,000 | 31 | |||
| Shares | Market Value• ($000) | |||||
| Zhejiang Huahai Pharmaceutical Co. Ltd. Class A | 13,300 | 31 | ||||
| Hengdian Group DMEGC Magnetics Co. Ltd. Class A | 13,800 | �� 31 | ||||
| Sinotruk Jinan Truck Co. Ltd. Class A | 14,420 | 31 | ||||
| Shenzhen Megmeet Electrical Co. Ltd. Class A | 7,200 | 31 | ||||
| Longshine Technology Group Co. Ltd. Class A | 10,300 | 31 | ||||
| Shenzhen Gongjin Electronics Co. Ltd. Class A | 20,000 | 31 | ||||
| Lianhe Chemical Technology Co. Ltd. Class A | 26,100 | 31 | ||||
| * | Shenzhen Kangtai Biological Products Co. Ltd. Class A | 7,800 | 30 | |||
| AVIC Industry-Finance Holdings Co. Ltd. Class A | 59,800 | 30 | ||||
| BBMG Corp. Class A | 100,200 | 30 | ||||
| 2 | China East Education Holdings Ltd. | 70,000 | 30 | |||
| Shenyang Xingqi Pharmaceutical Co. Ltd. Class A | 1,200 | 30 | ||||
| Beijing Chunlizhengda Medical Instruments Co. Ltd. Class H | 17,500 | 30 | ||||
| * | Niu Technologies ADR | 9,737 | 30 | |||
| GRG Metrology & Test Group Co. Ltd. Class A | 14,900 | 30 | ||||
| Shaanxi Construction Engineering Group Corp. Ltd. Class A | 45,600 | 30 | ||||
| Shanghai Daimay Automotive Interior Co. Ltd. Class A | 11,745 | 30 | ||||
| * | Shandong Hi-Speed New Energy Group Ltd. | 85,600 | 30 | |||
| 2 | Midea Real Estate Holding Ltd. | 30,600 | 29 | |||
| SooChow Securities Co. Ltd. Class A | 25,400 | 29 | ||||
| Shenzhen Gas Corp. Ltd. Class A | 30,200 | 29 | ||||
| G-bits Network Technology Xiamen Co. Ltd. Class A | 500 | 29 | ||||
| Innuovo Technology Co. Ltd. Class A | 32,800 | 29 | ||||
| * | Shenzhen FRD Science & Technology Co. Ltd. Class A | 11,700 | 29 | |||
| * | Qingdao Sentury Tire Co. Ltd. Class A | 6,400 | 29 | |||
| Shares | Market Value• ($000) | |||||
| Angang Steel Co. Ltd. Class H | 110,000 | 28 | ||||
| * | Agile Group Holdings Ltd. | 248,000 | 28 | |||
| *,3 | KWG Group Holdings Ltd. | 238,500 | 28 | |||
| Tofflon Science & Technology Group Co. Ltd. Class A | 10,300 | 28 | ||||
| * | Beijing Sinnet Technology Co. Ltd. Class A | 20,400 | 28 | |||
| City Development Environment Co. Ltd. Class A | 18,700 | 28 | ||||
| Ningbo Xusheng Group Co. Ltd. Class A | 9,100 | 28 | ||||
| * | SOHO China Ltd. | 231,500 | 27 | |||
| Jointown Pharmaceutical Group Co. Ltd. Class A | 19,370 | 27 | ||||
| * | Chongqing Iron & Steel Co. Ltd. Class A | 126,900 | 27 | |||
| Konfoong Materials International Co. Ltd. Class A | 3,300 | 27 | ||||
| Shanghai Belling Co. Ltd. Class A | 12,400 | 27 | ||||
| Sino-Platinum Metals Co. Ltd. Class A | 13,363 | 27 | ||||
| Shanxi Taigang Stainless Steel Co. Ltd. Class A | 49,600 | 27 | ||||
| * | Talkweb Information System Co. Ltd. Class A | 11,800 | 27 | |||
| Sino Wealth Electronic Ltd. Class A | 7,469 | 27 | ||||
| Digital China Group Co. Ltd. Class A | 6,200 | 27 | ||||
| *,2 | Shimao Services Holdings Ltd. | 139,000 | 27 | |||
| 2 | Hangzhou Tigermed Consulting Co. Ltd. Class H | 4,900 | 27 | |||
| Zhejiang HangKe Technology Inc. Co. Class A | 7,252 | 27 | ||||
| Hangzhou Lion Electronics Co. Ltd. Class A | 6,000 | 27 | ||||
| GoodWe Technologies Co. Ltd. Class A | 1,428 | 27 | ||||
| Shanghai Fudan-Zhangjiang Bio-Pharmaceutical Co. Ltd. Class H | 82,000 | 26 | ||||
| West China Cement Ltd. | 260,000 | 26 | ||||
| China International Marine Containers Group Co. Ltd. Class H | 46,950 | 26 | ||||
| Shares | Market Value• ($000) | |||||
| Shenzhen Agricultural Products Group Co. Ltd. Class A | 28,200 | 26 | ||||
| Beijing Strong Biotechnologies Inc. Class A | 9,900 | 26 | ||||
| * | Jonjee Hi-Tech Industrial & Commercial Holding Co. Ltd. Class A | 5,700 | 26 | |||
| Ningbo Joyson Electronic Corp. Class A | 10,200 | 26 | ||||
| Weihai Guangwei Composites Co. Ltd. Class A | 6,720 | 26 | ||||
| Shanghai Pret Composites Co. Ltd. Class A | 13,700 | 26 | ||||
| Shanghai Hanbell Precise Machinery Co. Ltd. Class A | 7,600 | �� 26 | ||||
| *,2 | Archosaur Games Inc. | 57,000 | 26 | |||
| Zhejiang Jiuzhou Pharmaceutical Co. Ltd. Class A | 7,100 | 26 | ||||
| 2,3 | Joinn Laboratories China Co. Ltd. Class H | 13,132 | 26 | |||
| Huaxin Cement Co. Ltd. Class H | 28,200 | 26 | ||||
| Beijing Dabeinong Technology Group Co. Ltd. Class A | 28,100 | 25 | ||||
| Red Avenue New Materials Group Co. Ltd. Class A | 6,100 | 25 | ||||
| 2 | Shanghai Haohai Biological Technology Co. Ltd. Class H | 4,400 | 25 | |||
| * | Jilin Electric Power Co. Ltd. Class A | 37,000 | 25 | |||
| Yunnan Copper Co. Ltd. Class A | 15,700 | 25 | ||||
| Beijing eGOVA Co. Ltd. Class A | 8,880 | 25 | ||||
| Xinjiang Communications Construction Group Co. Ltd. Class A | 10,400 | 25 | ||||
| Anhui Truchum Advanced Materials & Technology Co. Ltd. Class A | 25,500 | 25 | ||||
| Wuhan DR Laser Technology Corp. Ltd. Class A | 3,584 | 25 | ||||
| Shenzhen Kstar Science & Technology Co. Ltd. Class A | 6,000 | 25 | ||||
| Shenzhen Topband Co. Ltd. Class A | 17,100 | 25 | ||||
| 2 | Medlive Technology Co. Ltd. | 27,500 | 25 | |||
| Shares | Market Value• ($000) | |||||
| Chengdu ALD Aviation Manufacturing Corp. Class A | 8,800 | 25 | ||||
| * | Hebei Sinopack Electronic Technology Co. Ltd. Class A | 1,800 | 25 | |||
| Inner Mongolia Dazhong Mining Co. Ltd. Class A | 17,100 | 25 | ||||
| *,2 | Alliance International Education Leasing Holdings Ltd. | 151,000 | 25 | |||
| Shanghai Jinjiang International Hotels Co. Ltd. Class B | 14,600 | 24 | ||||
| Shandong Sun Paper Industry JSC Ltd. Class A | 15,000 | 24 | ||||
| Shanghai Yuyuan Tourist Mart Group Co. Ltd. Class A | 23,900 | 24 | ||||
| China Meheco Co. Ltd. Class A | 13,800 | 24 | ||||
| China Resources Double Crane Pharmaceutical Co. Ltd. Class A | 11,000 | 24 | ||||
| Anhui Construction Engineering Group Co. Ltd. Class A | 35,000 | 24 | ||||
| * | Q Technology Group Co. Ltd. | 65,000 | 24 | |||
| Advanced Technology & Materials Co. Ltd. Class A | 18,300 | 24 | ||||
| Norinco International Cooperation Ltd. Class A | 11,800 | 24 | ||||
| Zhejiang Dingli Machinery Co. Ltd. Class A | 3,300 | 24 | ||||
| 2 | Pharmaron Beijing Co. Ltd. Class H | 10,350 | 24 | |||
| * | Hengyi Petrochemical Co. Ltd. Class A | 22,400 | 24 | |||
| China Kepei Education Group Ltd. | 88,000 | 24 | ||||
| *,2 | Viva Biotech Holdings | 128,500 | 24 | |||
| Nantong Jianghai Capacitor Co. Ltd. Class A | 9,500 | 24 | ||||
| Jiangsu Azure Corp. Class A | 18,100 | 24 | ||||
| Huali Industrial Group Co. Ltd. Class A | 3,400 | 24 | ||||
| Yunnan Yuntianhua Co. Ltd. Class A | 10,300 | 24 | ||||
| Wuxi Autowell Technology Co. Ltd. Class A | 1,018 | 24 | ||||
| Shares | Market Value• ($000) | |||||
| * | Chengdu CORPRO Technology Co. Ltd. Class A | 7,900 | 23 | |||
| Sealand Securities Co. Ltd. Class A | 44,000 | 23 | ||||
| Fiberhome Telecommunication Technologies Co. Ltd. Class A | 9,400 | 23 | ||||
| * | Zhejiang Jinke Tom Culture Industry Co. Ltd. Class A | 30,600 | 23 | |||
| * | China Aluminum International Engineering Corp. Ltd. Class A | 33,900 | 23 | |||
| *,2 | CStone Pharmaceuticals | 80,000 | 23 | |||
| Avary Holding Shenzhen Co. Ltd. Class A | 7,800 | 23 | ||||
| Jiangsu Lihua Animal Husbandry Stock Co. Ltd. Class A | 9,180 | 23 | ||||
| Youngor Group Co. Ltd. Class A | 24,300 | 23 | ||||
| * | YaGuang Technology Group Co. Ltd. Class A | 24,200 | 23 | |||
| Jiaozuo Wanfang Aluminum Manufacturing Co. Ltd. Class A | 33,400 | 23 | ||||
| Chengdu Leejun Industrial Co. Ltd. Class A | 21,800 | 23 | ||||
| Shanghai Huace Navigation Technology Ltd. Class A | 5,300 | 23 | ||||
| Shanghai Huafon Aluminium Corp. Class A | 10,400 | 23 | ||||
| Geovis Technology Co. Ltd. Class A | 3,412 | 23 | ||||
| * | Alpha Group Class A | 18,300 | �� 22 | |||
| Hainan Strait Shipping Co. Ltd. Class A | 27,750 | 22 | ||||
| 2 | Qingdao Port International Co. Ltd. Class H | 43,000 | 22 | |||
| Nanjing Iron & Steel Co. Ltd. Class A | 44,500 | 22 | ||||
| * | Pengdu Agriculture & Animal Husbandry Co. Ltd. Class A | 95,300 | 22 | |||
| Tangrenshen Group Co. Ltd. Class A | 24,600 | 22 | ||||
| Beijing Tongtech Co. Ltd. Class A | 9,020 | 22 | ||||
| * | Shengda Resources Co. Ltd. Class A | 11,100 | 22 | |||
| Eastern Communications Co. Ltd. Class A | 13,600 | 22 | ||||
| Shares | Market Value• ($000) | |||||
| * | Zhejiang Akcome New Energy Technology Co. Ltd. | 67,800 | 22 | |||
| Eastroc Beverage Group Co. Ltd. Class A | 800 | 22 | ||||
| Beijing Huafeng Test & Control Technology Co. Ltd. Class A | 1,169 | 22 | ||||
| 3peak Inc. Class A | 882 | 22 | ||||
| * | Sino-Ocean Group Holding Ltd. | 455,500 | 21 | |||
| * | FIH Mobile Ltd. | 243,000 | 21 | |||
| * | Jiangsu Hoperun Software Co. Ltd. Class A | 7,600 | 21 | |||
| Shenzhen Sunway Communication Co. Ltd. Class A | 8,800 | 21 | ||||
| Hefei Meiya Optoelectronic Technology Inc. Class A | 6,500 | 21 | ||||
| Northeast Securities Co. Ltd. Class A | 19,200 | 21 | ||||
| Hunan Valin Steel Co. Ltd. Class A | 25,300 | 21 | ||||
| Zhejiang Communications Technology Co. Ltd. Class A | 36,960 | 21 | ||||
| Oppein Home Group Inc. Class A | 1,600 | 21 | ||||
| Chongqing Three Gorges Water Conservancy & Electric Power Co. Ltd. Class A | 19,300 | 21 | ||||
| Zhejiang Wanma Co. Ltd. Class A | 15,000 | 21 | ||||
| * | China SCE Group Holdings Ltd. | 412,000 | 21 | |||
| Amoy Diagnostics Co. Ltd. Class A | 6,420 | 21 | ||||
| Shenzhen Fastprint Circuit Tech Co. Ltd. Class A | 12,300 | 21 | ||||
| * | Youdao Inc. ADR | 5,399 | 21 | |||
| * | I-Mab ADR | 11,131 | 21 | |||
| Arcsoft Corp. Ltd. Class A | 3,820 | 21 | ||||
| Sino Biological Inc. Class A | 1,700 | 21 | ||||
| Chengdu RML Technology Co. Ltd. Class A | 2,600 | 21 | ||||
| Yunnan Tin Co. Ltd. Class A | 10,200 | 20 | ||||
| Jiangsu Guotai International Group Co. Ltd. Class A | 19,400 | 20 | ||||
| Guangdong Tapai Group Co. Ltd. Class A | 17,800 | 20 | ||||
| Shares | Market Value• ($000) | |||||
| Leyard Optoelectronic Co. Ltd. Class A | 23,300 | 20 | ||||
| * | Shenzhen Everwin Precision Technology Co. Ltd. Class A | 14,200 | 20 | |||
| Shenzhen Yinghe Technology Co. Ltd. Class A | 6,200 | 20 | ||||
| Shanghai Zhangjiang High-Tech Park Development Co. Ltd. Class A | 8,800 | 20 | ||||
| CSG Holding Co. Ltd. Class A | 24,600 | 20 | ||||
| Infore Environment Technology Group Co. Ltd. Class A | 29,500 | 20 | ||||
| * | Shanghai Tongji Science & Technology Industrial Co. Ltd. Class A | 15,600 | 20 | |||
| Edifier Technology Co. Ltd. Class A | 8,600 | 20 | ||||
| Shanghai Wanye Enterprises Co. Ltd. Class A | 9,200 | 20 | ||||
| Yankershop Food Co. Ltd. Class A | 1,950 | 20 | ||||
| Hunan TV & Broadcast Intermediary Co. Ltd. Class A | 24,300 | 20 | ||||
| Shanghai Haohai Biological Technology Co. Ltd. Class A | 1,374 | 20 | ||||
| Edan Instruments Inc. Class A | 13,000 | 20 | ||||
| Shandong Weifang Rainbow Chemical Co. Ltd. Class A | 1,900 | 20 | ||||
| Ausnutria Dairy Corp. Ltd. | 46,000 | 19 | ||||
| * | Beijing BDStar Navigation Co. Ltd. Class A | 4,600 | 19 | |||
| Daan Gene Co. Ltd. Class A | 14,600 | 19 | ||||
| IKD Co. Ltd. Class A | 5,700 | 19 | ||||
| Zhejiang Jiemei Electronic & Technology Co. Ltd. Class A | 5,000 | 19 | ||||
| China Merchants Expressway Network & Technology Holdings Co. Ltd. Class A | 14,300 | 19 | ||||
| Hexing Electrical Co. Ltd. Class A | 5,300 | 19 | ||||
| Sinocare Inc. Class A | 5,700 | 19 | ||||
| Biem.L.Fdlkk Garment Co. Ltd. Class A | 4,100 | 19 | ||||
| Shares | Market Value• ($000) | |||||
| Beijing GeoEnviron Engineering & Technology Inc. Class A | 14,600 | 19 | ||||
| Zhejiang Weiming Environment Protection Co. Ltd. Class A | 7,657 | 19 | ||||
| Sanquan Food Co. Ltd. Class A | 9,630 | 19 | ||||
| Yusys Technologies Co. Ltd. Class A | 7,680 | 19 | ||||
| Milkyway Chemical Supply Chain Service Co. Ltd. Class A | 1,700 | 19 | ||||
| Jiangsu Provincial Agricultural Reclamation & Development Corp. Class A | 11,400 | 19 | ||||
| * | KWG Living Group Holdings Ltd. | 180,906 | 19 | |||
| CETC Digital Technology Co. Ltd. Class A | 6,240 | 19 | ||||
| * | Roshow Technology Co. Ltd. Class A | 20,400 | 19 | |||
| Chongqing Fuling Electric Power Industrial Co. Ltd. Class A | 10,320 | 19 | ||||
| Shenzhen Fortune Trend Technology Co. Ltd. Class A | 907 | 19 | ||||
| China Kings Resources Group Co. Ltd. Class A | 5,320 | 19 | ||||
| Jiangsu ToLand Alloy Co. Ltd. Class A | 4,030 | 19 | ||||
| Jiangxi Jovo Energy Co. Ltd. Class A | 5,800 | 19 | ||||
| ZWSOFT Co. Ltd. Guangzhou Class A | 1,045 | 19 | ||||
| Inner Mongolia Xingye Silver&Tin Mining Co. Ltd. Class A | 14,400 | 18 | ||||
| * | Topsec Technologies Group Inc. Class A | 13,800 | 18 | |||
| Shanghai M&G Stationery Inc. Class A | 3,500 | 18 | ||||
| Suning Universal Co. Ltd. Class A | 43,100 | 18 | ||||
| Jiangxi Wannianqing Cement Co. Ltd. Class A | 15,700 | 18 | ||||
| China Wafer Level CSP Co. Ltd. Class A | 6,000 | 18 | ||||
| Chongqing Zaisheng Technology Corp. Ltd. Class A | 28,400 | 18 | ||||
| * | Yijiahe Technology Co. Ltd. Class A | 4,200 | 18 | |||
| Shares | Market Value• ($000) | |||||
| Jiangsu Nata Opto-electronic Material Co. Ltd. Class A | 4,160 | 18 | ||||
| Shanghai Medicilon Inc. Class A | 1,783 | 18 | ||||
| Xinxiang Richful Lube Additive Co. Ltd. Class A | 2,470 | 18 | ||||
| Zhejiang Weixing Industrial Development Co. Ltd. Class A | 13,300 | 18 | ||||
| Hainan Haide Capital Management Co. Ltd. Class A | 11,165 | 18 | ||||
| Dajin Heavy Industry Co. Ltd. Class A | 5,200 | 18 | ||||
| Qingdao Gaoce Technology Co. Ltd. Class A | 2,861 | 18 | ||||
| * | China High Speed Transmission Equipment Group Co. Ltd. | 51,000 | 17 | |||
| Shenzhen Zhongjin Lingnan Nonfemet Co. Ltd. Class A | 24,700 | 17 | ||||
| * | Sunward Intelligent Equipment Co. Ltd. Class A | 20,700 | 17 | |||
| China Resources Boya Bio-pharmaceutical Group Co. Ltd. Class A | 4,000 | 17 | ||||
| Sonoscape Medical Corp. Class A | 2,700 | 17 | ||||
| JL Mag Rare-Earth Co. Ltd. Class A | 7,200 | 17 | ||||
| Xinhuanet Co. Ltd. Class A | 3,600 | 17 | ||||
| Keshun Waterproof Technologies Co. Ltd. Class A | 16,460 | 17 | ||||
| Shandong Dawn Polymer Co. Ltd. Class A | 9,000 | 17 | ||||
| State Grid Information & Communication Co. Ltd. Class A | 8,100 | 17 | ||||
| Guangdong Hybribio Biotech Co. Ltd. Class A | 12,825 | 17 | ||||
| * | Hainan Development Holdings Nanhai Co. Ltd. Class A | 13,500 | 17 | |||
| Zhejiang Cfmoto Power Co. Ltd. Class A | 900 | 17 | ||||
| Chongyi Zhangyuan Tungsten Industry Co. Ltd. Class A | 22,490 | 17 | ||||
| *,2,3 | Kintor Pharmaceutical Ltd. | 37,500 | 17 | |||
| Shares | Market Value• ($000) | |||||
| China National Gold Group Gold Jewellery Co. Ltd. Class A | 11,400 | 17 | ||||
| Henan Mingtai Al Industrial Co. Ltd. Class A | 8,800 | 17 | ||||
| Pacific Textiles Holdings Ltd. | 77,000 | 16 | ||||
| Xinhua Winshare Publishing & Media Co. Ltd. Class H | 22,000 | 16 | ||||
| Guangdong Provincial Expressway Development Co. Ltd. Class A | 15,200 | 16 | ||||
| Zhejiang Wanfeng Auto Wheel Co. Ltd. Class A | 20,800 | 16 | ||||
| Chengdu Xingrong Environment Co. Ltd. Class A | 22,200 | 16 | ||||
| * | Youzu Interactive Co. Ltd. Class A | 9,200 | 16 | |||
| Zhejiang Xianju Pharmaceutical Co. Ltd. Class A | 9,900 | 16 | ||||
| Guangdong Zhongsheng Pharmaceutical Co. Ltd. Class A | 7,700 | 16 | ||||
| Shandong Xinhua Pharmaceutical Co. Ltd. Class A | 5,700 | 16 | ||||
| Jiangsu Shuangxing Color Plastic New Materials Co. Ltd. Class A | 12,600 | 16 | ||||
| Shanghai Kaibao Pharmaceutical Co. Ltd. Class A | 17,400 | 16 | ||||
| Black Peony Group Co. Ltd. Class A | 19,800 | 16 | ||||
| Intco Medical Technology Co. Ltd. Class A | 5,300 | 16 | ||||
| 2 | Shenzhen Hepalink Pharmaceutical Group Co. Ltd. Class H | 31,000 | 16 | |||
| Sichuan Development Lomon Co. Ltd. Class A | 15,400 | 16 | ||||
| CHN Energy Changyuan Electric Power Co. Ltd. Class A | 23,900 | 16 | ||||
| CNSIG Inner Mongolia Chemical Industry Co. Ltd. Class A | 12,870 | 16 | ||||
| Anhui Guangxin Agrochemical Co. Ltd. Class A | 5,740 | 16 | ||||
| Beyondsoft Corp. Class A | 8,800 | 16 | ||||
| Shares | Market Value• ($000) | |||||
| Qingdao East Steel Tower Stock Co. Ltd. Class A | 16,000 | 16 | ||||
| Jiangsu Guomao Reducer Co. Ltd. Class A | 6,700 | 16 | ||||
| Lizhong Sitong Light Alloys Group Co. Ltd. Class A | 5,200 | 16 | ||||
| Sichuan Anning Iron & Titanium Co. Ltd. Class A | 3,900 | 16 | ||||
| PNC Process Systems Co. Ltd. Class A | 4,320 | 16 | ||||
| Beijing Originwater Technology Co. Ltd. Class A | 20,105 | 15 | ||||
| Tayho Advanced Materials Group Co. Ltd. Class A | 5,700 | 15 | ||||
| JSTI Group Class A | 18,000 | 15 | ||||
| Sunflower Pharmaceutical Group Co. Ltd. Class A | 4,700 | 15 | ||||
| Xinyu Iron & Steel Co. Ltd. Class A | 27,300 | 15 | ||||
| Zhejiang Wolwo Bio-Pharmaceutical Co. Ltd. Class A | 3,400 | 15 | ||||
| Shanghai Waigaoqiao Free Trade Zone Group Co. Ltd. Class A | 9,300 | 15 | ||||
| Hangxiao Steel Structure Co. Ltd. Class A | 28,100 | 15 | ||||
| Shenzhen Desay Battery Technology Co. Class A | 3,600 | 15 | ||||
| * | Zhejiang Narada Power Source Co. Ltd. Class A | 6,900 | 15 | |||
| * | Beijing Water Business Doctor Co. Ltd. Class A | 15,600 | 15 | |||
| Xinjiang Tianshan Cement Co. Ltd. Class A | 13,800 | 15 | ||||
| Suzhou Anjie Technology Co. Ltd. Class A | 8,300 | 15 | ||||
| Shenzhen Sunline Tech Co. Ltd. Class A | 10,300 | 15 | ||||
| Shenzhen H&T Intelligent Control Co. Ltd. Class A | 7,500 | 15 | ||||
| Zhejiang Xinan Chemical Industrial Group Co. Ltd. Class A | 11,060 | 15 | ||||
| Wuchan Zhongda Group Co. Ltd. Class A | 23,600 | 15 | ||||
| Shandong Jinjing Science & Technology Co. Ltd. Class A | 14,500 | 15 | ||||
| Shares | Market Value• ($000) | |||||
| * | Bohai Leasing Co. Ltd. Class A | 40,800 | 15 | |||
| Fibocom Wireless Inc. Class A | 5,220 | 15 | ||||
| Era Co. Ltd. Class A | 18,600 | 15 | ||||
| * | Shandong Longda Meishi Co. Ltd. Class A | 14,700 | 15 | |||
| Chengdu Kanghua Biological Products Co. Ltd. Class A | 1,750 | 15 | ||||
| Moon Environment Technology Co. Ltd. Class A | 6,600 | 15 | ||||
| Shanghai MicroPort Endovascular MedTech Group Co. Ltd. Class A | 671 | 15 | ||||
| Ningbo Zhenyu Technology Co. Ltd. Class A | 1,800 | 15 | ||||
| * | Road King Infrastructure Ltd. | 59,000 | 14 | |||
| BBMG Corp. Class H | 133,000 | 14 | ||||
| * | OFILM Group Co. Ltd. Class A | 18,000 | 14 | |||
| * | Shandong Yisheng Livestock & Poultry Breeding Co. Ltd. Class A | 8,700 | 14 | |||
| 2 | China Everbright Greentech Ltd. | 125,000 | 14 | |||
| * | Sichuan Hexie Shuangma Co. Ltd. Class A | 6,000 | 14 | |||
| * | Zhejiang Jingu Co. Ltd. Class A | 15,900 | 14 | |||
| Zhejiang Jingxin Pharmaceutical Co. Ltd. Class A | �� 9,300 | 14 | ||||
| Guangdong Dowstone Technology Co. Ltd. Class A | 9,200 | 14 | ||||
| * | Sai Micro Electronics Inc. Class A | 4,500 | 14 | |||
| KPC Pharmaceuticals Inc. Class A | 6,400 | 14 | ||||
| China CAMC Engineering Co. Ltd. Class A | 10,100 | 14 | ||||
| Yantai Zhenghai Magnetic Material Co. Ltd. Class A | 8,500 | 14 | ||||
| Sinofibers Technology Co. Ltd. Class A | 2,700 | 14 | ||||
| Nanjing Yunhai Special Metals Co. Ltd. Class A | 5,300 | 14 | ||||
| Qingdao Haier Biomedical Co. Ltd. Class A | 2,543 | 14 | ||||
| Shares | Market Value• ($000) | |||||
| Hangzhou Electronic Soul Network Technology Co. Ltd. Class A | 3,100 | 14 | ||||
| * | Guangdong Guanghua Sci-Tech Co. Ltd. Class A | 6,500 | 14 | |||
| Hubei Yihua Chemical Industry Co. Ltd. Class A | 9,000 | 14 | ||||
| Jingjin Equipment Inc. Class A | 3,760 | 14 | ||||
| Jiangsu Amer New Material Co. Ltd. Class A | 11,600 | 14 | ||||
| Nuode New Materials Co. Ltd. Class A | 17,200 | 14 | ||||
| Wencan Group Co. Ltd. Class A | 2,800 | 14 | ||||
| Shenzhen Tagen Group Co. Ltd. Class A | 14,300 | 13 | ||||
| Fujian Star-net Communication Co. Ltd. Class A | 5,100 | 13 | ||||
| CETC Potevio Science & Technology Co. Ltd. Class A | 4,600 | 13 | ||||
| * | Tianma Microelectronics Co. Ltd. Class A | 11,400 | 13 | |||
| * | Beijing SuperMap Software Co. Ltd. Class A | 4,000 | 13 | |||
| Yunda Holding Co. Ltd. Class A | 9,800 | 13 | ||||
| C&S Paper Co. Ltd. Class A | 9,200 | 13 | ||||
| Shandong Hi-speed Co. Ltd. Class A | 14,300 | 13 | ||||
| Telling Telecommunication Holding Co. Ltd. Class A | 10,900 | 13 | ||||
| Zhejiang Medicine Co. Ltd. Class A | 9,000 | 13 | ||||
| * | Gree Real Estate Co. Ltd. Class A | 15,800 | 13 | |||
| Bafang Electric Suzhou Co. Ltd. Class A | 1,680 | 13 | ||||
| Pacific Shuanglin Bio-pharmacy Co. Ltd. Class A | 5,300 | 13 | ||||
| Winall Hi-Tech Seed Co. Ltd. Class A | 8,960 | 13 | ||||
| Jade Bird Fire Co. Ltd. Class A | 5,590 | 13 | ||||
| Wuxi NCE Power Co. Ltd. Class A | 2,660 | 13 | ||||
| Sineng Electric Co. Ltd. Class A | 3,144 | 13 | ||||
| Marssenger Kitchenware Co. Ltd. Class A | 4,800 | 13 | ||||
| Shares | Market Value• ($000) | |||||
| Shanghai Waigaoqiao Free Trade Zone Group Co. Ltd. Class B | 16,700 | 12 | ||||
| Guocheng Mining Co. Ltd. Class A | 7,100 | 12 | ||||
| * | PCI Technology Group Co. Ltd. Class A | 14,900 | 12 | |||
| * | Times China Holdings Ltd. | 184,000 | 12 | |||
| Wuhan Raycus Fiber Laser Technologies Co. Ltd. Class A | 3,315 | 12 | ||||
| Grandblue Environment Co. Ltd. Class A | 4,800 | 12 | ||||
| Laobaixing Pharmacy Chain JSC Class A | 3,328 | 12 | ||||
| Shenzhen Suntak Circuit Technology Co. Ltd. Class A | 7,900 | 12 | ||||
| Lier Chemical Co. Ltd. Class A | 6,800 | 12 | ||||
| Shenzhen Woer Heat-Shrinkable Material Co. Ltd. Class A | 12,800 | 12 | ||||
| China Zheshang Bank Co. Ltd. Class A | 33,540 | 12 | ||||
| Beijing Capital Eco-Environment Protection Group Co. Ltd. Class A | 29,300 | 12 | ||||
| * | Guangdong Create Century Intelligent Equipment Group Corp. Ltd. Class A | 14,600 | 12 | |||
| Ligao Foods Co. Ltd. Class A | 1,200 | 12 | ||||
| KBC Corp. Ltd. Class A | 1,055 | 12 | ||||
| * | Tibet Mineral Development Co. Class A | 3,600 | 12 | |||
| Guizhou Chanhen Chemical Corp. Class A | 4,900 | 12 | ||||
| Guangdong Jia Yuan Technology Shares Co. Ltd. Class A | 4,293 | 12 | ||||
| Jiangsu Cnano Technology Co. Ltd. Class A | 3,205 | 12 | ||||
| Jiangsu Huahong Technology Stock Co. Ltd. Class A | 8,900 | 12 | ||||
| Shanghai Bailian Group Co. Ltd. Class B | 19,200 | 11 | ||||
| Joyoung Co. Ltd. Class A | 5,800 | 11 | ||||
| * | Shenzhen Airport Co. Ltd. Class A | 11,600 | 11 | |||
| Hunan Aihua Group Co. Ltd. Class A | 3,800 | 11 | ||||
| Shares | Market Value• ($000) | |||||
| CNNC Hua Yuan Titanium Dioxide Co. Ltd. Class A | 15,900 | 11 | ||||
| * | Tech-Bank Food Co. Ltd. Class A | 18,000 | 11 | |||
| Shanghai AtHub Co. Ltd. Class A | 3,360 | 11 | ||||
| PharmaBlock Sciences Nanjing Inc. Class A | 1,800 | 11 | ||||
| Bank of Changsha Co. Ltd. Class A | 10,000 | 11 | ||||
| CTS International Logistics Corp. Ltd. Class A | 10,800 | 11 | ||||
| Chongqing Rural Commercial Bank Co. Ltd. Class A | 20,400 | 11 | ||||
| DBG Technology Co. Ltd. Class A | 7,500 | 11 | ||||
| Xiamen Xiangyu Co. Ltd. Class A | 11,000 | 11 | ||||
| Guangdong Aofei Data Technology Co. Ltd. Class A | 8,207 | 11 | ||||
| Longhua Technology Group Luoyang Co. Ltd. Class A | 10,000 | 11 | ||||
| QuakeSafe Technologies Co. Ltd. Class A | 3,839 | 11 | ||||
| * | Archermind Technology Nanjing Co. Ltd. Class A | 1,600 | 11 | |||
| Anhui Jiangnan Chemical Industry Co. Ltd. Class A | 15,700 | 11 | ||||
| Zhejiang Windey Co. Ltd. Class A | 7,150 | 11 | ||||
| Tongling Jingda Special Magnet Wire Co. Ltd. Class A | 19,100 | 11 | ||||
| Hunan Zhongke Electric Co. Ltd. Class A | 7,500 | 11 | ||||
| Suplet Power Co. Ltd. Class A | 4,550 | 11 | ||||
| Jiangsu Lopal Tech Co. Ltd. Class A | 6,000 | 11 | ||||
| People's Insurance Co. Group of China Ltd. Class A | 13,900 | 11 | ||||
| Zhejiang Tiantie Industry Co. Ltd. Class A | 12,100 | 11 | ||||
| Hand Enterprise Solutions Co. Ltd. Class A | 8,300 | 10 | ||||
| * | RiseSun Real Estate Development Co. Ltd. Class A | 28,700 | 10 | |||
| Shenzhen Ysstech Info-tech Co. Ltd. Class A | 7,600 | 10 | ||||
| * | Sichuan Haite High-tech Co. Ltd. Class A | 7,900 | 10 | |||
| Shares | Market Value• ($000) | |||||
| * | Guangdong Dongfang Precision Science & Technology Co. Ltd. Class A | 13,700 | 10 | |||
| * | Fangda Special Steel Technology Co. Ltd. Class A | 15,200 | 10 | |||
| * | Aotecar New Energy Technology Co. Ltd. Class A | 30,000 | 10 | |||
| Beijing Aerospace Shenzhou Intelligent Equipment Technology Co. Ltd. Class A | 6,600 | 10 | ||||
| * | Orient Group Inc. Class A | 32,200 | 10 | |||
| Shenzhen Changhong Technology Co. Ltd. Class A | 5,000 | 10 | ||||
| * | China Express Airlines Co. Ltd. Class A | 9,600 | 10 | |||
| * | CanSino Biologics Inc. Class A | 948 | 10 | |||
| Zhejiang Qianjiang Motorcycle Co. Ltd. Class A | 4,800 | 10 | ||||
| Zhongtai Securities Co. Ltd. Class A | 9,800 | 10 | ||||
| Shandong WIT Dyne Health Co. Ltd. Class A | 2,300 | 10 | ||||
| * | Bestway Marine & Energy Technology Co. Ltd. Class A | 16,200 | 10 | |||
| * | Jinlei Technology Co. Ltd. Class A | 2,700 | 10 | |||
| Luyang Energy-Saving Materials Co. Ltd. | 4,400 | 10 | ||||
| Zhejiang Shuanghuan Driveline Co. Ltd. Class A | 2,200 | 10 | ||||
| * | Shenzhen Fine Made Electronics Group Co. Ltd. Class A | 2,200 | 10 | |||
| Jiangsu Boqian New Materials Stock Co. Ltd. Class A | 2,400 | 10 | ||||
| Xilinmen Furniture Co. Ltd. Class A | 3,600 | 10 | ||||
| Beijing Dahao Technology Corp. Ltd. Class A | 4,920 | 10 | ||||
| Eastern Communications Co. Ltd. Class B | 24,000 | 9 | ||||
| * | Dongjiang Environmental Co. Ltd. Class A | 11,300 | 9 | |||
| * | STO Express Co. Ltd. Class A | 6,300 | 9 | |||
| FAWER Automotive Parts Co. Ltd. Class A | 12,500 | 9 | ||||
| Shares | Market Value• ($000) | |||||
| * | 5I5J Holding Group Co. Ltd. Class A | 20,800 | 9 | |||
| Guangzhou Shiyuan Electronic Technology Co. Ltd. Class A | 1,200 | 9 | ||||
| Heilongjiang Agriculture Co. Ltd. Class A | 4,800 | �� 9 | ||||
| Hainan Poly Pharm Co. Ltd. Class A | 3,500 | 9 | ||||
| Guangzhou Baiyunshan Pharmaceutical Holdings Co. Ltd. Class A | 2,100 | 9 | ||||
| Joincare Pharmaceutical Group Industry Co. Ltd. Class A | 5,900 | 9 | ||||
| Ningbo Peacebird Fashion Co. Ltd. Class A | 3,600 | 9 | ||||
| Wuhu Token Science Co. Ltd. Class A | 11,500 | 9 | ||||
| * | Focused Photonics Hangzhou Inc. Class A | 4,200 | 9 | |||
| Zhongshan Broad Ocean Motor Co. Ltd. Class A | 12,700 | 9 | ||||
| Shanghai Stonehill Technology Co. Ltd. Class A | 20,000 | 9 | ||||
| Shandong Hi-Speed Road & Bridge Co. Ltd. Class A | 10,100 | 9 | ||||
| Goldenmax International Group Ltd. Class A | 7,000 | 9 | ||||
| Zhejiang Garden Biopharmaceutical Co. Ltd. Class A | 5,500 | 9 | ||||
| Mayinglong Pharmaceutical Group Co. Ltd. Class A | 3,000 | 9 | ||||
| Shanghai Runda Medical Technology Co. Ltd. Class A | 4,900 | 9 | ||||
| Monalisa Group Co. Ltd. Class A | 3,500 | 9 | ||||
| Hangzhou Dptech Technologies Co. Ltd. Class A | 4,350 | 9 | ||||
| Bear Electric Appliance Co. Ltd. Class A | 1,100 | 9 | ||||
| * | Yunnan Lincang Xinyuan Germanium Industrial Co. Ltd. Class A | 5,000 | 9 | |||
| Shenzhen Microgate Technology Co. Ltd. Class A | 7,000 | 9 | ||||
| Zhejiang Hailide New Material Co. Ltd. Class A | 12,000 | 9 | ||||
| * | Ningxia Zhongyin Cashmere Co. Ltd. Class A | 36,600 | 9 | |||
| Shares | Market Value• ($000) | |||||
| Ningbo Huaxiang Electronic Co. Ltd. Class A | 4,200 | 8 | ||||
| Chengdu Kanghong Pharmaceutical Group Co. Ltd. Class A | 3,700 | 8 | ||||
| Qingdao Eastsoft Communication Technology Co. Ltd. Class A | 4,000 | 8 | ||||
| Bluestar Adisseo Co. Class A | 7,400 | 8 | ||||
| Renhe Pharmacy Co. Ltd. Class A | 8,300 | 8 | ||||
| Sumavision Technologies Co. Ltd. Class A | 11,000 | 8 | ||||
| Xuji Electric Co. Ltd. Class A | 3,100 | 8 | ||||
| Shennan Circuits Co. Ltd. Class A | 900 | 8 | ||||
| Shandong Xiantan Co. Ltd. Class A | 7,300 | 8 | ||||
| Guangzhou Zhiguang Electric Co. Ltd. Class A | 7,900 | 8 | ||||
| Shenzhen Center Power Tech Co. Ltd. Class A | 3,900 | 8 | ||||
| * | Zhejiang Tianyu Pharmaceutical Co. Ltd. Class A | 2,660 | 8 | |||
| Tibet Rhodiola Pharmaceutical Holding Co. Class A | 1,200 | 8 | ||||
| Sichuan Jiuzhou Electric Co. Ltd. Class A | 9,400 | 8 | ||||
| * | Anhui Tatfook Technology Co. Ltd. Class A | 6,000 | 8 | |||
| Zhejiang Orient Gene Biotech Co. Ltd. Class A | 1,543 | 8 | ||||
| Truking Technology Ltd. Class A | 4,900 | 8 | ||||
| Shantui Construction Machinery Co. Ltd. Class A | 11,900 | 8 | ||||
| * | Yuzhou Group Holdings Co. Ltd. | 319,000 | 7 | |||
| * | Hytera Communications Corp. Ltd. Class A | 8,400 | 7 | |||
| Shenzhen Yan Tian Port Holding Co. Ltd. Class A | 10,800 | 7 | ||||
| * | Jinke Properties Group Co. Ltd. Class A | 22,100 | 7 | |||
| * | Beijing VRV Software Corp. Ltd. Class A | 10,400 | 7 | |||
| Aerospace Hi-Tech Holdings Group Ltd. Class A | 4,900 | 7 | ||||
| Shares | Market Value• ($000) | |||||
| Chongqing Zongshen Power Machinery Co. Ltd. Class A | 7,900 | 7 | ||||
| * | Gansu Qilianshan Cement Group Co. Ltd. Class A | 4,300 | 7 | |||
| Shanghai Zijiang Enterprise Group Co. Ltd. Class A | 10,000 | 7 | ||||
| COFCO Biotechnology Co. Ltd. Class A | 7,000 | 7 | ||||
| Shandong Jincheng Pharmaceutical Group Co. Ltd. Class A | 2,800 | 7 | ||||
| Zhejiang Jiecang Linear Motion Technology Co. Ltd. Class A | 2,700 | 7 | ||||
| * | Lushang Freda Pharmaceutical Co. Ltd. Class A | 5,800 | 7 | |||
| * | Wuxi Boton Technology Co. Ltd. Class A | 2,600 | 7 | |||
| * | INKON Life Technology Co. Ltd. Class A | 5,300 | 7 | |||
| * | Lancy Co. Ltd. Class A | 2,300 | 7 | |||
| Shenzhen Click Technology Co. Ltd. Class A | 4,400 | 7 | ||||
| Shanghai Fullhan Microelectronics Co. Ltd. Class A | 1,000 | 7 | ||||
| Hangzhou Onechance Tech Corp. Class A | 2,000 | 7 | ||||
| * | Shanghai Bright Power Semiconductor Co. Ltd. Class A | 424 | 7 | |||
| Yibin Tianyuan Group Co. Ltd. Class A | 9,000 | 7 | ||||
| Shenzhen Das Intellitech Co. Ltd. Class A | 12,700 | 6 | ||||
| Suzhou Gold Mantis Construction Decoration Co. Ltd. Class A | 9,000 | 6 | ||||
| * | Konka Group Co. Ltd. Class A | 10,500 | 6 | |||
| Anhui Jinhe Industrial Co. Ltd. Class A | 2,000 | 6 | ||||
| * | Huafon Microfibre Shanghai Technology Co. Ltd. Class A | 12,400 | 6 | |||
| BGI Genomics Co. Ltd. Class A | 800 | 6 | ||||
| Luoniushan Co. Ltd. Class A | 7,800 | 6 | ||||
| Han's Laser Technology Industry Group Co. Ltd. Class A | 1,800 | 6 | ||||
| Digital China Information Service Co. Ltd. Class A | 3,500 | 6 | ||||
| Shares | Market Value• ($000) | |||||
| Xiamen Kingdomway Group Co. Class A | 2,400 | 6 | ||||
| Zhejiang Orient Financial Holdings Group Co. Ltd. Class A | 11,700 | 6 | ||||
| Quectel Wireless Solutions Co. Ltd. Class A | 869 | 6 | ||||
| Gansu Shangfeng Cement Co. Ltd. Class A | 4,920 | 6 | ||||
| PhiChem Corp. Class A | 2,600 | 6 | ||||
| Client Service International Inc. Class A | 2,850 | 6 | ||||
| Xinzhi Group Co. Ltd. Class A | 3,000 | 6 | ||||
| Anhui Huilong Agricultural Means of Production Co. Ltd. Class A | 6,100 | 6 | ||||
| Jenkem Technology Co. Ltd. Class A | 437 | 6 | ||||
| Shanghai Shibei Hi-Tech Co. Ltd. Class B | 29,400 | 5 | ||||
| Chengzhi Co. Ltd. Class A | 4,900 | 5 | ||||
| *,1 | China Aoyuan Group Ltd. | 91,000 | 5 | |||
| * | Shanying International Holding Co. Ltd. Class A | 15,900 | 5 | |||
| ADAMA Ltd. Class A | 5,000 | 5 | ||||
| Electric Connector Technology Co. Ltd. Class A | 1,100 | 5 | ||||
| * | YanTai Shuangta Food Co. Ltd. Class A | 8,100 | 5 | |||
| Fulin Precision Co. Ltd. Class A | 3,750 | 5 | ||||
| Zhejiang Starry Pharmaceutical Co. Ltd. Class A | 2,800 | 5 | ||||
| Shandong Head Group Co. Ltd. Class A | 2,000 | 5 | ||||
| * | Jin Tong Ling Technology Group Co. Ltd. Class A | 12,200 | 5 | |||
| * | Beijing North Star Co. Ltd. Class H | 44,000 | 4 | |||
| Shenzhen Leaguer Co. Ltd. Class A | 3,200 | 4 | ||||
| Guangdong Advertising Group Co. Ltd. Class A | 5,100 | 4 | ||||
| * | Beijing Compass Technology Development Co. Ltd. Class A | 500 | 4 | |||
| * | Differ Group Auto Ltd. | 488,000 | 4 | |||
| Skyworth Digital Co. Ltd. Class A | 1,700 | 3 | ||||
| Maccura Biotechnology Co. Ltd. Class A | 1,500 | 3 | ||||
| Shares | Market Value• ($000) | |||||
| Wuhan Fingu Electronic Technology Co. Ltd. Class A | 2,100 | 3 | ||||
| Shandong Dongyue Organosilicon Material Co. Ltd. Class A | 2,200 | 3 | ||||
| Chengdu Wintrue Holding Co. Ltd. Class A | 2,200 | 3 | ||||
| Xizi Clean Energy Equipment Manufacturing Co. Ltd. Class A | 900 | 2 | ||||
| BrightGene Bio-Medical Technology Co. Ltd. Class A | 889 | 2 | ||||
| Foryou Corp. Class A | 500 | 2 | ||||
| * | Triumph New Energy Co. Ltd. Class A | 300 | 1 | |||
| *,1 | Yango Group Co. Ltd. Class A | 15,800 | 1 | |||
| *,1 | China Zhongwang Holdings Ltd. | 133,200 | — | |||
| 251,098 | ||||||
| Colombia (0.0%) | ||||||
| Bancolombia SA | 53,281 | 379 | ||||
| Interconexion Electrica SA ESP | 69,057 | 253 | ||||
| Bancolombia SA ADR | 3,800 | 101 | ||||
| 733 | ||||||
| Czech Republic (0.0%) | ||||||
| Komercni Banka A/S | 16,385 | 512 | ||||
| 2 | Moneta Money Bank A/S | 78,199 | 291 | |||
| 803 | ||||||
| Denmark (2.3%) | ||||||
| Novo Nordisk A/S Class B | 259,788 | 47,919 | ||||
| DSV A/S | 29,685 | 5,637 | ||||
| * | Genmab A/S | 10,967 | 4,202 | |||
| * | Vestas Wind Systems A/S | 167,435 | 3,869 | |||
| Coloplast A/S Class B (XCSE) | 19,843 | 2,260 | ||||
| AP Moller - Maersk A/S Class B | 1,071 | 1,944 | ||||
| Pandora A/S | 14,639 | 1,516 | ||||
| Novozymes A/S Class B | 34,907 | 1,511 | ||||
| Chr Hansen Holding A/S | 17,821 | 1,162 | ||||
| Tryg A/S | 54,222 | 1,034 | ||||
| Ringkjoebing Landbobank A/S | 5,511 | 816 | ||||
| SimCorp A/S | 6,773 | 720 | ||||
| * | Demant A/S | 16,451 | 672 | |||
| * | Jyske Bank A/S (Registered) | 7,959 | 566 | |||
| * | GN Store Nord A/S | 24,544 | 501 | |||
| Sydbank A/S | 10,541 | 495 | ||||
| * | NKT A/S | 8,757 | 474 | |||
| * | Ambu A/S Class B | 29,441 | 356 | |||
| Shares | Market Value• ($000) | |||||
| * | Zealand Pharma A/S Class A | 9,400 | 350 | |||
| ROCKWOOL A/S Class B | 1,258 | 321 | ||||
| * | Bavarian Nordic A/S | 12,217 | 271 | |||
| Topdanmark A/S | 5,466 | 259 | ||||
| * | ALK-Abello A/S Class B | 19,927 | 237 | |||
| AP Moller - Maersk A/S Class A | 131 | 234 | ||||
| D/S Norden A/S | 4,550 | 218 | ||||
| H Lundbeck A/S | 38,008 | 193 | ||||
| *,2 | Netcompany Group A/S | 5,066 | 192 | |||
| Alm Brand A/S | 109,972 | 182 | ||||
| * | Chemometec A/S | 2,439 | 149 | |||
| Spar Nord Bank A/S | 9,375 | 141 | ||||
| * | NTG Nordic Transport Group A/S | 2,231 | 122 | |||
| TORM plc Class A | 4,874 | 120 | ||||
| Dfds A/S | 3,398 | 114 | ||||
| * | Coloplast A/S Class B | 926 | 106 | |||
| Schouw & Co. A/S | 966 | 71 | ||||
| H Lundbeck A/S Class A | 3,013 | 13 | ||||
| 78,947 | ||||||
| Egypt (0.0%) | ||||||
| Commercial International Bank Egypt SAE | 351,576 | 648 | ||||
| * | EFG Holding S.A.E. | 224,472 | 116 | |||
| Telecom Egypt Co. | 67,366 | 57 | ||||
| Madinet Masr For Housing & Development | 440,666 | 48 | ||||
| 869 | ||||||
| Finland (0.8%) | ||||||
| Nordea Bank Abp | 571,625 | 6,259 | ||||
| Nokia OYJ | 881,684 | 3,526 | ||||
| Sampo OYJ Class A | 80,076 | 3,515 | ||||
| UPM-Kymmene OYJ | 86,562 | 2,962 | ||||
| Kone OYJ Class B | 55,527 | 2,526 | ||||
| Stora Enso OYJ | 104,286 | 1,326 | ||||
| Elisa OYJ | 26,755 | 1,313 | ||||
| Kesko OYJ Class B | 48,089 | 939 | ||||
| Valmet OYJ | 29,055 | 739 | ||||
| Orion OYJ Class B | 16,923 | 692 | ||||
| Huhtamaki OYJ | 13,528 | 465 | ||||
| TietoEVRY OYJ | 12,926 | 316 | ||||
| Kojamo OYJ | 29,350 | 292 | ||||
| Uponor OYJ | 8,761 | 277 | ||||
| Kemira OYJ | 15,535 | 246 | ||||
| * | QT Group OYJ | 3,324 | 212 | |||
| Nokian Renkaat OYJ | 22,781 | 197 | ||||
| 2 | Terveystalo OYJ | 12,303 | 104 | |||
| Tokmanni Group Corp. | 6,631 | 98 | ||||
| Revenio Group OYJ | 2,865 | 73 | ||||
| Citycon OYJ | 10,816 | 66 | ||||
| Sanoma OYJ | 8,012 | 62 | ||||
| YIT OYJ | 17,941 | 44 | ||||
| F-Secure OYJ | 15,991 | 41 | ||||
| * | Finnair OYJ | 62,177 | 35 | |||
| *,1 | Ahlstrom-Munksjo OYJ | 884 | 17 | |||
| Shares | Market Value• ($000) | |||||
| Raisio OYJ | 4,240 | 9 | ||||
| Oriola OYJ Class B | 4,424 | 5 | ||||
| 26,356 | ||||||
| France (4.5%) | ||||||
| Sanofi | 180,475 | 19,221 | ||||
| L'Oreal SA | 38,307 | 16,826 | ||||
| BNP Paribas SA | 183,157 | 11,844 | ||||
| Hermes International SCA | 5,632 | 11,583 | ||||
| EssilorLuxottica SA | 49,530 | 9,310 | ||||
| AXA SA | 296,159 | 8,898 | ||||
| Kering SA | 12,017 | 6,426 | ||||
| Danone SA | 101,759 | 5,932 | ||||
| STMicroelectronics NV | 107,721 | 5,084 | ||||
| Legrand SA | 45,495 | 4,482 | ||||
| Cie Generale des Etablissements Michelin SCA | 120,375 | 3,766 | ||||
| Orange SA | 303,551 | 3,408 | ||||
| Societe Generale SA | 116,283 | 3,294 | ||||
| Publicis Groupe SA | 38,989 | 3,042 | ||||
| Edenred | 42,521 | 2,710 | ||||
| Credit Agricole SA | 188,136 | 2,372 | ||||
| Carrefour SA | 100,924 | 1,929 | ||||
| Sodexo SA | 13,141 | 1,410 | ||||
| *,2 | Worldline SA | 41,788 | 1,360 | |||
| Teleperformance SE | 9,757 | 1,348 | ||||
| Eurofins Scientific SE | 20,408 | 1,256 | ||||
| Arkema SA | 11,702 | 1,223 | ||||
| Vivendi SE | 124,742 | 1,136 | ||||
| Gecina SA | 10,436 | 1,116 | ||||
| Sartorius Stedim Biotech | 3,908 | 1,108 | ||||
| Accor SA | 30,947 | 1,107 | ||||
| Getlink SE | 63,905 | 1,070 | ||||
| Klepierre SA | 38,638 | 1,021 | ||||
| Rexel SA | 43,462 | 1,019 | ||||
| * | Unibail-Rodamco-Westfield | 17,245 | 920 | |||
| SCOR SE | 26,436 | 822 | ||||
| Elis SA | 40,690 | 777 | ||||
| * | SOITEC | 4,240 | 775 | |||
| Ipsen SA | 5,642 | 731 | ||||
| Valeo SE | 36,991 | 719 | ||||
| BioMerieux | 6,809 | 703 | ||||
| Aeroports de Paris | 5,173 | 681 | ||||
| Wendel SE | 6,590 | 602 | ||||
| 2 | Amundi SA | 8,982 | 535 | |||
| SES SA Class A ADR | 71,065 | 517 | ||||
| Covivio SA | 10,369 | 506 | ||||
| 2 | Verallia SA | 10,369 | 495 | |||
| Eurazeo SE | 8,356 | 492 | ||||
| * | Ubisoft Entertainment SA | 16,123 | 488 | |||
| * | Forvia SE (XPAR) | 22,754 | 482 | |||
| SEB SA | 4,243 | 465 | ||||
| Sopra Steria Group SACA | 2,028 | 446 | ||||
| 2 | Neoen SA | 10,105 | 303 | |||
| Rubis SCA | 11,559 | 282 | ||||
| IPSOS | 5,456 | 273 | ||||
| * | Air France-KLM | 17,648 | 269 | |||
| Shares | Market Value• ($000) | |||||
| Societe BIC SA | 3,005 | 192 | ||||
| Sodexo SA French Loyalty Line | 1,731 | 186 | ||||
| * | JCDecaux SE | 9,912 | 184 | |||
| Virbac SA | 618 | 184 | ||||
| Rothschild & Co. | 4,287 | 180 | ||||
| Coface SA | 13,403 | 179 | ||||
| Imerys SA | 5,164 | 176 | ||||
| 2 | ALD SA | 17,494 | 169 | |||
| Interparfums SA | 2,514 | 166 | ||||
| Trigano SA | 1,174 | 165 | ||||
| 3 | Eutelsat Communications SA | 26,152 | 159 | |||
| Peugeot Invest | 1,412 | 157 | ||||
| * | SES-imagotag SA | 1,260 | 149 | |||
| Lagardere SA | 6,228 | 147 | ||||
| * | Voltalia SA (Registered) | 7,203 | 126 | |||
| ICADE | 3,310 | 125 | ||||
| * | Carmila SA | 7,818 | 122 | |||
| Metropole Television SA | 8,254 | 113 | ||||
| Cie Plastic Omnium SE | 6,334 | 111 | ||||
| *,3 | Valneva SE | 15,268 | 105 | |||
| * | Euroapi SA | 6,766 | 92 | |||
| Nexity SA | 5,129 | 85 | ||||
| Argan SA | 955 | 77 | ||||
| Mercialys SA | 8,169 | 76 | ||||
| Quadient SA | 3,391 | 70 | ||||
| Beneteau SA | 4,558 | 69 | ||||
| * | ID Logistics Group | 256 | 67 | |||
| * | Forvia SE (MTAA) | 2,833 | 60 | |||
| Antin Infrastructure Partners SA | 4,064 | 60 | ||||
| Television Francaise 1 | 7,087 | 58 | ||||
| *,2 | X-Fab Silicon Foundries SE | 5,051 | 57 | |||
| Clariane SE | 8,211 | 56 | ||||
| Derichebourg SA | 9,125 | 50 | ||||
| Fnac Darty SA | 1,500 | 47 | ||||
| LISI | 1,700 | 42 | ||||
| 2 | Maisons du Monde SA | 4,411 | 41 | |||
| * | OVH Groupe SAS | 4,002 | 41 | |||
| Vetoquinol SA | 410 | 39 | ||||
| *,2 | Elior Group SA | 15,833 | 35 | |||
| Bonduelle SCA | 2,165 | 26 | ||||
| Manitou BF SA | 983 | 26 | ||||
| *,2 | SMCP SA | 3,555 | 23 | |||
| * | Believe SA | 2,144 | 22 | |||
| *,3 | Casino Guichard Perrachon SA | 4,805 | 15 | |||
| GL Events | 718 | 15 | ||||
| Vicat SA | 393 | 13 | ||||
| Jacquet Metals SACA | 618 | 12 | ||||
| Equasens | 152 | 12 | ||||
| Lisi SA | 498 | 12 | ||||
| *,2 | Aramis Group SAS | 2,503 | 11 | |||
| Altarea SCA | 93 | 9 | ||||
| Boiron SA | 65 | 4 | ||||
| 151,001 | ||||||
| Germany (5.1%) | ||||||
| SAP SE | 181,677 | 25,345 | ||||
| Allianz SE (Registered) | 65,908 | 16,021 | ||||
| Shares | Market Value• ($000) | |||||
| Deutsche Telekom AG (Registered) | 559,778 | 11,981 | ||||
| Mercedes-Benz Group AG | 142,476 | 10,426 | ||||
| Bayer AG (Registered) | 163,205 | 8,929 | ||||
| Infineon Technologies AG | 216,418 | 7,734 | ||||
| DHL Group | 157,976 | 7,367 | ||||
| adidas AG | 27,542 | �� 5,497 | ||||
| Bayerische Motoren Werke AG | 52,187 | 5,489 | ||||
| Deutsche Boerse AG | 30,532 | 5,420 | ||||
| Merck KGaA | 21,586 | 3,875 | ||||
| Deutsche Bank AG (Registered) | 336,745 | 3,663 | ||||
| Daimler Truck Holding AG | 78,229 | 2,753 | ||||
| Vonovia SE | 114,003 | 2,735 | ||||
| Symrise AG Class A | 22,275 | 2,322 | ||||
| Beiersdorf AG | 17,418 | 2,281 | ||||
| 2 | Siemens Healthineers AG | 45,050 | 2,255 | |||
| Fresenius SE & Co. KGaA | 69,643 | 2,233 | ||||
| Brenntag SE | 26,928 | 2,178 | ||||
| Hannover Rueck SE | 10,230 | 2,176 | ||||
| Heidelberg Materials AG | 24,686 | 1,985 | ||||
| Commerzbank AG | 174,415 | 1,916 | ||||
| * | QIAGEN NV | 39,796 | 1,816 | |||
| Henkel AG & Co. KGaA | 25,637 | 1,772 | ||||
| Fresenius Medical Care AG & Co. KGaA | 34,836 | 1,677 | ||||
| *,2 | Covestro AG | 30,793 | 1,635 | |||
| Continental AG | 18,599 | 1,380 | ||||
| Puma SE | 17,655 | 1,183 | ||||
| *,2 | Delivery Hero SE | 32,079 | 1,170 | |||
| *,2 | Zalando SE | 37,606 | 1,169 | |||
| GEA Group AG | 28,778 | 1,135 | ||||
| 2 | Scout24 SE | 13,517 | 931 | |||
| * | LEG Immobilien SE | 12,870 | 927 | |||
| * | Deutsche Lufthansa AG (Registered) | 99,845 | 892 | |||
| * | HelloFresh SE | 27,543 | 888 | |||
| HUGO BOSS AG | 10,890 | 820 | ||||
| Gerresheimer AG | 5,802 | 753 | ||||
| FUCHS SE | 22,462 | 737 | ||||
| Knorr-Bremse AG | 10,541 | 720 | ||||
| Bechtle AG | 14,491 | 705 | ||||
| Freenet AG | 28,200 | 675 | ||||
| AIXTRON SE | 17,609 | 669 | ||||
| K+S AG (Registered) | 34,818 | 654 | ||||
| Nemetschek SE | 9,328 | 644 | ||||
| Evonik Industries AG | 33,382 | 640 | ||||
| * | Evotec SE | 26,838 | 629 | |||
| Carl Zeiss Meditec AG | 6,073 | 602 | ||||
| Rational AG | 758 | 577 | ||||
| Talanx AG | 7,940 | 534 | ||||
| LANXESS AG | 16,738 | 528 | ||||
| KION Group AG | 12,990 | 519 | ||||
| Aurubis AG | 5,306 | 439 | ||||
| *,2 | TeamViewer SE | 23,522 | 436 | |||
| Wacker Chemie AG | 2,187 | 322 | ||||
| Shares | Market Value• ($000) | |||||
| United Internet AG (Registered) | 16,451 | 316 | ||||
| Siltronic AG | 3,920 | 313 | ||||
| * | Fraport AG Frankfurt Airport Services Worldwide | 5,751 | 311 | |||
| Stabilus SE | 5,198 | 292 | ||||
| * | Encavis AG | 17,519 | 268 | |||
| * | TAG Immobilien AG | 23,320 | 264 | |||
| 3 | ProSiebenSat.1 Media SE | 33,053 | 262 | |||
| * | Nordex SE | 20,001 | 239 | |||
| * | Aroundtown SA | 132,750 | 239 | |||
| * | Software AG | 6,785 | 234 | |||
| Hella GmbH & Co. KGaA | 3,181 | 227 | ||||
| Telefonica Deutschland Holding AG | 116,033 | 221 | ||||
| 2 | Befesa SA | 5,842 | 215 | |||
| * | Vitesco Technologies Group AG | 2,530 | 200 | |||
| Duerr AG | 6,459 | 193 | ||||
| Jenoptik AG | 6,378 | 187 | ||||
| CompuGroup Medical SE & Co. KGaA | 3,988 | 186 | ||||
| CANCOM SE | 6,192 | 180 | ||||
| Suedzucker AG | 11,157 | 180 | ||||
| Krones AG | 1,648 | 178 | ||||
| Kontron AG | 7,644 | 166 | ||||
| * | MorphoSys AG | 5,355 | 161 | |||
| Salzgitter AG | 5,339 | 157 | ||||
| Fielmann Group AG | 3,222 | 151 | ||||
| Sixt SE | 1,407 | 150 | ||||
| Deutsche Wohnen SE | 6,329 | 145 | ||||
| VERBIO Vereinigte BioEnergie AG | 3,048 | 144 | ||||
| Synlab AG | 13,286 | 136 | ||||
| PNE AG | 9,583 | 132 | ||||
| * | Hypoport SE | 693 | 129 | |||
| Stroeer SE & Co. KGaA | 2,800 | 127 | ||||
| * | Grand City Properties SA | 13,736 | 123 | |||
| *,2 | Auto1 Group SE | 14,476 | 121 | |||
| * | flatexDEGIRO AG | 13,702 | 120 | |||
| * | SUSE SA | 7,029 | 118 | |||
| *,2 | Redcare Pharmacy NV | 980 | 117 | |||
| GRENKE AG | 4,528 | 115 | ||||
| RTL Group SA | 3,068 | 113 | ||||
| * | SMA Solar Technology AG | 1,388 | 112 | |||
| * | METRO AG | 13,995 | 111 | |||
| 2 | Deutsche Pfandbriefbank AG | 13,314 | 105 | |||
| Atoss Software AG | 423 | 103 | ||||
| Dermapharm Holding SE | 2,010 | 96 | ||||
| Energiekontor AG | 948 | 90 | ||||
| Wacker Neuson SE | 3,980 | 88 | ||||
| Eckert & Ziegler Strahlen- und Medizintechnik AG | 2,398 | 86 | ||||
| *,3 | Nagarro SE | 1,094 | 82 | |||
| Shares | Market Value• ($000) | |||||
| 1&1 AG | 5,343 | 79 | ||||
| Norma Group SE | 4,214 | 77 | ||||
| Vossloh AG | 1,407 | 63 | ||||
| Deutz AG | 12,936 | 61 | ||||
| * | CECONOMY AG | 22,876 | 60 | |||
| Draegerwerk AG & Co. KGaA | 1,290 | 53 | ||||
| STRATEC SE | 976 | 53 | ||||
| GFT Technologies SE | 1,903 | 53 | ||||
| * | Adtran Networks SE | 2,375 | 52 | |||
| Hornbach Holding AG & Co. KGaA | 649 | 51 | ||||
| 2 | DWS Group GmbH & Co. KGaA | 1,444 | 50 | |||
| Adesso SE | 385 | 48 | ||||
| Secunet Security Networks AG | 181 | 44 | ||||
| Takkt AG | 2,938 | 43 | ||||
| New Work SE | 399 | 43 | ||||
| Software AG (XETR) | 1,198 | 41 | ||||
| *,3 | Varta AG | 1,838 | 40 | |||
| 2 | Instone Real Estate Group SE | 5,402 | 35 | |||
| PATRIZIA SE | 3,200 | 31 | ||||
| Deutsche Beteiligungs AG | 832 | 29 | ||||
| * | About You Holding SE | 4,154 | 28 | |||
| DIC Asset AG | 5,723 | 27 | ||||
| KWS Saat SE & Co. KGaA | 396 | 24 | ||||
| BayWa AG | 684 | 24 | ||||
| Basler AG | 1,584 | 24 | ||||
| CropEnergies AG | 2,432 | 22 | ||||
| Deutsche EuroShop AG | 797 | 18 | ||||
| ElringKlinger AG | 1,438 | 9 | ||||
| Wuestenrot & Wuerttembergische AG | 318 | 5 | ||||
| Hamburger Hafen und Logistik AG | 346 | 4 | ||||
| 171,953 | ||||||
| Greece (0.1%) | ||||||
| * | Eurobank Ergasias Services & Holdings SA | 445,726 | 773 | |||
| * | Alpha Services & Holdings SA | 362,655 | 610 | |||
| Hellenic Telecommunications Organization SA | 38,776 | 579 | ||||
| * | National Bank of Greece SA | 82,397 | 559 | |||
| JUMBO SA | 16,061 | 496 | ||||
| * | Piraeus Financial Holdings SA | 121,034 | 417 | |||
| * | Aegean Airlines SA | 11,894 | 170 | |||
| Fourlis Holdings SA | 22,860 | 115 | ||||
| Hellenic Exchanges - Athens Stock Exchange SA | 17,518 | 100 | ||||
| Terna Energy SA | 5,096 | 91 | ||||
| Shares | Market Value• ($000) | |||||
| GEK Terna Holding Real Estate Construction SA | 5,870 | 86 | ||||
| Titan Cement International SA | 2,698 | 54 | ||||
| Autohellas Tourist & Trading SA | 2,922 | 45 | ||||
| Sarantis SA | 4,643 | 39 | ||||
| * | Ellaktor SA | 13,171 | 36 | |||
| Viohalco SA | 4,507 | 34 | ||||
| * | Holding Co. ADMIE IPTO SA | 12,993 | 32 | |||
| Quest Holdings SA | 2,608 | 18 | ||||
| * | LAMDA Development SA | 930 | 7 | |||
| 4,261 | ||||||
| Hong Kong (1.6%) | ||||||
| AIA Group Ltd. | 1,933,800 | 17,498 | ||||
| Hong Kong Exchanges & Clearing Ltd. | 211,600 | 8,201 | ||||
| Sun Hung Kai Properties Ltd. | 240,500 | 2,707 | ||||
| Techtronic Industries Co. Ltd. | 219,500 | 2,165 | ||||
| Link REIT | 431,220 | 2,138 | ||||
| BOC Hong Kong Holdings Ltd. | 614,000 | 1,706 | ||||
| Hang Seng Bank Ltd. | 125,200 | 1,596 | ||||
| Lenovo Group Ltd. | 1,284,000 | 1,451 | ||||
| Wharf Real Estate Investment Co. Ltd. | 268,000 | 1,117 | ||||
| MTR Corp. Ltd. | 220,500 | 920 | ||||
| 2 | WH Group Ltd. | 1,520,592 | 783 | |||
| Sino Land Co. Ltd. | 626,000 | 717 | ||||
| *,2 | Samsonite International SA | 203,400 | 681 | |||
| 2 | ESR Group Ltd. | 447,400 | 671 | |||
| Hongkong Land Holdings Ltd. | 178,800 | 634 | ||||
| Want Want China Holdings Ltd. | 844,000 | 558 | ||||
| ASMPT Ltd. | 54,800 | 548 | ||||
| PRADA SpA | 83,200 | 543 | ||||
| Henderson Land Development Co. Ltd. | 180,400 | 495 | ||||
| PCCW Ltd. | 1,025,590 | 488 | ||||
| Hang Lung Properties Ltd. | 343,000 | 457 | ||||
| Swire Pacific Ltd. Class B | 345,000 | 455 | ||||
| SITC International Holdings Co. Ltd. | 238,000 | 444 | ||||
| Swire Properties Ltd. | 208,600 | 436 | ||||
| Chow Tai Fook Jewellery Group Ltd. | 279,000 | 423 | ||||
| Swire Pacific Ltd. Class A | 49,000 | 404 | ||||
| Wharf Holdings Ltd. | 164,000 | 347 | ||||
| Bank of East Asia Ltd. | 236,800 | 337 | ||||
| Orient Overseas International Ltd. | 20,500 | 275 | ||||
| Hysan Development Co. Ltd. | 127,000 | 265 | ||||
| Shares | Market Value• ($000) | |||||
| L'Occitane International SA | 72,000 | 255 | ||||
| AAC Technologies Holdings Inc. | 126,500 | 245 | ||||
| 2 | BOC Aviation Ltd. | 29,200 | 219 | |||
| Pacific Basin Shipping Ltd. | 747,000 | 202 | ||||
| Vitasoy International Holdings Ltd. | 130,000 | 168 | ||||
| Giordano International Ltd. | 420,000 | 161 | ||||
| Man Wah Holdings Ltd. | 207,200 | 151 | ||||
| VTech Holdings Ltd. | 22,600 | 138 | ||||
| Luk Fook Holdings International Ltd. | 55,180 | 137 | ||||
| Fortune REIT | 220,000 | 137 | ||||
| * | MMG Ltd. | 408,000 | 135 | |||
| Kerry Properties Ltd. | 72,500 | 134 | ||||
| First Pacific Co. Ltd. | 304,000 | 129 | ||||
| Yue Yuen Industrial Holdings Ltd. | 103,000 | 129 | ||||
| * | Cowell e Holdings Inc. | 58,000 | 114 | |||
| * | Cathay Pacific Airways Ltd. | 92,181 | 98 | |||
| DFI Retail Group Holdings Ltd. | 39,400 | 97 | ||||
| * | Shangri-La Asia Ltd. | 134,000 | 92 | |||
| Nexteer Automotive Group Ltd. | 142,000 | 91 | ||||
| Hang Lung Group Ltd. | 57,000 | 79 | ||||
| * | China Travel International Investment Hong Kong Ltd. | 412,000 | 78 | |||
| * | IGG Inc. | 159,000 | 75 | |||
| *,2 | Sirnaomics Ltd. | 11,950 | 74 | |||
| * | Theme International Holdings Ltd. | 770,000 | 73 | |||
| United Laboratories International Holdings Ltd. | 80,000 | 71 | ||||
| * | Vobile Group Ltd. | 247,000 | 71 | |||
| Hong Kong Technology Venture Co. Ltd. | 148,000 | 66 | ||||
| Johnson Electric Holdings Ltd. | 48,500 | 65 | ||||
| Champion REIT | 180,000 | 58 | ||||
| LK Technology Holdings Ltd. | 57,500 | 55 | ||||
| Cafe de Coral Holdings Ltd. | 40,000 | 49 | ||||
| Beijing Tong Ren Tang Chinese Medicine Co. Ltd. | 27,000 | 49 | ||||
| Dah Sing Financial Holdings Ltd. | 22,000 | 48 | ||||
| Stella International Holdings Ltd. | 46,000 | 48 | ||||
| HKBN Ltd. | 97,500 | 47 | ||||
| Value Partners Group Ltd. | 129,000 | 44 | ||||
| Shares | Market Value• ($000) | |||||
| * | Realord Group Holdings Ltd. | 64,000 | 44 | |||
| Chow Sang Sang Holdings International Ltd. | 35,000 | 42 | ||||
| Dah Sing Banking Group Ltd. | 58,800 | 40 | ||||
| Far East Consortium International Ltd. | 168,000 | 38 | ||||
| Kerry Logistics Network Ltd. | 39,500 | 37 | ||||
| *,2 | Fosun Tourism Group | 36,400 | 37 | |||
| SmarTone Telecommunications Holdings Ltd. | 65,000 | 36 | ||||
| Asia Cement China Holdings Corp. | 93,000 | 36 | ||||
| *,2,3 | Everest Medicines Ltd. | 15,500 | 36 | |||
| *,2 | FIT Hon Teng Ltd. | 221,000 | 30 | |||
| 2 | IMAX China Holding Inc. | 24,100 | 29 | |||
| *,2 | Hua Medicine | 133,000 | 29 | |||
| *,2 | Jacobio Pharmaceuticals Group Co. Ltd. | 60,900 | 29 | |||
| Hutchison Telecommunications Hong Kong Holdings Ltd. | 202,000 | 28 | ||||
| VSTECS Holdings Ltd. | 52,000 | 27 | ||||
| Truly International Holdings Ltd. | 234,000 | 26 | ||||
| Texhong International Group Ltd. | 49,000 | 26 | ||||
| * | Vesync Co. Ltd. | 64,000 | 26 | |||
| * | Shun Tak Holdings Ltd. | 180,000 | 25 | |||
| *,2 | JS Global Lifestyle Co. Ltd. | 176,000 | 25 | |||
| * | C-Mer Eye Care Holdings Ltd. | 52,000 | 24 | |||
| * | Powerlong Real Estate Holdings Ltd. | 218,000 | 23 | |||
| *,2 | Frontage Holdings Corp. | 82,000 | 23 | |||
| Prosperity REIT | 113,000 | 22 | ||||
| Singamas Container Holdings Ltd. | 216,000 | 20 | ||||
| * | Esprit Holdings Ltd. | 357,471 | 19 | |||
| * | Television Broadcasts Ltd. | 38,900 | 19 | |||
| Powerlong Commercial Management Holdings Ltd. | 37,000 | 19 | ||||
| SUNeVision Holdings Ltd. | 33,000 | 16 | ||||
| * | CMBC Capital Holdings Ltd. | 164,250 | 16 | |||
| * | Sa Sa International Holdings Ltd. | 106,000 | 15 | |||
| EC Healthcare | 31,000 | 15 | ||||
| Texwinca Holdings Ltd. | 96,000 | 14 | ||||
| * | Haitong International Securities Group Ltd. | 144,430 | 12 | |||
| Shares | Market Value• ($000) | |||||
| *,2 | JW Cayman Therapeutics Co. Ltd. | 37,500 | 11 | |||
| * | Apollo Future Mobility Group Ltd. | 864,000 | 10 | |||
| *,2 | Antengene Corp. Ltd. | 55,500 | 9 | |||
| K Wah International Holdings Ltd. | 26,000 | 8 | ||||
| * | Renze Harvest International Ltd. | 168,000 | 6 | |||
| CITIC Telecom International Holdings Ltd. | 12,000 | 5 | ||||
| Sun Hung Kai & Co. Ltd. | 11,000 | 4 | ||||
| Guotai Junan International Holdings Ltd. | 25,000 | 2 | ||||
| *,1 | MH Development Ltd. | 6,000 | — | |||
| 54,300 | ||||||
| Hungary (0.1%) | ||||||
| OTP Bank Nyrt. | 39,195 | 1,599 | ||||
| Richter Gedeon Nyrt. | 26,163 | 655 | ||||
| Magyar Telekom Telecommunications plc | 55,008 | 73 | ||||
| 2,327 | ||||||
| Iceland (0.0%) | ||||||
| 2 | Arion Banki HF | 240,114 | 258 | |||
| Sjova-Almennar Tryggingar hf | 152,709 | 40 | ||||
| Vatryggingafelag Islands Hf | 226,296 | 33 | ||||
| Siminn HF | 238,478 | 19 | ||||
| 350 | ||||||
| India (4.4%) | ||||||
| Infosys Ltd. | 581,585 | 10,078 | ||||
| HDFC Bank Ltd. | 489,061 | 9,261 | ||||
| Hindustan Unilever Ltd. | 146,896 | 4,444 | ||||
| Axis Bank Ltd. | 375,932 | 4,417 | ||||
| Bharti Airtel Ltd. | 425,072 | 4,151 | ||||
| Bajaj Finance Ltd. | 39,422 | 3,407 | ||||
| ICICI Bank Ltd. | 253,274 | 2,924 | ||||
| Asian Paints Ltd. | 73,398 | 2,886 | ||||
| Maruti Suzuki India Ltd. | 21,967 | 2,653 | ||||
| Titan Co. Ltd. | 68,325 | 2,560 | ||||
| HCL Technologies Ltd. | 180,837 | 2,558 | ||||
| Sun Pharmaceutical Industries Ltd. | 176,050 | 2,360 | ||||
| State Bank of India | 292,319 | 1,980 | ||||
| UltraTech Cement Ltd. | 18,558 | 1,859 | ||||
| Nestle India Ltd. | 5,724 | 1,519 | ||||
| Power Grid Corp. of India Ltd. | 510,538 | 1,507 | ||||
| Dr Reddy's Laboratories Ltd. | 19,804 | 1,340 | ||||
| Adani Ports & Special Economic Zone Ltd. | 135,703 | 1,297 | ||||
| Grasim Industries Ltd. | 58,872 | 1,273 | ||||
| 2 | HDFC Life Insurance Co. Ltd. | 161,528 | 1,257 | |||
| Cipla Ltd. | 79,944 | 1,213 | ||||
| Bajaj Finserv Ltd. | 63,185 | 1,135 | ||||
| Shares | Market Value• ($000) | |||||
| Wipro Ltd. | 227,359 | 1,120 | ||||
| Shriram Finance Ltd. | 46,310 | 1,078 | ||||
| * | Zomato Ltd. | 912,809 | 1,074 | |||
| *,2 | Avenue Supermarts Ltd. | 23,805 | 1,070 | |||
| 2 | SBI Life Insurance Co. Ltd. | 68,385 | 1,067 | |||
| Britannia Industries Ltd. | 19,089 | 1,030 | ||||
| Tata Consumer Products Ltd. | 94,053 | 947 | ||||
| Apollo Hospitals Enterprise Ltd. | 15,960 | 927 | ||||
| Divi's Laboratories Ltd. | 21,133 | 916 | ||||
| Eicher Motors Ltd. | 22,603 | 910 | ||||
| * | Max Healthcare Institute Ltd. | 122,867 | 875 | |||
| Cholamandalam Investment & Finance Co. Ltd. | 63,516 | 860 | ||||
| Varun Beverages Ltd. | 72,510 | 787 | ||||
| * | Adani Green Energy Ltd. | 69,599 | 779 | |||
| Hero MotoCorp Ltd. | 21,439 | 755 | ||||
| Trent Ltd. | 30,132 | 745 | ||||
| * | Godrej Consumer Products Ltd. | 58,149 | 706 | |||
| Pidilite Industries Ltd. | 23,176 | 704 | ||||
| *,2 | InterGlobe Aviation Ltd. | 23,193 | 682 | |||
| * | Yes Bank Ltd. | 3,339,275 | 677 | |||
| SRF Ltd. | 23,167 | 659 | ||||
| Indian Hotels Co. Ltd. Class A | 128,150 | 651 | ||||
| 2 | ICICI Lombard General Insurance Co. Ltd. | 39,834 | 632 | |||
| Bajaj Auto Ltd. | 11,215 | 624 | ||||
| Info Edge India Ltd. | 11,838 | 619 | ||||
| TVS Motor Co. Ltd. | 35,854 | 614 | ||||
| Marico Ltd. | 89,032 | 613 | ||||
| Havells India Ltd. | 36,632 | 612 | ||||
| Dabur India Ltd. | 91,286 | 609 | ||||
| Ambuja Cements Ltd. | 115,783 | 599 | ||||
| UPL Ltd. | 82,058 | 586 | ||||
| * | IDFC First Bank Ltd. | 520,672 | 586 | |||
| Coforge Ltd. | 8,861 | 584 | ||||
| CG Power & Industrial Solutions Ltd. | 111,728 | 579 | ||||
| Persistent Systems Ltd. | 8,787 | 569 | ||||
| DLF Ltd. | 91,219 | 555 | ||||
| PI Industries Ltd. | 12,626 | 553 | ||||
| Tube Investments of India Ltd. | 15,724 | 550 | ||||
| APL Apollo Tubes Ltd. | 27,072 | 548 | ||||
| Power Finance Corp. Ltd. | 173,554 | 545 | ||||
| Supreme Industries Ltd. | 10,002 | 538 | ||||
| 2 | HDFC Asset Management Co. Ltd. | 16,657 | 508 | |||
| Federal Bank Ltd. | 288,374 | 501 | ||||
| Colgate-Palmolive India Ltd. | 21,308 | 500 | ||||
| Lupin Ltd. | 36,696 | 486 | ||||
| Tata Elxsi Ltd. | 5,517 | 482 | ||||
| * | Delhivery Ltd. | 91,155 | 481 | |||
| REC Ltd. | 163,642 | 471 | ||||
| Shares | Market Value• ($000) | |||||
| 2 | AU Small Finance Bank Ltd. | 53,712 | 469 | |||
| Mphasis Ltd. | 15,941 | 467 | ||||
| Page Industries Ltd. | 956 | 463 | ||||
| Ashok Leyland Ltd. | 203,119 | 451 | ||||
| * | Max Financial Services Ltd. | 39,681 | 447 | |||
| * | Suzlon Energy Ltd. | 1,458,219 | 432 | |||
| 2 | ICICI Prudential Life Insurance Co. Ltd. | 63,255 | 431 | |||
| Voltas Ltd. | 40,053 | 421 | ||||
| SBI Cards & Payment Services Ltd. | 42,716 | 421 | ||||
| Astral Ltd. | 17,818 | 420 | ||||
| Polycab India Ltd. | 6,751 | 417 | ||||
| Bank of Baroda | 183,685 | 415 | ||||
| KPIT Technologies Ltd. | 29,253 | 415 | ||||
| Embassy Office Parks REIT | 111,182 | 410 | ||||
| Aurobindo Pharma Ltd. | 40,137 | 402 | ||||
| Indian Railway Catering & Tourism Corp. Ltd. | 47,910 | 389 | ||||
| Tata Communications Ltd. | 17,870 | 386 | ||||
| Zee Entertainment Enterprises Ltd. | 119,688 | 379 | ||||
| Balkrishna Industries Ltd. | 13,507 | 379 | ||||
| IIFL Finance Ltd. | 51,715 | 379 | ||||
| Samvardhana Motherson International Ltd. | 325,624 | 376 | ||||
| Jubilant Foodworks Ltd. | 59,920 | 370 | ||||
| Adani Total Gas Ltd. | 47,263 | 363 | ||||
| Indraprastha Gas Ltd. | 64,138 | 362 | ||||
| Bajaj Holdings & Investment Ltd. | 3,984 | 358 | ||||
| 2 | Sona Blw Precision Forgings Ltd. | 49,110 | 353 | |||
| * | FSN E-Commerce Ventures Ltd. | 218,788 | 353 | |||
| Mahindra & Mahindra Financial Services Ltd. | 96,880 | 348 | ||||
| KEI Industries Ltd. | 10,600 | 346 | ||||
| 2 | Bandhan Bank Ltd. | 124,169 | 344 | |||
| Berger Paints India Ltd. | 39,014 | 338 | ||||
| Muthoot Finance Ltd. | 21,709 | 330 | ||||
| Crompton Greaves Consumer Electricals Ltd. | 90,905 | 329 | ||||
| ACC Ltd. | 13,561 | 328 | ||||
| AIA Engineering Ltd. | 7,314 | 326 | ||||
| * | Dixon Technologies India Ltd. | 5,245 | 317 | |||
| Fortis Healthcare Ltd. | 78,951 | 316 | ||||
| * | Indus Towers Ltd. | 148,928 | 315 | |||
| Dalmia Bharat Ltd. | 12,429 | 313 | ||||
| Carborundum Universal Ltd. | 22,595 | 310 | ||||
| IDFC Ltd. | 209,109 | 307 | ||||
| Deepak Nitrite Ltd. | 11,462 | 307 | ||||
| Shares | Market Value• ($000) | |||||
| * | One 97 Communications Ltd. | 29,662 | 306 | |||
| Sundram Fasteners Ltd. | 19,854 | 305 | ||||
| Kotak Mahindra Bank Ltd. | 14,125 | 300 | ||||
| Torrent Pharmaceuticals Ltd. | 12,902 | 287 | ||||
| Navin Fluorine International Ltd. | 5,160 | 287 | ||||
| Tata Chemicals Ltd. | 22,342 | 286 | ||||
| *,2 | Macrotech Developers Ltd. | 34,914 | 282 | |||
| 2 | Laurus Labs Ltd. | 58,314 | 281 | |||
| Zydus Lifesciences Ltd. | 37,093 | 280 | ||||
| Schaeffler India Ltd. | 7,534 | 278 | ||||
| NMDC Ltd. | 183,617 | 273 | ||||
| LIC Housing Finance Ltd. | 53,107 | 271 | ||||
| Canara Bank | 67,689 | 262 | ||||
| Apollo Tyres Ltd. | 54,622 | 256 | ||||
| Blue Star Ltd. | 28,290 | 253 | ||||
| Kajaria Ceramics Ltd. | 14,110 | 251 | ||||
| Coromandel International Ltd. | 18,638 | 245 | ||||
| 2 | RBL Bank Ltd. | 84,625 | 244 | |||
| Bosch Ltd. | 1,084 | 243 | ||||
| Linde India Ltd. | 3,212 | 243 | ||||
| *,2 | Aster DM Healthcare Ltd. | 60,595 | 243 | |||
| Union Bank of India Ltd. | 231,832 | 240 | ||||
| Piramal Enterprises Ltd. | 18,819 | 239 | ||||
| Cholamandalam Financial Holdings Ltd. | 20,025 | 238 | ||||
| Escorts Kubota Ltd. | 6,114 | 233 | ||||
| NCC Ltd. | 113,086 | 231 | ||||
| Oberoi Realty Ltd. | 17,079 | 231 | ||||
| Emami Ltd. | 36,251 | 230 | ||||
| Phoenix Mills Ltd. | 10,508 | 228 | ||||
| Biocon Ltd. | 72,396 | 227 | ||||
| Natco Pharma Ltd. | 20,481 | 226 | ||||
| Gujarat Fluorochemicals Ltd. | 6,143 | 226 | ||||
| Computer Age Management Services Ltd. | 7,793 | 223 | ||||
| * | PVR Inox Ltd. | 10,128 | 219 | |||
| SKF India Ltd. | 3,474 | 219 | ||||
| Atul Ltd. | 2,438 | 216 | ||||
| Amara Raja Batteries Ltd. | 28,315 | 215 | ||||
| Grindwell Norton Ltd. | 7,784 | 214 | ||||
| Ipca Laboratories Ltd. | 20,194 | 213 | ||||
| Poly Medicure Ltd. | 12,009 | 212 | ||||
| KEC International Ltd. | 26,052 | 211 | ||||
| Finolex Cables Ltd. | 15,794 | 210 | ||||
| Finolex Industries Ltd. | 72,070 | 208 | ||||
| NHPC Ltd. | 339,704 | 206 | ||||
| Prestige Estates Projects Ltd. | 26,341 | 205 | ||||
| Thermax Ltd. | 6,011 | 204 | ||||
| Narayana Hrudayalaya Ltd. | 16,140 | 203 | ||||
| Shares | Market Value• ($000) | |||||
| Elgi Equipments Ltd. | 33,761 | 200 | ||||
| Can Fin Homes Ltd. | 21,911 | 199 | ||||
| Sonata Software Ltd. | 15,729 | 199 | ||||
| Brigade Enterprises Ltd. | 27,656 | 198 | ||||
| EIH Ltd. | 64,453 | 194 | ||||
| Punjab National Bank | 255,022 | 194 | ||||
| * | Aditya Birla Capital Ltd. | 88,884 | 194 | |||
| JB Chemicals & Pharmaceuticals Ltd. | 5,810 | 194 | ||||
| V-Guard Industries Ltd. | 50,797 | 193 | ||||
| Motherson Sumi Wiring India Ltd. | 257,220 | 193 | ||||
| Westlife Foodworld Ltd. | 16,809 | 190 | ||||
| Exide Industries Ltd. | 58,485 | 188 | ||||
| Redington Ltd. | 99,304 | 188 | ||||
| 2 | Syngene International Ltd. | 20,002 | 187 | |||
| JK Cement Ltd. | 4,602 | 183 | ||||
| Akzo Nobel India Ltd. | 5,519 | 183 | ||||
| 2 | Indian Railway Finance Corp. Ltd. | 302,861 | 183 | |||
| Aarti Industries Ltd. | 30,604 | 182 | ||||
| Glenmark Pharmaceuticals Ltd. | 19,567 | 181 | ||||
| Suven Pharmaceuticals Ltd. | 29,059 | 180 | ||||
| Angel One Ltd. | 7,915 | 179 | ||||
| * | Gujarat Gas Ltd. | 32,791 | 178 | |||
| * | CreditAccess Grameen Ltd. | 10,221 | 175 | |||
| Manappuram Finance Ltd. | 93,394 | 174 | ||||
| Indian Bank | 37,677 | 172 | ||||
| Kansai Nerolac Paints Ltd. | 42,100 | 169 | ||||
| Bata India Ltd. | 8,230 | 168 | ||||
| IRB Infrastructure Developers Ltd. | 491,950 | 168 | ||||
| Birlasoft Ltd. | 26,813 | 165 | ||||
| CRISIL Ltd. | 3,429 | 164 | ||||
| Bayer CropScience Ltd. | 2,800 | 163 | ||||
| UNO Minda Ltd. | 22,490 | 163 | ||||
| 2 | ICICI Securities Ltd. | 21,613 | 163 | |||
| Chambal Fertilisers & Chemicals Ltd. | 48,046 | 160 | ||||
| Mahanagar Gas Ltd. | 12,969 | 160 | ||||
| * | Devyani International Ltd. | 67,918 | 160 | |||
| Lakshmi Machine Works Ltd. | 860 | 159 | ||||
| Bank of India | 150,769 | 156 | ||||
| BSE Ltd. | 12,146 | 156 | ||||
| Oracle Financial Services Software Ltd. | 3,124 | 155 | ||||
| Karur Vysya Bank Ltd. | 102,986 | 151 | ||||
| Zensar Technologies Ltd. | 23,716 | 151 | ||||
| Vedant Fashions Ltd. | 9,932 | 151 | ||||
| KPR Mill Ltd. | 16,373 | 150 | ||||
| Alkem Laboratories Ltd. | 3,359 | 148 | ||||
| Sumitomo Chemical India Ltd. | 27,465 | 146 | ||||
| Shares | Market Value• ($000) | |||||
| *,2 | PNB Housing Finance Ltd. | 18,371 | 144 | |||
| * | Aditya Birla Fashion & Retail Ltd. | 54,020 | 143 | |||
| 360 ONE WAM Ltd. | 24,360 | 143 | ||||
| * | Aavas Financiers Ltd. | 7,197 | 142 | |||
| 2 | Dr Lal PathLabs Ltd. | 5,395 | 142 | |||
| 2 | Mindspace Business Parks REIT | 38,203 | 142 | |||
| Mastek Ltd. | 4,950 | 142 | ||||
| Whirlpool of India Ltd. | 7,161 | 141 | ||||
| Gateway Distriparks Ltd. | 136,208 | 141 | ||||
| *,2 | Lemon Tree Hotels Ltd. | 107,192 | 141 | |||
| 2 | Nippon Life India Asset Management Ltd. | 37,289 | 140 | |||
| Central Depository Services India Ltd. | 10,163 | 140 | ||||
| Intellect Design Arena Ltd. | 15,767 | 140 | ||||
| Poonawalla Fincorp Ltd. | 27,778 | 140 | ||||
| Hindustan Zinc Ltd. | 36,232 | 139 | ||||
| 2 | IndiaMart InterMesh Ltd. | 3,770 | 139 | |||
| Kalyan Jewellers India Ltd. | 45,284 | 138 | ||||
| National Aluminium Co. Ltd. | 120,978 | 137 | ||||
| JM Financial Ltd. | 144,324 | 136 | ||||
| Rajesh Exports Ltd. | 22,377 | 135 | ||||
| Tanla Platforms Ltd. | 11,484 | 135 | ||||
| Zydus Wellnes Ltd. | 6,698 | 133 | ||||
| 2 | Indian Energy Exchange Ltd. | 86,389 | 132 | |||
| Relaxo Footwears Ltd. | 11,513 | 131 | ||||
| Ajanta Pharma Ltd. | 6,240 | 130 | ||||
| AstraZeneca Pharma India Ltd. | 2,527 | 130 | ||||
| Bajaj Electricals Ltd. | 9,251 | 130 | ||||
| * | Affle India Ltd. | 10,011 | 130 | |||
| 2 | Equitas Small Finance Bank Ltd. | 117,793 | 129 | |||
| * | Bombay Burmah Trading Co. | 10,636 | 128 | |||
| PNC Infratech Ltd. | 31,815 | 127 | ||||
| Gujarat Pipavav Port Ltd. | 80,315 | 126 | ||||
| UTI Asset Management Co. Ltd. | 13,965 | 126 | ||||
| Ceat Ltd. | 4,588 | 125 | ||||
| Great Eastern Shipping Co. Ltd. | 13,508 | 125 | ||||
| * | Medplus Health Services Ltd. | 12,612 | 124 | |||
| Karnataka Bank Ltd. | 46,225 | 123 | ||||
| Raymond Ltd. | 5,086 | 123 | ||||
| City Union Bank Ltd. | 82,480 | 123 | ||||
| * | Vodafone Idea Ltd. | 1,123,026 | 123 | |||
| 2 | Godrej Agrovet Ltd. | 21,051 | 122 | |||
| Balrampur Chini Mills Ltd. | 25,755 | 121 | ||||
| * | Indiabulls Housing Finance Ltd. | 50,205 | 120 | |||
| Shares | Market Value• ($000) | |||||
| Hatsun Agro Product Ltd. | 8,159 | 118 | ||||
| Care Ratings Ltd. | 11,667 | 117 | ||||
| * | Kaveri Seed Co. Ltd. | 17,682 | 117 | |||
| Avanti Feeds Ltd. | 22,146 | 116 | ||||
| Asahi India Glass Ltd. | 16,150 | 116 | ||||
| JK Lakshmi Cement Ltd. | 14,107 | 115 | ||||
| Kalpataru Projects International Ltd. | 14,467 | 115 | ||||
| VIP Industries Ltd. | 14,063 | 113 | ||||
| PTC India Ltd. | 66,473 | 112 | ||||
| Welspun Corp. Ltd. | 28,252 | 112 | ||||
| eClerx Services Ltd. | 5,713 | 112 | ||||
| * | Amber Enterprises India Ltd. | 3,167 | 111 | |||
| *,2 | Krishna Institute of Medical Sciences Ltd. | 4,575 | 110 | |||
| Motilal Oswal Financial Services Ltd. | 9,746 | 108 | ||||
| Happiest Minds Technologies Ltd. | 9,337 | 105 | ||||
| *,2 | Tejas Networks Ltd. | 9,976 | 105 | |||
| Jindal Saw Ltd. | 24,514 | 104 | ||||
| * | V-Mart Retail Ltd. | 3,833 | 103 | |||
| KRBL Ltd. | 20,932 | 102 | ||||
| Gujarat State Petronet Ltd. | 30,461 | 102 | ||||
| Aptus Value Housing Finance India Ltd. | 31,288 | 102 | ||||
| Century Textiles & Industries Ltd. | 8,117 | 101 | ||||
| CIE Automotive India Ltd. | 16,024 | 101 | ||||
| Bajaj Consumer Care Ltd. | 32,552 | 101 | ||||
| * | TeamLease Services Ltd. | 3,463 | 101 | |||
| Vaibhav Global Ltd. | 18,866 | 101 | ||||
| Gujarat Narmada Valley Fertilizers & Chemicals Ltd. | 13,731 | 101 | ||||
| DCB Bank Ltd. | 71,201 | 100 | ||||
| * | Triveni Turbine Ltd. | 21,258 | 100 | |||
| CCL Products India Ltd. | 13,601 | 99 | ||||
| Cera Sanitaryware Ltd. | 852 | 98 | ||||
| * | Godrej Industries Ltd. | 14,866 | 96 | |||
| Hitachi Energy India Ltd. | 1,796 | 95 | ||||
| Pfizer Ltd. | 2,032 | 94 | ||||
| Sterlite Technologies Ltd. | 45,252 | 94 | ||||
| EPL Ltd. | 39,713 | 94 | ||||
| 2 | Brookfield India Real Estate Trust | 31,131 | 93 | |||
| * | Restaurant Brands Asia Ltd. | 60,920 | 93 | |||
| EID Parry India Ltd. | 15,993 | 92 | ||||
| Granules India Ltd. | 25,705 | 92 | ||||
| * | Tata Teleservices Maharashtra Ltd. | 85,777 | 91 | |||
| Jubilant Pharmova Ltd. Class A | 15,700 | 89 | ||||
| Shares | Market Value• ($000) | |||||
| Vinati Organics Ltd. | 3,971 | 89 | ||||
| Alkyl Amines Chemicals | 2,943 | 89 | ||||
| GlaxoSmithKline Pharmaceuticals Ltd. | 5,071 | 88 | ||||
| * | Indiabulls Real Estate Ltd. | 90,985 | 88 | |||
| * | Sun Pharma Advanced Research Co. Ltd. | 28,046 | 87 | |||
| Welspun India Ltd. | 55,556 | 84 | ||||
| * | Piramal Pharma Ltd. | 67,312 | 84 | |||
| Strides Pharma Science Ltd. | 15,586 | 83 | ||||
| Edelweiss Financial Services Ltd. | 125,759 | 83 | ||||
| Trident Ltd. | 187,460 | 83 | ||||
| DCM Shriram Ltd. | 7,257 | 82 | ||||
| Century Plyboards India Ltd. | 9,875 | 82 | ||||
| Route Mobile Ltd. | 4,308 | 82 | ||||
| 2 | Endurance Technologies Ltd. | 4,052 | 81 | |||
| KNR Constructions Ltd. | 24,359 | 81 | ||||
| Orient Electric Ltd. | 27,671 | 80 | ||||
| * | Vardhman Textiles Ltd. | 16,852 | 80 | |||
| Craftsman Automation Ltd. | 1,356 | 80 | ||||
| Sobha Ltd. | 10,730 | 79 | ||||
| * | Alok Industries Ltd. | 320,847 | 77 | |||
| Firstsource Solutions Ltd. | 38,991 | 77 | ||||
| Mahindra Lifespace Developers Ltd. | 11,232 | 77 | ||||
| * | IFCI Ltd. | 412,343 | 76 | |||
| Graphite India Ltd. | 13,217 | 76 | ||||
| Alembic Pharmaceuticals Ltd. | 7,940 | 74 | ||||
| Rallis India Ltd. | 25,921 | 74 | ||||
| Multi Commodity Exchange of India Ltd. | 3,581 | 73 | ||||
| 2 | Metropolis Healthcare Ltd. | 4,469 | 72 | |||
| Deepak Fertilisers & Petrochemicals Corp. Ltd. | 9,893 | 72 | ||||
| 2 | Quess Corp. Ltd. | 13,750 | 71 | |||
| * | Chemplast Sanmar Ltd. | 11,255 | 71 | |||
| *,2 | New India Assurance Co. Ltd. | 44,883 | 70 | |||
| Gujarat State Fertilizers & Chemicals Ltd. | 33,039 | 70 | ||||
| Birla Corp. Ltd. | 4,984 | 69 | ||||
| Garware Technical Fibres Ltd. | 1,797 | 69 | ||||
| South Indian Bank Ltd. | 238,605 | 67 | ||||
| Procter & Gamble Health Ltd. | 1,146 | 67 | ||||
| Saregama India Ltd. | 14,041 | 67 | ||||
| Fine Organic Industries Ltd. | 1,161 | 67 | ||||
| * | Global Health Ltd. | 7,675 | 66 | |||
| Jubilant Ingrevia Ltd. | 10,447 | 65 | ||||
| NOCIL Ltd. | 23,823 | 65 | ||||
| Shares | Market Value• ($000) | |||||
| Rhi Magnesita India Ltd. | 7,494 | 65 | ||||
| *,1 | Nuvama Wealth Management Ltd. | 1,895 | 65 | |||
| ZF Commercial Vehicle Control Systems India Ltd. | 385 | 64 | ||||
| Balaji Amines Ltd. | 2,333 | 63 | ||||
| TTK Prestige Ltd. | 6,540 | 62 | ||||
| Clean Science & Technology Ltd. | 3,557 | 61 | ||||
| Blue Dart Express Ltd. | 789 | 60 | ||||
| Symphony Ltd. | 5,587 | 60 | ||||
| * | Nuvoco Vistas Corp. Ltd. | 14,469 | 59 | |||
| GMM Pfaudler Ltd. | 2,987 | 57 | ||||
| IDBI Bank Ltd. | 78,888 | 57 | ||||
| BASF India Ltd. | 1,770 | 56 | ||||
| *,2 | General Insurance Corp. of India | 20,787 | 55 | |||
| * | Borosil Renewables Ltd. | 10,389 | 55 | |||
| JK Paper Ltd. | 12,236 | 54 | ||||
| NBCC India Ltd. | 85,173 | 53 | ||||
| Rain Industries Ltd. | 26,663 | 52 | ||||
| * | Just Dial Ltd. | 5,648 | 52 | |||
| Galaxy Surfactants Ltd. | 1,566 | 51 | ||||
| * | Dhani Services Ltd. | 84,039 | 49 | |||
| Polyplex Corp. Ltd. | 3,353 | 49 | ||||
| * | Sheela Foam Ltd. | 3,563 | 48 | |||
| * | Infibeam Avenues Ltd. | 261,334 | 46 | |||
| * | TV18 Broadcast Ltd. | 71,623 | 42 | |||
| Allcargo Logistics Ltd. | 10,977 | 36 | ||||
| Brightcom Group Ltd. | 154,046 | 32 | ||||
| * | Campus Activewear Ltd. | 8,205 | 30 | |||
| * | Sapphire Foods India Ltd. | 1,515 | 26 | |||
| Vakrangee Ltd. | 86,136 | 16 | ||||
| * | NIIT Ltd. | 13,822 | 13 | |||
| *,1 | Digidrive Distributors Ltd. | 2,808 | 5 | |||
| 149,626 | ||||||
| Indonesia (0.7%) | ||||||
| Bank Central Asia Tbk. PT | 9,191,316 | 5,533 | ||||
| Bank Rakyat Indonesia Persero Tbk. PT | 11,639,396 | 4,240 | ||||
| Bank Mandiri Persero Tbk. PT | 7,387,140 | 2,921 | ||||
| Telkom Indonesia Persero Tbk. PT | 7,894,700 | 1,930 | ||||
| Bank Negara Indonesia Persero Tbk. PT | 1,362,600 | 821 | ||||
| * | Merdeka Copper Gold Tbk. PT | 2,986,800 | 662 | |||
| Sumber Alfaria Trijaya Tbk. PT | 2,848,000 | 543 | ||||
| * | Charoen Pokphand Indonesia Tbk. PT | 1,230,900 | 418 | |||
| Kalbe Farma Tbk. PT | 2,891,600 | 344 | ||||
| Indofood Sukses Makmur Tbk. PT | 693,500 | 323 | ||||
| Sarana Menara Nusantara Tbk. PT | 4,317,800 | 292 | ||||
| Barito Pacific Tbk. PT | 3,954,274 | 278 | ||||
| Shares | Market Value• ($000) | |||||
| Unilever Indonesia Tbk. PT | 893,100 | 215 | ||||
| Indah Kiat Pulp & Paper Tbk. PT | 357,800 | 214 | ||||
| Indofood CBP Sukses Makmur Tbk. PT | 270,600 | 199 | ||||
| Dayamitra Telekomunikasi PT | 3,675,800 | 181 | ||||
| Indosat Tbk. PT | 280,000 | 177 | ||||
| Elang Mahkota Teknologi Tbk. PT | 4,514,400 | 169 | ||||
| Indocement Tunggal Prakarsa Tbk. PT | 236,800 | 166 | ||||
| Mitra Keluarga Karyasehat Tbk. PT | 878,600 | 163 | ||||
| Tower Bersama Infrastructure Tbk. PT | 1,080,560 | 149 | ||||
| Ciputra Development Tbk. PT | 1,970,300 | 148 | ||||
| XL Axiata Tbk. PT | 903,550 | 148 | ||||
| Medikaloka Hermina Tbk. PT | 1,613,400 | 148 | ||||
| Summarecon Agung Tbk. PT | 3,327,206 | 147 | ||||
| Mitra Adiperkasa Tbk. PT | 1,091,500 | 139 | ||||
| Vale Indonesia Tbk. PT | 256,700 | 99 | ||||
| Japfa Comfeed Indonesia Tbk. PT | 1,080,400 | 92 | ||||
| Matahari Department Store Tbk. PT | 534,600 | 91 | ||||
| Avia Avian Tbk. PT | 2,306,500 | 91 | ||||
| BFI Finance Indonesia Tbk. PT | 1,111,600 | 88 | ||||
| * | Bumi Serpong Damai Tbk. PT | 1,078,700 | 80 | |||
| Pakuwon Jati Tbk. PT | 2,457,700 | 73 | ||||
| * | Panin Financial Tbk. PT | 3,652,100 | 70 | |||
| * | Bank Pan Indonesia Tbk. PT | 809,000 | 69 | |||
| Bank Pembangunan Daerah Jawa Barat Dan Banten Tbk. PT | 865,526 | 67 | ||||
| Mayora Indah Tbk. PT | 374,700 | 64 | ||||
| * | Bank Bukopin Tbk. PT | 9,900,640 | 63 | |||
| * | Adhi Karya Persero Tbk. PT | 2,192,343 | 62 | |||
| Ace Hardware Indonesia Tbk. PT | 1,262,600 | 61 | ||||
| Bank Syariah Indonesia Tbk. PT | 534,000 | 60 | ||||
| * | Smartfren Telecom Tbk. PT | 16,193,800 | 59 | |||
| Jasa Marga Persero Tbk. PT | 191,300 | 54 | ||||
| * | Global Mediacom Tbk. PT | 2,154,300 | 43 | |||
| *,1 | Waskita Karya Persero Tbk. PT | 3,046,719 | 40 | |||
| Bank BTPN Syariah Tbk. PT | 276,900 | 39 | ||||
| Shares | Market Value• ($000) | |||||
| Industri Jamu Dan Farmasi Sido Muncul Tbk. PT | 872,600 | 36 | ||||
| Ramayana Lestari Sentosa Tbk. PT | 945,400 | 35 | ||||
| * | Bank Neo Commerce Tbk. PT | 1,417,538 | 32 | |||
| Bank Tabungan Negara Persero Tbk. PT | 342,048 | 28 | ||||
| Surya Citra Media Tbk. PT | 2,787,300 | 27 | ||||
| * | Lippo Karawaci Tbk. PT | 3,991,800 | 26 | |||
| Bank Danamon Indonesia Tbk. PT | 109,100 | 21 | ||||
| Media Nusantara Citra Tbk. PT | 608,900 | 21 | ||||
| * | Alam Sutera Realty Tbk. PT | 1,777,500 | 21 | |||
| Astra Agro Lestari Tbk. PT | 38,600 | 19 | ||||
| * | Wijaya Karya Persero Tbk. PT | 489,100 | 13 | |||
| * | Bank Raya Indonesia Tbk. PT | 373,851 | 9 | |||
| *,1 | Trada Alam Minera Tbk. PT | 477,100 | — | |||
| 22,321 | ||||||
| Ireland (0.2%) | ||||||
| Kerry Group plc Class A | 25,583 | 2,387 | ||||
| Kingspan Group plc (XDUB) | 23,490 | 1,985 | ||||
| Bank of Ireland Group plc | 176,362 | 1,756 | ||||
| AIB Group plc | 209,160 | 952 | ||||
| Glanbia plc (XDUB) | 25,873 | 430 | ||||
| Kingspan Group plc (XLON) | 2,173 | 183 | ||||
| * | Dalata Hotel Group plc | 22,784 | 106 | |||
| Glanbia plc (XLON) | 28 | 1 | ||||
| 7,800 | ||||||
| Israel (0.4%) | ||||||
| * | Nice Ltd. | 10,700 | 2,085 | |||
| Bank Leumi Le-Israel BM | 263,184 | 2,043 | ||||
| Bank Hapoalim BM | 229,404 | 1,899 | ||||
| Israel Discount Bank Ltd. Class A | 219,739 | 1,099 | ||||
| Mizrahi Tefahot Bank Ltd. | 23,926 | 787 | ||||
| * | Nova Ltd. | 4,483 | 578 | |||
| * | Tower Semiconductor Ltd. | 18,770 | 548 | |||
| Bezeq The Israeli Telecommunication Corp. Ltd. | 287,146 | 389 | ||||
| First International Bank of Israel Ltd. | 8,609 | 348 | ||||
| Azrieli Group Ltd. | 6,235 | 334 | ||||
| * | Enlight Renewable Energy Ltd. | 18,274 | 297 | |||
| * | Camtek Ltd. | 4,306 | 262 | |||
| Phoenix Holdings Ltd. | 22,910 | 230 | ||||
| Shares | Market Value• ($000) | |||||
| Reit 1 Ltd. | 51,819 | 221 | ||||
| * | Perion Network Ltd. | 6,614 | 220 | |||
| * | Shufersal Ltd. | 40,795 | 190 | |||
| * | Big Shopping Centers Ltd. | 2,153 | 180 | |||
| Alony Hetz Properties & Investments Ltd. | 20,175 | 153 | ||||
| Sapiens International Corp. NV | 4,900 | 146 | ||||
| * | Clal Insurance Enterprises Holdings Ltd. | 9,523 | 141 | |||
| Harel Insurance Investments & Financial Services Ltd. | 16,468 | 120 | ||||
| * | Strauss Group Ltd. | 5,310 | 115 | |||
| Isracard Ltd. | 27,519 | 112 | ||||
| Hilan Ltd. | 1,863 | 96 | ||||
| Electra Ltd. | 245 | 95 | ||||
| One Software Technologies Ltd. | 7,504 | 95 | ||||
| * | Shikun & Binui Ltd. | 36,562 | 91 | |||
| Matrix IT Ltd. | 4,483 | 91 | ||||
| Sella Capital Real Estate Ltd. | 38,179 | 80 | ||||
| * | Partner Communications Co. Ltd. | 18,911 | 79 | |||
| Mega Or Holdings Ltd. | 4,166 | 77 | ||||
| FIBI Holdings Ltd. | 1,731 | 75 | ||||
| Maytronics Ltd. | 6,590 | 71 | ||||
| Fox Wizel Ltd. | 893 | 65 | ||||
| Delta Galil Ltd. | 1,506 | 59 | ||||
| * | Kamada Ltd. | 10,240 | 59 | |||
| Danel Adir Yeoshua Ltd. | 724 | 58 | ||||
| Summit Real Estate Holdings Ltd. | 4,301 | 57 | ||||
| Rami Levy Chain Stores Hashikma Marketing 2006 Ltd. | 890 | 51 | ||||
| Elco Ltd. | 1,586 | 51 | ||||
| * | Cellcom Israel Ltd. | 15,170 | 50 | |||
| IDI Insurance Co. Ltd. | 2,191 | 48 | ||||
| Menora Mivtachim Holdings Ltd. | 2,250 | 47 | ||||
| Israel Canada T.R Ltd. | 19,092 | 43 | ||||
| AudioCodes Ltd. | 3,589 | 37 | ||||
| G City Ltd. | 11,329 | 36 | ||||
| * | AFI Properties Ltd. | 1,025 | 34 | |||
| * | Allot Ltd. | 5,846 | 15 | |||
| 14,057 | ||||||
| Italy (1.7%) | ||||||
| UniCredit SpA | 307,439 | 7,490 | ||||
| Intesa Sanpaolo SpA | 2,574,923 | 6,876 | ||||
| Ferrari NV | 19,663 | 6,234 | ||||
| Stellantis NV | 256,626 | 4,764 | ||||
| Assicurazioni Generali SpA | 216,960 | 4,494 | ||||
| Moncler SpA | 35,293 | 2,391 | ||||
| CNH Industrial NV | 161,827 | 2,231 | ||||
| Terna - Rete Elettrica Nazionale | 250,741 | 2,068 | ||||
| Shares | Market Value• ($000) | |||||
| Mediobanca Banca di Credito Finanziario SpA | 113,575 | 1,483 | ||||
| FinecoBank Banca Fineco SpA | 106,239 | 1,452 | ||||
| Stellantis NV (XPAR) | 73,590 | 1,364 | ||||
| Banco BPM SpA | 237,436 | 1,133 | ||||
| Recordati Industria Chimica e Farmaceutica SpA | 17,473 | 876 | ||||
| Interpump Group SpA | 14,891 | 753 | ||||
| 2 | Poste Italiane SpA | 66,567 | 739 | |||
| *,2 | Nexi SpA | 102,016 | 732 | |||
| * | Telecom Italia SpA (Bearer) | 2,300,351 | 705 | |||
| Amplifon SpA | 21,397 | 695 | ||||
| 2 | Infrastrutture Wireless Italiane SpA | 51,036 | 631 | |||
| BPER Banca | 163,173 | 491 | ||||
| Reply SpA | 4,502 | 460 | ||||
| Brunello Cucinelli SpA | 5,363 | 443 | ||||
| Azimut Holding SpA | 18,768 | 434 | ||||
| Buzzi SpA | 13,995 | 418 | ||||
| Banca Popolare di Sondrio SPA | 86,982 | 413 | ||||
| Italgas SpA | 69,870 | 397 | ||||
| Unipol Gruppo SpA | 67,062 | 373 | ||||
| 2 | Pirelli & C SpA | 73,857 | 368 | |||
| DiaSorin SpA | 3,402 | 359 | ||||
| Brembo SpA | 22,072 | 307 | ||||
| Banca Mediolanum SpA | 33,476 | 306 | ||||
| 2 | BFF Bank SpA | 23,955 | 257 | |||
| Tamburi Investment Partners SpA | 26,773 | 256 | ||||
| Banca Generali SpA | 6,834 | 249 | ||||
| De' Longhi SpA | 9,242 | 244 | ||||
| 2 | Carel Industries SpA | 7,464 | 210 | |||
| * | Banca Monte dei Paschi di Siena SpA | 72,137 | 200 | |||
| 2 | Anima Holding SpA | 46,105 | 190 | |||
| * | Telecom Italia SpA (Registered) | 599,561 | 186 | |||
| 2 | Enav SpA | 45,370 | 183 | |||
| Arnoldo Mondadori Editore SpA | 73,257 | 171 | ||||
| 2 | Technogym SpA | 19,768 | 169 | |||
| Banca IFIS SpA | 8,740 | 153 | ||||
| Maire Tecnimont SpA | 37,554 | 150 | ||||
| Salvatore Ferragamo SpA | 7,840 | 125 | ||||
| SOL SpA | 4,538 | 124 | ||||
| Gruppo MutuiOnline SpA | 3,987 | 113 | ||||
| Sesa SpA | 932 | 109 | ||||
| Biesse SpA | 7,676 | 107 | ||||
| Tinexta SpA | 5,052 | 101 | ||||
| Danieli & C Officine Meccaniche SpA Saving Shares | 5,269 | 100 | ||||
| Italmobiliare SpA | 3,648 | 98 | ||||
| El.En. SpA | 7,636 | 91 | ||||
| 2 | RAI Way SpA | 15,400 | 86 | |||
| Shares | Market Value• ($000) | |||||
| Rizzoli Corriere Della Sera Mediagroup SpA | 109,788 | 86 | ||||
| Webuild SpA | 39,750 | 81 | ||||
| MARR SpA | 4,699 | 69 | ||||
| Zignago Vetro SpA | 3,537 | 61 | ||||
| *,2 | GVS SpA | 9,878 | 61 | |||
| Salcef Group SpA | 2,286 | 61 | ||||
| MFE-MediaForEurope NV Class A | 113,926 | 58 | ||||
| Immobiliare Grande Distribuzione SIIQ SpA | 22,995 | 57 | ||||
| Credito Emiliano SpA | 6,294 | 53 | ||||
| Sanlorenzo SpA | 1,303 | 52 | ||||
| 2 | doValue SpA | 9,811 | 48 | |||
| *,3 | Juventus Football Club SpA | 104,047 | 41 | |||
| Piaggio & C SpA | 9,562 | 37 | ||||
| UnipolSai Assicurazioni SpA | 14,275 | 36 | ||||
| MFE-MediaForEurope NV Class B | 48,774 | 35 | ||||
| Danieli & C Officine Meccaniche SpA | 1,043 | 25 | ||||
| * | Tod's SpA | 471 | 19 | |||
| Datalogic SpA | 2,377 | 17 | ||||
| Cementir Holding NV | 1,388 | 12 | ||||
| Alerion Cleanpower SpA | 239 | 7 | ||||
| 56,468 | ||||||
| Japan (17.4%) | ||||||
| Toyota Motor Corp. | 1,980,600 | 34,124 | ||||
| Sony Group Corp. | 204,700 | 17,030 | ||||
| Mitsubishi UFJ Financial Group Inc. | 1,925,700 | 15,363 | ||||
| Keyence Corp. | 32,400 | 13,452 | ||||
| Tokyo Electron Ltd. | 73,900 | 10,976 | ||||
| Shin-Etsu Chemical Co. Ltd. | 321,000 | 10,231 | ||||
| Sumitomo Mitsui Financial Group Inc. | 211,800 | 9,683 | ||||
| Daiichi Sankyo Co. Ltd. | 312,700 | 9,210 | ||||
| Honda Motor Co. Ltd. | 275,200 | 8,893 | ||||
| KDDI Corp. | 267,900 | 7,964 | ||||
| Recruit Holdings Co. Ltd. | 222,549 | 7,928 | ||||
| Takeda Pharmaceutical Co. Ltd. | 255,757 | 7,904 | ||||
| Nintendo Co. Ltd. | 173,900 | 7,456 | ||||
| SoftBank Group Corp. | 161,100 | 7,220 | ||||
| Mizuho Financial Group Inc. | 424,320 | 6,992 | ||||
| Tokio Marine Holdings Inc. | 310,000 | 6,841 | ||||
| Hoya Corp. | 57,000 | 6,324 | ||||
| Fast Retailing Co. Ltd. | 25,700 | 5,896 | ||||
| Oriental Land Co. Ltd. | 155,400 | 5,598 | ||||
| Nippon Telegraph & Telephone Corp. | 4,815,000 | 5,560 | ||||
| Murata Manufacturing Co. Ltd. | 95,300 | 5,331 | ||||
| SoftBank Corp. | 458,543 | 5,259 | ||||
| 3 | Seven & i Holdings Co. Ltd. | 127,800 | 5,244 | |||
| Shares | Market Value• ($000) | |||||
| Denso Corp. | 75,200 | 5,133 | ||||
| Astellas Pharma Inc. | 306,700 | 4,640 | ||||
| FANUC Corp. | 161,200 | 4,585 | ||||
| SMC Corp. | 9,400 | 4,570 | ||||
| Nidec Corp. | 84,900 | 4,418 | ||||
| Panasonic Holdings Corp. | 359,100 | 4,133 | ||||
| Canon Inc. | 165,000 | 4,061 | ||||
| Central Japan Railway Co. | 30,900 | 3,962 | ||||
| Advantest Corp. | 30,700 | 3,843 | ||||
| Bridgestone Corp. | 97,500 | 3,786 | ||||
| Fujitsu Ltd. | 30,200 | 3,775 | ||||
| FUJIFILM Holdings Corp. | 60,400 | 3,569 | ||||
| East Japan Railway Co. | 60,700 | 3,432 | ||||
| Chugai Pharmaceutical Co. Ltd. | 111,500 | 3,399 | ||||
| Ajinomoto Co. Inc. | 79,800 | 3,381 | ||||
| Mitsui Fudosan Co. Ltd. | 154,100 | 3,374 | ||||
| Terumo Corp. | 110,300 | 3,337 | ||||
| * | Renesas Electronics Corp. | 199,577 | 3,325 | |||
| Daiwa House Industry Co. Ltd. | 112,500 | 3,125 | ||||
| Suzuki Motor Corp. | 77,500 | 3,045 | ||||
| Kao Corp. | 78,800 | 3,044 | ||||
| Kubota Corp. | 187,000 | 3,009 | ||||
| Otsuka Holdings Co. Ltd. | 78,000 | 2,963 | ||||
| Dai-ichi Life Holdings Inc. | 158,900 | 2,953 | ||||
| Eisai Co. Ltd. | 44,500 | 2,813 | ||||
| Olympus Corp. | 208,100 | 2,811 | ||||
| MS&AD Insurance Group Holdings Inc. | 78,000 | 2,801 | ||||
| Kyocera Corp. | 53,900 | 2,765 | ||||
| Disco Corp. | 13,900 | 2,747 | ||||
| Japan Post Holdings Co. Ltd. | 351,767 | 2,697 | ||||
| Shiseido Co. Ltd. | 65,900 | 2,674 | ||||
| Aeon Co. Ltd. | 127,800 | 2,649 | ||||
| Unicharm Corp. | 65,700 | 2,621 | ||||
| Mitsubishi Estate Co. Ltd. | 196,400 | 2,502 | ||||
| NEC Corp. | 46,500 | 2,451 | ||||
| Bandai Namco Holdings Inc. | 104,000 | 2,413 | ||||
| Secom Co. Ltd. | 33,900 | 2,373 | ||||
| Sompo Holdings Inc. | 54,300 | 2,363 | ||||
| Sumitomo Mitsui Trust Holdings Inc. | 61,300 | 2,296 | ||||
| Nippon Yusen KK | 82,900 | 2,206 | ||||
| TDK Corp. | 59,800 | 2,177 | ||||
| Shionogi & Co. Ltd. | 48,500 | 2,130 | ||||
| Sekisui House Ltd. | 102,400 | 2,087 | ||||
| Nomura Research Institute Ltd. | 71,300 | 2,049 | ||||
| Nomura Holdings Inc. | 517,300 | 2,003 | ||||
| Japan Post Bank Co. Ltd. | 245,218 | 1,968 | ||||
| Lasertec Corp. | 12,600 | 1,959 | ||||
| Shares | Market Value• ($000) | |||||
| Toyota Industries Corp. | 27,300 | 1,928 | ||||
| Resona Holdings Inc. | 362,750 | 1,922 | ||||
| Shimano Inc. | 12,700 | 1,863 | ||||
| West Japan Railway Co. | 41,651 | 1,803 | ||||
| Sumitomo Realty & Development Co. Ltd. | 68,700 | 1,756 | ||||
| Sumitomo Electric Industries Ltd. | 143,000 | 1,751 | ||||
| Nitto Denko Corp. | 25,500 | 1,740 | ||||
| Yaskawa Electric Corp. | 44,300 | 1,737 | ||||
| Sysmex Corp. | 32,600 | 1,730 | ||||
| Japan Exchange Group Inc. | 97,700 | 1,705 | ||||
| Omron Corp. | 32,600 | 1,573 | ||||
| Asahi Kasei Corp. | 240,000 | 1,549 | ||||
| Daiwa Securities Group Inc. | 270,000 | 1,535 | ||||
| NTT Data Group Corp. | 112,000 | 1,506 | ||||
| Mitsui OSK Lines Ltd. | 54,000 | 1,495 | ||||
| Toray Industries Inc. | 274,800 | 1,482 | ||||
| Pan Pacific International Holdings Corp. | 72,700 | 1,449 | ||||
| M3 Inc. | 72,700 | 1,449 | ||||
| Nissan Motor Co. Ltd. | 338,400 | 1,439 | ||||
| Mitsubishi Chemical Group Corp. | 240,900 | 1,438 | ||||
| Ono Pharmaceutical Co. Ltd. | 75,800 | 1,432 | ||||
| Shimadzu Corp. | 48,700 | 1,431 | ||||
| Yamaha Motor Co. Ltd. | 54,100 | 1,400 | ||||
| Z Holdings Corp. | 459,900 | 1,381 | ||||
| Nitori Holdings Co. Ltd. | 12,100 | 1,377 | ||||
| Tokyu Corp. | 108,200 | 1,367 | ||||
| T&D Holdings Inc. | 85,100 | 1,349 | ||||
| Capcom Co. Ltd. | 31,100 | 1,312 | ||||
| Nexon Co. Ltd. | 64,300 | 1,304 | ||||
| Nippon Paint Holdings Co. Ltd. | 167,113 | 1,291 | ||||
| Isuzu Motors Ltd. | 99,800 | 1,278 | ||||
| Kawasaki Kisen Kaisha Ltd. | 37,900 | 1,270 | ||||
| MINEBEA MITSUMI Inc. | 74,400 | 1,261 | ||||
| MEIJI Holdings Co. Ltd. | 50,300 | 1,261 | ||||
| MatsukiyoCocokara & Co. | 21,200 | 1,248 | ||||
| Yakult Honsha Co. Ltd. | 23,038 | 1,207 | ||||
| Dai Nippon Printing Co. Ltd. | 43,700 | 1,194 | ||||
| Hankyu Hanshin Holdings Inc. | 32,100 | 1,152 | ||||
| Nippon Building Fund Inc. | 272 | 1,149 | ||||
| Aisin Corp. | 34,300 | 1,145 | ||||
| Makita Corp. | 41,500 | 1,138 | ||||
| Kintetsu Group Holdings Co. Ltd. | 35,700 | 1,130 | ||||
| Yamato Holdings Co. Ltd. | 59,700 | 1,121 | ||||
| Hamamatsu Photonics KK | 24,200 | 1,120 | ||||
| SG Holdings Co. Ltd. | 77,434 | 1,119 | ||||
| Shares | Market Value• ($000) | |||||
| Ibiden Co. Ltd. | 18,500 | 1,115 | ||||
| Daito Trust Construction Co. Ltd. | 10,100 | 1,114 | ||||
| Dentsu Group Inc. | 37,300 | 1,114 | ||||
| Nissan Chemical Corp. | 26,000 | 1,114 | ||||
| Rohm Co. Ltd. | 13,300 | 1,109 | ||||
| Tobu Railway Co. Ltd. | 40,400 | 1,108 | ||||
| Asics Corp. | 30,200 | 1,099 | ||||
| Mazda Motor Corp. | 102,600 | 1,069 | ||||
| Niterra Co. Ltd. | 44,400 | 1,030 | ||||
| Sekisui Chemical Co. Ltd. | 66,300 | 1,017 | ||||
| Toppan Inc. | 41,400 | 1,000 | ||||
| Japan Real Estate Investment Corp. | 229 | 952 | ||||
| SBI Holdings Inc. | 46,400 | 947 | ||||
| TIS Inc. | 40,000 | 943 | ||||
| Mitsui Chemicals Inc. | 34,500 | 935 | ||||
| Toho Co. Ltd. | 24,300 | 926 | ||||
| Nissin Foods Holdings Co. Ltd. | 10,400 | 908 | ||||
| JSR Corp. | 32,300 | 902 | ||||
| Odakyu Electric Railway Co. Ltd. | 60,600 | 901 | ||||
| Rohto Pharmaceutical Co. Ltd. | 34,500 | 898 | ||||
| 3 | Nomura Real Estate Master Fund Inc. | 757 | 890 | |||
| Konami Group Corp. | 15,300 | 888 | ||||
| Concordia Financial Group Ltd. | 194,300 | 861 | ||||
| Daifuku Co. Ltd. | 46,000 | 849 | ||||
| Kurita Water Industries Ltd. | 21,800 | 849 | ||||
| Keisei Electric Railway Co. Ltd. | 22,100 | 846 | ||||
| MISUMI Group Inc. | 48,500 | 845 | ||||
| USS Co. Ltd. | 47,700 | 833 | ||||
| Kyowa Kirin Co. Ltd. | 44,900 | 821 | ||||
| SUMCO Corp. | 61,300 | 819 | ||||
| Kuraray Co. Ltd. | 71,500 | 812 | ||||
| Brother Industries Ltd. | 47,700 | 807 | ||||
| Seiko Epson Corp. | 51,100 | 800 | ||||
| Trend Micro Inc. | 18,800 | 798 | ||||
| BayCurrent Consulting Inc. | 23,200 | 797 | ||||
| Chiba Bank Ltd. | 111,400 | 795 | ||||
| Zensho Holdings Co. Ltd. | 16,800 | 792 | ||||
| Bank of Kyoto Ltd. | 13,600 | 785 | ||||
| Azbil Corp. | 23,400 | 780 | ||||
| Oji Holdings Corp. | 190,300 | 778 | ||||
| Koito Manufacturing Co. Ltd. | 45,400 | 770 | ||||
| * | ANA Holdings Inc. | 33,841 | 764 | |||
| Hulic Co. Ltd. | 84,670 | 760 | ||||
| NH Foods Ltd. | 24,400 | 757 | ||||
| Yamaha Corp. | 24,500 | 756 | ||||
| Shizuoka Financial Group Inc. | 92,800 | 754 | ||||
| Amada Co. Ltd. | 71,100 | 752 | ||||
| Shares | Market Value• ($000) | |||||
| Nisshin Seifun Group Inc. | 56,900 | 750 | ||||
| Haseko Corp. | 59,800 | 742 | ||||
| Nippon Prologis REIT Inc. | 369 | 742 | ||||
| TOTO Ltd. | 26,700 | 732 | ||||
| Fukuoka Financial Group Inc. | 30,900 | 730 | ||||
| Keio Corp. | 20,700 | 716 | ||||
| Toyo Suisan Kaisha Ltd. | 17,100 | 705 | ||||
| Rakuten Group Inc. | 177,700 | 691 | ||||
| Otsuka Corp. | 15,000 | 669 | ||||
| Keihan Holdings Co. Ltd. | 23,300 | 665 | ||||
| Nikon Corp. | 61,400 | 662 | ||||
| Hoshizaki Corp. | 17,000 | 652 | ||||
| Santen Pharmaceutical Co. Ltd. | 69,800 | 648 | ||||
| Lixil Corp. | 51,600 | 646 | ||||
| Taiyo Yuden Co. Ltd. | 23,100 | 642 | ||||
| Tokyu Fudosan Holdings Corp. | 102,300 | 636 | ||||
| Japan Airlines Co. Ltd. | 30,623 | 631 | ||||
| Suntory Beverage & Food Ltd. | 19,600 | 631 | ||||
| Asahi Intecc Co. Ltd. | 31,000 | 629 | ||||
| Isetan Mitsukoshi Holdings Ltd. | 54,400 | 624 | ||||
| SCREEN Holdings Co. Ltd. | 5,900 | 601 | ||||
| COMSYS Holdings Corp. | 28,100 | 598 | ||||
| Nagoya Railroad Co. Ltd. | 36,800 | 591 | ||||
| Taiheiyo Cement Corp. | 30,800 | 591 | ||||
| Resonac Holdings Corp. | 35,967 | 585 | ||||
| Daiwa House REIT Investment Corp. | 308 | 584 | ||||
| Marui Group Co. Ltd. | 33,400 | 578 | ||||
| Sumitomo Forestry Co. Ltd. | 20,300 | 571 | ||||
| Stanley Electric Co. Ltd. | 32,300 | 567 | ||||
| Alfresa Holdings Corp. | 32,100 | 548 | ||||
| 3 | Aozora Bank Ltd. | 27,900 | 548 | |||
| Hirose Electric Co. Ltd. | 4,500 | 545 | ||||
| Advance Residence Investment Corp. | 224 | 539 | ||||
| Hikari Tsushin Inc. | 3,200 | 532 | ||||
| Nippon Sanso Holdings Corp. | 22,000 | 530 | ||||
| McDonald's Holdings Co. Japan Ltd. | 13,300 | 529 | ||||
| 3 | Hisamitsu Pharmaceutical Co. Inc. | 15,600 | 528 | |||
| Sohgo Security Services Co. Ltd. | 82,000 | 523 | ||||
| Persol Holdings Co. Ltd. | 30,600 | 523 | ||||
| Iwatani Corp. | 9,900 | 521 | ||||
| CyberAgent Inc. | 81,100 | 516 | ||||
| Mitsubishi HC Capital Inc. | 78,860 | 512 | ||||
| Shares | Market Value• ($000) | |||||
| NSK Ltd. | 87,300 | 508 | ||||
| Keikyu Corp. | 54,600 | 504 | ||||
| Nippon Express Holdings Inc. | 9,500 | 493 | ||||
| Kansai Paint Co. Ltd. | 29,900 | 490 | ||||
| Sanrio Co. Ltd. | 9,400 | 490 | ||||
| Japan Post Insurance Co. Ltd. | 30,239 | 487 | ||||
| Hachijuni Bank Ltd. | 88,900 | 479 | ||||
| Teijin Ltd. | 46,800 | 475 | ||||
| 3 | Ryohin Keikaku Co. Ltd. | 36,500 | 471 | |||
| Seibu Holdings Inc. | 44,500 | 471 | ||||
| Orix JREIT Inc. | 378 | 470 | ||||
| Nabtesco Corp. | 24,400 | 461 | ||||
| Square Enix Holdings Co. Ltd. | 12,100 | 459 | ||||
| Sanwa Holdings Corp. | 29,100 | 443 | ||||
| United Urban Investment Corp. | 409 | 440 | ||||
| Yamada Holdings Co. Ltd. | 139,700 | 439 | ||||
| Kobayashi Pharmaceutical Co. Ltd. | 8,800 | 434 | ||||
| * | Mercari Inc. | 18,800 | 428 | |||
| Shinko Electric Industries Co. Ltd. | 10,400 | 426 | ||||
| Toagosei Co. Ltd. | 44,400 | 423 | ||||
| Lion Corp. | 38,600 | 420 | ||||
| TechnoPro Holdings Inc. | 17,100 | 419 | ||||
| GMO Payment Gateway Inc. | 6,500 | 412 | ||||
| Mitsubishi Motors Corp. | 104,100 | 407 | ||||
| Kyushu Railway Co. | 18,400 | 401 | ||||
| Yokohama Rubber Co. Ltd. | 19,700 | 400 | ||||
| Nippon Shinyaku Co. Ltd. | 9,100 | 398 | ||||
| Fuyo General Lease Co. Ltd. | 4,800 | 397 | ||||
| Tsuruha Holdings Inc. | 5,400 | 395 | ||||
| Nomura Real Estate Holdings Inc. | 15,700 | 395 | ||||
| Hirogin Holdings Inc. | 63,100 | 394 | ||||
| Goldwin Inc. | 5,500 | 393 | ||||
| Mebuki Financial Group Inc. | 141,900 | 392 | ||||
| Nifco Inc. | 13,200 | 389 | ||||
| 3 | J Front Retailing Co. Ltd. | 36,500 | 384 | |||
| Hakuhodo DY Holdings Inc. | 40,300 | 382 | ||||
| Zenkoku Hosho Co. Ltd. | 10,900 | 378 | ||||
| Oracle Corp. Japan | 5,400 | 377 | ||||
| Yamazaki Baking Co. Ltd. | 19,800 | 375 | ||||
| Tokyo Ohka Kogyo Co. Ltd. | 5,500 | 372 | ||||
| Lintec Corp. | 22,400 | 369 | ||||
| Koei Tecmo Holdings Co. Ltd. | 23,780 | 369 | ||||
| Nagase & Co. Ltd. | 21,500 | 368 | ||||
| Shares | Market Value• ($000) | |||||
| Kose Corp. | 4,400 | 365 | ||||
| Credit Saison Co. Ltd. | 23,200 | 363 | ||||
| Toyo Seikan Group Holdings Ltd. | 19,600 | 355 | ||||
| Japan Hotel REIT Investment Corp. | 698 | 354 | ||||
| * | SHIFT Inc. | 1,700 | 350 | |||
| Open House Group Co. Ltd. | 10,200 | 345 | ||||
| Miura Co. Ltd. | 14,900 | 344 | ||||
| Medipal Holdings Corp. | 19,200 | 329 | ||||
| Fujikura Ltd. | 39,600 | 328 | ||||
| Nankai Electric Railway Co. Ltd. | 15,600 | 328 | ||||
| ZOZO Inc. | 16,400 | 328 | ||||
| Alps Alpine Co. Ltd. | 39,200 | 327 | ||||
| Kaken Pharmaceutical Co. Ltd. | 13,300 | 326 | ||||
| SCSK Corp. | 18,800 | 326 | ||||
| Wacoal Holdings Corp. | 14,800 | 325 | ||||
| Tokyo Seimitsu Co. Ltd. | 5,900 | 325 | ||||
| Maruha Nichiro Corp. | 18,600 | 325 | ||||
| INFRONEER Holdings Inc. | 31,108 | 325 | ||||
| Macnica Holdings Inc. | 6,900 | 323 | ||||
| Tokyo Century Corp. | 8,400 | 322 | ||||
| Nippon Kayaku Co. Ltd. | 35,600 | 319 | ||||
| Nichirei Corp. | 13,500 | 319 | ||||
| Iida Group Holdings Co. Ltd. | 19,500 | 319 | ||||
| THK Co. Ltd. | 17,400 | 318 | ||||
| Tokyo Tatemono Co. Ltd. | 23,900 | 314 | ||||
| Sekisui House REIT Inc. | 540 | 312 | ||||
| Shimamura Co. Ltd. | 3,000 | 309 | ||||
| Daishi Hokuetsu Financial Group Inc. | 12,300 | 308 | ||||
| Seino Holdings Co. Ltd. | 21,100 | 307 | ||||
| Fujitec Co. Ltd. | 12,000 | 307 | ||||
| Kadokawa Corp. | 12,844 | 302 | ||||
| Suzuken Co. Ltd. | 10,100 | 299 | ||||
| Takashimaya Co. Ltd. | 19,900 | 299 | ||||
| Invincible Investment Corp. | 709 | 295 | ||||
| Daihen Corp. | 8,000 | 292 | ||||
| Japan Prime Realty Investment Corp. | 114 | 289 | ||||
| * | Money Forward Inc. | 7,500 | 282 | |||
| Konica Minolta Inc. | 91,100 | 281 | ||||
| DIC Corp. | 16,200 | 279 | ||||
| Rinnai Corp. | 14,400 | 279 | ||||
| Industrial & Infrastructure Fund Investment Corp. | 278 | 279 | ||||
| Iyogin Holdings Inc. | 39,800 | 276 | ||||
| Kamigumi Co. Ltd. | 12,200 | 275 | ||||
| Internet Initiative Japan Inc. | 15,600 | 271 | ||||
| Mitsui Fudosan Logistics Park Inc. | 79 | 269 | ||||
| Daicel Corp. | 32,100 | 268 | ||||
| Shares | Market Value• ($000) | |||||
| Coca-Cola Bottlers Japan Holdings Inc. | 20,400 | 266 | ||||
| Sundrug Co. Ltd. | 9,000 | 266 | ||||
| JTEKT Corp. | 29,200 | 264 | ||||
| NSD Co. Ltd. | 15,000 | 263 | ||||
| Nakanishi Inc. | 10,400 | 262 | ||||
| * | Park24 Co. Ltd. | 18,500 | 261 | |||
| Rakus Co. Ltd. | 16,000 | 260 | ||||
| OKUMA Corp. | 5,500 | 258 | ||||
| Nippon Gas Co. Ltd. | 16,500 | 257 | ||||
| Pigeon Corp. | 21,900 | 254 | ||||
| Nihon Kohden Corp. | 9,500 | 253 | ||||
| Activia Properties Inc. | 90 | 252 | ||||
| Anritsu Corp. | 34,100 | 250 | ||||
| *,3 | Right On Co. Ltd. | 67,000 | 250 | |||
| NOK Corp. | 17,800 | 249 | ||||
| Ito En Ltd. | 8,400 | 248 | ||||
| Ulvac Inc. | 6,400 | 248 | ||||
| Kaneka Corp. | 8,800 | 247 | ||||
| Toyo Corp. | 26,500 | 246 | ||||
| Artnature Inc. | 45,700 | 246 | ||||
| Toho Gas Co. Ltd. | 13,700 | 245 | ||||
| Gunma Bank Ltd. | 53,000 | 244 | ||||
| Toyoda Gosei Co. Ltd. | 11,300 | 244 | ||||
| Kyushu Financial Group Inc. | 49,600 | 243 | ||||
| DMG Mori Co. Ltd. | 13,300 | 242 | ||||
| Tomy Co. Ltd. | 14,900 | 242 | ||||
| Maruwa Co. Ltd. | 1,300 | 242 | ||||
| Nagatanien Holdings Co. Ltd. | 14,900 | 241 | ||||
| LaSalle Logiport REIT | 233 | 238 | ||||
| Daiwabo Holdings Co. Ltd. | 11,700 | 237 | ||||
| Nippon Electric Glass Co. Ltd. | 13,300 | 235 | ||||
| Taisho Pharmaceutical Holdings Co. Ltd. | 5,700 | 235 | ||||
| Denka Co. Ltd. | 12,300 | 232 | ||||
| Mitsui High-Tec Inc. | 3,400 | 231 | ||||
| BIPROGY Inc. | 8,900 | 230 | ||||
| Daiwa Office Investment Corp. | 49 | 230 | ||||
| Fuji Soft Inc. | 7,600 | 229 | ||||
| Sanken Electric Co. Ltd. | 3,000 | 229 | ||||
| Kewpie Corp. | 13,700 | 228 | ||||
| NET One Systems Co. Ltd. | 11,600 | 227 | ||||
| SHO-BOND Holdings Co. Ltd. | 5,600 | 226 | ||||
| Casio Computer Co. Ltd. | 25,400 | 225 | ||||
| Citizen Watch Co. Ltd. | 36,800 | 225 | ||||
| Nihon M&A Center Holdings Inc. | 40,500 | 225 | ||||
| ST Corp. | 21,400 | 225 | ||||
| Furukawa Electric Co. Ltd. | 13,000 | 223 | ||||
| Nishi-Nippon Financial Holdings Inc. | 21,500 | 222 | ||||
| Shares | Market Value• ($000) | |||||
| Mitsubishi Estate Logistics REIT Investment Corp. | 82 | 222 | ||||
| Sumitomo Rubber Industries Ltd. | 21,000 | 221 | ||||
| Yamaguchi Financial Group Inc. | 27,600 | 219 | ||||
| Toyo Tire Corp. | 14,500 | 218 | ||||
| ADEKA Corp. | 11,300 | 217 | ||||
| Sugi Holdings Co. Ltd. | 4,800 | 215 | ||||
| Kagome Co. Ltd. | 9,200 | 215 | ||||
| Mori Trust REIT Inc. | 422 | 213 | ||||
| Sankyu Inc. | 6,100 | 213 | ||||
| Frontier Real Estate Investment Corp. | 66 | 213 | ||||
| House Foods Group Inc. | 9,800 | 212 | ||||
| Kakaku.com Inc. | 17,800 | 212 | ||||
| 77 Bank Ltd. | 9,800 | 212 | ||||
| Ezaki Glico Co. Ltd. | 8,000 | 211 | ||||
| EXEO Group Inc. | 9,900 | 211 | ||||
| Zeon Corp. | 18,800 | 207 | ||||
| Kenedix Office Investment Corp. | 87 | 205 | ||||
| Daiwa Securities Living Investments Corp. | 268 | 205 | ||||
| Sumitomo Bakelite Co. Ltd. | 4,300 | 203 | ||||
| Fujimi Inc. | 8,700 | 201 | ||||
| Dowa Holdings Co. Ltd. | 6,200 | 199 | ||||
| Hanwa Co. Ltd. | 6,200 | 197 | ||||
| Kenedix Residential Next Investment Corp. | 126 | 196 | ||||
| GS Yuasa Corp. | 10,300 | 195 | ||||
| Jeol Ltd. | 6,100 | 194 | ||||
| * | Sharp Corp. | 31,400 | 193 | |||
| Daiseki Co. Ltd. | 6,380 | 193 | ||||
| Rengo Co. Ltd. | 28,300 | 192 | ||||
| Ushio Inc. | 15,100 | 190 | ||||
| NHK Spring Co. Ltd. | 24,300 | 188 | ||||
| Tsumura & Co. | 10,000 | 188 | ||||
| Morinaga Milk Industry Co. Ltd. | 4,600 | 188 | ||||
| Calbee Inc. | 9,300 | 186 | ||||
| Daiichikosho Co. Ltd. | 9,400 | 182 | ||||
| Mori Hills REIT Investment Corp. | 181 | 182 | ||||
| 3 | ABC-Mart Inc. | 9,900 | 180 | |||
| * | PeptiDream Inc. | 14,000 | 180 | |||
| Topcon Corp. | 14,900 | 179 | ||||
| Yushin Precision Equipment Co. Ltd. | 37,700 | 179 | ||||
| Mizuho Leasing Co. Ltd. | 5,400 | 178 | ||||
| Mabuchi Motor Co. Ltd. | 5,700 | 174 | ||||
| Amano Corp. | 8,000 | 174 | ||||
| Morinaga & Co. Ltd. | 4,700 | 171 | ||||
| Toyota Boshoku Corp. | 9,000 | 170 | ||||
| Meitec Corp. | 9,700 | 170 | ||||
| Relo Group Inc. | 14,400 | 169 | ||||
| OSG Corp. | 13,400 | 169 | ||||
| PALTAC Corp. | 5,100 | 168 | ||||
| * | Fujita Kanko Inc. | 5,100 | 167 | |||
| Shares | Market Value• ($000) | |||||
| Information Services International-Dentsu Ltd. | 4,100 | 164 | ||||
| Gunze Ltd. | 5,200 | 164 | ||||
| * | Hino Motors Ltd. | 41,200 | 161 | |||
| Toridoll Holdings Corp. | 5,900 | 161 | ||||
| NTT UD REIT Investment Corp. | 169 | 161 | ||||
| Nisshinbo Holdings Inc. | 21,600 | 160 | ||||
| Nissui Corp. | 30,500 | 160 | ||||
| Sangetsu Corp. | 7,700 | 160 | ||||
| Kanamoto Co. Ltd. | 9,400 | 159 | ||||
| Hokuhoku Financial Group Inc. | 17,500 | 158 | ||||
| Osaka Soda Co. Ltd. | 3,300 | 158 | ||||
| Takeuchi Manufacturing Co. Ltd. | 4,900 | 156 | ||||
| Dexerials Corp. | 6,300 | 156 | ||||
| Canon Marketing Japan Inc. | 5,900 | 155 | ||||
| SMS Co. Ltd. | 8,000 | 154 | ||||
| Sotetsu Holdings Inc. | 7,800 | 152 | ||||
| Hazama Ando Corp. | 18,600 | 152 | ||||
| Pilot Corp. | 4,700 | 151 | ||||
| Benesse Holdings Inc. | 11,800 | 150 | ||||
| Fancl Corp. | 8,500 | 149 | ||||
| Okamura Corp. | 10,000 | 149 | ||||
| Hulic REIT Inc. | 134 | 149 | ||||
| Descente Ltd. | 5,800 | 147 | ||||
| Kaga Electronics Co. Ltd. | 3,200 | 145 | ||||
| Nippon Kanzai Holdings Co. Ltd. | 7,900 | 145 | ||||
| Fuji Corp. | 8,700 | 143 | ||||
| Japan Material Co. Ltd. | 7,800 | 143 | ||||
| Seven Bank Ltd. | 66,700 | 142 | ||||
| Fujitsu General Ltd. | 7,300 | 141 | ||||
| SBI Shinsei Bank Ltd. | 7,277 | 141 | ||||
| Wellneo Sugar Co. Ltd. | 9,400 | 140 | ||||
| Ain Holdings Inc. | 3,900 | 139 | ||||
| Yoshinoya Holdings Co. Ltd. | 7,100 | 139 | ||||
| TKC Corp. | 5,500 | 139 | ||||
| * | Sansan Inc. | 14,000 | 139 | |||
| JAFCO Group Co. Ltd. | 10,800 | 138 | ||||
| Sawai Group Holdings Co. Ltd. | 4,300 | 138 | ||||
| Japan Aviation Electronics Industry Ltd. | 6,500 | 137 | ||||
| Nextage Co. Ltd. | 6,100 | 137 | ||||
| Shiga Bank Ltd. | 6,100 | 136 | ||||
| Ferrotec Holdings Corp. | 6,500 | 135 | ||||
| K's Holdings Corp. | 14,400 | 133 | ||||
| Glory Ltd. | 6,100 | 129 | ||||
| Taiyo Holdings Co. Ltd. | 7,100 | 128 | ||||
| Mitsubishi Logistics Corp. | 4,800 | 127 | ||||
| * | Leopalace21 Corp. | 50,300 | 126 | |||
| Kenedix Retail REIT Corp. | 63 | 125 | ||||
| Kyudenko Corp. | 4,000 | 123 | ||||
| Shares | Market Value• ($000) | |||||
| * | Nippon Paper Industries Co. Ltd. | 13,700 | 123 | |||
| Digital Garage Inc. | 4,800 | 123 | ||||
| Kureha Corp. | 2,100 | 123 | ||||
| Resorttrust Inc. | 7,600 | 122 | ||||
| Pola Orbis Holdings Inc. | 9,400 | 121 | ||||
| Elecom Co. Ltd. | 10,100 | 121 | ||||
| Kyoritsu Maintenance Co. Ltd. | 2,800 | 121 | ||||
| 3 | Aeon Mall Co. Ltd. | 10,000 | 120 | |||
| Tokuyama Corp. | 7,500 | 120 | ||||
| Taikisha Ltd. | 3,800 | 119 | ||||
| Japan Excellent Inc. | 131 | 119 | ||||
| Chugin Financial Group Inc. | 17,900 | 119 | ||||
| Nishi-Nippon Railroad Co. Ltd. | 6,300 | 118 | ||||
| TS Tech Co. Ltd. | 10,000 | 118 | ||||
| As One Corp. | 3,000 | 118 | ||||
| Mochida Pharmaceutical Co. Ltd. | 5,100 | 118 | ||||
| JVCKenwood Corp. | 27,100 | 118 | ||||
| H2O Retailing Corp. | 9,700 | 117 | ||||
| Fuji Kyuko Co. Ltd. | 3,200 | 117 | ||||
| Outsourcing Inc. | 14,900 | 117 | ||||
| MIRAIT ONE Corp. | 8,800 | 117 | ||||
| NTN Corp. | 58,400 | 116 | ||||
| San-In Godo Bank Ltd. | 18,200 | 115 | ||||
| Sumitomo Osaka Cement Co. Ltd. | 4,200 | 115 | ||||
| Takasago Thermal Engineering Co. Ltd. | 5,700 | 115 | ||||
| Nippon Shokubai Co. Ltd. | 3,000 | 114 | ||||
| Organo Corp. | 4,100 | 114 | ||||
| Kanematsu Corp. | 8,100 | 114 | ||||
| Okasan Securities Group Inc. | 28,900 | 114 | ||||
| Hokuetsu Corp. | 18,200 | 113 | ||||
| NEC Networks & System Integration Corp. | 8,500 | 113 | ||||
| Mani Inc. | 8,500 | 111 | ||||
| C Uyemura & Co. Ltd. | 1,700 | 111 | ||||
| Izumi Co. Ltd. | 4,200 | 110 | ||||
| Aichi Financial Group Inc. | 6,563 | 110 | ||||
| H.U. Group Holdings Inc. | 6,000 | 109 | ||||
| ARE Holdings Inc. | 8,400 | 109 | ||||
| Sumitomo Pharma Co. Ltd. | 31,100 | 108 | ||||
| GMO internet group Inc. | 6,700 | 108 | ||||
| Sumitomo Warehouse Co. Ltd. | 6,300 | 108 | ||||
| FP Corp. | 5,500 | 106 | ||||
| Seria Co. Ltd. | 6,700 | 106 | ||||
| Takuma Co. Ltd. | 9,600 | 106 | ||||
| Yaoko Co. Ltd. | 2,000 | 105 | ||||
| Katitas Co. Ltd. | 6,500 | 104 | ||||
| EM Systems Co. Ltd. | 20,400 | 104 | ||||
| Shares | Market Value• ($000) | |||||
| Heiwa Real Estate REIT Inc. | 104 | 104 | ||||
| Rorze Corp. | 1,300 | 103 | ||||
| Torishima Pump Manufacturing Co. Ltd. | 7,900 | 103 | ||||
| Bank of Iwate Ltd. | 5,900 | 102 | ||||
| Kumiai Chemical Industry Co. Ltd. | 13,100 | 101 | ||||
| Simplex Holdings Inc. | 5,100 | 101 | ||||
| Makino Milling Machine Co. Ltd. | 2,100 | 100 | ||||
| Toho Holdings Co. Ltd. | 5,000 | 100 | ||||
| Nipro Corp. | 12,000 | 99 | ||||
| DCM Holdings Co. Ltd. | 11,900 | 99 | ||||
| Inabata & Co. Ltd. | 4,500 | 98 | ||||
| Kokuyo Co. Ltd. | 6,300 | 98 | ||||
| Shibaura Machine Co. Ltd. | 3,400 | 98 | ||||
| Menicon Co. Ltd. | 7,000 | 98 | ||||
| Juroku Financial Group Inc. | 3,900 | 98 | ||||
| Prima Meat Packers Ltd. | 5,600 | 97 | ||||
| Tadano Ltd. | 12,000 | 97 | ||||
| DeNA Co. Ltd. | 9,300 | 96 | ||||
| Open Up Group Inc. | 7,000 | 96 | ||||
| AZ-COM MARUWA Holdings Inc. | 6,100 | 95 | ||||
| Hokkoku Financial Holdings Inc. | 2,800 | 94 | ||||
| Belc Co. Ltd. | 2,000 | 93 | ||||
| Milbon Co. Ltd. | 3,000 | 93 | ||||
| Nitto Kogyo Corp. | 3,500 | 93 | ||||
| Daio Paper Corp. | 10,900 | 93 | ||||
| Tokai Rika Co. Ltd. | 5,900 | 92 | ||||
| Trusco Nakayama Corp. | 5,200 | 92 | ||||
| Nippon Soda Co. Ltd. | 2,500 | 92 | ||||
| CRE Logistics REIT Inc. | 79 | 92 | ||||
| Heiwa Real Estate Co. Ltd. | 3,400 | 91 | ||||
| Nikkon Holdings Co. Ltd. | 4,000 | 91 | ||||
| CKD Corp. | 6,500 | 90 | ||||
| Tokyo Individualized Educational Institute Inc. | 27,000 | 90 | ||||
| Riken Keiki Co. Ltd. | 2,500 | 90 | ||||
| Aica Kogyo Co. Ltd. | 3,700 | 88 | ||||
| Nitto Boseki Co. Ltd. | 3,200 | 88 | ||||
| Starts Corp. Inc. | 4,200 | 88 | ||||
| Shoei Co. Ltd. | 5,200 | 88 | ||||
| Shibaura Mechatronics Corp. | 500 | 88 | ||||
| Toa Corp. | 6,000 | 88 | ||||
| TBS Holdings Inc. | 4,900 | 87 | ||||
| Iino Kaiun Kaisha Ltd. | 12,100 | 87 | ||||
| Bic Camera Inc. | 11,700 | 87 | ||||
| Base Co. Ltd. | 2,900 | 87 | ||||
| Bando Chemical Industries Ltd. | 8,200 | 86 | ||||
| DTS Corp. | 3,900 | 86 | ||||
| Shares | Market Value• ($000) | |||||
| Ichigo Office REIT Investment Corp. | 140 | 86 | ||||
| Megachips Corp. | 2,900 | 84 | ||||
| 3 | Ministop Co. Ltd. | 8,500 | 84 | |||
| Seiren Co. Ltd. | 5,100 | 84 | ||||
| Tokyo Kiraboshi Financial Group Inc. | 3,200 | 84 | ||||
| Intage Holdings Inc. | 6,900 | 83 | ||||
| Mitsubishi Logisnext Co. Ltd. | 8,800 | 83 | ||||
| Sanyo Electric Railway Co. Ltd. | 5,400 | 83 | ||||
| Kitz Corp. | 11,400 | 82 | ||||
| Japan Wool Textile Co. Ltd. | 9,300 | 80 | ||||
| Mitsui-Soko Holdings Co. Ltd. | 2,800 | 80 | ||||
| 3 | AEON Financial Service Co. Ltd. | 9,100 | 79 | |||
| PAL GROUP Holdings Co. Ltd. | 5,600 | 79 | ||||
| Yamazen Corp. | 10,100 | 79 | ||||
| Change Holdings Inc. | 5,600 | 79 | ||||
| KeePer Technical Laboratory Co. Ltd. | 1,700 | 79 | ||||
| Ryosan Co. Ltd. | 2,700 | 78 | ||||
| Kissei Pharmaceutical Co. Ltd. | 3,300 | 77 | ||||
| Jaccs Co. Ltd. | 2,200 | 77 | ||||
| MOS Food Services Inc. | 3,300 | 77 | ||||
| Monex Group Inc. | 21,600 | 77 | ||||
| Heiwado Co. Ltd. | 4,600 | 76 | ||||
| JP-Holdings Inc. | 33,800 | 76 | ||||
| Matsuyafoods Holdings Co. Ltd. | 2,600 | 76 | ||||
| Hyakugo Bank Ltd. | 22,000 | 76 | ||||
| Shochiku Co. Ltd. | 1,000 | 76 | ||||
| KOMEDA Holdings Co. Ltd. | 3,900 | 76 | ||||
| Advance Logistics Investment Corp. | 84 | 76 | ||||
| Meiko Electronics Co. Ltd. | 3,100 | 76 | ||||
| Topre Corp. | 6,300 | 75 | ||||
| UACJ Corp. | 3,500 | 75 | ||||
| Hirata Corp. | 1,400 | 75 | ||||
| Takara Bio Inc. | 7,600 | 74 | ||||
| Iriso Electronics Co. Ltd. | 2,500 | 74 | ||||
| Aoyama Trading Co. Ltd. | 6,600 | 73 | ||||
| Toshiba TEC Corp. | 3,000 | 73 | ||||
| * | Raksul Inc. | 7,600 | 73 | |||
| Aiful Corp. | 30,400 | 72 | ||||
| Musashi Seimitsu Industry Co. Ltd. | 6,100 | 72 | ||||
| Godo Steel Ltd. | 2,400 | 72 | ||||
| Toho Titanium Co. Ltd. | 5,300 | 72 | ||||
| Joyful Honda Co. Ltd. | 6,100 | 72 | ||||
| PHC Holdings Corp. | 7,400 | 72 | ||||
| Arata Corp. | 1,900 | 71 | ||||
| Nippon Yakin Kogyo Co. Ltd. | 2,300 | 71 | ||||
| * | UT Group Co. Ltd. | 4,300 | 71 | |||
| Shares | Market Value• ($000) | |||||
| Cybozu Inc. | 4,700 | 70 | ||||
| JCR Pharmaceuticals Co. Ltd. | 8,000 | 70 | ||||
| Life Corp. | 2,800 | 70 | ||||
| Yodogawa Steel Works Ltd. | 3,000 | 70 | ||||
| Japan Best Rescue System Co. Ltd. | 14,200 | 70 | ||||
| Ariake Japan Co. Ltd. | 1,900 | 69 | ||||
| Fuji Media Holdings Inc. | 6,600 | 69 | ||||
| FCC Co. Ltd. | 5,200 | 69 | ||||
| en Japan Inc. | 3,900 | 68 | ||||
| Kiyo Bank Ltd. | 6,600 | 68 | ||||
| Kyokuyo Co. Ltd. | 2,600 | 68 | ||||
| Fuso Chemical Co. Ltd. | 2,300 | 67 | ||||
| Hosiden Corp. | 5,400 | 67 | ||||
| Nishimatsu Construction Co. Ltd. | 2,625 | 67 | ||||
| Nissha Co. Ltd. | 5,500 | 67 | ||||
| * | RENOVA Inc. | 7,100 | 67 | |||
| Central Glass Co. Ltd. | 3,300 | 66 | ||||
| Raito Kogyo Co. Ltd. | 4,700 | 66 | ||||
| Sakata INX Corp. | 7,000 | 66 | ||||
| Transcosmos Inc. | 3,000 | 66 | ||||
| Tsubakimoto Chain Co. | 2,500 | 66 | ||||
| North Pacific Bank Ltd. | 31,300 | 66 | ||||
| Hokkan Holdings Ltd. | 6,000 | 65 | ||||
| Inaba Denki Sangyo Co. Ltd. | 3,000 | 65 | ||||
| Towa Corp. | 2,600 | 65 | ||||
| Tsurumi Manufacturing Co. Ltd. | 3,100 | 65 | ||||
| OSAKA Titanium Technologies Co. Ltd. | 2,800 | 64 | ||||
| Zuken Inc. | 2,200 | 64 | ||||
| BML Inc. | 3,200 | 63 | ||||
| Seiko Group Corp. | 3,400 | 63 | ||||
| Maxell Ltd. | 5,800 | 63 | ||||
| Konishi Co. Ltd. | 3,700 | 63 | ||||
| Nisshin Oillio Group Ltd. | 2,200 | 63 | ||||
| Benefit One Inc. | 7,300 | 63 | ||||
| JCU Corp. | 2,700 | 63 | ||||
| Duskin Co. Ltd. | 2,800 | 63 | ||||
| Paramount Bed Holdings Co. Ltd. | 3,900 | 63 | ||||
| Hokuto Corp. | 4,900 | 62 | ||||
| Max Co. Ltd. | 3,300 | 62 | ||||
| Nanto Bank Ltd. | 3,400 | 62 | ||||
| Nichiha Corp. | 2,900 | 62 | ||||
| Noritake Co. Ltd. | 1,500 | 62 | ||||
| Ricoh Leasing Co. Ltd. | 2,100 | 62 | ||||
| Sinko Industries Ltd. | 4,500 | 62 | ||||
| Tri Chemical Laboratories Inc. | 3,300 | 62 | ||||
| Japan Lifeline Co. Ltd. | 7,700 | 61 | ||||
| Chudenko Corp. | 3,700 | 61 | ||||
| Nichicon Corp. | 6,300 | 61 | ||||
| Nippn Corp. | 4,300 | 61 | ||||
| * | euglena Co. Ltd. | 11,000 | 61 | |||
| Adastria Co. Ltd. | 3,000 | 60 | ||||
| KFC Holdings Japan Ltd. | 2,900 | 60 | ||||
| Musashino Bank Ltd. | 3,300 | 60 | ||||
| Shares | Market Value• ($000) | |||||
| Ai Holdings Corp. | 3,700 | 60 | ||||
| Premium Group Co. Ltd. | 5,400 | 60 | ||||
| Shizuoka Gas Co. Ltd. | 8,400 | 59 | ||||
| Achilles Corp. | 5,800 | 59 | ||||
| Shoei Foods Corp. | 1,900 | 59 | ||||
| Wakita & Co. Ltd. | 6,400 | 59 | ||||
| Koshidaka Holdings Co. Ltd. | 6,400 | 59 | ||||
| KH Neochem Co. Ltd. | 3,800 | 59 | ||||
| Asahi Diamond Industrial Co. Ltd. | 9,400 | 58 | ||||
| United Arrows Ltd. | 3,900 | 58 | ||||
| Hioki EE Corp. | 1,100 | 58 | ||||
| Onward Holdings Co. Ltd. | 16,300 | 58 | ||||
| dip Corp. | 2,400 | 58 | ||||
| TOKAI Holdings Corp. | 9,000 | 58 | ||||
| Tama Home Co. Ltd. | 2,400 | 58 | ||||
| Furukawa Co. Ltd. | 4,700 | 57 | ||||
| Aeon Delight Co. Ltd. | 2,600 | 57 | ||||
| Systena Corp. | 31,000 | 57 | ||||
| Mizuno Corp. | 1,800 | 57 | ||||
| Nippon Densetsu Kogyo Co. Ltd. | 3,900 | 57 | ||||
| Noritsu Koki Co. Ltd. | 2,800 | 57 | ||||
| Yokorei Co. Ltd. | 6,300 | 57 | ||||
| LITALICO Inc. | 3,800 | 57 | ||||
| Nishio Holdings Co. Ltd. | 2,300 | 56 | ||||
| Matsuya Co. Ltd. | 7,400 | 55 | ||||
| Mitsuuroko Group Holdings Co. Ltd. | 6,100 | 55 | ||||
| Nippon Carbon Co. Ltd. | 1,800 | 55 | ||||
| * | Nippon Sheet Glass Co. Ltd. | 10,500 | 55 | |||
| Tachibana Eletech Co. Ltd. | 3,000 | 55 | ||||
| Tokai Tokyo Financial Holdings Inc. | 17,500 | 54 | ||||
| Fuji Seal International Inc. | 4,500 | 54 | ||||
| Ichibanya Co. Ltd. | 1,400 | 54 | ||||
| San-A Co. Ltd. | 1,600 | 54 | ||||
| Idec Corp. | 2,600 | 54 | ||||
| EDION Corp. | 5,400 | 54 | ||||
| Nojima Corp. | 6,200 | 54 | ||||
| Sintokogio Ltd. | 7,200 | 54 | ||||
| Zojirushi Corp. | 4,400 | 54 | ||||
| Insource Co. Ltd. | 7,200 | 54 | ||||
| West Holdings Corp. | 2,800 | 54 | ||||
| Siix Corp. | 4,900 | 53 | ||||
| Keiyo Bank Ltd. | 13,000 | 53 | ||||
| Enplas Corp. | 700 | 53 | ||||
| Toyo Construction Co. Ltd. | 7,000 | 53 | ||||
| Senshu Electric Co. Ltd. | 2,000 | 53 | ||||
| KYB Corp. | 1,600 | 52 | ||||
| Komori Corp. | 6,900 | 52 | ||||
| Retail Partners Co. Ltd. | 4,700 | 52 | ||||
| Mitsubishi Pencil Co. Ltd. | 3,900 | 52 | ||||
| Nomura Co. Ltd. | 8,800 | 52 | ||||
| Shares | Market Value• ($000) | |||||
| Sakai Moving Service Co. Ltd. | 1,400 | 52 | ||||
| Nippon Pillar Packing Co. Ltd. | 1,800 | 52 | ||||
| Megmilk Snow Brand Co. Ltd. | 3,100 | 51 | ||||
| Argo Graphics Inc. | 2,200 | 51 | ||||
| YAMABIKO Corp. | 5,000 | 51 | ||||
| Toyo Gosei Co. Ltd. | 1,000 | 51 | ||||
| Septeni Holdings Co. Ltd. | 17,600 | 51 | ||||
| ARCLANDS Corp. | 4,400 | 50 | ||||
| Awa Bank Ltd. | 3,200 | 50 | ||||
| Geo Holdings Corp. | 2,800 | 50 | ||||
| Ichiyoshi Securities Co. Ltd. | 10,600 | 50 | ||||
| Miroku Jyoho Service Co. Ltd. | 4,800 | 50 | ||||
| Tekken Corp. | 3,600 | 50 | ||||
| Kyorin Pharmaceutical Co. Ltd. | 4,100 | 50 | ||||
| JINS Holdings Inc. | 2,100 | 50 | ||||
| Nippon Light Metal Holdings Co. Ltd. | 4,690 | 50 | ||||
| Genky DrugStores Co. Ltd. | 1,400 | 50 | ||||
| * | PKSHA Technology Inc. | 2,900 | 50 | |||
| Kosaido Holdings Co. Ltd. | 2,600 | 50 | ||||
| Japan Pulp & Paper Co. Ltd. | 1,500 | 49 | ||||
| Torii Pharmaceutical Co. Ltd. | 1,900 | 49 | ||||
| TSI Holdings Co. Ltd. | 9,900 | 49 | ||||
| ARTERIA Networks Corp. | 3,600 | 49 | ||||
| Aiphone Co. Ltd. | 2,300 | 48 | ||||
| Sato Holdings Corp. | 3,300 | 48 | ||||
| Topy Industries Ltd. | 3,100 | 48 | ||||
| T Hasegawa Co. Ltd. | 2,000 | 48 | ||||
| Japan Transcity Corp. | 10,900 | 48 | ||||
| Starzen Co. Ltd. | 2,700 | 48 | ||||
| Earth Corp. | 1,400 | 48 | ||||
| Senshu Ikeda Holdings Inc. | 26,300 | 48 | ||||
| San ju San Financial Group Inc. | 4,000 | 48 | ||||
| Chugoku Marine Paints Ltd. | 4,800 | 47 | ||||
| Riken Corp. | 2,100 | 47 | ||||
| Ryobi Ltd. | 2,400 | 47 | ||||
| ESPEC Corp. | 3,000 | 47 | ||||
| Trancom Co. Ltd. | 900 | 47 | ||||
| Yuasa Trading Co. Ltd. | 1,600 | 47 | ||||
| Aisan Industry Co. Ltd. | 5,200 | 46 | ||||
| Fuji Co. Ltd. | 3,700 | 46 | ||||
| WATAMI Co. Ltd. | 5,700 | 46 | ||||
| Unipres Corp. | 5,500 | 46 | ||||
| Acom Co. Ltd. | 19,000 | 45 | ||||
| MIXI Inc. | 2,700 | 45 | ||||
| VT Holdings Co. Ltd. | 12,700 | 45 | ||||
| Future Corp. | 4,200 | 45 | ||||
| Shares | Market Value• ($000) | |||||
| Sanyo Chemical Industries Ltd. | 1,600 | 45 | ||||
| Yondoshi Holdings Inc. | 3,500 | 45 | ||||
| Uchida Yoko Co. Ltd. | 1,000 | 45 | ||||
| MCJ Co. Ltd. | 5,500 | 45 | ||||
| J Trust Co. Ltd. | 13,800 | 44 | ||||
| Daiichi Jitsugyo Co. Ltd. | 1,200 | 44 | ||||
| Fujiya Co. Ltd. | 2,600 | 44 | ||||
| Funai Soken Holdings Inc. | 2,400 | 44 | ||||
| Kohnan Shoji Co. Ltd. | 1,800 | 44 | ||||
| Studio Alice Co. Ltd. | 3,000 | 44 | ||||
| Ogaki Kyoritsu Bank Ltd. | 3,200 | 44 | ||||
| Sanyo Denki Co. Ltd. | 900 | 44 | ||||
| Yahagi Construction Co. Ltd. | 5,100 | 44 | ||||
| Yonex Co. Ltd. | 4,600 | 44 | ||||
| Pasona Group Inc. | 3,900 | 44 | ||||
| Feed One Co. Ltd. | 7,780 | 44 | ||||
| * | Vision Inc. | 3,800 | 44 | |||
| Mirai Corp. | 135 | 44 | ||||
| Altech Corp. | 2,500 | 44 | ||||
| Fuji Oil Holdings Inc. | 2,700 | 43 | ||||
| Aichi Steel Corp. | 1,700 | 43 | ||||
| Teikoku Electric Manufacturing Co. Ltd. | 2,500 | 43 | ||||
| ASKUL Corp. | 3,200 | 43 | ||||
| Kurimoto Ltd. | 2,200 | 43 | ||||
| Asahi Yukizai Corp. | 1,500 | 42 | ||||
| Kameda Seika Co. Ltd. | 1,400 | 42 | ||||
| Qol Holdings Co. Ltd. | 3,200 | 42 | ||||
| JAC Recruitment Co. Ltd. | 2,300 | 42 | ||||
| Doutor Nichires Holdings Co. Ltd. | 2,600 | 42 | ||||
| Anicom Holdings Inc. | 9,400 | 42 | ||||
| Sala Corp. | 8,100 | 42 | ||||
| * | HIS Co. Ltd. | 3,000 | 41 | |||
| Maruzen Showa Unyu Co. Ltd. | 1,500 | 41 | ||||
| Tokyo Electron Device Ltd. | 600 | 41 | ||||
| Sinfonia Technology Co. Ltd. | 3,800 | 41 | ||||
| Showa Sangyo Co. Ltd. | 1,981 | 41 | ||||
| Tachi-S Co. Ltd. | 3,400 | 41 | ||||
| Vector Inc. | 4,500 | 41 | ||||
| Usen-Next Holdings Co. Ltd. | 1,700 | 41 | ||||
| Bank of the Ryukyus Ltd. | 5,500 | 40 | ||||
| Inageya Co. Ltd. | 3,900 | 40 | ||||
| Piolax Inc. | 2,500 | 40 | ||||
| Digital Arts Inc. | 1,200 | 40 | ||||
| Press Kogyo Co. Ltd. | 8,800 | 40 | ||||
| Sumitomo Densetsu Co. Ltd. | 2,000 | 40 | ||||
| Towa Pharmaceutical Co. Ltd. | 2,100 | 40 | ||||
| Hankyu Hanshin REIT Inc. | 41 | 40 | ||||
| Procrea Holdings Inc. | 2,900 | 40 | ||||
| Shares | Market Value• ($000) | |||||
| SKY Perfect JSAT Holdings Inc. | 8,600 | 39 | ||||
| CMK Corp. | 9,300 | 39 | ||||
| Daiwa Industries Ltd. | 4,000 | 39 | ||||
| Fujicco Co. Ltd. | 2,900 | 39 | ||||
| Anest Iwata Corp. | 4,600 | 39 | ||||
| Mitsui DM Sugar Holdings Co. Ltd. | 1,900 | 39 | ||||
| Optex Group Co. Ltd. | 3,200 | 39 | ||||
| WingArc1st Inc. | 2,300 | 39 | ||||
| Dai Nippon Toryo Co. Ltd. | 5,700 | 38 | ||||
| Ishihara Sangyo Kaisha Ltd. | 3,900 | 38 | ||||
| Kurabo Industries Ltd. | 2,400 | 38 | ||||
| Bank of Nagoya Ltd. | 1,300 | 38 | ||||
| Okamoto Industries Inc. | 1,200 | 38 | ||||
| Hyakujushi Bank Ltd. | 2,500 | 38 | ||||
| Sanyo Special Steel Co. Ltd. | 2,000 | 38 | ||||
| TOMONY Holdings Inc. | 13,300 | 38 | ||||
| * | Istyle Inc. | 11,000 | 38 | |||
| RS Technologies Co. Ltd. | 2,000 | 38 | ||||
| Aeon Hokkaido Corp. | 6,500 | 38 | ||||
| Futaba Industrial Co. Ltd. | 7,800 | 37 | ||||
| Ines Corp. | 3,200 | 37 | ||||
| Rock Field Co. Ltd. | 3,500 | 37 | ||||
| Token Corp. | 700 | 37 | ||||
| Toyo Kanetsu KK | 1,600 | 37 | ||||
| Tsugami Corp. | 4,600 | 37 | ||||
| Warabeya Nichiyo Holdings Co. Ltd. | 2,000 | 37 | ||||
| MEC Co. Ltd. | 1,400 | 37 | ||||
| Snow Peak Inc. | 3,400 | 37 | ||||
| Prestige International Inc. | 8,900 | 36 | ||||
| ES-Con Japan Ltd. | 6,100 | 36 | ||||
| Neturen Co. Ltd. | 5,200 | 36 | ||||
| Shin Nippon Biomedical Laboratories Ltd. | 2,300 | 36 | ||||
| Ki-Star Real Estate Co. Ltd. | 1,100 | 36 | ||||
| Chiyoda Integre Co. Ltd. | 1,800 | 35 | ||||
| G-Tekt Corp. | 2,800 | 35 | ||||
| Nippon Signal Co. Ltd. | 5,300 | 35 | ||||
| Tochigi Bank Ltd. | 17,200 | 35 | ||||
| Noevir Holdings Co. Ltd. | 900 | 35 | ||||
| * | Japan Display Inc. | 131,700 | 35 | |||
| Roland Corp. | 1,300 | 35 | ||||
| Nippon Fine Chemical Co. Ltd. | 2,000 | 35 | ||||
| Computer Engineering & Consulting Ltd. | 2,900 | 34 | ||||
| Keiyo Co. Ltd. | 5,900 | 34 | ||||
| Nichiban Co. Ltd. | 2,600 | 34 | ||||
| Nippon Sharyo Ltd. | 2,400 | 34 | ||||
| Sumida Corp. | 3,000 | 34 | ||||
| Sodick Co. Ltd. | 7,200 | 34 | ||||
| Tanseisha Co. Ltd. | 6,300 | 34 | ||||
| Totetsu Kogyo Co. Ltd. | 1,800 | 34 | ||||
| Shares | Market Value• ($000) | |||||
| Mitsubishi Research Institute Inc. | 1,000 | 34 | ||||
| eRex Co. Ltd. | 5,300 | 34 | ||||
| TRE Holdings Corp. | 4,200 | 34 | ||||
| Health Care & Medical Investment Corp. | 33 | 34 | ||||
| Roland DG Corp. | 1,400 | 33 | ||||
| Koa Corp. | 2,600 | 33 | ||||
| Sumitomo Mitsui Construction Co. Ltd. | 11,800 | 33 | ||||
| Oita Bank Ltd. | 2,000 | 33 | ||||
| Shima Seiki Manufacturing Ltd. | 2,400 | 33 | ||||
| Tenma Corp. | 1,900 | 33 | ||||
| CTI Engineering Co. Ltd. | 1,100 | 33 | ||||
| TV Asahi Holdings Corp. | 2,800 | 32 | ||||
| Arakawa Chemical Industries Ltd. | 4,600 | 32 | ||||
| Fukushima Galilei Co. Ltd. | 900 | 32 | ||||
| Kanto Denka Kogyo Co. Ltd. | 5,600 | 32 | ||||
| Komeri Co. Ltd. | 1,500 | 32 | ||||
| Mitsuba Corp. | 6,100 | 32 | ||||
| Nihon Parkerizing Co. Ltd. | 4,000 | 32 | ||||
| Shibusawa Warehouse Co. Ltd. | 1,400 | 32 | ||||
| Star Micronics Co. Ltd. | 2,500 | 32 | ||||
| Pack Corp. | 1,500 | 32 | ||||
| Tsubaki Nakashima Co. Ltd. | 5,700 | 32 | ||||
| Broadleaf Co. Ltd. | 8,600 | 32 | ||||
| Weathernews Inc. | 700 | 31 | ||||
| Fujibo Holdings Inc. | 1,300 | 31 | ||||
| Kyodo Printing Co. Ltd. | 1,400 | 31 | ||||
| Nippon Thompson Co. Ltd. | 8,000 | 31 | ||||
| Ryoyo Electro Corp. | 1,300 | 31 | ||||
| Senko Group Holdings Co. Ltd. | 4,400 | 31 | ||||
| Shikoku Kasei Holdings Corp. | 3,100 | 31 | ||||
| COLOPL Inc. | 7,100 | 31 | ||||
| ZIGExN Co. Ltd. | 7,800 | 31 | ||||
| Chilled & Frozen Logistics Holdings Co. Ltd. | 3,200 | 31 | ||||
| Avant Group Corp. | 3,200 | 31 | ||||
| Itoham Yonekyu Holdings Inc. | 5,400 | 30 | ||||
| FULLCAST Holdings Co. Ltd. | 2,100 | 30 | ||||
| Mandom Corp. | 3,000 | 30 | ||||
| Mitsuboshi Belting Ltd. | 900 | 30 | ||||
| Pacific Industrial Co. Ltd. | 3,100 | 30 | ||||
| Riso Kagaku Corp. | 1,900 | 30 | ||||
| Seikagaku Corp. | 5,500 | 30 | ||||
| SWCC Corp. | 2,200 | 30 | ||||
| TOC Co. Ltd. | 7,000 | 30 | ||||
| Shares | Market Value• ($000) | |||||
| Toyo Ink SC Holdings Co. Ltd. | 1,900 | 30 | ||||
| Zenrin Co. Ltd. | 4,800 | 30 | ||||
| Vital KSK Holdings Inc. | 4,400 | 30 | ||||
| Hoosiers Holdings Co. Ltd. | 4,100 | 30 | ||||
| Fixstars Corp. | 3,500 | 30 | ||||
| YAKUODO Holdings Co. Ltd. | 1,700 | 30 | ||||
| TechMatrix Corp. | 2,700 | 30 | ||||
| m-up Holdings Inc. | 2,900 | 30 | ||||
| Integrated Design & Engineering Holdings Co. Ltd. | 1,300 | 30 | ||||
| Key Coffee Inc. | 2,000 | 29 | ||||
| Nippon Seiki Co. Ltd. | 3,800 | 29 | ||||
| Riken Vitamin Co. Ltd. | 1,800 | 29 | ||||
| Shinko Shoji Co. Ltd. | 3,600 | 29 | ||||
| Yamagata Bank Ltd. | 3,900 | 29 | ||||
| Yokowo Co. Ltd. | 2,500 | 29 | ||||
| Solasto Corp. | 6,400 | 29 | ||||
| Nisso Corp. | 5,000 | 29 | ||||
| JDC Corp. | 6,900 | 29 | ||||
| Elan Corp. | 4,800 | 29 | ||||
| * | Demae-Can Co. Ltd. | 10,400 | 29 | |||
| Akita Bank Ltd. | 2,200 | 28 | ||||
| Goldcrest Co. Ltd. | 2,100 | 28 | ||||
| Komatsu Matere Co. Ltd. | 5,600 | 28 | ||||
| Kintetsu Department Store Co. Ltd. | 1,400 | 28 | ||||
| Nissan Shatai Co. Ltd. | 4,500 | 28 | ||||
| Okura Industrial Co. Ltd. | 1,600 | 28 | ||||
| Shikoku Bank Ltd. | 4,400 | 28 | ||||
| Tamron Co. Ltd. | 900 | 28 | ||||
| Yurtec Corp. | 4,400 | 28 | ||||
| DKS Co. Ltd. | 2,400 | 28 | ||||
| Osaka Organic Chemical Industry Ltd. | 1,600 | 28 | ||||
| Fibergate Inc. | 2,700 | 28 | ||||
| Midac Holdings Co. Ltd. | 2,200 | 28 | ||||
| KPP Group Holdings Co. Ltd. | 6,200 | 28 | ||||
| Obara Group Inc. | 1,000 | 27 | ||||
| Avex Inc. | 2,700 | 27 | ||||
| Riso Kyoiku Co. Ltd. | 15,700 | 27 | ||||
| Dainichiseika Color & Chemicals Manufacturing Co. Ltd. | 1,700 | 27 | ||||
| Ichigo Inc. | 12,400 | 27 | ||||
| Oki Electric Industry Co. Ltd. | 4,300 | 27 | ||||
| SBS Holdings Inc. | 1,300 | 27 | ||||
| Tocalo Co. Ltd. | 2,800 | 27 | ||||
| Sakai Chemical Industry Co. Ltd. | 2,000 | 27 | ||||
| Sankyo Tateyama Inc. | 4,400 | 27 | ||||
| V Technology Co. Ltd. | 1,600 | 26 | ||||
| Marudai Food Co. Ltd. | 2,200 | 26 | ||||
| Nippon Parking Development Co. Ltd. | 17,100 | 26 | ||||
| Nippon Road Co. Ltd. | 400 | 26 | ||||
| Shares | Market Value• ($000) | |||||
| Rheon Automatic Machinery Co. Ltd. | 2,700 | 26 | ||||
| Riken Technos Corp. | 5,300 | 26 | ||||
| SRA Holdings | 1,100 | 26 | ||||
| Mie Kotsu Group Holdings Inc. | 6,400 | 26 | ||||
| Furuya Metal Co. Ltd. | 400 | 26 | ||||
| Shinwa Co. Ltd. | 1,600 | 25 | ||||
| Fudo Tetra Corp. | 2,000 | 25 | ||||
| Fukui Bank Ltd. | 2,300 | 25 | ||||
| Nihon Nohyaku Co. Ltd. | 5,200 | 25 | ||||
| Sumitomo Seika Chemicals Co. Ltd. | 800 | 25 | ||||
| Tatsuta Electric Wire & Cable Co. Ltd. | 5,200 | 25 | ||||
| Toho Bank Ltd. | 13,000 | 25 | ||||
| Yamashin-Filter Corp. | 11,300 | 25 | ||||
| One REIT Inc. | 14 | 25 | ||||
| ASKA Pharmaceutical Holdings Co. Ltd. | 2,200 | 25 | ||||
| Autobacs Seven Co. Ltd. | 2,200 | 24 | ||||
| Chuo Spring Co. Ltd. | 4,700 | 24 | ||||
| Nissei ASB Machine Co. Ltd. | 800 | 24 | ||||
| CI Takiron Corp. | 5,900 | 24 | ||||
| Sumitomo Riko Co. Ltd. | 3,200 | 24 | ||||
| Sanei Architecture Planning Co. Ltd. | 1,700 | 24 | ||||
| Gree Inc. | 5,700 | 24 | ||||
| Takaoka Toko Co. Ltd. | 1,600 | 24 | ||||
| Toyobo Co. Ltd. | 3,200 | 23 | ||||
| Central Security Patrols Co. Ltd. | 1,100 | 23 | ||||
| Fujimori Kogyo Co. Ltd. | 900 | 23 | ||||
| Fukuda Corp. | 700 | 23 | ||||
| JSP Corp. | 1,700 | 23 | ||||
| * | Jamco Corp. | 2,200 | 23 | |||
| Kanaden Corp. | 2,300 | 23 | ||||
| Infocom Corp. | 1,200 | 23 | ||||
| Nissin Corp. | 1,300 | 23 | ||||
| Tosei Corp. | 1,800 | 23 | ||||
| Ryoden Corp. | 1,400 | 23 | ||||
| Tamura Corp. | 5,700 | 23 | ||||
| Tayca Corp. | 2,500 | 23 | ||||
| S-Pool Inc. | 6,900 | 23 | ||||
| Ebase Co. Ltd. | 4,800 | 23 | ||||
| Exedy Corp. | 1,200 | 22 | ||||
| Furuno Electric Co. Ltd. | 2,500 | 22 | ||||
| Hokkaido Gas Co. Ltd. | 1,400 | 22 | ||||
| * | Sourcenext Corp. | 17,100 | 22 | |||
| Nihon Tokushu Toryo Co. Ltd. | 2,400 | 22 | ||||
| * | Nippon Chemi-Con Corp. | 2,300 | 22 | |||
| France Bed Holdings Co. Ltd. | 2,600 | 22 | ||||
| Shin-Etsu Polymer Co. Ltd. | 2,300 | 22 | ||||
| Xebio Holdings Co. Ltd. | 3,200 | 22 | ||||
| NEC Capital Solutions Ltd. | 1,000 | 22 | ||||
| Shares | Market Value• ($000) | |||||
| Airtrip Corp. | 1,400 | 22 | ||||
| Daiken Corp. | 1,000 | 21 | ||||
| Hibiya Engineering Ltd. | 1,400 | 21 | ||||
| Oriental Shiraishi Corp. | 9,400 | 21 | ||||
| Bunka Shutter Co. Ltd. | 2,700 | 20 | ||||
| Chiyoda Co. Ltd. | 3,000 | 20 | ||||
| Chubu Shiryo Co. Ltd. | 2,600 | 20 | ||||
| Nakayama Steel Works Ltd. | 3,100 | 20 | ||||
| Macromill Inc. | 3,900 | 20 | ||||
| Oro Co. Ltd. | 1,400 | 20 | ||||
| Cosel Co. Ltd. | 2,100 | 19 | ||||
| * | KNT-CT Holdings Co. Ltd. | 1,800 | 19 | |||
| Kyosan Electric Manufacturing Co. Ltd. | 6,000 | 19 | ||||
| Valor Holdings Co. Ltd. | 1,300 | 19 | ||||
| Nihon Chouzai Co. Ltd. | 2,000 | 19 | ||||
| Tv Tokyo Holdings Corp. | 900 | 19 | ||||
| * | Net Protections Holdings Inc. | 7,000 | 19 | |||
| ESCON Japan REIT Investment Corp. | 24 | 19 | ||||
| Tosei REIT Investment Corp. | 20 | 19 | ||||
| Happinet Corp. | 1,000 | 18 | ||||
| Joshin Denki Co. Ltd. | 1,200 | 18 | ||||
| CMIC Holdings Co. Ltd. | 1,500 | 18 | ||||
| Nitto Kohki Co. Ltd. | 1,300 | 18 | ||||
| Nippon Beet Sugar Manufacturing Co. Ltd. | 1,400 | 18 | ||||
| Nippon Ceramic Co. Ltd. | 1,000 | 18 | ||||
| Nitta Corp. | 800 | 18 | ||||
| Digital Holdings Inc. | 2,500 | 18 | ||||
| Asahi Co. Ltd. | 2,000 | 18 | ||||
| Restar Holdings Corp. | 1,100 | 18 | ||||
| YA-MAN Ltd. | 2,600 | 18 | ||||
| Nittoku Co. Ltd. | 1,100 | 18 | ||||
| Yukiguni Maitake Co. Ltd. | 2,900 | 18 | ||||
| Nafco Co. Ltd. | 1,400 | 18 | ||||
| Futaba Corp. | 4,500 | 17 | ||||
| Fuso Pharmaceutical Industries Ltd. | 1,200 | 17 | ||||
| Ichikoh Industries Ltd. | 4,600 | 17 | ||||
| Kansai Food Market Ltd. | 1,700 | 17 | ||||
| J-Oil Mills Inc. | 1,400 | 17 | ||||
| * | Pacific Metals Co. Ltd. | 1,600 | 17 | |||
| Tokyu Construction Co. Ltd. | 3,300 | 17 | ||||
| Saibu Gas Holdings Co. Ltd. | 1,200 | 17 | ||||
| NS United Kaiun Kaisha Ltd. | 600 | 17 | ||||
| * | Unitika Ltd. | 11,200 | 17 | |||
| Yorozu Corp. | 2,700 | 17 | ||||
| FIDEA Holdings Co. Ltd. | 1,600 | 17 | ||||
| Aeon Fantasy Co. Ltd. | 700 | 16 | ||||
| Iseki & Co. Ltd. | 1,900 | 16 | ||||
| Toho Zinc Co. Ltd. | 1,400 | 16 | ||||
| Tomoku Co. Ltd. | 1,000 | 16 | ||||
| Shares | Market Value• ($000) | |||||
| ValueCommerce Co. Ltd. | 1,800 | 16 | ||||
| Medical Data Vision Co. Ltd. | 3,200 | 16 | ||||
| METAWATER Co. Ltd. | 1,200 | 16 | ||||
| Bell System24 Holdings Inc. | 1,500 | 16 | ||||
| Belluna Co. Ltd. | 3,100 | 15 | ||||
| Daido Metal Co. Ltd. | 4,000 | 15 | ||||
| Fuji Pharma Co. Ltd. | 1,900 | 15 | ||||
| Mirarth Holdings Inc. | 4,800 | 15 | ||||
| Kyokuto Kaihatsu Kogyo Co. Ltd. | 1,200 | 15 | ||||
| Yokogawa Bridge Holdings Corp. | 800 | 15 | ||||
| Takamiya Co. Ltd. | 4,200 | 15 | ||||
| Kamakura Shinsho Ltd. | 3,400 | 15 | ||||
| Daiki Aluminium Industry Co. Ltd. | 1,500 | 15 | ||||
| Corona Corp. Class A | 2,200 | 14 | ||||
| Hodogaya Chemical Co. Ltd. | 600 | 14 | ||||
| Oiles Corp. | 1,000 | 14 | ||||
| Takasago International Corp. | 700 | 14 | ||||
| I-PEX Inc. | 1,200 | 14 | ||||
| Aida Engineering Ltd. | 1,900 | 13 | ||||
| Central Sports Co. Ltd. | 800 | 13 | ||||
| Tsukishima Holdings Co. Ltd. | 1,400 | 13 | ||||
| Tsutsumi Jewelry Co. Ltd. | 800 | 13 | ||||
| Ohara Inc. | 1,400 | 13 | ||||
| LIFULL Co. Ltd. | 7,700 | 13 | ||||
| Create SD Holdings Co. Ltd. | 500 | 13 | ||||
| Konoike Transport Co. Ltd. | 900 | 13 | ||||
| Sanki Engineering Co. Ltd. | 1,100 | 12 | ||||
| Daito Pharmaceutical Co. Ltd. | 770 | 12 | ||||
| Hosokawa Micron Corp. | 400 | 11 | ||||
| Halows Co. Ltd. | 400 | 11 | ||||
| Matsuda Sangyo Co. Ltd. | 700 | 11 | ||||
| Noritz Corp. | 1,000 | 11 | ||||
| SB Technology Corp. | 700 | 11 | ||||
| Direct Marketing MiX Inc. | 2,700 | 11 | ||||
| Alpha Systems Inc. | 500 | 10 | ||||
| Union Tool Co. | 400 | 10 | ||||
| World Holdings Co. Ltd. | 600 | 10 | ||||
| Proto Corp. | 1,200 | 10 | ||||
| * | TerraSky Co. Ltd. | 700 | 10 | |||
| Takamatsu Construction Group Co. Ltd. | 500 | 9 | ||||
| Nichiden Corp. | 500 | 9 | ||||
| Sekisui Jushi Corp. | 500 | 9 | ||||
| Shibuya Corp. | 500 | 9 | ||||
| TPR Co. Ltd. | 700 | 9 | ||||
| Shares | Market Value• ($000) | |||||
| Tokushu Tokai Paper Co. Ltd. | 400 | 9 | ||||
| Linical Co. Ltd. | 1,900 | 9 | ||||
| Moriroku Holdings Co. Ltd. | 600 | 9 | ||||
| Eiken Chemical Co. Ltd. | 800 | 8 | ||||
| DyDo Group Holdings Inc. | 200 | 8 | ||||
| Axial Retailing Inc. | 300 | 8 | ||||
| Nachi-Fujikoshi Corp. | 300 | 8 | ||||
| Alpen Co. Ltd. | 600 | 8 | ||||
| KAWADA TECHNOLOGIES Inc. | 200 | 8 | ||||
| World Co. Ltd. | 700 | 8 | ||||
| *,3 | Open Door Inc. | 1,000 | 8 | |||
| Matsui Securities Co. Ltd. | 1,300 | 7 | ||||
| Gecoss Corp. | 1,100 | 7 | ||||
| Marvelous Inc. | 1,400 | 7 | ||||
| T-Gaia Corp. | 600 | 7 | ||||
| Sekisui Kasei Co. Ltd. | 2,400 | 7 | ||||
| Towa Bank Ltd. | 1,700 | 7 | ||||
| Cleanup Corp. | 1,200 | 6 | ||||
| * | FDK Corp. | 1,000 | 6 | |||
| Koatsu Gas Kogyo Co. Ltd. | 1,200 | 6 | ||||
| Dai-Dan Co. Ltd. | 300 | 6 | ||||
| Tokyo Base Co. Ltd. | 2,700 | 6 | ||||
| Raccoon Holdings Inc. | 1,100 | 6 | ||||
| * | Akebono Brake Industry Co. Ltd. | 5,400 | 5 | |||
| Advan Group Co. Ltd. | 800 | 5 | ||||
| MTI Ltd. | 1,400 | 5 | ||||
| Osaka Steel Co. Ltd. | 400 | 5 | ||||
| Tokai Corp. | 400 | 5 | ||||
| Orient Corp. | 500 | 4 | ||||
| Taiho Kogyo Co. Ltd. | 700 | 4 | ||||
| Chori Co. Ltd. | 200 | 4 | ||||
| Wowow Inc. | 500 | 4 | ||||
| Okuwa Co. Ltd. | 700 | 4 | ||||
| Sanoh Industrial Co. Ltd. | 600 | 4 | ||||
| * | Gurunavi Inc. | 1,600 | 4 | |||
| Japan Medical Dynamic Marketing Inc. | 700 | 4 | ||||
| Taki Chemical Co. Ltd. | 100 | 3 | ||||
| Toenec Corp. | 100 | 3 | ||||
| Robot Home Inc. | 2,200 | 3 | ||||
| Gakken Holdings Co. Ltd. | 400 | 2 | ||||
| Shindengen Electric Manufacturing Co. Ltd. | 100 | 2 | ||||
| * | Media Do Co. Ltd. | 200 | 2 | |||
| Airport Facilities Co. Ltd. | 200 | 1 | ||||
| 588,379 | ||||||
| Kuwait (0.3%) | ||||||
| National Bank of Kuwait SAKP | 1,232,009 | 3,676 | ||||
| Kuwait Finance House KSCP | 1,466,446 | 3,543 | ||||
| Shares | Market Value• ($000) | |||||
| Mobile Telecommunications Co. KSCP | 281,799 | 466 | ||||
| * | Agility Public Warehousing Co. KSC | 236,894 | 442 | |||
| Boubyan Bank KSCP | 205,885 | 407 | ||||
| Mabanee Co. KPSC | 113,213 | 307 | ||||
| National Industries Group Holding SAK | 355,789 | 262 | ||||
| Gulf Bank KSCP | 274,922 | 225 | ||||
| Warba Bank KSCP | 209,136 | 136 | ||||
| Boursa Kuwait Securities Co. KPSC | 16,677 | 108 | ||||
| Burgan Bank SAK | 165,785 | 104 | ||||
| * | Kuwait Projects Co. Holding KSCP | 260,973 | 104 | |||
| Salhia Real Estate Co. KSCP | 66,894 | 104 | ||||
| Kuwait Telecommunications Co. | 51,605 | 95 | ||||
| * | Alimtiaz Investment Group KSC | 393,277 | 90 | |||
| Jazeera Airways Co. KSCP | 15,409 | 83 | ||||
| Kuwait International Bank KSCP | 150,793 | 79 | ||||
| Integrated Holding Co. KCSC | 46,810 | 63 | ||||
| * | National Real Estate Co. KPSC | 206,404 | 54 | |||
| 10,348 | ||||||
| Malaysia (0.5%) | ||||||
| Malayan Banking Bhd. | 1,142,800 | 2,243 | ||||
| Public Bank Bhd. | 2,272,500 | 2,071 | ||||
| CIMB Group Holdings Bhd. | 1,217,400 | 1,476 | ||||
| Petronas Chemicals Group Bhd. | 432,000 | 663 | ||||
| Celcomdigi Bhd. | 648,100 | 612 | ||||
| Press Metal Aluminium Holdings Bhd. | 550,500 | 575 | ||||
| IHH Healthcare Bhd. | 432,400 | 552 | ||||
| Sime Darby Plantation Bhd. | 575,200 | 546 | ||||
| MISC Bhd. | 267,674 | 415 | ||||
| IOI Corp. Bhd. | 456,900 | 397 | ||||
| Kuala Lumpur Kepong Bhd. | 84,600 | 393 | ||||
| PPB Group Bhd. | 102,700 | 348 | ||||
| Axiata Group Bhd. | 684,600 | 348 | ||||
| Hong Leong Bank Bhd. | 79,000 | 340 | ||||
| Gamuda Bhd. | 347,700 | 338 | ||||
| TIME dotCom Bhd. | 280,500 | 333 | ||||
| Malaysia Airports Holdings Bhd. | 195,100 | 310 | ||||
| RHB Bank Bhd. | 252,500 | 305 | ||||
| Nestle Malaysia Bhd. | 10,100 | 284 | ||||
| Maxis Bhd. | 325,400 | 281 | ||||
| Inari Amertron Bhd. | 404,900 | 275 | ||||
| Sime Darby Bhd. | 471,200 | 233 | ||||
| AMMB Holdings Bhd. | 283,400 | 228 | ||||
| Shares | Market Value• ($000) | |||||
| Pentamaster Corp. Bhd. | 177,250 | 202 | ||||
| Telekom Malaysia Bhd. | 178,782 | 197 | ||||
| Alliance Bank Malaysia Bhd. | 261,000 | 194 | ||||
| Bermaz Auto Bhd. | 364,300 | 176 | ||||
| My EG Services Bhd. | 1,007,800 | 173 | ||||
| QL Resources Bhd. | 141,500 | 165 | ||||
| Bursa Malaysia Bhd. | 102,900 | 153 | ||||
| * | Top Glove Corp. Bhd. | 888,400 | 147 | |||
| Padini Holdings Bhd. | 159,600 | 136 | ||||
| Mega First Corp. Bhd. | 187,000 | 134 | ||||
| Frontken Corp. Bhd. | 174,200 | 132 | ||||
| ViTrox Corp. Bhd. | 80,200 | 131 | ||||
| Fraser & Neave Holdings Bhd. | 23,500 | 129 | ||||
| Malaysian Pacific Industries Bhd. | 19,700 | 122 | ||||
| KPJ Healthcare Bhd. | 474,900 | 119 | ||||
| Genting Plantations Bhd. | 101,500 | 118 | ||||
| Hartalega Holdings Bhd. | 274,600 | 116 | ||||
| 2 | MR DIY Group M Bhd. | 345,000 | 115 | |||
| Malaysia Building Society Bhd. | 716,600 | 114 | ||||
| FGV Holdings Bhd. | 378,900 | 111 | ||||
| Hong Leong Financial Group Bhd. | 26,900 | 106 | ||||
| D&O Green Technologies Bhd. | 129,900 | 99 | ||||
| Scientex Bhd. | 111,400 | 91 | ||||
| VS Industry Bhd. | 434,600 | 90 | ||||
| Syarikat Takaful Malaysia Keluarga Bhd. | 112,600 | 90 | ||||
| Westports Holdings Bhd. | 114,100 | 86 | ||||
| * | Chin Hin Group Bhd. | 90,500 | 84 | |||
| * | PMB Technology Bhd. | 101,000 | 79 | |||
| UWC Bhd. | 98,400 | 74 | ||||
| United Plantations Bhd. | 20,400 | 70 | ||||
| CTOS Digital Bhd. | 221,500 | 68 | ||||
| Malaysian Resources Corp. Bhd. | 663,900 | 64 | ||||
| * | Greatech Technology Bhd. | 62,200 | 60 | |||
| Kossan Rubber Industries Bhd. | 185,000 | 51 | ||||
| 2 | Lotte Chemical Titan Holding Bhd. | 192,400 | 51 | |||
| UMW Holdings Bhd. | 44,900 | 46 | ||||
| SP Setia Bhd. Group | 187,100 | 37 | ||||
| WCT Holdings Bhd. | 339,300 | 37 | ||||
| Astro Malaysia Holdings Bhd. | 306,900 | 34 | ||||
| Cahya Mata Sarawak Bhd. | 102,500 | 26 | ||||
| UEM Sunrise Bhd. | 131,300 | 21 | ||||
| * | Hong Seng Consolidated Bhd. | 518,100 | 5 | |||
| 17,819 | ||||||
| Mexico (1.0%) | ||||||
| America Movil SAB de CV Class B | 4,747,141 | 4,469 | ||||
| Shares | Market Value• ($000) | |||||
| Grupo Financiero Banorte SAB de CV | 483,400 | 4,094 | ||||
| Fomento Economico Mexicano SAB de CV | 308,223 | 3,449 | ||||
| Wal-Mart de Mexico SAB de CV | 868,200 | 3,420 | ||||
| * | Cemex SAB de CV | 2,602,900 | 2,053 | |||
| Grupo Bimbo SAB de CV Class A | 388,634 | 1,912 | ||||
| Grupo Aeroportuario del Pacifico SAB de CV Class B | 65,700 | 1,207 | ||||
| Grupo Aeroportuario del Sureste SAB de CV Class B | 37,660 | 1,026 | ||||
| Coca-Cola Femsa SAB de CV | 101,010 | 856 | ||||
| * | Grupo Financiero Inbursa SAB de CV | 303,100 | 655 | |||
| Grupo Elektra SAB de CV | 9,080 | 625 | ||||
| Fibra Uno Administracion SA de CV | 420,500 | 613 | ||||
| Arca Continental SAB de CV | 62,900 | 612 | ||||
| Grupo Aeroportuario del Centro Norte SAB de CV Class B | 47,753 | 553 | ||||
| Gruma SAB de CV Class B | 31,360 | 524 | ||||
| Grupo Carso SAB de CV | 64,693 | 516 | ||||
| Corp. Inmobiliaria Vesta SAB de CV | 126,200 | 468 | ||||
| 2 | FIBRA Macquarie Mexico | 235,463 | 440 | |||
| Grupo Televisa SAB | 437,300 | 388 | ||||
| Grupo Comercial Chedraui SA de CV | 67,200 | 376 | ||||
| TF Administradora Industrial S de RL de CV | 195,700 | 367 | ||||
| 2 | Banco del Bajio SA | 111,700 | 352 | |||
| Orbia Advance Corp. SAB de CV | 133,300 | 297 | ||||
| * | Alsea SAB de CV | 82,600 | 291 | |||
| Prologis Property Mexico SA de CV | 78,433 | 275 | ||||
| * | Industrias Penoles SAB de CV | 19,130 | 271 | |||
| Regional SAB de CV | 36,700 | 269 | ||||
| Kimberly-Clark de Mexico SAB de CV Class A | 94,400 | 212 | ||||
| La Comer SAB de CV | 86,700 | 188 | ||||
| Gentera SAB de CV | 150,500 | 184 | ||||
| Operadora De Sites Mexicanos SAB de CV | 181,600 | 170 | ||||
| * | Controladora Vuela Cia de Aviacion SAB de CV Class A | 143,500 | 143 | |||
| Shares | Market Value• ($000) | |||||
| Qualitas Controladora SAB de CV | 17,700 | 140 | ||||
| * | Sitios Latinoamerica SAB de CV | 272,347 | 114 | |||
| Bolsa Mexicana de Valores SAB de CV | 55,300 | 110 | ||||
| El Puerto de Liverpool SAB de CV | 17,000 | 106 | ||||
| *,2 | Grupo Traxion SAB de CV Class A | 53,400 | 97 | |||
| Megacable Holdings SAB de CV | 35,600 | 86 | ||||
| Genomma Lab Internacional SAB de CV Class B | 102,900 | 83 | ||||
| *,2 | Nemak SAB de CV | 327,600 | 72 | |||
| Grupo Rotoplas SAB de CV | 24,620 | 37 | ||||
| Alpek SAB de CV Class A | 32,100 | 32 | ||||
| Concentradora Fibra Danhos SA de CV | 25,700 | 32 | ||||
| 32,184 | ||||||
| Netherlands (3.2%) | ||||||
| ASML Holding NV | 65,422 | 43,017 | ||||
| ING Groep NV | 583,921 | 8,274 | ||||
| * | Prosus NV | 117,670 | 8,116 | |||
| Koninklijke Ahold Delhaize NV | 160,592 | 5,253 | ||||
| Wolters Kluwer NV | 41,628 | 5,016 | ||||
| *,2 | Adyen NV | 4,884 | 4,078 | |||
| ASM International NV | 7,806 | 3,758 | ||||
| * | Koninklijke Philips NV | 153,733 | 3,455 | |||
| Universal Music Group NV | 122,470 | 3,036 | ||||
| DSM-Firmenich AG | 28,840 | 2,668 | ||||
| Akzo Nobel NV | 29,621 | 2,405 | ||||
| Koninklijke KPN NV | 562,263 | 1,968 | ||||
| 3 | NN Group NV | 47,944 | 1,846 | |||
| Aegon NV | 303,095 | 1,553 | ||||
| BE Semiconductor Industries NV | 12,992 | 1,491 | ||||
| EXOR NV | 15,950 | 1,411 | ||||
| IMCD NV | 10,035 | 1,382 | ||||
| Randstad NV | 19,599 | 1,150 | ||||
| ASR Nederland NV | 26,005 | 1,137 | ||||
| 2 | Euronext NV | 14,332 | 1,035 | |||
| 2 | ABN AMRO Bank NV | 67,156 | 988 | |||
| 2 | Signify NV | 22,521 | 637 | |||
| *,2 | Just Eat Takeaway.com NV | 32,508 | 457 | |||
| TKH Group NV | 9,592 | 442 | ||||
| JDE Peet's NV | 14,940 | 416 | ||||
| * | InPost SA | 32,122 | 377 | |||
| OCI NV | 14,637 | 370 | ||||
| Koninklijke Vopak NV | 9,947 | 359 | ||||
| Allfunds Group plc | 59,019 | 349 | ||||
| * | Galapagos NV | 7,324 | 277 | |||
| Corbion NV | 10,555 | 252 | ||||
| *,2 | Basic-Fit NV | 7,386 | 225 | |||
| APERAM SA | 7,156 | 202 | ||||
| *,2 | Alfen NV | 3,351 | 194 | |||
| Shares | Market Value• ($000) | |||||
| 2 | CTP NV | 13,380 | 190 | |||
| Eurocommercial Properties NV | 6,306 | 151 | ||||
| PostNL NV | 52,070 | 121 | ||||
| Majorel Group Luxembourg SA | 3,742 | 120 | ||||
| * | TomTom NV | 8,898 | 71 | |||
| Flow Traders Ltd. | 2,694 | 54 | ||||
| Brunel International NV | 3,101 | 42 | ||||
| Wereldhave NV | 1,276 | 22 | ||||
| Vastned Retail NV | 701 | 15 | ||||
| NSI NV | 625 | 13 | ||||
| * | Ebusco Holding NV | 307 | 2 | |||
| 108,395 | ||||||
| New Zealand (0.3%) | ||||||
| Fisher & Paykel Healthcare Corp. Ltd. | 101,172 | 1,366 | ||||
| Spark New Zealand Ltd. | 361,478 | 1,094 | ||||
| * | Auckland International Airport Ltd. | 226,285 | 1,054 | |||
| Meridian Energy Ltd. | 235,533 | 753 | ||||
| Infratil Ltd. | 115,436 | 695 | ||||
| EBOS Group Ltd. | 24,943 | 564 | ||||
| Mainfreight Ltd. | 13,338 | 521 | ||||
| * | a2 Milk Co. Ltd. | 135,168 | 402 | |||
| Ryman Healthcare Ltd. | 90,946 | 360 | ||||
| Fletcher Building Ltd. | 120,526 | 347 | ||||
| Mercury NZ Ltd. | 92,026 | 341 | ||||
| Chorus Ltd. | 56,007 | 268 | ||||
| Summerset Group Holdings Ltd. | 43,015 | 263 | ||||
| Heartland Group Holdings Ltd. | 135,080 | 144 | ||||
| Precinct Properties New Zealand Ltd. | 167,459 | 123 | ||||
| Stride Property Group | 134,058 | 111 | ||||
| Freightways Group Ltd. | 18,588 | 97 | ||||
| Kiwi Property Group Ltd. | 175,245 | 92 | ||||
| SKY Network Television Ltd. | 61,285 | 91 | ||||
| * | Air New Zealand Ltd. | 166,443 | 80 | |||
| Vector Ltd. | 30,069 | 72 | ||||
| Argosy Property Ltd. | 97,257 | 68 | ||||
| Skellerup Holdings Ltd. | 17,971 | 46 | ||||
| KMD Brands Ltd. | 51,665 | 26 | ||||
| Scales Corp. Ltd. | 9,888 | 18 | ||||
| * | Pacific Edge Ltd. | 114,132 | 7 | |||
| * | Synlait Milk Ltd. | 7,302 | 6 | |||
| 9,009 | ||||||
| Norway (0.5%) | ||||||
| DNB Bank ASA | 170,526 | 3,371 | ||||
| Mowi ASA | 76,998 | 1,396 | ||||
| Norsk Hydro ASA | 229,226 | 1,268 | ||||
| Yara International ASA | 29,850 | 1,088 | ||||
| Telenor ASA | 99,703 | 1,068 | ||||
| Orkla ASA | 116,581 | 890 | ||||
| Storebrand ASA | 95,363 | 764 | ||||
| TOMRA Systems ASA | 42,722 | 586 | ||||
| Salmar ASA | 10,802 | 527 | ||||
| Bakkafrost P/F | 9,199 | 464 | ||||
| SpareBank 1 SMN | 32,459 | 429 | ||||
| Shares | Market Value• ($000) | |||||
| SpareBank 1 SR-Bank ASA | 33,329 | 403 | ||||
| Schibsted ASA Class A | 18,609 | 395 | ||||
| * | Nordic Semiconductor ASA | 30,919 | 376 | |||
| Gjensidige Forsikring ASA | 22,776 | 354 | ||||
| * | Adevinta ASA | 43,226 | 307 | |||
| * | NEL ASA | 237,162 | 259 | |||
| Hafnia Ltd. | 38,201 | 223 | ||||
| Schibsted ASA Class B | 10,696 | 210 | ||||
| *,2 | AutoStore Holdings Ltd. | 121,992 | 208 | |||
| Borregaard ASA | 14,037 | 204 | ||||
| Aker ASA Class A | 3,243 | 200 | ||||
| * | Kahoot! ASA | 57,004 | 184 | |||
| 2 | BW LPG Ltd. | 13,321 | 161 | |||
| Atea ASA | 12,433 | 154 | ||||
| Leroy Seafood Group ASA | 35,260 | 146 | ||||
| Wallenius Wilhelmsen ASA | 14,719 | 119 | ||||
| FLEX LNG Ltd. | 3,843 | 117 | ||||
| 2 | Scatec ASA | 16,143 | 108 | |||
| 2 | Europris ASA | 18,874 | 107 | |||
| Veidekke ASA | 10,924 | 103 | ||||
| *,2 | Crayon Group Holding ASA | 12,606 | 102 | |||
| 2 | Elkem ASA | 47,514 | 98 | |||
| 2 | Entra ASA | 9,765 | 91 | |||
| MPC Container Ships ASA | 53,024 | 91 | ||||
| Austevoll Seafood ASA | 11,638 | 84 | ||||
| Bonheur ASA | 3,216 | 70 | ||||
| Grieg Seafood ASA | 8,499 | 60 | ||||
| Hoegh Autoliners ASA | 8,631 | 60 | ||||
| Sparebank 1 Oestlandet | 4,578 | 58 | ||||
| * | Aker Carbon Capture ASA | 50,252 | 58 | |||
| Stolt-Nielsen Ltd. | 2,215 | 55 | ||||
| * | Hexagon Composites ASA | 12,496 | 44 | |||
| Wilh Wilhelmsen Holding ASA Class A | 975 | 27 | ||||
| Arendals Fossekompani ASA | 1,417 | 20 | ||||
| * | Aker Horizons ASA | 38,312 | 17 | |||
| * | Hexagon Purus ASA | 4,288 | 8 | |||
| 17,132 | ||||||
| Pakistan (0.0%) | ||||||
| Millat Tractors Ltd. | 44,430 | 64 | ||||
| United Bank Ltd. | 101,400 | 46 | ||||
| * | Lucky Cement Ltd. | 23,964 | 44 | |||
| Habib Bank Ltd. | 121,342 | 38 | ||||
| * | TRG Pakistan | 98,500 | 29 | |||
| Engro Fertilizers Ltd. | 92,446 | 24 | ||||
| Systems Ltd. | 16,462 | 23 | ||||
| MCB Bank Ltd. | 43,000 | 18 | ||||
| 286 | ||||||
| Philippines (0.2%) | ||||||
| BDO Unibank Inc. | 412,134 | 1,013 | ||||
| SM Prime Holdings Inc. | 1,872,700 | 966 | ||||
| Shares | Market Value• ($000) | |||||
| International Container Terminal Services Inc. | 204,870 | 749 | ||||
| Ayala Land Inc. | 1,367,800 | 655 | ||||
| Bank of the Philippine Islands | 318,063 | 618 | ||||
| JG Summit Holdings Inc. | 485,200 | 313 | ||||
| PLDT Inc. | 13,690 | 278 | ||||
| Universal Robina Corp. | 125,750 | 248 | ||||
| Metropolitan Bank & Trust Co. | 223,077 | 217 | ||||
| Jollibee Foods Corp. | 47,590 | 199 | ||||
| 2 | Monde Nissin Corp. | 1,047,900 | 133 | |||
| Globe Telecom Inc. | 3,980 | 127 | ||||
| GT Capital Holdings Inc. | 11,630 | 118 | ||||
| Metro Pacific Investments Corp. | 1,223,000 | 109 | ||||
| Robinsons Retail Holdings Inc. | 124,080 | 108 | ||||
| Wilcon Depot Inc. | 252,300 | 99 | ||||
| Security Bank Corp. | 53,520 | 76 | ||||
| * | Cebu Air Inc. | 101,020 | 64 | |||
| Century Pacific Food Inc. | 115,400 | 55 | ||||
| AREIT Inc. | 94,300 | 55 | ||||
| Manila Water Co. Inc. | 166,400 | 52 | ||||
| * | Converge Information & Communications Technology Solutions Inc. | 368,400 | 51 | |||
| Robinsons Land Corp. | 176,600 | 46 | ||||
| Megaworld Corp. | 704,000 | 25 | ||||
| RL Commercial REIT Inc. | 249,800 | 21 | ||||
| D&L Industries Inc. | 101,700 | 12 | ||||
| 6,407 | ||||||
| Poland (0.2%) | ||||||
| * | Powszechna Kasa Oszczednosci Bank Polski SA | 151,138 | 1,365 | |||
| Powszechny Zaklad Ubezpieczen SA | 102,050 | 1,022 | ||||
| Bank Polska Kasa Opieki SA | 29,562 | 772 | ||||
| *,2 | Dino Polska SA | 7,660 | 702 | |||
| LPP SA | 186 | 626 | ||||
| *,2 | Allegro.eu SA | 72,808 | 582 | |||
| CD Projekt SA | 10,741 | 383 | ||||
| * | Santander Bank Polska SA | 4,132 | 372 | |||
| * | KRUK SA | 2,501 | 242 | |||
| Asseco Poland SA | 11,594 | 206 | ||||
| Orange Polska SA | 109,659 | 190 | ||||
| *,2 | Pepco Group NV | 23,436 | 183 | |||
| * | mBank SA | 1,637 | 170 | |||
| * | Alior Bank SA | 12,039 | �� 164 | |||
| * | Bank Millennium SA | 72,607 | 107 | |||
| Cyfrowy Polsat SA | 31,836 | 105 | ||||
| Bank Handlowy w Warszawie SA | 4,281 | 90 | ||||
| * | AmRest Holdings SE | 8,831 | 59 | |||
| * | CCC SA | 5,109 | 55 | |||
| Shares | Market Value• ($000) | |||||
| * | Grupa Azoty SA | 4,644 | 28 | |||
| Warsaw Stock Exchange | 1,564 | 14 | ||||
| 7,437 | ||||||
| Portugal (0.1%) | ||||||
| Jeronimo Martins SGPS SA | 43,947 | 1,120 | ||||
| EDP Renovaveis SA | 45,863 | 839 | ||||
| * | Banco Comercial Portugues SA | 1,384,355 | 386 | |||
| NOS SGPS SA | 84,622 | 319 | ||||
| Sonae SGPS SA | 197,943 | 209 | ||||
| CTT-Correios de Portugal SA | 39,640 | 145 | ||||
| REN - Redes Energeticas Nacionais SGPS SA | 46,945 | 128 | ||||
| Navigator Co. SA | 12,569 | 46 | ||||
| * | Greenvolt-Energias Renovaveis SA | 3,501 | 24 | |||
| Altri SGPS SA | 4,107 | 20 | ||||
| 3,236 | ||||||
| Qatar (0.3%) | ||||||
| Qatar National Bank QPSC | 740,231 | 3,171 | ||||
| Qatar Islamic Bank SAQ | 296,872 | 1,575 | ||||
| Commercial Bank PSQC | 550,607 | 859 | ||||
| Industries Qatar QSC | 246,386 | 836 | ||||
| Masraf Al Rayan QSC | 1,036,092 | 631 | ||||
| Qatar Gas Transport Co. Ltd. | 458,592 | 467 | ||||
| Ooredoo QPSC | 137,432 | 408 | ||||
| Mesaieed Petrochemical Holding Co. | 654,554 | 331 | ||||
| Qatar Navigation QSC | 96,438 | 253 | ||||
| Vodafone Qatar QSC | 466,805 | 237 | ||||
| Barwa Real Estate Co. | 286,341 | 206 | ||||
| Doha Bank QPSC | 410,310 | 194 | ||||
| Qatar Aluminum Manufacturing Co. | 427,710 | 156 | ||||
| United Development Co. QSC | 355,162 | 109 | ||||
| Medicare Group | 61,475 | 101 | ||||
| Al Meera Consumer Goods Co. QSC | 20,566 | 78 | ||||
| 9,612 | ||||||
| Romania (0.0%) | ||||||
| * | Banca Transilvania SA | 90,981 | 419 | |||
| * | MED Life SA | 11,561 | 47 | |||
| One United Properties SA | 156,822 | 32 | ||||
| * | Teraplast SA | 209,443 | 21 | |||
| 519 | ||||||
| Russia (0.0%) | ||||||
| *,1 | Sberbank of Russia PJSC | 1,437,070 | — | |||
| *,1 | Mobile TeleSystems PJSC ADR | 8,336 | — | |||
| *,1 | Unipro PJSC | 2,240,000 | — | |||
| *,1 | VTB Bank PJSC GDR | 17,656 | — | |||
| Shares | Market Value• ($000) | |||||
| *,1 | PhosAgro PJSC | 3,204 | — | |||
| *,1 | OGK-2 PJSC | 6,493,000 | — | |||
| *,1 | Polyus PJSC | 3,525 | — | |||
| *,1 | TGC-1 PJSC | 698,000,000 | — | |||
| *,1 | RusHydro PJSC | 6,697,000 | — | |||
| *,1 | Aeroflot PJSC | 169,870 | — | |||
| *,1 | Rostelecom PJSC | 108,980 | — | |||
| *,1 | Novolipetsk Steel PJSC | 118,300 | — | |||
| *,1 | Mobile TeleSystems PJSC | 72,320 | — | |||
| *,1 | Magnit PJSC | 9,808 | — | |||
| *,1 | Mosenergo PJSC | 1,671,000 | — | |||
| *,1 | Federal Grid Co. - Rosseti PJSC (Registered) | 59,114,436 | — | |||
| *,1 | M.Video PJSC | 15,392 | — | |||
| *,1 | VTB Bank PJSC | 511,420,000 | — | |||
| *,1 | Inter RAO UES PJSC | 3,338,400 | — | |||
| *,1 | EL5-ENERO PJSC | 20,838,000 | — | |||
| *,1 | Sistema PJSFC | 466,300 | — | |||
| *,1 | Moscow Exchange MICEX-RTS PJSC | 175,830 | — | |||
| *,1,2 | Detsky Mir PJSC | 100,010 | — | |||
| *,1 | Credit Bank of Moscow PJSC | 1,108,700 | — | |||
| *,1 | Novorossiysk Commercial Sea Port PJSC | 1,721,500 | — | |||
| *,1 | Cherkizovo Group PJSC | 1,432 | — | |||
| *,1 | Samolet Group | 951 | — | |||
| *,1 | IDGC of Centre & Volga Region PJSC | 13,690,000 | — | |||
| — | ||||||
| Saudi Arabia (0.9%) | ||||||
| Al Rajhi Bank | 322,867 | 6,207 | ||||
| Saudi National Bank | 482,156 | 4,592 | ||||
| Saudi Telecom Co. | 290,223 | 3,080 | ||||
| * | Saudi Arabian Mining Co. | 202,699 | 2,184 | |||
| Riyad Bank | 245,178 | 1,988 | ||||
| Alinma Bank | 154,579 | 1,519 | ||||
| Banque Saudi Fransi | 94,547 | 966 | ||||
| Elm Co. | 3,965 | 897 | ||||
| Arab National Bank | 113,343 | 779 | ||||
| Etihad Etisalat Co. | 56,281 | 677 | ||||
| Almarai Co. JSC | 36,949 | 624 | ||||
| Sahara International Petrochemical Co. | 55,517 | 539 | ||||
| * | Dar Al Arkan Real Estate Development Co. | 83,582 | 414 | |||
| Arabian Internet & Communications Services Co. | 4,364 | 410 | ||||
| Savola Group | 36,989 | 373 | ||||
| Co. for Cooperative Insurance | 11,727 | 363 | ||||
| Jarir Marketing Co. | 86,220 | 339 | ||||
| Abdullah Al Othaim Markets Co. | 82,580 | 320 | ||||
| Mobile Telecommunications Co. Saudi Arabia | 79,713 | 287 | ||||
| Shares | Market Value• ($000) | |||||
| Saudi Airlines Catering Co. | 8,842 | 254 | ||||
| Saudia Dairy & Foodstuff Co. | 2,925 | 249 | ||||
| Leejam Sports Co. JSC | 5,437 | 222 | ||||
| Advanced Petrochemical Co. | 16,820 | 191 | ||||
| Arriyadh Development Co. | 30,775 | 175 | ||||
| Astra Industrial Group | 7,037 | 172 | ||||
| Arabian Centres Co. Ltd. | 27,779 | 166 | ||||
| * | National Industrialization Co. | 45,468 | 154 | |||
| Jadwa REIT Saudi Fund | 44,868 | 144 | ||||
| United International Transportation Co. | 6,872 | 135 | ||||
| * | Dur Hospitality Co. | 15,330 | 114 | |||
| * | Mediterranean & Gulf Cooperative Insurance & Reinsurance Co. | 28,462 | 110 | |||
| * | Tabuk Cement Co. | 26,491 | 105 | |||
| Yanbu Cement Co. | 10,314 | 100 | ||||
| Hail Cement Co. | 26,970 | 93 | ||||
| Northern Region Cement Co. | 30,836 | 93 | ||||
| Bawan Co. | 9,947 | 93 | ||||
| Eastern Province Cement Co. | 7,888 | 89 | ||||
| * | Methanol Chemicals Co. | 14,617 | 89 | |||
| * | Saudi Pharmaceutical Industries & Medical Appliances Corp. | 8,007 | 80 | |||
| Saudi Chemical Co. Holding | 63,750 | 76 | ||||
| City Cement Co. | 13,514 | 73 | ||||
| Al Masane Al Kobra Mining Co. | 5,115 | 73 | ||||
| Saudi Ceramic Co. | 9,332 | 72 | ||||
| * | Sinad Holding Co. | 23,127 | 70 | |||
| BinDawood Holding Co. | 41,810 | 69 | ||||
| Najran Cement Co. | 19,398 | 65 | ||||
| * | Zamil Industrial Investment Co. | 7,113 | 48 | |||
| * | Al Jouf Cement Co. | 14,789 | 48 | |||
| Al-Dawaa Medical Services Co. | 1,751 | 45 | ||||
| * | Fawaz Abdulaziz Al Hokair & Co. | 5,533 | 31 | |||
| * | Saudi Public Transport Co. | 4,324 | 21 | |||
| 30,077 | ||||||
| Singapore (1.0%) | ||||||
| DBS Group Holdings Ltd. | 297,300 | 7,318 | ||||
| Oversea-Chinese Banking Corp. Ltd. | 566,600 | 5,257 | ||||
| United Overseas Bank Ltd. | 205,600 | 4,319 | ||||
| Singapore Telecommunications Ltd. | 1,291,000 | 2,268 | ||||
| Shares | Market Value• ($000) | |||||
| CapitaLand Ascendas REIT | 552,900 | 1,132 | ||||
| Singapore Exchange Ltd. | 157,300 | 1,120 | ||||
| Keppel Corp. Ltd. | 217,100 | 1,114 | ||||
| Wilmar International Ltd. | 397,987 | 1,113 | ||||
| CapitaLand Integrated Commercial Trust | 787,200 | 1,112 | ||||
| CapitaLand Investment Ltd. | 458,600 | 1,099 | ||||
| Singapore Airlines Ltd. | 205,100 | 1,042 | ||||
| * | Seatrium Ltd. | 7,050,977 | 756 | |||
| Venture Corp. Ltd. | 58,900 | 571 | ||||
| UOL Group Ltd. | 109,800 | 539 | ||||
| Mapletree Logistics Trust | 421,800 | 524 | ||||
| Keppel DC REIT | 308,723 | 502 | ||||
| Frasers Centrepoint Trust | 283,419 | 469 | ||||
| ComfortDelGro Corp. Ltd. | 478,300 | 449 | ||||
| Mapletree Pan Asia Commercial Trust | 352,500 | 396 | ||||
| Mapletree Industrial Trust | 219,400 | 373 | ||||
| Frasers Logistics & Commercial Trust | 405,189 | 360 | ||||
| * | SATS Ltd. | 167,793 | 321 | |||
| City Developments Ltd. | 50,700 | 251 | ||||
| NetLink NBN Trust | 302,300 | 193 | ||||
| ESR-LOGOS REIT | 824,578 | 189 | ||||
| Raffles Medical Group Ltd. | 187,000 | 174 | ||||
| AEM Holdings Ltd. | 56,300 | 146 | ||||
| AIMS APAC REIT | 154,836 | 144 | ||||
| Olam Group Ltd. | 147,000 | 136 | ||||
| Keppel REIT | 207,800 | 133 | ||||
| Lendlease Global Commercial REIT | 310,632 | 132 | ||||
| Starhill Global REIT | 341,900 | 123 | ||||
| CapitaLand China Trust | 181,800 | 122 | ||||
| Hutchison Port Holdings Trust | 689,300 | 114 | ||||
| SIA Engineering Co. Ltd. | 61,500 | 109 | ||||
| iFAST Corp. Ltd. | 22,100 | 93 | ||||
| StarHub Ltd. | 106,900 | 81 | ||||
| Sheng Siong Group Ltd. | 67,800 | 76 | ||||
| First Resources Ltd. | 65,400 | 75 | ||||
| UMS Holdings Ltd. | 75,500 | 70 | ||||
| CDL Hospitality Trusts | 85,800 | 65 | ||||
| Singapore Post Ltd. | 161,500 | 59 | ||||
| Digital Core REIT Management Pte. Ltd. | 104,600 | 58 | ||||
| Hour Glass Ltd. | 34,800 | 50 | ||||
| Bumitama Agri Ltd. | 98,300 | 40 | ||||
| Silverlake Axis Ltd. | 130,249 | 28 | ||||
| Riverstone Holdings Ltd. | 52,900 | 25 | ||||
| Manulife US REIT | 209,594 | 14 | ||||
| Shares | Market Value• ($000) | |||||
| Nanofilm Technologies International Ltd. | 11,500 | 9 | ||||
| * | Yoma Strategic Holdings Ltd. | 71,400 | 5 | |||
| *,1 | Eagle Hospitality Trust | 38,000 | — | |||
| 34,868 | ||||||
| South Africa (1.0%) | ||||||
| Naspers Ltd. | 31,347 | 5,321 | ||||
| FirstRand Ltd. | 824,915 | 3,205 | ||||
| Standard Bank Group Ltd. | 229,676 | 2,345 | ||||
| Gold Fields Ltd. | 147,501 | 1,887 | ||||
| Absa Group Ltd. | 149,738 | 1,444 | ||||
| Bid Corp. Ltd. | 58,660 | 1,317 | ||||
| Capitec Bank Holdings Ltd. | 15,002 | 1,258 | ||||
| Shoprite Holdings Ltd. | 88,951 | 1,241 | ||||
| Sanlam Ltd. | 335,355 | 1,206 | ||||
| Bidvest Group Ltd. | 61,294 | 925 | ||||
| Remgro Ltd. | 107,730 | 904 | ||||
| Nedbank Group Ltd. | 77,069 | 882 | ||||
| Impala Platinum Holdings Ltd. | 147,097 | 757 | ||||
| Clicks Group Ltd. | 49,598 | 718 | ||||
| * | Discovery Ltd. | 77,908 | 605 | |||
| Woolworths Holdings Ltd. | 150,429 | 591 | ||||
| Aspen Pharmacare Holdings Ltd. | 58,729 | 536 | ||||
| Old Mutual Ltd. | 776,394 | 520 | ||||
| Vodacom Group Ltd. | 88,905 | 507 | ||||
| * | Northam Platinum Holdings Ltd. | 65,805 | 435 | |||
| Foschini Group Ltd. | 74,132 | 409 | ||||
| NEPI Rockcastle NV | 67,682 | 404 | ||||
| Mr Price Group Ltd. | 56,938 | 398 | ||||
| Harmony Gold Mining Co. Ltd. | 91,409 | 379 | ||||
| Growthpoint Properties Ltd. | 563,524 | 352 | ||||
| Anglo American Platinum Ltd. | 9,410 | 328 | ||||
| AVI Ltd. | 82,649 | 316 | ||||
| 2 | Pepkor Holdings Ltd. | 341,446 | 294 | |||
| Sappi Ltd. | 98,503 | 209 | ||||
| Life Healthcare Group Holdings Ltd. | 182,951 | 207 | ||||
| Tiger Brands Ltd. | 23,800 | 206 | ||||
| Investec Ltd. | 35,005 | 205 | ||||
| SPAR Group Ltd. | 36,395 | 199 | ||||
| Truworths International Ltd. | 50,716 | 195 | ||||
| MultiChoice Group | 46,797 | 194 | ||||
| OUTsurance Group Ltd. | 91,164 | 193 | ||||
| Kumba Iron Ore Ltd. | 8,339 | 183 | ||||
| Redefine Properties Ltd. | 964,963 | 183 | ||||
| Momentum Metropolitan Holdings | 154,309 | 164 | ||||
| African Rainbow Minerals Ltd. | 13,980 | 132 | ||||
| Netcare Ltd. | 157,245 | 110 | ||||
| Shares | Market Value• ($000) | |||||
| * | Fortress Real Estate Investments Ltd. Class B | 326,354 | 106 | |||
| Barloworld Ltd. | 20,248 | 91 | ||||
| Motus Holdings Ltd. | 16,791 | 90 | ||||
| MAS plc | 74,821 | 83 | ||||
| Pick n Pay Stores Ltd. | 44,098 | 81 | ||||
| Super Group Ltd. | 41,486 | 75 | ||||
| Vukile Property Fund Ltd. | 97,670 | 69 | ||||
| * | Telkom SA SOC Ltd. | 44,457 | 64 | |||
| DataTec Ltd. | 31,485 | 61 | ||||
| Ninety One Ltd. | 28,960 | 61 | ||||
| DRDGOLD Ltd. | 56,618 | 57 | ||||
| Equites Property Fund Ltd. | 75,121 | 50 | ||||
| KAP Ltd. | 332,934 | 44 | ||||
| SA Corporate Real Estate Ltd. | 439,502 | 44 | ||||
| Transaction Capital Ltd. | 128,158 | 44 | ||||
| * | Wilson Bayly Holmes-Ovcon Ltd. | 7,154 | 43 | |||
| Santam Ltd. | 2,634 | 41 | ||||
| Resilient REIT Ltd. | 19,260 | 40 | ||||
| AECI Ltd. | 6,429 | 37 | ||||
| Attacq Ltd. | 83,388 | 37 | ||||
| 2 | Dis-Chem Pharmacies Ltd. | 28,893 | 36 | |||
| Omnia Holdings Ltd. | 12,166 | 35 | ||||
| Raubex Group Ltd. | 23,881 | 33 | ||||
| Astral Foods Ltd. | 3,351 | 30 | ||||
| * | Fortress Real Estate Investments Ltd. Class A | 42,461 | 30 | |||
| Adcock Ingram Holdings Ltd. | 9,871 | 29 | ||||
| Hyprop Investments Ltd. | 16,725 | 29 | ||||
| Coronation Fund Managers Ltd. | 16,269 | 28 | ||||
| Cashbuild Ltd. | 2,490 | 24 | ||||
| Curro Holdings Ltd. | 34,490 | 18 | ||||
| JSE Ltd. | 2,651 | 14 | ||||
| * | Blue Label Telecoms Ltd. | 72,465 | 12 | |||
| Emira Property Fund Ltd. | 14,713 | 7 | ||||
| 33,407 | ||||||
| South Korea (3.7%) | ||||||
| Samsung Electronics Co. Ltd. | 789,497 | 39,930 | ||||
| SK Hynix Inc. | 89,269 | 8,208 | ||||
| Samsung SDI Co. Ltd. | 8,509 | 3,946 | ||||
| NAVER Corp. | 23,748 | 3,844 | ||||
| LG Chem Ltd. | 7,085 | 3,120 | ||||
| Hyundai Motor Co. | 21,441 | 3,064 | ||||
| 3 | Ecopro Co. Ltd. | 3,151 | 2,989 | |||
| KB Financial Group Inc. | 63,655 | 2,593 | ||||
| Shinhan Financial Group Co. Ltd. | 80,155 | 2,153 | ||||
| 3 | Celltrion Inc. | 18,419 | 2,004 | |||
| 3 | Ecopro BM Co. Ltd. | 7,581 | 1,857 | |||
| Shares | Market Value• ($000) | |||||
| Hyundai Mobis Co. Ltd. | 10,352 | 1,807 | ||||
| Kakao Corp. | 48,727 | 1,768 | ||||
| *,2 | Samsung Biologics Co. Ltd. | 2,970 | 1,655 | |||
| POSCO Future M Co. Ltd. | 4,643 | 1,576 | ||||
| Hana Financial Group Inc. | 46,883 | 1,401 | ||||
| LG Electronics Inc. | 15,567 | 1,159 | ||||
| Woori Financial Group Inc. | 108,993 | 981 | ||||
| Samsung Electro-Mechanics Co. Ltd. | 8,665 | 886 | ||||
| Samsung Fire & Marine Insurance Co. Ltd. | 4,708 | 877 | ||||
| LG Corp. | 13,905 | 863 | ||||
| 3 | Celltrion Healthcare Co. Ltd. | 16,412 | 803 | |||
| Meritz Financial Group Inc. | 17,164 | 709 | ||||
| Korea Zinc Co. Ltd. | 1,663 | 662 | ||||
| KakaoBank Corp. | 33,212 | 661 | ||||
| L&F Co. Ltd. | 4,029 | 654 | ||||
| * | Samsung Heavy Industries Co. Ltd. | 98,204 | 654 | |||
| HMM Co. Ltd. | 51,382 | 647 | ||||
| * | Samsung Engineering Co. Ltd. | 24,478 | 629 | |||
| Samsung Life Insurance Co. Ltd. | 11,450 | 585 | ||||
| * | Krafton Inc. | 4,702 | 551 | |||
| Samsung SDS Co. Ltd. | 5,109 | 548 | ||||
| LG H&H Co. Ltd. | 1,402 | 492 | ||||
| Yuhan Corp. | 8,679 | 478 | ||||
| NCSoft Corp. | 2,506 | 476 | ||||
| * | Kum Yang Co. Ltd. | 4,785 | 466 | |||
| * | Hanwha Solutions Corp. | 16,542 | 455 | |||
| 3 | Posco DX Co. Ltd. | 10,481 | 444 | |||
| LG Innotek Co. Ltd. | 2,100 | 428 | ||||
| DB Insurance Co. Ltd. | 6,920 | 427 | ||||
| * | CosmoAM&T Co. Ltd. | 3,307 | 394 | |||
| *,3 | HLB Inc. | 17,252 | 376 | |||
| Amorepacific Corp. | 3,709 | 375 | ||||
| * | LG Display Co. Ltd. | 36,637 | 371 | |||
| JYP Entertainment Corp. | 4,294 | 364 | ||||
| Samsung Securities Co. Ltd. | 12,794 | 361 | ||||
| Hyundai Glovis Co. Ltd. | 2,730 | 356 | ||||
| BNK Financial Group Inc. | 67,705 | 349 | ||||
| Hankook Tire & Technology Co. Ltd. | 11,267 | 330 | ||||
| Mirae Asset Securities Co. Ltd. | 64,531 | 325 | ||||
| Industrial Bank of Korea | 39,772 | 324 | ||||
| Hyundai Steel Co. | 10,970 | 300 | ||||
| Doosan Bobcat Inc. | 7,299 | 297 | ||||
| Hanmi Semiconductor Co. Ltd. | 6,523 | 294 | ||||
| Hotel Shilla Co. Ltd. | 4,382 | 292 | ||||
| Shares | Market Value• ($000) | |||||
| Coway Co. Ltd. | 8,670 | 283 | ||||
| Orion Corp. | 3,059 | 282 | ||||
| *,2 | SK IE Technology Co. Ltd. | 4,080 | 278 | |||
| CJ CheilJedang Corp. | 1,224 | 277 | ||||
| NH Investment & Securities Co. Ltd. | 33,668 | 262 | ||||
| * | SK Biopharmaceuticals Co. Ltd. | 3,849 | 249 | |||
| Hanmi Pharm Co. Ltd. | 1,104 | 246 | ||||
| Korea Investment Holdings Co. Ltd. | 5,489 | 216 | ||||
| DB HiTek Co. Ltd. | 5,308 | 214 | ||||
| Fila Holdings Corp. | 7,354 | 211 | ||||
| LG Uplus Corp. | 26,370 | 208 | ||||
| Hyundai Marine & Fire Insurance Co. Ltd. | 8,870 | 203 | ||||
| Kolmar Korea Co. Ltd. | 4,465 | 195 | ||||
| * | Hyundai Mipo Dockyard Co. Ltd. | 2,824 | 194 | |||
| SKC Co. Ltd. | 2,779 | 192 | ||||
| * | SK Bioscience Co. Ltd. | 3,377 | 188 | |||
| Youngone Corp. | 4,603 | 187 | ||||
| SM Entertainment Co. Ltd. | 1,778 | 185 | ||||
| * | Celltrion Pharm Inc. | 3,519 | 183 | |||
| F&F Co. Ltd. | 2,338 | 182 | ||||
| LEENO Industrial Inc. | 1,429 | 181 | ||||
| LOTTE Fine Chemical Co. Ltd. | 3,920 | 179 | ||||
| Hyosung Advanced Materials Corp. | 524 | 179 | ||||
| * | Alteogen Inc. | 5,181 | 177 | |||
| * | Kakao Games Corp. | 8,038 | 173 | |||
| * | Cosmax Inc. | 1,458 | 169 | |||
| * | Pearl Abyss Corp. | 4,645 | 169 | |||
| * | SOLUM Co. Ltd. | 7,156 | 165 | |||
| Hanjin Kal Corp. | 4,884 | 164 | ||||
| JB Financial Group Co. Ltd. | 21,976 | 161 | ||||
| LS Electric Co. Ltd. | 2,092 | 158 | ||||
| People & Technology Inc. | 2,911 | 154 | ||||
| Park Systems Corp. | 1,116 | 152 | ||||
| 3 | Eo Technics Co. Ltd. | 1,181 | 151 | |||
| KIWOOM Securities Co. Ltd. | 1,900 | 148 | ||||
| * | Sam Chun Dang Pharm Co. Ltd. | 2,216 | 147 | |||
| Medytox Inc. | 774 | 145 | ||||
| Hanon Systems | 20,946 | 144 | ||||
| JR Global REIT | 44,619 | 141 | ||||
| Binggrae Co. Ltd. | 3,313 | 140 | ||||
| Hansol Chemical Co. Ltd. | 1,145 | 140 | ||||
| Ecopro HN Co. Ltd. | 1,964 | 138 | ||||
| HL Mando Co. Ltd. | 4,209 | 133 | ||||
| Advanced Nano Products Co. Ltd. | 1,120 | 133 | ||||
| NongShim Co. Ltd. | 379 | 131 | ||||
| Daeduck Electronics Co. Ltd. | 5,916 | 129 | ||||
| Shares | Market Value• ($000) | |||||
| *,3 | Cosmochemical Co. Ltd. | 3,921 | 129 | |||
| CJ Corp. | 2,387 | 127 | ||||
| Hyundai Elevator Co. Ltd. | 3,707 | 126 | ||||
| CS Wind Corp. | 2,630 | 126 | ||||
| Hyundai Department Store Co. Ltd. | 2,381 | 125 | ||||
| Cheil Worldwide Inc. | 8,667 | 124 | ||||
| WONIK IPS Co. Ltd. | 5,305 | 124 | ||||
| DGB Financial Group Inc. | 21,571 | 122 | ||||
| i-SENS Inc. | 4,828 | 121 | ||||
| PharmaResearch Co. Ltd. | 1,081 | 118 | ||||
| Pan Ocean Co. Ltd. | 34,205 | 115 | ||||
| Jusung Engineering Co. Ltd. | 5,500 | 114 | ||||
| Hyosung TNC Corp. | 451 | 113 | ||||
| YG Entertainment Inc. | 1,825 | 112 | ||||
| Maeil Dairies Co. Ltd. | 3,291 | 111 | ||||
| Dongjin Semichem Co. Ltd. | 4,277 | 110 | ||||
| BGF retail Co. Ltd. | 929 | 110 | ||||
| S&S Tech Corp. | 3,081 | 110 | ||||
| Korea Asset In Trust Co. Ltd. | 47,142 | 109 | ||||
| * | Shinsung E&G Co. Ltd. | 48,757 | 109 | |||
| KCC Corp. | 654 | 108 | ||||
| * | Hyundai Bioscience Co. Ltd. | 5,242 | 108 | |||
| Hyundai Autoever Corp. | 806 | 107 | ||||
| Daehan Flour Mill Co. Ltd. | 1,068 | 106 | ||||
| AMOREPACIFIC Group | 4,161 | 106 | ||||
| S-1 Corp. | 2,499 | 105 | ||||
| Eusu Holdings Co. Ltd. | 23,518 | 105 | ||||
| * | Hanall Biopharma Co. Ltd. | 5,823 | 105 | |||
| * | Bioneer Corp. | 3,245 | 105 | |||
| LX Semicon Co. Ltd. | 1,551 | 104 | ||||
| Seoul Semiconductor Co. Ltd. | 11,036 | 98 | ||||
| Ottogi Corp. | 353 | 98 | ||||
| HD Hyundai Construction Equipment Co. Ltd. | 1,829 | 98 | ||||
| *,3 | Mezzion Pharma Co. Ltd. | 2,595 | 97 | |||
| 3 | Daejoo Electronic Materials Co. Ltd. | 1,286 | 96 | |||
| Shinsegae International Inc. | 6,659 | 95 | ||||
| *,2 | Netmarble Corp. | 2,939 | 95 | |||
| MegaStudyEdu Co. Ltd. | 2,449 | 95 | ||||
| Sindoh Co. Ltd. | 3,764 | 94 | ||||
| Dentium Co. Ltd. | 1,010 | 94 | ||||
| SIMMTECH Co. Ltd. | 3,410 | 93 | ||||
| * | Hanwha Life Insurance Co. Ltd. | 48,048 | 91 | |||
| SK REITs Co. Ltd. | 25,913 | 91 | ||||
| HAESUNG DS Co. Ltd. | 1,752 | 91 | ||||
| Shares | Market Value• ($000) | |||||
| Youngone Holdings Co. Ltd. | 1,569 | 89 | ||||
| * | Creative & Innovative System | 10,517 | 89 | |||
| Seobu T&D | 11,851 | 88 | ||||
| Koh Young Technology Inc. | 8,974 | 88 | ||||
| Mcnex Co. Ltd. | 3,985 | 88 | ||||
| Soulbrain Co. Ltd. | 509 | 88 | ||||
| Hansol Holdings Co. Ltd. | 40,245 | 87 | ||||
| Eugene Investment & Securities Co. Ltd. | 27,240 | 87 | ||||
| * | Oscotec Inc. | 4,105 | 87 | |||
| * | GemVax & Kael Co. Ltd. | 8,613 | 86 | |||
| Korean Reinsurance Co. | 14,175 | 85 | ||||
| Hana Micron Inc. | 5,283 | 85 | ||||
| Samsung Card Co. Ltd. | 3,697 | 84 | ||||
| DoubleUGames Co. Ltd. | 2,609 | 84 | ||||
| Shinsegae Inc. | 540 | 83 | ||||
| * | Eoflow Co. Ltd. | 4,134 | 83 | |||
| 3 | Foosung Co. Ltd. | 9,231 | 82 | |||
| * | Peptron Inc. | 2,777 | 82 | |||
| * | Duk San Neolux Co. Ltd. | 2,518 | 81 | |||
| * | SK oceanplant Co. Ltd. | 4,947 | 81 | |||
| Sam Young Electronics Co. Ltd. | 11,789 | 80 | ||||
| SPC Samlip Co. Ltd. | 1,535 | 80 | ||||
| * | HLB Life Science Co. Ltd. | 12,318 | 80 | |||
| * | Hana Tour Service Inc. | 2,152 | 79 | |||
| Innox Advanced Materials Co. Ltd. | 2,734 | 79 | ||||
| Youlchon Chemical Co. Ltd. | 3,154 | 77 | ||||
| DB Financial Investment Co. Ltd. | 24,968 | 77 | ||||
| LOTTE REIT Co. Ltd. | 30,078 | 77 | ||||
| KC Co. Ltd. | 5,641 | 75 | ||||
| KISWIRE Ltd. | 4,445 | 74 | ||||
| Partron Co. Ltd. | 12,074 | 74 | ||||
| Kolon Industries Inc. | 1,934 | 74 | ||||
| * | Chabiotech Co. Ltd. | 5,571 | 74 | |||
| Daou Technology Inc. | 5,200 | 73 | ||||
| CJ Logistics Corp. | 1,213 | 72 | ||||
| Lotte Shopping Co. Ltd. | 1,336 | 72 | ||||
| * | LegoChem Biosciences Inc. | 2,690 | 72 | |||
| Cuckoo Homesys Co. Ltd. | 4,132 | 71 | ||||
| Wemade Co. Ltd. | 2,568 | 70 | ||||
| InBody Co. Ltd. | 3,476 | 69 | ||||
| * | STCUBE | 6,890 | 69 | |||
| Namyang Dairy Products Co. Ltd. | 194 | 68 | ||||
| * | NHN Corp. | 3,452 | 68 | |||
| Eugene Technology Co. Ltd. | 2,626 | 68 | ||||
| * | Korea Line Corp. | 49,353 | 67 | |||
| * | Sungeel Hitech Co. Ltd. | 699 | 67 | |||
| SK Gas Ltd. | 688 | 66 | ||||
| Shares | Market Value• ($000) | |||||
| * | Wonik Holdings Co. Ltd. | 26,653 | 66 | |||
| AfreecaTV Co. Ltd. | 1,066 | 66 | ||||
| Hanil Holdings Co. Ltd. | 7,572 | 65 | ||||
| BH Co. Ltd. | 3,513 | 64 | ||||
| * | Sambu Engineering & Construction Co. Ltd. | 24,425 | 64 | |||
| Daesang Corp. | 4,629 | 63 | ||||
| * | Hugel Inc. | 742 | 63 | |||
| *,3 | Vaxcell-Bio Therapeutics Co. Ltd. | 1,986 | 63 | |||
| * | CJ ENM Co. Ltd. | 1,406 | 62 | |||
| NICE Information Service Co. Ltd. | 8,409 | 62 | ||||
| SL Corp. | 2,310 | 62 | ||||
| Innocean Worldwide Inc. | 2,014 | 62 | ||||
| L&C Bio Co. Ltd. | 2,238 | 62 | ||||
| Chunbo Co. Ltd. | 542 | 62 | ||||
| Samwha Capacitor Co. Ltd. | 2,038 | 61 | ||||
| Toptec Co. Ltd. | 9,683 | 61 | ||||
| * | SFA Semicon Co. Ltd. | 16,020 | 60 | |||
| * | Kumho Tire Co. Inc. | 16,081 | 60 | |||
| KC Tech Co. Ltd. | 3,625 | 60 | ||||
| ST Pharm Co. Ltd. | 968 | 59 | ||||
| LX Holdings Corp. | 9,687 | 59 | ||||
| * | Asiana Airlines Inc. | 6,963 | 58 | |||
| Kolmar Korea Holdings Co. Ltd. | 4,921 | 58 | ||||
| Dongwon Industries Co. Ltd. | 2,190 | 58 | ||||
| Dongwon F&B Co. Ltd. | 2,535 | 58 | ||||
| Han Kuk Carbon Co. Ltd. | 5,293 | 58 | ||||
| Advanced Process Systems Corp. | 4,113 | 57 | ||||
| Doosan Tesna Inc. | 1,544 | 57 | ||||
| Daishin Securities Co. Ltd. | 5,185 | 56 | ||||
| Samyang Foods Co. Ltd. | 383 | 56 | ||||
| Sebang Global Battery Co. Ltd. | 1,217 | 55 | ||||
| SK Securities Co. Ltd. | 112,916 | 55 | ||||
| Chong Kun Dang Pharmaceutical Corp. | 843 | 55 | ||||
| Hanil Cement Co. Ltd. | 5,724 | 55 | ||||
| * | Sangsangin Co. Ltd. | 15,579 | 54 | |||
| Yuanta Securities Korea Co. Ltd. | 28,078 | 54 | ||||
| * | NKMax Co. Ltd. | 4,832 | 54 | |||
| * | UniTest Inc. | 5,156 | 54 | |||
| *,3 | Enchem Co. Ltd. | 1,081 | 54 | |||
| CJ Freshway Corp. | 2,829 | 53 | ||||
| * | Aprogen Biologics | 145,301 | 53 | |||
| KH Vatec Co. Ltd. | 4,675 | 53 | ||||
| Harim Holdings Co. Ltd. | 9,638 | 53 | ||||
| Hanssem Co. Ltd. | 1,158 | 52 | ||||
| Daeduck Co. Ltd. | 10,366 | 51 | ||||
| iMarketKorea Inc. | 7,289 | 51 | ||||
| KT Skylife Co. Ltd. | 10,313 | 50 | ||||
| Ahnlab Inc. | 1,001 | 49 | ||||
| Shares | Market Value• ($000) | |||||
| Hanjin Transportation Co. Ltd. | 3,074 | 49 | ||||
| * | CMG Pharmaceutical Co. Ltd. | 26,786 | 49 | |||
| * | Modetour Network Inc. | 3,999 | 49 | |||
| Hyundai Bioland Co. Ltd. | 6,027 | 49 | ||||
| * | Amicogen Inc. | 3,483 | 48 | |||
| * | ABLBio Inc. | 3,505 | 48 | |||
| Dongsuh Cos. Inc. | 3,470 | 47 | ||||
| Dong-A ST Co. Ltd. | 1,015 | 47 | ||||
| Shinhan Alpha REIT Co. Ltd. | 10,056 | 47 | ||||
| * | Ananti Inc. | 7,379 | 46 | |||
| * | Daea TI Co. Ltd. | 19,070 | 46 | |||
| Hansol Technics Co. Ltd. | 9,370 | 46 | ||||
| * | Myoung Shin Industrial Co. Ltd. | 2,881 | 46 | |||
| JW Pharmaceutical Corp. | 1,301 | 45 | ||||
| * | IS Dongseo Co. Ltd. | 1,835 | 44 | |||
| SSANGYONG C&E Co. Ltd. | 10,590 | 44 | ||||
| TES Co. Ltd. | 2,992 | 44 | ||||
| * | iNtRON Biotechnology Inc. | 5,515 | 44 | |||
| * | Cafe24 Corp. | 4,294 | 44 | |||
| Humedix Co. Ltd. | 1,444 | 44 | ||||
| ENF Technology Co. Ltd. | 2,744 | 44 | ||||
| Daewoong Pharmaceutical Co. Ltd. | 544 | 43 | ||||
| * | Able C&C Co. Ltd. | 6,997 | 43 | |||
| Com2uSCorp | 1,190 | 43 | ||||
| ICD Co. Ltd. | 6,320 | 43 | ||||
| Tokai Carbon Korea Co. Ltd. | 624 | 43 | ||||
| * | Naturecell Co. Ltd. | 7,141 | 42 | |||
| INTOPS Co. Ltd. | 1,889 | 42 | ||||
| * | Pharmicell Co. Ltd. | 7,990 | 42 | |||
| Vieworks Co. Ltd. | 1,793 | 42 | ||||
| RFHIC Corp. | 3,212 | 42 | ||||
| Gradiant Corp. | 3,857 | 41 | ||||
| Sungwoo Hitech Co. Ltd. | 5,321 | 41 | ||||
| NICE Holdings Co. Ltd. | 3,866 | 41 | ||||
| * | Hanwha General Insurance Co. Ltd. | 12,867 | 41 | |||
| Woongjin Thinkbig Co. Ltd. | 22,181 | 41 | ||||
| *,3 | Humasis Co. Ltd. | 21,564 | 41 | |||
| * | Wysiwyg Studios Co. Ltd. | 18,032 | 41 | |||
| Intellian Technologies Inc. | 635 | 41 | ||||
| Daol Investment & Securities Co. Ltd. | 13,079 | 40 | ||||
| Seegene Inc. | 2,412 | 40 | ||||
| * | Interflex Co. Ltd. | 5,004 | 39 | |||
| Webzen Inc. | 3,628 | 39 | ||||
| Huons Co. Ltd. | 1,104 | 39 | ||||
| HS Industries Co. Ltd. | 13,845 | 38 | ||||
| Shares | Market Value• ($000) | |||||
| * | Eubiologics Co. Ltd. | 5,035 | 38 | |||
| Samyang Holdings Corp. | 694 | 37 | ||||
| Solus Advanced Materials Co. Ltd. | 1,516 | 37 | ||||
| Lotte Rental Co. Ltd. | 1,780 | 37 | ||||
| * | NEPES Corp. | 2,665 | 36 | |||
| Young Poong Corp. | 88 | 36 | ||||
| TY Holdings Co. Ltd. | 6,915 | 36 | ||||
| Zinus Inc. | 1,742 | 35 | ||||
| * | Medipost Co. Ltd. | 4,996 | 34 | |||
| * | Neowiz | 1,279 | 34 | |||
| HK inno N Corp. | 1,229 | 34 | ||||
| Daewoong Co. Ltd. | 3,023 | 33 | ||||
| Green Cross Holdings Corp. | 3,162 | 33 | ||||
| TKG Huchems Co. Ltd. | 1,974 | 33 | ||||
| * | Hancom Inc. | 2,992 | 33 | |||
| PI Advanced Materials Co. Ltd. | 1,453 | 33 | ||||
| * | ITM Semiconductor Co. Ltd. | 1,835 | 33 | |||
| * | Insun ENT Co. Ltd. | 5,066 | 32 | |||
| Tongyang Inc. | 40,643 | 32 | ||||
| * | AbClon Inc. | 2,495 | 32 | |||
| * | GeneOne Life Science Inc. | 10,592 | 31 | |||
| * | Hyundai Green Food | 3,278 | 31 | |||
| * | Jeju Air Co. Ltd. | 3,182 | 31 | |||
| Kwang Dong Pharmaceutical Co. Ltd. | 6,101 | 30 | ||||
| * | DIO Corp. | 1,349 | 30 | |||
| * | Tongyang Life Insurance Co. Ltd. | 9,006 | 30 | |||
| GC Cell Corp. | 1,068 | 30 | ||||
| Korea Electric Terminal Co. Ltd. | 722 | 29 | ||||
| * | Homecast Co. Ltd. | 8,585 | 29 | |||
| Taeyoung Engineering & Construction Co. Ltd. | 9,768 | 29 | ||||
| Samyang Corp. | 836 | 29 | ||||
| GOLFZON Co. Ltd. | 418 | 29 | ||||
| OptoElectronics Solutions Co. Ltd. | 2,577 | 28 | ||||
| HDC Holdings Co. Ltd. | 5,695 | 27 | ||||
| Hansae Co. Ltd. | 1,819 | 27 | ||||
| HL Holdings Corp. | 1,004 | 27 | ||||
| * | Genexine Inc. | 3,512 | 27 | |||
| KCC Glass Corp. | 840 | 27 | ||||
| * | Seojin System Co. Ltd. | 2,115 | 26 | |||
| Boryung | 3,724 | 26 | ||||
| * | Dongkuk Steel Mill Co. Ltd. | 3,456 | 26 | |||
| LF Corp. | 2,298 | 25 | ||||
| Unid Co. Ltd. | 564 | 25 | ||||
| Korea Petrochemical Ind Co. Ltd. | 249 | 24 | ||||
| * | Hanwha Investment & Securities Co. Ltd. | 12,702 | 24 | |||
| Green Cross Corp. | 275 | 24 | ||||
| Shares | Market Value• ($000) | |||||
| DongKook Pharmaceutical Co. Ltd. | 2,270 | 24 | ||||
| LX Hausys Ltd. | 610 | 24 | ||||
| * | Studio Dragon Corp. | 606 | 24 | |||
| Nexen Tire Corp. | 3,733 | 23 | ||||
| * | HLB Therapeutics Co. Ltd. | 7,952 | 23 | |||
| Hansol Paper Co. Ltd. | 2,818 | 23 | ||||
| Dong-A Socio Holdings Co. Ltd. | 303 | 22 | ||||
| * | Eutilex Co. Ltd. | 8,139 | 22 | |||
| * | OliX Pharmaceuticals Inc. | 1,510 | 22 | |||
| * | CrystalGenomics Invites Co. Ltd. | 8,036 | 21 | |||
| * | MedPacto Inc. | 1,912 | 21 | |||
| * | Yungjin Pharmaceutical Co. Ltd. | 10,899 | 20 | |||
| * | Il Dong Pharmaceutical Co. Ltd. | 1,676 | 20 | |||
| * | Inscobee Inc. | 20,202 | 19 | |||
| Huons Global Co. Ltd. | 996 | 19 | ||||
| Korea United Pharm Inc. | 915 | 19 | ||||
| Korea Real Estate Investment & Trust Co. Ltd. | 19,485 | 18 | ||||
| * | Com2uS Holdings Corp. | 778 | 18 | |||
| Solid Inc. | 4,031 | 18 | ||||
| * | BNC Korea Co. Ltd. | 5,668 | 18 | |||
| * | Hanwha Galleria Corp. | 17,902 | 18 | |||
| Handsome Co. Ltd. | 1,165 | 17 | ||||
| * | Komipharm International Co. Ltd. | 4,115 | 17 | |||
| Hyundai GF Holdings | 6,175 | 17 | ||||
| Soulbrain Holdings Co. Ltd. | 579 | 17 | ||||
| * | Helixmith Co. Ltd. | 4,555 | 17 | |||
| Hyundai Home Shopping Network Corp. | 528 | 17 | ||||
| * | Hyosung Chemical Corp. | 217 | 17 | |||
| * | Namsun Aluminum Co. Ltd. | 8,724 | 17 | |||
| Namhae Chemical Corp. | 2,835 | 16 | ||||
| * | Samsung Pharmaceutical Co. Ltd. | 7,549 | 16 | |||
| * | Dongsung Pharmaceutical Co. Ltd. | 3,606 | 16 | |||
| NHN KCP Corp. | 2,311 | 16 | ||||
| Nature Holdings Co. Ltd. | 949 | 16 | ||||
| * | Binex Co. Ltd. | 2,235 | 15 | |||
| Cuckoo Holdings Co. Ltd. | 938 | 15 | ||||
| Taekwang Industrial Co. Ltd. | 31 | 14 | ||||
| Shares | Market Value• ($000) | |||||
| * | Bukwang Pharmaceutical Co. Ltd. | 2,512 | 13 | |||
| * | CJ CGV Co. Ltd. | 2,121 | 13 | |||
| LG HelloVision Co. Ltd. | 4,383 | 13 | ||||
| * | Dongkuk CM Co. Ltd. | 2,083 | 13 | |||
| *,1 | Cellivery Therapeutics Inc. | 2,360 | 12 | |||
| Hankook & Co. Co. Ltd. | 1,208 | 10 | ||||
| Dongkuk Holdings Co. Ltd. | 1,109 | 10 | ||||
| Songwon Industrial Co. Ltd. | 652 | 10 | ||||
| Ilyang Pharmaceutical Co. Ltd. | 837 | 10 | ||||
| BGF Co. Ltd. | 3,740 | 10 | ||||
| * | Giantstep Inc. | 1,095 | 10 | |||
| * | Telcon RF Pharmaceutical Inc. | 12,975 | 9 | |||
| * | Enzychem Lifesciences Corp. | 5,028 | 7 | |||
| Lock&Lock Co. Ltd. | 1,322 | 6 | ||||
| Jeil Pharmaceutical Co. Ltd. | 482 | 6 | ||||
| Chongkundang Holdings Corp. | 97 | 4 | ||||
| 126,409 | ||||||
| Spain (1.4%) | ||||||
| Banco Santander SA | 2,668,066 | 10,415 | ||||
| Banco Bilbao Vizcaya Argentaria SA | 997,468 | 7,870 | ||||
| Industria de Diseno Textil SA | 175,540 | 6,725 | ||||
| Amadeus IT Group SA | 74,799 | 5,132 | ||||
| 2 | Cellnex Telecom SA | 93,701 | 3,584 | |||
| Telefonica SA | 851,818 | 3,530 | ||||
| CaixaBank SA | 643,053 | 2,605 | ||||
| 2 | Aena SME SA | 12,359 | 1,943 | |||
| Banco de Sabadell SA | 970,392 | 1,122 | ||||
| Bankinter SA | 124,809 | 800 | ||||
| Merlin Properties Socimi SA | 73,489 | 658 | ||||
| Fluidra SA | 17,001 | 382 | ||||
| Viscofan SA | 5,630 | 366 | ||||
| Acerinox SA | 31,506 | 316 | ||||
| Mapfre SA | 130,196 | 275 | ||||
| Vidrala SA | 2,890 | 272 | ||||
| Faes Farma SA | 76,966 | 269 | ||||
| Inmobiliaria Colonial Socimi SA | 39,797 | 242 | ||||
| Corp. ACCIONA Energias Renovables SA | 8,151 | 242 | ||||
| 2 | Unicaja Banco SA | 209,656 | 232 | |||
| Laboratorios Farmaceuticos Rovi SA | 3,118 | 177 | ||||
| Sacyr SA | 53,962 | 172 | ||||
| * | Solaria Energia y Medio Ambiente SA | 8,268 | 123 | |||
| Ebro Foods SA | 6,049 | 109 | ||||
| Shares | Market Value• ($000) | |||||
| Linea Directa Aseguradora SA Cia de Seguros y Reaseguros | 93,929 | 95 | ||||
| 2 | Gestamp Automocion SA | 20,764 | 93 | |||
| Almirall SA | 8,810 | 90 | ||||
| Pharma Mar SA | 1,817 | 70 | ||||
| * | Melia Hotels International SA | 10,538 | 69 | |||
| 2 | Global Dominion Access SA | 10,196 | 41 | |||
| Construcciones y Auxiliar de Ferrocarriles SA | 1,148 | 41 | ||||
| Lar Espana Real Estate Socimi SA | 6,008 | 38 | ||||
| 2 | Prosegur Cash SA | 56,654 | 37 | |||
| *,2 | Neinor Homes SA | 3,582 | 36 | |||
| * | Distribuidora Internacional de Alimentacion SA | 1,053,042 | 16 | |||
| * | NH Hotel Group SA | 2,962 | 13 | |||
| Atresmedia Corp. de Medios de Comunicacion SA | 2,847 | 11 | ||||
| Prosegur Cia de Seguridad SA | 6,488 | 11 | ||||
| 48,222 | ||||||
| Sweden (2.1%) | ||||||
| Atlas Copco AB Class A | 435,594 | 5,759 | ||||
| Investor AB Class B | 265,815 | 5,116 | ||||
| Assa Abloy AB Class B | 161,428 | 3,633 | ||||
| Skandinaviska Enskilda Banken AB Class A | 263,694 | 3,057 | ||||
| Swedbank AB Class A | 162,735 | 2,880 | ||||
| Epiroc AB Class A | 139,410 | 2,675 | ||||
| Atlas Copco AB Class B | 232,132 | 2,672 | ||||
| Telefonaktiebolaget LM Ericsson Class B | 499,087 | 2,561 | ||||
| Essity AB Class B | 103,283 | 2,411 | ||||
| Svenska Handelsbanken AB Class A | 258,134 | 2,154 | ||||
| Nibe Industrier AB Class B | 241,718 | 1,809 | ||||
| Investor AB Class A | 90,073 | 1,719 | ||||
| H & M Hennes & Mauritz AB Class B | 112,101 | 1,712 | ||||
| Svenska Cellulosa AB SCA Class B | 107,227 | 1,427 | ||||
| Industrivarden AB Class A | 51,701 | 1,347 | ||||
| Boliden AB | 47,348 | 1,259 | ||||
| EQT AB | 54,778 | 1,101 | ||||
| SKF AB Class B | 67,556 | 1,094 | ||||
| Trelleborg AB Class B | 39,555 | 1,004 | ||||
| Skanska AB Class B | 65,770 | 963 | ||||
| Telia Co. AB | 449,196 | 907 | ||||
| Castellum AB | 74,324 | 792 | ||||
| Securitas AB Class B | 88,206 | 718 | ||||
| Tele2 AB Class B | 100,975 | 713 | ||||
| Beijer Ref AB Class B | 62,143 | 712 | ||||
| SSAB AB Class B | 127,693 | 707 | ||||
| Shares | Market Value• ($000) | |||||
| Getinge AB Class B | 40,611 | 704 | ||||
| AddTech AB Class B | 38,140 | 644 | ||||
| Sagax AB Class B | 29,911 | 622 | ||||
| Holmen AB Class B | 15,982 | 606 | ||||
| 2 | Thule Group AB | 18,959 | 548 | |||
| * | Swedish Orphan Biovitrum AB | 28,339 | 547 | |||
| AAK AB | 28,332 | 525 | ||||
| * | Kinnevik AB Class B | 43,589 | 512 | |||
| Husqvarna AB Class B | 58,419 | 503 | ||||
| * | Fastighets AB Balder Class B | 105,140 | 503 | |||
| Elekta AB Class B | 65,422 | 467 | ||||
| L E Lundbergforetagen AB Class B | 11,177 | 454 | ||||
| Investment AB Latour Class B | 23,933 | 435 | ||||
| Axfood AB | 17,964 | 434 | ||||
| Avanza Bank Holding AB | 21,558 | 416 | ||||
| Electrolux AB Class B | 37,446 | 412 | ||||
| Epiroc AB Class B | 25,119 | 411 | ||||
| Fortnox AB | 78,822 | 409 | ||||
| Fabege AB | 45,345 | 388 | ||||
| Wihlborgs Fastigheter AB | 49,343 | 379 | ||||
| * | Volvo Car AB Class B | 91,989 | 349 | |||
| Nordnet AB publ | 25,143 | 325 | ||||
| Lagercrantz Group AB Class B | 30,622 | 321 | ||||
| 2 | Dometic Group AB | 49,747 | 319 | |||
| * | Sectra AB Class B | 19,370 | 303 | |||
| 2 | Bravida Holding AB | 38,064 | 271 | |||
| Loomis AB Class B | 9,936 | 263 | ||||
| Billerud Aktiebolag | 28,478 | 233 | ||||
| 2 | Munters Group AB | 18,331 | 226 | |||
| Electrolux Professional AB Class B | 40,253 | 217 | ||||
| *,2 | Sinch AB | 101,830 | 214 | |||
| Mycronic AB | 9,963 | 204 | ||||
| Vitec Software Group AB Class B | 3,693 | 199 | ||||
| Hemnet Group AB | 10,674 | 193 | ||||
| Lindab International AB | 13,108 | 192 | ||||
| Hexatronic Group AB | 32,964 | 179 | ||||
| Nyfosa AB | 28,158 | 177 | ||||
| JM AB | 13,235 | 174 | ||||
| HMS Networks AB | 4,300 | 172 | ||||
| Bure Equity AB | 8,372 | 168 | ||||
| Vitrolife AB | 12,002 | 163 | ||||
| Wallenstam AB Class B | 45,313 | 163 | ||||
| Storskogen Group AB Class B | 214,391 | 162 | ||||
| SSAB AB Class A | 27,836 | 160 | ||||
| Catena AB | 4,200 | 153 | ||||
| MIPS AB | 3,993 | 148 | ||||
| *,2 | BioArctic AB Class B | 5,204 | 148 | |||
| Medicover AB Class B | 10,152 | 146 | ||||
| Granges AB | 15,040 | 143 | ||||
| Hufvudstaden AB Class A | 11,692 | 135 | ||||
| Bufab AB | 4,829 | 130 | ||||
| Arjo AB Class B | 32,524 | 128 | ||||
| Shares | Market Value• ($000) | |||||
| AddLife AB Class B | 17,773 | 123 | ||||
| * | Modern Times Group MTG AB Class B | 17,667 | 120 | |||
| Nolato AB Class B | 27,698 | 119 | ||||
| Instalco AB | 34,472 | 117 | ||||
| * | Stillfront Group AB | 68,590 | 113 | |||
| Pandox AB Class B | 9,933 | 110 | ||||
| Biotage AB | 10,199 | 110 | ||||
| Addnode Group AB Class B | 16,068 | 109 | ||||
| * | OX2 AB Class B | 22,397 | 109 | |||
| * | Sdiptech AB Class B | 4,531 | 103 | |||
| * | Truecaller AB Class B | 31,680 | 99 | |||
| *,2 | Boozt AB | 10,586 | 98 | |||
| Atrium Ljungberg AB Class B | 5,230 | 95 | ||||
| Peab AB Class B | 21,094 | 86 | ||||
| Beijer Alma AB | 5,273 | 83 | ||||
| Bilia AB Class A | 8,435 | 81 | ||||
| Cibus Nordic Real Estate AB | 6,854 | 74 | ||||
| Concentric AB | 4,503 | 71 | ||||
| * | Camurus AB | 2,560 | 69 | |||
| Skandinaviska Enskilda Banken AB Class C | 5,756 | 68 | ||||
| Ratos AB Class B | 22,102 | 68 | ||||
| NCC AB Class B | 6,418 | 66 | ||||
| SkiStar AB | 6,073 | 65 | ||||
| Troax Group AB | 4,073 | 65 | ||||
| 3 | Intrum AB | 10,067 | 64 | |||
| 3 | Samhallsbyggnadsbolaget i Norden AB B Shares | 181,180 | 58 | |||
| NP3 Fastigheter AB | 3,741 | 57 | ||||
| * | Viaplay Group AB Class B | 11,860 | 56 | |||
| Corem Property Group AB Class B | 71,376 | 52 | ||||
| *,2 | Scandic Hotels Group AB | 15,177 | 49 | |||
| * | Systemair AB | 8,015 | 49 | |||
| Sagax AB | 19,461 | 47 | ||||
| NCC AB Class A | 4,523 | 46 | ||||
| Fagerhult Group AB | 8,279 | 40 | ||||
| Dios Fastigheter AB | 6,202 | 39 | ||||
| *,2 | Attendo AB | 13,033 | 37 | |||
| MEKO AB | 3,765 | 34 | ||||
| Platzer Fastigheter Holding AB Class B | 4,452 | 30 | ||||
| *,3 | BICO Group AB Class B | 7,308 | 29 | |||
| * | Cint Group AB | 26,005 | 23 | |||
| Clas Ohlson AB Class B | 2,408 | 22 | ||||
| * | Collector Bank AB | 7,003 | 22 | |||
| Volati AB | 2,413 | 20 | ||||
| 2 | Resurs Holding AB | 8,234 | 18 | |||
| Investment AB Oresund | 1,595 | 15 | ||||
| Svenska Handelsbanken AB Class B | 1,415 | 14 | ||||
| Husqvarna AB Class A | 1,455 | 12 | ||||
| Cloetta AB Class B | 4,552 | 8 | ||||
| Shares | Market Value• ($000) | |||||
| Samhallsbyggnadsbolaget i Norden AB | 20,190 | 6 | ||||
| * | Nobia AB | 3,638 | 3 | |||
| 70,370 | ||||||
| Switzerland (6.8%) | ||||||
| Nestle SA (Registered) | 442,833 | 53,246 | ||||
| Roche Holding AG (XVTX) | 114,798 | 33,692 | ||||
| Novartis AG (Registered) | 334,042 | 33,619 | ||||
| UBS Group AG (Registered) | 500,289 | 13,251 | ||||
| Zurich Insurance Group AG | 24,601 | 11,535 | ||||
| Lonza Group AG (Registered) | 12,374 | 6,825 | ||||
| Alcon Inc. | 81,487 | 6,801 | ||||
| Swiss Re AG | 47,616 | 4,624 | ||||
| Givaudan SA (Registered) | 1,339 | 4,460 | ||||
| Partners Group Holding AG | 3,726 | 4,016 | ||||
| Chocoladefabriken Lindt & Spruengli AG | 284 | 3,395 | ||||
| Swiss Life Holding AG (Registered) | 5,218 | 3,268 | ||||
| Geberit AG (Registered) | 5,749 | 2,975 | ||||
| Straumann Holding AG (Registered) | 17,883 | 2,704 | ||||
| Kuehne + Nagel International AG (Registered) | 8,605 | 2,585 | ||||
| Julius Baer Group Ltd. | 35,894 | 2,491 | ||||
| Swisscom AG (Registered) | 3,964 | 2,414 | ||||
| Sonova Holding AG (Registered) | 8,569 | 2,264 | ||||
| Logitech International SA (Registered) | 26,703 | 1,847 | ||||
| Schindler Holding AG | 8,062 | 1,795 | ||||
| 2 | VAT Group AG | 4,352 | 1,739 | |||
| Roche Holding AG (XSWX) | 4,970 | 1,549 | ||||
| SIG Group AG | 57,776 | 1,520 | ||||
| Swiss Prime Site AG (Registered) | 14,578 | 1,400 | ||||
| Baloise Holding AG (Registered) | 8,682 | 1,356 | ||||
| Helvetia Holding AG (Registered) | 6,715 | 1,021 | ||||
| Georg Fischer AG (Registered) | 15,673 | 1,013 | ||||
| Barry Callebaut AG (Registered) | 580 | 1,011 | ||||
| Swatch Group AG (Registered) | 18,126 | 966 | ||||
| Tecan Group AG (Registered) | 2,271 | 905 | ||||
| Belimo Holding AG (Registered) | 1,668 | 877 | ||||
| Clariant AG (Registered) | 49,873 | 830 | ||||
| Flughafen Zurich AG (Registered) | 4,014 | 826 | ||||
| Shares | Market Value• ($000) | |||||
| Chocoladefabriken Lindt & Spruengli AG (Registered) | 7 | 825 | ||||
| Temenos AG (Registered) | 10,393 | 824 | ||||
| 2 | Galenica AG | 10,013 | 795 | |||
| PSP Swiss Property AG (Registered) | 6,521 | 792 | ||||
| Swatch Group AG | 2,796 | 785 | ||||
| EMS-Chemie Holding AG (Registered) | 1,018 | 764 | ||||
| Siegfried Holding AG (Registered) | 630 | 569 | ||||
| Mobimo Holding AG (Registered) | 1,816 | 531 | ||||
| Bachem Holding AG | 5,253 | 489 | ||||
| Cembra Money Bank AG | 6,473 | 471 | ||||
| Banque Cantonale Vaudoise (Registered) | 4,142 | 449 | ||||
| Valiant Holding AG (Registered) | 4,072 | 437 | ||||
| Accelleron Industries AG | 14,781 | 399 | ||||
| Bucher Industries AG (Registered) | 902 | 370 | ||||
| Inficon Holding AG (Registered) | 287 | 366 | ||||
| Schindler Holding AG (Registered) | 1,572 | 330 | ||||
| DKSH Holding AG | 4,257 | 325 | ||||
| * | ams-OSRAM AG | 45,484 | 319 | |||
| Softwareone Holding AG | 15,866 | 317 | ||||
| Comet Holding AG (Registered) | 1,191 | 305 | ||||
| Emmi AG (Registered) | 278 | 299 | ||||
| SFS Group AG | 2,601 | 298 | ||||
| Allreal Holding AG (Registered) | 1,632 | 285 | ||||
| Stadler Rail AG | 6,965 | 283 | ||||
| * | Meyer Burger Technology AG | 627,153 | 282 | |||
| Forbo Holding AG (Registered) | 205 | 277 | ||||
| Burckhardt Compression Holding AG | 448 | 264 | ||||
| Swissquote Group Holding SA (Registered) | 1,313 | 261 | ||||
| Landis+Gyr Group AG | 3,335 | 246 | ||||
| Interroll Holding AG (Registered) | 80 | 238 | ||||
| Vontobel Holding AG (Registered) | 3,815 | 236 | ||||
| Huber + Suhner AG (Registered) | 3,004 | 231 | ||||
| dormakaba Holding AG | 429 | 224 | ||||
| Daetwyler Holding AG | 1,054 | 220 | ||||
| * | Aryzta AG | 125,139 | 208 | |||
| VZ Holding AG | 1,803 | 182 | ||||
| Shares | Market Value• ($000) | |||||
| Kardex Holding AG (Registered) | 734 | 168 | ||||
| 2 | Medacta Group SA | 1,188 | 167 | |||
| Komax Holding AG (Registered) | 653 | 164 | ||||
| St. Galler Kantonalbank AG (Registered) | 287 | 160 | ||||
| SKAN Group AG | 1,667 | 151 | ||||
| * | Dottikon Es Holding AG (Registered) | 590 | 147 | |||
| EFG International AG | 12,948 | 145 | ||||
| *,3 | Idorsia Ltd. | 21,510 | 117 | |||
| LEM Holding SA (Registered) | 52 | 117 | ||||
| *,2 | Sensirion Holding AG | 1,275 | 112 | |||
| * | Basilea Pharmaceutica AG (Registered) | 1,995 | 109 | |||
| Ypsomed Holding AG (Registered) | 362 | 107 | ||||
| u-blox Holding AG | 1,196 | 107 | ||||
| ALSO Holding AG (Registered) | 424 | 103 | ||||
| Bystronic AG | 139 | 94 | ||||
| PIERER Mobility AG | 1,075 | 88 | ||||
| Bossard Holding AG (Registered) Class A | 380 | 87 | ||||
| Schweiter Technologies AG | 118 | 85 | ||||
| OC Oerlikon Corp. AG (Registered) | 17,048 | 84 | ||||
| * | DocMorris AG | 1,113 | 84 | |||
| Bell Food Group AG (Registered) | 239 | 72 | ||||
| Implenia AG (Registered) | 1,982 | 71 | ||||
| Zehnder Group AG | 1,068 | 71 | ||||
| COSMO Pharmaceuticals NV | 1,312 | 66 | ||||
| *,2 | PolyPeptide Group AG | 1,883 | 53 | |||
| Intershop Holding AG | 77 | 52 | ||||
| *,2 | Medartis Holding AG | 540 | 52 | |||
| Rieter Holding AG (Registered) | 403 | 43 | ||||
| * | Autoneum Holding AG | 288 | 43 | |||
| Leonteq AG | 937 | 42 | ||||
| TX Group AG | 369 | 39 | ||||
| Arbonia AG | 3,407 | 36 | ||||
| VP Bank AG Class A | 345 | 35 | ||||
| Vetropack Holding AG (Registered) Class A | 673 | 35 | ||||
| Hiag Immobilien Holding AG | 274 | 23 | ||||
| APG SGA SA | 21 | 4 | ||||
| 230,449 | ||||||
| Taiwan (6.0%) | ||||||
| Taiwan Semiconductor Manufacturing Co. Ltd. | 3,979,630 | 68,382 | ||||
| Hon Hai Precision Industry Co. Ltd. | 1,981,130 | 6,614 | ||||
| MediaTek Inc. | 246,937 | 5,446 | ||||
| Delta Electronics Inc. | 357,496 | 3,863 | ||||
| Quanta Computer Inc. | 436,760 | 3,462 | ||||
| Shares | Market Value• ($000) | |||||
| United Microelectronics Corp. | 1,910,112 | 2,727 | ||||
| Fubon Financial Holding Co. Ltd. | 1,197,846 | 2,389 | ||||
| Chunghwa Telecom Co. Ltd. | 603,000 | 2,198 | ||||
| CTBC Financial Holding Co. Ltd. | 2,905,000 | 2,171 | ||||
| Cathay Financial Holding Co. Ltd. | 1,465,482 | 2,095 | ||||
| Mega Financial Holding Co. Ltd. | 1,808,528 | 2,035 | ||||
| ASE Technology Holding Co. Ltd. | 545,276 | 2,018 | ||||
| Nan Ya Plastics Corp. | 888,878 | 1,845 | ||||
| E.Sun Financial Holding Co. Ltd. | 2,330,781 | 1,788 | ||||
| Uni-President Enterprises Corp. | 795,000 | 1,763 | ||||
| Wistron Corp. | 470,000 | 1,718 | ||||
| China Steel Corp. | 2,059,796 | 1,713 | ||||
| Formosa Plastics Corp. | 631,784 | 1,577 | ||||
| Lite-On Technology Corp. | 348,958 | 1,492 | ||||
| Asustek Computer Inc. | 113,492 | 1,430 | ||||
| Yuanta Financial Holding Co. Ltd. | 1,823,122 | 1,395 | ||||
| First Financial Holding Co. Ltd. | 1,668,697 | 1,377 | ||||
| Taiwan Cooperative Financial Holding Co. Ltd. | 1,640,604 | 1,352 | ||||
| Chailease Holding Co. Ltd. | 234,247 | 1,306 | ||||
| Accton Technology Corp. | 86,000 | 1,283 | ||||
| Unimicron Technology Corp. | 208,000 | 1,204 | ||||
| Novatek Microelectronics Corp. | 90,995 | 1,138 | ||||
| Hotai Motor Co. Ltd. | 53,337 | 1,135 | ||||
| Largan Precision Co. Ltd. | 17,000 | 1,092 | ||||
| Taishin Financial Holding Co. Ltd. | 1,849,303 | 1,032 | ||||
| Formosa Chemicals & Fibre Corp. | 529,708 | 1,031 | ||||
| Hua Nan Financial Holdings Co. Ltd. | 1,556,450 | 1,002 | ||||
| Realtek Semiconductor Corp. | 76,294 | 997 | ||||
| * | China Development Financial Holding Corp. | 2,615,308 | 972 | |||
| SinoPac Financial Holdings Co. Ltd. | 1,757,021 | 943 | ||||
| Yageo Corp. | 61,506 | 934 | ||||
| Inventec Corp. | 493,000 | 869 | ||||
| E Ink Holdings Inc. | 151,728 | 867 | ||||
| Alchip Technologies Ltd. | 11,000 | 846 | ||||
| Gigabyte Technology Co. Ltd. | 78,000 | 831 | ||||
| President Chain Store Corp. | 94,000 | 788 | ||||
| Shares | Market Value• ($000) | |||||
| Shanghai Commercial & Savings Bank Ltd. | 574,087 | 768 | ||||
| Airtac International Group | 25,603 | 738 | ||||
| Taiwan Mobile Co. Ltd. | 247,000 | 723 | ||||
| Pegatron Corp. | 286,000 | 699 | ||||
| Wiwynn Corp. | 14,000 | 682 | ||||
| * | Shin Kong Financial Holding Co. Ltd. | 2,168,287 | 644 | |||
| Global Unichip Corp. | 14,000 | 637 | ||||
| eMemory Technology Inc. | 11,000 | 623 | ||||
| Compal Electronics Inc. | 620,000 | 619 | ||||
| AUO Corp. | 1,104,400 | 617 | ||||
| Elite Material Co. Ltd. | 44,000 | 601 | ||||
| * | Tatung Co. Ltd. | 360,000 | 571 | |||
| Evergreen Marine Corp. Taiwan Ltd. | 169,670 | 567 | ||||
| Tripod Technology Corp. | 95,000 | 563 | ||||
| Chang Hwa Commercial Bank Ltd. | 1,021,914 | 555 | ||||
| * | Innolux Corp. | 1,225,690 | 555 | |||
| Catcher Technology Co. Ltd. | 98,000 | 554 | ||||
| Chroma ATE Inc. | 61,000 | 534 | ||||
| WPG Holdings Ltd. | 306,680 | 528 | ||||
| Walsin Lihwa Corp. | 435,104 | 517 | ||||
| Micro-Star International Co. Ltd. | 102,000 | 510 | ||||
| Teco Electric & Machinery Co. Ltd. | 326,000 | 510 | ||||
| Far EasTone Telecommunications Co. Ltd. | 228,000 | 506 | ||||
| Voltronic Power Technology Corp. | 11,152 | 506 | ||||
| Globalwafers Co. Ltd. | 35,000 | 503 | ||||
| Asia Cement Corp. | 401,000 | 502 | ||||
| Far Eastern New Century Corp. | 564,000 | 498 | ||||
| Synnex Technology International Corp. | 256,000 | 491 | ||||
| Acer Inc. | 422,000 | 484 | ||||
| Asia Vital Components Co. Ltd. | 46,165 | 483 | ||||
| Eclat Textile Co. Ltd. | 30,000 | 478 | ||||
| * | Ruentex Development Co. Ltd. | 408,600 | 472 | |||
| ASPEED Technology Inc. | 5,500 | 464 | ||||
| Powerchip Semiconductor Manufacturing Corp. | 494,000 | 431 | ||||
| Feng TAY Enterprise Co. Ltd. | 77,728 | 409 | ||||
| Eva Airways Corp. | 405,932 | 401 | ||||
| Sino-American Silicon Products Inc. | 79,000 | 387 | ||||
| Yang Ming Marine Transport Corp. | 292,398 | 387 | ||||
| King Yuan Electronics Co. Ltd. | 158,000 | 380 | ||||
| Shares | Market Value• ($000) | |||||
| Taichung Commercial Bank Co. Ltd. | 811,434 | 375 | ||||
| Powertech Technology Inc. | 117,000 | 365 | ||||
| Oneness Biotech Co. Ltd. | 56,887 | 354 | ||||
| * | Winbond Electronics Corp. | 428,000 | 352 | |||
| Foxconn Technology Co. Ltd. | 200,000 | 349 | ||||
| Pou Chen Corp. | 379,000 | 340 | ||||
| Lien Hwa Industrial Holdings Corp. | 175,835 | 337 | ||||
| Parade Technologies Ltd. | 12,000 | 337 | ||||
| Faraday Technology Corp. | 31,000 | 334 | ||||
| Phison Electronics Corp. | 25,000 | 331 | ||||
| Radiant Opto-Electronics Corp. | 87,000 | 326 | ||||
| Yulon Finance Corp. | 56,569 | 315 | ||||
| King Slide Works Co. Ltd. | 11,000 | 314 | ||||
| Gold Circuit Electronics Ltd. | 46,500 | 313 | ||||
| TA Chen Stainless Pipe | 272,763 | 311 | ||||
| Taiwan High Speed Rail Corp. | 330,000 | 308 | ||||
| Lotes Co. Ltd. | 11,377 | 307 | ||||
| Giant Manufacturing Co. Ltd. | 49,740 | 305 | ||||
| Hiwin Technologies Corp. | 47,504 | 305 | ||||
| Vanguard International Semiconductor Corp. | 142,000 | 304 | ||||
| Sinbon Electronics Co. Ltd. | 31,000 | 301 | ||||
| Makalot Industrial Co. Ltd. | 28,707 | 301 | ||||
| Taiwan Business Bank | 713,787 | 299 | ||||
| China Airlines Ltd. | 410,000 | 291 | ||||
| International Games System Co. Ltd. | 16,000 | 288 | ||||
| Macronix International Co. Ltd. | 272,000 | 287 | ||||
| Cheng Shin Rubber Industry Co. Ltd. | 230,000 | 286 | ||||
| Jentech Precision Industrial Co. Ltd. | 13,999 | 283 | ||||
| Win Semiconductors Corp. | 65,000 | 277 | ||||
| Orient Semiconductor Electronics Ltd. | 183,000 | 270 | ||||
| Zhen Ding Technology Holding Ltd. | 88,000 | 266 | ||||
| * | China Petrochemical Development Corp. | 896,386 | 265 | |||
| Qisda Corp. | 187,000 | 262 | ||||
| Nanya Technology Corp. | 121,000 | 252 | ||||
| Simplo Technology Co. Ltd. | 26,000 | 251 | ||||
| Shares | Market Value• ($000) | |||||
| Nan Ya Printed Circuit Board Corp. | 33,000 | 249 | ||||
| Highwealth Construction Corp. | 181,418 | 245 | ||||
| Silicon Integrated Systems Corp. | 218,080 | 242 | ||||
| Poya International Co. Ltd. | 15,484 | 236 | ||||
| Ruentex Industries Ltd. | 119,002 | 233 | ||||
| Xxentria Technology Materials Corp. | 97,900 | 230 | ||||
| Via Technologies Inc. | 64,000 | 229 | ||||
| * | Bank of Kaohsiung Co. Ltd. | 578,337 | 227 | |||
| Yulon Motor Co. Ltd. | 86,185 | 225 | ||||
| Walsin Technology Corp. | 72,000 | 223 | ||||
| Wan Hai Lines Ltd. | 157,260 | 223 | ||||
| Wistron NeWeb Corp. | 53,000 | 222 | ||||
| Sanyang Motor Co. Ltd. | 95,000 | 221 | ||||
| Chicony Electronics Co. Ltd. | 68,000 | 220 | ||||
| Sigurd Microelectronics Corp. | 121,000 | 219 | ||||
| * | Charoen Pokphand Enterprise | 70,600 | 215 | |||
| * | IBF Financial Holdings Co. Ltd. | 575,060 | 215 | |||
| Huaku Development Co. Ltd. | 74,000 | 208 | ||||
| Kindom Development Co. Ltd. | 204,100 | 208 | ||||
| O-Bank Co. Ltd. | 698,000 | 208 | ||||
| Topco Scientific Co. Ltd. | 38,271 | 207 | ||||
| Merida Industry Co. Ltd. | 34,000 | 206 | ||||
| AP Memory Technology Corp. | 20,000 | 205 | ||||
| Bora Pharmaceuticals Co. Ltd. | 9,092 | 204 | ||||
| Hotai Finance Co. Ltd. | 49,500 | 200 | ||||
| Taiyen Biotech Co. Ltd. | 182,000 | 196 | ||||
| Senao International Co. Ltd. | 162,000 | 189 | ||||
| AGV Products Corp. | 466,000 | 186 | ||||
| Chipbond Technology Corp. | 85,000 | 186 | ||||
| YFY Inc. | 187,000 | 185 | ||||
| ASMedia Technology Inc. | 6,000 | 185 | ||||
| Sunonwealth Electric Machine Industry Co. Ltd. | 43,000 | 183 | ||||
| Test Research Inc. | 97,000 | 182 | ||||
| Nien Made Enterprise Co. Ltd. | 19,000 | 178 | ||||
| Compeq Manufacturing Co. Ltd. | 125,000 | 177 | ||||
| Systex Corp. | 50,000 | 176 | ||||
| AcBel Polytech Inc. | 120,883 | 176 | ||||
| Union Bank of Taiwan | 385,350 | 175 | ||||
| * | Nan Kang Rubber Tire Co. Ltd. | 141,000 | 173 | |||
| Acter Group Corp. Ltd. | 35,000 | 172 | ||||
| Shares | Market Value• ($000) | |||||
| * | HTC Corp. | 103,000 | 170 | |||
| Fusheng Precision Co. Ltd. | 27,000 | 168 | ||||
| Sercomm Corp. | 44,000 | 167 | ||||
| Tung Ho Steel Enterprise Corp. | 89,110 | 167 | ||||
| Mitac Holdings Corp. | 131,248 | 166 | ||||
| King's Town Bank Co. Ltd. | 142,000 | 165 | ||||
| * | Globe Union Industrial Corp. | 346,828 | 163 | |||
| Great Wall Enterprise Co. Ltd. | 94,402 | 162 | ||||
| Bizlink Holding Inc. | 20,708 | 162 | ||||
| Taiwan Fertilizer Co. Ltd. | 86,000 | 161 | ||||
| * | Radium Life Tech Co. Ltd. | 573,200 | 161 | |||
| Sunplus Technology Co. Ltd. | 158,000 | 159 | ||||
| Elan Microelectronics Corp. | 42,000 | 158 | ||||
| Dynamic Holding Co. Ltd. | 87,997 | 157 | ||||
| Sporton International Inc. | 19,372 | 156 | ||||
| Ardentec Corp. | 79,000 | 155 | ||||
| momo.com Inc. | 9,504 | 155 | ||||
| KEE TAI Properties Co. Ltd. | 341,000 | 154 | ||||
| FSP Technology Inc. | 95,000 | 152 | ||||
| Far Eastern Department Stores Ltd. | 203,000 | 151 | ||||
| Tong Yang Industry Co. Ltd. | 71,000 | 151 | ||||
| Ambassador Hotel | 83,000 | 149 | ||||
| * | Polaris Group | 55,000 | 149 | |||
| Taiwan Hon Chuan Enterprise Co. Ltd. | 45,000 | 147 | ||||
| Capital Securities Corp. | 307,000 | 142 | ||||
| Quanta Storage Inc. | 46,000 | 142 | ||||
| Nichidenbo Corp. | 85,000 | 142 | ||||
| Kung Long Batteries Industrial Co. Ltd. | 33,000 | 138 | ||||
| Ta Ya Electric Wire & Cable | 118,253 | 137 | ||||
| ITEQ Corp. | 43,466 | 134 | ||||
| AURAS Technology Co. Ltd. | 15,000 | 134 | ||||
| Kinsus Interconnect Technology Corp. | 40,000 | 133 | ||||
| Taiwan Union Technology Corp. | 34,000 | 133 | ||||
| Taiwan Semiconductor Manufacturing Co. Ltd. ADR | 1,419 | 133 | ||||
| YungShin Global Holding Corp. | 97,000 | 132 | ||||
| Chicony Power Technology Co. Ltd. | 36,000 | 132 | ||||
| Feng Hsin Steel Co. Ltd. | 62,000 | 131 | ||||
| * | Phihong Technology Co. Ltd. | 57,000 | 130 | |||
| Shares | Market Value• ($000) | |||||
| Century Iron & Steel Industrial Co. Ltd. | 26,000 | 130 | ||||
| United Integrated Services Co. Ltd. | 19,000 | 129 | ||||
| Hong Pu Real Estate Development Co. Ltd. | 161,000 | 129 | ||||
| Visual Photonics Epitaxy Co. Ltd. | 28,000 | 128 | ||||
| Chief Telecom Inc. | 11,000 | 128 | ||||
| * | Taiwan Glass Industry Corp. | 205,000 | 127 | |||
| Getac Holdings Corp. | 57,000 | 126 | ||||
| Grape King Bio Ltd. | 26,000 | 125 | ||||
| Sitronix Technology Corp. | 16,000 | 125 | ||||
| Coretronic Corp. | 50,000 | 124 | ||||
| WT Microelectronics Co. Ltd. | 58,000 | 124 | ||||
| FLEXium Interconnect Inc. | 43,000 | 123 | ||||
| * | Kuo Yang Construction Co. Ltd. | 207,000 | 123 | |||
| Microbio Co. Ltd. | 75,965 | 122 | ||||
| Taiwan Surface Mounting Technology Corp. | 42,000 | 121 | ||||
| Innodisk Corp. | 13,651 | 120 | ||||
| * | Ennostar Inc. | 84,000 | 120 | |||
| Goldsun Building Materials Co. Ltd. | 141,753 | 119 | ||||
| Jess-Link Products Co. Ltd. | 58,000 | 119 | ||||
| Gloria Material Technology Corp. | 83,000 | 117 | ||||
| Formosa Taffeta Co. Ltd. | 146,000 | 117 | ||||
| Standard Foods Corp. | 98,000 | 117 | ||||
| * | Mercuries Life Insurance Co. Ltd. | 710,421 | 117 | |||
| * | TaiMed Biologics Inc. | 31,000 | 115 | |||
| Taiwan Semiconductor Co. Ltd. | 43,000 | 113 | ||||
| Greatek Electronics Inc. | 62,000 | 113 | ||||
| Iron Force Industrial Co. Ltd. | 41,000 | 113 | ||||
| Ennoconn Corp. | 13,710 | 113 | ||||
| Shinkong Synthetic Fibers Corp. | 228,000 | 112 | ||||
| Wei Chuan Foods Corp. | 188,000 | 111 | ||||
| Career Technology MFG. Co. Ltd. | 152,513 | 109 | ||||
| Taiwan Secom Co. Ltd. | 33,000 | 109 | ||||
| Gudeng Precision Industrial Co. Ltd. | 10,000 | 108 | ||||
| ChipMOS Technologies Inc. | 89,000 | 107 | ||||
| Hota Industrial Manufacturing Co. Ltd. | 51,810 | 106 | ||||
| * | HannStar Display Corp. | 276,000 | 106 | |||
| * | Medigen Vaccine Biologics Corp. | 44,390 | 106 | |||
| Zyxel Group Corp. | 70,961 | 105 | ||||
| China Motor Corp. | 37,200 | 105 | ||||
| Shares | Market Value• ($000) | |||||
| L&K Engineering Co. Ltd. | 36,000 | 105 | ||||
| Tong Hsing Electronic Industries Ltd. | 25,322 | 105 | ||||
| Wah Lee Industrial Corp. | 36,720 | 104 | ||||
| Taiwan PCB Techvest Co. Ltd. | 75,000 | 104 | ||||
| * | Advanced Wireless Semiconductor Co. | 34,370 | 104 | |||
| Cheng Loong Corp. | 115,000 | 103 | ||||
| ITE Technology Inc. | 23,000 | 103 | ||||
| Arcadyan Technology Corp. | 22,123 | 103 | ||||
| Ichia Technologies Inc. | 69,000 | 102 | ||||
| * | CMC Magnetics Corp. | 259,747 | 102 | |||
| Ton Yi Industrial Corp. | 185,000 | 101 | ||||
| Wisdom Marine Lines Co. Ltd. | 70,543 | 101 | ||||
| Fulgent Sun International Holding Co. Ltd. | 25,000 | 101 | ||||
| Raydium Semiconductor Corp. | 10,000 | 101 | ||||
| Global Brands Manufacture Ltd. | 56,120 | 100 | ||||
| Topkey Corp. | 19,000 | 100 | ||||
| Kenda Rubber Industrial Co. Ltd. | 105,001 | 99 | ||||
| Chung Hung Steel Corp. | 135,000 | 98 | ||||
| TYC Brother Industrial Co. Ltd. | 90,000 | 97 | ||||
| Pan Jit International Inc. | 48,400 | 97 | ||||
| Eternal Materials Co. Ltd. | 106,400 | 97 | ||||
| Far Eastern International Bank | 265,036 | 96 | ||||
| XinTec Inc. | 27,000 | 96 | ||||
| Everlight Electronics Co. Ltd. | 66,000 | 95 | ||||
| President Securities Corp. | 155,532 | 95 | ||||
| Lotus Pharmaceutical Co. Ltd. | 12,000 | 95 | ||||
| Apex International Co. Ltd. | 53,000 | 95 | ||||
| Fitipower Integrated Technology Inc. | 21,083 | 95 | ||||
| Taiwan-Asia Semiconductor Corp. | 61,000 | 94 | ||||
| Wafer Works Corp. | 69,923 | 93 | ||||
| Flytech Technology Co. Ltd. | 44,000 | 93 | ||||
| Prince Housing & Development Corp. | 282,000 | 93 | ||||
| United Renewable Energy Co. Ltd. | 180,420 | 93 | ||||
| Hannstar Board Corp. | 54,000 | 93 | ||||
| Pan-International Industrial Corp. | 78,000 | 92 | ||||
| Pixart Imaging Inc. | 23,000 | 92 | ||||
| Bioteque Corp. | 27,000 | 92 | ||||
| Shares | Market Value• ($000) | |||||
| Foxsemicon Integrated Technology Inc. | 16,000 | 91 | ||||
| * | Adimmune Corp. | 86,000 | 90 | |||
| China Steel Chemical Corp. | 26,000 | 89 | ||||
| Sunny Friend Environmental Technology Co. Ltd. | 24,737 | 89 | ||||
| * | Unitech Printed Circuit Board Corp. | 154,363 | 88 | |||
| TCI Co. Ltd. | 17,297 | 88 | ||||
| Kuo Toong International Co. Ltd. | 91,330 | 87 | ||||
| Continental Holdings Corp. | 104,000 | 87 | ||||
| Kinpo Electronics | 170,000 | 86 | ||||
| * | RichWave Technology Corp. | 17,650 | 86 | |||
| VisEra Technologies Co. Ltd. | 13,000 | 86 | ||||
| * | Tyntek Corp. | 151,000 | 85 | |||
| Grand Pacific Petrochemical | 161,000 | 85 | ||||
| Egis Technology Inc. | 33,000 | 85 | ||||
| Holy Stone Enterprise Co. Ltd. | 27,300 | 84 | ||||
| * | Lung Yen Life Service Corp. | 74,000 | 84 | |||
| U-Ming Marine Transport Corp. | 59,000 | 84 | ||||
| Rich Development Co. Ltd. | 285,000 | 83 | ||||
| TXC Corp. | 28,000 | 83 | ||||
| Merry Electronics Co. Ltd. | 30,298 | 82 | ||||
| Soft-World International Corp. | 27,000 | 82 | ||||
| Elite Semiconductor Microelectronics Technology Inc. | 35,000 | 82 | ||||
| Darfon Electronics Corp. | 60,000 | 82 | ||||
| China Chemical & Pharmaceutical Co. Ltd. | 112,000 | 81 | ||||
| Evergreen International Storage & Transport Corp. | 91,000 | 81 | ||||
| Weltrend Semiconductor | 36,000 | 81 | ||||
| Sinyi Realty Inc. | 89,000 | 80 | ||||
| IEI Integration Corp. | 31,000 | 79 | ||||
| SDI Corp. | 25,000 | 79 | ||||
| Primax Electronics Ltd. | 38,000 | 79 | ||||
| Pegavision Corp. | 6,514 | 79 | ||||
| Taiwan Sakura Corp. | 40,000 | 78 | ||||
| Advanced Energy Solution Holding Co. Ltd. | 4,000 | 78 | ||||
| Lingsen Precision Industries Ltd. | 129,000 | 77 | ||||
| Dyaco International Inc. | 76,505 | 77 | ||||
| Shares | Market Value• ($000) | |||||
| China Electric Manufacturing Corp. | 140,540 | 76 | ||||
| China Bills Finance Corp. | 165,000 | 76 | ||||
| Advanced International Multitech Co. Ltd. | 32,000 | 76 | ||||
| Shinkong Insurance Co. Ltd. | 42,000 | 76 | ||||
| Etron Technology Inc. | 57,832 | 75 | ||||
| Sampo Corp. | 86,000 | 75 | ||||
| Gamania Digital Entertainment Co. Ltd. | 35,000 | 74 | ||||
| YC INOX Co. Ltd. | 85,476 | 73 | ||||
| Dimerco Express Corp. | 30,451 | 73 | ||||
| Nuvoton Technology Corp. | 19,000 | 73 | ||||
| China Metal Products | 64,000 | 72 | ||||
| Basso Industry Corp. | 59,000 | 72 | ||||
| USI Corp. | 108,000 | 72 | ||||
| * | Taiwan TEA Corp. | 98,000 | 71 | |||
| KMC Kuei Meng International Inc. | 16,000 | 71 | ||||
| Tong-Tai Machine & Tool Co. Ltd. | 128,000 | 70 | ||||
| Tainan Spinning Co. Ltd. | 148,000 | 70 | ||||
| Yieh Phui Enterprise Co. Ltd. | 148,365 | 70 | ||||
| Universal Vision Biotechnology Co. Ltd. | 6,678 | 70 | ||||
| Taiwan Mask Corp. | 32,000 | 70 | ||||
| Allied Supreme Corp. | 8,000 | 70 | ||||
| Machvision Inc. | 11,039 | 69 | ||||
| Co-Tech Development Corp. | 32,000 | 69 | ||||
| Johnson Health Tech Co. Ltd. | 28,000 | 68 | ||||
| * | CyberTAN Technology Inc. | 98,000 | 68 | |||
| Center Laboratories Inc. | 42,409 | 68 | ||||
| Sheng Yu Steel Co. Ltd. | 92,000 | 68 | ||||
| CHC Healthcare Group | 40,000 | 68 | ||||
| Brighton-Best International Taiwan Inc. | 66,000 | 68 | ||||
| Great Tree Pharmacy Co. Ltd. | 6,140 | 68 | ||||
| Solar Applied Materials Technology Corp. | 57,000 | 67 | ||||
| International CSRC Investment Holdings Co. | 104,990 | 66 | ||||
| Supreme Electronics Co. Ltd. | 42,980 | 65 | ||||
| Dynapack International Technology Corp. | 26,000 | 65 | ||||
| Chlitina Holding Ltd. | 11,000 | 65 | ||||
| TSRC Corp. | 86,000 | 64 | ||||
| Taiwan Paiho Ltd. | 42,000 | 63 | ||||
| Rechi Precision Co. Ltd. | 98,000 | 63 | ||||
| Taiflex Scientific Co. Ltd. | 46,000 | 63 | ||||
| Chia Hsin Cement Corp. | 107,100 | 63 | ||||
| Sinon Corp. | 55,000 | 63 | ||||
| Shares | Market Value• ($000) | |||||
| Elitegroup Computer Systems Co. Ltd. | 50,000 | 62 | ||||
| * | Rexon Industrial Corp. Ltd. | 56,000 | 61 | |||
| * | Zinwell Corp. | 66,000 | 60 | |||
| Hsin Kuang Steel Co. Ltd. | 41,000 | 60 | ||||
| * | OBI Pharma Inc. | 22,354 | 60 | |||
| Savior Lifetec Corp. | 104,436 | 60 | ||||
| * | Lealea Enterprise Co. Ltd. | 179,920 | 59 | |||
| * | HannsTouch Holdings Co. | 190,000 | 59 | |||
| Chang Wah Technology Co. Ltd. | 53,500 | 59 | ||||
| Cleanaway Co. Ltd. | 10,000 | 58 | ||||
| Asia Polymer Corp. | 71,757 | 57 | ||||
| Chung Hwa Pulp Corp. | 78,000 | 57 | ||||
| Sonix Technology Co. Ltd. | 41,000 | 57 | ||||
| TTY Biopharm Co. Ltd. | 24,000 | 57 | ||||
| Infortrend Technology Inc. | 86,000 | 57 | ||||
| Syncmold Enterprise Corp. | 30,000 | 57 | ||||
| FocalTech Systems Co. Ltd. | 25,203 | 57 | ||||
| Thinking Electronic Industrial Co. Ltd. | 12,000 | 57 | ||||
| D-Link Corp. | 71,760 | 56 | ||||
| Hung Sheng Construction Ltd. | 92,600 | 56 | ||||
| Namchow Holdings Co. Ltd. | 37,000 | 56 | ||||
| Shiny Chemical Industrial Co. Ltd. | 13,750 | 56 | ||||
| Transcend Information Inc. | 24,000 | 55 | ||||
| Cheng Uei Precision Industry Co. Ltd. | 37,000 | 54 | ||||
| Chun Yuan Steel Industry Co. Ltd. | 99,000 | 54 | ||||
| Farglory Land Development Co. Ltd. | 31,000 | 54 | ||||
| Alpha Networks Inc. | 43,772 | 54 | ||||
| PharmaEngine Inc. | 20,000 | 54 | ||||
| Brogent Technologies Inc. | 15,100 | 54 | ||||
| Chin-Poon Industrial Co. Ltd. | 43,000 | 53 | ||||
| TPK Holding Co. Ltd. | 49,000 | 53 | ||||
| Chang Wah Electromaterials Inc. | 56,000 | 53 | ||||
| Cathay Real Estate Development Co. Ltd. | 110,000 | 52 | ||||
| Motech Industries Inc. | 56,594 | 52 | ||||
| Sensortek Technology Corp. | 5,000 | 52 | ||||
| Hu Lane Associate Inc. | 11,275 | 51 | ||||
| Zeng Hsing Industrial Co. Ltd. | 16,115 | 51 | ||||
| * | Cub Elecparts Inc. | 10,745 | 51 | |||
| Shares | Market Value• ($000) | |||||
| Mercuries & Associates Holding Ltd. | 119,281 | 50 | ||||
| Gemtek Technology Corp. | 42,000 | 49 | ||||
| Advanced Ceramic X Corp. | 8,000 | 49 | ||||
| * | Yeong Guan Energy Technology Group Co. Ltd. | 28,468 | 49 | |||
| General Interface Solution Holding Ltd. | 25,000 | 49 | ||||
| UPI Semiconductor Corp. | 7,000 | 49 | ||||
| Oriental Union Chemical Corp. | 75,000 | 48 | ||||
| Chunghwa Precision Test Tech Co. Ltd. | 3,000 | 48 | ||||
| BES Engineering Corp. | 150,000 | 47 | ||||
| Everlight Chemical Industrial Corp. | 77,000 | 47 | ||||
| Longchen Paper & Packaging Co. Ltd. | 100,803 | 47 | ||||
| LandMark Optoelectronics Corp. | 15,000 | 47 | ||||
| Posiflex Technology Inc. | 14,000 | 46 | ||||
| Nan Liu Enterprise Co. Ltd. | 19,000 | 46 | ||||
| Speed Tech Corp. | 26,000 | 46 | ||||
| Kaimei Electronic Corp. | 23,200 | 46 | ||||
| Sincere Navigation Corp. | 71,900 | 45 | ||||
| ASROCK Inc. | 6,000 | 44 | ||||
| UPC Technology Corp. | 91,000 | 43 | ||||
| T3EX Global Holdings Corp. | 18,000 | 42 | ||||
| Tung Thih Electronic Co. Ltd. | 10,000 | 41 | ||||
| Synmosa Biopharma Corp. | 35,820 | 41 | ||||
| * | Asia Pacific Telecom Co. Ltd. | 204,779 | 40 | |||
| Elite Advanced Laser Corp. | 30,000 | 39 | ||||
| Genesys Logic Inc. | 11,000 | 39 | ||||
| Marketech International Corp. | 9,000 | 39 | ||||
| Holtek Semiconductor Inc. | 19,000 | 38 | ||||
| * | TaiDoc Technology Corp. | 7,000 | 38 | |||
| Actron Technology Corp. | 7,000 | 38 | ||||
| Shin Zu Shing Co. Ltd. | 14,165 | 37 | ||||
| * | Foresee Pharmaceuticals Co. Ltd. | 14,538 | 37 | |||
| AmTRAN Technology Co. Ltd. | 90,888 | 35 | ||||
| Darwin Precisions Corp. | 75,000 | 35 | ||||
| Adlink Technology Inc. | 17,000 | 34 | ||||
| Taiwan Styrene Monomer | 70,000 | 34 | ||||
| China General Plastics Corp. | 43,155 | 33 | ||||
| Shares | Market Value• ($000) | |||||
| * | China Man-Made Fiber Corp. | 133,240 | 33 | |||
| * | Shining Building Business Co. Ltd. | 112,000 | 33 | |||
| * | Federal Corp. | 61,000 | 33 | |||
| Gourmet Master Co. Ltd. | 9,000 | 32 | ||||
| Formosa Sumco Technology Corp. | 7,000 | 32 | ||||
| * | Li Peng Enterprise Co. Ltd. | 128,000 | 31 | |||
| Nantex Industry Co. Ltd. | 25,000 | 29 | ||||
| Global Mixed Mode Technology Inc. | 4,000 | 29 | ||||
| Swancor Holding Co. Ltd. | �� 10,000 | 29 | ||||
| Ability Enterprise Co. Ltd. | 36,000 | 26 | ||||
| 91APP Inc. | 8,000 | 26 | ||||
| Anpec Electronics Corp. | 6,000 | 26 | ||||
| Panion & BF Biotech Inc. | 8,000 | 26 | ||||
| RDC Semiconductor Co. Ltd. | 8,240 | 25 | ||||
| * | Taigen Biopharmaceuticals Holdings Ltd. | 49,000 | 24 | |||
| Ho Tung Chemical Corp. | 85,000 | 23 | ||||
| Yulon Nissan Motor Co. Ltd. | 4,000 | 23 | ||||
| * | PChome Online Inc. | 15,430 | 21 | |||
| Fittech Co. Ltd. | 10,000 | 21 | ||||
| Amazing Microelectronic Corp. | 6,242 | 21 | ||||
| VIA Labs Inc. | 3,000 | 21 | ||||
| * | Medigen Biotechnology Corp. | 18,000 | 20 | |||
| St. Shine Optical Co. Ltd. | 3,000 | 19 | ||||
| * | Ritek Corp. | 71,214 | 19 | |||
| Ultra Chip Inc. | 6,000 | 17 | ||||
| Altek Corp. | 14,000 | 16 | ||||
| * | ALI Corp. | 27,000 | 15 | |||
| * | Gigasolar Materials Corp. | 5,790 | 15 | |||
| ScinoPharm Taiwan Ltd. | 13,000 | 11 | ||||
| Shin Foong Specialty & Applied Materials Co. Ltd. | 7,000 | 11 | ||||
| GeneReach Biotechnology Corp. | 5,660 | 6 | ||||
| *,1 | Unity Opto Technology Co. Ltd. | 90,000 | — | |||
| *,1 | Pharmally International Holding Co. Ltd. | 1,282 | — | |||
| 203,261 | ||||||
| Thailand (0.7%) | ||||||
| CP ALL PCL (Foreign) | 1,022,600 | 1,904 | ||||
| Delta Electronics Thailand PCL (Foreign) | 463,200 | 1,434 | ||||
| * | Airports of Thailand PCL (Foreign) | 688,800 | 1,425 | |||
| Shares | Market Value• ($000) | |||||
| Bangkok Dusit Medical Services PCL (Foreign) | 1,725,200 | 1,379 | ||||
| Advanced Info Service PCL (Foreign) | 195,500 | 1,205 | ||||
| Siam Cement PCL (Foreign) | 118,200 | 1,056 | ||||
| Kasikornbank PCL (Foreign) | 276,700 | 1,031 | ||||
| SCB X PCL (Foreign) | 299,600 | 1,009 | ||||
| Central Pattana PCL (Foreign) | 503,800 | 988 | ||||
| Bumrungrad Hospital PCL (Foreign) | 94,300 | 697 | ||||
| Minor International PCL (Foreign) | 696,400 | 661 | ||||
| Krung Thai Bank PCL (Foreign) | 983,000 | 542 | ||||
| Central Retail Corp. PCL (Foreign) | 444,400 | 523 | ||||
| Energy Absolute PCL (Foreign) | 285,400 | 515 | ||||
| Bangkok Bank PCL (Foreign) | 102,700 | 497 | ||||
| Charoen Pokphand Foods PCL (Foreign) | 762,500 | 451 | ||||
| Intouch Holdings PCL (Foreign) | 195,356 | 406 | ||||
| Home Product Center PCL (Foreign) | 1,024,400 | 400 | ||||
| Bangkok Expressway & Metro PCL (Foreign) | 1,508,700 | 373 | ||||
| PTT Global Chemical PCL (Foreign) | 319,600 | 340 | ||||
| TMBThanachart Bank PCL (Foreign) | 6,695,824 | 327 | ||||
| Tisco Financial Group PCL (Foreign) | 110,400 | 325 | ||||
| True Corp. PCL (Foreign) | 1,623,714 | 320 | ||||
| Land & Houses PCL (Foreign) | 1,277,100 | 303 | ||||
| Indorama Ventures PCL (Foreign) | 350,700 | 290 | ||||
| Krungthai Card PCL (Foreign) | 202,600 | 280 | ||||
| BTS Group Holdings PCL (Foreign) | 1,331,200 | 279 | ||||
| Kiatnakin Phatra Bank PCL (Foreign) | 158,400 | 271 | ||||
| Thonburi Healthcare Group PCL (Foreign) | 120,600 | 226 | ||||
| CP Axtra PCL (Foreign) | 214,037 | 221 | ||||
| SCG Packaging PCL (Foreign) | 188,000 | 220 | ||||
| * | Central Plaza Hotel PCL (Foreign) | 158,700 | 216 | |||
| Com7 PCL (Foreign) | 214,100 | 197 | ||||
| Thai Union Group PCL (Foreign) | 464,300 | 190 | ||||
| KCE Electronics PCL (Foreign) | 126,800 | ��� 184 | ||||
| Osotspa PCL (Foreign) | 209,000 | 179 | ||||
| Shares | Market Value• ($000) | |||||
| Thanachart Capital PCL (Foreign) | 118,500 | 173 | ||||
| Hana Microelectronics PCL (Foreign) | 94,300 | 167 | ||||
| Supalai PCL (Foreign) | 246,800 | 153 | ||||
| Berli Jucker PCL (Foreign) | 154,400 | 149 | ||||
| Srisawad Corp. PCL (Foreign) | 99,100 | 144 | ||||
| Asset World Corp. PCL (Foreign) | 1,079,700 | 134 | ||||
| Siam Global House PCL (Foreign) | 247,874 | 133 | ||||
| Ngern Tid Lor PCL (Foreign) | 194,513 | 131 | ||||
| AP Thailand PCL (Foreign) | 357,600 | 130 | ||||
| * | Beyond Securities PCL (Foreign) | 493,900 | 129 | |||
| JMT Network Services PCL (Foreign) | 96,292 | 128 | ||||
| Sansiri PCL (Foreign) | 2,125,700 | 124 | ||||
| Muangthai Capital PCL (Foreign) | 105,000 | 122 | ||||
| Sino-Thai Engineering & Construction PCL (Foreign) | 303,000 | 104 | ||||
| Amata Corp. PCL (Foreign) | 136,593 | 99 | ||||
| Ramkhamhaeng Hospital PCL (Foreign) | 75,100 | 94 | ||||
| Bangkok Chain Hospital PCL (Foreign) | 168,500 | 93 | ||||
| Bangkok Commercial Asset Management PCL (Foreign) | 270,300 | 92 | ||||
| Forth Corp. PCL (Foreign) | 90,900 | 91 | ||||
| Vibhavadi Medical Center PCL (Foreign) | 1,254,700 | 82 | ||||
| Chularat Hospital PCL (Foreign) | 885,000 | 80 | ||||
| AEON Thana Sinsap Thailand PCL (Foreign) | 15,000 | 75 | ||||
| Thailand Future Fund | 347,700 | 75 | ||||
| Mega Lifesciences PCL (Foreign) | 56,000 | 70 | ||||
| VGI PCL (Foreign) | 790,949 | 67 | ||||
| Quality Houses PCL (Foreign) | 994,900 | 66 | ||||
| Jaymart Group Holdings PCL (Foreign) | 95,100 | 65 | ||||
| Plan B Media PCL (Foreign) | 228,468 | 61 | ||||
| 3 | Dohome PCL (Foreign) | 183,366 | 61 | |||
| Dhipaya Group Holdings PCL (Foreign) | 50,400 | 60 | ||||
| TOA Paint Thailand PCL (Foreign) | 75,200 | 57 | ||||
| Bangkok Life Assurance PCL NVDR | 80,800 | 56 | ||||
| Shares | Market Value• ($000) | |||||
| * | Bangkok Airways PCL (Foreign) | 110,500 | 55 | |||
| Siam City Cement PCL (Foreign) | 13,400 | 53 | ||||
| * | Jasmine Technology Solution PCL (Foreign) | 51,700 | 53 | |||
| Sri Trang Agro-Industry PCL (Foreign) | 125,500 | 52 | ||||
| Thai Vegetable Oil PCL (Foreign) | 76,070 | 51 | ||||
| Thoresen Thai Agencies PCL (Foreign) | 289,000 | 51 | ||||
| BEC World PCL (Foreign) | 193,400 | 48 | ||||
| Tipco Asphalt PCL (Foreign) | 94,800 | 47 | ||||
| TTW PCL (Foreign) | 179,400 | 45 | ||||
| TQM Alpha PCL (Foreign) | 46,700 | 41 | ||||
| * | Bangkok Land PCL (Foreign) | 1,730,200 | 40 | |||
| Singer Thailand PCL (Foreign) | 90,800 | 39 | ||||
| Major Cineplex Group PCL (Foreign) | 92,700 | 38 | ||||
| Thaicom PCL (Foreign) | 93,100 | 38 | ||||
| Workpoint Entertainment PCL (Foreign) | 80,100 | 35 | ||||
| *,1 | Thai Airways International PCL (Foreign) | 469,000 | 34 | |||
| MBK PCL (Foreign) | 59,400 | 31 | ||||
| * | Jasmine International PCL (Foreign) | 539,700 | 31 | |||
| Taokaenoi Food & Marketing PCL (Foreign) | 77,500 | 31 | ||||
| Pruksa Holding PCL (Foreign) | 78,900 | 30 | ||||
| Sri Trang Gloves Thailand PCL (Foreign) | 142,600 | 30 | ||||
| MK Restaurants Group PCL (Foreign) | 21,000 | 28 | ||||
| BCPG PCL (Foreign) | 95,352 | 28 | ||||
| Ratchthani Leasing PCL (Foreign) | 285,000 | 28 | ||||
| GFPT PCL (Foreign) | 83,900 | 26 | ||||
| * | Italian-Thai Development PCL (Foreign) | 575,900 | 26 | |||
| Thaifoods Group PCL (Foreign) | 213,600 | 24 | ||||
| Precious Shipping PCL (Foreign) | 89,000 | 23 | ||||
| LPN Development PCL (Foreign) | 190,300 | 23 | ||||
| * | Super Energy Corp. PCL (Foreign) | 1,608,300 | 23 | |||
| SPCG PCL (Foreign) | 57,800 | 21 | ||||
| * | Samart Corp. PCL (Foreign) | 116,300 | 20 | |||
| Shares | Market Value• ($000) | |||||
| * | Rabbit Holdings PCL (Foreign) | 738,100 | 19 | |||
| Origin Property PCL (Foreign) | 38,000 | 11 | ||||
| Advanced Info Service PCL | 1,200 | 7 | ||||
| 25,309 | ||||||
| Turkey (0.3%) | ||||||
| * | Turk Hava Yollari AO | 84,323 | 772 | |||
| BIM Birlesik Magazalar A/S | 70,553 | 666 | ||||
| Akbank TAS | 483,007 | 520 | ||||
| Turkiye Sise ve Cam Fabrikalari A/S | 265,964 | 510 | ||||
| Turkiye Is Bankasi A/S Class C | 509,653 | 401 | ||||
| * | Eregli Demir ve Celik Fabrikalari TAS | 248,984 | 400 | |||
| * | Turkcell Iletisim Hizmetleri A/S | 187,165 | 390 | |||
| Ford Otomotiv Sanayi A/S | 9,454 | 305 | ||||
| Yapi ve Kredi Bankasi A/S | 464,668 | 276 | ||||
| Is Yatirim Menkul Degerler A/S | 150,933 | 240 | ||||
| AG Anadolu Grubu Holding A/S | 26,745 | 207 | ||||
| Coca-Cola Icecek A/S | 13,425 | 198 | ||||
| * | Pegasus Hava Tasimaciligi A/S | 5,600 | 183 | |||
| * | Hektas Ticaret TAS | 188,434 | 181 | |||
| Turkiye Garanti Bankasi A/S | 95,765 | 180 | ||||
| Tofas Turk Otomobil Fabrikasi A/S | 16,997 | 172 | ||||
| * | Gubre Fabrikalari TAS | 12,309 | 164 | |||
| Migros Ticaret A/S | 12,293 | 160 | ||||
| Kardemir Karabuk Demir Celik Sanayi ve Ticaret A/S | 162,844 | 152 | ||||
| Turk Traktor ve Ziraat Makineleri A/S | 4,460 | 152 | ||||
| * | Oyak Cimento Fabrikalari A/S | 60,330 | 143 | |||
| 2 | Mavi Giyim Sanayi ve Ticaret A/S Class B | 33,892 | 137 | |||
| * | Petkim Petrokimya Holding A/S | 160,441 | 123 | |||
| * | Ulker Biskuvi Sanayi A/S | 43,170 | 98 | |||
| Emlak Konut Gayrimenkul Yatirim Ortakligi A/S | 297,714 | 96 | ||||
| Borusan Yatirim ve Pazarlama A/S | 1,289 | 96 | ||||
| Sok Marketler Ticaret A/S | 40,730 | 95 | ||||
| Sarkuysan Elektrolitik Bakir Sanayi ve Ticaret A/S | 66,713 | 94 | ||||
| *,2 | MLP Saglik Hizmetleri A/S Class B | 18,870 | 90 | |||
| Shares | Market Value• ($000) | |||||
| Dogus Otomotiv Servis ve Ticaret A/S | 7,746 | 83 | ||||
| * | Turkiye Vakiflar Bankasi TAO | 162,457 | 83 | |||
| * | TAV Havalimanlari Holding A/S | 17,778 | 82 | |||
| Nuh Cimento Sanayi A/S | 11,274 | 80 | ||||
| * | Yatas Yatak ve Yorgan Sanayi ve Ticaret A/S | 53,666 | 79 | |||
| * | Arcelik A/S | 11,806 | 72 | |||
| * | Is Gayrimenkul Yatirim Ortakligi A/S | 99,192 | 71 | |||
| * | Tat Gida Sanayi A/S | 42,142 | 68 | |||
| Torunlar Gayrimenkul Yatirim Ortakligi A/S | 70,799 | 68 | ||||
| Dogan Sirketler Grubu Holding A/S | 124,692 | 66 | ||||
| Logo Yazilim Sanayi ve Ticaret A/S | 23,155 | 64 | ||||
| * | Turk Telekomunikasyon A/S | 63,776 | 61 | |||
| * | Aksigorta A/S | 315,652 | 60 | |||
| Cimsa Cimento Sanayi ve Ticaret A/S | 7,525 | 60 | ||||
| * | Konya Cimento Sanayii A/S | 247 | 54 | |||
| EGE Endustri ve Ticaret A/S | 195 | 52 | ||||
| Aygaz A/S | 11,072 | 50 | ||||
| * | Koza Anadolu Metal Madencilik Isletmeleri A/S | 20,611 | 50 | |||
| * | Is Finansal Kiralama A/S | 96,694 | 48 | |||
| * | Turkiye Halk Bankasi A/S | 93,985 | 47 | |||
| Bera Holding A/S | 92,664 | 47 | ||||
| Akcansa Cimento A/S | 8,930 | 46 | ||||
| EIS Eczacibasi Ilac ve Sinai ve Finansal Yatirimlar Sanayi ve Ticaret A/S | 24,671 | 46 | ||||
| * | Turkiye Sinai Kalkinma Bankasi A/S | 159,385 | 42 | |||
| Tekfen Holding A/S | 22,841 | 41 | ||||
| Kartonsan Karton Sanayi ve Ticaret A/S | 12,049 | 38 | ||||
| * | Bursa Cimento Fabrikasi A/S | 119,826 | 36 | |||
| 2 | Enerjisa Enerji A/S | 18,394 | 35 | |||
| * | Vestel Elektronik Sanayi ve Ticaret A/S | 13,419 | 34 | |||
| * | Baticim Bati Anadolu Cimento Sanayii A/S | 13,816 | 32 | |||
| Kordsa Teknik Tekstil A/S | 9,659 | 30 | ||||
| * | Penta Teknoloji Urunleri Dagitim Ticaret A/S | 34,291 | 30 | |||
| Kardemir Karabuk Demir Celik Sanayi ve Ticaret A/S Class A | 31,509 | 28 | ||||
| * | Imas Makina Sanayi A/S | 36,497 | 24 | |||
| * | Iskenderun Demir ve Celik A/S | 15,458 | 23 | |||
| Shares | Market Value• ($000) | |||||
| Brisa Bridgestone Sabanci Sanayi ve Ticaret A/S | 7,642 | 21 | ||||
| * | Ziraat Gayrimenkul Yatirim Ortakligi A/S | 102,610 | 21 | |||
| * | Albaraka Turk Katilim Bankasi A/S | 119,176 | 18 | |||
| * | Kizilbuk Gayrimenkul Yatirim Ortakligi A/S | 19,623 | 17 | |||
| Polisan Holding A/S | 33,442 | 16 | ||||
| Baskent Dogalgaz Dagitim Gayrimenkul Yatirim Ortakligi A/S | 21,642 | 15 | ||||
| Kervan Gida Sanayi ve Ticaret A/S Class B | 14,653 | 14 | ||||
| * | Sinpas Gayrimenkul Yatirim Ortakligi A/S | 113,550 | 14 | |||
| Sekerbank Turk A/S | 83,507 | 13 | ||||
| Turkiye Petrol Rafinerileri A/S | 1 | — | ||||
| * | Zorlu Enerji Elektrik Uretim A/S | 1 | — | |||
| 9,180 | ||||||
| United Arab Emirates (0.4%) | ||||||
| Emirates Telecommunications Group Co. PJSC | 584,376 | 3,156 | ||||
| First Abu Dhabi Bank PJSC | 732,986 | 2,729 | ||||
| Emaar Properties PJSC | 1,107,440 | 2,128 | ||||
| * | Alpha Dhabi Holding PJSC | 222,668 | 1,218 | |||
| Abu Dhabi Commercial Bank PJSC | 468,102 | 1,100 | ||||
| Dubai Electricity & Water Authority PJSC | 1,258,441 | 874 | ||||
| Aldar Properties PJSC | 563,840 | 807 | ||||
| Abu Dhabi Islamic Bank PJSC | 259,408 | 736 | ||||
| Air Arabia PJSC | 500,431 | 402 | ||||
| Dubai Investments PJSC | 352,810 | 238 | ||||
| Emaar Development PJSC | 128,179 | 229 | ||||
| Sharjah Islamic Bank | 286,561 | 196 | ||||
| * | National Marine Dredging Co. | 32,870 | 194 | |||
| * | RAK Properties PJSC | 520,983 | 164 | |||
| Dubai Financial Market PJSC | 301,364 | 132 | ||||
| GFH Financial Group BSC | 390,935 | 104 | ||||
| AL Yah Satellite Communications Co-PJSC-Yah Sat | 149,892 | 103 | ||||
| Aramex PJSC | 127,687 | 88 | ||||
| *,1 | Arabtec Holding PJSC | 101,139 | 15 | |||
| 14,613 | ||||||
| United Kingdom (7.9%) | ||||||
| AstraZeneca plc | 244,678 | 32,866 | ||||
| Unilever plc (XLON) | 313,286 | 15,999 | ||||
| GSK plc | 668,465 | 11,709 | ||||
| Shares | Market Value• ($000) | |||||
| RELX plc | 316,166 | 10,305 | ||||
| Reckitt Benckiser Group plc | 118,526 | 8,554 | ||||
| London Stock Exchange Group plc | 71,121 | 7,358 | ||||
| Compass Group plc | 289,625 | 7,303 | ||||
| CRH plc | 122,898 | 7,063 | ||||
| Lloyds Banking Group plc | 11,001,303 | 5,878 | ||||
| Ferguson plc | 34,601 | 5,614 | ||||
| Prudential plc | 457,912 | 5,577 | ||||
| Experian plc | 153,540 | 5,362 | ||||
| Unilever plc (XAMS) | 101,641 | 5,200 | ||||
| Ashtead Group plc | 73,184 | 5,105 | ||||
| Barclays plc | 2,585,851 | 4,817 | ||||
| Tesco plc | 1,224,435 | 4,119 | ||||
| 3i Group plc | 159,438 | 4,015 | ||||
| Haleon plc | 875,066 | 3,583 | ||||
| Standard Chartered plc | 386,581 | 3,478 | ||||
| Vodafone Group plc | 3,661,158 | 3,394 | ||||
| Rentokil Initial plc | 420,236 | 3,199 | ||||
| Legal & General Group plc | 985,632 | 2,723 | ||||
| NatWest Group plc | 906,199 | 2,635 | ||||
| Informa plc | 246,683 | 2,279 | ||||
| Aviva plc | 466,573 | 2,214 | ||||
| Sage Group plc | 179,017 | 2,200 | ||||
| InterContinental Hotels Group plc | 28,206 | 2,122 | ||||
| Bunzl plc | 58,425 | 2,092 | ||||
| Smith & Nephew plc | 149,414 | 2,016 | ||||
| Smurfit Kappa Group plc | 46,050 | 1,933 | ||||
| Segro plc | 206,774 | 1,928 | ||||
| Next plc | 21,385 | 1,890 | ||||
| Halma plc | 66,378 | 1,799 | ||||
| Burberry Group plc | 64,949 | 1,793 | ||||
| WPP plc | 183,168 | 1,776 | ||||
| BT Group plc | 1,173,190 | 1,716 | ||||
| Croda International plc | 23,715 | 1,656 | ||||
| Admiral Group plc | 47,249 | 1,489 | ||||
| Mondi plc | 89,446 | 1,486 | ||||
| Associated British Foods plc | 54,613 | 1,376 | ||||
| Whitbread plc | 31,065 | 1,351 | ||||
| Pearson plc | 123,236 | 1,306 | ||||
| United Utilities Group plc | 106,072 | 1,270 | ||||
| 2 | Auto Trader Group plc | 159,550 | 1,223 | |||
| Severn Trent plc | 37,500 | 1,139 | ||||
| B&M European Value Retail SA | 153,411 | 1,121 | ||||
| * | Ocado Group plc | 100,844 | 1,111 | |||
| St. James's Place plc | 96,513 | 1,079 | ||||
| Rightmove plc | 151,311 | 1,071 | ||||
| Antofagasta plc | 58,366 | 1,069 | ||||
| J Sainsbury plc | 311,646 | 1,066 | ||||
| Kingfisher plc | 357,130 | 1,058 | ||||
| Berkeley Group Holdings plc | 19,537 | 1,004 | ||||
| Barratt Developments plc | 174,880 | 1,002 | ||||
| DCC plc | 17,954 | 982 | ||||
| Shares | Market Value• ($000) | |||||
| * | Marks & Spencer Group plc | 340,219 | 976 | |||
| DS Smith plc | 243,450 | 961 | ||||
| * | Wise plc Class A | 118,424 | 959 | |||
| Coca-Cola HBC AG | 33,070 | 953 | ||||
| Howden Joinery Group plc | 101,632 | 951 | ||||
| M&G plc | 393,059 | 949 | ||||
| Taylor Wimpey plc | 636,671 | 920 | ||||
| Dechra Pharmaceuticals plc | 17,853 | 858 | ||||
| Diploma plc | 21,473 | 850 | ||||
| Intermediate Capital Group plc | 49,688 | 849 | ||||
| Beazley plc | 119,123 | 822 | ||||
| Hikma Pharmaceuticals plc | 29,510 | 815 | ||||
| Phoenix Group Holdings plc | 122,433 | 807 | ||||
| Games Workshop Group plc | 5,878 | 805 | ||||
| Land Securities Group plc | 104,889 | 799 | ||||
| JD Sports Fashion plc | 434,855 | 798 | ||||
| Spectris plc | 18,869 | 794 | ||||
| UNITE Group plc | 65,975 | 785 | ||||
| Britvic plc | 67,669 | 752 | ||||
| 2 | ConvaTec Group plc | 252,993 | 743 | |||
| Persimmon plc | 54,839 | 739 | ||||
| British Land Co. plc | 179,997 | 736 | ||||
| abrdn plc | 352,141 | 735 | ||||
| Tate & Lyle plc | 79,860 | 714 | ||||
| Johnson Matthey plc | 34,563 | 713 | ||||
| RS Group plc | 73,321 | 705 | ||||
| Schroders plc | 133,544 | 695 | ||||
| Hargreaves Lansdown plc | 70,036 | 674 | ||||
| Investec plc | 113,936 | 673 | ||||
| Greggs plc | 21,458 | 669 | ||||
| Endeavour Mining plc | 31,943 | 652 | ||||
| Hiscox Ltd. | 49,695 | 627 | ||||
| Bellway plc | 23,036 | 623 | ||||
| ITV plc | 642,719 | 575 | ||||
| Vistry Group plc | 56,713 | 561 | ||||
| Man Group plc | 207,200 | 555 | ||||
| Inchcape plc | 55,595 | 537 | ||||
| Derwent London plc | 21,937 | 516 | ||||
| * | Direct Line Insurance Group plc | 234,864 | 481 | |||
| WH Smith plc | 24,571 | 456 | ||||
| IG Group Holdings plc | 52,945 | 453 | ||||
| * | TUI AG | 75,901 | 450 | |||
| LondonMetric Property plc | 175,355 | 402 | ||||
| Softcat plc | 20,626 | 392 | ||||
| Genus plc | 13,141 | 387 | ||||
| *,2 | Network International Holdings plc | 78,478 | 386 | |||
| Pennon Group plc | 47,237 | 385 | ||||
| * | International Distributions Services plc | 124,831 | 383 | |||
| Shares | Market Value• ($000) | |||||
| Virgin Money UK plc | 181,120 | 372 | ||||
| Safestore Holdings plc | 32,209 | 352 | ||||
| Grainger plc | 113,645 | 340 | ||||
| Bank of Georgia Group plc | 7,686 | 339 | ||||
| Domino's Pizza Group plc | 65,609 | 328 | ||||
| * | Oxford Nanopore Technologies plc | 107,185 | 324 | |||
| * | Darktrace plc | 70,484 | 321 | |||
| Big Yellow Group plc | 23,557 | 320 | ||||
| Shaftesbury Capital plc | 214,573 | 319 | ||||
| * | Carnival plc | 22,340 | 316 | |||
| Pets at Home Group plc | 65,569 | 313 | ||||
| 2 | Airtel Africa plc | 207,911 | 300 | |||
| * | easyJet plc | 55,847 | 298 | |||
| Close Brothers Group plc | 28,390 | 295 | ||||
| Mitie Group plc | 238,464 | 293 | ||||
| TBC Bank Group plc | 8,117 | 292 | ||||
| *,2 | Deliveroo plc Class A | 202,828 | 290 | |||
| Paragon Banking Group plc | 42,275 | 282 | ||||
| * | International Consolidated Airlines Group SA | 137,503 | 281 | |||
| Computacenter plc | 9,981 | 276 | ||||
| OSB Group plc | 62,537 | 270 | ||||
| TP ICAP Group plc | 128,646 | 269 | ||||
| 4imprint Group plc | 4,119 | 266 | ||||
| Hays plc | 195,323 | 265 | ||||
| Grafton Group plc | 23,343 | 255 | ||||
| *,2 | Watches of Switzerland Group plc | 34,680 | 255 | |||
| Victrex plc | 13,350 | 254 | ||||
| Cranswick plc | 5,851 | 250 | ||||
| * | Frasers Group plc | 23,752 | 243 | |||
| Dunelm Group plc | 16,399 | 242 | ||||
| Lancashire Holdings Ltd. | 32,351 | 234 | ||||
| Plus500 Ltd. | 12,851 | 232 | ||||
| Redrow plc | 38,445 | 231 | ||||
| * | IWG plc | 98,718 | 224 | |||
| *,2 | Trainline plc | 74,686 | 221 | |||
| Moneysupermarket.com Group plc | 69,893 | 220 | ||||
| Coats Group plc | 226,470 | 220 | ||||
| Pagegroup plc | 41,055 | 218 | ||||
| Centamin plc | 192,034 | 213 | ||||
| *,2 | Aston Martin Lagonda Global Holdings plc | 45,706 | 206 | |||
| Kainos Group plc | 13,262 | 204 | ||||
| 2 | Quilter plc | 187,691 | 203 | |||
| Firstgroup plc | 109,698 | 201 | ||||
| Sirius Real Estate Ltd. | 180,711 | 199 | ||||
| * | THG plc Class B | 159,991 | 199 | |||
| Telecom Plus plc | 9,552 | 192 | ||||
| Fresnillo plc | 26,432 | 192 | ||||
| Supermarket Income REIT plc | 194,176 | 190 | ||||
| Assura plc | 321,991 | 187 | ||||
| Shares | Market Value• ($000) | |||||
| Primary Health Properties plc | 154,184 | 184 | ||||
| Savills plc | 15,760 | 182 | ||||
| Hammerson plc | 574,845 | 175 | ||||
| Ashmore Group plc | 69,207 | 170 | ||||
| Spirent Communications plc | 85,580 | 170 | ||||
| Future plc | 17,277 | 170 | ||||
| Dr. Martens plc | 85,408 | 170 | ||||
| * | Ascential plc | 61,681 | 157 | |||
| Bytes Technology Group plc | 25,620 | 157 | ||||
| Rathbones Group plc | 6,545 | 146 | ||||
| 2 | JTC plc | 16,112 | 142 | |||
| Just Group plc | 144,144 | 137 | ||||
| Great Portland Estates plc | 25,718 | 137 | ||||
| Genuit Group plc | 33,160 | 134 | ||||
| RHI Magnesita NV | 3,748 | 134 | ||||
| Workspace Group plc | 20,840 | 132 | ||||
| AJ Bell plc | 35,417 | 130 | ||||
| Volution Group plc | 26,478 | 128 | ||||
| * | Helios Towers plc | 109,266 | 126 | |||
| IntegraFin Holdings plc | 39,648 | 121 | ||||
| Premier Foods plc | 75,666 | 118 | ||||
| * | Auction Technology Group plc | 13,116 | 118 | |||
| Redde Northgate plc | 27,801 | 113 | ||||
| Marshalls plc | 31,469 | 109 | ||||
| Clarkson plc | 3,174 | 109 | ||||
| * | Moonpig Group plc | 48,020 | 103 | |||
| * | S4 Capital plc | 77,426 | 97 | |||
| 2 | Spire Healthcare Group plc | 34,587 | 95 | |||
| Currys plc | 141,319 | 89 | ||||
| * | PureTech Health plc | 35,771 | 89 | |||
| Keller Group plc | 8,904 | 87 | ||||
| Vesuvius plc | 15,181 | 85 | ||||
| PZ Cussons plc | 40,812 | 82 | ||||
| 2 | Bridgepoint Group plc | 36,608 | 81 | |||
| IP Group plc | 107,808 | 80 | ||||
| Hilton Food Group plc | 9,416 | 80 | ||||
| * | Alphawave IP Group plc | 43,172 | 79 | |||
| Ninety One plc | 35,925 | 78 | ||||
| Crest Nicholson Holdings plc | 33,944 | 77 | ||||
| 2 | Ibstock plc | 39,118 | 74 | |||
| * | AO World plc | 60,942 | 72 | |||
| Picton Property Income Ltd. | 81,152 | 71 | ||||
| Mobico Group plc | 66,519 | 70 | ||||
| * | Greencore Group plc | 64,694 | 69 | |||
| FDM Group Holdings plc | 9,307 | 68 | ||||
| * | Elementis plc | 46,692 | 67 | |||
| * | Molten Ventures plc | 21,588 | 66 | |||
| 2 | TI Fluid Systems plc | 39,793 | 64 | |||
| 2 | Petershill Partners plc | 28,505 | 63 | |||
| Halfords Group plc | 26,302 | 61 | ||||
| *,3 | ASOS plc | 11,038 | 61 | |||
| Liontrust Asset Management plc | 7,017 | 58 | ||||
| Shares | Market Value• ($000) | |||||
| XP Power Ltd. | 2,029 | 55 | ||||
| * | Oxford Biomedica plc | 12,600 | 51 | |||
| Wickes Group plc | 27,870 | 50 | ||||
| Jupiter Fund Management plc | 38,914 | 49 | ||||
| *,2 | Trustpilot Group plc | 46,538 | 48 | |||
| * | Ferrexpo plc | 48,315 | 47 | |||
| * | Synthomer plc | 57,042 | 46 | |||
| Hochschild Mining plc | 39,324 | 46 | ||||
| NCC Group plc | 34,647 | 44 | ||||
| Vanquis Banking Group plc | 30,705 | 40 | ||||
| CLS Holdings plc | 23,736 | 38 | ||||
| Helical plc | 10,512 | 31 | ||||
| 2 | Bakkavor Group plc | 21,342 | 27 | |||
| * | SIG plc | 45,294 | 19 | |||
| AG Barr plc | 2,978 | 18 | ||||
| 2 | CMC Markets plc | 9,033 | 12 | |||
| *,1 | NMC Health plc | 4,208 | — | |||
| 266,555 | ||||||
| Total Common Stocks (Cost $3,372,957) | 3,342,280 | |||||
| Preferred Stocks (0.7%) | ||||||
| Samsung Electronics Co. Ltd. Preference Shares | 130,919 | 5,344 | ||||
| Itau Unibanco Holding SA Preference Shares | 742,778 | 4,114 | ||||
| Banco Bradesco SA Preference Shares | 824,706 | 2,490 | ||||
| Sartorius AG Preference Shares | 4,449 | 1,819 | ||||
| Itausa SA Preference Shares | 819,211 | 1,529 | ||||
| Henkel AG & Co. KGaA Preference Shares | 19,334 | 1,482 | ||||
| Sociedad Quimica y Minera de Chile SA Preference Shares Class B | 16,720 | 1,035 | ||||
| Bayerische Motoren Werke AG Preference Shares | 9,444 | 907 | ||||
| Hyundai Motor Co. Preference Shares | 11,596 | 898 | ||||
| Gerdau SA Preference Shares | 171,150 | 893 | ||||
| LG Chem Ltd. Preference Shares | 2,724 | 703 | ||||
| Bancolombia SA Preference Shares | 56,362 | 375 | ||||
| Cia Energetica de Minas Gerais Preference Shares | 131,686 | 328 | ||||
| Sixt SE Preference Shares | 3,840 | 249 | ||||
| LG Electronics Inc. Preference Shares | 6,781 | 240 | ||||
| Metalurgica Gerdau SA Preference Shares | 91,100 | 217 | ||||
| Shares | Market Value• ($000) | |||||
| Samsung SDI Co. Ltd. Preference Shares | 911 | 207 | ||||
| Samsung Fire & Marine Insurance Co. Ltd. Preference Shares | 1,490 | 204 | ||||
| Marcopolo SA Preference Shares | 132,300 | 162 | ||||
| Bradespar SA Preference Shares | 35,309 | 160 | ||||
| * | Azul SA Preference Shares | 49,063 | 144 | |||
| Unipar Carbocloro SA Preference Shares Class B | 8,521 | 133 | ||||
| Amorepacific Corp. Preference Shares | 4,447 | 132 | ||||
| Raizen SA Preference Shares | 179,700 | 132 | ||||
| Banco Pan SA Preference Shares | 53,100 | 94 | ||||
| Cia de Ferro Ligas da Bahia FERBASA Preference Shares | 10,100 | 94 | ||||
| CTEEP-Cia de Transmissao de Energia Eletrica Paulista Preference Shares | 17,400 | 88 | ||||
| Banco Davivienda SA Preference Shares | 19,293 | 87 | ||||
| Grupo Aval Acciones y Valores SA Preference Shares | 638,547 | 79 | ||||
| Corem Property Group AB Preference Shares | 4,568 | 79 | ||||
| Usinas Siderurgicas de Minas Gerais SA Usiminas Preference Shares Class A | 53,400 | 74 | ||||
| LG H&H Co. Ltd. Preference Shares | 474 | 69 | ||||
| Randon SA Implementos e Participacoes Preference Shares | 27,400 | 66 | ||||
| * | Alpargatas SA Preference Shares | 36,500 | 62 | |||
| * | Gol Linhas Aereas Inteligentes SA Preference Shares | 40,679 | 58 | |||
| Grupo de Inversiones Suramericana SA Preference Shares | 16,290 | 50 | ||||
| Daishin Securities Co. Ltd. Preference Shares | 3,701 | 38 | ||||
| Cia de Saneamento do Parana Preference Shares | 37,400 | 34 | ||||
| Banco do Estado do Rio Grande do Sul SA Preference Shares Class B | 9,200 | 23 | ||||
| Shares | Market Value• ($000) | |||||
| Draegerwerk AG & Co. KGaA Preference Shares | 235 | 11 | ||||
| FUCHS SE Preference Shares | 203 | 9 | ||||
| Iguatemi SA Preference Shares | 4,931 | 7 | ||||
| CJ CheilJedang Corp. Preference Shares | 25 | 3 | ||||
| *,1 | Rosseti Lenenergo PJSC Preference Shares | 25,440 | — | |||
| Total Preferred Stocks (Cost $26,830) | 24,922 | |||||
| Rights (0.0%) | ||||||
| * | Swedish Orphan Biovitrum AB Exp. 9/14/23 | 28,339 | 26 | |||
| * | Itausa SA Exp. 9/22/23 | 11,393 | 6 | |||
| * | SK REITs Co. Ltd. Exp. 9/22/23 | 9,700 | 3 | |||
| * | Marfrig Global Foods SA Exp. 9/18/23 | 22,933 | 1 | |||
| *,1 | S IMMO AG | 5,093 | — | |||
| *,1 | Samart Corp. PCL Exp. 12/19/23 | 1,163 | — | |||
| *,1 | CJ CGV Co. Ltd. Exp. 9/7/23 | 2,987 | — | |||
| *,1 | Actron Technology Corp. Exp. 9/18/23 | 574 | — | |||
| *,1 | Mercuries & Associates Holding Ltd. Exp. 9/12/23 | 20,688 | — | |||
| * | Gol Linhas Aereas Inteligentes SA Exp. 9/26/23 | 183,978 | — | |||
| Total Rights (Cost $33) | 36 | |||||
| Warrants (0.0%) | ||||||
| * | Webuild SpA Exp. 8/2/30 | 3,597 | 3 | |||
| Shares | Market Value• ($000) | |||||
| * | VGI PCL Exp. 5/23/27 | 88,419 | — | |||
| Total Warrants (Cost $—) | 3 | |||||
| Temporary Cash Investments (1.3%) | ||||||
| Money Market Fund (1.3%) | ||||||
| 4,5 | Vanguard Market Liquidity Fund, 5.384% (Cost $43,446) | 434,541 | 43,450 | |||
| Total Investments (100.6%) (Cost $3,443,266) | 3,410,691 | |||||
| Other Assets and Liabilities—Net (-0.6%) | (20,993) | |||||
| Net Assets (100%) | 3,389,698 | |||||
| Cost is in $000. |
| • | See Note A in Notes to Financial Statements. |
| * | Non-income-producing security. |
| 1 | Security value determined using significant unobservable inputs. |
| 2 | Security exempt from registration under Rule 144A of the Securities Act of 1933. Such securities may be sold in transactions exempt from registration, normally to qualified institutional buyers. At August 31, 2023, the aggregate value was $106,252,000, representing 3.1% of net assets. |
| 3 | Includes partial security positions on loan to broker-dealers. The total value of securities on loan is $26,431,000. |
| 4 | Affiliated money market fund available only to Vanguard funds and certain trusts and accounts managed by Vanguard. Rate shown is the 7-day yield. |
| 5 | Collateral of $31,046,000 was received for securities on loan. |
| ADR—American Depositary Receipt. | |
| GDR—Global Depositary Receipt. | |
| NVDR—Non-Voting Depositary Receipt. | |
| REIT—Real Estate Investment Trust. |
| Futures Contracts | ||||
| ($000) | ||||
| Expiration | Number of Long (Short) Contracts | Notional Amount | Value and Unrealized Appreciation (Depreciation) | |
| Long Futures Contracts | ||||
| MSCI EAFE Index | September 2023 | 140 | 14,765 | (275) |
| MSCI Emerging Market Index | September 2023 | 136 | 6,659 | (245) |
| (520) | ||||
| Forward Currency Contracts | |||||||
| Contract Settlement Date | Contract Amount (000) | Unrealized Appreciation ($000) | Unrealized (Depreciation) ($000) | ||||
| Counterparty | Receive | Deliver | |||||
| BNP Paribas | 9/20/23 | AUD | 1,553 | USD | 1,047 | — | (40) |
| BNP Paribas | 9/20/23 | EUR | 1,272 | USD | 1,411 | — | (31) |
| BNP Paribas | 9/20/23 | HKD | 21,319 | USD | 2,732 | — | (12) |
| JPMorgan Chase Bank, N.A. | 9/20/23 | INR | 111,596 | USD | 1,355 | — | (8) |
| JPMorgan Chase Bank, N.A. | 9/20/23 | INR | 107,647 | USD | 1,299 | — | — |
| BNP Paribas | 9/20/23 | JPY | 585,372 | USD | 4,134 | — | (101) |
| JPMorgan Chase Bank, N.A. | 9/20/23 | JPY | 200,000 | USD | 1,408 | — | (30) |
| Toronto-Dominion Bank | 9/20/23 | USD | 1,431 | AUD | 2,136 | 46 | — |
| UBS AG | 9/20/23 | USD | 3,804 | CHF | 3,418 | — | (72) |
| Toronto-Dominion Bank | 9/20/23 | USD | 2,947 | EUR | 2,725 | — | (11) |
| Toronto-Dominion Bank | 9/20/23 | USD | 1,355 | GBP | 1,091 | — | (27) |
| UBS AG | 9/20/23 | USD | 2,737 | HKD | 21,389 | 8 | — |
| Goldman Sachs International | 9/20/23 | USD | 941 | HKD | 7,353 | 3 | — |
| BNP Paribas | 9/20/23 | USD | 5,700 | JPY | 784,753 | 293 | — |
| BNP Paribas | 9/20/23 | USD | 827 | KRW | 1,069,562 | 17 | — |
| Toronto-Dominion Bank | 9/20/23 | USD | 934 | SGD | 1,256 | 4 | — |
| BNP Paribas | 9/20/23 | USD | 1,893 | TWD | 58,168 | 63 | — |
| UBS AG | 9/20/23 | USD | 236 | TWD | 7,197 | 10 | — |
| 444 | (332) | ||||||
| AUD—Australian dollar. |
| CHF—Swiss franc. |
| EUR—euro. |
| GBP—British pound. |
| HKD—Hong Kong dollar. |
| INR—Indian rupee. |
| JPY—Japanese yen. |
| KRW—Korean won. |
| SGD—Singapore dollar. |
| TWD—Taiwanese dollar. |
| USD—U.S. dollar. |
| ($000s, except shares, footnotes, and per-share amounts) | Amount |
| Assets | |
| Investments in Securities, at Value1 | |
| Unaffiliated Issuers (Cost $3,399,820) | 3,367,241 |
| Affiliated Issuers (Cost $43,446) | 43,450 |
| Total Investments in Securities | 3,410,691 |
| Investment in Vanguard | 117 |
| Foreign Currency, at Value (Cost $3,535) | 3,519 |
| Cash Collateral Pledged—Futures Contracts | 650 |
| Receivables for Investment Securities Sold | 5,155 |
| Receivables for Accrued Income | 10,175 |
| Unrealized Appreciation—Forward Currency Contracts | 444 |
| Total Assets | 3,430,751 |
| Liabilities | |
| Due to Custodian | 5,129 |
| Payables for Investment Securities Purchased | 198 |
| Collateral for Securities on Loan | 31,046 |
| Payables to Vanguard | 245 |
| Variation Margin Payable—Futures Contracts | 163 |
| Unrealized Depreciation—Forward Currency Contracts | 332 |
| Deferred Foreign Capital Gains Taxes | 3,940 |
| Total Liabilities | 41,053 |
| Net Assets | 3,389,698 |
| 1 Includes $26,431,000 of securities on loan. | |
| At August 31, 2023, net assets consisted of: | |
| Paid-in Capital | 3,562,615 |
| Total Distributable Earnings (Loss) | (172,917) |
| Net Assets | 3,389,698 |
| Net Assets | |
| Applicable to 64,400,000 outstanding $.001 par value shares of beneficial interest (unlimited authorization) | 3,389,698 |
| Net Asset Value Per Share | $52.64 |
| Year Ended August 31, 2023 | |
| ($000) | |
| Investment Income | |
| Income | |
| Dividends1 | 89,760 |
| Interest2 | 297 |
| Securities Lending—Net | 511 |
| Total Income | 90,568 |
| Expenses | |
| The Vanguard Group—Note B | |
| Investment Advisory Services | 212 |
| Management and Administrative | 2,751 |
| Marketing and Distribution | 162 |
| Custodian Fees | 439 |
| Auditing Fees | 47 |
| Shareholders’ Reports | 76 |
| Trustees’ Fees and Expenses | 2 |
| Other Expenses | 199 |
| Total Expenses | 3,888 |
| Net Investment Income | 86,680 |
| Realized Net Gain (Loss) | |
| Investment Securities Sold2,3 | (73,481) |
| Futures Contracts | 2,238 |
| Forward Currency Contracts | 690 |
| Foreign Currencies | (333) |
| Realized Net Gain (Loss) | (70,886) |
| Change in Unrealized Appreciation (Depreciation) | |
| Investment Securities2,4 | 325,735 |
| Futures Contracts | (386) |
| Forward Currency Contracts | (462) |
| Foreign Currencies | 363 |
| Change in Unrealized Appreciation (Depreciation) | 325,250 |
| Net Increase (Decrease) in Net Assets Resulting from Operations | 341,044 |
| 1 | Dividends are net of foreign withholding taxes of $11,154,000. |
| 2 | Interest income, realized net gain (loss), capital gain distributions received, and change in unrealized appreciation (depreciation) from an affiliated company of the fund were $269,000, $4,000, less than $1,000, and $2,000, respectively. Purchases and sales are for temporary cash investment purposes. |
| 3 | Realized Gain (Loss) is net of foreign capital gains taxes of $38,000. |
| 4 | The change in unrealized appreciation (depreciation) is net of the change in deferred foreign capital gains taxes of $1,835,000. |
| Year Ended August 31, | ||
| 2023 ($000) | 2022 ($000) | |
| Increase (Decrease) in Net Assets | ||
| Operations | ||
| Net Investment Income | 86,680 | 85,865 |
| Realized Net Gain (Loss) | (70,886) | (70,545) |
| Change in Unrealized Appreciation (Depreciation) | 325,250 | (789,356) |
| Net Increase (Decrease) in Net Assets Resulting from Operations | 341,044 | (774,036) |
| Distributions | ||
| Total Distributions | (80,304) | (87,251) |
| Capital Share Transactions | ||
| Issued | 265,085 | 1,164,332 |
| Issued in Lieu of Cash Distributions | — | — |
| Redeemed | — | — |
| Net Increase (Decrease) from Capital Share Transactions | 265,085 | 1,164,332 |
| Total Increase (Decrease) | 525,825 | 303,045 |
| Net Assets | ||
| Beginning of Period | 2,863,873 | 2,560,828 |
| End of Period | 3,389,698 | 2,863,873 |
| For a Share Outstanding Throughout Each Period | Year Ended August 31, | September 18, 20181 to August 31, 2019 | |||
| 2023 | 2022 | 2021 | 2020 | ||
| Net Asset Value, Beginning of Period | $48.46 | $64.34 | $52.38 | $48.09 | $50.00 |
| Investment Operations | |||||
| Net Investment Income2 | 1.385 | 1.632 | 1.295 | 1.192 | 1.529 |
| Net Realized and Unrealized Gain (Loss) on Investments | 4.073 | (15.837) | 11.907 | 4.138 | (2.714) |
| Total from Investment Operations | 5.458 | (14.205) | 13.202 | 5.330 | (1.185) |
| Distributions | |||||
| Dividends from Net Investment Income | (1.278) | (1.675) | (1.242) | (1.040) | (.725) |
| Distributions from Realized Capital Gains | — | — | — | — | — |
| Total Distributions | (1.278) | (1.675) | (1.242) | (1.040) | (.725) |
| Net Asset Value, End of Period | $52.64 | $48.46 | $64.34 | $52.38 | $48.09 |
| Total Return | 11.36% | -22.38% | 25.45% | 11.23% | -2.36% |
| Ratios/Supplemental Data | |||||
| Net Assets, End of Period (Millions) | $3,390 | $2,864 | $2,561 | $1,205 | $418 |
| Ratio of Total Expenses to Average Net Assets | 0.12% | 0.12% | 0.12% | 0.15% | 0.17%3,4 |
| Ratio of Net Investment Income to Average Net Assets | 2.72% | 2.89% | 2.14% | 2.45% | 3.30%3 |
| Portfolio Turnover Rate5 | 9% | 12% | 7% | 12% | 22% |
| 1 | Inception. |
| 2 | Calculated based on average shares outstanding. |
| 3 | Annualized. |
| 4 | The ratio of expenses to average net assets for the period net of reduction from custody fee offset arrangements was 0.15%. |
| 5 | Excludes the value of portfolio securities received or delivered as a result of in-kind purchases or redemptions of the fund’s capital shares, including ETF Creation Units. |
| Level 1 ($000) | Level 2 ($000) | Level 3 ($000) | Total ($000) | |
| Investments | ||||
| Assets | ||||
| Common Stocks | 306,601 | 3,034,465 | 1,214 | 3,342,280 |
| Preferred Stocks | 12,528 | 12,394 | — | 24,922 |
| Rights | 7 | 29 | — | 36 |
| Warrants | — | 3 | — | 3 |
| Temporary Cash Investments | 43,450 | — | — | 43,450 |
| Total | 362,586 | 3,046,891 | 1,214 | 3,410,691 |
| Derivative Financial Instruments | ||||
| Assets | ||||
| Forward Currency Contracts | — | 444 | — | 444 |
| Liabilities | ||||
| Futures Contracts1 | 520 | — | — | 520 |
| Forward Currency Contracts | — | 332 | — | 332 |
| Total | 520 | 332 | — | 852 |
| 1 | Includes cumulative appreciation (depreciation) on futures contracts and centrally cleared swaps, if any, as reported in the Schedule of Investments. Only current day’s variation margin is reported within the Statement of Assets and Liabilities. |
| Statement of Assets and Liabilities | Equity Contracts ($000) | Foreign Exchange Contracts ($000) | Total ($000) |
| Unrealized Appreciation—Forward Currency Contracts | — | 444 | 444 |
| Total Assets | — | 444 | 444 |
| Unrealized Depreciation—Futures Contracts1 | 520 | — | 520 |
| Unrealized Depreciation—Forward Currency Contracts | — | 332 | 332 |
| Total Liabilities | 520 | 332 | 852 |
| 1 | Includes cumulative appreciation (depreciation) on futures contracts and centrally cleared swaps, if any, as reported in the Schedule of Investments. Only current day’s variation margin is reported within the Statement of Assets and Liabilities. |
| Realized Net Gain (Loss) on Derivatives | Equity Contracts ($000) | Foreign Exchange Contracts ($000) | Total ($000) |
| Futures Contracts | 2,238 | — | 2,238 |
| Forward Currency Contracts | — | 690 | 690 |
| Realized Net Gain (Loss) on Derivatives | 2,238 | 690 | 2,928 |
| Change in Unrealized Appreciation (Depreciation) on Derivatives | |||
| Futures Contracts | (386) | — | (386) |
| Forward Currency Contracts | — | (462) | (462) |
| Change in Unrealized Appreciation (Depreciation) on Derivatives | (386) | (462) | (848) |
| Amount ($000) | |
| Undistributed Ordinary Income | 30,207 |
| Undistributed Long-Term Gains | — |
| Net Unrealized Gains (Losses) | (53,855) |
| Capital Loss Carryforwards | (149,932) |
| Qualified Late-Year Losses | — |
| Other Temporary Differences | 663 |
| Total | (172,917) |
| Year Ended August 31, | ||
| 2023 Amount ($000) | 2022 Amount ($000) | |
| Ordinary Income* | 80,304 | 87,251 |
| Long-Term Capital Gains | — | — |
| Total | 80,304 | 87,251 |
| * | Includes short-term capital gains, if any. |
| Amount ($000) | |
| Tax Cost | 3,460,776 |
| Gross Unrealized Appreciation | 441,750 |
| Gross Unrealized Depreciation | (491,759) |
| Net Unrealized Appreciation (Depreciation) | (50,009) |
| Year Ended August 31, | |||
| 2023 Shares (000) | 2022 Shares (000) | ||
| Issued | 5,300 | 19,300 | |
| Issued in Lieu of Cash Distributions | — | — | |
| Redeemed | — | — | |
| Net Increase (Decrease) in Shares Outstanding | 5,300 | 19,300 | |
Philadelphia, Pennsylvania
October 18, 2023
| Matthew Benchener | Thomas M. Rampulla |
| Joseph Brennan | Karin A. Risi |
| Mortimer J. Buckley | Anne E. Robinson |
| Gregory Davis | Michael Rollings |
| John James | Nitin Tandon |
| Chris D. McIsaac | Lauren Valente |

Who Are Deaf or Hard of Hearing > 800-749-7273
All rights reserved.
Vanguard Marketing Corporation, Distributor.

| 1 | |
| 2 | |
| 4 | |
| 7 | |
| 67 | |
| 69 |
| • | For the 12 months ended August 31, 2023, Vanguard ESG U.S. Corporate Bond ETF returned 1.09% (based on net asset value), roughly in line with the 1.14% return of its expense-free benchmark. |
| • | Early in the period, inflation in many developed markets began to ease off multidecade highs but remained stubbornly high in some sectors, including services, which felt the effects of a tight labor market. While aggressive interest rate hikes by many major central banks including the Federal Reserve fanned fears of recession and weighed on bond prices, the economy proved more resilient than expected. |
| • | The yield of the bellwether 10-year U.S. Treasury bond rose significantly over the period, from 3.19% to 4.11%. With yield spreads narrowing for corporate bonds, they outperformed both Treasuries and mortgage-backed securities. |
| • | By sector, bonds issued by industrial companies and financial institutions posted gains, while those of utility companies finished the period in negative territory. |
| • | By maturity, return from shorter-dated corporate bonds in the index more than offset declines from their long-dated counterparts. By credit quality, corporate bonds on the bottom rung of the investment-grade ladder performed better than higher-rated bonds. |
| Average Annual Total Returns Periods Ended August 31, 2023 | |||
| One Year | Three Years | Five Years | |
| Stocks | |||
| Russell 1000 Index (Large-caps) | 15.40% | 9.93% | 10.77% |
| Russell 2000 Index (Small-caps) | 4.65 | 8.12 | 3.14 |
| Russell 3000 Index (Broad U.S. market) | 14.76 | 9.81 | 10.25 |
| FTSE All-World ex US Index (International) | 12.02 | 4.49 | 3.74 |
| Bonds | |||
| Bloomberg U.S. Aggregate Float Adjusted Index (Broad taxable market) | -1.05% | -4.40% | 0.55% |
| Bloomberg Municipal Bond Index (Broad tax-exempt market) | 1.70 | -1.32 | 1.52 |
| FTSE Three-Month U.S. Treasury Bill Index | 4.44 | 1.63 | 1.68 |
| CPI | |||
| Consumer Price Index | 3.67% | 5.71% | 4.02% |
| • | Based on actual fund return. This section helps you to estimate the actual expenses that you paid over the period. The ”Ending Account Value“ shown is derived from the fund’s actual return, and the third column shows the dollar amount that would have been paid by an investor who started with $1,000 in the fund. You may use the information here, together with the amount you invested, to estimate the expenses that you paid over the period. |
| • | Based on hypothetical 5% yearly return. This section is intended to help you compare your fund‘s costs with those of other mutual funds. It assumes that the fund had a yearly return of 5% before expenses, but that the expense ratio is unchanged. In this case—because the return used is not the fund’s actual return—the results do not apply to your investment. The example is useful in making comparisons because the Securities and Exchange Commission requires all mutual funds to calculate expenses based on a 5% return. You can assess your fund’s costs by comparing this hypothetical example with the hypothetical examples that appear in shareholder reports of other funds. |
| Six Months Ended August 31, 2023 | |||
| ESG U.S. Corporate Bond ETF | Beginning Account Value 2/28/2023 | Ending Account Value 8/31/2023 | Expenses Paid During Period |
| Based on Actual Fund Return | $1,000.00 | $1,021.80 | $0.61 |
| Based on Hypothetical 5% Yearly Return | 1,000.00 | 1,024.60 | 0.61 |
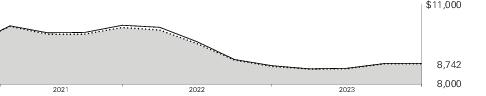
| Average Annual Total Returns Periods Ended August 31, 2023 | ||||
| One Year | Since Inception (9/22/2020) | Final Value of a $10,000 Investment | ||
 | ESG U.S. Corporate Bond ETF Net Asset Value | 1.09% | -4.47% | $8,742 |
| ESG U.S. Corporate Bond ETF Market Price | 1.47 | -4.43 | 8,753 | |
 | Bloomberg MSCI US Corporate SRI Select Index | 1.14 | -4.40 | 8,762 |
 | Bloomberg U.S. Corporate Bond Index | 0.90 | -4.37 | 8,768 |
| Cumulative Returns of ETF Shares: September 22, 2020, Through August 31, 2023 | ||
| One Year | Since Inception (9/22/2020) | |
| ESG U.S. Corporate Bond ETF Market Price | 1.47% | -12.47% |
| ESG U.S. Corporate Bond ETF Net Asset Value | 1.09 | -12.58 |
| Bloomberg MSCI US Corporate SRI Select Index | 1.14 | -12.38 |
| Corporate Bonds – Communications | 13.0% |
| Corporate Bonds – Consumer Discretionary | 6.8 |
| Corporate Bonds – Consumer Staples | 3.6 |
| Corporate Bonds – Financials | 43.8 |
| Corporate Bonds – Health Care | 15.4 |
| Corporate Bonds – Industrials | 1.9 |
| Corporate Bonds – Materials | 1.2 |
| Corporate Bonds – Real Estate | 2.1 |
| Corporate Bonds – Technology | 12.1 |
| Corporate Bonds – Utilities | 0.1 |
| Coupon | Maturity Date | Face Amount ($000) | Market Value• ($000) | |||
| Corporate Bonds (98.4%) | ||||||
| Communications (12.8%) | ||||||
| Activision Blizzard Inc. | 3.400% | 9/15/26 | 115 | 110 | ||
| Activision Blizzard Inc. | 2.500% | 9/15/50 | 195 | 124 | ||
| Alphabet Inc. | 0.450% | 8/15/25 | 110 | 101 | ||
| Alphabet Inc. | 1.998% | 8/15/26 | 240 | 222 | ||
| Alphabet Inc. | 0.800% | 8/15/27 | 185 | 160 | ||
| Alphabet Inc. | 1.100% | 8/15/30 | 200 | 160 | ||
| Alphabet Inc. | 2.050% | 8/15/50 | 286 | 171 | ||
| Alphabet Inc. | 2.250% | 8/15/60 | 210 | 122 | ||
| America Movil SAB de CV | 3.625% | 4/22/29 | 210 | 192 | ||
| America Movil SAB de CV | 2.875% | 5/7/30 | 195 | 168 | ||
| America Movil SAB de CV | 4.700% | 7/21/32 | 140 | 133 | ||
| America Movil SAB de CV | 6.375% | 3/1/35 | 75 | 81 | ||
| America Movil SAB de CV | 6.125% | 3/30/40 | 180 | 187 | ||
| America Movil SAB de CV | 4.375% | 7/16/42 | 150 | 127 | ||
| America Movil SAB de CV | 4.375% | 4/22/49 | 155 | 131 | ||
| AT&T Inc. | 5.539% | 2/20/26 | 180 | 180 | ||
| AT&T Inc. | 1.700% | 3/25/26 | 380 | 346 | ||
| AT&T Inc. | 3.800% | 2/15/27 | 110 | 105 | ||
| AT&T Inc. | 4.250% | 3/1/27 | 275 | 265 | ||
| AT&T Inc. | 2.300% | 6/1/27 | 355 | 318 | ||
| AT&T Inc. | 1.650% | 2/1/28 | 285 | 244 | ||
| 1 | AT&T Inc. | 4.100% | 2/15/28 | 270 | 256 | |
| AT&T Inc. | 4.350% | 3/1/29 | 355 | 336 | ||
| 1 | AT&T Inc. | 4.300% | 2/15/30 | 375 | 350 | |
| AT&T Inc. | 2.750% | 6/1/31 | 265 | 219 | ||
| AT&T Inc. | 2.250% | 2/1/32 | 340 | 265 | ||
| AT&T Inc. | 2.550% | 12/1/33 | 460 | 351 | ||
| AT&T Inc. | 5.400% | 2/15/34 | 300 | 291 | ||
| AT&T Inc. | 4.500% | 5/15/35 | 325 | 289 | ||
| AT&T Inc. | 5.250% | 3/1/37 | 85 | 80 | ||
| AT&T Inc. | 4.850% | 3/1/39 | 189 | 168 | ||
| AT&T Inc. | 3.500% | 6/1/41 | 270 | 198 | ||
| AT&T Inc. | 4.300% | 12/15/42 | 230 | 186 | ||
| AT&T Inc. | 4.350% | 6/15/45 | 155 | 122 | ||
| AT&T Inc. | 4.750% | 5/15/46 | 210 | 175 | ||
| AT&T Inc. | 5.650% | 2/15/47 | 50 | 48 | ||
| AT&T Inc. | 4.500% | 3/9/48 | 220 | 176 | ||
| AT&T Inc. | 4.550% | 3/9/49 | 150 | 120 | ||
| AT&T Inc. | 3.650% | 6/1/51 | 350 | 239 | ||
| Coupon | Maturity Date | Face Amount ($000) | Market Value• ($000) | |||
| AT&T Inc. | 3.300% | 2/1/52 | 115 | 75 | ||
| AT&T Inc. | 3.500% | 9/15/53 | 895 | 589 | ||
| AT&T Inc. | 3.550% | 9/15/55 | 880 | 574 | ||
| AT&T Inc. | 3.800% | 12/1/57 | 677 | 456 | ||
| AT&T Inc. | 3.650% | 9/15/59 | 710 | 459 | ||
| AT&T Inc. | 3.850% | 6/1/60 | 225 | 153 | ||
| Bell Telephone Co. of Canada or Bell Canada | 5.100% | 5/11/33 | 150 | 145 | ||
| Bell Telephone Co. of Canada or Bell Canada | 4.464% | 4/1/48 | 60 | 49 | ||
| Bell Telephone Co. of Canada or Bell Canada | 3.650% | 8/15/52 | 75 | 54 | ||
| Booking Holdings Inc. | 3.600% | 6/1/26 | 165 | 159 | ||
| Booking Holdings Inc. | 4.625% | 4/13/30 | 210 | 205 | ||
| British Telecommunications plc | 9.625% | 12/15/30 | 300 | 365 | ||
| Charter Communications Operating LLC | 4.908% | 7/23/25 | 450 | 442 | ||
| Charter Communications Operating LLC | 3.750% | 2/15/28 | 90 | 82 | ||
| Charter Communications Operating LLC | 4.200% | 3/15/28 | 165 | 154 | ||
| Charter Communications Operating LLC | 2.250% | 1/15/29 | 185 | 153 | ||
| Charter Communications Operating LLC | 5.050% | 3/30/29 | 195 | 186 | ||
| Charter Communications Operating LLC | 2.800% | 4/1/31 | 340 | 274 | ||
| Charter Communications Operating LLC | 2.300% | 2/1/32 | 200 | 151 | ||
| Charter Communications Operating LLC | 4.400% | 4/1/33 | 100 | 88 | ||
| Charter Communications Operating LLC | 6.384% | 10/23/35 | 225 | 218 | ||
| Charter Communications Operating LLC | 5.375% | 4/1/38 | 105 | 89 | ||
| Charter Communications Operating LLC | 3.500% | 6/1/41 | 235 | 155 | ||
| Charter Communications Operating LLC | 3.500% | 3/1/42 | 270 | 176 | ||
| Charter Communications Operating LLC | 6.484% | 10/23/45 | 360 | 331 | ||
| Charter Communications Operating LLC | 5.375% | 5/1/47 | 230 | 183 | ||
| Charter Communications Operating LLC | 5.750% | 4/1/48 | 348 | 293 | ||
| Charter Communications Operating LLC | 5.125% | 7/1/49 | 115 | 88 | ||
| Charter Communications Operating LLC | 4.800% | 3/1/50 | 265 | 196 | ||
| Charter Communications Operating LLC | 3.700% | 4/1/51 | 210 | 130 | ||
| Charter Communications Operating LLC | 3.900% | 6/1/52 | 295 | 188 | ||
| Charter Communications Operating LLC | 5.250% | 4/1/53 | 100 | 79 | ||
| Charter Communications Operating LLC | 3.850% | 4/1/61 | 270 | 161 | ||
| Charter Communications Operating LLC | 4.400% | 12/1/61 | 180 | 118 | ||
| Charter Communications Operating LLC | 3.950% | 6/30/62 | 145 | 87 | ||
| Charter Communications Operating LLC | 5.500% | 4/1/63 | 125 | 98 | ||
| Comcast Corp. | 3.375% | 8/15/25 | 160 | 155 | ||
| Comcast Corp. | 3.950% | 10/15/25 | 360 | 351 | ||
| Comcast Corp. | 5.250% | 11/7/25 | 100 | 100 | ||
| Comcast Corp. | 3.150% | 3/1/26 | 240 | 229 | ||
| Comcast Corp. | 2.350% | 1/15/27 | 220 | 202 | ||
| Comcast Corp. | 3.300% | 2/1/27 | 215 | 203 | ||
| Comcast Corp. | 3.150% | 2/15/28 | 95 | 88 | ||
| Comcast Corp. | 3.550% | 5/1/28 | 195 | 184 | ||
| Comcast Corp. | 4.150% | 10/15/28 | 460 | 443 | ||
| Comcast Corp. | 4.550% | 1/15/29 | 110 | 108 | ||
| Comcast Corp. | 2.650% | 2/1/30 | 250 | 217 | ||
| Comcast Corp. | 3.400% | 4/1/30 | 190 | 173 | ||
| Comcast Corp. | 4.250% | 10/15/30 | 175 | 166 | ||
| Comcast Corp. | 1.950% | 1/15/31 | 200 | 162 | ||
| Comcast Corp. | 1.500% | 2/15/31 | 185 | 145 | ||
| Comcast Corp. | 5.500% | 11/15/32 | 70 | 72 | ||
| Comcast Corp. | 4.250% | 1/15/33 | 175 | 164 | ||
| Comcast Corp. | 4.650% | 2/15/33 | 120 | 117 | ||
| Comcast Corp. | 7.050% | 3/15/33 | 210 | 239 | ||
| Coupon | Maturity Date | Face Amount ($000) | Market Value• ($000) | |||
| Comcast Corp. | 4.800% | 5/15/33 | 110 | 108 | ||
| Comcast Corp. | 4.200% | 8/15/34 | 50 | 46 | ||
| Comcast Corp. | 5.650% | 6/15/35 | 110 | 114 | ||
| Comcast Corp. | 4.400% | 8/15/35 | 135 | 125 | ||
| Comcast Corp. | 3.200% | 7/15/36 | 135 | 109 | ||
| Comcast Corp. | 3.900% | 3/1/38 | 205 | 174 | ||
| Comcast Corp. | 4.600% | 10/15/38 | 70 | 64 | ||
| Comcast Corp. | 3.250% | 11/1/39 | 120 | 92 | ||
| Comcast Corp. | 3.750% | 4/1/40 | 200 | 164 | ||
| Comcast Corp. | 4.600% | 8/15/45 | 40 | 35 | ||
| Comcast Corp. | 3.400% | 7/15/46 | 160 | 117 | ||
| Comcast Corp. | 4.000% | 8/15/47 | 95 | 76 | ||
| Comcast Corp. | 3.969% | 11/1/47 | 240 | 192 | ||
| Comcast Corp. | 4.000% | 3/1/48 | 160 | 129 | ||
| Comcast Corp. | 4.700% | 10/15/48 | 218 | 197 | ||
| Comcast Corp. | 3.999% | 11/1/49 | 310 | 247 | ||
| Comcast Corp. | 3.450% | 2/1/50 | 210 | 153 | ||
| Comcast Corp. | 2.800% | 1/15/51 | 237 | 150 | ||
| Comcast Corp. | 2.887% | 11/1/51 | 554 | 354 | ||
| Comcast Corp. | 2.450% | 8/15/52 | 275 | 161 | ||
| Comcast Corp. | 4.049% | 11/1/52 | 165 | 132 | ||
| Comcast Corp. | 5.350% | 5/15/53 | 135 | 132 | ||
| Comcast Corp. | 2.937% | 11/1/56 | 587 | 365 | ||
| Comcast Corp. | 4.950% | 10/15/58 | 180 | 166 | ||
| Comcast Corp. | 2.650% | 8/15/62 | 210 | 120 | ||
| Comcast Corp. | 2.987% | 11/1/63 | 453 | 273 | ||
| Comcast Corp. | 5.500% | 5/15/64 | 150 | 146 | ||
| Deutsche Telekom International Finance BV | 8.750% | 6/15/30 | 410 | 482 | ||
| Discovery Communications LLC | 3.950% | 3/20/28 | 235 | 218 | ||
| Discovery Communications LLC | 4.125% | 5/15/29 | 140 | 129 | ||
| Discovery Communications LLC | 3.625% | 5/15/30 | 105 | 92 | ||
| Discovery Communications LLC | 5.200% | 9/20/47 | 140 | 113 | ||
| Discovery Communications LLC | 5.300% | 5/15/49 | 170 | 138 | ||
| Discovery Communications LLC | 4.650% | 5/15/50 | 90 | 67 | ||
| Discovery Communications LLC | 4.000% | 9/15/55 | 195 | 127 | ||
| Electronic Arts Inc. | 1.850% | 2/15/31 | 150 | 120 | ||
| Electronic Arts Inc. | 2.950% | 2/15/51 | 95 | 61 | ||
| Expedia Group Inc. | 3.800% | 2/15/28 | 150 | 140 | ||
| Expedia Group Inc. | 3.250% | 2/15/30 | 160 | 139 | ||
| Fox Corp. | 4.709% | 1/25/29 | 265 | 255 | ||
| Fox Corp. | 5.476% | 1/25/39 | 215 | 194 | ||
| Fox Corp. | 5.576% | 1/25/49 | 123 | 110 | ||
| Grupo Televisa SAB | 5.000% | 5/13/45 | 30 | 25 | ||
| Grupo Televisa SAB | 6.125% | 1/31/46 | 150 | 144 | ||
| Meta Platforms Inc. | 3.500% | 8/15/27 | 270 | 257 | ||
| Meta Platforms Inc. | 4.600% | 5/15/28 | 180 | 178 | ||
| Meta Platforms Inc. | 4.800% | 5/15/30 | 140 | 139 | ||
| Meta Platforms Inc. | 3.850% | 8/15/32 | 385 | 353 | ||
| Meta Platforms Inc. | 4.950% | 5/15/33 | 225 | 224 | ||
| Meta Platforms Inc. | 4.450% | 8/15/52 | 275 | 233 | ||
| Meta Platforms Inc. | 5.600% | 5/15/53 | 305 | 306 | ||
| Meta Platforms Inc. | 4.650% | 8/15/62 | 200 | 170 | ||
| Meta Platforms Inc. | 5.750% | 5/15/63 | 235 | 237 | ||
| Netflix Inc. | 5.875% | 2/15/25 | 35 | 35 | ||
| Netflix Inc. | 4.375% | 11/15/26 | 150 | 146 | ||
| Coupon | Maturity Date | Face Amount ($000) | Market Value• ($000) | |||
| Netflix Inc. | 4.875% | 4/15/28 | 160 | 158 | ||
| Netflix Inc. | 5.875% | 11/15/28 | 275 | 283 | ||
| Omnicom Group Inc. | 3.650% | 11/1/24 | 175 | 171 | ||
| Omnicom Group Inc. | 3.600% | 4/15/26 | 90 | 86 | ||
| Omnicom Group Inc. | 2.600% | 8/1/31 | 115 | 94 | ||
| Orange SA | 9.000% | 3/1/31 | 329 | 399 | ||
| Orange SA | 5.375% | 1/13/42 | 115 | 110 | ||
| Orange SA | 5.500% | 2/6/44 | 65 | 63 | ||
| Paramount Global | 4.000% | 1/15/26 | 125 | 120 | ||
| Paramount Global | 7.875% | 7/30/30 | 140 | 148 | ||
| Paramount Global | 4.950% | 1/15/31 | 240 | 214 | ||
| Paramount Global | 4.200% | 5/19/32 | 275 | 229 | ||
| Paramount Global | 6.875% | 4/30/36 | 100 | 96 | ||
| Paramount Global | 4.375% | 3/15/43 | 85 | 59 | ||
| Paramount Global | 5.850% | 9/1/43 | 40 | 33 | ||
| Paramount Global | 4.950% | 5/19/50 | 135 | 99 | ||
| Rogers Communications Inc. | 2.950% | 3/15/25 | 50 | 48 | ||
| Rogers Communications Inc. | 3.200% | 3/15/27 | 135 | 125 | ||
| Rogers Communications Inc. | 3.800% | 3/15/32 | 235 | 201 | ||
| Rogers Communications Inc. | 5.000% | 3/15/44 | 95 | 81 | ||
| Rogers Communications Inc. | 4.300% | 2/15/48 | 120 | 89 | ||
| Rogers Communications Inc. | 4.350% | 5/1/49 | 70 | 53 | ||
| Rogers Communications Inc. | 3.700% | 11/15/49 | 105 | 71 | ||
| Rogers Communications Inc. | 4.550% | 3/15/52 | 265 | 205 | ||
| Sprint Capital Corp. | 6.875% | 11/15/28 | 275 | 291 | ||
| Sprint Capital Corp. | 8.750% | 3/15/32 | 235 | 280 | ||
| Sprint LLC | 7.625% | 2/15/25 | 195 | 199 | ||
| Sprint LLC | 7.625% | 3/1/26 | 170 | 176 | ||
| Telefonica Emisiones SA | 4.103% | 3/8/27 | 275 | 262 | ||
| Telefonica Emisiones SA | 7.045% | 6/20/36 | 175 | 187 | ||
| Telefonica Emisiones SA | 4.665% | 3/6/38 | 120 | 99 | ||
| Telefonica Emisiones SA | 5.213% | 3/8/47 | 315 | 264 | ||
| Telefonica Emisiones SA | 4.895% | 3/6/48 | 70 | 56 | ||
| Telefonica Emisiones SA | 5.520% | 3/1/49 | 195 | 170 | ||
| Telefonica Europe BV | 8.250% | 9/15/30 | 180 | 205 | ||
| TELUS Corp. | 3.400% | 5/13/32 | 135 | 114 | ||
| TELUS Corp. | 4.600% | 11/16/48 | 35 | 29 | ||
| Time Warner Cable Enterprises LLC | 8.375% | 7/15/33 | 115 | 128 | ||
| Time Warner Cable LLC | 6.550% | 5/1/37 | 190 | 180 | ||
| Time Warner Cable LLC | 7.300% | 7/1/38 | 135 | 136 | ||
| Time Warner Cable LLC | 6.750% | 6/15/39 | 135 | 130 | ||
| Time Warner Cable LLC | 5.875% | 11/15/40 | 135 | 117 | ||
| Time Warner Cable LLC | 5.500% | 9/1/41 | 225 | 185 | ||
| Time Warner Cable LLC | 4.500% | 9/15/42 | 240 | 175 | ||
| T-Mobile USA Inc. | 3.500% | 4/15/25 | 540 | 522 | ||
| T-Mobile USA Inc. | 1.500% | 2/15/26 | 210 | 191 | ||
| T-Mobile USA Inc. | 2.250% | 2/15/26 | 220 | 204 | ||
| T-Mobile USA Inc. | 2.625% | 4/15/26 | 115 | 107 | ||
| T-Mobile USA Inc. | 3.750% | 4/15/27 | 415 | 393 | ||
| T-Mobile USA Inc. | 4.750% | 2/1/28 | 150 | 146 | ||
| T-Mobile USA Inc. | 2.050% | 2/15/28 | 220 | 192 | ||
| T-Mobile USA Inc. | 4.950% | 3/15/28 | 30 | 30 | ||
| T-Mobile USA Inc. | 4.800% | 7/15/28 | 85 | 83 | ||
| T-Mobile USA Inc. | 2.625% | 2/15/29 | 50 | 43 | ||
| T-Mobile USA Inc. | 3.375% | 4/15/29 | 310 | 278 | ||
| Coupon | Maturity Date | Face Amount ($000) | Market Value• ($000) | |||
| T-Mobile USA Inc. | 3.875% | 4/15/30 | 790 | 720 | ||
| T-Mobile USA Inc. | 2.550% | 2/15/31 | 325 | 268 | ||
| T-Mobile USA Inc. | 2.875% | 2/15/31 | 95 | 80 | ||
| T-Mobile USA Inc. | 3.500% | 4/15/31 | 385 | 336 | ||
| T-Mobile USA Inc. | 2.250% | 11/15/31 | 200 | 159 | ||
| T-Mobile USA Inc. | 2.700% | 3/15/32 | 90 | 73 | ||
| T-Mobile USA Inc. | 5.200% | 1/15/33 | 140 | 137 | ||
| T-Mobile USA Inc. | 5.050% | 7/15/33 | 275 | 265 | ||
| T-Mobile USA Inc. | 4.375% | 4/15/40 | 205 | 176 | ||
| T-Mobile USA Inc. | 3.000% | 2/15/41 | 300 | 211 | ||
| T-Mobile USA Inc. | 4.500% | 4/15/50 | 345 | 285 | ||
| T-Mobile USA Inc. | 3.300% | 2/15/51 | 535 | 358 | ||
| T-Mobile USA Inc. | 3.400% | 10/15/52 | 230 | 156 | ||
| T-Mobile USA Inc. | 5.650% | 1/15/53 | 250 | 244 | ||
| T-Mobile USA Inc. | 5.750% | 1/15/54 | 30 | 30 | ||
| T-Mobile USA Inc. | 3.600% | 11/15/60 | 205 | 137 | ||
| T-Mobile USA Inc. | 5.800% | 9/15/62 | 160 | 155 | ||
| 1 | TWDC Enterprises 18 Corp. | 3.150% | 9/17/25 | 80 | 77 | |
| TWDC Enterprises 18 Corp. | 3.000% | 2/13/26 | 109 | 104 | ||
| 1 | TWDC Enterprises 18 Corp. | 1.850% | 7/30/26 | 120 | 110 | |
| 1 | TWDC Enterprises 18 Corp. | 2.950% | 6/15/27 | 80 | 75 | |
| 1 | TWDC Enterprises 18 Corp. | 4.125% | 6/1/44 | 70 | 59 | |
| VeriSign Inc. | 2.700% | 6/15/31 | 100 | 82 | ||
| Verizon Communications Inc. | 3.500% | 11/1/24 | 110 | 107 | ||
| Verizon Communications Inc. | 3.376% | 2/15/25 | 270 | 262 | ||
| Verizon Communications Inc. | 0.850% | 11/20/25 | 220 | 200 | ||
| Verizon Communications Inc. | 1.450% | 3/20/26 | 70 | 64 | ||
| Verizon Communications Inc. | 2.625% | 8/15/26 | 270 | 251 | ||
| Verizon Communications Inc. | 4.125% | 3/16/27 | 540 | 520 | ||
| Verizon Communications Inc. | 3.000% | 3/22/27 | 10 | 9 | ||
| Verizon Communications Inc. | 2.100% | 3/22/28 | 345 | 302 | ||
| Verizon Communications Inc. | 4.329% | 9/21/28 | 420 | 402 | ||
| Verizon Communications Inc. | 3.875% | 2/8/29 | 110 | 103 | ||
| Verizon Communications Inc. | 4.016% | 12/3/29 | 480 | 446 | ||
| Verizon Communications Inc. | 3.150% | 3/22/30 | 235 | 206 | ||
| Verizon Communications Inc. | 1.500% | 9/18/30 | 130 | 101 | ||
| Verizon Communications Inc. | 1.680% | 10/30/30 | 250 | 196 | ||
| Verizon Communications Inc. | 1.750% | 1/20/31 | 225 | 175 | ||
| Verizon Communications Inc. | 2.550% | 3/21/31 | 282 | 232 | ||
| Verizon Communications Inc. | 2.355% | 3/15/32 | 437 | 346 | ||
| Verizon Communications Inc. | 5.050% | 5/9/33 | 275 | 267 | ||
| Verizon Communications Inc. | 4.500% | 8/10/33 | 270 | 249 | ||
| Verizon Communications Inc. | 4.400% | 11/1/34 | 212 | 192 | ||
| Verizon Communications Inc. | 5.250% | 3/16/37 | 200 | 195 | ||
| Verizon Communications Inc. | 4.812% | 3/15/39 | 120 | 109 | ||
| Verizon Communications Inc. | 2.650% | 11/20/40 | 340 | 226 | ||
| Verizon Communications Inc. | 3.400% | 3/22/41 | 425 | 316 | ||
| Verizon Communications Inc. | 2.850% | 9/3/41 | 155 | 106 | ||
| Verizon Communications Inc. | 6.550% | 9/15/43 | 105 | 117 | ||
| Verizon Communications Inc. | 4.125% | 8/15/46 | 125 | 99 | ||
| Verizon Communications Inc. | 4.862% | 8/21/46 | 200 | 176 | ||
| Verizon Communications Inc. | 4.522% | 9/15/48 | 150 | 126 | ||
| Verizon Communications Inc. | 4.000% | 3/22/50 | 205 | 157 | ||
| Verizon Communications Inc. | 2.875% | 11/20/50 | 410 | 251 | ||
| Verizon Communications Inc. | 3.550% | 3/22/51 | 515 | 360 | ||
| Coupon | Maturity Date | Face Amount ($000) | Market Value• ($000) | |||
| Verizon Communications Inc. | 3.875% | 3/1/52 | 160 | 120 | ||
| Verizon Communications Inc. | 5.012% | 8/21/54 | 115 | 102 | ||
| Verizon Communications Inc. | 2.987% | 10/30/56 | 445 | 266 | ||
| Verizon Communications Inc. | 3.000% | 11/20/60 | 330 | 194 | ||
| Verizon Communications Inc. | 3.700% | 3/22/61 | 285 | 194 | ||
| Vodafone Group plc | 4.125% | 5/30/25 | 270 | 264 | ||
| Vodafone Group plc | 6.150% | 2/27/37 | 190 | 195 | ||
| Vodafone Group plc | 4.375% | 2/19/43 | 150 | 122 | ||
| Vodafone Group plc | 5.250% | 5/30/48 | 30 | 27 | ||
| Vodafone Group plc | 4.875% | 6/19/49 | 305 | 259 | ||
| Vodafone Group plc | 4.250% | 9/17/50 | 180 | 138 | ||
| Walt Disney Co. | 3.350% | 3/24/25 | 170 | 165 | ||
| Walt Disney Co. | 1.750% | 1/13/26 | 200 | 185 | ||
| Walt Disney Co. | 2.200% | 1/13/28 | 210 | 189 | ||
| Walt Disney Co. | 2.000% | 9/1/29 | 255 | 216 | ||
| Walt Disney Co. | 3.800% | 3/22/30 | 115 | 108 | ||
| Walt Disney Co. | 2.650% | 1/13/31 | 240 | 206 | ||
| Walt Disney Co. | 6.200% | 12/15/34 | 140 | 152 | ||
| Walt Disney Co. | 6.400% | 12/15/35 | 135 | 148 | ||
| Walt Disney Co. | 6.650% | 11/15/37 | 170 | 191 | ||
| Walt Disney Co. | 4.625% | 3/23/40 | 110 | 102 | ||
| Walt Disney Co. | 3.500% | 5/13/40 | 205 | 164 | ||
| Walt Disney Co. | 2.750% | 9/1/49 | 295 | 189 | ||
| Walt Disney Co. | 4.700% | 3/23/50 | 175 | 159 | ||
| Walt Disney Co. | 3.600% | 1/13/51 | 370 | 278 | ||
| Walt Disney Co. | 3.800% | 5/13/60 | 120 | 90 | ||
| Warnermedia Holdings Inc. | 3.638% | 3/15/25 | 265 | 256 | ||
| Warnermedia Holdings Inc. | 3.755% | 3/15/27 | 500 | 469 | ||
| Warnermedia Holdings Inc. | 4.054% | 3/15/29 | 140 | 129 | ||
| Warnermedia Holdings Inc. | 4.279% | 3/15/32 | 580 | 512 | ||
| Warnermedia Holdings Inc. | 5.050% | 3/15/42 | 500 | 411 | ||
| Warnermedia Holdings Inc. | 5.141% | 3/15/52 | 810 | 645 | ||
| Warnermedia Holdings Inc. | 5.391% | 3/15/62 | 410 | 325 | ||
| Weibo Corp. | 3.375% | 7/8/30 | 145 | 114 | ||
| WPP Finance 2010 | 3.750% | 9/19/24 | 120 | 117 | ||
| 54,783 | ||||||
| Consumer Discretionary (6.7%) | ||||||
| Alibaba Group Holding Ltd. | 3.600% | 11/28/24 | 318 | 310 | ||
| Alibaba Group Holding Ltd. | 3.400% | 12/6/27 | 225 | 209 | ||
| Alibaba Group Holding Ltd. | 2.125% | 2/9/31 | 195 | 156 | ||
| Alibaba Group Holding Ltd. | 4.000% | 12/6/37 | 185 | 150 | ||
| Alibaba Group Holding Ltd. | 2.700% | 2/9/41 | 210 | 134 | ||
| Alibaba Group Holding Ltd. | 4.200% | 12/6/47 | 125 | 93 | ||
| Alibaba Group Holding Ltd. | 3.150% | 2/9/51 | 160 | 97 | ||
| Alibaba Group Holding Ltd. | 4.400% | 12/6/57 | 125 | 92 | ||
| Alibaba Group Holding Ltd. | 3.250% | 2/9/61 | 70 | 40 | ||
| Amazon.com Inc. | 4.700% | 11/29/24 | 100 | 99 | ||
| Amazon.com Inc. | 3.800% | 12/5/24 | 185 | 182 | ||
| Amazon.com Inc. | 3.000% | 4/13/25 | 245 | 237 | ||
| Amazon.com Inc. | 0.800% | 6/3/25 | 240 | 223 | ||
| Amazon.com Inc. | 4.600% | 12/1/25 | 255 | 253 | ||
| Amazon.com Inc. | 5.200% | 12/3/25 | 110 | 110 | ||
| Amazon.com Inc. | 1.000% | 5/12/26 | 370 | 334 | ||
| Amazon.com Inc. | 3.300% | 4/13/27 | 175 | 167 | ||
| Amazon.com Inc. | 1.200% | 6/3/27 | 225 | 198 | ||
| Coupon | Maturity Date | Face Amount ($000) | Market Value• ($000) | |||
| Amazon.com Inc. | 3.150% | 8/22/27 | 555 | 522 | ||
| Amazon.com Inc. | 4.550% | 12/1/27 | 135 | 134 | ||
| Amazon.com Inc. | 1.650% | 5/12/28 | 160 | 140 | ||
| Amazon.com Inc. | 3.450% | 4/13/29 | 210 | 198 | ||
| Amazon.com Inc. | 4.650% | 12/1/29 | 215 | 214 | ||
| Amazon.com Inc. | 1.500% | 6/3/30 | 340 | 276 | ||
| Amazon.com Inc. | 2.100% | 5/12/31 | 285 | 236 | ||
| Amazon.com Inc. | 3.600% | 4/13/32 | 250 | 230 | ||
| Amazon.com Inc. | 4.700% | 12/1/32 | 255 | 253 | ||
| Amazon.com Inc. | 4.800% | 12/5/34 | 150 | 151 | ||
| Amazon.com Inc. | 3.875% | 8/22/37 | 310 | 280 | ||
| Amazon.com Inc. | 2.875% | 5/12/41 | 205 | 154 | ||
| Amazon.com Inc. | 4.950% | 12/5/44 | 210 | 207 | ||
| Amazon.com Inc. | 4.050% | 8/22/47 | 415 | 358 | ||
| Amazon.com Inc. | 2.500% | 6/3/50 | 230 | 146 | ||
| Amazon.com Inc. | 3.100% | 5/12/51 | 380 | 271 | ||
| Amazon.com Inc. | 3.950% | 4/13/52 | 390 | 325 | ||
| Amazon.com Inc. | 4.250% | 8/22/57 | 260 | 225 | ||
| Amazon.com Inc. | 2.700% | 6/3/60 | 288 | 177 | ||
| Amazon.com Inc. | 3.250% | 5/12/61 | 200 | 139 | ||
| Amazon.com Inc. | 4.100% | 4/13/62 | 170 | 141 | ||
| 1 | American Honda Finance Corp. | 2.150% | 9/10/24 | 35 | 34 | |
| 1 | American Honda Finance Corp. | 1.500% | 1/13/25 | 150 | 142 | |
| 1 | American Honda Finance Corp. | 1.200% | 7/8/25 | 160 | 148 | |
| 1 | American Honda Finance Corp. | 1.000% | 9/10/25 | 10 | 9 | |
| 1 | American Honda Finance Corp. | 5.250% | 7/7/26 | 85 | 85 | |
| 1 | American Honda Finance Corp. | 2.000% | 3/24/28 | 160 | 140 | |
| 1 | American Honda Finance Corp. | 5.125% | 7/7/28 | 85 | 85 | |
| Aptiv plc | 3.250% | 3/1/32 | 85 | 72 | ||
| Aptiv plc | 3.100% | 12/1/51 | 220 | 134 | ||
| Aptiv plc | 4.150% | 5/1/52 | 90 | 67 | ||
| AutoZone Inc. | 4.000% | 4/15/30 | 130 | 120 | ||
| AutoZone Inc. | 4.750% | 8/1/32 | 120 | 115 | ||
| BorgWarner Inc. | 2.650% | 7/1/27 | 205 | 186 | ||
| eBay Inc. | 1.900% | 3/11/25 | 105 | 99 | ||
| eBay Inc. | 1.400% | 5/10/26 | 135 | 122 | ||
| eBay Inc. | 3.600% | 6/5/27 | 85 | 80 | ||
| eBay Inc. | 2.700% | 3/11/30 | 115 | 98 | ||
| eBay Inc. | 2.600% | 5/10/31 | 85 | 70 | ||
| eBay Inc. | 4.000% | 7/15/42 | 62 | 49 | ||
| eBay Inc. | 3.650% | 5/10/51 | 115 | 82 | ||
| General Motors Co. | 6.125% | 10/1/25 | 195 | 196 | ||
| General Motors Co. | 4.200% | 10/1/27 | 150 | 141 | ||
| General Motors Co. | 6.800% | 10/1/27 | 215 | 222 | ||
| General Motors Co. | 5.000% | 10/1/28 | 130 | 126 | ||
| General Motors Co. | 5.400% | 10/15/29 | 120 | 116 | ||
| General Motors Co. | 5.600% | 10/15/32 | 220 | 212 | ||
| General Motors Co. | 5.000% | 4/1/35 | 25 | 22 | ||
| General Motors Co. | 6.600% | 4/1/36 | 195 | 196 | ||
| General Motors Co. | 5.150% | 4/1/38 | 100 | 87 | ||
| General Motors Co. | 6.250% | 10/2/43 | 195 | 183 | ||
| General Motors Co. | 5.200% | 4/1/45 | 140 | 115 | ||
| General Motors Co. | 6.750% | 4/1/46 | 115 | 113 | ||
| General Motors Co. | 5.400% | 4/1/48 | 85 | 71 | ||
| General Motors Co. | 5.950% | 4/1/49 | 90 | 81 | ||
| Coupon | Maturity Date | Face Amount ($000) | Market Value• ($000) | |||
| General Motors Financial Co. Inc. | 1.200% | 10/15/24 | 170 | 161 | ||
| General Motors Financial Co. Inc. | 3.500% | 11/7/24 | 130 | 126 | ||
| General Motors Financial Co. Inc. | 4.000% | 1/15/25 | 100 | 97 | ||
| General Motors Financial Co. Inc. | 2.900% | 2/26/25 | 195 | 186 | ||
| General Motors Financial Co. Inc. | 3.800% | 4/7/25 | 165 | 159 | ||
| General Motors Financial Co. Inc. | 4.350% | 4/9/25 | 165 | 161 | ||
| General Motors Financial Co. Inc. | 2.750% | 6/20/25 | 75 | 71 | ||
| General Motors Financial Co. Inc. | 4.300% | 7/13/25 | 85 | 83 | ||
| General Motors Financial Co. Inc. | 6.050% | 10/10/25 | 45 | 45 | ||
| General Motors Financial Co. Inc. | 1.250% | 1/8/26 | 190 | 171 | ||
| General Motors Financial Co. Inc. | 5.250% | 3/1/26 | 165 | 163 | ||
| General Motors Financial Co. Inc. | 5.400% | 4/6/26 | 215 | 212 | ||
| General Motors Financial Co. Inc. | 1.500% | 6/10/26 | 255 | 226 | ||
| General Motors Financial Co. Inc. | 4.000% | 10/6/26 | 150 | 142 | ||
| General Motors Financial Co. Inc. | 4.350% | 1/17/27 | 105 | 100 | ||
| General Motors Financial Co. Inc. | 5.000% | 4/9/27 | 35 | 34 | ||
| General Motors Financial Co. Inc. | 2.700% | 8/20/27 | 135 | 120 | ||
| General Motors Financial Co. Inc. | 6.000% | 1/9/28 | 115 | 115 | ||
| General Motors Financial Co. Inc. | 2.400% | 4/10/28 | 115 | 99 | ||
| General Motors Financial Co. Inc. | 5.800% | 6/23/28 | 155 | 154 | ||
| General Motors Financial Co. Inc. | 2.400% | 10/15/28 | 80 | 68 | ||
| General Motors Financial Co. Inc. | 4.300% | 4/6/29 | 155 | 142 | ||
| General Motors Financial Co. Inc. | 5.850% | 4/6/30 | 35 | 34 | ||
| General Motors Financial Co. Inc. | 3.600% | 6/21/30 | 65 | 56 | ||
| General Motors Financial Co. Inc. | 2.350% | 1/8/31 | 90 | 70 | ||
| General Motors Financial Co. Inc. | 2.700% | 6/10/31 | 100 | 79 | ||
| General Motors Financial Co. Inc. | 3.100% | 1/12/32 | 170 | 136 | ||
| General Motors Financial Co. Inc. | 6.400% | 1/9/33 | 115 | 116 | ||
| Hasbro Inc. | 3.900% | 11/19/29 | 185 | 168 | ||
| Home Depot Inc. | 3.350% | 9/15/25 | 95 | 92 | ||
| Home Depot Inc. | 4.000% | 9/15/25 | 105 | 103 | ||
| Home Depot Inc. | 3.000% | 4/1/26 | 160 | 153 | ||
| Home Depot Inc. | 2.125% | 9/15/26 | 140 | 129 | ||
| Home Depot Inc. | 2.500% | 4/15/27 | 105 | 97 | ||
| Home Depot Inc. | 2.875% | 4/15/27 | 130 | 122 | ||
| Home Depot Inc. | 2.800% | 9/14/27 | 75 | 70 | ||
| Home Depot Inc. | 1.500% | 9/15/28 | 65 | 56 | ||
| Home Depot Inc. | 3.900% | 12/6/28 | 90 | 87 | ||
| Home Depot Inc. | 2.950% | 6/15/29 | 195 | 177 | ||
| Home Depot Inc. | 2.700% | 4/15/30 | 180 | 158 | ||
| Home Depot Inc. | 1.375% | 3/15/31 | 70 | 55 | ||
| Home Depot Inc. | 1.875% | 9/15/31 | 175 | 141 | ||
| Home Depot Inc. | 3.250% | 4/15/32 | 155 | 138 | ||
| Home Depot Inc. | 4.500% | 9/15/32 | 120 | 117 | ||
| Home Depot Inc. | 5.875% | 12/16/36 | 284 | 305 | ||
| Home Depot Inc. | 3.300% | 4/15/40 | 131 | 103 | ||
| Home Depot Inc. | 5.950% | 4/1/41 | 125 | 134 | ||
| Home Depot Inc. | 4.200% | 4/1/43 | 60 | 52 | ||
| Home Depot Inc. | 4.875% | 2/15/44 | 85 | 80 | ||
| Home Depot Inc. | 4.400% | 3/15/45 | 105 | 92 | ||
| Home Depot Inc. | 4.250% | 4/1/46 | 235 | 201 | ||
| Home Depot Inc. | 3.900% | 6/15/47 | 160 | 130 | ||
| Home Depot Inc. | 4.500% | 12/6/48 | 200 | 179 | ||
| Home Depot Inc. | 3.125% | 12/15/49 | 120 | 84 | ||
| Home Depot Inc. | 3.350% | 4/15/50 | 185 | 135 | ||
| Coupon | Maturity Date | Face Amount ($000) | Market Value• ($000) | |||
| Home Depot Inc. | 2.375% | 3/15/51 | 190 | 113 | ||
| Home Depot Inc. | 2.750% | 9/15/51 | 130 | 84 | ||
| Home Depot Inc. | 3.625% | 4/15/52 | 270 | 205 | ||
| Home Depot Inc. | 4.950% | 9/15/52 | 75 | 72 | ||
| Home Depot Inc. | 3.500% | 9/15/56 | 180 | 132 | ||
| Honda Motor Co. Ltd. | 2.271% | 3/10/25 | 320 | 306 | ||
| Honda Motor Co. Ltd. | 2.534% | 3/10/27 | 110 | 101 | ||
| Honda Motor Co. Ltd. | 2.967% | 3/10/32 | 105 | 92 | ||
| Lennar Corp. | 4.750% | 11/29/27 | 75 | 73 | ||
| 2 | LKQ Corp. | 5.750% | 6/15/28 | 95 | 94 | |
| Lowe's Cos. Inc. | 4.400% | 9/8/25 | 145 | 143 | ||
| Lowe's Cos. Inc. | 3.375% | 9/15/25 | 85 | 82 | ||
| Lowe's Cos. Inc. | 4.800% | 4/1/26 | 80 | 79 | ||
| Lowe's Cos. Inc. | 2.500% | 4/15/26 | 160 | 150 | ||
| Lowe's Cos. Inc. | 3.350% | 4/1/27 | 35 | 33 | ||
| Lowe's Cos. Inc. | 3.100% | 5/3/27 | 265 | 247 | ||
| Lowe's Cos. Inc. | 1.300% | 4/15/28 | 25 | 21 | ||
| Lowe's Cos. Inc. | 1.700% | 9/15/28 | 120 | 102 | ||
| Lowe's Cos. Inc. | 3.650% | 4/5/29 | 201 | 187 | ||
| Lowe's Cos. Inc. | 4.500% | 4/15/30 | 170 | 164 | ||
| Lowe's Cos. Inc. | 1.700% | 10/15/30 | 120 | 95 | ||
| Lowe's Cos. Inc. | 2.625% | 4/1/31 | 135 | 113 | ||
| Lowe's Cos. Inc. | 3.750% | 4/1/32 | 190 | 170 | ||
| Lowe's Cos. Inc. | 5.000% | 4/15/33 | 130 | 127 | ||
| Lowe's Cos. Inc. | 5.150% | 7/1/33 | 130 | 128 | ||
| Lowe's Cos. Inc. | 2.800% | 9/15/41 | 120 | 82 | ||
| Lowe's Cos. Inc. | 3.700% | 4/15/46 | 170 | 127 | ||
| Lowe's Cos. Inc. | 4.050% | 5/3/47 | 180 | 140 | ||
| Lowe's Cos. Inc. | 3.000% | 10/15/50 | 240 | 152 | ||
| Lowe's Cos. Inc. | 4.250% | 4/1/52 | 170 | 134 | ||
| Lowe's Cos. Inc. | 5.625% | 4/15/53 | 175 | 170 | ||
| Lowe's Cos. Inc. | 4.450% | 4/1/62 | 145 | 113 | ||
| Lowe's Cos. Inc. | 5.800% | 9/15/62 | 145 | 140 | ||
| Magna International Inc. | 2.450% | 6/15/30 | 95 | 80 | ||
| 1 | Marriott International Inc. | 3.125% | 6/15/26 | 105 | 99 | |
| Marriott International Inc. | 5.000% | 10/15/27 | 90 | 89 | ||
| Marriott International Inc. | 4.900% | 4/15/29 | 10 | 10 | ||
| 1 | Marriott International Inc. | 4.625% | 6/15/30 | 160 | 152 | |
| 1 | Marriott International Inc. | 2.850% | 4/15/31 | 170 | 141 | |
| 1 | Marriott International Inc. | 3.500% | 10/15/32 | 120 | 102 | |
| 1 | McDonald's Corp. | 3.300% | 7/1/25 | 113 | 109 | |
| 1 | McDonald's Corp. | 3.700% | 1/30/26 | 200 | 193 | |
| 1 | McDonald's Corp. | 3.500% | 3/1/27 | 60 | 57 | |
| 1 | McDonald's Corp. | 3.500% | 7/1/27 | 145 | 138 | |
| 1 | McDonald's Corp. | 3.800% | 4/1/28 | 125 | 120 | |
| 1 | McDonald's Corp. | 2.625% | 9/1/29 | 109 | 96 | |
| 1 | McDonald's Corp. | 2.125% | 3/1/30 | 60 | 51 | |
| 1 | McDonald's Corp. | 3.600% | 7/1/30 | 30 | 28 | |
| 1 | McDonald's Corp. | 4.600% | 9/9/32 | 35 | 34 | |
| 1 | McDonald's Corp. | 4.700% | 12/9/35 | 175 | 167 | |
| 1 | McDonald's Corp. | 6.300% | 10/15/37 | 125 | 136 | |
| 1 | McDonald's Corp. | 6.300% | 3/1/38 | 150 | 163 | |
| 1 | McDonald's Corp. | 4.875% | 12/9/45 | 195 | 180 | |
| 1 | McDonald's Corp. | 4.450% | 3/1/47 | 205 | 177 | |
| 1 | McDonald's Corp. | 4.450% | 9/1/48 | 107 | 93 | |
| Coupon | Maturity Date | Face Amount ($000) | Market Value• ($000) | |||
| 1 | McDonald's Corp. | 3.625% | 9/1/49 | 205 | 155 | |
| 1 | McDonald's Corp. | 4.200% | 4/1/50 | 75 | �� 62 | |
| 1 | McDonald's Corp. | 5.150% | 9/9/52 | 40 | 38 | |
| Mercedes-Benz Finance North America LLC | 8.500% | 1/18/31 | 230 | 281 | ||
| NIKE Inc. | 2.400% | 3/27/25 | 90 | 86 | ||
| NIKE Inc. | 2.375% | 11/1/26 | 95 | 88 | ||
| NIKE Inc. | 2.750% | 3/27/27 | 154 | 144 | ||
| NIKE Inc. | 2.850% | 3/27/30 | 165 | 147 | ||
| NIKE Inc. | 3.250% | 3/27/40 | 135 | 109 | ||
| NIKE Inc. | 3.875% | 11/1/45 | 120 | 103 | ||
| NIKE Inc. | 3.375% | 3/27/50 | 178 | 137 | ||
| NVR Inc. | 3.000% | 5/15/30 | 107 | 92 | ||
| O'Reilly Automotive Inc. | 3.600% | 9/1/27 | 125 | 118 | ||
| O'Reilly Automotive Inc. | 4.700% | 6/15/32 | 120 | 115 | ||
| Ralph Lauren Corp. | 2.950% | 6/15/30 | 180 | 158 | ||
| Stanley Black & Decker Inc. | 2.300% | 3/15/30 | 110 | 91 | ||
| Stanley Black & Decker Inc. | 2.750% | 11/15/50 | 90 | 52 | ||
| 1 | Stanley Black & Decker Inc. | 4.000% | 3/15/60 | 115 | 91 | |
| Starbucks Corp. | 3.800% | 8/15/25 | 170 | 165 | ||
| Starbucks Corp. | 4.750% | 2/15/26 | 90 | 89 | ||
| Starbucks Corp. | 4.000% | 11/15/28 | 130 | 125 | ||
| Starbucks Corp. | 3.550% | 8/15/29 | 160 | 148 | ||
| Starbucks Corp. | 2.250% | 3/12/30 | 75 | 63 | ||
| Starbucks Corp. | 2.550% | 11/15/30 | 210 | 178 | ||
| Starbucks Corp. | 3.000% | 2/14/32 | 20 | 17 | ||
| Starbucks Corp. | 4.500% | 11/15/48 | 130 | 111 | ||
| Starbucks Corp. | 4.450% | 8/15/49 | 125 | 106 | ||
| Starbucks Corp. | 3.500% | 11/15/50 | 135 | 98 | ||
| TJX Cos. Inc. | 2.250% | 9/15/26 | 165 | 152 | ||
| Tractor Supply Co. | 5.250% | 5/15/33 | 85 | 83 | ||
| VF Corp. | 2.400% | 4/23/25 | 150 | 142 | ||
| VF Corp. | 2.950% | 4/23/30 | 85 | 71 | ||
| 28,564 | ||||||
| Consumer Staples (3.5%) | ||||||
| Bunge Ltd. Finance Corp. | 2.750% | 5/14/31 | 165 | 138 | ||
| Campbell Soup Co. | 3.950% | 3/15/25 | 110 | 107 | ||
| Campbell Soup Co. | 4.150% | 3/15/28 | 115 | 109 | ||
| Coca-Cola Co. | 1.750% | 9/6/24 | 90 | 87 | ||
| Coca-Cola Co. | 3.375% | 3/25/27 | 115 | 110 | ||
| Coca-Cola Co. | 1.450% | 6/1/27 | 210 | 187 | ||
| Coca-Cola Co. | 1.500% | 3/5/28 | 145 | 127 | ||
| Coca-Cola Co. | 1.000% | 3/15/28 | 215 | 184 | ||
| Coca-Cola Co. | 2.125% | 9/6/29 | 190 | 166 | ||
| Coca-Cola Co. | 3.450% | 3/25/30 | 175 | 163 | ||
| Coca-Cola Co. | 1.650% | 6/1/30 | 75 | 62 | ||
| Coca-Cola Co. | 2.000% | 3/5/31 | 70 | 58 | ||
| Coca-Cola Co. | 1.375% | 3/15/31 | 190 | 150 | ||
| Coca-Cola Co. | 2.250% | 1/5/32 | 210 | 176 | ||
| Coca-Cola Co. | 2.500% | 6/1/40 | 115 | 83 | ||
| Coca-Cola Co. | 2.875% | 5/5/41 | 70 | 53 | ||
| Coca-Cola Co. | 2.600% | 6/1/50 | 203 | 135 | ||
| Coca-Cola Co. | 3.000% | 3/5/51 | 175 | 126 | ||
| Coca-Cola Co. | 2.500% | 3/15/51 | 255 | 165 | ||
| Coca-Cola Co. | 2.750% | 6/1/60 | 160 | 104 | ||
| Conagra Brands Inc. | 4.600% | 11/1/25 | 125 | 122 | ||
| Coupon | Maturity Date | Face Amount ($000) | Market Value• ($000) | |||
| Conagra Brands Inc. | 1.375% | 11/1/27 | 105 | 89 | ||
| Conagra Brands Inc. | 4.850% | 11/1/28 | 125 | 122 | ||
| Conagra Brands Inc. | 5.300% | 11/1/38 | 105 | 97 | ||
| Conagra Brands Inc. | 5.400% | 11/1/48 | 130 | 118 | ||
| Dollar General Corp. | 4.250% | 9/20/24 | 20 | 20 | ||
| Dollar General Corp. | 3.500% | 4/3/30 | 125 | 111 | ||
| Dollar General Corp. | 5.450% | 7/5/33 | 85 | 82 | ||
| Dollar Tree Inc. | 4.000% | 5/15/25 | 135 | 131 | ||
| Dollar Tree Inc. | 4.200% | 5/15/28 | 125 | 118 | ||
| Dollar Tree Inc. | 2.650% | 12/1/31 | 90 | 73 | ||
| General Mills Inc. | 4.000% | 4/17/25 | 110 | 107 | ||
| General Mills Inc. | 3.200% | 2/10/27 | 20 | 19 | ||
| General Mills Inc. | 4.200% | 4/17/28 | 125 | 120 | ||
| General Mills Inc. | 2.875% | 4/15/30 | 135 | 118 | ||
| General Mills Inc. | 4.950% | 3/29/33 | 150 | 146 | ||
| Haleon UK Capital plc | 3.125% | 3/24/25 | 185 | 178 | ||
| Haleon US Capital LLC | 3.375% | 3/24/27 | 250 | 235 | ||
| Haleon US Capital LLC | 3.375% | 3/24/29 | 110 | 101 | ||
| Haleon US Capital LLC | 3.625% | 3/24/32 | 250 | 222 | ||
| Haleon US Capital LLC | 4.000% | 3/24/52 | 85 | 68 | ||
| Hormel Foods Corp. | 1.700% | 6/3/28 | 110 | 95 | ||
| Hormel Foods Corp. | 1.800% | 6/11/30 | 130 | 107 | ||
| J M Smucker Co. | 3.500% | 3/15/25 | 110 | 107 | ||
| JBS USA LUX SA | 2.500% | 1/15/27 | 95 | 85 | ||
| JBS USA LUX SA | 5.125% | 2/1/28 | 135 | 131 | ||
| JBS USA LUX SA | 5.500% | 1/15/30 | 220 | 213 | ||
| JBS USA LUX SA | 3.625% | 1/15/32 | 40 | 33 | ||
| JBS USA LUX SA | 3.000% | 5/15/32 | 130 | 101 | ||
| JBS USA LUX SA | 5.750% | 4/1/33 | 265 | 254 | ||
| JBS USA LUX SA | 4.375% | 2/2/52 | 85 | 60 | ||
| JBS USA LUX SA | 6.500% | 12/1/52 | 165 | 157 | ||
| Kellogg Co. | 3.250% | 4/1/26 | 130 | 124 | ||
| Keurig Dr Pepper Inc. | 4.597% | 5/25/28 | 120 | 117 | ||
| Keurig Dr Pepper Inc. | 3.950% | 4/15/29 | 90 | 85 | ||
| Keurig Dr Pepper Inc. | 3.200% | 5/1/30 | 95 | 84 | ||
| Keurig Dr Pepper Inc. | 4.050% | 4/15/32 | 120 | 110 | ||
| Keurig Dr Pepper Inc. | 3.800% | 5/1/50 | 70 | 53 | ||
| Keurig Dr Pepper Inc. | 4.500% | 4/15/52 | 175 | 149 | ||
| Kimberly-Clark Corp. | 3.100% | 3/26/30 | 110 | 99 | ||
| Kraft Heinz Foods Co. | 3.000% | 6/1/26 | 180 | 170 | ||
| Kraft Heinz Foods Co. | 3.875% | 5/15/27 | 175 | 167 | ||
| Kraft Heinz Foods Co. | 6.875% | 1/26/39 | 75 | 82 | ||
| Kraft Heinz Foods Co. | 5.000% | 6/4/42 | 65 | 59 | ||
| Kraft Heinz Foods Co. | 5.200% | 7/15/45 | 245 | 225 | ||
| Kraft Heinz Foods Co. | 4.375% | 6/1/46 | 380 | 314 | ||
| Kraft Heinz Foods Co. | 4.875% | 10/1/49 | 175 | 155 | ||
| McCormick & Co. Inc. | 3.400% | 8/15/27 | 50 | 47 | ||
| Mead Johnson Nutrition Co. | 4.125% | 11/15/25 | 161 | 157 | ||
| Mondelez International Inc. | 1.500% | 5/4/25 | 150 | 140 | ||
| Mondelez International Inc. | 2.625% | 3/17/27 | 50 | 46 | ||
| Mondelez International Inc. | 2.750% | 4/13/30 | 32 | 28 | ||
| Mondelez International Inc. | 3.000% | 3/17/32 | 115 | 98 | ||
| Mondelez International Inc. | 2.625% | 9/4/50 | 140 | 87 | ||
| PepsiCo Inc. | 2.250% | 3/19/25 | 170 | 163 | ||
| PepsiCo Inc. | 2.750% | 4/30/25 | 100 | 96 | ||
| Coupon | Maturity Date | Face Amount ($000) | Market Value• ($000) | |||
| PepsiCo Inc. | 2.850% | 2/24/26 | 75 | 71 | ||
| PepsiCo Inc. | 2.375% | 10/6/26 | 80 | 75 | ||
| PepsiCo Inc. | 3.000% | 10/15/27 | 150 | 141 | ||
| PepsiCo Inc. | 3.600% | 2/18/28 | 140 | 134 | ||
| PepsiCo Inc. | 2.625% | 7/29/29 | 155 | 139 | ||
| PepsiCo Inc. | 2.750% | 3/19/30 | 150 | 133 | ||
| PepsiCo Inc. | 1.625% | 5/1/30 | 90 | 74 | ||
| PepsiCo Inc. | 1.400% | 2/25/31 | 45 | 36 | ||
| PepsiCo Inc. | 1.950% | 10/21/31 | 175 | 143 | ||
| PepsiCo Inc. | 3.900% | 7/18/32 | 130 | 123 | ||
| PepsiCo Inc. | 4.450% | 2/15/33 | 65 | 65 | ||
| PepsiCo Inc. | 2.625% | 10/21/41 | 160 | 116 | ||
| PepsiCo Inc. | 4.450% | 4/14/46 | 90 | 84 | ||
| PepsiCo Inc. | 3.450% | 10/6/46 | 90 | 71 | ||
| PepsiCo Inc. | 2.875% | 10/15/49 | 135 | 96 | ||
| PepsiCo Inc. | 3.625% | 3/19/50 | 110 | 88 | ||
| PepsiCo Inc. | 2.750% | 10/21/51 | 170 | 115 | ||
| Pilgrim's Pride Corp. | 4.250% | 4/15/31 | 120 | 104 | ||
| Pilgrim's Pride Corp. | 3.500% | 3/1/32 | 130 | 105 | ||
| Pilgrim's Pride Corp. | 6.250% | 7/1/33 | 145 | 144 | ||
| Procter & Gamble Co. | 0.550% | 10/29/25 | 300 | 273 | ||
| Procter & Gamble Co. | 1.000% | 4/23/26 | 100 | 91 | ||
| Procter & Gamble Co. | 2.450% | 11/3/26 | 160 | 150 | ||
| Procter & Gamble Co. | 1.900% | 2/1/27 | 80 | 73 | ||
| Procter & Gamble Co. | 2.850% | 8/11/27 | 145 | 136 | ||
| Procter & Gamble Co. | 3.000% | 3/25/30 | 150 | 137 | ||
| Procter & Gamble Co. | 1.200% | 10/29/30 | 200 | 160 | ||
| Procter & Gamble Co. | 1.950% | 4/23/31 | 130 | 109 | ||
| Procter & Gamble Co. | 2.300% | 2/1/32 | 40 | 34 | ||
| Sysco Corp. | 3.750% | 10/1/25 | 35 | 34 | ||
| Sysco Corp. | 3.300% | 7/15/26 | 105 | 100 | ||
| Sysco Corp. | 3.250% | 7/15/27 | 125 | 116 | ||
| Sysco Corp. | 5.950% | 4/1/30 | 107 | 111 | ||
| Sysco Corp. | 6.600% | 4/1/50 | 150 | 165 | ||
| Sysco Corp. | 3.150% | 12/14/51 | 45 | 30 | ||
| Target Corp. | 2.250% | 4/15/25 | 260 | 248 | ||
| Target Corp. | 2.500% | 4/15/26 | 75 | 71 | ||
| Target Corp. | 1.950% | 1/15/27 | 140 | 128 | ||
| Target Corp. | 3.375% | 4/15/29 | 45 | 42 | ||
| Target Corp. | 2.350% | 2/15/30 | 120 | 103 | ||
| Target Corp. | 4.500% | 9/15/32 | 75 | 72 | ||
| Target Corp. | 4.000% | 7/1/42 | 165 | 143 | ||
| Target Corp. | 2.950% | 1/15/52 | 140 | 93 | ||
| Target Corp. | 4.800% | 1/15/53 | 135 | 124 | ||
| Tyson Foods Inc. | 4.000% | 3/1/26 | 150 | 145 | ||
| Tyson Foods Inc. | 3.550% | 6/2/27 | 240 | 225 | ||
| Tyson Foods Inc. | 4.350% | 3/1/29 | 85 | 80 | ||
| Tyson Foods Inc. | 4.550% | 6/2/47 | 85 | 68 | ||
| Tyson Foods Inc. | 5.100% | 9/28/48 | 145 | 126 | ||
| Unilever Capital Corp. | 2.900% | 5/5/27 | 115 | 107 | ||
| Unilever Capital Corp. | 3.500% | 3/22/28 | 45 | 43 | ||
| Unilever Capital Corp. | 2.125% | 9/6/29 | 25 | 22 | ||
| Unilever Capital Corp. | 1.750% | 8/12/31 | 90 | 72 | ||
| Unilever Capital Corp. | 5.900% | 11/15/32 | 95 | 103 | ||
| Walgreens Boots Alliance Inc. | 3.800% | 11/18/24 | 160 | 156 | ||
| Coupon | Maturity Date | Face Amount ($000) | Market Value• ($000) | |||
| Walgreens Boots Alliance Inc. | 3.450% | 6/1/26 | 110 | 104 | ||
| Walgreens Boots Alliance Inc. | 4.800% | 11/18/44 | 105 | 82 | ||
| Walgreens Boots Alliance Inc. | 4.100% | 4/15/50 | 50 | 34 | ||
| 15,252 | ||||||
| Financials (43.1%) | ||||||
| 1 | Aegon NV | 5.500% | 4/11/48 | 185 | 174 | |
| AerCap Ireland Capital DAC | 1.650% | 10/29/24 | 350 | 333 | ||
| 1 | AerCap Ireland Capital DAC | 1.750% | 10/29/24 | 140 | 133 | |
| AerCap Ireland Capital DAC | 3.500% | 1/15/25 | 100 | 97 | ||
| AerCap Ireland Capital DAC | 6.500% | 7/15/25 | 210 | 211 | ||
| AerCap Ireland Capital DAC | 1.750% | 1/30/26 | 105 | 95 | ||
| AerCap Ireland Capital DAC | 2.450% | 10/29/26 | 225 | 202 | ||
| AerCap Ireland Capital DAC | 3.650% | 7/21/27 | 180 | 166 | ||
| AerCap Ireland Capital DAC | 5.750% | 6/6/28 | 150 | 149 | ||
| AerCap Ireland Capital DAC | 3.000% | 10/29/28 | 350 | 303 | ||
| AerCap Ireland Capital DAC | 3.300% | 1/30/32 | 505 | 410 | ||
| AerCap Ireland Capital DAC | 3.400% | 10/29/33 | 265 | 210 | ||
| AerCap Ireland Capital DAC | 3.850% | 10/29/41 | 230 | 170 | ||
| Aflac Inc. | 3.600% | 4/1/30 | 115 | 104 | ||
| 1 | Air Lease Corp. | 2.300% | 2/1/25 | 125 | 118 | |
| Air Lease Corp. | 3.375% | 7/1/25 | 90 | 86 | ||
| 1 | Air Lease Corp. | 2.875% | 1/15/26 | 215 | 201 | |
| 1 | Air Lease Corp. | 3.750% | 6/1/26 | 95 | 90 | |
| Air Lease Corp. | 1.875% | 8/15/26 | 100 | 89 | ||
| Air Lease Corp. | 2.200% | 1/15/27 | 265 | 237 | ||
| Air Lease Corp. | 3.125% | 12/1/30 | 75 | 63 | ||
| 1 | Air Lease Corp. | 2.875% | 1/15/32 | 10 | 8 | |
| Allstate Corp. | 5.250% | 3/30/33 | 155 | 152 | ||
| Ally Financial Inc. | 5.800% | 5/1/25 | 90 | 89 | ||
| Ally Financial Inc. | 4.750% | 6/9/27 | 75 | 70 | ||
| Ally Financial Inc. | 7.100% | 11/15/27 | 30 | 30 | ||
| Ally Financial Inc. | 2.200% | 11/2/28 | 165 | 133 | ||
| Ally Financial Inc. | 6.992% | 6/13/29 | 85 | 85 | ||
| 1 | Ally Financial Inc. | 8.000% | 11/1/31 | 238 | 246 | |
| American Express Co. | 3.000% | 10/30/24 | 195 | 189 | ||
| American Express Co. | 2.250% | 3/4/25 | 210 | 200 | ||
| American Express Co. | 3.950% | 8/1/25 | 160 | 155 | ||
| American Express Co. | 4.200% | 11/6/25 | 65 | 63 | ||
| American Express Co. | 4.900% | 2/13/26 | 90 | 89 | ||
| American Express Co. | 4.990% | 5/1/26 | 110 | 108 | ||
| American Express Co. | 3.125% | 5/20/26 | 220 | 208 | ||
| American Express Co. | 1.650% | 11/4/26 | 135 | 120 | ||
| American Express Co. | 2.550% | 3/4/27 | 295 | 268 | ||
| American Express Co. | 3.300% | 5/3/27 | 347 | 323 | ||
| American Express Co. | 5.389% | 7/28/27 | 160 | 159 | ||
| American Express Co. | 5.850% | 11/5/27 | 240 | 245 | ||
| American Express Co. | 4.050% | 5/3/29 | 130 | 123 | ||
| American Express Co. | 5.282% | 7/27/29 | 115 | 114 | ||
| American Express Co. | 4.989% | 5/26/33 | 70 | 66 | ||
| American Express Co. | 4.420% | 8/3/33 | 50 | 46 | ||
| American Express Co. | 5.043% | 5/1/34 | 139 | 134 | ||
| American Express Co. | 5.625% | 7/28/34 | 55 | 54 | ||
| American Express Co. | 4.050% | 12/3/42 | 130 | 111 | ||
| American International Group Inc. | 2.500% | 6/30/25 | 114 | 108 | ||
| American International Group Inc. | 3.900% | 4/1/26 | 91 | 88 | ||
| Coupon | Maturity Date | Face Amount ($000) | Market Value• ($000) | |||
| American International Group Inc. | 5.125% | 3/27/33 | 85 | 82 | ||
| American International Group Inc. | 4.800% | 7/10/45 | 30 | 26 | ||
| American International Group Inc. | 4.750% | 4/1/48 | 225 | 198 | ||
| 1 | American International Group Inc. | 5.750% | 4/1/48 | 45 | 43 | |
| American International Group Inc. | 4.375% | 6/30/50 | 90 | 74 | ||
| Ameriprise Financial Inc. | 5.150% | 5/15/33 | 90 | 88 | ||
| Aon Corp. | 3.750% | 5/2/29 | 10 | 9 | ||
| Aon Corp. | 2.800% | 5/15/30 | 120 | 103 | ||
| Aon Corp. | 5.350% | 2/28/33 | 35 | 35 | ||
| Aon Corp. | 3.900% | 2/28/52 | 115 | 88 | ||
| Aon Global Ltd. | 3.875% | 12/15/25 | 194 | 188 | ||
| Arch Capital Group Ltd. | 3.635% | 6/30/50 | 130 | 94 | ||
| Arthur J Gallagher & Co. | 3.500% | 5/20/51 | 155 | 107 | ||
| Athene Holding Ltd. | 4.125% | 1/12/28 | 180 | 168 | ||
| Australia & New Zealand Banking Group Ltd. | 5.375% | 7/3/25 | 200 | 200 | ||
| 1 | Australia & New Zealand Banking Group Ltd. | 3.700% | 11/16/25 | 105 | 102 | |
| Australia & New Zealand Banking Group Ltd. | 5.088% | 12/8/25 | 50 | 50 | ||
| AXA SA | 8.600% | 12/15/30 | 85 | 103 | ||
| Banco Bilbao Vizcaya Argentaria SA | 1.125% | 9/18/25 | 145 | 132 | ||
| Banco Bilbao Vizcaya Argentaria SA | 5.862% | 9/14/26 | 10 | 10 | ||
| Banco Bilbao Vizcaya Argentaria SA | 6.138% | 9/14/28 | 130 | 131 | ||
| Banco Santander SA | 3.496% | 3/24/25 | 200 | 193 | ||
| Banco Santander SA | 2.746% | 5/28/25 | 200 | 189 | ||
| Banco Santander SA | 5.147% | 8/18/25 | 225 | 221 | ||
| Banco Santander SA | 5.179% | 11/19/25 | 170 | 166 | ||
| Banco Santander SA | 1.849% | 3/25/26 | 115 | 104 | ||
| Banco Santander SA | 4.250% | 4/11/27 | 210 | 199 | ||
| Banco Santander SA | 5.294% | 8/18/27 | 390 | 382 | ||
| Banco Santander SA | 1.722% | 9/14/27 | 65 | 57 | ||
| Banco Santander SA | 3.800% | 2/23/28 | 115 | 105 | ||
| Banco Santander SA | 4.175% | 3/24/28 | 175 | 164 | ||
| Banco Santander SA | 4.379% | 4/12/28 | 65 | 61 | ||
| Banco Santander SA | 3.306% | 6/27/29 | 130 | 115 | ||
| Banco Santander SA | 3.490% | 5/28/30 | 150 | 130 | ||
| Banco Santander SA | 2.749% | 12/3/30 | 225 | 174 | ||
| Banco Santander SA | 2.958% | 3/25/31 | 120 | 99 | ||
| Banco Santander SA | 3.225% | 11/22/32 | 110 | 86 | ||
| Banco Santander SA | 6.921% | 8/8/33 | 200 | 200 | ||
| 1 | Bank of America Corp. | 4.000% | 1/22/25 | 340 | 332 | |
| 1 | Bank of America Corp. | 3.950% | 4/21/25 | 270 | 262 | |
| 1 | Bank of America Corp. | 3.875% | 8/1/25 | 290 | 282 | |
| 1 | Bank of America Corp. | 0.981% | 9/25/25 | 285 | 270 | |
| 1 | Bank of America Corp. | 3.093% | 10/1/25 | 210 | 203 | |
| 1 | Bank of America Corp. | 2.456% | 10/22/25 | 275 | 264 | |
| 1 | Bank of America Corp. | 1.530% | 12/6/25 | 320 | 303 | |
| 1 | Bank of America Corp. | 3.366% | 1/23/26 | 284 | 274 | |
| 1 | Bank of America Corp. | 2.015% | 2/13/26 | 355 | 335 | |
| 1 | Bank of America Corp. | 4.450% | 3/3/26 | 290 | 282 | |
| 1 | Bank of America Corp. | 3.384% | 4/2/26 | 540 | 519 | |
| 1 | Bank of America Corp. | 3.500% | 4/19/26 | 275 | 262 | |
| 1 | Bank of America Corp. | 1.319% | 6/19/26 | 430 | 396 | |
| 1 | Bank of America Corp. | 4.827% | 7/22/26 | 280 | 275 | |
| 1 | Bank of America Corp. | 4.250% | 10/22/26 | 253 | 243 | |
| 1 | Bank of America Corp. | 1.197% | 10/24/26 | 355 | 322 | |
| Bank of America Corp. | 5.080% | 1/20/27 | 305 | 301 | ||
| Coupon | Maturity Date | Face Amount ($000) | Market Value• ($000) | |||
| 1 | Bank of America Corp. | 1.658% | 3/11/27 | 230 | 208 | |
| 1 | Bank of America Corp. | 3.559% | 4/23/27 | 285 | 270 | |
| Bank of America Corp. | 1.734% | 7/22/27 | 625 | 559 | ||
| 1 | Bank of America Corp. | 3.248% | 10/21/27 | 255 | 238 | |
| 1 | Bank of America Corp. | 4.183% | 11/25/27 | 350 | 332 | |
| 1 | Bank of America Corp. | 3.824% | 1/20/28 | 260 | 245 | |
| 1 | Bank of America Corp. | 2.551% | 2/4/28 | 295 | 267 | |
| 1 | Bank of America Corp. | 3.705% | 4/24/28 | 235 | 220 | |
| Bank of America Corp. | 4.376% | 4/27/28 | 260 | 249 | ||
| 1 | Bank of America Corp. | 3.593% | 7/21/28 | 240 | 223 | |
| 1 | Bank of America Corp. | 4.948% | 7/22/28 | 300 | 294 | |
| Bank of America Corp. | 6.204% | 11/10/28 | 175 | 179 | ||
| 1 | Bank of America Corp. | 3.419% | 12/20/28 | 693 | 635 | |
| 1 | Bank of America Corp. | 3.970% | 3/5/29 | 285 | 266 | |
| Bank of America Corp. | 5.202% | 4/25/29 | 400 | 394 | ||
| 1 | Bank of America Corp. | 2.087% | 6/14/29 | 370 | 315 | |
| 1 | Bank of America Corp. | 4.271% | 7/23/29 | 398 | 375 | |
| 1 | Bank of America Corp. | 3.974% | 2/7/30 | 370 | 341 | |
| 1 | Bank of America Corp. | 3.194% | 7/23/30 | 300 | 263 | |
| 1 | Bank of America Corp. | 2.884% | 10/22/30 | 285 | 244 | |
| 1 | Bank of America Corp. | 2.496% | 2/13/31 | 400 | 332 | |
| 1 | Bank of America Corp. | 2.592% | 4/29/31 | 425 | 354 | |
| 1 | Bank of America Corp. | 1.898% | 7/23/31 | 325 | 256 | |
| 1 | Bank of America Corp. | 1.922% | 10/24/31 | 315 | 247 | |
| 1 | Bank of America Corp. | 2.651% | 3/11/32 | 235 | 193 | |
| Bank of America Corp. | 2.687% | 4/22/32 | 540 | 441 | ||
| Bank of America Corp. | 2.299% | 7/21/32 | 410 | 323 | ||
| Bank of America Corp. | 2.572% | 10/20/32 | 415 | 333 | ||
| 1 | Bank of America Corp. | 2.972% | 2/4/33 | 490 | 403 | |
| Bank of America Corp. | 4.571% | 4/27/33 | 485 | 449 | ||
| 1 | Bank of America Corp. | 5.015% | 7/22/33 | 565 | 543 | |
| Bank of America Corp. | 5.288% | 4/25/34 | 560 | 547 | ||
| Bank of America Corp. | 2.482% | 9/21/36 | 325 | 247 | ||
| Bank of America Corp. | 6.110% | 1/29/37 | 185 | 191 | ||
| Bank of America Corp. | 3.846% | 3/8/37 | 225 | 191 | ||
| 1 | Bank of America Corp. | 4.244% | 4/24/38 | 255 | 222 | |
| Bank of America Corp. | 7.750% | 5/14/38 | 295 | 345 | ||
| 1 | Bank of America Corp. | 4.078% | 4/23/40 | 215 | 181 | |
| 1 | Bank of America Corp. | 2.676% | 6/19/41 | 585 | 403 | |
| 1 | Bank of America Corp. | 5.875% | 2/7/42 | 170 | 176 | |
| Bank of America Corp. | 3.311% | 4/22/42 | 390 | 292 | ||
| 1 | Bank of America Corp. | 5.000% | 1/21/44 | 265 | 252 | |
| 1 | Bank of America Corp. | 4.443% | 1/20/48 | 235 | 200 | |
| 1 | Bank of America Corp. | 3.946% | 1/23/49 | 90 | 71 | |
| 1 | Bank of America Corp. | 4.330% | 3/15/50 | 375 | 317 | |
| 1 | Bank of America Corp. | 4.083% | 3/20/51 | 575 | 462 | |
| 1 | Bank of America Corp. | 2.831% | 10/24/51 | 130 | 83 | |
| 1 | Bank of America Corp. | 3.483% | 3/13/52 | 110 | 80 | |
| Bank of America Corp. | 2.972% | 7/21/52 | 280 | 185 | ||
| Bank of America NA | 5.650% | 8/18/25 | 250 | 251 | ||
| Bank of America NA | 5.526% | 8/18/26 | 250 | 251 | ||
| 1 | Bank of America NA | 6.000% | 10/15/36 | 160 | 168 | |
| 1 | Bank of Montreal | 4.250% | 9/14/24 | 35 | 34 | |
| Bank of Montreal | 5.200% | 12/12/24 | 105 | 104 | ||
| 1 | Bank of Montreal | 1.500% | 1/10/25 | 115 | 109 | |
| Coupon | Maturity Date | Face Amount ($000) | Market Value• ($000) | |||
| 1 | Bank of Montreal | 1.850% | 5/1/25 | 155 | 146 | |
| 1 | Bank of Montreal | 3.700% | 6/7/25 | 175 | 169 | |
| Bank of Montreal | 5.300% | 6/5/26 | 85 | 85 | ||
| 1 | Bank of Montreal | 1.250% | 9/15/26 | 215 | 190 | |
| 1 | Bank of Montreal | 0.949% | 1/22/27 | 165 | 148 | |
| 1 | Bank of Montreal | 2.650% | 3/8/27 | 215 | 196 | |
| 1 | Bank of Montreal | 4.700% | 9/14/27 | 125 | 122 | |
| Bank of Montreal | 5.203% | 2/1/28 | 125 | 124 | ||
| 1 | Bank of Montreal | 3.803% | 12/15/32 | 110 | 97 | |
| Bank of Montreal | 3.088% | 1/10/37 | 145 | 112 | ||
| 1 | Bank of New York Mellon Corp. | 2.100% | 10/24/24 | 170 | 164 | |
| 1 | Bank of New York Mellon Corp. | 3.000% | 2/24/25 | 120 | 116 | |
| 1 | Bank of New York Mellon Corp. | 1.600% | 4/24/25 | 145 | 136 | |
| 1 | Bank of New York Mellon Corp. | 3.350% | 4/25/25 | 105 | 101 | |
| 1 | Bank of New York Mellon Corp. | 2.800% | 5/4/26 | 110 | 103 | |
| Bank of New York Mellon Corp. | 4.414% | 7/24/26 | 90 | 88 | ||
| 1 | Bank of New York Mellon Corp. | 2.450% | 8/17/26 | 10 | 9 | |
| 1 | Bank of New York Mellon Corp. | 2.050% | 1/26/27 | 100 | 90 | |
| Bank of New York Mellon Corp. | 4.947% | 4/26/27 | 145 | 143 | ||
| 1 | Bank of New York Mellon Corp. | 3.250% | 5/16/27 | 145 | 136 | |
| 1 | Bank of New York Mellon Corp. | 3.400% | 1/29/28 | 35 | 33 | |
| 1 | Bank of New York Mellon Corp. | 3.442% | 2/7/28 | 210 | 198 | |
| 1 | Bank of New York Mellon Corp. | 3.850% | 4/28/28 | 165 | 157 | |
| 1 | Bank of New York Mellon Corp. | 5.802% | 10/25/28 | 70 | 71 | |
| Bank of New York Mellon Corp. | 4.543% | 2/1/29 | 80 | 78 | ||
| 1 | Bank of New York Mellon Corp. | 3.300% | 8/23/29 | 100 | 89 | |
| 1 | Bank of New York Mellon Corp. | 4.289% | 6/13/33 | 148 | 136 | |
| 1 | Bank of New York Mellon Corp. | 5.834% | 10/25/33 | 170 | 174 | |
| Bank of New York Mellon Corp. | 4.706% | 2/1/34 | 80 | 75 | ||
| 1 | Bank of New York Mellon Corp. | 4.967% | 4/26/34 | 110 | 106 | |
| Bank of Nova Scotia | 5.250% | 12/6/24 | 135 | 134 | ||
| Bank of Nova Scotia | 1.450% | 1/10/25 | 220 | 208 | ||
| Bank of Nova Scotia | 2.200% | 2/3/25 | 205 | 195 | ||
| 1 | Bank of Nova Scotia | 3.450% | 4/11/25 | 160 | 155 | |
| Bank of Nova Scotia | 1.300% | 6/11/25 | 100 | 93 | ||
| Bank of Nova Scotia | 5.450% | 6/12/25 | 185 | 184 | ||
| Bank of Nova Scotia | 4.500% | 12/16/25 | 185 | 179 | ||
| Bank of Nova Scotia | 4.750% | 2/2/26 | 30 | 29 | ||
| Bank of Nova Scotia | 1.050% | 3/2/26 | 165 | 148 | ||
| Bank of Nova Scotia | 1.350% | 6/24/26 | 105 | 94 | ||
| Bank of Nova Scotia | 2.700% | 8/3/26 | 90 | 84 | ||
| Bank of Nova Scotia | 1.300% | 9/15/26 | 170 | 151 | ||
| Bank of Nova Scotia | 1.950% | 2/2/27 | 60 | 54 | ||
| Bank of Nova Scotia | 5.250% | 6/12/28 | 110 | 109 | ||
| Bank of Nova Scotia | 4.850% | 2/1/30 | 140 | 135 | ||
| Bank of Nova Scotia | 2.450% | 2/2/32 | 90 | 73 | ||
| Bank of Nova Scotia | 4.588% | 5/4/37 | 150 | 129 | ||
| Barclays plc | 4.375% | 9/11/24 | 265 | 259 | ||
| Barclays plc | 3.650% | 3/16/25 | 220 | 212 | ||
| Barclays plc | 4.375% | 1/12/26 | 245 | 236 | ||
| 1 | Barclays plc | 2.852% | 5/7/26 | 100 | 95 | |
| Barclays plc | 5.200% | 5/12/26 | 254 | 247 | ||
| Barclays plc | 5.304% | 8/9/26 | 200 | 197 | ||
| Barclays plc | 7.325% | 11/2/26 | 120 | 123 | ||
| Barclays plc | 5.829% | 5/9/27 | 225 | 223 | ||
| Coupon | Maturity Date | Face Amount ($000) | Market Value• ($000) | |||
| Barclays plc | 2.279% | 11/24/27 | 255 | 227 | ||
| Barclays plc | 4.337% | 1/10/28 | 250 | 236 | ||
| Barclays plc | 4.836% | 5/9/28 | 225 | 208 | ||
| Barclays plc | 5.501% | 8/9/28 | 175 | 171 | ||
| Barclays plc | 7.385% | 11/2/28 | 170 | 177 | ||
| 1 | Barclays plc | 4.972% | 5/16/29 | 215 | 204 | |
| 1 | Barclays plc | 5.088% | 6/20/30 | 155 | 142 | |
| Barclays plc | 2.645% | 6/24/31 | 105 | 84 | ||
| Barclays plc | 2.667% | 3/10/32 | 85 | 66 | ||
| Barclays plc | 2.894% | 11/24/32 | 195 | 152 | ||
| Barclays plc | 5.746% | 8/9/33 | 125 | 120 | ||
| Barclays plc | 7.437% | 11/2/33 | 255 | 273 | ||
| Barclays plc | 6.224% | 5/9/34 | 225 | 222 | ||
| Barclays plc | 7.119% | 6/27/34 | 175 | 175 | ||
| Barclays plc | 3.564% | 9/23/35 | 165 | 131 | ||
| Barclays plc | 3.811% | 3/10/42 | 100 | 70 | ||
| Barclays plc | 3.330% | 11/24/42 | 105 | 72 | ||
| Barclays plc | 5.250% | 8/17/45 | 190 | 170 | ||
| Barclays plc | 4.950% | 1/10/47 | 195 | 168 | ||
| BlackRock Inc. | 3.250% | 4/30/29 | 135 | 125 | ||
| BlackRock Inc. | 2.400% | 4/30/30 | 118 | 101 | ||
| BlackRock Inc. | 1.900% | 1/28/31 | 85 | 69 | ||
| BlackRock Inc. | 2.100% | 2/25/32 | 100 | 80 | ||
| BlackRock Inc. | 4.750% | 5/25/33 | 115 | 112 | ||
| 1 | BNP Paribas SA | 4.250% | 10/15/24 | 200 | 196 | |
| Brighthouse Financial Inc. | 3.700% | 6/22/27 | 80 | 74 | ||
| Brighthouse Financial Inc. | 4.700% | 6/22/47 | 128 | 95 | ||
| Canadian Imperial Bank of Commerce | 2.250% | 1/28/25 | 112 | 107 | ||
| Canadian Imperial Bank of Commerce | 3.300% | 4/7/25 | 135 | 130 | ||
| Canadian Imperial Bank of Commerce | 5.144% | 4/28/25 | 90 | 89 | ||
| Canadian Imperial Bank of Commerce | 3.945% | 8/4/25 | 260 | 252 | ||
| Canadian Imperial Bank of Commerce | 3.450% | 4/7/27 | 130 | 121 | ||
| Canadian Imperial Bank of Commerce | 5.001% | 4/28/28 | 110 | 108 | ||
| Canadian Imperial Bank of Commerce | 3.600% | 4/7/32 | 90 | 80 | ||
| Capital One Financial Corp. | 3.300% | 10/30/24 | 255 | 248 | ||
| Capital One Financial Corp. | 3.200% | 2/5/25 | 110 | 106 | ||
| Capital One Financial Corp. | 4.250% | 4/30/25 | 10 | 10 | ||
| Capital One Financial Corp. | 4.200% | 10/29/25 | 195 | 187 | ||
| Capital One Financial Corp. | 2.636% | 3/3/26 | 130 | 123 | ||
| Capital One Financial Corp. | 4.985% | 7/24/26 | 45 | 44 | ||
| Capital One Financial Corp. | 3.750% | 7/28/26 | 175 | 164 | ||
| Capital One Financial Corp. | 3.750% | 3/9/27 | 200 | 186 | ||
| Capital One Financial Corp. | 3.650% | 5/11/27 | 160 | 149 | ||
| Capital One Financial Corp. | 1.878% | 11/2/27 | 575 | 504 | ||
| Capital One Financial Corp. | 3.800% | 1/31/28 | 285 | 262 | ||
| Capital One Financial Corp. | 4.927% | 5/10/28 | 90 | 87 | ||
| Capital One Financial Corp. | 5.468% | 2/1/29 | 115 | 111 | ||
| Capital One Financial Corp. | 6.312% | 6/8/29 | 90 | 90 | ||
| Capital One Financial Corp. | 3.273% | 3/1/30 | 140 | 120 | ||
| Capital One Financial Corp. | 2.359% | 7/29/32 | 100 | 71 | ||
| Capital One Financial Corp. | 5.268% | 5/10/33 | 150 | 139 | ||
| Capital One Financial Corp. | 5.817% | 2/1/34 | 150 | 142 | ||
| Capital One Financial Corp. | 6.377% | 6/8/34 | 250 | 247 | ||
| Charles Schwab Corp. | 3.850% | 5/21/25 | 80 | 78 | ||
| Charles Schwab Corp. | 0.900% | 3/11/26 | 90 | 80 | ||
| Coupon | Maturity Date | Face Amount ($000) | Market Value• ($000) | |||
| Charles Schwab Corp. | 1.150% | 5/13/26 | 200 | 178 | ||
| Charles Schwab Corp. | 2.450% | 3/3/27 | 165 | 149 | ||
| Charles Schwab Corp. | 2.000% | 3/20/28 | 160 | 138 | ||
| Charles Schwab Corp. | 1.650% | 3/11/31 | 125 | 96 | ||
| Charles Schwab Corp. | 2.300% | 5/13/31 | 90 | 72 | ||
| Charles Schwab Corp. | 1.950% | 12/1/31 | 210 | 161 | ||
| Charles Schwab Corp. | 2.900% | 3/3/32 | 130 | 107 | ||
| Charles Schwab Corp. | 5.853% | 5/19/34 | 100 | 100 | ||
| Charles Schwab Corp. | 6.136% | 8/24/34 | 120 | 122 | ||
| Chubb Corp. | 6.000% | 5/11/37 | 110 | 117 | ||
| Chubb INA Holdings Inc. | 3.150% | 3/15/25 | 105 | 102 | ||
| Chubb INA Holdings Inc. | 3.350% | 5/3/26 | 250 | 239 | ||
| Chubb INA Holdings Inc. | 1.375% | 9/15/30 | 170 | 134 | ||
| Chubb INA Holdings Inc. | 4.350% | 11/3/45 | 140 | 122 | ||
| Chubb INA Holdings Inc. | 3.050% | 12/15/61 | 100 | 65 | ||
| CI Financial Corp. | 3.200% | 12/17/30 | 130 | 100 | ||
| CI Financial Corp. | 4.100% | 6/15/51 | 95 | 57 | ||
| Citigroup Inc. | 3.875% | 3/26/25 | 100 | 97 | ||
| Citigroup Inc. | 3.300% | 4/27/25 | 210 | 203 | ||
| Citigroup Inc. | 4.400% | 6/10/25 | 300 | 293 | ||
| Citigroup Inc. | 5.500% | 9/13/25 | 175 | 174 | ||
| Citigroup Inc. | 3.700% | 1/12/26 | 250 | 240 | ||
| Citigroup Inc. | 2.014% | 1/25/26 | 300 | 284 | ||
| �� | Citigroup Inc. | 4.600% | 3/9/26 | 165 | 161 | |
| Citigroup Inc. | 3.290% | 3/17/26 | 100 | 96 | ||
| 1 | Citigroup Inc. | 3.106% | 4/8/26 | 440 | 421 | |
| Citigroup Inc. | 3.400% | 5/1/26 | 275 | 260 | ||
| Citigroup Inc. | 5.610% | 9/29/26 | 250 | 249 | ||
| Citigroup Inc. | 3.200% | 10/21/26 | 450 | 420 | ||
| Citigroup Inc. | 4.300% | 11/20/26 | 100 | 96 | ||
| Citigroup Inc. | 1.122% | 1/28/27 | 295 | 264 | ||
| Citigroup Inc. | 1.462% | 6/9/27 | 410 | 365 | ||
| Citigroup Inc. | 4.450% | 9/29/27 | 435 | 416 | ||
| 1 | Citigroup Inc. | 3.887% | 1/10/28 | 330 | 312 | |
| 1 | Citigroup Inc. | 3.070% | 2/24/28 | 250 | 230 | |
| Citigroup Inc. | 4.658% | 5/24/28 | 225 | 219 | ||
| 1 | Citigroup Inc. | 3.668% | 7/24/28 | 360 | 335 | |
| Citigroup Inc. | 4.125% | 7/25/28 | 210 | 196 | ||
| 1 | Citigroup Inc. | 3.520% | 10/27/28 | 310 | 286 | |
| 1 | Citigroup Inc. | 4.075% | 4/23/29 | 250 | 234 | |
| 1 | Citigroup Inc. | 3.980% | 3/20/30 | 340 | 313 | |
| 1 | Citigroup Inc. | 2.976% | 11/5/30 | 225 | 193 | |
| 1 | Citigroup Inc. | 2.666% | 1/29/31 | 305 | 255 | |
| 1 | Citigroup Inc. | 4.412% | 3/31/31 | 435 | 404 | |
| 1 | Citigroup Inc. | 2.572% | 6/3/31 | 375 | 310 | |
| Citigroup Inc. | 2.561% | 5/1/32 | 285 | 229 | ||
| Citigroup Inc. | 6.625% | 6/15/32 | 110 | 115 | ||
| Citigroup Inc. | 2.520% | 11/3/32 | 300 | 238 | ||
| Citigroup Inc. | 3.057% | 1/25/33 | 330 | 272 | ||
| Citigroup Inc. | 3.785% | 3/17/33 | 305 | 265 | ||
| Citigroup Inc. | 4.910% | 5/24/33 | 255 | 243 | ||
| Citigroup Inc. | 6.270% | 11/17/33 | 350 | 365 | ||
| Citigroup Inc. | 6.174% | 5/25/34 | 400 | 399 | ||
| 1 | Citigroup Inc. | 3.878% | 1/24/39 | 146 | 120 | |
| Citigroup Inc. | 8.125% | 7/15/39 | 237 | 295 | ||
| Coupon | Maturity Date | Face Amount ($000) | Market Value• ($000) | |||
| 1 | Citigroup Inc. | 5.316% | 3/26/41 | 150 | 142 | |
| Citigroup Inc. | 5.875% | 1/30/42 | 145 | 147 | ||
| Citigroup Inc. | 2.904% | 11/3/42 | 155 | 107 | ||
| Citigroup Inc. | 6.675% | 9/13/43 | 125 | 131 | ||
| Citigroup Inc. | 5.300% | 5/6/44 | 90 | 82 | ||
| Citigroup Inc. | 4.650% | 7/30/45 | 95 | 82 | ||
| Citigroup Inc. | 4.750% | 5/18/46 | 260 | 217 | ||
| 1 | Citigroup Inc. | 4.281% | 4/24/48 | 100 | 84 | |
| Citigroup Inc. | 4.650% | 7/23/48 | 360 | 312 | ||
| 1 | Citizens Bank NA | 2.250% | 4/28/25 | 40 | 37 | |
| Citizens Financial Group Inc. | 3.250% | 4/30/30 | 125 | 105 | ||
| CME Group Inc. | 3.000% | 3/15/25 | 65 | 63 | ||
| CME Group Inc. | 2.650% | 3/15/32 | 70 | 59 | ||
| CME Group Inc. | 5.300% | 9/15/43 | 38 | 38 | ||
| Commonwealth Bank of Australia | 5.079% | 1/10/25 | 40 | 40 | ||
| Cooperatieve Rabobank UA | 1.375% | 1/10/25 | 75 | 71 | ||
| 1 | Cooperatieve Rabobank UA | 3.375% | 5/21/25 | 180 | 174 | |
| Cooperatieve Rabobank UA | 4.375% | 8/4/25 | 65 | 63 | ||
| 1 | Cooperatieve Rabobank UA | 3.750% | 7/21/26 | 195 | 183 | |
| 1 | Cooperatieve Rabobank UA | 5.250% | 5/24/41 | 155 | 158 | |
| Cooperatieve Rabobank UA | 5.750% | 12/1/43 | 175 | 171 | ||
| Cooperatieve Rabobank UA | 5.250% | 8/4/45 | 140 | 128 | ||
| 1 | Credit Suisse AG | 3.625% | 9/9/24 | 415 | 404 | |
| 1 | Credit Suisse AG | 3.700% | 2/21/25 | 500 | 482 | |
| Credit Suisse AG | 1.250% | 8/7/26 | 40 | 35 | ||
| Credit Suisse AG | 5.000% | 7/9/27 | 250 | 244 | ||
| Credit Suisse AG | 7.500% | 2/15/28 | 295 | 315 | ||
| 1 | Deutsche Bank AG | 3.961% | 11/26/25 | 120 | 116 | |
| Deutsche Bank AG | 1.686% | 3/19/26 | 120 | 109 | ||
| Deutsche Bank AG | 6.119% | 7/14/26 | 100 | 99 | ||
| Deutsche Bank AG | 2.129% | 11/24/26 | 215 | 195 | ||
| Deutsche Bank AG | 7.146% | 7/13/27 | 150 | 152 | ||
| Deutsche Bank AG | 2.311% | 11/16/27 | 271 | 238 | ||
| Deutsche Bank AG | 2.552% | 1/7/28 | 40 | 35 | ||
| Deutsche Bank AG | 6.720% | 1/18/29 | 210 | 212 | ||
| 1 | Deutsche Bank AG | 3.547% | 9/18/31 | 185 | 155 | |
| Deutsche Bank AG | 3.729% | 1/14/32 | 110 | 85 | ||
| Deutsche Bank AG | 3.035% | 5/28/32 | 150 | 119 | ||
| Deutsche Bank AG | 4.875% | 12/1/32 | 160 | 140 | ||
| Deutsche Bank AG | 3.742% | 1/7/33 | 140 | 105 | ||
| Deutsche Bank AG | 7.079% | 2/10/34 | 205 | 195 | ||
| Discover Bank | 2.450% | 9/12/24 | 105 | 101 | ||
| 1 | Discover Bank | 3.450% | 7/27/26 | 145 | 133 | |
| 1 | Discover Bank | 4.650% | 9/13/28 | 100 | 92 | |
| Discover Financial Services | 4.100% | 2/9/27 | 115 | 107 | ||
| Discover Financial Services | 6.700% | 11/29/32 | 90 | 90 | ||
| Equitable Holdings Inc. | 4.350% | 4/20/28 | 227 | 215 | ||
| Equitable Holdings Inc. | 5.000% | 4/20/48 | 156 | 131 | ||
| Everest Reinsurance Holdings Inc. | 3.500% | 10/15/50 | 110 | 75 | ||
| Everest Reinsurance Holdings Inc. | 3.125% | 10/15/52 | 165 | 105 | ||
| Fairfax Financial Holdings Ltd. | 5.625% | 8/16/32 | 75 | 72 | ||
| Fifth Third Bancorp | 2.375% | 1/28/25 | 375 | 357 | ||
| Fifth Third Bancorp | 2.550% | 5/5/27 | 125 | 112 | ||
| Fifth Third Bancorp | 6.361% | 10/27/28 | 115 | 116 | ||
| Fifth Third Bancorp | 6.339% | 7/27/29 | 115 | 116 | ||
| Coupon | Maturity Date | Face Amount ($000) | Market Value• ($000) | |||
| Fifth Third Bancorp | 4.772% | 7/28/30 | 110 | 103 | ||
| Fifth Third Bancorp | 8.250% | 3/1/38 | 95 | 107 | ||
| 1 | Fifth Third Bank NA | 3.950% | 7/28/25 | 40 | 39 | |
| 1 | Fifth Third Bank NA | 3.850% | 3/15/26 | 135 | 126 | |
| Franklin Resources Inc. | 1.600% | 10/30/30 | 130 | 102 | ||
| Global Payments Inc. | 2.650% | 2/15/25 | 92 | 88 | ||
| Global Payments Inc. | 1.200% | 3/1/26 | 120 | 107 | ||
| Global Payments Inc. | 4.800% | 4/1/26 | 115 | 112 | ||
| Global Payments Inc. | 2.150% | 1/15/27 | 70 | 62 | ||
| Global Payments Inc. | 3.200% | 8/15/29 | 150 | 131 | ||
| Global Payments Inc. | 2.900% | 5/15/30 | 155 | 131 | ||
| Global Payments Inc. | 2.900% | 11/15/31 | 120 | 98 | ||
| Global Payments Inc. | 5.400% | 8/15/32 | 150 | 147 | ||
| Global Payments Inc. | 4.150% | 8/15/49 | 135 | 99 | ||
| Global Payments Inc. | 5.950% | 8/15/52 | 35 | 33 | ||
| Goldman Sachs Capital I | 6.345% | 2/15/34 | 140 | 141 | ||
| Goldman Sachs Group Inc. | 5.700% | 11/1/24 | 250 | 250 | ||
| Goldman Sachs Group Inc. | 3.500% | 1/23/25 | 293 | 284 | ||
| Goldman Sachs Group Inc. | 3.500% | 4/1/25 | 414 | 400 | ||
| Goldman Sachs Group Inc. | 3.750% | 5/22/25 | 230 | 222 | ||
| 1 | Goldman Sachs Group Inc. | 3.272% | 9/29/25 | 260 | 252 | |
| Goldman Sachs Group Inc. | 4.250% | 10/21/25 | 125 | 121 | ||
| Goldman Sachs Group Inc. | 0.855% | 2/12/26 | 260 | 241 | ||
| Goldman Sachs Group Inc. | 3.750% | 2/25/26 | 275 | 264 | ||
| Goldman Sachs Group Inc. | 5.798% | 8/10/26 | 270 | 269 | ||
| Goldman Sachs Group Inc. | 3.500% | 11/16/26 | 377 | 354 | ||
| 1 | Goldman Sachs Group Inc. | 1.093% | 12/9/26 | 365 | 328 | |
| Goldman Sachs Group Inc. | 5.950% | 1/15/27 | 115 | 116 | ||
| Goldman Sachs Group Inc. | 3.850% | 1/26/27 | 325 | 308 | ||
| Goldman Sachs Group Inc. | 1.431% | 3/9/27 | 315 | 282 | ||
| Goldman Sachs Group Inc. | 1.542% | 9/10/27 | 305 | 269 | ||
| Goldman Sachs Group Inc. | 1.948% | 10/21/27 | 460 | 409 | ||
| Goldman Sachs Group Inc. | 2.640% | 2/24/28 | 375 | 339 | ||
| Goldman Sachs Group Inc. | 3.615% | 3/15/28 | 390 | 365 | ||
| 1 | Goldman Sachs Group Inc. | 3.691% | 6/5/28 | 390 | 365 | |
| Goldman Sachs Group Inc. | 4.482% | 8/23/28 | 250 | 241 | ||
| 1 | Goldman Sachs Group Inc. | 3.814% | 4/23/29 | 390 | 361 | |
| 1 | Goldman Sachs Group Inc. | 4.223% | 5/1/29 | 443 | 417 | |
| Goldman Sachs Group Inc. | 2.600% | 2/7/30 | 265 | 224 | ||
| Goldman Sachs Group Inc. | 3.800% | 3/15/30 | 300 | 273 | ||
| Goldman Sachs Group Inc. | 1.992% | 1/27/32 | 260 | 202 | ||
| Goldman Sachs Group Inc. | 2.615% | 4/22/32 | 370 | 300 | ||
| Goldman Sachs Group Inc. | 2.383% | 7/21/32 | 480 | 379 | ||
| Goldman Sachs Group Inc. | 2.650% | 10/21/32 | 370 | 297 | ||
| Goldman Sachs Group Inc. | 6.125% | 2/15/33 | 260 | 276 | ||
| Goldman Sachs Group Inc. | 3.102% | 2/24/33 | 465 | 387 | ||
| Goldman Sachs Group Inc. | 6.750% | 10/1/37 | 655 | 694 | ||
| 1 | Goldman Sachs Group Inc. | 4.017% | 10/31/38 | 155 | 129 | |
| 1 | Goldman Sachs Group Inc. | 4.411% | 4/23/39 | 85 | 73 | |
| Goldman Sachs Group Inc. | 6.250% | 2/1/41 | 405 | 428 | ||
| Goldman Sachs Group Inc. | 3.210% | 4/22/42 | 275 | 198 | ||
| Goldman Sachs Group Inc. | 2.908% | 7/21/42 | 215 | 149 | ||
| Goldman Sachs Group Inc. | 3.436% | 2/24/43 | 50 | 37 | ||
| 1 | Goldman Sachs Group Inc. | 4.800% | 7/8/44 | 215 | 192 | |
| Goldman Sachs Group Inc. | 5.150% | 5/22/45 | 265 | 244 | ||
| Coupon | Maturity Date | Face Amount ($000) | Market Value• ($000) | |||
| Goldman Sachs Group Inc. | 4.750% | 10/21/45 | 190 | 171 | ||
| Hartford Financial Services Group Inc. | 3.600% | 8/19/49 | 120 | 88 | ||
| HSBC Holdings plc | 4.250% | 8/18/25 | 140 | 135 | ||
| 1 | HSBC Holdings plc | 2.633% | 11/7/25 | 215 | 206 | |
| HSBC Holdings plc | 4.180% | 12/9/25 | 300 | 292 | ||
| HSBC Holdings plc | 4.300% | 3/8/26 | 380 | 367 | ||
| HSBC Holdings plc | 2.999% | 3/10/26 | 275 | 262 | ||
| 1 | HSBC Holdings plc | 1.645% | 4/18/26 | 185 | 172 | |
| HSBC Holdings plc | 3.900% | 5/25/26 | 150 | 143 | ||
| 1 | HSBC Holdings plc | 2.099% | 6/4/26 | 260 | 242 | |
| 1 | HSBC Holdings plc | 4.292% | 9/12/26 | 145 | 140 | |
| HSBC Holdings plc | 7.336% | 11/3/26 | 125 | 129 | ||
| HSBC Holdings plc | 4.375% | 11/23/26 | 145 | 138 | ||
| HSBC Holdings plc | 1.589% | 5/24/27 | 380 | 338 | ||
| HSBC Holdings plc | 5.887% | 8/14/27 | 275 | 274 | ||
| HSBC Holdings plc | 2.251% | 11/22/27 | 340 | 303 | ||
| 1 | HSBC Holdings plc | 4.041% | 3/13/28 | 295 | 277 | |
| HSBC Holdings plc | 4.755% | 6/9/28 | 255 | 245 | ||
| HSBC Holdings plc | 5.210% | 8/11/28 | 240 | 234 | ||
| 1 | HSBC Holdings plc | 2.013% | 9/22/28 | 125 | 107 | |
| HSBC Holdings plc | 7.390% | 11/3/28 | 190 | 200 | ||
| HSBC Holdings plc | 6.161% | 3/9/29 | 255 | 257 | ||
| 1 | HSBC Holdings plc | 4.583% | 6/19/29 | 365 | 345 | |
| HSBC Holdings plc | 2.206% | 8/17/29 | 230 | 193 | ||
| HSBC Holdings plc | 4.950% | 3/31/30 | 335 | 322 | ||
| 1 | HSBC Holdings plc | 3.973% | 5/22/30 | 335 | 302 | |
| 1 | HSBC Holdings plc | 2.848% | 6/4/31 | 220 | 181 | |
| 1 | HSBC Holdings plc | 2.357% | 8/18/31 | 130 | 103 | |
| HSBC Holdings plc | 2.804% | 5/24/32 | 280 | 224 | ||
| HSBC Holdings plc | 2.871% | 11/22/32 | 135 | 107 | ||
| HSBC Holdings plc | 4.762% | 3/29/33 | 265 | 235 | ||
| HSBC Holdings plc | 5.402% | 8/11/33 | 245 | 234 | ||
| HSBC Holdings plc | 8.113% | 11/3/33 | 255 | 277 | ||
| HSBC Holdings plc | 6.254% | 3/9/34 | 505 | 510 | ||
| HSBC Holdings plc | 6.547% | 6/20/34 | 225 | 220 | ||
| HSBC Holdings plc | 6.500% | 5/2/36 | 65 | 66 | ||
| HSBC Holdings plc | 6.500% | 9/15/37 | 200 | 204 | ||
| 1 | HSBC Holdings plc | 6.500% | 9/15/37 | 135 | 132 | |
| HSBC Holdings plc | 6.800% | 6/1/38 | 100 | 103 | ||
| HSBC Holdings plc | 6.100% | 1/14/42 | 135 | 141 | ||
| HSBC Holdings plc | 6.332% | 3/9/44 | 325 | 327 | ||
| HSBC Holdings plc | 5.250% | 3/14/44 | 252 | 221 | ||
| HSBC USA Inc. | 5.625% | 3/17/25 | 50 | 50 | ||
| Huntington Bancshares Inc. | 4.443% | 8/4/28 | 90 | 85 | ||
| Huntington Bancshares Inc. | 6.208% | 8/21/29 | 120 | 121 | ||
| Huntington Bancshares Inc. | 2.550% | 2/4/30 | 115 | 94 | ||
| Huntington National Bank | 5.699% | 11/18/25 | 40 | 39 | ||
| Huntington National Bank | 4.552% | 5/17/28 | 125 | 118 | ||
| Huntington National Bank | 5.650% | 1/10/30 | 100 | 98 | ||
| ING Groep NV | 3.869% | 3/28/26 | 50 | 48 | ||
| ING Groep NV | 3.950% | 3/29/27 | 260 | 247 | ||
| ING Groep NV | 1.726% | 4/1/27 | 185 | 166 | ||
| ING Groep NV | 4.017% | 3/28/28 | 125 | 118 | ||
| ING Groep NV | 4.550% | 10/2/28 | 70 | 67 | ||
| ING Groep NV | 4.050% | 4/9/29 | 70 | 65 | ||
| Coupon | Maturity Date | Face Amount ($000) | Market Value• ($000) | |||
| ING Groep NV | 2.727% | 4/1/32 | 85 | 69 | ||
| ING Groep NV | 4.252% | 3/28/33 | 170 | 153 | ||
| Intercontinental Exchange Inc. | 3.650% | 5/23/25 | 145 | 141 | ||
| Intercontinental Exchange Inc. | 3.750% | 12/1/25 | 130 | 125 | ||
| Intercontinental Exchange Inc. | 4.000% | 9/15/27 | 160 | 153 | ||
| Intercontinental Exchange Inc. | 4.350% | 6/15/29 | 85 | 81 | ||
| Intercontinental Exchange Inc. | 2.100% | 6/15/30 | 235 | 194 | ||
| Intercontinental Exchange Inc. | 1.850% | 9/15/32 | 325 | 247 | ||
| Intercontinental Exchange Inc. | 4.600% | 3/15/33 | 160 | 153 | ||
| Intercontinental Exchange Inc. | 2.650% | 9/15/40 | 130 | 91 | ||
| Intercontinental Exchange Inc. | 4.250% | 9/21/48 | 200 | 168 | ||
| Intercontinental Exchange Inc. | 3.000% | 6/15/50 | 140 | 93 | ||
| Intercontinental Exchange Inc. | 4.950% | 6/15/52 | 185 | 172 | ||
| Intercontinental Exchange Inc. | 3.000% | 9/15/60 | 205 | 127 | ||
| Intercontinental Exchange Inc. | 5.200% | 6/15/62 | 90 | 86 | ||
| JPMorgan Chase & Co. | 3.875% | 9/10/24 | 315 | 309 | ||
| JPMorgan Chase & Co. | 3.125% | 1/23/25 | 310 | 300 | ||
| JPMorgan Chase & Co. | 3.900% | 7/15/25 | 380 | 369 | ||
| 1 | JPMorgan Chase & Co. | 2.301% | 10/15/25 | 205 | 197 | |
| JPMorgan Chase & Co. | 1.561% | 12/10/25 | 345 | 326 | ||
| JPMorgan Chase & Co. | 5.546% | 12/15/25 | 340 | 339 | ||
| JPMorgan Chase & Co. | 2.595% | 2/24/26 | 120 | 115 | ||
| 1 | JPMorgan Chase & Co. | 2.005% | 3/13/26 | 230 | 217 | |
| JPMorgan Chase & Co. | 3.300% | 4/1/26 | 365 | 347 | ||
| 1 | JPMorgan Chase & Co. | 2.083% | 4/22/26 | 470 | 442 | |
| JPMorgan Chase & Co. | 4.080% | 4/26/26 | 290 | 283 | ||
| JPMorgan Chase & Co. | 3.200% | 6/15/26 | 185 | 175 | ||
| JPMorgan Chase & Co. | 2.950% | 10/1/26 | 300 | 280 | ||
| JPMorgan Chase & Co. | 1.045% | 11/19/26 | 375 | 338 | ||
| JPMorgan Chase & Co. | 4.125% | 12/15/26 | 215 | 207 | ||
| 1 | JPMorgan Chase & Co. | 3.960% | 1/29/27 | 320 | 308 | |
| JPMorgan Chase & Co. | 1.040% | 2/4/27 | 180 | 161 | ||
| JPMorgan Chase & Co. | 1.578% | 4/22/27 | 450 | 404 | ||
| JPMorgan Chase & Co. | 1.470% | 9/22/27 | 225 | 199 | ||
| JPMorgan Chase & Co. | 4.250% | 10/1/27 | 170 | 164 | ||
| JPMorgan Chase & Co. | 3.625% | 12/1/27 | 170 | 160 | ||
| 1 | JPMorgan Chase & Co. | 3.782% | 2/1/28 | 390 | 368 | |
| JPMorgan Chase & Co. | 2.947% | 2/24/28 | 100 | 92 | ||
| JPMorgan Chase & Co. | 4.323% | 4/26/28 | 320 | 308 | ||
| 1 | JPMorgan Chase & Co. | 3.540% | 5/1/28 | 355 | 331 | |
| 1 | JPMorgan Chase & Co. | 2.182% | 6/1/28 | 250 | 222 | |
| JPMorgan Chase & Co. | 4.851% | 7/25/28 | 400 | 392 | ||
| 1 | JPMorgan Chase & Co. | 3.509% | 1/23/29 | 355 | 327 | |
| 1 | JPMorgan Chase & Co. | 4.005% | 4/23/29 | 265 | 248 | |
| JPMorgan Chase & Co. | 2.069% | 6/1/29 | 315 | 270 | ||
| 1 | JPMorgan Chase & Co. | 4.203% | 7/23/29 | 265 | 250 | |
| JPMorgan Chase & Co. | 5.299% | 7/24/29 | 200 | 199 | ||
| 1 | JPMorgan Chase & Co. | 4.452% | 12/5/29 | 355 | 338 | |
| 1 | JPMorgan Chase & Co. | 3.702% | 5/6/30 | 310 | 283 | |
| JPMorgan Chase & Co. | 4.565% | 6/14/30 | 190 | 181 | ||
| 1 | JPMorgan Chase & Co. | 2.739% | 10/15/30 | 400 | 343 | |
| 1 | JPMorgan Chase & Co. | 4.493% | 3/24/31 | 395 | 375 | |
| 1 | JPMorgan Chase & Co. | 2.522% | 4/22/31 | 310 | 260 | |
| 1 | JPMorgan Chase & Co. | 2.956% | 5/13/31 | 375 | 318 | |
| JPMorgan Chase & Co. | 1.764% | 11/19/31 | 230 | 180 | ||
| Coupon | Maturity Date | Face Amount ($000) | Market Value• ($000) | |||
| JPMorgan Chase & Co. | 1.953% | 2/4/32 | 360 | 284 | ||
| JPMorgan Chase & Co. | 2.580% | 4/22/32 | 440 | 360 | ||
| JPMorgan Chase & Co. | 2.545% | 11/8/32 | 315 | 254 | ||
| JPMorgan Chase & Co. | 2.963% | 1/25/33 | 380 | 315 | ||
| JPMorgan Chase & Co. | 4.586% | 4/26/33 | 245 | 229 | ||
| JPMorgan Chase & Co. | 4.912% | 7/25/33 | 690 | 663 | ||
| JPMorgan Chase & Co. | 5.717% | 9/14/33 | 360 | 360 | ||
| JPMorgan Chase & Co. | 5.350% | 6/1/34 | 450 | 445 | ||
| JPMorgan Chase & Co. | 6.400% | 5/15/38 | 262 | 288 | ||
| 1 | JPMorgan Chase & Co. | 3.882% | 7/24/38 | 285 | 240 | |
| JPMorgan Chase & Co. | 5.500% | 10/15/40 | 125 | 126 | ||
| 1 | JPMorgan Chase & Co. | 3.109% | 4/22/41 | 225 | 166 | |
| JPMorgan Chase & Co. | 5.600% | 7/15/41 | 245 | 248 | ||
| JPMorgan Chase & Co. | 2.525% | 11/19/41 | 245 | 165 | ||
| JPMorgan Chase & Co. | 5.400% | 1/6/42 | 175 | 175 | ||
| JPMorgan Chase & Co. | 3.157% | 4/22/42 | 185 | 135 | ||
| JPMorgan Chase & Co. | 5.625% | 8/16/43 | 190 | 189 | ||
| JPMorgan Chase & Co. | 4.850% | 2/1/44 | 135 | 127 | ||
| JPMorgan Chase & Co. | 4.950% | 6/1/45 | 225 | 206 | ||
| 1 | JPMorgan Chase & Co. | 4.260% | 2/22/48 | 170 | 142 | |
| 1 | JPMorgan Chase & Co. | 4.032% | 7/24/48 | 200 | 161 | |
| 1 | JPMorgan Chase & Co. | 3.964% | 11/15/48 | 455 | 360 | |
| 1 | JPMorgan Chase & Co. | 3.897% | 1/23/49 | 200 | 157 | |
| 1 | JPMorgan Chase & Co. | 3.109% | 4/22/51 | 207 | 140 | |
| JPMorgan Chase & Co. | 3.328% | 4/22/52 | 510 | 358 | ||
| 1 | KeyBank NA | 3.300% | 6/1/25 | 120 | 112 | |
| 1 | KeyBank NA | 4.150% | 8/8/25 | 250 | 236 | |
| 1 | KeyBank NA | 4.900% | 8/8/32 | 75 | 62 | |
| KeyBank NA | 5.000% | 1/26/33 | 100 | 87 | ||
| 1 | KeyCorp | 2.250% | 4/6/27 | 80 | 69 | |
| 1 | KeyCorp | 4.100% | 4/30/28 | 95 | 85 | |
| 1 | KeyCorp | 2.550% | 10/1/29 | 80 | 63 | |
| 1 | KeyCorp | 4.789% | 6/1/33 | 130 | 112 | |
| Lloyds Banking Group plc | 4.500% | 11/4/24 | 65 | 64 | ||
| Lloyds Banking Group plc | 4.450% | 5/8/25 | 180 | 176 | ||
| Lloyds Banking Group plc | 4.582% | 12/10/25 | 40 | 38 | ||
| 1 | Lloyds Banking Group plc | 2.438% | 2/5/26 | 260 | 247 | |
| Lloyds Banking Group plc | 3.511% | 3/18/26 | 165 | 159 | ||
| Lloyds Banking Group plc | 4.650% | 3/24/26 | 215 | 207 | ||
| Lloyds Banking Group plc | 4.716% | 8/11/26 | 235 | 230 | ||
| Lloyds Banking Group plc | 3.750% | 1/11/27 | 175 | 164 | ||
| Lloyds Banking Group plc | 1.627% | 5/11/27 | 240 | 214 | ||
| Lloyds Banking Group plc | 3.750% | 3/18/28 | 40 | 37 | ||
| Lloyds Banking Group plc | 4.375% | 3/22/28 | 140 | 133 | ||
| Lloyds Banking Group plc | 4.550% | 8/16/28 | 120 | 114 | ||
| 1 | Lloyds Banking Group plc | 3.574% | 11/7/28 | 225 | 204 | |
| Lloyds Banking Group plc | 5.871% | 3/6/29 | 200 | 199 | ||
| Lloyds Banking Group plc | 4.976% | 8/11/33 | 100 | 92 | ||
| Lloyds Banking Group plc | 7.953% | 11/15/33 | 145 | 155 | ||
| Lloyds Banking Group plc | 5.300% | 12/1/45 | 60 | 53 | ||
| Lloyds Banking Group plc | 3.369% | 12/14/46 | 175 | 114 | ||
| Lloyds Banking Group plc | 4.344% | 1/9/48 | 180 | 134 | ||
| M&T Bank Corp. | 5.053% | 1/27/34 | 100 | 91 | ||
| 1 | Manufacturers & Traders Trust Co. | 2.900% | 2/6/25 | 135 | 128 | |
| Manufacturers & Traders Trust Co. | 4.650% | 1/27/26 | 290 | 277 | ||
| Coupon | Maturity Date | Face Amount ($000) | Market Value• ($000) | |||
| Manufacturers & Traders Trust Co. | 4.700% | 1/27/28 | 150 | 140 | ||
| Marsh & McLennan Cos. Inc. | 4.375% | 3/15/29 | 155 | 150 | ||
| Marsh & McLennan Cos. Inc. | 2.250% | 11/15/30 | 175 | 144 | ||
| Marsh & McLennan Cos. Inc. | 4.900% | 3/15/49 | 85 | 78 | ||
| Mastercard Inc. | 2.000% | 3/3/25 | 10 | 10 | ||
| Mastercard Inc. | 2.950% | 11/21/26 | 90 | 85 | ||
| Mastercard Inc. | 3.300% | 3/26/27 | 215 | 204 | ||
| Mastercard Inc. | 4.875% | 3/9/28 | 170 | 171 | ||
| Mastercard Inc. | 2.950% | 6/1/29 | 96 | 87 | ||
| Mastercard Inc. | 3.350% | 3/26/30 | 165 | 152 | ||
| Mastercard Inc. | 2.000% | 11/18/31 | 110 | 89 | ||
| Mastercard Inc. | 3.650% | 6/1/49 | 195 | 156 | ||
| Mastercard Inc. | 3.850% | 3/26/50 | 125 | 104 | ||
| MetLife Inc. | 4.550% | 3/23/30 | 215 | 209 | ||
| MetLife Inc. | 5.375% | 7/15/33 | 85 | 85 | ||
| MetLife Inc. | 6.375% | 6/15/34 | 55 | 59 | ||
| MetLife Inc. | 5.700% | 6/15/35 | 165 | 169 | ||
| 1 | MetLife Inc. | 6.400% | 12/15/36 | 95 | 95 | |
| MetLife Inc. | 5.875% | 2/6/41 | 90 | 93 | ||
| MetLife Inc. | 4.125% | 8/13/42 | 75 | 62 | ||
| MetLife Inc. | 4.875% | 11/13/43 | 105 | 96 | ||
| MetLife Inc. | 4.050% | 3/1/45 | 120 | 98 | ||
| MetLife Inc. | 4.600% | 5/13/46 | 80 | 70 | ||
| MetLife Inc. | 5.000% | 7/15/52 | 115 | 105 | ||
| MetLife Inc. | 5.250% | 1/15/54 | 75 | 71 | ||
| Mitsubishi UFJ Financial Group Inc. | 2.193% | 2/25/25 | 315 | 299 | ||
| Mitsubishi UFJ Financial Group Inc. | 3.777% | 3/2/25 | 198 | 192 | ||
| Mitsubishi UFJ Financial Group Inc. | 1.412% | 7/17/25 | 195 | 180 | ||
| Mitsubishi UFJ Financial Group Inc. | 5.063% | 9/12/25 | 230 | 228 | ||
| Mitsubishi UFJ Financial Group Inc. | 0.962% | 10/11/25 | 150 | 141 | ||
| Mitsubishi UFJ Financial Group Inc. | 5.719% | 2/20/26 | 170 | 170 | ||
| Mitsubishi UFJ Financial Group Inc. | 3.850% | 3/1/26 | 225 | 216 | ||
| Mitsubishi UFJ Financial Group Inc. | 2.757% | 9/13/26 | 75 | 69 | ||
| Mitsubishi UFJ Financial Group Inc. | 3.677% | 2/22/27 | 145 | 138 | ||
| Mitsubishi UFJ Financial Group Inc. | 1.538% | 7/20/27 | 355 | 316 | ||
| Mitsubishi UFJ Financial Group Inc. | 3.287% | 7/25/27 | 80 | 74 | ||
| Mitsubishi UFJ Financial Group Inc. | 1.640% | 10/13/27 | 140 | 124 | ||
| Mitsubishi UFJ Financial Group Inc. | 2.341% | 1/19/28 | 360 | 323 | ||
| Mitsubishi UFJ Financial Group Inc. | 3.961% | 3/2/28 | 120 | 114 | ||
| Mitsubishi UFJ Financial Group Inc. | 5.017% | 7/20/28 | 200 | 196 | ||
| Mitsubishi UFJ Financial Group Inc. | 4.050% | 9/11/28 | 145 | 138 | ||
| Mitsubishi UFJ Financial Group Inc. | 5.354% | 9/13/28 | 50 | 50 | ||
| Mitsubishi UFJ Financial Group Inc. | 5.422% | 2/22/29 | 250 | 249 | ||
| Mitsubishi UFJ Financial Group Inc. | 3.741% | 3/7/29 | 235 | 217 | ||
| Mitsubishi UFJ Financial Group Inc. | 3.195% | 7/18/29 | 235 | 208 | ||
| Mitsubishi UFJ Financial Group Inc. | 2.559% | 2/25/30 | 140 | 118 | ||
| Mitsubishi UFJ Financial Group Inc. | 2.048% | 7/17/30 | 200 | 161 | ||
| Mitsubishi UFJ Financial Group Inc. | 2.309% | 7/20/32 | 155 | 123 | ||
| Mitsubishi UFJ Financial Group Inc. | 2.494% | 10/13/32 | 35 | 28 | ||
| Mitsubishi UFJ Financial Group Inc. | 2.852% | 1/19/33 | 175 | 143 | ||
| Mitsubishi UFJ Financial Group Inc. | 5.133% | 7/20/33 | 110 | 107 | ||
| Mitsubishi UFJ Financial Group Inc. | 5.472% | 9/13/33 | 100 | 99 | ||
| Mitsubishi UFJ Financial Group Inc. | 5.441% | 2/22/34 | 70 | 69 | ||
| Mitsubishi UFJ Financial Group Inc. | 5.406% | 4/19/34 | 200 | 197 | ||
| Mitsubishi UFJ Financial Group Inc. | 3.751% | 7/18/39 | 170 | 140 | ||
| Coupon | Maturity Date | Face Amount ($000) | Market Value• ($000) | |||
| 1 | Mizuho Financial Group Inc. | 2.226% | 5/25/26 | 180 | 168 | |
| Mizuho Financial Group Inc. | 1.234% | 5/22/27 | 215 | 190 | ||
| Mizuho Financial Group Inc. | 1.554% | 7/9/27 | 130 | 115 | ||
| Mizuho Financial Group Inc. | 3.170% | 9/11/27 | 135 | 124 | ||
| Mizuho Financial Group Inc. | 4.018% | 3/5/28 | 225 | 212 | ||
| Mizuho Financial Group Inc. | 5.667% | 5/27/29 | 10 | 10 | ||
| Mizuho Financial Group Inc. | 5.778% | 7/6/29 | 200 | 200 | ||
| 1 | Mizuho Financial Group Inc. | 4.254% | 9/11/29 | 350 | 327 | |
| 1 | Mizuho Financial Group Inc. | 3.153% | 7/16/30 | 100 | 86 | |
| 1 | Mizuho Financial Group Inc. | 2.201% | 7/10/31 | 160 | 127 | |
| 1 | Mizuho Financial Group Inc. | 1.979% | 9/8/31 | 75 | 58 | |
| Mizuho Financial Group Inc. | 2.564% | 9/13/31 | 110 | 86 | ||
| Mizuho Financial Group Inc. | 5.669% | 9/13/33 | 25 | 25 | ||
| Mizuho Financial Group Inc. | 5.748% | 7/6/34 | 200 | 198 | ||
| 1 | Morgan Stanley | 3.700% | 10/23/24 | 345 | 338 | |
| 1 | Morgan Stanley | 4.000% | 7/23/25 | 305 | 296 | |
| 1 | Morgan Stanley | 0.864% | 10/21/25 | 150 | 141 | |
| 1 | Morgan Stanley | 1.164% | 10/21/25 | 335 | 316 | |
| Morgan Stanley | 5.000% | 11/24/25 | 210 | 207 | ||
| 1 | Morgan Stanley | 3.875% | 1/27/26 | 335 | 322 | |
| 1 | Morgan Stanley | 2.630% | 2/18/26 | 255 | 243 | |
| 1 | Morgan Stanley | 2.188% | 4/28/26 | 375 | 354 | |
| Morgan Stanley | 4.679% | 7/17/26 | 185 | 181 | ||
| 1 | Morgan Stanley | 3.125% | 7/27/26 | 420 | 393 | |
| 1 | Morgan Stanley | 4.350% | 9/8/26 | 305 | 294 | |
| Morgan Stanley | 6.138% | 10/16/26 | 200 | 201 | ||
| Morgan Stanley | 0.985% | 12/10/26 | 345 | 309 | ||
| Morgan Stanley | 3.625% | 1/20/27 | 341 | 322 | ||
| Morgan Stanley | 5.050% | 1/28/27 | 205 | 203 | ||
| Morgan Stanley | 3.950% | 4/23/27 | 335 | 316 | ||
| Morgan Stanley | 1.593% | 5/4/27 | 440 | 394 | ||
| 1 | Morgan Stanley | 1.512% | 7/20/27 | 300 | 266 | |
| Morgan Stanley | 2.475% | 1/21/28 | 135 | 122 | ||
| Morgan Stanley | 4.210% | 4/20/28 | 305 | 291 | ||
| 1 | Morgan Stanley | 3.591% | 7/22/28 | 415 | 384 | |
| Morgan Stanley | 6.296% | 10/18/28 | 185 | 190 | ||
| 1 | Morgan Stanley | 3.772% | 1/24/29 | 450 | 417 | |
| Morgan Stanley | 5.123% | 2/1/29 | 205 | 201 | ||
| 1 | Morgan Stanley | 5.164% | 4/20/29 | 270 | 265 | |
| Morgan Stanley | 5.449% | 7/20/29 | 300 | 298 | ||
| 1 | Morgan Stanley | 4.431% | 1/23/30 | 400 | 380 | |
| 1 | Morgan Stanley | 2.699% | 1/22/31 | 350 | 295 | |
| 1 | Morgan Stanley | 3.622% | 4/1/31 | 280 | 249 | |
| 1 | Morgan Stanley | 1.794% | 2/13/32 | 360 | 277 | |
| Morgan Stanley | 7.250% | 4/1/32 | 190 | 216 | ||
| 1 | Morgan Stanley | 1.928% | 4/28/32 | 200 | 154 | |
| 1 | Morgan Stanley | 2.239% | 7/21/32 | 390 | 306 | |
| 1 | Morgan Stanley | 2.511% | 10/20/32 | 265 | 211 | |
| Morgan Stanley | 2.943% | 1/21/33 | 320 | 262 | ||
| Morgan Stanley | 4.889% | 7/20/33 | 225 | 213 | ||
| Morgan Stanley | 6.342% | 10/18/33 | 390 | 409 | ||
| 1 | Morgan Stanley | 5.250% | 4/21/34 | 605 | 587 | |
| 1 | Morgan Stanley | 5.424% | 7/21/34 | 100 | 98 | |
| Morgan Stanley | 2.484% | 9/16/36 | 510 | 384 | ||
| Morgan Stanley | 5.297% | 4/20/37 | 200 | 186 | ||
| Coupon | Maturity Date | Face Amount ($000) | Market Value• ($000) | |||
| Morgan Stanley | 5.948% | 1/19/38 | 155 | 151 | ||
| 1 | Morgan Stanley | 3.971% | 7/22/38 | 225 | 188 | |
| 1 | Morgan Stanley | 4.457% | 4/22/39 | 115 | 101 | |
| Morgan Stanley | 3.217% | 4/22/42 | 255 | 188 | ||
| Morgan Stanley | 6.375% | 7/24/42 | 250 | 273 | ||
| Morgan Stanley | 4.300% | 1/27/45 | 335 | 285 | ||
| Morgan Stanley | 4.375% | 1/22/47 | 270 | 231 | ||
| 1 | Morgan Stanley | 5.597% | 3/24/51 | 280 | 281 | |
| 1 | Morgan Stanley | 2.802% | 1/25/52 | 280 | 177 | |
| Morgan Stanley Bank NA | 5.479% | 7/16/25 | 50 | 50 | ||
| 1 | Morgan Stanley Bank NA | 4.754% | 4/21/26 | 95 | 94 | |
| Nasdaq Inc. | 5.350% | 6/28/28 | 115 | 115 | ||
| Nasdaq Inc. | 5.550% | 2/15/34 | 155 | 154 | ||
| Nasdaq Inc. | 5.950% | 8/15/53 | 85 | 84 | ||
| Nasdaq Inc. | 6.100% | 6/28/63 | 85 | 84 | ||
| National Australia Bank Ltd. | 5.132% | 11/22/24 | 90 | 90 | ||
| National Australia Bank Ltd. | 3.500% | 6/9/25 | 95 | 92 | ||
| National Australia Bank Ltd. | 3.375% | 1/14/26 | 110 | 105 | ||
| 1 | National Australia Bank Ltd. | 2.500% | 7/12/26 | 85 | 79 | |
| National Australia Bank Ltd. | 3.905% | 6/9/27 | 40 | 38 | ||
| National Australia Bank Ltd. | 4.944% | 1/12/28 | 400 | 397 | ||
| National Bank of Canada | 5.250% | 1/17/25 | 60 | 60 | ||
| NatWest Group plc | 4.800% | 4/5/26 | 285 | 278 | ||
| NatWest Group plc | 7.472% | 11/10/26 | 70 | 72 | ||
| NatWest Group plc | 1.642% | 6/14/27 | 100 | 89 | ||
| 1 | NatWest Group plc | 3.073% | 5/22/28 | 215 | 194 | |
| NatWest Group plc | 5.516% | 9/30/28 | 25 | 25 | ||
| 1 | NatWest Group plc | 4.892% | 5/18/29 | 250 | 238 | |
| NatWest Group plc | 5.808% | 9/13/29 | 200 | 198 | ||
| 1 | NatWest Group plc | 3.754% | 11/1/29 | 95 | 90 | |
| 1 | NatWest Group plc | 5.076% | 1/27/30 | 290 | 276 | |
| 1 | NatWest Group plc | 4.445% | 5/8/30 | 175 | 161 | |
| NatWest Group plc | 6.016% | 3/2/34 | 100 | 99 | ||
| 1 | NatWest Group plc | 3.032% | 11/28/35 | 80 | 62 | |
| Nomura Holdings Inc. | 2.648% | 1/16/25 | 85 | 81 | ||
| Nomura Holdings Inc. | 5.099% | 7/3/25 | 75 | 74 | ||
| Nomura Holdings Inc. | 1.851% | 7/16/25 | 195 | 180 | ||
| Nomura Holdings Inc. | 1.653% | 7/14/26 | 185 | 164 | ||
| Nomura Holdings Inc. | 2.329% | 1/22/27 | 200 | 177 | ||
| Nomura Holdings Inc. | 2.172% | 7/14/28 | 150 | 126 | ||
| Nomura Holdings Inc. | 3.103% | 1/16/30 | 115 | 97 | ||
| Nomura Holdings Inc. | 2.679% | 7/16/30 | 85 | 69 | ||
| Nomura Holdings Inc. | 2.608% | 7/14/31 | 130 | 102 | ||
| Nomura Holdings Inc. | 2.999% | 1/22/32 | 65 | 52 | ||
| Nomura Holdings Inc. | 6.181% | 1/18/33 | 135 | 137 | ||
| Northern Trust Corp. | 3.950% | 10/30/25 | 115 | 111 | ||
| Northern Trust Corp. | 4.000% | 5/10/27 | 135 | 130 | ||
| Northern Trust Corp. | 1.950% | 5/1/30 | 120 | 99 | ||
| Northern Trust Corp. | 6.125% | 11/2/32 | 100 | 102 | ||
| PayPal Holdings Inc. | 2.400% | 10/1/24 | 190 | 184 | ||
| PayPal Holdings Inc. | 1.650% | 6/1/25 | 85 | 80 | ||
| PayPal Holdings Inc. | 2.650% | 10/1/26 | 135 | 126 | ||
| PayPal Holdings Inc. | 2.850% | 10/1/29 | 135 | 119 | ||
| PayPal Holdings Inc. | 2.300% | 6/1/30 | 140 | 118 | ||
| PayPal Holdings Inc. | 4.400% | 6/1/32 | 115 | 110 | ||
| Coupon | Maturity Date | Face Amount ($000) | Market Value• ($000) | |||
| PayPal Holdings Inc. | 3.250% | 6/1/50 | 175 | 124 | ||
| PayPal Holdings Inc. | 5.050% | 6/1/52 | 95 | 92 | ||
| 1 | PNC Bank NA | 2.950% | 2/23/25 | 130 | 125 | |
| 1 | PNC Bank NA | 3.100% | 10/25/27 | 60 | 55 | |
| 1 | PNC Bank NA | 4.050% | 7/26/28 | 205 | 189 | |
| 1 | PNC Bank NA | 2.700% | 10/22/29 | 50 | 42 | |
| PNC Financial Services Group Inc. | 5.671% | 10/28/25 | 115 | 114 | ||
| PNC Financial Services Group Inc. | 5.812% | 6/12/26 | 110 | 110 | ||
| PNC Financial Services Group Inc. | 2.600% | 7/23/26 | 175 | 163 | ||
| PNC Financial Services Group Inc. | 4.758% | 1/26/27 | 140 | 137 | ||
| PNC Financial Services Group Inc. | 3.150% | 5/19/27 | 111 | 103 | ||
| PNC Financial Services Group Inc. | 5.354% | 12/2/28 | 110 | 108 | ||
| PNC Financial Services Group Inc. | 3.450% | 4/23/29 | 345 | 311 | ||
| PNC Financial Services Group Inc. | 5.582% | 6/12/29 | 360 | 357 | ||
| PNC Financial Services Group Inc. | 2.550% | 1/22/30 | 185 | 155 | ||
| PNC Financial Services Group Inc. | 2.307% | 4/23/32 | 50 | 40 | ||
| PNC Financial Services Group Inc. | 4.626% | 6/6/33 | 85 | 77 | ||
| PNC Financial Services Group Inc. | 6.037% | 10/28/33 | 185 | 188 | ||
| PNC Financial Services Group Inc. | 5.068% | 1/24/34 | 170 | 161 | ||
| PNC Financial Services Group Inc. | 5.939% | 8/18/34 | 100 | 101 | ||
| Progressive Corp. | 4.125% | 4/15/47 | 210 | 174 | ||
| 1 | Prudential Financial Inc. | 5.700% | 12/14/36 | 200 | 204 | |
| 1 | Prudential Financial Inc. | 5.375% | 5/15/45 | 90 | 88 | |
| 1 | Prudential Financial Inc. | 4.500% | 9/15/47 | 50 | 45 | |
| Prudential Financial Inc. | 3.905% | 12/7/47 | 150 | 117 | ||
| 1 | Prudential Financial Inc. | 5.700% | 9/15/48 | 130 | 123 | |
| Prudential Financial Inc. | 3.935% | 12/7/49 | 120 | 92 | ||
| 1 | Prudential Financial Inc. | 4.350% | 2/25/50 | 115 | 96 | |
| 1 | Prudential Financial Inc. | 3.700% | 10/1/50 | 15 | 13 | |
| 1 | Prudential Financial Inc. | 3.700% | 3/13/51 | 120 | 89 | |
| Prudential Financial Inc. | 5.125% | 3/1/52 | 220 | 197 | ||
| Prudential Financial Inc. | 6.000% | 9/1/52 | 100 | 96 | ||
| Prudential Funding Asia plc | 3.125% | 4/14/30 | 140 | 123 | ||
| Raymond James Financial Inc. | 4.950% | 7/15/46 | 110 | 96 | ||
| Raymond James Financial Inc. | 3.750% | 4/1/51 | 140 | 102 | ||
| Regions Financial Corp. | 2.250% | 5/18/25 | 115 | 107 | ||
| RenaissanceRe Holdings Ltd. | 5.750% | 6/5/33 | 50 | 49 | ||
| 1 | Royal Bank of Canada | 0.750% | 10/7/24 | 155 | 147 | |
| 1 | Royal Bank of Canada | 5.660% | 10/25/24 | 145 | 145 | |
| 1 | Royal Bank of Canada | 2.250% | 11/1/24 | 245 | 236 | |
| 1 | Royal Bank of Canada | 1.600% | 1/21/25 | 110 | 104 | |
| Royal Bank of Canada | 3.375% | 4/14/25 | 215 | 208 | ||
| 1 | Royal Bank of Canada | 4.950% | 4/25/25 | 155 | 153 | |
| 1 | Royal Bank of Canada | 1.150% | 6/10/25 | 200 | 185 | |
| 1 | Royal Bank of Canada | 4.875% | 1/12/26 | 155 | 153 | |
| 1 | Royal Bank of Canada | 0.875% | 1/20/26 | 190 | 171 | |
| 1 | Royal Bank of Canada | 4.650% | 1/27/26 | 95 | 93 | |
| Royal Bank of Canada | 1.200% | 4/27/26 | 150 | 134 | ||
| 1 | Royal Bank of Canada | 1.150% | 7/14/26 | 135 | 120 | |
| 1 | Royal Bank of Canada | 1.400% | 11/2/26 | 139 | 123 | |
| Royal Bank of Canada | 3.625% | 5/4/27 | 205 | 193 | ||
| 1 | Royal Bank of Canada | 4.240% | 8/3/27 | 210 | 202 | |
| 1 | Royal Bank of Canada | 6.000% | 11/1/27 | 165 | 169 | |
| 1 | Royal Bank of Canada | 4.900% | 1/12/28 | 105 | 103 | |
| 1 | Royal Bank of Canada | 5.200% | 8/1/28 | 50 | 50 | |
| Coupon | Maturity Date | Face Amount ($000) | Market Value• ($000) | |||
| 1 | Royal Bank of Canada | 2.300% | 11/3/31 | 130 | 104 | |
| Royal Bank of Canada | 3.875% | 5/4/32 | 95 | 86 | ||
| 1 | Royal Bank of Canada | 5.000% | 2/1/33 | 290 | 281 | |
| 1 | Royal Bank of Canada | 5.000% | 5/2/33 | 110 | 106 | |
| Santander Holdings USA Inc. | 3.450% | 6/2/25 | 140 | 134 | ||
| Santander Holdings USA Inc. | 4.500% | 7/17/25 | 110 | 107 | ||
| Santander Holdings USA Inc. | 3.244% | 10/5/26 | 115 | 105 | ||
| Santander Holdings USA Inc. | 4.400% | 7/13/27 | 140 | 133 | ||
| Santander Holdings USA Inc. | 2.490% | 1/6/28 | 170 | 149 | ||
| Santander Holdings USA Inc. | 6.499% | 3/9/29 | 120 | 119 | ||
| 1 | Santander UK Group Holdings plc | 1.532% | 8/21/26 | 115 | 104 | |
| Santander UK Group Holdings plc | 6.833% | 11/21/26 | 200 | 202 | ||
| Santander UK Group Holdings plc | 1.673% | 6/14/27 | 170 | 150 | ||
| Santander UK Group Holdings plc | 2.469% | 1/11/28 | 160 | 141 | ||
| 1 | Santander UK Group Holdings plc | 3.823% | 11/3/28 | 195 | 176 | |
| Santander UK Group Holdings plc | 6.534% | 1/10/29 | 80 | 81 | ||
| State Street Corp. | 3.300% | 12/16/24 | 100 | 97 | ||
| State Street Corp. | 3.550% | 8/18/25 | 135 | 130 | ||
| 1 | State Street Corp. | 2.354% | 11/1/25 | 85 | 82 | |
| State Street Corp. | 5.104% | 5/18/26 | 125 | 124 | ||
| State Street Corp. | 2.650% | 5/19/26 | 75 | 71 | ||
| State Street Corp. | 5.272% | 8/3/26 | 115 | 115 | ||
| State Street Corp. | 2.400% | 1/24/30 | 190 | 162 | ||
| State Street Corp. | 2.200% | 3/3/31 | 140 | 111 | ||
| State Street Corp. | 4.164% | 8/4/33 | 95 | 86 | ||
| State Street Corp. | 4.821% | 1/26/34 | 75 | 71 | ||
| State Street Corp. | 5.159% | 5/18/34 | 85 | 82 | ||
| Sumitomo Mitsui Financial Group Inc. | 2.448% | 9/27/24 | 100 | 97 | ||
| Sumitomo Mitsui Financial Group Inc. | 2.348% | 1/15/25 | 130 | 124 | ||
| Sumitomo Mitsui Financial Group Inc. | 1.474% | 7/8/25 | 230 | 213 | ||
| Sumitomo Mitsui Financial Group Inc. | 0.948% | 1/12/26 | 135 | 121 | ||
| Sumitomo Mitsui Financial Group Inc. | 5.464% | 1/13/26 | 200 | 199 | ||
| Sumitomo Mitsui Financial Group Inc. | 3.784% | 3/9/26 | 155 | 148 | ||
| Sumitomo Mitsui Financial Group Inc. | 2.632% | 7/14/26 | 260 | 240 | ||
| Sumitomo Mitsui Financial Group Inc. | 1.402% | 9/17/26 | 515 | 456 | ||
| Sumitomo Mitsui Financial Group Inc. | 3.010% | 10/19/26 | 220 | 204 | ||
| Sumitomo Mitsui Financial Group Inc. | 3.446% | 1/11/27 | 60 | 56 | ||
| Sumitomo Mitsui Financial Group Inc. | 3.364% | 7/12/27 | 125 | 116 | ||
| Sumitomo Mitsui Financial Group Inc. | 3.352% | 10/18/27 | 150 | 138 | ||
| Sumitomo Mitsui Financial Group Inc. | 5.520% | 1/13/28 | 150 | 150 | ||
| Sumitomo Mitsui Financial Group Inc. | 3.544% | 1/17/28 | 160 | 148 | ||
| Sumitomo Mitsui Financial Group Inc. | 3.944% | 7/19/28 | 60 | 56 | ||
| Sumitomo Mitsui Financial Group Inc. | 1.902% | 9/17/28 | 220 | 185 | ||
| Sumitomo Mitsui Financial Group Inc. | 3.040% | 7/16/29 | 355 | 310 | ||
| Sumitomo Mitsui Financial Group Inc. | 5.710% | 1/13/30 | 100 | 100 | ||
| Sumitomo Mitsui Financial Group Inc. | 2.750% | 1/15/30 | 100 | 85 | ||
| Sumitomo Mitsui Financial Group Inc. | 2.130% | 7/8/30 | 240 | 193 | ||
| Sumitomo Mitsui Financial Group Inc. | 2.142% | 9/23/30 | 145 | 115 | ||
| Sumitomo Mitsui Financial Group Inc. | 2.222% | 9/17/31 | 101 | 80 | ||
| Sumitomo Mitsui Financial Group Inc. | 5.766% | 1/13/33 | 200 | 202 | ||
| Sumitomo Mitsui Financial Group Inc. | 2.930% | 9/17/41 | 55 | 38 | ||
| Sumitomo Mitsui Financial Group Inc. | 6.184% | 7/13/43 | 200 | 201 | ||
| 1 | Synchrony Bank | 5.400% | 8/22/25 | 250 | 242 | |
| Synchrony Financial | 4.875% | 6/13/25 | 10 | 10 | ||
| Synchrony Financial | 4.500% | 7/23/25 | 82 | 78 | ||
| Coupon | Maturity Date | Face Amount ($000) | Market Value• ($000) | |||
| Synchrony Financial | 3.950% | 12/1/27 | 75 | 67 | ||
| Synchrony Financial | 2.875% | 10/28/31 | 70 | 52 | ||
| 1 | Toronto-Dominion Bank | 0.700% | 9/10/24 | 20 | 19 | |
| 1 | Toronto-Dominion Bank | 4.285% | 9/13/24 | 145 | 143 | |
| 1 | Toronto-Dominion Bank | 1.450% | 1/10/25 | 225 | 213 | |
| Toronto-Dominion Bank | 3.766% | 6/6/25 | 185 | 180 | ||
| 1 | Toronto-Dominion Bank | 1.150% | 6/12/25 | 90 | 83 | |
| 1 | Toronto-Dominion Bank | 0.750% | 9/11/25 | 160 | 146 | |
| 1 | Toronto-Dominion Bank | 0.750% | 1/6/26 | 230 | 207 | |
| Toronto-Dominion Bank | 5.103% | 1/9/26 | 140 | 139 | ||
| 1 | Toronto-Dominion Bank | 1.200% | 6/3/26 | 180 | 160 | |
| 1 | Toronto-Dominion Bank | 5.532% | 7/17/26 | 140 | 140 | |
| 1 | Toronto-Dominion Bank | 1.250% | 9/10/26 | 160 | 142 | |
| 1 | Toronto-Dominion Bank | 1.950% | 1/12/27 | 140 | 126 | |
| 1 | Toronto-Dominion Bank | 2.800% | 3/10/27 | 160 | 147 | |
| Toronto-Dominion Bank | 4.108% | 6/8/27 | 190 | 181 | ||
| 1 | Toronto-Dominion Bank | 4.693% | 9/15/27 | 190 | 185 | |
| Toronto-Dominion Bank | 5.156% | 1/10/28 | 105 | 104 | ||
| 1 | Toronto-Dominion Bank | 5.523% | 7/17/28 | 150 | 151 | |
| 1 | Toronto-Dominion Bank | 2.000% | 9/10/31 | 130 | 103 | |
| 1 | Toronto-Dominion Bank | 3.625% | 9/15/31 | 130 | 121 | |
| 1 | Toronto-Dominion Bank | 3.200% | 3/10/32 | 265 | 225 | |
| Toronto-Dominion Bank | 4.456% | 6/8/32 | 190 | 177 | ||
| 1 | Travelers Cos. Inc. | 6.250% | 6/15/37 | 120 | 131 | |
| Travelers Cos. Inc. | 5.350% | 11/1/40 | 40 | 40 | ||
| Travelers Cos. Inc. | 3.050% | 6/8/51 | 75 | 52 | ||
| 1 | Truist Bank | 2.150% | 12/6/24 | 155 | 148 | |
| 1 | Truist Bank | 1.500% | 3/10/25 | 180 | 168 | |
| 1 | Truist Bank | 3.625% | 9/16/25 | 155 | 147 | |
| 1 | Truist Bank | 3.300% | 5/15/26 | 170 | 158 | |
| 1 | Truist Bank | 3.800% | 10/30/26 | 115 | 106 | |
| 1 | Truist Bank | 2.636% | 9/17/29 | 10 | 9 | |
| 1 | Truist Bank | 2.250% | 3/11/30 | 145 | 115 | |
| 1 | Truist Financial Corp. | 2.850% | 10/26/24 | 150 | 145 | |
| Truist Financial Corp. | 4.000% | 5/1/25 | 20 | 19 | ||
| 1 | Truist Financial Corp. | 3.700% | 6/5/25 | 95 | 92 | |
| 1 | Truist Financial Corp. | 1.200% | 8/5/25 | 135 | 124 | |
| 1 | Truist Financial Corp. | 4.260% | 7/28/26 | 120 | 116 | |
| 1 | Truist Financial Corp. | 5.900% | 10/28/26 | 60 | 60 | |
| 1 | Truist Financial Corp. | 1.267% | 3/2/27 | 135 | 120 | |
| 1 | Truist Financial Corp. | 6.047% | 6/8/27 | 130 | 130 | |
| 1 | Truist Financial Corp. | 1.125% | 8/3/27 | 10 | 8 | |
| 1 | Truist Financial Corp. | 4.123% | 6/6/28 | 60 | 57 | |
| 1 | Truist Financial Corp. | 4.873% | 1/26/29 | 160 | 153 | |
| 1 | Truist Financial Corp. | 1.887% | 6/7/29 | 120 | 100 | |
| 1 | Truist Financial Corp. | 1.950% | 6/5/30 | 50 | 40 | |
| 1 | Truist Financial Corp. | 4.916% | 7/28/33 | 90 | 80 | |
| 1 | Truist Financial Corp. | 6.123% | 10/28/33 | 360 | 362 | |
| 1 | Truist Financial Corp. | 5.122% | ��1/26/34 | 105 | 98 | |
| 1 | Truist Financial Corp. | 5.867% | 6/8/34 | 130 | 129 | |
| UBS Group AG | 3.750% | 3/26/25 | 265 | 256 | ||
| UBS Group AG | 4.550% | 4/17/26 | 265 | 256 | ||
| UBS Group AG | 4.875% | 5/15/45 | 210 | 187 | ||
| 1 | US Bancorp | 3.600% | 9/11/24 | 100 | 98 | |
| US Bancorp | 1.450% | 5/12/25 | 100 | 94 | ||
| Coupon | Maturity Date | Face Amount ($000) | Market Value• ($000) | |||
| 1 | US Bancorp | 3.950% | 11/17/25 | 225 | 218 | |
| 1 | US Bancorp | 3.100% | 4/27/26 | 170 | 159 | |
| 1 | US Bancorp | 2.375% | 7/22/26 | 105 | 97 | |
| US Bancorp | 5.727% | 10/21/26 | 25 | 25 | ||
| 1 | US Bancorp | 3.150% | 4/27/27 | 170 | 157 | |
| 1 | US Bancorp | 2.215% | 1/27/28 | 120 | 107 | |
| 1 | US Bancorp | 3.900% | 4/26/28 | 90 | 84 | |
| 1 | US Bancorp | 4.548% | 7/22/28 | 150 | 143 | |
| US Bancorp | 4.653% | 2/1/29 | 95 | 91 | ||
| US Bancorp | 5.775% | 6/12/29 | 150 | 150 | ||
| 1 | US Bancorp | 3.000% | 7/30/29 | 110 | 94 | |
| 1 | US Bancorp | 1.375% | 7/22/30 | 133 | 101 | |
| 1 | US Bancorp | 2.677% | 1/27/33 | 95 | 75 | |
| 1 | US Bancorp | 4.967% | 7/22/33 | 150 | 137 | |
| US Bancorp | 5.850% | 10/21/33 | 500 | 498 | ||
| US Bancorp | 4.839% | 2/1/34 | 75 | 70 | ||
| US Bancorp | 5.836% | 6/12/34 | 150 | 150 | ||
| US Bancorp | 2.491% | 11/3/36 | 130 | 96 | ||
| 1 | US Bank NA | 2.050% | 1/21/25 | 165 | 157 | |
| 1 | US Bank NA | 2.800% | 1/27/25 | 105 | 101 | |
| Visa Inc. | 3.150% | 12/14/25 | 370 | 355 | ||
| Visa Inc. | 1.900% | 4/15/27 | 230 | 208 | ||
| Visa Inc. | 2.750% | 9/15/27 | 190 | 176 | ||
| Visa Inc. | 2.050% | 4/15/30 | 185 | 157 | ||
| Visa Inc. | 1.100% | 2/15/31 | 135 | 105 | ||
| Visa Inc. | 4.150% | 12/14/35 | 295 | 278 | ||
| Visa Inc. | 2.700% | 4/15/40 | 50 | 37 | ||
| Visa Inc. | 4.300% | 12/14/45 | 390 | 353 | ||
| Visa Inc. | 3.650% | 9/15/47 | 175 | 143 | ||
| Visa Inc. | 2.000% | 8/15/50 | 140 | 83 | ||
| Wachovia Corp. | 5.500% | 8/1/35 | 125 | 121 | ||
| 1 | Wells Fargo & Co. | 3.300% | 9/9/24 | 245 | 239 | |
| 1 | Wells Fargo & Co. | 3.000% | 2/19/25 | 85 | 82 | |
| 1 | Wells Fargo & Co. | 3.550% | 9/29/25 | 770 | 739 | |
| 1 | Wells Fargo & Co. | 2.406% | 10/30/25 | 400 | 384 | |
| 1 | Wells Fargo & Co. | 2.164% | 2/11/26 | 420 | 397 | |
| Wells Fargo & Co. | 3.000% | 4/22/26 | 390 | 365 | ||
| 1 | Wells Fargo & Co. | 3.908% | 4/25/26 | 150 | 145 | |
| 1 | Wells Fargo & Co. | 2.188% | 4/30/26 | 185 | 174 | |
| 1 | Wells Fargo & Co. | 4.100% | 6/3/26 | 155 | 149 | |
| 1 | Wells Fargo & Co. | 4.540% | 8/15/26 | 150 | 146 | |
| Wells Fargo & Co. | 3.000% | 10/23/26 | 210 | 194 | ||
| 1 | Wells Fargo & Co. | 3.196% | 6/17/27 | 350 | 327 | |
| 1 | Wells Fargo & Co. | 4.300% | 7/22/27 | 300 | 287 | |
| 1 | Wells Fargo & Co. | 3.526% | 3/24/28 | 620 | 577 | |
| 1 | Wells Fargo & Co. | 3.584% | 5/22/28 | 130 | 121 | |
| 1 | Wells Fargo & Co. | 2.393% | 6/2/28 | 600 | 534 | |
| 1 | Wells Fargo & Co. | 4.808% | 7/25/28 | 360 | 349 | |
| 1 | Wells Fargo & Co. | 4.150% | 1/24/29 | 195 | 184 | |
| 1 | Wells Fargo & Co. | 5.574% | 7/25/29 | 500 | 498 | |
| 1 | Wells Fargo & Co. | 2.879% | 10/30/30 | 450 | 385 | |
| 1 | Wells Fargo & Co. | 2.572% | 2/11/31 | 335 | 280 | |
| 1 | Wells Fargo & Co. | 4.478% | 4/4/31 | 325 | 304 | |
| 1 | Wells Fargo & Co. | 3.350% | 3/2/33 | 420 | 354 | |
| 1 | Wells Fargo & Co. | 4.897% | 7/25/33 | 445 | 419 | |
| Coupon | Maturity Date | Face Amount ($000) | Market Value• ($000) | |||
| Wells Fargo & Co. | 5.389% | 4/24/34 | 620 | 604 | ||
| 1 | Wells Fargo & Co. | 5.557% | 7/25/34 | 510 | 503 | |
| 1 | Wells Fargo & Co. | 3.068% | 4/30/41 | 480 | 344 | |
| Wells Fargo & Co. | 5.375% | 11/2/43 | 255 | 235 | ||
| Wells Fargo & Co. | 5.606% | 1/15/44 | 220 | 207 | ||
| 1 | Wells Fargo & Co. | 4.650% | 11/4/44 | 180 | 149 | |
| Wells Fargo & Co. | 3.900% | 5/1/45 | 250 | 196 | ||
| 1 | Wells Fargo & Co. | 4.900% | 11/17/45 | 250 | 214 | |
| 1 | Wells Fargo & Co. | 4.400% | 6/14/46 | 210 | 166 | |
| 1 | Wells Fargo & Co. | 4.750% | 12/7/46 | 240 | 199 | |
| 1 | Wells Fargo & Co. | 5.013% | 4/4/51 | 655 | 591 | |
| 1 | Wells Fargo & Co. | 4.611% | 4/25/53 | 420 | 355 | |
| 1 | Wells Fargo Bank NA | 5.550% | 8/1/25 | 250 | 250 | |
| 1 | Wells Fargo Bank NA | 5.450% | 8/7/26 | 250 | 251 | |
| 1 | Wells Fargo Bank NA | 5.850% | 2/1/37 | 115 | 115 | |
| 1 | Wells Fargo Bank NA | 6.600% | 1/15/38 | 145 | 153 | |
| Westpac Banking Corp. | 5.350% | 10/18/24 | 110 | 110 | ||
| Westpac Banking Corp. | 1.019% | 11/18/24 | 145 | 137 | ||
| Westpac Banking Corp. | 2.350% | 2/19/25 | 90 | 86 | ||
| Westpac Banking Corp. | 2.850% | 5/13/26 | 205 | 193 | ||
| Westpac Banking Corp. | 1.150% | 6/3/26 | 150 | 135 | ||
| Westpac Banking Corp. | 2.700% | 8/19/26 | 80 | 75 | ||
| Westpac Banking Corp. | 3.350% | 3/8/27 | 135 | 127 | ||
| Westpac Banking Corp. | 4.043% | 8/26/27 | 50 | 49 | ||
| Westpac Banking Corp. | 5.457% | 11/18/27 | 315 | 320 | ||
| Westpac Banking Corp. | 3.400% | 1/25/28 | 50 | 47 | ||
| Westpac Banking Corp. | 1.953% | 11/20/28 | 280 | 240 | ||
| Westpac Banking Corp. | 2.650% | 1/16/30 | 95 | 83 | ||
| 1 | Westpac Banking Corp. | 2.894% | 2/4/30 | 200 | 189 | |
| Westpac Banking Corp. | 2.150% | 6/3/31 | 80 | 66 | ||
| 1 | Westpac Banking Corp. | 4.322% | 11/23/31 | 255 | 238 | |
| Westpac Banking Corp. | 5.405% | 8/10/33 | 100 | 94 | ||
| Westpac Banking Corp. | 4.110% | 7/24/34 | 125 | 110 | ||
| Westpac Banking Corp. | 2.668% | 11/15/35 | 200 | 154 | ||
| Westpac Banking Corp. | 3.020% | 11/18/36 | 155 | 118 | ||
| Westpac Banking Corp. | 4.421% | 7/24/39 | 120 | 97 | ||
| Westpac Banking Corp. | 2.963% | 11/16/40 | 90 | 58 | ||
| Westpac Banking Corp. | 3.133% | 11/18/41 | 100 | 65 | ||
| Willis North America Inc. | 4.650% | 6/15/27 | 175 | 170 | ||
| Willis North America Inc. | 5.350% | 5/15/33 | 50 | 48 | ||
| 184,362 | ||||||
| Health Care (15.1%) | ||||||
| Abbott Laboratories | 2.950% | 3/15/25 | 190 | 184 | ||
| Abbott Laboratories | 3.750% | 11/30/26 | 190 | 184 | ||
| 3 | Abbott Laboratories | 4.750% | 11/30/36 | 135 | 134 | |
| Abbott Laboratories | 4.900% | 11/30/46 | 370 | 360 | ||
| AbbVie Inc. | 2.600% | 11/21/24 | 530 | 512 | ||
| AbbVie Inc. | 3.800% | 3/15/25 | 340 | 331 | ||
| AbbVie Inc. | 3.600% | 5/14/25 | 487 | 472 | ||
| AbbVie Inc. | 3.200% | 5/14/26 | 190 | 181 | ||
| AbbVie Inc. | 2.950% | 11/21/26 | 460 | 430 | ||
| AbbVie Inc. | 4.250% | 11/14/28 | 180 | 174 | ||
| AbbVie Inc. | 3.200% | 11/21/29 | 570 | 514 | ||
| AbbVie Inc. | 4.550% | 3/15/35 | 255 | 241 | ||
| AbbVie Inc. | 4.500% | 5/14/35 | 325 | 306 | ||
| Coupon | Maturity Date | Face Amount ($000) | Market Value• ($000) | |||
| AbbVie Inc. | 4.300% | 5/14/36 | 230 | 211 | ||
| AbbVie Inc. | 4.050% | 11/21/39 | 345 | 296 | ||
| AbbVie Inc. | 4.400% | 11/6/42 | 310 | 271 | ||
| AbbVie Inc. | 4.850% | 6/15/44 | 160 | 146 | ||
| AbbVie Inc. | 4.750% | 3/15/45 | 140 | 126 | ||
| AbbVie Inc. | 4.700% | 5/14/45 | 380 | 341 | ||
| AbbVie Inc. | 4.450% | 5/14/46 | 225 | 195 | ||
| AbbVie Inc. | 4.875% | 11/14/48 | 155 | 143 | ||
| AbbVie Inc. | 4.250% | 11/21/49 | 690 | 581 | ||
| Aetna Inc. | 3.500% | 11/15/24 | 100 | 97 | ||
| Aetna Inc. | 6.625% | 6/15/36 | 100 | 107 | ||
| Aetna Inc. | 3.875% | 8/15/47 | 150 | 112 | ||
| Agilent Technologies Inc. | 2.300% | 3/12/31 | 150 | 123 | ||
| Amgen Inc. | 5.250% | 3/2/25 | 175 | 174 | ||
| Amgen Inc. | 3.125% | 5/1/25 | 110 | 106 | ||
| Amgen Inc. | 2.600% | 8/19/26 | 185 | 172 | ||
| Amgen Inc. | 2.200% | 2/21/27 | 285 | 259 | ||
| Amgen Inc. | 3.200% | 11/2/27 | 195 | 181 | ||
| Amgen Inc. | 5.150% | 3/2/28 | 475 | 474 | ||
| Amgen Inc. | 1.650% | 8/15/28 | 100 | 85 | ||
| Amgen Inc. | 3.000% | 2/22/29 | 105 | 95 | ||
| Amgen Inc. | 4.050% | 8/18/29 | 105 | 99 | ||
| Amgen Inc. | 2.450% | 2/21/30 | 145 | 123 | ||
| Amgen Inc. | 5.250% | 3/2/30 | 325 | 325 | ||
| Amgen Inc. | 2.300% | 2/25/31 | 150 | 124 | ||
| Amgen Inc. | 2.000% | 1/15/32 | 115 | 90 | ||
| Amgen Inc. | 3.350% | 2/22/32 | 95 | 83 | ||
| Amgen Inc. | 4.200% | 3/1/33 | 50 | 46 | ||
| Amgen Inc. | 5.250% | 3/2/33 | 565 | 562 | ||
| Amgen Inc. | 3.150% | 2/21/40 | 200 | 149 | ||
| Amgen Inc. | 2.800% | 8/15/41 | 130 | 90 | ||
| Amgen Inc. | 5.600% | 3/2/43 | 370 | 363 | ||
| Amgen Inc. | 4.400% | 5/1/45 | 345 | 290 | ||
| Amgen Inc. | 4.563% | 6/15/48 | 195 | 166 | ||
| Amgen Inc. | 3.375% | 2/21/50 | 175 | 123 | ||
| Amgen Inc. | 4.663% | 6/15/51 | 360 | 309 | ||
| Amgen Inc. | 3.000% | 1/15/52 | 170 | 110 | ||
| Amgen Inc. | 4.200% | 2/22/52 | 150 | 119 | ||
| Amgen Inc. | 4.875% | 3/1/53 | 20 | 18 | ||
| Amgen Inc. | 5.650% | 3/2/53 | 585 | 580 | ||
| Amgen Inc. | 2.770% | 9/1/53 | 250 | 150 | ||
| Amgen Inc. | 4.400% | 2/22/62 | 40 | 32 | ||
| Amgen Inc. | 5.750% | 3/2/63 | 395 | 390 | ||
| AstraZeneca Finance LLC | 1.200% | 5/28/26 | 130 | 117 | ||
| AstraZeneca Finance LLC | 4.875% | 3/3/28 | 120 | 120 | ||
| AstraZeneca Finance LLC | 1.750% | 5/28/28 | 145 | 126 | ||
| AstraZeneca Finance LLC | 2.250% | 5/28/31 | 70 | 58 | ||
| AstraZeneca plc | 3.375% | 11/16/25 | 230 | 221 | ||
| AstraZeneca plc | 0.700% | 4/8/26 | 125 | 112 | ||
| AstraZeneca plc | 3.125% | 6/12/27 | 125 | 117 | ||
| AstraZeneca plc | 4.000% | 1/17/29 | 145 | 139 | ||
| AstraZeneca plc | 1.375% | 8/6/30 | 110 | 87 | ||
| AstraZeneca plc | 6.450% | 9/15/37 | 330 | 371 | ||
| AstraZeneca plc | 4.000% | 9/18/42 | 145 | 125 | ||
| AstraZeneca plc | 4.375% | 11/16/45 | 100 | 89 | ||
| Coupon | Maturity Date | Face Amount ($000) | Market Value• ($000) | |||
| AstraZeneca plc | 4.375% | 8/17/48 | 107 | 96 | ||
| AstraZeneca plc | 3.000% | 5/28/51 | 160 | 113 | ||
| Baxalta Inc. | 4.000% | 6/23/25 | 205 | 199 | ||
| Baxter International Inc. | 1.322% | 11/29/24 | 135 | 128 | ||
| Baxter International Inc. | 2.600% | 8/15/26 | 116 | 107 | ||
| Baxter International Inc. | 1.915% | 2/1/27 | 165 | 147 | ||
| Baxter International Inc. | 2.272% | 12/1/28 | 140 | 120 | ||
| Baxter International Inc. | 2.539% | 2/1/32 | 270 | 217 | ||
| Baxter International Inc. | 3.132% | 12/1/51 | 55 | 35 | ||
| Becton Dickinson & Co. | 3.734% | 12/15/24 | 100 | 98 | ||
| Becton Dickinson & Co. | 3.700% | 6/6/27 | 189 | 179 | ||
| Becton Dickinson & Co. | 4.693% | 2/13/28 | 35 | 34 | ||
| Becton Dickinson & Co. | 2.823% | 5/20/30 | 150 | 130 | ||
| Becton Dickinson & Co. | 1.957% | 2/11/31 | 185 | 149 | ||
| Becton Dickinson & Co. | 4.685% | 12/15/44 | 55 | 49 | ||
| Becton Dickinson & Co. | 4.669% | 6/6/47 | 190 | 168 | ||
| Biogen Inc. | 4.050% | 9/15/25 | 55 | 53 | ||
| Biogen Inc. | 2.250% | 5/1/30 | 520 | 428 | ||
| Biogen Inc. | 3.150% | 5/1/50 | 140 | 91 | ||
| Bio-Rad Laboratories Inc. | 3.700% | 3/15/32 | 125 | 109 | ||
| Boston Scientific Corp. | 2.650% | 6/1/30 | 235 | 202 | ||
| Bristol-Myers Squibb Co. | 0.750% | 11/13/25 | 145 | 132 | ||
| Bristol-Myers Squibb Co. | 3.200% | 6/15/26 | 247 | 235 | ||
| Bristol-Myers Squibb Co. | 1.125% | 11/13/27 | 110 | 95 | ||
| Bristol-Myers Squibb Co. | 3.900% | 2/20/28 | 125 | 120 | ||
| Bristol-Myers Squibb Co. | 3.400% | 7/26/29 | 257 | 238 | ||
| Bristol-Myers Squibb Co. | 1.450% | 11/13/30 | 110 | 87 | ||
| Bristol-Myers Squibb Co. | 2.950% | 3/15/32 | 130 | 113 | ||
| Bristol-Myers Squibb Co. | 4.125% | 6/15/39 | 235 | 207 | ||
| Bristol-Myers Squibb Co. | 2.350% | 11/13/40 | 70 | 47 | ||
| Bristol-Myers Squibb Co. | 3.550% | 3/15/42 | 240 | 191 | ||
| Bristol-Myers Squibb Co. | 4.350% | 11/15/47 | 160 | 138 | ||
| Bristol-Myers Squibb Co. | 4.550% | 2/20/48 | 177 | 157 | ||
| Bristol-Myers Squibb Co. | 4.250% | 10/26/49 | 425 | 359 | ||
| Bristol-Myers Squibb Co. | 2.550% | 11/13/50 | 175 | 107 | ||
| Bristol-Myers Squibb Co. | 3.700% | 3/15/52 | 230 | 177 | ||
| Bristol-Myers Squibb Co. | 3.900% | 3/15/62 | 175 | 133 | ||
| Cardinal Health Inc. | 3.410% | 6/15/27 | 50 | 47 | ||
| Cencora Inc. | 3.450% | 12/15/27 | 160 | 150 | ||
| Cencora Inc. | 2.700% | 3/15/31 | 120 | 101 | ||
| Centene Corp. | 4.250% | 12/15/27 | 55 | 51 | ||
| Centene Corp. | 2.450% | 7/15/28 | 215 | 184 | ||
| Centene Corp. | 4.625% | 12/15/29 | 250 | 230 | ||
| Centene Corp. | 3.375% | 2/15/30 | 620 | 530 | ||
| Centene Corp. | 3.000% | 10/15/30 | 60 | 50 | ||
| Centene Corp. | 2.500% | 3/1/31 | 25 | 20 | ||
| Centene Corp. | 2.625% | 8/1/31 | 545 | 433 | ||
| 1 | Cigna Group | 3.250% | 4/15/25 | 155 | 149 | |
| Cigna Group | 4.125% | 11/15/25 | 190 | 185 | ||
| 1 | Cigna Group | 4.500% | 2/25/26 | 237 | 232 | |
| 1 | Cigna Group | 3.400% | 3/1/27 | 75 | 70 | |
| Cigna Group | 4.375% | 10/15/28 | 405 | 390 | ||
| Cigna Group | 2.400% | 3/15/30 | 231 | 194 | ||
| Cigna Group | 2.375% | 3/15/31 | 195 | 160 | ||
| Cigna Group | 5.400% | 3/15/33 | 70 | 70 | ||
| Coupon | Maturity Date | Face Amount ($000) | Market Value• ($000) | |||
| Cigna Group | 4.800% | 8/15/38 | 235 | 216 | ||
| Cigna Group | 3.200% | 3/15/40 | 90 | 67 | ||
| 1 | Cigna Group | 4.800% | 7/15/46 | 150 | 133 | |
| 1 | Cigna Group | 3.875% | 10/15/47 | 185 | 141 | |
| Cigna Group | 4.900% | 12/15/48 | 325 | 289 | ||
| Cigna Group | 3.400% | 3/15/50 | 225 | 157 | ||
| Cigna Group | 3.400% | 3/15/51 | 165 | 115 | ||
| CVS Health Corp. | 4.100% | 3/25/25 | 125 | 122 | ||
| CVS Health Corp. | 3.875% | 7/20/25 | 310 | 301 | ||
| CVS Health Corp. | 5.000% | 2/20/26 | 110 | 109 | ||
| CVS Health Corp. | 2.875% | 6/1/26 | 232 | 217 | ||
| CVS Health Corp. | 3.000% | 8/15/26 | 175 | 164 | ||
| CVS Health Corp. | 3.625% | 4/1/27 | 180 | 170 | ||
| CVS Health Corp. | 1.300% | 8/21/27 | 185 | 159 | ||
| CVS Health Corp. | 4.300% | 3/25/28 | 385 | 370 | ||
| CVS Health Corp. | 5.000% | 1/30/29 | 115 | 113 | ||
| CVS Health Corp. | 3.250% | 8/15/29 | 300 | 268 | ||
| CVS Health Corp. | 5.125% | 2/21/30 | 100 | 98 | ||
| CVS Health Corp. | 3.750% | 4/1/30 | 230 | 209 | ||
| CVS Health Corp. | 1.750% | 8/21/30 | 190 | 151 | ||
| CVS Health Corp. | 5.250% | 1/30/31 | 85 | 84 | ||
| CVS Health Corp. | 1.875% | 2/28/31 | 170 | 133 | ||
| CVS Health Corp. | 2.125% | 9/15/31 | 85 | 67 | ||
| CVS Health Corp. | 5.250% | 2/21/33 | 500 | 489 | ||
| CVS Health Corp. | 5.300% | 6/1/33 | 140 | 137 | ||
| CVS Health Corp. | 4.780% | 3/25/38 | 590 | 529 | ||
| CVS Health Corp. | 4.125% | 4/1/40 | 125 | 102 | ||
| CVS Health Corp. | 2.700% | 8/21/40 | 160 | 107 | ||
| CVS Health Corp. | 5.300% | 12/5/43 | 60 | 55 | ||
| CVS Health Corp. | 5.125% | 7/20/45 | 345 | 307 | ||
| CVS Health Corp. | 5.050% | 3/25/48 | 980 | 861 | ||
| CVS Health Corp. | 4.250% | 4/1/50 | 165 | 130 | ||
| CVS Health Corp. | 5.625% | 2/21/53 | 65 | 62 | ||
| CVS Health Corp. | 5.875% | 6/1/53 | 35 | 34 | ||
| CVS Health Corp. | 6.000% | 6/1/63 | 85 | 83 | ||
| Danaher Corp. | 2.600% | 10/1/50 | 145 | 93 | ||
| Danaher Corp. | 2.800% | 12/10/51 | 20 | 13 | ||
| DENTSPLY SIRONA Inc. | 3.250% | 6/1/30 | 90 | 77 | ||
| DH Europe Finance II Sarl | 2.600% | 11/15/29 | 145 | 128 | ||
| DH Europe Finance II Sarl | 3.250% | 11/15/39 | 160 | 127 | ||
| DH Europe Finance II Sarl | 3.400% | 11/15/49 | 115 | 86 | ||
| Elevance Health Inc. | 3.350% | 12/1/24 | 105 | 102 | ||
| Elevance Health Inc. | 2.375% | 1/15/25 | 180 | 172 | ||
| Elevance Health Inc. | 1.500% | 3/15/26 | 60 | 54 | ||
| Elevance Health Inc. | 3.650% | 12/1/27 | 132 | 124 | ||
| Elevance Health Inc. | 4.101% | 3/1/28 | 145 | 139 | ||
| Elevance Health Inc. | 2.875% | 9/15/29 | 110 | 97 | ||
| Elevance Health Inc. | 2.250% | 5/15/30 | 135 | 113 | ||
| Elevance Health Inc. | 2.550% | 3/15/31 | 115 | 96 | ||
| Elevance Health Inc. | 4.750% | 2/15/33 | 110 | 106 | ||
| Elevance Health Inc. | 4.625% | 5/15/42 | 140 | 124 | ||
| Elevance Health Inc. | 4.650% | 1/15/43 | 145 | 129 | ||
| Elevance Health Inc. | 4.650% | 8/15/44 | 100 | 87 | ||
| Elevance Health Inc. | 4.375% | 12/1/47 | 185 | 156 | ||
| Elevance Health Inc. | 4.550% | 3/1/48 | 105 | 90 | ||
| Coupon | Maturity Date | Face Amount ($000) | Market Value• ($000) | |||
| Elevance Health Inc. | 3.700% | 9/15/49 | 125 | 93 | ||
| Elevance Health Inc. | 3.125% | 5/15/50 | 120 | 81 | ||
| Elevance Health Inc. | 3.600% | 3/15/51 | 115 | 84 | ||
| Elevance Health Inc. | 6.100% | 10/15/52 | 90 | 95 | ||
| Elevance Health Inc. | 5.125% | 2/15/53 | 105 | 98 | ||
| Eli Lilly & Co. | 3.375% | 3/15/29 | 77 | 72 | ||
| Eli Lilly & Co. | 4.700% | 2/27/33 | 30 | 30 | ||
| Eli Lilly & Co. | 2.250% | 5/15/50 | 231 | 142 | ||
| Eli Lilly & Co. | 4.875% | 2/27/53 | 275 | 270 | ||
| Eli Lilly & Co. | 2.500% | 9/15/60 | 165 | 98 | ||
| Eli Lilly & Co. | 4.950% | 2/27/63 | 50 | 49 | ||
| GE HealthCare Technologies Inc. | 5.650% | 11/15/27 | 410 | 415 | ||
| GE HealthCare Technologies Inc. | 5.905% | 11/22/32 | 35 | 36 | ||
| GE HealthCare Technologies Inc. | 6.377% | 11/22/52 | 220 | 236 | ||
| Gilead Sciences Inc. | 3.500% | 2/1/25 | 130 | 127 | ||
| Gilead Sciences Inc. | 3.650% | 3/1/26 | 222 | 213 | ||
| Gilead Sciences Inc. | 2.950% | 3/1/27 | 140 | 130 | ||
| Gilead Sciences Inc. | 1.200% | 10/1/27 | 160 | 138 | ||
| Gilead Sciences Inc. | 1.650% | 10/1/30 | 180 | 145 | ||
| Gilead Sciences Inc. | 4.600% | 9/1/35 | 165 | 157 | ||
| Gilead Sciences Inc. | 4.000% | 9/1/36 | 90 | 80 | ||
| Gilead Sciences Inc. | 2.600% | 10/1/40 | 140 | 97 | ||
| Gilead Sciences Inc. | 5.650% | 12/1/41 | 85 | 87 | ||
| Gilead Sciences Inc. | 4.800% | 4/1/44 | 255 | 234 | ||
| Gilead Sciences Inc. | 4.500% | 2/1/45 | 185 | 162 | ||
| Gilead Sciences Inc. | 4.750% | 3/1/46 | 265 | 242 | ||
| Gilead Sciences Inc. | 4.150% | 3/1/47 | 185 | 155 | ||
| Gilead Sciences Inc. | 2.800% | 10/1/50 | 205 | 132 | ||
| GlaxoSmithKline Capital Inc. | 3.625% | 5/15/25 | 110 | 107 | ||
| GlaxoSmithKline Capital Inc. | 3.875% | 5/15/28 | 165 | 159 | ||
| GlaxoSmithKline Capital Inc. | 6.375% | 5/15/38 | 280 | 319 | ||
| GlaxoSmithKline Capital plc | 3.375% | 6/1/29 | 90 | 84 | ||
| HCA Inc. | 5.375% | 2/1/25 | 310 | 308 | ||
| HCA Inc. | 5.250% | 4/15/25 | 245 | 243 | ||
| HCA Inc. | 5.875% | 2/15/26 | 170 | 170 | ||
| HCA Inc. | 5.250% | 6/15/26 | 175 | 173 | ||
| HCA Inc. | 5.375% | 9/1/26 | 100 | 99 | ||
| HCA Inc. | 4.500% | 2/15/27 | 95 | 92 | ||
| HCA Inc. | 3.125% | 3/15/27 | 210 | 193 | ||
| HCA Inc. | 5.200% | 6/1/28 | 50 | 49 | ||
| HCA Inc. | 5.625% | 9/1/28 | 185 | 185 | ||
| HCA Inc. | 5.875% | 2/1/29 | 150 | 151 | ||
| HCA Inc. | 4.125% | 6/15/29 | 210 | 194 | ||
| HCA Inc. | 3.500% | 9/1/30 | 375 | 328 | ||
| HCA Inc. | 2.375% | 7/15/31 | 95 | 75 | ||
| HCA Inc. | 3.625% | 3/15/32 | 195 | 168 | ||
| HCA Inc. | 5.500% | 6/1/33 | 150 | 148 | ||
| HCA Inc. | 5.125% | 6/15/39 | 135 | 122 | ||
| HCA Inc. | 5.500% | 6/15/47 | 235 | 214 | ||
| HCA Inc. | 5.250% | 6/15/49 | 260 | 227 | ||
| HCA Inc. | 3.500% | 7/15/51 | 165 | 110 | ||
| HCA Inc. | 4.625% | 3/15/52 | 205 | 164 | ||
| HCA Inc. | 5.900% | 6/1/53 | 100 | 96 | ||
| Humana Inc. | 1.350% | 2/3/27 | 140 | 123 | ||
| Humana Inc. | 3.700% | 3/23/29 | 85 | 79 | ||
| Coupon | Maturity Date | Face Amount ($000) | Market Value• ($000) | |||
| Humana Inc. | 2.150% | 2/3/32 | 95 | 74 | ||
| Humana Inc. | 5.875% | 3/1/33 | 20 | 21 | ||
| Humana Inc. | 4.950% | 10/1/44 | 108 | 96 | ||
| Humana Inc. | 5.500% | 3/15/53 | 85 | 82 | ||
| Johnson & Johnson | 2.625% | 1/15/25 | 60 | 58 | ||
| Johnson & Johnson | 0.550% | 9/1/25 | 100 | 92 | ||
| Johnson & Johnson | 2.450% | 3/1/26 | 250 | 236 | ||
| Johnson & Johnson | 2.950% | 3/3/27 | 135 | 128 | ||
| Johnson & Johnson | 0.950% | 9/1/27 | 75 | 65 | ||
| Johnson & Johnson | 2.900% | 1/15/28 | 215 | 201 | ||
| Johnson & Johnson | 1.300% | 9/1/30 | 160 | 130 | ||
| Johnson & Johnson | 4.375% | 12/5/33 | 170 | 168 | ||
| Johnson & Johnson | 3.550% | 3/1/36 | 105 | 93 | ||
| Johnson & Johnson | 3.625% | 3/3/37 | 210 | 186 | ||
| Johnson & Johnson | 5.950% | 8/15/37 | 180 | 199 | ||
| Johnson & Johnson | 3.400% | 1/15/38 | 185 | 157 | ||
| Johnson & Johnson | 2.100% | 9/1/40 | 140 | 96 | ||
| Johnson & Johnson | 3.700% | 3/1/46 | 220 | 183 | ||
| Johnson & Johnson | 3.750% | 3/3/47 | 75 | 63 | ||
| Johnson & Johnson | 3.500% | 1/15/48 | 95 | 77 | ||
| Johnson & Johnson | 2.250% | 9/1/50 | 100 | 63 | ||
| Johnson & Johnson | 2.450% | 9/1/60 | 155 | 95 | ||
| Laboratory Corp. of America Holdings | 3.600% | 2/1/25 | 155 | 150 | ||
| Laboratory Corp. of America Holdings | 4.700% | 2/1/45 | 165 | 141 | ||
| Medtronic Global Holdings SCA | 4.250% | 3/30/28 | 115 | 112 | ||
| Medtronic Global Holdings SCA | 4.500% | 3/30/33 | 175 | 169 | ||
| Medtronic Inc. | 4.375% | 3/15/35 | 205 | 194 | ||
| Medtronic Inc. | 4.625% | 3/15/45 | 195 | 183 | ||
| Merck & Co. Inc. | 2.750% | 2/10/25 | 280 | 271 | ||
| Merck & Co. Inc. | 0.750% | 2/24/26 | 175 | 158 | ||
| Merck & Co. Inc. | 1.700% | 6/10/27 | 225 | 202 | ||
| Merck & Co. Inc. | 1.900% | 12/10/28 | 95 | 83 | ||
| Merck & Co. Inc. | 3.400% | 3/7/29 | 160 | 149 | ||
| Merck & Co. Inc. | 1.450% | 6/24/30 | 140 | 113 | ||
| Merck & Co. Inc. | 2.150% | 12/10/31 | 205 | 168 | ||
| Merck & Co. Inc. | 4.500% | 5/17/33 | 200 | 195 | ||
| Merck & Co. Inc. | 3.900% | 3/7/39 | 110 | 96 | ||
| Merck & Co. Inc. | 2.350% | 6/24/40 | 115 | 80 | ||
| Merck & Co. Inc. | 4.150% | 5/18/43 | 180 | 159 | ||
| Merck & Co. Inc. | 4.900% | 5/17/44 | 35 | 34 | ||
| Merck & Co. Inc. | 3.700% | 2/10/45 | 245 | 200 | ||
| Merck & Co. Inc. | 4.000% | 3/7/49 | 160 | 135 | ||
| Merck & Co. Inc. | 2.450% | 6/24/50 | 140 | 87 | ||
| Merck & Co. Inc. | 2.750% | 12/10/51 | 300 | 196 | ||
| Merck & Co. Inc. | 5.000% | 5/17/53 | 175 | 171 | ||
| Merck & Co. Inc. | 2.900% | 12/10/61 | 175 | 110 | ||
| Merck & Co. Inc. | 5.150% | 5/17/63 | 125 | 122 | ||
| Mylan Inc. | 4.550% | 4/15/28 | 125 | 118 | ||
| Mylan Inc. | 5.200% | 4/15/48 | 210 | 163 | ||
| Novartis Capital Corp. | 1.750% | 2/14/25 | 125 | 119 | ||
| Novartis Capital Corp. | 3.000% | 11/20/25 | 145 | 139 | ||
| Novartis Capital Corp. | 2.000% | 2/14/27 | 215 | 196 | ||
| Novartis Capital Corp. | 3.100% | 5/17/27 | 220 | 208 | ||
| Novartis Capital Corp. | 2.200% | 8/14/30 | 235 | 200 | ||
| Novartis Capital Corp. | 4.400% | 5/6/44 | 220 | 203 | ||
| Coupon | Maturity Date | Face Amount ($000) | Market Value• ($000) | |||
| Novartis Capital Corp. | 4.000% | 11/20/45 | 115 | 99 | ||
| Novartis Capital Corp. | 2.750% | 8/14/50 | 90 | 62 | ||
| Pfizer Inc. | 0.800% | 5/28/25 | 125 | 116 | ||
| Pfizer Inc. | 2.750% | 6/3/26 | 165 | 156 | ||
| Pfizer Inc. | 3.000% | 12/15/26 | 190 | 180 | ||
| Pfizer Inc. | 3.600% | 9/15/28 | 85 | 81 | ||
| Pfizer Inc. | 3.450% | 3/15/29 | 240 | 225 | ||
| Pfizer Inc. | 2.625% | 4/1/30 | 148 | 130 | ||
| Pfizer Inc. | 1.700% | 5/28/30 | 70 | 58 | ||
| Pfizer Inc. | 1.750% | 8/18/31 | 110 | 88 | ||
| Pfizer Inc. | 4.000% | 12/15/36 | 170 | 154 | ||
| Pfizer Inc. | 3.900% | 3/15/39 | 95 | 82 | ||
| Pfizer Inc. | 7.200% | 3/15/39 | 275 | 332 | ||
| Pfizer Inc. | 2.550% | 5/28/40 | 185 | 132 | ||
| Pfizer Inc. | 4.300% | 6/15/43 | 135 | 122 | ||
| Pfizer Inc. | 4.400% | 5/15/44 | 140 | 127 | ||
| Pfizer Inc. | 4.125% | 12/15/46 | 140 | 121 | ||
| Pfizer Inc. | 4.200% | 9/15/48 | 175 | 154 | ||
| Pfizer Inc. | 4.000% | 3/15/49 | 185 | 159 | ||
| Pfizer Inc. | 2.700% | 5/28/50 | 200 | 135 | ||
| Pfizer Investment Enterprises Pte. Ltd. | 4.650% | 5/19/25 | 220 | 218 | ||
| Pfizer Investment Enterprises Pte. Ltd. | 4.450% | 5/19/26 | 125 | 123 | ||
| Pfizer Investment Enterprises Pte. Ltd. | 4.450% | 5/19/28 | 350 | 343 | ||
| Pfizer Investment Enterprises Pte. Ltd. | 4.650% | 5/19/30 | 325 | 320 | ||
| Pfizer Investment Enterprises Pte. Ltd. | 4.750% | 5/19/33 | 575 | 566 | ||
| Pfizer Investment Enterprises Pte. Ltd. | 5.110% | 5/19/43 | 335 | 326 | ||
| Pfizer Investment Enterprises Pte. Ltd. | 5.300% | 5/19/53 | 695 | 695 | ||
| Pfizer Investment Enterprises Pte. Ltd. | 5.340% | 5/19/63 | 480 | 473 | ||
| 1 | Providence St. Joseph Health Obligated Group | 2.700% | 10/1/51 | 115 | 67 | |
| Quest Diagnostics Inc. | 2.950% | 6/30/30 | 110 | 95 | ||
| Regeneron Pharmaceuticals Inc. | 1.750% | 9/15/30 | 150 | 119 | ||
| Regeneron Pharmaceuticals Inc. | 2.800% | 9/15/50 | 85 | 53 | ||
| Revvity Inc. | 3.300% | 9/15/29 | 105 | 93 | ||
| Royalty Pharma plc | 1.200% | 9/2/25 | 135 | 123 | ||
| Royalty Pharma plc | 1.750% | 9/2/27 | 145 | 125 | ||
| Royalty Pharma plc | 2.200% | 9/2/30 | 85 | 68 | ||
| Royalty Pharma plc | 3.300% | 9/2/40 | 175 | 120 | ||
| Royalty Pharma plc | 3.550% | 9/2/50 | 120 | 78 | ||
| Sanofi | 3.625% | 6/19/28 | 140 | 135 | ||
| Shire Acquisitions Investments Ireland DAC | 3.200% | 9/23/26 | 370 | 347 | ||
| Smith & Nephew plc | 2.032% | 10/14/30 | 120 | 95 | ||
| Stryker Corp. | 3.375% | 11/1/25 | 355 | 341 | ||
| Stryker Corp. | 3.500% | 3/15/26 | 138 | 132 | ||
| Stryker Corp. | 1.950% | 6/15/30 | 85 | 70 | ||
| Stryker Corp. | 4.625% | 3/15/46 | 25 | 22 | ||
| Takeda Pharmaceutical Co. Ltd. | 5.000% | 11/26/28 | 250 | 248 | ||
| Takeda Pharmaceutical Co. Ltd. | 2.050% | 3/31/30 | 310 | 255 | ||
| Takeda Pharmaceutical Co. Ltd. | 3.025% | 7/9/40 | 205 | 149 | ||
| Takeda Pharmaceutical Co. Ltd. | 3.175% | 7/9/50 | 225 | 151 | ||
| Takeda Pharmaceutical Co. Ltd. | 3.375% | 7/9/60 | 70 | 46 | ||
| Thermo Fisher Scientific Inc. | 1.215% | 10/18/24 | 280 | 267 | ||
| Thermo Fisher Scientific Inc. | 2.600% | 10/1/29 | 110 | 96 | ||
| Thermo Fisher Scientific Inc. | 2.000% | 10/15/31 | 240 | 193 | ||
| Thermo Fisher Scientific Inc. | 2.800% | 10/15/41 | 195 | 140 | ||
| Thermo Fisher Scientific Inc. | 4.100% | 8/15/47 | 70 | 60 | ||
| Coupon | Maturity Date | Face Amount ($000) | Market Value• ($000) | |||
| UnitedHealth Group Inc. | 3.750% | 7/15/25 | 265 | 258 | ||
| UnitedHealth Group Inc. | 5.150% | 10/15/25 | 90 | 90 | ||
| UnitedHealth Group Inc. | 3.100% | 3/15/26 | 200 | 191 | ||
| UnitedHealth Group Inc. | 1.150% | 5/15/26 | 110 | 99 | ||
| UnitedHealth Group Inc. | 3.450% | 1/15/27 | 80 | 76 | ||
| UnitedHealth Group Inc. | 2.950% | 10/15/27 | 145 | 134 | ||
| UnitedHealth Group Inc. | 5.250% | 2/15/28 | 80 | 82 | ||
| UnitedHealth Group Inc. | 3.850% | 6/15/28 | 145 | 139 | ||
| UnitedHealth Group Inc. | 3.875% | 12/15/28 | 105 | 100 | ||
| UnitedHealth Group Inc. | 4.250% | 1/15/29 | 170 | 165 | ||
| UnitedHealth Group Inc. | 4.000% | 5/15/29 | 25 | 24 | ||
| UnitedHealth Group Inc. | 2.875% | 8/15/29 | 50 | 45 | ||
| UnitedHealth Group Inc. | 5.300% | 2/15/30 | 110 | 112 | ||
| UnitedHealth Group Inc. | 2.000% | 5/15/30 | 200 | 167 | ||
| UnitedHealth Group Inc. | 2.300% | 5/15/31 | 190 | 159 | ||
| UnitedHealth Group Inc. | 4.200% | 5/15/32 | 140 | 132 | ||
| UnitedHealth Group Inc. | 5.350% | 2/15/33 | 175 | 180 | ||
| UnitedHealth Group Inc. | 4.500% | 4/15/33 | 415 | 400 | ||
| UnitedHealth Group Inc. | 4.625% | 7/15/35 | 160 | 155 | ||
| UnitedHealth Group Inc. | 5.800% | 3/15/36 | 27 | 29 | ||
| UnitedHealth Group Inc. | 6.875% | 2/15/38 | 235 | 273 | ||
| UnitedHealth Group Inc. | 3.500% | 8/15/39 | 90 | 74 | ||
| UnitedHealth Group Inc. | 3.050% | 5/15/41 | 75 | 56 | ||
| UnitedHealth Group Inc. | 4.250% | 3/15/43 | 50 | 44 | ||
| UnitedHealth Group Inc. | 4.750% | 7/15/45 | 260 | 242 | ||
| UnitedHealth Group Inc. | 4.200% | 1/15/47 | 155 | 131 | ||
| UnitedHealth Group Inc. | 3.750% | 10/15/47 | 175 | 138 | ||
| UnitedHealth Group Inc. | 4.250% | 6/15/48 | 185 | 157 | ||
| UnitedHealth Group Inc. | 4.450% | 12/15/48 | 150 | 131 | ||
| UnitedHealth Group Inc. | 3.700% | 8/15/49 | 80 | 62 | ||
| UnitedHealth Group Inc. | 2.900% | 5/15/50 | 50 | 33 | ||
| UnitedHealth Group Inc. | 3.250% | 5/15/51 | 270 | 191 | ||
| UnitedHealth Group Inc. | 4.750% | 5/15/52 | 200 | 182 | ||
| UnitedHealth Group Inc. | 5.875% | 2/15/53 | 250 | 267 | ||
| UnitedHealth Group Inc. | 5.050% | 4/15/53 | 360 | 344 | ||
| UnitedHealth Group Inc. | 3.875% | 8/15/59 | 70 | 54 | ||
| UnitedHealth Group Inc. | 3.125% | 5/15/60 | 105 | 69 | ||
| UnitedHealth Group Inc. | 4.950% | 5/15/62 | 160 | 147 | ||
| UnitedHealth Group Inc. | 6.050% | 2/15/63 | 285 | 310 | ||
| UnitedHealth Group Inc. | 5.200% | 4/15/63 | 165 | 158 | ||
| Utah Acquisition Sub Inc. | 3.950% | 6/15/26 | 115 | 109 | ||
| Utah Acquisition Sub Inc. | 5.250% | 6/15/46 | 150 | 119 | ||
| Viatris Inc. | 1.650% | 6/22/25 | 175 | 162 | ||
| Viatris Inc. | 2.700% | 6/22/30 | 105 | 85 | ||
| Viatris Inc. | 3.850% | 6/22/40 | 70 | 49 | ||
| Viatris Inc. | 4.000% | 6/22/50 | 105 | 69 | ||
| Wyeth LLC | 6.500% | 2/1/34 | 135 | 151 | ||
| Wyeth LLC | 5.950% | 4/1/37 | 225 | 241 | ||
| Zimmer Biomet Holdings Inc. | 1.450% | 11/22/24 | 155 | 147 | ||
| Zimmer Biomet Holdings Inc. | 3.550% | 4/1/25 | 125 | 121 | ||
| Zimmer Biomet Holdings Inc. | 2.600% | 11/24/31 | 90 | 73 | ||
| Zoetis Inc. | 4.500% | 11/13/25 | 100 | 98 | ||
| Zoetis Inc. | 3.000% | 9/12/27 | 90 | 84 | ||
| Zoetis Inc. | 2.000% | 5/15/30 | 80 | 66 | ||
| Coupon | Maturity Date | Face Amount ($000) | Market Value• ($000) | |||
| Zoetis Inc. | 5.600% | 11/16/32 | 40 | 41 | ||
| Zoetis Inc. | 4.700% | 2/1/43 | 200 | 181 | ||
| 64,763 | ||||||
| Industrials (1.9%) | ||||||
| Amphenol Corp. | 2.800% | 2/15/30 | 130 | 113 | ||
| Amphenol Corp. | 2.200% | 9/15/31 | 50 | 40 | ||
| Carrier Global Corp. | 2.242% | 2/15/25 | 210 | 200 | ||
| Carrier Global Corp. | 2.493% | 2/15/27 | 125 | 114 | ||
| Carrier Global Corp. | 2.722% | 2/15/30 | 185 | 159 | ||
| Carrier Global Corp. | 2.700% | 2/15/31 | 20 | 17 | ||
| Carrier Global Corp. | 3.377% | 4/5/40 | 135 | 101 | ||
| Carrier Global Corp. | 3.577% | 4/5/50 | 290 | 207 | ||
| Deere & Co. | 3.900% | 6/9/42 | 160 | 140 | ||
| Deere & Co. | 3.750% | 4/15/50 | 85 | 73 | ||
| FedEx Corp. | 3.250% | 4/1/26 | 105 | 100 | ||
| FedEx Corp. | 3.100% | 8/5/29 | 45 | 40 | ||
| FedEx Corp. | 4.250% | 5/15/30 | 215 | 204 | ||
| FedEx Corp. | 2.400% | 5/15/31 | 65 | 54 | ||
| FedEx Corp. | 3.250% | 5/15/41 | 125 | 91 | ||
| FedEx Corp. | 5.100% | 1/15/44 | 75 | 68 | ||
| FedEx Corp. | 4.750% | 11/15/45 | 130 | 112 | ||
| FedEx Corp. | 4.550% | 4/1/46 | 200 | 167 | ||
| FedEx Corp. | 4.400% | 1/15/47 | 75 | 62 | ||
| FedEx Corp. | 4.050% | 2/15/48 | 130 | 101 | ||
| FedEx Corp. | 4.950% | 10/17/48 | 85 | 76 | ||
| FedEx Corp. | 5.250% | 5/15/50 | 125 | 116 | ||
| Illinois Tool Works Inc. | 2.650% | 11/15/26 | 255 | 239 | ||
| Illinois Tool Works Inc. | 3.900% | 9/1/42 | 115 | 99 | ||
| Ingersoll Rand Inc. | 5.700% | 8/14/33 | 120 | 122 | ||
| 1 | John Deere Capital Corp. | 1.250% | 1/10/25 | 130 | 123 | |
| 1 | John Deere Capital Corp. | 3.450% | 3/13/25 | 125 | 122 | |
| 1 | John Deere Capital Corp. | 3.400% | 6/6/25 | 235 | 228 | |
| 1 | John Deere Capital Corp. | 4.050% | 9/8/25 | 75 | 73 | |
| 1 | John Deere Capital Corp. | 4.800% | 1/9/26 | 150 | 149 | |
| 1 | John Deere Capital Corp. | 0.700% | 1/15/26 | 100 | 90 | |
| 1 | John Deere Capital Corp. | 4.150% | 9/15/27 | 110 | 107 | |
| 1 | John Deere Capital Corp. | 4.750% | 1/20/28 | 135 | 134 | |
| 1 | John Deere Capital Corp. | 4.950% | 7/14/28 | 300 | 301 | |
| 1 | John Deere Capital Corp. | 4.700% | 6/10/30 | 118 | 117 | |
| Otis Worldwide Corp. | 2.056% | 4/5/25 | 138 | 131 | ||
| Otis Worldwide Corp. | 2.565% | 2/15/30 | 160 | 137 | ||
| Otis Worldwide Corp. | 3.362% | 2/15/50 | 80 | 58 | ||
| Republic Services Inc. | 3.950% | 5/15/28 | 85 | 81 | ||
| Republic Services Inc. | 1.750% | 2/15/32 | 50 | 39 | ||
| Republic Services Inc. | 5.000% | 4/1/34 | 120 | 118 | ||
| Southwest Airlines Co. | 5.250% | 5/4/25 | 225 | 223 | ||
| Southwest Airlines Co. | 5.125% | 6/15/27 | 280 | 276 | ||
| Trane Technologies Luxembourg Finance SA | 3.800% | 3/21/29 | 80 | 75 | ||
| Trimble Inc. | 6.100% | 3/15/33 | 60 | 61 | ||
| 1 | United Airlines Pass-Through Trust Class A Series 2023-1 | 5.800% | 1/15/36 | 120 | 120 | |
| United Parcel Service Inc. | 3.900% | 4/1/25 | 219 | 215 | ||
| United Parcel Service Inc. | 3.050% | 11/15/27 | 170 | 159 | ||
| United Parcel Service Inc. | 3.400% | 3/15/29 | 92 | 86 | ||
| United Parcel Service Inc. | 4.450% | 4/1/30 | 107 | 105 | ||
| United Parcel Service Inc. | 4.875% | 3/3/33 | 105 | 105 | ||
| Coupon | Maturity Date | Face Amount ($000) | Market Value• ($000) | |||
| United Parcel Service Inc. | 6.200% | 1/15/38 | 180 | 201 | ||
| United Parcel Service Inc. | 3.750% | 11/15/47 | 50 | 40 | ||
| United Parcel Service Inc. | 4.250% | 3/15/49 | 91 | 78 | ||
| United Parcel Service Inc. | 5.300% | 4/1/50 | 190 | 192 | ||
| United Parcel Service Inc. | 5.050% | 3/3/53 | 140 | 137 | ||
| Waste Connections Inc. | 4.200% | 1/15/33 | 75 | 69 | ||
| Waste Connections Inc. | 2.950% | 1/15/52 | 135 | 88 | ||
| Waste Management Inc. | 3.150% | 11/15/27 | 310 | 289 | ||
| Waste Management Inc. | 4.875% | 2/15/29 | 100 | 99 | ||
| Waste Management Inc. | 1.500% | 3/15/31 | 70 | 55 | ||
| Waste Management Inc. | 4.150% | 4/15/32 | 60 | 56 | ||
| Waste Management Inc. | 4.875% | 2/15/34 | 150 | 146 | ||
| Westinghouse Air Brake Technologies Corp. | 3.450% | 11/15/26 | 110 | 104 | ||
| Westinghouse Air Brake Technologies Corp. | 4.950% | 9/15/28 | 150 | 145 | ||
| WW Grainger Inc. | 4.600% | 6/15/45 | 125 | 115 | ||
| 8,062 | ||||||
| Materials (1.2%) | ||||||
| Air Products and Chemicals Inc. | 2.050% | 5/15/30 | 195 | 165 | ||
| Air Products and Chemicals Inc. | 2.700% | 5/15/40 | 35 | 25 | ||
| Air Products and Chemicals Inc. | 2.800% | 5/15/50 | 130 | 88 | ||
| AngloGold Ashanti Holdings plc | 3.375% | 11/1/28 | 60 | 52 | ||
| ArcelorMittal SA | 6.550% | 11/29/27 | 140 | 143 | ||
| ArcelorMittal SA | 6.800% | 11/29/32 | 135 | 139 | ||
| Berry Global Inc. | 1.570% | 1/15/26 | 185 | 168 | ||
| Carlisle Cos. Inc. | 2.750% | 3/1/30 | 115 | 97 | ||
| Celanese US Holdings LLC | 6.050% | 3/15/25 | 69 | 69 | ||
| Celanese US Holdings LLC | 6.165% | 7/15/27 | 240 | 240 | ||
| Celanese US Holdings LLC | 6.350% | 11/15/28 | 120 | 120 | ||
| Celanese US Holdings LLC | 6.330% | 7/15/29 | 75 | 75 | ||
| Celanese US Holdings LLC | 6.550% | 11/15/30 | 120 | 120 | ||
| Celanese US Holdings LLC | 6.379% | 7/15/32 | 105 | 104 | ||
| Celanese US Holdings LLC | 6.700% | 11/15/33 | 120 | 121 | ||
| CF Industries Inc. | 5.150% | 3/15/34 | 110 | 104 | ||
| CF Industries Inc. | 4.950% | 6/1/43 | 100 | 84 | ||
| CF Industries Inc. | 5.375% | 3/15/44 | 75 | 67 | ||
| DuPont de Nemours Inc. | 4.493% | 11/15/25 | 250 | 245 | ||
| DuPont de Nemours Inc. | 4.725% | 11/15/28 | 230 | 227 | ||
| DuPont de Nemours Inc. | 5.319% | 11/15/38 | 190 | 186 | ||
| DuPont de Nemours Inc. | 5.419% | 11/15/48 | 255 | 247 | ||
| Eagle Materials Inc. | 2.500% | 7/1/31 | 145 | 117 | ||
| Huntsman International LLC | 4.500% | 5/1/29 | 60 | 56 | ||
| International Flavors & Fragrances Inc. | 5.000% | 9/26/48 | 125 | 99 | ||
| Martin Marietta Materials Inc. | 2.400% | 7/15/31 | 10 | 8 | ||
| Martin Marietta Materials Inc. | 3.200% | 7/15/51 | 100 | 67 | ||
| Newmont Corp. | 2.250% | 10/1/30 | 95 | 77 | ||
| Newmont Corp. | 2.600% | 7/15/32 | 120 | 96 | ||
| Newmont Corp. | 6.250% | 10/1/39 | 105 | 110 | ||
| Newmont Corp. | 4.875% | 3/15/42 | 115 | 103 | ||
| Nutrien Ltd. | 4.200% | 4/1/29 | 140 | 132 | ||
| Nutrien Ltd. | 5.000% | 4/1/49 | 109 | 95 | ||
| Nutrien Ltd. | 5.800% | 3/27/53 | 75 | 73 | ||
| Sherwin-Williams Co. | 3.450% | 6/1/27 | 235 | 222 | ||
| Sherwin-Williams Co. | 2.950% | 8/15/29 | 129 | 114 | ||
| Sherwin-Williams Co. | 4.500% | 6/1/47 | 180 | 153 | ||
| Suzano Austria GmbH | 6.000% | 1/15/29 | 215 | 214 | ||
| Coupon | Maturity Date | Face Amount ($000) | Market Value• ($000) | |||
| Suzano Austria GmbH | 5.000% | 1/15/30 | 110 | 102 | ||
| Suzano Austria GmbH | 3.750% | 1/15/31 | 135 | 114 | ||
| 1 | Suzano Austria GmbH | 3.125% | 1/15/32 | 75 | 59 | |
| Vulcan Materials Co. | 3.500% | 6/1/30 | 100 | 90 | ||
| WRKCo Inc. | 4.900% | 3/15/29 | 165 | 159 | ||
| 5,146 | ||||||
| Real Estate (2.1%) | ||||||
| Alexandria Real Estate Equities Inc. | 3.375% | 8/15/31 | 170 | 147 | ||
| Alexandria Real Estate Equities Inc. | 2.000% | 5/18/32 | 105 | 80 | ||
| Alexandria Real Estate Equities Inc. | 1.875% | 2/1/33 | 123 | 91 | ||
| Alexandria Real Estate Equities Inc. | 2.950% | 3/15/34 | 75 | 59 | ||
| Alexandria Real Estate Equities Inc. | 3.000% | 5/18/51 | 100 | 60 | ||
| Alexandria Real Estate Equities Inc. | 3.550% | 3/15/52 | 105 | 72 | ||
| American Tower Corp. | 4.000% | 6/1/25 | 85 | 82 | ||
| American Tower Corp. | 3.375% | 10/15/26 | 130 | 122 | ||
| American Tower Corp. | 2.750% | 1/15/27 | 70 | 64 | ||
| American Tower Corp. | 3.550% | 7/15/27 | 160 | 148 | ||
| American Tower Corp. | 3.800% | 8/15/29 | 240 | 218 | ||
| American Tower Corp. | 2.900% | 1/15/30 | 130 | 111 | ||
| American Tower Corp. | 2.100% | 6/15/30 | 140 | 112 | ||
| American Tower Corp. | 1.875% | 10/15/30 | 120 | 93 | ||
| American Tower Corp. | 5.650% | 3/15/33 | 50 | 50 | ||
| American Tower Corp. | 5.550% | 7/15/33 | 50 | 49 | ||
| American Tower Corp. | 3.100% | 6/15/50 | 135 | 84 | ||
| American Tower Corp. | 2.950% | 1/15/51 | 150 | 91 | ||
| Boston Properties LP | 3.200% | 1/15/25 | 45 | 43 | ||
| Boston Properties LP | 3.650% | 2/1/26 | 180 | 170 | ||
| Boston Properties LP | 2.750% | 10/1/26 | 135 | 122 | ||
| Boston Properties LP | 6.750% | 12/1/27 | 25 | 26 | ||
| Boston Properties LP | 4.500% | 12/1/28 | 105 | 97 | ||
| Boston Properties LP | 3.400% | 6/21/29 | 148 | 127 | ||
| Boston Properties LP | 3.250% | 1/30/31 | 130 | 106 | ||
| Boston Properties LP | 2.550% | 4/1/32 | 120 | 90 | ||
| Boston Properties LP | 2.450% | 10/1/33 | 100 | 71 | ||
| Brixmor Operating Partnership LP | 4.125% | 5/15/29 | 50 | 45 | ||
| Brixmor Operating Partnership LP | 4.050% | 7/1/30 | 175 | 158 | ||
| Camden Property Trust | 2.800% | 5/15/30 | 120 | 104 | ||
| CBRE Services Inc. | 5.950% | 8/15/34 | 75 | 74 | ||
| Crown Castle Inc. | 3.200% | 9/1/24 | 20 | 19 | ||
| Crown Castle Inc. | 4.450% | 2/15/26 | 70 | 68 | ||
| Crown Castle Inc. | 3.700% | 6/15/26 | 60 | 57 | ||
| Crown Castle Inc. | 1.050% | 7/15/26 | 180 | 159 | ||
| Crown Castle Inc. | 2.900% | 3/15/27 | 50 | 46 | ||
| Crown Castle Inc. | 3.650% | 9/1/27 | 70 | 65 | ||
| Crown Castle Inc. | 5.000% | 1/11/28 | 45 | 44 | ||
| Crown Castle Inc. | 3.800% | 2/15/28 | 100 | 93 | ||
| Crown Castle Inc. | 4.800% | 9/1/28 | 65 | 63 | ||
| Crown Castle Inc. | 3.300% | 7/1/30 | 130 | 113 | ||
| Crown Castle Inc. | 2.250% | 1/15/31 | 75 | 60 | ||
| Crown Castle Inc. | 2.100% | 4/1/31 | 175 | 138 | ||
| Crown Castle Inc. | 2.500% | 7/15/31 | 60 | 48 | ||
| Crown Castle Inc. | 5.100% | 5/1/33 | 85 | 82 | ||
| Crown Castle Inc. | 2.900% | 4/1/41 | 160 | 108 | ||
| Crown Castle Inc. | 3.250% | 1/15/51 | 177 | 115 | ||
| Digital Realty Trust LP | 3.700% | 8/15/27 | 140 | 131 | ||
| Coupon | Maturity Date | Face Amount ($000) | Market Value• ($000) | |||
| Digital Realty Trust LP | 5.550% | 1/15/28 | 110 | 110 | ||
| Digital Realty Trust LP | 3.600% | 7/1/29 | 120 | 108 | ||
| Equinix Inc. | 2.625% | 11/18/24 | 115 | 111 | ||
| Equinix Inc. | 3.200% | 11/18/29 | 165 | 145 | ||
| Equinix Inc. | 2.150% | 7/15/30 | 94 | 76 | ||
| Equinix Inc. | 2.500% | 5/15/31 | 45 | 37 | ||
| Equinix Inc. | 3.900% | 4/15/32 | 140 | 125 | ||
| ERP Operating LP | 4.500% | 7/1/44 | 85 | 72 | ||
| GLP Capital LP | 5.250% | 6/1/25 | 45 | 44 | ||
| GLP Capital LP | 5.375% | 4/15/26 | 90 | 88 | ||
| GLP Capital LP | 5.300% | 1/15/29 | 70 | 66 | ||
| GLP Capital LP | 3.250% | 1/15/32 | 75 | 60 | ||
| Healthcare Realty Holdings LP | 2.000% | 3/15/31 | 115 | 89 | ||
| Healthpeak OP LLC | 3.000% | 1/15/30 | 90 | 78 | ||
| Healthpeak OP LLC | 5.250% | 12/15/32 | 85 | 82 | ||
| 1 | Host Hotels & Resorts LP | 3.500% | 9/15/30 | 60 | 51 | |
| Prologis LP | 4.875% | 6/15/28 | 55 | 54 | ||
| Prologis LP | 2.250% | 4/15/30 | 125 | 105 | ||
| Prologis LP | 1.250% | 10/15/30 | 50 | 38 | ||
| Prologis LP | 4.750% | 6/15/33 | 75 | 72 | ||
| Prologis LP | 5.125% | 1/15/34 | 85 | 84 | ||
| Prologis LP | 5.250% | 6/15/53 | 105 | 100 | ||
| Realty Income Corp. | 3.250% | 1/15/31 | 145 | 125 | ||
| Realty Income Corp. | 5.625% | 10/13/32 | 95 | 95 | ||
| Sabra Health Care LP | 3.200% | 12/1/31 | 95 | 72 | ||
| Simon Property Group LP | 2.000% | 9/13/24 | 75 | 72 | ||
| Simon Property Group LP | 3.375% | 10/1/24 | 125 | 122 | ||
| Simon Property Group LP | 3.500% | 9/1/25 | 105 | 101 | ||
| Simon Property Group LP | 3.300% | 1/15/26 | 220 | 210 | ||
| Simon Property Group LP | 3.250% | 11/30/26 | 50 | 47 | ||
| Simon Property Group LP | 3.375% | 6/15/27 | 35 | 33 | ||
| Simon Property Group LP | 3.375% | 12/1/27 | 145 | 134 | ||
| Simon Property Group LP | 1.750% | 2/1/28 | 50 | 43 | ||
| Simon Property Group LP | 2.450% | 9/13/29 | 195 | 165 | ||
| Simon Property Group LP | 2.650% | 7/15/30 | 110 | 93 | ||
| Simon Property Group LP | 3.250% | 9/13/49 | 113 | 74 | ||
| Simon Property Group LP | 3.800% | 7/15/50 | 60 | 43 | ||
| Sun Communities Operating LP | 2.700% | 7/15/31 | 165 | 131 | ||
| Ventas Realty LP | 4.400% | 1/15/29 | 110 | 103 | ||
| VICI Properties LP | 4.750% | 2/15/28 | 210 | 200 | ||
| VICI Properties LP | 4.950% | 2/15/30 | 140 | 132 | ||
| VICI Properties LP | 5.125% | 5/15/32 | 190 | 176 | ||
| VICI Properties LP | 5.625% | 5/15/52 | 95 | 84 | ||
| Welltower OP LLC | 4.000% | 6/1/25 | 231 | 224 | ||
| Welltower OP LLC | 4.250% | 4/15/28 | 145 | 137 | ||
| Welltower OP LLC | 3.100% | 1/15/30 | 125 | 109 | ||
| Welltower OP LLC | 2.800% | 6/1/31 | 20 | 16 | ||
| 8,911 | ||||||
| Technology (11.9%) | ||||||
| Adobe Inc. | 3.250% | 2/1/25 | 120 | 117 | ||
| Adobe Inc. | 2.150% | 2/1/27 | 150 | 138 | ||
| Adobe Inc. | 2.300% | 2/1/30 | 160 | 139 | ||
| Apple Inc. | 1.800% | 9/11/24 | 135 | 130 | ||
| Apple Inc. | 2.750% | 1/13/25 | 195 | 189 | ||
| Apple Inc. | 2.500% | 2/9/25 | 270 | 260 | ||
| Coupon | Maturity Date | Face Amount ($000) | Market Value• ($000) | |||
| Apple Inc. | 1.125% | 5/11/25 | 315 | 295 | ||
| Apple Inc. | 3.200% | 5/13/25 | 125 | 121 | ||
| Apple Inc. | 0.550% | 8/20/25 | 135 | 124 | ||
| Apple Inc. | 0.700% | 2/8/26 | 275 | 249 | ||
| Apple Inc. | 3.250% | 2/23/26 | 475 | 457 | ||
| Apple Inc. | 2.450% | 8/4/26 | 260 | 243 | ||
| Apple Inc. | 2.050% | 9/11/26 | 277 | 256 | ||
| Apple Inc. | 3.350% | 2/9/27 | 260 | 248 | ||
| Apple Inc. | 3.200% | 5/11/27 | 205 | 195 | ||
| Apple Inc. | 3.000% | 6/20/27 | 170 | 160 | ||
| Apple Inc. | 2.900% | 9/12/27 | 280 | 262 | ||
| Apple Inc. | 3.000% | 11/13/27 | 105 | 99 | ||
| Apple Inc. | 1.200% | 2/8/28 | 200 | 173 | ||
| Apple Inc. | 4.000% | 5/10/28 | 140 | 137 | ||
| Apple Inc. | 1.400% | 8/5/28 | 255 | 219 | ||
| Apple Inc. | 3.250% | 8/8/29 | 120 | 112 | ||
| Apple Inc. | 2.200% | 9/11/29 | 225 | 197 | ||
| Apple Inc. | 1.650% | 5/11/30 | 270 | 225 | ||
| Apple Inc. | 1.250% | 8/20/30 | 100 | 80 | ||
| Apple Inc. | 1.650% | 2/8/31 | 310 | 254 | ||
| Apple Inc. | 1.700% | 8/5/31 | 100 | 81 | ||
| Apple Inc. | 3.350% | 8/8/32 | 375 | 344 | ||
| Apple Inc. | 4.300% | 5/10/33 | 50 | 49 | ||
| Apple Inc. | 4.500% | 2/23/36 | 163 | 163 | ||
| Apple Inc. | 2.375% | 2/8/41 | 175 | 125 | ||
| Apple Inc. | 3.850% | 5/4/43 | 270 | 234 | ||
| Apple Inc. | 4.450% | 5/6/44 | 75 | 71 | ||
| Apple Inc. | 3.450% | 2/9/45 | 130 | 105 | ||
| Apple Inc. | 4.375% | 5/13/45 | 255 | 234 | ||
| Apple Inc. | 4.650% | 2/23/46 | 450 | 430 | ||
| Apple Inc. | 3.850% | �� 8/4/46 | 285 | 241 | ||
| Apple Inc. | 4.250% | 2/9/47 | 100 | 91 | ||
| Apple Inc. | 3.750% | 9/12/47 | 220 | 183 | ||
| Apple Inc. | 3.750% | 11/13/47 | 145 | 121 | ||
| Apple Inc. | 2.950% | 9/11/49 | 215 | 153 | ||
| Apple Inc. | 2.650% | 5/11/50 | 315 | 210 | ||
| Apple Inc. | 2.400% | 8/20/50 | 145 | 93 | ||
| Apple Inc. | 2.650% | 2/8/51 | 320 | 212 | ||
| Apple Inc. | 2.700% | 8/5/51 | 225 | 150 | ||
| Apple Inc. | 3.950% | 8/8/52 | 190 | 160 | ||
| Apple Inc. | 4.850% | 5/10/53 | 100 | 99 | ||
| Apple Inc. | 2.550% | 8/20/60 | 90 | 57 | ||
| Apple Inc. | 2.800% | 2/8/61 | 345 | 222 | ||
| Apple Inc. | 2.850% | 8/5/61 | 210 | 136 | ||
| Apple Inc. | 4.100% | 8/8/62 | 170 | 142 | ||
| Applied Materials Inc. | 3.300% | 4/1/27 | 186 | 177 | ||
| Applied Materials Inc. | 1.750% | 6/1/30 | 40 | 33 | ||
| Applied Materials Inc. | 4.350% | 4/1/47 | 145 | 130 | ||
| Applied Materials Inc. | 2.750% | 6/1/50 | 20 | 14 | ||
| Autodesk Inc. | 2.400% | 12/15/31 | 140 | 114 | ||
| Automatic Data Processing Inc. | 3.375% | 9/15/25 | 145 | 140 | ||
| Automatic Data Processing Inc. | 1.700% | 5/15/28 | 90 | 79 | ||
| Automatic Data Processing Inc. | 1.250% | 9/1/30 | 125 | 100 | ||
| Broadcom Corp. | 3.875% | 1/15/27 | 250 | 237 | ||
| Broadcom Corp. | 3.500% | 1/15/28 | 110 | 101 | ||
| Coupon | Maturity Date | Face Amount ($000) | Market Value• ($000) | |||
| Broadcom Inc. | 3.150% | 11/15/25 | 60 | 57 | ||
| Broadcom Inc. | 3.459% | 9/15/26 | 75 | 71 | ||
| 2 | Broadcom Inc. | 1.950% | 2/15/28 | 110 | 95 | |
| Broadcom Inc. | 4.110% | 9/15/28 | 260 | 245 | ||
| 2 | Broadcom Inc. | 4.000% | 4/15/29 | 85 | 78 | |
| Broadcom Inc. | 4.750% | 4/15/29 | 185 | 178 | ||
| Broadcom Inc. | 4.150% | 11/15/30 | 210 | 192 | ||
| 2 | Broadcom Inc. | 2.450% | 2/15/31 | 280 | 226 | |
| 2 | Broadcom Inc. | 4.150% | 4/15/32 | 180 | 161 | |
| Broadcom Inc. | 4.300% | 11/15/32 | 210 | 190 | ||
| 2 | Broadcom Inc. | 2.600% | 2/15/33 | 280 | 216 | |
| 2 | Broadcom Inc. | 3.419% | 4/15/33 | 313 | 259 | |
| 2 | Broadcom Inc. | 3.469% | 4/15/34 | 290 | 237 | |
| 2 | Broadcom Inc. | 3.137% | 11/15/35 | 300 | 229 | |
| 2 | Broadcom Inc. | 3.187% | 11/15/36 | 345 | 259 | |
| 2 | Broadcom Inc. | 4.926% | 5/15/37 | 322 | 290 | |
| 2 | Broadcom Inc. | 3.500% | 2/15/41 | 355 | 260 | |
| 2 | Broadcom Inc. | 3.750% | 2/15/51 | 320 | 229 | |
| Broadridge Financial Solutions Inc. | 2.900% | 12/1/29 | 65 | 56 | ||
| Broadridge Financial Solutions Inc. | 2.600% | 5/1/31 | 115 | 94 | ||
| CDW LLC | 2.670% | 12/1/26 | 165 | 150 | ||
| CDW LLC | 3.569% | 12/1/31 | 210 | 178 | ||
| Cintas Corp. No. 2 | 3.700% | 4/1/27 | 205 | 197 | ||
| Cintas Corp. No. 2 | 4.000% | 5/1/32 | 95 | 89 | ||
| Cisco Systems Inc. | 2.950% | 2/28/26 | 175 | 168 | ||
| Cisco Systems Inc. | 2.500% | 9/20/26 | 200 | 187 | ||
| Cisco Systems Inc. | 5.900% | 2/15/39 | 180 | 195 | ||
| Cisco Systems Inc. | 5.500% | 1/15/40 | 205 | 213 | ||
| Corning Inc. | 4.375% | 11/15/57 | 90 | 73 | ||
| Corning Inc. | 5.450% | 11/15/79 | 130 | 117 | ||
| Dell International LLC | 5.850% | 7/15/25 | 165 | 165 | ||
| Dell International LLC | 6.020% | 6/15/26 | 475 | 480 | ||
| Dell International LLC | 4.900% | 10/1/26 | 247 | 242 | ||
| Dell International LLC | 5.250% | 2/1/28 | 100 | 100 | ||
| Dell International LLC | 5.300% | 10/1/29 | 235 | 232 | ||
| Dell International LLC | 5.750% | 2/1/33 | 130 | 130 | ||
| Dell International LLC | 8.100% | 7/15/36 | 75 | 86 | ||
| 2 | Dell International LLC | 3.375% | 12/15/41 | 155 | 109 | |
| Dell International LLC | 8.350% | 7/15/46 | 91 | 112 | ||
| 2 | Dell International LLC | 3.450% | 12/15/51 | 180 | 118 | |
| Equifax Inc. | 2.600% | 12/1/24 | 160 | 154 | ||
| Equifax Inc. | 5.100% | 12/15/27 | 55 | 54 | ||
| Equifax Inc. | 2.350% | 9/15/31 | 190 | 149 | ||
| Fidelity National Information Services Inc. | 1.150% | 3/1/26 | 220 | 198 | ||
| Fidelity National Information Services Inc. | 1.650% | 3/1/28 | 270 | 232 | ||
| Fidelity National Information Services Inc. | 2.250% | 3/1/31 | 125 | 101 | ||
| Fidelity National Information Services Inc. | 5.100% | 7/15/32 | 80 | 78 | ||
| Fidelity National Information Services Inc. | 3.100% | 3/1/41 | 90 | 63 | ||
| Fiserv Inc. | 3.850% | 6/1/25 | 60 | 58 | ||
| Fiserv Inc. | 3.200% | 7/1/26 | 220 | 208 | ||
| Fiserv Inc. | 2.250% | 6/1/27 | 140 | 126 | ||
| Fiserv Inc. | 5.450% | 3/2/28 | 80 | 80 | ||
| Fiserv Inc. | 4.200% | 10/1/28 | 185 | 177 | ||
| Fiserv Inc. | 3.500% | 7/1/29 | 285 | 260 | ||
| Fiserv Inc. | 2.650% | 6/1/30 | 110 | 93 | ||
| Coupon | Maturity Date | Face Amount ($000) | Market Value• ($000) | |||
| Fiserv Inc. | 5.600% | 3/2/33 | 80 | 80 | ||
| Fiserv Inc. | 4.400% | 7/1/49 | 252 | 205 | ||
| Hewlett Packard Enterprise Co. | 5.900% | 10/1/24 | 120 | 120 | ||
| Hewlett Packard Enterprise Co. | 4.900% | 10/15/25 | 240 | 237 | ||
| Hewlett Packard Enterprise Co. | 1.750% | 4/1/26 | 105 | 96 | ||
| Hewlett Packard Enterprise Co. | 6.350% | 10/15/45 | 119 | 122 | ||
| HP Inc. | 2.200% | 6/17/25 | 185 | 174 | ||
| HP Inc. | 3.000% | 6/17/27 | 110 | 101 | ||
| HP Inc. | 4.750% | 1/15/28 | 40 | 39 | ||
| HP Inc. | 4.000% | 4/15/29 | 185 | 173 | ||
| HP Inc. | 2.650% | 6/17/31 | 190 | 153 | ||
| HP Inc. | 5.500% | 1/15/33 | 150 | 146 | ||
| HP Inc. | 6.000% | 9/15/41 | 173 | 170 | ||
| Intel Corp. | 3.400% | 3/25/25 | 235 | 228 | ||
| Intel Corp. | 3.700% | 7/29/25 | 205 | 199 | ||
| Intel Corp. | 4.875% | 2/10/26 | 115 | 114 | ||
| Intel Corp. | 2.600% | 5/19/26 | 65 | 61 | ||
| Intel Corp. | 3.750% | 3/25/27 | 75 | 72 | ||
| Intel Corp. | 3.150% | 5/11/27 | 180 | 169 | ||
| Intel Corp. | 3.750% | 8/5/27 | 180 | 172 | ||
| Intel Corp. | 4.875% | 2/10/28 | 165 | 164 | ||
| Intel Corp. | 1.600% | 8/12/28 | 105 | 90 | ||
| Intel Corp. | 4.000% | 8/5/29 | 85 | 81 | ||
| Intel Corp. | 2.450% | 11/15/29 | 210 | 182 | ||
| Intel Corp. | 5.125% | 2/10/30 | 30 | 30 | ||
| Intel Corp. | 3.900% | 3/25/30 | 170 | 159 | ||
| Intel Corp. | 2.000% | 8/12/31 | 170 | 137 | ||
| Intel Corp. | 4.150% | 8/5/32 | 140 | 132 | ||
| Intel Corp. | 4.000% | 12/15/32 | 130 | 120 | ||
| Intel Corp. | 5.200% | 2/10/33 | 165 | 165 | ||
| Intel Corp. | 4.600% | 3/25/40 | 175 | 159 | ||
| Intel Corp. | 2.800% | 8/12/41 | 135 | 94 | ||
| Intel Corp. | 4.800% | 10/1/41 | 110 | 100 | ||
| Intel Corp. | 5.625% | 2/10/43 | 310 | 309 | ||
| Intel Corp. | 4.900% | 7/29/45 | 165 | 160 | ||
| Intel Corp. | 4.100% | 5/19/46 | 100 | 82 | ||
| Intel Corp. | 4.100% | 5/11/47 | 155 | 126 | ||
| Intel Corp. | 3.734% | 12/8/47 | 300 | 227 | ||
| Intel Corp. | 3.250% | 11/15/49 | 300 | 204 | ||
| Intel Corp. | 4.750% | 3/25/50 | 110 | 96 | ||
| Intel Corp. | 3.050% | 8/12/51 | 175 | 113 | ||
| Intel Corp. | 4.900% | 8/5/52 | 160 | 144 | ||
| Intel Corp. | 5.700% | 2/10/53 | 240 | 238 | ||
| Intel Corp. | 3.100% | 2/15/60 | 80 | 50 | ||
| Intel Corp. | 4.950% | 3/25/60 | 50 | 45 | ||
| Intel Corp. | 3.200% | 8/12/61 | 100 | 62 | ||
| Intel Corp. | 5.050% | 8/5/62 | 90 | 80 | ||
| Intel Corp. | 5.900% | 2/10/63 | 190 | 190 | ||
| International Business Machines Corp. | 4.000% | 7/27/25 | 35 | 34 | ||
| International Business Machines Corp. | 4.500% | 2/6/26 | 105 | 103 | ||
| International Business Machines Corp. | 3.450% | 2/19/26 | 178 | 171 | ||
| International Business Machines Corp. | 3.300% | 5/15/26 | 295 | 281 | ||
| International Business Machines Corp. | 1.700% | 5/15/27 | 190 | 168 | ||
| International Business Machines Corp. | 4.150% | 7/27/27 | 150 | 145 | ||
| International Business Machines Corp. | 4.500% | 2/6/28 | 120 | 118 | ||
| Coupon | Maturity Date | Face Amount ($000) | Market Value• ($000) | |||
| International Business Machines Corp. | 3.500% | 5/15/29 | 375 | 346 | ||
| International Business Machines Corp. | 1.950% | 5/15/30 | 220 | 181 | ||
| International Business Machines Corp. | 4.400% | 7/27/32 | 40 | 38 | ||
| International Business Machines Corp. | 4.750% | 2/6/33 | 30 | 29 | ||
| International Business Machines Corp. | 4.150% | 5/15/39 | 285 | 244 | ||
| International Business Machines Corp. | 4.000% | 6/20/42 | 145 | 119 | ||
| International Business Machines Corp. | 4.250% | 5/15/49 | 300 | 247 | ||
| International Business Machines Corp. | 2.950% | 5/15/50 | 140 | 90 | ||
| International Business Machines Corp. | 4.900% | 7/27/52 | 100 | 91 | ||
| KLA Corp. | 4.650% | 11/1/24 | 123 | 122 | ||
| KLA Corp. | 4.100% | 3/15/29 | 45 | 43 | ||
| KLA Corp. | 4.650% | 7/15/32 | 100 | 98 | ||
| KLA Corp. | 3.300% | 3/1/50 | 110 | 79 | ||
| KLA Corp. | 4.950% | 7/15/52 | 150 | 141 | ||
| KLA Corp. | 5.250% | 7/15/62 | 90 | 87 | ||
| Lam Research Corp. | 3.750% | 3/15/26 | 105 | 102 | ||
| Lam Research Corp. | 4.000% | 3/15/29 | 170 | 163 | ||
| Lam Research Corp. | 1.900% | 6/15/30 | 65 | 54 | ||
| Lam Research Corp. | 4.875% | 3/15/49 | 105 | 98 | ||
| Lam Research Corp. | 2.875% | 6/15/50 | 85 | 57 | ||
| Marvell Technology Inc. | 2.950% | 4/15/31 | 105 | 88 | ||
| Microchip Technology Inc. | 0.983% | 9/1/24 | 80 | 76 | ||
| Microchip Technology Inc. | 4.250% | 9/1/25 | 155 | 151 | ||
| Micron Technology Inc. | 6.750% | 11/1/29 | 45 | 47 | ||
| Micron Technology Inc. | 4.663% | 2/15/30 | 125 | 117 | ||
| Micron Technology Inc. | 2.703% | 4/15/32 | 190 | 150 | ||
| Micron Technology Inc. | 5.875% | 2/9/33 | 95 | 94 | ||
| Microsoft Corp. | 2.700% | 2/12/25 | 265 | 256 | ||
| Microsoft Corp. | 3.125% | 11/3/25 | 380 | 367 | ||
| Microsoft Corp. | 2.400% | 8/8/26 | 445 | 417 | ||
| Microsoft Corp. | 3.300% | 2/6/27 | 450 | 432 | ||
| Microsoft Corp. | 3.500% | 2/12/35 | 260 | 236 | ||
| Microsoft Corp. | 3.450% | 8/8/36 | 285 | 253 | ||
| Microsoft Corp. | 4.100% | 2/6/37 | 120 | 114 | ||
| Microsoft Corp. | 4.450% | 11/3/45 | 145 | 138 | ||
| Microsoft Corp. | 3.700% | 8/8/46 | 236 | 200 | ||
| Microsoft Corp. | 4.250% | 2/6/47 | 150 | 139 | ||
| Microsoft Corp. | 2.525% | 6/1/50 | 680 | 449 | ||
| Microsoft Corp. | 2.921% | 3/17/52 | 709 | 503 | ||
| Microsoft Corp. | 4.500% | 2/6/57 | 100 | 94 | ||
| Microsoft Corp. | 2.675% | 6/1/60 | 475 | 305 | ||
| Microsoft Corp. | 3.041% | 3/17/62 | 250 | 173 | ||
| Motorola Solutions Inc. | 4.600% | 5/23/29 | 160 | 154 | ||
| Motorola Solutions Inc. | 2.300% | 11/15/30 | 110 | 88 | ||
| Motorola Solutions Inc. | 2.750% | 5/24/31 | 105 | 85 | ||
| NetApp Inc. | 1.875% | 6/22/25 | 110 | 103 | ||
| NVIDIA Corp. | 3.200% | 9/16/26 | 160 | 153 | ||
| NVIDIA Corp. | 1.550% | 6/15/28 | 160 | 139 | ||
| NVIDIA Corp. | 2.850% | 4/1/30 | 155 | 139 | ||
| NVIDIA Corp. | 2.000% | 6/15/31 | 90 | 74 | ||
| NVIDIA Corp. | 3.500% | 4/1/40 | 160 | 133 | ||
| NVIDIA Corp. | 3.500% | 4/1/50 | 165 | 130 | ||
| NXP BV | 4.300% | 6/18/29 | 225 | 211 | ||
| NXP BV | 3.400% | 5/1/30 | 135 | 119 | ||
| NXP BV | 2.500% | 5/11/31 | 110 | 89 | ||
| Coupon | Maturity Date | Face Amount ($000) | Market Value• ($000) | |||
| NXP BV | 2.650% | 2/15/32 | 40 | 32 | ||
| NXP BV | 5.000% | 1/15/33 | 135 | 128 | ||
| NXP BV | 3.250% | 5/11/41 | 95 | 68 | ||
| Oracle Corp. | 2.950% | 11/15/24 | 215 | 208 | ||
| Oracle Corp. | 2.500% | 4/1/25 | 410 | 390 | ||
| Oracle Corp. | 2.950% | 5/15/25 | 280 | 268 | ||
| Oracle Corp. | 5.800% | 11/10/25 | 125 | 126 | ||
| Oracle Corp. | 1.650% | 3/25/26 | 340 | 310 | ||
| Oracle Corp. | 2.650% | 7/15/26 | 345 | 320 | ||
| Oracle Corp. | 2.800% | 4/1/27 | 290 | 266 | ||
| Oracle Corp. | 3.250% | 11/15/27 | 325 | 301 | ||
| Oracle Corp. | 2.300% | 3/25/28 | 210 | 185 | ||
| Oracle Corp. | 6.150% | 11/9/29 | 125 | 130 | ||
| Oracle Corp. | 2.950% | 4/1/30 | 250 | 216 | ||
| Oracle Corp. | 2.875% | 3/25/31 | 375 | 317 | ||
| Oracle Corp. | 6.250% | 11/9/32 | 220 | 230 | ||
| Oracle Corp. | 4.900% | 2/6/33 | 250 | 239 | ||
| Oracle Corp. | 4.300% | 7/8/34 | 220 | 197 | ||
| Oracle Corp. | 3.900% | 5/15/35 | 130 | 111 | ||
| Oracle Corp. | 3.850% | 7/15/36 | 180 | 149 | ||
| Oracle Corp. | 3.800% | 11/15/37 | 190 | 153 | ||
| Oracle Corp. | 6.500% | 4/15/38 | 205 | 216 | ||
| Oracle Corp. | 6.125% | 7/8/39 | 215 | 218 | ||
| Oracle Corp. | 3.600% | 4/1/40 | 325 | 246 | ||
| Oracle Corp. | 5.375% | 7/15/40 | 290 | 270 | ||
| Oracle Corp. | 3.650% | 3/25/41 | 260 | 196 | ||
| Oracle Corp. | 4.500% | 7/8/44 | 220 | 180 | ||
| Oracle Corp. | 4.125% | 5/15/45 | 340 | 263 | ||
| Oracle Corp. | 4.000% | 7/15/46 | 310 | 232 | ||
| Oracle Corp. | 4.000% | 11/15/47 | 230 | 172 | ||
| Oracle Corp. | 3.600% | 4/1/50 | 511 | 352 | ||
| Oracle Corp. | 3.950% | 3/25/51 | 385 | 281 | ||
| Oracle Corp. | 6.900% | 11/9/52 | 320 | 348 | ||
| Oracle Corp. | 5.550% | 2/6/53 | 270 | 251 | ||
| Oracle Corp. | 4.375% | 5/15/55 | 215 | 165 | ||
| Oracle Corp. | 3.850% | 4/1/60 | 350 | 237 | ||
| Oracle Corp. | 4.100% | 3/25/61 | 160 | 114 | ||
| Qorvo Inc. | 4.375% | 10/15/29 | 105 | 95 | ||
| QUALCOMM Inc. | 3.450% | 5/20/25 | 125 | 121 | ||
| QUALCOMM Inc. | 3.250% | 5/20/27 | 252 | 238 | ||
| QUALCOMM Inc. | 1.300% | 5/20/28 | 60 | 51 | ||
| QUALCOMM Inc. | 2.150% | 5/20/30 | 285 | 242 | ||
| QUALCOMM Inc. | 1.650% | 5/20/32 | 220 | 171 | ||
| QUALCOMM Inc. | 4.650% | 5/20/35 | 85 | 83 | ||
| QUALCOMM Inc. | 4.800% | 5/20/45 | 145 | 137 | ||
| QUALCOMM Inc. | 4.300% | 5/20/47 | 230 | 199 | ||
| QUALCOMM Inc. | 3.250% | 5/20/50 | 100 | 73 | ||
| QUALCOMM Inc. | 4.500% | 5/20/52 | 115 | 100 | ||
| QUALCOMM Inc. | 6.000% | 5/20/53 | 115 | 124 | ||
| Quanta Services Inc. | 2.900% | 10/1/30 | 145 | 122 | ||
| RELX Capital Inc. | 4.000% | 3/18/29 | 150 | 142 | ||
| RELX Capital Inc. | 3.000% | 5/22/30 | 75 | 66 | ||
| Roper Technologies Inc. | 4.200% | 9/15/28 | 115 | 110 | ||
| Roper Technologies Inc. | 1.750% | 2/15/31 | 60 | 47 | ||
| S&P Global Inc. | 2.450% | 3/1/27 | 190 | 175 | ||
| Coupon | Maturity Date | Face Amount ($000) | Market Value• ($000) | |||
| S&P Global Inc. | 2.700% | 3/1/29 | 130 | 116 | ||
| S&P Global Inc. | 4.250% | 5/1/29 | 150 | 144 | ||
| S&P Global Inc. | 2.900% | 3/1/32 | 165 | 141 | ||
| S&P Global Inc. | 3.700% | 3/1/52 | 120 | 93 | ||
| Salesforce Inc. | 3.700% | 4/11/28 | 230 | 220 | ||
| Salesforce Inc. | 1.500% | 7/15/28 | 55 | 47 | ||
| Salesforce Inc. | 1.950% | 7/15/31 | 165 | 134 | ||
| Salesforce Inc. | 2.700% | 7/15/41 | 150 | 107 | ||
| Salesforce Inc. | 2.900% | 7/15/51 | 210 | 140 | ||
| Salesforce Inc. | 3.050% | 7/15/61 | 120 | 77 | ||
| ServiceNow Inc. | 1.400% | 9/1/30 | 193 | 152 | ||
| Texas Instruments Inc. | 1.375% | 3/12/25 | 150 | 142 | ||
| Texas Instruments Inc. | 2.250% | 9/4/29 | 130 | 113 | ||
| Texas Instruments Inc. | 4.900% | 3/14/33 | 35 | 35 | ||
| Texas Instruments Inc. | 3.875% | 3/15/39 | 175 | 151 | ||
| Texas Instruments Inc. | 4.150% | 5/15/48 | 195 | 169 | ||
| Texas Instruments Inc. | 5.050% | 5/18/63 | 125 | 120 | ||
| TSMC Arizona Corp. | 1.750% | 10/25/26 | 160 | 144 | ||
| TSMC Arizona Corp. | 3.875% | 4/22/27 | 90 | 87 | ||
| TSMC Arizona Corp. | 2.500% | 10/25/31 | 195 | 162 | ||
| TSMC Arizona Corp. | 4.250% | 4/22/32 | 140 | 133 | ||
| TSMC Arizona Corp. | 3.125% | 10/25/41 | 20 | 15 | ||
| TSMC Arizona Corp. | 3.250% | 10/25/51 | 140 | 101 | ||
| TSMC Arizona Corp. | 4.500% | 4/22/52 | 100 | 91 | ||
| Verisk Analytics Inc. | 4.000% | 6/15/25 | 211 | 205 | ||
| VMware Inc. | 4.500% | 5/15/25 | 50 | 49 | ||
| VMware Inc. | 1.400% | 8/15/26 | 210 | 186 | ||
| VMware Inc. | 3.900% | 8/21/27 | 215 | 202 | ||
| VMware Inc. | 1.800% | 8/15/28 | 125 | 105 | ||
| VMware Inc. | 4.700% | 5/15/30 | 155 | 146 | ||
| VMware Inc. | 2.200% | 8/15/31 | 145 | 113 | ||
| Western Digital Corp. | 4.750% | 2/15/26 | 300 | 286 | ||
| Workday Inc. | 3.500% | 4/1/27 | 195 | 184 | ||
| Workday Inc. | 3.700% | 4/1/29 | 180 | 166 | ||
| Workday Inc. | 3.800% | 4/1/32 | 185 | 164 | ||
| Xilinx Inc. | 2.375% | 6/1/30 | 85 | 73 | ||
| 50,833 | ||||||
| Utilities (0.1%) | ||||||
| American Water Capital Corp. | 4.450% | 6/1/32 | 90 | 86 | ||
| American Water Capital Corp. | 6.593% | 10/15/37 | 92 | 102 | ||
| American Water Capital Corp. | 3.750% | 9/1/47 | 105 | 82 | ||
| Coupon | Maturity Date | Face Amount ($000) | Market Value• ($000) | |||
| Commonwealth Edison Co. | 4.000% | 3/1/48 | 80 | 64 | ||
| PPL Electric Utilities Corp. | 5.250% | 5/15/53 | 95 | 92 | ||
| 426 | ||||||
| Total Investments (98.4%) (Cost $468,290) | 421,102 | |||||
| Other Assets and Liabilities—Net (1.6%) | 7,022 | |||||
| Net Assets (100%) | 428,124 | |||||
| Cost is in $000. |
| • | See Note A in Notes to Financial Statements. |
| 1 | The average or expected maturity is shorter than the final maturity shown because of the possibility of interim principal payments and prepayments or the possibility of the issue being called. |
| 2 | Security exempt from registration under Rule 144A of the Securities Act of 1933. Such securities may be sold in transactions exempt from registration, normally to qualified institutional buyers. At August 31, 2023, the aggregate value was $2,860,000, representing 0.7% of net assets. |
| 3 | Securities with a value of $43,000 have been segregated as initial margin for open futures contracts. |
| DAC—Designated Activity Company. |
| Futures Contracts | ||||
| ($000) | ||||
| Expiration | Number of Long (Short) Contracts | Notional Amount | Value and Unrealized Appreciation (Depreciation) | |
| Short Futures Contracts | ||||
| 10-Year U.S. Treasury Note | December 2023 | (3) | (333) | (3) |
| ($000s, except shares, footnotes, and per-share amounts) | Amount |
| Assets | |
| Investments in Securities, at Value—Unaffiliated Issuers (Cost $468,290) | 421,102 |
| Investment in Vanguard | 14 |
| Cash | 891 |
| Receivables for Investment Securities Sold | 4,492 |
| Receivables for Accrued Income | 4,844 |
| Total Assets | 431,343 |
| Liabilities | |
| Payables for Investment Securities Purchased | 3,194 |
| Payables to Vanguard | 22 |
| Variation Margin Payable—Futures Contracts | 3 |
| Total Liabilities | 3,219 |
| Net Assets | 428,124 |
| At August 31, 2023, net assets consisted of: | |
| Paid-in Capital | 487,527 |
| Total Distributable Earnings (Loss) | (59,403) |
| Net Assets | 428,124 |
| Net Assets | |
| Applicable to 7,000,000 outstanding $.001 par value shares of beneficial interest (unlimited authorization) | 428,124 |
| Net Asset Value Per Share | $61.16 |
| Year Ended August 31, 2023 | |
| ($000) | |
| Investment Income | |
| Income | |
| Interest | 13,797 |
| Total Income | 13,797 |
| Expenses | |
| The Vanguard Group—Note B | |
| Investment Advisory Services | 8 |
| Management and Administrative | 305 |
| Marketing and Distribution | 21 |
| Custodian Fees | 13 |
| Auditing Fees | 40 |
| Shareholders’ Reports | 31 |
| Trustees’ Fees and Expenses | — |
| Professional Services | 30 |
| Other Expenses | 1 |
| Total Expenses | 449 |
| Expenses Paid Indirectly | (5) |
| Net Expenses | 444 |
| Net Investment Income | 13,353 |
| Realized Net Gain (Loss) | |
| Investment Securities Sold1 | (7,958) |
| Futures Contracts | (32) |
| Realized Net Gain (Loss) | (7,990) |
| Change in Unrealized Appreciation (Depreciation) | |
| Investment Securities | (1,149) |
| Futures Contracts | (3) |
| Change in Unrealized Appreciation (Depreciation) | (1,152) |
| Net Increase (Decrease) in Net Assets Resulting from Operations | 4,211 |
| 1 | Includes ($760,000) of net gain (loss) resulting from in-kind redemptions. |
| Year Ended August 31, | ||
| 2023 | 2022 | |
| ($000) | ($000) | |
| Increase (Decrease) in Net Assets | ||
| Operations | ||
| Net Investment Income | 13,353 | 6,515 |
| Realized Net Gain (Loss) | (7,990) | (6,275) |
| Change in Unrealized Appreciation (Depreciation) | (1,152) | (47,718) |
| Net Increase (Decrease) in Net Assets Resulting from Operations | 4,211 | (47,478) |
| Distributions | ||
| Total Distributions | (12,789) | (6,003) |
| Capital Share Transactions | ||
| Issued | 104,363 | 174,694 |
| Issued in Lieu of Cash Distributions | — | — |
| Redeemed | (5,969) | — |
| Net Increase (Decrease) from Capital Share Transactions | 98,394 | 174,694 |
| Total Increase (Decrease) | 89,816 | 121,213 |
| Net Assets | ||
| Beginning of Period | 338,308 | 217,095 |
| End of Period | 428,124 | 338,308 |
| For a Share Outstanding Throughout Each Period | Year Ended August 31, | September 22, 20201 to August 31, 2021 | |
| 2023 | 2022 | ||
| Net Asset Value, Beginning of Period | $62.65 | $74.86 | $75.00 |
| Investment Operations | |||
| Net Investment Income2 | 2.217 | 1.542 | 1.211 |
| Net Realized and Unrealized Gain (Loss) on Investments | (1.574) | (12.307) | (.330) |
| Total from Investment Operations | .643 | (10.765) | .881 |
| Distributions | |||
| Dividends from Net Investment Income | (2.133) | (1.445) | (1.021) |
| Distributions from Realized Capital Gains | — | — | — |
| Total Distributions | (2.133) | (1.445) | (1.021) |
| Net Asset Value, End of Period | $61.16 | $62.65 | $74.86 |
| Total Return | 1.09% | -14.54% | 1.20% |
| Ratios/Supplemental Data | |||
| Net Assets, End of Period (Millions) | $428 | $338 | $217 |
| Ratio of Total Expenses to Average Net Assets | 0.12%3 | 0.12%3 | 0.12%4 |
| Ratio of Net Investment Income to Average Net Assets | 3.62% | 2.26% | 1.74%4 |
| Portfolio Turnover Rate5 | 28% | 34% | 24% |
| 1 | Inception. |
| 2 | Calculated based on average shares outstanding. |
| 3 | The ratio of expenses to average net assets for the period net of reduction from custody fee offset arrangements was 0.12%. |
| 4 | Annualized. |
| 5 | Excludes the value of portfolio securities received or delivered as a result of in-kind purchases or redemptions of the fund’s capital shares, including ETF Creation Units. |
| Level 1 ($000) | Level 2 ($000) | Level 3 ($000) | Total ($000) | |
| Investments | ||||
| Assets | ||||
| Corporate Bonds | — | 421,102 | — | 421,102 |
| Derivative Financial Instruments | ||||
| Liabilities | ||||
| Futures Contracts1 | 3 | — | — | 3 |
| 1 | Includes cumulative appreciation (depreciation) on futures contracts and centrally cleared swaps, if any, as reported in the Schedule of Investments. Only current day’s variation margin is reported within the Statement of Assets and Liabilities. |
| Amount ($000) | |
| Paid-in Capital | (760) |
| Total Distributable Earnings (Loss) | 760 |
| Amount ($000) | |
| Undistributed Ordinary Income | 1,390 |
| Undistributed Long-Term Gains | — |
| Net Unrealized Gains (Losses) | (47,188) |
| Capital Loss Carryforwards | (13,605) |
| Qualified Late-Year Losses | — |
| Other Temporary Differences | — |
| Total | (59,403) |
| Year Ended August 31, | ||
| 2023 | 2022 | |
| Amount ($000) | Amount ($000) | |
| Ordinary Income* | 12,789 | 6,003 |
| Long-Term Capital Gains | — | — |
| Total | 12,789 | 6,003 |
| * | Includes short-term capital gains, if any. |
| Amount ($000) | |
| Tax Cost | 468,290 |
| Gross Unrealized Appreciation | 793 |
| Gross Unrealized Depreciation | (47,981) |
| Net Unrealized Appreciation (Depreciation) | (47,188) |
| Year Ended August 31, | |||
| 2023 Shares (000) | 2022 Shares (000) | ||
| Issued | 1,700 | 2,500 | |
| Issued in Lieu of Cash Distributions | — | — | |
| Redeemed | (100) | — | |
| Net Increase (Decrease) in Shares Outstanding | 1,600 | 2,500 | |
Philadelphia, Pennsylvania
October 19, 2023
| Matthew Benchener | Thomas M. Rampulla |
| Joseph Brennan | Karin A. Risi |
| Mortimer J. Buckley | Anne E. Robinson |
| Gregory Davis | Michael Rollings |
| John James | Nitin Tandon |
| Chris D. McIsaac | Lauren Valente |

Who Are Deaf or Hard of Hearing > 800-749-7273
All rights reserved.
Vanguard Marketing Corporation, Distributor.
Item 2: Code of Ethics.
The Registrant has adopted a code of ethics that applies to the Registrant’s principal executive officer, principal financial officer, principal accounting officer or controller or persons performing similar functions. The Code of Ethics was amended during the reporting period covered by this report to make certain technical, non-material changes.
Item 3: Audit Committee Financial Expert.
All members of the Audit Committee have been determined by the Registrant’s Board of Trustees to be Audit Committee Financial Experts and to be independent: F. Joseph Loughrey, Mark Loughridge, Sarah Bloom Raskin, and Peter F. Volanakis.
Item 4: Principal Accountant Fees and Services.
| (a) | Audit Fees. |
Audit Fees of the Registrant.
Fiscal Year Ended August 31, 2023: $736,000
Fiscal Year Ended August 31, 2022: $714,000
Aggregate Audit Fees of Registered Investment Companies in the Vanguard Group.
Fiscal Year Ended August 31, 2023: $9,326,156
Fiscal Year Ended August 31, 2022: $10,494,508
Includes fees billed in connection with audits of the Registrant, other registered investment companies in the Vanguard complex, The Vanguard Group, Inc., and Vanguard Marketing Corporation.
| (b) | Audit-Related Fees. |
Fiscal Year Ended August 31, 2023: $3,295,934
Fiscal Year Ended August 31, 2022: $2,757,764
Includes fees billed in connection with assurance and related services provided to the Registrant, other registered investment companies in the Vanguard complex, The Vanguard Group, Inc., and Vanguard Marketing Corporation.
| (c) | Tax Fees. |
Fiscal Year Ended August 31, 2023: $1,678,928
Fiscal Year Ended August 31, 2022: $5,202,689
Includes fees billed in connection with tax compliance, planning, and advice services provided to the Registrant, other registered investment companies in the Vanguard complex, The Vanguard Group, Inc., and Vanguard Marketing Corporation.
| (d) | All Other Fees. |
Fiscal Year Ended August 31, 2023: $25,000
Fiscal Year Ended August 31, 2022: $298,000
Includes fees billed for services related to tax reported information provided to the Registrant, other registered investment companies in the Vanguard complex, The Vanguard Group, Inc., and Vanguard Marketing Corporation.
(e) (1) Pre-Approval Policies. The policy of the Registrant’s Audit Committee is to consider, and, if appropriate, approve before the principal accountant is engaged for such services, all specific audit and non-audit services provided to: the Registrant, other registered investment companies in the Vanguard complex, The Vanguard Group, Inc., and entities controlled by The Vanguard Group, Inc. that provide ongoing services to the Registrant. In making a determination, the Audit Committee considers whether the services are consistent with maintaining the principal accountant’s independence.
In the event of a contingency situation in which the principal accountant is needed to provide services in between scheduled Audit Committee meetings, the Chairman of the Audit Committee would be called on to consider and, if appropriate, pre-approve audit or permitted non-audit services in an amount sufficient to complete services through the next Audit Committee meeting, and to determine if such services would be consistent with maintaining the accountant’s independence. At the next scheduled Audit Committee meeting, services and fees would be presented to the Audit Committee for formal consideration, and, if appropriate, approval by the entire Audit Committee. The Audit Committee would again consider whether such services and fees are consistent with maintaining the principal accountant’s independence.
The Registrant’s Audit Committee is informed at least annually of all audit and non-audit services provided by the principal accountant to the Vanguard complex, whether such services are provided to: the Registrant, other registered investment companies in the Vanguard complex, The Vanguard Group, Inc., or other entities controlled by The Vanguard Group, Inc. that provide ongoing services to the Registrant.
(2) No percentage of the principal accountant’s fees or services were approved pursuant to the waiver provision of paragraph (c)(7)(i)(C) of Rule 2-01 of Regulation S-X.
(f) For the most recent fiscal year, over 50% of the hours worked under the principal accountant’s engagement were not performed by persons other than full-time, permanent employees of the principal accountant.
| (g) | Aggregate Non-Audit Fees. |
Fiscal Year Ended August 31, 2023: $1,703,928
Fiscal Year Ended August 31, 2022: $5,500,689
Includes fees billed for non-audit services provided to the Registrant, other registered investment companies in the Vanguard complex, The Vanguard Group, Inc., and Vanguard Marketing Corporation.
(h) For the most recent fiscal year, the Audit Committee has determined that the provision of all non-audit services was consistent with maintaining the principal accountant’s independence.
Item 5: Audit Committee of Listed Registrants.
The Registrant is a listed issuer as defined in rule 10A-3 under the Securities Exchange Act of 1934 (“Exchange Act”). The Registrant has a separately-designated standing audit committee established in accordance with Section 3(a)(58)(A) of the Exchange Act. The Registrant’s audit committee members are: F. Joseph Loughrey, Mark Loughridge, Sarah Bloom Raskin, and Peter F. Volanakis.
Item 6: Investments.
Not applicable. The complete schedule of investments is included as part of the report to shareholders filed under Item 1 of this Form.
Item 7: Disclosure of Proxy Voting Policies and Procedures for Closed-End Management Investment Companies.
Not applicable.
Item 8: Portfolio Managers of Closed-End Management Investment Companies.
Not applicable.
Item 9: Purchase of Equity Securities by Closed-End Management Investment Company and Affiliated Purchasers.
Not applicable.
Item 10: Submission of Matters to a Vote of Security Holders.
Not applicable.
Item 11: Controls and Procedures.
(a) Disclosure Controls and Procedures. The Principal Executive and Financial Officers concluded that the Registrant’s Disclosure Controls and Procedures are effective based on their evaluation of the Disclosure Controls and Procedures as of a date within 90 days of the filing date of this report.
(b) Internal Control Over Financial Reporting. There were no significant changes in the Registrant’s Internal Control Over Financial Reporting or in other factors that could significantly affect this control subsequent to the date of the evaluation, including any corrective actions with regard to significant deficiencies and material weaknesses.
Item 12: Disclosure of Securities Lending Activities for Closed-End Management Investment Companies.
Not applicable.
Item 13: Exhibits.
| (a)(1) | Code of Ethics filed herewith. |
| (a)(2) | Certifications filed herewith. |
| (a)(2) | Certifications filed herewith. |
Pursuant to the requirements of the Securities Exchange Act of 1934 and the Investment Company Act of 1940, the registrant has duly caused this report to be signed on its behalf by the undersigned, thereunto duly authorized.
| VANGUARD WORLD FUND | ||
| BY: | /s/ MORTIMER J. BUCKLEY* | |
| MORTIMER J. BUCKLEY | ||
| CHIEF EXECUTIVE OFFICER |
Date: October 19, 2023
Pursuant to the requirements of the Securities Exchange Act of 1934 and the Investment Company Act of 1940, this report has been signed below by the following persons on behalf of the registrant and in the capacities and on the dates indicated.
| VANGUARD WORLD FUND | ||
| BY: | /s/ MORTIMER J. BUCKLEY* | |
| MORTIMER J. BUCKLEY | ||
| CHIEF EXECUTIVE OFFICER |
Date: October 19, 2023
| VANGUARD WORLD FUND | ||
| BY: | /s/ CHRISTINE BUCHANAN* | |
| CHRISTINE BUCHANAN | ||
| CHIEF FINANCIAL OFFICER |
Date: October 19, 2023
| * By: | /s/ Anne E. Robinson |
Anne E. Robinson, pursuant to a Power of Attorney filed on July 21, 2023 (see File Number 33-53683) and to a Power of Attorney filed on March 29, 2023 (see File Number 2-11444), Incorporated by Reference.