| | UNITED STATES | |
| | SECURITIES AND EXCHANGE COMMISSION | |
| | Washington, D.C. 20549 | |
| | | |
| | FORM N-CSR | |
| | | |
| CERTIFIED SHAREHOLDER REPORT OF REGISTERED MANAGEMENT | |
| | INVESTMENT COMPANIES | |
| | | |
| Investment Company Act file number 811-5240 | |
| | | |
| | The Dreyfus/Laurel Funds Trust | |
| | (Exact name of Registrant as specified in charter) | |
| | | |
| | c/o The Dreyfus Corporation | |
| | 200 Park Avenue | |
| | New York, New York 10166 | |
| | (Address of principal executive offices) (Zip code) | |
| | | |
| | Mark N. Jacobs, Esq. | |
| | 200 Park Avenue | |
| | New York, New York 10166 | |
| | (Name and address of agent for service) | |
| | | |
| Registrant's telephone number, including area code: (212) 922-6000 | |
| | | |
| Date of fiscal year end: | 12/31 | |
| | | |
| Date of reporting period: | 06/30/04 | |
FORM N-CSR
Item 1. Reports to Stockholders.
The views expressed in this report reflect those of the portfolio manager only through the end of the period covered and do not necessarily represent the views of Dreyfus or any other person in the Dreyfus organization. Any such views are subject to change at any time based upon market or other conditions and Dreyfus disclaims any responsibility to update such views.These views may not be relied on as investment advice and, because investment decisions for a Dreyfus fund are based on numerous factors, may not be relied on as an indication of trading intent on behalf of any Dreyfus fund.
Not FDIC-Insured • Not Bank-Guaranteed • May Lose Value
Contents
THE FUND
2
| Letter from the Chairman
|
3
| Discussion of Fund Performance
|
6
| Statement of Investments
|
21
| Statement of Options Written
|
22
| Statement of Assets and Liabilities
|
23
| Statement of Operations
|
24
| Statement of Changes in Net Assets
|
26
| Financial Highlights
|
30
| Notes to Financial Statements
|
FOR MORE INFORMATION
|
Back Cover
|
| Dreyfus Premier |
| Managed Income Fund |
The Fund

LETTER FROM THE CHAIRMAN
Dear Shareholder:
This semiannual report for Dreyfus Premier Managed Income Fund covers the six-month period from January 1, 2004, through June 30, 2004. Inside, you'll find valuable information about how the fund was managed during the reporting period, including a discussion with the fund's portfolio manager, Kent Wosepka.
The U.S. economy increasingly showed signs of sustainable growth during the first half of 2004,causing heightened volatility in most sectors of the U.S. bond market.When it became clearer in the spring that an unexpectedly strong job market and higher energy prices reflected renewed inflationary pressures, many fixed-income investors began to anticipate higher interest rates. In fact, on the last day of the reporting period, the Federal Reserve Board raised short-term rates in what many analysts believe is the first in a series of gradual increases.
To many investors, the move to a less accommodative monetary policy marks the beginning of a new phase in the economic cycle. At times such as these, when market conditions are in a period of transition, we believe it is especially important for you to stay in close contact with your financial advisor, who can help you position your portfolio in a way that is designed to respond to the challenges and opportunities of today's changing investment environment.
Thank you for your continued confidence and support.
Sincerely,

Stephen E. Canter
Chairman and Chief Executive Officer The Dreyfus Corporation
July 15, 2004
2

DISCUSSION OF FUND PERFORMANCE
Kent Wosepka, Portfolio Manager
How did Dreyfus Premier Managed Income Fund perform relative to its benchmark?
For the six-month period ended June 30, 2004, Dreyfus Premier Managed Income Fund achieved total returns of 0.51% for Class A shares, 0.04% for Class B shares, 0.05% for Class C shares and 0.64% for Class R shares.1 In comparison, the fund's benchmark, the Lehman Brothers U.S. Aggregate Index (the "Index"), produced a total return of 0.15% for the same period.2
Although the bond market was under pressure during the first half of 2004 as investors anticipated higher short-term interest rates, the fund benefited from its investments in inflation-protected securities, European debt and non-investment-grade U.S. corporate bonds that generally held their values better than U.S. Treasury securities. As a result, the fund's returns were in line with its benchmark during the reporting period.
What is the fund's investment approach?
The fund seeks high current income consistent with what is believed to be prudent risk of capital.
The fund invests at least 65% of its total assets in various types of U.S. government and corporate debt obligations rated investment-grade (or their unrated equivalent as determined by Dreyfus).The fund also normally invests at least 65% of its total assets in debt obligations having effective maturities of 10 years or less.We do not attempt to match the sector percentages of any index, nor do we attempt to predict the direction of interest rates by substantially altering the fund's sensitivity to changes in rates. Instead, the heart of our investment process is selecting individual securities that possess a combination of superior fundamentals and attractive relative valuations.
What other factors influenced the fund's performance?
Early in 2004, economic reports showed continued gains in U.S. economic growth, but that strength did not appear to extend to the labor
The Fund 3
DISCUSSION OF FUND PERFORMANCE (continued)
markets.As a result, interest rates remained near historically low levels, and prospects for inflation seemed subdued. Consequently, the Federal Reserve Board (the "Fed") left short-term interest rates unchanged at 1%, their lowest level since 1958.
In early April, however, the U.S. Labor Department released data showing unexpectedly strong job growth, and oil and gas prices rose sharply, causing fixed-income investors to anticipate a reacceleration of inflation. For its part, the Fed indicated in public comments that it was prepared to raise interest rates. Indeed, on June 30, the last day of the reporting period, the Fed increased the overnight federal funds rate by 25 basis points. In this environment, the fund's holdings of treasury inflation-adjusted securities outperformed "traditional" U.S. Treasury securities, benefiting its performance.
In addition, non-investment-grade U.S. corporate bond prices, which respond primarily to credit-quality trends, fared better than comparable U.S.Treasury securities during the reporting period.The fund received particularly strong contributions from non-investment-grade corporate bonds, which are not part of the Index and are currently still held by the fund. For example, Tyco International, a diversified manufacturing conglomerate, saw its credit rating upgraded on the strength of rising profits and its recovery from the corporate scandals associated with prior management. The fund also enjoyed good performance from investment-grade corporate bonds issued by AT&T Wireless Services, which was acquired during the reporting period by Cingular Wireless LLC.
While a strong economy drove U.S. interest rates higher, sluggish economic conditions prevented interest rates in Europe from rising nearly as much as they did in the United States. As a result, the portfolio's holdings of European government bonds fared relatively well. In addition, as we generally avoided the more riskier emerging-market debt issues, the fund's emerging market selection yielded overall positive results for the reporting period as a whole.
Another factor positively influencing the fund's overall performance was the fund's shorter than average duration — a measure of sensitivity to
4
changing interest rates — early in the reporting period. As the reporting period progressed, we increased our duration slightly in response to what we believed was the end of a market "sell-off." However, higher energy prices and a strengthening job market later in the reporting period led to a drop in bond prices and conversely higher yields. As a result, our slightly longer duration detracted from the fund's performance later in the reporting period, but overall, our defensive positioning for most of the reporting period helped the fund's relative returns.
What is the fund's current strategy?
In our view, recent comments from the Fed suggest that its June 30 rate hike was the first in a series of periodic and gradual increases. While yields of longer-term securities have already risen to some extent to reflect this expectation, as of the end of the reporting period we continue to believe that intermediate-term and long-term bond yields are likely to rise further. Therefore, we have maintained the fund's average duration in a range that is shorter than that of the Index, which should enable us to capture higher yields more quickly should the opportunity arise. In the meantime, we intend to continue to emphasize corporate bonds, which we expect to benefit from an improving U.S. economy, and European bonds, which may perform relatively well in a relatively stable U.S interest-rate environment. Finally, we may focus more intently on emerging-markets debt if, as we expect, the global economy continues to improve.
July 15, 2004
1
| Total return includes reinvestment of dividends and any capital gains paid, and does not take into consideration the maximum initial sales charge in the case of Class A shares, or the applicable contingent deferred sales charges imposed on redemptions in the case of Class B and Class C shares. Had these charges been reflected, returns would have been lower. Past performance is no guarantee of future results. Share price, yield and investment return fluctuate such that upon redemption, fund shares may be worth more or less than their original cost.
|
2
| SOURCE: LIPPER INC. — Reflects reinvestment of dividends and, where applicable, capital gain distributions.The Lehman Brothers U.S. Aggregate Index is a widely accepted, unmanaged total return index of corporate, U.S. government and U.S. government agency debt instruments, mortgage-backed securities and asset-backed securities with an average maturity of 1-10 years.
|
The Fund 5
| STATEMENT OF INVESTMENTS |
| June 30, 2004 (Unaudited) |
| | Principal | | | |
| Bonds and Notes—110.4% | Amount a | | Value ($) | |
|
| |
| |
| Advertising—.1% | | | | |
| Lamar Media, | | | | |
| Notes, 7.25%, 2013 | 30,000 | | 30,675 | |
| Asset-Backed Ctfs.—Auto Loans—4.6% | | | | |
| Americredit Automobile Receivable Trust, | | | | |
| Ser. 2000-D, Cl. A4, 1.57%, 2007 | 56,581 b | | 56,673 | |
| BMW Vehicle Owner Trust: | | | | |
| Ser. 2004-A, Cl. A1, 1.18%, 2005 | 460,544 | | 459,968 | |
| Ser. 2004-A, Cl. A4, 3.32%, 2009 | 145,000 | | 143,618 | |
| DaimlerChrysler Auto Trust, | | | | |
| Ser. 2003-A, Cl. A4, 2.88%, 2009 | 305,000 | | 303,084 | |
| Ford Credit Owner Trust, | | | | |
| Ser. 2004-A, Cl. C, 4.19%, 2009 | 50,000 | | 50,031 | |
| Honda Auto Receivables Owner Trust, | | | | |
| Ser. 2004-1,Cl. A1, 1.139%, 2005 | 254,199 | | 254,131 | |
| Nissan Auto Receivables Owner Trust, | | | | |
| Ser. 2003-C, Cl. A4, 2.7%, 2007 | 490,000 | | 486,333 | |
| Whole Auto Loan Trust, | | | | |
| Ser. 2003-1, Cl. A2A, 1.4%, 2006 | 719,748 | | 719,225 | |
| | | | 2,473,063 | |
| Asset—Backed Ctfs.—Credit Cards—7.8% | | | | |
| American Express Master Trust, | | | | |
| Ser. 2002-1, Cl. A, 1.31%, 2005 | 435,000 b | | 435,520 | |
| Capital One Multi-Asset Execution Trust: | | | | |
| Ser. 2002-B1, Cl. B1, 1.92%, 2008 | 565,000 b | | 568,216 | |
| Ser. 2003-B2, Cl. B2, 3.5%, 2009 | 85,000 | | 85,382 | |
| Ser. 2003-C4, Cl. C4, 6%, 2013 | 390,000 | | 402,154 | |
| Ser. 2004-C1, Cl. C1, 3.4%, 2009 | 230,000 | | 226,455 | |
| Chase Credit Card Master Trust: | | | | |
| Ser. 2000-3, Cl. A, 1.37%, 2008 | 245,000 b | | 245,502 | |
| Ser. 2002-2, Cl. C, 2.14%, 2007 | 300,000 b | | 301,346 | |
| Ser. 2002-6, Cl. B, 1.59%, 2008 | 220,000 b | | 220,732 | |
| Ser. 2002-8, Cl. A, 1.30%, 2008 | 185,000 b | | 185,212 | |
| Citibank Credit Card Issuance Trust: | | | | |
| Ser. 2000-B1, Cl. B1, 7.05%, 2007 | 90,000 | | 94,746 | |
| Ser. 2002-A2, Cl. A2, 1.28%, 2007 | 440,000 b | | 440,268 | |
| MBNA Credit Card Master Note Trust: | | | | |
| Ser. 1997-J, Cl. A, 1.36%, 2007 | 735,000 b | | 735,597 | |
| Ser. 2002-A1, Cl. A1, 4.95%, 2009 | 140,000 | | 145,791 | |
| Ser. 2004-A4, Cl. A4, 2.7%, 2009 | 100,000 | | 97,885 | |
| | | | 4,184,806 | |
6
| | Principal | | |
| Bonds and Notes (continued) | Amount a | Value ($) | |
|
|
| |
| Asset—Backed Ctfs.—Equipment—.5% | | | |
| John Deere Owner Trust, | | | |
| Ser. 2004-A, Cl. A1, 1.14%, 2005 | 267,736 | 267,147 | |
| Asset—Backed Ctfs.—Home Equity Loans—.9% | | | |
| Ameriquest Mortgage Securities, | | | |
| Ser. 2004-FR1, Cl. A3, 2.65%, 2034 | 140,000 | 137,886 | |
| Chase Funding Mortgage Loan, | | | |
| Ser. 2003-4, Cl. 2A1, 1.42%, 2021 | 322,676 b | 322,876 | |
| CitiFinancial Mortgage Securities, | | | |
| Ser. 2003-2, Cl. AV1, 1.4%, 2033 | 5,550 b | 5,554 | |
| | | 466,316 | |
| Asset—Backed Ctfs.—Manufactured Homes—.1% | | | |
| Vanderbilt Mortgage Finance, | | | |
| Ser. 1999-A, Cl. 1A6, 6.75%, 2029 | 80,000 | 80,049 | |
| Asset—Backed Ctfs.—Student Loans—.1% | | | |
| SLM Student Loan Trust, | | | |
| Ser. 2001-2, Cl. A1L, 1.21%, 2009 | 43,502 b | 43,666 | |
| Automotive—1.2% | | | |
| DaimlerChrysler, | | | |
| Notes, 7.75%, 2005 | 260,000 | 272,121 | |
| Notes, Ser. A, 7.375%, 2006 | 160,000 | 171,872 | |
| ERAC USA Finance, | | | |
| Notes, 7.95%, 2009 | 100,000 c | 115,190 | |
| General Motors: | | | |
| Discount Debs., 0/7.75%, 2036 | 180,000 d | 67,553 | |
| | | 626,736 | |
| Banking—4.4% | | | |
| Bank One, | | | |
| Notes, 6.5%, 2006 | 255,000 | 269,205 | |
| Chevy Chase Bank, | | | |
| Sub. Notes, 6.875%, 2013 | 145,000 | 145,725 | |
| City National, | | | |
| Sr. Notes, 5.125%, 2013 | 75,000 | 72,947 | |
| HBOS Capital Funding, | | | |
| Bonds, 6.071%, 2049 | 260,000 b,c | 261,523 | |
| Industrial Bank of Korea, | | | |
| Sub. Notes, 4%, 2014 | 75,000 b,c | 70,250 | |
| National Westminster Bank, | | | |
| Sub. Notes, 7.375%, 2009 | 320,000 | 362,874 | |
The Fund 7
S T A T E M E N T O F I N V E S T M E N T S ( U n a u d i t e d ) (continued)
| | Principal | | | |
| Bonds and Notes (continued) | Amount a | | Value ($) | |
|
| |
| |
| Banking (continued) | | | | |
| Northern Rock, | | | | |
| Notes, 5.6%, 2049 | 140,000 b,c | | 136,279 | |
| Union Planters Bank, | | | | |
| Notes, 5.125%, 2007 | 150,000 | | 157,379 | |
| Washington Mutual: | | | | |
| Notes, 2.4%, 2005 | 315,000 | | 312,913 | |
| Sub. Notes, 4.625%, 2014 | 145,000 | | 132,497 | |
| Zions Bancorp, | | | | |
| Sub. Notes, 6%, 2015 | 410,000 | | 414,219 | |
| | | | 2,335,811 | |
| Building & Construction—.5% | | | | |
| American Standard, | | | | |
| Sr. Notes, 7.375%, 2008 | 40,000 | | 43,400 | |
| D.R. Horton: | | | | |
| Sr. Notes, 5%, 2009 | 100,000 | | 98,625 | |
| Sr. Notes, 8.5%, 2012 | 105,000 | | 116,550 | |
| | | | 258,575 | |
| Cable/Media—3.5% | | | | |
| British Sky Broadcasting: | | | | |
| Notes, 6.875%, 2009 | 191,000 | | 208,807 | |
| Sr. Notes, 8.2%, 2009 | 60,000 | | 69,202 | |
| CSC , | | | | |
| Sr. Notes, 6.75%, 2012 | 45,000 c | | 43,425 | |
| Cablevision Systems, | | | | |
| Sr. Notes, 5.67%, 2009 | 75,000 b,c | | 77,250 | |
| Cox Communications, | | | | |
| Notes, 7.125%, 2012 | 260,000 | | 285,396 | |
| DirecTV Holdings/Finance, | | | | |
| Sr. Notes, 8.375%, 2013 | 50,000 | | 55,563 | |
| Echostar DBS: | | | | |
| Sr. Notes, 5.75%, 2008 | 45,000 | | 44,606 | |
| Sr. Notes, 10.375%, 2007 | 190,000 | | 204,013 | |
| Liberty Media, | | | | |
| Notes, 3.5%, 2006 | 465,000 e | | 464,402 | |
| News America, | | | | |
| Debs., 7.25%, 2018 | 130,000 | | 143,673 | |
| Rogers Cable, | | | | |
| Sr. Secured Notes, 6.25%, 2013 | 75,000 | | 70,982 | |
| Salem Communications, | | | | |
| Sr. Sub. Notes, 7.75%, 2010 | 80,000 | | 82,100 | |
8
| | Principal | | | |
| Bonds and Notes (continued) | Amount a | | Value ($) | |
|
| |
| |
| Cable/Media (continued) | | | | |
| Univision Communications, | | | | |
| Sr. Notes, 7.85%, 2011 | 95,000 | | 109,705 | |
| | | | 1,859,124 | |
| Chemicals—.3% | | | | |
| ICI Wilmington, | | | | |
| Notes, 4.375%, 2008 | 145,000 e | | 142,377 | |
| Commercial Mortgage | | | | |
| Pass-Through Ctfs.—4.0% | | | | |
| Bear Stearns Commercial Mortgage Securities, | | | | |
| Ser. 2003-T12, Cl. A3, 4.24%, 2039 | 295,000 | | 285,444 | |
| CS First Boston Mortgage Securities, | | | | |
| Ser. 2001-CF2, Cl. A4, 6.505%, 2034 | 135,000 | | 146,280 | |
| Calwest Industrial Trust, | | | | |
| Ser. 2002-CALW, Cl. A, 6.127%, 2017 | 70,000 c | | 73,254 | |
| Chase Commercial Mortgage Securities, | | | | |
| Ser. 1997-2, Cl. C, 6.6%, 2029 | 40,000 | | 43,014 | |
| Countrywide Alternative Loan Trust, | | | | |
| Stripped Security, Interest Only Class, | | | | |
| Ser. 2004-J5, Cl. 1AI0, 0.75%, 2006 | 8,400,000 f | | 56,364 | |
| DLJ Commercial Mortgage, | | | | |
| Ser. 1999-CG1, Cl. A1A, 6.08%, 2032 | 112,100 | | 117,358 | |
| First Chicago/Lennar Trust, | | | | |
| Ser. 1997-CHL1, Cl. D, 7.902%, 2039 | 275,000 c | | 284,367 | |
| GMAC Commercial Mortgage Securities, | | | | |
| Ser. 1996-C1, Cl. F, 7.86%, 2006 | 250,000 c | | 269,427 | |
| J.P. Morgan Commercial Mortgage Finance: | | | | |
| Ser. 1997-C5, Cl. A3, 7.088%, 2029 | 170,000 | | 183,940 | |
| Ser. 1997-C5, Cl. B, 7.159%, 2029 | 105,000 | | 114,497 | |
| Morgan Stanley Dean Witter Capital I, | | | | |
| Ser. 1999-CAM1, Cl. A4, 7.02%, 2032 | 70,000 | | 77,651 | |
| Ser. 1999-RM1, Cl. A2, 6.71%, 2031 | 200,000 | | 218,281 | |
| Ser. 2001-PPM, Cl. A3, 6.54%, 2031 | 250,000 | | 269,483 | |
| | | | 2,139,360 | |
| Commercial Services—1.3% | | | | |
| Aramark Services, | | | | |
| Sr. Notes, 7%, 2007 | 500,000 | | 540,064 | |
| Ford, | | | | |
| Notes, 9.3%, 2030 | 145,000 | | 160,188 | |
| | | | 700,252 | |
The Fund 9
S T A T E M E N T O F I N V E S T M E N T S ( U n a u d i t e d ) (continued)
| | Principal | | | |
| Bonds and Notes (continued) | Amount a | | Value ($) | |
|
| |
| |
| Consumer—.0% | | | | |
| Scotts, | | | | |
| Sr. Sub. Notes, 6.625%, 2013 | 20,000 | | 20,100 | |
| Containers—.4% | | | | |
| Ball, | | | | |
| Notes, 6.875%, 2012 | 140,000 | | 142,800 | |
| Owens-Brockway Glass Containers, | | | | |
| Sr. Secured Notes, 7.75%, 2011 | 65,000 e | | 67,925 | |
| | | | 210,725 | |
| Environmental Control—1.1% | | | | |
| Allied Waste: | | | | |
| Sr. Notes, Ser. B, 7.625%, 2006 | 275,000 | | 289,781 | |
| Sr. Notes, Ser. B, 8.875%, 2008 | 110,000 | | 121,000 | |
| Waste Management: | | | | |
| Sr. Notes, 7%, 2028 | 75,000 | | 78,079 | |
| Sr. Notes, 7.375%, 2010 | 85,000 | | 95,618 | |
| Sr. Notes, 7.375%, 2029 | 30,000 | | 32,604 | |
| | | | 617,082 | |
| Financial Services—8.0% | | | | |
| Amvescap, | | | | |
| Sr. Notes, 6.6%, 2005 | 450,000 | | 463,574 | |
| Countrywide Home Loan, | | | | |
| Notes, Ser. L, 1.26%, 2006 | 300,000 b,e | | 300,091 | |
| Ford Motor Credit, | | | | |
| Notes, 6.5%, 2007 | 540,000 | | 567,726 | |
| Notes, 7.6%, 2005 | 345,000 | | 361,261 | |
| GMAC: | | | | |
| Notes, 4.15%, 2005 | 335,000 | | 338,896 | |
| Sr. Unsub, 5.85%, 2009 | 525,000 | | 532,517 | |
| Glencore Funding, | | | | |
| Notes, 6%, 2014 | 305,000 c | | 283,408 | |
| Goldman Sachs Capital I, | | | | |
| Notes, 6.345%, 2034 | 80,000 | | 75,367 | |
| J.P. Morgan Chase & Co., | | | | |
| Sub. Notes, 4.875%, 2014 | 130,000 e | | 122,709 | |
| Jefferies: | | | | |
| Sr. Notes, 7.75%, 2012 | 55,000 | | 62,415 | |
| Sr. Notes, Ser. B, 7.5%, 2007 | 70,000 | | 77,615 | |
| Lehman Brothers, | | | | |
| Notes, 4.8%, 2014 | 290,000 e | | 271,651 | |
10
| | | Principal | | | |
| Bonds and Notes (continued) | | Amount a | | Value ($) | |
|
|
| |
| |
| Finance (continued) | | | | | |
| Leucadia National, | | | | | |
| Sr. Notes, 7%, 2013 | | 135,000 | | 134,156 | |
| Linde Finance, | | | | | |
| Notes, 6%, 2049 | EUR | 125,000 | | 158,585 | |
| Morgan Stanley, | | | | | |
| Sub. Notes, 4.75%, 2014 | | 120,000 | | 110,925 | |
| SLM, | | | | | |
| Notes, 2.75%, 2005 | | 160,000 | | 159,971 | |
| St. George Funding, | | | | | |
| Bonds, 8.485%, 2049 | | 100,000 c | | 113,522 | |
| Textron Financial, | | | | | |
| Notes, 7.125%, 2004 | | 125,000 | | 127,599 | |
| | | | | 4,261,988 | |
| Food & Beverages—.7% | | | | | |
| Del Monte, | | | | | |
| Sr. Sub. Notes, 8.625%, 2012 | | 70,000 | | 75,775 | |
| Pathmark Stores, | | | | | |
| Sr. Sub. Notes, 8.75%, 2012 | | 70,000 e | | 70,350 | |
| Safeway, | | | | | |
| Sr. Notes, 4.125%, 2008 | | 115,000 | | 112,677 | |
| Stater Brothers, | | | | | |
| Sr. Notes, 8.125%, 2012 | | 100,000 c | | 100,875 | |
| | | | | 359,677 | |
| Foreign/Governmental—8.4% | | | | | |
| Banco Nacional de Desenvolvimento | | | | | |
| Economico e Social, | | | | | |
| Unsub. Notes, 9.622%, 2008 | | 150,000 b,e | | 152,389 | |
| Bundesobligation, | | | | | |
| Bonds, Ser. 140, 4.5%, 2007 | EUR | 990,000 | | 1,254,429 | |
| Deutschland, | | | | | |
| Bonds, Ser. 2, 5%, 2012 | EUR | 1,055,000 | | 1,361,218 | |
| Federal Republic of Brazil, | | | | | |
| Bonds, Ser. EI-L 2.063%, 2006 | | 137,600 b | | 135,192 | |
| Notes, 12%, 2010 | | 175,000 | | 187,250 | |
| Republic of Bulgaria, | | | | | |
| Bonds, 8.25%, 2015 | | 85,000 c | | 99,238 | |
| Republic of El Salvador: | | | | | |
| Notes, 8.5%, 2011 | | 60,000 c,e | | 65,400 | |
| Notes, 9.5%, 2006 | | 120,000 | | 133,290 | |
The Fund 11
S T A T E M E N T O F I N V E S T M E N T S ( U n a u d i t e d ) (continued)
| | Principal | | | |
| Bonds and Notes (continued) | Amount a | | Value ($) | |
|
| |
| |
| Foreign/Governmental (continued) | | | | |
| Republic of South Africa, | | | | |
| Notes, 6.5%, 2014 | 120,000 | | 121,500 | |
| Russian Federation: | | | | |
| Unsub. Notes, 5%, 2030 | 160,000 | | 146,400 | |
| Unsub. Notes, 10%, 2007 | 125,000 | | 140,660 | |
| Unsub. Notes, 12.75%, 2028 | 90,000 | | 131,299 | |
| Ukraine Government, | | | | |
| Sr. Notes, 11%, 2007 | 154,003 | | 166,549 | |
| United Mexican States: | | | | |
| Notes, 6.625%, 2015 | 35,000 | | 34,825 | |
| Notes, 8.375%, 2011 | 145,000 | | 164,213 | |
| Notes, Ser. A, 6.375%, 2013 | 185,000 e | | 185,093 | |
| | | | 4,478,945 | |
| Gaming & Lodging—4.2% | | | | |
| Ameristar Casinos, | | | | |
| Sr. Sub. Notes, 10.75%, 2009 | 35,000 | | 40,075 | |
| Caesars Entertainment: | | | | |
| Sr. Notes, 7%, 2004 | 100,000 | | 100,000 | |
| Sr. Notes, 8.5%, 2006 | 50,000 e | | 54,500 | |
| Sr. Sub. Notes, 7.875%, 2005 | 80,000 | | 84,300 | |
| Carnival: | | | | |
| Debs., 6.65%, 2028 | 155,000 | | 155,271 | |
| Notes, 3.75%, 2007 | 205,000 | | 202,840 | |
| Notes, 7.05%, 2005 | 300,000 | | 310,325 | |
| Coast Hotels & Casino, | | | | |
| Sr. Sub. Notes, 9.5%, 2009 | 115,000 | | 121,325 | |
| Horseshoe Gaming, | | | | |
| Sr. Sub. Notes, Ser. B, 8.625%, 2009 | 235,000 | | 246,163 | |
| Mohegan Tribal Gaming Authority, | | | | |
| Sr. Notes, 8.125%, 2006 | 350,000 | | 371,000 | |
| Sr. Sub. Notes, 8%, 2012 | 50,000 | | 53,500 | |
| Royal Caribbean Cruises: | | | | |
| Sr. Notes, 8.25%, 2005 | 175,000 e | | 182,000 | |
| Sr. Notes, 8.75%, 2011 | 140,000 e | | 155,750 | |
| Turning Stone Casino Entertainment, | | | | |
| Sr. Notes, 9.125%, 2010 | 160,000 c | | 168,000 | |
| | | | 2,245,049 | |
| Health Care—.9% | | | | |
| Boston Scientific, | | | | |
| Notes, 6.625%, 2005 | 275,000 | | 282,857 | |
12
| | | Principal | | | |
| Bonds and Notes (continued) | | Amount a | | Value ($) | |
|
|
| |
| |
| Health Care (continued) | | | | | |
| HCA, | | | | | |
| Sr. Notes, 7.125%, 2006 | | 100,000 | | 105,681 | |
| Wyeth: | | | | | |
| Bonds, 6.45%, 2024 | | 50,000 | | 47,676 | |
| Bonds, 6.5%, 2034 | | 50,000 | | 47,276 | |
| | | | | 483,490 | |
| Industrial—2.0% | | | | | |
| Hutchinson Whampoa International, | | | | | |
| Notes, 5.45%, 2010 | | 135,000 c | | 132,718 | |
| International Steel, | | | | | |
| Sr. Notes, 6.5%, 2014 | | 125,000 c | | 117,813 | |
| RPM International, | | | | | |
| Bonds, 6.25%, 2013 | | 145,000 c | | 145,762 | |
| Teck Cominco, | | | | | |
| Notes, 7%, 2012 | | 165,000 | | 176,726 | |
| Tyco International: | | | | | |
| Notes, 6.125%, 2007 | EUR | 260,000 | | 339,684 | |
| Notes, 6.125%, 2009 | | 70,000 | | 74,389 | |
| Notes, 6.375%, 2011 | | 75,000 | | 79,900 | |
| | | | | 1,066,992 | |
| Insurance—.6% | | | | | |
| ACE Ina, | | | | | |
| Notes, 5.875%, 2014 | | 80,000 | | 81,087 | |
| Principal Life Inc. Funding, | | | | | |
| Secured Notes, 1.152%, 2005 | | 230,000 b | | 230,671 | |
| | | | | 311,758 | |
| Oil & Gas—.7% | | | | | |
| Amerada Hess, | | | | | |
| Notes, 7.3%, 2031 | | 135,000 | | 137,477 | |
| Pemex Project Funding Master Trust, | | | | | |
| Notes, 7.375%, 2014 | | 205,000 | | 210,125 | |
| XTO Energy, | | | | | |
| Sr. Notes, 6.25%, 2013 | | 15,000 | | 15,630 | |
| | | | | 363,232 | |
| Paper & Paper Related—1.7% | | | | | |
| Abitibi-Consolidated: | | | | | |
| Bonds, 8.3%, 2005 | | 125,000 | | 129,994 | |
| Debs., 8.5%, 2029 | | 155,000 | | 146,679 | |
The Fund 13
S T A T E M E N T O F I N V E S T M E N T S ( U n a u d i t e d ) (continued)
| | Principal | | | |
| Bonds and Notes (continued) | Amount a | | Value ($) | |
|
| |
| |
| Paper & Paper Related (continued) | | | | |
| Domtar, | | | | |
| Notes, 5.375%, 2013 | 140,000 e | | 133,367 | |
| Georgia-Pacific, | | | | |
| Sr. Notes, 8.875%, 2010 | 120,000 | | 136,500 | |
| Sappi Papier, | | | | |
| Notes, 6.75%, 2012 | 240,000 c | | 256,506 | |
| UPM-Kymmene, | | | | |
| Sr. Notes, 5.625%, 2014 | 100,000 c | | 99,087 | |
| | | | 902,133 | |
| Pipelines—1.4% | | | | |
| ANR Pipeline, | | | | |
| Sr. Notes, 7%, 2025 | 50,000 | | 51,000 | |
| Centerpoint Energy Resources, | | | | |
| Sr. Notes, Ser. B, 7.875%, 2013 | 125,000 | | 140,088 | |
| Consolidated Natural Gas, | | | | |
| Notes, 7.25%, 2004 | 145,000 | | 146,809 | |
| El Paso Natural Gas, | | | | |
| Sr. Notes, Ser. A, 7.625%, 2010 | 130,000 | | 133,900 | |
| Northwest Pipeline, | | | | |
| Debs., 6.625%, 2007 | 210,000 | | 217,350 | |
| Transcontinental Gas, | | | | |
| Notes, 6.125%, 2005 | 60,000 | | 61,200 | |
| | | | 750,347 | |
| Publishing—.0% | | | | |
| Dex Media Finance/ West, | | | | |
| Sr. Notes, Ser. B, 8.5%, 2010 | 15,000 | | 16,425 | |
| Racetracks—.2% | | | | |
| Speedway Motorsports, | | | | |
| Sr. Sub. Notes, 6.75%, 2013 | 105,000 c | | 106,575 | |
| Real Estate Investment Trusts—1.8% | | | | |
| Archstone-Smith Trust: | | | | |
| Notes, 3%, 2008 | 85,000 | | 80,875 | |
| Sr. Notes, 5%, 2007 | 75,000 | | 77,219 | |
| Boston Properties, | | | | |
| Sr. Notes, 5.625%, 2015 | 85,000 | | 83,159 | |
| Duke Realty, | | | | |
| Sr. Notes, 6.95%, 2011 | 170,000 | | 186,693 | |
| ERP Operating, | | | | |
| Notes, 4.75%, 2009 | 55,000 e | | 55,119 | |
14
| | Principal | | | |
| Bonds and Notes (continued) | Amount a | | Value ($) | |
|
| |
| |
| Real Estate Investment Trusts (continued) | | | | |
| First Industrial, | | | | |
| Notes, 5.25%, 2009 | 50,000 | | 50,397 | |
| Notes, 6.42%, 2014 | 55,000 c | | 56,452 | |
| Healthcare Realty Trust, | | | | |
| Sr. Notes, 8.125%, 2011 | 275,000 | | 316,595 | |
| Rouse, | | | | |
| Notes, 3.625%, 2009 | 40,000 | | 38,042 | |
| | | | 944,551 | |
| Residential Mortgage Pass-Through Ctfs.—1.4% | | | | |
| Countrywide Alternative Loan Trust, | | | | |
| Ser.2004-J5, Cl. 1A1, 1.53%, 2034 | 125,000 b | | 125,000 | |
| Granite Mortgages, | | | | |
| Ser. 2003-3, Cl. 1A1, 1.23%, 2019 | 268,999 b | | 268,999 | |
| Permanent Financing, | | | | |
| Ser. 3, Cl. A, 1.139%, 2004 | 350,000 b | | 349,970 | |
| Structured Asset Mortgage Investment, | | | | |
| Ser. 1998-2, Cl. B, 6.75%, 2030 | 14,458 | | 13,890 | |
| | | | 757,859 | |
| Retail—.9% | | | | |
| Office Depot, | | | | |
| Sr. Notes, 6.25%, 2013 | 75,000 | | 77,383 | |
| Yum! Brands, | | | | |
| Sr. Notes, 7.65%, 2008 | 110,000 | | 122,927 | |
| Sr. Notes, 8.875%, 2011 | 243,000 | | 293,620 | |
| | | | 493,930 | |
| State Government—1.3% | | | | |
| Golden State Tobacco Securitization, | | | | |
| Asset-Backed Ctfs., Ser. A-3, 7.875%, 2042 | 580,000 | | 588,828 | |
| Sacramento County California Pension Funding, | | | | |
| Bonds, Ser. C-1, 3.4225%, 2030 | 100,000 | | 93,335 | |
| | | | 682,163 | |
| Telecommunications—3.7% | | | | |
| AT&T Wireless Services, | | | | |
| Sr. Notes, 7.875%, 2011 | 125,000 | | 142,370 | |
| Citizens Communications, | | | | |
| Sr. Notes, 9.25%, 2011 | 65,000 | | 68,023 | |
| Deutsche Telekom International Finance, | | | | |
| Notes, 8.75%, 2030 | 245,000 b | | 299,056 | |
The Fund 15
S T A T E M E N T O F I N V E S T M E N T S ( U n a u d i t e d ) (continued)
| | | Principal | | | |
| Bonds and Notes (continued) | | Amount a | | Value ($) | |
|
|
| |
| |
| Telecommunications (continued) | | | | | |
| France Telecom, | | | | | |
| Notes, 8.75%, 2011 | | 110,000 b | | 127,636 | |
| MCI: | | | | | |
| Sr. Notes, 5.908%, 2007 | | 41,000 | | 39,873 | |
| Sr. Notes, 6.688%, 2009 | | 41,000 | | 38,028 | |
| Sr. Notes, 7.735%, 2014 | | 35,000 e | | 31,413 | |
| Qwest, | | | | | |
| Notes, 5.625%, 2008 | | 70,000 | | 68,775 | |
| Rogers Wireless, | | | | | |
| Secured Notes, 6.375%, 2014 | | 50,000 c | | 46,250 | |
| Sprint Capital: | | | | | |
| Notes, 8.375%, 2012 | | 165,000 | | 189,914 | |
| Notes, 8.75%, 2032 | | 215,000 | | 251,253 | |
| Telecom Italia Capital, | | | | | |
| Notes, Cl. B, 5.25%, 2013 | | 130,000 c | | 126,049 | |
| Telus, | | | | | |
| Notes, 8%, 2011 | | 475,000 | | 540,595 | |
| | | | | 1,969,235 | |
| Tobacco—1.9% | | | | | |
| Altria: | | | | | |
| Notes, 7%, 2013 | | 270,000 e | | 275,415 | |
| Sr. Notes, 5.625%, 2008 | | 370,000 | | 371,964 | |
| Philip Morris Capital, | | | | | |
| Bonds, 4.5%, 2006 | CHF | 460,000 | | 370,084 | |
| | | | | 1,017,463 | |
| Transportation—.5% | | | | | |
| FedEx, | | | | | |
| Notes, 2.65%, 2007 | | 285,000 c | | 276,942 | |
| U.S. Government—5.9% | | | | | |
| U.S. Treasury Bonds, | | | | | |
| 6.25%, 5/15/2030 | | 530,000 | | 593,579 | |
| U.S. Treasury Notes: | | | | | |
| 3.25%, 8/15/2008 | | 1,530,000 e | | 1,511,533 | |
| 4.375%, 8/15/2012 | | 1,055,000 | | 1,050,456 | |
| | | | | 3,155,568 | |
16
| | Principal | | | |
| Bonds and Notes (continued) | Amount a | | Value ($) | |
|
| |
| |
| U.S. Government Agencies/Mortgage-Backed—28.2% | | | | |
| Federal Home Loan Mortgage Corp.: | | | | |
| 5%, 10/1/2018 | 720,856 | | 723,329 | |
| 6%, 7/1/2017-4/1/2033 | 573,294 | | 589,792 | |
| Federal National Mortgage Association: | | | | |
| 3.53%, 7/1/2010 | 295,323 | | 280,462 | |
| 4.06%, 6/1/2013 | 100,000 | | 92,937 | |
| 5%, | 860,000 g | | 840,413 | |
| 5%, 5/1/2018-4/1/2019 | 565,402 | | 567,522 | |
| 5.5%, | 850,000 g | | 846,013 | |
| 5.5%, 3/1/2033-1/1/2034 | 1,421,209 | | 1,419,038 | |
| 6%, | 5,125,000 g | | 5,211,459 | |
| 6%, 4/1/2018-6/1/2033 | 937,035 | | 968,602 | |
| 6.5%, | 270,000 g | | 281,137 | |
| 6.5%, 12/1/2031-11/1/2032 | 951,692 | | 992,006 | |
| 7%, 5/1/2032-6/1/2032 | 130,491 | | 137,748 | |
| Grantor Trust, | | | | |
| Ser. 2001-T6, Cl. B, 6.088%, 5/25/2011 | 275,000 | | 293,227 | |
| Ser. 2001-T11, Cl. B, 5.503%, 9/25/2011 | 75,000 | | 77,492 | |
| Government National Mortgage Association I: | | | | |
| 6.5%, 9/15/2032 | 254,989 | | 266,862 | |
| 8%, 2/15/2030-5/15/2030 | 25,402 | | 27,855 | |
| Ser. 2002-48, Cl. PF, 1.553%, 5/15/2029 | 6,313 b | | 6,318 | |
| Ser. 2003-88, Cl. AC, 2.914%, 6/16/2018 | 315,241 | | 306,282 | |
| Ser. 2003-96, Cl. B, 3.607%, 8/16/2018 | 175,000 | | 172,690 | |
| Ser. 2004-25, Cl. AB, 1.698%, 11/16/2006 | 112,643 | | 112,295 | |
| Ser. 2004-25, Cl. AC, 3.377%, 1/16/2023 | 350,000 | | 340,273 | |
| Ser. 2004-43, Cl. A, 2.822%, 12/16/2019 | 300,000 | | 290,993 | |
| Ser. 2004-51, Cl. A, 4.145%, 9/20/2008 | 260,000 | | 260,000 | |
| | | | 15,104,745 | |
| Utilities-Gas/Electric—5.2% | | | | |
| AES: | | | | |
| Secured Notes, 10%, 2005 | 62,149 c | | 63,858 | |
| Sr. Secured Notes, 8.75%, 2013 | 125,000 c | | 134,531 | |
| Consumers Energy: | | | | |
| First Mortgage Bonds, 6.25%, 2006 | 25,000 | | 26,278 | |
| First Mortgage Bonds, Ser. B, 5.375%, 2013 | 185,000 | | 181,476 | |
The Fund 17
S T A T E M E N T O F I N V E S T M E N T S ( U n a u d i t e d ) (continued)
| | Principal | | | |
| Bonds and Notes (continued) | Amount a | | Value ($) | |
|
| |
| |
| Utilities-Gas/Electric (continued) | | | | |
| Dominion Resources, | | | | |
| Sr. Notes, Ser. F, 5.25%, 2033 | 40,000 | | 38,157 | |
| Enterprise Capital Trust II, | | | | |
| Notes, Ser. B, 2.806%, 2028 | 160,000 b | | 151,395 | |
| FirstEnergy: | | | | |
| Sr. Notes, Ser. A, 5.5%, 2006 | 310,000 | | 320,879 | |
| Sr. Notes, Ser. B, 6.45%, 2011 | 110,000 | | 114,210 | |
| IPALCO Enterprises, | | | | |
| Sr. Secured Notes, 7.625%, 2011 | 75,000 | | 81,750 | |
| Illinois Power, | | | | |
| First Mortgage Bonds, 7.5%, 2009 | 115,000 e | | 126,213 | |
| Indianapolis Power & Light, | | | | |
| First Mortgage Bonds, 6.3%, 2013 | 35,000 c | | 34,380 | |
| Monongahela Power, | | | | |
| First Mortgage Bonds, 6.7%, 2014 | 50,000 c | | 50,727 | |
| Niagara Mohawk Power, | | | | |
| Sr. Notes, Ser. G, 7.75%, 2008 | 35,000 | | 39,434 | |
| NiSource Capital Markets, | | | | |
| Notes, 7.86%, 2017 | 75,000 | | 87,931 | |
| PPL Capital Funding Trust I, | | | | |
| Notes, 7.29%, 2006 | 220,000 | | 231,077 | |
| Powergen U.S. Funding, | | | | |
| Notes, 4.5%, 2004 | 200,000 | | 201,420 | |
| Southern California Edison, | | | | |
| First Reference Mortgage Bonds, 8%, 2007 | 250,000 | | 276,330 | |
| TXU, | | | | |
| Notes, Ser. C, 6.375%, 2008 | 245,000 | | 260,819 | |
| TXU Gas Capital I, | | | | |
| Capital Securities, 2.95%, 2028 | 170,000 b | | 159,088 | |
| United Utilities, | | | | |
| Notes, 6.25%, 2005 | 55,000 | | 57,044 | |
| Westar Energy, | | | | |
| First Mortgage Bonds, 7.875%, 2007 | 160,000 | | 176,920 | |
| | | | 2,813,917 | |
| Total Bonds and Notes | | | | |
| (cost $58,639,562) | | | 59,018,848 | |
18
| | | | | Face Amount | | | |
| | | | | Covered by | | | |
| Options—.0% | | | | | Contracts ($) | | Value ($) | |
|
|
|
|
|
| |
| |
| Call Options; | | | | | | | | |
| U.S. Treasury Notes: | | | | | | | |
| 3%, 2/15/2009, February 2005 @ | $ | 101.109375 | 2,270,000 | | 1,596 | |
| 3.125%, 4/15/2009, November 2004 @ $ | 97.828125 | 1,150,000 | | 6,334 | |
| 3.25%, 1/15/2009, July 2004 @ $ | 100.593750 | 1,685,000 | | 66 | |
| | | | | | | | 7,996 | |
| Put Options; | | | | | | | | |
| U.S. Treasury Notes: | | | | | | | |
| 4%, 2/15/2014, | | | | | | | |
| August 2004 @ $ | 95.80078125 | | | 1,110,000 | | 14,907 | |
| Total Options | | | | | | | | |
| (cost $ | 60,230) | | | | | | 22,903 | |
|
|
|
|
|
| |
| |
| | | | | | | | | |
| Preferred Stocks—.6% | | | Shares | | Value ($) | |
|
|
|
| |
| |
| Automotive—.1% | | | | | | | |
| General Motors, | | | | | | | | |
| Ser. C, Cum. Conv., $ | 1.5625 | | | 2,250 | | 65,813 | |
| Banking—.2% | | | | | | | | |
| Sovereign Capital Trust IV, | | | | | | |
| Cum. Conv., $ | 2.1875 | | | | 1,400 | | 66,500 | |
| Real Estate Investment Trusts—.3% | | | | | | |
| Equity Office Properties Trust, | | | | | | |
| Ser. B, Cum. Conv., $ | 2.625 | | | 3,140 | | 160,925 | |
| Total Prefered Stocks | | | | | | | |
| (cost $ | 264,066) | | | | | | 293,238 | |
|
|
|
|
|
| |
| |
| | | | | | Principal | | | |
| Short-Term Investments—2.0% | | | Amount ($) | | Value ($) | |
|
|
|
| |
| |
| U.S. Government Agencies—.5% | | | | | | |
| Federal National Mortgage Association, | | | | | | |
| Agency Discount Notes, 1.25%, 7/30/2004 | | 260,000 | | 259,738 | |
| U.S. Treasury Bills—1.5% | | | | | | |
| .92%, 7/15/2004 | | | | 796,000 | | 795,634 | |
| Total Short-Term Investments | | | | | | |
| (cost $ | 1,055,452) | | | | | | 1,055,372 | |
The Fund 19
S T A T E M E N T O F I N V E S T M E N T S ( U n a u d i t e d ) (continued)
| Investment of Cash Collateral | | | | |
| for Securities Loaned—5.1% | Shares | | Value ($) | |
|
| |
| |
| Registered Investment Company; | | | | |
| Dreyfus Institutional Cash Advantage Plus Fund | | | | |
| (cost $ | 2,752,442) | 2,752,442 h | | 2,752,442 | |
|
|
| |
| |
| | | | | | |
| Total Investments | | | | |
| (cost $ | 62,771,752) | 118.1% | | 63,142,803 | |
| Liabilities, Less Cash and Receivables | (18.1%) | | (9,662,429) | |
| Net Assets | 100.0% | | 53,480,374 | |
a Principal amount stated in U.S. Dollars unless otherwise noted.
CHF—Swiss Francs EUR—Euros
b
| Variable rate security—interest rate subject to periodic change.
|
c
| Securities exempt from registration under Rule 144A of the Securities Act of 1933.These securities may be resold in transactions exempt from registration, normally to qualified institutional buyers. At June 30, 2004, these securities amounted to $3,809,058 or 7.1% of net assets.
|
d
| Zero coupon until a specified date at which time the stated coupon rate becomes effective until maturity.
|
e
| All or a portion of these securities are on loan. At June 30, 2004, the total market value of the fund's securities on loan is $2,640,981 and the total market value of the collateral held by the fund is $2,752,442.
|
f
| Notional face amount shown.
|
g
| Purchased on a forward commitment basis.
|
h
| Investment in affiliated money market mutual fund.
|
See notes to financial statements.
20
| STATEMENT OF OPTIONS WRITTEN |
| June 30, 2004 (Unaudited) |
| Call Options | | | | | | | |
| | | | | Face Amount | | | |
| | | | | Covered by | | | |
| Issuer | | | | Contracts ($) | | Value ($) | |
|
|
| |
| |
| |
| U.S. Treasury Notes: | | | | | | | |
| 2.5%, 5/31/2006, July 2004 @ $ | 99.241875 | | 2,680,000 | | 10,364 | |
| 2.5%, 5/31/2006, July 2004 @ $ | 99.38672 | | 2,675,000 | | 7,315 | |
| 3.25%, 1/15/2009, July 2004 @ $ | 103.78125 | | 1,685,000 | | 0 | |
| 3.125%, 4/15/2009, | | | | | | | |
| November 2004 @ $ | 100.828125 | | | 1,150,000 | | 854 | |
| | | | | | | | |
| Put Options | | | | | | | |
| Issuer | | | | | | | |
|
|
| |
| |
| |
| U.S. Treasury Notes: | | | | | | | |
| 3.25%, 1/15/2009, July 2004 @ $ | 97.40625 | | 1,685,000 | | 4,081 | |
| 2.5%, 5/31/2006, July 2004 @ $ | 99.242180 | | 2,680,000 | | 1,884 | |
| 2.5%, 5/31/2006, July 2004 @ $ | 99.38672 | | 2,675,000 | | 1,985 | |
| 4%, 2/15/2014, August 2004 @ $ | 93.390625 | | 2,220,000 | | 7,215 | |
| 3.125%, 4/15/2009, | | | | | | | |
| November 2004 @ $ | 94.828125 | | | 1,150,000 | | 4,492 | |
| (Premiums received $ | 73,703) | | | | | 38,190 | |
See notes to financial statements.
The Fund 21
| STATEMENT OF ASSETS AND LIABILITIES |
| June 30, 2004 (Unaudited) |
| | | | Cost | Value | |
| |
|
|
| |
| Assets ($): | | | | | |
| Investments in securities—See Statement of Investments (including | | | |
| securities on loan, valued at $2,640,981)—Note 1(c): | | | |
| Unaffiliated issuers | | 60,019,310 | 60,390,361 | |
| Affiliated issuers | | 2,752,442 | 2,752,442 | |
| Cash | | | | | 645,681 | |
| Receivable for investment securities sold | | 6,261,002 | |
| Dividends and interest receivable | | | 635,707 | |
| Receivable from broker for swaps opened | | 4,360 | |
| Receivable for shares of Beneficial Interest subscribed | | 3,542 | |
| Unrealized appreciation on swaps—Note 3 | | 3,136 | |
| Receivable on forward currency exchange contracts | | 602 | |
| Unrealized appreciation on forward | | | |
| currency exchange contracts—Note 3 | | 94 | |
| | | | | | 70,696,927 | |
|
|
|
|
|
| |
| Liabilities ($): | | | | | |
| Due to The Dreyfus Corporation and affiliates—Note 2(b) | | 47,490 | |
| Payable for investment securities purchased | | 14,302,359 | |
| Liability for securities on loan—Note 1(c) | | 2,752,442 | |
| Payable for shares of Beneficial Interest redeemed | | 49,980 | |
| Outstanding options written, at value (premiums | | | |
| received | $ | | 73,703)—See Statement of Options Written | | 38,190 | |
| Unrealized depreciation on forward | | | |
| currency exchange contracts—Note 3 | | 24,553 | |
| Unrealized depreciation on swaps—Note 3 | | 1,539 | |
| | | | | | 17,216,553 | |
|
|
|
|
|
| |
| Net Assets ( | $) | | | 53,480,374 | |
|
|
|
|
| |
| Composition of Net Assets ($): | | | |
| Paid-in capital | | | | 61,141,194 | |
| Accumulated distributions in excess of investment income—net | | (89,953) | |
| Accumulated net realized gain (loss) on investments | | (7,961,589) | |
| Accumulated net unrealized appreciation (depreciation) | | | |
| on investments and foreign currency transactions | | 390,722 | |
|
|
| |
| Net Assets ( | $) | | | 53,480,374 | |
| Net Asset Value Per Share | | | | | | | | |
| | Class A | | Class B | | Class C | | Class R | |
|
| |
| |
| |
| |
| Net Assets ($) | 41,798,554 | | 8,149,784 | | 1,568,194 | | 1,963,842 | |
| Shares Outstanding | 3,897,227 | | 759,950 | | 146,095 | | 183,267 | |
|
| |
| |
| |
| |
| Net Asset Value Per Share ($) | 10.73 | | 10.72 | | 10.73 | | 10.72 | |
See notes to financial statements.
22
| STATEMENT OF OPERATIONS |
| Six Months Ended June 30, 2004 (Unaudited) |
| Investment Income ($): | | |
| Income: | | |
| Interest | 1,207,321 | |
| Cash dividends | 11,001 | |
| Income from securities lending | 5,029 | |
| Total Income | 1,223,351 | |
| Expenses: | | |
| Management fee—Note 2(a) | 196,992 | |
| Distribution and service fees—Note 2(b) | 109,123 | |
| Loan commitment fees—Note 4 | 276 | |
| Total Expenses | 306,391 | |
| Investment Income—Net | 916,960 | |
|
| |
| Realized and Unrealized Gain (Loss) on Investments—Note 3 ($): | | |
| Net realized gain (loss) on investments and foreign currency transactions | 457,965 | |
| Net realized gain (loss) on options transactions | 80,147 | |
| Net realized gain (loss) on swap transactions | (11,433) | |
| Net realized gain (loss) on forward currency exchange contracts | 7,118 | |
| Net Realized Gain (Loss) | 533,797 | |
| Net unrealized appreciation (depreciation) on investments, options | | |
| transactions, foreign currency transactions and swap transactions | (1,236,766) | |
| Net Realized and Unrealized Gain (Loss) on Investments | (702,969) | |
| Net Increase in Net Assets Resulting from Operations | 213,991 | |
See notes to financial statements.
The Fund 23
STATEMENT OF CHANGES IN NET ASSETS
| | Six Months Ended | | | |
| | June 30, 2004 | | Year Ended | |
| | (Unaudited) | | December 31, 2003 | |
|
| |
| |
| Operations ($): | | | | |
| Investment income—net | 916,960 | | 1,831,974 | |
| Net realized gain (loss) on investments | 533,797 | | 1,124,467 | |
| Net unrealized appreciation | | | | |
| (depreciation) on investments | (1,236,766) | | 273,748 | |
| Net Increase (Decrease) in Net Assets | | | | |
| Resulting from Operations | 213,991 | | 3,230,189 | |
|
| |
| |
| Dividends to Shareholders from ($): | | | | |
| Investment income—net: | | | | |
| Class A shares | (907,494) | | (1,639,080) | |
| Class B shares | (161,431) | | (321,778) | |
| Class C shares | (28,230) | | (50,998) | |
| Class R shares | (44,071) | | (128,194) | |
| Net realized gain on investments: | | | | |
| Class A shares | — | | (191,821) | |
| Class B shares | — | | (45,150) | |
| Class C shares | — | | (7,407) | |
| Class R shares | — | | (15,330) | |
| Total Dividends | (1,141,226) | | (2,399,758) | |
|
| |
| |
| Beneficial Interest Transactions ($): | | | | |
| Net proceeds from shares sold: | | | | |
| Class A shares | 1,700,737 | | 2,714,221 | |
| Class B shares | 230,981 | | 803,504 | |
| Class C shares | 246,041 | | 243,918 | |
| Class R shares | 6,089 | | 624,957 | |
| Dividends reinvested: | | | | |
| Class A shares | 754,531 | | 1,538,344 | |
| Class B shares | 101,495 | | 234,934 | |
| Class C shares | 10,876 | | 23,252 | |
| Class R shares | 30,608 | | 119,763 | |
| Cost of shares redeemed: | | | | |
| Class A shares | (3,747,577) | | (8,623,372) | |
| Class B shares | (2,346,074) | | (3,353,257) | |
| Class C shares | (351,120) | | (580,018) | |
| Class R shares | (242,821) | | (1,970,340) | |
| Increase (Decrease) in Net Assets | | | | |
| from Beneficial Interest Transactions | (3,606,234) | | (8,224,094) | |
| Total Increase (Decrease) in Net Assets | (4,533,469) | | (7,393,663) | |
|
| |
| |
| Net Assets ($): | | | | |
| Beginning of Period | 58,013,843 | | 65,407,506 | |
| End of Period | 53,480,374 | | 58,013,843 | |
| Undistributed (distributions in excess of) | | | | |
| investment income—net | (89,953) | | 134,313 | |
24
| | Six Months Ended | | | |
| | June 30, 2004 | | Year Ended | |
| | (Unaudited) | | December 31, 2003 | |
|
| |
| |
| Capital Share Transactions: | | | | |
| Class Aa | | | | |
| Shares sold | 156,339 | | 250,306 | |
| Shares issued for dividends reinvested | 69,234 | | 141,478 | |
| Shares redeemed | (346,566) | | (797,689) | |
| Net Increase (Decrease) in Shares Outstanding | (120,993) | | (405,905) | |
|
| |
| |
| Class Ba | | | | |
| Shares sold | 21,132 | | 74,092 | |
| Shares issued for dividends reinvested | 9,309 | | 21,608 | |
| Shares redeemed | (216,090) | | (309,933) | |
| Net Increase (Decrease) in Shares Outstanding | (185,649) | | (214,233) | |
|
| |
| |
| Class C | | | | |
| Shares sold | 22,294 | | 22,348 | |
| Shares issued for dividends reinvested | 997 | | 2,137 | |
| Shares redeemed | (32,258) | | (53,386) | |
| Net Increase (Decrease) in Shares Outstanding | (8,967) | | (28,901) | |
|
| |
| |
| Class R | | | | |
| Shares sold | 554 | | 57,462 | |
| Shares issued for dividends reinvested | 2,811 | | 11,025 | |
| Shares redeemed | (22,281) | | (181,593) | |
| Net Increase (Decrease) in Shares Outstanding | (18,916) | | (113,106) | |
a During the period ended June 30, 2004, 66,129 Class B shares representing $716,823 were automatically converted to 66,129 Class A shares and during the period ended December 31, 2003, 45,778 Class B shares representing $497,111 were automatically converted to 45,774 Class A shares.
See notes to financial statements.
The Fund 25
FINANCIAL HIGHLIGHTS
The following tables describe the performance for each share class for the fiscal periods indicated. All information (except portfolio turnover) reflects financial results for a single fund share.Total return shows how much your investment in the fund would have increased (or decreased) during each period, assuming you had reinvested all dividends and distributions.These figures have been derived from the fund's financial statements.
| | Six Months Ended | | | | | | | | | | | |
| | June 30, 2004 | | | | Year Ended December 31, | | | |
| | | | | |
| | | |
| Class A Shares | (Unaudited) | | 2003 | | 2002 | | 2001 a | | 2000 | | 1999 | |
|
| |
| |
| |
| |
| |
| |
| Per Share Data ($): | | | | | | | | | | | | |
| Net asset value, | | | | | | | | | | | | |
| beginning of period | 10.90 | | 10.75 | | 10.37 | | 10.29 | | 9.99 | | 10.81 | |
| Investment Operations: | | | | | | | | | | | | |
| Investment income—net | .19b | | .33b | | .38b | | .52b | | .61 | | .64 | |
| Net realized and unrealized | | | | | | | | | | | | |
| gain (loss) on investments | (.13) | | .26 | | .42 | | .10 | | .30 | | (.82) | |
| Total from Investment Operations | .06 | | .59 | | .80 | | .62 | | .91 | | (.18) | |
| Distributions: | | | | | | | | | | | | |
| Dividends from | | | | | | | | | | | | |
| investment income—net | (.23) | | (.39) | | (.42) | | (.54) | | (.61) | | (.64) | |
| Dividends from net realized | | | | | | | | | | | | |
| gain on investments | — | | (.05) | | — | | — | | — | | — | |
| Total Distributions | (.23) | | (.44) | | (.42) | | (.54) | | (.61) | | (.64) | |
| Net asset value, end of period | 10.73 | | 10.90 | | 10.75 | | 10.37 | | 10.29 | | 9.99 | |
|
| |
| |
| |
| |
| |
| |
| Total Return (%)c | .51d | | 5.51 | | 7.87 | | 6.09 | | 9.53 | | (1.75) | |
|
| |
| |
| |
| |
| |
| |
| Ratios/Supplemental Data (%): | | | | | | | | | | | | |
| Ratio of expenses | | | | | | | | | | | | |
| to average net assets | .95e | | .95 | | .95 | | .95 | | .95 | | .95 | |
| Ratio of net investment income | | | | | | | | | | | | |
| to average net assets | 3.40e | | 3.06 | | 3.63 | | 5.01 | | 6.16 | | 6.21 | |
| Portfolio Turnover Rate | 178.00d,f | | 469.41f | | 524.46 | | 477.71 | | 531.86 | | 309.42 | |
|
| |
| |
| |
| |
| |
| |
| Net Assets, end of period | | | | | | | | | | | | |
| ($ X 1,000) | 41,799 | | 43,811 | | 47,571 | | 49,729 | | 51,527 | | 60,755 | |
a As required, effective January 1, 2001, the fund has adopted the provisions of the AICPA Audit and Accounting Guide for Investment Companies and began amortizing discount or premium on fixed income securities on a scientific basis and including paydown gains and losses in interest income.The effect of this change for the period ended December 31, 2001 was to decrease net investment income per share by $.02, increase net realized and unrealized gain (loss) on investments per share by $.02 and decrease the ratio of net investment income to average net assets from 5.16% to 5.01%. Per share data and ratios/supplemental data for periods prior to January 1, 2001 have not been restated to reflect this change in presentation.
b
| Based on average shares outstanding at each month end.
|
c
| Exclusive of sales charge.
|
d
| Not annualized.
|
e
| Annualized.
|
f
| The portfolio turnover rates excluding mortgage dollar roll transactons for the six month period ended June 30, 2004 and the year ended December 31, 2003 were 91.61% and 272.57%, respectively.
|
See notes to financial statements.
26
| | Six Months Ended | | | | | | | | | | | |
| | June 30, 2004 | | | | Year Ended December 31, | | | |
| | | | | |
| | | |
| Class B Shares | (Unaudited) | | 2003 | | 2002 | | 2001 a | | 2000 | | 1999 | |
|
| |
| |
| |
| |
| |
| |
| Per Share Data ($): | | | | | | | | | | | | |
| Net asset value, | | | | | | | | | | | | |
| beginning of period | 10.90 | | 10.75 | | 10.37 | | 10.29 | | 9.99 | | 10.81 | |
| Investment Operations: | | | | | | | | | | | | |
| Investment income—net | .14b | | .25b | | .30b | | .44b | | .54 | | .57 | |
| Net realized and unrealized | | | | | | | | | | | | |
| gain (loss) on investments | (.13) | | .25 | | .42 | | .10 | | .30 | | (.83) | |
| Total from Investment Operations | .01 | | .50 | | .72 | | .54 | | .84 | | (.26) | |
| Distributions: | | | | | | | | | | | | |
| Dividends from | | | | | | | | | | | | |
| investment income—net | (.19) | | (.30) | | (.34) | | (.46) | | (.54) | | (.56) | |
| Dividends from net realized | | | | | | | | | | | | |
| gain on investments | — | | (.05) | | — | | — | | — | | — | |
| Total Distributions | (.19) | | (.35) | | (.34) | | (.46) | | (.54) | | (.56) | |
| Net asset value, end of period | 10.72 | | 10.90 | | 10.75 | | 10.37 | | 10.29 | | 9.99 | |
|
| |
| |
| |
| |
| |
| |
| Total Return (%)c | .04d | | 4.73 | | 7.07 | | 5.30 | | 8.73 | | (2.48) | |
|
| |
| |
| |
| |
| |
| |
| Ratios/Supplemental Data (%): | | | | | | | | | | | | |
| Ratio of expenses | | | | | | | | | | | | |
| to average net assets | 1.70e | | 1.70 | | 1.70 | | 1.70 | | 1.70 | | 1.70 | |
| Ratio of net investment income | | | | | | | | | | | | |
| to average net assets | 2.65e | | 2.31 | | 2.91 | | 4.27 | | 5.41 | | 5.44 | |
| Portfolio Turnover Rate | 178.00d,f | | 469.41f | | 524.46 | | 477.71 | | 531.86 | | 309.42 | |
|
| |
| |
| |
| |
| |
| |
| Net Assets, end of period | | | | | | | | | | | | |
| ($ X 1,000) | 8,150 | | 10,309 | | 12,470 | | 14,172 | | 15,069 | | 15,905 | |
a As required, effective January 1, 2001, the fund has adopted the provisions of the AICPA Audit and Accounting Guide for Investment Companies and began amortizing discount or premium on fixed income securities on a scientific basis and including paydown gains and losses in interest income.The effect of this change for the period ended December 31, 2001 was to decrease net investment income per share by $.02, increase net realized and unrealized gain (loss) on investments per share by $.02 and decrease the ratio of net investment income to average net assets from 4.42% to 4.27%. Per share data and ratios/supplemental data for periods prior to January 1, 2001 have not been restated to reflect this change in presentation.
b
| Based on average shares outstanding at each month end.
|
c
| Exclusive of sales charge.
|
d
| Not annualized.
|
e
| Annualized.
|
f
| The portfolio turnover rates excluding mortgage dollar roll transactons for the six month period ended June 30, 2004 and the year ended December 31, 2003 were 91.61% and 272.57%, respectively.
|
See notes to financial statements.
The Fund 27
FINANCIAL HIGHLIGHTS (continued)
| | Six Months Ended | | | | | | | | | | | |
| | June 30, 2004 | | | | Year Ended December 31, | | | |
| | | | | |
| | | |
| Class C Shares | (Unaudited) | | 2003 | | 2002 | | 2001 a | | 2000 | | 1999 | |
|
| |
| |
| |
| |
| |
| |
| Per Share Data ($): | | | | | | | | | | | | |
| Net asset value, | | | | | | | | | | | | |
| beginning of period | 10.91 | | 10.76 | | 10.38 | | 10.30 | | 10.00 | | 10.82 | |
| Investment Operations: | | | | | | | | | | | | |
| Investment income—net | .14b | | .25b | | .31b | | .45b | | .54 | | .57 | |
| Net realized and unrealized | | | | | | | | | | | | |
| gain (loss) on investments | (.13) | | .25 | | .41 | | .09 | | .30 | | (.83) | |
| Total from Investment Operations | .01 | | .50 | | .72 | | .54 | | .84 | | (.26) | |
| Distributions: | | | | | | | | | | | | |
| Dividends from | | | | | | | | | | | | |
| investment income—net | (.19) | | (.30) | | (.34) | | (.46) | | (.54) | | (.56) | |
| Dividends from net realized | | | | | | | | | | | | |
| gain on investments | — | | (.05) | | — | | — | | — | | — | |
| Total Distributions | (.19) | | (.35) | | (.34) | | (.46) | | (.54) | | (.56) | |
| Net asset value, end of period | 10.73 | | 10.91 | | 10.76 | | 10.38 | | 10.30 | | 10.00 | |
|
| |
| |
| |
| |
| |
| |
| Total Return (%)c | .05d | | 4.73 | | 7.06 | | 5.29 | | 8.73 | | (2.48) | |
|
| |
| |
| |
| |
| |
| |
| Ratios/Supplemental Data (%): | | | | | | | | | | | | |
| Ratio of expenses | | | | | | | | | | | | |
| to average net assets | 1.70e | | 1.70 | | 1.70 | | 1.70 | | 1.70 | | 1.70 | |
| Ratio of net investment income | | | | | | | | | | | | |
| to average net assets | 2.65e | | 2.31 | | 2.92 | | 4.30 | | 5.42 | | 5.46 | |
| Portfolio Turnover Rate | 178.00d,f | | 469.41f | | 524.46 | | 477.71 | | 531.86 | | 309.42 | |
|
| |
| |
| |
| |
| |
| |
| Net Assets, end of period | | | | | | | | | | | | |
| ($ X 1,000) | 1,568 | | 1,692 | | 1,980 | | 2,245 | | 2,834 | | 3,695 | |
a As required, effective January 1, 2001, the fund has adopted the provisions of the AICPA Audit and Accounting Guide for Investment Companies and began amortizing discount or premium on fixed income securities on a scientific basis and including paydown gains and losses in interest income.The effect of this change for the period ended December 31, 2001 was to decrease net investment income per share by $.02, increase net realized and unrealized gain (loss) on investments per share by $.02 and decrease the ratio of net investment income to average net assets from 4.44% to 4.30%. Per share data and ratios/supplemental data for periods prior to January 1, 2001 have not been restated to reflect this change in presentation.
b
| Based on average shares outstanding at each month end.
|
c
| Exclusive of sales charge.
|
d
| Not annualized.
|
e
| Annualized.
|
f
| The portfolio turnover rates excluding mortgage dollar roll transactons for the six month period ended June 30, 2004 and the year ended December 31, 2003 were 91.61% and 272.57%, respectively.
|
See notes to financial statements.
28
| | Six Months Ended | | | | | | | | | | | |
| | June 30, 2004 | | | | Year Ended December 31, | | | |
| | | | | |
| | | |
| Class R Shares | (Unaudited) | | 2003 | | 2002 | | 2001 a | | 2000 | | 1999 | |
|
| |
| |
| |
| |
| |
| |
| Per Share Data ($): | | | | | | | | | | | | |
| Net asset value, | | | | | | | | | | | | |
| beginning of period | 10.89 | | 10.74 | | 10.36 | | 10.28 | | 9.98 | | 10.81 | |
| Investment Operations: | | | | | | | | | | | | |
| Investment income—net | .19b | | .37b | | .41b | | .56b | | .65 | | .67 | |
| Net realized and unrealized | | | | | | | | | | | | |
| gain (loss) on investments | (.12) | | .24 | | .41 | | .08 | | .29 | | (.84) | |
| Total from Investment Operations | .07 | | .61 | | .82 | | .64 | | .94 | | (.17) | |
| Distributions: | | | | | | | | | | | | |
| Dividends from | | | | | | | | | | | | |
| investment income—net | (.24) | | (.41) | | (.44) | | (.56) | | (.64) | | (.66) | |
| Dividends from net realized | | | | | | | | | | | | |
| gain on investments | — | | (.05) | | — | | — | | — | | — | |
| Total Distributions | (.24) | | (.46) | | (.44) | | (.56) | | (.64) | | (.66) | |
| Net asset value, end of period | 10.72 | | 10.89 | | 10.74 | | 10.36 | | 10.28 | | 9.98 | |
|
| |
| |
| |
| |
| |
| |
| Total Return (%) | .64c | | 5.78 | | 8.14 | | 6.24 | | 9.92 | | (1.57) | |
|
| |
| |
| |
| |
| |
| |
| Ratios/Supplemental Data (%): | | | | | | | | | | | | |
| Ratio of expenses | | | | | | | | | | | | |
| to average net assets | .70d | | .70 | | .70 | | .70 | | .70 | | .70 | |
| Ratio of net investment income | | | | | | | | | | | | |
| to average net assets | 3.52d | | 3.70 | | 3.88 | | 5.34 | | 6.41 | | 6.45 | |
| Portfolio Turnover Rate | 178.00c,e | | 469.41e | | 524.46 | | 477.71 | | 531.86 | | 309.42 | |
|
| |
| |
| |
| |
| |
| |
| Net Assets, end of period | | | | | | | | | | | | |
| ($ X 1,000) | 1,964 | | 2,202 | | 3,387 | | 3,595 | | 4,813 | | 9,270 | |
a As required, effective January 1, 2001, the fund has adopted the provisions of the AICPA Audit and Accounting Guide for Investment Companies and began amortizing discount or premium on fixed income securities on a scientific basis and including paydown gains and losses in interest income.The effect of this change for the period ended December 31, 2001 was to decrease net investment income per share by $.01, increase net realized and unrealized gain (loss) on investments per share by $.01 and decrease the ratio of net investment income to average net assets from 5.49% to 5.34%. Per share data and ratios/supplemental data for periods prior to January 1, 2001 have not been restated to reflect this change in presentation.
b
| Based on average shares outstanding at each month end.
|
c
| Not annualized.
|
d
| Annualized.
|
e
| The portfolio turnover rates excluding mortgage dollar roll transactons for the six month period ended June 30, 2004 and the year ended December 31, 2003 were 91.61% and 272.57%, respectively.
|
See notes to financial statements.
The Fund 29
NOTES TO FINANCIAL STATEMENTS (Unaudited)
NOTE 1—Significant Accounting Policies:
Dreyfus Premier Managed Income Fund (the "fund") is a separate diversified series of The Dreyfus/Laurel Funds Trust (the "Trust"), which is registered under the Investment Company Act of 1940, as amended (the "Act"), as an open-end management investment company and operates as a series company currently offering three series, including the fund. The fund's investment objective is to seek high current income consistent with what is believed to be prudent risk of capital primarily through investments in investment-grade corporate and U.S. Government obligations which primarily have maturities of 10 years or less. The Dreyfus Corporation (the "Manager" or "Dreyfus") serves as the fund's investment manager. The Manager is a wholly-owned subsidiary of Mellon Financial Corporation ("Mellon Financial").
Dreyfus Service Corporation (the "Distributor"), a wholly-owned subsidiary of the Manager, is the distributor of the fund's shares. The fund is authorized to issue an unlimited number of shares of Beneficial Interest in the following classes of shares: Class A, Class B, Class C and Class R. Class A, Class B and Class C shares are sold primarily to retail investors through financial intermediaries and bear a distribution fee and/or service fee. Class A shares are sold with a front-end sales charge, while Class B and Class C shares are subject to a contingent deferred sales charge ("CDSC"). Class B shares automatically convert to Class A shares after six years. Class R shares are sold primarily to bank trust departments and other financial service providers (including Mellon Financial and its affiliates) acting on behalf of customers having a qualified trust or investment account or relationship at such institution, and bear no distribution fee or service fee. Class R shares are offered without a front-end sales charge or CDSC. Each class of shares has identical rights and privileges, except with respect to distribution fees and voting rights on matters affecting a single class.
Investment income, net of expenses (other than class specific expenses) and realized and unrealized gains and losses are allocated daily to each class of shares based upon the relative proportion of net assets of each class.
30
The fund's financial statements are prepared in accordance with U.S. generally accepted accounting principles, which may require the use of management estimates and assumptions. Actual results could differ from those estimates.
(a) Portfolio valuation: Investments in securities (excluding short-term investments (other than U.S. Treasury Bills), options, swap transactions and financial futures) are valued each business day by an independent pricing service (the "Service") approved by the Board of Trustees. Investments for which quoted bid prices are readily available and are representative of the bid side of the market in the judgment of the Service are valued at the mean between the quoted bid prices (as obtained by the Service from dealers in such securities) and asked prices (as calculated by the Service based upon its evaluation of the market for such securities). Other investments are valued as determined by the Service, based on methods which include consideration of: yields or prices of securities of comparable quality, coupon, maturity and type; indications as to values from dealers; and general market conditions. Securities for which there are no such valuations are valued at fair value as determined in good faith under the direction of the Board of Trustees. Short-term investments, other than U.S. Treasury Bills, are carried at amortized cost,which approximates value.Financial futures,and options, which are traded on an exchange, are valued at the last sales price on the securities exchange on which such securities are primarily traded or at the last sales price on the national securities market on each business day. Options traded over-the-counter are priced at the mean between the bid prices and asked prices. Investments denominated in foreign currencies are translated to U.S. dollars at the prevailing rates of exchange. Forward currency exchange contracts are valued at the forward rate. Swap transactions are valued based on future cash flows and other factors, such as interest rates and underlying securities.
(b) Foreign currency transactions: The fund does not isolate that portion of the results of operations resulting from changes in foreign exchange rates on investments from the fluctuations arising from changes
The Fund 31
NOTES TO FINANCIAL STATEMENTS (Unaudited) (continued)
in the market prices of securities held. Such fluctuations are included with the net realized and unrealized gain or loss from investments.
Net realized foreign exchange gains or losses arise from sales and maturities of short-term securities, sales of foreign currencies, currency gains or losses realized on securities transactions and the difference between the amount of dividends, interest and foreign withholding taxes recorded on the fund's books and the U.S. dollar equivalent of the amounts actually received or paid. Net unrealized foreign exchange gains and losses arise from changes in the value of assets and liabilities other than investments in securities, resulting from changes in exchange rates. Such gains and losses are included with net realized and unrealized gain or loss on investments.
(c) Securities transactions and investment income: Securities transactions are recorded on a trade date basis. Realized gain and loss from securities transactions are recorded on the identified cost basis. Dividend income is recorded on the ex-dividend date and interest income, including, where applicable, accretion of discount and amortization of premium on investments, is recognized on the accrual basis.
The fund may lend securities to qualified institutions. At origination, all loans are secured by collateral of at least 102% of the value of U.S. securities loaned and 105% of the value of foreign securities loaned. Collateral equivalent to at least 100% of the market value of securities on loan will be maintained at all times. Cash collateral is invested in certain money market mutual funds managed by the Manager as shown in the fund's Statement of Investments.The fund will be entitled to receive all income on securities loaned, in addition to income earned as a result of the lending transaction. Although each security loaned is fully collateralized, the fund would bear the risk of delay in recovery of, or loss of rights in, the securities loaned should a borrower fail to return the securities in a timely manner
(d) Affiliated issuers: Investments in other investment companies advised by the Manager are defined as "affiliated" in the Act.
32
(e) Concentration of Risk: The fund invests primarily in debt securities. Failure of an issuer of the debt securities to make timely interest or principal payments, or a decline or the perception of a decline in the credit quality of a debt security, can cause the debt security's price to fall, potentially lowering the fund's share price. In addition the value of debt securities may decline due to general market conditions that are not specifically related to a particular company, such as real or perceived adverse economic conditions, changes in outlook for corporate earnings, changes in interest or currency rates or adverse investor sentiment.They may also decline because of factors that affect a particular industry.
(f) Dividends to shareholders: It is the policy of the fund to declare dividends daily from investment income-net. Such dividends are paid monthly. Dividends from net realized capital gain, if any, are normally declared and paid annually, but the fund may make distributions on a more frequent basis to comply with the distribution requirements of the Internal Revenue Code of 1986, as amended (the "Code").To the extent that net realized capital gain can be offset by capital loss carryovers, it is the policy of the fund not to distribute such gain. Income and captial gain distributions are determined in accordance with income tax regulations, which may differ from U.S. generally accepted accounting principles.
(g) Federal income taxes: It is the policy of the fund to continue to qualify as a regulated investment company, if such qualification is in the best interests of its shareholders, by complying with the applicable provisions of the Code, and to make distributions of taxable income sufficient to relieve it from substantially all federal income and excise taxes.
The fund has an unused capital loss carryover of $8,243,852 available for federal income tax purposes to be applied against future net securities profits, if any, realized subsequent to December 31, 2003. If not applied, $970,306 of the carryover expires in fiscal 2004, $4,432,909 expires in fiscal 2007 and $2,840,637 expires in fiscal 2008.
The Fund 33
NOTES TO FINANCIAL STATEMENTS (Unaudited) (continued)
The tax character of distributions paid to shareholders during the fiscal year ended December 31, 2003 was as follows: ordinary income $2,399,758. The tax character of current year distributions will be determined at the end of the current fiscal year.
NOTE 2—Investment Management Fee and Other Transactions With Affiliates:
(a) Investment management fee: Pursuant to an Investment Management agreement with the Manager, the Manager provides or arranges for one or more third parties and/or affiliates to provide investment advisory, administrative, custody, fund accounting and transfer agency services to the fund.The Manager also directs the investments of the fund in accordance with its investment objective, policies and limitations. For these services, the fund is contractually obligated to pay the Manager a fee, calculated daily and paid monthly, at the annual rate of .70% of the value of the fund's average daily net assets. Out of its fee, the Manager pays all of the expenses of the fund except brokerage fees, taxes, interest, commitment fees, Rule 12b-1 distribution fees and expenses, service fees, fees and expenses of non-interested Trustees (including counsel fees) and extraordinary expenses. In addition, the Manager is required to reduce its fee in an amount equal to the fund's allocable portion of fees and expenses of the non-interested Trustees (including counsel fees). Each Trustee receives $40,000 per year, plus $5,000 for each joint Board meeting of The Dreyfus/Laurel Funds, Inc., The Dreyfus/Laurel Tax-Free Municipal Funds, and the Trust (the "Dreyfus/Laurel Funds") attended, $2,000 for separate committee meetings attended which are not held in conjunction with a regularly scheduled board meeting and $500 for Board meetings and separate committee meetings attended that are conducted by telephone and is reimbursed for travel and out-of-pocket expenses.The Chairman of the Board receives an additional 25% of such compensation (with the exception of reimbursable amounts). These fees pertain to the Dreyfus/Laurel Funds and are charged and allocated to each series based on net assets. In the event that there is a joint committee meeting of the Dreyfus/Laurel Funds and the Dreyfus High Yield Strategies Fund, the $2,000 fee will be allocated between the Dreyfus/Laurel Funds and the
34
Dreyfus High Yield Strategies Fund.Amounts required to be paid by the Trust directly to the non-interested Trustees, that would be applied to offset a portion of the management fee payable to the Manager, are in fact paid directly by the Manager to the non-interested Trustees.
During the period ended June 30, 2004, the Distributor retained $446 from commissions earned on sales of the fund's Class A shares and $14,004 and $40 from contingent deferred sales charges on redemptions on the fund's Class B and Class C shares, respectively.
(b) Distribution and service plan: Under separate Distribution Plans (the "Plans") adopted pursuant to Rule 12b-1 under the Act, Class A shares pay annually up to .25% of the value of the average daily net assets to compensate the Distributor for shareholder servicing activities and expenses primarily intended to result in the sale of Class A shares. Class B and Class C shares may pay the Distributor for distributing their shares at an aggregate annual rate of .75% of the value of the average daily net assets of Class B and Class C shares. Class B and Class C shares are also subject to a service plan adopted pursuant to Rule 12b-1 (the "Service Plan"), under which Class B and Class C shares pay the Distributor for providing certain services to the holders of their shares a fee at the annual rate of .25% of the value of the average daily net assets of Class B and Class C shares. During the period ended June 30, 2004, Class A, Class B and Class C shares were charged $54,086, $35,134 and $6,144, respectively, pursuant to their respective Plans. Class B and Class C shares were charged $11,711 and $2,048, respectively, pursuant to the Service Plan.
Under its terms, the Plans and Service Plan shall remain in effect from year to year, provided such continuance is approved annually by a vote of majority of those Trustees who are not "interested persons" of the Trust and who have no direct or indirect financial interest in the operation of or in any agreement related to the Plans or Service Plan.
The components of Due to The Dreyfus Corporation and affiliates in the Statement of Assets and Liabilities consists of: management fees $30,858, Rule 12b-1 distribution plan fees $14,621 and shareholder services plan fees $2,011.
The Fund 35
NOTES TO FINANCIAL STATEMENTS (Unaudited) (continued)
NOTE 3—Securities Transactions:
The aggregate amount of purchases and sales (including paydowns) of investment securities, excluding short-term securities, forward currency exchange contracts, options transactions and swap transactions during the period ended June 30, 2004, amounted to $109,125,229 and $113,259,694, respectively, of which $52,961,514 in purchases and $53,148,444 in sales were from dollar roll transactions.
The fund may enter into dollar roll transactions with respect to mortgage-backed securities. In a dollar roll transaction, the fund sells mortgage-backed securities to a financial institution and simultaneously agrees to accept substantially similar (same type, coupon and maturity) securities at a later date, at an agreed upon price.
In addition, the following table summarizes the fund's call/put options written during the period ended June 30, 2004:
| | Face Amount | | | | Options Terminated | |
| | | | | |
| |
| | Covered by | | Premiums | | | | Net Realized | |
| Options Written: | Contracts ($) | | Received ($) | | Cost ($) | | Gain (Loss) ($) | |
|
| |
| |
| |
| |
| Contracts outstanding | | | | | | | | |
| December 31, 2003 | 7,050,000 | | 66,385 | | — | | — | |
| Contracts written | 31,225,000 | | 163,384 | | | | | |
| Contracts Terminated; | | | | | | | | |
| Closed | 5,770,000 | | 60,538 | | 90,116 | | (29,578) | |
| Expired | 13,905,000 | | 95,528 | | — | | 95,528 | |
| Total Contracts | | | | | | | | |
| Terminated | 19,675,000 | | 156,066 | | 90,116 | | 65,950 | |
| Contracts outstanding | | | | | | | | |
| June 30, 2004 | 18,600,000 | | 73,703 | | | | | |
The fund may purchase and write (sell) call/put options in order to gain exposure to or protect against change in the market.
As a writer of call options, the fund receives a premium at the outset and then bears the market risk of unfavorable changes in the price of the financial instruments underlying the options. Generally, the fund would incur a gain, to the extent of the premium, if the price of the underlying financial instrument decreases between the date the option is written and the date on which the option is terminated. Generally, the fund would realize a loss, if the price of the financial instrument increases between those dates.
36
As a writer of put options, the fund receives a premium at the outset and then bears the market risk of unfavorable changes in the price of the financial instruments underlying the options. Generally, the fund would incur a gain, to the extent of the premium, if the price of the underlying financial instrument increases between the date the option is written and the date on which the option is terminated. Generally, the fund would realize a loss, if the price of the financial instrument decreases between those dates.
The fund enters into forward currency exchange contracts in order to hedge its exposure to changes in foreign currency exchange rates on its foreign portfolio holdings and to settle foreign currency transac-tions.When executing forward currency exchange contracts, the fund is obligated to buy or sell a foreign currency at a specified rate on a certain date in the future. With respect to sales of forward currency exchange contracts, the fund would incur a loss if the value of the contract increases between the date the forward contract is opened and the date the forward contract is closed.The fund realizes a gain if the value of the contract decreases between those dates. With respect to purchases of forward currency exchange contracts, the fund would incur a loss if the value of the contract decreases between the date the forward contract is opened and the date the forward contract is closed. The fund realizes a gain if the value of the contract increases between those dates. The fund is also exposed to credit risk associated with counterparty nonperformance on these forward currency exchange contracts which is typically limited to the unrealized gain on each open contract. The following summarizes open forward currency exchange contracts at June 30, 2004:
| | | Foreign | | | | | | Unrealized | |
| Forward Currency | | Currency | | | | | | Appreciation | |
| Exchange Contracts | | Amounts | | Proceeds ($) | | Value ($) | | (Depreciation) ($) | |
| |
| |
| |
| |
| |
| Sales: | | | | | | | | | |
| Swiss Franc, expiring | | | | | | | | | |
| 9/15/2004 | | 490,000 | | 392,000 | | 391,906 | | 94 | |
| Euro, expiring | | | | | | | | | |
| 9/15/2004 | | 2,182,500 | | 2,636,569 | | 2,661,122 | | (24,553) | |
| Total | | | | | | | | (24,459) | |
The Fund 37
NOTES TO FINANCIAL STATEMENTS (Unaudited) (continued)
The fund may enter into swap agreements to exchange the interest rate on, or return generated by, one nominal instrument for the return generated by another nominal instrument.
Total return swaps involve commitments to pay interest in exchange for a market-linked return based on a notional amount.To the extent the total return of the security or index underlying the transaction exceeds or falls short of the offsetting interest rate obligation, the fund will receive a payment from or make a payment to the counterparty, respectively. Total return swaps are marked-to-market daily and the change, if any, is recorded as unrealized appreciation or depreciation in the Statement of Operations. Periodic payments received or made at the end of each measurement period, but prior to termination, are recorded as realized gains or losses in the Statement of Operations.The following summarizes total return swaps entered into by the fund at June 30, 2004:
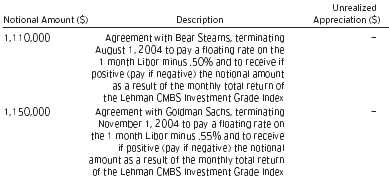
Credit default swaps involve commitments to pay a fixed rate in exchange for payment if a credit event affecting a third party (the referenced company) occurs. Credit events may include a failure to pay interest, bankruptcy, or restructuring. Net periodic interest payments to be received or paid are accrued daily and are recorded in net realized gain (loss) on swap transactions in the Statement of Operations. Credit default swaps are marked-to-market daily and the charge, if any, is recorded as unrealized appreciation or depreciation in the Statement of Operations.
38
In addition, the following summarizes open credit default swap agreements at June 30, 2004:
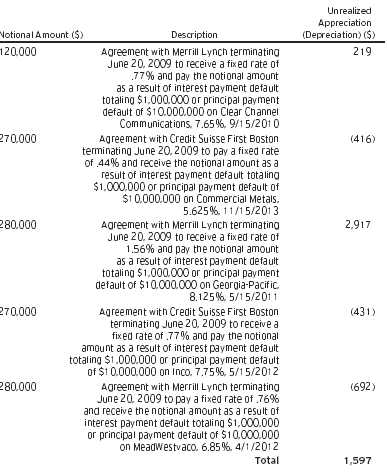
Realized gains and losses on maturity or termination of swaps are presented in the Statement of Operations. Risks may arise upon entering into these agreements from the potential inability of the counterparties to meet the terms of the agreement and are generally limited to the amount of net payments to be received, if any, at the date of default.
The Fund 39
NOTES TO FINANCIAL STATEMENTS (Unaudited) (continued)
At June 30, 2004, accumulated net unrealized appreciation on investments was $371,051, consisting of $901,048 gross unrealized appreciation and $529,997 gross unrealized depreciation.
At June 30, 2004, the cost of investments for federal income tax purposes was substantially the same as the cost for financial reporting purposes (see the Statement of Investments).
NOTE 4—Bank Line of Credit:
The fund participates with other Dreyfus-managed funds in a $350 million redemption credit facility (the "Facility") to be utilized for temporary or emergency purposes, including the financing of redemptions. In connection therewith, the fund has agreed to pay commitment fees on its pro rata portion of the Facility. Interest is charged to the fund based on prevailing market rates in effect at the time of borrowings. During the period ended June 30, 2004, the fund did not borrow under the Facility.
NOTE 5—Legal Matters:
Two class actions (which have been consolidated) have been filed against Mellon Financial and Mellon Bank, N.A., and Dreyfus and Founders Asset Management LLC (the "Investment Advisers"), and the directors of all or substantially all of the Dreyfus funds, alleging that the Investment Advisers improperly used assets of the Dreyfus funds, in the form of directed brokerage commissions and 12b-1 fees, to pay brokers to promote sales of Dreyfus funds, and that the use of fund assets to make these payments was not properly disclosed to investors.The complaints further allege that the directors breached their fiduciary duties to fund shareholders under the Investment Company Act of 1940 and at common law. The complaints seek unspecified compensatory and punitive
40
damages, rescission of the funds' contracts with the Investment Advisers, an accounting of all fees paid, and an award of attorneys' fees and litigation expenses. Dreyfus and the Dreyfus funds believe the allegations to be totally without merit and will defend the actions vigorously.
Additional lawsuits arising out of these circumstances and presenting similar allegations and requests for relief may be filed against the defendants in the future. Neither Dreyfus nor the Dreyfus funds believe that any of the pending actions will have a material adverse effect on the Dreyfus funds or Dreyfus' ability to perform its contracts with the Dreyfus funds.
The Fund 41
For More Information
| Dreyfus Premier |
| Managed Income Fund |
| 200 Park Avenue |
| New York, NY 10166 |
| |
| Manager |
| The Dreyfus Corporation |
| 200 Park Avenue |
| New York, NY 10166 |
|
| |
| Custodian |
| Mellon Bank, N.A. |
| One Mellon Bank Center |
| Pittsburgh, PA 15258 |
| |
| Transfer Agent & |
| Dividend Disbursing Agent |
| Dreyfus Transfer, Inc. |
| 200 Park Avenue |
| New York, NY 10166 |
| |
| Distributor |
| Dreyfus Service Corporation |
| 200 Park Avenue |
| New York, NY 10166 |
To obtain information:
By telephone
Call your financial representative or 1-800-554-4611
By mail Write to: The Dreyfus Premier Family of Funds 144 Glenn Curtiss Boulevard Uniondale, NY 11556-0144
A description of the policies and procedures that the fund uses to determine how to vote proxies relating to portfolio securities is available, without charge, by calling the telephone number listed above, or by visiting the SEC's website at http://www.sec.gov
© 2004 Dreyfus Service Corporation 0349SA0604

The views expressed in this report reflect those of the portfolio manager only through the end of the period covered and do not necessarily represent the views of Dreyfus or any other person in the Dreyfus organization. Any such views are subject to change at any time based upon market or other conditions and Dreyfus disclaims any responsibility to update such views.These views may not be relied on as investment advice and, because investment decisions for a Dreyfus fund are based on numerous factors, may not be relied on as an indication of trading intent on behalf of any Dreyfus fund.
Not FDIC-Insured • Not Bank-Guaranteed • May Lose Value
Contents
THE FUND
2
| Letter from the Chairman
|
3
| Discussion of Fund Performance
|
6
| Statement of Investments
|
10
| Statement of Assets and Liabilities
|
11
| Statement of Operations
|
12
| Statement of Changes in Net Assets
|
15
| Financial Highlights
|
21
| Notes to Financial Statements
|
FOR MORE INFORMATION
|
Back Cover
|
| Dreyfus Premier |
| Core Value Fund |
The Fund

LETTER FROM THE CHAIRMAN
Dear Shareholder:
This semiannual report for Dreyfus Premier Core Value Fund covers the six-month period from January 1, 2004, through June 30, 2004. Inside, you'll find valuable information about how the fund was managed during the reporting period, including a discussion with Brian Ferguson, portfolio manager and member of the Large Cap Value Team of The Boston Company Asset Management.
Although the U.S. economy increasingly showed signs of sustainable growth during the first half of 2004, most major stock-market indices generally ended the reporting period only slightly higher than where they began.The positive effects of rising corporate earnings were largely offset by uncertainty related to the situation in Iraq, renewed inflationary pressures and potentially higher interest rates. In fact, on the last day of the reporting period, the Federal Reserve Board raised short-term rates in what many analysts believe is the first in a series of gradual increases.
To many investors, the move to a less accommodative monetary policy marks the beginning of a new phase in the economic cycle. At times such as these, when market conditions are in a period of transition, we believe it is especially important for you to stay in close contact with your financial advisor, who can help you position your portfolio in a way that is designed to respond to the challenges and opportunities of today's changing investment environment.
Thank you for your continued confidence and support.
Sincerely,

Stephen E. Canter
Chairman and Chief Executive Officer The Dreyfus Corporation
July 15, 2004
2

DISCUSSION OF FUND PERFORMANCE
| Brian Ferguson, Portfolio Manager |
| Large Cap Value Team |
How did Dreyfus Premier Core Value Fund perform relative to its benchmark?
For the six-month period ended June 30, 2004, Dreyfus Premier Core Value Fund produced total returns of 2.84% for its Class A Shares, 2.48% for its Class B Shares, 2.48% for its Class C shares, 2.90% for its Institutional shares, 2.97% for its Class R shares and 2.72% for its Class T shares.1 In comparison, the fund's benchmark, the S&P 500/BARRA Value Index, produced a total return of 4.17% for the same period.2
We attribute the fund's performance to a sluggish market environment in which positive factors, such as strong economic growth and higher corporate earnings, were offset by investors' concerns regarding inflationary pressures and higher interest rates.The fund's returns modestly trailed that of its benchmark due to its emphasis on technology stocks, which lagged during the reporting period, and its limited exposure to two of the better-performing areas of the market, energy and financial services.
As of April 5, 2004, investment decisions for the fund are being made by a committee of portfolio managers, the Large Cap Value Team of the Boston Company Asset Management, an affiliate of The Dreyfus Corporation. Each committee member is also an employee of The Dreyfus Corporation.
What is the fund's investment approach?
The fund invests primarily in large-cap companies that are considered undervalued based on traditional measures, such as price-to-earnings ratios. When choosing stocks, we use a "bottom-up" stock selection approach, focusing on individual companies, rather than a "top-down" approach that forecasts market trends. We also focus on a company's relative value, financial strength, sales and earnings momentum and likely catalysts that could ignite the stock price.
The Fund 3
DISCUSSION OF FUND PERFORMANCE (continued)
What other factors influenced the fund's performance?
In contrast to the U.S. stock market's strong returns during 2003, stock prices rose only modestly during the first half of 2004 as investors grew increasingly concerned about the potential effects of higher interest rates, renewed inflationary pressures and ongoing geopolitical instability on corporate earnings.These concerns became more manifest in early April, 2004, when the U.S. Department of Labor released statistics showing unexpected strength in labor markets and energy prices surged higher. So on June 30, 2004, in a widely anticipated effort to forestall a potential acceleration of inflation, the Federal Reserve Board raised short-term interest rates to 1.25%.
In this environment, the fund's performance lagged that of its benchmark, primarily due to our emphasis on technology stocks, including two semiconductor stocks, Intel and Fairchild Semiconductor, Cl A. These stocks had lower profits primarily as a result of the eroding effects of higher costs associated with research and development activities. In addition, we had less exposure than the benchmark to energy stocks, one of the strongest areas during the reporting period due to rising oil prices.While we attempted to participate in the sector's gains later in the reporting period, we missed the bulk of its earlier gains. Within financial services, we favored the large investment banks and asset managers, both of which are more cyclical in nature and were hurt from the anticipation of the short-term interest rate hike that occurred on June 30, 2004.
Many of the fund's stocks posted gains for the reporting period. The fund's strongest returns stemmed from the utilities and capital goods areas.Within utilities,Texas Utilities benefited when its new CEO shed underperforming assets and, through restructuring and cost-cutting measures, led the company to higher earnings.Two wireless communications companies, AT&T Wireless Services, Inc., and Sprint (FON Group) benefited from improving business fundamentals as well as acquisition and consolidation activity, respectively. Clear winners
4
among the fund's capital goods stocks included Boeing, whose stock price rose when several indicators indicated a positive inflection point in the commercial aerospace business cycle, and L.M. Ericsson Telephone Co., the manufacturer of wireless handsets, whose stock rose more than 70% during the reporting period. Eaton stock also rose, largely due to its trucking division and the anticipation of sales of replacement engine parts to meet new emissions regulations coming out in 2007. Finally, our holdings in John Deere appreciated due to an improved agricultural cycle that gave farmers more disposable income to buy farm equipment.
What is the fund's current strategy?
We have continued to employ our "bottom-up" stock selection strategy, looking for large-cap value stocks that possess what we believe are strong business fundamentals and have a catalyst in place that is likely to generate capital appreciation.As of the end of the reporting period, we have found a greater number of stocks that meet these criteria within the capital goods, technology and consumer services industries. Conversely, we have identified fewer opportunities within the utilities, financial services, transportation and basic industries areas.We also have gradually increased the portfolio's energy exposure to capture higher returns that may result in an environment of rising oil prices.
July 15, 2004
1
| Total return includes reinvestment of dividends and any capital gains paid, and does not take into consideration the maximum initial sales charges in the case of Class A and Class T shares, or the applicable contingent deferred sales charges imposed on redemptions in the case of Class B and Class C shares. Had these charges been reflected, returns would have been lower. Past performance is no guarantee of future results. Share price and investment return fluctuate such that upon redemption, fund shares may be worth more or less than original cost.
|
2
| SOURCE: LIPPER INC. — Reflects the reinvestment of dividends and, where applicable, capital gain distributions.The S&P 500/BARRA Value Index is a capitalization-weighted index of all the stocks in the Standard & Poor's 500 Composite Price Index ("S&P 500 Index") that have low price-to-book ratios.The S&P 500 Index is a widely accepted, unmanaged index of U.S. stock market performance.
|
The Fund 5
| STATEMENT OF INVESTMENTS |
| June 30, 2004 (Unaudited) |
| Common Stocks—97.6% | Shares | | Value ($) | |
|
| |
| |
| Banking—12.0% | | | | |
| Bank of America | 367,318 | | 31,082,449 | |
| Citigroup | 674,833 | | 31,379,735 | |
| Fannie Mae | 127,500 | | 9,098,400 | |
| U.S. Bancorp | 414,300 | | 11,418,108 | |
| Wachovia | 344,800 | | 15,343,600 | |
| | | | 98,322,292 | |
| Basic Industries—1.7% | | | | |
| Bowater | 100,700 | | 4,188,113 | |
| China Steel, ADR | 7 a,b | | 131 | |
| International Paper | 222,500 | | 9,945,750 | |
| | | | 14,133,994 | |
| Beverages & Tobacco—.7% | | | | |
| Altria Group | 116,900 | | 5,850,845 | |
| Brokerage—9.8% | | | | |
| Goldman Sachs Group | 256,600 | | 24,161,456 | |
| J.P. Morgan Chase & Co. | 646,300 | | 25,057,051 | |
| Merrill Lynch | 196,150 | | 10,588,177 | |
| Morgan Stanley | 387,700 | | 20,458,929 | |
| | | | 80,265,613 | |
| Capital Goods—11.2% | | | | |
| Boeing | 425,900 | | 21,759,231 | |
| Eaton | 82,800 | | 5,360,472 | |
| Emerson Electric | 96,960 | | 6,161,808 | |
| NCR | 144,400 c | | 7,160,796 | |
| Nokia, ADR | 907,100 | | 13,189,234 | |
| Tyco International | 269,100 | | 8,917,974 | |
| United Technologies | 233,800 | | 21,388,024 | |
| Xerox | 521,300 c | | 7,558,850 | |
| | | | 91,496,389 | |
| Consumer Durables—1.8% | | | | |
| Koninklijke (Royal) Philips Electronics | | | | |
| (New York Shares) | 533,900 | | 14,522,080 | |
6
| Common Stocks (continued) | Shares | | Value ($) | |
|
| |
| |
| Consumer Non-Durables—2.8% | | | | |
| Jones Apparel Group | 170,200 | | 6,719,496 | |
| Kimberly-Clark | 69,800 | | 4,598,424 | |
| Kraft Foods, Cl. A | 242,100 | | 7,669,728 | |
| Newell Rubbermaid | 175,400 b | | 4,121,900 | |
| | | | 23,109,548 | |
| Consumer Services—14.5% | | | | |
| Advance Auto Parts | 113,900 c | | 5,032,102 | |
| AutoZone | 139,900 c | | 11,205,990 | |
| Clear Channel Communications | 349,100 | | 12,899,245 | |
| DST Systems | 170,005 c | | 8,175,541 | |
| Interpublic Group of Companies | 265,800 b,c | | 3,649,434 | |
| Kroger | 213,300 c | | 3,882,060 | |
| Liberty Media, Cl. A | 1,742,680 c | | 15,666,693 | |
| Liberty Media International, Cl. A | 87,134 c | | 3,232,671 | |
| McDonald's | 328,400 | | 8,538,400 | |
| Omnicom Group | 187,100 | | 14,199,019 | |
| Safeway | 331,100 b,c | | 8,390,074 | |
| Viacom, Cl. B | 426,600 | | 15,238,152 | |
| Walt Disney | 332,100 | | 8,465,229 | |
| | | | 118,574,610 | |
| Electronic Components & Instrument—.7% | | | | |
| Seagate Technology | 395,700 c | | 5,709,951 | |
| Energy—10.8% | | | | |
| Apache | 116,400 | | 5,069,220 | |
| BP, ADR | 221,600 | | 11,871,112 | |
| ChevronTexaco | 108,800 | | 10,239,168 | |
| Cooper Cameron | 87,400 c | | 4,256,380 | |
| Exxon Mobil | 640,532 | | 28,446,026 | |
| Pioneer Natural Resources | 142,400 b | | 4,995,392 | |
| Schlumberger | 205,000 | | 13,019,550 | |
| Total SA, ADR | 108,800 | | 10,453,504 | |
| | | | 88,350,352 | |
The Fund 7
S T A T E M E N T O F I N V E S T M E N T S ( U n a u d i t e d ) (continued)
| Common Stocks (continued) | Shares | | Value ($) | |
|
| |
| |
| Health Care—4.4% | | | | |
| Cardinal Health | 107,400 | | 7,523,370 | |
| Medco Health Solutions | 391,300 c | | 14,673,750 | |
| PacifiCare Health Systems | 113,990 c | | 4,406,853 | |
| Pfizer | 286,900 | | 9,834,932 | |
| | | | 36,438,905 | |
| Insurance—10.7% | | | | |
| Allstate | 177,100 | | 8,244,005 | |
| American International Group | 230,693 | | 16,443,797 | |
| CIGNA | 63,900 | | 4,396,959 | |
| Genworth Financial, Cl. A | 407,900 c | | 9,361,305 | |
| Hartford Financial Services Group | 202,500 | | 13,919,850 | |
| Marsh & McLennan Cos. | 92,400 | | 4,193,112 | |
| PMI Group | 278,200 | | 12,107,264 | |
| Prudential Financial | 304,100 | | 14,131,527 | |
| UnumProvident | 270,000 | | 4,293,000 | |
| | | | 87,090,819 | |
| Merchandising—.5% | | | | |
| Dollar General | 225,500 | | 4,410,780 | |
| Technology—9.6% | | | | |
| Automatic Data Processing | 308,400 | | 12,915,792 | |
| Fairchild Semiconductor, Cl. A | 353,600 c | | 5,788,432 | |
| Intel | 275,500 | | 7,603,800 | |
| International Business Machines | 105,300 | | 9,282,195 | |
| Microsoft | 919,700 | | 26,266,632 | |
| Oracle | 697,500 c | | 8,321,175 | |
| SunGard Data Systems | 308,000 c | | 8,008,000 | |
| | | | 78,186,026 | |
| Telecommunications—2.3% | | | | |
| SK Telecom, ADR | 270 b | | 5,667 | |
| Sprint (FON Group) | 1,075,850 | | 18,934,960 | |
| | | | 18,940,627 | |
8
| Common Stocks (continued) | Shares | | Value ($) | |
|
|
|
| |
| Utilities—4.1% | | | | | |
| ALLTEL | | | 169,600 | | 8,585,152 | |
| Entergy | | | 76,700 | | 4,295,967 | |
| Exelon | | | 124,900 | | 4,157,921 | |
| TXU | | | 145,500 | | 5,894,205 | |
| Verizon Communications | | 287,556 | | 10,406,652 | |
| | | | | | 33,339,897 | |
| Total Common Stocks | | | | | |
| (cost $ | 690,370,109) | | | | 798,742,728 | |
|
|
|
|
|
| |
| | | | | | | |
| Preferred Stocks—.9% | | | | | |
|
|
|
|
| |
| Consumer Services; | | | | | |
| News Corp, ADR | | | | | |
| (cost $ | 3,099,095) | | 212,900 | | 7,000,152 | |
|
|
|
|
|
| |
| | | | Principal | | | |
| Short-Term Investments—.6% | Amount ($) | Value ($) | |
|
|
| |
| Commercial Paper; | | | | | |
| General Electric Capital, | | | | | |
| 1.25%, 7/1/2004 | | | | | |
| (cost $ | 4,894,000) | | 4,894,000 | | 4,894,000 | |
|
|
|
|
|
| |
| Investment of Cash Collateral | | | | |
| for Securities Loaned—1.5% | Shares | | Value ($) | |
|
|
|
| |
| Registered Investment Company; | | | | |
| Dreyfus Institutional Cash Advantage Fund | | | | |
| (cost $ | 12,375,605) | | 12,375,605 | d | 12,375,605 | |
|
|
|
|
|
| |
| | | | | | | |
| Total Investments (cost $ | 710,738,809) | 100.6% | | 823,012,485 | |
| Liabilities, Less Cash and Receivables | (.6%) | | (4,970,655) | |
| Net Assets | | 100.0% | | 818,041,830 | |
a Security exempt from registration under Rule 144A of the Securities Act of 1933.This security may be resold in transaction exempt from registration, normally to qualified institutional buyers. At June 30, 2004, this security amounted to $131.
b
| All or a portion of these securities are on loan. At June 30, 2004, the total market value of the fund's securities on loan is $11,903,121 and the total market value of the collateral held by the fund is $12,375,605.
|
c
| Non-income producing.
|
d
| Investment in affiliated money market mutual fund.
|
See notes to financial statements.
The Fund 9
| STATEMENT OF ASSETS AND LIABILITIES |
| June 30, 2004 (Unaudited) |
| | | Cost | Value | |
|
|
|
| |
| Assets ($): | | | | |
| Investments in securities—See Statement | | | |
| of Investments (including securities on loan, | | | |
| valued at $11,903,121)—Note 1(b): | | | |
| Unaffiliated issuers | 698,363,204 | 810,636,880 | |
| Affiliated issuers | 12,375,605 | 12,375,605 | |
| Receivable for investment securities sold | | 8,068,324 | |
| Dividends and interest receivable | | 752,081 | |
| Receivable for shares of Beneficial Interest subscribed | | 238,555 | |
| | | | 832,071,445 | |
|
|
|
| |
| Liabilities ($): | | | | |
| Due to The Dreyfus Corporation and affiliates—Note 2(b) | | 812,953 | |
| Cash overdraft due to Custodian | | 53,555 | |
| Liability for securities on loan—Note 1(b) | | 12,375,605 | |
| Payable for shares of Beneficial Interest redeemed | | 787,502 | |
| | | | 14,029,615 | |
|
|
|
| |
| Net Assets ( | $) | | 818,041,830 | |
|
|
|
| |
| Composition of Net Assets ($): | | | |
| Paid-in capital | | | 784,118,490 | |
| Accumulated undistributed investment income—net | | 395,194 | |
| Accumulated net realized gain (loss) on investments | | (78,745,530) | |
| Accumulated net unrealized appreciation | | | |
| (depreciation) on investments | | 112,273,676 | |
|
|
| |
| Net Assets ( | $) | | 818,041,830 | |
| Net Asset Value Per Share | | | | | | | | | | | |
| | | Class A | | Class B | | Class C | | Class R | | Class T | | Institutional | |
|
|
| |
| |
| |
| |
| |
| |
| Net Assets ($) | | 617,379,941 | | 79,004,013 | | 21,938,070 | | 56,867,500 | | 2,608,953 | | 40,243,353 | |
| Shares | | | | | | | | | | | | | |
| Outstanding | | 21,936,055 | | 2,853,729 | | 792,348 | | 2,021,184 | | 92,722 | | 1,430,795 | |
|
|
| |
| |
| |
| |
| |
| |
| Net Asset Value | | | | | | | | | | | | |
| Per Share ( | $) | 28.14 | | 27.68 | | 27.69 | | 28.14 | | 28.14 | | 28.13 | |
See notes to financial statements.
10
| STATEMENT OF OPERATIONS |
| Six Months Ended June 30, 2004 (Unaudited) |
| Investment Income ( | $): | | |
| Income: | | | |
| Cash dividends (net of $183,034 foreign taxes withheld at source) | 6,708,068 | |
| Interest | | 99,408 | |
| Income from securities lending | 68,372 | |
| Total Income | | 6,875,848 | |
| Expenses: | | | |
| Management fee—Note 2(a) | | 3,697,186 | |
| Distribution and service fees—Note 2(b) | 1,325,056 | |
| Loan commitment fees—Note 4 | 3,630 | |
| Total Expenses | | 5,025,872 | |
| Investment Income—Net | | 1,849,976 | |
|
|
| |
| Realized and Unrealized Gain (Loss) on Investments—Note 3 ($): | | |
| Net realized gain (loss) on investments | 58,022,003 | |
| Net unrealized appreciation (depreciation) on investments | (37,700,612) | |
| Net Realized and Unrealized Gain (Loss) on Investments | 20,321,391 | |
| Net Increase in Net Assets Resulting from Operations | 22,171,367 | |
See notes to financial statements.
The Fund 11
STATEMENT OF CHANGES IN NET ASSETS
| | Six Months Ended | | | |
| | June 30, 2004 | | Year Ended | |
| | (Unaudited) | | December 31, 2003 | |
|
| |
| |
| Operations ($): | | | | |
| Investment income—net | 1,849,976 | | 4,486,434 | |
| Net realized gain (loss) on investments | 58,022,003 | | 2,244,365 | |
| Net unrealized appreciation | | | | |
| (depreciation) on investments | (37,700,612) | | 171,665,107 | |
| Net Increase (Decrease) in Net Assets | | | | |
| Resulting from Operations | 22,171,367 | | 178,395,906 | |
|
| |
| |
| Dividends to Shareholders from ($): | | | | |
| Investment income—net: | | | | |
| Class A shares | (1,540,363) | | (3,672,165) | |
| Class B shares | — | | (42,807) | |
| Class C shares | — | | (12,034) | |
| Class R shares | (210,800) | | (431,331) | |
| Class T shares | (3,221) | | (8,129) | |
| Institutional shares | (121,691) | | (294,312) | |
| Total Dividends | (1,876,075) | | (4,460,778) | |
|
| |
| |
| Beneficial Interest Transactions ($): | | | | |
| Net proceeds from shares sold: | | | | |
| Class A shares | 39,274,412 | | 69,547,747 | |
| Class B shares | 5,008,133 | | 11,334,683 | |
| Class C shares | 3,004,886 | | 9,950,055 | |
| Class R shares | 4,514,079 | | 6,484,312 | |
| Class T shares | 369,327 | | 466,996 | |
| Institutional shares | 616,445 | | 674,229 | |
12
| | Six Months Ended | | | |
| | June 30, 2004 | | Year Ended | |
| | (Unaudited) | | December 31, 2003 | |
|
| |
| |
| Beneficial Interest Transactions (continued): | | | | |
| Dividends reinvested: | | | | |
| Class A shares | 1,336,430 | | 3,178,046 | |
| Class B shares | — | | 36,527 | |
| Class C shares | — | | 9,238 | |
| Class R shares | 210,692 | | 431,021 | |
| Class T shares | 3,113 | | 8,023 | |
| Institutional shares | 118,212 | | 285,477 | |
| Cost of shares redeemed: | | | | |
| Class A shares | (46,217,078) | | (101,503,555) | |
| Class B shares | (6,705,328) | | (11,884,065) | |
| Class C shares | (4,079,419) | | (12,880,056) | |
| Class R shares | (1,936,757) | | (5,795,921) | |
| Class T shares | (82,436) | | (246,690) | |
| Institutional shares | (3,417,323) | | (5,373,560) | |
| Increase (Decrease) in Net Assets | | | | |
| from Beneficial Interest Transactions | (7,982,612) | | (35,277,493) | |
| Total Increase (Decrease) in Net Assets | 12,312,680 | | 138,657,635 | |
|
| |
| |
| Net Assets ($): | | | | |
| Beginning of Period | 805,729,150 | | 667,071,515 | |
| End of Period | 818,041,830 | | 805,729,150 | |
| Undistributed investment income—net | 395,194 | | 421,293 | |
The Fund 13
STATEMENT OF CHANGES IN NET ASSETS (continued)
| | Six Months Ended | | | |
| | June 30, 2004 | | Year Ended | |
| | (Unaudited) | | December 31, 2003 | |
|
| |
| |
| Capital Share Transactions: | | | | |
| Class Aa | | | | |
| Shares sold | 1,387,513 | | 2,953,000 | |
| Shares issued for dividends reinvested | 47,353 | | 134,142 | |
| Shares redeemed | (1,645,747) | | (4,326,654) | |
| Net Increase (Decrease) in Shares Outstanding | (210,881) | | (1,239,512) | |
|
| |
| |
| Class Ba | | | | |
| Shares sold | 180,314 | | 486,046 | |
| Shares issued for dividends reinvested | — | | 1,655 | |
| Shares redeemed | (242,063) | | (525,823) | |
| Net Increase (Decrease) in Shares Outstanding | (61,749) | | (38,122) | |
|
| |
| |
| Class C | | | | |
| Shares sold | 108,307 | | 452,412 | |
| Shares issued for dividends reinvested | — | | 421 | |
| Shares redeemed | (147,806) | | (599,607) | |
| Net Increase (Decrease) in Shares Outstanding | (39,499) | | (146,774) | |
|
| |
| |
| Class R | | | | |
| Shares sold | 160,234 | | 271,825 | |
| Shares issued for dividends reinvested | 7,467 | | 18,131 | |
| Shares redeemed | (68,724) | | (237,711) | |
| Net Increase (Decrease) in Shares Outstanding | 98,977 | | 52,245 | |
|
| |
| |
| Class T | | | | |
| Shares sold | 12,979 | | 20,540 | |
| Shares issued for dividends reinvested | 110 | | 338 | |
| Shares redeemed | (2,906) | | (10,977) | |
| Net Increase (Decrease) in Shares Outstanding | 10,183 | | 9,901 | |
|
| |
| |
| Institutional Shares | | | | |
| Shares sold | 21,892 | | 29,399 | |
| Shares issued for dividends reinvested | 4,191 | | 12,070 | |
| Shares redeemed | (121,528) | | (240,152) | |
| Net Increase (Decrease) in Shares Outstanding | (95,445) | | (198,683) | |
a During the period ended June 30, 2004, 40,691 Class B shares representing $1,129,310 were automatically converted to 40,025 Class A shares and during the period ended December 31, 2003, 33,502 Class B shares representing $773,643 were automatically converted to 32,995 Class A shares.
See notes to financial statements.
14
FINANCIAL HIGHLIGHTS
The following tables describe the performance for each share class for the fiscal periods indicated.All information (except portfolio turnover rate) reflects financial results for a single fund share.Total return shows how much your investment in the fund would have increased (or decreased) during each period assuming you had reinvested all dividends and distributions.These figures have been derived from the fund's financial statements.
| | Six Months Ended | | | | | | | | | | | |
| | | June 30, 2004 | | | | Year Ended December 31, | | | |
| | | | | | |
| | | |
| Class A Shares | | (Unaudited) | | 2003 | | 2002 | | 2001 | | 2000 | | 1999 | |
|
|
| |
| |
| |
| |
| |
| |
| Per Share Data ($): | | | | | | | | | | | | |
| Net asset value, | | | | | | | | | | | | | |
| beginning of period | 27.44 | | 21.57 | | 28.62 | | 30.93 | | 30.83 | | 29.26 | |
| Investment Operations: | | | | | | | | | | | | |
| Investment income—neta | .07 | | .17 | | .10 | | .17 | | .24 | | .13 | |
| Net realized and unrealized | | | | | | | | | | | | |
| gain (loss) on investments | .70 | | 5.86 | | (7.06) | | (1.46) | | 3.04 | | 4.78 | |
| Total from | | | | | | | | | | | | | |
| Investment Operations | .77 | | 6.03 | | (6.96) | | (1.29) | | 3.28 | | 4.91 | |
| Distributions: | | | | | | | | | | | | | |
| Dividends from investment | | | | | | | | | | | | |
| income—net | | (.07) | | (.16) | | (.09) | | (.16) | | (.23) | | (.13) | |
| Dividends from net realized | | | | | | | | | | | | |
| gain on investments | — | | — | | — | | (.86) | | (2.95) | | (3.21) | |
| Total Distributions | | (.07) | | (.16) | | (.09) | | (1.02) | | (3.18) | | (3.34) | |
| Net asset value, end of period | 28.14 | | 27.44 | | 21.57 | | 28.62 | | 30.93 | | 30.83 | |
|
| |
| |
| |
| |
| |
| |
| Total Return (%) | b | 2.84c | | 28.09 | | (24.36) | | (4.04) | | 11.21 | | 17.29 | |
|
|
| |
| |
| |
| |
| |
| |
| Ratios/Supplemental Data (%): | | | | | | | | | | | | |
| Ratio of expenses to | | | | | | | | | | | | |
| average net assets | .57c | | 1.15 | | 1.15 | | 1.15 | | 1.15 | | 1.15 | |
| Ratio of net investment income | | | | | | | | | | | | |
| to average net assets | .26c | | .71 | | .41 | | .58 | | .79 | | .41 | |
| Portfolio Turnover Rate | 45.24c | | 54.58 | | 67.21 | | 68.77 | | 88.70 | | 91.22 | |
|
| |
| |
| |
| |
| |
| |
| Net Assets, end of period | | | | | | | | | | | | |
| ($ X 1,000) | | 617,380 | | 607,633 | | 504,371 | | 695,054 | | 634,410 | | 590,129 | |
a Based on average shares outstanding at each month end.
b
| Exclusive of sales charge.
|
c
| Not annualized.
|
See notes to financial statements.
The Fund 15
FINANCIAL HIGHLIGHTS (continued)
| | Six Months Ended | | | | | | | | | | | |
| | June 30, 2004 | | | | Year Ended December 31, | | | |
| | | | | |
| | | |
| Class B Shares | | (Unaudited) | | 2003 | | 2002 | | 2001 | | 2000 | | 1999 | |
|
|
| |
| |
| |
| |
| |
| |
| Per Share Data ($): | | | | | | | | | | | | |
| Net asset value, | | | | | | | | | | | | | |
| beginning of period | 27.02 | | 21.27 | | 28.33 | | 30.68 | | 30.64 | | 29.19 | |
| Investment Operations: | | | | | | | | | | | | |
| Investment income (loss)—neta | (.03) | | (.01) | | (.08) | | (.07) | | .01 | | (.10) | |
| Net realized and unrealized | | | | | | | | | | | | |
| gain (loss) on investments | .69 | | 5.77 | | (6.98) | | (1.42) | | 3.01 | | 4.76 | |
| Total from Investment Operations | .66 | | 5.76 | | (7.06) | | (1.49) | | 3.02 | | 4.66 | |
| Distributions: | | | | | | | | | | | | | |
| Dividends from investment | | | | | | | | | | | | |
| income—net | | — | | (.01) | | — | | (.00)b | | (.03) | | — | |
| Dividends from net realized | | | | | | | | | | | | |
| gain on investments | — | | — | | — | | (.86) | | (2.95) | | (3.21) | |
| Total Distributions | | — | | (.01) | | — | | (.86) | | (2.98) | | (3.21) | |
| Net asset value, end of period | 27.68 | | 27.02 | | 21.27 | | 28.33 | | 30.68 | | 30.64 | |
|
| |
| |
| |
| |
| |
| |
| Total Return (%) | c | 2.48d | | 27.12 | | (24.92) | | (4.79) | | 10.39 | | 16.37 | |
|
|
| |
| |
| |
| |
| |
| |
| Ratios/Supplemental Data (%): | | | | | | | | | | | | |
| Ratio of expenses to | | | | | | | | | | | | |
| average net assets | .94d | | 1.90 | | 1.90 | | 1.90 | | 1.90 | | 1.90 | |
| Ratio of net investment income | | | | | | | | | | | | |
| (loss) to average net assets | (.11)d | | (.04) | | (.33) | | (.24) | | .03 | | (.33) | |
| Portfolio Turnover Rate | 45.24d | | 54.58 | | 67.21 | | 68.77 | | 88.70 | | 91.22 | |
|
| |
| |
| |
| |
| |
| |
| Net Assets, end of period | | | | | | | | | | | | |
| ($ X 1,000) | | 79,004 | | 78,780 | | 62,820 | | 68,123 | | 17,209 | | 6,792 | |
a Based on average shares outstanding at each month end.
b
| Amount represents less than $.01 per share.
|
c
| Exclusive of sales charge.
|
d
| Not annualized.
|
See notes to financial statements.
16
| | Six Months Ended | | | | | | | | | | | |
| | June 30, 2004 | | | | Year Ended December 31, | | | |
| | | | | |
| | | |
| Class C Shares | | (Unaudited) | | 2003 | | 2002 | | 2001 | | 2000 | | 1999 | |
|
|
| |
| |
| |
| |
| |
| |
| Per Share Data ($): | | | | | | | | | | | | |
| Net asset value, | | | | | | | | | | | | | |
| beginning of period | 27.02 | | 21.27 | | 28.34 | | 30.68 | | 30.64 | | 29.19 | |
| Investment Operations: | | | | | | | | | | | | |
| Investment income (loss)—neta | (.03) | | (.01) | | (.08) | | (.06) | | .00b | | (.11) | |
| Net realized and unrealized | | | | | | | | | | | | |
| gain (loss) on investments | .70 | | 5.77 | | (6.99) | | (1.42) | | 3.02 | | 4.77 | |
| Total from Investment Operations | .67 | | 5.76 | | (7.07) | | (1.48) | | 3.02 | | 4.66 | |
| Distributions: | | | | | | | | | | | | | |
| Dividends from investment | | | | | | | | | | | | |
| income—net | | — | | (.01) | | — | | (.00)b | | (.03) | | — | |
| Dividends from net realized | | | | | | | | | | | | |
| gain on investments | — | | — | | — | | (.86) | | (2.95) | | (3.21) | |
| Total Distributions | | — | | (.01) | | — | | (.86) | | (2.98) | | (3.21) | |
| Net asset value, end of period | 27.69 | | 27.02 | | 21.27 | | 28.34 | | 30.68 | | 30.64 | |
|
| |
| |
| |
| |
| |
| |
| Total Return (%) | c | 2.48d | | 27.12 | | (24.95) | | (4.75) | | 10.35 | | 16.41 | |
|
|
| |
| |
| |
| |
| |
| |
| Ratios/Supplemental Data (%): | | | | | | | | | | | | |
| Ratio of expenses to | | | | | | | | | | | | |
| average net assets | .94d | | 1.90 | | 1.90 | | 1.90 | | 1.90 | | 1.90 | |
| Ratio of net investment income | | | | | | | | | | | | |
| (loss)to average net assets | (.11)d | | (.04) | | (.32) | | (.24) | | .01 | | (.35) | |
| Portfolio Turnover Rate | 45.24d | | 54.58 | | 67.21 | | 68.77 | | 88.70 | | 91.22 | |
|
| |
| |
| |
| |
| |
| |
| Net Assets, end of period | | | | | | | | | | | | |
| ($ X 1,000) | | 21,938 | | 22,480 | | 20,819 | | 23,612 | | 3,459 | | 1,192 | |
a Based on average shares outstanding at each month end.
b
| Amount represents less than $.01 per share.
|
c
| Exclusive of sales charge.
|
d
| Not annualized.
|
See notes to financial statements.
The Fund 17
FINANCIAL HIGHLIGHTS (continued)
| | Six Months Ended | | | | | | | | | | | |
| | June 30, 2004 | | | | Year Ended December 31, | | | |
| | | | | |
| | | |
| Class R Shares | (Unaudited) | | 2003 | | 2002 | | 2001 | | 2000 | | 1999 | |
|
| |
| |
| |
| |
| |
| |
| Per Share Data ($): | | | | | | | | | | | | |
| Net asset value, | | | | | | | | | | | | |
| beginning of period | 27.43 | | 21.56 | | 28.62 | | 30.92 | | 30.82 | | 29.25 | |
| Investment Operations: | | | | | | | | | | | | |
| Investment income—neta | .11 | | .22 | | .17 | | .23 | | .32 | | .20 | |
| Net realized and unrealized | | | | | | | | | | | | |
| gain (loss) on investments | .71 | | 5.87 | | (7.08) | | (1.44) | | 3.04 | | 4.79 | |
| Total from Investment Operations | .82 | | 6.09 | | (6.91) | | (1.21) | | 3.36 | | 4.99 | |
| Distributions: | | | | | | | | | | | | |
| Dividends from investment | | | | | | | | | | | | |
| income—net | (.11) | | (.22) | | (.15) | | (.23) | | (.31) | | (.21) | |
| Dividends from net realized | | | | | | | | | | | | |
| gain on investments | — | | — | | — | | (.86) | | (2.95) | | (3.21) | |
| Total Distributions | (.11) | | (.22) | | (.15) | | (1.09) | | (3.26) | | (3.42) | |
| Net asset value, end of period | 28.14 | | 27.43 | | 21.56 | | 28.62 | | 30.92 | | 30.82 | |
|
| |
| |
| |
| |
| |
| |
| Total Return (%) | 2.97b | | 28.43 | | (24.18) | | (3.80) | | 11.49 | | 17.59 | |
|
| |
| |
| |
| |
| |
| |
| Ratios/Supplemental Data (%): | | | | | | | | | | | | |
| Ratio of expenses to | | | | | | | | | | | | |
| average net assets | .45b | | .90 | | .90 | | .90 | | .90 | | .90 | |
| Ratio of net investment income | | | | | | | | | | | | |
| to average net assets | .38b | | .95 | | .67 | | .78 | | 1.03 | | .65 | |
| Portfolio Turnover Rate | 45.24b | | 54.58 | | 67.21 | | 68.77 | | 88.70 | | 91.22 | |
|
| |
| |
| |
| |
| |
| |
| Net Assets, end of period | | | | | | | | | | | | |
| ($ X 1,000) | 56,868 | | 52,723 | | 40,320 | | 46,555 | | 1,138 | | 885 | |
| a | Based on average shares outstanding at each month end. |
| b | Not annualized. |
See notes to financial statements.
18
| | Six Months Ended | | | | | | | | | | | |
| | | June 30, 2004 | | | | Year Ended December 31, | | | |
| | | | | | |
| | | |
| Class T Shares | | (Unaudited) | | 2003 | | 2002 | | 2001 | | 2000 | | 1999a | |
|
|
| |
| |
| |
| |
| |
| |
| Per Share Data ($): | | | | | | | | | | | | |
| Net asset value, | | | | | | | | | | | | | |
| beginning of period | 27.43 | | 21.57 | | 28.63 | | 30.93 | | 30.84 | | 32.45 | |
| Investment Operations: | | | | | | | | | | | | |
| Investment income—netb | .04 | | .11 | | .05 | | .07 | | .17 | | .01 | |
| Net realized and unrealized | | | | | | | | | | | | |
| gain (loss) on investments | .71 | | 5.85 | | (7.07) | | (1.42) | | 3.03 | | 1.23 | |
| Total from Investment Operations | .75 | | 5.96 | | (7.02) | | (1.35) | | 3.20 | | 1.24 | |
| Distributions: | | | | | | | | | | | | | |
| Dividends from investment | | | | | | | | | | | | |
| income—net | | (.04) | | (.10) | | (.04) | | (.09) | | (.16) | | (.02) | |
| Dividends from net realized | | | | | | | | | | | | |
| gain on investments | — | | — | | — | | (.86) | | (2.95) | | (2.83) | |
| Total Distributions | | (.04) | | (.10) | | (.04) | | (.95) | | (3.11) | | (2.85) | |
| Net asset value, end of period | 28.14 | | 27.43 | | 21.57 | | 28.63 | | 30.93 | | 30.84 | |
|
| |
| |
| |
| |
| |
| |
| Total Return (%) | c | 2.72d | | 27.72 | | (24.53) | | (4.28) | | 10.89 | | 4.10d | |
|
|
| |
| |
| |
| |
| |
| |
| Ratios/Supplemental Data (%): | | | | | | | | | | | | |
| Ratio of expenses to | | | | | | | | | | | | |
| average net assets | .70d | | 1.40 | | 1.40 | | 1.40 | | 1.40 | | .53d | |
| Ratio of net investment income | | | | | | | | | | | | |
| to average net assets | .14d | | .45 | | .21 | | .25 | | .57 | | .05d | |
| Portfolio Turnover Rate | 45.24d | | 54.58 | | 67.21 | | 68.77 | | 88.70 | | 91.22 | |
|
| |
| |
| |
| |
| |
| |
| Net Assets, end of period | | | | | | | | | | | | |
| ($ X 1,000) | | 2,609 | | 2,264 | | 1,567 | | 1,132 | | 154 | | 18 | |
a From August 16, 1999 (commencement of initial offering) to December 31, 1999.
b
| Based on average shares outstanding at each month end.
|
c
| Exclusive of sales charge.
|
d
| Not annualized.
|
See notes to financial statements.
The Fund 19
FINANCIAL HIGHLIGHTS (continued)
| | Six Months Ended | | | | | | | | | | | |
| | June 30, 2004 | | | | Year Ended December 31, | | | |
| | | | | |
| | | |
| Institutional Shares | (Unaudited) | | 2003 | | 2002 | | 2001 | | 2000 | | 1999 | |
|
| |
| |
| |
| |
| |
| |
| Per Share Data ($): | | | | | | | | | | | | |
| Net asset value, | | | | | | | | | | | | |
| beginning of period | 27.42 | | 21.55 | | 28.60 | | 30.90 | | 30.81 | | 29.24 | |
| Investment Operations: | | | | | | | | | | | | |
| Investment income—neta | .09 | | .19 | | .13 | | .20 | | .27 | | .16 | |
| Net realized and unrealized | | | | | | | | | | | | |
| gain (loss) on investments | .70 | | 5.87 | | (7.07) | | (1.45) | | 3.04 | | 4.78 | |
| Total from Investment Operations | .79 | | 6.06 | | (6.94) | | (1.25) | | 3.31 | | 4.94 | |
| Distributions: | | | | | | | | | | | | |
| Dividends from investment | | | | | | | | | | | | |
| income—net | (.08) | | (.19) | | (.11) | | (.19) | | (.27) | | (.16) | |
| Dividends from net realized | | | | | | | | | | | | |
| gain on investments | — | | — | | — | | (.86) | | (2.95) | | (3.21) | |
| Total Distributions | (.08) | | (.19) | | (.11) | | (1.05) | | (3.22) | | (3.37) | |
| Net asset value, end of period | 28.13 | | 27.42 | | 21.55 | | 28.60 | | 30.90 | | 30.81 | |
|
| |
| |
| |
| |
| |
| |
| Total Return (%) | 2.90b | | 28.25 | | (24.28) | | (3.96) | | 11.30 | | 17.41 | |
|
| |
| |
| |
| |
| |
| |
| Ratios/Supplemental Data (%): | | | | | | | | | | | | |
| Ratio of expenses to | | | | | | | | | | | | |
| average net assets | .52b | | 1.05 | | 1.05 | | 1.05 | | 1.05 | | 1.05 | |
| Ratio of net investment income | | | | | | | | | | | | |
| to average net assets | .31b | | .81 | | .51 | | .70 | | .89 | | .50 | |
| Portfolio Turnover Rate | 45.24b | | 54.58 | | 67.21 | | 68.77 | | 88.70 | | 91.22 | |
|
| |
| |
| |
| |
| |
| |
| Net Assets, end of period | | | | | | | | | | | | |
| ($ X 1,000) | 40,243 | | 41,848 | | 37,174 | | 58,557 | | 63,473 | | 65,111 | |
| a | Based on average shares outstanding at each month end. |
| b | Not annualized. |
| See notes to financial statements. |
20
NOTES TO FINANCIAL STATEMENTS (Unaudited)
NOTE 1—Significant Accounting Policies:
Dreyfus Premier Core Value Fund (the "fund") is a separate diversified series of The Dreyfus/Laurel Funds Trust (the "Trust") which is registered under the Investment Company Act of 1940, as amended (the "Act"), as an open-end management investment company and operates as a series company currently offering three series, including the fund. The fund's investment objective is to seek long-term capital growth.The Dreyfus Corporation (the "Manager" or "Dreyfus") serves as the fund's investment manager. The Manager is a wholly-owned subsidiary of Mellon Financial Corporation ("Mellon Financial").
Dreyfus Service Corporation (the "Distributor"), a wholly-owned subsidiary of the Manager, is the distributor of the fund's shares.The fund is authorized to issue an unlimited number of shares of Beneficial Interest in each of the following classes of shares: Class A, Class B, Class C, Class R, Class T and Institutional shares. Class A, Class B, Class C and Class T shares are sold primarily to retail investors through financial intermediaries and bear a distribution fee and/or service fee. Class A and Class T shares are subject to a front-end sales charge, while Class B and Class C shares are subject to a contingent deferred sales charge ("CDSC"). Class B shares automatically convert to Class A shares after six years. Class R shares are sold primarily to bank trust departments and other financial service providers (including Mellon Financial and its affiliates) acting on behalf of customers having a qualified trust or investment account or relationship at such institution, and bear no distribution or service fees. Class R and Institutional shares are offered without a front-end sales charge or CDSC. Institutional shares are offered only to those customers of certain financial planners and investment advisers who held shares of a predecessor class of the fund as of April 4, 1994, and bear a distribution fee. Each class of shares has identical rights and privileges, except with respect to the distribution and service fees and voting rights on matters affecting a single class.
The Fund 21
NOTES TO FINANCIAL STATEMENTS (Unaudited) (continued)
Investment income, net of expenses (other than class specific expenses) and realized and unrealized gains and losses are allocated daily to each class of shares based upon the relative proportion of net assets of each class.
The fund's financial statements are prepared in accordance with U.S. generally accepted accounting principles, which may require the use of management estimates and assumptions. Actual results could differ from those estimates.
(a) Portfolio valuation: Investments in securities are valued at the last sales price on the securities exchange or national securities market on which such securities are primarily traded. Securities listed on the National Market System, for which market quotations are available are valued at the official closing price or, if there is no official closing price that day, at the last sale price. Securities not listed on an exchange or the national securities market, or securities for which there were no transactions, are valued at the average of the most recent bid and asked prices. Bid price is used when no asked price is available.When market quotations or official closing prices are not readily available, or are determined not to reflect accurately fair value, such as when the value of a security has been significantly affected by events after the close of the exchange or market on which the security is principally traded (for example, a foreign exchange or market), but before the fund calculates its net asset value, the fund may value these investments at fair value as determined in accordance with the procedures approved by the fund's Board. Fair valuing of securities may be determined with the assistance of a pricing service using calculations based on indices of domestic securities and other appropriate indicators, such as prices of relevant ADR's and futures contracts. Investments denominated in foreign currencies are translated to U.S. dollars at the prevailing rates of exchange. Forward currency exchange contracts are valued at the forward rate.
(b) Securities transactions and investment income: Securities transactions are recorded on a trade date basis. Realized gain and loss from securities transactions are recorded on the identified cost basis.
22
Dividend income is recognized on the ex-dividend date and interest income, including, where applicable, accretion of discount and amortization of premium on investments, is recognized on the accrual basis.
The fund may lend securities to qualified institutions. At origination, all loans are secured by collateral of at least 102% of the value of U.S. securities loaned and 105% of the value of foreign securities loaned. Collateral equivalent to at least 100% of the market value of securities on loan will be maintained at all times. Cash collateral is invested in certain money market mutual funds managed by the Manager as shown in the fund's Statement of Investments.The fund will be entitled to receive all income on securities loaned, in addition to income earned as a result of the lending transaction. Although each security loaned is fully collateralized, the fund would bear the risk of delay in recovery of, or loss of rights in, the securities loaned should a borrower fail to return the securities in a timely manner.
(c) Affiliated issuers: Investments in other investment companies advised by the Manager are defined as "affiliated" in the Act.
(d) Foreign currency transactions: The fund does not isolate that portion of the results of operations resulting from changes in foreign exchange rates on investments from the fluctuations arising from changes in the market prices of securities held. Such fluctuations are included with the net realized and unrealized gain or loss from investments.
Net realized foreign exchange gains or losses arise from sales and maturities of short-term securities, sales of foreign currencies, currency gains or losses realized on securities transactions and the difference between the amount of dividends, interest, and foreign withholding taxes recorded on the fund's books and the U.S. dollar equivalent of the amounts actually received or paid. Net unrealized foreign exchange gains and losses arise from changes in the value of assets and liabilities other than investments in securities, resulting from changes in exchange rates. Such gains and losses are included with net realized and unrealized gain or loss on investments.
The Fund 23
NOTES TO FINANCIAL STATEMENTS (Unaudited) (continued)
(e) Forward currency exchange contracts: The fund enters into forward currency exchange contracts in order to hedge its exposure to changes in foreign currency exchange rates on its foreign portfolio holdings and to settle foreign currency transactions. When executing forward currency exchange contracts, the fund is obligated to buy or sell a foreign currency at a specified rate on a certain date in the future. With respect to sales of forward currency exchange contracts, the fund would incur a loss if the value of the contract increases between the date the forward contract is opened and the date the forward contract is closed.The fund realizes a gain if the value of the contract decreases between those dates. With respect to purchases of forward currency exchange contracts, the fund would incur a loss if the value of the contract decreases between the date the forward contract is opened and the date the forward contract is closed.The fund realizes a gain if the value of the contract increases between those dates. The fund is also exposed to credit risk associated with counter party nonperformance on these forward currency exchange contracts which is typically limited to the unrealized gain on each open contract. At June 30, 2004, there were no open forward currency exchange contracts.
(f) Dividends to shareholders: Dividends are recorded on the ex-dividend date. Dividends from investment income-net are declared and paid on a quarterly basis. Dividends from net realized capital gain, if any, are normally declared and paid annually, but the fund may make distributions on a more frequent basis to comply with the distribution requirements of the Internal Revenue Code of 1986, as amended (the "Code"). To the extent that net realized capital gain can be offset by capital loss carryovers, it is the policy of the fund not to distribute such gain. Income and capital gain distributions are determined in accordance with income tax regulations, which may differ from U.S. generally accepted accounting principles.
(g) Federal income taxes: It is the policy of the fund to continue to qualify as a regulated investment company, if such qualification is in the best interests of its shareholders, by complying with the applicable provisions of the Code, and to make distributions of taxable income sufficient to relieve it from substantially all federal income and excise taxes.
24
The fund has an unused capital loss carryover of $136,140,578 available for federal income tax purposes to be applied against future net securities profits, if any, realized subsequent to December 31, 2003. If not applied, $4,087,843 of the carryover expires in fiscal 2009, $118,801,482 expires in fiscal 2010 and $13,251,253 expires in fiscal 2011.
The tax character of distributions paid to shareholders during the fiscal year ended December 31, 2003 was as follows: ordinary income $4,460,778. The tax character of current year distributions will be determined at the end of the current fiscal year.
NOTE 2—Investment Management Fee and Other Transactions With Affiliates:
(a) Investment management fee: Pursuant to an Investment Management agreement with the Manager, the Manager provides or arranges for one or more third parties and/or affiliates to provide investment advisory, administrative, custody, fund accounting and transfer agency services to the fund. The Manager also directs the investments of the fund in accordance with its investment objective, policies and limitations. For these services, the fund is contractually obligated to pay the Manager a fee, calculated daily and paid monthly, at the annual rate of .90% of the value of the fund's average daily net assets. Out of its fee, the Manager pays all of the expenses of the fund except brokerage fees, taxes, interest, commitment fees, Rule 12b-1 distribution fees and expenses, service fees, fees and expenses of non-interested Trustees (including counsel fees) and extraordinary expenses. In addition, the Manager is required to reduce its fee in an amount equal to the fund's allocable portion of fees and expenses of the non-interested Trustees (including counsel fees). Each Trustee receives $40,000 per year, plus $5,000 for each joint Board meeting of The Dreyfus/Laurel Funds, Inc., The Dreyfus/Laurel Tax-Free Municipal Funds, and the Trust (the "Dreyfus/Laurel Funds") attended, $2,000 for separate committee meetings attended which are not held in conjunction with a regularly scheduled board meeting and $500 for Board meetings and separate committee meetings attended that are conducted by telephone and is reimbursed for travel and out-of-pocket expenses.The Chairman of the
The Fund 25
NOTES TO FINANCIAL STATEMENTS (Unaudited) (continued)
Board receives an additional 25% of such compensation (with the exception of reimbursable amounts). These fees are charged and allocated to each series based on net assets. In the event that there is a joint committee meeting of the Dreyfus/Laurel Funds and the Dreyfus High Yield Strategies Fund, the $2,000 fee will be allocated between the Dreyfus/Laurel Funds and the Dreyfus High Yield Strategies Fund. Amounts required to be paid by the Trust directly to the non-interested Trustees, that would be applied to offset a portion of the management fee payable to the Manager, are in fact paid directly by the Manager to the non-interested Trustees.
During the period ended June 30, 2004, the Distributor retained $54,991 and $1,159 from commissions earned on sales of the fund's Class A and Class T shares, respectively, and $102,695 and $6,876 from contingent deferred sales charges on redemptions on the fund's Class B and Class C shares, respectively.
(b) Distribution and service plan: Under separate Distribution Plans (the "Plans") adopted pursuant to Rule 12b-1 under the Act, Class A shares and Institutional shares may pay annually up to .25% and .15%, respectively, of the value of their average daily net assets to compensate the Distributor for shareholder servicing activities and expenses primarily intended to result in the sale of Class A shares and Institutional shares. Class B, Class C and Class T shares pay the Distributor for distributing their shares at an aggregate annual rate of .75% of the value of the average daily net assets of Class B and Class C shares, and .25% of the value of average daily net assets of Class T shares.The Distributor may pay one or more agents in respect of advertising, marketing and other distribution services for Class T shares and determines the amounts, if any, to be paid to agents and the basis on which such payments are made. Class B, Class C and Class T shares are also subject to a service plan adopted pursuant to Rule 12b-1 (the "Service Plan"), under which Class B, Class C and Class T shares pay the Distributor for providing certain services to the holders of their shares a fee at the annual rate of .25% of the value of the average daily net assets of Class B, Class C and Class T shares, respectively. During the period ended
26
June 30, 2004, Class A, Class B, Class C, Class T and Institutional shares were charged $775,117, $299,490, $85,036, $3,100 and $31,038, respectively, pursuant to their respective Plans. During the period ended June 30, 2004, Class B, Class C and Class T shares were charged $99,830, $28,345 and $3,100, respectively, pursuant to the Service Plan.
Under its terms, the Plans and Service Plan shall remain in effect from year to year, provided such continuance is approved annually by a vote of majority of those Trustees who are not "interested persons" of the Trust and who have no direct or indirect financial interest in the operation of or in any agreement related to the Plans or Service Plan.
The components of Due to The Dreyfus Corporation and affiliates in the Statement of Assets and Liabilities consists of: management fees $599,075, Rule 12b-1 distribution plan fees $192,776 and shareholder services plan fees $21,102.
(c) The Company and the Manager have received an exemptive order from the SEC which, among other things, permits the fund to use cash collateral received in connection with lending the fund's securities and other uninvested cash to purchase shares of one or more registered money market mutual funds advised by the Manager in excess of the limitations imposed by the Act.
NOTE 3—Securities Transactions:
The aggregate amount of purchases and sales of investment securities, excluding short-term securities, during the period ended June 30, 2004, amounted to $363,657,128 and $369,380,761, respectively.
At June 30, 2004, accumulated net unrealized appreciation on investments was $112,273,676, consisting of $124,679,111 gross unrealized appreciation and $12,405,435 gross unrealized depreciation.
At June 30,2004,the cost of investments for federal income tax purposes was substantially the same as the cost for financial reporting purposes (see the Statement of Investments).
The Fund 27
NOTES TO FINANCIAL STATEMENTS (Unaudited) (continued)
NOTE 4—Bank Line of Credit:
The fund participates with other Dreyfus-managed funds in a $350 million redemption credit facility ("the Facility") to be utilized for temporary or emergency purposes, including the financing of redemptions. In connection therewith, the fund has agreed to pay commitment fees on its pro rata portion of the Facility. Interest is charged to the fund based on prevailing market rates in effect at the time of borrowings. During the period ended June 30, 2004, the fund did not borrow under the Facility.
NOTE 5—Legal Matters:
Two class actions (which have been consolidated) have been filed against Mellon Financial and Mellon Bank, N.A., and Dreyfus and Founders Asset Management LLC (the "Investment Advisers"), and the directors of all or substantially all of the Dreyfus funds, alleging that the Investment Advisers improperly used assets of the Dreyfus funds, in the form of directed brokerage commissions and 12b-1 fees, to pay brokers to promote sales of Dreyfus funds, and that the use of fund assets to make these payments was not properly disclosed to investors.The complaints further allege that the directors breached their fiduciary duties to fund shareholders under the Investment Company Act of 1940 and at common law. The complaints seek unspecified compensatory and punitive damages, rescission of the funds' contracts with the Investment Advisers, an accounting of all fees paid, and an award of attorneys' fees and litigation expenses. Dreyfus and the Dreyfus funds believe the allegations to be totally without merit and will defend the actions vigorously.
Additional lawsuits arising out of these circumstances and presenting similar allegations and requests for relief may be filed against the defendants in the future. Neither Dreyfus nor the Dreyfus funds believe that any of the pending actions will have a material adverse effect on the Dreyfus funds or Dreyfus' ability to perform its contracts with the Dreyfus funds.
28
For More Information
| Dreyfus Premier |
| Core Value Fund |
| 200 Park Avenue |
| New York, NY 10166 |
| |
| Manager |
| The Dreyfus Corporation |
| 200 Park Avenue |
| New York, NY 10166 |
|
| |
| Custodian |
| Mellon Bank, N.A. |
| One Mellon Bank Center |
| Pittsburgh, PA 15258 |
| |
| Transfer Agent & |
| Dividend Disbursing Agent |
| Dreyfus Transfer, Inc. |
| 200 Park Avenue |
| New York, NY 10166 |
| |
| Distributor |
| Dreyfus Service Corporation |
| 200 Park Avenue |
| New York, NY 10166 |
To obtain information:
By telephone
Call your financial representative or 1-800-554-4611
By mail Write to: The Dreyfus Premier Family of Funds 144 Glenn Curtiss Boulevard Uniondale, NY 11556-0144
A description of the policies and procedures that the fund uses to determine how to vote proxies relating to portfolio securities is available, without charge, by calling the telephone number listed above, or by visiting the SEC's website at http://www.sec.gov
© 2004 Dreyfus Service Corporation 0312SA0604

The views expressed in this report reflect those of the portfolio manager only through the end of the period covered and do not necessarily represent the views of Dreyfus or any other person in the Dreyfus organization. Any such views are subject to change at any time based upon market or other conditions and Dreyfus disclaims any responsibility to update such views.These views may not be relied on as investment advice and, because investment decisions for a Dreyfus fund are based on numerous factors, may not be relied on as an indication of trading intent on behalf of any Dreyfus fund.
Not FDIC-Insured • Not Bank-Guaranteed • May Lose Value
Contents
THE FUND
2
| Letter from the Chairman
|
3
| Discussion of Fund Performance
|
6
| Statement of Investments
|
22
| Statement of Assets and Liabilities
|
23
| Statement of Operations
|
24
| Statement of Changes in Net Assets
|
27
| Financial Highlights
|
31
| Notes to Financial Statements
|
FOR MORE INFORMATION
|
Back Cover
|
| Dreyfus Premier |
| Limited Term High Yield Fund |
The Fund

LETTER FROM THE CHAIRMAN
Dear Shareholder:
This semiannual report for Dreyfus Premier Limited Term High Yield Fund covers the six-month period from January 1, 2004, through June 30, 2004. Inside, you'll find valuable information about how the fund was managed during the reporting period, including a discussion with Gerald E. Thunelius, portfolio manager and Director of the Dreyfus Taxable Fixed Income Team that manages the fund.
The U.S. economy increasingly showed signs of sustainable growth during the first half of 2004, causing heightened volatility in most sectors of the U.S. bond market.When it became clearer in the spring that an unexpectedly strong job market and higher energy prices reflected renewed inflationary pressures, many fixed-income investors began to anticipate higher interest rates. In fact, on the last day of the reporting period, the Federal Reserve Board raised short-term rates in what many analysts believe is the first in a series of gradual increases.
To many investors, the move to a less accommodative monetary policy marks the beginning of a new phase in the economic cycle. At times such as these, when market conditions are in a period of transition, we believe it is especially important for you to stay in close contact with your financial advisor, who can help you position your portfolio in a way that is designed to respond to the challenges and opportunities of today's changing investment environment.
Thank you for your continued confidence and support.
Sincerely,

Stephen E. Canter
Chairman and Chief Executive Officer The Dreyfus Corporation
July 15, 2004
2

DISCUSSION OF FUND PERFORMANCE
| Gerald E. Thunelius, Director and Senior Portfolio Manager |
| Dreyfus Taxable Fixed Income Team |
How did Dreyfus Premier Limited Term High Yield Fund perform relative to its benchmark?
For the six-month period ended June 30, 2004, the fund achieved total returns of 1.68% for its Class A shares, 1.57% for Class B shares, 1.31% for Class C shares and 1.96% for Class R shares.The fund generated aggregate income dividends of $0.2738 for Class A shares, $0.2558 for Class B shares, $0.2470 for Class C shares and $0.2840 for Class R shares.1 In comparison, the Merrill Lynch High Yield Master II Index, the fund's benchmark, achieved a total return of 1.36% for the same period.2
High-yield corporate bonds produced modestly positive total returns during the first half of 2004, as the beneficial effects of stronger economic growth were largely offset by concerns regarding rising interest rates and high corporate bond valuations compared to historical norms.The fund's returns ranged from in line with to modestly higher than the benchmark's return, which we attribute to the value added by our security selection strategy.
What is the fund's investment approach?
The fund seeks to maximize total return, consisting of capital appreciation and current income.The average effective maturity of the fund is limited to a maximum of 5.5 years.
We normally invest at least 80% of the fund's assets in fixed-income securities that are rated below investment grade ("high yield" or "junk" bonds) or are the unrated equivalent as determined by Dreyfus. Our approach to selecting individual issues is based on careful credit analysis.We thoroughly analyze the business, management and financial strength of each of the companies whose bonds we buy, then project each issuer's ability to repay its debt.
The Fund 3
DISCUSSION OF FUND PERFORMANCE (continued)
What other factors influenced the fund's performance?
High-yield corporate bonds remained in a relatively narrow trading range during the first half of 2004. On one hand, continuing economic growth, improving business conditions for many individual issuers and industries and a relatively limited supply of newly issued bonds supported security prices. On the other hand, the market's returns were constrained by the uncertainty of ongoing geopolitical instability and investors' mounting concerns that long-dormant inflationary pressures might resurface, potentially leading to higher interest rates.
In addition, in January 2004, high-yield bond prices generally reached multi-year highs, while yield differences relative to U.S.Treasury securities hovered near historical lows.These market conditions suggested to us that corporate bonds might be overvalued, and we adopted a more defensive investment posture, emphasizing higher-quality, shorter-term securities and increasing the percentage of assets allocated to cash equivalents.This shift to a more conservative positioning benefited the fund's relative performance during the first quarter of 2004, when investors began to question the sustainability of the economic recovery, and high-yield bond prices fell modestly.
In early April, however, the U.S. Department of Labor released a report showing unexpected strength in U.S. labor markets, and investors were reassured that the economic recovery remained intact. Although the prospect of further improvements in business conditions was tempered by renewed inflation concerns amid rising employment and higher energy prices, high-yield bond prices started to rally. Accordingly, we redeployed some of the fund's cash to high-yield securities. By the end of the reporting period, corporate bond prices began to approach their January 2004 highs, and on June 30, 2004, the Federal Reserve Board raised short-term interest rates by 25 basis points in what most analysts regarded as the first in a series of gradual increases.
In this environment, the fund received positive contributions to performance from its holdings in the chemicals and gaming industries, both areas where the fund had what we considered to be greater expo-
4
sure than its benchmark. In the chemicals area, bonds issued by Resolution Performance Products fared particularly well. The fund's returns also were boosted by its relatively light holdings of bonds from telecommunications companies, which generally lost value during the reporting period. In the telecommunications sector, however, the fund received especially good results from the bonds of Fairpoint Communications, which the company still owns, when the company announced that it would replace its high-yield bonds with income deposit securities — which trade like stocks on an exchange.
What is the fund's current strategy?
In light of the high-yield bond market's rally during the second quarter of 2004, we have maintained a generally conservative investment posture, including a "barbell" strategy in which higher-quality, shorter-term bonds are balanced by longer-term bonds from issuers that we believe to have strong credit characteristics.At the same time, we remain alert for trading opportunities among bonds whose prices, in our analysis, may not fully reflect the quality of their underlying businesses. In our view, this is a prudent approach in a rising interest-rate environment characterized by historically high security valuations.
July 15, 2004
1
| Total return includes reinvestment of dividends and any capital gains paid, and does not take into consideration the maximum initial sales charge in the case of Class A shares, or the applicable contingent deferred sales charges imposed on redemptions in the case of Class B and Class C shares. Had these charges been reflected, returns would have been lower. Past performance is no guarantee of future results. Share price, yield and investment return fluctuate such that upon redemption, fund shares may be worth more or less than their original cost.
|
2
| SOURCE: LIPPER INC. — Reflects reinvestment of dividends and, where applicable, capital gain distributions.The Merrill Lynch HighYield Master II Index is an unmanaged performance benchmark composed of U.S. domestic andYankee bonds rated below investment grade with at least $100 million par amount outstanding and greater than or equal to one year to maturity.
|
The Fund 5
| STATEMENT OF INVESTMENTS |
| June 30, 2004 (Unaudited) |
| | Principal | | | |
| Bonds and Notes—92.2% | Amount ($) | Value ($) | |
|
|
| |
| Advertising—.8% | | | | |
| RH Donnelley Finance: | | | | |
| Sr. Notes, 8.875%, 2010 | 783,000 | a | 863,258 | |
| Sr. Sub. Notes, 10.875%, 2012 | 3,272,000 | a | 3,811,880 | |
| | | | 4,675,138 | |
| Aerospace & Defense—1.5% | | | | |
| Argo Tech, | | | | |
| Sr. Notes, 9.25%, 2011 | 1,470,000 | a | 1,521,450 | |
| Armor, | | | | |
| Sr. Sub. Notes, 8.25%, 2013 | 2,250,000 | | 2,418,750 | |
| K&F Industries, | | | | |
| Sr. Sub. Notes, Ser. B, 9.625%, 2010 | 785,000 | | 864,481 | |
| L-3 Communications, | | | | |
| Sr. Sub. Notes, 6.125%, 2013 | 2,000,000 | | 1,940,000 | |
| Vought Aircraft Industries, | | | | |
| Sr. Notes, 8%, 2011 | 2,800,000 | a | 2,674,000 | |
| | | | 9,418,681 | |
| Agricultural—.1% | | | | |
| Seminis Vegetable Seeds, | | | | |
| Sr. Sub. Notes, 10.25%, 2013 | 755,000 | | 824,837 | |
| Airlines—.7% | | | | |
| AMR, | | | | |
| Debs., 9.75%, 2021 | 200,000 | | 145,000 | |
| Aircraft Lease Portfolio Securitization 1996-1, | | | | |
| Pass-Through Trust, Ctfs., | | | | |
| Cl. D, 12.75%, 2006 | 2,115,124 | b | 21,151 | |
| Northwest Airlines: | | | | |
| Pass-Through Ctfs., Ser. 1996-1, 7.67%, 2015 | 1,636,058 | | 1,340,447 | |
| Sr. Notes, 10%, 2009 | 2,402,000 | c | 1,813,510 | |
| United AirLines, | | | | |
| Enhanced Pass-Through Ctfs., | | | | |
| Ser. 1997-1A, 1.535%, 2049 | 817,529 | d | 672,773 | |
| | | | 3,992,881 | |
| Auto Manufacturing—.3% | | | | |
| Navistar International, | | | | |
| Sr. Notes, 7.5%, 2011 | 1,601,000 | | 1,649,029 | |
| Automotive, Trucks & Parts—1.0% | | | | |
| Accuride, | | | | |
| Sr. Sub. Notes, Ser. B, 9.25%, 2008 | 2,265,000 | | 2,321,625 | |
| Airxcel, | | | | |
| Sr. Sub. Notes, Ser. B, 11%, 2007 | 611,000 | | 565,175 | |
6
| | Principal | | | |
| Bonds and Notes (continued) | Amount ($) | Value ($) | |
|
|
| |
| Automotive, Trucks & Parts (continued) | | | | |
| Collins & Aikman Products, | | | | |
| Sr. Notes, 10.75%, 2011 | 754,000 | | 761,540 | |
| HLI Operating, | | | | |
| Sr. Notes, 10.5%, 2010 | 350,000 | | 395,500 | |
| Tenneco Automotive, | | | | |
| Secured Sr. Notes, Ser. B, 10.25%, 2013 | 1,200,000 | c | 1,362,000 | |
| UIS, | | | | |
| Sr. Sub. Notes, 9.375%, 2013 | 768,000 | c | 787,200 | |
| | | | 6,193,040 | |
| Building & Construction—1.9% | | | | |
| Atrium Cos., | | | | |
| Sr. Sub. Notes, Ser. B, 10.5%, 2009 | 1,890,000 | | 1,989,225 | |
| K Hovnanian Enterprises, | | | | |
| Sr. Sub. Notes, 8.875%, 2012 | 1,000,000 | | 1,055,000 | |
| KB Home, | | | | |
| Sr. Sub. Notes, 7.75%, 2010 | 2,000,000 | | 2,070,000 | |
| Owens Corning: | | | | |
| Bonds, 7.5%, 2018 | 394,000 | b | 179,270 | |
| Notes, 7%, 2009 | 5,000,000 | b | 2,275,000 | |
| Techical Olympics USA, | | | | |
| Sub. Notes, 7.5%, 2011 | 1,500,000 | c | 1,402,500 | |
| WCI Communities, | | | | |
| Sr. Sub. Notes, 10.625%, 2011 | 2,300,000 | | 2,558,750 | |
| | | | 11,529,745 | |
| Chemicals—5.4% | | | | |
| HMP Equity: | | | | |
| Sr. Discount Notes, 0%, 2008 | 1,867,000 | a | 1,092,195 | |
| Units, 0%, 2008 | 526,000 | a,e | 407,650 | |
| Huntsman, | | | | |
| Gtd. Sr. Notes, 11.625%, 2010 | 1,081,000 | c | 1,199,910 | |
| Huntsman ICI Chemicals, | | | | |
| Sr. Sub. Notes, 10.125%, 2009 | 6,968,000 | c | 7,142,200 | |
| Nalco, | | | | |
| Sr. Sub. Notes, 8.875%, 2013 | 4,153,000 | a,c | 4,371,033 | |
| OM Group, | | | | |
| Sr. Sub. Notes, 9.25%, 2011 | 3,600,000 | | 3,708,000 | |
| Resolution Performance Products: | | | | |
| Notes, 8%, 2009 | 749,000 | c | 780,833 | |
| Sr. Sub. Notes, 13.5%, 2010 | 7,797,000 | | 7,309,688 | |
The Fund 7
S T A T E M E N T O F I N V E S T M E N T S ( U n a u d i t e d ) (continued)
| | Principal | | | |
| Bonds and Notes (continued) | Amount ($) | Value ($) | |
|
|
| |
| Chemicals (continued) | | | | |
| Rhodia SA: | | | | |
| Sr. Notes, 7.625%, 2010 | 3,267,000 | a,c | 2,972,970 | |
| Sr. Notes, 10.25%, 2010 | 2,195,000 | a,c | 2,227,923 | |
| Rockwood Specialties, | | | | |
| Sr. Sub. Notes, 10.625%, 2011 | 1,506,000 | | 1,611,420 | |
| | | | 32,823,822 | |
| Commercial Mortgage Pass-Through Ctfs.—.3% | | | | |
| Structured Asset Securities, REMIC, | | | | |
| Ser. 1996-CFL, Cl. H, 7.75%, 2028 | 1,750,000 | | 1,983,572 | |
| Commercial Services—.6% | | | | |
| Brickman, | | | | |
| Sr. Sub. Notes, Ser. B, 11.75%, 2009 | 1,037,000 | | 1,197,737 | |
| United Rentals North America: | | | | |
| Sr. Sub. Notes, 7%, 2014 | 1,000,000 | | 895,000 | |
| Sr. Sub. Notes, 7.75%, 2013 | 1,500,000 | | 1,425,000 | |
| | | | 3,517,737 | |
| Consumer Products—.8% | | | | |
| Ames Tru Temper, | | | | |
| Sr. Sub Notes, 10%, 2012 | 1,604,000 | a | 1,616,030 | |
| Amscan, | | | | |
| Sr. Sub. Notes, 8.75%, 2014 | 882,000 | a | 870,975 | |
| Playtex Products, | | | | |
| Sr. Sub. Notes, 9.375%, 2011 | 2,546,000 | c | 2,488,715 | |
| | | | 4,975,720 | |
| Diversified Financial Service—1.8% | | | | |
| BCP Caylux Holdings Luxemburg SCA, | | | | |
| Sr. Sub. Notes, 9.625%, 2014 | 3,750,000 | a,c | 3,904,688 | |
| Finova, | | | | |
| Notes, 7.5%, 2009 | 4,329,418 | | 2,392,004 | |
| Stena, | | | | |
| Sr. Notes, 7.5%, 2013 | 1,001,000 | | 994,742 | |
| Trump Casino Holdings/Funding, | | | | |
| First Priority Mortgage Notes, 12.625%, 2010 | 3,458,000 | c | 3,561,740 | |
| | | | 10,853,174 | |
| Electric Utilities—6.2% | | | | |
| Allegheny Energy Statutory Trust 2001: | | | | |
| Secured Notes, 10.25%, 2007 | 188,453 | a | 193,164 | |
| Secured Notes, 13%, 2007 | 3,572,546 | a | 3,867,281 | |
8
| | Principal | | | |
| Bonds and Notes (continued) | Amount ($) | Value ($) | |
|
|
| |
| Electric Utilities (continued) | | | | |
| Allegheny Energy Supply: | | | | |
| Bonds, 8.25%, 2012 | 6,827,000 | a,c | 6,784,331 | |
| Notes, 7.8%, 2011 | 1,090,000 | c | 1,070,925 | |
| CMS Energy, | | | | |
| Sr. Notes, 9.875%, 2007 | 2,862,000 | | 3,098,115 | |
| Calpine: | | | | |
| Secured Notes, 8.5%, 2010 | 13,684,000 | a | 11,391,930 | |
| Secured Notes, 8.75%, 2013 | 2,000,000 | a,c | 1,650,000 | |
| Secured Notes, 9.875%, 2011 | 1,002,000 | a | 856,710 | |
| Calpine Generating: | | | | |
| Secured Notes, 7.35%, 2010 | 960,000 | a,c,d | 921,600 | |
| Secured Notes, 10.25%, 2011 | 264,000 | a,c,d | 240,240 | |
| Nevada Power, | | | | |
| Mortgage Notes, 6.5%, 2012 | 483,000 | a | 461,265 | |
| Reliant Energy, | | | | |
| Sr. Secured Notes, 9.25%, 2010 | 5,023,000 | | 5,387,168 | |
| Sierra Pacific Resources, | | | | |
| Sr. Notes, 8.625%, 2014 | 1,910,000 | a | 1,871,800 | |
| | | | 37,794,529 | |
| Electrical & Electronics—1.4% | | | | |
| Dresser, | | | | |
| Sr. Sub. Notes, 9.375%, 2011 | 2,088,000 | | 2,244,600 | |
| Fisher Scientific International, | | | | |
| Sr. Sub. Notes, 8%, 2013 | 2,485,000 | | 2,671,375 | |
| Imax, | | | | |
| Sr. Notes, 9.625%, 2010 | 1,002,000 | a,c | 944,385 | |
| Rayovac, | | | | |
| Sr. Sub. Notes, 8.5%, 2013 | 497,000 | | 524,335 | |
| Stoneridge, | | | | |
| Sr. Notes, 11.5%, 2012 | 1,825,000 | | 2,158,063 | |
| | | | 8,542,758 | |
| Entertainment—2.5% | | | | |
| Argosy Gaming, | | | | |
| Sr. Sub. Notes, 9%, 2011 | 1,768,000 | c | 1,962,480 | |
| Bally Total Fitness, | | | | |
| Sr. Notes, 10.5%, 2011 | 2,707,000 | c | 2,558,115 | |
| Intrawest, | | | | |
| Sr. Notes, 7.5%, 2013 | 2,500,000 | | 2,456,250 | |
The Fund 9
S T A T E M E N T O F I N V E S T M E N T S ( U n a u d i t e d ) (continued)
| | Principal | | | |
| Bonds and Notes (continued) | Amount ($) | Value ($) | |
|
|
| |
| Entertainment (continued) | | | | |
| K2, | | | | |
| Sr. Notes, 7.375%, 2014 | 800,000 | a | 818,000 | |
| Mohegan Tribal Gaming Authority: | | | | |
| Sr. Sub. Notes, 6.375%, 2009 | 2,048,000 | | 2,063,360 | |
| Sr. Sub. Notes, 8.375%, 2011 | 1,048,000 | | 1,137,080 | |
| Penn National Gaming, | | | | |
| Sr. Sub. Notes, 6.875%, 2011 | 1,625,000 | a | 1,602,656 | |
| Six Flags, | | | | |
| Sr. Notes, 9.625%, 2014 | 990,000 | a | 990,000 | |
| Vail Resorts, | | | | |
| Sr. Sub. Notes, 6.75%, 2014 | 1,500,000 | | 1,428,750 | |
| | | | 15,016,691 | |
| Environmental Control—1.9% | | | | |
| Allied Waste: | | | | |
| Gtd. Sr. Notes, Ser. B, 7.625%, 2006 | 5,630,000 | | 5,932,613 | |
| Secured Notes, 6.375%, 2011 | 703,000 | a | 692,455 | |
| Sr. Notes, 7.875%, 2013 | 1,874,000 | | 1,967,700 | |
| Capital Environmental Resource, | | | | |
| Sr. Sub. Notes, 9.5%, 2014 | 936,000 | a | 964,080 | |
| Geo Sub, | | | | |
| Sr. Notes, 11%, 2012 | 1,090,000 | a | 1,107,712 | |
| Synagro Technologies, | | | | |
| Sr. Sub. Notes, 9.5%, 2009 | 1,030,000 | c | 1,081,500 | |
| | | | 11,746,060 | |
| Food & Beverages—1.8% | | | | |
| Agrilink Foods, | | | | |
| Sr. Sub. Notes, 11.875%, 2008 | 257,000 | | 273,062 | |
| American Seafoods, | | | | |
| Sr. Sub. Notes, 10.125%, 2010 | 2,875,000 | | 3,450,000 | |
| Del Monte, | | | | |
| Sr. Sub. Notes, 8.625%, 2012 | 1,031,000 | | 1,116,058 | |
| Dole Foods: | | | | |
| Debs., 8.75%, 2013 | 780,000 | | 819,000 | |
| Sr. Notes, 8.625%, 2009 | 1,005,000 | | 1,057,763 | |
| Sr. Notes, 8.875%, 2011 | 1,558,000 | | 1,655,375 | |
| Land O'Lakes, | | | | |
| Sr. Notes, 8.75%, 2011 | 1,673,000 | c | 1,547,525 | |
| National Beef Packing, | | | | |
| Sr. Notes, 10.5%, 2011 | 1,021,000 | | 1,087,364 | |
| | | | 11,006,147 | |
10
| | Principal | | | |
| Bonds and Notes (continued) | Amount ($) | Value ($) | |
|
|
| |
| Foreign/Governmental—1.6% | | | | |
| Federative Republic of Brazil, | | | | |
| Bonds, 11%, 2040 | 266,000 | | 251,038 | |
| Republic of Argentina, | | | | |
| Bonds, Ser. L-GP, 6%, 2023 | 1,312,000 | b | 671,185 | |
| Republic of Costa Rica: | | | | |
| Bonds, 6.548%, 2014 | 1,140,000 | | 981,375 | |
| Bonds, 9.995%, 2020 | 64,000 | | 67,101 | |
| Notes, 6.914%, 2008 | 1,002,000 | | 985,013 | |
| Republic of Panama, | | | | |
| Bonds, 9.625%, 2011 | 1,765,000 | | 1,963,562 | |
| Republic of Peru, | | | | |
| Bonds, 8.375%, 2016 | 2,048,000 | | 1,914,880 | |
| Russian Federation, | | | | |
| Sr. Bonds, 5%, 2030 | 3,025,000 | d | 2,767,875 | |
| | | | 9,602,029 | |
| Gaming & Lodging—5.0% | | | | |
| Coast Hotels & Casinos, | | | | |
| Sr. Sub. Notes, 9.5%, 2009 | 1,553,000 | | 1,638,415 | |
| Inn of the Mountain Gods Resort & Casino, | | | | |
| Sr. Notes, 12%, 2010 | 1,988,000 | a,c | 2,216,620 | |
| Kerzner International, | | | | |
| Sr. Notes, 8.875%, 2011 | 3,462,000 | | 3,712,995 | |
| MGM Mirage: | | | | |
| Sr. Collateralized Notes, 6.95%, 2005 | 277,000 | | 283,925 | |
| Sr. Notes, 8.5%, 2010 | 1,988,000 | | 2,156,980 | |
| Mandalay Resort, | | | | |
| Sr. Notes, 6.5%, 2009 | 2,024,000 | | 2,067,010 | |
| Park Place Entertainment: | | | | |
| Sr. Sub. Notes, 7.875%, 2005 | 2,348,000 | | 2,474,205 | |
| Sr. Sub. Notes, 7.875%, 2010 | 1,266,000 | c | 1,341,960 | |
| Sr. Sub. Notes, 8.875%, 2008 | 4,236,000 | | 4,606,650 | |
| Resorts International Hotel and Casino, | | | | |
| First Mortgage, 11.5%, 2009 | 3,274,000 | c | 3,715,990 | |
| Station Casinos, | | | | |
| Sr. Sub. Notes, 6.5%, 2014 | 1,500,000 | a | 1,451,250 | |
| Turning Stone Casino Entertainment, | | | | |
| Sr. Notes, 9.125%, 2010 | 2,311,000 | a | 2,426,550 | |
| Wynn Las Vegas, | | | | |
| Second Mortgage, 12%, 2010 | 1,964,000 | c | 2,361,710 | |
| | | | 30,454,260 | |
The Fund 11
S T A T E M E N T O F I N V E S T M E N T S ( U n a u d i t e d ) (continued)
| | Principal | | | |
| Bonds and Notes (continued) | Amount ($) | Value ($) | |
|
|
| |
| Healthcare—5.1% | | | | |
| Alaris Medical Systems, | | | | |
| Sr. Sub. Notes, 7.25%, 2011 | 1,835,000 | | 2,027,675 | |
| Beverly Enterprises, | | | | |
| Sr. Sub Notes, 7.875%, 2014 | 1,069,000 | a | 1,056,974 | |
| Extendicare Health Services, | | | | |
| Sr. Notes, 9.5%, 2010 | 658,000 | | 733,669 | |
| Hanger Orthopedic, | | | | |
| Sr. Notes, 10.375%, 2009 | 3,767,000 | c | 3,870,593 | |
| Healthsouth: | | | | |
| Sr. Notes, 6.875%, 2005 | 1,001,000 | c | 1,007,256 | |
| Sr. Notes, 7%, 2008 | 2,964,000 | c | 2,897,310 | |
| Mariner Health Care, | | | | |
| Sr. Sub. Notes, 8.25%, 2013 | 1,189,000 | a | 1,254,395 | |
| Medex, | | | | |
| Sr. Sub. Notes, 8.875%, 2013 | 2,500,000 | | 2,650,000 | |
| Province Healthcare, | | | | |
| Sr. Sub. Notes, 7.5%, 2013 | 4,746,000 | c | 4,603,620 | |
| Tenet HealthCare: | | | | |
| Notes, 7.375%, 2013 | 4,423,000 | c | 4,024,930 | |
| Sr. Notes, 5.375%, 2006 | 1,000,000 | c | 1,010,000 | |
| Sr. Notes, 9.875%, 2014 | 2,672,001 | a | 2,732,121 | |
| Triad Hospitals, | | | | |
| Sr. Sub. Notes, 7%, 2013 | 3,340,000 | c | 3,189,700 | |
| | | | 31,058,243 | |
| Machinery—1.3% | | | | |
| Case New Holland: | | | | |
| Sr. Notes, 6%, 2009 | 1,090,000 | a | 1,019,150 | |
| Sr. Notes, 9.25%, 2011 | 5,566,000 | a | 5,872,130 | |
| Hawk, | | | | |
| Sr. Notes, 12%, 2006 | 1,029,663 | | 1,057,979 | |
| | | | 7,949,259 | |
| Manufacturing—2.6% | | | | |
| Hexcel, | | | | |
| Sr. Sub. Notes, 9.75%, 2009 | 3,971,000 | | 4,184,441 | |
| JB Poindexter & Co., | | | | |
| Sr. Notes, 8.75%, 2014 | 2,181,000 | a | 2,224,620 | |
| Key Components, | | | | |
| Sr. Notes, 10.5%, 2008 | 1,354,000 | | 1,374,310 | |
| MAAX, | | | | |
| Sr. Sub. Notes, 9.75%, 2012 | 534,000 | a | 552,690 | |
12
| | Principal | | | |
| Bonds and Notes (continued) | Amount ($) | Value ($) | |
|
|
| |
| Manufacturing (continued) | | | | |
| Polypore, | | | | |
| Sr. Sub. Notes, 8.75%, 2012 | 1,371,000 | a | 1,436,123 | |
| SPX, | | | | |
| Sr. Notes, 7.5%, 2013 | 2,250,000 | | 2,317,500 | |
| TD Funding, | | | | |
| Sr. Sub. Notes, 8.375%, 2011 | 2,500,000 | | 2,550,000 | |
| Tyco International, | | | | |
| Notes, 5.8%, 2006 | 840,000 | | 876,462 | |
| | | | 15,516,146 | |
| Media—8.9% | | | | |
| Adelphia Communications, | | | | |
| Sr. Notes Ser. B, 7.75%, 2009 | 1,921,000 | b | 1,858,566 | |
| CSC Holdings: | | | | |
| Sr. Notes, 6.75%, 2012 | 3,422,000 | a,c | 3,302,230 | |
| Sr. Notes, Ser. B, 7.625%, 2011 | 2,000,000 | | 2,015,000 | |
| Sr. Notes, 7.875%, 2007 | 1,977,000 | | 2,065,965 | |
| Charter Communications Holdings/Capital: | | | | |
| Sr. Discount Notes, 0/11.75%, 2011 | 4,431,000 | f | 2,891,228 | |
| Sr. Notes, 8.75%, 2013 | 4,130,000 | a,c | 3,975,125 | |
| Sr. Notes, 10%, 2011 | 657,000 | | 523,958 | |
| Sr. Notes, 10.25%, 2010 | 5,494,000 | a,c | 5,562,675 | |
| Sr. Notes, 10.75%, 2009 | 3,692,000 | | 3,119,740 | |
| Dex Media East/Finance: | | | | |
| Notes, 12.125%, 2012 | 3,574,000 | c | 4,190,515 | |
| Sr. Notes, 9.875%, 2009 | 2,700,000 | | 3,044,250 | |
| Dex Media West/Finance, | | | | |
| Sr. Sub Notes, Ser. B, 9.875%, 2013 | 3,970,000 | | 4,376,925 | |
| Granite Broadcasting, | | | | |
| Secured Notes, 9.75%, 2010 | 2,000,000 | a | 1,870,000 | |
| Gray Television, | | | | |
| Sr. Sub. Notes, 9.25%, 2011 | 514,000 | c | 566,043 | |
| LBI Media: | | | | |
| Sr. Discount Notes, 0/11%, 2013 | 1,492,000 | f | 1,061,185 | |
| Sr. Sub. Notes, 10.125%, 2012 | 1,500,000 | | 1,680,000 | |
| Lodgenet Entertainment, | | | | |
| Sr. Sub. Debs., 9.5%, 2013 | 548,000 | | 601,430 | |
| Nexstar Finance: | | | | |
| Sr. Discount Notes, 0/11.375%, 2013 | 2,571,000 | f | 1,851,120 | |
| Sr. Sub Notes, 7%, 2014 | 3,248,000 | c | 3,085,600 | |
The Fund 13
S T A T E M E N T O F I N V E S T M E N T S ( U n a u d i t e d ) (continued)
| | Principal | | | |
| Bonds and Notes (continued) | Amount ($) | Value ($) | |
|
|
| |
| Media (continued) | | | | |
| Pegasus Communications, | | | | |
| Sr. Sub. Notes, Ser. B, 12.5%, 2007 | 4,191,000 | b,c | 2,053,590 | |
| Spanish Broadcasting System, | | | | |
| Sr. Sub. Notes, 9.625%, 2009 | 4,246,000 | | 4,500,759 | |
| | | | 54,195,904 | |
| Mining & Metal—2.5% | | | | |
| AK Steel: | | | | |
| Sr. Notes, 7.75%, 2012 | 5,278,000 | c | 4,789,785 | |
| Sr. Notes, 7.875%, 2009 | 2,419,000 | c | 2,273,860 | |
| Consol Energy, | | | | |
| Notes, 7.875%, 2012 | 3,553,000 | c | 3,686,238 | |
| Earle M Jorgensen, | | | | |
| Secured Notes, 9.75%, 2012 | 1,320,000 | | 1,452,000 | |
| Ispat Inland ULC, | | | | |
| Sr. Secured Notes, 9.75%, 2014 | 2,898,000 | a | 2,999,430 | |
| | | | 15,201,313 | |
| Oil & Gas—4.8% | | | | |
| Coastal: | | | | |
| Notes, 7.625%, 2008 | 3,065,000 | | 2,850,450 | |
| Notes, 7.75%, 2010 | 1,600,000 | c | 1,452,000 | |
| Sr. Debs., 6.5%, 2008 | 1,067,000 | | 965,635 | |
| El Paso Production, | | | | |
| Sr. Notes, 7.75%, 2013 | 2,040,000 | | 1,881,900 | |
| Hanover Compressor: | | | | |
| Sr. Notes, 8.625%, 2010 | 1,000,000 | c | 1,040,000 | |
| Sr. Notes, 9%, 2014 | 1,632,000 | | 1,701,360 | |
| Hanover Equipment Trust: | | | | |
| Sr. Secured Notes, Ser A, 8.5%, 2008 | 3,243,000 | c | 3,445,688 | |
| Sr. Secured Notes, Ser. B, 8.75%, 2011 | 15,000 | | 16,125 | |
| McMoRan Exploration, | | | | |
| Conv. Sr. Notes, 6%, 2008 | 5,126,000 | a | 6,984,175 | |
| Petroleum Geo-Services, | | | | |
| Notes, 10%, 2010 | 2,500,000 | | 2,600,000 | |
| Pride International, | | | | |
| Sr. Notes, 7.375%, 2014 | 801,000 | a | 813,015 | |
| Range Resources, | | | | |
| Sr. Sub Notes, 7.375%, 2013 | 1,338,000 | a | 1,338,000 | |
| Wiser Oil, | | | | |
| Sr. Sub Notes, 9.5%, 2007 | 3,762,000 | | 3,827,835 | |
| | | | 28,916,183 | |
14
| | Principal | | | |
| Bonds and Notes (continued) | Amount ($) | Value ($) | |
|
|
| |
| Packaging & Containers—2.8% | | | | |
| Buhrmann US, | | | | |
| Sr. Sub. Notes, 12.25%, 2009 | 2,000,000 | | 2,201,191 | |
| Graham Packaging, | | | | |
| Sr. Sub. Notes, Ser. B, 8.75%, 2008 | 1,835,000 | | 1,853,350 | |
| Owens-Brockway: | | | | |
| Secured Notes, 8.75%, 2012 | 1,000,000 | | 1,090,000 | |
| Sr. Notes, 8.25%, 2013 | 515,000 | | 534,313 | |
| Sr. Secured Notes, 7.75%, 2011 | 1,025,000 | c | 1,071,125 | |
| Sr. Secured Notes, 8.875%, 2009 | 935,000 | | 1,014,475 | |
| Pliant: | | | | |
| Sr. Secured Discount Notes, 0/11.125%, 2009 | 1,445,000 | c,f | 1,224,638 | |
| Sr. Secured Notes, 11.125%, 2009 | 520,000 | c | 559,000 | |
| Sr. Sub. Notes, 13%, 2010 | 1,025,000 | c | 922,500 | |
| Stone Container: | | | | |
| Sr. Notes, 8.375%, 2012 | 1,254,000 | | 1,316,700 | |
| Sr. Notes, 9.75%, 2011 | 2,761,000 | c | 3,050,905 | |
| Tekni-Plex: | | | | |
| Sr. Secured Notes, 8.75%, 2013 | 1,086,000 | a,c | 1,042,560 | |
| Sr. Sub. Notes, Ser. B, 12.75%, 2010 | 877,000 | | 846,305 | |
| | | | 16,727,062 | |
| Paper & Forest Products—2.5% | | | | |
| Appleton Papers, | | | | |
| Sr. Sub. Notes, 9.75%, 2014 | 1,604,000 | a | 1,616,030 | |
| Buckeye Technologies, | | | | |
| Sr. Notes, 8.5%, 2013 | 1,255,000 | | 1,273,825 | |
| Georgia-Pacific: | | | | |
| Sr. Notes, 7.375%, 2008 | 2,080,000 | | 2,225,600 | |
| Sr. Sub. Notes, 8.875%, 2010 | 8,927,000 | | 10,154,463 | |
| | | | 15,269,918 | |
| Pipelines—3.3% | | | | |
| ANR Pipeline, | | | | |
| Notes, 8.875%, 2010 | 2,540,000 | | 2,787,650 | |
| Dynegy: | | | | |
| Secured Notes, 9.875%, 2010 | 5,109,000 | a,c | 5,517,720 | |
| Secured Notes, 10.125%, 2013 | 4,680,000 | a,c | 5,089,500 | |
| Pacific Energy Finance, | | | | |
| Sr. Notes, 7.125%, 2014 | 1,335,000 | a | 1,361,700 | |
| Southern Natural Gas, | | | | |
| Notes, 8.875%, 2010 | 2,057,000 | c | 2,257,558 | |
The Fund 15
S T A T E M E N T O F I N V E S T M E N T S ( U n a u d i t e d ) (continued)
| | Principal | | | |
| Bonds and Notes (continued) | Amount ($) | Value ($) | |
|
|
| |
| Pipelines (continued) | | | | |
| Utilicorp Canada Finance, | | | | |
| Sr. Notes, 7.75%, 2011 | 1,069,000 | c | 983,480 | |
| Williams Cos., | | | | |
| Sr. Notes, 8.625%, 2010 | 2,120,000 | c | 2,342,600 | |
| | | | 20,340,208 | |
| Real Estate Investment Trust—.5% | | | | |
| CB Richard Ellis Services, | | | | |
| Sr. Sub. Notes, 11.25%, 2011 | 1,500,000 | | 1,717,500 | |
| Host Marriott, | | | | |
| Sr. Notes, Ser. B, 7.875%, 2008 | 1,469,000 | | 1,513,070 | |
| | | | 3,230,570 | |
| Residential Mortgage Pass-Through Ctfs.—.1% | | | | |
| MORSERV, | | | | |
| Ser. 1996-1, Cl. B5, 7%, 2011 | 135,130 | a | 107,536 | |
| Residential Accredit Loans, | | | | |
| Mortgage Asst-Backed Pass-Through Ctfs., REMIC: | | | | |
| Ser. 1997-QS6, Cl. B2, 7.5%, 2012 | 75,221 | | 77,628 | |
| Ser. 1997-QS6, Cl. B3, 7.5%, 2012 | 75,030 | | 57,053 | |
| | | | 242,217 | |
| Retail—1.2% | | | | |
| Dillards, | | | | |
| Notes, 6.875%, 2005 | 94,000 | | 97,525 | |
| JC Penney, | | | | |
| Sr. Notes, 8%, 2010 | 1,550,000 | | 1,739,875 | |
| Remington Arms, | | | | |
| Sr. Notes, 10.5%, 2011 | 387,000 | | 377,325 | |
| Rite Aid: | | | | |
| Sr. Secured Notes, 8.125%, 2010 | 1,180,000 | | 1,247,850 | |
| Sr. Secured Notes, 12.5%, 2006 | 1,025,000 | c | 1,165,938 | |
| Sonic Automotive, | | | | |
| Sr. Sub. Notes, Ser. B, 8.625%, 2013 | 1,750,000 | | 1,833,125 | |
| VICORP Restaurants, | | | | |
| Sr. Notes, 10.5%, 2011 | 955,000 | a,c | 955,000 | |
| | | | 7,416,638 | |
| Structured Index—8.4% | | | | |
| AB Svensk Exportkredit, | | | | |
| GSNE-ER Indexed Notes, 0%, 2007 | 6,090,000 | a,g | 5,843,355 | |
| Crown Street Managed Investment | | | | |
| Transaction Securities "MINTS", | | | | |
| Floating Rate Part. Sec., Credit Link, 3.55%, 2007 | 2,750,000 | a,d,h | 2,743,125 | |
16
| | Principal | | | |
| Bonds and Notes (continued) | Amount ($) | Value ($) | |
|
|
| |
| Structured Index (continued) | | | | |
| DJ TRAC-X NA: | | | | |
| Credit Linked Trust Ctfs., 6.05%, 2009 | 27,473,000 | a,c,i | 26,820,516 | |
| Credit Linked Trust Ctfs., 7.375%, 2009 | 15,929,000 | a,c,i | 15,590,509 | |
| | | | 50,997,505 | |
| Technology—1.2% | | | | |
| AMI Semiconductor, | | | | |
| Sr. Sub. Notes, 10.75%, 2013 | 1,514,000 | c | 1,775,165 | |
| Amkor Technology, | | | | |
| Sr. Notes, 7.125%, 2011 | 1,500,000 | a,c | 1,413,750 | |
| ON Semiconductor, | | | | |
| Notes, 13%, 2008 | 1,950,000 | | 2,247,375 | |
| Seagate Technology, | | | | |
| Sr. Notes, 8%, 2009 | 2,000,000 | c | 2,100,000 | |
| | | | 7,536,290 | |
| Telecommunications—9.2% | | | | |
| ACC Escrow, | | | | |
| Sr. Notes, Ser. B, 10%, 2011 | 1,532,000 | | 1,329,010 | |
| American Tower: | | | | |
| Sr. Notes, 7.5%, 2012 | 1,116,000 | a,c | 1,085,308 | |
| Sr. Notes, 9.375%, 2009 | 4,371,000 | c | 4,687,898 | |
| Sr. Sub. Notes, 7.25%, 2011 | 1,001,000 | | 1,008,508 | |
| American Tower Escrow, | | | | |
| Discount Notes, 0%, 2008 | 510,000 | e | 374,850 | |
| Call-Net Enterprises, | | | | |
| Sr.Secured Notes, 10.625%, 2008 | 1,000,000 | c | 1,000,000 | |
| Crown Castle International: | | | | |
| Sr. Notes, 7.5%, 2013 | 3,009,000 | | 3,009,000 | |
| Sr. Notes, 9.375%, 2011 | 1,716,000 | c | 1,896,180 | |
| Sr. Notes, Ser. B, 7.5%, 2013 | 1,736,000 | | 1,736,000 | |
| Dobson Communications, | | | | |
| Sr. Notes, 8.875%, 2013 | 1,090,000 | c | 833,850 | |
| Fairpoint Communications, | | | | |
| Sr. Notes, 11.875%, 2010 | 515,000 | | 590,963 | |
| Horizon PCS, | | | | |
| Sr. Notes, 13.75%, 2011 | 2,850,000 | b,c | 1,353,750 | |
| Innova S de RL, | | | | |
| Notes, 9.375%, 2013 | 2,035,000 | c | 2,141,838 | |
| Insight Midwest/Capital, | | | | |
| Sr. Notes, 10.5%, 2010 | 2,000,000 | a,c | 2,190,000 | |
The Fund 17
S T A T E M E N T O F I N V E S T M E N T S ( U n a u d i t e d ) (continued)
| | Principal | | | |
| Bonds and Notes (continued) | Amount ($) | Value ($) | |
|
|
| |
| Telecommunications (continued) | | | | |
| Kabel Deutschland, | | | | |
| Sr. Notes, 10.625%, 2014 | 1,570,000 | a | 1,621,025 | |
| MJD Communications, | | | | |
| Floating Rate Notes, Ser. B, 5.5575%, 2008 | 4,500,000 | d | 4,275,000 | |
| Nextel Communications, | | | | |
| Sr. Notes, 7.375%, 2015 | 2,000,000 | | 2,030,000 | |
| Nextel Partners, | | | | |
| Sr. Notes, 12.5%, 2009 | 1,798,000 | c | 2,103,660 | |
| Pegasus Satellite Communications: | | | | |
| Sr. Notes, 11.25%, 2010 | 1,336,000 | a,b,c | 674,680 | |
| Sr. Notes, 12.375%, 2006 | 750,000 | b,c | 367,500 | |
| Qwest: | | | | |
| Bank Notes, Ser. A, 6.5%, 2007 | 3,227,000 | d | 3,356,080 | |
| Bank Notes, Ser. B, 6.95%, 2010 | 1,051,000 | d | 1,037,863 | |
| Qwest Services: | | | | |
| Notes, 13%, 2007 | 4,226,000 | a,c | 4,838,770 | |
| Notes, 14%, 2010 | 1,600,000 | a | 1,868,000 | |
| SBA Communications, | | | | |
| Sr. Discount Notes, 0/9.75%, 2011 | 5,962,000 | c,f | 4,441,690 | |
| Spectrasite, | | | | |
| Sr. Notes, 8.25%, 2010 | 1,559,000 | c | 1,613,565 | |
| US Unwired, | | | | |
| Secured Notes, 10%, 2012 | 1,068,000 | a | 1,084,020 | |
| Verizon Global Funding, | | | | |
| Notes, 6.75%, 2005 | 200,000 | a | 210,861 | |
| Western Wireless, | | | | |
| Sr. Notes, 9.25%, 2013 | 3,227,000 | | 3,339,944 | |
| | | | 56,099,813 | |
| Textiles & Apparrel—.5% | | | | |
| Dan River, | | | | |
| Sr. Notes, 12.75%, 2009 | 2,006,000 | a,b,c | 571,710 | |
| Levi Strauss & Co., | | | | |
| Sr. Notes, 12.25%, 2012 | 353,000 | c | 349,470 | |
| William Carter, | | | | |
| Sr. Sub Notes, Ser. B, 10.875%, 2011 | 1,663,000 | | 1,891,663 | |
| | | | 2,812,843 | |
18
| | | | Principal | | | |
| Bonds and Notes (continued) | Amount ($) | Value ($) | |
|
|
| |
| Transportation—1.2% | | | | | | |
| Atlantic Express Transportation, | | | | |
| Units, 12%, 2008 | | | 478,000 | a | 475,610 | |
| CHC Helicopter, | | | | | | | |
| Sr. Sub. Notes, 7.375%, 2014 | 1,405,000 | a | 1,387,438 | |
| General Maritime, | | | | | | |
| Sr. Notes, 10%, 2013 | | 2,000,000 | | 2,212,500 | |
| TFM, S.A. de C.V., | | | | | | | |
| Sr. Notes, 10.25%, 2007 | 3,245,000 | c | 3,228,775 | |
| | | | | | | 7,304,323 | |
| U.S. Government Securities—.5% | | | | |
| United States Treasury Notes: | | | | |
| 4%, 6/15/2009 | | | 1,800,000 | | 1,815,948 | |
| 4.75%, 5/15/2014 | | | 1,471,000 | | 1,486,799 | |
| | | | | | | 3,302,747 | |
| Total Bonds and Notes | | | | | |
| (cost $ | 552,309,226) | | | | | 560,717,032 | |
|
|
|
|
|
|
| |
| | | | | Face Amount | | | |
| | | | | Covered by | | | |
| Options—.0% | | | | Contracts ($) | Value ($) | |
|
|
|
|
|
| |
| Put Options; | | | | | | | |
| U.S. Treasury Note, 2.5%, 5/31/2006 | | | | |
| September 2004 @ | $ | 99.39 | | | | |
| (cost $ | 37,811) | | | 5,975,000 | | 20,539 | |
|
|
|
|
|
|
| |
| | | | | | | | |
| Preferred Stocks—2.2% | Shares | | Value ($) | |
|
|
|
| |
| Diversified Financial Service—.1% | | | | |
| Williams Holdings Of Delaware, | | | | |
| Cum. Conv., $ | 2.75 | | | 7,800 | a | 550,875 | |
| Media—1.5% | | | | | | | |
| Paxson Communications, | | | | | |
| Cum. Conv., $ | 975 | | | 902 | a | 6,403,535 | |
| Spanish Broadcasting System, | | | | |
| Cum. Conv., Ser. B, $ | 107.5 | 2,927 | | 3,000,159 | |
| | | | | | | 9,403,694 | |
The Fund 19
S T A T E M E N T O F I N V E S T M E N T S ( U n a u d i t e d ) (continued)
| Preferred Stocks (continued) | Shares | Value ($) | |
|
|
| |
| Mining & Metals—.6% | | | |
| Kaiser Group Holdings, | | | |
| Cum., $ | 3.85 | 67,539 | 3,714,645 | |
| Textiles & Apparel—.0% | | | |
| Cluett American, | | | |
| Cum., $ | 12.5 | 51 | 1,033 | |
| Total Prefered Stocks | | | |
| (cost $ | 12,620,385) | | 13,670,247 | |
|
|
|
| |
| | | | | |
| Common Stocks—2.9% | | | |
|
|
| |
| Oil & Gas—.0% | | | |
| Link Energy | 460,276 c,j | 41,425 | |
| Telecommunications—.4% | | | |
| AboveNet | | 64,685 | 1,875,865 | |
| Neon Communications | 182,744 j,k | 411,174 | |
| Stellex Aerostructures | 429 j,k | 0 | |
| | | | 2,287,039 | |
| Textiles & Apparel—2.5% | | | |
| HCI Direct, Cl. A | 910,714 j,k,l,n | 15,117,852 | |
| Total Common Stocks | | | |
| (cost $ | 18,562,876) | | 17,446,316 | |
|
|
|
| |
| | | | | |
| Other—.0% | | | |
|
|
| |
| Financial—.0% | | | |
| Ono Finance (warrants) | 1,000 j | 1 | |
| Mining & Metals—.0% | | | |
| Kaiser Group Holdings (rights) | 202,510 j,k,n | 0 | |
| Telecommunication—.0% | | | |
| AboveNet (warrants) | 5,083 j | 45,751 | |
| AboveNet (warrants) | 5,980 j | 29,900 | |
| Loral Cyberstar (warrants) | 164,345 j | 1,643 | |
| MGC Communications (warrants) | 250 a,j | 0 | |
| Neon Communications (warrants) | 182,744 j,k | 0 | |
| | | | 77,294 | |
| Total Other | | | |
| (cost $ | 279,965) | | 77,295 | |
20
| | | | Principal | | | |
| Short-Term Investments—.0% | Amount ($) | Value ($) | |
|
|
| |
| U.S. Treasury Bills, | | | | | |
| .95%, 07/01/2004 | | | | | |
| (cost $ | 14,991) | | 15,000 | | 14,990 | |
|
|
|
|
|
| |
| | | | | | | |
| Other Investments—1.4% | Shares | | Value ($) | |
|
|
|
| |
| Registered Investment Companies: | | | | |
| Dreyfus Institutional Cash Advantage Fund | 2,931,000 | m | 2,931,000 | |
| Dreyfus Institutional Cash Advantage Plus Fund | 2,931,000 | m | 2,931,000 | |
| Dreyfus Institutional Preferred Plus Money Market Fund | 2,931,000 | m | 2,931,000 | |
| Total Other Investments | | | | | |
| (cost $ | 8,793,000) | | | | 8,793,000 | |
|
|
|
|
|
| |
| Investment of Cash Collateral | | | | |
| for Securities Loaned—31.2% | | | | |
|
|
|
| |
| Registered Investment Company; | | | | |
| Dreyfus Institutional Cash Advantage Fund | | | | |
| (cost $ | 189,901,150) | | 189,901,150 | m | 189,901,150 | |
|
|
|
|
|
| |
| | | | | | | |
| Total Investment (cost $ | 782,519,404) | 129.9% | | 790,640,569 | |
| Liabilities, Less Cash and Receivables | (29.9%) | | (182,171,689) | |
| Net Assets | | 100.0% | | 608,468,880 | |
a Securities exempt from registration under Rule 144A of the Securities Act of 1933.These securities may be resold in transactions exempt from registration, normally to qualified institutional buyers. At June 30, 2004, these securities amounted to $201,842,067 or 33.2% of net assets.
b
| Non-income producing—security in default.
|
c
| All or a portion of these securities are on loan. At June 30, 2004, the total market value of the fund's securities on loan is $181,937,828 and the total market value of the collateral held by the fund is $189,901,150.
|
d
| Variable rate security—interest rate subject to periodic change.
|
e
| Units represent bond with warrant attached to purchase common stock.
|
f
| Zero coupon until a specified date at which time the stated coupon rate becomes effective until maturity.
|
g
| Security linked to Goldman Sachs Non-Energy—Excess Return Index.
|
h
| Credit Linked Notes.
|
i
| Security linked to a portfolio of debt securities.
|
j
| Non-income producing security.
|
k
| The value of these securities has been determined in good faith under the direction of the Board of Trustees.
|
l
| Investment in non-controlled affiliates (cost $9,805,658)—See note 1(d).
|
m
| Investments in affiliated money market mutual funds.
|
n
| Security restricted as to public resale. Investments in restricted securities, with a value of $15,117,852 or 2.5% of net assets, are as follows:
|
| | Acquisition | | Purchase | | Percentage of | | | |
| Issuer | Date | | Price ($) | | Net Assets (%) | | Valuation ($) | |
|
| |
| |
| |
| |
| HCI Direct, Cl. A | 6/20/2002 | | 10.767 | | 2.48 | | 16.6 | |
| Kaiser Group Holdings (rights) | 6/26/2001 | | — | | — | | — | |
See notes to financial statements.
The Fund 21
| STATEMENT OF ASSETS AND LIABILITIES |
| June 30, 2004 (Unaudited) |
| | | Cost | Value | |
|
|
|
| |
| Assets ($): | | | | |
| Investments in securities— | | | |
| See Statement of Investments (including securities | | | |
| on loan, valued at $181,937,828)—Note 1(c): | | | |
| Unaffiliated issuers | 574,019,596 | 576,828,567 | |
| Affiliated issuers | 208,499,808 | 213,812,002 | |
| Cash | | | 6,706,284 | |
| Interest and dividends receivable | | 11,174,368 | |
| Receivable for investment securities sold | | 4,701,828 | |
| Receivable for shares of Beneficial Interest subscribed | | 395,245 | |
| Other assets | | | 68,767 | |
| | | | 813,687,061 | |
|
|
|
| |
| Liabilities ($): | | | |
| Due to The Dreyfus Corporation and affiliates—Note 2(b) | | 628,343 | |
| Liability for securities on loan—Note 1(c) | | 189,901,150 | |
| Payable for investment securities purchased | | 12,093,067 | |
| Payable for shares of Beneficial Interest redeemed | | 2,450,578 | |
| Other liabilities | | | 145,043 | |
| | | | 205,218,181 | |
|
|
|
| |
| Net Assets ( | $) | | 608,468,880 | |
|
|
|
| |
| Composition of Net Assets ($): | | | |
| Paid-in capital | | | 1,044,988,561 | |
| Accumulated distributions in excess of investment income—net | | (43,689) | |
| Accumulated net realized gain (loss) on investments | | (444,597,157) | |
| Accumulated net unrealized appreciation (depreciation) | | | |
| on investments and foreign currency transactions | | 8,121,165 | |
|
|
| |
| Net Assets ( | $) | | 608,468,880 | |
| Net Asset Value Per Share | | | | | | | | |
| | Class A | | Class B | | Class C | | Class R | |
|
| |
| |
| |
| |
| Net Assets ($) | 255,222,514 | | 211,201,164 | | 116,588,379 | | 25,456,823 | |
| Shares Outstanding | 35,043,789 | | 28,969,904 | | 15,989,066 | | 3,494,021 | |
|
| |
| |
| |
| |
| Net Asset Value Per Share ($) | 7.28 | | 7.29 | | 7.29 | | 7.29 | |
See notes to financial statements.
22
| STATEMENT OF OPERATIONS |
| Six Months Ended June 30, 2004 (Unaudited) |
| Investment Income ($): | | |
| Income: | | |
| Interest | 21,687,744 | |
| Dividends: | | |
| Unaffiliated issuers | 724,280 | |
| Affiliated issuers | 131,794 | |
| Income from securities lending | 192,668 | |
| Total Income | 22,736,486 | |
| Expenses: | | |
| Management fee—Note 2(a) | 1,886,960 | |
| Distribution and service fees—Note 2(b) | 1,564,376 | |
| Total Expenses | 3,451,336 | |
| Investment Income—Net | 19,285,150 | |
|
| |
| Realized and Unrealized Gain (Loss) on Investments—Note 3 ($): | | |
| Net realized gain (loss) on investments and | | |
| foreign currency transations | 8,216,301 | |
| Net realized gain (loss) on financial futures | (1,354) | |
| Net realized gain (loss) on swaps transactions | (1,530,639) | |
| Net realized gain (loss) on forward | | |
| currency exchange contracts | (16,010) | |
| Net Realized Gain (Loss) | 6,668,298 | |
| Net unrealized appreciation (depreciation) on investments | | |
| and foreign currency transactions | (10,666,010) | |
| Net Realized and Unrealized Gain (Loss) on Investments | (3,997,712) | |
| Net Increase in Net Assets Resulting from Operations | 15,287,438 | |
See notes to financial statements.
The Fund 23
STATEMENT OF CHANGES IN NET ASSETS
| | Six Months Ended | | | |
| | June 30, 2004 | | Year Ended | |
| | (Unaudited) | | December 31, 2003 | |
|
| |
| |
| Operations ($): | | | | |
| Investment income—net | 19,285,150 | | 41,396,075 | |
| Net realized gain (loss) on investments | 6,668,298 | | (59,302,124) | |
| Net unrealized appreciation | | | | |
| (depreciation) on investments | (10,666,010) | | 141,501,721 | |
| Net Increase (Decrease) in Net Assets | | | | |
| Resulting from Operations | 15,287,438 | | 123,595,672 | |
|
| |
| |
| Dividends to Shareholders from ($): | | | | |
| Investment income—net: | | | | |
| Class A shares | (8,110,380) | | (14,764,836) | |
| Class B shares | (7,535,731) | | (22,036,756) | |
| Class C shares | (3,271,845) | | (6,525,596) | |
| Class R shares | (387,346) | | (104,181) | |
| Total Dividends | (19,305,302) | | (43,431,369) | |
|
| |
| |
| Beneficial Interest Transactions ($): | | | | |
| Net proceeds from shares sold: | | | | |
| Class A shares | 80,598,520 | | 189,616,421 | |
| Class B shares | 6,689,071 | | 40,291,681 | |
| Class C shares | 7,311,597 | | 25,359,160 | |
| Class R shares | 2,245,563 | | 2,122,931 | |
| Net assets received in connection with | | | | |
| reorganization—Note 1: | | | | |
| Class A shares | 54,982,849 | | — | |
| Class B shares | 43,560,106 | | — | |
| Class C shares | 48,040,484 | | — | |
| Class R shares | 27,857,157 | | — | |
24
| | Six Months Ended | | | |
| | June 30, 2004 | | Year Ended | |
| | (Unaudited) | | December 31, 2003 | |
|
| |
| |
| Beneficial Interest Transactions ($) (continued): | | | | |
| Dividends reinvested: | | | | |
| Class A shares | 3,823,428 | | 7,016,001 | |
| Class B shares | 2,658,309 | | 6,501,640 | |
| Class C shares | 1,309,708 | | 2,146,779 | |
| Class R shares | 362,820 | | 101,800 | |
| Cost of shares redeemed: | | | | |
| Class A shares | (73,362,079) | | (154,570,015) | |
| Class B shares | (78,409,959) | | (79,046,284) | |
| Class C shares | (25,741,145) | | (15,365,410) | |
| Class R shares | (6,486,097) | | (1,228,484) | |
| Increase (Decrease) in Net Assets from | | | | |
| Beneficial Interest Transactions | 95,440,332 | | 22,946,220 | |
| Total Increase (Decrease) in Net Assets | 91,422,468 | | 103,110,523 | |
|
| |
| |
| Net Assets ($): | | | | |
| Beginning of Period | 517,046,412 | | 413,935,889 | |
| End of Period | 608,468,880 | | 517,046,412 | |
The Fund 25
STATEMENT OF CHANGES IN NET ASSETS (continued)
| | Six Months Ended | | | |
| | June 30, 2004 | | Year Ended | |
| | (Unaudited) | | December 31, 2003 | |
|
| |
| |
| Capital Share Transactions: | | | | |
| Class Aa | | | | |
| Shares sold | 11,412,534 | | 27,218,889 | |
| Shares issued in connection | | | | |
| with reorganization—Note 1 | 7,450,835 | | — | |
| Shares issued for dividends reinvested | 519,011 | | 1,002,962 | |
| Shares redeemed | (9,944,504) | | (22,017,916) | |
| Net Increase (Decrease) in Shares Outstanding | 9,437,876 | | 6,203,935 | |
|
| |
| |
| Class Ba | | | | |
| Shares sold | 1,177,266 | | 5,811,928 | |
| Shares issued in connection | | | | |
| with reorganization—Note 1 | 5,891,364 | | — | |
| Shares issued for dividends reinvested | 360,562 | | 934,823 | |
| Shares redeemed | (10,617,019) | | (11,228,470) | |
| Net Increase (Decrease) in Shares Outstanding | (3,187,827) | | (4,481,719) | |
|
| |
| |
| Class C | | | | |
| Shares sold | 1,193,206 | | 3,645,801 | |
| Shares issued in connection | | | | |
| with reorganization—Note 1 | 6,497,931 | | — | |
| Shares issued for dividends reinvested | 178,062 | | 307,408 | |
| Shares redeemed | (3,511,704) | | (2,197,438) | |
| Net Increase (Decrease) in Shares Outstanding | 4,357,495 | | 1,755,771 | |
|
| |
| |
| Class R | | | | |
| Shares sold | 397,674 | | 314,667 | |
| Shares issued in connection | | | | |
| with reorganization—Note 1 | 3,773,591 | | — | |
| Shares issued for dividends reinvested | 49,883 | | 14,486 | |
| Shares redeemed | (899,979) | | (174,477) | |
| Net Increase (Decrease) in Shares Outstanding | 3,321,169 | | 154,676 | |
| a | During the period ended June 30, 2004, 3,378,014 Class B shares representing $25,002,232 were automatically |
| | converted to 3,379,724 Class A shares and during the period ended December 31, 2003, 3,158,289 Class B |
| | shares representing $22,641,055 were automatically converted to 3,158,302 Class A shares. |
See notes to financial statements.
26
FINANCIAL HIGHLIGHTS
The following tables describe the performance for each share class for the fiscal periods indicated.All information (except portfolio turnover rate) reflects financial results for a single fund share.Total return shows how much your investment in the fund would have increased (or decreased) during each period, assuming you had reinvested all dividends and distributions.These figures have been derived from the fund's financial statements.
| | Six Months Ended | | | | | | | | | | | |
| | June 30, 2004 | | | | Year Ended December 31, | | | |
| | | | | |
| | | |
| Class A Shares | (Unaudited) | | 2003 | | 2002 | | 2001 a | | 2000 | | 1999 | |
|
| |
| |
| |
| |
| |
| |
| Per Share Data ($): | | | | | | | | | | | | |
| Net asset value, | | | | | | | | | | | | |
| beginning of period | 7.43 | | 6.28 | | 7.94 | | 8.95 | | 10.45 | | 11.33 | |
| Investment Operations: | | | | | | | | | | | | |
| Investment income—net | .27b | | .63b | | .68b | | .84b | | 1.07 | | 1.12 | |
| Net realized and unrealized | | | | | | | | | | | | |
| gain (loss) on investments | (.15) | | 1.17 | | (1.62) | | (.96) | | (1.47) | | (.90) | |
| Total from Investment Operations | .12 | | 1.80 | | (.94) | | (.12) | | (.40) | | .22 | |
| Distributions: | | | | | | | | | | | | |
| Dividends from | | | | | | | | | | | | |
| investment income—net | (.27) | | (.65) | | (.72) | | (.89) | | (1.10) | | (1.10) | |
| Net asset value, end of period | 7.28 | | 7.43 | | 6.28 | | 7.94 | | 8.95 | | 10.45 | |
|
| |
| |
| |
| |
| |
| |
| Total Return (%)c | 1.68d | | 29.87 | | (12.19) | | (1.62) | | (4.26) | | 1.99 | |
|
| |
| |
| |
| |
| |
| |
| Ratios/Supplemental Data (%): | | | | | | | | | | | | |
| Ratio of operating expenses | | | | | | | | | | | | |
| to average net assets | .95e | | .97 | | .95 | | .95 | | .95 | | .95 | |
| Ratio of interest expense | | | | | | | | | | | | |
| to average net assets | — | | .00f | | .01 | | .01 | | .01 | | .01 | |
| Ratio of net investment income | | | | | | | | | | | | |
| to average net assets | 7.47e | | 8.87 | | 10.05 | | 9.91 | | 10.80 | | 10.19 | |
| Portfolio Turnover Rate | 48.28d | | 235.42 | | 340.47 | | 158.92 | | 26.76 | | 40.79 | |
|
| |
| |
| |
| |
| |
| |
| Net Assets, end of period | | | | | | | | | | | | |
| ($ x 1,000) | 255,223 | | 191,270 | | 121,775 | | 114,886 | | 132,652 | | 106,959 | |
a As required, effective January 1, 2001, the fund has adopted the provisions of the AICPA Audit and Accounting Guide for Investment Companies and began amortizing discount or premium on fixed income securities on a scientific basis and including paydown gains and losses in interest income.The effect of this change for the period ended December 31, 2001 was to decrease net investment income per share by $.06, increase net realized and unrealized gain (loss) on investments per share by $.06, and decrease the ratio of net investment income to average net assets from 10.52% to 9.91%. Per share data and ratios/supplemental data for periods prior to January 1, 2001 have not been restated to reflect this change in presentation.
b
| Based on average shares outstanding at each month end.
|
c
| Exclusive of sales charge.
|
d
| Not annualized.
|
e
| Annualized.
|
f
| Amount represents less than .01%.
|
See notes to financial statements.
The Fund 27
FINANCIAL HIGHLIGHTS (continued)
| | Six Months Ended | | | | | | | | | | | |
| | June 30, 2004 | | | | Year Ended December 31, | | | |
| | | | | |
| | | |
| Class B Shares | (Unaudited) | | 2003 | | 2002 | | 2001 a | | 2000 | | 1999 | |
|
| |
| |
| |
| |
| |
| |
| Per Share Data ($): | | | | | | | | | | | | |
| Net asset value, | | | | | | | | | | | | |
| beginning of period | 7.43 | | 6.28 | | 7.94 | | 8.95 | | 10.45 | | 11.33 | |
| Investment Operations: | | | | | | | | | | | | |
| Investment income—net | .25b | | .59b | | .66b | | .80b | | 1.02 | | 1.06 | |
| Net realized and unrealized | | | | | | | | | | | | |
| gain (loss) on investments | (.13) | | 1.18 | | (1.64) | | (.96) | | (1.47) | | (.89) | |
| Total from Investment Operations | .12 | | 1.77 | | (.98) | | (.16) | | (.45) | | .17 | |
| Distributions: | | | | | | | | | | | | |
| Dividends from | | | | | | | | | | | | |
| investment income—net | (.26) | | (.62) | | (.68) | | (.85) | | (1.05) | | (1.05) | |
| Net asset value, end of period | 7.29 | | 7.43 | | 6.28 | | 7.94 | | 8.95 | | 10.45 | |
|
| |
| |
| |
| |
| |
| |
| Total Return (%)c | 1.57d | | 29.25 | | (12.64) | | (2.10) | | (4.74) | | 1.48 | |
|
| |
| |
| |
| |
| |
| |
| Ratios/Supplemental Data (%): | | | | | | | | | | | | |
| Ratio of operating expenses | | | | | | | | | | | | |
| to average net assets | 1.45e | | 1.47 | | 1.45 | | 1.45 | | 1.45 | | 1.45 | |
| Ratio of interest expense | | | | | | | | | | | | |
| to average net assets | — | | .00f | | .01 | | .01 | | .01 | | .01 | |
| Ratio of net investment income | | | | | | | | | | | | |
| to average net assets | 6.99e | | 8.46 | | 9.41 | | 9.42 | | 10.32 | | 9.70 | |
| Portfolio Turnover Rate | 48.28d | | 235.42 | | 340.47 | | 158.92 | | 26.76 | | 40.79 | |
|
| |
| |
| |
| |
| |
| |
| Net Assets, end of period | | | | | | | | | | | | |
| ($ x 1,000) | 211,201 | | 239,015 | | 230,011 | | 325,834 | | 403,702 | | 562,605 | |
a As required, effective January 1, 2001, the fund has adopted the provisions of the AICPA Audit and Accounting Guide for Investment Companies and began amortizing discount or premium on fixed income securities on a scientific basis and including paydown gains and losses in interest income.The effect of this change for the period ended December 31, 2001 was to decrease net investment income per share by $.05, increase net realized and unrealized gain (loss) on investments per share by $.05, and decrease the ratio of net investment income to average net assets from 10.03% to 9.42%. Per share data and ratios/supplemental data for periods prior to January 1, 2001 have not been restated to reflect this change in presentation.
b
| Based on average shares outstanding at each month end.
|
c
| Exclusive of sales charge.
|
d
| Not annualized.
|
e
| Annualized.
|
f
| Amount represents less than .01%.
|
See notes to financial statements.
28
| | Six Months Ended | | | | | | | | | | | |
| | June 30, 2004 | | | | Year Ended December 31, | | | |
| | | | | |
| | | |
| Class C Shares | (Unaudited) | | 2003 | | 2002 | | 2001 a | | 2000 | | 1999 | |
|
| |
| |
| |
| |
| |
| |
| Per Share Data ($): | | | | | | | | | | | | |
| Net asset value, | | | | | | | | | | | | |
| beginning of period | 7.43 | | 6.28 | | 7.95 | | 8.96 | | 10.45 | | 11.33 | |
| Investment Operations: | | | | | | | | | | | | |
| Investment income—net | .24b | | .57b | | .64b | | .78b | | 1.01 | | 1.04 | |
| Net realized and unrealized | | | | | | | | | | | | |
| gain (loss) on investments | (.13) | | 1.18 | | (1.65) | | (.96) | | (1.47) | | (.90) | |
| Total from Investment Operations | .11 | | 1.75 | | (1.01) | | (.18) | | (.46) | | .14 | |
| Distributions: | | | | | | | | | | | | |
| Dividends from | | | | | | | | | | | | |
| investment income—net | (.25) | | (.60) | | (.66) | | (.83) | | (1.03) | | (1.02) | |
| Net asset value, end of period | 7.29 | | 7.43 | | 6.28 | | 7.95 | | 8.96 | | 10.45 | |
|
| |
| |
| |
| |
| |
| |
| Total Return (%)c | 1.31d | | 29.10 | | (12.97) | | (2.23) | | (4.96) | | 1.23 | |
|
| |
| |
| |
| |
| |
| |
| Ratios/Supplemental Data (%): | | | | | | | | | | | | |
| Ratio of operating expenses | | | | | | | | | | | | |
| to average net assets | 1.70e | | 1.72 | | 1.70 | | 1.70 | | 1.70 | | 1.70 | |
| Ratio of interest expense | | | | | | | | | | | | |
| to average net assets | — | | .00f | | .01 | | .01 | | .01 | | .01 | |
| Ratio of net investment income | | | | | | | | | | | | |
| to average net assets | 6.75e | | 8.15 | | 9.17 | | 9.17 | | 10.09 | | 9.45 | |
| Portfolio Turnover Rate | 48.28d | | 235.42 | | 340.47 | | 158.92 | | 26.76 | | 40.79 | |
|
| |
| |
| |
| |
| |
| |
| Net Assets, end of period | | | | | | | | | | | | |
| ($ x 1,000) | 116,588 | | 86,479 | | 62,036 | | 84,044 | | 105,167 | | 170,011 | |
a As required, effective January 1, 2001, the fund has adopted the provisions of the AICPA Audit and Accounting Guide for Investment Companies and began amortizing discount or premium on fixed income securities on a scientific basis and including paydown gains and losses in interest income.The effect of this change for the period ended December 31, 2001 was to decrease net investment income per share by $.05, increase net realized and unrealized gain (loss) on investments per share by $.05, and decrease the ratio of net investment income to average net assets from 9.78% to 9.17%. Per share data and ratios/supplemental data for periods prior to January 1, 2001 have not been restated to reflect this change in presentation.
b
| Based on average shares outstanding at each month end.
|
c
| Exclusive of sales charge.
|
d
| Not Annualized.
|
e
| Annualized.
|
f
| Amount represents less than .01%.
|
See notes to financial statements.
The Fund 29
FINANCIAL HIGHLIGHTS (continued)
| | Six Months Ended | | | | | | | | | | | |
| | June 30, 2004 | | | | Year Ended December 31, | | | |
| | | | | |
| | | |
| Class R Shares | (Unaudited) | | 2003 | | 2002 | | 2001 a | | 2000 | | 1999 | |
|
| |
| |
| |
| |
| |
| |
| Per Share Data ($): | | | | | | | | | | | | |
| Net asset value, | | | | | | | | | | | | |
| beginning of period | 7.43 | | 6.27 | | 7.94 | | 8.95 | | 10.44 | | 11.32 | |
| Investment Operations: | | | | | | | | | | | | |
| Investment income—net | .22b | | .67b | | .70b | | .86b | | 1.16 | | 1.05 | |
| Net realized and unrealized | | | | | | | | | | | | |
| gain (loss) on investments | (.08) | | 1.16 | | (1.64) | | (.96) | | (1.52) | | (.80) | |
| Total from Investment Operations | .14 | | 1.83 | | (.94) | | (.10) | | (.36) | | .25 | |
| Distributions: | | | | | | | | | | | | |
| Dividends from | | | | | | | | | | | | |
| investment income—net | (.28) | | (.67) | | (.73) | | (.91) | | (1.13) | | (1.13) | |
| Net asset value, end of period | 7.29 | | 7.43 | | 6.27 | | 7.94 | | 8.95 | | 10.44 | |
|
| |
| |
| |
| |
| |
| |
| Total Return (%) | 1.96c | | 30.15 | | (11.99) | | (1.26) | | (4.02) | | 2.24 | |
|
| |
| |
| |
| |
| |
| |
| Ratios/Supplemental Data (%): | | | | | | | | | | | | |
| Ratio of operating expenses | | | | | | | | | | | | |
| to average net assets | .70d | | .72 | | .70 | | .70 | | .70 | | .70 | |
| Ratio of interest expense | | | | | | | | | | | | |
| to average net assets | — | | .00e | | .00e | | .01 | | .01 | | .01 | |
| Ratio of net investment income | | | | | | | | | | | | |
| to average net assets | 7.75d | | 9.26 | | 10.08 | | 10.19 | | 11.01 | | 10.65 | |
| Portfolio Turnover Rate | 48.28c | | 235.42 | | 340.47 | | 158.92 | | 26.76 | | 40.79 | |
|
| |
| |
| |
| |
| |
| |
| Net Assets, end of period | | | | | | | | | | | | |
| ($ x 1,000) | 25,457 | | 1,283 | | 114 | | 131 | | 143 | | 329 | |
a As required, effective January 1, 2001, the fund has adopted the provisions of the AICPA Audit and Accounting Guide for Investment Companies and began amortizing discount or premium on fixed income securities on a scientific basis and including paydown gains and losses in interest income.The effect of this change for the period ended December 31, 2001 was to decrease net investment income per share by $.05 and increase net realized and unrealized gain (loss) on investments per share by $.05, and decrease the ratio of net investment income to average net assets from 10.80% to 10.19%. Per share data and ratios/supplemental data for periods prior to January 1, 2001 have not been restated to reflect this change in presentation.
b
| Based on average shares outstanding at each month end.
|
c
| Not annualized.
|
d
| Annualized.
|
e
| Amount represents less than .01%.
|
See notes to financial statements.
30
NOTES TO FINANCIAL STATEMENTS (Unaudited)
NOTE 1—Significant Accounting Policies:
Dreyfus Premier Limited Term High Yield Fund (the "fund") is a separate diversified series of The Dreyfus/Laurel Funds Trust (the "Trust") which is registered under the Investment Company Act of 1940, as amended (the "Act"), as an open-end management investment company and operates as a series company currently offering three series, including the fund. The fund's investment objective is to seek to maximize total return, consisting of capital appreciation and current income.The Dreyfus Corporation (the "Manager" or "Dreyfus") serves as the fund's investment manager. The Manager is a wholly-owned subsidiary of Mellon Financial Corporation ("Mellon Financial").
On April 30, 2004, pursuant to an Agreement and Plan of Reorganization previously approved by the fund's shareholders, all of the assets, subject to the liabilities, of the High Yield Fund of the Bear Stearns Funds, were transferred to the fund in exchange for shares of Beneficial Interest of the fund of equal value. Shareholders of Class A, Class B, Class C and Class Y shares of the High Yield Fund received Class A, Class B, Class C and Class R shares, respectively, of the fund, in each case, in an amount equal to the aggregate net asset value of their respective investment in the High Yield Fund at the time of the exchange.The fund's net asset value on April 30, 2004 was $7.38 per share for Class A shares, $7.39 per share for Class B shares, $7.39 per share for Class C shares and $7.39 per share for Class R shares and a total of 7,450,835 Class A shares, 5,891,364 Class B shares, 6,497,931 Class C shares and 3,773,591 Class R shares, representing net assets of $54,982,849 Class A shares, $43,560,106 Class B shares, $48,040,484 Class C shares and $27,857,157 Class R shares (including $7,843,349 net unrealized appreciation on investments), were issued to the shareholders of the High Yield Fund in the exchange.The exchange was a tax free event to shareholders.
Dreyfus Service Corporation (the "Distributor"), a wholly-owned subsidiary of the Manager, is the Distributor of the fund's shares. The fund is authorized to issue an unlimited number of shares of Beneficial Interest in each of the following classes of shares: Class A, Class B,
The Fund 31
NOTES TO FINANCIAL STATEMENTS (Unaudited) (continued)
Class C and Class R. Class A, Class B and Class C shares are sold primarily to retail investors through financial intermediaries and bear a distribution fee and/or service fee. Class A shares are sold with a front-end sales charge, while Class B and Class C shares are subject to a contingent deferred sales charge ("CDSC"). Class B shares automatically convert to Class A shares after six years. Class R shares are sold primarily to bank trust departments and other financial service providers (including Mellon Financial and its affiliates) acting on behalf of customers having a qualified trust or investment account or relationship at such institution, and bear no distribution or service fees. Class R shares are offered without a front-end sales charge or CDSC. Each class of shares has identical rights and privileges, except with respect to distribution and service fees and voting rights on matters affecting a single class.
Investment income, net of expenses (other than class specific expenses) and realized and unrealized gains and losses are allocated daily to each class of shares based upon the relative proportion of net assets of each class.
The fund's financial statements are prepared in accordance with U.S. generally accepted accounting principles, which may require the use of management estimates and assumptions. Actual results could differ from those estimates.
(a) Portfolio valuation: Investments in securities (excluding short-term investments (other than U.S. Treasury Bills), options, swap transactions and financial futures) are valued each business day by an independent pricing service (the "Service") approved by the Board of Trustees. Investments for which quoted bid prices are readily available and are representative of the bid side of the market in the judgment of the Service are valued at the mean between the quoted bid prices (as obtained by the Service from dealers in such securities) and asked prices (as calculated by the Service based upon its evaluation of the market for such securities). Other investments (which constitute a majority of the portfolio securities) are valued as determined by the Service, based on methods which include consideration of: yields or prices of securities of comparable quality, coupon, maturity and type; indications as to values
32
from dealers; and general market conditions. Securities for which there are no such valuations are valued at fair value as determined in good faith under the direction of the Board of Trustees. Short-term investments, other than U.S. Treasury Bills, are carried at amortized cost, which approximates value. Financial futures, and options, which are traded on an exchange, are valued at the last sales price on the securities exchange on which such securities are primarily traded or at the last sales price on the national securities market on each business day. Options traded over-the-counter are priced at the mean between the bid prices and asked prices. Investments denominated in foreign currencies are translated to U.S. dollars at the prevailing rates of exchange. Swap transactions are valued based on future cash flows and other factors, such as interest rates and underlying securities.
(b) Foreign currency transactions: The fund does not isolate that portion of the results of operations resulting from changes in foreign exchange rates on investments from the fluctuations arising from changes in the market prices of securities held. Such fluctuations are included with the net realized and unrealized gain or loss from investments.
Net realized foreign exchange gains or losses arise from sales and maturities of short-term securities, sales of foreign currencies, currency gains or losses realized on securities transactions and the difference between the amount of dividends, interest and foreign withholding taxes recorded on the fund's books and the U.S. dollar equivalent of the amounts actually received or paid. Net unrealized foreign exchange gains and losses arise from changes in the value of assets and liabilities other than investments in securities, resulting from changes in exchange rates. Such gains and losses are included with net realized and unrealized gain or loss on investments.
(c) Securities transactions and investment income: Securities transactions are recorded on a trade date basis. Realized gain and loss from securities transactions are recorded on the identified cost basis. Dividend income is recognized on the ex-dividend date and interest income, including, where applicable, accretion of discount and amortization of premium on investments, is recognized on the accrual basis.
The Fund 33
NOTES TO FINANCIAL STATEMENTS (Unaudited) (continued)
The fund may lend securities to qualified institutions. At origination, all loans are secured by collateral of at least 102% of the value of U.S. securities loaned and 105% of the value of foreign securities loaned. Collateral equivalent to at least 100% of the market value of securities on loan will be maintained at all times. Cash collateral is invested in certain money market mutual funds managed by the Manager as shown in the fund's Statement of Investments.The fund will be entitled to receive all income on securities loaned, in addition to income earned as a result of the lending transaction. Although each security loaned is fully collateralized, the fund would bear the risk of delay in recovery of, or loss of rights in, the securities loaned should a borrower fail to return the securities in a timely manner.
(d) Affiliated issuers: Issuers in which the fund held 5% or more of the outstanding voting securities are defined as "affiliated" in the Act. The following summarizes affiliated issuers during the period ended June 30, 2004:
| | | | Shares | | | | | | | | | |
| | | |
| | | | | | | | | |
| | Beginning | | | | | | End of | | Dividend | | Market | |
| Name of issuer | of Period | | Purchases | | Sales | | Period | | Income ($) | | Value ($) | |
|
| |
| |
| |
| |
| |
| |
| HCI Direct, CL. A | 910,714 | | — | | — | | 910,714 | | — | | 15,117,852 | |
(e) Concentration of Risk: The fund invests primarily in debt securities. Failure of an issuer of the debt securities to make timely interest or principal payments, or a decline or the perception of a decline in the credit quality of a debt security, can cause the debt security's price to fall, potentially lowering the fund's share price. High yield ("junk") bonds involve greater credit risk, including the risk of default, than investment grade bonds, and are considered predominantly speculative with respect to the issuer's continuing ability to make principal and interest payments. In addition, the value of debt securities may decline due to general market conditions that are not specifically related to a particular company, such as real or perceived adverse economic conditions, changes in outlook for corporate earnings, changes in interest or currency rates or adverse investor sentiment. They may also decline because of factors that affect a particular industry.
34
(f) Dividends to shareholders: It is the policy of the fund to declare dividends daily from investment income-net. Such dividends are paid monthly. Dividends from net realized capital gain, if any, are normally declared and paid annually, but the fund may make distributions on a more frequent basis to comply with the distribution requirements of the Internal Revenue Code of 1986, as amended (the "Code").To the extent that net realized capital gain can be offset by capital loss carryovers, it is the policy of the fund not to distribute such gain. Income and capital gain distributions are determined in accordance with income tax regulations, which may differ from U.S. generally accepted accounting principles.
(g) Federal income taxes: It is the policy of the fund to continue to qualify as a regulated investment company, if such qualification is in the best interests of its shareholders, by complying with the applicable provisions of the Code, and to make distributions of taxable income sufficient to relieve it from substantially all federal income and excise taxes.
The fund has an unused capital loss carryover of $450,887,386 available for federal income tax purposes to be applied against future net securities profits, if any, realized subsequent to December 31, 2003. If not applied, $1,959,797 of the carryover expires in fiscal 2005, $18,246,245 expires in fiscal 2006, $42,732,799 expires in fiscal 2007, $46,414,386 expires in fiscal 2008, $139,308,651 expires in fiscal 2009, $129,731,870 expires in fiscal 2010 and $72,493,638 expires in fiscal 2011.
Based on certain provisions in the Internal Revenue Code, various limitations regarding the future utilization of these carryforwards, brought forward as a result of the fund's merger with Dreyfus Premier High Yield Securities fund may apply.
The tax character of distributions paid to shareholders during the fiscal year ended December 31, 2003 was as follows: ordinary income $43,431,369. The tax character of current year distributions will be determined at the end of the current fiscal year.
The Fund 35
NOTES TO FINANCIAL STATEMENTS (Unaudited) (continued)
NOTE 2—Investment Management Fee and Other Transactions with Affiliates:
(a) Investment management fee: Pursuant to an Investment Management agreement with the Manager, the Manager provides or arranges for one or more third parties and/or affiliates to provide investment advisory, administrative, custody, fund accounting and transfer agency services to the fund. The Manager also directs the investments of the fund in accordance with its investment objective, policies and limitations. For these services, the fund is contractually obligated to pay the Manager a fee, calculated daily and paid monthly, at the annual rate of .70% of the value of the fund's average daily net assets. Out of its fee, the Manager pays all of the expenses of the fund except brokerage fees, taxes, interest, commitment fees, Rule 12b-1 distribution fees and expenses, service fees and expenses of non-interested Trustees (including counsel fees) and extraordinary expenses. In addition, the Manager is required to reduce its fee in an amount equal to the fund's allocable portion of fees and expenses of the non-interested Trustees (including counsel fees). Each Trustee receives $40,000 per year, plus $5,000 for each joint Board meeting of The Dreyfus/Laurel Funds, Inc., The Dreyfus/Laurel Tax-Free Municipal Funds and Trust (the "Dreyfus/Laurel Funds") attended, $2,000 for separate committee meetings attended which are not held in conjunction with a regularly scheduled board meeting and $500 for Board meetings and separate committee meetings attended that are conducted by telephone and is reimbursed for travel and out-of-pocket expenses.The Chairman of the Board receives an additional 25% of such compensation (with the exception of reimbursable amounts). In the event that there is a joint committee meeting of the Dreyfus/Laurel Funds and the Dreyfus High Yield Strategies Fund, the $2,000 fee will be allocated between the Dreyfus/Laurel Funds and the Dreyfus High Yield Strategies Fund. These fees and expenses are charged and allocated to each series based on net assets. Amounts required to be paid by the Trust directly to the non-interested Trustees, that would be applied to offset a portion of the management fee payable to the Manager, are in fact paid directly by the Manager to the non-interested Trustees.
36
During the period ended June 30, 2004, the Distributor retained $24,586 from commissions earned on sales of the fund's Class A shares and $394,080 and $19,173 from contingent deferred sales charges on redemptions of the fund's Class B and Class C shares, respectively.
(b) Distribution and service plan: Under separate Distribution Plans (the "Plans") adopted pursuant to Rule 12b-1 under the Act, Class A shares pay annually up to .25% of the value of the average daily net assets to compensate the Distributor for shareholder servicing activities and expenses primarily intended to result in the sale of Class A shares. Class B and Class C shares pay the Distributor for distributing their shares at an aggregate annual rate of .50% and .75% of the value of the average daily net assets of Class B and Class C shares, respectively. Class B and Class C shares are also subject to a service plan adopted pursuant to Rule 12b-1 (the "Service Plan"), under which Class B and Class C shares pay the Distributor for providing certain services to the holders of their shares a fee at the annual rate of .25% of the value of the average daily net assets of Class B and Class C shares. During the period ended June 30, 2004, Class A, Class B and Class C shares were charged $270,999, $539,574 and $363,012, respectively, pursuant to their respective Plans. During the period ended June 30, 2004, Class B and Class C shares were charged $269,787 and $121,004, respectively, pursuant to the Service Plan.
Under its terms, the Plans and Service Plan shall remain in effect from year to year, provided such continuance is approved annually by a vote of majority of those Trustees who are not "interested persons" of the Trust and who have no direct or indirect financial interest in the operation of or in any agreement related to the Plans or Service Plan.
The components of Due to The Dreyfus Corporation and affiliates in the Statement of Assets and Liabilities consists of: management fees $349,599, Rule 12b-1 distribution plan fees $211,349 and shareholder services plan fees $67,395.
(c) Pursuant to an exemptive order from the Securities and Exchange Commission, the may fund invest its available cash balances in affiliated money market mutual funds as shown in the fund's Statement of
The Fund 37
NOTES TO FINANCIAL STATEMENTS (Unaudited) (continued)
Investments. Management fees of the underlying money market mutual funds have been waived by the Manager.
NOTE 3—Securities Transactions:
The aggregate amount of purchases and sales (including paydowns) of investment securities, excluding short-term securities, financial futures, forward currency exchange contracts, options transactions and swap transactions during the period ended June 30, 2004, amounted to $254,332,144 and $289,240,024, respectively.
The fund may purchase and write (sell) call/put options in order to gain exposure to or protect against changes in the market.
As a writer of call options, the fund receives a premium at the outset and then bears the market risk of unfavorable changes in the price of the financial instruments underlying the options. Generally, the fund would incur a gain, to the extent of the premium, if the price of the underlying financial instrument decreases between the date the option is written and the date on which the option is terminated. Generally, the fund would realize a loss, if the price of the financial instrument increases between those dates. At June 30, 2004, there were no call options written outstanding.
As writer of put options, the fund receives a premium at the outset and then bears the market risk of unfavorable changes in the price of the financial instruments underlying the options. Generally, the fund would incur a gain, to the extent of the premium, if the price of the underlying financial instrument increases between the date the option is written and the date on which the option is terminated. Generally, the fund would realize a loss, if the price of the financial instrument decreases between those dates. At June 30, 2004, there were no put options written outstanding.
The fund may invest in financial futures contracts in order to gain exposure to or protect against changes in the market. The fund is exposed to market risk as a result of changes in the value of the under-
38
lying financial instruments. Investments in financial futures require the fund to "mark to market" on a daily basis, which reflects the change in the market value of the contracts at the close of each day's trading. Accordingly, variation margin payments are received or made to reflect daily unrealized gains or losses.When the contracts are closed, the fund recognizes a realized gain or loss.These investments require initial margin deposits with a broker.The amount of these deposits is determined by the exchange or Board of Trade on which the contract is traded and is subject to change. At June 30, 2004, there were no financial futures contracts outstanding.
The fund enters into forward currency exchange contracts in order to hedge its exposure to changes in foreign currency exchange rates on its foreign portfolio holdings and to settle foreign currency transactions. When executing forward currency exchange contracts, the fund is obligated to buy or sell a foreign currency at a specified rate on a certain date in the future.With respect to sales of forward currency exchange contracts, the fund would incur a loss if the value of the contract increases between the date the forward contract is opened and the date the forward contract is closed.The fund realizes a gain if the value of the contract decreases between those dates.With respect to purchases of forward currency exchange contracts, the fund would incur a loss if the value of the contract decreases between the date the forward contract is opened and the date the forward contract is closed.The fund realizes a gain if the value of the contract increases between those dates.The fund is also exposed to credit risk associated with counterparty nonperformance on these forward currency exchange contracts which is typically limited to the unrealized gain on each open contract. At June 30, 2004, there were no forward currency exchange contracts outstanding.
The fund may enter into swap agreements to exchange the interest rate on, or return generated by, one nominal instrument for the return generated by another nominal instrument.
The Fund 39
NOTES TO FINANCIAL STATEMENTS (Unaudited) (continued)
Total return swaps involve commitments to pay interest in exchange for a market-linked return based on a notional amount.To the extent the total return of the security or index underlying the transaction exceeds or falls short of the offsetting interest rate obligation, the fund will receive a payment from or make a payment to the counterparty, respectively. Total return swaps are marked-to-market daily and the change, if any, is recorded as unrealized appreciation or depreciation in the Statement of Operations. Periodic payments received or made at the end of each measurement period, but prior to termination, are recorded as realized gains or losses in the Statement of Operations. At June 30, 2004, there were no total return swaps outstanding.
Credit default swaps involve commitments to pay a fixed rate in exchange for payment if a credit event affecting a third party (the referenced company) occurs. Credit events may include a failure to pay interest, bankruptcy, or restructuring. Net periodic interest payments to be received or paid are accrued daily and are recorded in net realized gain (loss) on swap transactions in the Statement of Operations. Credit default swaps are market-to-market daily and the charge, if any is recorded as unrealized appreciation or depreciation in the Statement of Operations.At June 30, 2004, there were no credit default swaps outstanding.
Realized gains or losses on maturity or termination of swaps are presented in the Statement of Operations. Risks may arise upon entering into these agreements from the potential inability of the counterparties to meet the terms of the agreement and are generally limited to the amount of net payments to be received, if any, at the date of default.
At June 30, 2004, accumulated net unrealized appreciation on investments was $8,121,165, consisting of $32,583,478 gross unrealized appreciation and $24,462,313 gross unrealized depreciation.
At June 30, 2004, the cost of investments for federal income tax purposes was substantially the same as the cost for financial reporting purposes (see the Statement of Investments).
40
NOTE 4—Bank Lines of Credit:
The fund may borrow up to $20 million for leveraging purposes under a short-term unsecured line of credit and participates with other Dreyfus-managed funds in a $100 million unsecured line of credit primarily to be utilized for temporary or emergency purposes, including the financing of redemptions. Interest is charged to the fund based on prevailing market rates in effect at the time of borrowings. During the period ended June 30, 2004, the fund did not borrow under the line of credit.
NOTE 5—Legal Matters:
Two class actions (which have been consolidated) have been filed against Mellon Financial and Mellon Bank, N.A., and Dreyfus and Founders Asset Management LLC (the "Investment Advisers"), and the directors of all or substantially all of the Dreyfus funds, alleging that the Investment Advisers improperly used assets of the Dreyfus funds, in the form of directed brokerage commissions and 12b-1 fees, to pay brokers to promote sales of Dreyfus funds, and that the use of fund assets to make these payments was not properly disclosed to investors.The complaints further allege that the directors breached their fiduciary duties to fund shareholders under the Investment Company Act of 1940 and at common law. The complaints seek unspecified compensatory and punitive damages, rescission of the funds' contracts with the Investment Advisers, an accounting of all fees paid, and an award of attorneys' fees and litigation expenses. Dreyfus and the Dreyfus funds believe the allegations to be totally without merit and will defend the actions vigorously.
Additional lawsuits arising out of these circumstances and presenting similar allegations and requests for relief may be filed against the defendants in the future. Neither Dreyfus nor the Dreyfus funds believe that any of the pending actions will have a material adverse effect on the Dreyfus funds or Dreyfus' ability to perform its contracts with the Dreyfus funds.
The Fund 41
For More Information
| Dreyfus Premier |
| Limited Term |
| High Yield Fund |
| 200 Park Avenue |
| New York, NY 10166 |
| |
| Manager |
| The Dreyfus Corporation |
| 200 Park Avenue |
| New York, NY 10166 |
| |
| Custodian |
| Mellon Bank, N.A. |
| One Mellon Bank Center |
| Pittsburgh, PA 15258 |
| |
| Transfer Agent & |
| Dividend Disbursing Agent |
| Dreyfus Transfer, Inc. |
| 200 Park Avenue |
| New York, NY 10166 |
| |
| Distributor |
| Dreyfus Service Corporation |
| 200 Park Avenue |
| New York, NY 10166 |
To obtain information:
By telephone
Call your financial representative or 1-800-554-4611
By mail Write to: The Dreyfus Premier Family of Funds 144 Glenn Curtiss Boulevard Uniondale, NY 11556-0144
A description of the policies and procedures that the fund uses to determine how to vote proxies relating to portfolio securities is available, without charge, by calling the telephone number listed above, or by visiting the SEC's website at http://www.sec.gov
© 2004 Dreyfus Service Corporation 0029SA0604
Item 2. Code of Ethics.
Not applicable.
Item 3. Audit Committee Financial Expert.
Not applicable.
Item 4. Principal Accountant Fees and Services.
Not Applicable.
Item 5. Audit Committee of Listed Registrants.
Not applicable.
Item 6. [Reserved]
Item 7. Disclosure of Proxy Voting Policies and Procedures for Closed-End Management
Investment Companies.
Not applicable.
Item 8. Purchases of Equity Securities by Closed-End Management Investment Companies and Affiliated Purchasers.
Not applicable.
Item 9. Submission of Matters to a Vote of Security Holders.
Not applicable.
Item 10. Controls and Procedures.
(a) The Registrant's principal executive and principal financial officers have concluded, based on their evaluation of the Registrant's disclosure controls and procedures as of a date within 90 days of the filing date of this report, that the Registrant's disclosure controls and procedures are reasonably designed to ensure that information required to be disclosed by the Registrant on Form N-CSR is recorded, processed, summarized and reported within the required time periods and that information required to be disclosed by the Registrant in the reports that it files or submits on Form N-CSR is accumulated and communicated to the Registrant's management, including its principal executive and principal financial officers, as appropriate to allow timely decisions regarding required disclosure.
(b) There were no changes to the Registrant's internal control over financial reporting that occurred during the Registrant's most recently ended fiscal half-year that have materially affected, or are reasonably likely to materially affect, the Registrant's internal control over financial reporting.
-2-
Item 11. Exhibits.
(a)(1) not applicable
(a)(2) Certifications of principal executive and principal financial officers as required by Rule 30a-2(a) under the Investment Company Act of 1940.
(a)(3) Not applicable.
(b) Certification of principal executive and principal financial officers as required by Rule 30a-2(b) under the Investment Company Act of 1940.
-3-
SIGNATURES
Pursuant to the requirements of the Securities Exchange Act of 1934 and the Investment Company Act of 1940, the Registrant has duly caused this Report to be signed on its behalf by the undersigned, thereunto duly authorized.
| The Dreyfus/Laurel Funds Trust |
| | |
| By: | /s/ Stephen E. Canter |
| |
|
| | Stephen E. Canter |
| | Chief Executive Officer |
Date:
August 26, 2004
Pursuant to the requirements of the Securities Exchange Act of 1934 and the Investment Company Act of 1940, this Report has been signed below by the following persons on behalf of the Registrant and in the capacities and on the dates indicated.
| By: | /s/ Stephen E. Canter |
| |
|
| | Stephen E. Canter |
| | Chief Executive Officer |
Date:
August 26, 2004
| By: | /s/ James Windels |
| |
|
| | James Windels |
| | Chief Financial Officer |
Date:
August 26, 2004
EXHIBIT INDEX
(a)(2) Certifications of principal executive and principal financial officers as required by Rule 30a-2(a) under the Investment Company Act of 1940. (EX-99.CERT)
(b) Certification of principal executive and principal financial officers as required by Rule 30a-2(b) under the Investment Company Act of 1940. (EX-99.906CERT)
-4-