| UNITED STATES |
| SECURITIES AND EXCHANGE COMMISSION |
| Washington, D.C. 20549 |
| CERTIFIED SHAREHOLDER REPORT OF REGISTERED MANAGEMENT |
| INVESTMENT COMPANIES |
| Investment Company Act file number | | 811-524 |
| The Dreyfus/Laurel Funds Trust |
| (Exact name of Registrant as specified in charter) |
| c/o The Dreyfus Corporation |
| 200 Park Avenue |
| New York, New York 10166 |
| (Address of principal executive offices) (Zip code) |
| |
| Mark N. Jacobs, Esq. |
| 200 Park Avenue |
| New York, New York 10166 |
| (Name and address of agent for service) |
| Registrant's telephone number, including area code: | | (212) 922-6000 |
| Date of fiscal year end: | | 12/31 | | |
| Date of reporting period: | | 12/31/04 | | |
SSL-DOCS2 70128344v14
| | | | | FORM N-CSR |
| Item 1. | | Reports to Stockholders. | | |
| Dreyfus Premier |
| Core Value Fund |
| ANNUAL REPORT December 31, 2004 |

Save time. Save paper. View your next shareholder report online as soon as it’s available. Log into www.dreyfus.com and sign up for Dreyfus eCommunications. It’s simple and only takes a few minutes.
The views expressed in this report reflect those of the portfolio manager only through the end of the period covered and do not necessarily represent the views of Dreyfus or any other person in the Dreyfus organization. Any such views are subject to change at any time based upon market or other conditions and Dreyfus disclaims any responsibility to update such views.These views may not be relied on as investment advice and, because investment decisions for a Dreyfus fund are based on numerous factors, may not be relied on as an indication of trading intent on behalf of any Dreyfus fund.
Not FDIC-Insured • Not Bank-Guaranteed • May Lose Value
| Contents |
| |
| | | THE FUND |
| |
|
| 2 | | Letter from the Chairman |
| 3 | | Discussion of Fund Performance |
| 6 | | Fund Performance |
| 8 | | Understanding Your Fund’s Expenses |
| 8 | | Comparing Your Fund’s Expenses |
| With Those of Other Funds |
| 9 | | Statement of Investments |
| 14 | | Statement of Assets and Liabilities |
| 15 | | Statement of Operations |
| 16 | | Statement of Changes in Net Assets |
| 19 | | Financial Highlights |
| 25 | | Notes to Financial Statements |
| 34 | | Report of Independent Registered |
| | | Public Accounting Firm |
| 35 | | Important Tax Information |
| 36 | | Board Members Information |
| 38 | | Officers of the Fund |
| FOR MORE INFORMATION |
|
| | | Back Cover |
| Dreyfus Premier |
| Core Value Fund |

LETTER FROM THE CHAIRMAN
We are pleased to present this annual report for Dreyfus Premier Core Value Fund, covering the 12-month period from January 1, 2004, through December 31, 2004. Inside, you’ll find valuable information about how the fund was managed during the reporting period, including a discussion with the fund’s portfolio manager, Brian Ferguson, portfolio manager and member of the Large Cap Value Team of The Boston Company Asset Management.
2004 represented the second consecutive year of positive stock market performance. Unlike the 2003 rally, however, in which most stocks rose as general business conditions improved, 2004’s market performance largely reflected the strengths and weaknesses of individual companies and industries. As a result, fundamental research and professional judgment became more important determinants of mutual fund performance in 2004.
What’s ahead for stocks in 2005? No one knows for certain. Positive influences remain in place, including moderately expanding U.S. and global economies and low inflation. Nonetheless, a number of risks — such as rising short-term interest rates, currency fluctuations and generally slowing corporate earnings — could threaten the market environment.
As always, we urge our shareholders to view the stock market from a long-term perspective, measured in years rather than weeks or months. One of the best ways to ensure a long-term perspective is to establish an investment plan with the help of your financial advisor, and review it periodically to track your progress toward your financial goals.
Thank you for your continued confidence and support.

DISCUSSION OF FUND PERFORMANCE
| Brian Ferguson, Portfolio Manager |
| Large Cap Value Team |
How did Dreyfus Premier Core Value Fund perform relative to its benchmark?
For the 12-month period ended December 31, 2004, Dreyfus Premier Core Value Fund produced total returns of 11.41% for its Class A Shares, 10.62% for its Class B Shares, 10.62% for its Class C Shares, 11.53% for its Institutional shares, 11.69% for its Class R Shares and 11.14% for its Class T Shares.1 In comparison, the fund’s benchmark, the S&P 500/BARRA Value Index, produced a total return of 15.71% for the same period.2
We attribute the fund’s performance to the stock market’s strength over the final months of 2004, which stood in stark contrast to its relatively sluggish performance earlier in the year. Although the fund benefited from the positive contributions produced by a number of individual stocks and market sectors, its returns underperformed the S&P 500/BARRA Value Index.The fund’s underperformance in 2004 was primarily due to its emphasis on technology stocks, which lagged the averages amid lackluster customer demand, and its relatively light exposure to energy stocks, which prevented the portfolio from participating fully in the sector’s gains when gas and oil prices surged higher.
We are pleased to announce that on April 5, 2004, the Large Cap Value Team of The Boston Company Asset Management, an affiliate of The Dreyfus Corporation, started managing the fund. Each committee member is also an employee of The Dreyfus Corporation.
What is the fund’s investment approach?
The fund invests primarily in large-cap value companies that are considered undervalued based on traditional measures, such as price-to-earnings ratios. When choosing stocks, we use a “bottom-up” stock selection approach, focusing on individual companies, rather than a
The Fund 3
DISCUSSION OF FUND PERFORMANCE (continued)
|
“top-down” approach that forecasts market trends.We also focus on a company’s relative value, financial strength, sales and earnings momentum and likely catalysts that could ignite the stock price.
What other factors influenced the fund’s performance?
U.S. stock prices rose only modestly during the first 10 months of the reporting period, primarily because investors were worried about the sustainability of the economic recovery amid sluggish labor markets, rising interest rates, higher oil prices and the insurgency in Iraq. By the fourth quarter of 2004, however, the resolution of the U.S. presidential election lifted a cloud of uncertainty from the economy and market, and most stocks rallied strongly throughout the end of the year.
While we are pleased that a number of the fund’s individual stocks and market sectors participated significantly in the market’s strength, its returns lagged the S&P 500/BARRA Value Index. That’s because the fund’s bottom-up security selection strategy resulted in heavier exposure in technology stocks than the benchmark.The fund’s performance was hindered by two of its semiconductor holdings, Intel and Fairchild Semiconductor, which declined sharply when profits fell due to higher costs associated with research-and-development activities and investments in new plants. In addition, the fund’s relative performance suffered as a result of its relatively light holdings within the energy group, which benefited from rising oil and gas prices and comprised one of the S&P 500/BARRA Value Index’s stronger-performing sectors during the year.
A handful of stocks in other sectors also provided disappointing results. In the health care sector, drug distributor Cardinal Health suffered when allegations of accounting irregularities led to the departure of the company’s Chief Financial Officer.The fund’s media holdings were hurt when advertising spending, as a whole, failed to meet analysts’ expectations, despite advertisers’ historical tendency to spend heavily during the Olympics and U.S. elections.
On the other hand, the fund enjoyed strong returns from a number of its investments during the reporting period. For instance, the fund
received particularly robust returns from the utilities sector, where wireless communications companies such as AT&T Wireless Services and Sprint benefited from improving business fundamentals and industry consolidation. Electric utilities also posted solid gains, most notably TXU and power producers Exelon and Entergy.
In the capital goods area, the fund received strong contributions from its positions in wireless handset manufacturer Ericsson L.M., diversified industrial products manufacturer Eaton Corporation and aerospace giant Boeing, whose stock price rose due to a positive inflection point in the commercial aerospace business cycle.
What is the fund’s current strategy?
While we have continued to rely on our “bottom-up” stock selection strategy to identify attractively valued stocks, as of the end of the reporting period we have focused on companies that we believe should benefit from higher levels of corporate capital spending. Accordingly, the fund ended 2004 with greater exposure than the benchmark to the capital goods, consumer services, consumer non-durables and technology areas. Conversely, the fund has less exposure than the benchmark to the basic materials, health care, utilities and financial sectors. In our view, this positioning will allow the fund to benefit from continued economic growth in the next phase of the business cycle.
| 1 | | Total return includes reinvestment of dividends and any capital gains paid, and does not take into |
| | | consideration the maximum initial sales charges in the case of Class A and Class T shares or the |
| | | applicable contingent deferred sales charges imposed on redemptions in the case of Class B and |
| | | Class C shares. Had these charges been reflected, returns would have been lower. Past performance |
| | | is no guarantee of future results. Share price and investment return fluctuate such that upon |
| | | redemption, fund shares may be worth more or less than their original cost. |
| 2 | | SOURCE: LIPPER INC. — Reflects the reinvestment of dividends and, where applicable, |
| | | capital gain distributions.The S&P 500/BARRA Value Index is a capitalization-weighted |
| | | index of all the stocks in the Standard & Poor’s 500 Composite Price Index (“S&P 500 |
| | | Index”) that have low price-to-book ratios.The S&P 500 Index is a widely accepted, unmanaged |
| | | index of U.S. stock market performance. |
The Fund 5
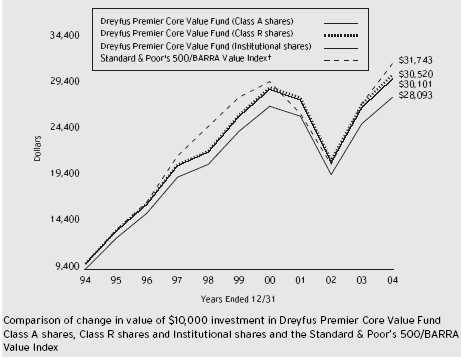
| † Source: Lipper Inc. |
| Past performance is not predictive of future performance. |
| The above graph compares a $10,000 investment made in Class A shares, Institutional shares and Class R shares of |
| Dreyfus Premier Core Value Fund on 12/31/94 to a $10,000 investment made in the Standard & Poor’s |
| 500/BARRA Value Index (the “Index”) on that date. All dividends and capital gain distributions are reinvested. |
| Performance for Class B, Class C and Class T shares will vary from the performance of Class A, Institutional and |
| Class R shares shown above due to differences in charges and expenses. |
| The fund’s performance shown in the line graph takes into account the maximum initial sales charge on Class A |
| shares and all other applicable fees and expenses for Class A shares, Institutional shares and Class R shares.The |
| Index is a capitalization-weighted index of all the stocks in the S&P 500 that have low price-to-book ratios.The |
| Index does not take into account charges, fees and other expenses. Further information relating to fund performance, |
| including expense reimbursements, if applicable, is contained in the Financial Highlights section of the prospectus and |
| elsewhere in this report. |
| Average Annual Total Returns as of 12/31/04 | | | | | | |
| |
| | | Inception | | | | | | | | From |
| | | Date | | 1 Year | | 5 Years | | 10 Years | | Inception |
| |
| |
| |
| |
| |
|
| Class A shares | | | | | | | | | | |
| with maximum sales charge (5.75%) | | | | 5.02% | | 1.66% | | 10.88% | | |
| without sales charge | | | | 11.41% | | 2.87% | | 11.54% | | |
| Class B shares | | | | | | | | | | |
| with applicable redemption charge † | | 1/16/98 | | 6.62% | | 1.74% | | — | | 5.30%†† |
| without redemption | | 1/16/98 | | 10.62% | | 2.10% | | — | | 5.30%†† |
| Class C shares | | | | | | | | | | |
| with applicable redemption charge ††† | | 1/16/98 | | 9.62% | | 2.09% | | — | | 5.20% |
| without redemption | | 1/16/98 | | 10.62% | | 2.09% | | — | | 5.20% |
| Class R shares | | | | 11.69% | | 3.13% | | 11.80% | | |
| Institutional shares | | | | 11.53% | | 2.97% | | 11.65% | | |
| Class T shares | | | | | | | | | | |
| with applicable sales charge (4.5%) | | 8/16/99 | | 6.15% | | 1.66% | | — | | 2.31% |
| without sales charge | | 8/16/99 | | 11.14% | | 2.60% | | — | | 3.18% |
Past performance is not predictive of future performance.The fund’s performance shown in the graph and table does not reflect the deduction of taxes that a shareholder would pay on fund distributions or the redemption of fund shares.
| † | | The maximum contingent deferred sales charge for Class B shares is 4%.After six years Class B shares convert to |
| | | Class A shares. |
| †† | | Assumes the conversion of Class B shares to Class A shares at the end of the sixth year following the date of |
| | | purchase. |
| ††† | | The maximum contingent deferred sales charge for Class C shares is 1% for shares redeemed within one year of the |
| | | date of purchase. |
The Fund 7
U N D E R S TA N D I N G YO U R F U N D ’ S E X P E N S E S ( U n a u d i t e d )
As a mutual fund investor, you pay ongoing expenses, such as management fees and other expenses. Using the information below, you can estimate how these expenses affect your investment and compare them with the expenses of other funds.You also may pay one-time transaction expenses, including sales charges (loads) and redemption fees, which are not shown in this section and would have resulted in higher total expenses. For more information, see your fund’s prospectus or talk to your financial adviser.
Review your fund’s expenses
The table below shows the expenses you would have paid on a $1,000 investment in Dreyfus Premier Core Value Fund from July 1, 2004 to December 31, 2004. It also shows how much a $1,000 investment would be worth at the close of the period, assuming actual returns and expenses.
| Expenses and Value of a $1,000 Investment |
| assuming actual returns for the six months ended December 31, 2004 |
| | | Class A | | Class B | | Class C | | Class R | | Class T | | Institutional |
| |
| |
| |
| |
| |
| |
|
| Expenses paid | | | | | | | | | | | | |
| per $1,000 † | | $ 6.02 | | $ 9.93 | | $ 9.93 | | $ 4.72 | | $ 7.33 | | $ 5.50 |
| Ending value | | | | | | | | | | | | |
| (after expenses) | | $1,083.30 | | $1,079.40 | | $1,079.40 | | $1,084.70 | | $1,082.00 | | $1,083.90 |
| COMPARING YOUR FUND’S EXPENSES |
| WITH THOSE OF OTHER FUNDS (Unaudited) |
Using the SEC’s method to compare expenses
The Securities and Exchange Commission (SEC) has established guidelines to help investors assess fund expenses. Per these guidelines, the table below shows your fund’s expenses based on a $1,000 investment, assuming a hypothetical 5% annualized return. You can use this information to compare the ongoing expenses (but not transaction expenses or total cost) of investing in the fund with those of other funds.All mutual fund shareholder reports will provide this information to help you make this comparison. Please note that you cannot use this information to estimate your actual ending account balance and expenses paid during the period.
| Expenses and Value of a $1,000 Investment |
| assuming a hypothetical 5% annualized return for the six months ended December 31, 2004 |
| | | Class A | | Class B | | Class C | | Class R | | Class T | | Institutional |
| |
| |
| |
| |
| |
| |
|
| Expenses paid | | | | | | | | | | | | |
| per $1,000 † | | $ 5.84 | | $ 9.63 | | $ 9.63 | | $ 4.57 | | $ 7.10 | | $ 5.33 |
| Ending value | | | | | | | | | | | | |
| (after expenses) | | $1,019.36 | | $1,015.58 | | $1,015.58 | | $1,020.61 | | $1,018.10 | | $1,019.86 |
- Expenses are equal to the fund’s annualized expense ratio of 1.15% for Class A, 1.90% for Class B, 1.90% for Class C, .90% for Class R, 1.40% for Class T and 1.05% for Institutional multiplied by the average account value over the period, multiplied by 184/366 (to reflect the one-half year period).
STATEMENT OF INVESTMENTS
December 31, 2004
|
| Common Stocks—99.5% | | Shares | | Value ($) |
| |
| |
|
| Banking—15.6% | | | | |
| Bank of America | | 572,536 | | 26,903,467 |
| Citigroup | | 631,033 | | 30,403,169 |
| Countrywide Financial | | 124,300 | | 4,600,343 |
| Fannie Mae | | 99,100 | | 7,056,911 |
| Freddie Mac | | 184,100 | | 13,568,170 |
| PNC Financial Services Group | | 78,500 | | 4,509,040 |
| SunTrust Banks | | 59,800 | | 4,418,024 |
| U.S. Bancorp | | 382,300 | | 11,973,636 |
| Wachovia | | 340,800 | | 17,926,080 |
| Wells Fargo & Co. | | 134,800 | | 8,377,820 |
| | | | | 129,736,660 |
| Basic Industries—3.1% | | | | |
| Bowater | | 93,900 | | 4,128,783 |
| China Steel, ADR | | 7 a | | 158 |
| Dow Chemical | | 165,300 | | 8,184,003 |
| E. I. du Pont de Nemours | | 86,695 | | 4,252,389 |
| International Paper | | 220,000 | | 9,240,000 |
| | | | | 25,805,333 |
| Beverages & Tobacco—.8% | | | | |
| Altria Group | | 115,500 | | 7,057,050 |
| Brokerage—9.0% | | | | |
| Goldman Sachs Group | | 165,800 | | 17,249,832 |
| J.P. Morgan Chase & Co. | | 601,500 | | 23,464,515 |
| Merrill Lynch | | 208,050 | | 12,435,149 |
| Morgan Stanley | | 383,200 | | 21,275,264 |
| | | | | 74,424,760 |
| Broadcasting & Publishing—1.6% | | |
| Time Warner | | 677,500 b | | 13,170,600 |
| Capital Goods—12.0% | | | | |
| Boeing | | 264,200 | | 13,677,634 |
| Eaton | | 69,800 | | 5,050,728 |
| Emerson Electric | | 64,260 | | 4,504,626 |
| General Electric | | 664,900 | | 24,268,850 |
The Fund 9
S T A T E M E N T O F I N V E S T M E N T S (continued)
| Common Stocks (continued) | | Shares | | | | Value ($) |
| |
| |
| |
|
| Capital Goods (continued) | | | | | | |
| Nokia, ADR | | 526,000 | | | | 8,242,420 |
| Tyco International | | 627,400 | | | | 22,423,276 |
| United Technologies | | 183,900 | | | | 19,006,065 |
| Xerox | | 137,950 | | b | | 2,346,530 |
| | | | | | | 99,520,129 |
| Consumer Durables—.5% | | | | | | |
| Koninklijke (Royal) Philips Electronics | | | | | | |
| (New York Shares) | | 154,100 | | | | 4,083,650 |
| Consumer Non-Durables—4.3% | | | | | | |
| Coca-Cola | | 99,100 | | | | 4,125,533 |
| Colgate-Palmolive | | 163,200 | | | | 8,349,312 |
| General Mills | | 90,000 | | | | 4,473,900 |
| Jones Apparel Group | | 103,700 | | | | 3,792,309 |
| Kimberly-Clark | | 69,000 | | | | 4,540,890 |
| Kraft Foods, Cl. A | | 183,900 | | | | 6,548,679 |
| Newell Rubbermaid | | 173,300 | | c | | 4,192,127 |
| | | | | | | 36,022,750 |
| Consumer Services—11.3% | | | | | | |
| Advance Auto Parts | | 129,900 | | b | | 5,674,032 |
| Clear Channel Communications | | 407,100 | | | | 13,633,779 |
| DST Systems | | 173,900 | | b | | 9,063,668 |
| Liberty Media, Cl. A | | 1,185,080 | | b | | 13,012,178 |
| Liberty Media International, Cl. A | | 86,134 | | b | | 3,981,975 |
| McDonald’s | | 268,200 | | | | 8,598,492 |
| News, Cl. A | | 362,400 | | | | 6,762,384 |
| Omnicom Group | | 164,900 | | | | 13,904,368 |
| Safeway | | 327,300 | | b | | 6,460,902 |
| Viacom, Cl. B | | 344,400 | | | | 12,532,716 |
| | | | | | | 93,624,494 |
| Energy—11.8% | | | | | | |
| Apache | | 115,000 | | c | | 5,815,550 |
| BP, ADR | | 194,000 | | | | 11,329,600 |
| Common Stocks (continued) | | Shares | | Value ($) |
| |
| |
|
| Energy (continued) | | | | |
| ChevronTexaco | | 182,900 | | 9,604,079 |
| ConocoPhillips | | 162,060 | | 14,071,670 |
| Exxon Mobil | | 723,332 | | 37,077,998 |
| Schlumberger | | 122,200 | | 8,181,290 |
| Total SA, ADR | | 107,500 | | 11,807,800 |
| | | | | 97,887,987 |
| Health Care—4.4% | | | | |
| Boston Scientific | | 215,500 b | | 7,661,025 |
| Caremark Rx | | 181,700 b | | 7,164,431 |
| Medco Health Solutions | | 136,700 b | | 5,686,720 |
| PacifiCare Health Systems | | 37,100 b | | 2,096,892 |
| Pfizer | | 126,000 | | 3,388,140 |
| Schering-Plough | | 212,300 | | 4,432,824 |
| WellPoint | | 49,800 b | | 5,727,000 |
| | | | | 36,157,032 |
| Insurance—7.3% | | | | |
| ACE | | 51,100 | | 2,184,525 |
| Allstate | | 97,500 | | 5,042,700 |
| American International Group | | 165,193 | | 10,848,224 |
| Genworth Financial, Cl. A | | 305,795 | | 8,256,465 |
| Hartford Financial Services Group | | 108,900 | | 7,547,859 |
| PMI Group | | 275,000 | | 11,481,250 |
| Prudential Financial | | 269,700 | | 14,822,712 |
| | | | | 60,183,735 |
| Merchandising—.6% | | | | |
| Dollar General | | 222,900 | | 4,629,633 |
| Technology—7.1% | | | | |
| Automatic Data Processing | | 267,900 | | 11,881,365 |
| Fairchild Semiconductor, Cl. A | | 250,200 b | | 4,068,252 |
| Hewlett-Packard | | 208,400 | | 4,370,148 |
| International Business Machines | | 84,900 | | 8,369,442 |
The Fund 11
S T A T E M E N T O F I N V E S T M E N T S (continued)
| Common Stocks (continued) | | Shares | | Value ($) |
| |
| |
|
| Technology (continued) | | | | |
| Microsoft | | 579,200 | | 15,470,432 |
| Oracle | | 726,100 b | | 9,962,092 |
| SunGard Data Systems | | 160,700 b | | 4,552,631 |
| | | | | 58,674,362 |
| Telecommunications—1.8% | | | | |
| Sprint (FON Group) | | 608,950 | | 15,132,408 |
| Transportation—.3% | | | | |
| Union Pacific | | 32,600 | | 2,192,350 |
| Utilities—8.0% | | | | |
| ALLTEL | | 123,495 | | 7,256,566 |
| Dominion Resources | | 61,600 | | 4,172,784 |
| Edison International | | 142,200 | | 4,554,666 |
| Entergy | | 112,300 | | 7,590,357 |
| Exelon | | 198,100 | | 8,730,267 |
| PG&E | | 135,500 | | 4,509,440 |
| PPL | | 86,800 | | 4,624,704 |
| TXU | | 38,700 | | 2,498,472 |
| Verizon Communications | | 444,656 | | 18,013,015 |
| Vodafone Group, ADR | | 161,800 | | 4,430,084 |
| | | | | 66,380,355 |
| Total Common Stocks | | | | |
| (cost $666,694,412) | | | | 824,683,288 |
| |
| |
|
| | | Principal | | |
| Short-Term Investments—.7% | | Amount ($) | | Value ($) |
| |
| |
|
| Commercial Paper; | | | | |
| General Electric Capital, | | | | |
| 2.17%, 1/3/2005 | | | | |
| (cost $6,008,000) | | 6,008,000 | | 6,008,000 |
| Investment of Cash Collateral | | | | |
| for Securities Loaned—1.3% | | Shares | | Value ($) |
| |
| |
|
| Registered Investment Company; | | | | |
| Dreyfus Institutional Cash Advantage Fund | | | | |
| (cost $10,312,500) | | | | 10,312,500 d | | 10,312,500 |
| |
| |
| |
|
| |
| Total Investments (cost $683,014,912) | | 101.5% | | 841,003,788 |
| |
| Liabilities, Less Cash and Receivables | | (1.5%) | | (12,201,374) |
| |
| Net Assets | | | | 100.0% | | 828,802,414 |
| |
| ADR—American Depository Receipt. | | | | |
| a | | Security exempt from registration under Rule 144A of the Securities Act of 1933.This security may be resold in |
| | | transaction exempt from registration, normally to qualified institutional buyers.This security has been determined to be |
| | | liquid by the Board of Trustees.At December 31, 2004, this security amounted to $158. | | |
| b | | Non-income producing. | | | | | | |
| c | | All or a portion of these securities are on loan.At December 31, 2004, the total market value of the fund’s securities |
| | | on loan is $10,007,677 and the total market value of the collateral held by the fund is $10,312,500. |
| d | | Investment in affiliated money market mutual funds. | | | | |
| |
| |
| |
|
| |
| |
| |
| Portfolio Summary (Unaudited) † | | | | |
| |
| | | | | Value (%) | | | | Value (%) |
| |
| |
| |
| |
|
| Banking | | 15.6 | | Consumer Non-Durables | | 4.3 |
| Capital Goods | | 12.0 | | Basic Industries | | 3.1 |
| Energy | | 11.8 | | Short Term/ | | |
| Consumer Services | | 11.3 | | Money Market Investments | | 2.0 |
| Brokerage | | 9.0 | | Telecommunications | | 1.8 |
| Utilities | | 8.0 | | Broadcasting & Publishing | | 1.6 |
| Insurance | | 7.3 | | Other | | 2.2 |
| Technology | | 7.1 | | | | |
| Health Care | | 4.4 | | | | 101.5 |
| |
| † | | Based on net assets. | | | | | | |
| See notes to financial statements. | | | | |
The Fund 13
| STATEMENT OF ASSETS AND LIABILITIES |
| December 31, 2004 |
| | | Cost | | Value |
| |
| |
|
| Assets ($): | | | | |
| Investments in securities—See Statement of | | | | |
| Investments (including securities on loan, | | | | |
| valued at $10,007,677)—Note 1(b): | | | | |
| Unaffiliated issuers | | 672,702,412 | | 830,691,288 |
| Affiliated issuers | | 10,312,500 | | 10,312,500 |
| Receivable for investment securities sold | | | | 3,518,061 |
| Dividends and interest receivable | | | | 1,136,354 |
| Receivable for shares of Beneficial Interest subscribed | | 182,206 |
| | | | | 845,840,409 |
| |
| |
|
| Liabilities ($): | | | | |
| Due to The Dreyfus Corporation and affiliates—Note 3(b) | | 937,877 |
| Cash overdraft due to Custodian | | | | 45,748 |
| Liability for securities on loan—Note 1(b) | | | | 10,312,500 |
| Payable for investment securities purchased | | | | 1,566,257 |
| Payable for shares of Beneficial Interest redeemed | | 4,175,613 |
| | | | | 17,037,995 |
| |
| |
|
| Net Assets ($) | | | | 828,802,414 |
| |
| |
|
| Composition of Net Assets ($): | | | | |
| Paid-in capital | | | | 735,090,322 |
| Accumulated undistributed investment income—net | | 922,455 |
| Accumulated net realized gain (loss) on investments | | (65,199,239) |
| Accumulated net unrealized appreciation | | | | |
| (depreciation) on investments | | | | 157,988,876 |
| |
| |
|
| Net Assets ($) | | | | 828,802,414 |
| Net Asset Value Per Share | | | | | | | | |
| | | Class A | | Class B | | Class C | | Class R | | Class T | | Institutional |
| |
| |
| |
| |
| |
| |
|
| Net Assets ($) | | 634,007,300 | | 78,153,749 | | 21,958,470 | | 50,535,844 | | 2,945,060 | | 41,201,991 |
| Shares | | | | | | | | | | | | |
| Outstanding | | 20,900,152 | | 2,619,721 | | 736,224 | | 1,666,270 | | 97,107 | | 1,358,959 |
| |
| |
| |
| |
| |
| |
|
| Net Asset Value | | | | | | | | | | |
| Per Share ($) | | 30.34 | | 29.83 | | 29.83 | | 30.33 | | 30.33 | | 30.32 |
See notes to financial statements.
|
STATEMENT OF OPERATIONS
Year Ended December 31, 2004
|
| Investment Income ($): | | |
| Income: | | |
| Cash dividends (net of $209,149 foreign taxes withheld at source) | | 16,039,764 |
| Interest | | 136,875 |
| Income from securities lending | | 79,929 |
| Total Income | | 16,256,568 |
| Expenses: | | |
| Management fee—Note 3(a) | | 7,329,969 |
| Distribution and service fees—Note 3(b) | | 2,617,704 |
| Loan commitment fees—Note 2 | | 7,777 |
| Total Expenses | | 9,955,450 |
| Investment Income—Net | | 6,301,118 |
| |
|
| Realized and Unrealized Gain (Loss) on Investments—Note 4 ($): |
| Net realized gain (loss) on investments | | 71,568,294 |
| Net unrealized appreciation (depreciation) on investments | | 8,014,588 |
| Net Realized and Unrealized Gain (Loss) on Investments | | 79,582,882 |
| Net Increase in Net Assets Resulting from Operations | | 85,884,000 |
See notes to financial statements.
|
The Fund 15
STATEMENT OF CHANGES IN NET ASSETS
| | | Year Ended December 31, |
| |
|
| | | 2004 | | 2003 |
| |
| |
|
| Operations ($): | | | | |
| Investment income—net | | 6,301,118 | | 4,486,434 |
| Net realized gain (loss) on investments | | 71,568,294 | | 2,244,365 |
| Net unrealized appreciation | | | | |
| (depreciation) on investments | | 8,014,588 | | 171,665,107 |
| Net Increase (Decrease) in Net Assets | | |
| Resulting from Operations | | 85,884,000 | | 178,395,906 |
| |
| |
|
| Dividends to Shareholders from ($): | | | | |
| Investment income—net: | | | | |
| Class A shares | | (4,697,408) | | (3,672,165) |
| Class B shares | | (149,699) | | (42,807) |
| Class C shares | | (41,992) | | (12,034) |
| Class R shares | | (549,414) | | (431,331) |
| Class T shares | | (14,243) | | (8,129) |
| Institutional shares | | (347,200) | | (294,312) |
| Total Dividends | | (5,799,956) | | (4,460,778) |
| |
| |
|
| Beneficial Interest Transactions ($): | | | | |
| Net proceeds from shares sold: | | | | |
| Class A shares | | 59,592,432 | | 69,547,747 |
| Class B shares | | 6,208,956 | | 11,334,683 |
| Class C shares | | 4,440,112 | | 9,950,055 |
| Class R shares | | 7,087,324 | | 6,484,312 |
| Class T shares | | 813,497 | | 466,996 |
| Institutional shares | | 804,835 | | 674,229 |
| | | Year Ended December 31, |
| |
|
| | | 2004 | | 2003 |
| |
| |
|
| Beneficial Interest Transactions ($) (continued): | | |
| Dividends reinvested: | | | | |
| Class A shares | | 4,081,538 | | 3,178,046 |
| Class B shares | | 129,596 | | 36,527 |
| Class C shares | | 31,529 | | 9,238 |
| Class R shares | | 549,093 | | 431,021 |
| Class T shares | | 13,773 | | 8,023 |
| Institutional shares | | 336,538 | | 285,477 |
| Cost of shares redeemed: | | | | |
| Class A shares | | (98,384,063) | | (101,503,555) |
| Class B shares | | (14,428,736) | | (11,884,065) |
| Class C shares | | (7,117,650) | | (12,880,056) |
| Class R shares | | (14,874,540) | | (5,795,921) |
| Class T shares | | (422,625) | | (246,690) |
| Institutional shares | | (5,872,389) | | (5,373,560) |
| Increase (Decrease) in Net Assets | | | | |
| from Beneficial Interest Transactions | | (57,010,780) | | (35,277,493) |
| Total Increase (Decrease) in Net Assets | | 23,073,264 | | 138,657,635 |
| |
| |
|
| Net Assets ($): | | | | |
| Beginning of Period | | 805,729,150 | | 667,071,515 |
| End of Period | | 828,802,414 | | 805,729,150 |
| Undistributed investment income—net | | 922,455 | | 421,293 |
The Fund 17
STATEMENT OF CHANGES IN NET ASSETS (continued)
|
| | | Year Ended December 31, |
| |
|
| | | 2004 | | 2003 |
| |
| |
|
| Capital Share Transactions: | | | | |
| Class A a | | | | |
| Shares sold | | 2,113,462 | | 2,953,000 |
| Shares issued for dividends reinvested | | 141,041 | | 134,142 |
| Shares redeemed | | (3,501,287) | | (4,326,654) |
| Net Increase (Decrease) in Shares Outstanding | | (1,246,784) | | (1,239,512) |
| |
| |
|
| Class B a | | | | |
| Shares sold | | 218,548 | | 486,046 |
| Shares issued for dividends reinvested | | 4,398 | | 1,655 |
| Shares redeemed | | (518,703) | | (525,823) |
| Net Increase (Decrease) in Shares Outstanding | | (295,757) | | (38,122) |
| |
| |
|
| Class C | | | | |
| Shares sold | | 159,821 | | 452,412 |
| Shares issued for dividends reinvested | | 1,071 | | 421 |
| Shares redeemed | | (256,515) | | (599,607) |
| Net Increase (Decrease) in Shares Outstanding | | (95,623) | | (146,774) |
| |
| |
|
| Class R | | | | |
| Shares sold | | 252,461 | | 271,825 |
| Shares issued for dividends reinvested | | 19,085 | | 18,131 |
| Shares redeemed | | (527,483) | | (237,711) |
| Net Increase (Decrease) in Shares Outstanding | | (255,937) | | 52,245 |
| |
| |
|
| Class T | | | | |
| Shares sold | | 28,795 | | 20,540 |
| Shares issued for dividends reinvested | | 471 | | 338 |
| Shares redeemed | | (14,698) | | (10,977) |
| Net Increase (Decrease) in Shares Outstanding | | 14,568 | | 9,901 |
| |
| |
|
| Institutional Shares | | | | |
| Shares sold | | 28,607 | | 29,399 |
| Shares issued for dividends reinvested | | 11,656 | | 12,070 |
| Shares redeemed | | (207,544) | | (240,152) |
| Net Increase (Decrease) in Shares Outstanding | | (167,281) | | (198,683) |
| a | | During the period ended December 31, 2004, 92,290 Class B shares representing $2,541,700 were automatically |
| | | converted to 90,750 Class A shares and during the period ended December 31, 2003, 33,502 Class B shares |
| | | representing $773,643 were automatically converted to 32,995 Class A shares. |
| See notes to financial statements. |
The following tables describe the performance for each share class for the fiscal periods indicated.All information (except portfolio turnover rate) reflects financial results for a single fund share.Total return shows how much your investment in the fund would have increased (or decreased) during each period assuming you had reinvested all dividends and distributions.These figures have been derived from the fund’s financial statements.
| | | | | Year Ended December 31, | | |
| |
| |
| |
|
| Class A Shares | | 2004 | | 2003 | | 2002 | | 2001 | | 2000 |
| |
| |
| |
| |
| |
|
| Per Share Data ($): | | | | | | | | | | |
| Net asset value, beginning of period | | 27.44 | | 21.57 | | 28.62 | | 30.93 | | 30.83 |
| Investment Operations: | | | | | | | | | | |
| Investment income—net a | | .24 | | .17 | | .10 | | .17 | | .24 |
| Net realized and unrealized | | | | | | | | | | |
| gain (loss) on investments | | 2.88 | | 5.86 | | (7.06) | | (1.46) | | 3.04 |
| Total from Investment Operations | | 3.12 | | 6.03 | | (6.96) | | (1.29) | | 3.28 |
| Distributions: | | | | | | | | | | |
| Dividends from investment income—net | | (.22) | | (.16) | | (.09) | | (.16) | | (.23) |
| Dividends from net realized | | | | | | | | | | |
| gain on investments | | — | | — | | — | | (.86) | | (2.95) |
| Total Distributions | | (.22) | | (.16) | | (.09) | | (1.02) | | (3.18) |
| Net asset value, end of period | | 30.34 | | 27.44 | | 21.57 | | 28.62 | | 30.93 |
| |
| |
| |
| |
| |
|
| Total Return (%) b | | 11.41 | | 28.09 | | (24.36) | | (4.04) | | 11.21 |
| |
| |
| |
| |
| |
|
| Ratios/Supplemental Data (%): | | | | | | | | | | |
| Ratio of total expenses | | | | | | | | | | |
| to average net assets | | 1.15 | | 1.15 | | 1.15 | | 1.15 | | 1.15 |
| Ratio of net investment income | | | | | | | | | | |
| to average net assets | | .86 | | .71 | | .41 | | .58 | | .79 |
| Portfolio Turnover Rate | | 74.98 | | 54.58 | | 67.21 | | 68.77 | | 88.70 |
| |
| |
| |
| |
| |
|
| Net Assets, end of period ($ X 1,000) | | 634,007 | | 607,633 | | 504,371 | | 695,054 | | 634,410 |
| a | | Based on average shares outstanding at each month end. |
| b | | Exclusive of sales charge. |
| See notes to financial statements. |
The Fund 19
FINANCIAL HIGHLIGHTS (continued)
|
| | | | | | | Year Ended December 31, | | |
| | | |
| |
| |
|
| Class B Shares | | 2004 | | 2003 | | 2002 | | 2001 | | 2000 |
| |
| |
| |
| |
| |
|
| Per Share Data ($): | | | | | | | | | | |
| Net asset value, beginning of period | | 27.02 | | 21.27 | | 28.33 | | 30.68 | | 30.64 |
| Investment Operations: | | | | | | | | | | |
| Investment income (loss)—net a | | .02 | | (.01) | | (.08) | | (.07) | | .01 |
| Net realized and unrealized | | | | | | | | | | |
| gain (loss) on investments | | 2.85 | | 5.77 | | (6.98) | | (1.42) | | 3.01 |
| Total from Investment Operations | | 2.87 | | 5.76 | | (7.06) | | (1.49) | | 3.02 |
| Distributions: | | | | | | | | | | |
| Dividends from investment income—net | | (.06) | | (.01) | | — | | (.00)b | | (.03) |
| Dividends from net realized | | | | | | | | | | |
| gain on investments | | — | | — | | — | | (.86) | | (2.95) |
| Total Distributions | | (.06) | | (.01) | | — | | (.86) | | (2.98) |
| Net asset value, end of period | | 29.83 | | 27.02 | | 21.27 | | 28.33 | | 30.68 |
| |
| |
| |
| |
| |
|
| Total Return (%) c | | 10.62 | | 27.12 | | (24.92) | | (4.79) | | 10.39 |
| |
| |
| |
| |
| |
|
| Ratios/Supplemental Data (%): | | | | | | | | | | |
| Ratio of total expenses | | | | | | | | | | |
| to average net assets | | 1.90 | | 1.90 | | 1.90 | | 1.90 | | 1.90 |
| Ratio of net investment income | | | | | | | | | | |
| (loss) to average net assets | | .10 | | (.04) | | (.33) | | (.24) | | .03 |
| Portfolio Turnover Rate | | 74.98 | | 54.58 | | 67.21 | | 68.77 | | 88.70 |
| |
| |
| |
| |
| |
|
| Net Assets, end of period ($ X 1,000) | | 78,154 | | 78,780 | | 62,820 | | 68,123 | | 17,209 |
| |
| a | | Based on average shares outstanding at each month end. | | | | | | | | |
| b | | Amount represents less than $.01 per share. | | | | | | | | |
| c | | Exclusive of sales charge. | | | | | | | | | | |
| See notes to financial statements. | | | | | | | | | | |
| | | | | | | Year Ended December 31, | | |
| | | |
| |
| |
|
| Class C Shares | | 2004 | | 2003 | | 2002 | | 2001 | | 2000 |
| |
| |
| |
| |
| |
|
| Per Share Data ($): | | | | | | | | | | |
| Net asset value, beginning of period | | 27.02 | | 21.27 | | 28.34 | | 30.68 | | 30.64 |
| Investment Operations: | | | | | | | | | | |
| Investment income (loss)—net a | | .02 | | (.01) | | (.08) | | (.06) | | .00b |
| Net realized and unrealized | | | | | | | | | | |
| gain (loss) on investments | | 2.85 | | 5.77 | | (6.99) | | (1.42) | | 3.02 |
| Total from Investment Operations | | 2.87 | | 5.76 | | (7.07) | | (1.48) | | 3.02 |
| Distributions: | | | | | | | | | | |
| Dividends from investment income—net | | (.06) | | (.01) | | — | | (.00)b | | (.03) |
| Dividends from net realized | | | | | | | | | | |
| gain on investments | | — | | — | | — | | (.86) | | (2.95) |
| Total Distributions | | (.06) | | (.01) | | — | | (.86) | | (2.98) |
| Net asset value, end of period | | 29.83 | | 27.02 | | 21.27 | | 28.34 | | 30.68 |
| |
| |
| |
| |
| |
|
| Total Return (%) c | | 10.62 | | 27.12 | | (24.95) | | (4.75) | | 10.35 |
| |
| |
| |
| |
| |
|
| Ratios/Supplemental Data (%): | | | | | | | | | | |
| Ratio of total expenses | | | | | | | | | | |
| to average net assets | | 1.90 | | 1.90 | | 1.90 | | 1.90 | | 1.90 |
| Ratio of net investment income | | | | | | | | | | |
| (loss) to average net assets | | .10 | | (.04) | | (.32) | | (.24) | | .01 |
| Portfolio Turnover Rate | | 74.98 | | 54.58 | | 67.21 | | 68.77 | | 88.70 |
| |
| |
| |
| |
| |
|
| Net Assets, end of period ($ X 1,000) | | 21,958 | | 22,480 | | 20,819 | | 23,612 | | 3,459 |
| |
| a | | Based on average shares outstanding at each month end. | | | | | | | | |
| b | | Amount represents less than $.01 per share. | | | | | | | | |
| c | | Exclusive of sales charge. | | | | | | | | | | |
| See notes to financial statements. | | | | | | | | | | |
The Fund 21
FINANCIAL HIGHLIGHTS (continued)
|
| | | | | Year Ended December 31, | | |
| |
| |
| |
|
| Class R Shares | | 2004 | | 2003 | | 2002 | | 2001 | | 2000 |
| |
| |
| |
| |
| |
|
| Per Share Data ($): | | | | | | | | | | |
| Net asset value, beginning of period | | 27.43 | | 21.56 | | 28.62 | | 30.92 | | 30.82 |
| Investment Operations: | | | | | | | | | | |
| Investment income—net a | | .31 | | .22 | | .17 | | .23 | | .32 |
| Net realized and unrealized | | | | | | | | | | |
| gain (loss) on investments | | 2.88 | | 5.87 | | (7.08) | | (1.44) | | 3.04 |
| Total from Investment Operations | | 3.19 | | 6.09 | | (6.91) | | (1.21) | | 3.36 |
| Distributions: | | | | | | | | | | |
| Dividends from investment income—net | | (.29) | | (.22) | | (.15) | | (.23) | | (.31) |
| Dividends from net realized | | | | | | | | | | |
| gain on investments | | — | | — | | — | | (.86) | | (2.95) |
| Total Distributions | | (.29) | | (.22) | | (.15) | | (1.09) | | (3.26) |
| Net asset value, end of period | | 30.33 | | 27.43 | | 21.56 | | 28.62 | | 30.92 |
| |
| |
| |
| |
| |
|
| Total Return (%) | | 11.69 | | 28.43 | | (24.18) | | (3.80) | | 11.49 |
| |
| |
| |
| |
| |
|
| Ratios/Supplemental Data (%): | | | | | | | | | | |
| Ratio of total expenses | | | | | | | | | | |
| to average net assets | | .90 | | .90 | | .90 | | .90 | | .90 |
| Ratio of net investment income | | | | | | | | | | |
| to average net assets | | 1.09 | | .95 | | .67 | | .78 | | 1.03 |
| Portfolio Turnover Rate | | 74.98 | | 54.58 | | 67.21 | | 68.77 | | 88.70 |
| |
| |
| |
| |
| |
|
| Net Assets, end of period ($ X 1,000) | | 50,536 | | 52,723 | | 40,320 | | 46,555 | | 1,138 |
| |
| a Based on average shares outstanding at each month end. | | | | | | | | |
| See notes to financial statements. | | | | | | | | | | |
| | | | | | | Year Ended December 31, | | |
| | | |
| |
| |
|
| Class T Shares | | 2004 | | 2003 | | 2002 | | 2001 | | 2000 |
| |
| |
| |
| |
| |
|
| Per Share Data ($): | | | | | | | | | | |
| Net asset value, beginning of period | | 27.43 | | 21.57 | | 28.63 | | 30.93 | | 30.84 |
| Investment Operations: | | | | | | | | | | |
| Investment income—net a | | .18 | | .11 | | .05 | | .07 | | .17 |
| Net realized and unrealized | | | | | | | | | | |
| gain (loss) on investments | | 2.87 | | 5.85 | | (7.07) | | (1.42) | | 3.03 |
| Total from Investment Operations | | 3.05 | | 5.96 | | (7.02) | | (1.35) | | 3.20 |
| Distributions: | | | | | | | | | | |
| Dividends from investment income—net | | (.15) | | (.10) | | (.04) | | (.09) | | (.16) |
| Dividends from net realized | | | | | | | | | | |
| gain on investments | | — | | — | | — | | (.86) | | (2.95) |
| Total Distributions | | (.15) | | (.10) | | (.04) | | (.95) | | (3.11) |
| Net asset value, end of period | | 30.33 | | 27.43 | | 21.57 | | 28.63 | | 30.93 |
| |
| |
| |
| |
| |
|
| Total Return (%) b | | 11.14 | | 27.72 | | (24.53) | | (4.28) | | 10.89 |
| |
| |
| |
| |
| |
|
| Ratios/Supplemental Data (%): | | | | | | | | | | |
| Ratio of total expenses | | | | | | | | | | |
| to average net assets | | 1.40 | | 1.40 | | 1.40 | | 1.40 | | 1.40 |
| Ratio of net investment income | | | | | | | | | | |
| to average net assets | | .65 | | .45 | | .21 | | .25 | | .57 |
| Portfolio Turnover Rate | | 74.98 | | 54.58 | | 67.21 | | 68.77 | | 88.70 |
| |
| |
| |
| |
| |
|
| Net Assets, end of period ($ X 1,000) | | 2,945 | | 2,264 | | 1,567 | | 1,132 | | 154 |
| |
| a | | Based on average shares outstanding at each month end. | | | | | | | | |
| b | | Exclusive of sales charge. | | | | | | | | | | |
| See notes to financial statements. | | | | | | | | | | |
The Fund 23
FINANCIAL HIGHLIGHTS (continued)
|
| | | | | Year Ended December 31, | | |
| |
| |
| |
|
| Institutional Shares | | 2004 | | 2003 | | 2002 | | 2001 | | 2000 |
| |
| |
| |
| |
| |
|
| Per Share Data ($): | | | | | | | | | | |
| Net asset value, beginning of period | | 27.42 | | 21.55 | | 28.60 | | 30.90 | | 30.81 |
| Investment Operations: | | | | | | | | | | |
| Investment income—net a | | .27 | | .19 | | .13 | | .20 | | .27 |
| Net realized and unrealized | | | | | | | | | | |
| gain (loss) on investments | | 2.88 | | 5.87 | | (7.07) | | (1.45) | | 3.04 |
| Total from Investment Operations | | 3.15 | | 6.06 | | (6.94) | | (1.25) | | 3.31 |
| Distributions: | | | | | | | | | | |
| Dividends from investment income—net | | (.25) | | (.19) | | (.11) | | (.19) | | (.27) |
| Dividends from net realized | | | | | | | | | | |
| gain on investments | | — | | — | | — | | (.86) | | (2.95) |
| Total Distributions | | (.25) | | (.19) | | (.11) | | (1.05) | | (3.22) |
| Net asset value, end of period | | 30.32 | | 27.42 | | 21.55 | | 28.60 | | 30.90 |
| |
| |
| |
| |
| |
|
| Total Return (%) | | 11.53 | | 28.25 | | (24.28) | | (3.96) | | 11.30 |
| |
| |
| |
| |
| |
|
| Ratios/Supplemental Data (%): | | | | | | | | | | |
| Ratio of total expenses | | | | | | | | | | |
| to average net assets | | 1.05 | | 1.05 | | 1.05 | | 1.05 | | 1.05 |
| Ratio of net investment income | | | | | | | | | | |
| to average net assets | | .96 | | .81 | | .51 | | .70 | | .89 |
| Portfolio Turnover Rate | | 74.98 | | 54.58 | | 67.21 | | 68.77 | | 88.70 |
| |
| |
| |
| |
| |
|
| Net Assets, end of period ($ X 1,000) | | 41,202 | | 41,848 | | 37,174 | | 58,557 | | 63,473 |
| |
| a Based on average shares outstanding at each month end. | | | | | | | | |
| See notes to financial statements. | | | | | | | | | | |
NOTES TO FINANCIAL STATEMENTS
NOTE 1—Significant Accounting Policies:
Dreyfus Premier Core Value Fund (the “fund”) is a separate diversified series of The Dreyfus/Laurel Funds Trust (the “Trust”) which is registered under the Investment Company Act of 1940, as amended (the “Act”), as an open-end management investment company and operates as a series company currently offering three series, including the fund. The fund’s investment objective is to seek long-term capital growth. The Dreyfus Corporation (the “Manager” or “Dreyfus”) serves as the fund’s investment manager.The Manager is a wholly-owned subsidiary of Mellon Financial Corporation (“Mellon Financial”).
Dreyfus Service Corporation (the “Distributor”), a wholly-owned subsidiary of the Manager, is the distributor of the fund’s shares.The fund is authorized to issue an unlimited number of shares of Beneficial Interest in each of the following classes of shares: Class A, Class B, Class C, Class R, Class T and Institutional shares. Class A, Class B, Class C and Class T shares are sold primarily to retail investors through financial intermediaries and bear a distribution fee and/or service fee. Class A and Class T shares are subject to a front-end sales charge, while Class B and Class C shares are subject to a contingent deferred sales charge (“CDSC”). Class B shares automatically convert to Class A shares after six years. Class R shares are sold primarily to bank trust departments and other financial service providers (including Mellon Financial and its affiliates) acting on behalf of customers having a qualified trust or investment account or relationship at such institution, and bear no distribution or service fees. Class R and Institutional shares are offered without a front-end sales charge or CDSC. Institutional shares are offered only to those customers of certain financial planners and investment advisers who held shares of a predecessor class of the fund as of April 4, 1994, and bear a distribution fee. Each class of shares has identical rights and privileges, except with respect to the distribution and service fees and voting rights on matters affecting a single class. Income, expenses (other than expenses attributable to a specific class), and realized and unrealized gains or losses on investments are allocated to each class of shares based on its relative net assets.
The Fund 25
NOTES TO FINANCIAL STATEMENTS (continued)
|
The fund’s financial statements are prepared in accordance with U.S. generally accepted accounting principles, which may require the use of management estimates and assumptions. Actual results could differ from those estimates.
(a) Portfolio valuation: Investments in securities are valued at the last sales price on the securities exchange or national securities market on which such securities are primarily traded. Securities listed on the National Market System, for which market quotations are available are valued at the official closing price or, if there is no official closing price that day, at the last sale price. Securities not listed on an exchange or the national securities market, or securities for which there were no transactions, are valued at the average of the most recent bid and asked prices. Bid price is used when no asked price is available. Investments in registered investment companies are valued at their net asset value. When market quotations or official closing prices are not readily available, or are determined not to reflect accurately fair value, such as when the value of a security has been significantly affected by events after the close of the exchange or market on which the security is principally traded (for example, a foreign exchange or market), but before the fund calculates its net asset value, the fund may value these investments at fair value as determined in accordance with the procedures approved by the Board of Trustees. Fair valuing of securities may be determined with the assistance of a pricing service using calculations based on indices of domestic securities and other appropriate indicators, such as prices of relevant ADR’s and futures contracts. For other securities that are fair valued by the Board of Trustees, certain factors may be considered such as: fundamental analytical data, the nature and duration of restrictions on disposition, an evaluation of the forces that influence the market in which the securities are purchased and sold, and public trading in similar securities of the issuer or comparable issuers. Investments denominated in foreign currencies are translated to U.S. dollars at the prevailing rates of exchange. Forward currency exchange contracts are valued at the forward rate.
(b) Securities transactions and investment income: Securities transactions are recorded on a trade date basis. Realized gain and loss from securities transactions are recorded on the identified cost basis. Dividend income is recognized on the ex-dividend date and interest income, including, where applicable, accretion of discount and amortization of premium on investments, is recognized on the accrual basis.
Pursuant to a securities lending agreement with Mellon Bank, N.A., an affiliate of the Manager, the fund may lend securities to qualified institutions.At origination, all loans are secured by collateral of at least 102% of the value of U.S. securities loaned and 105% of the value of foreign securities loaned. Collateral equivalent to at least 100% of the market value of securities on loan will be maintained at all times. Cash collateral is invested in certain money market mutual funds managed by the Manager. The fund will be entitled to receive all income on securities loaned, in addition to income earned as a result of the lending transaction. Although each security loaned is fully collateralized, the fund would bear the risk of delay in recovery of, or loss of rights in, the securities loaned should a borrower fail to return the securities in a timely manner.
(c) Affiliated issuers: Investments in other investment companies advised by the Manager are defined as “affiliated” in the Act.
(d) Foreign currency transactions: The fund does not isolate that portion of the results of operations resulting from changes in foreign exchange rates on investments from the fluctuations arising from changes in the market prices of securities held. Such fluctuations are included with the net realized and unrealized gain or loss on investments.
Net realized foreign exchange gains or losses arise from sales and maturities of short-term securities, sales of foreign currencies, currency gains or losses realized on securities transactions and the difference between the amount of dividends, interest, and foreign withholding taxes recorded on the fund’s books and the U.S. dollar equivalent of the
The Fund 27
NOTES TO FINANCIAL STATEMENTS (continued)
|
amounts actually received or paid. Net unrealized foreign exchange gains and losses arise from changes in the value of assets and liabilities other than investments in securities, resulting from changes in exchange rates. Such gains and losses are included with net realized and unrealized gain or loss on investments.
(e) Forward currency exchange contracts: The fund enters into forward currency exchange contracts in order to hedge its exposure to changes in foreign currency exchange rates on its foreign portfolio holdings and to settle foreign currency transactions. When executing forward currency exchange contracts, the fund is obligated to buy or sell a foreign currency at a specified rate on a certain date in the future. With respect to sales of forward currency exchange contracts, the fund would incur a loss if the value of the contract increases between the date the forward contract is opened and the date the forward contract is closed.The fund realizes a gain if the value of the contract decreases between those dates. With respect to purchases of forward currency exchange contracts, the fund would incur a loss if the value of the contract decreases between the date the forward contract is opened and the date the forward contract is closed.The fund realizes a gain if the value of the contract increases between those dates.The fund is also exposed to credit risk associated with counter party nonperformance on these forward currency exchange contracts which is typically limited to the unrealized gain on each open contract. At December 31, 2004, there were no open forward currency exchange contracts.
(f) Dividends to shareholders: Dividends are recorded on the ex-dividend date. Dividends from investment income-net are declared and paid on a quarterly basis. Dividends from net realized capital gain, if any, are normally declared and paid annually, but the fund may make distributions on a more frequent basis to comply with the distribution requirements of the Internal Revenue Code of 1986, as amended (the “Code”).To the extent that net realized capital gain can be offset by
capital loss carryovers, it is the policy of the fund not to distribute such gain. Income and capital gain distributions are determined in accordance with income tax regulations, which may differ from U.S. generally accepted accounting principles.
(g) Federal income taxes: It is the policy of the fund to continue to qualify as a regulated investment company, if such qualification is in the best interests of its shareholders, by complying with the applicable provisions of the Code, and to make distributions of taxable income sufficient to relieve it from substantially all federal income and excise taxes.
At December 31, 2004, the components of accumulated earnings on a tax basis were as follows: undistributed ordinary income $922,455, accumulated capital losses $64,270,696 and unrealized appreciation $157,060,333.
The accumulated capital loss carryover is available to be applied against future net securities profits, if any, realized subsequent to December 31, 2004. If not applied, $51,019,444 of the carryover expires in fiscal 2010 and $13,251,252 expires in fiscal 2011.
The tax character of distributions paid to shareholders during the fiscal periods ended December 31, 2004 and December 31, 2003 were as follows: ordinary income $5,799,956 and $4,460,778, respectively.
NOTE 2—Bank Line of Credit:
|
The fund participates with other Dreyfus-managed funds in a $350 million redemption credit facility (“the Facility”) to be utilized for temporary or emergency purposes, including the financing of redemptions. In connection therewith, the fund has agreed to pay commitment fees on its pro rata portion of the Facility. Interest is charged to the fund based on prevailing market rates in effect at the time of borrowings. During the period ended December 31, 2004, the fund did not borrow under the Facility.
The Fund 29
NOTES TO FINANCIAL STATEMENTS (continued)
|
NOTE 3—Investment Management Fee and Other Transactions With Affiliates:
(a) Pursuant to an Investment Management agreement with the Manager, the Manager provides or arranges for one or more third parties and/or affiliates to provide investment advisory, administrative, custody, fund accounting and transfer agency services to the fund. The Manager also directs the investments of the fund in accordance with its investment objective, policies and limitations. For these services, the fund is contractually obligated to pay the Manager a fee, calculated daily and paid monthly, at the annual rate of .90% of the value of the fund’s average daily net assets. Out of its fee, the Manager pays all of the expenses of the fund except brokerage fees, taxes, interest, commitment fees, Rule 12b-1 distribution fees and expenses, service fees, fees and expenses of non-interested Trustees (including counsel fees) and extraordinary expenses. In addition, the Manager is required to reduce its fee in an amount equal to the fund’s allocable portion of fees and expenses of the non-interested Trustees (including counsel fees). Each Trustee receives $40,000 per year, plus $5,000 for each joint Board meeting of The Dreyfus/Laurel Funds, Inc., The Dreyfus/Laurel Tax-Free Municipal Funds, and the Trust (the “Dreyfus/Laurel Funds”) attended, $2,000 for separate committee meetings attended which are not held in conjunction with a regularly scheduled board meeting and $500 for Board meetings and separate committee meetings attended that are conducted by telephone and is reimbursed for travel and out-of-pocket expenses. The Chairman of the Board receives an additional 25% of such compensation (with the exception of reimbursable amounts). These fees are charged and allocated to each series based on net assets. In the event that there is a joint committee meeting of the Dreyfus/Laurel Funds and the Dreyfus High Yield Strategies Fund, the $2,000 fee will be allocated between the Dreyfus/Laurel Funds and the Dreyfus High Yield Strategies Fund. Amounts required to be paid by the Trust directly to the non-interested Trustees, that would be applied to offset a portion of the management fee payable to the Manager, are in fact paid directly by the Manager to the non-interested Trustees.
During the period ended December 31, 2004, the Distributor retained $70,881 and $2,422 from commissions earned on sales of the fund’s Class A and Class T shares, respectively, and $194,071 and $9,741 from contingent deferred sales charges on redemptions on the fund’s Class B and Class C shares, respectively.
(b) Under separate Distribution Plans (the “Plans”) adopted pursuant to Rule 12b-1 under the Act,Class A shares and Institutional shares may pay annually up to .25% and .15%, respectively, of the value of their average daily net assets to compensate the Distributor for shareholder servicing activities and expenses primarily intended to result in the sale of Class A shares and Institutional shares. Class B, Class C and Class T shares pay the Distributor for distributing their shares at an aggregate annual rate of .75% of the value of the average daily net assets of Class B and Class C shares, and .25% of the value of average daily net assets of Class T shares.The Distributor may pay one or more agents in respect of advertising, marketing and other distribution services for Class T shares and determines the amounts, if any, to be paid to agents and the basis on which such payments are made. Class B, Class C and Class T shares are also subject to a service plan adopted pursuant to Rule 12b-1 (the “Service Plan”), under which Class B, Class C and Class T shares pay the Distributor for providing certain services to the holders of their shares a fee at the annual rate of .25% of the value of the average daily net assets of Class B, Class C and Class T shares,respectively.During the period ended December 31,2004, Class A, Class B, Class C, Class T and Institutional shares were charged $1,541,045, $585,739, $166,166, $6,537 and $61,045, respectively, pursuant to their respective Plans. During the period ended December 31, 2004,Class B,Class C and Class T shares were charged $195,246,$55,389 and $6,537, respectively, pursuant to the Service Plan.
Under its terms, the Plans and Service Plan shall remain in effect from year to year, provided such continuance is approved annually by a vote of majority of those Trustees who are not “interested persons” of the Trust and who have no direct or indirect financial interest in the operation of or in any agreement related to the Plans or Service Plan.
The Fund 31
NOTES TO FINANCIAL STATEMENTS (continued)
|
The components of Due to The Dreyfus Corporation and affiliates in the Statement of Assets and Liabilities consist of: management fees $699,575, Rule 12b-1 distribution plan fees $215,243 and shareholder services plan fees $23,059.
(c) The Company and the Manager have received an exemptive order from the SEC which, among other things, permits the fund to use cash collateral received in connection with lending the fund’s securities and other uninvested cash to purchase shares of one or more registered money market mutual funds advised by the Manager in excess of the limitations imposed by the Act.
NOTE 4—Securities Transactions:
|
The aggregate amount of purchases and sales of investment securities, excluding short-term securities, during the period ended December 31, 2004, amounted to $597,472,843 and $643,411,684, respectively.
At December 31, 2004, the cost of investments for federal income tax purposes was $683,943,455; accordingly, accumulated net unrealized appreciation on investments was $157,060,333, consisting of $164,791,966 gross unrealized appreciation and $7,731,633 gross unrealized depreciation.
In early 2004, two purported class and derivative actions were filed against Mellon Financial, Mellon Bank, N.A., Dreyfus, Founders Asset Management LLC, and certain directors of the Dreyfus Funds and the Dreyfus Founders Funds (together, the “Funds”). In September 2004, plaintiffs served a Consolidated Amended Complaint (the “Amended Complaint”) on behalf of a purported class of all persons who acquired interests in any of the Funds between January 30, 1999 and November 17, 2003, and derivatively on behalf of the Funds. The Amended Complaint in the newly styled In re Dreyfus Mutual Funds Fee Litigation also named the Distributor, Premier Mutual Fund
Services, Inc. and two additional Fund directors as defendants and alleges violations of the Investment Company Act of 1940, the Investment Advisers Act of 1940, the Pennsylvania Unfair Trade Practices and Consumer Protection Law and common-law claims. Plaintiffs seek to recover allegedly improper and excessive Rule 12b-1 and advisory fees allegedly charged to the Funds for marketing and distribution services. More specifically, plaintiffs claim, among other things, that 12b-1 fees and directed brokerage were improperly used to pay brokers to recommend the Funds over other funds, and that such payments were not disclosed to investors. In addition, plaintiffs assert that economies of scale and soft-dollar benefits were not passed on to the Funds. Plaintiffs further allege that 12b-1 fees were improperly charged to certain of the Funds that were closed to new investors.The Amended Complaint seeks compensatory and punitive damages, rescission of the advisory contracts, and an accounting and restitution of any unlawful fees, as well as an award of attorneys’ fees and litigation expenses. As noted, some of the claims in this litigation are asserted derivatively on behalf of the Funds that have been named as nominal defendants.With respect to such derivative claims, no relief is sought against the Funds. Dreyfus believes the allegations to be totally without merit and intends to defend the action vigorously. Defendants filed motions to dismiss the Amended Complaint on November 12, 2004, and those motions are pending.
Additional lawsuits arising out of these circumstances and presenting similar allegations and requests for relief may be filed against the defendants in the future. Neither Dreyfus nor the Funds believe that any of the pending actions will have a material adverse effect on the Funds or Dreyfus’ ability to perform its contract with the Funds.
The Fund 33
| REPORT OF INDEPENDENT REGISTERED |
| PUBLIC ACCOUNTING FIRM |

We have audited the accompanying statement of assets and liabilities, of Dreyfus Premier Core Value Fund (the “Fund”) of The Dreyfus/Laurel Funds Trust, including the statement of investments as of December 31, 2004, and the related statement of operations for the year then ended, the statements of changes in net assets for each of the two years in the period then ended, and the financial highlights for each of the five years in the period then ended.These financial statements and financial highlights are the responsibility of the Fund’s management. Our responsibility is to express an opinion on these financial statements and financial highlights based on our audits.
We conducted our audits in accordance with the standards of the Public Company Accounting Oversight Board (United States).Those standards require that we plan and perform the audit to obtain reasonable assurance about whether the financial statements and financial highlights are free of material misstatement. An audit includes examining, on a test basis, evidence supporting the amounts and disclosures in the financial statements. Our procedures included confirmation of securities owned as of December 31, 2004, by correspondence with the custodian.As to securities purchased and sold but not yet received or delivered, we performed other appropriate auditing procedures.An audit also includes assessing the accounting principles used and significant estimates made by manage-ment,as well as evaluating the overall financial statement presentation.We believe that our audits provide a reasonable basis for our opinion.
In our opinion, the financial statements and financial highlights referred to above present fairly, in all material respects, the financial position of Dreyfus Premier Core Value Fund of The Dreyfus/Laurel Funds Trust as of December 31, 2004 and the results of its operations for the year then ended, the changes in its net assets for each of the two years in the period then ended, and its financial highlights for each of the five years in the period then ended, in conformity with U.S. generally accepted accounting principles.
| New York, New York |
| February 18, 2005 |
IMPORTANT TAX INFORMATION (Unaudited)
For federal tax purposes, the fund hereby designates 55.47% of the ordinary dividends paid during the fiscal year ended December 31, 2004 as qualifying for the corporate dividends received deduction and also for the fiscal year ended December 31, 2004, certain dividends paid by the fund may be subject to a maximum tax rate of 15%, as provided for by the Jobs and Growth Tax Relief Reconciliation Act of 2003. Of the distributions paid during the fiscal year, $5,799,955 represents the maximum amount that may be considered qualified dividend income. Shareholders will receive notification in January 2005 of the percentage applicable to the preparation of their 2004 income tax returns.
The Fund 35
BOARD MEMBERS INFORMATION (Unaudited)
| Joseph S. DiMartino (61) |
| Chairman of the Board (1999) |
| Principal Occupation During Past 5 Years: |
| • Corporate Director and Trustee |
| | Other Board Memberships and Affiliations:
|
- The Muscular Dystrophy Association, Director
- Levcor International, Inc., an apparel fabric processor, Director
- Century Business Services, Inc., a provider of outsourcing functions for small and medium size companies, Director
- The Newark Group, a provider of a national market of paper recovery facilities, paperboard mills and paperboard converting plants, Director
- Azimuth Trust, an institutional asset management firm, Member of Board of Managers and Advisory Board
| No. of Portfolios for which Board Member Serves: 186 |
| ——————— |
| James Fitzgibbons (70) |
| Board Member (1994) |
Principal Occupation During Past 5 Years:
- Chairman of the Board, Davidson Cotton Company (1998-2002)
Other Board Memberships and Affiliations:
- Bill Barrett Company, an oil and gas exploration company, Director
| No. of Portfolios for which Board Member Serves: 23 |
| ——————— |
| J. Tomlinson Fort (76) |
| Board Member (1987) |
Principal Occupation During Past 5 Years:
• Retired; Of Counsel, Reed Smith LLP (1998-2004)
| | Other Board Memberships and Affiliations:
|
- Allegheny College, Emeritus Trustee
- Pittsburgh Ballet Theatre,Trustee
- American College of Trial Lawyers, Fellow
| No. of Portfolios for which Board Member Serves: 23 |
| ——————— |
| Kenneth A. Himmel (58) |
| Board Member (1994) |
| | Principal Occupation During Past 5 Years:
|
- President and CEO,Related Urban Development,a real estate development company (1996-present)
- President and CEO, Himmel & Company, a real estate development company (1980-present)
- CEO, American Food Management, a restaurant company (1983-present)
| | No. of Portfolios for which Board Member Serves: 23
|
| Stephen J. Lockwood (57) |
| Board Member (1994) |
| | Principal Occupation During Past 5 Years:
|
- Chairman of the Board, Stephen J. Lockwood and Company LLC, an investment company (2000-present)
- Chairman of the Board and CEO, LDG Reinsurance Corporation (1977-2000)
| | Other Board Memberships and Affiliations:
|
- BDML Holdings, an insurance company, Chairman of the Board
- Affiliated Managers Group, an investment management company, Director
| No. of Portfolios for which Board Member Serves: 23 |
| ——————— |
| Roslyn Watson (55) |
| Board Member (1994) |
Principal Occupation During Past 5 Years:
- Principal,Watson Ventures, Inc., a real estate investment company (1993-present)
| | Other Board Memberships and Affiliations:
|
- American Express Centurion Bank, Director
- The Hyams Foundation Inc., a Massachusetts Charitable Foundation,Trustee
- National Osteoporosis Foundation,Trustee
| No. of Portfolios for which Board Member Serves: 23 |
| ——————— |
| Benaree Pratt Wiley (58) |
| Board Member (1998) |
| | Principal Occupation During Past 5 Years:
|
- President and CEO,The Partnership, an organization dedicated to increasing the representation of African Americans in positions of leadership, influence and decision-making in Boston, MA (1991-present)
| | Other Board Memberships and Affiliations:
|
- Boston College, Associate Trustee
- The Greater Boston Chamber of Commerce, Director
- Mass. Development, Director
- Commonwealth Institute, Director
- Efficacy Institute, Director
- PepsiCo African-American, Advisory Board
- The Boston Foundation, Director
- Harvard Business School Alumni Board, Director
| No. of Portfolios for which Board Member Serves: 23 |
| ——————— |
Once elected all Board Members serve for an indefinite term.The address of the Board Members and Officers is in c/o The Dreyfus Corporation, 200 Park Avenue, New York, New York 10166.Additional information about the Board Members is available in the fund’s Statement of Additional Information which can be obtained from Dreyfus free of charge by calling this toll free number: 1-800-554-4611.
| Ruth Marie Adams, Emeritus Board Member |
| Francis P. Brennan, Emeritus Board Member |
The Fund 37
OFFICERS OF THE FUND (Unaudited)
STEPHEN E. CANTER, President since March 2000.
Chairman of the Board, Chief Executive Officer and Chief Operating Officer of the Manager, and an officer of 92 investment companies (comprised of 185 portfolios) managed by the Manager. Mr. Canter also is a Board member and, where applicable, an Executive Committee Member of the other investment management subsidiaries of Mellon Financial Corporation, each of which is an affiliate of the Manager. He is 59 years old and has been an employee of the Manager since May 1995.
STEPHEN R. BYERS, Executive Vice President since November 2002.
Chief Investment Officer,Vice Chairman and a director of the Manager, and an officer of 92 investment companies (comprised of 185 portfolios) managed by the Manager. Mr. Byers also is an officer, director or an Executive Committee Member of certain other investment management subsidiaries of Mellon Financial Corporation, each of which is an affiliate of the Manager. He is 51 years old and has been an employee of the Manager since January 2000. Prior to joining the Manager, he served as an Executive Vice President-Capital Markets, Chief Financial Officer and Treasurer at Gruntal & Co., L.L.C.
MARK N. JACOBS, Vice President since March 2000.
Executive Vice President, Secretary and General Counsel of the Manager, and an officer of 93 investment companies (comprised of 201 portfolios) managed by the Manager. He is 58 years old and has been an employee of the Manager since June 1977.
STEVEN F. NEWMAN, Secretary since March 2000.
Associate General Counsel and Assistant Secretary of the Manager, and an officer of 93 investment companies (comprised of 201 portfolios) managed by the Manager. He is 55 years old and has been an employee of the Manager since July 1980.
JAMES BITETTO, Assistant Secretary since October 2004.
Assistant General Counsel and Assistant Secretary of the Manager, and an officer of 4 investment companies (comprised of 23 portfolios) managed by the Manager. He is 38 years old and has been an employee of the Manager since December 1996.
JEFF PRUSNOFSKY, Assistant Secretary since March 2000.
Associate General Counsel of the Manager, and an officer of 26 investment companies (comprised of 88 portfolios) managed by the Manager. He is 39 years old and has been an employee of the Manager since October 1990.
MICHAEL A. ROSENBERG, Assistant Secretary since March 2000.
Associate General Counsel of the Manager, and an officer of 90 investment companies (comprised of 194 portfolios) managed by the Manager. He is 44 years old and has been an employee of the Manager since October 1991.
JAMES WINDELS, Treasurer since November 2001.
Director – Mutual Fund Accounting of the Manager, and an officer of 93 investment companies (comprised of 201 portfolios) managed by the Manager. He is 46 years old and has been an employee of the Manager since April 1985.
RICHARD CASSARO, Assistant Treasurer since August 2003.
Senior Accounting Manager – Equity Funds of the Manager, and an officer of 26 investment companies (comprised of 102 portfolios) managed by the Manager. He is 44 years old and has been an employee of the Manager since September 1982.
ERIK D. NAVILOFF, Assistant Treasurer since December 2002.
Senior Accounting Manager – Taxable Fixed Income Funds of the Manager, and an officer of 19 investment companies (comprised of 75 portfolios) managed by the Manager. He is 36 years old and has been an employee of the Manager since November 1992.
ROBERT SVAGNA, Assistant Treasurer since December 2002.
Senior Accounting Manager – Equity Funds of the Manager, and an officer of 27 investment companies (comprised of 107 portfolios) managed by the Manager. He is 37 years old and has been an employee of the Manager since November 1990.
KENNETH J. SANDGREN, Assistant Treasurer since November 2001.
Mutual Funds Tax Director of the Manager, and an officer of 93 investment companies (comprised of 201 portfolios) managed by the Manager. He is 50 years old and has been an employee of the Manager since June 1993.
JOSEPH W. CONNOLLY, Chief Compliance Officer since October 2004.
Chief Compliance Officer of the Manager and The Dreyfus Family of Funds (93 investment companies, comprising 201 portfolios). From November 2001 through March 2004, Mr. Connolly was first Vice-President, Mutual Fund Servicing for Mellon Global Securities Services. In that capacity, Mr. Connolly was responsible for managing Mellon’s Custody, Fund Accounting and Fund Administration services to third-party mutual fund clients. He is 47 years old and has served in various capacities with the Manager since 1980, including manager of the firm’s Fund Accounting Department from 1997 through October 2001.
WILLIAM GERMENIS, Anti-Money Laundering Compliance Officer since September 2002.
Vice President and Anti-Money Laundering Compliance Officer of the Distributor, and the Anti-Money Laundering Compliance Officer of 88 investment companies (comprised of 196 portfolios) managed by the Manager. He is 34 years old and has been an employee of the Distributor since October 1998.
The Fund 39
NOTES
| Dreyfus Premier |
| Core Value Fund |
| 200 Park Avenue |
| New York, NY 10166 |
| |
| Manager |
| The Dreyfus Corporation |
| 200 Park Avenue |
| New York, NY 10166 |
| |
| Custodian |
| Mellon Bank, N.A. |
| One Mellon Bank Center |
| Pittsburgh, PA 15258 |
| Transfer Agent & |
| Dividend Disbursing Agent |
| Dreyfus Transfer, Inc. |
| 200 Park Avenue |
| New York, NY 10166 |
| |
| Distributor |
| Dreyfus Service Corporation |
| 200 Park Avenue |
| New York, NY 10166 |
Telephone Call your financial representative or 1-800-554-4611
| Mail | | The Dreyfus Premier Family of Funds |
| | | 144 Glenn Curtiss Boulevard, Uniondale, NY 11556-0144 |
The fund files its complete schedule of portfolio holdings with the Securities and Exchange Commission (“SEC”) for the first and third quarters of each fiscal year on Form N-Q. The fund’s Forms N-Q are available on the SEC’s website at http://www.sec.gov and may be reviewed and copied at the SEC’s Public Reference Room in Washington, DC. Information on the operation of the Public Reference Room may be obtained by calling 1-800-SEC-0330.
A description of the policies and procedures that the fund uses to determine how to vote proxies relating to portfolio securities, and information regarding how the fund voted these proxies for the 12-month period ended June 30, 2004, is available through the fund’s website at http://www.dreyfus.com and on the SEC’s website at http://www.sec.gov. The description of the policies and procedures is also available without charge, upon request, by calling 1-800-645-6561.
© 2005 Dreyfus Service Corporation

| Dreyfus Premier |
| Limited Term |
| High Yield Fund |
| ANNUAL REPORT December 31, 2004 |

Save time. Save paper. View your next shareholder report online as soon as it’s available. Log into www.dreyfus.com and sign up for Dreyfus eCommunications. It’s simple and only takes a few minutes.
The views expressed in this report reflect those of the portfolio manager only through the end of the period covered and do not necessarily represent the views of Dreyfus or any other person in the Dreyfus organization. Any such views are subject to change at any time based upon market or other conditions and Dreyfus disclaims any responsibility to update such views.These views may not be relied on as investment advice and, because investment decisions for a Dreyfus fund are based on numerous factors, may not be relied on as an indication of trading intent on behalf of any Dreyfus fund.
Not FDIC-Insured • Not Bank-Guaranteed • May Lose Value
| Contents |
| |
| | | THE FUND |
| |
|
| 2 | | Letter from the Chairman |
| 3 | | Discussion of Fund Performance |
| 6 | | Fund Performance |
| 8 | | Understanding Your Fund’s Expenses |
| 8 | | Comparing Your Fund’s Expenses |
| With Those of Other Funds |
| 9 | | Statement of Investments |
| 24 | | Statement of Assets and Liabilities |
| 25 | | Statement of Operations |
| 26 | | Statement of Changes in Net Assets |
| 28 | | Financial Highlights |
| 32 | | Notes to Financial Statements |
| 45 | | Report of Independent Registered |
| | | Public Accounting Firm |
| 46 | | Important Tax Information |
| 47 | | Board Members Information |
| 49 | | Officers of the Fund |
| FOR MORE INFORMATION |
|
| | | Back Cover |
| Dreyfus Premier |
| Limited Term High Yield Fund |

LETTER FROM THE CHAIRMAN
We are pleased to present this annual report for Dreyfus Premier Limited Term High Yield Bond Fund, covering the 12-month period from January 1, 2004, through December 31, 2004. Inside, you’ll find valuable information about how the fund was managed during the reporting period, including a discussion with Gerald E.Thunelius, portfolio manager for the fund during its recently completed fiscal year.
Despite a moderately growing economy and rising interest rates over the second half of the year, the yield of the benchmark 10-year U.S. Treasury bond ended 2004 virtually unchanged from where it began. At the same time, corporate bonds generally continued to gain value as business conditions improved, and mortgage-backed securities benefited from waning prepayment activity among homeowners.
Can bonds continue to deliver positive results in 2005? No one knows for certain. However, with short-term interest rates rising and the economy gaining momentum, we believe that some areas of the fixed-income market are likely to be stronger than others. What’s required for success, in our view, is strong fundamental research and keen professional judgment.
As always, we urge our shareholders to view the financial markets from a long-term perspective, measured in years rather than weeks or months. One of the best ways to ensure a long-term perspective is to establish an investment plan with the help of your financial advisor, and review it periodically to track your progress toward your financial goals.
Thank you for your continued confidence and support.

DISCUSSION OF FUND PERFORMANCE
How did Dreyfus Premier Limited Term High Yield Fund perform during the period?
For the 12-month period ended December 31, 2004, the fund achieved total returns of 10.44% for its Class A shares, 10.06% for Class B shares, 9.63% for Class C shares and 10.87% for Class R shares.The fund generated aggregate income dividends of $0.5321 for Class A shares, $0.4964 for Class B shares, $0.4777 for Class C shares and $0.5510 for Class R shares.1 In comparison, the Merrill Lynch High Yield Master II Index (the “Index”), the fund’s benchmark, achieved a total return of 10.87% for the same period.2
Corporate bond prices rose during 2004 as business conditions improved in a stronger economy. Returns were particularly strong during the second half of the year when political and economic uncertainty began to ease. The fund’s returns were generally in line with the Index, after accounting for fund fees and expenses. Additionally, the fund’s exposure to “lower-rated” high-yield bonds helped the fund keep pace with the Index as bonds of such quality were the Index’s best performers over the reporting period.
What is the fund’s investment approach?
The fund seeks to maximize total return, consisting of capital appreciation and current income.The average effective maturity of the fund is limited to a maximum of 5.5 years.
At least 80% of the fund’s assets are invested in fixed-income securities that are rated below investment grade (“high yield” or “junk” bonds) or are the unrated equivalent as determined by Dreyfus. Individual issues are selected based on careful credit analysis. We thoroughly analyze the business, management and financial strength of each of the companies whose bonds we buy, then project each issuer’s ability to repay its debt.
The Fund 3
DISCUSSION OF FUND PERFORMANCE (continued)
|
What other factors influenced the fund’s performance?
The U.S. economy generally strengthened over the reporting period, leading to improved business conditions for many corporate bond issuers. During the first quarter of 2004, however, the economy generally recovered more slowly than investors had expected, and inflationary pressures remained low. As a result, bond prices generally were little changed over the reporting period’s first half.
However, the U.S. economy appeared to gain momentum during the spring of 2004, when surprisingly strong labor statistics and higher energy prices suggested that long-dormant inflationary pressures might be resurfacing. Although rising inflation concerns led to sharply lower prices for U.S.Treasury securities and other areas of the bond market that tend to be more sensitive to changing interest rates, high-yield corporate bonds held more of their value as investors continued to look forward to better business conditions and a strengthening economy.
To forestall a potential acceleration of inflation, the Federal Reserve Board (the “Fed”) raised its target for short-term interest rates five times between June and December, driving the overnight federal funds rate to 2.25% . The initial rate hike in late June represented the Fed’s first move toward higher interest rates in more than four years. However, new economic data released during the summer of 2004 proved generally disappointing. Investors’ inflation fears began to wane, and the more interest-rate-sensitive areas of the U.S. bond market rallied later in the reporting period, while prices of high-yield corporate bonds remained relatively flat.
In this environment, we attempted to balance the fund’s positions in lower-rated corporate bonds with holdings of shorter-term, more highly rated high-yield bonds.This “barbell” structure was designed to help the fund participate in the income and potential gains of lower-rated credits while attempting to manage risks through higher-quality, shorter-term positions. Indeed, this investment posture helped the fund participate in a market rally over the final months of 2004.The rally was driven by improving investor sentiment after the resolution of the presidential election and amid signs of stronger economic growth.
The fund received particularly strong contributions to performance during the reporting period from its holdings in the utilities sector and its relatively light exposure to retailers. Among individual issues, chemicals producer Resolution Performance Products/Capital ranked among the fund’s top performers. The fund also received positive contributions from a number of bonds that once were considered “distressed” credits, including building products manufacturer Owens Corning and apparel maker HCI Direct. Good results from these positions were partially offset by disappointing returns from others, such as energy company Calpine, which was hurt by deteriorating business fundamentals, and media company Pegasus Communications, which encountered financial difficulties. The fund’s returns also were hampered by its relatively large cash holdings during 2004.
What is the fund’s current strategy?
Effective January 31, 2005, Jonathan Uhrig became primary portfolio manager of the fund. John McNichols was appointed as an additional portfolio manager. Mr. Uhrig is a Portfolio Manager for High Yield Strategies, and is also head of high-yield trading, at Standish Mellon Asset Management, LLC — an affiliate of Dreyfus. Mr. McNichols is the Director of Credit Research and Investment at Standish Mellon, overseeing all of Standish Mellon's global credit research. Each manages the portfolio under a dual-employee relationship with Dreyfus, using the proprietary investment processes of Standish Mellon, and will manage the fund accordingly.
| 1 | | Total return includes reinvestment of dividends and any capital gains paid, and does not take into |
| | | consideration the maximum initial sales charge in the case of Class A shares, or the applicable | | |
| | | contingent deferred sales charges imposed on redemptions in the case of Class B and Class C | | |
| | | shares. Had these charges been reflected, returns would have been lower. Past performance is no | | |
| | | guarantee of future results. Share price, yield and investment return fluctuate such that upon | | |
| | | redemption, fund shares may be worth more or less than their original cost. | | |
| 2 | | SOURCE: LIPPER INC. — Reflects reinvestment of dividends and, where applicable, capital |
| | | gain distributions.The Merrill Lynch High Yield Master II Index is an unmanaged performance |
| | | benchmark composed of U.S. domestic and Yankee bonds rated below investment grade with at | | |
| | | least $100 million par amount outstanding and greater than or equal to one year to maturity. | | |
| |
| | | The Fund | | 5 |
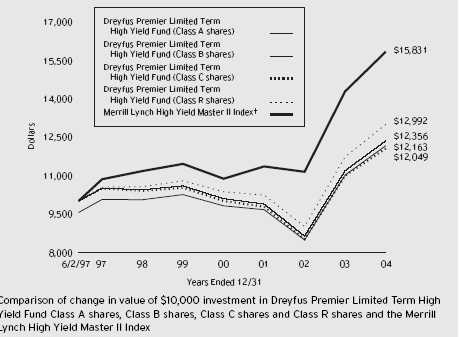
| † Source: Lipper Inc. |
| Past performance is not predictive of future performance. |
| The above graph compares a $10,000 investment made in each of the Class A, Class B, Class C and Class R shares |
| of Dreyfus Premier Limited Term High Yield Fund on 6/2/97 (inception date) to a $10,000 investment made in the |
| Merrill Lynch High Yield Master II Index (the “Index”). For comparative purposes, the value of the Index on 5/31/97 |
| is used as the beginning value on 6/2/97.All dividends and capital gain distributions are reinvested. |
| The fund’s performance shown in the line graph takes into account the maximum initial sales charge on Class A shares |
| and all other applicable fees and expenses on all classes.The Index is an unmanaged performance benchmark composed of |
| U.S. domestic and Yankee bonds rated below investment grade with at least $100 million par amounts outstanding and |
| greater than or equal to one year to maturity. Both interest and price changes are calculated daily based on an accrued |
| schedule and trader pricing.The Index does not take into account charges, fees and other expenses. Further information |
| relating to fund performance, including expense reimbursements, if applicable, is contained in the Financial Highlights |
| section of the prospectus and elsewhere in this report. |
| Average Annual Total Returns as of 12/31/04 | | | | | | |
| |
| | | Inception | | | | | | From |
| | | Date | | 1 Year | | 5 Years | | Inception |
| |
| |
| |
| |
|
| Class A shares | | | | | | | | |
| with maximum sales charge (4.5%) | | 6/2/97 | | 5.48% | | 2.53% | | 2.62% |
| without sales charge | | 6/2/97 | | 10.44% | | 3.47% | | 3.24% |
| Class B shares | | | | | | | | |
| with applicable redemption charge † | | 6/2/97 | | 6.06% | | 2.73% | | 2.83% |
| without redemption | | 6/2/97 | | 10.06% | | 2.99% | | 2.83% |
| Class C shares | | | | | | | | |
| with applicable redemption charge †† | | 6/2/97 | | 8.63% | | 2.74% | | 2.49% |
| without redemption | | 6/2/97 | | 9.63% | | 2.74% | | 2.49% |
| Class R shares | | 6/2/97 | | 10.87% | | 3.77% | | 3.51% |
Past performance is not predictive of future performance.The fund’s performance shown in the graph and table does not reflect the deduction of taxes that a shareholder would pay on fund distributions or the redemption of fund shares. Performance for Class B shares assumes the conversion of Class B shares to Class A shares at the end of the sixth year following the date of purchase.
| † | | The maximum contingent deferred sales charge for Class B shares is 4%.After six years Class B shares convert to |
| | | Class A shares. |
| †† | | The maximum contingent deferred sales charge for Class C shares is 1% for shares redeemed within one year of the |
| | | date of purchase. |
The Fund 7
U N D E R S TA N D I N G YO U R F U N D ’ S E X P E N S E S ( U n a u d i t e d )
As a mutual fund investor, you pay ongoing expenses, such as management fees and other expenses. Using the information below, you can estimate how these expenses affect your investment and compare them with the expenses of other funds.You also may pay one-time transaction expenses, including sales charges (loads) and redemption fees, which are not shown in this section and would have resulted in higher total expenses. For more information, see your fund’s prospectus or talk to your financial adviser.
Review your fund’s expenses
The table below shows the expenses you would have paid on a $1,000 investment in Dreyfus Premier Limited Term High Yield Fund from July 1, 2004 to December 31, 2004. It also shows how much a $1,000 investment would be worth at the close of the period, assuming actual returns and expenses.
| Expenses and Value of a $1,000 Investment | | | | | | |
| assuming actual returns for the six months ended December 31, 2004 | | |
| | | Class A | | Class B | | Class C | | Class R |
| |
| |
| |
| |
|
| Expenses paid per $1,000 † | | $ 4.98 | | $ 7.59 | | $ 8.90 | | $ 3.67 |
| Ending value (after expenses) | | $1,086.20 | | $1,083.60 | | $1,082.20 | | $1,087.40 |
| COMPARING YOUR FUND’S EXPENSES |
| WITH THOSE OF OTHER FUNDS (Unaudited) |
Using the SEC’s method to compare expenses
The Securities and Exchange Commission (SEC) has established guidelines to help investors assess fund expenses. Per these guidelines, the table below shows your fund’s expenses based on a $1,000 investment, assuming a hypothetical 5% annualized return. You can use this information to compare the ongoing expenses (but not transaction expenses or total cost) of investing in the fund with those of other funds.All mutual fund shareholder reports will provide this information to help you make this comparison. Please note that you cannot use this information to estimate your actual ending account balance and expenses paid during the period.
| Expenses and Value of a $1,000 Investment |
| assuming a hypothetical 5% annualized return for the six months ended December 31, 2004 |
| | | Class A | | Class B | | Class C | | Class R |
| |
| |
| |
| |
|
| Expenses paid per $1,000 † | | $ 4.82 | | $ 7.35 | | $ 8.62 | | $ 3.56 |
| Ending value (after expenses) | | $1,020.36 | | $1,017.85 | | $1,016.59 | | $1,021.62 |
| † Expenses are equal to the fund’s annualized expense ratio of .95% for Class A, 1.45% for Class B, 1.70% for |
| Class C and .70% Class R; multiplied by the average account value over the period, multiplied by 184/366 (to |
| reflect the one-half year period). |
STATEMENT OF INVESTMENTS
December 31, 2004
|
| | | Principal | | | | |
| Bonds and Notes—86.7% | | Amount ($) | | Value ($) |
| |
| |
|
| Advertising—.8% | | | | | | |
| RH Donnelley Finance: | | | | | | |
| Sr. Notes, 8.875%, 2010 | | 783,000 | | a | | 876,960 |
| Sr. Sub. Notes, 10.875%, 2012 | | 3,402,000 | | a | | 4,056,885 |
| | | | | | | 4,933,845 |
| Aerospace & Defense—1.7% | | | | | | |
| Argo-Tech, | | | | | | |
| Sr. Notes, 9.25%, 2011 | | 1,470,000 | | | | 1,620,675 |
| Armor, | | | | | | |
| Sr. Sub. Notes, 8.25%, 2013 | | 2,250,000 | | b | | 2,531,250 |
| DRS Technologies, | | | | | | |
| Sr. Sub. Notes, 6.875%, 2013 | | 524,000 | | a | | 550,200 |
| TD Funding, | | | | | | |
| Sr. Sub. Notes, 8.375%, 2011 | | 2,500,000 | | | | 2,693,750 |
| Vought Aircraft Industries, | | | | | | |
| Sr. Notes, 8%, 2011 | | 2,800,000 | | | | 2,737,000 |
| | | | | | | 10,132,875 |
| Agricultural—.2% | | | | | | |
| Seminis Vegetable Seeds, | | | | | | |
| Sr. Sub. Notes, 10.25%, 2013 | | 755,000 | | | | 853,150 |
| Airlines—.9% | | | | | | |
| AMR, | | | | | | |
| Debs., 9.75%, 2021 | | 200,000 | | b | | 146,000 |
| Aircraft Lease Portfolio Securitization, | | | | | | |
| Pass-Through Trust, Ctfs., 1996-1, 12.75%, 2006 | | 2,115,124 | | c | | 21,151 |
| Delta Airlines, | | | | | | |
| Pass-Through Ctfs., Ser. 2001-1, Cl. B, 7.711%, 2011 | | 1,575,000 | | | | 1,211,746 |
| Northwest Airlines: | | | | | | |
| Pass-Through Ctfs., Ser. 1996-1, 7.67%, 2015 | | 1,618,525 | | | | 1,407,963 |
| Sr. Notes, 10%, 2009 | | 2,402,000 | | b | | 2,035,695 |
| United AirLines, | | | | | | |
| Enhanced Pass-Through Ctfs., | | | | | | |
| Ser. 1997-1A, 2.02%, 2049 | | 716,535 | | d | | 611,458 |
| | | | | | | 5,434,013 |
| Auto Manufacturing—.3% | | | | | | |
| Navistar International, | | | | | | |
| Sr. Notes, 7.5%, 2011 | | 1,601,000 | | b | | 1,725,078 |
The Fund 9
S T A T E M E N T O F I N V E S T M E N T S (continued)
| | | Principal | | | | |
| Bonds and Notes (continued) | | Amount ($) | | Value ($) |
| |
| |
|
| Automotive, Trucks & Parts—1.4% | | | | | | |
| Accuride, | | | | | | |
| Sr. Sub. Notes, Ser. B, 9.25%, 2008 | | 2,265,000 | | | | 2,310,300 |
| Airxcel, | | | | | | |
| Sr. Sub. Notes, Ser. B, 11%, 2007 | | 544,000 | | | | 541,280 |
| Collins & Aikman Products: | | | | | | |
| Sr. Notes, 10.75%, 2011 | | 754,000 | | b | | 772,850 |
| Sr. Sub. Notes, 12.875%, 2012 | | 2,089,000 | | a,b | | 1,814,819 |
| HLI Operating, | | | | | | |
| Sr. Notes, 10.5%, 2010 | | 350,000 | | b | | 377,125 |
| Tenneco Automotive, | | | | | | |
| Sr. Secured Notes, Ser. B, 10.25%, 2013 | | 1,200,000 | | b | | 1,422,000 |
| United Components, | | | | | | |
| Sr. Sub. Notes, 9.375%, 2013 | | 768,000 | | b | | 837,120 |
| | | | | | | 8,075,494 |
| Building & Construction—2.3% | | | | | | |
| Asia Aluminum, | | | | | | |
| Secured Notes, 8%, 2011 | | 601,000 | | a | | 610,015 |
| Atrium Cos., | | | | | | |
| Sr. Sub. Notes, Ser. B, 10.5%, 2009 | | 1,890,000 | | | | 1,998,675 |
| Goodman Global, | | | | | | |
| Sr. Sub. Notes, 7.875%, 2012 | | 524,000 | | a | | 521,380 |
| K Hovnanian Enterprises, | | | | | | |
| Sr. Sub. Notes, 8.875%, 2012 | | 1,000,000 | | b | | 1,110,000 |
| KB Home, | | | | | | |
| Sr. Sub. Notes, 7.75%, 2010 | | 2,000,000 | | | | 2,175,000 |
| Owens Corning: | | | | | | |
| Bonds, 7.5%, 2018 | | 394,000 | | c | | 324,065 |
| Notes, 7%, 2009 | | 3,500,000 | | c | | 2,870,000 |
| THL Buildco, | | | | | | |
| Sr. Sub. Notes, 8.5%, 2014 | | 1,573,000 | | a | | 1,651,650 |
| WCI Communities, | | | | | | |
| Sr. Sub. Notes, 10.625%, 2011 | | 2,300,000 | | | | 2,564,500 |
| | | | | | | 13,825,285 |
| Chemicals—5.6% | | | | | | |
| Crompton, | | | | | | |
| Sr. Notes, 9.875%, 2012 | | 3,678,000 | | a | | 4,229,700 |
| HMP Equity, | | | | | | |
| Sr. Discount Notes, 0%, 2008 | | 2,393,000 | | | | 1,594,336 |
| | | Principal | | | | |
| Bonds and Notes (continued) | | Amount ($) | | Value ($) |
| |
| |
|
| Chemicals (continued) | | | | | | |
| Huntsman, | | | | | | |
| Sr. Secured Notes, 11.625%, 2010 | | 557,000 | | | | 661,437 |
| Sr. Sub. Notes, 9.875%, 2009 | | 524,000 | | | | 577,710 |
| Huntsman ICI Chemicals, | | | | | | |
| Sr. Sub. Notes, 10.125%, 2009 | | 5,409,000 | | b | | 5,720,018 |
| Nalco, | | | | | | |
| Sr. Sub. Notes, 8.875%, 2013 | | 4,153,000 | | b | | 4,578,682 |
| OM Group, | | | | | | |
| Sr. Sub. Notes, 9.25%, 2011 | | 3,600,000 | | | | 3,852,000 |
| Resolution Performance Products/Capital, | | | | |
| Sr. Secured Notes, 8%, 2009 | | 749,000 | | | | 808,920 |
| Rhodia: | | | | | | |
| Sr. Notes, 7.625%, 2010 | | 3,267,000 | | b | | 3,291,502 |
| Sr. Notes, 10.25%, 2010 | | 5,583,000 | | b | | 6,308,790 |
| Rockwood Specialties, | | | | | | |
| Sr. Sub. Notes, 10.625%, 2011 | | 1,506,000 | | | | 1,739,430 |
| | | | | | | 33,362,525 |
| Commercial Mortgage Pass-Through Ctfs.—.3% | | | | |
| Structured Asset Securities, REMIC, | | | | | | |
| Ser. 1996-CFL, Cl. H, 7.75%, 2028 | | 1,750,000 | | | | 1,971,954 |
| Commercial Services—.5% | | | | | | |
| Brickman, | | | | | | |
| Sr. Sub. Notes, Ser. B, 11.75%, 2009 | | 1,037,000 | | | | 1,218,475 |
| United Rentals North America, | | | | | | |
| Sr. Sub. Notes, 7.75%, 2013 | | 1,800,000 | | b | | 1,773,000 |
| | | | | | | 2,991,475 |
| Consumer Products—1.1% | | | | | | |
| Ames True Temper, | | | | | | |
| Sr. Sub. Notes, 10%, 2012 | | 1,604,000 | | | | 1,652,120 |
| Amscan, | | | | | | |
| Sr. Sub. Notes, 8.75%, 2014 | | 1,944,000 | | | | 1,953,720 |
| Playtex Products, | | | | | | |
| Sr. Sub. Notes, 9.375%, 2011 | | 2,546,000 | | b | | 2,730,585 |
| | | | | | | 6,336,425 |
| Diversified Financial Services—2.0% | | | | | | |
| BCP Caylux Holdings Luxembourg SCA, | | | | | | |
| Sr. Sub. Notes, 9.625%, 2014 | | 3,750,000 | | a | | 4,246,875 |
The Fund 11
S T A T E M E N T O F I N V E S T M E N T S (continued)
| | | Principal | | | | |
| Bonds and Notes (continued) | | Amount ($) | | Value ($) |
| |
| |
|
| Diversified Financial Services (continued) | | | | | | |
| Finova, | | | | | | |
| Notes, 7.5%, 2009 | | 3,435,380 | | | | 1,700,513 |
| K&F Acquistions, | | | | | | |
| Sr. Sub. Notes, 7.75%, 2014 | | 645,000 | | a | | 669,188 |
| Stena, | | | | | | |
| Sr. Notes, 7.5%, 2013 | | 1,001,000 | | | | 1,053,552 |
| Trump Casino Holdings/Funding, | | | | | | |
| First Priority Mortgage Notes, 12.625%, 2010 | | 3,982,000 | | | | 4,330,425 |
| | | | | | | 12,000,553 |
| Electric Utilities—7.0% | | | | | | |
| Allegheny Energy Statutory Trust 2001: | | | | | | |
| Secured Notes, 10.25%, 2007 | | 3,760,999 | | a | | 4,279,058 |
| Allegheny Energy Supply: | | | | | | |
| Bonds, 8.25%, 2012 | | 6,827,000 | | a,b | | 7,663,308 |
| Notes, 7.8%, 2011 | | 1,090,000 | | | | 1,193,550 |
| CMS Energy, | | | | | | |
| Sr. Notes, 9.875%, 2007 | | 2,862,000 | | | | 3,212,595 |
| Calpine: | | | | | | |
| Secured Notes, 7.755%, 2010 | | 10,206,000 | | a,b | | 8,802,675 |
| Secured Notes, 8.75%, 2013 | | 2,000,000 | | a | | 1,660,000 |
| Secured Notes, 9.875%, 2011 | | 1,003,000 | | a | | 882,640 |
| Calpine Generating: | | | | | | |
| Secured Notes, 8.31%, 2010 | | 960,000 | | d | | 943,200 |
| Secured Notes, 11.169%, 2011 | | 264,000 | | d | | 259,380 |
| Mirant, | | | | | | |
| Sr. Notes, 7.4%, 2004 | | 1,814,000 | | a,c | | 1,342,360 |
| Nevada Power: | | | | | | |
| Mortgage Bonds, Ser. A, 8.25%, 2011 | | 1,321,000 | | | | 1,524,104 |
| Mortgage Notes, 6.5%, 2012 | | 483,000 | | | | 513,187 |
| Notes, Ser. E, 10.875%, 2009 | | 1,184,000 | | | | 1,373,440 |
| Reliant Energy, | | | | | | |
| Sr. Secured, Notes, 9.25%, 2010 | | 5,023,000 | | | | 5,625,760 |
| Sierra Pacific Resources, | | | | | | |
| Sr. Notes, 8.625%, 2014 | | 1,910,000 | | | | 2,167,850 |
| | | | | | | 41,443,107 |
| Electrical & Electronics—1.5% | | | | | | |
| Dresser, | | | | | | |
| Sr. Sub. Notes, 9.375%, 2011 | | 2,088,000 | | | | 2,296,800 |
| Fisher Scientific International, | | | | | | |
| Sr. Sub. Notes, 8%, 2013 | | 2,485,000 | | | | 2,832,900 |
| |
| |
| 12 | | | | | | |
| | | Principal | | | | |
| Bonds and Notes (continued) | | Amount ($) | | Value ($) |
| |
| |
|
| Electrical & Electronics (continued) | | | | |
| Imax, | | | | | | |
| Sr. Notes, 9.625%, 2010 | | 1,002,000 | | b | | 1,097,190 |
| Rayovac, | | | | | | |
| Sr. Sub. Notes, 8.5%, 2013 | | 497,000 | | b | | 554,155 |
| Stoneridge, | | | | | | |
| Sr. Notes, 11.5%, 2012 | | 1,825,000 | | | | 2,130,688 |
| | | | | | | 8,911,733 |
| Entertainment—1.7% | | | | | | |
| Argosy Gaming, | | | | | | |
| Sr. Sub. Notes, 9%, 2011 | | 1,768,000 | | b | | 1,980,160 |
| Bally Total Fitness, | | | | | | |
| Sr. Notes, 10.5%, 2011 | | 2,707,000 | | b | | 2,740,838 |
| Intrawest, | | | | | | |
| Sr. Notes, 7.5%, 2013 | | 2,656,000 | | | | 2,838,600 |
| Six Flags, | | | | | | |
| Sr. Notes, 9.625%, 2014 | | 990,000 | | b | | 999,900 |
| Vail Resorts, | | | | | | |
| Sr. Sub. Notes, 6.75%, 2014 | | 1,500,000 | | | | 1,533,750 |
| | | | | | | 10,093,248 |
| Environmental Control—3.6% | | | | | | |
| Allied Waste: | | | | | | |
| Secured Notes, 6.375%, 2011 | | 703,000 | | | | 683,668 |
| Sr. Notes, Ser. B, 7.625%, 2006 | | 5,630,000 | | | | 5,827,050 |
| Sr. Notes, Ser. B, 8.5%, 2008 | | 3,109,000 | | | | 3,311,085 |
| Sr. Notes, Ser. B, 8.875%, 2008 | | 6,308,000 | | | | 6,781,100 |
| Sr. Notes, Ser. B, 9.25%, 2012 | | 1,054,000 | | | | 1,146,225 |
| Geo Sub, | | | | | | |
| Sr. Notes, 11%, 2012 | | 1,090,000 | | | | 1,100,900 |
| IMCO Recycling Escrow, | | | | | | |
| Sr. Notes, 9%, 2014 | | 259,000 | | a | | 270,655 |
| Synagro Technologies, | | | | | | |
| Sr. Sub. Notes, 9.5%, 2009 | | 1,030,000 | | b | | 1,127,850 |
| Waste Services, | | | | | | |
| Sr. Sub. Notes, 9.5%, 2014 | | 936,000 | | a,b | | 936,000 |
| | | | | | | 21,184,533 |
| Food & Beverages—2.3% | | | | | | |
| Agrilink Foods, | | | | | | |
| Sr. Sub. Notes, 11.875%, 2008 | | 257,000 | | | | 268,886 |
| American Seafoods, | | | | | | |
| Sr. Sub. Notes, 10.125%, 2010 | | 2,875,000 | | b | | 3,090,625 |
The Fund 13
S T A T E M E N T O F I N V E S T M E N T S (continued)
| | | Principal | | | | |
| Bonds and Notes (continued) | | Amount ($) | | Value ($) |
| |
| |
|
| Food & Beverages (continued) | | | | | | |
| Corn Products International: | | | | | | |
| Sr. Notes, 8.25%, 2007 | | 1,065,000 | | | | 1,172,398 |
| Sr. Notes, 8.45%, 2009 | | 1,065,000 | | | | 1,236,565 |
| Del Monte, | | | | | | |
| Sr. Sub. Notes, 8.625%, 2012 | | 1,031,000 | | | | 1,159,875 |
| Dole Food: | | | | | | |
| Debs., 8.75%, 2013 | | 780,000 | | | | 875,550 |
| Sr. Notes, 8.625%, 2009 | | 1,005,000 | | | | 1,097,963 |
| Sr. Notes, 8.875%, 2011 | | 1,558,000 | | | | 1,702,115 |
| Land O’Lakes, | | | | | | |
| Sr. Notes, 8.75%, 2011 | | 1,673,000 | | b | | 1,673,000 |
| National Beef Packing, | | | | | | |
| Sr. Notes, 10.5%, 2011 | | 1,021,000 | | | | 1,077,155 |
| | | | | | | 13,354,132 |
| Gaming & Lodging—6.1% | | | | | | |
| Inn of the Mountain Gods Resort & Casino, | | | | |
| Sr. Notes, 12%, 2010 | | 3,234,000 | | b | | 3,799,950 |
| Isle of Capri Casinos, | | | | | | |
| Sr. Sub. Notes, 9%, 2012 | | 1,050,000 | | | | 1,162,875 |
| Kerzner International, | | | | | | |
| Notes, 8.875%, 2011 | | 3,462,000 | | | | 3,799,545 |
| MGM Mirage: | | | | | | |
| Notes, 8.5%, 2010 | �� | 1,988,000 | | | | 2,271,290 |
| Sr. Collateralized Notes, 6.95%, 2005 | | 277,000 | | | | 277,693 |
| Mandalay Resort, | | | | | | |
| Sr. Notes, 6.5%, 2009 | | 2,024,000 | | | | 2,145,440 |
| Mohegan Tribal Gaming Authority, | | | | | | |
| Sr. Sub. Notes, 6.375%, 2009 | | 2,048,000 | | b | | 2,114,560 |
| Park Place Entertainment: | | | | | | |
| Sr. Sub. Notes, 7.875%, 2005 | | 2,348,000 | | | | 2,441,920 |
| Sr. Sub. Notes, 7.875%, 2010 | | 1,266,000 | | b | | 1,432,162 |
| Sr. Sub. Notes, 8.875%, 2008 | | 5,301,000 | | | | 6,016,635 |
| Resorts International Hotel and Casino, | | | | | | |
| First Mortgage, 11.5%, 2009 | | 3,274,000 | | | | 3,863,320 |
| Station Casinos, | | | | | | |
| Sr. Sub. Notes, 6.5%, 2014 | | 1,500,000 | | b | | 1,548,750 |
| Turning Stone Casino Entertainment, | | | | | | |
| Sr. Notes, 9.125%, 2010 | | 3,104,000 | | a | | 3,375,600 |
| Wynn Las Vegas Capital, | | | | | | |
| First Mortgage Notes, 6.625%, 2014 | | 1,559,000 | | a | | 1,551,205 |
| | | | | | | 35,800,945 |
| |
| 14 | | | | | | |
| | | Principal | | | | |
| Bonds and Notes (continued) | | Amount ($) | | Value ($) |
| |
| |
|
| Health Care—4.6% | | | | | | |
| Beverly Enterprises, | | | | | | |
| Sr. Sub. Notes, 7.875%, 2014 | | 1,069,000 | | a | | 1,151,848 |
| Extendicare Health Services, | | | | | | |
| Sr. Notes, 9.5%, 2010 | | 658,000 | | | | 740,250 |
| Hanger Orthopedic, | | | | | | |
| Sr. Notes, 10.375%, 2009 | | 3,243,000 | | b | | 3,364,612 |
| Healthsouth: | | | | | | |
| Sr. Notes, 6.875%, 2005 | | 1,001,000 | | | | 1,012,261 |
| Sr. Notes, 7%, 2008 | | 2,964,000 | | b | | 3,023,280 |
| Medex, | | | | | | |
| Sr. Sub. Notes, 8.875%, 2013 | | 2,500,000 | | | | 2,925,000 |
| Province Healthcare, | | | | | | |
| Sr. Sub. Notes, 7.5%, 2013 | | 2,741,000 | | | | 3,083,625 |
| Tenet HealthCare: | | | | | | |
| Notes, 7.375%, 2013 | | 2,868,000 | | | | 2,796,300 |
| Sr. Notes, 5.375%, 2006 | | 1,000,000 | | b | | 1,010,000 |
| Sr. Notes, 9.875%, 2014 | | 4,249,000 | | a,b | | 4,652,655 |
| Triad Hospitals, | | | | | | |
| Sr. Sub. Notes, 7%, 2013 | | 3,340,000 | | b | | 3,431,850 |
| | | | | | | 27,191,681 |
| Machinery—1.2% | | | | | | |
| Case New Holland: | | | | | | |
| Sr. Notes, 6%, 2009 | | 1,090,000 | | a | | 1,068,200 |
| Sr. Notes, 9.25%, 2011 | | 5,566,000 | | a | | 6,220,005 |
| | | | | | | 7,288,205 |
| Manufacturing—1.9% | | | | | | |
| Hexcel, | | | | | | |
| Sr. Sub. Notes, 9.75%, 2009 | | 3,971,000 | | b | | 4,149,695 |
| JB Poindexter, | | | | | | |
| Sr. Notes, 8.75%, 2014 | | 2,181,000 | | a | | 2,328,218 |
| Key Components/Finance, | | | | | | |
| Sr. Notes, 10.5%, 2008 | | 1,354,000 | | | | 1,411,545 |
| MAAX, | | | | | | |
| Sr. Sub. Notes, 9.75%, 2012 | | 534,000 | | a | | 567,375 |
| Polypore: | | | | | | |
| Sr. Discount Note, 0/10.50%, 2012 | | 2,435,000 | | a,e | | 1,570,575 |
| Sr. Sub. Notes, 8.75%, 2012 | | 1,371,000 | | | | 1,439,550 |
| | | | | | | 11,466,958 |
| Media—9.8% | | | | | | |
| Adelphia Communications, | | | | | | |
| Sr. Notes, Ser. B, 7.75%, 2009 | | 1,921,000 | | c | | 1,805,740 |
The Fund 15
S T A T E M E N T O F I N V E S T M E N T S (continued)
| | | Principal | | | | |
| Bonds and Notes (continued) | | Amount ($) | | Value ($) |
| |
| |
|
| Media (continued) | | | | | | |
| CSC Holdings: | | | | | | |
| Sr. Notes, 7.875%, 2007 | | 1,977,000 | | | | 2,130,218 |
| Sr. Notes, Ser. B, 7.625%, 2011 | | 2,000,000 | | | | 2,165,000 |
| Charter Communications Holdings: | | | | | | |
| Sr. Discount Notes, 0/11.75%, 2011 | | 4,431,000 | | e | | 3,278,940 |
| Sr. Notes, 8.75%, 2013 | | 4,130,000 | | b | | 4,284,875 |
| Sr. Notes, 10%, 2011 | | 657,000 | | | | 565,020 |
| Sr. Notes, 10.25%, 2010 | | 4,494,000 | | | | 4,786,110 |
| Sr. Notes, 10.75%, 2009 | | 3,692,000 | | b | | 3,378,180 |
| Dex Media East Finance, | | | | | | |
| Sr. Sub. Notes, Ser. B, 9.875%, 2009 | | 2,908,000 | | | | 3,326,025 |
| Sr. Sub. Notes, Ser. B, 12.125%, 2012 | | 2,323,000 | | | | 2,842,771 |
| Dex Media West/Finance, | | | | | | |
| Sr. Sub. Notes, Ser. B, 9.875%, 2013 | | 2,879,000 | | | | 3,332,442 |
| Granite Broadcasting, | | | | | | |
| Notes, 9.75%, 2010 | | 2,000,000 | | | | 1,920,000 |
| Gray Television, | | | | | | |
| Sr. Sub. Notes, 9.25%, 2011 | | 514,000 | | | | 578,250 |
| Kabel Deutschland, | | | | | | |
| Sr. Notes, 10.625%, 2014 | | 1,570,000 | | a | | 1,813,350 |
| LBI Media: | | | | | | |
| Sr. Discount Notes, 0/11%, 2013 | | 1,492,000 | | e | | 1,104,080 |
| Sr. Sub. Notes, 10.125%, 2012 | | 1,500,000 | | | | 1,681,875 |
| Lodgenet Entertainment, | | | | | | |
| Sr. Sub. Deb., 9.5%, 2013 | | 548,000 | | | | 608,280 |
| Nexstar Finance: | | | | | | |
| Sr. Discount Notes, 0/11.375%, 2013 | | 2,571,000 | | e | | 2,043,945 |
| Sr. Sub. Notes, 7%, 2014 | | 3,248,000 | | | | 3,231,760 |
| Pegasus Communications, | | | | | | |
| Sr. Sub. Notes, Ser. B, 12.5%, 2007 | | 3,374,000 | | c | | 2,184,665 |
| Salem Communications, | | | | | | |
| Sr. Sub. Notes, Ser. B, 9%, 2011 | | 2,605,000 | | | | 2,872,012 |
| Spanish Broadcasting System, | | | | | | |
| Sr. Sub. Notes, 9.625%, 2009 | | 4,246,000 | | | | 4,468,915 |
| Young Broadcasting: | | | | | | |
| Sr. Sub. Notes, 8.75%, 2014 | | 2,648,000 | | b | | 2,681,100 |
| Sr. Sub. Notes, 10%, 2011 | | 525,000 | | b | | 563,062 |
| | | | | | | 57,646,615 |
| | | Principal | | | | |
| Bonds and Notes (continued) | | Amount ($) | | Value ($) |
| |
| |
|
| Mining & Metals—2.1% | | | | | | |
| AK Steel: | | | | | | |
| Sr. Notes, 7.75%, 2012 | | 2,636,000 | | b | | 2,728,260 |
| Sr. Notes, 7.875%, 2009 | | 2,419,000 | | | | 2,476,451 |
| CSN Islands VIII, | | | | | | |
| Sr. Notes, 10%, 2015 | | 1,577,000 | | a | | 1,701,189 |
| Consol Energy, | | | | | | |
| Notes, 7.875%, 2012 | | 3,553,000 | | | | 3,997,125 |
| Earle M Jorgensen, | | | | | | |
| Sr. Secured Notes, 9.75%, 2012 | | 1,320,000 | | | | 1,491,600 |
| | | | | | | 12,394,625 |
| Oil & Gas—5.4% | | | | | | |
| Coastal: | | | | | | |
| Notes, 7.625%, 2008 | | 4,733,000 | | b | | 4,969,650 |
| Notes, 7.75%, 2010 | | 4,731,000 | | b | | 4,967,550 |
| Sr. Deb., 6.5%, 2008 | | 1,067,000 | | | | 1,085,673 |
| El Paso Production, | | | | | | |
| Sr. Notes, 7.75%, 2013 | | 2,040,000 | | | | 2,147,100 |
| Hanover Compressor: | | | | | | |
| Sr. Notes, 8.625%, 2010 | | 1,000,000 | | b | | 1,097,500 |
| Sr. Notes, 9%, 2014 | | 1,632,000 | | | | 1,823,760 |
| Hanover Equipment Trust: | | | | | | |
| Sr. Secured Notes, Ser A., 8.5%, 2008 | | 3,243,000 | | b | | 3,502,440 |
| Sr. Secured Notes, Ser. B, 8.75%, 2011 | | 15,000 | | | | 16,350 |
| McMoRan Exploration: | | | | | | |
| Sr. Notes, 5.25%, 2011 | | 1,036,000 | | a,b | | 1,469,825 |
| Sr. Notes, 6%, 2008 | | 5,126,000 | | a | | 7,772,297 |
| Petroleum Geo-Services, | | | | | | |
| Notes, 10%, 2010 | | 2,500,000 | | | | 2,862,500 |
| | | | | | | 31,714,645 |
| Packaging & Containers—2.4% | | | | | | |
| Jefferson Smurfit, | | | | | | |
| Sr. Notes, 8.25%, 2012 | | 1,052,000 | | | | 1,151,940 |
| Owens-Brockway: | | | | | | |
| Sr. Notes, 6.75%, 2014 | | 519,000 | | a | | 526,785 |
| Sr. Notes, 8.25%, 2013 | | 515,000 | | | | 569,075 |
| Sr. Secured Notes, 7.75%, 2011 | | 1,025,000 | | | | 1,114,687 |
| Sr. Secured Notes, 8.75%, 2012 | | 1,156,000 | | | | 1,309,170 |
| Sr. Secured Notes, 8.875%, 2009 | | 935,000 | | | | 1,020,319 |
The Fund 17
S T A T E M E N T O F I N V E S T M E N T S (continued)
| | | Principal | | | | |
| Bonds and Notes (continued) | | Amount ($) | | Value ($) |
| |
| |
|
| Packaging & Containers (continued) | | | | | | |
| Pliant: | | | | | | |
| Sr. Secured Discount Notes, 0/11.125%, 2009 | | 1,445,000 | | e | | 1,342,044 |
| Sr. Secured Notes, 11.125%, 2009 | | 520,000 | | | | 569,400 |
| Sr. Sub. Notes, 13%, 2010 | | 1,025,000 | | b | | 1,004,500 |
| Stone Container: | | | | | | |
| Sr. Notes, 8.375%, 2012 | | 1,254,000 | | | | 1,373,130 |
| Sr. Notes, 9.75%, 2011 | | 2,761,000 | | b | | 3,037,100 |
| Tekni-Plex, | | | | | | |
| Secured Notes, 8.75%, 2013 | | 1,086,000 | | a,b | | 1,086,000 |
| | | | | | | 14,104,150 |
| Paper & Forest Products—2.7% | | | | | | |
| Appleton Papers, | | | | | | |
| Sr. Sub Notes, Sr. B, 9.75%, 2014 | | 1,604,000 | | b | | 1,780,440 |
| Buckeye Technologies, | | | | | | |
| Sr. Notes, 8.5%, 2013 | | 1,255,000 | | | | 1,367,950 |
| Georgia-Pacific: | | | | | | |
| Sr. Notes, 7.375%, 2008 | | 2,080,000 | | | | 2,272,400 |
| Sr. Notes, 8.875%, 2010 | | 8,927,000 | | | | 10,433,431 |
| | | | | | | 15,854,221 |
| Pipelines—2.2% | | | | | | |
| ANR Pipeline, | | | | | | |
| Notes, 8.875%, 2010 | | 2,540,000 | | | | 2,857,500 |
| Dynegy: | | | | | | |
| Secured Notes, 9.875%, 2010 | | 5,109,000 | | a | | 5,734,853 |
| Secured Notes, 10.125%, 2013 | | 1,794,000 | | a | | 2,063,100 |
| Southern Natural Gas, | | | | | | |
| Notes, 8.875%, 2010 | | 2,057,000 | | b | | 2,314,125 |
| | | | | | | 12,969,578 |
| Real Estate Investment Trust—.4% | | | | | | |
| CB Richard Ellis Services, | | | | | | |
| Sr. Sub. Notes, 11.25%, 2011 | | 1,500,000 | | | | 1,732,500 |
| Host Marriott, | | | | | | |
| Sr. Notes, Ser. B, 7.875%, 2008 | | 699,000 | | | | 721,718 |
| | | | | | | 2,454,218 |
| Residential Mortgage Pass-Through Ctfs.—.0% | | | | | | |
| MORSERV, | | | | | | |
| Ser. 1996-1, Cl. B5, 7%, 2011 | | 103,772 | | a | | 87,511 |
| | | Principal | | | | |
| Bonds and Notes (continued) | | Amount ($) | | Value ($) |
| |
| |
|
| Residential Mortgage Pass-Through Ctfs. (continued) | | | | |
| Residential Accredit Loans, | | | | | | |
| Mortgage Asst-Backed Pass-Through Ctfs., REMIC: | | | | |
| Ser. 1997-QS6, Cl. B2, 7.5%, 2012 | | 63,350 | | | | 64,699 |
| Ser. 1997-QS6, Cl. B3, 7.5%, 2012 | | 63,189 | | | | 51,075 |
| | | | | | | 203,285 |
| Retail—1.2% | | | | | | |
| Dillards, | | | | | | |
| Notes, 6.875%, 2005 | | 94,000 | | | | 96,350 |
| JC Penney, | | | | | | |
| Sr. Notes, 8%, 2010 | | 1,706,000 | | | | 1,957,635 |
| Remington Arms, | | | | | | |
| Sr. Notes, 10.5%, 2011 | | 387,000 | | | | 375,390 |
| Rite Aid: | | | | | | |
| Sr. Secured Notes, 8.125%, 2010 | | 1,180,000 | | | | 1,253,750 |
| Sr. Secured Notes, 12.5%, 2006 | | 1,025,000 | | b | | 1,158,250 |
| Saks, | | | | | | |
| Notes, 7.5%, 2010 | | 1,052,000 | | | | 1,125,640 |
| VICORP Restaurants, | | | | | | |
| Sr. Notes, 10.5%, 2011 | | 955,000 | | | | 964,550 |
| | | | | | | 6,931,565 |
| Structured Index—.5% | | | | | | |
| AB Svensk Exportkredit, | | | | | | |
| GSNE-ER Indexed Notes, 0%, 2007 | | 3,045,000 | | a,f | | 2,888,183 |
| Technology—.9% | | | | | | |
| AMI Semiconductor, | | | | | | |
| Sr. Sub. Notes, 10.75%, 2013 | | 1,514,000 | | | | 1,786,520 |
| Amkor Technology, | | | | | | |
| Sr. Notes, 7.125%, 2011 | | 1,500,000 | | b | | 1,417,500 |
| Seagate Technology HDD, | | | | | | |
| Sr. Notes, 8%, 2009 | | 2,000,000 | | b | | 2,170,000 |
| | | | | | | 5,374,020 |
| Telecommunications—10.0% | | | | | | |
| American Tower: | | | | | | |
| Sr. Notes, 7.125%, 2012 | | 1,561,000 | | a | | 1,603,927 |
| Sr. Notes, 9.375%, 2009 | | 2,087,000 | | b | | 2,217,438 |
| Sr. Sub. Notes, 7.25%, 2011 | | 2,561,000 | | | | 2,727,465 |
The Fund 19
S T A T E M E N T O F I N V E S T M E N T S (continued)
| | | Principal | | | | |
| Bonds and Notes (continued) | | Amount ($) | | Value ($) |
| |
| |
|
| Telecommunications (continued) | | | | | | |
| American Tower Escrow, | | | | | | |
| Discount Notes, 0%, 2008 | | 510,000 | | | | 383,775 |
| Call-Net Enterprises, | | | | | | |
| Sr. Secured Notes, 10.625%, 2008 | | 500,000 | | b | | 502,500 |
| Crown Castle International: | | | | | | |
| Sr. Notes, 7.5%, 2013 | | 2,009,000 | | b | | 2,169,720 |
| Sr. Notes, 9.375%, 2011 | | 3,301,000 | | | | 3,713,625 |
| Sr. Notes, Ser. B, 7.5%, 2013 | | 1,736,000 | | b | | 1,874,880 |
| Dobson Communications, | | | | | | |
| Sr. Notes, 8.875%, 2013 | | 1,099,000 | | b | | 777,543 |
| Fairpoint Communications, | | | | | | |
| Sr. Notes, 11.875%, 2010 | | 515,000 | | | | 605,125 |
| Innova S de RL, | | | | | | |
| Notes, 9.375%, 2013 | | 2,035,000 | | b | | 2,324,987 |
| Insight Midwest/Capital, | | | | | | |
| Sr. Notes, 10.5%, 2010 | | 2,000,000 | | | | 2,200,000 |
| MJD Communications, | | | | | | |
| Floating Rate Notes, Ser. B, 6.4875%, 2008 | | 4,500,000 | | d | | 4,455,000 |
| Nextel Communications, | | | | | | |
| Sr. Notes, 7.375%, 2015 | | 2,000,000 | | | | 2,210,000 |
| Nextel Partners, | | | | | | |
| Sr. Notes, 12.5%, 2009 | | 1,798,000 | | b | | 2,045,225 |
| Pegasus Satellite Communications, | | | | | | |
| Sr. Notes, 12.375%, 2006 | | 750,000 | | c | | 485,625 |
| Qwest: | | | | | | |
| Bank Note, Ser. A, 6.5%, 2007 | | 3,227,000 | | a,d | | 3,364,147 |
| Bank Note, Ser. B, 6.95%, 2010 | | 1,051,000 | | a,d | | 1,074,647 |
| Qwest Services: | | | | | | |
| Notes, 14%, 2010 | | 1,600,000 | | a | | 1,932,000 |
| Sr. Secured Notes, 13.5%, 2007 | | 5,807,000 | | a,b | | 6,663,532 |
| SBA Telecommunications, | | | | | | |
| Sr. Discount Notes, 0/9.75%, 2011 | | 5,962,000 | | e | | 5,052,795 |
| Spectrasite, | | | | | | |
| Sr. Notes, 8.25%, 2010 | | 2,090,000 | | | | 2,241,525 |
| Ubiquitel Operations, | | | | | | |
| Sr. Notes, 9.875%, 2011 | | 1,560,000 | | a | | 1,758,900 |
| US Unwired, | | | | | | |
| Sr. Secured Notes, Ser. B, 10%, 2012 | | 2,649,000 | | b | | 2,999,992 |
| Verizon Global Funding, | | | | | | |
| Notes, 6.75%, 2005 | | 200,000 | | a | | 206,518 |
| |
| |
| 20 | | | | | | |
| | | Principal | | | | |
| Bonds and Notes (continued) | | Amount ($) | | Value ($) |
| |
| |
|
| Telecommunications (continued) | | | | | | |
| Western Wireless, | | | | | | |
| Sr. Notes, 9.25%, 2013 | | 3,227,000 | | | | 3,525,497 |
| | | | | 59,116,388 |
| Textiles & Apparel—.5% | | | | | | |
| Dan River, | | | | | | |
| Sr. Notes, 12.75%, 2009 | | 2,006,000 | | a,b,c | | 396,185 |
| Levi Strauss & Co., | | | | | | |
| Sr. Notes, 12.25%, 2012 | | 353,000 | | | | 394,478 |
| William Carter, | | | | | | |
| Sr. Sub. Notes, Ser. B, 10.875%, 2011 | | 1,663,000 | | | | 1,870,875 |
| | | | | | | 2,661,538 |
| Transportation—1.6% | | | | | | |
| CHC Helicopter, | | | | | | |
| Sr. Sub. Notes, 7.375%, 2014 | | 1,405,000 | | | | 1,489,300 |
| General Maritime, | | | | | | |
| Sr. Notes, 10%, 2013 | | 2,000,000 | | | | 2,310,000 |
| Gulfmark Offshore, | | | | | | |
| Sr. Notes, 7.75%, 2014 | | 2,113,000 | | a,b | | 2,250,345 |
| TFM, S.A. de C.V., | | | | | | |
| Sr. Notes, 10.25%, 2007 | | 3,245,000 | | b | | 3,472,150 |
| | | | | | | 9,521,795 |
| Total Bonds and Notes | | | | | | |
| (cost $480,106,953) | | | | 512,212,040 |
| |
| |
|
| |
| Preferred Stocks—2.2% | | Shares | | | | Value ($) |
| |
| |
| |
|
| Commercial Services—.6% | | | | | | |
| Kaiser Group Holdings, | | | | | | |
| Cum., $3.85 | | 60,785 | | | | 3,343,175 |
| Diversified Financial Service—.1% | | | | | | |
| Williams Holdings Of Delaware, | | | | | | |
| Cum. Conv., $2.75 | | 7,800 | | a | | 655,200 |
| Media—1.5% | | | | | | |
| Paxson Communications, | | | | | | |
| Cum. Conv., $975 | | 969 | | a | | 5,328,309 |
| Spanish Broadcasting System, | | | | | | |
| Cum. Conv., Ser. B, $107.5 | | 3,086 | | | | 3,441,363 |
| | | | | | | 8,769,672 |
| |
| |
| |
| | | The Fund | | 21 |
S T A T E M E N T O F I N V E S T M E N T S (continued)
| Preferred Stocks (continued) | | Shares | | Value ($) |
| |
| |
|
| Textiles & Apparel—.0% | | | | |
| Cluett American, | | | | |
| Cum., $12.5 | | 51 | | 1,033 |
| Total Preferred Stocks | | | | |
| (cost $13,099,638) | | | | 12,769,080 |
| |
| |
|
| |
| Common Stock—.4% | | | | |
| |
| |
|
| Oil & Gas—.0% | | | | |
| Link Energy | | 460,276 g | | 41,425 |
| Telecommunications—.4% | | | | |
| AboveNet | | 64,685 b,g | | 2,069,920 |
| Neon Communications | | 182,744 g,h | | 502,546 |
| Stellex Aerostructures | | 429 g,h | | 0 |
| | | | | 2,572,466 |
| Total Common Stocks | | | | |
| (cost $8,757,218) | | | | 2,613,891 |
| |
| |
|
| |
| Other—.0% | | | | |
| |
| |
|
| Chemicals—0.0% | | | | |
| Huntsman (warrants) | | 526 a,g | | 247,487 |
| Financial—.0% | | | | |
| Ono Finance, | | 1,000 a,g | | 1 |
| Mining And Metals—.0% | | | | |
| Kaiser Group Holdings (rights) | | 202,510 g,h,i | | 0 |
| Telecommunications—.0% | | | | |
| AboveNet (warrants) | | 5,083 g | | 60,996 |
| AboveNet (warrants) | | 5,980 g | | 47,840 |
| Loral Cyberstar (warrants) | | 164,345 g | | 1,643 |
| Neon Communications (warrants) | | 182,744 g,h | | 0 |
| | | | | 110,479 |
| Total Other | | | | |
| (cost $333,985) | | | | 357,967 |
| |
| |
|
| |
| Other Investments—9.2% | | | | |
| |
| |
|
| Registered Investment Company; | | | | |
| Dreyfus Institutional Preferred Plus Money Market Fund | | |
| (cost $54,157,000) | | 54,157,000 j | | 54,157,000 |
| |
| |
| 22 | | | | |
| Investment of Cash Collateral | | | | |
| for Securities Loaned—18.8% | | Shares | | Value ($) |
| |
| |
|
| Registered Investment Company; | | | | |
| Dreyfus Institutional Cash Advantage Fund | | | | |
| (cost $111,311,715) | | 111,311,715 j | | 111,311,715 |
| |
| |
|
| Total Investment (cost $667,766,509) | | 117.3% | | 693,421,693 |
| Liabilities, Less Cash and Receivables | | (17.3%) | | (102,299,492) |
| Net Assets | | 100.0% | | 591,122,201 |
| a Securities exempt from registration under Rule 144A of the Securities Act of 1933.These securities may be resold in |
| transactions exempt from registration, normally to qualified institutional buyers and are deemed to be liquid.At |
| December 31, 2004, these securities amounted to $118,174,340 or 20.0% of net assets. |
| b All or a portion of these securities are on loan.At December 31, 2004, the total market value of the fund’s securities |
| on loan is $107,845,143 and the total market value of the collateral held by the fund is $111,311,715. |
| c Non-income producing—security in default. |
| d Variable rate security—interest rate subject to periodic change. |
| e Zero coupon until a specified date at which time the stated coupon rate becomes effective until maturity |
| f Security linked to Goldman Sachs Commodity Non-Energy—Excess Return Index. |
| g Non-income producing security. |
| h The value of these securities has been determined in good faith under the direction of the Board of Trustees. |
| i Investments in affiliated money market mutual funds. |
| j Security restricted as to public resale. Investments in restricted securities with a value of $0 or 0% of net assets: |
| | | Acquisition | | Purchase | | Percentage of | | |
| Issuer | | Date | | Price ($) | | Net Assets (%) | | Valuation ($) |
| |
| |
| |
| |
|
| Kaiser Group Holdings (rights) | | 6/26/2001 | | — | | — | | — |
| |
| |
| |
| |
|
| |
| |
| |
| Portfolio Summary (Unaudited) † | | | | | | |
| |
| | | Value (%) | | | | | | Value (%) |
| |
| |
| |
| |
|
| Money Market Investments | | 28.0 | | Packaging & Containers | | 2.4 |
| Telecommunications | | 10.0 | | Building & Construction | | 2.3 |
| Media | | 9.8 | | Food & Beverages | | 2.3 |
| Electric Utilities | | 7.0 | | Pipelines | | | | 2.2 |
| Gaming & Lodging | | 6.1 | | Preferred Stocks | | 2.2 |
| Chemicals | | 5.6 | | Mining & Metals | | 2.1 |
| Oil & Gas | | 5.4 | | Diversified Financial Service | | 2.0 |
| Health Care | | 4.6 | | Other | | | | 19.0 |
| Environmental Control | | 3.6 | | | | | | |
| Paper & Forest Products | | 2.7 | | | | | | 117.3 |
| |
| † Based on net assets. | | | | | | | | |
| See notes to financial statements. | | | | | | | | |
| |
| |
| | | | | | | The Fund | | 23 |
| STATEMENT OF ASSETS AND LIABILITIES |
| December 31, 2004 |
| | | | | | | Cost | | Value |
| |
| |
| |
| |
|
| Assets ($): | | | | | | | | |
| Investments in securities—See Statement of | | | | | | |
| Investments (including securities on loan, | | | | | | |
| valued at $107,845,143)—Note 1(c): | | | | | | |
| Unaffiliated issuers | | | | 502,297,794 | | 527,952,978 |
| Affiliated issuers | | | | | | 165,468,715 | | 165,468,715 |
| Cash denominated in foreign currencies | | | | 728 | | 780 |
| Interest and dividends receivable | | | | | | 10,396,948 |
| Receivable for shares of Beneficial Interest subscribed | | | | 389,291 |
| Paydowns receivable | | | | | | | | 4,100 |
| | | | | | | | | 704,212,812 |
| |
| |
| |
| |
|
| Liabilities ($): | | | | | | | | |
| Due to The Dreyfus Corporation and affiliates—Note 3(b) | | | | 618,729 |
| Cash overdraft due to Custodian | | | | | | 303,785 |
| Liability for securities on loan—Note 1(c) | | | | | | 111,311,715 |
| Payable for shares of Beneficial Interest redeemed | | | | 856,382 |
| | | | | | | | | 113,090,611 |
| |
| |
| |
| |
|
| Net Assets ($) | | | | | | | | 591,122,201 |
| |
| |
| |
| |
|
| Composition of Net Assets ($): | | | | | | |
| Paid-in capital | | | | | | | | 1,130,965,032 |
| Accumulated undistributed investment income—net | | | | 291,303 |
| Accumulated net realized gain (loss) on investments | | | | (565,789,371) |
| Accumulated net unrealized appreciation (depreciation) | | | | |
| on investments and foreign currency transactions | | | | 25,655,237 |
| |
| |
|
| Net Assets ($) | | | | | | | | 591,122,201 |
| |
| |
| |
| |
|
| |
| |
| Net Asset Value Per Share | | | | | | |
| | | Class A | | Class B | | Class C | | Class R |
| |
| |
| |
| |
|
| Net Assets ($) | | 286,342,335 | | 167,756,099 | | 115,309,454 | | 21,714,313 |
| Shares Outstanding | | 37,454,700 | | 21,921,271 | | 15,064,915 | | 2,839,063 |
| |
| |
| |
| |
|
| Net Asset Value | | | | | | | | |
| Per Share ($) | | 7.65 | | 7.65 | | 7.65 | | 7.65 |
See notes to financial statements.
|
STATEMENT OF OPERATIONS
Year Ended December 31, 2004
|
| Investment Income ($): | | |
| Income: | | |
| Interest | | 43,042,036 |
| Dividends: | | |
| Unaffiliated issuers | | 1,460,304 |
| Affiliated issuers | | 457,459 |
| Income from securities lending | | 445,491 |
| Total Income | | 45,405,290 |
| Expenses: | | |
| Management fee—Note 3(a) | | 3,996,768 |
| Distribution and service fees—Note 3(b) | | 3,197,572 |
| Total Expenses | | 7,194,340 |
| Investment Income—Net | | 38,210,950 |
| |
|
| Realized and Unrealized Gain (Loss) on Investments—Note 4 ($): |
| Net realized gain (loss) on investments and | | |
| foreign currency transations | | 20,837,219 |
| Net realized gain (loss) on financial futures | | (1,354) |
| Net realized gain (loss) on swaps transactions | | (1,530,639) |
| Net realized gain (loss) on options transactions | | (37,811) |
| Net realized gain (loss) on forward currency exchange contracts | | (16,010) |
| Net Realized Gain (Loss) | | 19,251,405 |
| Net unrealized appreciation (depreciation) | | |
| on investments and foreign currency transactions | | 6,868,062 |
| Net Realized and Unrealized Gain (Loss) on Investments | | 26,119,467 |
| Net Increase in Net Assets Resulting from Operations | | 64,330,417 |
See notes to financial statements.
|
The Fund 25
STATEMENT OF CHANGES IN NET ASSETS
| | | Year Ended December 31, |
| |
|
| | | 2004 | | 2003 |
| |
| |
|
| Operations ($): | | | | |
| Investment income—net | | 38,210,950 | | 41,396,075 |
| Net realized gain (loss) on investments | | 19,251,405 | | (59,302,124) |
| Net unrealized appreciation | | | | |
| (depreciation) on investments | | 6,868,062 | | 141,501,721 |
| Net Increase (Decrease) in Net Assets | | | | |
| Resulting from Operations | | 64,330,417 | | 123,595,672 |
| |
| |
|
| Dividends to Shareholders from ($): | | | | |
| Investment income—net: | | | | |
| Class A shares | | (17,670,867) | | (14,764,836) |
| Class B shares | | (13,553,136) | | (22,036,756) |
| Class C shares | | (6,858,589) | | (6,525,596) |
| Class R shares | | (1,146,962) | | (104,181) |
| Total Dividends | | (39,229,554) | | (43,431,369) |
| |
| |
|
| Beneficial Interest Transactions ($): | | | | |
| Net proceeds from shares sold: | | | | |
| Class A shares | | 143,560,072 | | 189,616,421 |
| Class B shares | | 11,499,028 | | 40,291,681 |
| Class C shares | | 13,351,452 | | 25,359,160 |
| Class R shares | | 4,068,189 | | 2,122,931 |
| Net assets received in connection with | | | | |
| reorganization—Note 1: | | | | |
| Class A shares | | 54,982,849 | | — |
| Class B shares | | 43,560,106 | | — |
| Class C shares | | 48,040,484 | | — |
| Class R shares | | 27,857,157 | | — |
| Dividends reinvested: | | | | |
| Class A shares | | 8,223,762 | | 7,016,001 |
| Class B shares | | 4,893,592 | | 6,501,640 |
| Class C shares | | 2,818,558 | | 2,146,779 |
| Class R shares | | 1,098,662 | | 101,800 |
| Cost of shares redeemed: | | | | |
| Class A shares | | (123,038,793) | | (154,570,015) |
| Class B shares | | (137,887,079) | | (79,046,284) |
| Class C shares | | (40,201,205) | | (15,365,410) |
| Class R shares | | (13,851,908) | | (1,228,484) |
| Increase (Decrease) in Net Assets from | | | | |
| Beneficial Interest Transactions | | 48,974,926 | | 22,946,220 |
| Total Increase (Decrease) in Net Assets | | 74,075,789 | | 103,110,523 |
| |
| |
|
| Net Assets ($): | | | | |
| Beginning of Period | | 517,046,412 | | 413,935,889 |
| End of Period | | 591,122,201 | | 517,046,412 |
| Undistributed (distributions in excess of) | | | | |
| investment income—net | | 291,303 | | (23,537) |
| 26 | | | | |
| | | Year Ended December 31, |
| |
|
| | | 2004 | | 2003 |
| |
| |
|
| Capital Share Transactions: | | | | |
| Class A a | | | | |
| Shares sold | | 19,901,069 | | 27,218,889 |
| Shares issued in connection | | | | |
| with reorganization—Note 1 | | 7,450,835 | | — |
| Shares issued for dividends reinvested | | 1,107,484 | | 1,002,962 |
| Shares redeemed | | (16,610,601) | | (22,017,916) |
| Net Increase (Decrease) in Shares Outstanding | | 11,848,787 | | 6,203,935 |
| |
| |
|
| Class B a | | | | |
| Shares sold | | 1,822,259 | | 5,811,928 |
| Shares issued in connection | | | | |
| with reorganization—Note 1 | | 5,891,364 | | — |
| Shares issued for dividends reinvested | | 659,624 | | 934,823 |
| Shares redeemed | | (18,609,707) | | (11,228,470) |
| Net Increase (Decrease) in Shares Outstanding | | (10,236,460) | | (4,481,719) |
| |
| |
|
| Class C | | | | |
| Shares sold | | 2,001,558 | | 3,645,801 |
| Shares issued in connection | | | | |
| with reorganization—Note 1 | | 6,497,931 | | — |
| Shares issued for dividends reinvested | | 379,720 | | 307,408 |
| Shares redeemed | | (5,445,865) | | (2,197,438) |
| Net Increase (Decrease) in Shares Outstanding | | 3,433,344 | | 1,755,771 |
| |
| |
|
| Class R | | | | |
| Shares sold | | 642,443 | | 314,667 |
| Shares issued in connection | | | | |
| with reorganization—Note 1 | | 3,773,591 | | — |
| Shares issued for dividends reinvested | | 148,256 | | 14,486 |
| Shares redeemed | | (1,898,079) | | (174,477) |
| Net Increase (Decrease) in Shares Outstanding | | 2,666,211 | | 154,676 |
| a | | During the period ended December 31, 2004, 6,247,945 Class B shares representing $51,135,116 were |
| | | automatically converted to 6,898,745 Class A shares and during the period ended December 31, 2003, 3,158,289 |
| | | Class B shares representing $22,641,055 were automatically converted to 3,158,302 Class A shares. |
| See notes to financial statements. |
The Fund 27
The following tables describe the performance for each share class for the fiscal periods indicated.All information (except portfolio turnover rate) reflects financial results for a single fund share.Total return shows how much your investment in the fund would have increased (or decreased) during each period, assuming you had reinvested all dividends and distributions.These figures have been derived from the fund’s financial statements.
| | | | | Year Ended December 31, | | |
| |
| |
| |
|
| Class A Shares | | 2004 a | | 2003 | | 2002 | | 2001 b | | 2000 |
| |
| |
| |
| |
| |
|
| Per Share Data ($): | | | | | | | | | | |
| Net asset value, beginning of period | | 7.43 | | 6.28 | | 7.94 | | 8.95 | | 10.45 |
| Investment Operations: | | | | | | | | | | |
| Investment income—net | | .52c | | .63c | | .68c | | .84c | | 1.07 |
| Net realized and unrealized | | | | | | | | | | |
| gain (loss) on investments | | .23 | | 1.17 | | (1.62) | | (.96) | | (1.47) |
| Total from Investment Operations | | .75 | | 1.80 | | (.94) | | (.12) | | (.40) |
| Distributions: | | | | | | | | | | |
| Dividends from investment income—net | | (.53) | | (.65) | | (.72) | | (.89) | | (1.10) |
| Net asset value, end of period | | 7.65 | | 7.43 | | 6.28 | | 7.94 | | 8.95 |
| |
| |
| |
| |
| |
|
| Total Return (%) d | | 10.44 | | 29.87 | | (12.19) | | (1.62) | | (4.26) |
| |
| |
| |
| |
| |
|
| Ratios/Supplemental Data (%): | | | | | | | | | | |
| Ratio of total expenses | | | | | | | | | | |
| to average net assets | | .95 | | .97 | | .96 | | .96 | | .96 |
| Ratio of net investment income | | | | | | | | | | |
| to average net assets | | 7.00 | | 8.87 | | 10.05 | | 9.91 | | 10.80 |
| Portfolio Turnover Rate | | 129.27 | | 235.42 | | 340.47 | | 158.92 | | 26.76 |
| |
| |
| |
| |
| |
|
| Net Assets, end of period ($ x 1,000) | | 286,342 | | 191,270 | | 121,775 | | 114,886 | | 132,652 |
| a | | As of January 1, 2004, the fund has adopted the method of accounting for interim payments on swap contracts in |
| | | accordance with Financial Accounting Standards Board Statement No. 133.These interim payments are reflected |
| | | within net realized and unrealized gain (loss) on swap contracts, however, prior to January 1, 2004, these interim |
| | | payments were reflected within interest income/expense in the Statement of Operations.The effect of these changes |
| | | for the fiscal year ended December 31, 2004, was to increase net investment income per share by less than $.01, |
| | | decrease net realized and unrealized gain (loss) on investments per share by less than $.01 and had no effect on the |
| | | ratio of net investment income to average net assets. |
| b | | As required, effective January 1, 2001, the fund has adopted the provisions of the AICPA Audit and Accounting |
| | | Guide for Investment Companies and began accreting discount or amortizing premium on fixed income securities on |
| | | a scientific basis and including paydown gains and losses in interest income.The effect of this change for the period |
| | | ended December 31, 2001 was to decrease net investment income per share by $.06, increase net realized and |
| | | unrealized gain (loss) on investments per share by $.06, and decrease the ratio of net investment income to average |
| | | net assets from 10.52% to 9.91%. Per share data and ratios/supplemental data for periods prior to January 1, |
| | | 2001 have not been restated to reflect this change in presentation. |
| c | | Based on average shares outstanding at each month end. |
| d | | Exclusive of sales charge. |
| See notes to financial statements. |
| | | | | Year Ended December 31, | | |
| |
| |
| |
|
| Class B Shares | | 2004 a | | 2003 | | 2002 | | 2001 b | | 2000 |
| |
| |
| |
| |
| |
|
| Per Share Data ($): | | | | | | | | | | |
| Net asset value, beginning of period | | 7.43 | | 6.28 | | 7.94 | | 8.95 | | 10.45 |
| Investment Operations: | | | | | | | | | | |
| Investment income—net | | .47c | | .59c | | .66c | | .80c | | 1.02 |
| Net realized and unrealized | | | | | | | | | | |
| gain (loss) on investments | | .25 | | 1.18 | | (1.64) | | (.96) | | (1.47) |
| Total from Investment Operations | | .72 | | 1.77 | | (.98) | | (.16) | | (.45) |
| Distributions: | | | | | | | | | | |
| Dividends from investment income—net | | (.50) | | (.62) | | (.68) | | (.85) | | (1.05) |
| Net asset value, end of period | | 7.65 | | 7.43 | | 6.28 | | 7.94 | | 8.95 |
| |
| |
| |
| |
| |
|
| Total Return (%) d | | 10.06 | | 29.25 | | (12.64) | | (2.10) | | (4.74) |
| |
| |
| |
| |
| |
|
| Ratios/Supplemental Data (%): | | | | | | | | | | |
| Ratio of total expenses | | | | | | | | | | |
| to average net assets | | 1.45 | | 1.47 | | 1.46 | | 1.46 | | 1.46 |
| Ratio of net investment income | | | | | | | | | | |
| to average net assets | | 6.50 | | 8.46 | | 9.41 | | 9.42 | | 10.32 |
| Portfolio Turnover Rate | | 129.27 | | 235.42 | | 340.47 | | 158.92 | | 26.76 |
| |
| |
| |
| |
| |
|
| Net Assets, end of period ($ x 1,000) | | 167,756 | | 239,015 | | 230,011 | | 325,834 | | 403,702 |
| a As of January 1, 2004, the fund has adopted the method of accounting for interim payments on swap contracts in |
| accordance with Financial Accounting Standards Board Statement No. 133.These interim payments are reflected |
| within net realized and unrealized gain (loss) on swap contracts, however, prior to November 1, 2004, these interim |
| payments were reflected within interest income/expense in the Statement of Operations.The effect of these changes |
| for the fiscal year ended December 31, 2004, was to increase net investment income per share by less than $.01, |
| decrease net realized and unrealized gain (loss) on investments per share by less than $.01 and had no effect on the |
| ratio of net investment income to average net assets. |
| b As required, effective January 1, 2001, the fund has adopted the provisions of the AICPA Audit and Accounting |
| Guide for Investment Companies and began accreting discount or amortizing premium on fixed income securities on |
| a scientific basis and including paydown gains and losses in interest income.The effect of this change for the period |
| ended December 31, 2001 was to decrease net investment income per share by $.05, increase net realized and |
| unrealized gain (loss) on investments per share by $.05, and decrease the ratio of net investment income to average |
| net assets from 10.03% to 9.42%. Per share data and ratios/supplemental data for periods prior to January 1, |
| 2001 have not been restated to reflect this change in presentation. |
| c Based on average shares outstanding at each month end. |
| d Exclusive of sales charge. |
See notes to financial statements.
The Fund 29
FINANCIAL HIGHLIGHTS (continued)
|
| | | | | Year Ended December 31, | | |
| |
| |
| |
|
| Class C Shares | | 2004 a | | 2003 | | 2002 | | 2001 b | | 2000 |
| |
| |
| |
| |
| |
|
| Per Share Data ($): | | | | | | | | | | |
| Net asset value, beginning of period | | 7.43 | | 6.28 | | 7.95 | | 8.96 | | 10.45 |
| Investment Operations: | | | | | | | | | | |
| Investment income—net | | .46c | | .57c | | .64c | | .78c | | 1.01 |
| Net realized and unrealized | | | | | | | | | | |
| gain (loss) on investments | | .24 | | 1.18 | | (1.65) | | (.96) | | (1.47) |
| Total from Investment Operations | | .70 | | 1.75 | | (1.01) | | (.18) | | (.46) |
| Distributions: | | | | | | | | | | |
| Dividends from investment income—net | | (.48) | | (.60) | | (.66) | | (.83) | | (1.03) |
| Net asset value, end of period | | 7.65 | | 7.43 | | 6.28 | | 7.95 | | 8.96 |
| |
| |
| |
| |
| |
|
| Total Return (%) d | | 9.63 | | 29.10 | | (12.97) | | (2.23) | | (4.96) |
| |
| |
| |
| |
| |
|
| Ratios/Supplemental Data (%): | | | | | | | | | | |
| Ratio of total expenses | | | | | | | | | | |
| to average net assets | | 1.70 | | 1.72 | | 1.71 | | 1.71 | | 1.71 |
| Ratio of net investment income | | | | | | | | | | |
| to average net assets | | 6.26 | | 8.15 | | 9.17 | | 9.17 | | 10.09 |
| Portfolio Turnover Rate | | 129.27 | | 235.42 | | 340.47 | | 158.92 | | 26.76 |
| |
| |
| |
| |
| |
|
| Net Assets, end of period ($ x 1,000) | | 115,309 | | 86,479 | | 62,036 | | 84,044 | | 105,167 |
| a | | As of January 1, 2004, the fund has adopted the method of accounting for interim payments on swap contracts in |
| | | accordance with Financial Accounting Standards Board Statement No. 133.These interim payments are reflected |
| | | within net realized and unrealized gain (loss) on swap contracts, however, prior to November 1, 2004, these interim |
| | | payments were reflected within interest income/expense in the Statement of Operations.The effect of these changes |
| | | for the fiscal year ended December 31, 2004, was to increase net investment income per share by less than $.01, |
| | | decrease net realized and unrealized gain (loss) on investments per share by less than $.01 and had no effect on |
| | | the ratio of net investment income to average net assets. |
| b | | As required, effective January 1, 2001, the fund has adopted the provisions of the AICPA Audit and Accounting |
| | | Guide for Investment Companies and began accreting discount or amortizing premium on fixed income securities on |
| | | a scientific basis and including paydown gains and losses in interest income.The effect of this change for the period |
| | | ended December 31, 2001 was to decrease net investment income per share by $.05, increase net realized and |
| | | unrealized gain (loss) on investments per share by $.05, and decrease the ratio of net investment income to average |
| | | net assets from 9.78% to 9.17%. Per share data and ratios/supplemental data for periods prior to January 1, |
| | | 2001 have not been restated to reflect this change in presentation. |
| c | | Based on average shares outstanding at each month end. |
| d | | Exclusive of sales charge. |
| See notes to financial statements. |
| | | | | Year Ended December 31, | | |
| |
| |
| |
|
| Class R Shares | | 2004 a | | 2003 | | 2002 | | 2001 b | | 2000 |
| |
| |
| |
| |
| |
|
| Per Share Data ($): | | | | | | | | | | |
| Net asset value, beginning of period | | 7.43 | | 6.27 | | 7.94 | | 8.95 | | 10.44 |
| Investment Operations: | | | | | | | | | | |
| Investment income—net | | .52c | | .67c | | .70c | | .86c | | 1.16 |
| Net realized and unrealized | | | | | | | | | | |
| gain (loss) on investments | | .25 | | 1.16 | | (1.64) | | (.96) | | (1.52) |
| Total from Investment Operations | | .77 | | 1.83 | | (.94) | | (.10) | | (.36) |
| Distributions: | | | | | | | | | | |
| Dividends from investment income—net | | (.55) | | (.67) | | (.73) | | (.91) | | (1.13) |
| Net asset value, end of period | | 7.65 | | 7.43 | | 6.27 | | 7.94 | | 8.95 |
| |
| |
| |
| |
| |
|
| Total Return (%) | | 10.87 | | 30.15 | | (11.99) | | (1.26) | | (4.02) |
| |
| |
| |
| |
| |
|
| Ratios/Supplemental Data (%): | | | | | | | | | | |
| Ratio of total expenses | | | | | | | | | | |
| to average net assets | | .70 | | .72 | | .70 | | .71 | | .71 |
| Ratio of net investment income | | | | | | | | | | |
| to average net assets | | 7.31 | | 9.26 | | 10.08 | | 10.19 | | 11.01 |
| Portfolio Turnover Rate | | 129.27 | | 235.42 | | 340.47 | | 158.92 | | 26.76 |
| |
| |
| |
| |
| |
|
| Net Assets, end of period ($ x 1,000) | | 21,714 | | 1,283 | | 114 | | 131 | | 143 |
| a | | As of January 1, 2004, the fund has adopted the method of accounting for interim payments on swap contracts in |
| | | accordance with Financial Accounting Standards Board Statement No. 133.These interim payments are reflected |
| | | within net realized and unrealized gain (loss) on swap contracts, however, prior to November 1, 2004, these interim |
| | | payments were reflected within interest income/expense in the Statement of Operations.The effect of these changes |
| | | for the fiscal year ended December 31, 2004, was to increase net investment income per share by less than $.01, |
| | | decrease net realized and unrealized gain (loss) on investments per share by less than $.01 and had no effect on |
| | | the ratio of net investment income to average net assets. |
| b | | As required, effective January 1, 2001, the fund has adopted the provisions of the AICPA Audit and Accounting |
| | | Guide for Investment Companies and began accreting discount or amortizing premium on fixed income securities on a |
| | | scientific basis and including paydown gains and losses in interest income.The effect of this change for the period |
| | | ended December 31, 2001 was to decrease net investment income per share by $.05 and increase net realized and |
| | | unrealized gain (loss) on investments per share by $.05, and decrease the ratio of net investment income to average |
| | | net assets from 10.80% to 10.19%. Per share data and ratios/supplemental data for periods prior to January 1, |
| | | 2001 have not been restated to reflect this change in presentation. |
| c | | Based on average shares outstanding at each month end. |
| See notes to financial statements. |
The Fund 31
NOTES TO FINANCIAL STATEMENTS
NOTE 1—Significant Accounting Policies:
Dreyfus Premier Limited Term High Yield Fund (the “fund”) is a separate diversified series of The Dreyfus/Laurel Funds Trust (the “Trust”) which is registered under the Investment Company Act of 1940, as amended (the “Act”), as an open-end management investment company and operates as a series company currently offering three series, including the fund. The fund’s investment objective is to seek to maximize total return, consisting of capital appreciation and current income.The Dreyfus Corporation (the “Manager” or “Dreyfus”) serves as the fund’s investment manager. The Manager is a wholly-owned subsidiary of Mellon Financial Corporation (“Mellon Financial”).
On April 30,2004,pursuant to an Agreement and Plan of Reorganization previously approved by the fund’s shareholders, all of the assets, subject to the liabilities, of the High Yield Fund of the Bear Stearns Funds, were transferred to the fund in exchange for shares of Beneficial Interest of the fund of equal value. Shareholders of Class A, Class B, Class C and Class Y shares of the High Yield Fund received Class A, Class B, Class C and Class R shares, respectively, of the fund, in each case, in an amount equal to the aggregate net asset value of their respective investment in the High Yield Fund at the time of the exchange. The fund’s net asset value on April 30, 2004 was $7.38 per share for Class A shares, $7.39 per share for Class B shares, $7.39 per share for Class C shares and $7.39 per share for Class R shares and a total of 7,450,835 Class A shares, 5,891,364 Class B shares, 6,497,931 Class C shares and 3,773,591 Class R shares, representing net assets of $54,982,849 Class A shares, $43,560,106 Class B shares, $48,040,484 Class C shares and $27,857,157 Class R shares (including $7,843,349 net unrealized appreciation on investments), were issued to the shareholders of the High Yield Fund in the exchange.The exchange was a tax free event to shareholders.
Dreyfus Service Corporation (the “Distributor”), a wholly-owned subsidiary of the Manager, is the Distributor of the fund’s shares.The fund is authorized to issue an unlimited number of shares of Beneficial Interest in each of the following classes of shares: Class A, Class B, Class C and
Class R. Class A, Class B and Class C shares are sold primarily to retail investors through financial intermediaries and bear a distribution fee and/or service fee. Class A shares are sold with a front-end sales charge, while Class B and Class C shares are subject to a contingent deferred sales charge (“CDSC”). Class B shares automatically convert to Class A shares after six years. Class R shares are sold primarily to bank trust departments and other financial service providers (including Mellon Financial and its affiliates) acting on behalf of customers having a qualified trust or investment account or relationship at such institution, and bear no distribution or service fees. Class R shares are offered without a front-end sales charge or CDSC. Each class of shares has identical rights and privileges, except with respect to distribution and service fees and voting rights on matters affecting a single class. Income, expenses (other than expenses attributable to a specific class), and realized and unrealized gains or losses on investments are allocated to each class of shares based on its relative net assets.
The fund’s financial statements are prepared in accordance with U.S. generally accepted accounting principles, which may require the use of management estimates and assumptions. Actual results could differ from those estimates.
(a) Portfolio valuation: Investments in securities (excluding short-term investments (other than U.S. Treasury Bills), financial futures, options, swaps and forward currency exchange contracts) are valued each business day by an independent pricing service (the “Service”) approved by the Board of Trustees. Investments for which quoted bid prices are readily available and are representative of the bid side of the market in the judgment of the Service are valued at the mean between the quoted bid prices (as obtained by the Service from dealers in such securities) and asked prices (as calculated by the Service based upon its evaluation of the market for such securities). Other investments (which constitute a majority of the portfolio securities) are valued as determined by the Service, based on methods which include consideration of: yields or prices of securities of comparable quality, coupon, maturity and type; indications as to values from dealers; and general market conditions.
The Fund 33
NOTES TO FINANCIAL STATEMENTS (continued)
|
Securities for which there are no such valuations are valued at fair value as determined in good faith under the direction of the fund’s Board of Trustees. Restricted securities, as well as securities or other assets for which recent market quotations are not readily available, are not valued by a pricing service approved by the Board of Trustees, or are determined by the fund not to reflect accurately fair value (such as when an event occurs after the close of the exchange on which the security is principally traded and that is determined by the fund to have changed the value of the security), are valued at fair value as determined in good faith under the direction of the Board of Trustees.The factors that may be considered when fair valuing a security include fundamental analytical data, the nature and duration of restrictions on disposition, an evaluation of the forces that influence the market in which the securities are purchased and sold and public trading in similar securities of the issuer or comparable issuers. Short-term investments, excluding U.S.Treasury Bills, are carried at amortized cost, which approximates value. Financial futures and options, which are traded on an exchange, are valued at the last sales price on the securities exchange on which such securities are primarily traded or at the last sales price on the national securities market on each business day. Options traded over-the-counter are priced at the mean between the bid and asked prices. Investments denominated in foreign currencies are translated to U.S. dollars at the prevailing rates of exchange. Swap transactions are valued daily based upon future cash flows and other factors, such as interest rates and underlying securities.
(b) Foreign currency transactions: The fund does not isolate that portion of the results of operations resulting from changes in foreign exchange rates on investments from the fluctuations arising from changes in the market prices of securities held. Such fluctuations are included with the net realized and unrealized gain or loss on investments.
Net realized foreign exchange gains or losses arise from sales and maturities of short-term securities, sales of foreign currencies, currency gains or losses realized on securities transactions and the difference between the amount of dividends, interest and foreign withholding taxes
recorded on the fund’s books and the U.S. dollar equivalent of the amounts actually received or paid. Net unrealized foreign exchange gains and losses arise from changes in the value of assets and liabilities other than investments in securities, resulting from changes in exchange rates. Such gains and losses are included with net realized and unrealized gain or loss on investments.
(c) Securities transactions and investment income: Securities transactions are recorded on a trade date basis. Realized gain and loss from securities transactions are recorded on the identified cost basis. Dividend income is recognized on the ex-dividend date and interest income, including, where applicable, accretion of discount and amortization of premium on investments, is recognized on the accrual basis.
Pursuant to a securities lending agreement with Mellon Bank, N.A., an affiliate of the Manager, the fund may lend securities to qualified institu-tions.At origination, all loans are secured by collateral of at least 102% of the value of U.S. securities loaned and 105% of the value of foreign securities loaned. Collateral equivalent to at least 100% of the market value of securities on loan will be maintained at all times. Cash collateral is invested in certain money market mutual funds managed by the Manager. The fund will be entitled to receive all income on securities loaned, in addition to income earned as a result of the lending transac-tion.Although each security loaned is fully collateralized, the fund would bear the risk of delay in recovery of, or loss of rights in, the securities loaned should a borrower fail to return the securities in a timely manner.
| (d) Affiliated | | issuers: Issuers in which the fund held 5% or more of |
| the outstanding voting securities are defined as “affiliated” in the Act. |
| The following summarizes affiliated issuers during the period ended |
| December 31, 2004: | | | | | | | | | | |
| | | | | Shares | | | | | | | | |
| |
| |
| |
| |
| | | | |
| | | Beginning | | | | | | End of | | Dividend | | Market |
| Name of issuer | | of Period | | Purchases | | Sales | | Period | | Income ($) | | Value ($) |
| |
| |
| |
| |
| |
| |
|
| HCI Direct, CL. A | | 910,714 | | — | | 910,714 | | — | | — | | — |
The Fund 35
NOTES TO FINANCIAL STATEMENTS (continued)
|
(e) Concentration of Risk: The fund invests primarily in debt securities. Failure of an issuer of the debt securities to make timely interest or principal payments, or a decline or the perception of a decline in the credit quality of a debt security, can cause the debt security’s price to fall, potentially lowering the fund’s share price. High yield (“junk”) bonds involve greater credit risk, including the risk of default, than investment grade bonds, and are considered predominantly speculative with respect to the issuer’s continuing ability to make principal and interest payments. In addition, the value of debt securities may decline due to general market conditions that are not specifically related to a particular company, such as real or perceived adverse economic conditions, changes in outlook for corporate earnings, changes in interest or currency rates or adverse investor sentiment. They may also decline because of factors that affect a particular industry.
(f) Dividends to shareholders: It is the policy of the fund to declare dividends daily from investment income-net. Such dividends are paid monthly. Dividends from net realized capital gain, if any, are normally declared and paid annually, but the fund may make distributions on a more frequent basis to comply with the distribution requirements of the Internal Revenue Code of 1986, as amended (the “Code”).To the extent that net realized capital gain can be offset by capital loss carryovers, it is the policy of the fund not to distribute such gain. Income and capital gain distributions are determined in accordance with income tax regulations, which may differ from U.S. generally accepted accounting principles.
(g) Federal income taxes: It is the policy of the fund to continue to qualify as a regulated investment company, if such qualification is in the best interests of its shareholders, by complying with the applicable provisions of the Code, and to make distributions of taxable income sufficient to relieve it from substantially all federal income and excise taxes.
At December 31, 2004, the components of accumulated earnings on a tax basis were as follows: undistributed ordinary income $366,353, accumulated capital losses $563,089,337 and unrealized appreciation $22,880,153.
The accumulated capital loss carryover is available to be applied against future net securities profits, if any, realized subsequent to December 31, 2004. If not applied, $3,498,719 of the carryover expires in fiscal 2005, $9,855,717 expires in fiscal 2006, $57,739,194 expires in fiscal 2007, $109,480,427 expires in fiscal 2008, $171,244,927 expires in fiscal 2009, $138,776,715 expires in fiscal 2010 and $72,493,638 expires in fiscal 2011. Based on certain provisions in the Internal Revenue Code, various limitations regarding the future utilization of these carryfor-wards, brought forward as a result of the fund’s merger with the following funds may apply: Dreyfus Short Term High Yield Fund, Dreyfus Premier High Yield Securities Fund and Bear Stearns High Yield Total Return Portfolio. It is probable that the Fund will not be able to utilize most of its capital loss carryovers prior to its expiration date.
The tax character of distributions paid to shareholders during the fiscal periods ended December 31, 2004 and December 31, 2003 were as follows: ordinary income $39,229,554 and $43,431,369, respectively.
During the period ended December 31, 2004, as a result of permanent book to tax differences primarily due to the tax treatment for amortization of premiums, paydown gains and losses, swap transactions and capital loss carryover from merged funds, the fund increased accumulated undistributed investment income-net by $1,333,444, decreased accumulated net realized gain (loss) on investments by $133,775,321 and increased paid-in capital by $132,441,877. Net assets were not affected by this reclassification.
NOTE 2—Bank Lines of Credit:
|
The fund may borrow up to $20 million for leveraging purposes under a short-term unsecured line of credit and participates with other Dreyfus-managed funds in a $100 million unsecured line of credit primarily to be utilized for temporary or emergency purposes, including the financing of redemptions. Interest is charged to the fund based on prevailing market rates in effect at the time of borrowings. During the period ended December 31, 2004, the fund did not borrow under the line of credit.
The Fund 37
During the period ended December 31, 2004, the Distributor retained $36,091 from commissions earned on sales of the fund’s Class A shares and $686,440 and $25,746 from contingent deferred sales charges on redemptions of the fund’s Class B and Class C shares, respectively.
(b) Under separate Distribution Plans (the “Plans”) adopted pursuant to Rule 12b-1 under the Act, Class A shares pay annually up to .25% of the value of the average daily net assets to compensate the Distributor for shareholder servicing activities and expenses primarily intended to result in the sale of Class A shares. Class B and Class C shares pay the Distributor for distributing their shares at an aggregate annual rate of .50% and .75% of the value of the average daily net assets of Class B and Class C shares, respectively. Class B and Class C shares are also subject to a service plan adopted pursuant to Rule 12b-1 (the “Service Plan”), under which Class B and Class C shares pay the Distributor for providing certain services to the holders of their shares a fee at the annual rate of .25% of the value of the average daily net assets of Class B and Class C shares. During the period ended December 31, 2004, Class A, Class B and Class C shares were charged $617,501, $1,008,483 and $800,510, respectively, pursuant to their respective Plans. During the period ended December 31, 2004, Class B and Class C shares were charged $504,241 and $266,837, respectively, pursuant to the Service Plan.
Under its terms, the Plans and Service Plan shall remain in effect from year to year, provided such continuance is approved annually by a vote of majority of those Trustees who are not “interested persons” of the Trust and who have no direct or indirect financial interest in the operation of or in any agreement related to the Plans or Service Plan.
The components of Due to The Dreyfus Corporation and affiliates in the Statement of Assets and Liabilities consist of: management fees $352,568, Rule 12b-1 distribution plan fees $205,949 and service plan fees $60,212.
The Fund 39
NOTES TO FINANCIAL STATEMENTS (continued)
|
(c) Pursuant to an exemptive order from the Securities and Exchange Commission, the fund invests its available cash balances in affiliated money market mutual funds. Management fees of the underlying money market mutual funds have been waived by the Manager.
NOTE 4—Securities Transactions:
|
The aggregate amount of purchases and sales (including paydowns) of investment securities, excluding short-term securities, financial futures, forward currency exchange contracts, options transactions and swap transactions during the period ended December 31, 2004, amounted to $576,641,274 and $550,673,859, respectively.
The fund may purchase and write (sell) call/put options in order to gain exposure to or protect against changes in the market.
As a writer of call options, the fund receives a premium at the outset and then bears the market risk of unfavorable changes in the price of the financial instruments underlying the options. Generally, the fund would incur a gain, to the extent of the premium, if the price of the underlying financial instrument decreases between the date the option is written and the date on which the option is terminated. Generally, the fund would realize a loss, if the price of the financial instrument increases between those dates. At December 31, 2004, there were no call options written outstanding.
As writer of put options, the fund receives a premium at the outset and then bears the market risk of unfavorable changes in the price of the financial instruments underlying the options. Generally, the fund would incur a gain, to the extent of the premium, if the price of the underlying financial instrument increases between the date the option is written and the date on which the option is terminated. Generally, the fund would realize a loss, if the price of the financial instrument decreases between those dates. At December 31, 2004, there were no put options written outstanding.
The fund may invest in financial futures contracts in order to gain exposure to or protect against changes in the market. The fund is exposed to market risk as a result of changes in the value of the underlying financial instruments. Investments in financial futures require the fund to “mark to market” on a daily basis, which reflects the change in the market value of the contracts at the close of each day’s trading. Accordingly, variation margin payments are received or made to reflect daily unrealized gains or losses.When the contracts are closed, the fund recognizes a realized gain or loss.These investments require initial margin deposits with a broker.The amount of these deposits is determined by the exchange or Board of Trade on which the contract is traded and is subject to change. At December 31, 2004, there were no financial futures contracts outstanding.
The fund enters into forward currency exchange contracts in order to hedge its exposure to changes in foreign currency exchange rates on its foreign portfolio holdings and to settle foreign currency transactions. When executing forward currency exchange contracts, the fund is obligated to buy or sell a foreign currency at a specified rate on a certain date in the future.With respect to sales of forward currency exchange contracts, the fund would incur a loss if the value of the contract increases between the date the forward contract is opened and the date the forward contract is closed.The fund realizes a gain if the value of the contract decreases between those dates.With respect to purchases of forward currency exchange contracts, the fund would incur a loss if the value of the contract decreases between the date the forward contract is opened and the date the forward contract is closed.The fund realizes a gain if the value of the contract increases between those dates. The fund is also exposed to credit risk associated with counterparty nonperformance on these forward currency exchange contracts which is typically limited to the unrealized gain on each open contract.At December 31, 2004, there were no forward currency exchange contracts outstanding.
The Fund 41
NOTES TO FINANCIAL STATEMENTS (continued)
|
The fund may enter into swap agreements to exchange the interest rate on, or return generated by, one nominal instrument for the return generated by another nominal instrument.
As of January 1, 2004, the fund has adopted the method of accounting for interim payments on swap contracts in accordance with Financial Accounting Standards Board Statement No. 133.The fund accrues for the interim payments on swap contracts on a daily basis, with the net amount recorded within unrealized appreciation (depreciation) of swap contracts in the Statement of Assets and Liabilities. Once the interim payments are settled in cash, the net amount is recorded as realized gain (loss) on swaps, in addition to realized gain (loss) recorded upon the termination of swaps contracts in the Statement of Operations. Prior to January 1, 2004, these interim payments were reflected within interest income in the Statement of Operations. Fluctuations in the value of swap contracts are recorded as a component of net change in unrealized appreciation (depreciation) on investments.
Credit default swaps involve commitments to pay a fixed interest rate in exchange for payment if a credit event affecting a third party (the referenced company) occurs. Credit events may include a failure to pay interest or principal, bankruptcy, or restructuring. At December 31, 2004, there were no credit default swaps outstanding.
Total return swaps involve commitments to pay interest in exchange for a market-linked return based on a notional amount. To the extent the total return of the security or index underlying the transaction exceeds or falls short of the offsetting interest rate obligation, the fund will receive a payment from or make a payment to the counterparty, respectively.At December 31, 2004, there were no total return swaps outstanding.
Risks may arise upon entering into these agreements from the potential inability of the counterparties to meet the terms of the agreement and are generally limited to the amount of net payments to be received, if any, at the date of default.
At December 31, 2004, the cost of investments for federal income tax purposes was $670,541,592; accordingly, accumulated net unrealized appreciation on investments was $22,880,101, consisting of $41,947,187 gross unrealized appreciation and $19,067,086 gross unrealized depreciation.
In early 2004, two purported class and derivative actions were filed against Mellon Financial, Mellon Bank, N.A., Dreyfus, Founders Asset Management LLC, and certain directors of the Dreyfus Funds and the Dreyfus Founders Funds (together, the “Funds”). In September 2004, plaintiffs served a Consolidated Amended Complaint (the “Amended Complaint”) on behalf of a purported class of all persons who acquired interests in any of the Funds between January 30, 1999 and November 17, 2003, and derivatively on behalf of the Funds. The Amended Complaint in the newly styled In re Dreyfus Mutual Funds Fee Litigation also named the Distributor, Premier Mutual Fund Services, Inc. and two additional Fund directors as defendants and alleges violations of the Investment Company Act of 1940, the Investment Advisers Act of 1940, the Pennsylvania Unfair Trade Practices and Consumer Protection Law and common-law claims. Plaintiffs seek to recover allegedly improper and excessive Rule 12b-1 and advisory fees allegedly charged to the Funds for marketing and distribution services. More specifically, plaintiffs claim, among other things, that 12b-1 fees and directed brokerage were improperly used to pay brokers to recommend the Funds over other funds, and that such payments were not disclosed to investors. In addition, plaintiffs assert that economies of scale and soft-dollar benefits were not passed on to the Funds. Plaintiffs further allege that 12b-1 fees were improperly charged to certain of the Funds that were closed to new investors.The Amended Complaint seeks compensatory and punitive damages, rescission of the advisory contracts, and an accounting and restitution
The Fund 43
NOTES TO FINANCIAL STATEMENTS (continued)
|
of any unlawful fees, as well as an award of attorneys’ fees and litigation expenses. As noted, some of the claims in this litigation are asserted derivatively on behalf of the Funds that have been named as nominal defendants.With respect to such derivative claims, no relief is sought against the Funds. Dreyfus believes the allegations to be totally without merit and intends to defend the action vigorously. Defendants filed motions to dismiss the Amended Complaint on November 12, 2004, and those motions are pending.
Additional lawsuits arising out of these circumstances and presenting similar allegations and requests for relief may be filed against the defendants in the future. Neither Dreyfus nor the Funds believe that any of the pending actions will have a material adverse effect on the Funds or Dreyfus’ ability to perform its contract with the Funds.
| REPORT OF INDEPENDENT REGISTERED |
| PUBLIC ACCOUNTING FIRM |
| The Board of Trustees and Shareholders |
| The Dreyfus/Laurel Funds Trust: |
We have audited the accompanying statement of assets and liabilities of Dreyfus Premier Limited Term High Yield Fund (the “Fund”) of The Dreyfus/Laurel Funds Trust, including the statement of investments, as of December 31, 2004, and the related statement of operations for the year then ended, the statements of changes in net assets for each of the two years in the period then ended, and the financial highlights for each of the five years in the period then ended. These financial statements and financial highlights are the responsibility of the Fund’s management. Our responsibility is to express an opinion on these financial statements and financial highlights based on our audits.
We conducted our audits in accordance with the standards of the Public Company Accounting Oversight Board (United States).Those standards require that we plan and perform the audit to obtain reasonable assurance about whether the financial statements and financial highlights are free of material misstatement.An audit also includes examining, on a test basis, evidence supporting the amounts and disclosures in the financial statements. Our procedures included confirmation of securities owned as of December 31, 2004, by correspondence with the custodian and brokers. An audit also includes assessing the accounting principles used and significant estimates made by management, as well as evaluating the overall financial statement presentation.We believe that our audits provide a reasonable basis for our opinion.
In our opinion, the financial statements and financial highlights referred to above present fairly, in all material respects, the financial position of Dreyfus Premier Limited Term High Yield Fund of The Dreyfus/Laurel Funds Trust as of December 31, 2004 and the results of its operations for the year then ended,the changes in its net assets for each of the two years in the period then ended, and the financial highlights for each of the five years in the period then ended, in conformity with U.S. generally accepted accounting principles.

| New York, New York |
| February 18, 2005 |
The Fund 45
IMPORTANT TAX INFORMATION (Unaudited)
For federal tax purposes, the fund hereby designates 1.50% of the ordinary dividends paid during the fiscal year ended December 31, 2004 as qualifying for the corporate dividends received deduction and also for the fiscal year ended December 31, 2004, certain dividends paid by the fund may be subject to a maximum tax rate of 15%, as provided for by the Jobs and Growth Tax Relief Reconciliation Act of 2003. Of the distributions paid during the fiscal year, $561,126 represents the maximum amount that may be considered qualified dividend income. Shareholders will receive notification in January 2005 of the percentage applicable to the preparation of their 2004 income tax returns.
BOARD MEMBERS INFORMATION (Unaudited)
| Joseph S. DiMartino (61) |
| Chairman of the Board (1999) |
| Principal Occupation During Past 5 Years: |
| • Corporate Director and Trustee |
| | Other Board Memberships and Affiliations:
|
- The Muscular Dystrophy Association, Director
- Levcor International, Inc., an apparel fabric processor, Director
- Century Business Services, Inc., a provider of outsourcing functions for small and medium size companies, Director
- The Newark Group, a provider of a national market of paper recovery facilities, paperboard mills and paperboard converting plants, Director
- Azimuth Trust, an institutional asset management firm, Member of Board of Managers and Advisory Board
| No. of Portfolios for which Board Member Serves: 186 |
| ——————— |
| James Fitzgibbons (70) |
| Board Member (1994) |
Principal Occupation During Past 5 Years:
• Chairman of the Board, Davidson Cotton Company (1998-2002)
Other Board Memberships and Affiliations:
• Bill Barrett Company, an oil and gas exploration company, Director
| No. of Portfolios for which Board Member Serves: 23 |
| ——————— |
| J. Tomlinson Fort (76) |
| Board Member (1987) |
| Principal Occupation During Past 5 Years: |
| • Retired; Of Counsel, Reed Smith LLP (1998-2004) |
| | Other Board Memberships and Affiliations:
|
- Allegheny College, Emeritus Trustee
- Pittsburgh Ballet Theatre,Trustee
- American College of Trial Lawyers, Fellow
| No. of Portfolios for which Board Member Serves: 23 |
| ——————— |
| Kenneth A. Himmel (58) |
| Board Member (1994) |
| | Principal Occupation During Past 5 Years:
|
- President and CEO,Related Urban Development,a real estate development company (1996-present)
- President and CEO, Himmel & Company, a real estate development company (1980-present)
- CEO, American Food Management, a restaurant company (1983-present)
| | No. of Portfolios for which Board Member Serves: 23
|
The Fund 47
BOARD MEMBERS INFORMATION (Unaudited) (continued)
| Stephen J. Lockwood (57) |
| Board Member (1994) |
| | Principal Occupation During Past 5 Years:
|
- Chairman of the Board, Stephen J. Lockwood and Company LLC, an investment company (2000-present)
- Chairman of the Board and CEO, LDG Reinsurance Corporation (1977-2000)
| | Other Board Memberships and Affiliations:
|
- BDML Holdings, an insurance company, Chairman of the Board
- Affiliated Managers Group, an investment management company, Director
| No. of Portfolios for which Board Member Serves: 23 |
| ——————— |
| Roslyn Watson (55) |
| Board Member (1994) |
Principal Occupation During Past 5 Years:
• Principal,Watson Ventures, Inc., a real estate investment company (1993-present)
Other Board Memberships and Affiliations:
- American Express Centurion Bank, Director
- The Hyams Foundation Inc., a Massachusetts Charitable Foundation,Trustee
- National Osteoporosis Foundation,Trustee
| No. of Portfolios for which Board Member Serves: 23 |
| ——————— |
| Benaree Pratt Wiley (58) |
| Board Member (1998) |
| | Principal Occupation During Past 5 Years:
|
- President and CEO,The Partnership, an organization dedicated to increasing the representation of African Americans in positions of leadership, influence and decision-making in Boston, MA (1991-present)
| | Other Board Memberships and Affiliations:
|
- Boston College, Associate Trustee
- The Greater Boston Chamber of Commerce, Director
- Mass. Development, Director
- Commonwealth Institute, Director
- Efficacy Institute, Director
- PepsiCo African-American, Advisory Board
- The Boston Foundation, Director
- Harvard Business School Alumni Board, Director
| No. of Portfolios for which Board Member Serves: 23 |
| ——————— |
Once elected all Board Members serve for an indefinite term.The address of the Board Members and Officers is in c/o The Dreyfus Corporation, 200 Park Avenue, New York, New York 10166.Additional information about the Board Members is available in the fund’s Statement of Additional Information which can be obtained from Dreyfus free of charge by calling this toll free number: 1-800-554-4611.
| Ruth Marie Adams, Emeritus Board Member |
| Francis P. Brennan, Emeritus Board Member |
48
OFFICERS OF THE FUND (Unaudited)
STEPHEN E. CANTER, President since March 2000.
Chairman of the Board, Chief Executive Officer and Chief Operating Officer of the Manager, and an officer of 92 investment companies (comprised of 185 portfolios) managed by the Manager. Mr. Canter also is a Board member and, where applicable, an Executive Committee Member of the other investment management subsidiaries of Mellon Financial Corporation, each of which is an affiliate of the Manager. He is 59 years old and has been an employee of the Manager since May 1995.
STEPHEN R. BYERS, Executive Vice President since November 2002.
Chief Investment Officer,Vice Chairman and a director of the Manager, and an officer of 92 investment companies (comprised of 185 portfolios) managed by the Manager. Mr. Byers also is an officer, director or an Executive Committee Member of certain other investment management subsidiaries of Mellon Financial Corporation, each of which is an affiliate of the Manager. He is 51 years old and has been an employee of the Manager since January 2000. Prior to joining the Manager, he served as an Executive Vice President-Capital Markets, Chief Financial Officer and Treasurer at Gruntal & Co., L.L.C.
MARK N. JACOBS, Vice President since March 2000.
Executive Vice President, Secretary and General Counsel of the Manager, and an officer of 93 investment companies (comprised of 201 portfolios) managed by the Manager. He is 58 years old and has been an employee of the Manager since June 1977.
STEVEN F. NEWMAN, Secretary since March 2000.
Associate General Counsel and Assistant Secretary of the Manager, and an officer of 93 investment companies (comprised of 201 portfolios) managed by the Manager. He is 55 years old and has been an employee of the Manager since July 1980.
JAMES BITETTO, Assistant Secretary since October 2004.
Assistant General Counsel and Assistant Secretary of the Manager, and an officer of 4 investment companies (comprised of 23 portfolios) managed by the Manager. He is 38 years old and has been an employee of the Manager since December 1996.
JEFF PRUSNOFSKY, Assistant Secretary since March 2000.
Associate General Counsel of the Manager, and an officer of 26 investment companies (comprised of 88 portfolios) managed by the Manager. He is 39 years old and has been an employee of the Manager since October 1990.
MICHAEL A. ROSENBERG, Assistant Secretary since March 2000.
Associate General Counsel of the Manager, and an officer of 90 investment companies (comprised of 194 portfolios) managed by the Manager. He is 44 years old and has been an employee of the Manager since October 1991.
JAMES WINDELS, Treasurer since November 2001.
Director – Mutual Fund Accounting of the Manager, and an officer of 93 investment companies (comprised of 201 portfolios) managed by the Manager. He is 46 years old and has been an employee of the Manager since April 1985.
The Fund 49
OFFICERS OF THE FUND (Unaudited) (continued)
RICHARD CASSARO, Assistant Treasurer since August 2003.
Senior Accounting Manager – Equity Funds of the Manager, and an officer of 26 investment companies (comprised of 102 portfolios) managed by the Manager. He is 44 years old and has been an employee of the Manager since September 1982.
ERIK D. NAVILOFF, Assistant Treasurer since December 2002.
Senior Accounting Manager – Taxable Fixed Income Funds of the Manager, and an officer of 19 investment companies (comprised of 75 portfolios) managed by the Manager. He is 36 years old and has been an employee of the Manager since November 1992.
ROBERT SVAGNA, Assistant Treasurer since December 2002.
Senior Accounting Manager – Equity Funds of the Manager, and an officer of 27 investment companies (comprised of 107 portfolios) managed by the Manager. He is 37 years old and has been an employee of the Manager since November 1990.
KENNETH J. SANDGREN, Assistant Treasurer since November 2001.
Mutual Funds Tax Director of the Manager, and an officer of 93 investment companies (comprised of 201 portfolios) managed by the Manager. He is 50 years old and has been an employee of the Manager since June 1993.
JOSEPH W. CONNOLLY, Chief Compliance Officer since October 2004.
Chief Compliance Officer of the Manager and The Dreyfus Family of Funds (93 investment companies, comprising 201 portfolios). From November 2001 through March 2004, Mr. Connolly was first Vice-President, Mutual Fund Servicing for Mellon Global Securities Services. In that capacity, Mr. Connolly was responsible for managing Mellon’s Custody, Fund Accounting and Fund Administration services to third-party mutual fund clients. He is 47 years old and has served in various capacities with the Manager since 1980, including manager of the firm’s Fund Accounting Department from 1997 through October 2001.
WILLIAM GERMENIS, Anti-Money Laundering Compliance Officer since September 2002.
Vice President and Anti-Money Laundering Compliance Officer of the Distributor, and the Anti-Money Laundering Compliance Officer of 88 investment companies (comprised of 196 portfolios) managed by the Manager. He is 34 years old and has been an employee of the Distributor since October 1998.
NOTES
| Dreyfus Premier |
| Limited Term |
| High Yield Fund |
| 200 Park Avenue |
| New York, NY 10166 |
| |
| Manager |
| The Dreyfus Corporation |
| 200 Park Avenue |
| New York, NY 10166 |
| |
| Custodian |
| Mellon Bank, N.A. |
| One Mellon Bank Center |
| Pittsburgh, PA 15258 |
| Transfer Agent & |
| Dividend Disbursing Agent |
| Dreyfus Transfer, Inc. |
| 200 Park Avenue |
| New York, NY 10166 |
| |
| Distributor |
| Dreyfus Service Corporation |
| 200 Park Avenue |
| New York, NY 10166 |
Telephone Call your financial representative or 1-800-554-4611
| Mail | | The Dreyfus Premier Family of Funds |
| | | 144 Glenn Curtiss Boulevard, Uniondale, NY 11556-0144 |
The fund files its complete schedule of portfolio holdings with the Securities and Exchange Commission (“SEC”) for the first and third quarters of each fiscal year on Form N-Q. The fund’s Forms N-Q are available on the SEC’s website at http://www.sec.gov and may be reviewed and copied at the SEC’s Public Reference Room in Washington, DC. Information on the operation of the Public Reference Room may be obtained by calling 1-800-SEC-0330.
A description of the policies and procedures that the fund uses to determine how to vote proxies relating to portfolio securities, and information regarding how the fund voted these proxies for the 12-month period ended June 30, 2004, is available through the fund’s website at http://www.dreyfus.com and on the SEC’s website at http://www.sec.gov. The description of the policies and procedures is also available without charge, upon request, by calling 1-800-645-6561.
© 2005 Dreyfus Service Corporation

| Dreyfus Premier | | |
| Managed Income | | Fund |
| ANNUAL REPORT December 31, 2004 |

Save time. Save paper. View your next shareholder report online as soon as it’s available. Log into www.dreyfus.com and sign up for Dreyfus eCommunications. It’s simple and only takes a few minutes.
The views expressed in this report reflect those of the portfolio manager only through the end of the period covered and do not necessarily represent the views of Dreyfus or any other person in the Dreyfus organization. Any such views are subject to change at any time based upon market or other conditions and Dreyfus disclaims any responsibility to update such views.These views may not be relied on as investment advice and, because investment decisions for a Dreyfus fund are based on numerous factors, may not be relied on as an indication of trading intent on behalf of any Dreyfus fund.
Not FDIC-Insured • Not Bank-Guaranteed • May Lose Value
| Contents |
| |
| | | THE FUND |
| |
|
| 2 | | Letter from the Chairman |
| 3 | | Discussion of Fund Performance |
| 6 | | Fund Performance |
| 8 | | Understanding Your Fund’s Expenses |
| 8 | | Comparing Your Fund’s Expenses |
| With Those of Other Funds |
| 9 | | Statement of Investments |
| 23 | | Statement of Options Written |
| 24 | | Statement of Assets and Liabilities |
| 25 | | Statement of Operations |
| 26 | | Statement of Changes in Net Assets |
| 28 | | Financial Highlights |
| 32 | | Notes to Financial Statements |
| 47 | | Report of Independent Registered |
| | | Public Accounting Firm |
| 48 | | Important Tax Information |
| 49 | | Board Members Information |
| 51 | | Officers of the Fund |
| FOR MORE INFORMATION |
|
| | | Back Cover |
| Dreyfus Premier |
| Managed Income Fund |

LETTER FROM THE CHAIRMAN
We are pleased to present this annual report for Dreyfus Premier Managed Income Fund, covering the 12-month period from January 1, 2004, through December 31, 2004. Inside, you’ll find valuable information about how the fund was managed during the reporting period, including a discussion with the fund’s portfolio manager, Kent Wosepka.
Despite a moderately growing economy and rising interest rates over the second half of the year, the yield of the benchmark 10-year U.S. Treasury bond ended 2004 virtually unchanged from where it began. At the same time, corporate bonds generally continued to gain value as business conditions improved, and mortgage-backed securities benefited from waning prepayment activity among homeowners.
Can bonds continue to deliver positive results in 2005? No one knows for certain. However, with short-term interest rates rising and the economy gaining momentum, we believe that some areas of the fixed-income market are likely to be stronger than others. What’s required for success, in our view, is strong fundamental research and keen professional judgment.
As always, we urge our shareholders to view the financial markets from a long-term perspective, measured in years rather than weeks or months. One of the best ways to ensure a long-term perspective is to establish an investment plan with the help of your financial advisor, and review it periodically to track your progress toward your financial goals.
Thank you for your continued confidence and support.

DISCUSSION OF FUND PERFORMANCE
Kent Wosepka, Portfolio Manager
|
How did Dreyfus Premier Managed Income Fund perform relative to its benchmark?
For the 12-month period ended December 31, 2004, Dreyfus Premier Managed Income Fund produced total returns of 5.15% for Class A shares, 4.27% for Class B shares, 4.28% for Class C shares and 5.43% for Class R shares.1 In comparison, the fund’s benchmark, the Lehman Brothers U.S. Aggregate Index, produced a total return of 4.34% for the same period.2
Despite rising short-term interest rates, higher oil prices and a strengthening economy — factors that have derailed the bond market in the past — bonds produced positive total returns during 2004 as foreign investors fueled demand for U.S. Treasury securities and business conditions improved for corporate bond issuers.The fund generally produced higher returns than its benchmark, primarily due to its emphasis on international, emerging markets and high-yield securities.
What is the fund’s investment approach?
The fund seeks high current income consistent with what is believed to be prudent risk of capital.The fund invests at least 65% of its total assets in various types of U.S. government and corporate debt obligations rated investment grade (or their unrated equivalent as determined by Dreyfus).The fund also normally invests at least 65% of its total assets in debt obligations having effective maturities of 10 years or less. We do not attempt to match the sector percentages of any index, nor do we attempt to predict the direction of interest rates by substantially altering the fund’s sensitivity to changes in rates. Instead, the heart of our investment process is selecting individual securities that possess a combination of superior fundamentals and attractive relative valuations.
The Fund 3
DISCUSSION OF FUND PERFORMANCE (continued)
|
What other factors influenced the fund’s performance?
The fund’s results were influenced in 2004 by the bond market’s surprising strength in the face of historically negative economic and market forces. The Federal Reserve Board (the “Fed”) raised short-term interest rates five times between June and December, from 1% to 2.25% . Oil prices surged past $50 per barrel in October, while the “Core” Consumer Price Index, a barometer of inflation, doubled.After anemic job growth over the previous three years, the U.S. economy created two million jobs during 2004, and unemployment dropped.
Historically, these factors have produced higher bond yields to compensate investors for greater risks. However, yields and prices of the benchmark 10-year U.S.Treasury bond ended the year little changed from where it began as greater demand from foreign buyers outweighed the negative factors. Governments in Asia, most notably Japan and China, ranked among the most active purchasers of U.S.Treasury securities during the year.
In this environment, the fund focused new purchases primarily on German bonds, which helped it outperform the benchmark. Germany’s economy has weakened amid high levels of unemployment, and lower yields on Germany’s long-term bonds have supported higher prices. Bonds from emerging markets, especially Russia and other oil producing countries, also helped drive the fund’s strong relative performance.Although Russia defaulted on its government debt as recently as 1998, the country’s economy more recently has benefited greatly from its position as the world’s second largest exporter of oil.
High-yield bonds issued by U.S. corporations performed well during the year as business conditions improved.We invested in a number of corporate bonds, including some in the home construction industry, that received credit-rating upgrades from the major ratings agencies. Since many institutional investors are prohibited from purchasing bonds rated below investment grade, such upgrades attract the attention of more investors, helping to boost prices.
On the other hand, the fund’s performance compared to the benchmark was constrained by its relatively light exposure to mortgage-backed securities. Mortgage-backed securities tend to do well when yields stay flat or increase moderately, primarily because they pay significantly more income than U.S. Treasury bonds. During 2004, mortgage-backed securities also benefited from lower prepayment activity as fewer homeowners refinanced their mortgages.
What is the fund’s current strategy?
As of year-end, we have positioned the fund for a greater rise in short-term interest rates than in longer-term bond yields. This strategy includes an emphasis on securities at the shorter and longer ends of the maturity spectrum.As the Fed continues to raise short-term rates, the fund’s shorter-term holdings are designed to make funds available for reinvestment at higher prevailing rates. At the same time, in our judgment, the fund’s holdings of longer-term bonds will continue to earn competitive levels of current income.
We also have positioned the fund to emphasize European bonds, where we believe relatively weak economic growth should support bond prices. However, high-yield bonds in the United States and emerging market bonds appear to us to be more fully valued, and we have reduced the fund’s exposure to these sectors, focusing primarily on securities that we believe are likely to receive credit-rating upgrades.
| 1 | | Total return includes reinvestment of dividends and any capital gains paid, and does not take into |
| | | consideration the maximum initial sales charge in the case of Class A shares, or the applicable |
| | | contingent deferred sales charge imposed on redemptions in the case of Class B and Class C |
| | | shares. Had these charges been reflected, returns would have been lower. Past performance is no |
| | | guarantee of future results. Share price, yield and investment return fluctuate such that upon |
| | | redemption, fund shares may be worth more or less than their original cost. |
| 2 | | SOURCE: LIPPER INC. — Reflects reinvestment of dividends and, where applicable, capital |
| | | gain distributions.The Lehman Brothers U.S.Aggregate Index is a widely accepted, unmanaged |
| | | total return index of corporate, U.S. government and U.S. government agency debt instruments, |
| | | mortgage-backed securities and asset-backed securities with an average maturity of 1-10 years. |
The Fund 5

| † Source: Lipper Inc. |
| Past performance is not predictive of future performance. |
| The above graph compares a $10,000 investment made in Class A shares, Class B shares, Class C shares and Class R |
| shares of Dreyfus Premier Managed Income Fund on 12/31/94 to a $10,000 investment made in the Lehman |
| Brothers U.S.Aggregate Index (the “Index”) on that date.All dividends and capital gain distributions are reinvested. |
| The fund’s performance shown in the line graph takes into account the maximum initial sales charge on Class A shares |
| and all other applicable fees and expenses on all classes.The Index is a widely accepted, unmanaged index of corporate, |
| U.S. government and U.S. government agency debt instruments, mortgage-backed securities, and asset-backed securities. |
| The Index does not take into account charges, fees and other expenses. Further information relating to fund performance, |
| including expense reimbursements, if applicable, is contained in the Financial Highlights section of the prospectus and |
| elsewhere in this report. |
| Average Annual Total Returns as of | | 12/31/04 | | | | | | |
| | | | | 1 Year | | 5 Years | | 10 Years |
| |
| |
| |
| |
|
| Class A shares | | | | | | | | |
| with maximum sales charge (4.5%) | | | | 0.45% | | 5.84% | | 6.19% |
| without sales charge | | | | 5.15% | | 6.82% | | 6.68% |
| Class B shares | | | | | | | | |
| with applicable redemption charge † | | | | 0.27% | | 5.69% | | 6.20% |
| without redemption | | | | 4.27% | | 6.01% | | 6.20% |
| Class C shares | | | | | | | | |
| with applicable redemption charge †† | | | | 3.28% | | 6.01% | | 5.88% |
| without redemption | | | | 4.28% | | 6.01% | | 5.88% |
| Class R shares | | | | 5.43% | | 7.09% | | 6.94% |
Past performance is not predictive of future performance.The fund’s performance shown in the graph and table does not reflect the deduction of taxes that a shareholder would pay on fund distributions or the redemption of fund shares. Performance for Class B shares assumes the conversion of Class B shares to Class A shares at the end of the sixth year following the date of purchase.
| † | | The maximum contingent deferred sales charge for Class B shares is 4%.After six years Class B shares convert to |
| | | Class A shares. |
| †† | | The maximum contingent deferred sales charge for Class C shares is 1% for shares redeemed within one year of the |
| | | date of purchase. |
The Fund 7
U N D E R S TA N D I N G YO U R F U N D ’ S E X P E N S E S ( U n a u d i t e d )
As a mutual fund investor, you pay ongoing expenses, such as management fees and other expenses. Using the information below, you can estimate how these expenses affect your investment and compare them with the expenses of other funds.You also may pay one-time transaction expenses, including sales charges (loads) and redemption fees, which are not shown in this section and would have resulted in higher total expenses. For more information, see your fund’s prospectus or talk to your financial adviser.
Review your fund’s expenses
The table below shows the expenses you would have paid on a $1,000 investment in Dreyfus Premier Managed Income Fund from July 1, 2004 to December 31, 2004. It also shows how much a $1,000 investment would be worth at the close of the period, assuming actual returns and expenses.
| Expenses and Value of a $1,000 Investment | | | | | | |
| assuming actual returns for the six months ended December 31, 2004 | | |
| | | Class A | | Class B | | Class C | | Class R |
| |
| |
| |
| |
|
| Expenses paid per $1,000 † | | $ 4.89 | | $ 8.73 | | $ 8.73 | | $ 3.60 |
| Ending value (after expenses) | | $1,046.20 | | $1,042.30 | | $1,042.30 | | $1,047.70 |
| COMPARING YOUR FUND’S EXPENSES |
| WITH THOSE OF OTHER FUNDS (Unaudited) |
Using the SEC’s method to compare expenses
The Securities and Exchange Commission (SEC) has established guidelines to help investors assess fund expenses. Per these guidelines, the table below shows your fund’s expenses based on a $1,000 investment, assuming a hypothetical 5% annualized return. You can use this information to compare the ongoing expenses (but not transaction expenses or total cost) of investing in the fund with those of other funds.All mutual fund shareholder reports will provide this information to help you make this comparison. Please note that you cannot use this information to estimate your actual ending account balance and expenses paid during the period.
| Expenses and Value of a $1,000 Investment |
| assuming a hypothetical 5% annualized return for the six months ended December 31, 2004 |
| | | Class A | | Class B | | Class C | | Class R |
| |
| |
| |
| |
|
| Expenses paid per $1,000 † | | $ 4.82 | | $ 8.62 | | $ 8.62 | | $ 3.56 |
| Ending value (after expenses) | | $1,020.36 | | $1,016.59 | | $1,016.59 | | $1,021.62 |
| † Expenses are equal to the fund’s annualized expense ratio of .95% for Class A, 1.70% for Class B, 1.70% for |
| Class C and .70% Class R; multiplied by the average account value over the period, multiplied by 184/366 (to |
| reflect the one-half year period). |
STATEMENT OF INVESTMENTS
December 31, 2004
|
| | | Principal | | | | |
| Bonds and Notes—109.9% | | Amount a | | Value ($) |
| |
| |
|
| Advertising—.1% | | | | | | |
| Lamar Media, | | | | | | |
| Notes, 7.25%, 2013 | | 30,000 | | | | 32,550 |
| Asset-Backed Ctfs./Auto Loans—4.3% | | | | | | |
| AmeriCredit Automobile Receivables Trust, | | | | | | |
| Ser. 2000-D, Cl. A4, 2.541%, 2007 | | 37,707 | | b | | 37,744 |
| BMW Vehicle Owner Trust, | | | | | | |
| Ser. 2004-A, Cl. A4, 3.32%, 2009 | | 145,000 | | | | 144,462 |
| Capital Auto Receivables Asset Trust, | | | | | | |
| Ser. 2004-2, Cl. A1B, 2.37%, 2007 | | 805,000 | | b | | 805,000 |
| Ford Credit Auto Owner Trust, | | | | | | |
| Ser. 2004-A, Cl. C, 4.19%, 2009 | | 50,000 | | | | 50,233 |
| Hyundai Auto Receivables Trust, | | | | | | |
| Ser. 2004-A, Cl. C, 3.36%, 2011 | | 70,000 | | | | 69,648 |
| MMCA Automoblie Trust, | | | | | | |
| Ser. 2002-1, Cl. B, 5.37%, 2010 | | 106,605 | | | | 107,772 |
| USAA Auto Owner Trust, | | | | | | |
| Ser. 2004-3, Cl. A1, 2.3365%, 2005 | | 221,969 | | | | 221,792 |
| WFS Financial Owner Trust: | | | | | | |
| Ser. 2004-3, Cl. B, 3.51%, 2012 | | 225,000 | | | | 224,273 |
| Ser. 2004-4, Cl. A2, 2.5%, 2007 | | 150,000 | | | | 149,297 |
| Ser. 2004-4, Cl. B, 3.13%, 2012 | | 220,000 | | | | 217,662 |
| Whole Auto Loan Trust: | | | | | | |
| Ser. 2004-1, Cl. A, 2.15%, 2005 | | 212,631 | | | | 212,631 |
| Ser. 2004-1, Cl. D, 5.6%, 2011 | | 50,000 | | c | | 49,789 |
| | | | | | | 2,290,303 |
| Asset-Backed Ctfs./Credit Cards—6.9% | | | | | | |
| Capital One Multi-Asset Execution Trust: | | | | | | |
| Ser. 2002-B1, Cl. B1, 3.082%, 2008 | | 565,000 | | b | | 566,875 |
| Ser. 2003-B2, Cl. B2, 3.5%, 2009 | | 85,000 | | | | 85,095 |
| Ser. 2003-C4, Cl. C4, 6%, 2013 | | 255,000 | | | | 272,658 |
| Ser. 2004-C1, Cl. C1, 3.4%, 2009 | | 230,000 | | | | 228,420 |
| Chase Credit Card Master Trust: | | | | | | |
| Ser. 2000-3, Cl. A, 2.532%, 2008 | | 245,000 | | b | | 245,379 |
| Ser. 2002-2, Cl. C, 3.302%, 2007 | | 300,000 | | b | | 300,710 |
| Ser. 2002-6, Cl. B, 2.752%, 2008 | | 220,000 | | b | | 220,453 |
| Ser. 2002-8, Cl. A, 2.462%, 2008 | | 185,000 | | b | | 185,213 |
| Citibank Credit Card Issuance Trust: | | | | | | |
| Ser. 2000-B1, Cl. B1, 7.05%, 2007 | | 90,000 | | | | 92,553 |
| Ser. 2002-A2, Cl. A2, 2.32%, 2007 | | 440,000 | | b | | 440,158 |
| Discover Card Master Trust I, | | | | | | |
| Ser. 2000-5, Cl. B, 2.81%, 2007 | | 240,000 | | b | | 240,282 |
The Fund 9
S T A T E M E N T O F I N V E S T M E N T S (continued)
| | | Principal | | | | |
| Bonds and Notes (continued) | | Amount a | | Value ($) |
| |
| |
|
| Asset-Backed Ctfs./Credit Cards (continued) | | | | |
| Household Credit Card Master Note Trust I, | | | | | | |
| Ser. 2000-1, Cl. A, 2.542%, 2008 | | 550,000 | | b | | 551,018 |
| MBNA Credit Card Master Note Trust: | | | | | | |
| Ser. 2002-A1, Cl. A1, 4.95%, 2009 | | 140,000 | | | | 144,639 |
| Ser. 2004-A4, Cl. A4, 2.7%, 2009 | | 100,000 | | | | 98,386 |
| | | | | | | 3,671,839 |
| Asset-Backed Ctfs./Equipment—.2% | | | | | | |
| John Deere Owner Trust, | | | | | | |
| Ser. 2004-A, Cl. A1, 1.14%, 2005 | | 86,335 | | | | 86,316 |
| Asset-Backed Ctfs./Home Equity Loans—5.9% | | | | |
| Ameriquest Mortgage Securities: | | | | | | |
| Ser. 2003-8, Cl. AF3, 4.37%, 2033 | | 160,000 | | | | 160,215 |
| Ser. 2004-FR1, Cl. A3, 2.65%, 2034 | | 140,000 | | | | 138,252 |
| Chase Funding Loan Acquisition Trust, | | | | | | |
| Ser. 2004-AQ1, Cl. A1, 2.6%, 2013 | | 141,749 | | | | 141,773 |
| Chec LoanTrust, | | | | | | |
| Ser. 2004-2, Cl. A1, 2.59%, 2025 | | 149,748 | | b | | 149,748 |
| Countrywide Asset-Backed Certificates: | | | | | | |
| Ser. 2004-10, Cl. 2AV1, 2.58%, 2023 | | 232,693 | | b | | 232,693 |
| Ser. 2004-12, Cl. AF6, 4.634%, 2035 | | 105,000 | | | | 104,606 |
| Ser. 2004-14, Cl. A1, 2.56%, 2036 | | 505,000 | | b | | 505,000 |
| Option One Mortgage Loan Trust, | | | | | | |
| Ser. 2004-3, Cl. A2, 2.5675%, 2034 | | 331,008 | | b | | 331,221 |
| Residential Asset Mortgage Products: | | | | | | |
| Ser. 2004-RS8, Cl. AI2, 3.81%, 2026 | | 55,000 | | | | 55,044 |
| Ser. 2004-RS12, Cl. AII1, 2.54%, 2027 | | 530,000 | | b | | 529,958 |
| Ser. 2004-RS12, Cl. AI6, 4.547%, 2034 | | 145,000 | | | | 143,058 |
| Residential Asset Securities: | | | | | | |
| Ser. 2001-KS3, Cl. MII1, 2.97%, 2031 | | 151,089 | | b | | 151,628 |
| Ser. 2004-KS6, Cl. AI1, 2.56%, 2022 | | 305,610 | | b | | 305,804 |
| Ser. 2004-KS10, Cl. AI1, 2.59%, 2013 | | 208,371 | | b | | 208,371 |
| | | | | | | 3,157,371 |
| Asset-Backed Ctfs./ | | | | | | |
| Manufactured Homes—.4% | | | | | | |
| Origen Manufactured Housing: | | | | | | |
| Ser. 2004-B, Cl. A1, 2.87%, 2013 | | 70,132 | | | | 69,622 |
| Ser. 2004-B, Cl. A2, 3.79%, 2017 | | 65,000 | | | | 64,520 |
| Vanderbilt Mortgage Finance, | | | | | | |
| Ser. 1999-A, Cl. 1A6, 6.75%, 2029 | | 80,000 | | | | 84,423 |
| | | | | | | 218,565 |
| |
| |
| 10 | | | | | | |
| | | Principal | | |
| Bonds and Notes (continued) | | Amount a | | Value ($) |
| |
| |
|
| Automotive—1.5% | | | | |
| DaimlerChrysler: | | | | |
| Notes, 7.75%, 2005 | | 260,000 | | 265,564 |
| Notes, Ser. A, 7.375%, 2006 | | 160,000 | | 169,594 |
| ERAC USA Finance, | | | | |
| Notes, 7.95%, 2009 | | 100,000 c | | 116,239 |
| Ford Motor, | | | | |
| Bonds, 6.625%, 2028 | | 165,000 | | 154,346 |
| General Motors, | | | | |
| Discount Debs., 0/7.75%, 2036 | | 180,000 d | | 74,947 |
| | | | | 780,690 |
| Banking—4.8% | | | | |
| Bank One, | | | | |
| Notes, 6.5%, 2006 | | 255,000 | | 264,037 |
| Chevy Chase Bank, | | | | |
| Sub. Notes, 6.875%, 2013 | | 145,000 | | 150,438 |
| City National, | | | | |
| Sr. Notes, 5.125%, 2013 | | 75,000 | | 75,876 |
| HBOS Capital Funding, | | | | |
| Bonds, 6.071%, 2049 | | 260,000 b,c | | 279,163 |
| Industrial Bank of Korea, | | | | |
| Sub. Notes, 4%, 2014 | | 75,000 b,c | | 73,445 |
| National Westminster Bank, | | | | |
| Sub. Notes, 7.375%, 2009 | | 320,000 | | 364,669 |
| Popular, | | | | |
| Notes, Ser. E, 6.125%, 2006 | | 305,000 | | 318,003 |
| Union Planters Bank, | | | | |
| Notes, 5.125%, 2007 | | 150,000 | | 156,299 |
| Washington Mutual: | | | | |
| Notes, 2.4%, 2005 | | 315,000 | | 313,033 |
| Sub. Notes, 4.625%, 2014 | | 145,000 | | 138,884 |
| Zions Bancorp, | | | | |
| Sub. Notes, 6%, 2015 | | 410,000 | | 437,930 |
| | | | | 2,571,777 |
| Building & Construction—.3% | | | | |
| American Standard, | | | | |
| Sr. Notes, 7.375%, 2008 | | 40,000 | | 43,903 |
| D.R. Horton, | | | | |
| Sr. Notes, 8.5%, 2012 | | 105,000 | | 117,600 |
| | | | | 161,503 |
The Fund 11
S T A T E M E N T O F I N V E S T M E N T S (continued)
| | | Principal | | | | |
| Bonds and Notes (continued) | | Amount a | | Value ($) |
| |
| |
|
| Cable/Media—1.1% | | | | | | |
| British Sky Broadcasting, | | | | | | |
| Sr. Notes, 6.875%, 2009 | | 126,000 | | | | 138,348 |
| Cablevision Systems, | | | | | | |
| Sr. Notes, 6.67%, 2009 | | 75,000 | | b,c | | 79,875 |
| Clear Channel Communications, | | | | | | |
| Notes, 4.25%, 2009 | | 135,000 | | | | 133,765 |
| DirecTV Holdings/Finance, | | | | | | |
| Sr. Notes, 8.375%, 2013 | | 50,000 | | | | 56,312 |
| Liberty Media, | | | | | | |
| Notes, 3.5%, 2006 | | 205,000 | | | | 203,945 |
| | | | | | | 612,245 |
| Chemicals—1.3% | | | | | | |
| ICI Wilmington: | | | | | | |
| Notes, 4.375%, 2008 | | 30,000 | | | | 30,196 |
| Notes, 5.625%, 2013 | | 115,000 | | | | 119,313 |
| International Flavors & Fragrance, | | | | | | |
| Notes, 6.45%, 2006 | | 240,000 | | | | 249,649 |
| Lubrizol, | | | | | | |
| Debs., 6.5%, 2034 | | 270,000 | | | | 275,896 |
| | | | | | | 675,054 |
| Commercial Mortgage Pass-Through Ctfs.—4.9% | | | | |
| Bear Stearns Commercial Mortgage Securities: | | | | |
| Ser. 1998-2, Cl. B, 6.75%, 2030 | | 5,407 | | | | 5,393 |
| Ser. 2003-T12, Cl. A3, 4.24%, 2039 | | 295,000 | | | | 293,398 |
| Ser. 2004-PWR5, Cl. A3, 4.565%, 2042 | | 120,000 | | | | 120,731 |
| CS First Boston Mortgage Securities, | | | | | | |
| Ser. 2001-CF2, Cl. A4, 6.505%, 2034 | | 135,000 | | | | 149,499 |
| Calwest Industrial Trust, | | | | | | |
| Ser. 2002-CALW, Cl. A, 6.127%, 2017 | | 70,000 | | c | | 76,192 |
| Chase Commercial Mortgage Securities, | | | | | | |
| Ser. 1997-2, Cl. C, 6.6%, 2029 | | 40,000 | | | | 42,988 |
| DLJ Commercial Mortgage: | | | | | | |
| Ser. 1998-CF2, Cl. A1B, 6.24%, 2031 | | 120,000 | | | | 129,265 |
| Ser. 1999-CG1, Cl. A1A, 6.08%, 2032 | | 101,554 | | | | 105,288 |
| First Chicago/Lennar Trust, | | | | | | |
| Ser. 1997-CHL1, Cl. D, 7.8095%, 2039 | | 275,000 | | b,c | | 280,199 |
| GMAC Commercial Mortgage Securities, | | | | | | |
| Ser. 1996-C1, Cl. F, 7.86%, 2006 | | 250,000 | | c | | 265,788 |
| J.P. Morgan Commercial Mortgage Finance: | | | | | | |
| Ser. 1997-C5, Cl. A3, 7.088%, 2029 | | 156,380 | | | | 166,402 |
| Ser. 1997-C5, Cl. B, 7.159%, 2029 | | 105,000 | | | | 113,501 |
| |
| 12 | | | | | | |
| | | Principal | | | | |
| Bonds and Notes (continued) | | Amount a | | Value ($) |
| |
| |
|
| Commercial Mortgage | | | | | | |
| Pass-Through Ctfs. (continued) | | | | | | |
| Lehman Brothers Floating Rate Mortgage Trust, | | | | |
| Ser. 2004-LLFA, Cl. A1, 2.5325%, 2017 | | 164,847 | | b,c | | 164,847 |
| Mach One Trust, | | | | | | |
| Ser. 2004-1A, Cl. A1, 3.89%, 2040 | | 127,422 | | c | | 126,902 |
| Morgan Stanley Capital I: | | | | | | |
| Ser. 1999-CAM1, Cl. A4, 7.02%, 2032 | | 70,000 | | | | 78,061 |
| Ser. 1999-RM1, Cl. A2, 6.71%, 2031 | | 200,000 | | | | 217,863 |
| Morgan Stanley Dean Witter Capital I, | | | | | | |
| Ser. 2001-PPM, Cl. A3, 6.54%, 2031 | | 250,000 | | | | 269,530 |
| | | | | | | 2,605,847 |
| Commercial Services—1.0% | | | | | | |
| Aramark Services, | | | | | | |
| Sr. Notes, 7%, 2007 | | 500,000 | | | | 533,739 |
| Consumer—.0% | | | | | | |
| Scotts, | | | | | | |
| Sr. Sub. Notes, 6.625%, 2013 | | 20,000 | | | | 21,150 |
| Containers—.2% | | | | | | |
| Owens-Brockway Glass Containers: | | | | | | |
| Sr. Notes, 6.75%, 2014 | | 50,000 | | c | | 50,750 |
| Sr. Secured Notes, 7.75%, 2011 | | 65,000 | | | | 70,687 |
| | | | | | | 121,437 |
| Environmental Control—.2% | | | | | | |
| Waste Management: | | | | | | |
| Sr. Notes, 7%, 2028 | | 75,000 | | | | 84,850 |
| Sr. Notes, 7.375%, 2029 | | 30,000 | | | | 35,351 |
| | | | | | | 120,201 |
| Financial Services—5.1% | | | | | | |
| Amvescap: | | | | | | |
| Notes, 5.375%, 2013 | | 135,000 | | | | 136,427 |
| Notes, 5.375%, 2014 | | 285,000 | | c | | 284,613 |
| Countrywide Home Loan, | | | | | | |
| Notes, Ser. L, 2.18%, 2006 | | 300,000 | | b | | 299,964 |
| Deluxe, | | | | | | |
| Notes, 3.5%, 2007 | | 270,000 | | c | | 266,695 |
| Ford Motor Credit: | | | | | | |
| Notes, 7.6%, 2005 | | 345,000 | | | | 353,101 |
| Sr. Notes, 5.8%, 2009 | | 520,000 | | | | 531,986 |
| Glencore Funding, | | | | | | |
| Notes, 6%, 2014 | | 305,000 | | c | | 295,597 |
The Fund 13
S T A T E M E N T O F I N V E S T M E N T S (continued)
| | | | | Principal | | | | |
| Bonds and Notes (continued) | | | | Amount a | | Value ($) |
| |
| |
| |
|
| Financial Services (continued) | | | | | | | | |
| Goldman Sachs Capital I, | | | | | | | | |
| Notes, 6.345%, 2034 | | | | 160,000 | | e | | 167,173 |
| Jefferies: | | | | | | | | |
| Sr. Notes, 7.75%, 2012 | | | | 55,000 | | | | 62,493 |
| Sr. Notes, Ser. B, 7.5%, 2007 | | | | 70,000 | | | | 76,646 |
| Leucadia National, | | | | | | | | |
| Sr. Notes, 7%, 2013 | | | | 115,000 | | | | 119,025 |
| SLM, | | | | | | | | |
| Notes, 2.75%, 2005 | | | | 160,000 | | | | 159,298 |
| | | | | | | | | 2,753,018 |
| Food & Beverages—1.3% | | | | | | | | |
| Del Monte, | | | | | | | | |
| Sr. Sub. Notes, 8.625%, 2012 | | | | 70,000 | | | | 78,750 |
| H.J. Heinz, | | | | | | | | |
| Bonds, 6.189%, 2005 | | | | 375,000 | | b,c | | 384,289 |
| Safeway, | | | | | | | | |
| Sr. Notes, 4.125%, 2008 | | | | 105,000 | | | | 104,475 |
| Stater Brothers, | | | | | | | | |
| Sr. Notes, 8.125%, 2012 | | | | 100,000 | | e | | 106,250 |
| | | | | | | | | 673,764 |
| Foreign/Governmental—7.9% | | | | | | | | |
| Banco Nacional de Desenvolvimento | | | | | | | | |
| Economico e Social, | | | | | | | | |
| Unsub. Notes, 5.832%, 2008 | | | | 150,000 | | b | | 154,227 |
| Deutschland: | | | | | | | | |
| Bonds, 4%, 2009 | | EUR | | 1,160,000 | | | | 1,639,598 |
| Bonds, 5%, 2012 | | EUR | | 1,055,000 | | | | 1,579,655 |
| Republic of El Salvador: | | | | | | | | |
| Notes, 8.5%, 2011 | | | | 60,000 | | c | | 68,400 |
| Notes, 9.5%, 2006 | | | | 120,000 | | | | 130,397 |
| Republic of Panama, | | | | | | | | |
| Bonds, 9.625%, 2011 | | | | 115,000 | | | | 136,275 |
| Russian Federation: | | | | | | | | |
| Unsub. Notes, 10%, 2007 | | | | 125,000 | | e | | 141,575 |
| Unsub. Notes, 12.75%, 2028 | | | | 90,000 | | | | 148,007 |
| Ukraine Government, | | | | | | | | |
| Notes, 5.33%, 2009 | | | | 100,000 | | b,c | | 105,750 |
| United Mexican States, | | | | | | | | |
| Notes, Ser. A, 6.75%, 2034 | | | | 135,000 | | | | 133,650 |
| | | | | | | | | 4,237,534 |
| |
| 14 | | | | | | | | |
| | | | | Principal | | | | |
| Bonds and Notes (continued) | | | | Amount a | | Value ($) |
| |
| |
| |
|
| Gaming/Lodging—1.9% | | | | | | | | |
| Ameristar Casinos, | | | | | | | | |
| Sr. Sub. Notes, 10.75%, 2009 | | | | 35,000 | | | | 39,200 |
| Caesars Entertainment: | | | | | | | | |
| Sr. Notes, 8.5%, 2006 | | | | 50,000 | | | | 54,375 |
| Sr. Sub. Notes, 7.875%, 2005 | | | | 80,000 | | | | 83,200 |
| Carnival, | | | | | | | | |
| Notes, 7.05%, 2005 | | | | 300,000 | | | | 304,509 |
| MGM Mirage, | | | | | | | | |
| Sr. Notes, 6%, 2009 | | | | 90,000 | | | | 92,700 |
| Mohegan Tribal Gaming Authority: | | | | | | | | |
| Sr. Sub. Notes, 7.125%, 2014 | | | | 60,000 | | | | 63,450 |
| Sr. Sub. Notes, 8%, 2012 | | | | 50,000 | | | | 54,500 |
| Royal Caribbean Cruises, | | | | | | | | |
| Sr. Notes, 8.25%, 2005 | | | | 175,000 | | | | 177,625 |
| Turning Stone Casino Entertainment, | | | | | | |
| Sr. Notes, 9.125%, 2010 | | | | 160,000 | | c | | 174,000 |
| | | | | | | | | 1,043,559 |
| Health Care—.9% | | | | | | | | |
| Boston Scientific, | | | | | | | | |
| Notes, 6.625%, 2005 | | | | 275,000 | | | | 277,048 |
| HCA, | | | | | | | | |
| Sr. Notes, 7.125%, 2006 | | | | 100,000 | | | | 103,834 |
| Wyeth, | | | | | | | | |
| Bonds, 6.5%, 2034 | | | | 80,000 | | | | 85,640 |
| | | | | | | | | 466,522 |
| Industrial—1.8% | | | | | | | | |
| International Steel, | | | | | | | | |
| Sr. Notes, 6.5%, 2014 | | | | 125,000 | | e | | 134,687 |
| RPM International: | | | | | | | | |
| Bonds, 6.25%, 2013 | | | | 145,000 | | | | 151,087 |
| Sr. Notes, 4.45%, 2009 | | | | 125,000 | | c | | 122,698 |
| Teck Cominco, | | | | | | | | |
| Notes, 7%, 2012 | | | | 165,000 | | | | 183,157 |
| Tyco International, | | | | | | | | |
| Notes, 6.125%, 2007 | | EUR | | 260,000 | | | | 379,137 |
| �� | | | | | | | | 970,766 |
| Insurance—1.3% | | | | | | | | |
| Cincinnati Financial, | | | | | | | | |
| Notes, 6.125%, 2034 | | | | 145,000 | | c | | 147,048 |
The Fund 15
S T A T E M E N T O F I N V E S T M E N T S (continued)
| | | Principal | | |
| Bonds and Notes (continued) | | Amount a | | Value ($) |
| |
| |
|
| Insurance (continued) | | | | |
| Nationwide Mutual Insurance, | | | | |
| Notes, 7.875%, 2033 | | 110,000 c | | 131,465 |
| Principal Life Inc. Funding, | | | | |
| Secured Notes, 2.67%, 2005 | | 230,000 b | | 230,026 |
| Prudential Financial: | | | | |
| Notes, Ser. B, 5.1%, 2014 | | 85,000 | | 85,570 |
| Sr. Notes, 4.104%, 2006 | | 100,000 | | 101,140 |
| | | | | 695,249 |
| Manufacturing—.8% | | | | |
| Bombardier: | | | | |
| Notes, 6.3%, 2014 | | 200,000 c | | 174,500 |
| Notes, 7.45%, 2034 | | 320,000 c,e | | 274,400 |
| | | | | 448,900 |
| Oil & Gas—.4% | | | | |
| Pemex Project Funding Master Trust, | | | | |
| Notes, 7.375%, 2014 | | 205,000 | | 228,370 |
| Paper & Paper Related—1.5% | | | | |
| Abitibi-Consolidated: | | | | |
| Bonds, 8.3%, 2005 | | 125,000 | | 128,438 |
| Debs., 8.5%, 2029 | | 155,000 | | 150,931 |
| Georgia-Pacific, | | | | |
| Sr. Notes, 8.875%, 2010 | | 120,000 | | 140,250 |
| Sappi Papier, | | | | |
| Notes, 6.75%, 2012 | | 240,000 c | | 267,061 |
| UPM-Kymmene, | | | | |
| Sr. Notes, 5.625%, 2014 | | 100,000 c | | 104,497 |
| | | | | 791,177 |
| Pipelines—.9% | | | | |
| ANR Pipeline, | | | | |
| Sr. Notes, 7%, 2025 | | 50,000 | | 50,875 |
| El Paso Natural Gas, | | | | |
| Sr. Notes, Ser. A, 7.625%, 2010 | | 130,000 | | 143,000 |
| Northwest Pipeline, | | | | |
| Debs., 6.625%, 2007 | | 210,000 | | 223,650 |
| Transcontinental Gas Pipe Line, | | | | |
| Notes, 6.125%, 2005 | | 60,000 | | 60,000 |
| | | | | 477,525 |
| Publishing—.6% | | | | |
| Dex Media Finance/West, | | | | |
| Sr. Notes, Ser. B, 8.5%, 2010 | | 15,000 | | 16,763 |
| |
| 16 | | | | |
| | | Principal | | | | |
| Bonds and Notes (continued) | | Amount a | | Value ($) |
| |
| |
|
| Publishing (continued) | | | | | | |
| Reed Elsevier Capital, | | | | | | |
| Notes, 6.125%, 2006 | | 270,000 | | | | 280,045 |
| | | | | | | 296,808 |
| Racetracks—.2% | | | | | | |
| Speedway Motorsports, | | | | | | |
| Sr. Sub. Notes, Ser. B, 6.75%, 2013 | | 105,000 | | | | 111,038 |
| Real Estate—2.0% | | | | | | |
| Archstone-Smith Operating Trust: | | | | | | |
| Notes, 3%, 2008 | | 85,000 | | | | 82,104 |
| Notes, 5.625%, 2014 | | 70,000 | | | | 72,859 |
| Sr. Notes, 5%, 2007 | | 75,000 | | | | 77,136 |
| Arden Realty: | | | | | | |
| Notes, 5.2%, 2011 | | 65,000 | | | | 65,668 |
| Sr. Notes, 7%, 2007 | | 60,000 | | | | 65,427 |
| Boston Properties, | | | | | | |
| Sr. Notes, 5.625%, 2015 | | 85,000 | | | | 87,786 |
| Duke Realty: | | | | | | |
| Notes, 5.4%, 2014 | | 75,000 | | e | | 77,035 |
| Sr. Notes, 6.95%, 2011 | | 170,000 | | | | 190,158 |
| ERP Operating, | | | | | | |
| Notes, 4.75%, 2009 | | 55,000 | | | | 56,216 |
| Healthcare Realty Trust, | | | | | | |
| Sr. Notes, 8.125%, 2011 | | 275,000 | | | | 320,758 |
| | | | | | | 1,095,147 |
| Residential Mortgage Pass-Through Ctfs.—1.9% | | | | |
| Bank of America Mortgage Securities, | | | | | | |
| Ser. 2004-F, Cl. 2A7, 4.18%, 2034 | | 417,537 | | b | | 416,492 |
| Countrywide Alternative Loan Trust: | | | | | | |
| Ser. 2004-J5, Cl. 1A1, 2.6075%, 2034 | | 82,643 | | b | | 82,739 |
| Stripped Security, Interest Only Class, | | | | | | |
| Ser. 2004-J5, Cl. 1AI0, .75%, 2006 | | 5,287,521 | | f | | 35,448 |
| Washington Mutual: | | | | | | |
| Ser. 2003-AR10, Cl. A6, 4.08%, 2033 | | 203,000 | | b | | 201,440 |
| Ser. 2004-AR7, Cl. A6, 3.95%, 2034 | | 135,000 | | b | | 133,486 |
| Ser. 2004-AR9, Cl. A7, 4.23%, 2034 | | 165,000 | | b | | 165,233 |
| | | | | | | 1,034,838 |
| Retail—.3% | | | | | | |
| May Department Stores: | | | | | | |
| Notes, 3.95%, 2007 | | 45,000 | | | | 45,103 |
| Notes, 4.8%, 2009 | | 45,000 | | | | 45,803 |
The Fund 17
S T A T E M E N T O F I N V E S T M E N T S (continued)
| | | | | Principal | | | | |
| Bonds and Notes (continued) | | | | Amount a | | Value ($) |
| |
| |
| |
|
| Retail (continued) | | | | | | | | |
| Office Depot, | | | | | | | | |
| Sr. Notes, 6.25%, 2013 | | | | 75,000 | | | | 80,163 |
| | | | | | | | | 171,069 |
| Semiconductors—.2% | | | | | | | | |
| Freescale Semiconductor, | | | | | | | | |
| Sr. Notes, 6.875%, 2011 | | | | 70,000 | | | | 75,425 |
| State Government—1.7% | | | | | | | | |
| Badger Tobacco Asset Securitization, | | | | | | | | |
| Asset-Backed Ctfs., 6.125%, 2027 | | | | 200,000 | | | | 198,900 |
| Golden State Tobacco Securitization, | | | | | | | | |
| Asset-Backed Ctfs., Ser. A-3, 7.875%, 2042 | | | | 580,000 | | | | 629,799 |
| Sacramento County California Pension Funding, | | | | | | |
| Bonds, Ser. C-1, 0%, 2030 | | | | 100,000 | | | | 94,700 |
| | | | | | | | | 923,399 |
| Telecommunications—1.8% | | | | | | | | |
| Deutsche Telekom International Finance, | | | | | | | | |
| Notes, 8.75%, 2030 | | | | 245,000 | | b | | 324,478 |
| France Telecom, | | | | | | | | |
| Notes, 8.75%, 2011 | | | | 110,000 | | b | | 131,381 |
| MCI, | | | | | | | | |
| Sr. Notes, 5.908%, 2007 | | | | 41,000 | | | | 42,076 |
| Qwest: | | | | | | | | |
| Notes, 5.625%, 2008 | | | | 70,000 | | | | 71,575 |
| Sr. Notes, 7.875%, 2011 | | | | 65,000 | | c | | 70,850 |
| Rogers Wireless: | | | | | | | | |
| Secured Notes, 7.25%, 2012 | | | �� | 60,000 | | c,e | | 63,900 |
| Secured Notes, 7.5%, 2015 | | | | 15,000 | | c | | 15,900 |
| SBC Communications, | | | | | | | | |
| Notes, 5.625%, 2016 | | | | 90,000 | | | | 93,171 |
| Sprint Capital, | | | | | | | | |
| Notes, 8.75%, 2032 | | | | 110,000 | | | | 147,005 |
| | | | | | | | | 960,336 |
| Tobacco—.8% | | | | | | | | |
| Philip Morris Capital, | | | | | | | | |
| Bonds, 4%, 2006 | | CHF | | 460,000 | | | | 412,112 |
| Transportation—.5% | | | | | | | | |
| FedEx, | | | | | | | | |
| Notes, 2.65%, 2007 | | | | 285,000 | | | | 279,287 |
| |
| |
| |
| 18 | | | | | | | | |
| | | Principal | | |
| Bonds and Notes (continued) | | Amount a | | Value ($) |
| |
| |
|
| U.S. Government—7.7% | | | | |
| U.S. Treasury Bonds, | | | | |
| 6.25%, 5/15/2030 | | 1,200,000 | | 1,435,068 |
| U.S. Treasury Inflation Protected Securities, | | | | |
| .875%, 4/15/2010 | | 1,078,036 g | | 1,068,394 |
| U.S. Treasury Notes: | | | | |
| 2.875%, 11/30/2006 | | 1,225,000 e | | 1,221,555 |
| 3.375%, 9/15/2009 | | 70,000 | | 69,382 |
| 3.875%, 5/15/2009 | | 295,000 e | | 299,437 |
| | | | | 4,093,836 |
| U.S. Government Agencies/Mortgage-Backed—29.7% | | |
| Federal Home Loan Mortgage Corp.: | | | | |
| 4%, 10/1/2009 | | 122,681 | | 123,255 |
| 4.5%, 10/1/2009 | | 123,239 | | 124,817 |
| 5%, 10/1/2018 | | 673,058 | | 684,204 |
| 6%, 7/1/2017-4/1/2033 | | 444,606 | | 461,613 |
| Federal National Mortgage Association: | | | | |
| 3.53%, 7/1/2010 | | 292,689 | | 282,993 |
| 4.06%, 6/1/2013 | | 100,000 | | 94,843 |
| 5% | | 860,000 h | | 859,806 |
| 5%, 7/1/2011-4/1/2019 | | 759,186 | | 772,379 |
| 5.5% | | 1,335,000 h | | 1,360,422 |
| 5.5%, 12/1/2024-1/1/2034 | | 1,828,721 | | 1,862,300 |
| 6% | | 3,915,000 h | | 4,048,345 |
| 6%, 4/1/2018-6/1/2033 | | 828,859 | | 864,018 |
| 6.5%, 12/1/2031-11/1/2032 | | 752,512 | | 790,188 |
| 7%, 5/1/2032-7/1/2032 | | 105,466 | | 111,827 |
| Grantor Trust: | | | | |
| Ser. 2001-T6, Cl. B, 6.088%, 5/25/2011 | | 275,000 | | 301,637 |
| Ser. 2001-T11, Cl. B, 5.503%, 9/25/2011 | | 75,000 | | 80,007 |
| Government National Mortgage Association I: | | | | |
| 6.5%, 9/15/2032 | | 214,127 | | 225,703 |
| 8%, 2/15/2030-5/15/2030 | | 12,329 | | 13,388 |
| Ser. 2003-64, Cl. A, 3.089%, 4/16/2024 | | 56,232 | | 55,625 |
| Ser. 2003-88, Cl. AC, 2.9141%, 6/16/2018 | | 300,040 | | 293,763 |
| Ser. 2003-96, Cl. B, 3.6072%, 8/16/2018 | | 175,000 | | 173,861 |
| Ser. 2004-9, Cl. A, 3.36%, 8/16/2022 | | 122,488 | | 120,517 |
| Ser. 2004-23, Cl. B, 2.946%, 3/16/2019 | | 140,000 | | 136,113 |
| Ser. 2004-25, Cl. AB, 1.698%, 11/16/2006 | | 43,910 | | 43,817 |
| Ser. 2004-25, Cl. AC, 3.377%, 1/16/2023 | | 350,000 | | 344,419 |
| Ser. 2004-43, Cl. A, 2.822%, 12/16/2019 | | 391,397 | | 381,752 |
The Fund 19
S T A T E M E N T O F I N V E S T M E N T S (continued)
| | | Principal | | | | |
| Bonds and Notes (continued) | | Amount a | | Value ($) |
| |
| |
|
| U.S. Government Agencies/Mortgage-Backed (continued) | | | | |
| Government National Mortgage Association I (continued): | | | | |
| Ser. 2004-51, Cl. A, 4.145%, 2/16/2018 | | 254,493 | | | | 256,313 |
| Ser. 2004-57, Cl. A, 3.022%, 1/16/2019 | | 205,894 | | | | 202,118 |
| Ser. 2004-67, Cl. A, 3.648%, 9/16/2017 | | 270,247 | | | | 269,249 |
| Ser. 2004-77, Cl. A, 3.402%, 3/16/2020 | | 222,738 | | | | 219,907 |
| Ser. 2004-97, Cl. AB, 3.084%, 4/16/2022 | | 224,342 | | | | 219,091 |
| Ser. 2004-108, Cl. A, 3.999%, 5/16/2027 | | 125,000 | | | | 124,942 |
| | | | | | | 15,903,232 |
| Utilities-Gas/Electric—5.6% | | | | | | |
| AES, | | | | | | |
| Sr. Secured Notes, 8.75%, 2013 | | 125,000 | | c | | 142,656 |
| Consumers Energy: | | | | | | |
| First Mortgage Bonds, 5.5%, 2016 | | 100,000 | | c | | 103,183 |
| First Mortgage Bonds, 6.25%, 2006 | | 25,000 | | | | 26,112 |
| First Mortgage Bonds, Ser. B, 5.375%, 2013 | | 185,000 | | | | 191,645 |
| First Mortgage Bonds, Ser. F, 4%, 2010 | | 155,000 | | | | 152,424 |
| Dominion Resources, | | | | | | |
| Notes, Ser. A, 3.66%, 2006 | | 95,000 | | | | 95,205 |
| Enterprise Capital Trust II, | | | | | | |
| Capital Securities, Ser. B, 3.78%, 2028 | | 160,000 | | b | | 157,541 |
| FPL Group Capital, | | | | | | |
| Notes, 7.625%, 2006 | | 225,000 | | | | 240,435 |
| FirstEnergy, | | | | | | |
| Sr. Notes, Ser. A, 5.5%, 2006 | | 310,000 | | | | 320,163 |
| IPALCO Enterprises, | | | | | | |
| Sr. Secured Notes, 8.625%, 2011 | | 75,000 | | b | | 84,375 |
| Illinois Power, | | | | | | |
| First Mortgage Bonds, 7.5%, 2009 | | 115,000 | | | | 129,829 |
| Indianapolis Power & Light, | | | | | | |
| First Mortgage Bonds, 6.6%, 2034 | | 35,000 | | c | | 37,621 |
| Monongahela Power, | | | | | | |
| First Mortgage Bonds, 6.7%, 2014 | | 50,000 | | c | | 55,644 |
| Nevada Power, | | | | | | |
| Bonds, 5.875%, 2015 | | 50,000 | | c | | 50,625 |
| Niagara Mohawk Power, | | | | | | |
| Sr. Notes, Ser. G, 7.75%, 2008 | | 35,000 | | | | 39,407 |
| NiSource Capital Markets, | | | | | | |
| Notes, 7.86%, 2017 | | 75,000 | | | | 89,139 |
| NiSource Finance, | | | | | | |
| Notes, 2.915%, 2009 | | 275,000 | | b | | 274,990 |
| |
| |
| |
| 20 | | | | | | |
| | | Principal | | |
| Bonds and Notes (continued) | | Amount a | | Value ($) |
| |
| |
|
| Utilities-Gas/Electric (continued) | | | | |
| PPL Capital Funding Trust I, | | | | |
| Notes, 7.29%, 2006 | | 220,000 | | 229,583 |
| TXU: | | | | |
| Notes, 4.8%, 2009 | | 275,000 c | | 275,788 |
| Notes, Ser. C, 6.375%, 2008 | | 65,000 | | 69,099 |
| United Utilities, | | | | |
| Notes, 6.25%, 2005 | | 55,000 | | 56,063 |
| Westar Energy, | | | | |
| First Mortgage Bonds, 7.875%, 2007 | | 160,000 | | 174,791 |
| | | | | 2,996,318 |
| Total Bonds and Notes | | | | |
| (cost $57,646,376) | | | | 58,799,816 |
| |
| |
|
| |
| Preferred Stocks—1.3% | | Shares | | Value ($) |
| |
| |
|
| Automotive—.1% | | | | |
| General Motors, | | | | |
| Ser. C, Cum. Conv., $1.5625 | | 2,250 | | 59,906 |
| Banking—.1% | | | | |
| Sovereign Capital Trust IV, | | | | |
| Conv., $2.1875 | | 1,400 | | 68,600 |
| Real Estate—.8% | | | | |
| Equity Office Properties Trust, | | | | |
| Ser. B, Cum. Conv., $2.625 | | 7,840 | | 404,740 |
| U.S. Government Agencies—.3% | | | | |
| Federal National Mortgage Association: | | | | |
| Conv., $ 1.344 | | 100 | | 105,000 |
| Non Conv., $ 1.75 | | 900 | | 51,244 |
| | | | | 156,244 |
| Total Preferred Stocks | | | | |
| (cost $648,061) | | | | 689,490 |
| |
| |
|
| | | Face Amount | | |
| | | Covered by | | |
| Options—.0% | | Contracts ($) | | Value ($) |
| |
| |
|
| Call Options; | | | | |
| U.S. Treasury Notes, | | | | |
| 3%, 2/15/2009, | | | | |
| February 2005 @ $101.109 | | 2,270,000 | | 177 |
The Fund 21
S T A T E M E N T O F I N V E S T M E N T S (continued)
| | | Face Amount | | |
| | | Covered by | | |
| Options (continued) | | Contracts ($) | | Value ($) |
| |
| |
|
| Put Options; | | | | |
| U.S. Treasury Notes, | | | | |
| 4.25%, 11/15/2014, March 2005 @ $98.008 | | 1,090,000 | | 4,807 |
| Total Options | | | | |
| (cost $28,799) | | | | 4,984 |
| |
| |
|
| |
| Investment of Cash Collateral | | | | |
| for Securities Loaned—4.4% | | Shares | | Value ($) |
| |
| |
|
| Registered Investment Company; | | | | |
| Dreyfus Institutional Cash Advantage Plus Fund | | | | |
| (cost $2,374,338) | | 2,374,338 i | | 2,374,338 |
| |
| |
|
| |
| Total Investments (cost $60,697,574) | | 115.6% | | 61,868,628 |
| Liabilities, Less Cash and Receivables | | (15.6%) | | (8,341,753) |
| Net Assets | | 100.0% | | 53,526,875 |
a Principal amount stated in U.S. Dollars unless otherwise noted. CHF—Swiss Francs EUR—Euros b Variable rate security—interest rate subject to periodic change. c Securities exempt from registration under Rule 144A of the Securities Act of 1933.These securities may be resold in transactions exempt from registration, normally to qualified institutional buyers.These securities have been deemed to be liquid by the Board of Trustees. At December 31, 2004, these securities amounted to $5,180,369 or 9.7% of net assets. d Zero coupon until a specified date at which time the stated coupon rate becomes effective until maturity. e All or a portion of these securities are on loan.At December 31, 2004, the total market value of the fund’s securities on loan is $2,313,380 and the total market value of the collateral held by the fund is $2,374,338. f Notional face amount shown. g Principal amount for accrual purposes is periodically adjusted based on changes in the Consumer Price Index. h Purchased on a forward commitment basis. i Investment in affiliated money market mutual fund.
| Portfolio Summary (Unaudited)† | | | | |
| |
| | | Value (%) | | | | Value (%) |
| |
| |
| |
|
| Corporate Bonds | | 38.4 | | Money Market Investments | | 4.4 |
| U.S.Government/Agency Securities | | 37.4 | | State Government | | 1.7 |
| Mortgage/Asset Backed | | 24.5 | | Preferred Stock | | 1.3 |
| Foreign | | 7.9 | | | | 115.6 |
| |
| † Based on net assets. | | | | | | |
| See notes to financial statements. | | | | | | |
| |
| 22 | | | | | | |
| STATEMENT OF OPTIONS WRITTEN |
| December 31, 2004 |
| Put Options | | | | |
| | | Face Amount | | |
| | | Covered by | | |
| Issuer | | Contracts ($) | | Value ($) |
| |
| |
|
| U.S. Treasury Notes, | | | | |
| 4.25%, 11/15/2014, March 2005 @ $ 96.195 | | |
| (Premiums received $15,498) | | 2,180,000 | | 2,790 |
See notes to financial statements.
|
The Fund 23
| STATEMENT OF ASSETS AND LIABILITIES |
| December 31, 2004 |
| | | Cost | | Value |
| |
| |
|
| Assets ($): | | | | |
| Investments in securities—See Statement of | | | | |
| Investments (including securities on loan, | | | | |
| valued at $2,313,380)—Note 1(c): | | | | |
| Unaffiliated issuers | | 58,323,236 | | 59,494,290 |
| Affiliated issuers | | 2,374,338 | | 2,374,338 |
| Dividends and interest receivable | | | | 476,355 |
| Receivable for shares of Beneficial Interest subscribed | | 40,179 |
| Unrealized appreciation on swaps—Note 4 | | | | 34,146 |
| Receivable from broker for swap transactions—Note 4 | | 239 |
| | | | | 62,419,547 |
| |
| |
|
| Liabilities ($): | | | | |
| Due to The Dreyfus Corporation and affiliates—Note 3(b) | | 47,610 |
| Cash overdraft due to Custodian | | | | 121,235 |
| Payable for investment securities purchased | | | | 6,264,722 |
| Liability for securities on loan—Note 1(c) | | | | 2,374,338 |
| Unrealized depreciation on forward currency | | | | |
| exchange contracts—Note 4 | | | | 55,504 |
| Unrealized depreciation on swaps—Note 4 | | | | 15,087 |
| Payable for shares of Beneficial Interest redeemed | | 11,386 |
| Outstanding options written, at value (premiums | | |
| received $15,498)—See Statement of Options Written | | 2,790 |
| | | | | 8,892,672 |
| |
| |
|
| Net Assets ($) | | | | 53,526,875 |
| |
| |
|
| Composition of Net Assets ($): | | | | |
| Paid-in capital | | | | 59,928,502 |
| Accumulated distributions in excess of investment income—net | | | | (89,897) |
| Accumulated net realized gain (loss) on investments | | | | | | (7,466,037) |
| Accumulated net unrealized appreciation (depreciation) | | | | |
| on investments and foreign currency transactions | | | | | | 1,154,307 |
| |
| |
| |
|
| Net Assets ($) | | | | | | | | 53,526,875 |
| |
| |
| |
| |
|
| |
| |
| Net Asset Value Per Share | | | | | | | | |
| | | Class A | | Class B | | Class C | | Class R |
| |
| |
| |
| |
|
| Net Assets ($) | | 43,466,419 | | 6,536,890 | | 1,597,928 | | 1,925,638 |
| Shares Outstanding | | 3,974,931 | | 597,853 | | 146,015 | | 176,253 |
| |
| |
| |
| |
|
| Net Asset Value Per Share ($) | | 10.94 | | 10.93 | | 10.94 | | 10.93 |
See notes to financial statements.
|
| STATEMENT OF OPERATIONS |
| Year Ended December 31, 2004 |
| Investment Income ($): | | |
| Income: | | |
| Interest | | 2,373,853 |
| Cash dividends | | 24,580 |
| Income from securities lending | | 7,892 |
| Total Income | | 2,406,325 |
| Expenses: | | |
| Management fee—Note 3(a) | | 386,804 |
| Distribution and service fees—Note 3(b) | | 208,165 |
| Loan commitment fees—Note 2 | | 559 |
| Total Expenses | | 595,528 |
| Investment Income—Net | | 1,810,797 |
| |
|
| Realized and Unrealized Gain (Loss) on Investments—Note 4 ($): |
| Net realized gain (loss) on investments and foreign currency transactions | | 1,504,788 |
| Net realized gain (loss) on options transactions | | 83,007 |
| Net realized gain (loss) on swap transactions | | 75,269 |
| Net realized gain (loss) on forward currency exchange contracts | | (383,518) |
| Net Realized Gain (Loss) | | 1,279,546 |
| Net unrealized appreciation (depreciation) on investments, options, | | |
| foreign currency transactions and swap transactions | | (473,181) |
| Net Realized and Unrealized Gain (Loss) on Investments | | 806,365 |
| Net Increase in Net Assets Resulting from Operations | | 2,617,162 |
See notes to financial statements.
|
The Fund 25
STATEMENT OF CHANGES IN NET ASSETS
| | | Year Ended December 31, |
| |
|
| | | 2004 | | 2003 |
| |
| |
|
| Operations ($): | | | | |
| Investment income—net | | 1,810,797 | | 1,831,974 |
| Net realized gain (loss) on investments | | 1,279,546 | | 1,124,467 |
| Net unrealized appreciation | | | | |
| (depreciation) on investments | | (473,181) | | 273,748 |
| Net Increase (Decrease) in Net Assets | | | | |
| Resulting from Operations | | 2,617,162 | | 3,230,189 |
| |
| |
|
| Dividends to Shareholders from ($): | | | | |
| Investment income—net: | | | | |
| Class A shares | | (1,857,056) | | (1,639,080) |
| Class B shares | | (294,406) | | (321,778) |
| Class C shares | | (58,188) | | (50,998) |
| Class R shares | | (89,430) | | (128,194) |
| Net realized gain on investments: | | | | |
| Class A shares | | (162,127) | | (191,821) |
| Class B shares | | (24,367) | | (45,150) |
| Class C shares | | (5,995) | | (7,407) |
| Class R shares | | (7,103) | | (15,330) |
| Total Dividends | | (2,498,672) | | (2,399,758) |
| |
| |
|
| Beneficial Interest Transactions ($): | | | | |
| Net proceeds from shares sold: | | | | |
| Class A shares | | 4,553,755 | | 2,714,221 |
| Class B shares | | 924,770 | | 803,504 |
| Class C shares | | 712,131 | | 243,918 |
| Class R shares | | 43,431 | | 624,957 |
| Dividends reinvested: | | | | |
| Class A shares | | 1,676,686 | | 1,538,344 |
| Class B shares | | 207,747 | | 234,934 |
| Class C shares | | 26,626 | | 23,252 |
| Class R shares | | 70,620 | | 119,763 |
| Cost of shares redeemed: | | | | |
| Class A shares | | (6,678,813) | | (8,623,372) |
| Class B shares | | (4,912,989) | | (3,353,257) |
| Class C shares | | (832,552) | | (580,018) |
| Class R shares | | (396,870) | | (1,970,340) |
| Increase (Decrease) in Net Assets | | | | |
| from Beneficial Interest Transactions | | (4,605,458) | | (8,224,094) |
| Total Increase (Decrease) in Net Assets | | (4,486,968) | | (7,393,663) |
| |
| |
|
| Net Assets ($): | | | | |
| Beginning of Period | | 58,013,843 | | 65,407,506 |
| End of Period | | 53,526,875 | | 58,013,843 |
| Undistributed (distributions in excess of) | | | | |
| investment income—net | | (89,897) | | 134,313 |
| 26 | | | | |
| | | Year Ended December 31, |
| |
|
| | | 2004 | | 2003 |
| |
| |
|
| Capital Share Transactions: | | | | |
| Class A a | | | | |
| Shares sold | | 417,605 | | 250,306 |
| Shares issued for dividends reinvested | | 153,629 | | 141,478 |
| Shares redeemed | | (614,523) | | (797,689) |
| Net Increase (Decrease) in Shares Outstanding | | (43,289) | | (405,905) |
| |
| |
|
| Class B a | | | | |
| Shares sold | | 84,696 | | 74,092 |
| Shares issued for dividends reinvested | | 19,036 | | 21,608 |
| Shares redeemed | | (451,478) | | (309,933) |
| Net Increase (Decrease) in Shares Outstanding | | (347,746) | | (214,233) |
| |
| |
|
| Class C | | | | |
| Shares sold | | 64,695 | | 22,348 |
| Shares issued for dividends reinvested | | 2,437 | | 2,137 |
| Shares redeemed | | (76,179) | | (53,386) |
| Net Increase (Decrease) in Shares Outstanding | | (9,047) | | (28,901) |
| |
| |
|
| Class R | | | | |
| Shares sold | | 3,963 | | 57,462 |
| Shares issued for dividends reinvested | | 6,477 | | 11,025 |
| Shares redeemed | | (36,370) | | (181,593) |
| Net Increase (Decrease) in Shares Outstanding | | (25,930) | | (113,106) |
| a | | During the period ended December 31, 2004, 181,667 Class B shares representing $1,976,034 were |
| | | automatically converted to 181,651 Class A shares and during the period ended December 31, 2003, 45,778 Class |
| | | B shares representing $497,111 were automatically converted to 45,774 Class A shares. |
| See notes to financial statements. |
The Fund 27
The following tables describe the performance for each share class for the fiscal periods indicated.All information (except portfolio turnover rate) reflects financial results for a single fund share.Total return shows how much your investment in the fund would have increased (or decreased) during each period, assuming you had reinvested all dividends and distributions.These figures have been derived from the fund’s financial statements.
| | | | | Year Ended December 31, | | |
| |
| |
| |
|
| Class A Shares | | 2004 a | | 2003 | | 2002 | | 2001 b | | 2000 |
| |
| |
| |
| |
| |
|
| Per Share Data ($): | | | | | | | | | | |
| Net asset value, beginning of period | | 10.90 | | 10.75 | | 10.37 | | 10.29 | | 9.99 |
| Investment Operations: | | | | | | | | | | |
| Investment income—net | | .37c | | .33c | | .38c | | .52c | | .61 |
| Net realized and unrealized | | | | | | | | | | |
| gain (loss) on investments | | .18 | | .26 | | .42 | | .10 | | .30 |
| Total from Investment Operations | | .55 | | .59 | | .80 | | .62 | | .91 |
| Distributions: | | | | | | | | | | |
| Dividends from investment income—net | | (.47) | | (.39) | | (.42) | | (.54) | | (.61) |
| Dividends from net realized | | | | | | | | | | |
| gain on investments | | (.04) | | (.05) | | — | | — | | — |
| Total Distributions | | (.51) | | (.44) | | (.42) | | (.54) | | (.61) |
| Net asset value, end of period | | 10.94 | | 10.90 | | 10.75 | | 10.37 | | 10.29 |
| |
| |
| |
| |
| |
|
| Total Return (%) d | | 5.15 | | 5.51 | | 7.87 | | 6.09 | | 9.53 |
| |
| |
| |
| |
| |
|
| Ratios/Supplemental Data (%): | | | | | | | | | | |
| Ratio of total expenses to average net assets | | .95 | | .95 | | .95 | | .95 | | .95 |
| Ratio of net investment income | | | | | | | | | | |
| to average net assets | | 3.38 | | 3.06 | | 3.63 | | 5.01 | | 6.16 |
| Portfolio Turnover Rate | | 315.33e | | 469.41e | | 524.46 | | 477.71 | | 531.86 |
| |
| |
| |
| |
| |
|
| Net Assets, end of period ($ X 1,000) | | 43,466 | | 43,811 | | 47,571 | | 49,729 | | 51,527 |
| a As of January 1, 2004, the fund has adopted the method of accounting for interim payments on swap contracts in |
| accordance with Financial Accounting Standards Board Statement No. 133.These interim payments are reflected |
| within net realized and unrealized gain (loss) on swap contracts, however, prior to January 1, 2004, these interim |
| payments were reflected within interest income/expense in the Statement of Operations.The effect of these changes for |
| the fiscal year ended December 31, 2004, was to decrease net investment income per share by $.02, increase net |
| realized and unrealized gain (loss) on investments per share by $.02 and decrease the ratio of net investment income |
| to average net assets from 3.52% to 3.38%. |
| b As required, effective January 1, 2001, the fund has adopted the provisions of the AICPA Audit and Accounting |
| Guide for Investment Companies and began accreting discount or amortizing premium on fixed income securities on a |
| scientific basis and including paydown gains and losses in interest income.The effect of this change for the period |
| ended December 31, 2001 was to decrease net investment income per share by $.02, increase net realized and |
| unrealized gain (loss) on investments per share by $.02 and decrease the ratio of net investment income to average net |
| assets from 5.16% to 5.01%. Per share data and ratios/supplemental data for periods prior to January 1, 2001 |
| have not been restated to reflect this change in presentation. |
| c Based on average shares outstanding at each month end. |
| d Exclusive of sales charge. |
| e The portfolio turnover rates excluding mortgage dollar roll transactions for the years ended December 31, 2004 and |
| December 31, 2003 were 189.68% and 272.57%, respectively. |
See notes to financial statements.
28
| | | | | Year Ended December 31, | | |
| |
| |
| |
|
| Class B Shares | | 2004 a | | 2003 | | 2002 | | 2001 b | | 2000 |
| |
| |
| |
| |
| |
|
| Per Share Data ($): | | | | | | | | | | |
| Net asset value, beginning of period | | 10.90 | | 10.75 | | 10.37 | | 10.29 | | 9.99 |
| Investment Operations: | | | | | | | | | | |
| Investment income—net | | .30c | | .25c | | .30c | | .44c | | .54 |
| Net realized and unrealized | | | | | | | | | | |
| gain (loss) on investments | | .16 | | .25 | | .42 | | .10 | | .30 |
| Total from Investment Operations | | .46 | | .50 | | .72 | | .54 | | .84 |
| Distributions: | | | | | | | | | | |
| Dividends from investment income—net | | (.39) | | (.30) | | (.34) | | (.46) | | (.54) |
| Dividends from net realized | | | | | | | | | | |
| gain on investments | | (.04) | | (.05) | | — | | — | | — |
| Total Distributions | | (.43) | | (.35) | | (.34) | | (.46) | | (.54) |
| Net asset value, end of period | | 10.93 | | 10.90 | | 10.75 | | 10.37 | | 10.29 |
| |
| |
| |
| |
| |
|
| Total Return (%) d | | 4.27 | | 4.73 | | 7.07 | | 5.30 | | 8.73 |
| |
| |
| |
| |
| |
|
| Ratios/Supplemental Data (%): | | | | | | | | | | |
| Ratio of total expenses to average net assets | | 1.70 | | 1.70 | | 1.70 | | 1.70 | | 1.70 |
| Ratio of net investment income | | | | | | | | | | |
| to average net assets | | 2.77 | | 2.31 | | 2.91 | | 4.27 | | 5.41 |
| Portfolio Turnover Rate | | 315.33e | | 469.41e | | 524.46 | | 477.71 | | 531.86 |
| |
| |
| |
| |
| |
|
| Net Assets, end of period ($ X 1,000) | | 6,537 | | 10,309 | | 12,470 | | 14,172 | | 15,069 |
| a As of January 1, 2004, the fund has adopted the method of accounting for interim payments on swap contracts in |
| accordance with Financial Accounting Standards Board Statement No. 133.These interim payments are reflected |
| within net realized and unrealized gain (loss) on swap contracts, however, prior to January 1, 2004, these interim |
| payments were reflected within interest income/expense in the Statement of Operations.The effect of these changes for |
| the fiscal year ended December 31, 2004, was to decrease net investment income per share by $.01, increase net |
| realized and unrealized gain (loss) on investments per share by $.01 and decrease the ratio of net investment income |
| to average net assets from 2.88% to 2.77%. |
| b As required, effective January 1, 2001, the fund has adopted the provisions of the AICPA Audit and Accounting |
| Guide for Investment Companies and began accreting discount or amortizing premium on fixed income securities on a |
| scientific basis and including paydown gains and losses in interest income.The effect of this change for the period |
| ended December 31, 2001 was to decrease net investment income per share by $.02, increase net realized and |
| unrealized gain (loss) on investments per share by $.02 and decrease the ratio of net investment income to average net |
| assets from 4.42% to 4.27%. Per share data and ratios/supplemental data for periods prior to January 1, 2001 |
| have not been restated to reflect this change in presentation. |
| c Based on average shares outstanding at each month end. |
| d Exclusive of sales charge. |
| e The portfolio turnover rates excluding mortgage dollar roll transactions for the years ended December 31, 2004 and |
| December 31, 2003 were 189.68% and 272.57%, respectively. |
See notes to financial statements.
The Fund 29
FINANCIAL HIGHLIGHTS (continued)
|
| | | | | Year Ended December 31, | | |
| |
| |
| |
|
| Class C Shares | | 2004 a | | 2003 | | 2002 | | 2001 b | | 2000 |
| |
| |
| |
| |
| |
|
| Per Share Data ($): | | | | | | | | | | |
| Net asset value, beginning of period | | 10.91 | | 10.76 | | 10.38 | | 10.30 | | 10.00 |
| Investment Operations: | | | | | | | | | | |
| Investment income—net | | .29c | | .25c | | .31c | | .45c | | .54 |
| Net realized and unrealized | | | | | | | | | | |
| gain (loss) on investments | | .17 | | .25 | | .41 | | .09 | | .30 |
| Total from Investment Operations | | .46 | | .50 | | .72 | | .54 | | .84 |
| Distributions: | | | | | | | | | | |
| Dividends from investment income—net | | (.39) | | (.30) | | (.34) | | (.46) | | (.54) |
| Dividends from net realized | | | | | | | | | | |
| gain on investments | | (.04) | | (.05) | | — | | — | | — |
| Total Distributions | | (.43) | | (.35) | | (.34) | | (.46) | | (.54) |
| Net asset value, end of period | | 10.94 | | 10.91 | | 10.76 | | 10.38 | | 10.30 |
| |
| |
| |
| |
| |
|
| Total Return (%) d | | 4.28 | | 4.73 | | 7.06 | | 5.29 | | 8.73 |
| |
| |
| |
| |
| |
|
| Ratios/Supplemental Data (%): | | | | | | | | | | |
| Ratio of total expenses to average net assets | | 1.70 | | 1.70 | | 1.70 | | 1.70 | | 1.70 |
| Ratio of net investment income | | | | | | | | | | |
| to average net assets | | 2.66 | | 2.31 | | 2.92 | | 4.30 | | 5.42 |
| Portfolio Turnover Rate | | 315.33e | | 469.41e | | 524.46 | | 477.71 | | 531.86 |
| |
| |
| |
| |
| |
|
| Net Assets, end of period ($ X 1,000) | | 1,598 | | 1,692 | | 1,980 | | 2,245 | | 2,834 |
| a | | As of January 1, 2004, the fund has adopted the method of accounting for interim payments on swap contracts in |
| | | accordance with Financial Accounting Standards Board Statement No. 133.These interim payments are reflected |
| | | within net realized and unrealized gain (loss) on swap contracts, however, prior to January 1, 2004, these interim |
| | | payments were reflected within interest income/expense in the Statement of Operations.The effect of these changes for |
| | | the fiscal year ended December 31, 2004, was to decrease net investment income per share by $.01, increase net |
| | | realized and unrealized gain (loss) on investments per share by $.01 and decrease the ratio of net investment income |
| | | to average net assets from 2.80% to 2.66%. |
| b | | As required, effective January 1, 2001, the fund has adopted the provisions of the AICPA Audit and Accounting |
| | | Guide for Investment Companies and began accreting discount or amortizing premium on fixed income securities on a |
| | | scientific basis and including paydown gains and losses in interest income.The effect of this change for the period |
| | | ended December 31, 2001 was to decrease net investment income per share by $.02, increase net realized and |
| | | unrealized gain (loss) on investments per share by $.02 and decrease the ratio of net investment income to average net |
| | | assets from 4.44% to 4.30%. Per share data and ratios/supplemental data for periods prior to January 1, 2001 |
| | | have not been restated to reflect this change in presentation. |
| c | | Based on average shares outstanding at each month end. |
| d | | Exclusive of sales charge. |
| e | | The portfolio turnover rates excluding mortgage dollar roll transactions for the years ended December 31, 2004 and |
| | | December 31, 2003 were 189.68% and 272.57%, respectively. |
| See notes to financial statements. |
| 30 | | |
| | | | | Year Ended December 31, | | |
| |
| |
| |
|
| Class R Shares | | 2004 a | | 2003 | | 2002 | | 2001 b | | 2000 |
| |
| |
| |
| |
| |
|
| Per Share Data ($): | | | | | | | | | | |
| Net asset value, beginning of period | | 10.89 | | 10.74 | | 10.36 | | 10.28 | | 9.98 |
| Investment Operations: | | | | | | | | | | |
| Investment income—net | | .39c | | .37c | | .41c | | .56c | | .65 |
| Net realized and unrealized | | | | | | | | | | |
| gain (loss) on investments | | .19 | | .24 | | .41 | | .08 | | .29 |
| Total from Investment Operations | | .58 | | .61 | | .82 | | .64 | | .94 |
| Distributions: | | | | | | | | | | |
| Dividends from investment income—net | | (.50) | | (.41) | | (.44) | | (.56) | | (.64) |
| Dividends from net realized | | | | | | | | | | |
| gain on investments | | (.04) | | (.05) | | — | | — | | — |
| Total Distributions | | (.54) | | (.46) | | (.44) | | (.56) | | (.64) |
| Net asset value, end of period | | 10.93 | | 10.89 | | 10.74 | | 10.36 | | 10.28 |
| |
| |
| |
| |
| |
|
| Total Return (%) | | 5.43 | | 5.78 | | 8.14 | | 6.24 | | 9.92 |
| |
| |
| |
| |
| |
|
| Ratios/Supplemental Data (%): | | | | | | | | | | |
| Ratio of total expenses to average net assets | | .70 | | .70 | | .70 | | .70 | | .70 |
| Ratio of net investment income | | | | | | | | | | |
| to average net assets | | 3.61 | | 3.70 | | 3.88 | | 5.34 | | 6.41 |
| Portfolio Turnover Rate | | 315.33d | | 469.41d | | 524.46 | | 477.71 | | 531.86 |
| |
| |
| |
| |
| |
|
| Net Assets, end of period ($ X 1,000) | | 1,926 | | 2,202 | | 3,387 | | 3,595 | | 4,813 |
| a As of January 1, 2004, the fund has adopted the method of accounting for interim payments on swap contracts in |
| accordance with Financial Accounting Standards Board Statement No. 133.These interim payments are reflected |
| within net realized and unrealized gain (loss) on swap contracts, however, prior to January 1, 2004, these interim |
| payments were reflected within interest income/expense in the Statement of Operations.The effect of these changes for |
| the fiscal year ended December 31, 2004, was to decrease net investment income per share by $.02, increase net |
| realized and unrealized gain (loss) on investments per share by $.02 and decrease the ratio of net investment income |
| to average net assets from 3.74% to 3.61%. |
| b As required, effective January 1, 2001, the fund has adopted the provisions of the AICPA Audit and Accounting |
| Guide for Investment Companies and began accreting discount or amortizing premium on fixed income securities on a |
| scientific basis and including paydown gains and losses in interest income.The effect of this change for the period |
| ended December 31, 2001 was to decrease net investment income per share by $.01, increase net realized and |
| unrealized gain (loss) on investments per share by $.01 and decrease the ratio of net investment income to average net |
| assets from 5.49% to 5.34%. Per share data and ratios/supplemental data for periods prior to January 1, 2001 |
| have not been restated to reflect this change in presentation. |
| c Based on average shares outstanding at each month end. |
| d The portfolio turnover rates excluding mortgage dollar roll transactions for the years ended December 31, 2004 and |
| December 31, 2003 were 189.68% and 272.57%, respectively. |
See notes to financial statements.
The Fund 31
NOTES TO FINANCIAL STATEMENTS
NOTE 1—Significant Accounting Policies:
Dreyfus Premier Managed Income Fund (the “fund”) is a separate diversified series of The Dreyfus/Laurel Funds Trust (the “Trust”), which is registered under the Investment Company Act of 1940, as amended (the “Act”), as an open-end management investment company and operates as a series company currently offering three series, including the fund. The fund’s investment objective is to seek high current income consistent with what is believed to be prudent risk of capital primarily through investments in investment-grade corporate and U.S. Government obligations which primarily have maturities of 10 years or less. The Dreyfus Corporation (the “Manager” or “Dreyfus”) serves as the fund’s investment manager. The Manager is a wholly-owned subsidiary of Mellon Financial Corporation (“Mellon Financial”).
Dreyfus Service Corporation (the “Distributor”), a wholly-owned subsidiary of the Manager, is the distributor of the fund’s shares.The fund is authorized to issue an unlimited number of shares of Beneficial Interest in the following classes of shares: Class A, Class B, Class C and Class R. Class A, Class B and Class C shares are sold primarily to retail investors through financial intermediaries and bear a distribution fee and/or service fee. Class A shares are sold with a front-end sales charge, while Class B and Class C shares are subject to a contingent deferred sales charge (“CDSC”). Class B shares automatically convert to Class A shares after six years. Class R shares are sold primarily to bank trust departments and other financial service providers (including Mellon Bank and its affiliates) acting on behalf of customers having a qualified trust or investment account or relationship at such institution, and bear no distribution fee or service fee. Class R shares are offered without a front-end sales charge or CDSC. Each class of shares has identical rights and privileges, except with respect to distribution fees and voting rights on matters affecting a single class. Income, expenses (other than expenses attributable to a specific class), and realized and unrealized gains or losses on investments are allocated to each class of shares based on its relative net assets.
The fund’s financial statements are prepared in accordance with U.S. generally accepted accounting principles, which may require the use of management estimates and assumptions. Actual results could differ from those estimates.
(a) Portfolio valuation: Investments in securities (excluding short-term investments (other than U.S. Treasury Bills), financial futures, options, swaps and forward currency exchange contracts) are valued each business day by an independent pricing service (the “Service”) approved by the Board of Trustees. Investments for which quoted bid prices are readily available and are representative of the bid side of the market in the judgment of the Service are valued at the mean between the quoted bid prices (as obtained by the Service from dealers in such securities) and asked prices (as calculated by the Service based upon its evaluation of the market for such securities). Other investments (which constitute a majority of the portfolio securities) are valued as determined by the Service, based on methods which include consideration of: yields or prices of securities of comparable quality, coupon, maturity and type; indications as to values from dealers; and general market conditions. Securities for which there are no such valuations are valued at fair value as determined in good faith under the direction of the Board of Trustees. Restricted securities, as well as securities or other assets for which recent market quotations are not readily available and are not valued by a pricing service approved by the Board of Trustees, or are determined by the fund not to reflect accurately fair value (such as when an event occurs after the close of the exchange on which the security is principally traded and that is determined by the fund to have changed the value of the security), are valued at fair value as determined in good faith under the direction of the Board of Trustees.The factors that may be considered when fair valuing a security include fundamental analytical data, the nature and duration of restrictions on disposition, an evaluation of the forces that influence the market in which the securities are purchased and sold and public trading in similar securities of the issuer or comparable issuers. Short-term investments,
The Fund 33
NOTES TO FINANCIAL STATEMENTS (continued)
|
excluding U.S. Treasury Bills, are carried at amortized cost, which approximates value. Financial futures and options, which are traded on an exchange, are valued at the last sales price on the securities exchange on which such securities are primarily traded or at the last sales price on the national securities market on each business day. Options traded over-the-counter are priced at the mean between the bid and asked prices. Investments denominated in foreign currencies are translated to U.S. dollars at the prevailing rates of exchange. Forward currency exchange contracts are valued at the forward rate. Swap transactions are valued daily based upon future cash flows and other factors, such as interest rates and underlying securities.
(b) Foreign currency transactions: The fund does not isolate that portion of the results of operations resulting from changes in foreign exchange rates on investments from the fluctuations arising from changes in the market prices of securities held. Such fluctuations are included with the net realized and unrealized gain or loss on investments.
Net realized foreign exchange gains or losses arise from sales and maturities of short-term securities, sales of foreign currencies, currency gains or losses realized on securities transactions and the difference between the amount of dividends, interest and foreign withholding taxes recorded on the fund’s books and the U.S. dollar equivalent of the amounts actually received or paid. Net unrealized foreign exchange gains and losses arise from changes in the value of assets and liabilities other than investments in securities, resulting from changes in exchange rates. Such gains and losses are included with net realized and unrealized gain or loss on investments.
(c) Securities transactions and investment income: Securities transactions are recorded on a trade date basis. Realized gain and loss from securities transactions are recorded on the identified cost basis. Dividend income is recorded on the ex-dividend date and interest income, including, where applicable, accretion of discount and amortization of premium on investments, is recognized on the accrual basis.
Pursuant to a securities lending agreement with Mellon Bank, N.A., an affiliate of the Manager, the fund may lend securities to qualified institutions.At origination, all loans are secured by collateral of at least 102% of the value of U.S. securities loaned and 105% of the value of foreign securities loaned. Collateral equivalent to at least 100% of the market value of securities on loan will be maintained at all times. Cash collateral is invested in certain money market mutual funds managed by the Manager. The fund will be entitled to receive all income on securities loaned, in addition to income earned as a result of the lending transaction. Although each security loaned is fully collateralized, the fund would bear the risk of delay in recovery of, or loss of rights in, the securities loaned should a borrower fail to return the securities in a timely manner.
(d) Affiliated issuers: Investments in other investment companies advised by the Manager are defined as “affiliated” in the Act.
(e) Concentration of Risk: The fund invests primarily in debt securities. Failure of an issuer of the debt securities to make timely interest or principal payments, or a decline or the perception of a decline in the credit quality of a debt security, can cause the debt security’s price to fall, potentially lowering the fund’s share price. In addition the value of debt securities may decline due to general market conditions that are not specifically related to a particular company, such as real or perceived adverse economic conditions, changes in outlook for corporate earnings, changes in interest or currency rates or adverse investor sentiment.They may also decline because of factors that affect a particular industry.
(f) Dividends to shareholders: It is the policy of the fund to declare dividends daily from investment income-net. Such dividends are paid monthly. Dividends from net realized capital gain, if any, are normally declared and paid annually, but the fund may make distributions on a more frequent basis to comply with the distribution requirements of
The Fund 35
NOTES TO FINANCIAL STATEMENTS (continued)
|
the Internal Revenue Code of 1986, as amended (the “Code”).To the extent that net realized capital gain can be offset by capital loss carryovers, it is the policy of the fund not to distribute such gain.
(g) Federal income taxes: It is the policy of the fund to continue to qualify as a regulated investment company, if such qualification is in the best interests of its shareholders, by complying with the applicable provisions of the Code, and to make distributions of taxable income sufficient to relieve it from substantially all federal income and excise taxes.
At December 31, 2004, the components of accumulated earnings on a tax basis were as follows: undistributed ordinary income $395,595, accumulated capital losses $7,273,546 and unrealized appreciation $476,324.
The accumulated capital loss carryover is available to be applied against future net securities profits, if any, realized subsequent to December 31, 2004. If not applied, $4,432,909 of the carryover expires in fiscal 2007 and $2,840,637 expires in fiscal 2008.
The tax character of distributions paid to shareholders during the fiscal periods ended December 31, 2004 and December 31, 2003 were as follows: ordinary income $2,498,672 and $2,399,758, respectively.
During the period ended December 31, 2004, as a result of permanent book to tax differences primarily due to the tax treatment for amortization of premiums, the expiration of capital loss carryover and foreign currency transactions, the fund increased accumulated undistributed investment income-net by $264,073, decreased accumulated net realized gain (loss) on investments by $50,605 and decreased paid-in capital by $213,468. Net assets were not affected by this reclassification.
NOTE 2—Bank Line of Credit:
|
The fund participates with other Dreyfus-managed funds in a $350 million redemption credit facility (the “Facility”) to be utilized for temporary or emergency purposes, including the financing of redemptions. In connection therewith, the fund has agreed to pay commitment fees on its pro rata portion of the Facility. Interest is charged to the fund
based on prevailing market rates in effect at the time of borrowings. During the period ended December 31, 2004, the fund did not borrow under the Facility.
NOTE 3—Investment Management Fee and Other Transactions With Affiliates:
(a) Pursuant to an Investment Management agreement with the Manager, the Manager provides or arranges for one or more third parties and/or affiliates to provide investment advisory, administrative, custody, fund accounting and transfer agency services to the fund. The Manager also directs the investments of the fund in accordance with its investment objective, policies and limitations. For these services, the fund is contractually obligated to pay the Manager a fee, calculated daily and paid monthly, at the annual rate of .70% of the value of the fund’s average daily net assets. Out of its fee, the Manager pays all of the expenses of the fund except brokerage fees, taxes, interest, commitment fees, Rule 12b-1 distribution fees and expenses, service fees, fees and expenses of non-interested Trustees (including counsel fees) and extraordinary expenses. In addition, the Manager is required to reduce its fee in an amount equal to the fund’s allocable portion of fees and expenses of the non-interested Trustees (including counsel fees). Each Trustee receives $40,000 per year, plus $5,000 for each joint Board meeting of The Dreyfus/Laurel Funds, Inc., The Dreyfus/Laurel Tax-Free Municipal Funds, and the Trust (the “Dreyfus/Laurel Funds”) attended, $2,000 for separate committee meetings attended which are not held in conjunction with a regularly scheduled board meeting and $500 for Board meetings and separate committee meetings attended that are conducted by telephone and is reimbursed for travel and out-of-pocket expenses. The Chairman of the Board receives an additional 25% of such compensation (with the exception of reimbursable amounts). These fees pertain to the Dreyfus/Laurel Funds and are charged and allocated to each series based on net assets. In the event that there is a joint committee meeting of the Dreyfus/Laurel Funds and the Dreyfus
The Fund 37
The components of Due to The Dreyfus Corporation and affiliates in the Statement of Assets and Liabilities consist of: management fees $31,413, Rule 12b-1 distribution plan fees $14,457 and shareholder services plan fees $1,740.
NOTE 4—Securities Transactions:
The aggregate amount of purchases and sales (including paydowns) of investment securities, excluding short-term securities, forward currency exchange contracts, options transactions and swap transactions during the period ended December 31, 2004, amounted to $190,283,588 and $195,759,898, respectively, of which $75,820,288 in purchases and $76,101,128 in sales were from dollar roll transactions.
The fund may enter into dollar roll transactions with respect to mortgage-backed securities. In a dollar roll transaction, the fund sells mortgage-backed securities to a financial institution and simultaneously agrees to accept substantially similar (same type, coupon and maturity) securities at a later date, at an agreed upon price.
In addition, the following table summarizes the fund’s call/put options written during the period ended December 31, 2004:
| | | Face Amount | | | | Options Terminated |
| | | | | |
|
| | | Covered by | | Premiums | | | | Net Realized |
| Options Written: | | Contracts ($) | | Received ($) | | Cost ($) | | Gain/(Loss) ($) |
| |
| |
| |
| |
|
| Contracts outstanding | | | | | | | | |
| December 31, 2003 | | 7,050,000 | | 66,385 | | — | | — |
| Contracts written | | 37,665,000 | | 210,331 | | | | |
| Contracts Terminated; | | | | | | | | |
| Closed | | 11,125,000 | | 73,089 | | 127,981 | | (54,892) |
| Expired | | 31,410,000 | | 188,129 | | — | | 188,129 |
| Total Contracts | | | | | | | | |
| Terminated | | 42,535,000 | | 261,218 | | 127,981 | | 133,237 |
| Contracts outstanding | | | | | | | | |
| December 31, 2004 | | 2,180,000 | | 15,498 | | | | |
The fund may purchase and write (sell) call/put options in order to gain exposure to or protect against change in the market.
The Fund 39
NOTES TO FINANCIAL STATEMENTS (continued)
|
As a writer of call options, the fund receives a premium at the outset and then bears the market risk of unfavorable changes in the price of the financial instruments underlying the options. Generally, the fund would incur a gain, to the extent of the premium, if the price of the underlying financial instrument decreases between the date the option is written and the date on which the option is terminated. Generally, the fund would realize a loss, if the price of the financial instrument increases between those dates.
As a writer of put options, the fund receives a premium at the outset and then bears the market risk of unfavorable changes in the price of the financial instruments underlying the options. Generally, the fund would incur a gain, to the extent of the premium, if the price of the underlying financial instrument increases between the date the option is written and the date on which the option is terminated. Generally, the fund would realize a loss, if the price of the financial instrument decreases between those dates.
The fund enters into forward currency exchange contracts in order to hedge its exposure to changes in foreign currency exchange rates on its foreign portfolio holdings and to settle foreign currency transactions. When executing forward currency exchange contracts, the fund is obligated to buy or sell a foreign currency at a specified rate on a certain date in the future.With respect to sales of forward currency exchange contracts, the fund would incur a loss if the value of the contract increases between the date the forward contract is opened and the date the forward contract is closed.The fund realizes a gain if the value of the contract decreases between those dates.With respect to purchases of forward currency exchange contracts, the fund would incur a loss if the value of the contract decreases between the date the forward contract is opened and the date the forward contract is closed.The fund realizes a gain if the value of the contract increases between those dates. The fund is also exposed to credit risk associated with counterparty nonperformance on these forward currency exchange contracts which is typically limited to
the unrealized gain on each open contract. The following summarizes open forward currency exchange contracts at December 31, 2004:
| | | Foreign | | | | | | |
| Forward Currency | | Currency | | | | | | Unrealized |
| Exchange Contracts | | Amounts | | Proceeds ($) | | Value ($) | | (Depreciation) ($) |
| |
| |
| |
| |
|
| Sales: | | | | | | | | |
| Euro, | | | | | | | | |
| expiring 3/16/2005 | | 2,602,500 | | 3,478,678 | | 3,530,551 | | (51,873) |
| Swiss Franc, | | | | | | | | |
| expiring 3/16/2005 | | 490,000 | | 426,458 | | 430,089 | | (3,631) |
| Total | | | | | | | | (55,504) |
The fund may enter into swap agreements to exchange the interest rate on, or return generated by, one nominal instrument for the return generated by another nominal instrument.
As of January 1, 2004, the fund has adopted the method of accounting for interim payments on swap contracts in accordance with Financial Accounting Standards Board Statement No. 133.The fund accrues for the interim payments on swap contracts on a daily basis, with the net amount recorded within unrealized appreciation (depreciation) of swap contracts in the Statement of Assets and Liabilities. Once the interim payments are settled in cash, the net amount is recorded as realized gain (loss) on swaps, in addition to realized gain (loss) recorded upon the termination of swaps contracts in the Statement of Operations. Prior to January 1, 2004, these interim payments were reflected within interest income in the Statement of Operations. Fluctuations in the value of swap contracts are recorded as a component of net change in unrealized appreciation (depreciation) on investments.
Total return swaps involve commitments to pay interest in exchange for a market-linked return based on a notional amount. To the extent the total return of the security or index underlying the transaction exceeds or falls short of the offsetting interest rate obligation, the fund will receive a payment from or make a payment to the counterparty, respectively.At December 31, 2004, there were no total return swaps outstanding.
The Fund 41
NOTES TO FINANCIAL STATEMENTS (continued)
|
The fund may enter into interest rate swaps which involve the exchange of commitments to pay and receive interest based on a notional principal amount. Interest rate swaps are marked-to-market daily and change, if any, is recorded as unrealized appreciation or depreciation in the Statement of Operations.The following summarizes interest rate swaps entered into by the fund at December 31, 2004:
| | | | | Unrealized |
| Notional Amount ($) | | Description | | Appreciation ($) |
| |
| |
|
| 270,000 | | Interest Rate Swap Agreement with | | 3,274 |
| | | Bear Stearns terminating November 19, | | |
| | | 2009 to pay 3 month LIBOR and | | |
| | | receive a fixed rate of 3.907% | | |
| 270,000 | | Interest Rate Swap Agreement with | | 3,223 |
| | | Bear Stearns terminating November 22, | | |
| | | 2009 to pay 3 month LIBOR and | | |
| | | receive a fixed rate of 3.85% | | |
| 269,000 | | Interest Rate Swap Agreement with | | 3,238 |
| | | Lehman Brothers terminating | | |
| | | November 18, 2009 to pay 3 month | | |
| | | LIBOR and receive a fixed rate of 3.97% | | |
| 270,000 | | Interest Rate Swap Agreement with | | 3,094 |
| | | Lehman Brothers terminating | | |
| | | December 2, 2009 to pay 3 month | | |
| | | LIBOR and receive a fixed rate of 4.097% | | |
| 135,000 | | Interest Rate Swap Agreement with | | 1,450 |
| | | Lehman Brothers terminating | | |
| | | December 13, 2009 to pay 1 month | | |
| LIBOR and receive a fixed rate of 3.9175% |
| 530,000 | | Interest Rate Swap Agreement with | | 5,536 |
| | | Lehman Brothers terminating | | |
| | | December 17, 2008 to pay 1 month | | |
| LIBOR and receive a fixed rate of 3.68375% |
| Total | | | | 19,815 |
Credit default swaps involve commitments to pay or receive a fixed interest rate in exchange for payment if a credit event affecting a third party (the referenced company) occurs. Credit events may include a failure to pay interest or principal, bankruptcy, or restructuring. For those credit default swaps in which the fund is receiving a fixed rate, the fund is providing credits protection on the underlying instrument. The maximum payouts for these contracts are limited to the notional amount of each swap.
The following summarizes open credit default swap agreements at December 31, 2004:
| | | | | Unrealized |
| | | | | Appreciation |
| Notional Amount ($) | | Description | | (Depreciation) ($) |
| |
| |
|
| 269,000 | | Agreement with Bear Stearns terminating | | (295) |
| | | December 20, 2009 to receive a fixed rate of | | |
| | | 1.25% and pay the notional amount as a | | |
| | | result of interest payment default totaling | | |
| | | $1,000,000 or principal payment default of | | |
| | | $10,000,000 on Altria, 7%, 11/4/2013 | | |
| 127,000 | | Agreement with Lehman Brothers terminating | | (5,883) |
| | | September 20, 2009 to pay a fixed rate of | | |
| | | 4.8% and receive the notional amount as a | | |
| | | result of interest payment default totaling | | |
| | | $1,000,000 or principal payment default of | | |
| $10,000,000 on Bombardier, 6.75%, 5/1/2012 |
| 135,000 | | Agreement with Lehman Brothers terminating | | 128 |
| | | December 20, 2009 to receive a fixed rate of | | |
| .445% and pay the notional amount as a result of |
| interest payment default totaling $1,000,000 or |
| | | principal payment default of $10,000,000 on | | |
| Countrywide Home Loans, 5.625%, 7/15/2009 |
| 530,000 | | Agreement with Bear Stearns terminating | | (1,430) |
| | | December 20, 2008 to receive a fixed rate of | | |
| | | 1.96% and pay the notional amount as a | | |
| | | result of interest payment default totaling | | |
| | | $1,000,000 or principal payment default of | | |
| | | $10,000,000 on GMAC, 6.875%, 8/28/2012 | | |
| 280,000 | | Agreement with Merrill Lynch terminating | | 6,371 |
| June 20, 2009 to receive a fixed rate of 1.56% |
| | | and pay the notional amount as a result of | | |
| | | interest payment default totaling $1,000,000 | | |
| | | or principal payment default of $10,000,000 | | |
| | | on Georgia-Pacific, 8.125%, 5/15/2011 | | |
| 270,000 | | Agreement with Bear Stearns terminating | | 336 |
| | | December 20, 2014 to pay a fixed rate of | | |
| | | .18% and receive the notional amount as a | | |
| | | result of interest payment default totaling | | |
| | | $1,000,000 or principal payment default of | | |
| $10,000,000 on HSBC Bank, 2.11%, 4/12/2006 |
| 280,000 | | Agreement with Merrill Lynch terminating | | (4,801) |
| | | June 20, 2009 to pay a fixed rate of .76% | | |
| | | and receive the notional amount as a result of | | |
| interest payment default totaling $1,000,000 or |
| | | principal payment default of $10,000,000 on | | |
| | | MeadWestvaco, 6.85%, 4/1/2012 | | |
The Fund 43
Risks may arise upon entering into these agreements from the potential inability of the counterparties to meet the terms of the agreement and are generally limited to the amount of net payments to be received, if any, at the date of default.
At December 31, 2004, the cost of investments for federal income tax purposes was $61,431,061; accordingly, accumulated net unrealized appreciation on investments was $437,567, consisting of $773,058 gross unrealized appreciation and $335,491 gross unrealized depreciation.
In early 2004, two purported class and derivative actions were filed against Mellon Financial, Mellon Bank, N.A., Dreyfus, Founders Asset Management LLC, and certain directors of the Dreyfus Funds and the Dreyfus Founders Funds (together, the “Funds”). In September 2004, plaintiffs served a Consolidated Amended Complaint (the “Amended Complaint”) on behalf of a purported class of all persons who acquired interests in any of the Funds between January 30, 1999 and November 17, 2003, and derivatively on behalf of the Funds. The Amended Complaint in the newly styled In re Dreyfus Mutual Funds Fee Litigation also named the Distributor, Premier Mutual Fund Services, Inc. and two additional Fund directors as defendants and alleges violations of the Investment Company Act of 1940, the Investment Advisers Act of 1940, the Pennsylvania Unfair Trade Practices and Consumer Protection Law and common-law claims. Plaintiffs seek to recover allegedly improper and excessive Rule 12b-1 and advisory fees allegedly charged to the Funds for marketing and distribution services. More specifically, plaintiffs claim, among other things, that 12b-1 fees and directed brokerage were improperly used to pay brokers to recommend the Funds over other funds, and that such payments were not disclosed to investors. In addition, plaintiffs assert
The Fund 45
NOTES TO FINANCIAL STATEMENTS (continued)
|
that economies of scale and soft-dollar benefits were not passed on to the Funds. Plaintiffs further allege that 12b-1 fees were improperly charged to certain of the Funds that were closed to new investors.The Amended Complaint seeks compensatory and punitive damages, rescission of the advisory contracts, and an accounting and restitution of any unlawful fees, as well as an award of attorneys’ fees and litigation expenses. As noted, some of the claims in this litigation are asserted derivatively on behalf of the Funds that have been named as nominal defendants.With respect to such derivative claims, no relief is sought against the Funds. Dreyfus believes the allegations to be totally without merit and intends to defend the action vigorously. Defendants filed motions to dismiss the Amended Complaint on November 12, 2004, and those motions are pending.
Additional lawsuits arising out of these circumstances and presenting similar allegations and requests for relief may be filed against the defendants in the future. Neither Dreyfus nor the Funds believe that any of the pending actions will have a material adverse effect on the Funds or Dreyfus’ ability to perform its contract with the Funds.
| REPORT OF INDEPENDENT REGISTERED |
| PUBLIC ACCOUNTING FIRM |
| The Board of Trustees and Shareholders |
| The Dreyfus/Laurel Funds Trust: |
We have audited the accompanying statement of assets and liabilities, including the statements of investments and options written, of Dreyfus Premier Managed Income Fund (the “Fund”) of The Dreyfus/Laurel Funds Trust, as of December 31, 2004, and the related statement of operations for the year then ended, the statement of changes in net assets for each of the two years in the period then ended, and the financial highlights for each of the five years in the period then ended.These financial statements and financial highlights are the responsibility of the Fund’s management. Our responsibility is to express an opinion on these financial statements and financial highlights based on our audits.
We conducted our audits in accordance with the standards of the Public Company Accounting Oversight Board (United States).Those standards require that we plan and perform the audit to obtain reasonable assurance about whether the financial statements and financial highlights are free of material misstatement. An audit includes examining, on a test basis, evidence supporting the amounts and disclosures in the financial statements. Our procedures included confirmation of securities owned as of December 31, 2004, by correspondence with the custodian and brokers. An audit also includes assessing the accounting principles used and significant estimates made by management, as well as evaluating the overall financial statement presentation.We believe that our audits provide a reasonable basis for our opinion.
In our opinion, the financial statements and financial highlights referred to above present fairly, in all material respects, the financial position of Dreyfus Premier Managed Income Fund of The Dreyfus/Laurel Funds Trust as of December 31, 2004 and the results of its operations for the year then ended, the changes in its net assets for each of the two years in the period then ended, and the financial highlights for each of the five years in the period then ended, in conformity with U.S. generally accepted accounting principles.
| New York, New York |
| February 18, 2005 |
The Fund 47
IMPORTANT TAX INFORMATION (Unaudited)
For federal tax purposes, the fund hereby designates 1.04% of the ordinary dividends paid during the fiscal year ended December 31, 2004 as qualifying for the corporate dividends received deduction and also for the fiscal year ended December 31, 2004, certain dividends paid by the fund may be subject to a maximum tax rate of 15%, as provided for by the Jobs and Growth Tax Relief Reconciliation Act of 2003. Of the distributions paid during the fiscal year, $10,169 represents the maximum amount that may be considered qualified dividend income. Shareholders will receive notification in January 2005 of the percentage applicable to the preparation of their 2004 income tax returns.
BOARD MEMBERS INFORMATION (Unaudited)
| Joseph S. DiMartino (61) |
| Chairman of the Board (1999) |
| Principal Occupation During Past 5 Years: |
| • Corporate Director and Trustee |
| | Other Board Memberships and Affiliations:
|
- The Muscular Dystrophy Association, Director
- Levcor International, Inc., an apparel fabric processor, Director
- Century Business Services, Inc., a provider of outsourcing functions for small and medium size companies, Director
- The Newark Group, a provider of a national market of paper recovery facilities, paperboard mills and paperboard converting plants, Director
- Azimuth Trust, an institutional asset management firm, Member of Board of Managers and Advisory Board
| No. of Portfolios for which Board Member Serves: 186 |
| ——————— |
| James Fitzgibbons (70) |
| Board Member (1994) |
Principal Occupation During Past 5 Years:
• Chairman of the Board, Davidson Cotton Company (1998-2002)
Other Board Memberships and Affiliations:
• Bill Barrett Company, an oil and gas exploration company, Director
| No. of Portfolios for which Board Member Serves: 23 |
| ——————— |
| J. Tomlinson Fort (76) |
| Board Member (1987) |
| Principal Occupation During Past 5 Years: |
| • Retired; Of Counsel, Reed Smith LLP (1998-2004) |
| | Other Board Memberships and Affiliations:
|
- Allegheny College, Emeritus Trustee
- Pittsburgh Ballet Theatre,Trustee
- American College of Trial Lawyers, Fellow
| No. of Portfolios for which Board Member Serves: 23 |
| ——————— |
| Kenneth A. Himmel (58) |
| Board Member (1994) |
| | Principal Occupation During Past 5 Years:
|
- President and CEO,Related Urban Development,a real estate development company (1996-present)
- President and CEO, Himmel & Company, a real estate development company (1980-present)
- CEO, American Food Management, a restaurant company (1983-present)
| | No. of Portfolios for which Board Member Serves: 23
|
The Fund 49
BOARD MEMBERS INFORMATION (Unaudited) (continued)
| Stephen J. Lockwood (57) |
| Board Member (1994) |
| | Principal Occupation During Past 5 Years:
|
- Chairman of the Board, Stephen J. Lockwood and Company LLC, an investment company (2000-present)
- Chairman of the Board and CEO, LDG Reinsurance Corporation (1977-2000)
| | Other Board Memberships and Affiliations:
|
- BDML Holdings, an insurance company, Chairman of the Board
- Affiliated Managers Group, an investment management company, Director
| No. of Portfolios for which Board Member Serves: 23 |
| ——————— |
| Roslyn Watson (55) |
| Board Member (1994) |
| Principal Occupation During Past 5 Years: |
| • Principal,Watson Ventures, Inc., a real estate investment company (1993-present) |
| | Other Board Memberships and Affiliations:
|
- American Express Centurion Bank, Director
- The Hyams Foundation Inc., a Massachusetts Charitable Foundation,Trustee
- National Osteoporosis Foundation,Trustee
| No. of Portfolios for which Board Member Serves: 23 |
| ——————— |
| Benaree Pratt Wiley (58) |
| Board Member (1998) |
| | Principal Occupation During Past 5 Years:
|
- President and CEO,The Partnership, an organization dedicated to increasing the representation of African Americans in positions of leadership, influence and decision-making in Boston, MA (1991-present)
| | Other Board Memberships and Affiliations:
|
- Boston College, Associate Trustee
- The Greater Boston Chamber of Commerce, Director
- Mass. Development, Director
- Commonwealth Institute, Director
- Efficacy Institute, Director
- PepsiCo African-American, Advisory Board
- The Boston Foundation, Director
- Harvard Business School Alumni Board, Director
| No. of Portfolios for which Board Member Serves: 23 |
| ——————— |
Once elected all Board Members serve for an indefinite term.The address of the Board Members and Officers is in c/o The Dreyfus Corporation, 200 Park Avenue, New York, New York 10166.Additional information about the Board Members is available in the fund’s Statement of Additional Information which can be obtained from Dreyfus free of charge by calling this toll free number: 1-800-554-4611.
| Ruth Marie Adams, Emeritus Board Member |
| Francis P. Brennan, Emeritus Board Member |
50
OFFICERS OF THE FUND (Unaudited)
STEPHEN E. CANTER, President since March 2000.
Chairman of the Board, Chief Executive Officer and Chief Operating Officer of the Manager, and an officer of 92 investment companies (comprised of 185 portfolios) managed by the Manager. Mr. Canter also is a Board member and, where applicable, an Executive Committee Member of the other investment management subsidiaries of Mellon Financial Corporation, each of which is an affiliate of the Manager. He is 59 years old and has been an employee of the Manager since May 1995.
STEPHEN R. BYERS, Executive Vice President since November 2002.
Chief Investment Officer,Vice Chairman and a director of the Manager, and an officer of 92 investment companies (comprised of 185 portfolios) managed by the Manager. Mr. Byers also is an officer, director or an Executive Committee Member of certain other investment management subsidiaries of Mellon Financial Corporation, each of which is an affiliate of the Manager. He is 51 years old and has been an employee of the Manager since January 2000. Prior to joining the Manager, he served as an Executive Vice President-Capital Markets, Chief Financial Officer and Treasurer at Gruntal & Co., L.L.C.
MARK N. JACOBS, Vice President since March 2000.
Executive Vice President, Secretary and General Counsel of the Manager, and an officer of 93 investment companies (comprised of 201 portfolios) managed by the Manager. He is 58 years old and has been an employee of the Manager since June 1977.
STEVEN F. NEWMAN, Secretary since March 2000.
Associate General Counsel and Assistant Secretary of the Manager, and an officer of 93 investment companies (comprised of 201 portfolios) managed by the Manager. He is 55 years old and has been an employee of the Manager since July 1980.
JAMES BITETTO, Assistant Secretary since October 2004.
Assistant General Counsel and Assistant Secretary of the Manager, and an officer of 4 investment companies (comprised of 23 portfolios) managed by the Manager. He is 38 years old and has been an employee of the Manager since December 1996.
JEFF PRUSNOFSKY, Assistant Secretary since March 2000.
Associate General Counsel of the Manager, and an officer of 26 investment companies (comprised of 88 portfolios) managed by the Manager. He is 39 years old and has been an employee of the Manager since October 1990.
MICHAEL A. ROSENBERG, Assistant Secretary since March 2000.
Associate General Counsel of the Manager, and an officer of 90 investment companies (comprised of 194 portfolios) managed by the Manager. He is 44 years old and has been an employee of the Manager since October 1991.
JAMES WINDELS, Treasurer since November 2001.
Director – Mutual Fund Accounting of the Manager, and an officer of 93 investment companies (comprised of 201 portfolios) managed by the Manager. He is 46 years old and has been an employee of the Manager since April 1985.
The Fund 51
OFFICERS OF THE FUND (Unaudited) (continued)
RICHARD CASSARO, Assistant Treasurer since August 2003.
Senior Accounting Manager – Equity Funds of the Manager, and an officer of 26 investment companies (comprised of 102 portfolios) managed by the Manager. He is 44 years old and has been an employee of the Manager since September 1982.
ERIK D. NAVILOFF, Assistant Treasurer since December 2002.
Senior Accounting Manager – Taxable Fixed Income Funds of the Manager, and an officer of 19 investment companies (comprised of 75 portfolios) managed by the Manager. He is 36 years old and has been an employee of the Manager since November 1992.
ROBERT SVAGNA, Assistant Treasurer since December 2002.
Senior Accounting Manager – Equity Funds of the Manager, and an officer of 27 investment companies (comprised of 107 portfolios) managed by the Manager. He is 37 years old and has been an employee of the Manager since November 1990.
KENNETH J. SANDGREN, Assistant Treasurer since November 2001.
Mutual Funds Tax Director of the Manager, and an officer of 93 investment companies (comprised of 201 portfolios) managed by the Manager. He is 50 years old and has been an employee of the Manager since June 1993.
JOSEPH W. CONNOLLY, Chief Compliance Officer since October 2004.
Chief Compliance Officer of the Manager and The Dreyfus Family of Funds (93 investment companies, comprising 201 portfolios). From November 2001 through March 2004, Mr. Connolly was first Vice-President, Mutual Fund Servicing for Mellon Global Securities Services. In that capacity, Mr. Connolly was responsible for managing Mellon’s Custody, Fund Accounting and Fund Administration services to third-party mutual fund clients. He is 47 years old and has served in various capacities with the Manager since 1980, including manager of the firm’s Fund Accounting Department from 1997 through October 2001.
WILLIAM GERMENIS, Anti-Money Laundering Compliance Officer since September 2002.
Vice President and Anti-Money Laundering Compliance Officer of the Distributor, and the Anti-Money Laundering Compliance Officer of 88 investment companies (comprised of 196 portfolios) managed by the Manager. He is 34 years old and has been an employee of the Distributor since October 1998.
| Dreyfus Premier |
| Managed Income Fund |
| 200 Park Avenue |
| New York, NY 10166 |
| |
| Manager |
| The Dreyfus Corporation |
| 200 Park Avenue |
| New York, NY 10166 |
| |
| Custodian |
| Mellon Bank, N.A. |
| One Mellon Bank Center |
| Pittsburgh, PA 15258 |
| Transfer Agent & |
| Dividend Disbursing Agent |
| Dreyfus Transfer, Inc. |
| 200 Park Avenue |
| New York, NY 10166 |
| |
| Distributor |
| Dreyfus Service Corporation |
| 200 Park Avenue |
| New York, NY 10166 |
Telephone Call your financial representative or 1-800-554-4611
| Mail | | The Dreyfus Premier Family of Funds |
| | | 144 Glenn Curtiss Boulevard, Uniondale, NY 11556-0144 |
The fund files its complete schedule of portfolio holdings with the Securities and Exchange Commission (“SEC”) for the first and third quarters of each fiscal year on Form N-Q. The fund's Forms N-Q are available on the SEC’s website at http://www.sec.gov and may be reviewed and copied at the SEC’s Public Reference Room in Washington, DC. Information on the operation of the Public Reference Room may be obtained by calling 1-800-SEC-0330.
Information regarding how the fund voted proxies relating to portfolio securities for the 12-month period ended June 30, 2004, is available on the SEC’s website at http://www.sec.gov and without charge, upon request, by calling 1-800-645-6561.
© 2005 Dreyfus Service Corporation

The Registrant has adopted a code of ethics that applies to the Registrant's principal executive officer, principal financial officer, principal accounting officer or controller, or persons performing similar functions. There have been no amendments to, or waivers in connection with, the Code of Ethics during the period covered by this Report.
| Item 3. | | Audit Committee Financial Expert. |
The Registrant's Board has determined that Joseph S. DiMartino, a member of the Audit Committee of the Board, is an audit committee financial expert as defined by the Securities and Exchange Commission (the "SEC"). Joseph S. DiMartino is "independent" as defined by the SEC for purposes of audit committee financial expert determinations.
| Item 4. | | Principal Accountant Fees and Services |
(a) Audit Fees. The aggregate fees billed for each of the last two fiscal years (the "Reporting Periods") for professional services rendered by the Registrant's principal accountant (the "Auditor") for the audit of the Registrant's annual financial statements, or services that are normally provided by the Auditor in connection with the statutory and regulatory filings or engagements for the Reporting Periods, were $79,200 in 2003 and $84,550 in 2004.
(b) Audit-Related Fees. The aggregate fees billed in the Reporting Periods for assurance and related services by the Auditor that are reasonably related to the performance of the audit of the Registrant's financial statements and are not reported under paragraph (a) of this Item 4 were $18,100 in 2003 and $10,750 in 2004. These services consisted of security counts required by Rule 17f-2 under the Investment Company Act of 1940, as amended.
The aggregate fees billed in the Reporting Periods for non-audit assurance and related services by the Auditor to the Registrant's investment adviser (not including any sub-investment adviser whose role is primarily portfolio management and is subcontracted with or overseen by another investment adviser), and any entity controlling, controlled by or under common control with the investment adviser that provides ongoing services to the Registrant ("Service Affiliates"), that were reasonably related to the performance of the annual audit of the Service Affiliate, which required pre-approval by the Audit Committee were $0 in 2003 and $0 in 2004.
Note: For the second paragraph in each of (b) through (d) of this Item 4, certain of such services were not pre-approved prior to May 6, 2003, when such services were required to be pre-approved. On and after May 6, 2003, 100% of all services provided by the Auditor were pre-approved as required. For comparative purposes, the fees shown assume that all such services were pre-approved, including services that were not pre-approved prior to the compliance date of the pre-approval requirement.
(c) Tax Fees. The aggregate fees billed in the Reporting Periods for professional services rendered by the Auditor for tax compliance, tax advice and tax planning ("Tax Services") were $5,400 in 2003 and $5,653 in 2004. These services consisted of review or preparation of U.S. federal, state, local and excise tax returns.
The aggregate fees billed in the Reporting Periods for Tax Services by the Auditor to Service Affiliates which required pre-approval by the Audit Committee were $0 in 2003 and $0 in 2004.
(d) All Other Fees. The aggregate fees billed in the Reporting Periods for products and services provided by the Auditor, other than the services reported in paragraphs (a) through (c) of this Item, were $0 in 2003 and $0 in 2004.
The aggregate fees billed in the Reporting Periods for Non-Audit Services by the Auditor to Service Affiliates, other than the services reported in paragraphs (b) through (c) of this Item, which required pre-approval by the Audit Committee were $0 in 2003 and $0 in 2004.
Audit Committee Pre-Approval Policies and Procedures. The Registrant's Audit Committee has established policies and procedures (the "Policy") for pre-approval (within specified fee limits) of the Auditor's engagements for non-audit services to the Registrant and Service Affiliates without specific case-by-case consideration. Pre-approval considerations include whether the proposed services are compatible with maintaining the Auditor's independence. Pre-approvals pursuant to the Policy are considered annually.
Non-Audit Fees. The aggregate non-audit fees billed by the Auditor for services rendered to the Registrant, and rendered to Service Affiliates, for the Reporting Periods were $1,692,125 in 2003 and $2,476,483 in 2004.
Auditor Independence. The Registrant's Audit Committee has considered whether the provision of non-audit services that were rendered to Service Affiliates which were not pre-approved (not requiring pre-approval) is compatible with maintaining the Auditor's independence.
| Item 5. | | Audit Committee of Listed Registrants. |
| | | Not applicable. |
| Item 6. | | Schedule of Investments. |
| | | Not applicable. |
| Item 7. | | Disclosure of Proxy Voting Policies and Procedures for Closed-End Management |
| | | Investment Companies. |
| | | Not applicable. |
| Item 8. | | Purchases of Equity Securities by Closed-End Management Investment Companies and |
| | | Affiliated Purchasers. |
| | | Not applicable. |
| Item 9. | | Submission of Matters to a Vote of Security Holders. |
| |
| -3- |
The Registrant has a Nominating Committee (the "Committee"), which is responsible for selecting and nominating persons for election or appointment by the Registrant's Board as Board members. The Committee has adopted a Nominating Committee Charter (the "Charter"). Pursuant to the Charter, the Committee will consider recommendations for nominees from shareholders submitted to the Secretary of the Registrant, c/o The Dreyfus Corporation Legal Department, 200 Park Avenue, 8th Floor West, New York, New York 10166. A nomination submission must include information regarding the recommended nominee as specified in the Charter. This information includes all information relating to a recommended nominee that is required to be disclosed in solicitations or proxy statements for the election of Board members, as well as information sufficient to evaluate the factors to be considered by the Committee, including character and integrity, business and professional experience, and whether the person has the ability to apply sound and independent business judgment and would act in the interests of the Registrant and its shareholders.
Nomination submissions are required to be accompanied by a written consent of the individual to stand for election if nominated by the Board and to serve if elected by the shareholders, and such additional information must be provided regarding the recommended nominee as reasonably requested by the Committee.
| Item 10. | | Controls and Procedures. |
(a) The Registrant's principal executive and principal financial officers have concluded, based on their evaluation of the Registrant's disclosure controls and procedures as of a date within 90 days of the filing date of this report, that the Registrant's disclosure controls and procedures are reasonably designed to ensure that information required to be disclosed by the Registrant on Form N-CSR is recorded, processed, summarized and reported within the required time periods and that information required to be disclosed by the Registrant in the reports that it files or submits on Form N-CSR is accumulated and communicated to the Registrant's management, including its principal executive and principal financial officers, as appropriate to allow timely decisions regarding required disclosure.
(b) There were no changes to the Registrant's internal control over financial reporting that occurred during the second fiscal quarter of the period covered by this report that have materially affected, or are reasonably likely to materially affect, the Registrant's internal control over financial reporting.
| (a)(1) | | Code of ethics referred to in Item 2. |
| (a)(2) | | Certifications of principal executive and principal financial officers as required by Rule 30a-2(a) |
| under the Investment Company Act of 1940. |
| (a)(3) | | Not applicable. |
| (b) | | Certification of principal executive and principal financial officers as required by Rule 30a-2(b) |
| under the Investment Company Act of 1940. |
Pursuant to the requirements of the Securities Exchange Act of 1934 and the Investment Company Act of 1940, the Registrant has duly caused this Report to be signed on its behalf by the undersigned, thereunto duly authorized.
| | The Dreyfus/Laurel Funds Trust
|
| By: | | /s/ Stephen E. Canter |
| | | Stephen E. Canter |
| | | President |
| |
| Date: | | February 28, 2005 |
Pursuant to the requirements of the Securities Exchange Act of 1934 and the Investment Company Act of 1940, this Report has been signed below by the following persons on behalf of the Registrant and in the capacities and on the dates indicated.
| By: | | /s/ Stephen E. Canter |
| | | Stephen E. Canter |
| | | Chief Executive Officer |
| |
| Date: | | February 28, 2005 |
| |
| By: | | /s/ James Windels |
| James Windels |
| | | Chief Financial Officer |
| |
| Date: | | February 28, 2005 |
| | | EXHIBIT INDEX |
| (a)(1) | | Code of ethics referred to in Item 2. |
| (a)(2) | | Certifications of principal executive and principal financial officers as required by Rule 30a- |
| 2(a) under the Investment Company Act of 1940. (EX-99.CERT) |
| (b) | | Certification of principal executive and principal financial officers as required by Rule 30a- |
| 2(b) under the Investment Company Act of 1940. (EX-99.906CERT) |