| UNITED STATES |
| SECURITIES AND EXCHANGE COMMISSION |
| Washington, D.C. 20549 |
| |
| |
| FORM N-CSR |
| |
| CERTIFIED SHAREHOLDER REPORT OF REGISTERED MANAGEMENT |
| INVESTMENT COMPANIES |
| |
| Investment Company Act file number 811-524 |
| |
| | | The Dreyfus/Laurel Funds Trust |
| | | (Exact name of Registrant as specified in charter) |
| |
| |
| | | c/o The Dreyfus Corporation |
| | | 200 Park Avenue |
| | | New York, New York 10166 |
| (Address of principal executive offices) (Zip code) |
| |
| | | Mark N. Jacobs, Esq. |
| | | 200 Park Avenue |
| | | New York, New York 10166 |
| | | (Name and address of agent for service) |
| |
| Registrant's telephone number, including area code: (212) 922-6000 |
| |
| Date of fiscal year end: | | 12/31 |
| |
| Date of reporting period: | | 12/31/2005 |
| |
| The following N-CSR relates only to the Registrant’s series listed below and does not affect the other series |
| of the Registrant, which | | have different fiscal year ends and, therefore, different N-CSR reporting |
| requirements. Separate N-CSR Forms will be filed for these series, as appropriate. |
| |
| |
| Dreyfus Premier Core Value Fund |
| Dreyfus Premier Limited Term High Yield Fund |
| Dreyfus Premier Managed Income Fund |
-1-
| Item 1. | | Reports to Stockholders. |

Save time. Save paper. View your next shareholder report online as soon as it’s available. Log into www.dreyfus.com and sign up for Dreyfus eCommunications. It’s simple and only takes a few minutes.
The views expressed in this report reflect those of the portfolio manager only through the end of the period covered and do not necessarily represent the views of Dreyfus or any other person in the Dreyfus organization. Any such views are subject to change at any time based upon market or other conditions and Dreyfus disclaims any responsibility to update such views.These views may not be relied on as investment advice and, because investment decisions for a Dreyfus fund are based on numerous factors, may not be relied on as an indication of trading intent on behalf of any Dreyfus fund.
Not FDIC-Insured • Not Bank-Guaranteed • May Lose Value
| Contents |
| |
| | | THE FUND |
| |
|
| 2 | | Letter from the Chairman |
| 3 | | Discussion of Fund Performance |
| 6 | | Fund Performance |
| 8 | | Understanding Your Fund’s Expenses |
| 8 | | Comparing Your Fund’s Expenses |
| With Those of Other Funds |
| 9 | | Statement of Investments |
| 13 | | Statement of Assets and Liabilities |
| 14 | | Statement of Operations |
| 15 | | Statement of Changes in Net Assets |
| 18 | | Financial Highlights |
| 24 | | Notes to Financial Statements |
| 32 | | Report of Independent Registered |
| | | Public Accounting Firm |
| 33 | | Important Tax Information |
| 34 | | Information About the Review and |
| | | Approval of the Fund’s Investment |
| | | Management Agreement |
| 39 | | Board Members Information |
| 41 | | Officers of the Fund |
| FOR MORE INFORMATION |
|
| | | Back Cover |
| Dreyfus Premier |
| Core Value Fund |

LETTER FROM THE CHAIRMAN
We are pleased to present this annual report for Dreyfus Premier Core Value Fund, covering the 12-month period from January 1, 2005, through December 31, 2005. Inside, you’ll find valuable information about how the fund was managed during the reporting period, including a discussion with Brian Ferguson, portfolio manager and member of the Large Cap Value Team of The Boston Company Asset Management.
Stocks generally absorbed both good and bad news in 2005 to post modestly positive total returns. On the plus side, an expanding U.S. economy and low inflation helped support corporate earnings in most industry groups. Negative influences included rising short-term interest rates and escalating energy prices, which many analysts feared might erode corporate profits. In addition, hurricanes Katrina, Rita and Wilma disrupted economic activity along the Gulf Coast.
We expect the U.S. economy to continue its moderate expansion in 2006, fueled in part by a rebound in corporate capital spending and exports. The labor market likely will remain relatively strong while inflation should stay low, supporting consumers’ real incomes. Risks in the new year include the possible end of the boom in the housing market, where we believe prices are more likely to stall than plunge.
As always, we encourage you to speak with your financial consultant about how these and other market forces may affect your investments. Thank you for your continued confidence and support.
| The Dreyfus Corporation |
| January 17, 2006 |

DISCUSSION OF FUND PERFORMANCE
Brian Ferguson, Portfolio Manager, Large Cap Value Team
How did Dreyfus Premier Core Value Fund perform relative to its benchmark?
For the 12-month period ended December 31, 2005, Dreyfus Premier Core Value Fund produced total returns of 5.18% for its Class A shares, 4.47% for its Class B shares, 4.43% for its Class C shares, 5.45% for its Class R shares, 4.95% for its Class T shares and 5.33% for its Institutional shares.1 In comparison, the fund’s benchmark, the S&P 500/BARRA Value Index, produced a total return of 6.33% for the same period.2
A growing economy and solid corporate earnings helped stocks advance modestly in 2005, despite widespread concerns regarding high energy prices and rising interest rates. The fund’s returns were roughly in line with the S&P 500/BARRA Value Index,as relatively strong performance in the consumer discretionary, consumer staples and financial sectors was undercut by lagging performance in materials and health care stocks.
What is the fund’s investment approach?
The fund invests primarily in large-cap value companies that are considered undervalued based on traditional measures, such as price-to-earnings ratios. When choosing stocks, we use a “bottom-up” stock selection approach, focusing on individual companies, rather than a “top-down” approach that forecasts market trends.We also focus on a company’s relative value, financial strength, sales and earnings momentum and likely catalysts that could ignite the stock price.
What other factors influenced the fund’s performance?
Despite steady economic growth and rising corporate earnings, returns from the U.S. stock market were limited during much of 2005 by investors’ concerns regarding rising interest rates and volatile energy prices.The Federal Reserve Board (the “Fed”) raised short-term interest rates at each of eight scheduled meetings during the year, driving the
The Fund 3
DISCUSSION OF FUND PERFORMANCE (continued)
|
overnight federal funds rate from 2.25% to 4.25% . Contrary to historical norms, however, these moves did not cause longer-term bond yields to rise significantly, helping to contain corporate borrowing costs and support profit margins.While sharply higher energy costs threatened to erode earnings of industrial companies that use oil and gas in their manufacturing processes, other market sectors — most notably energy and utilities — benefited from higher commodity prices.Toward the end of the year, energy prices moderated and investors began to look forward to the end of the Fed’s rate hikes, resulting in a modest market rally.
Our stock selection strategy in the consumer discretionary sector contributed significantly to the fund’s 2005 performance. The fund particularly benefited from its lack of exposure to U.S. auto manufacturers, such as General Motors and Ford, which struggled due to high labor costs and greater foreign competition. The fund also benefited from relatively light exposure to newspaper publishers that were weakened by competition from online media for advertising dollars. The relatively defensive consumer staples sector performed well for the fund, as food and tobacco giant Altria Group rose in an improved litigation environment. Another consumer staples holding, Colgate-Palmolive, gained ground on prospects of better earnings growth.
The fund’s performance also was bolstered by our stock selection strategy in the financials sector. Property and casualty insurance companies, such as Chubb and ACE, performed well when pricing power improved in the wake of Hurricane Katrina.The fund also largely avoided weakness among regional banks, which were weighed down by rising interest rates and a slowdown in mortgage originations.The telecommunications sector represented another positive contributor to the fund’s performance, primarily due to our emphasis on wireless companies and relatively light exposure to regional land-line providers.
Relative performance in some other sectors, however, was more disappointing. In the health care area, medical supplies maker Boston Scientific saw its stock decline in the aftermath of a safety-related recall of its surgical stents.The materials sector also was a laggard for the fund, as paper manufacturers were pressured by lower pricing dynamics.
As energy prices surged, the fund’s relatively heavy exposure to the energy sector contributed to overall returns, but the fund’s energy gains trailed the benchmark’s as a result of our greater emphasis on integrated oil companies, such as Exxon Mobil. Oil and gas refiners, as well as exploration and production companies, produced higher returns for the benchmark.
What is the fund’s current strategy?
We remain committed to our “bottom-up” stock selection process, which we believe is an effective method to identify attractively valued stocks under a variety of market conditions.We have found a number of attractive opportunities in the energy sector, which we believe may continue to benefit from high commodity prices.We also have emphasized relatively defensive consumer staples stocks over the more economically sensitive consumer discretionary sector. In the financials area, we still favor insurers, which historically have been relatively insensitive to rising interest rates, over regional banks. We also are optimistic about a rebound in capital spending among businesses, which could benefit business conditions in the industrials and technology sectors.
| 1 | | Total return includes reinvestment of dividends and any capital gains paid, and does not take into |
| | | consideration the maximum initial sales charges in the case of Class A and Class T shares or the |
| | | applicable contingent deferred sales charges imposed on redemptions in the case of Class B and |
| | | Class C shares. Had these charges been reflected, returns would have been lower. Past performance |
| | | is no guarantee of future results. Share price and investment return fluctuate such that upon |
| | | redemption, fund shares may be worth more or less than their original cost. |
| 2 | | SOURCE: LIPPER INC. — Reflects the reinvestment of dividends and, where applicable, |
| | | capital gain distributions.The S&P 500/BARRA Value Index is a capitalization-weighted |
| | | index of all the stocks in the Standard & Poor’s 500 Composite Price Index (“S&P 500 |
| | | Index”) that have low price-to-book ratios.The S&P 500 Index is a widely accepted, unmanaged |
| | | index of U.S. stock market performance. |
The Fund 5
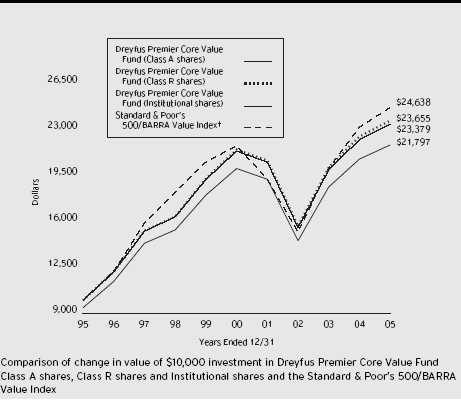
| † Source: Lipper Inc. |
| Past performance is not predictive of future performance. |
| The above graph compares a $10,000 investment made in Class A shares, Institutional shares and Class R shares of |
| Dreyfus Premier Core Value Fund on 12/31/95 to a $10,000 investment made in the Standard & Poor’s |
| 500/BARRA Value Index (the “Index”) on that date. All dividends and capital gain distributions are reinvested. |
| Performance for Class B, Class C and Class T shares will vary from the performance of Class A, Institutional and |
| Class R shares shown above due to differences in charges and expenses. |
| The fund’s performance shown in the line graph takes into account the maximum initial sales charge on Class A |
| shares and all other applicable fees and expenses for Class A shares, Institutional shares and Class R shares.The |
| Index is a capitalization-weighted index of all the stocks in the S&P 500 that have low price-to-book ratios.The |
| Index does not take into account charges, fees and other expenses. Further information relating to fund performance, |
| including expense reimbursements, if applicable, is contained in the Financial Highlights section of the prospectus and |
| elsewhere in this report. |
| Average Annual Total Returns as of 12/31/05 | | | | | | |
| |
| | | Inception | | | | | | | | From |
| | | Date | | 1 Year | | 5 Years | | 10 Years | | Inception |
| |
| |
| |
| |
| |
|
| Class A shares | | | | | | | | | | |
| with maximum sales charge (5.75%) | | | | (0.86)% | | 0.53% | | 8.10% | | |
| without sales charge | | | | 5.18% | | 1.73% | | 8.75% | | |
| Class B shares | | | | | | | | | | |
| with applicable redemption charge † | | 1/16/98 | | 0.47% | | 0.60% | | — | | 5.29%†† |
| without redemption | | 1/16/98 | | 4.47% | | 0.98% | | — | | 5.29%†† |
| Class C shares | | | | | | | | | | |
| with applicable redemption charge ††† | | 1/16/98 | | 3.43% | | 0.98% | | — | | 5.11% |
| without redemption | | 1/16/98 | | 4.43% | | 0.98% | | — | | 5.11% |
| Class R shares | | | | 5.45% | | 1.99% | | 8.99% | | |
| Institutional shares | | | | 5.33% | | 1.84% | | 8.86% | | |
| Class T shares | | | | | | | | | | |
| with applicable sales charge (4.5%) | | 8/16/99 | | 0.23% | | 0.55% | | — | | 2.72% |
| without sales charge | | 8/16/99 | | 4.95% | | 1.48% | | — | | 3.46% |
Past performance is not predictive of future performance.The fund’s performance shown in the graph and table does not reflect the deduction of taxes that a shareholder would pay on fund distributions or the redemption of fund shares.
| † | | The maximum contingent deferred sales charge for Class B shares is 4%. After six years Class B shares convert to |
| | | Class A shares. |
| †† | | Assumes the conversion of Class B shares to Class A shares at the end of the sixth year following the date |
| | | of purchase. |
| ††† | | The maximum contingent deferred sales charge for Class C shares is 1% for shares redeemed within one year of the |
| | | date of purchase. |
The Fund 7
U N D E R S TA N D I N G YO U R F U N D ’ S E X P E N S E S ( U n a u d i t e d )
As a mutual fund investor, you pay ongoing expenses, such as management fees and other expenses. Using the information below, you can estimate how these expenses affect your investment and compare them with the expenses of other funds.You also may pay one-time transaction expenses, including sales charges (loads) and redemption fees, which are not shown in this section and would have resulted in higher total expenses. For more information, see your fund’s prospectus or talk to your financial adviser.
Review your fund’s expenses
The table below shows the expenses you would have paid on a $1,000 investment in Dreyfus Premier Core Value Fund from July 1, 2005 to December 31, 2005. It also shows how much a $1,000 investment would be worth at the close of the period, assuming actual returns and expenses.
| Expenses and Value of a $1,000 Investment |
| assuming actual returns for the six months ended December 31, 2005 |
| | | Class A | | Class B | | Class C | | Class R | | Class T | | Institutional |
| |
| |
| |
| |
| |
| |
|
| Expenses paid | | | | | | | | | | | | |
| per $1,000 † | | $ 5.97 | | $ 9.85 | | $ 9.85 | | $ 4.68 | | $ 7.26 | | $ 5.45 |
| Ending value | | | | | | | | | | | | |
| (after expenses) | | $1,059.70 | | $1,056.00 | | $1,056.00 | | $1,061.00 | | $1,058.70 | | $1,060.60 |
COMPARING YOUR FUND’S EXPENSES WITH THOSE OF OTHER FUNDS (Unaudited)
Using the SEC’s method to compare expenses
The Securities and Exchange Commission (SEC) has established guidelines to help investors assess fund expenses. Per these guidelines, the table below shows your fund’s expenses based on a $1,000 investment, assuming a hypothetical 5% annualized return. You can use this information to compare the ongoing expenses (but not transaction expenses or total cost) of investing in the fund with those of other funds.All mutual fund shareholder reports will provide this information to help you make this comparison. Please note that you cannot use this information to estimate your actual ending account balance and expenses paid during the period.
| Expenses and Value of a $1,000 Investment |
| assuming a hypothetical 5% annualized return for the six months ended December 31, 2005 |
| | | Class A | | Class B | | Class C | | Class R | | Class T | | Institutional |
| |
| |
| |
| |
| |
| |
|
| Expenses paid | | | | | | | | | | | | |
| per $1,000 † | | $ 5.85 | | $ 9.65 | | $ 9.65 | | $ 4.58 | | $ 7.12 | | $ 5.35 |
| Ending value | | | | | | | | | | | | |
| (after expenses) | | $1,019.41 | | $1,015.63 | | $1,015.63 | | $1,020.67 | | $1,018.15 | | $1,019.91 |
| † | | Expenses are equal to the fund’s annualized expense ratio of 1.15% for Class A, 1.90% for Class B, 1.90% for |
| | | Class C, .90% for Class R, 1.40% for Class T and 1.05% for Institutional multiplied by the average account |
| | | value over the period, multiplied by 184/365 (to reflect the one-half year period). |
STATEMENT OF INVESTMENTS
December 31, 2005
|
| Common Stocks—99.7% | | Shares | | Value ($) |
| |
| |
|
| Banking—12.9% | | | | |
| Bank of America | | 527,736 | | 24,355,016 |
| Citigroup | | 607,433 | | 29,478,723 |
| Wachovia | | 231,500 | | 12,237,090 |
| Washington Mutual | | 176,600 | | 7,682,100 |
| Wells Fargo & Co. | | 244,300 | | 15,349,369 |
| | | | | 89,102,298 |
| Basic Industries—2.0% | | | | |
| Bowater | | 98,200 | | 3,016,704 |
| Dow Chemical | | 68,400 | | 2,997,288 |
| E I Du Pont de Nemours & Co. | | 90,195 | | 3,833,288 |
| Rohm & Haas | | 82,800 | | 4,009,176 |
| | | | | 13,856,456 |
| Beverages & Tobacco—2.4% | | | | |
| Altria Group | | 220,200 | | 16,453,344 |
| Broadcasting & Publishing—1.0% | | | | |
| Time Warner | | 380,300 | | 6,632,432 |
| Capital Goods—8.6% | | | | |
| Boeing | | 74,700 | | 5,246,928 |
| Cooper Industries, Cl. A | | 50,500 | | 3,686,500 |
| Eaton | | 78,300 | | 5,253,147 |
| Emerson Electric | | 112,360 | | 8,393,292 |
| General Electric | | 303,700 | | 10,644,685 |
| Tyco International | | 441,200 | | 12,733,032 |
| United Technologies | | 242,800 | | 13,574,948 |
| | | | | 59,532,532 |
| Consumer Cyclical—1.0% | | | | |
| Johnson Controls | | 95,600 | | 6,970,196 |
| Consumer Non-Durables—4.1% | | | | |
| Cadbury Schweppes, ADR | | 129,800 | | 4,970,042 |
| Campbell Soup | | 151,000 | | 4,495,270 |
| Colgate-Palmolive | | 205,600 | | 11,277,160 |
| Estee Lauder Cos., Cl. A | | 113,900 | | 3,813,372 |
| General Mills | | 68,180 | | 3,362,638 |
| | | | | 27,918,482 |
The Fund 9
STATEMENT OF INVESTMENTS (continued)
|
| Common Stocks (continued) | | Shares | | Value ($) |
| |
| |
|
| Consumer Services—7.3% | | | | |
| CCE Spinco | | 2,300 a | | 30,130 |
| Clear Channel Communications | | 356,000 | | 11,196,200 |
| Comcast, Cl. A | | 104,300 a | | 2,707,628 |
| CVS | | 176,500 | | 4,663,130 |
| Kohl’s | | 49,000 a | | 2,381,400 |
| McDonald’s | | 209,800 | | 7,074,456 |
| News, Cl. A | | 422,000 | | 6,562,100 |
| Omnicom Group | | 102,900 | | 8,759,877 |
| Walt Disney | | 279,700 | | 6,704,409 |
| | | | | 50,079,330 |
| Energy—12.9% | | | | |
| Apache | | 46,600 | | 3,193,032 |
| BP, ADR | | 94,900 | | 6,094,478 |
| Chevron | | 196,900 | | 11,178,013 |
| ConocoPhillips | | 262,720 | | 15,285,050 |
| Devon Energy | | 75,500 | | 4,721,770 |
| Exxon Mobil | | 498,232 | | 27,985,691 |
| Halliburton | | 52,900 | | 3,277,684 |
| Marathon Oil | | 111,700 | | 6,810,349 |
| NRG Energy | | 85,000 a | | 4,005,200 |
| Schlumberger | | 68,000 | | 6,606,200 |
| | | | | 89,157,467 |
| Financial Services—22.6% | | | | |
| ACE | | 72,200 | | 3,858,368 |
| Allstate | | 56,400 | | 3,049,548 |
| American International Group | | 202,493 | | 13,816,097 |
| AON | | 116,600 | | 4,191,770 |
| Capital One Financial | | 91,800 | | 7,931,520 |
| Chubb | | 78,500 | | 7,665,525 |
| Countrywide Financial | | 122,500 | | 4,188,275 |
| Freddie Mac | | 153,200 | | 10,011,620 |
| Genworth Financial, Cl. A | | 367,195 | | 12,697,603 |
| Goldman Sachs Group | | 53,560 | | 6,840,148 |
| JPMorgan Chase & Co. | | 565,000 | | 22,424,850 |
| Merrill Lynch & Co. | | 241,650 | | 16,366,955 |
| Common Stocks (continued) | | Shares | | Value ($) |
| |
| |
|
| Financial Services (continued) | | | | |
| Morgan Stanley | | 63,500 | | 3,602,990 |
| PMI Group | | 193,300 | | 7,938,831 |
| PNC Financial Services Group | | 62,200 | | 3,845,826 |
| Prudential Financial | | 97,000 | | 7,099,430 |
| St. Paul Travelers Cos. | | 230,300 | | 10,287,501 |
| SunTrust Banks | | 67,200 | | 4,889,472 |
| XL Capital, Cl. A | | 73,030 | | 4,920,761 |
| | | | | 155,627,090 |
| Health Care—6.2% | | | | |
| Abbott Laboratories | | 182,800 | | 7,207,804 |
| Boston Scientific | | 131,900 a | | 3,230,231 |
| Medco Health Solutions | | 65,800 a | | 3,671,640 |
| Pfizer | | 528,500 | | 12,324,620 |
| WellPoint | | 105,600 a | | 8,425,824 |
| Wyeth | | 176,200 | | 8,117,534 |
| | | | | 42,977,653 |
| Retail Trade—.5% | | | | |
| TJX Cos. | | 153,600 | | 3,568,128 |
| Technology—8.1% | | | | |
| Accenture, Cl. A | | 247,300 | | 7,139,551 |
| Automatic Data Processing | | 259,800 | | 11,922,222 |
| Fairchild Semiconductor International | | 198,300 a | | 3,353,253 |
| Hewlett-Packard | | 419,900 | | 12,021,737 |
| International Business Machines | | 103,400 | | 8,499,480 |
| Microsoft | | 370,800 | | 9,696,420 |
| Motorola | | 125,000 | | 2,823,750 |
| | | | | 55,456,413 |
| Telecommunications—.9% | | | | |
| Sprint Nextel | | 258,250 | | 6,032,720 |
| Transportation—1.5% | | | | |
| Union Pacific | | 128,700 | | 10,361,637 |
| Utilities—7.7% | | | | |
| Alltel | | 76,395 | | 4,820,525 |
| AT&T | | 732,600 | | 17,941,374 |
| Constellation Energy Group | | 77,300 | | 4,452,480 |
The Fund 11
STATEMENT OF INVESTMENTS (continued)
|
| Common Stocks (continued) | | Shares | | Value ($) |
| |
| |
|
| Utilities (continued) | | | | |
| Edison International | | 87,800 | | 3,828,958 |
| Entergy | | 46,300 | | 3,178,495 |
| Exelon | | 98,965 | | 5,259,000 |
| FPL Group | | 78,200 | | 3,249,992 |
| PG & E | | 175,000 | | 6,496,000 |
| Vodafone Group, ADR | | 167,100 | | 3,587,637 |
| | | | | 52,814,461 |
| Total Common Stocks | | | | |
| (cost $595,155,116) | | | | 686,540,639 |
| |
| |
|
| | | Principal | | |
| Short-Term Investment—.7% | | Amount ($) | | Value ($) |
| |
| |
|
| Commercial Paper; | | | | |
| General Electric, | | | | |
| 4.20%, 1/3/2006 | | | | |
| (cost $4,734,000) | | 4,734,000 | | 4,734,000 |
| |
| |
|
| Total Investments (cost $599,889,116) | | 100.4% | | 691,274,639 |
| Liabilities, Less Cash and Receivables | | (.4%) | | (2,534,787) |
| Net Assets | | 100.0% | | 688,739,852 |
ADR—American Depository Receipts.
a Non-income producing.
|
| Portfolio Summary (Unaudited)† | | | | |
| |
| | | Value (%) | | | | Value (%) |
| |
| |
| |
|
| Financial Services | | 22.6 | | Consumer Services | | 7.3 |
| Energy | | 12.9 | | Health Care | | 6.2 |
| Banking | | 12.9 | | Consumer Non-Durables | | 4.1 |
| Capital Goods | | 8.6 | | Other | | 10.0 |
| Technology | | 8.1 | | | | |
| Utilities | | 7.7 | | | | 100.4 |
| |
| † Based on net assets. | | | | | | |
| See notes to financial statements. | | | | |
STATEMENT OF ASSETS AND LIABILITIES
December 31, 2005
| | | | | | | | | | | Cost | | Value |
| |
| |
| |
| |
| |
| |
|
| Assets ($): | | | | | | | | | | | | |
| Investments in securities—See Statement of Investments | | 599,889,116 | | 691,274,639 |
| Cash | | | | | | | | | | | | 19,252 |
| Receivable for investment securities sold | | | | | | | | 551,665 |
| Dividends and interest receivable | | | | | | | | 1,019,910 |
| Receivable for shares of Beneficial Interest subscribed | | | | | | 220,603 |
| | | | | | | | | | | 693,086,069 |
| |
| |
| |
| |
| |
|
| Liabilities ($): | | | | | | | | | | | | |
| Due to The Dreyfus Corporation and affiliates—Note 3(b) | | | | | | 780,289 |
| Payable for investment securities purchased | | | | | | | | 277,461 |
| Payable for shares of Beneficial Interest redeemed | | | | | | 3,288,467 |
| | | | | | | | | | | | | 4,346,217 |
| |
| |
| |
| |
| |
| |
|
| Net Assets ($) | | | | | | | | | | 688,739,852 |
| |
| |
| |
| |
| |
|
| Composition of Net Assets ($): | | | | | | | | |
| Paid-in capital | | | | | | | | | | | | 569,242,000 |
| Accumulated undistributed investment income—net | | | | | | 69,556 |
| Accumulated net realized gain (loss) on investments | | | | | | 28,042,773 |
| Accumulated net unrealized appreciation | | | | | | | | |
| (depreciation) on investments | | | | | | | | 91,385,523 |
| |
| |
| |
| |
|
| Net Assets ($) | | | | | | | | | | 688,739,852 |
| |
| |
| |
| |
| |
|
| |
| |
| Net Asset Value Per Share | | | | | | | | |
| | | Class A | | Class B | | Class C | | Class R | | Class T | | Institutional |
| |
| |
| |
| |
| |
| |
|
| Net Assets ($) | | 556,016,879 | | 64,238,945 20,563,775 | | 4,739,550 | | 2,840,191 | | 40,340,512 |
| Shares | | | | | | | | | | | | |
| Outstanding | | 17,718,530 | | 2,080,940 | | 666,555 | | 151,120 | | 90,533 | | 1,286,201 |
| |
| |
| |
| |
| |
| |
|
| Net Asset Value | | | | | | | | | | |
| Per Share ($) | | 31.38 | | 30.87 | | 30.85 | | 31.36 | | 31.37 | | 31.36 |
See notes to financial statements.
|
The Fund 13
STATEMENT OF OPERATIONS
Year Ended December 31, 2005
|
| Investment Income ($): | | |
| Income: | | |
| Cash dividends (net of $50,270 foreign taxes withheld at source) | | 16,401,586 |
| Interest | | 170,954 |
| Income from securities lending | | 34,803 |
| Total Income | | 16,607,343 |
| Expenses: | | |
| Management fee—Note 3(a) | | 6,967,779 |
| Distribution and service fees—Note 3(b) | | 2,475,527 |
| Interest expense—Note 2 | | 22,240 |
| Loan commitment fees—Note 2 | | 5,867 |
| Total Expenses | | 9,471,413 |
| Investment Income—Net | | 7,135,930 |
| |
|
| Realized and Unrealized Gain (Loss) on Investments—Note 4 ($): |
| Net realized gain (loss) on investments | | 96,968,863 |
| Net unrealized appreciation (depreciation) on investments | | (66,603,353) |
| Net Realized and Unrealized Gain (Loss) on Investments | | 30,365,510 |
| Net Increase in Net Assets Resulting from Operations | | 37,501,440 |
See notes to financial statements.
|
STATEMENT OF CHANGES IN NET ASSETS
| | | Year Ended December 31, |
| |
|
| | | 2005 | | 2004 |
| |
| |
|
| Operations ($): | | | | |
| Investment income—net | | 7,135,930 | | 6,301,118 |
| Net realized gain (loss) on investments | | 96,968,863 | | 71,568,294 |
| Net unrealized appreciation | | | | |
| (depreciation) on investments | | (66,603,353) | | 8,014,588 |
| Net Increase (Decrease) in Net Assets | | |
| Resulting from Operations | | 37,501,440 | | 85,884,000 |
| |
| |
|
| Dividends to Shareholders from ($): | | | | |
| Investment income—net: | | | | |
| Class A shares | | (6,671,140) | | (4,697,408) |
| Class B shares | | (261,483) | | (149,699) |
| Class C shares | | (82,006) | | (41,992) |
| Class R shares | | (450,170) | | (549,414) |
| Class T shares | | (25,630) | | (14,243) |
| Institutional shares | | (498,400) | | (347,200) |
| Net realized gain on investments: | | | | |
| Class A shares | | (3,000,559) | | — |
| Class B shares | | (351,900) | | — |
| Class C shares | | (112,649) | | — |
| Class R shares | | (29,847) | | — |
| Class T shares | | (15,252) | | — |
| Institutional shares | | (216,644) | | — |
| Total Dividends | | (11,715,680) | | (5,799,956) |
The Fund 15
STATEMENT OF CHANGES IN NET ASSETS (continued)
|
| | | Year Ended December 31, |
| |
|
| | | 2005 | | 2004 |
| |
| |
|
| Beneficial Interest Transactions ($): | | | | |
| Net proceeds from shares sold: | | | | |
| Class A shares | | 41,179,970 | | 59,592,432 |
| Class B shares | | 2,182,340 | | 6,208,956 |
| Class C shares | | 2,154,740 | | 4,440,112 |
| Class R shares | | 6,465,122 | | 7,087,324 |
| Class T shares | | 330,242 | | 813,497 |
| Institutional shares | | 430,423 | | 804,835 |
| Dividends reinvested: | | | | |
| Class A shares | | 8,340,534 | | 4,081,538 |
| Class B shares | | 542,997 | | 129,596 |
| Class C shares | | 146,513 | | 31,529 |
| Class R shares | | 479,481 | | 549,093 |
| Class T shares | | 39,548 | | 13,773 |
| Institutional shares | | 696,125 | | 336,538 |
| Cost of shares redeemed: | | | | |
| Class A shares | | (147,388,521) | | (98,384,063) |
| Class B shares | | (18,785,780) | | (14,428,736) |
| Class C shares | | (4,377,438) | | (7,117,650) |
| Class R shares | | (54,381,780) | | (14,874,540) |
| Class T shares | | (577,204) | | (422,625) |
| Institutional shares | | (3,325,634) | | (5,872,389) |
| Increase (Decrease) in Net Assets | | | | |
| from Beneficial Interest Transactions | | (165,848,322) | | (57,010,780) |
| Total Increase (Decrease) in Net Assets | | (140,062,562) | | 23,073,264 |
| |
| |
|
| Net Assets ($): | | | | |
| Beginning of Period | | 828,802,414 | | 805,729,150 |
| End of Period | | 688,739,852 | | 828,802,414 |
| Undistributed investment income—net | | 69,556 | | 922,455 |
| | | Year Ended December 31, |
| |
|
| | | 2005 | | 2004 |
| |
| |
|
| Capital Share Transactions: | | | | |
| Class A a | | | | |
| Shares sold | | 1,359,291 | | 2,113,462 |
| Shares issued for dividends reinvested | | 269,242 | | 141,041 |
| Shares redeemed | | (4,810,155) | | (3,501,287) |
| Net Increase (Decrease) in Shares Outstanding | | (3,181,622) | | (1,246,784) |
| |
| |
|
| Class B a | | | | |
| Shares sold | | 72,352 | | 218,548 |
| Shares issued for dividends reinvested | | 17,579 | | 4,398 |
| Shares redeemed | | (628,712) | | (518,703) |
| Net Increase (Decrease) in Shares Outstanding | | (538,781) | | (295,757) |
| |
| |
|
| Class C | | | | |
| Shares sold | | 71,987 | | 159,821 |
| Shares issued for dividends reinvested | | 4,750 | | 1,071 |
| Shares redeemed | | (146,406) | | (256,515) |
| Net Increase (Decrease) in Shares Outstanding | | (69,669) | | (95,623) |
| |
| |
|
| Class R | | | | |
| Shares sold | | 211,002 | | 252,461 |
| Shares issued for dividends reinvested | | 15,771 | | 19,085 |
| Shares redeemed | | (1,741,923) | | (527,483) |
| Net Increase (Decrease) in Shares Outstanding | | (1,515,150) | | (255,937) |
| |
| |
|
| Class T | | | | |
| Shares sold | | 10,988 | | 28,795 |
| Shares issued for dividends reinvested | | 1,273 | | 471 |
| Shares redeemed | | (18,835) | | (14,698) |
| Net Increase (Decrease) in Shares Outstanding | | (6,574) | | 14,568 |
| |
| |
|
| Institutional Shares | | | | |
| Shares sold | | 14,298 | | 28,607 |
| Shares issued for dividends reinvested | | 22,474 | | 11,656 |
| Shares redeemed | | (109,530) | | (207,544) |
| Net Increase (Decrease) in Shares Outstanding | | (72,758) | | (167,281) |
| a | | During the period ended December 31, 2005, 152,245 Class B shares representing $4,558,620 were |
| | | automatically converted to 149,654 Class A shares and during the period ended December 31, 2004, 92,290 |
| | | Class B shares representing $2,541,700 were automatically converted to 90,750 Class A shares. |
| See notes to financial statements. |
The Fund 17
The following tables describe the performance for each share class for the fiscal periods indicated. All information (except portfolio turnover rate) reflects financial results for a single fund share.Total return shows how much your investment in the fund would have increased (or decreased) during each period assuming you had reinvested all dividends and distributions.These figures have been derived from the fund’s financial statements.
| | | | | Year Ended December 31, | | |
| |
| |
| |
|
| Class A Shares | | 2005 | | 2004 | | 2003 | | 2002 | | 2001 |
| |
| |
| |
| |
| |
|
| Per Share Data ($): | | | | | | | | | | |
| Net asset value, beginning of period | | 30.34 | | 27.44 | | 21.57 | | 28.62 | | 30.93 |
| Investment Operations: | | | | | | | | | | |
| Investment income—net a | | .30 | | .24 | | .17 | | .10 | | .17 |
| Net realized and unrealized gain | | | | | | | | | | |
| (loss) on investments | | 1.26 | | 2.88 | | 5.86 | | (7.06) | | (1.46) |
| Total from Investment Operations | | 1.56 | | 3.12 | | 6.03 | | (6.96) | | (1.29) |
| Distributions: | | | | | | | | | | |
| Dividends from investment | | | | | | | | | | |
| income—net | | (.35) | | (.22) | | (.16) | | (.09) | | (.16) |
| Dividends from net realized | | | | | | | | | | |
| gain on investments | | (.17) | | — | | — | | — | | (.86) |
| Total Distributions | | (.52) | | (.22) | | (.16) | | (.09) | | (1.02) |
| Net asset value, end of period | | 31.38 | | 30.34 | | 27.44 | | 21.57 | | 28.62 |
| |
| |
| |
| |
| |
|
| Total Return (%) b | | 5.18 | | 11.41 | | 28.09 | | (24.36) | | (4.04) |
| |
| |
| |
| |
| |
|
| Ratios/Supplemental Data (%): | | | | | | | | | | |
| Ratio of total expenses | | | | | | | | | | |
| to average net assets | | 1.15 | | 1.15 | | 1.15 | | 1.15 | | 1.15 |
| Ratio of net investment income | | | | | | | | | | |
| to average net assets | | .99 | | .86 | | .71 | | .41 | | .58 |
| Portfolio Turnover Rate | | 55.95 | | 74.98 | | 54.58 | | 67.21 | | 68.77 |
| |
| |
| |
| |
| |
|
| Net Assets, end of period ($ X 1,000) | | 556,017 | | 634,007 | | 607,633 | | 504,371 | | 695,054 |
| a | | Based on average shares outstanding at each month end. |
| b | | Exclusive of sales charge. |
See notes to financial statements.
| | | | | | | Year Ended December 31, | | |
| | | |
| |
| |
|
| Class B Shares | | 2005 | | 2004 | | 2003 | | 2002 | | 2001 |
| |
| |
| |
| |
| |
|
| Per Share Data ($): | | | | | | | | | | |
| Net asset value, beginning of period | | 29.83 | | 27.02 | | 21.27 | | 28.33 | | 30.68 |
| Investment Operations: | | | | | | | | | | |
| Investment income (loss)—net a | | .07 | | .02 | | (.01) | | (.08) | | (.07) |
| Net realized and unrealized gain | | | | | | | | | | |
| (loss) on investments | | 1.26 | | 2.85 | | 5.77 | | (6.98) | | (1.42) |
| Total from Investment Operations | | 1.33 | | 2.87 | | 5.76 | | (7.06) | | (1.49) |
| Distributions: | | | | | | | | | | |
| Dividends from investment | | | | | | | | | | |
| income—net | | (.12) | | (.06) | | (.01) | | — | | (.00)b |
| Dividends from net realized | | | | | | | | | | |
| gain on investments | | (.17) | | — | | — | | — | | (.86) |
| Total Distributions | | (.29) | | (.06) | | (.01) | | — | | (.86) |
| Net asset value, end of period | | 30.87 | | 29.83 | | 27.02 | | 21.27 | | 28.33 |
| |
| |
| |
| |
| |
|
| Total Return (%) c | | 4.47 | | 10.62 | | 27.12 | | (24.92) | | (4.79) |
| |
| |
| |
| |
| |
|
| Ratios/Supplemental Data (%): | | | | | | | | | | |
| Ratio of total expenses | | | | | | | | | | |
| to average net assets | | 1.90 | | 1.90 | | 1.90 | | 1.90 | | 1.90 |
| Ratio of net investment income (loss) | | | | | | | | | | |
| to average net assets | | .24 | | .10 | | (.04) | | (.33) | | (.24) |
| Portfolio Turnover Rate | | 55.95 | | 74.98 | | 54.58 | | 67.21 | | 68.77 |
| |
| |
| |
| |
| |
|
| Net Assets, end of period ($ X 1,000) | | 64,239 | | 78,154 | | 78,780 | | 62,820 | | 68,123 |
| |
| a | | Based on average shares outstanding at each month end. | | | | | | | | |
| b | | Amount represents less than $.01 per share. | | | | | | | | |
| c | | Exclusive of sales charge. | | | | | | | | | | |
| See notes to financial statements. | | | | | | | | | | |
The Fund 19
FINANCIAL HIGHLIGHTS (continued)
|
| | | | | | | Year Ended December 31, | | |
| | | |
| |
| |
|
| Class C Shares | | 2005 | | 2004 | | 2003 | | 2002 | | 2001 |
| |
| |
| |
| |
| |
|
| Per Share Data ($): | | | | | | | | | | |
| Net asset value, beginning of period | | 29.83 | | 27.02 | | 21.27 | | 28.34 | | 30.68 |
| Investment Operations: | | | | | | | | | | |
| Investment income (loss)—net a | | .07 | | .02 | | (.01) | | (.08) | | (.06) |
| Net realized and unrealized gain | | | | | | | | | | |
| (loss) on investments | | 1.24 | | 2.85 | | 5.77 | | (6.99) | | (1.42) |
| Total from Investment Operations | | 1.31 | | 2.87 | | 5.76 | | (7.07) | | (1.48) |
| Distributions: | | | | | | | | | | |
| Dividends from investment | | | | | | | | | | |
| income—net | | (.12) | | (.06) | | (.01) | | — | | (.00)b |
| Dividends from net realized | | | | | | | | | | |
| gain on investments | | (.17) | | — | | — | | — | | (.86) |
| Total Distributions | | (.29) | | (.06) | | (.01) | | — | | (.86) |
| Net asset value, end of period | | 30.85 | | 29.83 | | 27.02 | | 21.27 | | 28.34 |
| |
| |
| |
| |
| |
|
| Total Return (%) c | | 4.43 | | 10.62 | | 27.12 | | (24.95) | | (4.75) |
| |
| |
| |
| |
| |
|
| Ratios/Supplemental Data (%): | | | | | | | | | | |
| Ratio of total expenses | | | | | | | | | | |
| to average net assets | | 1.90 | | 1.90 | | 1.90 | | 1.90 | | 1.90 |
| Ratio of net investment income (loss) | | | | | | | | | | |
| to average net assets | | .24 | | .10 | | (.04) | | (.32) | | (.24) |
| Portfolio Turnover Rate | | 55.95 | | 74.98 | | 54.58 | | 67.21 | | 68.77 |
| |
| |
| |
| |
| |
|
| Net Assets, end of period ($ X 1,000) | | 20,564 | | 21,958 | | 22,480 | | 20,819 | | 23,612 |
| |
| a | | Based on average shares outstanding at each month end. | | | | | | | | |
| b | | Amount represents less than $.01 per share. | | | | | | | | |
| c | | Exclusive of sales charge. | | | | | | | | | | |
| See notes to financial statements. | | | | | | | | | | |
| | | | | Year Ended December 31, | | |
| |
| |
| |
|
| Class R Shares | | 2005 | | 2004 | | 2003 | | 2002 | | 2001 |
| |
| |
| |
| |
| |
|
| Per Share Data ($): | | | | | | | | | | |
| Net asset value, beginning of period | | 30.33 | | 27.43 | | 21.56 | | 28.62 | | 30.92 |
| Investment Operations: | | | | | | | | | | |
| Investment income—net a | | .38 | | .31 | | .22 | | .17 | | .23 |
| Net realized and unrealized gain | | | | | | | | | | |
| (loss) on investments | | 1.25 | | 2.88 | | 5.87 | | (7.08) | | (1.44) |
| Total from Investment Operations | | 1.63 | | 3.19 | | 6.09 | | (6.91) | | (1.21) |
| Distributions: | | | | | | | | | | |
| Dividends from investment | | | | | | | | | | |
| income—net | | (.43) | | (.29) | | (.22) | | (.15) | | (.23) |
| Dividends from net realized | | | | | | | | | | |
| gain on investments | | (.17) | | — | | — | | — | | (.86) |
| Total Distributions | | (.60) | | (.29) | | (.22) | | (.15) | | (1.09) |
| Net asset value, end of period | | 31.36 | | 30.33 | | 27.43 | | 21.56 | | 28.62 |
| |
| |
| |
| |
| |
|
| Total Return (%) | | 5.45 | | 11.69 | | 28.43 | | (24.18) | | (3.80) |
| |
| |
| |
| |
| |
|
| Ratios/Supplemental Data (%): | | | | | | | | | | |
| Ratio of total expenses | | | | | | | | | | |
| to average net assets | | .90 | | .90 | | .90 | | .90 | | .90 |
| Ratio of net investment income | | | | | | | | | | |
| to average net assets | | 1.25 | | 1.09 | | .95 | | .67 | | .78 |
| Portfolio Turnover Rate | | 55.95 | | 74.98 | | 54.58 | | 67.21 | | 68.77 |
| |
| |
| |
| |
| |
|
| Net Assets, end of period ($ X 1,000) | | 4,740 | | 50,536 | | 52,723 | | 40,320 | | 46,555 |
| |
| a Based on average shares outstanding at each month end. | | | | | | | | |
| See notes to financial statements. | | | | | | | | | | |
The Fund 21
FINANCIAL HIGHLIGHTS (continued)
|
| | | | | | | Year Ended December 31, | | |
| | | |
| |
| |
|
| Class T Shares | | 2005 | | 2004 | | 2003 | | 2002 | | 2001 |
| |
| |
| |
| |
| |
|
| Per Share Data ($): | | | | | | | | | | |
| Net asset value, beginning of period | | 30.33 | | 27.43 | | 21.57 | | 28.63 | | 30.93 |
| Investment Operations: | | | | | | | | | | |
| Investment income—net a | | .23 | | .18 | | .11 | | .05 | | .07 |
| Net realized and unrealized gain | | | | | | | | | | |
| (loss) on investments | | 1.26 | | 2.87 | | 5.85 | | (7.07) | | (1.42) |
| Total from Investment Operations | | 1.49 | | 3.05 | | 5.96 | | (7.02) | | (1.35) |
| Distributions: | | | | | | | | | | |
| Dividends from investment | | | | | | | | | | |
| income—net | | (.28) | | (.15) | | (.10) | | (.04) | | (.09) |
| Dividends from net realized | | | | | | | | | | |
| gain on investments | | (.17) | | — | | — | | — | | (.86) |
| Total Distributions | | (.45) | | (.15) | | (.10) | | (.04) | | (.95) |
| Net asset value, end of period | | 31.37 | | 30.33 | | 27.43 | | 21.57 | | 28.63 |
| |
| |
| |
| |
| |
|
| Total Return (%) b | | 4.95 | | 11.14 | | 27.72 | | (24.53) | | (4.28) |
| |
| |
| |
| |
| |
|
| Ratios/Supplemental Data (%): | | | | | | | | | | |
| Ratio of total expenses | | | | | | | | | | |
| to average net assets | | 1.40 | | 1.40 | | 1.40 | | 1.40 | | 1.40 |
| Ratio of net investment income | | | | | | | | | | |
| to average net assets | | .74 | | .65 | | .45 | | .21 | | .25 |
| Portfolio Turnover Rate | | 55.95 | | 74.98 | | 54.58 | | 67.21 | | 68.77 |
| |
| |
| |
| |
| |
|
| Net Assets, end of period ($ X 1,000) | | 2,840 | | 2,945 | | 2,264 | | 1,567 | | 1,132 |
| |
| a | | Based on average shares outstanding at each month end. | | | | | | | | |
| b | | Exclusive of sales charge. | | | | | | | | | | |
| See notes to financial statements. | | | | | | | | | | |
| | | | | Year Ended December 31, | | |
| |
| |
| |
|
| Institutional Shares | | 2005 | | 2004 | | 2003 | | 2002 | | 2001 |
| |
| |
| |
| |
| |
|
| Per Share Data ($): | | | | | | | | | | |
| Net asset value, beginning of period | | 30.32 | | 27.42 | | 21.55 | | 28.60 | | 30.90 |
| Investment Operations: | | | | | | | | | | |
| Investment income—net a | | .33 | | .27 | | .19 | | .13 | | .20 |
| Net realized and unrealized | | | | | | | | | | |
| gain (loss) on investments | | 1.26 | | 2.88 | | 5.87 | | (7.07) | | (1.45) |
| Total from Investment Operations | | 1.59 | | 3.15 | | 6.06 | | (6.94) | | (1.25) |
| Distributions: | | | | | | | | | | |
| Dividends from investment | | | | | | | | | | |
| income—net | | (.38) | | (.25) | | (.19) | | (.11) | | (.19) |
| Dividends from net realized | | | | | | | | | | |
| gain on investments | | (.17) | | — | | — | | — | | (.86) |
| Total Distributions | | (.55) | | (.25) | | (.19) | | (.11) | | (1.05) |
| Net asset value, end of period | | 31.36 | | 30.32 | | 27.42 | | 21.55 | | 28.60 |
| |
| |
| |
| |
| |
|
| Total Return (%) | | 5.33 | | 11.53 | | 28.25 | | (24.28) | | (3.96) |
| |
| |
| |
| |
| |
|
| Ratios/Supplemental Data (%): | | | | | | | | | | |
| Ratio of total expenses | | | | | | | | | | |
| to average net assets | | 1.05 | | 1.05 | | 1.05 | | 1.05 | | 1.05 |
| Ratio of net investment income | | | | | | | | | | |
| to average net assets | | 1.09 | | .96 | | .81 | | .51 | | .70 |
| Portfolio Turnover Rate | | 55.95 | | 74.98 | | 54.58 | | 67.21 | | 68.77 |
| |
| |
| |
| |
| |
|
| Net Assets, end of period ($ X 1,000) | | 40,341 | | 41,202 | | 41,848 | | 37,174 | | 58,557 |
| |
| a Based on average shares outstanding at each month end. | | | | | | | | |
| See notes to financial statements. | | | | | | | | | | |
The Fund 23
NOTES TO FINANCIAL STATEMENTS
NOTE 1—Significant Accounting Policies:
Dreyfus Premier Core Value Fund (the “fund”) is a separate diversified series of The Dreyfus/Laurel Funds Trust (the “Trust”) which is registered under the Investment Company Act of 1940, as amended (the “Act”), as an open-end management investment company and operates as a series company currently offering five series, including the fund. The fund’s investment objective is to seek long-term capital growth.The Dreyfus Corporation (the “Manager” or “Dreyfus”) serves as the fund’s investment manager. The Manager is a wholly-owned subsidiary of Mellon Financial Corporation (“Mellon Financial”).
Dreyfus Service Corporation (the “Distributor”), a wholly-owned subsidiary of the Manager, is the distributor of the fund’s shares. The fund is authorized to issue an unlimited number of shares of Beneficial Interest in each of the following classes of shares: Class A, Class B, Class C, Class R, Class T and Institutional shares. Class A, Class B, Class C and Class T shares are sold primarily to retail investors through financial intermediaries and bear a distribution fee and/or service fee. Class A and Class T shares are subject to a front-end sales charge, while Class B and Class C shares are subject to a contingent deferred sales charge (“CDSC”). Class B shares automatically convert to Class A shares after six years. Class R shares are sold primarily to bank trust departments and other financial service providers (including Mellon Financial and its affiliates) acting on behalf of customers having a qualified trust or investment account or relationship at such institution, and bear no distribution or service fees. Class R and Institutional shares are offered without a front-end sales charge or CDSC. Institutional shares are offered only to those customers of certain financial planners and investment advisers who held shares of a predecessor class of the fund as of April 4, 1994, and bear a distribution fee. Each class of shares has identical rights and privileges, except with respect to the distribution and service fees and voting rights on matters affecting a single class. Income, expenses (other than expenses attributable to a specific class), and realized and unrealized gains or losses on investments are allocated to each class of shares based on its relative net assets.
The fund’s financial statements are prepared in accordance with U.S. generally accepted accounting principles, which may require the use of management estimates and assumptions. Actual results could differ from those estimates.
(a) Portfolio valuation: Investments in securities are valued at the last sales price on the securities exchange or national securities market on which such securities are primarily traded. Securities listed on the National Market System, for which market quotations are available are valued at the official closing price or, if there is no official closing price that day, at the last sale price. Securities not listed on an exchange or the national securities market, or securities for which there were no transactions, are valued at the average of the most recent bid and asked prices. Bid price is used when no asked price is available. Investments in registered investment companies are valued at their net asset value. When market quotations or official closing prices are not readily available, or are determined not to reflect accurately fair value, such as when the value of a security has been significantly affected by events after the close of the exchange or market on which the security is principally traded (for example, a foreign exchange or market), but before the fund calculates its net asset value, the fund may value these investments at fair value as determined in accordance with the procedures approved by the Board of Trustees. Fair valuing of securities may be determined with the assistance of a pricing service using calculations based on indices of domestic securities and other appropriate indicators, such as prices of relevant ADR’s and futures contracts. For other securities that are fair valued by the Board of Trustees, certain factors may be considered such as: fundamental analytical data, the nature and duration of restrictions on disposition, an evaluation of the forces that influence the market in which the securities are purchased and sold, and public trading in similar securities of the issuer or comparable issuers. Investments denominated in foreign currencies are translated to U.S. dollars at the prevailing rates of exchange. Forward currency exchange contracts are valued at the forward rate.
The Fund 25
NOTES TO FINANCIAL STATEMENTS (continued)
|
(b) Securities transactions and investment income: Securities transactions are recorded on a trade date basis. Realized gain and loss from securities transactions are recorded on the identified cost basis. Dividend income is recognized on the ex-dividend date and interest income, including, where applicable, accretion of discount and amortization of premium on investments, is recognized on the accrual basis.
Pursuant to a securities lending agreement with Mellon Bank, N.A., an affiliate of the Manager, the fund may lend securities to qualified institutions.At origination, all loans are secured by collateral of at least 102% of the value of U.S. securities loaned and 105% of the value of foreign securities loaned. Collateral equivalent to at least 100% of the market value of securities on loan will be maintained at all times. Cash collateral is invested in certain money market mutual funds managed by the Manager. The fund will be entitled to receive all income on securities loaned, in addition to income earned as a result of the lending transaction. Although each security loaned is fully collateralized, the fund would bear the risk of delay in recovery of, or loss of rights in, the securities loaned should a borrower fail to return the securities in a timely manner.
(c) Affiliated issuers: Investments in other investment companies advised by the Manager are defined as “affiliated” in the Act.
(d) Foreign currency transactions: The fund does not isolate that portion of the results of operations resulting from changes in foreign exchange rates on investments from the fluctuations arising from changes in the market prices of securities held. Such fluctuations are included with the net realized and unrealized gain or loss from investments.
Net realized foreign exchange gains or losses arise from sales and maturities of short-term securities, sales of foreign currencies, currency gains or losses realized on securities transactions and the difference between the amount of dividends, interest, and foreign withholding taxes recorded on the fund’s books and the U.S. dollar equivalent of the amounts actually received or paid. Net unrealized foreign exchange gains and losses arise from changes in the value of assets and
liabilities other than investments in securities, resulting from changes in exchange rates. Such gains and losses are included with net realized and unrealized gain or loss on investments.
(e) Dividends to shareholders: Dividends are recorded on the ex-dividend date. Dividends from investment income-net are declared and paid on a quarterly basis. Dividends from net realized capital gain are normally declared and paid annually, but the fund may make distributions on a more frequent basis to comply with the distribution requirements of the Internal Revenue Code of 1986, as amended (the “Code”). To the extent that net realized capital gain can be offset by capital loss carryovers, if any, it is the policy of the fund not to distribute such gain. Income and capital gain distributions are determined in accordance with income tax regulations, which may differ from U.S. generally accepted accounting principles.
(f) Federal income taxes: It is the policy of the fund to continue to qualify as a regulated investment company, if such qualification is in the best interests of its shareholders, by complying with the applicable provisions of the Code, and to make distributions of taxable income sufficient to relieve it from substantially all federal income and excise taxes.
At December 31, 2005, the components of accumulated earnings on a tax basis were as follows: undistributed ordinary income $69,556, undistributed capital gains $28,596,726 and unrealized appreciation $90,831,570.
The tax character of distributions paid to shareholders during the fiscal periods ended December 31, 2005 and December 31, 2004 were as follows: ordinary income $7,988,829 and $5,799,956 and long-term capital gains $3,726,851 and $0, respectively.
NOTE 2—Bank Line of Credit:
|
The fund participates with other Dreyfus-managed funds in a $350 million redemption credit facility (“the Facility”) to be utilized for temporary or emergency purposes, including the financing of redemp-
The Fund 27
NOTES TO FINANCIAL STATEMENTS (continued)
|
tions. In connection therewith, the fund has agreed to pay commitment fees on its pro rata portion of the Facility. Interest is charged to the fund based on prevailing market rates in effect at the time of borrowing.
The average daily amount of borrowings outstanding under the Facility during the period ended December 31, 2005, was $496,600 with a related weighted average annualized interest rate of 4.48% .
NOTE 3—Investment Management Fee and Other Transactions With Affiliates:
(a) Pursuant to an Investment Management agreement with the Manager, the Manager provides or arranges for one or more third parties and/or affiliates to provide investment advisory, administrative, custody, fund accounting and transfer agency services to the fund.The Manager also directs the investments of the fund in accordance with its investment objective, policies and limitations. For these services, the fund is contractually obligated to pay the Manager a fee, calculated daily and paid monthly, at the annual rate of .90% of the value of the fund’s average daily net assets. Out of its fee, the Manager pays all of the expenses of the fund except brokerage fees, taxes, interest, commitment fees, Rule 12b-1 distribution fees and expenses, service fees, fees and expenses of non-interested Trustees (including counsel fees) and extraordinary expenses. In addition, the Manager is required to reduce its fee in an amount equal to the fund’s allocable portion of fees and expenses of the non-interested Trustees (including counsel fees). Effective October 1, 2005, each Trustee receives $45,000 per year, plus $6,000 for each joint Board meeting of The Dreyfus/Laurel Funds, Inc., The Dreyfus/Laurel Tax-Free Municipal Funds, and the Trust (collectively, the “Dreyfus/Laurel Funds”) attended, $2,000 for separate in-person committee meetings attended which are not held in conjunction with a regularly scheduled Board meeting and $1,500 for Board meetings and separate committee meetings attended that are conducted by telephone and is reimbursed for travel and out-of-pocket expenses.With respect to Board meetings, the Chairman of the Board receives an additional 25% of such compensation (with the
exception of reimbursable amounts). With respect to compensation committee meetings, the Chair of the compensation committee receives $900 per meeting and, with respect to audit committee meetings, the Chair of the audit committee receives $1,350 per meeting. In the event that there is an in-person joint committee meeting or a joint telephone meeting of the Dreyfus/Laurel Funds and the Dreyfus High Yield Strategies Fund, the $2,000 or $1,500 fee, as applicable, will be allocated between the Dreyfus/Laurel Funds and the Dreyfus High Yield Strategies Fund. Prior to October 1, 2005, each Trustee received $40,000 per year, plus $5,000 for each joint Board meeting of the Dreyfus/Laurel Funds attended, $2,000 for separate committee meetings attended which were not held in conjunction with a regularly scheduled Board meeting and $500 for Board meetings and separate committee meetings attended that were conducted by telephone and was reimbursed for travel and out-of-pocket expenses.The Chairman of the Board received an additional 25% of such compensation (with the exception of reimbursable amounts). In the event that there was a joint committee meeting of the Dreyfus/Laurel Funds and Dreyfus High Yield Strategies Fund, the $2,000 fee was allocated between the Dreyfus/Laurel Funds and Dreyfus High Yield Strategies Fund.These fees and expenses are charged and allocated to each series based on net assets. Amounts required to be paid by the Trust directly to the non-interested Trustees, that would be applied to offset a portion of the management fee payable to the Manager, are in fact paid directly by the Manager to the non-interested Trustees.
During the period ended December 31, 2005, the Distributor retained $28,184 and $756 from commissions earned on sales of the fund’s Class A and Class T shares, respectively, and $200,428 and $2,055 from contingent deferred sales charges on redemptions on the fund’s Class B and Class C shares, respectively.
(b) Under separate Distribution Plans (the “Plans”) adopted pursuant to Rule 12b-1 under the Act, Class A shares and Institutional shares may pay annually up to .25% and ..15%, respectively, of the value of
The Fund 29
NOTES TO FINANCIAL STATEMENTS (continued)
|
their average daily net assets to compensate the Distributor for shareholder servicing activities and expenses primarily intended to result in the sale of Class A shares and Institutional shares. Class B, Class C and Class T shares pay the Distributor for distributing their shares at an aggregate annual rate of .75% of the value of the average daily net assets of Class B and Class C shares, and .25% of the value of average daily net assets of Class T shares.The Distributor may pay one or more agents in respect of advertising, marketing and other distribution services for Class T shares and determines the amounts, if any, to be paid to agents and the basis on which such payments are made. Class B, Class C and Class T shares are also subject to a service plan adopted pursuant to Rule 12b-1 (the “Service Plan”), under which Class B, Class C and Class T shares pay the Distributor for providing certain services to the holders of their shares a fee at the annual rate of .25% of the value of the average daily net assets of Class B, Class C and Class T shares, respectively. During the period ended December 31, 2005, Class A, Class B, Class C, Class T and Institutional shares were charged $1,492,402, $524,854, $156,637, $7,218 and $60,035, respectively, pursuant to their respective Plans. During the period ended December 31, 2005, Class B, Class C and Class T shares were charged $174,951, $52,212 and $7,218, respectively, pursuant to the Service Plan.
Under its terms, the Plans and Service Plan shall remain in effect from year to year, provided such continuance is approved annually by a vote of majority of those Trustees who are not “interested persons” of the Trust and who have no direct or indirect financial interest in the operation of or in any agreement related to the Plans or Service Plan.
The components of Due to The Dreyfus Corporation and affiliates in the Statement of Assets and Liabilities consist of: management fees $568,425, Rule 12b-1 distribution plan fees $191,807 and shareholder services plan fees $20,057.
(c) The Trust and the Manager have received an exemptive order from the SEC which, among other things, permits the fund to use cash collateral received in connection with lending the fund’s securities and other uninvested cash to purchase shares of one or more registered money market mutual funds advised by the Manager in excess of the limitations imposed by the Act.
NOTE 4—Securities Transactions:
The aggregate amount of purchases and sales of investment securities, excluding short-term securities, during the period ended December 31, 2005, amounted to $428,166,715 and $596,640,678, respectively.
At December 31, 2005, the cost of investments for federal income tax purposes was $600,443,069; accordingly, accumulated net unrealized appreciation on investments was $90,831,570, consisting of $108,517,356 gross unrealized appreciation and $17,685,786 gross unrealized depreciation.
The Fund 31
REPORT OF INDEPENDENT REGISTERED PUBLIC ACCOUNTING FIRM
The Board of Trustees and Shareholders The Dreyfus/Laurel Funds Trust:
We have audited the accompanying statement of assets and liabilities, of Dreyfus Premier Core Value Fund (the “Fund”) of The Dreyfus/ Laurel Funds Trust, including the statement of investments as of December 31, 2005, and the related statement of operations for the year then ended, the statement of changes in net assets for each of the years in the two-year period then ended, and the financial highlights for each of the years in the five-year period then ended.These financial statements and financial highlights are the responsibility of the Fund’s management. Our responsibility is to express an opinion on these financial statements and financial highlights based on our audits.
We conducted our audits in accordance with standards of the Public Company Accounting Oversight Board (United States). Those standards require that we plan and perform the audit to obtain reasonable assurance about whether the financial statements and financial highlights are free of material misstatement. An audit also includes examining, on a test basis, evidence supporting the amounts and disclosures in the financial statements. Our procedures included confirmation of securities owned as of December 31, 2005, by correspondence with the custodian and broker. An audit also includes assessing the accounting principles used and significant estimates made by management, as well as evaluating the overall financial statement presentation.We believe that our audits provide a reasonable basis for our opinion.
In our opinion, the financial statements and financial highlights referred to above present fairly, in all material respects, the financial position of Dreyfus Premier Core Value Fund of The Dreyfus/Laurel Funds Trust as of December 31, 2005, the results of its operations for the year then ended, the changes in its net assets for each of the years in the two-year period then ended, and the financial highlights for each of the years in the five-year period then ended, in conformity with U.S. generally accepted accounting principles.
New York, New York
February 17, 2006
|
IMPORTANT TAX INFORMATION (Unaudited)
For federal tax purposes, the fund hereby designates $.1701 per share as a long-term capital gain distribution paid on December 28, 2005. The fund also hereby designates 100% of the ordinary dividends paid during the fiscal year ended December 31, 2005 as qualifying for the corporate dividends received deduction. For the fiscal year ended December 31, 2005, certain dividends paid by the fund may be subject to a maximum tax rate of 15%, as provided for by the Jobs and Growth Tax Relief Reconciliation Act of 2003. Of the distributions paid during the fiscal year, $7,988,829 represents the maximum amount that may be considered qualified dividend income. Shareholders will receive notification in January 2006 of the percentage applicable to the preparation of their 2005 income tax returns.
The Fund 33
INFORMATION ABOUT THE REVIEW AND APPROVAL OF THE
FUND’S INVESTMENT MANAGEMENT AGREEMENT (Unaudited)
At a meeting of the Trust’s Board of Trustees held on October 26 and 27, 2005, the Board considered the re-approval, through its annual renewal date of April 4, 2006, of the fund’s Investment Management Agreement (“Management Agreement”), pursuant to which the Manager provides the fund with investment advisory and administrative services.The Board members, none of whom are “interested persons” (as defined in the Investment Company Act of 1940, as amended) of the fund were assisted in their review by independent legal counsel and met with counsel in executive session separate from representatives of the Manager.
Analysis of Nature, Extent and Quality of Services Provided to the Fund. The Board members reviewed information previously provided to them in a presentation from representatives of the Manager at the March 29 and 30, 2005 Board meetings regarding services provided to the fund and other funds in the Dreyfus fund complex, and discussed the nature, extent and quality of the services provided to the fund pursuant to its Management Agreement. The Manager’s representatives reviewed the fund’s distribution of accounts and the relationships the Manager has with various intermediaries and the different needs of each.The Manager’s representatives noted the diversity of distribution of the fund as well as among the funds in the Dreyfus fund complex, and the Manager’s corresponding need for broad, deep, and diverse resources to be able to provide ongoing shareholder services to each of the fund’s distribution channels.The Board also reviewed the number of shareholder accounts in the fund, as well as the fund’s asset size.
The Board members also considered the Manager’s research and portfolio management capabilities and that the Manager also provides oversight of day-to-day fund operations, including fund accounting and administration and assistance in meeting legal and regulatory requirements. The Board members also considered the Manager’s extensive administrative, accounting and compliance infrastructure.
Comparative Analysis of the Fund’s Performance and Management Fee and Expense Ratio. The Board members reviewed the fund’s per-
formance, management fee and expense ratio and placed significant emphasis on comparisons to a group of comparable funds and Lipper category averages, as applicable. The group of comparable funds was previously approved by the Board for this purpose, and was prepared using a Board-approved selection methodology that was based, in part, on selecting non-affiliated funds reported in the same Lipper category as the fund.The Board members discussed the results of the comparisons for various periods ended September 30, 2005, and noted that the fund’s total return performance was lower than the comparison group averages for the one-, three-, five- and ten-year periods. The Board also noted that the fund’s total return performance was lower than the Lipper category averages for the three-, five- and ten-year periods, but was higher than the Lipper category average for the one-year period, noting that the fund’s one-year total return performance rankings in the comparison group and Lipper category had improved since January 31, 2005, the period the Board reviewed in connection with its consideration of the renewal of the fund’s Management Agreement at the March 29 and 30, 2005 Board meeting.The Board noted the portfolio management change that occurred in April 2004.
The Board members also discussed the fund’s management fee and expense ratio and reviewed the range of management fees and expense ratios in the comparison group and the expense ratio averages of the comparison group and Lipper category.The fund was the only fund in the comparison group of funds with a “unitary fee” structure. The Board members noted that the fund’s expense ratio was lower than the comparison group and Lipper category averages.
Representatives of the Manager reviewed with the Board members the fees paid to the Manager or its affiliates by mutual funds managed by the Manager or its affiliates with similar investment objectives, policies and strategies, and included in the same Lipper category, as the fund, or in the “Large-Cap Value Variable Insurance Products” category of Lipper (the “Similar Funds”), and by other accounts managed by the Manager with similar investment objectives, policies and strategies as
The Fund 35
I N FO R M AT I O N A B O U T T H E R E V I E W A N D A P P R OVA L O F T H E F U N D ’ S M A N A G E M E N T I N V E S T M E N T A G R E E M E N T ( U n a u d i t e d ) ( c o n t i n u e d )
the fund (collectively with the Similar Funds, the “Similar Accounts”). The Manager’s representatives explained the nature of the Similar Accounts and the differences, from the Manager’s perspective, in providing services to such Similar Accounts as compared to managing and providing services to the fund. The Manager’s representatives also reviewed the costs associated with distribution through intermediaries. The Board analyzed differences in fees paid to the Manager and discussed the relationship of the fees paid in light of the Manager’s performance and the services provided, noting the fund’s “unitary fee” structure. The Board members considered the relevance of the fee information provided for the Similar Accounts to evaluate the appropriateness and reasonableness of the fund’s management fee.The Board acknowledged that differences in fees paid by the Similar Accounts seemed to be consistent with the services provided.
Analysis of Profitability and Economies of Scale. The Manager’s representatives reviewed the dollar amount of expenses allocated and profit received by the Manager and the method used to determine such expenses and profit.The Board considered information prepared by an independent consulting firm regarding the Manager’s approach to allocating costs to, and determining the profitability of, individual funds and the entire Dreyfus mutual fund complex. The Manager’s representatives stated that the methodology had also been reviewed by an independent registered public accounting firm which, like the consultant, found the methodology to be reasonable.The consulting firm also analyzed where any economies of scale might emerge in connection with the management of the fund.The Board members evaluated the analysis in light of the relevant circumstances for the fund, including the recent decline in assets, and the extent to which economies of scale would be realized as the fund grows and whether fee levels reflect these economies of scale for the benefit of fund investors.The Board members also considered potential benefits to the Manager from acting as investment adviser and noted the soft dollar arrangements with respect to trading the fund’s portfolio.
It was noted that the Board members should consider the Manager’s profitability with respect to the fund as part of their evaluation of whether the fee under the Management Agreement bears a reasonable relationship to the mix of services provided by the Manager, including the nature, extent and quality of such services. The Board further noted that a discussion of economies of scale is predicated on increasing assets and that, if a fund’s assets had been decreasing, the possibility that the Manager may have realized any economies of scale would be less. It also was noted that the profitability percentage for managing the fund was within ranges determined by appropriate court cases to be reasonable given the services rendered and given the fund’s overall performance and generally superior service levels provided.
At the conclusion of these discussions, each of the Independent Trustees expressed the opinion that he or she had been furnished with sufficient information to make an informed business decision with respect to continuation of the fund’s Management Agreement. Based on the discussions and considerations as described above, the Board made the following conclusions and determinations.
- The Board concluded that the nature, extent and quality of the ser- vices provided by the Manager are adequate and appropriate.
- While the Board was concerned with the fund’s total return per- formance, the Board believed the Manager was seeking to improve it; it noted the change in portfolio managers in April 2004 and the fund’s improved one-year total return performance rankings in its comparison group and Lipper category.
- The Board concluded that the fee paid by the fund to the Manager was reasonable in light of comparative performance and expense and advisory fee information, cost of services provided and profits to be realized and benefits derived or to be derived by the Manager from its relationship with the fund.
The Fund 37
I N FO R M AT I O N A B O U T T H E R E V I E W A N D A P P R OVA L O F T H E F U N D ’ S M A N A G E M E N T I N V E S T M E N T A G R E E M E N T ( U n a u d i t e d ) ( c o n t i n u e d )
- The Board determined that the economies of scale which may accrue to the Manager and its affiliates in connection with the man- agement of the fund had been adequately considered by the Manager in connection with the management fee rate charged to the fund and that, to the extent in the future it were to be deter- mined that material economies of scale had not been shared with the fund, the Board would seek to have those economies of scale shared with the fund.
The Board members considered these conclusions and determinations, along with information received on a routine and regular basis throughout the year, and, without any one factor being dispositive, the Board determined that re-approval of the fund’s Management Agreement was in the best interests of the fund and its shareholders and that the Management Agreement would be renewed through its annual renewal period, April 4, 2006.
BOARD MEMBERS INFORMATION (Unaudited)
| Joseph S. DiMartino (62) |
| Chairman of the Board (1995) |
| Principal Occupation During Past 5 Years: |
| • Corporate Director and Trustee |
| Other Board Memberships and Affiliations: |
| • The Muscular Dystrophy Association, Director |
| • Levcor International, Inc., an apparel fabric processor, Director |
| • Century Business Services, Inc., a provider of outsourcing functions for small and medium size |
| companies, Director |
| • The Newark Group, a provider of a national market of paper recovery facilities, paperboard |
| mills and paperboard converting plants, Director |
| • Sunair Services Corporation, engages in the design, manufacture and sale of high frequency |
| systems for long-range voice and data communications, as well as providing certain outdoor- |
| related services to homes and businesses, Director |
| No. of Portfolios for which Board Member Serves: 193 |
| ——————— |
| James Fitzgibbons (71) |
| Board Member (1994) |
| Principal Occupation During Past 5 Years: |
| • Chairman of the Board, Davidson Cotton Company (1998-2002) |
| Other Board Memberships and Affiliations: |
| • Bill Barrett Company, an oil and gas exploration company, Director |
| No. of Portfolios for which Board Member Serves: 23 |
| ——————— |
| J. Tomlinson Fort (77) |
| Board Member (1987) |
| Principal Occupation During Past 5 Years: |
| • Retired; Of Counsel, Reed Smith LLP (1998-2004) |
| Other Board Memberships and Affiliations: |
| • Allegheny College, Emeritus Trustee |
| • Pittsburgh Ballet Theatre,Trustee |
| • American College of Trial Lawyers, Fellow |
| No. of Portfolios for which Board Member Serves: 23 |
| ——————— |
| Kenneth A. Himmel (59) |
| Board Member (1994) |
| Principal Occupation During Past 5 Years: |
| • President and CEO, Related Urban Development, a real estate development company |
| (1996-present) |
| • President and CEO, Himmel & Company, a real estate development company (1980-present) |
| • CEO, American Food Management, a restaurant company (1983-present) |
| No. of Portfolios for which Board Member Serves: 23 |
The Fund 39
BOARD MEMBERS INFORMATION (Unaudited) (continued)
| Stephen J. Lockwood (58) |
| Board Member (1994) |
| Principal Occupation During Past 5 Years: |
| • Chairman of the Board, Stephen J. Lockwood and Company LLC, an investment company |
| (2000-present) |
| • Chairman of the Board and CEO, LDG Reinsurance Corporation (1977-2000) |
| Other Board Memberships and Affiliations: |
| • BDML Holdings, an insurance company, Chairman of the Board |
| • Affiliated Managers Group, an investment management company, Director |
| No. of Portfolios for which Board Member Serves: 23 |
| ——————— |
| Roslyn Watson (56) |
| Board Member (1994) |
| Principal Occupation During Past 5 Years: |
| • Principal,Watson Ventures, Inc., a real estate investment company (1993-present) |
| Other Board Memberships and Affiliations: |
| • American Express Centurion Bank, Director |
| • The Hyams Foundation Inc., a Massachusetts Charitable Foundation,Trustee |
| • National Osteoporosis Foundation,Trustee |
| No. of Portfolios for which Board Member Serves: 23 |
| ——————— |
| Benaree Pratt Wiley (59) |
| Board Member (1998) |
| Principal Occupation During Past 5 Years: |
| • President and CEO,The Partnership, an organization dedicated to increasing the representa- |
| tion of African Americans in positions of leadership, influence and decision-making in Boston, |
| MA (1991-present) |
| Other Board Memberships and Affiliations: |
| • Boston College, Associate Trustee |
| • The Greater Boston Chamber of Commerce, Director |
| • Mass. Development, Director |
| • Commonwealth Institute, Director |
| • Efficacy Institute, Director |
| • PepsiCo African-American, Advisory Board |
| • The Boston Foundation, Director |
| • Harvard Business School Alumni Board, Director |
| No. of Portfolios for which Board Member Serves: 23 |
| ——————— |
| Once elected all Board Members serve for an indefinite term.The address of the Board Members and Officers is in c/o |
| The Dreyfus Corporation, 200 Park Avenue, New York, New York 10166. Additional information about the Board |
| Members is available in the fund’s Statement of Additional Information which can be obtained from Dreyfus free of |
| charge by calling this toll free number: 1-800-554-4611. |
| Francis P. Brennan, Emeritus Board Member |
| 40 |
OFFICERS OF THE FUND (Unaudited)
| STEPHEN E. CANTER, President since |
| March 2000. |
Chairman of the Board, Chief Executive Officer and Chief Operating Officer of the Manager, and an officer of 90 investment companies (comprised of 184 portfolios) managed by the Manager. Mr. Canter also is a Board member and, where applicable, an Executive Committee Member of the other investment management subsidiaries of Mellon Financial Corporation, each of which is an affiliate of the Manager. He is 60 years old and has been an employee of the Manager since May 1995.
| STEPHEN R. BYERS, Executive Vice |
| President since November 2002. |
Chief Investment Officer,Vice Chairman and a director of the Manager, and an officer of 90 investment companies (comprised of 184 portfolios) managed by the Manager. Mr. Byers also is an officer, director or an Executive Committee Member of certain other investment management subsidiaries of Mellon Financial Corporation, each of which is an affiliate of the Manager. He is 52 years old and has been an employee of the Manager since January 2000.
| MARK N. JACOBS, Vice President since |
| March 2000. |
Executive Vice President, Secretary and General Counsel of the Manager, and an officer of 91 investment companies (comprised of 200 portfolios) managed by the Manager. He is 59 years old and has been an employee of the Manager since June 1977.
| MICHAEL A. ROSENBERG, Vice President |
| and Secretary since August 2005. |
Associate General Counsel of the Manager, and an officer of 91 investment companies (comprised of 200 portfolios) managed by the Manager. He is 45 years old and has been an employee of the Manager since October 1991.
| JAMES BITETTO, Vice President and |
| Assistant Secretary since August 2005. |
Assistant General Counsel and Assistant Secretary of the Manager, and an officer of 91 investment companies (comprised of 200 portfolios) managed by the Manager. He is 39 years old and has been an employee of the Manager since December 1996.
| JONI LACKS CHARATAN, Vice President |
| and Assistant Secretary since August |
| 2005. |
Associate General Counsel of the Manager, and an officer of 91 investment companies (comprised of 200 portfolios) managed by the Manager. She is 50 years old and has been an employee of the Manager since October 1988.
| JOSEPH M. CHIOFFI, Vice President and |
| Assistant Secretary since August 2005. |
Assistant General Counsel of the Manager, and an officer of 91 investment companies (comprised of 200 portfolios) managed by the Manager. He is 44 years old and has been an employee of the Manager since June 2000.
| JANETTE E. FARRAGHER, Vice President |
| and Assistant Secretary since August |
| 2005. |
Associate General Counsel of the Manager, and an officer of 91 investment companies (comprised of 200 portfolios) managed by the Manager. She is 43 years old and has been an employee of the Manager since February 1984.
| JOHN B. HAMMALIAN, Vice President and |
| Assistant Secretary since August 2005. |
Associate General Counsel of the Manager, and an officer of 91 investment companies (comprised of 200 portfolios) managed by the Manager. He is 42 years old and has been an employee of the Manager since February 1991
The Fund 41
OFFICERS OF THE FUND (Unaudited) (continued)
| ROBERT R. MULLERY, Vice President and |
| Assistant Secretary since August 2005. |
Associate General Counsel of the Manager, and an officer of 91 investment companies (comprised of 200 portfolios) managed by the Manager. He is 53 years old and has been an employee of the Manager since May 1986.
| JEFF PRUSNOFSKY, Vice President and |
| Assistant Secretary since August 2005. |
Associate General Counsel of the Manager, and an officer of 91 investment companies (comprised of 200 portfolios) managed by the Manager. He is 40 years old and has been an employee of the Manager since October 1990.
| JAMES WINDELS, Treasurer since |
| November 2001. |
Director – Mutual Fund Accounting of the Manager, and an officer of 91 investment companies (comprised of 200 portfolios) managed by the Manager. He is 47 years old and has been an employee of the Manager since April 1985.
| ERIK D. NAVILOFF, Assistant Treasurer |
| since December 2002. |
Senior Accounting Manager – Taxable Fixed Income Funds of the Manager, and an officer of 91 investment companies (comprised of 200 portfolios) managed by the Manager. He is 37 years old and has been an employee of the Manager since November 1992.
| ROBERT ROBOL, Assistant Treasurer |
| since August 2005. |
Senior Accounting Manager – Money Market and Municipal Bond Funds of the Manager, and an officer of 91 investment companies (comprised of 200 portfolios) managed by the Manager. He is 41 years old and has been an employee of the Manager since October 1988.
| ROBERT SVAGNA, Assistant Treasurer |
| since December 2002. |
Senior Accounting Manager – Equity Funds of the Manager, and an officer of 91 investment companies (comprised of 200 portfolios) managed by the Manager. He is 38 years old and has been an employee of the Manager since November 1990.
| GAVIN C. REILLY, Assistant Treasurer |
| since December 2005. |
Tax Manager of the Investment Accounting and Support Department of the Manager, and an officer of 91 investment companies (comprised of 200 portfolios) managed by the Manager. He is 37 years old and has been an employee of the Manager since April 1991.
| JOSEPH W. CONNOLLY, Chief Compliance |
| Officer since October 2004. |
Chief Compliance Officer of the Manager and The Dreyfus Family of Funds (91 investment companies, comprised of 200 portfolios). From November 2001 through March 2004, Mr. Connolly was first Vice-President, Mutual Fund Servicing for Mellon Global Securities Services. In that capacity, Mr. Connolly was responsible for managing Mellon’s Custody, Fund Accounting and Fund Administration services to third-party mutual fund clients. He is 48 years old and has served in various capacities with the Manager since 1980, including manager of the firm’s Fund Accounting Department from 1997 through October 2001.
| WILLIAM GERMENIS, Anti-Money |
| Laundering Compliance Officer since July |
| 2002. |
Vice President and Anti-Money Laundering Compliance Officer of the Distributor, and the Anti-Money Laundering Compliance Officer of 87 investment companies (comprised of 196 portfolios) managed by the Manager. He is 35 years old and has been an employee of the Distributor since October 1998.
42
NOTES
| Dreyfus Premier |
| Core Value Fund |
| 200 Park Avenue |
| New York, NY 10166 |
| |
| Manager |
| The Dreyfus Corporation |
| 200 Park Avenue |
| New York, NY 10166 |
| |
| Custodian |
| Mellon Bank, N.A. |
| One Mellon Bank Center |
| Pittsburgh, PA 15258 |
| Transfer Agent & |
| Dividend Disbursing Agent |
| Dreyfus Transfer, Inc. |
| 200 Park Avenue |
| New York, NY 10166 |
| |
| Distributor |
| Dreyfus Service Corporation |
| 200 Park Avenue |
| New York, NY 10166 |
Telephone Call your financial representative or 1-800-554-4611
| Mail | | The Dreyfus Premier Family of Funds |
| | | 144 Glenn Curtiss Boulevard, Uniondale, NY 11556-0144 |
The fund files its complete schedule of portfolio holdings with the Securities and Exchange Commission (“SEC”) for the first and third quarters of each fiscal year on Form N-Q. The fund’s Forms N-Q are available on the SEC’s website at http://www.sec.gov and may be reviewed and copied at the SEC’s Public Reference Room in Washington, DC. Information on the operation of the Public Reference Room may be obtained by calling 1-800-SEC-0330.
A description of the policies and procedures that the fund uses to determine how to vote proxies relating to portfolio securities, and information regarding how the fund voted these proxies for the 12-month period ended June 30, 2005, is available at http://www.dreyfus.com and on the SEC’s website at http://www.sec.gov. The description of the policies and procedures is also available without charge, upon request, by calling 1-800-645-6561.
© 2006 Dreyfus Service Corporation

Save time. Save paper. View your next shareholder report online as soon as it’s available. Log into www.dreyfus.com and sign up for Dreyfus eCommunications. It’s simple and only takes a few minutes.
The views expressed in this report reflect those of the portfolio manager only through the end of the period covered and do not necessarily represent the views of Dreyfus or any other person in the Dreyfus organization. Any such views are subject to change at any time based upon market or other conditions and Dreyfus disclaims any responsibility to update such views.These views may not be relied on as investment advice and, because investment decisions for a Dreyfus fund are based on numerous factors, may not be relied on as an indication of trading intent on behalf of any Dreyfus fund.
Not FDIC-Insured • Not Bank-Guaranteed • May Lose Value
| | | Contents |
| |
| | | T H E F U N D |
| |
|
| 2 | | Letter from the Chairman |
| 3 | | Discussion of Fund Performance |
| 6 | | Fund Performance |
| 8 | | Understanding Your Fund’s Expenses |
| 8 | | Comparing Your Fund’s Expenses |
| | | With Those of Other Funds |
| 9 | | Statement of Investments |
| 25 | | Statement of Assets and Liabilities |
| 26 | | Statement of Operations |
| 27 | | Statement of Changes in Net Assets |
| 30 | | Financial Highlights |
| 34 | | Notes to Financial Statements |
| 46 | | Report of Independent Registered |
| | | Public Accounting Firm |
| 47 | | Important Tax Information |
| 48 | | Board Members Information |
| 50 | | Officers of the Fund |
| | | F O R M O R E I N F O R M AT I O N |
| |
|
| | | Back Cover |
| Dreyfus Premier |
| Limited Term High Yield Fund |

L E T T E R F R O M T H E C H A I R M A N
Dear Shareholder:
We are pleased to present this annual report for Dreyfus Premier Limited Term High Yield Fund, covering the 12-month period from January 1, 2005, through December 31, 2005. Inside, you’ll find valuable information about how the fund was managed during the reporting period, including a discussion with the fund’s primary portfolio manager, Jonathan Uhrig.
Most sectors of the taxable fixed-income marketplace shrugged off bad news and responded to more positive factors in 2005. Although short-term interest rates rose by 200 basis points due to eight consecutive increases by the Federal Reserve Board during the year, the yield of the 10-year U.S.Treasury security ended the year only 17 basis points higher than where it began.Analysts generally attribute the bond market’s resilience to low inflation and robust investor demand, especially from overseas investors.
We expect the U.S. economy to continue its moderate expansion in 2006, while inflation should stay low and investor demand for income-producing securities should remain high. Risks in the new year include uncertainty regarding Fed policy under a new chairman and the possibility of continued turmoil in the automotive sector, including some of the corporate bond market’s largest issuers.
As always, we encourage you to speak with your financial consultant about how these and other market forces may affect your investments. Thank you for your continued confidence and support.
| | The Dreyfus Corporation
January 17, 2006
|

D I S C U S S I O N O F F U N D P E R F O R M A N C E
Jonathan Uhrig, Portfolio Manager
How did Dreyfus Premier Limited Term High Yield Fund perform during the period?
For the 12-month period ended December 31, 2005, the fund achieved total returns of 2.22% for its Class A shares, 1.73% for Class B shares, 1.48% for Class C shares and 2.34% for Class R shares. The fund generated aggregate income dividends of $0.56 for Class A shares, $0.52 for Class B shares, $0.50 for Class C shares and $0.58 for Class R shares.1 In comparison, the Merrill Lynch U.S. High Yield Master II Constrained Index (the “Merrill Lynch Constrained Index”) achieved a total return of 2.76% for the same period.2 The fund’s previous benchmark, the Merrill Lynch High Yield Master II Index, achieved a total return of 2.74% for the same period.3
Effective August 4, 2005, the fund adopted a new benchmark, the Merrill Lynch U.S. High Yield Master II Constrained Index. The Merrill Lynch Constrained Index is similar to the previous benchmark, except the Merrill Lynch Constrained Index is capitalization-weighted, and restricts the weighting of any individual issue to 2%.
High yield bonds generally produced positive total returns during 2005 as supportive factors, such as a growing economy and low default rates, were offset by concerns regarding rising interest rates, financial problems in the automotive industry and an increase in highly leveraged financing transactions. The fund produced slightly lower returns than the indices, which we attribute primarily to its transition early in the year to the current management team. In addition, fund fees and expenses are not reflected in either benchmark’s performance.
What is the fund’s investment approach?
The fund seeks to maximize total return, consisting of capital appreciation and current income. The average effective maturity of the fund is limited to a maximum of 5.5 years.
At least 80% of the fund’s assets is invested in fixed-income securities that are rated below investment grade (“high yield” or “junk” bonds) or
D I S C U S S I O N O F F U N D P E R F O R M A N C E (continued)
are the unrated equivalent as determined by Dreyfus. Individual issues are selected based on careful credit analysis.We thoroughly analyze the business, management and financial strength of each of the companies whose bonds we buy, then project each issuer’s ability to repay its debt.
What other factors influenced the fund’s performance?
The general tenor of news in the bond market took a turn for the worse in 2005. Eight consecutive increases in short-term interest rates from the Federal Reserve Board, a series of headline-grabbing financial problems in the U.S. automotive industry; the high-profile bankruptcies of energy utility Calpine Generating, financial services company REFCO and auto parts supplier Delphi Automotive; and ongoing weakness due to high fuel and labor costs in the airline industry all contributed to nervousness among fixed-income investors. In addition, the investment-grade corporate bond market encountered credit issues when a number of companies, frustrated by lagging stock market valuations, pursued leveraged financing transactions or outright sales that harmed prices of covenant-free debt issues.
These negative influences were balanced to a significant degree by more positive factors. Steady economic expansion and low inflation helped support business conditions for many high yield issuers, and default rates generally stayed low. In addition, investor demand remained high for securities producing competitive levels of current income, while the supply of newly issued high yield bonds declined, supporting prices. As a result, high yield bonds generally ended a challenging year with positive total returns.
During much of the year, we repositioned the fund to have less exposure to lower-rated high yield credits, concentrating primarily on investments with “single-B” and “double-B” credit ratings.This change proved to be beneficial for performance, as the upper and middle credit-rating tiers generally outperformed the lower tier.
The high yield market achieved relatively strong returns from the fixed-line telecommunications, banks, wireless telecommunications, railroads and insurance sectors. The automotive, auto parts and suppliers, airlines, and paper and forest products areas lagged the averages in 2005.The fund benefited from its underweighted positions
in the airlines, automotive and paper and forest products sectors as well as its relatively heavy exposure to wireless telecommunications companies. However, the fund was underweighted in the bonds of wireless company Level 3 Communications, which rallied near year-end.
In addition, the fund avoided the full brunt of weakness stemming from the bankruptcy of Calpine, which composed a substantially larger portion of both indices relative to that of the fund’s portfolio. Finally, despite a privatizing transaction, the fund’s overweighted position in bonds from forest products company Georgia Pacific fared well due to restrictive covenants that led them to be tendered out at favorable price levels.
What is the fund’s current strategy?
As of year-end, conditions in the high yield market appear to be favor-able.The seemingly relentless search for yield by investors has shown few signs of easing, high yield default rates are projected by major rating agencies to remain roughly unchanged in 2006, and supply-and-demand factors generally have remained positive. However, we remain concerned about the recent shift in corporate financing activity toward transactions that benefit stockholders over bondholders.Accordingly, we have maintained the fund’s focus on securities with credit ratings at the higher end of the high yield range. In our view, the key to performance in 2006 may be efficient credit management and risk control, which we hope will be combined with worthwhile new financing opportunities.
| 1 | | Total return includes reinvestment of dividends and any capital gains paid, and does not take into |
| | | consideration the maximum initial sales charge in the case of Class A shares, or the applicable |
| | | contingent deferred sales charges imposed on redemptions in the case of Class B and Class C |
| | | shares. Had these charges been reflected, returns would have been lower. Past performance is no |
| | | guarantee of future results. Share price, yield and investment return fluctuate such that upon |
| | | redemption, fund shares may be worth more or less than their original cost. |
| 2 | | SOURCE: BLOOMBERG — Reflects reinvestment of dividends and, where applicable, |
| | | capital gain distributions.The Merrill Lynch U.S. High Yield Master II Constrained Index is an |
| | | unmanaged performance benchmark composed of U.S. dollar-denominated domestic and Yankee |
| | | bonds rated below investment grade with at least $100 million par amount outstanding and at |
| | | least one year remaining to maturity. Bonds are capitalization-weighted.Total allocations to an |
| | | issuer are capped at 2%. |
| 3 | | SOURCE: LIPPER INC. — Reflects reinvestment of dividends and, where applicable, capital |
| | | gain distributions.The Merrill Lynch High Yield Master II Index is an unmanaged performance |
| | | benchmark composed of U.S. domestic and Yankee bonds rated below investment grade with at |
| | | least $100 million par amount outstanding and greater than or equal to one year to maturity. |
| |
| |
| | | T h e F u n d 5 |
F U N D P E R F O R M A N C E
|
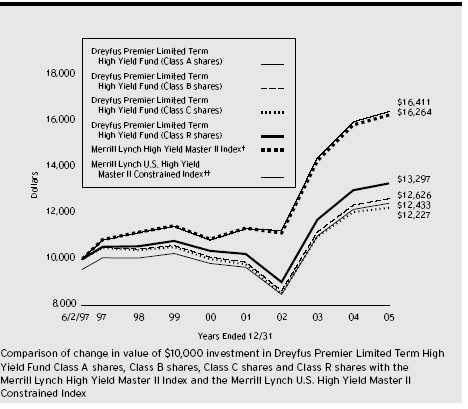
| † | | Source: Lipper Inc. |
| †† | | Source: Bloomberg L.P. |
| Past performance is not predictive of future performance. |
| The above graph compares a $10,000 investment made in each of the Class A, Class B, Class C and Class R shares |
| of Dreyfus Premier Limited Term High Yield Fund on 6/2/97 (inception date) to a $10,000 investment made in the |
| Merrill Lynch U.S. High Yield Master II Constrained Index (the “Merrill Lynch Constrained Index”) and the Merrill |
| Lynch High Yield Master II Index (the “Merrill Lynch Index”). For comparative purposes, the value of the Index on |
| 5/31/97 is used as the beginning value on 6/2/97. All dividends and capital gain distributions are reinvested. |
| On August 4, 2005, the fund’s benchmark was changed to the Merrill Lynch Constrained Index from the Merrill |
| Lynch Index because the former is expected to more accurately reflect the asset composition of the fund’s portfolio. |
| The fund’s performance shown in the line graph takes into account the maximum initial sales charge on Class A shares |
| and all other applicable fees and expenses on all classes.The Merrill Lynch Constrained Index is an unmanaged |
| performance benchmark composed of U.S. dollar-denominated domestic and Yankee bonds rated below investment grade |
| with at least $100 million par amount outstanding and at least one year remaining to maturity. Bonds are |
| capitalization-weighted.Total allocations to an issuer are capped at 2%.The Merrill Lynch Index is an unmanaged |
| performance benchmark composed of U.S. domestic and Yankee bonds rated below investment grade with at least $100 |
| million par amounts outstanding and greater than or equal to one year to maturity.The indices do not take into account |
| charges, fees and other expenses. Further information relating to fund performance, including expense reimbursements, if |
| applicable, is contained in the Financial Highlights section of the prospectus and elsewhere in this report. |
| 6 | | |
| Average Annual Total Returns as of 12/31/05 | | | | | | |
| | | Inception | | | | | | From |
| | | Date | | 1 Year | | 5 Years | | Inception |
| |
| |
| |
| |
|
| Class A shares | | | | | | | | |
| with maximum sales charge (4.5%) | | 6/2/97 | | (2.38)% | | 3.88% | | 2.57% |
| without sales charge | | 6/2/97 | | 2.22% | | 4.84% | | 3.12% |
| Class B shares | | | | | | | | |
| with applicable redemption charge † | | 6/2/97 | | (2.07)% | | 4.08% | | 2.75% |
| without redemption | | 6/2/97 | | 1.73% | | 4.35% | | 2.75% |
| Class C shares | | | | | | | | |
| with applicable redemption charge †† | | 6/2/97 | | 0.53% | | 4.09% | | 2.37% |
| without redemption | | 6/2/97 | | 1.48% | | 4.09% | | 2.37% |
| Class R shares | | 6/2/97 | | 2.34% | | 5.12% | | 3.38% |
| Past performance is not predictive of future performance.The fund’s performance shown in the graph and table does not |
| reflect the deduction of taxes that a shareholder would pay on fund distributions or the redemption of fund shares. |
| Performance for Class B shares assumes the conversion of Class B shares to Class A shares at the end of the sixth year |
| following the date of purchase. |
| † | | The maximum contingent deferred sales charge for Class B shares is 4%. After six years Class B shares convert to |
| | | Class A shares. |
| †† | | The maximum contingent deferred sales charge for Class C shares is 1% for shares redeemed within one year of the |
| | | date of purchase. |
U N D E R S TA N D I N G YO U R F U N D ’ S E X P E N S E S ( U n a u d i t e d )
As a mutual fund investor, you pay ongoing expenses, such as management fees and other expenses. Using the information below, you can estimate how these expenses affect your investment and compare them with the expenses of other funds.You also may pay one-time transaction expenses, including sales charges (loads) and redemption fees, which are not shown in this section and would have resulted in higher total expenses. For more information, see your fund’s prospectus or talk to your financial adviser.
Review your fund’s expenses
The table below shows the expenses you would have paid on a $1,000 investment in Dreyfus Premier Limited Term High Yield Fund from July 1, 2005 to December 31, 2005. It also shows how much a $1,000 investment would be worth at the close of the period, assuming actual returns and expenses.
| Expenses and Value of a $1,000 Investment | | | | | | |
| assuming actual returns for the six months ended December 31, 2005 | | |
| | | Class A | | Class B | | Class C | | Class R |
| |
| |
| |
| |
|
| Expenses paid per $1,000 † | | $ 4.84 | | $ 7.39 | | $ 8.65 | | $ 3.57 |
| Ending value (after expenses) | | $1,022.20 | | $1,021.10 | | $1,018.40 | | $1,023.50 |
C O M P A R I N G Y O U R F U N D ’ S E X P E N S E S W I T H T H O S E O F O T H E R F U N D S ( U n a u d i t e d )
Using the SEC’s method to compare expenses
The Securities and Exchange Commission (SEC) has established guidelines to help investors assess fund expenses. Per these guidelines, the table below shows your fund’s expenses based on a $1,000 investment, assuming a hypothetical 5% annualized return. You can use this information to compare the ongoing expenses (but not transaction expenses or total cost) of investing in the fund with those of other funds.All mutual fund shareholder reports will provide this information to help you make this comparison. Please note that you cannot use this information to estimate your actual ending account balance and expenses paid during the period.
Expenses and Value of a $1,000 Investment assuming a hypothetical 5% annualized return for the six months ended December 31, 2005
| | | Class A | | Class B | | Class C | | Class R |
| |
| |
| |
| |
|
| Expenses paid per $1,000 † | | $ 4.84 | | $ 7.37 | | $ 8.64 | | $ 3.57 |
| Ending value (after expenses) | | $1,020.42 | | $1,017.90 | | $1,016.64 | | $1,021.68 |
| † Expenses are equal to the fund’s annualized expense ratio of .95% for Class A, 1.45% for Class B, 1.70% for |
| Class C and .70% for Class R; multiplied by the average account value over the period, multiplied by 184/365 (to |
| reflect the one-half year period). |
| S TAT E M E N T O F I N V E S T M E N T S | | | | |
| D e c e m b e r 3 1 , 2 0 0 5 | | | | | | |
| |
| |
| |
|
| |
| |
| |
| | | Principal | | | | |
| Bonds and Notes—93.0% | | Amount a | | Value ($) |
| |
| |
|
| Advertising—.9% | | | | | | |
| RH Donnelley Financial, | | | | | | |
| Sr. Sub. Notes, 10.875%, 2012 | | 3,402,000 | | b | | 3,852,765 |
| Aerospace & Defense—2.1% | | | | | | |
| Argo-Tech, | | | | | | |
| Sr. Notes, 9.25%, 2011 | | 1,470,000 | | | | 1,514,100 |
| Armor, | | | | | | |
| Sr. Sub. Notes, 8.25%, 2013 | | 2,250,000 | | | | 2,430,000 |
| DRS Technologies, | | | | | | |
| Sr. Sub. Notes, 6.875%, 2013 | | 524,000 | | | | 503,695 |
| L-3 Communications: | | | | | | |
| Conv. Bonds, 3%, 2035 | | 550,000 | | b | | 546,563 |
| Sr. Sub. Notes, 6.375%, 2015 | | 1,410,000 | | b | | 1,413,525 |
| Transdigm, | | | | | | |
| Sr. Sub Notes, 8.375%, 2011 | | 2,500,000 | | | | 2,643,750 |
| | | | | | | 9,051,633 |
| Agricultural—.2% | | | | | | |
| Alliance One International, | | | | | | |
| Notes, 11%, 2012 | | 800,000 | | b | | 708,000 |
| Airlines—.5% | | | | | | |
| Northwest Airlines, | | | | | | |
| Pass-Through Ctfs., | | | | | | |
| Ser. 1996-1, 7.67%, 2015 | | 1,573,758 | | | | 1,421,599 |
| United AirLines, | | | | | | |
| Enhanced Pass-Through Ctfs., | | | | | | |
| Ser. 1997-1A, 4.09%, 2049 | | 664,963 | | c | | 665,133 |
| | | | | | | 2,086,732 |
| Auto Manufacturing—.4% | | | | | | |
| Navistar International, | | | | | | |
| Sr. Notes, 7.5%, 2011 | | 1,601,000 | | d | | 1,532,958 |
| Auto Trucks & Parts—1.9% | | | | | | |
| Cooper-Standard Automotive, | | | | | | |
| Sr. Sub. Notes, 8.375%, 2014 | | 525,000 | | | | 401,625 |
| Goodyear Tire & Rubber, | | | | | | |
| Sr. Notes, 9%, 2015 | | 2,565,000 | | b,d | | 2,539,350 |
| HLI Operating, | | | | | | |
| Sr. Notes, 10.5%, 2010 | | 350,000 | | d | | 287,875 |
S TAT E M E N T O F I N V E S T M E N T S (continued)
|
| | | Principal | | | | |
| Bonds and Notes (continued) | | Amount a | | Value ($) |
| |
| |
|
| Auto Trucks & Parts (continued) | | | | | | |
| Polypore International, | | | | | | |
| Sr. Discount Notes, 0/10.5%, 2012 | | 2,435,000 | | e | | 1,375,775 |
| Tenneco Automotive, | | | | | | |
| Secured Notes, Ser. B, 10.25%, 2013 | | 1,200,000 | | | | 1,317,000 |
| United Components, | | | | | | |
| Sr. Sub. Notes, 9.375%, 2013 | | 768,000 | | | | 768,000 |
| Visteon, | | | | | | |
| Sr. Notes, 8.25%, 2010 | | 1,800,000 | | | | 1,539,000 |
| | | | | | | 8,228,625 |
| Banking—.7% | | | | | | |
| Chevy Chase Bank, | | | | | | |
| Sub. Notes, 6.875%, 2013 | | 1,770,000 | | | | 1,831,950 |
| Colonial Bank NA/Montgomery AL, | | | | | | |
| Sub. Notes, 6.375%, 2015 | | 1,100,000 | | | | 1,133,158 |
| | | | | | | 2,965,108 |
| Building & Construction—1.8% | | | | | | |
| Asia Aluminum, | | | | | | |
| Secured Notes, 8%, 2011 | | 601,000 | | b | | 589,731 |
| Beazer Homes, | | | | | | |
| Sr. Notes, 6.875%, 2015 | | 550,000 | | | | 530,063 |
| Compression Polymers, | | | | | | |
| Sr. Notes, 10.5%, 2013 | | 975,000 | | b | | 950,625 |
| Goodman Global: | | | | | | |
| Sr. Notes, 7.49%, 2012 | | 1,615,000 | | b,f | | 1,606,925 |
| Sr. Sub. Notes, 7.875%, 2012 | | 524,000 | | b,f | | 489,940 |
| Nortek, | | | | | | |
| Sr. Sub. Notes, 8.5%, 2014 | | 1,573,000 | | | | 1,525,810 |
| Owens Corning: | | | | | | |
| Debs., 7.5%, 2018 | | 394,000 | | c | | 308,305 |
| Notes, 7%, 2009 | | 2,000,000 | | c | | 1,525,000 |
| Texas Industries, | | | | | | |
| Sr. Notes, 7.25%, 2013 | | 255,000 | | b | | 265,837 |
| | | | | | | 7,792,236 |
| Chemicals—3.8% | | | | | | |
| Huntsman: | | | | | | |
| Sr. Notes, 9.875%, 2009 | | 524,000 | | | | 555,440 |
| Sr. Secured Notes, 11.625%, 2010 | | 362,000 | | | | 414,038 |
| | | Principal | | | | |
| Bonds and Notes (continued) | | Amount a | | Value ($) |
| |
| |
|
| Chemicals (continued) | | | | | | |
| Huntsman ICI Chemicals, | | | | | | |
| Sr. Sub. Notes, 10.125%, 2009 | | 5,389,000 | | | | 5,591,087 |
| Nalco, | | | | | | |
| Sr. Sub. Notes, 8.875%, 2013 | | 4,153,000 | | d | | 4,371,032 |
| PQ, | | | | | | |
| Sr. Sub. Notes, 7.5%, 2013 | | 325,000 | | b | | 303,875 |
| Rhodia, | | | | | | |
| Sr. Notes, 10.25%, 2010 | | 3,583,000 | | | | 3,941,300 |
| Rockwood Specialties, | | | | | | |
| Sr. Sub. Notes, 10.63%, 2011 | | 1,098,000 | | | | 1,209,173 |
| | | | | | | 16,385,945 |
| Commercial & Professional Services—1.4% | | | | |
| Brickman, | | | | | | |
| Sr. Sub. Notes, Ser. B, 11.75%, 2009 | | 1,037,000 | | | | 1,153,662 |
| Corrections Corp. of America, | | | | | | |
| Sr. Sub. Notes, 6.25%, 2013 | | 2,850,000 | | | | 2,835,750 |
| Hertz: | | | | | | |
| Sr. Notes, 8.875%, 2014 | | 950,000 | | b | | 972,563 |
| Sr. Sub. Notes, 10.5%, 2016 | | 430,000 | | b | | 445,050 |
| Williams Scotsman, | | | | | | |
| Sr. Notes, 8.5%, 2015 | | 500,000 | | | | 520,000 |
| | | | | | | 5,927,025 |
| Consumer Products—1.4% | | | | | | |
| Ames True Temper, | | | | | | |
| Sr. Sub. Notes, 10%, 2012 | | 1,604,000 | | d | | 1,267,160 |
| Amscan, | | | | | | |
| Sr. Sub. Notes, 8.75%, 2014 | | 1,944,000 | | d | | 1,647,540 |
| Playtex Products, | | | | | | |
| Sr. Sub. Notes, 9.375%, 2011 | | 2,546,000 | | | | 2,679,665 |
| Rayovac, | | | | | | |
| Sr. Sub. Notes, 8.5%, 2013 | | 497,000 | | | | 436,118 |
| | | | | | | 6,030,483 |
| Diversified Financial Services—6.7% | | | | | | |
| BCP Crystal US, | | | | | | |
| Sr. Sub. Notes, 9.625%, 2014 | | 2,438,000 | | | | 2,724,465 |
| CCM Merger, | | | | | | |
| Notes, 8%, 2013 | | 630,000 | | b | | 607,950 |
S TAT E M E N T O F I N V E S T M E N T S (continued)
|
| | | Principal | | | | |
| Bonds and Notes (continued) | | Amount a | | Value ($) |
| |
| |
|
| Diversified Financial Services (continued) | | | | | | |
| Consolidated Communications Illinois/Texas, | | | | | | |
| Sr. Notes, 9.75%, 2012 | | 761,000 | | | | 814,270 |
| E*Trade Financial, | | | | | | |
| Sr. Notes, 7.375%, 2013 | | 320,000 | | b | | 325,600 |
| FINOVA, | | | | | | |
| Notes, 7.5%, 2009 | | 1,827,420 | | | | 648,734 |
| Ford Motor Credit: | | | | | | |
| Global Landmark Securities, 7.375%, 2009 | | 945,000 | | | | 838,775 |
| Notes, 5.29%, 2006 | | 5,120,000 | | f | | 4,972,559 |
| Glencore Funding, | | | | | | |
| Notes, 6%, 2014 | | 1,375,000 | | b | | 1,295,305 |
| GMAC: | | | | | | |
| Notes, 5.125%, 2008 | | 1,340,000 | | | | 1,193,546 |
| Notes, 7.75%, 2010 | | 3,665,000 | | | | 3,425,573 |
| Sr. Notes, 5.375%, 2011 | | 1,000,000 | | | | 1,056,300 |
| K&F Acquisition, | | | | | | |
| Sr. Sub. Notes, 7.75%, 2014 | | 645,000 | | | | 654,675 |
| Kansas City Southern Railway, | | | | | | |
| Sr. Notes, 9.5%, 2008 | | 1,165,000 | | | | 1,266,938 |
| Nell AF SARL, | | | | | | |
| Sr. Notes, 8.375%, 2015 | | 1,250,000 | | b | | 1,243,750 |
| Noble, | | | | | | |
| Sr. Notes, 6.625%, 2015 | | 2,275,000 | | b | | 2,099,213 |
| Residential Capital: | | | | | | |
| Sr. Notes, 6.375%, 2010 | | 3,230,000 | | | | 3,285,223 |
| Sr. Notes, 6.875%, 2015 | | 840,000 | | d | | 894,133 |
| Stena AB, | | | | | | |
| Sr. Notes, 7.5%, 2013 | | 1,001,000 | | | | 965,965 |
| | | | | | | 28,312,974 |
| Diversified Metals & Mining—2.1% | | | | | | |
| Consol Energy, | | | | | | |
| Notes, 7.875%, 2012 | | 3,553,000 | | | | 3,894,977 |
| CSN Islands VIII, | | | | | | |
| Sr. Notes, 10%, 2015 | | 1,577,000 | | b | | 1,766,240 |
| Earle M Jorgensen, | | | | | | |
| Sr. Secured Notes, 9.75%, 2012 | | 1,320,000 | | | | 1,419,000 |
| | | Principal | | | | |
| Bonds and Notes (continued) | | Amount a | | Value ($) |
| |
| |
|
| Diversified Metals & Mining (continued) | | | | |
| Freeport-McMoRan Copper & Gold, | | | | | | |
| Sr. Notes, 6.875%, 2014 | | 500,000 | | | | 507,500 |
| Gibraltar Industries, | | | | | | |
| Sr. Sub. Notes, 8%, 2015 | | 670,000 | | b | | 678,375 |
| Southern Peru Copper, | | | | | | |
| Notes, 6.375%, 2015 | | 600,000 | | b | | 600,407 |
| | | | | | | 8,866,499 |
| Electric Utilities—7.7% | | | | | | |
| AES, | | | | | | |
| Sr. Sub. Notes, 9.375%, 2010 | | 1,000,000 | | | | 1,097,500 |
| Allegheny Energy Supply, | | | | | | |
| Bonds, 8.25%, 2012 | | 5,190,000 | | b | | 5,877,675 |
| Calpine Generating, | | | | | | |
| Secured Notes, 13.2%, 2011 | | 264,000 | | | | 269,280 |
| CMS Energy, | | | | | | |
| Sr. Notes, 9.875%, 2007 | | 2,862,000 | | | | 3,076,650 |
| FPL Energy National Wind, | | | | | | |
| Notes, 6.125%, 2019 | | 2,371,447 | | b | | 2,325,571 |
| Mirant: | | | | | | |
| Sr. Notes, 7.38%, 2013 | | 3,190,000 | | b | | 3,241,837 |
| Sr. Notes, 7.4%, 2004 | | 1,814,000 | | b,c,d | | 2,258,430 |
| Nevada Power: | | | | | | |
| First Mortgage, 6.50%, 2012 | | 483,000 | | | | 497,490 |
| Mortgage, Bonds Ser. A, 8.25%, 2011 | | 1,321,000 | | | | 1,469,613 |
| Notes, Ser. E, 10.875%, 2009 | | 770,000 | | | | 845,075 |
| NRG Energy, | | | | | | |
| Sr. Secured Notes, 8%, 2013 | | 702,000 | | | | 786,240 |
| Reliant Energy, | | | | | | |
| Sr. Secured Notes, 9.25%, 2010 | | 5,023,000 | | | | 5,048,115 |
| Sierra Pacific Power, | | | | | | |
| Mortgage Notes, 6.25%, 2012 | | 1,150,000 | | | | 1,173,000 |
| Sierra Pacific Resources, | | | | | | |
| Sr. Notes, 8.625%, 2014 | | 1,910,000 | | | | 2,076,149 |
| TECO Energy, | | | | | | |
| Sr. Notes, 6.75%, 2015 | | 400,000 | | | | 416,000 |
S TAT E M E N T O F I N V E S T M E N T S (continued)
|
| | | Principal | | | | |
| Bonds and Notes (continued) | | Amount a | | Value ($) |
| |
| |
|
| Electric Utilities (continued) | | | | | | |
| TXU, | | | | | | |
| Sr. Notes, 5.55%, 2014 | | 2,625,000 | | d | | 2,506,444 |
| | | | | | | 32,965,069 |
| Electrical & Electronics—1.1% | | | | | | |
| Dresser, | | | | | | |
| Sr. Sub. Notes, 9.375%, 2011 | | 2,088,000 | | | | 2,208,060 |
| Fisher Scientific International, | | | | | | |
| Sr. Sub. Notes, 6.125%, 2015 | | 1,275,000 | | b | | 1,281,375 |
| Imax, | | | | | | |
| Sr. Notes, 9.625%, 2010 | | 1,002,000 | | | | 1,037,070 |
| | | | | | | 4,526,505 |
| Entertainment—3.4% | | | | | | |
| AMC Entertainment, | | | | | | |
| Sr. Sub. Notes, 9.875%, 2012 | | 1,100,000 | | d | | 1,083,500 |
| Cinemark: | | | | | | |
| Sr. Discount Notes, 0/9.75%, 2014 | | 1,550,000 | | e | | 1,154,750 |
| Sr. Sub. Notes, 9%, 2013 | | 90,000 | | | | 95,625 |
| Isle of Capri Casinos, | | | | | | |
| Sr. Sub. Notes, 9%, 2012 | | 1,050,000 | | | | 1,115,625 |
| Leslie’s Poolmart, | | | | | | |
| Sr. Notes, 7.75%, 2013 | | 850,000 | | | | 856,375 |
| Mashantucket Western Pequot Tribe, | | | | | | |
| Bonds, 5.912%, 2021 | | 2,800,000 | | b | | 2,804,709 |
| Mohegan Tribal Gaming Authority: | | | | | | |
| Sr. Notes, 6.125%, 2013 | | 2,800,000 | | | | 2,765,000 |
| Sr. Sub. Notes, 6.375%, 2009 | | 2,048,000 | | | | 2,071,040 |
| Penn National Gaming, | | | | | | |
| Sr. Sub. Notes, 6.75%, 2015 | | 640,000 | | | | 632,000 |
| Seneca Gaming, | | | | | | |
| Sr. Notes, 7.25%, 2012 | | 450,000 | | b | | 455,063 |
| Vail Resorts, | | | | | | |
| Sr. Sub. Notes, 6.75%, 2014 | | 1,500,000 | | | | 1,507,500 |
| | | | | | | 14,541,187 |
| | | Principal | | | | |
| Bonds and Notes (continued) | | Amount a | | Value ($) |
| |
| |
|
| Environmental Control—2.6% | | | | | | |
| Allied Waste: | | | | | | |
| Sr. Notes, Ser. B, 8.5%, 2008 | | 8,667,000 | | | | 9,143,685 |
| Sr. Notes, Ser. B, 9.25%, 2012 | | 703,000 | | | | 764,513 |
| Geo Sub, | | | | | | |
| Sr. Notes, 11%, 2012 | | 1,090,000 | | | | 1,073,650 |
| | | | | | | 10,981,848 |
| Food & Beverages—2.5% | | | | | | |
| Agrilink Foods, | | | | | | |
| Sr. Sub. Notes, 11.875%, 2008 | | 257,000 | | | | 263,425 |
| American Seafoods, | | | | | | |
| Sr. Sub. Notes, 10.125%, 2010 | | 1,000,000 | | d | | 1,053,750 |
| Corn Products International, | | | | | | |
| Sr. Notes, 8.45%, 2009 | | 1,065,000 | | | | 1,174,677 |
| Del Monte, | | | | | | |
| Sr. Sub. Notes, 8.625%, 2012 | | 1,031,000 | | | | 1,100,592 |
| Dole Foods: | | | | | | |
| Debs., 8.75%, 2013 | | 780,000 | | | | 807,300 |
| Sr. Notes, 8.625%, 2009 | | 768,000 | | d | | 791,040 |
| Sr. Notes, 8.875%, 2011 | | 555,000 | | | | 571,650 |
| Ingles Markets, | | | | | | |
| Sr. Sub. Notes, 8.875%, 2011 | | 400,000 | | | | 416,000 |
| Smithfield Foods, | | | | | | |
| Sr. Notes, 7%, 2011 | | 700,000 | | | | 717,500 |
| Stater Brothers: | | | | | | |
| Sr. Notes, 7.99%, 2010 | | 650,000 | | f | | 653,250 |
| Sr. Notes, 8.125%, 2012 | | 2,970,000 | | d | | 2,955,150 |
| | | | | | | 10,504,334 |
| Gaming & Lodging—5.7% | | | | | | |
| Gaylord Entertainment, | | | | | | |
| Sr. Notes, 6.75%, 2014 | | 975,000 | | | | 960,375 |
| HMH Properties, | | | | | | |
| Gtd. Sr. Notes, Ser. B, | | | | | | |
| 7.875%, 2008 | | 312,000 | | | | 317,070 |
S TAT E M E N T O F I N V E S T M E N T S (continued)
|
| | | Principal | | | | |
| Bonds and Notes (continued) | | Amount a | | Value ($) |
| |
| |
|
| Gaming & Lodging (continued) | | | | | | |
| Inn of the Mountain Gods Resort & Casino, | | | | |
| Sr. Notes, 12%, 2010 | | 3,234,000 | | | | 3,217,830 |
| Mandalay Resort, | | | | | | |
| Sr. Notes, 6.5%, 2009 | | 2,024,000 | | | | 2,056,890 |
| MGM Mirage, | | | | | | |
| Notes, 8.5%, 2010 | | 1,988,000 | | | | 2,164,435 |
| Park Place Entertainment: | | | | | | |
| Sr. Sub. Notes, 7.875%, 2010 | | 1,266,000 | | | | 1,367,280 |
| Sr. Sub. Notes, 8.875%, 2008 | | 5,301,000 | | | | 5,744,959 |
| Resorts International Hotel and Casino, | | | | | | |
| First Mortgage, 11.5%, 2009 | | 3,274,000 | | | | 3,642,325 |
| Station Casinos, | | | | | | |
| Sr. Sub. Notes, 6.5%, 2014 | | 1,500,000 | | d | | 1,522,500 |
| Turning Stone Casino Entertainment, | | | | | | |
| Sr. Notes, 9.125%, 2010 | | 1,644,000 | | b | | 1,701,540 |
| Wynn Las Vegas Capital, | | | | | | |
| First Mortgage Notes, 6.625%, 2014 | | 1,559,000 | | d | | 1,523,922 |
| | | | | | | 24,219,126 |
| Health Care—4.2% | | | | | | |
| Beverly Enterprises, | | | | | | |
| Sr. Sub. Notes, 7.875%, 2014 | | 1,069,000 | | | | 1,149,175 |
| Coventry Health Care, | | | | | | |
| Sr. Notes, 8.125%, 2012 | | 175,000 | | | | 186,812 |
| DaVita, | | | | | | |
| Sr. Sub. Notes, 7.25%, 2015 | | 1,450,000 | | d | | 1,475,375 |
| Extendicare Health Services, | | | | | | |
| Sr. Notes, 9.5%, 2010 | | 658,000 | | | | 701,593 |
| HCA, | | | | | | |
| Notes, 8.75%, 2010 | | 3,560,000 | | | | 3,955,149 |
| Healthsouth, | | | | | | |
| Sr. Notes, 8.375%, 2011 | | 1,925,000 | | d | | 1,968,312 |
| Psychiatric Solutions, | | | | | | |
| Sr. Sub. Notes, 7.75%, 2015 | | 500,000 | | | | 518,750 |
| Tenet Healthcare, | | | | | | |
| Sr. Notes, 9.875%, 2014 | | 4,317,000 | | | | 4,392,548 |
| | | Principal | | | | |
| Bonds and Notes (continued) | | Amount a | | Value ($) |
| |
| |
|
| Health Care (continued) | | | | | | |
| Triad Hospitals, | | | | | | |
| Sr. Sub. Notes, 7%, 2013 | | 3,340,000 | | d | | 3,365,050 |
| | | | | | | 17,712,764 |
| Machinery—1.9% | | | | | | |
| Case New Holland, | | | | | | |
| Sr. Notes, 9.25%, 2011 | | 2,976,000 | | | | 3,199,200 |
| Columbus McKinnon, | | | | | | |
| Sr. Sub. Notes, 8.875%, 2013 | | 605,000 | | b | | 632,225 |
| Douglas Dynamics, | | | | | | |
| Sr. Notes, 7.75%, 2012 | | 3,715,000 | | b | | 3,603,550 |
| Terex, | | | | | | |
| Notes, 7.375%, 2014 | | 635,000 | | | | 631,825 |
| | | | | | | 8,066,800 |
| Manufacturing—1.0% | | | | | | |
| Bombardier, | | | | | | |
| Notes, 6.3%, 2014 | | 1,500,000 | | b | | 1,320,000 |
| JB Poindexter & Co. | | | | | | |
| Sr. Notes, 8.75%, 2014 | | 2,181,000 | | | | 1,853,850 |
| Polypore, | | | | | | |
| Sr. Sub. Notes, 8.75%, 2012 | | 1,371,000 | | | | 1,213,335 |
| | | | | | | 4,387,185 |
| Media—6.5% | | | | | | |
| Adelphia Communications, | | | | | | |
| Sr. Notes, Ser. B, 7.75%, 2009 | | 1,921,000 | | c | | 1,085,365 |
| CCO Holdings LLC, | | | | | | |
| Sr. Notes, 8.75%, 2013 | | 2,345,000 | | | | 2,245,337 |
| CSC Holdings: | | | | | | |
| Sr. Notes, 7.625%, 2011 | | 2,000,000 | | | | 2,000,000 |
| Sr. Notes, 7.875%, 2007 | | 1,977,000 | | | | 2,021,483 |
| Sr. Notes, Ser.B, 8.125%, 2009 | | 750,000 | | | | 761,250 |
| Dex Media East Finance: | | | | | | |
| Sr. Sub. Notes, Ser. B, 9.875%, 2009 | | 2,908,000 | | | | 3,158,815 |
| Sr. Sub. Notes, Ser. B, 12.125%, 2012 | | 2,323,000 | | | | 2,729,525 |
| Dex Media West/Finance, | | | | | | |
| Sr. Sub. Notes, Ser. B, 9.875%, 2013 | | 2,879,000 | | | | 3,210,085 |
S TAT E M E N T O F I N V E S T M E N T S (continued)
|
| | | Principal | | | | |
| Bonds and Notes (continued) | | Amount a | | Value ($) |
| |
| |
|
| Media (continued) | | | | | | |
| Entercom Radio Capital, | | | | | | |
| Sr. Sub. Notes, 7.625%, 2014 | | 460,000 | | | | 463,450 |
| Kabel Deutschland, | | | | | | |
| Sr. Notes, 10.625%, 2014 | | 1,570,000 | | b | | 1,660,275 |
| LBI Media: | | | | | | |
| Sr. Discount Notes, 0/11%, 2013 | | 1,492,000 | | e | | 1,098,485 |
| Sr. Sub. Notes, 10.125%, 2012 | | 1,500,000 | | | | 1,599,375 |
| Lodgenet Entertainment, | | | | | | |
| Sr. Sub. Deb., 9.5%, 2013 | | 548,000 | | | | 598,690 |
| Nexstar Finance, | | | | | | |
| Sr. Discount Notes, 0/11.375%, 2013 | | 2,571,000 | | e | | 1,950,746 |
| Pegasus Communications, | | | | | | |
| Sr. Sub. Notes, Ser. B, 12.5%, 2007 | | 1,929,853 | | c | | 176,099 |
| Radio One, | | | | | | |
| Sr. Sub. Notes, Ser. B, 8.875%, 2011 | | 250,000 | | | | 265,000 |
| Salem Communications, | | | | | | |
| Sr. Sub. Notes, Ser. B, 9%, 2011 | | 2,605,000 | | | | 2,758,044 |
| | | | | | | 27,782,024 |
| Oil & Gas—3.2% | | | | | | |
| Colorado Interstate Gas, | | | | | | |
| Sr. Notes, 5.95%, 2015 | | 540,000 | | | | 524,275 |
| El Paso Production, | | | | | | |
| Sr. Notes, 7.75%, 2013 | | 2,040,000 | | | | 2,126,700 |
| Hanover Compressor: | | | | | | |
| Sr. Notes, 8.625%, 2010 | | 1,000,000 | | | | 1,062,500 |
| Sr. Notes, 9%, 2014 | | 1,632,000 | | | | 1,787,040 |
| Hanover Equipment Trust: | | | | | | |
| Sr. Secured Notes, | | | | | | |
| Ser. A, 8.5%, 2008 | | 2,745,000 | | d | | 2,858,231 |
| Sr. Secured Notes, | | | | | | |
| Ser. B, 8.75%, 2011 | | 15,000 | | | | 15,938 |
| McMoRan Exploration, | | | | | | |
| Sr. Notes, 5.25%, 2011 | | 1,036,000 | | b | | 1,284,640 |
| Pogo Producing, | | | | | | |
| Sr. Sub. Notes, 6.625%, 2015 | | 2,150,000 | | | | 2,107,000 |
| Whiting Petroleum, | | | | | | |
| Sr. Sub. Notes, 7.25%, 2013 | | 2,000,000 | | | | 2,035,000 |
| | | | | | | 13,801,324 |
| | | Principal | | | | |
| Bonds and Notes (continued) | | Amount a | | Value ($) |
| |
| |
|
| Packaging & Containers—6.8% | | | | | | |
| Berry Plastics, | | | | | | |
| Sr. Sub. Notes, 10.75%, 2012 | | 915,000 | | d | | 988,200 |
| Crown Americas Capital: | | | | | | |
| Sr. Notes, 7.625%, 2013 | | 6,715,000 | | b | | 7,000,387 |
| Sr. Notes, 7.75%, 2015 | | 3,835,000 | | b | | 3,988,400 |
| Jefferson Smurfit, | | | | | | |
| Sr. Notes, 8.25%, 2012 | | 1,052,000 | | | | 1,015,180 |
| Norampac, | | | | | | |
| Sr. Notes, 6.75%, 2013 | | 975,000 | | | | 945,750 |
| Owens Brockway: | | | | | | |
| Sr. Notes, 6.75%, 2014 | | 519,000 | | | | 506,025 |
| Sr. Notes, 8.25%, 2013 | | 515,000 | | | | 534,313 |
| Sr. Secured Notes, 7.75%, 2011 | | 1,025,000 | | | | 1,074,969 |
| Sr. Secured Notes, 8.75%, 2012 | | 1,156,000 | | | | 1,248,480 |
| Sr. Secured Notes, 8.875%, 2009 | | 935,000 | | | | 980,581 |
| Owens-Illinois, | | | | | | |
| Debs., 7.8%, 2018 | | 2,000,000 | | | | 2,000,000 |
| Plastipak, | | | | | | |
| Sr. Notes, 8.5%, 2015 | | 2,200,000 | | b | | 2,233,000 |
| Pliant, | | | | | | |
| Sr. Secured Discount Notes, | | | | | | |
| 0/11.125%, 2009 | | 1,445,000 | | e,g | | 1,222,831 |
| Solo Cup, | | | | | | |
| Sr. Sub. Notes, 8.5%, 2014 | | 1,525,000 | | d | | 1,342,000 |
| Stone Container: | | | | | | |
| Sr. Notes, 8.375%, 2012 | | 1,254,000 | | d | | 1,219,515 |
| Sr. Notes, 9.75%, 2011 | | 2,761,000 | | d | | 2,802,415 |
| | | | | | | 29,102,046 |
| Paper & Forest Products—1.4% | | | | | | |
| Appleton Papers, | | | | | | |
| Sr. Sub. Notes, 9.75%, 2014 | | 3,104,000 | | | | 2,917,760 |
| Buckeye Technologies, | | | | | | |
| Sr. Notes, 8.5%, 2013 | | 1,255,000 | | | | 1,261,275 |
| Georgia-Pacific, | | | | | | |
| Sr. Notes, 8%, 2014 | | 725,000 | | | | 696,000 |
| Temple-Inland, | | | | | | |
| Bonds, 6.625%, 2018 | | 865,000 | | d | | 893,020 |
| | | | | | | 5,768,055 |
S TAT E M E N T O F I N V E S T M E N T S (continued)
|
| | | | | Principal | | | | |
| Bonds and Notes (continued) | | | | Amount a | | Value ($) |
| |
| |
| |
|
| Pipelines—6.5% | | | | | | | | |
| ANR Pipeline, | | | | | | | | |
| Notes, 8.875%, 2010 | | | | 2,540,000 | | | | 2,727,236 |
| Dynegy: | | | | | | | | |
| Secured Notes, 9.875%, 2010 | | | | 5,109,000 | | b | | 5,626,286 |
| Secured Notes, 10.125%, 2013 | | | | 1,794,000 | | b | | 2,036,190 |
| El Paso: | | | | | | | | |
| Debs., Ser. WI, 6.5%, 2008 | | | | 1,067,000 | | b | | 1,061,665 |
| Notes, Ser. WI, 7.63%, 2008 | | | | 4,733,000 | | | | 4,827,660 |
| Notes, Ser. WI, 7.75%, 2010 | | | | 2,731,000 | | | | 2,799,275 |
| Northwest Pipeline, | | | | | | | | |
| Sr. Notes, 8.125%, 2010 | | | | 2,575,000 | | | | 2,742,375 |
| Southern Natural Gas, | | | | | | | | |
| Notes, 8.875%, 2010 | | | | 2,057,000 | | | | 2,208,631 |
| Williams Cos.: | | | | | | | | |
| Notes, 7.125%, 2011 | | | | 250,000 | | | | 260,938 |
| Notes, 7.625%, 2019 | | | | 975,000 | | | | 1,050,562 |
| Notes, 7.875%, 2021 | | | | 2,070,000 | | | | 2,251,125 |
| | | | | | | | | 27,591,943 |
| Real Estate Investment Trust—1.5% | | | | | | |
| BF Saul, | | | | | | | | |
| Sr. Secured Notes, 7.5%, 2014 | | | | 2,300,000 | | | | 2,351,750 |
| CB Richard Ellis Services, | | | | | | | | |
| Sr. Sub. Notes, 11.25%, 2011 | | | | 1,500,000 | | | | 1,620,000 |
| Host Marriott, | | | | | | | | |
| Sr. Notes, Ser. M, 7%, 2012 | | | | 2,500,000 | | d | | 2,575,000 |
| | | | | | | | | 6,546,750 |
| Retail—1.8% | | | | | | | | |
| Amerigas Partners, | | | | | | | | |
| Sr. Notes, 7.25%, 2015 | | | | 1,245,000 | | | | 1,276,125 |
| Central European Distributor, | | | | | | | | |
| Sr. Secured Bonds, 8%, 2012 | | EUR | | 625,000 | | b | | 802,086 |
| JC Penney, | | | | | | | | |
| Sr. Notes, 8%, 2010 | | | | 1,706,000 | | | | 1,877,021 |
| Neiman-Marcus, | | | | | | | | |
| Sr. Notes, 9%, 2015 | | | | 365,000 | | b | | 375,038 |
| | | Principal | | | | |
| Bonds and Notes (continued) | | Amount a | | Value ($) |
| |
| |
|
| Retail (continued) | | | | | | |
| Rite Aid: | | | | | | |
| Sr. Secured Notes, 8.125%, 2010 | | 1,180,000 | | | | 1,206,550 |
| Sr. Secured Notes, 12.5%, 2006 | | 1,025,000 | | | | 1,077,531 |
| VICORP Restaurants, | | | | | | |
| Sr. Notes, 10.5%, 2011 | | 955,000 | | d | | 890,538 |
| | | | | | | 7,504,889 |
| State Government—.5% | | | | | | |
| Erie Tobacco Asset Securitization, | | | | | | |
| Asset-Backed Bonds, 6%, 6/1/2028 | | 700,000 | | | | 686,441 |
| Tobacco Settlement Authority of Iowa, | | | | | | |
| Asset-Backed Bonds, Series A, 6.5%, 6/1/2023 | | 1,445,000 | | | | 1,450,448 |
| | | | | | | 2,136,889 |
| Structured Index—.7% | | | | | | |
| AB Svensk Exportkredit, | | | | | | |
| GSNE-ER Indexed Notes, 0%, 2007 | | 3,045,000 | | b,h | | 2,985,623 |
| Technology—1.0% | | | | | | |
| Freescale Semiconductor, | | | | | | |
| Sr. Notes, 6.875%, 2011 | | 3,815,000 | | | | 4,024,825 |
| Sungard Data Systems, | | | | | | |
| Sr. Notes, 8.52%, 2013 | | 300,000 | | b,f | | 312,000 |
| | | | | | | 4,336,825 |
| Telecommunications—6.1% | | | | | | |
| American Tower: | | | | | | |
| Sr. Notes, 7.125%, 2012 | | 1,561,000 | | | | 1,615,635 |
| Sr. Sub. Notes, 7.25%, 2011 | | 606,000 | | | | 633,270 |
| American Tower Escrow, | | | | | | |
| Discount Notes, 0%, 2008 | | 510,000 | | | | 401,625 |
| Hawaiian Telcom Communications, | | | | | | |
| Sr. Notes, 9.95%, 2013 | | 1,125,000 | | b,f | | 1,091,250 |
| Innova S de RL, | | | | | | |
| Notes, 9.375%, 2013 | | 2,035,000 | | | | 2,269,025 |
| Intelsat Bermuda: | | | | | | |
| Sr. Notes, 8.25%, 2013 | | 1,610,000 | | b | | 1,634,150 |
| Sr. Notes, 8.7%, 2012 | | 1,475,000 | | b,f | | 1,506,343 |
S TAT E M E N T O F I N V E S T M E N T S (continued)
|
| | | Principal | | | | |
| Bonds and Notes (continued) | | Amount a | | Value ($) |
| |
| |
|
| Telecommunications (continued) | | | | | | |
| MCI, | | | | | | |
| Sr. Notes, 8.735%, 2014 | | 40,000 | | | | 44,350 |
| Nextel Communications, | | | | | | |
| Sr. Notes, Ser. D, 7.375%, 2015 | | 2,000,000 | | | | 2,112,284 |
| Pegasus Satellite Communications, | | | | | | |
| Sr. Notes, 12.375%, 2006 | | 429,113 | | c | | 39,158 |
| Qwest: | | | | | | |
| Bank Note, Ser. A, 8.53%, 2007 | | 1,290,800 | | d | | 1,319,843 |
| Bank Note, Ser. B, 6.95%, 2010 | | 1,051,000 | | d | | 1,062,824 |
| Sr. Notes, 7.875%, 2011 | | 440,000 | | | | 476,300 |
| Qwest Communications International, | | | | | | |
| Sr. Notes, 7.5%, 2014 | | 2,935,000 | | b | | 3,030,387 |
| Rural Cellular, | | | | | | |
| Sr. Notes, 9.875%, 2010 | | 600,000 | | | | 636,000 |
| SBA Telecommunications, | | | | | | |
| Sr. Discount Notes, 0/9.75%, 2011 | | 3,887,000 | | e | | 3,624,627 |
| UbiquiTel Operating, | | | | | | |
| Sr. Notes, 9.875%, 2011 | | 1,560,000 | | | | 1,735,500 |
| US Unwired, | | | | | | |
| Second Priority Sr. Secured Notes, | | | | | | |
| Ser. B, 10%, 2012 | | 2,149,000 | | | | 2,428,370 |
| Wind Acquisition Finance, | | | | | | |
| Sr. Bonds, 10.75%, 2015 | | 500,000 | | b | | 518,750 |
| | | | | | | 26,179,691 |
| Textiles & Apparel—1.0% | | | | | | |
| INVISTA, | | | | | | |
| Notes, 9.25%, 2012 | | 3,710,000 | | b | | 3,978,975 |
| Levi Strauss & Co., | | | | | | |
| Sr. Notes, 12.25%, 2012 | | 353,000 | | | | 395,360 |
| | | | | | | 4,374,335 |
| Transportation—2.0% | | | | | | |
| CHC Helicopter, | | | | | | |
| Sr. Sub. Notes, 7.375%, 2014 | | 1,405,000 | | | | 1,427,831 |
| Greenbrier Cos., | | | | | | |
| Sr. Notes, 8.375%, 2015 | | 1,500,000 | | | | 1,537,500 |
| Gulfmark Offshore, | | | | | | |
| Sr. Notes, 7.75%, 2014 | | 2,113,000 | | d | | 2,208,085 |
| | | Principal | | |
| Bonds and Notes (continued) | | Amount a | | Value ($) |
| |
| |
|
| Transportation (continued) | | | | |
| TFM, S.A. de C.V., | | | | |
| Sr. Notes, 10.25%, 2007 | | 3,245,000 | | 3,439,700 |
| | | | | 8,613,116 |
| Total Bonds and Notes | | | | |
| (cost $392,038,070) | | | | 396,369,311 |
| |
| |
|
| |
| Preferred Stocks—2.2% | | Shares | | Value ($) |
| |
| |
|
| Banking—1.1% | | | | |
| Sovereign Capital Trust IV, | | | | |
| Conv., $2.1875 | | 108,900 | | 4,791,600 |
| Diversified Financial Services—.2% | | | | |
| Williams Holdings Of Delaware, | | | | |
| Cum. Conv., $2.75 | | 7,800 b | | 877,500 |
| Media—.9% | | | | |
| Paxson Communications, | | | | |
| Cum. Conv., $975 | | 305 b | | 2,114,895 |
| Spanish Broadcasting System (Units), | | | | |
| Cum. Conv., Ser. B, $107.5 | | 1,482 | | 1,604,281 |
| | | | | 3,719,176 |
| Total Preferred Stocks | | | | |
| (cost $10,145,321) | | | | 9,388,276 |
| |
| |
|
| |
| Common Stocks—.1% | | | | |
| |
| |
|
| Chemicals—.1% | | | | |
| Huntsman | | 10,294 i | | 177,263 |
| Gaming & Lodging—.0% | | | | |
| Trump Entertainment Resorts | | 5,455 d,i | | 109,816 |
| Telecommunications—.0% | | | | |
| iPCS | | 527 i | | 25,428 |
| Textiles & Apparel—.0% | | | | |
| Dan River | | 64,520 i | | 19,356 |
| Total Common Stocks | | | | |
| (cost $1,130,368) | | | | 331,863 |
S TAT E M E N T O F I N V E S T M E N T S (continued)
|
| Other Investments—3.5% | | Shares | | Value ($) |
| |
| |
|
| Registered Investment Company; | | | | |
| Dreyfus Institutional Preferred Plus Money Market Fund | | |
| (cost $15,027,000) | | | | 15,027,000 j | | 15,027,000 |
| |
| |
| |
|
| |
| Investment of Cash Collateral | | | | |
| for Securities Loaned—8.0% | | | | |
| |
| |
|
| Registered Investment Company; | | | | |
| Dreyfus Institutional Cash Advanatage Plus Fund | | |
| (cost $33,964,185) | | | | 33,964,185 j | | 33,964,185 |
| |
| |
| |
|
| |
| Total Investments (cost $452,304,944) | | 106.8% | | 455,080,635 |
| Liabilities, Less Cash and Receivables | | (6.8%) | | (28,960,274) |
| Net Assets | | | | 100.0% | | 426,120,361 |
| |
| a | | Principal amount stated in U.S. Dollars unless otherwised noted. | | |
| | | EUR—Euro | | | | | | |
| b | | Securities exempt from registration under rule 144A of the Securities Act of 1933.These securities may be resold in |
| | | transactions exempt from registration, normally to qualified institutional buyers. At December 31, 2005, these |
| | | securities amounted to $92,921,404 or 21.8% of net assets. | | |
| c | | Non-income producing—security in default. | | | | |
| d | | All or a portion of these securities are on loan. At December 31, 2005, the total market value of the fund’s securities |
| | | on loan is $32,076,596 and the total market value of the collateral held by the fund is $33,382,745. |
| e | | Zero coupon until a specified date at which time the stated coupon rate becomes effective until maturity. |
| f | | Variable rate security—interest rate subject to periodic change. | | |
| g | | Subsequent to December 31, 2005, this security became non-income producing—Security in default. |
| h | | Security linked to Goldman Sachs Non-Energy—Excess Return Index. | | |
| i | | Non-income producing. | | | | | | |
| j | | Investment in affiliated money market mutual fund. | | | | |
| |
| |
| |
|
| |
| |
| |
| |
| Portfolio Summary (Unaudited) † | | | | |
| |
| | | | | Value (%) | | | | Value (%) |
| |
| |
| |
| |
|
| Corporate Bonds | | 91.8 | | Common Stocks | | .1 |
| Money Market Investments | | 11.5 | | Forward Currency Exchange |
| Preferred Stocks | | 2.2 | | Contracts/Swaps | | .0 |
| Structured Index | | .7 | | | | |
| State Government | | .5 | | | | 106.8 |
| |
| † | | Based on net assets. | | | | | | |
| See notes to financial statements. | | | | | | |
| |
| |
| |
| 24 | | | | | | | | |
S TAT E M E N T O F A S S E T S A N D L I A B I L I T I E S
| D e c e m b e r 3 1 , 2 0 0 5 | | | | |
| |
| |
|
| |
| |
| |
| |
| | | Cost | | Value |
| |
| |
|
| Assets ($): | | | | |
| Investments in securities—See Statement of | | | | |
| Investments (including securities on loan, | | | | |
| valued at $32,076,596)—Note 1(c): | | | | |
| Unaffiliated issuers | | 403,313,759 | | 406,089,450 |
| Affiliated issuers | | 48,991,185 | | 48,991,185 |
| Interest and dividends receivable | | | | 7,874,966 |
| Receivable for shares of Beneficial Interest subscribed | | 151,071 |
| Unrealized appreciation on swaps—Note 4 | | | | 96,148 |
| Unrealized appreciation on forward currency | | | | |
| exchange contracts—Note 4 | | | | 19,312 |
| | | | | 463,222,132 |
| |
| |
|
| Liabilities ($): | | | | |
| Due to The Dreyfus Corporation and affiliates—Note 3(b) | | 440,436 |
| Cash overdraft due to Custodian | | | | 1,514,020 |
| Liability for securities on loan—Note 1(c) | | | | 33,964,185 |
| Payable for shares of Beneficial Interest redeemed | | 1,094,957 |
| Unrealized depreciation on swaps—Note 4 | | | | 88,173 |
| | | | | 37,101,771 |
| |
| |
|
| Net Assets ($) | | | | 426,120,361 |
| |
| |
|
| Composition of Net Assets ($): | | | | |
| Paid-in capital | | | | 991,484,549 |
| Accumulated undistributed investment income—net | | | | | | 519,317 |
| Accumulated net realized gain (loss) on investments | | | | (568,689,750) |
| Accumulated net unrealized appreciation (depreciation) on | | | | |
| investments, swap transactions and foreign currency transactions | | | | 2,806,245 |
| |
| |
|
| Net Assets ($) | | | | | | | | 426,120,361 |
| |
| |
| |
| |
|
| |
| |
| Net Asset Value Per Share | | | | | | | | |
| | | Class A | | Class B | | Class C | | Class R |
| |
| |
| |
| |
|
| Net Assets ($) | | 236,421,472 | | 96,333,988 | | 74,769,787 | | 18,595,114 |
| Shares Outstanding | | 32,675,532 | | 13,301,062 | | 10,321,291 | | 2,569,000 |
| |
| |
| |
| |
|
| Net Asset Value Per Share ($) | | 7.24 | | 7.24 | | 7.24 | | 7.24 |
See notes to financial statements.
|
| S TAT E M E N T O F | | O P E R AT I O N S | | |
| Ye a r E n d e d D e c e m b e r 3 1 , | | 2 0 0 5 | | |
| |
| |
|
| |
| |
| |
| |
| Investment Income ($): | | | | |
| Income: | | | | |
| Interest | | | | 36,861,079 |
| Dividends: | | | | |
| Unaffiliated issuers | | | | 879,135 |
| Affiliated issuers | | | | 303,103 |
| Income from securities lending | | | | 317,409 |
| Total Income | | | | 38,360,726 |
| Expenses: | | | | |
| Management fee—Note 3(a) | | | | 3,418,762 |
| Distribution and service fees—Note 3(b) | | 2,432,761 |
| Total Expenses | | | | 5,851,523 |
| Investment Income—Net | | | | 32,509,203 |
| |
| |
|
| Realized and Unrealized Gain (Loss) on Investments—Note 4 ($): |
| Net realized gain (loss) on investments and | | |
| foreign currency transactions | | | | (2,949,368) |
| Net realized gain (loss) on financial futures | | (20,081) |
| Net realized gain (loss) on swaps transactions | | 77,381 |
| Net realized gain (loss) on forward currency | | |
| exchange contracts | | | | 39,468 |
| Net Realized Gain (Loss) | | | | (2,852,600) |
| Net unrealized appreciation (depreciation) on investments, | | |
| swap transactions and foreign currency transactions | | (22,848,992) |
| Net Realized and Unrealized Gain (Loss) on Investments | | (25,701,592) |
| Net Increase in Net Assets Resulting from Operations | | 6,807,611 |
See notes to financial statements.
|
S TAT E M E N T O F C H A N G E S I N N E T A S S E T S
| | | Year Ended December 31, |
| |
|
| | | 2005 | | 2004 |
| |
| |
|
| Operations ($): | | | | |
| Investment income—net | | 32,509,203 | | 38,210,950 |
| Net realized gain (loss) on investments | | (2,852,600) | | 19,251,405 |
| Net unrealized appreciation | | | | |
| (depreciation) on investments | | (22,848,992) | | 6,868,062 |
| Net Increase (Decrease) in Net Assets | | |
| Resulting from Operations | | 6,807,611 | | 64,330,417 |
| |
| |
|
| Dividends to Shareholders from ($): | | | | |
| Investment income—net: | | | | |
| Class A shares | | (19,677,901) | | (17,670,867) |
| Class B shares | | (8,613,629) | | (13,553,136) |
| Class C shares | | (5,955,584) | | (6,858,589) |
| Class R shares | | (1,582,799) | | (1,146,962) |
| Total Dividends | | (35,829,913) | | (39,229,554) |
| |
| |
|
| Beneficial Interest Transactions ($): | | | | |
| Net proceeds from shares sold: | | | | |
| Class A shares | | 59,099,619 | | 143,560,072 |
| Class B shares | | 6,675,161 | | 11,499,028 |
| Class C shares | | 8,186,044 | | 13,351,452 |
| Class R shares�� | | 2,787,806 | | 4,068,189 |
| Net assets received in connection with | | | | |
| reorganization—Note 1: | | | | |
| Class A shares | | — | | 54,982,849 |
| Class B shares | | — | | 43,560,106 |
| Class C shares | | — | | 48,040,484 |
| Class R shares | | — | | 27,857,157 |
S TAT E M E N T O F C H A N G E S I N N E T A S S E T S (continued)
| | | Year Ended December 31, |
| |
|
| | | 2005 | | 2004 |
| |
| |
|
| Beneficial Interest Transactions ($) (continued): | | |
| Dividends reinvested: | | | | |
| Class A shares | | 9,034,344 | | 8,223,762 |
| Class B shares | | 3,492,415 | | 4,893,592 |
| Class C shares | | 2,427,417 | | 2,818,558 |
| Class R shares | | 1,562,942 | | 1,098,662 |
| Cost of shares redeemed: | | | | |
| Class A shares | | (103,059,712) | | (123,038,793) |
| Class B shares | | (74,071,992) | | (137,887,079) |
| Class C shares | | (45,812,229) | | (40,201,205) |
| Class R shares | | (6,301,353) | | (13,851,908) |
| Increase (Decrease) in Net Assets from | | | | |
| Beneficial Interest Transactions | | (135,979,538) | | 48,974,926 |
| Total Increase (Decrease) in Net Assets | | (165,001,840) | | 74,075,789 |
| |
| |
|
| Net Assets ($): | | | | |
| Beginning of Period | | 591,122,201 | | 517,046,412 |
| End of Period | | 426,120,361 | | 591,122,201 |
| Undistributed investment income—net | | 519,317 | | 291,303 |
| | | Year Ended December 31, |
| |
|
| | | 2005 | | 2004 |
| |
| |
|
| Capital Share Transactions: | | | | |
| Class A a | | | | |
| Shares sold | | 7,969,751 | | 19,901,069 |
| Shares issued in connection with reorganization—Note 1 | | — | | 7,450,835 |
| Shares issued for dividends reinvested | | 1,229,853 | | 1,107,484 |
| Shares redeemed | | (13,978,772) | | (16,610,601) |
| Net Increase (Decrease) in Shares Outstanding | | (4,779,168) | | 11,848,787 |
| |
| |
|
| Class B a | | | | |
| Shares sold | | 902,004 | | 1,822,259 |
| Shares issued in connection with reorganization—Note 1 | | — | | 5,891,364 |
| Shares issued for dividends reinvested | | 474,662 | | 659,624 |
| Shares redeemed | | (9,996,875) | | (18,609,707) |
| Net Increase (Decrease) in Shares Outstanding | | (8,620,209) | | (10,236,460) |
| |
| |
|
| Class C | | | | |
| Shares sold | | 1,101,288 | | 2,001,558 |
| Shares issued in connection with reorganization—Note 1 | | — | | 6,497,931 |
| Shares issued for dividends reinvested | | 329,845 | | 379,720 |
| Shares redeemed | | (6,174,757) | | (5,445,865) |
| Net Increase (Decrease) in Shares Outstanding | | (4,743,624) | | 3,433,344 |
| |
| |
|
| Class R | | | | |
| Shares sold | | 372,287 | | 642,443 |
| Shares issued in connection with reorganization—Note 1 | | — | | 3,773,591 |
| Shares issued for dividends reinvested | | 212,799 | | 148,256 |
| Shares redeemed | | (855,149) | | (1,898,079) |
| Net Increase (Decrease) in Shares Outstanding | | (270,063) | | 2,666,211 |
| a | | During the period ended December 31, 2005, 3,607,798 Class B shares representing $26,903,740 were |
| | | automatically converted to 3,610,991 Class A shares and during the period ended December 31, 2004, 6,247,945 |
| | | Class B shares representing $51,135,116 were automatically converted to 6,898,745 Class A shares. |
| See notes to financial statements. |
F I N A N C I A L H I G H L I G H T S
|
The following tables describe the performance for each share class for the fiscal periods indicated. All information (except portfolio turnover rate) reflects financial results for a single fund share.Total return shows how much your investment in the fund would have increased (or decreased) during each period, assuming you had reinvested all dividends and distributions.These figures have been derived from the fund’s financial statements.
| | | | | Year Ended December 31, | | |
| |
| |
| |
|
| Class A Shares | | 2005 | | 2004 a | | 2003 | | 2002 | | 2001 b |
| |
| |
| |
| |
| |
|
| Per Share Data ($): | | | | | | | | | | |
| Net asset value, beginning of period | | 7.65 | | 7.43 | | 6.28 | | 7.94 | | 8.95 |
| Investment Operations: | | | | | | | | | | |
| Investment income—net c | | .51 | | .52 | | .63 | | .68 | | .84 |
| Net realized and unrealized gain | | | | | | | | | | |
| (loss) on investments | | (.36) | | .23 | | 1.17 | | (1.62) | | (.96) |
| Total from Investment Operations | | .15 | | .75 | | 1.80 | | (.94) | | (.12) |
| Distributions: | | | | | | | | | | |
| Dividends from investment income—net | | (.56) | | (.53) | | (.65) | | (.72) | | (.89) |
| Net asset value, end of period | | 7.24 | | 7.65 | | 7.43 | | 6.28 | | 7.94 |
| |
| |
| |
| |
| |
|
| Total Return (%) d | | 2.22 | | 10.44 | | 29.87 | | (12.19) | | (1.62) |
| |
| |
| |
| |
| |
|
| Ratios/Supplemental Data (%): | | | | | | | | | | |
| Ratio of total expenses | | | | | | | | | | |
| to average net assets | | .95 | | .95 | | .97 | | .96 | | .96 |
| Ratio of net investment income | | | | | | | | | | |
| to average net assets | | 6.93 | | 7.00 | | 8.87 | | 10.05 | | 9.91 |
| Portfolio Turnover Rate | | 40.57 | | 129.27 | | 235.42 | | 340.47 | | 158.92 |
| |
| |
| |
| |
| |
|
| Net Assets, end of period ($ x 1,000) | | 236,421 | | 286,342 | | 191,270 | | 121,775 | | 114,886 |
| a | | As of January 1, 2004, the fund has adopted the method of accounting for interim payments on swap contracts in |
| | | accordance with Financial Accounting Standards Board Statement No. 133.These interim payments are reflected |
| | | within net realized and unrealized gain (loss) on swap contracts, however, prior to January 1, 2004, these interim |
| | | payments were reflected within interest income/expense in the Statement of Operations.The effect of these changes for |
| | | the fiscal year ended December 31, 2004 was to increase net investment income per share by less than $.01, decrease |
| | | net realized and unrealized gain (loss) on investments per share by less than $.01 and had no effect on the ratio of |
| | | net investment income to average net assets. |
| b | | As required, effective January 1, 2001, the fund has adopted the provisions of the AICPA Audit and Accounting |
| | | Guide for Investment Companies and began accreting discount or amortizing premium on fixed income securities on a |
| | | scientific basis and including paydown gains and losses in interest income.The effect of this change for the fiscal year |
| | | ended December 31, 2001 was to decrease net investment income per share by $.06, increase net realized and |
| | | unrealized gain (loss) on investments per share by $.06, and decrease the ratio of net investment income to average |
| | | net assets from 10.52% to 9.91%. |
| c | | Based on average shares outstanding at each month end. |
| d | | Exclusive of sales charge. |
| See notes to financial statements. |
| | | | | Year Ended December 31, | | |
| |
| |
| |
|
| Class B Shares | | 2005 | | 2004 a | | 2003 | | 2002 | | 2001 b |
| |
| |
| |
| |
| |
|
| Per Share Data ($): | | | | | | | | | | |
| Net asset value, beginning of period | | 7.65 | | 7.43 | | 6.28 | | 7.94 | | 8.95 |
| Investment Operations: | | | | | | | | | | |
| Investment income—net c | | .46 | | .47 | | .59 | | .66 | | .80 |
| Net realized and unrealized gain | | | | | | | | | | |
| (loss) on investments | | (.35) | | .25 | | 1.18 | | (1.64) | | (.96) |
| Total from Investment Operations | | .11 | | .72 | | 1.77 | | (.98) | | (.16) |
| Distributions: | | | | | | | | | | |
| Dividends from investment income—net | | (.52) | | (.50) | | (.62) | | (.68) | | (.85) |
| Net asset value, end of period | | 7.24 | | 7.65 | | 7.43 | | 6.28 | | 7.94 |
| |
| |
| |
| |
| |
|
| Total Return (%) d | | 1.73 | | 10.06 | | 29.25 | | (12.64) | | (2.10) |
| |
| |
| |
| |
| |
|
| Ratios/Supplemental Data (%): | | | | | | | | | | |
| Ratio of total expenses | | | | | | | | | | |
| to average net assets | | 1.45 | | 1.45 | | 1.47 | | 1.46 | | 1.46 |
| Ratio of net investment income | | | | | | | | | | |
| to average net assets | | 6.36 | | 6.50 | | 8.46 | | 9.41 | | 9.42 |
| Portfolio Turnover Rate | | 40.57 | | 129.27 | | 235.42 | | 340.47 | | 158.92 |
| |
| |
| |
| |
| |
|
Net Assets, end of period ($ x 1,000)
96,333 167,756 239,015 230,011 325,834
| a | | As of January 1, 2004, the fund has adopted the method of accounting for interim payments on swap contracts in |
| | | accordance with Financial Accounting Standards Board Statement No. 133.These interim payments are reflected |
| | | within net realized and unrealized gain (loss) on swap contracts, however, prior to January 1, 2004, these interim |
| | | payments were reflected within interest income/expense in the Statement of Operations.The effect of these changes for |
| | | the fiscal year ended December 31, 2004 was to increase net investment income per share by less than $.01, decrease |
| | | net realized and unrealized gain (loss) on investments per share by less than $.01 and had no effect on the ratio of |
| | | net investment income to average net assets. |
| b | | As required, effective January 1, 2001, the fund has adopted the provisions of the AICPA Audit and Accounting |
| | | Guide for Investment Companies and began accreting discount or amortizing premium on fixed income securities |
| | | on a scientific basis and including paydown gains and losses in interest income.The effect of this change for the |
| | | fiscal year ended December 31, 2001 was to decrease net investment income per share by $.05, increase net |
| | | realized and unrealized gain (loss) on investments per share by $.05, and decrease the ratio of net investment |
| | | income to average net assets from 10.03% to 9.42%. |
| c | | Based on average shares outstanding at each month end. |
| d | | Exclusive of sales charge. |
| See notes to financial statements. |
F I N A N C I A L H I G H L I G H T S (continued)
|
| | | | | Year Ended December 31, | | |
| |
| |
| |
|
| Class C Shares | | 2005 | | 2004 a | | 2003 | | 2002 | | 2001 b |
| |
| |
| |
| |
| |
|
| Per Share Data ($): | | | | | | | | | | |
| Net asset value, beginning of period | | 7.65 | | 7.43 | | 6.28 | | 7.95 | | 8.96 |
| Investment Operations: | | | | | | | | | | |
| Investment income—net c | | .45 | | .46 | | .57 | | .64 | | .78 |
| Net realized and unrealized gain | | | | | | | | | | |
| (loss) on investments | | (.36) | | .24 | | 1.18 | | (1.65) | | (.96) |
| Total from Investment Operations | | .09 | | .70 | | 1.75 | | (1.01) | | (.18) |
| Distributions: | | | | | | | | | | |
| Dividends from investment income—net | | (.50) | | (.48) | | (.60) | | (.66) | | (.83) |
| Net asset value, end of period | | 7.24 | | 7.65 | | 7.43 | | 6.28 | | 7.95 |
| |
| |
| |
| |
| |
|
| Total Return (%) d | | 1.48 | | 9.63 | | 29.10 | | (12.97) | | (2.23) |
| |
| |
| |
| |
| |
|
| Ratios/Supplemental Data (%): | | | | | | | | | | |
| Ratio of total expenses | | | | | | | | | | |
| to average net assets | | 1.70 | | 1.70 | | 1.72 | | 1.71 | | 1.71 |
| Ratio of net investment income | | | | | | | | | | |
| to average net assets | | 6.14 | | 6.26 | | 8.15 | | 9.17 | | 9.17 |
| Portfolio Turnover Rate | | 40.57 | | 129.27 | | 235.42 | | 340.47 | | 158.92 |
| |
| |
| |
| |
| |
|
| Net Assets, end of period ($ x 1,000) | | 74,769 | | 115,309 | | 86,479 | | 62,036 | | 84,044 |
| a | | As of January 1, 2004, the fund has adopted the method of accounting for interim payments on swap contracts in |
| | | accordance with Financial Accounting Standards Board Statement No. 133.These interim payments are reflected |
| | | within net realized and unrealized gain (loss) on swap contracts, however, prior to January 1, 2004, these interim |
| | | payments were reflected within interest income/expense in the Statement of Operations.The effect of these changes for |
| | | the fiscal year ended December 31, 2004 was to increase net investment income per share by less than $.01, decrease |
| | | net realized and unrealized gain (loss) on investments per share by less than $.01 and had no effect on the ratio of |
| | | net investment income to average net assets. |
| b | | As required, effective January 1, 2001, the fund has adopted the provisions of the AICPA Audit and Accounting |
| | | Guide for Investment Companies and began accreting discount or amortizing premium on fixed income securities on a |
| | | scientific basis and including paydown gains and losses in interest income.The effect of this change for the fiscal year |
| | | ended December 31, 2001 was to decrease net investment income per share by $.05, increase net realized and |
| | | unrealized gain (loss) on investments per share by $.05, and decrease the ratio of net investment income to average |
| | | net assets from 9.78% to 9.17%. |
| c | | Based on average shares outstanding at each month end. |
| d | | Exclusive of sales charge. |
| See notes to financial statements. |
| | | | | Year Ended December 31, | | |
| |
| |
| |
|
| Class R Shares | | 2005 | | 2004 a | | 2003 | | 2002 | | 2001 b |
| |
| |
| |
| |
| |
|
| Per Share Data ($): | | | | | | | | | | |
| Net asset value, beginning of period | | 7.65 | | 7.43 | | 6.27 | | 7.94 | | 8.95 |
| Investment Operations: | | | | | | | | | | |
| Investment income—net c | | .53 | | .52 | | .67 | | .70 | | .86 |
| Net realized and unrealized gain | | | | | | | | | | |
| (loss) on investments | | (.36) | | .25 | | 1.16 | | (1.64) | | (.96) |
| Total from Investment Operations | | .17 | | .77 | | 1.83 | | (.94) | | (.10) |
| Distributions: | | | | | | | | | | |
| Dividends from investment income—net | | (.58) | | (.55) | | (.67) | | (.73) | | (.91) |
| Net asset value, end of period | | 7.24 | | 7.65 | | 7.43 | | 6.27 | | 7.94 |
| |
| |
| |
| |
| |
|
| Total Return (%) | | 2.34 | | 10.87 | | 30.15 | | (11.99) | | (1.26) |
| |
| |
| |
| |
| |
|
| Ratios/Supplemental Data (%): | | | | | | | | | | |
| Ratio of total expenses | | | | | | | | | | |
| to average net assets | | .70 | | .70 | | .72 | | .70 | | .71 |
| Ratio of net investment income | | | | | | | | | | |
| to average net assets | | 7.18 | | 7.31 | | 9.26 | | 10.08 | | 10.19 |
| Portfolio Turnover Rate | | 40.57 | | 129.27 | | 235.42 | | 340.47 | | 158.92 |
| |
| |
| |
| |
| |
|
| Net Assets, end of period ($ x 1,000) | | 18,595 | | 21,714 | | 1,283 | | 114 | | 131 |
| a | | As of January 1, 2004, the fund has adopted the method of accounting for interim payments on swap contracts in |
| | | accordance with Financial Accounting Standards Board Statement No. 133.These interim payments are reflected |
| | | within net realized and unrealized gain (loss) on swap contracts, however, prior to January 1, 2004, these interim |
| | | payments were reflected within interest income/expense in the Statement of Operations.The effect of these changes for |
| | | the fiscal year ended December 31, 2004 was to increase net investment income per share by less than $.01, decrease |
| | | net realized and unrealized gain (loss) on investments per share by less than $.01 and had no effect on the ratio of |
| | | net investment income to average net assets. |
| b | | As required, effective January 1, 2001, the fund has adopted the provisions of the AICPA Audit and Accounting |
| | | Guide for Investment Companies and began accreting discount or amortizing premium on fixed income securities |
| | | on a scientific basis and including paydown gains and losses in interest income.The effect of this change for the |
| | | fiscal year ended December 31, 2001 was to decrease net investment income per share by $.05 and increase net |
| | | realized and unrealized gain (loss) on investments per share by $.05, and decrease the ratio of net investment |
| | | income to average net assets from 10.80% to 10.19%. |
| c | | Based on average shares outstanding at each month end. |
| See notes to financial statements. |
N O T E S T O F I N A N C I A L S TAT E M E N T S
NOTE 1—Significant Accounting Policies:
Dreyfus Premier Limited Term High Yield Fund (the “fund”) is a separate diversified series of The Dreyfus/Laurel Funds Trust (the “Trust”) which is registered under the Investment Company Act of 1940, as amended (the “Act”), as an open-end management investment company and operates as a series company currently offering five series, including the fund. The fund’s investment objective is to seek to maximize total return, consisting of capital appreciation and current income. The Dreyfus Corporation (the “Manager” or “Dreyfus”) serves as the fund’s investment manager. The Manager is a wholly-owned subsidiary of Mellon Financial Corporation (“Mellon Financial”).
On April 30, 2004, pursuant to an Agreement and Plan of Reorganization, all of the assets, subject to the liabilities, of the High Yield Total Return Portfolio (“High Yield Fund”) of The Bear Stearns Funds, were transferred to the fund in exchange for shares of Beneficial Interest of the fund of equal value. Shareholders of Class A, Class B, Class C and Class Y shares of the High Yield Fund received Class A, Class B, Class C and Class R shares, respectively, of the fund, in each case, in an amount equal to the aggregate net asset value of their respective investment in the High Yield Fund at the time of the exchange. The fund’s net asset value on April 30, 2004 was $7.38 per share for Class A shares, $7.39 per share for Class B shares, $7.39 per share for Class C shares and $7.39 per share for Class R shares and a total of 7,450,835 Class A shares, 5,891,364 Class B shares, 6,497,931 Class C shares and 3,773,591 Class R shares, representing net assets of $54,982,849 Class A shares, $43,560,106 Class B shares, $48,040,484 Class C shares and $27,857,157 Class R shares (including $7,843,349 net unrealized appreciation on investments), were issued to the shareholders of the High Yield Fund in the exchange.The exchange was a tax free event to shareholders.
Dreyfus Service Corporation (the “Distributor”), a wholly-owned subsidiary of the Manager, is the Distributor of the fund’s shares.The fund is authorized to issue an unlimited number of shares of Beneficial
Interest in each of the following classes of shares: Class A, Class B, Class C and Class R. Class A, Class B and Class C shares are sold primarily to retail investors through financial intermediaries and bear a distribution fee and/or service fee. Class A shares are sold with a front-end sales charge, while Class B and Class C shares are subject to a contingent deferred sales charge (“CDSC”). Class B shares automatically convert to Class A shares after six years. Class R shares are sold primarily to bank trust departments and other financial service providers (including Mellon Financial and its affiliates) acting on behalf of customers having a qualified trust or investment account or relationship at such institution, and bear no distribution or service fees. Class R shares are offered without a front-end sales charge or CDSC. Each class of shares has identical rights and privileges, except with respect to distribution and service fees and voting rights on matters affecting a single class. Income, expenses (other than expenses attributable to a specific class), and realized and unrealized gains or losses on investments are allocated to each class of shares based on its relative net assets.
The fund’s financial statements are prepared in accordance with U.S. generally accepted accounting principles, which may require the use of management estimates and assumptions. Actual results could differ from those estimates.
(a) Portfolio valuation: Investments in securities (excluding short-term investments (other than U.S. Treasury Bills), financial futures, options, swaps and forward currency exchange contracts) are valued each business day by an independent pricing service (the “Service”) approved by the Board of Trustees. Investments for which quoted bid prices are readily available and are representative of the bid side of the market in the judgment of the Service are valued at the mean between the quoted bid prices (as obtained by the Service from dealers in such securities) and asked prices (as calculated by the Service based upon its evaluation of the market for such securities). Other investments (which constitute a majority of the portfolio securities) are valued as determined by the Service, based on methods which include consideration of: yields or prices of
N O T E S T O F I N A N C I A L S TAT E M E N T S (continued)
securities of comparable quality, coupon, maturity and type; indications as to values from dealers; and general market conditions. Securities for which there are no such valuations are valued at fair value as determined in good faith under the direction of the Board of Trustees. Restricted securities, as well as securities or other assets for which recent market quotations are not readily available and are not valued by a pricing service approved by the Board of Trustees, or are determined by the fund not to reflect accurately fair value (such as when an event occurs after the close of the exchange on which the security is principally traded and that is determined by the fund to have changed the value of the security), are valued at fair value as determined in good faith under the direction of the Board of Trustees.The factors that may be considered when fair valuing a security include fundamental analytical data, the nature and duration of restrictions on disposition, an evaluation of the forces that influence the market in which the securities are purchased and sold and public trading in similar securities of the issuer or comparable issuers. Short-term investments, excluding U.S.Treasury Bills, are carried at amortized cost, which approximates value. Investments in registered investment companies are valued at their net asset value. Financial futures and options, which are traded on an exchange, are valued at the last sales price on the securities exchange on which such securities are primarily traded or at the last sales price on the national securities market on each business day. Options traded over-the-counter are priced at the mean between the bid and asked prices. Investments denominated in foreign currencies are translated to U.S. dollars at the prevailing rates of exchange. Investments in swap transactions are valued each business day by a pricing service approved by the Board of Trustees. Swaps are valued by the service by using a swap pricing model which incorporates among other factors, default probabilities, recovery rates, credit curves of the underlying issuer and swap spreads on interest rates.
(b) Foreign currency transactions: The fund does not isolate that portion of the results of operations resulting from changes in foreign exchange rates on investments from the fluctuations arising from changes in the market prices of securities held. Such fluctuations are included with the net realized and unrealized gain or loss on investments.
Net realized foreign exchange gains or losses arise from sales and maturities of short-term securities, sales of foreign currencies, currency gains or losses realized on securities transactions and the difference between the amount of dividends, interest and foreign withholding taxes recorded on the fund’s books and the U.S. dollar equivalent of the amounts actually received or paid. Net unrealized foreign exchange gains and losses arise from changes in the value of assets and liabilities other than investments in securities, resulting from changes in exchange rates. Such gains and losses are included with net realized and unrealized gain or loss on investments.
(c) Securities transactions and investment income: Securities transactions are recorded on a trade date basis. Realized gain and loss from securities transactions are recorded on the identified cost basis. Dividend income is recognized on the ex-dividend date and interest income, including, where applicable, accretion of discount and amortization of premium on investments, is recognized on the accrual basis.
Pursuant to a securities lending agreement with Mellon Bank, N.A., an affiliate of the Manager, the fund may lend securities to qualified institu-tions.At origination, all loans are secured by collateral of at least 102% of the value of U.S. securities loaned and 105% of the value of foreign securities loaned. Collateral equivalent to at least 100% of the market value of securities on loan will be maintained at all times. Cash collateral is invested in certain money market mutual funds managed by the Manager. The fund will be entitled to receive all income on securities loaned, in addition to income earned as a result of the lending transac-tion.Although each security loaned is fully collateralized, the fund would bear the risk of delay in recovery of, or loss of rights in, the securities loaned should a borrower fail to return the securities in a timely manner.
(d) Affiliated issuers: Investments in other investment companies advised by the Manager are defined as “affiliated” in the Act.
(e) Concentration of Risk: The fund invests primarily in debt securities. Failure of an issuer of the debt securities to make timely interest or principal payments, or a decline or the perception of a decline
N O T E S T O F I N A N C I A L S TAT E M E N T S (continued)
in the credit quality of a debt security, can cause the debt security’s price to fall, potentially lowering the fund’s share price. High yield (“junk”) bonds involve greater credit risk, including the risk of default, than investment grade bonds, and are considered predominantly speculative with respect to the issuer’s continuing ability to make principal and interest payments. In addition, the value of debt securities may decline due to general market conditions that are not specifically related to a particular company, such as real or perceived adverse economic conditions, changes in outlook for corporate earnings, changes in interest or currency rates or adverse investor sentiment. They may also decline because of factors that affect a particular industry.
(f) Dividends to shareholders: It is the policy of the fund to declare dividends daily from investment income-net. Such dividends are paid monthly. Dividends from net realized capital gain, if any, are normally declared and paid annually, but the fund may make distributions on a more frequent basis to comply with the distribution requirements of the Internal Revenue Code of 1986, as amended (the “Code”).To the extent that net realized capital gain can be offset by capital loss carryovers, it is the policy of the fund not to distribute such gain. Income and capital gain distributions are determined in accordance with income tax regulations, which may differ from U.S. generally accepted accounting principles.
(g) Federal income taxes: It is the policy of the fund to continue to qualify as a regulated investment company, if such qualification is in the best interests of its shareholders, by complying with the applicable provisions of the Code, and to make distributions of taxable income sufficient to relieve it from substantially all federal income and excise taxes.
At December 31, 2005, the components of accumulated earnings on a tax basis were as follows: undistributed ordinary income $839,279, accumulated capital losses $566,441,837 and unrealized appreciation $238,369.
The accumulated capital loss carryover is available to be applied against future net securities profits, if any, realized subsequent to December 31, 2005. If not applied, $9,855,717 of the carryover expires in fiscal 2006,
$57,739,194 expires in fiscal 2007, $109,480,427 expires in fiscal 2008, $171,244,927 expires in fiscal 2009, $138,776,715 expires in fiscal 2010, $72,493,638 expires in fiscal 2011 and $6,851,219 expires in fiscal 2013. Based on certain provisions in the Internal Revenue Code, various limitations regarding the future utilization of these carryforwards, brought forward as a result of the fund’s merger with the following funds may apply: Dreyfus Short Term High Yield Fund, Dreyfus Premier High Yield Securities Fund and High Yield Fund. It is probable that the fund will not be able to utilize most of its capital loss carryovers prior to its expiration date.
The tax character of distributions paid to shareholders during the fiscal periods ended December 31, 2005 and December 31, 2004 were as follows: ordinary income $35,829,913 and $39,229,554, respectively.
During the period ended December 31, 2005, as a result of permanent book to tax differences, primarily due to the tax treatment for amortization of premiums, paydown gains and losses and the expiration of capital loss carryover from merged funds, the fund increased accumulated undistributed investment income-net by $3,548,724, decreased accumulated net realized gain (loss) on investments by $47,779 and decreased paid-in capital by $3,500,945. Net assets were not affected by this reclassification.
NOTE 2—Bank Lines of Credit:
|
The fund may borrow up to $20 million for leveraging purposes under a short-term unsecured line of credit and participates with other Dreyfus-managed funds in a $100 million unsecured line of credit primarily to be utilized for temporary or emergency purposes, including the financing of redemptions. Interest is charged to the fund based on prevailing market rates in effect at the time of borrowing. During the period ended December 31, 2005, the fund did not borrow under the line of credit.
NOTE 3—Investment Management Fee and Other Transactions with Affiliates:
(a) Pursuant to an Investment Management agreement with the Manager, the Manager provides or arranges for one or more third parties and/or affiliates to provide investment advisory, administrative, cus-
N O T E S T O F I N A N C I A L S TAT E M E N T S (continued)
tody, fund accounting and transfer agency services to the fund. The Manager also directs the investments of the fund in accordance with its investment objective, policies and limitations. For these services, the fund is contractually obligated to pay the Manager a fee, calculated daily and paid monthly, at the annual rate of .70% of the value of the fund’s average daily net assets. Out of its fee, the Manager pays all of the expenses of the fund except brokerage fees, taxes, interest, commitment fees, Rule 12b-1 distribution fees and expenses, service fees and expenses of non-interested Trustees (including counsel fees) and extraordinary expenses. In addition, the Manager is required to reduce its fee in an amount equal to the fund’s allocable portion of fees and expenses of the non-interested Trustees (including counsel fees). Effective October 1, 2005 each Trustee receives $45,000 per year, plus $6,000 for each joint Board meeting of The Dreyfus/Laurel Funds, Inc., The Dreyfus/Laurel Tax-Free Municipal Funds and Trust (collectively the “Dreyfus/Laurel Funds”) attended, $2,000 for separate in-person committee meetings attended which are not held in conjunction with a regularly scheduled Board meeting and $1,500 for Board meetings and separate committee meetings attended that are conducted by telephone and is reimbursed for travel and out-of-pocket expenses.With respect to Board meetings, the Chairman of the Board receives an additional 25% of such compensation (with the exception of reimbursable amounts). With respect to compensation committee meetings, the Chair of the compensation committee receives $900 per meeting and, with respect to audit committee meetings, the Chair of the audit committee receives $1,350 per meeting. In the event that there is an in-person joint committee meeting or a joint telephone meeting of the Dreyfus/Laurel Funds and the Dreyfus High Yield Strategies Fund, the $2,000 or $1,500 fee, as applicable, will be allocated between the Dreyfus/Laurel Funds and the Dreyfus High Yield Strategies Fund. Prior to October 1, 2005, each Trustee received $40,000 per year, plus $5,000 for each joint Board meeting of the Dreyfus/Laurel Funds attended, $2,000 for separate committe meetings attended which were not held in conjunction with a regularly scheduled Board meeting and $500 for Board meetings and
separate committee meetings attended that were conducted by telephone and was reimbursed for travel and out-of-pocket expenses. The Chairman of the Board received an additional 25% of such compensation (with the exception of reimbursable amounts). In the event that there was a joint committee meeting of the Dreyfus/Laurel Funds and Dreyfus High Yield Strategies Fund, the $2,000 fee was allocated between the Dreyfus/Laurel Funds and Dreyfus High Yield Strategies Fund.These fees and expenses are charged and allocated to each series based on net assets.Amounts required to be paid by the Trust directly to the non-interested Trustees, that would be applied to offset a portion of the management fee payable to the Manager, are in fact paid directly by the Manager to the non-interested Trustees.
During the period ended December 31, 2005, the Distributor retained $16,653 from commissions earned on sales of the fund’s Class A shares and $485,520 and $13,611 from contingent deferred sales charges on redemptions of the fund’s Class B and Class C shares, respectively.
(b) Under separate Distribution Plans (the “Plans”) adopted pursuant to Rule 12b-1 under the Act, Class A shares pay annually up to .25% of the value of the average daily net assets to compensate the Distributor for shareholder servicing activities and expenses primarily intended to result in the sale of Class A shares. Class B and Class C shares pay the Distributor for distributing their shares at an aggregate annual rate of .50% and .75% of the value of the average daily net assets of Class B and Class C shares, respectively. Class B and Class C shares are also subject to a service plan adopted pursuant to Rule 12b-1 (the “Service Plan”), under which Class B and Class C shares pay the Distributor for providing certain services to the holders of their shares a fee at the annual rate of .25% of the value of the average daily net assets of Class B and Class C shares. During the period ended December 31, 2005, Class A, Class B and Class C shares were charged $648,235, $608,513 and $653,817, respectively, pursuant to their respective Plans. During the period ended December 31, 2005, Class B
N O T E S T O F I N A N C I A L S TAT E M E N T S (continued)
and Class C shares were charged $304,257 and $217,939, respectively, pursuant to the Service Plan.
Under its terms, the Plans and Service Plan shall remain in effect from year to year, provided such continuance is approved annually by a vote of majority of those Trustees who are not “interested persons” of the Trust and who have no direct or indirect financial interest in the operation of or in any agreement related to the Plans or Service Plan.
The components of Due to The Dreyfus Corporation and affiliates in the Statement of Assets and Liabilities consist of: management fees $263,904, Rule 12b-1 distribution plan fees $139,848 and service plan fees $36,684.
(c) The Trust and the Manager have received an exemptive order from the SEC which, among other things, permits the fund to use cash collateral received in connection with lending the fund’s securities and other uninvested cash to purchase shares of one or more registered money market mutual funds advised by the Manager in excess of the limitations imposed by the Act.
NOTE 4—Securities Transactions:
|
The aggregate amount of purchases and sales (including paydowns) of investment securities, excluding short-term securities, financial futures, forward currency exchange contracts and swap transactions during the period ended December 31, 2005, amounted to $190,928,227 and $284,264,024, respectively.
The fund may invest in financial futures contracts in order to gain exposure to or protect against changes in the market. The fund is exposed to market risk as a result of changes in the value of the underlying financial instruments. Investments in financial futures require the fund to “mark to market” on a daily basis, which reflects the change in the market value of the contracts at the close of each day’s trading. Accordingly, variation margin payments are received or made to reflect daily unrealized gains or losses.When the contracts are closed, the fund
recognizes a realized gain or loss.These investments require initial margin deposits with a broker.The amount of these deposits is determined by the exchange or Board of Trade on which the contract is traded and is subject to change. At December 31, 2005, there were no financial futures contracts outstanding.
The fund enters into forward currency exchange contracts in order to hedge its exposure to changes in foreign currency exchange rates on its foreign portfolio holdings and to settle foreign currency transac-tions.When executing forward currency exchange contracts, the fund is obligated to buy or sell a foreign currency at a specified rate on a certain date in the future. With respect to sales of forward currency exchange contracts, the fund would incur a loss if the value of the contract increases between the date the forward contract is opened and the date the forward contract is closed.The fund realizes a gain if the value of the contract decreases between those dates. With respect to purchases of forward currency exchange contracts, the fund would incur a loss if the value of the contract decreases between the date the forward contract is opened and the date the forward contract is closed. The fund realizes a gain if the value of the contract increases between those dates. The fund is also exposed to credit risk associated with counterparty nonperformance on these forward currency exchange contracts which is typically limited to the unrealized gain on each open contract. The following summarizes open forward currency exchange contracts at December 31, 2005:
| | | Foreign | | | | | | |
| Forward Currency | | Currency | | | | | | Unrealized |
| Exchange Contracts | | Amounts | | Proceeds ($) | | Value ($) | | Appreciation ($) |
| |
| |
| |
| |
|
| Sales; | | | | | | | | |
| Euro, expiring | | | | | | | | |
| 3/15/2006 | | 1,540,000 | | 1,848,062 | | 1,828,750 | | 19,312 |
The fund may enter into swap agreements to exchange the interest rate on, or return generated by, one nominal instrument for the return generated by another nominal instrument.
N O T E S T O F I N A N C I A L S TAT E M E N T S (continued)
The fund accrues for the interim payments on swap contracts on a daily basis, with the net amount recorded within unrealized appreciation (depreciation) on swap contracts in the Statement of Assets and Liabilities. Once the interim payments are settled in cash, the net amount is recorded as realized gain (loss) on swaps, in addition to realized gain (loss) recorded upon the termination of swaps contracts in the Statement of Operations. Fluctuations in the value of swap contracts are recorded as a component of net change in unrealized appreciation (depreciation) on investments.
Credit default swaps involve commitments to pay a fixed interest rate in exchange for payment if a credit event affecting a third party (the referenced company) occurs. For those credit default swaps in which the fund is receiving a fixed rate, the fund is providing credit protection on the underlying instrument. The maximum payouts for these contracts are limited to the notional amount of each swap. Credit events may include a failure to pay interest or principal, bankruptcy, or restructuring. The following summarizes open credit default swaps entered into by the fund at December 31, 2005:
| | | | | Unrealized |
| | | | | Appreciation |
| Notional Amount ($) Description | | (Depreciation) ($) |
| |
|
| 575,000 | | Agreement with JP Morgan terminating | | 38,469 |
| September 20, 2010 to pay a fixed rate of |
| 1.07% and receive the notional amount as |
| a result of interest payment default totaling |
| $1,000,000 or principal payment default of |
| | | $10,000,000 on Cooper Tire & Rubber, | | |
| | | 7.75%, 12/15/2009 | | |
| 7,977,500 | | Agreement with Lehman Brothers terminating | | (24,969) |
| June 20,2010 to pay a fixed rate of .35% |
| and receive the notional amount as a result of |
| | | interest payment default totaling $1,000,000 or | | |
| principal payment default of $10,000,000 on |
| | | Dow Jones CDX.NA.IG.4 | | |
| 5,022,500 | | Agreement with Merrill Lynch terminating | | (8,640) |
| | | June 20, 2010 to pay a fixed rate of | | |
| .305% and receive the notional amount as |
| a result of interest payment default totaling |
| $1,000,000 or principal payment default of |
| $10,000,000 on Dow Jones CDX.NA.IG.4 |
| | | | | Unrealized |
| | | | | Appreciation |
| Notional Amount ($) | | Description | | (Depreciation) ($) |
| |
| |
|
| 2,675,000 | | Agreement with JP Morgan terminating | | 16,544 |
| | | June 20, 2010 to pay a fixed rate of | | |
| | | 1.95% and receive the notional amount | | |
| as a result of interest payment default totaling |
| $1,000,000 or principal payment default of |
| | | $10,000,000 on Owens Brockaway, | | |
| | | 8.25%, 5/15/2013 | | |
| 2,675,000 | | Agreement with JP Morgan terminating | | (54,564) |
| | | June 20, 2010 to receive a fixed rate of | | |
| | | 2.6% and pay the notional amount as | | |
| a result of interest payment default totaling |
| $1,000,000 or principal payment default of |
| | | $10,000,000 on Owens Illinois, | | |
| | | 7.5%, 5/15/2010 | | |
| 5,160,000 | | Agreement with Morgan Stanley terminating | | 41,135 |
| December 20, 2010 to pay a fixed rate of |
| .62% and receive the notional amount as |
| a result of interest payment default totaling |
| $1,000,000 or principal payment default of |
| | | $10,000,000 on Wendy’s International, | | |
| | | 6.25%, 11/15/2011 | | |
| Total | | | | 7,975 |
Risks may arise upon entering into these agreements from the potential inability of the counterparties to meet the terms of the agreement and are generally limited to the amount of net payments to be received, if any, at the date of default.
At December 31, 2005, the cost of investments for federal income tax purposes was $454,853,381; accordingly, accumulated net unrealized appreciation on investments was $227,254, consisting of $14,003,800 gross unrealized appreciation and $13,776,546 gross unrealized depreciation.
R E P O R T O F I N D E P E N D E N T R E G I S T E R E D P U B L I C A C C O U N T I N G F I R M
The Board of Trustees and Shareholders The Dreyfus/Laurel Funds Trust:
We have audited the accompanying statement of assets and liabilities of Dreyfus Premier Limited Term High Yield Fund (the “Fund”) of The Dreyfus/Laurel Funds Trust, including the statement of investments, as of December 31, 2005, and the related statement of operations for the year then ended, the statement of changes in net assets for each of the years in the two-year period then ended, and the financial highlights for each of the years in the five-year period then ended. These financial statements and financial highlights are the responsibility of the Fund’s management. Our responsibility is to express an opinion on these financial statements and financial highlights based on our audits.
We conducted our audits in accordance with standards of the Public Company Accounting Oversight Board (United States).Those standards require that we plan and perform the audit to obtain reasonable assurance about whether the financial statements and financial highlights are free of material misstatement. An audit also includes examining, on a test basis, evidence supporting the amounts and disclosures in the financial statements. Our procedures included confirmation of securities owned as of December 31, 2005, by correspondence with the custodian and brokers. An audit also includes assessing the accounting principles used and significant estimates made by management, as well as evaluating the overall financial statement presentation.We believe that our audits provide a reasonable basis for our opinion.
In our opinion, the financial statements and financial highlights referred to above present fairly, in all material respects, the financial position of Dreyfus Premier Limited Term High Yield Fund of The Dreyfus/Laurel Funds Trust as of December 31, 2005, and the results of its operations for the year then ended, the changes in its net assets for each of the years in the two-year period then ended, and the financial highlights for each of the years in the five-year period then ended, in conformity with U.S. generally accepted accounting principles.
New York, New York
February 17, 2006
|

I M P O R TA N T TA X I N F O R M AT I O N ( U n a u d i t e d )
In accordance with federal tax law, the fund hereby designates 2.34% of the ordinary dividends paid during the fiscal year ended December 31, 2005 as qualifying for the corporate dividends received deduction. For the fiscal year ended December 31, 2005, certain dividends paid by the fund may be subject to a maximum tax rate of 15%, as provided for by the Jobs and Growth Tax Relief Reconciliation Act of 2003. Of the distributions paid during the fiscal year, $879,135 represents the maximum amount that may be considered qualified dividend income. Shareholders will receive notification in January 2006 of the percentage applicable to the preparation of their 2005 income tax returns. Also the fund designates 94.79% of ordinary income dividends paid during the fiscal year ended December 31, 2005 as qualifying “interest related dividends”.
B O A R D M E M B E R S I N F O R M AT I O N ( U n a u d i t e d )
| Joseph S. DiMartino (62) |
| Chairman of the Board (1999) |
| Principal Occupation During Past 5 Years: |
| • Corporate Director and Trustee |
| Other Board Memberships and Affiliations: |
| • The Muscular Dystrophy Association, Director |
| • Levcor International, Inc., an apparel fabric processor, Director |
| • Century Business Services, Inc., a provider of outsourcing functions for small and medium size |
| companies, Director |
| • The Newark Group, a provider of a national market of paper recovery facilities, paperboard |
| mills and paperboard converting plants, Director |
| • Sunair Services Corporation, engages in the design, manufacture and sale of high frequency |
| systems for long-range voice and data communications, as well as providing certain outdoor- |
| related services to homes and businesses, Director |
| No. of Portfolios for which Board Member Serves: 193 |
| ——————— |
| James Fitzgibbons (71) |
| Board Member (1994) |
| Principal Occupation During Past 5 Years: |
| • Chairman of the Board, Davidson Cotton Company (1998-2002) |
| Other Board Memberships and Affiliations: |
| • Bill Barrett Company, an oil and gas exploration company, Director |
| No. of Portfolios for which Board Member Serves: 23 |
| ——————— |
| J. Tomlinson Fort (77) |
| Board Member (1987) |
| Principal Occupation During Past 5 Years: |
| • Retired; Of Counsel, Reed Smith LLP (1998-2004) |
| Other Board Memberships and Affiliations: |
| • Allegheny College, Emeritus Trustee |
| • Pittsburgh Ballet Theatre,Trustee |
| • American College of Trial Lawyers, Fellow |
| No. of Portfolios for which Board Member Serves: 23 |
| ——————— |
| Kenneth A. Himmel (59) |
| Board Member (1994) |
| Principal Occupation During Past 5 Years: |
| • President and CEO, Related Urban Development, a real estate development company |
| (1996-present) |
| • President and CEO, Himmel & Company, a real estate development company (1980-present) |
| • CEO, American Food Management, a restaurant company (1983-present) |
| No. of Portfolios for which Board Member Serves: 23 |
| 48 |
| Stephen J. Lockwood (58) |
| Board Member (1994) |
| Principal Occupation During Past 5 Years: |
| • Chairman of the Board, Stephen J. Lockwood and Company LLC, an investment company |
| (2000-present) |
| • Chairman of the Board and CEO, LDG Reinsurance Corporation (1977-2000) |
| Other Board Memberships and Affiliations: |
| • BDML Holdings, an insurance company, Chairman of the Board |
| • Affiliated Managers Group, an investment management company, Director |
| No. of Portfolios for which Board Member Serves: 23 |
| ——————— |
| Roslyn Watson (56) |
| Board Member (1994) |
| Principal Occupation During Past 5 Years: |
| • Principal,Watson Ventures, Inc., a real estate investment company (1993-present) |
| Other Board Memberships and Affiliations: |
| • American Express Centurion Bank, Director |
| • The Hyams Foundation Inc., a Massachusetts Charitable Foundation,Trustee |
| • National Osteoporosis Foundation,Trustee |
| No. of Portfolios for which Board Member Serves: 23 |
| ——————— |
| Benaree Pratt Wiley (59) |
| Board Member (1998) |
| Principal Occupation During Past 5 Years: |
| • President and CEO,The Partnership, an organization dedicated to increasing the representa- |
| tion of African Americans in positions of leadership, influence and decision-making in Boston, |
| MA (1991-present) |
| Other Board Memberships and Affiliations: |
| • Boston College, Associate Trustee |
| • The Greater Boston Chamber of Commerce, Director |
| • Mass. Development, Director |
| • Commonwealth Institute, Director |
| • Efficacy Institute, Director |
| • PepsiCo African-American, Advisory Board |
| • The Boston Foundation, Director |
| • Harvard Business School Alumni Board, Director |
| No. of Portfolios for which Board Member Serves: 23 |
| ——————— |
| Once elected all Board Members serve for an indefinite term.The address of the Board Members and Officers is in c/o |
| The Dreyfus Corporation, 200 Park Avenue, New York, New York 10166. Additional information about the Board |
| Members is available in the fund’s Statement of Additional Information which can be obtained from Dreyfus free of |
| charge by calling this toll free number: 1-800-554-4611. |
| Francis P. Brennan, Emeritus Board Member |
| T h e F u n d 49 |
O F F I C E R S O F T H E F U N D ( U n a u d i t e d )
| STEPHEN E. CANTER, President since |
| March 2000. |
Chairman of the Board, Chief Executive Officer and Chief Operating Officer of the Manager, and an officer of 90 investment companies (comprised of 184 portfolios) managed by the Manager. Mr. Canter also is a Board member and, where applicable, an Executive Committee Member of the other investment management subsidiaries of Mellon Financial Corporation, each of which is an affiliate of the Manager. He is 60 years old and has been an employee of the Manager since May 1995.
| STEPHEN R. BYERS, Executive Vice |
| President since November 2002. |
Chief Investment Officer,Vice Chairman and a director of the Manager, and an officer of 90 investment companies (comprised of 184 portfolios) managed by the Manager. Mr. Byers also is an officer, director or an Executive Committee Member of certain other investment management subsidiaries of Mellon Financial Corporation, each of which is an affiliate of the Manager. He is 52 years old and has been an employee of the Manager since January 2000.
| MARK N. JACOBS, Vice President since |
| March 2000. |
Executive Vice President, Secretary and General Counsel of the Manager, and an officer of 91 investment companies (comprised of 200 portfolios) managed by the Manager. He is 59 years old and has been an employee of the Manager since June 1977.
| MICHAEL A. ROSENBERG, Vice President |
| and Secretary since August 2005. |
Associate General Counsel of the Manager, and an officer of 91 investment companies (comprised of 200 portfolios) managed by the Manager. He is 45 years old and has been an employee of the Manager since October 1991.
| JAMES BITETTO, Vice President and |
| Assistant Secretary since August 2005. |
Assistant General Counsel and Assistant Secretary of the Manager, and an officer of 91 investment companies (comprised of 200 portfolios) managed by the Manager. He is 39 years old and has been an employee of the Manager since December 1996.
| JONI LACKS CHARATAN, Vice President |
| and Assistant Secretary since |
| August 2005. |
Associate General Counsel of the Manager, and an officer of 91 investment companies (comprised of 200 portfolios) managed by the Manager. She is 50 years old and has been an employee of the Manager since October 1988.
| JOSEPH M. CHIOFFI, Vice President and |
| Assistant Secretary since August 2005. |
Assistant General Counsel of the Manager, and an officer of 91 investment companies (comprised of 200 portfolios) managed by the Manager. He is 44 years old and has been an employee of the Manager since June 2000.
| JANETTE E. FARRAGHER, Vice President |
| and Assistant Secretary since |
| August 2005. |
Associate General Counsel of the Manager, and an officer of 91 investment companies (comprised of 200 portfolios) managed by the Manager. She is 43 years old and has been an employee of the Manager since February 1984.
| JOHN B. HAMMALIAN, Vice President and |
| Assistant Secretary since August 2005. |
Associate General Counsel of the Manager, and an officer of 91 investment companies (comprised of 200 portfolios) managed by the Manager. He is 42 years old and has been an employee of the Manager since February 1991
| ROBERT R. MULLERY, Vice President and |
| Assistant Secretary since August 2005. |
Associate General Counsel of the Manager, and an officer of 91 investment companies (comprised of 200 portfolios) managed by the Manager. He is 53 years old and has been an employee of the Manager since May 1986.
| JEFF PRUSNOFSKY, Vice President and |
| Assistant Secretary since August 2005. |
Associate General Counsel of the Manager, and an officer of 91 investment companies (comprised of 200 portfolios) managed by the Manager. He is 40 years old and has been an employee of the Manager since October 1990.
| JAMES WINDELS, Treasurer since |
| November 2001. |
Director – Mutual Fund Accounting of the Manager, and an officer of 91 investment companies (comprised of 200 portfolios) managed by the Manager. He is 47 years old and has been an employee of the Manager since April 1985.
| ERIK D. NAVILOFF, Assistant Treasurer |
| since December 2002. |
Senior Accounting Manager – Taxable Fixed Income Funds of the Manager, and an officer of 91 investment companies (comprised of 200 portfolios) managed by the Manager. He is 37 years old and has been an employee of the Manager since November 1992.
| ROBERT ROBOL, Assistant Treasurer |
| since August 2005. |
Senior Accounting Manager – Money Market and Municipal Bond Funds of the Manager, and an officer of 91 investment companies (comprised of 200 portfolios) managed by the Manager. He is 41 years old and has been an employee of the Manager since October 1988.
| ROBERT SVAGNA, Assistant Treasurer |
| since December 2002. |
Senior Accounting Manager – Equity Funds of the Manager, and an officer of 91 investment companies (comprised of 200 portfolios) managed by the Manager. He is 38 years old and has been an employee of the Manager since November 1990.
| GAVIN C. REILLY, Assistant Treasurer |
| since December 2005. |
Tax Manager of the Investment Accounting and Support Department of the Manager, and an officer of 91 investment companies (comprised of 200 portfolios) managed by the Manager. He is 37 years old and has been an employee of the Manager since April 1991.
| JOSEPH W. CONNOLLY, Chief Compliance |
| Officer since October 2004. |
Chief Compliance Officer of the Manager and The Dreyfus Family of Funds (91 investment companies, comprised of 200 portfolios). From November 2001 through March 2004, Mr. Connolly was first Vice-President, Mutual Fund Servicing for Mellon Global Securities Services. In that capacity, Mr. Connolly was responsible for managing Mellon’s Custody, Fund Accounting and Fund Administration services to third-party mutual fund clients. He is 48 years old and has served in various capacities with the Manager since 1980, including manager of the firm’s Fund Accounting Department from 1997 through October 2001.
| WILLIAM GERMENIS, Anti-Money |
| Laundering Compliance Officer since |
| July 2002. |
Vice President and Anti-Money Laundering Compliance Officer of the Distributor, and the Anti-Money Laundering Compliance Officer of 87 investment companies (comprised of 196 portfolios) managed by the Manager. He is 35 years old and has been an employee of the Distributor since October 1998.
N O T E S
| Dreyfus Premier |
| Limited Term |
| High Yield Fund |
| 200 Park Avenue |
| New York, NY 10166 |
| |
| Manager |
| The Dreyfus Corporation |
| 200 Park Avenue |
| New York, NY 10166 |
| |
| Custodian |
| Mellon Bank, N.A. |
| One Mellon Bank Center |
| Pittsburgh, PA 15258 |
| Transfer Agent & |
| Dividend Disbursing Agent |
| Dreyfus Transfer, Inc. |
| 200 Park Avenue |
| New York, NY 10166 |
| |
| Distributor |
| Dreyfus Service Corporation |
| 200 Park Avenue |
| New York, NY 10166 |
Telephone Call your financial representative or 1-800-554-4611
| Mail | | The Dreyfus Premier Family of Funds |
| | | 144 Glenn Curtiss Boulevard, Uniondale, NY 11556-0144 |
The fund files its complete schedule of portfolio holdings with the Securities and Exchange Commission (“SEC”) for the first and third quarters of each fiscal year on Form N-Q. The fund’s Forms N-Q are available on the SEC’s website at http://www.sec.gov and may be reviewed and copied at the SEC’s Public Reference Room in Washington, DC. Information on the operation of the Public Reference Room may be obtained by calling 1-800-SEC-0330.
A description of the policies and procedures that the fund uses to determine how to vote proxies relating to portfolio securities, and information regarding how the fund voted these proxies for the 12-month period ended June 30, 2005, is available at http://www.dreyfus.com and on the SEC’s website at http://www.sec.gov. The description of the policies and procedures is also available without charge, upon request, by calling 1-800-645-6561.
| © 2006 Dreyfus Service Corporation |

Save time. Save paper. View your next shareholder report online as soon as it’s available. Log into www.dreyfus.com and sign up for Dreyfus eCommunications. It’s simple and only takes a few minutes.
The views expressed in this report reflect those of the portfolio manager only through the end of the period covered and do not necessarily represent the views of Dreyfus or any other person in the Dreyfus organization. Any such views are subject to change at any time based upon market or other conditions and Dreyfus disclaims any responsibility to update such views.These views may not be relied on as investment advice and, because investment decisions for a Dreyfus fund are based on numerous factors, may not be relied on as an indication of trading intent on behalf of any Dreyfus fund.
Not FDIC-Insured • Not Bank-Guaranteed • May Lose Value
| Contents |
| |
| | | THE FUND |
| |
|
| 2 | | Letter from the Chairman |
| 3 | | Discussion of Fund Performance |
| 6 | | Fund Performance |
| 8 | | Understanding Your Fund’s Expenses |
| 8 | | Comparing Your Fund’s Expenses |
| With Those of Other Funds |
| 9 | | Statement of Investments |
| 26 | | Statement of Financial Futures |
| 26 | | Statement of Options Written |
| 27 | | Statement of Assets and Liabilities |
| 28 | | Statement of Operations |
| 29 | | Statement of Changes in Net Assets |
| 31 | | Financial Highlights |
| 35 | | Notes to Financial Statements |
| 50 | | Report of Independent Registered |
| | | Public Accounting Firm |
| 51 | | Important Tax Information |
| 52 | | Board Members Information |
| 54 | | Officers of the Fund |
| FOR MORE INFORMATION |
|
| | | Back Cover |
| Dreyfus Premier |
| Managed Income Fund |

LETTER FROM THE CHAIRMAN
We are pleased to present this annual report for Dreyfus Premier Managed Income Fund, covering the 12-month period from January 1, 2005, through December 31, 2005. Inside, you’ll find valuable information about how the fund was managed during the reporting period, including a discussion with Kent Wosepka, portfolio manager and head of the investment committee that manages the fund and comprises the Standish Fixed Income Team of Standish Mellon Asset Management, LLC, an affiliate of Dreyfus.
Most sectors of the taxable fixed-income marketplace shrugged off bad news and responded to more positive factors in 2005. Although short-term interest rates rose by 200 basis points due to eight consecutive increases by the Federal Reserve Board during the year, the yield of the 10-year U.S. Treasury security ended the year only 17 basis points higher than where it began. Analysts generally attribute the bond market’s resilience to low inflation and robust investor demand, especially from overseas investors.
We expect the U.S. economy to continue its moderate expansion in 2006, while inflation should stay low and investor demand for income-producing securities should remain high. Risks in the new year include uncertainty regarding Fed policy under a new chairman and the possibility of continued turmoil in the automotive sector, including some of the corporate bond market’s largest issuers.
As always, we encourage you to speak with your financial consultant about how these and other market forces may affect your investments. Thank you for your continued confidence and support.

DISCUSSION OF FUND PERFORMANCE
Kent Wosepka, Portfolio Manager
|
How did Dreyfus Premier Managed Income Fund perform relative to its benchmark?
For the 12-month period ended December 31, 2005, Dreyfus Premier Managed Income Fund produced total returns of 2.50% for Class A shares, 1.84% for Class B shares, 1.83% for Class C shares and 2.76% for Class R shares.1 In comparison, the fund’s benchmark, the Lehman Brothers U.S. Aggregate Index (the “Index”), produced a total return of 2.43% for the same period.2
Although low inflation and robust investor demand generally supported bond prices during 2005, rising short-term interest rates limited their returns.The fund generally produced results that were in line with its benchmark, due in part to positive performance from corporate bonds, foreign securities and Treasury Inflation Protected Securities (“TIPS”).
What is the fund’s investment approach?
The fund seeks high current income consistent with what is believed to be prudent risk of capital.The fund invests at least 65% of its total assets in various types of U.S. government and corporate debt obligations rated investment grade (or their unrated equivalent as determined by Dreyfus).The fund also normally invests at least 65% of its total assets in debt obligations having effective maturities of 10 years or less.We do not attempt to match the sector percentages of any index, nor do we attempt to predict the direction of interest rates by substantially altering the fund’s sensitivity to changes in rates. Instead, the heart of our investment process is selecting individual securities that possess a combination of superior fundamentals and attractive relative valuations.
What other factors affected the fund’s performance?
In its ongoing effort to forestall potential inflationary pressures, the Federal Reserve Board (the “Fed”) raised the overnight federal funds
The Fund 3
DISCUSSION OF FUND PERFORMANCE (continued)
|
rate eight consecutive times during the reporting period, driving it from 2.25% to 4.25% .Longer-term bond prices held up surprisingly well,with investors expressing confidence in the Fed’s inflation-fighting ability. In addition, prices of U.S. government securities were supported by robust demand from overseas investors, including central banks in Asia.
Although the fund benefited from this trend for much of the year by adopting a “barbell” strategy that focused on securities at both ends of the fund’s maturity range, an emphasis on shorter-term maturities in January 2005 held back its relative performance. Later in the reporting period, we gradually moved away from this barbell strategy, limiting the fund’s participation when yield differences continued to narrow.
The fund enjoyed relatively robust results from bonds from non-U.S. issuers, especially the emerging markets of Argentina, Brazil and Russia. These nations benefited from greater fiscal and political stability as well as rising demand for the commodities, such as crude oil, they produce. The fund also received good results from German bonds, where interest rates have remained low in a sluggish economy, helping to support bond prices.
U.S. corporate bonds experienced heightened volatility compared to other market sectors, with improving business conditions for many issuers offset by turmoil in the automotive sector. Most significantly, General Motors and Ford Motor Company reported disappointing financial results in the spring, prompting the major bond rating agencies to downgrade their debt to the high-yield category. Nonetheless, the fund’s performance benefited from its corporate bond holdings, largely due to the success of our security selection strategy. The fund held relatively few automotive bonds when the automakers’ financial problems became known, and we subsequently established positions in shorter-maturity securities from General Motors’ more financially sound financing subsidiaries, enabling the fund to participate in the sector’s rebound during the summer.
Finally, the fund received strong contributions from TIPS, which benefited from increases in the Consumer Price Index stemming from higher energy prices. In addition, our holdings of municipal bonds backed by the states’ settlements with U.S. tobacco companies also performed well, which at times offered higher yields than comparable taxable bonds during the year. On the other hand, the fund’s underweighted position in mortgage-backed securities prevented it from participating fully in the sector’s relatively attractive returns.
What is the fund’s current strategy?
As of year-end, most of the higher-yielding bond market sectors appeared richly valued to us, suggesting that risks currently outweigh potential rewards in these areas. Accordingly, we have adopted a more conservative investment posture, reducing the fund’s exposure to lower-rated, longer-term corporate bonds, focusing instead on shorter-term securities that we believe are likely to receive credit-rating upgrades.We also have attempted to add value through positions in commercial mortgage-backed securities and asset-backed securities, which we currently regard as more attractive than U.S. Treasuries. In our view, these are prudent strategies as the economy moves to the next phase of the cycle.
| 1 | | Total return includes reinvestment of dividends and any capital gains paid, and does not take into |
| | | consideration the maximum initial sales charge in the case of Class A shares, or the applicable |
| | | contingent deferred sales charges imposed on redemptions in the case of Class B and Class C |
| | | shares. Had these charges been reflected, returns would have been lower. Past performance is no |
| | | guarantee of future results. Share price, yield and investment return fluctuate such that upon |
| | | redemption, fund shares may be worth more or less than their original cost. |
| 2 | | SOURCE: LIPPER INC. — Reflects reinvestment of dividends and, where applicable, capital |
| | | gain distributions.The Lehman Brothers U.S. Aggregate Index is a widely accepted, unmanaged |
| | | total return index of corporate, U.S. government and U.S. government agency debt instruments, |
| | | mortgage-backed securities and asset-backed securities with an average maturity of 1-10 years. |
The Fund 5

| † Source: Lipper Inc. |
| Past performance is not predictive of future performance. |
| The above graph compares a $10,000 investment made in Class A, Class B, Class C and Class R shares of Dreyfus |
| Premier Managed Income Fund on 12/31/95 to a $10,000 investment made in the Lehman Brothers U.S. Aggregate |
| Index (the “Index”) on that date. All dividends and capital gain distributions are reinvested. |
| The fund’s performance shown in the line graph takes into account the maximum initial sales charge on Class A shares |
| and all other applicable fees and expenses on all classes.The Index is a widely accepted, unmanaged index of corporate, |
| U.S. government and U.S. government agency debt instruments, mortgage-backed securities, and asset-backed securities. |
| The Index does not take into account charges, fees and other expenses. Further information relating to fund performance, |
| including expense reimbursements, if applicable, is contained in the Financial Highlights section of the prospectus and |
| elsewhere in this report. |
| Average Annual Total Returns as of 12/31/05 | | | | |
| | | 1 Year | | 5 Years | | 10 Years |
| |
| |
| |
|
| Class A shares | | | | | | |
| with maximum sales charge (4.5%) | | (2.15)% | | 4.46% | | 4.77% |
| without sales charge | | 2.50% | | 5.41% | | 5.25% |
| Class B shares | | | | | | |
| with applicable redemption charge † | | (2.07)% | | 4.29% | | 4.77% |
| without redemption | | 1.84% | | 4.63% | | 4.77% |
| Class C shares | | | | | | |
| with applicable redemption charge †† | | 0.86% | | 4.63% | | 4.46% |
| without redemption | | 1.83% | | 4.63% | | 4.46% |
| Class R shares | | 2.76% | | 5.66% | | 5.50% |
| Past performance is not predictive of future performance.The fund’s performance shown in the graph and table does not |
| reflect the deduction of taxes that a shareholder would pay on fund distributions or the redemption of fund shares. |
| Performance for Class B shares assumes the conversion of Class B shares to Class A shares at the end of the sixth year |
| following the date of purchase. |
| † | | The maximum contingent deferred sales charge for Class B shares is 4%. After six years Class B shares convert to |
| | | Class A shares. |
| †† | | The maximum contingent deferred sales charge for Class C shares is 1% for shares redeemed within one year of the |
| | | date of purchase. |
The Fund 7
U N D E R S TA N D I N G YO U R F U N D ’ S E X P E N S E S ( U n a u d i t e d )
As a mutual fund investor, you pay ongoing expenses, such as management fees and other expenses. Using the information below, you can estimate how these expenses affect your investment and compare them with the expenses of other funds.You also may pay one-time transaction expenses, including sales charges (loads) and redemption fees, which are not shown in this section and would have resulted in higher total expenses. For more information, see your fund’s prospectus or talk to your financial adviser.
Review your fund’s expenses
The table below shows the expenses you would have paid on a $1,000 investment in Dreyfus Premier Managed Income Fund from July 1, 2005 to December 31, 2005. It also shows how much a $1,000 investment would be worth at the close of the period, assuming actual returns and expenses.
| Expenses and Value of a $1,000 Investment | | | | | | |
| assuming actual returns for the six months ended December 31, 2005 | | | | |
| | | Class A | | Class B | | Class C | | Class R |
| |
| |
| |
| |
|
| Expenses paid per $1,000 † | | $ 4.80 | | $ 8.57 | | $ 8.57 | | $ 3.54 |
| Ending value (after expenses) | | $1,002.90 | | $999.20 | | $999.20 | | $1,004.20 |
COMPARING YOUR FUND’S EXPENSES WITH THOSE OF OTHER FUNDS (Unaudited)
Using the SEC’s method to compare expenses
The Securities and Exchange Commission (SEC) has established guidelines to help investors assess fund expenses. Per these guidelines, the table below shows your fund’s expenses based on a $1,000 investment, assuming a hypothetical 5% annualized return. You can use this information to compare the ongoing expenses (but not transaction expenses or total cost) of investing in the fund with those of other funds.All mutual fund shareholder reports will provide this information to help you make this comparison. Please note that you cannot use this information to estimate your actual ending account balance and expenses paid during the period.
Expenses and Value of a $1,000 Investment assuming a hypothetical 5% annualized return for the six months ended December 31, 2005
| | | Class A | | Class B | | Class C | | Class R |
| |
| |
| |
| |
|
| Expenses paid per $1,000 † | | $ 4.84 | | $ 8.64 | | $ 8.64 | | $ 3.57 |
| Ending value (after expenses) | | $1,020.42 | | $1,016.64 | | $1,016.64 | | $1,021.68 |
| † Expenses are equal to the fund’s annualized expense ratio of .95% for Class A, 1.70% for Class B, 1.70% for |
| Class C and .70% for Class R; multiplied by the average account value over the period, multiplied by 184/365 (to |
| reflect the one-half year period). |
STATEMENT OF INVESTMENTS
December 31, 2005
|
| | | | | Principal | | | | |
| Bonds and Notes—110.3% | | | | Amount a | | Value ($) |
| |
| |
| |
|
| Advertising—.1% | | | | | | | | |
| Lamar Media, | | | | | | | | |
| Notes, 7.25%, 2013 | | | | 30,000 | | | | 31,275 |
| Aerospace & Defense—.1% | | | | | | | | |
| L-3 Communications, | | | | | | | | |
| Conv. Bonds, 3%, 2035 | | | | 45,000 | | b | | 44,719 |
| Agriculture—1.0% | | | | | | | | |
| Altria, | | | | | | | | |
| Notes, 7%, 2013 | | | | 125,000 | | | | 136,988 |
| Philip Morris Capital, | | | | | | | | |
| Notes, 4%, 2006 | | CHF | | 460,000 | | | | 353,117 |
| | | | | | | | | 490,105 |
| Asset-Backed Ctfs./Automobile Receivables—1.9% | | | | | | |
| BMW Vehicle Owner Trust, | | | | | | | | |
| Ser. 2004-A, Cl. A4, 3.32%, 2009 | | | | 145,000 | | | | 142,120 |
| Ford Credit Auto Owner Trust: | | | | | | | | |
| Ser. 2004-A, Cl. C, 4.19%, 2009 | | | | 50,000 | | | | 49,305 |
| Ser. 2005-B, Cl. B, 4.64%, 2010 | | | | 125,000 | | | | 123,812 |
| Hyundai Auto Receivables Trust, | | | | | | | | |
| Ser. 2004-A, Cl. C, 3.36%, 2011 | | | | 70,000 | | | | 68,685 |
| MMCA Automobile Trust, | | | | | | | | |
| Ser. 2002-1, Cl. B, 5.37%, 2010 | | | | 106,605 | | | | 106,388 |
| WFS Financial Owner Trust: | | | | | | | | |
| Ser. 2004-3, Cl. B, 3.51%, 2012 | | | | 141,270 | | | | 138,392 |
| Ser. 2004-4, Cl. B, 3.13%, 2012 | | | | 151,112 | | | | 148,121 |
| Ser. 2005-2, Cl. B, 4.57%, 2012 | | | | 170,000 | | | | 168,756 |
| Whole Auto Loan Trust, | | | | | | | | |
| Ser. 2004-1, Cl. D, 5.6%, 2011 | | | | 34,253 | | b | | 34,171 |
| | | | | | | | | 979,750 |
| Asset-Backed Ctfs./Credit Cards—.4% | | | | | | | | |
| Capital One Multi-Asset Execution Trust, | | | | | | | | |
| Ser. 2004-C1, Cl. C1, 3.4%, 2009 | | | | 230,000 | | | | 226,349 |
| Asset-Backed Ctfs./Home Equity Loans—2.8% | | | | | | |
| Ameriquest Mortgage Securities, | | | | | | | | |
| Ser. 2003-8, Cl. AF3, 4.37%, 2033 | | | | 117,924 | | | | 117,585 |
| Citigroup Mortgage Loan Trust, | | | | | | | | |
| Ser. 2005-HE1, Cl. A3A, 4.47%, 2035 | | | | 92,257 | | c | | 92,270 |
The Fund 9
STATEMENT OF INVESTMENTS (continued)
|
| | | Principal | | | | |
| Bonds and Notes (continued) | | Amount a | | Value ($) |
| |
| |
|
| Asset-Backed Ctfs./Home Equity Loans (continued) | | | | |
| Fremont Home Loan Trust, | | | | | | |
| Ser. 2005-1, Cl. 2A1, 4.48%, 2035 | | 45,797 | | c | | 45,839 |
| Home Equity Asset Trust: | | | | | | |
| Ser. 2005-8, Cl. M4, 4.96%, 2036 | | 125,000 | | c | | 124,704 |
| Ser. 2005-8, Cl. M5, 4.99%, 2036 | | 165,000 | | c | | 164,433 |
| Morgan Stanley ABS Capital I, | | | | | | |
| Ser. 2005-WMC3, Cl. A2A, 4.47%, 2035 | | 74,485 | | c | | 74,515 |
| Option One Mortgage Loan Trust, | | | | | | |
| Ser. 2005-4, Cl. M1, 4.82%, 2035 | | 255,000 | | c | | 255,266 |
| Residential Asset Securities: | | | | | | |
| Ser. 2001-KS3, Cl. MII1, 4.93%, 2031 | | 114,167 | | c | | 114,296 |
| Ser. 2004-KS10, Cl. AI1, 4.55%, 2013 | | 48,821 | | c | | 48,857 |
| Ser. 2005-EMX1, Cl. AI1, 4.48%, 2035 | | 72,630 | | c | | 72,689 |
| Ser. 2005-EMX3, Cl. M1, 4.81%, 2035 | | 145,000 | | c | | 145,149 |
| Ser. 2005-EMX3, Cl. M2, 4.83%, 2035 | | 160,000 | | c | | 160,098 |
| | | | | | | 1,415,701 |
| Asset-Backed Ctfs./Manufactured Housing—.8% | | | | |
| Green Tree Financial, | | | | | | |
| Ser. 1994-7, Cl. M1, 9.25%, 2020 | | 101,201 | | | | 106,374 |
| Origen Manufactured Housing: | | | | | | |
| Ser. 2004-B, Cl. A1, 2.87%, 2013 | | 29,878 | | | | 29,635 |
| Ser. 2004-B, Cl. A2, 3.79%, 2017 | | 65,000 | | | | 63,485 |
| Ser. 2005-B, Cl. A2, 5.247%, 2018 | | 115,000 | | | | 115,241 |
| Vanderbilt Mortgage Finance, | | | | | | |
| Ser. 1999-A, Cl. 1A6, 6.75%, 2029 | | 80,000 | | | | 83,273 |
| | | | | | | 398,008 |
| Asset-Backed Ctfs./Other—3.4% | | | | | | |
| Asset-Backed Funding Certificates, | | | | | | |
| Ser. 2005-WMC1, Cl. M2, 4.83%, 2035 | | 255,000 | | c | | 254,257 |
| Credit-Based Asset Servicing and Securitization: | | | | |
| Ser. 2005-CB4, Cl. AV1, 4.48%, 2035 | | 78,294 | | c | | 78,342 |
| Ser. 2005-CB8, Cl. AF5, 5.653%, 2035 | | 235,000 | | | | 236,579 |
| First Franklin Mortgage Loan Asset-Backed Certificates, | | | | |
| Ser. 2005-FFH3, Cl. 2A1, 4.51%, 2035 | | 201,724 | | c | | 201,874 |
| Merrill Lynch Mortgage Investors: | | | | | | |
| Ser. 2005-WMC1, Cl. A2A, 4.48%, 2035 | | 41,939 | | c | | 41,972 |
| Ser. 2005-WMC2, Cl. A2A, 4.47%, 2036 | | 45,051 | | c | | 45,056 |
| Morgan Stanley ABS Capital I, | | | | | | |
| Ser. 2005-WMC6, Cl. A2A, 4.49%, 2035 | | 184,018 | | c | | 184,149 |
| Park Place Securities, | | | | | | |
| Ser. 2005-WHQ2, Cl. A2A, 4.48%, 2035 | | 117,765 | | c | | 117,857 |
| |
| 10 | | | | | | |
| | | Principal | | | | |
| Bonds and Notes (continued) | | Amount a | | Value ($) |
| |
| |
|
| Asset-Backed Ctfs./Other (continued) | | | | | | |
| Popular ABS Mortgage Pass-Through Trust, | | | | | | |
| Ser. 2005-6, Cl. M1, 5.91%, 2036 | | 145,000 | | | | 145,000 |
| Residential Asset Mortgage Products: | | | | | | |
| Ser. 2004-RS12, Cl. AI6, 4.547%, 2034 | | 145,000 | | | | 139,988 |
| Ser. 2005-RS2, Cl. AII1, 4.49%, 2035 | | 96,835 | | c | | 96,930 |
| Ser. 2005-RS2, Cl. M2, 4.86%, 2035 | | 140,000 | | c | | 141,302 |
| Ser. 2005-RS2, Cl. M3, 4.93%, 2035 | | 45,000 | | c | | 45,331 |
| | | | | | | 1,728,637 |
| Automotive—.7% | | | | | | |
| DaimlerChrysler: | | | | | | |
| Notes, 4.875%, 2010 | | 65,000 | | | | 63,528 |
| Notes, Ser. E, 4.78%, 2008 | | 250,000 | | c | | 250,336 |
| General Motors, | | | | | | |
| Discount Debs., 0/7.75%, 2036 | | 180,000 | | d | | 41,400 |
| | | | | | | 355,264 |
| Banking—4.6% | | | | | | |
| Chevy Chase Bank, | | | | | | |
| Sub. Notes, 6.875%, 2013 | | 145,000 | | | | 150,075 |
| Chuo Mitsui Trust & Banking, | | | | | | |
| Sub. Notes, 5.506%, 2049 | | 200,000 | | b,c | | 194,149 |
| City National, | | | | | | |
| Sr. Notes, 5.125%, 2013 | | 75,000 | | | | 74,671 |
| Colonial Bank, | | | | | | |
| Sub. Notes, 6.375%, 2015 | | 250,000 | | | | 257,536 |
| Industrial Bank of Korea, | | | | | | |
| Sub. Notes, 4%, 2014 | | 75,000 | | b,c | | 71,961 |
| National Westminster Bank, | | | | | | |
| Sub. Notes, 7.375%, 2009 | | 320,000 | | | | 347,692 |
| Popular, | | | | | | |
| Notes, Ser. F, 4.83%, 2007 | | 125,000 | | c | | 125,027 |
| Sovereign Bancorp, | | | | | | |
| Sr. Notes, 4.69%, 2009 | | 170,000 | | b,c | | 170,174 |
| Sumitomo Mitsui Banking, | | | | | | |
| Notes, 5.625%, 2049 | | 140,000 | | b,c | | 139,735 |
| Wells Fargo Capital, | | | | | | |
| Capital Securities, Cl. B, 7.95%, 2026 | | 300,000 | | b | | 317,988 |
| Zions Bancorp: | | | | | | |
| Sr. Notes, 2.7%, 2006 | | 255,000 | | | | 253,359 |
| Sub. Notes, 6%, 2015 | | 240,000 | | | | 251,270 |
| | | | | | | 2,353,637 |
The Fund 11
STATEMENT OF INVESTMENTS (continued)
|
| | | Principal | | | | |
| Bonds and Notes (continued) | | Amount a | | Value ($) |
| |
| |
|
| Chemicals—1.4% | | | | | | |
| ICI Wilmington: | | | | | | |
| Notes, 4.375%, 2008 | | 30,000 | | | | 29,253 |
| Notes, 5.625%, 2013 | | 115,000 | | | | 114,648 |
| International Flavors & Fragrances, | | | | | | |
| Notes, 6.45%, 2006 | | 240,000 | | | | 241,168 |
| Lubrizol, | | | | | | |
| Sr. Debs., 6.5%, 2034 | | 70,000 | | | | 73,325 |
| RPM International: | | | | | | |
| Bonds, 6.25%, 2013 | | 145,000 | | | | 146,403 |
| Sr. Notes, 4.45%, 2009 | | 125,000 | | | | 119,962 |
| | | | | | | 724,759 |
| Commercial Mortgage Pass-Through Ctfs.—4.4% | | | | |
| Bayview Commercial Asset Trust: | | | | | | |
| Ser. 2005-3A, Cl. A2, 4.78%, 2035 | | 187,939 | | b,c | | 187,939 |
| Ser. 2005-3A, Cl. B1, 5.48%, 2035 | | 98,915 | | b,c | | 98,915 |
| Ser. 2005-3A, Cl. B3, 7.38%, 2035 | | 98,915 | | b,c | | 98,915 |
| Ser. 2005-4A, Cl. M5, 5.02%, 2036 | | 100,000 | | b,c | | 100,000 |
| Bear Stearns Commercial Mortgage Securities: | | | | |
| Ser. 2003-T12, Cl. A3, 4.24%, 2039 | | 295,000 | | | | 284,735 |
| Ser. 2004-PWR5, Cl. A3, 4.565%, 2042 | | 120,000 | | | | 117,051 |
| Ser. 2005-T18, Cl. A2, 4.556%, 2042 | | 125,000 | | | | 122,833 |
| CS First Boston Mortgage Securities, | | | | | | |
| Ser. 2001-CF2, Cl. A4, 6.505%, 2034 | | 135,000 | | | | 142,923 |
| Calwest Industrial Trust, | | | | | | |
| Ser. 2002-CALW, Cl. A, 6.127%, 2017 | | 130,000 | | b | | 136,903 |
| Chase Commercial Mortgage Securities, | | | | | | |
| Ser. 1997-2, Cl. C, 6.6%, 2029 | | 40,000 | | | | 41,083 |
| Crown Castle Towers, | | | | | | |
| Ser. 2005-1A, Cl. D, 5.612%, 2035 | | 115,000 | | b | | 112,082 |
| DLJ Commercial Mortgage, | | | | | | |
| Ser. 1998-CF2, Cl. A1B, 6.24%, 2031 | | 120,000 | | | | 123,754 |
| J.P. Morgan Commercial Mortgage Finance, | | | | | | |
| Ser. 1997-C5, Cl. B, 7.159%, 2029 | | 105,000 | | | | 108,113 |
| Mach One Trust, | | | | | | |
| Ser. 2004-1A, Cl. A1, 3.89%, 2040 | | 121,986 | | b | | 119,189 |
| Morgan Stanley Capital I: | | | | | | |
| Ser. 1999-CAM1, Cl. A4, 7.02%, 2032 | | 70,000 | | | | 73,910 |
| Ser. 1999-RM1, Cl. A2, 6.71%, 2031 | | 177,097 | | | | 183,857 |
| Ser. 2001-PPM, Cl. A3, 6.54%, 2031 | | 188,449 | | | | 194,813 |
| | | | | | | 2,247,015 |
| |
| |
| 12 | | | | | | |
| | | Principal | | |
| Bonds and Notes (continued) | | Amount a | | Value ($) |
| |
| |
|
| Commercial Services—.8% | | | | |
| Aramark Services, | | | | |
| Sr. Notes, 7%, 2007 | | 250,000 | | 255,669 |
| Erac USA Finance, | | | | |
| Notes, 7.95%, 2009 | | 100,000 b | | 109,992 |
| R.R. Donnelley & Sons, | | | | |
| Notes, 5%, 2006 | | 70,000 | | 69,617 |
| | | | | 435,278 |
| Diversified Financial Services—7.7% | | | | |
| Amvescap: | | | | |
| Notes, 5.375%, 2013 | | 135,000 | | 133,235 |
| Notes, 5.375%, 2014 | | 185,000 | | 181,676 |
| Sr. Notes, 5.9%, 2007 | | 225,000 | | 225,828 |
| CIT, | | | | |
| Sr. Notes, 4.49%, 2008 | | 185,000 c | | 185,274 |
| Fondo LatinoAmericano de Reservas, | | | | |
| Notes, 3%, 2006 | | 115,000 b | | 113,814 |
| Ford Motor Credit: | | | | |
| Global Landmark Securities, 6.5%, 2007 | | 274,000 | | 265,152 |
| Sr. Notes, 7.2%, 2007 | | 121,000 | | 115,224 |
| GMAC, | | | | |
| Notes, 5.05%, 2007 | | 265,000 c | | 251,849 |
| Glencore Funding, | | | | |
| Notes, 6%, 2014 | | 305,000 b | | 287,322 |
| HSBC Finance, | | | | |
| Sr. Notes, 4.841%, 2012 | | 280,000 c | | 280,480 |
| ILFC E-Capital Trust I, | | | | |
| Bonds, 5.9%, 2065 | | 200,000 b,c | | 200,999 |
| Jefferies: | | | | |
| Sr. Notes, 7.75%, 2012 | | 55,000 | | 61,235 |
| Sr. Notes, Ser. B, 7.5%, 2007 | | 70,000 | | 72,616 |
| Leucadia National, | | | | |
| Sr. Notes, 7%, 2013 | | 115,000 | | 115,000 |
| MBNA Capital, | | | | |
| Capital Securities, Ser. A, 8.278%, 2026 | | 80,000 | | 85,198 |
| Mizuho JGB Investment, | | | | |
| Non-Cumulative Preferred Securities, | | | | |
| Ser. A, 9.87%, 2049 | | 100,000 b,c | | 110,656 |
| NiSource Capital Markets, | | | | |
| Notes, 7.86%, 2017 | | 75,000 | | 86,366 |
The Fund 13
STATEMENT OF INVESTMENTS (continued)
|
| | | Principal | | | | |
| Bonds and Notes (continued) | | Amount a | | Value ($) |
| |
| |
|
| Diversified Financial Services (continued) | | | | | | |
| Pemex Finance, | | | | | | |
| Bonds, Ser. 1999-2, Cl. A1, 9.69%, 2009 | | 225,000 | | | | 243,390 |
| Residential Capital: | | | | | | |
| Sr. Notes, 5.896%, 2007 | | 195,000 | | c | | 195,565 |
| Sr. Notes, 6.375%, 2010 | | 195,000 | | | | 198,334 |
| SB Treasury, | | | | | | |
| Bonds, Ser. A, 9.4%, 2049 | | 280,000 | | b,c | | 306,806 |
| St. George Funding, | | | | | | |
| Bonds, 8.485%, 2049 | | 225,000 | | b,c | | 245,421 |
| | | | | | | 3,961,440 |
| Electronics—.2% | | | | | | |
| Thomas & Betts, | | | | | | |
| Notes, 6.5%, 2006 | | 110,000 | | | | 110,024 |
| Entertainment/Leisure—.5% | | | | | | |
| Carnival, | | | | | | |
| Notes, 7.3%, 2007 | | 120,000 | | | | 123,603 |
| Mohegan Tribal Gaming Authority: | | | | | | |
| Sr. Notes, 6.125%, 2013 | | 20,000 | | | | 19,750 |
| Sr. Sub. Notes, 7.125%, 2014 | | 60,000 | | | | 61,725 |
| Speedway Motorsports, | | | | | | |
| Sr. Sub. Notes, 6.75%, 2013 | | 70,000 | | | | 71,225 |
| | | | | | | 276,303 |
| Environmental Control—.4% | | | | | | |
| Oakmont Asset Trust, | | | | | | |
| Notes, 4.514%, 2008 | | 105,000 | | b | | 102,793 |
| Waste Management: | | | | | | |
| Sr. Notes, 7%, 2028 | | 75,000 | | | | 84,751 |
| Sr. Notes, 7.375%, 2029 | | 30,000 | | | | 35,165 |
| | | | | | | 222,709 |
| Food & Beverages—1.2% | | | | | | |
| Bavaria, | | | | | | |
| Sr. Notes, 8.875%, 2010 | | 240,000 | | b | | 261,900 |
| H.J. Heinz, | | | | | | |
| Notes, 6.428%, 2008 | | 150,000 | | b,c | | 154,191 |
| Safeway, | | | | | | |
| Sr. Notes, 4.125%, 2008 | | 85,000 | | | | 82,361 |
| Stater Brothers, | | | | | | |
| Sr. Notes, 8.125%, 2012 | | 100,000 | | | | 99,500 |
| | | | | | | 597,952 |
| |
| |
| 14 | | | | | | |
| | | | | Principal | | |
| Bonds and Notes (continued) | | | | Amount a | | Value ($) |
| |
| |
| |
|
| Foreign/Government—3.0% | | | | | | |
| Argentina Bonos, | | | | | | |
| Bonds, 4.01%, 2012 | | | | 485,000 c | | 382,180 |
| Banco Nacional de Desenvolvimento | | | | | | |
| Economico e Social, | | | | | | |
| Notes, 5.73%, 2008 | | | | 250,000 c | | 250,000 |
| Brazilian Government International Bond, | | | | |
| Bonds, 12.5%, 2016 | | BRL | | 665,000 | | 285,817 |
| El Salvador Government International Bond, | | | | |
| Notes, 8.5%, 2011 | | | | 60,000 b | | 66,900 |
| Export-Import Bank of Korea, | | | | | | |
| Sr. Notes, 4.5%, 2009 | | | | 100,000 | | 98,311 |
| Mexican Bonos, | | | | | | |
| Bonds, 9%, 2011 | | MXN | | 1,500,000 | | 147,374 |
| Russia Government International Bond: | | | | |
| Notes, 10%, 2007 | | | | 110,000 | | 117,865 |
| Notes, 12.75%, 2028 | | | | 45,000 | | 82,672 |
| Ukraine Government International Bond, | | | | |
| Notes, 7.343%, 2009 | | | | 100,000 b,c | | 108,125 |
| | | | | | | 1,539,244 |
| Gaming/Lodging—.5% | | | | | | |
| Ameristar Casinos, | | | | | | |
| Sr. Sub. Notes, 10.75%, 2009 | | | | 35,000 | | 37,275 |
| Caesars Entertainment, | | | | | | |
| Sr. Notes, 8.5%, 2006 | | | | 50,000 | | 51,320 |
| MGM Mirage, | | | | | | |
| Sr. Notes, 6%, 2009 | | | | 90,000 | | 89,888 |
| Turning Stone Casino Resort Enterprise, | | | | |
| Sr. Notes, 9.125%, 2010 | | | | 80,000 b | | 82,800 |
| | | | | | | 261,283 |
| Health Care—.6% | | | | | | |
| Baxter International, | | | | | | |
| Sr. Notes, 5.196%, 2008 | | | | 140,000 | | 140,482 |
| Coventry Health Care, | | | | | | |
| Sr. Notes, 5.875%, 2012 | | | | 80,000 | | 81,200 |
| HCA, | | | | | | |
| Sr. Notes, 7.125%, 2006 | | | | 100,000 | | 101,320 |
| | | | | | | 323,002 |
| Homebuilders—.8% | | | | | | |
| American Standard, | | | | | | |
| Sr. Notes, 7.375%, 2008 | | | | 145,000 | | 151,131 |
The Fund 15
STATEMENT OF INVESTMENTS (continued)
|
| | | | | Principal | | |
| Bonds and Notes (continued) | | | | Amount a | | Value ($) |
| |
| |
| |
|
| Homebuilders (continued) | | | | | | |
| D.R. Horton, | | | | | | |
| Sr. Notes, 5.875%, 2013 | | | | 120,000 | | 116,077 |
| Schuler Homes, | | | | | | |
| Notes, 10.5%, 2011 | | | | 115,000 | | 124,200 |
| | | | | | | 391,408 |
| Household Products—.0% | | | | | | |
| Scotts Miracle-Gro, | | | | | | |
| Sr. Sub. Notes, 6.625%, 2013 | | | | 20,000 | | 20,350 |
| Insurance—1.1% | | | | | | |
| AON, | | | | | | |
| Capital Securities, 8.205%, 2027 | | | | 105,000 | | 125,062 |
| Ace Capital Trust II, | | | | | | |
| Capital Securities, 9.7%, 2030 | | | | 140,000 | | 195,351 |
| Assurant, | | | | | | |
| Sr. Notes, 6.75%, 2034 | | | | 55,000 | | 59,970 |
| Nippon Life Insurance, | | | | | | |
| Notes, 4.875%, 2010 | | | | 125,000 b | | 123,192 |
| Phoenix Cos., | | | | | | |
| Sr. Notes, 6.675%, 2008 | | | | 70,000 | | 70,690 |
| | | | | | | 574,265 |
| Manufacturing—1.2% | | | | | | |
| Bombardier: | | | | | | |
| Notes, 6.3%, 2014 | | | | 200,000 b | | 176,000 |
| Notes, 7.45%, 2034 | | | | 120,000 b | | 102,000 |
| Tyco International, | | | | | | |
| Notes, 6.125%, 2007 | | EUR | | 260,000 | | 320,137 |
| | | | | | | 598,137 |
| Media—1.6% | | | | | | |
| Clear Channel Communications, | | | | | | |
| Notes, 4.25%, 2009 | | | | 265,000 | | 254,929 |
| DirecTV Holdings/Financing, | | | | | | |
| Sr. Notes, 8.375%, 2013 | | | | 33,000 | | 35,640 |
| Liberty Media, | | | | | | |
| Sr. Notes, 5.99%, 2006 | | | | 250,000 c | | 251,765 |
| Media General, | | | | | | |
| Notes, 6.95%, 2006 | | | | 125,000 | | 126,006 |
| Univision Communications, | | | | | | |
| Sr. Notes, 2.875%, 2006 | | | | 135,000 | | 132,847 |
| | | | | | | 801,187 |
| |
| |
| 16 | | | | | | |
| | | Principal | | | | |
| Bonds and Notes (continued) | | Amount a | | Value ($) |
| |
| |
|
| Mining & Metals—.9% | | | | | | |
| Falconbridge: | | | | | | |
| Bonds, 5.375%, 2015 | | 25,000 | | | | 24,147 |
| Notes, 6%, 2015 | | 150,000 | | | | 151,742 |
| International Steel, | | | | | | |
| Sr. Notes, 6.5%, 2014 | | 105,000 | | | | 105,525 |
| Ispat Inland ULC, | | | | | | |
| Secured Notes, 9.75%, 2014 | | 35,000 | | | | 39,812 |
| Southern Copper, | | | | | | |
| Notes, 7.5%, 2035 | | 125,000 | | b | | 124,861 |
| | | | | | | 446,087 |
| Oil & Gas—1.6% | | | | | | |
| Colorado Interstate Gas, | | | | | | |
| Sr. Notes, 5.95%, 2015 | | 70,000 | | | | 67,962 |
| Enterprise Products Operating, | | | | | | |
| Sr. Notes, Ser. B, 4.625%, 2009 | | 255,000 | | | | 248,924 |
| Oneok, | | | | | | |
| Sr. Notes, 5.51%, 2008 | | 175,000 | | | | 175,779 |
| Pemex Project Funding Master Trust, | | | | | | |
| Notes, 7.375%, 2014 | | 205,000 | | | | 228,268 |
| Sempra Energy, | | | | | | |
| Sr. Notes, 4.621%, 2007 | | 80,000 | | | | 79,459 |
| | | | | | | 800,392 |
| Packaging & Containers—.5% | | | | | | |
| Crown Americas/Capital: | | | | | | |
| Sr. Notes, 7.625%, 2013 | | 75,000 | | b | | 78,188 |
| Sr. Notes, 7.75%, 2015 | | 50,000 | | b | | 52,000 |
| Sealed Air, | | | | | | |
| Bonds, 6.875%, 2033 | | 120,000 | | b | | 124,549 |
| | | | | | | 254,737 |
| Paper & Forest Products—1.0% | | | | | | |
| Celulosa Arauco y Constitucion, | | | | | | |
| Notes, 5.625%, 2015 | | 120,000 | | | | 119,380 |
| Georgia-Pacific, | | | | | | |
| Sr. Notes, 8%, 2024 | | 55,000 | | | | 52,800 |
| Sappi Papier, | | | | | | |
| Notes, 6.75%, 2012 | | 240,000 | | b | | 229,494 |
| Temple-Inland, | | | | | | |
| Bonds, 6.625%, 2018 | | 105,000 | | e | | 108,401 |
| | | | | | | 510,075 |
The Fund 17
STATEMENT OF INVESTMENTS (continued)
|
| | | Principal | | |
| Bonds and Notes (continued) | | Amount a | | Value ($) |
| |
| |
|
| Pharmaceuticals—.1% | | | | |
| Medco Health Solutions, | | | | |
| Sr. Notes, 7.25%, 2013 | | 60,000 | | 66,008 |
| Pipelines—.8% | | | | |
| ANR Pipeline, | | | | |
| Sr. Notes, 7%, 2025 | | 50,000 | | 49,744 |
| El Paso Natural Gas, | | | | |
| Sr. Notes, Ser. A, 7.625%, 2010 | | 130,000 | | 137,355 |
| Northwest Pipeline, | | | | |
| Debs., 6.625%, 2007 | | 210,000 | | 215,513 |
| | | | | 402,612 |
| Real Estate Investment Trust—3.5% | | |
| Archstone-Smith Operating Trust: | | | | |
| Notes, 3%, 2008 | | 85,000 | | 80,857 |
| Sr. Notes, 5%, 2007 | | 75,000 | | 74,987 |
| Arden Realty: | | | | |
| Notes, 5.2%, 2011 | | 115,000 | | 116,632 |
| Sr. Notes, 7%, 2007 | | 60,000 | | 62,264 |
| Boston Properties, | | | | |
| Sr. Notes, 5.625%, 2015 | | 85,000 | | 86,058 |
| Commercial Net Lease Realty, | | | | |
| Sr. Notes, 6.15%, 2015 | | 100,000 | | 101,678 |
| Duke Realty: | | | | |
| Notes, 3.5%, 2007 | | 70,000 | | 68,133 |
| Sr. Notes, 6.95%, 2011 | | 170,000 | | 182,453 |
| EOP Operating, | | | | |
| Notes, 7.5%, 2029 | | 110,000 | | 124,313 |
| ERP Operating: | | | | |
| Notes, 4.75%, 2009 | | 55,000 | | 54,405 |
| Notes, 5.125%, 2016 | | 75,000 | | 72,378 |
| Healthcare Realty Trust, | | | | |
| Sr. Notes, 8.125%, 2011 | | 225,000 | | 249,483 |
| Mack-Cali Realty: | | | | |
| Notes, 5.05%, 2010 | | 130,000 | | 128,644 |
| Sr. Notes, 5.125%, 2015 | | 75,000 | | 73,182 |
| Regency Centers, | | | | |
| Notes, 5.25%, 2015 | | 125,000 | | 122,942 |
| | | Principal | | | | |
| Bonds and Notes (continued) | | Amount a | | Value ($) |
| |
| |
|
| Real Estate Investment Trust (continued) | | | | |
| Simon Property: | | | | | | |
| Notes, 4.6%, 2010 | | 105,000 | | | | 102,461 |
| Notes, 4.875%, 2010 | | 75,000 | | | | 74,035 |
| | | | | | | 1,774,905 |
| Residential Mortgage | | | | | | |
| Pass-Through Ctfs.—4.6% | | | | | | |
| Banc of America Mortgage Securities, | | | | | | |
| Ser. 2004-F, Cl. 2A7, 4.16%, 2034 | | 347,446 | | c | | 338,551 |
| Citigroup Mortgage Loan Trust: | | | | | | |
| Ser. 2005-WF1, Cl. A5, 5.01%, 2035 | | 140,000 | | | | 136,175 |
| Ser. 2005-WF2, Cl. AF2, 4.922%, 2035 | | 108,548 | | | | 108,208 |
| Countrywide Alternative Loan Trust, | | | | | | |
| Stripped Security, Interest Only Class, | | | | | | |
| Ser. 2004-J5, Cl. 1A10, .75%, 2006 | | 2,093,861 | | f | | 10,622 |
| First Chicago/Lennar Trust, | | | | | | |
| Ser. 1997-CHL1, Cl. D, 7.7%, 2039 | | 275,000 | | b,c | | 276,375 |
| Impac CMB Trust: | | | | | | |
| Ser. 2005-8, Cl. 2M2, 5.13%, 2036 | | 134,643 | | c | | 134,498 |
| Ser. 2005-8, Cl. 2M3, 5.88%, 2036 | | 99,736 | | c | | 96,079 |
| J.P. Morgan Mortgage Trust, | | | | | | |
| Ser. 2005-A1, Cl. 5A1, 4.485%, 2035 | | 75,843 | | c | | 73,765 |
| Nomura Asset Acceptance: | | | | | | |
| Ser. 2005-AP1, Cl. 2A5, 4.855%, 2035 | | 200,000 | | | | 196,430 |
| Ser. 2005-AP2, Cl. A5, 4.976%, 2035 | | 150,000 | | | | 145,269 |
| Ser. 2005-WF1, Cl. 2A5, 5.159%, 2035 | | 115,000 | | | | 112,218 |
| Opteum Mortgage Acceptance, | | | | | | |
| Ser. 2005-1, Cl. A2, 4.52%, 2035 | | 114,620 | | c | | 114,619 |
| Structured Asset Mortgage Investments, | | | | | | |
| Ser. 1998-2, Cl. B, 6.15%, 2030 | | 2,220 | | c | | 2,208 |
| Washington Mutual: | | | | | | |
| Ser. 2003-AR10, Cl. A6, 4.066%, 2033 | | 203,000 | | c | | 198,513 |
| Ser. 2004-AR7, Cl. A6, 3.946%, 2034 | | 135,000 | | c | | 130,680 |
| Ser. 2004-AR9, Cl. A7, 4.178%, 2034 | | 165,000 | | c | | 161,712 |
| Wells Fargo Mortgage Backed Securities Trust, | | | | |
| Ser. 2003-1, Cl. 2A9, 5.75%, 2033 | | 150,000 | | | | 150,063 |
| | | | | | | 2,385,985 |
The Fund 19
STATEMENT OF INVESTMENTS (continued)
|
| | | Principal | | |
| Bonds and Notes (continued) | | Amount a | | Value ($) |
| |
| |
|
| Retail—.2% | | | | |
| May Department Stores: | | | | |
| Notes, 3.95%, 2007 | | 45,000 | | 44,266 |
| Notes, 4.8%, 2009 | | 45,000 | | 44,408 |
| | | | | 88,674 |
| Semiconductors—.1% | | | | |
| Freescale Semiconductor, | | | | |
| Sr. Notes, 6.875%, 2011 | | 70,000 | | 73,850 |
| State Government—1.6% | | | | |
| Badger Tobacco Asset Securitization, | | | | |
| Asset-Backed Ctfs., 6.125%, 2027 | | 185,000 | | 195,034 |
| Erie County Tobacco Asset Securitization, | | | | |
| Asset-Backed Ctfs., Ser. E, 6%, 2028 | | 175,000 | | 171,610 |
| New York Counties Tobacco Trust III, | | | | |
| Pass-Through Ctfs., Ser. B, 6%, 2027 | | 180,000 | | 177,260 |
| Sacramento County California Pension Funding, | | |
| Bonds, Ser. C-1, 0%, 2030 | | 100,000 | | 97,572 |
| Tobacco Settlement Authority of Iowa, | | | | |
| Asset-Backed Ctfs., Ser. A, 6.5%, 2023 | | 170,000 | | 170,641 |
| Tobacco Settlement Financing Corp. of N.J., | | |
| Asset-Backed Ctfs., 5.75%, 2032 | | 20,000 | | 20,787 |
| | | | | 832,904 |
| Telecommunications—1.9% | | | | |
| Deutsche Telekom International Finance, | | | | |
| Notes, 8.25%, 2030 | | 80,000 c | | 102,053 |
| France Telecom, | | | | |
| Notes, 8%, 2011 | | 110,000 c | | 122,995 |
| MCI, | | | | |
| Sr. Notes, 6.908%, 2007 | | 41,000 c | | 41,410 |
| Nextel Communications, | | | | |
| Sr. Notes, Ser. F, 5.95%, 2014 | | 95,000 | | 95,620 |
| Qwest: | | | | |
| Notes, 5.625%, 2008 | | 70,000 e | | 69,650 |
| Sr. Notes, 7.74%, 2013 | | 100,000 b,c | | 108,375 |
| Sr. Notes, 7.875%, 2011 | | 65,000 | | 70,363 |
| Sprint Capital, | | | | |
| Notes, 8.75%, 2032 | | 190,000 | | 252,909 |
| | | Principal | | |
| Bonds and Notes (continued) | | Amount a | | Value ($) |
| |
| |
|
| Telecommunications (continued) | | | | |
| Telecom Italia Capital, | | | | |
| Notes, 4.73%, 2011 | | 125,000 c | | 125,726 |
| | | | | 989,101 |
| Transportation—.2% | | | | |
| Ryder System, | | | | |
| Notes, 3.5%, 2009 | | 130,000 | | 123,500 |
| U.S. Government—15.1% | | | | |
| U.S. Treasury Bonds, | | | | |
| 5.25%, 11/15/2028 | | 1,225,000 | | 1,336,487 |
| U.S. Treasury Inflation Protected Securities, | | | | |
| 3.375%, 1/15/2007 | | 2,495,562 e,g | | 2,514,308 |
| U.S. Treasury Notes: | | | | |
| 3.5%, 2/15/2010 | | 1,850,000 e | | 1,790,021 |
| 3.625%, 4/30/2007 | | 830,000 e | | 821,567 |
| 4.75%, 5/15/2014 | | 1,295,000 e | | 1,326,909 |
| | | | | 7,789,292 |
| U.S. Government Agencies/Mortgage-Backed—32.5% | | |
| Federal Home Loan Mortgage Corp.: | | | | |
| 4%, 10/1/2009 | | 100,803 | | 98,314 |
| 4.5%, 10/1/2009 | | 97,042 | | 95,677 |
| 5%, 10/1/2018 | | 557,803 | | 553,268 |
| 6%, 7/1/2017-4/1/2033 | | 340,441 | | 345,382 |
| Federal National Mortgage Association: | | | | |
| 3.53%, 7/1/2010 | | 287,228 | | 270,801 |
| 4.06%, 6/1/2013 | | 100,000 | | 92,437 |
| 4.5% | | 2,050,000 h | | 1,994,896 |
| 5% | | 3,535,000 h | | 3,431,212 |
| 5%, 7/1/2011-4/1/2019 | | 611,254 | | 606,512 |
| 5.5% | | 1,335,000 h | | 1,326,447 |
| 5.5%, 12/1/2024-1/1/2034 | | 1,553,631 | | 1,545,567 |
| 6% | | 1,475,000 h | | 1,506,801 |
| 6%, 2/1/2033-6/1/2033 | | 301,124 | | 304,605 |
| 6.5%, 12/1/2031-11/1/2032 | | 510,154 | | 524,558 |
| 7%, 5/1/2032-7/1/2032 | | 65,098 | | 67,946 |
| Grantor Trust: | | | | |
| Ser. 2001-T6, Cl. B, 6.088%, 5/25/2011 | | 275,000 | | 290,128 |
| Ser. 2001-T11, Cl. B, 5.503%, 9/25/2011 | | 75,000 | | 77,451 |
The Fund 21
STATEMENT OF INVESTMENTS (continued)
|
| | | Principal | | | | |
| Bonds and Notes (continued) | | Amount a | | Value ($) |
| |
| |
|
| U.S. Government Agencies/Mortgage-Backed (continued) | | | | |
| Government National Mortgage Association: | | | | | | |
| 6.5%, 9/15/2032 | | 128,221 | | | | 134,031 |
| 8%, 2/15/2030-5/15/2030 | | 8,756 | | | | 9,377 |
| Ser. 2003-64, Cl. A, 3.089%, 4/16/2024 | | 26,260 | | | | 25,700 |
| Ser. 2003-88, Cl. AC, 2.914%, 6/16/2018 | | 253,668 | | | | 243,615 |
| Ser. 2003-96, Cl. B, 3.607%, 8/16/2018 | | 175,000 | | | | 170,125 |
| Ser. 2004-9, Cl. A, 3.36%, 8/16/2022 | | 115,036 | | | | 110,448 |
| Ser. 2004-23, Cl. B, 2.946%, 3/16/2019 | | 140,000 | | | | 133,472 |
| Ser. 2004-25, Cl. AC, 3.377%, 1/16/2023 | | 332,063 | | | | 319,824 |
| Ser. 2004-43, Cl. A, 2.822%, 12/16/2019 | | 361,924 | | | | 346,054 |
| Ser. 2004-51, Cl. A, 4.145%, 2/16/2018 | | 239,512 | | | | 234,929 |
| Ser. 2004-57, Cl. A, 3.022%, 1/16/2019 | | 195,631 | | | | 187,879 |
| Ser. 2004-67, Cl. A, 3.648%, 9/16/2017 | | 169,708 | | | | 165,859 |
| Ser. 2004-77, Cl. A, 3.402%, 3/16/2020 | | 203,596 | | | | 196,653 |
| Ser. 2004-97, Cl. AB, 3.084%, 4/16/2022 | | 216,213 | | | | 207,174 |
| Ser. 2004-108, Cl. A, 3.999%, 5/16/2027 | | 121,890 | | | | 118,639 |
| Ser. 2005-9, Cl. A, 4.026%, 5/16/2022 | | 96,953 | | | | 94,716 |
| Ser. 2005-12, Cl. A, 4.044%, 5/16/2021 | | 66,275 | | | | 64,843 |
| Ser. 2005-14, Cl. A, 4.13%, 2/16/2027 | | 142,404 | | | | 139,283 |
| Ser. 2005-29, Cl. A, 4.016%, 7/16/2027 | | 168,254 | | | | 163,798 |
| Ser. 2005-32, Cl. B, 4.385%, 8/16/2030 | | 150,000 | | | | 147,188 |
| Ser. 2005-42, Cl. A, 4.045%, 7/16/2020 | | 146,675 | | | | 143,615 |
| Ser. 2005-50, Cl. A, 4.015%, 11/16/2026 | | 123,630 | | | | 120,647 |
| Ser. 2005-79, Cl. A, 3.998%, 10/16/2033 | | 124,672 | | | | 121,256 |
| | | | | | | 16,731,127 |
| Utilities-Gas & Electric—4.5% | | | | | | |
| Consumers Energy: | | | | | | |
| First Mortgage Bonds, Ser. B, 5.375%, 2013 | | 115,000 | | | | 114,334 |
| First Mortgage Bonds, Ser. F, 4%, 2010 | | 155,000 | | | | 147,341 |
| Dominion Resources: | | | | | | |
| Sr. Notes, Ser. D, 4.819%, 2007 | | 255,000 | | c | | 255,239 |
| Sr. Notes, Ser. G, 3.66%, 2006 | | 95,000 | | c | | 93,905 |
| FPL Energy National Wind, | | | | | | |
| Secured Notes, 5.608%, 2024 | | 97,743 | | b | | 97,656 |
| FPL Group Capital, | | | | | | |
| Notes, Ser. B, 5.551%, 2008 | | 200,000 | | | | 201,834 |
| | | Principal | | | | |
| Bonds and Notes (continued) | | Amount a | | Value ($) |
| |
| |
|
| Utilities-Gas & Electric (continued) | | | | | | |
| FirstEnergy, | | | | | | |
| Sr. Notes, Ser. B, 6.45%, 2011 | | 235,000 | | | | 249,403 |
| IPALCO Enterprises, | | | | | | |
| Sr. Secured Notes, 8.625%, 2011 | | 75,000 | | c | | 82,125 |
| Illinois Power, | | | | | | |
| First Mortgage Bonds, 7.5%, 2009 | | 115,000 | | | | 122,932 |
| Mirant, | | | | | | |
| Sr. Notes, 7.375%, 2013 | | 55,000 | | b | | 55,894 |
| Nevada Power, | | | | | | |
| Bonds, Ser. L, 5.875%, 2015 | | 50,000 | | | | 49,866 |
| Niagara Mohawk Power, | | | | | | |
| Sr. Notes, Ser. G, 7.75%, 2008 | | 35,000 | | | | 37,392 |
| NiSource Finance, | | | | | | |
| Notes, 4.95%, 2009 | | 275,000 | | c | | 276,153 |
| PPL Capital Funding Trust I, | | | | | | |
| Notes, 7.29%, 2006 | | 220,000 | | | | 221,355 |
| TXU: | | | | | | |
| Notes, Ser. C, 6.375%, 2008 | | 65,000 | | | | 66,309 |
| Sr. Notes, Ser. J, 6.375%, 2006 | | 125,000 | | | | 126,262 |
| Sr. Notes, Ser. O, 4.8%, 2009 | | 145,000 | | | | 140,196 |
| | | | | | | 2,338,196 |
| Total Bonds and Notes | | | | | | |
| (cost $57,010,802) | | | | | | 56,715,246 |
| |
| |
| |
|
| |
| Preferred Stocks—.9% | | Shares | | | | Value ($) |
| |
| |
| |
|
| Banking—.1% | | | | | | |
| Sovereign Capital Trust IV, | | | | | | |
| Conv., $2.1875 | | 1,400 | | | | 61,600 |
| Real Estate Investment Trust—.8% | | | | | | |
| Equity Office Properties Trust, | | | | | | |
| Cum. Conv., Ser. B, $2.625 | | 7,840 | | | | 394,744 |
| Total Preferred Stocks | | | | | | |
| (cost $446,811) | | | | | | 456,344 |
The Fund 23
STATEMENT OF INVESTMENTS (continued)
|
| | | Face Amount | | |
| | | Covered by | | |
| Options—.1% | | Contracts ($) | | Value ($) |
| |
| |
|
| Call Options—.1% | | | | |
| Dow Jones CDX.EM.4, | | | | |
| February 2006 @ 100.9 | | 1,008,000 | | 8,568 |
| U.S. Treasury Notes, | | | | |
| 4.5%, 11/15/2015, | | | | |
| February 2006 @ 100.265625 | | 1,507,000 | | 15,778 |
| | | | | 24,346 |
| Put Options—.0% | | | | |
| 6-Month Euribor Interest Swap, | | | | |
| November 2006 @ 3.405 | | 855,000 | | 9,679 |
| U.S. Treasury Notes, | | | | |
| 4.25%, 8/15/2015, | | | | |
| February 2006 @ 96.859375 | | 520,000 | | 1,055 |
| U.S. Treasury Notes, | | | | |
| 4.25%, 8/15/2015, | | | | |
| February 2006 @ 97.171875 | | 520,000 | | 1,352 |
| | | | | 12,086 |
| Total Options | | | | |
| (cost $39,685) | | | | 36,432 |
| |
| |
|
| |
| | | Principal | | |
| Short-Term Investments—3.1% | | Amount ($) | | Value ($) |
| |
| |
|
| Agency Discount Notes—3.0% | | | | |
| Federal National Mortgage Association, | | | | |
| 4.15%, 1/12/2006 | | 1,525,000 | | 1,523,066 |
| U.S. Treasury Bills—.1% | | | | |
| 3.85%, 3/9/2006 | | 75,000 i | | 74,474 |
| Total Short-Term Investments | | | | |
| (cost $1,597,529) | | | | 1,597,540 |
| Investment of Cash Collateral | | | | |
| for Securities Loaned—2.8% | | Shares | | Value ($) |
| |
| |
|
| Registered Investment Company; | | | | |
| Dreyfus Institutional Cash Advantage Plus Fund | | | | |
| (cost $1,460,402) | | 1,460,402 j | | 1,460,402 |
| |
| |
|
| Total Investments (cost $60,555,229) | | 117.2% | | 60,265,964 |
| Liabilities, Less Cash and Receivables | | (17.2%) | | (8,839,673) |
| Net Assets | | 100.0% | | 51,426,291 |
| a Principal amount stated in U.S. Dollars unless otherwise noted. |
| BRL—Brazilian Real |
| CHF—Swiss Francs |
| EUR—Euro |
| MXN—Mexican Peso |
| b Securities exempt from registration under Rule 144A of the Securities Act of 1933.These securities may be resold in |
| transactions exempt from registration, normally to qualified institutional buyers. At December 31, 2005, these |
| securities amounted to $5,527,143 or 10.7% of net assets. |
| c Variable rate security—interest rate subject to periodic change. |
| d Zero coupon until a specified date at which time the stated coupon rate becomes effective until maturity. |
| e All or a portion of these securities are on loan. At December 31, 2005, the total market value of the fund’s securities |
| on loan is $6,523,191 and the total market value of the collateral held by the fund is $6,689,277, consisting of |
| cash collateral of $1,460,402 and U.S. Government and agency securities valued at $5,228,875. |
| f Notional face amount shown. |
| g Principal amount for accrual purposes is periodically adjusted based on changes in the Consumer Price Index. |
| h Purchased on a forward commitment basis. |
| i Held by a broker as collateral for open financial futures. |
| j Investment in affiliated money market mutual fund. |
| Portfolio Summary (Unaudited) † | | | | |
| |
| | | Value (%) | | | | Value (%) |
| |
| |
| |
|
| U.S. Government/Agency Securities/ | | Foreign/Government | | 3.0 |
| Mortgage-Backed | | 47.5 | | State Government | | 1.6 |
| Corporate Bonds | | 39.9 | | Preferred Stocks | | .9 |
| Mortgage/Asset-Backed | | 18.3 | | Futures/Options/Swaps/Forward | | |
| Short-Term/ | | | | Currency Exchange Contracts | | .1 |
| Money Market Investments | | 5.9 | | | | 117.2 |
| |
| † Based on net assets. | | | | | | |
| See notes to financial statements. | | | | | | |
The Fund 25
STATEMENT OF FINANCIAL FUTURES
December 31, 2005
| | | | | Market Value | | | | Unrealized |
| | | | | Covered by | | | | (Depreciation) |
| | | Contracts | | Contracts ($) | | Expiration | | at 12/31/2005 ($) |
| |
| |
| |
| |
|
| |
| Financial Futures Long | | | | | | | | |
| U.S. Treasury 5 Year Notes | | 65 | | 6,912,344 | | March 2006 | | (3,519) |
See notes to financial statements.
|
STATEMENT OF OPTIONS WRITTEN
December 31, 2005
| | | Face Amount | | |
| | | Covered by | | |
| Issuer | | Contracts ($) | | Value ($) |
| |
| |
|
| Call Options: | | | | |
| Dow Jones CDX.NA.IG.4 | | | | |
| January 2006 @ .55 | | 2,550,000 | | 2,040 |
| Dow Jones CDX.EM.4 | | | | |
| February 2006 @ 101.7 | | 2,016,000 | | 9,072 |
| U.S. Treasury Notes, | | | | |
| 4.5%, 11/15/2015, February 2006 @ 101.679688 | | 3,014,000 | | 13,382 |
| Put Options: | | | | |
| Dow Jones CDX.EM.4 | | | | |
| January 2006 @ .575 | | 2,550,000 | | 2,295 |
| Dow Jones CDX.NA.IG.4 | | | | |
| February 2006 @ .575 | | 2,521,000 | | 5,065 |
| Dow Jones CDX.NA.IG.4 | | | | |
| February 2006 @ .6 | | 2,521,000 | | 1,114 |
| U.S. Treasury Notes, | | | | |
| 4.25%, 8/15/2015, February 2006 @ 95.316406 | | 1,040,000 | | 395 |
| U.S. Treasury Notes, | | | | |
| 4.25%, 8/15/2015, February 2006 @ 95.609375 | | 1,040,000 | | 531 |
| (Premiums received $42,442) | | | | 33,894 |
See notes to financial statements.
|
STATEMENT OF ASSETS AND LIABILITIES
December 31, 2005
| | | Cost | | Value |
| |
| |
|
| Assets ($): | | | | |
| Investments in securities—See Statement of Investments | | |
| (including securities on loan, valued at $6,523,191)—Note 1(c): | | |
| Unaffiliated issuers | | 59,094,827 | | 58,805,562 |
| Affiliated issuers | | 1,460,402 | | 1,460,402 |
| Cash | | | | 423,442 |
| Receivable for open mortgage-backed dollar rolls | | | | 1,451,506 |
| Dividends and interest receivable | | | | 454,448 |
| Unrealized appreciation on swaps—Note 4 | | | | 40,375 |
| Receivable for shares of Beneficial Interest subscribed | | 24,382 |
| Receivable from broker from swap transactions—Note 4 | | 21,383 |
| Unrealized appreciation on forward currency | | | | |
| exchange contracts—Note 4 | | | | 12,873 |
| Paydown receivable | | | | 1,383 |
| | | | | 62,695,756 |
| |
| |
|
| Liabilities ($): | | | | |
| Due to The Dreyfus Corporation and affiliates—Note 3(b) | | 39,430 |
| Payable for open mortgage-backed dollar rolls | | | | 9,665,570 |
| Liability for securities on loan—Note 1(c) | | | | 1,460,402 |
| Unrealized depreciation on swaps—Note 4 | | | | 56,790 |
| Outstanding options written, at value (premiums | | | | |
| received $42,442)—See Statement of Options Written—Note 4 | | 33,894 |
| Payable for shares of Beneficial Interest redeemed | | | | 10,332 |
| Payable for futures variation margin—Note 4 | | | | 3,047 |
| | | | | 11,269,465 |
| |
| |
|
| Net Assets ($) | | | | 51,426,291 |
| |
| |
|
| Composition of Net Assets ($): | | | | |
| Paid-in capital | | | | 59,178,659 |
| Accumulated undistributed investment income—net | | | | 17,690 |
| Accumulated net realized gain (loss) on investments | | | | (7,481,231) |
| Accumulated net unrealized appreciation (depreciation) | | |
| on investments, options transactions, swap transactions | | |
| and foreign currency transactions [including ($3,519) | | |
| net unrealized (depreciation) on financial futures] | | | | (288,827) |
| |
| |
|
| Net Assets ($) | | | | 51,426,291 |
| Net Asset Value Per Share | | | | | | | | |
| | | Class A | | Class B | | Class C | | Class R |
| |
| |
| |
| |
|
| Net Assets ($) | | 43,915,379 | | 4,044,134 | | 1,658,224 | | 1,808,554 |
| Shares Outstanding | | 4,122,064 | | 379,639 | | 155,517 | | 169,912 |
| |
| |
| |
| |
|
| Net Asset Value Per Share ($) | | 10.65 | | 10.65 | | 10.66 | | 10.64 |
| |
| See notes to financial statements. | | | | | | The Fund | | 27 |
STATEMENT OF OPERATIONS
Year Ended December 31, 2005
|
| Investment Income ($): | | |
| Income: | | |
| Interest | | 2,388,275 |
| Cash dividends | | 23,643 |
| Income from securities lending | | 6,658 |
| Total Income | | 2,418,576 |
| Expenses: | | |
| Management fee—Note 3(a) | | 362,574 |
| Distribution and service fees—Note 3(b) | | 173,895 |
| Loan commitment fees—Note 2 | | 381 |
| Total Expenses | | 536,850 |
| Investment Income—Net | | 1,881,726 |
| |
|
| Realized and Unrealized Gain (Loss) on Investments—Note 4 ($): |
| Net realized gain (loss) on investments and foreign currency transactions | | 503,918 |
| Net realized gain (loss) on forward currency exchange contracts | | 272,857 |
| Net realized gain (loss) on swap transactions | | 48,450 |
| Net realized gain (loss) on financial futures | | 5,412 |
| Net realized gain (loss) on options transactions | | 3,196 |
| Net Realized Gain (Loss) | | 833,833 |
| Net unrealized appreciation (depreciation) on investments, options, | | |
| foreign currency transactions and swap transactions [including | | |
| ($3,519) net unrealized (depreciation) on financial futures] | | (1,443,134) |
| Net Realized and Unrealized Gain (Loss) on Investments | | (609,301) |
| Net Increase in Net Assets Resulting from Operations | | 1,272,425 |
See notes to financial statements.
|
STATEMENT OF CHANGES IN NET ASSETS
| | | Year Ended December 31, |
| |
|
| | | 2005 | | 2004 |
| |
| |
|
| Operations ($): | | | | |
| Investment income—net | | 1,881,726 | | 1,810,797 |
| Net realized gain (loss) on investments | | 833,833 | | 1,279,546 |
| Net unrealized appreciation | | | | |
| (depreciation) on investments | | (1,443,134) | | (473,181) |
| Net Increase (Decrease) in Net Assets | | | | |
| Resulting from Operations | | 1,272,425 | | 2,617,162 |
| |
| |
|
| Dividends to Shareholders from ($): | | | | |
| Investment income—net: | | | | |
| Class A shares | | (1,925,411) | | (1,857,056) |
| Class B shares | | (179,019) | | (294,406) |
| Class C shares | | (60,333) | | (58,188) |
| Class R shares | | (85,448) | | (89,430) |
| Net realized gain on investments: | | | | |
| Class A shares | | (316,748) | | (162,127) |
| Class B shares | | (29,230) | | (24,367) |
| Class C shares | | (10,980) | | (5,995) |
| Class R shares | | (13,060) | | (7,103) |
| Total Dividends | | (2,620,229) | | (2,498,672) |
| |
| |
|
| Beneficial Interest Transactions ($): | | | | |
| Net proceeds from shares sold: | | | | |
| Class A shares | | 6,790,514 | | 4,553,755 |
| Class B shares | | 1,042,809 | | 924,770 |
| Class C shares | | 623,177 | | 712,131 |
| Class R shares | | 73,941 | | 43,431 |
| Dividends reinvested: | | | | |
| Class A shares | | 1,846,222 | | 1,676,686 |
| Class B shares | | 150,509 | | 207,747 |
| Class C shares | | 33,241 | | 26,626 |
| Class R shares | | 73,712 | | 70,620 |
| Cost of shares redeemed: | | | | |
| Class A shares | | (7,043,996) | | (6,678,813) |
| Class B shares | | (3,574,694) | | (4,912,989) |
| Class C shares | | (550,762) | | (832,552) |
| Class R shares | | (217,453) | | (396,870) |
| Increase (Decrease) in Net Assets from | | | | |
| Beneficial Interest Transactions | | (752,780) | | (4,605,458) |
| Total Increase (Decrease) in Net Assets | | (2,100,584) | | (4,486,968) |
| |
| |
|
| Net Assets ($): | | | | |
| Beginning of Period | | 53,526,875 | | 58,013,843 |
| End of Period | | 51,426,291 | | 53,526,875 |
| Undistributed (distributions in excess of) | | | | |
| investment income—net | | 17,690 | | (89,897) |
| | | | | The Fund 29 |
STATEMENT OF CHANGES IN NET ASSETS (continued)
|
| | | Year Ended December 31, |
| |
|
| | | 2005 | | 2004 |
| |
| |
|
| Capital Share Transactions: | | | | |
| Class A a | | | | |
| Shares sold | | 626,773 | | 417,605 |
| Shares issued for dividends reinvested | | 170,901 | | 153,629 |
| Shares redeemed | | (650,541) | | (614,523) |
| Net Increase (Decrease) in Shares Outstanding | | 147,133 | | (43,289) |
| |
| |
|
| Class B a | | | | |
| Shares sold | | 96,560 | | 84,696 |
| Shares issued for dividends reinvested | | 13,924 | | 19,036 |
| Shares redeemed | | (328,698) | | (451,478) |
| Net Increase (Decrease) in Shares Outstanding | | (218,214) | | (347,746) |
| |
| |
|
| Class C | | | | |
| Shares sold | | 57,799 | | 64,695 |
| Shares issued for dividends reinvested | | 3,071 | | 2,437 |
| Shares redeemed | | (51,368) | | (76,179) |
| Net Increase (Decrease) in Shares Outstanding | | 9,502 | | (9,047) |
| |
| |
|
| Class R | | | | |
| Shares sold | | 6,783 | | 3,963 |
| Shares issued for dividends reinvested | | 6,830 | | 6,477 |
| Shares redeemed | | (19,954) | | (36,370) |
| Net Increase (Decrease) in Shares Outstanding | | (6,341) | | (25,930) |
| |
| a During the period ended December 31, 2005, 164,321 Class B shares representing $1,790,542 were |
| automatically converted to 164,317 Class A shares and during the period ended December 31, 2004, 181,667 |
| Class B shares representing $1,976,034 were automatically converted to 181,651 Class A shares. |
| See notes to financial statements. | | | | |
The following tables describe the performance for each share class for the fiscal periods indicated.All information (except portfolio turnover rate) reflects financial results for a single fund share.Total return shows how much your investment in the fund would have increased (or decreased) during each period, assuming you had reinvested all dividends and distributions.These figures have been derived from the fund’s financial statements.
| | | | | Year Ended December 31, | | |
| |
| |
| |
|
| Class A Shares | | 2005 | | 2004 a | | 2003 | | 2002 | | 2001 b |
| |
| |
| |
| |
| |
|
| Per Share Data ($): | | | | | | | | | | |
| Net asset value, beginning of period | | 10.94 | | 10.90 | | 10.75 | | 10.37 | | 10.29 |
| Investment Operations: | | | | | | | | | | |
| Investment income—net c | | .40 | | .37 | | .33 | | .38 | | .52 |
| Net realized and unrealized | | | | | | | | | | |
| gain (loss) on investments | | (.13) | | .18 | | .26 | | .42 | | .10 |
| Total from Investment Operations | | .27 | | .55 | | .59 | | .80 | | .62 |
| Distributions: | | | | | | | | | | |
| Dividends from investment income—net | | (.48) | | (.47) | | (.39) | | (.42) | | (.54) |
| Dividends from net realized | | | | | | | | | | |
| gain on investments | | (.08) | | (.04) | | (.05) | | — | | — |
| Total Distributions | | (.56) | | (.51) | | (.44) | | (.42) | | (.54) |
| Net asset value, end of period | | 10.65 | | 10.94 | | 10.90 | | 10.75 | | 10.37 |
| |
| |
| |
| |
| |
|
| Total Return (%) d | | 2.50 | | 5.15 | | 5.51 | | 7.87 | | 6.09 |
| |
| |
| |
| |
| |
|
| Ratios/Supplemental Data (%): | | | | | | | | | | |
| Ratio of total expenses | | | | | | | | | | |
| to average net assets | | .95 | | .95 | | .95 | | .95 | | .95 |
| Ratio of net investment income | | | | | | | | | | |
| to average net assets | | 3.72 | | 3.38 | | 3.06 | | 3.63 | | 5.01 |
| Portfolio Turnover Rate | | 345.82e | | 315.33e | | 469.41e | | 524.46 | | 477.71 |
| |
| |
| |
| |
| |
|
| Net Assets, end of period ($ X 1,000) | | 43,915 | | 43,466 | | 43,811 | | 47,571 | | 49,729 |
| a As of January 1, 2004, the fund has adopted the method of accounting for interim payments on swap contracts in |
| accordance with Financial Accounting Standards Board Statement No. 133.These interim payments are reflected |
| within net realized and unrealized gain (loss) on swap contracts, however, prior to January 1, 2004, these interim |
| payments were reflected within interest income/expense in the Statement of Operations.The effect of these changes for |
| the fiscal year ended December 31, 2004, was to decrease net investment income per share by $.02, increase net |
| realized and unrealized gain (loss) on investments per share by $.02 and decrease the ratio of net investment income |
| to average net assets from 3.52% to 3.38%. |
| b As required, effective January 1, 2001, the fund has adopted the provisions of the AICPA Audit and Accounting |
| Guide for Investment Companies and began accreting discount or amortizing premium on fixed income securities on a |
| scientific basis and including paydown gains and losses in interest income.The effect of this change for the fiscal year |
| ended December 31, 2001 was to decrease net investment income per share by $.02, increase net realized and |
| unrealized gain (loss) on investments per share by $.02 and decrease the ratio of net investment income to average net |
| assets from 5.16% to 5.01%. |
| c Based on average shares outstanding at each month end. |
| d Exclusive of sales charge. |
| e The portfolio turnover rates excluding mortgage dollar roll transactions for the years ended December 31, 2005, |
| December 31, 2004 and December 31, 2003 were 198.52%, 189.68% and 272.57%, respectively. |
See notes to financial statements.
The Fund 31
FINANCIAL HIGHLIGHTS (continued)
|
| | | | | Year Ended December 31, | | |
| |
| |
| |
|
| Class B Shares | | 2005 | | 2004 a | | 2003 | | 2002 | | 2001 b |
| |
| |
| |
| |
| |
|
| Per Share Data ($): | | | | | | | | | | |
| Net asset value, beginning of period | | 10.93 | | 10.90 | | 10.75 | | 10.37 | | 10.29 |
| Investment Operations: | | | | | | | | | | |
| Investment income—net c | | .32 | | .30 | | .25 | | .30 | | .44 |
| Net realized and unrealized | | | | | | | | | | |
| gain (loss) on investments | | (.12) | | .16 | | .25 | | .42 | | .10 |
| Total from Investment Operations | | .20 | | .46 | | .50 | | .72 | | .54 |
| Distributions: | | | | | | | | | | |
| Dividends from investment income—net | | (.40) | | (.39) | | (.30) | | (.34) | | (.46) |
| Dividends from net realized | | | | | | | | | | |
| gain on investments | | (.08) | | (.04) | | (.05) | | — | | — |
| Total Distributions | | (.48) | | (.43) | | (.35) | | (.34) | | (.46) |
| Net asset value, end of period | | 10.65 | | 10.93 | | 10.90 | | 10.75 | | 10.37 |
| |
| |
| |
| |
| |
|
| Total Return (%) d | | 1.84 | | 4.27 | | 4.73 | | 7.07 | | 5.30 |
| |
| |
| |
| |
| |
|
| Ratios/Supplemental Data (%): | | | | | | | | | | |
| Ratio of total expenses | | | | | | | | | | |
| to average net assets | | 1.70 | | 1.70 | | 1.70 | | 1.70 | | 1.70 |
| Ratio of net investment income | | | | | | | | | | |
| to average net assets | | 2.99 | | 2.77 | | 2.31 | | 2.91 | | 4.27 |
| Portfolio Turnover Rate | | 345.82e | | 315.33e | | 469.41e | | 524.46 | | 477.71 |
| |
| |
| |
| |
| |
|
| Net Assets, end of period ($ X 1,000) | | 4,044 | | 6,537 | | 10,309 | | 12,470 | | 14,172 |
| a As of January 1, 2004, the fund has adopted the method of accounting for interim payments on swap contracts in |
| accordance with Financial Accounting Standards Board Statement No. 133.These interim payments are reflected |
| within net realized and unrealized gain (loss) on swap contracts, however, prior to January 1, 2004, these interim |
| payments were reflected within interest income/expense in the Statement of Operations.The effect of these changes for |
| the fiscal year ended December 31, 2004, was to decrease net investment income per share by $.01, increase net |
| realized and unrealized gain (loss) on investments per share by $.01 and decrease the ratio of net investment income |
| to average net assets from 2.88% to 2.77%. |
| b As required, effective January 1, 2001, the fund has adopted the provisions of the AICPA Audit and Accounting |
| Guide for Investment Companies and began accreting discount or amortizing premium on fixed income securities on a |
| scientific basis and including paydown gains and losses in interest income.The effect of this change for the fiscal year |
| ended December 31, 2001 was to decrease net investment income per share by $.02, increase net realized and |
| unrealized gain (loss) on investments per share by $.02 and decrease the ratio of net investment income to average net |
| assets from 4.42% to 4.27%. |
| c Based on average shares outstanding at each month end. |
| d Exclusive of sales charge. |
| e The portfolio turnover rates excluding mortgage dollar roll transactions for the years ended December 31, 2005, |
| December 31, 2004 and December 31, 2003 were 198.52%, 189.68% and 272.57%, respectively. |
See notes to financial statements.
32
| | | | | Year Ended December 31, | | |
| |
| |
| |
|
| Class C Shares | | 2005 | | 2004 a | | 2003 | | 2002 | | 2001 b |
| |
| |
| |
| |
| |
|
| Per Share Data ($): | | | | | | | | | | |
| Net asset value, beginning of period | | 10.94 | | 10.91 | | 10.76 | | 10.38 | | 10.30 |
| Investment Operations: | | | | | | | | | | |
| Investment income—net c | | .32 | | .29 | | .25 | | .31 | | .45 |
| Net realized and unrealized | | | | | | | | | | |
| gain (loss) on investments | | (.12) | | .17 | | .25 | | .41 | | .09 |
| Total from Investment Operations | | .20 | | .46 | | .50 | | .72 | | .54 |
| Distributions: | | | | | | | | | | |
| Dividends from investment income—net | | (.40) | | (.39) | | (.30) | | (.34) | | (.46) |
| Dividends from net realized | | | | | | | | | | |
| gain on investments | | (.08) | | (.04) | | (.05) | | — | | — |
| Total Distributions | | (.48) | | (.43) | | (.35) | | (.34) | | (.46) |
| Net asset value, end of period | | 10.66 | | 10.94 | | 10.91 | | 10.76 | | 10.38 |
| |
| |
| |
| |
| |
|
| Total Return (%) d | | 1.83 | | 4.28 | | 4.73 | | 7.06 | | 5.29 |
| |
| |
| |
| |
| |
|
| Ratios/Supplemental Data (%): | | | | | | | | | | |
| Ratio of total expenses | | | | | | | | | | |
| to average net assets | | 1.70 | | 1.70 | | 1.70 | | 1.70 | | 1.70 |
| Ratio of net investment income | | | | | | | | | | |
| to average net assets | | 2.98 | | 2.66 | | 2.31 | | 2.92 | | 4.30 |
| Portfolio Turnover Rate | | 345.82e | | 315.33e | | 469.41e | | 524.46 | | 477.71 |
| |
| |
| |
| |
| |
|
| Net Assets, end of period ($ X 1,000) | | 1,658 | | 1,598 | | 1,692 | | 1,980 | | 2,245 |
| a As of January 1, 2004, the fund has adopted the method of accounting for interim payments on swap contracts in |
| accordance with Financial Accounting Standards Board Statement No. 133.These interim payments are reflected |
| within net realized and unrealized gain (loss) on swap contracts, however, prior to January 1, 2004, these interim |
| payments were reflected within interest income/expense in the Statement of Operations.The effect of these changes for |
| the fiscal year ended December 31, 2004, was to decrease net investment income per share by $.01, increase net |
| realized and unrealized gain (loss) on investments per share by $.01 and decrease the ratio of net investment income |
| to average net assets from 2.80% to 2.66%. |
| b As required, effective January 1, 2001, the fund has adopted the provisions of the AICPA Audit and Accounting |
| Guide for Investment Companies and began accreting discount or amortizing premium on fixed income securities on a |
| scientific basis and including paydown gains and losses in interest income.The effect of this change for the fiscal year |
| ended December 31, 2001 was to decrease net investment income per share by $.02, increase net realized and |
| unrealized gain (loss) on investments per share by $.02 and decrease the ratio of net investment income to average net |
| assets from 4.44% to 4.30%. |
| c Based on average shares outstanding at each month end. |
| d Exclusive of sales charge. |
| e The portfolio turnover rates excluding mortgage dollar roll transactions for the years ended December 31, 2005, |
| December 31, 2004 and December 31, 2003 were 198.52%, 189.68% and 272.57%, respectively. |
See notes to financial statements
The Fund 33
FINANCIAL HIGHLIGHTS (continued)
|
| | | | | Year Ended December 31, | | |
| |
| |
| |
|
| Class R Shares | | 2005 | | 2004 a | | 2003 | | 2002 | | 2001 b |
| |
| |
| |
| |
| |
|
| Per Share Data ($): | | | | | | | | | | |
| Net asset value, beginning of period | | 10.93 | | 10.89 | | 10.74 | | 10.36 | | 10.28 |
| Investment Operations: | | | | | | | | | | |
| Investment income—net c | | .43 | | .39 | | .37 | | .41 | | .56 |
| Net realized and unrealized | | | | | | | | | | |
| gain (loss) on investments | | (.13) | | .19 | | .24 | | .41 | | .08 |
| Total from Investment Operations | | .30 | | .58 | | .61 | | .82 | | .64 |
| Distributions: | | | | | | | | | | |
| Dividends from investment income—net | | (.51) | | (.50) | | (.41) | | (.44) | | (.56) |
| Dividends from net realized | | | | | | | | | | |
| gain on investments | | (.08) | | (.04) | | (.05) | | — | | — |
| Total Distributions | | (.59) | | (.54) | | (.46) | | (.44) | | (.56) |
| Net asset value, end of period | | 10.64 | | 10.93 | | 10.89 | | 10.74 | | 10.36 |
| |
| |
| |
| |
| |
|
| Total Return (%) | | 2.76 | | 5.43 | | 5.78 | | 8.14 | | 6.24 |
| |
| |
| |
| |
| |
|
| Ratios/Supplemental Data (%): | | | | | | | | | | |
| Ratio of total expenses | | | | | | | | | | |
| to average net assets | | .70 | | .70 | | .70 | | .70 | | .70 |
| Ratio of net investment income | | | | | | | | | | |
| to average net assets | | 3.97 | | 3.61 | | 3.70 | | 3.88 | | 5.34 |
| Portfolio Turnover Rate | | 345.82d | | 315.33d | | 469.41d | | 524.46 | | 477.71 |
| |
| |
| |
| |
| |
|
| Net Assets, end of period ($ X 1,000) | | 1,809 | | 1,926 | | 2,202 | | 3,387 | | 3,595 |
| a | | As of January 1, 2004, the fund has adopted the method of accounting for interim payments on swap contracts in |
| | | accordance with Financial Accounting Standards Board Statement No. 133.These interim payments are reflected |
| | | within net realized and unrealized gain (loss) on swap contracts, however, prior to January 1, 2004, these interim |
| | | payments were reflected within interest income/expense in the Statement of Operations.The effect of these changes for |
| | | the fiscal year ended December 31, 2004, was to decrease net investment income per share by $.02, increase net |
| | | realized and unrealized gain (loss) on investments per share by $.02 and decrease the ratio of net investment income |
| | | to average net assets from 3.74% to 3.61%. |
| b | | As required, effective January 1, 2001, the fund has adopted the provisions of the AICPA Audit and Accounting |
| | | Guide for Investment Companies and began accreting discount or amortizing premium on fixed income securities on a |
| | | scientific basis and including paydown gains and losses in interest income.The effect of this change for the fiscal year |
| | | ended December 31, 2001 was to decrease net investment income per share by $.01, increase net realized and |
| | | unrealized gain (loss) on investments per share by $.01 and decrease the ratio of net investment income to average net |
| | | assets from 5.49% to 5.34%. |
| c | | Based on average shares outstanding at each month end. |
| d | | The portfolio turnover rates excluding mortgage dollar roll transactions for the years ended December 31, 2005, |
| | | December 31, 2004 and December 31, 2003 were 198.52%, 189.68% and 272.57%, respectively. |
| See notes to financial statements. |
NOTES TO FINANCIAL STATEMENTS
NOTE 1—Significant Accounting Policies:
Dreyfus Premier Managed Income Fund (the “fund”) is a separate diversified series of The Dreyfus/Laurel Funds Trust (the “Trust”), which is registered under the Investment Company Act of 1940, as amended (the “Act”), as an open-end management investment company and operates as a series company currently offering five series, including the fund.The fund’s investment objective is to seek high current income consistent with what is believed to be prudent risk of capital primarily through investments in investment-grade corporate and U.S. Government obligations which primarily have maturities of 10 years or less.The Dreyfus Corporation (the “Manager” or “Dreyfus”) serves as the fund’s investment manager. The Manager is a wholly-owned subsidiary of Mellon Financial Corporation (“Mellon Financial”).
Dreyfus Service Corporation (the “Distributor”), a wholly-owned subsidiary of the Manager, is the distributor of the fund’s shares.The fund is authorized to issue an unlimited number of shares of Beneficial Interest in the following classes of shares: Class A, Class B, Class C and Class R. Class A, Class B and Class C shares are sold primarily to retail investors through financial intermediaries and bear a distribution fee and/or service fee. Class A shares are sold with a front-end sales charge, while Class B and Class C shares are subject to a contingent deferred sales charge (“CDSC”). Class B shares automatically convert to Class A shares after six years. Class R shares are sold primarily to bank trust departments and other financial service providers (including Mellon Bank and its affiliates) acting on behalf of customers having a qualified trust or investment account or relationship at such institution, and bear no distribution fee or service fee. Class R shares are offered without a front-end sales charge or CDSC. Each class of shares has identical rights and privileges, except with respect to distribution fees and voting rights on matters affecting a single class. Income, expenses (other than expenses attributable to a specific class), and realized and unrealized gains or losses on investments are allocated to each class of shares based on its relative net assets.
The Fund 35
NOTES TO FINANCIAL STATEMENTS (continued)
|
The fund’s financial statements are prepared in accordance with U.S. generally accepted accounting principles, which may require the use of management estimates and assumptions. Actual results could differ from those estimates.
(a) Portfolio valuation: Investments in securities (excluding short-term investments (other than U.S. Treasury Bills), financial futures, options, swaps and forward currency exchange contracts) are valued each business day by an independent pricing service (the “Service”) approved by the Board of Trustees. Investments for which quoted bid prices are readily available and are representative of the bid side of the market in the judgment of the Service are valued at the mean between the quoted bid prices (as obtained by the Service from dealers in such securities) and asked prices (as calculated by the Service based upon its evaluation of the market for such securities). Other investments (which constitute a majority of the portfolio securities) are valued as determined by the Service, based on methods which include consideration of: yields or prices of securities of comparable quality, coupon, maturity and type; indications as to values from dealers; and general market conditions. Securities for which there are no such valuations are valued at fair value as determined in good faith under the direction of the Board of Trustees. Restricted securities, as well as securities or other assets for which recent market quotations are not readily available and are not valued by a pricing service approved by the Board of Trustees, or are determined by the fund not to reflect accurately fair value (such as when an event occurs after the close of the exchange on which the security is principally traded and that is determined by the fund to have changed the value of the security), are valued at fair value as determined in good faith under the direction of the Board of Trustees.The factors that may be considered when fair valuing a security include fundamental analytical data,the nature and duration of restrictions on disposition, an evaluation of the forces that influence the market in which the securities are purchased and sold and public trading in similar securities of the issuer or comparable issuers. Short-term investments, excluding U.S. Treasury Bills, are carried at amortized cost, which approximates value. Investments in registered investment companies are valued at their net asset value. Financial
futures and options, which are traded on an exchange, are valued at the last sales price on the securities exchange on which such securities are primarily traded or at the last sales price on the national securities market on each business day. Options traded over-the-counter are priced at the mean between the bid and asked prices. Investments denominated in foreign currencies are translated to U.S. dollars at the prevailing rates of exchange. Forward currency exchange contracts are valued at the forward rate. Investments in swap transactions are valued each business day by a pricing service approved by the Board of Trustees. Swaps are valued by the service by using a swap pricing model which incorporates among other factors, default probabilities, recovery rates, credit curves of the underlying issuer and swap spreads on interest rates.
(b) Foreign currency transactions: The fund does not isolate that portion of the results of operations resulting from changes in foreign exchange rates on investments from the fluctuations arising from changes in the market prices of securities held. Such fluctuations are included with the net realized and unrealized gain or loss on investments.
Net realized foreign exchange gains or losses arise from sales and maturities of short-term securities, sales of foreign currencies, currency gains or losses realized on securities transactions and the difference between the amount of dividends, interest and foreign withholding taxes recorded on the fund’s books and the U.S. dollar equivalent of the amounts actually received or paid. Net unrealized foreign exchange gains and losses arise from changes in the value of assets and liabilities other than investments in securities, resulting from changes in exchange rates. Such gains and losses are included with net realized and unrealized gain or loss on investments.
(c) Securities transactions and investment income: Securities transactions are recorded on a trade date basis. Realized gain and loss from securities transactions are recorded on the identified cost basis. Dividend income is recorded on the ex-dividend date and interest income, including, where applicable, accretion of discount and amortization of premium on investments, is recognized on the accrual basis.
The Fund 37
NOTES TO FINANCIAL STATEMENTS (continued)
|
Pursuant to a securities lending agreement with Mellon Bank, N.A., an affiliate of the Manager, the fund may lend securities to qualified institutions.At origination, all loans are secured by collateral of at least 102% of the value of U.S. securities loaned and 105% of the value of foreign securities loaned. Collateral equivalent to at least 100% of the market value of securities on loan will be maintained at all times. Cash collateral is invested in certain money market mutual funds managed by the Manager. The fund will be entitled to receive all income on securities loaned, in addition to income earned as a result of the lending transaction. Although each security loaned is fully collateralized, the fund would bear the risk of delay in recovery of, or loss of rights in, the securities loaned should a borrower fail to return the securities in a timely manner.
(d) Affiliated issuers: Investments in other investment companies advised by the Manager are defined as “affiliated” in the Act.
(e) Concentration of Risk: The fund invests primarily in debt securities. Failure of an issuer of the debt securities to make timely interest or principal payments, or a decline or the perception of a decline in the credit quality of a debt security, can cause the debt security’s price to fall, potentially lowering the fund’s share price. In addition the value of debt securities may decline due to general market conditions that are not specifically related to a particular company, such as real or perceived adverse economic conditions, changes in outlook for corporate earnings, changes in interest or currency rates or adverse investor sentiment.They may also decline because of factors that affect a particular industry.
(f) Dividends to shareholders: It is the policy of the fund to declare dividends daily from investment income-net. Such dividends are paid monthly. Dividends from net realized capital gain, if any, are normally declared and paid annually, but the fund may make distributions on a more frequent basis to comply with the distribution requirements of the Internal Revenue Code of 1986, as amended (the “Code”).To the extent that net realized capital gain can be offset by capital loss carryovers, it is the policy of the fund not to distribute such gain.
(g) Federal income taxes: It is the policy of the fund to continue to qualify as a regulated investment company, if such qualification is in the best interests of its shareholders, by complying with the applicable provisions of the Code, and to make distributions of taxable income sufficient to relieve it from substantially all federal income and excise taxes.
At December 31, 2005, the components of accumulated earnings on a tax basis were as follows: undistributed ordinary income $111,518, accumulated capital losses $7,122,182 and unrealized depreciation $584,671. In addition, the fund had $157,033 of capital losses realized after October 31, 2005, which were deferred for tax purposes to the first day of the following fiscal year.
The accumulated capital loss carryover is available to be applied against future net securities profits, if any, realized subsequent to December 31, 2005. If not applied, $4,281,545 of the carryover expires in fiscal 2007 and $2,840,637 expires in fiscal 2008.
The tax character of distributions paid to shareholders during the fiscal periods ended December 31, 2005 and December 31, 2004 were as follows: ordinary income $2,620,229 and $2,498,672, respectively.
During the period ended December 31, 2005, as a result of permanent book to tax differences, primarily due to the tax treatment for amortization of premiums, treasury inflation protected securities, paydown gains and losses and foreign currency transactions, the fund increased accumulated undistributed investment income-net by $476,072, decreased accumulated net realized gain (loss) on investments by $479,009 and increased paid-in capital by $2,937. Net assets were not affected by this reclassification.
NOTE 2—Bank Line of Credit:
|
The fund participates with other Dreyfus-managed funds in a $350 million redemption credit facility (the “Facility”) to be utilized for temporary or emergency purposes, including the financing of redemptions. In connection therewith, the fund has agreed to pay commitment fees on its pro rata portion of the Facility. Interest is charged to the fund
The Fund 39
NOTES TO FINANCIAL STATEMENTS (continued)
|
based on prevailing market rates in effect at the time of borrowing. During the period ended December 31, 2005, the fund did not borrow under the Facility.
NOTE 3—Investment Management Fee and Other Transactions With Affiliates:
(a) Pursuant to an Investment Management agreement with the Manager, the Manager provides or arranges for one or more third parties and/or affiliates to provide investment advisory, administrative, custody, fund accounting and transfer agency services to the fund.The Manager also directs the investments of the fund in accordance with its investment objective, policies and limitations. For these services, the fund is contractually obligated to pay the Manager a fee, calculated daily and paid monthly, at the annual rate of .70% of the value of the fund’s average daily net assets. Out of its fee, the Manager pays all of the expenses of the fund except brokerage fees, taxes, interest, commitment fees, Rule 12b-1 distribution fees and expenses, service fees, fees and expenses of non-interested Trustees (including counsel fees) and extraordinary expenses. In addition, the Manager is required to reduce its fee in an amount equal to the fund’s allocable portion of fees and expenses of the non-interested Trustees (including counsel fees). Effective October 1, 2005, each Trustee receives $45,000 per year, plus $6,000 for each joint Board meeting of The Dreyfus/Laurel Funds, Inc., The Dreyfus/Laurel Tax-Free Municipal Funds, and the Trust (collectively the “Dreyfus/Laurel Funds”) attended, $2,000 for separate in-person committee meetings attended which are not held in conjunction with a regularly scheduled Board meeting and $1,500 for Board meetings and separate committee meetings attended that are conducted by telephone and is reimbursed for travel and out-of-pocket expenses.With respect to Board meetings, the Chairman of the Board receives an additional 25% of such compensation (with the exception of reimbursable amounts). With respect to compensation committee meetings, the Chair of the compensation committee receives $900 per meeting and, with respect to audit committee meetings, the Chair of the audit committee receives $1,350 per meeting. In the event that there is an in-person joint committee meeting or joint
telephone meeting of the Dreyfus/Laurel Funds and the Dreyfus High Yield Strategies Fund, the $2,000 or $1,500 fee, as applicable, will be allocated between the Dreyfus/Laurel Funds and the Dreyfus High Yield Strategies Fund. Prior to October 1, 2005, each Trustee received $40,000 per year, plus $5,000 for each joint Board meeting of the Dreyfus/Laurel Funds attended, $2,000 for separate committee meetings attended which were not held in conjunction with a regularly scheduled Board meeting and $500 for Board meetings and separate committee meetings attended that were conducted by telephone and was reimbursed for travel and out-of-pocket expenses.The Chairman of the Board received an additional 25% of such compensation (with the exception of reimbursable amounts). In the event that there was a joint committee meeting of the Dreyfus/Laurel Funds and Dreyfus High Yield Strategies Fund, the $2,000 fee was allocated between the Dreyfus/Laurel Funds and Dreyfus High Yield Strategies Fund.These fees and expenses are charged and allocated to each series based on net assets. Amounts required to be paid by the Trust directly to the non-interested Trustees, that would be applied to offset a portion of the management fee payable to the Manager, are in fact paid directly by the Manager to the non-interested Trustees.
During the period ended December 31, 2005, the Distributor retained $6,370 from commissions earned on sales of the fund’s Class A shares and $12,276 and $13 from contingent deferred sales charges on redemptions on the fund’s Class B and Class C shares, respectively.
(b) Under separate Distribution Plans (the “Plans”) adopted pursuant to Rule 12b-1 under the Act, Class A shares pay annually up to .25% of the value of the average daily net assets to compensate the Distributor for shareholder servicing activities and expenses primarily intended to result in the sale of Class A shares. Class B and Class C shares may pay the Distributor for distributing their shares at an aggregate annual rate of .75% of the value of the average daily net assets of Class B and Class C shares. Class B and Class C shares are also subject to a service plan adopted pursuant to Rule 12b-1 (the “Service Plan”), under which Class B and Class C shares pay the Distributor for providing certain ser-
The Fund 41
NOTES TO FINANCIAL STATEMENTS (continued)
|
vices to the holders of their shares a fee at the annual rate of .25% of the value of the average daily net assets of Class B and Class C shares. During the period ended December 31, 2005, Class A, Class B and Class C shares were charged $108,606, $36,663 and $12,304, respectively, pursuant to their respective Plans. Class B and Class C shares were charged $12,221 and $4,101, respectively, pursuant to the Service Plan.
Under its terms, the Plans and Service Plan shall remain in effect from year to year, provided such continuance is approved annually by a vote of majority of those Trustees who are not “interested persons” of the Trust and who have no direct or indirect financial interest in the operation of or in any agreement related to the Plans or Service Plan.
The components of Due to The Dreyfus Corporation and affiliates in the Statement of Assets and Liabilities consist of: management fees $25,431, Rule 12b-1 distribution plan fees $12,831 and shareholder services plan fees $1,168.
(c) The Trust and the Manager have received an exemptive order from the SEC which, among other things, permits the fund to use cash collateral received in connection with lending the fund’s securities to purchase shares of one or more registered money market mutual funds advised by the Manager in excess of the limitations imposed by the Act.
NOTE 4—Securities Transactions:
|
The aggregate amount of purchases and sales (including paydowns) of investment securities, excluding short-term securities, forward currency exchange contracts, futures, options and swap transactions during the period ended December 31, 2005, amounted to $202,076,657 and $203,134,647, respectively, of which $86,072,929 in purchases and $86,187,582 in sales were from mortgage dollar roll transactions.
A mortgage dollar roll transaction involves a sale by the fund of mortgage related securities that it holds with an agreement by the fund to repurchase similar securities at an agreed upon price and date. The securities purchased will bear the same interest rate as those sold, but generally will be collateralized by pools of mortgages with different prepayment histories than those securities sold.
The fund may purchase and write (sell) call/put options in order to gain exposure to or protect against change in the market.
As a writer of call options, the fund receives a premium at the outset and then bears the market risk of unfavorable changes in the price of the financial instruments underlying the options. Generally, the fund would incur a gain, to the extent of the premium, if the price of the underlying financial instrument decreases between the date the option is written and the date on which the option is terminated. Generally, the fund would realize a loss, if the price of the financial instrument increases between those dates.
As a writer of put options, the fund receives a premium at the outset and then bears the market risk of favorable changes in the price of the financial instruments underlying the options. Generally, the fund would incur a gain, to the extent of the premium, if the price of the underlying financial instrument increases between the date the option is written and the date on which the option is terminated. Generally, the fund would realize a loss, if the price of the financial instrument decreases between those dates.
In addition, the following table summarizes the fund’s call/put options written during the period ended December 31, 2005:
| | | Face Amount | | | | Options Terminated |
| | | | | |
|
| | | Covered by | | Premiums | | | | Net Realized |
| Options Written: | | Contracts ($) | | Received ($) | | Cost ($) | | Gain/(Loss) ($) |
| |
| |
| |
| |
|
| Contracts outstanding | | | | | | | | |
| December 31, 2004 | | 2,180,000 | | 15,498 | | — | | — |
| Contracts written | | 41,112,000 | | 124,363 | | | | |
| Contracts Terminated; | | | | | | | | |
| Closed | | 12,950,000 | | 32,008 | | 40,508 | | (8,500) |
| Expired | | 13,090,000 | | 65,411 | | — | | 65,411 |
| Total Contracts | | | | | | | | |
| Terminated | | 26,040,000 | | 97,419 | | 40,508 | | 56,911 |
| Contracts outstanding | | | | | | | | |
| December 31, 2005 | | 17,252,000 | | 42,442 | | | | |
The fund may invest in financial futures contracts in order to gain exposure to or protect against changes in the market. The fund is exposed to market risk as a result of changes in the value of the under-
The Fund 43
NOTES TO FINANCIAL STATEMENTS (continued)
|
lying financial instruments. Investments in financial futures require the fund to “mark to market” on a daily basis, which reflects the change in the market value of the contracts at the close of each day’s trading. Accordingly, variation margin payments are received or made to reflect daily unrealized gains or losses.When the contracts are closed, the fund recognizes a realized gain or loss.These investments require initial margin deposits with a broker.The amount of these deposits is determined by the exchange or Board of Trade on which the contract is traded and is subject to change. Contracts open at December 31, 2005 are set forth in the Statement of Financial Futures.
The fund enters into forward currency exchange contracts in order to hedge its exposure to changes in foreign currency exchange rates on its foreign portfolio holdings and to settle foreign currency transactions. When executing forward currency exchange contracts, the fund is obligated to buy or sell a foreign currency at a specified rate on a certain date in the future.With respect to sales of forward currency exchange contracts, the fund would incur a loss if the value of the contract increases between the date the forward contract is opened and the date the forward contract is closed.The fund realizes a gain if the value of the contract decreases between those dates.With respect to purchases of forward currency exchange contracts, the fund would incur a loss if the value of the contract decreases between the date the forward contract is opened and the date the forward contract is closed.The fund realizes a gain if the value of the contract increases between those dates. The fund is also exposed to credit risk associated with counterparty nonperformance on these forward currency exchange contracts which is typically limited to the unrealized gain on each open contract. The following summarizes open forward currency exchange contracts at December 31, 2005:
| | | Foreign | | | | | | |
| Forward Currency | | Currency | | | | | | Unrealized |
| Exchange Contracts | | Amounts | | Proceeds ($) | | Value ($) | | Appreciation ($) |
| |
| |
| |
| |
|
| Sales: | | | | | | | | |
| Euro, expiring | | | | | | | | |
| 3/15/2006 | | 282,500 | | 340,992 | | 335,469 | | 5,523 |
| Swiss Franc, | | | | | | | | |
| expiring 3/15/2006 | | 490,000 | | 382,484 | | 375,134 | | 7,350 |
| Total | | | | | | | | 12,873 |
The fund may enter into swap agreements to exchange the interest rate on, or return generated by, one nominal instrument for the return generated by another nominal instrument.
The fund accrues for the interim payments on swap contracts on a daily basis, with the net amount recorded within unrealized appreciation (depreciation) of swap contracts in the Statement of Assets and Liabilities. Once the interim payments are settled in cash, the net amount is recorded as realized gain (loss) on swaps, in addition to realized gain (loss) recorded upon the termination of swaps contracts in the Statement of Operations. Fluctuations in the value of swap contracts are recorded as a component of net change in unrealized appreciation (depreciation) on investments.
The fund may enter into interest rate swaps which involve the exchange of commitments to pay and receive interest based on a notional principal amount. The following summarizes interest rate swaps entered into by the fund at December 31, 2005:
| | | | | Unrealized |
| | | | | Appreciation |
| Notional Amount ($) | | Description | | (Depreciation) ($) |
| |
| |
|
| 270,000 | | Interest Rate Swap Agreement with Lehman | | (7,268) |
| | | Brothers terminating December 2, 2009 | | |
| | | to pay 1 month LIBOR and receive a | | |
| | | fixed rate of 4.097% | | |
| 1,281,000 | | Interest Rate Swap Agreement with | | (18,138) |
| | | Merrill Lynch terminating May 13, 2008 | | |
| | | to pay 3 month LIBOR and receive a | | |
| | | fixed rate of 4.1725% | | |
| 1,281,000 | | Interest Rate Swap Agreement with | | 23,812 |
| | | Merrill Lynch terminating May 13, 2015 | | |
| | | to receive 3 month LIBOR and pay a | | |
| | | fixed rate of 4.6425% | | |
| | | | | (1,594) |
Credit default swaps involve commitments to pay or receive a fixed interest rate in exchange for payment if a credit event affecting a third party (the referenced company) occurs. Credit events may include a failure to pay interest or principal, bankruptcy, or restructuring. For those credit default swaps in which the fund is receiving a fixed rate, the fund is providing credits protection on the underlying instrument.
The Fund 45
NOTES TO FINANCIAL STATEMENTS (continued)
|
The maximum payouts for these contracts are limited to the notional amount of each swap. The following summarizes open credit default swap agreements at December 31, 2005:
| | | | | Unrealized |
| | | | | Appreciation |
| Notional Amount ($) | | Description | | (Depreciation) ($) |
| |
| |
|
| 80,000 | | Agreement with Bear Stearns terminating | | (747) |
| June 20, 2010 to pay a fixed rate of .415% |
| and receive the notional amount as a result of |
| interest payment default totaling $1,000,000 |
| or principal payment default of $10,000,000 |
| | | on Alcoa, 6%, 1/15/2012 | | |
| 177,000 | | Agreement with Bear Stearns terminating | | (2,410) |
| | | June 20, 2010 to pay a fixed rate of .52% | | |
| and receive the notional amount as a result of |
| interest payment default totaling $1,000,000 |
| or principal payment default of $10,000,000 |
| | | on Alcoa, 6.5%, 6/1/2011 | | |
| 58,000 | | Agreement with Morgan Stanley terminating | | (132) |
| | | September 20, 2015 to pay a fixed rate of | | |
| | | 1.15% and receive the notional amount as | | |
| | | a result of interest payment default totaling | | |
| | | $1,000,000 or principal payment default of | | |
| | | $10,000,000 on CenturyTel, | | |
| | | 7.875%, 8/15/2012 | | |
| 198,000 | | Agreement with Citibank terminating | | (595) |
| | | September 20, 2015 to pay a fixed rate of | | |
| | | 1.16% and receive the notional amount as | | |
| | | a result of interest payment default totaling | | |
| | | $1,000,000 or principal payment default | | |
| | | of $10,000,000 on CenturyTel, | | |
| | | 7.875%, 8/15/2012 | | |
| 257,000 | | Agreement with Bear Stearns terminating | | (988) |
| | | June 20, 2010 to pay a fixed rate of .31% | | |
| and receive the notional amount as a result of |
| interest payment default totaling $1,000,000 |
| or principal payment default of $10,000,000 |
| | | on ConocoPhillips, 4.75%, 10/15/2012 | | |
| 1,520,000 | | Agreement with Goldman Sachs terminating | | 611 |
| March 20, 2006 to receive a fixed rate of .2% |
| | | and pay the notional amount as a result of | | |
| interest payment default totaling $1,000,000 |
| or principal payment default of $10,000,000 |
| on Consolidated Natural Gas, 6%, 10/15/2010 |
| 63,000 | | Agreement with J.P. Morgan Chase & Co. | | 4,457 |
| | | terminating September 20, 2010 to pay a | | |
| fixed rate of 1.07% and receive the notional |
| | | amount as a result of interest payment | | |
| | | default totaling $1,000,000 or principal | | |
| | | payment default of $10,000,000 on | | |
| Cooper Tire & Rubber, 7.75%, 12/15/2009 |
| | | | | | | Unrealized |
| | | | | | | Appreciation |
| Notional Amount ($) | | Description | | (Depreciation) ($) |
| |
| |
|
| 230,000 | | Agreement with Morgan Stanley terminating | | | | (3,847) |
| June 20, 2010 to pay a fixed rate of .685% |
| and receive the notional amount as a result of |
| interest payment default totaling $1,000,000 |
| or principal payment default of $10,000,000 |
| | | on Dow Jones CDX.NA.IG.4 | | | | |
| 240,000 | | Agreement with Citigroup terminating | | | | (4,062) |
| June 20, 2010 to pay a fixed rate of .685% |
| and receive the notional amount as a result of |
| interest payment default totaling $1,000,000 |
| or principal payment default of $10,000,000 |
| | | on Dow Jones CDX.NA.IG.4 | | | | |
| 355,000 | | Agreement with Citigroup terminating | | | | (6,296) |
| June 20, 2010 to pay a fixed rate of .705% |
| and receive the notional amount as a result of |
| interest payment default totaling $1,000,000 |
| or principal payment default of $10,000,000 |
| | | on Dow Jones CDX.NA.IG.4 | | | | |
| 269,300 | | Agreement with Merrill Lynch terminating | | | | (463) |
| June 20, 2010 to pay a fixed rate of .305% |
| and receive the notional amount as a result of |
| interest payment default totaling $1,000,000 |
| or principal payment default of $10,000,000 |
| | | on Dow Jones CDX.NA.IG.4 | | | | |
| 427,700 | | Agreement with Morgan Stanley terminating | | | | (1,298) |
| June 20, 2010 to pay a fixed rate of .35% |
| and receive the notional amount as a result of |
| interest payment default totaling $1,000,000 |
| or principal payment default of $10,000,000 |
| | | on Dow Jones CDX.NA.IG.4 | | | | |
| 129,000 | | Agreement with Morgan Stanley terminating | | | | (3,042) |
| September 20, 2006 to receive a fixed rate of |
| 2% and pay the notional amount as a result of |
| interest payment default totaling $1,000,000 |
| or principal payment default of $10,000,000 |
| | | on GMAC, 6.875%, 8/28/2012 | | | | |
| 270,000 | | Agreement with Bear Stearns terminating | | | | (1,010) |
| | | December 20, 2014 to pay a fixed rate of | | | | |
| .18% and receive the notional amount as a |
| | | result of interest payment default totaling | | | | |
| $1,000,000 or principal payment default of |
| $10,000,000 on HSBC Bank, 5%, 4/12/2006 |
| 80,000 | | Agreement with Morgan Stanley terminating | | | | 331 |
| | | December 20, 2010 to pay a fixed rate of | | | | |
| .77% and receive the notional amount as a |
| | | result of interest payment default totaling | | | | |
| | | $1,000,000 or principal payment | | | | |
| | | default of $10,000,000 on | | | | |
| | | Koninklijke KPN, 8%, 10/1/2010 | | | | |
| |
| |
| | | The Fund | | 47 |
NOTES TO FINANCIAL STATEMENTS (continued)
|
| | | | | Unrealized |
| | | | | Appreciation |
| Notional Amount ($) | | Description | | (Depreciation) ($) |
| |
| |
|
| 161,000 | | Agreement with Lehman Brothers | | 456 |
| | | terminating December 20, 2010 to pay | | |
| | | a fixed rate of .8% and receive the | | |
| | | notional amount as a result of interest | | |
| | | payment default totaling $1,000,000 or | | |
| | | principal payment default of $10,000,000 | | |
| | | on Koninklijke KPN, 8%, 10/1/2010 | | |
| 341,000 | | Agreement with Citigroup terminating | | (6,425) |
| | | June 20, 2015 to pay a fixed rate of .62% | | |
| | | and receive the notional amount as a | | |
| | | result of interest payment default totaling | | |
| | | $1,000,000 or principal payment default of | | |
| | | $10,000,000 on Morgan Stanley, | | |
| | | 6.6%, 4/1/2012 | | |
| 269,000 | | Agreement with Lehman Brothers | | 940 |
| | | terminating December 20, 2009 to receive | | |
| | | a fixed rate of .47% and pay the notional | | |
| | | amount as a result of interest payment | | |
| | | default totaling $1,000,000 or principal | | |
| | | payment default of $10,000,000 on | | |
| | | News America, 7.25%, 5/18/2018 | | |
| 120,000 | | Agreement with Bear Stearns terminating | | (69) |
| | | June 20, 2010 to pay a fixed rate of .4% | | |
| | | and receive the notional amount as a | | |
| | | result of interest payment default totaling | | |
| | | $1,000,000 or principal payment default of | | |
| $10,000,000 on Nucor, 4.875%, 10/1/2012 |
| 224,875 | | Agreement with Morgan Stanley terminating | | 1,316 |
| | | May 20, 2006 to receive a fixed rate of 2% | | |
| | | and pay the notional amount as a result of | | |
| interest payment default totaling $1,000,000 |
| or principal payment default of $10,000,000 |
| on Republic of Argentina, 3.01%, 8/3/2012 |
| 161,000 | | Agreement with J.P. Morgan Chase & Co. | | 453 |
| terminating December 20, 2010 to receive a |
| | | fixed rate of 1.5% and pay the notional | | |
| | | amount as a result of interest payment | | |
| | | default totaling $1,000,000 or principal | | |
| | | payment default of $10,000,000 on | | |
| | | Republic of Panama, 8.875%, 9/30/2027 | | |
| 161,000 | | Agreement with J.P. Morgan Chase & Co. | | 3,109 |
| | | terminating December 20, 2010 to pay a | | |
| | | fixed rate of 1.7% and receive the notional | | |
| | | amount as a result of interest payment | | |
| | | default totaling $1,000,000 or principal | | |
| | | payment default of $10,000,000 on | | |
| | | Republic of Peru, 8.75%, 11/21/2033 | | |
| | | | | Unrealized |
| | | | | Appreciation |
| Notional Amount ($) | | Description | | (Depreciation) ($) |
| |
| |
|
| 270,000 | | Agreement with Bear Stearns terminating | | 1,582 |
| December 20, 2014 to receive a fixed rate of |
| | | .53% and pay the notional amount as a | | |
| | | result of interest payment default totaling | | |
| | | $1,000,000 or principal payment default of | | |
| | | $10,000,000 on Washington Mutual, | | |
| | | 4%, 1/15/2009 | | |
| 124,000 | | Agreement with Citigroup terminating | | 659 |
| | | March 20, 2015 to receive a fixed rate of | | |
| | | .53% and pay the notional amount as a | | |
| | | result of interest payment default totaling | | |
| | | $1,000,000 or principal payment default of | | |
| | | $10,000,000 on Washington Mutual, | | |
| | | 4%, 1/15/2009 | | |
| 210,000 | | Agreement with Morgan Stanley terminating | | 2,649 |
| | | December 20, 2015 to pay a fixed rate of | | |
| | | .97% and receive the notional amount as a | | |
| | | result of interest payment default totaling | | |
| | | $1,000,000 or principal payment default of | | |
| $10,000,000 on Wendy’s, 6.25%, 11/15/2011 |
| | | | | (14,821) |
Risks may arise upon entering into these agreements from the potential inability of the counterparties to meet the terms of the agreement and are generally limited to the amount of net payments to be received, if any, at the date of default.
At December 31, 2005, the cost of investments for federal income tax purposes was $60,814,064; accordingly, accumulated net unrealized depreciation on investments was $548,100, consisting of $361,481 gross unrealized appreciation and $909,581 gross unrealized depreciation.
The Fund 49
REPORT OF INDEPENDENT REGISTERED PUBLIC ACCOUNTING FIRM
The Board of Trustees and Shareholders The Dreyfus/Laurel Funds Trust:
We have audited the accompanying statement of assets and liabilities of Dreyfus Premier Managed Income Fund (the “Fund”) of The Dreyfus/Laurel Funds Trust including the statements of investments, financial futures and options written as of December 31, 2005, and the related statement of operations for the year then ended, the statement of changes in net assets for each of the years in the two-year period then ended, and the financial highlights for each of the years in the five-year period then ended. These financial statements and financial highlights are the responsibility of the Fund’s management. Our responsibility is to express an opinion on these financial statements and financial highlights based on our audits.
We conducted our audits in accordance with the standards of the Public Company Accounting Oversight Board (United States).Those standards require that we plan and perform the audit to obtain reasonable assurance about whether the financial statements and financial highlights are free of material misstatement. An audit includes examining, on a test basis, evidence supporting the amounts and disclosures in the financial statements. Our procedures included confirmation of securities owned as of December 31, 2005, by correspondence with the custodian and brokers, or by other appropriate auditing procedures where replies from brokers were not received.An audit also includes assessing the accounting principles used and significant estimates made by management, as well as evaluating the overall financial statement presentation.We believe that our audits provide a reasonable basis for our opinion.
In our opinion, the financial statements and financial highlights referred to above present fairly, in all material respects, the financial position of Dreyfus Premier Managed Income Fund of The Dreyfus/Laurel Funds Trust as of December 31, 2005, and the results of its operations for the year then ended, the changes in its net assets for each of the years in the two-year period then ended, and the financial highlights for each of the years in the five-year period then ended, in conformity with U.S. generally accepted accounting principles.
New York, New York
February 17, 2006
|

IMPORTANT TAX INFORMATION (Unaudited)
In accordance with federal tax law, the fund hereby designates 1.10% of the ordinary dividends paid during the fiscal year ended December 31, 2005 as qualifying for the corporate dividends received deduction. For the fiscal year ended December 31, 2005, certain dividends paid by the fund may be subject to a maximum tax rate of 15%, as provided for by the Jobs and Growth Tax Relief Reconciliation Act of 2003. Of the distributions paid during the fiscal year, $3,063 represents the maximum amount that may be considered qualified dividend income. Shareholders will receive notification in January 2006 of the percentage applicable to the preparation of their 2005 income tax returns. Also the fund designates 87.84% of ordinary income dividends paid during the fiscal year ended December 31, 2005 as qualifying “interest related dividends”.
The Fund 51
BOARD MEMBERS INFORMATION (Unaudited)
| Joseph S. DiMartino (62) |
| Chairman of the Board (1999) |
| Principal Occupation During Past 5 Years: |
| • Corporate Director and Trustee |
| Other Board Memberships and Affiliations: |
| • The Muscular Dystrophy Association, Director |
| • Levcor International, Inc., an apparel fabric processor, Director |
| • Century Business Services, Inc., a provider of outsourcing functions for small and medium size |
| companies, Director |
| • The Newark Group, a provider of a national market of paper recovery facilities, paperboard |
| mills and paperboard converting plants, Director |
| • Sunair Services Corporation, engages in the design, manufacture and sale of high frequency |
| systems for long-range voice and data communications, as well as providing certain outdoor- |
| related services to homes and businesses, Director |
| No. of Portfolios for which Board Member Serves: 193 |
| ——————— |
| James Fitzgibbons (71) |
| Board Member (1994) |
| Principal Occupation During Past 5 Years: |
| • Chairman of the Board, Davidson Cotton Company (1998-2002) |
| Other Board Memberships and Affiliations: |
| • Bill Barrett Company, an oil and gas exploration company, Director |
| No. of Portfolios for which Board Member Serves: 23 |
| ——————— |
| J. Tomlinson Fort (77) |
| Board Member (1987) |
| Principal Occupation During Past 5 Years: |
| • Retired; Of Counsel, Reed Smith LLP (1998-2004) |
| Other Board Memberships and Affiliations: |
| • Allegheny College, Emeritus Trustee |
| • Pittsburgh Ballet Theatre,Trustee |
| • American College of Trial Lawyers, Fellow |
| No. of Portfolios for which Board Member Serves: 23 |
| ——————— |
| Kenneth A. Himmel (59) |
| Board Member (1994) |
| Principal Occupation During Past 5 Years: |
| • President and CEO,Related Urban Development,a real estate development company (1996-present) |
| • President and CEO, Himmel & Company, a real estate development company (1980-present) |
| • CEO, American Food Management, a restaurant company (1983-present) |
| No. of Portfolios for which Board Member Serves: 23 |
| 52 |
| Stephen J. Lockwood (58) |
| Board Member (1994) |
| Principal Occupation During Past 5 Years: |
| • Chairman of the Board, Stephen J. Lockwood and Company LLC, an investment company |
| (2000-present) |
| • Chairman of the Board and CEO, LDG Reinsurance Corporation (1977-2000) |
| Other Board Memberships and Affiliations: |
| • BDML Holdings, an insurance company, Chairman of the Board |
| • Affiliated Managers Group, an investment management company, Director |
| No. of Portfolios for which Board Member Serves: 23 |
| ——————— |
| Roslyn Watson (56) |
| Board Member (1994) |
| Principal Occupation During Past 5 Years: |
| • Principal,Watson Ventures, Inc., a real estate investment company (1993-present) |
| Other Board Memberships and Affiliations: |
| • American Express Centurion Bank, Director |
| • The Hyams Foundation Inc., a Massachusetts Charitable Foundation,Trustee |
| • National Osteoporosis Foundation,Trustee |
| No. of Portfolios for which Board Member Serves: 23 |
| ——————— |
| Benaree Pratt Wiley (59) |
| Board Member (1998) |
| Principal Occupation During Past 5 Years: |
| • President and CEO,The Partnership, an organization dedicated to increasing the |
| representation of African Americans in positions of leadership, influence and |
| decision-making in Boston, MA (1991-present) |
| Other Board Memberships and Affiliations: |
| • Boston College, Associate Trustee |
| • The Greater Boston Chamber of Commerce, Director |
| • Mass. Development, Director |
| • Commonwealth Institute, Director |
| • Efficacy Institute, Director |
| • PepsiCo African-American, Advisory Board |
| • The Boston Foundation, Director |
| • Harvard Business School Alumni Board, Director |
| No. of Portfolios for which Board Member Serves: 23 |
| ——————— |
| Once elected all Board Members serve for an indefinite term.The address of the Board Members and Officers is in c/o |
| The Dreyfus Corporation, 200 Park Avenue, New York, New York 10166. Additional information about the Board |
| Members is available in the fund’s Statement of Additional Information which can be obtained from Dreyfus free of |
| charge by calling this toll free number: 1-800-554-4611. |
| Francis P. Brennan, Emeritus Board Member |
| The Fund 53 |
OFFICERS OF THE FUND (Unaudited)
| STEPHEN E. CANTER, President since |
| March 2000. |
Chairman of the Board, Chief Executive Officer and Chief Operating Officer of the Manager, and an officer of 90 investment companies (comprised of 184 portfolios) managed by the Manager. Mr. Canter also is a Board member and, where applicable, an Executive Committee Member of the other investment management subsidiaries of Mellon Financial Corporation, each of which is an affiliate of the Manager. He is 60 years old and has been an employee of the Manager since May 1995.
| STEPHEN R. BYERS, Executive Vice |
| President since November 2002. |
Chief Investment Officer,Vice Chairman and a director of the Manager, and an officer of 90 investment companies (comprised of 184 portfolios) managed by the Manager. Mr. Byers also is an officer, director or an Executive Committee Member of certain other investment management subsidiaries of Mellon Financial Corporation, each of which is an affiliate of the Manager. He is 52 years old and has been an employee of the Manager since January 2000.
| MARK N. JACOBS, Vice President since |
| March 2000. |
Executive Vice President, Secretary and General Counsel of the Manager, and an officer of 91 investment companies (comprised of 200 portfolios) managed by the Manager. He is 59 years old and has been an employee of the Manager since June 1977.
| MICHAEL A. ROSENBERG, Vice President |
| and Secretary since August 2005. |
Associate General Counsel of the Manager, and an officer of 91 investment companies (comprised of 200 portfolios) managed by the Manager. He is 45 years old and has been an employee of the Manager since October 1991.
| JAMES BITETTO, Vice President and |
| Assistant Secretary since August 2005. |
Assistant General Counsel and Assistant Secretary of the Manager, and an officer of 91 investment companies (comprised of 200 portfolios) managed by the Manager. He is 39 years old and has been an employee of the Manager since December 1996.
| JONI LACKS CHARATAN, Vice President |
| and Assistant Secretary since |
| August 2005. |
Associate General Counsel of the Manager, and an officer of 91 investment companies (comprised of 200 portfolios) managed by the Manager. She is 50 years old and has been an employee of the Manager since October 1988.
| JOSEPH M. CHIOFFI, Vice President and |
| Assistant Secretary since August 2005. |
Assistant General Counsel of the Manager, and an officer of 91 investment companies (comprised of 200 portfolios) managed by the Manager. He is 44 years old and has been an employee of the Manager since June 2000.
| JANETTE E. FARRAGHER, Vice President |
| and Assistant Secretary since |
| August 2005. |
Associate General Counsel of the Manager, and an officer of 91 investment companies (comprised of 200 portfolios) managed by the Manager. She is 43 years old and has been an employee of the Manager since February 1984.
| JOHN B. HAMMALIAN, Vice President and |
| Assistant Secretary since August 2005. |
Associate General Counsel of the Manager, and an officer of 91 investment companies (comprised of 200 portfolios) managed by the Manager. He is 42 years old and has been an employee of the Manager since February 1991.
| ROBERT R. MULLERY, Vice President and |
| Assistant Secretary since August 2005. |
Associate General Counsel of the Manager, and an officer of 91 investment companies (comprised of 200 portfolios) managed by the Manager. He is 53 years old and has been an employee of the Manager since May 1986.
| JEFF PRUSNOFSKY, Vice President and |
| Assistant Secretary since August 2005. |
Associate General Counsel of the Manager, and an officer of 91 investment companies (comprised of 200 portfolios) managed by the Manager. He is 40 years old and has been an employee of the Manager since October 1990.
| JAMES WINDELS, Treasurer since |
| November 2001. |
Director – Mutual Fund Accounting of the Manager, and an officer of 91 investment companies (comprised of 200 portfolios) managed by the Manager. He is 47 years old and has been an employee of the Manager since April 1985.
| ERIK D. NAVILOFF, Assistant Treasurer |
| since December 2002. |
Senior Accounting Manager – Taxable Fixed Income Funds of the Manager, and an officer of 91 investment companies (comprised of 200 portfolios) managed by the Manager. He is 37 years old and has been an employee of the Manager since November 1992.
| ROBERT ROBOL, Assistant Treasurer |
| since August 2005. |
Senior Accounting Manager – Money Market and Municipal Bond Funds of the Manager, and an officer of 91 investment companies (comprised of 200 portfolios) managed by the Manager. He is 41 years old and has been an employee of the Manager since October 1988.
| ROBERT SVAGNA, Assistant Treasurer |
| since December 2002. |
Senior Accounting Manager – Equity Funds of the Manager, and an officer of 91 investment companies (comprised of 200 portfolios) managed by the Manager. He is 38 years old and has been an employee of the Manager since November 1990.
| GAVIN C. REILLY, Assistant Treasurer |
| since December 2005. |
Tax Manager of the Investment Accounting and Support Department of the Manager, and an officer of 91 investment companies (comprised of 200 portfolios) managed by the Manager. He is 37 years old and has been an employee of the Manager since April 1991.
| JOSEPH W. CONNOLLY, Chief Compliance |
| Officer since October 2004. |
Chief Compliance Officer of the Manager and The Dreyfus Family of Funds (91 investment companies, comprised of 200 portfolios). From November 2001 through March 2004, Mr. Connolly was first Vice-President, Mutual Fund Servicing for Mellon Global Securities Services. In that capacity, Mr. Connolly was responsible for managing Mellon’s Custody, Fund Accounting and Fund Administration services to third-party mutual fund clients. He is 48 years old and has served in various capacities with the Manager since 1980, including manager of the firm’s Fund Accounting Department from 1997 through October 2001.
| WILLIAM GERMENIS, Anti-Money |
| Laundering Compliance Officer since |
| July 2002. |
Vice President and Anti-Money Laundering Compliance Officer of the Distributor, and the Anti-Money Laundering Compliance Officer of 87 investment companies (comprised of 196 portfolios) managed by the Manager. He is 35 years old and has been an employee of the Distributor since October 1998.
The Fund 55
NOTES
| Dreyfus Premier |
| Managed Income Fund |
| 200 Park Avenue |
| New York, NY 10166 |
| |
| Manager |
| The Dreyfus Corporation |
| 200 Park Avenue |
| New York, NY 10166 |
| |
| Custodian |
| Mellon Bank, N.A. |
| One Mellon Bank Center |
| Pittsburgh, PA 15258 |
| Transfer Agent & |
| Dividend Disbursing Agent |
| Dreyfus Transfer, Inc. |
| 200 Park Avenue |
| New York, NY 10166 |
| |
| Distributor |
| Dreyfus Service Corporation |
| 200 Park Avenue |
| New York, NY 10166 |
Telephone Call your financial representative or 1-800-554-4611
| Mail | | The Dreyfus Premier Family of Funds |
| | | 144 Glenn Curtiss Boulevard, Uniondale, NY 11556-0144 |
The fund files its complete schedule of portfolio holdings with the Securities and Exchange Commission (“SEC”) for the first and third quarters of each fiscal year on Form N-Q. The fund’s Forms N-Q are available on the SEC’s website at http://www.sec.gov and may be reviewed and copied at the SEC’s Public Reference Room in Washington, DC. Information on the operation of the Public Reference Room may be obtained by calling 1-800-SEC-0330.
A description of the policies and procedures that the fund uses to determine how to vote proxies relating to portfolio securities, and information regarding how the fund voted these proxies for the 12-month period ended June 30, 2005, is available at http://www.dreyfus.com and on the SEC’s website at http://www.sec.gov. The description of the policies and procedures is also available without charge, upon request, by calling 1-800-645-6561.
© 2006 Dreyfus Service Corporation

[INSERT REPORT HERE]
The Registrant has adopted a code of ethics that applies to the Registrant's principal executive officer, principal financial officer, principal accounting officer or controller, or persons performing similar functions. There have been no amendments to, or waivers in connection with, the Code of Ethics during the period covered by this Report.
| Item 3. | | Audit Committee Financial Expert. |
The Registrant's Board has determined that Joseph S. DiMartino, a member of the Audit Committee of the Board, is an audit committee financial expert as defined by the Securities and Exchange Commission (the "SEC"). Joseph S. DiMartino is "independent" as defined by the SEC for purposes of audit committee financial expert determinations.
| Item 4. | | Principal Accountant Fees and Services |
(a) Audit Fees. The aggregate fees billed for each of the last two fiscal years (the "Reporting Periods") for professional services rendered by the Registrant's principal accountant (the "Auditor") for the audit of the Registrant's annual financial statements, or services that are normally provided by the Auditor in connection with the statutory and regulatory filings or engagements for the Reporting Periods, were $84,550 in 2004 and $103,700 in 2005.
(b) Audit-Related Fees. The aggregate fees billed in the Reporting Periods for assurance and related services by the Auditor that are reasonably related to the performance of the audit of the Registrant's financial statements and are not reported under paragraph (a) of this Item 4 were $10,750 in 2004 and $11,100 in 2005. These services consisted of security counts required by Rule 17f-2 under the Investment Company Act of 1940, as amended.
The aggregate fees billed in the Reporting Periods for non-audit assurance and related services by the Auditor to the Registrant's investment adviser (not including any sub-investment adviser whose role is primarily portfolio management and is subcontracted with or overseen by another investment adviser), and any entity controlling, controlled by or under common control with the investment adviser that provides ongoing services to the Registrant ("Service Affiliates"), that were reasonably related to the performance of the annual audit of the Service Affiliate, which required pre-approval by the Audit Committee were $ 0 in 2004 and $ 0 in 2005.
Note: For the second paragraph in each of (b) through (d) of this Item 4, certain of such services were not pre-approved prior to May 6, 2003, when such services were required to be pre-approved. On and after May 6, 2003, 100% of all services provided by the Auditor were pre-approved as required. For comparative purposes, the fees shown assume that all such services were pre-approved, including services that were not pre-approved prior to the compliance date of the pre-approval requirement.
(c) Tax Fees. The aggregate fees billed in the Reporting Periods for professional services rendered by the Auditor for tax compliance, tax advice and tax planning ("Tax Services") were $5,653 in 2004 and $5,775 in 2005. These services consisted of review or preparation of U.S. federal, state, local and excise tax returns.
The aggregate fees billed in the Reporting Periods for Tax Services by the Auditor to Service Affiliates which required pre-approval by the Audit Committee were $ 0 in 2004 and $ 0 in 2005.
(d) All Other Fees. The aggregate fees billed in the Reporting Periods for products and services provided by the Auditor, other than the services reported in paragraphs (a) through (c) of this Item, were $ 0 in 2004 and $ 0 in 2005.
The aggregate fees billed in the Reporting Periods for Non-Audit Services by the Auditor to Service Affiliates, other than the services reported in paragraphs (b) through (c) of this Item, which required pre-approval by the Audit Committee were $ 0 in 2004 and $ 0 in 2005.
Audit Committee Pre-Approval Policies and Procedures. The Registrant's Audit Committee has established policies and procedures (the "Policy") for pre-approval (within specified fee limits) of the Auditor's engagements for non-audit services to the Registrant and Service Affiliates without specific case-by-case consideration. Pre-approval considerations include whether the proposed services are compatible with maintaining the Auditor's independence. Pre-approvals pursuant to the Policy are considered annually.
Non-Audit Fees. The aggregate non-audit fees billed by the Auditor for services rendered to the Registrant, and rendered to Service Affiliates, for the Reporting Periods were $ 2,476,483 in 2004 and $975,000 in 2005.
Auditor Independence. The Registrant's Audit Committee has considered whether the provision of non-audit services that were rendered to Service Affiliates which were not pre-approved (not requiring pre-approval) is compatible with maintaining the Auditor's independence.
| Item 5. | | Audit Committee of Listed Registrants. |
| | | Not applicable. |
| Item 6. | | Schedule of Investments. |
| | | Not applicable. |
| Item 7. | | Disclosure of Proxy Voting Policies and Procedures for Closed-End Management |
| | | Investment Companies. |
| | | Not applicable. |
| Item 8. | | Portfolio Managers of Closed-End Management Investment Companies. |
| | | Not applicable. |
| Item 9. | | Purchases of Equity Securities by Closed-End Management Investment Companies and |
| | | Affiliated Purchasers. |
| | | Not applicable. |
| Item 10. | | Submission of Matters to a Vote of Security Holders. |
The Registrant has a Nominating Committee (the "Committee"), which is responsible for selecting and nominating persons for election or appointment by the Registrant's Board as Board members. The Committee has adopted a Nominating Committee Charter (the "Charter"). Pursuant to the Charter, the Committee will consider recommendations for nominees from shareholders submitted to the Secretary of the Registrant, c/o The Dreyfus Corporation Legal Department, 200 Park Avenue, 8th Floor East, New York, New York 10166. A nomination submission must include information regarding the recommended nominee as specified in the Charter. This information includes all information relating to a recommended nominee that is required to be disclosed in solicitations or proxy statements for the election of Board members, as well as information sufficient to evaluate the factors to be considered by the Committee, including character and integrity, business and professional experience, and whether the person has the ability to apply sound and independent business judgment and would act in the interests of the Registrant and its shareholders. Nomination submissions are required to be accompanied by a written consent of the individual to stand for election if nominated by the Board and to serve if elected by the shareholders, and such additional information must be provided regarding the recommended nominee as reasonably requested by the Committee.
| Item 11. | | Controls and Procedures. |
(a) The Registrant's principal executive and principal financial officers have concluded, based on their evaluation of the Registrant's disclosure controls and procedures as of a date within 90 days of the filing date of this report, that the Registrant's disclosure controls and procedures are reasonably designed to ensure that information required to be disclosed by the Registrant on Form N-CSR is recorded, processed, summarized and reported within the required time periods and that information required to be disclosed by the Registrant in the reports that it files or submits on Form N-CSR is accumulated and communicated to the Registrant's management, including its principal executive and principal financial officers, as appropriate to allow timely decisions regarding required disclosure.
(b) There were no changes to the Registrant's internal control over financial reporting that occurred during the second fiscal quarter of the period covered by this report that have materially affected, or are reasonably likely to materially affect, the Registrant's internal control over financial reporting.
| (a)(1) | | Code of ethics referred to in Item 2. |
| (a)(2) | | Certifications of principal executive and principal financial officers as required by Rule 30a-2(a) |
| under the Investment Company Act of 1940. |
| (a)(3) | | Not applicable. |
| (b) | | Certification of principal executive and principal financial officers as required by Rule 30a-2(b) |
| under the Investment Company Act of 1940. |
Pursuant to the requirements of the Securities Exchange Act of 1934 and the Investment Company Act of 1940, the Registrant has duly caused this Report to be signed on its behalf by the undersigned, thereunto duly authorized.
The Dreyfus/Laurel Funds Trust

Pursuant to the requirements of the Securities Exchange Act of 1934 and the Investment Company Act of 1940, this Report has been signed below by the following persons on behalf of the Registrant and in the capacities and on the dates indicated.
| EXHIBIT INDEX |
| (a)(1) | | Code of ethics referred to in Item 2. |
| (a)(2) | | Certifications of principal executive and principal financial officers as required by Rule 30a- |
| 2(a) under the Investment Company Act of 1940. (EX-99.CERT) |
| (b) | | Certification of principal executive and principal financial officers as required by Rule 30a- |
| 2(b) under the Investment Company Act of 1940. (EX-99.906CERT) |