| UNITED STATES |
| SECURITIES AND EXCHANGE COMMISSION |
| Washington, D.C. 20549 |
| FORM N-CSR |
| CERTIFIED SHAREHOLDER REPORT OF REGISTERED MANAGEMENT |
| INVESTMENT COMPANIES |
| Investment Company Act file number 811-524 |
| The Dreyfus/Laurel Funds Trust |
| (Exact name of Registrant as specified in charter) |
| c/o The Dreyfus Corporation |
| 200 Park Avenue |
| New York, New York 10166 |
| (Address of principal executive offices) (Zip code) |
| |
| Mark N. Jacobs, Esq. |
| 200 Park Avenue |
| New York, New York 10166 |
| (Name and address of agent for service) |
| |
| Registrant's telephone number, including area code: (212) 922-6000 |
| Date of fiscal year end: | | 12/31 |
| Date of reporting period: | | 12/31/2006 |
The following N-CSR relates only to the Registrant’s series listed below and does not affect the other series of the Registrant, which have different fiscal year ends and, therefore, different N-CSR reporting requirements. Separate N-CSR Forms will be filed for these series, as appropriate.
| Dreyfus Premier Core Value Fund |
| Dreyfus Premier Limited Term High Yield Fund |
| Dreyfus Premier Managed Income Fund |
Item 1. Reports to Stockholders.
| Dreyfus Premier |
| Core Value Fund |
ANNUAL REPORT December 31, 2006

Save time. Save paper. View your next shareholder report online as soon as it’s available. Log into www.dreyfus.com and sign up for Dreyfus eCommunications. It’s simple and only takes a few minutes.
The views expressed in this report reflect those of the portfolio manager only through the end of the period covered and do not necessarily represent the views of Dreyfus or any other person in the Dreyfus organization. Any such views are subject to change at any time based upon market or other conditions and Dreyfus disclaims any responsibility to update such views.These views may not be relied on as investment advice and, because investment decisions for a Dreyfus fund are based on numerous factors, may not be relied on as an indication of trading intent on behalf of any Dreyfus fund.
Not FDIC-Insured • Not Bank-Guaranteed • May Lose Value
| Contents |
| |
| | | THE FUND |
| |
|
| 2 | | A Letter from the CEO |
| 3 | | Discussion of Fund Performance |
| 6 | | Fund Performance |
| 8 | | Understanding Your Fund’s Expenses |
| 8 | | Comparing Your Fund’s Expenses |
| With Those of Other Funds |
| 9 | | Statement of Investments |
| 13 | | Statement of Assets and Liabilities |
| 14 | | Statement of Operations |
| 15 | | Statement of Changes in Net Assets |
| 18 | | Financial Highlights |
| 24 | | Notes to Financial Statements |
| 34 | | Report of Independent Registered |
| | | Public Accounting Firm |
| 35 | | Important Tax Information |
| 36 | | Board Members Information |
| 38 | | Officers of the Fund |
| |
| FOR MORE INFORMATION |
|
| | | Back Cover |
The Fund
| Dreyfus Premier |
| Core Value Fund |

A LETTER FROM THE CEO
Dear Shareholder:
We are pleased to present this annual report for Dreyfus Premier Core Value Fund, covering the 12-month period from January 1, 2006, through December 31, 2006.
2006 proved to be a good year for the financial markets.Virtually all sectors and capitalization ranges of the U.S. equity markets generated strong returns, especially over the second half of the year.A number of positive factors contributed to the markets’ gains in 2006, including an expanding domestic economy, subdued inflation, stabilizing interest rates, rising productivity and robust corporate profits.
In our analysis, 2006 provided an excellent reminder of the need for a long-term investment perspective. Adopting too short a time frame proved costly for some investors last year, as chasing recent winners often meant buying the next month’s losers. Indeed, history shows that reacting to near-term developments with extreme shifts in strategy rarely is the right decision.We believe that a better course of action is to set a portfolio mix to meet future goals, while attempting to ignore short term market fluctuations in favor of a longer-term view.
For information about how the fund performed during the reporting period, as well as market perspectives, we have provided a Discussion of Fund Performance given by the fund’s portfolio manager.
Thank you for your continued confidence and support.We wish you good health and prosperity in 2007.
2

DISCUSSION OF FUND PERFORMANCE
Brian Ferguson, Portfolio Manager
How did Dreyfus Premier Core Value Fund perform relative to its benchmark?
For the 12-month period ended December 31, 2006, Dreyfus Premier Core Value Fund produced total returns of 21.00% for its Class A shares, 20.12% for its Class B shares, 20.07% for its Class C shares, 21.26% for its Class R shares, 20.67% for its Class T shares and 21.11% for its Institutional shares.1 In comparison, the fund’s benchmark, the Russell 1000 Value Index, produced a total return of 22.25% for the same period.2 The fund’s previous benchmark, the S&P 500/Citigroup Value Index, achieved a total return of 20.80% for the same period.3
Stock prices generally rose in 2006, primarily due to strong corporate earnings in a growing U.S. economy.The fund’s returns were slightly lower than the Russell 1000 Value Index as a result of attractive results from the consumer discretionary and information technology sectors. Furthermore, the fund’s returns were in line with the S&P 500/Citigroup Value Index primarily due to strong performance in information technology and industrials sectors.
What is the fund’s investment approach?
The fund invests primarily in large-cap companies that are considered undervalued based on traditional measures, such as price-to-earnings ratios. When choosing stocks, we use a “bottom-up” stock selection approach, focusing on individual companies, rather than a “top-down” approach that forecasts market trends. We also focus on a company’s relative value, financial strength, sales and earnings momentum and likely catalysts that could ignite the stock price.
What other factors influenced the fund’s performance?
The U.S. stock market ended 2006 with double-digit gains, as investors remained hopeful regarding the strength of corporate earnings despite mixed economic signals, such as volatile energy prices and cooling hous-
| | DISCUSSION OF FUND PERFORMANCE (continued)
|
ing markets.The market rallied particularly strongly over the second half of the year, when an uneventful hurricane season and warm weather in many parts of the United States contributed to a decline in energy prices, giving relief to inflation worries. In addition, after more than two years of steady rate hikes, the Federal Reserve Board refrained from raising short-term interest rates over the second half of the year. In this environment, stock prices rose as U.S. companies continued to report healthy earnings and mergers-and-acquisitions activity increased.
A successful stock selection strategy in the consumer discretionary sector contributed significantly to the fund’s relative performance during the reporting period, with particularly strong results coming from media giants News Corp., which was sold during the reporting period, and Walt Disney. News Corp. prospered amid better results from Fox News, anticipation of a spin-off of its Sky Italia unit and the acquisition of MySpace.com.Walt Disney rose in the wake of successful cost control measures, improved profit margins from its theme parks and stronger results from its television and film businesses. Conversely, the fund held no shares of Viacom, where results fell short of expectations. Finally, the fund benefited from its relatively light holdings of homebuilders, which saw their financial results deteriorate in a slowing housing market.
The fund’s investments in the information technology sector also fared relatively well. Broadband equipment maker Cisco Systems gained value due to a general increase in broadband usage and expectations of greater corporate demand for its products. Computer and printer maker Hewlett Packard, helmed by new management, gained market share in a variety of product areas, and consulting firm Accenture benefited from higher levels of outsourcing and corporate spending.
On the other hand, some disappointments detracted from the fund’s relative performance. In the financials sector, the fund did not participate as fully as the benchmark in strong returns from real estate investment trusts, and our emphasis on lagging insurance companies detracted from performance. For example, Genworth Financial was pressured by concerns regarding its long-term care and mortgage insurance businesses, as well as its former parent’s move to divest its remaining stake in the com-
4
pany. In the health care sector, the fund’s results were hurt by relatively light exposure to drug developer Merck & Co., which was sold during the reporting period, and which rose as legal concerns diminished and research & development prospects improved. Shares of medical products maker Boston Scientific, which were eventually sold during the reporting period, declined due to merger integration issues and concerns regarding low reimbursement policies by Medicare and other insurers.
What is the fund’s current strategy?
We have continued to rely on our bottom-up stock selection process, as we believe it to be an effective method of identifying attractively valued stocks under a variety of market conditions.We have continued to find attractive values in traditionally defensive areas, including the consumer staples sector and the homebuilding and retail industries within the consumer discretionary sector. Information technology stocks remain attractive to us, largely due to the ongoing boom in Internet demand.While in the past we have found attractive opportunities in the energy area, we recently reduced our emphasis on the sector due to the possible effects of recent warmer weather and shifting supply-and-demand influences on commodity prices.
January 16, 2007
| 1 | | Total return includes reinvestment of dividends and any capital gains paid, and does not take into |
| | | consideration the maximum initial sales charges in the case of Class A and Class T shares or the |
| | | applicable contingent deferred sales charges imposed on redemptions in the case of Class B and |
| | | Class C shares. Had these charges been reflected, returns would have been lower. Past performance |
| | | is no guarantee of future results. Share price and investment return fluctuate such that upon |
| | | redemption, fund shares may be worth more or less than their original cost. |
| | | Part of the fund’s recent performance is attributable to positive returns from its initial public |
| | | offering (IPO) investments. There can be no guarantee that IPOs will have or continue to |
| | | have a positive effect on fund performance. |
| 2 | | SOURCE: LIPPER INC. — Reflects the reinvestment of dividends and, where applicable, |
| | | capital gain distributions.The Russell 1000 Value Index is an unmanaged index which measures |
| | | the performance of those Russell 1000 companies with lower price-to-book ratios and lower |
| | | forecasted growth values. |
| 3 | | SOURCE: LIPPER INC. — Reflects the reinvestment of dividends and, where applicable, |
| | | capital gain distributions.The S&P 500/Citigroup Value Index calculates growth and value in |
| | | separate dimensions. Style scores are calculated taking standardized measures of 3 growth factors |
| | | and 4 value factors for each constituent. Combined, the growth and value indices are exhaustive, |
| | | containing the full market capitalization of the S&P 500. |
The Fund 5
FUND PERFORMANCE
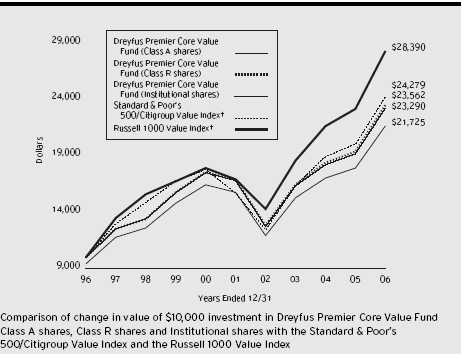
| † Source: Lipper Inc. |
| Past performance is not predictive of future performance. |
| Part of the fund’s recent performance is attributable to positive returns from its initial public offering (IPO) investments. |
| There can be no guarantee that IPOs will have or continue to have a positive effect on fund performance. |
| The above graph compares a $10,000 investment made in Class A shares, Institutional shares and Class R shares of |
| Dreyfus Premier Core Value Fund on 12/31/96 to a $10,000 investment made in the Russell 1000 Value Index (the |
| “Russell Index”) and the Standard & Poor’s 500/Citigroup Value Index (the “S&P 500/Citigroup Value Index”) on |
| that date. All dividends and capital gain distributions are reinvested. Performance for Class B, Class C and Class T |
| shares will vary from the performance of Class A, Institutional and Class R shares shown above due to differences in |
| charges and expenses. |
| In December 2005, Standard & Poor’s 500 replaced the S&P/BARRA Value Index with the S&P/Citigroup Value |
| Index. In October 2006, the fund’s benchmark was changed from the S&P 500/Citigroup Value Index to the |
| Russell 1000 Value Index because the Russell 1000 Value Index is expected to more accurately reflect the fund’s |
| investment approach. |
| The fund’s performance shown in the line graph takes into account the maximum initial sales charge on Class A shares |
| and all other applicable fees and expenses for Class A shares, Institutional shares and Class R shares.The Russell 1000 |
| Value Index is an unmanaged index, which measures the performance of those Russell 1000 companies with lower price- |
| to-book ratios and lower forecasted growth values.The S&P/Citigroup Value Index is a market capitalization weighted |
| index representing the value stocks in the S&P 500 Index. All of the stocks in the S&P 500 Index are allocated into |
| value or growth sub-indexes. Stocks that do not have pure value or growth characteristics have their market capitalizations |
| distributed between the value and growth indexes.The S&P 500 Index is a widely accepted, unmanaged index of U.S. |
| stock market performance. Both indices are unmanaged, do not incur fees and other expenses, and cannot be invested in |
| directly. Further information relating to fund performance, including expense reimbursements, if applicable, is contained in |
| the Financial Highlights section of the prospectus and elsewhere in this report. |
6
| Average Annual Total Returns as of 12/31/06 | | | | | | |
| |
| | | | | Inception | | | | | | | | From |
| | | | | Date | | 1 Year | | 5 Years | | 10 Years | | Inception |
| |
| |
| |
| |
| |
| |
|
| Class A shares | | | | | | | | | | |
| with maximum sales charge (5.75%) | | | | 14.06% | | 5.30% | | 8.07% | | |
| without sales charge | | | | 21.00% | | 6.56% | | 8.71% | | |
| Class B shares | | | | | | | | | | |
| with applicable redemption charge † | | 1/16/98 | | 16.12% | | 5.47% | | — | | 6.94%†† |
| without redemption | | 1/16/98 | | 20.12% | | 5.79% | | — | | 6.94%†† |
| Class C shares | | | | | | | | | | |
| with applicable redemption charge ††† | | 1/16/98 | | 19.07% | | 5.76% | | — | | 6.68% |
| without redemption | | 1/16/98 | | 20.07% | | 5.76% | | — | | 6.68% |
| Class R shares | | | | 21.26% | | 6.82% | | 8.95% | | |
| Class T shares | | | | | | | | | | |
| with applicable sales charge (4.5%) | | 8/16/99 | | 15.24% | | 5.32% | | — | | 4.98% |
| without sales charge | | 8/16/99 | | 20.67% | | 6.29% | | — | | 5.64% |
| Institutional shares | | | | 21.11% | | 6.68% | | 8.82% | | |
| |
| Past performance is not predictive of future performance.The fund’s performance shown in the graph and table does not |
| reflect the deduction of taxes that a shareholder would pay on fund distributions or the redemption of fund shares. |
| † | | The maximum contingent deferred sales charge for Class B shares is 4%. After six years Class B shares convert to |
| | | Class A shares. | | | | | | | | | | |
| †† | | Assumes the conversion of Class B shares to Class A shares at the end of the sixth year following the date of |
| | | purchase. | | | | | | | | | | |
| ††† | | The maximum contingent deferred sales charge for Class C shares is 1% for shares redeemed within one year of the |
| | | date of purchase. | | | | | | | | | | |
UNDERSTANDING YOUR FUND’S EXPENSES(Unaudited)
As a mutual fund investor, you pay ongoing expenses, such as management fees and other expenses. Using the information below, you can estimate how these expenses affect your investment and compare them with the expenses of other funds.You also may pay one-time transaction expenses, including sales charges (loads) and redemption fees, which are not shown in this section and would have resulted in higher total expenses. For more information, see your fund’s prospectus or talk to your financial adviser.
Review your fund’s expenses
The table below shows the expenses you would have paid on a $1,000 investment in Dreyfus Premier Core Value Fund from July 1, 2006 to December 31, 2006. It also shows how much a $1,000 investment would be worth at the close of the period, assuming actual returns and expenses.
| Expenses and Value of a $1,000 Investment | | | | | | |
| assuming actual returns for the six months ended December 31, 2006 | | | | |
| | | Class A | | Class B | | Class C | | Class R | | Class T | | Institutional |
| |
| |
| |
| |
| |
| |
|
| Expenses paid | | | | | | | | | | | | |
| per $1,000 † | | $ 6.24 | | $ 10.29 | | $ 10.29 | | $ 4.89 | | $ 7.59 | | $ 5.70 |
| Ending value | | | | | | | | | | | | |
| (after expenses) | | $1,152.70 | | $1,148.50 | | $1,148.20 | | $1,153.90 | | $1,151.20 | | $1,153.30 |
| COMPARING YOUR FUND’S EXPENSES |
| WITH THOSE OF OTHER FUNDS (Unaudited) |
Using the SEC’s method to compare expenses
The Securities and Exchange Commission (SEC) has established guidelines to help investors assess fund expenses. Per these guidelines, the table below shows your fund’s expenses based on a $1,000 investment, assuming a hypothetical 5% annualized return. You can use this information to compare the ongoing expenses (but not transaction expenses or total cost) of investing in the fund with those of other funds.All mutual fund shareholder reports will provide this information to help you make this comparison. Please note that you cannot use this information to estimate your actual ending account balance and expenses paid during the period.
| Expenses and Value of a $1,000 Investment | | | | | | |
| assuming a hypothetical 5% annualized return for the six months ended December 31, 2006 |
| | | Class A | | Class B | | Class C | | Class R | | Class T | | Institutional |
| |
| |
| |
| |
| |
| |
|
| Expenses paid | | | | | | | | | | | | |
| per $1,000 † | | $ 5.85 | | $ 9.65 | | $ 9.65 | | $ 4.58 | | $ 7.12 | | $ 5.35 |
| Ending value | | | | | | | | | | | | |
| (after expenses) | | $1,019.41 | | $1,015.63 | | $1,015.63 | | $1,020.67 | | $1,018.15 | | $1,019.91 |
| † Expenses are equal to the fund’s annualized expense ratio of 1.15% for Class A, 1.90% for Class B, 1.90% for |
| Class C, .90% for Class R, 1.40% for Class T and 1.05% for Institutional multiplied by the average account |
| value over the period, multiplied by 184/365 (to reflect the one-half year period). | | | | |
8
| STATEMENT OF INVESTMENTS |
| December 31, 2006 |
| Common Stocks—99.9% | | Shares | | Value ($) |
| |
| |
|
| Banking—9.8% | | | | |
| Bank of America | | 448,626 | | 23,952,142 |
| Bank of New York | | 85,100 | | 3,350,387 |
| Capital One Financial | | 115,700 | | 8,888,074 |
| PNC Financial Services Group | | 49,000 | | 3,627,960 |
| SunTrust Banks | | 39,800 | | 3,361,110 |
| U.S. Bancorp | | 194,900 | | 7,053,431 |
| Wachovia | | 157,700 | | 8,981,015 |
| Wells Fargo & Co. | | 211,200 | | 7,510,272 |
| | | | | 66,724,391 |
| Consumer Discretionary—8.2% | | | | |
| Comcast, Cl. A | | 82,300 a | | 3,483,759 |
| Federated Department Stores | | 73,400 | | 2,798,742 |
| Gap | | 175,700 | | 3,426,150 |
| Johnson Controls | | 60,900 | | 5,232,528 |
| Lowe’s Cos. | | 109,470 | | 3,409,991 |
| Marriott International, Cl. A | | 72,590 | | 3,463,995 |
| McDonald’s | | 147,400 | | 6,534,242 |
| News, Cl. A | | 304,000 | | 6,529,920 |
| Omnicom Group | | 74,000 | | 7,735,960 |
| Time Warner | | 300,300 | | 6,540,534 |
| TJX Cos. | | 143,610 | | 4,095,757 |
| Toll Brothers | | 74,630 a | | 2,405,325 |
| | | | | 55,656,903 |
| Consumer Staples—9.8% | | | | |
| Altria Group | | 223,800 | | 19,206,516 |
| Cadbury Schweppes, ADR | | 166,500 | | 7,147,845 |
| Clorox | | 53,100 | | 3,406,365 |
| Colgate-Palmolive | | 51,157 | | 3,337,483 |
| Dean Foods | | 176,700 a | | 7,470,876 |
| Kraft Foods, Cl. A | | 124,600 | | 4,448,220 |
| Procter & Gamble | | 262,000 | | 16,838,740 |
| SUPERVALU | | 122,550 | | 4,381,162 |
| | | | | 66,237,207 |
| Energy—13.2% | | | | |
| Anadarko Petroleum | | 74,100 | | 3,224,832 |
| Chesapeake Energy | | 107,800 | | 3,131,590 |
| Chevron | | 201,600 | | 14,823,648 |
The Fund 9
STATEMENT OF INVESTMENTS (continued)
| Common Stocks (continued) | | Shares | | Value ($) |
| |
| |
|
| Energy (continued) | | | | |
| ConocoPhillips | | 226,720 | | 16,312,504 |
| Devon Energy | | 48,000 | | 3,219,840 |
| EOG Resources | | 58,500 | | 3,653,325 |
| Exxon Mobil | | 357,682 | | 27,409,172 |
| Hess | | 68,440 | | 3,392,571 |
| Marathon Oil | | 73,800 | | 6,826,500 |
| Valero Energy | | 142,700 | | 7,300,532 |
| | | | | 89,294,514 |
| Financial—24.1% | | | | |
| Ambac Financial Group | | 38,400 | | 3,420,288 |
| American International Group | | 142,193 | | 10,189,550 |
| AON | | 133,600 | | 4,721,424 |
| Chubb | | 115,200 | | 6,095,232 |
| CIT Group | | 66,700 | | 3,719,859 |
| Citigroup | | 512,313 | | 28,535,834 |
| Countrywide Financial | | 96,600 | | 4,100,670 |
| Equity Residential | | 64,700 | | 3,283,525 |
| Franklin Resources | | 40,160 | | 4,424,427 |
| Freddie Mac | | 128,900 | | 8,752,310 |
| Genworth Financial, Cl. A | | 206,255 | | 7,055,984 |
| Goldman Sachs Group | | 19,660 | | 3,919,221 |
| JPMorgan Chase & Co. | | 404,800 | | 19,551,840 |
| Lincoln National | | 108,100 | | 7,177,840 |
| Merrill Lynch & Co. | | 156,650 | | 14,584,115 |
| MetLife | | 115,000 | | 6,786,150 |
| Morgan Stanley | | 97,900 | | 7,971,997 |
| PMI Group | | 119,800 | | 5,650,966 |
| Prudential Financial | | 63,600 | | 5,460,696 |
| St. Paul Travelers Cos. | | 65,800 | | 3,532,802 |
| Washington Mutual | | 101,800 | | 4,630,882 |
| | | | | 163,565,612 |
| Health Care—8.6% | | | | |
| Abbott Laboratories | | 164,500 | | 8,012,795 |
| Amgen | | 44,300 a | | 3,026,133 |
| Baxter International | | 111,590 | | 5,176,660 |
| Bristol-Myers Squibb | | 103,000 | | 2,710,960 |
| Pfizer | | 647,360 | | 16,766,624 |
10
| Common Stocks (continued) | | Shares | | Value ($) |
| |
| |
|
| Health Care (continued) | | | | |
| Sanofi-Aventis, ADR | | 94,700 | | 4,372,299 |
| Thermo Fisher Scientific | | 83,300 a | | 3,772,657 |
| WellPoint | | 73,000 a | | 5,744,370 |
| Wyeth | | 174,100 | | 8,865,172 |
| | | | | 58,447,670 |
| Industrial—6.4% | | | | |
| Eaton | | 41,800 | | 3,140,852 |
| General Electric | | 625,060 | | 23,258,483 |
| Honeywell International | | 72,100 | | 3,261,804 |
| Lockheed Martin | | 41,200 | | 3,793,284 |
| Tyco International | | 221,900 | | 6,745,760 |
| Union Pacific | | 36,670 | | 3,374,373 |
| | | | | 43,574,556 |
| Information Technology—7.1% | | | | |
| Accenture, Cl. A | | 266,700 | | 9,849,231 |
| Automatic Data Processing | | 96,200 | | 4,737,850 |
| Cisco Systems | | 248,300 a | | 6,786,039 |
| Hewlett-Packard | | 277,100 | | 11,413,749 |
| International Business Machines | | 40,000 | | 3,886,000 |
| Microsoft | | 120,700 | | 3,604,102 |
| NCR | | 94,400 a | | 4,036,544 |
| Sun Microsystems | | 748,100 a | | 4,054,702 |
| | | | | 48,368,217 |
| Materials—1.9% | | | | |
| Dow Chemical | | 94,300 | | 3,766,342 |
| E.I. du Pont de Nemours & Co. | | 71,295 | | 3,472,779 |
| Phelps Dodge | | 20,000 | | 2,394,400 |
| Rohm & Haas | | 65,500 | | 3,348,360 |
| | | | | 12,981,881 |
| Telecommunications—5.8% | | | | |
| Alltel | | 45,895 | | 2,775,730 |
| AT & T | | 599,300 | | 21,424,975 |
| BellSouth | | 138,200 | | 6,510,602 |
| Sprint Nextel | | 124,450 | | 2,350,860 |
| Verizon Communications | | 170,600 | | 6,353,144 |
| | | | | 39,415,311 |
The Fund 11
| | STATEMENT OF INVESTMENTS (continued)
|
| Common Stocks (continued) | | Shares | | Value ($) |
| |
| |
|
| Utilities—5.0% | | | | | | |
| Constellation Energy Group | | 72,900 | | 5,020,623 |
| Edison International | | | | 69,300 | | 3,151,764 |
| Entergy | | | | 36,400 | | 3,360,448 |
| Exelon | | | | 102,765 | | 6,360,126 |
| FPL Group | | | | 61,600 | | 3,352,272 |
| Mirant | | | | 116,800 a | | 3,687,376 |
| NRG Energy | | | | 73,000 a | | 4,088,730 |
| Questar | | | | 59,400 | | 4,933,170 |
| | | | | | | | | 33,954,509 |
| Total Common Stocks | | | | | | |
| (cost $551,327,600) | | | | | | 678,220,771 |
| |
| |
| |
|
| |
| Other Investment—.8% | | | | |
| |
| |
|
| Registered Investment Company; | | | | |
| Dreyfus Institutional Preferred | | | | |
| Plus Money Market Fund | | | | |
| (cost $5,145,000) | | | | 5,145,000 b | | 5,145,000 |
| |
| |
| |
|
| |
| Total Investments (cost $556,472,600) | | 100.7% | | 683,365,771 |
| Liabilities, Less Cash and Receivables | | (.7%) | | (4,781,302) |
| Net Assets | | | | 100.0% | | 678,584,469 |
| |
| ADR—American Depository Receipts | | | | |
| a | | Non-income producing security. | | | | |
| b | | Investment in affiliated money market mutual fund. | | | | |
| |
| |
| |
|
| |
| |
| |
| Portfolio Summary | | (Unaudited) † | | | | |
| | | | | Value (%) | | | | Value (%) |
| |
| |
| |
| |
|
| Financial | | 24.1 | | Industrial | | 6.4 |
| Energy | | 13.2 | | Telecommunications | | 5.8 |
| Banking | | 9.8 | | Utilities | | 5.0 |
| Consumer Staples | | 9.8 | | Materials | | 1.9 |
| Health Care | | 8.6 | | Money Market Investment | | .8 |
| Consumer Discretionary | | 8.2 | | | | |
| Information Technology | | 7.1 | | | | 100.7 |
| |
| † | | Based on net assets. | | | | | | |
| See notes to financial statements. | | | | |
12
| STATEMENT OF ASSETS AND LIABILITIES |
| December 31, 2006 |
| | | | | | | | | Cost Value |
| |
| |
| |
| |
|
| Assets ($): | | | | | | | | |
| Investments in securities—See Statement of Investments | | |
| Unaffiliated issuers | | | | | | 551,327,600 678,220,771 |
| Affiliated isuuers | | | | | | 5,145,000 5,145,000 |
| Cash | | | | | | | | 15,621 |
| Dividends and interest receivable | | | | 922,162 |
| Receivable for shares of Beneficial Interest subscribed | | 13,699 |
| | | | | | | | | 684,317,253 |
| |
| |
| |
| |
|
| Liabilities ($): | | | | | | | | |
| Due to The Dreyfus Corporation and affiliates—Note 3(b) | | 732,744 |
| Payable for investment securities purchased | | | | 4,263,510 |
| Payable for shares of Beneficial Interest redeemed | | 736,039 |
| Interest payable—Note 2 | | | | | | 491 |
| | | | | | | | | 5,732,784 |
| |
| |
| |
| |
|
| Net Assets ($) | | | | | | | | 678,584,469 |
| |
| |
| |
| |
|
| Composition of Net Assets ($): | | | | |
| Paid-in capital | | | | | | | | 542,615,686 |
| Accumulated undistributed investment income—net | | 490,141 |
| Accumulated net realized gain (loss) on investments | | 8,585,471 |
| Accumulated net unrealized appreciation | | | | |
| (depreciation) on investments | | | | 126,893,171 |
| |
| |
|
| Net Assets ($) | | | | | | | | 678,584,469 |
| |
| |
| |
| |
|
| |
| |
| Net Asset Value Per Share | | | | |
| | | Class A | | Class B | | Class C | | Class R Class T Institutional |
| |
| |
| |
| |
|
| Net Assets ($) | | 548,601,357 | | 55,112,194 | | 20,918,808 | | 6,011,852 3,434,272 44,505,986 |
| Shares | | | | | | | | |
| Outstanding | | 17,141,289 | | 1,755,014 | | 666,708 | | 187,986 107,342 1,391,474 |
| |
| |
| |
| |
|
| Net Asset Value | | | | | | |
| Per Share ($) | | 32.00 | | 31.40 | | 31.38 | | 31.98 31.99 31.98 |
See notes to financial statements.
| STATEMENT OF OPERATIONS |
| Year Ended December 31, 2006 |
| Investment Income ($): | | |
| Income: | | |
| Cash dividends: | | |
| Unaffiliated issuers | | 15,632,024 |
| Affiliated issuers | | 157,402 |
| Interest | | 36,007 |
| Income from securities lending | | 2,503 |
| Total Income | | 15,827,936 |
| Expenses: | | |
| Management fee—Note 3(a) | | 6,111,130 |
| Distribution and service fees—Note 3(b) | | 2,236,994 |
| Interest expense—Note 2 | | 8,469 |
| Loan commitment fees—Note 2 | | 5,281 |
| Total Expenses | | 8,361,874 |
| Investment Income—Net | | 7,466,062 |
| |
|
| Realized and Unrealized Gain (Loss) on Investments—Note 4 ($): |
| Net realized gain (loss) on investments | | 85,435,127 |
| Net unrealized appreciation (depreciation) on investments | | 35,507,648 |
| Net Realized and Unrealized Gain (Loss) on Investments | | 120,942,775 |
| Net Increase in Net Assets Resulting from Operations | | 128,408,837 |
See notes to financial statements.
14
STATEMENT OF CHANGES IN NET ASSETS
| | | Year Ended December 31, |
| |
|
| | | 2006 | | 2005 |
| |
| |
|
| Operations ($): | | | | |
| Investment income—net | | 7,466,062 | | 7,135,930 |
| Net realized gain (loss) on investments | | 85,435,127 | | 96,968,863 |
| Net unrealized appreciation | | | | |
| (depreciation) on investments | | 35,507,648 | | (66,603,353) |
| Net Increase (Decrease) in Net Assets | | |
| Resulting from Operations | | 128,408,837 | | 37,501,440 |
| |
| |
|
| Dividends to Shareholders from ($): | | | | |
| Investment income—net: | | | | |
| Class A shares | | (6,116,596) | | (6,671,140) |
| Class B shares | | (207,125) | | (261,483) |
| Class C shares | | (72,968) | | (82,006) |
| Class R shares | | (76,497) | | (450,170) |
| Class T shares | | (26,990) | | (25,630) |
| Institutional shares | | (518,978) | | (498,400) |
| Net realized gain on investments: | | | | |
| Class A shares | | (84,798,475) | | (3,000,559) |
| Class B shares | | (8,849,926) | | (351,900) |
| Class C shares | | (3,240,011) | | (112,649) |
| Class R shares | | (870,947) | | (29,847) |
| Class T shares | | (495,795) | | (15,252) |
| Institutional shares | | (6,663,598) | | (216,644) |
| Total Dividends | | (111,937,906) | | (11,715,680) |
| |
| |
|
| Beneficial Interest Transactions ($): | | | | |
| Net proceeds from shares sold: | | | | |
| Class A shares | | 33,450,766 | | 41,179,970 |
| Class B shares | | 1,510,935 | | 2,182,340 |
| Class C shares | | 2,094,368 | | 2,154,740 |
| Class R shares | | 1,340,569 | | 6,465,122 |
| Class T shares | | 701,874 | | 330,242 |
| Institutional shares | | 867,944 | | 430,423 |
STATEMENT OF CHANGES IN NET ASSETS (continued)
| | | Year Ended December 31, |
| |
|
| | | 2006 | | 2005 |
| |
| |
|
| Beneficial Interest Transactions ($) (continued): | | |
| Dividends reinvested: | | | | |
| Class A shares | | 79,114,953 | | 8,340,534 |
| Class B shares | | 8,203,108 | | 542,997 |
| Class C shares | | 2,610,615 | | 146,513 |
| Class R shares | | 944,387 | | 479,481 |
| Class T shares | | 504,754 | | 39,548 |
| Institutional shares | | 7,044,317 | | 696,125 |
| Cost of shares redeemed: | | | | |
| Class A shares | | (133,374,410) | | (147,388,521) |
| Class B shares | | (20,355,944) | | (18,785,780) |
| Class C shares | | (4,756,622) | | (4,377,438) |
| Class R shares | | (1,104,642) | | (54,381,780) |
| Class T shares | | (686,496) | | (577,204) |
| Institutional shares | | (4,736,790) | | (3,325,634) |
| Increase (Decrease) in Net Assets | | | | |
| from Beneficial Interest Transactions | | (26,626,314) | | (165,848,322) |
| Total Increase (Decrease) in Net Assets | | (10,155,383) | | (140,062,562) |
| |
| |
|
| Net Assets ($): | | | | |
| Beginning of Period | | 688,739,852 | | 828,802,414 |
| End of Period | | 678,584,469 | | 688,739,852 |
| Undistributed investment income—net | | 490,141 | | 69,556 |
16
| | | Year Ended December 31, |
| |
|
| | | 2006 | | 2005 |
| |
| |
|
| Capital Share Transactions: | | | | |
| Class A a | | | | |
| Shares sold | | 1,027,585 | | 1,359,291 |
| Shares issued for dividends reinvested | | 2,488,150 | | 269,242 |
| Shares redeemed | | (4,092,976) | | (4,810,155) |
| Net Increase (Decrease) in Shares Outstanding | | (577,241) | | (3,181,622) |
| |
| |
|
| Class B a | | | | |
| Shares sold | | 47,312 | | 72,352 |
| Shares issued for dividends reinvested | | 262,866 | | 17,579 |
| Shares redeemed | | (636,104) | | (628,712) |
| Net Increase (Decrease) in Shares Outstanding | | (325,926) | | (538,781) |
| |
| |
|
| Class C | | | | |
| Shares sold | | 65,670 | | 71,987 |
| Shares issued for dividends reinvested | | 83,675 | | 4,750 |
| Shares redeemed | | (149,192) | | (146,406) |
| Net Increase (Decrease) in Shares Outstanding | | 153 | | (69,669) |
| |
| |
|
| Class R | | | | |
| Shares sold | | 40,533 | | 211,002 |
| Shares issued for dividends reinvested | | 29,734 | | 15,771 |
| Shares redeemed | | (33,401) | | (1,741,923) |
| Net Increase (Decrease) in Shares Outstanding | | 36,866 | | (1,515,150) |
| |
| |
|
| Class T | | | | |
| Shares sold | | 21,515 | | 10,988 |
| Shares issued for dividends reinvested | | 15,865 | | 1,273 |
| Shares redeemed | | (20,571) | | (18,835) |
| Net Increase (Decrease) in Shares Outstanding | | 16,809 | | (6,574) |
| |
| |
|
| Institutional Shares | | | | |
| Shares sold | | 27,122 | | 14,298 |
| Shares issued for dividends reinvested | | 221,572 | | 22,474 |
| Shares redeemed | | (143,421) | | (109,530) |
| Net Increase (Decrease) in Shares Outstanding | | 105,273 | | (72,758) |
| |
| a During the period ended December 31, 2006, 192,361 Class B shares representing $6,138,847 were |
| automatically converted to 189,051 Class A shares and during the period ended December 31, 2005, 152,245 |
| Class B shares representing $4,558,620 were automatically converted to 149,654 Class A shares. |
| See notes to financial statements. | | | | |
FINANCIAL HIGHLIGHTS
The following tables describe the performance for each share class for the fiscal periods indicated. All information (except portfolio turnover rate) reflects financial results for a single fund share.Total return shows how much your investment in the fund would have increased (or decreased) during each period assuming you had reinvested all dividends and distributions.These figures have been derived from the fund’s financial statements.
| | | | | | | Year Ended December 31, | | |
| | | |
| |
| |
|
| Class A Shares | | 2006 | | 2005 | | 2004 | | 2003 | | 2002 |
| |
| |
| |
| |
| |
|
| Per Share Data ($): | | | | | | | | | | |
| Net asset value, beginning of period | | 31.38 | | 30.34 | | 27.44 | | 21.57 | | 28.62 |
| Investment Operations: | | | | | | | | | | |
| Investment income—net a | | .38 | | .30 | | .24 | | .17 | | .10 |
| Net realized and unrealized | | | | | | | | | | |
| gain (loss) on investments | | 5.94 | | 1.26 | | 2.88 | | 5.86 | | (7.06) |
| Total from Investment Operations | | 6.32 | | 1.56 | | 3.12 | | 6.03 | | (6.96) |
| Distributions: | | | | | | | | | | |
| Dividends from investment income—net | | (.37) | | (.35) | | (.22) | | (.16) | | (.09) |
| Dividends from net realized | | | | | | | | | | |
| gain on investments | | (5.33) | | (.17) | | — | | — | | — |
| Total Distributions | | (5.70) | | (.52) | | (.22) | | (.16) | | (.09) |
| Net asset value, end of period | | 32.00 | | 31.38 | | 30.34 | | 27.44 | | 21.57 |
| |
| |
| |
| |
| |
|
| Total Return (%) b | | 21.00 | | 5.18 | | 11.41 | | 28.09 | | (24.36) |
| |
| |
| |
| |
| |
|
| Ratios/Supplemental Data (%): | | | | | | | | | | |
| Ratio of total expenses | | | | | | | | | | |
| to average net assets | | 1.15 | | 1.15 | | 1.15 | | 1.15 | | 1.15 |
| Ratio of net investment income | | | | | | | | | | |
| to average net assets | | 1.17 | | .99 | | .86 | | .71 | | .41 |
| Portfolio Turnover Rate | | 44.73 | | 55.95 | | 74.98 | | 54.58 | | 67.21 |
| |
| |
| |
| |
| |
|
| Net Assets, end of period ($ X 1,000) | | 548,601 | | 556,017 | | 634,007 | | 607,633 | | 504,371 |
| |
| a | | Based on average shares outstanding at each month end. | | | | | | | | |
| b | | Exclusive of sales charge. | | | | | | | | | | |
| See notes to financial statements. | | | | | | | | | | |
18
| | | | | | | Year Ended December 31, | | |
| | | |
| |
| |
|
| Class B Shares | | 2006 | | 2005 | | 2004 | | 2003 | | 2002 |
| |
| |
| |
| |
| |
|
| Per Share Data ($): | | | | | | | | | | |
| Net asset value, beginning of period | | 30.87 | | 29.83 | | 27.02 | | 21.27 | | 28.33 |
| Investment Operations: | | | | | | | | | | |
| Investment income (loss)—net a | | .13 | | .07 | | .02 | | (.01) | | (.08) |
| Net realized and unrealized | | | | | | | | | | |
| gain (loss) on investments | | 5.85 | | 1.26 | | 2.85 | | 5.77 | | (6.98) |
| Total from Investment Operations | | 5.98 | | 1.33 | | 2.87 | | 5.76 | | (7.06) |
| Distributions: | | | | | | | | | | |
| Dividends from investment income—net | | (.12) | | (.12) | | (.06) | | (.01) | | — |
| Dividends from net realized | | | | | | | | | | |
| gain on investments | | (5.33) | | (.17) | | — | | — | | — |
| Total Distributions | | (5.45) | | (.29) | | (.06) | | (.01) | | — |
| Net asset value, end of period | | 31.40 | | 30.87 | | 29.83 | | 27.02 | | 21.27 |
| |
| |
| |
| |
| |
|
| Total Return (%) b | | 20.12 | | 4.47 | | 10.62 | | 27.12 | | (24.92) |
| |
| |
| |
| |
| |
|
| Ratios/Supplemental Data (%): | | | | | | | | | | |
| Ratio of total expenses | | | | | | | | | | |
| to average net assets | | 1.90 | | 1.90 | | 1.90 | | 1.90 | | 1.90 |
| Ratio of net investment income | | | | | | | | | | |
| (loss)to average net assets | | .42 | | .24 | | .10 | | (.04) | | (.33) |
| Portfolio Turnover Rate | | 44.73 | | 55.95 | | 74.98 | | 54.58 | | 67.21 |
| |
| |
| |
| |
| |
|
| Net Assets, end of period ($ X 1,000) | | 55,112 | | 64,239 | | 78,154 | | 78,780 | | 62,820 |
| a | | Based on average shares outstanding at each month end. | | | | | | | | |
| b | | Exclusive of sales charge. | | | | | | | | | | |
| See notes to financial statements. | | | | | | | | | | |
| | FINANCIAL HIGHLIGHTS (continued)
|
| | | | | | | Year Ended December 31, | | |
| | | |
| |
| |
|
| Class C Shares | | 2006 | | 2005 | | 2004 | | 2003 | | 2002 |
| |
| |
| |
| |
| |
|
| Per Share Data ($): | | | | | | | | | | |
| Net asset value, beginning of period | | 30.85 | | 29.83 | | 27.02 | | 21.27 | | 28.34 |
| Investment Operations: | | | | | | | | | | |
| Investment income (loss)—net a | | .14 | | .07 | | .02 | | (.01) | | (.08) |
| Net realized and unrealized | | | | | | | | | | |
| gain (loss) on investments | | 5.84 | | 1.24 | | 2.85 | | 5.77 | | (6.99) |
| Total from Investment Operations | | 5.98 | | 1.31 | | 2.87 | | 5.76 | | (7.07) |
| Distributions: | | | | | | | | | | |
| Dividends from investment income—net | | (.12) | | (.12) | | (.06) | | (.01) | | — |
| Dividends from net realized | | | | | | | | | | |
| gain on investments | | (5.33) | | (.17) | | — | | — | | — |
| Total Distributions | | (5.45) | | (.29) | | (.06) | | (.01) | | — |
| Net asset value, end of period | | 31.38 | | 30.85 | | 29.83 | | 27.02 | | 21.27 |
| |
| |
| |
| |
| |
|
| Total Return (%) b | | 20.07 | | 4.43 | | 10.62 | | 27.12 | | (24.95) |
| |
| |
| |
| |
| |
|
| Ratios/Supplemental Data (%): | | | | | | | | | | |
| Ratio of total expenses | | | | | | | | | | |
| to average net assets | | 1.90 | | 1.90 | | 1.90 | | 1.90 | | 1.90 |
| Ratio of net investment income | | | | | | | | | | |
| (loss) to average net assets | | .42 | | .24 | | .10 | | (.04) | | (.32) |
| Portfolio Turnover Rate | | 44.73 | | 55.95 | | 74.98 | | 54.58 | | 67.21 |
| |
| |
| |
| |
| |
|
| Net Assets, end of period ($ X 1,000) | | 20,919 | | 20,564 | | 21,958 | | 22,480 | | 20,819 |
| |
| a | | Based on average shares outstanding at each month end. | | | | | | | | |
| b | | Exclusive of sales charge. | | | | | | | | | | |
| See notes to financial statements. | | | | | | | | | | |
20
| | | | | Year Ended December 31, | | |
| |
| |
| |
|
| Class R Shares | | 2006 | | 2005 | | 2004 | | 2003 | | 2002 |
| |
| |
| |
| |
| |
|
| Per Share Data ($): | | | | | | | | | | |
| Net asset value, beginning of period | | 31.36 | | 30.33 | | 27.43 | | 21.56 | | 28.62 |
| Investment Operations: | | | | | | | | | | |
| Investment income—net a | | .46 | | .38 | | .31 | | .22 | | .17 |
| Net realized and unrealized | | | | | | | | | | |
| gain (loss) on investments | | 5.95 | | 1.25 | | 2.88 | | 5.87 | | (7.08) |
| Total from Investment Operations | | 6.41 | | 1.63 | | 3.19 | | 6.09 | | (6.91) |
| Distributions: | | | | | | | | | | |
| Dividends from investment income—net | | (.46) | | (.43) | | (.29) | | (.22) | | (.15) |
| Dividends from net realized | | | | | | | | | | |
| gain on investments | | (5.33) | | (.17) | | — | | — | | — |
| Total Distributions | | (5.79) | | (.60) | | (.29) | | (.22) | | (.15) |
| Net asset value, end of period | | 31.98 | | 31.36 | | 30.33 | | 27.43 | | 21.56 |
| |
| |
| |
| |
| |
|
| Total Return (%) | | 21.26 | | 5.45 | | 11.69 | | 28.43 | | (24.18) |
| |
| |
| |
| |
| |
|
| Ratios/Supplemental Data (%): | | | | | | | | | | |
| Ratio of total expenses | | | | | | | | | | |
| to average net assets | | .90 | | .90 | | .90 | | .90 | | .90 |
| Ratio of net investment income | | | | | | | | | | |
| to average net assets | | 1.42 | | 1.25 | | 1.09 | | .95 | | .67 |
| Portfolio Turnover Rate | | 44.73 | | 55.95 | | 74.98 | | 54.58 | | 67.21 |
| |
| |
| |
| |
| |
|
| Net Assets, end of period ($ X 1,000) | | 6,012 | | 4,740 | | 50,536 | | 52,723 | | 40,320 |
| |
| a Based on average shares outstanding at each month end. | | | | | | | | |
| See notes to financial statements. | | | | | | | | | | |
FINANCIAL HIGHLIGHTS (continued)
| | | | | | | Year Ended December 31, | | |
| | | |
| |
| |
|
| Class T Shares | | 2006 | | 2005 | | 2004 | | 2003 | | 2002 |
| |
| |
| |
| |
| |
|
| Per Share Data ($): | | | | | | | | | | |
| Net asset value, beginning of period | | 31.37 | | 30.33 | | 27.43 | | 21.57 | | 28.63 |
| Investment Operations: | | | | | | | | | | |
| Investment income—net a | | .30 | | .23 | | .18 | | .11 | | .05 |
| Net realized and unrealized | | | | | | | | | | |
| gain (loss) on investments | | 5.94 | | 1.26 | | 2.87 | | 5.85 | | (7.07) |
| Total from Investment Operations | | 6.24 | | 1.49 | | 3.05 | | 5.96 | | (7.02) |
| Distributions: | | | | | | | | | | |
| Dividends from investment income—net | | (.29) | | (.28) | | (.15) | | (.10) | | (.04) |
| Dividends from net realized | | | | | | | | | | |
| gain on investments | | (5.33) | | (.17) | | — | | — | | — |
| Total Distributions | | (5.62) | | (.45) | | (.15) | | (.10) | | (.04) |
| Net asset value, end of period | | 31.99 | | 31.37 | | 30.33 | | 27.43 | | 21.57 |
| |
| |
| |
| |
| |
|
| Total Return (%) b | | 20.67 | | 4.95 | | 11.14 | | 27.72 | | (24.53) |
| |
| |
| |
| |
| |
|
| Ratios/Supplemental Data (%): | | | | | | | | | | |
| Ratio of total expenses | | | | | | | | | | |
| to average net assets | | 1.40 | | 1.40 | | 1.40 | | 1.40 | | 1.40 |
| Ratio of net investment income | | | | | | | | | | |
| to average net assets | | .93 | | .74 | | .65 | | .45 | | .21 |
| Portfolio Turnover Rate | | 44.73 | | 55.95 | | 74.98 | | 54.58 | | 67.21 |
| |
| |
| |
| |
| |
|
| Net Assets, end of period ($ X 1,000) | | 3,434 | | 2,840 | | 2,945 | | 2,264 | | 1,567 |
| |
| a | | Based on average shares outstanding at each month end. | | | | | | | | |
| b | | Exclusive of sales charge. | | | | | | | | | | |
| See notes to financial statements. | | | | | | | | | | |
22
| | | | | Year Ended December 31, | | |
| |
| |
| |
|
| Institutional Shares | | 2006 | | 2005 | | 2004 | | 2003 | | 2002 |
| |
| |
| |
| |
| |
|
| Per Share Data ($): | | | | | | | | | | |
| Net asset value, beginning of period | | 31.36 | | 30.32 | | 27.42 | | 21.55 | | 28.60 |
| Investment Operations: | | | | | | | | | | |
| Investment income—net a | | .42 | | .33 | | .27 | | .19 | | .13 |
| Net realized and unrealized | | | | | | | | | | |
| gain (loss) on investments | | 5.94 | | 1.26 | | 2.88 | | 5.87 | | (7.07) |
| Total from Investment Operations | | 6.36 | | 1.59 | | 3.15 | | 6.06 | | (6.94) |
| Distributions: | | | | | | | | | | |
| Dividends from investment income—net | | (.41) | | (.38) | | (.25) | | (.19) | | (.11) |
| Dividends from net realized | | | | | | | | | | |
| gain on investments | | (5.33) | | (.17) | | — | | — | | — |
| Total Distributions | | (5.74) | | (.55) | | (.25) | | (.19) | | (.11) |
| Net asset value, end of period | | 31.98 | | 31.36 | | 30.32 | | 27.42 | | 21.55 |
| |
| |
| |
| |
| |
|
| Total Return (%) | | 21.11 | | 5.33 | | 11.53 | | 28.25 | | (24.28) |
| |
| |
| |
| |
| |
|
| Ratios/Supplemental Data (%): | | | | | | | | | | |
| Ratio of total expenses | | | | | | | | | | |
| to average net assets | | 1.05 | | 1.05 | | 1.05 | | 1.05 | | 1.05 |
| Ratio of net investment income | | | | | | | | | | |
| to average net assets | | 1.28 | | 1.09 | | .96 | | .81 | | .51 |
| Portfolio Turnover Rate | | 44.73 | | 55.95 | | 74.98 | | 54.58 | | 67.21 |
| |
| |
| |
| |
| |
|
| Net Assets, end of period ($ X 1,000) | | 44,506 | | 40,341 | | 41,202 | | 41,848 | | 37,174 |
| |
| a Based on average shares outstanding at each month end. | | | | | | | | |
| See notes to financial statements. | | | | | | | | | | |
NOTES TO FINANCIAL STATEMENTS
NOTE 1—Significant Accounting Policies:
Dreyfus Premier Core Value Fund (the “fund”) is a separate diversified series of The Dreyfus/Laurel Funds Trust (the “Trust”) which is registered under the Investment Company Act of 1940, as amended (the “Act”), as an open-end management investment company and operates as a series company offering six series, including the fund, as of the date of this report. The fund’s investment objective is to seek long-term capital growth.The Dreyfus Corporation (the “Manager” or “Dreyfus”) serves as the fund’s investment manager. The Manager is a wholly-owned subsidiary of Mellon Financial Corporation (“Mellon Financial”).
On December 4, 2006, Mellon Financial and The Bank of New York Company, Inc. announced that they had entered into a definitive agreement to merge. The new company will be called The Bank of New York Mellon Corporation. As part of this transaction, Dreyfus would become a wholly-owned subsidiary of The Bank of New York Mellon Corporation.The transaction is subject to certain regulatory approvals and the approval of The Bank of New York Company, Inc.’s and Mellon Financial’s shareholders, as well as other customary conditions to closing. Subject to such approvals and the satisfaction of the other conditions, Mellon Financial and The Bank of New York Company, Inc. expect the transaction to be completed in the third quarter of 2007.
Dreyfus Service Corporation (the “Distributor”), a wholly-owned subsidiary of the Manager, is the distributor of the fund’s shares.The fund is authorized to issue an unlimited number of shares of Beneficial Interest in each of the following classes of shares: Class A, Class B, Class C, Class R, Class T and Institutional shares. Class A, Class B, Class C and Class T shares are sold primarily to retail investors through financial intermediaries and bear a distribution fee and/or service fee. Class A and Class T shares are subject to a front-end sales charge, while Class B and Class C shares are subject to a contingent deferred sales charge (“CDSC”). Class B shares automatically convert to Class A shares after six years. Class R shares are sold primarily to bank trust departments
24
and other financial service providers (including Mellon Financial and its affiliates) acting on behalf of customers having a qualified trust or investment account or relationship at such institution, and bear no distribution or service fees. Class R and Institutional shares are offered without a front-end sales charge or CDSC. Institutional shares are offered only to those customers of certain financial planners and investment advisers who held shares of a predecessor class of the fund as of April 4, 1994, and bear a distribution fee. Each class of shares has identical rights and privileges, except with respect to the distribution and service fees and voting rights on matters affecting a single class. Income, expenses (other than expenses attributable to a specific class), and realized and unrealized gains or losses on investments are allocated to each class of shares based on its relative net assets.
Effective March 1, 2006, Class A shares of the fund may be purchased at net asset value (“NAV”) without payment of a sales charge:
- By qualified investors who (i) purchase Class A shares directly through the Distributor, and (ii) have, or whose spouse or minor children have, beneficially owned shares and continuously maintained an open account directly through the Distributor in a Dreyfus-managed fund, including the fund, or a Founders Asset Management LLC
(“Founders”) managed fund since on or before February 28, 2006. Founders is a wholly-owned subsidiary of the Distributor. - With the cash proceeds from an investor’s exercise of employment- related stock options, whether invested in the fund directly or indi- rectly through an exchange from a Dreyfus-managed money market fund, provided that the proceeds are processed through an entity that has entered into an agreement with the Distributor specifically relat- ing to processing stock options. Upon establishing the account in the fund or the Dreyfus-managed money market fund, the investor and the investor’s spouse and minor children become eligible to purchase Class A shares of the fund at NAV, whether or not using the proceeds of the employment-related stock options.
NOTES TO FINANCIAL STATEMENTS (continued)
- By members of qualified affinity groups who purchase Class A shares directly through the Distributor, provided that the qualified affinity group has entered into an affinity agreement with the Distributor.
Effective March 1, 2006, Class A and Class T shares of the fund may be purchased at NAV without payment of a sales charge:
- For Dreyfus-sponsored IRA “Rollover Accounts” with the distribu- tion proceeds from qualified and non-qualified retirement plans or a Dreyfus-sponsored 403(b)(7) plan, provided that, in the case of a qualified or non-qualified retirement plan, the rollover is processed through an entity that has entered into an agreement with the Distributor specifically relating to processing rollovers. Upon estab- lishing the Dreyfus-sponsored IRA rollover account in the fund, the shareholder becomes eligible to make subsequent purchases of Class A or Class T shares of the fund at NAV in such account.
Effective June 1, 2006, the fund no longer offers Class B shares, except in connection with dividend reinvestment and permitted exchanges of Class B shares.
The fund’s financial statements are prepared in accordance with U.S. generally accepted accounting principles, which may require the use of management estimates and assumptions. Actual results could differ from those estimates.
(a) Portfolio valuation: Investments in securities are valued at the last sales price on the securities exchange or national securities market on which such securities are primarily traded. Securities listed on the National Market System, for which market quotations are available are valued at the official closing price or, if there is no official closing price that day, at the last sale price. Securities not listed on an exchange or the national securities market, or securities for which there were no transactions, are valued at the average of the most recent bid and asked prices. Bid price is used when no asked price is available. Registered open-ended investment companies that are not traded on an exchange are valued at their NAV. When market quotations or official closing prices are not readily available, or are determined not to reflect accu-
26
rately fair value, such as when the value of a security has been significantly affected by events after the close of the exchange or market on which the security is principally traded (for example, a foreign exchange or market), but before the fund calculates its NAV, the fund may value these investments at fair value as determined in accordance with the procedures approved by the Board of Trustees. Fair valuing of securities may be determined with the assistance of a pricing service using calculations based on indices of domestic securities and other appropriate indicators, such as prices of relevant ADR’s and futures contracts. For other securities that are fair valued by the Board of Trustees, certain factors may be considered such as: fundamental analytical data, the nature and duration of restrictions on disposition, an evaluation of the forces that influence the market in which the securities are purchased and sold, and public trading in similar securities of the issuer or comparable issuers. Investments denominated in foreign currencies are translated to U.S. dollars at the prevailing rates of exchange. Forward currency exchange contracts are valued at the forward rate.
On September 20, 2006, the Financial Accounting Standards Board (FASB) released Statement of Financial Accounting Standards No. 157 “Fair Value Measurements” (“FAS 157”). FAS 157 establishes an authoritative definition of fair value, sets out a framework for measuring fair value, and requires additional disclosures about fair-value measurements. The application of FAS 157 is required for fiscal years beginning after November 15, 2007 and interim periods within those fiscal years. Management does not believe that the application of this standard will have a material impact on the financial statements of the fund.
(b) Securities transactions and investment income: Securities transactions are recorded on a trade date basis. Realized gain and loss from securities transactions are recorded on the identified cost basis. Dividend income is recognized on the ex-dividend date and interest income, including, where applicable, accretion of discount and amortization of premium on investments, is recognized on the accrual basis.
| | NOTES TO FINANCIAL STATEMENTS (continued)
|
Pursuant to a securities lending agreement with Mellon Bank, N.A., an affiliate of the Manager, the fund may lend securities to qualified institutions. It is the fund’s policy, that at origination, all loans are secured by collateral of at least 102% of the value of U.S. securities loaned and 105% of the value of foreign securities loaned. It is the fund’s policy that collateral equivalent to at least 100% of the market value of securities on loan is maintained at all times. Cash collateral is invested in certain money market mutual funds managed by the Manager. The fund is entitled to receive all income on securities loaned, in addition to income earned as a result of the lending transaction. Although each security loaned is fully collateralized, the fund bears the risk of delay in recovery of, or loss of rights in, the securities loaned should a borrower fail to return the securities in a timely manner.
(c) Affiliated issuers: Investments in other investment companies advised by the Manager are defined as “affiliated” in the Act.
(d) Foreign currency transactions: The fund does not isolate that portion of the results of operations resulting from changes in foreign exchange rates on investments from the fluctuations arising from changes in the market prices of securities held. Such fluctuations are included with the net realized and unrealized gain or loss from investments.
Net realized foreign exchange gains or losses arise from sales and maturities of short-term securities, sales of foreign currencies, currency gains or losses realized on securities transactions and the difference between the amount of dividends, interest, and foreign withholding taxes recorded on the fund’s books and the U.S. dollar equivalent of the amounts actually received or paid. Net unrealized foreign exchange gains and losses arise from changes in the value of assets and liabilities other than investments in securities, resulting from changes in exchange rates. Such gains and losses are included with net realized and unrealized gain or loss on investments.
(e) Dividends to shareholders: Dividends are recorded on the ex-dividend date. Dividends from investment income-net are declared
28
and paid on a quarterly basis. Dividends from net realized capital gain, if any, are normally declared and paid annually, but the fund may make distributions on a more frequent basis to comply with the distribution requirements of the Internal Revenue Code of 1986, as amended (the “Code”).To the extent that net realized capital gain can be offset by capital loss carryovers, if any, it is the policy of the fund not to distribute such gain. Income and capital gain distributions are determined in accordance with income tax regulations, which may differ from U.S. generally accepted accounting principles.
(f) Federal income taxes: It is the policy of the fund to continue to qualify as a regulated investment company, if such qualification is in the best interests of its shareholders, by complying with the applicable provisions of the Code, and to make distributions of taxable income sufficient to relieve it from substantially all federal income and excise taxes.
On July 13, 2006, the FASB released FASB Interpretation No. 48 “Accounting for Uncertainty in Income Taxes” (FIN 48). FIN 48 provides guidance for how uncertain tax positions should be recognized, measured, presented and disclosed in the financial statements. FIN 48 requires the evaluation of tax positions taken or expected to be taken in the course of preparing the fund’s tax returns to determine whether the tax positions are “more-likely-than-not” of being sustained by the applicable tax authority.Tax positions not deemed to meet the more-likely-than-not threshold would be recorded as a tax benefit or expense in the current year. Adoption of FIN 48 is required for fiscal years beginning after December 15, 2006 and is to be applied to all open tax years as of the effective date. Management does not believe that the application of this standard will have a material impact on the financial statements of the fund.
At December 31, 2006, the components of accumulated earnings on a tax basis were as follows: undistributed ordinary income $2,577,146, undistributed capital gains $6,848,897 and unrealized appreciation $126,542,740.
| | NOTES TO FINANCIAL STATEMENTS (continued)
|
The tax character of distributions paid to shareholders during the fiscal periods ended December 31, 2006 and December 31, 2005 were as follows: ordinary income $20,615,240 and $7,988,829 and long-term capital gains $91,322,666 and $3,726,851, respectively.
During the period ended December 31, 2006, as a result of permanent book to tax differences, primarily due to the tax treatment for real estate investment trusts, the fund decreased accumulated undistributed investment income-net by $26,323 and increased accumulated net realized gain (loss) on investments by the same amount. Net assets were not affected by this reclassification.
NOTE 2—Bank Line of Credit:
The fund participates with other Dreyfus-managed funds in a $350 million redemption credit facility (“the Facility”) to be utilized for temporary or emergency purposes, including the financing of redemptions. In connection therewith, the fund has agreed to pay commitment fees on its pro rata portion of the Facility. Interest is charged to the fund based on prevailing market rates in effect at the time of borrowing.
The average daily amount of borrowings outstanding under the Facility during the period ended December 31, 2006, was $152,600 with a related weighted average annualized interest rate of 5.55% .
NOTE 3—Investment Management Fee and Other Transactions With Affiliates:
(a) Pursuant to an Investment Management agreement with the Manager, the Manager provides or arranges for one or more third parties and/or affiliates to provide investment advisory, administrative, custody, fund accounting and transfer agency services to the fund.The Manager also directs the investments of the fund in accordance with its investment objective, policies and limitations. For these services, the fund is contractually obligated to pay the Manager a fee, calculated daily and paid monthly, at the annual rate of .90% of the value of the fund’s average daily net assets. Out of its fee, the Manager pays all of
30
the expenses of the fund except brokerage fees, taxes, interest, commitment fees, Rule 12b-1 distribution fees and expenses, service fees and expenses of non-interested Trustees (including counsel fees) and extraordinary expenses. In addition, the Manager is required to reduce its fee in an amount equal to the fund’s allocable portion of fees and expenses of the non-interested Trustees (including counsel fees). Each Trustee receives $45,000 per year, plus $6,000 for each joint Board meeting of The Dreyfus/Laurel Funds, Inc.,The Dreyfus/Laurel Tax-Free Municipal Funds and the Trust (collectively, the “Dreyfus/Laurel Funds”) attended, $2,000 for separate in-person committee meetings attended which are not held in conjunction with a regularly scheduled Board meeting and $1,500 for Board meetings and separate committee meetings attended that are conducted by telephone and is reimbursed for travel and out-of-pocket expenses. With respect to Board meetings, the Chairman of the Board receives an additional 25% of such compensation (with the exception of reimbursable amounts). With respect to compensation committee meetings, the Chair of the compensation committee receives $900 per meeting and, with respect to audit committee meetings, the Chair of the audit committee receives $1,350 per meeting. In the event that there is an in-person joint committee meeting or a joint telephone meeting of the Dreyfus/Laurel Funds and Dreyfus High Yield Strategies Fund, the $2,000 or $1,500 fee, as applicable, will be allocated between the Dreyfus/Laurel Funds and Dreyfus High Yield Strategies Fund. These fees and expenses are charged and allocated to each series based on net assets. Amounts required to be paid by the Trust directly to the non-interested Trustees, that would be applied to offset a portion of the management fee payable to the Manager, are in fact paid directly by the Manager to the non-interested Trustees.
During the period ended December 31, 2006, the Distributor retained $20,016 and $598 from commissions earned on sales of the fund’s Class A and Class T shares, respectively, and $139,670 and $4,023 from CDSC on redemptions on the fund’s Class B and Class C shares, respectively.
| | NOTES TO FINANCIAL STATEMENTS (continued)
|
(b) Under separate Distribution Plans (the “Plans”) adopted pursuant to Rule 12b-1 under the Act, Class A shares and Institutional shares may pay annually up to .25% and ..15%, respectively, of the value of their average daily net assets to compensate the Distributor for shareholder servicing activities and expenses primarily intended to result in the sale of Class A shares and Institutional shares. Class B, Class C and Class T shares pay the Distributor for distributing their shares at an aggregate annual rate of .75% of the value of the average daily net assets of Class B and Class C shares, and .25% of the value of average daily net assets of Class T shares.The Distributor may pay one or more agents in respect of advertising, marketing and other distribution services for Class T shares and determines the amounts, if any, to be paid to agents and the basis on which such payments are made. Class B, Class C and Class T shares are also subject to a service plan adopted pursuant to Rule 12b-1 (the “Service Plan”), under which Class B, Class C and Class T shares pay the Distributor for providing certain services to the holders of their shares a fee at the annual rate of .25% of the value of the average daily net assets of Class B, Class C and Class T shares, respectively. During the period ended December 31, 2006, Class A, Class B, Class C, Class T and Institutional shares were charged $1,375,700, $435,235, $152,038, $7,563 and $63,138 respectively, pursuant to their respective Plans. During the period ended December 31, 2006, Class B, Class C and Class T shares were charged $145,078, $50,679 and $7,563, respectively, pursuant to the Service Plan.
Under its terms, the Plans and Service Plan shall remain in effect from year to year, provided such continuance is approved annually by a vote of majority of those Trustees who are not “interested persons” of the Trust and who have no direct or indirect financial interest in the operation of or in any agreement related to the Plans or Service Plan.
32
The components of Due to The Dreyfus Corporation and affiliates in the Statement of Assets and Liabilities consist of: management fees $537,658, Rule 12b-1 distribution plan fees $177,616 and shareholder services plan fees $17,470.
(c) The Trust and the Manager have received an exemptive order from the SEC which, among other things, permits the fund to use cash collateral received in connection with lending the fund’s securities and other uninvested cash to purchase shares of one or more registered money market mutual funds advised by the Manager in excess of the limitations imposed by the Act.
NOTE 4—Securities Transactions:
The aggregate amount of purchases and sales of investment securities, excluding short-term securities, during the period ended December 31, 2006, amounted to $302,908,351 and $431,854,661, respectively.
At December 31, 2006, the cost of investments for federal income tax purposes was $556,823,031; accordingly, accumulated net unrealized depreciation on investments was $126,542,740 consisting of $131,102,585 gross unrealized appreciation and $4,559,845 gross unrealized depreciation.
| REPORT OF INDEPENDENT REGISTERED |
| PUBLIC ACCOUNTING FIRM |
| The Board of Trustees and Shareholders of |
| The Dreyfus/Laurel Funds Trust: |
We have audited the accompanying statement of assets and liabilities of Dreyfus Premier Core Value Fund (the “Fund”) of The Dreyfus/Laurel Funds Trust, including the statement of investments as of December 31, 2006, and the related statement of operations for the year then ended, the statements of changes in net assets for each of the years in the two-year period then ended, and the financial highlights for each of the years in the five-year period then ended.These financial statements and financial highlights are the responsibility of the Fund’s management. Our responsibility is to express an opinion on these financial statements and financial highlights based on our audits.
We conducted our audits in accordance with standards of the Public Company Accounting Oversight Board (United States).Those standards require that we plan and perform the audit to obtain reasonable assurance about whether the financial statements and financial highlights are free of material misstatement. An audit also includes examining, on a test basis, evidence supporting the amounts and disclosures in the financial statements. Our procedures included confirmation of securities owned as of December 31, 2006, by correspondence with the custodian and brokers. An audit also includes assessing the accounting principles used and significant estimates made by management, as well as evaluating the overall financial statement presentation.We believe that our audits provide a reasonable basis for our opinion.
In our opinion, the financial statements and financial highlights referred to above present fairly, in all material respects, the financial position of Dreyfus Premier Core Value Fund of The Dreyfus/Laurel Funds Trust as of December 31, 2006, and the results of its operations for the year then ended, the changes in its net assets for each of the years in the two-year period then ended, and the financial highlights for each of the years in the five-year period then ended, in conformity with U.S. generally accepted accounting principles.

| New York, New York |
| February 16, 2007 |
34
IMPORTANT TAX INFORMATION (Unaudited)
For federal tax purposes, the fund hereby designates $1.3460 per share as a long-term capital gain paid on March 31, 2006, and also designates $3.2750 per share as a long-term capital gain distribution and $.7100 per share as a short-term capital gain distribution paid on December 21, 2006.The fund also hereby designates 62.12% of the ordinary dividends paid during the fiscal year ended December 31, 2006 as qualifying for the corporate dividends received deduction. For the fiscal year ended December 31, 2006, certain dividends paid by the fund may be subject to a maximum tax rate of 15%, as provided for by the Jobs and Growth Tax Relief Reconciliation Act of 2003. Of the distributions paid during the fiscal year, $15,390,132 represents the maximum amount that may be considered qualified dividend income. Shareholders will receive notification in January 2007 of the percentage applicable to the preparation of their 2006 income tax returns.
BOARD MEMBERS INFORMATION (Unaudited)
| Joseph S. DiMartino (63) |
| Chairman of the Board (1995) |
| Principal Occupation During Past 5 Years: |
| • Corporate Director and Trustee |
Other Board Memberships and Affiliations:
- The Muscular Dystrophy Association, Director
- Century Business Services, Inc., a provider of outsourcing functions for small and medium size companies, Director
- The Newark Group, a provider of a national market of paper recovery facilities, paperboard mills and paperboard converting plants, Director
- Sunair Services Corporation, engaging in the design, manufacture and sale of high frequency systems for long-range voice and data communications, as well as providing certain outdoor-related services to homes and businesses, Director
No. of Portfolios for which Board Member Serves: 190
———————
| James M. Fitzgibbons (72) |
| Board Member (1994) |
| Principal Occupation During Past 5 Years: |
| • Chairman of the Board, Davidson Cotton Company (1998-2002) |
| Other Board Memberships and Affiliations: |
| • Bill Barrett Company, an oil and gas exploration company, Director |
No. of Portfolios for which Board Member Serves: 27
———————
| J. Tomlinson Fort (78) |
| Board Member (1987) |
| Principal Occupation During Past 5 Years: |
| • Retired; Of Counsel, Reed Smith LLP (1998-2005) |
Other Board Memberships and Affiliations:
- Allegheny College, Emeritus Trustee
- Pittsburgh Ballet Theatre,Trustee
- American College of Trial Lawyers, Fellow
No. of Portfolios for which Board Member Serves: 27
———————
| Kenneth A. Himmel (60) |
| Board Member (1994) |
Principal Occupation During Past 5 Years:
- President and CEO,Related Urban Development,a real estate development company (1996-present)
- President and CEO, Himmel & Company, a real estate development company (1980-present)
- CEO, American Food Management, a restaurant company (1983-present)
No. of Portfolios for which Board Member Serves: 27
36
| Stephen J. Lockwood (59) |
| Board Member (1994) |
Principal Occupation During Past 5 Years:
- Chairman of the Board, Stephen J. Lockwood and Company LLC, an investment company (2000-present)
No. of Portfolios for which Board Member Serves: 27
———————
| Roslyn M. Watson (57) |
| Board Member (1994) |
| Principal Occupation During Past 5 Years: |
| • Principal,Watson Ventures, Inc., a real estate investment company (1993-present) |
Other Board Memberships and Affiliations:
- American Express Centurion Bank, Director
- The Hyams Foundation Inc., a Massachusetts Charitable Foundation,Trustee
- National Osteoporosis Foundation,Trustee
No. of Portfolios for which Board Member Serves: 27
———————
| Benaree Pratt Wiley (60) |
| Board Member (1998) |
Principal Occupation During Past 5 Years:
- Principal,The Wiley Group, a firm specializing in strategy and business development (2005-present)
- President and CEO,The Partnership, an organization dedicated to increasing the representa- tion of African Americans in positions of leadership, influence and decision-making in Boston, MA (1991-2005)
Other Board Memberships and Affiliations:
- Boston College,Trustee
- Blue Cross Blue Shield of Massachusetts, Director
- Commonwealth Institute, Director
- Efficacy Institute, Director
- PepsiCo African-American, Advisory Board
- The Boston Foundation, Director
- Harvard Business School Alumni Board, Director
No. of Portfolios for which Board Member Serves: 27
———————
Once elected all Board Members serve for an indefinite term, but achieve Emeritus status upon reaching age 80.The address of the Board Members and Officers is in c/o The Dreyfus Corporation, 200 Park Avenue, New York, New York 10166. Additional information about the Board Members is available in the fund’s Statement of Additional Information which can be obtained from Dreyfus free of charge by calling this toll free number: 1-800-554-4611.
Francis P. Brennan, Emeritus Board Member
OFFICERS OF THE FUND (Unaudited)
| J. DAVID OFFICER, President since |
| December 2006. |
Chief Operating Officer,Vice Chairman and a director of the Manager, and an officer of 90 investment companies (comprised of 190 portfolios) managed by the Manager. He is 58 years old and has been an employee of the Manager since April 1, 1998.
| MARK N. JACOBS, Vice President since |
| March 2000. |
Executive Vice President, Secretary and General Counsel of the Manager, and an officer of 91 investment companies (comprised of 206 portfolios) managed by the Manager. He is 60 years old and has been an employee of the Manager since June 1977.
| MICHAEL A. ROSENBERG, Vice President |
| and Secretary since August 2005. |
Associate General Counsel of the Manager, and an officer of 91 investment companies (comprised of 206 portfolios) managed by the Manager. He is 46 years old and has been an employee of the Manager since October 1991.
| JAMES BITETTO, Vice President and |
| Assistant Secretary since August 2005. |
Associate General Counsel and Assistant Secretary of the Manager, and an officer of 91 investment companies (comprised of 206 portfolios) managed by the Manager. He is 40 years old and has been an employee of the Manager since December 1996.
| JONI LACKS CHARATAN, Vice President |
| and Assistant Secretary since |
| August 2005. |
Associate General Counsel of the Manager, and an officer of 91 investment companies (comprised of 206 portfolios) managed by the Manager. She is 51 years old and has been an employee of the Manager since October 1988.
| JOSEPH M. CHIOFFI, Vice President and |
| Assistant Secretary since August 2005. |
Associate General Counsel of the Manager, and an officer of 91 investment companies (comprised of 206 portfolios) managed by the Manager. He is 45 years old and has been an employee of the Manager since June 2000.
| JANETTE E. FARRAGHER, Vice President |
| and Assistant Secretary since |
| August 2005. |
Associate General Counsel of the Manager, and an officer of 91 investment companies (comprised of 206 portfolios) managed by the Manager. She is 44 years old and has been an employee of the Manager since February 1984.
| JOHN B. HAMMALIAN, Vice President and |
| Assistant Secretary since August 2005. |
Associate General Counsel of the Manager, and an officer of 91 investment companies (comprised of 206 portfolios) managed by the Manager. He is 43 years old and has been an employee of the Manager since February 1991.
| ROBERT R. MULLERY, Vice President and |
| Assistant Secretary since August 2005. |
Associate General Counsel of the Manager, and an officer of 91 investment companies (comprised of 206 portfolios) managed by the Manager. He is 54 years old and has been an employee of the Manager since May 1986.
| JEFF PRUSNOFSKY, Vice President and |
| Assistant Secretary since August 2005. |
Associate General Counsel of the Manager, and an officer of 91 investment companies (comprised of 206 portfolios) managed by the Manager. He is 41 years old and has been an employee of the Manager since October 1990.
38
| JAMES WINDELS, Treasurer since |
| November 2001. |
Director – Mutual Fund Accounting of the Manager, and an officer of 91 investment companies (comprised of 206 portfolios) managed by the Manager. He is 48 years old and has been an employee of the Manager since April 1985.
| ERIK D. NAVILOFF, Assistant Treasurer |
| since December 2002. |
Senior Accounting Manager – Taxable Fixed Income Funds of the Manager, and an officer of 91 investment companies (comprised of 206 portfolios) managed by the Manager. He is 38 years old and has been an employee of the Manager since November 1992.
| ROBERT ROBOL, Assistant Treasurer |
| since August 2005. |
Senior Accounting Manager – Money Market and Municipal Bond Funds of the Manager, and an officer of 91 investment companies (comprised of 206 portfolios) managed by the Manager. He is 42 years old and has been an employee of the Manager since October 1988.
| ROBERT SVAGNA, Assistant Treasurer |
| since December 2002. |
Senior Accounting Manager – Equity Funds of the Manager, and an officer of 91 investment companies (comprised of 206 portfolios) managed by the Manager. He is 39 years old and has been an employee of the Manager since November 1990.
| GAVIN C. REILLY, Assistant Treasurer |
| since December 2005. |
Tax Manager of the Investment Accounting and Support Department of the Manager, and an officer of 91 investment companies (comprised of 206 portfolios) managed by the Manager. He is 38 years old and has been an employee of the Manager since April 1991.
| JOSEPH W. CONNOLLY, Chief Compliance |
| Officer since October 2004. |
Chief Compliance Officer of the Manager and The Dreyfus Family of Funds (91 investment companies, comprised of 206 portfolios). From November 2001 through March 2004, Mr. Connolly was first Vice-President, Mutual Fund Servicing for Mellon Global Securities Services. In that capacity, Mr. Connolly was responsible for managing Mellon’s Custody, Fund Accounting and Fund Administration services to third-party mutual fund clients. He is 49 years old and has served in various capacities with the Manager since 1980, including manager of the firm’s Fund Accounting Department from 1997 through October 2001.
| WILLIAM GERMENIS, Anti-Money |
| Laundering Compliance Officer since |
| July 2002. |
Vice President and Anti-Money Laundering Compliance Officer of the Distributor, and the Anti-Money Laundering Compliance Officer of 87 investment companies (comprised of 202 portfolios) managed by the Manager. He is 36 years old and has been an employee of the Distributor since October 1998.
NOTES
| For More | | Information |
| |
|
| |
| Dreyfus Premier | | Transfer Agent & |
| Core Value Fund | | Dividend Disbursing Agent |
| 200 Park Avenue | | |
| | | Dreyfus Transfer, Inc. |
| New York, NY 10166 | | |
| | | 200 Park Avenue |
| Manager | | New York, NY 10166 |
| The Dreyfus Corporation | | Distributor |
| 200 Park Avenue | | |
| | | Dreyfus Service Corporation |
| New York, NY 10166 | | |
| | | 200 Park Avenue |
| Custodian | | New York, NY 10166 |
| Mellon Bank, N.A. | | |
| One Mellon Bank Center | | |
| Pittsburgh, PA 15258 | | |
Telephone Call your financial representative or 1-800-554-4611
| Mail | | The Dreyfus Premier Family of Funds |
| | | 144 Glenn Curtiss Boulevard, Uniondale, NY 11556-0144 |
The fund files its complete schedule of portfolio holdings with the Securities and Exchange Commission (“SEC”) for the first and third quarters of each fiscal year on Form N-Q. The fund’s Forms N-Q are available on the SEC’s website at http://www.sec.gov and may be reviewed and copied at the SEC’s Public Reference Room in Washington, DC. Information on the operation of the Public Reference Room may be obtained by calling 1-202-551-8090.
A description of the policies and procedures that the fund uses to determine how to vote proxies relating to portfolio securities, and information regarding how the fund voted these proxies for the 12-month period ended June 30, 2006, is available at http://www.dreyfus.com and on the SEC’s website at http://www.sec.gov. The description of the policies and procedures is also available without charge, upon request, by calling 1-800-645-6561.
© 2007 Dreyfus Service Corporation

Save time. Save paper. View your next shareholder report online as soon as it’s available. Log into www.dreyfus.com and sign up for Dreyfus eCommunications. It’s simple and only takes a few minutes.
The views expressed in this report reflect those of the portfolio manager only through the end of the period covered and do not necessarily represent the views of Dreyfus or any other person in the Dreyfus organization. Any such views are subject to change at any time based upon market or other conditions and Dreyfus disclaims any responsibility to update such views.These views may not be relied on as investment advice and, because investment decisions for a Dreyfus fund are based on numerous factors, may not be relied on as an indication of trading intent on behalf of any Dreyfus fund.
Not FDIC-Insured • Not Bank-Guaranteed • May Lose Value
| Contents |
| |
| | | THE FUND |
| |
|
| 2 | | A Letter from the CEO |
| 3 | | Discussion of Fund Performance |
| 6 | | Fund Performance |
| 8 | | Understanding Your Fund’s Expenses |
| 8 | | Comparing Your Fund’s Expenses |
| With Those of Other Funds |
| 9 | | Statement of Investments |
| 24 | | Statement of Assets and Liabilities |
| 25 | | Statement of Operations |
| 26 | | Statement of Changes in Net Assets |
| 28 | | Financial Highlights |
| 32 | | Notes to Financial Statements |
| 45 | | Report of Independent Registered |
| | | Public Accounting Firm |
| 46 | | Important Tax Information |
| 47 | | Board Members Information |
| 49 | | Officers of the Fund |
| |
| FOR MORE INFORMATION |
|
| | | Back Cover |


A LETTER FROM THE CEO
Dear Shareholder:
We are pleased to present this annual report for Dreyfus Premier Limited Term High Yield Fund, covering the 12-month period from January 1, 2006, through December 31, 2006.
2006 proved to be a year of low volatility in the U.S. bond market.Yields of 10-year Treasury securities remained within a relatively narrow range of just 75 basis points, making 2006 the third least volatile bond market since 1970.Yet, a number of developments during the year might have suggested otherwise, including mounting economic uncertainty, volatile energy prices, softening real estate markets, a change in U.S. monetary policy and ongoing geopolitical turmoil.
Why did fixed-income investors appear to shrug off some of the year’s more negative influences? In our analysis, investors disregarded near-term concerns in favor of a longer view, looking to broader trends that showed moderately slower economic growth, subdued inflation, stabilizing short-term interest rates, a flat “yield curve” and persistently strong credit fundamentals. Indeed, 2006 confirmed that reacting to near-term influences with extreme shifts in investment strategy rarely is the right decision.We believe that a better course is to set a portfolio mix to meet long-term goals, while attempting to ignore short term market fluctuations.
For information about how the fund performed during the reporting period, as well as market perspectives, we have provided a Discussion of Fund Performance given by the fund’s portfolio manager.
Thank you for your continued confidence and support.We wish you good health and prosperity in 2007.
Thomas F. Eggers Chief Executive Officer The Dreyfus Corporation January 16, 2007

DISCUSSION OF FUND PERFORMANCE
David Bowser, Portfolio Manager
Note to Shareholders: On October 27, 2006, David Bowser replaced Jon Uhrig as the fund’s primary portfolio manager. Mr. Bowser has been a portfolio manager of the fund since July 2006.
How did Dreyfus Premier Limited Term High Yield Fund perform during the period?
For the 12-month period ended December 31, 2006, the fund achieved total returns of 8.66% for its Class A shares, 8.12% for Class B shares, 7.85% for Class C shares and 8.92% for Class R shares.The fund generated aggregate income dividends of $0.54 for Class A shares, $0.51 for Class B shares, $0.49 for Class C shares and $0.56 for Class R shares.1 In comparison, the Merrill Lynch U.S. High Yield Master II Constrained Index (the “Merrill Lynch Constrained Index”) achieved a total return of 10.73% for the same period.2
High yield bonds produced attractive returns in 2006 due to sound credit fundamentals and generally positive supply-and-demand factors. The fund produced lower returns than its benchmark, primarily due to our emphasis on securities toward the higher end of the high yield market’s credit-rating spectrum, which generally underperformed more speculative investments.
What is the fund’s investment approach?
The fund seeks to maximize total return, consisting of capital appreciation and current income.The average effective maturity of the fund is limited to a maximum of 5.5 years.
At least 80% of the fund’s assets are invested in fixed-income securities that are rated below investment grade (“high yield” or “junk” bonds) or are the unrated equivalent as determined by Dreyfus. Individual issues are selected based on careful credit analysis.We thoroughly analyze the business, management and financial strength of each of the companies whose bonds we buy, then project each issuer’s ability to repay its debt.
The Fund 3
DISCUSSION OF FUND PERFORMANCE (continued)
What other factors influenced the fund’s performance?
The high yield market remained persistently strong in 2006, supported by domestic and international investors who maintained a relatively high tolerance for risk in their search for high levels of current income. Robust demand was met during much of the year with a relatively light supply of newly issued securities, as a number of issuers turned instead to bank loans for financing. Several large leveraged buy-out transactions created a brief surge in supply at the end of the year, enabling 2006 to set a new record for high yield bond issuance. However, even the spike in new supply near year-end was easily absorbed by the market.
In addition, the high yield market benefited from robust credit fundamentals, with defaults continuing to hover near historical lows. Although investors’ heightened inflation and interest-rate concerns sparked a temporary correction in the spring, the market bounced back when it became apparent that cooling housing markets, falling energy prices and less robust employment gains were likely to produce a gradual economic slowdown, potentially keeping inflation in check.The Federal Reserve Board lent credence to this view when it refrained from raising short-term interest rates over the second half of the year, its first pauses after more than two years of rate hikes that sent the overnight federal funds rate to 5.25% .
However, yield differences along the credit-rating spectrum began 2006 at below-average levels and continued to narrow as the market rallied, suggesting to us that a relatively defensive investment posture might be prudent in a slowing economic environment. Accordingly, we focused on securities in the market’s upper and middle rating tiers, including bonds issued by regulated industries, such as utilities, banks and real estate investment trusts.This stance limited the fund’s participation in the rally among lower-tier credits, accounting for its lagging performance relative to its benchmark.
We also maintained an underweight position in the financially troubled automotive sector, which proved to be among the market’s top performing areas in 2006.We also held comparatively few bonds from cable and
4
media companies, some of which were distressed. Nonetheless, cable and media bonds generally performed well.
The fund achieved better results in other areas. In the wireline telecommunications industry, a number of the fund’s holdings received credit-rating upgrades during the fourth quarter as the industry consolidated. Bonds from U.S. tobacco companies also fared well in an improving legal environment.
What is the fund’s current strategy?
While we have seen little evidence of an end to the positive supply-and-demand factors that have supported high yield bond prices, we remain cautious regarding the possibility that unexpected developments could trigger a sharp sell-off, especially in the wake of the market’s sustained rally in 2006. Indeed, new issues recently coming to market have tended to fall toward the lower end of the credit range, which may be a sign of frothiness in the market.Therefore, we have continued to focus primarily on bonds from higher-quality issuers that, in our analysis, demonstrate relatively strong credit characteristics. At the same time, we have added opportunistically to some previously underexposed areas — including the wireless telecommunications, gaming and theater industries — in an attempt to boost the fund’s yield without substantially reducing its credit profile.
January 16, 2007
| 1 | | Total return includes reinvestment of dividends and any capital gains paid, and does not take into |
| | | consideration the maximum initial sales charge in the case of Class A shares, or the applicable |
| | | contingent deferred sales charges imposed on redemptions in the case of Class B and Class C |
| | | shares. Had these charges been reflected, returns would have been lower. Past performance is no |
| | | guarantee of future results. Share price, yield and investment return fluctuate such that upon |
| | | redemption, fund shares may be worth more or less than their original cost. |
| 2 | | SOURCE: BLOOMBERG — Reflects reinvestment of dividends and, where applicable, |
| | | capital gain distributions.The Merrill Lynch U.S. High Yield Master II Constrained Index is an |
| | | unmanaged performance benchmark composed of U.S. dollar-denominated domestic and Yankee |
| | | bonds rated below investment grade with at least $100 million par amount outstanding and at |
| | | least one year remaining to maturity. Bonds are capitalization-weighted.Total allocations to an |
| | | issuer are capped at 2%. |
The Fund 5
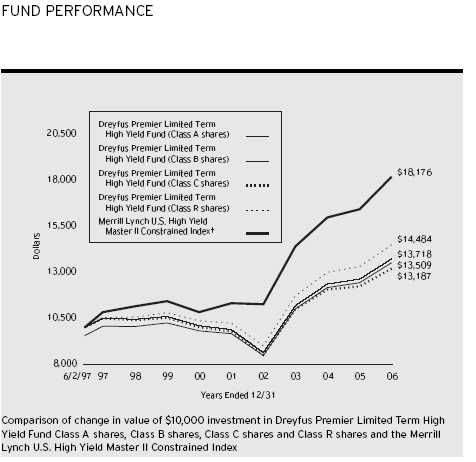
| † Source: Bloomberg L.P. |
| Past performance is not predictive of future performance. |
| The above graph compares a $10,000 investment made in each of the Class A, Class B, Class C and Class R shares |
| of Dreyfus Premier Limited Term High Yield Fund on 6/2/97 (inception date) to a $10,000 investment made in the |
| Merrill Lynch U.S. High Yield Master II Constrained Index (the “Index”) on that date. For comparative purposes, the |
| value of the Index on 5/31/97 is used as the beginning value on 6/2/97. All dividends and capital gain distributions |
| are reinvested. |
| The fund’s performance shown in the line graph takes into account the maximum initial sales charge on Class A shares |
| and all other applicable fees and expenses on all classes.The Index is an unmanaged performance benchmark composed of |
| U.S. dollar-denominated domestic and Yankee bonds rated below investment grade with at least $100 million par amount |
| outstanding and at least one year remaining to maturity. Bonds are capitalization-weighted.Total allocations to an issuer |
| are capped at 2%.The Index does not take into account charges, fees and other expenses. Further information relating to |
| fund performance, including expense reimbursements, if applicable, is contained in the Financial Highlights section of the |
| prospectus and elsewhere in this report. |
| Average Annual Total Returns as of 12/31/06 | | | | | | |
| |
| | | Inception | | | | | | From |
| | | Date | | 1 Year | | 5 Years | | Inception |
| |
| |
| |
| |
|
| Class A shares | | | | | | | | |
| with maximum sales charge (4.5%) | | 6/2/97 | | 3.78% | | 5.97% | | 3.19% |
| without sales charge | | 6/2/97 | | 8.66% | | 6.94% | | 3.69% |
| Class B shares | | | | | | | | |
| with applicable redemption charge † | | 6/2/97 | | 4.12% | | 6.16% | | 3.36% |
| without redemption | | 6/2/97 | | 8.12% | | 6.45% | | 3.36% |
| Class C shares | | | | | | | | |
| with applicable redemption charge †† | | 6/2/97 | | 6.85% | | 6.16% | | 2.93% |
| without redemption | | 6/2/97 | | 7.85% | | 6.16% | | 2.93% |
| Class R shares | | 6/2/97 | | 8.92% | | 7.20% | | 3.94% |
Past performance is not predictive of future performance.The fund’s performance shown in the graph and table does not reflect the deduction of taxes that a shareholder would pay on fund distributions or the redemption of fund shares. Performance for Class B shares assumes the conversion of Class B shares to Class A shares at the end of the sixth year following the date of purchase.
† The maximum contingent deferred sales charge for Class B shares is 4%. After six years Class B shares convert to Class A shares.
The maximum contingent deferred sales charge for Class C shares is 1% for shares redeemed within one year of the date of purchase.
The Fund 7
UNDERSTANDING YOUR FUND’S EXPENSES (Unaudited)
As a mutual fund investor, you pay ongoing expenses, such as management fees and other expenses. Using the information below, you can estimate how these expenses affect your investment and compare them with the expenses of other funds.You also may pay one-time transaction expenses, including sales charges (loads) and redemption fees, which are not shown in this section and would have resulted in higher total expenses. For more information, see your fund’s prospectus or talk to your financial adviser.
Review your fund’s expenses
The table below shows the expenses you would have paid on a $1,000 investment in Dreyfus Premier Limited Term High Yield Fund from July 1, 2006 to December 31, 2006. It also shows how much a $1,000 investment would be worth at the close of the period, assuming actual returns and expenses.
| Expenses and Value of a $1,000 Investment | | | | | | |
| assuming actual returns for the six months ended December 31, 2006 | | |
| | | Class A | | Class B | | Class C | | Class R |
| |
| |
| |
| |
|
| Expenses paid per $1,000 † | | $ 4.94 | | $ 7.54 | | $ 8.83 | | $ 3.64 |
| Ending value (after expenses) | | $1,064.00 | | $1,062.80 | | $1,060.00 | | $1,065.30 |
COMPARING YOUR FUND’S EXPENSES WITH THOSE OF OTHER FUNDS (Unaudited)
Using the SEC’s method to compare expenses
The Securities and Exchange Commission (SEC) has established guidelines to help investors assess fund expenses. Per these guidelines, the table below shows your fund’s expenses based on a $1,000 investment, assuming a hypothetical 5% annualized return. You can use this information to compare the ongoing expenses (but not transaction expenses or total cost) of investing in the fund with those of other funds.All mutual fund shareholder reports will provide this information to help you make this comparison. Please note that you cannot use this information to estimate your actual ending account balance and expenses paid during the period.
Expenses and Value of a $1,000 Investment assuming a hypothetical 5% annualized return for the six months ended December 31, 2006
| | | Class A | | Class B | | Class C | | Class R |
| |
| |
| |
| |
|
| Expenses paid per $1,000 † | | $ 4.84 | | $ 7.37 | | $ 8.64 | | $ 3.57 |
| Ending value (after expenses) | | $1,020.42 | | $1,017.90 | | $1,016.64 | | $1,021.68 |
† Expenses are equal to the fund’s annualized expense ratio of .95% for Class A, 1.45% for Class B, 1.70% for Class C and .70% Class R; multiplied by the average account value over the period, multiplied by 184/365 (to reflect the one-half year period).
8
| STATEMENT OF INVESTMENTS |
| December 31, 2006 |
| | | Coupon | | Maturity | | Principal | | |
| Bonds and Notes—95.3% | | Rate (%) | | Date | | Amount ($) | | Value ($) |
| |
| |
| |
| |
|
| Advertising—1.2% | | | | | | | | |
| Lamar Media, | | | | | | | | |
| Gtd. Notes | | 6.63 | | 8/15/15 | | 475,000 | | 473,219 |
| R.H. Donnelley Finance I, | | | | | | | | |
| Gtd. Notes | | 10.88 | | 12/15/12 | | 3,402,000 a | | 3,725,190 |
| | | | | | | | | 4,198,409 |
| Aerospace & Defense—1.3% | | | | | | | | |
| Alliant Techsystems, | | | | | | | | |
| Gtd. Notes | | 6.75 | | 4/1/16 | | 500,000 | | 501,250 |
| Argo-Tech, | | | | | | | | |
| Sr. Notes | | 9.25 | | 6/1/11 | | 1,470,000 | | 1,594,950 |
| DRS Technologies, | | | | | | | | |
| Sr. Sub. Notes | | 6.88 | | 11/1/13 | | 524,000 | | 530,550 |
| L-3 Communications, | | | | | | | | |
| Bonds | | 3.00 | | 8/1/35 | | 550,000 a | | 580,250 |
| L-3 Communications, | | | | | | | | |
| Sr. Sub. Notes, Ser. B | | 6.38 | | 10/15/15 | | 1,410,000 | | 1,402,950 |
| | | | | | | | | 4,609,950 |
| Agricultural—.2% | | | | | | | | |
| Alliance One International, | | | | | | | | |
| Gtd. Notes | | 11.00 | | 5/15/12 | | 800,000 | | 856,000 |
| Airlines—.3% | | | | | | | | |
| United AirLines, | | | | | | | | |
| Pass-Through Ctfs., Ser. 00-2 | | 7.81 | | 4/1/11 | | 981,877 | | 1,085,588 |
| Automobile Manufacturers—.5% | | | | | | |
| Ford Motor, | | | | | | | | |
| Bonds | | 6.50 | | 8/1/18 | | 1,355,000 b | | 1,029,800 |
| Ford Motor, | | | | | | | | |
| Notes | | 7.45 | | 7/16/31 | | 1,120,000 b | | 884,800 |
| | | | | | | | | 1,914,600 |
| Automotive, Trucks & Parts—1.7% | | | | | | |
| Cooper-Standard Automotive, | | | | | | | | |
| Gtd. Notes | | 8.38 | | 12/15/14 | | 525,000 b | | 416,062 |
| Goodyear Tire & Rubber, | | | | | | | | |
| Sr. Notes | | 8.63 | | 12/1/11 | | 500,000 a | | 518,750 |
| Goodyear Tire & Rubber, | | | | | | | | |
| Sr. Notes | | 9.00 | | 7/1/15 | | 1,715,000 | | 1,805,037 |
| Goodyear Tire & Rubber, | | | | | | | | |
| Sr. Notes | | 9.14 | | 12/1/09 | | 500,000 a,c | | 504,375 |
The Fund 9
STATEMENT OF INVESTMENTS (continued)
| | | Coupon | | Maturity | | Principal | | |
| Bonds and Notes (continued) | | Rate (%) | | Date | | Amount ($) | | Value ($) |
| |
| |
| |
| |
|
| Automotive, Trucks & | | | | | | | | |
| Parts (continued) | | | | | | | | |
| Tenneco, | | | | | | | | |
| Scd. Notes, Ser. B | | 10.25 | | 7/15/13 | | 1,200,000 | | 1,320,000 |
| United Components, | | | | | | | | |
| Sr. Sub. Notes | | 9.38 | | 6/15/13 | | 1,288,000 | | 1,339,520 |
| | | | | | | | | 5,903,744 |
| Banks—.9% | | | | | | | | |
| Chevy Chase Bank, F.S.B., | | | | | | | | |
| Sub. Notes | | 6.88 | | 12/1/13 | | 2,970,000 | | 2,984,850 |
| Shinsei Finance Cayman, | | | | | | | | |
| Bonds | | 6.42 | | 1/29/49 | | 300,000 a,c | | 300,177 |
| | | | | | | | | 3,285,027 |
| Building & Construction—1.1% | | | | | | | | |
| Beazer Homes USA, | | | | | | | | |
| Gtd. Notes | | 6.88 | | 7/15/15 | | 550,000 | | 541,750 |
| Goodman Global Holdings, | | | | | | | | |
| Sr. Sub. Notes | | 7.88 | | 12/15/12 | | 524,000 | | 517,450 |
| Goodman Global Holdings, | | | | | | | | |
| Sr. Notes, Ser. B | | 8.36 | | 6/15/12 | | 1,159,000 b,c | | 1,179,283 |
| Nortek, | | | | | | | | |
| Sr. Sub. Notes | | 8.50 | | 9/1/14 | | 1,573,000 b | | 1,549,405 |
| Texas Industries, | | | | | | | | |
| Sr. Unscd. Notes | | 7.25 | | 7/15/13 | | 210,000 | | 214,200 |
| | | | | | | | | 4,002,088 |
| Chemicals—4.4% | | | | | | | | |
| Airgas, | | | | | | | | |
| Sr. Sub. Notes | | 6.25 | | 7/15/14 | | 1,100,000 | | 1,067,000 |
| CPG International I, | | | | | | | | |
| Sr. Unscd. Notes | | 10.50 | | 7/1/13 | | 975,000 | | 998,156 |
| Huntsman International, | | | | | | | | |
| Gtd. Notes | | 9.88 | | 3/1/09 | | 323,000 | | 334,305 |
| Huntsman, | | | | | | | | |
| Gtd. Notes | | 11.63 | | 10/15/10 | | 362,000 | | 397,295 |
| Ineos Group Holdings, | | | | | | | | |
| Sr. Sub. Notes | | 8.50 | | 2/15/16 | | 2,550,000 a,b | | 2,448,000 |
| Lyondell Chemical, | | | | | | | | |
| Gtd. Notes | | 8.00 | | 9/15/14 | | 1,250,000 | | 1,303,125 |
| Nalco, | | | | | | | | |
| Sr. Sub. Notes | | 8.88 | | 11/15/13 | | 4,153,000 b | | 4,417,754 |
10
| | | Coupon | | Maturity | | Principal | | |
| Bonds and Notes (continued) | | Rate (%) | | Date | | Amount ($) | | Value ($) |
| |
| |
| |
| |
|
| Chemicals (continued) | | | | | | | | |
| Rhodia, | | | | | | | | |
| Sr. Notes | | 10.25 | | 6/1/10 | | 2,330,000 | | 2,667,850 |
| Rockwood Specialties Group, | | | | | | | | |
| Sr. Sub. Notes | | 10.63 | | 5/15/11 | | 1,098,000 | | 1,174,860 |
| Westlake Chemical, | | | | | | | | |
| Gtd. Notes | | 6.63 | | 1/15/16 | | 615,000 | | 598,088 |
| | | | | | | | | 15,406,433 |
| Commercial & Professional | | | | | | | | |
| Services—1.9% | | | | | | | | |
| Brickman Group, | | | | | | | | |
| Gtd. Notes, Ser. B | | 11.75 | | 12/15/09 | | 1,037,000 | | 1,106,997 |
| Corrections Corp. of America, | | | | | | | | |
| Gtd. Notes | | 6.25 | | 3/15/13 | | 1,710,000 | | 1,703,587 |
| Education Management, | | | | | | | | |
| Sr. Notes | | 8.75 | | 6/1/14 | | 625,000 a | | 650,000 |
| Education Management, | | | | | | | | |
| Sr. Sub. Notes | | 10.25 | | 6/1/16 | | 1,310,000 a,b | | 1,391,875 |
| Hertz, | | | | | | | | |
| Sr. Notes | | 8.88 | | 1/1/14 | | 950,000 a | | 999,875 |
| Hertz, | | | | | | | | |
| Sr. Sub. Notes | | 10.50 | | 1/1/16 | | 430,000 a | | 475,150 |
| Williams Scotsman, | | | | | | | | |
| Gtd. Notes | | 8.50 | | 10/1/15 | | 500,000 | | 524,375 |
| | | | | | | | | 6,851,859 |
| Commercial Mortgage | | | | | | | | |
| Pass-Through Ctfs.—.3% | | | | | | | | |
| Global Signal Trust, | | | | | | | | |
| Ser. 2006-1, Cl. F | | 7.04 | | 2/15/36 | | 1,080,000 a | | 1,099,412 |
| Consumer Products—.8% | | | | | | | | |
| Playtex Products, | | | | | | | | |
| Gtd. Notes | | 9.38 | | 6/1/11 | | 2,546,000 | | 2,666,935 |
| Diversified Financial Services—7.9% | | | | | | |
| BCP Crystal U.S. Holdings, | | | | | | | | |
| Sr. Sub. Notes | | 9.63 | | 6/15/14 | | 2,438,000 | | 2,706,180 |
| C & M Finance, | | | | | | | | |
| Gtd. Notes | | 8.10 | | 2/1/16 | | 325,000 a | | 334,579 |
| CCM Merger, | | | | | | | | |
| Notes | | 8.00 | | 8/1/13 | | 630,000 a | | 618,975 |
The Fund 11
STATEMENT OF INVESTMENTS (continued)
| | | | | Coupon | | Maturity | | Principal | | |
| Bonds and Notes (continued) | | Rate (%) | | Date | | Amount ($) | | Value ($) |
| |
| |
| |
| |
|
| Diversified Financial | | | | | | | | |
| Services (continued) | | | | | | | | |
| Consolidated Communications | | | | | | | | |
| Illinois/Texas Holdings, Sr. Notes | | 9.75 | | 4/1/12 | | 761,000 | | 818,075 |
| E*TRADE FINANCIAL, | | | | �� | | | | |
| Sr. Notes | | | | 8.00 | | 6/15/11 | | 320,000 | | 336,000 |
| FCE Bank, | | | | | | | | | | |
| Notes | | EUR | | 4.72 | | 9/30/09 | | 2,825,000 c,d | | 3,648,000 |
| FINOVA Group, | | | | | | | | | | |
| Notes | | | | 7.50 | | 11/15/09 | | 1,603,000 | | 472,885 |
| Ford Motor Credit, | | | | | | | | | | |
| Notes | | | | 5.63 | | 10/1/08 | | 945,000 b | | 928,365 |
| Ford Motor Credit, | | | | | | | | | | |
| Sr. Unscd. Notes | | | | 8.00 | | 12/15/16 | | 650,000 | | 643,382 |
| Ford Motor Credit, | | | | | | | | | | |
| Sr. Unscd. Notes | | | | 8.63 | | 11/1/10 | | 1,135,000 | | 1,169,261 |
| Ford Motor Credit, | | | | | | | | | | |
| Sr. Unscd. Notes | | | | 9.75 | | 9/15/10 | | 368,000 a | | 391,785 |
| General Motors Acceptance | | | | | | | | |
| International Finance, | | | | | | | | |
| Gtd. Notes | | EUR | | 4.38 | | 10/31/07 | | 1,800,000 d | | 2,369,195 |
| GMAC, | | | | | | | | | | |
| Sr. Unsub. Notes | | EUR | | 5.38 | | 6/6/11 | | 1,000,000 d | | 1,333,924 |
| GMAC, | | | | | | | | | | |
| Notes | | | | 6.13 | | 1/22/08 | | 1,375,000 b | | 1,372,331 |
| GMAC, | | | | | | | | | | |
| Notes | | | | 7.75 | | 1/19/10 | | 3,665,000 | | 3,838,615 |
| Idearc, | | | | | | | | | | |
| Sr. Notes | | | | 8.00 | | 11/15/16 | | 2,545,000 a | | 2,595,900 |
| K & F Acquisition, | | | | | | | | | | |
| Gtd. Notes | | | | 7.75 | | 11/15/14 | | 645,000 | | 667,575 |
| Kansas City Southern Railway, | | | | | | | | |
| Gtd. Notes | | | | 7.50 | | 6/15/09 | | 600,000 | | 608,250 |
| Nell, | | | | | | | | | | |
| Gtd. Notes | | | | 8.38 | | 8/15/15 | | 1,250,000 a,b | | 1,290,625 |
| Stena, | | | | | | | | | | |
| Sr. Notes | | | | 7.50 | | 11/1/13 | | 1,001,000 | | 993,492 |
| UCI Holdco, | | | | | | | | | | |
| Sr. Notes | | | | 12.37 | | 12/15/13 | | 800,000 a,c | | 782,000 |
| | | | | | | | | | | 27,919,394 |
12
| | | Coupon | | Maturity | | Principal | | |
| Bonds and Notes (continued) | | Rate (%) | | Date | | Amount ($) | | Value ($) |
| |
| |
| |
| |
|
| Diversified Metals & Mining—2.1% | | | | | | |
| Consol Energy, | | | | | | | | |
| Gtd. Notes | | 7.88 | | 3/1/12 | | 3,553,000 | | 3,766,180 |
| CSN Islands IX, | | | | | | | | |
| Gtd. Notes | | 10.50 | | 1/15/15 | | 1,577,000 a | | 1,845,090 |
| Freeport-McMoRan Copper & Gold, | | | | | | | | |
| Sr. Notes | | 6.88 | | 2/1/14 | | 500,000 b | | 512,500 |
| Gibraltar Industries, | | | | | | | | |
| Gtd. Notes, Ser. B | | 8.00 | | 12/1/15 | | 670,000 | | 664,138 |
| Southern Copper, | | | | | | | | |
| Sr. Notes | | 6.38 | | 7/27/15 | | 600,000 | | 613,527 |
| | | | | | | | | 7,401,435 |
| Electric Utilities—7.7% | | | | | | | | |
| AES, | | | | | | | | |
| Sr. Notes | | 8.88 | | 2/15/11 | | 1,000,000 | | 1,077,500 |
| AES, | | | | | | | | |
| Sr. Notes | | 9.38 | | 9/15/10 | | 1,000,000 | | 1,091,250 |
| Allegheny Energy Supply, | | | | | | | | |
| Sr. Unscd. Bonds | | 8.25 | | 4/15/12 | | 5,190,000 a | | 5,721,975 |
| Edison Mission Energy, | | | | | | | | |
| Sr. Unscd. Notes | | 7.50 | | 6/15/13 | | 1,185,000 b | | 1,244,250 |
| FPL Energy National Wind, | | | | | | | | |
| Scd. Bonds | | 6.13 | | 3/25/19 | | 2,220,403 a | | 2,154,939 |
| Mirant Americas Generation, | | | | | | | | |
| Sr. Notes | | 8.30 | | 5/1/11 | | 1,625,000 | | 1,673,750 |
| Mirant North America, | | | | | | | | |
| Gtd. Notes | | 7.38 | | 12/31/13 | | 3,915,000 | | 3,993,300 |
| Nevada Power, | | | | | | | | |
| Mortgage Notes, Ser. A | | 8.25 | | 6/1/11 | | 1,321,000 | | 1,449,648 |
| NRG Energy, | | | | | | | | |
| Gtd. Notes | | 7.25 | | 2/1/14 | | 1,050,000 | | 1,060,500 |
| NRG Energy, | | | | | | | | |
| Gtd. Notes | | 7.38 | | 1/15/17 | | 565,000 | | 567,825 |
| Reliant Energy, | | | | | | | | |
| Scd. Notes | | 9.25 | | 7/15/10 | | 2,548,000 b | | 2,688,140 |
| Reliant Energy, | | | | | | | | |
| Scd. Notes | | 9.50 | | 7/15/13 | | 1,800,000 | | 1,939,500 |
| Sierra Pacific Resources, | | | | | | | | |
| Sr. Notes | | 8.63 | | 3/15/14 | | 1,910,000 b | | 2,060,239 |
The Fund 13
STATEMENT OF INVESTMENTS (continued)
| | | | | Coupon | | Maturity | | Principal | | |
| Bonds and Notes (continued) | | Rate (%) | | Date | | Amount ($) | | Value ($) |
| |
| |
| |
| |
|
| Electric Utilities (continued) | | | | | | | | |
| TECO Energy, | | | | | | | | | | |
| Sr. Notes | | | | 6.75 | | 5/1/15 | | 400,000 | | 420,000 |
| | | | | | | | | | | 27,142,816 |
| Environmental Control—.7% | | | | | | | | |
| Allied Waste North America, | | | | | | | | | | |
| Gtd. Notes, Ser. B | | | | 9.25 | | 9/1/12 | | 703,000 | | 750,452 |
| Geo Sub, | | | | | | | | | | |
| Sr. Notes | | | | 11.00 | | 5/15/12 | | 1,090,000 | | 1,057,300 |
| WCA Waste, | | | | | | | | | | |
| Gtd. Notes | | | | 9.25 | | 6/15/14 | | 525,000 | | 551,250 |
| | | | | | | | | | | 2,359,002 |
| Food & Beverages—2.5% | | | | | | | | | | |
| Dean Foods, | | | | | | | | | | |
| Gtd. Notes | | | | 7.00 | | 6/1/16 | | 750,000 | | 761,250 |
| Del Monte, | | | | | | | | | | |
| Sr. Sub. Notes | | | | 8.63 | | 12/15/12 | | 1,031,000 | | 1,092,860 |
| Dole Food, | | | | | | | | | | |
| Sr. Notes | | | | 8.63 | | 5/1/09 | | 768,000 | | 767,040 |
| Dole Food, | | | | | | | | | | |
| Debs. | | | | 8.75 | | 7/15/13 | | 780,000 b | | 760,500 |
| Dole Food, | | | | | | | | | | |
| Sr. Notes | | | | 8.88 | | 3/15/11 | | 555,000 b | | 549,450 |
| Ingles Markets, | | | | | | | | | | |
| Gtd. Notes | | | | 8.88 | | 12/1/11 | | 400,000 | | 419,000 |
| Smithfield Foods, | | | | | | | | | | |
| Sr. Notes | | | | 7.00 | | 8/1/11 | | 700,000 | | 710,500 |
| Stater Brothers Holdings, | | | | | | | | | | |
| Sr. Notes | | | | 8.13 | | 6/15/12 | | 2,970,000 | | 3,029,400 |
| Stater Brothers Holdings, | | | | | | | | | | |
| Sr. Notes | | | | 8.86 | | 6/15/10 | | 650,000 c | | 661,375 |
| | | | | | | | | | | 8,751,375 |
| Health Care—4.3% | | | | | | | | | | |
| Angiotech Pharmaceuticals, | | | | | | | | | | |
| Sr. Sub. Notes | | | | 7.75 | | 4/1/14 | | 275,000 a | | 240,625 |
| DaVita, | | | | | | | | | | |
| Gtd. Notes | | | | 7.25 | | 3/15/15 | | 1,150,000 | | 1,178,750 |
| Fresenius Finance, | | | | | | | | | | |
| Gtd. Notes | | EUR | | 5.00 | | 1/31/13 | | 150,000 a,d | | 202,033 |
14
| | | Coupon | | Maturity | | Principal | | |
| Bonds and Notes (continued) | | Rate (%) | | Date | | Amount ($) | | Value ($) |
| |
| |
| |
| |
|
| Health Care (continued) | | | | | | | | |
| HCA, | | | | | | | | |
| Sr. Unscd. Notes | | 6.95 | | 5/1/12 | | 1,700,000 b | | 1,615,000 |
| HCA, | | | | | | | | |
| Sr. Unscd. Notes | | 8.75 | | 9/1/10 | | 1,860,000 | | 1,943,700 |
| HCA, | | | | | | | | |
| Scd. Notes | | 9.13 | | 11/15/14 | | 350,000 a | | 374,937 |
| HCA, | | | | | | | | |
| Scd. Notes | | 9.25 | | 11/15/16 | | 1,300,000 a | | 1,395,875 |
| Psychiatric Solutions, | | | | | | | | |
| Gtd. Notes | | 7.75 | | 7/15/15 | | 500,000 | | 501,250 |
| Tenet Healthcare, | | | | | | | | |
| Sr. Notes | | 9.88 | | 7/1/14 | | 4,317,000 | | 4,414,133 |
| Triad Hospitals, | | | | | | | | |
| Sr. Sub. Notes | | 7.00 | | 11/15/13 | | 3,340,000 | | 3,377,575 |
| | | | | | | | | 15,243,878 |
| Lodging & Entertainment—9.3% | | | | | | | | |
| AMC Entertainment, | | | | | | | | |
| Sr. Sub. Notes | | 9.88 | | 2/1/12 | | 680,000 b | | 717,400 |
| Cinemark USA, | | | | | | | | |
| Sr. Sub. Notes | | 9.00 | | 2/1/13 | | 90,000 b | | 95,850 |
| Cinemark, | | | | | | | | |
| Sr. Discount Notes | | 9.75 | | 3/15/14 | | 3,250,000 e | | 2,807,188 |
| Gaylord Entertainment, | | | | | | | | |
| Gtd. Notes | | 6.75 | | 11/15/14 | | 975,000 | | 972,562 |
| Isle of Capri Casinos, | | | | | | | | |
| Gtd. Notes | | 9.00 | | 3/15/12 | | 1,050,000 b | | 1,102,500 |
| Leslie’s Poolmart, | | | | | | | | |
| Sr. Notes | | 7.75 | | 2/1/13 | | 850,000 | | 850,000 |
| Mandalay Resort Group, | | | | | | | | |
| Sr. Notes | | 6.50 | | 7/31/09 | | 1,651,000 | | 1,677,829 |
| Marquee Holdings, | | | | | | | | |
| Sr. Discount Notes | | 12.00 | | 8/15/14 | | 610,000 e | | 514,688 |
| MGM Mirage, | | | | | | | | |
| Gtd. Notes | | 8.50 | | 9/15/10 | | 1,988,000 | | 2,137,100 |
| Mohegan Tribal Gaming Authority, | | | | | | | | |
| Sr. Notes | | 6.13 | | 2/15/13 | | 2,800,000 b | | 2,793,000 |
| Mohegan Tribal Gaming Authority, | | | | | | | | |
| Sr. Sub. Notes | | 6.38 | | 7/15/09 | | 2,048,000 b | | 2,058,240 |
The Fund 15
STATEMENT OF INVESTMENTS (continued)
| | | Coupon | | Maturity | | Principal | | |
| Bonds and Notes (continued) | | Rate (%) | | Date | | Amount ($) | | Value ($) |
| |
| |
| |
| |
|
| Lodging & Entertainment (continued) | | | | | | |
| Park Place Entertainment, | | | | | | | | |
| Sr. Sub. Notes | | 7.88 | | 3/15/10 | | 1,266,000 | | 1,326,135 |
| Penn National Gaming, | | | | | | | | |
| Sr. Sub. Notes | | 6.75 | | 3/1/15 | | 640,000 | | 630,400 |
| Pokagon Gaming Authority, | | | | | | | | |
| Sr. Notes | | 10.38 | | 6/15/14 | | 2,825,000 a | | 3,107,500 |
| Resorts International Hotel & | | | | | | | | |
| Casino, First Mortgage Notes | | 11.50 | | 3/15/09 | | 490,000 | | 507,763 |
| Scientific Games, | | | | | | | | |
| Gtd. Notes | | 6.25 | | 12/15/12 | | 1,940,000 | | 1,906,050 |
| Seneca Gaming, | | | | | | | | |
| Sr. Unscd. Notes, Ser. B | | 7.25 | | 5/1/12 | | 450,000 | | 460,125 |
| Speedway Motorsports, | | | | | | | | |
| Sr. Sub. Notes | | 6.75 | | 6/1/13 | | 1,875,000 | | 1,884,375 |
| Station Casinos, | | | | | | | | |
| Sr. Sub. Notes | | 6.50 | | 2/1/14 | | 500,000 b | | 446,875 |
| Vail Resorts, | | | | | | | | |
| Sr. Sub. Notes | | 6.75 | | 2/15/14 | | 1,500,000 | | 1,507,500 |
| Wimar OpCo/Finance, | | | | | | | | |
| Sr. Notes | | 9.63 | | 12/15/14 | | 3,800,000 a | | 3,781,000 |
| Wynn Las Vegas/Capital, | | | | | | | | |
| First Mortgage Notes | | 6.63 | | 12/1/14 | | 1,559,000 b | | 1,557,051 |
| | | | | | | | | 32,841,131 |
| Machinery—2.9% | | | | | | | | |
| Case New Holland, | | | | | | | | |
| Gtd. Notes | | 9.25 | | 8/1/11 | | 2,976,000 | | 3,165,720 |
| Columbus McKinnon, | | | | | | | | |
| Sr. Sub. Notes | | 8.88 | | 11/1/13 | | 605,000 | | 641,300 |
| Douglas Dynamics, | | | | | | | | |
| Gtd. Notes | | 7.75 | | 1/15/12 | | 3,715,000 a | | 3,510,675 |
| Terex, | | | | | | | | |
| Gtd. Notes | | 7.38 | | 1/15/14 | | 2,725,000 | | 2,779,500 |
| | | | | | | | | 10,097,195 |
| Manufacturing—1.3% | | | | | | | | |
| Bombardier, | | | | | | | | |
| Notes | | 6.30 | | 5/1/14 | | 1,000,000 a | | 945,000 |
| J.B. Poindexter & Co., | | | | | | | | |
| Gtd. Notes | | 8.75 | | 3/15/14 | | 1,025,000 | | 876,375 |
| Polypore International, | | | | | | | | |
| Sr. Discount Notes | | 10.50 | | 10/1/12 | | 2,435,000 b,e | | 1,948,000 |
16
| | | Coupon | | Maturity | | Principal | | |
| Bonds and Notes (continued) | | Rate (%) | | Date | | Amount ($) | | Value ($) |
| |
| |
| |
| |
|
| Manufacturing (continued) | | | | | | | | |
| RBS Global/Rexnord, | | | | | | | | |
| Sr. Sub. Notes | | 11.75 | | 8/1/16 | | 825,000 a,b | | 866,250 |
| | | | | | | | | 4,635,625 |
| Media—6.4% | | | | | | | | |
| Adelphia Communications, | | | | | | | | |
| Sr. Notes, Ser. B | | 7.75 | | 1/15/09 | | 1,921,000 f | | 1,772,122 |
| CCO Holdings/Capital, | | | | | | | | |
| Sr. Notes | | 8.75 | | 11/15/13 | | 2,345,000 | | 2,447,594 |
| CSC Holdings, | | | | | | | | |
| Sr. Notes, Ser. B | | 7.63 | | 4/1/11 | | 2,000,000 | | 2,047,500 |
| CSC Holdings, | | | | | | | | |
| Sr. Notes, Ser. B | | 8.13 | | 7/15/09 | | 750,000 b | | 780,937 |
| Dex Media East/Finance, | | | | | | | | |
| Gtd. Notes | | 9.88 | | 11/15/09 | | 2,908,000 | | 3,053,400 |
| Dex Media East/Finance, | | | | | | | | |
| Gtd. Notes | | 12.13 | | 11/15/12 | | 2,323,000 b | | 2,564,011 |
| Dex Media West/Finance, | | | | | | | | |
| Sr. Sub. Notes, Ser. B | | 9.88 | | 8/15/13 | | 2,879,000 | | 3,152,505 |
| Entercom Radio/Capital, | | | | | | | | |
| Gtd. Notes | | 7.63 | | 3/1/14 | | 460,000 | | 462,300 |
| Kabel Deutschland, | | | | | | | | |
| Gtd. Notes | | 10.63 | | 7/1/14 | | 1,570,000 | | 1,748,587 |
| LBI Media, | | | | | | | | |
| Gtd. Notes | | 10.13 | | 7/15/12 | | 1,500,000 | | 1,599,375 |
| LBI Media, | | | | | | | | |
| Sr. Discount Notes | | 11.00 | | 10/15/13 | | 1,492,000 e | | 1,292,445 |
| Lodgenet Entertainment, | | | | | | | | |
| Sr. Sub. Debs. | | 9.50 | | 6/15/13 | | 548,000 | | 593,210 |
| Nexstar Finance Holdings, | | | | | | | | |
| Sr. Discount Notes | | 11.38 | | 4/1/13 | | 956,000 e | | 861,595 |
| Pegasus Communications, | | | | | | | | |
| Sr. Notes, Ser. B | | 12.50 | | 8/1/07 | | 1,834,923 f | | 167,437 |
| Radio One, | | | | | | | | |
| Gtd. Notes, Ser. B | | 8.88 | | 7/1/11 | | 250,000 b | | 259,375 |
| | | | | | | | | 22,802,393 |
| Oil & Gas—9.0% | | | | | | | | |
| ANR Pipeline, | | | | | | | | |
| Notes | | 8.88 | | 3/15/10 | | 2,540,000 | | 2,677,389 |
| Chesapeake Energy, | | | | | | | | |
| Gtd. Notes | | 7.63 | | 7/15/13 | | 325,000 | | 344,094 |
The Fund 17
STATEMENT OF INVESTMENTS (continued)
| | | Coupon | | Maturity | | Principal | | |
| Bonds and Notes (continued) | | Rate (%) | | Date | | Amount ($) | | Value ($) |
| |
| |
| |
| |
|
| Oil & Gas (continued) | | | | | | | | |
| Colorado Interstate Gas, | | | | | | | | |
| Sr. Notes | | 5.95 | | 3/15/15 | | 540,000 | | 535,499 |
| Dynegy Holdings, | | | | | | | | |
| Sr. Unscd. Notes | | 8.38 | | 5/1/16 | | 2,535,000 | | 2,674,425 |
| El Paso Production Holding, | | | | | | | | |
| Gtd. Notes | | 7.75 | | 6/1/13 | | 2,040,000 | | 2,144,550 |
| El Paso, | | | | | | | | |
| Sr. Notes | | 7.75 | | 6/15/10 | | 2,731,000 | | 2,901,688 |
| Hanover Compressor, | | | | | | | | |
| Gtd. Notes | | 8.63 | | 12/15/10 | | 1,000,000 | | 1,050,000 |
| Hanover Compressor, | | | | | | | | |
| Sr. Notes | | 9.00 | | 6/1/14 | | 1,632,000 | | 1,770,720 |
| Hanover Equipment Trust, | | | | | | | | |
| Scd. Notes, Ser. A | | 8.50 | | 9/1/08 | | 2,745,000 b | | 2,793,038 |
| Hanover Equipment Trust, | | | | | | | | |
| Scd. Notes, Ser. B | | 8.75 | | 9/1/11 | | 15,000 | | 15,713 |
| McMoRan Exploration, | | | | | | | | |
| Sr. Notes | | 5.25 | | 10/6/11 | | 1,036,000 a | | 1,127,945 |
| Northwest Pipeline, | | | | | | | | |
| Gtd. Notes | | 8.13 | | 3/1/10 | | 2,575,000 | | 2,694,094 |
| Pogo Producing, | | | | | | | | |
| Sr. Sub. Notes | | 6.63 | | 3/15/15 | | 2,150,000 | | 2,058,625 |
| Southern Natural Gas, | | | | | | | | |
| Unsub. Notes | | 8.88 | | 3/15/10 | | 2,057,000 | | 2,168,263 |
| Whiting Petroleum, | | | | | | | | |
| Sr. Sub. Notes | | 7.25 | | 5/1/13 | | 2,000,000 | | 2,015,000 |
| Williams Cos., | | | | | | | | |
| Notes | | 7.13 | | 9/1/11 | | 250,000 | | 261,250 |
| Williams Cos., | | | | | | | | |
| Notes | | 7.37 | | 10/1/10 | | 2,375,000 a,b,c | | 2,434,375 |
| Williams Cos., | | | | | | | | |
| Sr. Notes | | 7.63 | | 7/15/19 | | 975,000 b | | 1,048,125 |
| Williams Cos., | �� | | | | | | | |
| Notes | | 7.88 | | 9/1/21 | | 1,170,000 b | | 1,260,675 |
| | | | | | | | | 31,975,468 |
| Packaging & Containers—6.2% | | | | | | | | |
| Berry Plastics Holding, | | | | | | | | |
| Scd. Notes | | 8.88 | | 9/15/14 | | 565,000 a | | 576,300 |
| Berry Plastics Holding, | | | | | | | | |
| Scd. Notes | | 9.24 | | 9/15/14 | | 180,000 a,c | | 183,150 |
18
| | | Coupon | | Maturity | | Principal | | |
| Bonds and Notes (continued) | | Rate (%) | | Date | | Amount ($) | | Value ($) |
| |
| |
| |
| |
|
| Packaging & Containers (continued) | | | | | | |
| Crown Americas/Capital, | | | | | | | | |
| Gtd. Notes | | 7.63 | | 11/15/13 | | 3,715,000 | | 3,845,025 |
| Crown Americas/Capital, | | | | | | | | |
| Sr. Notes | | 7.75 | | 11/15/15 | | 3,835,000 | | 3,997,987 |
| Norampac, | | | | | | | | |
| Sr. Notes | | 6.75 | | 6/1/13 | | 975,000 b | | 953,062 |
| Owens Brockway Glass Container, | | | | | | | | |
| Gtd. Notes | | 6.75 | | 12/1/14 | | 519,000 | | 506,025 |
| Owens Brockway Glass Container, | | | | | | | | |
| Gtd. Notes | | 7.75 | | 5/15/11 | | 1,025,000 b | | 1,058,313 |
| Owens Brockway Glass Container, | | | | | | | | |
| Gtd. Notes | | 8.25 | | 5/15/13 | | 515,000 | | 534,956 |
| Owens Brockway Glass Container, | | | | | | | | |
| Scd. Notes | | 8.75 | | 11/15/12 | | 1,156,000 | | 1,231,140 |
| Owens Brockway Glass Container, | | | | | | | | |
| Gtd. Notes | | 8.88 | | 2/15/09 | | 822,000 | | 844,605 |
| Owens-Illinois, | | | | | | | | |
| Debs. | | 7.80 | | 5/15/18 | | 2,000,000 b | | 2,002,500 |
| Plastipak Holdings, | | | | | | | | |
| Sr. Notes | | 8.50 | | 12/15/15 | | 2,200,000 a | | 2,299,000 |
| Solo Cup, | | | | | | | | |
| Sr. Sub. Notes | | 8.50 | | 2/15/14 | | 1,525,000 b | | 1,326,750 |
| Stone Container, | | | | | | | | |
| Sr. Notes | | 9.75 | | 2/1/11 | | 2,372,000 | | 2,457,985 |
| | | | | | | | | 21,816,798 |
| Paper & Forest Products—2.0% | | | | | | | | |
| Appleton Papers, | | | | | | | | |
| Sr. Sub. Notes, Ser. B | | 9.75 | | 6/15/14 | | 1,104,000 | | 1,142,640 |
| Buckeye Technologies, | | | | | | | | |
| Sr. Notes | | 8.50 | | 10/1/13 | | 905,000 | | 959,300 |
| Georgia-Pacific, | | | | | | | | |
| Gtd. Notes | | 7.00 | | 1/15/15 | | 3,410,000 a | | 3,418,525 |
| Georgia-Pacific, | | | | | | | | |
| Sr. Notes | | 8.00 | | 1/15/24 | | 725,000 | | 739,500 |
| Temple-Inland, | | | | | | | | |
| Bonds | | 6.63 | | 1/15/18 | | 865,000 | | 898,720 |
| | | | | | | | | 7,158,685 |
| Property & Casualty Insurance—.5% | | | | | | |
| Allmerica Financial, | | | | | | | | |
| Debs. | | 7.63 | | 10/15/25 | | 1,500,000 b | | 1,615,014 |
The Fund 19
STATEMENT OF INVESTMENTS (continued)
| | | Coupon | | Maturity | | Principal | | |
| Bonds and Notes (continued) | | Rate (%) | | Date | | Amount ($) | | Value ($) |
| |
| |
| |
| |
|
| Real Estate Investment Trusts—1.4% | | | | | | |
| B.F. Saul REIT, | | | | | | | | |
| Scd. Notes | | 7.50 | | 3/1/14 | | 2,300,000 | | 2,348,875 |
| Host Marriott, | | | | | | | | |
| Sr. Notes, Ser. M | | 7.00 | | 8/15/12 | | 2,500,000 | | 2,550,000 |
| | | | | | | | | 4,898,875 |
| Retail—1.3% | | | | | | | | |
| Amerigas Partners, | | | | | | | | |
| Sr. Unscd. Notes | | 7.25 | | 5/20/15 | | 1,245,000 | | 1,266,787 |
| Central European Distribution, | | | | | | | | |
| Scd. Bonds EUR | | 8.00 | | 7/25/12 | | 625,000 a,d | | 892,792 |
| Neiman-Marcus Group | | | | | | | | |
| Gtd. Notes | | 9.00 | | 10/15/15 | | 365,000 | | 400,131 |
| Rite Aid, | | | | | | | | |
| Scd. Notes | | 8.13 | | 5/1/10 | | 1,180,000 | | 1,210,975 |
| VICORP Restaurants, | | | | | | | | |
| Sr. Notes | | 10.50 | | 4/15/11 | | 955,000 | | 921,575 |
| | | | | | | | | 4,692,260 |
| State/Government | | | | | | | | |
| General Obligations—1.4% | | | | | | | | |
| Erie Tobacco Asset | | | | | | | | |
| Securitization/NY, Tobacco | | | | | | | | |
| Settlement Asset-Backed Bonds | | 6.00 | | 6/1/28 | | 700,000 | | 704,543 |
| Michigan Tobacco Settlement | | | | | | | | |
| Finance Authority, Tobacco | | | | | | | | |
| Settlement Asset-Backed Bonds | | 7.31 | | 6/1/34 | | 1,475,000 | | 1,533,159 |
| Tobacco Settlement Authority of | | | | | | | | |
| Iowa, Tobacco Settlement | | | | | | | | |
| Asset-Backed Bonds | | 6.50 | | 6/1/23 | | 2,910,000 | | 2,884,916 |
| | | | | | | | | 5,122,618 |
| Technology—1.8% | | | | | | | | |
| Fisher Scientific International, | | | | | | | | |
| Sr. Sub. Notes | | 6.13 | | 7/1/15 | | 1,275,000 | | 1,262,534 |
| Freescale Semiconductor, | | | | | | | | |
| Sr. Notes | | 8.88 | | 12/15/14 | | 2,785,000 a | | 2,788,481 |
| Freescale Semiconductor, | | | | | | | | |
| Sr. Sub. Notes | | 10.13 | | 12/15/16 | | 805,000 a | | 810,031 |
| NXP/Funding, | | | | | | | | |
| Scd. Bonds | | 7.88 | | 10/15/14 | | 320,000 a | | 332,400 |
| NXP/Funding, | | | | | | | | |
| Scd. Notes | | 8.12 | | 10/15/13 | | 325,000 a,c | | 331,500 |
20
| | | | | Coupon | | Maturity | | Principal | | |
| Bonds and Notes (continued) | | Rate (%) | | Date | | Amount ($) | | Value ($) |
| |
| |
| |
| |
|
| Technology (continued) | | | | | | | | | | |
| Sensata Technologies, | | | | | | | | | | |
| Sr. Sub. Notes | | EUR | | 9.25 | | 5/1/16 | | 475,000 a,c,d | | 632,295 |
| Sungard Data Systems, | | | | | | | | | | |
| Gtd. Notes | | | | 9.97 | | 8/15/13 | | 300,000 c | | 313,125 |
| | | | | | | | | | | 6,470,366 |
| Telecommunications—9.1% | | | | | | | | |
| American Tower, | | | | | | | | | | |
| Sr. Notes | | | | 7.13 | | 10/15/12 | | 1,561,000 | | 1,611,733 |
| Intelsat Bermuda, | | | | | | | | | | |
| Sr. Notes | | | | 11.25 | | 6/15/16 | | 2,200,000 a | | 2,425,500 |
| Intelsat Subsidiary Holding, | | | | | | | | | | |
| Sr. Notes | | | | 8.25 | | 1/15/13 | | 1,610,000 | | 1,642,200 |
| Intelsat Subsidiary Holding, | | | | | | | | | | |
| Gtd. Notes | | | | 10.48 | | 1/15/12 | | 1,475,000 c | | 1,495,281 |
| Level 3 Financing, | | | | | | | | | | |
| Sr. Notes | | | | 9.25 | | 11/1/14 | | 2,150,000 a | | 2,203,750 |
| Nextel Communications, | | | | | | | | | | |
| Sr. Notes, Ser. D | | | | 7.38 | | 8/1/15 | | 2,000,000 | | 2,052,822 |
| Nordic Telephone Holdings, | | | | | | | | | | |
| Sr. Notes | | EUR | | 8.25 | | 5/1/16 | | 1,175,000 a,d | | 1,713,336 |
| Nortel Networks, | | | | | | | | | | |
| Gtd. Notes | | | | 10.75 | | 7/15/16 | | 275,000 a | | 302,156 |
| PanAmSat, | | | | | | | | | | |
| Gtd. Notes | | | | 9.00 | | 6/15/16 | | 275,000 a | | 292,531 |
| Pegasus Satellite Communications, | | | | | | | | |
| Sr. Notes | | | | 12.38 | | 8/1/08 | | 408,020 f | | 37,232 |
| Qwest Communications | | | | | | | | | | |
| International, Gtd. Notes, Ser. B | | 7.50 | | 2/15/14 | | 2,935,000 | | 3,037,725 |
| Qwest, | | | | | | | | | | |
| Bank Note, Ser. B | | | | 6.95 | | 6/30/10 | | 375,000 c | | 382,969 |
| Qwest, | | | | | | | | | | |
| Bank Note, Ser. B | | | | 6.95 | | 6/30/10 | | 676,000 c | | 690,365 |
| Qwest, | | | | | | | | | | |
| Sr. Notes | | | | 7.88 | | 9/1/11 | | 440,000 | | 470,800 |
| Qwest, | | | | | | | | | | |
| Sr. Notes | | | | 8.61 | | 6/15/13 | | 710,000 c | | 772,125 |
| Rural Cellular, | | | | | | | | | | |
| Sr. Notes | | | | 9.88 | | 2/1/10 | | 600,000 b | | 641,250 |
| UbiquiTel Operating, | | | | | | | | | | |
| Gtd. Notes | | | | 9.88 | | 3/1/11 | | 1,560,000 | | 1,692,600 |
The Fund 21
STATEMENT OF INVESTMENTS (continued)
| | | Coupon | | Maturity | | Principal | | |
| Bonds and Notes (continued) | | Rate (%) | | Date | | Amount ($) | | Value ($) |
| |
| |
| |
| |
|
| Telecommunications (continued) | | | | | | | | |
| US Unwired, | | | | | | | | |
| Gtd. Notes, Ser. B | | 10.00 | | 6/15/12 | | 2,149,000 b | | 2,374,645 |
| Wind Acquisition Finance, | | | | | | | | |
| Gtd. Bonds | | 10.75 | | 12/1/15 | | 500,000 a | | 571,250 |
| Windstream, | | | | | | | | |
| Sr. Notes | | 8.13 | | 8/1/13 | | 5,425,000 a | | 5,899,688 |
| Windstream, | | | | | | | | |
| Sr. Notes | | 8.63 | | 8/1/16 | | 1,660,000 a,b | | 1,826,000 |
| | | | | | | | | 32,135,958 |
| Textiles & Apparel—1.2% | | | | | | | | |
| Invista, | | | | | | | | |
| Notes | | 9.25 | | 5/1/12 | | 3,710,000 a | | 3,997,525 |
| Levi Strauss & Co., | | | | | | | | |
| Sr. Notes | | 12.25 | | 12/15/12 | | 353,000 | | 394,478 |
| | | | | | | | | 4,392,003 |
| Transportation—1.7% | | | | | | | | |
| CHC Helicopter, | | | | | | | | |
| Sr. Sub. Notes | | 7.38 | | 5/1/14 | | 1,405,000 | | 1,361,094 |
| Greenbrier Cos., | | | | | | | | |
| Gtd. Notes | | 8.38 | | 5/15/15 | | 1,500,000 | | 1,533,750 |
| Gulfmark Offshore, | | | | | | | | |
| Gtd. Notes | | 7.75 | | 7/15/14 | | 2,113,000 | | 2,165,825 |
| Kansas City Southern of Mexico, | | | | | | | | |
| Sr. Notes | | 7.63 | | 12/1/13 | | 825,000 a | | 827,062 |
| | | | | | | | | 5,887,731 |
| Total Bonds and Notes | | | | | | | | |
| (cost $330,623,900) | | | | | | | | 337,240,065 |
| |
| |
| |
| |
|
| |
| Preferred Stocks—1.9% | | | | | | Shares | | Value ($) |
| |
| |
| |
| |
|
| Banks—1.0% | | | | | | | | |
| Sovereign Capital Trust IV, | | | | | | | | |
| Conv., Cum. $2.1875 | | | | | | 71,900 | | 3,577,025 |
| Media—.9% | | | | | | | | |
| ION Media Networks, | | | | | | | | |
| Conv., $975 | | | | | | 328 a | | 1,444,665 |
| Spanish Broadcasting System, | | | | | | | | |
| Ser. B, Cum. $107.51 | | | | | | 1,482 | | 1,633,922 |
| | | | | | | | | 3,078,587 |
| Total Preferred Stocks | | | | | | | | |
| (cost $8,088,610) | | | | | | | | 6,655,612 |
22
| Common Stocks—.6% | | Shares | | Value ($) |
| |
| |
|
| Building & Construction—.3% | | | | |
| Owens Corning | | 39,076 g | | 1,168,372 |
| Chemicals—.0% | | | | |
| Huntsman | | 10,294 g | | 195,277 |
| Oil & Gas—.3% | | | | |
| Williams Cos | | 35,807 | | 935,279 |
| Total Common Stocks | | | | |
| (cost $2,231,741) | | | | 2,298,928 |
| |
| |
|
| |
| Investment of Cash Collateral | | | | |
| for Securities Loaned—12.8% | | | | |
| |
| |
|
| Registered Investment Company; | | | | |
| Dreyfus Institutional Cash Advantage Fund | | | | |
| (cost $45,149,660) | | 45,149,660 h | | 45,149,660 |
| |
| |
|
| |
| Total Investments (cost $386,093,911) | | 110.6% | | 391,344,265 |
| Liabilities, Less Cash and Receivables | | (10.6%) | | (37,625,441) |
| Net Assets | | 100.0% | | 353,718,824 |
| a | | Securities exempt from registration under Rule 144A of the Securities Act of 1933.These securities may be resold in |
| | | transactions exempt from registration, normally to qualified institutional buyers. At December 31, 2006, these |
| | | securities amounted to $80,183,074 or 22.7% of net assets. | | |
| b | | All or a portion of these securities are on loan. At December 31, 2006, the total market value of the fund’s securities |
| | | on loan is $41,937,887 and the total market value of the collateral held by the fund is $45,165,860, consisting of |
| | | cash collateral of $45,149,660 and U.S. Government and agency securities valued at $16,200. |
| c | | Variable rate security—interest rate subject to periodic change. | | |
| d | | Principal amount stated in U.S. Dollars unless otherwise noted. | | |
| | | EUR—Euro | | | | | | |
| e | | Zero coupon until a specified date at which time the stated coupon rate becomes effective until maturity. |
| f | | Non-income producing—security in default. | | | | |
| g | | Non-income producing security. | | | | | | |
| h | | Investment in affiliated money market mutual fund. | | | | |
| |
| |
| |
|
| |
| |
| |
| Portfolio Summary (Unaudited) † | | | | |
| |
| | | Value (%) | | | | Value (%) |
| |
| |
| |
|
| |
| Corporate Bonds | | 93.6 | | Common Stocks | | .6 |
| Money Market Investment | | 12.8 | | Asset/Mortgage-Backed | | .3 |
| Preferred Stocks | | 1.9 | | | | |
| State/Government General Obligations | | 1.4 | | | | 110.6 |
| |
| † | | Based on net assets. | | | | | | |
| See notes to financial statements. | | | | | | |
The Fund 23
| STATEMENT OF ASSETS AND LIABILITIES |
| December 31, 2006 |
| | | | | | | Cost | | Value |
| |
| |
| |
| |
|
| Assets ($): | | | | | | | | |
| Investments in securities—See Statement of Investments (including | | | | |
| securities on loan, valued at $41,937,887)—Note 1(c): | | | | |
| Unaffiliated issuers | | | | | | 340,944,251 | | 346,194,605 |
| Affiliated issuers | | | | | | 45,149,660 | | 45,149,660 |
| Cash denominated in foreign currencies | | | | 381,192 | | 393,556 |
| Interest and dividends receivable | | | | | | | | 6,440,599 |
| Swaps premiums paid | | | | | | | | 1,918,866 |
| Receivable for shares of Beneficial Interest subscribed | | | | 109,900 |
| Receivable for closed forward currency exchange contracts | | | | 102,942 |
| Unrealized appreciation on swaps—Note 4 | | | | | | 74,493 |
| Other assets | | | | | | | | 1,543,529 |
| | | | | | | | | 401,928,150 |
| |
| |
| |
| |
|
| Liabilities ($): | | | | | | | | |
| Due to The Dreyfus Corporation and affiliates—Note 3(b) | | | | 354,586 |
| Cash overdraft due to Custodian | | | | | | | | 1,744,774 |
| Liability for securities on loan—Note 1(c) | | | | | | 45,149,660 |
| Payable for shares of Beneficial Interest redeemed | | | | | | 698,909 |
| Unrealized depreciation on swaps—Note 4 | | | | | | 190,189 |
| Unrealized depreciation on forward | | | | | | |
| currency exchange contracts—Note 4 | | | | | | 71,208 |
| | | | | | | | | 48,209,326 |
| |
| |
| |
| |
|
| Net Assets ($) | | | | | | | | 353,718,824 |
| |
| |
| |
| |
|
| Composition of Net Assets ($): | | | | | | | | |
| Paid-in capital | | | | | | | | 829,017,827 |
| Accumulated distributions in excess of investment income—net | | | | (249,078) |
| Accumulated net realized gain (loss) on investments | | | | |
| and foreign currency transactions | | | | | | (480,128,434) |
| Accumulated net unrealized appreciation (depreciation) on | | | | |
| investments, swap transactions and foreign currency transactions | | 5,078,509 |
| |
|
| Net Assets ($) | | | | | | | | 353,718,824 |
| |
| |
| |
| |
|
| |
| |
| Net Asset Value Per Share | | | | | | | | |
| | | Class A | | Class B | | Class C | | Class R |
| |
| |
| |
| |
|
| Net Assets ($) | | 202,098,304 | | 67,833,813 | | 65,728,108 | | 18,058,599 |
| Shares Outstanding | | 27,570,022 | | 9,245,294 | | 8,955,765 | | 2,462,891 |
| |
| |
| |
| |
|
| Net Asset Value Per Share ($) | | 7.33 | | 7.34 | | 7.34 | | 7.33 |
See notes to financial statements.
24
| STATEMENT OF OPERATIONS |
| Year Ended December 31, 2006 |
| Investment Income ($): | | |
| Income: | | |
| Interest | | 28,717,604 |
| Dividends: | | |
| Unaffiliated issuers | | 577,971 |
| Affiliated issuers | | 123,627 |
| Income from securities lending | | 138,286 |
| Total Income | | 29,557,488 |
| Expenses: | | |
| Management fee—Note 3(a) | | 2,682,603 |
| Distribution and service fees—Note 3(b) | | 1,835,387 |
| Interest expense—Note 2 | | 7,242 |
| Total Expenses | | 4,525,232 |
| Investment Income—Net | | 25,032,256 |
| |
|
| Realized and Unrealized Gain (Loss) on Investments—Note 4 ($): |
| Net realized gain (loss) on investments and foreign currency transactions | | 5,392,326 |
| Net realized gain (loss) on swaps transactions | | 11,852 |
| Net realized gain (loss) on forward currency exchange contracts | | (380,219) |
| Net Realized Gain (Loss) | | 5,023,959 |
| Net unrealized appreciation (depreciation) on investments, | | |
| swap transactions and foreign currency transactions | | 2,272,264 |
| Net Realized and Unrealized Gain (Loss) on Investments | | 7,296,223 |
| Net Increase in Net Assets Resulting from Operations | | 32,328,479 |
See notes to financial statements.
The Fund 25
STATEMENT OF CHANGES IN NET ASSETS
| | | Year Ended December 31, |
| |
|
| | | 2006 | | 2005 |
| |
| |
|
| Operations ($): | | | | |
| Investment income—net | | 25,032,256 | | 32,509,203 |
| Net realized gain (loss) on investments | | 5,023,959 | | (2,852,600) |
| Net unrealized appreciation | | | | |
| (depreciation) on investments | | 2,272,264 | | (22,848,992) |
| Net Increase (Decrease) in Net Assets | | | | |
| Resulting from Operations | | 32,328,479 | | 6,807,611 |
| |
| |
|
| Dividends to Shareholders from ($): | | | | |
| Investment income—net: | | | | |
| Class A shares | | (16,213,908) | | (19,677,901) |
| Class B shares | | (5,618,531) | | (8,613,629) |
| Class C shares | | (4,708,337) | | (5,955,584) |
| Class R shares | | (1,384,831) | | (1,582,799) |
| Total Dividends | | (27,925,607) | | (35,829,913) |
| |
| |
|
| Beneficial Interest Transactions ($): | | | | |
| Net proceeds from shares sold: | | | | |
| Class A shares | | 24,562,106 | | 59,099,619 |
| Class B shares | | 2,985,895 | | 6,675,161 |
| Class C shares | | 7,985,544 | | 8,186,044 |
| Class R shares | | 3,347,791 | | 2,787,806 |
| Dividends reinvested: | | | | |
| Class A shares | | 8,054,669 | | 9,034,344 |
| Class B shares | | 2,649,119 | | 3,492,415 |
| Class C shares | | 1,924,723 | | 2,427,417 |
| Class R shares | | 1,363,284 | | 1,562,942 |
| Cost of shares redeemed: | | | | |
| Class A shares | | (69,472,740) | | (103,059,712) |
| Class B shares | | (34,967,375) | | (74,071,992) |
| Class C shares | | (19,803,807) | | (45,812,229) |
| Class R shares | | (5,433,618) | | (6,301,353) |
| Increase (Decrease) in Net Assets from | | | | |
| Beneficial Interest Transactions | | (76,804,409) | | (135,979,538) |
| Total Increase (Decrease) in Net Assets | | (72,401,537) | | (165,001,840) |
| |
| |
|
| Net Assets ($): | | | | |
| Beginning of Period | | 426,120,361 | | 591,122,201 |
| End of Period | | 353,718,824 | | 426,120,361 |
| Undistributed (distributions in excess of) | | | | |
| investment income—net | | (249,078) | | 519,317 |
26
| | | Year Ended December 31, |
| |
|
| | | 2006 | | 2005 |
| |
| |
|
| Capital Share Transactions: | | | | |
| Class A a | | | | |
| Shares sold | | 3,402,897 | | 7,969,751 |
| Shares issued for dividends reinvested | | 1,115,544 | | 1,229,853 |
| Shares redeemed | | (9,623,951) | | (13,978,772) |
| Net Increase (Decrease) in Shares Outstanding | | (5,105,510) | | (4,779,168) |
| |
| |
|
| Class B a | | | | |
| Shares sold | | 412,273 | | 902,004 |
| Shares issued for dividends reinvested | | 366,732 | | 474,662 |
| Shares redeemed | | (4,834,773) | | (9,996,875) |
| Net Increase (Decrease) in Shares Outstanding | | (4,055,768) | | (8,620,209) |
| |
| |
|
| Class C | | | | |
| Shares sold | | 1,104,471 | | 1,101,288 |
| Shares issued for dividends reinvested | | 266,305 | | 329,845 |
| Shares redeemed | | (2,736,302) | | (6,174,757) |
| Net Increase (Decrease) in Shares Outstanding | | (1,365,526) | | (4,743,624) |
| |
| |
|
| Class R | | | | |
| Shares sold | | 461,934 | | 372,287 |
| Shares issued for dividends reinvested | | 188,704 | | 212,799 |
| Shares redeemed | | (756,747) | | (855,149) |
| Net Increase (Decrease) in Shares Outstanding | | (106,109) | | (270,063) |
a During the period ended December 31, 2006, 1,462,933 Class B shares representing $10,587,498 were automatically converted to 1,464,542 Class A shares and during the period ended December 31, 2005, 3,607,798 Class B shares representing $26,903,740 were automatically converted to 3,610,991 Class A shares.
See notes to financial statements.
The Fund 27
FINANCIAL HIGHLIGHTS
The following tables describe the performance for each share class for the fiscal periods indicated. All information (except portfolio turnover rate) reflects financial results for a single fund share.Total return shows how much your investment in the fund would have increased (or decreased) during each period, assuming you had reinvested all dividends and distributions.These figures have been derived from the fund’s financial statements.
| | | | | Year Ended December 31, | | |
| |
| |
| |
|
| Class A Shares | | 2006 | | 2005 | | 2004 a | | 2003 | | 2002 |
| |
| |
| |
| |
| |
|
| Per Share Data ($): | | | | | | | | | | |
| Net asset value, beginning of period | | 7.24 | | 7.65 | | 7.43 | | 6.28 | | 7.94 |
| Investment Operations: | | | | | | | | | | |
| Investment income—net b | | .49 | | .51 | | .52 | | .63 | | .68 |
| Net realized and unrealized | | | | | | | | | | |
| gain (loss) on investments | | .14 | | (.36) | | .23 | | 1.17 | | (1.62) |
| Total from Investment Operations | | .63 | | .15 | | .75 | | 1.80 | | (.94) |
| Distributions: | | | | | | | | | | |
| Dividends from investment income—net | | (.54) | | (.56) | | (.53) | | (.65) | | (.72) |
| Net asset value, end of period | | 7.33 | | 7.24 | | 7.65 | | 7.43 | | 6.28 |
| |
| |
| |
| |
| |
|
| Total Return (%) c | | 8.66 | | 2.22 | | 10.44 | | 29.87 | | (12.19) |
| |
| |
| |
| |
| |
|
| Ratios/Supplemental Data (%): | | | | | | | | | | |
| Ratio of total expenses | | | | | | | | | | |
| to average net assets | | .95 | | .95 | | .95 | | .97 | | .96 |
| Ratio of net investment income | | | | | | | | | | |
| to average net assets | | 6.76 | | 6.93 | | 7.00 | | 8.87 | | 10.05 |
| Portfolio Turnover Rate | | 29.98 | | 40.57 | | 129.27 | | 235.42 | | 340.47 |
| |
| |
| |
| |
| |
|
| Net Assets, end of period ($ x 1,000) | | 202,098 | | 236,421 | | 286,342 | | 191,270 | | 121,775 |
| a | | As of January 1, 2004, the fund has adopted the method of accounting for interim payments on swap contracts in |
| | | accordance with Financial Accounting Standards Board Statement No. 133.These interim payments are reflected |
| | | within net realized and unrealized gain (loss) on swap contracts, however, prior to January 1, 2004, these interim |
| | | payments were reflected within interest income/expense in the Statement of Operations.The effect of these changes for |
| | | the fiscal year ended December 31, 2004 was to increase net investment income per share by less than $.01, decrease |
| | | net realized and unrealized gain (loss) on investments per share by less than $.01 and had no effect on the ratio of |
| | | net investment income to average net assets. |
| b | | Based on average shares outstanding at each month end. |
| c | | Exclusive of sales charge. |
| See notes to financial statements. |
| | | | | Year Ended December 31, | | |
| |
| |
| |
|
| Class B Shares | | 2006 | | 2005 | | 2004 a | | 2003 | | 2002 |
| |
| |
| |
| |
| |
|
| Per Share Data ($): | | | | | | | | | | |
| Net asset value, beginning of period | | 7.24 | | 7.65 | | 7.43 | | 6.28 | | 7.94 |
| Investment Operations: | | | | | | | | | | |
| Investment income—net b | | .45 | | .46 | | .47 | | .59 | | .66 |
| Net realized and unrealized | | | | | | | | | | |
| gain (loss) on investments | | .16 | | (.35) | | .25 | | 1.18 | | (1.64) |
| Total from Investment Operations | | .61 | | .11 | | .72 | | 1.77 | | (.98) |
| Distributions: | | | | | | | | | | |
| Dividends from investment income—net | | (.51) | | (.52) | | (.50) | | (.62) | | (.68) |
| Net asset value, end of period | | 7.34 | | 7.24 | | 7.65 | | 7.43 | | 6.28 |
| |
| |
| |
| |
| |
|
| Total Return (%) c | | 8.12 | | 1.73 | | 10.06 | | 29.25 | | (12.64) |
| |
| |
| |
| |
| |
|
| Ratios/Supplemental Data (%): | | | | | | | | | | |
| Ratio of total expenses | | | | | | | | | | |
| to average net assets | | 1.45 | | 1.45 | | 1.45 | | 1.47 | | 1.46 |
| Ratio of net investment income | | | | | | | | | | |
| to average net assets | | 6.25 | | 6.36 | | 6.50 | | 8.46 | | 9.41 |
| Portfolio Turnover Rate | | 29.98 | | 40.57 | | 129.27 | | 235.42 | | 340.47 |
| |
| |
| |
| |
| |
|
| Net Assets, end of period ($ x 1,000) | | 67,834 | | 96,334 | | 167,756 | | 239,015 | | 230,011 |
| a | | As of January 1, 2004, the fund has adopted the method of accounting for interim payments on swap contracts in |
| | | accordance with Financial Accounting Standards Board Statement No. 133.These interim payments are reflected |
| | | within net realized and unrealized gain (loss) on swap contracts, however, prior to January 1, 2004, these interim |
| | | payments were reflected within interest income/expense in the Statement of Operations.The effect of these changes for |
| | | the fiscal year ended December 31, 2004 was to increase net investment income per share by less than $.01, decrease |
| | | net realized and unrealized gain (loss) on investments per share by less than $.01 and had no effect on the ratio of |
| | | net investment income to average net assets. |
| b | | Based on average shares outstanding at each month end. |
| c | | Exclusive of sales charge. |
| See notes to financial statements. |
The Fund 29
FINANCIAL HIGHLIGHTS (continued)
| | | | | Year Ended December 31, | | |
| |
| |
| |
|
| Class C Shares | | 2006 | | 2005 | | 2004 a | | 2003 | | 2002 |
| |
| |
| |
| |
| |
|
| Per Share Data ($): | | | | | | | | | | |
| Net asset value, beginning of period | | 7.24 | | 7.65 | | 7.43 | | 6.28 | | 7.95 |
| Investment Operations: | | | | | | | | | | |
| Investment income—net b | | .43 | | .45 | | .46 | | .57 | | .64 |
| Net realized and unrealized | | | | | | | | | | |
| gain (loss) on investments | | .16 | | (.36) | | .24 | | 1.18 | | (1.65) |
| Total from Investment Operations | | .59 | | .09 | | .70 | | 1.75 | | (1.01) |
| Distributions: | | | | | | | | | | |
| Dividends from investment income—net | | (.49) | | (.50) | | (.48) | | (.60) | | (.66) |
| Net asset value, end of period | | 7.34 | | 7.24 | | 7.65 | | 7.43 | | 6.28 |
| |
| |
| |
| |
| |
|
| Total Return (%) c | | 7.85 | | 1.48 | | 9.63 | | 29.10 | | (12.97) |
| |
| |
| |
| |
| |
|
| Ratios/Supplemental Data (%): | | | | | | | | | | |
| Ratio of total expenses | | | | | | | | | | |
| to average net assets | | 1.70 | | 1.70 | | 1.70 | | 1.72 | | 1.71 |
| Ratio of net investment income | | | | | | | | | | |
| to average net assets | | 6.01 | | 6.14 | | 6.26 | | 8.15 | | 9.17 |
| Portfolio Turnover Rate | | 29.98 | | 40.57 | | 129.27 | | 235.42 | | 340.47 |
| |
| |
| |
| |
| |
|
| Net Assets, end of period ($ x 1,000) | | 65,728 | | 74,770 | | 115,309 | | 86,479 | | 62,036 |
| a | | As of January 1, 2004, the fund has adopted the method of accounting for interim payments on swap contracts in |
| | | accordance with Financial Accounting Standards Board Statement No. 133.These interim payments are reflected |
| | | within net realized and unrealized gain (loss) on swap contracts, however, prior to January 1, 2004, these interim |
| | | payments were reflected within interest income/expense in the Statement of Operations.The effect of these changes for |
| | | the fiscal year ended December 31, 2004 was to increase net investment income per share by less than $.01, decrease |
| | | net realized and unrealized gain (loss) on investments per share by less than $.01 and had no effect on the ratio of |
| | | net investment income to average net assets. |
| b | | Based on average shares outstanding at each month end. |
| c | | Exclusive of sales charge. |
| See notes to financial statements. |
| | | | | Year Ended December 31, | | |
| |
| |
| |
|
| Class R Shares | | 2006 | | 2005 | | 2004 a | | 2003 | | 2002 |
| |
| |
| |
| |
| |
|
| Per Share Data ($): | | | | | | | | | | |
| Net asset value, beginning of period | | 7.24 | | 7.65 | | 7.43 | | 6.27 | | 7.94 |
| Investment Operations: | | | | | | | | | | |
| Investment income—net b | | .51 | | .53 | | .52 | | .67 | | .70 |
| Net realized and unrealized | | | | | | | | | | |
| gain (loss) on investments | | .14 | | (.36) | | .25 | | 1.16 | | (1.64) |
| Total from Investment Operations | | .65 | | .17 | | .77 | | 1.83 | | (.94) |
| Distributions: | | | | | | | | | | |
| Dividends from investment income—net | | (.56) | | (.58) | | (.55) | | (.67) | | (.73) |
| Net asset value, end of period | | 7.33 | | 7.24 | | 7.65 | | 7.43 | | 6.27 |
| |
| |
| |
| |
| |
|
| Total Return (%) | | 8.92 | | 2.34 | | 10.87 | | 30.15 | | (11.99) |
| |
| |
| |
| |
| |
|
| Ratios/Supplemental Data (%): | | | | | | | | | | |
| Ratio of total expenses | | | | | | | | | | |
| to average net assets | | .70 | | .70 | | .70 | | .72 | | .70 |
| Ratio of net investment income | | | | | | | | | | |
| to average net assets | | 7.01 | | 7.18 | | 7.31 | | 9.26 | | 10.08 |
| Portfolio Turnover Rate | | 29.98 | | 40.57 | | 129.27 | | 235.42 | | 340.47 |
| |
| |
| |
| |
| |
|
| Net Assets, end of period ($ x 1,000) | | 18,059 | | 18,595 | | 21,714 | | 1,283 | | 114 |
| a | | As of January 1, 2004, the fund has adopted the method of accounting for interim payments on swap contracts in |
| | | accordance with Financial Accounting Standards Board Statement No. 133.These interim payments are reflected |
| | | within net realized and unrealized gain (loss) on swap contracts, however, prior to January 1, 2004, these interim |
| | | payments were reflected within interest income/expense in the Statement of Operations.The effect of these changes for |
| | | the fiscal year ended December 31, 2004 was to increase net investment income per share by less than $.01, decrease |
| | | net realized and unrealized gain (loss) on investments per share by less than $.01 and had no effect on the ratio of |
| | | net investment income to average net assets. |
| b | | Based on average shares outstanding at each month end. |
| See notes to financial statements. |
The Fund 31
NOTES TO FINANCIAL STATEMENTS
NOTE 1—Significant Accounting Policies:
Dreyfus Premier Limited Term High Yield Fund (the “fund”) is a separate diversified series of The Dreyfus/Laurel Funds Trust (the “Trust”) which is registered under the Investment Company Act of 1940, as amended (the “Act”), as an open-end management investment company and operates as a series company currently offering six series, including the fund. The fund’s investment objective is to seek to maximize total return, consisting of capital appreciation and current income. The Dreyfus Corporation (the “Manager” or “Dreyfus”) serves as the fund’s investment manager. The Manager is a wholly-owned subsidiary of Mellon Financial Corporation (“Mellon Financial”).
On December 4, 2006, Mellon Financial and The Bank of New York Company, Inc. announced that they had entered into a definitive agreement to merge. The new company will be called The Bank of New York Mellon Corporation. As part of this transaction, Dreyfus would become a wholly-owned subsidiary of The Bank of New York Mellon Corporation. The transaction is subject to certain regulatory approvals and the approval of The Bank of New York Company, Inc.’s and Mellon Financial’s shareholders, as well as other customary conditions to closing. Subject to such approvals and the satisfaction of the other conditions, Mellon Financial and The Bank of New York Company, Inc. expect the transaction to be completed in the third quarter of 2007.
Dreyfus Service Corporation (the “Distributor”), a wholly-owned subsidiary of the Manager, is the Distributor of the fund’s shares.The fund is authorized to issue an unlimited number of shares of Beneficial Interest in each of the following classes of shares: Class A, Class B, Class C and Class R. Class A, Class B and Class C shares are sold primarily to retail investors through financial intermediaries and bear a distribution fee and/or service fee. Class A shares are sold with a front-end sales charge, while Class B and Class C shares are subject to a contingent deferred sales charge (“CDSC”). Class B shares automatically convert to Class A shares after six years. Class R shares are sold primarily to bank
trust departments and other financial service providers (including Mellon Financial and its affiliates) acting on behalf of customers having a qualified trust or investment account or relationship at such institution, and bear no distribution or service fees. Class R shares are offered without a front-end sales charge or CDSC. Each class of shares has identical rights and privileges, except with respect to distribution and service fees and voting rights on matters affecting a single class. Income, expenses (other than expenses attributable to a specific class), and realized and unrealized gains or losses on investments are allocated to each class of shares based on its relative net assets.
Effective March 1, 2006, Class A shares of the fund may be purchased at net asset value (“NAV”) without payment of a sales charge:
- By qualified investors who (i) purchase Class A shares directly through the Distributor, and (ii) have, or whose spouse or minor children have, beneficially owned shares and continuously maintained an open account directly through the Distributor in a Dreyfus-managed fund, including the fund, or a Founders Asset Management LLC
(“Founders”) managed fund since on or before February 28, 2006. Founders is a wholly-owned subsidiary of the Distributor. - With the cash proceeds from an investor’s exercise of employment- related stock options, whether invested in the fund directly or indi- rectly through an exchange from a Dreyfus-managed money market fund, provided that the proceeds are processed through an entity that has entered into an agreement with the Distributor specifically relat- ing to processing stock options. Upon establishing the account in the fund or the Dreyfus-managed money market fund, the investor and the investor’s spouse and minor children become eligible to purchase Class A shares of the fund at NAV, whether or not using the proceeds of the employment-related stock options.
- By members of qualified affinity groups who purchase Class A shares directly through the Distributor, provided that the qualified affinity group has entered into an affinity agreement with the Distributor.
The Fund 33
NOTES TO FINANCIAL STATEMENTS (continued)
Effective June 1, 2006, the fund no longer offers Class B shares, except in connection with dividend reinvestment and permitted exchanges of Class B shares.
(a) Portfolio valuation: Investments in securities (excluding short-term investments other than U.S. Treasury Bills), financial futures, options, swaps and forward currency exchange contracts are valued each business day by an independent pricing service (the “Service”) approved by the Board of Trustees. Investments for which quoted bid prices are readily available and are representative of the bid side of the market in the judgment of the Service are valued at the mean between the quoted bid prices (as obtained by the Service from dealers in such securities) and asked prices (as calculated by the Service based upon its evaluation of the market for such securities). Other investments (which constitute a majority of the portfolio securities) are valued as determined by the Service, based on methods which include consideration of: yields or prices of securities of comparable quality, coupon, maturity and type; indications as to values from dealers; and general market conditions. Restricted securities, as well as securities or other assets for which recent market quotations are not readily available and are not valued by a pricing service approved by the Board of Trustees, or are determined by the fund not to reflect accurately fair value, are valued at fair value as determined in good faith under the direction of the Board of Trustees. The factors that may be considered when fair valuing a security include fundamental analytical data, the nature and duration of restrictions on disposition, an evaluation of the forces that influence the market in which the securities are purchased and sold and public trading in similar securities of the issuer or comparable issuers. Short-term investments, excluding U.S.Treasury Bills, are carried at amortized cost, which approximates fair value. Registered open-end investment companies that are not traded on an exchange
The fund’s financial statements are prepared in accordance with U.S. generally accepted accounting principles, which may require the use of management estimates and assumptions. Actual results could differ from those estimates.
are valued at their net asset value. Financial futures and options, which are traded on an exchange, are valued at the last sales price on the securities exchange on which such securities are primarily traded or at the last sales price on the national securities market on each business day. Options traded over-the-counter are priced at the mean between the bid and asked prices. Investments denominated in foreign currencies are translated to U.S. dollars at the prevailing rates of exchange. Investments in swap transactions are valued each business day by a pricing service approved by the Board of Trustees. Swaps are valued by the service by using a swap pricing model which incorporates among other factors, default probabilities, recovery rates, credit curves of the underlying issuer and swap spreads on interest rates.
On September 20, 2006, the Financial Accounting Standards Board (FASB) released Statement of Financial Accounting Standards No. 157 “Fair Value Measurements” (“FAS 157”). FAS 157 establishes an authoritative definition of fair value, sets out a framework for measuring fair value, and requires additional disclosures about fair-value measurements. The application of FAS 157 is required for fiscal years beginning after November 15, 2007 and interim periods within those fiscal years. Management does not believe that the application of this standard will have a material impact on the financial statements of the portfolio.
(b) Foreign currency transactions: The fund does not isolate that portion of the results of operations resulting from changes in foreign exchange rates on investments from the fluctuations arising from changes in the market prices of securities held. Such fluctuations are included with the net realized and unrealized gain or loss on investments.
Net realized foreign exchange gains or losses arise from sales and maturities of short-term securities, sales of foreign currencies, currency gains or losses realized on securities transactions and the difference between the amount of dividends, interest and foreign withholding taxes recorded on the fund’s books and the U.S. dollar equivalent of the amounts actually received or paid. Net unrealized foreign exchange gains and losses arise from changes in the value of assets and liabilities
The Fund 35
NOTES TO FINANCIAL STATEMENTS (continued)
other than investments in securities, resulting from changes in exchange rates. Such gains and losses are included with net realized and unrealized gain or loss on investments.
(c) Securities transactions and investment income: Securities transactions are recorded on a trade date basis. Realized gain and loss from securities transactions are recorded on the identified cost basis. Dividend income is recognized on the ex-dividend date and interest income, including, where applicable, accretion of discount and amortization of premium on investments, is recognized on the accrual basis.
Pursuant to a securities lending agreement with Mellon Bank, N.A., an affiliate of the Manager, the fund may lend securities to qualified institutions. It is the fund’s policy, that at origination, all loans are secured by collateral of at least 102% of the value of U.S. securities loaned and 105% of the value of foreign securities loaned. Collateral equivalent to at least 100% of the market value of securities on loan is maintained at all times. Cash collateral is invested in certain money market mutual funds managed by the Manager.The fund is entitled to receive all income on securities loaned, in addition to income earned as a result of the lending transaction.Although each security loaned is fully collateralized, the fund bears the risk of delay in recovery of, or loss of rights in, the securities loaned should a borrower fail to return the securities in a timely manner.
(d) Affiliated issuers: Investments in other investment companies advised by the Manager are defined as “affiliated” in the Act.
(e) Concentration of Risk: The fund invests primarily in debt securities. Failure of an issuer of the debt securities to make timely interest or principal payments, or a decline or the perception of a decline in the credit quality of a debt security, can cause the debt security’s price to fall, potentially lowering the fund’s share price. High yield (“junk”) bonds involve greater credit risk, including the risk of default, than investment grade bonds, and are considered predominantly speculative with respect to the issuer’s continuing ability to make principal and
36
interest payments. In addition, the value of debt securities may decline due to general market conditions that are not specifically related to a particular company, such as real or perceived adverse economic conditions, changes in outlook for corporate earnings, changes in interest or currency rates or adverse investor sentiment. They may also decline because of factors that affect a particular industry.
(f) Dividends to shareholders: It is the policy of the fund to declare dividends daily from investment income-net. Such dividends are paid monthly. Dividends from net realized capital gain, if any, are normally declared and paid annually, but the fund may make distributions on a more frequent basis to comply with the distribution requirements of the Internal Revenue Code of 1986, as amended (the “Code”).To the extent that net realized capital gain can be offset by capital loss carryovers, it is the policy of the fund not to distribute such gain. Income and capital gain distributions are determined in accordance with income tax regulations, which may differ from U.S. generally accepted accounting principles.
(g) Federal income taxes: It is the policy of the fund to continue to qualify as a regulated investment company, if such qualification is in the best interests of its shareholders, by complying with the applicable provisions of the Code, and to make distributions of taxable income sufficient to relieve it from substantially all federal income and excise taxes.
On July 13, 2006, the FASB released FASB Interpretation No. 48, “Accounting for Uncertainty in Income Taxes” (FIN 48). FIN 48 provides guidance for how uncertain tax positions should be recognized, measured, presented and disclosed in the financial statements. FIN 48 requires the evaluation of tax positions taken or expected to be taken in the course of preparing the portfolio’s tax returns to determine whether the tax positions are “more-likely-than-not” of being sustained by the applicable tax authority.Tax positions not deemed to meet the more-likely-than-not threshold would be recorded as a tax benefit or expense in the current year. Adoption of FIN 48 is required for fiscal
The Fund 37
NOTES TO FINANCIAL STATEMENTS (continued)
years beginning after December 15, 2006 and is to be applied to all open tax years as of the effective date. Management does not believe that the application of this standard will have a material impact on the financial statements of the portfolio.
At December 31, 2006, the components of accumulated earnings on a tax basis were as follows: undistributed ordinary income $578,627, accumulated capital losses $478,138,042 and unrealized appreciation $2,260,412.
The accumulated capital loss carryover is available to be applied against future net securities profits, if any, realized subsequent to December 31, 2006. If not applied, $44,631,820 expires in fiscal 2007, $53,989,658 expires in fiscal 2008, $161,394,992 expires in fiscal 2009, $138,776,715 expires in fiscal 2010, $72,493,638 expires in fiscal 2011 and $6,851,219 expires in fiscal 2013. Based on certain provisions in the Internal Revenue Code, various limitations regarding the future utilization of these carryforwards, brought forward as a result of the fund’s merger with the following funds may apply: Dreyfus Short Term High Yield Fund, Dreyfus Premier High Yield Securities Fund and High Yield Total Fund. It is probable that the fund will not be able to utilize most of its capital loss carryovers prior to its expiration date.
The tax character of distributions paid to shareholders during the fiscal periods ended December 31, 2006 and December 31, 2005 were as follows: ordinary income $27,925,607 and $35,829,913, respectively.
During the period ended December 31, 2006, as a result of permanent book to tax differences, primarily due to the tax treatment for foreign currency transactions, amortization of premiums, consent fees, expiration of capital loss carryovers and other book to tax differences under the provisions of Section 382 of the Code, the fund increased accumulated undistributed investment income-net by $2,124,956, increased accumulated net realized gain (loss) on investments by $83,537,357 and decreased paid-in capital by $85,662,313. Net assets were not affected by this reclassification.
38
NOTE 2—Bank Lines of Credit:
The fund may borrow up to $20 million for leveraging purposes under a short-term unsecured line of credit and participates with other Dreyfus-managed funds in a $100 million unsecured line of credit primarily to be utilized for temporary or emergency purposes, including the financing of redemptions. Interest is charged to the fund based on prevailing market rates in effect at the time of borrowing.
The average daily amount of borrowings outstanding under the leveraging arrangement during the period ended December 31, 2006, was approximately $125,000 with a related weighted average annualized interest rate of 5.80% ..
NOTE 3—Investment Management Fee and Other Transactions with Affiliates:
(a) Pursuant to an Investment Management agreement with the Manager, the Manager provides or arranges for one or more third parties and/or affiliates to provide investment advisory, administrative, custody, fund accounting and transfer agency services to the fund.The Manager also directs the investments of the fund in accordance with its investment objective, policies and limitations. For these services, the fund is contractually obligated to pay the Manager a fee, calculated daily and paid monthly, at the annual rate of .70% of the value of the fund’s average daily net assets. Out of its fee, the Manager pays all of the expenses of the fund except brokerage fees, taxes, interest, commitment fees, Rule 12b-1 distribution fees and expenses, service fees and expenses of non-interested Trustees (including counsel fees) and extraordinary expenses. In addition, the Manager is required to reduce its fee in an amount equal to the fund’s allocable portion of fees and expenses of the non-interested Trustees (including counsel fees). Each Trustee receives $45,000 per year, plus $6,000 for each joint Board meeting of The Dreyfus/Laurel Funds, Inc., The Dreyfus/Laurel Tax-Free Municipal Funds and the Trust (collectively, the “Dreyfus/Laurel Funds”) attended, $2,000 for separate
The Fund 39
NOTES TO FINANCIAL STATEMENTS (continued)
in-person committee meetings attended which are not held in conjunction with a regularly scheduled Board meeting and $1,500 for Board meetings and separate committee meetings attended that are conducted by telephone and is reimbursed for travel and out-of-pocket expenses. With respect to Board meetings, the Chairman of the Board receives an additional 25% of such compensation (with the exception of reimbursable amounts).With respect to compensation committee meetings, the Chairman of the compensation committee receives $900 per meeting and, with respect to audit committee meetings, the Chairman of the audit committee receives $1,350 per meeting. In the event that there is an in-person joint committee meeting or a joint telephone meeting of the Dreyfus/Laurel Funds and Dreyfus High Yield Strategies Fund, the $2,000 or $1,500 fee, as applicable, will be allocated between the Dreyfus/Laurel Funds and Dreyfus High Yield Strategies Fund. These fees and expenses are charged and allocated to each series based on net assets. Amounts required to be paid by the Trust directly to the non-interested Trustees, that would be applied to offset a portion of the management fee payable to the Manager, are in fact paid directly by the Manager to the non-interested Trustees.
During the period ended December 31, 2006, the Distributor retained $6,162 from commissions earned on sales of the fund’s Class A shares and $251,123 and $4,839 from CDSC on redemptions of the fund’s Class B and Class C shares, respectively.
(b) Under separate Distribution Plans (the “Plans”) adopted pursuant to Rule 12b-1 under the Act, Class A shares pay annually up to .25% of the value of the average daily net assets to compensate the Distributor for shareholder servicing activities and expenses primarily intended to result in the sale of Class A shares. Class B and Class C shares pay the Distributor for distributing their shares at an aggregate annual rate of .50% and .75% of the value of the average daily net assets of Class B and Class C shares, respectively. Class B and Class C shares are also subject to a service plan adopted pursuant to Rule 12b-1 (the “Service Plan”), under which Class B and Class C shares pay the Distributor for providing certain services to the holders of their shares a fee at the annual rate of .25% of the value of the average daily net
assets of Class B and Class C shares. During the period ended December 31, 2006, Class A, Class B and Class C shares were charged $539,468, $399,796 and $522,169, respectively, pursuant to their respective Plans. During the period ended December 31, 2006, Class B and Class C shares were charged $199,898 and $174,056, respectively, pursuant to the Service Plan.
Under its terms, the Plans and Service Plan shall remain in effect from year to year, provided such continuance is approved annually by a vote of a majority of those Trustees who are not “interested persons” of the Trust and who have no direct or indirect financial interest in the operation of or in any agreement related to the Plans or Service Plan.
The components of Due to The Dreyfus Corporation and affiliates in the Statement of Assets and Liabilities consist of: management fees $211,833, Rule 12b-1 distribution plan fees $114,208 and service plan fees $28,545.
(c) The Trust and the Manager have received an exemptive order from the SEC which, among other things, permits the fund to use cash collateral received in connection with lending the fund’s securities and other uninvested cash to purchase shares of one or more registered money market mutual funds advised by the Manager in excess of the limitations imposed by the Act.
NOTE 4—Securities Transactions:
The aggregate amount of purchases and sales (including paydowns) of investment securities, excluding short-term securities, forward currency exchange contracts and swap transactions during the period ended December 31, 2006, amounted to $113,012,771 and $179,836,511, respectively.
The fund may invest in financial futures contracts in order to gain exposure to or protect against changes in the market. The fund is exposed to market risk as a result of changes in the value of the underlying financial instruments. Investments in financial futures require the fund to “mark to market” on a daily basis, which reflects the change in the market value of the contracts at the close of each day’s trading.
The Fund 41
NOTES TO FINANCIAL STATEMENTS (continued)
Accordingly, variation margin payments are received or made to reflect daily unrealized gains or losses.When the contracts are closed, the fund recognizes a realized gain or loss.These investments require initial margin deposits with a broker.The amount of these deposits is determined by the exchange or Board of Trade on which the contract is traded and is subject to change. At December 31, 2006, there were no financial futures contracts outstanding.
The fund enters into forward currency exchange contracts in order to hedge its exposure to changes in foreign currency exchange rates on its foreign portfolio holdings and to settle foreign currency transactions. When executing forward currency exchange contracts, the fund is obligated to buy or sell a foreign currency at a specified rate on a certain date in the future. With respect to sales of forward currency exchange contracts, the fund would incur a loss if the value of the contract increases between the date the forward contract is opened and the date the forward contract is closed.The fund realizes a gain if the value of the contract decreases between those dates.With respect to purchases of forward currency exchange contracts, the fund would incur a loss if the value of the contract decreases between the date the forward contract is opened and the date the forward contract is closed. The fund realizes a gain if the value of the contract increases between those dates. The fund is also exposed to credit risk associated with counterparty nonperformance on these forward currency exchange contracts which is typically limited to the unrealized gain on each open contract.The following summarizes open forward currency exchange contracts at December 31, 2006:
| | | Foreign | | | | |
| Forward Currency | | Currency | | | | Unrealized |
| Exchange Contracts | | Amounts | | Proceeds ($) Value ($) | | (Depreciation ($) |
| |
| |
| |
|
| Sales; | | | | | | |
| Euro, | | | | | | |
| expiring 3/21/2007 | | 7,740,000 | | 10,177,326 10,248,534 | | (71,208) |
The fund may enter into swap agreements to exchange the interest rate on, or return generated by, one nominal instrument for the return generated by another nominal instrument.
The fund accrues for the interim payments on swap contracts on a daily basis, with the net amount recorded within unrealized appreciation (depreciation) on swap contracts in the Statement of Assets and Liabilities. Once the interim payments are settled in cash, the net amount is recorded as realized gain (loss) on swaps, in addition to realized gain (loss) recorded upon the termination of swaps contracts in the Statement of Operations. Fluctuations in the value of swap contracts are recorded as a component of net change in unrealized appreciation (depreciation) on investments.
Credit default swaps involve commitments to pay a fixed interest rate in exchange for payment if a credit event affecting a third party (the referenced company) occurs. For those credit default swaps in which the fund is receiving a fixed rate, the fund is providing credit protection on the underlying instrument. The maximum payouts for these contracts are limited to the notional amount of each swap. Credit events may include a failure to pay interest or principal, bankruptcy, or restructuring. The following summarizes open credit default swaps entered into by the fund at December 31, 2006:
| | | | | | | | | | | Unrealized |
| Notional | | Reference | | | | (Pay) Receive | | Expiration | | Appreciation |
| Amount ($) | | Entity | | Counterparty | | Fixed Rate (%) | | Date | | (Depreciation)($) |
| |
| |
| |
| |
| |
|
| |
| 7,977,500 | | Dow Jones | | Lehman | | | | | | |
| | | CDX.NA.IG.4 Index | | Brothers | | (0.35) | | 6/20/2010 | | (77,696) |
| 5,022,500 | | Dow Jones | | | | | | | | |
| | | CDX.NA.IG.4 Index | | Merrill Lynch | | (0.31) | | 6/20/2010 | | (41,583) |
| 2,825,000 | | ITRAXX S5 Index | | UBS | | 0.40 | | 6/20/2011 | | 18,907 |
| 3,049,000 | | Kimberly Clark, | | JPMorgan | | | | | | |
| | | 6.875%, 2/15/2014 | | Chase | | (0.19) | | 12/20/2011 | | 55 |
| 800,000 | | Kimberly Clark, | | JPMorgan | | | | | | |
| | | 6.875%, 2/15/2014 | | Chase | | (0.37) | | 12/20/2016 | | 1,389 |
| 1,700,000 | | Kimberly Clark, | | JPMorgan | | | | | | |
| | | 6.875%, 2/15/2014 | | Chase | | (0.37) | | 12/20/2016 | | 2,951 |
| 2,500,000 | | Kimberly Clark, | | JPMorgan | | | | | | |
| | | 6.875%, 2/15/2014 | | Chase | | (0.37) | | 12/20/2016 | | 4,340 |
| 2,675,000 | | Owens-Brockway | | | | | | | | |
| | | Glass Container, | | JPMorgan | | | | | | |
| | | 8.875%, 2/15/2009 | | Chase | | (1.95) | | 6/20/2010 | | (42,820) |
| 2,675,000 | | Owens-Illinois, | | JPMorgan | | | | | | |
| | | 7.5%, 5/15/2010 | | Chase | | 2.60 | | 6/20/2010 | | 46,851 |
| 8,390,000 | | Structured Model | | | | | | | | |
| | | Portfolio 0-3% | | UBS | | — | | 9/20/2013 | | — |
The Fund 43
NOTES TO FINANCIAL STATEMENTS (continued)
| | | | | | | | | | | Unrealized |
| Notional | | Reference | | | | (Pay) Receive | | Expiration | | Appreciation |
| Amount ($) | | Entity | | Counterparty | | Fixed Rate (%) | | Date (Depreciation)($) |
| |
| |
| |
| |
|
| |
| 1,800,000 | | Telekom Finanze, | | | | | | | | |
| | | 5%, 7/22/2013 | | UBS | | (0.45) | | 9/20/2011 | | (12,224) |
| 1,800,000 | | Wolters Kluwer, | | | | | | | | |
| | | 5.125%, 1/27/2014 | | UBS | | (0.55) | | 9/20/2011 | | (15,866) |
| | | | | | | | | | | (115,696) |
Risks may arise upon entering into these agreements from the potential inability of the counterparties to meet the terms of the agreement and are generally limited to the amount of net payments to be received, if any, at the date of default.
At December 31, 2006, the cost of investments for federal income tax purposes was $388,288,344: accordingly, accumulated net unrealized appreciation on investments was $3,055,921, consisting of $11,569,459 gross unrealized appreciation and $8,513,538 gross unrealized depreciation.
REPORT OF INDEPENDENT REGISTERED PUBLIC ACCOUNTING FIRM
The Board of Trustees and Shareholders of The Dreyfus/Laurel Funds Trust:
We have audited the accompanying statement of assets and liabilities of Dreyfus Premier Limited Term High Yield Fund (the “Fund”) of The Dreyfus/Laurel Funds Trust, including the statement of investments, as of December 31, 2006, and the related statement of operations for the year then ended, the statements of changes in net assets for each of the years in the two-year period then ended, and the financial highlights for each of the years in the five-year period then ended. These financial statements and financial highlights are the responsibility of the Fund’s management. Our responsibility is to express an opinion on these financial statements and financial highlights based on our audits.
We conducted our audits in accordance with standards of the Public Company Accounting Oversight Board (United States).Those standards require that we plan and perform the audit to obtain reasonable assurance about whether the financial statements and financial highlights are free of material misstatement.An audit also includes examining, on a test basis, evidence supporting the amounts and disclosures in the financial statements. Our procedures included confirmation of securities owned as of December 31, 2006, by correspondence with the custodian and brokers or by other appropriate auditing procedures where replies from brokers were not received.An audit also includes assessing the accounting principles used and significant estimates made by management, as well as evaluating the overall financial statement presentation.We believe that our audits provide a reasonable basis for our opinion.
In our opinion, the financial statements and financial highlights referred to above present fairly, in all material respects, the financial position of Dreyfus Premier Limited Term High Yield Fund of The Dreyfus/Laurel Funds Trust as of December 31, 2006 and the results of its operations for the year then ended, the changes in its net assets for each of the years in the two-year period then ended, and the financial highlights for each of the years in the five-year period then ended, in conformity with U.S. generally accepted accounting principles.

| New York, New York |
| February 16, 2007 |
The Fund 45
IMPORTANT TAX INFORMATION (Unaudited)
In accordance with federal tax law, the fund hereby designates 2.09% of the ordinary dividends paid during the fiscal year ended December 31, 2006 as qualifying for the corporate dividends received deduction. For the fiscal year ended December 31, 2006, certain dividends paid by the fund may be subject to a maximum tax rate of 15%, as provided for by the Jobs and Growth Tax Relief Reconciliation Act of 2003. Of the distributions paid during the fiscal year, $577,971 represents the maximum amount that may be considered qualified dividend income. Shareholders will receive notification in January 2007 of the percentage applicable to the preparation of their 2005 income tax returns.Also, the fund hereby designates 91.28% of ordinary income dividends paid during the fiscal year ended December 31, 2006 as qualifying interest related dividends.

NOTES
Telephone Call your financial representative or 1-800-554-4611
| Mail | | The Dreyfus Premier Family of Funds |
| | | 144 Glenn Curtiss Boulevard, Uniondale, NY 11556-0144 |
The fund files its complete schedule of portfolio holdings with the Securities and Exchange Commission (“SEC”) for the first and third quarters of each fiscal year on Form N-Q. The fund’s Forms N-Q are available on the SEC’s website at http://www.sec.gov and may be reviewed and copied at the SEC’s Public Reference Room in Washington, DC. Information on the operation of the Public Reference Room may be obtained by calling 1-202-551-8090.
A description of the policies and procedures that the fund uses to determine how to vote proxies relating to portfolio securities, and information regarding how the fund voted these proxies for the 12-month period ended June 30, 2006, is available at http://www.dreyfus.com and on the SEC’s website at http://www.sec.gov. The description of the policies and procedures is also available without charge, upon request, by calling 1-800-645-6561.
Save time. Save paper. View your next shareholder report online as soon as it’s available. Log into www.dreyfus.com and sign up for Dreyfus eCommunications. It’s simple and only takes a few minutes.
The views expressed in this report reflect those of the portfolio manager only through the end of the period covered and do not necessarily represent the views of Dreyfus or any other person in the Dreyfus organization. Any such views are subject to change at any time based upon market or other conditions and Dreyfus disclaims any responsibility to update such views.These views may not be relied on as investment advice and, because investment decisions for a Dreyfus fund are based on numerous factors, may not be relied on as an indication of trading intent on behalf of any Dreyfus fund.
Not FDIC-Insured • Not Bank-Guaranteed • May Lose Value
| Contents |
| |
| | | THE FUND |
| |
|
| 2 | | A Letter from the CEO |
| 3 | | Discussion of Fund Performance |
| 6 | | Fund Performance |
| 8 | | Understanding Your Fund’s Expenses |
| 8 | | Comparing Your Fund’s Expenses |
| With Those of Other Funds |
| 9 | | Statement of Investments |
| 30 | | Statement of Financial Futures |
| 30 | | Statement of Options Written |
| 31 | | Statement of Assets and Liabilities |
| 32 | | Statement of Operations |
| 33 | | Statement of Changes in Net Assets |
| 35 | | Financial Highlights |
| 39 | | Notes to Financial Statements |
| 56 | | Report of Independent Registered |
| | | Public Accounting Firm |
| 57 | | Important Tax Information |
| 58 | | Board Members Information |
| 60 | | Officers of the Fund |
| |
| FOR MORE INFORMATION |
|
| | | Back Cover |


A LETTER FROM THE CEO
Dear Shareholder:
We are pleased to present this annual report for Dreyfus Premier Managed Income Fund, covering the 12-month period from January 1, 2006, through December 31, 2006.
2006 proved to be a year of low volatility in the U.S. bond market.Yields of 10-year Treasury securities remained within a relatively narrow range of just 75 basis points, making 2006 the third least volatile bond market since 1970.Yet, a number of developments during the year might have suggested otherwise, including mounting economic uncertainty, volatile energy prices, softening real estate markets, a change in U.S. monetary policy and ongoing geopolitical turmoil.
Why did fixed-income investors appear to shrug off some of the year’s more negative influences? In our analysis, investors disregarded near-term concerns in favor of a longer view, looking to broader trends that showed moderately slower economic growth, subdued inflation, stabilizing short-term interest rates, a flat “yield curve” and persistently strong credit fundamentals. Indeed, 2006 confirmed that reacting to near-term influences with extreme shifts in investment strategy rarely is the right decision.We believe that a better course is to set a portfolio mix to meet long-term goals, while attempting to ignore short term market fluctuations.
For information about how the fund performed during the reporting period, as well as market perspectives, we have provided a Discussion of Fund Performance given by the fund’s portfolio manager.
Thank you for your continued confidence and support.We wish you good health and prosperity in 2007.

| Thomas F. Eggers |
| Chief Executive Officer |
| The Dreyfus Corporation |
| January 16, 2007 |

DISCUSSION OF FUND PERFORMANCE
Kent Wosepka, Portfolio Manager
How did Dreyfus Premier Managed Income Fund perform relative to its benchmark?
For the 12-month period ended December 31, 2006, Dreyfus Premier Managed Income Fund produced total returns of 4.67% for Class A shares, 3.90% for Class B shares, 3.89% for Class C shares and 4.93% for Class R shares.1 In comparison, the Lehman Brothers U.S. Aggregate Index (the “Index”), the fund’s benchmark, produced a total return of 4.33% for the same period. 2
After producing relatively lackluster returns over the first half of the year, the bond market rallied over the second half as short-term interest rates stabilized and economic growth slowed.The fund’s Class A and R shares produced higher returns than its benchmark, which we attribute primarily to the performance of the fund’s high yield corporate bond, investment-grade corporate bond and asset-backed securities holdings. However, the fund is also subject to fees and expenses to which the Index is not subject.
What is the fund’s investment approach?
The fund seeks high current income consistent with what is believed to be prudent risk of capital.The fund invests at least 65% of its total assets in various types of U.S. government and corporate debt obligations rated investment grade (or their unrated equivalent as determined by Dreyfus).The fund also normally invests at least 65% of its total assets in debt obligations having effective maturities of 10 years or less.We do not attempt to match the sector percentages of any index, nor do we attempt to predict the direction of interest rates by substantially altering the fund’s sensitivity to changes in rates. Instead, the heart of our investment process is selecting individual securities that possess a combination of superior fundamentals and attractive relative valuations.
The Fund 3
DISCUSSION OF FUND PERFORMANCE (continued)
What other factors influenced the fund’s performance?
Bond prices declined modestly over the first six months of 2006 due to intensifying inflation concerns in a generally robust economic environment. However, investor sentiment improved markedly over the second half of the year, as U.S. economic growth moderated amid cooling housing markets and more modest employment gains. As a result, following four increases in short-term interest rates over the first half of the year, the Federal Reserve Board (the “Fed”) held the overnight federal funds rate steady at 5.25% at each of four meetings between August and December, its first pauses in more than two years. Investors first anticipated and then reacted favorably to the Fed’s shift in policy, and the longer end of the bond market rallied.
Despite the economic slowdown, business fundamentals remained healthy in most industries, generally supporting prices of corporate bonds across the credit-rating spectrum. In the U.S. government securities market, low levels of volatility helped mortgage-backed securities, asset-backed securities and other high quality, “yield advantaged” instruments outperform U.S.Treasury securities.
In this environment, the fund’s positions in high yield bonds helped it participate in the rally among lower-rated credits.At the same time, we attempted to manage the risks of lower-rated securities by focusing on bonds with relatively short maturities, which we regarded as less likely to be affected by unexpected adverse developments.We also established shorter-maturity positions in the investment-grade corporate bond market, where we avoided issuers that we believed might be vulnerable to activities that tend to be unfriendly to bondholders, such as leveraged buyouts. Instead, we favored regulated industries where such activities are less common.
The fund’s holdings of asset-backed securities provided higher yields than U.S.Treasury securities, contributing positively to returns. However, we maintained an underweight position in mortgage-backed securities, a strategy that detracted modestly from the fund’s relative performance in the low volatility investment environment. In addition, tactical positions
in Treasury Inflation Protected Securities underperformed the averages when energy prices remained low during the fall, helping to keep a lid on inflation expectations.
The fund also benefited to a degree from our duration management strategy. A modestly short average duration over the first half of 2006 helped protect the fund from the potentially adverse effects of rising interest rates, while a shift in mid-year to a slightly long position helped boost its participation in the market rally during the second half. Despite narrowing yield differences along the market’s maturity spectrum, the fund’s “bulleted” yield curve strategy had relatively little impact on performance. Finally, the fund’s derivative investments generally fared well, including tactical positions in credit default swaps designed to provide protection from declines in specific markets or issuers.
What is the fund’s current strategy?
Although high yield and investment-grade corporate bonds have reached richer valuations overall, we have continued to uncover what we believe to be compelling opportunities among individual issuers. With the Fed appearing to remain on hold for the foreseeable future, we have maintained the fund’s average duration in a range that is slightly longer than industry averages. Finally, we recently increased the fund’s positions in bonds from the emerging markets, including securities from Brazil and Poland, that we believe may benefit as local inflation rates fall and currency exchange rates improve.
January 16, 2007
| 1 | | Total return includes reinvestment of dividends and any capital gains paid, and does not take into |
| | | consideration the maximum initial sales charge in the case of Class A shares, or the applicable |
| | | contingent deferred sales charges imposed on redemptions in the case of Class B and Class C |
| | | shares. Had these charges been reflected, returns would have been lower. Past performance is no |
| | | guarantee of future results. Share price, yield and investment return fluctuate such that upon |
| | | redemption, fund shares may be worth more or less than their original cost. |
| 2 | | SOURCE: LIPPER INC. — Reflects reinvestment of dividends and, where applicable, capital |
| | | gain distributions.The Lehman Brothers U.S. Aggregate Index is a widely accepted, unmanaged |
| | | total return index of corporate, U.S. government and U.S. government agency debt instruments, |
| | | mortgage-backed securities and asset-backed securities with an average maturity of 1-10 years. |
The Fund 5
FUND PERFORMANCE
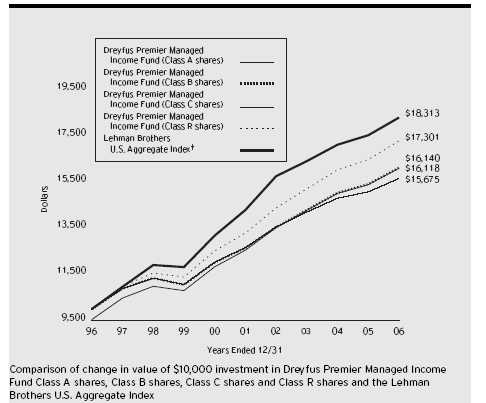
| † Source: Lipper Inc. |
| Past performance is not predictive of future performance. |
| The above graph compares a $10,000 investment made in Class A, Class B, Class C and Class R shares of Dreyfus |
| Premier Managed Income Fund on 12/31/96 to a $10,000 investment made in the Lehman Brothers U.S. Aggregate |
| Index (the “Index”) on that date. All dividends and capital gain distributions are reinvested. |
| The fund’s performance shown in the line graph takes into account the maximum initial sales charge on Class A shares |
| and all other applicable fees and expenses on all classes.The Index is a widely accepted, unmanaged index of corporate, |
| U.S. government and U.S. government agency debt instruments, mortgage-backed securities, and asset-backed securities. |
| The Index does not take into account charges, fees and other expenses. Further information relating to fund performance, |
| including expense reimbursements, if applicable, is contained in the Financial Highlights section of the prospectus and |
| elsewhere in this report. |
| Average Annual Total Returns | | as of 12/31/06 | | | | | | |
| | | | | 1 Year | | 5 Years | | 10 Years |
| |
| |
| |
| |
|
| Class A shares | | | | | | | | |
| with maximum sales charge (4.5%) | | | | (0.03)% | | 4.16% | | 4.89% |
| without sales charge | | | | 4.67% | | 5.13% | | 5.38% |
| Class B shares | | | | | | | | |
| with applicable redemption charge † | | | | (0.10)% | | 4.01% | | 4.90% |
| without redemption | | | | 3.90% | | 4.35% | | 4.90% |
| Class C shares | | | | | | | | |
| with applicable redemption charge †† | | | | 2.89% | | 4.34% | | 4.60% |
| without redemption | | | | 3.89% | | 4.34% | | 4.60% |
| Class R shares | | | | 4.93% | | 5.40% | | 5.64% |
Past performance is not predictive of future performance.The fund’s performance shown in the graph and table does not reflect the deduction of taxes that a shareholder would pay on fund distributions or the redemption of fund shares. Performance for Class B shares assumes the conversion of Class B shares to Class A shares at the end of the sixth year following the date of purchase.
† The maximum contingent deferred sales charge for Class B shares is 4%. After six years Class B shares convert to Class A shares.
The maximum contingent deferred sales charge for Class C shares is 1% for shares redeemed within one year of the date of purchase.
The Fund 7
UNDERSTANDING YOUR FUND’S EXPENSES (Unaudited)
As a mutual fund investor, you pay ongoing expenses, such as management fees and other expenses. Using the information below, you can estimate how these expenses affect your investment and compare them with the expenses of other funds.You also may pay one-time transaction expenses, including sales charges (loads) and redemption fees, which are not shown in this section and would have resulted in higher total expenses. For more information, see your fund’s prospectus or talk to your financial adviser.
Review your fund’s expenses
The table below shows the expenses you would have paid on a $1,000 investment in Dreyfus Premier Managed Income Fund from July 1, 2006 to December 31, 2006. It also shows how much a $1,000 investment would be worth at the close of the period, assuming actual returns and expenses.
| Expenses and Value of a $1,000 Investment | | | | | | |
| assuming actual returns for the six months ended December 31, 2006 | | | | |
| | | Class A | | Class B | | Class C | | Class R |
| |
| |
| |
| |
|
| Expenses paid per $1,000 † | | $ 4.91 | | $ 8.78 | | $ 8.78 | | $ 3.62 |
| Ending value (after expenses) | | $1,052.40 | | $1,048.60 | | $1,048.50 | | $1,053.80 |
COMPARING YOUR FUND’S EXPENSES WITH THOSE OF OTHER FUNDS (Unaudited)
Using the SEC’s method to compare expenses
The Securities and Exchange Commission (SEC) has established guidelines to help investors assess fund expenses. Per these guidelines, the table below shows your fund’s expenses based on a $1,000 investment, assuming a hypothetical 5% annualized return. You can use this information to compare the ongoing expenses (but not transaction expenses or total cost) of investing in the fund with those of other funds.All mutual fund shareholder reports will provide this information to help you make this comparison. Please note that you cannot use this information to estimate your actual ending account balance and expenses paid during the period.
Expenses and Value of a $1,000 Investment assuming a hypothetical 5% annualized return for the six months ended December 31, 2006
| | | Class A | | Class B | | Class C | | Class R |
| |
| |
| |
| |
|
| Expenses paid per $1,000 † | | $ 4.84 | | $ 8.64 | | $ 8.64 | | $ 3.57 |
| Ending value (after expenses) | | $1,020.42 | | $1,016.64 | | $1,016.64 | | $1,021.68 |
† Expenses are equal to the fund’s annualized expense ratio of .95% for Class A, 1.70% for Class B, 1.70% for Class C and .70% for Class R; multiplied by the average account value over the period, multiplied by 184/365 (to reflect the one-half year period).
| STATEMENT OF INVESTMENTS |
| December 31, 2006 |
| | | Coupon | | Maturity | | Principal | | |
| Bonds and Notes—128.7% | | Rate (%) | | Date | | Amount ($) | | Value ($) |
| |
| |
| |
| |
|
| Advertising—.1% | | | | | | | | |
| Lamar Media, | | | | | | | | |
| Gtd. Notes | | 7.25 | | 1/1/13 | | 30,000 | | 30,713 |
| Aerospace & Defense—.1% | | | | | | | | |
| L-3 Communications, | | | | | | | | |
| Bonds | | 3.00 | | 8/1/35 | | 45,000 a | | 47,475 |
| Agricultural—.2% | | | | | | | | |
| Philip Morris, | | | | | | | | |
| Debs. | | 7.75 | | 1/15/27 | | 105,000 | | 127,705 |
| Asset-Backed Ctfs./ | | | | | | | | |
| Auto Receivables—1.5% | | | | | | | | |
| BMW Vehicle Owner Trust, | | | | | | | | |
| Ser. 2004-A, Cl. A4 | | 3.32 | | 2/25/09 | | 145,000 | | 143,695 |
| Ford Credit Auto Owner Trust, | | | | | | | | |
| Ser. 2004-A, Cl. C | | 4.19 | | 7/15/09 | | 50,000 | | 49,545 |
| Ford Credit Auto Owner Trust, | | | | | | | | |
| Ser. 2005-B, Cl. B | | 4.64 | | 4/15/10 | | 125,000 | | 124,035 |
| Hyundai Auto Receivables Trust, | | | | | | | | |
| Ser. 2006-A, Cl. A2 | | 5.13 | | 2/16/09 | | 82,563 | | 82,564 |
| Hyundai Auto Receivables Trust, | | | | | | | | |
| Ser. 2006-B, Cl. C | | 5.25 | | 5/15/13 | | 50,000 | | 50,037 |
| WFS Financial Owner Trust, | | | | | | | | |
| Ser. 2004-4, Cl. B | | 3.13 | | 5/17/12 | | 87,005 | | 85,293 |
| WFS Financial Owner Trust, | | | | | | | | |
| Ser. 2004-3, Cl. B | | 3.51 | | 2/17/12 | | 80,744 | | 79,595 |
| WFS Financial Owner Trust, | | | | | | | | |
| Ser. 2005-2, Cl. B | | 4.57 | | 11/19/12 | | 170,000 | | 168,320 |
| Whole Auto Loan Trust, | | | | | | | | |
| Ser. 2004-1, Cl. D | | 5.60 | | 3/15/11 | | 8,304 a | | 8,295 |
| | | | | | | | | 791,379 |
| Asset-Backed Ctfs./Credit Cards—.4% | | | | | | |
| Capital One Multi-Asset Execution | | | | | | |
| Trust, Ser. 2004-C1, Cl. C1 | | 3.40 | | 11/16/09 | | 230,000 | | 229,948 |
| Asset-Backed Ctfs./ | | | | | | | | |
| Home Equity Loans—7.1% | | | | | | | | |
| Asset-Backed Funding Ctfs., | | | | | | | | |
| Ser. 2005-WMC1, Cl. M2 | | 5.80 | | 6/25/35 | | 255,000 b | | 256,020 |
| Citicorp Residential Mortgage | | | | | | | | |
| Securities, Ser. 2006-1, Cl. A1 | | 5.96 | | 7/25/36 | | 175,345 b | | 175,409 |
The Fund 9
STATEMENT OF INVESTMENTS (continued)
| | | Coupon | | Maturity | | Principal | | |
| Bonds and Notes (continued) | | Rate (%) | | Date | | Amount ($) | | Value ($) |
| |
| |
| |
| |
|
| Asset-Backed Ctfs./ | | | | | | | | |
| Home Equity Loans (continued) | | | | | | | | |
| Citigroup Mortgage Loan Trust, | | | | | | | | |
| Ser. 2005-WF1, Cl. A5 | | 5.01 | | 2/25/35 | | 140,000 b | | 135,474 |
| Countrywide Asset-Backed | | | | | | | | |
| Certificates, Ser. 2006-1, Cl. AF1 | | 5.48 | | 7/25/36 | | 119,750 b | | 119,834 |
| Countrywide Asset-Backed | | | | | | | | |
| Certificates, Ser. 2004-3, Cl. M3 | | 6.22 | | 5/25/34 | | 125,000 b | | 125,775 |
| Credit-Based Asset Servicing and | | | | | | | | |
| Securitization, Ser. 2005-CB4, | | | | | | | | |
| Cl. AV1 | | 5.45 | | 8/25/35 | | 26,345 b | | 26,361 |
| Credit-Based Asset Servicing and | | | | | | | | |
| Securitization, Ser. 2006-CB1, | | | | | | | | |
| Cl. AF1 | | 5.46 | | 1/25/36 | | 112,851 b | | 112,377 |
| Credit-Based Asset Servicing and | | | | | | | | |
| Securitization, Ser. 2005-CB8, | | | | | | | | |
| Cl. AF5 | | 5.65 | | 12/25/35 | | 235,000 b | | 233,811 |
| Credit-Based Asset Servicing and | | | | | | | | |
| Securitization, Ser. 2006-CB2, | | | | | | | | |
| Cl. AF1 | | 5.72 | | 12/25/36 | | 57,249 b | | 57,074 |
| Home Equity Asset Trust, | | | | | | | | |
| Ser. 2005-8, Cl. M4 | | 5.93 | | 2/25/36 | | 125,000 b | | 125,540 |
| Home Equity Mortgage Trust, | | | | | | | | |
| Ser. 2006-5, Cl. A1 | | 5.50 | | 1/25/37 | | 116,437 b | | 116,489 |
| Morgan Stanley ABS Capital I, | | | | | | | | |
| Ser. 2006-HE3, Cl. A2A | | 5.39 | | 4/25/36 | | 31,959 b | | 31,979 |
| Morgan Stanley ABS Capital I, | | | | | | | | |
| Ser. 2005-WMC6, Cl. A2A | | 5.46 | | 7/25/35 | | 38,550 b | | 38,580 |
| Morgan Stanley Home Equity Loans, | | | | | | |
| Ser. 2006-3, Cl. A1 | | 5.40 | | 4/25/36 | | 118,455 b | | 118,530 |
| Morgan Stanley Mortgage Loan | | | | | | | | |
| Trust, Ser. 2006-15XS, Cl. A6B | | 5.83 | | 11/25/36 | | 75,000 b | | 75,259 |
| Option One Mortgage Loan Trust, | | | | | | | | |
| Ser. 2005-4, Cl. M1 | | 5.79 | | 11/25/35 | | 255,000 b | | 255,415 |
| Ownit Mortgage Loan Asset Backed | | | | | | | | |
| Certificates, Ser. 2006-1, Cl. AF1 | | 5.42 | | 12/25/36 | | 184,632 b | | 183,766 |
| Popular ABS Mortgage Pass-Through | | | | | | |
| Trust, Ser. 2005-6, Cl. M1 | | 5.91 | | 1/25/36 | | 145,000 b | | 145,254 |
| Renaissance Home Equity Loan | | | | | | | | |
| Trust, Ser. 2006-4, Cl. AV1 | | 5.42 | | 1/25/37 | | 105,000 b | | 105,000 |
| Renaissance Home Equity Loan | | | | | | | | |
| Trust, Ser. 2006-1, Cl. AF2 | | 5.53 | | 5/25/36 | | 225,000 b | | 224,409 |
10
| | | Coupon | | Maturity | | Principal | | |
| Bonds and Notes (continued) | | Rate (%) | | Date | | Amount ($) | | Value ($) |
| |
| |
| |
| |
|
| Asset-Backed Ctfs./ | | | | | | | | |
| Home Equity Loans (continued) | | | | | | | | |
| Renaissance Home Equity Loan | | | | | | | | |
| Trust, Ser. 2006-3, Cl. AF2 | | 5.58 | | 11/25/36 | | 250,000 b | | 249,976 |
| Renaissance Home Equity Loan | | | | | | | | |
| Trust, Ser. 2006-3, Cl. AF1 | | 5.92 | | 11/25/36 | | 232,191 b | | 232,062 |
| Renaissance Home Equity Loan | | | | | | | | |
| Trust, Ser. 2006-2, Cl. AF1 | | 6.00 | | 8/25/36 | | 190,972 b | | 190,681 |
| Residential Asset Mortgage | | | | | | | | |
| Products, Ser. 2004-RS12, Cl. AI6 | | 4.55 | | 12/25/34 | | 145,000 | | 141,139 |
| Residential Asset Securities, | | | | | | | | |
| Ser. 2005-EMX3, Cl. M1 | | 5.78 | | 9/25/35 | | 145,000 b | | 145,748 |
| Residential Asset Securities, | | | | | | | | |
| Ser. 2005-EMX3, Cl. M2 | | 5.80 | | 9/25/35 | | 160,000 b | | 160,708 |
| Residential Asset Securities, | | | | | | | | |
| Ser. 2001-KS3, Cl. MII1 | | 6.18 | | 9/25/31 | | 81,387 b | | 81,455 |
| | | | | | | | | 3,864,125 |
| Asset-Backed Ctfs./ | | | | | | | | |
| Manufactured Housing—.6% | | | | | | | | |
| Green Tree Financial, | | | | | | | | |
| Ser. 1994-7, Cl. M1 | | 9.25 | | 3/15/20 | | 68,221 | | 70,634 |
| Origen Manufactured Housing, | | | | | | | | |
| Ser. 2004-B, Cl. A2 | | 3.79 | | 12/15/17 | | 58,617 | | 57,447 |
| Origen Manufactured Housing, | | | | | | | | |
| Ser. 2005-B, Cl. A2 | | 5.25 | | 12/15/18 | | 115,000 | | 114,441 |
| Vanderbilt Mortgage Finance, | | | | | | | | |
| Ser. 1999-A, Cl. 1A6 | | 6.75 | | 3/7/29 | | 80,000 | | 82,923 |
| | | | | | | | | 325,445 |
| Automobile Manufacturers—1.0% | | | | | | | | |
| DaimlerChrysler N.A. Holding, | | | | | | | | |
| Notes | | 4.88 | | 6/15/10 | | 65,000 | | 63,412 |
| DaimlerChrysler N.A. Holding, | | | | | | | | |
| Gtd. Notes | | 5.79 | | 3/13/09 | | 135,000 b | | 135,212 |
| DaimlerChrysler N.A. Holding, | | | | | | | | |
| Gtd. Notes, Ser. E | | 5.90 | | 10/31/08 | | 250,000 b | | 251,097 |
| General Motors, | | | | | | | | |
| Debs. | | 7.75 | | 3/15/36 | | 180,000 c | | 66,600 |
| | | | | | | | | 516,321 |
| Automotive, Trucks & Parts—.1% | | | | | | | | |
| Goodyear Tire & Rubber, | | | | | | | | |
| Sr. Notes | | 9.14 | | 12/1/09 | | 30,000 a,b | | 30,263 |
The Fund 11
STATEMENT OF INVESTMENTS (continued)
| | | Coupon | | Maturity | | Principal | | |
| Bonds and Notes (continued) | | Rate (%) | | Date | | Amount ($) | | Value ($) |
| |
| |
| |
| |
|
| Banks—7.4% | | | | | | | | |
| Capital One Financial, | | | | | | | | |
| Sr. Notes | | 5.63 | | 9/10/09 | | 200,000 b | | 201,053 |
| Chevy Chase Bank, | | | | | | | | |
| Sub. Notes | | 6.88 | | 12/1/13 | | 145,000 | | 145,725 |
| Chuo Mitsui Trust & Banking, | | | | | | | | |
| Sub. Notes | | 5.51 | | 12/29/49 | | 200,000 a,b | | 191,339 |
| Colonial Bank N.A./Montgomery, AL, | | | | | | |
| Sub. Notes | | 6.38 | | 12/1/15 | | 250,000 | | 256,948 |
| Glitnir Banki, | | | | | | | | |
| Unscd. Bonds | | 7.45 | | 9/14/49 | | 250,000 a,b | | 263,917 |
| Greater Bay Bancorp, | | | | | | | | |
| Sr. Notes, Ser. B | | 5.25 | | 3/31/08 | | 100,000 | | 99,738 |
| Industrial Bank of Korea, | | | | | | | | |
| Sub. Notes | | 4.00 | | 5/19/14 | | 235,000 a,b | | 227,784 |
| Islandsbanki, | | | | | | | | |
| Notes | | 5.53 | | 10/15/08 | | 65,000 a,b | | 64,895 |
| Landsbanki Islands, | | | | | | | | |
| Sr. Notes | | 6.07 | | 8/25/09 | | 250,000 a,b | | 252,035 |
| National Westminster Bank/United | | | | | | | | |
| Kingdom, Sub. Notes | | 7.38 | | 10/1/09 | | 320,000 | | 337,192 |
| NB Capital Trust IV, | | | | | | | | |
| Gtd. Cap. Secs. | | 8.25 | | 4/15/27 | | 180,000 | | 187,887 |
| Popular North America, | | | | | | | | |
| Notes | | 5.71 | | 12/12/07 | | 125,000 b | | 125,300 |
| Sovereign Bancorp, | | | | | | | | |
| Sr. Notes | | 5.65 | | 3/1/09 | | 195,000 a,b | | 195,589 |
| SunTrust Preferred Capital I, | | | | | | | | |
| Bank Gtd. Notes | | 5.85 | | 12/31/49 | | 35,000 b | | 35,305 |
| USB Capital IX, | | | | | | | | |
| Gtd. Notes | | 6.19 | | 4/15/49 | | 500,000 b,d | | 511,119 |
| Washington Mutual, | | | | | | | | |
| Sub. Notes | | 4.63 | | 4/1/14 | | 265,000 d | | 248,454 |
| Washington Mutual, | | | | | | | | |
| Notes | | 5.67 | | 1/15/10 | | 145,000 b | | 145,759 |
| Western Financial Bank, | | | | | | | | |
| Sub. Debs. | | 9.63 | | 5/15/12 | | 165,000 | | 180,370 |
| Zions Bancorporation, | | | | | | | | |
| Sr. Unscd. Notes | | 5.49 | | 4/15/08 | | 105,000 b | | 105,106 |
| | | Coupon | | Maturity | | Principal | | |
| Bonds and Notes (continued) | | Rate (%) | | Date | | Amount ($) | | Value ($) |
| |
| |
| |
| |
|
| Banks (continued) | | | | | | | | |
| Zions Bancorporation, | | | | | | | | |
| Sub. Notes | | 6.00 | | 9/15/15 | | 240,000 | | 244,809 |
| | | | | | | | | 4,020,324 |
| Building & Construction—1.0% | | | | | | | | |
| American Standard, | | | | | | | | |
| Gtd. Notes | | 7.38 | | 2/1/08 | | 145,000 | | 147,447 |
| Centex, | | | | | | | | |
| Notes | | 4.75 | | 1/15/08 | | 65,000 | | 64,398 |
| D.R. Horton, | | | | | | | | |
| Gtd. Notes | | 5.88 | | 7/1/13 | | 120,000 | | 118,127 |
| D.R. Horton, | | | | | | | | |
| Unsub. Notes | | 6.00 | | 4/15/11 | | 30,000 d | | 30,159 |
| D.R. Horton, | | | | | | | | |
| Gtd. Notes | | 8.00 | | 2/1/09 | | 95,000 | | 99,524 |
| Owens Corning, | | | | | | | | |
| Sr. Unscd. Notes | | 6.50 | | 12/1/16 | | 85,000 a | | 86,503 |
| | | | | | | | | 546,158 |
| Chemicals—.6% | | | | | | | | |
| Equistar Chemicals/Funding, | | | | | | | | |
| Gtd. Notes | | 10.13 | | 9/1/08 | | 50,000 | | 53,375 |
| ICI Wilmington, | | | | | | | | |
| Gtd. Notes | | 4.38 | | 12/1/08 | | 60,000 | | 58,897 |
| Lubrizol, | | | | | | | | |
| Debs. | | 6.50 | | 10/1/34 | | 70,000 | | 70,667 |
| RPM International, | | | | | | | | |
| Sr. Notes | | 4.45 | | 10/15/09 | | 125,000 | | 120,783 |
| | | | | | | | | 303,722 |
| Commercial & | | | | | | | | |
| Professional Services—.8% | | | | | | | | |
| Aramark Services, | | | | | | | | |
| Gtd. Notes | | 7.00 | | 5/1/07 | | 250,000 | | 250,710 |
| ERAC USA Finance, | | | | | | | | |
| Notes | | 5.63 | | 4/30/09 | | 70,000 a,b | | 70,181 |
| ERAC USA Finance, | | | | | | | | |
| Notes | | 7.95 | | 12/15/09 | | 100,000 a | | 106,684 |
| | | | | | | | | 427,575 |
The Fund 13
STATEMENT OF INVESTMENTS (continued)
| | | Coupon | | Maturity | | Principal | | |
| Bonds and Notes (continued) | | Rate (%) | | Date | | Amount ($) | | Value ($) |
| |
| |
| |
| |
|
| Commercial Mortgage | | | | | | | | |
| Pass-Through Ctfs.—5.2% | | | | | | | | |
| Bayview Commercial Asset Trust, | | | | | | | | |
| Ser. 2006-SP2, Cl. A | | 5.63 | | 1/25/37 | | 208,171 a,b | | 208,171 |
| Bayview Commercial Asset Trust, | | | | | | | | |
| Ser. 2005-3A, Cl. A2 | | 5.75 | | 11/25/35 | | 168,046 a,b | | 168,046 |
| Bayview Commercial Asset Trust, | | | | | | | | |
| Ser. 2005-4A, Cl. M5 | | 6.00 | | 1/25/36 | | 92,824 a,b | | 92,824 |
| Bayview Commercial Asset Trust, | | | | | | | | |
| Ser. 2005-3A, Cl. B1 | | 6.45 | | 11/25/35 | | 88,445 a,b | | 88,659 |
| Bayview Commercial Asset Trust, | | | | | | | | |
| Ser. 2005-3A, Cl. B3 | | 8.35 | | 11/25/35 | | 88,445 a,b | | 89,845 |
| Bear Stearns Commercial Mortgage | | | | | | | | |
| Securities, Ser. 2003-T12, Cl. A3 | | 4.24 | | 8/13/39 | | 295,000 | | 285,631 |
| Bear Stearns Commercial Mortgage | | | | | | | | |
| Securities, Ser. 2005-T18, Cl. A2 | | 4.56 | | 2/13/42 | | 125,000 b | | 122,803 |
| Bear Stearns Commercial Mortgage | | | | | | | | |
| Securities, Ser. 2004-PWR5, Cl. A3 | | 4.57 | | 7/11/42 | | 120,000 | | 116,798 |
| Calwest Industrial Trust, | | | | | | | | |
| Ser. 2002-CALW, Cl. A | | 6.13 | | 2/15/17 | | 130,000 a | | 135,131 |
| Chase Commercial Mortgage | | | | | | | | |
| Securities, Ser. 1997-2, Cl. C | | 6.60 | | 12/19/29 | | 40,000 | | 40,279 |
| Credit Suisse/Morgan Stanley | | | | | | | | |
| Commercial Mortgage Certificates, | | | | | | | | |
| Ser. 2006-HC1A, Cl. A1 | | 5.54 | | 5/15/23 | | 20,000 a,b | | 20,019 |
| Crown Castle Towers, | | | | | | | | |
| Ser. 2005-1A, Cl. D | | 5.61 | | 6/15/35 | | 115,000 a | | 114,469 |
| Crown Castle Towers, | | | | | | | | |
| Ser. 2006-1A, Cl. D | | 5.77 | | 11/15/36 | | 75,000 a | | 74,953 |
| DLJ Commercial Mortgage, | | | | | | | | |
| Ser. 1998-CF2, Cl. A1B | | 6.24 | | 11/12/31 | | 118,982 | | 120,355 |
| Global Signal Trust, | | | | | | | | |
| Ser. 2006-1, Cl. D | | 6.05 | | 2/15/36 | | 160,000 a | | 161,560 |
| Global Signal Trust, | | | | | | | | |
| Ser. 2006-1, Cl. E | | 6.50 | | 2/15/36 | | 35,000 a | | 35,500 |
| J.P. Morgan Commercial Mortgage | | | | | | | | |
| Finance, Ser. 1997-C5, Cl. B | | 7.16 | | 9/15/29 | | 52,174 | | 52,189 |
| Mach One Trust Commercial | | | | | | | | |
| Mortgage-Backed, | | | | | | | | |
| Ser. 2004-1A, Cl. A1 | | 3.89 | | 5/28/40 | | 111,849 a | | 110,385 |
| | | Coupon | | Maturity | | Principal | | |
| Bonds and Notes (continued) | | Rate (%) | | Date | | Amount ($) | | Value ($) |
| |
| |
| |
| |
|
| Commercial Mortgage | | | | | | | | |
| Pass-Through Ctfs. (continued) | | | | | | | | |
| Morgan Stanley Capital I, | | | | | | | | |
| Ser. 1999-RM1, Cl. A2 | | 6.71 | | 12/15/31 | | 141,128 | | 143,830 |
| Morgan Stanley Capital I, | | | | | | | | |
| Ser. 1999-CAM1, Cl. A4 | | 7.02 | | 3/15/32 | | 50,114 | | 51,346 |
| Morgan Stanley Dean Witter Capital | | | | | | | | |
| I, Ser. 2001-PPM, Cl. A3 | | 6.54 | | 2/15/31 | | 125,236 | | 128,095 |
| SBA CMBS Trust, | | | | | | | | |
| Ser. 2006-1A, Cl. D | | 5.85 | | 11/15/36 | | 70,000 a | | 70,135 |
| Washington Mutual Asset | | | | | | | | |
| Securities, Ser. 2003-C1A, Cl. A | | 3.83 | | 1/25/35 | | 398,450 a | | 384,939 |
| | | | | | | | | 2,815,962 |
| Consumer Products—.0% | | | | | | | | |
| Scotts Miracle-Gro, | | | | | | | | |
| Sr. Sub. Notes | | 6.63 | | 11/15/13 | | 20,000 | | 21,050 |
| Diversified Financial Services—10.9% | | | | | | |
| American Express, | | | | | | | | |
| Sub. Debs. | | 6.80 | | 9/1/66 | | 75,000 b | | 80,118 |
| Ameriprise Financial, | | | | | | | | |
| Jr. Sub. Notes | | 7.52 | | 6/1/66 | | 235,000 b | | 258,511 |
| Amvescap, | | | | | | | | |
| Gtd. Notes | | 5.38 | | 2/27/13 | | 135,000 | | 133,774 |
| Amvescap, | | | | | | | | |
| Notes | | 5.38 | | 12/15/14 | | 185,000 | | 181,955 |
| Amvescap, | | | | | | | | |
| Sr. Notes | | 5.90 | | 1/15/07 | | 225,000 | | 225,023 |
| CIT Group, | | | | | | | | |
| Sr. Notes | | 5.52 | | 8/15/08 | | 185,000 b | | 185,467 |
| Countrywide Financial, | | | | | | | | |
| Gtd. Notes | | 5.50 | | 1/5/09 | | 260,000 b | | 260,087 |
| FCE Bank, | | | | | | | | |
| Notes EUR | | 4.72 | | 9/30/09 | | 100,000 b,e | | 129,133 |
| Ford Motor Credit, | | | | | | | | |
| Notes | | 6.19 | | 9/28/07 | | 130,000 b | | 129,852 |
| Ford Motor Credit, | | | | | | | | |
| Sr. Unsub. Notes | | 7.20 | | 6/15/07 | | 121,000 | | 121,109 |
| Fuji JGB Investment, | | | | | | | | |
| Bonds | | 9.87 | | 12/29/49 | | 100,000 a,b | | 106,008 |
The Fund 15
STATEMENT OF INVESTMENTS (continued)
| | | Coupon | | Maturity | | Principal | | |
| Bonds and Notes (continued) | | Rate (%) | | Date | | Amount ($) | | Value ($) |
| |
| |
| |
| |
|
| Diversified Financial | | | | | | | | |
| Services (continued) | | | | | | | | |
| Glencore Funding, | | | | | | | | |
| Gtd. Notes | | 6.00 | | 4/15/14 | | 140,000 a | | 136,674 |
| GMAC, | | | | | | | | |
| Notes | | 6.27 | | 1/16/07 | | 265,000 b | | 265,001 |
| HSBC Finance, | | | | | | | | |
| Sr. Notes | | 5.71 | | 9/14/12 | | 280,000 b | | 282,740 |
| International Lease Finance, | | | | | | | | |
| Sr. Unscd. Notes | | 5.59 | | 5/24/10 | | 125,000 b | | 125,568 |
| Jefferies Group, | | | | | | | | |
| Sr. Notes, Ser. B | | 7.50 | | 8/15/07 | | 70,000 | | 70,573 |
| Jefferies Group, | | | | | | | | |
| Sr. Notes | | 7.75 | | 3/15/12 | | 55,000 | | 59,928 |
| Kaupthing Bank, | | | | | | | | |
| Sr. Notes | | 6.07 | | 1/15/10 | | 235,000 a,b | | 236,745 |
| Kaupthing Bank, | | | | | | | | |
| Notes | | 7.13 | | 5/19/16 | | 365,000 a | | 387,812 |
| Leucadia National, | | | | | | | | |
| Sr. Notes | | 7.00 | | 8/15/13 | | 115,000 | | 117,300 |
| MBNA Capital, | | | | | | | | |
| Gtd. Cap. Secs., Ser. A | | 8.28 | | 12/1/26 | | 80,000 | | 83,394 |
| MUFG Capital Finance 1, | | | | | | | | |
| Gtd. Bonds | | 6.35 | | 3/15/49 | | 215,000 b | | 218,763 |
| NIPSCO Capital Markets, | | | | | | | | |
| Notes | | 7.86 | | 3/27/17 | | 75,000 | | 83,003 |
| Pemex Finance, | | | | | | | | |
| Notes | | 9.03 | | 2/15/11 | | 165,750 | | 176,632 |
| Pemex Finance, | | | | | | | | |
| Bonds | | 9.69 | | 8/15/09 | | 165,000 | | 178,379 |
| Residential Capital, | | | | | | | | |
| Sr. Unscd. Notes | | 6.38 | | 6/30/10 | | 125,000 | | 126,553 |
| Residential Capital, | | | | | | | | |
| Gtd. Notes | | 7.20 | | 4/17/09 | | 240,000 a,b | | 241,326 |
| SB Treasury, | | | | | | | | |
| Bonds | | 9.40 | | 12/29/49 | | 280,000 a,b | | 294,808 |
| SLM, | | | | | | | | |
| Notes, Ser. A | | 5.52 | | 7/27/09 | | 375,000 b | | 375,924 |
| St. George Funding, | | | | | | | | |
| Bonds | | 8.49 | | 12/29/49 | | 410,000 a,b | | 430,789 |
| | | Coupon | | Maturity | | Principal | | |
| Bonds and Notes (continued) | | Rate (%) | | Date | | Amount ($) | | Value ($) |
| |
| |
| |
| |
|
| Diversified Financial | | | | | | | | |
| Services (continued) | | | | | | | | |
| Tokai Preferred Capital, | | | | | | | | |
| Bonds | | 9.98 | | 12/29/49 | | 220,000 a,b | | 233,397 |
| | | | | | | | | 5,936,346 |
| Diversified Metals & | | | | | | | | |
| Mining—.6% | | | | | | | | |
| Falconbridge, | | | | | | | | |
| Bonds | | 5.38 | | 6/1/15 | | 25,000 | | 24,490 |
| Noranda, | | | | | | | | |
| Notes | | 6.00 | | 10/15/15 | | 150,000 | | 153,235 |
| Reliance Steel & Aluminum, | | | | | | | | |
| Gtd. Notes | | 6.20 | | 11/15/16 | | 130,000 a | | 129,281 |
| | | | | | | | | 307,006 |
| Electric Utilities—4.3% | | | | | | | | |
| Cogentrix Energy, | | | | | | | | |
| Gtd. Notes | | 8.75 | | 10/15/08 | | 125,000 a | | 133,095 |
| Consumers Energy, | | | | | | | | |
| First Mortgage Bonds, Ser. F | | 4.00 | | 5/15/10 | | 155,000 | | 148,270 |
| Consumers Energy, | | | | | | | | |
| First Mortgage Bonds, Ser. B | | 5.38 | | 4/15/13 | | 115,000 | | 114,037 |
| Dominion Resources/VA, | | | | | | | | |
| Sr. Unscd. Notes, Ser. B | | 5.55 | | 11/14/08 | | 140,000 b | | 140,093 |
| Dominion Resources/VA, | | | | | | | | |
| Sr. Notes, Ser. D | | 5.66 | | 9/28/07 | | 255,000 b | | 255,156 |
| DTE Energy, | | | | | | | | |
| Sr. Notes, Ser. A | | 6.65 | | 4/15/09 | | 200,000 | | 205,416 |
| FirstEnergy, | | | | | | | | |
| Notes, Ser. B | | 6.45 | | 11/15/11 | | 235,000 | | 245,315 |
| FPL Energy National Wind, | | | | | | | | |
| Scd. Bonds | | 5.61 | | 3/10/24 | | 92,446 a | | 90,962 |
| FPL Group Capital, | | | | | | | | |
| Gtd. Debs., Ser. B | | 5.55 | | 2/16/08 | | 200,000 | | 200,311 |
| IPALCO Enterprises, | | | | | | | | |
| Sr. Scd. Notes | | 8.63 | | 11/14/11 | | 75,000 b | | 81,938 |
| Mirant North America, | | | | | | | | |
| Gtd. Notes | | 7.38 | | 12/31/13 | | 55,000 | | 56,100 |
| National Grid, | | | | | | | | |
| Sr. Unscd. Notes | | 6.30 | | 8/1/16 | | 100,000 | | 103,754 |
The Fund 17
STATEMENT OF INVESTMENTS (continued)
| | | | | Coupon | | Maturity | | Principal | | |
| Bonds and Notes (continued) | | Rate (%) | | Date | | Amount ($) | | Value ($) |
| |
| |
| |
| |
|
| Electric Utilities (continued) | | | | | | | | |
| Niagara Mohawk Power, | | | | | | | | |
| Sr. Notes, Ser. G | | | | 7.75 | | 10/1/08 | | 35,000 | | 36,285 |
| NiSource Finance, | | | | | | | | | | |
| Gtd. Notes | | | | 5.94 | | 11/23/09 | | 275,000 b | | 275,299 |
| TXU, | | | | | | | | | | |
| Sr. Notes, Ser. O | | | | 4.80 | | 11/15/09 | | 145,000 d | | 142,236 |
| TXU, | | | | | | | | | | |
| Notes, Ser. C | | | | 6.38 | | 1/1/08 | | 65,000 | | 65,638 |
| Virginia Electric & Power, | | | | | | | | |
| Sr. Notes, Ser. A | | | | 5.38 | | 2/1/07 | | 35,000 | | 34,994 |
| | | | | | | | | | | 2,328,899 |
| Environmental Control—.4% | | | | | | | | |
| Oakmont Asset Trust, | | | | | | | | |
| Notes | | | | 4.51 | | 12/22/08 | | 130,000 a | | 126,959 |
| USA Waste Services, | | | | | | | | |
| Sr. Notes | | | | 7.00 | | 7/15/28 | | 75,000 | | 80,723 |
| Waste Management, | | | | | | | | |
| Gtd. Notes | | | | 7.38 | | 5/15/29 | | 30,000 | | 33,974 |
| | | | | | | | | | | 241,656 |
| Food & Beverages—.8% | | | | | | | | |
| H.J. Heinz, | | | | | | | | | | |
| Notes | | | | 6.43 | | 12/1/20 | | 150,000 a | | 152,744 |
| Safeway, | | | | | | | | | | |
| Sr. Unscd. Notes | | | | 4.13 | | 11/1/08 | | 85,000 | | 83,058 |
| Stater Brothers Holdings, | | | | | | | | |
| Sr. Notes | | | | 8.13 | | 6/15/12 | | 100,000 | | 102,000 |
| Tyson Foods, | | | | | | | | | | |
| Sr. Unscd. Notes | | | | 6.85 | | 4/1/16 | | 80,000 b | | 82,546 |
| | | | | | | | | | | 420,348 |
| Foreign/Governmental—6.8% | | | | | | | | |
| Banco Nacional de Desenvolvimento | | | | | | | | |
| Economico e Social, Unsub. Notes | | 5.17 | | 6/16/08 | | 220,000 b | | 218,350 |
| Export-Import Bank of Korea, | | | | | | | | |
| Sr. Notes | | | | 4.50 | | 8/12/09 | | 100,000 | | 98,088 |
| Federal Republic of Brazil, | | | | | | | | |
| Bonds | | BRL | | 12.50 | | 1/5/16 | | 1,005,000 d,e | | 535,451 |
| Mexican Bonos, | | | | | | | | | | |
| Bonds, Ser. M | | MXN | | 9.00 | | 12/22/11 | | 2,600,000 e | | 257,653 |
18
| | | Coupon | | Maturity | | Principal | | |
| Bonds and Notes (continued) | | Rate (%) | | Date | | Amount ($) | | Value ($) |
| |
| |
| |
| |
|
| Foreign/Governmental (continued) | | | | | | | | |
| Poland Government, | | | | | | | | |
| Bonds, Ser. 0608 PLN | | 5.75 | | 6/24/08 | | 4,620,000 e | | 1,618,879 |
| Republic of Argentina, | | | | | | | | |
| Bonds | | 5.59 | | 8/3/12 | | 545,000 b | | 398,395 |
| Republic of El Salvador, | | | | | | | | |
| Unscd. Notes | | 8.50 | | 7/25/11 | | 60,000 a | | 66,660 |
| Russian Federation, | | | | | | | | |
| Unsub. Bonds | | 8.25 | | 3/31/10 | | 497,786 a | | 521,430 |
| | | | | | | | | 3,714,906 |
| Health Care—1.0% | | | | | | | | |
| Baxter International, | | | | | | | | |
| Sr. Unscd. Notes | | 5.20 | | 2/16/08 | | 140,000 | | 139,685 |
| Coventry Health Care, | | | | | | | | |
| Sr. Notes | | 5.88 | | 1/15/12 | | 80,000 | | 79,388 |
| HCA, | | | | | | | | |
| Sr. Unscd. Notes | | 7.88 | | 2/1/11 | | 115,000 | | 115,577 |
| HCA, | | | | | | | | |
| Sr. Unscd. Notes | | 8.75 | | 9/1/10 | | 40,000 | | 41,800 |
| Medco Health Solutions, | | | | | | | | |
| Sr. Notes | | 7.25 | | 8/15/13 | | 60,000 | | 64,488 |
| Teva Pharmaceutical Finance, | | | | | | | | |
| Gtd. Notes | | 6.15 | | 2/1/36 | | 85,000 | | 82,862 |
| | | | | | | | | 523,800 |
| Lodging & Entertainment—.6% | | | | | | | | |
| Cinemark, | | | | | | | | |
| Sr. Discount Notes | | 9.75 | | 3/15/14 | | 15,000 c | | 12,956 |
| Harrah’s Operating, | | | | | | | | |
| Gtd. Notes | | 7.13 | | 6/1/07 | | 65,000 | | 65,311 |
| MGM Mirage, | | | | | | | | |
| Gtd. Notes | | 8.50 | | 9/15/10 | | 155,000 | | 166,625 |
| Mohegan Tribal Gaming Authority, | | | | | | | | |
| Sr. Notes | | 6.13 | | 2/15/13 | | 20,000 | | 19,950 |
| Speedway Motorsports, | | | | | | | | |
| Sr. Sub. Notes | | 6.75 | | 6/1/13 | | 70,000 | | 70,350 |
| | | | | | | | | 335,192 |
| Machinery—.2% | | | | | | | | |
| Terex, | | | | | | | | |
| Gtd. Notes | | 7.38 | | 1/15/14 | | 115,000 | | 117,300 |
The Fund 19
STATEMENT OF INVESTMENTS (continued)
| | | Coupon | | Maturity | | Principal | | |
| Bonds and Notes (continued) | | Rate (%) | | Date | | Amount ($) | | Value ($) |
| |
| |
| |
| |
|
| Manufacturing—.2% | | | | | | | | |
| Tyco International Group, | | | | | | | | |
| Gtd. Notes | | 6.88 | | 1/15/29 | | 115,000 | | 131,122 |
| Media—1.9% | | | | | | | | |
| Comcast, | | | | | | | | |
| Gtd. Notes | | 5.67 | | 7/14/09 | | 225,000 b | | 225,659 |
| COX Communications, | | | | | | | | |
| Notes | | 7.13 | | 10/1/12 | | 60,000 | | 64,039 |
| Cox Enterprises, | | | | | | | | |
| Notes | | 8.00 | | 2/15/07 | | 320,000 a | | 320,652 |
| Time Warner, | | | | | | | | |
| Gtd. Notes | | 5.61 | | 11/13/09 | | 290,000 b | | 290,417 |
| Viacom, | | | | | | | | |
| Gtd. Notes | | 5.63 | | 5/1/07 | | 105,000 | | 105,063 |
| | | | | | | | | 1,005,830 |
| Oil & Gas—2.8% | | | | | | | | |
| Anadarko Petroleum, | | | | | | | | |
| Sr. Unscd. Notes | | 5.76 | | 9/15/09 | | 319,000 b | | 320,540 |
| ANR Pipeline, | | | | | | | | |
| Sr. Notes | | 7.00 | | 6/1/25 | | 50,000 | | 53,660 |
| BJ Services, | | | | | | | | |
| Sr. Unscd. Notes | | 5.54 | | 6/1/08 | | 500,000 b | | 500,350 |
| Colorado Interstate Gas, | | | | | | | | |
| Sr. Notes | | 5.95 | | 3/15/15 | | 70,000 | | 69,416 |
| El Paso Natural Gas, | | | | | | | | |
| Sr. Notes, Ser. A | | 7.63 | | 8/1/10 | | 130,000 | | 136,500 |
| Marathon Oil, | | | | | | | | |
| Notes | | 5.38 | | 6/1/07 | | 175,000 | | 174,953 |
| Northwest Pipeline, | | | | | | | | |
| Sr. Unscd. Notes | | 6.63 | | 12/1/07 | | 210,000 | | 211,575 |
| Sempra Energy, | | | | | | | | |
| Sr. Notes | | 4.62 | | 5/17/07 | | 80,000 | | 79,702 |
| | | | | | | | | 1,546,696 |
| Packaging & Containers—.5% | | | | | | | | |
| Crown Americas/Capital, | | | | | | | | |
| Gtd. Notes | | 7.63 | | 11/15/13 | | 75,000 | | 77,625 |
| Crown Americas/Capital, | | | | | | | | |
| Sr. Notes | | 7.75 | | 11/15/15 | | 50,000 | | 52,125 |
| Sealed Air, | | | | | | | | |
| Bonds | | 6.88 | | 7/15/33 | | 120,000 a | | 120,434 |
| | | | | | | | | 250,184 |
20
| | | Coupon | | Maturity | | Principal | | |
| Bonds and Notes (continued) | | Rate (%) | | Date | | Amount ($) | | Value ($) |
| |
| |
| |
| |
|
| Paper & Forest Products—.7% | | | | | | | | |
| Georgia-Pacific, | | | | | | | | |
| Gtd. Notes | | 7.00 | | 1/15/15 | | 175,000 a | | 175,438 |
| Sappi Papier Holding, | | | | | | | | |
| Gtd. Notes | | 6.75 | | 6/15/12 | | 105,000 a | | 104,839 |
| Temple-Inland, | | | | | | | | |
| Bonds | | 6.63 | | 1/15/18 | | 105,000 | | 109,093 |
| | | | | | | | | 389,370 |
| Property & Casualty Insurance—2.1% | | | | | | |
| Allmerica Financial, | | | | | | | | |
| Debs. | | 7.63 | | 10/15/25 | | 70,000 | | 75,367 |
| AON Capital Trust A, | | | | | | | | |
| Gtd. Cap. Secs. | | 8.21 | | 1/1/27 | | 105,000 | | 121,628 |
| AON, | | | | | | | | |
| Notes | | 6.95 | | 1/15/07 | | 100,000 b | | 100,045 |
| Assurant, | | | | | | | | |
| Sr. Notes | | 6.75 | | 2/15/34 | | 55,000 | | 59,284 |
| Chubb, | | | | | | | | |
| Sr. Notes | | 5.47 | | 8/16/08 | | 250,000 | | 250,755 |
| Hartford Financial Services Group, | | | | | | | | |
| Sr. Notes | | 5.66 | | 11/16/08 | | 250,000 | | 251,025 |
| Marsh & McLennan Cos., | | | | | | | | |
| Sr. Notes | | 5.38 | | 3/15/07 | | 220,000 | | 219,938 |
| Phoenix Cos., | | | | | | | | |
| Sr. Unscd. Notes | | 6.68 | | 2/16/08 | | 70,000 | | 70,623 |
| | | | | | | | | 1,148,665 |
| Real Estate Investment Trusts—4.8% | | | | | | |
| Archstone-Smith Operating Trust, | | | | | | | | |
| Notes | | 3.00 | | 6/15/08 | | 85,000 | | 82,158 |
| Archstone-Smith Operating Trust, | | | | | | | | |
| Notes | | 5.00 | | 8/15/07 | | 75,000 | | 74,821 |
| Boston Properties, | | | | | | | | |
| Sr. Notes | | 5.63 | | 4/15/15 | | 85,000 | | 85,443 |
| Commercial Net Lease Realty, | | | | | | | | |
| Sr. Unscd. Notes | | 6.15 | | 12/15/15 | | 100,000 | | 101,280 |
| Duke Realty, | | | | | | | | |
| Notes | | 3.50 | | 11/1/07 | | 70,000 | | 68,846 |
| Duke-Weeks Realty, | | | | | | | | |
| Sr. Notes | | 6.95 | | 3/15/11 | | 170,000 | | 179,600 |
| EOP Operating, | | | | | | | | |
| Notes | | 5.97 | | 10/1/10 | | 50,000 b | | 50,659 |
The Fund 21
STATEMENT OF INVESTMENTS (continued)
| | | Coupon | | Maturity | | Principal | | |
| Bonds and Notes (continued) | | Rate (%) | | Date | | Amount ($) | | Value ($) |
| |
| |
| |
| |
|
| Real Estate Investment | | | | | | | | |
| Trusts (continued) | | | | | | | | |
| EOP Operating, | | | | | | | | |
| Sr. Notes | | 7.00 | | 7/15/11 | | 195,000 | | 211,230 |
| ERP Operating, | | | | | | | | |
| Notes | | 4.75 | | 6/15/09 | | 55,000 | | 54,141 |
| ERP Operating, | | | | | | | | |
| Notes | | 5.13 | | 3/15/16 | | 75,000 d | | 72,970 |
| Federal Realty Investment Trust, | | | | | | | | |
| Sr. Unscd. Notes | | 5.40 | | 12/1/13 | | 50,000 | | 49,512 |
| Federal Realty Investment Trust, | | | | | | | | |
| Notes | | 6.00 | | 7/15/12 | | 55,000 | | 56,201 |
| Healthcare Realty Trust, | | | | | | | | |
| Sr. Notes | | 8.13 | | 5/1/11 | | 225,000 | | 244,252 |
| Host Hotels & Resorts, | | | | | | | | |
| Gtd. Notes | | 6.88 | | 11/1/14 | | 20,000 a | | 20,350 |
| HRPT Properties Trust, | | | | | | | | |
| Sr. Unscd. Notes | | 5.96 | | 3/16/11 | | 250,000 b | | 250,363 |
| Mack-Cali Realty, | | | | | | | | |
| Unscd. Notes | | 5.05 | | 4/15/10 | | 130,000 | | 127,982 |
| Mack-Cali Realty, | | | | | | | | |
| Sr. Unscd. Notes | | 5.13 | | 1/15/15 | | 75,000 | | 72,227 |
| Mack-Cali Realty, | | | | | | | | |
| Notes | | 5.25 | | 1/15/12 | | 55,000 | | 54,159 |
| Regency Centers, | | | | | | | | |
| Gtd. Notes | | 5.25 | | 8/1/15 | | 125,000 | | 121,397 |
| Simon Property Group, | | | | | | | | |
| Notes | | 4.60 | | 6/15/10 | | 105,000 d | | 102,489 |
| Simon Property Group, | | | | | | | | |
| Notes | | 4.88 | | 8/15/10 | | 75,000 | | 74,020 |
| Socgen Real Estate, | | | | | | | | |
| Bonds | | 7.64 | | 12/29/49 | | 470,000 a,b | | 477,349 |
| | | | | | | | | 2,631,449 |
| Residential Mortgage | | | | | | | | |
| Pass-Through Ctfs.—5.4% | | | | | | | | |
| American General Mortgage Loan | | | | | | | | |
| Trust, Ser. 2006-1, Cl. A1 | | 5.75 | | 12/25/35 | | 93,688 a,b | | 93,578 |
| Banc of America Mortgage | | | | | | | | |
| Securities, Ser. 2004-F, Cl. 2A7 | | 4.15 | | 7/25/34 | | 298,565 b | | 291,732 |
| | | Coupon | | Maturity | | Principal | | |
| Bonds and Notes (continued) | | Rate (%) | | Date | | Amount ($) | | Value ($) |
| |
| |
| |
| |
|
| Residential Mortgage | | | | | | | | |
| Pass-Through Ctfs. (continued) | | | | | | | | |
| ChaseFlex Trust, | | | | | | | | |
| Ser. 2006-2, Cl. A1A | | 5.59 | | 9/25/36 | | 77,842 b | | 77,808 |
| ChaseFlex Trust, | | | | | | | | |
| Ser. 2006-2, Cl. A5 | | 5.99 | | 9/25/36 | | 120,000 b | | 120,158 |
| Citigroup Mortgage Loan Trust, | | | | | | | | |
| Ser. 2005-WF2, Cl. AF2 | | 4.92 | | 8/25/35 | | 50,223 b | | 49,866 |
| CSAB Mortgage Backed Trust, | | | | | | | | |
| Ser. 2006-3, Cl. A1A | | 6.00 | | 11/25/36 | | 107,977 b | | 107,839 |
| Impac CMB Trust, | | | | | | | | |
| Ser. 2005-8, Cl. 2M2 | | 6.10 | | 2/25/36 | | 130,000 b | | 130,200 |
| Impac CMB Trust, | | | | | | | | |
| Ser. 2005-8, Cl. 2M3 | | 6.85 | | 2/25/36 | | 96,297 b | | 95,580 |
| Impac Secured Assets CMN Owner | | | | | | | | |
| Trust, Ser. 2006-1, Cl. 2A1 | | 5.70 | | 5/25/36 | | 68,936 b | | 69,101 |
| IndyMac Index Mortgage Loan Trust, | | | | | | |
| Ser. 2006-AR25, Cl. 4A2 | | 6.18 | | 9/25/36 | | 112,503 b | | 113,666 |
| J.P. Morgan Alternative Loan | | | | | | | | |
| Trust, Ser. 2006-S4, Cl. A6 | | 5.71 | | 12/25/36 | | 105,000 b | | 104,817 |
| J.P. Morgan Mortgage Trust, | | | | | | | | |
| Ser. 2005-A1, Cl. 5A1 | | 4.48 | | 2/25/35 | | 70,203 b | | 68,295 |
| New Century Alternative Mortgage | | | | | | |
| Loan Trust, Ser. 2006-ALT2, | | | | | | | | |
| Cl. AF6A | | 5.89 | | 10/15/36 | | 70,000 b | | 70,268 |
| Nomura Asset Acceptance, | | | | | | | | |
| Ser. 2005-AP1, Cl. 2A5 | | 4.86 | | 2/25/35 | | 200,000 b | | 193,509 |
| Nomura Asset Acceptance, | | | | | | | | |
| Ser. 2005-AP2, Cl. A5 | | 4.98 | | 5/25/35 | | 150,000 b | | 145,457 |
| Nomura Asset Acceptance, | | | | | | | | |
| Ser. 2005-WF1, Cl. 2A5 | | 5.16 | | 3/25/35 | | 115,000 b | | 112,293 |
| Structured Asset Mortgage | | | | | | | | |
| Investments, Ser. 1998-2, Cl. B | | 5.98 | | 4/30/30 | | 1,870 b | | 1,868 |
| Washington Mutual, | | | | | | | | |
| Ser. 2004-AR7, Cl. A6 | | 3.94 | | 7/25/34 | | 135,000 b | | 131,206 |
| Washington Mutual, | | | | | | | | |
| Ser. 2003-AR10, Cl. A6 | | 4.06 | | 10/25/33 | | 203,000 b | | 199,248 |
| Washington Mutual, | | | | | | | | |
| Ser. 2004-AR9, Cl. A7 | | 4.16 | | 8/25/34 | | 165,000 b | | 160,706 |
The Fund 23
STATEMENT OF INVESTMENTS (continued)
| | | Coupon | | Maturity | | Principal | | |
| Bonds and Notes (continued) | | Rate (%) | | Date | | Amount ($) | | Value ($) |
| |
| |
| |
| |
|
| Residential Mortgage | | | | | | | | |
| Pass-Through Ctfs. (continued) | | | | | | | | |
| Wells Fargo Mortgage Backed | | | | | | | | |
| Securities Trust, | | | | | | | | |
| Ser. 2005-AR1, Cl. 1A1 | | 4.54 | | 2/25/35 | | 462,904 b | | 454,251 |
| Wells Fargo Mortgage Backed | | | | | | | | |
| Securities Trust, Ser. 2003-1, | | | | | | | | |
| Cl. 2A9 | | 5.75 | | 2/25/33 | | 150,000 | | 147,629 |
| | | | | | | | | 2,939,075 |
| Retail—.4% | | | | | | | | |
| CVS, | | | | | | | | |
| Sr. Unscd. Notes | | 5.75 | | 8/15/11 | | 45,000 | | 45,587 |
| Home Depot, | | | | | | | | |
| Sr. Unscd. Notes | | 5.49 | | 12/16/09 | | 85,000 b | | 85,063 |
| May Department Stores, | | | | | | | | |
| Notes | | 3.95 | | 7/15/07 | | 45,000 | | 44,568 |
| May Department Stores, | | | | | | | | |
| Notes | | 4.80 | | 7/15/09 | | 45,000 | | 44,308 |
| | | | | | | | | 219,526 |
| State/Government | | | | | | | | |
| General Obligations—1.7% | | | | | | | | |
| Erie Tobacco Asset | | | | | | | | |
| Securitization/NY, Tobacco | | | | | | | | |
| Settlement Asset-Backed Bonds | | 6.00 | | 6/1/28 | | 75,000 | | 75,487 |
| Michigan Tobacco Settlement | | | | | | | | |
| Finance Authority, | | | | | | | | |
| Tobacco Settlement | | | | | | | | |
| Asset-Backed Bonds | | 7.31 | | 6/1/34 | | 410,000 | | 426,166 |
| Michigan Tobacco Settlement | | | | | | | | |
| Finance Authority, Tobacco | | | | | | | | |
| Settlement Asset-Backed Bonds | | 7.43 | | 6/1/34 | | 100,000 b | | 100,283 |
| New York Counties Tobacco Trust | | | | | | | | |
| IV, Tobacco Settlement | | | | | | | | |
| Pass-Through Bonds | | 6.00 | | 6/1/27 | | 170,000 | | 166,389 |
| Tobacco Settlement Authority of | | | | | | | | |
| Iowa, Tobacco Settlement | | | | | | | | |
| Asset-Backed Bonds | | 6.50 | | 6/1/23 | | 170,000 | | 168,535 |
| | | | | | | | | 936,860 |
| Technology—.2% | | | | | | | | |
| Hewlett-Packard, | | | | | | | | |
| Sr. Unscd. Notes | | 5.50 | | 5/22/09 | | 100,000 b | | 100,225 |
24
| | | | | Coupon | | Maturity | | Principal | | |
| Bonds and Notes (continued) | | Rate (%) | | Date | | Amount ($) | | Value ($) |
| |
| |
| |
| |
|
| Telecommunications—4.3% | | | | | | | | | | |
| America Movil, | | | | | | | | | | |
| Gtd. Notes | | | | 5.47 | | 6/27/08 | | 45,000 a,b | | 44,974 |
| AT & T, | | | | | | | | | | |
| Notes | | | | 5.46 | | 5/15/08 | | 125,000 b | | 125,116 |
| Deutsche Telekom International | | | | | | | | |
| Finance, Gtd. Bonds | | | | 8.00 | | 6/15/10 | | 235,000 b | | 254,658 |
| Deutsche Telekom International | | | | | | | | |
| Finance, Gtd. Bonds | | | | 8.25 | | 6/15/30 | | 105,000 b | | 129,453 |
| France Telecom, | | | | | | | | | | |
| Notes | | | | 7.75 | | 3/1/11 | | 110,000 b | | 119,927 |
| Intelsat, | | | | | | | | | | |
| Sr. Notes | | | | 5.25 | | 11/1/08 | | 150,000 | | 146,625 |
| KPN, | | | | | | | | | | |
| Sr. Unsub. Bonds | | | | 8.38 | | 10/1/30 | | 95,000 | | 109,148 |
| Nextel Communications, | | | | | | | | | | |
| Gtd. Notes, Ser. F | | | | 5.95 | | 3/15/14 | | 95,000 | | 92,646 |
| Nextel Partners, | | | | | | | | | | |
| Gtd. Notes | | | | 8.13 | | 7/1/11 | | 150,000 | | 156,937 |
| Nordic Telephone Holdings, | | | | | | | | | | |
| Sr. Notes | | EUR | | 8.25 | | 5/1/16 | | 50,000 a,e | | 72,908 |
| PanAmSat, | | | | | | | | | | |
| Gtd. Notes | | | | 9.00 | | 6/15/16 | | 100,000 a | | 106,375 |
| Qwest, | | | | | | | | | | |
| Sr. Notes | | | | 7.88 | | 9/1/11 | | 65,000 | | 69,550 |
| Qwest, | | | | | | | | | | |
| Sr. Notes | | | | 8.61 | | 6/15/13 | | 100,000 b | | 108,750 |
| Sprint Capital, | | | | | | | | | | |
| Gtd. Notes | | | | 8.75 | | 3/15/32 | | 95,000 | | 114,667 |
| Telefonica Emisiones, | | | | | | | | | | |
| Gtd. Notes | | | | 5.98 | | 6/20/11 | | 250,000 | | 254,729 |
| U.S. West Communications, | | | | | | | | | | |
| Notes | | | | 5.63 | | 11/15/08 | | 70,000 d | | 70,437 |
| Verizon Communications, | | | | | | | | | | |
| Sr. Notes | | | | 5.50 | | 8/15/07 | | 175,000 b | | 175,001 |
| Windstream, | | | | | | | | | | |
| Sr. Notes | | | | 8.13 | | 8/1/13 | | 140,000 a | | 152,250 |
| Windstream, | | | | | | | | | | |
| Sr. Notes | | | | 8.63 | | 8/1/16 | | 45,000 a | | 49,500 |
| | | | | | | | | | | 2,353,651 |
The Fund 25
STATEMENT OF INVESTMENTS (continued)
| | | Coupon | | Maturity | | Principal | | |
| Bonds and Notes (continued) | | Rate (%) | | Date | | Amount ($) | | Value ($) |
| |
| |
| |
| |
|
| Textiles & Apparel—.2% | | | | | | | | |
| Mohawk Industries, | | | | | | | | |
| Sr. Unscd. Notes | | 5.75 | | 1/15/11 | | 95,000 | | 95,150 |
| Transportation—.2% | | | | | | | | |
| Ryder System, | | | | | | | | |
| Notes | | 3.50 | | 3/15/09 | | 130,000 | | 124,298 |
| U.S. Government Agencies/ | | | | | | | | |
| Mortgage-Backed—22.0% | | | | | | | | |
| Federal Home Loan Mortgage Corp.: | | | | | | |
| 5.50% | | | | | | 275,000 f | | 274,828 |
| 6.00% | | | | | | 275,000 f | | 278,697 |
| 4.00%, 10/1/09 | | | | | | 84,252 | | 82,241 |
| 4.50%, 10/1/09 | | | | | | 81,945 | | 81,149 |
| 5.00%, 10/1/18 | | | | | | 467,036 | | 460,021 |
| 6.00%, 7/1/17—4/1/33 | | | | | | 219,126 | | 221,657 |
| Federal National Mortgage Association: | | | | | | |
| 5.00% | | | | | | 275,000 f | | 270,358 |
| 5.50% | | | | | | 690,000 f | | 682,017 |
| 6.00% | | | | | | 3,350,000 f | | 3,386,676 |
| 3.53%, 7/1/10 | | | | | | 281,544 | | 266,639 |
| 4.06%, 6/1/13 | | | | | | 100,000 | | 93,562 |
| 5.00%, 7/1/11—4/1/19 | | | | | | 516,422 | | 510,551 |
| 5.50%, 12/1/24—1/1/34 | | | | | | 1,330,075 | | 1,318,743 |
| 6.00%, 2/1/33—6/1/33 | | | | | | 247,001 | | 249,330 |
| 6.50%, 12/1/31—9/1/32 | | | | | | 196,906 | | 201,552 |
| 7.00%, 5/1/32—7/1/32 | | | | | | 49,295 | | 50,724 |
| Grantor Trust, | | | | | | | | |
| Ser. 2001-T11, Cl. B, 5.50%, 9/25/11 | | | | 75,000 | | 76,561 |
| Grantor Trust, | | | | | | | | |
| Ser. 2001-T6, Cl. B, 6.09%, 5/25/11 | | | | 275,000 | | 285,953 |
| Government National Mortgage Association I: | | | | | | |
| 6.50%, 9/15/32 | | | | | | 85,579 | | 87,949 |
| 8.00%, 2/15/30—5/15/30 | | | | | | 5,427 | | 5,752 |
| Ser. 2004-43, Cl. A, 2.82%, 12/16/19 | | | | 337,028 | | 323,951 |
| Ser. 2003-88, Cl. AC, 2.91%, 6/16/18 | | | | 218,294 | | 211,103 |
| Ser. 2004-23, Cl. B, 2.95%, 3/16/19 | | | | 136,029 | | 130,624 |
| Ser. 2004-57, Cl. A, 3.02%, 1/16/19 | | | | 163,056 | | 157,343 |
| Ser. 2004-97, Cl. AB, 3.08%, 4/16/22 | | | | 202,876 | | 195,875 |
| Ser. 2003-64, Cl. A, 3.09%, 4/16/24 | | | | 14,641 | | 14,419 |
| Ser. 2004-9, Cl. A, 3.36%, 8/16/22 | | | | 87,699 | | 84,633 |
| Ser. 2004-25, Cl. AC, 3.38%, 1/16/23 | | | | 314,650 | | 304,168 |
| Ser. 2004-77, Cl. A, 3.40%, 3/16/20 | | | | 174,582 | | 169,393 |
| Ser. 2003-96, Cl. B, 3.61%, 8/16/18 | | | | 96,006 | | 94,319 |
| Ser. 2004-67, Cl. A, 3.65%, 9/16/17 | | | | 143,754 | | 140,468 |
26
| | | Principal | | |
| Bonds and Notes (continued) | | Amount ($) | | Value ($) |
| |
| |
|
| U.S. Government Agencies/ | | | | |
| Mortgage-Backed (continued) | | | | |
| Government National Mortgage Association I (continued): | | |
| Ser. 2004-108, Cl. A, 4.00%, 5/16/27 | | 117,457 | | 114,376 |
| Ser. 2005-79, Cl. A, 4.00%, 10/16/33 | | 120,891 | | 117,905 |
| Ser. 2005-50, Cl. A, 4.02%, 10/16/26 | | 120,212 | | 117,404 |
| Ser. 2005-29, Cl. A, 4.02%, 7/16/27 | | 161,918 | | 157,610 |
| Ser. 2005-9, Cl. A, 4.03%, 5/16/22 | | 93,115 | | 91,185 |
| Ser. 2005-12, Cl. A, 4.04%, 5/16/21 | | 63,144 | | 61,825 |
| Ser. 2005-42, Cl. A, 4.05%, 7/16/20 | | 139,739 | | 136,942 |
| Ser. 2005-14, Cl. A, 4.13%, 2/16/27 | | 115,443 | | 113,355 |
| Ser. 2004-51, Cl. A, 4.15%, 2/16/18 | | 171,003 | | 167,799 |
| Ser. 2005-32, Cl. B, 4.39%, 8/16/30 | | 150,000 | | 147,414 |
| | | | | 11,937,071 |
| U.S. Government Securities—29.6% | | | | |
| U.S. Treasury Inflation Protected | | | | |
| Securities, 2.00%, 1/15/16 | | 1,006,751 g | | 972,081 |
| U.S. Treasury Notes | | | | |
| 4.50%, 11/30/11 | | 14,710,000 h | | 14,583,597 |
| 4.63%, 11/15/16 | | 450,000 h | | 447,188 |
| | | | | 16,002,866 |
| Total Bonds and Notes | | | | |
| (cost $69,894,334) | | | | 69,835,656 |
| |
| |
|
| |
| |
| Preferred Stocks—.2% | | Shares | | Value ($) |
| |
| |
|
| Banks—.1% | | | | |
| Sovereign Capital Trust IV, | | | | |
| Conv., Cum. $2.1875 | | 1,400 | | 69,650 |
| Diversified Financial Services—.1% | | | | |
| AES Trust VII, | | | | |
| Conv., Cum. $3.00 | | 1,000 | | 49,750 |
| Total Preferred Stocks | | | | |
| (cost $118,700) | | | | 119,400 |
| |
| |
|
| |
| | | Face Amount | | |
| | | Covered by | | |
| Options—.1% | | Contracts ($) | | Value ($) |
| |
| |
|
| Call Options—.1% | | | | |
| 12-Month Euribor Interest Swap, | | | | |
| March 2007 @ 4.488 | | 3,395,000 | | 1,162 |
| 3-Month Floor USD Libor-BBA | | | | |
| Interest Rate, October 2009 @ 4 | | 5,090,000 | | 9,195 |
The Fund 27
STATEMENT OF INVESTMENTS (continued)
| | | Face Amount | | |
| | | Covered by | | |
| Options (continued) | | Contracts ($) | | Value ($) |
| |
| |
|
| Call Options (continued) | | | | |
| Dow Jones CDX.EM.6, | | | | |
| January 2007 @ 100.65 | | 510,000 | | 1,122 |
| Dow Jones CDX.EM.6, | | | | |
| January 2007 @ 100.65 | | 800,000 | | 1,760 |
| Dow Jones CDX.IG.5, | | | | |
| June 2007 @ 145 | | 1,060,000 | | 7,985 |
| U.S. Treasury 10-Year Note Futures, | | | | |
| March 2007 @ 110 | | 2,000,000 | | 1,563 |
| | | | | 22,787 |
| Put Options—.0% | | | | |
| 12-Month Euribor Interest Swap, | | | | |
| May 2007 @ 4.1785 | | 855,000 | | 5,325 |
| 3-Month Capped USD Libor-BBA | | | | |
| Interest Rate, June 2007 @ 5.75 | | 9,650,000 | | 225 |
| | | | | 5,550 |
| Total Options | | | | |
| (cost $63,351) | | | | 28,337 |
| |
| |
|
| | | Principal | | |
| Short-Term Investments—5.0% | | Amount ($) | | Value ($) |
| |
| |
|
| Corporate Notes—1.4% | | | | |
| Egyptian Treasury Bills, | | | | |
| 9.06%, 3/15/07 | | 490,000 a,i | | 504,318 |
| Egyptian Treasury Bills, | | | | |
| 9.36%, 2/28/07 | | 270,000 a,i | | 274,309 |
| | | | | 778,627 |
| U.S. Treasury Bills—3.6% | | | | |
| 4.85%, 3/8/07 | | 75,000 j | | 74,354 |
| 4.91%, 1/4/07 | | 1,865,000 | | 1,864,758 |
| | | | | 1,939,112 |
| Total Short-Term Investments | | | | |
| (cost $2,699,022) | | | | 2,717,739 |
| |
| |
|
| |
| Other Investment—1.2% | | Shares | | Value ($) |
| |
| |
|
| Registered Investment Company; | | | | |
| Dreyfus Institutional Preferred | | | | |
| Plus Money Market Fund | | | | |
| (cost $629,000) | | 629,000 k | | 629,000 |
28
| Investment of Cash Collateral | | | | |
| for Securities Loaned—3.3% | | Shares | | Value ($) |
| |
| |
|
| Registered Investment Company; | | | | |
| Dreyfus Institutional Cash | | | | |
| Advantage Plus Fund | | | | |
| (cost $1,815,400) | | 1,815,400 k | | 1,815,400 |
| |
| |
|
| Total Investments (cost $75,219,807) | | 138.5% | | 75,145,532 |
| Liabilities, Less Cash and Receivables | | (38.5%) | | (20,871,930) |
| Net Assets | | 100.0% | | 54,273,602 |
| a Securities exempt from registration under Rule 144A of the Securities Act of 1933.These securities may be resold in |
| transactions exempt from registration, normally to qualified institutional buyers. At December 31, 2006, these |
| securities amounted to $9,105,560 or 16.8% of net assets. |
| b Variable rate security—interest rate subject to periodic change. |
| c Zero coupon until a specified date at which time the stated coupon rate becomes effective until maturity. |
| d All or a portion of these securities are on loan. At December 31, 2006, the total market value of the fund’s securities |
| on loan is $1,707,780 and the total market value of the collateral held by the fund is $1,815,400. |
| e Principal amount stated in U.S. Dollars unless otherwise noted. |
| BRL—Brazilian Real |
| EUR—Euro |
| MXN—Mexican Peso |
| PLN—Poland Zloty |
| f Purchased on a forward commitment basis. |
| g Principal amount for accrual purposes is periodically adjusted based on changes in the Consumer Price Index. |
| h Purchased on a delayed delivery basis. |
| i Credit Linked Notes. |
| j Held by a broker as collateral for open financial futures positions. |
| k Investment in affiliated money market mutual fund. |
| Portfolio Summary (Unaudited) † | | | | |
| |
| | | Value (%) | | | | Value (%) |
| |
| |
| |
|
| U.S. Government & Agencies | | 51.6 | | State/Government | | |
| Corporate Bonds | | 48.4 | | General Obligations | | 1.7 |
| Asset/Mortgage-Backed | | 20.2 | | Preferred Stocks | | .2 |
| Short-Term/Money | | | | Options | | .1 |
| Market Investments | | 9.5 | | | | |
| Foreign/Governmental | | 6.8 | | | | 138.5 |
| |
| † Based on net assets. | | | | | | |
| See notes to financial statements. | | | | | | |
The Fund 29
| STATEMENT OF FINANCIAL FUTURES |
| December 31, 2006 |
| | | | | | | | | Unrealized |
| | | | | Market Value | | | | Appreciation |
| | | | | Covered by | | | | (Depreciation) |
| | | Contracts | | Contracts ($) | | Expiration | | at 12/31/2006 ($) |
| |
| |
| |
| |
|
| Financial Futures Long | | | | | | | | |
| U.S. Treasury 5 Year Notes | | 47 | | 4,937,938 | | March 2007 | | (27,260) |
| U.S. Treasury 30 Year Bonds | | 6 | | 668,625 | | March 2007 | | (18,188) |
| Financial Futures Short | | | | | | | | |
| U.S. Treasury 2 Year Notes | | 24 | | (4,896,750) | | March 2007 | | 10,443 |
| U.S. Treasury 10 Year Notes | | 31 | | (3,331,531) | | March 2007 | | 62,449 |
| | | | | | | | | 27,444 |
See notes to financial statements.
| STATEMENT OF OPTIONS WRITTEN |
| December 31, 2006 |
| | | Face Amount | | |
| | | Covered by | | |
| | | Contracts ($) | | Value ($) |
| |
| |
|
| Put Options | | | | |
| 12-Month Euribor Interest Swap | | | | |
| March 2007 @ 5.973 | | | | |
| (Premiums received $12,222) | | 3,395,000 | | (215) |
| |
| See notes to financial statements. | | | | |
| STATEMENT OF ASSETS AND LIABILITIES |
| December 31, 2006 |
| | | | | | | Cost | | Value |
| |
| |
| |
| |
|
| Assets ($): | | | | | | | | |
| Investments in securities—See Statement of Investments | | | | |
| (including securities on loan, valued at $1,707,780)—Note 1(c): | | | | |
| Unaffiliated issuers | | | | | | 72,775,407 | | 72,701,132 |
| Affiliated issuers | | | | | | 2,444,400 | | 2,444,400 |
| Cash | | | | | | | | 7,654 |
| Receivable for investment securities sold | | | | | | 3,500,626 |
| Dividends and interest receivable | | | | | | | | 635,189 |
| Unrealized appreciation on swaps—Note 4 | | | | | | 284,513 |
| Swaps premiums paid | | | | | | | | 217,036 |
| Receivable from broker for swap transactions—Note 4 | | | | 36,412 |
| Unrealized appreciation on forward currency exchange contracts—Note 4 | | 20,211 |
| Receivable for shares of Beneficial Interest subscribed | | | | 17,268 |
| Receivable for futures variation margin—Note 4 | | | | | | 2,250 |
| Receivable for closed forward currency exchange contracts | | | | 1,295 |
| Other assets | | | | | | | | 141,648 |
| | | | | | | | | 80,009,634 |
| |
| |
| |
| |
|
| Liabilities ($): | | | | | | | | |
| Due to The Dreyfus Corporation and affiliates—Note 3(b) | | | | 45,364 |
| Payable for investment securities purchased | | | | | | 18,788,560 |
| Payable for open mortgage backed dollar rolls | | | | | | 4,917,279 |
| Liability for securities on loan—Note 1(c) | | | | | | 1,815,400 |
| Unrealized depreciation on swaps—Note 4 | | | | | | 127,723 |
| Payable for shares of Beneficial Interest redeemed | | | | | | 37,505 |
| Cash overdraft denominated in foreign currencies | | | | 4,088 | | 2,643 |
| Unrealized depreciation on forward currency exchange contracts—Note 4 | | 1,343 |
| Outstanding options written, at value (premiums received | | | | |
| $12,222)—See Statement of Options Written—Note 4 | | | | 215 |
| | | | | | | | | 25,736,032 |
| |
| |
| |
| |
|
| Net Assets ($) | | | | | | | | 54,273,602 |
| |
| |
| |
| |
|
| Composition of Net Assets ($): | | | | | | | | |
| Paid-in capital | | | | | | | | 61,899,484 |
| Accumulated distributions in excess of investment income—net | | | | (72,636) |
| Accumulated net realized gain (loss) on investments | | | | | | (7,698,453) |
| Accumulated net unrealized appreciation (depreciation) on investments, | | |
| options transactions, swap transactions and foreign currency transactions | | |
| (including $27,444 net unrealized appreciation on financial futures) | | 145,207 |
| |
|
| Net Assets ($) | | | | | | | | 54,273,602 |
| |
| |
| |
| |
|
| |
| |
| |
| Net Asset Value Per Share | | | | | | | | |
| | | Class A | | Class B | | Class C | | Class R |
| |
| |
| |
| |
|
| Net Assets ($) | | 47,252,674 | | 2,773,278 | | 2,097,042 | | 2,150,608 |
| Shares Outstanding | | 4,428,178 | | 259,925 | | 196,349 | | 201,743 |
| |
| |
| |
| |
|
| Net Asset Value Per Share ($) | | 10.67 | | 10.67 | | 10.68 | | 10.66 |
See notes to financial statements.
The Fund 31
| STATEMENT OF OPERATIONS |
| Year Ended December 31, 2006 |
| Investment Income ($): | | |
| Income: | | |
| Interest | | 2,667,877 |
| Cash dividends: | | |
| Unaffiliated issuers | | 18,890 |
| Affiliated issuers | | 23,675 |
| Income from securities lending | | 1,828 |
| Total Income | | 2,712,270 |
| Expenses: | | |
| Management fee—Note 3(a) | | 353,070 |
| Distribution and service fees—Note 3(b) | | 159,933 |
| Loan commitment fees—Note 2 | | 394 |
| Total Expenses | | 513,397 |
| Investment Income—Net | | 2,198,873 |
| |
|
| Realized and Unrealized Gain (Loss) on Investments—Note 4 ($): |
| Net realized gain (loss) on investments and foreign currency transactions | | 156,347 |
| Net realized gain (loss) on swap transactions | | 46,554 |
| Net realized gain (loss) on options transactions | | 21,310 |
| Net realized gain (loss) on forward currency exchange contracts | | (134,463) |
| Net realized gain (loss) on financial futures | | (279,776) |
| Net Realized Gain (Loss) | | (190,028) |
| Net unrealized appreciation (depreciation) on investments, | | |
| forward currency exchange contracts, foreign currency | | |
| transactions, options and swap transactions (including $30,963 | | |
| net unrealized appreciation on financial futures) | | 434,034 |
| Net Realized and Unrealized Gain (Loss) on Investments | | 244,006 |
| Net Increase in Net Assets Resulting from Operations | | 2,442,879 |
See notes to financial statements.
STATEMENT OF CHANGES IN NET ASSETS
| | | Year Ended December 31, |
| |
|
| | | 2006 | | 2005 |
| |
| |
|
| Operations ($): | | | | |
| Investment income—net | | 2,198,873 | | 1,881,726 |
| Net realized gain (loss) on investments | | (190,028) | | 833,833 |
| Net unrealized appreciation | | | | |
| (depreciation) on investments | | 434,034 | | (1,443,134) |
| Net Increase (Decrease) in Net Assets | | | | |
| Resulting from Operations | | 2,442,879 | | 1,272,425 |
| |
| |
|
| Dividends to Shareholders from ($): | | | | |
| Investment income—net: | | | | |
| Class A shares | | (2,033,770) | | (1,925,411) |
| Class B shares | | (129,603) | | (179,019) |
| Class C shares | | (69,336) | | (60,333) |
| Class R shares | | (84,536) | | (85,448) |
| Net realized gain on investments: | | | | |
| Class A shares | | — | | (316,748) |
| Class B shares | | — | | (29,230) |
| Class C shares | | — | | (10,980) |
| Class R shares | | — | | (13,060) |
| Total Dividends | | (2,317,245) | | (2,620,229) |
| |
| |
|
| Beneficial Interest Transactions ($): | | | | |
| Net proceeds from shares sold: | | | | |
| Class A shares | | 12,417,172 | | 6,790,514 |
| Class B shares | | 667,285 | | 1,042,809 |
| Class C shares | | 1,285,514 | | 623,177 |
| Class R shares | | 595,821 | | 73,941 |
| Dividends reinvested: | | | | |
| Class A shares | | 1,705,392 | | 1,846,222 |
| Class B shares | | 97,660 | | 150,509 |
| Class C shares | | 29,617 | | 33,241 |
| Class R shares | | 66,131 | | 73,712 |
| Cost of shares redeemed: | | | | |
| Class A shares | | (10,912,615) | | (7,043,996) |
| Class B shares | | (2,022,593) | | (3,574,694) |
| Class C shares | | (887,977) | | (550,762) |
| Class R shares | | (319,730) | | (217,453) |
| Increase (Decrease) in Net Assets from | | | | |
| Beneficial Interest Transactions | | 2,721,677 | | (752,780) |
| Total Increase (Decrease) in Net Assets | | 2,847,311 | | (2,100,584) |
| |
| |
|
| Net Assets ($): | | | | |
| Beginning of Period | | 51,426,291 | | 53,526,875 |
| End of Period | | 54,273,602 | | 51,426,291 |
| Undistributed (distributions in excess of) | | | | |
| investment income—net | | (72,636) | | 17,690 |
The Fund 33
STATEMENT OF CHANGES IN NET ASSETS (continued)
| | | Year Ended December 31, |
| |
|
| | | 2006 | | 2005 |
| |
| |
|
| Capital Share Transactions: | | | | |
| Class Aa | | | | |
| Shares sold | | 1,178,484 | | 626,773 |
| Shares issued for dividends reinvested | | 161,611 | | 170,901 |
| Shares redeemed | | (1,033,981) | | (650,541) |
| Net Increase (Decrease) in Shares Outstanding | | 306,114 | | 147,133 |
| |
| |
|
| Class B a | | | | |
| Shares sold | | 63,406 | | 96,560 |
| Shares issued for dividends reinvested | | 9,261 | | 13,924 |
| Shares redeemed | | (192,381) | | (328,698) |
| Net Increase (Decrease) in Shares Outstanding | | (119,714) | | (218,214) |
| |
| |
|
| Class C | | | | |
| Shares sold | | 121,979 | | 57,799 |
| Shares issued for dividends reinvested | | 2,803 | | 3,071 |
| Shares redeemed | | (83,950) | | (51,368) |
| Net Increase (Decrease) in Shares Outstanding | | 40,832 | | 9,502 |
| |
| |
|
| Class R | | | | |
| Shares sold | | 55,827 | | 6,783 |
| Shares issued for dividends reinvested | | 6,271 | | 6,830 |
| Shares redeemed | | (30,267) | | (19,954) |
| Net Increase (Decrease) in Shares Outstanding | | 31,831 | | (6,341) |
a During the period ended December 31, 2006, 97,534 Class B shares representing $1,024,145 were automatically converted to 97,513 Class A shares and during the period ended December 31, 2005, 164,321 Class B shares representing $1,790,542 were automatically converted to 164,317 Class A shares.
See notes to financial statements.
FINANCIAL HIGHLIGHTS
The following tables describe the performance for each share class for the fiscal periods indicated.All information (except portfolio turnover rate) reflects financial results for a single fund share.Total return shows how much your investment in the fund would have increased (or decreased) during each period, assuming you had reinvested all dividends and distributions.These figures have been derived from the fund’s financial statements.
| | | | | Year Ended December 31, | | |
| |
| |
| |
|
| Class A Shares | | 2006 | | 2005 | | 2004 a | | 2003 | | 2002 |
| |
| |
| |
| |
| |
|
| Per Share Data ($): | | | | | | | | | | |
| Net asset value, beginning of period | | 10.65 | | 10.94 | | 10.90 | | 10.75 | | 10.37 |
| Investment Operations: | | | | | | | | | | |
| Investment income—net b | | .47 | | .40 | | .37 | | .33 | | .38 |
| Net realized and unrealized | | | | | | | | | | |
| gain (loss) on investments | | .04 | | (.13) | | .18 | | .26 | | .42 |
| Total from Investment Operations | | .51 | | .27 | | .55 | | .59 | | .80 |
| Distributions: | | | | | | | | | | |
| Dividends from investment income—net | | (.49) | | (.48) | | (.47) | | (.39) | | (.42) |
| Dividends from net realized | | | | | | | | | | |
| gain on investments | | — | | (.08) | | (.04) | | (.05) | | — |
| Total Distributions | | (.49) | | (.56) | | (.51) | | (.44) | | (.42) |
| Net asset value, end of period | | 10.67 | | 10.65 | | 10.94 | | 10.90 | | 10.75 |
| |
| |
| |
| |
| |
|
| Total Return (%) c | | 4.67 | | 2.50 | | 5.15 | | 5.51 | | 7.87 |
| |
| |
| |
| |
| |
|
| Ratios/Supplemental Data (%): | | | | | | | | | | |
| Ratio of total expenses | | | | | | | | | | |
| to average net assets | | .95 | | .95 | | .95 | | .95 | | .95 |
| Ratio of net investment income | | | | | | | | | | |
| to average net assets | | 4.43 | | 3.72 | | 3.38 | | 3.06 | | 3.63 |
| Portfolio Turnover Rate | | 422.95d | | 345.82d | | 315.33d | | 469.41d | | 524.46 |
| |
| |
| |
| |
| |
|
| Net Assets, end of period ($ X 1,000) | | 47,253 | | 43,915 | | 43,466 | | 43,811 | | 47,571 |
| a | | As of January 1, 2004, the fund has adopted the method of accounting for interim payments on swap contracts in |
| | | accordance with Financial Accounting Standards Board Statement No. 133.These interim payments are reflected |
| | | within net realized and unrealized gain (loss) on swap contracts, however, prior to January 1, 2004, these interim |
| | | payments were reflected within interest income/expense in the Statement of Operations.The effect of these changes for |
| | | the fiscal year ended December 31, 2004, was to decrease net investment income per share by $.02, increase net |
| | | realized and unrealized gain (loss) on investments per share by $.02 and decrease the ratio of net investment income |
| | | to average net assets from 3.52% to 3.38%. |
| b | | Based on average shares outstanding at each month end. |
| c | | Exclusive of sales charge. |
| d | | The portfolio turnover rates excluding mortgage dollar roll transactions for the years ended December 31, 2006, |
| | | December 31, 2005, December 31, 2004 and December 31, 2003 were 334.24%, 198.52%, 189.68% and |
| | | 272.57%, respectively. |
| See notes to financial statements. |
The Fund 35
FINANCIAL HIGHLIGHTS (continued)
| | | | | Year Ended December 31, | | |
| |
| |
| |
|
| Class B Shares | | 2006 | | 2005 | | 2004 a | | 2003 | | 2002 |
| |
| |
| |
| |
| |
|
| Per Share Data ($): | | | | | | | | | | |
| Net asset value, beginning of period | | 10.65 | | 10.93 | | 10.90 | | 10.75 | | 10.37 |
| Investment Operations: | | | | | | | | | | |
| Investment income—net b | | .38 | | .32 | | .30 | | .25 | | .30 |
| Net realized and unrealized | | | | | | | | | | |
| gain (loss) on investments | | .05 | | (.12) | | .16 | | .25 | | .42 |
| Total from Investment Operations | | .43 | | .20 | | .46 | | .50 | | .72 |
| Distributions: | | | | | | | | | | |
| Dividends from investment income—net | | (.41) | | (.40) | | (.39) | | (.30) | | (.34) |
| Dividends from net realized | | | | | | | | | | |
| gain on investments | | — | | (.08) | | (.04) | | (.05) | | — |
| Total Distributions | | (.41) | | (.48) | | (.43) | | (.35) | | (.34) |
| Net asset value, end of period | | 10.67 | | 10.65 | | 10.93 | | 10.90 | | 10.75 |
| |
| |
| |
| |
| |
|
| Total Return (%) c | | 3.90 | | 1.84 | | 4.27 | | 4.73 | | 7.07 |
| |
| |
| |
| |
| |
|
| Ratios/Supplemental Data (%): | | | | | | | | | | |
| Ratio of total expenses | | | | | | | | | | |
| to average net assets | | 1.70 | | 1.70 | | 1.70 | | 1.70 | | 1.70 |
| Ratio of net investment income | | | | | | | | | | |
| to average net assets | | 3.68 | | 2.99 | | 2.77 | | 2.31 | | 2.91 |
| Portfolio Turnover Rate | | 422.95d | | 345.82d | | 315.33d | | 469.41d | | 524.46 |
| |
| |
| |
| |
| |
|
| Net Assets, end of period ($ X 1,000) | | 2,773 | | 4,044 | | 6,537 | | 10,309 | | 12,470 |
| a | | As of January 1, 2004, the fund has adopted the method of accounting for interim payments on swap contracts in |
| | | accordance with Financial Accounting Standards Board Statement No. 133.These interim payments are reflected |
| | | within net realized and unrealized gain (loss) on swap contracts, however, prior to January 1, 2004, these interim |
| | | payments were reflected within interest income/expense in the Statement of Operations.The effect of these changes for |
| | | the fiscal year ended December 31, 2004, was to decrease net investment income per share by $.01, increase net |
| | | realized and unrealized gain (loss) on investments per share by $.01 and decrease the ratio of net investment income |
| | | to average net assets from 2.88% to 2.77%. |
| b | | Based on average shares outstanding at each month end. |
| c | | Exclusive of sales charge. |
| d | | The portfolio turnover rates excluding mortgage dollar roll transactions for the years ended December 31, 2006, |
| | | December 31, 2005, December 31, 2004 and December 31, 2003 were 334.24%, 198.52%, 189.68% and |
| | | 272.57%, respectively. |
| See notes to financial statements. |
| | | | | Year Ended December 31, | | |
| |
| |
| |
|
| Class C Shares | | 2006 | | 2005 | | 2004 a | | 2003 | | 2002 |
| |
| |
| |
| |
| |
|
| Per Share Data ($): | | | | | | | | | | |
| Net asset value, beginning of period | | 10.66 | | 10.94 | | 10.91 | | 10.76 | | 10.38 |
| Investment Operations: | | | | | | | | | | |
| Investment income—net b | | .39 | | .32 | | .29 | | .25 | | .31 |
| Net realized and unrealized | | | | | | | | | | |
| gain (loss) on investments | | .04 | | (.12) | | .17 | | .25 | | .41 |
| Total from Investment Operations | | .43 | | .20 | | .46 | | .50 | | .72 |
| Distributions: | | | | | | | | | | |
| Dividends from investment income—net | | (.41) | | (.40) | | (.39) | | (.30) | | (.34) |
| Dividends from net realized | | | | | | | | | | |
| gain on investments | | — | | (.08) | | (.04) | | (.05) | | — |
| Total Distributions | | (.41) | | (.48) | | (.43) | | (.35) | | (.34) |
| Net asset value, end of period | | 10.68 | | 10.66 | | 10.94 | | 10.91 | | 10.76 |
| |
| |
| |
| |
| |
|
| Total Return (%) c | | 3.89 | | 1.83 | | 4.28 | | 4.73 | | 7.06 |
| |
| |
| |
| |
| |
|
| Ratios/Supplemental Data (%): | | | | | | | | | | |
| Ratio of total expenses | | | | | | | | | | |
| to average net assets | | 1.70 | | 1.70 | | 1.70 | | 1.70 | | 1.70 |
| Ratio of net investment income | | | | | | | | | | |
| to average net assets | | 3.67 | | 2.98 | | 2.66 | | 2.31 | | 2.92 |
| Portfolio Turnover Rate | | 422.95d | | 345.82d | | 315.33d | | 469.41d | | 524.46 |
| |
| |
| |
| |
| |
|
| Net Assets, end of period ($ X 1,000) | | 2,097 | | 1,658 | | 1,598 | | 1,692 | | 1,980 |
| a | | As of January 1, 2004, the fund has adopted the method of accounting for interim payments on swap contracts in |
| | | accordance with Financial Accounting Standards Board Statement No. 133.These interim payments are reflected |
| | | within net realized and unrealized gain (loss) on swap contracts, however, prior to January 1, 2004, these interim |
| | | payments were reflected within interest income/expense in the Statement of Operations.The effect of these changes for |
| | | the fiscal year ended December 31, 2004, was to decrease net investment income per share by $.01, increase net |
| | | realized and unrealized gain (loss) on investments per share by $.01 and decrease the ratio of net investment income |
| | | to average net assets from 2.80% to 2.66%. |
| b | | Based on average shares outstanding at each month end. |
| c | | Exclusive of sales charge. |
| d | | The portfolio turnover rates excluding mortgage dollar roll transactions for the years ended December 31, 2006, |
| | | December 31, 2005, December 31, 2004 and December 31, 2003 were 334.24%, 198.52%, 189.68% and |
| | | 272.57%, respectively. |
| See notes to financial statements. |
The Fund 37
FINANCIAL HIGHLIGHTS (continued)
| | | | | Year Ended December 31, | | |
| |
| |
| |
|
| Class R Shares | | 2006 | | 2005 | | 2004 a | | 2003 | | 2002 |
| |
| |
| |
| |
| |
|
| Per Share Data ($): | | | | | | | | | | |
| Net asset value, beginning of period | | 10.64 | | 10.93 | | 10.89 | | 10.74 | | 10.36 |
| Investment Operations: | | | | | | | | | | |
| Investment income—net b | | .49 | | .43 | | .39 | | .37 | | .41 |
| Net realized and unrealized | | | | | | | | | | |
| gain (loss) on investments | | .05 | | (.13) | | .19 | | .24 | | .41 |
| Total from Investment Operations | | .54 | | .30 | | .58 | | .61 | | .82 |
| Distributions: | | | | | | | | | | |
| Dividends from investment income—net | | (.52) | | (.51) | | (.50) | | (.41) | | (.44) |
| Dividends from net realized | | | | | | | | | | |
| gain on investments | | — | | (.08) | | (.04) | | (.05) | | — |
| Total Distributions | | (.52) | | (.59) | | (.54) | | (.46) | | (.44) |
| Net asset value, end of period | | 10.66 | | 10.64 | | 10.93 | | 10.89 | | 10.74 |
| |
| |
| |
| |
| |
|
| Total Return (%) | | 4.93 | | 2.76 | | 5.43 | | 5.78 | | 8.14 |
| |
| |
| |
| |
| |
|
| Ratios/Supplemental Data (%): | | | | | | | | | | |
| Ratio of total expenses | | | | | | | | | | |
| to average net assets | | .70 | | .70 | | .70 | | .70 | | .70 |
| Ratio of net investment income | | | | | | | | | | |
| to average net assets | | 4.68 | | 3.97 | | 3.61 | | 3.70 | | 3.88 |
| Portfolio Turnover Rate | | 422.95c | | 345.82c | | 315.33c | | 469.41c | | 524.46 |
| |
| |
| |
| |
| |
|
| Net Assets, end of period ($ X 1,000) | | 2,151 | | 1,809 | | 1,926 | | 2,202 | | 3,387 |
| a | | As of January 1, 2004, the fund has adopted the method of accounting for interim payments on swap contracts in |
| | | accordance with Financial Accounting Standards Board Statement No. 133.These interim payments are reflected |
| | | within net realized and unrealized gain (loss) on swap contracts, however, prior to January 1, 2004, these interim |
| | | payments were reflected within interest income/expense in the Statement of Operations.The effect of these changes for |
| | | the fiscal year ended December 31, 2004, was to decrease net investment income per share by $.02, increase net |
| | | realized and unrealized gain (loss) on investments per share by $.02 and decrease the ratio of net investment income |
| | | to average net assets from 3.74% to 3.61%. |
| b | | Based on average shares outstanding at each month end. |
| c | | The portfolio turnover rates excluding mortgage dollar roll transactions for the years ended December 31, 2006, |
| | | December 31, 2005, December 31, 2004 and December 31, 2003 were 334.24%, 198.52%, 189.68% and |
| | | 272.57%, respectively. |
| See notes to financial statements. |
NOTES TO FINANCIAL STATEMENTS
NOTE 1—Significant Accounting Policies:
Dreyfus Premier Managed Income Fund (the “fund”) is a separate diversified series of The Dreyfus/Laurel Funds Trust (the “Trust”), which is registered under the Investment Company Act of 1940, as amended (the “Act”), as an open-end management investment company and operates as a series company offering six series, including the fund, as of the date of this report. The fund’s investment objective is to seek high current income consistent with what is believed to be prudent risk of capital primarily through investments in investment-grade corporate and U.S. Government obligations which primarily have maturities of 10 years or less. The Dreyfus Corporation (the “Manager” or “Dreyfus”) serves as the fund’s investment manager. The Manager is a wholly-owned subsidiary of Mellon Financial Corporation (“Mellon Financial”).
On December 4, 2006, Mellon Financial and The Bank of New York Company, Inc. announced that they had entered into a definitive agreement to merge. The new company will be called The Bank of New York Mellon Corporation. As part of this transaction, Dreyfus would become a wholly-owned subsidiary of The Bank of New York Mellon Corporation.The transaction is subject to certain regulatory approvals and the approval of The Bank of New York Company, Inc.’s and Mellon Financial’s shareholders, as well as other customary conditions to closing. Subject to such approvals and the satisfaction of the other conditions, Mellon Financial and The Bank of New York Company, Inc. expect the transaction to be completed in the third quarter of 2007.
Dreyfus Service Corporation (the “Distributor”), a wholly-owned subsidiary of the Manager, is the distributor of the fund’s shares.The fund is authorized to issue an unlimited number of shares of Beneficial Interest in the following classes of shares: Class A, Class B, Class C and Class R. Class A, Class B and Class C shares are sold primarily to retail investors through financial intermediaries and bear a distribution fee and/or service fee. Class A shares are sold with a front-end sales charge, while Class B and Class C shares are subject to a contingent deferred sales charge (“CDSC”). Class B shares automatically convert to Class A
The Fund 39
NOTES TO FINANCIAL STATEMENTS (continued)
shares after six years. Class R shares are sold primarily to bank trust departments and other financial service providers (including Mellon Bank and its affiliates) acting on behalf of customers having a qualified trust or investment account or relationship at such institution, and bear no distribution fee or service fee. Class R shares are offered without a front-end sales charge or CDSC. Each class of shares has identical rights and privileges, except with respect to distribution fees and voting rights on matters affecting a single class. Income, expenses (other than expenses attributable to a specific class), and realized and unrealized gains or losses on investments are allocated to each class of shares based on its relative net assets.
Effective March 1, 2006, Class A shares of the fund may be purchased at net asset value (“NAV”) without payment of a sales charge:
- By qualified investors who (i) purchase Class A shares directly through the Distributor, and (ii) have, or whose spouse or minor children have, beneficially owned shares and continuously maintained an open account directly through the Distributor in a Dreyfus-managed fund, including the fund, or a Founders Asset Management LLC
(“Founders”) managed fund since on or before February 28, 2006. Founders is a wholly-owned subsidiary of the Distributor. - With the cash proceeds from an investor’s exercise of employment- related stock options, whether invested in the fund directly or indi- rectly through an exchange from a Dreyfus-managed money market fund, provided that the proceeds are processed through an entity that has entered into an agreement with the Distributor specifically relat- ing to processing stock options. Upon establishing the account in the fund or the Dreyfus-managed money market fund, the investor and the investor’s spouse and minor children become eligible to purchase Class A shares of the fund at NAV, whether or not using the proceeds of the employment-related stock options.
- By members of qualified affinity groups who purchase Class A shares directly through the Distributor, provided that the qualified affinity group has entered into an affinity agreement with the Distributor.
Effective June 1, 2006, the fund no longer offers Class B shares, except in connection with dividend reinvestment and permitted exchanges of Class B shares.
The fund’s financial statements are prepared in accordance with U.S. generally accepted accounting principles, which may require the use of management estimates and assumptions. Actual results could differ from those estimates.
(a) Portfolio valuation: Investments in securities (excluding short-term investments other than U.S. Treasury Bills), financial futures, options, swaps and forward currency exchange contracts are valued each business day by an independent pricing service (the “Service”) approved by the Board of Trustees. Investments for which quoted bid prices are readily available and are representative of the bid side of the market in the judgment of the Service are valued at the mean between the quoted bid prices (as obtained by the Service from dealers in such securities) and asked prices (as calculated by the Service based upon its evaluation of the market for such securities). Other investments (which constitute a majority of the portfolio securities) are valued as determined by the Service, based on methods which include consideration of: yields or prices of securities of comparable quality, coupon, maturity and type; indications as to values from dealers; and general market conditions. Restricted securities, as well as securities or other assets for which recent market quotations are not readily available and are not valued by a pricing service approved by the Board of Trustees, or are determined by the fund not to reflect accurately fair value, are valued at fair value as determined in good faith under the direction of the Board of Trustees.The factors that may be considered when fair valuing a security include fundamental analytical data, the nature and duration of restrictions on disposition, an evaluation of the forces that influence the market in which the securities are purchased and sold and public trading in similar securities of the issuer or comparable issuers. Short-term investments, excluding U.S. Treasury Bills, are carried at amortized cost, which
The Fund 41
NOTES TO FINANCIAL STATEMENTS (continued)
approximates fair value.Registered open-end investment companies that are not traded on an exchange are valued at their NAV. Financial futures and options, which are traded on an exchange, are valued at the last sales price on the securities exchange on which such securities are primarily traded or at the last sales price on the national securities market on each business day. Options traded over-the-counter are priced at the mean between the bid and asked prices. Investments denominated in foreign currencies are translated to U.S. dollars at the prevailing rates of exchange. Forward currency exchange contracts are valued at the forward rate. Investments in swap transactions are valued each business day by a pricing service approved by the Board of Trustees. Swaps are valued by the service by using a swap pricing model which incorporates among other factors, default probabilities, recovery rates, credit curves of the underlying issuer and swap spreads on interest rates.
On September 20, 2006, the Financial Accounting Standards Board (FASB) released Statement of Financial Accounting Standards No. 157 “Fair Value Measurements” (“FAS 157”). FAS 157 establishes an authoritative definition of fair value, sets out a framework for measuring fair value, and requires additional disclosures about fair-value measurements. The application of FAS 157 is required for fiscal years beginning after November 15, 2007 and interim periods within those fiscal years. Management does not believe that the application of this standard will have a material impact on the financial statements of the fund.
(b) Foreign currency transactions: The fund does not isolate that portion of the results of operations resulting from changes in foreign exchange rates on investments from the fluctuations arising from changes in the market prices of securities held. Such fluctuations are included with the net realized and unrealized gain or loss on investments.
Net realized foreign exchange gains or losses arise from sales and maturities of short-term securities, sales of foreign currencies, currency gains or losses realized on securities transactions and the difference between the amount of dividends, interest and foreign withholding taxes recorded on the fund’s books and the U.S. dollar equivalent of the
amounts actually received or paid. Net unrealized foreign exchange gains and losses arise from changes in the value of assets and liabilities other than investments in securities, resulting from changes in exchange rates. Such gains and losses are included with net realized and unrealized gain or loss on investments.
(c) Securities transactions and investment income: Securities transactions are recorded on a trade date basis. Realized gain and loss from securities transactions are recorded on the identified cost basis. Dividend income is recorded on the ex-dividend date and interest income, including, where applicable, accretion of discount and amortization of premium on investments, is recognized on the accrual basis.
Pursuant to a securities lending agreement with Mellon Bank, N.A., an affiliate of the Manager, the fund may lend securities to qualified institutions. It is the fund’s policy, that at origination, all loans are secured by collateral of at least 102% of the value of U.S. securities loaned and 105% of the value of foreign securities loaned. Collateral equivalent to at least 100% of the market value of securities on loan is maintained at all times. Cash collateral is invested in certain money market mutual funds managed by the Manager.The fund is entitled to receive all income on securities loaned, in addition to income earned as a result of the lending transaction.Although each security loaned is fully collateralized, the fund bears the risk of delay in recovery of, or loss of rights in, the securities loaned should a borrower fail to return the securities in a timely manner.
(d) Affiliated issuers: Investments in other investment companies advised by the Manager are defined as “affiliated” in the Act.
(e) Concentration of Risk: The fund invests primarily in debt securities. Failure of an issuer of the debt securities to make timely interest or principal payments, or a decline or the perception of a decline in the credit quality of a debt security, can cause the debt security’s price to fall, potentially lowering the fund’s share price. In addition the value of debt securities may decline due to general market con-
The Fund 43
NOTES TO FINANCIAL STATEMENTS (continued)
ditions that are not specifically related to a particular company, such as real or perceived adverse economic conditions, changes in outlook for corporate earnings, changes in interest or currency rates or adverse investor sentiment.They may also decline because of factors that affect a particular industry.
(f) Dividends to shareholders: It is the policy of the fund to declare dividends daily from investment income-net. Such dividends are paid monthly. Dividends from net realized capital gain, if any, are normally declared and paid annually, but the fund may make distributions on a more frequent basis to comply with the distribution requirements of the Internal Revenue Code of 1986, as amended (the “Code”).To the extent that net realized capital gain can be offset by capital loss carryovers, it is the policy of the fund not to distribute such gain.
(g) Federal income taxes: It is the policy of the fund to continue to qualify as a regulated investment company, if such qualification is in the best interests of its shareholders, by complying with the applicable provisions of the Code, and to make distributions of taxable income sufficient to relieve it from substantially all federal income and excise taxes.
On July 13, 2006, the FASB released FASB Interpretation No. 48 “Accounting for Uncertainty in Income Taxes” (FIN 48). FIN 48 provides guidance for how uncertain tax positions should be recognized, measured, presented and disclosed in the financial statements. FIN 48 requires the evaluation of tax positions taken or expected to be taken in the course of preparing the fund’s tax returns to determine whether the tax positions are “more-likely-than-not” of being sustained by the applicable tax authority.Tax positions not deemed to meet the more-likely-than-not threshold would be recorded as a tax benefit or expense in the current year. Adoption of FIN 48 is required for fiscal years beginning after December 15, 2006 and is to be applied to all open tax years as of the effective date. Management does not believe that the application of this standard will have a material impact on the financial statements of the fund.
At December 31, 2006, the components of accumulated earnings on a tax basis were as follows: undistributed ordinary income $114,254, accumulated capital losses $7,402,051 and unrealized depreciation $304,138. In addition, the fund had $33,947 of capital losses realized after October 31, 2006, which were deferred for tax purposes to the first day of the following fiscal year.
The accumulated capital loss carryover is available to be applied against future net securities profits, if any, realized subsequent to December 31, 2006. If not applied, $4,281,545 of the carryover expires in fiscal 2007, $2,840,637 expires in fiscal 2008 and $279,869 expires in fiscal 2014.
The tax character of distributions paid to shareholders during the fiscal periods ended December 31, 2006 and December 31, 2005, were as follows: ordinary income $2,317,245 and $2,620,229, respectively.
During the period ended December 31, 2006, as a result of permanent book to tax differences, primarily due to the tax treatment for amortization of premiums, treasury inflation protected securities, paydown gains and losses, swap periodic payments and foreign currency transactions, the fund increased accumulated undistributed investment income-net by $28,046, decreased net realized gain (loss) on investments by $27,194 and decreased paid-in capital by $852. Net assets were not affected by this reclassification.
NOTE 2—Bank Line of Credit:
The fund participates with other Dreyfus-managed funds in a $350 million redemption credit facility (the “Facility”) to be utilized for temporary or emergency purposes, including the financing of redemptions. In connection therewith, the fund has agreed to pay commitment fees on its pro rata portion of the Facility. Interest is charged to the fund based on prevailing market rates in effect at the time of borrowing. During the period ended December 31, 2006, the fund did not borrow under the Facility.
The Fund 45
NOTES TO FINANCIAL STATEMENTS (continued)
NOTE 3—Investment Management Fee and Other Transactions With Affiliates:
(a) Pursuant to an Investment Management agreement with the Manager, the Manager provides or arranges for one or more third parties and/or affiliates to provide investment advisory, administrative, custody, fund accounting and transfer agency services to the fund. The Manager also directs the investments of the fund in accordance with its investment objective, policies and limitations. For these services, the fund is contractually obligated to pay the Manager a fee, calculated daily and paid monthly, at the annual rate of .70% of the value of the fund’s average daily net assets. Out of its fee, the Manager pays all of the expenses of the fund except brokerage fees, taxes, interest, commitment fees, Rule 12b-1 distribution fees and expenses, service fees and expenses of non-interested Trustees (including counsel fees) and extraordinary expenses. In addition, the Manager is required to reduce its fee in an amount equal to the fund’s allocable portion of fees and expenses of the non-interested Trustees (including counsel fees). Each Trustee receives $45,000 per year, plus $6,000 for each joint Board meeting of The Dreyfus/Laurel Funds, Inc., The Dreyfus/Laurel Tax-Free Municipal Funds and Trust (collectively, the “Dreyfus/Laurel Funds”) attended, $2,000 for separate in-person committee meetings attended which are not held in conjunction with a regularly scheduled Board meeting and $1,500 for Board meetings and separate committee meetings attended that are conducted by telephone and is reimbursed for travel and out-of-pocket expenses.With respect to Board meetings, the Chairman of the Board receives an additional 25% of such compensation (with the exception of reimbursable amounts).With respect to compensation committee meetings, the Chair of the compensation committee receives $900 per meeting and, with respect to audit committee meetings, the Chair of the audit committee receives $1,350 per meeting. In the event that there is an in-person joint committee meeting or a joint telephone meeting of the Dreyfus/Laurel Funds and Dreyfus High Yield Strategies Fund, the $2,000 or $1,500 fee, as applicable, will be allocated between the Dreyfus/Laurel Funds and Dreyfus High Yield Strategies Fund. These fees and expenses are charged and allocated to each series based on net assets. Amounts
required to be paid by the Trust directly to the non-interested Trustees, that would be applied to offset a portion of the management fee payable to the Manager, are in fact paid directly by the Manager to the non-interested Trustees.
During the period ended December 31, 2006, the Distributor retained $5,254 from commissions earned on sales of the fund’s Class A shares and $4,637 and $964 from CDSC on redemptions on the fund’s Class B and Class C shares, respectively.
(b) Under separate Distribution Plans (the “Plans”) adopted pursuant to Rule 12b-1 under the Act, Class A shares pay annually up to .25% of the value of the average daily net assets to compensate the Distributor for shareholder servicing activities and expenses primarily intended to result in the sale of Class A shares. Class B and Class C shares may pay the Distributor for distributing their shares at an aggregate annual rate of .75% of the value of the average daily net assets of Class B and Class C shares. Class B and Class C shares are also subject to a service plan adopted pursuant to Rule 12b-1 (the “Service Plan”), under which Class B and Class C shares pay the Distributor for providing certain services to the holders of their shares a fee at the annual rate of .25% of the value of the average daily net assets of Class B and Class C shares. During the period ended December 31, 2006, Class A, Class B and Class C shares were charged $109,080, $24,821 and $13,319, respectively, pursuant to their respective Plans. Class B and Class C shares were charged $8,273 and $4,440, respectively, pursuant to the Service Plan.
Under its terms, the Plans and Service Plan shall remain in effect from year to year, provided such continuance is approved annually by a vote of majority of those Trustees who are not “interested persons” of the Trust and who have no direct or indirect financial interest in the operation of or in any agreement related to the Plans or Service Plan.
The components of Due to The Dreyfus Corporation and affiliates in the Statement of Assets and Liabilities consist of: management fees $31,246, Rule 12b-1 distribution plan fees $13,100 and shareholder services plan fees $1,018.
The Fund 47
NOTES TO FINANCIAL STATEMENTS (continued)
(c) The Trust and the Manager have received an exemptive order from the SEC which, among other things, permits the fund to use cash collateral received in connection with lending the fund’s securities and other uninvested cash to purchase shares of one or more registered money market mutual funds advised by the Manager in excess of the limitations imposed by the Act.
NOTE 4—Securities Transactions:
The aggregate amount of purchases and sales (including paydowns) of investment securities, excluding short-term securities, forward currency exchange contracts, futures, options and swap transactions during the period ended December 31, 2006, amounted to $302,107,066 and $288,657,555, respectively, of which $60,503,641 in purchases and $60,540,319 in sales were from mortgage dollar roll transactions.
A mortgage dollar roll transaction involves a sale by the fund of mortgage related securities that it holds with an agreement by the fund to repurchase similar securities at an agreed upon price and date. The securities purchased will bear the same interest rate as those sold, but generally will be collateralized by pools of mortgages with different prepayment histories than those securities sold.
The fund may purchase and write (sell) call/put options in order to gain exposure to or protect against change in the market.
As a writer of call options, the fund receives a premium at the outset and then bears the market risk of unfavorable changes in the price of the financial instruments underlying the options. Generally, the fund would incur a gain, to the extent of the premium, if the price of the underlying financial instrument decreases between the date the option is written and the date on which the option is terminated. Generally, the fund would realize a loss, if the price of the financial instrument increases between those dates.
As a writer of put options, the fund receives a premium at the outset and then bears the market risk of unfavorable changes in the price of the financial instruments underlying the options. Generally, the fund would incur a gain, to the extent of the premium, if the price of the
underlying financial instrument increases between the date the option is written and the date on which the option is terminated. Generally, the fund would realize a loss, if the price of the financial instrument decreases between those dates.
In addition, the following table summarizes the fund’s call/put options written during the period ended December 31, 2006:
| | | Face Amount | | | | Options Terminated |
| | | | | |
|
| | | Covered by | | Premiums | | | | Net Realized |
| Options Written: | | Contracts ($) | | Received ($) | | Cost ($) | | Gain/(Loss) ($) |
| |
| |
| |
| |
|
| Contracts outstanding | | | | | | | | |
| December 31, 2005 | | 17,252,000 | | 42,442 | | — | | — |
| Contracts written | | 208,015,000 | | 91,851 | | | | |
| Contracts terminated; | | | | | | | | |
| Closed | | 25,747,000 | | 50,628 | | 113,675 | | (63,047) |
| Expired | | 196,125,000 | | 71,443 | | — | | 71,443 |
| Total contracts | | | | | | | | |
| terminated | | 221,872,000 | | 122,071 | | 113,675 | | 8,396 |
| Contracts outstanding | | | | | | | | |
| December 31, 2006 | | 3,395,000 | | 12,222 | | | | |
The fund may invest in financial futures contracts in order to gain exposure to or protect against changes in the market. The fund is exposed to market risk as a result of changes in the value of the underlying financial instruments. Investments in financial futures require the fund to “mark to market” on a daily basis, which reflects the change in the market value of the contracts at the close of each day’s trading. Accordingly, variation margin payments are received or made to reflect daily unrealized gains or losses.When the contracts are closed, the fund recognizes a realized gain or loss.These investments require initial margin deposits with a broker.The amount of these deposits is determined by the exchange or Board of Trade on which the contract is traded and is subject to change. Contracts open at December 31, 2006 are set forth in the Statement of Financial Futures.
The fund enters into forward currency exchange contracts in order to hedge its exposure to changes in foreign currency exchange rates on its foreign portfolio holdings and to settle foreign currency transactions. When executing forward currency exchange contracts, the fund is
The Fund 49
NOTES TO FINANCIAL STATEMENTS (continued)
obligated to buy or sell a foreign currency at a specified rate on a certain date in the future. With respect to sales of forward currency exchange contracts, the fund would incur a loss if the value of the contract increases between the date the forward contract is opened and the date the forward contract is closed.The fund realizes a gain if the value of the contract decreases between those dates.With respect to purchases of forward currency exchange contracts, the fund would incur a loss if the value of the contract decreases between the date the forward contract is opened and the date the forward contract is closed. The fund realizes a gain if the value of the contract increases between those dates. The fund is also exposed to credit risk associated with counterparty nonperformance on these forward currency exchange contracts which is typically limited to the unrealized gain on each open contract.The following summarizes open forward currency exchange contracts at December 31, 2006:
| | | Foreign | | | | Unrealized |
| Forward Currency | | Currency | | | | Appreciation |
| Exchange Contracts | | Amounts | | Cost ($) Value ($) | | (Depreciation) ($) |
| |
| |
| |
|
| Purchases: | | | | | | |
| Euro, expiring | | | | | | |
| 2/28/2007 | | 405,000 | | 534,276 535,815 | | 1,539 |
| Icelandic Krona, | | | | | | |
| expiring 3/21/2007 | | 9,416,000 | | 133,372 132,545 | | (827) |
| Sales: | | | | Proceeds ($) | | |
| Euro, expiring | | | | | | |
| 3/21/2007 | | 250,978 | | 331,804 332,320 | | (516) |
| Poland Zloty, | | | | | | |
| expiring 3/21/2007 | | 4,750,000 | | 1,658,809 1,640,137 | | 18,672 |
| Total | | | | | | 18,868 |
The fund may enter into swap agreements to exchange the interest rate on, or return generated by, one nominal instrument for the return generated by another nominal instrument.
The fund accrues for the interim payments on swap contracts on a daily basis, with the net amount recorded within unrealized appreciation (depreciation) of swap contracts in the Statement of Assets and Liabilities.
Once the interim payments are settled in cash, the net amount is recorded as realized gain (loss) on swaps, in addition to realized gain (loss) recorded upon the termination of swaps contracts in the Statement of Operations. Fluctuations in the value of swap contracts are recorded as a component of net change in unrealized appreciation (depreciation) on investments.
The fund may enter into interest rate swaps which involve the exchange of commitments to pay and receive interest based on a notional principal amount. The following summarizes interest rate swaps entered into by the fund at December 31, 2006:
| | | | | | | | | | | Unrealized |
| Notional | | Reference | | | | (Pay) Receive | | | | Appreciation |
| Amount | | Entity/Currency | | Counterparty | | Fixed Rate (%) Expiration (Depreciation)($) |
| |
| |
| |
|
| |
| 270,000 | | USD-1Month | | Lehman | | | | | | |
| | | LIBOR BBA | | Brothers | | 4.10 | | 12/2/2009 | | (7,576) |
| 1,281,000 | | USD-3 Month | | | | | | | | |
| | | LIBOR BBA | | Merrill Lynch | | 4.17 | | 5/13/2008 | | (19,671) |
| 3,350,000 | | USD-3 Month | | J.P. Morgan | | | | | | |
| | | LIBOR BBA | | Chase Bank | | 5.56 | | 8/3/2016 | | 143,563 |
| 3,885,000 | | USD-3 Month | | | | | | | | |
| | | LIBOR BBA | | Merrill Lynch | | 5.43 | | 6/8/2008 | | 9,440 |
| 537,000,000 | | JPY-6 Month | | | | | | | | |
| | | LIBOR BBA | | UBS Warburg | | .88 | | 5/11/2008 | | 6,019 |
| 14,700,000 | | SEK-3 Month | | Morgan | | | | | | |
| | | STIBOR | | Stanley | | 3.76 | | 12/4/2008 | | (6,860) |
| | | | | | | | | | | 124,915 |
Credit default swaps involve commitments to pay or receive a fixed interest rate in exchange for payment if a credit event affecting a third party (the referenced company) occurs. Credit events may include a failure to pay interest or principal, bankruptcy, or restructuring. For those credit default swaps in which the fund is receiving a fixed rate, the fund is providing credit protection on the underlying instrument. The maximum payouts for these contracts are limited to the notional amount of each swap. The following summarizes open credit default swap agreements at December 31, 2006:
The Fund 51
NOTES TO FINANCIAL STATEMENTS (continued)
| | | | | | | | | | | Unrealized |
| Notional | | Reference | | | | (Pay) Receive | | Appreciation |
| Amount ($) | | Entity | | Counterparty | | Fixed Rate (%) Expiration (Depreciation)($) |
| |
| |
| |
|
| |
| 805,000 | | ABX.HE.BBB | | Deutsche | | | | | | |
| | | 2006-1 Index | | Bank | | (1.54) | | 7/25/2045 | | (726) |
| 805,000 | | ABX.HE.BBB | | Morgan | | | | | | |
| | | 2006-1 Index | | Stanley | | (1.54) | | 7/25/2045 | | (222) |
| 535,000 | | ABX.HE.BBB | | Deutsche | | | | | | |
| | | 2006-2 Index | | Bank | | 1.33 | | 5/25/2046 | | (3,455) |
| 535,000 | | ABX.HE.BBB | | Morgan | | | | | | |
| | | 2006-2 Index | | Stanley | | 1.33 | | 5/25/2046 | | (2,786) |
| 80,000 | | Alcoa, 6%, | | Bear | | | | | | |
| | | 1/15/2012 | | Stearns & Co. | | (.42) | | 6/20/2010 | | (814) |
| 177,000 | | Alcoa, 6.5%, | | Bear | | | | | | |
| | | 6/1/2011 | | Stearns & Co. | | (.52) | | 6/20/2010 | | (2,402) |
| 1,070,000 | | Altria, 7%, | | | | | | | | |
| | | 11/4/2013 | | Citigroup | | (.27) | | 12/20/2011 | | (1,524) |
| 198,000 | | CenturyTel, | | | | | | | | |
| | | 7.875%, | | | | | | | | |
| | | 8/15/2012 | | Citigroup | | (1.16) | | 9/20/2015 | | 98 |
| 58,000 | | CenturyTel, | | | | | | | | |
| | | 7.875%, | | | | | | | | |
| | | 8/15/2012 | | Morgan Stanley | | (1.15) | | 9/20/2015 | | 68 |
| 120,000 | | Clear Channel | | | | | | | | |
| | | Communications, | | | | | | | | |
| | | 6.875%, | | Lehman | | | | | | |
| | | 6/15/2018 | | Brothers | | .75 | | 12/20/2008 | | 233 |
| 300,000 | | CMLTI 2006-WMC1, | | | | | | | | |
| | | Cl. M8, 6.71%, | | Morgan | | | | | | |
| | | 12/25/2035 | | Stanley | | (1.20) | | 12/25/2035 | | 6,590 |
| 257,000 | | ConocoPhillips, | | | | | | | | |
| | | 4.75%, | | Bear | | | | | | |
| | | 10/15/2012 | | Stearns & Co. | | (.31) | | 6/20/2010 | | (1,765) |
| 160,000 | | DIRECTV, | | Lehman | | | | | | |
| | | 8.375%, 3/15/13 | | Brothers | | (2.35) | | 12/20/2016 | | 1,333 |
| 260,000 | | Dow Jones. | | | | | | | | |
| | | CDX.EM.6 Index | | UBS Warburg | | 1.40 | | 12/20/2011 | | 1,816 |
| 250,000 | | Dow Jones. | | Deutsche | | | | | | |
| | | CDX.EM.6 Index | | Bank | | 1.40 | | 12/20/2011 | | 5,725 |
| 355,000 | | Dow Jones | | | | | | | | |
| | | CDX.NA.IG.4 Index | | Citigroup | | (.71) | | 6/20/2010 | | (7,546) |
| 230,000 | | Dow Jones | | Morgan | | | | | | |
| | | CDX.NA.IG.4 Index | | Stanley | | (.69) | | 6/20/2010 | | (4,740) |
| 240,000 | | Dow Jones | | | | | | | | |
| | | CDX.NA.IG.4 Index | | Citigroup | | (.69) | | 6/20/2010 | | (4,946) |
| 427,700 | | Dow Jones | | Morgan | | | | | | |
| | | CDX.NA.IG.4 Index | | Stanley | | (.35) | | 6/20/2010 | | (4,166) |
| 269,300 | | Dow Jones | | | | | | | | |
| | | CDX.NA.IG.4 Index | | Merrill Lynch | | (.31) | | 6/20/2010 | | (2,230) |
| 740,000 | | Dow Jones | | | | | | | | |
| | | CDX.NA.IG.7 Index | | Citigroup | | (1.09) | | 12/20/2016 | | 1,755 |
| | | | | | | | | | | Unrealized |
| Notional | | Reference | | | | (Pay) Receive | | Appreciation |
| Amount ($) | | Entity | | Counterparty | | Fixed Rate (%) Expiration (Depreciation)($) |
| |
| |
| |
|
| |
| 1,480,000 | | Dow Jones | | | | | | | | |
| | | CDX.NA.IG.7 Index | | Citigroup | | .51 | | 12/20/2016 | | (1,634) |
| 800,000 | | Dow Jones | | J.P. Morgan | | | | | | |
| | | CDX.NA.IG.7 Index | | Chase Bank | | (1.10) | | 12/20/2016 | | 1,741 |
| 1,600,000 | | Dow Jones | | J.P. Morgan | | | | | | |
| | | CDX.NA.IG.7 Index | | Chase Bank | | .51 | | 12/20/2016 | | (1,138) |
| 60,000 | | Echostar, | | Lehman | | | | | | |
| | | 6.625%, 10/1/14 | | Brothers | | 2.20 | | 12/20/2016 | | (1,501) |
| 100,000 | | Echostar, 6.625%, | | Lehman | | | | | | |
| | | 10/1/14 | | Brothers | | 2.25 | | 12/20/2016 | | (2,155) |
| 995,000 | | Enterprise | | | | | | | | |
| | | Products Operating, | | Deutsche | | | | | | |
| | | 7.5%, 2/1/2011 | | Bank | | (.28) | | 9/20/2009 | | (2,140) |
| 995,000 | | Enterprise | | | | | | | | |
| | | Products Operating, | | Deutsche | | | | | | |
| | | 7.5%, 2/1/2011 | | Bank | | .50 | | 9/20/2011 | | 7,938 |
| 325,000 | | JPMAC 2005-FRE1, | | | | | | | | |
| | | Cl. M8, 7.15%, | | Morgan | | | | | | |
| | | 10/25/2035 | | Stanley | | (1.17) | | 10/25/2035 | | 7,330 |
| 970,000 | | JPMCC 2006-CB15, | | | | | | | | |
| | | Cl. AJ, 5.89%, | | Merrill | | | | | | |
| | | 6/12/2043 | | Lynch | | (.13) | | 6/20/2016 | | (101) |
| 150,000 | | Kaupthing Bank, | | Deutsche | | | | | | |
| | | 5.52%, 12/1/2009 | | Bank | | .65 | | 9/20/2007 | | 518 |
| 575,000 | | Kaupthing Bank, | | Deutsche | | | | | | |
| | | 5.52%, 12/1/2009 | | Bank | | .52 | | 9/20/2007 | | 1,423 |
| 110,000 | | Kimberly-Clark, | | | | | | | | |
| | | 6.875%, | | J.P. Morgan | | | | | | |
| | | 2/15/2014 | | Chase Bank | | (.37) | | 12/20/2016 | | 191 |
| 100,000 | | Kimberly-Clark, | | | | | | | | |
| | | 6.875%, | | Morgan | | | | | | |
| | | 2/15/2014 | | Stanley | | (.38) | | 12/20/2016 | | 96 |
| 410,000 | | Kimberly-Clark, | | | | | | | | |
| | | 6.875%, | | J.P. Morgan | | | | | | |
| | | 2/15/2014 | | Chase Bank | | (.37) | | 12/20/2016 | | 712 |
| 400,000 | | Kimberly-Clark, | | | | | | | | |
| | | 6.875%, | | J.P. Morgan | | | | | | |
| | | 2/15/2014 | | Chase Bank | | (.37) | | 12/20/2016 | | 694 |
| 300,000 | | MABS Trust, | | | | | | | | |
| | | 2005-WMC1, Cl. M8, | | J.P. Morgan | | | | | | |
| | | 3/25/2035 | | Chase Bank | | (1.18) | | 4/25/2009 | | 1,477 |
| 341,000 | | Morgan Stanley, | | | | | | | | |
| | | 6.6%, 4/1/2012 | | Citigroup | | (.62) | | 6/20/2015 | | (7,418) |
| 269,000 | | News America, | | Lehman | | | | | | |
| | | 7.25%, 5/18/2018 | | Brothers | | .47 | | 12/20/2009 | | 2,852 |
| 535,000 | | Northern Tobacco | | | | | | | | |
| | | 5%, 6/1/2046 | | Citigroup | | 1.35 | | 12/20/2011 | | 4,165 |
The Fund 53
NOTES TO FINANCIAL STATEMENTS (continued)
| | | | | | | | | | | Unrealized |
| Notional | | Reference | | | | (Pay) Receive | | Appreciation |
| Amount ($) | | Entity | | Counterparty | | Fixed Rate (%) Expiration (Depreciation)($) |
| |
| |
| |
|
| |
| 120,000 | | Nucor, 4.875%, | | Bear | | | | | | |
| | | 10/1/2012 | | Stearns & Co. | | (.40) | | 6/20/2010 | | (1,151) |
| 122,500 | | Republic of Peru, | | | | | | | | |
| | | 8.75%, 11/21/2033 | | UBS | | 1.30 | | 8/20/2011 | | 3,086 |
| 250,000 | | Republic of | | | | | | | | |
| | | Venezuela, | | Deutsche | | | | | | |
| | | 9.25%, 9/15/2027 | | Bank | | (2.87) | | 10/20/2016 | | (17,172) |
| 260,000 | | Republic of | | | | | | | | |
| | | Venezuela, | | | | | | | | |
| | | 9.25%, 9/15/2027 | | UBS | | (2.33) | | 11/20/2016 | | (6,928) |
| 535,000 | | Southern California | | | | | | | | |
| | | Tobacco | | | | | | | | |
| | | 5%, 6/1/2037 | | Citigroup | | 1.35 | | 12/20/2011 | | 4,165 |
| 350,000 | | Structured Index | | Morgan | | | | | | |
| | | | | Stanley | | (.70) | | 6/20/2013 | | (1,033) |
| 350,000 | | Structured Index | | Morgan | | | | | | |
| | | | | Stanley | | 2.25 | | 6/20/2016 | | 12,734 |
| 145,000 | | Structured Index | | Morgan | | | | | | |
| | | | | Stanley | | (.55) | | 6/20/2013 | | 786 |
| 145,000 | | Structured Index | | Morgan | | | | | | |
| | | | | Stanley | | 1.62 | | 6/20/2016 | | (1,516) |
| 405,000 | | Structured Model | | J.P. Morgan | | | | | | |
| | | Portfolio 0-3% | | Chase Bank | | — | | 9/20/2013 | | 11,137 |
| 568,000 | | Structured Model | | Morgan | | | | | | |
| | | Portfolio 0-3% | | Stanley | | — | | 9/20/2013 | | 39,488 |
| 277,000 | | Structured Model | | | | | | | | |
| | | Portfolio 0-3% | | UBS | | — | | 9/20/2013 | | 7,340 |
| 150,000 | | VF, 8.5%, | | Morgan | | | | | | |
| | | 10/1/2010 | | Stanley | | (.72) | | 6/20/2016 | | (2,100) |
| 180,000 | | VF, 8.5%, | | Morgan | | | | | | |
| | | 10/1/2010 | | Stanley | | (.46) | | 6/20/2011 | | (1,937) |
| 100,000 | | VF, 8.5%, | | Morgan | | | | | | |
| | | 10/1/2010 | | Stanley | | (.45) | | 6/20/2011 | | (1,035) |
| 270,000 | | VF, 8.5%, | | | | | | | | |
| | | 10/1/2010 | | UBS | | (.45) | | 6/20/2011 | | (2,796) |
| 235,000 | | Wolters Kluwer, | | | | | | | | |
| | | 5.125%, | | | | | | | | |
| | | 1/27/2014 | | UBS | | (.92) | | 9/20/2016 | | (4,539) |
| | | | | | | | | | | 31,875 |
Risks may arise upon entering into these agreements from the potential inability of the counterparties to meet the terms of the agreement and are generally limited to the amount of net payments to be received, if any, at the date of default.
At December 31, 2006, the cost of investments for federal income tax purposes was $75,445,928; accordingly, accumulated net unrealized depreciation on investments was $300,396, consisting of $630,062 gross unrealized appreciation and $930,458 gross unrealized depreciation.
The Fund 55
REPORT OF INDEPENDENT REGISTERED PUBLIC ACCOUNTING FIRM
The Board of Trustees and Shareholders of The Dreyfus/Laurel Funds Trust:
We have audited the accompanying statement of assets and liabilities of Dreyfus Premier Managed Income Fund (the “Fund”) of The Dreyfus/Laurel Funds Trust including the statements of investments, financial futures and options written as of December 31, 2006, and the related statement of operations for the year then ended, the statement of changes in net assets for each of the years in the two-year period then ended, and the financial highlights for each of the years in the five-year period then ended. These financial statements and financial highlights are the responsibility of the Fund’s management. Our responsibility is to express an opinion on these financial statements and financial highlights based on our audits.
We conducted our audits in accordance with the standards of the Public Company Accounting Oversight Board (United States).Those standards require that we plan and perform the audit to obtain reasonable assurance about whether the financial statements and financial highlights are free of material misstatement. An audit includes examining, on a test basis, evidence supporting the amounts and disclosures in the financial statements. Our procedures included confirmation of securities owned as of December 31, 2006, by correspondence with the custodian and brokers, or by other appropriate auditing procedures where replies from brokers were not received.An audit also includes assessing the accounting principles used and significant estimates made by management, as well as evaluating the overall financial statement presentation.We believe that our audits provide a reasonable basis for our opinion.
In our opinion, the financial statements and financial highlights referred to above present fairly, in all material respects, the financial position of Dreyfus Premier Managed Income Fund of The Dreyfus/Laurel Funds Trust as of December 31, 2006, and the results of its operations for the year then ended, the changes in its net assets for each of the years in the two-year period then ended, and the financial highlights for each of the years in the five-year period then ended, in conformity with U.S. generally accepted accounting principles.
| New York, New York |
| February 16, 2007 |
IMPORTANT TAX INFORMATION (Unaudited)
In accordance with federal tax law, the fund hereby designates .88% of the ordinary dividends paid during the fiscal year ended December 31, 2006 as qualifying for the corporate dividends received deduction. For the fiscal year ended December 31, 2006, certain dividends paid by the fund may be subject to a maximum tax rate of 15%, as provided for by the Jobs and Growth Tax Relief Reconciliation Act of 2003. Of the distributions paid during the fiscal year, $32,275 represents the maximum amount that may be considered qualified dividend income. Shareholders will receive notification in January 2007 of the percentage applicable to the preparation of their 2006 income tax returns. Also, the fund hereby designates 88.68% of ordinary income dividends paid during the fiscal year ended December 31, 2006 as qualifying interest related dividends.
The Fund 57
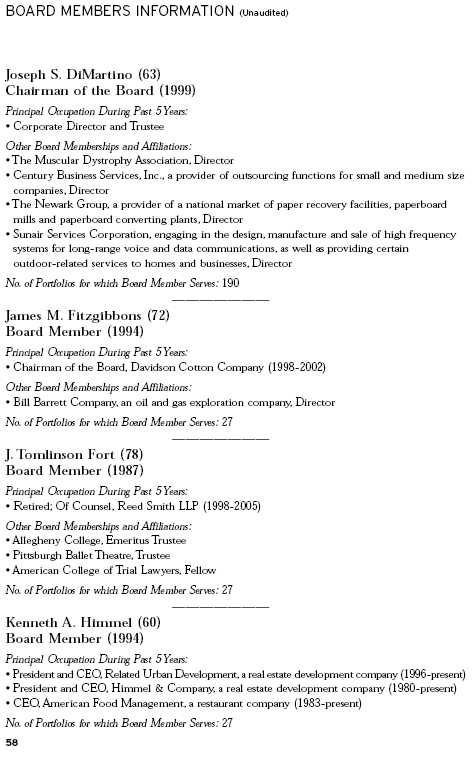
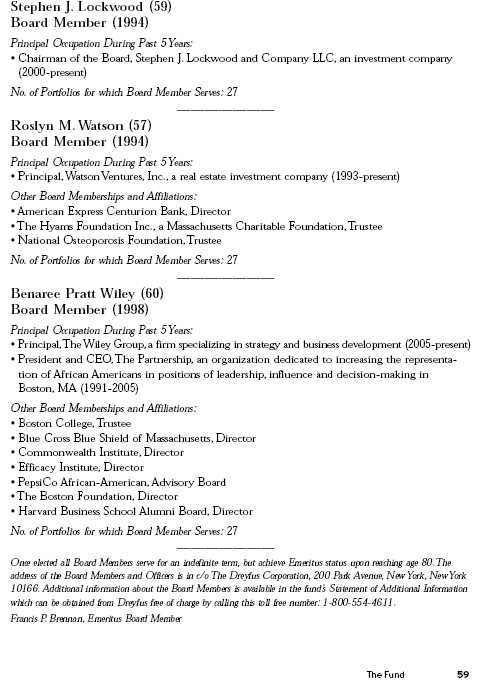
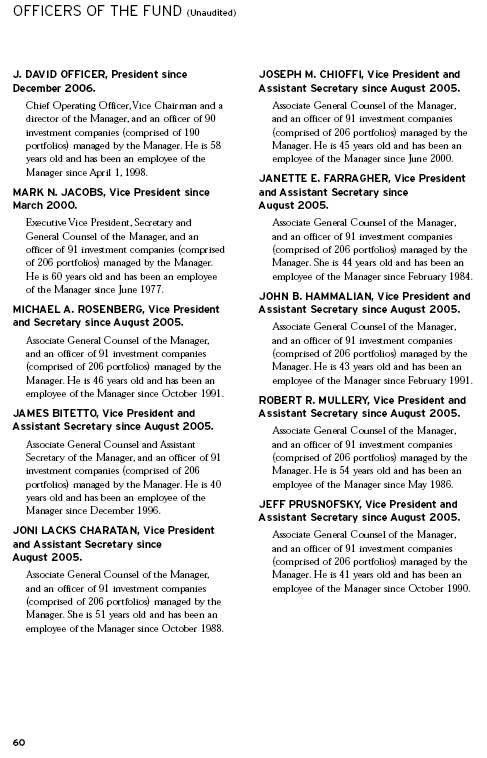
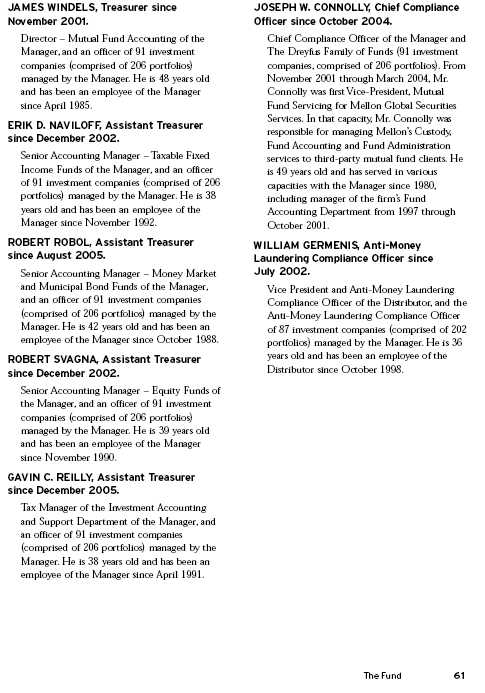
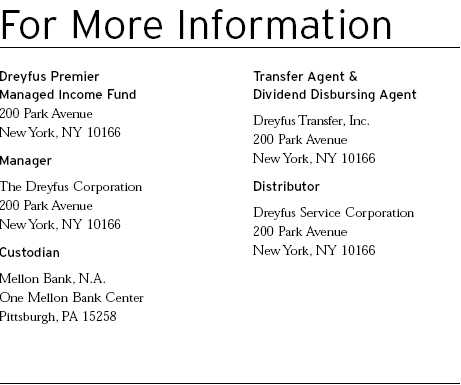
Telephone Call your financial representative or 1-800-554-4611
| Mail | | The Dreyfus Premier Family of Funds |
| | | 144 Glenn Curtiss Boulevard, Uniondale, NY 11556-0144 |
The fund files its complete schedule of portfolio holdings with the Securities and Exchange Commission (“SEC”) for the first and third quarters of each fiscal year on Form N-Q. The fund’s Forms N-Q are available on the SEC’s website at http://www.sec.gov and may be reviewed and copied at the SEC’s Public Reference Room in Washington, DC. Information on the operation of the Public Reference Room may be obtained by calling 1-202-551-8090.
A description of the policies and procedures that the fund uses to determine how to vote proxies relating to portfolio securities, and information regarding how the fund voted these proxies for the 12-month period ended June 30, 2006, is available at http://www.dreyfus.com and on the SEC’s website at http://www.sec.gov. The description of the policies and procedures is also available without charge, upon request, by calling 1-800-645-6561.

Item 2. Code of Ethics.
The Registrant has adopted a code of ethics that applies to the Registrant's principal executive officer, principal financial officer, principal accounting officer or controller, or persons performing similar functions. There have been no amendments to, or waivers in connection with, the Code of Ethics during the period covered by this Report.
Item 3. Audit Committee Financial Expert.
The Registrant's Board has determined that Joseph S. DiMartino, a member of the Audit Committee of the Board, is an audit committee financial expert as defined by the Securities and Exchange Commission (the "SEC"). Joseph S. DiMartino is "independent" as defined by the SEC for purposes of audit committee financial expert determinations.
Item 4. Principal Accountant Fees and Services.
(a) Audit Fees. The aggregate fees billed for each of the last two fiscal years (the "Reporting Periods") for professional services rendered by the Registrant's principal accountant (the "Auditor") for the audit of the Registrant's annual financial statements, or services that are normally provided by the Auditor in connection with the statutory and regulatory filings or engagements for the Reporting Periods, were $103,700 in 2005 and $106,820 in 2006.
(b) Audit-Related Fees. The aggregate fees billed in the Reporting Periods for assurance and related services by the Auditor that are reasonably related to the performance of the audit of the Registrant's financial statements and are not reported under paragraph (a) of this Item 4 were $11,100 in 2005 and $11,405 in 2006. These services consisted of security counts required by Rule 17f-2 under the Investment Company Act of 1940, as amended.
The aggregate fees billed in the Reporting Periods for non-audit assurance and related services by the Auditor to the Registrant's investment adviser (not including any sub-investment adviser whose role is primarily portfolio management and is subcontracted with or overseen by another investment adviser), and any entity controlling, controlled by or under common control with the investment adviser that provides ongoing services to the Registrant ("Service Affiliates"), that were reasonably related to the performance of the annual audit of the Service Affiliate, which required pre-approval by the Audit Committee were $0 in 2005 and $0 in 2006.
Note: For the second paragraph in each of (b) through (d) of this Item 4, certain of such services were not pre-approved prior to May 6, 2003, when such services were required to be pre-approved. On and after May 6, 2003, 100% of all services provided by the Auditor were pre-approved as required. For comparative purposes, the fees shown assume that all such services were pre-approved, including services that were not pre-approved prior to the compliance date of the pre-approval requirement.
(c) Tax Fees. The aggregate fees billed in the Reporting Periods for professional services rendered by the Auditor for tax compliance, tax advice and tax planning ("Tax Services") were $5,775 in 2005 and $6,270 in 2006. These services consisted of review or preparation of U.S. federal, state, local and excise tax returns.
The aggregate fees billed in the Reporting Periods for Tax Services by the Auditor to Service Affiliates which required pre-approval by the Audit Committee were $0 in 2005 and $0 in 2006.
(d) All Other Fees. The aggregate fees billed in the Reporting Periods for products and services provided by the Auditor, other than the services reported in paragraphs (a) through (c) of this Item, were $0 in 2005 and $0 in 2006.
The aggregate fees billed in the Reporting Periods for Non-Audit Services by the Auditor to Service Affiliates, other than the services reported in paragraphs (b) through (c) of this Item, which required pre-approval by the Audit Committee were $0 in 2005 and $0 in 2006.
Audit Committee Pre-Approval Policies and Procedures. The Registrant's Audit Committee has established policies and procedures (the "Policy") for pre-approval (within specified fee limits) of the Auditor's engagements for non-audit services to the Registrant and Service Affiliates without specific case-by-case consideration. Pre-approval considerations include whether the proposed services are compatible with maintaining the Auditor's independence. Pre-approvals pursuant to the Policy are considered annually.
Non-Audit Fees. The aggregate non-audit fees billed by the Auditor for services rendered to the Registrant, and rendered to Service Affiliates, for the Reporting Periods were $975,000 in 2005 and $1,202,000 in 2006.
Auditor Independence. The Registrant's Audit Committee has considered whether the provision of non-audit services that were rendered to Service Affiliates which were not pre-approved (not requiring pre-approval) is compatible with maintaining the Auditor's independence.
| Item 5. | | Audit Committee of Listed Registrants. |
| | | Not applicable. |
| Item 6. | | Schedule of Investments. |
| | | Not applicable. |
| Item 7. | | Disclosure of Proxy Voting Policies and Procedures for Closed-End Management |
| | | Investment Companies. |
| | | Not applicable. |
| Item 8. | | Portfolio Managers of Closed-End Management Investment Companies. |
| | | Not applicable. |
| Item 9. | | Purchases of Equity Securities by Closed-End Management Investment Companies and |
| | | Affiliated Purchasers. |
| | | Not applicable. |
| Item 10. | | Submission of Matters to a Vote of Security Holders. |
The Registrant has a Nominating Committee (the "Committee"), which is responsible for selecting and nominating persons for election or appointment by the Registrant's Board as Board members. The Committee has adopted a Nominating Committee Charter (the "Charter"). Pursuant to the Charter, the Committee will consider recommendations for nominees from shareholders submitted to the Secretary of the
Registrant, c/o The Dreyfus Corporation Legal Department, 200 Park Avenue, 8th Floor East, New York, New York 10166. A nomination submission must include information regarding the recommended nominee as specified in the Charter. This information includes all information relating to a recommended nominee that is required to be disclosed in solicitations or proxy statements for the election of Board members, as well as information sufficient to evaluate the factors to be considered by the Committee, including character and integrity, business and professional experience, and whether the person has the ability to apply sound and independent business judgment and would act in the interests of the Registrant and its shareholders. Nomination submissions are required to be accompanied by a written consent of the individual to stand for election if nominated by the Board and to serve if elected by the shareholders, and such additional information must be provided regarding the recommended nominee as reasonably requested by the Committee.
Item 11. Controls and Procedures.
(a) The Registrant's principal executive and principal financial officers have concluded, based on their evaluation of the Registrant's disclosure controls and procedures as of a date within 90 days of the filing date of this report, that the Registrant's disclosure controls and procedures are reasonably designed to ensure that information required to be disclosed by the Registrant on Form N-CSR is recorded, processed, summarized and reported within the required time periods and that information required to be disclosed by the Registrant in the reports that it files or submits on Form N-CSR is accumulated and communicated to the Registrant's management, including its principal executive and principal financial officers, as appropriate to allow timely decisions regarding required disclosure.
(b) There were no changes to the Registrant's internal control over financial reporting that occurred during the second fiscal quarter of the period covered by this report that have materially affected, or are reasonably likely to materially affect, the Registrant's internal control over financial reporting.
Item 12. Exhibits.
| (a)(1) | | Code of ethics referred to in Item 2. |
| (a)(2) | | Certifications of principal executive and principal financial officers as required by Rule 30a-2(a) |
| under the Investment Company Act of 1940. |
| (a)(3) | | Not applicable. |
| (b) | | Certification of principal executive and principal financial officers as required by Rule 30a-2(b) |
| under the Investment Company Act of 1940. |
Pursuant to the requirements of the Securities Exchange Act of 1934 and the Investment Company Act of 1940, the Registrant has duly caused this Report to be signed on its behalf by the undersigned, thereunto duly authorized.
The Dreyfus/Laurel Funds Trust

Pursuant to the requirements of the Securities Exchange Act of 1934 and the Investment Company Act of 1940, this Report has been signed below by the following persons on behalf of the Registrant and in the capacities and on the dates indicated.
EXHIBIT INDEX
| (a)(1) | | Code of ethics referred to in Item 2. |
| |
| (a)(2) | | Certifications of principal executive and principal financial officers as required by Rule 30a- |
| 2(a) under the Investment Company Act of 1940. (EX-99.CERT) |
| |
| (b) | | Certification of principal executive and principal financial officers as required by Rule 30a- |
| 2(b) under the Investment Company Act of 1940. (EX-99.906CERT) |
Exhibit (a)(1)