| UNITED STATES |
| SECURITIES AND EXCHANGE COMMISSION |
| Washington, D.C. 20549 |
| |
| |
| FORM N-CSR |
| |
| CERTIFIED SHAREHOLDER REPORT OF REGISTERED MANAGEMENT |
| INVESTMENT COMPANIES |
| |
| Investment Company Act file number 811-524 |
| |
| The Dreyfus/Laurel Funds Trust |
| (Exact name of Registrant as specified in charter) |
| |
| |
| c/o The Dreyfus Corporation |
| 200 Park Avenue |
| New York, New York 10166 |
| (Address of principal executive offices) (Zip code) |
| |
| Michael A. Rosenberg, Esq. |
| 200 Park Avenue |
| New York, New York 10166 |
| (Name and address of agent for service) |
| |
| Registrant's telephone number, including area code: (212) 922-6000 |
| Date of fiscal year end: | | 5/31 |
| Date of reporting period: | | 5/31/07 |
The following N-CSR relates only to Dreyfus Premier Equity Income Fund and does not affect the other series of the Registrant, which have different fiscal year ends and, therefore, different N-CSR reporting requirements. Separate N-CSR Forms will be filed for those series, as appropriate.
FORM N-CSR
| Item 1. | | Reports to Stockholders. |
Dreyfus Premier Equity Income Fund
ANNUAL REPORT May 31, 2007

Save time. Save paper. View your next shareholder report online as soon as it’s available. Log into www.dreyfus.com and sign up for Dreyfus eCommunications. It’s simple and only takes a few minutes.
The views expressed in this report reflect those of the portfolio manager only through the end of the period covered and do not necessarily represent the views of Dreyfus or any other person in the Dreyfus organization. Any such views are subject to change at any time based upon market or other conditions and Dreyfus disclaims any responsibility to update such views.These views may not be relied on as investment advice and, because investment decisions for a Dreyfus fund are based on numerous factors, may not be relied on as an indication of trading intent on behalf of any Dreyfus fund.
Not FDIC-Insured • Not Bank-Guaranteed • May Lose Value
| Contents |
| |
| | | THE FUND |
| |
|
| 2 | | A Letter from the CEO |
| 3 | | Discussion of Fund Performance |
| 6 | | Fund Performance |
| 8 | | Understanding Your Fund’s Expenses |
| 8 | | Comparing Your Fund’s Expenses |
| With Those of Other Funds |
| 9 | | Statement of Investments |
| 13 | | Statement of Assets and Liabilities |
| 14 | | Statement of Operations |
| 15 | | Statement of Changes in Net Assets |
| 17 | | Financial Highlights |
| 18 | | Notes to Financial Statements |
| 26 | | Report of Independent Registered |
| | | Public Accounting Firm |
| 27 | | Important Tax Information |
| 28 | | Board Members Information |
| 30 | | Officers of the Fund |
| FOR MORE INFORMATION |
|
| | | Back Cover |
| Dreyfus Premier |
| Equity Income Fund |
The Fund

A LETTER FROM THE CEO
Dear Shareholder:
We are pleased to present this annual report for Dreyfus Premier Equity Income Fund, covering the period from the fund’s inception on July 5, 2006, through May 31, 2007.
The U.S. economy continued to moderate during the reporting period as cooling housing markets took their toll on consumer and business spending. Labor markets, however, remained quite strong, and key measures of inflation have stayed stubbornly above the Federal Reserve’s stated “comfort zone.” Our economists believe that the anemic rate of U.S. economic growth recorded in the first quarter of 2007 should be the weakest reading of the current midcycle slowdown, and economic growth is likely to recover eventually to a near-trend pace.
The likely implications of our economic outlook include a long pause in Fed policy before a limited easing of short-term interest rates, a modest drop in 10-year Treasury bond yields, high levels of mergers-and-acquisitions activity and a probable continuation of the ongoing shift in investor sentiment toward higher-quality stocks. We expect these developments to produce both challenges and opportunities in the equity markets. As always, your financial advisor can help you position your investments for these trends.
For information about how the fund performed during the reporting period, as well as market perspectives, we have provided a Discussion of Fund Performance given by the fund’s Portfolio Manager.
Thank you for your continued confidence and support.
2

DISCUSSION OF FUND PERFORMANCE
For the period from fund’s inception on July 5, 2006, through May 31, 2007, as provided by Jocelin A. Reed, Portfolio Manager
Market and Fund Performance Overview
Stocks rose sharply during the reporting period on the strength of robust domestic and global economic growth, which enabled a wide range of companies to post better-than-expected revenues and profits. These positive factors outweighed the negative impact of increasing inflationary pressures, rising short-term interest rates and a pullback in U.S. housing prices.The fund’s income-oriented investment approach responded well in this environment, enabling the fund to post returns that roughly matched those of its benchmark.
From the fund’s inception on July 5, 2006 through May 31, 2007, the fund produced total returns of 21.89% for Class A shares, 21.06% for Class C shares, 22.17% for Class I shares and 21.62% for Class T shares.1 In comparison, the fund’s benchmark, the Standard & Poor’s 500 Composite Stock Price Index (“S&P 500 Index”), provided a total return of 22.61% from June 30, 2006, through May 31, 2007.2
Effective 6/1/07, Class R shares were renamed Class I shares.
The Fund’s Investment Approach
The fund seeks total return consisting of capital appreciation and income. To pursue its goal, the fund invests primarily in equity securities, with a particular focus on dividend-paying stocks and other investments and investment techniques that provide income. When selecting securities, we use a computer model to identify and rank stocks within an industry or sector. Next, based on fundamental analysis, we generally select what we believe to be the most attractive of the higher ranked securities. We manage risk by diversifying the fund’s investments across companies and industries, seeking to limit the potential adverse impact of a decline in any one stock or industry.
The Fund 3
DISCUSSION OF FUND PERFORMANCE (continued)
Emphasis on Income, Stock Selections Boost Fund Performance
Rising corporate revenues and healthy cash flows set the stage for a wide range of companies to increase annual dividend rates or offer one-time dividend payouts, conditions that the fund attempts to target in its investment approach. The fund succeeded in maintaining an average yield of 2.56% compared with an average yield of 1.80% for the benchmark. This relatively strong yield contributed positively to the fund’s relative rate of return.
Our stock selection strategy also produced strong results in a wide range of industry groups, enabling the fund to outperform the benchmark in the consumer cyclicals, industrials, materials and processing and health care sectors. Among consumer cyclical holdings, restaurant chain McDonald’s produced strong gains by successfully renovating stores while expanding globally and maintaining profit margins through the introduction of higher margin, healthier products. Retailer Family Dollar Stores benefited from unexpectedly robust levels of consumer spending despite high gasoline prices.
Top performers among industrials included transport and shipping companies Frontline and Overseas Shipholding Group, and home and lawn care provider ServiceMaster, which rose on a buyout offer from a private equity firm. Oil transport specialist Frontline exemplified the fund’s emphasis on current and prospective dividend yields.As of May 31, 2007, Frontline provided an annual dividend yield of more than 13%, and appeared well structured to continue paying at those levels even during a slowdown in the business cycle.The fund’s emphasis on defense and aerospace companies further bolstered relative returns within the industrial sector. Holdings such as General Dynamics, Raytheon and Lockheed Martin rose on evidence of steady revenue growth as the U.S. defense budget continued to expand.
Among materials and processing companies, Southern Copper more than doubled on the strength of rising commodity prices, while another copper mining holding, Phelps Dodge, was acquired by a
4
competitor at a premium price. Finally, in the health care sector, pharmaceutical maker Merck & Co. benefited from an improving product pipeline and relatively attractive valuation.
The fund’s performance relative to the benchmark suffered notably in the technology area, where dividend-yielding, value-oriented issues tended to lag more volatile, higher growth stocks. In particular, data storage company Imation declined when it issued a disappointing earnings report and warned of lower-than-expected revenues. On the other hand, some technology holdings bucked the negative trend. For example, computer maker Hewlett-Packard rose sharply on evidence that the company was taking market share from competitors.
Continuing to Focus on Dividend Yield
We believe the fund’s ongoing emphasis on dividend-paying stocks is well suited to help meet investors’ objectives for current income, particularly in today’s environment of rising interest rates. In addition, we believe that dividends represent an effective use of excess cash flow by growing companies seeking to increase shareholder value, which is why growing yields historically have proven to be a reasonably good indication of long-term stock performance. Accordingly, we have maintained our focus on companies featuring strong dividend yields, particularly those our quantitative forecasting techniques identify as offering above-average potential for future dividend growth.
June 15, 2007
| 1 | | Total return includes reinvestment of dividends and any capital gains paid, and does not take into |
| | | consideration the maximum initial sales charges in the case of Class A and Class T shares, or the |
| | | applicable contingent deferred sales charge imposed on redemptions in the case of Class C shares. |
| | | Had these charges been reflected, returns would have been lower. Past performance is no guarantee |
| | | of future results. Share price and investment return fluctuate such that upon redemption, fund |
| | | shares may be worth more or less than their original cost. Return figures provided reflect the |
| | | absorption of certain fund expenses by The Dreyfus Corporation in effect through May 31, 2008, |
| | | at which time it may be extended, terminated or modified. Had these expenses not been absorbed, |
| | | the fund’s returns would have been lower. |
| 2 | | SOURCE: LIPPER INC. — Reflects reinvestment of dividends and, where applicable, capital |
| | | gain distributions.The Standard & Poor’s 500 Composite Stock Price Index is a widely accepted, |
| | | unmanaged index of U.S. stock market performance. For comparative purposes, the value of the |
| | | Index on 6/30/06 is used as the beginning value on 7/5/06. |
The Fund 5
FUND PERFORMANCE
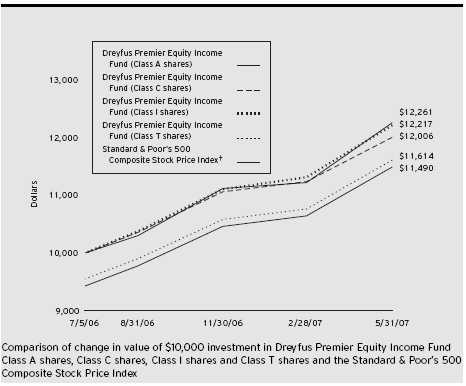
† Source: Lipper Inc.
Past performance is not predictive of future performance.
The above graph compares a $10,000 investment made in Class A, Class C, Class I and Class T shares of Dreyfus Premier Equity Income Fund on 7/5/06 (inception date) to a $10,000 investment made in the Standard & Poor’s 500 Composite Stock Price Index (the “Index”) on that date. For comparative purposes, the value of the Index on 6/30/06 is used as the beginning value on 7/5/06. All dividends and capital gain distributions are reinvested. The fund’s performance shown in the line graph above takes into account the maximum initial sales charge on Class A shares, the applicable contingent deferred sales charge on Class C shares and all other applicable fees and expenses on all classes. Dreyfus Premier Equity Income Fund primarily seeks total return by investing in stocks, focusing on dividend-paying stocks and other instruments that provide income.The Index is a widely accepted, unmanaged index of U.S. stock market performance.The Index does not take into account charges, fees and other expenses.These factors can contribute to the Index potentially outperforming the fund. Further information relating to fund performance, including expense reimbursements, if applicable, is contained in the Financial Highlights section of the prospectus and elsewhere in this report.
6
| Actual Aggregate Total Returns | | as of | | 5/31/07 | | | | |
| |
| | | | | | | Inception | | From |
| | | | | | | Date | | Inception |
| |
| |
| |
| |
|
| Class A shares | | | | | | | | |
| with maximum sales charge (5.75%) | | | | | | 7/5/06 | | 14.90% |
| without sales charge | | | | | | 7/5/06 | | 21.89% |
| Class C shares | | | | | | | | |
| with applicable redemption charge † | | | | | | 7/5/06 | | 20.06% |
| without redemption | | | | | | 7/5/06 | | 21.06% |
| Class I shares | | | | | | 7/5/06 | | 22.17% |
| Class T shares | | | | | | | | |
| with applicable sales charge (4.5%) | | | | | | 7/5/06 | | 16.14% |
| without sales charge | | | | | | 7/5/06 | | 21.62% |
Past performance is not predictive of future performance.The fund’s performance shown in the graph and table does not reflect the deduction of taxes that a shareholder would pay on fund distributions or the redemption of fund shares.
† The maximum contingent deferred sales charge for Class C shares is 1% for shares redeemed within one year of the date of purchase.
The Fund 7
UNDERSTANDING YOUR FUND’S EXPENSES (Unaudited)
As a mutual fund investor, you pay ongoing expenses, such as management fees and other expenses. Using the information below, you can estimate how these expenses affect your investment and compare them with the expenses of other funds.You also may pay one-time transaction expenses, including sales charges (loads) and redemption fees, which are not shown in this section and would have resulted in higher total expenses. For more information, see your fund’s prospectus or talk to your financial adviser.
Review your fund’s expenses
The table below shows the expenses you would have paid on a $1,000 investment in Dreyfus Premier Equity Income Fund from December 1, 2006 to May 31, 2007. It also shows how much a $1,000 investment would be worth at the close of the period, assuming actual returns and expenses.
| Expenses and Value of a $1,000 Investment | | | | | | |
| assuming actual returns for the six months ended May 31, 2007 | | | | |
| | | Class A | | Class C | | Class R | | Class T |
| |
| |
| |
| |
|
| Expenses paid per $1,000 † | | $ 7.85 | | $ 11.75 | | $ 6.54 | | $ 9.15 |
| Ending value (after expenses) | | $1,098.40 | | $1,094.40 | | $1,100.00 | | $1,097.40 |
COMPARING YOUR FUND’S EXPENSES WITH THOSE OF OTHER FUNDS (Unaudited)
Using the SEC’s method to compare expenses
The Securities and Exchange Commission (SEC) has established guidelines to help investors assess fund expenses. Per these guidelines, the table below shows your fund’s expenses based on a $1,000 investment, assuming a hypothetical 5% annualized return. You can use this information to compare the ongoing expenses (but not transaction expenses or total cost) of investing in the fund with those of other funds.All mutual fund shareholder reports will provide this information to help you make this comparison. Please note that you cannot use this information to estimate your actual ending account balance and expenses paid during the period.
| Expenses and Value of a $1,000 Investment | | | | | | |
| assuming a hypothetical 5% annualized return for the six months ended May 31, 2007 |
| | | Class A | | Class C | | Class R | | Class T |
| |
| |
| |
| |
|
| Expenses paid per $1,000 † | | $ 7.54 | | $ 11.30 | | $ 6.29 | | $ 8.80 |
| Ending value (after expenses) | | $1,017.45 | | $1,013.71 | | $1,018.70 | | $1,016.21 |
† Expenses are equal to the fund’s annualized expense ratio of 1.50% for Class A, 2.25% for Class C, 1.25% for Class R and 1.75% for Class T, multiplied by the average account value over the period, multiplied by 182/365 (to reflect the one-half year period).
8
STATEMENT OF INVESTMENTS
May 31, 2007
| Common Stocks—97.5% | | Shares | | Value ($) |
| |
| |
|
| Consumer Discretionary—9.7% | | | | |
| Barnes & Noble | | 200 | | 8,554 |
| Choice Hotels International | | 300 | | 12,096 |
| Family Dollar Stores | | 200 | | 6,730 |
| Interactive Data | | 500 | | 14,515 |
| J.C. Penney | | 100 | | 8,048 |
| McDonald’s | | 300 | | 15,165 |
| McGraw-Hill Cos. | | 125 | | 8,789 |
| NIKE, Cl. B | | 200 | | 11,350 |
| Nordstrom | | 200 | | 10,386 |
| ServiceMaster | | 800 | | 12,384 |
| Snap-On | | 200 | | 10,814 |
| Staples | | 300 | | 7,518 |
| Walt Disney | | 600 | | 21,264 |
| Wolverine World Wide | | 200 | | 5,806 |
| | | | | 153,419 |
| Consumer Hard Goods—2.4% | | | | |
| General Motors | | 500 | | 14,995 |
| Harley-Davidson | | 100 | | 6,109 |
| Hasbro | | 300 | | 9,645 |
| Steelcase, Cl. A | | 400 | | 7,768 |
| | | | | 38,517 |
| Consumer Staples—8.1% | | | | |
| Coca-Cola | | 500 | | 26,495 |
| ConAgra Foods | | 300 | | 7,650 |
| H.J. Heinz | | 175 | | 8,327 |
| Kellogg | | 100 | | 5,398 |
| Kraft Foods, Cl. A | | 403 | | 13,637 |
| Loews—Carolina Group | | 150 | | 11,662 |
| McCormick & Co. | | 325 | | 12,119 |
| PepsiCo | | 300 | | 20,499 |
| Procter & Gamble | | 100 | | 6,355 |
| Reynolds American | | 250 | | 16,260 |
| | | | | 128,402 |
| Energy—12.0% | | | | |
| Chevron | | 500 | | 40,745 |
| ConocoPhillips | | 325 | | 25,165 |
| Exxon Mobil | | 775 | | 64,457 |
The Fund 9
STATEMENT OF INVESTMENTS (continued)
| Common Stocks (continued) | | Shares | | Value ($) |
| |
| |
|
| Energy (continued) | | | | |
| Frontline | | 325 | | 14,885 |
| Marathon Oil | | 125 | | 15,476 |
| Overseas Shipholding Group | | 225 | | 17,899 |
| Valero Energy | | 150 | | 11,193 |
| | | | | 189,820 |
| Financial—20.2% | | | | |
| Bank of America | | 725 | | 36,765 |
| CapitalSource | | 400 | | 10,520 |
| Chubb | | 300 | | 16,461 |
| Citigroup | | 525 | | 28,607 |
| Essex Property Trust | | 100 | | 12,723 |
| Fannie Mae | | 300 | | 19,176 |
| Goldman Sachs Group | | 125 | | 28,853 |
| Hartford Financial Services Group | | 125 | | 12,896 |
| Host Hotels & Resorts | | 450 | | 11,484 |
| JPMorgan Chase & Co. | | 650 | | 33,689 |
| MCG Capital | | 500 | | 8,820 |
| Merrill Lynch & Co. | | 200 | | 18,546 |
| MetLife | | 200 | | 13,600 |
| Moody’s | | 125 | | 8,706 |
| People’s United Financial | | 520 | | 10,499 |
| Regions Financial | | 200 | | 7,134 |
| Ventas | | 200 | | 8,472 |
| Wachovia | | 275 | | 14,902 |
| Washington Mutual | | 325 | | 14,209 |
| Whitney Holding | | 200 | | 6,208 |
| | | | | 322,270 |
| Health Care—11.6% | | | | |
| Aetna | | 300 | | 15,879 |
| Becton, Dickinson & Co. | | 100 | | 7,625 |
| Biovail | | 225 | | 5,458 |
| CIGNA | | 25 | | 4,191 |
| Humana | | 200 a | | 12,410 |
| Johnson & Johnson | | 600 | | 37,962 |
| McKesson | | 325 | | 20,517 |
| Merck & Co. | | 600 | | 31,470 |
| Pfizer | | 1,025 | | 28,177 |
10
| Common Stocks (continued) | | Shares | | Value ($) |
| |
| |
|
| Health Care (continued) | | | | |
| Quest Diagnostics | | 125 | | 6,128 |
| UnitedHealth Group | | 250 | | 13,693 |
| | | | | 183,510 |
| Industrial—8.8% | | | | |
| Equifax | | 100 | | 4,203 |
| General Dynamics | | 225 | | 18,054 |
| General Electric | | 800 | | 30,064 |
| Ingersoll-Rand, Cl. A | | 225 | | 11,549 |
| Lockheed Martin | | 200 | | 19,620 |
| Norfolk Southern | | 100 | | 5,788 |
| Pitney Bowes | | 325 | | 15,519 |
| Raytheon | | 350 | | 19,460 |
| Waste Management | | 400 | | 15,468 |
| | | | | 139,725 |
| Information Technology—12.0% | | | | |
| Accenture, Cl. A | | 525 | | 21,494 |
| ADTRAN | | 300 | | 8,118 |
| Analog Devices | | 150 | | 5,431 |
| Applied Materials | | 675 | | 12,892 |
| FactSet Research Systems | | 100 | | 6,383 |
| Hewlett-Packard | | 375 | | 17,141 |
| Imation | | 175 | | 6,634 |
| Infosys Technologies, ADR | | 250 | | 12,312 |
| International Business Machines | | 100 | | 10,660 |
| Linear Technology | | 200 | | 7,178 |
| Maxim Integrated Products | | 250 | | 7,688 |
| Microchip Technology | | 275 | | 11,160 |
| Microsoft | | 625 | | 19,169 |
| Motorola | | 600 | | 10,914 |
| Nokia, ADR | | 400 | | 10,952 |
| QUALCOMM | | 300 | | 12,885 |
| Texas Instruments | | 275 | | 9,724 |
| | | | | 190,735 |
| Materials—3.6% | | | | |
| Ashland | | 200 | | 12,064 |
| Dow Chemical | | 400 | | 18,152 |
| International Paper | | 300 | | 11,751 |
The Fund 11
STATEMENT OF INVESTMENTS (continued)
| Common Stocks (continued) | | Shares | | | | Value ($) |
| |
| |
| |
|
| Materials (continued) | | | | | | |
| Nucor | | 125 | | | | 8,443 |
| Wausau Paper | | 500 | | | | 6,845 |
| | | | | | | 57,255 |
| Telecommunication Services—4.2% | | | | | | |
| AT & T | | 750 | | | | 31,005 |
| BCE | | 300 | | | | 11,070 |
| Bell Aliant Regional (Units) | | 23 | | a,b | | 0 |
| Citizens Communications | | 600 | | | | 9,510 |
| Windstream | | 1,000 | | | | 15,020 |
| | | | | | | 66,605 |
| Utilities—4.9% | | | | | | |
| Atmos Energy | | 375 | | | | 12,146 |
| Duke Energy | | 500 | | | | 9,770 |
| OGE Energy | | 75 | | | | 2,769 |
| PG & E | | 275 | | | | 13,547 |
| Pinnacle West Capital | | 300 | | | | 13,929 |
| Puget Energy | | 300 | | | | 7,563 |
| Sempra Energy | | 150 | | | | 9,198 |
| UGI | | 300 | | | | 8,640 |
| | | | | | | 77,562 |
| |
| |
| |
|
| |
| Total Investments (cost $1,341,236) | | 97.5% | | | | 1,547,820 |
| Cash and Receivables (Net) | | 2.5% | | | | 40,435 |
| Net Assets | | 100.0% | | | | 1,588,255 |
ADR—American Depository Receipts a Non-income producing security. b Security exempt from registration under Rule 144A of the Securities Act of 1933.This security may be resold in transactions exempt from registration, normally to qualified institutional buyers. At May 31, 2007, this security amounted to $0.00 or 0.0% of net assets.
| Portfolio Summary (Unaudited) † | | | | |
| |
| | | Value (%) | | | | Value (%) |
| |
| |
| |
|
| Financial | | 20.2 | | Consumer Staples | | 8.1 |
| Information Technology | | 12.0 | | Utilities | | 4.9 |
| Energy | | 12.0 | | Telecommunication Services | | 4.2 |
| Health Care | | 11.6 | | Materials | | 3.6 |
| Consumer Discretionary | | 9.7 | | Consumer Hard Goods | | 2.4 |
| Industrial | | 8.8 | | | | 97.5 |
| |
| † Based on net assets. | | | | | | |
| See notes to financial statements. | | | | | | |
12
STATEMENT OF ASSETS AND LIABILITIES
May 31, 2007
| | | | | | | Cost | | Value |
| |
| |
| |
| |
|
| Assets ($): | | | | | | | | |
| Investments in securities—See Statement of Investments | | | | 1,341,236 | | 1,547,820 |
| Cash | | | | | | | | 83,892 |
| Dividends and interest receivable | | | | | | | | 3,567 |
| Prepaid expenses | | | | | | | | 65,216 |
| Due from The Dreyfus Corporation and affiliates—Note 3(d) | | | | 8,935 |
| | | | | | | | | 1,709,430 |
| |
| |
| |
| |
|
| Liabilities ($): | | | | | | | | |
| Payable for investment securities purchased | | | | | | 63,648 |
| Accrued expenses and other liabilities | | | | | | 57,527 |
| | | | | | | | | 121,175 |
| |
| |
| |
| |
|
| Net Assets ($) | | | | | | | | 1,588,255 |
| |
| |
| |
| |
|
| Composition of Net Assets ($): | | | | | | | | |
| Paid-in capital | | | | | | | | 1,357,403 |
| Accumulated undistributed investment income—net | | | | | | 1,587 |
| Accumulated net realized gain (loss) on investments | | | | | | 22,681 |
| Accumulated net unrealized appreciation | | | | | | |
| (depreciation) on investments | | | | | | | | 206,584 |
| |
| |
| |
| |
|
| Net Assets ($) | | | | | | | | 1,588,255 |
| |
| |
| |
| |
|
| |
| |
| Net Asset Value Per Share | | | | | | | | |
| | | Class A | | Class C | | Class R | | Class T |
| |
| |
| |
| |
|
| Net Assets ($) | | 1,303,958 | | 120,923 | | 82,245 | | 81,129 |
| Shares Outstanding | | 86,932 | | 8,085 | | 5,480 | | 5,413 |
| |
| |
| |
| |
|
| Net Asset Value Per Share ($) | | 15.00 | | 14.96 | | 15.01 | | 14.99 |
See notes to financial statements.
The Fund 13
STATEMENT OF OPERATIONS
From July 5, 2006 (commencement of operations) to May 31, 2007
| Investment Income ($): | | |
| Income: | | |
| Cash dividends (net of $139 foreign taxes withheld at source): | | |
| Unaffiliated issuers | | 30,555 |
| Affiliated issuers | | 947 |
| Interest | | 633 |
| Total Income | | 32,135 |
| Expenses: | | |
| Management fee—Note 3(a) | | 8,595 |
| Prospectus and shareholders’ reports | | 47,417 |
| Auditing fees | | 32,709 |
| Registration fees | | 30,023 |
| Shareholder servicing costs—Note 3(d) | | 3,287 |
| Legal fees | | 2,251 |
| Custodian fees—Note 3(d) | | 1,587 |
| Trustees’ fees and expenses—Note 3(b) | | 1,181 |
| Distribution fees—Note 3(c) | | 610 |
| Commitment fee—Note 2 | | 2 |
| Miscellaneous | | 8,996 |
| Total Expenses | | 136,658 |
| Less—expense reimbursement from The Dreyfus | | |
| Corporation due to undertaking—Note 3(a) | | (117,755) |
| Less—reduction in custody fees due to earnings credits—Note 1(b) | | (1,226) |
| Net Expenses | | 17,677 |
| Investment Income—Net | | 14,458 |
| |
|
| Realized and Unrealized Gain (Loss) on Investments—Note 4 ($): |
| Net realized gain (loss) on investments | | 28,654 |
| Net unrealized appreciation (depreciation) on investments | | 206,584 |
| Net Realized and Unrealized Gain (Loss) on Investments | | 235,238 |
| Net Increase in Net Assets Resulting from Operations | | 249,696 |
See notes to financial statements.
14
STATEMENT OF CHANGES IN NET ASSETS
From July 5, 2006 (commencement of operations) to May 31, 2007
| Operations ($): | | |
| Investment income—net | | 14,458 |
| Net realized gain (loss) on investments | | 28,654 |
| Net unrealized appreciation | | |
| (depreciation) on investments | | 206,584 |
| Net Increase (Decrease) in Net Assets | | |
| Resulting from Operations | | 249,696 |
| |
|
| Dividends to Shareholders from ($): | | |
| Investment income—net: | | |
| Class A shares | | (11,434) |
| Class C shares | | (399) |
| Class R shares | | (687) |
| Class T shares | | (630) |
| Net realized gain on investments: | | |
| Class A shares | | (5,240) |
| Class C shares | | (270) |
| Class R shares | | (266) |
| Class T shares | | (354) |
| Total Dividends | | (19,280) |
| |
|
| Beneficial Interest Transactions ($): | | |
| Net proceeds from shares sold: | | |
| Class A shares | | 1,128,016 |
| Class C shares | | 106,923 |
| Class R shares | | 71,000 |
| Class T shares | | 68,258 |
| Dividends reinvested: | | |
| Class A shares | | 16,527 |
| Class C shares | | 647 |
| Class R shares | | 953 |
| Class T shares | | 984 |
| Cost of shares redeemed: | | |
| Class A shares | | (35,373) |
| Class C shares | | (96) |
| Increase (Decrease) in Net Assets | | |
| from Beneficial Interest Transactions | | 1,357,839 |
| Total Increase (Decrease) in Net Assets | | 1,588,255 |
| |
|
| Net Assets ($): | | |
| Beginning of Period | | — |
| End of Period | | 1,588,255 |
| Undistributed investment income—net | | 1,587 |
The Fund 15
STATEMENT OF CHANGES IN NET ASSETS (continued)
| Capital Share Transactions: | | |
| Class A | | |
| Shares sold | | 88,274 |
| Shares issued for dividends reinvested | | 1,206 |
| Shares redeemed | | (2,548) |
| Net Increase (Decrease) in Shares Outstanding | | 86,932 |
| |
|
| Class C | | |
| Shares sold | | 8,044 |
| Shares issued for dividends reinvested | | 47 |
| Shares redeemed | | (6) |
| Net Increase (Decrease) in Shares Outstanding | | 8,085 |
| |
|
| Class R | | |
| Shares sold | | 5,410 |
| Shares issued for dividends reinvested | | 70 |
| Net Increase (Decrease) in Shares Outstanding | | 5,480 |
| |
|
| Class T | | |
| Shares sold | | 5,341 |
| Shares issued for dividends reinvested | | 72 |
| Net Increase (Decrease) in Shares Outstanding | | 5,413 |
See notes to financial statements.
16
FINANCIAL HIGHLIGHTS
The following table describes the performance for each share class for the period from July 5, 2006 (commencement of operations) to May 31, 2007. All information (except portfolio turnover rate) reflects financial results for a single fund share. Total return shows how much your investment in the fund would have increased (or decreased) during the period, assuming you had reinvested all dividends and distributions.These figures have been derived from the fund’s financial statements.
| | | | | Class A | | Class C | | Class R | | Class T |
| | | | | Shares | | Shares | | Shares | | Shares |
| |
| |
| |
| |
| |
|
| Per Share Data ($): | | | | | | | | |
| Net asset value, beginning of period | | 12.50 | | 12.50 | | 12.50 | | 12.50 |
| Investment Operations: | | | | | | | | |
| Investment income—net a | | .16 | | .06 | | .19 | | .13 |
| Net realized and unrealized | | | | | | | | |
| gain (loss) on investments | | 2.56 | | 2.56 | | 2.56 | | 2.56 |
| Total from Investment Operations | | 2.72 | | 2.62 | | 2.75 | | 2.69 |
| Distributions: | | | | | | | | |
| Dividends from investment income—net | | (.15) | | (.09) | | (.17) | | (.13) |
| Dividends from net realized | | | | | | | | |
| gain on investments | | (.07) | | (.07) | | (.07) | | (.07) |
| Total Distributions | | (.22) | | (.16) | | (.24) | | (.20) |
| Net asset value, end of period | | 15.00 | | 14.96 | | 15.01 | | 14.99 |
| |
| |
| |
| |
|
| Total Return (%) b | | 21.89c | | 21.06c | | 22.17 | | 21.62c |
| |
| |
| |
| |
|
| Ratios/Supplemental Data (%): | | | | | | | | |
| Ratio of total expenses to | | | | | | | | |
| average net assets b | | 10.66 | | 11.39 | | 10.63 | | 10.95 |
| Ratio of net expenses | | | | | | | | |
| to average net assets b | | 1.36 | | 2.04 | | 1.13 | | 1.59 |
| Ratio of net investment income | | | | | | | | |
| to average net assets b | | 1.18 | | .47 | | 1.44 | | .96 |
| Portfolio Turnover Rate b | | 28.54 | | 28.54 | | 28.54 | | 28.54 |
| |
| |
| |
| |
|
| Net Assets, end of period ($ x 1,000) | | 1,304 | | 121 | | 82 | | 81 |
| |
| a | | Based on average shares outstanding at each month end. | | | | | | |
| b | | Not annualized. | | | | | | | | |
| c | | Exclusive of sales charge. | | | | | | | | |
| See notes to financial statements. | | | | | | | | |
The Fund 17
NOTES TO FINANCIAL STATEMENTS
NOTE 1—Significant Accounting Policies:
Dreyfus Premier Equity Income Fund (the “fund”) is a separate diversified series of The Dreyfus/Laurel Funds Trust (the “Trust”) which is registered under the Investment Company Act of 1940, as amended (the “Act”), as a open-end management investment company and operates as a series company currently offering six series, including the fund, which commenced operations on July 5, 2006.The fund’s investment objective seeks total return consisting of capital appreciation and income. The Dreyfus Corporation (the “Manager” or “Dreyfus”) serves as the fund’s investment adviser. During the reporting period, the Manager was a wholly-owned subsidiary of Mellon Financial Corporation (“Mellon Financial”).
On July 1, 2007, Mellon Financial and The Bank of New York Company, Inc. merged, forming The Bank of New York Mellon Corporation. As part of this transaction, Dreyfus became a wholly-owned subsidiary of The Bank of New York Mellon Corporation.
Dreyfus Service Corporation (the “Distributor”), a wholly-owned subsidiary of the Manager, is the distributor of the fund’s shares. Effective June 30, 2007, the Distributor will be known as MBSC Securities Corporation. The fund is authorized to issue an unlimited number of shares of Beneficial Interest in each of the following classes of shares: Class A, Class C, Class R and Class T. Class A and Class T shares are subject to a sales charge imposed at the time of purchase. Class C shares are subject to a contingent deferred sales charge (“CDSC”) on shares redeemed within one year of purchase. Class R shares are sold at net asset value per share only to institutional investors. Other differences between the classes include the services offered to and the expenses borne by each class and certain voting rights. Income, expenses (other than expenses attributable to a specific class), and realized and unrealized gains or losses on investments are allocated to each class of shares based on its relative net assets.
18
The fund’s Board of Trustees approved the redesignation of the fund’s Class R shares as Class I shares, effective June 1, 2007.The description of the eligibility requirements for Class I shares remains the same as it was for Class R shares.
The Trust accounts separately for the assets, liabilities and operations of each series. Expenses directly attributable to each series are charged to that series’ operations; expenses which are applicable to all series are allocated among them on a pro rata basis.
The fund’s financial statements are prepared in accordance with U.S. generally accepted accounting principles, which may require the use of management estimates and assumptions. Actual results could differ from those estimates.
The fund enters into contracts that contain a variety of indemnifications. The fund’s maximum exposure under these arrangements is unknown.The fund does not anticipate recognizing any loss related to these arrangements.
(a) Portfolio valuation: Investments in securities are valued at the last sales price on the securities exchange or national securities market on which such securities are primarily traded. Securities listed on the National Market System for which market quotations are available are valued at the official closing price or, if there is no official closing price that day, at the last sales price. Securities not listed on an exchange or the national securities market, or securities for which there were no transactions, are valued at the average of the most recent bid and asked prices, except for open short positions, where the asked price is used for valuation purposes. Bid price is used when no asked price is available. Registered open-end investment companies that are not traded on an exchange are valued at their net asset value.When market quotations or official closing prices are not readily available, or are determined not to reflect accurately fair value, such as when the value of a security has
The Fund 19
NOTES TO FINANCIAL STATEMENTS (continued)
been significantly affected by events after the close of the exchange or market on which the security is principally traded (for example, a foreign exchange or market), but before the fund calculates its net asset value, the fund may value these investments at fair value as determined in accordance with the procedures approved by the Board of Trustees. Fair valuing of securities may be determined with the assistance of a pricing service using calculations based on indices of domestic securities and other appropriate indicators, such as prices of relevant ADR’s and futures contracts. For other securities that are fair valued by the Board of Trustees, certain factors may be considered such as: fundamental analytical data, the nature and duration of restrictions on disposition, an evaluation of the forces that influence the market in which the securities are purchased and sold and public trading in similar securities of the issuer or comparable issuers. Financial futures are valued at the last sales price. Investments denominated in foreign currencies are translated to U.S. dollars at the prevailing rates of exchange. Forward currency exchange contracts are valued at the forward rate.
On September 20, 2006, the Financial Accounting Standards Board (FASB) released Statement of Financial Accounting Standards No. 157 “Fair Value Measurements” (“FAS 157”). FAS 157 establishes an authoritative definition of fair value, sets out a framework for measuring fair value, and requires additional disclosures about fair-value mea-surements.The application of FAS 157 is required for fiscal years beginning after November 15, 2007 and interim periods within those fiscal years. Management does not believe that the application of this standard will have a material impact on the financial statements of the fund.
(b) Securities transactions and investment income: Securities transactions are recorded on a trade date basis. Realized gain and loss from securities transactions are recorded on the identified cost basis. Dividend income is recognized on the ex-dividend date and interest income, including, where applicable, accretion of discount and amortization of premium on investments, is recognized on the accrual basis.
20
The fund has an arrangement with the custodian bank whereby the fund receives earnings credits from the custodian when positive cash balances are maintained, which are used to offset custody fees. For financial reporting purposes, the fund includes net earnings credits as an expense offset in the Statement of Operations.
(c) Affiliated issuers: Investments in other investment companies advised by Dreyfus are defined as “affiliated” in the Act.
(d) Dividends to shareholders: Dividends are recorded on the ex-dividend date. Dividends from investment income-net are declared and paid monthly and dividends from net realized capital gain, if any, are normally declared and paid annually, but the fund may make distributions on a more frequent basis to comply with the distribution requirements of the Internal Revenue Code of 1986, as amended (the “Code”).To the extent that net realized capital gain can be offset by capital loss carryovers, if any, it is the policy of the fund not to distribute such gain. Income and capital gain distributions are determined in accordance with income tax regulations, which may differ from U.S. generally accepted accounting principles.
(e) Federal income taxes: It is the policy of the fund to continue to qualify as a regulated investment company, if such qualification is in the best interests of its shareholders, by complying with the applicable provisions of the Code, and to make distributions of taxable income sufficient to relieve it from substantially all federal income and excise taxes.
On July 13, 2006, the FASB released FASB Interpretation No. 48 “Accounting for Uncertainty in Income Taxes” (FIN 48). FIN 48 provides guidance for how uncertain tax positions should be recognized, measured, presented and disclosed in the financial statements. FIN 48 requires the evaluation of tax positions taken or expected to be taken in the course of preparing the fund’s tax returns to determine whether the tax positions are “more-likely-than-not” of being sustained by the applicable tax authority.Tax positions not deemed to meet the more-
The Fund 21
NOTES TO FINANCIAL STATEMENTS (continued)
likely-than-not threshold would be recorded as a tax benefit or expense in the current year. Adoption of FIN 48 is required for fiscal years beginning after December 15, 2006 and is to be applied to all open tax years as of the effective date. Management does not believe that the application of this standard will have a material impact on the financial statements of the fund.
At May 31, 2007, the components of accumulated earnings on a tax basis were as follows: undistributed ordinary income $24,268 and unrealized appreciation $206,584.
The tax character of distributions paid to shareholders during the fiscal year ended May 31, 2007, was as follows: ordinary income $19,280.
During the period ended May 31, 2007, as a result of permanent book to tax differences, primarily due to the tax treatment for real estate investment trusts, the fund increased accumulated undistributed investment income-net by $279, increased accumulated net realized gain (loss) on investments by $157 and decreased paid-in capital by $436. Net assets were not affected by this reclassification.
NOTE 2—Bank Line of Credit:
The fund participates with other Dreyfus-managed funds in a $350 million redemption credit facility (the “Facility”) to be utilized for temporary or emergency purposes, including the financing of redemptions. In connection therewith, the fund has agreed to pay commitment fees on its pro rata portion of the Facility. Interest is charged to the fund based on prevailing market rates in effect at the time of borrowing. During the period ended May 31, 2007, the fund did not borrow under the Facility.
NOTE 3—Management Fee and Other Transactions With Affiliates:
(a) Pursuant to a management agreement (“Agreement”) with the Manager, the management fee is computed at the annual rate of .75% of the value of the fund’s average daily net assets and is payable
22
monthly.The Manager has contractually agreed to waive receipt of its fees and/or assume the expenses of the fund, until May 31, 2008, so that annual fund operating expenses (excluding Rule 12b-1 fees, shareholder services fees, taxes, interest, brokerage commissions, commitment fees on borrowings and extraordinary expenses) do not exceed 1.25% of the fund’s average daily net assets.The expense reimbursement, pursuant to the undertaking, amounted to $117,755 during the period ended May 31, 2007.
During the period ended May 31, 2007, the Distributor retained $185 from commissions earned on sales of the fund’s Class A shares.
(b) Each Trustee receives $45,000 per year, plus $6,000 for each joint board meeting of the Trust, The Dreyfus/Laurel Funds, Inc. and The Dreyfus/Laurel Tax-Free Municipal Funds (collectively, the “Dreyfus/Laurel Funds”), attended, $2,000 for separate in-person committee meetings attended which are not held in conjunction with a regularly scheduled Board meeting and $1,500 for Board meetings and separate committee meetings attended that are conducted by telephone and is reimbursed for travel and out-of-pocket expenses.With respect to Board Meetings, the Chairman of the Board receives an additional 25% of such compensation (with the exception of reimbursable amounts). With respect to compensation committee meetings, the Chair of the compensation committee receives $900 per meeting and, with respect to audit committee meetings, the Chair of the audit committee receives $1,350 per meeting. In the event that there is an in-person joint committee meeting of the Dreyfus/Laurel Funds and Dreyfus High Yield Strategies Fund, the $2,000 or $1,500 fee, as applicable, will be allocated between the Dreyfus/Laurel Funds and Dreyfus High Yield Strategies Fund.These fees and expenses are charged and allocated to each series based on net assets.Amounts required to be paid by the Trust directly to the non-interested Trustees, that would be applied to offset a portion of the management fee payable by certain other series of the Trust to the Manager, are in fact paid directly by the Manager to the non-interested Trustees.
The Fund 23
NOTES TO FINANCIAL STATEMENTS (continued)
(c) Under the Distribution Plan (the “Plan”) adopted pursuant to Rule 12b-1 under the Act, Class C and Class T shares pay the Distributor for distributing their shares at an annual rate of .75% of the value of the average daily net assets of Class C shares and .25% of the value of the average daily net assets of Class T shares. During the period ended May 31, 2007, Class C and Class T shares were charged $456 and $154, respectively, pursuant to the Plan.
(d) Under the Shareholder Services Plan, Class A, Class C and Class T shares pay the Distributor at an annual rate of .25% of the value of their average daily net assets for the provision of certain services.The services provided may include personal services relating to shareholder accounts, such as answering shareholder inquiries regarding Class A, Class C and Class T shares and providing reports and other information, and services related to the maintenance of shareholder accounts. The Distributor may make payments to Service Agents (a securities dealer, financial institution or other industry professional) in respect of these services.The Distributor determines the amounts to be paid to Service Agents. During the period ended May 31, 2007, Class A, Class C and Class T shares were charged $2,433, $152 and $154, respectively, pursuant to the Shareholder Services Plan.
The fund compensates Dreyfus Transfer, Inc., a wholly-owned subsidiary of the Manager, under a transfer agency agreement for providing personnel and facilities to perform transfer agency services for the fund. During the period ended May 31, 2007, the fund was charged $371 pursuant to the transfer agency agreement.
The fund compensates Mellon Bank, N.A., an affiliate of the Manager, under a custody agreement for providing custodial services for the fund. During the period ended May 31, 2007, the fund was charged $1,587 pursuant to the custody agreement.
During the period ended May 31, 2007, the fund was charged $4,089 for services performed by the Chief Compliance Officer.
24
The components of “Due from The Dreyfus Corporation and affiliates” in the Statement of Assets and Liabilities consist of: management fees $215, Rule 12b-1 distribution plan fees $87, shareholder services plan fees $312, custodian fees $598, chief compliance officer fees $3,748 and transfer agency per account fees $90, which are offset against an expense reimbursement currently in effect in the amount of $13,985.
(e) The Trust and the Manager have received an exemptive order from the SEC which, among other things, permits the fund to use collateral received in connection with lending the fund’s securities to purchase shares of one or more registered money market mutual funds advised by the Manager in excess of the limitations imposed by the Act.
NOTE 4—Securities Transactions:
The aggregate amount of purchases and sales of investment securities, excluding short-term securities and forward currency exchange contracts, during the period ended May 31, 2007, amounted to $1,663,481 and $350,972, respectively.
At May 31, 2007, the cost of investments for federal income tax purposes was $1,341,236; accordingly, accumulated net unrealized appreciation on investments was $206,584, consisting of $217,881 gross unrealized appreciation and $11,297 gross unrealized depreciation.
The Fund 25
REPORT OF INDEPENDENT REGISTERED PUBLIC ACCOUNTING FIRM
The Board of Trustees and Shareholders of The Dreyfus/Laurel Funds, Trust:
We have audited the accompanying statement of assets and liabilities of Dreyfus Premier Equity Income Fund (the “Fund”) of The Dreyfus/Laurel Funds Trust, including the statement of investments, as of May 31, 2007, and the related statements of operations, changes in net assets and the financial highlights for the period from July 5, 2006 (commencement of operations) through May 31, 2007.These financial statements and financial highlights are the responsibility of the Fund’s management. Our responsibility is to express an opinion on these financial statements and financial highlights based on our audit.
We conducted our audit in accordance with the standards of the Public Company Accounting Oversight Board (United States).Those standards require that we plan and perform the audit to obtain reasonable assurance about whether the financial statements and financial highlights are free of material misstatement. An audit includes examining, on a test basis, evidence supporting the amounts and disclosures in the financial statements. Our procedures included confirmation of securities owned as of May 31, 2007, by correspondence with the custodian and brokers. An audit also includes assessing the accounting principles used and significant estimates made by management, as well as evaluating the overall financial statement presentation. We believe that our audit provides a reasonable basis for our opinion.
In our opinion, the financial statements and financial highlights referred to above present fairly, in all material respects, the financial position of Dreyfus Premier Equity Income Fund of The Dreyfus/Laurel Funds Trust, as of May 31, 2007, and the results of its operations and the changes in its net assets and the financial highlights for the period from July 5, 2006 to May 31, 2007, in conformity with U.S. generally accepted accounting principles.

| New York, New York |
| July 16, 2007 |
26
IMPORTANT TAX INFORMATION ( U n a u d i t e d )
For federal tax purposes, the fund hereby designates $.0660 per share as a qualified short-term capital gain distribution paid on December 29, 2006.Also the fund hereby designates 59.77% of the ordinary dividends paid during the fiscal year ended May 31, 2007 as qualifying for the corporate dividends received deduction.Also certain dividends paid by the fund may be subject to a maximum tax rate of 15%, as provided for by the Jobs and Growth Tax Relief Reconciliation Act of 2003. Of the distributions paid during the fiscal year, $19,281 represents the maximum amount that may be considered qualified dividend income. Shareholders will receive notification in January 2008 of the percentage applicable to the preparation of their 2007 income tax returns.
The Fund 27
BOARD MEMBERS INFORMATION ( U n a u d i t e d )
| Joseph S. DiMartino (63) |
| Chairman of the Board (1999) |
| Principal Occupation During Past 5 Years: |
| • Corporate Director and Trustee |
| Other Board Memberships and Affiliations: |
| • The Muscular Dystrophy Association, Director |
| • Century Business Services, Inc., a provider of outsourcing functions for small and medium size |
| companies, Director |
| • The Newark Group, a provider of a national market of paper recovery facilities, paperboard |
| mills and paperboard converting plants, Director |
| • Sunair Services Corporation, a provider of certain outdoor-related services to homes and |
| businesses, Director |
| No. of Portfolios for which Board Member Serves: 186 |
| James M. Fitzgibbons (72) |
| Board Member (1994) |
| Principal Occupation During Past 5 Years: |
| • Chairman of the Board, Davidson Cotton Company (1998-2002) |
| Other Board Memberships and Affiliations: |
| • Bill Barrett Company, an oil and gas exploration company, Director |
| No. of Portfolios for which Board Member Serves: 27 |
| J. Tomlinson Fort (78) |
| Board Member (1987) |
| Principal Occupation During Past 5 Years: |
| • Retired; Of Counsel, Reed Smith LLP (1998-present) |
| Other Board Memberships and Affiliations: |
| • Allegheny College, Emeritus Trustee |
| • Pittsburgh Ballet Theatre,Trustee |
| • American College of Trial Lawyers, Fellow |
| No. of Portfolios for which Board Member Serves: 27 |
| Kenneth A. Himmel (60) |
| Board Member (1994) |
| Principal Occupation During Past 5 Years: |
| • President and CEO, Related Urban Development, a real estate development company |
| (1996-present) |
| • President and CEO, Himmel & Company, a real estate development company (1980-present) |
| • CEO, American Food Management, a restaurant company (1983-present) |
| No. of Portfolios for which Board Member Serves: 27 |
28
| Stephen J. Lockwood (59) |
| Board Member (1994) |
| Principal Occupation During Past 5 Years: |
| • Chairman of the Board, Stephen J. Lockwood and Company LLC, an investment company |
| (2000-present) |
| No. of Portfolios for which Board Member Serves: 27 |
| Roslyn M. Watson (57) |
| Board Member (1994) |
| Principal Occupation During Past 5 Years: |
| • Principal,Watson Ventures, Inc., a real estate investment company (1993-present) |
| Other Board Memberships and Affiliations: |
| • American Express Centurion Bank, Director |
| • The Hyams Foundation Inc., a Massachusetts Charitable Foundation,Trustee |
| • National Osteoporosis Foundation,Trustee |
| No. of Portfolios for which Board Member Serves: 27 |
| ——————— |
| Benaree Pratt Wiley (60) |
| Board Member (1998) |
| Principal Occupation During Past 5 Years: |
| • Principal,The Wiley Group, a firm specializing in strategy and business development |
| (2005-present) |
| • President and CEO,The Partnership, an organization dedicated to increasing the |
| representation of African Americans in positions of leadership, influence and decision-making |
| in Boston, MA (1991-2005) |
| Other Board Memberships and Affiliations: |
| • Boston College,Trustee |
| • Blue Cross Blue Shield of Massachusetts, Director |
| • Commonwealth Institute, Director |
| • Efficacy Institute, Director |
| • PepsiCo African-American, Advisory Board |
| • The Boston Foundation, Director |
| • Harvard Business School Alumni Board, Director |
| No. of Portfolios for which Board Member Serves: 36 |
Once elected all Board Members serve for an indefinite term, but achieve Emeritus status upon reaching age 80.The address of the Board Members and Officers is in c/o The Dreyfus Corporation, 200 Park Avenue, New York, New York 10166. Additional information about the Board Members is available in the fund’s Statement of Additional Information which can be obtained from Dreyfus free of charge by calling this toll free number: 1-800-554-4611.
Francis P. Brennan, Emeritus Board Member
The Fund 29
OFFICERS OF THE FUND ( U n a u d i t e d )
| J. DAVID OFFICER, President since |
| December 2006. |
Chief Operating Officer,Vice Chairman and Director of the Manager, and an officer of 86 investment companies (comprised of 168 portfolios) managed by the Manager. He is 58 years old and has been an employee of the Manager since April 1998.
| MARK N. JACOBS, Vice President since |
| March 2000. |
Executive Vice President, Secretary and General Counsel of the Manager, and an officer of 87 investment companies (comprised of 184 portfolios) managed by the Manager. He is 61 years old and has been an employee of the Manager since June 1977.
| MICHAEL A. ROSENBERG, Vice President |
| and Secretary since August 2005. |
Associate General Counsel of the Manager, and an officer of 87 investment companies (comprised of 184 portfolios) managed by the Manager. He is 47 years old and has been an employee of the Manager since October 1991.
| JAMES BITETTO, Vice President and |
| Assistant Secretary since August 2005. |
Associate General Counsel and Assistant Secretary of the Manager, and an officer of 87 investment companies (comprised of 184 portfolios) managed by the Manager. He is 40 years old and has been an employee of the Manager since December 1996.
| JONI LACKS CHARATAN, Vice President |
| and Assistant Secretary since |
| August 2005. |
Associate General Counsel of the Manager, and an officer of 87 investment companies (comprised of 184 portfolios) managed by the Manager. She is 51 years old and has been an employee of the Manager since October 1988.
| JOSEPH M. CHIOFFI, Vice President and |
| Assistant Secretary since August 2005. |
Associate General Counsel of the Manager, and an officer of 87 investment companies (comprised of 184 portfolios) managed by the Manager. He is 45 years old and has been an employee of the Manager since June 2000.
| JANETTE E. FARRAGHER, Vice President |
| and Assistant Secretary since |
| August 2005. |
Associate General Counsel of the Manager, and an officer of 87 investment companies (comprised of 184 portfolios) managed by the Manager. She is 44 years old and has been an employee of the Manager since February 1984.
| JOHN B. HAMMALIAN, Vice President and |
| Assistant Secretary since August 2005. |
Associate General Counsel of the Manager, and an officer of 87 investment companies (comprised of 184 portfolios) managed by the Manager. He is 43 years old and has been an employee of the Manager since February 1991.
| ROBERT R. MULLERY, Vice President and |
| Assistant Secretary since August 2005. |
Associate General Counsel of the Manager, and an officer of 87 investment companies (comprised of 184 portfolios) managed by the Manager. He is 55 years old and has been an employee of the Manager since May 1986.
| JEFF PRUSNOFSKY, Vice President and |
| Assistant Secretary since August 2005. |
Associate General Counsel of the Manager, and an officer of 87 investment companies (comprised of 184 portfolios) managed by the Manager. He is 42 years old and has been an employee of the Manager since October 1990.
| JAMES WINDELS, Treasurer since |
| November 2001. |
Director – Mutual Fund Accounting of the Manager, and an officer of 87 investment companies (comprised of 184 portfolios) managed by the Manager. He is 48 years old and has been an employee of the Manager since April 1985.
| ROBERT ROBOL, Assistant Treasurer |
| since December 2002. |
Senior Accounting Manager – Money Market and Municipal Bond Funds of the Manager, and an officer of 87 investment companies (comprised of 184 portfolios) managed by the Manager. He is 43 years old and has been an employee of the Manager since October 1988.
| ROBERT SVAGNA, Assistant Treasurer |
| since December 2002. |
Senior Accounting Manager – Equity Funds of the Manager, and an officer of 87 investment companies (comprised of 184 portfolios) managed by the Manager. He is 40 years old and has been an employee of the Manager since November 1990.
| GAVIN C. REILLY, Assistant Treasurer |
| since December 2005. |
Tax Manager of the Investment Accounting and Support Department of the Manager, and an officer of 87 investment companies (comprised of 184 portfolios) managed by the Manager. He is 38 years old and has been an employee of the Manager since April 1991.
| JOSEPH W. CONNOLLY, Chief Compliance |
| Officer since October 2004. |
Chief Compliance Officer of the Manager and The Dreyfus Family of Funds (87 investment companies, comprised of 184 portfolios). From November 2001 through March 2004, Mr. Connolly was first Vice-President, Mutual Fund Servicing for Mellon Global Securities Services. In that capacity, Mr. Connolly was responsible for managing Mellon’s Custody, Fund Accounting and Fund Administration services to third-party mutual fund clients. He is 50 years old and has served in various capacities with the Manager since 1980, including manager of the firm’s Fund Accounting Department from 1997 through October 2001.
| WILLIAM GERMENIS, Anti-Money |
| Laundering Compliance Officer since |
| July 2002. |
Vice President and Anti-Money Laundering Compliance Officer of the Distributor, and the Anti-Money Laundering Compliance Officer of 83 investment companies (comprised of 180 portfolios) managed by the Manager. He is 36 years old and has been an employee of the Distributor since October 1998.
The Fund 31
NOTES
The Registrant has adopted a code of ethics that applies to the Registrant's principal executive officer, principal financial officer, principal accounting officer or controller, or persons performing similar functions There have been no amendments to, or waivers in connection with, the Code of Ethics during the covered by this Report.
| Item 3. | | Audit Committee Financial Expert. |
The Registrant's Board has determined that Joseph S. DiMartino, a member of the Audit Committee of the Board, is an audit committee financial expert as defined by the Securities and Exchange Commission (the "SEC"). Joseph S. DiMartino is "independent" as defined by the SEC for purposes of audit committee financial expert determinations.
| Item 4. | | Principal Accountant Fees and Services |
(a) Audit Fees. The aggregate fees billed for each of the last two fiscal years (the "Reporting Periods") for professional services rendered by the Registrant's principal accountant (the "Auditor") for the audit of the Registrant's annual financial statements, or services that are normally provided by the Auditor in connection with the statutory and regulatory filings or engagements for the Reporting Periods, were $0 in 2006 and $26,925 in 2007.
(b) Audit-Related Fees. The aggregate fees billed in the Reporting Periods for assurance and related services by the Auditor that are reasonably related to the performance of the audit of the Registrant's financial statements and are not reported under paragraph (a) of this Item 4 were $0 in 2006 and $0 in 2007.
The aggregate fees billed in the Reporting Periods for non-audit assurance and related services by the Auditor to the Registrant's investment adviser (not including any sub-investment adviser whose role is primarily portfolio management and is subcontracted with or overseen by another investment adviser), and any entity controlling, controlled by or under common control with the investment adviser that provides ongoing services to the Registrant ("Service Affiliates"), that were reasonably related to the performance of the annual audit of the Service Affiliate, which required pre-approval by the Audit Committee were $0 in 2006 and $0 in 2007.
Note: For the second paragraph in each of (b) through (d) of this Item 4, certain of such services were not pre-approved prior to May 6, 2003, when such services were required to be pre-approved. On and after May 6, 2003, 100% of all services provided by the Auditor were pre-approved as required. For comparative purposes, the fees shown assume that all such services were pre-approved, including services that were not pre-approved prior to the compliance date of the pre-approval requirement.
(c) Tax Fees. The aggregate fees billed in the Reporting Periods for professional services rendered by the Auditor for tax compliance, tax advice and tax planning ("Tax Services") were $0 in 2006 and $0 in 2007. These services consisted of review or preparation of U.S. federal, state, local and excise tax returns.
The aggregate fees billed in the Reporting Periods for Tax Services by the Auditor to Service Affiliates which required pre-approval by the Audit Committee were $0 in 2006 and $0 in 2007.
(d) All Other Fees. The aggregate fees billed in the Reporting Periods for products and services provided by the Auditor, other than the services reported in paragraphs (a) through (c) of this Item, were $0 in 2006 and $0 in 2007.
The aggregate fees billed in the Reporting Periods for Non-Audit Services by the Auditor to Service Affiliates, other than the services reported in paragraphs (b) through (c) of this Item, which required pre-approval by the Audit Committee were $0 in 2006 and $0 in 2007.
Audit Committee Pre-Approval Policies and Procedures. The Registrant's Audit Committee has established policies and procedures (the "Policy") for pre-approval (within specified fee limits) of the Auditor's engagements for non-audit services to the Registrant and Service Affiliates without specific case-by-case consideration. Pre-approval considerations include whether the proposed services are compatible with maintaining the Auditor's independence. Pre-approvals pursuant to the Policy are considered annually.
Non-Audit Fees. The aggregate non-audit fees billed by the Auditor for services rendered to the Registrant, and rendered to Service Affiliates, for the Reporting Periods were $0 in 2006 and $3,669,000 in 2007.
Auditor Independence. The Registrant's Audit Committee has considered whether the provision of non-audit services that were rendered to Service Affiliates which were not pre-approved (not requiring pre-approval) is compatible with maintaining the Auditor's independence.
| Item 5. | | Audit Committee of Listed Registrants. |
| | | Not applicable. |
| Item 6. | | Schedule of Investments. |
| | | Not applicable. |
| Item 7. | | Disclosure of Proxy Voting Policies and Procedures for Closed-End Management |
| | | Investment Companies. |
| | | Not applicable. |
| Item 8. | | Portfolio Managers of Closed-End Management Investment Companies. |
| | | Not applicable. |
| Item 9. | | Purchases of Equity Securities by Closed-End Management Investment Companies and |
| | | Affiliated Purchasers. |
| | | Not applicable. |
| Item 10. | | Submission of Matters to a Vote of Security Holders. |
The Registrant has a Nominating Committee (the "Committee"), which is responsible for selecting and nominating persons for election or appointment by the Registrant's Board as Board members. The Committee has adopted a Nominating Committee Charter (the "Charter"). Pursuant to the Charter, the Committee will consider recommendations for nominees from shareholders submitted to the Secretary of the Registrant, c/o The Dreyfus Corporation Legal Department, 200 Park Avenue, 8th Floor East, New York, New York 10166. A nomination submission must include information regarding the recommended nominee
as specified in the Charter. This information includes all information relating to a recommended nominee that is required to be disclosed in solicitations or proxy statements for the election of Board members, as well as information sufficient to evaluate the factors to be considered by the Committee, including character and integrity, business and professional experience, and whether the person has the ability to apply sound and independent business judgment and would act in the interests of the Registrant and its shareholders. Nomination submissions are required to be accompanied by a written consent of the individual to stand for election if nominated by the Board and to serve if elected by the shareholders, and such additional information must be provided regarding the recommended nominee as reasonably requested by the Committee.
Item 11. Controls and Procedures.
(a) The Registrant's principal executive and principal financial officers have concluded, based on their evaluation of the Registrant's disclosure controls and procedures as of a date within 90 days of the filing date of this report, that the Registrant's disclosure controls and procedures are reasonably designed to ensure that information required to be disclosed by the Registrant on Form N-CSR is recorded, processed, summarized and reported within the required time periods and that information required to be disclosed by the Registrant in the reports that it files or submits on Form N-CSR is accumulated and communicated to the Registrant's management, including its principal executive and principal financial officers, as appropriate to allow timely decisions regarding required disclosure.
(b) There were no changes to the Registrant's internal control over financial reporting that occurred during the second fiscal quarter of the period covered by this report that have materially affected, or are reasonably likely to materially affect, the Registrant's internal control over financial reporting.
(a)(1) Code of ethics referred to in Item 2.
(a)(2) Certifications of principal executive and principal financial officers as required by Rule 30a-2(a) under the Investment Company Act of 1940.
(a)(3) Not applicable.
(b) Certification of principal executive and principal financial officers as required by Rule 30a-2(b) under the Investment Company Act of 1940.
SIGNATURES
Pursuant to the requirements of the Securities Exchange Act of 1934 and the Investment Company Act of 1940, the Registrant has duly caused this Report to be signed on its behalf by the undersigned, thereunto duly authorized.
The Dreyfus/Laurel Funds Trust
| By: | | /s/ J. David Officer |
| | | J. David Officer |
| | | President |
| |
| Date: | | July 23, 2007 |
Pursuant to the requirements of the Securities Exchange Act of 1934 and the Investment Company Act of 1940, this Report has been signed below by the following persons on behalf of the Registrant and in the capacities and on the dates indicated.
| By: | | /s/ J. David Officer |
| | | J. David Officer |
| | | President |
| |
| Date: | | July 23, 2007 |
| By: | | /s/ James Windels |
| | | James Windels |
| | | Treasurer |
| |
| Date: | | July 23, 2007 |
EXHIBIT INDEX
(a)(1) Code of ethics referred to in Item 2.
(a)(2) Certifications of principal executive and principal financial officers as required by Rule 30a-2(a) under the Investment Company Act of 1940. (EX-99.CERT)
(b) Certification of principal executive and principal financial officers as required by Rule 30a-2(b) under the Investment Company Act of 1940. (EX-99.906CERT)