| UNITED STATES |
| SECURITIES AND EXCHANGE COMMISSION |
| Washington, D.C. 20549 |
| |
| |
| FORM N-CSR |
| |
| CERTIFIED SHAREHOLDER REPORT OF REGISTERED MANAGEMENT |
| INVESTMENT COMPANIES |
| |
| Investment Company Act file number 811-524 |
| |
| The Dreyfus/Laurel Funds Trust |
| (Exact name of Registrant as specified in charter) |
| |
| |
| c/o The Dreyfus Corporation |
| 200 Park Avenue |
| New York, New York 10166 |
| (Address of principal executive offices) (Zip code) |
| |
| Michael A. Rosenberg, Esq. |
| 200 Park Avenue |
| New York, New York 10166 |
| (Name and address of agent for service) |
| |
| Registrant's telephone number, including area code: (212) 922-6000 |
| Date of fiscal year end: | | 08/31 |
| Date of reporting period: | | 08/31/2007 |
The following N-CSR relates only to Dreyfus Tax Managed Balanced Fund, a series of the Registrant, and does not affect the other series of the Registrant, which have different fiscal year ends and, therefore, different N-CSR reporting requirements. Separate N-CSR Forms will be filed for those series, as appropriate.
FORM N-CSR
Item 1. Reports to Stockholders.
Save time. Save paper. View your next shareholder report online as soon as it’s available. Log into www.dreyfus.com and sign up for Dreyfus eCommunications. It’s simple and only takes a few minutes.
The views expressed in this report reflect those of the portfolio manager only through the end of the period covered and do not necessarily represent the views of Dreyfus or any other person in the Dreyfus organization. Any such views are subject to change at any time based upon market or other conditions and Dreyfus disclaims any responsibility to update such views.These views may not be relied on as investment advice and, because investment decisions for a Dreyfus fund are based on numerous factors, may not be relied on as an indication of trading intent on behalf of any Dreyfus fund.
Not FDIC-Insured • Not Bank-Guaranteed • May Lose Value
| Contents |
| |
| | | THE FUND |
| |
|
| 2 | | A Letter from the CEO |
| 3 | | Discussion of Fund Performance |
| 6 | | Fund Performance |
| 7 | | Understanding Your Fund’s Expenses |
| 7 | | Comparing Your Fund’s Expenses |
| With Those of Other Funds |
| 8 | | Statement of Investments |
| 15 | | Statement of Assets and Liabilities |
| 16 | | Statement of Operations |
| 17 | | Statement of Changes in Net Assets |
| 18 | | Financial Highlights |
| 19 | | Notes to Financial Statements |
| 27 | | Report of Independent Registered |
| | | Public Accounting Firm |
| 28 | | Important Tax Information |
| 29 | | Board Members Information |
| 31 | | Officers of the Fund |
| FOR MORE INFORMATION |
|
| | | Back Cover |
| Dreyfus |
| Tax Managed |
| Balanced Fund |
The Fund

A LETTER FROM THE CEO
Dear Shareholder:
We are pleased to present this annual report for Dreyfus Tax Managed Balanced Fund, covering the 12-month period from September 1, 2006, through August 31, 2007.
An intensifying credit crisis over the spring and summer of 2007 produced heightened volatility in the financial markets.As credit concerns spread from the sub-prime mortgage area to other fixed-income market sectors, investors’ appetite for risk shifted from ample to cautious. This change led to a “flight to quality,” which produced price gains in U.S.Treasury securities and, to a lesser extent, high-quality municipal bonds. In contrast, the more credit-sensitive areas of the taxable and tax-exempt bond markets suffered sharp declines.While these changes led to declines across most capitalization ranges of the U.S. stock market, earlier gains enabled most equity indices to post relatively attractive results for the reporting period overall.
In our analysis, the downside risks to the U.S. economy have increased, with the housing recession and consumer slowdown likely to be more intense than previously expected.Many investors were encouraged by the Fed’s decision in August to lower the discount rate and even more so by its decision to lower the federal funds rate 50 basis points at its September meeting. We believe that these monetary policy changes will help to stabilize short-term market volatility and allow for the current economic cycle to moderate gradually.With that said, we also feel that these factors are likely to continue to produce opportunities for some market sectors and challenges for others, which is why we encourage you to talk with your financial advisor to help ensure that your portfolio remains aligned with your current financial needs and future investment goals.
For information about how the fund performed during the reporting period, as well as market perspectives, we have provided a Discussion of Fund Performance given by the fund’s Portfolio Managers.
Thank you for your continued confidence and support.
2

DISCUSSION OF FUND PERFORMANCE
For the period of September 1, 2006, through August 31, 2007, as provided by Joseph P. Darcy, Senior Portfolio Manager, Fixed Income Portion, and Fayez Sarofim of Fayez Sarofim & Co., Sub-Investment Adviser, Equity Portion
Fund and Market Performance Overview
Stocks and municipal bonds produced relatively attractive returns during much of the reporting period as the U.S. economy expanded, corporate earnings grew and credit fundamentals remained sound. However, market turbulence increased in July and August due to economic concerns arising from a credit crunch in fixed-income markets.The large, well-established market leaders in which the fund’s equity portion invests held up relatively well during the downturn, while municipal bonds fared less favorably due to selling pressure.The fund produced a lower return than its benchmark, due mainly to underperformance among equities early in the reporting period, when investors favored smaller stocks over larger ones.
For the 12-month period ended August 31, 2007, Dreyfus Tax Managed Balanced Fund produced a 5.43% total return.1 The fund’s benchmark, a blended index composed of 55% Lehman Brothers Municipal Bond Index (the “Lehman Index”) and 45% Standard & Poor’s 500 Composite Stock Price Index (“S&P 500 Index”),produced an 8.07% total return for the same period.2 Individually, the Lehman Index produced a 2.30% return and the S&P 500 Index produced a 15.13% return.
The Fund’s Investment Approach
The fund seeks to provide an attractive after-tax total return consisting of federally tax-exempt income and capital appreciation.To pursue its goal, the fund normally invests the majority of its assets in municipal bonds that provide income exempt from federal income tax.The fund’s target investment allocation in municipal bonds is 55% of its assets. From time to time, we may re-balance the fund’s portfolio, and will do so quarterly if necessary to maintain its municipal bond holdings above 50% of assets. The fund employs a tax-managed strategy to invest the balance of its assets primarily in equity securities, focusing on “blue-chip” companies with market capitalizations exceeding $5 billion at the time of purchase, including multinational companies.
The fund only invests in municipal bonds rated investment grade by independent rating agencies or the unrated equivalent as determined by Dreyfus at the time of purchase.3 The fund seeks to maintain a minimum average
The Fund 3
DISCUSSION OF FUND PERFORMANCE (continued)
credit quality of AA/Aa with respect to its portfolio of municipal bonds.We may buy and sell bonds based on credit quality, market outlook and yield potential.When selecting municipal bonds for investment, we may assess the current interest rate environment and the municipal bond’s credit profile and potential volatility in different rate environments. We primarily focus on bonds with the potential to offer attractive current income, typically looking for bonds that can provide consistently attractive current yields or that are trading at competitive market prices.
The fund invests the balance of its assets primarily in equity securities, such as common stocks, preferred stocks, warrants and convertible securities. In choosing equities, we first identify economic sectors that we believe will expand over the next three to five years or longer. Using fundamental analysis, we then seek companies within these sectors that have dominant positions in their industries and have demonstrated sustained patterns of profitability, strong balance sheets, an expanding global presence and the potential to achieve predictable, above-average earnings growth.We also are alert to companies that we consider undervalued.We attempt to enhance after-tax returns by minimizing the fund’s annual taxable distributions.To do so, we generally seek to maintain a low annual portfolio turnover rate.
Market Leadership Shifted Toward Large, High-Quality Companies
Stocks continued to advance for much of the reporting period, and municipal bonds retained their value, in an environment of moderate economic growth, stable short-term interest rates and rising corporate earnings. Municipal bonds also were supported by robust investor demand and sound fiscal conditions.As they had for some time, equity investors maintained an ample appetite for risk, which benefited shares of smaller, lower-quality companies more than the blue-chip stocks that comprise the bulk of the fund’s holdings. Consequently, the fund’s returns trailed its benchmark.
This market environment began to change in June 2007, when credit concerns in the taxable bond market’s sub-prime mortgage sector spread to other areas of the financial markets. Investors curtailed their appetite for risk amid worries that intensifying weakness in housing markets might derail the U.S. economy. Although credit fundamentals remained sound, municipal bonds were hurt by selling pressure, as some highly leveraged institutional investors attempted to raise cash. In the stock market, high-quality companies returned to favor. Because we had anticipated this shift, the fund’s equity portion was positioned to benefit from investors’ renewed resistance to risk.
4
Energy Stocks Boosted Fund Performance
In the fund’s municipal bond portfolio, we continued to focus on higher-quality, longer-term securities with provisions for early redemption.To help ensure liquidity, we emphasized issuers with national name recognition.
In the stock portfolio,overweighted exposure to the energy sector contributed positively to the fund’s returns, as rising oil and gas prices bolstered the earnings of large, integrated energy producers. The fund also benefited from an underweighted position in the financials sector, which was among the hardest hit areas during the credit crisis.We focused mainly on large, diversified financial services providers, which declined less severely than smaller banks.
The fund’s emphasis on consumer staples companies detracted somewhat from performance as investors became more concerned about consumer spending. Nonetheless, the fund received relatively strong contributions from consumer-oriented giants Coca-Cola,Altria Group and Nestle.
Positioned for New Opportunities
We believe that the fund’s holdings of high-quality municipal bonds are well positioned for slower economic growth.We also are encouraged by the apparent return to favor of blue chip stocks. In particular, technology stocks appear poised to benefit from stronger corporate investment. We have established new positions in technology leaders such as Microchip Technology, Cisco Systems and Texas Instruments.We also initiated positions in industrial companies United Technologies and Caterpillar, which we expect to benefit from robust demand from overseas markets.
September 19, 2007
| | | Portfolio turnover rates are subject to change. Portfolio turnover rates alone do not |
| | | automatically result in high or low distribution rates. There can be no guarantee that the |
| | | fund will generate any specific level of distribution annually. |
| 1 | | Total return includes reinvestment of dividends and any capital gains paid. Past performance is no |
| | | guarantee of future results. Share price, yield and investment return fluctuate such that upon |
| | | redemption, fund shares may be worth more or less than their original cost. Income from municipal |
| | | bonds may be subject to state and local taxes, and some income may be subject to the federal |
| | | alternative minimum tax (AMT) for certain investors. Any capital gains and any dividends |
| | | received from the fund’s equity investments are fully taxable. Return figure provided reflects the |
| | | absorption of certain fund expenses by The Dreyfus Corporation pursuant to an undertaking in |
| | | effect until August 31, 2008, at which time it may be extended, terminated or modified. Had |
| | | these expenses not been absorbed, the fund’s return would have been lower. |
| 2 | | SOURCE: LIPPER INC. — Reflects reinvestment of dividends and, where applicable, capital |
| | | gain distributions.The Lehman Brothers Municipal Bond Index is a widely accepted, unmanaged |
| | | total return performance benchmark for the long-term, investment-grade, tax-exempt bond market. |
| | | The Standard & Poor’s 500 Composite Stock Price Index is a widely accepted, unmanaged index of |
| | | U.S. stock market performance. Index returns do not reflect fees and expenses associated with |
| | | operating a mutual fund. |
| 3 | | The fund may continue to own investment grade bonds (at the time of purchase) which are |
| | | subsequently downgraded to below investment grade. |
The Fund 5
FUND PERFORMANCE
| Average Annual Total Returns | | as of 8/31/07 | | | | |
| | | Inception | | | | From |
| | | Date | | 1 Year | | Inception |
| |
| |
| |
|
| Fund | | 9/30/05 | | 5.58% | | 5.38% |
† Source: Lipper Inc.
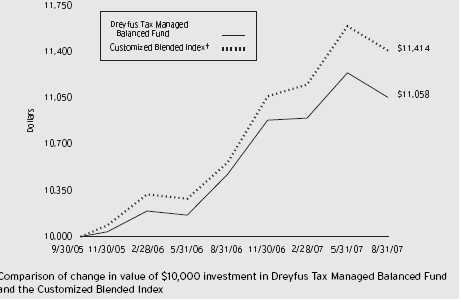
Past performance is not predictive of future performance.The fund’s performance shown in the graph and table does not reflect the deduction of taxes that a shareholder would pay on fund distributions or the redemption of fund shares. The above graph compares a $10,000 investment made in Dreyfus Tax Managed Balanced Fund on 9/30/05 (inception date) to a $10,000 investment made in the Customized Blended Index (the “Index”) composed of 55% Lehman Brothers Municipal Bond Index and 45% Standard and Poor’s 500 Composite Stock Price Index on that date.The Index is calculated on a year-to-year basis. All capital gains and distributions are reinvested.
The fund’s performance shown in the line graph takes into account all applicable fees and expenses.The fund normally invests the majority of its assets in municipal bonds that provide income exempt from federal income tax.The fund will employ a tax-managed strategy to invest the balance of its assets primarily in equity securities.
The Lehman Brothers Municipal Bond Index is a widely accepted, unmanaged total return performance benchmark for the long-term, investment-grade, tax-exempt bond market.The Standard & Poor’s 500 Composite Stock Price Index is a widely accepted, unmanaged index of U.S. stock market performance.The indices do not take into account charges, fees and other expenses. Further information relating to fund performance, including expense reimbursements, if applicable, is contained in the Financial Highlights section of the prospectus and elsewhere in this report.
UNDERSTANDING YOUR FUND’S EXPENSES (Unaudited)
As a mutual fund investor, you pay ongoing expenses, such as management fees and other expenses. Using the information below, you can estimate how these expenses affect your investment and compare them with the expenses of other funds.You also may pay one-time transaction expenses, including sales charges (loads) and redemption fees, which are not shown in this section and would have resulted in higher total expenses. For more information, see your fund’s prospectus or talk to your financial adviser.
Review your fund’s expenses
The table below shows the expenses you would have paid on a $1,000 investment in Dreyfus Tax Managed Balanced Fund from March 1, 2007 to August 31, 2007. It also shows how much a $1,000 investment would be worth at the close of the period, assuming actual returns and expenses.
| Expenses and Value of a $1,000 Investment |
| assuming actual returns for the six months ended August 31, 2007 |
|
| |
| Expenses paid per $1,000 † | | $ 5.84 |
| Ending value (after expenses) | | $1,013.10 |
COMPARING YOUR FUND’S EXPENSES WITH THOSE OF OTHER FUNDS (Unaudited)
Using the SEC’s method to compare expenses
The Securities and Exchange Commission (SEC) has established guidelines to help investors assess fund expenses. Per these guidelines, the table below shows your fund’s expenses based on a $1,000 investment, assuming a hypothetical 5% annualized return. You can use this information to compare the ongoing expenses (but not transaction expenses or total cost) of investing in the fund with those of other funds.All mutual fund shareholder reports will provide this information to help you make this comparison. Please note that you cannot use this information to estimate your actual ending account balance and expenses paid during the period.
| Expenses and Value of a $1,000 Investment |
| assuming a hypothetical 5% annualized return for the six months ended August 31, 2007 |
|
| |
| Expenses paid per $1,000 † | | $ 5.85 |
| Ending value (after expenses) | | $1,019.41 |
† Expenses are equal to the fund’s annualized expense ratio of 1.15%, multiplied by the average account value over the period, multiplied by 184/365 (to reflect the one-half year period).
The Fund 7
STATEMENT OF INVESTMENTS
August 31, 2007
| Common Stocks—42.9% | | Shares | | Value ($) |
| |
| |
|
| Consumer Discretionary—3.7% | | | | |
| Home Depot | | 480 | | 18,389 |
| McDonald’s | | 380 | | 18,715 |
| McGraw-Hill Cos. | | 870 | | 43,900 |
| News, Cl. A | | 1,350 | | 27,311 |
| Target | | 380 | | 25,053 |
| | | | | 133,368 |
| Consumer Staples—11.1% | | | | |
| Altria Group | | 1,140 | | 79,127 |
| Coca-Cola | | 1,060 | | 57,007 |
| Estee Lauder Cos., Cl. A | | 270 | | 11,229 |
| Kraft Foods, Cl. A | | 379 | | 12,151 |
| Nestle, ADR | | 480 | | 52,200 |
| PepsiCo | | 670 | | 45,580 |
| Procter & Gamble | | 870 | | 56,820 |
| SYSCO | | 480 | | 16,022 |
| Wal-Mart Stores | | 380 | | 16,579 |
| Walgreen | | 870 | | 39,211 |
| Whole Foods Market | | 280 a | | 12,393 |
| | | | | 398,319 |
| Energy—9.0% | | | | |
| Chevron | | 670 | | 58,799 |
| ConocoPhillips | | 670 | | 54,866 |
| Exxon Mobil | | 1,250 | | 107,163 |
| Halliburton | | 480 | | 16,603 |
| Occidental Petroleum | | 580 | | 32,880 |
| Total, ADR | | 480 | | 36,043 |
| Transocean | | 190 b | | 19,967 |
| | | | | 326,321 |
| Financial—7.8% | | | | |
| American Express | | 380 | | 22,276 |
| Ameriprise Financial | | 280 | | 17,083 |
| Bank of America | | 770 | | 39,024 |
| Citigroup | | 1,150 | | 53,912 |
8
| Common Stocks (continued) | | Shares | | Value ($) |
| |
| |
|
| Financial (continued) | | | | |
| HSBC Holdings, ADR | | 480 | | 43,349 |
| JPMorgan Chase & Co. | | 770 | | 34,280 |
| Merrill Lynch & Co. | | 480 | | 35,376 |
| Prudential Financial | | 190 | | 17,058 |
| SunTrust Banks | | 240 | | 18,900 |
| | | | | 281,258 |
| Health Care—2.6% | | | | |
| Abbott Laboratories | | 480 | | 24,917 |
| Eli Lilly & Co. | | 280 | | 16,058 |
| Johnson & Johnson | | 580 | | 35,838 |
| Medtronic | | 200 | | 10,568 |
| Thermo Fisher Scientific | | 150 b | | 8,135 |
| | | | | 95,516 |
| Industrial—4.0% | | | | |
| Caterpillar | | 380 | | 28,793 |
| Emerson Electric | | 570 | | 28,061 |
| General Electric | | 1,530 | | 59,471 |
| United Technologies | | 380 | | 28,359 |
| | | | | 144,684 |
| Information Technology—3.9% | | | | |
| Automatic Data Processing | | 480 | | 21,955 |
| Cisco Systems | | 480 b | | 15,322 |
| Intel | | 2,120 | | 54,590 |
| Microchip Technology | | 190 | | 7,319 |
| Microsoft | | 670 | | 19,249 |
| QUALCOMM | | 190 | | 7,579 |
| Texas Instruments | | 480 | | 16,435 |
| | | | | 142,449 |
| Materials—.8% | | | | |
| Praxair | | 380 | | 28,751 |
| Total Common Stocks | | | | |
| (cost $1,345,228) | | | | 1,550,666 |
The Fund 9
STATEMENT OF INVESTMENTS (continued)
| Long-Term Municipal | | Coupon | | Maturity | | Principal | | |
| Investments—52.1% | | Rate (%) | | Date | | Amount ($) | | Value ($) |
| |
| |
| |
| |
|
| California—5.5% | | | | | | | | |
| Golden State Tobacco | | | | | | | | |
| Securitization Corporation, | | | | | | | | |
| Enhanced Tobacco Settlement | | | | | | | | |
| Asset-Backed Bonds | | 5.00 | | 6/1/45 | | 100,000 | | 98,078 |
| Sweetwater Union High School | | | | | | | | |
| District Public Financing | | | | | | | | |
| Authority, Special Tax Revenue | | | | | | | | |
| (Insured; FSA) | | 5.00 | | 9/1/27 | | 100,000 | | 101,881 |
| Georgia—2.8% | | | | | | | | |
| Atlanta, | | | | | | | | |
| Water and Wastewater Revenue | | | | | | | | |
| (Insured; FSA) | | 5.00 | | 11/1/43 | | 100,000 | | 100,862 |
| Hawaii—2.8% | | | | | | | | |
| Kauai County, | | | | | | | | |
| GO (Insured; FGIC) | | 5.00 | | 8/1/29 | | 100,000 | | 102,725 |
| Kansas—5.7% | | | | | | | | |
| Butler County Unified School | | | | | | | | |
| District Number 490, GO | | | | | | | | |
| Improvement (Insured; FSA) | | 5.00 | | 9/1/29 | | 100,000 | | 102,753 |
| Kansas Development Finance | | | | | | | | |
| Authority, Revenue | | | | | | | | |
| (Kansas Department of | | | | | | | | |
| Administration-Comprehensive | | | | | | | | |
| Transportation Program) | | | | | | | | |
| (Insured; FGIC) | | 5.00 | | 11/1/25 | | 100,000 | | 103,223 |
| Kentucky—2.9% | | | | | | | | |
| Kentucky Economic Development | | | | | | | | |
| Finance Authority, MFHR | | | | | | | | |
| (Christian Care Communities | | | | | | | | |
| Projects) (Collateralized; GNMA) | | 5.25 | | 11/20/25 | | 100,000 | | 104,214 |
| Michigan—2.8% | | | | | | | | |
| Michigan Hospital Finance | | | | | | | | |
| Authority, HR (Sparrow | | | | | | | | |
| Obligated Group) (Insured; MBIA) | | 5.00 | | 11/15/36 | | 100,000 | | 100,596 |
| Minnesota—2.8% | | | | | | | | |
| Chaska, | | | | | | | | |
| Electric Revenue | | 5.00 | | 10/1/30 | | 100,000 | | 100,623 |
| Nebraska—2.9% | | | | | | | | |
| Lincoln, | | | | | | | | |
| Electric System Revenue | | 5.00 | | 9/1/29 | | 100,000 | | 102,283 |
10
| Long-Term Municipal | | Coupon | | Maturity | | Principal | | |
| Investments (continued) | | Rate (%) | | Date | | Amount ($) | | Value ($) |
| |
| |
| |
| |
|
| Nevada—2.8% | | | | | | | | |
| Clark County, | | | | | | | | |
| Airport System Revenue | | | | | | | | |
| (Insured; AMBAC) | | 5.00 | | 7/1/40 | | 100,000 | | 100,929 |
| New Jersey—2.7% | | | | | | | | |
| New Jersey Health Care | | | | | | | | |
| Facilities Financing Authority, | | | | | | | | |
| Revenue (Hunterdon | | | | | | | | |
| Medical Center Issue) | | 5.13 | | 7/1/35 | | 100,000 | | 99,187 |
| New York—5.4% | | | | | | | | |
| New York State Dormitory | | | | | | | | |
| Authority, Mental Health | | | | | | | | |
| Services Facilities | | | | | | | | |
| Improvement Revenue | | | | | | | | |
| (Insured; AMBAC) | | 5.00 | | 2/15/30 | | 100,000 | | 101,961 |
| Westchester Tobacco Asset | | | | | | | | |
| Securitization Corporation, | | | | | | | | |
| Tobacco Settlement | | | | | | | | |
| Asset-Backed Bonds | | 5.13 | | 6/1/45 | | 100,000 | | 92,637 |
| North Carolina—3.0% | | | | | | | | |
| Charlotte-Mecklenburg Hospital | | | | | | | | |
| Authority, Health Care Revenue | | 5.00 | | 1/15/45 | | 100,000 | | 106,687 |
| South Carolina—2.8% | | | | | | | | |
| South Carolina Transportation | | | | | | | | |
| Infrastructure Bank, Revenue | | | | | | | | |
| (Insured; AMBAC) | | 5.00 | | 10/1/33 | | 100,000 | | 102,239 |
| Texas—5.6% | | | | | | | | |
| North Harris County Regional Water | | | | | | |
| Authority, Senior Lien Revenue | | | | | | | | |
| (Insured; MBIA) | | 5.00 | | 12/15/32 | | 100,000 | | 101,795 |
| Trinity River Authority, | | | | | | | | |
| Regional Wastewater System | | | | | | | | |
| Revenue (Insured; MBIA) | | 5.00 | | 8/1/29 | | 100,000 | | 102,126 |
| U.S. Related—1.6% | | | | | | | | |
| Puerto Rico Infrastructure | | | | | | | | |
| Financing Authority, Special | | | | | | | | |
| Tax Revenue (Insured; AMBAC) | | 0.00 | | 7/1/36 | | 250,000 | | 58,818 |
| Total Long-Term Municipal | | | | | | | | |
| Investments | | | | | | | | |
| (cost $1,901,893) | | | | | | | | 1,883,617 |
The Fund 11
STATEMENT OF INVESTMENTS (continued)
| Short-Term Municipal | | Coupon | | Maturity | | Principal | | |
| Investments—2.8% | | Rate (%) | | Date | | Amount ($) | | Value ($) |
| |
| |
| |
| |
|
| Alabama; | | | | | | | | |
| West Jefferson Industrial | | | | | | | | |
| Development Board, PCR | | | | | | | | |
| (Alabama Power Company Project) | | | | | | | | |
| (cost $100,000) | | 3.96 | | 9/1/07 | | 100,000 c | | 100,000 |
| |
| |
| |
| |
|
| |
| Investment of Cash Collateral | | | | | | | | |
| for Securities Loaned—.4% | | | | | | | | |
| |
| |
| |
| |
|
| Registered Investment Company; | | | | | | | | |
| Dreyfus Institutional Cash Advantage Fund | | | | | | |
| (cost $12,880) | | | | | | 12,880 d | | 12,880 |
| |
| |
| |
| |
|
| |
| Total Investments (cost $3,360,001) | | | | | | 98.2% | | 3,547,163 |
| Cash and Receivables (Net) | | | | | | 1.8% | | 66,656 |
| Net Assets | | | | | | 100.0% | | 3,613,819 |
ADR—American Depository Receipts a All or a portion of these securities are on loan. At August 31, 2007, the total market value of the fund’s securities on loan is $12,393 and the total market value of the collateral held by the fund is $12,880. b Non-income producing security. c Securities payable on demand.Variable interest rate—subject to periodic change. d Investment in affiliated money market mutual fund.
| Portfolio Summary (Unaudited) † | | | | |
| |
| | | Value (%) | | | | Value (%) |
| |
| |
| |
|
| Long-Term Municipal Investments | | 52.1 | | Consumer Discretionary | | 3.7 |
| Consumer Staples | | 11.1 | | Short-Term Municipal Investment | | 2.8 |
| Energy | | 9.0 | | Health Care | | 2.6 |
| Financial | | 7.8 | | Materials | | .8 |
| Industrial | | 4.0 | | Money Market Investment | | .4 |
| Information Technology | | 3.9 | | | | 98.2 |
† Based on net assets.
See notes to financial statements.
12
| Summary of Abbreviations | | | | |
| |
| ACA | | American Capital Access | | AGC | | ACE Guaranty Corporation |
| AGIC | | Asset Guaranty Insurance | | AMBAC | | American Municipal Bond |
| | | Company | | | | Assurance Corporation |
| ARRN | | Adjustable Rate Receipt Notes | | BAN | | Bond Anticipation Notes |
| BIGI | | Bond Investors Guaranty Insurance | | BPA | | Bond Purchase Agreement |
| CGIC | | Capital Guaranty Insurance | | CIC | | Continental Insurance |
| | | Company | | | | Company |
| CIFG | | CDC Ixis Financial Guaranty | | CMAC | | Capital Market Assurance |
| | | | | | | Corporation |
| COP | | Certificate of Participation | | CP | | Commercial Paper |
| EDR | | Economic Development Revenue | | EIR | | Environmental Improvement |
| | | | | | | Revenue |
| FGIC | | Financial Guaranty Insurance | | | | |
| | | Company | | FHA | | Federal Housing Administration |
| FHLB | | Federal Home Loan Bank | | FHLMC | | Federal Home Loan Mortgage |
| | | | | | | Corporation |
| FNMA | | Federal National | | | | |
| | | Mortgage Association | | FSA | | Financial Security Assurance |
| GAN | | Grant Anticipation Notes | | GIC | | Guaranteed Investment Contract |
| GNMA | | Government National | | | | |
| | | Mortgage Association | | GO | | General Obligation |
| HR | | Hospital Revenue | | IDB | | Industrial Development Board |
| IDC | | Industrial Development Corporation | | IDR | | Industrial Development Revenue |
| LOC | | Letter of Credit | | LOR | | Limited Obligation Revenue |
| LR | | Lease Revenue | | MBIA | | Municipal Bond Investors Assurance |
| | | | | | | Insurance Corporation |
| MFHR | | Multi-Family Housing Revenue | | MFMR | | Multi-Family Mortgage Revenue |
| PCR | | Pollution Control Revenue | | PILOT | | Payment in Lieu of Taxes |
| RAC | | Revenue Anticipation Certificates | | RAN | | Revenue Anticipation Notes |
| RAW | | Revenue Anticipation Warrants | | RRR | | Resources Recovery Revenue |
| SAAN | | State Aid Anticipation Notes | | SBPA | | Standby Bond Purchase Agreement |
| SFHR | | Single Family Housing Revenue | | SFMR | | Single Family Mortgage Revenue |
| SONYMA | | State of New York Mortgage Agency | | SWDR | | Solid Waste Disposal Revenue |
| TAN | | Tax Anticipation Notes | | TAW | | Tax Anticipation Warrants |
| TRAN | | Tax and Revenue Anticipation Notes | | XLCA | | XL Capital Assurance |
The Fund 13
STATEMENT OF INVESTMENTS (continued)
| Summary of Combined Ratings (Unaudited) | | |
| |
| Fitch | | or | | Moody’s | | or | | Standard & Poor’s | | Value (%) †† |
| |
| |
| |
| |
| |
|
| AAA | | | | Aaa | | | | AAA | | 64.7 |
| AA | | | | Aa | | | | AA | | 10.5 |
| A | | | | A | | | | A | | 15.0 |
| BBB | | | | Baa | | | | BBB | | 4.7 |
| F1 | | | | MIG1/P1 | | | | SP1/A1 | | 5.1 |
| | | | | | | | | | | 100.0 |
Based on total investments. See notes to financial statements.
14
STATEMENT OF ASSETS AND LIABILITIES
August 31, 2007
| | | Cost | | Value |
| |
| |
|
| Assets ($): | | | | |
| Investments in securities—See Statement of Investments | | |
| (including securities on loan, valued at $12,393)—Note 1(b): | | |
| Unaffiliated issuers | | 3,347,121 | | 3,534,283 |
| Affiliated issuers | | 12,880 | | 12,880 |
| Cash | | | | 61,029 |
| Dividends and interest receivable | | | | 28,938 |
| Receivable for investment securities sold | | 18,356 |
| Prepaid expenses | | | | 11,412 |
| Due from The Dreyfus Corporation and affiliates—Note 3(b) | | 6,269 |
| | | | | 3,673,167 |
| |
| |
|
| Liabilities ($): | | | | |
| Liability for securities on loan—Note 1(b) | | 12,880 |
| Accrued expenses | | | | 46,468 |
| | | | | 59,348 |
| |
| |
|
| Net Assets ($) | | | | 3,613,819 |
| |
| |
|
| Composition of Net Assets ($): | | | | |
| Paid-in capital | | | | 3,330,393 |
| Accumulated undistributed investment income—net | | 24,573 |
| Accumulated net realized gain (loss) on investments | | 71,691 |
| Accumulated net unrealized appreciation | | |
| (depreciation) on investments | | | | 187,162 |
| |
| |
|
| Net Assets ($) | | | | 3,613,819 |
| |
| |
|
| Shares Outstanding | | | | |
| (unlimited number of $.001 par value shares of Beneficial Interest authorized) | | 272,036 |
| Net Asset Value, offering and redemption price per share—Note 3(d) ($) | | 13.28 |
See notes to financial statements.
The Fund 15
STATEMENT OF OPERATIONS
Year Ended August 31, 2007
| Investment Income ($): | | |
| Income: | | |
| Cash dividends (net of $420 foreign taxes withheld at source) | | 41,959 |
| Interest income | | 109,977 |
| Income from securities lending | | 198 |
| Total Income | | 152,134 |
| Expenses: | | |
| Management fee—Note 3(a) | | 28,757 |
| Auditing fees | | 40,695 |
| Registration fees | | 32,560 |
| Legal fees | | 25,412 |
| Prospectus and shareholders’ reports | | 12,620 |
| Service plan fees—Note 3(b) | | 11,007 |
| Trustees’ fees and expenses—Note 3(c) | | 2,607 |
| Shareholder servicing costs—Note 3(b) | | 2,037 |
| Interest expense—Note 2 | | 167 |
| Custodian fees—Note 3(b) | | 163 |
| Miscellaneous | | 14,480 |
| Total Expenses | | 170,505 |
| Less—expense reimbursement from | | |
| The Dreyfus Corporation due to undertaking—Note 3(a) | | (119,717) |
| Less—reduction in custody fees | | |
| due to earnings credits—Note 1(b) | | (156) |
| Net Expenses | | 50,632 |
| Investment Income—Net | | 101,502 |
| |
|
| Realized and Unrealized Gain (Loss) on Investments—Note 4 ($): |
| Net realized gain (loss) on investments | | 85,943 |
| Net unrealized appreciation (depreciation) on investments | | 64,150 |
| Net Realized and Unrealized Gain (Loss) on Investments | | 150,093 |
| Net Increase in Net Assets Resulting from Operations | | 251,595 |
See notes to financial statements.
16
STATEMENT OF CHANGES IN NET ASSETS
| | | Year Ended August 31, |
| |
|
| | | 2007 | | 2006 a |
| |
| |
|
| Operations ($): | | | | |
| Investment income—net | | 101,502 | | 86,708 |
| Net realized gain (loss) on investments | | 85,943 | | (14,252) |
| Net unrealized appreciation | | | | |
| (depreciation) on investments | | 64,150 | | 123,012 |
| Net Increase (Decrease) in Net Assets | | | | |
| Resulting from Operations | | 251,595 | | 195,468 |
| |
| |
|
| Dividends to Shareholders from ($): | | | | |
| Investment income—net | | (104,455) | | (59,182) |
| |
| |
|
| Beneficial Interest Transactions ($): | | | | |
| Net proceeds from shares sold | | 680,338 | | 4,688,969 |
| Dividends reinvested | | 53,036 | | 56,449 |
| Cost of shares redeemed | | (1,866,886) | | (281,513) |
| Increase (Decrease) in Net Assets from | | | | |
| Beneficial Interest Transactions | | (1,133,512) | | 4,463,905 |
| Total Increase (Decrease) in Net Assets | | (986,372) | | 4,600,191 |
| |
| |
|
| Net Assets ($): | | | | |
| Beginning of Period | | 4,600,191 | | — |
| End of Period | | 3,613,819 | | 4,600,191 |
| Undistributed investment income—net | | 24,573 | | 27,526 |
| |
| |
|
| Capital Share Transactions (Shares): | | | | |
| Shares sold | | 50,889 | | 374,557 |
| Shares issued for dividends reinvested | | 4,006 | | 4,484 |
| Shares redeemed | | (139,540) | | (22,360) |
| Net Increase (Decrease) in Shares Outstanding | | (84,645) | | 356,681 |
a From September 30, 2005 (commencement of operations) to August 31, 2006. See notes to financial statements.
The Fund 17
FINANCIAL HIGHLIGHTS
The following table describes the performance for the fiscal periods indicated. Total return shows how much your investment in the fund would have increased (or decreased) during each period, assuming you had reinvested all dividends and distributions.These figures have been derived from the fund’s financial statements.
| | | Year Ended August 31, |
| |
|
| | | 2007 | | 2006 a |
| |
| |
|
| Per Share Data ($): | | | | |
| Net asset value, beginning of period | | 12.90 | | 12.50 |
| Investment Operations: | | | | |
| Investment income—net b | | .31 | | .28 |
| Net realized and unrealized gain (loss) on investments | | .38 | | .31 |
| Total from Investment Operations | | .69 | | .59 |
| Distributions: | | | | |
| Dividends from investment income—net | | (.31) | | (.19) |
| Net asset value, end of period | | 13.28 | | 12.90 |
| |
| |
|
| Total Return (%) | | 5.43 | | 4.73c |
| |
| |
|
| Ratios/Supplemental Data (%): | | | | |
| Ratio of total expenses to average net assets | | 3.87 | | 3.37c |
| Ratio of net expenses to average net assets | | 1.15 | | 1.06c |
| Ratio of net investment income to average net assets | | 2.31 | | 2.19c |
| Portfolio Turnover Rate | | 7.17 | | 13.80c |
| |
| |
|
| Net Assets, end of period ($ x 1,000) | | 3,614 | | 4,600 |
a From September 30, 2005 (commencement of operations) to August 31, 2006. b Based on average shares outstanding at each month end. c Not annualized.
See notes to financial statements.
18
NOTES TO FINANCIAL STATEMENTS
NOTE 1—Significant Accounting Policies:
Dreyfus Tax Managed Balanced Fund (the “fund”) is a separate diversified series of The Dreyfus/Laurel Funds Trust (the “Trust”), which is registered under the Investment Company Act of 1940, as amended (the “Act”), as an open-end management investment company and operates as a series company currently offering six series, including the fund. The fund’s investment objective seeks to provide an attractive after-tax total return consisting of federally tax-exempt income and capital appreciation. The Dreyfus Corporation (the “Manager” or “Dreyfus”) serves as the fund’s investment adviser. Dreyfus was a wholly-owned subsidiary of Mellon Financial Corporation (“Mellon Financial”). Fayez Sarofim & Co. (“Sarofim & Co.”) serves as the fund’s sub-investment adviser with respect to the equity portion of the fund’s portfolio. MBSC Securities Corporation (the “Distributor”), a wholly-owned subsidiary of Dreyfus, is the distributor of the fund’s shares, which are sold to the public without a sales charge.
On July 1, 2007, Mellon Financial and The Bank of New York Company, Inc. merged, forming The Bank of New York Mellon Corporation (“BNY Mellon”). As part of this transaction, Dreyfus became a wholly-owned subsidiary of BNY Mellon.
As of August 31, 2007, MBC Investments Corp., an indirect subsidiary of BNY Mellon, held 115,498 of the fund’s shares.
The fund’s financial statements are prepared in accordance with U.S. generally accepted accounting principles, which may require the use of management estimates and assumptions. Actual results could differ from those estimates.
(a) Portfolio valuation: Investments in equity securities are valued at the last sales price on the securities exchange or national securities market on which such securities are primarily traded. Securities listed on the National Market System for which market quotations are available are valued at the official closing price or, if there is no official closing price that day, at the last sales price. Securities not listed on an
The Fund 19
NOTES TO FINANCIAL STATEMENTS (continued)
exchange or the national securities market, or securities for which there were no transactions, are valued at the average of the most recent bid and asked prices, except for open short positions, where the asked price is used for valuation purposes. Bid price is used when no asked price is available. Registered open-end investment companies that are not traded on the exchange are valued at their net asset value.When market quotations or official closing prices are not readily available, or are determined not to reflect accurately fair value, such as when the value of the security has been significantly affected by events after the close of the exchange or market on which the security is principally traded (for example, a foreign exchange or market), but before the fund calculates its net asset value, the fund may value these investments at fair value as determined in accordance with the procedures approved by the Trust’s Board. Fair valuing of securities may be determined with the assistance of a pricing service using calculations based on indices of domestic securities and other appropriate indicators, such as prices of relevant ADR’s and futures contracts. For other securities that are fair valued by the Trust’s Board, certain factors may be considered such as: fundamental analytical data, the nature and duration of restrictions on disposition, an evaluation of the forces that influence the market in which securities are purchased and sold and public trading in similar securities of the issuer or comparable issuers.
Investments in municipal bond securities are valued each business day by an independent pricing service (the “Service”) approved by the Trust’s Board. Investments for which quoted bid prices are readily available and are representative of the bid side of the market in the judgment of the Service are valued at the mean between the quoted bid prices (as obtained by the Service from dealers in such securities) and asked prices (as calculated by the Service based upon its evaluation of the market for such securities). Other investments (which constitute a majority of the portfolio securities) are carried at fair value as determined by the Service, based on methods which include consideration of: yields or prices of municipal securities of comparable quality, coupon, maturity
20
and type; indications as to values from dealers; and general market conditions. Options and financial futures on municipal and U.S. Treasury securities are valued at the last sales price on the securities exchange on which such securities are primarily traded or at the last sales price on the national securities market on each business day.
On September 20, 2006, the Financial Accounting Standards Board (“FASB”) released Statement of Financial Accounting Standards No. 157 “Fair Value Measurements” (“FAS 157”). FAS 157 establishes an authoritative definition of fair value, sets out a framework for measuring fair value, and requires additional disclosures about fair-value measure-ments.The application of FAS 157 is required for fiscal years beginning after November 15, 2007 and interim periods within those fiscal years. Management does not believe that the application of this standard will have a material impact on the financial statements of the fund.
(b) Securities transactions and investment income: Securities transactions are recorded on a trade date basis. Realized gain and loss from securities transactions are recorded on the identified cost basis. For investments in equity securities, dividend income is recognized on the ex-dividend date and interest income, including, where applicable, accretion of discount and amortization of premium on investments, is recognized on the accrual basis. For investments in municipal bond securities, interest income, adjusted for accretion of discount and amortization of premium on investments, is earned from settlement date and recognized on the accrual basis. Securities purchased or sold on a when-issued or delayed-delivery basis may be settled a month or more after the trade date.
The fund has an arrangement with the custodian bank whereby the fund receives earnings credits from the custodian when positive cash balances are maintained, which are used to offset custody fees. For financial reporting purposes, the fund includes net earnings credits as an expense offset in the Statement of Operations.
The Fund 21
NOTES TO FINANCIAL STATEMENTS (continued)
Pursuant to a securities lending agreement with Mellon Bank, N.A., an affiliate of the Manager, the fund may lend securities to qualified institutions. It is the fund’s policy, that at origination, all loans are secured by collateral of at least 102% of the value of U.S. securities loaned and 105% of the value of foreign securities loaned. Collateral equivalent to at least 100% of the market value of securities on loan is maintained at all times. Cash collateral is invested in certain money market mutual funds managed by the Manager.The fund is entitled to receive all income on securities loaned, in addition to income earned as a result of the lending transaction.Although each security loaned is fully collateralized, the fund bears the risk of delay in recovery of, or loss of rights in, the securities loaned should a borrower fail to return the securities in a timely manner.
(c) Affiliated issuers: Investments in other investment companies advised by the Manager are defined as “affiliated” in the Act.
(d) Dividends to shareholders: Dividends are recorded on the ex-dividend date. For investments in equity securities, dividends from investment income-net are normally declared and paid annually. For investments in municipal bond securities, it is the policy of the fund to declare and pay dividends from investment income-net, monthly. Dividends from net realized capital gain, if any, are normally declared and paid annually, but the fund may make distributions on a more frequent basis to comply with the distribution requirements of the Internal Revenue Code of 1986, as amended (the “Code”). To the extent that net realized capital gain can be offset by capital loss carryovers, it is the policy of the fund not to distribute such gain. Income and capital gain distributions are determined in accordance with income tax regulations, which may differ from U.S. generally accepted accounting principles.
(e) Federal income taxes: It is the policy of the fund to continue to qualify as a regulated investment company, if such qualification is in the best interests of its shareholders, by complying with the applicable provisions of the Code, and to make distributions of taxable income
22
with respect to equity securities and to distribute tax exempt dividends with respect to municipal securities and to make distributions of net realized capital gain sufficient to relieve it from substantially all federal income and excise taxes.
The FASB released FASB Interpretation No. 48 “Accounting for Uncertainty in Income Taxes” (FIN 48). FIN 48 provides guidance for how uncertain tax positions should be recognized, measured, presented and disclosed in the financial statements. FIN 48 requires the evaluation of tax positions taken or expected to be taken in the course of preparing the fund’s tax returns to determine whether the tax positions are “more-likely-than-not” of being sustained by the applicable tax authority.Tax positions not deemed to meet the more-likely-than-not threshold would be recorded as a tax benefit or expense in the current year.Adoption of FIN 48 is required for fiscal years beginning after December 15, 2006. Management believes that the application of this standard does not have a material impact on the financial statements of the fund.
At August 31, 2007, the components of accumulated earnings on a tax basis were as follows: undistributed ordinary income $18,346, undistributed tax exempt income $6,227, undistributed capital gains $71,823 and unrealized appreciation $187,030.
The tax characters of distributions paid to shareholders during the fiscal periods ended August 31, 2007 and August 31, 2006, were as follows: ordinary income $29,948 and $3,593 and tax exempt income $74,507 and $55,589, respectively.
NOTE 2—Bank Lines of Credit:
The fund may borrow up to $250 thousand for leveraging purposes under a short-term unsecured line of credit and participates with other Dreyfus-managed funds in a $100 million unsecured line of credit primarily to be utilized for temporary or emergency purposes, including the financing of redemptions. Interest is charged to the fund based on prevailing market rates in effect at the time of borrowing.
The Fund 23
NOTES TO FINANCIAL STATEMENTS (continued)
The average daily amount of borrowings outstanding under both arrangements during the period ended August 31, 2007 was approximately $2,900 with a related weighted average annualized interest rate of 5.81% .
NOTE 3—Investment Management Fee and Other Transactions With Affiliates:
(a) Pursuant to an Investment Management Agreement between Dreyfus and the Trust, the Trust has agreed to pay Dreyfus a management fee computed at the annual rate of .65% of the value of the fund’s average daily net assets and is payable monthly.
Dreyfus has contractually agreed to waive receipt of its fees and/or assume certain expenses of the fund, until August 31, 2008, so the expenses, exclusive of taxes, brokerage fees, interest on borrowings and extraordinary expenses, do not exceed an annual rate of 1.15% of the value of the fund’s average daily net assets.The expense reimbursement, pursuant to the undertaking, amounted to $119,717 during the period ended August 31, 2007.
Pursuant to a Sub-Investment Advisory Agreement between Dreyfus and Sarofim & Co., Dreyfus pays Sarofim & Co. an annual fee of .251% of the value of the fund’s average daily net assets representing the equity portion of the fund’s portfolio and is payable monthly.
(b) Under the Service Plan (the “Plan”) adopted pursuant to Rule 12b-1 under the Act, the fund reimburses the Distributor for distributing the fund’s shares, servicing shareholder accounts and for advertising and marketing relating to the fund at an annual aggregate rate of up to .25% of the value of the fund’s aggregate daily net assets. The Distributor may pay one or more Service Agents a fee in respect of these services and determines the amount, if any, to be paid to Service Agents under the Plan and the basis on which such payments were made. During the period ended August 31, 2007, the fund was charged $11,007 pursuant to the Plan.
24
The fund compensates Dreyfus Transfer, Inc., a wholly-owned subsidiary of Dreyfus, under a transfer agency agreement for providing personnel and facilities to perform transfer agency services for the fund. During the period ended August 31, 2007, the fund was charged $1,292 pursuant to the transfer agency agreement.
The fund compensates Mellon Bank. N.A., an affiliate of the Manager, under a custody agreement for providing custodial services for the fund. During the period ended August 31, 2007, the fund was charged $163 pursuant to the custody agreement.
During the period ended August 31, 2007, the fund was charged $4,539 for services performed by the Chief Compliance Officer.
The components of “Due from The Dreyfus Corporation and affiliates” in the Statement of Assets and Liabilities consist of: an expense reimbursement of $10,653, which is offset by management fees $2,048, custodian fees $193, chief compliance officer fees $2,009 and transfer agency per account fees $134.
(c) Each Trustee receives $45,000 per year, plus $6,000 for each joint Board meeting of The Dreyfus/Laurel Funds, Inc., the Trust and The Dreyfus/Laurel Tax-Free Municipal Funds (collectively, the “Dreyfus/Laurel Funds”) attended, $2,000 for separate in-person committee meetings attended which are not held in conjunction with a regularly scheduled Board meeting and $1,500 for Board meetings and separate committee meetings attended that are conducted by telephone and is reimbursed for travel and out-of-pocket expenses.With respect to Board meetings, the Chairman of the Board receives an additional 25% of such compensation (with the exception of reimbursable amounts). With respect to compensation committee meetings, the Chair of the compensation committee receives $900 per meeting and, with respect to audit committee meetings, the Chair of the audit committee receives $1,350 per meeting. In the event that there is an in-person joint committee meeting or a joint telephone
The Fund 25
NOTES TO FINANCIAL STATEMENTS (continued)
meeting of the Dreyfus/Laurel Funds and Dreyfus High Yield Strategies Fund, the $2,000 or $1,500 fee, as applicable, will be allocated between the Dreyfus/Laurel Funds and Dreyfus High Yield Strategies Fund.These fees and expenses are charged and allocated to each series based on net assets. Amounts required to be paid by the Trust directly to the non-interested Trustees, that would be applied to offset a portion of the management fee payable to Dreyfus, are in fact paid directly by Dreyfus to the non-interested Trustees.
(d) A 1% redemption fee is charged and retained by the fund on certain shares redeemed within thirty days following the date of issuance, including redemptions made through use of the fund’s exchange privilege. Effective December 1, 2007, the fund will no longer assess a redemption fee on shares that are redeemed or exchanged before the end of the required holding period. The fund reserves the right to impose a redemption fee in the future.
NOTE 4—Securities Transactions:
The aggregate amount of purchases and sales of investment securities, excluding short-term securities, during the period ended August 31, 2007, amounted to $297,820 and $1,235,391, respectively.
At August 31, 2007, the cost of investments for federal income tax purposes was $3,360,133; accordingly, accumulated net unrealized appreciation on investments was $187,030, consisting of $229,717 gross unrealized appreciation and $42,687 gross unrealized depreciation.
26
REPORT OF INDEPENDENT REGISTERED PUBLIC ACCOUNTING FIRM
The Board of Trustees and Shareholders of The Dreyfus/Laurel Funds Trust:
We have audited the accompanying statement of assets and liabilities of Dreyfus Tax Managed Balanced Fund (the “Fund”) of The Dreyfus/Laurel Funds Trust, including the statement of investments, as of August 31, 2007, and the related statement of operations for the year then ended, the statement of changes in net assets and the financial highlights for the year then ended and for the period from September 30, 2005 (commencement of operations) to August 31, 2006. These financial statements and financial highlights are the responsibility of the Fund’s management. Our responsibility is to express an opinion on these financial statements and financial highlights based on our audits.
We conducted our audits in accordance with the standards of the Public Company Accounting Oversight Board (United States).Those standards require that we plan and perform the audit to obtain reasonable assurance about whether the financial statements and financial highlights are free of material misstatement. An audit includes examining, on a test basis, evidence supporting the amounts and disclosures in the financial statements. Our procedures included confirmation of securities owned as of August 31, 2007, by correspondence with the custodian. An audit also includes assessing the accounting principles used and significant estimates made by management, as well as evaluating the overall financial statement presentation.We believe that our audits provide a reasonable basis for our opinion.
In our opinion, the financial statements and financial highlights referred to above present fairly, in all material respects, the financial position of Dreyfus Tax Managed Balanced Fund of The Dreyfus/Laurel Funds Trust as of August 31, 2007, and the results of its operations for the year then ended,the changes in its net assets and the financial highlights for the year then ended and for the period from September 30, 2005 to August 31, 2006, in conformity with U.S. generally accepted accounting principles.

| New York, New York |
| October 18, 2007 |
The Fund 27
IMPORTANT TAX INFORMATION (Unaudited)
In accordance with federal tax law, the fund hereby designates $74,507 as “exempt interest dividends” paid from interest income during its fiscal year ended August 31, 2007 (not generally subject to regular federal income tax).Also the fund hereby designates 100% of the ordinary dividends paid during the fiscal year ended August 31, 2007 as qualifying for the corporate dividends received deduction. Also certain dividends paid by the fund may be subject to a maximum tax rate of 15%, as provided for by the Jobs and Growth Tax Relief Reconciliation Act of 2003. Of the distributions paid during the fiscal year, $29,948 represents the maximum amount that may be considered qualified dividend income. Shareholders will receive notification in January 2008 of the percentage applicable to the preparation of their 2007 income tax returns and as required by federal tax law rules, shareholders will also receive notification of their portion of the fund’s taxable ordinary dividends (if any), capital gains distributions (if any) paid for the 2007 calendar year on Form 1099-DIV which will be mailed by January 31, 2008.
28
BOARD MEMBERS INFORMATION (Unaudited)
| Joseph S. DiMartino (63) |
| Chairman of the Board (1995) |
| Principal Occupation During Past 5 Years: |
| • Corporate Director and Trustee |
| |
| Other Board Memberships and Affiliations: |
| • The Muscular Dystrophy Association, Director |
| • Century Business Services, Inc., a provider of outsourcing functions for small and medium size |
| companies, Director |
| • The Newark Group, a provider of a national market of paper recovery facilities, paperboard |
| mills and paperboard converting plants, Director |
| • Sunair Services Corporation, a provider of certain outdoor-related services to homes and |
| businesses, Director |
| • Ivory Investment Management, L.P., a registered investment advisor to three private funds, |
| Senior Advisor |
| |
| No. of Portfolios for which Board Member Serves: 163 |
| James M. Fitzgibbons (72) |
| Board Member (1994) |
| Principal Occupation During Past 5 Years: |
| • Chairman of the Board, Davidson Cotton Company (1998-2002) |
| |
| Other Board Memberships and Affiliations: |
| • Bill Barrett Company, an oil and gas exploration company, Director |
| |
| No. of Portfolios for which Board Member Serves: 24 |
| J. Tomlinson Fort (79) |
| Board Member (1987) |
| Principal Occupation During Past 5 Years: |
| • Retired 2005-present |
| • Of Counsel, Reed Smith LLP (1998-2005) |
| |
| Other Board Memberships and Affiliations: |
| • Allegheny College, Emeritus Trustee |
| • Pittsburgh Ballet Theatre,Trustee |
| • American College of Trial Lawyers, Fellow |
| |
| No. of Portfolios for which Board Member Serves: 24 |
| Kenneth A. Himmel (61) |
| Board Member (1994) |
| Principal Occupation During Past 5 Years: |
| • President and CEO,Related Urban Development,a real estate development company (1996-present) |
| • President and CEO, Himmel & Company, a real estate development company (1980-present) |
| • CEO, American Food Management, a restaurant company (1983-present) |
| |
| No. of Portfolios for which Board Member Serves: 24 |
The Fund 29
BOARD MEMBERS INFORMATION (Unaudited) (continued)
| Stephen J. Lockwood (60) |
| Board Member (1994) |
| Principal Occupation During Past 5 Years: |
| • Chairman of the Board, Stephen J. Lockwood and Company LLC, an investment company |
| (2000-present) |
| No. of Portfolios for which Board Member Serves: 24 |
| Roslyn M. Watson (57) |
| Board Member (1994) |
| Principal Occupation During Past 5 Years: |
| • Principal,Watson Ventures, Inc., a real estate investment company (1993-present) |
| Other Board Memberships and Affiliations: |
| • American Express Bank, Director |
| • The Hyams Foundation Inc., a Massachusetts Charitable Foundation,Trustee |
| • National Osteoporosis Foundation,Trustee |
| No. of Portfolios for which Board Member Serves: 24 |
Benaree Pratt Wiley (61) Board Member (1998)
| Principal Occupation During Past 5 Years: |
| • Principal,The Wiley Group, a firm specializing in strategy and business development |
| (2005-present) |
| • President and CEO,The Partnership, an organization dedicated to increasing the |
| representation of African Americans in positions of leadership, influence and |
| decision-making in Boston, MA (1991-2005) |
| Other Board Memberships and Affiliations: |
| • Boston College,Trustee |
| • Blue Cross Blue Shield of Massachusetts, Director |
| • Commonwealth Institute, Director |
| • Efficacy Institute, Director |
| • PepsiCo African-American, Advisory Board |
| • The Boston Foundation, Director |
| • Harvard Business School Alumni Board, Director |
| No. of Portfolios for which Board Member Serves: 34 |
Once elected all Board Members serve for an indefinite term, but achieve Emeritus status upon reaching age 80.The address of the Board Members and Officers is in c/o The Dreyfus Corporation, 200 Park Avenue, New York, New York 10166. Additional information about the Board Members is available in the fund’s Statement of Additional Information which can be obtained from Dreyfus free of charge by calling this toll free number: 1-800-554-4611.
Francis P. Brennan, Emeritus Board Member
30
OFFICERS OF THE FUND (Unaudited)
| J. DAVID OFFICER, President since |
| December 2006. |
| Chief Operating Officer,Vice Chairman and a |
| Director of the Manager, and an officer of 82 |
| investment companies (comprised of 163 |
| portfolios) managed by the Manager. He is 59 |
| years old and has been an employee of the |
| Manager since April 1998. |
| PHILLIP N. MAISANO, Executive Vice |
| President since July 2007. |
| Chief Investment Officer,Vice Chair and a |
| director of the Manager, and an officer of 82 |
| investment companies (comprised of 163 |
| portfolios) managed by the Manager. Mr. |
| Maisano also is an officer and/or Board |
| member of certain other investment |
| management subsidiaries of The Bank of New |
| York Mellon Corporation, each of which is an |
| affiliate of the Manager. He is 60 years old and |
| has been an employee of the Manager since |
| November 2006. Prior to joining the Manager, |
| Mr. Maisano served as Chairman and Chief |
| Executive Officer of EACM Advisors, an |
| affiliate of the Manager, since August 2004, and |
| served as Chief Executive Officer of Evaluation |
| Associates, a leading institutional investment |
| consulting firm, from 1988 until 2004. |
| MICHAEL A. ROSENBERG, Vice President |
| and Secretary since August 2005. |
| Associate General Counsel of the Manager, |
| and an officer of 83 investment companies |
| (comprised of 180 portfolios) managed by the |
| Manager. He is 47 years old and has been an |
| employee of the Manager since October 1991. |
| JAMES BITETTO, Vice President and |
| Assistant Secretary since August 2005. |
| Associate General Counsel and Assistant |
| Secretary of the Manager, and an officer of 83 |
| investment companies (comprised of 180 |
| portfolios) managed by the Manager. He is 41 |
| years old and has been an employee of the |
| Manager since December 1996. |
| JONI LACKS CHARATAN, Vice President |
| and Assistant Secretary since |
| August 2005. |
| Associate General Counsel of the Manager, |
| and an officer of 83 investment companies |
| (comprised of 180 portfolios) managed by the |
| Manager. She is 51 years old and has been an |
| employee of the Manager since October 1988. |
| JOSEPH M. CHIOFFI, Vice President and |
| Assistant Secretary since August 2005. |
| Associate General Counsel of the Manager, |
| and an officer of 83 investment companies |
| (comprised of 180 portfolios) managed by the |
| Manager. He is 45 years old and has been an |
| employee of the Manager since June 2000. |
| JANETTE E. FARRAGHER, Vice President |
| and Assistant Secretary since |
| August 2005. |
| Associate General Counsel of the Manager, |
| and an officer of 83 investment companies |
| (comprised of 180 portfolios) managed by the |
| Manager. She is 44 years old and has been an |
| employee of the Manager since February 1984. |
| JOHN B. HAMMALIAN, Vice President and |
| Assistant Secretary since August 2005. |
| Associate General Counsel of the Manager, |
| and an officer of 83 investment companies |
| (comprised of 180 portfolios) managed by the |
| Manager. He is 44 years old and has been an |
| employee of the Manager since February 1991. |
| ROBERT R. MULLERY, Vice President and |
| Assistant Secretary since August 2005. |
| Associate General Counsel of the Manager, |
| and an officer of 83 investment companies |
| (comprised of 180 portfolios) managed by the |
| Manager. He is 55 years old and has been an |
| employee of the Manager since May 1986. |
The Fund 31
OFFICERS OF THE FUND (Unaudited) (continued)
| JEFF PRUSNOFSKY, Vice President and |
| Assistant Secretary since August 2005. |
| Associate General Counsel of the Manager, |
| and an officer of 83 investment companies |
| (comprised of 180 portfolios) managed by the |
| Manager. He is 42 years old and has been an |
| employee of the Manager since October 1990. |
| JAMES WINDELS, Treasurer since |
| November 2001. |
| Director – Mutual Fund Accounting of the |
| Manager, and an officer of 83 investment |
| companies (comprised of 180 portfolios) |
| managed by the Manager. He is 48 years old |
| and has been an employee of the Manager |
| since April 1985. |
| ROBERT ROBOL, Assistant Treasurer |
| since December 2002. |
| Senior Accounting Manager – Money Market |
| and Municipal Bond Funds of the Manager, |
| and an officer of 83 investment companies |
| (comprised of 180 portfolios) managed by the |
| Manager. He is 43 years old and has been an |
| employee of the Manager since October 1988. |
| ROBERT SALVIOLO, Assistant Treasurer |
| since July 2007. |
| Senior Accounting Manager – Equity Funds of |
| the Manager, and an officer of 83 investment |
| companies (comprised of 180 portfolios) |
| managed by the Manager. He is 40 years old |
| and has been an employee of the Manager |
| since June 1989. |
| ROBERT SVAGNA, Assistant Treasurer |
| since December 2002. |
| Senior Accounting Manager – Equity Funds of |
| the Manager, and an officer of 83 investment |
| companies (comprised of 180 portfolios) |
| managed by the Manager. He is 40 years old |
| and has been an employee of the Manager |
| since November 1990. |
| GAVIN C. REILLY, Assistant Treasurer |
| since December 2005. |
| Tax Manager of the Investment Accounting |
| and Support Department of the Manager, and |
| an officer of 83 investment companies |
| (comprised of 180 portfolios) managed by the |
| Manager. He is 39 years old and has been an |
| employee of the Manager since April 1991. |
| JOSEPH W. CONNOLLY, Chief Compliance |
| Officer since October 2004. |
| Chief Compliance Officer of the Manager and |
| The Dreyfus Family of Funds (83 investment |
| companies, comprised of 180 portfolios). From |
| November 2001 through March 2004, Mr. |
| Connolly was first Vice-President, Mutual |
| Fund Servicing for Mellon Global Securities |
| Services. In that capacity, Mr. Connolly was |
| responsible for managing Mellon’s Custody, |
| Fund Accounting and Fund Administration |
| services to third-party mutual fund clients. He |
| is 50 years old and has served in various |
| capacities with the Manager since 1980, |
| including manager of the firm’s Fund |
| Accounting Department from 1997 through |
| October 2001. |
| WILLIAM GERMENIS, Anti-Money |
| Laundering Compliance Officer since |
| July 2002. |
| Vice President and Anti-Money Laundering |
| Compliance Officer of the Distributor, and the |
| Anti-Money Laundering Compliance Officer |
| of 79 investment companies (comprised of 176 |
| portfolios) managed by the Manager. He is 36 |
| years old and has been an employee of the |
| Distributor since October 1998. |
32
Item 2. Code of Ethics.
The Registrant has adopted a code of ethics that applies to the Registrant's principal executive officer, principal financial officer, principal accounting officer or controller, or persons performing similar functions. There have been no amendments to, or waivers in connection with, the Code of Ethics during the period covered by this Report.
Item 3. Audit Committee Financial Expert.
The Registrant's Board has determined that Joseph S. DiMartino, a member of the Audit Committee of the Board, is an audit committee financial expert as defined by the Securities and Exchange Commission (the "SEC"). Joseph S. DiMartino is "independent" as defined by the SEC for purposes of audit committee financial expert determinations.
Item 4. Principal Accountant Fees and Services.
(a) Audit Fees. The aggregate fees billed for each of the last two fiscal years (the "Reporting Periods") for professional services rendered by the Registrant's principal accountant (the "Auditor") for the audit of the Registrant's annual financial statements, or services that are normally provided by the Auditor in connection with the statutory and regulatory filings or engagements for the Reporting Periods, were $27,190 in 2006 and $28,000 in 2007.
(b) Audit-Related Fees. The aggregate fees billed in the Reporting Periods for assurance and related services by the Auditor that are reasonably related to the performance of the audit of the Registrant's financial statements and are not reported under paragraph (a) of this Item 4 were $3,800 in 2006 and $3,915 in 2007. These services consisted of security counts required by Rule 17f-2 under the Investment Company Act of 1940, as amended.
The aggregate fees billed in the Reporting Periods for non-audit assurance and related services by the Auditor to the Registrant's investment adviser (not including any sub-investment adviser whose role is primarily portfolio management and is subcontracted with or overseen by another investment adviser), and any entity controlling, controlled by or under common control with the investment adviser that provides ongoing services to the Registrant ("Service Affiliates"), that were reasonably related to the performance of the annual audit of the Service Affiliate, which required pre-approval by the Audit Committee were $0 in 2006 and $0 in 2007.
Note: For the second paragraph in each of (b) through (d) of this Item 4, certain of such services were not pre-approved prior to May 6, 2003, when such services were required to be pre-approved. On and after May 6, 2003, 100% of all services provided by the Auditor were pre-approved as required. For comparative purposes, the fees shown assume that all such services were pre-approved, including services that were not pre-approved prior to the compliance date of the pre-approval requirement.
(c) Tax Fees. The aggregate fees billed in the Reporting Periods for professional services rendered by the Auditor for tax compliance, tax advice and tax planning ("Tax Services") were $2,090 in 2006 and $2,090 in 2007. These services consisted of review or preparation of U.S. federal, state, local and excise tax returns.
The aggregate fees billed in the Reporting Periods for Tax Services by the Auditor to Service Affiliates which required pre-approval by the Audit Committee were $0 in 2006 and $0 in 2007.
(d) All Other Fees. The aggregate fees billed in the Reporting Periods for products and services provided by the Auditor, other than the services reported in paragraphs (a) through (c) of this Item, were $0 in 2006 and $0 in 2007.
The aggregate fees billed in the Reporting Periods for Non-Audit Services by the Auditor to Service Affiliates, other than the services reported in paragraphs (b) through (c) of this Item, which required pre-approval by the Audit Committee were $0 in 2006 and $0 in 2007.
Audit Committee Pre-Approval Policies and Procedures. The Registrant's Audit Committee has established policies and procedures (the "Policy") for pre-approval (within specified fee limits) of the Auditor's engagements for non-audit services to the Registrant and Service Affiliates without specific case-by-case consideration. Pre-approval considerations include whether the proposed services are compatible with maintaining the Auditor's independence. Pre-approvals pursuant to the Policy are considered annually.
Non-Audit Fees. The aggregate non-audit fees billed by the Auditor for services rendered to the Registrant, and rendered to Service Affiliates, for the Reporting Periods were $1,582,000 in 2006 and $2,455,000 in 2007.
Auditor Independence. The Registrant's Audit Committee has considered whether the provision of non-audit services that were rendered to Service Affiliates which were not pre-approved (not requiring pre-approval) is compatible with maintaining the Auditor's independence.
| Item 5. | | Audit Committee of Listed Registrants. |
| | | Not applicable. |
| Item 6. | | Schedule of Investments. |
| | | Not applicable. |
| Item 7. | | Disclosure of Proxy Voting Policies and Procedures for Closed-End Management |
| | | Investment Companies. |
| | | Not applicable. |
| Item 8. | | Portfolio Managers of Closed-End Management Investment Companies. |
| | | Not applicable |
| Item 9. | | Purchases of Equity Securities by Closed-End Management Investment Companies and |
| | | Affiliated Purchasers. |
| | | Not applicable. |
| Item 10. | | Submission of Matters to a Vote of Security Holders. |
The Registrant has a Nominating Committee (the "Committee"), which is responsible for selecting and nominating persons for election or appointment by the Registrant's Board as Board members. The Committee has adopted a Nominating Committee Charter (the "Charter"). Pursuant to the Charter, the
Committee will consider recommendations for nominees from shareholders submitted to the Secretary of the Registrant, c/o The Dreyfus Corporation Legal Department, 200 Park Avenue, 8th Floor East, New York, New York 10166. A nomination submission must include information regarding the recommended nominee as specified in the Charter. This information includes all information relating to a recommended nominee that is required to be disclosed in solicitations or proxy statements for the election of Board members, as well as information sufficient to evaluate the factors to be considered by the Committee, including character and integrity, business and professional experience, and whether the person has the ability to apply sound and independent business judgment and would act in the interests of the Registrant and its shareholders.
Nomination submissions are required to be accompanied by a written consent of the individual to stand for election if nominated by the Board and to serve if elected by the shareholders, and such additional information must be provided regarding the recommended nominee as reasonably requested by the Committee.
Item 11. Controls and Procedures.
(a) The Registrant's principal executive and principal financial officers have concluded, based on their evaluation of the Registrant's disclosure controls and procedures as of a date within 90 days of the filing date of this report, that the Registrant's disclosure controls and procedures are reasonably designed to ensure that information required to be disclosed by the Registrant on Form N-CSR is recorded, processed, summarized and reported within the required time periods and that information required to be disclosed by the Registrant in the reports that it files or submits on Form N-CSR is accumulated and communicated to the Registrant's management, including its principal executive and principal financial officers, as appropriate to allow timely decisions regarding required disclosure.
(b) There were no changes to the Registrant's internal control over financial reporting that occurred during the second fiscal quarter of the period covered by this report that have materially affected, or are reasonably likely to materially affect, the Registrant's internal control over financial reporting.
Item 12. Exhibits.
(a)(1) Code of ethics referred to in Item 2.
(a)(2) Certifications of principal executive and principal financial officers as required by Rule 30a-2(a) under the Investment Company Act of 1940.
(a)(3) Not applicable.
(b) Certification of principal executive and principal financial officers as required by Rule 30a-2(b) under the Investment Company Act of 1940.
SIGNATURES
Pursuant to the requirements of the Securities Exchange Act of 1934 and the Investment Company Act of 1940, the Registrant has duly caused this Report to be signed on its behalf by the undersigned, thereunto duly authorized.
| The Dreyfus/Laurel Funds Trust |
| |
| By: | | /s/ J. David Officer |
| | | J. David Officer |
| | | President |
| |
| Date: | | October 23, 2007 |
Pursuant to the requirements of the Securities Exchange Act of 1934 and the Investment Company Act of 1940, this Report has been signed below by the following persons on behalf of the Registrant and in the capacities and on the dates indicated.
| By: | | /s/ J. David Officer |
| | | J. David Officer |
| | | President |
| |
| Date: | | October 23, 2007 |
| |
| |
| By: | | /s/ James Windels |
| | | James Windels |
| | | Treasurer |
| |
| Date: | | October 23, 2007 |
EXHIBIT INDEX
| (a)(1) | | Code of ethics referred to in Item 2. |
| |
| (a)(2) | | Certifications of principal executive and principal financial officers as required by Rule 30a- |
| 2(a) under the Investment Company Act of 1940. (EX-99.CERT) |
| |
| (b) | | Certification of principal executive and principal financial officers as required by Rule 30a- |
| 2(b) under the Investment Company Act of 1940. (EX-99.906CERT) |