| UNITED STATES |
| SECURITIES AND EXCHANGE COMMISSION |
| Washington, D.C. 20549 |
| FORM N-CSR |
| |
| CERTIFIED SHAREHOLDER REPORT OF REGISTERED MANAGEMENT |
| INVESTMENT COMPANIES |
Investment Company Act file number 811-524
|
| The Dreyfus/Laurel Funds Trust |
| (Exact name of Registrant as specified in charter) |
| c/o The Dreyfus Corporation |
| 200 Park Avenue |
| New York, New York 10166 |
| (Address of principal executive offices) (Zip code) |
| |
| Michael A. Rosenberg, Esq. |
| 200 Park Avenue |
| New York, New York 10166 |
| (Name and address of agent for service) |
| |
| Registrant's telephone number, including area code: (212) 922-6000 |
| Date of fiscal year end: | | 10/31 |
| Date of reporting period: | | 10/31/2007 |
The following N-CSR relates only to the series of the Registrant listed below, and does not affect the other series of the Registrant, which have different fiscal year ends and, therefore, different N-CSR reporting requirements. Separate N-CSR Forms will be filed for those series, as appropriate.
Dreyfus Premier 130/30 Growth Fund
Dreyfus Premier Global Equity Income Fund
Dreyfus Premier International Bond Fund
|
FORM N-CSR
Item 1. Reports to Stockholders.
Save time. Save paper. View your next shareholder report online as soon as it’s available. Log into www.dreyfus.com and sign up for Dreyfus eCommunications. It’s simple and only takes a few minutes.
The views expressed in this report reflect those of the portfolio manager only through the end of the period covered and do not necessarily represent the views of Dreyfus or any other person in the Dreyfus organization. Any such views are subject to change at any time based upon market or other conditions and Dreyfus disclaims any responsibility to update such views.These views may not be relied on as investment advice and, because investment decisions for a Dreyfus fund are based on numerous factors, may not be relied on as an indication of trading intent on behalf of any Dreyfus fund.
Not FDIC-Insured • Not Bank-Guaranteed • May Lose Value
| | | Contents |
| |
| | | THE FUND |
| |
|
| 2 | | Discussion of Fund Performance |
| 4 | | Understanding Your Fund’s Expenses |
| 4 | | Comparing Your Fund’s Expenses |
| | | With Those of Other Funds |
| 5 | | Statement of Investments |
| 9 | | Statement of Securities Sold Short |
| 10 | | Statement of Assets and Liabilities |
| 11 | | Statement of Operations |
| 12 | | Statement of Cash Flows |
| 13 | | Statement of Changes in Net Assets |
| 14 | | Financial Highlights |
| 15 | | Notes to Financial Statements |
| 23 | | Report of Independent Registered |
| | | Public Accounting Firm |
| 24 | | Information About the Review and Approval |
| | | of the Fund’s Management Agreement |
| 28 | | Board Members Information |
| 30 | | Officers of the Fund |
| | | FOR MORE INFORMATION |
| |
|
| | | Back Cover |
| Dreyfu Premier |
| 130/30 Growth Fund |

DISCUSSION OF FUND PERFORMANCE
For the period between October 18, 2007, and October 31, 2007 Warren Chiang, CFA, Prabhu Palani, CFA, and Wesley Boggs, Portfolio Managers
Please note, due to the short period of existence since the fund’s inception on October 18, 2007, through the annual reporting period ended October 31, 2007, the discussion of fund performance is limited and will be discussed more extensively in the next semiannual report dated April 30, 2008.
Fund Performance Overview
Despite bouts of heightened volatility stemming from a domestic credit crisis and a slowing U.S. economy, large-cap growth stocks posted respectable returns due to generally healthy corporate earnings and robust global economic growth.
From the fund’s inception on October 18, 2007, through the end of the reporting period on October 31, 2007, Dreyfus Premier 130/30 Growth Fund produced total returns of –0.24% for Class A shares, –0.24% for Class C shares, –0.24 for Class I shares and –0.24% for Class T shares.1 In comparison, the Russell 1000 Growth Index produced a total return of 1.53% for the same period.2
The Fund’s Investment Approach
The fund seeks capital appreciation. The fund normally invests at least 80% of its net assets in equity securities. The fund intends to take both long and short positions in stocks chosen through a quantitatively-driven investment process. The fund’s portfolio managers apply a systematic, quantitative investment approach designed to identify and exploit relative misevaluations primarily within the U.S stock market.Active investment decisions to take long or short posi-
2
tions in individual securities are driven by this quantitative investment process. The portfolio managers use a proprietary valuation model that identifies and ranks stocks based on a long-term relative valuation model that utilizes forward looking estimates of risk and return, an earnings sustainability model that gauges how well earnings forecasts are likely to reflect changes in future cash flows, and a set of behavioral factors, including earnings revisions and share buy-backs.
The Fund’s Current Strategy
We try to find new opportunities by using a quantitative approach in which all investments decisions are based primarily on valuation and relative value.The investment approach is sector-neutral and holdings are purchased from a large-cap universe of stocks.
November 15, 2007
| 1 | | Total return includes reinvestment of dividends and any capital gains paid, and does not take into |
| | | consideration the maximum initial sales charges in the case of Class A and Class T shares, or the |
| | | applicable contingent deferred sales charges imposed on redemptions in the case of Class C shares. |
| | | Had these charges been reflected, returns would have been lower. Past performance is no guarantee |
| | | of future results. Share price and investment return fluctuate such that upon redemption, fund |
| | | shares may be worth more or less than their original cost. Return figures provided reflect the |
| | | absorption of certain fund expenses by The Dreyfus Corporation pursuant to an agreement in |
| | | effect until October 31, 2008. Had these expenses not been absorbed, the fund’s returns would |
| | | have been lower. |
| 2 | | SOURCE: Bloomberg. – Reflects reinvestment of net dividends and, where applicable, capital |
| | | gain distributions.The Russell 1000 Growth Index is a widely accepted, unmanaged large-cap |
| | | index that measures the performance of those Russell 1000 Index companies with higher price-to- |
| | | book ratios and higher forecasted growth values. |
The Fund 3
UNDERSTANDING YOUR FUND’S EXPENSES (Unaudited)
As a mutual fund investor, you pay ongoing expenses, such as management fees and other expenses. Using the information below, you can estimate how these expenses affect your investment and compare them with the expenses of other funds.You also may pay one-time transaction expenses, including sales charges (loads) and redemption fees, which are not shown in this section and would have resulted in higher total expenses. For more information, see your fund’s prospectus or talk to your financial adviser.
Review your fund’s expenses
The table below shows the expenses you would have paid on a $1,000 investment in Dreyfus Premier 130/30 Growth Fund from October 18, 2007 (commencement of operations) to October 31, 2007. It also shows how much a $1,000 investment would be worth at the close of the period, assuming actual returns and expenses.
| Expenses and Value of a $1,000 Investment | | | | | | |
| assuming actual returns for the period ended October 31, 2007† | | | | |
| | | Class A | | Class C | | Class I | | Class T |
| |
| |
| |
| |
|
| Expenses paid per $1,000 †† | | $ .61 | | $ .90 | | $ .52 | | $ .71 |
| Ending value (after expenses) | | $997.60 | | $997.60 | | $997.60 | | $997.60 |
| COMPARING YOUR FUND’S EXPENSES |
| WITH THOSE OF OTHER FUNDS (Unaudited) |
Using the SEC’s method to compare expenses
The Securities and Exchange Commission (SEC) has established guidelines to help investors assess fund expenses. Per these guidelines, the table below shows your fund’s expenses based on a $1,000 investment, assuming a hypothetical 5% annualized return. You can use this information to compare the ongoing expenses (but not transaction expenses or total cost) of investing in the fund with those of other funds.All mutual fund shareholder reports will provide this information to help you make this comparison. Please note that you cannot use this information to estimate your actual ending account balance and expenses paid during the period.
| Expenses and Value of a $1,000 Investment | | | | | | | | |
| assuming a hypothetical 5% annualized return for the period ended October 31, 2007† | | |
| | | Class A | | Class C | | Class I | | | | Class T |
| |
| |
| |
| |
| |
|
| Expenses paid per $1,000 †† | | $ .61 | | $ .90 | | $ .52 | | $ | | .71 |
| Ending value (after expenses) | | $1,001.30 | | $1,001.02 | | $1,001.40 | | $1,001.21 |
| † From October 18, 2007 (commencement of operations) to October 31, 2007. | | | | | | |
Expenses are equal to the fund’s annualized expense ratio of 1.60% for Class A, 2.35% for Class C, 1.35% for Class I and 1.85% for Class T, multiplied by the average account value over the period, multiplied by 14/365 (to reflect the one-half year period).
4
| STATEMENT OF INVESTMENTS |
| October 31, 2007 |
| Common Stocks—128.5% | | Shares | | Value ($) |
| |
| |
|
| Consumer Discretionary—22.3% | | | | |
| Coach | | 1,200 a,b | | 43,872 |
| Darden Restaurants | | 1,100 b | | 47,300 |
| Harman International Industries | | 50 b | | 4,210 |
| Harrah’s Entertainment | | 50 b | | 4,412 |
| Home Depot | | 1,800 b | | 56,718 |
| J.C. Penney | | 800 b | | 44,992 |
| Newell Rubbermaid | | 1,600 b | | 46,656 |
| News, Cl. A | | 2,600 b | | 56,342 |
| NutriSystem | | 1,500 a,b | | 45,150 |
| OfficeMax | | 1,400 b | | 44,310 |
| Omnicom Group | | 1,000 b | | 50,980 |
| Polo Ralph Lauren | | 700 b | | 48,160 |
| Snap-On | | 900 | | 44,919 |
| Starwood Hotels & Resorts Worldwide | | 800 | | 45,488 |
| Station Casinos | | 50 | | 4,490 |
| Time Warner | | 2,600 | | 47,476 |
| Walt Disney | | 1,600 b | | 55,408 |
| | | | | 690,883 |
| Consumer Staples—11.3% | | | | |
| Clorox | | 600 b | | 37,542 |
| ConAgra Foods | | 1,800 b | | 42,714 |
| Del Monte Foods | | 4,300 b | | 44,462 |
| Kroger | | 1,700 b | | 49,963 |
| McCormick & Co. | | 1,300 b | | 45,539 |
| Wal-Mart Stores | | 1,600 | | 72,336 |
| Walgreen | | 1,500 | | 59,475 |
| | | | | 352,031 |
| Energy—9.8% | | | | |
| Dresser-Rand Group | | 1,100 a,b | | 42,570 |
| Murphy Oil | | 200 b | | 14,726 |
| NRG Energy | | 100 a,b | | 4,566 |
| Schlumberger | | 50 b | | 4,829 |
| Smith International | | 700 b | | 46,235 |
| St. Mary Land & Exploration | | 700 b | | 29,652 |
| Sunoco | | 600 | | 44,160 |
The Fund 5
STATEMENT OF INVESTMENTS (continued)
| Common Stocks (continued) | | Shares | | | | Value ($) |
| |
| |
| |
|
| Energy (continued) | | | | | | |
| Transocean | | 500 | | a,b | | 59,685 |
| Valero Energy | | 800 | | | | 56,344 |
| | | | | | | 302,767 |
| Financial—12.8% | | | | | | |
| Ambac Financial Group | | 700 | | b | | 25,781 |
| American International Group | | 700 | | b | | 44,184 |
| Assurant | | 800 | | b | | 46,752 |
| Fifth Third Bancorp | | 1,400 | | b | | 43,792 |
| Genworth Financial, Cl. A | | 1,500 | | b | | 40,950 |
| Merrill Lynch & Co. | | 700 | | b | | 46,214 |
| Moody’s | | 1,000 | | b | | 43,720 |
| Morgan Stanley | | 700 | | b | | 47,082 |
| ProLogis | | 100 | | b | | 7,174 |
| Simon Property Group | | 50 | | b | | 5,206 |
| W.R. Berkley | | 1,500 | | b | | 45,135 |
| | | | | | | 395,990 |
| Health Care—16.9% | | | | | | |
| Amgen | | 300 | | a,b | | 17,433 |
| Bristol-Myers Squibb | | 2,300 | | b | | 68,977 |
| Cardinal Health | | 800 | | b | | 54,424 |
| Celgene | | 100 | | a,b | | 6,600 |
| Dade Behring Holdings | | 50 | | b | | 3,846 |
| Endo Pharmaceuticals Holdings | | 1,300 | | a,b | | 38,090 |
| Genentech | | 200 | | a,b | | 14,826 |
| Genzyme | | 100 | | a,b | | 7,597 |
| Health Net | | 900 | | a,b | | 48,249 |
| Medtronic | | 1,300 | | b | | 61,672 |
| Merck & Co. | | 700 | | b | | 40,782 |
| Schering-Plough | | 2,000 | | b | | 61,040 |
| Watson Pharmaceuticals | | 1,500 | | a | | 45,840 |
| WellPoint | | 700 | | a | | 55,461 |
| | | | | | | 524,837 |
| Industrial—16.3% | | | | | | |
| Boeing | | 800 | | b | | 78,872 |
| Cooper Industries, Cl. A | | 800 | | b | | 41,912 |
| Copart | | 1,200 | | a,b | | 46,056 |
6
| Common Stocks (continued) | | Shares | | Value ($) |
| |
| |
|
| Industrial (continued) | | | | |
| Emerson Electric | | 700 b | | 36,589 |
| GATX | | 1,100 b | | 45,067 |
| Hertz Global Holdings | | 2,100 a,b | | 45,528 |
| Hubbell, Cl. B | | 800 b | | 44,000 |
| Pall | | 1,200 b | | 48,084 |
| Pitney Bowes | | 100 b | | 4,004 |
| Precision Castparts | | 400 b | | 59,924 |
| SPX | | 500 b | | 50,650 |
| Waste Management | | 100 | | 3,639 |
| | | | | 504,325 |
| Information Technology—21.9% | | | | |
| Adobe Systems | | 1,200 a,b | | 57,480 |
| Agilent Technologies | | 1,300 a,b | | 47,905 |
| Applied Materials | | 900 b | | 17,478 |
| Automatic Data Processing | | 1,200 b | | 59,472 |
| BMC Software | | 1,500 a,b | | 50,760 |
| CA | | 800 b | | 21,160 |
| Ciena | | 1,000 a,b | | 47,860 |
| Cognizant Technology Solutions, Cl. A | | 1,000 a,b | | 41,460 |
| Google, Cl. A | | 50 a | | 35,350 |
| Intel | | 2,500 | | 67,250 |
| MEMC Electronic Materials | | 800 a,b | | 58,576 |
| National Instruments | | 1,300 b | | 42,172 |
| QUALCOMM | | 1,700 b | | 72,641 |
| Red Hat | | 2,200 a,b | | 47,498 |
| WebMD Health, CL. A | | 300 a | | 13,791 |
| | | | | 680,853 |
| Materials—4.6% | | | | |
| Allegheny Technologies | | 50 b | | 5,108 |
| Freeport-McMoRan Copper & Gold | | 100 b | | 11,768 |
| International Paper | | 1,300 b | | 48,048 |
| Monsanto | | 700 b | | 68,341 |
| Newmont Mining | | 100 b | | 5,086 |
| Vulcan Materials | | 50 | | 4,276 |
| | | | | 142,627 |
The Fund 7
STATEMENT OF INVESTMENTS (continued)
| Common Stocks (continued) | | Shares | | Value ($) |
| |
| |
|
| Technology—9.9% | | | | |
| Apple | | 100 a,b | | 18,995 |
| Cisco Systems | | 900 a,b | | 29,754 |
| Dell | | 2,500 a,b | | 76,500 |
| Hewlett-Packard | | 1,900 b | | 98,192 |
| International Business Machines | | 200 | | 23,224 |
| Microsoft | | 1,600 b | | 58,896 |
| | | | | 305,561 |
| Telecommunication Services—2.7% | | | | |
| Qwest Communications International | | 5,300 a,b | | 38,054 |
| US Cellular | | 500 a | | 47,075 |
| | | | | 85,129 |
| |
| |
|
| |
| Total Investments (cost $3,989,519) | | 128.5% | | 3,985,003 |
| Liabilities, Less Cash and Receivables | | (28.5%) | | (884,357) |
| Net Assets | | 100.0% | | 3,100,646 |
| a | | Non-income producing security. |
| b | | Partially held by a broker as collateral for open short positions. |
| Portfolio Summary | | (Unaudited) † | | | | |
| |
| | | Value (%) | | | | Value (%) |
| |
| |
| |
|
| Consumer Discretionary | | 22.3 | | Technology | | 9.9 |
| Information Technology | | 21.9 | | Energy | | 9.8 |
| Health Care | | 16.9 | | Materials | | 4.6 |
| Industrial | | 16.3 | | Telecommunication Services | | 2.7 |
| Financial | | 12.8 | | | | |
| Consumer Staples | | 11.3 | | | | 128.5 |
| † Based on net assets. |
| See notes to financial statements. |
8
| STATEMENT OF SECURITIES SOLD SHORT |
| October 31, 2007 |
| Common Stocks—29.8% | | Shares | | Value ($) |
| |
| |
|
| Consumer Discretionary—9.0% | | | | |
| Career Education | | 1,400 a | | 50,036 |
| Circuit City Stores | | 5,700 | | 45,201 |
| Dillards, Cl. A | | 2,100 | | 48,363 |
| Hearst—Argyle Television | | 1,900 | | 42,370 |
| Panera Bread, Cl. A | | 100 a | | 4,099 |
| Sears Holdings | | 300 a | | 40,437 |
| Toll Brothers | | 2,100 a | | 48,111 |
| | | | | 278,617 |
| Consumer Staples—1.4% | | | | |
| Smithfield Foods | | 1,500 a | | 43,005 |
| Energy—1.6% | | | | |
| Newfield Exploration | | 900 a | | 48,456 |
| Financial—3.8% | | | | |
| Fidelity National Financial | | 2,700 | | 41,553 |
| First American | | 1,300 | | 39,130 |
| Philadelphia Consolidated Holding | | 900 a | | 36,720 |
| | | | | 117,403 |
| Health Care—2.1% | | | | |
| Health Management Associates, Cl. A | | 7,000 | | 46,270 |
| Pediatrix Medical Group | | 300 a | | 19,650 |
| | | | | 65,920 |
| Industrial—6.0% | | | | |
| General Cable | | 600 a | | 43,194 |
| Ingersoll—Rand, Cl. A | | 900 | | 45,315 |
| J.B. Hunt Transport Services | | 500 | | 13,860 |
| Roper Industries | | 600 | | 42,486 |
| Timken | | 1,200 | | 39,912 |
| | | | | 184,767 |
| Information Technology—3.8% | | | | |
| Fair Issac | | 1,300 | | 49,296 |
| Iron Mountain | | 1,300 a | | 45,149 |
| Micron Technology | | 2,300 a | | 24,173 |
| | | | | 118,618 |
| Materials—1.4% | | | | |
| Dow Chemical | | 1,000 | | 45,040 |
| Telecommunication Services—.7% | | | | |
| Sprint Nextel | | 1,300 | | 22,230 |
| Total Securities Sold Short (cost $922,445) | | 29.8% | | 924,056 |
| a Non-income producing security |
| See notes to financial statements. |
The Fund 9
| STATEMENT OF ASSETS AND LIABILITIES |
| October 31, 2007 |
| | | | | | | Cost | | Value |
| |
| |
| |
| |
|
| Assets ($): | | | | | | | | |
| Investments in securities—See Statement of Investments | | 3,989,519 | | 3,985,003 |
| Cash | | | | | | | | 40,515 |
| Dividends receivable | | | | | | | | 1,136 |
| Due from The Dreyfus Corporation and affiliates—Note 2(d) | | | | 25,602 |
| | | | | | | | | 4,052,256 |
| |
| |
| |
| |
|
| Liabilities ($): | | | | | | | | |
| Securities sold short, at value (proceeds $922,445) | | | | |
| —See Statement of Securities Sold Short | | | | | | 924,056 |
| Due to Broker | | | | | | | | 119 |
| Accrued expenses | | | | | | | | 27,435 |
| | | | | | | | | 951,610 |
| |
| |
| |
| |
|
| Net Assets ($) | | | | | | | | 3,100,646 |
| |
| |
| |
| |
|
| Composition of Net Assets ($): | | | | | | | | |
| Paid-in capital | | | | | | | | 3,106,773 |
| Accumulated net unrealized appreciation (depreciation) | | | | |
| on investments and securities sold short | | | | | | (6,127) |
| |
| |
| |
|
| Net Assets ($) | | | | | | | | 3,100,646 |
| |
| |
| |
| |
|
| |
| |
| Net Asset Value Per Share | | | | | | | | |
| | | Class A | | Class C | | Class I | | Class T |
| |
| |
| |
| |
|
| Net Assets ($) | | 2,202,912 | | 299,187 | | 299,302 | | 299,245 |
| Shares Outstanding | | 176,661 | | 24,000 | | 24,000 | | 24,000 |
| |
| |
| |
| |
|
| Net Asset Value Per Share ($) | | 12.47 | | 12.47 | | 12.47 | | 12.47 |
See notes to financial statements.
10
| STATEMENT OF OPERATIONS |
| From October 18, 2007 (commencement of operations) to October 31, 2007 |
| Investment Income ($): | | |
| Income: | | |
| Cash dividends | | 1,136 |
| Expenses: | | |
| Management fee—Note 2(a) | | 988 |
| Auditing fees | | 18,500 |
| Prospectus and shareholders’ reports | | 4,458 |
| Custodian fees—Note 2(d) | | 875 |
| Legal fees | | 600 |
| Shareholder servicing costs—Note 2(d) | | 344 |
| Trustees’ fees and expenses—Note 2(b) | | 142 |
| Distribution fees—Note 2(c) | | 113 |
| Interest expense—Note 2(e) | | 119 |
| Registration fees | | 95 |
| Miscellaneous | | 3,972 |
| Total Expenses | | 30,206 |
| Less—expense reimbursement from | | |
| The Dreyfus Corporation due to undertaking—Note 2(a) | | (28,254) |
| Net Expenses | | 1,952 |
| Investment (Loss)—Net | | (816) |
| |
|
| Realized and Unrealized Gain (Loss) on Investments—Note 3 ($): |
| Net realized gain (loss) on investments | | 25 |
| Net unrealized appreciation (depreciation) on investments | | (6,127) |
| Net Realized and Unrealized Gain (Loss) on Investments | | (6,102) |
| Net (Decrease) in Net Assets Resulting from Operations | | (6,918) |
See notes to financial statements.
The Fund 11
| STATEMENT OF CASH FLOWS |
| From October 18, 2007 (commencement of operations) to October 31, 2007 |
| Cash Flows from Operating Activities ($): | | | | |
| Operating expenses paid | | (1,664) |
| Paid from The Dreyfus Corporation | | 1,664 | | — |
| |
| |
|
| Cash Flows from Investing Activities ($): | | | | |
| Purchases of portfolio securities | | (3,994,244) |
| Proceeds from sales of portfolio securities | | 4,750 | | |
| Proceeds from securities sold short | | 922,445 | | (3,067,049) |
| |
| |
|
| Cash Flows from Financing Activites ($): | | | | |
| Net Beneficial Interest transactions | | | | 3,107,564 |
| Increase in cash | | | | 40,515 |
| Cash at beginning of period | | | | — |
| Cash at end of period | | | | 40,515 |
| |
| |
|
| Reconciliation of Net Increase in Net Assets Resulting | | |
| from Operations to Net Cash Provided by Operating Activities | | |
| Net decrease in Net Assets Resulting from Operations | | | | (6,918) |
| |
| |
|
| Adjustments to reconcile net increase in net assets resulting | | |
| from operations to net cash used by operating activities ($): | | |
| Increase in administrative and accrued expenses | | | | 27,435 |
| Increase in due from The Dreyfus Corporation | | | | (25,602) |
| Net realized gains on investments | | | | (25) |
| Net unrealized depreciation on investments | | | | 6,127 |
| Increase in dividends and interest receivable | | | | (1,017) |
| Net Cash Provided by Operating Activities | | | | — |
See notes to financial statements.
12
STATEMENT OF CHANGES IN NET ASSETS
From October 18, 2007 (commencement of operations) to October 31, 2007
| Operations ($): | | |
| Investment (loss)—net | | (816) |
| Net realized gain (loss) on investments | | 25 |
| Net unrealized appreciation (depreciation) on investments | | (6,127) |
| Net Increase (Decrease) in Net Assets | | |
| Resulting from Operations | | (6,918) |
| |
|
| Beneficial Interest Transactions ($): | | |
| Net proceeds from shares sold: | | |
| Class A | | 2,207,564 |
| Class C | | 300,000 |
| Class I | | 300,000 |
| Class T | | 300,000 |
| Increase (Decrease) in Net Assets from | | |
| Beneficial Interest Transactions | | 3,107,564 |
| Total Increase (Decrease) in Net Assets | | 3,100,646 |
| |
|
| Net Assets ($): | | |
| End of Period | | 3,100,646 |
| |
|
| Capital Share Transactions (Shares): | | |
| Class A | | |
| Shares sold | | 176,661 |
| Net Increase (Decrease) in Shares Outstanding | | 176,661 |
| |
|
| Class C | | |
| Shares sold | | 24,000 |
| Net Increase (Decrease) in Shares Outstanding | | 24,000 |
| |
|
| Class I | | |
| Shares sold | | 24,000 |
| Net Increase (Decrease) in Shares Outstanding | | 24,000 |
| |
|
| Class T | | |
| Shares sold | | 24,000 |
| Net Increase (Decrease) in Shares Outstanding | | 24,000 |
See notes to financial statements.
The Fund 13
FINANCIAL HIGHLIGHTS
The following table describes the performance for each share class for the period from October 18, 2007 (commencement of operations) to October 31, 2007. All information (except portfolio turnover rate) reflects financial results for a single fund share. Total return shows how much your investment in the fund would have increased (or decreased) during the period, assuming you had reinvested all dividends and distributions.These figures have been derived from the fund’s financial statements.
| | | Class A | | Class C | | Class I | | Class T |
| | | Shares | | Shares | | Shares | | Shares |
| |
| |
| |
| |
|
| Per Share Data ($): | | | | | | | | |
| Net asset value, beginning of period | | 12.50 | | 12.50 | | 12.50 | | 12.50 |
| Investment Operations: | | | | | | | | |
| Investment (loss)—net a | | (.00)b | | (.01) | | (.00)b | | (.00)b |
| Net realized and unrealized | | | | | | | | |
| gain (loss) on investments | | (.03) | | (.02) | | (.03) | | (.03) |
| Total from Investment Operations | | (.03) | | (.03) | | (.03) | | (.03) |
| Net asset value, end of period | | 12.47 | | 12.47 | | 12.47 | | 12.47 |
| |
| |
| |
| |
|
| Total Return (%) c | | (.24) | | (.24) | | (.24) | | (.24) |
| |
| |
| |
| |
|
| Ratios/Supplemental Data (%): | | | | | | | | |
| Ratio of total expenses | | | | | | | | |
| to average net assets d | | 25.89 | | 26.52 | | 25.52 | | 26.02 |
| Ratio of net expenses | | | | | | | | |
| to average net assets d | | 1.60 | | 2.35 | | 1.35 | | 1.85 |
| Ratio of net investment (loss) | | | | | | | | |
| to average net assets d | | (.63) | | (1.38) | | (.38) | | (.88) |
| Portfolio Turnover Rate c | | .12 | | .12 | | .12 | | .12 |
| |
| |
| |
| |
|
| Net Assets, end of period ($ x 1,000) | | 2,203 | | 299 | | 299 | | 299 |
| a | | Based on average shares outstanding at each month end. |
| b | | Amount represents less than $.01. |
| c | | Not annualized. |
| d | | Annualized. |
| See notes to financial statements. |
14
NOTES TO FINANCIAL STATEMENTS
NOTE 1—Significant Accounting Policies:
Dreyfus Premier 130/30 Growth Fund (the “fund”) is a separate diversified series of The Dreyfus/Laurel Funds Trust (the “Trust”), which is registered under the Investment Company Act of 1940, as amended (the “Act”), as an open-end management investment company and operates as a series company currently offering eight series, including the fund which commenced operations on October 18, 2007.The fund’s investment objective seeks capital appreciation.The Dreyfus Corporation (the “Manager” or “Dreyfus”) serves as the fund’s investment adviser. Dreyfus is wholly-owned subsidiary of The Bank of New York Mellon Corporation (“BNY Mellon”). Mellon Capital Management Corporation (“Mellon Capital”) an affiliate of BNY Mellon, serves as the fund’s sub-investment adviser.
MBSC Securities Corporation (the “Distributor”), a wholly-owned subsidiary of Dreyfus is the distributor of the fund’s shares.The fund is authorized to issue an unlimited number of shares of Beneficial Interest in each of the following classes of shares: Class A, Class C, Class I and Class T. Class A and Class C shares are sold primarily to retail investors through financial intermediaries and bear a distribution fee and/or service fee. Class A shares are sold with a front-end sales charge, while Class C shares are subject to a contingent deferred sales charge (“CDSC”). Class I shares are sold primarily to bank trust departments and other financial service providers (including Mellon Bank, N.A. and its affiliates) acting on behalf of customers having a qualified trust or investment account or relationship at such institution, and bear no distribution or service fees. Class I shares are offered without a front-end sales charge or CDSC. Each class of shares has identical rights and privileges, except with respect to distribution and service fees and voting rights on matters affecting a single class. Income, expenses (other than expenses attributable to a specific class), and realized and unrealized gains or losses on investments are allocated to each class of shares based on its relative net assets.
The Fund 15
NOTES TO FINANCIAL STATEMENTS (continued)
As of October 31, 2007, MBC Investments Corp., an indirect subsidiary of BNY Mellon, held 168,000 Class A shares and all of the outstanding Class C, Class I and Class T shares of the fund.
The Trust accounts separately for the assets, liabilities and operations of each series. Expenses directly attributable to each series are charged to that series’ operations; expenses which are applicable to all series are allocated among them on a pro rata basis.
The fund’s financial statements are prepared in accordance with U.S. generally accepted accounting principles, which may require the use of management estimates and assumptions. Actual results could differ from those estimates.
The fund enters into contracts that contain a variety of indemnifications. The fund’s maximum exposure under these arrangements is unknown.The fund does not anticipate recognizing any loss related to these arrangements.
(a) Portfolio valuation: Investments in securities (including options) are valued at the last sales price on the securities exchange or national securities market on which such securities are primarily traded. Securities listed on the National Market System for which market quotations are available are valued at the official closing price or, if there is no official closing price that day, at the last sale price. Securities not listed on an exchange or the national securities market, or securities for which there were no transactions, are valued at the average of the most recent bid and asked prices, except for open short positions, where the asked price is used for valuation purposes. Bid price is used when no asked price is available. Registered open-end investment companies that are not traded on an exchange are valued at their net asset value. When market quotations or official closing prices are not readily available, or are determined not to reflect accurately fair value, such as when the value of a security has been significantly affected by events after the close of the exchange or market on which the security is principally traded (for example, a foreign exchange or market), but before the fund
16
calculates its net asset value, the fund may value these investments at fair value as determined in accordance with the procedures approved by the Board of Trustees. Fair valuing of securities may be determined with the assistance of a pricing service using calculations based on indices of domestic securities and other appropriate indicators, such as prices of relevant ADR’s and futures contracts. For other securities that are fair valued by the Board of Trustees, certain factors may be considered such as: fundamental analytical data, the nature and duration of restrictions on disposition, an evaluation of the forces that influence the market in which the securities are purchased and sold, and public trading in similar securities of the issuer or comparable issuers. Financial futures are valued at the last sales price.
The Financial Accounting Standards Board (“FASB”) released Statement of Financial Accounting Standards No. 157 “Fair Value Measurements” (“FAS 157”). FAS 157 establishes an authoritative definition of fair value, sets out a framework for measuring fair value, and requires additional disclosures about fair-value measurements.The application of FAS 157 is required for fiscal years beginning after November 15, 2007 and interim periods within those fiscal years. Management does not believe that the application of this standard will have a material impact on the financial statements of the fund.
(b) Securities transactions and investment income: Securities transactions are recorded on a trade date basis. Realized gains and losses from securities transactions are recorded on the identified cost basis. Dividend income is recognized on the ex-dividend date and interest income, including, where applicable, accretion of discount and amortization of premium on investments, is recognized on the accrual basis.
The fund has an arrangement with the custodian bank whereby the fund receives earnings credits from the custodian when positive cash balances are maintained, which are used to offset custody fees. For financial reporting purposes, the fund includes net earnings credits as an expense offset in the Statement of Operations.
The Fund 17
NOTES TO FINANCIAL STATEMENTS (continued)
(c) Affiliated issuers: Investments in other investment companies advised by Dreyfus are defined as “affiliated” in the Act.
(d) Concentration of risk: The fund enters into short sales. Short sales involve selling a security the fund does not own in anticipation that the security’s price will decline. Short sales may involve substantial risk and “leverage.”The fund may be required to buy the security sold short at a time when the security has appreciated in value, thus resulting in a loss to the fund. Short positions in stocks involve more risk than long positions in stocks. In theory, stocks sold short have unlimited risk.
(e) Dividends to shareholders: Dividends are recorded on the ex-dividend date. Dividends from investment income-net and dividends from net realized capital gains, if any, are normally declared and paid annually, but the fund may make distributions on a more frequent basis to comply with the distribution requirements of the Internal Revenue Code of 1986, as amended (the “Code”).To the extent that net realized capital gains can be offset by capital loss carryovers, it is the policy of the fund not to distribute such gains. Income and capital gain distributions are determined in accordance with income tax regulations, which may differ from U.S. generally accepted accounting principles.
(f) Federal income taxes: It is the policy of the fund to continue to qualify as a regulated investment company, if such qualification is in the best interests of its shareholders, by complying with the applicable provisions of the Code, and to make distributions of taxable income sufficient to relieve it from substantially all federal income and excise taxes.
The FASB released FASB Interpretation No. 48 “Accounting for Uncertainty in Income Taxes” (FIN 48). FIN 48 provides guidance for how uncertain tax positions should be recognized, measured, presented and disclosed in the financial statements. FIN 48 requires the evaluation of tax positions taken or expected to be taken in the course of preparing the fund’s tax returns to determine whether the tax positions are “more-likely-than-not” of being sustained by the applicable tax authority. Tax positions not deemed to meet the more-likely-than-not threshold would
18
be recorded as a tax benefit or expense in the current year.Adoption of FIN 48 is required for fiscal years beginning after December 15,2006 and is to be applied to all open tax years as of the effective date. Management does not believe that the application of this standard will have a material impact on the financial statements of the fund.
At October 31, 2007, the components of accumulated earnings on a tax basis were as follows: unrealized depreciation $6,127.
During the period ended October 31, 2007, as a result of permanent book to tax differences, primarily due to the tax treatment for net operating losses, the fund increased accumulated undistributed investment income-net by $816, decreased accumulated net realized gain (loss) on investments by $25 and decreased paid-in capital by $791. Net assets and net asset value per share were not affected by this reclassification.
NOTE 2—Investment Management Fee and Other Transactions With Affiliates:
(a) Pursuant to an Investment Management agreement between the Manager and the Trust, the Trust has agreed to pay the Manager a management fee computed at the annual rate of .85% of the value of the fund’s average daily net assets and is payable monthly.The Manager has contractually agreed, until October 31, 2008, to waive receipt of its fees and/or assume the expenses of the fund so that annual fund operating expenses (excluding Rule 12b-1 fees, shareholder services fees, taxes, interest, brokerage commissions, commitments fees on borrowings (such as interest charged by the fund’s prime broker, substitute dividend expenses on securities sold short and, extraordinary expenses) do not exceed 1.25% .The expense reimbursement, pursuant to the undertaking, amounted to $28,254 during the period ended October 31, 2007.
Pursuant to a Sub-Investment Advisory Agreement between Dreyfus and Mellon Capital, Dreyfus pays Mellon Capital an annual fee of 0.41% of the value of the fund’s average net assets, payable monthly.
The Fund 19
NOTES TO FINANCIAL STATEMENTS (continued)
(b) Each Trustee receives $45,000 per year, plus $6,000 for each joint Board meeting of The Dreyfus/Laurel Funds, Inc., The Trust and The Dreyfus/Laurel Tax-Free Municipal Funds, (collectively the “Dreyfus/Laurel Funds”) attended, $2,000 for separate in-person committee meetings attended which are not held in conjunction with a regularly scheduled Board meeting and $1,500 for Board meetings and separate committee meetings attended that are conducted by telephone and is reimbursed for travel and out-of-pocket expenses.With respect to Board meetings, the Chairman of the Board receives an additional 25% of such compensation (with the exception of reimbursable amounts). With respect to compensation committee meetings, the Chair of the compensation committee receives $900 per meeting and, with respect to audit committee meetings, the Chair of the audit committee receives $1,350 per meeting. In the event that there is an in-person joint meeting of the Dreyfus/Laurel Funds and Dreyfus High Yield Strategies Fund, the $2,000 or $1,500 fee, as applicable, will be allocated between the Dreyfus/Laurel Funds and Dreyfus High Yield Strategies Fund. These fees and expenses are changed and allocated to each series based on net assets.
(c) Under the Distribution Plan (the “Plan”) adopted pursuant to Rule 12b-1 under the Act, Class C and Class T shares pay the Distributor for distributing their shares at an annual rate of .75% of the value of the average daily net assets of Class C shares and .25% of the value of the average daily net assets of Class T shares. During the period ended October 31, 2007, Class C and Class T shares were charged $85 and $28, pursuant to the Plan.
(d) Under the Shareholder Services Plan, Class A, Class C and Class T shares pay the Distributor at an annual rate of .25% of the value of their average daily net assets for the provision of certain services.The services provided may include personal services relating to shareholder accounts, such as answering shareholder inquiries regarding the fund and providing reports and other information, and services related to the maintenance of shareholder accounts. The Distributor may make payments to Service Agents (a securities dealer, financial
20
institution or other industry professional) in respect of these services. The Distributor determines the amounts to be paid to Service Agents. During the period ended October 31, 2007, Class A, Class C and Class T shares were charged $206, $28 and $28, respectively, pursuant to the Shareholder Services Plan.
The fund compensates Dreyfus Transfer, Inc., a wholly-owned subsidiary of Dreyfus, under a transfer agency agreement for providing personnel and facilities to perform transfer agency services for the fund. During the period ended October 31, 2007, the fund was charged $12 pursuant to the transfer agency agreement.
The fund compensates Mellon Bank, N.A., an affiliate of Dreyfus, under a custody agreement for providing custodial services for the fund. During the period ended October 31, 2007, the fund was charged $875 pursuant to the custody agreement.
During the period ended October 31, 2007, the fund was charged $402 for services performed by the Chief Compliance Officer.
The components of “Due from The Dreyfus Corporation and affiliates” in the Statement of Assets and Liabilities consist of: an expense reimbursement of $28,254, which is offset by management fees $988, Rule 12b-1 distribution plan fees $113, shareholder services plan fees $262, custodian fees $875, chief compliance officer fees $402 and transfer agency per account fees $12.
(e) Prime broker fees charged on the fund are included in interest expense.
NOTE 3—Securities Transactions:
The following summarizes the aggregate amount of purchases and sales of investment securities and securities sold short, excluding short-term securities, during the period ended October 31, 2007:
| | | Purchases ($) | | Sales ($) |
| |
| |
|
| Long transactions | | 3,994,244 | | 4,750 |
| Short sale transactions | | — | | 922,445 |
| Total | | 3,994,244 | | 927,195 |
The Fund 21
NOTES TO FINANCIAL STATEMENTS (continued)
The fund is engaged in short-selling which obligates the fund to replace the security borrowed by purchasing the security at current market value.The fund would incur a loss if the price of the security increases between the date of the short sale and the date on which the fund replaces the borrowed security. The fund would realize a gain if the price of the security declines between those dates. Until the fund replaces the borrowed security, the fund will maintain daily a segregated account with a broker or custodian, of permissible liquid assets sufficient to cover its short position. Securities sold short at October 31, 2007, and their related market values and proceeds are set forth in the Statement of Securities Sold Short.
At October 31, 2007, the cost of investments for federal income tax purposes was $3,989,519; accordingly, accumulated net unrealized depreciation on investments was $4,516, consisting of $90,793 gross unrealized appreciation and $95,309 gross unrealized depreciation.
22
| REPORT OF INDEPENDENT REGISTERED |
| PUBLIC ACCOUNTING FIRM |
The Board of Trustees and Shareholders of The Dreyfus/Laurel Funds Trust:
We have audited the accompanying statement of assets and liabilities of Dreyfus Premier 130/30 Growth Fund (the “Fund”) of The Dreyfus/Laurel Funds Trust, including the statements of investments and securities sold short, as of October 31, 2007, and the related statements of operations, cash flows, changes in net assets, and the financial highlights for the period from October 18, 2007 (commencement of operations) to October 31, 2007.These financial statements and financial highlights are the responsibility of the Fund’s management. Our responsibility is to express an opinion on these financial statements and financial highlights based on our audit.
We conducted our audit in accordance with the standards of the Public Company Accounting Oversight Board (United States).Those standards require that we plan and perform the audit to obtain reasonable assurance about whether the financial statements and financial highlights are free of material misstatement. An audit includes examining, on a test basis, evidence supporting the amounts and disclosures in the financial statements. Our procedures included confirmation of securities owned as of October 31, 2007, by correspondence with the custodian.An audit also includes assessing the accounting principles used and significant estimates made by management, as well as evaluating the overall financial statement presentation.We believe that our audit provides a reasonable basis for our opinion.
In our opinion, the financial statements and financial highlights referred to above present fairly, in all material respects, the financial position of Dreyfus Premier 130/30 Growth Fund of The Dreyfus/Laurel Funds Trust as of October 31, 2007, results of its operations, its cash flows, changes in its net assets and its financial highlights for the period from October 18, 2007 to October 31, 2007, in conformity with U.S. generally accepted accounting principles.

| | New York, New York
December 20, 2007
|
The Fund 23
| INFORMATION ABOUT THE REVIEW AND APPROVAL |
| OF THE FUND’S MANAGEMENT AGREEMENT (Unaudited) |
At a meeting of the fund’s Board of Trustees held on April 25-26, 2007, the Board considered the approval, through its renewal date of April 4, 2009, of the fund’s Management Agreement (“Management Agreement”), pursuant to which the Manager will provide the fund with investment advisory services and administrative services and the Sub-Investment Advisory Agreement between the Manager and Mellon Capital Management Corporation (“Mellon Capital”), an affiliate of the Manager, with respect to the fund, pursuant to which Mellon Capital provides day-to-day management of the fund’s investments subject to the Manager’s oversight.The Board members, none of whom are “interested persons” (as defined in the Investment Company Act of 1940, as amended) of the fund, were assisted in their review by independent legal counsel and met with counsel in executive session separate from representatives of the Manager and Mellon Capital.
Analysis of Nature, Extent and Quality of Services Provided to the Fund.The Board members considered information previously provided to them in a presentation from representatives of the Manager regarding services provided to other funds in the Dreyfus fund complex, and representatives of the Manager confirmed that there had been no material changes in this information. The Board also discussed the nature, extent and quality of the services to be provided to the fund pursuant to its Management Agreement and by Mellon Capital pursuant to the Sub-Investment Advisory Agreement. The Board members also referenced information provided and discussions at previous meetings regarding the relationships the Manager has with various intermediaries and the different needs of each, the diversity of distribution among the funds in the Dreyfus fund complex, and the Manager’s corresponding need for broad, deep and diverse resources to be able to provide ongoing shareholder services to the different distribution channels.
The Board members considered the Manager’s and Mellon Capital’s research and portfolio management capabilities. The Board members also considered that the Manager also provides oversight of day-to-day fund operations,including fund accounting and administration and assis-
24
tance in meeting legal and regulatory requirements, and the Manager’s extensive administrative, accounting and compliance infrastructure, as well as the Manager’s supervisory activities over Mellon Capital.
Comparative Analysis of the Fund’s Performance and Management Fee and Expense Ratio. As the fund had not yet commenced operations, the Board members were not able to review the fund’s performance. The Board discussed with representatives of the Manager the portfolio management team and the fund’s investment objective and policies.
The Board members reviewed and placed significant emphasis on comparisons of the proposed advisory fee to those of funds in the Lipper Long/Short Equity Funds category. The fund’s contractual management fee was below the ranges of the average and median contractual advisory or adviser/administration fees of the funds in the category (both with and without any fee waivers and reimbursements). The fund’s total expense ratio (as limited through October 31, 2008 by agreement with the Manager) was below the average and median for the category (net of any fee waivers and reimbursements).
Representatives of the Manager reviewed with the Board members the fees paid to the Manager or its affiliates by the only mutual fund managed by the Manager or its affiliates included in the Lipper Long/Short Equity Funds category (the “Similar Fund”). Representatives of the Manager provided the Board members with fee information for other accounts managed by Mellon Capital with similar policies and strategies as the fund (the “Similar Accounts”).The Manager’s representatives explained the nature of the Similar Accounts and the differences, from Mellon Capital’s perspective, in providing services to certain of the Similar Accounts as compared to managing and providing services to the fund.The Board members analyzed differences in fees paid to the Manager or Mellon Capital and discussed the relationship of the advisory fees paid in light of the services to be provided.The Board members considered the relevance of the fee information provided for the Similar Fund and Similar Accounts to evaluate the appropri-
The Fund 25
| INFORMATION ABOUT THE REVIEW AND APPROVAL OF THE |
| FUND’S MANAGEMENT AGREEMENT (Unaudited) (continued) |
ateness and reasonableness of the fund’s management fee and sub-investment advisory fee.The Board acknowledged that differences in fees paid by the Similar Accounts seemed to be consistent with the services to be provided.
The Board considered the proposed fee to Mellon Capital in relation to the fee to be paid to the Manager and the respective services to be provided by Mellon Capital and the Manager. The Board also noted that Mellon Capital’s fee would be paid by the Manager and not the fund.
Analysis of Profitability and Economies of Scale. As the fund had not yet commenced operations, the Manager’s representatives were not able to review the dollar amount of expenses allocated and profit received by the Manager.The Board members also considered potential benefits to the Manager or Mellon Capital from acting as investment adviser and sub-investment adviser, respectively, and noted the possibility of future soft dollar arrangements with respect to trading the fund’s portfolio.The Board also considered whether the fund would be able to participate in any economies of scale that the Manager may experience in the event that the fund attracts a large amount of assets. The Board members noted the uncertainty of the estimated asset levels and discussed the renewal requirements for advisory agreements and their ability to review the management fee annually after an initial term of the Management Agreement.
At the conclusion of these discussions, the Board agreed that it had been furnished with sufficient information to make an informed business decision with respect to approving the fund’s Management Agreement and Sub-Investment Advisory Agreement. Based on the discussions and considerations as described above, the Board made the following conclusions and determinations.
- The Board concluded that the nature, extent and quality of the ser- vices to be provided by the Manager and Mellon Capital are adequate and appropriate.
26
- The Board concluded that the fee to be paid by the fund to the Manager was reasonable, in light of the services to be provided, com- parative expense and advisory fee information, and benefits anticipated to be derived by the Manager or Mellon Capital from its relationship with the fund and that the fee to be paid by the Manager to Mellon Capital is reasonable and appropriate.
- The Board determined that since the fund had not commenced oper- ations, economies of scale were not a factor, but, to the extent that material economies of scale are not shared with the fund in the future, the Board would seek to do so in connection with future renewals.
The Board members considered these conclusions and determinations, and, without any one factor being dispositive, the Board determined that approval of the fund’s Management Agreement and Sub-Investment Advisory Agreement was in the best interests of the fund and its shareholders.
The Fund 27
BOARD MEMBERS INFORMATION (Unaudited)
Joseph S. DiMartino (64) Chairman of the Board (1999)
| Principal Occupation During Past 5 Years: |
| • Corporate Director and Trustee |
| Other Board Memberships and Affiliations: |
| • The Muscular Dystrophy Association, Director |
| • Century Business Services, Inc., a provider of outsourcing functions for small and medium size |
| companies, Director |
| • The Newark Group, a provider of a national market of paper recovery facilities, paperboard |
| mills and paperboard converting plants, Director |
| • Sunair Services Corporation, a provider of certain outdoor-related services to homes and |
| businesses, Director |
| No. of Portfolios for which Board Member Serves: 165 |
| James M. Fitzgibbons (73) |
| Board Member (1994) |
| Principal Occupation During Past 5 Years: |
| • Chairman of the Board, Davidson Cotton Company (1998-2002) |
| Other Board Memberships and Affiliations: |
| • Bill Barrett Company, an oil and gas exploration company, Director |
| No. of Portfolios for which Board Member Serves: 26 |
J. Tomlinson Fort (79) Board Member (1994)
| Principal Occupation During Past 5 Years: |
| • Retired (2005-present) |
| • Of Counsel, Reed Smith LLP (1998-2005) |
| Other Board Memberships and Affiliations: |
| • Allegheny College, Emeritus Trustee |
| • Pittsburgh Ballet Theatre,Trustee |
| • American College of Trial Lawyers, Fellow |
| No. of Portfolios for which Board Member Serves: 26 |
Kenneth A. Himmel (61) Board Member (1994)
| Principal Occupation During Past 5 Years: |
| • President and CEO,Related Urban Development,a real estate development company (1996-present) |
| • President and CEO, Himmel & Company, a real estate development company (1980-present) |
| • CEO, American Food Management, a restaurant company (1983-present) |
| No. of Portfolios for which Board Member Serves: 26 |
28
| Stephen J. Lockwood (60) |
| Board Member (1994) |
| Principal Occupation During Past 5 Years: |
| • Chairman of the Board, Stephen J. Lockwood and Company LLC, an investment company |
| (2000-present) |
| No. of Portfolios for which Board Member Serves: 26 |
| Roslyn M. Watson (58) |
| Board Member (1994) |
| Principal Occupation During Past 5 Years: |
| • Principal,Watson Ventures, Inc., a real estate investment company (1993-present) |
| Other Board Memberships and Affiliations: |
| • American Express Bank, Director |
| • The Hyams Foundation Inc., a Massachusetts Charitable Foundation,Trustee |
| • National Osteoporosis Foundation,Trustee |
| No. of Portfolios for which Board Member Serves: 26 |
| Benaree Pratt Wiley (61) |
| Board Member (1998) |
| Principal Occupation During Past 5 Years: |
| • Principal,The Wiley Group, a firm specializing in strategy and business development |
| (2005-present) |
| • President and CEO,The Partnership, an organization dedicated to increasing the representa- |
| tion of African Americans in positions of leadership, influence and decision-making in |
| Boston, MA (1991-2005) |
| Other Board Memberships and Affiliations: |
| • Boston College,Trustee |
| • Blue Cross Blue Shield of Massachusetts, Director |
| • Commonwealth Institute, Director |
| • Efficacy Institute, Director |
| • PepsiCo African-American, Advisory Board |
| • The Boston Foundation, Director |
| • Harvard Business School Alumni Board, Director |
| No. of Portfolios for which Board Member Serves: 36 |
Once elected all Board Members serve for an indefinite term, but achieve Emeritus status upon reaching age 80.The address of the Board Members and Officers is in c/o The Dreyfus Corporation, 200 Park Avenue, New York, New York 10166. Additional information about the Board Members is available in the fund’s Statement of Additional Information which can be obtained from Dreyfus free of charge by calling this toll free number: 1-800-554-4611.
Francis P. Brennan, Emeritus Board Member
The Fund 29
OFFICERS OF THE FUND (Unaudited)
| J. DAVID OFFICER, President since |
| December 2006. |
Chief Operating Officer,Vice Chairman and a Director of the Manager, and an officer of 82 investment companies (comprised of 165 portfolios) managed by the Manager. He is 59 years old and has been an employee of the Manager since April 1998.
| PHILLIP N. MAISANO, Executive Vice |
| President since July 2007. |
Chief Investment Officer,Vice Chair and a director of the Manager, and an officer of 82 investment companies (comprised of 165 portfolios) managed by the Manager. Mr. Maisano also is an officer and/or Board member of certain other investment management subsidiaries of The Bank of New York Mellon Corporation, each of which is an affiliate of the Manager. He is 60 years old and has been an employee of the Manager since November 2006. Prior to joining the Manager, Mr. Maisano served as Chairman and Chief Executive Officer of EACM Advisors, an affiliate of the Manager, since August 2004, and served as Chief Executive Officer of Evaluation Associates, a leading institutional investment consulting firm, from 1988 until 2004.
| MICHAEL A. ROSENBERG, Vice President |
| and Secretary since August 2005. |
Associate General Counsel of the Manager, and an officer of 83 investment companies (comprised of 182 portfolios) managed by the Manager. He is 47 years old and has been an employee of the Manager since October 1991.
| JAMES BITETTO, Vice President and |
| Assistant Secretary since August 2005. |
Associate General Counsel and Secretary of the Manager, and an officer of 83 investment companies (comprised of 182 portfolios) managed by the Manager. He is 41 years old and has been an employee of the Manager since December 1996.
| JONI LACKS CHARATAN, Vice President |
| and Assistant Secretary since |
| August 2005. |
Associate General Counsel of the Manager, and an officer of 83 investment companies (comprised of 182 portfolios) managed by the Manager. She is 51 years old and has been an employee of the Manager since October 1988.
| JOSEPH M. CHIOFFI, Vice President and |
| Assistant Secretary since August 2005. |
Associate General Counsel of the Manager, and an officer of 83 investment companies (comprised of 182 portfolios) managed by the Manager. He is 45 years old and has been an employee of the Manager since June 2000.
| JANETTE E. FARRAGHER, Vice President |
| and Assistant Secretary since |
| August 2005. |
Associate General Counsel of the Manager, and an officer of 83 investment companies (comprised of 182 portfolios) managed by the Manager. She is 44 years old and has been an employee of the Manager since February 1984.
| JOHN B. HAMMALIAN, Vice President and |
| Assistant Secretary since August 2005. |
Associate General Counsel of the Manager, and an officer of 83 investment companies (comprised of 182 portfolios) managed by the Manager. He is 44 years old and has been an employee of the Manager since February 1991.
| ROBERT R. MULLERY, Vice President and |
| Assistant Secretary since August 2005. |
Associate General Counsel of the Manager, and an officer of 83 investment companies (comprised of 182 portfolios) managed by the Manager. He is 55 years old and has been an employee of the Manager since May 1986.
30
| JEFF PRUSNOFSKY, Vice President and |
| Assistant Secretary since August 2005. |
Associate General Counsel of the Manager, and an officer of 83 investment companies (comprised of 182 portfolios) managed by the Manager. He is 42 years old and has been an employee of the Manager since October 1990.
| JAMES WINDELS, Treasurer since |
| November 2001. |
Director – Mutual Fund Accounting of the Manager, and an officer of 83 investment companies (comprised of 182 portfolios) managed by the Manager. He is 49 years old and has been an employee of the Manager since April 1985.
| ROBERT ROBOL, Assistant Treasurer |
| since December 2002. |
Senior Accounting Manager – Money Market and Municipal Bond Funds of the Manager, and an officer of 83 investment companies (comprised of 182 portfolios) managed by the Manager. He is 43 years old and has been an employee of the Manager since October 1988.
| ROBERT SALVIOLO, Assistant Treasurer |
| since July 2007. |
Senior Accounting Manager – Equity Funds of the Manager, and an officer of 83 investment companies (comprised of 182 portfolios) managed by the Manager. He is 40 years old and has been an employee of the Manager since June 1989.
| ROBERT SVAGNA, Assistant Treasurer |
| since December 2002. |
Senior Accounting Manager – Equity Funds of the Manager, and an officer of 83 investment companies (comprised of 182 portfolios) managed by the Manager. He is 40 years old and has been an employee of the Manager since November 1990.
| GAVIN C. REILLY, Assistant Treasurer |
| since December 2005. |
Tax Manager of the Investment Accounting and Support Department of the Manager, and an officer of 83 investment companies (comprised of 182 portfolios) managed by the Manager. He is 39 years old and has been an employee of the Manager since April 1991.
| JOSEPH W. CONNOLLY, Chief Compliance |
| Officer since October 2004. |
Chief Compliance Officer of the Manager and The Dreyfus Family of Funds (83 investment companies, comprised of 182 portfolios). From November 2001 through March 2004, Mr. Connolly was first Vice-President, Mutual Fund Servicing for Mellon Global Securities Services. In that capacity, Mr. Connolly was responsible for managing Mellon’s Custody, Fund Accounting and Fund Administration services to third-party mutual fund clients. He is 50 years old and has served in various capacities with the Manager since 1980, including manager of the firm’s Fund Accounting Department from 1997 through October 2001.
| WILLIAM GERMENIS, Anti-Money |
| Laundering Compliance Officer since |
| July 2002. |
Vice President and Anti-Money Laundering Compliance Officer of the Distributor, and the Anti-Money Laundering Compliance Officer of 79 investment companies (comprised of 178 portfolios) managed by the Manager. He is 37 years old and has been an employee of the Distributor since October 1998.
The Fund 31
NOTES

Save time. Save paper. View your next shareholder report online as soon as it’s available. Log into www.dreyfus.com and sign up for Dreyfus eCommunications. It’s simple and only takes a few minutes.
The views expressed in this report reflect those of the portfolio manager only through the end of the period covered and do not necessarily represent the views of Dreyfus or any other person in the Dreyfus organization. Any such views are subject to change at any time based upon market or other conditions and Dreyfus disclaims any responsibility to update such views.These views may not be relied on as investment advice and, because investment decisions for a Dreyfus fund are based on numerous factors, may not be relied on as an indication of trading intent on behalf of any Dreyfus fund.
Not FDIC-Insured • Not Bank-Guaranteed • May Lose Value
| Contents |
| |
| | | THE FUND |
| |
|
| 2 | | Discussion of Fund Performance |
| 4 | | Understanding Your Fund’s Expenses |
| 4 | | Comparing Your Fund’s Expenses |
| With Those of Other Funds |
| 5 | | Statement of Investments |
| 9 | | Statement of Assets and Liabilities |
| 10 | | Statement of Operations |
| 11 | | Statement of Changes in Net Assets |
| 12 | | Financial Highlights |
| 13 | | Notes to Financial Statements |
| 22 | | Report of Independent Registered |
| | | Public Accounting Firm |
| 23 | | Information About the Review and |
| | | Approval of the Fund’s Investment |
| Management Agreement |
| 27 | | Board Members Information |
| 29 | | Officers of the Fund |
| FOR MORE INFORMATION |
|
| | | Back Cover |
The Fund
| Dreyfus Premier |
| Global Equity |
| Income Fund |

DISCUSSION OF FUND PERFORMANCE
For the period between October 18, 2007 and October 31, 2007 as provided by James Harries, Portfolio Manager, Newton Capital Management Limited is the Sub-Investment Adviser
Please note, due to the short period of existence since the fund’s inception on October 18, 2007, through the annual reporting period ended October 31, 2007, the discussion of fund performance is limited and will be discussed more extensively in the next semiannual report dated April 30, 2008.
Fund and Market Performance Overview
The fund was launched on October 18, 2007, and therefore the period under review is very short. Over that time the fund performed strongly relative to world equity markets.This was a result of strong stock selection and asset allocation.
From the fund’s inception on October 18, 2007, through the end of the reporting period on October 31, 2007, Dreyfus Premier Global Equity Income Fund produced total returns of 5.04% for Class A shares, 4.96% for Class C shares, 5.04% for Class I shares and 5.04% for Class T shares.1 In comparison, the FTSEX World Index, the fund’s benchmark, produced a total return of 2.02% for the same period.2
The Fund’s Investment Approach
The fund seeks total return (consisting of capital appreciation and income). The fund normally invests at least 80% of its assets in equity securities.The fund seeks to focus on dividend-paying stocks of companies located in developed capital markets.The fund ordinarily invests in at least in three countries, and, at times, may invest a substantial portion of its assets in a single country.The fund’s portfolio manager will typically purchase stocks that, at the time of purchase, have a yield of at least 50% more than the yield of the FTSE World Index. In choosing stocks, the portfolio manager considers key trends to global
2
economic variables, such as gross domestic product, inflation and interest rates; investment themes, such as changing demographics, the impact of new technologies and the globalization of industries and brands; relative values of equity securities, bonds and cash; company fundamentals; and long-term trends in currency movements.
The entire portfolio was established in the period under review. The fund has limited exposure to the U.S. equity market and currency which allows it to have greater exposure to countries and currencies that we perceive to offer better value. Companies did well during the short period in areas including Brazilian oil, Hong Kong conglomerates and U.S. pharmaceuticals.
The Fund’s Current Strategy
The fund draws on Newton’s global thematic investment process to try to achieve its investment objective. Key overweights during the period included, telecommunications, oil and gas and mining. Sectors that had limited exposure within the fund included banks and retailers.
November 15, 2007
| 1 | | Total return includes reinvestment of dividends and any capital gains paid, and does not take into |
| | | consideration the maximum initial sales charges in the case of Class A and Class T shares, or the |
| | | applicable contingent deferred sales charges imposed on redemptions in the case of Class C shares. |
| | | Had these charges been reflected, returns would have been lower. Past performance is no guarantee |
| | | of future results. Share price and investment return fluctuate such that upon redemption, fund |
| | | shares may be worth more or less than their original cost. Return figures provided reflect the |
| | | absorption of certain fund expenses by The Dreyfus Corporation pursuant to an agreement in |
| | | effect until October 31, 2008. Had these expenses not been absorbed, the fund’s returns would |
| | | have been lower. |
| 2 | | SOURCE: Bloomberg. – Reflects reinvestment of dividends and, where applicable, capital gain |
| | | distributions.The FTSE World Index is a widely accepted, unmanaged free-float market |
| | | capitalization-weighted index that is designed to measure the performance of 90% of the |
| | | world’s investable stocks issued by large and mid-cap companies in developed and advanced |
| | | emerging markets. |
The Fund 3
UNDERSTANDING YOUR FUND’S EXPENSES (Unaudited)
As a mutual fund investor, you pay ongoing expenses, such as management fees and other expenses. Using the information below, you can estimate how these expenses affect your investment and compare them with the expenses of other funds.You also may pay one-time transaction expenses, including sales charges (loads) and redemption fees, which are not shown in this section and would have resulted in higher total expenses. For more information, see your fund’s prospectus or talk to your financial adviser.
Review your fund’s expenses
The table below shows the expenses you would have paid on a $1,000 investment in Dreyfus Premier Global Equity Income Fund from October 18, 2007 (commencement of operations) to October 31, 2007. It also shows how much a $1,000 investment would be worth at the close of the period, assuming actual returns and expenses.
| Expenses and Value of a $1,000 Investment | | | | | | | | | | |
| assuming actual returns for the period ended October 31, 2007 † | | | | | | | | |
| | | Class A | | Class C | | | | Class I | | | | Class T |
| |
| |
| |
| |
| |
| |
|
| Expenses paid per $1,000 †† | | $ .59 | | $ .88 | | $ | | .49 | | $ | | .69 |
| Ending value (after expenses) | | $1,050.40 | | $1,049.60 | | $1,050.40 | | $1,050.40 |
| COMPARING YOUR FUND’S EXPENSES |
| WITH THOSE OF OTHER FUNDS (Unaudited) |
Using the SEC’s method to compare expenses
The Securities and Exchange Commission (SEC) has established guidelines to help investors assess fund expenses. Per these guidelines, the table below shows your fund’s expenses based on a $1,000 investment, assuming a hypothetical 5% annualized return. You can use this information to compare the ongoing expenses (but not transaction expenses or total cost) of investing in the fund with those of other funds.All mutual fund shareholder reports will provide this information to help you make this comparison. Please note that you cannot use this information to estimate your actual ending account balance and expenses paid during the period.
| Expenses and Value of a $1,000 Investment | | | | | | | | |
| assuming a hypothetical 5% annualized return for the period ended October 31, 2007 † | | |
| | | Class A | | Class C | | Class I | | | | Class T |
| |
| |
| |
| |
| |
|
| Expenses paid per $1,000 †† | | $ .58 | | $ .86 | | $ .48 | | $ | | .67 |
| Ending value (after expenses) | | $1,001.34 | | $1,001.05 | | $1,001.44 | | $1,001.25 |
| † | | From October 18, 2007 (commencement of operations) to October 31, 2007. |
| †† | | Expenses are equal to the fund’s annualized expense ratio of 1.50% for Class A, 2.25% for Class C, 1.25% for |
| | | Class I and 1.75% for Class T; multiplied by the average account value over the period, multiplied by 14/365 (to |
| | | reflect the actual days since inception). |
4
| STATEMENT OF INVESTMENTS |
| October 31, 2007 |
| Common Stocks—95.7% | | Shares | | Value ($) |
| |
| |
|
| Australia—4.5% | | | | |
| Telstra (Installment Receipts) | | 47,804 | | 142,733 |
| Brazil—10.1% | | | | |
| Companhia de Saneamento de Minas Gerais | | 3,300 | | 61,766 |
| Natura Cosmeticos | | 4,400 | | 52,707 |
| Petroleo Brasileiro, ADR (Preferred) | | 892 | | 74,205 |
| Tele Norte Leste Participacoes, ADR | | 2,737 | | 59,667 |
| Terna Participacoes | | 3,395 | | 66,477 |
| | | | | 314,822 |
| Canada—1.3% | | | | |
| Fording Canadian Coal Trust | | 1,107 | | 40,482 |
| France—5.1% | | | | |
| AXA | | 1,270 | | 56,762 |
| Societe Generale | | 280 | | 46,984 |
| Total | | 714 | | 57,547 |
| | | | | 161,293 |
| Germany—6.3% | | | | |
| Deutsche Post | | 3,664 | | 110,960 |
| Deutsche Wohnen | | 629 | | 27,876 |
| E.ON | | 307 | | 59,980 |
| | | | | 198,816 |
| Hong Kong—4.0% | | | | |
| Hopewell Highway Infrastructure | | 82,000 | | 77,544 |
| Swire Pacific, Cl. A | | 3,500 | | 50,118 |
| | | | | 127,662 |
| Italy—1.9% | | | | |
| ENI | | 1,618 | | 59,052 |
| Malaysia—2.6% | | | | |
| Bursa Malaysia | | 17,500 | | 83,131 |
The Fund 5
STATEMENT OF INVESTMENTS (continued)
| Common Stocks (continued) | | Shares | | Value ($) |
| |
| |
|
| Netherlands—4.3% | | | | |
| Royal Dutch Shell, Cl. A | | 1,391 | | 60,881 |
| Unilever | | 2,325 | | 75,394 |
| | | | | 136,275 |
| Norway—1.8% | | | | |
| NYA | | 1,717 | | 58,071 |
| Philippines—1.2% | | | | |
| First Gen | | 27,900 | | 38,950 |
| Russia—2.9% | | | | |
| Evraz Group, GDR | | 1,033 | | 77,504 |
| Uralkali, GDR | | 590 a | | 14,809 |
| | | | | 92,313 |
| Singapore—7.7% | | | | |
| DBS Group Holdings | | 3,000 | | 46,889 |
| Fortune REIT | | 24,000 | | 18,144 |
| Mapletree Logistics Trust | | 37,000 | | 30,877 |
| Parkway Holdings | | 19,000 | | 55,071 |
| Singapore Post | | 38,000 | | 32,255 |
| Singapore Technologies Engineering | | 23,000 | | 60,859 |
| | | | | 244,095 |
| South Korea—4.0% | | | | |
| Korea Exchange Bank | | 1,742 | | 29,021 |
| LG Telecom | | 8,924 a | | 97,347 |
| | | | | 126,368 |
| Spain—2.1% | | | | |
| Clinica Baviera | | 876 | | 31,388 |
| Telefonica | | 1,011 | | 33,370 |
| | | | | 64,758 |
| Switzerland—1.0% | | | | |
| Compagnie Financiere Richemont, Cl. A | | 445 | | 31,767 |
| Taiwan—3.1% | | | | |
| High Tech Computer | | 2,000 | | 41,541 |
6
| Common Stocks (continued) | | Shares | | Value ($) |
| |
| |
|
| Taiwan (continued) | | | | |
| Taiwan Semiconductor Manufacturing | | 28,000 | | 55,885 |
| | | | | 97,426 |
| Thailand—6.8% | | | | |
| Advanced Info Service | | 21,300 | | 60,117 |
| Bangkok Expressway | | 38,900 | | 30,577 |
| Banpu Public | | 4,600 | | 65,025 |
| Siam Commercial Bank | | 19,900 | | 59,684 |
| | | | | 215,403 |
| United Kingdom—15.2% | | | | |
| Admiral Group | | 1,504 | | 32,037 |
| Antofagasta Holdings | | 3,419 | | 58,099 |
| BP | | 4,778 | | 61,844 |
| Cable & Wireless | | 21,768 | | 88,067 |
| Immarsat | | 3,476 | | 36,761 |
| KT& G, GDR | | 1,422 b | | 57,150 |
| Old Mutual | | 13,120 | | 50,303 |
| Smiths Group | | 1,377 | | 32,232 |
| Vodafone Group | | 15,529 | | 60,877 |
| | | | | 477,370 |
| United States—9.8% | | | | |
| Altria Group | | 620 | | 45,217 |
| AT & T | | 767 | | 32,053 |
| Bristol-Myers Squibb | | 1,345 | | 40,337 |
| Eli Lilly & Co. | | 679 | | 36,768 |
| Merck & Co. | | 840 | | 48,938 |
| Pfizer | | 1,540 | | 37,899 |
| Reynolds American | | 1,072 | | 69,069 |
| | | | | 310,281 |
| Total Common Stocks | | | | |
| (cost $2,825,874) | | | | 3,021,068 |
The Fund 7
STATEMENT OF INVESTMENTS (continued)
| Preferred Stocks—1.5% | | Shares | | Value ($) |
| |
| |
|
| Italy | | | | |
| Unipol | | | | |
| (cost $42,870) | | 13,375 | | 47,846 |
| |
| |
|
| Total Investments (cost $2,868,744) | | 97.2% | | 3,068,914 |
| Cash and Receivables (Net) | | 2.8% | | 88,443 |
| Net Assets | | 100.0% | | 3,157,357 |
| ADR—American Depository Receipts |
| GDR—Global Depository Receipts |
| a Non-income producing security. |
| b Security is exempt from registration under Rule 144A of the Securities Act of 1933.This security may be resold in |
| transactions exempt from registration, normally to qualified institutional buyers. At October 31, 2007, this security |
| amounted to $57,150 or 1.8% of net assets. |
| Portfolio Summary | | (Unaudited) † | | | | |
| |
| | | Value (%) | | | | Value (%) |
| |
| |
| |
|
| Telecommunications | | 19.3 | | Consumer Goods | | 9.5 |
| Financial | | 17.8 | | Health Care | | 7.9 |
| Oil & Gas | | 11.8 | | Utilities | | 7.2 |
| Industrial | | 10.9 | | Technology | | 3.1 |
| Materials | | 9.7 | | | | 97.2 |
| † Based on net assets. |
| See notes to financial statements. |
8
| STATEMENT OF ASSETS AND LIABILITIES |
| October 31, 2007 |
| | | Cost | | Value |
| |
| |
|
| Assets ($): | | | | |
| Investments in securities-See Statement of Investments | | 2,868,744 | | 3,068,914 |
| Cash denominated in foreign currencies | | 131,797 | | 132,477 |
| Receivable for investment securities sold | | | | 81,667 |
| Dividends and interest receivable | | | | 6,022 |
| Unrealized appreciation on forward currency | | | | |
| exchange contracts—Note 3 | | | | 96 |
| Due from The Dreyfus Corporation and affiliates—Note 2(d) | | 23,965 |
| | | | | 3,313,141 |
| |
| |
|
| Liabilities ($): | | | | |
| Cash overdraft due to Custodian | | | | 11,267 |
| Payable for investment securities purchased | | | | 118,468 |
| Unrealized depreciation on forward currency | | | | |
| exchange contracts—Note 3 | | | | 241 |
| Accrued expenses | | | | 25,808 |
| | | | | 155,784 |
| |
| |
|
| Net Assets ($) | | | | 3,157,357 |
| |
| |
|
| Composition of Net Assets ($): | | | | |
| Paid-in capital | | | | 2,965,463 |
| Accumulated investment (loss)—net | | | | (9,236) |
| Accumulated net unrealized appreciation (depreciation) | | | | |
| on investments and foreign currency transactions | | | | 201,130 |
| |
| |
|
| Net Assets ($) | | | | 3,157,357 |
See notes to financial statements.
| Net Asset Value Per Share | | | | | | | | |
| | | Class A | | Class C | | Class I | | Class T |
| |
| |
| |
| |
|
| Net Assets ($) | | 2,211,495 | | 315,227 | | 315,348 | | 315,287 |
| Shares Outstanding | | 168,325 | | 24,000 | | 24,000 | | 24,000 |
| |
| |
| |
| |
|
| Net Asset Value Per Share ($) | | 13.14 | | 13.13 | | 13.14 | | 13.14 |
The Fund 9
| STATEMENT OF OPERATIONS |
| From October 18, 2007 (commencement of operations) to October 31, 2007 |
| Investment Income ($): | | |
| Income: | | |
| Cash dividends (net of $744 foreign taxes withheld at source): | | |
| Unaffiliated issuers | | 3,643 |
| Affiliated issuers | | 2,340 |
| Total Income | | 5,983 |
| Expenses: | | |
| Management fee—Note 2(a) | | 994 |
| Auditing fees | | 18,500 |
| Prospectus and shareholders’ reports | | 4,000 |
| Custodian fees—Note 2(d) | | 3,000 |
| Legal fees | | 600 |
| Shareholder servicing costs—Note 2(d) | | 344 |
| Trustees’ fees and expenses—Note 2(b) | | 225 |
| Distribution fees—Note 2(c) | | 116 |
| Registration fees | | 93 |
| Miscellaneous | | 2,722 |
| Total Expenses | | 30,594 |
| Less—expense reimbursement from The Dreyfus Corporation | | |
| due to undertaking—Note 2(a) | | (28,751) |
| Net Expenses | | 1,843 |
| Investment Income—Net | | 4,140 |
| |
|
| Realized and Unrealized Gain (Loss) on Investments—Note 3 ($): |
| Net realized gain (loss) on investments and foreign currency transactions | | (67,953) |
| Net realized gain (loss) on forward currency exchange contracts | | 15,978 |
| Net Realized Gain (Loss) | | (51,975) |
| Net unrealized appreciation (depreciation) | | |
| on investments and foreign currency transactions | | 201,130 |
| Net Realized and Unrealized Gain (Loss) on Investments | | 149,155 |
| Net Increase in Net Assets Resulting from Operations | | 153,295 |
See notes to financial statements.
10
See notes to financial statements.
| STATEMENT OF CHANGES IN NET ASSETS |
| From October 18, 2007 (commencement of operations) to October 31, 2007 |
| Operations ($): | | |
| Investment income—net | | 4,140 |
| Net realized gain (loss) on investments | | (51,975) |
| Net unrealized appreciation | | |
| (depreciation) on investments | | 201,130 |
| Net Increase (Decrease) in Net Assets | | |
| Resulting from Operations | | 153,295 |
| |
|
| Beneficial Interest Transactions ($): | | |
| Net proceeds from shares sold: | | |
| Class A shares | | 2,104,062 |
| Class C shares | | 300,000 |
| Class I shares | | 300,000 |
| Class T shares | | 300,000 |
| Increase (Decrease) in Net Assets | | |
| from Beneficial Interest Transactions | | 3,004,062 |
| Total Increase (Decrease) in Net Assets | | 3,157,357 |
| |
|
| Net Assets ($): | | |
| Beginning of Period | | — |
| End of Period | | 3,157,357 |
| Accumulated investment (loss)—net | | (9,236) |
| |
|
| Capital Share Transactions (Shares): | | |
| Class A | | |
| Shares sold | | 168,325 |
| |
|
| Class C | | |
| Shares sold | | 24,000 |
| |
|
| Class I | | |
| Shares sold | | 24,000 |
| |
|
| Class T | | |
| Shares sold | | 24,000 |
The Fund 11
FINANCIAL HIGHLIGHTS
The following table describes the performance for each share class from October 18, 2007 (commencement of operations) to October 31, 2007. All information (except portfolio turnover rate) reflects financial results for a single fund share. Total return shows how much your investment in the fund would have increased (or decreased) during the period, assuming you had reinvested all dividends and distributions.These figures have been derived from the fund’s financial statements.
| | | Class A | | Class C | | Class I | | Class T |
| | | Shares | | Shares | | Shares | | Shares |
| |
| |
| |
| |
|
| Per Share Data ($): | | | | | | | | |
| Net asset value, beginning of period | | 12.50 | | 12.50 | | 12.50 | | 12.50 |
| Investment Operations: | | | | | | | | |
| Investment income—net a | | .02 | | .01 | | .02 | | .02 |
| Net realized and unrealized | | | | | | | | |
| gain (loss) on investments | | .62 | | .62 | | .62 | | .62 |
| Total from Investment Operations | | .64 | | .63 | | .64 | | .64 |
| Net asset value, end of period | | 13.14 | | 13.13 | | 13.14 | | 13.14 |
| |
| |
| |
| |
|
| Total Return (%) b | | 5.04c | | 4.96c | | 5.04 | | 5.04c |
| |
| |
| |
| |
|
| Ratios/Supplemental Data (%): | | | | | | | | |
| Ratio of total expenses | | | | | | | | |
| to average net assets d | | 26.08 | | 26.83 | | 25.84 | | 26.34 |
| Ratio of net expenses | | | | | | | | |
| to average net assets d | | 1.50 | | 2.25 | | 1.25 | | 1.75 |
| Ratio of net investment income | | | | | | | | |
| to average net assets d | | 3.62 | | 2.86 | | 3.86 | | 3.36 |
| Portfolio Turnover Rate b | | 3.45 | | 3.45 | | 3.45 | | 3.45 |
| |
| |
| |
| |
|
| Net Assets, end of period ($ x 1,000) | | 2,211 | | 315 | | 315 | | 315 |
| a | | Based on average shares outstanding. |
| b | | Not annualized. |
| c | | Exclusive of sales charge. |
| d | | Annualized. |
| See notes to financial statements. |
12
NOTES TO FINANCIAL STATEMENTS
NOTE 1—Significant Accounting Policies:
Dreyfus Premier Global Equity Income Fund (the “fund”) is a separate diversified series of The Dreyfus/Laurel Funds Trust (the “Trust”) which is registered under the Investment Company Act of 1940, as amended (the “Act”), as a diversified open-end management investment company and operates as a series company currently offering eight series, including the fund, which commenced operations on October 18, 2007.The fund’s investment objective is to seek total return (consisting of capital appreciation and income).The Dreyfus Corporation (the “Manager” or “Dreyfus”) serves as the fund’s investment adviser. Dreyfus is a wholly-owned subsidiary of The Bank of New York Mellon Corporation (“BNY Mellon”). Newton Capital Management Limited (“Newton”) an affiliate of BNY Mellon, serves as the fund’s sub-investment adviser.
MBSC Securities Corporation (the “Distributor”), a wholly-owned subsidiary of the Manager, is the distributor of the fund’s shares. The fund is authorized to issue an unlimited number of shares of Beneficial Interest in each of the following classes of shares: Class A, Class C, Class I and Class T. Class A, Class C and T shares are sold primarily to retail investors through financial intermediaries and bear a distribution fee and/or shareholder services fee. Class A and Class T shares are sold with a front-end sales charge, while Class C shares are subject to a contingent deferred sales charge (“CDSC”). Class I shares are sold primarily to bank trust departments and other financial service providers (including Mellon Bank, N.A. and its affiliates) acting on behalf of customers having a qualified trust or an investment account or relationship at such institution and bear no distribution or shareholder services fees. Class I shares are offered without a front-end sales charge or CDSC. Each class of shares has identical rights and privileges, except with respect to distribution and service fees and voting rights on matters affecting a single class. Income, expenses (other than expenses attributable to a specific class), and realized and unrealized gains or losses on investments are allocated to each class of shares based on its relative net assets.
The Fund 13
NOTES TO FINANCIAL STATEMENTS (continued)
As of October 31, 2007, MBC Investments Corp., an indirect subsidiary of BNY Mellon, held 168,000 of the outstanding Class A shares and all of the outstanding Class C, Class I and Class T shares of the fund.
The fund’s financial statements are prepared in accordance with U.S. generally accepted accounting principles, which may require the use of management estimates and assumptions. Actual results could differ from those estimates.
(a) Portfolio valuation: Investments in securities are valued at the last sales price on the securities exchange or national securities market on which such securities are primarily traded. Securities listed on the National Market System for which market quotations are available are valued at the official closing price or, if there is no official closing price that day, at the last sales price. Securities not listed on an exchange or the national securities market, or securities for which there were no transactions, are valued at the average of the most recent bid and asked prices, except for open short positions, where the asked price is used for valuation purposes. Bid price is used when no asked price is available. Registered open-end investment companies that are not traded on an exchange are valued at their net asset value.When market quotations or official closing prices are not readily available, or are determined not to reflect accurately fair value,such as when the value of a security has been significantly affected by events after the close of the exchange or market on which the security is principally traded (for example, a foreign exchange or market), but before the fund calculates its net asset value, the fund may value these investments at fair value as determined in accordance with the procedures approved by the Board of Trustees. Fair valuing of securities may be determined with the assistance of a pricing service using calculations based on indices of domestic securities and other appropriate indicators,such as prices of relevant ADR’s and futures contracts. For other securities that are fair valued by the Board of Trustees, certain factors may be considered such as: fundamental analytical data, the nature and duration of restrictions on disposition, an
14
evaluation of the forces that influence the market in which the securities are purchased and sold and public trading in similar securities of the issuer or comparable issuers. Financial futures are valued at the last sales price. Investments denominated in foreign currencies are translated to U.S. dollars at the prevailing rates of exchange. Forward currency exchange contracts are valued at the forward rate.
The Financial Accounting Standards Board (“FASB”) released Statement of Financial Accounting Standards No. 157 “Fair Value Measurements” (“FAS 157”). FAS 157 establishes an authoritative definition of fair value, sets out a framework for measuring fair value, and requires additional disclosures about fair-value measurements.The application of FAS 157 is required for fiscal years beginning after November 15, 2007 and interim periods within those fiscal years. Management does not believe that the application of this standard will have a material impact on the financial statements of the fund.
(b) Foreign currency transactions: The fund does not isolate that portion of the results of operations resulting from changes in foreign exchange rates on investments from the fluctuations arising from changes in market prices of securities held. Such fluctuations are included with the net realized and unrealized gain or loss on investments.
Net realized foreign exchange gains or losses arise from sales and maturities of short-term securities, sales of foreign currencies, currency gains or losses realized on securities transactions and cash balances and the difference between the amounts of dividends, interest and foreign withholding taxes recorded on the fund’s books and the U.S. dollar equivalent of the amounts actually received or paid. Net unrealized foreign exchange gains or losses arise from changes in the value of assets and liabilities other than investments in securities, resulting from changes in exchange rates. Such gains and losses are included with net realized and unrealized gain or loss on investments.
The Fund 15
NOTES TO FINANCIAL STATEMENTS (continued)
(c) Securities transactions and investment income: Securities transactions are recorded on a trade date basis. Realized gains and losses from securities transactions are recorded on the identified cost basis. Dividend income is recognized on the ex-dividend date and interest income, including, where applicable, accretion of discount and amortization of premium on investments, is recognized on the accrual basis.
The fund has an arrangement with the custodian bank whereby the fund receives earnings credits from the custodian when positive cash balances are maintained, which are used to offset custody fees. For financial reporting purposes, the fund includes net earnings credits, if any, as an expense offset in the Statement of Operations.
(d) Affiliated issuers: Investments in other investment companies advised by Dreyfus are defined as “affiliated” in the Act.
(e) Dividends to shareholders: Dividends are recorded on the ex-dividend date. Dividends from investment income-net and dividends from net realized capital gains, if any, are normally declared and paid annually, but the fund may make distributions on a more frequent basis to comply with the distribution requirements of the Internal Revenue Code of 1986, as amended (the “Code”).To the extent that net realized capital gains can be offset by capital loss carryovers, if any, it is the policy of the fund not to distribute such gains. Income and capital gain distributions are determined in accordance with income tax regulations, which may differ from U.S. generally accepted accounting principles.
(f) Federal income taxes: It is the policy of the fund to continue to qualify as a regulated investment company, if such qualification is in the best interests of its shareholders, by complying with the applicable provisions of the Code, and to make distributions of taxable income sufficient to relieve it from substantially all federal income and excise taxes.
The FASB released FASB Interpretation No. 48 “Accounting for Uncertainty in Income Taxes” (FIN 48). FIN 48 provides guidance for how uncertain tax positions should be recognized, measured, pre-
16
sented and disclosed in the financial statements. FIN 48 requires the evaluation of tax positions taken or expected to be taken in the course of preparing the fund’s tax returns to determine whether the tax positions are “more-likely-than-not” of being sustained by the applicable tax authority.Tax positions not deemed to meet the more-likely-than-not threshold would be recorded as a tax benefit or expense in the current year.Adoption of FIN 48 is required for fiscal years beginning after December 15, 2006 and is to be applied to all open tax years as of the effective date. Management does not believe that the application of this standard will have a material impact on the financial statements of the fund.
At October 31, 2007, the components of accumulated earnings on a tax basis were as follows: unrealized appreciation $191,894.
During the period ended October 31, 2007, as a result of permanent book to tax differences, primarily due to the tax treatment for foreign currency gains and losses and net operating losses, the fund decreased accumulated undistributed investment income-net by $13,376, increased accumulated net realized gain (loss) on investments by $51,975 and decreased paid-in capital by $38,599. Net assets and net asset value per share were not affected by this reclassification.
NOTE 2—Investment Management Fee and Other Transactions With Affiliates:
(a) Pursuant to an Investment Management agreement between the Manager and the Trust, the Trust has agreed to pay the Manager a management fee computed at the annual rate of .85% of the value of the fund’s average daily net assets and is payable monthly.The Manager has contractually agreed, until October 31, 2008, to waive receipt of its fees and/or assume the expenses of the fund so that the annual operating expenses (excluding Rule 12b-1 fees, shareholder services fees, taxes, interest, brokerage commissions, commitment fees on borrowings and extraordinary expenses) do not exceed 1.25% .The expense reimburse-
The Fund 17
NOTES TO FINANCIAL STATEMENTS (continued)
ment, pursuant to the undertaking, amounted to $28,751 during the period ended October 31, 2007.
Pursuant to a Sub-Investment Advisory Agreement between the Manager and Newton, the Manager pays Newton an annual fee of .41% of the value of the fund’s average net assets, payable monthly.
(b) Each Trustee receives $45,000 per year, plus $6,000 for each joint Board meeting of The Dreyfus/Laurel Funds, Inc., The Trust and The Dreyfus/Laurel Tax-Free Municipal Funds, (collectively, the “Dreyfus/Laurel Funds”) attended, $2,000 for separate in-person committee meetings attended which are not held in conjunction with a regularly scheduled Board meeting and $1,500 for Board meetings and separate committee meetings attended that are conducted by telephone and is reimbursed for travel and out-of-pocket expenses. With respect to Board meetings, the Chairman of the Board receives an additional 25% of such compensation (with the exception of reimbursable amounts). With respect to compensation committee meetings, the Chair of the compensation committee receives $900 per meeting and, with respect to audit committee meetings, the Chair of the audit committee receives $1,350 per meeting. In the event that there is an in-person joint committee meeting of the Dreyfus/Laurel Funds and Dreyfus High Yield Strategies Fund, the $2,000 or $1,500 fee, as applicable, will be allocated between the Dreyfus/Laurel Funds and Dreyfus High Yield Strategies Fund.These fees and expenses are charged and allocated to each series based on net assets.
(c) Under the Distribution Plan (the “Plan”) adopted pursuant to Rule 12b-1 under the Act, Class C and Class T shares pay the Distributor for distributing their shares at an annual rate of .75% of the value of the average daily net assets of Class C shares and .25% of the value of the average daily net assets of Class T shares. During the period ended October 31, 2007, Class C and Class T shares were charged $87 and $29, respectively, pursuant to the Plan.
18
(d) Under the Shareholder Services Plan, Class A, Class C and Class T shares pay the Distributor at an annual rate of .25% of the value of their average daily net assets for the provision of certain services.The services provided may include personal services relating to shareholder accounts, such as answering shareholder inquiries regarding the fund and providing reports and other information, and services related to the maintenance of shareholder accounts.The Distributor may make payments to Service Agents (a securities dealer, financial institution or other industry professional) in respect of these services.The Distributor determines the amounts to be paid to Service Agents. During the period ended October 31, 2007, Class A, Class C and Class T shares were charged $205, $29 and $29, respectively, pursuant to the Shareholder Services Plan.
Under its terms, the Plan and Shareholder Services Plan shall remain in effect from year to year, provided such continuance is approved annually by a vote of majority of those Trustees who are not “interested persons” of the Trust and who have no direct or indirect financial interest in the operation of or in any agreement related to the Plan or Shareholder Services Plan.
The fund compensates Dreyfus Transfer, Inc., a wholly-owned subsidiary of Dreyfus, under a transfer agency agreement for providing personnel and facilities to perform transfer agency services for the fund. During the period ended October 31, 2007, the fund was charged $12 pursuant to the transfer agency agreement.
The fund compensates Mellon Bank, N.A., an affiliate of the Manager, under a custody agreement for providing custodial services for the fund. During the period ended October 31, 2007, the fund was charged $3,000 pursuant to the custody agreement.
During the period ended October 31, 2007, the fund was charged $414 for services performed by the Chief Compliance Officer.
The Fund 19
NOTES TO FINANCIAL STATEMENTS (continued)
The components of “Due from The Dreyfus Corporation and affiliates” in the Statement of Assets and Liabilities consist of: an expense reimbursement of $28,751, which is offset by management fees $994, Rule 12b-1 distribution plan fees $116, shareholder services plan fees $262, chief compliance officer fees $414 and custodian fees $3,000.
NOTE 3—Securities Transactions:
The aggregate amount of purchases and sales of investment securities, excluding short-term securities and forward currency exchange contracts, during the period ended October 31, 2007, amounted to $2,912,513 and $105,981, respectively.
The fund enters into forward currency exchange contracts in order to hedge its exposure to changes in foreign currency exchange rates on its foreign portfolio holdings and to settle foreign currency transactions. When executing forward currency exchange contracts, the fund is obligated to buy or sell a foreign currency at a specified rate on a certain date in the future. With respect to sales of forward currency exchange contracts, the fund would incur a loss if the value of the contract increases between the date the forward contract is opened and the date the forward contract is closed.The fund realizes a gain if the value of the contract decreases between those dates.With respect to purchases of forward currency exchange contracts, the fund would incur a loss if the value of the contract decreases between the date the forward contract is opened and the date the forward contract is closed.The fund realizes a gain if the value of the contract increases between those dates.The fund is also exposed to credit risk associated with counterparty nonperfor-
20
mance on these forward currency exchange contracts which is typically limited to the unrealized gain on each open contract.The following summarizes open forward currency exchange contracts at October 31, 2007:
| | | Foreign | | | | | | Unrealized |
| Forward Currency | | Currency | | | | | | Appreciation |
| Exchange Contracts | | Amounts | | Cost ($) | | Value ($) | | (Depreciation) ($) |
| |
| |
| |
| |
|
| Purchases: | | | | | | | | |
| Canadian Dollar, | | | | | | | | |
| expiring 11/2/2007 | | 14,037 | | 14,731 | | 14,827 | | 96 |
| Sales: | | | | Proceeds($) | | | | |
| British Pound, | | | | | | | | |
| expiring 11/2/2007 | | 30,157 | | 62,480 | | 62,721 | | (241) |
| Total | | | | | | | | (145) |
At October 31, 2007, the cost of investments for federal income tax purposes was $2,877,980; accordingly, accumulated net unrealized appreciation on investments was $190,934, consisting of $206,462 gross unrealized appreciation and $15,528 gross unrealized depreciation.
The Fund 21
| REPORT OF INDEPENDENT REGISTERED |
| PUBLIC ACCOUNTING FIRM |
| The Board of Trustees and Shareholders of |
| The Dreyfus/Laurel Funds Trust: |
We have audited the accompanying statement of assets and liabilities of Dreyfus Premier Global Equity Income Fund (the “Fund”) of The Dreyfus/Laurel Funds Trust, including the statement of investments, as of October 31, 2007, and the related statements of operations, changes in net assets, and the financial highlights for the period from October 18, 2007 (commencement of operations) to October 31, 2007.These financial statements and financial highlights are the responsibility of the Fund’s management. Our responsibility is to express an opinion on these financial statements and financial highlights based on our audit.
We conducted our audit in accordance with the standards of the Public Company Accounting Oversight Board (United States).Those standards require that we plan and perform the audit to obtain reasonable assurance about whether the financial statements and financial highlights are free of material misstatement. An audit includes examining, on a test basis, evidence supporting the amounts and disclosures in the financial statements. Our procedures included confirmation of securities owned as of October 31, 2007, by correspondence with the custodian and brokers or by other appropriate auditing procedures where replies from brokers were not received. An audit also includes assessing the accounting principles used and significant estimates made by management, as well as evaluating the overall financial statement presentation. We believe that our audit provides a reasonable basis for our opinion.
In our opinion, the financial statements and financial highlights referred to above present fairly, in all material respects, the financial position of Dreyfus Premier Global Equity Income Fund of The Dreyfus/Laurel Funds Trust as of October 31, 2007, and the results of its operations, the changes in its net assets and the financial highlights for the period from October 18, 2007 to October 31, 2007, in conformity with U.S. generally accepted accounting principles.

| New York, New York |
| December 20, 2007 |
22
| INFORMATION ABOUT THE REVIEW AND APPROVAL OF THE |
| FUND’S INVESTMENT MANAGEMENT AGREEMENT (Unaudited) |
At a meeting of the fund’s Board of Trustees held on April 25-26, 2007, the Board considered the approval, through its renewal date of April 4, 2009, of the fund’s Management Agreement (“Management Agreement”), pursuant to which the Manager will provide the fund with investment advisory services and administrative services, and the Sub-Investment Advisory Agreement between the Manager and Newton Capital Management Limited (“Newton”), an affiliate of the Manager, with respect to the fund, pursuant to which Newton provides day-to-day management of the fund’s investments subject to the Manager’s oversight. The Board members, none of whom are “interested persons” (as defined in the Investment Company Act of 1940, as amended) of the fund, were assisted in their review by independent legal counsel and met with counsel in executive session separate from representatives of the Manager and Newton.
Analysis of Nature, Extent and Quality of Services Provided to the Fund.The Board members considered information previously provided to them in a presentation from representatives of the Manager regarding services provided to other funds in the Dreyfus fund complex, and representatives of the Manager confirmed that there had been no material changes in this information. The Board also discussed the nature, extent and quality of the services to be provided to the fund pursuant to its Management Agreement and by Newton pursuant to the Sub-Investment Advisory Agreement. The Board members also referenced information provided and discussions at previous meetings regarding the relationships the Manager has with various intermediaries and the different needs of each, the diversity of distribution among the funds in the Dreyfus fund complex, and the Manager’s corresponding need for broad, deep and diverse resources to be able to provide ongoing shareholder services to the different distribution channels.
The Board members considered the Manager’s and Newton’s research and portfolio management capabilities.The Board members also considered that the Manager also provides oversight of day-to-day fund operations, including fund accounting and administration and assis-
The Fund 23
| INFORMATION ABOUT THE REVIEW AND APPROVAL OF THE FUND’S |
| INVESTMENT MANAGEMENT AGREEMENT (Unaudited) (continued) |
tance in meeting legal and regulatory requirements, and the Manager’s extensive administrative, accounting and compliance infrastructure, as well as the Manager’s supervisory activities over Newton.
Comparative Analysis of the Fund’s Performance and Management Fee and Expense Ratio. As the fund had not yet commenced operations, the Board members were not able to review the fund’s performance. The Board discussed with representatives of the Manager the portfolio manager and the fund’s investment objective and policies.
The Board members reviewed and placed significant emphasis on comparisons of the proposed advisory fee to those of funds in the Lipper Global Large-Cap Core Funds category.The fund’s contractual management fee was within the range of the average and above the range of the median contractual advisory or adviser/administration fees of the funds in the category, but was higher than the average and the median advisory or adviser/administration fees of the funds in the category (net any fee waivers and reimbursements). The fund’s total expense ratio (as limited through October 31, 2008 by agreement with the Manager) was below the average and median for the category (net of any fee waivers and reimbursements).
Representatives of the Manager reviewed with the Board members the fees paid to the Manager or its affiliates by the only mutual fund managed by the Manager or its affiliates included in the Lipper Global Large-Cap Core Funds category (the “Similar Fund”). Representatives of the Manager provided the Board members with fee information for other accounts managed by Newton with similar policies and strategies as the fund (the “Similar Accounts”). The Manager’s representatives explained the nature of the Similar Accounts and the differences, from Newton’s perspective, in providing services to certain of the Similar Accounts as compared to managing and providing services to the fund. The Board members analyzed differences in fees paid to the Manager or Newton and discussed the relationship of the advisory fees paid in light of the services to be provided.The Board members considered the relevance of the fee information provided for the Similar Fund and
24
Similar Accounts to evaluate the appropriateness and reasonableness of the fund’s management fee and sub-investment advisory fee.The Board acknowledged that differences in fees paid by the Similar Accounts seemed to be consistent with the Services provided.
The Board considered the proposed fee to Newton in relation to the fee to be paid to the Manager and the respective services to be provided by Newton and the Manager.The Board also noted that Newton’s fee would be paid by the Manager and not the fund.
Analysis of Profitability and Economies of Scale. As the fund had not yet commenced operations, the Manager’s representatives were not able to review the dollar amount of expenses allocated and profit received by the Manager.The Board members also considered potential benefits to the Manager or Newton from acting as investment adviser and sub-investment adviser, respectively, and noted the possibility of future soft dollar arrangements with respect to trading the fund’s portfolio.The Board also considered whether the fund would be able to participate in any economies of scale that the Manager may experience in the event that the fund attracts a large amount of assets. The Board members noted the uncertainty of the estimated asset levels and discussed the renewal requirements for advisory agreements and their ability to review the management fee annually after an initial term of the Management Agreement.
At the conclusion of these discussions, the Board agreed that it had been furnished with sufficient information to make an informed business decision with respect to approving the fund’s Management Agreement and Sub-Investment Advisory Agreement. Based on the discussions and considerations as described above, the Board made the following conclusions and determinations.
- The Board concluded that the nature, extent and quality of the services to be provided by the Manager and Newton are adequate and appropriate.
The Fund 25
| INFORMATION ABOUT THE REVIEW AND APPROVAL OF THE FUND’S |
| INVESTMENT MANAGEMENT AGREEMENT (Unaudited) (continued) |
- The Board concluded that the fee to be paid by the fund to the Manager was reasonable, in light of the services to be provided, com- parative expense and advisory fee information, and benefits antici- pated to be derived by the Manager or Newton from its relationship with the fund and that the fee to be paid by the Manager to Newton is reasonable and appropriate.
- The Board determined that since the fund had not commenced oper- ations, economies of scale were not a factor, but, to the extent that material economies of scale are not shared with the fund in the future, the Board would seek to do so in connection with future renewals.
The Board members considered these conclusions and determinations, and, without any one factor being dispositive, the Board determined that approval of the fund’s Management Agreement and Sub-Investment Advisory Agreement was in the best interests of the fund and its shareholders.
26
BOARD MEMBERS INFORMATION (Unaudited)
| Joseph S. DiMartino (64) |
| Chairman of the Board (1999) |
| Principal Occupation During Past 5 Years: |
| • Corporate Director and Trustee |
Other Board Memberships and Affiliations:
- The Muscular Dystrophy Association, Director
- Century Business Services, Inc., a provider of outsourcing functions for small and medium size companies, Director
- The Newark Group, a provider of a national market of paper recovery facilities, paperboard mills and paperboard converting plants, Director
- Sunair Services Corporation, a provider of certain outdoor-related services to homes and businesses, Director
No. of Portfolios for which Board Member Serves: 165 ———————
| James M. Fitzgibbons (73) |
| Board Member (1994) |
| Principal Occupation During Past 5 Years: |
| • Chairman of the Board, Davidson Cotton Company (1998-2002) |
| Other Board Memberships and Affiliations: |
| • Bill Barrett Company, an oil and gas exploration company, Director |
No. of Portfolios for which Board Member Serves: 26 ———————
| J. Tomlinson Fort (79) |
| Board Member (1987) |
Principal Occupation During Past 5 Years:
- Retired (2005-present)
- Of Counsel, Reed Smith LLP (1998-2005)
Other Board Memberships and Affiliations:
- Allegheny College, Emeritus Trustee
- Pittsburgh Ballet Theatre,Trustee
- American College of Trial Lawyers, Fellow
No. of Portfolios for which Board Member Serves: 26 ———————
| Kenneth A. Himmel (61) |
| Board Member (1994) |
Principal Occupation During Past 5 Years:
- President and CEO,Related Urban Development,a real estate development company (1996-present)
- President and CEO, Himmel & Company, a real estate development company (1980-present)
- CEO, American Food Management, a restaurant company (1983-present)
No. of Portfolios for which Board Member Serves: 26
The Fund 27
BOARD MEMBERS INFORMATION (Unaudited) (continued)
| Stephen J. Lockwood (60) |
| Board Member (1994) |
Principal Occupation During Past 5 Years:
- Chairman of the Board, Stephen J. Lockwood and Company LLC, an investment company (2000-present)
No. of Portfolios for which Board Member Serves: 26 ———————
| Roslyn M. Watson (58) |
| Board Member (1994) |
Principal Occupation During Past 5 Years:
• Principal,Watson Ventures, Inc., a real estate investment company (1993-present)
Other Board Memberships and Affiliations:
- American Express Bank, Director
- The Hyams Foundation Inc., a Massachusetts Charitable Foundation,Trustee
- National Osteoporosis Foundation,Trustee
No. of Portfolios for which Board Member Serves: 26 ———————
| Benaree Pratt Wiley (61) |
| Board Member (1998) |
Principal Occupation During Past 5 Years:
- Principal,The Wiley Group, a firm specializing in strategy and business development (2005-present)
- President and CEO,The Partnership, an organization dedicated to increasing the representa- tion of African Americans in positions of leadership, influence and decision-making in Boston, MA (1991-2005)
Other Board Memberships and Affiliations:
- Boston College,Trustee
- Blue Cross Blue Shield of Massachusetts, Director
- Commonwealth Institute, Director
- Efficacy Institute, Director
- PepsiCo African-American, Advisory Board
- The Boston Foundation, Director
- Harvard Business School Alumni Board, Director
No. of Portfolios for which Board Member Serves: 36 ———————
Once elected all Board Members serve for an indefinite term, but achieve Emeritus status upon reaching age 80.The address of the Board Members and Officers is in c/o The Dreyfus Corporation, 200 Park Avenue, New York, New York 10166.Additional information about the Board Members is available in the fund’s Statement of Additional Information which can be obtained from Dreyfus free of charge by calling this toll free number: 1-800-554-4611.
Francis P. Brennan, Emeritus Board Member
28
OFFICERS OF THE FUND (Unaudited)
| J. DAVID OFFICER, President since |
| December 2006. |
Chief Operating Officer,Vice Chairman and a Director of the Manager, and an officer of 82 investment companies (comprised of 165 portfolios) managed by the Manager. He is 59 years old and has been an employee of the Manager since April 1998.
| PHILLIP N. MAISANO, Executive Vice |
| President since July 2007. |
Chief Investment Officer,Vice Chair and a director of the Manager, and an officer of 82 investment companies (comprised of 165 portfolios) managed by the Manager. Mr. Maisano also is an officer and/or Board member of certain other investment management subsidiaries of The Bank of New York Mellon Corporation, each of which is an affiliate of the Manager. He is 60 years old and has been an employee of the Manager since November 2006. Prior to joining the Manager, Mr. Maisano served as Chairman and Chief Executive Officer of EACM Advisors, an affiliate of the Manager, since August 2004, and served as Chief Executive Officer of Evaluation Associates, a leading institutional investment consulting firm, from 1988 until 2004.
| MICHAEL A. ROSENBERG, Vice President |
| and Secretary since August 2005. |
Associate General Counsel of the Manager, and an officer of 83 investment companies (comprised of 182 portfolios) managed by the Manager. He is 47 years old and has been an employee of the Manager since October 1991.
| JAMES BITETTO, Vice President and |
| Assistant Secretary since August 2005. |
Associate General Counsel and Secretary of the Manager, and an officer of 83 investment companies (comprised of 182 portfolios) managed by the Manager. He is 41 years old and has been an employee of the Manager since December 1996.
| JONI LACKS CHARATAN, Vice President |
| and Assistant Secretary since |
| August 2005. |
Associate General Counsel of the Manager, and an officer of 83 investment companies (comprised of 182 portfolios) managed by the Manager. She is 51 years old and has been an employee of the Manager since October 1988.
| JOSEPH M. CHIOFFI, Vice President and |
| Assistant Secretary since August 2005. |
Associate General Counsel of the Manager, and an officer of 83 investment companies (comprised of 182 portfolios) managed by the Manager. He is 45 years old and has been an employee of the Manager since June 2000.
| JANETTE E. FARRAGHER, Vice President |
| and Assistant Secretary since |
| August 2005. |
Associate General Counsel of the Manager, and an officer of 83 investment companies (comprised of 182 portfolios) managed by the Manager. She is 44 years old and has been an employee of the Manager since February 1984.
| JOHN B. HAMMALIAN, Vice President and |
| Assistant Secretary since August 2005. |
Associate General Counsel of the Manager, and an officer of 83 investment companies (comprised of 182 portfolios) managed by the Manager. He is 44 years old and has been an employee of the Manager since February 1991.
| ROBERT R. MULLERY, Vice President and |
| Assistant Secretary since August 2005. |
Associate General Counsel of the Manager, and an officer of 83 investment companies (comprised of 182 portfolios) managed by the Manager. He is 55 years old and has been an employee of the Manager since May 1986.
The Fund 29
OFFICERS OF THE FUND (Unaudited) (continued)
| JEFF PRUSNOFSKY, Vice President and |
| Assistant Secretary since August 2005. |
Associate General Counsel of the Manager, and an officer of 83 investment companies (comprised of 182 portfolios) managed by the Manager. He is 42 years old and has been an employee of the Manager since October 1990.
| JAMES WINDELS, Treasurer since |
| November 2001. |
Director – Mutual Fund Accounting of the Manager, and an officer of 83 investment companies (comprised of 182 portfolios) managed by the Manager. He is 49 years old and has been an employee of the Manager since April 1985.
| ROBERT ROBOL, Assistant Treasurer |
| since December 2002. |
Senior Accounting Manager – Money Market and Municipal Bond Funds of the Manager, and an officer of 83 investment companies (comprised of 182 portfolios) managed by the Manager. He is 43 years old and has been an employee of the Manager since October 1988.
| ROBERT SALVIOLO, Assistant Treasurer |
| since July 2007. |
Senior Accounting Manager – Equity Funds of the Manager, and an officer of 83 investment companies (comprised of 182 portfolios) managed by the Manager. He is 40 years old and has been an employee of the Manager since June 1989.
| ROBERT SVAGNA, Assistant Treasurer |
| since December 2002. |
Senior Accounting Manager – Equity Funds of the Manager, and an officer of 83 investment companies (comprised of 182 portfolios) managed by the Manager. He is 40 years old and has been an employee of the Manager since November 1990.
| GAVIN C. REILLY, Assistant Treasurer |
| since December 2005. |
Tax Manager of the Investment Accounting and Support Department of the Manager, and an officer of 83 investment companies (comprised of 182 portfolios) managed by the Manager. He is 39 years old and has been an employee of the Manager since April 1991.
| JOSEPH W. CONNOLLY, Chief Compliance |
| Officer since October 2004. |
Chief Compliance Officer of the Manager and The Dreyfus Family of Funds (83 investment companies, comprised of 182 portfolios). From November 2001 through March 2004, Mr. Connolly was first Vice-President, Mutual Fund Servicing for Mellon Global Securities Services. In that capacity, Mr. Connolly was responsible for managing Mellon’s Custody, Fund Accounting and Fund Administration services to third-party mutual fund clients. He is 50 years old and has served in various capacities with the Manager since 1980, including manager of the firm’s Fund Accounting Department from 1997 through October 2001.
| WILLIAM GERMENIS, Anti-Money |
| Laundering Compliance Officer since |
| July 2002. |
Vice President and Anti-Money Laundering Compliance Officer of the Distributor, and the Anti-Money Laundering Compliance Officer of 79 investment companies (comprised of 178 portfolios) managed by the Manager. He is 37 years old and has been an employee of the Distributor since October 1998.
30
NOTES
For More Information
Telephone Call your financial representative or 1-800-554-4611
| Mail | | The Dreyfus Premier Family of Funds |
| | | 144 Glenn Curtiss Boulevard, Uniondale, NY 11556-0144 |
The fund files its complete schedule of portfolio holdings with the Securities and Exchange Commission (“SEC”) for the first and third quarters of each fiscal year on Form N-Q. The fund’s Forms N-Q are available on the SEC’s website at http://www.sec.gov and may be reviewed and copied at the SEC’s Public Reference Room in Washington, DC. Information on the operation of the Public Reference Room may be obtained by calling 1-202-551-8090.
A description of the policies and procedures that the fund uses to determine how to vote proxies relating to portfolio securities is available at http://www.dreyfus.com. The description of the policies and procedures is also available without charge, upon request, by calling 1-800-645-6561.

© 2007 MBSC Securities Corporation
Save time. Save paper. View your next shareholder report online as soon as it’s available. Log into www.dreyfus.com and sign up for Dreyfus eCommunications. It’s simple and only takes a few minutes.
The views expressed in this report reflect those of the portfolio manager only through the end of the period covered and do not necessarily represent the views of Dreyfus or any other person in the Dreyfus organization. Any such views are subject to change at any time based upon market or other conditions and Dreyfus disclaims any responsibility to update such views.These views may not be relied on as investment advice and, because investment decisions for a Dreyfus fund are based on numerous factors, may not be relied on as an indication of trading intent on behalf of any Dreyfus fund.
Not FDIC-Insured • Not Bank-Guaranteed • May Lose Value
| Contents |
| |
| | | THE FUND |
| |
|
| 2 | | A Letter from the CEO |
| 3 | | Discussion of Fund Performance |
| 6 | | Fund Performance |
| 8 | | Understanding Your Fund’s Expenses |
| 8 | | Comparing Your Fund’s Expenses |
| With Those of Other Funds |
| 9 | | Statement of Investments |
| 16 | | Statement of Financial Futures |
| 17 | | Statement of Assets and Liabilities |
| 18 | | Statement of Operations |
| 19 | | Statement of Changes in Net Assets |
| 21 | | Financial Highlights |
| 24 | | Notes to Financial Statements |
| 39 | | Report of Independent Registered |
| | | Public Accounting Firm |
| 40 | | Important Tax Information |
| 41 | | Board Members Information |
| 43 | | Officers of the Fund |
| |
| FOR MORE INFORMATION |
|
| | | Back Cover |
The Fund
| Dreyfus Premier |
| International Bond Fund |

A LETTER FROM THE CEO
Dear Shareholder:
We are pleased to present this annual report for Dreyfus Premier International Bond Fund, covering the 12-month period from November 1, 2006, through October 31, 2007.
After an extended period of steady gains, turmoil in U.S. credit markets over the summer of 2007 led to heightened volatility in some international bond markets. Nonetheless, fundamentals in the global economy have remained relatively robust, and credit concerns affecting U.S. sub-prime mortgages appear to have had a limited impact on conditions in overseas fixed-income markets.
While we expect the global economic expansion to continue, it probably will do so at a slower rate as U.S. consumer spending moderates and some high-flying emerging markets, notably China, take steps to reduce unsustainably high growth rates. In addition, the U.S. dollar has declined against most major currencies throughout most of the reporting period, making investments denominated in foreign currencies more valuable for U.S. residents. Lastly, a stubborn U.S. trade deficit and stronger economic growth in overseas markets continue to attract global capital away from U.S. markets and toward those with higher potential returns. As always, we encourage you to discuss these developments with your financial advisor, who can help you make any adjustments that may be right for your portfolio.
For information about how the fund performed during the reporting period, as well as market perspectives, we have provided a Discussion of Fund Performance given by the fund’s Portfolio Manager.
Thank you for your continued confidence and support.
| Thomas F. Eggers |
| Chief Executive Officer |
| The Dreyfus Corporation |
| November 15, 2007 |
2

DISCUSSION OF FUND PERFORMANCE
For the period of November 1, 2006, through October 31, 2007, as provided by Thomas F. Fahey, Portfolio Manager
Fund and Market Performance Overview
Unhedged exposure to international fixed-income securities produced strong results during the reporting period as the U.S. dollar continued to decline in value against most other currencies.While turmoil in the U.S. sub-prime mortgage sector affected some international markets, overseas securities generally rebounded by the reporting period’s end. The fund’s returns were driven primarily by an out-of-index position in U.S.Treasury securities and underweighted exposure to Europe.
For the 12-month period ended October 31, 2007, Dreyfus Premier International Bond Fund Class A shares achieved a total return of 10.06%, Class C shares achieved 9.25%, and Class I shares achieved 10.30% .1 Please note that effective June 1, 2007, Class R shares were renamed Class I shares. In comparison, the fund’s benchmark, the J.P. Morgan Global Government Bond Index, Excluding U.S. (Unhedged) (the “Index”), produced a total return of 9.94% for the same period.2
The Fund’s Investment Approach
The fund seeks to maximize total return from capital appreciation and income.To pursue its goal, the fund normally invests at least 80% of its assets in fixed-income securities. The fund also normally invests at least 65% of its assets in non-U.S. dollar-denominated fixed-income securities of foreign governments and companies located in various countries, including emerging markets. The fund ordinarily invests in at least five countries other than the United States and, at times, may invest a substantial portion of its assets in a single foreign country.Generally,the fund seeks to maintain a portfolio with an investment grade average credit quality.
We focus on identifying undervalued government bond markets, currencies, sectors and securities. We look for fixed-income securities with the potential for added value, such as those involving the potential for credit upgrades, unique structural characteristics or innovative features.We select securities for the fund’s portfolio by:
- Using fundamental economic research and quantitative analysis to allocate assets among countries and currencies based on a compara- tive valuation of interest and inflation rate trends, government fiscal and monetary policies, and the credit quality of government debt.
The Fund 3
DISCUSSION OF FUND PERFORMANCE (continued)
- Focusing on sectors and individual securities that appear to be rela- tively undervalued and actively traded among sectors.
We currently intend to hedge some, but not necessarily all, of the fund’s foreign currency exposure to the Index, but, at times, we may seek to manage currency risk, and we may find opportunities to add value by hedging a portion of the fund’s currency exposure to the U.S. dollar.
U.S. Treasuries Outperformed Most International Bonds
Early in the reporting period, international bond markets proved to be relatively calm, despite robust economic growth in emerging markets and rising interest rates in Europe. However, market volatility resurged worldwide in mid-June 2007, when credit concerns spread quickly from the U.S. sub-prime mortgage sector to other areas of the financial markets, sparking a “flight to quality” as fixed-income investors reassessed their attitudes toward risk. Investors flocked to U.S.Treasury securities, supporting their prices, while more credit-sensitive areas of the U.S. and international bond markets declined sharply.
The flight to quality helped U.S.Treasury securities rank as one of the world’s top-performing fixed-income market sectors during the reporting period.The fund participated in the sector’s strength through positions in longer-term U.S. Treasuries, which are not included in the benchmark.The fund held no securities backed by sub-prime mortgages.
While sub-prime turmoil also affected a number of foreign banks and hedge funds, the crisis’s impact on overseas markets proved to be limited by the reporting period’s end, as rebounds in most international bond markets erased previous declines.
Country Allocation Strategies Helped Support Fund Returns
The fund benefited from its unhedged exposure to international bonds and currencies.The value of the U.S. dollar continued to fall, making investments denominated in other currencies more valuable for U.S. residents.
The fund achieved particularly attractive relative results through an underweighted position in European government bonds, where yield differences narrowed relative to U.S.Treasuries as the European Central Bank signaled an end to higher short-term interest rates in the aftermath of the credit crisis. Conversely, the fund benefited from overweighted exposure to higher yielding, longer-duration U.K. bonds.
While government bonds comprised the bulk of the fund’s investments, it held some higher-coupon, shorter-duration corporate cred-
4
its from issuers that we regarded as sound credit risks. The fund also employed credit default swaps to protect the fund from declines in corporate-backed credits.These positions contributed positively to the fund’s performance during the reporting period.
Positioned for an Uncertain Global Investment Environment
We expect heightened market volatility to persist. In our view, the outlook for international fixed-income markets depends to a degree on the performance of the U.S. economy. If the United States avoids a full-blown recession, international markets may continue to do well. However,a U.S.recession could derail international markets.Accordingly, we have maintained a generally cautious investment posture,with longer-duration investment postures in the United States, Japan and the United Kingdom balanced by shorter-duration positions in continental Europe.
November 15, 2007
| | | Foreign bonds are subject to special risks including exposure to currency fluctuations, |
| | | changing political and economic conditions, and potentially less liquidity. |
| | | Investments in foreign currencies are subject to the risk that those currencies will decline in |
| | | value relative to the U.S. dollar, or, in the case of hedged positions, that the U.S. dollar will |
| | | decline relative to the currency being hedged. Currency rates in foreign countries may |
| | | fluctuate significantly over short periods of time. A decline in the value of foreign currencies |
| | | relative to the U.S. dollar will reduce the value of securities held by the fund and |
| | | denominated in those currencies. |
| | | The fund may use derivative instruments, such as options, futures and options on futures, forward |
| | | contracts, swaps (including credit default swaps on corporate bonds and asset-backed securities), |
| | | options on swaps, and other credit derivatives. A small investment in derivatives could have a |
| | | potentially large impact on the fund’s performance.The use of derivatives involves risks different |
| | | from, or possibly greater than, the risks associated with investing directly in the underlying assets. |
| | | Credit default swaps and similar instruments involve greater risks than if the fund had invested in |
| | | the reference obligation directly, since, in addition to general market risks, they are subject to |
| | | illiquidity risk, counterparty risk and credit risks. |
| 1 | | Total return includes reinvestment of dividends and any capital gains paid and does not take into |
| | | consideration the maximum initial sales charge in the case of Class A shares or the applicable |
| | | contingent deferred sales charge imposed on redemptions in the case of Class C shares. Had these |
| | | charges been reflected, returns would have been lower. Past performance is no guarantee of future |
| | | results. Share price and investment return fluctuate such that upon redemption, fund shares may be |
| | | worth more or less than their original cost. Return figures provided reflect the absorption of certain |
| | | fund expenses by The Dreyfus Corporation pursuant to an agreement in effect through October |
| | | 31, 2008, at which time it may be extended, modified or terminated. Had these expenses not |
| | | been absorbed, the fund’s returns would have been lower. |
| 2 | | SOURCE: Bloomberg L.P. — Reflects reinvestment of dividends and, where applicable, capital |
| | | gain distributions.The J.P. Morgan Global Government Bond Index, Excluding U.S. (Unhedged) |
| | | is a widely used benchmark for measuring performance and quantifying risk across international |
| | | fixed-income bond markets.The Index measures the total, principal, and interest returns in each |
| | | market. Index returns do not reflect fees and expenses associated with operating a mutual fund. |
The Fund 5
FUND PERFORMANCE
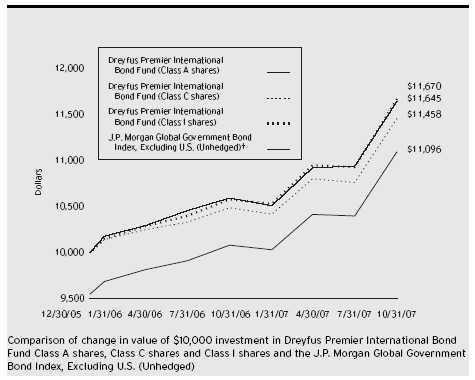
| † Source: Bloomberg L.P. |
| Past performance is not predictive of future performance. |
| The above graph compares a $10,000 investment made in Class A, Class C and Class I shares of Dreyfus Premier |
| International Bond Fund on 12/30/05 (inception date) to a $10,000 investment made in the J.P. Morgan Global |
| Government Bond Index, Excluding U.S. (Unhedged) (the “Index”) on that date. All dividends and capital gain |
| distributions are reinvested. |
| The fund invests 80% of its assets primarily in fixed-income securities.The fund’s performance shown in the line graph |
| takes into account the maximum initial sales charge on Class A shares and all other applicable fees and expenses on all |
| classes.The Index is a widely used benchmark for measuring performance and quantifying risk across international fixed |
| income bond markets.The Index measures the total, principal and interest returns in each market.The Index does not |
| take into account charges, fees and other expenses. Further information relating to fund performance, including expense |
| reimbursements, if applicable, is contained in the Financial Highlights section of the prospectus and elsewhere in this report. |
6
| Average Annual Total Returns as of 10/31/07 | | | | |
| |
| | | Inception | | | | From |
| | | Date | | 1 Year | | Inception |
| |
| |
| |
|
| Class A shares | | | | | | |
| with maximum sales charge (4.5%) | | 12/30/05 | | 5.14% | | 5.81% |
| without sales charge | | 12/30/05 | | 10.06% | | 8.50% |
| Class C shares | | | | | | |
| with applicable redemption charge † | | 12/30/05 | | 8.25% | | 7.68% |
| without redemption | | 12/30/05 | | 9.25% | | 7.68% |
| Class I shares | | 12/30/05 | | 10.30% | | 8.76% |
Past performance is not predictive of future performance.The fund’s performance shown in the graph and table does not reflect the deduction of taxes that a shareholder would pay on the fund distributions or the redemption of fund shares.
| † The maximum contingent deferred sales charge for Class C shares is 1% for shares redeemed within one year of the |
| date of purchase. |
The Fund 7
UNDERSTANDING YOUR FUND’S EXPENSES (Unaudited)
As a mutual fund investor, you pay ongoing expenses, such as management fees and other expenses. Using the information below, you can estimate how these expenses affect your investment and compare them with the expenses of other funds.You also may pay one-time transaction expenses, including sales charges (loads) and redemption fees, which are not shown in this section and would have resulted in higher total expenses. For more information, see your fund’s prospectus or talk to your financial adviser.
Review your fund’s expenses
The table below shows the expenses you would have paid on a $1,000 investment in Dreyfus Premier International Bond Fund from May 1, 2007 to October 31, 2007. It also shows how much a $1,000 investment would be worth at the close of the period, assuming actual returns and expenses.
| Expenses and Value of a $1,000 Investment | | | | |
| assuming actual returns for the six months ended October 31, 2007 | | |
| | | Class A | | Class C | | Class I |
| |
| |
| |
|
| Expenses paid per $1,000 † | | $ 5.73 | | $ 9.61 | | $ 4.43 |
| Ending value (after expenses) | | $1,065.40 | | $1,060.80 | | $1,065.90 |
| COMPARING YOUR FUND’S EXPENSES |
| WITH THOSE OF OTHER FUNDS (Unaudited) |
Using the SEC’s method to compare expenses
The Securities and Exchange Commission (SEC) has established guidelines to help investors assess fund expenses. Per these guidelines, the table below shows your fund’s expenses based on a $1,000 investment, assuming a hypothetical 5% annualized return. You can use this information to compare the ongoing expenses (but not transaction expenses or total cost) of investing in the fund with those of other funds.All mutual fund shareholder reports will provide this information to help you make this comparison. Please note that you cannot use this information to estimate your actual ending account balance and expenses paid during the period.
| Expenses and Value of a $1,000 Investment | | | | |
| assuming a hypothetical 5% annualized return for the six months ended October 31, 2007 |
| | | Class A | | Class C | | Class I |
| |
| |
| |
|
| Expenses paid per $1,000 † | | $ 5.60 | | $ 9.40 | | $ 4.33 |
| Ending value (after expenses) | | $1,019.66 | | $1,015.88 | | $1,020.92 |
| † Expenses are equal to the fund's annualized expense ratio of 1.10% for Class A, 1.85% for Class C and .85% for |
| Class I; multiplied by the average account value over the period, multiplied by 184/365 (to reflect the one-half year |
| period). |
8
| STATEMENT OF INVESTMENTS |
| October 31, 2007 |
| | | | | Coupon | | Maturity | | Principal | | |
| Bonds and Notes—92.9% | | | | Rate (%) | | Date | | Amount ($) | | Value ($) |
| |
| |
| |
| |
| |
|
| Argentina—1.0% | | | | | | | | | | |
| Republic of Argentina, | | | | | | | | | | |
| Bonds | | | | 5.39 | | 8/3/12 | | 40,000 a | | 23,130 |
| Republic of Argentina BONAR, | | | | | | | | |
| Bonds, Ser. VII | | | | 7.00 | | 9/12/13 | | 60,000 | | 54,510 |
| | | | | | | | | | | 77,640 |
| Belgium—1.2% | | | | | | | | | | |
| Belgium Kingdom, | | | | | | | | | | |
| Bonds, Ser. 44 | | EUR | | 5.00 | | 3/28/35 | | 30,000 b | | 23,668 |
| Belgium Kingdom, | | | | | | | | | | |
| Bonds, Ser. 40 | | EUR | | 5.50 | | 9/28/17 | | 15,000 b | | 46,046 |
| Delhaize Group, | | | | | | | | | | |
| Sr. Unsub. Notes | | | | 6.50 | | 6/15/17 | | 10,000 b | | 10,255 |
| | | | | | | | | | | 79,969 |
| Brazil—2.2% | | | | | | | | | | |
| Federal Republic of Brazil, | | | | | | | | | | |
| Unscd. Bonds | | BRL | | 12.50 | | 1/5/16 | | 250,000 b,c | | 163,485 |
| Cayman Islands—.2% | | | | | | | | | | |
| BES Finance, | | | | | | | | | | |
| Bank Gtd. Notes | | EUR | | 4.50 | | 12/29/49 | | 10,000 a,b | | 13,435 |
| Egypt—1.2% | | | | | | | | | | |
| Arab Republic of Egypt, | | | | | | | | | | |
| Unsub. Bonds | | EGP | | 8.75 | | 7/18/12 | | 500,000 b,d | | 93,339 |
| France—4.2% | | | | | | | | | | |
| Dexia Municipal Agency, | | | | | | | | | | |
| Scd. Notes | | JPY | | 0.80 | | 5/21/12 | | 9,000,000 b | | 76,859 |
| France Government, | | | | | | | | | | |
| Bonds | | EUR | | 4.75 | | 4/25/35 | | 140,000 b | | 208,646 |
| Societe Generale, | | | | | | | | | | |
| Sub. Bonds | | EUR | | 4.20 | | 1/29/49 | | 25,000 a,b | | 33,008 |
| | | | | | | | | | | 318,513 |
| Germany—2.5% | | | | | | | | | | |
| KFW, | | | | | | | | | | |
| Gov’t Gtd. Bonds | | JPY | | 1.75 | | 3/23/10 | | 21,000,000 b,c | | 185,781 |
| Ireland—5.4% | | | | | | | | | | |
| DEPFA ACS BANK, | | | | | | | | | | |
| Covered Public Loans | | JPY | | 0.75 | | 9/22/08 | | 30,000,000 b | | 260,038 |
The Fund 9
STATEMENT OF INVESTMENTS (continued)
| | | | | Coupon | | Maturity | | Principal | | |
| Bonds and Notes (continued) | | | | Rate (%) | | Date | | Amount ($) | | Value ($) |
| |
| |
| |
| |
| |
|
| Ireland (continued) | | | | | | | | | | |
| GE Capital European Funding, | | | | | | | | | | |
| Gtd. Notes | | EUR | | 4.41 | | 5/4/11 | | 105,000 b | | 151,294 |
| | | | | | | | | | | 411,332 |
| Italy—1.9% | | | | | | | | | | |
| Atlantia, | | | | | | | | | | |
| Gtd. Notes | | EUR | | 5.21 | | 6/9/11 | | 100,000 b | | 145,274 |
| Japan—15.0% | | | | | | | | | | |
| Development Bank of Japan, | | | | | | | | | | |
| Gov’t. Gtd. Bonds | | JPY | | 1.05 | | 6/20/23 | | 28,000,000 b | | 211,373 |
| Development Bank of Japan, | | | | | | | | | | |
| Gov’t. Gtd. Bonds | | JPY | | 1.40 | | 6/20/12 | | 8,000,000 b,c | | 70,105 |
| Development Bank of Japan, | | | | | | | | | | |
| Gov’t. Gtd. Bonds | | JPY | | 1.70 | | 9/20/22 | | 24,000,000 b | | 200,457 |
| Japan Finance for Municipal | | | | | | | | | | |
| Enterprises, Gov’t. Gtd. Bonds | | JPY | | 1.35 | | 11/26/13 | | 11,000,000 b | | 95,930 |
| Japan Finance for Municipal | | | | | | | | | | |
| Enterprises, Gov’t. Gtd. Notes | | JPY | | 1.55 | | 2/21/12 | | 6,000,000 b | | 53,194 |
| Japan Government, | | | | | | | | | | |
| Bonds, Ser. 244 | | JPY | | 1.00 | | 12/20/12 | | 11,000,000 b | | 94,863 |
| Japan Government, | | | | | | | | | | |
| Bonds, Ser. 244 | | JPY | | 1.00 | | 12/20/12 | | 12,000,000 b | | 103,487 |
| Japan Government CPI, | | | | | | | | | | |
| Bonds, Ser. 10 | | JPY | | 1.10 | | 12/10/16 | | 35,000,000 b | | 302,224 |
| | | | | | | | | | | 1,131,633 |
| Luxembourg—1.3% | | | | | | | | | | |
| TNK-BP Finance, | | | | | | | | | | |
| Gtd. Notes | | | | 7.50 | | 3/13/13 | | 100,00 d | | 100,500 |
| Mexico—1.1% | | | | | | | | | | |
| Mexican Bonos, | | | | | | | | | | |
| Bonds, Ser. MI10 | | MXN | | 8.00 | | 12/19/13 | | 860,000 b | | 81,659 |
| Netherlands—6.3% | | | | | | | | | | |
| Crown European Holdings, | | | | | | | | | | |
| Scd. Notes | | EUR | | 6.25 | | 9/1/11 | | 15,000 b | | 22,105 |
| E.ON International Finance, | | | | | | | | | | |
| Gtd. Notes | | EUR | | 5.50 | | 10/2/17 | | 20,000 b | | 29,771 |
| Netherlands Government, | | | | | | | | | | |
| Bonds | | EUR | | 4.00 | | 1/15/37 | | 305,000 b | | 403,447 |
10
| | | | | Coupon | | Maturity | | Principal | | |
| Bonds and Notes (continued) | | | | Rate (%) | | Date | | Amount ($) | | Value ($) |
| |
| |
| |
| |
| |
|
| Netherlands (continued) | | | | | | | | | | |
| Repsol International Finance, | | | | | | | | | | |
| Gtd. Notes | | EUR | | 4.63 | | 10/8/14 | | 15,000 b | | 20,815 |
| | | | | | | | | | | 476,138 |
| South Africa—1.3% | | | | | | | | | | |
| Republic of South Africa, | | | | | | | | | | |
| Notes | | | | 5.88 | | 5/30/22 | | 100,000 | | 100,790 |
| Supranational—3.2% | | | | | | | | | | |
| European Investment Bank, | | | | | | | | | | |
| Sr. Unscd. Notes | | JPY | | 1.40 | | 6/20/17 | | 28,600,000 b | | 244,559 |
| Sweden—1.0% | | | | | | | | | | |
| Swedish Government, | | | | | | | | | | |
| Bonds, Ser. 1050 | | SEK | | 3.00 | | 7/12/16 | | 550,000 b | | 79,099 |
| United Kingdom—26.5% | | | | | | | | | | |
| FCE Bank, | | | | | | | | | | |
| Notes | | EUR | | 5.73 | | 9/30/09 | | 10,000 a,b | | 182,078 |
| HSBC Capital Funding | | | | | | | | | | |
| Gtd. Bonds | | EUR | | 5.37 | | 12/24/49 | | 25,000 a,b | | 35,471 |
| Llyods TSB Bank, | | | | | | | | | | |
| Sub. Notes | | EUR | | 6.35 | | 10/29/49 | | 10,000 a,b | | 14,992 |
| National Grid, | | | | | | | | | | |
| Sr. Unscd. Notes | | | | 6.30 | | 8/1/16 | | 10,000 | | 10,307 |
| Northern Rock, | | | | | | | | | | |
| Sub. Notes | | | | 6.59 | | 6/29/49 | | 240,000 a,d | | 192,320 |
| SABMiller, | | | | | | | | | | |
| Gtd. Notes | | | | 5.66 | | 7/1/09 | | 10,000 a,d | | 10,043 |
| United Kingdom Gilt, | | | | | | | | | | |
| Bonds | | GBP | | 4.00 | | 3/7/09 | | 120,000 b | | 245,818 |
| United Kingdom Gilt, | | | | | | | | | | |
| Bonds | | GBP | | 4.00 | | 9/7/16 | | 55,000 b | | 106,893 |
| United Kingdom Gilt, | | | | | | | | | | |
| Bonds | | GBP | | 4.25 | | 3/7/11 | | 225,000 b | | 456,771 |
| United Kingdom Gilt, | | | | | | | | | | |
| Bonds | | GBP | | 4.25 | | 6/7/32 | | 30,000 b | | 59,155 |
| United Kingdom Gilt, | | | | | | | | | | |
| Bonds | | GBP | | 4.75 | | 6/7/10 | | 140,000 b | | 289,271 |
| United Kingdom Gilt, | | | | | | | | | | |
| Bonds | | GBP | | 5.00 | | 9/7/14 | | 135,000 b | | 281,271 |
The Fund 11
STATEMENT OF INVESTMENTS (continued)
| | | | | Coupon | | Maturity | | Principal | | |
| Bonds and Notes (continued) | | | | Rate (%) | | Date | | Amount ($) | | Value ($) |
| |
| |
| |
| |
| |
|
| United Kingdom (continued) | | | | | | | | | | |
| United Kingdom Gilt, | | | | | | | | | | |
| Bonds | | GBP | | 8.00 | | 9/27/13 | | 50,000 b | | 119,734 |
| | | | | | | | | | | 2,004,124 |
| United States—17.4% | | | | | | | | | | |
| BAC Capital Trust XIII, | | | | | | | | | | |
| Jr. Sub. Notes | | | | 6.09 | | 3/15/43 | | 15,000 | | 13,816 |
| Bear Stearns Commercial Mortgage | | | | | | | | |
| Securities, Ser. 2006-PW14, | | | | | | | | | | |
| Cl. AAB | | | | 5.17 | | 12/11/38 | | 65,000 | | 63,523 |
| Capmark Financial Group, | | | | | | | | | | |
| Gtd. Notes | | | | 5.88 | | 5/10/12 | | 15,000 d | | 13,479 |
| Citigroup, | | | | | | | | | | |
| Notes | | JPY | | 0.80 | | 10/30/08 | | 2,900,000 b | | 25,095 |
| Citigroup, | | | | | | | | | | |
| Sr. Notes | | | | 5.30 | | 10/17/12 | | 25,000 | | 25,101 |
| Coventry Health Care, | | | | | | | | | | |
| Sr. Unscd. Notes | | | | 5.95 | | 3/15/17 | | 15,000 | | 14,626 |
| Crown Castle Towers, | | | | | | | | | | |
| Ser. 2006-1A, Cl. D | | | | 5.77 | | 11/15/36 | | 25,000 d | | 24,118 |
| Duke Energy Carolinas, | | | | | | | | | | |
| Sr. Notes | | | | 5.68 | | 11/30/12 | | 15,000 | | 15,302 |
| Erac USA Finance, | | | | | | | | | | |
| Bonds | | | | 5.30 | | 11/15/08 | | 35,000 d | | 34,719 |
| ERP Operating, | | | | | | | | | | |
| Unscd. Notes | | | | 5.75 | | 6/15/17 | | 20,000 | | 19,399 |
| Federal National Mortgage | | | | | | | | | | |
| Association | | | | 6.00 | | 1/15/29 | | 365,000 | | 366,880 |
| First Union-Chase Commercial | | | | | | | | | | |
| Mortgage, Ser. 1999-C2, Cl. G | | | | 5.95 | | 6/15/31 | | 25,000 | | 24,680 |
| Florida Power, | | | | | | | | | | |
| First Mortgage Bonds | | | | 6.35 | | 9/15/37 | | 5,000 | | 5,268 |
| General Electrical Capital, | | | | | | | | | | |
| Sr. Uncd. Notes | | JPY | | 2.00 | | 2/22/17 | | 7,000,000 b | | 60,016 |
| General Electrical Capital, | | | | | | | | | | |
| Sr. Uncd. Notes | | | | 5.63 | | 9/15/17 | | 65,000 | | 65,757 |
12
| | | | | Coupon | | Maturity | | Principal | | |
| Bonds and Notes (continued) | | | | Rate (%) | | Date | | Amount ($) | | Value ($) |
| |
| |
| |
| |
| |
|
| United States (continued) | | | | | | | | | | |
| Goldman Sachs Mortgage | | | | | | | | | | |
| Securities Corporation II, | | | | | | | | | | |
| Ser. 2007-EOP, Cl. L | | | | 6.42 | | 3/6/20 | | 25,000 a,d | | 24,250 |
| Government National | | | | | | | | | | |
| Mortgage Association I: | | | | | | | | | | |
| Ser. 2004-23, Cl. B, | | | | | | | | | | |
| 2.95%, 3/16/19 | | | | | | | | 29,895 | | 29,031 |
| Ser. 2006-68, Cl. A, | | | | | | | | | | |
| 3.89%, 7/16/26 | | | | | | | | 24,412 | | 23,888 |
| Ser. 2006-67, Cl. A, | | | | | | | | | | |
| 3.95%, 11/16/30 | | | | | | | | 54,041 | | 52,918 |
| Ser. 2005-76, Cl. A, | | | | | | | | | | |
| 3.96%, 5/16/30 | | | | | | | | 33,505 | | 32,860 |
| Ser. 2005-79, Cl. A, | | | | | | | | | | |
| 4.00%, 10/16/33 | | | | | | | | 30,659 | | 30,159 |
| Ser. 2007-34, Cl. A, | | | | | | | | | | |
| 4.27%, 11/16/26 | | | | | | | | 24,755 | | 24,424 |
| HVB Funding Trust VIII, | | | | | | | | | | |
| Jr. Sub. Bonds | | EUR | | 7.06 | | 3/29/49 | | 20,000 a,b | | 30,349 |
| Kentucky Power, | | | | | | | | | | |
| Sr. Notes | | | | 6.00 | | 9/15/17 | | 30,000 d | | 30,233 |
| Midamerican Energy Holdings, | | | | | | | | | | |
| Bonds | | | | 6.50 | | 9/15/37 | | 15,000 d | | 15,435 |
| Morgan Stanley Capital I, | | | | | | | | | | |
| Ser. 2006-IQ12, Cl. A1 | | | | 5.26 | | 12/15/43 | | 22,198 | | 22,219 |
| News America, | | | | | | | | | | |
| Gtd. Notes | | | | 6.15 | | 3/1/37 | | 20,000 | | 19,259 |
| NiSource Finance, | | | | | | | | | | |
| Gtd. Notes | | | | 6.06 | | 11/23/09 | | 10,000 a | | 9,966 |
| PSEG Power, | | | | | | | | | | |
| Gtd. Notes | | | | 7.75 | | 4/15/11 | | 15,000 | | 16,149 |
| Public Service of Colorado, | | | | | | | | | | |
| First Mortgage Bonds | | | | 7.88 | | 10/1/12 | | 15,000 | | 16,726 |
| RBS Capital Trust A, | | | | | | | | | | |
| Gtd. Bonds | | | | 6.47 | | 12/29/49 | | 10,000 a | | 14,857 |
The Fund 13
STATEMENT OF INVESTMENTS (continued)
| | | Coupon | | Maturity | | Principal | | |
| Bonds and Notes (continued) | | Rate (%) | | Date | | Amount ($) | | Value ($) |
| |
| |
| |
| |
|
| United States (continued) | | | | | | | | |
| Sovereign Bancorp, | | | | | | | | |
| Sr. Unscd. Notes | | 5.44 | | 3/23/10 | | 10,000 a | | 9,921 |
| Sprint Capital, | | | | | | | | |
| Gtd. Notes | | 8.38 | | 3/15/12 | | 15,000 | | 16,397 |
| Steel Dynamics, | | | | | | | | |
| Sr. Notes | | 7.38 | | 11/1/12 | | 10,000 d | | 10,050 |
| Time Warner Cable, | | | | | | | | |
| Sr. Unscd. Notes | | 5.40 | | 7/2/12 | | 10,000 d | | 9,984 |
| Time Warner, | | | | | | | | |
| Gtd. Notes | | 5.73 | | 11/13/09 | | 10,000 a | | 9,946 |
| Tokai Preferred Capital, | | | | | | | | |
| Bonds | | 9.98 | | 12/29/49 | | 35,000 a,c,d | | 36,113 |
| Virginia Electric Power, | | | | | | | | |
| Sr. Notes | | 5.95 | | 9/15/17 | | 20,000 | | 20,456 |
| Washington Mutual Bank, | | | | | | | | |
| Notes | | 5.45 | | 5/1/09 | | 10,000 a | | 9,841 |
| Willis North America, | | | | | | | | |
| Gtd. Notes | | 6.20 | | 3/28/17 | | 15,000 | | 15,164 |
| Windstream, | | | | | | | | |
| Gtd. Notes | | 8.13 | | 8/1/13 | | 10,000 | | 10,625 |
| | | | | | | | | 1,312,999 |
| Total Bonds and Notes | | | | | | | | |
| (cost $6,715,137) | | | | | | | | 7,020,269 |
| |
| |
| |
| |
|
| | | Face Amount | | |
| | | Covered by | | |
| Options—.1% | | Contracts ($) | | Value ($) |
| |
| |
|
| Call Options | | | | |
| 3-Month USD Libor-BBA, Swaption | | | | |
| Total Options (cost $9,856) | | 140,000 | | 9,691 |
| |
| |
|
| | | Principal | | |
| Short-Term Investments—3.6% | | Amount ($) | | Value ($) |
| |
| |
|
| Commercial Paper—3.3% | | | | |
| Cox Communications | | | | |
| 5.86%, 1/15/08 | | 250,000 a,d | | 249,598 |
| U.S. Treasury Bills—.3% | | | | |
| 4.13%, 12/6/07 | | 20,000 e | | 19,924 |
| Total Short-Term Investments | | | | |
| (cost $269,517) | | | | 269,522 |
14
| Other Investment—1.4% | | Shares | | Value ($) |
| |
| |
|
| Registered Investment Company; | | | | |
| Dreyfus Institutional Preferred | | | | |
| Plus Money Market Fund | | | | |
| (cost $103,000) | | 103,000 f | | 103,000 |
| |
| |
|
| |
| Investment of Cash Collateral | | | | |
| for Securities Loaned—6.3% | | | | |
| |
| |
|
| Registered Investment Company; | | | | |
| Dreyfus Institutional Cash | | | | |
| Advantage Fund | | | | |
| (cost $480,103) | | 480,103 f | | 480,103 |
| |
| |
|
| |
| Total Investments (cost $7,577,613) | | 104.3% | | 7,882,585 |
| Liabilities, Less Cash and Receivables | | (4.3%) | | (326,748) |
| Net Assets | | 100.0% | | 7,555,837 |
| a | | Variable rate security—interest rate subject to periodic change. |
| b | | Principal amount stated in U.S. Dollars unless otherwise noted. |
| | | BRL—Brazilian Real |
| | | EGP—Egypt |
| | | EUR—Euro |
| | | GBP—British Pound |
| | | JPY—JapaneseYen |
| | | MXN—Mexican Peso |
| | | SEK—Swedish Krona |
| c All or a portion of these securities are on loan. At October 31, 2007, the total market value of the fund’s securities |
| on loan is $450,861 and the total market value of the collateral held by the fund is $480,103. |
| d Securities exempt from registration under Rule 144A of the Securities Act of 1933.These securities may be resold in |
| transactions exempt from registration, normally to qualified institutional buyers. At October 31, 2007, these securities |
| amounted to $844,181 or 11.2% of net assets. |
| e All or partially held by a broker as collateral for open financial futures positions. |
| f Investment in affiliated money market mutual fund. |
| Portfolio Summary (Unaudited) † | | | | |
| |
| | | Value (%) | | | | Value (%) |
| |
| |
| |
|
| Foreign/Governmental | | 53.0 | | U.S. Government & Agencies | | 7.4 |
| Corporate Bonds | | 30.4 | | Asset/Mortgage-Backed | | 2.1 |
| Short-Term/Money | | | | Options | | .1 |
| Market Investments | | 11.3 | | | | 104.3 |
| † Based on net assets. |
| See notes to financial statements. |
The Fund 15
| STATEMENT OF FINANCIAL FUTURES |
| October 31, 2007 |
| | | | | | | | | Unrealized |
| | | | | Market Value | | | | Appreciation |
| | | | | Covered by | | | | (Depreciation) |
| | | Contracts | | Contracts ($) | | Expiration | | at 10/31/2007 ($) |
| |
| |
| |
| |
|
| Financial Futures Short | | | | | | | | |
| U.S. Treasury 10 Year Notes | | 3 | | (330,047) | | December 2007 | | 1,165 |
| U.S. Treasury 30 Year Bonds | | 2 | | (225,188) | | December 2007 | | (1,067) |
| Financial Futures Long | | | | | | | | |
| U.S. Treasury 2 Year Notes | | 4 | | 828,438 | | December 2007 | | 1,006 |
| Euro Bond 10 Year | | 5 | | 820,679 | | December 2007 | | 1,294 |
| | | | | | | | | 2,398 |
See notes to financial statements.
16
| STATEMENT OF ASSETS AND LIABILITIES |
| October 31, 2007 |
| | | Cost | | Value |
| |
| |
|
| Assets ($): | | | | |
| Investments in securities—See Statement of Investments | | |
| (including securities on loan, valued at $450,861)—Note 1(c): | | |
| Unaffiliated issuers | | 6,994,510 | | 7,299,482 |
| Affiliated issuers | | 583,103 | | 583,103 |
| Cash | | | | 270,898 |
| Cash denominated in foreign currencies | | 75,153 | | 75,510 |
| Receivable for open mortgage-backed dollar rolls—Note 4 | | 365,599 |
| Receivable for investment securities sold | | | | 135,133 |
| Unrealized appreciation on forward currency exchange contracts—Note 4 | | 132,523 |
| Dividends and interest receivable | | | | 83,664 |
| Unrealized appreciation on swap contracts—Note 4 | | 24,723 |
| Swaps Premium paid—Note 4 | | | | 16,161 |
| Receivable from broker for swap transactions—Note 4 | | 4,930 |
| Receivable for shares of Beneficial Interest subscribed | | 1,242 |
| Prepaid expenses | | | | 3,254 |
| | | | | 8,996,222 |
| |
| |
|
| Liabilities ($): | | | | |
| Due to The Dreyfus Corporation and affiliates—Note 3(d) | | 13,043 |
| Liability for securities on loan—Note 1(c) | | | | 480,103 |
| Payable for investment securities purchased | | | | 456,228 |
| Payable for open mortgage-backed dollar rolls—Note 4 | | 364,886 |
| Unrealized depreciation on forward currency exchange contracts—Note 4 | | 63,662 |
| Unrealized depreciation on swap contracts—Note 4 | | 11,516 |
| Payable for shares of Beneficial Interest redeemed | | 2,237 |
| Payable for futures variation margin—Note 4 | | | | 1,964 |
| Payable to broker from swap transactions—Note 4 | | 512 |
| Accrued expenses | | | | 46,234 |
| | | | | 1,440,385 |
| |
| |
|
| Net Assets ($) | | | | 7,555,837 |
| |
| |
|
| Composition of Net Assets ($): | | | | |
| Paid-in capital | | | | 6,958,185 |
| Accumulated undistributed investment income—net | | 71,472 |
| Accumulated net realized gain (loss) on investments | | 132,635 |
| Accumulated net unrealized appreciation (depreciation) on investments, | | |
| options transactions, transactions swap transactions and foreign currency | | |
| transactions (including $2,398 net unrealized appreciation on financial futures) | | 393,545 |
| |
|
| Net Assets ($) | | | | 7,555,837 |
| Net Asset Value Per Share | | | | | | |
| | | Class A | | Class C | | Class I |
| |
| |
| |
|
| Net Assets ($) | | 3,428,850 | | 2,734,040 | | 1,392,947 |
| Shares Outstanding | | 249,005 | | 199,533 | | 100,995 |
| |
| |
| |
|
| Net Asset Value Per Share ($) | | 13.77 | | 13.70 | | 13.79 |
See notes to financial statements.
The Fund 17
| STATEMENT OF OPERATIONS |
| Year Ended October 31, 2007 |
| Investment Income ($): | | |
| Income: | | |
| Interest | | 223,650 |
| Dividends; | | |
| Affiliated issuers | | 5,538 |
| Income from securities lending | | 685 |
| Total Income | | 229,873 |
| Expenses: | | |
| Management fee—Note 3(a) | | 36,533 |
| Registration fees | | 60,358 |
| Auditing fees | | 26,748 |
| Custodian fees—Note 3(d) | | 18,376 |
| Distribution fees—Note 3(c) | | 17,502 |
| Shareholder servicing costs—Note 3(d) | | 14,187 |
| Prospectus and shareholders’ reports | | 8,898 |
| Legal fees | | 4,649 |
| Trustees’ fees and expenses—Note 3(b) | | 2,570 |
| Loan commitment fees—Note 2 | | 18 |
| Miscellaneous | | 28,028 |
| Total Expenses | | 217,867 |
| Less-expense reimbursement from The Dreyfus | | |
| Corporation due to undertaking—Note 3(a) | | (136,461) |
| Less-reduction in custody fees due to earnings credits—Note 1(c) | | (310) |
| Net Expenses | | 81,096 |
| Investment Income-Net | | 148,777 |
| |
|
| Realized and Unrealized Gain (Loss) on Investments—Note 4 ($): |
| Net realized gain (loss) on investments and foreign currency transactions | | 122,673 |
| Net realized gain (loss) on options transactions | | 8,605 |
| Net realized gain (loss) on financial futures | | (7,169) |
| Net realized gain (loss) on swap transactions | | 14,238 |
| Net realized gain (loss) on forward currency exchange contracts | | 44,826 |
| Net Realized Gain (Loss) | | 183,173 |
| Net unrealized appreciation (depreciation) on investments, options | | |
| transactions, swap transactions and foreign currency transactions | | |
| (including $2,398 net unrealized appreciation on financial futures) | | 278,724 |
| Net Realized and Unrealized Gain (Loss) on Investments | | 461,897 |
| Net Increase in Net Assets Resulting from Operations | | 610,674 |
See notes to financial statements.
18
STATEMENT OF CHANGES IN NET ASSETS
| | | Year Ended October 31, |
| |
|
| | | 2007a | | 2006b |
| |
| |
|
| Operations ($): | | | | |
| Investment income—net | | 148,777 | | 89,127 |
| Net realized gain (loss) on investments | | 183,173 | | 70,176 |
| Net unrealized appreciation | | | | |
| (depreciation) on investments | | 278,724 | | 114,821 |
| Net Increase (Decrease) in Net Assets | | | | |
| Resulting from Operations | | 610,674 | | 274,124 |
| |
| |
|
| Dividends to Shareholders from ($): | | | | |
| Investment income—net: | | | | |
| Class A shares | | (96,020) | | (23,904) |
| Class C shares | | (79,801) | | (14,104) |
| Class I shares | | (48,327) | | (13,259) |
| Net realized gain on investments: | | | | |
| Class A shares | | (4,794) | | — |
| Class C shares | | (4,568) | | — |
| Class I shares | | (2,369) | | — |
| Total Dividends | | (235,879) | | (51,267) |
| |
| |
|
| Beneficial Interest Transactions ($): | | | | |
| Net proceeds from shares sold: | | | | |
| Class A shares | | 1,127,533 | | 2,182,434 |
| Class C shares | | 319,124 | | 2,111,556 |
| Class I shares | | 137,920 | | 1,098,900 |
| Dividends reinvested: | | | | |
| Class A shares | | 96,169 | | 23,437 |
| Class C shares | | 79,786 | | 14,104 |
| Class I shares | | 46,582 | | 13,001 |
| Cost of shares redeemed: | | | | |
| Class A shares | | (257,314) | | (3,004) |
| Class C shares | | (10,776) | | (26) |
| Class I shares | | (21,241) | | — |
| Increase (Decrease) in Net Assets | | | | |
| from Beneficial Interest Transactions | | 1,517,783 | | 5,440,402 |
| Total Increase (Decrease) in Net Assets | | 1,892,578 | | 5,663,259 |
| |
| |
|
| Net Assets ($): | | | | |
| Beginning of Period | | 5,663,259 | | — |
| End of Period | | 7,555,837 | | 5,663,259 |
| Undistributed investment income—net | | 71,472 | | 97,495 |
The Fund 19
STATEMENT OF CHANGES IN NET ASSETS (continued)
| | | Year Ended October 31, |
| |
|
| | | 2007a | | 2006b |
| |
| |
|
| Capital Share Transactions: | | | | |
| Class A | | | | |
| Shares sold | | 85,817 | | 174,228 |
| Shares issued for dividends reinvested | | 7,491 | | 1,827 |
| Shares redeemed | | (20,124) | | (234) |
| Net Increase (Decrease) in Shares Outstanding | | 73,184 | | 175,821 |
| |
| |
|
| Class C | | | | |
| Shares sold | | 24,399 | | 168,666 |
| Shares issued for dividends reinvested | | 6,222 | | 1,100 |
| Shares redeemed | | (852) | | (2) |
| Net Increase (Decrease) in Shares Outstanding | | 29,769 | | 169,764 |
| |
| |
|
| Class I | | | | |
| Shares sold | | 10,347 | | 87,695 |
| Shares issued for dividends reinvested | | 3,625 | | 1,014 |
| Shares redeemed | | (1,686) | | — |
| Net Increase (Decrease) in Shares Outstanding | | 12,286 | | 88,709 |
| a | | Effective June 1, 2007, the fund redesignated Class R shares to Class I shares. |
| b | | From December 30, 2005 (commencement of operations) to October 31, 2006. |
| See notes to financial statements. |
20
FINANCIAL HIGHLIGHTS
The following tables describe the performance for each share class for the fiscal periods indicated.All information (except portfolio turnover rate) reflects financial results for a single fund share.Total return shows how much your investment in the fund would have increased (or decreased) during each period, assuming you had reinvested all dividends and distributions.These figures have been derived from the fund’s financial statements.
| | | Year Ended October 31, |
| |
|
| Class A Shares | | 2007 | | 2006a |
| |
| |
|
| Per Share Data ($): | | | | |
| Net asset value, beginning of period | | 13.05 | | 12.50 |
| Investment Operations: | | | | |
| Investment income—net b | | .35 | | .24 |
| Net realized and unrealized gain (loss) on investments | | .92 | | .45 |
| Total from Investment Operations | | 1.27 | | .69 |
| Distributions: | | | | |
| Dividends from investment income—net | | (.52) | | (.14) |
| Dividends from net realized gain on investments | | (.03) | | — |
| Total Distributions | | (.55) | | (.14) |
| Net asset value, end of period | | 13.77 | | 13.05 |
| |
| |
|
| Total Return (%) c | | 10.06 | | 5.58d |
| |
| |
|
| Ratios/Supplemental Data (%): | | | | |
| Ratio of total expenses to average net assets | | 3.33 | | 4.98e,f |
| Ratio of net expenses to average net assets | | 1.09 | | 1.01e |
| Ratio of net investment income to average net assets | | 2.69 | | 2.29e |
| Portfolio Turnover Rate | | 127.97g | | 105.86d |
| |
| |
|
| Net Assets, end of period ($ x 1,000) | | 3,429 | | 2,294 |
| a From December 30, 2005 (commencement of operations) to October 31, 2006. |
| b Based on average shares outstanding at each month end. |
| c Exclusive of sales charge. |
| d Not annualized. |
| e Annualized. |
| f The fund’s expense ratio net of earnings credits for Class A was 4.91%. |
| g The portfolio turnover rate excluding mortgage dollar roll transactions for the period ended October 31, 2007 was |
| 116.54%. |
| See notes to financial statements. |
The Fund 21
FINANCIAL HIGHLIGHTS (continued)
| | | Year Ended October 31, |
| |
|
| Class C Shares | | 2007 | | 2006a |
| |
| |
|
| Per Share Data ($): | | | | |
| Net asset value, beginning of period | | 13.02 | | 12.50 |
| Investment Operations: | | | | |
| Investment income—net b | | .25 | | .16 |
| Net realized and unrealized gain (loss) on investments | | .92 | | .45 |
| Total from Investment Operations | | 1.17 | | .61 |
| Distributions: | | | | |
| Dividends from investment income—net | | (.46) | | (.09) |
| Dividends from net realized gain on investments | | (.03) | | — |
| Total Distributions | | (.49) | | (.09) |
| Net asset value, end of period | | 13.70 | | 13.02 |
| |
| |
|
| Total Return (%) c | | 9.25 | | 4.88d |
| |
| |
|
| Ratios/Supplemental Data (%): | | | | |
| Ratio of total expenses to average net assets | | 4.09 | | 5.72e,f |
| Ratio of net expenses to average net assets | | 1.84 | | 1.76e |
| Ratio of net investment income to average net assets | | 1.93 | | 1.53e |
| Portfolio Turnover Rate | | 127.97g | | 105.86d |
| |
| |
|
| Net Assets, end of period ($ x 1,000) | | 2,734 | | 2,211 |
| a From December 30, 2005 (commencement of operations) to October 31, 2006. |
| b Based on average shares outstanding at each month end. |
| c Exclusive of sales charge. |
| d Not annualized. |
| e Annualized. |
| f The fund’s expense ratio net earnings credits for Class C was 5.64%. |
| g The portfolio turnover rate excluding mortgage dollar roll transactions for the period ended October 31, 2007 was |
| 116.54%. |
| See notes to financial statements. |
22
| | | Year Ended October 31, |
| |
|
| Class I Shares | | 2007a | | 2006b |
| |
| |
|
| Per Share Data ($): | | | | |
| Net asset value, beginning of period | | 13.06 | | 12.50 |
| Investment Operations: | | | | |
| Investment income—net c | | .38 | | .27 |
| Net realized and unrealized gain (loss) on investments | | .92 | | .45 |
| Total from Investment Operations | | 1.30 | | .72 |
| Distributions: | | | | |
| Dividends from investment income—net | | (.54) | | (.16) |
| Dividends from net realized gain on investments | | (.03) | | — |
| Total Distributions | | (.57) | | (.16) |
| Net asset value, end of period | | 13.79 | | 13.06 |
| |
| |
|
| Total Return (%) | | 10.30 | | 5.80d |
| |
| |
|
| Ratios/Supplemental Data (%): | | | | |
| Ratio of total expenses to average net assets | | 3.09 | | 4.74e,f |
| Ratio of net expenses to average net assets | | .84 | | .76e |
| Ratio of net investment income to average net assets | | 2.93 | | 2.53e |
| Portfolio Turnover Rate | | 127.97g | | 105.86d |
| |
| |
|
| Net Assets, end of period ($ x 1,000) | | 1,393 | | 1,158 |
| a Effective June 1, 2007, the fund redesignated Class R shares to Class I shares. |
| b From December 30, 2005 (commencement of operations) to October 31, 2006. |
| c Based on average shares outstanding at each month end. |
| d Not annualized. |
| e Annualized. |
| f The fund’s expense ratio net of earnings credits for Class I was 4.67%. |
| g The portfolio turnover rate excluding mortgage dollar roll transactions for the period ended October 31, 2007 |
| was 116.54%. |
| See notes to financial statements. |
The Fund 23
NOTES TO FINANCIAL STATEMENTS
NOTE 1—Significant Accounting Policies:
Dreyfus Premier International Bond Fund (the “fund”) is a separate diversified series of The Dreyfus/Laurel Funds Trust (the “Trust”) which is registered under the Investment Company Act of 1940, as amended (the “Act”), as an open-end management investment company and operates as a series company currently offering eight series, including the fund.The fund’s investment objective seeks to maximize total return, consisting of capital appreciation and current income.The Dreyfus Corporation (the “Manager” or “Dreyfus”) serves as the fund’s investment adviser.
On July 1,2007,Mellon Financial Corporation (“Mellon Financial”) and The Bank of New York Company, Inc. merged, forming The Bank of New York Mellon Corporation (“BNY Mellon”). As part of this transaction, Dreyfus became a wholly-owned subsidiary of BNY Mellon.
The fund’s Board of Trustees approved the redesignation of the fund’s Class R shares as Class I shares, effective June 1, 2007.The description of the eligibility requirements for Class I shares remains the same as it was for Class R shares.
MBSC Securities Corporation (the “Distributor”), a wholly-owned subsidiary of the Manager, is the Distributor of the fund’s shares.The fund is authorized to issue an unlimited number of shares of Beneficial Interest in each of the following classes of shares: Class A, Class C and Class I. Class A and Class C shares are sold primarily to retail investors through financial intermediaries and bear a distribution fee and/or service fee. Class A shares are sold with a front-end sales charge, while Class C shares are subject to a contingent deferred sales charge (“CDSC”). Class I shares are sold primarily to bank trust departments and other financial service providers (including Mellon Bank, N.A. and its affiliates) acting on behalf of customers having a qualified trust or investment account or relationship at such institution, and bear no distribution or service fees. Class I shares are offered without a front-end sales charge or CDSC. Each class of shares has identical rights and privileges, except with respect to distribution and service fees and
24
voting rights on matters affecting a single class. Income, expenses (other than expenses attributable to a specific class), and realized and unrealized gains or losses on investments are allocated to each class of shares based on its relative net assets.
As of October 31, 2007, MBC Investments Corp., an indirect subsidiary of BNY Mellon, held 168,766 of Class A, 167,266 of Class C and 84,628 of Class I shares of the fund.
The fund’s financial statements are prepared in accordance with U.S. generally accepted accounting principles, which may require the use of management estimates and assumptions. Actual results could differ from those estimates.
(a) Portfolio valuation: Investments in securities excluding short-term investments (other than U.S.Treasury Bills), options, swaps and forward currency exchange contracts are valued each business day by an independent pricing service (the “Service”) approved by the Board of Trustees. Investments for which quoted bid prices are readily available and are representative of the bid side of the market in the judgment of the Service are valued at the mean between the quoted bid prices (as obtained by the Service from dealers in such securities) and asked prices (as calculated by the Service based upon its evaluation of the market for such securities). Other investments (which constitute a majority of the portfolio securities) are valued as determined by the Service, based on methods which include consideration of: yields or prices of securities of comparable quality, coupon, maturity and type; indications as to values from dealers; and general market conditions. Securities for which there are no such valuations are valued at fair value as determined in good faith under the direction of the Board of Trustees. Restricted securities, as well as securities or other assets for which recent market quotations are not readily available and are not valued by a pricing service approved by the Board of Trustees, or are determined by the fund not to reflect accurately fair value, are valued at fair value as determined in good faith under the direction of the Board of Trustees.The factors that may be considered when fair valuing a security include fundamen-
The Fund 25
NOTES TO FINANCIAL STATEMENTS (continued)
tal analytical data, the nature and duration of restrictions on disposition, an evaluation of the forces that influence the market in which the securities are purchased and sold and public trading in similar securities of the issuer or comparable issuers. Short-term investments, excluding U.S.Treasury Bills, are carried at amortized cost, which approximates value. Registered open-ended investment companies that are not traded on an exchange are valued at their net asset value. Financial futures and options, which are traded on an exchange, are valued at the last sales price on the securities exchange on which such securities are primarily traded or at the last sales price on the national securities market on each business day. Options traded over-the-counter are priced at the mean between the bid and asked price. Investments in swap transactions are valued each business day by a pricing service approved by the Board of Trustees. Swaps are valued by the Service by using a swap pricing model which incorporates among other factors, default probabilities, recovery rates, credit curves of the underlying issuer and swap spreads on interest rates. Investments denominated in foreign currencies are translated to U.S. dollars at the prevailing rates of exchange. Forward currency exchange contracts are valued at the forward rate.
The Financial Accounting Standards Board (“FASB”) released Statement of Financial Accounting Standards No. 157 “Fair Value Measurements” (“FAS 157”). FAS 157 establishes an authoritative definition of fair value, sets out a framework for measuring fair value, and requires additional disclosures about fair-value measurements.The application of FAS 157 is required for fiscal years beginning after November 15,2007 and interim periods within those fiscal years.Management does not believe that the application of this standard will have a material impact on the financial statements of the fund.
(b) Foreign currency transactions: The fund does not isolate that portion of the results of operations resulting from changes in foreign exchange rates on investments from the fluctuations arising from changes in the market prices of securities held. Such fluctuations are included with the net realized and unrealized gain or loss on investments.
26
Net realized foreign exchange gains or losses arise from sales and maturities of short-term securities, sales of foreign currencies, currency gains or losses realized on securities transactions and the difference between the amounts of dividends, interest and foreign withholding taxes recorded on the fund’s books and the U.S. dollar equivalent of the amounts actually received or paid. Net unrealized foreign exchange gains and losses arise from changes in the value of assets and liabilities other than investments in securities, resulting from changes in exchange rates. Such gains and losses are included with net realized and unrealized gain or loss on investments.
(c) Securities transactions and investment income: Securities transactions are recorded on a trade date basis. Realized gains and losses from securities transactions are recorded on the identified cost basis. Dividend income is recognized on the ex-dividend date and interest income, including, where applicable, accretion of discount and amortization of premium on investments, is recognized on the accrual basis.
The fund has an arrangement with the custodian bank whereby the fund receives earnings credits from the custodian when positive cash balances are maintained, which are used to offset custody fees. For financial reporting purposes, the fund includes net earnings credits as an expense offset in the Statement of Operations.
Pursuant to a securities lending agreement with Mellon Bank, N.A. (“Mellon Bank”), an affiliate of the Manager, the fund may lend securities to qualified institutions. It is the fund’s policy, that at origination, all loans are secured by collateral of at least 102% of the value of U.S. securities loaned and 105% of the value of foreign securities loaned. Collateral equivalent to at least 100% of the market value of securities on loan is maintained at all times. Cash collateral is invested in certain money market mutual funds managed by the Manager. The fund is entitled to receive all income on securities loaned, in addition to income earned as a result of the lending transaction. Although each security loaned is fully collateralized, the fund bears the risk of delay
The Fund 27
NOTES TO FINANCIAL STATEMENTS (continued)
in recovery of, or loss of rights in, the securities loaned should a borrower fail to return the securities in a timely manner. During the period ended October 31, 2007. Mellon Bank earned $369, pursuant to the securities lending agreement.
(d) Affiliated issuers: Investments in other investment companies advised by the Manager are defined as “affiliated” in the Act.
(e) Concentration of Risk: The fund invests primarily in debt securities. Failure of an issuer of the debt securities to make timely interest or principal payments, or a decline or the perception of a decline in the credit quality of a debt security, can cause the debt security’s price to fall, potentially lowering the fund’s share price. In addition, the value of debt securities may decline due to general market conditions that are not specifically related to a particular company, such as real or perceived adverse economic conditions, changes in outlook for corporate earnings, changes in interest or currency rates or adverse investor sentiment.They may also decline because of factors that affect a particular industry.
(f) Dividends to shareholders: It is the policy of the fund to declare and pay dividends from investment income-net, quarterly. Dividends from net realized capital gains, if any, are normally declared and paid annually, but the fund may make distributions on a more frequent basis to comply with the distribution requirements of the Internal Revenue Code of 1986, as amended (the “Code”).To the extent that net realized capital gains can be offset by capital loss carryovers, if any, it is the policy of the fund not to distribute such gains. Income and capital gain distributions are determined in accordance with income tax regulations, which may differ from U.S. generally accepted accounting principles.
On October 31, 2007, the Board of Trustees declared a cash dividend of $.087, $.061 and $.093 per share from undistributed investment income-net for Class A, Class C and Class I shares, respectively, payable on November 1, 2007 (ex-dividend date), to shareholders of record as of the close of business on October 31, 2007.
28
(g) Federal income taxes: It is the policy of the fund to continue to qualify as a regulated investment company, if such qualification is in the best interests of its shareholders, by complying with the applicable provisions of the Code, and to make distributions of taxable income sufficient to relieve it from substantially all federal income and excise taxes.
The FASB released FASB Interpretation No. 48 “Accounting for Uncertainty in Income Taxes” (FIN 48). FIN 48 provides guidance for how uncertain tax positions should be recognized, measured, presented and disclosed in the financial statements. FIN 48 requires the evaluation of tax positions taken or expected to be taken in the course of preparing the fund’s tax returns to determine whether the tax positions are “more-likely-than-not” of being sustained by the applicable tax authority. Tax positions not deemed to meet the more-likely-than-not threshold would be recorded as a tax benefit or expense in the current year.Adoption of FIN 48 is required for fiscal years beginning after December 15,2006 and is to be applied to all open tax years as of the effective date. Management does not believe that the application of this standard will have a material impact on the financial statements of the fund.
At October 31, 2007, the components of accumulated earnings on a tax basis were as follows: undistributed ordinary income $233,779, undistributed capital gains $112,833 and unrealized appreciation $251,040.
The tax characters of distributions paid to shareholders during the fiscal periods ended October 31, 2007 and October 31, 2006, were as follows: ordinary income $225,963 and $51,267 and long term capital gains $9,916 and $0, respectively.
During the period ended October 31, 2007, as a result of permanent book tax differences, primarily due to tax treatment for amortization of premiums, foreign currency transactions and treatment of swap periodic payments, the fund increased accumulated undistributed investment income-net by $49,348 and decreased accumulated net realized gain (loss) on investments by the same amount. Net assets and net asset value per share were not affected by this reclassification.
The Fund 29
NOTES TO FINANCIAL STATEMENTS (continued)
NOTE 2—Bank Line of Credit:
The fund participates with other Dreyfus-managed funds in a $350 million redemption credit facility (the “Facility”) to be utilized for temporary or emergency purposes, including the financing of redemptions. In connection therewith, the fund has agreed to pay commitment fees on its pro rata portion of the Facility. Interest is charged to the fund based on prevailing market rates in effect at the time of borrowing. During the period ended October 31, 2007, the fund did not borrow under the Facility.
NOTE 3—Investment Management Fee and Other Transactions with Affiliates:
(a) Pursuant to an Investment Management agreement between the Manager and the Trust, the Trust has agreed to pay the Manager a management fee computed at the annual rate of .60% of the value of the fund’s average daily net assets and is payable monthly.The Manager has contractually agreed to waive receipt of its fees and/or assume certain expenses of the fund, until October 31, 2008, so the expenses, exclusive of taxes, brokerage fees, Rule 12b-1 distribution plan fees, shareholder services plan fees, interest expense, commitment fees and extraordinary expenses, do not exceed an annual rate of .85% of the value of the fund’s average daily net assets. The expense reimbursement, pursuant to the undertaking, amounted to $136,461 during the period ended October 31, 2007.
(b) Each Trustee receives $45,000 per year, plus $6,000 for each joint Board meeting of The Dreyfus/Laurel Funds, Inc.,The Trust and The Dreyfus/Laurel Tax-Free Municipal Funds, (collectively, the “Dreyfus/Laurel Funds”) attended, $2,000 for separate in-person committee meetings attended which are not held in conjunction with a regularly scheduled Board meeting and $1,500 for Board meetings and separate committee meetings attended that are conducted by telephone and is reimbursed for travel and out-of-pocket expenses.With respect to Board meetings, the Chairman of the Board receives an
30
additional 25% of such compensation (with the exception of reimbursable amounts). With respect to compensation committee meetings, the Chair of the compensation committee receives $900 per meeting and, with respect to audit committee meetings, the Chair of the audit committee receives $1,350 per meeting. In the event that there is an in-person joint committee meeting of the Dreyfus/Laurel Funds and Dreyfus High Yield Strategies Fund, the $2,000 or $1,500 fee, as applicable, will be allocated between the Dreyfus/Laurel Funds and Dreyfus High Yield Strategies Fund. These fees and expenses are charged and allocated to each series based on net assets.
(c) Under the Distribution Plan (the “Plan”) adopted pursuant to Rule 12b-1 under the Act, Class C shares pay the Distributor for distributing their shares at an annual rate of .75% of the value of the average daily net assets of Class C shares. During the period ended October 31, 2007, Class C shares were charged $17,502 pursuant to the Plan.
(d) Under the Shareholder Services Plan, Class A and Class C shares pay the Distributor at an annual rate of .25% of the value of their average daily net assets for the provision of certain services.The services provided may include personal services relating to shareholder accounts, such as answering shareholder inquiries regarding the fund and providing reports and other information, and services related to the maintenance of shareholder accounts.The Distributor may make payments to Service Agents (a securities dealer, financial institution or other industry professional) in respect of these services. The Distributor determines the amounts to be paid to Service Agents. During the period ended October 31, 2007, Class A and Class C shares were charged $6,405 and $5,834, respectively, pursuant to the Shareholder Services Plan.
The Fund 31
NOTES TO FINANCIAL STATEMENTS (continued)
Under its terms, the Plan and Shareholder Services Plan shall remain in effect from year to year, provided such continuance is approved annually by a vote of a majority of those Trustees who are not “interested persons” of the Trust and who have no direct or indirect financial interest in the operation of or in any agreement related to the Plan or Shareholder Services Plan.
The fund compensates Dreyfus Transfer, Inc., a wholly-owned subsidiary of the Manager, under a transfer agency agreement for providing personnel and facilities to perform transfer agency services for the fund. During the period ended October 31, 2007, the fund was charged $1,952 pursuant to the transfer agency agreement.
The fund compensates Mellon Bank, an affiliate of the Manager, under a custody agreement for providing custodial services for the fund. During the period ended October 31, 2007, the fund was charged $18,376 pursuant to the custody agreement.
During the period ended October 31, 2007 the fund was charged $4,660 for services performed by the Chief Compliance Officer.
The components of “Due to The Dreyfus Corporation and affiliates” in the Statement of Assets and Liabilities consist of: management fees $3,661, Rule 12b-1 distribution plan fees $1,696, service plan fees $1,235, custody fees $7,077, chief compliance officer fees $2,812 and transfer agency per account fees $48 which are offset against an expense reimbursement currently in effect in the amount of $3,486.
NOTE 4—Securities Transactions:
The aggregate amount of purchases and sales (including paydowns) of investment securities, excluding short-term securities, forward currency exchange contracts, financial futures, options transactions and swap transactions during the period ended October 31, 2007, amounted to $8,746,615 and $7,374,785,respectively,of which $657,934 in purchases and $658,672 in sales were from mortgage dollar roll transactions.
A mortgage dollar roll transaction involves a sale by the fund of mortgage related securities that it holds with an agreement by the fund to
32
repurchase similar securities at an agreed upon price and date. The securities purchased will bear the same interest rate as those sold, but generally will be collateralized by pools of mortgages with different prepayment histories than those securities sold.
The fund may purchase and write (sell) call/put options in order to gain exposure to or protect against change in the market.
As a writer of call options, the fund receives a premium at the outset and then bears the market risk of unfavorable changes in the price of the financial instruments underlying the options. Generally, the fund would incur a gain, to the extent of the premium, if the price of the underlying financial instrument decreases between the date the option is written and the date on which the option is terminated. Generally, the fund would realize a loss, if the price of the financial instrument increases between those dates.
As a writer of put options, the fund receives a premium at the outset and then bears the market risk of unfavorable changes in the price of the financial instruments underlying the options. Generally, the fund would incur a gain, to the extent of the premium, if the price of the underlying financial instrument increases between the date the option is written and the date on which the option is terminated. Generally, the fund would realize a loss, if the price of the financial instrument decreases between those dates.
In addition, the following table summarizes the fund’s call/put options written during the period ended October 31, 2007:
| | | Face Amount | | | | Options Terminated |
| | | | | |
|
| | | Covered by | | Premiums | | | | Net Realized |
| Options Written: | | Contracts ($) | | Received ($) | | Cost ($) | | Gain/(Loss) ($) |
| |
| |
| |
| |
|
| Contracts outstanding | | | | | | | | |
| October 31, 2006 | | 10,000,000 | | 1,650 | | | | |
| Contracts written | | 2,020,000 | | 2,000 | | | | |
| Contracts terminated: | | | | | | | | |
| Closed | | 1,720,000 | | 1,445 | | 1,806 | | (361) |
| Expired | | 10,300,000 | | 2,205 | | | | 2,205 |
| Contracts outstanding | | | | | | |
| October 31, 2007 | | — | | — | | | | |
The Fund 33
NOTES TO FINANCIAL STATEMENTS (continued)
The fund enters into forward currency exchange contracts to gain exposure to foreign currency, hedge its exposure against changes in exchange rates on its foreign portfolio holdings and to settle foreign currency transactions. When executing forward currency exchange contracts, the fund is obligated to buy or sell a foreign currency at a specified rate on a certain date in the future. With respect to sales of forward currency exchange contracts, the fund would incur a loss if the value of the contract increases between the date the forward contract is opened and the date the forward contract is closed.The fund realizes a gain if the value of the contract decreases between those dates. With respect to purchases of forward currency exchange contracts, the fund would incur a loss if the value of the contract decreases between the date the forward contract is opened and the date the forward contract is closed.The fund realizes a gain if the value of the contract increases between those dates.The fund is also exposed to credit risk associated with counterparty nonperformance on these forward currency exchange contracts which is typically limited to the unrealized gain on each open contract.The following summarizes open forward currency exchange contracts at October 31, 2007:
| | | Foreign | | | | | | Unrealized |
| Forward Currency | | Currency | | | | | | Appreciation |
| Exchange Contracts | | Amounts | | Cost ($) | | Value ($) | | (Depreciation) ($) |
| |
| |
| |
| |
|
| Purchases: | | | | | | | | |
| Australian Dollar, | | | | | | | | |
| Expiring | | | | | | | | |
| 12/19/2007 | | 241,295 | | 201,630 | | 224,284 | | 22,654 |
| Brazilian Real, | | | | | | | | |
| Expiring | | | | | | | | |
| 11/6/2007 | | 60,000 | | 32,877 | | 34,554 | | 1,677 |
| Canadian Dollar, | | | | | | | | |
| Expiring | | | | | | | | |
| 12/19/2007 | | 220,000 | | 213,640 | | 232,435 | | 18,795 |
| Columbian Peso, | | | | | | | | |
| Expiring | | | | | | | | |
| 11/6/2007 | | 66,000,000 | | 32,869 | | 33,254 | | 385 |
| Euro | | | | | | | | |
| Expiring | | | | | | | | |
| 12/19/2007 | | 1,480,000 | | 2,073,214 | | 2,144,816 | | 71,602 |
34
| | | Foreign | | | | | | Unrealized |
| Forward Currency | | Currency | | | | | | Appreciation |
| Exchange Contracts | | Amounts | | Cost ($) | | Value ($) | | (Depreciation) ($) |
| |
| |
| |
| |
|
| Purchases (continued): | | | | | | |
| Hungary Forint, | | | | | | | | |
| Expiring | | | | | | | | |
| 11/6/2007 | | 6,000,000 | | 33,727 | | 34,628 | | 901 |
| Indonesian Rupiah, | | | | | | |
| Expiring | | | | | | | | |
| 12/19/2007 | | 326,000,000 | | 35,628 | | 35,637 | | 9 |
| Japanese Yen, | | | | | | | | |
| Expiring | | | | | | | | |
| 12/19/2007 | | 90,565,000 | | 800,495 | | 789,747 | | (10,748) |
| Norwegian Krone, | | | | | | | | |
| Expiring | | | | | | | | |
| 12/19/2007 | | 700,000 | | 124,220 | | 130,272 | | 6,052 |
| Polish Zloty, | | | | | | | | |
| Expiring | | | | | | | | |
| 12/19/2007 | | 90,000 | | 35,740 | | 35,978 | | 238 |
| Russian Ruble, | | | | | | | | |
| Expiring | | | | | | | | |
| 12/24/2007 | | 3,210,000 | | 127,881 | | 130,013 | | 2,132 |
| Saudi Arabia Riyal, | | | | | | |
| Expiring | | | | | | | | |
| 3/25/2008 | | 240,000 | | 64,326 | | 64,256 | | (70) |
| South African Rand, | | | | | | |
| Expiring | | | | | | | | |
| 11/6/2007 | | 230,000 | | 33,178 | | 35,310 | | 2,132 |
| Swedish Krona, | | | | | | | | |
| Expiring | | | | | | | | |
| 12/19/2007 | | 375,320 | | 54,516 | | 59,106 | | 4,590 |
| Turkish Lira, | | | | | | | | |
| Expiring | | | | | | | | |
| 11/6/2007 | | 40,000 | | 32,771 | | 34,127 | | 1,356 |
| Sales: | | | | | | | | |
| Euro, | | | | | | | | |
| Expiring | | | | | | | | |
| 12/19/2007 | | 154,757 | | 215,696 | | 224,273 | | (8,577) |
| British Pounds, | | | | | | | | |
| Expiring | | | | | | | | |
| 12/19/2007 | | 505,000 | | 1,023,152 | | 1,048,721 | | (25,569) |
| Mexican New Peso, | | | | | | |
| Expiring | | | | | | | | |
| 12/19/2007 | | 890,000 | | 79,717 | | 83,019 | | (3,302) |
The Fund 35
NOTES TO FINANCIAL STATEMENTS (continued)
| | | Foreign | | | | | | Unrealized |
| Forward Currency | | Currency | | | | | | Appreciation |
| Exchange Contracts | | Amounts | | Cost ($) | | Value ($) | | (Depreciation) ($) |
| |
| |
| |
| |
|
| Sales (continued): | | | | | | | | |
| New Zealand Dollar, | | | | | | |
| Expiring | | | | | | | | |
| 12/19/2007 | | 270,000 | | 192,305 | | 207,279 | | (14,974) |
| Swedish Krona, | | | | | | | | |
| Expiring | | | | | | | | |
| 12/19/2007 | | 60,000 | | 9,027 | | 9,449 | | (422) |
| Total | | | | | | | | 68,861 |
The fund may enter into swap agreements to exchange the interest rate on, or return generated by, one nominal instrument for the return generated by another nominal instrument.
The fund accrues for the interim payments on swap contracts on a daily basis, with the net amount recorded within unrealized appreciation (depreciation) of swap contracts in the Statement of Assets and Liabilities. Once the interim payments are settled in cash, the net amount is recorded as realized gain (loss) on swaps, in addition to realized gain (loss) recorded upon the termination of swaps contracts in the Statement of Operations. Fluctuations in the value of swap contracts are recorded as a component of net change in unrealized appreciation (depreciation) on investments.
The fund may enter into interest rate swaps which involve the exchange of commitments to pay and receive interest based on a notional principal amount. The following summarizes interest rate swaps entered into by the fund at October 31, 2007:
| | | | | | | | | | | Unrealized |
| Notional | | Reference | | | | (Pay)/Receive | | | | Appreciation |
| Amount ($) | | Entity/Currency | | Counterparty | | Fixed Rate (%) Expiration (Depreciation)($) |
| |
| |
| |
|
| |
| 900,000 | | USD—3 Month | | JP Morgan | | | | | | |
| | | Libor | | Chase | | 4.90 | | 8/24/2009 | | 3,592 |
| 220,000 | | EUR—6 Month | | JP Morgan | | | | | | |
| | | Euribor | | Chase | | (4.16) | | 1/19/2012 | | (2,209) |
| 33,000,000 | | JPY—6 Month | | JP Morgan | | | | | | |
| | | Yenibor | | Chase | | 1.36 | | 1/19/2012 | | 2,240 |
| 56,000,000 | | JPY—6 Month | | | | | | | | |
| | | Yenibor | | UBS | | .88 | | 5/11/2008 | | (79) |
| 11,000,000 | | JPY—6 Month | | | | | | | | |
| | | Yenibor | | UBS | | 2.51 | | 6/6/2026 | | 3,927 |
36
| | | | | | | | | | | Unrealized |
| Notional | | Reference | | | | (Pay)/Receive | | Appreciation |
| Amount ($) | | Entity/Currency | | Counterparty | | Fixed Rate (%) Expiration (Depreciation)($) |
| |
| |
| |
|
| |
| 27,000,000 | | JPY—6 Month | | JP Morgan | | | | | | |
| | | Yenibor | | Chase | | 2.08 | | 7/28/2016 | | 8,582 |
| 2,000,000 | | JPY—6 Month | | JP Morgan | | | | | | |
| | | Yenibor | | Chase | | 2.69 | | 7/28/2036 | | 654 |
| 91,188 | | MYR—6 Month | | JP Morgan | | | | | | |
| | | Kilbor | | Chase | | 4.16 | | 10/31/2011 | | 224 |
| 370,000 | | NZD—6 Month | | JP Morgan | | | | | | |
| | | Libor | | Chase | | 7.88 | | 5/18/2010 | | 1,164 |
| 120,000 | | NZD—3 Month | | JP Morgan | | | | | | |
| | | Libor | | Chase | | 8.05 | | 6/21/2012 | | 1,310 |
| 920,000 | | THB—6 Month | | JP Morgan | | | | | | |
| | | Bibor | | Chase | | 5.18 | | 11/2/2011 | | 890 |
| | | | | | | | | | | 20,295 |
Credit default swaps involve commitments to pay or receive a fixed interest rate in exchange for payment if a credit event affecting a third party (the referenced company) occurs. Credit events may include a failure to pay interest or principal, bankruptcy, or restructuring. For those credit default swaps in which the fund is receiving a fixed rate, the fund is providing credit protection on the underlying instrument. The maximum payouts for these contracts are limited to the notional amount of each swap. The following summarizes open credit default swap agreements at October 31, 2007:
| | | | | | | | | | | Unrealized |
| Notional | | Reference | | | | (Pay)/Receive | | Appreciation |
| Amount ($) | | Entity | | Counterparty | | Fixed Rate (%) Expiration (Depreciation)($) |
| |
| |
| |
|
| |
| 40,000 | | AT&T, 5.1%, | | JP Morgan | | | | | | |
| | | 9/15/2014 | | Chase | | (.49) | | 3/20/2017 | | (178) |
| 30,000 | | AT&T, 5.1%, | | JP Morgan | | | | | | |
| | | 9/15/2014 | | Chase | | (.44) | | 3/20/2017 | | (20) |
| 90,000 | | Autozone, 5.875%, | | Goldman, | | | | | | |
| | | 10/15/2012 | | Sachs & Co. | | (.62) | | 6/20/2012 | | (258) |
| 55,000 | | Block Financial, | | JP Morgan | | | | | | |
| 5.125%, 10/30/2014 | | Chase | | (1.90) | | 9/20/2012 | | (113) |
| 200,000 | | CMBX 2007-3 | | JP Morgan | | | | | | |
| | | AAA Index | | Chase | | (.08) | | 12/13/2049 | | (1,358) |
| 100,000 | | CMBX 2007-3 | | JP Morgan | | | | | | |
| | | AAA Index | | Chase | | (.08) | | 12/13/2049 | | 447 |
| 100,000 | | Dow Jones | | JP Morgan | | | | | | |
| | | CDX.NA.H4 Index | | Chase | | (2.75) | | 6/20/2012 | | (3,924) |
| 50,000 | | Dow Jones | | Goldman, | | | | | | |
| | | CDX.NA.IG.8 Index | | Sachs & Co. | | (2.75) | | 6/20/2012 | | (1,126) |
The Fund 37
NOTES TO FINANCIAL STATEMENTS (continued)
| | | | | | | | | | | Unrealized |
| Notional | | Reference | | | | (Pay)/Receive | | Appreciation |
| Amount ($) | | Entity | | Counterparty | | Fixed Rate (%) Expiration (Depreciation)($) |
| |
| |
| |
|
| |
| 50,000 | | Dow Jones | | JP Morgan | | | | | | |
| | | CDX.NA.IG.8 Index | | Chase | | (2.75) | | 6/20/2012 | | (534) |
| 130,000 | | Dow Jones | | JP Morgan | | | | | | |
| | | CDX.NA.H4 Index | | Chase | | (3.75) | | 12/20/2007 | | 696 |
| 360,000 | | iTraxx Europe | | JP Morgan | | | | | | |
| | | Series 5 | | Chase | | (.45) | | 12/20/2007 | | 603 |
| 35,000 | | MBIA, 6.625%, | | | | | | | | |
| | | 10/1/2028 | | Deutsche Bank | | 2.48 | | 12/20/2008 | | (420) |
| 30,000 | | Republic of the | | | | | | | | |
| Philippines, 10.625%, | | JP Morgan | | | | | | |
| | | 3/16/2025 | | Chase | | (2.48) | | 9/20/2017 | | (1,297) |
| 30,000 | | Russian Federation, | | JP Morgan | | | | | | |
| | | 7.5%, 3/31/2030 | | Chase | | .67 | | 8/20/2012 | | 16 |
| 60,000 | | Russian Federation, | | JP Morgan | | | | | | |
| | | 7.5%, 3/31/2030 | | Chase | | .80 | | 8/20/2012 | | 378 |
| Total | | | | | | | | | | (7,088) |
Risks may arise upon entering into these agreements from the potential inability of the counterparties to meet the terms of the agreement and are generally limited to the amount of net payments to be received, if any, at the date of default.
At October 31, 2007, the cost of investments for federal income tax purposes was $7,580,473; accordingly, accumulated net unrealized appreciation on investments was $302,112, consisting of $318,652 gross unrealized appreciation and $16,540 gross unrealized depreciation.
38
| REPORT OF INDEPENDENT REGISTERED |
| PUBLIC ACCOUNTING FIRM |
| The Board of Trustees and Shareholders of |
| The Dreyfus/Laurel Funds Trust: |
We have audited the accompanying statement of assets and liabilities of Dreyfus Premier International Bond Fund (the “Fund”) of The Dreyfus/Laurel Funds Trust, including the statements of investments and financial futures, as of October 31, 2007, and the related operations for the year then ended, the statement of changes in net assets and the financial highlights for the year then ended and for the period from December 30, 2005 (commencement of operations) to October 31, 2006. These financial statements and financial highlights are the responsibility of the Fund’s management. Our responsibility is to express an opinion on these financial statements and financial highlights based on our audits.
We conducted our audits in accordance with the standards of the Public Company Accounting Oversight Board (United States).Those standards require that we plan and perform the audit to obtain reasonable assurance about whether the financial statements and financial highlights are free of material misstatement. An audit includes examining, on a test basis, evidence supporting the amounts and disclosures in the financial statements. Our procedures included confirmation of securities owned as of October 31, 2007, by correspondence with the custodian and brokers or by other appropriate auditing procedures where replies from brokers were not received.An audit also includes assessing the accounting principles used and significant estimates made by management, as well as evaluating the overall financial statement presentation.We believe that our audits provide a reasonable basis for our opinion.
In our opinion, the financial statements and financial highlights referred to above present fairly, in all material respects, the financial position of Dreyfus Premier International Bond Fund of The Dreyfus/Laurel Funds Trust as of October 31, 2007, and the results of its operations for the year then ended, the changes in its net assets and the financial highlights for the year then ended and for the period from December 30, 2005 to October 31, 2006, in conformity with U.S. generally accepted accounting principles.

| New York, New York |
| December 20, 2007 |
The Fund 39
IMPORTANT TAX INFORMATION ( U n a u d i t e d )
For federal tax purposes the fund hereby designates 28.68% of ordinary income dividends paid during the fiscal year ended October 31, 2007 as qualifying “interest related dividends”. Also, the fund hereby designates $.0224 per share as a long-term capital gain distribution and $.0041 per share as a short-term capital gain distribution paid on December 28, 2006.
40
BOARD MEMBERS INFORMATION (Unaudited)
| Joseph S. DiMartino (64) |
| Chairman of the Board (1999) |
| Principal Occupation During Past 5 Years: |
| • Corporate Director and Trustee |
Other Board Memberships and Affiliations:
- The Muscular Dystrophy Association, Director
- Century Business Services, Inc., a provider of outsourcing functions for small and medium size companies, Director
- The Newark Group, a provider of a national market of paper recovery facilities, paperboard mills and paperboard converting plants, Director
- Sunair Services Corporation, a provider of certain outdoor-related services to homes and businesses, Director
No. of Portfolios for which Board Member Serves: 165 ———————
| James M. Fitzgibbons (73) |
| Board Member (1994) |
| Principal Occupation During Past 5 Years: |
| • Chairman of the Board, Davidson Cotton Company (1998-2002) |
| Other Board Memberships and Affiliations: |
| • Bill Barrett Company, an oil and gas exploration company, Director |
No. of Portfolios for which Board Member Serves: 26 ———————
| J. Tomlinson Fort (79) |
| Board Member (1987) |
Principal Occupation During Past 5 Years:
- Retired (2005-present)
- Of Counsel, Reed Smith LLP (1998-2005)
Other Board Memberships and Affiliations:
- Allegheny College, Emeritus Trustee
- Pittsburgh Ballet Theatre,Trustee
- American College of Trial Lawyers, Fellow
No. of Portfolios for which Board Member Serves: 26 ———————
| Kenneth A. Himmel (61) |
| Board Member (1988) |
Principal Occupation During Past 5 Years:
- President and CEO,Related Urban Development,a real estate development company (1996-present)
- President and CEO, Himmel & Company, a real estate development company (1980-present)
- CEO, American Food Management, a restaurant company (1983-present)
No. of Portfolios for which Board Member Serves: 26
The Fund 41
BOARD MEMBERS INFORMATION (Unaudited) (continued)
| Stephen J. Lockwood (60) |
| Board Member (1993) |
Principal Occupation During Past 5 Years:
- Chairman of the Board, Stephen J. Lockwood and Company LLC, an investment company (2000-present)
No. of Portfolios for which Board Member Serves: 26 ———————
| Roslyn M. Watson (58) |
| Board Member (1992) |
| Principal Occupation During Past 5 Years: |
| • Principal,Watson Ventures, Inc., a real estate investment company (1993-present) |
Other Board Memberships and Affiliations:
- American Express Bank, Director
- The Hyams Foundation Inc., a Massachusetts Charitable Foundation,Trustee
- National Osteoporosis Foundation,Trustee
No. of Portfolios for which Board Member Serves: 26 ———————
| Benaree Pratt Wiley (61) |
| Board Member (1998) |
Principal Occupation During Past 5 Years:
- Principal,The Wiley Group, a firm specializing in strategy and business development (2005-present)
- President and CEO,The Partnership, an organization dedicated to increasing the representa- tion of African Americans in positions of leadership, influence and decision-making in Boston, MA (1991-2005)
Other Board Memberships and Affiliations:
- Boston College,Trustee
- Blue Cross Blue Shield of Massachusetts, Director
- Commonwealth Institute, Director
- Efficacy Institute, Director
- PepsiCo African-American, Advisory Board
- The Boston Foundation, Director
- Harvard Business School Alumni Board, Director
No. of Portfolios for which Board Member Serves: 36 ———————
Once elected all Board Members serve for an indefinite term, but achieve Emeritus status upon reaching age 80.The address of the Board Members and Officers is in c/o The Dreyfus Corporation, 200 Park Avenue, New York, New York 10166. Additional information about the Board Members is available in the fund’s Statement of Additional Information which can be obtained from Dreyfus free of charge by calling this toll free number: 1-800-554-4611.
Francis P. Brennan, Emeritus Board Member
42
OFFICERS OF THE FUND ( U n a u d i t e d )
| J. DAVID OFFICER, President since |
| December 2006. |
Chief Operating Officer,Vice Chairman and a Director of the Manager, and an officer of 82 investment companies (comprised of 165 portfolios) managed by the Manager. He is 59 years old and has been an employee of the Manager since April 1998.
| PHILLIP N. MAISANO, Executive Vice |
| President since July 2007. |
Chief Investment Officer,Vice Chair and a director of the Manager, and an officer of 82 investment companies (comprised of 165 portfolios) managed by the Manager. Mr. Maisano also is an officer and/or Board member of certain other investment management subsidiaries of The Bank of New York Mellon Corporation, each of which is an affiliate of the Manager. He is 60 years old and has been an employee of the Manager since November 2006. Prior to joining the Manager, Mr. Maisano served as Chairman and Chief Executive Officer of EACM Advisors, an affiliate of the Manager, since August 2004, and served as Chief Executive Officer of Evaluation Associates, a leading institutional investment consulting firm, from 1988 until 2004.
| MICHAEL A. ROSENBERG, Vice President |
| and Secretary since August 2005. |
Associate General Counsel of the Manager, and an officer of 83 investment companies (comprised of 182 portfolios) managed by the Manager. He is 47 years old and has been an employee of the Manager since October 1991.
| JAMES BITETTO, Vice President and |
| Assistant Secretary since August 2005. |
Associate General Counsel and Secretary of the Manager, and an officer of 83 investment companies (comprised of 182 portfolios) managed by the Manager. He is 41 years old and has been an employee of the Manager since December 1996.
| JONI LACKS CHARATAN, Vice President |
| and Assistant Secretary since |
| August 2005. |
Associate General Counsel of the Manager, and an officer of 83 investment companies (comprised of 182 portfolios) managed by the Manager. She is 51 years old and has been an employee of the Manager since October 1988.
| JOSEPH M. CHIOFFI, Vice President and |
| Assistant Secretary since August 2005. |
Associate General Counsel of the Manager, and an officer of 83 investment companies (comprised of 182 portfolios) managed by the Manager. He is 45 years old and has been an employee of the Manager since June 2000.
| JANETTE E. FARRAGHER, Vice President |
| and Assistant Secretary since |
| August 2005. |
Associate General Counsel of the Manager, and an officer of 83 investment companies (comprised of 182 portfolios) managed by the Manager. She is 44 years old and has been an employee of the Manager since February 1984.
| JOHN B. HAMMALIAN, Vice President and |
| Assistant Secretary since August 2005. |
Associate General Counsel of the Manager, and an officer of 83 investment companies (comprised of 182 portfolios) managed by the Manager. He is 44 years old and has been an employee of the Manager since February 1991.
| ROBERT R. MULLERY, Vice President and |
| Assistant Secretary since August 2005. |
Associate General Counsel of the Manager, and an officer of 83 investment companies (comprised of 182 portfolios) managed by the Manager. He is 55 years old and has been an employee of the Manager since May 1986.
The Fund 43
OFFICERS OF THE FUND (Unaudited) (continued)
| JEFF PRUSNOFSKY, Vice President and |
| Assistant Secretary since August 2005. |
Associate General Counsel of the Manager, and an officer of 83 investment companies (comprised of 182 portfolios) managed by the Manager. He is 42 years old and has been an employee of the Manager since October 1990.
| JAMES WINDELS, Treasurer since |
| November 2001. |
Director – Mutual Fund Accounting of the Manager, and an officer of 83 investment companies (comprised of 182 portfolios) managed by the Manager. He is 49 years old and has been an employee of the Manager since April 1985.
| ROBERT ROBOL, Assistant Treasurer |
| since December 2002. |
Senior Accounting Manager – Money Market and Municipal Bond Funds of the Manager, and an officer of 83 investment companies (comprised of 182 portfolios) managed by the Manager. He is 43 years old and has been an employee of the Manager since October 1988.
| ROBERT SALVIOLO, Assistant Treasurer |
| since July 2007. |
Senior Accounting Manager – Equity Funds of the Manager, and an officer of 83 investment companies (comprised of 182 portfolios) managed by the Manager. He is 40 years old and has been an employee of the Manager since June 1989.
| ROBERT SVAGNA, Assistant Treasurer |
| since December 2002. |
Senior Accounting Manager – Equity Funds of the Manager, and an officer of 83 investment companies (comprised of 182 portfolios) managed by the Manager. He is 40 years old and has been an employee of the Manager since November 1990.
| GAVIN C. REILLY, Assistant Treasurer |
| since December 2005. |
Tax Manager of the Investment Accounting and Support Department of the Manager, and an officer of 83 investment companies (comprised of 182 portfolios) managed by the Manager. He is 39 years old and has been an employee of the Manager since April 1991.
| JOSEPH W. CONNOLLY, Chief Compliance |
| Officer since October 2004. |
Chief Compliance Officer of the Manager and The Dreyfus Family of Funds (83 investment companies, comprised of 182 portfolios). From November 2001 through March 2004, Mr. Connolly was first Vice-President, Mutual Fund Servicing for Mellon Global Securities Services. In that capacity, Mr. Connolly was responsible for managing Mellon’s Custody, Fund Accounting and Fund Administration services to third-party mutual fund clients. He is 50 years old and has served in various capacities with the Manager since 1980, including manager of the firm’s Fund Accounting Department from 1997 through October 2001.
| WILLIAM GERMENIS, Anti-Money |
| Laundering Compliance Officer since |
| July 2002. |
Vice President and Anti-Money Laundering Compliance Officer of the Distributor, and the Anti-Money Laundering Compliance Officer of 79 investment companies (comprised of 178 portfolios) managed by the Manager. He is 37 years old and has been an employee of the Distributor since October 1998.
44
For More Information
Telephone Call your financial representative or 1-800-554-4611
| Mail | | The Dreyfus Premier Family of Funds |
| | | 144 Glenn Curtiss Boulevard, Uniondale, NY 11556-0144 |
The fund files its complete schedule of portfolio holdings with the Securities and Exchange Commission (“SEC”) for the first and third quarters of each fiscal year on Form N-Q. The fund’s Forms N-Q are available on the SEC’s website at http://www.sec.gov and may be reviewed and copied at the SEC’s Public Reference Room in Washington, DC. Information on the operation of the Public Reference Room may be obtained by calling 1-202-551-8090.
A description of the policies and procedures that the fund uses to determine how to vote proxies relating to portfolio securities, and information regarding how the fund voted these proxies for the 12-month period ended June 30, 2007, is available at http://www.dreyfus.com and on the SEC’s website at http://www.sec.gov. The description of the policies and procedures is also available without charge, upon request, by calling 1-800-645-6561.

© 2007 MBSC Securities Corporation
Item 2. Code of Ethics.
The Registrant has adopted a code of ethics that applies to the Registrant's principal executive officer, principal financial officer, principal accounting officer or controller, or persons performing similar functions There have been no amendments to, or waivers in connection with, the Code of Ethics during the period covered by this Report.
Item 3. Audit Committee Financial Expert.
The Registrant's Board has determined that Joseph S. DiMartino, a member of the Audit Committee of the Board, is an audit committee financial expert as defined by the Securities and Exchange Commission (the "SEC"). Joseph S. DiMartino is "independent" as defined by the SEC for purposes of audit committee financial expert determinations.
Item 4. Principal Accountant Fees and Services.
(a) Audit Fees. The aggregate fees billed for each of the last two fiscal years (the "Reporting Periods") for professional services rendered by the Registrant's principal accountant (the "Auditor") for the audit of the Registrant's annual financial statements, or services that are normally provided by the Auditor in connection with the statutory and regulatory filings or engagements for the Reporting Periods, were $32,180 in 2006 and $93,605 in 2007.
(b) Audit-Related Fees. The aggregate fees billed in the Reporting Periods for assurance and related services by the Auditor that are reasonably related to the performance of the audit of the Registrant's financial statements and are not reported under paragraph (a) of this Item 4 were $3,970 in 2006 and $4,090 in 2007. These services consisted of security counts required by Rule 17f-2 under the Investment Company Act of 1940, as amended.
The aggregate fees billed in the Reporting Periods for non-audit assurance and related services by the Auditor to the Registrant's investment adviser (not including any sub-investment adviser whose role is primarily portfolio management and is subcontracted with or overseen by another investment adviser), and any entity controlling, controlled by or under common control with the investment adviser that provides ongoing services to the Registrant ("Service Affiliates"), that were reasonably related to the performance of the annual audit of the Service Affiliate, which required pre-approval by the Audit Committee were $0 in 2006 and $0 in 2007.
Note: For the second paragraph in each of (b) through (d) of this Item 4, certain of such services were not pre-approved prior to May 6, 2003, when such services were required to be pre-approved. On and after May 6, 2003, 100% of all services provided by the Auditor were pre-approved as required. For comparative purposes, the fees shown assume that all such services were pre-approved, including services that were not pre-approved prior to the compliance date of the pre-approval requirement.
(c) Tax Fees. The aggregate fees billed in the Reporting Periods for professional services rendered by the Auditor for tax compliance, tax advice and tax planning ("Tax Services") were $0 in 2006 and $2,090 in 2007. These services consisted of review or preparation of U.S. federal, state, local and excise tax returns.
The aggregate fees billed in the Reporting Periods for Tax Services by the Auditor to Service Affiliates which required pre-approval by the Audit Committee were $0 in 2006 and $0 in 2007.
(d) All Other Fees. The aggregate fees billed in the Reporting Periods for products and services provided by the Auditor, other than the services reported in paragraphs (a) through (c) of this Item, were $0 in 2006 and $0 in 2007.
The aggregate fees billed in the Reporting Periods for Non-Audit Services by the Auditor to Service Affiliates, other than the services reported in paragraphs (b) through (c) of this Item, which required pre-approval by the Audit Committee were $0 in 2006 and $0 in 2007.
Audit Committee Pre-Approval Policies and Procedures. The Registrant's Audit Committee has established policies and procedures (the "Policy") for pre-approval (within specified fee limits) of the Auditor's engagements for non-audit services to the Registrant and Service Affiliates without specific case-by-case consideration. Pre-approval considerations include whether the proposed services are compatible with maintaining the Auditor's independence. Pre-approvals pursuant to the Policy are considered annually.
Non-Audit Fees. The aggregate non-audit fees billed by the Auditor for services rendered to the Registrant, and rendered to Service Affiliates, for the Reporting Periods were $2,762,100 in 2006 and $2,455,000 in 2007.
Auditor Independence. The Registrant's Audit Committee has considered whether the provision of non-audit services that were rendered to Service Affiliates which were not pre-approved (not requiring pre-approval) is compatible with maintaining the Auditor's independence.
| Item 5. | | Audit Committee of Listed Registrants. |
| | | Not applicable. |
| Item 6. | | Schedule of Investments. |
| | | Not applicable. |
| Item 7. | | Disclosure of Proxy Voting Policies and Procedures for Closed-End Management |
| | | Investment Companies. |
| | | Not applicable. |
| Item 8. | | Portfolio Managers of Closed-End Management Investment Companies. |
| | | Not applicable |
| Item 9. | | Purchases of Equity Securities by Closed-End Management Investment Companies and |
| | | Affiliated Purchasers. |
| | | Not applicable. |
| Item 10. | | Submission of Matters to a Vote of Security Holders. |
The Registrant has a Nominating Committee (the "Committee"), which is responsible for selecting and nominating persons for election or appointment by the Registrant's Board as Board members. The Committee has adopted a Nominating Committee Charter (the "Charter"). Pursuant to the Charter, the Committee will
consider recommendations for nominees from shareholders submitted to the Secretary of the Registrant, c/o The Dreyfus Corporation Legal Department, 200 Park Avenue, 8th Floor East, New York, New York 10166. A nomination submission must include information regarding the recommended nominee as specified in the Charter. This information includes all information relating to a recommended nominee that is required to be disclosed in solicitations or proxy statements for the election of Board members, as well as information sufficient to evaluate the factors to be considered by the Committee, including character and integrity, business and professional experience, and whether the person has the ability to apply sound and independent business judgment and would act in the interests of the Registrant and its shareholders. Nomination submissions are required to be accompanied by a written consent of the individual to stand for election if nominated by the Board and to serve if elected by the shareholders, and such additional information must be provided regarding the recommended nominee as reasonably requested by the Committee.
Item 11. Controls and Procedures.
(a) The Registrant's principal executive and principal financial officers have concluded, based on their evaluation of the Registrant's disclosure controls and procedures as of a date within 90 days of the filing date of this report, that the Registrant's disclosure controls and procedures are reasonably designed to ensure that information required to be disclosed by the Registrant on Form N-CSR is recorded, processed, summarized and reported within the required time periods and that information required to be disclosed by the Registrant in the reports that it files or submits on Form N-CSR is accumulated and communicated to the Registrant's management, including its principal executive and principal financial officers, as appropriate to allow timely decisions regarding required disclosure.
(b) There were no changes to the Registrant's internal control over financial reporting that occurred during the second fiscal quarter of the period covered by this report that have materially affected, or are reasonably likely to materially affect, the Registrant's internal control over financial reporting.
Item 12. Exhibits.
| (a)(1) | | Code of ethics referred to in Item 2. |
| (a)(2) | | Certifications of principal executive and principal financial officers as required by Rule 30a-2(a) |
| under the Investment Company Act of 1940. |
| (a)(3) | | Not applicable. |
| (b) | | Certification of principal executive and principal financial officers as required by Rule 30a-2(b) |
| under the Investment Company Act of 1940. |
Pursuant to the requirements of the Securities Exchange Act of 1934 and the Investment Company Act of 1940, the Registrant has duly caused this Report to be signed on its behalf by the undersigned, thereunto duly authorized.
The Dreyfus/Laurel Funds Trust
| By: | | /s/ J. David Officer |
| | | J. David Officer |
| | | President |
| |
| Date: | | December 18, 2007 |
| |
| Pursuant to the requirements of the Securities Exchange Act of 1934 and the Investment Company Act of |
| 1940, this Report has been signed below by the following persons on behalf of the Registrant and in the |
| capacities and on the dates indicated. |
| |
| By: | | /s/ J. David Officer |
| | | J. David Officer |
| | | President |
| |
| Date: | | December 18, 2007 |
| |
| By: | | /s/ James Windels |
| | | James Windels |
| | | Treasurer |
| |
| Date: | | December 18, 2007 |
| |
| EXHIBIT INDEX |
| |
| | | (a)(1) | | Code of ethics referred to in Item 2. |
| |
| | | (a)(2) | | Certifications of principal executive and principal financial officers as required by Rule 30a- |
| | | 2(a) under the Investment Company Act of 1940. (EX-99.CERT) |
| |
| | | (b) | | Certification of principal executive and principal financial officers as required by Rule 30a- |
| | | 2(b) under the Investment Company Act of 1940. (EX-99.906CERT) |
Exhibit (a)(1)