| UNITED STATES |
| SECURITIES AND EXCHANGE COMMISSION |
| Washington, D.C. 20549 |
FORM N-CSR
| CERTIFIED SHAREHOLDER REPORT OF REGISTERED MANAGEMENT |
| INVESTMENT COMPANIES |
| Investment Company Act file number | | 811-524 |
| The Dreyfus/Laurel Funds Trust |
| (Exact name of Registrant as specified in charter) |
| c/o The Dreyfus Corporation |
| 200 Park Avenue |
| New York, New York 10166 |
| (Address of principal executive offices) | | (Zip code) |
| Michael A. Rosenberg, Esq. |
| 200 Park Avenue |
| New York, New York 10166 |
| (Name and address of agent for service) |
| Registrant's telephone number, including area code: | | (212) 922-6000 |
| Date of fiscal year end: | | 12/31 |
| Date of reporting period: | | 12/31/2007 |
The following N-CSR relates only to the Registrant’s series listed below and does not affect the other series of the Registrant, which have different fiscal year ends and, therefore, different N-CSR reporting requirements. Separate N-CSR Forms will be filed for these series, as appropriate.
Dreyfus Premier Core Value Fund
Dreyfus Premier Limited Term High Yield Fund
Dreyfus Premier Managed Income Fund
|
| Item 1. | | Reports to Stockholders. |
Save time. Save paper. View your next shareholder report online as soon as it’s available. Log into www.dreyfus.com and sign up for Dreyfus eCommunications. It’s simple and only takes a few minutes.
The views expressed in this report reflect those of the portfolio manager only through the end of the period covered and do not necessarily represent the views of Dreyfus or any other person in the Dreyfus organization. Any such views are subject to change at any time based upon market or other conditions and Dreyfus disclaims any responsibility to update such views.These views may not be relied on as investment advice and, because investment decisions for a Dreyfus fund are based on numerous factors, may not be relied on as an indication of trading intent on behalf of any Dreyfus fund.
Not FDIC-Insured • Not Bank-Guaranteed • May Lose Value
| Contents |
| |
| | | THE FUND |
| |
|
| 2 | | A Letter from the CEO |
| 3 | | Discussion of Fund Performance |
| 6 | | Fund Performance |
| 8 | | Understanding Your Fund’s Expenses |
| 8 | | Comparing Your Fund’s Expenses |
| With Those of Other Funds |
| 9 | | Statement of Investments |
| 14 | | Statement of Assets and Liabilities |
| 15 | | Statement of Operations |
| 16 | | Statement of Changes in Net Assets |
| 19 | | Financial Highlights |
| 25 | | Notes to Financial Statements |
| 33 | | Report of Independent Registered |
| | | Public Accounting Firm |
| 34 | | Important Tax Information |
| 35 | | Board Members Information |
| 37 | | Officers of the Fund |
| |
| FOR MORE INFORMATION |
|
| | | Back Cover |
The Fund
| Dreyfus Premier |
| Core Value Fund |

A LETTER FROM THE CEO
Dear Shareholder:
We are pleased to present this annual report for Dreyfus Premier Core Value Fund, covering the 12-month period from January 1, 2007, through December 31, 2007.
Looking back, 2007 was a year of significant change for the stock market.Turmoil in the sub-prime mortgage market, declining housing values and soaring energy prices sparked a “flight to quality” in which investors reassessed their attitudes toward risk.As a result, smaller, more speculative companies that had led the stock market over the past several years lost value over the second half of the year, while shares of larger, multinational growth companies returned to favor. Many financial services and consumer discretionary companies were hurt by repercussions from the sub-prime lending crisis and economic downturn, but energy and basic materials producers generally moved higher along with underlying commodity prices.
The turbulence of 2007 reinforced a central principle of successful investing: diversification. Investors with broad exposure to the world’s stock and bond markets were better protected from the full impact of market volatility in areas that, earlier in the year, were among the bright spots at the time. As we look ahead, we believe that now is the perfect time to meet with your financial advisor, who can help you plan and diversify your investment portfolio in a way that manages the potential opportunities and risks that may continue to arise in 2008.
For information about how the fund performed during the reporting period, as well as market perspectives, we have provided a Discussion of Fund Performance given by the fund’s Portfolio Manager.
Thank you for your continued confidence and support.
| Thomas F. Eggers |
| Chief Executive Officer |
| The Dreyfus Corporation |
| January 15, 2008 |
2

DISCUSSION OF FUND PERFORMANCE
For the period of January 1, 2007, through December 31, 2007, as provided by Brian Ferguson, Portfolio Manager
Fund and Market Performance Overview
After posting moderate gains over the first half of 2007, stocks generally declined over the second half in response to slowing U.S. economic growth and a credit crisis emanating from the subprime mortgage sector of the bond market. While value-oriented stocks were hit particularly hard as investors reassessed their attitudes toward risk, the fund posted a positive absolute return for the reporting period overall, outperforming its benchmark on the strength of its stock selection strategy in nine of 10 market sectors represented in the benchmark.
For the 12-month period ended December 31, 2007, Dreyfus Premier Core Value Fund’s Class A shares produced a total return of 2.75%, Class B shares returned 2.01%, Class C shares returned 2.00%, Class I shares returned 3.04%, Class T shares returned 2.49% and Institutional shares returned 2.89% .1 In comparison, the fund’s benchmark, the Russell 1000 Value Index, produced a total return of –0.17% for the same period.2
The Fund’s Investment Approach
The fund invests primarily in large-cap companies that are considered undervalued based on traditional measures, such as price-to-earnings ratios. When choosing stocks, we use a “bottom-up” stock selection approach, focusing on individual companies, rather than a “top-down” approach that forecasts market trends.We also focus on a company’s relative value, financial strength, business momentum and likely catalysts that could ignite the stock price.
Market Volatility Produced Divergent Sector Returns
After a relatively long period of stability that lasted through midyear, U.S. stocks generally declined over the final six months of 2007 due mainly to declining housing prices, soaring energy costs and a credit crunch that began in the subprime mortgage market. These factors
The Fund 3
DISCUSSION OF FUND PERFORMANCE (continued)
dampened U.S. economic growth, which, by year-end, many analysts feared might slip into a recession.The Federal Reserve Board attempted to promote greater market liquidity and forestall a potential recession by making cash available to the banking system and reducing the overnight federal funds rate three times between September and December. Still, newly risk-averse investors punished stocks that they regarded as unlikely to sustain earnings growth during an economic downturn.
These developments led to widely disparate returns across market sectors, as energy and materials stocks advanced strongly due to rising commodity prices while the financials sector was hard-hit by subprime-related losses. In this environment, the fund outperformed the benchmark in nine of 10 market sectors. Our security selection strategy produced above-average results in eight of those areas, while our sector allocation strategy helped boost returns in the financials sector. Only the materials sector slightly lagged its counterpart within the Russell 1000 Value Index.
Utilities, Consumer and Technology Shares Supported Fund Returns
Our stock selection strategy produced particularly strong relative performance among utilities stocks, where we focused on unregulated power producers, such as Constellation Energy Group and NRG Energy, that had greater pricing power as demand for energy outpaced supply. In the consumer discretionary area, we eliminated the fund’s position in cable television operator Comcast early in the year, enabling the fund to avoid further weakness stemming from intensifying competitive pressures. Positions in certain discount retailers, such as The TJX Companies, also helped protect the fund from the brunt of the industry group’s decline. Our security selection strategy in the information technology sector identified some of the area’s top performers. Computer hardware maker Hewlett-Packard cut costs and gained market share after installing a new management team, and software giant Microsoft benefited from positive product cycles in its operating systems and gaming platform businesses.
While the fund’s financial holdings outperformed the benchmark’s financials component, the area nonetheless was a drag on absolute
returns. Especially hard-hit were companies with direct or indirect exposure to troubled U.S. housing markets, such as mortgage insurer PMI Group, which we considered attractively priced compared to its book value. However, we eliminated or trimmed the fund’s positions in housing-related stocks as the market declined, helping to avoid further deterioration.The materials sector was the only area in which the fund lagged the benchmark, primarily due to its underweighted exposure. We had regarded most materials companies as too richly valued.
Finding Value in a Challenging Market Environment
Heightened market volatility sometimes can produce investment opportunities among fundamentally sound companies that have been punished too severely by skittish investors. While we have begun to identify such opportunities, we have been cautious in taking advantage of them as negative investor sentiment may fuel further near-term price declines in some sectors. Instead, we have focused on several long-term, secular themes that we believe will produce gains in 2008 for participating companies.Themes include more demand for agricultural driven businesses, pricing power for electric utilities, the positive effects of political advertising spending on media companies and investments in U.S. financial companies by sovereign wealth funds. In our judgment, identifying the beneficiaries of these and other long-term themes may position the fund well for the long term.
January 15, 2008
| 1 | | Total return includes reinvestment of dividends and any capital gains paid, and does not take into |
| | | consideration the maximum initial sales charges in the case of Class A and Class T shares or the |
| | | applicable contingent deferred sales charges imposed on redemptions in the case of Class B and |
| | | Class C shares. Had these charges been reflected, returns would have been lower. Past performance |
| | | is no guarantee of future results. Share price and investment return fluctuate such that upon |
| | | redemption, fund shares may be worth more or less than their original cost. |
| 2 | | SOURCE: LIPPER INC. — Reflects the reinvestment of dividends and, where applicable, |
| | | capital gain distributions.The Russell 1000 Value Index is an unmanaged index, which measures |
| | | the performance of those Russell 1000 companies with lower price-to-book ratios and lower |
| | | forecasted growth values. |
The Fund 5
FUND PERFORMANCE
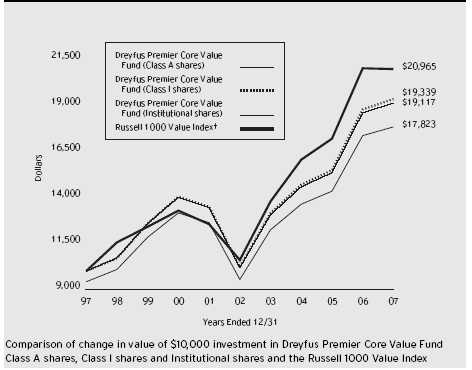
| † Source: Lipper Inc. |
| Past performance is not predictive of future performance. |
| The above graph compares a $10,000 investment made in Class A shares, Institutional shares and Class I shares of |
| Dreyfus Premier Core Value Fund on 12/31/97 to a $10,000 investment made in the Russell 1000 Value Index |
| (the “Index”) on that date. All dividends and capital gain distributions are reinvested. Performance for Class B, Class C |
| and Class T shares will vary from the performance of Class A, Institutional and Class I shares shown above due to |
| differences in charges and expenses. |
| The fund’s performance shown in the line graph takes into account the maximum initial sales charge on Class A shares |
| and all other applicable fees and expenses for Class A shares, Institutional shares and Class I shares.The Index is an |
| unmanaged index, which measures the performance of those Russell 1000 companies with lower price-to-book ratios and |
| lower forecasted growth values. Unlike a mutual fund, the Index is not subject to charges, fees and other expenses. Investors |
| cannot invest directly in any index. Further information relating to fund performance, including expense reimbursements, if |
| applicable, is contained in the Financial Highlights section of the prospectus and elsewhere in this report. |
6
| Average Annual Total Returns as of 12/31/07 | | | | |
| |
| | | Inception | | | | | | |
| | | Date | | 1 Year | | 5 Years | | 10 Years |
| |
| |
| |
| |
|
| Class A shares | | | | | | | | |
| with maximum sales charge (5.75%) | | | | (3.15)% | | 11.95% | | 5.95% |
| without sales charge | | | | 2.75% | | 13.29% | | 6.58% |
| Class B shares | | | | | | | | |
| with applicable redemption charge † | | 1/16/98 | | (1.72)% | | 12.22% | | 6.10%††,†††† |
| without redemption | | 1/16/98 | | 2.01% | | 12.47% | | 6.10%††,†††† |
| Class C shares | | | | | | | | |
| with applicable redemption charge ††† | | 1/16/98 | | 1.07% | | 12.46% | | 5.79%†††† |
| without redemption | | 1/16/98 | | 2.00% | | 12.46% | | 5.79%†††† |
| Class I shares | | | | 3.04% | | 13.58% | | 6.82% |
| Class T shares | | | | | | | | |
| with applicable sales charge (4.5%) | | 8/16/99 | | (2.13)% | | 11.96% | | 5.86%†††† |
| without sales charge | | 8/16/99 | | 2.49% | | 13.00% | | 6.35%†††† |
| Institutional shares | | | | 2.89% | | 13.42% | | 6.69% |
Past performance is not predictive of future performance.The fund’s performance shown in the graph and table does not reflect the deduction of taxes that a shareholder would pay on fund distributions or the redemption of fund shares.
| † | | The maximum contingent deferred sales charge for Class B shares is 4%. After six years Class B shares convert to |
| | | Class A shares. |
| †† | | Assumes the conversion of Class B shares to Class A shares at the end of the sixth year following the date of |
| | | purchase. |
| ††† | | The maximum contingent deferred sales charge for Class C shares is 1% for shares redeemed within one year of |
| | | the date of purchase. |
| †††† | | The total return performance figures presented for Class B, C and T shares of the fund reflect the performance of |
| | | the fund’s Class A shares for periods prior to 1/16/98, 1/16/98 and 8/16/99 (the inception dates for Class B, |
| | | C and T shares) respectively, adjusted to reflect the applicable sales load for that class and the applicable |
| | | distribution/servicing fees thereafter. |
The Fund 7
UNDERSTANDING YOUR FUND’S EXPENSES (Unaudited)
As a mutual fund investor, you pay ongoing expenses, such as management fees and other expenses. Using the information below, you can estimate how these expenses affect your investment and compare them with the expenses of other funds.You also may pay one-time transaction expenses, including sales charges (loads) and redemption fees, which are not shown in this section and would have resulted in higher total expenses. For more information, see your fund’s prospectus or talk to your financial adviser.
Review your fund’s expenses
The table below shows the expenses you would have paid on a $1,000 investment in Dreyfus Premier Core Value Fund from July 1, 2007 to December 31, 2007. It also shows how much a $1,000 investment would be worth at the close of the period, assuming actual returns and expenses.
| Expenses and Value of a $1,000 Investment | | | | | | |
| assuming actual returns for the six months ended December 31, 2007 | | | | |
| | | Class A | | Class B | | Class C | | Class I | | Class T | | Institutional |
| |
| |
| |
| |
| |
| |
|
| Expenses paid | | | | | | | | | | | | |
| per $1,000 † | | $ 5.69 | | $ 9.38 | | $ 9.38 | | $ 4.45 | | $ 6.92 | | $ 5.19 |
| Ending value | | | | | | | | | | | | |
| (after expenses) | | $961.70 | | $958.20 | | $958.20 | | $963.00 | | $960.20 | | $962.50 |
| COMPARING YOUR FUND’S EXPENSES |
| WITH THOSE OF OTHER FUNDS (Unaudited) |
Using the SEC’s method to compare expenses
The Securities and Exchange Commission (SEC) has established guidelines to help investors assess fund expenses. Per these guidelines, the table below shows your fund’s expenses based on a $1,000 investment, assuming a hypothetical 5% annualized return. You can use this information to compare the ongoing expenses (but not transaction expenses or total cost) of investing in the fund with those of other funds.All mutual fund shareholder reports will provide this information to help you make this comparison. Please note that you cannot use this information to estimate your actual ending account balance and expenses paid during the period.
| Expenses and Value of a $1,000 Investment | | | | | | |
| assuming a hypothetical 5% annualized return for the six months ended December 31, 2007 |
| | | Class A | | Class B | | Class C | | Class I | | Class T | | Institutional |
| |
| |
| |
| |
| |
| |
|
| Expenses paid | | | | | | | | | | | | |
| per $1,000 † | | $ 5.85 | | $ 9.65 | | $ 9.65 | | $ 4.58 | | $ 7.12 | | $ 5.35 |
| Ending value | | | | | | | | | | | | |
| (after expenses) | | $1,019.41 | | $1,015.63 | | $1,015.63 | | $1,020.67 | | $1,018.15 | | $1,019.91 |
| † Expenses are equal to the fund’s annualized expense ratio of 1.15% for Class A, 1.90% for Class B, 1.90% for |
| Class C, .90% for Class I, 1.40% for Class T and 1.05% for Institutional multiplied by the average account value |
| over the period, multiplied by 184/365 (to reflect the one-half year period). |
| STATEMENT OF INVESTMENTS |
| December 31, 2007 |
| Common Stocks—100.5% | | Shares | | Value ($) |
| |
| |
|
| Banking—6.3% | | | | |
| Bank of America | | 334,206 | | 13,789,340 |
| Citigroup | | 450,903 | | 13,274,584 |
| U.S. Bancorp | | 151,410 | | 4,805,753 |
| Wachovia | | 170,430 | | 6,481,453 |
| | | | | 38,351,130 |
| Consumer Discretionary—6.9% | | | | |
| Gap | | 170,240 | | 3,622,707 |
| Johnson Controls | | 84,660 | | 3,051,146 |
| Lowe’s Cos. | | 96,340 | | 2,179,212 |
| Macy’s | | 62,820 | | 1,625,153 |
| McDonald’s | | 53,100 | | 3,128,121 |
| News, Cl. A | | 331,430 | | 6,791,001 |
| Omnicom Group | | 147,200 a | | 6,996,416 |
| Royal Caribbean Cruises | | 75,560 a | | 3,206,766 |
| Time Warner | | 165,280 | | 2,728,773 |
| TJX Cos. | | 126,390 | | 3,631,185 |
| Toll Brothers | | 83,700 b | | 1,679,022 |
| Viacom, Cl. B | | 80,780 b | | 3,547,858 |
| | | | | 42,187,360 |
| Consumer Staples—11.0% | | | | |
| Altria Group | | 188,400 | | 14,239,272 |
| Cadbury Schweppes, ADR | | 135,690 | | 6,699,015 |
| Coca-Cola Enterprises | | 124,210 | | 3,233,186 |
| CVS Caremark | | 83,750 a | | 3,329,063 |
| Estee Lauder Cos., Cl. A | | 37,560 | | 1,637,992 |
| Kraft Foods, Cl. A | | 238,334 | | 7,776,838 |
| Molson Coors Brewing, Cl. B | | 58,560 a | | 3,022,867 |
| Procter & Gamble | | 265,530 | | 19,495,213 |
| Wal-Mart Stores | | 98,680 | | 4,690,260 |
| Walgreen | | 80,810 | | 3,077,245 |
| | | | | 67,200,951 |
The Fund 9
STATEMENT OF INVESTMENTS (continued)
| Common Stocks (continued) | | Shares | | | | Value ($) |
| |
| |
| |
|
| Energy—16.5% | | | | | | |
| Anadarko Petroleum | | 38,480 | | | | 2,527,751 |
| Chesapeake Energy | | 88,570a | | | | 3,471,944 |
| Chevron | | 191,800 | | | | 17,900,694 |
| Devon Energy | | 143,300 | | | | 12,740,803 |
| EOG Resources | | 51,670 | | | | 4,611,548 |
| Exxon Mobil | | 226,312 | | | | 21,203,171 |
| Hess | | 50,640 | | | | 5,107,550 |
| Marathon Oil | | 139,320 | | | | 8,479,015 |
| Occidental Petroleum | | 176,190 | | | | 13,564,868 |
| Valero Energy | | 66,310 | | | | 4,643,689 |
| XTO Energy | | 127,800a | | | | 6,563,808 |
| | | | | | | 100,814,841 |
| Exchange Traded Funds—.5% | | | | | | |
| iShares Russell 1000 Value Index Fund | | 38,210 | | | | 3,066,353 |
| Financial—19.7% | | | | | | |
| Aetna | | 60,440 | | | | 3,489,201 |
| American International Group | | 155,763 | | | | 9,080,983 |
| AON | | 77,320 | | | | 3,687,391 |
| Capital One Financial | | 69,420 | | | | 3,280,789 |
| Chubb | | 96,920 | | | | 5,289,894 |
| Fannie Mae | | 102,880 | | | | 4,113,142 |
| Franklin Resources | | 24,970 | | | | 2,857,317 |
| Freddie Mac | | 39,810 | | | | 1,356,327 |
| Genworth Financial, Cl. A | | 117,855a | | | | 2,999,410 |
| Goldman Sachs Group | | 42,560 | | | | 9,152,528 |
| Invesco | | 214,120a | | | | 6,719,086 |
| JPMorgan Chase & Co. | | 332,170 | | | | 14,499,221 |
| Lincoln National | | 91,030 | | | | 5,299,767 |
| Merrill Lynch & Co. | | 128,540 | | | | 6,900,027 |
| MetLife | | 96,760 | | | | 5,962,351 |
| Morgan Stanley | | 82,380 | | | | 4,375,202 |
| Northern Trust | | 60,250 | | | | 4,613,945 |
| PNC Financial Services Group | | 53,510 | | | | 3,512,932 |
10
| Common Stocks (continued) | | Shares | | Value ($) |
| |
| |
|
| Financial (continued) | | | | |
| Principal Financial Group | | 66,830 a | | 4,600,577 |
| Prudential Financial | | 48,370 | | 4,500,345 |
| T. Rowe Price Group | | 60,440 | | 3,679,587 |
| Wells Fargo & Co. | | 346,000 | | 10,445,740 |
| | | | | 120,415,762 |
| Health Care—7.8% | | | | |
| Abbott Laboratories | | 155,100 | | 8,708,865 |
| Amgen | | 87,810 b | | 4,077,896 |
| Baxter International | | 108,800 | | 6,315,840 |
| Covidien | | 75,960 | | 3,364,268 |
| Merck & Co. | | 164,630 | | 9,566,649 |
| Schering-Plough | | 161,720 | | 4,308,221 |
| Thermo Fisher Scientific | | 62,650 a,b | | 3,613,652 |
| Wyeth | | 173,780 | | 7,679,338 |
| | | | | 47,634,729 |
| Industrial—9.3% | | | | |
| Deere & Co. | | 44,850 | | 4,176,432 |
| Dover | | 62,230 | | 2,868,181 |
| Eaton | | 68,950 | | 6,684,703 |
| General Electric | | 622,240 | | 23,066,437 |
| Honeywell International | | 60,690 | | 3,736,683 |
| Lockheed Martin | | 28,000 | | 2,947,280 |
| Raytheon | | 61,140 | | 3,711,198 |
| Tyco International | | 46,700 | | 1,851,655 |
| Union Pacific | | 30,840 | | 3,874,121 |
| Waste Management | | 122,900 | | 4,015,143 |
| | | | | 56,931,833 |
| Information Technology—6.3% | | | | |
| Accenture, Cl. A | | 82,750 | | 2,981,483 |
| Automatic Data Processing | | 80,920 | | 3,603,368 |
| Cisco Systems | | 215,520 b | | 5,834,126 |
| Hewlett-Packard | | 140,020 | | 7,068,210 |
| Intel | | 184,390 | | 4,915,837 |
The Fund 11
STATEMENT OF INVESTMENTS (continued)
| Common Stocks (continued) | | Shares | | Value ($) |
| |
| |
|
| Information Technology (continued) | | |
| Microsoft | | 177,660 | | 6,324,696 |
| NCR | | 79,370 b | | 1,992,187 |
| Teradata | | 82,030 b | | 2,248,442 |
| Tyco Electronics | | 94,010 | | 3,490,591 |
| | | | | 38,458,940 |
| Materials—2.6% | | | | |
| Air Products & Chemicals | | 32,970 | | 3,251,831 |
| Allegheny Technologies | | 32,180 | | 2,780,352 |
| Celanese, Ser. A | | 72,920 | | 3,085,974 |
| Dow Chemical | | 79,270 | | 3,124,823 |
| Freeport-McMoRan Copper & Gold | | 32,400 a | | 3,319,056 |
| | | | | 15,562,036 |
| Telecommunications—6.5% | | | | |
| AT & T | | 639,965 | | 26,596,945 |
| Verizon Communications | | 300,310 | | 13,120,544 |
| | | | | 39,717,489 |
| Utilities—7.1% | | | | |
| Constellation Energy Group | | 61,380 | | 6,293,291 |
| Entergy | | 69,610 | | 8,319,787 |
| Exelon | | 86,495 | | 7,061,452 |
| Mirant | | 100,980 a,b | | 3,936,200 |
| NRG Energy | | 122,930 a,b | | 5,327,786 |
| Questar | | 119,240 | | 6,450,884 |
| Southern | | 161,370 | | 6,253,088 |
| | | | | 43,642,488 |
| Total Common Stocks | | | | |
| (cost $516,108,805) | | | | 613,983,912 |
| |
| |
|
| |
| Other Investment—.4% | | | | |
| |
| |
|
| Registered Investment Company; | | | | |
| Dreyfus Institutional Preferred | | | | |
| Plus Money Market Fund | | | | |
| (cost $2,349,000) | | 2,349,000 c | | 2,349,000 |
12
| Investment of Cash Collateral | | | | |
| for Securities Loaned—5.4% | | Shares | | Value ($) |
| |
| |
|
| Registered Investment Company; | | | | |
| Dreyfus Institutional Cash | | | | |
| Advantage Fund | | | | |
| (cost $32,853,503) | | 32,853,503 c | | 32,853,503 |
| |
| |
|
| |
| Total Investments (cost $551,311,308) | | 106.3% | | 649,186,415 |
| Liabilities, Less Cash and Receivables | | (6.3%) | | (38,596,303) |
| Net Assets | | 100.0% | | 610,590,112 |
| ADR—American Depository Receipts |
| a All or a portion of these securities are on loan. At December 31, 2007, the total market value of the fund’s securities |
| on loan is $33,481,450 and the total market value of the collateral held by the fund is $34,557,835, consisting of |
| cash collateral of $32,853,503 and U.S. Government and agency securities valued at $1,704,332. |
| b Non-income producing security. |
| c Investment in affiliated money market mutual fund. |
| Portfolio Summary (Unaudited) † | | | | |
| |
| | | Value (%) | | | | Value (%) |
| |
| |
| |
|
| Financial | | 19.7 | | Telecommunications | | 6.5 |
| Energy | | 16.5 | | Information Technology | | 6.3 |
| Consumer Staples | | 11.0 | | Banking | | 6.3 |
| Industrial | | 9.3 | | Money Market Investments | | 5.8 |
| Health Care | | 7.8 | | Materials | | 2.6 |
| Utilities | | 7.1 | | Exchange Traded Funds | | .5 |
| Consumer Discretionary | | 6.9 | | | | 106.3 |
| † Based on net assets. |
| See notes to financial statements. |
The Fund 13
| STATEMENT OF ASSETS AND LIABILITIES |
| December 31, 2007 |
| | | Cost | | Value |
| |
| |
|
| Assets ($): | | | | |
| Investments in securities—See Statement | | | | |
| of Investments (including securities on loan, | | |
| valued at $33,481,450)—Note 1(b): | | | | |
| Unaffiliated issuers | | 516,108,805 | | 613,983,912 |
| Affiliated issuers | | 35,202,503 | | 35,202,503 |
| Dividends and interest receivable | | | | 961,308 |
| Receivable for shares of Beneficial Interest subscribed | | 15,075 |
| | | | | 650,162,798 |
| |
| |
|
| Liabilities ($): | | | | |
| Due to The Dreyfus Corporation and affiliates—Note 3(b) | | 654,883 |
| Cash overdraft due to Custodian | | | | 8,707 |
| Liability for securities on loan—Note 1(b) | | | | 32,853,503 |
| Payable for shares of Beneficial Interest redeemed | | 6,052,520 |
| Interest payable—Note 2 | | | | 3,073 |
| | | | | 39,572,686 |
| |
| |
|
| Net Assets ($) | | | | 610,590,112 |
| |
| |
|
| Composition of Net Assets ($): | | | | |
| Paid-in capital | | | | 514,390,469 |
| Accumulated undistributed investment income—net | | 326,082 |
| Accumulated net realized gain (loss) on investments | | (2,001,546) |
| Accumulated net unrealized appreciation | | | | |
| (depreciation) on investments | | | | 97,875,107 |
| |
| |
|
| Net Assets ($) | | | | 610,590,112 |
| Net Asset Value Per Share | | | | | | | | |
| | | Class A | | Class B | | Class C | | Class I | | Class T | | Institutional |
| |
| |
| |
| |
| |
| |
|
| Net Assets ($) | | 522,906,156 | | 26,645,551 | | 16,572,494 | | 1,394,885 | | 2,392,102 | | 40,678,924 |
| Shares | | | | | | | | | | | | |
| Outstanding | | 17,505,764 | | 910,587 | | 566,860 | | 46,730 | | 80,118 | | 1,362,653 |
| |
| |
| |
| |
| |
| |
|
| Net Asset Value | | | | | | | | | | |
| Per Share ($) | | 29.87 | | 29.26 | | 29.24 | | 29.85 | | 29.86 | | 29.85 |
See notes to financial statements.
14
| STATEMENT OF OPERATIONS |
| Year Ended December 31, 2007 |
| Investment Income ($): | | |
| Income: | | |
| Cash dividends (net of $27,609 foreign taxes withheld at source): | | |
| Unaffiliated issuers | | 16,532,320 |
| Affiliated issuers | | 187,902 |
| Interest | | 176,090 |
| Income from securities lending | | 24,291 |
| Total Income | | 16,920,603 |
| Expenses: | | |
| Management fee—Note 3(a) | | 6,004,581 |
| Distribution and service fees—Note 3(b) | | 2,058,798 |
| Directors’ fees and expenses—Note 3(a) | | 45,206 |
| Loan commitment fees—Note 2 | | 5,866 |
| Interest expense—Note 2 | | 3,306 |
| Total Expenses | | 8,117,757 |
| Less—Director fees reimbursed | | |
| by the Manager—Note 3(a) | | (45,206) |
| Net Expenses | | 8,072,551 |
| Investment Income—Net | | 8,848,052 |
| |
|
| Realized and Unrealized Gain (Loss) on Investments—Note 4 ($): |
| Net realized gain (loss) on investments | | 39,344,889 |
| Net unrealized appreciation (depreciation) on investments | | (29,018,064) |
| Net Realized and Unrealized Gain (Loss) on Investments | | 10,326,825 |
| Net Increase in Net Assets Resulting from Operations | | 19,174,877 |
See notes to financial statements.
The Fund 15
STATEMENT OF CHANGES IN NET ASSETS
| | | Year Ended December 31, |
| |
|
| | | 2007a | | 2006 |
| |
| |
|
| Operations ($): | | | | |
| Investment income—net | | 8,848,052 | | 7,466,062 |
| Net realized gain (loss) on investments | | 39,344,889 | | 85,435,127 |
| Net unrealized appreciation | | | | |
| (depreciation) on investments | | (29,018,064) | | 35,507,648 |
| Net Increase (Decrease) in Net Assets | | |
| Resulting from Operations | | 19,174,877 | | 128,408,837 |
| |
| |
|
| Dividends to Shareholders from ($): | | | | |
| Investment income—net: | | | | |
| Class A shares | | (7,810,838) | | (6,116,596) |
| Class B shares | | (254,740) | | (207,125) |
| Class C shares | | (123,543) | | (72,968) |
| Class I shares | | (108,839) | | (76,497) |
| Class T shares | | (32,567) | | (26,990) |
| Institutional Shares | | (663,937) | | (518,978) |
| Net realized gain on investments: | | | | |
| Class A shares | | (42,093,570) | | (84,798,475) |
| Class B shares | | (2,466,684) | | (8,849,926) |
| Class C shares | | (1,391,903) | | (3,240,011) |
| Class I shares | | (508,414) | | (870,947) |
| Class T shares | | (201,432) | | (495,795) |
| Institutional Shares | | (3,287,550) | | (6,663,598) |
| Total Dividends | | (58,944,017) | | (111,937,906) |
| |
| |
|
| Beneficial Interest Transactions ($): | | | | |
| Net proceeds from shares sold: | | | | |
| Class A shares | | 40,085,946 | | 33,450,766 |
| Class B shares | | 550,036 | | 1,510,935 |
| Class C shares | | 1,179,760 | | 2,094,368 |
| Class I shares | | 1,096,343 | | 1,340,569 |
| Class T shares | | 296,144 | | 701,874 |
| Institutional Shares | | 847,676 | | 867,944 |
16
| | | Year Ended December 31, |
| |
|
| | | 2007a | | 2006 |
| |
| |
|
| Beneficial Interest Transactions ($) (continued): | | |
| Dividends reinvested: | | | | |
| Class A shares | | 43,432,695 | | 79,114,953 |
| Class B shares | | 2,534,368 | | 8,203,108 |
| Class C shares | | 1,288,594 | | 2,610,615 |
| Class I shares | | 615,892 | | 944,387 |
| Class T shares | | 227,701 | | 504,754 |
| Institutional Shares | | 3,856,636 | | 7,044,317 |
| Cost of shares redeemed: | | | | |
| Class A shares | | (74,701,854) | | (133,374,410) |
| Class B shares | | (30,469,016) | | (20,355,944) |
| Class C shares | | (5,813,398) | | (4,756,622) |
| Class I shares | | (5,900,616) | | (1,104,642) |
| Class T shares | | (1,445,146) | | (686,496) |
| Institutional Shares | | (5,906,978) | | (4,736,790) |
| Increase (Decrease) in Net Assets | | | | |
| from Capital Stock Transactions | | (28,225,217) | | (26,626,314) |
| Total Increase (Decrease) in Net Assets | | (67,994,357) | | (10,155,383) |
| |
| |
|
| Net Assets ($): | | | | |
| Beginning of Period | | 678,584,469 | | 688,739,852 |
| End of Period | | 610,590,112 | | 678,584,469 |
| Undistributed investment income—net | | 326,082 | | 490,141 |
The Fund 17
STATEMENT OF CHANGES IN NET ASSETS (continued)
| | | Year Ended December 31, |
| |
|
| | | 2007a | | 2006 |
| |
| |
|
| Capital Share Transactions: | | | | |
| Class Ab | | | | |
| Shares sold | | 1,223,509 | | 1,027,585 |
| Shares issued for dividends reinvested | | 1,432,160 | | 2,488,150 |
| Shares redeemed | | (2,291,194) | | (4,092,976) |
| Net Increase (Decrease) in Shares Outstanding | | 364,475 | | (577,241) |
| |
| |
|
| Class B b | | | | |
| Shares sold | | 17,264 | | 47,312 |
| Shares issued for dividends reinvested | | 85,084 | | 262,866 |
| Shares redeemed | | (946,775) | | (636,104) |
| Net Increase (Decrease) in Shares Outstanding | | (844,427) | | (325,926) |
| |
| |
|
| Class C | | | | |
| Shares sold | | 37,358 | | 65,670 |
| Shares issued for dividends reinvested | | 43,561 | | 83,675 |
| Shares redeemed | | (180,767) | | (149,192) |
| Net Increase (Decrease) in Shares Outstanding | | (99,848) | | 153 |
| |
| |
|
| Class I | | | | |
| Shares sold | | 33,594 | | 40,533 |
| Shares issued for dividends reinvested | | 20,309 | | 29,734 |
| Shares redeemed | | (195,159) | | (33,401) |
| Net Increase (Decrease) in Shares Outstanding | | (141,256) | | 36,866 |
| |
| |
|
| Class T | | | | |
| Shares sold | | 9,093 | | 21,515 |
| Shares issued for dividends reinvested | | 7,498 | | 15,865 |
| Shares redeemed | | (43,815) | | (20,571) |
| Net Increase (Decrease) in Shares Outstanding | | (27,224) | | 16,809 |
| |
| |
|
| Institutional Shares | | | | |
| Shares sold | | 26,624 | | 27,122 |
| Shares issued for dividends reinvested | | 127,036 | | 221,572 |
| Shares redeemed | | (182,481) | | (143,421) |
| Net Increase (Decrease) in Shares Outstanding | | (28,821) | | 105,273 |
| a | | Effective June 1, 2007, Class R shares were redesignated as Class I shares. |
| b | | During the period ended December 31, 2007, 576,529 Class B shares representing $18,595,312 were |
| | | automatically converted to 565,175 Class A shares and during the period ended December 31, 2006, 192,361 |
| | | Class B shares representing $6,138,847 were automatically converted to 189,051 Class A shares. |
| See notes to financial statements. |
18
FINANCIAL HIGHLIGHTS
The following tables describe the performance for each share class for the fiscal periods indicated. All information (except portfolio turnover rate) reflects financial results for a single fund share.Total return shows how much your investment in the fund would have increased (or decreased) during each period, assuming you had reinvested all dividends and distributions.These figures have been derived from the fund’s financial statements.
| | | | | Year Ended December 31, | | |
| |
| |
| |
|
| Class A Shares | | 2007 | | 2006 | | 2005 | | 2004 | | 2003 |
| |
| |
| |
| |
| |
|
| Per Share Data ($): | | | | | | | | | | |
| Net asset value, beginning of period | | 32.00 | | 31.38 | | 30.34 | | 27.44 | | 21.57 |
| Investment Operations: | | | | | | | | | | |
| Investment income—net a | | .45 | | .38 | | .30 | | .24 | | .17 |
| Net realized and unrealized | | | | | | | | | | |
| gain (loss) on investments | | .42 | | 5.94 | | 1.26 | | 2.88 | | 5.86 |
| Total from Investment Operations | | .87 | | 6.32 | | 1.56 | | 3.12 | | 6.03 |
| Distributions: | | | | | | | | | | |
| Dividends from investment income—net | | (.46) | | (.37) | | (.35) | | (.22) | | (.16) |
| Dividends from net realized | | | | | | | | | | |
| gain on investments | | (2.54) | | (5.33) | | (.17) | | — | | — |
| Total Distributions | | (3.00) | | (5.70) | | (.52) | | (.22) | | (.16) |
| Net asset value, end of period | | 29.87 | | 32.00 | | 31.38 | | 30.34 | | 27.44 |
| |
| |
| |
| |
| |
|
| Total Return (%) b | | 2.75 | | 21.00 | | 5.18 | | 11.41 | | 28.09 |
| |
| |
| |
| |
| |
|
| Ratios/Supplemental Data (%): | | | | | | | | | | |
| Ratio of total expenses | | | | | | | | | | |
| to average net assets | | 1.16 | | 1.15 | | 1.15 | | 1.15 | | 1.15 |
| Ratio of net expenses | | | | | | | | | | |
| to average net assets | | 1.15 | | 1.15 | | 1.15 | | 1.15 | | 1.15 |
| Ratio of net investment income | | | | | | | | | | |
| to average net assets | | 1.38 | | 1.17 | | .99 | | .86 | | .71 |
| Portfolio Turnover Rate | | 45.19 | | 44.73 | | 55.95 | | 74.98 | | 54.58 |
| |
| |
| |
| |
| |
|
| Net Assets, end of period ($ x 1,000) | | 522,906 | | 548,601 | | 556,017 | | 634,007 | | 607,633 |
| a | | Based on average shares outstanding at each month end. |
| b | | Exclusive of sales charge. |
See notes to financial statements.
The Fund 19
FINANCIAL HIGHLIGHTS (continued)
| | | | | Year Ended December 31, | | |
| |
| |
| |
|
| Class B Shares | | 2007 | | 2006 | | 2005 | | 2004 | | 2003 |
| |
| |
| |
| |
| |
|
| Per Share Data ($): | | | | | | | | | | |
| Net asset value, beginning of period | | 31.40 | | 30.87 | | 29.83 | | 27.02 | | 21.27 |
| Investment Operations: | | | | | | | | | | |
| Investment income—net a | | .22 | | .13 | | .07 | | .02 | | (.01) |
| Net realized and unrealized | | | | | | | | | | |
| gain (loss) on investments | | .39 | | 5.85 | | 1.26 | | 2.85 | | 5.77 |
| Total from Investment Operations | | .61 | | 5.98 | | 1.33 | | 2.87 | | 5.76 |
| Distributions: | | | | | | | | | | |
| Dividends from investment income—net | | (.21) | | (.12) | | (.12) | | (.06) | | (.01) |
| Dividends from net realized | | | | | | | | | | |
| gain on investments | | (2.54) | | (5.33) | | (.17) | | — | | — |
| Total Distributions | | (2.75) | | (5.45) | | (.29) | | (.06) | | (.01) |
| Net asset value, end of period | | 29.26 | | 31.40 | | 30.87 | | 29.83 | | 27.02 |
| |
| |
| |
| |
| |
|
| Total Return (%) b | | 2.01 | | 20.12 | | 4.47 | | 10.62 | | 27.12 |
| |
| |
| |
| |
| |
|
| Ratios/Supplemental Data (%): | | | | | | | | | | |
| Ratio of total expenses | | | | | | | | | | |
| to average net assets | | 1.91 | | 1.90 | | 1.90 | | 1.90 | | 1.90 |
| Ratio of net expenses | | | | | | | | | | |
| to average net assets | | 1.90 | | 1.90 | | 1.90 | | 1.90 | | 1.90 |
| Ratio of net investment income | | | | | | | | | | |
| to average net assets | | .70 | | .42 | | .24 | | .10 | | (.04) |
| Portfolio Turnover Rate | | 45.19 | | 44.73 | | 55.95 | | 74.98 | | 54.58 |
| |
| |
| |
| |
| |
|
| Net Assets, end of period ($ x 1,000) | | 26,646 | | 55,112 | | 64,239 | | 78,154 | | 78,780 |
| a | | Based on average shares outstanding at each month end. |
| b | | Exclusive of sales charge. |
| See notes to financial statements. |
20
| | | | | Year Ended December 31, | | |
| |
| |
| |
|
| Class C Shares | | 2007 | | 2006 | | 2005 | | 2004 | | 2003 |
| |
| |
| |
| |
| |
|
| Per Share Data ($): | | | | | | | | | | |
| Net asset value, beginning of period | | 31.38 | | 30.85 | | 29.83 | | 27.02 | | 21.27 |
| Investment Operations: | | | | | | | | | | |
| Investment income (loss)—net a | | .21 | | .14 | | .07 | | .02 | | (.01) |
| Net realized and unrealized | | | | | | | | | | |
| gain (loss) on investments | | .40 | | 5.84 | | 1.24 | | 2.85 | | 5.77 |
| Total from Investment Operations | | .61 | | 5.98 | | 1.31 | | 2.87 | | 5.76 |
| Distributions: | | | | | | | | | | |
| Dividends from investment income—net | | (.21) | | (.12) | | (.12) | | (.06) | | (.01) |
| Dividends from net realized | | | | | | | | | | |
| gain on investments | | (2.54) | | (5.33) | | (.17) | | — | | — |
| Total Distributions | | (2.75) | | (5.45) | | (.29) | | (.06) | | (.01) |
| Net asset value, end of period | | 29.24 | | 31.38 | | 30.85 | | 29.83 | | 27.02 |
| |
| |
| |
| |
| |
|
| Total Return (%) b | | 2.00 | | 20.07 | | 4.43 | | 10.62 | | 27.12 |
| |
| |
| |
| |
| |
|
| Ratios/Supplemental Data (%): | | | | | | | | | | |
| Ratio of total expenses | | | | | | | | | | |
| to average net assets | | 1.91 | | 1.90 | | 1.90 | | 1.90 | | 1.90 |
| Ratio of net expenses | | | | | | | | | | |
| to average net assets | | 1.90 | | 1.90 | | 1.90 | | 1.90 | | 1.90 |
| Ratio of net investment income | | | | | | | | | | |
| (loss) to average net assets | | .65 | | .42 | | .24 | | .10 | | (.04) |
| Portfolio Turnover Rate | | 45.19 | | 44.73 | | 55.95 | | 74.98 | | 54.58 |
| |
| |
| |
| |
| |
|
| Net Assets, end of period ($ x 1,000) | | 16,572 | | 20,919 | | 20,564 | | 21,958 | | 22,480 |
| a | | Based on average shares outstanding at each month end. |
| b | | Exclusive of sales charge. |
| See notes to financial statements. |
The Fund 21
FINANCIAL HIGHLIGHTS (continued)
| | | | | Year Ended December 31, | | |
| |
| |
| |
|
| Class I Shares | | 2007 a | | 2006 | | 2005 | | 2004 | | 2003 |
| |
| |
| |
| |
| |
|
| Per Share Data ($): | | | | | | | | | | |
| Net asset value, beginning of period | | 31.98 | | 31.36 | | 30.33 | | 27.43 | | 21.56 |
| Investment Operations: | | | | | | | | | | |
| Investment income—net b | | .57 | | .46 | | .38 | | .31 | | .22 |
| Net realized and unrealized | | | | | | | | | | |
| gain (loss) on investments | | .39 | | 5.95 | | 1.25 | | 2.88 | | 5.87 |
| Total from Investment Operations | | .96 | | 6.41 | | 1.63 | | 3.19 | | 6.09 |
| Distributions: | | | | | | | | | | |
| Dividends from investment income—net | | (.55) | | (.46) | | (.43) | | (.29) | | (.22) |
| Dividends from net realized | | | | | | | | | | |
| gain on investments | | (2.54) | | (5.33) | | (.17) | | — | | — |
| Total Distributions | | (3.09) | | (5.79) | | (.60) | | (.29) | | (.22) |
| Net asset value, end of period | | 29.85 | | 31.98 | | 31.36 | | 30.33 | | 27.43 |
| |
| |
| |
| |
| |
|
| Total Return (%) | | 3.04 | | 21.26 | | 5.45 | | 11.69 | | 28.43 |
| |
| |
| |
| |
| |
|
| Ratios/Supplemental Data (%): | | | | | | | | | | |
| Ratio of total expenses | | | | | | | | | | |
| to average net assets | | .91 | | .90 | | .90 | | .90 | | .90 |
| Ratio of net expenses | | | | | | | | | | |
| to average net assets | | .90 | | .90 | | .90 | | .90 | | .90 |
| Ratio of net investment income | | | | | | | | | | |
| to average net assets | | 1.63 | | 1.42 | | 1.25 | | 1.09 | | .95 |
| Portfolio Turnover Rate | | 45.19 | | 44.73 | | 55.95 | | 74.98 | | 54.58 |
| |
| |
| |
| |
| |
|
| Net Assets, end of period ($ x 1,000) | | 1,395 | | 6,012 | | 4,740 | | 50,536 | | 52,723 |
| a | | Effective June 1, 2007, Class R shares were redesignated as Class I shares. |
| b | | Based on average shares outstanding at each month end. |
| See notes to financial statements. |
| | | | | Year Ended December 31, | | |
| |
| |
| |
|
| Class T Shares | | 2007 | | 2006 | | 2005 | | 2004 | | 2003 |
| |
| |
| |
| |
| |
|
| Per Share Data ($): | | | | | | | | | | |
| Net asset value, beginning of period | | 31.99 | | 31.37 | | 30.33 | | 27.43 | | 21.57 |
| Investment Operations: | | | | | | | | | | |
| Investment income—net a | | .38 | | .30 | | .23 | | .18 | | .11 |
| Net realized and unrealized | | | | | | | | | | |
| gain (loss) on investments | | .41 | | 5.94 | | 1.26 | | 2.87 | | 5.85 |
| Total from Investment Operations | | .79 | | 6.24 | | 1.49 | | 3.05 | | 5.96 |
| Distributions: | | | | | | | | | | |
| Dividends from investment income—net | | (.38) | | (.29) | | (.28) | | (.15) | | (.10) |
| Dividends from net realized | | | | | | | | | | |
| gain on investments | | (2.54) | | (5.33) | | (.17) | | — | | — |
| Total Distributions | | (2.92) | | (5.62) | | (.45) | | (.15) | | (.10) |
| Net asset value, end of period | | 29.86 | | 31.99 | | 31.37 | | 30.33 | | 27.43 |
| |
| |
| |
| |
| |
|
| Total Return (%) b | | 2.49 | | 20.67 | | 4.95 | | 11.14 | | 27.72 |
| |
| |
| |
| |
| |
|
| Ratios/Supplemental Data (%): | | | | | | | | | | |
| Ratio of total expenses | | | | | | | | | | |
| to average net assets | | 1.41 | | 1.40 | | 1.40 | | 1.40 | | 1.40 |
| Ratio of net expenses | | | | | | | | | | |
| to average net assets | | 1.40 | | 1.40 | | 1.40 | | 1.40 | | 1.40 |
| Ratio of net investment income | | | | | | | | | | |
| to average net assets | | 1.17 | | .93 | | .74 | | .65 | | .45 |
| Portfolio Turnover Rate | | 45.19 | | 44.73 | | 55.95 | | 74.98 | | 54.58 |
| |
| |
| |
| |
| |
|
| Net Assets, end of period ($ x 1,000) | | 2,392 | | 3,434 | | 2,840 | | 2,945 | | 2,264 |
| a | | Based on average shares outstanding at each month end. |
| b | | Exclusive of sales charge. |
| See notes to financial statements. |
The Fund 23
FINANCIAL HIGHLIGHTS (continued)
| | | | | Year Ended December 31, | | |
| |
| |
| |
|
| Institutional Shares | | 2007 | | 2006 | | 2005 | | 2004 | | 2003 |
| |
| |
| |
| |
| |
|
| Per Share Data ($): | | | | | | | | | | |
| Net asset value, beginning of period | | 31.98 | | 31.36 | | 30.32 | | 27.42 | | 21.55 |
| Investment Operations: | | | | | | | | | | |
| Investment income—net a | | .48 | | .42 | | .33 | | .27 | | .19 |
| Net realized and unrealized | | | | | | | | | | |
| gain (loss) on investments | | .43 | | 5.94 | | 1.26 | | 2.88 | | 5.87 |
| Total from Investment Operations | | .91 | | 6.36 | | 1.59 | | 3.15 | | 6.06 |
| Distributions: | | | | | | | | | | |
| Dividends from investment income—net | | (.50) | | (.41) | | (.38) | | (.25) | | (.19) |
| Dividends from net realized | | | | | | | | | | |
| gain on investments | | (2.54) | | (5.33) | | (.17) | | — | | — |
| Total Distributions | | (3.04) | | (5.74) | | (.55) | | (.25) | | (.19) |
| Net asset value, end of period | | 29.85 | | 31.98 | | 31.36 | | 30.32 | | 27.42 |
| |
| |
| |
| |
| |
|
| Total Return (%) | | 2.89 | | 21.11 | | 5.33 | | 11.53 | | 28.25 |
| |
| |
| |
| |
| |
|
| Ratios/Supplemental Data (%): | | | | | | | | | | |
| Ratio of total expenses | | | | | | | | | | |
| to average net assets | | 1.06 | | 1.05 | | 1.05 | | 1.05 | | 1.05 |
| Ratio of net expenses | | | | | | | | | | |
| to average net assets | | 1.05 | | 1.05 | | 1.05 | | 1.05 | | 1.05 |
| Ratio of net investment income | | | | | | | | | | |
| to average net assets | | 1.49 | | 1.28 | | 1.09 | | .96 | | .81 |
| Portfolio Turnover Rate | | 45.19 | | 44.73 | | 55.95 | | 74.98 | | 54.58 |
| |
| |
| |
| |
| |
|
| Net Assets, end of period ($ x 1,000) | | 40,679 | | 44,506 | | 40,341 | | 41,202 | | 41,848 |
| a Based on average shares outstanding at each month end. |
| See notes to financial statements. |
24
NOTES TO FINANCIAL STATEMENTS
NOTE 1—Significant Accounting Policies:
Dreyfus Premier Core Value Fund (the “fund”) is a separate diversified series of The Dreyfus/Laurel Funds Trust (the “Trust”) which is registered under the Investment Company Act of 1940, as amended (the “Act”), as an open-end management investment company and operates as a series company offering eight series, including the fund, as of the date of this report. The fund’s investment objective is to seek long-term capital growth. The Dreyfus Corporation (the “Manager” or “Dreyfus”) serves as the fund’s investment adviser.
On July 1, 2007, Mellon Financial Corporation and The Bank of New York Company, Inc. merged, forming The Bank of New York Mellon Corporation (“BNY Mellon”). As part of this transaction, Dreyfus became a wholly-owned subsidiary of BNY Mellon.
The fund’s Board of Trustees approved the redesignation of the fund’s Class R shares as Class I shares, effective June 1, 2007.The eligibility requirements for Class I shares remained the same as for Class R shares.
MBSC Securities Corporation (the “Distributor”), a wholly-owned subsidiary of the Manager, is the distributor of the fund’s shares. The fund is authorized to issue an unlimited number of shares of Beneficial Interest in each of the following classes of shares: Class A, Class B, Class C, Class I, Class T and Institutional shares. Class A, Class B, Class C and Class T shares are sold primarily to retail investors through financial intermediaries and bear a distribution fee and/or service fee. Class A and Class T shares are subject to a front-end sales charge, while Class B and Class C shares are subject to a contingent deferred sales charge (“CDSC”). Class B shares automatically convert to Class A shares after six years.The fund does not offer Class B shares, except in connection with dividend reinvestment and permitted exchanges of Class B shares. Class I shares are sold primarily to bank trust departments and other financial service providers (including Mellon Bank, N.A. and its affiliates) acting on behalf of customers having a qualified trust or investment account or relationship at such institution, and bear no distribution or service fees. Class I and Institutional shares are offered
The Fund 25
NOTES TO FINANCIAL STATEMENTS (continued)
without a front-end sales charge or CDSC. Institutional shares are offered only to those customers of certain financial planners and investment advisers who held shares of a predecessor class of the fund as of April 4, 1994, and bear a distribution fee. Each class of shares has identical rights and privileges, except with respect to the distribution and service fees and voting rights on matters affecting a single class. Income, expenses (other than expenses attributable to a specific class), and realized and unrealized gains or losses on investments are allocated to each class of shares based on its relative net assets.
The fund’s financial statements are prepared in accordance with U.S. generally accepted accounting principles, which may require the use of management estimates and assumptions. Actual results could differ from those estimates.
(a) Portfolio valuation: Investments in securities are valued at the last sales price on the securities exchange or national securities market on which such securities are primarily traded. Securities listed on the National Market System, for which market quotations are available are valued at the official closing price or, if there is no official closing price that day, at the last sale price. Securities not listed on an exchange or the national securities market, or securities for which there were no transactions, are valued at the average of the most recent bid and asked prices. Bid price is used when no asked price is available. Registered open-ended investment companies that are not traded on an exchange are valued at their net asset value.When market quotations or official closing prices are not readily available, or are determined not to reflect accurately fair value, such as when the value of a security has been significantly affected by events after the close of the exchange or market on which the security is principally traded (for example, a foreign exchange or mar-ket),but before the fund calculates its net asset value, the fund may value these investments at fair value as determined in accordance with the procedures approved by the Board of Trustees. Fair valuing of securities may be determined with the assistance of a pricing service using calculations based on indices of domestic securities and other appropriate indicators, such as prices of relevant ADRs and futures contracts. For other securi-
ties that are fair valued by the Board of Trustees, certain factors may be considered such as: fundamental analytical data, the nature and duration of restrictions on disposition, an evaluation of the forces that influence the market in which the securities are purchased and sold, and public trading in similar securities of the issuer or comparable issuers. Investments denominated in foreign currencies are translated to U.S. dollars at the prevailing rates of exchange. Forward currency exchange contracts are valued at the forward rate.
The Financial Accounting Standards Board (“FASB”) released Statement of Financial Accounting Standards No. 157 “Fair Value Measurements” (“FAS 157”). FAS 157 establishes an authoritative definition of fair value, sets out a framework for measuring fair value, and requires additional disclosures about fair-value measurements. The application of FAS 157 is required for fiscal years beginning after November 15, 2007 and interim periods within those fiscal years. Management does not believe that the application of this standard will have a material impact on the financial statements of the fund.
(b) Securities transactions and investment income: Securities transactions are recorded on a trade date basis. Realized gains and losses from securities transactions are recorded on the identified cost basis. Dividend income is recognized on the ex-dividend date and interest income, including, where applicable, accretion of discount and amortization of premium on investments, is recognized on the accrual basis.
Pursuant to a securities lending agreement with Mellon Bank,N.A. (“Mellon Bank”), an affiliate of the Manager, the fund may lend securities to qualified institutions. It is the fund’s policy, that at origination, all loans are secured by collateral of at least 102% of the value of U.S. securities loaned and 105% of the value of foreign securities loaned. It is the fund’s policy that collateral equivalent to at least 100% of the market value of securities on loan is maintained at all times. Collateral is either in the form of cash, which can be invested in certain money market mutual funds managed by the Manager, U.S. Government and Agency securities or Letters of Credit.The fund is entitled to receive all
The Fund 27
NOTES TO FINANCIAL STATEMENTS (continued)
income on securities loaned, in addition to income earned as a result of the lending transaction.Although each security loaned is fully collateralized, the fund bears the risk of delay in recovery of, or loss of rights in, the securities loaned should a borrower fail to return the securities in a timely manner. During the period ended December 31, 2007, Mellon Bank earned $10,410 from lending fund portfolio securities, pursuant to the securities lending agreement.
(c) Affiliated issuers: Investments in other investment companies advised by the Manager are defined as “affiliated” in the Act.
(d) Foreign currency transactions: The fund does not isolate that portion of the results of operations resulting from changes in foreign exchange rates on investments from the fluctuations arising from changes in the market prices of securities held. Such fluctuations are included with the net realized and unrealized gains or losses from investments.
Net realized foreign exchange gains or losses arise from sales and maturities of short-term securities, sales of foreign currencies, currency gains or losses realized on securities transactions and the difference between the amount of dividends, interest, and foreign withholding taxes recorded on the fund’s books and the U.S. dollar equivalent of the amounts actually received or paid. Net unrealized foreign exchange gains and losses arise from changes in the value of assets and liabilities other than investments in securities, resulting from changes in exchange rates. Such gains and losses are included with net realized and unrealized gains or losses on investments.
(e) Dividends to shareholders: Dividends are recorded on the ex-dividend date. Dividends from investment income-net are declared and paid on a quarterly basis. Dividends from net realized capital gains, if any, are normally declared and paid annually, but the fund may make distributions on a more frequent basis to comply with the distribution requirements of the Internal Revenue Code of 1986, as amended (the “Code”).To the extent that net realized capital gains can be offset by capital loss carryovers, if any, it is the policy of the fund not to distribute such gains. Income and capital gain distributions are determined in
accordance with income tax regulations, which may differ from U.S. generally accepted accounting principles.
(f) Federal income taxes: It is the policy of the fund to continue to qualify as a regulated investment company, if such qualification is in the best interests of its shareholders, by complying with the applicable provisions of the Code, and to make distributions of taxable income sufficient to relieve it from substantially all federal income and excise taxes.
During the current year, the fund adopted FASB Interpretation No. 48 “Accounting for Uncertainty in Income Taxes” (“FIN 48”). FIN 48 provides guidance for how uncertain tax positions should be recognized, measured, presented and disclosed in the financial statements. FIN 48 requires the evaluation of tax positions taken or expected to be taken in the course of preparing the fund’s tax returns to determine whether the tax positions are “more-likely-than-not” of being sustained by the applicable tax authority.Tax positions not deemed to meet the more-likely-than-not threshold would be recorded as a tax benefit or expense in the current year.The adoption of FIN 48 had no impact on the operations of the fund for the period ended December 31, 2007.
The fund is not subject to examination by U.S. Federal, State and City tax authorities for the tax years before 2004.
At December 31, 2007, the components of accumulated earnings on a tax basis were as follows: undistributed ordinary income $326,082, undistributed capital gains $10,150 and unrealized appreciation $97,108,143. In addition, the fund had $1,244,732 of capital losses realized after October 31, 2007, which were deferred for tax purposes to the first day of the following fiscal year.
The tax characters of distributions paid to shareholders during the fiscal periods ended December 31, 2007 and December 31, 2006 were as follows: ordinary income $14,227,185 and $20,615,240 and long term capital gains $44,716,832 and $91,322,666, respectively.
During the period ended December 31, 2007, as a result of permanent book to tax differences, primarily due to the tax treatment for real
The Fund 29
NOTES TO FINANCIAL STATEMENTS (continued)
estate investment trust, the fund decreased accumulated undistributed investment income-net by $17,647 and increased accumulated net realized gain (loss) on investments by the same amount. Net assets and net asset value per share were not affected by this reclassification.
NOTE 2—Bank Line of Credit:
The fund participates with other Dreyfus-managed funds in a $350 million redemption credit facility (“the Facility”) to be utilized for temporary or emergency purposes, including the financing of redemptions. In connection therewith, the fund has agreed to pay commitment fees on its pro rata portion of the Facility. Interest is charged to the fund based on prevailing market rates in effect at the time of borrowing.
The average daily amount of borrowings outstanding under the Facility during the period ended December 31,2007,was approximately $63,200 with a related weighted average annualized interest rate of 5.23% .
NOTE 3—Investment Management Fee and Other Transactions With Affiliates:
(a) Pursuant to an Investment Management agreement with the Manager, the Manager provides or arranges for one or more third parties and/or affiliates to provide investment advisory, administrative, custody, fund accounting and transfer agency services to the fund.The Manager also directs the investments of the fund in accordance with its investment objective, policies and limitations. For these services, the fund is contractually obligated to pay the Manager a fee, calculated daily and paid monthly, at the annual rate of .90% of the value of the fund’s average daily net assets. Out of its fee, the Manager pays all of the expenses of the fund except brokerage fees, taxes, interest, commitment fees, Rule 12b-1 distribution fees and expenses, service fees and expenses of non-interested Trustees (including counsel fees) and extraordinary expenses. In addition, the Manager is required to reduce its fee in an amount equal to the fund’s allocable portion of fees and expenses of the non-interested Trustees (including counsel fees). Each Trustee receives $45,000 per year, plus $6,000 for each joint Board meeting of The Dreyfus/Laurel Funds, Inc.,The Dreyfus/Laurel Tax-
Free Municipal Funds and the Trust (collectively, the “Dreyfus/Laurel Funds”) attended, $2,000 for separate in-person committee meetings attended which are not held in conjunction with a regularly scheduled Board meeting and $1,500 for Board meetings and separate committee meetings attended that are conducted by telephone and is reimbursed for travel and out-of-pocket expenses. With respect to Board meetings, the Chairman of the Board receives an additional 25% of such compensation (with the exception of reimbursable amounts). With respect to compensation committee meetings, the Chair of the compensation committee receives $900 per meeting and, with respect to audit committee meetings, the Chair of the audit committee receives $1,350 per meeting. In the event that there is an in-person joint committee meeting or a joint telephone meeting of the Dreyfus/Laurel Funds and Dreyfus High Yield Strategies Fund, the $2,000 or $1,500 fee, as applicable, will be allocated between the Dreyfus/Laurel Funds and Dreyfus High Yield Strategies Fund.These fees and expenses are charged and allocated to each series based on net assets. Amounts required to be paid by the Trust directly to the non-interested Trustees, that would be applied to offset a portion of the management fee payable to the Manager, are in fact paid directly by the Manager to the non-interested Trustees.
During the period ended December 31, 2007, the Distributor retained $14,558, $397 and $1 from commissions earned on sales of the fund’s Class A, Class T shares and Institutional shares, respectively, and $81,277 and $5,106 from CDSC on redemptions on the fund’s Class B and Class C shares, respectively.
(b) Under separate Distribution Plans (the “Plans”) adopted pursuant to Rule 12b-1 under the Act, Class A shares and Institutional shares may pay annually up to .25% and ..15%, respectively, of the value of their average daily net assets to compensate the Distributor for shareholder servicing activities and expenses primarily intended to result in the sale of Class A shares and Institutional shares. Class B, Class C and Class T shares pay the Distributor for distributing their shares at an aggregate annual rate of .75% of the value of the average daily net
The Fund 31
NOTES TO FINANCIAL STATEMENTS (continued)
assets of Class B and Class C shares, and .25% of the value of average daily net assets of Class T shares.The Distributor may pay one or more agents in respect of advertising, marketing and other distribution services for Class T shares and determines the amounts, if any, to be paid to agents and the basis on which such payments are made. Class B, Class C and Class T shares are also subject to a service plan adopted pursuant to Rule 12b-1 (the “Service Plan”), under which Class B, Class C and Class T shares pay the Distributor for providing certain services to the holders of their shares a fee at the annual rate of .25% of the value of the average daily net assets of Class B, Class C and Class T shares, respectively. During the period ended December 31, 2007, Class A, Class B, Class C, Class T and Institutional shares were charged $1,386,132, $302,133, $141,833, $7,257 and $66,197 respectively, pursuant to their respective Plans. During the period ended December 31, 2007, Class B, Class C and Class T shares were charged $100,711, $47,278 and $7,257, respectively, pursuant to the Service Plan.
Under its terms, the Plans and Service Plan shall remain in effect from year to year, provided such continuance is approved annually by a vote of majority of those Trustees who are not “interested persons” of the Trust and who have no direct or indirect financial interest in the operation of or in any agreement related to the Plans or Service Plan.
The components of “Due to The Dreyfus Corporation and affiliates” in the Statement of Assets and Liabilities consist of: management fees $493,362, Rule 12b-1 distribution plan fees $151,333 and shareholder services plan fees $10,188.
NOTE 4—Securities Transactions:
The aggregate amount of purchases and sales of investment securities, excluding short-term securities, during the period ended December 31, 2007, amounted to $299,549,633 and $373,561,487, respectively.
At December 31, 2007, the cost of investments for federal income tax purposes was $552,078,272; accordingly, accumulated net unrealized appreciation on investments was $97,108,143, consisting of $119,475,335 gross unrealized appreciation and $22,367,192 gross unrealized depreciation.
| REPORT OF INDEPENDENT REGISTERED |
| PUBLIC ACCOUNTING FIRM |
| The Board of Trustees and Shareholders of |
| The Dreyfus/Laurel Funds Trust: |
We have audited the accompanying statement of assets and liabilities of Dreyfus Premier Core Value Fund (the “Fund”) of The Dreyfus/Laurel Funds Trust, including the statement of investments as of December 31, 2007, and the related statement of operations for the year then ended, the statement of changes in net assets for each of the years in the two-year period then ended, and the financial highlights for each of the years in the five-year period then ended.These financial statements and financial highlights are the responsibility of the Fund’s management. Our responsibility is to express an opinion on these financial statements and financial highlights based on our audits.
We conducted our audits in accordance with standards of the Public Company Accounting Oversight Board (United States).Those standards require that we plan and perform the audit to obtain reasonable assurance about whether the financial statements and financial highlights are free of material misstatement. An audit includes examining, on a test basis, evidence supporting the amounts and disclosures in the financial statements. Our procedures included confirmation of securities owned as of December 31, 2007 by correspondence with the custodian. An audit also includes assessing the accounting principles used and significant estimates made by management, as well as evaluating the overall financial statement presentation.We believe that our audits provide a reasonable basis for our opinion.
In our opinion, the financial statements and financial highlights referred to above present fairly, in all material respects, the financial position of Dreyfus Premier Core Value Fund of The Dreyfus/Laurel Funds Trust as of December 31, 2007, and the results of its operations for the year then ended, the changes in its net assets for each of the years in the two-year period then ended, and the financial highlights for each of the years in the five-year period then ended, in conformity with U.S. generally accepted accounting principles.

| New York, New York |
| February 21, 2008 |
The Fund 33
IMPORTANT TAX INFORMATION (Unaudited)
For federal tax purposes, the fund also hereby designates 93.12% of the ordinary dividends paid during the fiscal year ended December 31, 2007 as qualifying for the corporate dividends received deduction. For the fiscal year ended December 31, 2007, certain dividends paid by the fund may be subject to a maximum tax rate of 15%, as provided for by the Jobs and Growth Tax Relief Reconciliation Act of 2003. Of the distributions paid during the fiscal year, $11,650,039 represents the maximum amount that may be considered qualified dividend income. Shareholders will receive notification in January 2008 of the percentage applicable to the preparation of their 2007 income tax returns. Also the fund hereby designates $.3318 per share as a long-term capital gain distribution and $.1012 per share as a short-term capital gain distribution paid on March 30, 2007 and also the fund hereby designates $1.9456 per share as a long-term capital gain distribution and $.1614 per share as a short-term capital gain distribution paid on December 20, 2007.
34
BOARD MEMBERS INFORMATION (Unaudited)
| Joseph S. DiMartino (64) |
| Chairman of the Board (1995) |
| Principal Occupation During Past 5 Years: |
| • Corporate Director and Trustee |
Other Board Memberships and Affiliations:
- The Muscular Dystrophy Association, Director
- Century Business Services, Inc., a provider of outsourcing functions for small and medium size companies, Director
- The Newark Group, a provider of a national market of paper recovery facilities, paperboard mills and paperboard converting plants, Director
- Sunair Services Corporation, a provider of certain outdoor-related services to homes and businesses, Director
No. of Portfolios for which Board Member Serves: 163 ———————
| James M. Fitzgibbons (73) |
| Board Member (1994) |
Principal Occupation During Past 5 Years:
• Chairman of the Board, Davidson Cotton Company (1998-2002)
Other Board Memberships and Affiliations:
• Bill Barrett Company, an oil and gas exploration company, Director
No. of Portfolios for which Board Member Serves: 26 ———————
| J. Tomlinson Fort (79) |
| Board Member (1987) |
Principal Occupation During Past 5 Years:
- Retired (2005-present)
- Of Counsel, Reed Smith LLP (1998-2005)
Other Board Memberships and Affiliations:
- Allegheny College, Emeritus Trustee
- Pittsburgh Ballet Theatre,Trustee
- American College of Trial Lawyers, Fellow
No. of Portfolios for which Board Member Serves: 26 ———————
| Kenneth A. Himmel (61) |
| Board Member (1994) |
Principal Occupation During Past 5 Years:
- President and CEO,Related Urban Development,a real estate development company (1996-present)
- President and CEO, Himmel & Company, a real estate development company (1980-present)
- CEO, American Food Management, a restaurant company (1983-present)
No. of Portfolios for which Board Member Serves: 26
The Fund 35
BOARD MEMBERS INFORMATION (Unaudited) (continued)
| Stephen J. Lockwood (60) |
| Board Member (1994) |
Principal Occupation During Past 5 Years:
- Chairman of the Board, Stephen J. Lockwood and Company LLC, an investment company (2000-present)
No. of Portfolios for which Board Member Serves: 26 ———————
| Roslyn M. Watson (58) |
| Board Member (1994) |
| Principal Occupation During Past 5 Years: |
| • Principal,Watson Ventures, Inc., a real estate investment company (1993-present) |
Other Board Memberships and Affiliations:
- American Express Bank, Director
- The Hyams Foundation Inc., a Massachusetts Charitable Foundation,Trustee
- National Osteoporosis Foundation,Trustee
No. of Portfolios for which Board Member Serves: 26 ———————
| Benaree Pratt Wiley (61) |
| Board Member (1998) |
Principal Occupation During Past 5 Years:
- Principal,The Wiley Group, a firm specializing in strategy and business development (2005-present)
- President and CEO,The Partnership, an organization dedicated to increasing the representa- tion of African Americans in positions of leadership, influence and decision-making in Boston, MA (1991-2005)
Other Board Memberships and Affiliations:
- Boston College,Trustee
- Blue Cross Blue Shield of Massachusetts, Director
- Commonwealth Institute, Director
- Efficacy Institute, Director
- PepsiCo African-American, Advisory Board
- The Boston Foundation, Director
- Harvard Business School Alumni Board, Director
No. of Portfolios for which Board Member Serves: 36 ———————
Once elected all Board Members serve for an indefinite term, but achieve Emeritus status upon reaching age 80.The address of the Board Members and Officers is in c/o The Dreyfus Corporation, 200 Park Avenue, New York, New York 10166. Additional information about the Board Members is available in the fund’s Statement of Additional Information which can be obtained from Dreyfus free of charge by calling this toll free number: 1-800-554-4611.
Francis P. Brennan, Emeritus Board Member
36
OFFICERS OF THE FUND ( U n a u d i t e d )
| J. DAVID OFFICER, President since |
| December 2006. |
Chief Operating Officer,Vice Chairman and a Director of the Manager, and an officer of 78 investment companies (comprised of 163 portfolios) managed by the Manager. He is 59 years old and has been an employee of the Manager since April 1998.
| PHILLIP N. MAISANO, Executive Vice |
| President since July 2007. |
Chief Investment Officer,Vice Chair and a director of the Manager, and an officer of 78 investment companies (comprised of 163 portfolios) managed by the Manager. Mr. Maisano also is an officer and/or Board member of certain other investment management subsidiaries of The Bank of New York Mellon Corporation, each of which is an affiliate of the Manager. He is 60 years old and has been an employee of the Manager since November 2006. Prior to joining the Manager, Mr. Maisano served as Chairman and Chief Executive Officer of EACM Advisors, an affiliate of the Manager, since August 2004, and served as Chief Executive Officer of Evaluation Associates, a leading institutional investment consulting firm, from 1988 until 2004.
| MICHAEL A. ROSENBERG, Vice President |
| and Secretary since August 2005. |
Associate General Counsel of the Manager, and an officer of 79 investment companies (comprised of 180 portfolios) managed by the Manager. He is 47 years old and has been an employee of the Manager since October 1991.
| JAMES BITETTO, Vice President and |
| Assistant Secretary since August 2005. |
Associate General Counsel and Secretary of the Manager, and an officer of 79 investment companies (comprised of 180 portfolios) managed by the Manager. He is 41 years old and has been an employee of the Manager since December 1996.
| JONI LACKS CHARATAN, Vice President |
| and Assistant Secretary since |
| August 2005. |
Associate General Counsel of the Manager, and an officer of 79 investment companies (comprised of 180 portfolios) managed by the Manager. She is 52 years old and has been an employee of the Manager since October 1988.
| JOSEPH M. CHIOFFI, Vice President and |
| Assistant Secretary since August 2005. |
Associate General Counsel of the Manager, and an officer of 79 investment companies (comprised of 180 portfolios) managed by the Manager. He is 46 years old and has been an employee of the Manager since June 2000.
| JANETTE E. FARRAGHER, Vice President |
| and Assistant Secretary since |
| August 2005. |
Associate General Counsel of the Manager, and an officer of 79 investment companies (comprised of 180 portfolios) managed by the Manager. She is 45 years old and has been an employee of the Manager since February 1984.
| JOHN B. HAMMALIAN, Vice President and |
| Assistant Secretary since August 2005. |
Associate General Counsel of the Manager, and an officer of 79 investment companies (comprised of 180 portfolios) managed by the Manager. He is 44 years old and has been an employee of the Manager since February 1991.
| ROBERT R. MULLERY, Vice President and |
| Assistant Secretary since August 2005. |
Associate General Counsel of the Manager, and an officer of 79 investment companies (comprised of 180 portfolios) managed by the Manager. He is 55 years old and has been an employee of the Manager since May 1986.
The Fund 37
OFFICERS OF THE FUND ( U n a u d i t e d ) (continued)
| JEFF PRUSNOFSKY, Vice President and |
| Assistant Secretary since August 2005. |
Associate General Counsel of the Manager, and an officer of 79 investment companies (comprised of 180 portfolios) managed by the Manager. He is 42 years old and has been an employee of the Manager since October 1990.
| JAMES WINDELS, Treasurer since |
| November 2001. |
Director – Mutual Fund Accounting of the Manager, and an officer of 79 investment companies (comprised of 180 portfolios) managed by the Manager. He is 49 years old and has been an employee of the Manager since April 1985.
| ROBERT ROBOL, Assistant Treasurer |
| since December 2002. |
Senior Accounting Manager – Money Market and Municipal Bond Funds of the Manager, and an officer of 79 investment companies (comprised of 180 portfolios) managed by the Manager. He is 43 years old and has been an employee of the Manager since October 1988.
| ROBERT SALVIOLO, Assistant Treasurer |
| since July 2007. |
Senior Accounting Manager – Equity Funds of the Manager, and an officer of 79 investment companies (comprised of 180 portfolios) managed by the Manager. He is 40 years old and has been an employee of the Manager since June 1989.
| ROBERT SVAGNA, Assistant Treasurer |
| since December 2002. |
Senior Accounting Manager – Equity Funds of the Manager, and an officer of 79 investment companies (comprised of 180 portfolios) managed by the Manager. He is 40 years old and has been an employee of the Manager since November 1990.
| GAVIN C. REILLY, Assistant Treasurer |
| since December 2005. |
Tax Manager of the Investment Accounting and Support Department of the Manager, and an officer of 79 investment companies (comprised of 180 portfolios) managed by the Manager. He is 39 years old and has been an employee of the Manager since April 1991.
| JOSEPH W. CONNOLLY, Chief Compliance |
| Officer since October 2004. |
Chief Compliance Officer of the Manager and The Dreyfus Family of Funds (79 investment companies, comprised of 180 portfolios). From November 2001 through March 2004, Mr. Connolly was first Vice-President, Mutual Fund Servicing for Mellon Global Securities Services. In that capacity, Mr. Connolly was responsible for managing Mellon’s Custody, Fund Accounting and Fund Administration services to third-party mutual fund clients. He is 50 years old and has served in various capacities with the Manager since 1980, including manager of the firm’s Fund Accounting Department from 1997 through October 2001.
| WILLIAM GERMENIS, Anti-Money |
| Laundering Compliance Officer since |
| July 2002. |
Vice President and Anti-Money Laundering Compliance Officer of the Distributor, and the Anti-Money Laundering Compliance Officer of 75 investment companies (comprised of 176 portfolios) managed by the Manager. He is 37 years old and has been an employee of the Distributor since October 1998.
38
NOTES
For More Information
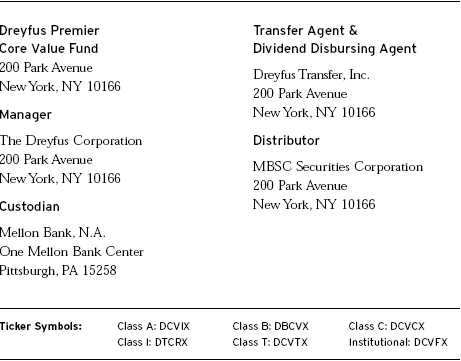
Telephone Call your financial representative or 1-800-554-4611
| Mail | | The Dreyfus Premier Family of Funds |
| | | 144 Glenn Curtiss Boulevard, Uniondale, NY 11556-0144 |
The fund files its complete schedule of portfolio holdings with the Securities and Exchange Commission (“SEC”) for the first and third quarters of each fiscal year on Form N-Q. The fund’s Forms N-Q are available on the SEC’s website at http://www.sec.gov and may be reviewed and copied at the SEC’s Public Reference Room in Washington, DC. Information on the operation of the Public Reference Room may be obtained by calling 1-202-551-8090.
A description of the policies and procedures that the fund uses to determine how to vote proxies relating to portfolio securities, and information regarding how the fund voted these proxies for the 12-month period ended June 30, 2007, is available at http://www.dreyfus.com and on the SEC’s website at http://www.sec.gov. The description of the policies and procedures is also available without charge, upon request, by calling 1-800-645-6561.

© 2008 MBSC Securities Corporation

Save time. Save paper. View your next shareholder report online as soon as it’s available. Log into www.dreyfus.com and sign up for Dreyfus eCommunications. It’s simple and only takes a few minutes.
The views expressed in this report reflect those of the portfolio manager only through the end of the period covered and do not necessarily represent the views of Dreyfus or any other person in the Dreyfus organization. Any such views are subject to change at any time based upon market or other conditions and Dreyfus disclaims any responsibility to update such views.These views may not be relied on as investment advice and, because investment decisions for a Dreyfus fund are based on numerous factors, may not be relied on as an indication of trading intent on behalf of any Dreyfus fund.
Not FDIC-Insured • Not Bank-Guaranteed • May Lose Value
| Contents |
| |
| | | THE FUND |
| |
|
| 2 | | A Letter from the CEO |
| 3 | | Discussion of Fund Performance |
| 6 | | Fund Performance |
| 8 | | Understanding Your Fund’s Expenses |
| 8 | | Comparing Your Fund’s Expenses |
| With Those of Other Funds |
| 9 | | Statement of Investments |
| 23 | | Statement of Assets and Liabilities |
| 24 | | Statement of Operations |
| 25 | | Statement of Changes in Net Assets |
| 27 | | Financial Highlights |
| 31 | | Notes to Financial Statements |
| 42 | | Report of Independent Registered |
| | | Public Accounting Firm |
| 43 | | Important Tax Information |
| 44 | | Board Members Information |
| 46 | | Officers of the Fund |
| |
| FOR MORE INFORMATION |
|
| | | Back Cover |
The Fund
| Dreyfus Premier |
| Limited Term High Yield Fund |

A LETTER FROM THE CEO
Dear Shareholder:
We are pleased to present this annual report for Dreyfus Premier Limited Term High Yield Fund, covering the 12-month period from January 1, 2007, through December 31, 2007.
Looking back,2007 was a year of significant change for U.S.fixed-income markets. Turmoil in the sub-prime mortgage market, declining housing values and soaring energy prices sparked a “flight to quality” among investors in which prices of U.S.Treasury securities surged higher while virtually all other domestic fixed-income sectors tumbled, including highly rated corporate bonds. Still, strong performance over the first half of the year helped most fixed-income indices post positive absolute returns for the year. During the second half of the year, the Fed took action to forestall a potential recession by implementing several short-term interest rate cuts. By the end of 2007, these actions contributed to a relatively wider yield-curve along the bond market’s maturity spectrum.
The turbulence of 2007 reinforced a central principle of successful investing: diversification. Investors with broad exposure to the world’s stock and bond markets were better protected from the full impact of market volatility in areas that, earlier in the year, were among the bright spots at the time. As we look ahead, we believe that now is the perfect time to meet with your financial advisor, who can help you plan and diversify your investment portfolio in a way that manages the potential opportunities and risks that may continue to arise in 2008.
For information about how the fund performed during the reporting period, as well as market perspectives, we have provided a Discussion of Fund Performance given by the fund’s Portfolio Managers.
Thank you for your continued confidence and support.

Thomas F. Eggers
Chief Executive Officer
The Dreyfus Corporation
January 15, 2008
|

DISCUSSION OF FUND PERFORMANCE
For the period of January 1, 2007, through December 31, 2007, as provided by Karen Bater and David Bowser, Portfolio Managers
Fund and Market Performance Overview
High yield bonds rallied over the first half of 2007 in response to robust investor demand, sound business conditions and historically low default rates. However, the market encountered considerable turbulence over the summer, when turmoil in the sub-prime mortgage sector appeared to spread to other areas of the bond market, sparking a credit and liquidity crisis that produced sharp declines in high-yield bond prices.As a result, the fund’s Class A and I shares produced returns that were slightly lower than its benchmark, primarily due to its bias toward higher-quality credits during the market downturn.
For the 12-month period ended December 31, 2007, Class A, B, C and I shares of Dreyfus Premier Limited Term High Yield Fund achieved total returns of 2.03%, 1.53%, 1.28% and 2.29%, respectively.1 In comparison, the Merrill Lynch U.S. High Yield Master II Constrained Index (the “Index”) achieved a total return of 2.57% over the same period.2
The Fund’s Investment Approach
The fund seeks to maximize total return, consisting of capital appreciation and current income.The average effective maturity of the fund is limited to a maximum of 5.5 years.
At least 80% of the fund’s assets are invested in fixed-income securities that are rated below investment grade (“high yield” or “junk” bonds) or are the unrated equivalent as determined by Dreyfus. Individual issues are selected based on careful credit analysis.We thoroughly analyze the business, management and financial strength of each of the companies whose bonds we buy, then project each issuer’s ability to repay its debt.
The Fund 3
DISCUSSION OF FUND PERFORMANCE (continued)
|
Summer Turbulence Interrupted a Long Market Rally
High yield market conditions generally remained favorable over the first six months of the reporting period, as a moderate economic slowdown, mild inflation and steady short-term interest rates helped support bond prices. In fact, yield differences between high yield bonds and U.S. Treasury securities reached all-time narrow levels in early June, evidence that these generally benign influences had fostered an environment in which investors were comfortable with credit risks. Issuers took advantage of investors’ ample appetite for risk by issuing a high volume of new securities to finance corporate acquisitions and leveraged buyouts, many featuring terms and covenants that historically have been considered unfavorable to bondholders.
Market conditions changed dramatically over the summer, when sub-prime credit concerns spread to other parts of the financial markets. Although we saw no change in business fundamentals and default rates remained low, fixed-income investors quickly became more cautious. Some highly leveraged buyouts stalled when buyers did not materialize for securities with questionable credit characteristics. In addition, selling pressure from highly leveraged hedge funds contributed to difficult liquidity conditions and sharply lower bond prices.
In an attempt to improve market liquidity,The Federal Reserve Board (the “Fed”) intervened in mid-August by reducing the discount rate. The Fed followed up in September, October and December with cuts in the federal funds rate.While these moves helped restore a degree of investor confidence, high yield bonds generally remained under pressure through year-end when the economy continued to lose momentum and several major banks reported substantial sub-prime-related losses.
Our Tilt Toward Quality Helped Cushion Volatility
As economic conditions began to deteriorate and defaults among sub-prime mortgages grew more severe near mid-year, we reduced the fund’s positions in lower-tier, CCC-rated credits and increased its focus on shorter-maturity, single-B rated bonds that ranked relatively high in their issuers’ capital structure. Typically, we selected bonds of
issuers with high levels of free cash flow, and we looked for certain covenants designed to protect the interests of bond holders.We found a number of such opportunities among credits from the aerospace, hotel and environmental services industries. Although these holdings were hurt along with other credits during the market downturn, which led to the slight attribution lag versus the Index, they held up well compared to market averages. Conversely, the fund held relatively little exposure to issuers that were directly affected by the sub-prime mortgage crisis and slowing economy, such as financial services firms, home builders and retailers.
Positioning for a New Phase of the Credit Cycle
As 2008 begins, additional signs of economic weakness have stoked recession fears, and many analysts were not completely surprised by the Fed’s inter-meeting rate-cut of 75 basis points on January 22, just after the end of the reporting period. Although default rates have remained near historical lows, we expect old-fashioned credit research to become a more important determinant of investment success. Our research-intensive approach has identified a number of income opportunities in the utilities, services, chemicals, cable, media and telecommunications industry groups, but relatively few among financial companies, real estate firms and retailers.
| 1 | | Total return includes reinvestment of dividends and any capital gains paid, and does not take into |
| | | consideration the maximum initial sales charge in the case of Class A shares, or the applicable |
| | | contingent deferred sales charges imposed on redemptions in the case of Class B and Class C |
| | | shares. Had these charges been reflected, returns would have been lower. Past performance is no |
| | | guarantee of future results. Share price, yield and investment return fluctuate such that upon |
| | | redemption, fund shares may be worth more or less than their original cost. |
| 2 | | SOURCE: BLOOMBERG — Reflects reinvestment of dividends and, where applicable, |
| | | capital gain distributions.The Merrill Lynch U.S. High Yield Master II Constrained Index is an |
| | | unmanaged performance benchmark composed of U.S. dollar-denominated domestic and Yankee |
| | | bonds rated below investment grade with at least $100 million par amount outstanding and at |
| | | least one year remaining to maturity. Bonds are capitalization-weighted.Total allocations to an |
| | | issuer are capped at 2%.The index does not reflect fees and expenses to which the fund is subject. |
The Fund 5
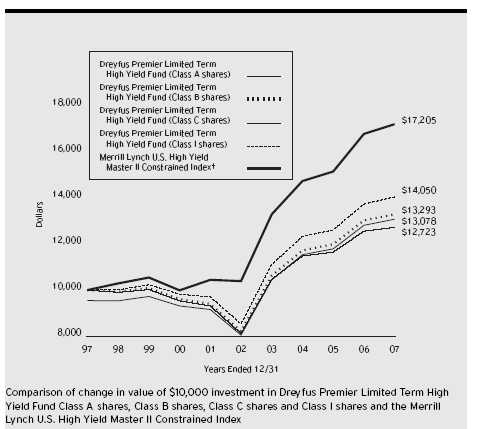
| † Source: Bloomberg L.P. |
| Past performance is not predictive of future performance. |
| The above graph compares a $10,000 investment made in each of the Class A, Class B, Class C and Class I shares of |
| Dreyfus Premier Limited Term High Yield Fund on 12/31/97 to a $10,000 investment made in the Merrill Lynch |
| U.S. High Yield Master II Constrained Index (the “Index”) on that date. All dividends and capital gain distributions |
| are reinvested. |
| The fund’s performance shown in the line graph takes into account the maximum initial sales charge on Class A shares |
| and all other applicable fees and expenses on all classes.The Index is an unmanaged performance benchmark composed of |
| U.S. dollar-denominated domestic and Yankee bonds rated below investment grade with at least $100 million par amount |
| outstanding and at least one year remaining to maturity. Bonds are capitalization-weighted.Total allocations to an issuer |
| are capped at 2%. Unlike a mutual fund, the Index is not subject to charges, fees and other expenses. Investors cannot |
| invest directly in any index. Further information relating to fund performance, including expense reimbursements, if |
| applicable, is contained in the Financial Highlights section of the prospectus and elsewhere in this report. |
| Average Annual Total Returns as of | | 12/31/07 | | | | | | |
| | | | | 1 Year | | 5 Years | | 10 Years |
| |
| |
| |
| |
|
| Class A shares | | | | | | | | |
| with maximum sales charge (4.5%) | | | | (2.51)% | | 9.18% | | 2.72% |
| without sales charge | | | | 2.03% | | 10.20% | | 3.20% |
| Class B shares | | | | | | | | |
| with applicable redemption charge † | | | | (2.26)% | | 9.42% | | 2.89% |
| without redemption | | | | 1.53% | | 9.70% | | 2.89% |
| Class C shares | | | | | | | | |
| with applicable redemption charge †† | | | | 0.33% | | 9.43% | | 2.44% |
| without redemption | | | | 1.28% | | 9.43% | | 2.44% |
| Class I shares | | | | 2.29% | | 10.47% | | 3.46% |
Past performance is not predictive of future performance.The fund’s performance shown in the graph and table does not reflect the deduction of taxes that a shareholder would pay on fund distributions or the redemption of fund shares. Performance for Class B shares assumes the conversion of Class B shares to Class A shares at the end of the sixth year following the date of purchase.
| † | | The maximum contingent deferred sales charge for Class B shares is 4%. After six years Class B shares convert to |
| | | Class A shares. |
| †† | | The maximum contingent deferred sales charge for Class C shares is 1% for shares redeemed within one year of the |
| | | date of purchase. |
The Fund 7
UNDERSTANDING YOUR FUND’S EXPENSES (Unaudited)
As a mutual fund investor, you pay ongoing expenses, such as management fees and other expenses. Using the information below, you can estimate how these expenses affect your investment and compare them with the expenses of other funds.You also may pay one-time transaction expenses, including sales charges (loads) and redemption fees, which are not shown in this section and would have resulted in higher total expenses. For more information, see your fund’s prospectus or talk to your financial adviser.
Review your fund’s expenses
The table below shows the expenses you would have paid on a $1,000 investment in Dreyfus Premier Limited Term High Yield Fund from July 1, 2007 to December 31, 2007. It also shows how much a $1,000 investment would be worth at the close of the period, assuming actual returns and expenses.
| Expenses and Value of a $1,000 Investment | | | | | | |
| assuming actual returns for the six months ended December 31, 2007 | | | | |
| | | Class A | | Class B | | Class C | | Class I |
| |
| |
| |
| |
|
| Expenses paid per $1,000 † | | $ 4.78 | | $ 7.28 | | $ 8.53 | | $ 3.52 |
| Ending value (after expenses) | | $994.50 | | $992.10 | | $990.80 | | $995.80 |
COMPARING YOUR FUND’S EXPENSES WITH THOSE OF OTHER FUNDS (Unaudited)
Using the SEC’s method to compare expenses
The Securities and Exchange Commission (SEC) has established guidelines to help investors assess fund expenses. Per these guidelines, the table below shows your fund’s expenses based on a $1,000 investment, assuming a hypothetical 5% annualized return. You can use this information to compare the ongoing expenses (but not transaction expenses or total cost) of investing in the fund with those of other funds.All mutual fund shareholder reports will provide this information to help you make this comparison. Please note that you cannot use this information to estimate your actual ending account balance and expenses paid during the period.
| Expenses and Value of a $1,000 Investment | | | | | | |
| assuming a hypothetical 5% annualized return for the six months ended December 31, 2007 |
| | | Class A | | Class B | | Class C | | Class I |
| |
| |
| |
| |
|
| Expenses paid per $1,000 † | | $ 4.84 | | $ 7.37 | | $ 8.64 | | $ 3.57 |
| Ending value (after expenses) | | $1,020.42 | | $1,017.90 | | $1,016.64 | | $1,021.68 |
† Expenses are equal to the fund’s annualized expense ratio of .95% for Class A, 1.45% for Class B, 1.70% for Class C and .70% for Class I; multiplied by the average account value over the period, multiplied by 184/365 (to reflect the one-half year period).
STATEMENT OF INVESTMENTS
December 31, 2007
|
| | | Coupon | | Maturity | | Principal | | |
| Bonds and Notes—95.2% | | Rate (%) | | Date | | Amount ($) | | Value ($) |
| |
| |
| |
| |
|
| Advertising—1.3% | | | | | | | | |
| Lamar Media, | | | | | | | | |
| Gtd. Notes, Ser. B | | 6.63 | | 8/15/15 | | 429,000 | | 419,348 |
| Lamar Media, | | | | | | | | |
| Sr. Unscd. Notes | | 6.63 | | 8/15/15 | | 1,725,000 | | 1,686,188 |
| R.H. Donnelley, | | | | | | | | |
| Sr. Notes | | 8.88 | | 10/15/17 | | 1,530,000 a | | 1,422,900 |
| | | | | | | | | 3,528,436 |
| Aerospace & Defense—1.8% | | | | | | | | |
| DRS Technologies, | | | | | | | | |
| Gtd. Notes | | 6.88 | | 11/1/13 | | 524,000 | | 524,000 |
| Esterline Technologies, | | | | | | | | |
| Gtd. Notes | | 6.63 | | 3/1/17 | | 1,375,000 | | 1,368,125 |
| L-3 Communications, | | | | | | | | |
| Gtd. Bonds | | 3.00 | | 8/1/35 | | 550,000 | | 667,563 |
| L-3 Communications, | | | | | | | | |
| Gtd. Notes, Ser. B | | 6.38 | | 10/15/15 | | 1,410,000 | | 1,395,900 |
| United AirLines, | | | | | | | | |
| Pass-Through Ctfs., Ser. 00-2 | | 7.81 | | 4/1/11 | | 981,877 | | 1,158,615 |
| | | | | | | | | 5,114,203 |
| Agricultural—.3% | | | | | | | | |
| Alliance One International, | | | | | | | | |
| Gtd. Notes | | 11.00 | | 5/15/12 | | 800,000 | | 840,000 |
| Asset-Backed Ctfs./ | | | | | | | | |
| Home Equity Loans—.0% | | | | | | | | |
| Countrywide Asset-Backed | | | | | | | | |
| Certificates, Ser. 2007-4, Cl. M8 | | 7.20 | | 9/25/37 | | 90,000 | | 40,489 |
| Countrywide Asset-Backed | | | | | | | | |
| Certificates, Ser. 2007-4, Cl. M7 | | 7.20 | | 9/25/37 | | 180,000 | | 51,352 |
| | | | | | | | | 91,841 |
| Automobile Manufacturers—2.4% | | | | | | |
| Ford Motor, | | | | | | | | |
| Unscd. Notes | | 7.45 | | 7/16/31 | | 3,315,000 | | 2,477,963 |
| General Motors, | | | | | | | | |
| Notes | | 7.20 | | 1/15/11 | | 2,615,000 b | | 2,412,338 |
| General Motors, | | | | | | | | |
| Sr. Unsub. Debs. | | 8.38 | | 7/15/33 | | 1,465,000 b | | 1,186,650 |
| GMAC, | | | | | | | | |
| Notes | | 7.00 | | 2/1/12 | | 805,000 | | 683,558 |
| | | | | | | | | 6,760,509 |
The Fund 9
| | STATEMENT OF INVESTMENTS (continued)
|
| | | Coupon | | Maturity | | Principal | | |
| Bonds and Notes (continued) | | Rate (%) | | Date | | Amount ($) | | Value ($) |
| |
| |
| |
| |
|
| Automotive, Trucks & Parts—2.5% | | | | | | |
| American Axle and Manufacturing, | | | | | | | | |
| Gtd. Notes | | 7.88 | | 3/1/17 | | 1,140,000 b | | 1,034,550 |
| Goodyear Tire & Rubber, | | | | | | | | |
| Gtd. Notes | | 8.63 | | 12/1/11 | | 461,000 | | 482,897 |
| Goodyear Tire & Rubber, | | | | | | | | |
| Sr. Notes | | 9.00 | | 7/1/15 | | 1,114,000 b | | 1,186,410 |
| Tenneco Automotive, | | | | | | | | |
| Gtd. Notes | | 8.63 | | 11/15/14 | | 2,070,000 | | 2,044,125 |
| Tenneco Automotive, | | | | | | | | |
| Scd. Notes, Ser. B | | 10.25 | | 7/15/13 | | 618,000 | | 661,260 |
| United Components, | | | | | | | | |
| Sr. Sub. Notes | | 9.38 | | 6/15/13 | | 1,613,000 | | 1,600,902 |
| | | | | | | | | 7,010,144 |
| Building & Construction—.6% | | | | | | | | |
| Goodman Global Holdings, | | | | | | | | |
| Gtd. Notes | | 7.88 | | 12/15/12 | | 524,000 | | 542,340 |
| Goodman Global Holdings, | | | | | | | | |
| Gtd. Notes, Ser. B | | 7.99 | | 6/15/12 | | 1,159,000 c | | 1,156,102 |
| | | | | | | | | 1,698,442 |
| Chemicals—2.3% | | | | | | | | |
| Airgas, | | | | | | | | |
| Gtd. Notes | | 6.25 | | 7/15/14 | | 1,450,000 b | | 1,392,000 |
| Ineos Group Holdings, | | | | | | | | |
| Gtd. Notes | | 8.50 | | 2/15/16 | | 2,550,000 a,b | | 2,282,250 |
| Nalco, | | | | | | | | |
| Sr. Sub. Notes | | 8.88 | | 11/15/13 | | 2,653,000 b | | 2,779,017 |
| | | | | | | | | 6,453,267 |
| Commercial & Professional | | | | | | | | |
| Services—2.3% | | | | | | | | |
| Aramark, | | | | | | | | |
| Gtd. Notes | | 8.50 | | 2/1/15 | | 1,012,000 | | 1,029,710 |
| Corrections Corp. of America, | | | | | | | | |
| Gtd. Notes | | 6.25 | | 3/15/13 | | 1,710,000 | | 1,692,900 |
| Education Management, | | | | | | | | |
| Gtd. Notes | | 8.75 | | 6/1/14 | | 625,000 | | 630,469 |
| Education Management, | | | | | | | | |
| Gtd. Notes | | 10.25 | | 6/1/16 | | 1,310,000 b | | 1,355,850 |
| Hertz, | | | | | | | | |
| Gtd. Notes | | 8.88 | | 1/1/14 | | 1,375,000 | | 1,400,781 |
10
| | | Coupon | | Maturity | | Principal | | |
| Bonds and Notes (continued) | | Rate (%) | | Date | | Amount ($) | | Value ($) |
| |
| |
| |
| |
|
| Commercial & Professional | | | | | | | | |
| Services (continued) | | | | | | | | |
| Hertz, | | | | | | | | |
| Gtd. Notes | | 10.50 | | 1/1/16 | | 430,000 | | 447,200 |
| | | | | | | | | 6,556,910 |
| Commercial Mortgage | | | | | | | | |
| Pass-Through Ctfs.—.4% | | | | | | | | |
| Global Signal Trust, | | | | | | | | |
| Ser. 2006-1, Cl. F | | 7.04 | | 2/15/36 | | 1,080,000 a | | 1,052,287 |
| Consumer Products—.3% | | | | | | | | |
| Chattem, | | | | | | | | |
| Sr. Sub. Notes | | 7.00 | | 3/1/14 | | 826,000 | | 819,805 |
| Diversified Financial Services—9.5% | | | | | | | | |
| Basell AF, | | | | | | | | |
| Gtd. Notes | | 8.38 | | 8/15/15 | | 2,175,000 a | | 1,767,188 |
| CCM Merger, | | | | | | | | |
| Notes | | 8.00 | | 8/1/13 | | 630,000 a | | 596,925 |
| Chevy Chase Bank, | | | | | | | | |
| Sub. Notes | | 6.88 | | 12/1/13 | | 2,550,000 | | 2,441,625 |
| Consolidated Communications | | | | | | | | |
| Illinois/Texas Holdings, Sr. Notes | | 9.75 | | 4/1/12 | | 761,000 | | 787,635 |
| Ford Motor Credit, | | | | | | | | |
| Unscd. Notes | | 7.38 | | 10/28/09 | | 4,745,000 | | 4,468,044 |
| Ford Motor Credit, | | | | | | | | |
| Sr. Unscd. Notes | | 8.00 | | 12/15/16 | | 1,820,000 | | 1,548,252 |
| Ford Motor Credit, | | | | | | | | |
| Sr. Unscd. Notes | | 8.63 | | 11/1/10 | | 1,135,000 | | 1,053,861 |
| GMAC, | | | | | | | | |
| Sr. Unsub. Notes EUR | | 5.38 | | 6/6/11 | | 1,000,000 d | | 1,209,571 |
| GMAC, | | | | | | | | |
| Notes | | 6.13 | | 1/22/08 | | 1,375,000 b | | 1,375,223 |
| GMAC, | | | | | | | | |
| Unsub. Notes | | 7.75 | | 1/19/10 | | 3,665,000 b | | 3,420,339 |
| GMAC, | | | | | | | | |
| Bonds | | 8.00 | | 11/1/31 | | 1,190,000 | | 1,000,636 |
| HUB International Holdings, | | | | | | | | |
| Sr. Sub. Notes | | 10.25 | | 6/15/15 | | 2,580,000 a | | 2,205,900 |
| Idearc, | | | | | | | | |
| Gtd. Notes | | 8.00 | | 11/15/16 | | 2,330,000 | | 2,149,425 |
The Fund 11
| | STATEMENT OF INVESTMENTS (continued)
|
| | | Coupon | | Maturity | | Principal | | |
| Bonds and Notes (continued) | | Rate (%) | | Date | | Amount ($) | | Value ($) |
| |
| |
| |
| |
|
| Diversified Financial | | | | | | | | |
| Services (continued) | | | | | | | | |
| Kansas City Southern Railway, | | | | | | | | |
| Gtd. Notes | | 7.50 | | 6/15/09 | | 600,000 | | 603,750 |
| Stena, | | | | | | | | |
| Sr. Notes | | 7.50 | | 11/1/13 | | 1,001,000 | | 992,241 |
| UCI Holdco, | | | | | | | | |
| Sr. Notes | | 12.49 | | 12/15/13 | | 902,393 a,c | | 857,273 |
| | | | | | | | | 26,477,888 |
| Diversified Metals & Mining—2.5% | | | | | | |
| Arch Western Finance, | | | | | | | | |
| Gtd. Notes | | 6.75 | | 7/1/13 | | 750,000 c | | 731,250 |
| CSN Islands IX, | | | | | | | | |
| Gtd. Notes | | 10.50 | | 1/15/15 | | 1,500,000 a,c | | 1,743,750 |
| Freeport-McMoRan Cooper & Gold, | | | | | | | | |
| Sr. Unscd. Notes | | 8.25 | | 4/1/15 | | 2,300,000 | | 2,443,750 |
| Gibraltar Industries, | | | | | | | | |
| Gtd. Notes, Ser. B | | 8.00 | | 12/1/15 | | 670,000 c | | 606,350 |
| Mashantucket Pequot Tribe, | | | | | | | | |
| Bonds | | 8.50 | | 11/15/15 | | 650,000 a,b | | 656,500 |
| Peabody Energy, | | | | | | | | |
| Gtd. Notes, Ser. B | | 6.88 | | 3/15/13 | | 805,000 | | 813,050 |
| | | | | | | | | 6,994,650 |
| Electric Utilities—6.8% | | | | | | | | |
| AES, | | | | | | | | |
| Sr. Notes | | 7.75 | | 10/15/15 | | 450,000 a | | 459,000 |
| AES, | | | | | | | | |
| Sr. Notes | | 8.00 | | 10/15/17 | | 300,000 a | | 308,250 |
| AES, | | | | | | | | |
| Sr. Unsub. Notes | | 8.88 | | 2/15/11 | | 1,490,000 | | 1,560,775 |
| AES, | | | | | | | | |
| Sr. Notes | | 9.38 | | 9/15/10 | | 1,000,000 | | 1,055,000 |
| Edison Mission Energy, | | | | | | | | |
| Sr. Notes | | 7.00 | | 5/15/17 | | 200,000 | | 197,500 |
| Edison Mission Energy, | | | | | | | | |
| Sr. Unscd. Notes | | 7.50 | | 6/15/13 | | 1,185,000 | | 1,220,550 |
| Energy Future Holdings, | | | | | | | | |
| Gtd. Notes | | 10.88 | | 11/1/17 | | 2,025,000 a | | 2,045,250 |
| Mirant Americas Generation, | | | | | | | | |
| Sr. Unscd. Notes | | 8.30 | | 5/1/11 | | 1,625,000 | | 1,637,187 |
12
| | | Coupon | | Maturity | | Principal | | |
| Bonds and Notes (continued) | | Rate (%) | | Date | | Amount ($) | | Value ($) |
| |
| |
| |
| |
|
| Electric Utilities (continued) | | | | | | | | |
| Mirant North America, | | | | | | | | |
| Gtd. Notes | | 7.38 | | 12/31/13 | | 2,315,000 | | 2,332,362 |
| Nevada Power, | | | | | | | | |
| Mortgage Notes, Ser. A | | 8.25 | | 6/1/11 | | 1,321,000 | | 1,441,443 |
| NRG Energy, | | | | | | | | |
| Gtd. Notes | | 7.25 | | 2/1/14 | | 1,050,000 | | 1,026,375 |
| NRG Energy, | | | | | | | | |
| Gtd. Notes | | 7.38 | | 2/1/16 | | 225,000 | | 219,938 |
| NRG Energy, | | | | | | | | |
| Gtd. Notes | | 7.38 | | 1/15/17 | | 565,000 | | 552,287 |
| Reliant Energy, | | | | | | | | |
| Sr. Notes | | 7.63 | | 6/15/14 | | 2,985,000 b | | 2,970,075 |
| Sierra Pacific Resources, | | | | | | | | |
| Sr. Unscd. Notes | | 8.63 | | 3/15/14 | | 1,910,000 | | 2,050,446 |
| | | | | | | | | 19,076,438 |
| Environmental Control—1.4% | | | | | | | | |
| Allied Waste North America, | | | | | | | | |
| Scd. Notes | | 6.88 | | 6/1/17 | | 3,400,000 b | | 3,332,000 |
| WCA Waste, | | | | | | | | |
| Gtd. Notes | | 9.25 | | 6/15/14 | | 625,000 | | 639,062 |
| | | | | | | | | 3,971,062 |
| Food & Beverages—2.3% | | | | | | | | |
| Dean Foods, | | | | | | | | |
| Gtd. Notes | | 7.00 | | 6/1/16 | | 750,000 | | 671,250 |
| Del Monte, | | | | | | | | |
| Sr. Sub. Notes | | 8.63 | | 12/15/12 | | 1,031,000 c | | 1,043,887 |
| Dole Food, | | | | | | | | |
| Sr. Notes | | 8.63 | | 5/1/09 | | 745,000 c | | 722,650 |
| Smithfield Foods, | | | | | | | | |
| Sr. Notes, Ser. B | | 7.75 | | 5/15/13 | | 700,000 | | 693,000 |
| Smithfield Foods, | | | | | | | | |
| Sr. Unscd. Notes | | 7.75 | | 7/1/17 | | 750,000 | | 729,375 |
| Stater Brothers Holdings, | | | | | | | | |
| Sr. Notes | | 8.13 | | 6/15/12 | | 2,675,000 | | 2,654,937 |
| | | | | | | | | 6,515,099 |
| Health Care—6.2% | | | | | | | | |
| Alliance Imaging, | | | | | | | | |
| Sr. Sub. Notes | | 7.25 | | 12/15/12 | | 495,000 a | | 472,725 |
The Fund 13
| | STATEMENT OF INVESTMENTS (continued)
|
| | | Coupon | | Maturity | | Principal | | |
| Bonds and Notes (continued) | | Rate (%) | | Date | | Amount ($) | | Value ($) |
| |
| |
| |
| |
|
| Health Care (continued) | | | | | | | | |
| Bausch & Lomb, | | | | | | | | |
| Sr. Unscd. Notes | | 9.88 | | 11/1/15 | | 1,095,000 a | | 1,114,162 |
| Community Health Systems, | | | | | | | | |
| Gtd. Notes | | 8.88 | | 7/15/15 | | 2,650,000 | | 2,712,938 |
| Davita, | | | | | | | | |
| Gtd. Notes | | 6.63 | | 3/15/13 | | 500,000 | | 500,000 |
| HCA, | | | | | | | | |
| Sr. Unscd. Notes | | 6.30 | | 10/1/12 | | 2,255,000 | | 2,018,225 |
| HCA, | | | | | | | | |
| Sr. Unscd. Notes | | 8.75 | | 9/1/10 | | 2,245,000 | | 2,275,869 |
| HCA, | | | | | | | | |
| Scd. Notes | | 9.13 | | 11/15/14 | | 350,000 | | 364,875 |
| HCA, | | | | | | | | |
| Scd. Notes | | 9.25 | | 11/15/16 | | 1,300,000 | | 1,368,250 |
| Psychiatric Solutions, | | | | | | | | |
| Gtd. Notes | | 7.75 | | 7/15/15 | | 1,650,000 | | 1,654,125 |
| Psychiatric Solutions, | | | | | | | | |
| Gtd. Notes | | 7.75 | | 7/15/15 | | 2,050,000 | | 2,055,125 |
| Tenet Healthcare, | | | | | | | | |
| Sr. Notes | | 6.38 | | 12/1/11 | | 1,260,000 | | 1,152,900 |
| Tenet Healthcare, | | | | | | | | |
| Sr. Notes | | 9.88 | | 7/1/14 | | 1,712,000 | | 1,639,240 |
| | | | | | | | | 17,328,434 |
| Lodging & Entertainment—9.7% | | | | | | | | |
| AMC Entertainment, | | | | | | | | |
| Sr. Sub. Notes | | 8.00 | | 3/1/14 | | 2,632,000 | | 2,487,240 |
| Cinemark, | | | | | | | | |
| Sr. Discount Notes | | 9.75 | | 3/15/14 | | 3,250,000 e | | 3,042,813 |
| Fontainebleau Las Vegas Holdings, | | | | | | | | |
| Mortgage Notes | | 10.25 | | 6/15/15 | | 1,815,000 a | | 1,583,587 |
| Gaylord Entertainment, | | | | | | | | |
| Gtd. Notes | | 6.75 | | 11/15/14 | | 1,425,000 | | 1,350,187 |
| Gaylord Entertainment, | | | | | | | | |
| Gtd. Notes | | 8.00 | | 11/15/13 | | 900,000 | | 900,000 |
| Mandalay Resort Group, | | | | | | | | |
| Sr. Unscd. Notes | | 6.50 | | 7/31/09 | | 1,651,000 | | 1,659,255 |
| Marquee Holdings, | | | | | | | | |
| Sr. Discount Notes | | 9.51 | | 8/15/14 | | 610,000 e | | 491,050 |
| MGM Mirage, | | | | | | | | |
| Gtd. Notes | | 8.38 | | 2/1/11 | | 470,000 b | | 482,925 |
14
| | | Coupon | | Maturity | | Principal | | |
| Bonds and Notes (continued) | | Rate (%) | | Date | | Amount ($) | | Value ($) |
| |
| |
| |
| |
|
| Lodging & Entertainment | | | | | | | | |
| (continued) | | | | | | | | |
| MGM Mirage, | | | | | | | | |
| Gtd. Notes | | 8.50 | | 9/15/10 | | 1,518,000 | | 1,582,515 |
| Mohegan Tribal Gaming Authority, | | | | | | | | |
| Gtd. Notes | | 6.38 | | 7/15/09 | | 2,048,000 b | | 2,058,240 |
| Pokagon Gaming Authority, | | | | | | | | |
| Sr. Notes | | 10.38 | | 6/15/14 | | 2,825,000 a | | 3,051,000 |
| Scientific Games, | | | | | | | | |
| Gtd. Notes | | 6.25 | | 12/15/12 | | 2,015,000 | | 1,934,400 |
| Seneca Gaming, | | | | | | | | |
| Sr. Unscd. Notes, Ser. B | | 7.25 | | 5/1/12 | | 1,200,000 | | 1,215,000 |
| Shingle Springs Tribal Group, | | | | | | | | |
| Sr. Notes | | 9.38 | | 6/15/15 | | 1,130,000 a | | 1,101,750 |
| Speedway Motorsports, | | | | | | | | |
| Sr. Sub. Notes | | 6.75 | | 6/1/13 | | 1,875,000 | | 1,856,250 |
| Station Casinos, | | | | | | | | |
| Sr. Sub. Notes | | 6.50 | | 2/1/14 | | 500,000 b | | 377,500 |
| Trump Entertainment Resorts, | | | | | | | | |
| Scd. Notes | | 8.50 | | 6/1/15 | | 555,000 | | 425,269 |
| Vail Resorts, | | | | | | | | |
| Gtd. Notes | | 6.75 | | 2/15/14 | | 1,500,000 | | 1,485,000 |
| | | | | | | | | 27,083,981 |
| Machinery—2.7% | | | | | | | | |
| Case, | | | | | | | | |
| Notes | | 7.25 | | 1/15/16 | | 2,500,000 b | | 2,512,500 |
| Columbus McKinnon, | | | | | | | | |
| Sr. Sub. Notes | | 8.88 | | 11/1/13 | | 605,000 | | 629,200 |
| Douglas Dynamics, | | | | | | | | |
| Gtd. Notes | | 7.75 | | 1/15/12 | | 1,980,000 a | | 1,722,600 |
| Terex, | | | | | | | | |
| Gtd. Notes | | 7.38 | | 1/15/14 | | 2,725,000 | | 2,772,687 |
| | | | | | | | | 7,636,987 |
| Manufacturing—2.1% | | | | | | | | |
| Bombardier, | | | | | | | | |
| Notes | | 6.30 | | 5/1/14 | | 1,500,000 a | | 1,473,750 |
| Bombardier, | | | | | | | | |
| Sr. Unscd. Notes | | 8.00 | | 11/15/14 | | 500,000 a | | 525,000 |
| J.B. Poindexter & Co., | | | | | | | | |
| Gtd. Notes | | 8.75 | | 3/15/14 | | 1,500,000 b | | 1,263,750 |
The Fund 15
| | STATEMENT OF INVESTMENTS (continued)
|
| | | Coupon | | Maturity | | Principal | | |
| Bonds and Notes (continued) | | Rate (%) | | Date | | Amount ($) | | Value ($) |
| |
| |
| |
| |
|
| Manufacturing (continued) | | | | | | | | |
| Mueller Water Products, | | | | | | | | |
| Gtd. Notes | | 7.38 | | 6/1/17 | | 385,000 | | 346,019 |
| Polypore, | | | | | | | | |
| Gtd. Notes | | 8.75 | | 5/15/12 | | 550,000 | | 540,375 |
| RBS Global & Rexnord, | | | | | | | | |
| Gtd. Notes | | 9.50 | | 8/1/14 | | 1,270,000 | | 1,263,650 |
| RBS Global & Rexnord, | | | | | | | | |
| Gtd. Notes | | 11.75 | | 8/1/16 | | 525,000 b | | 515,813 |
| | | | | | | | | 5,928,357 |
| Media—6.1% | | | | | | | | |
| CCH I Holdings, | | | | | | | | |
| Scd. Notes | | 11.00 | | 10/1/15 | | 2,395,000 | | 1,963,900 |
| CCH II, | | | | | | | | |
| Sr. Unscd. Notes | | 10.25 | | 9/15/10 | | 2,740,000 b | | 2,698,900 |
| CSC Holdings, | | | | | | | | |
| Sr. Notes, Ser. B | | 7.63 | | 4/1/11 | | 2,000,000 | | 2,005,000 |
| CSC Holdings, | | | | | | | | |
| Sr. Notes, Ser. B | | 8.13 | | 7/15/09 | | 750,000 | | 764,063 |
| Dex Media West/Finance, | | | | | | | | |
| Sr. Unscd. Notes, Ser. B | | 8.50 | | 8/15/10 | | 520,000 b | | 529,750 |
| Dex Media West/Finance, | | | | | | | | |
| Gtd. Notes, Ser. B | | 9.88 | | 8/15/13 | | 2,879,000 | | 3,001,358 |
| General Cable, | | | | | | | | |
| Gtd. Notes | | 7.13 | | 4/1/17 | | 605,000 | | 595,925 |
| ION Media Networks, | | | | | | | | |
| Sr. Sub. Notes | | 11.00 | | 7/31/13 | | 35,172 a | | 17,762 |
| Kabel Deutschland, | | | | | | | | |
| Gtd. Notes | | 10.63 | | 7/1/14 | | 1,795,000 | | 1,893,725 |
| LBI Media, | | | | | | | | |
| Sr. Sub. Notes | | 8.50 | | 8/1/17 | | 1,300,000 a | | 1,259,375 |
| Mediacom, | | | | | | | | |
| Sr. Unscd. Notes | | 9.50 | | 1/15/13 | | 465,000 | | 434,194 |
| Nexstar Finance Holdings, | | | | | | | | |
| Sr. Discount Notes | | 11.38 | | 4/1/13 | | 956,000 e | | 952,415 |
| Nexstar Finance, | | | | | | | | |
| Gtd. Notes | | 7.00 | | 1/15/14 | | 915,000 | | 856,669 |
| Radio One, | | | | | | | | |
| Gtd. Notes, Ser. B | | 8.88 | | 7/1/11 | | 95,000 | | 89,181 |
| | | | | | | | | 17,062,217 |
16
| | | Coupon | | Maturity | | Principal | | |
| Bonds and Notes (continued) | | Rate (%) | | Date | | Amount ($) | | Value ($) |
| |
| |
| |
| |
|
| Oil & Gas—5.0% | | | | | | | | |
| Chesapeake Energy, | | | | | | | | |
| Gtd. Notes | | 7.00 | | 8/15/14 | | 1,240,000 | | 1,252,400 |
| Chesapeake Energy, | | | | | | | | |
| Gtd. Notes | | 7.50 | | 6/15/14 | | 775,000 | | 792,438 |
| Cimarex Energy | | | | | | | | |
| Gtd. Notes | | 7.13 | | 5/1/17 | | 1,610,000 | | 1,589,875 |
| Colorado Interstate Gas, | | | | | | | | |
| Sr. Unscd. Notes | | 5.95 | | 3/15/15 | | 540,000 | | 536,930 |
| Dynegy Holdings, | | | | | | | | |
| Sr. Unscd. Notes | | 8.38 | | 5/1/16 | | 2,435,000 b | | 2,392,388 |
| Dynegy Holdings, | | | | | | | | |
| Sr. Notes | | 8.75 | | 2/15/12 | | 270,000 b | | 274,050 |
| Whiting Petroleum, | | | | | | | | |
| Gtd. Notes | | 7.25 | | 5/1/13 | | 2,000,000 b | | 1,980,000 |
| Williams Cos., | | | | | | | | |
| Sr. Unscd. Notes | | 7.13 | | 9/1/11 | | 250,000 b | | 265,313 |
| Williams Cos., | | | | | | | | |
| Notes | | 7.23 | | 10/1/10 | | 2,375,000 a,c | | 2,416,563 |
| Williams Cos., | | | | | | | | |
| Sr. Notes | | 7.63 | | 7/15/19 | | 975,000 | | 1,061,531 |
| Williams Cos., | | | | | | | | |
| Sr. Unscd. Notes | | 7.88 | | 9/1/21 | | 1,170,000 | | 1,303,088 |
| | | | | | | | | 13,864,576 |
| Packaging & Containers—6.3% | | | | | | | | |
| Ball, | | | | | | | | |
| Gtd. Notes | | 6.88 | | 12/15/12 | | 300,000 | | 306,000 |
| BPC Holding, | | | | | | | | |
| Scd. Notes | | 8.87 | | 9/15/14 | | 180,000 c | | 169,200 |
| BPC Holding, | | | | | | | | |
| Scd. Notes | | 8.88 | | 9/15/14 | | 1,345,000 b | | 1,284,475 |
| Crown Americas, | | | | | | | | |
| Gtd. Notes | | 7.63 | | 11/15/13 | | 3,715,000 | | 3,817,163 |
| Crown Americas, | | | | | | | | |
| Gtd. Notes | | 7.75 | | 11/15/15 | | 3,835,000 | | 3,969,225 |
| Norampac, | | | | | | | | |
| Gtd. Notes | | 6.75 | | 6/1/13 | | 2,380,000 b | | 2,183,650 |
| Owens Brockway Glass Container, | | | | | | | | |
| Gtd. Notes | | 6.75 | | 12/1/14 | | 519,000 | | 519,000 |
The Fund 17
| | STATEMENT OF INVESTMENTS (continued)
|
| | | Coupon | | Maturity | | Principal | | |
| Bonds and Notes (continued) | | Rate (%) | | Date | | Amount ($) | | Value ($) |
| |
| |
| |
| |
|
| Packaging & Containers (continued) | | | | | | | | |
| Owens Brockway Glass Container, | | | | | | | | |
| Gtd. Notes | | 8.25 | | 5/15/13 | | 515,000 | | 536,888 |
| Owens Brockway Glass Container, | | | | | | | | |
| Gtd. Notes | | 8.88 | | 2/15/09 | | 822,000 | | 826,110 |
| Plastipak Holdings, | | | | | | | | |
| Sr. Notes | | 8.50 | | 12/15/15 | | 2,200,000 a,b | | 2,211,000 |
| Stone Container, | | | | | | | | |
| Sr. Unscd. Notes | | 8.00 | | 3/15/17 | | 1,945,000 | | 1,889,081 |
| | | | | | | | | 17,711,792 |
| Paper & Forest Products—1.7% | | | | | | | | |
| Georgia-Pacific, | | | | | | | | |
| Gtd. Notes | | 7.00 | | 1/15/15 | | 3,410,000 a | | 3,333,275 |
| Georgia-Pacific, | | | | | | | | |
| Sr. Unscd. Notes | | 8.00 | | 1/15/24 | | 725,000 | | 677,875 |
| Verso Paper, | | | | | | | | |
| Gtd. Notes, Ser. B | | 11.38 | | 8/1/16 | | 635,000 | | 647,700 |
| | | | | | | | | 4,658,850 |
| Property & Casualty Insurance—1.3% | | | | | | |
| Allmerica Financial, | | | | | | | | |
| Debs. | | 7.63 | | 10/15/25 | | 1,500,000 | | 1,456,875 |
| Leucadia National, | | | | | | | | |
| Sr. Unscd. Notes | | 7.13 | | 3/15/17 | | 2,315,000 | | 2,152,950 |
| | | | | | | | | 3,609,825 |
| Real Estate Investment Trusts—1.6% | | | | | | |
| B.F. Saul REIT, | | | | | | | | |
| Scd. Notes | | 7.50 | | 3/1/14 | | 1,525,000 | | 1,410,625 |
| Host Marriott, | | | | | | | | |
| Gtd. Notes, Ser. M | | 7.00 | | 8/15/12 | | 2,500,000 | | 2,512,500 |
| Realogy, | | | | | | | | |
| Gtd. Notes | | 12.38 | | 4/15/15 | | 1,080,000 a,b | | 683,100 |
| | | | | | | | | 4,606,225 |
| Retail—3.3% | | | | | | | | |
| Amerigas Partners, | | | | | | | | |
| Sr. Unscd. Notes | | 7.25 | | 5/20/15 | | 1,245,000 | | 1,226,325 |
| Central European Distribution, | | | | | | | | |
| Scd. Bonds EUR | | 8.00 | | 7/25/12 | | 500,000 a,d | | 735,374 |
| | | | | Coupon | | Maturity | | Principal | | |
| Bonds and Notes (continued) | | Rate (%) | | Date | | Amount ($) | | Value ($) |
| |
| |
| |
| |
|
| Retail (continued) | | | | | | | | | | |
| Invista, | | | | | | | | | | |
| Sr. Unscd. Notes | | | | 9.25 | | 5/1/12 | | 3,710,000 a | | 3,858,400 |
| Levi Strauss & Co., | | | | | | | | | | |
| Sr. Unsub. Notes | | | | 9.75 | | 1/15/15 | | 700,000 | | 701,750 |
| Michaels Stores, | | | | | | | | | | |
| Gtd. Notes | | | | 10.00 | | 11/1/14 | | 880,000 b | | 840,400 |
| Neiman-Marcus Group, | | | | | | | | | | |
| Gtd. Notes | | | | 9.00 | | 10/15/15 | | 665,000 | | 689,106 |
| Rite Aid, | | | | | | | | | | |
| Gtd. Notes | | | | 9.38 | | 12/15/15 | | 1,470,000 | | 1,227,450 |
| | | | | | | | | | | 9,278,805 |
| Specialty Steel—.4% | | | | | | | | | | |
| Steel Dynamics, | | | | | | | | | | |
| Sr. Notes | | | | 7.38 | | 11/1/12 | | 1,200,000 a | | 1,212,000 |
| Technology—2.6% | | | | | | | | | | |
| Amkor Technologies, | | | | | | | | | | |
| Gtd. Notes | | | | 9.25 | | 6/1/16 | | 750,000 | | 755,625 |
| Belden, | | | | | | | | | | |
| Sr. Sub. Notes | | | | 7.00 | | 3/15/17 | | 500,000 | | 490,000 |
| Freescale Semiconductor, | | | | | | | | | | |
| Sr. Unscd. Notes | | | | 8.88 | | 12/15/14 | | 2,785,000 | | 2,499,538 |
| Freescale Semiconductor, | | | | | | | | | | |
| Gtd. Notes | | | | 10.13 | | 12/15/16 | | 805,000 b | | 668,150 |
| Sensata Technologies, | | | | | | | | | | |
| Gtd. Notes | | EUR | | 9.00 | | 5/1/16 | | 475,000 d | | 613,663 |
| Sungard Data Systems, | | | | | | | | | | |
| Gtd. Notes | | | | 10.25 | | 8/15/15 | | 2,100,000 | | 2,157,750 |
| | | | | | | | | | | 7,184,726 |
| Telecommunications—9.2% | | | | | | | | | | |
| Centennial Cellular Operating, | | | | | | | | |
| Gtd. Notes | | | | 10.13 | | 6/15/13 | | 815,000 | | 859,825 |
| Centennial Communications, | | | | | | | | | | |
| Sr. Unscd. Notes | | | | 8.13 | | 2/1/14 | | 600,000 c | | 594,000 |
| Cricket Communications I, | | | | | | | | | | |
| Gtd. Notes | | | | 9.38 | | 11/1/14 | | 740,000 | | 697,450 |
The Fund 19
| | STATEMENT OF INVESTMENTS (continued)
|
| | | | | Coupon | | Maturity | | Principal | | |
| Bonds and Notes (continued) | | Rate (%) | | Date | | Amount ($) | | Value ($) |
| |
| |
| |
| |
|
| Telecommunications (continued) | | | | | | | | |
| Digicel Group, | | | | | | | | | | |
| Sr. Notes | | | | 8.88 | | 1/15/15 | | 800,000 a | | 734,000 |
| Digicel Group, | | | | | | | | | | |
| Sr. Unscd. Notes | | | | 9.13 | | 1/15/15 | | 1,712,000 a,b | | 1,566,480 |
| Intelsat Bermuda, | | | | | | | | | | |
| Sr. Unscd. Notes | | | | 11.25 | | 6/15/16 | | 3,455,000 | | 3,584,562 |
| Intelsat Subsidiary Holding, | | | | | | | | | | |
| Sr. Notes | | | | 8.25 | | 1/15/13 | | 1,610,000 c | | 1,626,100 |
| Intelsat Subsidiary Holding, | | | | | | | | | | |
| Gtd. Notes | | | | 8.63 | | 1/15/15 | | 275,000 c | | 277,750 |
| Intelsat, | | | | | | | | | | |
| Sr. Unscd. Notes | | | | 7.63 | | 4/15/12 | | 1,360,000 | | 1,122,000 |
| Level 3 Financing, | | | | | | | | | | |
| Gtd. Notes | | | | 9.15 | | 2/15/15 | | 1,150,000 c | | 974,625 |
| MetroPCS Wireless, | | | | | | | | | | |
| Gtd. Notes | | | | 9.25 | | 11/1/14 | | 1,475,000 | | 1,393,875 |
| Nordic Telephone Holdings, | | | | | | | | | | |
| Scd. Notes | | EUR | | 8.25 | | 5/1/16 | | 1,175,000 a,d | | 1,740,994 |
| Nordic Telephone Holdings, | | | | | | | | | | |
| Scd. Bonds | | | | 8.88 | | 5/1/16 | | 300,000 a | | 309,000 |
| Qwest, | | | | | | | | | | |
| Bank Note, Ser. B | | | | 6.95 | | 6/30/10 | | 375,000 c | | 382,031 |
| Qwest, | | | | | | | | | | |
| Bank Note, Ser. B | | | | 6.95 | | 6/30/10 | | 477,000 c | | 485,944 |
| Qwest, | | | | | | | | | | |
| Sr. Notes | | | | 7.88 | | 9/1/11 | | 440,000 | | 459,800 |
| Qwest, | | | | | | | | | | |
| Sr. Notes | | | | 8.24 | | 6/15/13 | | 710,000 c | | 727,750 |
| US Unwired, | | | | | | | | | | |
| Gtd. Notes, Ser. B | | | | 10.00 | | 6/15/12 | | 2,149,000 b | | 2,278,557 |
| Wind Acquisition Finance, | | | | | | | | | | |
| Scd. Bonds | | | | 10.75 | | 12/1/15 | | 500,000 a | | 547,500 |
| Windstream, | | | | | | | | | | |
| Gtd. Notes | | | | 8.13 | | 8/1/13 | | 5,045,000 | | 5,246,800 |
| | | | | | | | | | | 25,609,043 |
| | | Coupon | | Maturity | | Principal | | |
| Bonds and Notes (continued) | | Rate (%) | | Date | | Amount ($) | | Value ($) |
| |
| |
| |
| |
|
| Transportation—.3% | | | | | | | | |
| Kansas City Southern of Mexico, | | | | | | | | |
| Sr. Unsub. Notes | | 7.63 | | 12/1/13 | | 825,000 | | 817,781 |
| Total Bonds and Notes | | | | | | | | |
| (cost $272,486,029) | | | | | | | | 266,554,580 |
| |
| |
| |
| |
|
| |
| Preferred Stocks—1.0% | | | | | | Shares | | Value ($) |
| |
| |
| |
| |
|
| Banks—.4% | | | | | | | | |
| Sovereign Capital Trust IV, | | | | | | | | |
| Conv., Cum. $2.1875 | | | | | | 41,900 | | 1,236,050 |
| Media—.6% | | | | | | | | |
| Spanish Broadcasting System, | | | | | | | | |
| Ser. B, Cum. $107.505 | | | | | | 1,482 | | 1,499,058 |
| Total Preferred Stocks | | | | | | | | |
| (cost $3,626,763) | | | | | | | | 2,735,108 |
| |
| |
| |
| |
|
| |
| Common Stocks—.3% | | | | | | | | |
| |
| |
| |
| |
|
| Cable & Media—.0% | | | | | | | | |
| Time Warner Cable, Cl. A | | | | | | 8 f | | 221 |
| Electric Utilities—.1% | | | | | | | | |
| Mirant | | | | | | 9,276 b,f | | 361,578 |
| Telecommunications—.2% | | | | | | | | |
| AboveNet | | | | | | 5,292 f | | 412,776 |
| AboveNet (warrants 9/8/2008) | | | | | | 718 f | | 39,490 |
| AboveNet (warrants 9/8/2010) | | | | | | 844 f | | 42,200 |
| | | | | | | | | 494,466 |
| Total Common Stocks | | | | | | | | |
| (cost $378,999) | | | | | | | | 856,265 |
| |
| |
| |
| |
|
| |
| Other Investment—2.2% | | | | | | | | |
| |
| |
| |
| |
|
| Registered Investment Company; | | | | | | |
| Dreyfus Institutional Preferred Plus Money Market Fund | | | | |
| (cost $6,050,000) | | | | | | 6,050,000 g | | 6,050,000 |
The Fund 21
| | STATEMENT OF INVESTMENTS (continued)
|
| Investment of Cash Collateral | | | | |
| for Securities Loaned—12.2% | | Shares | | Value ($) |
| |
| |
|
| Registered Investment Company; | | | | |
| Dreyfus Institutional Cash | | | | |
| Advantage Fund | | | | |
| (cost $34,274,830) | | 34,274,830 g | | 34,274,830 |
| |
| |
|
| Total Investments (cost $316,816,621) | | 110.9% | | 310,470,783 |
| Liabilities, Less Cash and Receivables | | (10.9%) | | (30,464,094) |
| Net Assets | | 100.0% | | 280,006,689 |
| a Securities exempt from registration under Rule 144A of the Securities Act of 1933.These securities may be resold in |
| transactions exempt from registration, normally to qualified institutional buyers. At December 31, 2007, these |
| securities amounted to $47,066,870 or 16.8% of net assets. |
| b All or a portion of these securities are on loan. At December 31, 2007, the total market value of the fund’s securities |
| on loan is $31,802,565 and the total market value of the collateral held by the fund is $34,685,093, consisting of |
| cash collateral of $34,274,830 and U.S. Government and Agency securities valued at $410,263. |
| c Variable rate security—interest rate subject to periodic change. |
| d Principal amount stated in U.S. Dollars unless otherwise noted. |
| EUR—Euro |
| e Zero coupon until a specified date at which time the stated coupon rate becomes effective until maturity. |
| f Non-income producing security. |
| g Investment in affiliated money market mutual fund. |
| Portfolio Summary (Unaudited) † | | | | |
| |
| | | Value (%) | | | | Value (%) |
| |
| |
| |
|
| Corporate Bonds | | 94.8 | | Asset/Mortgage-Backed | | .4 |
| Money Market Investments | | 14.4 | | Common Stocks | | .3 |
| Preferred Stocks | | 1.0 | | | | 110.9 |
| |
| † Based on net assets. | | | | | | |
| See notes to financial statements. | | | | | | |
STATEMENT OF ASSETS AND LIABILITIES
December 31, 2007
|
| | | | | | | Cost | | Value |
| |
| |
| |
| |
|
| Assets ($): | | | | | | | | |
| Investments in securities—See Statement of | | | | | | |
| Investments (including securities on loan, | | | | | | |
| valued at $31,802,565)—Note 1(c): | | | | | | |
| Unaffiliated issuers | | | | 276,491,791 | | 270,145,953 |
| Affiliated issuers | | | | 40,324,830 | | 40,324,830 |
| Cash denominated in foreign currencies | | | | 2,437 | | 2,404 |
| Interest and dividends receivable | | | | | | 5,561,882 |
| Receivable for shares of Beneficial Interest subscribed | | | | 93,511 |
| Unrealized appreciation on forward | | | | | | |
| currency exchange contracts—Note 4 | | | | | | 79,585 |
| Unrealized appreciation on swap contracts—Note 4 | | | | 23,465 |
| | | | | | | | | 316,231,630 |
| |
| |
| |
| |
|
| Liabilities ($): | | | | | | | | |
| Due to The Dreyfus Corporation and affiliates—Note 3(b) | | | | 272,893 |
| Cash overdraft due to Custodian | | | | | | 803,872 |
| Liability for securities on loan—Note 1(c) | | | | | | 34,274,830 |
| Payable for shares of Beneficial redeemed | | | | | | 838,662 |
| Unrealized depreciation on swap contracts—Note 4 | | | | 34,684 |
| | | | | | | | | 36,224,941 |
| |
| |
| |
| |
|
| Net Assets ($) | | | | | | | | 280,006,689 |
| |
| |
| |
| |
|
| Composition of Net Assets ($): | | | | | | |
| Paid-in capital | | | | | | | | 728,352,210 |
| Accumulated distributions in excess of investment income—net | | | | (169,930) |
| Accumulated net realized gain (loss) on | | | | | | |
| investments and foreign currency transactions | | | | (441,900,521) |
| Accumulated net unrealized appreciation (depreciation) on | | | | |
| investments, swap transactions and foreign currency transactions | | (6,275,070) |
| |
|
| Net Assets ($) | | | | | | | | 280,006,689 |
| |
| |
| |
| |
|
| |
| |
| Net Asset Value Per Share | | | | | | |
| | | Class A | | Class B | | Class C | | Class I |
| |
| |
| |
| |
|
| Net Assets ($) | | 169,453,110 | | 39,891,683 | | 53,293,757 | | 17,368,139 |
| Shares Outstanding | | 24,484,526 | | 5,758,318 | | 7,690,927 | | 2,508,277 |
| |
| |
| |
| |
|
| Net Asset Value | | | | | | | | |
| Per Share ($) | | 6.92 | | 6.93 | | 6.93 | | 6.92 |
See notes to financial statements.
|
The Fund 23
STATEMENT OF OPERATIONS
Year Ended December 31, 2007
|
| Investment Income ($): | | |
| Income: | | |
| Interest | | 23,852,892 |
| Dividends: | | |
| Unaffiliated issuers | | 320,064 |
| Affiliated issuers | | 295,890 |
| Income from securities lending | | 188,121 |
| Total Income | | 24,656,967 |
| Expenses: | | |
| Management fee—Note 3(a) | | 2,235,292 |
| Distribution and service fees—Note 3(b) | | 1,467,993 |
| Director fees—Note 3(a) | | 20,489 |
| Interest expense—Note 2 | | 4,333 |
| Total Expenses | | 3,728,107 |
| Less—Director fees reimbursed | | |
| by the Manager—Note 3(a) | | (20,489) |
| Net Expenses | | 3,707,618 |
| Investment Income—Net | | 20,949,349 |
| |
|
| Realized and Unrealized Gain (Loss) on Investments—Note 4 ($): |
| Net realized gain (loss) on investments and foreign currency transactions | | (1,113,899) |
| Net realized gain (loss) on swap transactions | | (2,541,918) |
| Net realized gain (loss) on forward currency exchange contracts | | (839,265) |
| Net Realized Gain (Loss) | | (4,495,082) |
| Net unrealized appreciation (depreciation) on investments, | | |
| swaps transactions and foreign currency transactions | | (11,353,579) |
| Net Realized and Unrealized Gain (Loss) on Investments | | (15,848,661) |
| Net Increase in Net Assets Resulting from Operations | | 5,100,688 |
See notes to financial statements.
|
STATEMENT OF CHANGES IN NET ASSETS
| | | Year Ended December 31, |
| |
|
| | | 2007 a | | 2006 |
| |
| |
|
| Operations ($): | | | | |
| Investment income—net | | 20,949,349 | | 25,032,256 |
| Net realized gain (loss) on investments | | (4,495,082) | | 5,023,959 |
| Net unrealized appreciation | | | | |
| (depreciation) on investments | | (11,353,579) | | 2,272,264 |
| Net Increase (Decrease) in Net Assets | | | | |
| Resulting from Operations | | 5,100,688 | | 32,328,479 |
| |
| |
|
| Dividends to Shareholders from ($): | | | | |
| Investment income—net: | | | | |
| Class A shares | | (13,922,341) | | (16,213,908) |
| Class B shares | | (3,561,162) | | (5,618,531) |
| Class C shares | | (3,977,856) | | (4,708,337) |
| Class I shares | | (1,317,667) | | (1,384,831) |
| Total Dividends | | (22,779,026) | | (27,925,607) |
| |
| |
|
| Beneficial Interest Transactions ($): | | | | |
| Net proceeds from shares sold: | | | | |
| Class A shares | | 22,371,989 | | 24,562,106 |
| Class B shares | | 551,723 | | 2,985,895 |
| Class C shares | | 4,606,504 | | 7,985,544 |
| Class I shares | | 8,226,009 | | 3,347,791 |
| Dividends reinvested: | | | | |
| Class A shares | | 7,383,384 | | 8,054,669 |
| Class B shares | | 1,862,672 | | 2,649,119 |
| Class C shares | | 1,617,711 | | 1,924,723 |
| Class I shares | | 1,285,311 | | 1,363,284 |
| Cost of shares redeemed: | | | | |
| Class A shares | | (51,863,201) | | (69,472,740) |
| Class B shares | | (27,684,167) | | (34,967,375) |
| Class C shares | | (15,258,190) | | (19,803,807) |
| Class I shares | | (9,133,542) | | (5,433,618) |
| Increase (Decrease) in Net Assets | | | | |
| from Beneficial Interest Transactions | | (56,033,797) | | (76,804,409) |
| Total Increase (Decrease) in Net Assets | | (73,712,135) | | (72,401,537) |
| |
| |
|
| Net Assets ($): | | | | |
| Beginning of Period | | 353,718,824 | | 426,120,361 |
| End of Period | | 280,006,689 | | 353,718,824 |
| Distributions in excess of | | | | |
| investment income—net | | (169,930) | | (249,078) |
The Fund 25
STATEMENT OF CHANGES IN NET ASSETS (continued)
|
| | | Year Ended December 31, |
| |
|
| | | 2007 a | | 2006 |
| |
| |
|
| Capital Share Transactions: | | | | |
| Class A b | | | | |
| Shares sold | | 3,102,079 | | 3,402,897 |
| Shares issued for dividends reinvested | | 1,030,483 | | 1,115,544 |
| Shares redeemed | | (7,218,058) | | (9,623,951) |
| Net Increase (Decrease) in Shares Outstanding | | (3,085,496) | | (5,105,510) |
| |
| |
|
| Class B b | | | | |
| Shares sold | | 76,165 | | 412,273 |
| Shares issued for dividends reinvested | | 258,768 | | 366,732 |
| Shares redeemed | | (3,821,909) | | (4,834,773) |
| Net Increase (Decrease) in Shares Outstanding | | (3,486,976) | | (4,055,768) |
| |
| |
|
| Class C | | | | |
| Shares sold | | 637,961 | | 1,104,471 |
| Shares issued for dividends reinvested | | 225,125 | | 266,305 |
| Shares redeemed | | (2,127,924) | | (2,736,302) |
| Net Increase (Decrease) in Shares Outstanding | | (1,264,838) | | (1,365,526) |
| |
| |
|
| Class I | | | | |
| Shares sold | | 1,147,277 | | 461,934 |
| Shares issued for dividends reinvested | | 178,834 | | 188,704 |
| Shares redeemed | | (1,280,725) | | (756,747) |
| Net Increase (Decrease) in Shares Outstanding | | 45,386 | | (106,109) |
| a | | Effective June 1, 2007, Class R shares were redesignated as Class I shares. |
| b | | During the period ended December 31, 2007, 1,205,939 Class B shares representing $8,746,306, were |
| | | automatically converted to 1,207,249 Class A shares and during the period ended December 31, 2006, 1,462,933 |
| | | Class B shares representing $10,587,498 were automatically converted to 1,464,542 Class A shares. |
| See notes to financial statements. |
FINANCIAL HIGHLIGHTS
The following tables describe the performance for each share class for the fiscal periods indicated. All information (except portfolio turnover rate) reflects financial results for a single fund share.Total return shows how much your investment in the fund would have increased (or decreased) during each period, assuming you had reinvested all dividends and distributions.These figures have been derived from the fund’s financial statements.
| | | | | Year Ended December 31, | | |
| |
| |
| |
|
| Class A Shares | | 2007 | | 2006 | | 2005 | | 2004 a | | 2003 |
| |
| |
| |
| |
| |
|
| Per Share Data ($): | | | | | | | | | | |
| Net asset value, beginning of period | | 7.33 | | 7.24 | | 7.65 | | 7.43 | | 6.28 |
| Investment Operations: | | | | | | | | | | |
| Investment income—net b | | .49 | | .49 | | .51 | | .52 | | .63 |
| Net realized and unrealized | | | | | | | | | | |
| gain (loss) on investments | | (.37) | | .14 | | (.36) | | .23 | | 1.17 |
| Total from Investment Operations | | .12 | | .63 | | .15 | | .75 | | 1.80 |
| Distributions: | | | | | | | | | | |
| Dividends from investment income—net | | (.53) | | (.54) | | (.56) | | (.53) | | (.65) |
| Net asset value, end of period | | 6.92 | | 7.33 | | 7.24 | | 7.65 | | 7.43 |
| |
| |
| |
| |
| |
|
| Total Return (%) c | | 2.03 | | 8.66 | | 2.22 | | 10.44 | | 29.87 |
| |
| |
| |
| |
| |
|
| Ratios/Supplemental Data (%): | | | | | | | | | | |
| Ratio of total expenses | | | | | | | | | | |
| to average net assets | | .96 | | .95 | | .95 | | .95 | | .97 |
| Ratio of net expenses | | | | | | | | | | |
| to average net assets | | .95 | | .95 | | .95 | | .95 | | .97 |
| Ratio of net investment income | | | | | | | | | | |
| to average net assets | | 6.78 | | 6.76 | | 6.93 | | 7.00 | | 8.87 |
| Portfolio Turnover Rate | | 50.65 | | 29.98 | | 40.57 | | 129.27 | | 235.42 |
| |
| |
| |
| |
| |
|
| Net Assets, end of period ($ x 1,000) | | 169,453 | | 202,098 | | 236,421 | | 286,342 | | 191,270 |
| a | | As of January 1, 2004, the fund has adopted the method of accounting for interim payments on swap contracts in |
| | | accordance with Financial Accounting Standards Board Statement No. 133.These interim payments are reflected |
| | | within net realized and unrealized gain (loss) on swap contracts, however, prior to January 1, 2004, these interim |
| | | payments were reflected within interest income/expense in the Statement of Operations.The effect of this change for |
| | | the fiscal year ended December 31, 2004, was to increase net investment income per share by less than $.01, decrease |
| | | net realized and unrealized gain (loss) on investments per share by less than $.01 and had no effect on the ratio of |
| | | net investment income to average net assets. |
| b | | Based on average shares outstanding at each month end. |
| c | | Exclusive of sales charge. |
| See notes to financial statements. |
The Fund 27
FINANCIAL HIGHLIGHTS (continued)
|
| | | | | Year Ended December 31, | | |
| |
| |
| |
|
| Class B Shares | | 2007 | | 2006 | | 2005 | | 2004 a | | 2003 |
| |
| |
| |
| |
| |
|
| Per Share Data ($): | | | | | | | | | | |
| Net asset value, beginning of period | | 7.34 | | 7.24 | | 7.65 | | 7.43 | | 6.28 |
| Investment Operations: | | | | | | | | | | |
| Investment income—net b | | .45 | | .45 | | .46 | | .47 | | .59 |
| Net realized and unrealized | | | | | | | | | | |
| gain (loss) on investments | | (.37) | | .16 | | (.35) | | .25 | | 1.18 |
| Total from Investment Operations | | .08 | | .61 | | .11 | | .72 | | 1.77 |
| Distributions: | | | | | | | | | | |
| Dividends from investment income—net | | (.49) | | (.51) | | (.52) | | (.50) | | (.62) |
| Net asset value, end of period | | 6.93 | | 7.34 | | 7.24 | | 7.65 | | 7.43 |
| |
| |
| |
| |
| |
|
| Total Return (%) c | | 1.53 | | 8.12 | | 1.73 | | 10.06 | | 29.25 |
| |
| |
| |
| |
| |
|
| Ratios/Supplemental Data (%): | | | | | | | | | | |
| Ratio of total expenses | | | | | | | | | | |
| to average net assets | | 1.46 | | 1.45 | | 1.45 | | 1.45 | | 1.47 |
| Ratio of net expenses | | | | | | | | | | |
| to average net assets | | 1.45 | | 1.45 | | 1.45 | | 1.45 | | 1.47 |
| Ratio of net investment income | | | | | | | | | | |
| to average net assets | | 6.24 | | 6.25 | | 6.36 | | 6.50 | | 8.46 |
| Portfolio Turnover Rate | | 50.65 | | 29.98 | | 40.57 | | 129.27 | | 235.42 |
| |
| |
| |
| |
| |
|
| Net Assets, end of period ($ x 1,000) | | 39,892 | | 67,834 | | 96,334 | | 167,756 | | 239,015 |
| a | | As of January 1, 2004, the fund has adopted the method of accounting for interim payments on swap contracts in |
| | | accordance with Financial Accounting Standards Board Statement No. 133.These interim payments are reflected |
| | | within net realized and unrealized gain (loss) on swap contracts, however, prior to January 1, 2004, these interim |
| | | payments were reflected within interest income/expense in the Statement of Operations.The effect of this change for |
| | | the fiscal year ended December 31, 2004, was to increase net investment income per share by less than $.01, decrease |
| | | net realized and unrealized gain (loss) on investments per share by less than $.01 and had no effect on the ratio of |
| | | net investment income to average net assets. |
| b | | Based on average shares outstanding at each month end. |
| c | | Exclusive of sales charge. |
| See notes to financial statements. |
| | | | | Year Ended December 31, | | |
| |
| |
| |
|
| Class C Shares | | 2007 | | 2006 | | 2005 | | 2004 a | | 2003 |
| |
| |
| |
| |
| |
|
| Per Share Data ($): | | | | | | | | | | |
| Net asset value, beginning of period | | 7.34 | | 7.24 | | 7.65 | | 7.43 | | 6.28 |
| Investment Operations: | | | | | | | | | | |
| Investment income—net b | | .43 | | .43 | | .45 | | .46 | | .57 |
| Net realized and unrealized | | | | | | | | | | |
| gain (loss) on investments | | (.36) | | .16 | | (.36) | | .24 | | 1.18 |
| Total from Investment Operations | | .07 | | .59 | | .09 | | .70 | | 1.75 |
| Distributions: | | | | | | | | | | |
| Dividends from investment income—net | | (.48) | | (.49) | | (.50) | | (.48) | | (.60) |
| Net asset value, end of period | | 6.93 | | 7.34 | | 7.24 | | 7.65 | | 7.43 |
| |
| |
| |
| |
| |
|
| Total Return (%) c | | 1.28 | | 7.85 | | 1.48 | | 9.63 | | 29.10 |
| |
| |
| |
| |
| |
|
| Ratios/Supplemental Data (%): | | | | | | | | | | |
| Ratio of total expenses | | | | | | | | | | |
| to average net assets | | 1.71 | | 1.70 | | 1.70 | | 1.70 | | 1.72 |
| Ratio of net expenses | | | | | | | | | | |
| to average net assets | | 1.70 | | 1.70 | | 1.70 | | 1.70 | | 1.72 |
| Ratio of net investment income | | | | | | | | | | |
| to average net assets | | 6.02 | | 6.01 | | 6.14 | | 6.26 | | 8.15 |
| Portfolio Turnover Rate | | 50.65 | | 29.98 | | 40.57 | | 129.27 | | 235.42 |
| |
| |
| |
| |
| |
|
| Net Assets, end of period ($ x 1,000) | | 53,294 | | 65,728 | | 74,770 | | 115,309 | | 86,479 |
| a | | As of January 1, 2004, the fund has adopted the method of accounting for interim payments on swap contracts in |
| | | accordance with Financial Accounting Standards Board Statement No. 133.These interim payments are reflected |
| | | within net realized and unrealized gain (loss) on swap contracts, however, prior to January 1, 2004, these interim |
| | | payments were reflected within interest income/expense in the Statement of Operations.The effect of this change for |
| | | the fiscal year ended December 31, 2004, was to increase net investment income per share by less than $.01, decrease |
| | | net realized and unrealized gain (loss) on investments per share by less than $.01 and had no effect on the ratio of |
| | | net investment income to average net assets. |
| b | | Based on average shares outstanding at each month end. |
| c | | Exclusive of sales charge. |
| See notes to financial statements. |
The Fund 29
FINANCIAL HIGHLIGHTS (continued)
|
| | | | | Year Ended December 31, | | |
| |
| |
| |
|
| Class I Shares | | 2007 a | | 2006 | | 2005 | | 2004 b | | 2003 |
| |
| |
| |
| |
| |
|
| Per Share Data ($): | | | | | | | | | | |
| Net asset value, beginning of period | | 7.33 | | 7.24 | | 7.65 | | 7.43 | | 6.27 |
| Investment Operations: | | | | | | | | | | |
| Investment income—net c | | .52 | | .51 | | .53 | | .52 | | .67 |
| Net realized and unrealized | | | | | | | | | | |
| gain (loss) on investments | | (.38) | | .14 | | (.36) | | .25 | | 1.16 |
| Total from Investment Operations | | .14 | | .65 | | .17 | | .77 | | 1.83 |
| Distributions: | | | | | | | | | | |
| Dividends from investment income—net | | (.55) | | (.56) | | (.58) | | (.55) | | (.67) |
| Net asset value, end of period | | 6.92 | | 7.33 | | 7.24 | | 7.65 | | 7.43 |
| |
| |
| |
| |
| |
|
| Total Return (%) | | 2.29 | | 8.92 | | 2.34 | | 10.87 | | 30.15 |
| |
| |
| |
| |
| |
|
| Ratios/Supplemental Data (%): | | | | | | | | | | |
| Ratio of total expenses | | | | | | | | | | |
| to average net assets | | .71 | | .70 | | .70 | | .70 | | .72 |
| Ratio of net expenses | | | | | | | | | | |
| to average net assets | | .70 | | .70 | | .70 | | .70 | | .72 |
| Ratio of net investment income | | | | | | | | | | |
| to average net assets | | 7.01 | | 7.01 | | 7.18 | | 7.31 | | 9.26 |
| Portfolio Turnover Rate | | 50.65 | | 29.98 | | 40.57 | | 129.27 | | 235.42 |
| |
| |
| |
| |
| |
|
| Net Assets, end of period ($ x 1,000) | | 17,368 | | 18,059 | | 18,595 | | 21,714 | | 1,283 |
| a | | Effective June 1, 2007, Class R shares were redesignated as Class I shares. |
| b | | As of January 1, 2004, the fund has adopted the method of accounting for interim payments on swap contracts in |
| | | accordance with Financial Accounting Standards Board Statement No. 133.These interim payments are reflected |
| | | within net realized and unrealized gain (loss) on swap contracts, however, prior to January 1, 2004, these interim |
| | | payments were reflected within interest income/expense in the Statement of Operations.The effect of this change for |
| | | the fiscal year ended December 31, 2004, was to increase net investment income per share by less than $.01, decrease |
| | | net realized and unrealized gain (loss) on investments per share by less than $.01 and had no effect on the ratio of |
| | | net investment income to average net assets. |
| c | | Based on average shares outstanding at each month end. |
| See notes to financial statements. |
NOTES TO FINANCIAL STATEMENTS
NOTE 1—Significant Accounting Policies:
Dreyfus Premier Limited Term High Yield Fund (the “fund”) is a separate diversified series of The Dreyfus/Laurel Funds Trust (the “Trust”) which is registered under the Investment Company Act of 1940, as amended (the “Act”), as an open-end management investment company and operates as a series company currently offering eight series, including the fund. The fund’s investment objective is to seek to maximize total return, consisting of capital appreciation and current income.The Dreyfus Corporation (the “Manager” or “Dreyfus”) serves as the fund’s investment manager.
On July 1, 2007, Mellon Financial Corporation and The Bank of New York Company, Inc. merged, forming The Bank of New York Mellon Corporation (“BNY Mellon”). As part of this transaction, Dreyfus became a wholly-owned subsidiary of BNY Mellon.
The fund’s Board of Trustees approved the redesignation of the fund’s Class R shares as Class I shares, effective June 1, 2007. The eligibility requirements for Class I shares remained the same as for Class R shares.
MBSC Securities Corporation (the “Distributor”), a wholly-owned subsidiary of the Manager, is the distributor of the fund’s shares. The fund is authorized to issue an unlimited number of shares of Beneficial Interest in each of the following classes of shares: Class A, Class B, Class C and Class I. Class A, Class B and Class C shares are sold primarily to retail investors through financial intermediaries and bear a distribution fee and/or service fee. Class A shares are sold with a front-end sales charge, while Class B and Class C shares are subject to a contingent deferred sales charge (“CDSC”). Class B shares automatically convert to Class A shares after six years. The fund no longer offers Class B shares, except in connection with dividend reinvestment and permitted exchanges of Class B shares. Class I shares are sold primarily to bank trust departments and other financial service providers (including Mellon Bank, N.A. and its affiliates) acting on behalf of customers having a qualified trust or investment account or relationship at such institution, and bear no distribution or service fees. Class I shares are
The Fund 31
NOTES TO FINANCIAL STATEMENTS (continued)
|
offered without a front-end sales charge or CDSC. Each class of shares has identical rights and privileges, except with respect to distribution, service fees, the allocation of certain transfer agency costs and voting rights on matters affecting a single class. Income, expenses (other than expenses attributable to a specific class), and realized and unrealized gains or losses on investments are allocated to each class of shares based on its relative net assets.
The fund’s financial statements are prepared in accordance with U.S. generally accepted accounting principles, which may require the use of management estimates and assumptions. Actual results could differ from those estimates.
(a) Portfolio valuation: Investments in securities (excluding short-term investments (other than U.S. Treasury Bills), financial futures, options, swaps and forward currency exchange contracts) are valued each business day by an independent pricing service (the “Service”) approved by the Board of Trustees. Investments for which quoted bid prices are readily available and are representative of the bid side of the market in the judgment of the Service are valued at the mean between the quoted bid prices (as obtained by the Service from dealers in such securities) and asked prices (as calculated by the Service based upon its evaluation of the market for such securities). Other investments (which constitute a majority of the portfolio securities) are valued as determined by the Service, based on methods which include consideration of: yields or prices of securities of comparable quality, coupon, maturity and type; indications as to values from dealers; and general market conditions. Securities for which there are no such valuations are valued at fair value as determined in good faith under the direction of the Board of Trustees. Restricted securities, as well as securities or other assets for which recent market quotations are not readily available and are not valued by a pricing service approved by the Board of Trustees, or are determined by the fund not to reflect accurately fair value (such as when an event occurs after the close of the exchange on which the security is principally traded and that is determined by the fund to have changed the value of the security), are valued at fair value as determined in good faith under
the direction of the Board of Trustees.The factors that may be considered when fair valuing a security include fundamental analytical data,the nature and duration of restrictions on disposition, an evaluation of the forces that influence the market in which the securities are purchased and sold and public trading in similar securities of the issuer or comparable issuers. Short-term investments, excluding U.S.Treasury Bills, are carried at amortized cost, which approximates fair value. Registered open-end investment companies that are not traded on an exchange are valued at their net asset value. Financial futures and options, which are traded on an exchange, are valued at the last sales price on the securities exchange on which such securities are primarily traded or at the last sales price on the national securities market on each business day. Options traded over-the-counter are priced at the mean between the bid and asked prices. Investments denominated in foreign currencies are translated to U.S. dollars at the prevailing rates of exchange. Investments in swap transactions are valued each business day by an independent pricing service approved by the Board of Trustees. Swaps are valued by the service by using a swap pricing model which incorporates among other factors, default probabilities, recovery rates, credit curves of the underlying issuer and swap spreads on interest rates.
The Financial Accounting Standards Board (“FASB”) released Statement of Financial Accounting Standards No. 157 “Fair Value Measurements” (“FAS 157”). FAS 157 establishes an authoritative definition of fair value, sets out a framework for measuring fair value, and requires additional disclosures about fair-value measurements.The application of FAS 157 is required for fiscal years beginning after November 15, 2007 and interim periods within those fiscal years. Management does not believe that the application of this standard will have a material impact on the financial statements of the fund.
(b) Foreign currency transactions: The fund does not isolate that portion of the results of operations resulting from changes in foreign exchange rates on investments from the fluctuations arising from changes in the market prices of securities held. Such fluctuations are included with the net realized and unrealized gain or loss on investments.
The Fund 33
NOTES TO FINANCIAL STATEMENTS (continued)
|
Net realized foreign exchange gains or losses arise from sales and maturities of short-term securities, sales of foreign currencies, currency gains or losses realized on securities transactions and the difference between the amount of dividends, interest and foreign withholding taxes recorded on the fund’s books and the U.S. dollar equivalent of the amounts actually received or paid. Net unrealized foreign exchange gains and losses arise from changes in the value of assets and liabilities other than investments in securities, resulting from changes in exchange rates. Such gains and losses are included with net realized and unrealized gain or loss on investments.
(c) Securities transactions and investment income: Securities transactions are recorded on a trade date basis. Realized gains and losses from securities transactions are recorded on the identified cost basis. Dividend income is recognized on the ex-dividend date and interest income, including, where applicable, accretion of discount and amortization of premium on investments, is recognized on the accrual basis.
Pursuant to a securities lending agreement with Mellon Bank, N.A. (“Mellon Bank”), an affiliate of the Manager, the fund may lend securities to qualified institutions. It is the fund’s policy, that at origination, all loans are secured by collateral of at least 102% of the value of U.S. securities loaned and 105% of the value of foreign securities loaned.Collateral equivalent to at least 100% of the market value of securities on loan is maintained at all times. Collateral is either in the form of cash, which can be invested in certain money market mutual funds managed by the Manager, U.S. Government and Agency securities or Letters of Credit. The fund is entitled to receive all income on securities loaned, in addition to income earned as a result of the lending transaction. Although each security loaned is fully collateralized, the fund bears the risk of delay in recovery of, or loss of rights in, the securities loaned should a borrower fail to return the securities in a timely manner. During the period ended December 31, 2007, Mellon Bank earned $101,296 from lending fund portfolio securities, pursuant to the securities lending agreement.
(d) Affiliated issuers: Investments in other investment companies advised by the Manager are defined as “affiliated” in the Act.
(e) Concentration of Risk: The fund invests primarily in debt securities. Failure of an issuer of the debt securities to make timely interest or principal payments, or a decline or the perception of a decline in the credit quality of a debt security, can cause the debt security’s price to fall, potentially lowering the fund’s share price. High yield (“junk”) bonds involve greater credit risk, including the risk of default, than investment grade bonds, and are considered predominantly speculative with respect to the issuer’s continuing ability to make principal and interest payments. In addition, the value of debt securities may decline due to general market conditions that are not specifically related to a particular company, such as real or perceived adverse economic conditions, changes in outlook for corporate earnings, changes in interest or currency rates or adverse investor sentiment. They may also decline because of factors that affect a particular industry.
(f) Dividends to shareholders: It is the policy of the fund to declare dividends daily from investment income-net. Such dividends are paid monthly. Dividends from net realized capital gains, if any, are normally declared and paid annually, but the fund may make distributions on a more frequent basis to comply with the distribution requirements of the Internal Revenue Code of 1986, as amended (the “Code”).To the extent that net realized capital gains can be offset by capital loss carryovers, it is the policy of the fund not to distribute such gains. Income and capital gain distributions are determined in accordance with income tax regulations, which may differ from U.S. generally accepted accounting principles.
(g) Federal income taxes: It is the policy of the fund to continue to qualify as a regulated investment company, if such qualification is in the best interests of its shareholders, by complying with the applicable provisions of the Code, and to make distributions of taxable income sufficient to relieve it from substantially all federal income and excise taxes.
During the current year, the fund adopted FASB Interpretation No. 48 “Accounting for Uncertainty in Income Taxes” (“FIN 48”). FIN 48 provides guidance for how uncertain tax positions should be recognized, measured, presented and disclosed in the financial state-
The Fund 35
NOTES TO FINANCIAL STATEMENTS (continued)
ments. FIN 48 requires the evaluation of tax positions taken or expected to be taken in the course of preparing the fund’s tax returns to determine whether the tax positions are “more-likely-than-not” of being sustained by the applicable tax authority. Tax positions not deemed to meet the more-likely-than-not threshold would be recorded as a tax benefit or expense in the current year.The adoption of FIN 48 had no impact on the operations of the fund for the period ended December 31, 2007.
The fund is not subject to examination by U.S. Federal, State and City tax authorities for the tax years before 2004.
At December 31, 2007, the components accumulated earnings on a tax basis were as follows: undistributed ordinary income $668,856, accumulated capital losses $438,156,194 and unrealized depreciation $8,536,592. In addition, the fund had $2,321,591 of capital losses realized after October 31, 2007 which were deferred for tax purposes to the first day of the following fiscal year.
The accumulated capital loss carryover is available to be applied against future net securities profits, if any, realized subsequent to December 31, 2007. If not applied, $53,989,658 of the carryover expires in fiscal 2008, $161,394,992 expires in fiscal 2009, $138,776,715 expires in fiscal 2010, $72,493,638 expires in fiscal 2011, $6,851,219 expires in fiscal 2013 and $4,649,972 expires in fiscal 2015. Based on certain provisions in the Internal Revenue Code, various limitations regarding the future utilization of these carry forwards, brought forward as a result of the fund’s merger with the following funds may apply: Dreyfus Short Term High Yield Fund, Dreyfus Premier High Yield Securities Fund and High Yield Total Fund. It is probable that the fund will not be able to utilize most of its capital loss carryovers prior to its expiration date.
The tax characters of distributions paid to shareholders during fiscal periods ended December 31, 2007 and December 31, 2006 were as follows: ordinary income $22,779,026 and $27,925,607, respectively.
During the period ended December 31, 2007, as a result of permanent book to tax differences, primarily due to the tax treatment for foreign
currency transactions, amortization of premiums, consent fees and expiration of capital loss carryovers, the fund increased accumulated undistributed investment income-net by $1,908,825, increased accumulated net realized gain (loss) on investments by $42,722,995 and decreased paid-in capital by $44,631,820. Net assets and net asset value per share were not affected by this reclassification.
NOTE 2—Bank Lines of Credit:
The fund may borrow up to $20 million for leveraging purposes under a short-term unsecured line of credit and participates with other Dreyfus-managed funds in a $100 million unsecured line of credit primarily to be utilized for temporary or emergency purposes, including the financing of redemptions. Interest is charged to the fund based on prevailing market rates in effect at the time of borrowing.
The average daily amount of borrowings outstanding under the leveraging arrangement during the period ended December 31, 2007, was approximately $74,600 with a related weight average annualized interest rate of 5.81% ..
NOTE 3—Investment Management Fee and Other Transactions with Affiliates:
(a) Pursuant to an Investment Management agreement with the Manager, the Manager provides or arranges for one or more third parties and/or affiliates to provide investment advisory, administrative, custody, fund accounting and transfer agency services to the fund.The Manager also directs the investments of the fund in accordance with its investment objective, policies and limitations. For these services, the fund is contractually obligated to pay the Manager a fee, calculated daily and paid monthly, at the annual rate of .70% of the value of the fund’s average daily net assets. Out of its fee, the Manager pays all of the expenses of the fund except brokerage fees, taxes, interest, commitment fees, Rule 12b-1 distribution fees and expenses, service fees and expenses of non-interested Trustees (including counsel fees) and extraordinary expenses. In addition, the Manager is required to
The Fund 37
NOTES TO FINANCIAL STATEMENTS (continued)
reduce its fee in an amount equal to the fund’s allocable portion of fees and expenses of the non-interested Trustees (including counsel fees). Each Trustee receives $45,000 per year, plus $6,000 for each joint Board meeting of The Dreyfus/Laurel Funds, Inc., The Dreyfus/Laurel Tax-Free Municipal Funds and the Trust (collectively the “Dreyfus/Laurel Funds”) attended, $2,000 for separate in-person committee meetings attended which are not held in conjunction with a regularly scheduled board meeting and $1,500 for Board meetings and separate committee meetings attended that are conducted by telephone and is reimbursed for travel and out-of-pocket expenses. With respect to Board meetings, the Chairman of the Board receives an additional 25% of such compensation (with the exception of reimbursable amounts). With respect to compensation committee meetings, the Chair of the compensation committee receives $900 per meeting and, with respect to audit committee meetings, the Chair of the audit committee receives $1,350 per meeting. In the event that there is an in-person joint committee meeting of the Dreyfus/Laurel Funds and Dreyfus High Yield Strategies Fund, the $2,000 or $1,500 fee, as applicable, will be allocated between the Dreyfus/Laurel Funds and Dreyfus High Yield Strategies Fund.These fees and expenses are charged and allocated to each series based on net assets. Amounts required to be paid by the Trust directly to the non-interested Trustees, that would be applied to offset a portion of the management fee payable to the Manager, are in fact paid directly by the Manager to the non-interested Trustees.
During the period ended December 31, 2007, the Distributor retained $3,778 from commissions earned on sales of the fund’s Class A shares and $199,829 and $5,237 from CDSC on redemptions of the fund’s Class B and Class C shares, respectively.
(b) Under separate Distribution Plans (the “Plans”) adopted pursuant to Rule 12b-1 under the Act, Class A shares pay annually up to .25% of the value of the average daily net assets to compensate the Distributor for shareholder servicing activities and expenses primarily
intended to result in the sale of Class A shares. Class B and Class C shares pay the Distributor for distributing their shares at an aggregate annual rate of .50% and .75% of the value of the average daily net assets of Class B and Class C shares, respectively. Class B and Class C shares are also subject to a service plan adopted pursuant to Rule 12b-1 (the “Service Plan”), under which Class B and Class C shares pay the Distributor for providing certain services to the holders of their shares a fee at the annual rate of .25% of the value of the average daily net assets of Class B and Class C shares. During the period ended December 31, 2007, Class A, Class B and Class C shares were charged $473,708, $260,641 and $452,493, respectively, pursuant to their respective Plans. During the period ended December 31, 2007, Class B and Class C shares were charged $130,320 and $150,831, respectively, pursuant to the Service Plan.
Under its terms, the Plans and Service Plan shall remain in effect from year to year, provided such continuance is approved annually by a vote of a majority of those Trustees who are not “interested persons” of the Trust and who have no direct or indirect financial interest in the operation of or in any agreement related to the Plans or Service Plan.
The components of “Due to The Dreyfus Corporation and affiliates” in the Statement of Assets and Liabilities consist of: management fees $165,467, Rule 12b-1 distribution plan fees $87,496 and service plan fees $19,930.
NOTE 4—Securities Transactions:
The aggregate amount of purchases and sales (including paydowns) of investment securities, excluding short-term securities, forward currency exchange contracts and swap transactions during the period ended December 31, 2007, amounted to $156,091,635 and $217,095,692, respectively.
The fund enters into forward currency exchange contracts in order to hedge its exposure to changes in foreign currency exchange rates on its
The Fund 39
NOTES TO FINANCIAL STATEMENTS (continued)
foreign portfolio holdings and to settle foreign currency transactions. When executing forward currency exchange contracts, the fund is obligated to buy or sell a foreign currency at a specified rate on a certain date in the future. With respect to sales of forward currency exchange contracts, the fund would incur a loss if the value of the contract increases between the date the forward contract is opened and the date the forward contract is closed.The fund realizes a gain if the value of the contract decreases between those dates.With respect to purchases of forward currency exchange contracts, the fund would incur a loss if the value of the contract decreases between the date the forward contract is opened and the date the forward contract is closed. The fund realizes a gain if the value of the contract increases between those dates. The fund is also exposed to credit risk associated with counterparty nonperformance on these forward currency exchange contracts which is typically limited to the unrealized gain on each open contract.The following summarizes open forward currency exchange contracts at December 31, 2007:
| | | Foreign | | | | | | |
| Forward Currency | | Currency | | | | | | Unrealized |
| Exchange Contracts | | Amounts | | Proceeds ($) | | Value ($) | | Appreciation ($) |
| |
| |
| |
| |
|
| Sales: | | | | | | | | |
| Euro, | | | | | | | | |
| Expiring 03/19/2008 | | 4,740,000 | | 7,004,251 | | 6,924,666 | | 79,585 |
The fund may enter into swap agreements to exchange the interest rate on, or return generated by, one nominal instrument for the return generated by another nominal instrument.
The fund accrues for the interim payments on swap contracts in accordance with Financial Accounting Standards Board Statement No. 133. The fund accrues for the interim payments on swap contracts on a daily basis, with the net amount recorded within unrealized appreciation (depreciation) on swap contracts in the Statement of Assets and Liabilities. Once the interim payments are settled in cash, the net amount is recorded as realized gain (loss) on swaps, in addition to realized gain (loss) recorded upon the termination of swaps contracts in the
Statement of Operations. Fluctuations in the value of swap contracts are recorded as a component of net change in unrealized appreciation (depreciation) on investments.
Credit default swaps involve commitments to pay a fixed interest rate in exchange for payment if a credit event affecting a third party (the referenced company) occurs. For those credit default swaps in which the fund is receiving a fixed rate, the fund is providing credit protection on the underlying instrument. The maximum payouts for these contracts are limited to the notional amount of each swap. Credit events may include a failure to pay interest or principal, bankruptcy, or restructuring. The following summarizes open credit default swaps entered into by the fund at December 31, 2007:
| | | | | | | | | Unrealized |
| Notional | | Reference | | | | (Pay)/Receive Expiration | | Appreciation |
| Amount ($) | | Entity | | Counterparty | | Fixed Rate (%) Date (Depreciation)($) |
| |
| |
| |
|
| |
| 2,675,000 | | Owens-Brockway, | | | | | | |
| | | 8.875%, | | | | | | |
| | | 2/15/2009 | | JPMorgan | | (1.95) 6/20/2010 | | (34,684) |
| 2,675,000 | | Owens-Illinois, | | | | | | |
| | | 7.5%, 5/15/2010 | | JPMorgan | | 2.60 6/20/2010 | | 23,465 |
| Total | | | | | | | | (11,219) |
Risks may arise upon entering into these agreements from the potential inability of the counterparties to meet the terms of the agreement and are generally limited to the amount of net payments to be received, if any, at the date of default.
At December 31, 2007, the cost of investments for federal income tax purposes was $318,532,252; accordingly, accumulated net unrealized depreciation on investments was $8,061,469, consisting of $3,621,272 gross unrealized appreciation and $11,682,741 gross unrealized depreciation.
The Fund 41
REPORT OF INDEPENDENT REGISTERED PUBLIC ACCOUNTING FIRM
| The Board of Trustees and Shareholders |
| The Dreyfus/Laurel Funds Trust: |
We have audited the accompanying statement of assets and liabilities of Dreyfus Premier Limited Term High Yield Fund (the “Fund”) of The Dreyfus/Laurel Funds Trust, including the statement of investments, as of December 31, 2007, and the related statement of operations for the year then ended, the statement of changes in net assets for each of the years in the two-year period then ended, and the financial highlights for each of the years in the five-year period then ended. These financial statements and financial highlights are the responsibility of the Fund’s management. Our responsibility is to express an opinion on these financial statements and financial highlights based on our audits.
We conducted our audits in accordance with the standards of the Public Company Accounting Oversight Board (United States).Those standards require that we plan and perform the audit to obtain reasonable assurance about whether the financial statements and financial highlights are free of material misstatement. An audit includes examining, on a test basis, evidence supporting the amounts and disclosures in the financial statements. Our procedures included confirmation of securities owned as of December 31, 2007, by correspondence with the custodian. An audit also includes assessing the accounting principles used and significant estimates made by management, as well as evaluating the overall financial statement presentation. We believe that our audits provide a reasonable basis for our opinion.
In our opinion, the financial statements and financial highlights referred to above present fairly, in all material respects, the financial position of Dreyfus Premier Limited Term High Yield Fund of The Dreyfus/Laurel Funds Trust as of December 31, 2007, and the results of its operations for the year then ended, the changes in its net assets for each of the years in the two-year period then ended, and the financial highlights for each of the years in the five-year period then ended, in conformity with U.S. generally accepted accounting principles.

New York, New York
February 22, 2008
|
IMPORTANT TAX INFORMATION (Unaudited)
In accordance with federal tax law, the fund hereby designates 1.28% of the ordinary dividends paid during the fiscal year ended December 31, 2007 as qualifying for the corporate dividends received deduction. For the fiscal year ended December 31, 2007, certain dividends paid by the fund may be subject to a maximum tax rate of 15%, as provided for by the Jobs and Growth tax Relief Reconciliation Act of 2003. Of the distributions paid during the fiscal year, $320,064 represents the maximum amount that may be considered qualified dividend income. Shareholders will receive notification in January 2008 of the percentage applicable to the preparation of their 2007 income tax returns. Also, the fund hereby designates 93.55% of ordinary income dividends paid during the fiscal year ended December 31, 2007 as qualifying interest related dividends.
The Fund 43
BOARD MEMBERS INFORMATION ( U n a u d i t e d )
Joseph S. DiMartino (64)
Chairman of the Board (1999)
|
Principal Occupation During Past 5 Years:
• Corporate Director and Trustee
|
Other Board Memberships and Affiliations:
|
- The Muscular Dystrophy Association, Director
- Century Business Services, Inc., a provider of outsourcing functions for small and medium size companies, Director
- The Newark Group, a provider of a national market of paper recovery facilities, paperboard mills and paperboard converting plants, Director
- Sunair Services Corporation, a provider of certain outdoor-related services to homes and businesses, Director
| No. of Portfolios for which Board Member Serves: 163 |
| ——————— |
| James M. Fitzgibbons (73) |
| Board Member (1994) |
| Principal Occupation During Past 5 Years: |
| • Chairman of the Board, Davidson Cotton Company (1998-2002) |
| Other Board Memberships and Affiliations: |
| • Bill Barrett Company, an oil and gas exploration company, Director |
| No. of Portfolios for which Board Member Serves: 26 |
| ——————— |
| J. Tomlinson Fort (79) |
| Board Member (1987) |
Principal Occupation During Past 5 Years:
|
- Retired (2005-present)
- Of Counsel, Reed Smith LLP (1998-2005)
Other Board Memberships and Affiliations:
|
- Allegheny College, Emeritus Trustee
- Pittsburgh Ballet Theatre,Trustee
- American College of Trial Lawyers, Fellow
| No. of Portfolios for which Board Member Serves: 26 |
| ——————— |
| Kenneth A. Himmel (61) |
| Board Member (1994) |
Principal Occupation During Past 5 Years:
|
- President and CEO, Related Urban Development, a real estate development company (1996-present)
- President and CEO, Himmel & Company, a real estate development company (1980-present)
- CEO, American Food Management, a restaurant company (1983-present)
No. of Portfolios for which Board Member Serves: 26
|
| | Stephen J. Lockwood (60)
Board Member (1994)
|
| | Principal Occupation During Past 5 Years:
|
- Chairman of the Board, Stephen J. Lockwood and Company LLC, an investment company (2000-present)
| | No. of Portfolios for which Board Member Serves: 26
|
| ——————— |
| Roslyn M. Watson (58) |
| Board Member (1994) |
| Principal Occupation During Past 5 Years: |
| • Principal,Watson Ventures, Inc., a real estate investment company (1993-present) |
| | Other Board Memberships and Affiliations:
|
- American Express Bank, Director
- The Hyams Foundation Inc., a Massachusetts Charitable Foundation,Trustee
- National Osteoporosis Foundation,Trustee
| No. of Portfolios for which Board Member Serves: 26 |
| ——————— |
| Benaree Pratt Wiley (61) |
| Board Member (1998) |
| | Principal Occupation During Past 5 Years:
|
- Principal,The Wiley Group, a firm specializing in strategy and business development (2005-present)
- President and CEO,The Partnership, an organization dedicated to increasing the representation of African Americans in positions of leadership, influence and decision-making in Boston, MA (1991-2005)
| | Other Board Memberships and Affiliations:
|
- Boston College,Trustee
- Blue Cross Blue Shield of Massachusetts, Director
- Commonwealth Institute, Director
- Efficacy Institute, Director
- PepsiCo African-American, Advisory Board
- The Boston Foundation, Director
- Harvard Business School Alumni Board, Director
| No. of Portfolios for which Board Member Serves: 36 |
| ——————— |
Once elected all Board Members serve for an indefinite term, but achieve Emeritus status upon reaching age 80.The address of the Board Members and Officers is in c/o The Dreyfus Corporation, 200 Park Avenue, New York, New York 10166.Additional information about the Board Members is available in the fund’s Statement of Additional Information which can be obtained from Dreyfus free of charge by calling this toll free number: 1-800-554-4611.
Francis P. Brennan, Emeritus Board Member
The Fund 45
OFFICERS OF THE FUND (Unaudited)
| J. DAVID OFFICER, President since |
| December 2006. |
Chief Operating Officer,Vice Chairman and a Director of the Manager, and an officer of 78 investment companies (comprised of 163 portfolios) managed by the Manager. He is 59 years old and has been an employee of the Manager since April 1998.
| PHILLIP N. MAISANO, Executive Vice |
| President since July 2007. |
Chief Investment Officer,Vice Chair and a director of the Manager, and an officer of 78 investment companies (comprised of 163 portfolios) managed by the Manager. Mr. Maisano also is an officer and/or Board member of certain other investment management subsidiaries of The Bank of New York Mellon Corporation, each of which is an affiliate of the Manager. He is 60 years old and has been an employee of the Manager since November 2006. Prior to joining the Manager, Mr. Maisano served as Chairman and Chief Executive Officer of EACM Advisors, an affiliate of the Manager, since August 2004, and served as Chief Executive Officer of Evaluation Associates, a leading institutional investment consulting firm, from 1988 until 2004.
| MICHAEL A. ROSENBERG, Vice President |
| and Secretary since August 2005. |
Associate General Counsel of the Manager, and an officer of 79 investment companies (comprised of 180 portfolios) managed by the Manager. He is 47 years old and has been an employee of the Manager since October 1991.
| JAMES BITETTO, Vice President and |
| Assistant Secretary since August 2005. |
Associate General Counsel and Secretary of the Manager, and an officer of 79 investment companies (comprised of 180 portfolios) managed by the Manager. He is 41 years old and has been an employee of the Manager since December 1996.
| JONI LACKS CHARATAN, Vice President |
| and Assistant Secretary since |
| August 2005. |
Associate General Counsel of the Manager, and an officer of 79 investment companies (comprised of 180 portfolios) managed by the Manager. She is 52 years old and has been an employee of the Manager since October 1988.
| JOSEPH M. CHIOFFI, Vice President and |
| Assistant Secretary since August 2005. |
Associate General Counsel of the Manager, and an officer of 79 investment companies (comprised of 180 portfolios) managed by the Manager. He is 46 years old and has been an employee of the Manager since June 2000.
| JANETTE E. FARRAGHER, Vice President |
| and Assistant Secretary since |
| August 2005. |
Associate General Counsel of the Manager, and an officer of 79 investment companies (comprised of 180 portfolios) managed by the Manager. She is 45 years old and has been an employee of the Manager since February 1984.
| JOHN B. HAMMALIAN, Vice President and |
| Assistant Secretary since August 2005. |
Associate General Counsel of the Manager, and an officer of 79 investment companies (comprised of 180 portfolios) managed by the Manager. He is 44 years old and has been an employee of the Manager since February 1991.
| ROBERT R. MULLERY, Vice President and |
| Assistant Secretary since August 2005. |
Associate General Counsel of the Manager, and an officer of 79 investment companies (comprised of 180 portfolios) managed by the Manager. He is 55 years old and has been an employee of the Manager since May 1986.
| JEFF PRUSNOFSKY, Vice President and |
| Assistant Secretary since August 2005. |
Associate General Counsel of the Manager, and an officer of 79 investment companies (comprised of 180 portfolios) managed by the Manager. He is 42 years old and has been an employee of the Manager since October 1990.
| JAMES WINDELS, Treasurer since |
| November 2001. |
Director – Mutual Fund Accounting of the Manager, and an officer of 79 investment companies (comprised of 180 portfolios) managed by the Manager. He is 49 years old and has been an employee of the Manager since April 1985.
| ROBERT ROBOL, Assistant Treasurer |
| since December 2002. |
Senior Accounting Manager – Money Market and Municipal Bond Funds of the Manager, and an officer of 79 investment companies (comprised of 180 portfolios) managed by the Manager. He is 43 years old and has been an employee of the Manager since October 1988.
| ROBERT SALVIOLO, Assistant Treasurer |
| since July 2007. |
Senior Accounting Manager – Equity Funds of the Manager, and an officer of 79 investment companies (comprised of 180 portfolios) managed by the Manager. He is 40 years old and has been an employee of the Manager since June 1989.
| ROBERT SVAGNA, Assistant Treasurer |
| since December 2002. |
Senior Accounting Manager – Equity Funds of the Manager, and an officer of 79 investment companies (comprised of 180 portfolios) managed by the Manager. He is 40 years old and has been an employee of the Manager since November 1990.
| GAVIN C. REILLY, Assistant Treasurer |
| since December 2005. |
Tax Manager of the Investment Accounting and Support Department of the Manager, and an officer of 79 investment companies (comprised of 180 portfolios) managed by the Manager. He is 39 years old and has been an employee of the Manager since April 1991.
| JOSEPH W. CONNOLLY, Chief Compliance |
| Officer since October 2004. |
Chief Compliance Officer of the Manager and The Dreyfus Family of Funds (79 investment companies, comprised of 180 portfolios). From November 2001 through March 2004, Mr. Connolly was first Vice-President, Mutual Fund Servicing for Mellon Global Securities Services. In that capacity, Mr. Connolly was responsible for managing Mellon’s Custody, Fund Accounting and Fund Administration services to third-party mutual fund clients. He is 50 years old and has served in various capacities with the Manager since 1980, including manager of the firm’s Fund Accounting Department from 1997 through October 2001.
| WILLIAM GERMENIS, Anti-Money |
| Laundering Compliance Officer since |
| July 2002. |
Vice President and Anti-Money Laundering Compliance Officer of the Distributor, and the Anti-Money Laundering Compliance Officer of 75 investment companies (comprised of 176 portfolios) managed by the Manager. He is 37 years old and has been an employee of the Distributor since October 1998.
The Fund 47
NOTES
| Telephone Call your financial representative or 1-800-554-4611 |
| Mail | | The Dreyfus Premier Family of Funds |
| | | 144 Glenn Curtiss Boulevard, Uniondale, NY 11556-0144 |
The fund files its complete schedule of portfolio holdings with the Securities and Exchange Commission (“SEC”) for the first and third quarters of each fiscal year on Form N-Q. The fund’s Forms N-Q are available on the SEC’s website at http://www.sec.gov and may be reviewed and copied at the SEC’s Public Reference Room in Washington, DC. Information on the operation of the Public Reference Room may be obtained by calling 1-202-551-8090.
A description of the policies and procedures that the fund uses to determine how to vote proxies relating to portfolio securities, and information regarding how the fund voted these proxies for the 12-month period ended June 30, 2007, is available at http://www.dreyfus.com and on the SEC’s website at http://www.sec.gov. The description of the policies and procedures is also available without charge, upon request, by calling 1-800-645-6561.

| | Dreyfus Premier
Managed Income Fund
|
ANNUAL REPORT December 31, 2007

Save time. Save paper. View your next shareholder report online as soon as it’s available. Log into www.dreyfus.com and sign up for Dreyfus eCommunications. It’s simple and only takes a few minutes.
The views expressed in this report reflect those of the portfolio manager only through the end of the period covered and do not necessarily represent the views of Dreyfus or any other person in the Dreyfus organization. Any such views are subject to change at any time based upon market or other conditions and Dreyfus disclaims any responsibility to update such views.These views may not be relied on as investment advice and, because investment decisions for a Dreyfus fund are based on numerous factors, may not be relied on as an indication of trading intent on behalf of any Dreyfus fund.
Not FDIC-Insured • Not Bank-Guaranteed • May Lose Value
| Contents |
| |
| | | THE FUND |
| |
|
| 2 | | A Letter from the CEO |
| 3 | | Discussion of Fund Performance |
| 6 | | Fund Performance |
| 8 | | Understanding Your Fund’s Expenses |
| 8 | | Comparing Your Fund’s Expenses |
| With Those of Other Funds |
| 9 | | Statement of Investments |
| 28 | | Statement of Financial Futures |
| 28 | | Statement of Options Written |
| 29 | | Statement of Assets and Liabilities |
| 30 | | Statement of Operations |
| 31 | | Statement of Changes in Net Assets |
| 33 | | Financial Highlights |
| 37 | | Notes to Financial Statements |
| 53 | | Report of Independent Registered |
| | | Public Accounting Firm |
| 54 | | Important Tax Information |
| 55 | | Board Members Information |
| 57 | | Officers of the Fund |
| |
| FOR MORE INFORMATION |
|
| | | Back Cover |
| Dreyfus Premier |
| Managed Income Fund |
The Fund

A LETTER FROM THE CEO
Dear Shareholder:
We are pleased to present this annual report for Dreyfus Premier Managed Income Fund, covering the 12-month period from January 1, 2007, through December 31, 2007.
Looking back, 2007 was a year of significant change for U.S. fixed-income markets.Turmoil in the sub-prime mortgage market, declining housing values and soaring energy prices sparked a “flight to quality” among investors in which prices of U.S. Treasury securities surged higher while virtually all other domestic fixed-income sectors tumbled, including highly rated corporate bonds. Still, strong performance over the first half of the year helped most fixed-income indices post positive absolute returns for the year. During the second half of the year, the Fed took action to forestall a potential recession by implementing several short-term interest rate cuts. By the end of 2007, these actions contributed to a relatively wider yield-curve along the bond market’s maturity spectrum.
The turbulence of 2007 reinforced a central principle of successful investing: diversification. Investors with broad exposure to the world’s stock and bond markets were better protected from the full impact of market volatility in areas that, earlier in the year, were among the bright spots at the time. As we look ahead, we believe that now is the perfect time to meet with your financial advisor, who can help you plan and diversify your investment portfolio in a way that manages the potential opportunities and risks that may continue to arise in 2008.
For information about how the fund performed during the reporting period, as well as market perspectives, we have provided a Discussion of Fund Performance given by the fund’s Portfolio Manager.
Thank you for your continued confidence and support.
Thomas F. Eggers
Chief Executive Officer
The Dreyfus Corporation
January 15, 2008
|

DISCUSSION OF FUND PERFORMANCE
For the period of January 1, 2007, through December 31, 2007, as provided by Kent Wosepka, Portfolio Manager
Fund and Market Performance Overview
While the U.S. bond market was relatively stable over the first half of 2007, the second half saw heightened market volatility as a credit crisis originating in the sub-prime mortgage sector sparked a “flight to quality” among investors. U.S.Treasury securities gained value in this environment, but other types of bonds generally declined in value.The fund underperformed its benchmark, which we attribute to sub-par performance among its holdings of corporate bonds and asset-backed securities as well as the portfolio’s underweight exposure to Treasuries relative to the fund’s benchmark.
For the 12-month period ended December 31, 2007, Class A, B, C and I shares of Dreyfus Premier Managed Income Fund produced total returns of 5.55%, 4.68% and, 4.64% and 5.72%, respectively.1 In comparison, the Lehman Brothers U.S.Aggregate Index (the “Index”), the fund’s benchmark, produced a total return of 6.97% for the same period.2
The Fund’s Investment Approach
|
The fund seeks high current income consistent with what is believed to be prudent risk of capital.The fund invests at least 65% of its total assets in various types of U.S. government and corporate debt obligations rated investment grade (or their unrated equivalent as determined by Dreyfus).The fund also normally invests at least 65% of its total assets in debt obligations having effective maturities of 10 years or less.We do not attempt to match the sector percentages of any index, nor do we attempt to predict the direction of interest rates by substantially altering the fund’s sensitivity to changes in rates. Instead, the heart of our investment process is selecting individual securities that possess a combination of superior fundamentals and attractive relative valuations.
Fixed-Income Securities Produced Mixed Results in 2007
Most sectors of the U.S. bond market produced positive absolute returns in 2007, but those results were achieved in a challenging mar-
The Fund 3
DISCUSSION OF FUND PERFORMANCE (continued)
|
ket environment over the second half of the year, when a sharp increase in delinquencies and defaults among sub-prime mortgages resulted in concerns that consumer spending and economic growth might slow. By July, sub-prime-related weakness had spread to other areas of the bond market, causing a flight to quality among investors and creating difficult liquidity conditions in a number of market sectors. Some highly leveraged institutional investors were forced to sell their more liquid and creditworthy bonds to raise cash for redemption requests and margin calls, putting downward pressure on prices of securities in market sectors with little or no exposure to sub-prime loans.
In an effort to promote greater liquidity and forestall a possible recession, the Federal Reserve Board (the “Fed”) reduced key short-term interest rates in August,September,October and December and pumped liquidity into the banking system. However, mounting losses among major financial institutions and intensifying economic concerns continued to weigh heavily on the bond market. U.S.Treasury securities fared well during the flight to quality, but higher-yielding bonds — including most corporate-backed and mortgage-backed securities — lost value as investors reassessed their attitudes toward risk.
Non-Treasury Holdings Hurt the Fund’s Performance Relative to the Index
Strategies that had supported the fund’s performance relative to its benchmark in previous reporting periods proved to be less successful during the credit crunch. As the crisis unfolded, the fund’s relatively light holdings of U.S. Treasuries and overweight position in shorter-duration corporate bonds and asset-backed securities proved to be a drag on its relative performance.We had adopted a defensive investment posture with regard to investment-grade corporate bonds, including an emphasis on companies in industries that tend to be less vulnerable to risks associated with leveraged buyouts. However, this focus detracted from relative performance during the credit crisis. While the fund’s holdings of asset-backed securities were composed primarily of AAA-rated bonds and fixed-rate mortgages, their underperformance had a negative impact on the fund’s returns. A modest position in high yield bonds also lagged the averages.
On a more positive note, the fund benefited from its “bulleted” yield curve strategy because of widening yield differences along the market’s maturity range, and from a slightly longer-than-average duration that helped the fund participate in gains among U.S.Treasuries.The fund’s modest holdings of non-dollar securities, particularly bonds from the emerging markets, also contributed positively to performance, as did the purchase of credit default swaps on certain corporate bonds.
Positioning the Fund for a Changing Market
Despite the Fed’s intervention, uncertainty has persisted with regard to the impact of elevated energy prices, tighter lending standards and the housing recession on economic growth. In addition to its inter-meeting rate-cut on January 22, we further expect the Fed to reduce short-term interest rates in 2008, and we have maintained the fund’s interest-rate strategies. In addition, we have found more opportunities among short-maturity international bonds, and we have increased the fund’s positions in credit default swaps on bonds of companies in economically-sensitive industries. In our view, these are prudent strategies in today’s uncertain market environment.
| | | The fund may use derivative instruments, such as options, futures and options on futures, forward |
| | | contracts, swaps (including credit default swaps on corporate bonds and asset-backed securities), |
| | | options on swaps, and other credit derivatives.A small investment in derivatives could have a |
| | | potentially large impact on the fund’s performance.The use of derivatives involves risks different |
| | | from, or possibly greater than, the risks associated with investing directly in the underlying assets. |
| | | Credit default swaps and similar instruments involve greater risks than if the fund had invested in |
| | | the reference obligation directly, since, in addition to general market risks, they are subject to |
| | | illiquidity risk, counterparty risk and credit risks. |
| 1 | | Total return includes reinvestment of dividends and any capital gains paid, and does not take into |
| | | consideration the maximum initial sales charge in the case of Class A shares, or the applicable |
| | | contingent deferred sales charges imposed on redemptions in the case of Class B and Class C |
| | | shares. Had these charges been reflected, returns would have been lower. Past performance is no |
| | | guarantee of future results. Share price, yield and investment return fluctuate such that upon |
| | | redemption, fund shares may be worth more or less than their original cost. |
| 2 | | SOURCE: LIPPER INC. — Reflects reinvestment of dividends and, where applicable, capital |
| | | gain distributions.The Lehman Brothers U.S.Aggregate Index is a widely accepted, unmanaged |
| | | total return index of corporate, U.S. government and U.S. government agency debt instruments, |
| | | mortgage-backed securities and asset-backed securities with an average maturity of 1-10 years. |
The Fund 5
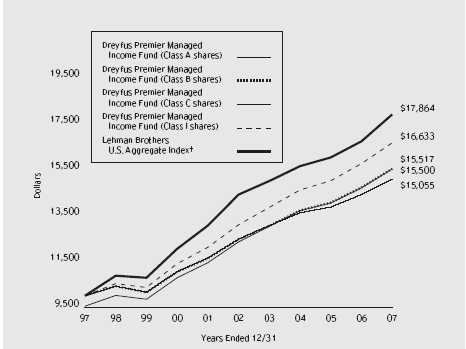
Comparison of change in value of $10,000 investment in Dreyfus Premier Managed Income Fund Class A shares, Class B shares, Class C shares and Class I shares and the Lehman Brothers U.S. Aggregate Index
| | † Source: Lipper Inc.
Past performance is not predictive of future performance.
The above graph compares a $10,000 investment made in Class A, Class B, Class C and Class I shares of Dreyfus
Premier Managed Income Fund on 12/31/97 to a $10,000 investment made in the Lehman Brothers U.S.Aggregate
Index (the “Index”) on that date.All dividends and capital gain distributions are reinvested.
The fund’s performance shown in the line graph takes into account the maximum initial sales charge on Class A shares
and all other applicable fees and expenses on all classes.The Index is a widely accepted, unmanaged index of corporate,
U.S. government and U.S. government agency debt instruments, mortgage-backed securities, and asset-backed securities.
Unlike a mutual fund, the Index is not subject to charges, fees and other expenses. Investors cannot invest directly in any
index. Further information relating to fund performance, including expense reimbursements, if applicable, is contained in
the Financial Highlights section of the prospectus and elsewhere in this report.
|
| Average Annual Total Returns as of | | 12/31/07 | | | | | | |
| | | | | 1 Year | | 5 Years | | 10 Years |
| |
| |
| |
| |
|
| Class A shares | | | | | | | | |
| with maximum sales charge (4.5%) | | | | 0.81% | | 3.71% | | 4.48% |
| without sales charge | | | | 5.55% | | 4.67% | | 4.96% |
| Class B shares | | | | | | | | |
| with applicable redemption charge † | | | | 0.68% | | 3.53% | | 4.49% |
| without redemption | | | | 4.68% | | 3.88% | | 4.49% |
| Class C shares | | | | | | | | |
| with applicable redemption charge †† | | | | 3.64% | | 3.87% | | 4.18% |
| without redemption | | | | 4.64% | | 3.87% | | 4.18% |
| Class I shares | | | | 5.72% | | 4.92% | | 5.22% |
Past performance is not predictive of future performance.The fund’s performance shown in the graph and table does not reflect the deduction of taxes that a shareholder would pay on fund distributions or the redemption of fund shares. Performance for Class B shares assumes the conversion of Class B shares to Class A shares at the end of the sixth year following the date of purchase.
† The maximum contingent deferred sales charge for Class B shares is 4%.After six years Class B shares convert to Class A shares.
The maximum contingent deferred sales charge for Class C shares is 1% for shares redeemed within one year of the date of purchase.
The Fund 7
UNDERSTANDING YOUR FUND’S EXPENSES (Unaudited)
As a mutual fund investor, you pay ongoing expenses, such as management fees and other expenses. Using the information below, you can estimate how these expenses affect your investment and compare them with the expenses of other funds.You also may pay one-time transaction expenses, including sales charges (loads) and redemption fees, which are not shown in this section and would have resulted in higher total expenses. For more information, see your fund’s prospectus or talk to your financial adviser.
Review your fund’s expenses
The table below shows the expenses you would have paid on a $1,000 investment in Dreyfus Premier Managed Income Fund from July 1, 2007 to December 31, 2007. It also shows how much a $1,000 investment would be worth at the close of the period, assuming actual returns and expenses.
| Expenses and Value of a $1,000 Investment | | | | | | |
| assuming actual returns for the six months ended December 31, 2007 | | | | |
| | | Class A | | Class B | | Class C | | Class I |
| |
| |
| |
| |
|
| Expenses paid per $1,000 † | | $ 4.89 | | $ 8.73 | | $ 8.73 | | $ 3.60 |
| Ending value (after expenses) | | $1,042.80 | | $1,038.00 | | $1,037.70 | | $1,043.20 |
COMPARING YOUR FUND’S EXPENSES WITH THOSE OF OTHER FUNDS (Unaudited)
Using the SEC’s method to compare expenses
The Securities and Exchange Commission (SEC) has established guidelines to help investors assess fund expenses. Per these guidelines, the table below shows your fund’s expenses based on a $1,000 investment, assuming a hypothetical 5% annualized return. You can use this information to compare the ongoing expenses (but not transaction expenses or total cost) of investing in the fund with those of other funds.All mutual fund shareholder reports will provide this information to help you make this comparison. Please note that you cannot use this information to estimate your actual ending account balance and expenses paid during the period.
Expenses and Value of a $1,000 Investment assuming a hypothetical 5% annualized return for the six months ended December 31, 2007
| | | Class A | | Class B | | Class C | | Class I |
| |
| |
| |
| |
|
| Expenses paid per $1,000 † | | $ 4.84 | | $ 8.64 | | $ 8.64 | | $ 3.57 |
| Ending value (after expenses) | | $1,020.42 | | $1,016.64 | | $1,016.64 | | $1,021.68 |
† Expenses are equal to the fund’s annualized expense ratio of .95% for Class A, 1.70% for Class B, 1.70% for
Class C and .70% for Class I; multiplied by the average account value over the period, multiplied by 184/365 (to
reflect the one-half year period).
|
STATEMENT OF INVESTMENTS
December 31, 2007
|
| | | Coupon | | Maturity | | Principal | | |
| Bonds and Notes—108.0% | | Rate (%) | | Date | | Amount ($) | | Value ($) |
| |
| |
| |
| |
|
| Agricultural—.1% | | | | | | | | |
| Philip Morris, | | | | | | | | |
| Sr. Unscd. Debs. | | 7.75 | | 1/15/27 | | 105,000 | | 135,654 |
| Asset-Backed Ctfs./ | | | | | | | | |
| Auto Receivables—2.1% | | | | | | | | |
| Americredit Prime Automobile | | | | | | | | |
| Receivables Trust, | | | | | | | | |
| Ser. 2007-1, Cl. E | | 6.96 | | 3/8/16 | | 480,000 a | | 436,498 |
| Capital Auto Receivables Asset | | | | | | | | |
| Trust, Ser. 2005-1, Cl. C | | 4.73 | | 9/15/10 | | 425,000 | | 425,113 |
| Capital Auto Receivables Asset | | | | | | | | |
| Trust, Ser. 2007-1, Cl. D | | 6.57 | | 9/16/13 | | 500,000 a | | 475,528 |
| Ford Credit Auto Owner Trust, | | | | | | | | |
| Ser. 2005-B, Cl. B | | 4.64 | | 4/15/10 | | 125,000 | | 125,027 |
| Ford Credit Auto Owner Trust, | | | | | | | | |
| Ser 2005-C, Cl. C | | 4.72 | | 2/15/11 | | 85,000 | | 85,246 |
| Ford Credit Auto Owner Trust, | | | | | | | | |
| Ser. 2007-A, Cl. D | | 7.05 | | 12/15/13 | | 250,000 a | | 239,197 |
| Hyundai Auto Receivables Trust, | | | | | | |
| Ser. 2006-B, Cl. C | | 5.25 | | 5/15/13 | | 60,000 | | 59,515 |
| WFS Financial Owner Trust, | | | | | | | | |
| Ser. 2004-4, Cl. B | | 3.13 | | 5/17/12 | | 47,203 | | 46,679 |
| WFS Financial Owner Trust, | | | | | | | | |
| Ser. 2004-3, Cl. B | | 3.51 | | 2/17/12 | | 42,656 | | 42,290 |
| WFS Financial Owner Trust, | | | | | | | | |
| Ser. 2005-3, Cl. B | | 4.50 | | 5/17/13 | | 95,000 | | 94,991 |
| WFS Financial Owner Trust, | | | | | | | | |
| Ser. 2005-3, Cl. C | | 4.54 | | 5/17/13 | | 50,000 | | 49,825 |
| WFS Financial Owner Trust, | | | | | | | | |
| Ser. 2005-2, Cl. B | | 4.57 | | 11/19/12 | | 170,000 | | 169,918 |
| | | | | | | | | 2,249,827 |
| Asset-Backed Ctfs./Credit Cards—4.0% | | | | | | |
| American Express Credit Account | | | | | | |
| Master Trust, Ser. 2007-6, | | | | | | | | |
| Cl. C | | 5.42 | | 1/15/13 | | 435,000 a,b | | 418,970 |
| Bank One Issuance Trust, | | | | | | | | |
| Ser. 2004-C1, Cl. C1 | | 5.53 | | 11/15/11 | | 980,000 b | | 967,368 |
| Bank One Issuance Trust, | | | | | | | | |
| Ser. 2003-C4, Cl. C4 | | 6.06 | | 2/15/11 | | 1,135,000 b | | 1,137,701 |
The Fund 9
| | STATEMENT OF INVESTMENTS (continued)
|
| | | Coupon | | Maturity | | Principal | | |
| Bonds and Notes (continued) | | Rate (%) | | Date | | Amount ($) | | Value ($) |
| |
| |
| |
| |
|
| Asset-Backed Ctfs./ | | | | | | | | |
| Credit Cards (continued) | | | | | | | | |
| Chase Issuance Trust, | | | | | | | | |
| Ser. 2006-C4, Cl. C4 | | 5.32 | | 1/15/14 | | 825,000 b | | 776,878 |
| Citibank Credit Card Issuance | | | | | | | | |
| Trust, Ser. 2003-C1, Cl. C1 | | 6.34 | | 4/7/10 | | 1,030,000 b | | 1,029,708 |
| | | | | | | | | 4,330,625 |
| Asset-Backed Ctfs./ | | | | | | | | |
| Home Equity Loans—.8% | | | | | | | | |
| Citicorp Residential Mortgage | | | | | | | | |
| Securities, Ser. 2006-1, Cl. A1 | | 5.96 | | 7/25/36 | | 80,304 b | | 79,917 |
| Citicorp Residential Mortgage | | | | | | | | |
| Securities, Ser. 2007-2, | | | | | | | | |
| Cl. A1A | | 5.98 | | 6/25/37 | | 253,322 b | | 252,226 |
| Citigroup Mortgage Loan Trust, | | | | | | | | |
| Ser. 2005-WF2, Cl. AF2 | | 4.92 | | 8/25/35 | | 3,089 b | | 3,082 |
| Citigroup Mortgage Loan Trust, | | | | | | | | |
| Ser. 2005-WF1, Cl. A5 | | 5.01 | | 2/25/35 | | 140,000 b | | 136,826 |
| Countrywide Asset-Backed | | | | | | | | |
| Certificates, Ser. 2006-1, | | | | | | | | |
| Cl. AF1 | | 5.00 | | 7/25/36 | | 8,962 b | | 8,950 |
| CSAB Mortgage Backed Trust, | | | | | | | | |
| Ser. 2006-3, Cl. A1A | | 6.00 | | 11/25/36 | | 69,246 b | | 69,409 |
| Morgan Stanley ABS Capital I, | | | | | | | | |
| Ser. 2006-HE3, Cl. A2A | | 4.91 | | 4/25/36 | | 10,481 b | | 10,406 |
| Morgan Stanley Mortgage Loan | | | | | | | | |
| Trust, Ser. 2006-15XS, Cl. A6B | | 5.83 | | 11/25/36 | | 75,000 b | | 70,341 |
| Popular ABS Mortgage Pass-Through | | | | | | |
| Trust, Ser. 2005-6, Cl. M1 | | 5.91 | | 1/25/36 | | 145,000 b | | 129,133 |
| Renaissance Home Equity Loan | | | | | | | | |
| Trust, Ser. 2005-2, Cl. M9 | | 6.64 | | 8/25/35 | | 130,000 b | | 58,247 |
| Residential Asset Securities, | | | | | | | | |
| Ser. 2001-KS3, Cl. MII1 | | 5.69 | | 9/25/31 | | 52,772 b | | 42,613 |
| | | | | | | | | 861,150 |
| Asset-Backed Ctfs./ | | | | | | | | |
| Manufactured Housing—.3% | | | | | | | | |
| Green Tree Financial, | | | | | | | | |
| Ser. 1994-7, Cl. M1 | | 9.25 | | 3/15/20 | | 54,453 | | 56,449 |
| Origen Manufactured Housing, | | | | | | | | |
| Ser. 2004-B, Cl. A2 | | 3.79 | | 12/15/17 | | 30,046 | | 29,815 |
10
| | | Coupon | | Maturity | | Principal | | |
| Bonds and Notes (continued) | | Rate (%) | | Date | | Amount ($) | | Value ($) |
| |
| |
| |
| |
|
| Asset-Backed Ctfs./ | | | | | | | | |
| Manufactured Housing (continued) | | | | | | |
| Origen Manufactured Housing, | | | | | | | | |
| Ser. 2005-B, Cl. A2 | | 5.25 | | 12/15/18 | | 115,000 | | 115,306 |
| Vanderbilt Mortgage Finance, | | | | | | | | |
| Ser. 1999-A, Cl. 1A6 | | 6.75 | | 3/7/29 | | 80,000 b | | 82,035 |
| | | | | | | | | 283,605 |
| Automobile Manufacturers—.7% | | | | | | |
| Daimler Finance North America, | | | | | | | | |
| Notes | | 4.88 | | 6/15/10 | | 65,000 | | 64,748 |
| Daimler Finance North America, | | | | | | | | |
| Gtd. Notes | | 5.46 | | 3/13/09 | | 320,000 b | | 318,306 |
| DaimlerChrysler North America, | | | | | | | | |
| Gtd. Notes, Ser. E | | 5.44 | | 10/31/08 | | 250,000 b | | 249,569 |
| DaimlerChrysler North America, | | | | | | | | |
| Gtd. Notes | | 5.54 | | 3/13/09 | | 135,000 b | | 134,100 |
| | | | | | | | | 766,723 |
| Automotive, Trucks & Parts—.0% | | | | | | |
| Goodyear Tire & Rubber, | | | | | | | | |
| Gtd. Notes | | 8.66 | | 12/1/09 | | 30,000 b | | 30,375 |
| Banks—5.6% | | | | | | | | |
| BAC Capital Trust XIV, | | | | | | | | |
| Bank Gtd. Notes | | 5.63 | | 12/31/49 | | 470,000 b | | 417,459 |
| Capital One Financial, | | | | | | | | |
| Sr. Unsub. Notes | | 5.43 | | 9/10/09 | | 540,000 b | | 510,595 |
| Chevy Chase Bank, | | | | | | | | |
| Sub. Notes | | 6.88 | | 12/1/13 | | 145,000 | | 138,838 |
| Colonial Bank, | | | | | | | | |
| Sub. Notes | | 6.38 | | 12/1/15 | | 250,000 | | 247,457 |
| Ford Motor Credit, | | | | | | | | |
| Sr. Notes | | 5.80 | | 1/12/09 | | 335,000 | | 318,056 |
| Greater Bay Bancorp, | | | | | | | | |
| Sr. Notes, Ser. B | | 5.25 | | 3/31/08 | | 100,000 | | 100,095 |
| Industrial Bank of Korea, | | | | | | | | |
| Sub. Notes | | 4.00 | | 5/19/14 | | 275,000 a,b | | 272,328 |
| Islandsbanki, | | | | | | | | |
| Notes | | 5.40 | | 10/15/08 | | 87,000 a,b | | 86,941 |
| J.P. Morgan & Co., | | | | | | | | |
| Sub. Notes | | 6.25 | | 1/15/09 | | 160,000 c | | 161,972 |
The Fund 11
| | STATEMENT OF INVESTMENTS (continued)
|
| | | Coupon | | Maturity | | Principal | | |
| Bonds and Notes (continued) | | Rate (%) | | Date | | Amount ($) | | Value ($) |
| |
| |
| |
| |
|
| Banks (continued) | | | | | | | | |
| Landsbanki Islands, | | | | | | | | |
| Sr. Notes | | 5.73 | | 8/25/09 | | 250,000 a,b | | 249,676 |
| Marshall & Ilsley Bank, | | | | | | | | |
| Sub. Notes, Ser. BN | | 5.40 | | 12/4/12 | | 260,000 b | | 245,517 |
| Marshall & Ilsley, | | | | | | | | |
| Sr. Unscd. Notes | | 5.63 | | 8/17/09 | | 325,000 | | 328,358 |
| Morgan Stanley, | | | | | | | | |
| Notes | | 3.88 | | 1/15/09 | | 690,000 | | 683,072 |
| NB Capital Trust IV, | | | | | | | | |
| Gtd. Cap. Secs. | | 8.25 | | 4/15/27 | | 180,000 | | 186,930 |
| Northern Rock, | | | | | | | | |
| Sub. Notes | | 6.59 | | 6/29/49 | | 215,000 a,b | | 133,503 |
| Royal Bank of Scotland Group, | | | | | | | | |
| Jr. Sub. Bonds | | 6.99 | | 10/29/49 | | 290,000 a,b | | 289,633 |
| Sovereign Bancorp, | | | | | | | | |
| Sr. Unscd. Notes | | 5.11 | | 3/23/10 | | 250,000 b | | 248,207 |
| Sovereign Bancorp, | | | | | | | | |
| Sr. Notes | | 5.40 | | 3/1/09 | | 195,000 b | | 192,368 |
| SunTrust Preferred Capital I, | | | | | | | | |
| Bank Gtd. Notes | | 5.85 | | 12/31/49 | | 330,000 b | | 291,472 |
| USB Capital IX, | | | | | | | | |
| Gtd. Notes | | 6.19 | | 4/15/49 | | 795,000 b,c | | 720,001 |
| Western Financial Bank, | | | | | | | | |
| Sub. Debs. | | 9.63 | | 5/15/12 | | 165,000 | | 177,522 |
| Zions Bancorporation, | | | | | | | | |
| Sr. Unscd. Notes | | 5.36 | | 4/15/08 | | 105,000 b | | 104,241 |
| | | | | | | | | 6,104,241 |
| Building & Construction—.4% | | | | | | | | |
| American Standard, | | | | | | | | |
| Gtd. Notes | | 7.38 | | 2/1/08 | | 145,000 | | 145,175 |
| Centex, | | | | | | | | |
| Sr. Unscd. Notes | | 4.75 | | 1/15/08 | | 65,000 | | 64,881 |
| D.R. Horton, | | | | | | | | |
| Gtd. Notes | | 5.88 | | 7/1/13 | | 120,000 | | 104,009 |
| D.R. Horton, | | | | | | | | |
| Sr. Unsub. Notes | | 6.00 | | 4/15/11 | | 15,000 | | 13,563 |
| Masco, | | | | | | | | |
| Sr. Unscd. Notes | | 5.43 | | 3/12/10 | | 140,000 b | | 135,301 |
| | | | | | | | | 462,929 |
12
| | | Coupon | | Maturity | | Principal | | |
| Bonds and Notes (continued) | | Rate (%) | | Date | | Amount ($) | | Value ($) |
| |
| |
| |
| |
|
| Chemicals—.1% | | | | | | | | |
| RPM International, | | | | | | | | |
| Sr. Unscd. Notes | | 4.45 | | 10/15/09 | | 125,000 | | 123,857 |
| Commercial & | | | | | | | | |
| Professional Services—.7% | | | | | | | | |
| Donnelley (R.R.) and Sons, | | | | | | | | |
| Sr. Unscd. Notes | | 6.13 | | 1/15/17 | | 410,000 | | 404,966 |
| ERAC USA Finance, | | | | | | | | |
| Notes | | 5.23 | | 4/30/09 | | 70,000 a,b | | 69,707 |
| ERAC USA Finance, | | | | | | | | |
| Gtd. Notes | | 6.38 | | 10/15/17 | | 215,000 a | | 208,085 |
| ERAC USA Finance, | | | | | | | | |
| Notes | | 7.95 | | 12/15/09 | | 100,000 a | | 104,986 |
| | | | | | | | | 787,744 |
| Commercial Mortgage | | | | | | | | |
| Pass-Through Ctfs.—2.9% | | | | | | | | |
| Bayview Commercial Asset Trust, | | | | | | | | |
| Ser. 2006-SP2, Cl. A | | 5.15 | | 1/25/37 | | 172,429 a,b | | 166,514 |
| Bayview Commercial Asset Trust, | | | | | | | | |
| Ser. 2005-3A, Cl. A2 | | 5.27 | | 11/25/35 | | 136,269 a,b | | 130,222 |
| Bayview Commercial Asset Trust, | | | | | | | | |
| Ser. 2005-4A, Cl. M5 | | 5.52 | | 1/25/36 | | 79,215 a,b | | 68,310 |
| Bayview Commercial Asset Trust, | | | | | | | | |
| Ser. 2005-3A, Cl. B1 | | 5.97 | | 11/25/35 | | 71,720 a,b | | 52,356 |
| Bayview Commercial Asset Trust, | | | | | | | | |
| Ser. 2005-3A, Cl. B3 | | 7.87 | | 11/25/35 | | 71,720 a,b | | 50,204 |
| Bear Stearns Commercial Mortgage | | | | | | | | |
| Securities, Ser. 2003-T12, Cl. A3 | | 4.24 | | 8/13/39 | | 295,000 b | | 292,551 |
| Bear Stearns Commercial Mortgage | | | | | | | | |
| Securities, Ser. 2005-T18 Cl. A2 | | 4.56 | | 2/13/42 | | 125,000 b | | 123,996 |
| Bear Stearns Commercial Mortgage | | | | | | | | |
| Securities, Ser. 2004-PWR5, Cl. A3 | | 4.57 | | 7/11/42 | | 120,000 | | 119,420 |
| Capco America Securitization, | | | | | | | | |
| Ser. 1998-D7, Cl. A1B | | 6.26 | | 10/15/30 | | 82,854 | | 83,266 |
| Credit Suisse/Morgan Stanley | | | | | | | | |
| Commercial Mortgage | | | | | | | | |
| Certificates, Ser. 2006-HC1A, | | | | | | | | |
| Cl. A1 | | 5.22 | | 5/15/23 | | 19,805 a,b | | 19,514 |
| Crown Castle Towers, | | | | | | | | |
| Ser. 2005-1A, Cl. D | | 5.61 | | 6/15/35 | | 115,000 a | | 113,918 |
The Fund 13
| | STATEMENT OF INVESTMENTS (continued)
|
| | | Coupon | | Maturity | | Principal | | |
| Bonds and Notes (continued) | | Rate (%) | | Date | | Amount ($) | | Value ($) |
| |
| |
| |
| |
|
| Commercial Mortgage | | | | | | | | |
| Pass-Through Ctfs. (continued) | | | | | | |
| Crown Castle Towers, | | | | | | | | |
| Ser. 2006-1A, Cl. D | | 5.77 | | 11/15/36 | | 75,000 a | | 71,874 |
| DLJ Commercial Mortgage, | | | | | | | | |
| Ser. 1998-CF2, Cl. A1B | | 6.24 | | 11/12/31 | | 107,459 | | 108,010 |
| DLJ Commercial Mortgage, | | | | | | | | |
| Ser. 1998-CGI, Cl. A1B | | 6.41 | | 6/10/31 | | 129,689 | | 129,733 |
| Global Signal Trust, | | | | | | | | |
| Ser. 2006-1, Cl. D | | 6.05 | | 2/15/36 | | 160,000 a | | 155,837 |
| Global Signal Trust, | | | | | | | | |
| Ser. 2006-1, Cl. E | | 6.50 | | 2/15/36 | | 35,000 a | | 34,048 |
| Goldman Sachs Mortgage Securities | | | | | | |
| Corporation II, Ser. 2007-EOP, | | | | | | | | |
| Cl. F | | 5.73 | | 3/6/20 | | 305,000 a,b | | 289,837 |
| Goldman Sachs Mortgage Securities | | | | | | |
| Corporation II, Ser. 2007-EOP, | | | | | | | | |
| Cl. G | | 5.77 | | 3/6/20 | | 150,000 a,b | | 141,466 |
| Goldman Sachs Mortgage Securities | | | | | | |
| Corporation II, Ser. 2007-EOP, | | | | | | | | |
| Cl. K | | 6.30 | | 3/6/20 | | 95,000 a,b | | 86,367 |
| Goldman Sachs Mortgage Securities | | | | | | |
| Corporation II, Ser. 2007-EOP, | | | | | | | | |
| Cl. L | | 6.55 | | 3/6/20 | | 330,000 a,b | | 310,200 |
| Morgan Stanley Capital I, | | | | | | | | |
| Ser. 1999-RM1, Cl. A2 | | 6.71 | | 12/15/31 | | 106,246 b | | 107,080 |
| Morgan Stanley Capital I, | | | | | | | | |
| Ser. 1999-CAM1, Cl. A4 | | 7.02 | | 3/15/32 | | 21,799 b | | 22,097 |
| Morgan Stanley Dean Witter Capital | | | | | | |
| I, Ser. 2001-PPM, Cl. A3 | | 6.54 | | 2/15/31 | | 72,261 | | 74,786 |
| Nationslink Funding, | | | | | | | | |
| Ser. 1998-2, Cl. A2 | | 6.48 | | 8/20/30 | | 94,049 | | 94,111 |
| SBA CMBS Trust, | | | | | | | | |
| Ser. 2006-1A, Cl. D | | 5.85 | | 11/15/36 | | 70,000 a | | 66,872 |
| Washington Mutual Commercial | | | | | | | | |
| Mortgage Securities Trust, | | | | | | | | |
| Ser. 2003-C1A, Cl. A | | 3.83 | | 1/25/35 | | 267,662 a | | 264,018 |
| | | | | | | | | 3,176,607 |
| Diversified Financial Services—7.6% | | | | | | |
| American International Group, | | | | | | | | |
| Sr. Unscd. Notes | | 5.85 | | 1/16/18 | | 300,000 | | 302,533 |
14
| | | | | Coupon | | Maturity | | Principal | | |
| Bonds and Notes (continued) | | Rate (%) | | Date | | Amount ($) | | Value ($) |
| |
| |
| |
| |
|
| Diversified Financial | | | | | | | | | | |
| Services (continued) | | | | | | | | | | |
| Ameriprise Financial, | | | | | | | | | | |
| Jr. Sub. Notes | | | | 7.52 | | 6/1/66 | | 240,000 b | | 239,371 |
| Amvescap, | | | | | | | | | | |
| Gtd. Notes | | | | 5.63 | | 4/17/12 | | 290,000 | | 286,264 |
| Capmark Financial Group, | | | | | | | | | | |
| Gtd. Notes | | | | 5.88 | | 5/10/12 | | 340,000 a | | 269,375 |
| CIT Group, | | | | | | | | | | |
| Sr. Notes | | | | 5.02 | | 8/15/08 | | 185,000 b | | 183,578 |
| Citigroup Capital XXI, | | | | | | | | | | |
| Gtd. Bonds | | | | 8.30 | | 12/21/77 | | 550,000 b | | 575,935 |
| Countrywide Financial, | | | | | | | | | | |
| Gtd. Notes | | | | 5.38 | | 1/5/09 | | 260,000 b | | 206,036 |
| FCE Bank, | | | | | | | | | | |
| Notes | | EUR | | 4.72 | | 9/30/09 | | 235,000 b,d | | 312,607 |
| Fuji JGB Investment, | | | | | | | | | | |
| Sub. Bonds | | | | 9.87 | | 12/29/49 | | 200,000 a,b | | 201,850 |
| Goldman Sachs Capital II, | | | | | | | | | | |
| Gtd. Bonds | | | | 5.79 | | 12/29/49 | | 170,000 b | | 151,497 |
| Goldman Sachs Group, | | | | | | | | | | |
| Sr. Sub. Notes | | | | 6.75 | | 10/1/37 | | 425,000 | | 417,721 |
| HSBC Finance, | | | | | | | | | | |
| Sr. Notes | | | | 5.34 | | 9/14/12 | | 280,000 b,c | | 270,709 |
| HUB International Holdings, | | | | | | | | |
| Sr. Sub. Notes | | | | 10.25 | | 6/15/15 | | 215,000 a | | 183,825 |
| International Lease Finance, | | | | | | | | |
| Sr. Unscd. Notes | | | | 5.25 | | 5/24/10 | | 125,000 b | | 123,365 |
| Janus Capital Group, | | | | | | | | | | |
| Notes | | | | 6.25 | | 6/15/12 | | 345,000 | | 353,576 |
| Jefferies Group, | | | | | | | | | | |
| Sr. Unscd. Notes | | | | 7.75 | | 3/15/12 | | 140,000 | | 152,153 |
| John Deere Capital, | | | | | | | | | | |
| Notes | | | | 5.16 | | 9/1/09 | | 80,000 b | | 80,187 |
| Kaupthing Bank, | | | | | | | | | | |
| Sr. Notes | | | | 5.94 | | 1/15/10 | | 235,000 a,b | | 234,304 |
| Lehman Brothers Holdings, | | | | | | | | | | |
| Sub. Notes | | | | 6.88 | | 7/17/37 | | 475,000 | | 465,844 |
| Leucadia National, | | | | | | | | | | |
| Sr. Unscd. Notes | | | | 7.00 | | 8/15/13 | | 115,000 | | 110,688 |
The Fund 15
| | STATEMENT OF INVESTMENTS (continued)
|
| | | Coupon | | Maturity | | Principal | | |
| Bonds and Notes (continued) | | Rate (%) | | Date | | Amount ($) | | Value ($) |
| |
| |
| |
| |
|
| Diversified Financial | | | | | | | | |
| Services (continued) | | | | | | | | |
| MBNA Capital A, | | | | | | | | |
| Gtd. Cap. Secs., Ser. A | | 8.28 | | 12/1/26 | | 80,000 | | 83,189 |
| Merrill Lynch & Co., | | | | | | | | |
| Notes, Ser. C | | 4.25 | | 2/8/10 | | 793,000 | | 777,760 |
| Merrill Lynch & Co., | | | | | | | | |
| Notes, Ser. C | | 5.10 | | 2/5/10 | | 80,000 b | | 77,997 |
| Merrill Lynch & Co., | | | | | | | | |
| Sr. Unscd. Notes | | 6.05 | | 8/15/12 | | 205,000 | | 209,144 |
| Merrill Lynch & Co., | | | | | | | | |
| Sub. Notes | | 6.11 | | 1/29/37 | | 470,000 | | 416,411 |
| Morgan Stanley, | | | | | | | | |
| Sr. Unscd. Notes | | 5.75 | | 8/31/12 | | 165,000 | | 168,596 |
| NIPSCO Capital Markets, | | | | | | | | |
| Notes | | 7.86 | | 3/27/17 | | 85,000 | | 96,126 |
| SB Treasury, | | | | | | | | |
| Jr. Sub. Bonds | | 9.40 | | 12/29/49 | | 430,000 a,b | | 438,519 |
| SLM, | | | | | | | | |
| Unscd. Notes, Ser. A | | 4.50 | | 7/26/10 | | 280,000 | | 256,966 |
| SLM, | | | | | | | | |
| Unscd. Notes, Ser. A | | 5.22 | | 7/27/09 | | 285,000 b | | 268,191 |
| Tokai Preferred Capital, | | | | | | | | |
| Bonds | | 9.93 | | 12/29/49 | | 420,000 a,b | | 425,607 |
| | | | | | | | | 8,339,924 |
| Electric Utilities—2.5% | | | | | | | | |
| AES, | | | | | | | | |
| Sr. Unsub. Notes | | 8.88 | | 2/15/11 | | 185,000 | | 193,788 |
| AES, | | | | | | | | |
| Sr. Notes | | 9.38 | | 9/15/10 | | 20,000 | | 21,100 |
| Dominion Resources, | | | | | | | | |
| Sr. Unscd. Notes, Ser. B | | 5.05 | | 11/14/08 | | 140,000 b | | 139,758 |
| Enel Finance International, | | | | | | | | |
| Gtd. Bonds | | 6.25 | | 9/15/17 | | 515,000 a | | 522,076 |
| FirstEnergy, | | | | | | | | |
| Unsub. Notes, Ser. B | | 6.45 | | 11/15/11 | | 570,000 | | 589,091 |
| IPALCO Enterprises, | | | | | | | | |
| Scd. Notes | | 8.63 | | 11/14/11 | | 85,000 b | | 89,250 |
| National Grid, | | | | | | | | |
| Sr. Unscd. Notes | | 6.30 | | 8/1/16 | | 150,000 | | 153,387 |
16
| | | | | Coupon | | Maturity | | Principal | | |
| Bonds and Notes (continued) | | Rate (%) | | Date | | Amount ($) | | Value ($) |
| |
| |
| |
| |
|
| Electric Utilities (continued) | | | | | | | | |
| Niagara Mohawk Power, | | | | | | | | |
| Sr. Unscd. Notes, Ser. G | | 7.75 | | 10/1/08 | | 215,000 | | 219,322 |
| NiSource Finance, | | | | | | | | | | |
| Gtd. Notes | | | | 5.59 | | 11/23/09 | | 275,000 b | | 272,466 |
| Nisource Finance, | | | | | | | | | | |
| Sr. Unscd. Notes | | | | 6.40 | | 3/15/18 | | 95,000 | | 94,962 |
| Ohio Power, | | | | | | | | | | |
| Unscd. Notes | | | | 5.42 | | 4/5/10 | | 145,000 b | | 143,805 |
| Pepco Holdings, | | | | | | | | | | |
| Sr. Unscd. Notes | | | | 5.75 | | 6/1/10 | | 180,000 b | | 179,660 |
| Texas Utilities, | | | | | | | | | | |
| Sr. Unscd. Notes, Ser. C | | 6.38 | | 1/1/08 | | 65,000 | | 65,000 |
| | | | | | | | | | | 2,683,665 |
| Environmental Control—.3% | | | | | | | | |
| Allied Waste North America, | | | | | | | | |
| Scd. Notes, Ser. B | | 5.75 | | 2/15/11 | | 10,000 | | 9,850 |
| Oakmont Asset Trust, | | | | | | | | |
| Notes | | | | 4.51 | | 12/22/08 | | 130,000 a | | 129,622 |
| USA Waste Services, | | | | | | | | |
| Sr. Unscd. Notes | | | | 7.00 | | 7/15/28 | | 175,000 | | 186,174 |
| | | | | | | | | | | 325,646 |
| Food & Beverages—.3% | | | | | | | | |
| H.J. Heinz, | | | | | | | | | | |
| Notes | | | | 6.43 | | 12/1/20 | | 150,000 a | | 152,741 |
| Kraft Foods, | | | | | | | | | | |
| Sr. Unscd. Notes | | | | 6.88 | | 2/1/38 | | 150,000 | | 156,233 |
| | | | | | | | | | | 308,974 |
| Foreign/Governmental—2.3% | | | | | | | | |
| Arab Republic of Egypt, | | | | | | | | |
| Unsub. Notes | | EGP | | 8.75 | | 7/18/12 | | 1,110,000 a,d | | 206,796 |
| Banco Nacional de | | | | | | | | | | |
| Desenvolvimento | | | | | | | | |
| Economico e Social, | | | | | | | | |
| Unsub. Notes | | | | 5.33 | | 6/16/08 | | 220,000 b | | 219,230 |
| Federal Republic of Brazil, | | | | | | | | |
| Unscd. Bonds | | BRL | | 12.50 | | 1/5/16 | | 665,000 c,d | | 406,659 |
| Mexican Bonos, | | | | | | | | | | |
| Bonds, Ser. M | | MXN | | 9.00 | | 12/22/11 | | 2,600,000 d | | 247,031 |
The Fund 17
| | STATEMENT OF INVESTMENTS (continued)
|
| | | Coupon | | Maturity | | Principal | | |
| Bonds and Notes (continued) | | Rate (%) | | Date | | Amount ($) | | Value ($) |
| |
| |
| |
| |
|
| Foreign/Governmental (continued) | | | | | | |
| Mexican Bonos, | | | | | | | | |
| Bonds, Ser. M 30 MXN | | 10.00 | | 11/20/36 | | 1,220,000 d | | 133,061 |
| Republic of Argentina, | | | | | | | | |
| Bonds | | 5.39 | | 8/3/12 | | 1,560,000 b | | 883,350 |
| Russian Federation, | | | | | | | | |
| Unsub. Bonds | | 8.25 | | 3/31/10 | | 355,571 a | | 369,794 |
| | | | | | | | | 2,465,921 |
| Health Care—.7% | | | | | | | | |
| Baxter International, | | | | | | | | |
| Sr. Unscd. Notes | | 5.20 | | 2/16/08 | | 140,000 | | 140,027 |
| HCA, | | | | | | | | |
| Sr. Unscd. Notes | | 6.75 | | 7/15/13 | | 50,000 | | 44,750 |
| HCA, | | | | | | | | |
| Sr. Unscd. Notes | | 7.88 | | 2/1/11 | | 115,000 | | 112,700 |
| HCA, | | | | | | | | |
| Sr. Unscd. Notes | | 8.75 | | 9/1/10 | | 150,000 | | 152,063 |
| Medco Health Solutions, | | | | | | | | |
| Sr. Unscd. Notes | | 7.25 | | 8/15/13 | | 60,000 | | 65,803 |
| Pacific Life Global Funding, | | | | | | | | |
| Notes | | 3.75 | | 1/15/09 | | 220,000 a | | 217,475 |
| Tenet Healthcare, | | | | | | | | |
| Sr. Notes | | 6.38 | | 12/1/11 | | 70,000 | | 64,050 |
| | | | | | | | | 796,868 |
| Lodging & Entertainment—.2% | | | | | | | | |
| MGM Mirage, | | | | | | | | |
| Gtd. Notes | | 8.50 | | 9/15/10 | | 155,000 | | 161,587 |
| Mohegan Tribal Gaming Authority, | | | | | | | | |
| Sr. Unscd. Notes | | 6.13 | | 2/15/13 | | 20,000 | | 19,650 |
| | | | | | | | | 181,237 |
| Machinery—.1% | | | | | | | | |
| Case New Holland, | | | | | | | | |
| Gtd. Notes | | 7.13 | | 3/1/14 | | 65,000 | | 65,162 |
| Terex, | | | | | | | | |
| Gtd. Notes | | 7.38 | | 1/15/14 | | 60,000 | | 61,050 |
| | | | | | | | | 126,212 |
| Manufacturing—.1% | | | | | | | | |
| Tyco International Group, | | | | | | | | |
| Gtd. Notes | | 6.88 | | 1/15/29 | | 60,000 | | 60,936 |
18
| | | Coupon | | Maturity | | Principal | | |
| Bonds and Notes (continued) | | Rate (%) | | Date | | Amount ($) | | Value ($) |
| |
| |
| |
| |
|
| Media—1.3% | | | | | | | | |
| Comcast, | | | | | | | | |
| Gtd. Notes | | 5.54 | | 7/14/09 | | 450,000 b | | 448,526 |
| Comcast, | | | | | | | | |
| Gtd. Notes | | 6.30 | | 11/15/17 | | 205,000 | | 213,083 |
| News America, | | | | | | | | |
| Gtd. Notes | | 6.15 | | 3/1/37 | | 435,000 | | 421,599 |
| Time Warner, | | | | | | | | |
| Gtd. Notes | | 5.11 | | 11/13/09 | | 290,000 b | | 282,990 |
| | | | | | | | | 1,366,198 |
| Oil & Gas—1.1% | | | | | | | | |
| Anadarko Petroleum, | | | | | | | | |
| Sr. Unscd. Notes | | 5.39 | | 9/15/09 | | 669,000 b | | 658,913 |
| ANR Pipeline, | | | | | | | | |
| Sr. Notes | | 7.00 | | 6/1/25 | | 50,000 | | 55,140 |
| BJ Services, | | | | | | | | |
| Sr. Unscd. Notes | | 5.29 | | 6/1/08 | | 500,000 b | | 500,525 |
| | | | | | | | | 1,214,578 |
| Property & Casualty Insurance—1.1% | | | | | | |
| Allmerica Financial, | | | | | | | | |
| Debs. | | 7.63 | | 10/15/25 | | 75,000 | | 72,844 |
| Chubb, | | | | | | | | |
| Sr. Unscd. Notes | | 5.47 | | 8/16/08 | | 250,000 | | 250,338 |
| Hartford Financial Services Group, | | | | | | |
| Sr. Notes | | 5.66 | | 11/16/08 | | 250,000 | | 252,521 |
| Leucadia National, | | | | | | | | |
| Sr. Unscd. Notes | | 7.13 | | 3/15/17 | | 355,000 | | 330,150 |
| Lincoln National, | | | | | | | | |
| Sr. Unscd. Notes | | 5.21 | | 3/12/10 | | 240,000 b | | 235,815 |
| Phoenix, | | | | | | | | |
| Sr. Unscd. Notes | | 6.68 | | 2/16/08 | | 70,000 | | 70,085 |
| | | | | | | | | 1,211,753 |
| Real Estate Investment Trusts—2.4% | | | | | | |
| Boston Properties, | | | | | | | | |
| Sr. Unscd. Notes | | 5.63 | | 4/15/15 | | 85,000 | | 82,323 |
| Commercial Net Realty, | | | | | | | | |
| Sr. Unscd. Notes | | 6.15 | | 12/15/15 | | 100,000 | | 100,071 |
| Duke Realty, | | | | | | | | |
| Sr. Notes | | 5.88 | | 8/15/12 | | 255,000 | | 257,864 |
The Fund 19
| | STATEMENT OF INVESTMENTS (continued)
|
| | | Coupon | | Maturity | | Principal | | |
| Bonds and Notes (continued) | | Rate (%) | | Date | | Amount ($) | | Value ($) |
| |
| |
| |
| |
|
| Real Estate Investment | | | | | | | | |
| Trusts (continued) | | | | | | | | |
| Duke Realty, | | | | | | | | |
| Sr. Notes | | 6.95 | | 3/15/11 | | 170,000 | | 178,336 |
| ERP Operating, | | | | | | | | |
| Notes | | 4.75 | | 6/15/09 | | 55,000 | | 54,282 |
| ERP Operating, | | | | | | | | |
| Notes | | 5.13 | | 3/15/16 | | 75,000 | | 69,894 |
| Federal Realty Investment Trust, | | | | | | | | |
| Sr. Unscd. Notes | | 5.40 | | 12/1/13 | | 50,000 | | 49,491 |
| Federal Realty Investment Trust, | | | | | | | | |
| Notes | | 6.00 | | 7/15/12 | | 55,000 | | 56,505 |
| Healthcare Realty Trust, | | | | | | | | |
| Sr. Unscd. Notes | | 8.13 | | 5/1/11 | | 225,000 | | 245,831 |
| HRPT Properties Trust, | | | | | | | | |
| Sr. Unscd. Notes | | 5.59 | | 3/16/11 | | 125,000 b | | 120,770 |
| Istar Financial, | | | | | | | | |
| Sr. Unscd. Notes | | 5.50 | | 3/9/10 | | 300,000 b | | 269,155 |
| Liberty Property, | | | | | | | | |
| Sr. Unscd. Notes | | 6.63 | | 10/1/17 | | 360,000 | | 360,837 |
| Mack-Cali Realty, | | | | | | | | |
| Sr. Unscd. Notes | | 5.05 | | 4/15/10 | | 335,000 | | 339,671 |
| Mack-Cali Realty, | | | | | | | | |
| Sr. Unscd. Notes | | 5.13 | | 1/15/15 | | 75,000 | | 73,896 |
| Mack-Cali Realty, | | | | | | | | |
| Notes | | 5.25 | | 1/15/12 | | 55,000 | | 55,823 |
| Regency Centers, | | | | �� | | | | |
| Gtd. Notes | | 5.25 | | 8/1/15 | | 125,000 | | 118,659 |
| Simon Property Group, | | | | | | | | |
| Notes | | 4.60 | | 6/15/10 | | 105,000 | | 104,436 |
| Simon Property Group, | | | | | | | | |
| Notes | | 4.88 | | 8/15/10 | | 75,000 | | 74,371 |
| | | | | | | | | 2,612,215 |
| Residential Mortgage | | | | | | | | |
| Pass-Through Ctfs.—2.3% | | | | | | | | |
| American General Mortgage Loan | | | | | | |
| Trust, Ser. 2006-1, Cl. A1 | | 5.75 | | 12/25/35 | | 45,371 a,b | | 45,107 |
| Banc of America Mortgage | | | | | | | | |
| Securities, Ser. 2004-F, | | | | | | | | |
| Cl. 2A7 | | 4.15 | | 7/25/34 | | 264,621 b | | 262,847 |
20
| | | Coupon | | Maturity | | Principal | | |
| Bonds and Notes (continued) | | Rate (%) | | Date | | Amount ($) | | Value ($) |
| |
| |
| |
| |
|
| Residential Mortgage | | | | | | | | |
| Pass-Through Ctfs. (continued) | | | | | | |
| ChaseFlex Trust, | | | | | | | | |
| Ser. 2006-2, Cl. A1A | | 5.59 | | 9/25/36 | | 38,077 b | | 38,230 |
| Credit Suisse Mortgage Capital | | | | | | | | |
| Certificates, Ser. 2007-1, | | | | | | | | |
| Cl. 1A6A | | 5.86 | | 2/25/37 | | 160,000 b | | 152,377 |
| Impac CMB Trust, | | | | | | | | |
| Ser. 2005-8, Cl. 2M2 | | 5.62 | | 2/25/36 | | 118,563 b | | 87,973 |
| Impac CMB Trust, | | | | | | | | |
| Ser. 2005-8, Cl. 2M3 | | 6.37 | | 2/25/36 | | 87,824 b | | 59,955 |
| Impac Secured Assets CMN Owner | | | | | | |
| Trust, Ser. 2006-1, Cl. 2A1 | | 5.22 | | 5/25/36 | | 64,370 b | | 60,785 |
| IndyMac Index | | | | | | | | |
| Mortgage Loan Trust, | | | | | | | | |
| Ser. 2006-AR25, Cl. 4A2 | | 6.14 | | 9/25/36 | | 90,101 b | | 91,129 |
| J.P. Morgan Alternative Loan | | | | | | | | |
| Trust, Ser. 2006-S4, Cl. A6 | | 5.71 | | 12/25/36 | | 105,000 b | | 97,234 |
| J.P. Morgan Mortgage Trust, | | | | | | | | |
| Ser. 2005-A1, Cl. 5A1 | | 4.48 | | 2/25/35 | | 63,624 b | | 62,068 |
| New Century Alternative Mortgage | | | | | | |
| Loan Trust, Ser. 2006-ALT2, | | | | | | | | |
| Cl. AF6A | | 5.96 | | 10/25/36 | | 70,000 b | | 69,522 |
| Nomura Asset Acceptance, | | | | | | | | |
| Ser. 2005-AP1, Cl. 2A5 | | 4.86 | | 2/25/35 | | 200,000 b | | 188,841 |
| Nomura Asset Acceptance, | | | | | | | | |
| Ser. 2005-AP2, Cl. A5 | | 4.98 | | 5/25/35 | | 150,000 b | | 143,295 |
| Nomura Asset Acceptance, | | | | | | | | |
| Ser. 2005-WF1, Cl. 2A5 | | 5.16 | | 3/25/35 | | 115,000 b | | 106,021 |
| Structured Asset Mortgage | | | | | | | | |
| Investments, Ser. 1998-2, Cl. B | | 5.84 | | 4/30/30 | | 1,670 b | | 1,663 |
| WaMu Mortgage Pass Through | | | | | | | | |
| Certificates, Ser. 2004-AR7, | | | | | | | | |
| Cl. A6 | | 3.94 | | 7/25/34 | | 135,000 b | | 133,488 |
| WaMu Mortgage Pass Through | | | | | | | | |
| Certificates, Ser. 2003-AR10, | | | | | | | | |
| Cl. A6 | | 4.06 | | 10/25/33 | | 203,000 b | | 201,845 |
| WaMu Mortgage Pass Through | | | | | | | | |
| Certificates, Ser. 2004-AR9, | | | | | | | | |
| Cl. A7 | | 4.14 | | 8/25/34 | | 165,000 b | | 163,630 |
The Fund 21
STATEMENT OF INVESTMENTS (continued)
|
| | | Coupon | | Maturity | | Principal | | |
| Bonds and Notes (continued) | | Rate (%) | | Date | | Amount ($) | | Value ($) |
| |
| |
| |
| |
|
| Residential Mortgage | | | | | | | | |
| Pass-Through Ctfs. (continued) | | | | | | | | |
| Wells Fargo Mortgage Backed | | | | | | | | |
| Securities Trust, | | | | | | | | |
| Ser. 2005-AR1, Cl. 1A1 | | 4.54 | | 2/25/35 | | 410,562 b | | 407,837 |
| Wells Fargo Mortgage Backed | | | | | | | | |
| Securities Trust, Ser. 2003-1, | | | | | | | | |
| Cl. 2A9 | | 5.75 | | 2/25/33 | | 150,000 | | 149,054 |
| | | | | | | | | 2,522,901 |
| Retail—.2% | | | | | | | | |
| CVS Caremark, | | | | | | | | |
| Sr. Unscd. Notes | | 5.44 | | 6/1/10 | | 110,000 b | | 108,894 |
| Home Depot, | | | | | | | | |
| Sr. Unscd. Notes | | 5.12 | | 12/16/09 | | 85,000 b | | 83,313 |
| May Department Stores, | | | | | | | | |
| Unscd. Notes | | 4.80 | | 7/15/09 | | 45,000 | | 44,761 |
| | | | | | | | | 236,968 |
| Specialty Steel—.2% | | | | | | | | |
| Steel Dynamics, | | | | | | | | |
| Sr. Notes | | 7.38 | | 11/1/12 | | 175,000 a | | 176,750 |
| State/Territory Gen Oblg—1.9% | | | | | | | | |
| Buckeye Tobacco Settlement | | | | | | | | |
| Financing Authority, Tobacco | | | | | | | | |
| Settlement Asset-Backed Bonds | | 5.13 | | 6/1/24 | | 450,000 | | 426,069 |
| California | | | | | | | | |
| GO (Insured; AMBAC) | | 3.50 | | 10/1/27 | | 75,000 | | 63,587 |
| Erie Tobacco Asset | | | | | | | | |
| Securitization/NY, Tobacco | | | | | | | | |
| Settlement Asset-Backed Bonds | | 6.00 | | 6/1/28 | | 75,000 | | 69,107 |
| Michigan Tobacco Settlement | | | | | | | | |
| Finance Authority, Tobacco | | | | | | | | |
| Settlement Asset-Backed Bonds | | 7.05 | | 6/1/34 | | 100,000 b | | 94,810 |
| Michigan Tobacco Settlement | | | | | | | | |
| Finance Authority, Tobacco | | | | | | | | |
| Settlement Asset-Backed Bonds | | 7.31 | | 6/1/34 | | 410,000 | | 386,265 |
| New York Counties Tobacco Trust | | | | | | | | |
| IV, Tobacco Settlement | | | | | | | | |
| Pass-Through Bonds | | 6.00 | | 6/1/27 | | 160,000 | | 156,234 |
| | | Coupon | | Maturity | | Principal | | |
| Bonds and Notes (continued) | | Rate (%) | | Date | | Amount ($) | | Value ($) |
| |
| |
| |
| |
|
| State/Territory Gen Oblg (continued) | | | | | | |
| Tobacco Settlement Authority of | | | | | | | | |
| Iowa, Tobacco Settlement | | | | | | | | |
| Asset-Backed Bonds | | 6.50 | | 6/1/23 | | 165,000 | | 157,418 |
| Tobacco Settlement Finance | | | | | | | | |
| Authority of West Virginia, | | | | | | | | |
| Tobacco Settlement | | | | | | | | |
| Asset-Backed Bonds | | 7.47 | | 6/1/47 | | 300,000 | | 288,495 |
| Tobacco Settlement Financing | | | | | | | | |
| Corporation of New Jersey, | | | | | | | | |
| Tobacco Settlement | | | | | | | | |
| Asset-Backed Bonds | | 4.50 | | 6/1/23 | | 455,000 | | 418,090 |
| | | | | | | | | 2,060,075 |
| Telecommunications—3.0% | | | | | | | | |
| America Movil, | | | | | | | | |
| Gtd. Notes | | 4.96 | | 6/27/08 | | 45,000 b | | 45,000 |
| AT & T, | | | | | | | | |
| Sr. Unscd. Notes | | 4.96 | | 5/15/08 | | 125,000 b | | 124,895 |
| AT & T, | | | | | | | | |
| Sr. Unscd. Notes | | 4.98 | | 2/5/10 | | 245,000 b | | 242,929 |
| France Telecom, | | | | | | | | |
| Sr. Unsub. Notes | | 7.75 | | 3/1/11 | | 110,000 b | | 118,313 |
| Intelsat Bermuda, | | | | | | | | |
| Sr. Unscd. Notes | | 11.25 | | 6/15/16 | | 105,000 | | 108,937 |
| Intelsat, | | | | | | | | |
| Sr. Unscd. Notes | | 5.25 | | 11/1/08 | | 200,000 | | 198,500 |
| Intelsat, | | | | | | | | |
| Sr. Unscd. Notes | | 7.63 | | 4/15/12 | | 105,000 | | 86,625 |
| Qwest, | | | | | | | | |
| Sr. Unscd. Notes | | 7.50 | | 10/1/14 | | 190,000 | | 193,800 |
| Qwest, | | | | | | | | |
| Sr. Notes | | 7.88 | | 9/1/11 | | 65,000 | | 67,925 |
| Qwest, | | | | | | | | |
| Sr. Notes | | 8.24 | | 6/15/13 | | 100,000 b | | 102,500 |
| Sprint Capital, | | | | | | | | |
| Gtd. Notes | | 6.88 | | 11/15/28 | | 400,000 | | 380,365 |
| Telefonica Emisiones, | | | | | | | | |
| Gtd. Notes | | 5.23 | | 6/19/09 | | 240,000 b | | 238,322 |
The Fund 23
| | STATEMENT OF INVESTMENTS (continued)
|
| | | Coupon | | Maturity | | Principal | | |
| Bonds and Notes (continued) | | Rate (%) | | Date | | Amount ($) | | Value ($) |
| |
| |
| |
| |
|
| Telecommunications (continued) | | | | | | |
| Telefonica Emisiones, | | | | | | | | |
| Gtd. Notes | | 5.98 | | 6/20/11 | | 470,000 | | 483,859 |
| Time Warner Cable, | | | | | | | | |
| Gtd. Notes | | 5.85 | | 5/1/17 | | 150,000 | | 150,638 |
| Time Warner, | | | | | | | | |
| Gtd. Notes | | 5.88 | | 11/15/16 | | 695,000 | | 691,909 |
| U.S. West Communications, | | | | | | | | |
| Notes | | 5.63 | | 11/15/08 | | 70,000 | | 70,000 |
| | | | | | | | | 3,304,517 |
| Textiles & Apparel—.3% | | | | | | | | |
| Mohawk Industries, | | | | | | | | |
| Sr. Unscd. Notes | | 5.75 | | 1/15/11 | | 275,000 | | 282,496 |
| Transportation—.1% | | | | | | | | |
| Ryder System, | | | | | | | | |
| Notes | | 3.50 | | 3/15/09 | | 130,000 | | 128,573 |
| U.S. Government Agencies/ | | | | | | | | |
| Mortgage-Backed—36.5% | | | | | | | | |
| Federal Home Loan Mortgage Corp.: | | | | | | |
| 4.00%, 10/1/09 | | | | | | 74,092 | | 73,266 |
| 4.50%, 10/1/09 | | | | | | 65,297 | | 64,841 |
| 5.00%, 10/1/18 | | | | | | 402,827 | | 403,883 |
| 5.50% | | | | | | 6,895,000 e | | 6,882,693 |
| 5.50%, 11/1/22—12/1/36 | | | | | | 3,519,218 | | 3,540,258 |
| 6.00%, 7/1/17—12/1/37 | | | | | | 6,245,679 | | 6,354,041 |
| Federal National Mortgage Association: | | | | | | |
| 3.53%, 7/1/10 | | | | | | 275,627 | | 270,884 |
| 4.06%, 6/1/13 | | | | | | 100,000 | | 97,512 |
| 5.00%, | | | | | | 195,000 e | | 195,213 |
| 5.00%, 7/1/11—1/1/22 | | | | | | 1,824,240 | | 1,827,988 |
| 5.50%, 8/1/22—1/1/37 | | | | | | 2,236,047 | | 2,250,229 |
| 6.00% | | | | | | 5,240,000 e | | 5,325,967 |
| 6.00%, 9/1/22—12/1/37 | | | | | | 5,561,037 | | 5,658,534 |
| 6.50% | | | | | | 790,000 e | | 812,088 |
| 6.50%, 12/1/31—12/1/37 | | | | | | 2,549,394 | | 2,621,958 |
| 7.00%, 5/1/32—7/1/32 | | | | | | 43,174 | | 45,466 |
| Grantor Trust, | | | | | | | | |
| Ser. 2001-T11, Cl. B, 5.50%, 9/25/11 | | | | 75,000 | | 77,358 |
| Grantor Trust, | | | | | | | | |
| Ser. 2001-T6, Cl. B, 6.09%, 5/25/11 | | | | 275,000 | | 287,546 |
| Government National Mortgage Association I: | | | | | | |
| 6.50%, 9/15/32 | | | | | | 60,481 | | 62,714 |
| 8.00%, 2/15/30—5/15/30 | | | | | | 5,067 | | 5,486 |
24
| | | Principal | | |
| Bonds and Notes (continued) | | Amount ($) | | Value ($) |
| |
| |
|
| U.S. Government Agencies/ | | | | |
| Mortgage-Backed (continued) | | | | |
| Government National Mortgage | | | | |
| Association I (continued): | | | | |
| Ser. 2004-43, Cl. A, 2.82%, 12/16/19 | | 305,574 | | 298,006 |
| Ser. 2003-88, Cl. AC, 2.91%, 6/16/18 | | 180,780 | | 178,295 |
| Ser. 2004-23, Cl. B, 2.95%, 3/16/19 | | 118,261 | | 115,423 |
| Ser. 2004-57, Cl. A, 3.02%, 1/16/19 | | 152,014 | | 148,789 |
| Ser. 2004-97, Cl. AB, 3.08%, 4/16/22 | | 180,861 | | 177,169 |
| Ser. 2007-46, Cl. A, 3.14%, 11/16/29 | | 135,178 | | 132,816 |
| Ser. 2004-9, Cl. A, 3.36%, 8/16/22 | | 65,214 | | 64,020 |
| Ser. 2004-25, Cl. AC, 3.38%, 1/16/23 | | 250,092 | | 245,542 |
| Ser. 2004-77, Cl. A, 3.40%, 3/16/20 | | 102,419 | | 100,933 |
| Ser. 2003-96, Cl. B, 3.61%, 8/16/18 | | 64,571 | | 63,905 |
| Ser. 2004-67, Cl. A, 3.65%, 9/16/17 | | 72,815 | | 71,992 |
| Ser. 2004-108, Cl. A, 4.00%, 5/16/27 | | 109,698 | | 108,270 |
| Ser. 2005-79, Cl. A, 4.00%, 10/16/33 | | 106,490 | | 105,323 |
| Ser. 2005-50, Cl. A, 4.02%, 10/16/26 | | 97,860 | | 96,821 |
| Ser. 2005-29, Cl. A, 4.02%, 7/16/27 | | 150,194 | | 148,323 |
| Ser. 2005-9, Cl. A, 4.03%, 5/16/22 | | 85,397 | | 84,509 |
| Ser. 2005-12, Cl. A, 4.04%, 5/16/21 | | 59,843 | | 59,228 |
| Ser. 2005-42, Cl. A, 4.05%, 7/16/20 | | 132,401 | | 131,095 |
| Ser. 2007-52, Cl. A, 4.05%, 10/16/25 | | 212,784 | | 210,506 |
| Ser. 2005-14, Cl. A, 4.13%, 2/16/27 | | 105,370 | | 104,416 |
| Ser. 2004-51, Cl. A, 4.15%, 2/16/18 | | 146,670 | | 145,356 |
| Ser. 2005-32, Cl. B, 4.39%, 8/16/30 | | 147,923 | | 147,037 |
| | | | | 39,795,699 |
| U.S. Government Securities—25.8% | | | | |
| U.S. Treasury Notes: | | | | |
| 3.88%, 9/15/10 | | 7,780,000 c | | 7,948,367 |
| 4.50%, 4/30/12 | | 15,180,000 c | | 15,861,916 |
| 4.63%, 11/15/16 | | 4,175,000 c | | 4,373,642 |
| | | | | 28,183,925 |
| Total Bonds and Notes | | | | |
| (cost $117,996,590) | | | | 117,699,368 |
| |
| |
|
| |
| Preferred Stocks—.3% | | Shares | | Value ($) |
| |
| |
|
| Banks—.0% | | | | |
| Sovereign Capital Trust IV, | | | | |
| Conv., Cum. $2.1875 | | 1,300 | | 38,350 |
The Fund 25
STATEMENT OF INVESTMENTS (continued)
|
| Preferred Stocks (continued) | | Shares | | Value ($) |
| |
| |
|
| Diversified Financial Services—.2% | | | | |
| AES Trust VII, | | | | |
| Conv., Cum. $3.00 | | 3,450 | | 171,638 |
| Manufacturing—.1% | | | | |
| CIT Group | | 8,500 f | | 160,310 |
| Total Preferred Stocks | | | | |
| (cost $448,979) | | | | 370,298 |
| |
| |
|
| | | Face Amount | | |
| | | Covered by | | |
| Options—.4% | | Contracts ($) | | Value ($) |
| |
| |
|
| Call Options | | | | |
| 3-Month Floor USD Libor-BBA | | | | |
| Interest Rate, October 2009 @ 4 | | 5,090,000 | | 39,242 |
| 3-Month USD Libor-BBA, | | | | |
| Swaption | | 950,000 | | 45,885 |
| 6-Month USD Libor-BBA, | | | | |
| Swaption | | 3,530,000 | | 273,519 |
| U.S. Treasury 5 Year Notes, | | | | |
| January 2008 @ 109.5 | | 9,100,000 | | 102,375 |
| Total Options | | | | |
| (cost $373,648) | | | | 461,021 |
| |
| |
|
| | | Principal | | |
| Short-Term Investments—.4% | | Amount ($) | | Value ($) |
| |
| |
|
| U.S. Treasury Bills; | | | | |
| 3.01%, 3/27/08 | | | | |
| (cost $390,178) | | 393,000 g | | 390,056 |
| |
| |
|
| |
| Other Investment—1.6% | | Shares | | Value ($) |
| |
| |
|
| Registered Investment Company; | | | | |
| Dreyfus Institutional Preferred | | | | |
| Plus Money Market Fund | | | | |
| (cost $1,793,000) | | 1,793,000 h | | 1,793,000 |
| Investment of Cash Collateral | | | | |
| | | for Securities Loaned—25.4% | | Shares | | Value ($) |
| |
| |
| |
|
| Registered Investment Company; | | | | |
| Dreyfus Institutional Cash | | | | | | |
| | | Advantage Plus Fund | | | | | | |
| | | (cost $27,668,329) | | | | 27,668,329 h | | 27,668,329 |
| |
| |
| |
| |
|
| |
| Total Investments (cost $148,670,724) | | 136.1% | | 148,382,072 |
| |
| Liabilities, Less Cash and Receivables | | (36.1%) | | (39,323,866) |
| |
| Net Assets | | | | 100.0% | | 109,058,206 |
| |
| a | | Securities exempt from registration under Rule 144A of the Securities Act of 1933.These securities may be resold in |
| | | transactions exempt from registration, normally to qualified institutional buyers.At December 31, 2007, these |
| | | securities amounted to $8,580,450 or 7.9% of net assets. | | |
| b | | Variable rate security—interest rate subject to periodic change. | | |
| c | | All or a portion of these securities are on loan.At December 31, 2007, the total market value of the fund’s securities |
| | | on loan is $28,388,070 and the total market value of the collateral held by the fund is $29,015,479, consisting of |
| | | cash collateral of $27,668,329 and U.S. Government and Agency securities valued at $1,347,150. |
| d | | Principal amount stated in U.S. Dollars unless otherwise noted. | | |
| | | BRL—Brazilian Real | | | | | | |
| | | EGP—Egyptian Pound | | | | | | |
| | | EUR—Euro | | | | | | |
| | | MXN—Mexican Peso | | | | | | |
| e | | Purchased on a forward commitment basis. | | | | |
| f | | Non-income producing security. | | | | | | |
| g | | All or partially held by a broker as collateral for open financial futures positions. | | |
| h | | Investment in affiliated money market mutual fund. | | | | |
| |
| |
| |
|
| |
| |
| |
| |
| Portfolio Summary (Unaudited) † | | | | |
| |
| | | | | Value (%) | | | | Value (%) |
| |
| |
| |
| |
|
| U.S. Government & Agencies | | 62.3 | | State/Government | | |
| Corporate Bonds | | 29.1 | | General Obligations | | 1.9 |
| Short-Term/Money | | | | Options | | .4 |
| | | Market Investments | | 27.4 | | Preferred Stocks | | .3 |
| Asset/Mortgage-Backed | | 12.4 | | | | |
| Foreign/Governmental | | 2.3 | | | | 136.1 |
| |
| † | | Based on net assets. | | | | | | |
| See notes to financial statements. | | | | | | |
The Fund 27
STATEMENT OF FINANCIAL FUTURES
December 31, 2007
| | | | | Market Value | | | | Unrealized |
| | | | | Covered by | | | | Appreciation |
| | | Contracts | | Contracts ($) | | Expiration | | at 12/31/2007 ($) |
| |
| |
| |
| |
|
| Financial Futures Long | | | | | | | | |
| U.S. Treasury 2 Year Notes | | 15 | | 3,153,750 | | March 2008 | | 5,833 |
| U.S. Treasury 5 Year Notes | | 106 | | 11,689,813 | | March 2008 | | 72,330 |
| U.S. Treasury 10 Year Notes | | 83 | | 9,411,422 | | March 2008 | | 79,018 |
| U.S. Treasury 30 Year Notes | | 7 | | 814,625 | | March 2008 | | 1,157 |
| | | | | | | | | 158,338 |
See notes to financial statements.
|
STATEMENT OF OPTIONS WRITTEN
December 31, 2007
| | | Face Amount | | |
| | | Covered by | | |
| | | Contracts ($) | | Value ($) |
| |
| |
|
| Call Options | | | | |
| U.S. Treasury 5 Year Notes | | 9,100,000 | | (55,453) |
| January 2008 @ 110.5 | | | | |
| Put Options | | | | |
| U.S. Treasury 5 Year Notes | | | | |
| January 2008 @ 108.5 | | 9,100,000 | | (11,375) |
| (Premiums received $73,532) | | (66,828) |
See notes to financial statements.
|
STATEMENT OF ASSETS AND LIABILITIES
December 31, 2007
| | | | | | | Cost | | Value |
| |
| |
| |
| |
|
| Assets ($): | | | | | | | | |
| Investments in securities—See Statement of Investments | | | | |
| (including securities on loan, valued at $28,388,070)—Note 1(c): | | |
| Unaffiliated issuers | | | | | | 119,209,395 | | 118,920,743 |
| Affiliated issuers | | | | | | 29,461,329 | | 29,461,329 |
| Cash | | | | | | | | 93,905 |
| Cash denominated in foreign currencies | | | | 21,668 | | 21,692 |
| Receivable for investment securities sold | | | | | | 12,044,573 |
| Receivable for shares of Beneficial Interest subscribed | | | | 1,896,827 |
| Dividends and interest receivable | | | | | | | | 903,304 |
| Unrealized appreciation on swap contracts—Note 4 | | | | 175,976 |
| Swaps premium paid | | | | | | | | 150,639 |
| Receivable for futures variation margin—Note 4 | | | | | | 84,485 |
| Receivable from broker for swap transactions—Note 4 | | | | 23,974 |
| Unrealized appreciation on forward currency exchange contracts—Note 4 | | 3,091 |
| | | | | | | | | 163,780,538 |
| |
| |
| |
| |
|
| Liabilities ($): | | | | | | | | |
| Due to The Dreyfus Corporation and affiliates—Note 3(b) | | | | 93,167 |
| Liability for securities on loan—Note 1(c) | | | | | | 27,668,329 |
| Payable for open mortgage backed dollar rolls | | | | | | 23,180,320 |
| Payable for investment securities purchased | | | | | | 3,206,416 |
| Unrealized depreciation on swap contracts—Note 4 | | | | 446,101 |
| Outstanding options written, at value (premiums received | | | | |
| $73,532)—See Statement of Options Written—Note 4 | | | | 66,828 |
| Payable for shares of Beneficial Interest redeemed | | | | 56,117 |
| Payable to broker from swap transactions—Note 4 | | | | 3,507 |
| Unrealized depreciation on forward currency exchange contracts—Note 4 | | 1,547 |
| | | | | | | | | 54,722,332 |
| |
| |
| |
| |
|
| Net Assets ($) | | | | | | | | 109,058,206 |
| |
| |
| |
| |
|
| Composition of Net Assets ($): | | | | | | |
| Paid-in capital | | | | | | | | 113,072,431 |
| Accumulated undistributed investment income—net | | | | 100,784 |
| Accumulated net realized gain (loss) on investments | | | | (3,723,637) |
| Accumulated net unrealized appreciation (depreciation) on investments, | | |
| options transactions, swap transactions and foreign currency transactions | | |
| (including $158,338 net unrealized appreciation on financial futures) | | (391,372) |
| |
|
| Net Assets ($) | | | | | | | | 109,058,206 |
| |
| |
| |
| |
|
| |
| |
| Net Asset Value Per Share | | | | | | |
| | | Class A | | Class B | | Class C | | Class I |
| |
| |
| |
| |
|
| Net Assets ($) | | 87,380,936 | | 2,387,493 | | 16,803,824 | | 2,485,953 |
| Shares Outstanding | | 8,168,692 | | 223,216 | | 1,569,656 | | 232,635 |
| |
| |
| |
| |
|
| Net Asset Value Per Share ($) | | 10.70 | | 10.70 | | 10.71 | | 10.69 |
| See notes to financial statements. | | | | | | The Fund 29 |
STATEMENT OF OPERATIONS
Year Ended December 31, 2007
|
| Investment Income ($): | | |
| Income: | | |
| Interest | | 3,766,641 |
| Cash dividends: | | |
| Unaffiliated issuers | | 15,313 |
| Affiliated issuers | | 67,875 |
| Income from securities lending | | 42,686 |
| Total Income | | 3,892,515 |
| Expenses: | | |
| Management fee—Note 3(a) | | 495,841 |
| Distribution and serivce fees—Note 3(b) | | 234,421 |
| Directors’ fees—Note 3(a) | | 7,857 |
| Loan commitment fees—Note 2 | | 583 |
| Total Expenses | | 738,702 |
| Less—Directors fees reimbursed by the Manager | | (7,857) |
| Net Expenses | | 730,845 |
| Investment Income-Net | | 3,161,670 |
| |
|
| Realized and Unrealized Gain (Loss) on Investments—Note 4 ($): |
| Net realized gain (loss) on investments and foreign currency transcations | | 1,131,642 |
| Net realized gain (loss) on options transactions | | 3,267 |
| Net realized gain (loss) on financial futures | | 56,626 |
| Net realized gain (loss) on swap transactions | | 50,989 |
| Net realized gain (loss) on forward currency exchange contracts | | 47,190 |
| Net Realized Gain (Loss) | | 1,289,714 |
| Net unrealized appreciation (depreciation) on investments, | | |
| forward currency exchange contracts, foreign currency | | |
| transaction, options and swap transactions (including | | |
| $130,894 net unrealized appreciation on financial futures) | | (536,579) |
| Net Realized and Unrealized Gain (Loss) on Investments | | 753,135 |
| Net Increase in Net Assets Resulting from Operations | | 3,914,805 |
See notes to financial statements.
|
STATEMENT OF CHANGES IN NET ASSETS
| | | Year Ended December 31, |
| |
|
| | | 2007a | | 2006 |
| |
| |
|
| Operations ($): | | | | |
| Investment income—net | | 3,161,670 | | 2,198,873 |
| Net realized gain (loss) on investments | | 1,289,714 | | (190,028) |
| Net unrealized appreciation | | | | |
| (depreciation) on investments | | (536,579) | | 434,034 |
| Net Increase (Decrease) in Net Assets | | | | |
| Resulting from Operations | | 3,914,805 | | 2,442,879 |
| |
| |
|
| Dividends to Shareholders from ($): | | | | |
| Investment income—net: | | | | |
| Class A shares | | (2,876,707) | | (2,033,770) |
| Class B shares | | (100,785) | | (129,603) |
| Class C shares | | (225,635) | | (69,336) |
| Class I shares | | (102,455) | | (84,536) |
| Net realized gain on investments: | | | | |
| Class A shares | | (48,213) | | — |
| Class B shares | | (1,335) | | — |
| Class C shares | | (8,877) | | — |
| Class I shares | | (1,390) | | — |
| Total Dividends | | (3,365,397) | | (2,317,245) |
| |
| |
|
| Beneficial Interest Transactions ($): | | | | |
| Net proceeds from shares sold: | | | | |
| Class A shares | | 50,085,831 | | 12,417,172 |
| Class B shares | | 983,072 | | 667,285 |
| Class C shares | | 15,662,545 | | 1,285,514 |
| Class I shares | | 611,994 | | 595,821 |
| Dividends reinvested: | | | | |
| Class A shares | | 2,420,270 | | 1,705,392 |
| Class B shares | | 74,967 | | 97,660 |
| Class C shares | | 170,866 | | 29,617 |
| Class I shares | | 88,620 | | 66,131 |
| Cost of shares redeemed: | | | | |
| Class A shares | | (12,808,421) | | (10,912,615) |
| Class B shares | | (1,452,767) | | (2,022,593) |
| Class C shares | | (1,231,767) | | (887,977) |
| Class I shares | | (370,014) | | (319,730) |
| Increase (Decrease) in Net Assets | | | | |
| from Beneficial Interest Transactions | | 54,235,196 | | 2,721,677 |
| Total Increase (Decrease) in Net Assets | | 54,784,604 | | 2,847,311 |
| |
| |
|
| Net Assets ($): | | | | |
| Beginning of Period | | 54,273,602 | | 51,426,291 |
| End of Period | | 109,058,206 | | 54,273,602 |
| Undistributed (distributions in | | | | |
| excess of) investment income—net | | 100,784 | | (72,636) |
The Fund 31
STATEMENT OF CHANGES IN NET ASSETS (continued)
|
| | | | | Year Ended December 31, |
| | | |
|
| | | | | 2007a | | 2006 |
| |
| |
| |
|
| Capital Share Transactions: | | | | |
| Class Ab | | | | |
| Shares sold | | 4,718,997 | | 1,178,484 |
| Shares issued for dividends reinvested | | 227,431 | | 161,611 |
| Shares redeemed | | (1,205,914) | | (1,033,981) |
| Net Increase (Decrease) in Shares Outstanding | | 3,740,514 | | 306,114 |
| |
| |
|
| Class B b | | | | |
| Shares sold | | 92,637 | | 63,406 |
| Shares issued for dividends reinvested | | 7,043 | | 9,261 |
| Shares redeemed | | (136,389) | | (192,381) |
| Net Increase (Decrease) in Shares Outstanding | | (36,709) | | (119,714) |
| |
| |
|
| Class C | | | | |
| Shares sold | | 1,473,210 | | 121,979 |
| Shares issued for dividends reinvested | | 16,026 | | 2,803 |
| Shares redeemed | | (115,929) | | (83,950) |
| Net Increase (Decrease) in Shares Outstanding | | 1,373,307 | | 40,832 |
| |
| |
|
| Class I | | | | |
| Shares sold | | 57,330 | | 55,827 |
| Shares issued for dividends reinvested | | 8,336 | | 6,271 |
| Shares redeemed | | (34,774) | | (30,267) |
| Net Increase (Decrease) in Shares Outstanding | | 30,892 | | 31,831 |
| a | | Effective June 1, 2007, Class R shares were redesignated as Class I shares. | | |
| b | | During the period ended December 31, 2007, 51,873 Class B shares representing $554,821 were automatically |
| | | converted to 51,868 Class A shares and during the period ended December 31, 2006, 97,534 Class B shares |
| | | representing $1,024,145 were automatically converted to 97,513 Class A shares. | | |
| See notes to financial statements. | | | | |
The following tables describe the performance for each share class for the fiscal periods indicated.All information (except portfolio turnover rate) reflects financial results for a single fund share.Total return shows how much your investment in the fund would have increased (or decreased) during each period, assuming you had reinvested all dividends and distributions.These figures have been derived from the fund’s financial statements.
| | | | | Year Ended December 31, | | |
| |
| |
| |
|
| Class A Shares | | 2007 | | 2006 | | 2005 | | 2004a | | 2003 |
| |
| |
| |
| |
| |
|
| Per Share Data ($): | | | | | | | | | | |
| Net asset value, beginning of period | | 10.67 | | 10.65 | | 10.94 | | 10.90 | | 10.75 |
| Investment Operations: | | | | | | | | | | |
| Investment income—net b | | .48 | | .47 | | .40 | | .37 | | .33 |
| Net realized and unrealized | | | | | | | | | | |
| gain (loss) on investments | | .07 | | .04 | | (.13) | | .18 | | .26 |
| Total from Investment Operations | | .55 | | .51 | | .27 | | .55 | | .59 |
| Distributions: | | | | | | | | | | |
| Dividends from investment income—net | | (.51) | | (.49) | | (.48) | | (.47) | | (.39) |
| Dividends from net realized | | | | | | | | | | |
| gain on investments | | (.01) | | — | | (.08) | | (.04) | | (.05) |
| Total Distributions | | (.52) | | (.49) | | (.56) | | (.51) | | (.44) |
| Net asset value, end of period | | 10.70 | | 10.67 | | 10.65 | | 10.94 | | 10.90 |
| |
| |
| |
| |
| |
|
| Total Return (%) c | | 5.55 | | 4.67 | | 2.50 | | 5.15 | | 5.51 |
| |
| |
| |
| |
| |
|
| Ratios/Supplemental Data (%): | | | | | | | | | | |
| Ratio of total expenses | | | | | | | | | | |
| to average net assets | | .96 | | .95 | | .95 | | .95 | | .95 |
| Ratio of net expenses | | | | | | | | | | |
| to average net assets d | | .95 | | .95 | | .95 | | .95 | | .95 |
| Ratio of net investment income | | | | | | | | | | |
| to average net assets | | 4.56 | | 4.43 | | 3.72 | | 3.38 | | 3.06 |
| Portfolio Turnover Rate | | 486.15e | | 422.95e | | 345.82e | | 315.33e | | 469.41e |
| |
| |
| |
| |
| |
|
| Net Assets, end of period ($ x 1,000) | | 87,381 | | 47,253 | | 43,915 | | 43,466 | | 43,811 |
| a As of January 1, 2004, the fund has adopted the method of accounting for interim payments on swap contracts in |
| accordance with Financial Accounting Standards Board Statement No. 133.These interim payments are reflected |
| within net realized and unrealized gain (loss) on swap contracts, however, prior to January 1, 2004, these interim |
| payments were reflected within interest income/expense in the Statement of Operations.The effect of these changes for |
| the fiscal year ended December 31, 2004, was to decrease net investment income per share by $.02, increase net |
| realized and unrealized gain (loss) on investments per share by $.02 and decrease the ratio of net investment income |
| to average net assets from 3.52% to 3.38%. |
| b Based on average shares outstanding at each month end. |
| c Exclusive of sales charge. |
| d The differences for periods represents less than .01%. |
| e The portfolio turnover rates excluding mortgage dollar roll transactions for the years ended December 31, 2007, |
| 2006, 2005, 2004 and 2003 were 330.38%, 334.24%, 198.52%, 189.68% and 272.57%, respectively. |
See notes to financial statements.
The Fund 33
| | FINANCIAL HIGHLIGHTS (continued)
|
| | | | | Year Ended December 31, | | |
| |
| |
| |
|
| Class B Shares | | 2007 | | 2006 | | 2005 | | 2004a | | 2003 |
| |
| |
| |
| |
| |
|
| Per Share Data ($): | | | | | | | | | | |
| Net asset value, beginning of period | | 10.67 | | 10.65 | | 10.93 | | 10.90 | | 10.75 |
| Investment Operations: | | | | | | | | | | |
| Investment income—net b | | .40 | | .38 | | .32 | | .30 | | .25 |
| Net realized and unrealized | | | | | | | | | | |
| gain (loss) on investments | | .07 | | .05 | | (.12) | | .16 | | .25 |
| Total from Investment Operations | | .47 | | .43 | | .20 | | .46 | | .50 |
| Distributions: | | | | | | | | | | |
| Dividends from investment income—net | | (.43) | | (.41) | | (.40) | | (.39) | | (.30) |
| Dividends from net realized | | | | | | | | | | |
| gain on investments | | (.01) | | — | | (.08) | | (.04) | | (.05) |
| Total Distributions | | (.44) | | (.41) | | (.48) | | (.43) | | (.35) |
| Net asset value, end of period | | 10.70 | | 10.67 | | 10.65 | | 10.93 | | 10.90 |
| |
| |
| |
| |
| |
|
| Total Return (%) c | | 4.68 | | 3.90 | | 1.84 | | 4.27 | | 4.73 |
| |
| |
| |
| |
| |
|
| Ratios/Supplemental Data (%): | | | | | | | | | | |
| Ratio of total expenses | | | | | | | | | | |
| to average net assets | | 1.71 | | 1.70 | | 1.70 | | 1.70 | | 1.70 |
| Ratio of net expenses | | | | | | | | | | |
| to average net assets d | | 1.70 | | 1.70 | | 1.70 | | 1.70 | | 1.70 |
| Ratio of net investment income | | | | | | | | | | |
| to average net assets | | 3.85 | | 3.68 | | 2.99 | | 2.77 | | 2.31 |
| Portfolio Turnover Rate | | 486.15e | | 422.95e | | 345.82e | | 315.33e | | 469.41e |
| |
| |
| |
| |
| |
|
| Net Assets, end of period ($ x 1,000) | | 2,387 | | 2,773 | | 4,044 | | 6,537 | | 10,309 |
| a As of January 1, 2004, the fund has adopted the method of accounting for interim payments on swap contracts in |
| accordance with Financial Accounting Standards Board Statement No. 133.These interim payments are reflected |
| within net realized and unrealized gain (loss) on swap contracts, however, prior to January 1, 2004, these interim |
| payments were reflected within interest income/expense in the Statement of Operations.The effect of these changes for |
| the fiscal year ended December 31, 2004, was to decrease net investment income per share by $.01, increase net |
| realized and unrealized gain (loss) on investments per share by $.01 and decrease the ratio of net investment income |
| to average net assets from 2.88% to 2.77%. |
| b Based on average shares outstanding at each month end. |
| c Exclusive of sales charge. |
| d The differences for periods represents less than .01%. |
| e The portfolio turnover rates excluding mortgage dollar roll transactions for the years ended December 31, 2007, |
| 2006, 2005, 2004 and 2003 were 330.38%, 334.24%, 198.52%, 189.68% and 272.57%, respectively. |
See notes to financial statements.
34
|
| | | | | Year Ended December 31, | | |
| |
| |
| |
|
| Class C Shares | | 2007 | | 2006 | | 2005 | | 2004a | | 2003 |
| |
| |
| |
| |
| |
|
| Per Share Data ($): | | | | | | | | | | |
| Net asset value, beginning of period | | 10.68 | | 10.66 | | 10.94 | | 10.91 | | 10.76 |
| Investment Operations: | | | | | | | | | | |
| Investment income—net b | | .37 | | .39 | | .32 | | .29 | | .25 |
| Net realized and unrealized gain | | | | | | | | | | |
| (loss) on investments | | .10 | | .04 | | (.12) | | .17 | | .25 |
| Total from Investment Operations | | .47 | | .43 | | .20 | | .46 | | .50 |
| Distributions: | | | | | | | | | | |
| Dividends from investment income—net | | (.43) | | (.41) | | (.40) | | (.39) | | (.30) |
| Dividends from net realized | | | | | | | | | | |
| gain on investments | | (.01) | | — | | (.08) | | (.04) | | (.05) |
| Total Distributions | | (.44) | | (.41) | | (.48) | | (.43) | | (.35) |
| Net asset value, end of period | | 10.71 | | 10.68 | | 10.66 | | 10.94 | | 10.91 |
| |
| |
| |
| |
| |
|
| Total Return (%) c | | 4.64 | | 3.89 | | 1.83 | | 4.28 | | 4.73 |
| |
| |
| |
| |
| |
|
| Ratios/Supplemental Data (%): | | | | | | | | | | |
| Ratio of total expenses | | | | | | | | | | |
| to average net assets | | 1.72 | | 1.70 | | 1.70 | | 1.70 | | 1.70 |
| Ratio of net expenses | | | | | | | | | | |
| to average net assets d | | 1.70 | | 1.70 | | 1.70 | | 1.70 | | 1.70 |
| Ratio of net investment income | | | | | | | | | | |
| to average net assets | | 3.67 | | 3.67 | | 2.98 | | 2.66 | | 2.31 |
| Portfolio Turnover Rate | | 486.15e | | 422.95e | | 345.82e | | 315.33e | | 469.41e |
| |
| |
| |
| |
| |
|
| Net Assets, end of period ($ x 1,000) | | 16,804 | | 2,097 | | 1,658 | | 1,598 | | 1,692 |
As of January 1, 2004, the fund has adopted the method of accounting for interim payments on swap contracts in accordance with Financial Accounting Standards Board Statement No. 133.These interim payments are reflected within net realized and unrealized gain (loss) on swap contracts, however, prior to January 1, 2004, these interim payments were reflected within interest income/expense in the Statement of Operations.The effect of these changes for the fiscal year ended December 31, 2004, was to decrease net investment income per share by $.01, increase net realized and unrealized gain (loss) on investments per share by $.01 and decrease the ratio of net investment income to average net assets from 2.80% to 2.66% .
Based on average shares outstanding at each month end. Exclusive of sales charge.
The differences for periods represents less than .01%.
The portfolio turnover rates excluding mortgage dollar roll transactions for the years ended December 31, 2007, 2006, 2005, 2004 and 2003 were 330.38%, 334.24%, 198.52%, 189.68% and 272.57%, respectively.
See notes to financial statements.
The Fund 35
| | FINANCIAL HIGHLIGHTS (continued)
|
| | | | | Year Ended December 31, | | |
| |
| |
| |
|
| Class I Shares | | 2007a | | 2006 | | 2005 | | 2004b | | 2003 |
| |
| |
| |
| |
| |
|
| Per Share Data ($): | | | | | | | | | | |
| Net asset value, beginning of period | | 10.66 | | 10.64 | | 10.93 | | 10.89 | | 10.74 |
| Investment Operations: | | | | | | | | | | |
| Investment income—net c | | .51 | | .49 | | .43 | | .39 | | .37 |
| Net realized and unrealized | | | | | | | | | | |
| gain (loss) on investments | | .07 | | .05 | | (.13) | | .19 | | .24 |
| Total from Investment Operations | | .58 | | .54 | | .30 | | .58 | | .61 |
| Distributions: | | | | | | | | | | |
| Dividends from investment income—net | | (.54) | | (.52) | | (.51) | | (.50) | | (.41) |
| Dividends from net realized | | | | | | | | | | |
| gain on investments | | (.01) | | — | | (.08) | | (.04) | | (.05) |
| Total Distributions | | (.55) | | (.52) | | (.59) | | (.54) | | (.46) |
| Net asset value, end of period | | 10.69 | | 10.66 | | 10.64 | | 10.93 | | 10.89 |
| |
| |
| |
| |
| |
|
| Total Return (%) | | 5.72 | | 4.93 | | 2.76 | | 5.43 | | 5.78 |
| |
| |
| |
| |
| |
|
| Ratios/Supplemental Data (%): | | | | | | | | | | |
| Ratio of total expenses | | | | | | | | | | |
| to average net assets | | .71 | | .70 | | .70 | | .70 | | .70 |
| Ratio of net expenses | | | | | | | | | | |
| to average net assets d | | .70 | | .70 | | .70 | | .70 | | .70 |
| Ratio of net investment income | | | | | | | | | | |
| to average net assets | | 4.83 | | 4.68 | | 3.97 | | 3.61 | | 3.70 |
| Portfolio Turnover Rate | | 486.15e | | 422.95e | | 345.82e | | 315.33e | | 469.41e |
| |
| |
| |
| |
| |
|
| Net Assets, end of period ($ x 1,000) | | 2,486 | | 2,151 | | 1,809 | | 1,926 | | 2,202 |
| a Effective June 1, 2007, Class R shares were redesignated as Class I share. |
| b As of January 1, 2004, the fund has adopted the method of accounting for interim payments on swap contracts in |
| accordance with Financial Accounting Standards Board Statement No. 133.These interim payments are reflected |
| within net realized and unrealized gain (loss) on swap contracts, however, prior to January 1, 2004, these interim |
| payments were reflected within interest income/expense in the Statement of Operations.The effect of these changes for |
| the fiscal year ended December 31, 2004, was to decrease net investment income per share by $.02, increase net |
| realized and unrealized gain (loss) on investments per share by $.02 and decrease the ratio of net investment income |
| to average net assets from 3.74% to 3.61%. |
| c Based on average shares outstanding at each month end. |
| d The differences for periods represents less than .01%. |
| e The portfolio turnover rates excluding mortgage dollar roll transactions for the years ended December 31, 2007, |
| 2006, 2005, 2004 and 2003 were 330.38%, 334.24%, 198.52%, 189.68% and 272.57%, respectively. |
See notes to financial statements.
36
|
NOTES TO FINANCIAL STATEMENTS
NOTE 1 - Significant Accounting Policies:
Dreyfus Premier Managed Income Fund (the “fund”) is a separate diversified series of The Dreyfus/Laurel Funds Trust (the “Trust”), which is registered under the Investment Company Act of 1940, as amended (the “Act”), as an open-end management investment company and operates as a series company offering eight series, including the fund, as of the date of this report.The fund’s investment objective is to seek high current income consistent with what is believed to be prudent risk of capital primarily through investments in investment-grade corporate and U.S. Government obligations which primarily have maturities of 10 years or less. The Dreyfus Corporation (the “Manager” or “Dreyfus”) serves as the fund’s investment advisor.
On July 1, 2007, Mellon Financial Corporation and The Bank of New York Company, Inc. merged, forming The Bank of New York Mellon Corporation (“BNY Mellon”). As part of this transaction, Dreyfus became a wholly-owned subsidiary of BNY Mellon.
The fund’s Board of Trustees approved the redesignation of the fund’s Class R shares as Class I shares, effective June 1, 2007. The eligibility requirements for Class I shares remained the same as for Class R shares.
MBSC Securities Corporation (the “Distributor”), a wholly-owned subsidiary of the Manager, is the distributor of the fund’s shares. The fund is authorized to issue an unlimited number of shares of Beneficial Interest in the following classes of shares: Class A, Class B, Class C and Class I. Class A, Class B and Class C shares are sold primarily to retail investors through financial intermediaries and bear a distribution fee and/or service fee. Class A shares are sold with a front-end sales charge, while Class B and Class C shares are subject to a contingent deferred sales charge (“CDSC”). Class B shares automatically convert to Class A shares after six years.The fund does not offer Class B shares, except in connection with dividend reinvestment and permitted exchanges of Class B shares. Class I shares are sold primarily to bank trust departments and other financial service providers (including Mellon Bank,
The Fund 37
NOTES TO FINANCIAL STATEMENTS (continued)
|
N.A. and its affiliates) acting on behalf of customers having a qualified trust or investment account or relationship at such institution, and bear no distribution fee or service fee. Class I shares are offered without a front-end sales charge or CDSC. Each class of shares has identical rights and privileges, except with respect to distribution fees and voting rights on matters affecting a single class. Income, expenses (other than expenses attributable to a specific class), and realized and unrealized gains or losses on investments are allocated to each class of shares based on its relative net assets.
The fund’s financial statements are prepared in accordance with U.S. generally accepted accounting principles, which may require the use of management estimates and assumptions. Actual results could differ from those estimates.
(a) Portfolio valuation: Investments in securities (excluding short-term investments other than U.S. Treasury Bills), financial futures, options, swaps and forward currency exchange contracts are valued each business day by an independent pricing service (the “Service”) approved by the Board of Trustees. Investments for which quoted bid prices are readily available and are representative of the bid side of the market in the judgment of the Service are valued at the mean between the quoted bid prices (as obtained by the Service from dealers in such securities) and asked prices (as calculated by the Service based upon its evaluation of the market for such securities). Other investments (which constitute a majority of the portfolio securities) are valued as determined by the Service, based on methods which include consideration of: yields or prices of securities of comparable quality, coupon, maturity and type; indications as to values from dealers; and general market conditions. Restricted securities, as well as securities or other assets for which recent market quotations are not readily available and are not valued by a pricing service approved by the Board of Trustees, or are determined by the fund not to reflect accurately fair value, are valued at fair value as determined in good faith under the direction of the Board of Trustees. The factors that may be considered when fair valuing a security include fundamental analytical data, the nature and
duration of restrictions on disposition, an evaluation of the forces that influence the market in which the securities are purchased and sold and public trading in similar securities of the issuer or comparable issuers. Short-term investments, excluding U.S.Treasury Bills, are carried at amortized cost, which approximates fair value. Registered open-end investment companies that are not traded on an exchange are valued at their net asset value. Financial futures and options, which are traded on an exchange, are valued at the last sales price on the securities exchange on which such securities are primarily traded or at the last sales price on the national securities market on each business day. Options traded over-the-counter are priced at the mean between the bid and asked prices. Investments denominated in foreign currencies are translated to U.S. dollars at the prevailing rates of exchange. Forward currency exchange contracts are valued at the forward rate. Investments in swap transactions are valued each business day by a pricing service approved by the Board of Trustees. Swaps are valued by the service by using a swap pricing model which incorporates among other factors, default probabilities, recovery rates, credit curves of the underlying issuer and swap spreads on interest rates.
The Financial Accounting Standards Board (“FASB”) released Statement of Financial Accounting Standards No. 157 “Fair Value Measurements” (“FAS 157”). FAS 157 establishes an authoritative definition of fair value, sets out a framework for measuring fair value, and requires additional disclosures about fair-value measurements. The application of FAS 157 is required for fiscal years beginning after November 15, 2007 and interim periods within those fiscal years. Management does not believe that the application of this standard will have a material impact on the financial statements of the fund.
(b) Foreign currency transactions: The fund does not isolate that portion of the results of operations resulting from changes in foreign exchange rates on investments from the fluctuations arising from changes in the market prices of securities held. Such fluctuations are included with the net realized and unrealized gains or losses on investments.
The Fund 39
NOTES TO FINANCIAL STATEMENTS (continued)
|
Net realized foreign exchange gains or losses arise from sales and maturities of short-term securities, sales of foreign currencies, currency gains or losses realized on securities transactions and the difference between the amount of dividends, interest and foreign withholding taxes recorded on the fund’s books and the U.S. dollar equivalent of the amounts actually received or paid. Net unrealized foreign exchange gains and losses arise from changes in the value of assets and liabilities other than investments in securities, resulting from changes in exchange rates. Such gains and losses are included with net realized and unrealized gains or losses on investments.
(c) Securities transactions and investment income: Securities transactions are recorded on a trade date basis. Realized gains and losses from securities transactions are recorded on the identified cost basis. Dividend income is recorded on the ex-dividend date and interest income, including, where applicable, accretion of discount and amortization of premium on investments, is recognized on the accrual basis.
Pursuant to a securities lending agreement with Mellon Bank, N.A. (“Mellon Bank”), an affiliate of the Manager, the fund may lend securities to qualified institutions. It is the fund’s policy, that at origination, all loans are secured by collateral of at least 102% of the value of U.S. securities loaned and 105% of the value of foreign securities loaned. Collateral equivalent to at least 100% of the market value of securities on loan is maintained at all times. Collateral is either in the form of cash, which can be invested in certain money market mutual funds managed by the Manager, U.S. Government and Agency securities or Letters of Credit. The fund is entitled to receive all income on securities loaned, in addition to income earned as a result of the lending transaction. Although each security loaned is fully collateralized, the fund bears the risk of delay in recovery of, or loss of rights in, the securities loaned should a borrower fail to return the securities in a timely manner. During the period ended December 31, 2007, Mellon Bank earned $22,985, from lending fund portfolio securities, pursuant to the securities lending agreement.
(d) Affiliated issuers: Investments in other investment companies advised by the Manager are defined as “affiliated” in the Act.
(e) Concentration of Risk: The fund invests primarily in debt securities. Failure of an issuer of the debt securities to make timely interest or principal payments, or a decline or the perception of a decline in the credit quality of a debt security, can cause the debt security’s price to fall, potentially lowering the fund’s share price. In addition the value of debt securities may decline due to general market conditions that are not specifically related to a particular company, such as real or perceived adverse economic conditions, changes in outlook for corporate earnings, changes in interest or currency rates or adverse investor sentiment.They may also decline because of factors that affect a particular industry.
(f) Dividends to shareholders: It is the policy of the fund to declare dividends daily from investment income-net. Such dividends are paid monthly. Dividends from net realized capital gains, if any, are normally declared and paid annually, but the fund may make distributions on a more frequent basis to comply with the distribution requirements of the Internal Revenue Code of 1986, as amended (the “Code”).To the extent that net realized capital gains can be offset by capital loss carryovers, it is the policy of the fund not to distribute such gains.
(g) Federal income taxes: It is the policy of the fund to continue to qualify as a regulated investment company, if such qualification is in the best interests of its shareholders, by complying with the applicable provisions of the Code, and to make distributions of taxable income sufficient to relieve it from substantially all federal income and excise taxes.
During the current year, the fund adopted FASB Interpretation No. 48 “Accounting for Uncertainty in Income Taxes” (“FIN 48”). FIN 48 provides guidance for how uncertain tax positions should be recognized, measured, presented and disclosed in the financial statements. FIN 48 requires the evaluation of tax positions taken or expected to be taken in the course of preparing the portfolio’s tax returns to determine whether the tax positions are “more-likely-than-not” of being sustained by the
The Fund 41
NOTES TO FINANCIAL STATEMENTS (continued)
|
applicable tax authority. Tax positions not deemed to meet the more-likely-than-not threshold would be recorded as a tax benefit or expense in the current year.The adoption of FIN 48 had no impact on the operations of the fund for the period ended December 31, 2007.
The fund is not subject to examinations by U.S. Federal, State and City tax authorities for the tax years before 2004.
At December 31, 2007, the components of accumulated earnings on a tax basis were as follows: undistributed ordinary income $142,243, accumulated capital losses $3,120,506 and unrealized depreciation $1,035,962.
The accumulated capital loss carryover is available to be applied against future net securities profits, if any, realized subsequent to December 31, 2007. If not applied, $2,840,637 of the carryover expires in fiscal 2008 and $279,869 expires in fiscal 2014.
The tax characters of distributions paid to shareholders during the fiscal periods ended December 31, 2007 and December 31, 2006, were as follows: ordinary income $3,365,397 and $2,317,245, respectively.
During the period ended December 31, 2007, as a result of permanent book to tax differences, primarily due to the tax treatment for amortization of premiums, treasury inflation protected securities, paydown gains and losses, swap periodic payments, foreign currency transactions and expiration of captial loss carryover, the fund increased accumulated undistributed investment income-net by $317,332, increased net realized gain (loss) on investments by $2,744,917 and decreased paid-in capital by $3,062,249. Net assets and net asset value per share were not affected by this reclassification.
NOTE 2—Bank Line of Credit:
|
The fund participates with other Dreyfus-managed funds in a $350 million redemption credit facility (the “Facility”) to be utilized for temporary or emergency purposes, including the financing of redemptions. In connection therewith, the fund has agreed to pay commit-
ment fees on its pro rata portion of the Facility. Interest is charged to the fund based on prevailing market rates in effect at the time of borrowing. During the period ended December 31, 2007, the fund did not borrow under the Facility.
NOTE 3—Investment Management Fee and Other Transactions With Affiliates:
(a) Pursuant to an Investment Management agreement with the Manager, the Manager provides or arranges for one or more third parties and/or affiliates to provide investment advisory, administrative, custody, fund accounting and transfer agency services to the fund.The Manager also directs the investments of the fund in accordance with its investment objective, policies and limitations. For these services, the fund is contractually obligated to pay the Manager a fee, calculated daily and paid monthly, at the annual rate of .70% of the value of the fund’s average daily net assets. Out of its fee, the Manager pays all of the expenses of the fund except brokerage fees, taxes, interest, commitment fees, Rule 12b-1 distribution fees and expenses, service fees and expenses of non-interested Trustees (including counsel fees) and extraordinary expenses. In addition, the Manager is required to reduce its fee in an amount equal to the fund’s allocable portion of fees and expenses of the non-interested Trustees (including counsel fees). Each Trustee receives $45,000 per year, plus $6,000 for each joint Board meeting of The Dreyfus/Laurel Funds, Inc.,The Dreyfus/Laurel Tax-Free Municipal Funds and Trust (collectively, the “Dreyfus/Laurel Funds”) attended, $2,000 for separate in-person committee meetings attended which are not held in conjunction with a regularly scheduled Board meeting and $1,500 for Board meetings and separate committee meetings attended that are conducted by telephone and is reimbursed for travel and out-of-pocket expenses. With respect to Board meetings, the Chairman of the Board receives an additional 25% of such compensation (with the exception of reimbursable amounts). With respect to compensation committee meetings, the Chair of the compensation committee receives $900 per meeting and, with respect
The Fund 43
NOTES TO FINANCIAL STATEMENTS (continued)
|
to audit committee meetings, the Chair of the audit committee receives $1,350 per meeting. In the event that there is an in-person joint committee meeting or a joint telephone meeting of the Dreyfus/Laurel Funds and Dreyfus High Yield Strategies Fund, the $2,000 or $1,500 fee, as applicable, will be allocated between the Dreyfus/Laurel Funds and Dreyfus High Yield Strategies Fund.These fees and expenses are charged and allocated to each series based on net assets. Amounts required to be paid by the Trust directly to the non-interested Trustees, that would be applied to offset a portion of the management fee payable to the Manager, are in fact paid directly by the Manager to the non-interested Trustees.
During the period ended December 31, 2007, the Distributor retained $7,103 from commissions earned on sales of the fund’s Class A shares and $5,234 and $249 from CDSC on redemptions on the fund’s Class B and Class C shares, respectively.
(b) Under separate Distribution Plans (the “Plans”) adopted pursuant to Rule 12b-1 under the Act, Class A shares pay annually up to .25% of the value of the average daily net assets to compensate the Distributor for shareholder servicing activities and expenses primarily intended to result in the sale of Class A shares. Class B and Class C shares may pay the Distributor for distributing their shares at an aggregate annual rate of .75% of the value of the average daily net assets of Class B and Class C shares. Class B and Class C shares are also subject to a service plan adopted pursuant to Rule 12b-1 (the “Service Plan”), under which Class B and Class C shares pay the Distributor for providing certain services to the holders of their shares a fee at the annual rate of .25% of the value of the average daily net assets of Class B and Class C shares. During the period ended December 31, 2007, Class A, Class B and Class C shares were charged $151,194, $18,628 and $43,792, respectively, pursuant to their respective Plans. Class B and Class C shares were charged $6,209 and $14,598, respectively, pursuant to the Service Plan.
Under its terms, the Plans and Service Plan shall remain in effect from year to year, provided such continuance is approved annually by a vote
of majority of those Trustees who are not “interested persons” of the Trust and who have no direct or indirect financial interest in the operation of or in any agreement related to the Plans or Service Plan.
The components of “Due to The Dreyfus Corporation and affiliates” in the Statement of Assets and Liabilities consist of: management fees $60,799, Rule 12b-1 distribution plan fees $28,732 and shareholder services plan fees $3,636.
NOTE 4—Securities Transactions:
The aggregate amount of purchases and sales (including paydowns) of investment securities, excluding short-term securities, forward currency exchange contracts, futures, options and swap transactions during the period ended December 31, 2007, amounted to $488,424,848 and $441,792,336, respectively, of which $141,487,943 in purchases and $141,559,506 in sales were from mortgage dollar roll transactions.
A mortgage dollar roll transaction involves a sale by the fund of mortgage related securities that it holds with an agreement by the fund to repurchase similar securities at an agreed upon price and date. The securities purchased will bear the same interest rate as those sold, but generally will be collateralized by pools of mortgages with different prepayment histories than those securities sold.
The fund may purchase and write (sell) call/put options in order to gain exposure to or protect against change in the market.
As a writer of call options, the fund receives a premium at the outset and then bears the market risk of unfavorable changes in the price of the financial instruments underlying the options. Generally, the fund would incur a gain, to the extent of the premium, if the price of the underlying financial instrument decreases between the date the option is written and the date on which the option is terminated. Generally, the fund would realize a loss, if the price of the financial instrument increases between those dates.
The Fund 45
NOTES TO FINANCIAL STATEMENTS (continued)
|
As a writer of put options, the fund receives a premium at the outset and then bears the market risk of unfavorable changes in the price of the financial instruments underlying the options. Generally, the fund would incur a gain, to the extent of the premium, if the price of the underlying financial instrument increases between the date the option is written and the date on which the option is terminated. Generally, the fund would realize a loss, if the price of the financial instrument decreases between those dates.
In addition, the following table summarizes the fund’s call/put options written during the period ended December 31, 2007:
| | | Face Amount | | | | Options Terminated |
| | | | | |
|
| | | Covered by | | Premiums | | | | Net Realized |
| Options Written: | | Contracts ($) | | Received ($) | | Cost ($) | | Gain (Loss) ($) |
| |
| |
| |
| |
|
| Contracts outstanding | | | | | | | | |
| December 31, 2006 | | 3,395,000 | | 12,222 | | — | | — |
| Contracts written | | 292,100,000 | | 266,296 | | | | |
| Contracts terminated; | | | | | | | | |
| Closed | | 221,200,000 | | 105,054 | | 142,719 | | (37,665) |
| Expired | | 56,095,000 | | 99,932 | | — | | 99,932 |
| Total contracts | | | | | | | | |
| terminated | | 277,295,000 | | 204,986 | | 142,719 | | 62,267 |
| Contracts outstanding | | | | | | | | |
| December 31, 2007 | | 18,200,000 | | 73,532 | | | | |
The fund may invest in financial futures contracts in order to gain exposure to or protect against changes in the market. The fund is exposed to market risk as a result of changes in the value of the underlying financial instruments. Investments in financial futures require the fund to “mark to market” on a daily basis, which reflects the change in the market value of the contracts at the close of each day’s trading. Accordingly, variation margin payments are received or made to reflect daily unrealized gains or losses.When the contracts are closed, the fund recognizes a realized gain or loss.These investments require initial margin deposits with a broker.The amount of these deposits is determined by the exchange or Board of Trade on which the contract is traded and is subject to change. Contracts open at December 31, 2007 are set forth in the Statement of Financial Futures.
The fund enters into forward currency exchange contracts in order to hedge its exposure to changes in foreign currency exchange rates on its foreign portfolio holdings and to settle foreign currency transac-tions.When executing forward currency exchange contracts, the fund is obligated to buy or sell a foreign currency at a specified rate on a certain date in the future. With respect to sales of forward currency exchange contracts, the fund would incur a loss if the value of the contract increases between the date the forward contract is opened and the date the forward contract is closed.The fund realizes a gain if the value of the contract decreases between those dates. With respect to purchases of forward currency exchange contracts, the fund would incur a loss if the value of the contract decreases between the date the forward contract is opened and the date the forward contract is closed. The fund realizes a gain if the value of the contract increases between those dates. The fund is also exposed to credit risk associated with counterparty nonperformance on these forward currency exchange contracts which is typically limited to the unrealized gain on each open contract. The following summarizes open forward currency exchange contracts at December 31, 2007:
| | | Foreign | | | | | | Unrealized |
| Forward Currency | | Currency | | | | | | Appreciation |
| Exchange Contracts | | Amounts | | Cost ($) | | Value ($) | | (Depreciation) ($) |
| |
| |
| |
| |
|
| Purchases: | | | | | | | | |
| Russian Ruble, | | | | | | | | |
| expiring 3/19/2008 | | 5,260,000 | | 212,508 | | 214,009 | | 1,501 |
| Saudi Arabia Riyal, | | | | | | | | |
| expiring 3/25/2008 | | 580,000 | | 155,454 | | 155,412 | | (42) |
| Saudi Arabia Riyal, | | | | | | | | |
| expiring 3/25/2008 | | 105,000 | | 28,226 | | 28,135 | | (91) |
| Saudi Arabia Riyal, | | | | | | | | |
| expiring 3/25/2008 | | 880,000 | | 235,862 | | 235,799 | | (63) |
| Sales: | | | | Proceeds ($) | | | | |
| Euro, | | | | | | | | |
| expiring 3/19/2008 | | 100,000 | | 147,680 | | 146,090 | | 1,590 |
| Euro, | | | | | | | | |
| expiring 3/19/2008 | | 70,000 | | 100,912 | | 102,263 | | (1,351) |
| Total | | | | | | | | 1,544 |
The Fund 47
NOTES TO FINANCIAL STATEMENTS (continued)
|
The fund may enter into swap agreements to exchange the interest rate on, or return generated by, one nominal instrument for the return generated by another nominal instrument.
The fund accrues for the interim payments on swap contracts on a daily basis, with the net amount recorded within unrealized appreciation (depreciation) of swap contracts in the Statement of Assets and Liabilities. Once the interim payments are settled in cash, the net amount is recorded as realized gain (loss) on swaps, in addition to realized gain (loss) recorded upon the termination of swaps contracts in the Statement of Operations. Fluctuations in the value of swap contracts are recorded as a component of net change in unrealized appreciation (depreciation) on investments.
Credit default swaps involve commitments to pay or receive a fixed interest rate in exchange for payment if a credit event affecting a third party (the referenced company) occurs. Credit events may include a failure to pay interest or principal, bankruptcy, or restructuring. For those credit default swaps in which the fund is receiving a fixed rate, the fund is providing credit protection on the underlying instrument. The maximum payouts for these contracts are limited to the notional amount of each swap. The following summarizes open credit default swap agreements at December 31, 2007:
| | | | | | | | | | | Unrealized |
| Notional | | Reference | | | | (Pay)/Receive | | Appreciation |
| Amount ($) | | Entity | | Counterparty | | Fixed Rate (%) Expiration (Depreciation)($) |
| |
| |
| |
|
| |
| 1,070,000 | | Altria Group, 7%, | | | | | | | | |
| | | 11/4/2013 | | Citibank | | (.27) | | 12/20/2011 | | 209 |
| 330,000 | | Auto Receivable | | | | | | | | |
| | | Backed, 2007-1, | | Lehman | | | | | | |
| | | BBB Index | | Brothers | | 1.50 | | 2/15/2014 | | (40,272) |
| 540,000 | | Auto Receivable | | | | | | | | |
| | | Backed, 2007-1, | | Lehman | | | | | | |
| | | BBB Index | | Brothers | | 1.50 | | 2/15/2014 | | (64,298) |
| 90,000 | | Autozone, 5.875%, | | | | | | | | |
| | | 10/15/2012 | | Deutsche Bank | | (.70) | | 9/20/2017 | | (743) |
| 580,000 | | Autozone, 5.875%, | | Goldman, | | | | | | |
| | | 10/15/2012 | | Sachs & Co. | | (.62) | | 6/20/2017 | | (1,475) |
| 125,000 | | Block Financial, | | | | | | | | |
| | | 5.125%, | | | | | | | | |
| | | 10/30/2014 | | Barclays | | (2.30) | | 12/20/2012 | | 1,243 |
| | | | | | | | | | | Unrealized |
| Notional | | Reference | | | | (Pay)/Receive | | Appreciation |
| Amount ($) | | Entity | | Counterparty | | Fixed Rate (%) Expiration (Depreciation)($) |
| |
| |
| |
|
| |
| 300,000 | | Block Financial, | | | | | | | | |
| | | 5.125%, | | | | | | | | |
| | | 10/30/2014 | | Barclays | | (1.95) | | 9/20/2014 | | 7,999 |
| 95,000 | | Block Financial, | | | | | | | | |
| | | 5.125%, | | | | | | | | |
| | | 10/30/2014 | | JPMorgan | | (2.80) | | 12/20/2012 | | (1,034) |
| 100,000 | | Block Financial, | | | | | | | | |
| | | 5.125%, | | | | | | | | |
| | | 10/30/2014 | | JPMorgan | | (2.25) | | 12/20/2012 | | 1,203 |
| 210,000 | | Block Financial, | | | | | | | | |
| | | 5.125%, | | Morgan | | | | | | |
| | | 10/30/2014 | | Stanley | | (1.95) | | 9/20/2014 | | 5,599 |
| 600,000 | | Block Financial, | | | | | | | | |
| | | 5.125%, | | Morgan | | | | | | |
| | | 10/30/2014 | | Stanley | | (2.32) | | 12/20/2012 | | 5,341 |
| 420,000 | | Capital One | | | | | | | | |
| | | Financial, 6.25%, | | | | | | | | |
| | | 11/15/2013 | | Barclays | | (2.50) | | 12/20/2012 | | 2,159 |
| 230,000 | | Capital One | | | | | | | | |
| | | Financial, 6.25%, | | | | | | | | |
| | | 11/15/2013 | | Deutsche Bank | | (2.53) | | 12/20/2012 | | 1,215 |
| 530,000 | | Capital One | | | | | | | | |
| | | Financial, 6.25%, | | | | | | | | |
| | | 11/15/2013 | | Deutsche Bank | | (2.57) | | 12/20/2012 | | 1,151 |
| 188,000 | | Capital One | | | | | | | | |
| | | Financial, 6.25%, | | Goldman, | | | | | | |
| | | 11/15/2013 | | Sachs & Co. | | (2.55) | | 12/20/2012 | | 835 |
| 270,000 | | Capital One | | | | | | | | |
| | | Financial, 6.25%, | | Goldman, | | | | | | |
| | | 11/15/2013 | | Sachs & Co. | | (2.35) | | 12/20/2012 | | 3,453 |
| 140,000 | | Capital One | | | | | | | | |
| | | Financial, 6.25%, | | | | | | | | |
| | | 11/15/2013 | | JPMorgan | | (2.75) | | 12/20/2012 | | (553) |
| 242,000 | | Capital One | | | | | | | | |
| | | Financial, 6.25%, | | | | | | | | |
| | | 11/15/2013 | | JPMorgan | | (2.35) | | 12/20/2012 | | 3,095 |
| 198,000 | | CenturyTel, | | | | | | | | |
| | | 7.875%, | | | | | | | | |
| | | 8/15/2012 | | Citibank | | (1.16) | | 9/20/2015 | | (5,366) |
| 58,000 | | CenturyTel, | | | | | | | | |
| | | 7.875%, | | Morgan | | | | | | |
| | | 8/15/2012 | | Stanley | | (1.15) | | 9/20/2015 | | (1,534) |
| 75,000 | | CenturyTel, | | | | | | | | |
| | | 7.875%, | | Morgan | | | | | | |
| | | 8/15/2012 | | Stanley | | (.85) | | 9/20/2017 | | (215) |
| 240,000 | | CSX, 5.3%, | | Goldman, | | | | | | |
| | | 2/15/2014 | | Sachs & Co. | | (.66) | | 12/20/2012 | | 169 |
| 330,000 | | CSX, 5.3%, | | | | | | | | |
| | | 2/15/2014 | | JPMorgan | | (.65) | | 12/20/2012 | | 381 |
| 360,000 | | CSX, 5.3%, | | | | | | | | |
| | | 2/15/2014 | | Merrill Lynch | | (.69) | | 12/20/2012 | | (234) |
The Fund 49
NOTES TO FINANCIAL STATEMENTS (continued)
|
| | | | | | | | | | | Unrealized |
| Notional | | Reference | | | | (Pay)/Receive | | Appreciation |
| Amount ($) | | Entity | | Counterparty | | Fixed Rate (%) Expiration (Depreciation)($) |
| |
| |
| |
|
| |
| 355,000 | | Darden Restaurants, | | | | | | | | |
| | | 7.125%, 2/1/2016 | | Deutsche Bank | | (.66) | | 12/20/2012 | | 2,590 |
| 285,000 | | Darden Restaurants, | | Goldman, | | | | | | |
| | | 7.125%, 2/1/2016 | | Sachs & Co. | | (.63) | | 12/20/2012 | | 2,465 |
| 290,000 | | Darden Restaurants, | | Morgan | | | | | | |
| | | 7.125%, 2/1/2016 | | Stanley | | (.61) | | 12/20/2012 | | 2,768 |
| 930,000 | | Dow Jones | | Goldman, | | | | | | |
| | | CDX.NA.IG.9 Index | | Sachs & Co. | | (.80) | | 12/20/2017 | | 8,326 |
| 955,000 | | Eastman Chemical, | | Morgan | | | | | | |
| | | 7.6%, 2/1/2027 | | Stanley | | (.50) | | 12/20/2012 | | (1,958) |
| 260,000 | | FedEx, 7.25%, | | | | | | | | |
| | | 2/15/2011 | | Citibank | | (.60) | | 12/20/2012 | | 203 |
| 520,000 | | FedEx, 7.25%, | | | | | | | | |
| | | 2/15/2011 | | Citibank | | (.55) | | 12/20/2012 | | 1,579 |
| 150,000 | | FedEx, 7.25%, | | | | | | | | |
| | | 2/15/2011 | | JPMorgan | | (.54) | | 12/20/2012 | | 523 |
| 125,000 | | First Data, 4.7%, | | Lehman | | | | | | |
| | | 8/1/2013 | | Brothers | | 2.90 | | 12/20/2009 | | (1,891) |
| 405,000 | | Global Structured | | | | | | | | |
| | | Tranche 0-3% | | JPMorgan | | - | | 9/20/2013 | | (39,385) |
| 288,000 | | Global Structured | | Morgan | | | | | | |
| | | Tranche 0-3% | | Stanley | | - | | 9/20/2013 | | (19,445) |
| 277,000 | | Global Structured | | | | | | | | |
| | | Tranche 0-3% | | UBS | | - | | 9/20/2013 | | (27,215) |
| 705,000 | | Goldman Sachs | | | | | | | | |
| | | Group Inc. | | Merrill Lynch | | (.69) | | 3/20/2013 | | (1,153) |
| 705,000 | | HSBC Finance Corp. | | Merrill Lynch | | (1.11) | | 3/20/2013 | | 1,005 |
| 500,000 | | Humana Inc. | | Goldman, | | | | | | |
| | | | | Sachs & Co. | | (.58) | | 3/20/2013 | | (774) |
| 1,880,000 | | iTraxx Europe | | | | | | | | |
| | | Senior Financials | | | | | | | | |
| | | Series 8 | | Barclays | | (.45) | | 12/20/2012 | | 17,857 |
| 2,500,000 | | iTraxx Europe | | | | | | | | |
| | | Senior Financials | | | | | | | | |
| | | Series 8 | | JPMorgan | | (.45) | | 12/20/2012 | | 23,199 |
| 1,300,000 | | Liberty Mutual | | | | | | | | |
| | | Insurance Company, | | Lehman | | | | | | |
| 7.875%,10/15/2026 | | Brothers | | (.35) | | 12/20/2014 | | 902 |
| 269,000 | | News America, | | Lehman | | | | | | |
| | | 7.25%, 5/18/2018 | | Brothers | | .47 | | 12/20/2009 | | 1,362 |
| 535,000 | | Northern Tobacco, | | | | | | | | |
| | | 5%, 6/1/2046 | | Citibank | | 1.35 | | 12/20/2011 | | (24,324) |
| 410,000 | | Republic of | | | | | | | | |
| | | Panama, 8.875%, | | | | | | | | |
| | | 9/30/2027 | | Deutsche Bank | | (1.57) | | 9/20/2017 | | (2,331) |
| 410,000 | | Republic of | | | | | | | | |
| | | the Philippines, | | | | | | | | |
| 10.625%, 3/16/2025 | | Barclays | | (2.56) | | 9/20/2017 | | (14,659) |
| | | | | | | | | | | Unrealized |
| Notional | | Reference | | | | (Pay)/Receive | | Appreciation |
| Amount ($) | | Entity | | Counterparty | | Fixed Rate (%) Expiration (Depreciation)($) |
| |
| |
| |
|
| |
| 410,000 | | Republic of Turkey, | | | | | | | | |
| | | 11.875%, | | | | | | | | |
| | | 1/15/2030 | | Barclays | | (2.82) | | 9/20/2017 | | (18,785) |
| 250,000 | | Republic of | | | | | | | | |
| | | Venezuela, | | | | | | | | |
| | | 9.25%, 9/15/2027 | | Deutsche Bank | | (2.87) | | 10/20/2016 | | 27,495 |
| 880,000 | | Republic of | | | | | | | | |
| | | Venezuela, | | | | | | | | |
| | | 9.25%, 9/15/2027 | | Barclays | | 4.45 | | 8/20/2012 | | 18,287 |
| 225,000 | | Republic of | | | | | | | | |
| | | Venezuela, | | | | | | | | |
| | | 9.25%, 9/15/2027 | | UBS | | (2.33) | | 11/20/2016 | | 32,246 |
| 125,000 | | Rite Aid, | | | | | | | | |
| | | 7.7% 2/15/2027 | | JPMorgan | | 3.55 | | 9/20/2010 | | (10,908) |
| 75,000 | | Rite Aid, | | Lehman | | | | | | |
| | | 7.7% 2/15/2027 | | Brothers | | 4.55 | | 9/20/2010 | | (4,802) |
| 100,000 | | Rite Aid, | | Lehman | | | | | | |
| | | 7.7% 2/15/2027 | | Brothers | | 4.85 | | 9/20/2010 | | (5,706) |
| 535,000 | | Southern | | | | | | | | |
| | | California Tobacco, | | | | | | | | |
| | | 5%, 6/1/2037 | | Citibank | | 1.35 | | 12/20/2011 | | (24,324) |
| 210,000 | | Standish | | | | | | | | |
| | | Structured Tranched | | | | | | | | |
| | | Portfolio 0-3% | | Barclays | | 13.40 | | 6/20/2012 | | (111,371) |
| 290,000 | | State Street, | | | | | | | | |
| | | 7.65%, 6/15/2010 | | Merrill Lynch | | (.55) | | 9/20/2012 | | (1,284) |
| 280,000 | | Univision | | | | | | | | |
| | | Communication, | | Lehman | | | | | | |
| | | 7.85%, 7/15/2011 | | Brothers | | 2.60 | | 6/20/2010 | | (16,055) |
| 500,000 | | Verizon | | Morgan | | | | | | |
| | | Communications | | Stanley | | (.41) | | 3/20/2018 | | 1,117 |
| 1,410,000 | | Wachovia | | | | | | | | |
| | | Corporation | | Merrill Lynch | | 1.00 | | 3/20/2013 | | (4,007) |
| Total | | | | | | | | | | (270,125) |
Risks may arise upon entering into these agreements from the potential inability of the counterparties to meet the terms of the agreement and are generally limited to the amount of net payments to be received, if any, at the date of default.
At December 31, 2007, the cost of investments for federal income tax purposes was $148,888,773; accordingly, accumulated net unrealized depreciation on investments was $506,701,consisting of $1,046,986 gross unrealized appreciation and $1,553,687 gross unrealized depreciation.
The Fund 51
NOTES TO FINANCIAL STATEMENTS (continued)
|
NOTE 5—Plan of Reorganization:
|
At a meeting of the Board of Trustees of The Dreyfus/Laurel Funds Trust (the “Trust”) held on October 24-25, 2007, the Board approved, subject to shareholder approval, an Agreement and Plan of Reorganization (the “Agreement”) between the Trust, on behalf of the fund, and Dreyfus Investment Grade Funds, Inc., on behalf of Dreyfus Premier Intermediate Term Income Fund (the “Acquiring Fund”). The Agreement provides for the transfer of the fund’s assets to the Acquiring Fund in a tax-free exchange for shares of the Acquiring Fund and the assumption by the Acquiring Fund of the fund’s stated liabilities, the distribution of shares of the Acquiring Fund to the fund’s shareholders and the subsequent termination of the fund (the “Reorganization”). It is currently contemplated that holders of fund shares as of December 21, 2007 will be asked to approve the Agreement on behalf of the fund at a special meeting of shareholders to be held on or about February 27, 2008. The Reorganization is expected to take place on or about March 27, 2008.
REPORT OF INDEPENDENT REGISTERED
PUBLIC ACCOUNTING FIRM
|
| | The Board of Trustees and Shareholders of
The Dreyfus/Laurel Funds Trust:
|
We have audited the accompanying statement of assets and liabilities of Dreyfus Premier Managed Income Fund (the “Fund”) of The Dreyfus/Laurel Funds Trust including the statements of investments, financial futures and options written as of December 31, 2007, and the related statement of operations for the year then ended, the statement of changes in net assets for each of the years in the two-year period then ended, and the financial highlights for each of the years in the five-year period then ended. These financial statements and financial highlights are the responsibility of the Fund’s management. Our responsibility is to express an opinion on these financial statements and financial highlights based on our audits.
We conducted our audits in accordance with the standards of the Public Company Accounting Oversight Board (United States).Those standards require that we plan and perform the audit to obtain reasonable assurance about whether the financial statements and financial highlights are free of material misstatement. An audit includes examining, on a test basis, evidence supporting the amounts and disclosures in the financial statements. Our procedures included confirmation of securities owned as of December 31, 2007, by correspondence with the custodian and brokers, or by other appropriate auditing procedures where replies from brokers were not received.An audit also includes assessing the accounting principles used and significant estimates made by management, as well as evaluating the overall financial statement presentation.We believe that our audits provide a reasonable basis for our opinion.
In our opinion, the financial statements and financial highlights referred to above present fairly, in all material respects, the financial position of Dreyfus Premier Managed Income Fund of The Dreyfus/Laurel Funds Trust as of December 31, 2007, and the results of its operations for the year then ended, the changes in its net assets for each of the years in the two-year period then ended, and the financial highlights for each of the years in the five-year period then ended, in conformity with U.S. generally accepted accounting principles.

| | New York, New York
February 22, 2008
|
The Fund 53
IMPORTANT TAX INFORMATION ( U n a u d i t e d )
In accordance with federal tax law, the fund hereby designates .48% of the ordinary dividends paid during the fiscal year ended December 31, 2007 as qualifying for the corporate dividends received deduction. For the fiscal year ended December 31, 2007, certain dividends paid by the fund may be subject to a maximum tax rate of 15%, as provided for by the Jobs and Growth Tax Relief Reconciliation Act of 2003. Of the distributions paid during the fiscal year, $15,313 represents the maximum amount that may be considered qualified dividend income. Shareholders will receive notification in January 2008 of the percentage applicable to the preparation of their 2007 income tax returns.Also, the fund hereby designates 95.50% of ordinary income dividends paid during the fiscal year ended December 31, 2007 as qualifying interest related dividends.Also, the fund hereby designates $.0060 per share as a short-term capital gain distribution paid on December 27, 2007.
BOARD MEMBERS INFORMATION (Unaudited)
Joseph S. DiMartino (64)
Chairman of the Board (1999)
|
Principal Occupation During Past 5 Years:
• Corporate Director and Trustee
|
Other Board Memberships and Affiliations:
|
- The Muscular Dystrophy Association, Director
- Century Business Services, Inc., a provider of outsourcing functions for small and medium size companies, Director
- The Newark Group, a provider of a national market of paper recovery facilities, paperboard mills and paperboard converting plants, Director
- Sunair Services Corporation, a provider of certain outdoor-related services to homes and businesses, Director
No. of Portfolios for which Board Member Serves: 163 ———————
James M. Fitzgibbons (73) Board Member (1994)
Principal Occupation During Past 5 Years:
• Chairman of the Board, Davidson Cotton Company (1998-2002)
Other Board Memberships and Affiliations:
• Bill Barrett Company, an oil and gas exploration company, Director
No. of Portfolios for which Board Member Serves: 26 ———————
J. Tomlinson Fort (79) Board Member (1987)
Principal Occupation During Past 5 Years:
|
- Retired (2005-present)
- Of Counsel, Reed Smith LLP (1998-2005)
Other Board Memberships and Affiliations:
|
- Allegheny College, Emeritus Trustee
- Pittsburgh Ballet Theatre,Trustee
- American College of Trial Lawyers, Fellow
No. of Portfolios for which Board Member Serves: 26 ———————
Kenneth A. Himmel (61) Board Member (1994)
Principal Occupation During Past 5 Years:
|
- President and CEO,Related Urban Development,a real estate development company (1996-present)
- President and CEO, Himmel & Company, a real estate development company (1980-present)
- CEO, American Food Management, a restaurant company (1983-present)
No. of Portfolios for which Board Member Serves: 26
|
The Fund 55
BOARD MEMBERS INFORMATION (Unaudited) (continued)
Stephen J. Lockwood (60)
Board Member (1994)
|
Principal Occupation During Past 5 Years:
|
- Chairman of the Board, Stephen J. Lockwood and Company LLC, an investment company (2000-present)
No. of Portfolios for which Board Member Serves: 26 ———————
Roslyn M. Watson (58) Board Member (1994)
Principal Occupation During Past 5 Years:
• Principal,Watson Ventures, Inc., a real estate investment company (1993-present)
Other Board Memberships and Affiliations:
|
- American Express Bank, Director
- The Hyams Foundation Inc., a Massachusetts Charitable Foundation,Trustee
- National Osteoporosis Foundation,Trustee
No. of Portfolios for which Board Member Serves: 26 ———————
Benaree Pratt Wiley (61) Board Member (1998)
Principal Occupation During Past 5 Years:
|
- Principal,The Wiley Group, a firm specializing in strategy and business development (2005-present)
- President and CEO,The Partnership, an organization dedicated to increasing the representa- tion of African Americans in positions of leadership, influence and decision-making in Boston, MA (1991-2005)
Other Board Memberships and Affiliations:
|
- Boston College,Trustee
- Blue Cross Blue Shield of Massachusetts, Director
- Commonwealth Institute, Director
- Efficacy Institute, Director
- PepsiCo African-American, Advisory Board
- The Boston Foundation, Director
- Harvard Business School Alumni Board, Director
No. of Portfolios for which Board Member Serves: 36 ———————
Once elected all Board Members serve for an indefinite term, but achieve Emeritus status upon reaching age 80.The address of the Board Members and Officers is in c/o The Dreyfus Corporation, 200 Park Avenue, New York, New York 10166.Additional information about the Board Members is available in the fund’s Statement of Additional Information which can be obtained from Dreyfus free of charge by calling this toll free number: 1-800-554-4611.
Francis P. Brennan, Emeritus Board Member
OFFICERS OF THE FUND (Unaudited)
| J. DAVID OFFICER, President since | | JONI LACKS CHARATAN, Vice President |
| December 2006. | | and Assistant Secretary since |
| Chief Operating Officer,Vice Chairman and a | | August 2005. |
| Director of the Manager, and an officer of 78 | | Associate General Counsel of the Manager, |
| investment companies (comprised of 163 | | and an officer of 79 investment companies |
| portfolios) managed by the Manager. He is 59 | | (comprised of 180 portfolios) managed by the |
| years old and has been an employee of the | | Manager. She is 52 years old and has been an |
| Manager since April 1998. | | employee of the Manager since October 1988. |
| |
| PHILLIP N. MAISANO, Executive Vice | | JOSEPH M. CHIOFFI, Vice President and |
| President since July 2007. | | Assistant Secretary since August 2005. |
| Chief Investment Officer,Vice Chair and a | | Associate General Counsel of the Manager, |
| director of the Manager, and an officer of 78 | | and an officer of 79 investment companies |
| investment companies (comprised of 163 | | (comprised of 180 portfolios) managed by the |
| portfolios) managed by the Manager. Mr. | | Manager. He is 46 years old and has been an |
| Maisano also is an officer and/or Board | | employee of the Manager since June 2000. |
| |
| member of certain other investment | | JANETTE E. FARRAGHER, Vice President |
| management subsidiaries of The Bank of New | | and Assistant Secretary since |
| York Mellon Corporation, each of which is an | | August 2005. |
| affiliate of the Manager. He is 60 years old and | | |
| has been an employee of the Manager since | | Associate General Counsel of the Manager, |
| November 2006. Prior to joining the Manager, | | and an officer of 79 investment companies |
| Mr. Maisano served as Chairman and Chief | | (comprised of 180 portfolios) managed by the |
| Executive Officer of EACM Advisors, an | | Manager. She is 45 years old and has been an |
| affiliate of the Manager, since August 2004, and | | employee of the Manager since February 1984. |
| served as Chief Executive Officer of Evaluation | | JOHN B. HAMMALIAN, Vice President and |
| Associates, a leading institutional investment | | Assistant Secretary since August 2005. |
| consulting firm, from 1988 until 2004. | | |
| | | Associate General Counsel of the Manager, |
| MICHAEL A. ROSENBERG, Vice President | | and an officer of 79 investment companies |
| and Secretary since August 2005. | | (comprised of 180 portfolios) managed by the |
| Associate General Counsel of the Manager, | | Manager. He is 44 years old and has been an |
| and an officer of 79 investment companies | | employee of the Manager since February 1991. |
| (comprised of 180 portfolios) managed by the | | ROBERT R. MULLERY, Vice President and |
| Manager. He is 47 years old and has been an | | Assistant Secretary since August 2005. |
| employee of the Manager since October 1991. | | |
| | | Associate General Counsel of the Manager, |
| JAMES BITETTO, Vice President and | | and an officer of 79 investment companies |
| Assistant Secretary since August 2005. | | (comprised of 180 portfolios) managed by the |
| Associate General Counsel and Secretary of | | Manager. He is 55 years old and has been an |
| the Manager, and an officer of 79 investment | | employee of the Manager since May 1986. |
| companies (comprised of 180 portfolios) | | |
| managed by the Manager. He is 41 years old | | |
| and has been an employee of the Manager | | |
| since December 1996. | | |
The Fund 57
OFFICERS OF THE FUND (Unaudited) (continued)
| JEFF PRUSNOFSKY, Vice President and | | GAVIN C. REILLY, Assistant Treasurer |
| Assistant Secretary since August 2005. | | since December 2005. |
| Associate General Counsel of the Manager, | | Tax Manager of the Investment Accounting |
| and an officer of 79 investment companies | | and Support Department of the Manager, and |
| (comprised of 180 portfolios) managed by the | | an officer of 79 investment companies |
| Manager. He is 42 years old and has been an | | (comprised of 180 portfolios) managed by the |
| employee of the Manager since October 1990. | | Manager. He is 39 years old and has been an |
| |
| JAMES WINDELS, Treasurer since | | employee of the Manager since April 1991. |
| November 2001. | | JOSEPH W. CONNOLLY, Chief Compliance |
| Director - Mutual Fund Accounting of the | | Officer since October 2004. |
| Manager, and an officer of 79 investment | | Chief Compliance Officer of the Manager and |
| companies (comprised of 180 portfolios) | | The Dreyfus Family of Funds (79 investment |
| managed by the Manager. He is 49 years old | | companies, comprised of 180 portfolios). From |
| and has been an employee of the Manager | | November 2001 through March 2004, Mr. |
| since April 1985. | | Connolly was first Vice-President, Mutual |
| |
| ROBERT ROBOL, Assistant Treasurer | | Fund Servicing for Mellon Global Securities |
| since December 2002. | | Services. In that capacity, Mr. Connolly was |
| | | responsible for managing Mellon’s Custody, |
| Senior Accounting Manager — Money Market | | Fund Accounting and Fund Administration |
| and Municipal Bond Funds of the Manager, | | services to third-party mutual fund clients. He |
| and an officer of 79 investment companies | | is 50 years old and has served in various |
| (comprised of 180 portfolios) managed by the | | capacities with the Manager since 1980, |
| Manager. He is 43 years old and has been an | | including manager of the firm’s Fund |
| employee of the Manager since October 1988. | | Accounting Department from 1997 through |
| ROBERT SALVIOLO, Assistant Treasurer | | October 2001. |
| since July 2007. | | WILLIAM GERMENIS, Anti-Money |
| Senior Accounting Manager - Equity Funds of | | Laundering Compliance Officer since |
| the Manager, and an officer of 79 investment | | July 2002. |
| companies (comprised of 180 portfolios) | | Vice President and Anti-Money Laundering |
| managed by the Manager. He is 40 years old | | Compliance Officer of the Distributor, and the |
| and has been an employee of the Manager | | Anti-Money Laundering Compliance Officer |
| since June 1989. | | of 75 investment companies (comprised of 176 |
| ROBERT SVAGNA, Assistant Treasurer | | portfolios) managed by the Manager. He is 37 |
| since December 2002. | | years old and has been an employee of the |
| | | Distributor since October 1998. |
| Senior Accounting Manager - Equity Funds of | | |
| the Manager, and an officer of 79 investment | | |
| companies (comprised of 180 portfolios) | | |
| managed by the Manager. He is 40 years old | | |
| and has been an employee of the Manager | | |
| since November 1990. | | |
NOTES
For More Information
Telephone Call your financial representative or 1-800-554-4611
| Mail | | The Dreyfus Premier Family of Funds |
| | | 144 Glenn Curtiss Boulevard, Uniondale, NY 11556-0144 |
The fund files its complete schedule of portfolio holdings with the Securities and Exchange Commission (“SEC”) for the first and third quarters of each fiscal year on Form N-Q. The fund’s Forms N-Q are available on the SEC’s website at http://www.sec.gov and may be reviewed and copied at the SEC’s Public Reference Room in Washington, DC. Information on the operation of the Public Reference Room may be obtained by calling 1-202-551-8090.
A description of the policies and procedures that the fund uses to determine how to vote proxies relating to portfolio securities, and information regarding how the fund voted these proxies for the 12-month period ended June 30, 2007, is available at http://www.dreyfus.com and on the SEC’s website at http://www.sec.gov. The description of the policies and procedures is also available without charge, upon request, by calling 1-800-645-6561.
© 2008 MBSC Securities Corporation

The Registrant has adopted a code of ethics that applies to the Registrant's principal executive officer, principal financial officer, principal accounting officer or controller, or persons performing similar functions. There have been no amendments to, or waivers in connection with, the Code of Ethics during the period covered by this Report.
| Item 3. | | Audit Committee Financial Expert. |
The Registrant's Board has determined that Joseph S. DiMartino, a member of the Audit Committee of the Board, is an audit committee financial expert as defined by the Securities and Exchange Commission (the "SEC"). Joseph S. DiMartino is "independent" as defined by the SEC for purposes of audit committee financial expert determinations.
| Item 4. | | Principal Accountant Fees and Services. |
(a) Audit Fees. The aggregate fees billed for each of the last two fiscal years (the "Reporting Periods") for professional services rendered by the Registrant's principal accountant (the "Auditor") for the audit of the Registrant's annual financial statements, or services that are normally provided by the Auditor in connection with the statutory and regulatory filings or engagements for the Reporting Periods, were $106,820 in 2006 and $110,030 in 2007.
(b) Audit-Related Fees. The aggregate fees billed in the Reporting Periods for assurance and related services by the Auditor that are reasonably related to the performance of the audit of the Registrant's financial statements and are not reported under paragraph (a) of this Item 4 were $11,405 in 2006 and $11,750 in 2007. These services consisted of security counts required by Rule 17f-2 under the Investment Company Act of 1940, as amended.
The aggregate fees billed in the Reporting Periods for non-audit assurance and related services by the Auditor to the Registrant's investment adviser (not including any sub-investment adviser whose role is primarily portfolio management and is subcontracted with or overseen by another investment adviser), and any entity controlling, controlled by or under common control with the investment adviser that provides ongoing services to the Registrant ("Service Affiliates"), that were reasonably related to the performance of the annual audit of the Service Affiliate, which required pre-approval by the Audit Committee were $0 in 2006 and $0 in 2007.
Note: For the second paragraph in each of (b) through (d) of this Item 4, certain of such services were not pre-approved prior to May 6, 2003, when such services were required to be pre-approved. On and after May 6, 2003, 100% of all services provided by the Auditor were pre-approved as required. For comparative purposes, the fees shown assume that all such services were pre-approved, including services that were not pre-approved prior to the compliance date of the pre-approval requirement.
(c) Tax Fees. The aggregate fees billed in the Reporting Periods for professional services rendered by the Auditor for tax compliance, tax advice and tax planning ("Tax Services") were $6,270 in 2006 and $6,450 in 2007. These services consisted of review or preparation of U.S. federal, state, local and excise tax returns.
-2-
The aggregate fees billed in the Reporting Periods for Tax Services by the Auditor to Service Affiliates which required pre-approval by the Audit Committee were $0 in 2006 and $0 in 2007.
(d) All Other Fees. The aggregate fees billed in the Reporting Periods for products and services provided by the Auditor, other than the services reported in paragraphs (a) through (c) of this Item, were $0 in 2006 and $0 in 2007.
The aggregate fees billed in the Reporting Periods for Non-Audit Services by the Auditor to Service Affiliates, other than the services reported in paragraphs (b) through (c) of this Item, which required pre-approval by the Audit Committee were $0 in 2006 and $0 in 2007.
Audit Committee Pre-Approval Policies and Procedures. The Registrant's Audit Committee has established policies and procedures (the "Policy") for pre-approval (within specified fee limits) of the Auditor's engagements for non-audit services to the Registrant and Service Affiliates without specific case-by-case consideration. Pre-approval considerations include whether the proposed services are compatible with maintaining the Auditor's independence. Pre-approvals pursuant to the Policy are considered annually.
Non-Audit Fees. The aggregate non-audit fees billed by the Auditor for services rendered to the Registrant, and rendered to Service Affiliates, for the Reporting Periods were $1,202,000 in 2006 and $2,790,000 in 2007.
Auditor Independence. The Registrant's Audit Committee has considered whether the provision of non-audit services that were rendered to Service Affiliates which were not pre-approved (not requiring pre-approval) is compatible with maintaining the Auditor's independence.
| Item 5. | | Audit Committee of Listed Registrants. |
| | | Not applicable. |
| Item 6. | | Schedule of Investments. |
| | | Not applicable. |
| Item 7. | | Disclosure of Proxy Voting Policies and Procedures for Closed-End Management |
| | | Investment Companies. |
| | | Not applicable. |
| Item 8. | | Portfolio Managers of Closed-End Management Investment Companies. |
| | | Not applicable. |
| Item 9. | | Purchases of Equity Securities by Closed-End Management Investment Companies and |
| | | Affiliated Purchasers. |
| | | Not applicable. |
| Item 10. | | Submission of Matters to a Vote of Security Holders. |
The Registrant has a Nominating Committee (the "Committee"), which is responsible for selecting and nominating persons for election or appointment by the Registrant's Board as Board members. The Committee has adopted a Nominating Committee Charter (the "Charter"). Pursuant to the Charter, the Committee will
-3-
consider recommendations for nominees from shareholders submitted to the Secretary of the Registrant, c/o The Dreyfus Corporation Legal Department, 200 Park Avenue, 8th Floor East, New York, New York 10166. A nomination submission must include information regarding the recommended nominee as specified in the Charter. This information includes all information relating to a recommended nominee that is required to be disclosed in solicitations or proxy statements for the election of Board members, as well as information sufficient to evaluate the factors to be considered by the Committee, including character and integrity, business and professional experience, and whether the person has the ability to apply sound and independent business judgment and would act in the interests of the Registrant and its shareholders. Nomination submissions are required to be accompanied by a written consent of the individual to stand for election if nominated by the Board and to serve if elected by the shareholders, and such additional information must be provided regarding the recommended nominee as reasonably requested by the Committee.
| Item 11. | | Controls and Procedures. |
(a) The Registrant's principal executive and principal financial officers have concluded, based on their evaluation of the Registrant's disclosure controls and procedures as of a date within 90 days of the filing date of this report, that the Registrant's disclosure controls and procedures are reasonably designed to ensure that information required to be disclosed by the Registrant on Form N-CSR is recorded, processed, summarized and reported within the required time periods and that information required to be disclosed by the Registrant in the reports that it files or submits on Form N-CSR is accumulated and communicated to the Registrant's management, including its principal executive and principal financial officers, as appropriate to allow timely decisions regarding required disclosure.
(b) There were no changes to the Registrant's internal control over financial reporting that occurred during the second fiscal quarter of the period covered by this report that have materially affected, or are reasonably likely to materially affect, the Registrant's internal control over financial reporting.
| (a)(1) | | Code of ethics referred to in Item 2. |
(a)(2) Certifications of principal executive and principal financial officers as required by Rule 30a-2(a) under the Investment Company Act of 1940.
(a)(3) Not applicable.
(b) Certification of principal executive and principal financial officers as required by Rule 30a-2(b) under the Investment Company Act of 1940.
-4-
SIGNATURES
Pursuant to the requirements of the Securities Exchange Act of 1934 and the Investment Company Act of 1940, the Registrant has duly caused this Report to be signed on its behalf by the undersigned, thereunto duly authorized.
The Dreyfus/Laurel Funds Trust
| By: | | /s/ J. David Officer |
| | | J. David Officer |
| | | President |
| |
| Date: | | 02/25/2008 |
Pursuant to the requirements of the Securities Exchange Act of 1934 and the Investment Company Act of 1940, this Report has been signed below by the following persons on behalf of the Registrant and in the capacities and on the dates indicated.
| By: | | /s/ J. David Officer |
| | | J. David Officer |
| | | President |
| |
| Date: | | 02/25/2008 |
| By: | | /s/ James Windels |
| | | James Windels |
| | | Treasurer |
| |
| Date: | | 02/25/2008 |
EXHIBIT INDEX
(a)(1) Code of ethics referred to in Item 2.
(a)(2) Certifications of principal executive and principal financial officers as required by Rule 30a-2(a) under the Investment Company Act of 1940. (EX-99.CERT)
(b) Certification of principal executive and principal financial officers as required by Rule 30a-2(b) under the Investment Company Act of 1940. (EX-99.906CERT)
-5-
Exhibit (a)(1)
| | THE DREYFUS FAMILY OF FUNDS
CODE OF ETHICS FOR PRINCIPAL EXECUTIVE
AND SENIOR FINANCIAL OFFICERS
|
1. Covered Officers/Purpose of the Code
This code of ethics (the "Code") for the investment companies within the complex (each, a "Fund") applies to each Fund's Principal Executive Officer, Principal Financial Officer, Principal Accounting Officer or Controller, or other persons performing similar functions, each of whom is listed on Exhibit A (the "Covered Officers"), for the purpose of promoting:
- honest and ethical conduct, including the ethical handling of actual or apparent conflicts of interest between personal and professional relationships;
- full, fair, accurate, timely and understandable disclosure in reports and documents that the Fund files with, or submits to, the Securities and Exchange Commission (the "SEC") and in other public communications made by the Fund;
- compliance with applicable laws and governmental rules and regulations;
- the prompt internal reporting of violations of the Code to an appropriate person or persons identified in the Code; and
- accountability for adherence to the Code.
Each Covered Officer should adhere to a high standard of business ethics and should be sensitive to situations that may give rise to actual as well as apparent conflicts of interest.
2. Covered Officers Should Handle Ethically Actual and Apparent Conflicts of Interest
Overview. A "conflict of interest" occurs when a Covered Officer's private interest interferes with the interests of, or his service to, the Fund. For example, a conflict of interest would arise if a Covered Officer, or a member of his family, receives improper personal benefits as a result of his position with the Fund.
Certain conflicts of interest arise out of the relationships between Covered Officers and the Fund and already are subject to conflict of interest provisions in the Investment Company Act of 1940, as amended (the "Investment Company Act"), and the Investment Advisers Act of 1940, as amended (the "Investment Advisers Act"). For example, Covered Officers may not individually engage in certain transactions (such as the purchase or sale of securities or other property) with the Fund because of their status as "affiliated persons" of the Fund. The compliance programs and procedures of the Fund and the Fund's investment adviser (the "Adviser") are designed to prevent, or identify and correct, violations of these provisions. The Code does not, and is not intended to, repeat or replace these programs and procedures, and the circumstances they cover fall outside of the parameters of the Code.
Although typically not presenting an opportunity for improper personal benefit, conflicts arise from, or as a result of, the contractual relationship between the Fund and the Adviser of
which the Covered Officers are also officers or employees. As a result, the Code recognizes that the Covered Officers, in the ordinary course of their duties (whether formally for the Fund or for the Adviser, or for both), will be involved in establishing policies and implementing decisions that will have different effects on the Adviser and the Fund. The participation of the Covered Officers in such activities is inherent in the contractual relationship between the Fund and the Adviser and is consistent with the performance by the Covered Officers of their duties as officers of the Fund and, if addressed in conformity with the provisions of the Investment Company Act and the Investment Advisers Act, will be deemed to have been handled ethically. In addition, it is recognized by the Fund's Board that the Covered Officers also may be officers or employees of one or more other investment companies covered by this or other codes of ethics.
Other conflicts of interest are covered by the Code, even if such conflicts of interest are not subject to provisions in the Investment Company Act and the Investment Advisers Act. Covered Officers should keep in mind that the Code cannot enumerate every possible scenario. The overarching principle of the Code is that the personal interest of a Covered Officer should not be placed improperly before the interest of the Fund.
| | Each Covered Officer must:
|
- not use his personal influence or personal relationships improperly to influence investment decisions or financial reporting by the Fund whereby the Covered Officer would benefit personally to the detriment of the Fund;
- not cause the Fund to take action, or fail to take action, for the individual personal benefit of the Covered Officer rather than the benefit of the Fund; and
- not retaliate against any employee or Covered Officer for reports of potential violations that are made in good faith.
3. Disclosure and Compliance
- Each Covered Officer should familiarize himself with the disclosure requirements generally applicable to the Fund within his area of responsibility;
- each Covered Officer should not knowingly misrepresent, or cause others to misrepresent, facts about the Fund to others, whether within or outside the Fund, including to the Fund's Board members and auditors, and to governmental regulators and self-regulatory organizations;
- each Covered Officer should, to the extent appropriate within his area of responsibility, consult with other officers and employees of the Fund and the Adviser with the goal of promoting full, fair, accurate, timely and understandable disclosure in the reports and documents the Fund files with, or submits to, the SEC and in other public communications made by the Fund; and
- it is the responsibility of each Covered Officer to promote compliance with the standards and restrictions imposed by applicable laws, rules and regulations.
4. Reporting and Accountability
Each Covered Officer must:
|
- upon adoption of the Code (or thereafter, as applicable, upon becoming a Covered Officer), affirm in writing to the Board that he has received, read, and understands the Code;
- annually thereafter affirm to the Board that he has complied with the requirements of the Code; and
- notify the Adviser's General Counsel (the "General Counsel") promptly if he knows of any violation of the Code. Failure to do so is itself a violation of the Code.
The General Counsel is responsible for applying the Code to specific situations in which questions are presented under it and has the authority to interpret the Code in any particular situation. However, waivers sought by any Covered Officer will be considered by the Fund's Board.
The Fund will follow these procedures in investigating and enforcing the Code:
- the General Counsel will take all appropriate action to investigate any potential violations reported to him;
- if, after such investigation, the General Counsel believes that no violation has occurred, the General Counsel is not required to take any further action;
- any matter that the General Counsel believes is a violation will be reported to the Board;
- if the Board concurs that a violation has occurred, it will consider appropriate action, which may include: review of, and appropriate modifications to, applicable policies and procedures; notification to appropriate personnel of the Adviser or its board; or dismissal of the Covered Officer;
- the Board will be responsible for granting waivers, as appropriate; and
- any waivers of or amendments to the Code, to the extent required, will be disclosed as provided by SEC rules.
5. Other Policies and Procedures
|
The Code shall be the sole code of ethics adopted by the Fund for purposes of Section 406 of the Sarbanes-Oxley Act of 2002 and the rules and forms applicable to registered investment companies thereunder. The Fund's, its principal underwriter's and the Adviser's codes of ethics under Rule 17j-1 under the Investment Company Act and the Adviser's additional policies and procedures, including its Code of Conduct, are separate requirements applying to the Covered Officers and others, and are not part of the Code.
6. Amendments
The Code may not be amended except in written form, which is specifically approved or ratified by a majority vote of the Fund's Board, including a majority of independent Board members.
7. Confidentiality
All reports and records prepared or maintained pursuant to the Code will be considered confidential and shall be maintained and protected accordingly. Except as otherwise required by law or the Code, such matters shall not be disclosed to anyone other than the appropriate Funds and their counsel, the appropriate Boards (or Committees) and their counsel and the Adviser.
The Code is intended solely for the internal use by the Fund and does not constitute an admission, by or on behalf of the Fund, as to any fact, circumstance, or legal conclusion.
| | Dated as of: July 1, 2003
|
| Exhibit A | | | | |
| Persons Covered by the Code of Ethics | | |
| J. David Officer | | President | | (Principal Executive Officer) |
| | | | | (Principal Financial and |
| James Windels | | Treasurer | | Accounting Officer) |
| Revised as of December 29, 2006 | | |