Great Bear Gold Project
Ontario, Canada
Voluntary National Instrument 43-101 Technical Report

Prepared for:
Kinross Gold Corporation
Prepared by:
Nicos Pfeiffer, P.Geo.
John Sims, CPG
Yves Breau, P.Eng.
Rick Greenwood, P.Geo.
Agung Prawasono, P.Eng.
Effective Date: December 31, 2022
Issue Date: February 13, 2023
 | Kinross Gold Corporation Great Bear Gold Project Ontario, Canada NI 43-101 Technical Report |
Contents
| 1. | SUMMARY | 1 | ||
| 1.1 | Executive Summary | 1 | ||
| 1.2 | Technical Summary | 6 | ||
| 2. | INTRODUCTION | 12 | ||
| 2.1 | Qualified Persons | 12 | ||
| 2.2 | Sources of Information | 12 | ||
| 2.3 | Effective Date | 13 | ||
| 2.4 | List of Abbreviations | 14 | ||
| 3. | RELIANCE ON OTHER EXPERTS | 15 | ||
| 4. | PROPERTY DESCRIPTION AND LOCATION | 16 | ||
| 4.1 | Location | 16 | ||
| 4.2 | Mineral Tenure | 16 | ||
| 4.3 | Mineral Claim Ownership Details | 19 | ||
| 4.4 | Environmental Liabilities and Other Significant Factors | 19 | ||
| 4.5 | Permitting | 19 | ||
| 4.6 | Other Liabilities | 20 | ||
| 5. | ACCESSIBILITY, CLIMATE, LOCAL RESOURCES, INFRASTRUCTURE AND PHYSIOGRAPHY | 21 | ||
| 5.1 | Accessibility | 21 | ||
| 5.2 | Climate | 21 | ||
| 5.3 | Local Resources | 22 | ||
| 5.4 | Infrastructure and Community Services | 22 | ||
| 5.5 | Physiography and Environment | 23 | ||
| 6. | HISTORY | 24 | ||
| 6.1 | 88-4 Zone (Limb Zone) | 30 | ||
| 6.2 | NS Zone (Hinge Zone) | 30 | ||
| 6.3 | LP Zone | 31 | ||
| 6.4 | Production | 31 | ||
| 7. | GEOLOGICAL SETTING | 32 | ||
| 7.1 | Regional Geology | 32 | ||
| 7.2 | Local Geology | 38 | ||
| 7.3 | Project Geology | 41 | ||
| 7.4 | Mineralization Styles and Target Areas | 50 | ||
| 7.5 | Metamorphism and Alteration | 59 | ||
| 7.6 | Structural Geology | 60 | ||
| 8. | DEPOSIT TYPES | 64 | ||
| 9. | EXPLORATION | 65 | ||
| 10. | DRILLING | 66 | ||
| 10.1 | Summary | 66 | ||
| 10.2 | Kinross 2022 Drilling Program | 66 | ||
| 11. | SAMPLE PREPARATION, ANALYSES, AND SECURITY | 71 | ||
| 11.1 | Sample Security | 71 | ||
TOC i
| Kinross Gold Corporation Great Bear Gold Project Ontario, Canada NI 43-101 Technical Report |
| 11.2 | Sample Preparation and Analysis | 71 | ||
| 11.3 | Quality Assurance/Quality Control | 73 | ||
| 11.4 | QP Opinion | 106 | ||
| 12. | DATA VERIFICATION | 107 | ||
| 12.1 | AGP Site Inspection | 107 | ||
| 12.2 | Independent Sample Analysis | 121 | ||
| 12.3 | QP Opinion | 123 | ||
| 13. | MINERAL PROCESSING AND METALLURGICAL TESTING | 124 | ||
| 13.1 | Introduction | 124 | ||
| 13.1 | Blue Coast Test Programs Results | 124 | ||
| 13.2 | SGS Metallurgical Scoping Test Work 2022 | 132 | ||
| 14. | MINERAL RESOURCE ESTIMATE | 146 | ||
| 14.1 | Summary of Mineral Resources | 146 | ||
| 14.2 | LP Zone Mineral Resource Estimate | 146 | ||
| 14.3 | Hinge and Limb Zone Mineral Resource Estimate | 176 | ||
| 14.4 | Underground Mineral Resource Sensitivity | 190 | ||
| 15. | MINERAL RESERVE ESTIMATE | 191 | ||
| 16. | MINING METHODS | 192 | ||
| 17. | RECOVERY METHODS | 193 | ||
| 18. | PROJECT INFRASTRUCTURE | 194 | ||
| 19. | MARKET STUDIES AND CONTRACTS | 195 | ||
| 20. | ENVIRONMENTAL STUDIES, PERMITTING, AND SOCIAL OR COMMUNITY IMPACT | 196 | ||
| 21. | CAPITAL AND OPERATING COSTS | 197 | ||
| 22. | ECONOMIC ANALYSIS | 198 | ||
| 23. | ADJACENT PROPERTIES | 199 | ||
| 24. | OTHER RELEVANT DATA AND INFORMATION | 201 | ||
| 25. | INTERPRETATION AND CONCLUSIONS | 202 | ||
| 25.1 | Geology and Mineral Resources | 202 | ||
| 25.2 | Metallurgical Testing | 203 | ||
| 26. | RECOMMENDATIONS | 205 | ||
| 26.1 | Exploration Drilling | 205 | ||
| 26.2 | Project Development | 206 | ||
| 26.3 | Advanced Exploration Program | 207 | ||
| 27. | REFERENCES | 208 | ||
| 28. | DATE AND SIGNATURE PAGE | 211 | ||
| 29. | CERTIFICATE OF QUALIFIED PERSON | 212 | ||
| 29.1 | Nicos Pfeiffer | 212 | ||
| 29.2 | John Sims | 214 | ||
| 29.3 | Yves Breau | 216 | ||
| 29.4 | Rick Greenwood | 218 | ||
| 29.5 | Agung Prawasono | 219 | ||
| 30. | APPENDIX 1 - LAND TENURE | 221 |
TOC ii
| Kinross Gold Corporation Great Bear Gold Project Ontario, Canada NI 43-101 Technical Report |
Tables
| Table 1-1: Summary of Project Mineral Resources – December 31, 2022 | 1 | |
| Table 2-1: Qualified Persons and their responsibilities | 12 | |
| Table 6-1: Exploration history 1944-February 2022 | 24 | |
| Table 6-2: Summary of Historical Drilling (1944 to February 2022) | 27 | |
| Table 7-1: Regional geology from Sanborn-Barrie et al., 2004 | 35 | |
| Table 10-1: Statistics of 2022 drilling | 68 | |
| Table 11-1: Summary of control samples – 2017 to 2019 | 74 | |
| Table 11-2: Summary of control sample results – 2017 to 2019 | 75 | |
| Table 11-3: Summary of control samples – 2020 – 2022 Great Bear drill programs | 90 | |
| Table 11-4: Summary of CRMs for 2020 – 2022 Great Bear drill program | 92 | |
| Table 11-5: Summary of control samples – 2022 Kinross drill program | 97 | |
| Table 11-6: Summary of CRMs for 2022 Kinross drill program | 99 | |
| Table 11-7: Summary of control samples – 2022 Kinross RC drill program | 102 | |
| Table 11-8: Summary of CRMs for 2022 Kinross RC drilling program | 103 | |
| Table 12-1: Drill hole collar locations - Hinge and Limb Zones | 109 | |
| Table 12-2: Drill hole collar locations - LP Zone | 109 | |
| Table 12-3: Summary of selected drill core for review | 111 | |
| Table 12-4: Summary of independent samples | 122 | |
| Table 12-5: Independent sample results | 122 | |
| Table 13-1: Quantitative analysis - Dixie Project composite head assays | 125 | |
| Table 13-2: Semi-quantitative ICP scan analysis - Dixie Project multi-element ICP scan | 126 | |
| Table 13-3: Semi-quantitative ICP scan analysis - LP multi-element ICP scan | 127 | |
| Table 13-4: Leaching results summary | 129 | |
| Table 13-5: Screened metallics for Au analysis | 136 | |
| Table 13-6: Screened metallics for Ag analysis | 136 | |
| Table 13-7: Quantitative analyses of the samples | 137 | |
| Table 13-8: Semi-quantitative analyses of the samples | 138 | |
| Table 13-9: XFR analysis of the samples | 139 | |
| Table 13-10: Comminution parameters | 140 | |
| Table 13-11: Gold data, coarse bottle roll cyanide leach test results (heap leach amenability) | 141 | |
| Table 13-12: Silver data, coarse ore bottle roll cyanide leach test results (heap leach amenability) | 141 | |
| Table 13-13: Gravity separation Au test results | 143 | |
| Table 13-14: Gravity separation Ag test results | 143 | |
| Table 13-15: Gravity separation tailing cyanide leach results, the effects of grind size | 144 | |
| Table 14-1: Summary of Project Mineral Resources – December 31, 2022 | 146 | |
| Table 14-2: LP Zone Mineral Resource summary – December 31, 2022 | 147 | |
| Table 14-3: Open pit Mineral Resource sensitivity - LP Zone | 148 | |
| Table 14-4: Uncapped statistics of composite data by domain | 154 | |
| Table 14-5: Capped statistics of composited data by domain | 155 | |
| Table 14-6: Summary of variogram parameters by domain | 158 | |
| Table 14-7: Block model extents and the block parameters | 159 |
TOC iii
| Kinross Gold Corporation Great Bear Gold Project Ontario, Canada NI 43-101 Technical Report |
| Table 14-8: Description of block model variables | 160 | |
| Table 14-9: Variables using majority codes, averages, and weighted averages | 161 | |
| Table 14-10: Comparison of tonnes, grade, and ounces in common blocks between the ground truth and long term models | 171 | |
| Table 14-11: Kinross corporate guidance for reconciliation variance | 171 | |
| Table 14-12: Hinge and Limb Zone Mineral Resource summary – December 31, 2022 | 176 | |
| Table 14-13: Capped and uncapped composite statistics by domain | 182 | |
| Table 14-14: Block model variables description | 185 | |
| Table 14-15: Ellipsoid search distances for each estimation domain | 186 | |
| Table 14-16: Underground Inferred Mineral Resource sensitivity - LP, Hinge, and Limb | 190 | |
| Table 30-1: Great Bear claim list | 222 |
Figures
| Figure 4-1: Location map | 17 | |
| Figure 4-2: Land tenure for Great Bear Property | 18 | |
| Figure 5-1: Property access | 21 | |
| Figure 5-2: Low rolling topography, partially forested, with mature stands and younger growth of black spruce | 23 | |
| Figure 6-1: Great Bear Project historical diamond drilling | 29 | |
| Figure 7-1: Regional setting of Great Bear Property within the Uchi Subprovince, on the south margin of the ca. 3 Ga North Caribou Terrane | 33 | |
| Figure 7-2: Regional Red Lake District geology with active and past producing mines | 34 | |
| Figure 7-3: Property scale regional geology | 35 | |
| Figure 7-4: Interpreted geology from drilling, prospecting, and geophysics | 38 | |
| Figure 7-5: Schematic illustration of documented subaqueous felsic lava deposits | 39 | |
| Figure 7-6: Schematic stratigraphy column for the Great Bear Project | 41 | |
| Figure 7-7: Dry core sample of Sediments from BR-051 at 87.5 m | 42 | |
| Figure 7-8: Dry core sample of Felsic Volcaniclastic from BR-046 at 87.5 m | 42 | |
| Figure 7-9: Wet core sample of Felsic Volcanic from DNW-011 at 13.2 m | 43 | |
| Figure 7-10: Dry core photo of Metasediments (2) from BR-065 at 264 m | 43 | |
| Figure 7-11: Wet core photo of Metasediments (2) from DNW-011 at 133.15 m | 44 | |
| Figure 7-12: Wet core photo of Felsic Volcanic (2) from DNW-011 at 141.45 m | 44 | |
| Figure 7-13: Wet core photo of Metasediments (3) from DNW-011 136.3 m and BR-060 315 m | 45 | |
| Figure 7-14: Wet core photo of Fragmental from BR-036 at 413 m to 420 m | 46 | |
| Figure 7-15: Wet core photo of Fragmental from DL-018 at 112 m | 47 | |
| Figure 7-16: Wet core photo of Mafic Volcanic – Fe-Tholeiite – Biotite Calcite Pillows from DL-018 at 136 m | 47 | |
| Figure 7-17: Dry core photo of Argillite from DHZ-026 at 48 m | 48 | |
| Figure 7-18: Wet core photo of Mafic Volcanic – High Mg-Tholeiite – Massive Basalt from DL-024 at 145.5 m | 49 | |
| Figure 7-19: Dry core photo of Mafic Volcanic – High Fe-Tholeiite – Pillow Basalt from DL-024 at 25.0 m | 49 | |
| Figure 7-20: Wet core photo of Ultramafic from DHZ-039 at 141 m | 50 | |
| Figure 7-21: Wet core photo of Feldspar Porphyry Dyke from DHZ-001 at 244.3 m | 50 |
TOC iv
| Kinross Gold Corporation Great Bear Gold Project Ontario, Canada NI 43-101 Technical Report |
| Figure 7-22: Internal Great Bear Resources Ltd. interpreted geology showing mineralization zones at the Project | 51 | |
| Figure 7-23: Silica sulphide replacement style mineralization of the Limb Zone | 52 | |
| Figure 7-24: Limb Zone with significant gold intercepts and MSO shapes looking northeast | 53 | |
| Figure 7-25: Hinge Zone style vein from DHZ-014 at 184.5 m | 54 | |
| Figure 7-26: Vertical section of Hinge Zone, looking northeast (± 7.5 m) with significant assays and MSO shapes | 55 | |
| Figure 7-27: Plan view of gold values >2.3 g/t for the LP Zone with geology and LP sub-zones | 56 | |
| Figure 7-28: Strong strained Felsic Volcanic with 5% to 10% fine-grained arsenopyrite and 1% fine visible gold in the foliation in BR-020 at 90.15 m | 57 | |
| Figure 7-29: Visible gold in foliation hosted by strained porphyritic Felsic Volcanic from DNW-011 at 58.25 m | 58 | |
| Figure 7-30: Recrystallized amphibole overprinting foliation (possible actinolite) and biotite alteration in contact with quartz vein (red line) | 59 | |
| Figure 7-31: Property structural interpretation showing folded terrains (grey shaded) and the Central (coloured) High Strain Corridor | 60 | |
| Figure 7-32: Conceptual sequence of Great Bear area deformation events (not to scale) | 62 | |
| Figure 7-33: Stereonets showing rotated foliation fabrics along the trend of the LP Fault Zone | 63 | |
| Figure 10-1: Drill holes from the 2022 drill program | 67 | |
| Figure 11-1: Graphical representation of total samples submitted and failure rates at SGS vs ActLabs | 76 | |
| Figure 11-2: Blank reference material BL-10 | 77 | |
| Figure 11-3: Control plot for BLK blank material (BL-10 and BLM combined); April 2017 – May 2019 | 78 | |
| Figure 11-4: Control plot for BL-10 blank material; June 2019 to December 2019 | 78 | |
| Figure 11-5: Control plot for BLM blank material; June 2019 to December 2019 | 79 | |
| Figure 11-6: Control plot for SRM GS12A | 80 | |
| Figure 11-7: Control plot for SRM GS1P5Q | 81 | |
| Figure 11-8: Control plot for SRM GS1P5R | 81 | |
| Figure 11-9: Control plot for SRM GS2S | 82 | |
| Figure 11-10: Control plot for SRM GS4H | 82 | |
| Figure 11-11: Control plot for SRM GS5W (Fire Assay) | 83 | |
| Figure 11-12: Control plot for SRM GS5W (Gravimetric Finish) | 83 | |
| Figure 11-13: Control plot for SRM GSP5E | 84 | |
| Figure 11-14: Control plot for SRM OREAS 209 | 84 | |
| Figure 11-15: Control plot for SRM OREAS 214 | 85 | |
| Figure 11-16: Control plot for SRM OREAS 221 | 85 | |
| Figure 11-17: Control plot for SRM OREAS 224 | 86 | |
| Figure 11-18: Control plot for SRM OREAS 228 | 86 | |
| Figure 11-19: Scatter plot for field duplicates | 88 | |
| Figure 11-20: Control plot for coarse reject analyses from SGS, Actlabs and ALS Global | 89 | |
| Figure 11-21: Control plot BLM | 91 | |
| Figure 11-22: Control plot for BLK | 91 | |
| Figure 11-23: Control plot for CDN-GS-1W | 93 | |
| Figure 11-24: Control plot for CDN-GS-4H | 93 | |
| Figure 11-25: Control plot for CDN-GS-P5E | 94 | |
| Figure 11-26: Control plot for OREAS 221 | 94 | |
TOC v
| Kinross Gold Corporation Great Bear Gold Project Ontario, Canada NI 43-101 Technical Report |
| Figure 11-27: Control plot for OREAS 226 | 95 | |
| Figure 11-28: Control plot for OREAS 232 | 95 | |
| Figure 11-29: Control plot for field duplicates; January 2020 to March 2021 | 96 | |
| Figure 11-30: Control plot for BLK | 98 | |
| Figure 11-31: Control plot for BLK_PStone | 98 | |
| Figure 11-32: Control plot for OREAS 230 | 100 | |
| Figure 11-33: Control plot for OREAS 233 | 100 | |
| Figure 11-34: Control plot for OREAS 238 | 101 | |
| Figure 11-35: Control plot for OREAS 240 | 101 | |
| Figure 11-36: Control plot for BLK | 103 | |
| Figure 11-37: Control plot for CDN-GS-12B | 104 | |
| Figure 11-38: Control plot for OREAS 211 | 104 | |
| Figure 11-39: Control plot for OREAS 233 | 105 | |
| Figure 11-40: Scatter plot for field duplicates | 106 | |
| Figure 12-1: Drill hole collars BR-207 (left, LP Zone), DHZ-060 and 061 (right, Hinge Zone) | 108 | |
| Figure 12-2: Drill logging and sampling facility at 117 Forestry Road | 112 | |
| Figure 12-3: Drill logging table; 117 Forestry Road | 113 | |
| Figure 12-4: Core cutting area; 117 Forestry Road | 113 | |
| Figure 12-5: Drill logging and sampling facility at 2 Industrial Park Road and 19 Young Street | 115 | |
| Figure 12-6: Drill logging tables at the 2 Industrial Park Road facility | 116 | |
| Figure 12-7: Drill core cutting room at the 2 Industrial Park Road facility | 117 | |
| Figure 12-8: Strapped core boxes (by drill hole), temporary core storage at the 2 Industrial Park facility | 118 | |
| Figure 12-9: Core racks at the core storage area; Project site | 119 | |
| Figure 12-10: Coarse rejects under tarpaulin at the core storage area; Project site | 120 | |
| Figure 12-11: Historic drill core storage area; near Hinge and Limb Zone | 121 | |
| Figure 13-1: Metallurgical sample locations from current and historical drill sites for test work programs | 135 | |
| Figure 13-2: EGRG test summary results | 142 | |
| Figure 14-1: LP Zone estimation domains, looking northwest | 150 | |
| Figure 14-2: LP Zone estimation domains segmented by parallel east-west trending shear zones | 151 | |
| Figure 14-3: LP Zone cumulative log histogram of assay sample lengths | 152 | |
| Figure 14-4: LP Zone contact plots: transition from background domains to bulk domains (left) and bulk domains to high-grade domains (right) | 153 | |
| Figure 14-5: LP Zone capping analysis | 154 | |
| Figure 14-6: Directional variograms for LP Zone domain 1500 estimated using OK | 157 | |
| Figure 14-7: Experimental variogram models of the Auro domain | �� | 165 |
| Figure 14-8: RC drill program assays within the high-grade population supporting strong continuity at 50 m and reasonable continuity at 75 m spacing | 166 | |
| Figure 14-9: LP Zone classification shells based on drill hole spacing | 167 | |
| Figure 14-10: Swath plots in major block model directions for gold as compared to the NN estimate for gold | 169 | |
| Figure 14-11: Ground truth model based on 8 m x 10 m RC grade control drilling | 170 | |
| Figure 14-12: Comparison of ground truth model to long-term model grade tonnage curves | 170 | |
| Figure 14-13: LP resource open pit shell in 3D | 173 |
TOC vi
| Kinross Gold Corporation Great Bear Gold Project Ontario, Canada NI 43-101 Technical Report |
| Figure 14-14: LP underground resource shapes | 175 | |
| Figure 14-15: Lithological model section cutting the main Limb vein with the folded metasedimentary layer | 178 | |
| Figure 14-16: Limb and Hinge histogram of assay sample lengths | 179 | |
| Figure 14-17: Limb and Hinge contact plot figures | 180 | |
| Figure 14-18: Limb 101 domain capped and uncapped statistics | 181 | |
| Figure 14-19: Hinge 201 domain capped and uncapped statistics | 182 | |
| Figure 14-20: Variogram model for Limb 101 domain estimated using OK | 184 | |
| Figure 14-21: Octree block model setup in Leapfrog | 185 | |
| Figure 14-22: Classification for Limb looking northeast (left) and Hinge looking northwest (right) | 188 | |
| Figure 14-23: Underground Hinge and Limb resource shapes looking northwest | 190 | |
| Figure 23-1: Location of the Great Bear Project and adjacent projects | 199 |
TOC vii
| Kinross Gold Corporation Great Bear Gold Project Ontario, Canada NI 43-101 Technical Report |
| 1. | Summary |
| 1.1 | Executive Summary |
Kinross Gold Corporation (Kinross) has prepared a Technical Report (the Technical Report) for its wholly-owned Great Bear gold project (the Project or the Property), located in northwest Ontario, Canada. This Technical Report conforms to National Instrument 43-101 Standards of Disclosure for Mineral Projects (NI 43-101).
The Project is a gold exploration property located within the Red Lake Mining District of Ontario, an area of historic gold mining and exploration. The Project is located 24 km southeast of the town of Red Lake, Ontario and is comprised of 471 unpatented mining claims totalling 9,140 hectares (ha). Kinross acquired the Project through acquisition of Great Bear Resources Ltd. (Great Bear) in February 2022 and now owns a 100% interest in the Property.
The purpose of this Technical Report is to support an initial Mineral Resource estimate with an effective date of December 31, 2022.
Mineral Resources were estimated for three target areas at the Property, the LP Zone and the satellite Hinge and Limb Zones, and are summarized in Table 1-1 with an effective date of December 31, 2022. Canadian Institute of Mining, Metallurgy and Petroleum (CIM) Definition Standards for Mineral Resources and Mineral Reserves dated May 10, 2014 (CIM (2014) Definitions) were used for classification of Mineral Resources.
Table 1-1: Summary of Project Mineral Resources – December 31, 2022
| Classification | Tonnes (000) | Grade (g/t Au) | Gold Ounces (000) | |||||||
| Measured | - | - | - | |||||||
| Indicated | 33,110 | 2.57 | 2,737 | |||||||
| TOTAL M&I | 33,110 | 2.57 | 2,737 | |||||||
| Inferred | 20,037 | 3.56 | 2,290 |
Notes:
| 1. | Mineral Resources estimated according to CIM (2014) Definitions. |
| 2. | Mineral Resources estimated at a gold price of US$1,700 per ounce. |
| 3. | Open pit Mineral Resources are estimated at a cut-off grade of 0.5 g/t Au. The LP Zone pit shell was selected at an input gold price of US$1,400/oz (for volume), but resources are reported based on a US$1,700/oz cut-off value. |
| 4. | Underground Mineral Resources are estimated at cut-off grades of 2.3 g/t for the LP and Hinge zones and 2.5 g/t Au for the Limb Zone. |
| 5. | Numbers may not add due to rounding. |
Page 1
| Kinross Gold Corporation Great Bear Gold Project Ontario, Canada NI 43-101 Technical Report |
The QP is not aware of any environmental, permitting, legal, title, taxation, socio-economic, marketing, political, or other relevant factors that could materially affect the Mineral Resource estimate.
Conclusions
Geology and Mineral Resources
| • | The Project lies within a regional northwest-southeast trending belt of metavolcanic and metasedimentary rocks which are bounded by intrusive batholiths. |
| • | Three zones of mineralization have been identified within the Project area, LP, Limb, and Hinge, representing three dominant styles of mineralization: silica sulphide replacement, quartz veining, and disseminated gold in a high strain corridor. |
| • | A combined total of 1,170 drill holes totalling 563,191 m have been drilled by Great Bear and Kinross between January 1, 2017 and December 31, 2022. |
| • | Mineral Resources conform to CIM (2014) Definitions. |
| • | As of December 31, 2022, Mineral Resources at the Project consist of: |
| ○ | Indicated: 33.1 Mt grading 2.57 g/t Au and containing 2.7 Moz of gold. |
| ○ | Inferred: 20.0 Mt grading 3.56 g/t Au and containing 2.3 Moz of gold. |
| • | The sample preparation and analyses are adequate for this type of deposit and style of gold mineralization and the sample handling and chain of custody, as documented, meet standard industry practice. |
| • | The quality assurance and quality control (QA/QC) program is in accordance with standard industry practice and CIM Estimation of Mineral Resources and Mineral Reserves Best Practice Guidelines dated November 29, 2019 (MRMR Best Practice Guidelines). Kinross personnel have taken reasonable measures to ensure that the sample analysis completed is sufficiently accurate and precise and that, based on the statistical analysis of the QA/QC results, the assay results are accurate and reliable and are suitable for Mineral Resource estimation. |
| • | The data used to support a Mineral Resource estimate are subject to validation using built-in software program that automatically triggers a data check for a range of data entry errors. Verification checks on surveys, collar coordinates, lithology, and assay data have been conducted. The checks were appropriate and consistent with industry standards. |
Page 2
| Kinross Gold Corporation Great Bear Gold Project Ontario, Canada NI 43-101 Technical Report |
| • | A reverse circulation (RC) drill program was undertaken in 2022 to generate a ground truth model separate from the resource model for validation purposes. A total of 433 drill holes were completed on a 8 m x 10 m grid designed to re-create a grade control drill program on approximately a quarter of a year of estimated production from the open pit across a combination of low, medium, and high grade. The variance between the two models is currently well within Kinross quarterly Key Performance Indicators (KPI) providing good confidence that the resource model is performing well. |
| • | The sample descriptions, sampling procedures, and data entries were conducted in accordance with industry standards. |
| • | The database is representative and adequate to support a Mineral Resource estimate for the Project. |
| • | An open pit and underground scenario was contemplated for the LP Zone and an underground scenario, for the Hinge and Limb zones. The open pit and underground resources were constrained within $1,400 open pit resource shells and $1,700 underground mineable shapes, respectively, and fulfill the CIM (2014) Definitions requirement of “reasonable prospects for eventual economic extraction” (RPEEE). |
Metallurgical Testing
| • | The following conclusions were noted based on the preliminary metallurgical test work carried out by Blue Coast Research Ltd. (Blue Coast Research) in 2020 and 2021: |
| ○ | Gold from each composite was readily cyanide soluble with extraction during standard cyanide leach tests ranging from 95% to 99%. |
| ○ | The addition of lead nitrate did not improve overall leach recovery from the LP material. Lead nitrate addition improved extraction kinetics from the highest-grade composite only. Extraction kinetics from all other composites were unaffected by the addition of lead nitrate. |
| ○ | Cyanide consumption was low, averaging 0.19 kg NaCN/tonne over all tests. |
| ○ | Higher sulphide content was noted in the Limb samples. |
Page 3
| Kinross Gold Corporation Great Bear Gold Project Ontario, Canada NI 43-101 Technical Report |
| ○ | The addition of lead nitrate improved overall gold recovery and increased gold dissolution kinetics in the Limb samples. The improvement in gold dissolution kinetics was noted to be up to 24 hours in some instances. |
| ○ | Lead nitrate addition reduced the dissolution of sulphur and resulted in lower consumption of cyanide. |
| ○ | Pre-treatment with lead nitrate prior to the addition of cyanide did not result in any additional gold recovery, compared to when lead nitrate was added just prior to cyanide. |
| ○ | Grinding to 75 microns appeared to improve gold recovery slightly compared to primary grinds of approximately P80=125 μm. |
| • | A more comprehensive metallurgical testing program is currently underway at SGS Canada Inc. (SGS) and has the purpose of evaluating the metallurgical response of the mineralization, providing the key metallurgical data for selection of a suitable processing flowsheet for plant design, and estimating metallurgical recoveries and processing costs for financial modelling. |
Recommendations
Based on the information presented in this Technical Report and results of the ongoing work on the Project, the QPs’ recommendations are summarized as follows.
All three target zones continue to warrant follow-up drilling. There is a three-fold objective for the continued drilling: establishing the extent of the deposit along strike and its depth potential, property-wide exploration, and definition drilling, with the first being the primary focus. The LP Zone is the most attractive target based on its potential size and high gold grades, and therefore continues to be prioritized.
Concurrently with drilling, the Project should continue with metallurgical and other technical studies and permitting. The Mineral Resource is substantial enough to initiate more advanced studies.
In addition, an Advanced Exploration Program (AEX) is recommended that would enable exploration drilling to be completed from underground, testing the depth of the deposit as well as better defining the deposit for engineering work.
Exploration Drilling
Exploration drilling at the Project should continue with multiple drill holes targeting both depth and strike potential. A specific focus should be on testing the deposit at and below the 1,000 m vertical depth to define the underground extents. For this purpose, additional drilling is proposed to be carried out on the Property. In conjunction with drilling, the Project should continue its ongoing highly technical program of data collection and analysis. The continued development of the geological model as well as continued geological mapping are considered highly important for Project advancement.
Page 4
| Kinross Gold Corporation Great Bear Gold Project Ontario, Canada NI 43-101 Technical Report |
Specific exploration recommendations for 2023 and beyond are as follows:
| 1. | Continue diamond drilling to test: |
| ○ | Extent of deposit along strike |
| ○ | Extent of deposit at depth |
| ○ | New targets throughout Property |
| ○ | Condemnation for potential infrastructure locations |
| ○ | Upgrade Inferred Mineral Resources to Indicated Resources where feasible, to allow for completion of technical studies and future Mineral Reserve estimation |
Project Development
Based on the current Mineral Resources, the Project shows sufficient economic potential to initiate advanced studies.
The QPs recommend that Great Bear continue with engineering studies on ground conditions, site layout, metallurgical testing, soil geotechnical drilling and testing, and environmental baseline studies. Great Bear will continue to follow standard project development framework, with both open pit and underground studied. Specific Project recommendations for 2023 and beyond are summarized below:
| 1. | Continue baseline environmental studies for input into permitting and engineering studies. |
| 2. | Continue to engage with our First Nations partners and local stakeholders. |
| 3. | Study the Project with engineering partners following project stage-gating (Scoping, PFS, FS). |
| 4. | Although the underground will not be fully defined, it is recommended that site infrastructure considers what the underground may become. |
| 5. | Further mine plan optimisation of the open pit and underground resource. |
Page 5
| Kinross Gold Corporation Great Bear Gold Project Ontario, Canada NI 43-101 Technical Report |
| 6. | Continue with metallurgical studies to test the variability of the deposits considering the significant strike length and depth. |
| 7. | Implement geotechnical work on both the bedrock and soil geotechnical characterization including geophysics, drilling, and laboratory testing using a speciality consultant. |
Advanced Exploration Program
The Property, centered around the LP Zone deposit, continues to be open at depth and additional drilling is required to estimate the potential at depth, approximately 500 vertical metres from surface. For this purpose, an AEX program should be evaluated which would require a portal and decline to be established to access the underground and drill from depth. The initial concept being contemplated would allow exploration drilling to start from approximately 600 vertical metres from surface and test the depth extent of the deposit. Due to the deposit’s characteristics, drilling from the underground is considered to be more feasible for upgrading the underground resource to a higher category. AEX has proved to be an efficient method to define underground deposits. AEX would also aid in the engineering studies and design of the future Project.
It is recommended by the QP that Great Bear complete the engineering and baseline environmental studies on the AEX program be completed as a priority and the Ontario permitting process be initiated.
| 1.2 | Technical Summary |
Property Description, Location and Land Tenure
The Project is located in northwest Ontario, Canada, at latitude 50.8764°N and longitude 93.6398° (Universal Transverse Mercator (UTM) Zone 15N 455665E, 5633910N (NAD83)). Red Lake, the nearest municipality, is 24 km to the north-northwest of the Property. Red Lake consists of six small communities, Balmertown, Cochenour, Madsen, McKenzie Island, Red Lake, and Starratt-Olsen, and is an enclave within the Unorganized Kenora District. Red Lake is 535 km northwest of Thunder Bay and 250 km east of Winnipeg, Manitoba.
The Property consists of a contiguous block comprising 471 unpatented mining claims totaling 9,140 ha. Kinross’ wholly-owned subsidiary Great Bear owns 100% of the claims.
Page 6
| Kinross Gold Corporation Great Bear Gold Project Ontario, Canada NI 43-101 Technical Report |
History
The first exploration work on the Property documented by Geology Ontario dates to 1944, with mapping/prospecting, diamond drilling, and geophysical work continuing to present.
Prior to acquisition by Kinross in 2022, a total of 974 diamond drill holes (DDH) for 390,227 m had been completed on the Property (historically named the Dixie Lake Property) between 1944 and February 2022. Other exploration activities included geological mapping, airborne and ground-based geophysical surveys, and geochemical sampling.
Historically, the most significant drill programs on the Project were completed by Consolidated Silver Standard Mines Ltd. (1988), Teck Resources Ltd. (1989-1990), Alberta Star Mining Corp./Fronteer Development Group Joint Venture (2003-2004), Grandview Gold Inc. (2005-2011), and Great Bear (2017-2022). These programs focused on two main target areas historically identified as the 88-4 Zone and the NS Zone, currently known as the Limb Zone and Hinge Zone respectively. The most recent drill program conducted by Great Bear discovered and drill-tested the third and largest target on the Property, the LP Zone.
No production has taken place on the Property.
Geology and Mineralization
The Property lies within the Red Lake greenstone belt of the Uchi Subprovince of the Archean Superior Province of the Canadian Shield. The belt is one of the most prolific gold camps in Canada, with gold production over 29 million ounces (Moz) from multiple deposits, including the Campbell-Goldcorp (>23 Moz), Cochenor-Willans (1.2 Moz), and Madsen (2.4 Moz) mines.
Because of the overburden and lack of outcrop exposure throughout the Property, most of the previous geological interpretation was based on geophysics, limited regional scale mapping, and diamond drilling.
The Property area lies within a regional northwest-southeast trending belt of metavolcanic and metasedimentary rocks which are bounded by intrusive batholiths. The southwestern portion of the Property is within the mafic domain and consists of mafic volcanic flows (high Fe-tholeiites and high Mg-tholeiites) intercalated with argillite, siltstone, iron formation, and minor local felsic volcanics. The younger sequence of intermediate to mafic volcanic and volcanic derived sedimentary rocks is located at the centre of the Property and has a similar stratigraphy to the western and eastern portions of the Property. The felsic domain dominates the northeastern portion of the Property. It consists of porphyritic felsic flows (dacites) and volcaniclastics intercalated with sedimentary rocks. The sequence is interpreted as a deformed felsic flow-dome complex. The mafic domain is in contact with a largely felsic/sedimentary domain in the northeast portion of the Property.
Page 7
| Kinross Gold Corporation Great Bear Gold Project Ontario, Canada NI 43-101 Technical Report |
Mafic volcanic dykes and sills are common throughout the Property, ranging from lamprophyre to gabbro/diorite. Intermediate felsic intrusive rocks are also noted throughout the region.
Three dominant styles of mineralization are observed within three target areas on the Property:
| 1. | Silica-sulphide replacement – Limb Zone |
Mineralization is associated with the rheological and geochemical contact between pillow basalt (Fe-tholeiites) and massive basalt and occurs as replacement of sediments, if present, or as silica flooding and quartz-calcite veining in the absence of sediments. Pyrrhotite (2% to 40%) is the dominant sulphide, with other sulphides including pyrite, arsenopyrite, chalcopyrite, minor sphalerite, and trace magnetite. Visible gold is not uncommon and, where observed, is associated with strong pyrrhotite and weaker arsenopyrite-pyrite mineralization. The zone is approximately 800 m long and has been drilled to a vertical depth exceeding 400 m. Mineralization plunges steeply northwest in a fold limb host dipping steeply to subvertically northeast.
| 2. | Quartz veining – Hinge Zone |
Mineralization is hosted by multiple lithologies including massive basalt (high Mg-tholeiite), argillite, and pillow basalt (high-Fe tholeiite). Individual veins are variable in width ranging from 1 cm to 5 m and can create zones up to 40 m. They are generally mineralized with fine-grained disseminated sulphides including pyrrhotite, pyrite, chalcopyrite, minor arsenopyrite, and trace sphalerite. Visible gold is very common ranging from trace to 5% as pin pricks, centimetre scale clusters, and fracture fill. The Hinge Zone is comprised of several subparallel anastomosing veins formed along the axial trace of a property wide D2 fold.
| 3. | Disseminated gold within high strain – LP Zone |
Mineralization occurs within a wide zone of high strain and increased metamorphic grade. The strain zone is very continuous for over 4 km and is slightly oblique to stratigraphy, intersecting multiple lithologies. The higher-grade gold mineralization appears to be controlled by the intersection of this strain zone and a metasediment unit. Recent drilling results indicate that it occurs within 50 m to 100 m of the metasedimentary/felsic volcanic contact. At least three gold mineralizing events have been recognized, including foliation parallel free gold in host rock, transposed quartz veins, and later quartz veins with visible gold that are slightly oblique to foliation.
Page 8
| Kinross Gold Corporation Great Bear Gold Project Ontario, Canada NI 43-101 Technical Report |
Exploration
Due to overburden and lack of outcrop in the area, exploration targets at the Project were interpreted from geophysical and surface geochemical surveys. These exploration tools included airborne magnetic and electromagnetic (EM) surveys, ground magnetics, very low frequency electromagnetic (VLF-EM), horizontal loop/Max-Min EM, induced polarization (IP), soil, mobile metal ion (MMI), and rock sampling. Anomalies and conductors from the geophysical surveys predominantly coincide with iron formation, graphitic argillites, and sulphide-bearing (pyrite and/or pyrrhotite) argillites, or mafic volcanics. The geochemical surveys, which were typically completed over the geophysical surveys, were then used to vector in on the most prospective targets for diamond drilling.
Diamond drilling has been carried out since 1944 and totals 597,194 m in 1,359 drill holes. Of these, Kinross has drilled 397 holes for a total of 206,967 m. In addition, Kinross has completed an RC drill program for a total of 34,530 m in 433 holes. The objective of the Kinross 2022 drill program was five-fold:
| 1. | Test the extents of known drill targets. |
| 2. | Infill zones of potentially economic mineralization to meet Inferred Mineral Resource classification status. |
| 3. | Carry out condemnation drilling to identify areas that may be used for capital development. |
| 4. | Begin drill testing the deep extension of the mineralization at a greater than one kilometre depth. |
| 5. | Mimic production drilling by drilling a tight grid of RC drill holes that would provide data for a ground truth block model. |
Metallurgical Testing
Two test work programs were completed by Blue Coast Research in 2020 and 2021 to provide an initial understanding of gold dissolution using standard cyanidation methods on composites from the LP, Hinge, and Limb zones of the Great Bear deposit. Additional cyanidation tests were conducted to evaluate the impacts of grind size, cyanide concentration, and lead nitrate addition on gold leaching.
Page 9
| Kinross Gold Corporation Great Bear Gold Project Ontario, Canada NI 43-101 Technical Report |
Following the acquisition, Kinross retained SGS to perform a more comprehensive test program, namely the Scoping Test Work program. This metallurgical testing program is underway at SGS. The evaluation program includes a wide range of characterization tests comprised of detailed chemical head analysis, mineralogy, comminution, and ore sorting. Gold recovery testing incorporates a brief investigation of the heap leaching option, and a detailed examination of standard milling circuit options, including gravity separation, flotation, and cyanide leaching. A rheometallurgical program covering thickening, rheology, and filtration is also included as well as a baseline acid rock drainage (ARD) testing on final tailings from selected leach tests. The results of the SGS test program are pending as of the effective date of this Technical Report.
Mineral Resource Estimate
A summary of the Mineral Resource estimate is provided in Table 1-1.
LP Zone
Snowden Supervisor v 8.14.2 (Supervisor) was used for geostatistical analysis, Leapfrog Geo 2021.5 (Leapfrog) was used to generate estimation domains, and Vulcan 2022.3 (Vulcan) was used for compositing and estimation. The bulk estimation domains were interpolated by ordinary kriging (OK), while the high-grade estimation domains and background domain were interpolated using inverse distance cubed (ID3).
The 2022 Great Bear LP Zone Scoping Study model classification criteria are based upon the geostatistical drill hole spacing analysis supported by historic exploration and deposit growth drilling, as well as the recent 2022 drill campaign designed to upgrade unclassified material to Inferred status in and around the preliminary pit area at the LP Zone. Drill hole distance criteria of 50 m and 75 m were used for classification of Indicated and Inferred material, respectively.
The LP zone pit shell was selected at an input gold price of US$1,400/oz (for volume), but resources are reported based on a US$1,700/oz cut-off grade. The US$1,400/oz shell size was selected as a result of initial optimizations between open pit and underground. Furthermore, only the Central section of the LP Zone was considered for open pit resource, with Discovery (NW) and Viggo (SE) areas considered entirely underground resource.
As of December 31, 2022, open pit Mineral Resources are estimated to total 33.1 Mt of Indicated material grading 2.57 g/t Au and containing 2.7 Moz of gold and 8.4 Mt of Inferred material grading 2.24 g/t Au and containing 606,000 oz of gold in the Inferred category. The underground Mineral Resources are estimated to total 10.6 Mt grading 4.54 g/t Au and containing 1.5 Moz, all classified as Inferred.
Page 10
| Kinross Gold Corporation Great Bear Gold Project Ontario, Canada NI 43-101 Technical Report |
Hinge and Limb Zones
Snowden Supervisor v8.14.3.1 was used for geostatistical analysis and Leapfrog Geo/Edge 2022.1.1 for geological and domain modelling, compositing, and estimation. The Limb estimation domains comprise a mineralized zone within metasediments with silica and sulphide replacement hosted in the north limb of the fold. The Hinge estimation domains encompass quartz veins within a tholeiitic basalt in the axial plane of the fold. The main vein at Limb was interpolated using OK and the remaining lenses, using ID3. The model classification criteria are based on drilling spacing analysis, 75 m for Limb and 50 m for Hinge, considering the differences in the mineralization and its continuity between the two zones.
The Mineral Resources were reported within underground reporting shapes generated using the MSO tool, and defined using a minimum stope thickness of 2.0 m, limited to areas of continuous mineralization. The cut-off grades were 2.3 Au g/t for the Hinge Zone and 2.5 Au g/t for the Limb Zone.
As of December 31, 2022, the combined Hinge and Limb underground Mineral Resources were estimated to total approximately 1.1 Mt grading 4.07 g/t Au and containing 137K oz of gold in the Inferred category.
Page 11
| Kinross Gold Corporation Great Bear Gold Project Ontario, Canada NI 43-101 Technical Report |
| 2. | Introduction |
Kinross Gold Corporation (Kinross) has prepared a Technical Report (the Technical Report) for its wholly-owned Great Bear gold project (the Project or the Property), located in northwest Ontario, Canada. This Technical Report conforms to National Instrument 43-101 Standards of Disclosure for Mineral Projects (NI 43-101).
The Project is a gold exploration property located within the Red Lake Mining District of Ontario, an area of historic gold mining and exploration. The Project is located 24 km southeast of the town of Red Lake, Ontario and is comprised of 471 unpatented mining claims totalling 9,140 hectares (ha). Kinross acquired the Project through acquisition of Great Bear Resources Ltd. (Great Bear) in February 2022 and now owns a 100% interest in the Property, with Great Bear Resources Ltd. the registered holder.
The purpose of this Technical Report is to support an initial Mineral Resource estimate with an effective date of December 31, 2022.
| 2.1 | Qualified Persons |
The Qualified Persons (QP) for this Technical Report are summarized in Table 2-1:
Table 2-1: Qualified Persons and their responsibilities
| QP Name, Designation, Title | Site Visit | Responsible for | ||
| Nicos Pfeiffer, P.Geo. Vice President Geology | Multiple in 2022 | Section 14 (except Mineral Resource Reporting) | ||
| John Sims, CPG Company Qualified Person, President of Sims Resources LLC | October 19 and 20, 2022 | Overall preparation of the Technical Report and in particular, Sections 1 to 10, and 23 to 27 | ||
| Yves Breau, P.Eng. Vice-President Metallurgy, Engineering and Energy | March 2022 | Section 13 | ||
| Rick Greenwood, P.Geo. Exploration Manager | Full time employee at Project site | Sections 11 and 12 | ||
| Agung Prawasono, P.Eng., PMP, Senior Director, Mine Planning | June 24, 2022 | Section 14 (Mineral Resource Reporting) |
| 2.2 | Sources of Information |
The Kinross QPs visited the Project as indicated in Table 2-1.
Page 12
| Kinross Gold Corporation Great Bear Gold Project Ontario, Canada NI 43-101 Technical Report |
While at the Project site, the Kinross QPs held discussions with site technical personnel; visited the proposed open pit site, drill rigs in the field, and core logging facility to review core and logging procedures; reviewed data collection and QA/QC procedures, geological interpretations, geological modelling, and resource estimation procedures; and reviewed existing infrastructure.
Information used to support this Technical Report has been derived from the reports and documents listed in Section 27 References of this Technical Report.
| 2.3 | Effective Date |
The effective date of the Mineral Resource estimate is December 31, 2022. There were no material changes to the information on the Project between the effective date and the signature date of the Technical Report.
Page 13
| Kinross Gold Corporation Great Bear Gold Project Ontario, Canada NI 43-101 Technical Report |
| 2.4 | List of Abbreviations |
Units of measurement used in this Technical Report conform to the metric system. All currency in this Technical Report is in US dollars (US$) unless otherwise noted.
| µm | micrometre | kWh | kilowatt-hour |
| °C | degree Celsius | L | litre |
| a | annum | m | metre |
| C$ | Canadian dollars | M | mega (million) |
| cm | centimetre | m2 | square metre |
| d | day | m3 | cubic metre |
| dia. | diameter | Ma | million years |
| g | gram | MASL | metres above sea level |
| G | giga (billion) | min | minute |
| Ga | billion years | mm | millimetre |
| g/L | gram per liter | Moz | million ounces |
| g/t | gram per tonne | Mst | million short tons |
| ha | hectare | Mt | million tonnes |
| in | inch | oz | Troy ounce (31.1035g) |
| kg | kilogram | ppm | part per million |
| km | kilometre | s | second |
| km/h | kilometre per hour | st | short ton |
| km2 | square kilometre | t | metric tonne |
| kWh/t | kilowatt-hour per tonne | US$ | United States dollar |
| kW | kilowatt | yr | year |
Page 14
| Kinross Gold Corporation Great Bear Gold Project Ontario, Canada NI 43-101 Technical Report |
| 3. | Reliance on Other Experts |
In the preparation of the Technical Report, the Qualified Persons relied on information provided by internal Kinross legal counsel for the discussion of claim numbers, title types, anniversary dates and confirmation that the claims are in good standing as of the date of this Technical Report summarized in Sections 1, 4, and Appendix 1.
Page 15
| Kinross Gold Corporation Great Bear Gold Project Ontario, Canada NI 43-101 Technical Report |
| 4. | Property Description and Location |
| 4.1 | Location |
The Project is located in northwest Ontario, Canada (Figure 4-1) at latitude 50.8764°N and longitude 93.6398° (Universal Transverse Mercator (UTM) Zone 15N 455665E, 5633910N (NAD83)). Red Lake, the nearest municipality, is 24 km north-northwest of the Property. Red Lake consists of six small communities—Balmertown, Cochenour, Madsen, McKenzie Island, Red Lake, and Starratt-Olsen—and is an enclave within the Unorganized Kenora District. Red Lake is 535 km northwest of Thunder Bay, Ontario and 250 km east of Winnipeg, Manitoba.
| 4.2 | Mineral Tenure |
The Property consists of a contiguous block comprising 471 unpatented mining claims totalling 9,140 ha, shown in Figure 4-2 and listed in Appendix 1 Table 30-1 of this Technical Report. Kinross’ wholly-owned subsidiary Great Bear Resources Ltd. (Great Bear) owns 100% of the claims.
Of the 471 unpatented mining claims, 436 are termed as Single Cell Mining Claims (SCMC) meaning that the claim holder holds the entirety of the mining cell. The remaining 35 unpatented claims are classified as Boundary Cell Mining Claims (BCMC) meaning that the claim is a partial cell and the cell is shared with another property owner. If, at any time, the other claim holder was to abandon or forfeit their portion of any of the BCMC, it would be converted to SCMC and the balance of the map cell would become part of the Great Bear Property. The 471 unpatented mining claims which comprise the Property are currently in good standing and assessment work credits are sufficient to maintain that standing for several years. The government of Ontario requires expenditures of $400 per year per SCMC, prior to expiry, to keep the claims in good standing for the following year(s). BCMC require expenditures of $200 per year. The Assessment Report describing the work completed by the company must be submitted by the expiry date of the claims to which the work credit is to be applied.
Page 16
| Kinross Gold Corporation Great Bear Gold Project Ontario, Canada NI 43-101 Technical Report |

Figure 4-1: Location map
Page 17
| Kinross Gold Corporation Great Bear Gold Project Ontario, Canada NI 43-101 Technical Report |

Figure 4-2: Land tenure for Great Bear Property
Page 18
| Kinross Gold Corporation Great Bear Gold Project Ontario, Canada NI 43-101 Technical Report |
| 4.3 | Mineral Claim Ownership Details |
In February 2022, Kinross completed the acquisition of Great Bear for approximately $1.4 billion. Great Bear Resources Ltd. owns 100% of the Great Bear Property.
The Property is subject to a 2% net smelter return (NSR) royalty that was granted by Great Bear to Great Bear Royalties Corp. on January 31, 2020. In September 2022, Great Bear Royalties Corp. was acquired by a wholly-owned subsidiary of Royal Gold Inc.
As the land is crown land, legal access to the claims is available by public roads which cross the Property.
| 4.4 | Environmental Liabilities and Other Significant Factors |
No known environmental liabilities exist on the Property from historical or present processing or operations. Comprehensive soil and water quality baseline tests commenced in 2022 and are continuing into 2023. There are areas that have been hydraulically and/or mechanically stripped to expose bedrock in the past, and several small trenching programs have taken place. These disturbed areas have been recorded by the Ontario Geological Survey (OGS) and are considered part of the legacy work of the Project area.
| 4.5 | Permitting |
Great Bear holds an Exploration Permit valid until November 23, 2025. This permit is issued under the authority of section 78.3 of the Mining Act and the Exploration Plans and Exploration Permits Regulation (O. Reg. 308/12). The permit covers multiple zones of high-grade mineralization across the Property and grants the company the right to use mechanized drilling (assembled weight of the drill >150 kg).
Great Bear holds a Land Use Permit (LUP) for a weather station on a 0.25 ha area. The LUP came into effect on May 1, 2022 and is valid until April 30, 2027.
Great Bear has a Memorandum of Understanding (MoU) with the Ministry of Natural Resources and Forestry (MNRF) for a bridge that crosses Dixie Creek, situated on public land as defined in section 1 of the Public Lands Act (RSO, 1990, c. P.43). The agreement is valid from February 23, 2020 to February 23, 2025.
Page 19
| Kinross Gold Corporation Great Bear Gold Project Ontario, Canada NI 43-101 Technical Report |
| 4.6 | Other Liabilities |
The QP is not aware of any other factors or risks that would affect or limit access, title, or the right or ability to perform work on the Property.
Page 20
| Kinross Gold Corporation Great Bear Gold Project Ontario, Canada NI 43-101 Technical Report |
| 5. | Accessibility, Climate, Local Resources, Infrastructure and Physiography |
| 5.1 | Accessibility |
Access to the Property from Red Lake is via Highway 105. From the highway turnoff, the claims are crossed by a network of all-season logging roads and seasonal trails built to service mineral exploration work (Figure 5-1). The southwestern portion of the claim is accessible by the Snake Falls Camp Road, where there is a small seasonal fishing camp.

Figure 5-1: Property access
| 5.2 | Climate |
The climate is typically mid-continental. Summers are warm and humid, with frequent rain showers and thunderstorms. Winters are cold. Snow usually starts falling around late October or early November and starts melting around March. Temperatures in the summer range from 15°C to 28°C with temperatures dipping to an average of -10°C to -20°C in the winter, with lows reaching -35°C.
Page 21
| Kinross Gold Corporation Great Bear Gold Project Ontario, Canada NI 43-101 Technical Report |
Total annual precipitation averages 6.3 cm. Snow accounts for approximately 24% of the precipitation. The summer months of June, July, August, and September account for more than half of the annual precipitation (54%). February is the driest month of the year, with an average precipitation of just 2.5 mm.
Exploration activities may be conducted year-round on the Property. Seasonal exploration activities, such as mapping and field sampling, are best conducted from May to October when there is no snow cover. Ground geophysical and diamond drilling programs can be conducted year-round but are preferred between late October and mid-March, when the lakes, streams, and muskeg are typically frozen, as well as in the drier summer months from May through September. This allows for easy mobilization of the heavy machinery required for drilling operations.
| 5.3 | Local Resources |
Water Supply
Water is abundant year-round on the Project and in the region. There are numerous lakes, rivers, and swamps on the Project and in the area. Seasonal temperature variations require that heating systems be utilized for water transportation systems (i.e., drilling hose line) during the winter and late fall.
Power
Hydroelectric power lines follow Highway 105 and cross the northeastern corner of the Property and run parallel to the northeastern boundary.
| 5.4 | Infrastructure and Community Services |
Red Lake is the closest community to the Project. It has a population of 4,094 residents, according to Statistics Canada in 2022. There is a fully functional airport that receives daily flights from Winnipeg, Manitoba and Thunder Bay, Ontario, Canada. The district has produced more than 28 million ounces (Moz) of gold since 1949, from four principal mines, only one of which is still in operation (Evolution’s Red Lake Gold Mine). Gold mining and seasonal tourism activity provide a stable economic base and the town offers all necessary facilities in support of mineral exploration efforts. Supplies and experienced, highly trained field personnel are available from the surrounding area and local communities.
Page 22
| Kinross Gold Corporation Great Bear Gold Project Ontario, Canada NI 43-101 Technical Report |
| 5.5 | Physiography and Environment |
The regional topography features low, rolling hills with numerous small lakes and spruce bogs. On the Property, the terrain is gently sloping with an elevation range of 350 MASL to 460 MASL. There are a few streams, including Dixie Creek, that have mature, meandering courses. The Property is partially forested with mature stands and younger growth of black spruce, poplar, birch and jack pine, all typical species of the boreal forest (Figure 5-2).

Figure 5-2: Low rolling topography, partially forested, with mature stands and younger growth of black spruce
Bedrock occurrences are rare on the Property; where observed, they are typically glacially polished. In aid of prospecting activities, overburden has been stripped from some areas of the claims to expose the bedrock underneath. Overburden depth typically ranges from 5 m to 20 m and averages 15 m. Overburden has been observed to be as deep as 50 m in places.
Page 23
| Kinross Gold Corporation Great Bear Gold Project Ontario, Canada NI 43-101 Technical Report |
| 6. | History |
The first exploration work on the Property documented by Geology Ontario dates to 1944, with mapping/prospecting, diamond drilling, and geophysical work continuing to present.
Prior to acquisition by Kinross, a total of 974 diamond drill holes (DDH) for 390,227 m had been completed on the Property (historically named the Dixie Lake Property) between 1944 and February 2022. Other exploration activities included geological mapping, and airborne and ground-based geophysical and geochemical surveys. The exploration history is summarized in Table 6-1.
Table 6-1: Exploration history 1944-February 2022
| Company | Year(s) | Description of Work | Area/Target | |||
| Boyle | 1944 | Drilling, x-ray, metres unknown | A-Zone (Main Zone) | |||
| Belgold Mines | 1945 | Prospecting | Dixie Lake Property | |||
| Trenching | A, B, C, D zones, Dixie Lake Property | |||||
| Caravelle Consolidated | 1969-1972 | Mapping | Dixie Lake Property | |||
| 1969 | Airborne, magnetic (Mag), electromagnetic (EM) – 1/8 mile line spacing. | Dorothy Prospect – covers much of the Property | ||||
| 1972 | Drilling 5 holes, 372.85 m | Dixie Lake Property | ||||
| Newmont Mining Corp. | 1970 | 6 holes, 679.14 m | Dixie Lake Property | |||
| Kerr Addison Mines Ltd | 1975 | 3 DDH, 306 m; EM, 32 line-miles Mag survey | Dixie Lake eastern central portion of the Property | |||
| Golden Terrace | 1985 | Airborne Mag, EM | Dixie Lake Property | |||
| Mutual Resources | 1988 | 3 trenches, rock sampling | North, Main, and South showings, Dixie Lake Property | |||
| 1988 | Ground Mag, very low frequency electromagnetics (VLF-EM), Max-Min – 31-33 line-km | Central part of the Dixie Lake Property | ||||
| 1989 | 1 drill hole, 216.5 m | 88-4 Zone | ||||
| Consolidated Silver Standard Mines Ltd. | 1988 | 7 BQ (36.5 mm) drill holes, 465 m | Dixie Lake Property, discovery of 88-4 Zone | |||
| 1989 | Mapping | Dixie Lake Property |
Page 24
| Kinross Gold Corporation Great Bear Gold Project Ontario, Canada NI 43-101 Technical Report |
| Company | Year(s) | Description of Work | Area/Target | |||
| Teck Resources Ltd./National Trust Co. | ||||||
| 1989 | Ground Mag, VLF-EM – 217.5 line-km, 25 m stations on 100 m spaced lines | Portions of Main and South Grids, Dixie Lake Property | ||||
| 1989 | Diamond drilling, 28 BQ drill holes, 4,090 m | Dixie Lake Property, 88-4 Zone | ||||
| 1990 | Ground Mag, VLF-EM – 217.5 line-km, 25 m spacing Extensive airborne survey Three induced polarization (IP) test lines | Dixie Lake Property | ||||
| 1990 | Diamond drilling, 12 BQ drill holes, 1,999.48 m | Dixie Lake Property, 88-4 Zone, and other geophysical targets | ||||
| Noranda | 1990 | Humus geochemistry, mapping, prospecting | Western Dixie Property | |||
| 1993 | EM 27.85 LKM and 21.77 LKM MAG Survey, 2 DDH, 174.4 m | Western Dixie Property | ||||
| 1994 | Diamond drilling, 1 NQ (47.6 mm), 104.5 m, mapping, prospecting | Central Dixie Lake, Bruce Lake area | ||||
| Cross Lake Minerals Ltd | 1997 | IP Survey 21 km, trenching | Dixie North | |||
| 1998 | IP Survey 39.2 km, trenching | Dixie North, Dixie Northeast | ||||
| Canadian Golden Dragon Resources Ltd. | 1996 | Humus geochemistry | Selected areas around IP anomalies, Dixie Lake Property | |||
| 1996-1997 | IP – 153.6 line-km at 100 m to 200 m line spacing | Large portion of Dixie Lake Property | ||||
| 1996 | Diamond drilling, 12 NQ drill holes, 1,888 m | Dixie Lake Property, 88-4 Zone | ||||
| 1997 | Diamond drilling, 15 NQ drill holes, 2,566 m, testing IP anomalies | Dixie Lake Property | ||||
| Cross Lake Minerals Ltd. | 1997 | Diamond drilling, 5 NQ drill holes, 836 m | Dixie Lake Property | |||
| Alberta Star Mining Corp./Fronteer Development Group | 2003 | Mobile Metal Ion (MMI) Survey | Dixie Lake Property, centered on 88-4 Zone | |||
| 2004 | Ground Mag, diamond drilling, 12 drill holes, 4,370.9 m | 88-4 Zone | ||||
| Perry English | 2004 | Magnetic/Magnetometer Survey 43 LKM | Dixie Lake, South of Byshe Area | |||
| 2005 | EM 27.4 line km, IP Survey 45.6 line km, line cutting | Dixie Lake Area |
Page 25
| Kinross Gold Corporation Great Bear Gold Project Ontario, Canada NI 43-101 Technical Report |
| Company | Year(s) | Description of Work | Area/Target |
| Grandview Gold Inc./Fronteer Development Group | 2003 | Diamond drilling, 10 NQ drill holes, 2,185.5 m | 88-4 Zone and one hole to the northwest of 88-4 Zone | |||
| 2004 | MMI Survey, 927 samples, Ground Mag survey, 50 m line spacing | Dixie Lake Property | ||||
| Grandview Gold Inc. | 2005 | Diamond drilling, 16 NQ drill holes, 2,772 m | 14 DDH west of 88-4 Zone, 2 DDH in 88-4 Zone | |||
| 2006 | Diamond drilling, 5 NQ drill holes, 1,033 m, MMI sampling | 88-4 Zone | ||||
| 2007 | Mapping | Dixie Lake Property | ||||
| 2007 | Diamond drilling, 18 NQ drill holes, 5,117 m | 88-4 Zone, Main Zone, South Zone, NS Zone, C-Zone, MMI-East | ||||
| 2008 | Diamond drilling, 3 NQ drill holes, 575.15 m | NS Zone | ||||
| 2009 | Diamond drilling, 7 NQ drill holes, 1,560 m | MMI Zone, Zone, Main, Zone, C- Zone, 88-4 Zone | ||||
| 2011 | Diamond drilling, 8 NQ drill holes, 1,611 m | MMI Zone, East Zone, Main Zone, C-Zone, 88-4 Zone | ||||
| Larry Kenneth Herbert | 2011-2012 | Trenching, airborne Mag | East of Dixie Lake – North within Property boundary | |||
| Laurentian Goldfields Ltd. | 2010-2013 | Airborne Magnetometer 7184 line km. Mapping and prospecting | Dixie East | |||
| Great Bear Resources Inc. | 2017-2022 | Diamond drilling 770 NQ drill holes, 355,083 m, airborne Mag and SkyTEM, trenching, mapping, soil geochemistry, grab sampling | Hinge and Limb zones, LP Zone |
Due to overburden and lack of outcrop in the area, exploration targets were interpreted from geophysical and surface geochemical surveys. These exploration tools include airborne magnetic and EM surveys, ground magnetics, VLF-EM, horizontal loop/Max-Min EM, IP, soil, MMI, and rock sampling. Anomalies and conductors from the geophysical surveys predominantly coincide with iron formation, graphitic argillites, and sulphide-bearing (pyrite and/or pyrrhotite) argillites, or mafic volcanics. The geochemical surveys, which were typically completed over the geophysical surveys, were then used to vector in on the most prospective targets for diamond drilling.
Historically, the most significant drill programs on the Project were completed by Consolidated Silver Standard Mines Ltd. (Consolidated Silver Standard, 1988), Teck Resources Ltd. (Teck, 1989-1990), Alberta Star Mining Corp./Fronteer Development Group Joint Venture (Alberta Star/Fronteer JV, 2003-2004), Grandview Gold Inc. (Grandview, 2005-2011), and Great Bear (2017-2022). These programs focused on two main target areas historically identified as the 88-4 Zone and the NS Zone. These zones are currently known as the Limb Zone and Hinge Zone respectively. The most recent drill program conducted by Great Bear discovered and drill-tested the third and largest target on the Property, the LP Zone.
Page 26
| Kinross Gold Corporation Great Bear Gold Project Ontario, Canada NI 43-101 Technical Report |
A summary of historical drilling on the Project is provided in Table 6-2 and historical drilling is illustrated in Figure 6-1.
Table 6-2: Summary of Historical Drilling (1944 to February 2022)
| Year | Company | Holes | Metres | |||
| 1944 | Drilling, x-ray, metres unknown | 8 | ||||
| 1945 | Belgold Mines, metres unknown | 4 | ||||
| 1950 | Unknown | 9 | 284.5 | |||
| 1970 | New Mont Mining Corp., Caravelle Mines Ltd, Omar Exploration | 9 | 927.5 | |||
| 1972 | Caravelle Mines Ltd | 2 | 124.6 | |||
| 1975 | Kerr Addison Mines | 3 | 306.0 | |||
| 1988 | Consolidated Silver Standard | 7 | 465.7 | |||
| 1989 | Teck Exploration Ltd | 28 | 4,090.6 | |||
| 1990 | Teck Exploration Ltd | 13 | 2216 | |||
| 1993 | Noranda | 2 | 174.4 | |||
| 1994 | Noranda | 1 | 104.5 | |||
| 1996 | Canadian Golden Dragon | 12 | 1,888.4 | |||
| 1997 | Canadian Golden Dragon, Cross Lake Minerals | 20 | 3,402.3 | |||
| 2003 | Fronteer Development Group Inc | 10 | 2,389.5 | |||
| 2004 | Fronteer Development Group Inc | 12 | 4,370.9 | |||
| 2005 | Grandview Gold Inc/Grandcru Resources | 20 | 3,371.6 | |||
| 2006 | Grandview Gold Inc | 5 | 1,033.3 | |||
| 2007 | Grandview Gold Inc | 18 | 5,117.0 | |||
| 2008 | Grandview Gold Inc/Trueclaim Resources | 6 | 1,706.1 | |||
| 2009 | Grandview Gold Inc | 7 | 1,559.5 | |||
| 2011 | Grandview Gold Inc | 8 | 1,611.3 | |||
| 2017 | Great Bear Resources Ltd | 9 | 1,093.0 | |||
| 2018 | Great Bear Resources Ltd | 70 | 16,578.6 | |||
| 2019 | Great Bear Resources Ltd | 164 | 68,869.0 |
Page 27
| Kinross Gold Corporation Great Bear Gold Project Ontario, Canada NI 43-101 Technical Report |
| Year | Company | Holes | Metres | |||
| 2020 | Great Bear Resources Ltd | 192 | 110,673.5 | |||
| 2021 | Great Bear Resources Ltd | 305 | 138,253.1 | |||
| Jan-Feb 2022 | Great Bear Resources Ltd | 30 | 19,616.1 | |||
| TOTAL | 974 | 390,227 | ||||
Page 28
| Kinross Gold Corporation Great Bear Gold Project Ontario, Canada NI 43-101 Technical Report |
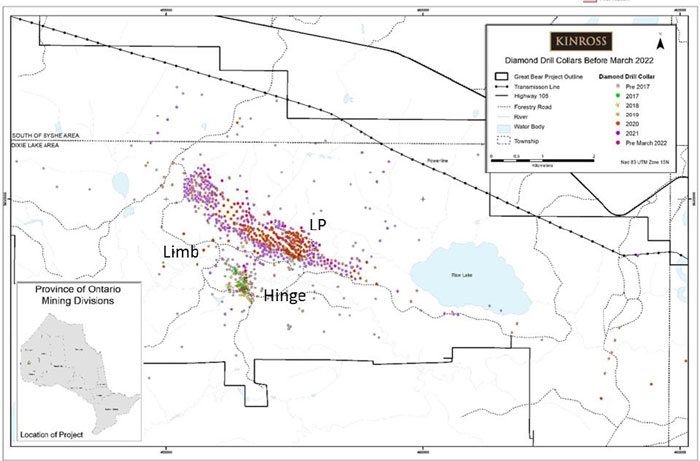
Figure 6-1: Great Bear Project historical diamond drilling
Page 29
| Kinross Gold Corporation Great Bear Gold Project Ontario, Canada NI 43-101 Technical Report |
| 6.1 | 88-4 Zone (Limb Zone) |
This zone was initially identified by Consolidated Silver Standard as a 700 m long geophysical response, characterized by a strong northwest trending EM conductor, with coincident magnetic and VLF-EM anomalies. In 1988, Consolidated Silver Standard drilled this geophysical anomaly and intersected 4.97 g/t Au over 4.2 m (DL-88-4) which led to the discovery of the 88-4 Zone (now known as the Limb Zone). This zone is defined by silica sulphide replacement +/- quartz veining at the contact between a high Fe-tholeiite and high Mg-tholeiite and associated argillite.
The Teck exploration program (1989-1990) concentrated on delineating the strike extents of the 88-4 Zone to approximately 200 m depth.
Teck produced the only published resource estimate for the Property which was completed on the 88-4 Zone (Janzen, 1989). The estimate used standard methodologies for the time, but this work pre-dates NI 43-101 guidelines and would not meet current standards as defined by the Canadian Institute of Mining, Metallurgy and Petroleum (CIM). This estimate is relevant only for historical interest. The QP has not completed sufficient work to classify the historical estimate as a current Mineral Resource and Kinross is not treating this estimate as a current Mineral Resource. .
Great Bear continued to further delineate the Limb Zone through diamond drilling and extended the strike and dip extents of the mineralization with step-out drilling to a depth of 800 m below surface with 400 m of strike extent.
| 6.2 | NS Zone (Hinge Zone) |
During 2007, Grandview was exploring the southeast extension of the 88-4 Zone and intersected high-grade mineralized quartz veining identified as the NS Zone. Unlike the 88-4 Zone, this mineralization consisted of relatively sulphide poor quartz veining hosted by mafic volcanics.
The discovery hole (DC-10-07) intersected 163.57 g/t Au over 0.46 m between 181.8 m and 182.3 m and 15.05 g/t Au over 2.0 m between 201.1 m and 203.1 m, which prompted further drilling on the zone. Additional results included 4.28 g/t Au over 6.35 m between 176.6-183m(DC-15-07) and 17.2 g/t Au over 2.2 m between 127.6-129.8m (DC-08-01R). Historic drilling at the NS Zone indicated that the mineralization was hosted by up to three massive white quartz veins with sub-vertical dip striking approximately east-west.
Page 30
| Kinross Gold Corporation Great Bear Gold Project Ontario, Canada NI 43-101 Technical Report |
| 6.3 | LP Zone |
Following a reconnaissance drill campaign in early 2019, Great Bear completed follow-up drilling on its DNW-008 drill hole approximately two kilometres northwest from the Limb Zone. The reconnaissance program had an objective to test the east-west trending structures on the Property responsible for mineralization occurring in the mafic domain southeast of what is known today as the LP Zone. The LP Discovery hole DNW-011 was planned 50 m step back to undercut DNW-008 which returned 0.57 g/t Au over 33.5 m mineralization from its collar to 41.5 m depth. The discovery hole was drilled reporting multiple mineralized horizons including 155 g/t Au over 2.5 m between 57.5 m and 60.0 m, 12.33 g/t Au over 14 m between 75.0 m and 89.0 m, and 0.6 g/t Au over 71.6 m between 98.0 m and 169.6 m.
Mineralization consisted of fine gold disseminated throughout porphyritic felsic host rocks associated with increased albitization and silicification. Isolated quartz veining also hosted visible gold within this domain. Great Bear continued drilling along strike of the new mineralization and known stratigraphy stepping out over 1.5 km, and re-logging DC-12-07 and extending DL-03-10, which had been sparsely sampled. This led to the discovery of unsampled high-grade mineralization in DC-12-07 of 2.73 g/t Au over 8.5 m between 190.5 m and 199.0 m (Yuma). The approach of testing geology and mineralization along strike continued by stepping one kilometre east and drilling BR-020 resulting in 4.18 g/t Au over 53.7 m between 81.0 m and 134.7 m (Auro).
| 6.4 | Production |
There is no known production from the Property.
Page 31
| Kinross Gold Corporation Great Bear Gold Project Ontario, Canada NI 43-101 Technical Report |
| 7. | Geological Setting |
| 7.1 | Regional Geology |
The Property lies within the Red Lake greenstone belt of the Uchi Subprovince of the Archean Superior Province of the Canadian Shield (Figure 7-1 and Figure 7-2). The most comprehensive geology description of the belt is provided by Sanborn-Barrie et al. (2001; 2004), compilations of Geological Survey of Canada (Open File 4256), and the Ontario Geological Survey (Preliminary Map P3460). It is briefly summarized here.
The Red Lake greenstone belt has 300 Ma history of tectono-magmatic deformation with episodes of magmatism, sedimentation, and intense hydrothermal activity (Sanborn-Barrie et al., 2001).
The rocks of the Red Lake (east trending) and Birch-Confederation (north trending) greenstone belts of the Uchi Subprovince are interpreted to have evolved by eruption and deposition of volcanic sedimentary sequences on the active continental margin (the North Caribou Terrane, 3.0 to 2.7 Ga), followed by subduction related arc volcanism (Figure 7-1). Continental collision with the Winnipeg River Terrane at 2.71-2.7 Ga led to subsequent crust thickening and metamorphism (Stott and Corfu, 1991; Sanborn-Barrie et al., 2000, 2001).
Both greenstone belts in the Red Lake District are dominated by the Balmer and Confederation Lake assemblages (Sanborn-Barrie et al., 2004).
Page 32
| Kinross Gold Corporation Great Bear Gold Project Ontario, Canada NI 43-101 Technical Report |

Source: Thurston et al., 1991
Figure 7-1: Regional setting of Great Bear Property within the Uchi Subprovince, on the south margin of the ca. 3 Ga North Caribou Terrane
Page 33
| Kinross Gold Corporation Great Bear Gold Project Ontario, Canada NI 43-101 Technical Report |

Source: Sanborn-Barrie et al., 2004
Figure 7-2: Regional Red Lake District geology with active and past producing mines
Page 34
| Kinross Gold Corporation Great Bear Gold Project Ontario, Canada NI 43-101 Technical Report |
The 1:250,000 GSC mapping of the East Uchi Subprovince (Sanborn-Barrie et al., 2004) classified the Project into four main rock types (Figure 7-3 and Table 7-1). These include: an unknown affinity Archean mafic volcanic, an amphibole facies mafic volcanic, Confederation assemblage intermediate to felsic volcanic (possible McNeely assemblage), and undated tonalite/quartz monzonite to granodiorite intrusive rocks. There has been no age dating in this area to confirm the assemblage affinity interpretation.

Source: Sanborn-Barrie et al., 2004
Figure 7-3: Property scale regional geology
Table 7-1: Regional geology from Sanborn-Barrie et al., 2004
| Age/Assemblage Affiliation | Rock Type | Description | ||
| Un-subdivided Archean (4000-2500 Ma) | Tonalite to Granodiorite | Medium grained, variably foliated biotite, hornblende biotite tonalite, and associated rocks | ||
| Un-subdivided Mafic Volcanic | Foliated, massive to pillowed basalt, amphibolite, and associated gabbroic rocks; lesser associated intermediate to felsic flows, tuff, and wacke | |||
| Un-subdivided Neoarchean (2800-2500 Ma) | Quartz Monzonite to Granodiorite | Variably foliated biotite quartz monzonite, granodiorite and granite; locally leucocratic and quartz and/or K-feldspar porphyritic |
Page 35
| Kinross Gold Corporation Great Bear Gold Project Ontario, Canada NI 43-101 Technical Report |
| Age/Assemblage Affiliation | Rock Type | Description | ||
| Confederation Assemblage (2745-2735 Ma) | Amphibolite | Amphibolite-facies mafic volcanic rocks locally pillowed east of Dixie Lake considered part of the Confederation assemblage, but sequence is not specified | ||
| Intermediate to Felsic Volcanic | Dacitic to rhyodacite pyroclastic rocks associated epiclastic rocks (regionally interpreted as McNeely sequence) |
Balmer assemblage (2989-2964 Ma)
Tholeiitic and komatiitic basalt, with minor felsic volcanic rocks, iron formation, and fine-grained clastic metasedimentary rocks. The assemblage is the host to the majority of Red Lake’s lode gold deposits.
Confederation assemblage (2750-2735 Ma)
Represented by three sequences: 1) McNeely calc-alkaline sequence (central Red Lake) consisting of intermediate to mafic volcanic rocks; 2) Heyson tholeiitic sequence (southeastern Red Lake) composed of felsic volcanics and interlayered with mafic flows, dacitic tuff, and plagioclase-phyric basaltic andesites; and 3) Graves sequence (northern Red Lake) consisting of basal polymictic conglomerate, intermediate pyroclastic rocks, syn-volcanic diorite, and tonalite.
Structure, Metamorphism, and Mineralisation
Structure
The Red Lake area underwent a complex protracted deformation that culminated in the Kenoran Orogeny which marks collision of the Northern Caribou and Winnipeg River Terranes (Sanborn-Barrie et al., 2004). The east trending Red Lake and north trending Birch-Confederation greenstone belts that form the East Uchi Subprovince are characterized by steeply dipping panels of metamorphosed volcanic and sedimentary rocks. Early, non-penetrative deformation (D0), which resulted in overturning and recumbent folding of Balmer assemblage rocks, is overprinted by two ductile deformation events (D1 and D2) recorded by two generations of folds and penetrative L-S fabrics throughout the belt. D1 fabrics and folds strike northerly, whereas D2 structures are east-northeast striking, except in the Cochenour-Campbell-Red Lake “mine trend”, where a high D2 strain zones strikes east-southeast. Subsequent brittle and semi-brittle structures occur at micro- to macro-scales and have both localized and offset gold mineralization (Dube et al., 2003).
Page 36
| Kinross Gold Corporation Great Bear Gold Project Ontario, Canada NI 43-101 Technical Report |
One of the macro-scale features, trending east-west from the Birch-Uchi belt in the east, through the Property, and then to the northwest, and traceable on high contrast anomalies of regional aeromagnetic data, is interpreted by Lee (2006) to represent a high strain zone.
Metamorphism
The regional metamorphic grade of the Red Lake and Birch-Uchi belts is characterized by mineral assemblages typical of greenschist facies metamorphism (Thompson, 2003). Amphibolite facies mineral assemblages that occur towards the margins of the greenstone belt and are recognized by the presence of garnet and staurolite in metasedimentary rocks and by hornblende clinopyroxene in mafic rocks are attributed to contact metamorphism with major plutons and minor intrusions.
Regional Mineralization
The Red Lake greenstone belt is one of the most prolific gold camps in Canada, with gold production over 29 million ounces (Moz) from multiple deposits, including the Campbell-Goldcorp (>23 Moz), Cochenor-Willans (1.2 Moz), and Madsen (2.4 Moz) mines (Armstrong et al., 2018). The largest and highest grade gold deposits are hosted in the Balmer assemblage. According to Dube et al. (2003b), all gold mineralization is epigenetic and structurally controlled, occurring in veins, lenses, fractures, and hinge zones along contacts between rheologically distinct units.
The Birch-Uchi belt is a volcanogenic massive sulphide (VMS) camp, host to the past-producing South Bay Mine that yielded 1.6 million tons (Mst) of ore averaging 11.06% Zn, 1.8% Cu, and 2.12 oz/t Ag (Atkinson et al., 1990). The deposit is associated with an exhalative argillaceous chert unit and FIII-type spherulitic flows and porphyries of the Confederation assemblage (Agnew sequence). Although most of the volcanic assemblages of the Red Lake greenstone belt host small zinc, copper, and sulphide occurrences, the most prospective volcanic sequence for VMS mineralization, based on known sulphide mineralization, synvolcanic alteration, and correlation with the Birch-Uchi belt, is the tholeiitic Heyson sequence with its high-temperature FIII-type rhyolitic rocks and associated exhalative units (Parker, 1999).
Also, the historic Griffith Mine, located approximately 10 km southeast of the Property, produced 22.8 Mst of iron ore pellets grading 66.7% Fe from 78.8 Mst of crude ore grading 23.9% magnetic iron (29-30% Fe). The mineralization consisted of tightly folded, banded iron formations within sediments of the English River Subprovince.
Page 37
| Kinross Gold Corporation Great Bear Gold Project Ontario, Canada NI 43-101 Technical Report |
| 7.2 | Local Geology |
Because of the overburden and lack of outcrop exposure throughout the Property, most of the previous geological interpretation was based on geophysics, limited regional scale mapping, and diamond drilling.
The Property area lies within a regional northwest-southeast trending belt of metavolcanic and metasedimentary rocks which are bounded by intrusive batholiths. The regional tectonostratigraphic assemblages of the East Uchi Subprovince (Sanborn-Barrie et al., 2004) have recently been subdivided by Great Bear into new lithologies based on visual core logging, geochemistry, and petrology. The division between mafic and intermediate-felsic domain still exists.
The southwestern portion of the Property is within the mafic domain and consists of mafic volcanic flows (high Fe-tholeiites and high Mg-tholeiites) intercalated with argillite, siltstone, iron formation, and minor local felsic volcanics (Figure 7-4). The association of these rocks is interpreted to be the sequence formed in a marine setting, in proximity to active venting in pre-existing anoxic basins. The strong magnetic response associated within this sequence is related to horizons of iron formation and argillites.

Figure 7-4: Interpreted geology from drilling, prospecting, and geophysics
Page 38
| Kinross Gold Corporation Great Bear Gold Project Ontario, Canada NI 43-101 Technical Report |
The younger sequence of intermediate to mafic volcanic and volcanic derived sedimentary rocks is located at the centre of the Property and has a similar stratigraphy to the western and eastern portions of the Property. However, these areas have a much higher proportion of felsic pyroclastic rocks in the strata. These are also interpreted to have been submarine flows. Basin development is characterized by relatively thin-bedded, silty argillite and common iron formation. The fine-grained volcanic facies suggest quiescent depositional conditions with subdued modification of the sedimentary sequences caused by volcanism.
The felsic domain dominates the northeastern portion of the Property. It consists of porphyritic felsic flows (dacites) and volcaniclastics intercalated with sedimentary rocks. The sequence is interpreted as a deformed felsic flow-dome complex (Figure 7-5).

Source: Submarine lava dome, based on the Gold Lake dome and flow complex (modified from Lambert et al., 1990). Illustration adopted from Sylvester et al. (1997) in de Wit & Ashwal (1997).
Figure 7-5: Schematic illustration of documented subaqueous felsic lava deposits
The mafic domain is in contact with a largely felsic/sedimentary domain in the northeast portion of the Property. The contact between the two domains is best described as gradational from mafic to sedimentary and felsic rocks, and where drilled is marked by a highly strained sedimentary sequence.
Topping directions, determined from graded bedding using oriented core data, are generally fining towards the northeast.
Page 39
| Kinross Gold Corporation Great Bear Gold Project Ontario, Canada NI 43-101 Technical Report |
Mafic volcanic dykes and sills are common throughout the Property, ranging from lamprophyre to gabbro/diorite (i.e., high level apophyses injected into and disrupting the stratigraphy). Intermediate felsic intrusive rocks are also noted throughout the region. Small intrusive bodies are mapped and have been intersected in both the historic and present drill campaigns.
Page 40
| Kinross Gold Corporation Great Bear Gold Project Ontario, Canada NI 43-101 Technical Report |
| 7.3 | Project Geology |
Lithological units have been identified and correlated across the Property and are represented as a schematic stratigraphic column in Figure 7-6. The stratigraphy is remarkably consistent throughout the drilled area. Well documented individual units from drill core are supported with litho-geochemical data and petrological descriptions.

Not to Scale
Figure 7-6: Schematic stratigraphy column for the Great Bear Project
Page 41
| Kinross Gold Corporation Great Bear Gold Project Ontario, Canada NI 43-101 Technical Report |
The stratigraphic units are briefly described below:
| • | Sediments: Dark to light grey, thinly bedded (<5 cm), fine to medium grained with local argillite beds. Magnetic susceptibility is overall low, but localized high magnetic response is observed in areas with an increased content of argillite. Occasional graded beds are noted with fining direction to the northeast (Figure 7-7). |

Figure 7-7: Dry core sample of Sediments from BR-051 at 87.5 m
| • | Felsic Volcaniclastic: A fine- to medium-grained, dark grey matrix with sporadic (<5%) less than 4 mm quartz and feldspar crystals. Rounded to angular heterolithic fragments (<5 cm wide) of leucocratic felsic volcanic and dark brown, fine-grained biotite rich fragments are observed. Fragments are often flattened, parallel to foliation (Figure 7-8). The unit is not magnetic and is moderately deformed, with sporadic weak to moderate biotite alteration. |

Figure 7-8: Dry core sample of Felsic Volcaniclastic from BR-046 at 87.5 m
| • | Felsic Volcanic - Porphyritic: Medium-grained, porphyritic and moderately to strongly foliated. Phenocrysts consist of blue-grey quartz (5%) and up to 10% milky white to yellow feldspar crystals up to 4 mm in diameter. They are stretched out in the foliation and slightly augen shaped. The groundmass is dark grey, composed of very fine grained (<50 µm) interlocking plagioclase and quartz of uncertain proportions. Dark brown biotite (8%) occurs as foliation parallel streaks (Figure 7-9). |
Page 42
| Kinross Gold Corporation Great Bear Gold Project Ontario, Canada NI 43-101 Technical Report |

Figure 7-9: Wet core sample of Felsic Volcanic from DNW-011 at 13.2 m
| • | Metasediments (2): Massive to thinly bedded, carbonaceous sedimentary rocks. Dark brown to dark grey, fined grained, intensely foliated, biotite rich, overprinted with garnet, staurolite, and andalusite porphyroblasts. Garnets are pink, rounded, up to 4 mm; staurolite is dark yellow, up to 3 mm; and andalusite is light grey, up to 1 cm and angular. Foliation, defined by the alignment of biotite, partially wraps porphyroblasts (Figure 7-10 and Figure 7-11). |

Figure 7-10: Dry core photo of Metasediments (2) from BR-065 at 264 m
Page 43
| Kinross Gold Corporation Great Bear Gold Project Ontario, Canada NI 43-101 Technical Report |
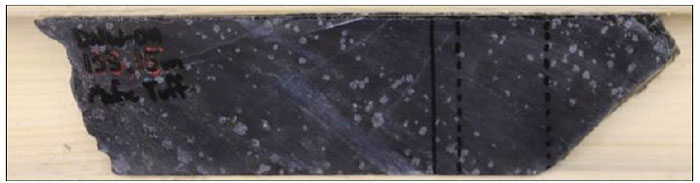
Figure 7-11: Wet core photo of Metasediments (2) from DNW-011 at 133.15 m
| • | Felsic Volcanic 2 - Aphyric: White to light grey, strongly deformed with a mottled appearance, this unit has a very fine grained to aphyric matrix, often translucent, with 1% to 7% plagioclase phenocrysts. The groundmass is comprised of very fine grained (<50 µm) plagioclase ± quartz. The plagioclase phenocrysts are partially stretched out in the foliation and overprinted by secondary albite, quartz, muscovite, calcite, and chlorite. Biotite content is less than 2% and partially chlorite altered (Figure 7-12). |
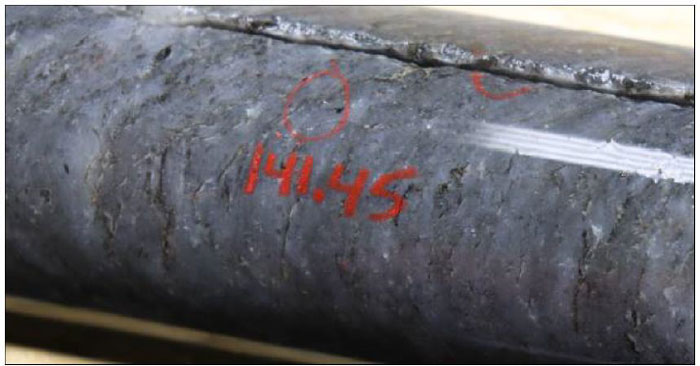
Note. Red circle indicates visible gold.
Figure 7-12: Wet core photo of Felsic Volcanic (2) from DNW-011 at 141.45 m
Page 44
| Kinross Gold Corporation Great Bear Gold Project Ontario, Canada NI 43-101 Technical Report |
| • | Metasediments (3): Fine-grained, thin to moderately bedded, grey-brown to black banded sericite altered sedimentary rocks. The unit is moderately to strongly foliated and usually has a strong banded appearance due to bedding parallel sericite alteration. Contacts between bands can be sharp or gradational (Figure 7-13). They may represent transposed graded bedding. The darker layers are defined by very fine grained biotite, while the grey layers are denoted by greenish muscovite. A second foliation was noted in thin section defined by kinks in muscovite flakes which are strongly aligned in the dominant foliation. |


Figure 7-13: Wet core photo of Metasediments (3) from DNW-011 136.3 m and BR-060 315 m
| • | Fragmental: Highly strained unit consisting of rounded to subangular lithic fragments set in a dark green-grey fine-grained matrix, with moderate to strong sericite alteration (Figure 7-14). Heterolithic fragments are 0.5 cm to 10 cm in size, varying from fine-grained and massive to quartz-phyric with millimetre phenocrysts. The unit is strongly foliated and brecciated. This unit marks the contact between felsic and mafic domains. |
Page 45
| Kinross Gold Corporation Great Bear Gold Project Ontario, Canada NI 43-101 Technical Report |

Figure 7-14: Wet core photo of Fragmental from BR-036 at 413 m to 420 m
The mafic domain dominates the southwestern portion of the Property and primarily consists of high Fe-tholeiitic basalt (locally pillowed) and high Mg-tholeiitic basalt (massive) intercalated with argillites and siltstones.
Page 46
| Kinross Gold Corporation Great Bear Gold Project Ontario, Canada NI 43-101 Technical Report |
| • | Mafic Volcanic - Fe-Tholeiite: This unit varies from massive to weak to strongly foliated pillow basalt. When strongly foliated, it has alternating bands of dark green hornblende with subsidiary bands of biotite, and light grey discontinuous wispy bands of calcite. In less strained zones, relic pillow selvages can be observed. Selvages are often centimetre-wide with strong chlorite and biotite alteration (Figure 7-15). Centimetre size metamorphic pink garnet becomes more abundant towards the fragmental contact. |
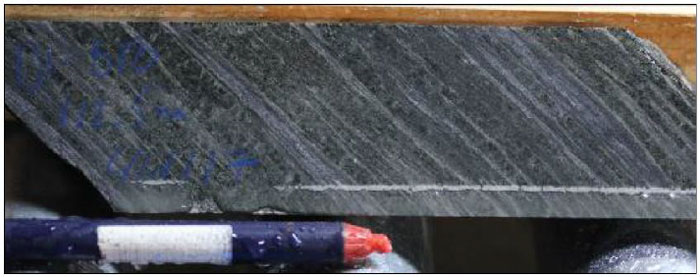
Figure 7-15: Wet core photo of Fragmental from DL-018 at 112 m
| • | Mafic Volcanic – Fe-Tholeiite – Biotite Calcite Pillows: This unit is dark green, fine-grained with decimetre scale pillows defined by calcite and biotite selvages. The unit contains fine-grained hornblende crystals mixed with biotite and layers of platy, elongated calcite. It is an Fe-tholeiite but is distinct from the unit described above in higher chalcopyrite concentration. That mineralization may account for a weak copper anomaly observed (Figure 7-16). |

Figure 7-16: Wet core photo of Mafic Volcanic – Fe-Tholeiite – Biotite Calcite Pillows from DL-018 at 136 m
Page 47
| Kinross Gold Corporation Great Bear Gold Project Ontario, Canada NI 43-101 Technical Report |
| • | Argillite: Fine-grained black to dark grey, highly deformed with folded and contorted bedding. Bedding is millimetre to less than 5 cm thick and averages approximately 1 cm (Figure 7-17). |

Figure 7-17: Dry core photo of Argillite from DHZ-026 at 48 m
Page 48
| Kinross Gold Corporation Great Bear Gold Project Ontario, Canada NI 43-101 Technical Report |
| • | Mafic Volcanic – Mg-Tholeiite – Massive Basalt: Dark green to grey, homogeneous, with no obvious pillow or flow breccia textures. The unit is moderately to strongly foliated. Amphiboles (approximately 5 mm clots) are common, set in a finer-grained quartz-feldspar-biotite groundmass. In a more intensely foliated rock, clots of amphibole are stretched and aligned into a foliation plane (Ross, 2018). These two amphibole forms indicate two separate amphibolite grade metamorphic events that outlasted deformation. The amphibole occurs as two minerals: hornblende and actinolite. The unit also contains minor biotite with weak chlorite and actinolite alteration and minor high-angle calcite veinlets (Figure 7-18). |

Figure 7-18: Wet core photo of Mafic Volcanic – High Mg-Tholeiite – Massive Basalt from DL-024 at 145.5 m
| • | Mafic Volcanic – High Fe-Tholeiite – Pillowed Basalt: This unit is dark green, coarse grained, with strong amphibole recrystallization. There are clear pillow selvages defined by interstitial calcite and chlorite altered chill margins. It is weakly to moderately foliated. The foliation is partially overprinted by fine-grained clots of amphibole set in a fine-grained groundmass of quartz-albite (Figure 7-19). |

Figure 7-19: Dry core photo of Mafic Volcanic – High Fe-Tholeiite – Pillow Basalt from DL-024 at 25.0 m
Page 49
| Kinross Gold Corporation Great Bear Gold Project Ontario, Canada NI 43-101 Technical Report |
| • | Ultramafic: The ultramafic consists of fibrous talc (50% to 55%) intergrown with pale Mg-chlorite or possibly serpentine (10% to 15%), with granules of calcite overprinted by prismatic porphyroblasts of pale amphibole (Figure 7-20). The amphibole crystals occur oblique to foliation but are partially wrapped by it, indicating a late syn-deformation timing (Ross, 2019). |

Figure 7-20: Wet core photo of Ultramafic from DHZ-039 at 141 m
| • | Feldspar Porphyry Dyke: The feldspar porphyry dyke is made up of 10% to 15% blocky plagioclase phenocrysts (<3 mm) set in a foliated quartz-plagioclase-biotite-calcite groundmass (Figure 7-21). The phenocrysts are unaltered. Pyrite is disseminated in the groundmass. The plagioclase is difficult to distinguish from the quartz in the groundmass due to the very fine grain size. Biotite content is 12% and is aligned in the foliation (Ross, 2019). |

Figure 7-21: Wet core photo of Feldspar Porphyry Dyke from DHZ-001 at 244.3 m
| 7.4 | Mineralization Styles and Target Areas |
Three dominant styles of mineralization are observed within three target areas on the Property (Figure 7-22):
| 1. | Silica-sulphide replacement – Limb Zone |
| 2. | Quartz veining – Hinge Zone |
| 3. | Disseminated gold within high strain – LP Zone |
Page 50
| Kinross Gold Corporation Great Bear Gold Project Ontario, Canada NI 43-101 Technical Report |

Figure 7-22: Internal Great Bear Resources Ltd. interpreted geology showing mineralization zones at the Project
Page 51
| Kinross Gold Corporation Great Bear Gold Project Ontario, Canada NI 43-101 Technical Report |
Silica Sulphide Replacement – Limb Zone
The silica sulphide replacement zones have been the focus of exploration at the Limb Zone (historically the 88-4 Zone target). This zone is associated with the rheological and geochemical contact between pillow basalt (Fe-tholeiites) and massive basalt (Mg-tholeiites). The contact is often marked by argillite/siltstones. Mineralization occurs as replacement of sediments, if present, or as silica flooding and quartz-calcite veining in the absence of sediments. Pyrrhotite is the dominant sulphide, with sulphides ranging in concentrations from 2% to 40% pyrrhotite, 2% to 15% pyrite, 1% to 4% arsenopyrite, 2% chalcopyrite, minor less than 2% sphalerite, and trace magnetite. Visible gold is not uncommon and, where observed, is associated with strong pyrrhotite and weaker arsenopyrite-pyrite mineralization (Figure 7-23). Higher-grade and more intense visible gold correlates well with a thinning or absence of sedimentary host rocks at the contact. An increase in silica flooding at the high Fe-tholeiite basalt and high Mg-tholeiite basalt contact is observed where sediments are thin or not deposited. Petrographic work by Ross (2004) identified the presence of gold-silver and lead-tellurides locally encapsulated within arsenopyrite. All native gold in the polished thin sections occurred as free gold crystals up to 50 microns in size.

Figure 7-23: Silica sulphide replacement style mineralization of the Limb Zone
Page 52
| Kinross Gold Corporation Great Bear Gold Project Ontario, Canada NI 43-101 Technical Report |
Alteration and mineralization are strongly correlated with the sulphidized sedimentary layer, both commonly exhibiting very sharp contacts with unmineralized or unaltered host rock. A strong shear component is present within and adjacent to the mineralized zone. The zone is approximately 800 m long and has been drilled to a vertical depth exceeding 400 m (Figure 7-24). Mineralization plunges steeply northwest in a fold limb host dipping steeply to subvertically northeast. It is generally considered that the Limb Zone lies on the north limb of a property scale F2 fold.

Figure 7-24: Limb Zone with significant gold intercepts and MSO shapes looking northeast
Page 53
| Kinross Gold Corporation Great Bear Gold Project Ontario, Canada NI 43-101 Technical Report |
Quartz Veining – Hinge Zone
Quartz veining has been observed throughout the Property and has been the main focus of exploration at the Hinge Zone. The quartz veining is hosted by multiple lithologies including massive basalt (high Mg-tholeiite), argillite, and pillow basalt (high-Fe tholeiite). Individual veins are variable in width ranging from 1 cm to 5 m and can create zones up to 40 m. They are generally mineralized with fine-grained disseminated sulphides consisting of 1% to 3% pyrrhotite, 1% to 2% pyrite, 1% to 2% chalcopyrite, less than 1% arsenopyrite, and trace sphalerite. Visible gold is very common ranging from trace to 5% as pin pricks, centimetre scale clusters, and fracture fill (Figure 7-25). These veins have a weak to strong, patchy to pervasive biotite and carbonate alteration halo ranging from several centimetres to approximately 2 m in width.
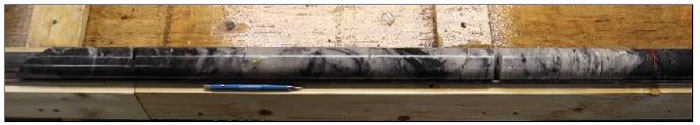
Note. Cluster of visible gold above centre of pencil.
Figure 7-25: Hinge Zone style vein from DHZ-014 at 184.5 m
Page 54
| Kinross Gold Corporation Great Bear Gold Project Ontario, Canada NI 43-101 Technical Report |
The Hinge Zone vein system is comprised of several subparallel anastomosing veins formed along the axial trace of a property wide D2 fold. The intersection between the fold and stratigraphy marks a plunge control on the higher grades within the veins (Figure 7-26).
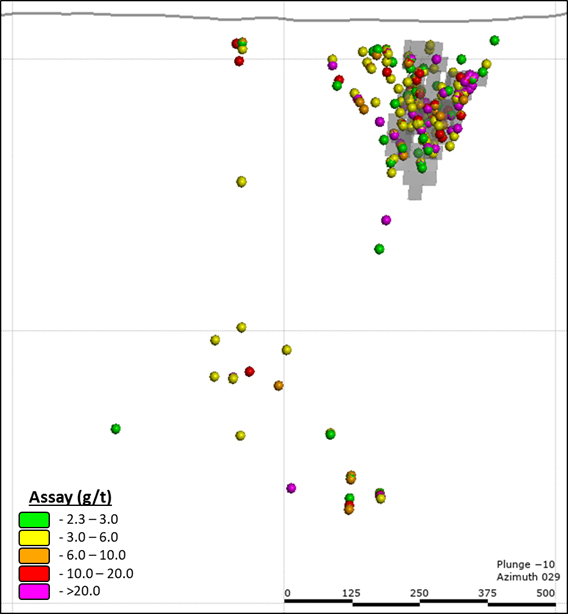
Figure 7-26: Vertical section of Hinge Zone, looking northeast (± 7.5 m) with significant assays and MSO shapes
Disseminated Gold in High Strain Corridor – LP Zone
The LP Zone exhibits a style of mineralization which is not observed in other parts of the Red Lake greenstone belt. The zone is associated with a high degree of deformation, widespread alteration, and transposition of primary textures as well as complete flattening of stratigraphy.
Page 55
| Kinross Gold Corporation Great Bear Gold Project Ontario, Canada NI 43-101 Technical Report |
The LP Zone mineralization occurs within a wide zone of high strain and increased metamorphic grade. The strain zone is very continuous for over 4 km and is slightly oblique to stratigraphy, intersecting multiple lithologies including the porphyritic felsic volcanic, metasediment 2, felsic volcanic 2, and metasediment 3. The deformation zone is up to 500 m wide. The higher-grade gold mineralization appears to be controlled by the intersection of this strain zone and the metasediment 2 unit. Ongoing LP Zone drilling has demonstrated that most of the greater than 5.0 g/t Au intercepts and nearly all of the greater than 10 g/t Au intercepts drilled along the LP Zone to date occur within 50 m to 100 m of the metasedimentary/felsic volcanic contact (Figure 7-27).
Gangue mineralization is variable across the zone and locally ranges from 0% to any amount of the following: 1% to 15% disseminated pyrite, 1% to 10% arsenopyrite (blebby and matted), 1% to 5% red and yellow sphalerite, 1% to 5% pyrrhotite, 1% to 5% chalcopyrite, 1% to 5% galena, and 1% to 3% scheelite (Figure 7-28). The LP Zone has been further sub-divided into six sub-zones named, from northwest to southeast, Discovery, Bruma, Yuma, Yauro, Auro, and Viggo.
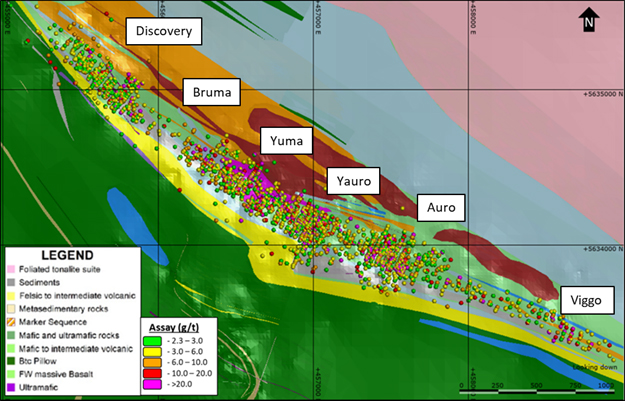
Figure 7-27: Plan view of gold values >2.3 g/t for the LP Zone with geology and LP sub-zones
Page 56
| Kinross Gold Corporation Great Bear Gold Project Ontario, Canada NI 43-101 Technical Report |
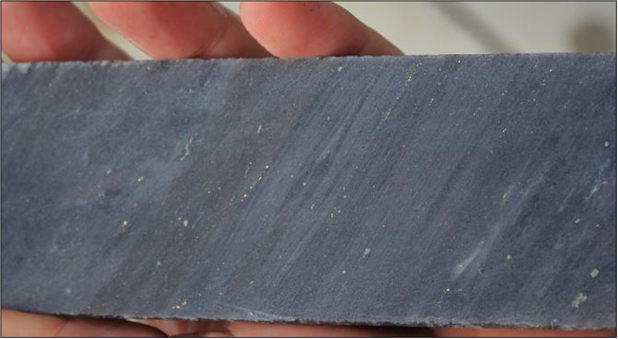
Figure 7-28: Strong strained Felsic Volcanic with 5% to 10% fine-grained arsenopyrite and 1% fine visible gold in the foliation in BR-020 at 90.15 m
Page 57
| Kinross Gold Corporation Great Bear Gold Project Ontario, Canada NI 43-101 Technical Report |
At least three gold mineralizing events have been recognized, including foliation parallel free gold in host rock, transposed quartz veins, and later quartz veins with visible gold that are slightly oblique to foliation (Figure 7-29).
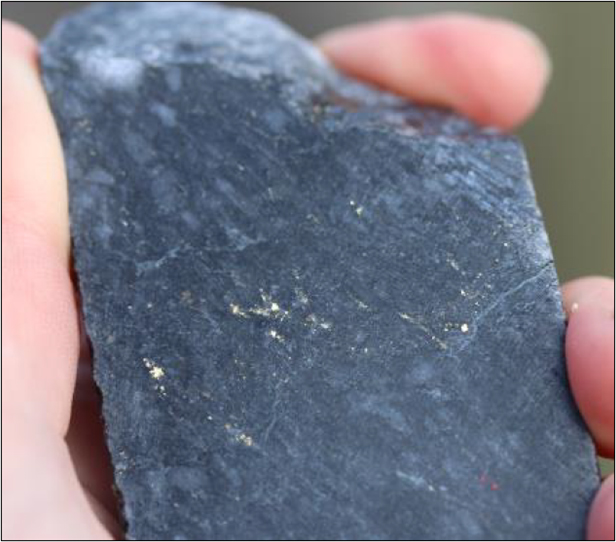
Figure 7-29: Visible gold in foliation hosted by strained porphyritic Felsic Volcanic from DNW-011 at 58.25 m
Page 58
| Kinross Gold Corporation Great Bear Gold Project Ontario, Canada NI 43-101 Technical Report |
| 7.5 | Metamorphism and Alteration |
This package of rock preserves a greenschist to amphibolite grade metamorphic assemblage with only minor amounts of retrograde chlorite-epidote ± sericite alteration related to younger cross-cutting calcite veinlets and micro fractures. The dominant amphibole minerals present in the area local to the Limb, Hinge, and LP Zones is hornblende with subordinate actinolite. There is evidence of two foliation forming events occurring at amphibolite grade metamorphic conditions, with these high-grade conditions outlasting the deformation and allowing the amphibole to recrystallize and partially overprint foliation (Figure 7-30).
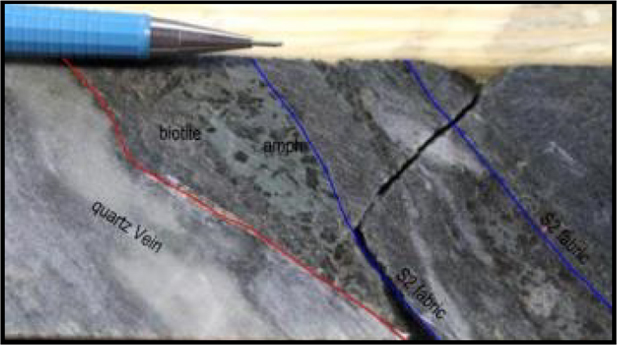
Figure 7-30: Recrystallized amphibole overprinting foliation (possible actinolite) and biotite alteration in contact with quartz vein (red line)
The Limb Zone exhibits greenschist to lower amphibolite grade metamorphism. The silica sulphide replacement alteration of the Limb Zone consists of dark grey, fine-grained silica replacing and flooding argillite and siltstones at the high Fe-tholeiite and high Mg-tholeiite contact. The alteration is fairly discrete and contained within the mineralization corridor. Weak carbonate quartz alteration is observed as a late stage veining event in wall rocks.
Metamorphic grade at the Hinge Zone is upper greenschist to lower amphibolite, consisting of minor late-stage amphibole growth. Alteration of quartz veining at the Hinge Zone consists of pervasive to patchy, dark brown, fine-grained biotite extending into the host rock for up to 2 m.
Metamorphic grade of the LP Zone, by contrast to the Hinge Zone and Limb Zone, is mainly amphibolite to upper greenschist facies. The felsic-intermediate units preserve an amphibolite grade metamorphic assemblage of albite, biotite, muscovite, and garnet with the sedimentary units containing garnet and staurolite (Ross, 2019). The LP Zone alteration is variable throughout its extent but can generally be described as strong to pervasive albitization and silicification of the felsic volcanic units and sericite/muscovite alteration of the metasediment units. The sericite/muscovite alteration can be banded (bedding parallel) or completely pervasive. Locally there is patchy biotite, but it does not appear to be associated with gold mineralizing events. Within the metasediments, coarser grained diffuse cordierite crystals (andalusite according to Ross, 2020) have no association with sulphides or visible gold.
Page 59
| Kinross Gold Corporation Great Bear Gold Project Ontario, Canada NI 43-101 Technical Report |
| 7.6 | Structural Geology |
The Property is divided into two main structural domains: the southwest and northeast domains exhibit folding, and the central domain exhibits high strain and mylonitic textures (Figure 7-31).
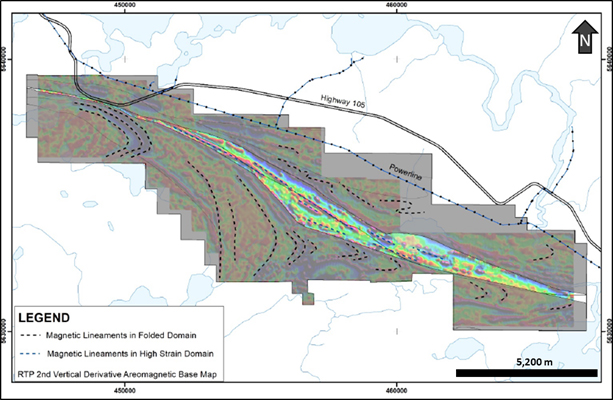
Figure 7-31: Property structural interpretation showing folded terrains (grey shaded) and the Central (coloured) High Strain Corridor
Page 60
| Kinross Gold Corporation Great Bear Gold Project Ontario, Canada NI 43-101 Technical Report |
Structural fabrics are interpreted from airborne magnetic data and where available, oriented core data (Figure 7-31). Detailed drilling at the Hinge and Limb Zones has provided numerous data points which validate the fold model in that area. A possible evolution of the Great Bear volcanic rocks involved early folding and tilting of the rock package followed by later warping or refolding of the main fabric. This model proposes three phases of deformation D1 through D3.
| • | D1 deformation: Early compression and uplift of the greenstone belt after the collision of the Caribou and Winnipeg River terranes. (Note that a penetrative foliation fabric is not preserved in the rocks.) |
| • | D2 deformation: Progressive strain, tilting, and continued uplift and folding, this deformation is marked by a penetrative foliation fabric (F2). Rocks develop a stretch lineation and mineralized veins are emplaced along weaknesses during D2 deformation. Bedding cleavage relationships observed in the Limb and Hinge Zones indicate that the folds verge to the northeast and plunge steeply to the northwest. |
Page 61
| Kinross Gold Corporation Great Bear Gold Project Ontario, Canada NI 43-101 Technical Report |
| • | D3 deformation: A broad scale warping of the F2 foliation fabric, most likely resulting from either emplacement of post-tectonic plutons or re-activation of earlier faults (Figure 7-32). |
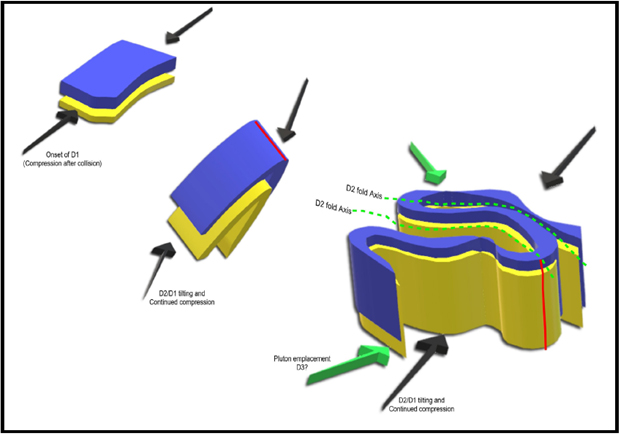
Source: Adamova (2021)
Figure 7-32: Conceptual sequence of Great Bear area deformation events (not to scale)
Page 62
| Kinross Gold Corporation Great Bear Gold Project Ontario, Canada NI 43-101 Technical Report |
The LP Zone, or central structural domain, most likely exhibits all of the above phrases of deformation, however, evidence of fold hinges, fold closures, and vergence directions is completely obliterated due to the high degree of flattening and transposition of rocks into the F2 foliation plane (Figure 7-33). The LP Fault, which was first identified by the Lithoprobe project and reported by Zeng and Calvert (2006), may represent a re-activated deep crustal fault which remained active throughout D2 and D3 deformation events. Rocks within the central domain (including mafic dykes and lamprophyres) exhibit a very high degree of strain often showing mylonitic textures. These same dykes in the folded terrains show lesser strain.
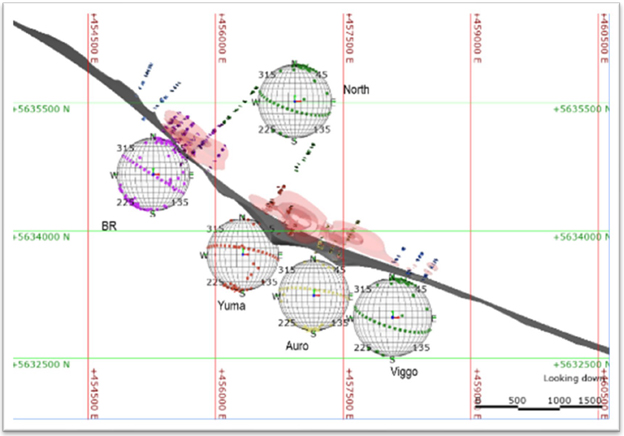
Figure 7-33: Stereonets showing rotated foliation fabrics along the trend of the LP Fault Zone
Page 63
| Kinross Gold Corporation Great Bear Gold Project Ontario, Canada NI 43-101 Technical Report |
| 8. | Deposit Types |
The Great Bear deposit is an Archean mesothermal gold deposit. The prolific Red Lake greenstone belt in Canada hosts numerous high-grade Archean mesothermal gold deposits that have produced more than 28 Moz of gold (Armstrong et al., 2018). The major gold deposits such as the Red Lake, Campbell, and Cochenour-Willans Mines are hosted by the Balmer assemblage and considered as shear-hosted vein-type deposits (Sanborn-Barrie et al., 2000). Madsen is a stratabound, replacement-style disseminated vein-type gold deposit that is hosted by a calc-silicate altered carbonatized mafic volcanic near the margin of a batholith (Dube et al., 2000). Within the Confederation greenstone belt, South Bay is a VMS deposit with bimodal mafic to felsic subaqueous volcanic stratigraphy (Stott and Corfu, 1992).
The Red Lake camp produced gold from the following principal types of mineralization (Lee, 2006):
| • | Carbonate veins consisting of ferroan dolomite and minor quartz with disseminated arsenopyrite and native gold; |
| • | Quartz-arsenopyrite replacement zones occurring as irregular sheets and lenses within mafic volcanics; |
| • | Sulphide replacement bodies composed of disseminated pyrite and pyrrhotite occurring in the mafic volcanics; |
| • | Of lesser importance, quartz veins containing free gold associated with small scale shear zones within intermediate to felsic intrusive. |
Gold mineralization styles on the Great Bear property include:
| • | Silica-sulphide replacement (Limb Zone) |
| • | Quartz veining in mafic volcanics (Hinge Zone) |
| • | Shear hosted; disseminated gold within high strain zones (LP Zone) |
Page 64
| Kinross Gold Corporation Great Bear Gold Project Ontario, Canada NI 43-101 Technical Report |
| 9. | Exploration |
Exploration work prior to the Property acquisition in February 2022 is described in Section 6, History. All exploration work completed by Kinross during 2022 was mainly drilling and is described in Section 10, Drilling.
Page 65
| Kinross Gold Corporation Great Bear Gold Project Ontario, Canada NI 43-101 Technical Report |
| 10. | Drilling |
| 10.1 | Summary |
To date, a total of 1,359 diamond drill holes for approximately 597,194 m and a total of 433 reverse circulation (RC) holes for approximately 34,530 m have been completed on the Project.
Drilling carried out by Kinross’ predecessors is described in Section 6, History and illustrated in Figure 6-1.
This section provides details of the Kinross 2022 drilling program.
| 10.2 | Kinross 2022 Drilling Program |
From acquisition of the Property in February 2022 to December 31, 2022, Kinross completed a total of 397 drill holes for a total of 206,967 m. Drill hole locations are illustrated in Figure 10-1. All diamond drill holes were drilled with NQ (47.6 mm) rods and core bits. Holes were continuously sampled, and sample widths were between 0.5 m and 1.5 m long. The samples were laid out based on lithology, alteration, mineralization, or structures.
The objective of the Kinross 2022 drill program was five-fold:
| 1. | Test the extents of known drill targets. |
| 2. | Infill zones of potentially economic mineralization to meet Inferred Mineral Resource classification status. |
| 3. | Carry out condemnation drilling to identify areas that may be used for capital development. |
| 4. | Begin drill testing the deep extension of the mineralization at a greater than one kilometre depth. |
| 5. | Mimic production drilling by drilling a tight grid of RC drill holes that would provide data for a ground truth block model. |
Page 66
| Kinross Gold Corporation Great Bear Gold Project Ontario, Canada NI 43-101 Technical Report |
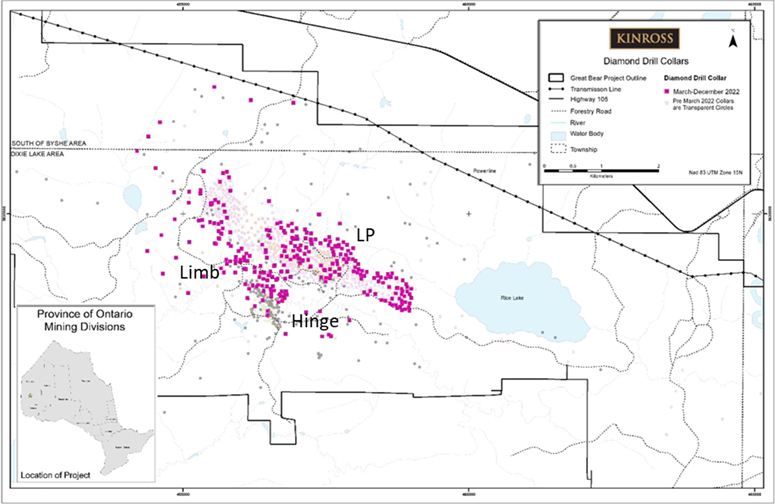
Figure 10-1: Drill holes from the 2022 drill program
Page 67
| Kinross Gold Corporation Great Bear Gold Project Ontario, Canada NI 43-101 Technical Report |
Drilling statistics for the Kinross 2022 drill program by zone, are summarized in Table 10-1.
Table 10-1: Statistics of 2022 drilling
| Zone/Sub-zone | Holes | Total Meterage (m) | ||||||
| Auro | 33 | 27,215 | ||||||
| Yauro | 23 | 20,099 | ||||||
| Yuma | 32 | 23,684 | ||||||
| Bruma | 29 | 25,919 | ||||||
| Discovery | 25 | 16,227 | ||||||
| Viggo | 62 | 28,941 | ||||||
| Limb | 50 | 34,181 | ||||||
| Hinge | 1 | 501 | ||||||
| Exploration and Condemnation Drilling | 34 | 17,3870 | ||||||
| Geotechnical and Metallurgical Drilling | 41 | 11,724 | ||||||
The RC drill program began in March 2022 and was concluded in July 2022. A total of 433 holes were completed for a total of 34,530 m. All RC holes were drilled with a 171 mm drill bit. Holes were under compression to ensure samples were dry. Samples were taken continuously in rock over 2 m intervals targeting 10 kg for each sample.
Where possible, best efforts were made to calculate true widths of zones. In established vein zones such as the Hinge and Limb Zones, true widths were calculated by intersecting the drill hole intercept with the vein geometry. In the LP Zone, true widths were calculated from the orientation of the estimation domains. These values range from 75% to 95% of true width and reported on a hole-by-hole basis.
Drilling Procedures
Chibougamau Diamond Drilling Ltd., Forage FTE Drilling Ltd., Hy-Tech Drilling Ltd., and Major Drilling Group International Inc. were used for the Kinross 2022 drill campaign. The drills were skid mounted diamond core drills and were capable of drilling a range of depths up to greater than 2,000 m. All holes drilled at the Project utilized NQ (47.6 mm) tools and rods. Drill holes were cased in HQ diameter core (63.5 mm) and reduced to NQ (47.6 mm) for the remainder of the drill hole. Regular drill rig visits indicated drill crews used adequate care in handling and boxing the core. Core was placed in wooden boxes with depth markers demarcating the end of every drill run (up to 3 m). Boxes were covered and brought to the core facility in Red Lake twice a day after morning and evening rig checks.
Page 68
| Kinross Gold Corporation Great Bear Gold Project Ontario, Canada NI 43-101 Technical Report |
All drill holes completed in all programs were initially set up using a handheld Garmin GPS60 unit. At the completion of the hole, casing was left in the hole and capped for diamond drill holes. The cap included the drill hole ID stamped onto a large metal flag for winter safety. At the completion of the program, the drill holes were surveyed with a differential global positioning system (GPS) and this information was added to the “Header” as the final UTM location.
Downhole surveys of the drill holes were conducted using a Reflex Gyro, a non-magnetic north seeking tool. In diamond drill holes, the first measurement was taken just past the casing at approximately 10 m, with readings taken every 10 m thereafter and again at the end of the hole. In RC drill holes, the first measurement was taken just past the casing at approximately 5 m, with readings taken every 5 m thereafter and again at the end of the hole. The non-magnetic, north seeking Gyro tool was selected after review of historical drilling which revealed significant erroneous downhole survey measurements due to excessively magnetic rocks.
Oriented core measurements were taken for all drill programs with the exception of the RC drill program. Measurements were taken at the end of each run (3 m) or when the core tube was pulled. Drillers used a Reflex ACT III RD Orientation Instrument to obtain the measurements.
As a result of competent bedrock and reliable drilling practices, drill core recovery rates were more than 98% for the duration of the Project.
Confidence values were assigned to all drill holes, including historic drill holes, based on whether the drill hole has had its collar found and surveyed by a differential GPS, whether the hole had downhole surveys carried out and if that survey was conducted using a non-magnetic device. For all modelling and estimation work, only high confidence drill holes were used (Confidence 1 and 2). To the QP’s knowledge, there are no drilling, sampling, or recovery factors that could materially impact the accuracy and reliability of the results.
Drill Core Logging
The following describes Kinross’ approach to diamond drill core analysis:
| • | The drill core is collected at the end of each shift and brought to the core logging facility in Red Lake. |
Page 69
| Kinross Gold Corporation Great Bear Gold Project Ontario, Canada NI 43-101 Technical Report |
| • | The core is geotechnically logged: orientation marks are measured, magnetic susceptibility and specific gravity values are recorded by the geotechnician. All data is recorded electronically on a tablet. |
| • | If any errors in blocking or box numbers are found, they are reported to the geologist. These errors are then reported to the drill supervisor so they can be corrected at the drill. |
| • | The drill holes are then logged by the geologist. Data including lithological type, alteration, structural elements, and sulphide content is recorded electronically on a tablet in Logger for the first nine months of the year and in acQuire for the remainder of the year. All data is recorded electronically and backed up automatically. |
| • | Wet and dry core is photographed for every box then labelled by hole ID and meterage. |
Page 70
| Kinross Gold Corporation Great Bear Gold Project Ontario, Canada NI 43-101 Technical Report |
| 11. | Sample Preparation, Analyses, and Security |
| 11.1 | Sample Security |
All samples are stored in Great Bear’s (now Kinross) secure core logging facilities. The logging facilities are kept locked and are only accessible to Kinross personnel.
Prior to shipping, the samples are manifested on the respective shipping forms. Samples are collected in standard plastic rock sample bags and stapled closed. The sample bags are placed in rice bags, which in turn are placed in plastic bin palettes. The bins are covered with plywood and a numbered security seal is applied. Kinross personnel load the bin palettes onto the transport trucks, operated by Red Lake based freight shipping company Gardewine North. Paper copies of the forms are sent along with the samples and a digital copy is sent to the laboratory via email. A digital copy of the forms is retained by Kinross.
Samples are generally shipped two or three times per week, depending on the amount of drilling.
| 11.2 | Sample Preparation and Analysis |
Great Bear has used several laboratories to perform their assay analyses on core and rock samples:
| • | Activation Laboratories Ltd (Actlabs) from July 2017 to June 2018 |
| • | SGS Ltd. (SGS), in Red Lake, from July 4, 2018, to December 31, 2019. |
| • | Actlabs, in Thunder Bay, from September 2019 to present. |
| • | Check assay samples and RC samples were sent to ALS Global (ALS). |
All assaying laboratories servicing Great Bear and Kinross samples are independent laboratories with ISO/IEC 17025:2017 accreditation from the International Organization for Standardization and Standards Council of Canada.
All pulps and coarse reject material from both laboratories were packaged and shipped to Kinross’s facility (Great Bear’s prior to acquisition) in Red Lake, at 2 Industrial Park, or at their core storage (core laydown) area on the Property.
Descriptions of the sample preparation and analyses conducted at Actlabs and SGS are presented below.
Page 71
| Kinross Gold Corporation Great Bear Gold Project Ontario, Canada NI 43-101 Technical Report |
Actlabs
Upon receipt at Actlabs in Thunder Bay, the entire sample is weighed (kg) and recorded (prep code RX10). The samples (<7 kg) are crushed up to 80% passing 2 mm, mechanically split to obtain a representative sample (250 g), and then pulverized to at least 95% -105 microns (µm). All the steel mills used in this process are mild steel and do not introduce Cr or Ni contamination (prep code RX1).
All samples were subject to near total digestion, using four acid digestion, and were analyzed for 36 elements by Inductively Coupled Plasma Mass Spectrometry (ICP-MS) (Actlabs Code: 8-4).
The samples were assayed for gold by fire assay (50 g) with an atomic absorption (AA) finish (Actlabs Code: 1A2-50). Sample results above the 10,000 ppb gold over limit were re-assayed using a gravimetric finish (Actlabs Code: 1A3). Samples with highly variable gold results, or that contained visible gold, had a 500 g split taken and sieved to 149 µm, and a metallic screen assay performed (Actlabs Code: 1A4).
In 2020, density measurements were also completed by Actlabs.
The Actlabs analytical codes and description are summarized as follows.
| • | 1A2-50 | (Au Fire Assay – AA, 50 g sample) |
| • | 1A3 | (Au Fire Assay – Gravimetric, 50 g sample, over limit) |
| • | 1F2 | (Au Fire Assay – AA, 30 g sample) |
| • | 8-4 | (4 Acid ICP-MS, 0.5 g sample, over limit) |
| • | 1A4 | (Au Fire Assay - Metallic Screen, 500 g sample) |
SGS
Once received at SGS in Red Lake, samples are weighed and dried. The sample (<3 kg) is then crushed to 75% passing a 2 mm screen. A 250 g split is then taken and pulverized to 85% passing 75 µm (SGS code: PRP89).
All samples were subject to near total digestion with four acids, 33 element geochemical analysis by Inductively Coupled Plasma Optical Emission Spectrometry (ICP-OES) (SGS code: ICP40B). Detection limits for some of the metals of interest were: Ag 2 ppm to 100 ppm, Sb 5 ppm to 1%, Zn 1 ppm to 1%.
Page 72
| Kinross Gold Corporation Great Bear Gold Project Ontario, Canada NI 43-101 Technical Report |
A larger 50 g sample was also analyzed for gold using fire assay and AA (SGS code: FAA515), which has a lower and upper detection limit of 5 ppb Au and 10,000 ppb Au, respectively. Samples that were greater than 10,000 ppb Au were analyzed by lead fusion fire assay with a gravimetric finish (SGS Code: FAG505). This method’s lower and upper limits are 0.5 ppm and 3,000 ppm, respectively.
Metallic screens were also requested by the field geologist if visible gold was noted or suspected during the logging process, or if the results from the fire assay were highly variable. In this case, a one kilogram split was taken and screened through a 160 mesh screen. The entire plus size sample fraction was assayed by fire assay. A 50 g minus size sample fraction was run in duplicate. The average of the two minus fraction assays and the plus fraction assay were combined by weight for total grade calculation.
The SGS analytical codes and description are summarized as follows:
| • | ICP40B (4 Acid ICP-OES, 0.2 g sample) |
| • | FAA515 (Au Fire Assay – AA, 50 g sample) |
| • | FAG505 (Au Fire Assay – Gravimetric, 50 g sample) |
| • | GO_FAS50M (Au, Ag, screen metallic) |
| 11.3 | Quality Assurance/Quality Control |
Great Bear and Kinross have carried out a quality assurance/quality control (QA/QC) program on all its drill core sampling since 2017 consisting of the insertion and analysis of blanks, Certified Reference Materials (CRM or standards), and duplicate samples to monitor the precision and accuracy or the reliability of the assay results from its drilling and sampling program. This is in addition to the quality control samples that are inserted by the assay laboratory and consist of blanks, standards, and duplicates.
Between May and August 2020, Great Bear retained Analytical Solutions Ltd. (ASL) to carry out a comparison of the two analytical methods used, fire assay and screen metallics, based on 54 drill core samples (from 2019 drill holes).
In August 2020, ASL reviewed 2,622 drill core duplicates obtained by the quartering of half core samples from Great Bear’s 2019 and 2020 drill holes. Due to the variability of the values typical of an orogenic gold project, ASL recommended that core duplicate collection be discontinued during the sampling program.
In September 2020, ASL completed guidelines for sampling and assay quality control for Great Bear. These procedures serve as the basis of Great Bear’s QA/QC program.
Page 73
| Kinross Gold Corporation Great Bear Gold Project Ontario, Canada NI 43-101 Technical Report |
| 11.3.1 | QA/QC – 2017 to 2019 by Great Bear |
The following has been modified from Adamova (2021). Kinross has reviewed the 2017-2019 QA/QC data with accompanying report and the QP is of the opinion that the assay results are accurate and reliable and suitable for Mineral Resource estimation.
Between 2017 to 2019, a total of 9,454 QA/QC samples, consisting of two types of blanks and 14 different CRMs, were inserted into the drill core sample stream nominally every 30 samples.
When selecting control sample types, Great Bear’s approach was to insert a blank, a sample representing low grade (approximately 1 g/t Au to 2 g/t Au), a standard representing mid-grade (approximately 3 g/t Au to 5 g/t Au), and a high-grade sample which should trigger a gravimetric analysis at greater than 10 g/t Au. CRMs were used to completion and if unable to obtain more of the same standard, Great Bear replaced it with a standard with the same approximate gold grade.
Table 11-1 provides a summary of control samples for blanks and CRMs.
Table 11-1: Summary of control samples – 2017 to 2019
| Description | 2017 - 2019 | Comments | ||
| Total Number of Samples | 83,574 | |||
| Number of Control Samples | 9,454 (11.3%) | |||
| Distribution | ||||
| Blanks | 4,726 (5.7%) | |||
| BLM | 1,701 | Actlabs + SGS | ||
| BLK | 1,591 | Actlabs + SGS | ||
| BM-10 | 1,436 | Actlabs + SGS | ||
| Standards (CRMs) | 4,726 (5.7%) | |||
| CDN-GS12A | 102 | Actlabs + SGS | ||
| CDN-GS1P5Q | 748 | SGS | ||
| CDN-GS1P5R | 824 | Actlabs + SGS | ||
| CDN-GS2S | 474 | SGS | ||
| CDN-GS4H | 467 | Actlabs + SGS | ||
| CDN-GS5W | 350 | SGS | ||
| CDN-GSP5E | 659 | Actlabs + SGS | ||
| OREAS 209 | 360 | Actlabs + SGS | ||
| OREAS 214 | 109 | SGS | ||
| OREAS 215 | 30 | Actlabs |
Page 74
| Kinross Gold Corporation Great Bear Gold Project Ontario, Canada NI 43-101 Technical Report |
| Description | 2017 - 2019 | Comments | ||
| OREAS 221 | 400 | Actlabs + SGS | ||
| OREAS 224 | 171 | SGS | ||
| OREAS 228 | 32 | Actlabs |
Note: summation errors may occur due to rounding.
Blank material that returns assays greater than 10 ppb Au is considered in the warning range. CRMs that return assays of ± 3 standard deviations (SD) from the certified value are considered outside the tolerable limits.
Sources of error in QA/QC samples can occur from data entry errors, sample mix-ups before, during or after shipping, switched samples at the laboratory, errors in the standard itself, and laboratory assaying errors.
Every QA/QC failure is followed up by the database manager in an attempt to recognize the most likely cause. Multiple failures on a single certificate and gradual migration of values over time are the two most likely causes for re-running certificates and batches. In general, single errors and outliers will be recognized as a warning but will not trigger re-assaying.
Table 11-2 shows a summary of the QA/QC control samples results for drilling programs between 2017 and 2019. These results are further broken down by laboratory where the sample analysis was completed. Figure 11-1 presents a graphical comparison of QA/QC results for control samples between 2017 and 2019.
Table 11-2: Summary of control sample results – 2017 to 2019
| Total Count | % Failures | Actlabs Count | Actlabs % Failures | SGS Count | SGS % Failures | |||||||||||||||||||
| Blanks | ||||||||||||||||||||||||
| BL10 | 1,701 | 2 | % | 323 | 1 | % | 1,378 | 3 | % | |||||||||||||||
| BLK | 1,591 | 5 | % | 193 | 0 | % | 1,398 | 6 | % | |||||||||||||||
| BLM | 1,436 | 1 | % | 331 | 1 | % | 1,105 | 2 | % | |||||||||||||||
| CRMs | ||||||||||||||||||||||||
| CDN-GS12A | 102 | 6 | % | 23 | 4 | % | 79 | 7 | % | |||||||||||||||
| CDN-GS1P5Q | 748 | 17 | % | - | - | 748 | 17 | % | ||||||||||||||||
| CDN-GS1P5R | 824 | 6 | % | 206 | 5 | % | 618 | 6 | % | |||||||||||||||
| CDN-GS2S | 474 | 14 | % | - | - | 474 | 14 | % | ||||||||||||||||
| CDN-GS4H | 467 | 8 | % | 211 | 1 | % | 256 | 13 | % | |||||||||||||||
| CDN-GS5W | 350 | 5 | % | - | - | 350 | 5 | % | ||||||||||||||||
Page 75
| Kinross Gold Corporation Great Bear Gold Project Ontario, Canada NI 43-101 Technical Report |
| Total Count | % Failures | Actlabs Count | Actlabs % Failures | SGS Count | SGS % Failures | |||||||||||||||||||
| CDN-GSP5E | 659 | 5 | % | 207 | 7 | % | 452 | 4 | % | |||||||||||||||
| OREAS 209 | 360 | 14 | % | 50 | 0 | % | 310 | 17 | % | |||||||||||||||
| OREAS 214 | 109 | 20 | % | - | - | 109 | 20 | % | ||||||||||||||||
| OREAS 215 | 30 | 0 | % | 30 | 0 | % | - | - | ||||||||||||||||
| OREAS 221 | 400 | 9 | % | 72 | 3 | % | 328 | 10 | % | |||||||||||||||
| OREAS 224 | 171 | 14 | % | - | - | 171 | 14 | % | ||||||||||||||||
| OREAS 228 | 32 | 3 | % | 32 | 3 | % | - | - | ||||||||||||||||
Note: summation errors may occur due to rounding.

Source: Adamova (2021)
Figure 11-1: Graphical representation of total samples submitted and failure rates at SGS vs ActLabs
Blanks
From 2017 to May 2019, two types of blank reference material were combined under the label BLK. The two types of blank materials were:
| • | BL-10: a commercially available ¾ inch unmineralized limestone marble gravel, purchased from a local hardware store |
Page 76
| Kinross Gold Corporation Great Bear Gold Project Ontario, Canada NI 43-101 Technical Report |
| • | BLM: a certified blank purchased from CDN Resources Laboratories Ltd. (CDNRL) (Figure 11-2). |
From June 2019, the two types of blank material were differentiated from each other in the database as “BL-10”, from CDNRL, and the commercial marble material as “BLM”.

Source: AGP (2021)
Figure 11-2: Blank reference material BL-10
Blanks are used to monitor the laboratory’s cleanliness between samples and provide a benchmark by which to monitor contamination. Generally, 100 g of the blank material was inserted into the sample series nominally every 20 samples and/or after an obvious mineralized interval. A blank failure was defined as having an assay value greater than 0.01 ppm Au.
Sample batches were often not re-run due to blank failures unless significant contamination is found. Failure of a blank sample may be due to contamination and, for this reason, any re-assaying of samples is completed on the sample batch. Typically, the sample range, including the last passed blank to the next passed blank, is re-analyzed if contamination is suspected.
Page 77
| Kinross Gold Corporation Great Bear Gold Project Ontario, Canada NI 43-101 Technical Report |
Figure 11-3 to Figure 11-5 present control plots of blank material for BLK, BL-10 and BLM, by laboratory. The red bars depict the warning limit of 0.01 g/t Au.

Source: Adamova (2021)
Figure 11-3: Control plot for BLK blank material (BL-10 and BLM combined); April 2017 – May 2019

Source: Adamova (2021)
Figure 11-4: Control plot for BL-10 blank material; June 2019 to December 2019
Page 78
| Kinross Gold Corporation Great Bear Gold Project Ontario, Canada NI 43-101 Technical Report |

Source: Adamova (2021)
Figure 11-5: Control plot for BLM blank material; June 2019 to December 2019
Standards
Commercial CRMs, or standards, are used to test the precision and accuracy of gold assays and to monitor the consistency of the laboratory’s performance. The standards were purchased in pre-measured individual packets weighing approximately 100 g and were sourced from ORE Research & Exploration PL (OREAS) and CDNRL. The CRMs were randomly inserted into the sample sequences, nominally every 20 to 30 samples.
A CRM outside of the acceptable tolerance levels was defined by analytical values that were greater than 3SD above or below the expected certified gold value. The results of the standard were reviewed in the context of the results of the batch, and the assay laboratory was notified of the CRM failure if deemed appropriate. In the event of a standard outside the tolerance limits, 10 samples above and 10 below the failed standard within a laboratory defined batch were selected for re-analysis. In cases where the standard failures occurred in “unmineralized” rock (generally in zones returning < 0.10 g/t Au) no action was taken but a note was made in the QA/QC sample tracking spreadsheet. Extreme outliers were often determined to be a result of the incorrect standard sample being inserted into the sample stream or errors in the sample data entry; these samples have been corrected in the database.
Page 79
| Kinross Gold Corporation Great Bear Gold Project Ontario, Canada NI 43-101 Technical Report |
Figure 11-6 to Figure 11-18 represent the control plots for each standard used in the 2017, 2018, and 2019 drill programs. The red solid lines denote the upper and lower tolerance levels of three standard deviations. Typically, only two or three different CRMs are used during any given time. The CRMs have overlapping insertion dates between 2017 and 2019 (Adamova, 2021).

Source: Adamova (2021)
Figure 11-6: Control plot for SRM GS12A
Page 80
| Kinross Gold Corporation Great Bear Gold Project Ontario, Canada NI 43-101 Technical Report |

Source: Adamova (2021)
Figure 11-7: Control plot for SRM GS1P5Q

Source: Adamova (2021)
Figure 11-8: Control plot for SRM GS1P5R
Page 81
| Kinross Gold Corporation Great Bear Gold Project Ontario, Canada NI 43-101 Technical Report |

Source: Adamova (2021)
Figure 11-9: Control plot for SRM GS2S
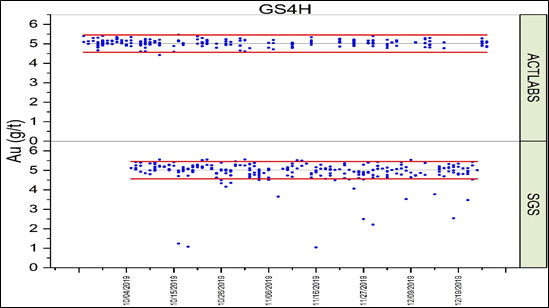
Source: Adamova (2021)
Figure 11-10: Control plot for SRM GS4H
Page 82
| Kinross Gold Corporation Great Bear Gold Project Ontario, Canada NI 43-101 Technical Report |
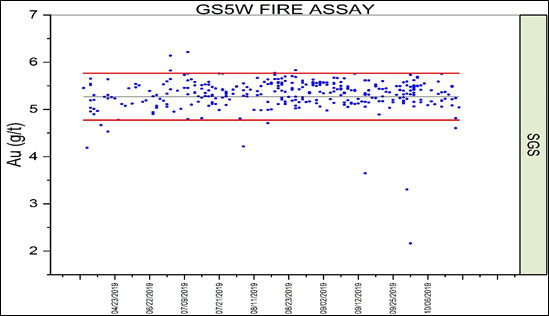
Source: Adamova (2021)
Figure 11-11: Control plot for SRM GS5W (Fire Assay)

Source: Adamova (2021)
Figure 11-12: Control plot for SRM GS5W (Gravimetric Finish)
Page 83
| Kinross Gold Corporation Great Bear Gold Project Ontario, Canada NI 43-101 Technical Report |

Source: Adamova (2021)
Figure 11-13: Control plot for SRM GSP5E
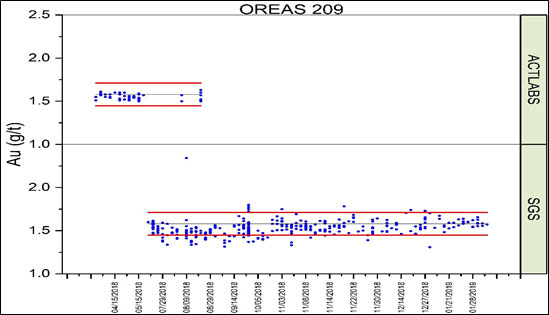
Source: Adamova (2021)
Figure 11-14: Control plot for SRM OREAS 209
Page 84
| Kinross Gold Corporation Great Bear Gold Project Ontario, Canada NI 43-101 Technical Report |

Source: Adamova (2021)
Figure 11-15: Control plot for SRM OREAS 214

Source: Adamova (2021)
Figure 11-16: Control plot for SRM OREAS 221
Page 85
| Kinross Gold Corporation Great Bear Gold Project Ontario, Canada NI 43-101 Technical Report |

Source: Adamova (2021)
Figure 11-17: Control plot for SRM OREAS 224

Source: Adamova (2021)
Figure 11-18: Control plot for SRM OREAS 228
Page 86
| Kinross Gold Corporation Great Bear Gold Project Ontario, Canada NI 43-101 Technical Report |
Field Duplicates
Field duplicate samples are used to monitor sample batches for potential sample mix-ups and monitor the data variability as a function of both laboratory error and sample homogeneity.
The duplicate samples were produced by quartering the half core sample into two quarter splits, with one sample recorded as the “original” sample and the other, the duplicate. Field duplicates were inserted every 40 to 60 samples.
Given the highly variable and nuggety nature of the mineralization, the field duplicates may produce assay samples that vary considerably. Thus, the results of the field duplicates do not fail, but highlight the variability of the different styles of mineralization. If the duplicate was selected from unmineralized rock and contained significant gold values, the sample was selected for re-assay using the coarse reject material.
Page 87
| Kinross Gold Corporation Great Bear Gold Project Ontario, Canada NI 43-101 Technical Report |
Figure 11-19 presents the scatter plot for the results of the field duplicates.

Figure 11-19: Scatter plot for field duplicates
Check Assays
Approximately 5% of gold bearing samples were sent for check assays to a different analytical laboratory. Check assays were completed on both pulps of the original sample and coarse rejects. A total of 179 samples were selected from drill holes BR-024, BR-035, and BR-050.
Page 88
| Kinross Gold Corporation Great Bear Gold Project Ontario, Canada NI 43-101 Technical Report |
Figure 11-20 presents the comparison of gold assays of original assays and coarse rejects for the 179 samples that were initially assayed at SGS and were sent to both Actlabs and ALS for check analyses.

Source: Adamova (2021)
Figure 11-20: Control plot for coarse reject analyses from SGS, Actlabs and ALS Global
Duplicate sampling of cut core and check assays preformed at Actlabs and ALS did not reveal any bias in assay results for Great Bear’s exploration programs.
| 11.3.2 | QA/QC – 2020 to February 2022 by Great Bear |
Between January 2020 and February 2022, Great Bear followed the same QA/QC procedures and insertion rates for the control samples used in its 2017 to 2019 drill programs.
Page 89
| Kinross Gold Corporation Great Bear Gold Project Ontario, Canada NI 43-101 Technical Report |
Eight of the thirteen CRMs were discontinued and six new CRMs were utilized during the 2020-2022 drilling programs.
Table 11-3 summarizes the blanks and CRMs used in the 2020-2022 drill programs.
Table 11-3: Summary of control samples – 2020 – 2022 Great Bear drill programs
| Description | 2020 – 2022 | Comments | ||
| Total Number of Samples | 245,460 | |||
| Number of Control Samples | 25,613 (10.4%) | |||
| Distribution | ||||
| Blanks | 12,670 (5.1%) | |||
| BLK | 9,215 | |||
| BLM | 1,707 | to Sep 2020 | ||
| BL-10 | 1,748 | to Sep 2020 | ||
| Standards (CRMs) | 12,943 (5.3%) | |||
| CDN-GS-12A | 102 | to Jul 2020 | ||
| CDN-GS-12B | 332 | |||
| CDN-GS-1P5R | 562 | to Aug 2020 | ||
| CDN-GS-1W | 962 | to Oct 2020 | ||
| CDN-GS-4H | 514 | to May 2020 | ||
| CDN-GS-P5E | 1,499 | to Oct 2020 | ||
| OREAS 216b | 1,135 | |||
| OREAS 221 | 1,093 | to Feb 2021 | ||
| OREAS 226 | 3,257 | |||
| OREAS 232 | 3.305 | |||
| OREAS 238 | 182 |
Blanks
Similar to 2019, Great Bear employed the two types of blank reference materials: BL-10 and BLM. Starting from August 2020, and on the recommendation of ASL, the certified blank exclusively used by Great Bear was the coarse silica material from OREAS (BLK).
Generally, 100 g of the blank material was inserted into the sample series nominally every 20 samples and/or after an obvious mineralized interval. A blank failure was defined as having an assay value greater than 0.025 ppm Au, which is equivalent to five times the detection limit of the Au FA-AA analytical method.
Page 90
| Kinross Gold Corporation Great Bear Gold Project Ontario, Canada NI 43-101 Technical Report |
Figure 11-21 and Figure 11-22 present the control plots of blank material for BLM and BLK, respectively. The failure rate from all three blank samples was 0.1% during the period (only 13 failures out of 12,670 blank samples inserted).

Figure 11-21: Control plot BLM

Figure 11-22: Control plot for BLK
Page 91
| Kinross Gold Corporation Great Bear Gold Project Ontario, Canada NI 43-101 Technical Report |
Standards
In 2020 to 2022, Great Bear followed the same QA/QC procedures used in its previous drill programs. The CRMs were inserted into the sample sequences, nominally every 20 to 30 samples.
Table 11-4 presents a summary of results for CRMs used between January 2020 and February 2022. Figure 11-23 to Figure 11-28 present the control plots for selected CRMs used during this period.
Table 11-4: Summary of CRMs for 2020 – 2022 Great Bear drill program
| CRM Name | Assay Lab. | Method | Count | Certified Value Au (g/t) | Standard Deviation | Average Assay Au (g/t) | No. of Failures | % Failures | |||||||||||||||||||||
| CDN-GS-12A | Actlabs | FA-GRAV | 102 | 12.31 | 0.27 | 12.38 | 8 | 7.8 | % | ||||||||||||||||||||
| CDN-GS-12B | Actlabs | FA-GRAV | 332 | 11.88 | 0.285 | 11.99 | 17 | 5.1 | % | ||||||||||||||||||||
| CDN-GS-1P5R | Actlabs | FA-AA | 562 | 1.81 | 0.07 | 1.80 | 22 | 3.9 | % | ||||||||||||||||||||
| CDN-GS-1W | Actlabs | FA-AA | 962 | 1.063 | 0.038 | 1.047 | 55 | 5.7 | % | ||||||||||||||||||||
| CDN-GS-4H | Actlabs | FA-AA | 514 | 5.01 | 0.15 | 5.01 | 16 | 3.1 | % | ||||||||||||||||||||
| CDN-GS-P5E | Actlabs | FA-AA | 1,499 | 0.655 | 0.031 | 0.640 | 102 | 6.8 | % | ||||||||||||||||||||
| OREAS 216b | Actlabs | FA-AA | 1,135 | 6.66 | 0.158 | 6.76 | 7 | 0.6 | % | ||||||||||||||||||||
| OREAS 221 | Actlabs | FA-AA | 1,093 | 1.062 | 0.036 | 1.057 | 9 | 0.8 | % | ||||||||||||||||||||
| OREAS 226 | Actlabs | FA-AA | 3,257 | 5.45 | 0.126 | 5.46 | 52 | 1.6 | % | ||||||||||||||||||||
| OREAS 232 | Actlabs | FA-AA | 3,305 | 0.902 | 0.023 | 0.901 | 39 | 1.2 | % | ||||||||||||||||||||
| OREAS 238 | Actlabs | FA-AA | 182 | 3.03 | 0.080 | 3.06 | 9 | 4.9 | % | ||||||||||||||||||||
| Total & Avg | All | 12,943 | 336 | 2.6 | % | ||||||||||||||||||||||||
FA-AA – fire assay AAS finish, FS-GRAV –fire assay gravimetric finish
Page 92
| Kinross Gold Corporation Great Bear Gold Project Ontario, Canada NI 43-101 Technical Report |

Figure 11-23: Control plot for CDN-GS-1W

Figure 11-24: Control plot for CDN-GS-4H
Page 93
| Kinross Gold Corporation Great Bear Gold Project Ontario, Canada NI 43-101 Technical Report |

Figure 11-25: Control plot for CDN-GS-P5E

Figure 11-26: Control plot for OREAS 221
Page 94
| Kinross Gold Corporation Great Bear Gold Project Ontario, Canada NI 43-101 Technical Report |

Figure 11-27: Control plot for OREAS 226
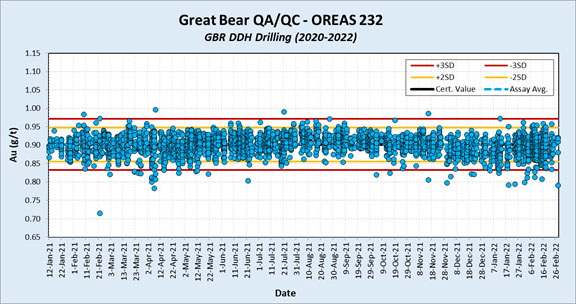
Figure 11-28: Control plot for OREAS 232
Field Duplicates
A similar procedure was followed during 2020 to February 2022 to those used in 2017 to 2019. Field duplicates were inserted every 40 to 60 samples.
Page 95
| Kinross Gold Corporation Great Bear Gold Project Ontario, Canada NI 43-101 Technical Report |
Figure 11-29 presents the scatter plot for the results of the field duplicates completed between January 2020 and March 2021. Field duplicate samples did not reveal any bias in assay results for Great Bear’s 2020-2021 exploration programs.

Figure 11-29: Control plot for field duplicates; January 2020 to March 2021
| 11.3.3 | QA/QC – March to December 2022 by Kinross |
Between March and December 2022, Kinross followed the same QA/QC procedures and insertion rates for the control samples used by Great Bear in its previous drilling programs.
Six of the eleven CRMs were discontinued and five new CRMs were utilized during the 2022 Kinross drill program.
Table 11-5 summarizes the blanks and CRMs used in the 2022 sampling program.
Page 96
| Kinross Gold Corporation Great Bear Gold Project Ontario, Canada NI 43-101 Technical Report |
Table 11-5: Summary of control samples – 2022 Kinross drill program
| Description | 2022 | Comments | ||||
| Total Number of Samples | 134,291 | |||||
| Number of Control Samples | 14,224 (10.6%) | |||||
| Distribution | ||||||
| Blanks | 7,084 (5.3%) | |||||
| BLK | 6,268 | |||||
| BLK_PStone | 816 | from Oct 2022 | ||||
| Standards (CRMs) | 7.140 (5.3%) | |||||
| CDN-GS-12B | 76 | |||||
| OREAS 211 | 1,116 | |||||
| OREAS 216B | 715 | to Jul 2022 | ||||
| OREAS 226 | 5 | to May 2022 | ||||
| OREAS 230 | 1,103 | |||||
| OREAS 232 | 1,266 | |||||
| OREAS 233 | 502 | |||||
| OREAS 237B | 179 | |||||
| OREAS 238 | 1,149 | |||||
| OREAS 240 | 1,029 |
Blanks
During 2022, Kinross continued using the certified coarse silica blank from OREAS (BLK) and employed one additional blank reference material (BLK_PStone) in October 2022.
Generally, 250 g of the blank material was inserted into the sample series nominally every 20 samples and/or after an obvious mineralized interval or if visible gold was noted. A blank failure was defined as having an assay value greater than 0.025 ppm Au.
Page 97
| Kinross Gold Corporation Great Bear Gold Project Ontario, Canada NI 43-101 Technical Report |
Figure 11-30 and Figure 11-31 present the control plots of blank material for BLK and BLK_PStone, respectively.

Figure 11-30: Control plot for BLK

Figure 11-31: Control plot for BLK_PStone
During the 2022 Kinross drill program, the failure rate from all blank samples was 0.2% (only 12 failures out of 7,084 blank samples inserted).
Page 98
| Kinross Gold Corporation Great Bear Gold Project Ontario, Canada NI 43-101 Technical Report |
Standards
For the 2022 drill program, Kinross followed the QA/QC procedures used by Great Bear in its previous drill programs. The CRMs are inserted into the sample sequences, nominally every 20 samples.
Table 11-6 presents a summary of results for CRMs used between March and December 2022. Figure 11-32 to Figure 11-35 present the control plots for CRMs used during this period.
Table 11-6: Summary of CRMs for 2022 Kinross drill program
| CRM Name | Assay Lab. | Method | Count | Certified Value Au (g/t) | Standard Deviation | Average Assay Au (g/t) | No. of Failures | % Failures | |||||||||
| GS12B | Actlabs | FA-GRAV | 76 | 11.88 | 0.285 | 11.92 | 2 | 2.6 | % | ||||||||
| OR211 | Actlabs | FA-AA | 1,116 | 0.768 | 0.027 | 0.758 | 17 | 1.5 | % | ||||||||
| OR216B | Actlabs | FA-AA | 715 | 6.66 | 0.158 | 6.73 | 17 | 2.4 | % | ||||||||
| OR226 | Actlabs | FA-AA | 5 | 5.45 | 0.126 | 5.37 | 0 | 0.0 | % | ||||||||
| OR230 | Actlabs | FA-AA | 1,103 | 0.337 | 0.013 | 0.332 | 19 | 1.7 | % | ||||||||
| OR232 | Actlabs | FA-AA | 1,266 | 0.902 | 0.023 | 0.899 | 19 | 1.5 | % | ||||||||
| OR233 | Actlabs | FA-AA | 502 | 1.05 | 0.029 | 1.05 | 9 | 1.8 | % | ||||||||
| OR237B | Actlabs | FA-AA | 179 | 2.26 | 0.067 | 2.28 | 7 | 3.9 | % | ||||||||
| OR238 | Actlabs | FA-AA | 1,149 | 3.03 | 0.080 | 3.04 | 23 | 2.0 | % | ||||||||
| OR240 | Actlabs | FA-AA | 1,029 | 5.51 | 0.139 | 5.53 | 18 | 1.7 | % | ||||||||
| Total & Avg | All | 7,140 | 131 | 1.8 | % |
FA-AA – fire assay AAS finish, FA-GRAV – fire assay gravimetric finish
Page 99
| Kinross Gold Corporation Great Bear Gold Project Ontario, Canada NI 43-101 Technical Report |

Figure 11-32: Control plot for OREAS 230

Figure 11-33: Control plot for OREAS 233
Page 100
| Kinross Gold Corporation Great Bear Gold Project Ontario, Canada NI 43-101 Technical Report |

Figure 11-34: Control plot for OREAS 238

Figure 11-35: Control plot for OREAS 240
Page 101
| Kinross Gold Corporation Great Bear Gold Project Ontario, Canada NI 43-101 Technical Report |
11.3.4 QA/QC – 2022 RC Drilling by Kinross
During the 2022 RC drill program, Kinross applied similar QA/QC procedures and insertion rates for the control samples to the diamond drill samples.
Table 11-7 summarizes the blanks and CRMs used in the 2022 Kinross RC drill program.
Table 11-7: Summary of control samples – 2022 Kinross RC drill program
| Description | 2022 | Comments | ||||
| Total Number of Samples | 14,273 | |||||
| Number of Control Samples | 2,081 (14.6%) | |||||
| Distribution | ||||||
| Blanks | 427 (3.0%) | |||||
| BLK | 427 | |||||
| Standards (CRMs) | 1,654 (11.6%) | |||||
| CDN-GS-12B | 117 | |||||
| OREAS 211 | 274 | |||||
| OREAS 216B | 66 | to Jul 2022 | ||||
| OREAS 230 | 308 | |||||
| OREAS 232 | 106 | to Jul 2022 | ||||
| OREAS 233 | 178 | |||||
| OREAS 238 | 281 | |||||
| OREAS 240 | 187 | |||||
| OREAS 243 | 137 |
Blanks
Similar to 2020, Kinross employed one blank reference material (BLK) in the sample stream. The blank failure rate for the RC program was relatively high at 6.3%. This was due mainly to the powdery nature of the RC samples that created a cloud of dust when poured into the crusher. This was identified at the early stage of the RC drill program and proactive measures, such as longer and more rigorous cleaning of the crusher by compressed air between each sample, were implemented.
Page 102
| Kinross Gold Corporation Great Bear Gold Project Ontario, Canada NI 43-101 Technical Report |
Figure 11-36 presents the control plot of blank material (BLK) inserted during the 2022 Kinross RC drill program.

Figure 11-36: Control plot for BLK
Standards
For the 2022 Kinross RC drill program, the CRMs were inserted into the sample sequences nominally every 10 samples.
Table 11-8 presents a summary of results for CRMs used for 2022 Kinross RC drill program. Figure 11-37 to Figure 11-39 present the control plots for CRMs used for this program.
Table 11-8: Summary of CRMs for 2022 Kinross RC drilling program
| CRM Name | Assay Lab. | Method | Count | Certified Value Au (g/t) | Standard Deviation | Average Assay Au (g/t) | No. of Failures | % Failures | |||||||||||||||
| CDN-GS-12B | ALS | FA-GRAV | 117 | 11.88 | 0.285 | 11.88 | 7 | 6.0 | % | ||||||||||||||
| OREAS 211 | ALS | FA-AA | 274 | 0.768 | 0.027 | 0.766 | 5 | 1.8 | % | ||||||||||||||
| OREAS 216B | ALS | FA-AA | 66 | 6.66 | 0.158 | 6.66 | 2 | 3.0 | % | ||||||||||||||
| OREAS 230 | ALS | FA-AA | 308 | 0.337 | 0.013 | 0.335 | 3 | 1.0 | % | ||||||||||||||
| OREAS 232 | ALS | FA-AA | 106 | 0.902 | 0.062 | 0.904 | 1 | 0.9 | % | ||||||||||||||
| OREAS 233 | ALS | FA-AA | 178 | 1.05 | 0.029 | 1.06 | 2 | 1.1 | % | ||||||||||||||
| OREAS 238 | ALS | FA-AA | 281 | 3.03 | 0.080 | 3.03 | 7 | 2.5 | % | ||||||||||||||
| OREAS 240 | ALS | FA-AA | 187 | 5.51 | 0.139 | 5.46 | 9 | 4.8 | % | ||||||||||||||
| OREAS 243 | ALS | FA-AA | 137 | 12.39 | 0.306 | 12.53 | 4 | 2.9 | % | ||||||||||||||
| Total & Avg | All | 1,654 | 40 | 2.4 | % |
Note. FA-AA – fire assay AAS finish, FA-GRAV – fire assay gravimetric finish
Page 103
| Kinross Gold Corporation Great Bear Gold Project Ontario, Canada NI 43-101 Technical Report |

Figure 11-37: Control plot for CDN-GS-12B

Figure 11-38: Control plot for OREAS 211
Page 104
| Kinross Gold Corporation Great Bear Gold Project Ontario, Canada NI 43-101 Technical Report |

Figure 11-39: Control plot for OREAS 233
Page 105
| Kinross Gold Corporation Great Bear Gold Project Ontario, Canada NI 43-101 Technical Report |
Field Duplicates
Figure 11-40 presents the scatter plot for the results of the field duplicates collected from the RC drill program. Field duplicate assays from 2022 RC drill program showed typical scatteredness of the nuggety gold mineralization but did not reveal any bias.

Figure 11-40: Scatter plot for field duplicates
| 11.4 | QP Opinion |
The QP is of the opinion that the preparation and analyses of the samples are adequate for this type of deposit and style of gold mineralization and that the sample handling and chain of custody, as documented, meet standard industry practice.
The QP has reviewed the QA/QC programs and is of the opinion that it is in accordance with standard industry practice and CIM Estimation of Mineral Resource & Mineral Reserve Best Practice Guidelines (CIM, 2019), Great Bear and Kinross personnel have taken reasonable measures to ensure that the sample analysis completed is sufficiently accurate and precise and that based on the statistical analysis of the QA/QC results, the assay results are accurate and reliable and suitable for Mineral Resource estimation.
Page 106
| Kinross Gold Corporation Great Bear Gold Project Ontario, Canada NI 43-101 Technical Report |
| 12. | Data Verification |
Technical information in this report has been derived from exploration programs by Great Bear and Kinross and from the existing reports and data collected by previous exploration companies that were reviewed by the QP. The QP has visited the site multiple times during 2021 and 2022 and reviewed all the procedures for collection and handling of the data from the drilling program, which includes but is not limited to the following.
| • | Historical drill hole collar coordinates |
| • | Core handling and storage procedures |
| • | Core logging and sampling procedures |
| • | QA/QC sample insertion procedure |
| • | Sample packing and shipment procedures |
In September 2022 Kinross transferred the drill hole data from Logger to acQuire database. Drill hole assays and survey data were reimported from the original certificates to ensure that accurate information is stored in the database. The data was compared between Logger and acQuire to verify the data was migrated correctly.
In July 2021, a consulting company, AGP Mining Consultants (AGP), was requested to review the data collection and handling procedures of Great Bear’s drilling program. The following chapters 12.1 and 12.2 are from AGP’s site visit report and follow-up work on independent sample analysis.
| 12.1 | AGP Site Inspection |
The site visit to the Property was conducted by Mr. Paul Daigle, a QP from AGP from July 12 to 15, 2021, with three days on site and exploration offices in Red Lake. The 2021 drill program was underway and near completion at the time of the visit. The author was accompanied on the site visit by:
| • | Dylan Langille, Project Geologist, Rimini for Great Bear |
| • | Rick Greenwood, Project Geologist, Rimini for Great Bear |
The site visit included an inspection of the Project site to review drill hole collars and collar coordinates; and an inspection of the two core logging, sampling, and storage facilities in Red Lake. The visit also included a review of selected drill core and drill logs.
Page 107
| Kinross Gold Corporation Great Bear Gold Project Ontario, Canada NI 43-101 Technical Report |
Drill Hole Collar Locations
AGP located 60 of the 299 drill hole collars (up to March 31, 2021) at the Hinge, Limb, and LP Zones; approximately 14% of Great Bear’s drill holes. The locations of diamond drill hole collars were surveyed in the field using a handheld GPS device (Garmin GPS map 62s) and using the NAD83 datum, the same datum used by Great Bear.
Casing is left in the hole and Great Bear drill hole collars are capped by an aluminum screw cap that is punched with the drill hole number with a threaded rod and metal tag welded at the top. The drill hole number on some of the red flags is still legible. Some drill hole casings use a red cap covering the top of the casing. Figure 12-1 shows the drill hole collars at the LP and Hinge Zones.

Source: AGP (2021)
Figure 12-1: Drill hole collars BR-207 (left, LP Zone), DHZ-060 and 061 (right, Hinge Zone)
The collar coordinates measured by AGP occurred within a 4 m tolerance of those reported in the drill hole database. In the QP’s opinion, the coordinates are acceptable, given the accuracy of the handheld GPS used to check the drill hole collar locations.
Page 108
| Kinross Gold Corporation Great Bear Gold Project Ontario, Canada NI 43-101 Technical Report |
Table 12-1 and Table 12-2 present the comparison of the AGP coordinates and the Great Bear surveyed drill hole coordinates for verified drill holes in the Hinge and Limb Zones and the LP Zone, respectively.
Table 12-1: Drill hole collar locations - Hinge and Limb Zones
| Drill Hole | Great Bear Easting (UTM E) | Great Bear Northing (UTM N) | AGP Easting (UTM E) | AGP Northing (UTM N) | Δ Easting (m) | Δ Northing (m) | |||||||
| BR-11-A | 455347 | 5635500 | 455350 | 5635500 | -3 | 0 | |||||||
| DSL-16 -17 -18 | 456384 | 5633306 | 456384 | 5633307 | 0 | -1 | |||||||
| DHZ-061 | 456395 | 5633309 | 456395 | 5633309 | 0 | 0 | |||||||
| DHZ-060 | 456395 | 5633309 | 456397 | 5633312 | -2 | -3 | |||||||
| DHZ-055 | 456455 | 5633339 | 456456 | 5633340 | -1 | -1 | |||||||
| DHZ-044 | 456479 | 5633298 | 456479 | 5633300 | 0 | -2 | |||||||
| DHZ-044 | 456479 | 5633298 | 456479 | 5633299 | 0 | -1 | |||||||
| DHZ-046 -047 | 456478 | 5633299 | 456478 | 5633295 | 0 | 4 | |||||||
| DHZ-036 035 | 456509 | 5633273 | 456508 | 5633271 | 1 | 2 | |||||||
| DHZ-037 | 456523 | 5633275 | 456526 | 5633273 | -3 | 2 | |||||||
| DHZ-038A | 456524 | 5633277 | 456526 | 5633273 | -2 | 4 | |||||||
| DHZ-028 -029 | 456540 | 5633276 | 456541 | 5633275 | -1 | 1 | |||||||
| DHZ-032 -033 -034 | 456511 | 5633228 | 456508 | 5633226 | 3 | 2 | |||||||
| DSL-009 -010 -011 | 456501 | 5633200 | 456497 | 5633200 | 4 | 0 | |||||||
| DHZ -022 -021 | 456523 | 5633162 | 456523 | 5633160 | 0 | 2 | |||||||
| DHZ -050 -051 -052 | 456457 | 5633218 | 456457 | 5633218 | 0 | 0 | |||||||
| DSL-019 - 020 -021 | 456428 | 5633209 | 456430 | 5633209 | -2 | 0 | |||||||
| DL-58-59 | 456348 | 5633545 | 456350 | 5633544 | -2 | 1 | |||||||
| DL-047 | 456168 | 5633745 | 456171 | 5633743 | -3 | 2 |
Source: AGP (2021)
Note: Datum is NAD 83 Zone 15 U.
Table 12-2: Drill hole collar locations - LP Zone
| Drill Hole | Great Bear Easting (UTM E) | Great Bear Northing (UTM N) | AGP Easting (UTM E) | AGP Northing (UTM N) | Δ Easting (m) | Δ Northing (m) | |||||||
| BR-207 | 457306 | 5634010 | 457305 | 5634011 | 1 | -1 | |||||||
| BR-206 | 457347 | 5634028 | 457348 | 5634025 | -1 | 3 | |||||||
| BR-237 | 457332 | 5633989 | 457329 | 5633987 | 3 | 2 | |||||||
| BR-203 BR-204 | 457374 | 5633984 | 457371 | 5633983 | 3 | 1 |
Page 109
| Kinross Gold Corporation Great Bear Gold Project Ontario, Canada NI 43-101 Technical Report |
| Drill Hole | Great Bear Easting (UTM E) | Great Bear Northing (UTM N) | AGP Easting (UTM E) | AGP Northing (UTM N) | Δ Easting (m) | Δ Northing (m) | |||||||
| BR-208 | 457353 | 5633943 | 457349 | 5633945 | 4 | -2 | |||||||
| BR-236 | 457271 | 5634080 | 457272 | 5634081 | -1 | -1 | |||||||
| BR-233 | 457221 | 5634118 | 457219 | 5634117 | 2 | 1 | |||||||
| BR-232 | 457196 | 5634144 | 457194 | 5634147 | 2 | -3 | |||||||
| BR-038 | 457155 | 5634131 | 457154 | 5634131 | 1 | 0 | |||||||
| BR-144 | 457118 | 5634163 | 457120 | 5634164 | -2 | -1 | |||||||
| BR-143 | 457081 | 5634208 | 457081 | 5634206 | 0 | 2 | |||||||
| BR-212 | 456977 | 5634200 | 456975 | 5634201 | 2 | -1 | |||||||
| BR-140 | 456955 | 5634239 | 456955 | 5634241 | 0 | -2 | |||||||
| BR-164 | 457493 | 5634178 | 457492 | 5634177 | 1 | 1 | |||||||
| BR-220 | 457435 | 5634149 | 457432 | 5634149 | 3 | 0 | |||||||
| BR-109 | 457413 | 5634095 | 457410 | 5634096 | 3 | -1 | |||||||
| BR-216 | 457412 | 5634095 | 457409 | 5634095 | 3 | 0 | |||||||
| BR-228 | 457512 | 5634241 | 457511 | 5634242 | 1 | -2 | |||||||
| BR-103 | 457736 | 5634241 | 457738 | 5634240 | -2 | 1 | |||||||
| REG-001 | 455916 | 5634199 | 455918 | 5634202 | -2 | -3 | |||||||
| BR-080 | 455975 | 5634707 | 455978 | 5634708 | -3 | -1 | |||||||
| DNW-006 | 455479 | 5635086 | 455478 | 5635084 | 1 | 2 | |||||||
| DNW-005 DNW-006 | 455507 | 5635074 | 455508 | 5635074 | -1 | 0 | |||||||
| DNW-008 | 455489 | 5635139 | 455489 | 5635141 | 0 | -2 |
Source: AGP (2021)
Note: Datum is NAD 83 Zone 15 U.
Drill Core Review
The site visit included a review of drill logs and their comparison to selected drill core intervals. Mineralized intervals were selected for the review. The lithological descriptions and sample intervals recorded in the drill logs were consistent with the drill core intervals reviewed. Visible gold, where logged, was observed.
Table 12-3 lists the selected drill core intervals examined during the site visit.
Page 110
| Kinross Gold Corporation Great Bear Gold Project Ontario, Canada NI 43-101 Technical Report |
Table 12-3: Summary of selected drill core for review
| Drill Hole | From (m) | To (m) | Interval (m) | Core Boxes | Target | ||||||
| BR-118 | 52.45 | 66.5 | 14.05 | 10 – 14 | LP/Auro | ||||||
| BR-118 | 144.10 | 166.10 | 22.00 | 44 – 49 | LP/Auro | ||||||
| BR-196 | 153.35 | 176.40 | 23.05 | 43 – 50 | LP/Auro | ||||||
| BR-198 | 185.10 | 207.40 | 22.30 | 53 – 60 | LP/Auro | ||||||
| BR-101 | 184.20 | 221.90 | 37.70 | 59 – 71 | LP/Auro | ||||||
| BR-167 | 280.15 | 311.65 | 31.50 | 95 – 106 | LP/Auro | ||||||
| BR-243 | 59.25 | 90.80 | 31.55 | 62 – 72 | LP/Auro | ||||||
| BR-251 | 59.25 | 90.80 | 31.55 | 11 – 21 | LP/Auro | ||||||
| DL-042 | 131.45 | 145.80 | 14.35 | 42 – 46 | Limb | ||||||
| DHZ-031 | 134.20 | 145.60 | 11.40 | 45 – 48 | Hinge | ||||||
| DHZ-020 | 181.26 | 192.80 | 11.54 | 60 - 65 | Hinge |
Source: AGP (2021)
Page 111
| Kinross Gold Corporation Great Bear Gold Project Ontario, Canada NI 43-101 Technical Report |
Drill Core Logging and Sampling Facilities
Great Bear maintains two logging and sampling facilities in Red Lake. The first facility is situated approximately 2.5 km northwest of Red Lake at 117 Forestry Road. This facility is a refurbished sawmill with a large warehouse split into a logging area and a core cutting area. Two ATCO trailers installed outside serve as an administration and exploration office at this site (Figure 12-2).
The interior of the core logging and sampling facility is clean and well maintained.

Source: AGP (2021)
Figure 12-2: Drill logging and sampling facility at 117 Forestry Road
Figure 12-3 and Figure 12-4 show the core logging tables and core cutting area, respectively.
Page 112
| Kinross Gold Corporation Great Bear Gold Project Ontario, Canada NI 43-101 Technical Report |

Source: AGP (2021)
Figure 12-3: Drill logging table; 117 Forestry Road

Source: AGP (2021)
Figure 12-4: Core cutting area; 117 Forestry Road
Page 113
| Kinross Gold Corporation Great Bear Gold Project Ontario, Canada NI 43-101 Technical Report |
Great Bear’s second facility is housed in three rented buildings in Red Lake, located at 2 Industrial Park Road and 19 Young Street, and a garage. These facilities were the original logging and sampling facilities when Great Bear initiated its drilling programs (Figure 12-5).
Each building contains logging tables and core cutting facilities (Figure 12-6 and Figure 12-7). There is a large yard where core boxes are temporarily stored before being sent to the core storage/core laydown yard on the Property. This facility is the staging area for shipping samples (from both facilities). It is secured by a lock and is located next to Gardewine North, the transport company used to ship samples to Actlabs in Thunder Bay.
The interior of this core logging and sampling facility is kept clean and is well maintained.
Page 114
| Kinross Gold Corporation Great Bear Gold Project Ontario, Canada NI 43-101 Technical Report |
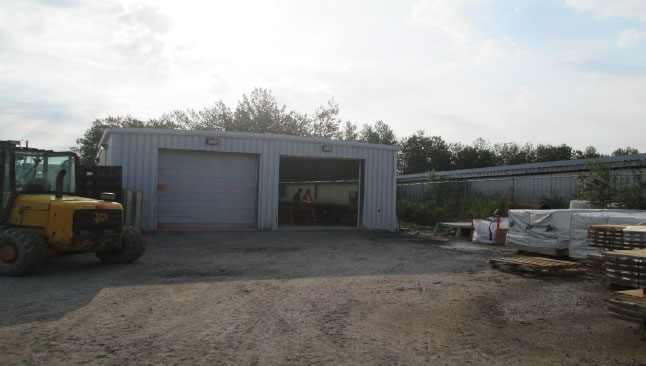

Source: AGP (2021)
Figure 12-5: Drill logging and sampling facility at 2 Industrial Park Road and 19 Young Street
Page 115
| Kinross Gold Corporation Great Bear Gold Project Ontario, Canada NI 43-101 Technical Report |

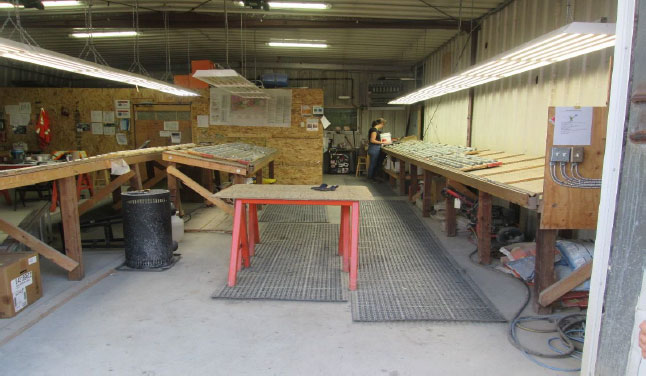
Source: AGP (2021)
Figure 12-6: Drill logging tables at the 2 Industrial Park Road facility
Page 116
| Kinross Gold Corporation Great Bear Gold Project Ontario, Canada NI 43-101 Technical Report |

Source: AGP (2021)
Figure 12-7: Drill core cutting room at the 2 Industrial Park Road facility
Core Storage
Drill core from the field is kept within secured logging facilities with access only for Great Bear or Rimini personnel.
Once the drill core is sampled, the core boxes are stacked criss-cross and strapped together for security. The core boxes are held temporarily at the 2 Industrial Park Road facility (Figure 12-8) until transported to the core storage area (core laydown area) on the Project site (Figure 12-9). Coarse rejects have also been transported to this area for storage (Figure 12-10).
Page 117
| Kinross Gold Corporation Great Bear Gold Project Ontario, Canada NI 43-101 Technical Report |

Source: AGP (2021)
Figure 12-8: Strapped core boxes (by drill hole), temporary core storage at the 2 Industrial Park facility
Page 118
| Kinross Gold Corporation Great Bear Gold Project Ontario, Canada NI 43-101 Technical Report |
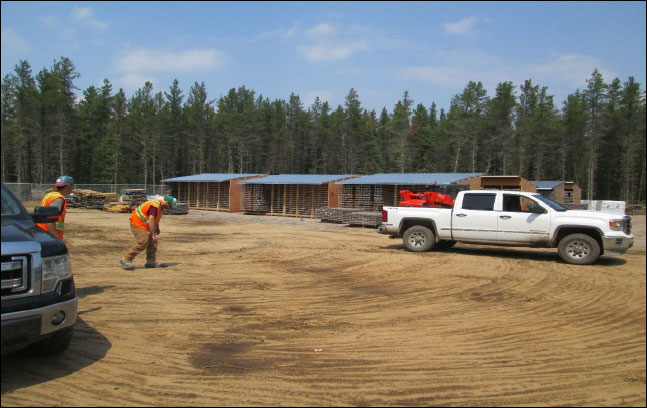
Source: AGP (2021)
Figure 12-9: Core racks at the core storage area; Project site
Page 119
| Kinross Gold Corporation Great Bear Gold Project Ontario, Canada NI 43-101 Technical Report |

Source: AGP (2021)
Figure 12-10: Coarse rejects under tarpaulin at the core storage area; Project site
Historic Drill Core
On the Project site, historic drill core is stored close to the Hinge and Limb Zones. The core boxes are stack in criss-cross, covered with empty core boxes, and strapped (Figure 12-11). The site is overgrown; however, the boxes appear to be in good condition. Any permanent marker labels are faded but many of the boxes have etched aluminum tags with information including drill hole number, drill hole interval, and box number.
Kinross has reviewed and mapped these drill holes and plans to transport the core to its core storage area on the Property.
Page 120
| Kinross Gold Corporation Great Bear Gold Project Ontario, Canada NI 43-101 Technical Report |
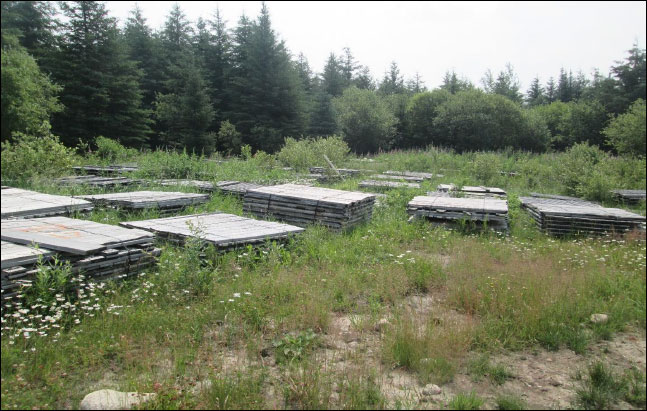
Source: AGP (2021)
Figure 12-11: Historic drill core storage area; near Hinge and Limb Zone
| 12.2 | Independent Sample Analysis |
The collection of independent samples is meant to demonstrate the presence of mineralization on the Property in similar ranges as reported by the issuer. These samples are not intended to act as duplicate samples.
AGP collected six samples by selecting sample intervals from the Great Bear drill core. The samples were collected from the same sample interval as noted in the drill hole database for comparison.
Page 121
| Kinross Gold Corporation Great Bear Gold Project Ontario, Canada NI 43-101 Technical Report |
AGP supervised the quartering of the drill core and collection of the selected sample intervals at Great Bear’s cutting room at the Forestry Road facility. The samples were placed in plastic sample bags with a sample tag inserted and sealed with a stapler. The six samples were placed in a rice bag and zip tied and kept under supervision by the QP. The samples were placed in a second rice bag and sealed with a numbered seal. The samples were shipped within one of Great Bear’s shipping bins by Gardewine North to Actlabs in Thunder Bay for sample preparation and analysis. Once received at Actlabs, the samples were:
| • | prepared by crushing the samples to 80% passing 2 mm and then a split of 250 g was pulverized to 95% passing 105 µm (Actlabs Code RX1). |
| • | Analyzed for gold by fire assay with an AA finish (Actlabs Code 1A2B-50). |
The six independent samples are shown in Table 12-4 and the comparison of gold results is presented in Table 12-5.
Table 12-4: Summary of independent samples
| AGP Sample No. | Great Bear Sample No. | Drill Hole | Sample Interval (m) | Interval (m) | Target | |||||
| A1047851 | DX156790 | BR-118 | 156.00 – 157.00 | 1.00 | LP (Yuma) | |||||
| A1047852 | DX106614 | BR-198 | 197.00 – 198.20 | 1.20 | LP (Auro) | |||||
| A1047853 | DX150087 | BR-167 | 289.60 – 290.35 | 0.75 | LP (Auro) | |||||
| A1047854 | A00370962 | DL-042 | 139.80 – 140.30 | 0.50 | Limb | |||||
| A1047855 | A00361035 | DHZ-020 | 185.10 – 185.85 | 0.75 | Hinge | |||||
| A1047856 | DX130522 | BR-243 | 65.00 – 65.70 | 0.70 | LP (NW) |
Source: AGP (2021)
Table 12-5: Independent sample results
| GBR Sample No. | AGP Sample No. | Great Bear Au (gpt Au) | AGP Au (gpt Au) | Δ Au (gpt Au) | |||||
| DX156790 | A1047851 | 4.94 | 4.14 | 0.80 | |||||
| DX106614 | A1047852 | 13.70 | 8.92 | 4.78 | |||||
| DX150087 | A1047853 | 6.00 | 5.28 | 0.72 | |||||
| A00370962 | A1047854 | 7.15 | 2.23 | 4.92 | |||||
| A00361035 | A1047855 | 2.43 | 1.70 | 0.73 | |||||
| DX130522 | A1047856 | 3.23 | 3.86 | -0.63 |
Source: AGP (2021)
The results of the independent samples have demonstrated the presence of gold mineralization on the Property. AGP interprets the differences of the gold grades in the independent samples to be due to the degree of variability of the gold mineralization. It should be noted that all samples, except one, returned values less than those of Great Bear, however, they are all in the range of those of Great Bear. It should also be noted that samples collected by AGP were quarter core, in lieu of half core collected by Great Bear.
Page 122
| Kinross Gold Corporation Great Bear Gold Project Ontario, Canada NI 43-101 Technical Report |
| 12.3 | QP Opinion |
The data used to support a Mineral Resource estimate are subject to validation, using built-in software program that automatically triggers a data check for a range of data entry errors. Verification checks on surveys, collar coordinates, lithology, and assay data have been conducted. The checks were appropriate and consistent with industry standards.
The QP for this section is of the opinion that the sample descriptions, sampling procedures, and data entries were conducted in accordance with industry standards.
The QP is also of the opinion that the database is representative and adequate to support a Mineral Resource estimate for the Project.
Page 123
| Kinross Gold Corporation Great Bear Gold Project Ontario, Canada NI 43-101 Technical Report |
| 13. | Mineral Processing and Metallurgical Testing |
| 13.1 | Introduction |
Kinross acquired Great Bear in 2022 following metallurgical test work performed at Blue Coast Research Ltd (Blue Coast Research) in 2020 and 2021. The two test work programs were designed to provide an initial understanding of gold dissolution using standard cyanidation methods on composites from the LP, Hinge, and Limb zones of the Great Bear deposit. Additional cyanidation tests were conducted to evaluate the impacts of grind size, cyanide concentration, and lead nitrate addition on gold leaching.
Following the acquisition, Kinross retained SGS Canada Inc. (SGS) to perform a more comprehensive test program, namely the Scoping Test Work program. This metallurgical testing program is still underway at the time of writing this report. The evaluation program includes a wide range of characterization tests comprised of detailed chemical head analysis, mineralogy, comminution, and ore sorting. Gold recovery testing incorporates a brief investigation of the heap leaching option, and a detailed examination of standard milling circuit options, including gravity separation, flotation, and cyanide leaching. A rheometallurgical program covering thickening, rheology, and filtration is also included as well as a baseline acid rock drainage (ARD) testing on final tailings from selected leach tests. Kinross notes that limited SGS Scoping Test Work results will be presented as the test work was underway at the time of writing this Technical Report.
As of the effective date of this Technical Report, the QP is not aware of any processing factors or deleterious elements that could have a significant effect on potential economic extraction.
| 13.1 | Blue Coast Test Programs Results |
Blue Coast Research completed two preliminary metallurgical test work programs on the Project (then Dixie Project) in 2020 and 2021.
Sampling Program
In 2020, three composites were selected by representatives from Great Bear. Each composite weighed approximately 20 kg and was comprised of drill core and/or assay rejects. The three composites are listed below:
| • | Hinge Zone Comp – a single composite from the Hinge Zone. |
| • | Dixie Limb (DL) Argillite Comp – a composite comprised of argillite rock type, within the Limb Zone. |
Page 124
| Kinross Gold Corporation Great Bear Gold Project Ontario, Canada NI 43-101 Technical Report |
| • | DL High Sulphide Comp – a composite that consists of higher sulphide material within the Limb Zone. The samples were all noted as being from the silica sulphide replacement rock type. |
In 2021, five composites were submitted by Great Bear. Four of the five composites were designed to represent variations in grade across the deposit, while the fifth composite was selected to evaluate the impact that higher arsenic zones may have on gold recovery. The composites were:
| • | LP Fault High Arsenic Comp – a composite selected to represent the LP material containing elevated quantities of arsenopyrite. |
| • | LP Fault 8-10 Comp – a composite with an expected average grade of 8 g/t to10 g/t Au. |
| • | LP Fault 3.5 Comp – a composite with an expected average grade of 3.5 g/t Au. |
| • | LP Fault 1.5 Comp – a composite with an expected average grade of 1.5 g/t Au. |
| • | LP Fault 0.5 Comp – a composite with an expected average grade of 0.5 g/t Au. |
Sample Head Analysis
A chemical characterization of the composites was performed at the Blue Coast Research laboratory through the following analysis:
| • | Quantitative Analysis (Au, sulphur, and carbon) |
| ○ | FA-GRAV for gold |
| ○ | ELTRA for carbon and total sulphur (Stot) and sulphide sulphur (S2) |
| ○ | CO3—ELTRA for total carbon (Ctot) |
| ○ | HCl-ELTRA for organic carbon (Corg) |
| • | Semi-Quantitative ICP Scan Analysis |
The samples and head assays are listed in Table 13-1 to Table 13-3.
Table 13-1: Quantitative analysis - Dixie Project composite head assays
| Composite | Au (g/t) | Stot (%) | S2- (%) | Ctot (%) | Corg (%) | ||||||||||
| Method | FA-GRAV | ELTRA | CO3—ELTRA | ELTRA | HCl-ELTRA | ||||||||||
| Hinge Zone Comp | 13.07 | 0.66 | 0.49 | 1.01 | 0.03 |
Page 125
| Kinross Gold Corporation Great Bear Gold Project Ontario, Canada NI 43-101 Technical Report |
| Composite | Au (g/t) | Stot (%) | S2- (%) | Ctot (%) | Corg (%) | ||||||||||
| DL Argillite Comp | 10.64 | 6.29 | 4.81 | 2.55 | 0.37 | ||||||||||
| DL High Sulphide Comp | 8.02 | 6.74 | 6.11 | 2.35 | 0.21 | ||||||||||
| LP Fault High Arsenic Comp | 9.43 | 1.13 | 1.07 | 0.56 | 0.02 | ||||||||||
| LP Fault 8-10 Comp | 21.9 | 0.94 | 0.79 | 0.26 | 0.06 | ||||||||||
| LP Fault 3.5 Comp | 3.97 | 1 | 0.9 | 0.22 | 0.04 | ||||||||||
| LP Fault 1.5 Comp | 1.54 | 0.86 | 0.6 | 0.21 | 0.02 | ||||||||||
| LP Fault 0.5 Comp | 0.65 | 0.79 | 0.59 | 0.25 | 0.02 |
Table 13-2: Semi-quantitative ICP scan analysis - Dixie Project multi-element ICP scan
| Element | Detection Limit | Units | Method | Hinge Zone Composite | DL Argillite Composite | DL HS Composite | |||||||||||||
| Ag | 0.2 | ppm | 4AD-ICP | 0.7 | 1.4 | 2.1 | |||||||||||||
| Al | 0.01 | % | 4AD-ICP | 5 | 4.5 | 2.9 | |||||||||||||
| As | 2 | ppm | 4AD-ICP | 28.3 | 2,887.40 | 3,798.10 | |||||||||||||
| Ba | 2 | ppm | 4AD-ICP | 191.6 | 184.8 | 104 | |||||||||||||
| Be | 0.2 | ppm | 4AD-ICP | 0.8 | 0.3 | <0.2 | |||||||||||||
| Bi | 2 | ppm | 4AD-ICP | <2 | <2 | <2 | |||||||||||||
| Ca | 0.01 | % | 4AD-ICP | 5.9 | 6.7 | 6.3 | |||||||||||||
| Cd | 0.2 | ppm | 4AD-ICP | 4 | 8.1 | 1.9 | |||||||||||||
| Co | 2 | ppm | 4AD-ICP | 27.7 | 36.7 | 32.6 | |||||||||||||
| Cr | 1 | ppm | 4AD-ICP | 197.6 | 116.4 | 92.9 | |||||||||||||
| Cu | 1 | ppm | 4AD-ICP | 111.7 | 296.3 | 317.7 | |||||||||||||
| Fe | 0.01 | % | 4AD-ICP | 5.7 | 11.2 | 12.2 | |||||||||||||
| Ga | 20 | ppm | 4AD-ICP | <20 | <20 | <20 | |||||||||||||
| Ge | 20 | ppm | 4AD-ICP | <20 | <20 | <20 | |||||||||||||
| Hf | 20 | ppm | 4AD-ICP | <20 | <20 | <20 | |||||||||||||
| Hg | 1 | ppm | 4AD-ICP | N/A | N/A | N/A | |||||||||||||
| In | 20 | ppm | 4AD-ICP | <20 | <20 | <20 | |||||||||||||
| K | 0.01 | % | 4AD-ICP | 0.7 | 0.5 | 0.2 | |||||||||||||
| Li | 2 | ppm | 4AD-ICP | 24.2 | 18.6 | 12.1 | |||||||||||||
| Mg | 0.01 | % | 4AD-ICP | 2.1 | 2.2 | 1.5 | |||||||||||||
| Mn | 2 | ppm | 4AD-ICP | 1,124.40 | 1,466.50 | 1,933.30 | |||||||||||||
| Mo | 1 | ppm | 4AD-ICP | 1.6 | 2.1 | 2.7 | |||||||||||||
| Na | 0.01 | % | 4AD-ICP | 1.4 | 2.7 | 1.6 |
Page 126
| Kinross Gold Corporation Great Bear Gold Project Ontario, Canada NI 43-101 Technical Report |
| Element | Detection Limit | Units | Method | Hinge Zone Composite | DL Argillite Composite | DL HS Composite | |||||||||||||
| Nb | 10 | ppm | 4AD-ICP | <10 | <10 | <10 | |||||||||||||
| Ni | 1 | ppm | 4AD-ICP | 72.6 | 71.2 | 50.7 | |||||||||||||
| P | 0.002 | % | 4AD-ICP | 0 | 0 | 0 | |||||||||||||
| Pb | 2 | ppm | 4AD-ICP | 4.3 | 43.5 | 15.1 | |||||||||||||
| Rb | 20 | ppm | 4AD-ICP | 33 | <20 | <20 | |||||||||||||
| Re | 20 | ppm | 4AD-ICP | <20 | <20 | <20 | |||||||||||||
| S | 0.01 | % | 4AD-ICP | 0.7 | 6.3 | 7.1 | |||||||||||||
| Sb | 2 | ppm | 4AD-ICP | <2 | <2 | 9 | |||||||||||||
| Se | 10 | ppm | 4AD-ICP | <10 | <10 | <10 | |||||||||||||
| Sn | 10 | ppm | 4AD-ICP | <10 | <10 | <10 | |||||||||||||
| Sr | 1 | ppm | 4AD-ICP | 123.5 | 330.8 | 269.1 | |||||||||||||
| Ta | 10 | ppm | 4AD-ICP | <10 | <10 | <10 | |||||||||||||
| Te | 10 | ppm | 4AD-ICP | <10 | 11.6 | 15.8 | |||||||||||||
| Ti | 0.01 | % | 4AD-ICP | 0.3 | 0.3 | 0.1 | |||||||||||||
| Tl | 2 | ppm | 4AD-ICP | <2 | <2 | <2 | |||||||||||||
| V | 1 | ppm | 4AD-ICP | 190.3 | 103.4 | 65.9 | |||||||||||||
| W | 10 | ppm | 4AD-ICP | 549.2 | 20.4 | 22.9 | |||||||||||||
| Zn | 2 | ppm | 4AD-ICP | 344.5 | 641.1 | 502.2 | |||||||||||||
| Zr | 4 | ppm | 4AD-ICP | 51 | 91.1 | 45.5 |
Table 13-3: Semi-quantitative ICP scan analysis - LP multi-element ICP scan
| Element | Detection Limit | Units | Method | LP Fault 0.5g Comp | LP Fault 1.5g Comp | LP Fault 3.5g Comp | LP Fault 8-10Comp | LP Fault High As Comp | |||||||||||||||||
| Ag | 0.2 | ppm | AR-ICP | <0.2 | <0.2 | 0.8 | 2.4 | 1.9 | |||||||||||||||||
| Al | 0.01 | % | AR-ICP | 1.36 | 1.26 | 1.06 | 0.6 | 0.81 | |||||||||||||||||
| As | 2 | ppm | AR-ICP | 147 | 506 | 421 | 3474 | 640 | |||||||||||||||||
| Ba | 2 | ppm | AR-ICP | 59 | 84 | 75 | 64 | 93 | |||||||||||||||||
| Be | 0.2 | ppm | AR-ICP | 0.4 | 0.2 | 0.5 | <0.2 | 0.2 | |||||||||||||||||
| Bi | 2 | ppm | AR-ICP | <2 | <2 | <2 | <2 | <2 | |||||||||||||||||
| Ca | 0.01 | % | AR-ICP | 1.11 | 0.91 | 0.9 | 0.87 | 1.79 | |||||||||||||||||
| Cd | 0.2 | ppm | AR-ICP | 3.1 | <0.2 | 0.2 | 0.3 | 0.5 | |||||||||||||||||
| Co | 2 | ppm | AR-ICP | 10 | 9 | 10 | 9 | 9 |
Page 127
| Kinross Gold Corporation Great Bear Gold Project Ontario, Canada NI 43-101 Technical Report |
| Element | Detection Limit | Units | Method | LP Fault 0.5g Comp | LP Fault 1.5g Comp | LP Fault 3.5g Comp | LP Fault 8-10Comp | LP Fault High As Comp | |||||||||||||||||
| Cr | 1 | ppm | AR-ICP | 47 | 68 | 61 | 64 | 46 | |||||||||||||||||
| Cu | 1 | ppm | AR-ICP | 47 | 26 | 46 | 31 | 29 | |||||||||||||||||
| Fe | 0.01 | % | AR-ICP | 2.73 | 2.51 | 2.71 | 2.07 | 2.45 | |||||||||||||||||
| Ga | 20 | ppm | AR-ICP | <20 | <20 | <20 | <20 | <20 | |||||||||||||||||
| Ge | 20 | ppm | AR-ICP | <20 | <20 | <20 | <20 | <20 | |||||||||||||||||
| Hf | 20 | ppm | AR-ICP | <20 | <20 | <20 | <20 | <20 | |||||||||||||||||
| Hg | 1 | ppm | AR-ICP | <3 | <3 | <3 | <3 | <3 | |||||||||||||||||
| In | 20 | ppm | AR-ICP | <20 | <20 | <20 | <20 | <20 | |||||||||||||||||
| K | 0.01 | % | AR-ICP | 0.77 | 0.73 | 0.81 | 0.4 | 0.54 | |||||||||||||||||
| Li | 2 | ppm | AR-ICP | 12 | 12 | 14 | 7 | 9 | |||||||||||||||||
| Mg | 0.01 | % | AR-ICP | 0.91 | 0.85 | 0.79 | 0.49 | 0.72 | |||||||||||||||||
| Mn | 2 | ppm | AR-ICP | 533 | 488 | 469 | 443 | 669 | |||||||||||||||||
| Mo | 1 | ppm | AR-ICP | 6 | 7 | 6 | 8 | 6 | |||||||||||||||||
| Na | 0.01 | % | AR-ICP | 0.05 | 0.06 | 0.04 | 0.04 | 0.04 | |||||||||||||||||
| Nb | 10 | ppm | AR-ICP | <10 | <10 | <10 | <10 | <10 | |||||||||||||||||
| Ni | 1 | ppm | AR-ICP | 16 | 17 | 17 | 14 | 17 | |||||||||||||||||
| P | 0.002 | % | AR-ICP | 0.06 | 0.054 | 0.063 | 0.04 | 0.055 | |||||||||||||||||
| Pb | 2 | ppm | AR-ICP | 139 | 18 | 59 | 46 | 15 | |||||||||||||||||
| Rb | 20 | ppm | AR-ICP | 59 | 54 | 52 | 22 | 30 | |||||||||||||||||
| Re | 20 | ppm | AR-ICP | <20 | <20 | <20 | <20 | <20 | |||||||||||||||||
| S | 0.01 | % | AR-ICP | 0.84 | 0.83 | 1.09 | 1 | 1.22 | |||||||||||||||||
| Sb | 2 | ppm | AR-ICP | 6 | 6 | 8 | 9 | 7 | |||||||||||||||||
| Se | 10 | ppm | AR-ICP | <10 | <10 | <10 | <10 | <10 | |||||||||||||||||
| Sn | 10 | ppm | AR-ICP | <10 | <10 | <10 | <10 | <10 | |||||||||||||||||
| Sr | 1 | ppm | AR-ICP | 16 | 19 | 10 | 25 | 25 | |||||||||||||||||
| Ta | 10 | ppm | AR-ICP | <10 | <10 | <10 | <10 | <10 | |||||||||||||||||
| Te | 10 | ppm | AR-ICP | <10 | <10 | <10 | <10 | <10 | |||||||||||||||||
| Ti | 0.01 | % | AR-ICP | 0.15 | 0.13 | 0.16 | 0.07 | 0.1 | |||||||||||||||||
| Tl | 2 | ppm | AR-ICP | 6 | 3 | <2 | 5 | 2 | |||||||||||||||||
| V | 1 | ppm | AR-ICP | 38 | 38 | 44 | 22 | 32 | |||||||||||||||||
| W | 10 | ppm | AR-ICP | 12 | <10 | 12 | 15 | 26 | |||||||||||||||||
| Zn | 2 | ppm | AR-ICP | 513 | 67 | 116 | 96 | 111 | |||||||||||||||||
| Zr | 4 | ppm | AR-ICP | 19 | 11 | 16 | 12 | 11 |
Page 128
| Kinross Gold Corporation Great Bear Gold Project Ontario, Canada NI 43-101 Technical Report |
Head assays results indicate the following:
| • | Silver content was relatively low and was not expected to influence carbon loadings or elution performance significantly. |
| • | Higher sulphide content was noted in the Limb samples. |
| • | Mercury levels were low. |
| • | Arsenic and antimony levels were low and are not expected to influence recoveries. |
| • | Organic carbon levels were low indicating that the preg-robbing potential should be low. |
| • | Base metal concentrations were low and should not influence carbon loadings. |
| • | Telluride levels were low and are not expected to adversely influence gold leaching kinetics or recovery. |
Leaching
A total of 22 bottle roll cyanidation tests were conducted on the composites. The following leach conditions were used:
| • | Residence time: 48-hour bottle |
| • | Pulp density: 40% solids |
| • | Cyanide concentration maintained: 1.0 g/L |
| • | pH was maintained: 10.5 and 11 with the addition of lime |
| • | Primary grind size: 80% passing 75 μm |
| • | Lead nitrate addition: 250 g/t |
A summary of test conditions and results is presented in Table 134.
Table 13-4: Leaching results summary
| Test ID | Feed | Purpose | Primary Grind (P80, µm) | NaCN Consumption (kg/t) | 48 hr Au Recovery (%) | Residue Grade (Au, g/t) | Calculated Head Grade (Au, g/t) | ||||||||
| CN-1 | Hinge Zone Comp | Effect of Primary Grind | 112 | 0.37 | 95.4 | 0.640 | 14.0 |
Page 129
| Kinross Gold Corporation Great Bear Gold Project Ontario, Canada NI 43-101 Technical Report |
| Test ID | Feed | Purpose | Primary Grind (P80, µm) | NaCN Consumption (kg/t) | 48 hr Au Recovery (%) | Residue Grade (Au, g/t) | Calculated Head Grade (Au, g/t) | ||||||||
| CN-2 | Hinge Zone Comp | Effect of Primary Grind | 74 | 0.43 | 97.2 | 0.390 | 13.9 | ||||||||
| CN-3 | DL Argillite Comp | Effect of Primary Grind | 138 | 1.10 | 92.9 | 0.720 | 10.1 | ||||||||
| CN-4 | DL Argillite Comp | Effect of Primary Grind | 77 | 4.47 | 88.3 | 1.272 | 10.9 | ||||||||
| CN-5 | DL High Sulphide Comp | Effect of Primary Grind | 121 | 1.11 | 93.1 | 0.620 | 9.0 | ||||||||
| CN-6 | DL High Sulphide Comp | Effect of Primary Grind | 74 | 1.91 | 96.1 | 0.347 | 8.9 | ||||||||
| CN-7 | DL Argillite Comp | Effect of Lead Nitrate | 78 | 1.66 | 97.0 | 0.313 | 10.4 | ||||||||
| CN-8 | DL Argillite Comp | Effect of Lead Nitrate | 76 | 1.43 | 97.4 | 0.287 | 11.1 | ||||||||
| CN-9 | DL Argillite Comp | Effect of Cyanide Concentration | 74 | 3.30 | 97.5 | 0.287 | 11.5 | ||||||||
| CN-10 | DL Argillite Comp | Effect of Lead Nitrate / Pre-treatment | 79 | 1.56 | 97.1 | 0.288 | 10.1 | ||||||||
| CN-11 | DL High Sulphide Comp | Effect of Lead Nitrate | 76 | 1.55 | 96.9 | 0.292 | 9.4 | ||||||||
| CN-12 | DL High Sulphide Comp | Effect of Lead Nitrate / Pre-treatment | 77 | 1.35 | 96.7 | 0.289 | 8.8 | ||||||||
| CN-13 | LP Fault High As Comp | Baseline | 77 | 0.19 | 98.0 | 0.183 | 9.2 | ||||||||
| CN-14 | LP Fault High As Comp | Effect of Lead Nitrate / Pre-treatment | 75 | 0.22 | 97.7 | 0.211 | 9.2 | ||||||||
| CN-15 | LP Fault 8-10 Comp | Baseline | 75 | 0.23 | 99.2 | 0.190 | 23.0 | ||||||||
| CN-16 | LP Fault 8-10 Comp | Effect of Lead Nitrate / Pre-treatment | 74 | 0.27 | 98.7 | 0.341 | 26.6 | ||||||||
| CN-17 | LP Fault 3.5 Comp | Baseline | 75 | 0.18 | 97.5 | 0.106 | 4.2 | ||||||||
| CN-18 | LP Fault 3.5 Comp | Effect of Lead Nitrate / Pre-treatment | 74 | 0.12 | 97.3 | 0.111 | 4.1 |
Page 130
| Kinross Gold Corporation Great Bear Gold Project Ontario, Canada NI 43-101 Technical Report |
| Test ID | Feed | Purpose | Primary Grind (P80, µm) | NaCN Consumption (kg/t) | 48 hr Au Recovery (%) | Residue Grade (Au, g/t) | Calculated Head Grade (Au, g/t) | ||||||||
| CN-19 | LP Fault 1.5 Comp | Baseline | 75 | 0.12 | 96.3 | 0.058 | 1.6 | ||||||||
| CN-20 | LP Fault 1.5 Comp | Effect of Lead Nitrate / Pre-treatment | 74 | 0.19 | 96.4 | 0.049 | 1.4 | ||||||||
| CN-21 | LP Fault 0.5 Comp | Baseline | 77 | 0.23 | 95.2 | 0.036 | 0.7 | ||||||||
| CN-22 | LP Fault 0.5 Comp | Effect of Lead Nitrate / Pre-treatment | 74 | 0.12 | 95.9 | 0.040 | 1.0 |
Test Work Conclusions
The following conclusions were noted from Blue Coast Research test work programs conducted on the Great Bear mineralization:
| • | Gold from each composite was readily cyanide soluble with extraction during standard cyanide leach tests ranging from 95% to 99% for LP. |
| • | The addition of lead nitrate did not improve overall leach recovery from the LP material. Lead nitrate addition improved extraction kinetics from the highest-grade composite only. Extraction kinetics from all other composites were unaffected by the addition of lead nitrate. |
| • | Cyanide consumption was low, averaging 0.19 kg NaCN/tonne over all tests. |
| • | Higher sulphide content was noted in the Limb samples. |
| • | The addition of lead nitrate improved overall gold recovery and increased gold dissolution kinetics in the Limb samples. The improvement in gold dissolution kinetics was noted to be up to 24 hours in some instances. |
| • | Lead nitrate addition reduced the dissolution of sulphur and resulted in lower consumption of cyanide. |
| • | Pre-treatment with lead nitrate prior to the addition of cyanide did not result in any additional gold recovery, compared to when lead nitrate was added just prior to cyanide. |
Page 131
| Kinross Gold Corporation Great Bear Gold Project Ontario, Canada NI 43-101 Technical Report |
| • | Grinding to 75 microns appeared to improve gold recovery slightly compared to primary grinds of approximately P80=125 μm. |
Test Work Recommendations
Based on results produced from the Blue Coast Research testing programs, the following recommendations were made for future work:
| • | Conduct a cyanide leach optimization program exploring: |
| ○ | the gold extraction at coarser grind sizes. |
| ○ | the impact of lower concentrations of sodium cyanide and the impact they have on gold dissolution. |
| • | Conduct gravity recoverable gold test work to determine the potential for gravity concentration on material from the Great Bear deposit. |
| • | Conduct comminution test work including Bond Ball Mill Work Index and Semi-autogenous Grinding (SAG) Mill Comminution (SMC) tests to determine grindability parameters. |
| • | Conduct a flotation test work program to determine how the material responds to flotation. |
| • | Conduct additional cyanidation test work. |
| • | Evaluate the benefits of lead nitrate addition in the Hinge Zone material. |
| • | Examine the impact of primary grind size when lead nitrate is applied. |
| • | Carry out a variability cyanidation study on discrete spatial samples to determine the variability of metallurgical response within the deposit and to provide a link to discrete 3D space. |
| 13.2 | SGS Metallurgical Scoping Test Work 2022 |
Sampling Program
Following the metallurgical test work performed at Blue Coast Research in 2020 and 2021, a more comprehensive test program was initiated by Kinross in 2022 after the acquisition of the Project. Samples were selected from different zones of the Great Bear deposit and sent to SGS for testing. This test work is underway at the time of writing this report. The purpose of the investigation is to evaluate the metallurgical response of the mineralization, provide the key metallurgical data for selection of a suitable processing flowsheet for plant design, and estimate metallurgical recoveries and processing costs for financial modelling.
Page 132
| Kinross Gold Corporation Great Bear Gold Project Ontario, Canada NI 43-101 Technical Report |
The method of preparing composite samples for the test work was based on grades and the need to obtain composites representative of the three mineralized zones of the Great Bear deposit, namely the LP Zone, Hinge Zone, and Limb Zone. The samples were predominantly NQ half drill cores from all three mineralized zones of the Great Bear deposit, with the exception of two LP samples which were PQ whole drill cores. The NQ half drill cores were from drilling programs executed prior to the acquisition. The two PQ whole drill cores consisted of fresh drill cores, BRP002 and BRP001, drilled following the Kinross acquisition in 2022.
Nine composite samples representative of the deposit were designed from the drill cores collected to represent the three different zones of the deposit. However, due to limited samples available, a single composite was generated from the Limb drill core collected. The nine composites are listed below:
| • | C01: LP composite made of BRP002 selected PQ whole core intervals |
| • | C02: LP composite made of BRP001 selected PQ whole core intervals |
| • | C03: LP composite made of selected NQ half core intervals |
| • | C04: LP composite made of selected NQ half core intervals |
| • | C05: LP composite made of selected NQ half core intervals |
| • | C06: LP composite made of selected NQ half core intervals |
| • | C07: Hinge composite made of selected NQ half core intervals |
| • | C08: Hinge composite made of selected NQ half core intervals |
| • | C09: Limb composite made of selected NQ half core intervals |
Figure 13-1 depicts the locations of the drill holes from where metallurgical samples for the three test work progssrams were retrieved in the Project area.
Page 133
| Kinross Gold Corporation Great Bear Gold Project Ontario, Canada NI 43-101 Technical Report |
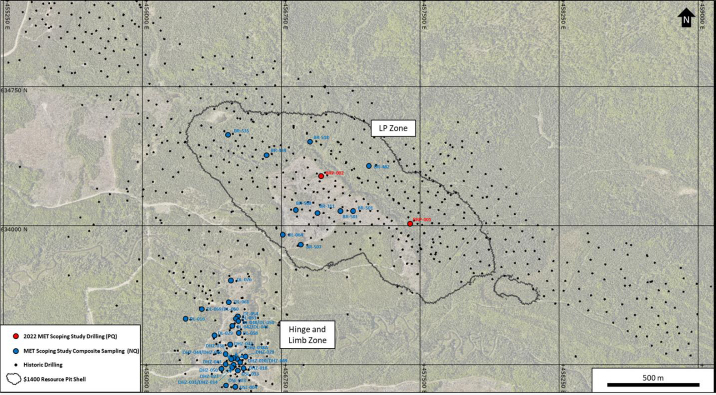
Figure 13-1: Metallurgical sample locations from current and historical drill sites for test work programs
Head Assays
One-kilogram sub-samples of minus 1.7 mm material representing each of the 20 samples were subjected to standard screened metallics analysis for gold and silver as follows:
| • | Samples were initially sieved at +/-106 μm. The minus 106 μm fraction was set aside, while the +106 μm fraction was briefly pulverized and the pulverized material re-sieved. |
| • | The minus 106 μm generated was combined with the previous minus 106 μm material and the process was repeated several times until only approximately 30 g remains on the sieve. |
| • | The +106 μm (metallics) fraction was fire assayed for gold and silver in its entirety. The combined minus 106 μm fraction was homogenized and two separately riffled approximately 30 g aliquots were submitted for fire assay for gold and silver to extinction. |
Page 134
| Kinross Gold Corporation Great Bear Gold Project Ontario, Canada NI 43-101 Technical Report |
| • | Depending on the anticipated (or known) silver grade of the sample, a separate undersize screen cut was typically retained and potentially subjected to acid digestion before being read for Ag by AAS. |
Screened metallic analysis was used due to coarse gold in the samples. Silver assay in the +150 mesh product was less than 5 g/t Ag in some samples. For purposes of calculating, the values are set at 5 g/t Ag.
Duplicate gold assays on the -150 mesh fraction of the samples listed in Table 13-5 reveal some differences in the gold grades. This appears to be a nugget effect. Screened metallic gold analysis indicated that gold concentration in the -150 mesh in samples C02, C03, C05, C06, C07, C08, and C09 was higher than in the +150 mesh fraction. Silver head analysis presented in Table 13-6 shows that more than 77% of silver in samples is in the -150 mesh fraction.
Table 13-5: Screened metallics for Au analysis
| Head | +150 Mesh | -150 Mesh | % Au Distribution | ||||||||||||||||||||||||
| Grade | Au, g/t | ||||||||||||||||||||||||||
| Ore Type | Comp | (Au, g/t) | % Mass | Au, g/t | % Mass | a | b | +150 Mesh | -150 Mesh | ||||||||||||||||||
| LP | C01 | 2.08 | 2.8 | 40.9 | 97.2 | 1.22 | 0.70 | 55.1 | 44.9 | ||||||||||||||||||
| LP | C02 | 3.29 | 2.5 | 55.6 | 97.5 | 2.12 | 1.72 | 43.1 | 56.9 | ||||||||||||||||||
| LP | C03 | 2.03 | 3.0 | 13.7 | 97.0 | 1.77 | 1.56 | 20.5 | 79.5 | ||||||||||||||||||
| LP | C04 | 1.97 | 2.1 | 46.3 | 97.9 | 0.90 | 1.11 | 50.0 | 50.0 | ||||||||||||||||||
| LP | C05 | 2.64 | 3.0 | 22.7 | 97.0 | 1.53 | 2.51 | 25.8 | 74.2 | ||||||||||||||||||
| LP | C06 | 3.72 | 3.1 | 19.0 | 96.9 | 3.22 | 3.25 | 15.6 | 84.4 | ||||||||||||||||||
| Hinge | C07 | 4.25 | 3.0 | 29.5 | 97.0 | 4.08 | 2.89 | 20.5 | 79.5 | ||||||||||||||||||
| Hinge | C08 | 4.36 | 2.6 | 24.6 | 97.4 | 3.92 | 3.71 | 14.7 | 85.3 | ||||||||||||||||||
| Limb | C09 | 9.73 | 2.7 | 128.0 | 97.3 | 7.16 | 5.73 | 35.6 | 64.4 | ||||||||||||||||||
Table 13-6: Screened metallics for Ag analysis
| Head | +150 Mesh | -150 Mesh | % Ag Distribution | ||||||||||||||||||||||||
| Grade | Ag, g/t | ||||||||||||||||||||||||||
| Ore Type | Comp | (Ag, g/t) | % Mass | Ag, g/t | % Mass | a | b | +150 Mesh | -150 Mesh | ||||||||||||||||||
| LP | C01 | 0.63 | 2.8 | 5 | 97.2 | 0.5 | -- | 22.3 | 77.7 | ||||||||||||||||||
| LP | C02 | 1.72 | 2.5 | 10 | 97.5 | 1.5 | -- | 14.8 | 85.2 | ||||||||||||||||||
| LP | C03 | 0.83 | 3.0 | 5 | 97.0 | 0.70 | -- | 18.3 | 81.7 | ||||||||||||||||||
Page 135
| Kinross Gold Corporation Great Bear Gold Project Ontario, Canada NI 43-101 Technical Report |
| Head | +150 Mesh | -150 Mesh | % Ag Distribution | ||||||||||||||||||||||||
| Grade | Ag, g/t | ||||||||||||||||||||||||||
| Ore Type | Comp | (Ag, g/t) | % Mass | Ag, g/t | % Mass | a | b | +150 Mesh | -150 Mesh | ||||||||||||||||||
| LP | C04 | 0.89 | 2.1 | 5 | 97.9 | 0.80 | -- | 11.9 | 88.1 | ||||||||||||||||||
| LP | C05 | 0.93 | 3.0 | 5 | 97.0 | 0.80 | -- | 16.2 | 83.8 | ||||||||||||||||||
| LP | C06 | 0.83 | 3.1 | 5 | 96.9 | 0.70 | -- | 18.4 | 81.6 | ||||||||||||||||||
| Hinge | C07 | 0.50 | -- | -- | -- | -- | -- | -- | -- | ||||||||||||||||||
| Hinge | C08 | 0.50 | -- | -- | -- | -- | -- | -- | -- | ||||||||||||||||||
| Limb | C09 | 0.70 | -- | -- | -- | -- | -- | -- | -- | ||||||||||||||||||
Separate, smaller representative cuts were pulverized and submitted for LECO analyses including S(T), S2-, C(T), C(graphitic) and CO32-, and for 30 element semi-quantitative ICP scan (aqua regia digest). The specific gravity of each sample was determined by gas comparison pycnometer.
S(total) and S(sulphide) have been performed as part of the head analysis. Ratios of S=/S(tot) presented in Table 13-7 indicate that 86% to 97% of the sulphur in the samples is present in the sulphide form. Gold deportment studies, on selected samples, will undoubtedly identify other sulphide minerals if sufficient amounts are present.
Results presented in Table 13-7 to Table 13-9 indicate that silver content is relatively low and is not expected to influence carbon loadings or elution performance significantly. Antimony levels are low and are not expected to influence recoveries. Organic carbon levels are low indicating that the preg-robbing potential should be low. Base metal concentrations are low and should not influence carbon loadings. The mercury analysis result is not yet available.
Table 13-7: Quantitative analyses of the samples
| LP | Hinge | Limb | |||||||||||||||||||||||||
| Element | C01 | C02 | C03 | C04 | C05 | C06 | C07 | C08 | C09 | ||||||||||||||||||
| Au, g/t | 2.08 | 3.29 | 2.03 | 1.97 | 2.64 | 3.72 | 4.25 | 4.36 | 9.73 | ||||||||||||||||||
| Ag, g/t | 0.6 | 1.7 | 0.8 | 0.9 | 0.9 | 0.8 | 0.5 | 0.5 | 0.7 | ||||||||||||||||||
| Au/Ag Ratio | 3.3 | 1.9 | 2.4 | 2.2 | 2.9 | 4.5 | 8.5 | 8.7 | 13.9 | ||||||||||||||||||
| As, % | 0.027 | 0.002 | -- | -- | -- | -- | -- | -- | -- | ||||||||||||||||||
| S, % | 0.69 | 2.85 | 1.22 | 1.89 | 0.62 | 1.3 | 0.44 | 0.49 | 4.11 | ||||||||||||||||||
| S=, % | 0.62 | 2.44 | 1.12 | 1.84 | 0.56 | 1.19 | 0.39 | 0.45 | 3.74 | ||||||||||||||||||
| S= /S % | 89.9 | 85.6 | 91.8 | 97.4 | 90.3 | 91.5 | 88.6 | 91.8 | 91.0 | ||||||||||||||||||
Page 136
| Kinross Gold Corporation Great Bear Gold Project Ontario, Canada NI 43-101 Technical Report |
| LP | Hinge | Limb | |||||||||||||||||||||||||
| Element | C01 | C02 | C03 | C04 | C05 | C06 | C07 | C08 | C09 | ||||||||||||||||||
| C(t), % | 0.21 | 0.07 | 0.24 | 0.28 | 0.45 | 0.45 | 1.05 | 1.2 | 2.18 | ||||||||||||||||||
| C(g), % | < 0.05 | < 0.05 | < 0.05 | < 0.05 | < 0.05 | < 0.05 | < 0.05 | < 0.05 | 0.22 | ||||||||||||||||||
| CO3, % | 1.06 | 0.4 | 0.52 | 0.65 | 2.4 | 2.26 | 4.79 | 5.69 | 9.37 | ||||||||||||||||||
Table 13-8: Semi-quantitative analyses of the samples
| Element | C01 | C02 | C03 | C04 | C05 | C06 | C07 | C08 | C09 | ||||||||||||||||||
| Ag, g/t | < 0.8 | 1.4 | < 0.8 | < 0.8 | < 0.8 | < 0.8 | 1.1 | < 0.8 | < 0.8 | ||||||||||||||||||
| Al, g/t | 15,600 | 14,400 | 8,280 | 8,730 | 13,200 | 9,610 | 16,500 | 14,000 | 8,230 | ||||||||||||||||||
| As, g/t | 292 | 32 | 256 | < 30 | 365 | 135 | 30 | 85 | 1770 | ||||||||||||||||||
| Ba, g/t | 137 | 86 | 85.2 | 89.6 | 133 | 155 | 145 | 97.9 | 152 | ||||||||||||||||||
| Be, g/t | 0.06 | 0.29 | 0.1 | 0.06 | 0.11 | 0.12 | < 0.05 | < 0.05 | 0.12 | ||||||||||||||||||
| Bi, g/t | < 10 | < 10 | < 10 | < 10 | < 10 | < 10 | < 10 | < 10 | < 10 | ||||||||||||||||||
| Ca, g/t | 9,500 | 8,080 | 10,100 | 11,400 | 17,200 | 16,400 | 38,700 | 45,000 | 51,600 | ||||||||||||||||||
| Cd, g/t | < 2 | < 2 | < 4 | < 4 | < 4 | < 4 | < 4 | < 4 | < 4 | ||||||||||||||||||
| Co, g/t | 17 | 16 | 9 | 12 | 11 | 11 | 25 | 22 | 36 | ||||||||||||||||||
| Cr, g/t | 75 | 60 | 78 | 86 | 77 | 88 | 122 | 95 | 116 | ||||||||||||||||||
| Cu, g/t | 43 | 28 | 46 | 206 | 31 | 53 | 108 | 121 | 235 | ||||||||||||||||||
| Fe, g/t | 30,700 | 35,000 | 21,800 | 24,800 | 22,800 | 24,000 | 30,300 | 32,600 | 79,900 | ||||||||||||||||||
| K, g/t | 10,300 | 6,910 | 4,340 | 5,470 | 8,410 | 5,500 | 3,810 | 2,420 | 2,530 | ||||||||||||||||||
| Li, g/t | < 20 | < 20 | < 20 | < 20 | < 20 | < 20 | < 20 | < 20 | < 20 | ||||||||||||||||||
| Mg, g/t | 9,940 | 7,040 | 5,740 | 7,700 | 8,260 | 8,010 | 12,500 | 9,520 | 10,800 | ||||||||||||||||||
| Mn, g/t | 399 | 398 | 334 | 408 | 890 | 598 | 674 | 851 | 1270 | ||||||||||||||||||
| Mo, g/t | < 6 | < 6 | 7 | 28 | < 6 | < 6 | < 6 | < 6 | < 6 | ||||||||||||||||||
| Na, g/t | 430 | 901 | 691 | 697 | 939 | 680 | 851 | 918 | 413 | ||||||||||||||||||
| Ni, g/t | 33 | 28 | 14 | 19 | 20 | 20 | 67 | 47 | 78 | ||||||||||||||||||
| P, g/t | 558 | 590 | 469 | 605 | 608 | 509 | 233 | 268 | 335 | ||||||||||||||||||
| Pb, g/t | < 20 | 123 | < 20 | < 20 | < 20 | 38 | < 20 | < 20 | < 20 | ||||||||||||||||||
| Sb, g/t | < 10 | < 10 | < 10 | < 10 | < 10 | < 10 | < 10 | < 10 | < 10 | ||||||||||||||||||
| Se, g/t | < 30 | < 30 | < 30 | < 30 | < 30 | < 30 | < 30 | < 30 | < 30 | ||||||||||||||||||
| Sn, g/t | < 20 | < 20 | < 20 | < 20 | < 20 | < 20 | < 20 | < 20 | < 20 | ||||||||||||||||||
| Sr, g/t | 19.3 | 30.7 | 17.5 | 16.7 | 30.8 | 27.2 | 25.4 | 20.1 | 120 | ||||||||||||||||||
| Ti, g/t | 1,580 | 791 | 742 | 979 | 1490 | 1060 | 998 | 830 | 514 | ||||||||||||||||||
| Tl, g/t | < 30 | < 30 | < 30 | < 30 | < 30 | < 30 | < 30 | < 30 | < 30 | ||||||||||||||||||
| V, g/t | 45 | 14 | 20 | 28 | 38 | 34 | 82 | 76 | 60 |
Page 137
| Kinross Gold Corporation Great Bear Gold Project Ontario, Canada NI 43-101 Technical Report |
| Element | C01 | C02 | C03 | C04 | C05 | C06 | C07 | C08 | C09 | ||||||||||||||||||
| Y, g/t | 5.9 | 5.5 | 6.6 | 5.2 | 5.6 | 5.3 | 5.5 | 5.7 | 5.7 | ||||||||||||||||||
| Zn, g/t | 70 | 159 | 65 | 89 | 288 | 166 | 42 | 35 | 276 |
Table 13-9: XFR analysis of the samples
| Oxide | C01 | C02 | C03 | C04 | C05 | C06 | C07 | C08 | C09 | |||||||||||||||||||
| SiO2% | 66.4 | 66.2 | 69.4 | 67 | 65.5 | 67.3 | 58 | 52.2 | 49.3 | |||||||||||||||||||
| Al2O3% | 14.0 | 14.1 | 13 | 14 | 14 | 13 | 11 | 12 | 8 | |||||||||||||||||||
| Fe2O3% | 5.14 | 5.67 | 3.83 | 4.06 | 4.11 | 4.17 | 9.46 | 12.2 | 14.8 | |||||||||||||||||||
| MgO % | 1.98 | 1.65 | 1.13 | 1.76 | 1.77 | 1.65 | 4.9 | 4.42 | 3.84 | |||||||||||||||||||
| CaO % | 3.15 | 2.34 | 2.72 | 3.43 | 3.89 | 3.27 | 8.64 | 10.8 | 8.98 | |||||||||||||||||||
| Na2O % | 2.7 | 1.35 | 3.82 | 3.77 | 3.69 | 4.24 | 1.8 | 1.88 | 2.89 | |||||||||||||||||||
| K2O % | 3.06 | 3.61 | 2 | 2 | 3 | 2 | 1 | 1 | 0 | |||||||||||||||||||
| TiO2% | 0.48 | 0.42 | 0.36 | 0.43 | 0.44 | 0.39 | 0.66 | 0.81 | 0.56 | |||||||||||||||||||
| P2O5% | 0.14 | 0.15 | 0.11 | 0.16 | 0.13 | 0.11 | 0.04 | 0.06 | 0.07 | |||||||||||||||||||
| MnO % | 0.07 | 0.11 | 0.05 | 0.05 | 0.15 | 0.08 | 0.18 | 0.27 | 0.28 | |||||||||||||||||||
| Cr2O3% | 0.02 | 0.02 | 0.04 | < 0.01 | 0.02 | 0.02 | 0.04 | 0.05 | 0.04 | |||||||||||||||||||
| V2O5% | 0.01 | < 0.01 | < 0.01 | 0 | < 0.01 | < 0.01 | 0 | 0 | 0 | |||||||||||||||||||
| LOI % | 1.66 | 3 | 3 | 2 | 2 | 2 | 4 | 4 | 5 | |||||||||||||||||||
| Sum % | 98.8 | 98.9 | 99.7 | 98.9 | 98.5 | 98.4 | 98.9 | 99.1 | 94.3 |
Comminution
Several comminution tests were performed to evaluate hardness, abrasiveness, and energy requirements for ore breakage. The tests include:
| • | JK drop-weight tests to determine ore resistance to the impact breakage |
| • | SMC tests (SAG Mill Comminution) |
| • | RWi - rod mill work index |
| • | BWi - Bond ball mill work index |
| • | CWi - impact crushing index |
| • | Ai - abrasion index |
Page 138
| Kinross Gold Corporation Great Bear Gold Project Ontario, Canada NI 43-101 Technical Report |
The results from the comminution testing are summarized in Table 13-10.
Table 13-10: Comminution parameters
| Bond Indices | |||||||||||||||||||||||||||||||||||||
| Sample | Relative | JK Parameters | CWI | RWI | BWI | Mbi | AI | ||||||||||||||||||||||||||||||
| Name | Density | A x b 1 | ta | SCSE | (kWh/t) | (kWh/t) | (kWh/t) | (kWh/t) | (g) | ||||||||||||||||||||||||||||
| C01 | 2.77 | 37.05 | 0.35 | 10.39 | 17.0 | 11.5 | 11.3 | 14.8 | 0.323 | ||||||||||||||||||||||||||||
| C02 | 2.79 | 33.5 | 0.31 | 11.0 | 20.40 | 12.8 | 11.9 | 15.8 | 0.269 | ||||||||||||||||||||||||||||
| C03 | 2.72 | -- | -- | -- | -- | -- | 13.0 | 18.6 | -- | ||||||||||||||||||||||||||||
| C04 | 2.74 | -- | -- | -- | -- | -- | -- | -- | -- | ||||||||||||||||||||||||||||
| C05 | 2.73 | -- | -- | -- | -- | -- | -- | -- | -- | ||||||||||||||||||||||||||||
| C06 | 2.73 | -- | -- | -- | -- | -- | -- | -- | -- | ||||||||||||||||||||||||||||
| C07 | 2.87 | -- | -- | -- | -- | -- | 15.7 | 23.4 | 0.506 | ||||||||||||||||||||||||||||
| C08 | 2.94 | -- | -- | -- | -- | 15.2 | 14.3 | 21.1 | 0.544 | ||||||||||||||||||||||||||||
| C09 | 2.93 | -- | -- | -- | -- | 15.8 | 15.0 | 22.2 | 0.440 | ||||||||||||||||||||||||||||
1 A x b from SMC Test. SCSE – Semi-autogenous Grinding Circuit Specific Energy
The determined Axb and SCSE parameters are categorized as “hard” ore, according to JKTech’s database; these values reflect the SAG energy requirement. BWi tests were conducted at a closing screen sizing of 90 and 75 microns. The results ranged between 11.3 kWh/t and 13.0 kWh/t for LP samples. Similar to the Limb sample, Hinge samples have an average BWi of 15 kWh/t. In comparison to the SGS hardness database, Hinge and Limb samples are hard materials whereas the LP mineralization falls in the range of moderately soft materials. From the SGS Ai database perspective, the comminution results indicate that Hinge and Limb are relatively more abrasive than LP.
Physical characteristics testing was conducted as part of comminution characteristics testing in the SGS Scoping Test Work program. Average rock densities of 2.75 g/cm3 and 2.91 g/cm3 were calculated for LP and Hinge samples, respectively. Only one Limb sample has been tested and gave a rock density of 2.93 g/cm3.
Heap Leach
Coarse Bottle Roll Tests
Heap leach amenability (COBR) tests were completed on crushed 2 kg charges in bottles on rolls on each of the samples: LP Fault C01, 02, and 03; Hinge C08; and Limb C09. The following conditions were applied:
| • | Feed Mass: 2,000 g |
| • | Feed size: -10 and -5 mm (two tests) |
Page 139
| Kinross Gold Corporation Great Bear Gold Project Ontario, Canada NI 43-101 Technical Report |
| • | Pulp Density: 50% solids (w/w) |
| • | Slurry pH: 10.5 – 11.0, maintained with lime |
| • | Cyanide Concentration: 1 g/L NaCN, maintained |
| • | Leach duration: 14 days, pregnant solutions subsampled and assayed for Au-Ag after 1, 2, 4, 7, 9, 10, and 14 days |
Coarse bottle roll cyanide leach test results are presented in Table 13-11 and Table 13-12. Results indicate a 20% increase in gold recovery with a finer grind. Limb recovery is the lowest and Hinge yielded the highest gold recovery. Silver recovery results showed that finer grinding had no major impact on LP silver recovery. LP samples produced the highest average silver recovery of 37.9%.
Table 13-11: Gold data, coarse bottle roll cyanide leach test results (heap leach amenability)
Feed Size, P100mm | NaCN added | CaO added | NaCN consumed | CaO consumed | Au Rec. (%) | Residue Grade (Au, g/t) | Head Grade (Au, g/t) | |||||||||||||||||||||
| All | 1.803 | 0.473 | 1.252 | 0.313 | 34.9 | 2.13 | 3.18 | |||||||||||||||||||||
| All -10 mm | 1.778 | 0.444 | 1.242 | 0.272 | 24.9 | 2.39 | 3.18 | |||||||||||||||||||||
| All -5 mm | 1.827 | 0.502 | 1.261 | 0.355 | 44.8 | 1.86 | 3.18 | |||||||||||||||||||||
| LP | 1.673 | 0.512 | 1.035 | 0.369 | 35.1 | 1.92 | 2.83 | |||||||||||||||||||||
| Hinge | 1.856 | 0.397 | 1.391 | 0.202 | 41.7 | 2.04 | 3.50 | |||||||||||||||||||||
| Limb | 2.139 | 0.432 | 1.764 | 0.257 | 27.4 | 2.83 | 3.90 | |||||||||||||||||||||
Table 13-12: Silver data, coarse ore bottle roll cyanide leach test results (heap leach amenability)
Feed Size, P100mm | NaCN added | CaO added | NaCN consumed | CaO consumed | Ag Rec. (%) | Residue Grade (Ag, g/t) | Head (Ag, g/t) | |||||||||||||||||||||
| All | 1.80 | 0.47 | 1.25 | 0.31 | 32.2 | 0.70 | 1.05 | |||||||||||||||||||||
| All -10 mm | 1.78 | 0.44 | 1.24 | 0.27 | 31.6 | 0.71 | 1.05 | |||||||||||||||||||||
| All -5 mm | 1.83 | 0.50 | 1.26 | 0.35 | 32.9 | 0.69 | 1.05 | |||||||||||||||||||||
| LP | 1.67 | 0.51 | 1.03 | 0.37 | 37.9 | 0.82 | 1.30 | |||||||||||||||||||||
| Hinge | 1.86 | 0.40 | 1.39 | 0.20 | 23.8 | 0.50 | 0.66 | |||||||||||||||||||||
| Limb | 2.14 | 0.43 | 1.76 | 0.26 | 23.7 | 0.55 | 0.72 | |||||||||||||||||||||
Page 140
| Kinross Gold Corporation Great Bear Gold Project Ontario, Canada NI 43-101 Technical Report |
Gravity
Milling test work is focused on gravity separation, gravity tailing cyanide leaching, and gravity tailing flotation. The majority of the tests are underway, and the results are not available yet.
Extended Gravity Recoverable Gold (E-GRG) Testing
The test consisted of three sequential liberation (stage grind) and recovery stages using 20 kg of material. The laboratory standard Knelson MD-3 concentrator was utilized to perform gravity separation after each grinding stage. The entire Knelson concentrate and a representative subsample of tailing from each stage were submitted for size fraction analysis for gold (gravity concentrate fractions were assayed to extinction). Assays from the three stages were used to construct a metallurgical balance from which the GRG number could be calculated. Note that 10 kg of the feed material (at -0.85 mm) was used for grind calibration.
The results of the E-GRG tests are summarized in Figure 13-2.

Figure 13-2: EGRG test summary results
Bulk Gravity Separation
Two-stage combined Knelson + Mozley procedure was performed on samples using standard operating procedures determined by SGS to simulate and investigate the action of a Knelson (or similar) centrifugal concentrator in commercial operation. The Mozley mass pull targets were set to be typical of the mass pull range in commercial production.
Page 141
| Kinross Gold Corporation Great Bear Gold Project Ontario, Canada NI 43-101 Technical Report |
Gold and silver recovery results are summarized in Table 13-13 and Table 13-14, respectively. Gravity recoveries of about 26% were achieved on LP samples, C02, and C04. Hinge and Limb achieved very high gold recoveries, with Hinge samples yielding the highest gold gravity recoveries. C09 showing the highest silver recovery of 49.7%.
Table 13-13: Gravity separation Au test results
| Concentrate | Tailing | Head (Au, g/t) | ||||||||||||||||||||||||||||||
| Comp | Test | Grind Size P80 µm | % Mass | Grade (Au, g/t) | Recovery Au (%) | Grade (Au, g/t) | Calc | Direct Assay | ||||||||||||||||||||||||
| C02 | G2 | 176 | 0.052 | 1,349 | 26.1 | 1.98 | 2.68 | 3.29 | ||||||||||||||||||||||||
| C04 | G4 | 142 | 0.055 | 613 | 26.6 | 0.93 | 1.26 | 1.97 | ||||||||||||||||||||||||
| C07 | G7 | 132 | 0.033 | 18,093 | 69.7 | 2.57 | 8.47 | 4.25 | ||||||||||||||||||||||||
| C08 | G8 | 126 | 0.031 | 11,240 | 67.8 | 1.63 | 5.06 | 4.36 | ||||||||||||||||||||||||
| C09 | G9 | 122 | 0.043 | 8,753 | 63.1 | 2.23 | 6.03 | 9.73 | ||||||||||||||||||||||||
Table 13-14: Gravity separation Ag test results
| Concentrate | Tailing | Head (Ag, g/t) | ||||||||||||||||||||||||||||||
| Comp | Test | Grind Size P80 µm | % Mass | Grade (Ag, g/t) | Recovery Ag (%) | Grade, (Ag, g/t) | Calc | Direct Assay | ||||||||||||||||||||||||
| C02 | G2 | 176 | 0.052 | 267 | 8.1 | 1.6 | 1.7 | 1.7 | ||||||||||||||||||||||||
| C04 | G4 | 142 | 0.055 | 101 | 4.6 | 1.1 | 1.2 | 0.9 | ||||||||||||||||||||||||
| C07 | G7 | 132 | 0.033 | 993 | 26.7 | 0.9 | 1.2 | 0.5 | ||||||||||||||||||||||||
| C08 | G8 | 126 | 0.031 | 617 | 21.6 | 0.7 | 0.9 | 0.5 | ||||||||||||||||||||||||
| C09 | G9 | 122 | 0.043 | 1,740 | 49.7 | 0.8 | 1.5 | 0.7 | ||||||||||||||||||||||||
Gravity + leach
Cyanide leach tests were completed on gravity separation tailing. All tests were conducted in bottles on rolls and included three kinetic subsamples for gold and silver analyses to monitor rates of extraction. Four tests were conducted on each gravity tailing for the purpose of semi-optimizing grind size between approximately 149 μm and 43 μm (P80). The following baseline leach conditions were recommended for the initial tests:
| • | Feed Mass: 1,000 g |
Page 142
| Kinross Gold Corporation Great Bear Gold Project Ontario, Canada NI 43-101 Technical Report |
| • | Pulp Density: 50% solids (w/w) |
| • | Slurry pH: 10.5 – 11.0, maintained with lime |
| • | Cyanide Concentration: 1 g/L NaCN, maintained |
| • | Dissolved oxygen: 7 mg/L to 8 mg/L, maintained with air sparge at 1 L/min |
| • | Leach duration: 48 hours, pregnant solutions subsampled and assayed for gold and silver after 6, 24, and 48 hours. |
Table 13-15 summarizes the gravity separation tailing cyanide leach results. Normalized recovery values were calculated with the actual assayed residue grades and the average overall calculated gravity separation head grade. The results indicate that high gold leach recoveries were achieved across all grind sizes with an average overall gold leach recovery of 95.4%.
Table 13-15: Gravity separation tailing cyanide leach results, the effects of grind size
| Reagents (kg/t of CN Feed) | Au Extraction/ Recovery (%) | Leach | Head Grade (Au, g/t) | ||||||||||||||||||||||||
| Deposit | Gravity | Grind Size | Consumed | Normalized | Residue | CN Test | Grav Test | ||||||||||||||||||||
| & Comp | Test No. | P80µm | NaCN | CaO | Grav Sep | Overall | (Au, g/t) | (calc) | (calc) | ||||||||||||||||||
| LP | |||||||||||||||||||||||||||
| C02 | G2 | 176 | 0.72 | 0.37 | 26.1 | 92.7 | 0.20 | 2.09 | 2.68 | ||||||||||||||||||
| G2 | 103 | 0.15 | 0.39 | 26.1 | 96.6 | 0.09 | 1.69 | 2.68 | |||||||||||||||||||
| G2 | ~75 | 1.22 | 0.29 | 26.1 | 96.3 | 0.10 | 1.76 | 2.68 | |||||||||||||||||||
| G2 | 53 | 1.57 | 0.26 | 26.1 | 95.3 | 0.13 | 1.59 | 2.68 | |||||||||||||||||||
| C04 | G4 | 142 | 0.73 | 0.32 | 26.6 | 90.5 | 0.12 | 0.91 | 1.26 | ||||||||||||||||||
| G4 | 92 | 0.19 | 0.33 | 26.6 | 92.9 | 0.09 | 0.85 | 1.26 | |||||||||||||||||||
| G4 | 72 | 0.82 | 0.35 | 26.6 | 95.2 | 0.06 | 1.34 | 1.26 | |||||||||||||||||||
| G4 | 53 | 1.13 | 0.32 | 26.6 | 94.1 | 0.08 | 1.36 | 1.26 | |||||||||||||||||||
| Hinge | |||||||||||||||||||||||||||
| C07 | G7 | 132 | 0.67 | 0.52 | 69.7 | 95.8 | 0.36 | 2.38 | 8.47 | ||||||||||||||||||
| G7 | 88 | 1.20 | 0.51 | 69.7 | 97.1 | 0.25 | 2.44 | 8.47 | |||||||||||||||||||
| G7 | 59 | 1.38 | 0.47 | 69.7 | 98.3 | 0.14 | 2.25 | 8.47 | |||||||||||||||||||
| C08 | G8 | 126 | 0.80 | 0.49 | 67.8 | 93.3 | 0.34 | 1.50 | 5.06 | ||||||||||||||||||
| G8 | 84 | 1.32 | 0.45 | 67.8 | 97.2 | 0.14 | 1.38 | 5.06 | |||||||||||||||||||
| G8 | 53 | 1.40 | 0.49 | 67.8 | 98.3 | 0.09 | 1.62 | 5.06 | |||||||||||||||||||
Page 143
| Kinross Gold Corporation Great Bear Gold Project Ontario, Canada NI 43-101 Technical Report |
| Reagents (kg/t of CN Feed) | Au Extraction/ Recovery (%) | Leach | Head Grade (Au, g/t) | ||||||||||||||||||||||||
| Deposit | Gravity | Grind Size | Consumed | Normalized | Residue | CN Test | Grav Test | ||||||||||||||||||||
| & Comp | Test No. | P80µm | NaCN | CaO | Grav Sep | Overall | (Au, g/t) | (calc) | (calc) | ||||||||||||||||||
| Limb | |||||||||||||||||||||||||||
| C09 | G9 | 122 | 1.45 | 0.81 | 63.1 | 96.7 | 0.20 | 2.20 | 6.03 | ||||||||||||||||||
| G9 | 81 | 1.95 | 0.85 | 63.1 | 97.0 | 0.18 | 2.03 | 6.03 | |||||||||||||||||||
| G9 | 52 | 2.54 | 0.90 | 63.1 | 97.8 | 0.14 | 1.73 | 6.03 | |||||||||||||||||||
Gravity + flotation
Following gravity separation, flotation tests were completed on gravity tailings using standard operating procedures as dictated by SGS Lakefield. All rougher flotation development testing were conducted on 2 kg (dry equivalent) charges of gravity separation tailing in Denver (type) D-12 flotation machines and flotation was performed using local municipal tap water at 35% solids pulp density. A simple and proven set of reagents was used for this test work:
| • | Potassium amyl xanthate (PAX) |
| • | Solvay Aerofloat 208 |
| • | Methyl isobutyl carbinol (MIBC) |
| • | Testing at the natural pH |
Results of the flotation tests were not available at the time of the writing of this report.
Page 144
| Kinross Gold Corporation Great Bear Gold Project Ontario, Canada NI 43-101 Technical Report |
| 14. | Mineral Resource Estimate |
| 14.1 | Summary of Mineral Resources |
Mineral Resources are stated in accordance with Canadian Institute of Mining, Metallurgy and Petroleum (CIM) Definition Standards for Mineral Resources and Mineral Reserves dated May 10, 2014 (CIM (2014) Definitions) as incorporated by reference into NI 43-101. Mineral Resources are estimated for the Project’s LP Zone and satellite Hinge and Limb Zones and have an effective date of December 31, 2022 (Table 14-1).
Table 14-1: Summary of Project Mineral Resources – December 31, 2022
| Tonnes | Grade | Gold Ounces | ||||||||||
| Classification | (000) | (g/t Au) | (000) | |||||||||
| Measured | - | - | - | |||||||||
| Indicated | 33,110 | 2.57 | 2,737 | |||||||||
| TOTAL M&I | 33,110 | 2.57 | 2,737 | |||||||||
| Inferred | 20,037 | �� | 3.56 | 2,290 | ||||||||
Notes:
| 1. | Mineral Resources estimated according to CIM (2014) Definitions. |
| 2. | Mineral Resources estimated at a gold price of US$1,700 per ounce. |
| 3. | Open pit Mineral Resources are estimated at a cut-off grade of 0.5 g/t Au. The LP Zone pit shell was selected at an input gold price of US$1,400/oz (for volume), but resources are reported based on a US$1,700/oz cut-off value. Please see Open Pit Shell and Cut-off Grade subsection for details. |
| 4. | Underground Mineral Resources are estimated at cut-off grades of 2.3 g/t Au for the LP and Hinge zones and 2.5 g/t Au for the Limb Zone. |
| 5. | Numbers may not add due to rounding. |
The QP is not aware of any environmental, permitting, legal, title, taxation, socio-economic, marketing, political, or other relevant factors that could materially affect the Mineral Resource estimate.
| 14.2 | LP Zone Mineral Resource Estimate |
Summary
Snowden Supervisor v 8.14.2 (Supervisor) was used for geostatistical analysis, Leapfrog Geo 2021.5 (Leapfrog) was used to generate estimation domains, and Vulcan 2022.3 (Vulcan) was used for compositing and estimation. The bulk estimation domains were interpolated by ordinary kriging (OK), while the high-grade estimation domains and background domain were interpolated using inverse distance cubed (ID3). Validation of the 2022 Great Bear LP Zone Scoping Study model (GB_LP_SS.bmf) against grade control data using the ground truth model (GT_LP_RC.bmf) showed a 0.1% difference at a 0 g/t Au cut-off grade in ounces of gold.
Page 145
| Kinross Gold Corporation Great Bear Gold Project Ontario, Canada NI 43-101 Technical Report |
The 2022 Great Bear LP Zone Scoping Study model classification criteria are based upon the geostatistical drill hole spacing analysis supported by historic exploration and deposit growth drilling, as well as the recent 2022 drill campaign designed to upgrade unclassified material to Inferred status in and around the preliminary pit area at the LP Zone. The open pit and underground Mineral Resource estimates for the LP Zone are summarized in Table 14-2.
Table 14-2: LP Zone Mineral Resource summary – December 31, 2022
| Tonnes | Grade | Gold Ounces | |||||||||
| Zone | Classification | (000) | (g/t Au) | (000) | |||||||
LP Zone | OP | Measured | - | - | - | ||||||
| Indicated | 33,110 | 2.57 | 2,737 | ||||||||
| TOTAL M&I | 33,110 | 2.57 | 2,737 | ||||||||
| Inferred | 8,400 | 2.24 | 606 | ||||||||
| UG | Measured | - | - | - | |||||||
| Indicated | - | - | - | ||||||||
| TOTAL M&I | - | - | - | ||||||||
| Inferred | 10,585 | 4.54 | 1,547 |
Notes:
| 1. | Mineral Resources estimated according to CIM (2014) Definitions. |
| 2. | Mineral Resources estimated at a gold price of US$1,700 per ounce. |
| 3. | Open pit Mineral Resources are estimated at a cut-off grade of 0.5 g/t Au. The LP Zone pit shell was selected at an input gold price of US$1,400/oz (for volume), but resources are reported based on a US$1,700/oz cut-off value. Please see Open Pit Shell and Cut-off Grade subsection for details. |
| 4. | Underground Mineral Resources are estimated at a cut-off grade of 2.3 g/t Au. |
| 5. | Numbers may not add due to rounding. |
Page 146
| Kinross Gold Corporation Great Bear Gold Project Ontario, Canada NI 43-101 Technical Report |
LP Zone Open Pit Mineral Resource Sensitivity
The cut-off grade sensitivity of the open pit Indicated and Inferred Mineral Resource estimates for the LP Zone are summarized in Table 14-3. The QP notes that the contained ounces are relatively insensitive to gold cut-off grades.
Table 14-3: Open pit Mineral Resource sensitivity - LP Zone
| INDICATED | CoG (g/t Au) | Tonnes (000) | Grade (g/t Au) | Gold Ounces (000) | |||||
Open Pit Indicated
| 0.5 | 33,110 | 2.57 | 2,737 | |||||
| 0.6 | 29,278 | 2.84 | 2,670 | ||||||
| 0.7 | 26,095 | 3.10 | 2,603 | ||||||
| 0.8 | 23,619 | 3.35 | 2,544 | ||||||
| 0.9 | 21,686 | 3.57 | 2,491 | ||||||
| 1.0 | 20,048 | 3.79 | 2,441 | ||||||
| 1.1 | 18,537 | 4.01 | 2,390 | ||||||
| 1.2 | 17,293 | 4.22 | 2,344 | ||||||
| 1.3 | 16,226 | 4.41 | 2,302 | ||||||
| 1.4 | 15,343 | 4.59 | 2,263 | ||||||
| 1.5 | 14,508 | 4.77 | 2,224 |
| INFERRED | CoG (g/t Au) | Tonnes (000) | Grade (g/t Au) | Gold Ounces (000) | |||||
Open Pit Inferred
| 0.5 | 8,400 | 2.24 | 606 | |||||
| 0.6 | 7,202 | 2.53 | 585 | ||||||
| 0.7 | 6,217 | 2.82 | 565 | ||||||
| 0.8 | 5,588 | 3.06 | 550 | ||||||
| 0.9 | 5,076 | 3.28 | 536 | ||||||
| 1.0 | 4,598 | 3.52 | 521 | ||||||
| 1.1 | 4,215 | 3.75 | 508 | ||||||
| 1.2 | 3,884 | 3.97 | 496 | ||||||
| 1.3 | 3,606 | 4.18 | 485 | ||||||
| 1.4 | 3,381 | 4.37 | 475 | ||||||
| 1.5 | 3,166 | 4.57 | 465 |
Resource Database
Only diamond drill core drilled from surface was considered in this estimate and no combined data types (RC, channel, trench, etc.) were used in the resource estimate.
All diamond drill holes were drilled with NQ sized drill bits. The Reflex ACT III core orientation tool was used to orient 100% of the drill core at site. Drill core is split for sampling leaving the orientation line behind in the unsampled core.
Page 147
| Kinross Gold Corporation Great Bear Gold Project Ontario, Canada NI 43-101 Technical Report |
In deposit areas, where recent closely spaced drilling was carried out with the purpose of upgrading resource classifications, whole core sampling accounts for approximately 5% of the total core drilled.
Only drill holes classified as Confidence 1 or 2 were used in the estimate.
The database cut-off and export date for the resource estimation was September 7, 2022. A total of 644 high-confidence drill holes in the LP Zone totalling 320,370 m of drill core and 287,942 raw assay samples were exported from acQuire to be used in the estimate.
Geological Model and Estimation Domains
Geologic logging and geostatistical analysis indicate that two broad grade populations exist in the mineralized rock. The first is a low-grade population that is made up of a large number of spatially continuous samples. This population has been modelled as broad, continuous domains that are referred to as the bulk domains. The second population is substantially higher grade and more limited in extent, falling completely within the bulk domains. This population has been modelled as limited strike, high-grade cores within the bulk domains and are referred to as the high-grade domains.
Current understanding suggests that the overburden on the Property is unmineralized and therefore all estimation domains are terminated on the lower contact of the alluvium model.
Page 148
| Kinross Gold Corporation Great Bear Gold Project Ontario, Canada NI 43-101 Technical Report |
Gold in the bulk and high-grade domains is predominantly found within the E31 (felsic volcaniclastics) rock unit within approximately 50 m to 100 m of the metasediment 2 contact. The E32 (fine-grained felsic volcaniclastics), metasedimentary, and fragmental (Felsic Volcaniclastics with Fragmentals) rock units are observed to contain minor gold mineralization, however, this mineralization is generally less continuous and lower grade than the mineralisation found in E31. Both bulk and high-grade domains were built considering these constraints and, where possible, follow the metasediment 2 contact rather than cross it (Figure 14-1).

Figure 14-1: LP Zone estimation domains, looking northwest
Page 149
| Kinross Gold Corporation Great Bear Gold Project Ontario, Canada NI 43-101 Technical Report |
The current understanding of the structural geology in the LP Zone is that two shear zones act as discontinuities to both mineralization and lithology. The LP_Shear and Yauro_Shear cross-cut the mineralization in approximately east-west striking, subvertical planes between Auro and Yauro, and Yauro and Yuma respectively. Estimation domains are truncated on these shear zones (Figure 14-2).

Figure 14-2: LP Zone estimation domains segmented by parallel east-west trending shear zones
Page 150
| Kinross Gold Corporation Great Bear Gold Project Ontario, Canada NI 43-101 Technical Report |
Compositing
Sample intervals are predominantly one metre in length with 69% of samples equal to or less than one metre in length (Figure 14-3). The block size for the model is 5 m x 1 m x 5 m to support underground mine planning. A composite size of one metre was selected as it does not split too many samples while representing the block dimensions well.
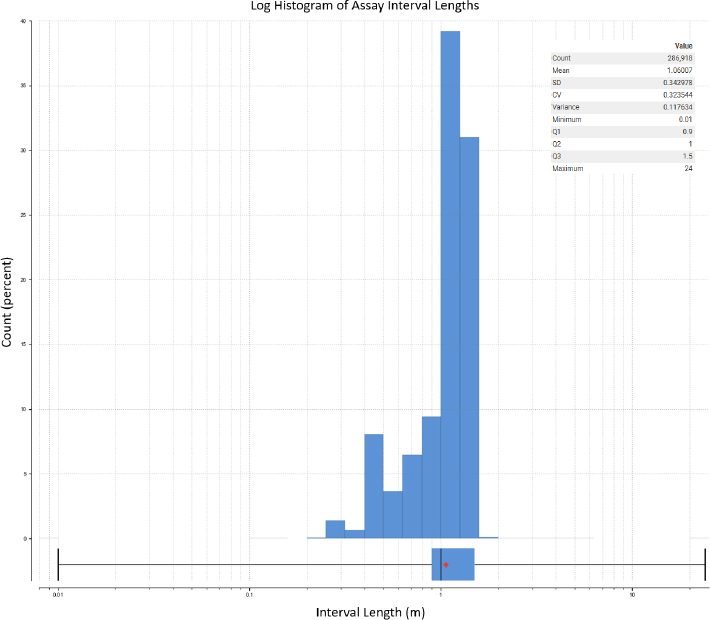
Figure 14-3: LP Zone cumulative log histogram of assay sample lengths
The contacts between mineralization domains and background domains were determined to be hard boundaries. To maintain this relationship, run-length composites were generated in Vulcan breaking on estimation domains. Remnant, short intervals were then distributed back over the composites of the domain. The composites were flagged by estimation domain during the compositing process.
Exploratory Data Analysis
The composite database flagged by estimation domain was exported to .csv and imported to Supervisor for further evaluation.
Page 151
| Kinross Gold Corporation Great Bear Gold Project Ontario, Canada NI 43-101 Technical Report |
Statistics
Contact Analysis
As the high-grade domains are internal to the bulk domains, two contact analysis plots were run on composites to determine whether a soft or hard boundary should be implemented between domains including:
| • | High-grade and bulk domains |
| • | Bulk domains and background domains |
The contact analysis indicated that a hard boundary was appropriate both between the high-grade and bulk domains and the bulk and background domains (Figure 14-4).

Figure 14-4: LP Zone contact plots: transition from background domains to bulk domains (left) and bulk domains to high-grade domains (right)
Page 152
| Kinross Gold Corporation Great Bear Gold Project Ontario, Canada NI 43-101 Technical Report |
Capping
Capping was reviewed based on the mineralization domains. Each of the domains was capped independently. Background mineralization was also analyzed and capped. Figure 14-5 presents a log histogram, log probability plot, and capped and uncapped statistics.

Figure 14-5: LP Zone capping analysis
Uncapped and capped statistical analyses for composite data by domain are shown below in Table 14-4 and Table 14-5, respectively.
Table 14-4: Uncapped statistics of composite data by domain
| Domain | N | Uncapped Mean (g/t Au) | Uncapped Median (g/t Au) | Uncapped SD (g/t Au) | Uncapped CV | Minimum (g/t Au) | Maximum (g/t Au) | |||||||||||||||
| 1 | 1,042 | 8.44 | 1.577 | 25.61 | 3.04 | 0.006 | 413.60 | |||||||||||||||
| 2 | 1,025 | 4.75 | 1.413 | 18.39 | 3.87 | 0.017 | 384.20 | |||||||||||||||
| 3 | 656 | 4.35 | 1.113 | 10.00 | 2.30 | 0.013 | 133.30 | |||||||||||||||
| 4 | 101 | 7.41 | 1.118 | 30.17 | 4.07 | 0.020 | 284.20 | |||||||||||||||
| 5 | 210 | 3.68 | 1.338 | 7.12 | 1.94 | 0.010 | 42.80 | |||||||||||||||
| 6 | 180 | 3.58 | 0.754 | 9.80 | 2.74 | 0.021 | 87.12 | |||||||||||||||
| 7 | 158 | 2.88 | 0.992 | 7.56 | 2.63 | 0.008 | 75.57 | |||||||||||||||
| 8 | 383 | 1.42 | 0.869 | 1.66 | 1.17 | 0.006 | 11.27 | |||||||||||||||
| 9 | 179 | 2.47 | 1.120 | 6.75 | 2.74 | 0.054 | 73.13 | |||||||||||||||
| 10 | 70 | 3.36 | 0.773 | 9.13 | 2.72 | 0.009 | 54.51 | |||||||||||||||
| 1000 | 3,111 | 0.88 | 0.234 | 3.97 | 4.49 | 0.003 | 119.60 | |||||||||||||||
| 1100 | 514 | 0.73 | 0.269 | 2.91 | 3.97 | 0.003 | 60.75 | |||||||||||||||
| 1200 | 911 | 1.06 | 0.162 | 5.63 | 5.30 | 0.003 | 114.85 | |||||||||||||||
| 1300 | 607 | 1.19 | 0.171 | 5.14 | 4.31 | 0.003 | 71.21 | |||||||||||||||
| 1400 | 1,061 | 0.46 | 0.080 | 1.43 | 3.08 | 0.003 | 24.41 |
Page 153
| Kinross Gold Corporation Great Bear Gold Project Ontario, Canada NI 43-101 Technical Report |
| Domain | N | Uncapped Mean (g/t Au) | Uncapped Median (g/t Au) | Uncapped SD (g/t Au) | Uncapped CV | Minimum (g/t Au) | Maximum (g/t Au) | |||||||||||||||
| 1500 | 6,177 | 0.29 | 0.072 | 1.56 | 5.37 | 0.003 | 56.72 | |||||||||||||||
| 1600 | 2,089 | 0.19 | 0.023 | 1.33 | 6.89 | 0.003 | 46.26 | |||||||||||||||
| 1700 | 1,767 | 0.42 | 0.128 | 1.19 | 2.83 | 0.003 | 27.35 | |||||||||||||||
| 1800 | 637 | 0.28 | 0.067 | 0.58 | 2.07 | 0.003 | 5.16 | |||||||||||||||
| 1900 | 156 | 0.37 | 0.089 | 0.87 | 2.37 | 0.003 | 8.63 | |||||||||||||||
| 2000 | 6,586 | 0.44 | 0.172 | 1.86 | 4.20 | 0.003 | 71.75 | |||||||||||||||
| 2100 | 2,579 | 0.66 | 0.114 | 5.04 | 7.63 | 0.003 | 169.40 | |||||||||||||||
| 2200 | 696 | 0.72 | 0.079 | 4.62 | 6.39 | 0.005 | 84.66 | |||||||||||||||
| 2300 | 2,579 | 0.58 | 0.087 | 3.79 | 6.48 | 0.003 | 135.40 | |||||||||||||||
| 2400 | 439 | 0.83 | 0.043 | 6.58 | 7.94 | 0.003 | 127.00 | |||||||||||||||
| 3000 | 11,172 | 0.48 | 0.189 | 3.89 | 8.05 | 0.003 | 380.00 | |||||||||||||||
| 3100 | 3,465 | 0.36 | 0.077 | 1.98 | 5.54 | 0.003 | 93.44 | |||||||||||||||
| 3200 | 1,259 | 0.46 | 0.046 | 2.77 | 5.98 | 0.003 | 53.70 | |||||||||||||||
| 3300 | 2,089 | 0.34 | 0.036 | 1.82 | 5.44 | 0.003 | 42.76 | |||||||||||||||
| 3400 | 402 | 0.42 | 0.058 | 1.06 | 2.51 | 0.003 | 10.34 | |||||||||||||||
| 4000 | 1,756 | 0.28 | 0.048 | 0.95 | 3.36 | 0.003 | 17.31 | |||||||||||||||
| 9999 | 330,188 | 0.06 | 0.006 | 1.94 | 31.16 | 0.003 | 949.50 |
Table 14-5: Capped statistics of composited data by domain
| Domain | Capping Value (g/t Au) | Capped Mean (g/t Au) | Capped SD (g/t Au) | Capped CV | |||||||||
| 1 | 205 | 8.07 | 21.22 | 2.63 | |||||||||
| 2 | 100 | 4.22 | 10.78 | 2.55 | |||||||||
| 3 | 90 | 4.28 | 9.26 | 2.16 | |||||||||
| 4 | 90 | 5.48 | 14.65 | 2.67 | |||||||||
| 5 | 40 | 3.65 | 6.98 | 1.91 | |||||||||
| 6 | 50 | 3.28 | 7.68 | 2.34 | |||||||||
| 7 | 45 | 2.68 | 5.91 | 2.20 | |||||||||
| 8 | 10 | 1.41 | 1.63 | 1.16 | |||||||||
| 9 | 50 | 2.34 | 5.50 | 2.35 | |||||||||
| 10 | 50 | 3.29 | 8.78 | 2.67 | |||||||||
| 1000 | 35 | 0.82 | 2.87 | 3.50 | |||||||||
| 1100 | 20 | 0.65 | 1.47 | 2.25 |
Page 154
| Kinross Gold Corporation Great Bear Gold Project Ontario, Canada NI 43-101 Technical Report |
| Domain | Capping Value (g/t Au) | Capped Mean (g/t Au) | Capped SD (g/t Au) | Capped CV | |||||||||
| 1200 | 65 | 0.98 | 4.16 | 4.26 | |||||||||
| 1300 | 60 | 1.17 | 4.90 | 4.17 | |||||||||
| 1400 | 20 | 0.46 | 1.37 | 2.97 | |||||||||
| 1500 | 45 | 0.29 | 1.44 | 5.02 | |||||||||
| 1600 | 30 | 0.19 | 1.09 | 5.87 | |||||||||
| 1700 | 20 | 0.42 | 1.11 | 2.66 | |||||||||
| 1800 | 20 | 0.28 | 0.58 | 2.07 | |||||||||
| 1900 | 5 | 0.35 | 0.67 | 1.93 | |||||||||
| 2000 | 50 | 0.44 | 1.73 | 3.94 | |||||||||
| 2100 | 70 | 0.61 | 3.83 | 6.26 | |||||||||
| 2200 | 50 | 0.66 | 3.65 | 5.53 | |||||||||
| 2300 | 50 | 0.54 | 2.68 | 4.94 | |||||||||
| 2400 | 45 | 0.64 | 3.38 | 5.27 | |||||||||
| 3000 | 60 | 0.45 | 1.40 | 3.11 | |||||||||
| 3100 | 30 | 0.34 | 1.29 | 3.80 | |||||||||
| 3200 | 45 | 0.45 | 2.62 | 5.75 | |||||||||
| 3300 | 40 | 0.33 | 1.79 | 5.37 | |||||||||
| 3400 | 20 | 0.42 | 1.06 | 2.51 | |||||||||
| 4000 | 20 | 0.28 | 0.95 | 3.36 | |||||||||
| 9999 | 20 | 0.05 | 0.44 | 8.33 |
Page 155
| Kinross Gold Corporation Great Bear Gold Project Ontario, Canada NI 43-101 Technical Report |
Variography
Only the bulk domains were estimated using OK. Each bulk domain had independent variography completed. The capped composite file flagged by estimation domains were imported into Supervisor and used to calculate the variograms for each domain and model the experimental variograms (Figure 14-6). Table 14-6 presents the breakdown of variogram parameters and directions.

Figure 14-6: Directional variograms for LP Zone domain 1500 estimated using OK
Page 156
| Kinross Gold Corporation Great Bear Gold Project Ontario, Canada NI 43-101 Technical Report |
Table 14-6: Summary of variogram parameters by domain
| Ranges in the Variogram Directions (m) | Orientations of the Variogram Directions (Vulcan)(degrees) | ||||||||||||||||||||||||
| Domain | Nugget | Sill Differential | Major Axis | Semi-major Axis | Minor Axis | Bearing | Plunge | Dip | |||||||||||||||||
| 0.841 | 68 | 46 | 13 | ||||||||||||||||||||||
| 1000 | 0.106 | 0.0534 | 506 | 215 | 25 | 352.4 | -63.2 | 159.6 | |||||||||||||||||
| 0.848 | 83 | 64 | 20 | ||||||||||||||||||||||
| 1100 | 0.1 | 0.515 | 278 | 95 | 40 | 341.9 | -65.2 | 144.6 | |||||||||||||||||
| 0.874 | 92 | 87 | 15 | ||||||||||||||||||||||
| 1200 | 0.0983 | 0.0276 | 366 | 211 | 21 | 1.3 | -74.2 | 162.0 | |||||||||||||||||
| 0.897 | 98 | 89 | 20 | ||||||||||||||||||||||
| 1300 | 0.0531 | 0.0498 | 311 | 297 | 40 | 340.7 | -72.0 | 147.1 | |||||||||||||||||
| 0.858 | 132 | 107 | 20 | ||||||||||||||||||||||
| 1400 | 0.0427 | 0.0991 | 312 | 289 | 40 | 356.3 | -74.2 | 162.0 | |||||||||||||||||
| 0.834 | 62 | 42 | 8 | ||||||||||||||||||||||
| 1500 | 0.141 | 0.0243 | 397 | 405 | 96 | 356.3 | -74.2 | 162.0 | |||||||||||||||||
| 0.877 | 88 | 42 | 20 | ||||||||||||||||||||||
| 1600 | 0.108 | 0.0152 | 457 | 68 | 40 | 340.7 | -72.0 | 147.1 | |||||||||||||||||
| 0.798 | 124 | 118 | 20 | ||||||||||||||||||||||
| 1700 | 0.0659 | 0.136 | 589 | 297 | 43 | 334.6 | -75.9 | 135.4 | |||||||||||||||||
| 0.819 | 95 | 46 | 20 | ||||||||||||||||||||||
| 1800 | 0.0507 | 0.13 | 326 | 176 | 40 | 345.7 | -72.0 | 147.1 | |||||||||||||||||
| 0.559 | 134 | 270 | 20 | ||||||||||||||||||||||
| 1900 | 0.0895 | 0.352 | 226 | 307 | 40 | 356.3 | -74.2 | 162.0 | |||||||||||||||||
| 0.777 | 82 | 73 | 53 | ||||||||||||||||||||||
| 2000 | 0.192 | 0.0309 | 804 | 743 | 70 | 320.4 | -65.2 | 128.1 | |||||||||||||||||
| 0.826 | 104 | 108 | 20 | ||||||||||||||||||||||
| 2100 | 0.0679 | 0.106 | 293 | 187 | 40 | 350.7 | -72.0 | 147.1 | |||||||||||||||||
| 0.893 | 129 | 68 | 20 | ||||||||||||||||||||||
| 2200 | 0.0957 | 0.0117 | 268 | 374 | 40 | 345.7 | -72.0 | 147.1 | |||||||||||||||||
| 0.851 | 187 | 104 | 20 | ||||||||||||||||||||||
| 2300 | 0.125 | 0.0244 | 372 | 293 | 40 | 333.2 | -62.0 | 136.8 | |||||||||||||||||
| 0.797 | 162 | 161 | 20 | ||||||||||||||||||||||
| 2400 | 0.144 | 0.0591 | 445 | 356 | 40 | 339.0 | -68.9 | 136.0 | |||||||||||||||||
| 0.756 | 63 | 50 | 18 | ||||||||||||||||||||||
Page 157
| Kinross Gold Corporation Great Bear Gold Project Ontario, Canada NI 43-101 Technical Report |
| Ranges in the Variogram Directions (m) | Orientations of the Variogram Directions (Vulcan)(degrees) | ||||||||||||||||||||||||
| Domain | Nugget | Sill Differential | Major Axis | Semi-major Axis | Minor Axis | Bearing | Plunge | Dip | |||||||||||||||||
| 3000 | 0.236 | 0.00838 | 434 | 378 | 20 | 316.7 | -49.0 | 105.3 | |||||||||||||||||
| 0.8 | 60 | 47 | 20 | ||||||||||||||||||||||
| 3100 | 0.164 | 0.0357 | 382 | 354 | 40 | 0.0 | -75.9 | 135.4 | |||||||||||||||||
| 0.847 | 117 | 32 | 20 | ||||||||||||||||||||||
| 3200 | 0.131 | 0.0218 | 130 | 154 | 40 | 5.7 | -72.0 | 147.1 | |||||||||||||||||
| 0.862 | 69 | 63 | 29 | ||||||||||||||||||||||
| 3300 | 0.114 | 0.0232 | 471 | 268 | 30 | 13.3 | -78.8 | 153.7 | |||||||||||||||||
| 0.761 | 91 | 68 | 20 | ||||||||||||||||||||||
| 3400 | 0.0927 | 0.147 | 232 | 115 | 40 | 40 | -85 | 180 | |||||||||||||||||
| 0.773 | 200 | 123 | 20 | ||||||||||||||||||||||
| 4000 | 0.19 | 0.0373 | 687 | 651 | 40 | 345.7 | -72.0 | 147.1 | |||||||||||||||||
Variogram orientations were visually confirmed in Vulcan by plotting the orientations and reviewing them with the estimation domains.
Dynamic Anisotropy
The morphology of the mineralized body is curviplanar in nature. To capture the appropriate variogram and search ellipse directions within domains that exhibit significant changes in orientation, dynamic anisotropy was used. A centre plane was generated in Leapfrog for each of the domains and transferred from Leapfrog to Vulcan to generate an anisotropy model to assign to the block model.
Block Modelling
Model Setup
The block model is a Vulcan extended model with a parent cell size of 5 m x 1 m x 5 m and no subcells. The block model extents are presented in Table 14-7 below.
Table 14-7: Block model extents and the block parameters
| Base Point (lower left corner) | Extents (m) | Block Size (m) | Rotation | |||||||||||||||||||||||||||||||
| East | North | Z | East | North | Z | East | North | Z | Bearing | Dip | Plunge | |||||||||||||||||||||||
| 454,650 | 5,634,560 | -675 | 4,420 | 1,325 | 1,080 | 5 | 1 | 5 | 117.2° | 0° | 0° | |||||||||||||||||||||||
Page 158
| Kinross Gold Corporation Great Bear Gold Project Ontario, Canada NI 43-101 Technical Report |
As the LP Zone has a considerable strike length, it was decided not to include subcells to keep the block model to a reasonable working size.
Once the block model was constructed, it was flagged using the Leapfrog estimation domains, rock model, overburden model, and classification solids, and the block fraction below topography was assigned from the high resolution LiDAR survey topography model (19_GBear_DEM_1m.00t).
The GB_LP_SS.bmf block model variables, variable type, and defaults are listed in Table 14-8 below.
Table 14-8: Description of block model variables
| Variable | Type | Default | Description | ||||||
| au | Double | 0 | Final gold grade estimate | ||||||
| aupass | Int | 0 | Estimation pass the block was estimated on | ||||||
| class | Int | 4 | Classification domain | ||||||
| domain | Int | 9999 | Estimation domain | ||||||
| rock | Int | 99 | Rock code | ||||||
| sg | Double | 2.715 | Density (g/cm3) | ||||||
| topo | Double | 0 | Fraction of block below topo (0 = entirely above, 1 = entirely below) | ||||||
| vo_bearing | Double | -99 | Bearing flagged from anisotropy model for dynamic anisotropy | ||||||
| vo_plunge | Double | -99 | Plunge flagged from anisotropy model for dynamic anisotropy | ||||||
| vo_dip | Double | -99 | Dip flagged from anisotropy model for dynamic anisotropy |
Page 159
| Kinross Gold Corporation Great Bear Gold Project Ontario, Canada NI 43-101 Technical Report |
A reblocked model was generated from the GB_LP_SS.bmf block model for open pit mine planning purposes. The reblocked model has a block size of 10 m x 5 m x 10 m with each block containing twenty 5 m x 1 m x 5 m block model blocks. The criteria used for combining data from multiple blocks to create one reblocked block are listed in Table 14-9.
Table 14-9: Variables using majority codes, averages, and weighted averages
| Variable | Accumulation Type | Weighting | ||
| au | Weighted average | sg | ||
| sg | Average | - |
The rock, domain, class, and topo fields were then reassigned from wireframes.
Bulk Density
A density database was exported as part of the resource data export from acQuire. The database contained 6,717 density measurements from diamond drill core taken by the analysing assay laboratory. The rock codes from the geological model were assigned to the density samples and average density values were calculated for each rock code after accounting for statistical outliers. Those average densities were then flagged into the block model by rock code.
As there are currently no overburden density samples taken on the Property, the overburden density used was generated through review of similar overburden types in the region. A temporary value of 1.9 g/cm3 was used until a full density study of the overburden is complete.
| Above Topography | 0 |
| Overburden | 1.9 t/m3 |
| Biotite_Calcite_Pillows_E1PBT | 2.96 t/m3 |
| Calc-Alk_Basalt_Undifferentiated_Arrow | 2.996 t/m3 |
| Dacite_BR_Disc | 2.85 t/m3 |
| Dyke 1 | 2.793 t/m3 |
| E31 | 2.715 t/m3 |
| E31_01 | 2.715 t/m3 |
| E31_02 | 2.715 t/m3 |
| E31_Vuggy | 2.676 t/m3 |
| E31M_magnetic_Combined | 2.72 t/m3 |
| E32_Fine_grained_felsic_combined | 2.673 t/m3 |
| Felsic_porphyry_dyke_combined | 2.71 t/m3 |
| Fragmental_1_Combined | 2.729 t/m3 |
| Fragmental_2_E3F2 | 2.695 t/m3 |
| Gabbro_BK_Limb | 2.793 t/m3 |
| Granite | 2.793 t/m3 |
| High_Fe_Tholeiite_Combined | 2.794 t/m3 |
| High_Mg_Dyke_combined | 2.974 t/m3 |
| High_Mg_Tholeiitic_basalt_Combined | 2.974 t/m3 |
| High_Mg_Tholeiitic_Basalt_Massive_E1M | 2.974 t/m3 |
| High_Mg_Tholeiitic_Basalt_Viggo | 2.974 t/m3 |
| Metasediment1_MS1 | 2.736 t/m3 |
| Metasediment2_MS2_combined | 2.768 t/m3 |
| Metasediment3_MS3 | 2.726 t/m3 |
| Rhyolite_combined | 2.73 t/m3 |
| Sediment_combined | 2.78 t/m3 |
| Sericite_schist_Combined | 2.709 t/m3 |
| Talcy_Ultramafic_Dyke_Combined | 2.83 t/m3 |
| Tonalite_Combined | 2.83 t/m3 |
| Ultramafic_dyke_02_Br_disc | 2.83 t/m3 |
| Ultramafic_dyke_03_Br_disc | 2.83 t/m3 |
| Ultramafic_dyke_Combined | 2.83 t/m3 |
| Amphibole_Schist_Viggo | 2.69 t/m3 |
| Barren Dykes | 2.69 t/m3 |
Page 160
| Kinross Gold Corporation Great Bear Gold Project Ontario, Canada NI 43-101 Technical Report |
Estimation
The 2022 Great Bear LP Zone Scoping Study model was built and estimated using Vulcan. The bulk estimation domains were estimated using OK, while the high-grade and background estimation domains were estimated using ID3. The estimate uses a two pass strategy in the bulk and high-grade estimation domains with a 200 m x 150 m x 50 m ellipse for pass one and a 100 m x 75 m x 25 m ellipse for pass two. The background estimation domain uses a single pass estimation strategy with a 250 m x 120 m x 40 m ellipse. Multiple estimates were run using various high-yield restriction radii and high-yield restriction grade thresholds, capping levels, estimation methodology (OK vs. ID3), and minimum and maximum samples included in order to align with the ground truth model.
High-grade Domains
The block model estimation used ID3 with the following implementation strategy:
| 1. | 5 m x 1 m x 5 m block discretization. |
Page 161
| Kinross Gold Corporation Great Bear Gold Project Ontario, Canada NI 43-101 Technical Report |
| 2. | A two pass search strategy was used, with a pass one ellipse diameter distance of 200 m x 150 m x 50 m and pass two ellipse diameter distance of 100 m x 75 m x 25 m. |
| 3. | Pass one required a minimum of three and maximum of eight samples. Pass two required a minimum of two and maximum of eight samples. |
| 4. | Passes one and two both used a maximum of two samples per drill hole. |
| 5. | Capping was applied during the estimation process in Vulcan. |
| 6. | Hard boundaries were used for all domains. |
| 7. | Dynamic anisotropy block model variables were used for local search ellipse orientations. |
Bulk Domains
The block model estimation used OK with the following implementation strategy:
| 1. | 5 m x 1 m x 5 m block discretization. |
| 2. | A two pass search strategy was used, with a pass one ellipse diameter distance of 200 m x 150 m x 50 m and pass two ellipse diameter distance of 100 m x 75 m x 25 m. |
| 3. | Pass one required a minimum of three and maximum of 16 samples. Pass two required a minimum of two and maximum of 16 samples. |
| 4. | Passes one and two both used a maximum of two samples per drill hole. |
| 5. | Capping was applied during the estimation process in Vulcan. |
| 6. | Hard boundaries were used for all domains. |
| 7. | Dynamic anisotropy block model variables were used for search ellipse and variogram orientations. |
Background Mineralization
The block model estimation used ID3 with the following implementation strategy:
| 1. | 5 m x 1 m x 5 m block discretization |
| 2. | A single pass search strategy was used, with the ellipse used of 250 m x 120 m x 40 m diameter. |
Page 162
| Kinross Gold Corporation Great Bear Gold Project Ontario, Canada NI 43-101 Technical Report |
| 3. | A minimum of three and maximum of eight samples were used. |
| 4. | A maximum of two samples per drill hole were used. |
| 5. | Capping was applied during the estimation process in Vulcan. |
| 6. | Hard boundaries were used for all domains. |
| 7. | Dynamic anisotropy block model variables were used for search ellipse orientation. |
Page 163
| Kinross Gold Corporation Great Bear Gold Project Ontario, Canada NI 43-101 Technical Report |
Classification
A preliminary drill hole spacing analysis was carried out using the variograms for the major bulk and high-grade domains. A normalized gamma of 0.8 (80% of the sill) corresponds approximately with a 50 m range while a normalized gamma of 0.9 (90% of the sill) corresponds approximately with a 75 m range across those experimental variogram models (Figure 14-7). From a preliminary classification perspective, those ranges were considered as the drill spacing criteria to be used for assigning the Indicated and Inferred classifications in the 2022 Great Bear LP Zone Scoping Study model.

Figure 14-7: Experimental variogram models of the Auro domain
Page 164
| Kinross Gold Corporation Great Bear Gold Project Ontario, Canada NI 43-101 Technical Report |
The RC program drilling supports the analyses suggesting that there is continuity in the high-grade gold population at 50 m and reasonable continuity at 75 m (Figure 14-8).

Figure 14-8: RC drill program assays within the high-grade population supporting strong continuity at 50 m and reasonable continuity at 75 m spacing
Classification shells for Indicated and Inferred were built around drill hole traces in Leapfrog (Figure 14-9). Buffers around traces were set at a 25 m radius for Indicated and 37.5 m radius for Inferred and polylines were built around contiguous or nearly contiguous buffer shapes. The shells outline areas with drill densities meeting the spacing criteria for Indicated and Inferred and show consistent continuity, which was then used to flag the model in Vulcan. This drill hole spacing analysis is currently only applicable to the open pit material, whereas all underground material is classified as Inferred. The Measured classification was not used at this stage of the Project.
Classification is updated after the estimation using a block model script. Blocks estimated in pass 2 are downgraded from Indicated to Inferred.
Page 165
| Kinross Gold Corporation Great Bear Gold Project Ontario, Canada NI 43-101 Technical Report |

Figure 14-9: LP Zone classification shells based on drill hole spacing
Page 166
| Kinross Gold Corporation Great Bear Gold Project Ontario, Canada NI 43-101 Technical Report |
Validation
Swath plots were constructed to review estimation results (Figure 14-10) for the gold estimate compared to a nearest neighbour (NN) estimate which replicates declustered raw composite data. Overall, in areas of dense data, the estimates replicate raw data very well.

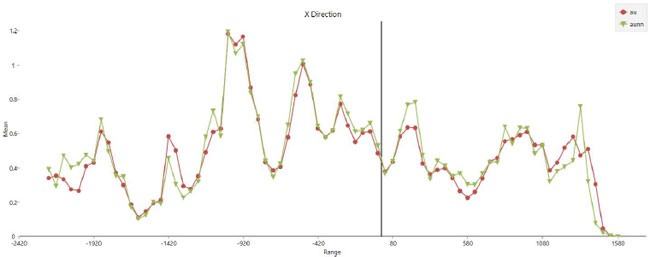
Page 167
| Kinross Gold Corporation Great Bear Gold Project Ontario, Canada NI 43-101 Technical Report |
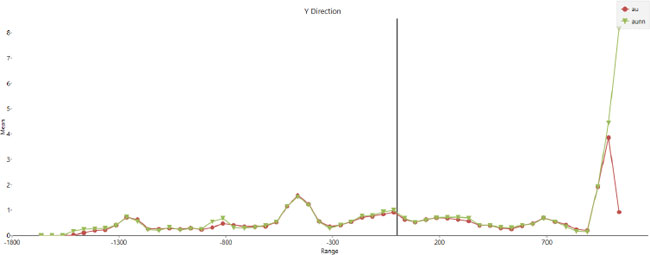
Figure 14-10: Swath plots in major block model directions for gold as compared to the NN estimate for gold
Ground Truth Model Validation
Independent of the 2022 Great Bear LP Zone Scoping Study model, a ground truth model was built using tightly spaced (433 collar locations, 8 m across strike x 10 m along strike) RC grade control drilling that covered a volume equivalent to approximately a quarter of a year of estimated production from the open pit to a depth of approximately five benches (Figure 14-11). The location selected included a combination of high grade, low grade, and waste. No estimation domains were used due to the data density within this model. The ground truth model applied a single cap across all drill holes at 150 g/t Au. No high-yield restriction search was used. The interpolation method used was inverse distance squared (ID2).
Page 168
| Kinross Gold Corporation Great Bear Gold Project Ontario, Canada NI 43-101 Technical Report |
Comparisons to the Great Bear ground truth model were run to validate the 2022 Great Bear LP Zone Scoping Study model. A grade tonnage curve (Figure 14-12) shows that at lower cut-off grades, the ground truth model has slightly higher grades and equal tonnes, with the difference becoming slightly more pronounced at higher cut-off grades where the ground truth model has lower tonnes and a higher grade. A comparison of tonnes, grades, and ounces between the two models at various cut-off grades is summarized in Table 14-10. The variance between the two models is currently well within Kinross quarterly Key Performance Indicators (KPI) as shown in Table 14-11.

Figure 14-11: Ground truth model based on 8 m x 10 m RC grade control drilling

Figure 14-12: Comparison of ground truth model to long-term model grade tonnage curves
Page 169
| Kinross Gold Corporation Great Bear Gold Project Ontario, Canada NI 43-101 Technical Report |
Table 14-10: Comparison of tonnes, grade, and ounces in common blocks between the ground truth and long term models
| Percent Difference | |||||||||||||
| Cut-off Grade (g/t Au) | Tonnes | Grade | Metal | ||||||||||
| 0.0 | 0 | % | -3 | % | -3 | % | |||||||
| 0.6 | -8 | % | 7 | % | 1 | % | |||||||
| 3.0 | -1 | % | 2 | % | 1 | % | |||||||
Table 14-11: Kinross corporate guidance for reconciliation variance
| KPIs | Month | Quarter | Year | ||||||||||
| F1 | ±25 | % | ±15 | % | ±10 | % | |||||||
| F2 | ±10 | % | ±7.5 | % | ±5 | % | |||||||
| F3 | ±25 | % | ±15 | % | ±10 | % |
Mineral Resource Reporting
Mineral Resources are reported as per the Mineral Resource estimation methodologies and classification criteria detailed in this Technical Report. The open pit and underground resources, as of December 31, 2022, were constrained with open pit resource shells and underground mineable shapes, respectively, in order to fulfill the CIM (2014) Definitions requirement of “reasonable prospects for eventual economic extraction” (RPEEE).
Open Pit Shell and Cut-off Grade
The Kinross QP prepared a preliminary open pit shell to constrain the block model for resource reporting purposes. The preliminary pit shell was generated using Datamine Studio NPVS software using the Lerchs-Grossmann (LG) algorithm. That part of the block model that falls within the preliminary pit shell was considered to have RPEEE and is reported as a Mineral Resource at a specified cut-off grade. The Kinross QP confirmed that most of the blocks above the cut-off grade located in the resource pit shell show good continuity (Figure 14-13).
The LP zone pit shell was selected at an input gold price of US$1,400/oz (for volume), but resources are reported based on a US$1,700/oz cut-off grade. The US$1,400/oz shell size was selected as a result of initial optimizations between open pit and underground. Furthermore, only the Central section of the LP Zone was considered for open pit resource, with Discovery (NW) and Viggo (SE) areas considered entirely underground resource.
Page 170
| Kinross Gold Corporation Great Bear Gold Project Ontario, Canada NI 43-101 Technical Report |
Assumptions used in the preliminary LG pit shell analysis were:
| ● | Gold price: US$1,700/oz (C$2,210/oz) |
| ● | Exchange rate: US$1.00 = C$1.30 |
| ● | Pit slope angles: |
| ○ | Overburden 0-5m Thick: 18° |
| ○ | Overburden 5-15m Thick: 14° |
| ○ | Overburden 15-40m Thick: 14.1° |
| ○ | Overburden 40m+ Thick: 10° |
| ○ | Hard Rock: 46° |
| ● | Process recovery of gold: 95.3% overall |
| ● | Mining cost for waste: C$3.69 per tonne |
| ● | Mining cost for mineralized material: C$3.69 per tonne |
| ● | Processing cost: C$18.68 per tonne |
| ● | General and administrative (G&A) costs: C$12.10 per tonne |
The LG analysis produced a pit discard cut-off grade of 0.50 g/t Au.
Process recovery of gold was calculated based on a feed grade recovery formula. The mining cost was derived from a base unit cost of C$3.38 per tonne and incremental vertical bench (10 m) cost of C$0.026 per tonne per bench below reference and C$0.017 per tonne per bench above reference.
Page 171
| Kinross Gold Corporation Great Bear Gold Project Ontario, Canada NI 43-101 Technical Report |


Figure 14-13: LP resource open pit shell in 3D
Page 172
| Kinross Gold Corporation Great Bear Gold Project Ontario, Canada NI 43-101 Technical Report |
Underground Reporting and Cut-off Grade
Underground Mineral Resources are reported within underground reporting shapes generated using the Mineable Shape Optimizer (MSO) tool, and defined using a minimum stope thickness of 2.5 m, limited to areas of continuous mineralization. A cut-off grade of 2.3 Au g/t was used for the LP Zone underground. All blocks within the underground constraining shapes have been included within the Mineral Resource estimate, and underground reporting shapes are presented in Figure 14-14. Underground resource is reported using $1700 MSOs up to the open pit resource shell. It was assumed that the crown pillars to surface and underneath the pits can be recovered. No surface water bodies are present in the breakthrough areas. Stope shapes that were considered too isolated or small to be reasonably accessed and extracted were excluded from the resource.
The Underground Mineral Resource cut-off grade was calculated with the gold price and full operating costs including mining, processing, and G&A. The cut-off grade has been calculated based on longitudinal long-hole stoping mining method with cemented backfilling, with underground extraction concurrent with the open pit mining.
Assumptions used to estimate the underground cut-off grade were:
| • | Gold price: US$1,700/oz (C$2,210/oz) |
| • | Exchange rate: US$1.00 = C$1.30 |
| • | Process recovery of gold: 95.9% |
| • | Mining cost: C$104.0 per tonne |
| • | Processing cost: C$18.68 per tonne |
| • | G&A costs: C$12.10 per tonne |
Page 173
| Kinross Gold Corporation Great Bear Gold Project Ontario, Canada NI 43-101 Technical Report |

Figure 14-14: LP underground resource shapes
Comparison to Previous Models
The 2022 Great Bear LP Zone Scoping Study model is the first model to be released for the zone and as such has no previous models to compare to.
Page 174
| Kinross Gold Corporation Great Bear Gold Project Ontario, Canada NI 43-101 Technical Report |
| 14.3 | Hinge and Limb Zone Mineral Resource Estimate |
Great Bear’s Hinge and Limb Zones are satellite deposits located approximately 750 m southwest of the main LP Zone. The resource inventory was built using Snowden Supervisor v8.14.3.1 for geostatistical analysis and Leapfrog Geo/Edge 2022.1.1 for geological and domain modelling, compositing, and estimation. The Limb estimation domains comprise a mineralized zone within metasediments with silica and sulphide replacement hosted in the north limb of the fold. The Hinge estimation domains encompass quartz veins within a tholeiitic basalt in the axial plane of the fold. The main vein at Limb was interpolated using OK and the remaining lenses, using ID3.
The model classification criteria are based on drilling spacing analysis, 75 m for Limb and 50 m for Hinge, considering the differences in the mineralization and its continuity between the two zones. The Mineral Resource estimate for the Hinge and Limb Zones are summarized in Table 14-12.
Table 14-12: Hinge and Limb Zone Mineral Resource summary – December 31, 2022
| Zone | Classification | Tonnes (000) | Grade (g/t Au) | Gold Ounces (000) | |||||||
| Hinge Zone | UG | Measured | - | - | - | ||||||
| Indicated | - | - | - | ||||||||
| TOTAL M&I | - | - | - | ||||||||
| Inferred | 263 | 5.93 | 50 | ||||||||
| Limb Zone | UG | Measured | - | - | - | ||||||
| Indicated | - | - | - | ||||||||
| TOTAL M&I | - | - | - | ||||||||
| Inferred | 788 | 3.44 | 87 | ||||||||
| Total | UG | Measured | - | - | - | ||||||
| Indicated | - | - | - | ||||||||
| TOTAL M&I | - | - | - | ||||||||
| Inferred | 1,052 | 4.06 | 138 |
Notes:
| 1. | Mineral Resources estimated according to CIM (2014) Definitions. |
| 2. | Mineral Resources estimated at a gold price of US$1,700 per ounce. |
| 3. | Underground Mineral Resources are estimated at a cut-off grade of 2.50 g/t Au for Limb and 2.30 g/t Au for Hinge. |
| 4. | Numbers may not add due to rounding. |
Page 175
| Kinross Gold Corporation Great Bear Gold Project Ontario, Canada NI 43-101 Technical Report |
Resource Database
The database cut-off and export date for the resource estimation was November 24, 2022. The database was exported from acQuire and consists of:
| • | 227 drill holes, totalling 88,676 m. |
| • | 2,996 samples for a total length of 2,064 m. |
| • | Historical data that did not have collar positions and survey data were removed from the resource database. |
Geological Model and Estimation Domains
The Limb estimation domains comprise a continuous mineralized zone within metasediments, occurring between high Fe tholeiite and calc-alkaline basalt in the north limb of the fold (Figure 14-15). The Hinge estimation domains comprise quartz veins within high Fe tholeiitic basalt in the axial plane of the fold. A total of six (101 to 106) estimation domains were built for Limb and 19 (201 to 219) estimation domains were built for Hinge.
The current understanding of the deposit suggests that the overburden on the Property is unmineralized, and therefore all estimation domains are terminated on the lower contact of the overburden model.
Page 176
| Kinross Gold Corporation Great Bear Gold Project Ontario, Canada NI 43-101 Technical Report |

Figure 14-15: Lithological model section cutting the main Limb vein with the folded metasedimentary layer
Page 177
| Kinross Gold Corporation Great Bear Gold Project Ontario, Canada NI 43-101 Technical Report |
Compositing
The sample intervals are predominantly 0.5 m in length and 90% of the samples are equal to or less than one metre in length (Figure 14-16). The minimum block size in the octree block model is 0.625 m x 0.625 m x 1 m to support underground planning. A composite size of one metre was selected as it covers the majority of the sample length while representing the block dimensions well at both Limb and Hinge.
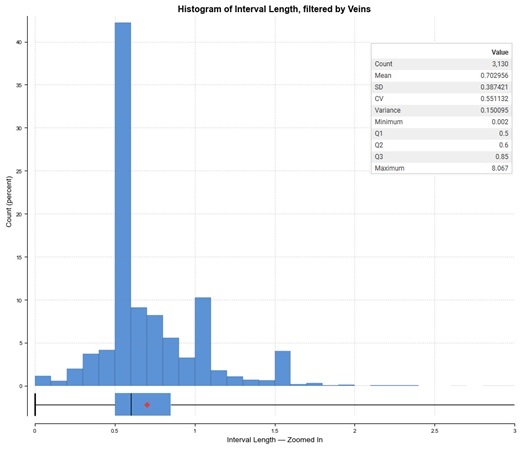
Figure 14-16: Limb and Hinge histogram of assay sample lengths
The contacts between mineralization domains and background were determined to be hard boundaries. The composites were generated in Leapfrog inside estimation domains and flagged with the corresponding domain code. Remnant, short intervals were then added to the previous interval.
Exploratory Data Analysis
The composite database flagged by the estimation domains was exported to .csv and imported to Supervisor for further evaluation.
Page 178
| Kinross Gold Corporation Great Bear Gold Project Ontario, Canada NI 43-101 Technical Report |
Statistics
Contact Analysis
The contact analysis shows that hard boundaries are appropriate and the estimation data should be constrained by the domains (Figure 14-17).
Grade transition from Limb 101 domain to background

Grade transition from Hinge 201 domain to background

Figure 14-17: Limb and Hinge contact plot figures
Page 179
| Kinross Gold Corporation Great Bear Gold Project Ontario, Canada NI 43-101 Technical Report |
Capping
Capping was carried out on a domain by domain basis and analyzed in four different graphs. The uncapped and capped statistics are shown to the right of the graphs in Figure 14-18 for Limb and Figure 14-19 for Hinge and summarized in Table 14-13 for both zones. Each domain was capped independently.

Figure 14-18: Limb 101 domain capped and uncapped statistics
Page 180
| Kinross Gold Corporation Great Bear Gold Project Ontario, Canada NI 43-101 Technical Report |

Figure 14-19: Hinge 201 domain capped and uncapped statistics
Table 14-13: Capped and uncapped composite statistics by domain
| Uncapped | Capped | ||||||||||||||||||||||
| Domain | Samples | Mean (g/t Au) | Median (g/t Au) | SD (g/t Au) | CV | Min (g/t Au) | Max (g/t Au) | Capping Value (g/t Au) | Mean (g/t Au) | SD (g/t Au) | CV | ||||||||||||
| 101 | 1,275 | 2.66 | 1.49 | 5.68 | 2.14 | 0.003 | 117.02 | 47 | 2.56 | 4.18 | 1.64 | ||||||||||||
| 102 | 28 | 1.34 | 0.96 | 1.13 | 0.84 | 0.005 | 5.44 | - | - | - | - | ||||||||||||
| 103 | 10 | 2.01 | 1.28 | 1.78 | 0.88 | 0.120 | 6.72 | - | - | - | - | ||||||||||||
| 104 | 6 | 2.12 | 0.55 | 3.44 | 1.63 | 0.397 | 9.81 | - | - | - | - | ||||||||||||
| 105 | 25 | 2.19 | 0.09 | 6.09 | 2.79 | 0.003 | 30.20 | 10 | 1.38 | 2.74 | 1.99 | ||||||||||||
| 106 | 94 | 2.41 | 1.65 | 3.17 | 1.32 | 0.003 | 25.61 | 10 | 2.24 | 2.22 | 0.99 | ||||||||||||
| 201 | 166 | 6.17 | 1.19 | 18.32 | 2.97 | 0.003 | 174.77 | 70 | 5.35 | 12.58 | 2.35 | ||||||||||||
| 202 | 80 | 3.20 | 1.35 | 6.58 | 2.05 | 0.006 | 50.09 | 30 | 2.95 | 4.98 | 1.69 | ||||||||||||
| 203 | 65 | 2.17 | 0.65 | 5.86 | 2.7 | 0.003 | 41.21 | 23 | 1.89 | 4.18 | 2.21 | ||||||||||||
| 204 | 15 | 1.83 | 1.31 | 1.77 | 0.97 | 0.003 | 6.60 | - | - | - | - | ||||||||||||
| 205 | 7 | 16.59 | 10.32 | 16.85 | 1.02 | 3.256 | 56.82 | 30 | 12.75 | 7.98 | 0.63 | ||||||||||||
Page 181
| Kinross Gold Corporation Great Bear Gold Project Ontario, Canada NI 43-101 Technical Report |
| Uncapped | Capped | ||||||||||||||||||||||
| Domain | Samples | Mean (g/t Au) | Median (g/t Au) | SD (g/t Au) | CV | Min (g/t Au) | Max (g/t Au) | Capping Value (g/t Au) | Mean (g/t Au) | SD (g/t Au) | CV | ||||||||||||
| 206 | 25 | 14.21 | 0.86 | 27.8 | 1.96 | 0.003 | 121.10 | 40 | 9.51 | 13.87 | 1.46 | ||||||||||||
| 207 | 10 | 2.05 | 1.62 | 1.41 | 0.69 | 0.115 | 5.18 | - | - | - | - | ||||||||||||
| 208 | 96 | 20.49 | 1.16 | 92.83 | 4.53 | 0.003 | 863.70 | 135 | 11.45 | 27.14 | 2.37 | ||||||||||||
| 209 | 79 | 4.53 | 0.62 | 11.42 | 2.52 | 0.003 | 58.40 | 30 | 3.58 | 7.5 | 2.1 | ||||||||||||
| 210 | 11 | 4.28 | 0.93 | 6.36 | 1.49 | 0.136 | 19.36 | - | - | - | - | ||||||||||||
| 211 | 14 | 3.83 | 0.54 | 8.31 | 2.17 | 0.049 | 32.66 | 10 | 2.21 | 3.14 | 1.42 | ||||||||||||
| 212 | 37 | 0.79 | 0.56 | 0.79 | 0.99 | 0.007 | 2.79 | - | - | - | - | ||||||||||||
| 213 | 14 | 1.45 | 0.67 | 1.36 | 0.94 | 0.003 | 4.15 | - | - | - | - | ||||||||||||
| 214 | 6 | 7.84 | 0.93 | 9.11 | 1.16 | 0.019 | 25.50 | 15 | 6.09 | 6.04 | 0.99 | ||||||||||||
| 215 | 9 | 3.18 | 1.82 | 3.65 | 1.15 | 0.095 | 12.28 | - | - | - | - | ||||||||||||
| 216 | 7 | 0.51 | 0.53 | 0.24 | 0.46 | 0.003 | 0.82 | - | - | - | - | ||||||||||||
| 217 | 39 | 2.64 | 0.16 | 6.78 | 2.57 | 0.003 | 33.94 | 22 | 2.33 | 5.51 | 2.36 | ||||||||||||
| 218 | 7 | 3.42 | 0.92 | 3.47 | 1.02 | 0.133 | 9.72 | - | - | - | - | ||||||||||||
| 219 | 13 | 6.56 | 0.66 | 12.88 | 1.96 | 0.162 | 49.10 | - | - | - | - | ||||||||||||
Page 182
| Kinross Gold Corporation Great Bear Gold Project Ontario, Canada NI 43-101 Technical Report |
Variography
Only the main Limb domain (code 101) was estimated using OK (Figure 14-20). The variograms were modelled in both Supervisor and Leapfrog with very similar results.

Figure 14-20: Variogram model for Limb 101 domain estimated using OK
Dynamic Anisotropy
Dynamic anisotropy was applied during the estimation in Leapfrog Edge due to the curviplanar nature of the veins. The wireframes were used to calculate the orientation of search ellipses for each block.
Page 183
| Kinross Gold Corporation Great Bear Gold Project Ontario, Canada NI 43-101 Technical Report |
Block Modelling
Model Setup
The block model was built in Leapfrog and the octree option was chosen in order to have small blocks to better fill the wireframes, replicate the solids volume, and minimize dilution in the optimization (Figure 14-21).

Figure 14-21: Octree block model setup in Leapfrog
A list of variables and their descriptions is presented in Table 14-14.
Table 14-14: Block model variables description
| Variable | Description | |
| Auppm | Final gold grade estimate | |
| Density | Density assigned by lithology and estimation domain | |
| Domain | Estimation domain codes | |
| Class | Classification domains | |
| Litho | Lithology codes | |
| Topo | Above and below topography code |
Bulk Density
The cores were sampled for specific gravity analysis and they are well spatially distributed throughout the deposit. A descriptive statistic was made for each rock code assigned from the geological model and an average density was assigned to lithology and estimation domains.
Page 184
| Kinross Gold Corporation Great Bear Gold Project Ontario, Canada NI 43-101 Technical Report |
As there are currently no overburden density samples taken on the Property, the overburden density used was generated through review of similar overburden types in the region. A temporary value of 1.9 g/cm3 was used until a full density study of the overburden is complete.
| • | Above Topography = 0 |
| • | Overburden = 1.9 t/m³ |
| • | Limb Domains = 2.9 t/m³ |
| • | Hinge Domains = 2.78 t/m³ |
| • | Rhyolite = 2.79 t/m³ |
| • | Metasediment = 2.8 t/m³ |
| • | Basalt = 2.89 t/m³ |
| • | Gabbro = 2.89 t/m³ |
| • | Ultramafic Dyke = 2.99 t/m³ |
Estimation
The main Limb estimation domain (code 101) was estimated using OK, while all the other veins from Limb and Hinge were estimated using ID3. The estimate employs a two pass strategy using the same search distance, varying the minimum number of samples (five samples in the first pass and one sample in the second pass). Both passes used a maximum of two samples per drill hole. High-grade restriction was used in the second pass in domains 101, 201, 202, and 203 to avoid spreading high grade in areas with sparse drilling support.
Table 14-15 lists search distances for each estimation domain.
Table 14-15: Ellipsoid search distances for each estimation domain
| Search Distance (m) | |||||||
| Domain | Maximum | Intermediate | Minimum | ||||
| 101 | 280 | 90 | 20 | ||||
| 102 | 100 | 50 | 10 | ||||
| 103 | 50 | 25 | 10 | ||||
| 104 | 200 | 100 | 20 | ||||
| 105 | 100 | 50 | 10 | ||||
Page 185
| Kinross Gold Corporation Great Bear Gold Project Ontario, Canada NI 43-101 Technical Report |
| Search Distance (m) | |||||||
| Domain | Maximum | Intermediate | Minimum | ||||
| 106 | 100 | 50 | 10 | ||||
| 201 | 150 | 50 | 10 | ||||
| 202 | 70 | 40 | 10 | ||||
| 203 | 70 | 40 | 10 | ||||
| 204 | 70 | 40 | 10 | ||||
| 205 | 70 | 40 | 10 | ||||
| 206 | 70 | 40 | 10 | ||||
| 207 | 70 | 40 | 10 | ||||
| 208 | 70 | 40 | 10 | ||||
| 209 | 70 | 40 | 10 | ||||
| 210 | 150 | 75 | 10 | ||||
| 211 | 200 | 150 | 30 | ||||
| 212 | 150 | 75 | 20 | ||||
| 213 | 150 | 100 | 10 | ||||
| 214 | 150 | 75 | 10 | ||||
| 215 | 75 | 50 | 10 | ||||
| 216 | 75 | 50 | 10 | ||||
| 217 | 150 | 75 | 10 | ||||
| 218 | 150 | 100 | 10 | ||||
| 219 | 100 | 75 | 10 | ||||
Page 186
| Kinross Gold Corporation Great Bear Gold Project Ontario, Canada NI 43-101 Technical Report |
Classification
All Inferred material is estimated in pass 1, which estimates blocks using at least five samples and a minimum of three drill holes. A drilling spacing of 75 m for Limb and 50 m for Hinge were also considered, as well as the mineralization continuity. The material that does not fit the specification above (including blocks estimated in pass 1) is coded as unclassified material (Figure 14-22).

Figure 14-22: Classification for Limb looking northeast (left) and Hinge looking northwest (right)
Validation
Swath plots in the X, Y, and Z directions were used to validate the Au estimation on the Limb and Hinge domains comparing them to the declustered data as an NN interpolator. Overall, the Inferred blocks show the same trends as the declustered data, with some discrepancies due to the use of high-grade restriction on the OK and ID3 estimators.
Mineral Resource Reporting
Mineral Resources are reported as per the Mineral Resource estimation methodologies and classification criteria detailed in this Technical Report. The underground resources, as of December 31, 2022, were constrained with underground mineable shapes in order to fulfill the RPEEE requirement of the CIM (2014) Definitions.
Page 187
| Kinross Gold Corporation Great Bear Gold Project Ontario, Canada NI 43-101 Technical Report |
Underground Reporting and Cut-Off Grade
Underground Mineral Resources are reported within underground reporting shapes generated using the MSO tool, and defined using a minimum stope thickness of 2.0 m, limited to areas of continuous mineralization. The cut-off grades were 2.3 Au g/t for the Hinge Zone and 2.5 Au g/t for the Limb Zone. All blocks within the underground constraining shapes have been included within the Mineral Resource estimate, and underground reporting shapes are presented in Figure 14-23. It was assumed that the crown pillars to surface and underneath the pits can be recovered. No surface water bodies are present in the breakthrough areas. Stope shapes that were considered too isolated or small to be reasonably accessed and extracted were excluded from the resource.
The Underground Mineral Resource cut-off grades were calculated with the gold price and full operating costs including mining, processing, and G&A. The cut-off grades have been calculated based on longitudinal long-hole stoping mining method with cemented backfilling, with underground extraction concurrent with the open pit mining.
Assumptions used to estimate the underground cut-off grades were:
| • | Gold price: US$1,700/oz (C$2,210/oz) |
| • | Exchange rate: US$1.00 = C$1.30 |
| • | Process recovery of gold: 93.7% for Limb and 93.6% for Hinge |
| • | Mining cost: C$104.00 per tonne |
| • | Processing cost per tonne: C$28.41 for Limb and C$19.79 for Hinge |
| • | G&A costs: C$12.10 per tonne |
Page 188
| Kinross Gold Corporation Great Bear Gold Project Ontario, Canada NI 43-101 Technical Report |

Figure 14-23: Underground Hinge and Limb resource shapes looking northwest
| 14.4 | Underground Mineral Resource Sensitivity |
The cut-off grade sensitivity of the underground Mineral Resource estimate for the LP, Hinge, and Limb zones is summarized in Table 14-16. The QP notes that the contained ounces are relatively insensitive to gold cut-off grades.
Table 14-16: Underground Inferred Mineral Resource sensitivity - LP, Hinge, and Limb
| CoG (g/t Au) | Tonnes (000) | Grade (g/t Au) | Gold Ounces (000) | ||||||
Underground | 2.3 | 11,636 | 4.50 | 1,684 | |||||
| 2.5 | 10,575 | 4.71 | 1,602 | ||||||
| 3.0 | 7,825 | 5.41 | 1,361 | ||||||
| 3.5 | 5,989 | 6.07 | 1,169 | ||||||
| 4.0 | 4,824 | 6.64 | 1,029 | ||||||
| 4.5 | 3,904 | 7.20 | 904 | ||||||
| 5.0 | 3,029 | 7.90 | 770 |
Page 189
| Kinross Gold Corporation Great Bear Gold Project Ontario, Canada NI 43-101 Technical Report |
| 15. | Mineral Reserve Estimate |
There are no Mineral Reserves estimated for this Project.
Page 190
| Kinross Gold Corporation Great Bear Gold Project Ontario, Canada NI 43-101 Technical Report |
| 16. | Mining Methods |
This section is not applicable.
Page 191
| Kinross Gold Corporation Great Bear Gold Project Ontario, Canada NI 43-101 Technical Report |
| 17. | Recovery Methods |
This section is not applicable.
Page 192
| Kinross Gold Corporation Great Bear Gold Project Ontario, Canada NI 43-101 Technical Report |
| 18. | Project Infrastructure |
This section is not applicable.
Page 193
| Kinross Gold Corporation Great Bear Gold Project Ontario, Canada NI 43-101 Technical Report |
| 19. | Market Studies and Contracts |
This section is not applicable.
Page 194
| Kinross Gold Corporation Great Bear Gold Project Ontario, Canada NI 43-101 Technical Report |
| 20. | Environmental Studies, Permitting, and Social or Community Impact |
This section is not applicable.
Page 195
| Kinross Gold Corporation Great Bear Gold Project Ontario, Canada NI 43-101 Technical Report |
| 21. | Capital and Operating Costs |
This section is not applicable.
Page 196
| Kinross Gold Corporation Great Bear Gold Project Ontario, Canada NI 43-101 Technical Report |
| 22. | Economic Analysis |
This section is not applicable.
Page 197
| Kinross Gold Corporation Great Bear Gold Project Ontario, Canada NI 43-101 Technical Report |
| 23. | Adjacent Properties |
There is significant historic and present gold production in the Red Lake mining camp. The entire Red Lake/Birch-Uchi Greenstone Belt continues to be explored by major and junior mining companies. Significant mining, preproduction, and greenfields exploration programs are taking place proximal to the Project (Figure 23-1).
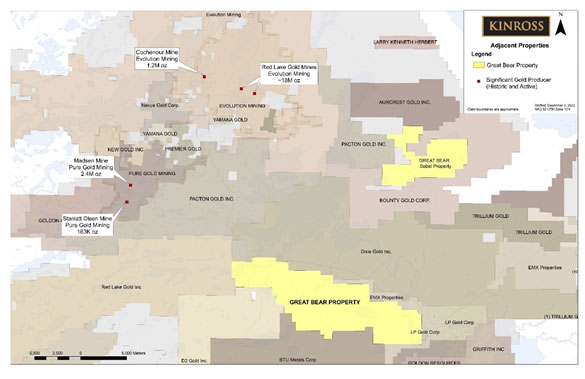
Figure 23-1: Location of the Great Bear Project and adjacent projects
The Project lies approximately 24 km southeast of Evolution Mining Limited’s Red Lake Gold Mine complex. The Red Lake Gold Mine complex is situated within the Red Lake Greenstone Belt and comprised of the historic, Campbell, Dickenson and Red Lake Mines which have produced approximately 24 million ounces of gold between 1948 and 2021 (Malegus, 2022).
Pure Gold Mining Inc., the owners of the 47 km2 claims that encompass the Madsen Mine project located 15km northwest of the Great Bear Project, suspended operations and placed the mine on care and maintenance on October 24, 2022. The historic Madsen and Starratt Olsen Mines combined, produced 2.6 million ounces (Malegus, 2022).
Page 198
| Kinross Gold Corporation Great Bear Gold Project Ontario, Canada NI 43-101 Technical Report |
A total of 25 junior companies and individual prospectors are significant claimholders in the Project area. A number of these claimholders are conducting current exploration programs. BTU Metals Corp. owns 19,723 ha directly south of the Great Bear property boundary. They have completed various exploration activities including till sampling, ground/airborne geophysical surveys, and diamond drilling.
The QP has compiled this information from publicly available data but has not personally verified data from adjacent properties. Results from neighbouring properties, verified or not, may not necessarily be indicative of the mineralization on the Project.
Page 199
| Kinross Gold Corporation Great Bear Gold Project Ontario, Canada NI 43-101 Technical Report |
| 24. | Other Relevant Data and Information |
No additional information or explanation is necessary to make this Technical Report understandable and not misleading.
Page 200
| Kinross Gold Corporation Great Bear Gold Project Ontario, Canada NI 43-101 Technical Report |
| 25. | Interpretation and Conclusions |
| 25.1 | Geology and Mineral Resources |
| • | The Project lies within a regional northwest-southeast trending belt of metavolcanic and metasedimentary rocks which are bounded by intrusive batholiths. |
| • | Three zones of mineralization have been identified within the Project area, LP, Limb, and Hinge, representing three dominant styles of mineralization: silica sulphide replacement, quartz veining, and disseminated gold in a high strain corridor. |
| • | A combined total of 1,170 drill holes totalling 563,191 m have been drilled by Great Bear and Kinross between January 1, 2017 and December 31, 2022. |
| • | Mineral Resources conform to CIM (2014) Definitions. |
| • | As of December 31, 2022, Mineral Resources at the Project consist of: |
| ○ | Indicated: 33.1 Mt grading 2.57 g/t Au and containing 2.7 Moz of gold. |
| ○ | Inferred: 20.0 Mt grading 3.56 g/t Au and containing 2.3 Moz of gold. |
| • | The sample preparation and analyses are adequate for this type of deposit and style of gold mineralization and the sample handling and chain of custody, as documented, meet standard industry practice. |
| • | The QA/QC program is in accordance with standard industry practice and CIM MRMR Best Practice Guidelines. Kinross personnel have taken reasonable measures to ensure that the sample analysis completed is sufficiently accurate and precise and that, based on the statistical analysis of the QA/QC results, the assay results are accurate and reliable and are suitable for Mineral Resource estimation. |
| • | The data used to support a Mineral Resource estimate are subject to validation using built-in software program that automatically triggers a data check for a range of data entry errors. Verification checks on surveys, collar coordinates, lithology, and assay data have been conducted. The checks were appropriate and consistent with industry standards. |
Page 201
| Kinross Gold Corporation Great Bear Gold Project Ontario, Canada NI 43-101 Technical Report |
| • | An RC drill program was undertaken in 2022 to generate a ground truth model separate from the resource model for validation purposes. A total of 433 drill holes were completed on a 8 m x 10 m grid designed to re-create a grade control drill program on approximately a quarter of a year of estimated production from the open pit across a combination of low, medium, and high grade. The variance between the two models is currently well within Kinross quarterly KPIs providing good confidence that the resource model is performing well. |
| • | The sample descriptions, sampling procedures, and data entries were conducted in accordance with industry standards. |
| • | The database is representative and adequate to support a Mineral Resource estimate for the Project. |
| • | An open pit and underground scenario was contemplated for the LP Zone and an underground scenario, for the Hinge and Limb zones. The open pit and underground resources were constrained within $1,400 open pit resource shells and $1,700 underground mineable shapes, respectively, and fulfill the CIM (2014) Definitions requirement of “reasonable prospects for eventual economic extraction” (RPEEE). |
| 25.2 | Metallurgical Testing |
| • | The following conclusions were noted based on the preliminary metallurgical test work carried out by Blue Coast Research in 2020 and 2021: |
| ○ | Gold from each composite was readily cyanide soluble with extraction during standard cyanide leach tests ranging from 95% to 99%. |
| ○ | The addition of lead nitrate did not improve overall leach recovery from the LP material. Lead nitrate addition improved extraction kinetics from the highest-grade composite only. Extraction kinetics from all other composites were unaffected by the addition of lead nitrate. |
| ○ | Cyanide consumption was low, averaging 0.19 kg NaCN/tonne over all tests. |
| ○ | Higher sulphide content was noted in the Limb samples. |
| ○ | The addition of lead nitrate improved overall gold recovery and increased gold dissolution kinetics in the Limb samples. The improvement in gold dissolution kinetics was noted to be up to 24 hours in some instances. |
| ○ | Lead nitrate addition reduced the dissolution of sulphur and resulted in lower consumption of cyanide. |
Page 202
| Kinross Gold Corporation Great Bear Gold Project Ontario, Canada NI 43-101 Technical Report |
| ○ | Pre-treatment with lead nitrate prior to the addition of cyanide did not result in any additional gold recovery, compared to when lead nitrate was added just prior to cyanide. |
| ○ | Grinding to 75 microns appeared to improve gold recovery slightly compared to primary grinds of approximately P80=125 μm. |
| • | A more comprehensive metallurgical testing program is currently underway at SGS and has the purpose of evaluating the metallurgical response of the mineralization, providing the key metallurgical data for selection of a suitable processing flowsheet for plant design, and estimating metallurgical recoveries and processing costs for financial modelling. |
Page 203
| Kinross Gold Corporation Great Bear Gold Project Ontario, Canada NI 43-101 Technical Report |
| 26. | Recommendations |
Based on the information presented in this Technical Report and results of the ongoing work on the Project, the QPs’ recommendations are summarized as follows.
All three target zones continue to warrant follow-up drilling. There is a three-fold objective for the continued drilling: establishing the extent of the deposit along strike and its depth potential, property-wide exploration, and definition drilling, with the first being the primary focus. The LP Zone is the most attractive target based on its potential size and high gold grades, and therefore continues to be prioritized.
Concurrently with drilling, the Project should continue with metallurgical and other technical studies and permitting. The Mineral Resource is substantial enough to initiate more advanced studies.
In addition, an Advanced Exploration Program (AEX) is recommended that would enable exploration drilling to be completed from underground, testing the depth of the deposit as well as better defining the deposit for engineering work.
| 26.1 | Exploration Drilling |
Exploration drilling at the Project should continue with multiple drill holes targeting both depth and strike potential. A specific focus should be on testing the deposit at and below the 1,000 m vertical depth to define the underground extents. For this purpose, additional drilling is proposed to be carried out on the Property. In conjunction with drilling, the Project should continue its ongoing highly technical program of data collection and analysis. The continued development of the geological model as well as continued geological mapping are considered highly important for Project advancement.
Specific exploration recommendations for 2023 and beyond are as follows:
| 1. | Continue diamond drilling to test: |
| ○ | Extent of deposit along strike |
| ○ | Extent of deposit at depth |
| ○ | New targets throughout Property |
| ○ | Condemnation for potential infrastructure locations |
Page 204
| Kinross Gold Corporation Great Bear Gold Project Ontario, Canada NI 43-101 Technical Report |
| ○ | Upgrade Inferred Mineral Resources to Indicated Resources where feasible, to allow for completion of technical studies and future Mineral Reserve estimation |
| 26.2 | Project Development |
Based on the current Mineral Resources, the Project shows sufficient economic potential to initiate advanced studies.
The QPs recommend that Great Bear continue with engineering studies on ground conditions, site layout, metallurgical testing, soil geotechnical drilling and testing, and environmental baseline studies. Great Bear will continue to follow standard project development framework, with both open pit and underground studied. Specific Project recommendations for 2023 and beyond are summarized below:
| 1. | Continue baseline environmental studies for input into permitting and engineering studies. |
| 2. | Continue to engage with our First Nations partners and local stakeholders. |
| 3. | Study the Project with engineering partners following project stage-gating (Scoping, PFS, FS). |
| 4. | Although the underground will not be fully defined, it is recommended that site infrastructure considers what the underground may become. |
| 5. | Further mine plan optimisation of the open pit and underground resource. |
| 6. | Continue with metallurgical studies to test the variability of the deposits considering the significant strike length and depth. |
| 7. | Implement geotechnical work on both the bedrock and soil geotechnical characterization including geophysics, drilling, and laboratory testing using a speciality consultant. |
Page 205
| Kinross Gold Corporation Great Bear Gold Project Ontario, Canada NI 43-101 Technical Report |
| 26.3 | Advanced Exploration Program |
The Property, centered around the LP Zone deposit, continues to be open at depth and additional drilling is required to estimate the potential at depth, approximately 500 vertical metres from surface. For this purpose, an AEX program should be evaluated which would require a portal and decline to be established to access the underground and drill from depth. The initial concept being contemplated would allow exploration drilling to start from approximately 600 vertical metres from surface and test the depth extent of the deposit. Due to the deposit’s characteristics, drilling from the underground is considered to be more feasible for upgrading the underground resource to a higher category. AEX has proved to be an efficient method to define underground deposits. AEX would also aid in the engineering studies and design of the future Project.
It is recommended by the QP that Great Bear complete the engineering and baseline environmental studies on the AEX program be completed as a priority and the Ontario permitting process be initiated.
Page 206
| Kinross Gold Corporation Great Bear Gold Project Ontario, Canada NI 43-101 Technical Report |
| 27. | References |
Adamova, A., 2021. Technical Report on the Dixie Property, Red Lake, Ontario, a NI 43-101 report prepared for Great Bear Resources Ltd., with an effective date of January 1, 2020, amended on April 6, 2021.
Armstrong B., Kolb, M., Hmidi, N., 2018. Red Lake Operations Ontario, Canada NI 43-101 Technical Report (published on SEDAR).
Canadian Institute of Mining, Metallurgy and Petroleum (CIM), 2014. CIM Definition Standards for Mineral Resources and Mineral Reserves, adopted by the CIM Council on May 10, 2014.
CIM, 2019. CIM Estimation of Mineral Resources & Mineral Reserves Best Practice Guidelines, adopted by the CIM Council on November 29, 2019.
Dube et al., 2003a. Geology of the Archean Goldcorp High-Grade Zone, Red Lake Mine, Ontario: implications for exploration and potential analogy with the Timmins camp; Abstract: CIMM Mining Industry Conference; Montreal 2003.
Dube et al., 2003b. Gold mineralization within the Red Lake mine trend: example from the Cochenour-Willians mine area, Red Lake, Ontario, with new key information from the Red Lake mine and potential analogy with the Timmins camp; Geological Survey of Canada Current Research, 2003C-21, 15p.
Dube et al., 2000. A preliminary report on amphibolite-facies, disseminated replacement-style mineralization at the Madsen gold mine, Red Lake, Ontario. Geological Survey of Canada, Current Research2000-C17, 12p.
Lee, C., 2006. Independent Technical Report on the Dixie Lake Project, Red Lake, Ontario. Fronteer Development Group 43-101 report prepared by SRK (published on SEDAR).
Lambert, M B; Burbidge, G; Jefferson, C W; Beaumont-smith, C; Lustwerk, R (1990). “Stratigraphy, Facies and Structure in Volcanic and Sedimentary Rocks of the Archean Back River Volcanic Complex, N.w.t.” Current Research, Part C, Geological Survey of Canada, Paper 90-IC: 151–165.
Malegus, P.M., Amyotte, E.G., Adrianwalla, C.J., Wiebe, K.E., Bousquet, P., Daniels, C.M., Pettigrew, T.K. and Dorland, G. 2022. Report of Activities 2021, Resident Geologist Program, Red Lake Regional Resident Geologist Report: Red Lake and Kenora Districts; Ontario Geological Survey, Open File Report 6381, 10p.
Page 207
| Kinross Gold Corporation Great Bear Gold Project Ontario, Canada NI 43-101 Technical Report |
Parker, J.R. 1999a. Gold potential in Ball, Todd and Fairlie township, Red Lake greenstone belt; in Summary of Field Work and Other Activities, Ontario Geological Survey, Open File Report 6000, p.20-1 to 20-11.
Parker, J.R. 1999b. Exploration potential for volcanogenic massive sulphide deposits (VMS) in the Red Lake greenstone belt; in Summary of Field Work and Other Activities, Ontario Geological Survey, Open File Report 6000, p.19-1 to 19-24.
Ross, K., 2004. Petrographic Report of Five Samples from the Dixie Lake Project, Red Lake District, Ontario. Panterra Geoservices Inc. Unpublished
Ross, K., 2018. Petrographic Report on the Dixie Gold Project, Red Lake District, Ontario. Panterra Geoservices Inc. Unpublished
Ross K., 2019. Petrographic Report on the Dixie Gold Project, Red Lake District, Ontario. Panterra Geoservices Inc. Unpublished
Ross K., 2020. Petrographic Report on the Dixie Gold Project, Red Lake District, Ontario. Panterra Geoservices Inc. Unpublished
Sanborn-Barrie, M., et al., 2001. Three hundred million years of tectonic history recorded by the Red Lake greenstone belt, Ontario; Geological Survey of Canada, Current Research2001-C19, 29p.
Sanborn-Barrie, M., Skulski, T., and Parker, J., 2001. Three hundred million years of tectonic history recorded in the Red Lake greenstone belt, Ontario; GSC, Current Research 2001-C19.
Sanborn-Barrie, M., Rogers, N., Skulski, T., Parker, J., McNicoll, V., and Devaney, J., 2004. Geology and Tectonostratigraphic Assemblages, East Uchi Subprovince, Red Lake and Birch-Uchi belts, Ontario; Geological Survey of Canada, open File 4256; Ontario Geological Survey, Preliminary Map P. 3460, scale 1:250,000
Sanborn-Barrie, M., et al., 2004. Geology, Red Lake greenstone belt, western Superior Province, Ontario, 1:50,000 map sheet; Geological Survey of Canada Open File 4594.Singh R., 2019. A Near Surface, High Grade Gold Discovery Dixie Project, Red Lake, Ontario https://greatbearresources.ca/wp-content/uploads/2019/02/GBR-MAR-Technical-PPT-1.pdf
Stott, G.M., and Corfu, F., 1991. Uchi Sub-province, in Geology of Ontario, Ontario Geological Survey, Special Volume 4, Pt. 1, pp. 145-236, ed. Thurston P. C. et al.
Page 208
| Kinross Gold Corporation Great Bear Gold Project Ontario, Canada NI 43-101 Technical Report |
Sylvester, P. J.; Harper, G. D.; Byerly, G. R.; Thurston, P. C. (1997). “Volcanic Aspects”. In De Wit, Maarten J.; Ashwal, Lewis D. (eds.). Greenstone belts. Oxford: Clarendon Press. pp. 55–90.
Thompson P., 2003. Toward a new metamorphic framework for gold exploration in the Red Lake greenstone belt. Ontario Geological Survey Open File report 6122, 51p.
Thurston, P.C., Osmani, I.A. and Stone, D., 1991. Northwestern Superior Province: Review and terrane analysis; in Geology of Ontario, Ontario Geological Survey, Special Volume 4, Part 1, p.81-144.
Zeng F. AJ Calvert, 2006, Imaging the upper part of the Red Lake greenstone belt, Northwestern Ontario, with 3D traveltime tomography, Canadian Journal of Earth Sciences 43 (7), p.849- 863.
Page 209
| Kinross Gold Corporation Great Bear Gold Project Ontario, Canada NI 43-101 Technical Report |
| 28. | Date and Signature Page |
This Technical Report entitled “Great Bear Gold Project Ontario, Canada - Voluntary National Instrument 43-101 Technical Report” with an effective date of December 31, 2022 was prepared by the following authors:
“Signed and sealed”
Nicos Pfeiffer, P.Geo.
Vice President Geology
February 13, 2023
“Signed and sealed”
John Sims, CPG
Company Qualified Person
President of Sims Resources LLC
February 13, 2023
“Signed and sealed”
Yves Breau, P.Eng.
Vice-President Metallurgy, Engineering and Energy
February 13, 2023
“Signed and sealed”
Rick Greenwood, P.Geo.
Exploration Manager
February 13, 2023
“Signed and sealed”
Agung Prawasono, P.Eng.
Senior Director, Mine Planning
February 13, 2023
Page 210
| Kinross Gold Corporation Great Bear Gold Project Ontario, Canada NI 43-101 Technical Report |
| 29. | Certificate of Qualified Person |
| 29.1 | Nicos Pfeiffer |
I, Nicos Pfeiffer, P.Geo., as an author of this report entitled “Great Bear Gold Project Ontario, Canada - Voluntary National Instrument 43-101 Technical Report” with an effective date of December 31, 2022, prepared for Kinross Gold Corporation, do hereby certify that:
| 1) | I am Vice President Geology with Kinross Gold Corp. of 25 York Street, 17th floor Toronto On. |
| 2) | I am a graduate of Carleton University, Ottawa, Ontario in 2009 with an Honours B.Sc. Earth Science. |
| 3) | I am registered as a Professional Geologist in the Province of Ontario (Reg# 2354). I have worked in geology for a total of 15 years. My relevant experience for the purpose of the Technical Report is: |
| • | Domestic and international experience in both underground and open pit operation geology roles. |
| • | Extensive experience in gold exploration and resource estimation. |
| • | Experience leading multi-disciplinary technical teams in both a corporate and operational capacity. |
| 4) | I have read the definition of “qualified person” set out in National Instrument 43-101 (NI 43-101) and certify that by reason of my education, affiliation with a professional association (as defined in NI 43-101) and past relevant work experience, I fulfill the requirements to be a “qualified person” for the purposes of NI 43-101. |
| 5) | I visited the Great Bear Project on numerous regular intervals throughout 2022. |
| 6) | I am responsible for Section 14 (except Mineral Resource Reporting) of the Technical Report. |
| 7) | I am not independent of the Issuer applying the test set out in Section 1.5 of NI 43-101. |
| 8) | I have had prior involvement with the property that is the subject of the Technical Report. |
| 9) | I have read NI 43-101, and the Technical Report has been prepared in compliance with NI 43-101 and Form 43-101F1. |
Page 211
| Kinross Gold Corporation Great Bear Gold Project Ontario, Canada NI 43-101 Technical Report |
| 10) | At the effective date of the Technical Report, to the best of my knowledge, information, and belief, Section 14 (except Mineral Resource Reporting) in the Technical Report for which I am responsible contains all scientific and technical information that is required to be disclosed to make the Technical Report not misleading. |
Dated this 13th of February 2023
(Signed and Sealed)
Nicos Pfeiffer, P.Geo.
Page 212
| Kinross Gold Corporation Great Bear Gold Project Ontario, Canada NI 43-101 Technical Report |
| 29.2 | John Sims |
I, John Sims, C.P.G., as an author of this report entitled “Great Bear Gold Project Ontario, Canada - Voluntary National Instrument 43-101 Technical Report” with an effective date of December 31, 2022, prepared for Kinross Gold Corporation, do hereby certify that:
| 1) | I am President of Sims Resources LLC, of 945 Wyoming Street Unit 214 Missoula, MT 59801. |
| 2) | I am a graduate of University of Montana, in 1992 with a BS Degree(s) in Geology and Mathematics. |
| 3) | My relevant experience for the purpose of this Technical Report is: |
| • | I have over 30 years of mining industry experience. My experience with respect to mineral resources and reserves includes resource exploration geologist in Chile, Honduras, Mexico, Tanzania and USA; exploration project manager in Nicaragua; mine site project manager and geologist at underground and open pit mines in western USA, Central and South America; 20 years of resource modelling and reserve optimization experience for deposits in Argentina, Australia, Chile, Bolivia, Ecuador, Ghana, Mauritania, Mexico, Russia, Tanzania and USA. I have 19 years of experience as a site and corporate Qualified Person which includes positions as a Senior Project Mine Geologist, then Director of Technical Services for Coeur d’Alene Mines Corporation, and as Director, then VP & SVP of Technical Services for Kinross Gold Corporation. I have contributed to, and project managed multi-disciplinary teams that required close interaction with mining engineers for mineral reserve estimation, as well as consideration of recovery methods, project infrastructure, costs and economics including Scoping, Prefeasibility and Feasibility studies. |
| 4) | I have read the definition of “qualified person” set out in National Instrument 43-101 (NI 43-101) and certify that by reason of my education, affiliation with a professional association (as defined in NI 43-101) and past relevant work experience, I fulfill the requirements to be a “qualified person” for the purposes of NI 43-101. |
| 5) | I visited the Great Bear Project on October 19 and 20, 2022. |
| 6) | I am responsible for the overall preparation of the Technical Report and in particular, Sections 1 to 10, and 23 to 27 of the Technical Report. |
| 7) | I am independent of the Issuer applying the test set out in Section 1.5 of NI 43-101. |
Page 213
| Kinross Gold Corporation Great Bear Gold Project Ontario, Canada NI 43-101 Technical Report |
| 8) | I have had no prior involvement with the property that is the subject of the Technical Report. |
| 9) | I have read NI 43-101, and the Technical Report has been prepared in compliance with NI 43-101 and Form 43-101F1. |
| 10) | At the effective date of the Technical Report, to the best of my knowledge, information, and belief, the Technical Report contains all scientific and technical information that is required to be disclosed to make the Technical Report not misleading. |
Dated this this 13th of February 2023
(Signed and Sealed)
John Sims, C.P.G.
Page 214
| Kinross Gold Corporation Great Bear Gold Project Ontario, Canada NI 43-101 Technical Report |
| 29.3 | Yves Breau |
I, Yves Breau, P.Eng., as an author of this report entitled “Great Bear Gold Project Ontario, Canada – Voluntary National Instrument 43-101 Technical Report” with an effective date of December 31, 2022, prepared for Kinross Gold Corporation, do hereby certify that:
| 1) | I am Vice-President Metallurgy, Engineering and Energy with Kinross Gold Corporation, of 25 York Street, 17th Floor, Toronto, Ontario, M5J 2V5. |
| 2) | I am a graduate of University of Laval, Québec City in 1997 with a bachelors in Materials and Metallurgy Engineering. |
| 3) | I am registered as a Professional Engineer in the Province of Ontario (Reg.# 100194755). I have worked as an engineer for a total of 23 years since my graduation. My relevant experience for the purpose of the Technical Report is: |
| • | My work experience has included multiple operations roles from metallurgist to process manager and multiple mining company corporate roles from manager to Vice-President. |
| • | In my roles in operations and corporate, I have completed many studies related to gold mineral processing. |
| 4) | I have read the definition of “qualified person” set out in National Instrument 43-101 (NI 43-101) and certify that by reason of my education, affiliation with a professional association (as defined in NI 43-101) and past relevant work experience, I fulfill the requirements to be a “qualified person” for the purposes of NI 43-101. |
| 5) | I visited the Great Bear Project in March 2022. |
| 6) | I am responsible for Section 13 of the Technical Report. |
| 7) | I am not independent of the Issuer applying the test set out in Section 1.5 of NI 43-101. |
| 8) | I have had no prior involvement with the property that is the subject of the Technical Report. |
| 9) | I have read NI 43-101, and the Technical Report has been prepared in compliance with NI 43-101 and Form 43-101F1. |
| 10) | At the effective date of the Technical Report, to the best of my knowledge, information, and belief, Section 13 in the Technical Report for which I am responsible contains all scientific and technical information that is required to be disclosed to make the Technical Report not misleading. |
Page 215
| Kinross Gold Corporation Great Bear Gold Project Ontario, Canada NI 43-101 Technical Report |
Dated this this 13th of February 2023
(Signed and Sealed)
Yves Breau, P.Eng.
Page 216
| Kinross Gold Corporation Great Bear Gold Project Ontario, Canada NI 43-101 Technical Report |
| 29.4 | Rick Greenwood |
I, Rick Greenwood, P.Geo., as an author of this report entitled “Great Bear Gold Project Ontario, Canada – Voluntary National Instrument 43-101 Technical Report” with an effective date of December 31, 2022, prepared for Kinross Gold Corporation, do hereby certify that:
| 1) | I am Exploration Manager with Kinross Gold Corp., of Red Lake, Ontario, Canada. |
| 2) | I am a graduate of Memorial University of Newfoundland and Labrador in 2004 with a Bachelor of Science (Hons.) Degree in Earth Science. |
| 3) | I am registered as a Professional Geologist in the Province of Ontario (Reg.# 2390). I have worked as a geologist for 19 years since my graduation. My relevant experience for the purpose of the Technical Report is: |
| • | 16+ years experience working in Archean Greenstone belt environments in the North West of Ontario as a Geologist to Exploration Manager. |
| 4) | I have read the definition of “qualified person” set out in National Instrument 43-101 (NI 43-101) and certify that by reason of my education, affiliation with a professional association (as defined in NI 43-101) and past relevant work experience, I fulfill the requirements to be a “qualified person” for the purposes of NI 43-101. |
| 5) | I am a full time employee at the Great Bear Gold Project site. |
| 6) | I am responsible for Sections 11 and 12 of the Technical Report. |
| 7) | I am not independent of the Issuer applying the test set out in Section 1.5 of NI 43-101. |
| 8) | I have been actively involved since March of 2018 on the project that is the subject of the Technical Report. |
| 9) | I have read NI 43-101, and the Technical Report has been prepared in compliance with NI 43-101 and Form 43-101F1. |
| 10) | At the effective date of the Technical Report, to the best of my knowledge, information, and belief, Sections 11 and 12 in the Technical Report for which I am responsible contain all scientific and technical information that is required to be disclosed to make the Technical Report not misleading. |
Dated this this 13th of February 2023
(Signed and Sealed)
Rick Greenwood, P.Geo.
Page 217
| Kinross Gold Corporation Great Bear Gold Project Ontario, Canada NI 43-101 Technical Report |
| 29.5 | Agung Prawasono |
I, Agung Prawasono, P.Eng., PMP, as an author of this report entitled “Great Bear Gold Project Ontario, Canada – Voluntary National Instrument 43-101 Technical Report” with an effective date of December 31, 2022, prepared for Kinross Gold Corporation, do hereby certify that:
| 1) | I am a Senior Director, Mine Planning with Kinross Gold Corporation, of 25 York Street, 17th Floor, Toronto, Ontario M5J 2V5. |
| 2) | I am a graduate of UPN “Veteran” Yogyakarta, Indonesia in 1999 with a Bachelor of Engineering Degree in Mining Engineering program. |
| 3) | I am registered as a Professional Engineer in the Province of Ontario (Reg.#100533117). I have worked as a mining engineer for a total of 23 years since my graduation. My relevant experience for the purpose of the Technical Report is 23 years’ experience in resource optimization related works that includes mine designs and mine planning for precious and base metal operations and projects in Indonesia, India, Africa, North America and South America. |
| 4) | I have read the definition of “qualified person” set out in National Instrument 43-101 (NI 43-101) and certify that by reason of my education, affiliation with a professional association (as defined in NI 43-101) and past relevant work experience, I fulfill the requirements to be a “qualified person” for the purposes of NI 43-101. |
| 5) | I visited the Great Bear Project on June 24, 2022. |
| 6) | I am responsible for the portion of Section 14 that covers Mineral Resource Reporting. |
| 7) | I am not independent of the Issuer applying the test set out in Section 1.5 of NI 43-101. |
| 8) | I have been actively involved since February of 2022 on the project that is the subject of the Technical Report. |
| 9) | I have read NI 43-101, and the Technical Report has been prepared in compliance with NI 43-101 and Form 43-101F1. |
| 10) | At the effective date of the Technical Report, to the best of my knowledge, information, and belief, Section 14 (Mineral Resource Reporting) in the Technical Report for which I am responsible contains all scientific and technical information that is required to be disclosed to make the Technical Report not misleading. |
Page 218
| Kinross Gold Corporation Great Bear Gold Project Ontario, Canada NI 43-101 Technical Report |
Dated this this 13th of February 2023
(Signed and Sealed)
Agung Prawasono, P.Eng., PMP
Page 219
| Kinross Gold Corporation Great Bear Gold Project Ontario, Canada NI 43-101 Technical Report |
| 30. | Appendix 1 - Land Tenure |
Page 220
| Kinross Gold Corporation Great Bear Gold Project Ontario, Canada NI 43-101 Technical Report |
Table 30-1: Great Bear claim list
Tenure Number | Title Type | Tenure Status | Issue Date | Anniversary Date | Area (ha) | ||||||
| 100967 | SCMC | Active | 2018-04-10 | 2024-09-13 | 20.3838 | ||||||
| 101494 | SCMC | Active | 2018-04-10 | 2024-09-13 | 20.3801 | ||||||
| 101530 | SCMC | Active | 2018-04-10 | 2024-08-03 | 20.3901 | ||||||
| 101612 | SCMC | Active | 2018-04-10 | 2026-08-03 | 20.3979 | ||||||
| 101895 | SCMC | Active | 2018-04-10 | 2024-08-04 | 20.3855 | ||||||
| 102017 | SCMC | Active | 2018-04-10 | 2024-06-21 | 20.3874 | ||||||
| 102839 | SCMC | Active | 2018-04-10 | 2024-02-08 | 20.3891 | ||||||
| 103070 | SCMC | Active | 2018-04-10 | 2024-08-04 | 20.3891 | ||||||
| 103309 | SCMC | Active | 2018-04-10 | 2024-08-03 | 20.3784 | ||||||
| 111854 | SCMC | Active | 2018-04-10 | 2024-08-03 | 20.3874 | ||||||
| 111855 | SCMC | Active | 2018-04-10 | 2024-08-03 | 20.3875 | ||||||
| 111856 | SCMC | Active | 2018-04-10 | 2024-09-08 | 20.3893 | ||||||
| 111882 | SCMC | Active | 2018-04-10 | 2024-08-03 | 20.3713 | ||||||
| 112519 | BCMC | Active | 2018-04-10 | 2025-08-03 | 3.3254 | ||||||
| 112520 | SCMC | Active | 2018-04-10 | 2024-08-03 | 20.3962 | ||||||
| 113713 | SCMC | Active | 2018-04-10 | 2024-08-03 | 20.3681 | ||||||
| 114024 | SCMC | Active | 2018-04-10 | 2024-08-03 | 20.3822 | ||||||
| 114025 | SCMC | Active | 2018-04-10 | 2024-08-03 | 20.3653 | ||||||
| 114026 | SCMC | Active | 2018-04-10 | 2024-08-03 | 20.3714 | ||||||
| 114064 | SCMC | Active | 2018-04-10 | 2024-08-03 | 20.3697 | ||||||
| 114065 | SCMC | Active | 2018-04-10 | 2024-08-03 | 20.3715 | ||||||
| 114070 | SCMC | Active | 2018-04-10 | 2024-08-03 | 20.3698 | ||||||
| 114071 | SCMC | Active | 2018-04-10 | 2024-08-03 | 20.3717 | ||||||
| 114072 | SCMC | Active | 2018-04-10 | 2024-08-03 | 20.3753 | ||||||
| 114286 | SCMC | Active | 2018-04-10 | 2024-08-03 | 20.3752 | ||||||
| 114299 | SCMC | Active | 2018-04-10 | 2024-08-03 | 20.3894 | ||||||
| 114301 | SCMC | Active | 2018-04-10 | 2024-08-03 | 20.3785 | ||||||
| 114302 | SCMC | Active | 2018-04-10 | 2024-08-03 | 20.3786 | ||||||
| 114303 | SCMC | Active | 2018-04-10 | 2024-08-03 | 20.3804 | ||||||
| 114304 | SCMC | Active | 2018-04-10 | 2024-08-03 | 20.3839 | ||||||
| 114652 | SCMC | Active | 2018-04-10 | 2024-09-13 | 20.3802 | ||||||
| 116114 | SCMC | Active | 2018-04-10 | 2024-08-03 | 20.3907 | ||||||
| 116131 | SCMC | Active | 2018-04-10 | 2024-09-13 | 20.3910 | ||||||
| 116196 | SCMC | Active | 2018-04-10 | 2024-06-06 | 20.3892 |
Page 221
| Kinross Gold Corporation Great Bear Gold Project Ontario, Canada NI 43-101 Technical Report |
Tenure Number | Title Type | Tenure Status | Issue Date | Anniversary Date | Area (ha) | ||||||
| 116197 | SCMC | Active | 2018-04-10 | 2024-06-21 | 20.3892 | ||||||
| 116500 | SCMC | Active | 2018-04-10 | 2024-08-03 | 20.3802 | ||||||
| 116858 | SCMC | Active | 2018-04-10 | 2024-08-03 | 20.3919 | ||||||
| 117355 | SCMC | Active | 2018-04-10 | 2024-08-03 | 20.3725 | ||||||
| 117356 | SCMC | Active | 2018-04-10 | 2026-08-03 | 20.3730 | ||||||
| 117357 | SCMC | Active | 2018-04-10 | 2024-08-03 | 20.3766 | ||||||
| 117411 | SCMC | Active | 2018-04-10 | 2024-08-03 | 20.3889 | ||||||
| 117462 | SCMC | Active | 2018-04-10 | 2024-08-03 | 20.3854 | ||||||
| 118161 | SCMC | Active | 2018-04-10 | 2024-08-04 | 20.3891 | ||||||
| 118232 | SCMC | Active | 2018-04-10 | 2024-08-03 | 20.3872 | ||||||
| 119141 | SCMC | Active | 2018-04-10 | 2024-09-13 | 20.3855 | ||||||
| 121662 | SCMC | Active | 2018-04-10 | 2024-08-03 | 20.3943 | ||||||
| 121663 | SCMC | Active | 2018-04-10 | 2024-08-03 | 20.3960 | ||||||
| 121774 | SCMC | Active | 2018-04-10 | 2024-08-03 | 20.3979 | ||||||
| 121820 | SCMC | Active | 2018-04-10 | 2024-02-05 | 20.3783 | ||||||
| 125191 | SCMC | Active | 2018-04-10 | 2024-08-04 | 20.3909 | ||||||
| 125336 | SCMC | Active | 2018-04-10 | 2024-06-29 | 20.3874 | ||||||
| 125688 | BCMC | Active | 2018-04-10 | 2025-02-08 | 2.3268 | ||||||
| 125785 | BCMC | Active | 2018-04-10 | 2024-08-03 | 11.2340 | ||||||
| 126417 | SCMC | Active | 2018-04-10 | 2024-08-03 | 20.3846 | ||||||
| 127173 | SCMC | Active | 2018-04-10 | 2024-08-03 | 20.3785 | ||||||
| 127174 | SCMC | Active | 2018-04-10 | 2024-08-03 | 20.3785 | ||||||
| 127175 | SCMC | Active | 2018-04-10 | 2024-08-03 | 20.3802 | ||||||
| 127704 | SCMC | Active | 2018-04-10 | 2024-08-03 | 20.3872 | ||||||
| 128876 | SCMC | Active | 2018-04-10 | 2024-02-05 | 20.3818 | ||||||
| 128877 | SCMC | Active | 2018-04-10 | 2024-01-05 | 20.3837 | ||||||
| 128878 | SCMC | Active | 2018-04-10 | 2024-09-13 | 20.3837 | ||||||
| 130582 | SCMC | Active | 2018-04-10 | 2024-08-03 | 20.3661 | ||||||
| 131296 | SCMC | Active | 2018-04-10 | 2024-08-03 | 20.3698 | ||||||
| 131305 | SCMC | Active | 2018-04-10 | 2024-08-03 | 20.3876 | ||||||
| 131309 | SCMC | Active | 2018-04-10 | 2024-08-03 | 20.3821 | ||||||
| 132390 | BCMC | Active | 2018-04-10 | 2024-09-08 | 6.1323 | ||||||
| 132391 | BCMC | Active | 2018-04-10 | 2024-09-08 | 6.4141 | ||||||
| 132392 | SCMC | Active | 2018-04-10 | 2026-08-03 | 20.3712 | ||||||
| 132557 | SCMC | Active | 2018-04-10 | 2024-08-03 | 20.3662 |
Page 222
| Kinross Gold Corporation Great Bear Gold Project Ontario, Canada NI 43-101 Technical Report |
Tenure Number | Title Type | Tenure Status | Issue Date | Anniversary Date | Area (ha) | ||||||
| 138479 | BCMC | Active | 2018-04-10 | 2025-08-03 | 3.4707 | ||||||
| 138480 | SCMC | Active | 2018-04-10 | 2024-08-03 | 20.3944 | ||||||
| 139245 | SCMC | Active | 2018-04-10 | 2024-09-13 | 20.3783 | ||||||
| 139246 | SCMC | Active | 2018-04-10 | 2024-09-13 | 20.3784 | ||||||
| 143920 | SCMC | Active | 2018-04-10 | 2026-08-03 | 20.3925 | ||||||
| 144522 | SCMC | Active | 2018-04-10 | 2024-08-03 | 20.3749 | ||||||
| 146647 | SCMC | Active | 2018-04-10 | 2024-08-03 | 20.3698 | ||||||
| 146648 | SCMC | Active | 2018-04-10 | 2024-08-03 | 20.3716 | ||||||
| 146649 | SCMC | Active | 2018-04-10 | 2024-08-03 | 20.3752 | ||||||
| 147364 | SCMC | Active | 2018-04-10 | 2024-08-03 | 20.3642 | ||||||
| 147882 | SCMC | Active | 2018-04-10 | 2024-08-03 | 20.3875 | ||||||
| 147887 | SCMC | Active | 2018-04-10 | 2024-08-03 | 20.3785 | ||||||
| 147888 | SCMC | Active | 2018-04-10 | 2024-08-03 | 20.3858 | ||||||
| 147969 | SCMC | Active | 2018-04-10 | 2024-08-03 | 20.3694 | ||||||
| 151438 | SCMC | Active | 2018-04-10 | 2024-08-03 | 20.3680 | ||||||
| 151443 | SCMC | Active | 2018-04-10 | 2024-08-03 | 20.3751 | ||||||
| 151959 | SCMC | Active | 2018-04-10 | 2024-09-08 | 20.3893 | ||||||
| 154397 | BCMC | Active | 2018-04-10 | 2024-08-04 | 1.2305 | ||||||
| 155096 | SCMC | Active | 2018-04-10 | 2024-08-03 | 20.3871 | ||||||
| 155097 | SCMC | Active | 2018-04-10 | 2024-08-03 | 20.3871 | ||||||
| 155098 | SCMC | Active | 2018-04-10 | 2024-08-03 | 20.3889 | ||||||
| 155608 | SCMC | Active | 2018-04-10 | 2024-08-03 | 20.3821 | ||||||
| 155648 | SCMC | Active | 2018-04-10 | 2024-08-03 | 20.3890 | ||||||
| 156818 | SCMC | Active | 2018-04-10 | 2024-09-08 | 20.3910 | ||||||
| 158073 | SCMC | Active | 2018-04-10 | 2024-08-03 | 20.3749 | ||||||
| 160649 | SCMC | Active | 2018-04-10 | 2024-08-03 | 20.3786 | ||||||
| 160650 | SCMC | Active | 2018-04-10 | 2024-08-03 | 20.3804 | ||||||
| 160652 | SCMC | Active | 2018-04-10 | 2024-08-03 | 20.3660 | ||||||
| 160653 | SCMC | Active | 2018-04-10 | 2024-08-03 | 20.3678 | ||||||
| 160654 | SCMC | Active | 2018-04-10 | 2024-08-03 | 20.3696 | ||||||
| 160690 | SCMC | Active | 2018-04-10 | 2024-08-03 | 20.3661 | ||||||
| 160695 | SCMC | Active | 2018-04-10 | 2024-08-03 | 20.3734 | ||||||
| 160898 | SCMC | Active | 2018-04-10 | 2024-08-03 | 20.3907 | ||||||
| 160939 | SCMC | Active | 2018-04-10 | 2024-02-05 | 20.3801 | ||||||
| 161433 | SCMC | Active | 2018-04-10 | 2024-08-03 | 20.3822 |
Page 223
| Kinross Gold Corporation Great Bear Gold Project Ontario, Canada NI 43-101 Technical Report |
Tenure Number | Title Type | Tenure Status | Issue Date | Anniversary Date | Area (ha) | ||||||
| 161434 | SCMC | Active | 2018-04-10 | 2024-08-03 | 20.3858 | ||||||
| 162005 | SCMC | Active | 2018-04-10 | 2024-08-03 | 20.3750 | ||||||
| 162006 | SCMC | Active | 2018-04-10 | 2024-08-03 | 20.3787 | ||||||
| 162318 | BCMC | Active | 2018-04-10 | 2024-09-08 | 4.9728 | ||||||
| 162792 | SCMC | Active | 2018-04-10 | 2024-08-03 | 20.3926 | ||||||
| 162793 | SCMC | Active | 2018-04-10 | 2024-08-03 | 20.3926 | ||||||
| 163391 | SCMC | Active | 2018-04-10 | 2024-08-03 | 20.3767 | ||||||
| 164901 | BCMC | Active | 2018-04-10 | 2024-09-13 | 14.2817 | ||||||
| 165478 | SCMC | Active | 2018-04-10 | 2024-08-03 | 20.3659 | ||||||
| 166020 | SCMC | Active | 2018-04-10 | 2024-08-03 | 20.3661 | ||||||
| 166024 | SCMC | Active | 2018-04-10 | 2024-08-03 | 20.3717 | ||||||
| 166308 | SCMC | Active | 2018-04-10 | 2024-08-03 | 20.3907 | ||||||
| 166309 | SCMC | Active | 2018-04-10 | 2024-08-03 | 20.3937 | ||||||
| 166310 | SCMC | Active | 2018-04-10 | 2024-08-03 | 20.3955 | ||||||
| 166311 | SCMC | Active | 2018-04-10 | 2024-08-03 | 20.3978 | ||||||
| 166752 | SCMC | Active | 2018-04-10 | 2024-08-03 | 20.3893 | ||||||
| 166753 | BCMC | Active | 2018-04-10 | 2025-08-03 | 6.8282 | ||||||
| 166757 | SCMC | Active | 2018-04-10 | 2024-08-03 | 20.3858 | ||||||
| 166823 | SCMC | Active | 2018-04-10 | 2024-08-03 | 20.3694 | ||||||
| 166824 | SCMC | Active | 2018-04-10 | 2024-08-03 | 20.3713 | ||||||
| 166894 | SCMC | Active | 2018-04-10 | 2024-08-03 | 20.3907 | ||||||
| 166895 | SCMC | Active | 2018-04-10 | 2024-08-03 | 20.3925 | ||||||
| 166896 | SCMC | Active | 2018-04-10 | 2024-08-03 | 20.3961 | ||||||
| 167506 | SCMC | Active | 2018-04-10 | 2024-08-03 | 20.3733 | ||||||
| 170319 | SCMC | Active | 2018-04-10 | 2024-02-08 | 20.3909 | ||||||
| 170893 | SCMC | Active | 2018-04-10 | 2024-08-03 | 20.3890 | ||||||
| 171031 | SCMC | Active | 2018-04-10 | 2024-08-04 | 20.3891 | ||||||
| 172297 | SCMC | Active | 2018-04-10 | 2024-08-03 | 20.3872 | ||||||
| 173077 | SCMC | Active | 2018-04-10 | 2024-08-03 | 20.3854 | ||||||
| 173078 | BCMC | Active | 2018-04-10 | 2024-08-04 | 14.9481 | ||||||
| 173190 | SCMC | Active | 2018-04-10 | 2024-08-03 | 20.3871 | ||||||
| 173746 | SCMC | Active | 2018-04-10 | 2024-08-04 | 20.3909 | ||||||
| 174508 | SCMC | Active | 2018-04-10 | 2024-08-03 | 20.3803 | ||||||
| 174543 | SCMC | Active | 2018-04-10 | 2026-08-03 | 20.3871 | ||||||
| 174544 | SCMC | Active | 2018-04-10 | 2024-08-03 | 20.3908 |
Page 224
| Kinross Gold Corporation Great Bear Gold Project Ontario, Canada NI 43-101 Technical Report |
Tenure Number | Title Type | Tenure Status | Issue Date | Anniversary Date | Area (ha) | ||||||
| 175718 | SCMC | Active | 2018-04-10 | 2024-08-03 | 20.3856 | ||||||
| 175743 | SCMC | Active | 2018-04-10 | 2024-08-03 | 20.3693 | ||||||
| 177634 | SCMC | Active | 2018-04-10 | 2024-07-31 | 20.3856 | ||||||
| 178443 | SCMC | Active | 2018-04-10 | 2024-09-13 | 20.3910 | ||||||
| 179661 | SCMC | Active | 2018-04-10 | 2024-08-03 | 20.3907 | ||||||
| 179662 | SCMC | Active | 2018-04-10 | 2024-08-03 | 20.3942 | ||||||
| 180358 | SCMC | Active | 2018-04-10 | 2024-09-13 | 20.3819 | ||||||
| 183121 | SCMC | Active | 2018-04-10 | 2024-09-26 | 20.3820 | ||||||
| 183122 | SCMC | Active | 2018-04-10 | 2024-09-26 | 20.3839 | ||||||
| 183133 | SCMC | Active | 2018-04-10 | 2024-02-08 | 20.3891 | ||||||
| 183134 | SCMC | Active | 2018-04-10 | 2024-02-08 | 20.3910 | ||||||
| 183135 | BCMC | Active | 2018-04-10 | 2024-08-04 | 2.9022 | ||||||
| 183942 | SCMC | Active | 2018-04-10 | 2024-09-13 | 20.3855 | ||||||
| 185056 | SCMC | Active | 2018-04-10 | 2024-08-03 | 20.3838 | ||||||
| 185075 | SCMC | Active | 2018-04-10 | 2024-08-03 | 20.3693 | ||||||
| 189773 | SCMC | Active | 2018-04-10 | 2024-08-03 | 20.3864 | ||||||
| 189774 | SCMC | Active | 2018-04-10 | 2024-08-03 | 20.3871 | ||||||
| 190450 | SCMC | Active | 2018-04-10 | 2024-08-03 | 20.3748 | ||||||
| 190451 | SCMC | Active | 2018-04-10 | 2024-08-03 | 20.3748 | ||||||
| 190510 | SCMC | Active | 2018-04-10 | 2024-08-03 | 20.3853 | ||||||
| 190529 | SCMC | Active | 2018-04-10 | 2024-08-03 | 20.3839 | ||||||
| 190530 | SCMC | Active | 2018-04-10 | 2024-08-03 | 20.3839 | ||||||
| 194179 | SCMC | Active | 2018-04-10 | 2024-09-13 | 20.3820 | ||||||
| 194753 | SCMC | Active | 2018-04-10 | 2026-08-03 | 20.3786 | ||||||
| 194754 | SCMC | Active | 2018-04-10 | 2024-08-03 | 20.3822 | ||||||
| 194758 | SCMC | Active | 2018-04-10 | 2024-08-03 | 20.3696 | ||||||
| 194796 | SCMC | Active | 2018-04-10 | 2024-08-03 | 20.3679 | ||||||
| 194797 | SCMC | Active | 2018-04-10 | 2024-08-03 | 20.3679 | ||||||
| 194798 | SCMC | Active | 2018-04-10 | 2024-08-03 | 20.3697 | ||||||
| 194799 | SCMC | Active | 2018-04-10 | 2024-08-03 | 20.3715 | ||||||
| 194846 | SCMC | Active | 2018-04-10 | 2024-09-13 | 20.3838 | ||||||
| 195647 | SCMC | Active | 2018-04-10 | 2024-08-03 | 20.3943 | ||||||
| 195648 | SCMC | Active | 2018-04-10 | 2024-08-03 | 20.3961 | ||||||
| 196042 | SCMC | Active | 2018-04-10 | 2026-08-03 | 20.3804 | ||||||
| 196043 | SCMC | Active | 2018-04-10 | 2024-08-03 | 20.3840 |
Page 225
| Kinross Gold Corporation Great Bear Gold Project Ontario, Canada NI 43-101 Technical Report |
Tenure Number | Title Type | Tenure Status | Issue Date | Anniversary Date | Area (ha) | ||||||
| 196617 | SCMC | Active | 2018-04-10 | 2024-09-08 | 20.3911 | ||||||
| 196618 | SCMC | Active | 2018-04-10 | 2024-08-03 | 20.3693 | ||||||
| 196755 | SCMC | Active | 2018-04-10 | 2024-08-03 | 20.3749 | ||||||
| 196768 | BCMC | Active | 2018-04-10 | 2025-08-03 | 0.7950 | ||||||
| 196769 | SCMC | Active | 2018-04-10 | 2024-08-03 | 20.3662 | ||||||
| 203213 | SCMC | Active | 2018-04-10 | 2024-08-03 | 20.3748 | ||||||
| 203214 | SCMC | Active | 2018-04-10 | 2024-08-03 | 20.3767 | ||||||
| 203461 | SCMC | Active | 2018-04-10 | 2024-02-05 | 20.3819 | ||||||
| 204777 | BCMC | Active | 2018-04-10 | 2025-08-03 | 18.8916 | ||||||
| 206957 | SCMC | Active | 2018-04-10 | 2024-08-03 | 20.3871 | ||||||
| 208273 | SCMC | Active | 2018-04-10 | 2024-02-08 | 20.3909 | ||||||
| 208274 | BCMC | Active | 2018-04-10 | 2025-02-08 | 2.1127 | ||||||
| 208970 | SCMC | Active | 2018-04-10 | 2024-08-03 | 20.3730 | ||||||
| 209018 | SCMC | Active | 2018-04-10 | 2024-08-03 | 20.3871 | ||||||
| 209033 | SCMC | Active | 2018-04-10 | 2024-08-03 | 20.3857 | ||||||
| 210200 | BCMC | Active | 2018-04-10 | 2024-09-08 | 15.0122 | ||||||
| 210640 | BCMC | Active | 2018-04-10 | 2025-08-03 | 1.0084 | ||||||
| 211240 | SCMC | Active | 2018-04-10 | 2024-08-03 | 20.3749 | ||||||
| 211435 | BCMC | Active | 2018-04-10 | 2024-09-08 | 0.4142 | ||||||
| 211438 | SCMC | Active | 2018-04-10 | 2024-08-03 | 20.3820 | ||||||
| 211554 | SCMC | Active | 2018-04-10 | 2024-01-05 | 20.3836 | ||||||
| 212738 | SCMC | Active | 2018-04-10 | 2024-08-03 | 20.3784 | ||||||
| 213301 | SCMC | Active | 2018-04-10 | 2024-08-03 | 20.3673 | ||||||
| 213302 | SCMC | Active | 2018-04-10 | 2024-08-03 | 20.3732 | ||||||
| 213342 | SCMC | Active | 2018-04-10 | 2024-08-03 | 20.3734 | ||||||
| 213343 | SCMC | Active | 2018-04-10 | 2024-08-03 | 20.3734 | ||||||
| 214064 | SCMC | Active | 2018-04-10 | 2024-08-03 | 20.3733 | ||||||
| 214086 | SCMC | Active | 2018-04-10 | 2024-08-03 | 20.3804 | ||||||
| 214206 | SCMC | Active | 2018-04-10 | 2024-06-06 | 20.3783 | ||||||
| 214243 | SCMC | Active | 2018-04-10 | 2024-08-03 | 20.3942 | ||||||
| 214244 | SCMC | Active | 2018-04-10 | 2024-08-03 | 20.3961 | ||||||
| 214245 | SCMC | Active | 2018-04-10 | 2024-08-03 | 20.3961 | ||||||
| 214884 | SCMC | Active | 2018-04-10 | 2024-02-05 | 20.3783 | ||||||
| 214885 | SCMC | Active | 2018-04-10 | 2024-02-05 | 20.3801 | ||||||
| 214970 | SCMC | Active | 2018-04-10 | 2024-06-06 | 20.3801 |
Page 226
| Kinross Gold Corporation Great Bear Gold Project Ontario, Canada NI 43-101 Technical Report |
Tenure Number | Title Type | Tenure Status | Issue Date | Anniversary Date | Area (ha) | ||||||
| 215002 | SCMC | Active | 2018-04-10 | 2024-08-03 | 20.3973 | ||||||
| 215076 | SCMC | Active | 2018-04-10 | 2024-08-03 | 20.3961 | ||||||
| 215583 | SCMC | Active | 2018-04-10 | 2024-08-03 | 20.3734 | ||||||
| 215600 | SCMC | Active | 2018-04-10 | 2024-08-03 | 20.3911 | ||||||
| 215604 | SCMC | Active | 2018-04-10 | 2024-08-03 | 20.3840 | ||||||
| 215698 | SCMC | Active | 2018-04-10 | 2024-09-13 | 20.3837 | ||||||
| 216179 | SCMC | Active | 2018-04-10 | 2024-08-03 | 20.3751 | ||||||
| 216182 | SCMC | Active | 2018-04-10 | 2024-08-03 | 20.3694 | ||||||
| 216871 | SCMC | Active | 2018-04-10 | 2026-08-03 | 20.3731 | ||||||
| 216872 | SCMC | Active | 2018-04-10 | 2026-08-03 | 20.3732 | ||||||
| 216889 | BCMC | Active | 2018-04-10 | 2025-08-03 | 19.0623 | ||||||
| 219093 | SCMC | Active | 2018-04-10 | 2024-08-03 | 20.3854 | ||||||
| 219094 | SCMC | Active | 2018-04-10 | 2024-08-04 | 20.3890 | ||||||
| 219753 | SCMC | Active | 2018-04-10 | 2024-08-04 | 20.3873 | ||||||
| 219754 | SCMC | Active | 2018-04-10 | 2024-08-04 | 20.3873 | ||||||
| 219755 | SCMC | Active | 2018-04-10 | 2024-08-04 | 20.3873 | ||||||
| 219756 | SCMC | Active | 2018-04-10 | 2024-08-04 | 20.3891 | ||||||
| 220084 | SCMC | Active | 2018-04-10 | 2024-01-05 | 20.3873 | ||||||
| 220387 | SCMC | Active | 2018-04-10 | 2024-08-03 | 20.3748 | ||||||
| 220491 | SCMC | Active | 2018-04-10 | 2024-08-03 | 20.3854 | ||||||
| 220492 | SCMC | Active | 2018-04-10 | 2026-08-03 | 20.3889 | ||||||
| 220493 | SCMC | Active | 2018-04-10 | 2024-08-03 | 20.3890 | ||||||
| 223477 | SCMC | Active | 2018-04-10 | 2024-09-13 | 20.3783 | ||||||
| 224337 | SCMC | Active | 2018-04-10 | 2024-09-13 | 20.3837 | ||||||
| 225358 | SCMC | Active | 2018-04-10 | 2024-08-03 | 20.3678 | ||||||
| 225359 | SCMC | Active | 2018-04-10 | 2024-08-03 | 20.3696 | ||||||
| 225399 | SCMC | Active | 2018-04-10 | 2024-08-03 | 20.3636 | ||||||
| 225400 | SCMC | Active | 2018-04-10 | 2024-08-03 | 20.3697 | ||||||
| 226147 | SCMC | Active | 2018-04-10 | 2024-06-29 | 20.3856 | ||||||
| 227046 | SCMC | Active | 2018-04-10 | 2024-08-03 | 20.3890 | ||||||
| 227047 | BCMC | Active | 2018-04-10 | 2025-08-03 | 12.8692 | ||||||
| 227692 | SCMC | Active | 2018-04-10 | 2024-08-04 | 20.3909 | ||||||
| 227758 | SCMC | Active | 2018-04-10 | 2024-08-03 | 20.3705 | ||||||
| 228366 | SCMC | Active | 2018-04-10 | 2024-08-03 | 20.3710 | ||||||
| 228367 | SCMC | Active | 2018-04-10 | 2024-08-03 | 20.3766 |
Page 227
| Kinross Gold Corporation Great Bear Gold Project Ontario, Canada NI 43-101 Technical Report |
Tenure Number | Title Type | Tenure Status | Issue Date | Anniversary Date | Area (ha) | ||||||
| 228368 | SCMC | Active | 2018-04-10 | 2024-08-03 | 20.3766 | ||||||
| 228423 | SCMC | Active | 2018-04-10 | 2024-08-03 | 20.3853 | ||||||
| 230251 | BCMC | Active | 2018-04-10 | 2024-09-08 | 15.8928 | ||||||
| 230256 | SCMC | Active | 2018-04-10 | 2024-08-03 | 20.3820 | ||||||
| 230862 | SCMC | Active | 2018-04-10 | 2024-01-05 | 20.3837 | ||||||
| 230995 | SCMC | Active | 2018-04-10 | 2024-07-31 | 20.3856 | ||||||
| 231498 | SCMC | Active | 2018-04-10 | 2024-08-03 | 20.3696 | ||||||
| 231499 | SCMC | Active | 2018-04-10 | 2024-08-03 | 20.3714 | ||||||
| 232022 | SCMC | Active | 2018-04-10 | 2024-08-03 | 20.3679 | ||||||
| 232023 | SCMC | Active | 2018-04-10 | 2024-08-03 | 20.3715 | ||||||
| 232026 | SCMC | Active | 2018-04-10 | 2024-08-03 | 20.3716 | ||||||
| 232027 | SCMC | Active | 2018-04-10 | 2026-08-03 | 20.3750 | ||||||
| 232749 | SCMC | Active | 2018-04-10 | 2024-08-03 | 20.3680 | ||||||
| 232822 | SCMC | Active | 2018-04-10 | 2024-08-03 | 20.3713 | ||||||
| 233502 | SCMC | Active | 2018-04-10 | 2024-08-03 | 20.3749 | ||||||
| 233503 | SCMC | Active | 2018-04-10 | 2024-08-03 | 20.3768 | ||||||
| 233525 | SCMC | Active | 2018-04-10 | 2024-08-03 | 20.3680 | ||||||
| 237571 | SCMC | Active | 2018-04-10 | 2024-06-21 | 20.3856 | ||||||
| 240469 | SCMC | Active | 2018-04-10 | 2026-08-03 | 20.3962 | ||||||
| 240559 | SCMC | Active | 2018-04-10 | 2026-08-03 | 20.3731 | ||||||
| 243808 | SCMC | Active | 2018-04-10 | 2024-08-03 | 20.3712 | ||||||
| 249285 | SCMC | Active | 2018-04-10 | 2024-08-03 | 20.3716 | ||||||
| 249300 | SCMC | Active | 2018-04-10 | 2024-08-03 | 20.3840 | ||||||
| 249354 | SCMC | Active | 2018-04-10 | 2024-08-03 | 20.3769 | ||||||
| 250047 | SCMC | Active | 2018-04-10 | 2024-08-03 | 20.3732 | ||||||
| 250588 | SCMC | Active | 2018-04-10 | 2024-08-03 | 20.3641 | ||||||
| 250589 | SCMC | Active | 2018-04-10 | 2024-08-03 | 20.3642 | ||||||
| 251392 | SCMC | Active | 2018-04-10 | 2024-08-03 | 20.3662 | ||||||
| 251828 | SCMC | Active | 2018-04-10 | 2024-08-03 | 20.3693 | ||||||
| 257281 | SCMC | Active | 2018-04-10 | 2024-08-03 | 20.3962 | ||||||
| 257282 | BCMC | Active | 2018-04-10 | 2025-08-03 | 3.1801 | ||||||
| 257283 | SCMC | Active | 2018-04-10 | 2024-08-03 | 20.3980 | ||||||
| 257656 | SCMC | Active | 2018-04-10 | 2024-08-03 | 20.3821 | ||||||
| 257657 | SCMC | Active | 2018-04-10 | 2024-08-03 | 20.3857 | ||||||
| 257658 | SCMC | Active | 2018-04-10 | 2024-08-03 | 20.3857 |
Page 228
| Kinross Gold Corporation Great Bear Gold Project Ontario, Canada NI 43-101 Technical Report |
Tenure Number | Title Type | Tenure Status | Issue Date | Anniversary Date | Area (ha) | ||||||
| 258749 | SCMC | Active | 2018-04-10 | 2026-08-03 | 20.3730 | ||||||
| 259546 | SCMC | Active | 2018-04-10 | 2024-02-05 | 20.3819 | ||||||
| 260267 | BCMC | Active | 2018-04-10 | 2024-09-08 | 2.7368 | ||||||
| 260775 | SCMC | Active | 2018-04-10 | 2024-08-03 | 20.3714 | ||||||
| 260810 | SCMC | Active | 2018-04-10 | 2024-09-13 | 20.3802 | ||||||
| 260900 | SCMC | Active | 2018-04-10 | 2024-06-21 | 20.3838 | ||||||
| 261312 | SCMC | Active | 2018-04-10 | 2024-08-03 | 20.3641 | ||||||
| 261313 | SCMC | Active | 2018-04-10 | 2024-08-03 | 20.3661 | ||||||
| 261501 | SCMC | Active | 2018-04-10 | 2024-09-13 | 20.3820 | ||||||
| 262023 | SCMC | Active | 2018-04-10 | 2024-08-03 | 20.3662 | ||||||
| 262024 | SCMC | Active | 2018-04-10 | 2024-08-03 | 20.3680 | ||||||
| 262043 | SCMC | Active | 2018-04-10 | 2024-08-03 | 20.3893 | ||||||
| 262104 | SCMC | Active | 2018-04-10 | 2024-08-03 | 20.3768 | ||||||
| 262155 | SCMC | Active | 2018-04-10 | 2024-09-13 | 20.3819 | ||||||
| 262202 | SCMC | Active | 2018-04-10 | 2024-08-03 | 20.3906 | ||||||
| 262203 | SCMC | Active | 2018-04-10 | 2024-08-03 | 20.3925 | ||||||
| 262204 | SCMC | Active | 2018-04-10 | 2024-08-03 | 20.3943 | ||||||
| 262782 | SCMC | Active | 2018-04-10 | 2026-08-03 | 20.3731 | ||||||
| 262797 | SCMC | Active | 2018-04-10 | 2024-08-03 | 20.3661 | ||||||
| 262798 | SCMC | Active | 2018-04-10 | 2024-08-03 | 20.3681 | ||||||
| 262800 | SCMC | Active | 2018-04-10 | 2024-08-03 | 20.3751 | ||||||
| 262808 | SCMC | Active | 2018-04-10 | 2024-08-03 | 20.3943 | ||||||
| 262856 | SCMC | Active | 2018-04-10 | 2024-02-05 | 20.3801 | ||||||
| 263838 | SCMC | Active | 2018-04-10 | 2024-08-03 | 20.3713 | ||||||
| 263839 | SCMC | Active | 2018-04-10 | 2024-08-03 | 20.3713 | ||||||
| 266221 | SCMC | Active | 2018-04-10 | 2024-09-08 | 20.3892 | ||||||
| 266297 | SCMC | Active | 2018-04-10 | 2024-08-03 | 20.3872 | ||||||
| 266890 | SCMC | Active | 2018-04-10 | 2024-08-03 | 20.3851 | ||||||
| 266891 | SCMC | Active | 2018-04-10 | 2024-08-03 | 20.3888 | ||||||
| 266892 | SCMC | Active | 2018-04-10 | 2024-08-03 | 20.3889 | ||||||
| 267609 | SCMC | Active | 2018-04-10 | 2024-08-03 | 20.3730 | ||||||
| 268724 | SCMC | Active | 2018-04-10 | 2024-08-03 | 20.3804 | ||||||
| 268725 | SCMC | Active | 2018-04-10 | 2024-08-03 | 20.3714 | ||||||
| 268759 | SCMC | Active | 2018-04-10 | 2024-08-03 | 20.3679 | ||||||
| 268761 | SCMC | Active | 2018-04-10 | 2024-08-03 | 20.3698 |
Page 229
| Kinross Gold Corporation Great Bear Gold Project Ontario, Canada NI 43-101 Technical Report |
Tenure Number | Title Type | Tenure Status | Issue Date | Anniversary Date | Area (ha) | ||||||
| 268762 | SCMC | Active | 2018-04-10 | 2024-08-03 | 20.3699 | ||||||
| 269493 | SCMC | Active | 2018-04-10 | 2024-08-03 | 20.3893 | ||||||
| 269495 | SCMC | Active | 2018-04-10 | 2024-08-03 | 20.3857 | ||||||
| 269657 | SCMC | Active | 2018-04-10 | 2024-08-03 | 20.3906 | ||||||
| 270090 | SCMC | Active | 2018-04-10 | 2024-08-03 | 20.3768 | ||||||
| 270256 | SCMC | Active | 2018-04-10 | 2024-08-03 | 20.3925 | ||||||
| 270257 | SCMC | Active | 2018-04-10 | 2024-08-03 | 20.3925 | ||||||
| 270274 | BCMC | Active | 2018-04-10 | 2024-09-13 | 2.2056 | ||||||
| 270305 | SCMC | Active | 2018-04-10 | 2024-02-05 | 20.3782 | ||||||
| 270578 | SCMC | Active | 2018-04-10 | 2024-09-08 | 20.3911 | ||||||
| 270786 | SCMC | Active | 2018-04-10 | 2024-08-03 | 20.3733 | ||||||
| 273668 | SCMC | Active | 2018-04-10 | 2024-09-26 | 20.3820 | ||||||
| 273682 | SCMC | Active | 2018-04-10 | 2024-09-08 | 20.3892 | ||||||
| 274264 | SCMC | Active | 2018-04-10 | 2024-08-03 | 20.3854 | ||||||
| 274386 | SCMC | Active | 2018-04-10 | 2024-08-03 | 20.3851 | ||||||
| 274387 | SCMC | Active | 2018-04-10 | 2024-08-03 | 20.3883 | ||||||
| 274915 | SCMC | Active | 2018-04-10 | 2024-08-04 | 20.3873 | ||||||
| 274981 | SCMC | Active | 2018-04-10 | 2024-08-03 | 20.3710 | ||||||
| 275583 | SCMC | Active | 2018-04-10 | 2024-08-03 | 20.3766 | ||||||
| 275648 | SCMC | Active | 2018-04-10 | 2024-08-03 | 20.3889 | ||||||
| 275662 | SCMC | Active | 2018-04-10 | 2024-08-03 | 20.3821 | ||||||
| 276608 | SCMC | Active | 2018-04-10 | 2024-08-03 | 20.3944 | ||||||
| 276609 | SCMC | Active | 2018-04-10 | 2024-08-03 | 20.3980 | ||||||
| 278973 | BCMC | Active | 2018-04-10 | 2024-09-08 | 3.7772 | ||||||
| 282263 | SCMC | Active | 2018-04-10 | 2024-08-03 | 20.3925 | ||||||
| 282264 | SCMC | Active | 2018-04-10 | 2024-08-03 | 20.3961 | ||||||
| 282351 | SCMC | Active | 2018-04-10 | 2024-08-03 | 20.3943 | ||||||
| 282352 | SCMC | Active | 2018-04-10 | 2024-08-03 | 20.3979 | ||||||
| 285771 | BCMC | Active | 2018-04-10 | 2025-02-08 | 2.1528 | ||||||
| 287654 | SCMC | Active | 2018-04-10 | 2024-08-03 | 20.3748 | ||||||
| 287704 | SCMC | Active | 2018-04-10 | 2024-08-03 | 20.3853 | ||||||
| 289641 | SCMC | Active | 2018-04-10 | 2024-08-03 | 20.3924 | ||||||
| 289642 | SCMC | Active | 2018-04-10 | 2024-08-03 | 20.3925 | ||||||
| 289643 | SCMC | Active | 2018-04-10 | 2024-08-03 | 20.3979 | ||||||
| 289644 | SCMC | Active | 2018-04-10 | 2024-08-03 | 20.3979 |
Page 230
| Kinross Gold Corporation Great Bear Gold Project Ontario, Canada NI 43-101 Technical Report |
Tenure Number | Title Type | Tenure Status | Issue Date | Anniversary Date | Area (ha) | ||||||
| 289645 | SCMC | Active | 2018-04-10 | 2024-08-03 | 20.3979 | ||||||
| 293160 | SCMC | Active | 2018-04-10 | 2024-08-04 | 20.3872 | ||||||
| 293161 | BCMC | Active | 2018-04-10 | 2024-08-03 | 11.2639 | ||||||
| 293784 | SCMC | Active | 2018-04-10 | 2024-08-03 | 20.3870 | ||||||
| 293812 | SCMC | Active | 2018-04-10 | 2024-08-04 | 20.3909 | ||||||
| 293813 | BCMC | Active | 2018-04-10 | 2024-08-04 | 3.5823 | ||||||
| 295044 | SCMC | Active | 2018-04-10 | 2024-08-03 | 20.3784 | ||||||
| 295045 | SCMC | Active | 2018-04-10 | 2024-08-03 | 20.3839 | ||||||
| 295081 | SCMC | Active | 2018-04-10 | 2026-08-03 | 20.3853 | ||||||
| 295082 | SCMC | Active | 2018-04-10 | 2024-08-03 | 20.3908 | ||||||
| 295570 | SCMC | Active | 2018-04-10 | 2024-09-08 | 20.3910 | ||||||
| 296298 | BCMC | Active | 2018-04-10 | 2024-09-08 | 1.3014 | ||||||
| 299899 | SCMC | Active | 2018-04-10 | 2026-08-03 | 20.3768 | ||||||
| 299901 | SCMC | Active | 2018-04-10 | 2024-08-03 | 20.3714 | ||||||
| 300610 | BCMC | Active | 2018-04-10 | 2025-08-03 | 18.7210 | ||||||
| 303859 | SCMC | Active | 2018-04-10 | 2024-01-05 | 20.3874 | ||||||
| 308584 | SCMC | Active | 2018-04-10 | 2024-08-03 | 20.3784 | ||||||
| 309145 | SCMC | Active | 2018-04-10 | 2026-08-03 | 20.3822 | ||||||
| 309190 | SCMC | Active | 2018-04-10 | 2024-08-03 | 20.3716 | ||||||
| 309191 | SCMC | Active | 2018-04-10 | 2024-08-03 | 20.3734 | ||||||
| 309192 | SCMC | Active | 2018-04-10 | 2024-08-03 | 20.3752 | ||||||
| 309916 | SCMC | Active | 2018-04-10 | 2024-08-03 | 20.3662 | ||||||
| 309927 | SCMC | Active | 2018-04-10 | 2024-08-03 | 20.3876 | ||||||
| 312652 | SCMC | Active | 2018-04-10 | 2024-09-13 | 20.3819 | ||||||
| 312653 | SCMC | Active | 2018-04-10 | 2024-08-04 | 20.3855 | ||||||
| 312786 | SCMC | Active | 2018-04-10 | 2024-06-21 | 20.3874 | ||||||
| 313814 | SCMC | Active | 2018-04-10 | 2024-08-03 | 20.3767 | ||||||
| 315879 | SCMC | Active | 2018-04-10 | 2024-08-03 | 20.3658 | ||||||
| 315880 | SCMC | Active | 2018-04-10 | 2024-08-03 | 20.3678 | ||||||
| 315881 | SCMC | Active | 2018-04-10 | 2024-08-03 | 20.3732 | ||||||
| 315914 | SCMC | Active | 2018-04-10 | 2024-08-03 | 20.3641 | ||||||
| 315917 | SCMC | Active | 2018-04-10 | 2024-08-03 | 20.3752 | ||||||
| 315919 | SCMC | Active | 2018-04-10 | 2024-08-03 | 20.3750 | ||||||
| 316626 | BCMC | Active | 2018-04-10 | 2025-08-03 | 19.2346 | ||||||
| 316627 | SCMC | Active | 2018-04-10 | 2024-08-03 | 20.3751 |
Page 231
| Kinross Gold Corporation Great Bear Gold Project Ontario, Canada NI 43-101 Technical Report |
Tenure Number | Title Type | Tenure Status | Issue Date | Anniversary Date | Area (ha) | ||||||
| 316642 | SCMC | Active | 2018-04-10 | 2024-08-03 | 20.3875 | ||||||
| 316644 | SCMC | Active | 2018-04-10 | 2024-08-03 | 20.3803 | ||||||
| 316645 | SCMC | Active | 2018-04-10 | 2024-08-03 | 20.3821 | ||||||
| 317831 | SCMC | Active | 2018-04-10 | 2024-08-03 | 20.3688 | ||||||
| 317874 | SCMC | Active | 2018-04-10 | 2024-08-03 | 20.3767 | ||||||
| 317890 | SCMC | Active | 2018-04-10 | 2024-08-03 | 20.3751 | ||||||
| 321860 | SCMC | Active | 2018-04-10 | 2024-06-21 | 20.3874 | ||||||
| 322398 | SCMC | Active | 2018-04-10 | 2024-08-04 | 20.3854 | ||||||
| 322399 | SCMC | Active | 2018-04-10 | 2024-08-03 | 20.3872 | ||||||
| 323006 | SCMC | Active | 2018-04-10 | 2024-08-03 | 20.3889 | ||||||
| 323026 | BCMC | Active | 2018-04-10 | 2024-08-04 | 4.2910 | ||||||
| 323736 | SCMC | Active | 2018-04-10 | 2024-08-03 | 20.3857 | ||||||
| 325968 | SCMC | Active | 2018-04-10 | 2026-08-03 | 20.3943 | ||||||
| 326071 | SCMC | Active | 2018-04-10 | 2024-08-03 | 20.3767 | ||||||
| 326180 | SCMC | Active | 2018-04-10 | 2024-08-04 | 20.3855 | ||||||
| 326181 | SCMC | Active | 2018-04-10 | 2024-09-13 | 20.3855 | ||||||
| 326847 | SCMC | Active | 2018-04-10 | 2024-09-08 | 20.3911 | ||||||
| 328159 | BCMC | Active | 2018-04-10 | 2024-09-08 | 5.5901 | ||||||
| 328677 | SCMC | Active | 2018-04-10 | 2024-08-03 | 20.3697 | ||||||
| 328793 | SCMC | Active | 2018-04-10 | 2024-09-13 | 20.3783 | ||||||
| 330514 | SCMC | Active | 2018-04-10 | 2024-08-03 | 20.3875 | ||||||
| 330705 | SCMC | Active | 2018-04-10 | 2024-08-03 | 20.3768 | ||||||
| 330731 | SCMC | Active | 2018-04-10 | 2024-08-03 | 20.3733 | ||||||
| 331593 | SCMC | Active | 2018-04-10 | 2026-08-03 | 20.3731 | ||||||
| 331594 | SCMC | Active | 2018-04-10 | 2026-08-03 | 20.3731 | ||||||
| 331769 | SCMC | Active | 2018-04-10 | 2024-09-13 | 20.3801 | ||||||
| 332096 | SCMC | Active | 2018-04-10 | 2024-08-03 | 20.3802 | ||||||
| 332151 | SCMC | Active | 2018-04-10 | 2024-08-03 | 20.3786 | ||||||
| 332154 | SCMC | Active | 2018-04-10 | 2026-08-03 | 20.3732 | ||||||
| 332188 | SCMC | Active | 2018-04-10 | 2024-08-03 | 20.3715 | ||||||
| 332190 | SCMC | Active | 2018-04-10 | 2024-08-03 | 20.3698 | ||||||
| 332450 | SCMC | Active | 2018-04-10 | 2024-08-03 | 20.3911 | ||||||
| 332451 | BCMC | Active | 2018-04-10 | 2025-08-03 | 6.6487 | ||||||
| 332843 | SCMC | Active | 2018-04-10 | 2024-08-03 | 20.3750 | ||||||
| 335323 | BCMC | Active | 2018-04-10 | 2024-08-04 | 4.9998 |
Page 232
| Kinross Gold Corporation Great Bear Gold Project Ontario, Canada NI 43-101 Technical Report |
Tenure Number | Title Type | Tenure Status | Issue Date | Anniversary Date | Area (ha) | ||||||
| 336083 | SCMC | Active | 2018-04-10 | 2024-08-03 | 20.3785 | ||||||
| 336084 | SCMC | Active | 2018-04-10 | 2024-08-03 | 20.3803 | ||||||
| 336085 | SCMC | Active | 2018-04-10 | 2024-08-03 | 20.3803 | ||||||
| 336086 | SCMC | Active | 2018-04-10 | 2024-08-03 | 20.3803 | ||||||
| 336134 | SCMC | Active | 2018-04-10 | 2026-08-03 | 20.3907 | ||||||
| 341289 | SCMC | Active | 2018-04-10 | 2024-08-03 | 20.3979 | ||||||
| 341326 | SCMC | Active | 2018-04-10 | 2024-06-29 | 20.3838 | ||||||
| 342166 | SCMC | Active | 2018-04-10 | 2024-09-08 | 20.3892 | ||||||
| 345290 | SCMC | Active | 2018-04-10 | 2024-08-03 | 20.3890 | ||||||
| 345391 | SCMC | Active | 2018-04-10 | 2024-08-03 | 20.3851 | ||||||
| 345392 | SCMC | Active | 2018-04-10 | 2024-08-03 | 20.3889 | ||||||
| 521875 | SCMC | Active | 2018-05-22 | 2025-05-22 | 20.3765 | ||||||
| 521876 | SCMC | Active | 2018-05-22 | 2025-05-22 | 20.3745 | ||||||
| 521877 | SCMC | Active | 2018-05-22 | 2025-05-22 | 20.3759 | ||||||
| 521878 | SCMC | Active | 2018-05-22 | 2025-05-22 | 20.3740 | ||||||
| 521879 | SCMC | Active | 2018-05-22 | 2025-05-22 | 20.3745 | ||||||
| 521880 | SCMC | Active | 2018-05-22 | 2025-05-22 | 20.3746 | ||||||
| 521881 | SCMC | Active | 2018-05-22 | 2025-05-22 | 20.3765 | ||||||
| 521882 | SCMC | Active | 2018-05-22 | 2025-05-22 | 20.3746 | ||||||
| 521883 | SCMC | Active | 2018-05-22 | 2025-05-22 | 20.3765 | ||||||
| 521884 | SCMC | Active | 2018-05-22 | 2025-05-22 | 20.3764 | ||||||
| 521885 | SCMC | Active | 2018-05-22 | 2025-05-22 | 20.3765 | ||||||
| 521886 | SCMC | Active | 2018-05-22 | 2025-05-22 | 20.3765 | ||||||
| 521887 | SCMC | Active | 2018-05-22 | 2025-05-22 | 20.3746 | ||||||
| 521888 | SCMC | Active | 2018-05-22 | 2025-05-22 | 20.3745 | ||||||
| 521889 | SCMC | Active | 2018-05-22 | 2025-05-22 | 20.3745 | ||||||
| 521890 | SCMC | Active | 2018-05-22 | 2025-05-22 | 20.3766 | ||||||
| 521891 | SCMC | Active | 2018-05-22 | 2025-05-22 | 20.3765 | ||||||
| 521892 | SCMC | Active | 2018-05-22 | 2025-05-22 | 20.3746 | ||||||
| 521893 | SCMC | Active | 2018-05-22 | 2025-05-22 | 20.3782 | ||||||
| 521894 | SCMC | Active | 2018-05-22 | 2025-05-22 | 20.3800 | ||||||
| 521895 | SCMC | Active | 2018-05-22 | 2025-05-22 | 20.3836 | ||||||
| 521896 | SCMC | Active | 2018-05-22 | 2025-05-22 | 20.3795 | ||||||
| 521897 | SCMC | Active | 2018-05-22 | 2025-05-22 | 20.3818 | ||||||
| 521898 | SCMC | Active | 2018-05-22 | 2025-05-22 | 20.3818 |
Page 233
| Kinross Gold Corporation Great Bear Gold Project Ontario, Canada NI 43-101 Technical Report |
Tenure Number | Title Type | Tenure Status | Issue Date | Anniversary Date | Area (ha) | ||||||
| 521899 | SCMC | Active | 2018-05-22 | 2025-05-22 | 20.3777 | ||||||
| 521900 | SCMC | Active | 2018-05-22 | 2025-05-22 | 20.3836 | ||||||
| 521901 | SCMC | Active | 2018-05-22 | 2025-05-22 | 20.3835 | ||||||
| 521902 | SCMC | Active | 2018-05-22 | 2025-05-22 | 20.3836 | ||||||
| 521903 | SCMC | Active | 2018-05-22 | 2025-05-22 | 20.3835 | ||||||
| 521904 | SCMC | Active | 2018-05-22 | 2025-05-22 | 20.3811 | ||||||
| 521905 | SCMC | Active | 2018-05-22 | 2025-05-22 | 20.3816 | ||||||
| 521906 | SCMC | Active | 2018-05-22 | 2025-05-22 | 20.3816 | ||||||
| 521907 | SCMC | Active | 2018-05-22 | 2025-05-22 | 20.3835 | ||||||
| 521908 | SCMC | Active | 2018-05-22 | 2025-05-22 | 20.3817 | ||||||
| 521909 | SCMC | Active | 2018-05-22 | 2025-05-22 | 20.3816 | ||||||
| 521910 | SCMC | Active | 2018-05-22 | 2025-05-22 | 20.3816 | ||||||
| 521911 | SCMC | Active | 2018-05-22 | 2025-05-22 | 20.3835 | ||||||
| 521912 | SCMC | Active | 2018-05-22 | 2025-05-22 | 20.3816 | ||||||
| 521913 | SCMC | Active | 2018-05-22 | 2025-05-22 | 20.3836 | ||||||
| 521914 | SCMC | Active | 2018-05-22 | 2025-05-22 | 20.3835 | ||||||
| 521915 | SCMC | Active | 2018-05-22 | 2025-05-22 | 20.3828 | ||||||
| Totals | 471 claims | 9,139.9622 | |||||||||
Page 234