UNITED STATES
SECURITIES AND EXCHANGE COMMISSION
Washington, D.C. 20549
FORM N-CSR
CERTIFIED SHAREHOLDER REPORT OF REGISTERED
MANAGEMENT INVESTMENT COMPANIES
Investment Company Act file number 811-3587
Fidelity Financial Trust
(Exact name of registrant as specified in charter)
245 Summer St., Boston, MA 02210
(Address of principal executive offices) (Zip code)
William C. Coffey, Secretary
245 Summer St.
Boston, Massachusetts 02210
(Name and address of agent for service)
Registrant's telephone number, including area code:
617-563-7000
Date of fiscal year end: | November 30 |
Date of reporting period: | May 31, 2019 |
Item 1.
Reports to Stockholders
Fidelity® Independence Fund Semi-Annual Report May 31, 2019 |
 |
Beginning on January 1, 2021, as permitted by regulations adopted by the Securities and Exchange Commission, paper copies of a fund’s shareholder reports will no longer be sent by mail, unless you specifically request paper copies of the reports from the fund or from your financial intermediary, such as a financial advisor, broker-dealer or bank. Instead, the reports will be made available on a website, and you will be notified by mail each time a report is posted and provided with a website link to access the report.
If you already elected to receive shareholder reports electronically, you will not be affected by this change and you need not take any action. You may elect to receive shareholder reports and other communications from a fund electronically, by contacting your financial intermediary. For Fidelity customers, visit Fidelity's web site or call Fidelity using the contact information listed below.
You may elect to receive all future reports in paper free of charge. If you wish to continue receiving paper copies of your shareholder reports, you may contact your financial intermediary or, if you are a Fidelity customer, visit Fidelity’s website, or call Fidelity at the applicable toll-free number listed below. Your election to receive reports in paper will apply to all funds held with the fund complex/your financial intermediary.
| Account Type | Website | Phone Number |
| Brokerage, Mutual Fund, or Annuity Contracts: | fidelity.com/mailpreferences | 1-800-343-3548 |
| Employer Provided Retirement Accounts: | netbenefits.fidelity.com/preferences (choose 'no' under Required Disclosures to continue to print) | 1-800-343-0860 |
| Advisor Sold Accounts Serviced Through Your Financial Intermediary: | Contact Your Financial Intermediary | Your Financial Intermediary's phone number |
| Advisor Sold Accounts Serviced by Fidelity: | institutional.fidelity.com | 1-877-208-0098 |
Contents
Board Approval of Investment Advisory Contracts and Management Fees |
To view a fund's proxy voting guidelines and proxy voting record for the 12-month period ended June 30, visit http://www.fidelity.com/proxyvotingresults or visit the Securities and Exchange Commission's (SEC) web site at http://www.sec.gov.
You may also call 1-800-544-8544 if you’re an individual investing directly with Fidelity, call 1-800-835-5092 if you’re a plan sponsor or participant with Fidelity as your recordkeeper or call 1-877-208-0098 on institutional accounts or if you’re an advisor or invest through one to request a free copy of the proxy voting guidelines.
Standard & Poor's, S&P and S&P 500 are registered service marks of The McGraw-Hill Companies, Inc. and have been licensed for use by Fidelity Distributors Corporation.
Other third-party marks appearing herein are the property of their respective owners.
All other marks appearing herein are registered or unregistered trademarks or service marks of FMR LLC or an affiliated company. © 2019 FMR LLC. All rights reserved.
This report and the financial statements contained herein are submitted for the general information of the shareholders of the Fund. This report is not authorized for distribution to prospective investors in the Fund unless preceded or accompanied by an effective prospectus.
A fund files its complete schedule of portfolio holdings with the SEC for the first and third quarters of each fiscal year on Form N-PORT. Forms N-PORT are available on the SEC’s web site at http://www.sec.gov. A fund's Forms N-PORT may be reviewed and copied at the SEC’s Public Reference Room in Washington, DC. Information regarding the operation of the SEC's Public Reference Room may be obtained by calling 1-800-SEC-0330.
For a complete list of a fund's portfolio holdings, view the most recent holdings listing, semiannual report, or annual report on Fidelity's web site at http://www.fidelity.com, http://www.institutional.fidelity.com, or http://www.401k.com, as applicable.
NOT FDIC INSURED •MAY LOSE VALUE •NO BANK GUARANTEE
Neither the Fund nor Fidelity Distributors Corporation is a bank.
Investment Summary (Unaudited)
Top Ten Stocks as of May 31, 2019
| % of fund's net assets | |
| Microsoft Corp. | 6.2 |
| Amazon.com, Inc. | 4.5 |
| Apple, Inc. | 2.9 |
| UnitedHealth Group, Inc. | 2.7 |
| JPMorgan Chase & Co. | 2.6 |
| Alphabet, Inc. Class C | 2.3 |
| Alphabet, Inc. Class A | 2.2 |
| Visa, Inc. Class A | 2.2 |
| Berkshire Hathaway, Inc. Class B | 2.1 |
| American Tower Corp. | 2.1 |
| 29.8 |
Top Five Market Sectors as of May 31, 2019
| % of fund's net assets | |
| Information Technology | 27.6 |
| Financials | 14.6 |
| Consumer Discretionary | 12.2 |
| Industrials | 11.9 |
| Health Care | 11.0 |
Asset Allocation (% of fund's net assets)
| As of May 31, 2019* | ||
| Stocks | 98.0% | |
| Convertible Securities | 0.1% | |
| Short-Term Investments and Net Other Assets (Liabilities) | 1.9% | |

* Foreign investments - 6.5%
Schedule of Investments May 31, 2019 (Unaudited)
Showing Percentage of Net Assets
| Common Stocks - 98.0% | |||
| Shares | Value (000s) | ||
| COMMUNICATION SERVICES - 10.6% | |||
| Entertainment - 2.9% | |||
| Live Nation Entertainment, Inc. (a) | 136,800 | $8,320 | |
| Netflix, Inc. (a) | 141,200 | 48,471 | |
| The Walt Disney Co. | 351,939 | 46,470 | |
| 103,261 | |||
| Interactive Media & Services - 6.3% | |||
| Alphabet, Inc.: | |||
| Class A (a) | 71,500 | 79,115 | |
| Class C (a) | 73,300 | 80,896 | |
| Facebook, Inc. Class A (a) | 360,640 | 64,003 | |
| 224,014 | |||
| Media - 1.4% | |||
| Charter Communications, Inc. Class A (a) | 31,706 | 11,947 | |
| Comcast Corp. Class A | 899,553 | 36,882 | |
| 48,829 | |||
| TOTAL COMMUNICATION SERVICES | 376,104 | ||
| CONSUMER DISCRETIONARY - 12.1% | |||
| Hotels, Restaurants & Leisure - 3.6% | |||
| Domino's Pizza, Inc. | 80,500 | 22,500 | |
| Hilton Worldwide Holdings, Inc. | 257,800 | 23,058 | |
| McDonald's Corp. | 325,600 | 64,557 | |
| Yum! Brands, Inc. | 183,869 | 18,819 | |
| 128,934 | |||
| Internet & Direct Marketing Retail - 4.5% | |||
| Amazon.com, Inc. (a) | 90,400 | 160,466 | |
| Specialty Retail - 2.8% | |||
| The Home Depot, Inc. | 374,500 | 71,099 | |
| TJX Companies, Inc. | 569,600 | 28,645 | |
| 99,744 | |||
| Textiles, Apparel & Luxury Goods - 1.2% | |||
| LVMH Moet Hennessy - Louis Vuitton SA | 26,300 | 9,924 | |
| NIKE, Inc. Class B | 401,400 | 30,964 | |
| 40,888 | |||
| TOTAL CONSUMER DISCRETIONARY | 430,032 | ||
| CONSUMER STAPLES - 2.5% | |||
| Food & Staples Retailing - 0.9% | |||
| Costco Wholesale Corp. | 136,350 | 32,667 | |
| Food Products - 0.2% | |||
| McCormick & Co., Inc. (non-vtg.) | 44,801 | 6,991 | |
| Household Products - 0.1% | |||
| Church & Dwight Co., Inc. | 62,384 | 4,642 | |
| Personal Products - 1.3% | |||
| Estee Lauder Companies, Inc. Class A | 152,800 | 24,605 | |
| Unilever NV (Certificaten Van Aandelen) (Bearer) | 334,700 | 20,147 | |
| 44,752 | |||
| TOTAL CONSUMER STAPLES | 89,052 | ||
| FINANCIALS - 14.6% | |||
| Banks - 6.0% | |||
| Bank of America Corp. | 1,897,200 | 50,466 | |
| Citigroup, Inc. | 399,100 | 24,804 | |
| HDFC Bank Ltd. | 278,000 | 9,704 | |
| JPMorgan Chase & Co. | 846,600 | 89,706 | |
| Wells Fargo & Co. | 815,371 | 36,178 | |
| 210,858 | |||
| Capital Markets - 3.9% | |||
| BlackRock, Inc. Class A | 41,100 | 17,080 | |
| Charles Schwab Corp. | 428,800 | 17,842 | |
| CME Group, Inc. | 78,400 | 15,062 | |
| FactSet Research Systems, Inc. | 22,649 | 6,301 | |
| IntercontinentalExchange, Inc. | 168,600 | 13,861 | |
| Moody's Corp. | 106,200 | 19,422 | |
| MSCI, Inc. | 134,200 | 29,525 | |
| S&P Global, Inc. | 94,100 | 20,126 | |
| 139,219 | |||
| Diversified Financial Services - 2.1% | |||
| Berkshire Hathaway, Inc. Class B (a) | 380,500 | 75,118 | |
| Insurance - 2.6% | |||
| AIA Group Ltd. | 704,200 | 6,615 | |
| Aon PLC | 70,900 | 12,767 | |
| Chubb Ltd. | 210,200 | 30,704 | |
| Marsh & McLennan Companies, Inc. | 239,500 | 22,896 | |
| The Travelers Companies, Inc. | 115,700 | 16,842 | |
| 89,824 | |||
| TOTAL FINANCIALS | 515,019 | ||
| HEALTH CARE - 11.0% | |||
| Biotechnology - 0.9% | |||
| Alexion Pharmaceuticals, Inc. (a) | 141,394 | 16,074 | |
| Amgen, Inc. | 92,014 | 15,339 | |
| 31,413 | |||
| Health Care Equipment & Supplies - 5.2% | |||
| Becton, Dickinson & Co. | 175,700 | 41,015 | |
| Boston Scientific Corp. (a) | 1,211,900 | 46,549 | |
| Danaher Corp. | 224,926 | 29,692 | |
| IDEXX Laboratories, Inc. (a) | 18,000 | 4,496 | |
| Intuitive Surgical, Inc. (a) | 65,700 | 30,541 | |
| Stryker Corp. | 168,100 | 30,803 | |
| 183,096 | |||
| Health Care Providers & Services - 3.6% | |||
| Humana, Inc. | 140,200 | 34,329 | |
| UnitedHealth Group, Inc. | 390,800 | 94,495 | |
| 128,824 | |||
| Life Sciences Tools & Services - 1.3% | |||
| Mettler-Toledo International, Inc. (a) | 16,800 | 12,148 | |
| Thermo Fisher Scientific, Inc. | 128,566 | 34,325 | |
| 46,473 | |||
| TOTAL HEALTH CARE | 389,806 | ||
| INDUSTRIALS - 11.9% | |||
| Aerospace & Defense - 4.2% | |||
| HEICO Corp. Class A | 129,575 | 12,732 | |
| Lockheed Martin Corp. | 85,400 | 28,911 | |
| Northrop Grumman Corp. | 144,900 | 43,941 | |
| Raytheon Co. | 80,991 | 14,133 | |
| TransDigm Group, Inc. (a) | 42,156 | 18,589 | |
| United Technologies Corp. | 237,904 | 30,047 | |
| 148,353 | |||
| Commercial Services & Supplies - 1.7% | |||
| Cintas Corp. | 70,435 | 15,625 | |
| Copart, Inc. (a) | 206,600 | 14,768 | |
| Rollins, Inc. | 484,768 | 18,213 | |
| Waste Connection, Inc. (United States) | 128,187 | 12,132 | |
| 60,738 | |||
| Electrical Equipment - 0.4% | |||
| AMETEK, Inc. | 192,000 | 15,723 | |
| Industrial Conglomerates - 0.6% | |||
| Honeywell International, Inc. | 4,456 | 732 | |
| Roper Technologies, Inc. | 62,400 | 21,461 | |
| 22,193 | |||
| Machinery - 0.2% | |||
| Gardner Denver Holdings, Inc. (a) | 158,849 | 5,396 | |
| Professional Services - 2.0% | |||
| CoStar Group, Inc. (a) | 7,500 | 3,822 | |
| IHS Markit Ltd. (a) | 644,975 | 37,015 | |
| TransUnion Holding Co., Inc. | 256,900 | 16,837 | |
| Verisk Analytics, Inc. | 95,400 | 13,356 | |
| 71,030 | |||
| Road & Rail - 2.8% | |||
| DSV de Sammensluttede Vognmaend A/S | 109,600 | 9,795 | |
| Lyft, Inc. | 278,736 | 14,455 | |
| Norfolk Southern Corp. | 211,600 | 41,292 | |
| Union Pacific Corp. | 193,675 | 32,301 | |
| 97,843 | |||
| TOTAL INDUSTRIALS | 421,276 | ||
| INFORMATION TECHNOLOGY - 27.6% | |||
| Electronic Equipment & Components - 0.5% | |||
| Amphenol Corp. Class A | 178,300 | 15,512 | |
| IT Services - 10.5% | |||
| Accenture PLC Class A | 253,900 | 45,212 | |
| Broadridge Financial Solutions, Inc. | 154,500 | 19,292 | |
| Fidelity National Information Services, Inc. | 186,800 | 22,472 | |
| Fiserv, Inc. (a) | 231,000 | 19,834 | |
| FleetCor Technologies, Inc. (a) | 41,900 | 10,819 | |
| Gartner, Inc. (a) | 69,200 | 10,470 | |
| Global Payments, Inc. | 137,379 | 21,162 | |
| GoDaddy, Inc. (a) | 230,299 | 17,134 | |
| Jack Henry & Associates, Inc. | 69,300 | 9,094 | |
| MasterCard, Inc. Class A | 283,200 | 71,222 | |
| PayPal Holdings, Inc. (a) | 347,500 | 38,138 | |
| VeriSign, Inc. (a) | 40,741 | 7,944 | |
| Visa, Inc. Class A | 484,700 | 78,197 | |
| 370,990 | |||
| Semiconductors & Semiconductor Equipment - 0.8% | |||
| NVIDIA Corp. | 213,900 | 28,975 | |
| Software - 12.9% | |||
| Adobe, Inc. (a) | 193,300 | 52,365 | |
| ANSYS, Inc. (a) | 49,048 | 8,804 | |
| Autodesk, Inc. (a) | 157,700 | 25,376 | |
| Citrix Systems, Inc. | 52,376 | 4,930 | |
| Intuit, Inc. | 220,000 | 53,867 | |
| Microsoft Corp. | 1,778,400 | 219,948 | |
| Salesforce.com, Inc. (a) | 237,900 | 36,020 | |
| ServiceNow, Inc. (a) | 33,590 | 8,798 | |
| SS&C Technologies Holdings, Inc. | 206,993 | 11,519 | |
| Synopsys, Inc. (a) | 70,800 | 8,244 | |
| Tanium, Inc. Class B (a)(b)(c) | 98,100 | 940 | |
| Workday, Inc. Class A (a) | 128,100 | 26,148 | |
| 456,959 | |||
| Technology Hardware, Storage & Peripherals - 2.9% | |||
| Apple, Inc. | 587,500 | 102,854 | |
| TOTAL INFORMATION TECHNOLOGY | 975,290 | ||
| MATERIALS - 2.1% | |||
| Chemicals - 2.1% | |||
| Ecolab, Inc. | 132,200 | 24,337 | |
| Linde PLC | 165,700 | 29,917 | |
| Sherwin-Williams Co. | 47,700 | 20,008 | |
| 74,262 | |||
| REAL ESTATE - 4.7% | |||
| Equity Real Estate Investment Trusts (REITs) - 4.7% | |||
| American Tower Corp. | 352,600 | 73,612 | |
| Crown Castle International Corp. | 280,400 | 36,455 | |
| Equinix, Inc. | 32,592 | 15,833 | |
| Prologis, Inc. | 252,108 | 18,573 | |
| SBA Communications Corp. Class A (a) | 96,900 | 20,970 | |
| 165,443 | |||
| UTILITIES - 0.9% | |||
| Electric Utilities - 0.9% | |||
| NextEra Energy, Inc. | 165,400 | 32,784 | |
| TOTAL COMMON STOCKS | |||
| (Cost $2,644,640) | 3,469,068 | ||
| Convertible Preferred Stocks - 0.1% | |||
| CONSUMER DISCRETIONARY - 0.1% | |||
| Hotels, Restaurants & Leisure - 0.1% | |||
| Neutron Holdings, Inc.: | |||
| Series C (b)(c) | 7,644,500 | 1,854 | |
| Series D (b)(c) | 1,443,299 | 350 | |
| 2,204 | |||
| INFORMATION TECHNOLOGY - 0.0% | |||
| Software - 0.0% | |||
| Bird Rides, Inc. Series C (b)(c) | 119,195 | 1,400 | |
| TOTAL CONVERTIBLE PREFERRED STOCKS | |||
| (Cost $3,148) | 3,604 | ||
| Money Market Funds - 2.0% | |||
| Fidelity Cash Central Fund 2.41% (d) | |||
| (Cost $71,375) | 71,361,193 | 71,375 | |
| TOTAL INVESTMENT IN SECURITIES - 100.1% | |||
| (Cost $2,719,163) | 3,544,047 | ||
| NET OTHER ASSETS (LIABILITIES) - (0.1)% | (4,994) | ||
| NET ASSETS - 100% | $3,539,053 |
Legend
(a) Non-income producing
(b) Restricted securities - Investment in securities not registered under the Securities Act of 1933 (excluding 144A issues). At the end of the period, the value of restricted securities (excluding 144A issues) amounted to $4,544,000 or 0.1% of net assets.
(c) Level 3 security
(d) Affiliated fund that is generally available only to investment companies and other accounts managed by Fidelity Investments. The rate quoted is the annualized seven-day yield of the fund at period end. A complete unaudited listing of the fund's holdings as of its most recent quarter end is available upon request. In addition, each Fidelity Central Fund's financial statements are available on the SEC's website or upon request.
Additional information on each restricted holding is as follows:
| Security | Acquisition Date | Acquisition Cost (000s) |
| Bird Rides, Inc. Series C | 12/21/18 | $1,400 |
| Neutron Holdings, Inc. Series C | 7/3/18 | $1,398 |
| Neutron Holdings, Inc. Series D | 1/25/19 | $350 |
| Tanium, Inc. Class B | 4/21/17 | $487 |
Affiliated Central Funds
Information regarding fiscal year to date income earned by the Fund from investments in Fidelity Central Funds is as follows:
| Fund | Income earned |
| (Amounts in thousands) | |
| Fidelity Cash Central Fund | $681 |
| Fidelity Securities Lending Cash Central Fund | 5 |
| Total | $686 |
Amounts in the income column in the above table include any capital gain distributions from underlying funds, which are presented in the corresponding line-item in the Statement of Operations, if applicable.
Investment Valuation
The following is a summary of the inputs used, as of May 31, 2019, involving the Fund's assets and liabilities carried at fair value. The inputs or methodology used for valuing securities may not be an indication of the risk associated with investing in those securities. For more information on valuation inputs, and their aggregation into the levels used below, please refer to the Investment Valuation section in the accompanying Notes to Financial Statements.
| Valuation Inputs at Reporting Date: | ||||
| Description | Total | Level 1 | Level 2 | Level 3 |
| (Amounts in thousands) | ||||
| Investments in Securities: | ||||
| Equities: | ||||
| Communication Services | $376,104 | $376,104 | $-- | $-- |
| Consumer Discretionary | 432,236 | 420,108 | 9,924 | 2,204 |
| Consumer Staples | 89,052 | 68,905 | 20,147 | -- |
| Financials | 515,019 | 498,700 | 16,319 | -- |
| Health Care | 389,806 | 389,806 | -- | -- |
| Industrials | 421,276 | 406,821 | 14,455 | -- |
| Information Technology | 976,690 | 974,350 | -- | 2,340 |
| Materials | 74,262 | 74,262 | -- | -- |
| Real Estate | 165,443 | 165,443 | -- | -- |
| Utilities | 32,784 | 32,784 | -- | -- |
| Money Market Funds | 71,375 | 71,375 | -- | -- |
| Total Investments in Securities: | $3,544,047 | $3,478,658 | $60,845 | $4,544 |
See accompanying notes which are an integral part of the financial statements.
Financial Statements
Statement of Assets and Liabilities
| Amounts in thousands (except per-share amounts) | May 31, 2019 (Unaudited) | |
| Assets | ||
| Investment in securities, at value — See accompanying schedule: Unaffiliated issuers (cost $2,647,788) | $3,472,672 | |
| Fidelity Central Funds (cost $71,375) | 71,375 | |
| Total Investment in Securities (cost $2,719,163) | $3,544,047 | |
| Foreign currency held at value (cost $5) | 5 | |
| Receivable for investments sold | 59,069 | |
| Receivable for fund shares sold | 184 | |
| Dividends receivable | 4,427 | |
| Distributions receivable from Fidelity Central Funds | 121 | |
| Prepaid expenses | 1 | |
| Other receivables | 99 | |
| Total assets | 3,607,953 | |
| Liabilities�� | ||
| Payable for investments purchased | $64,892 | |
| Payable for fund shares redeemed | 1,836 | |
| Accrued management fee | 1,626 | |
| Other affiliated payables | 448 | |
| Other payables and accrued expenses | 98 | |
| Total liabilities | 68,900 | |
| Net Assets | $3,539,053 | |
| Net Assets consist of: | ||
| Paid in capital | $2,542,333 | |
| Total distributable earnings (loss) | 996,720 | |
| Net Assets | $3,539,053 | |
| Net Asset Value and Maximum Offering Price | ||
| Independence: | ||
| Net Asset Value, offering price and redemption price per share ($3,280,748 ÷ 93,257 shares) | $35.18 | |
| Class K: | ||
| Net Asset Value, offering price and redemption price per share ($258,305 ÷ 7,339 shares) | $35.20 |
See accompanying notes which are an integral part of the financial statements.
Statement of Operations
| Amounts in thousands | Six months ended May 31, 2019 (Unaudited) | |
| Investment Income | ||
| Dividends | $22,063 | |
| Non-Cash dividends | 1,278 | |
| Income from Fidelity Central Funds | 686 | |
| Total income | 24,027 | |
| Expenses | ||
| Management fee | ||
| Basic fee | $9,514 | |
| Performance adjustment | (1,612) | |
| Transfer agent fees | 2,104 | |
| Accounting and security lending fees | 506 | |
| Custodian fees and expenses | 30 | |
| Independent trustees' fees and expenses | 10 | |
| Registration fees | 35 | |
| Audit | 38 | |
| Legal | 7 | |
| Miscellaneous | 13 | |
| Total expenses before reductions | 10,645 | |
| Expense reductions | (44) | |
| Total expenses after reductions | 10,601 | |
| Net investment income (loss) | 13,426 | |
| Realized and Unrealized Gain (Loss) | ||
| Net realized gain (loss) on: | ||
| Investment securities: | ||
| Unaffiliated issuers | 164,710 | |
| Foreign currency transactions | (56) | |
| Total net realized gain (loss) | 164,654 | |
| Change in net unrealized appreciation (depreciation) on: | ||
| Investment securities: | ||
| Unaffiliated issuers | (61,811) | |
| Assets and liabilities in foreign currencies | (1) | |
| Total change in net unrealized appreciation (depreciation) | (61,812) | |
| Net gain (loss) | 102,842 | |
| Net increase (decrease) in net assets resulting from operations | $116,268 |
See accompanying notes which are an integral part of the financial statements.
Statement of Changes in Net Assets
| Amounts in thousands | Six months ended May 31, 2019 (Unaudited) | Year ended November 30, 2018 |
| Increase (Decrease) in Net Assets | ||
| Operations | ||
| Net investment income (loss) | $13,426 | $29,000 |
| Net realized gain (loss) | 164,654 | 373,689 |
| Change in net unrealized appreciation (depreciation) | (61,812) | (237,242) |
| Net increase (decrease) in net assets resulting from operations | 116,268 | 165,447 |
| Distributions to shareholders | (367,006) | (469,108) |
| Share transactions - net increase (decrease) | 148,297 | 27,406 |
| Total increase (decrease) in net assets | (102,441) | (276,255) |
| Net Assets | ||
| Beginning of period | 3,641,494 | 3,917,749 |
| End of period | $3,539,053 | $3,641,494 |
See accompanying notes which are an integral part of the financial statements.
Financial Highlights
Fidelity Independence Fund
| Six months ended (Unaudited) May 31, | Years endedNovember 30, | |||||
| 2019 | 2018 | 2017 | 2016 | 2015 | 2014 | |
| Selected Per–Share Data | ||||||
| Net asset value, beginning of period | $38.38 | $41.90 | $35.38 | $39.08 | $40.89 | $35.10 |
| Income from Investment Operations | ||||||
| Net investment income (loss)A | .13 | .29 | .40B | .20 | .05 | .10 |
| Net realized and unrealized gain (loss) | .57 | 1.25 | 8.21 | (1.44) | .13 | 5.80 |
| Total from investment operations | .70 | 1.54 | 8.61 | (1.24) | .18 | 5.90 |
| Distributions from net investment income | (.22) | (.41) | (.18) | (.03) | (.04) | (.11) |
| Distributions from net realized gain | (3.68) | (4.65) | (1.91) | (2.43) | (1.95) | – |
| Total distributions | (3.90) | (5.06) | (2.09) | (2.46) | (1.99) | (.11) |
| Net asset value, end of period | $35.18 | $38.38 | $41.90 | $35.38 | $39.08 | $40.89 |
| Total ReturnC,D | 3.46% | 3.99% | 25.72% | (3.15)% | .63% | 16.87% |
| Ratios to Average Net AssetsE,F | ||||||
| Expenses before reductions | .61%G | .50% | .48% | .54% | .86% | .73% |
| Expenses net of fee waivers, if any | .61%G | .50% | .48% | .54% | .86% | .73% |
| Expenses net of all reductions | .61%G | .49% | .48% | .54% | .86% | .73% |
| Net investment income (loss) | .75%G | .73% | 1.06%B | .59% | .12% | .27% |
| Supplemental Data | ||||||
| Net assets, end of period (in millions) | $3,281 | $3,342 | $3,564 | $3,262 | $3,910 | $4,251 |
| Portfolio turnover rateH | 95%G | 46% | 62% | 76% | 48% | 53% |
A Calculated based on average shares outstanding during the period.
B Net investment income per share reflects a large, non-recurring dividend which amounted to $.07 per share. Excluding this non-recurring dividend, the ratio of net investment income (loss) to average net assets would have been .89%.
C Total returns for periods of less than one year are not annualized.
D Total returns would have been lower if certain expenses had not been reduced during the applicable periods shown.
E Fees and expenses of any underlying Fidelity Central Funds are not included in the Fund's expense ratio. The Fund indirectly bears its proportionate share of the expenses of any underlying Fidelity Central Funds.
F Expense ratios reflect operating expenses of the class. Expenses before reductions do not reflect amounts reimbursed by the investment adviser or reductions from brokerage service arrangements or reductions from other expense offset arrangements and do not represent the amount paid by the class during periods when reimbursements or reductions occur. Expenses net of fee waivers reflect expenses after reimbursement by the investment adviser but prior to reductions from brokerage service arrangements or other expense offset arrangements. Expenses net of all reductions represent the net expenses paid by the class.
G Annualized
H Amount does not include the portfolio activity of any underlying Fidelity Central Funds.
See accompanying notes which are an integral part of the financial statements.
Fidelity Independence Fund Class K
| Six months ended (Unaudited) May 31, | Years endedNovember 30, | |||||
| 2019 | 2018 | 2017 | 2016 | 2015 | 2014 | |
| Selected Per–Share Data | ||||||
| Net asset value, beginning of period | $38.42 | $41.94 | $35.41 | $39.12 | $40.93 | $35.14 |
| Income from Investment Operations | ||||||
| Net investment income (loss)A | .14 | .32 | .43B | .23 | .08 | .14 |
| Net realized and unrealized gain (loss) | .58 | 1.25 | 8.22 | (1.45) | .14 | 5.79 |
| Total from investment operations | .72 | 1.57 | 8.65 | (1.22) | .22 | 5.93 |
| Distributions from net investment income | (.25) | (.44) | (.22) | (.06) | (.08) | (.14) |
| Distributions from net realized gain | (3.68) | (4.65) | (1.91) | (2.43) | (1.95) | – |
| Total distributions | (3.94)C | (5.09) | (2.12)D | (2.49) | (2.03) | (.14) |
| Net asset value, end of period | $35.20 | $38.42 | $41.94 | $35.41 | $39.12 | $40.93 |
| Total ReturnE,F | 3.51% | 4.08% | 25.84% | (3.08)% | .73% | 16.95% |
| Ratios to Average Net AssetsG,H | ||||||
| Expenses before reductions | .53%I | .42% | .40% | .45% | .78% | .64% |
| Expenses net of fee waivers, if any | .53%I | .42% | .40% | .45% | .78% | .64% |
| Expenses net of all reductions | .53%I | .41% | .39% | .45% | .77% | .64% |
| Net investment income (loss) | .83%I | .81% | 1.15%B | .68% | .20% | .36% |
| Supplemental Data | ||||||
| Net assets, end of period (in millions) | $258 | $299 | $354 | $348 | $493 | $668 |
| Portfolio turnover rateJ | 95%I | 46% | 62% | 76% | 48% | 53% |
A Calculated based on average shares outstanding during the period.
B Net investment income per share reflects a large, non-recurring dividend which amounted to $.07 per share. Excluding this non-recurring dividend, the ratio of net investment income (loss) to average net assets would have been .97%.
C Total distributions of $3.94 per share is comprised of distributions from net investment income of $.253 and distributions from net realized gain of $3.682 per share.
D Total distributions of $2.12 per share is comprised of distributions from net investment income of $.216 and distributions from net realized gain of $1.907 per share.
E Total returns for periods of less than one year are not annualized.
F Total returns would have been lower if certain expenses had not been reduced during the applicable periods shown.
G Fees and expenses of any underlying Fidelity Central Funds are not included in the Fund's expense ratio. The Fund indirectly bears its proportionate share of the expenses of any underlying Fidelity Central Funds.
H Expense ratios reflect operating expenses of the class. Expenses before reductions do not reflect amounts reimbursed by the investment adviser or reductions from brokerage service arrangements or reductions from other expense offset arrangements and do not represent the amount paid by the class during periods when reimbursements or reductions occur. Expenses net of fee waivers reflect expenses after reimbursement by the investment adviser but prior to reductions from brokerage service arrangements or other expense offset arrangements. Expenses net of all reductions represent the net expenses paid by the class.
I Annualized
J Amount does not include the portfolio activity of any underlying Fidelity Central Funds.
See accompanying notes which are an integral part of the financial statements.
Notes to Financial Statements (Unaudited)
For the period ended May 31, 2019
(Amounts in thousands except percentages)
1. Organization.
Fidelity Independence Fund (the Fund) is a fund of Fidelity Financial Trust (the Trust) and is authorized to issue an unlimited number of shares. The Trust is registered under the Investment Company Act of 1940, as amended (the 1940 Act), as an open-end management investment company organized as a Massachusetts business trust. The Fund offers Independence and Class K shares, each of which has equal rights as to assets and voting privileges. Each class has exclusive voting rights with respect to matters that affect that class.
2. Investments in Fidelity Central Funds.
The Fund invests in Fidelity Central Funds, which are open-end investment companies generally available only to other investment companies and accounts managed by the investment adviser and its affiliates. The Fund's Schedule of Investments lists each of the Fidelity Central Funds held as of period end, if any, as an investment of the Fund, but does not include the underlying holdings of each Fidelity Central Fund. As an Investing Fund, the Fund indirectly bears its proportionate share of the expenses of the underlying Fidelity Central Funds.
The Money Market Central Funds seek preservation of capital and current income and are managed by Fidelity Investments Money Management, Inc. (FIMM), an affiliate of the investment adviser. Annualized expenses of the Money Market Central Funds as of their most recent shareholder report date ranged from less than .005% to .01%.
A complete unaudited list of holdings for each Fidelity Central Fund is available upon request or at the Securities and Exchange Commission (the SEC) website at www.sec.gov. In addition, the financial statements of the Fidelity Central Funds are available on the SEC website or upon request.
3. Significant Accounting Policies.
The Fund is an investment company and applies the accounting and reporting guidance of the Financial Accounting Standards Board (FASB) Accounting Standards Codification Topic 946 Financial Services – Investments Companies. The financial statements have been prepared in conformity with accounting principles generally accepted in the United States of America (GAAP), which require management to make certain estimates and assumptions at the date of the financial statements. Actual results could differ from those estimates. Subsequent events, if any, through the date that the financial statements were issued have been evaluated in the preparation of the financial statements. The following summarizes the significant accounting policies of the Fund:
Investment Valuation. Investments are valued as of 4:00 p.m. Eastern time on the last calendar day of the period. The Board of Trustees (the Board) has delegated the day to day responsibility for the valuation of the Fund's investments to the Fair Value Committee (the Committee) established by the Fund's investment adviser. In accordance with valuation policies and procedures approved by the Board, the Fund attempts to obtain prices from one or more third party pricing vendors or brokers to value its investments. When current market prices, quotations or currency exchange rates are not readily available or reliable, investments will be fair valued in good faith by the Committee, in accordance with procedures adopted by the Board. Factors used in determining fair value vary by investment type and may include market or investment specific events. The frequency with which these procedures are used cannot be predicted and they may be utilized to a significant extent. The Committee oversees the Fund's valuation policies and procedures and reports to the Board on the Committee's activities and fair value determinations. The Board monitors the appropriateness of the procedures used in valuing the Fund's investments and ratifies the fair value determinations of the Committee.
The Fund categorizes the inputs to valuation techniques used to value its investments into a disclosure hierarchy consisting of three levels as shown below:
- Level 1 – quoted prices in active markets for identical investments
- Level 2 – other significant observable inputs (including quoted prices for similar investments, interest rates, prepayment speeds, etc.)
- Level 3 – unobservable inputs (including the Fund's own assumptions based on the best information available)
Valuation techniques used to value the Fund's investments by major category are as follows:
Equity securities, including restricted securities, for which market quotations are readily available, are valued at the last reported sale price or official closing price as reported by a third party pricing vendor on the primary market or exchange on which they are traded and are categorized as Level 1 in the hierarchy. In the event there were no sales during the day or closing prices are not available, securities are valued at the last quoted bid price or may be valued using the last available price and are generally categorized as Level 2 in the hierarchy. For foreign equity securities, when market or security specific events arise, comparisons to the valuation of American Depositary Receipts (ADRs), futures contracts, Exchange-Traded Funds (ETFs) and certain indexes as well as quoted prices for similar securities may be used and would be categorized as Level 2 in the hierarchy. For equity securities, including restricted securities, where observable inputs are limited, assumptions about market activity and risk are used and these securities may be categorized as Level 3 in the hierarchy.
Investments in open-end mutual funds, including the Fidelity Central Funds, are valued at their closing net asset value (NAV) each business day and are categorized as Level 1 in the hierarchy.
Changes in valuation techniques may result in transfers in or out of an assigned level within the disclosure hierarchy. The aggregate value of investments by input level as of May 31, 2019 is included at the end of the Fund's Schedule of Investments.
Foreign Currency. The Fund may use foreign currency contracts to facilitate transactions in foreign-denominated securities. Gains and losses from these transactions may arise from changes in the value of the foreign currency or if the counterparties do not perform under the contracts' terms.
Foreign-denominated assets, including investment securities, and liabilities are translated into U.S. dollars at the exchange rates at period end. Purchases and sales of investment securities, income and dividends received and expenses denominated in foreign currencies are translated into U.S. dollars at the exchange rate in effect on the transaction date.
The effects of exchange rate fluctuations on investments are included with the net realized and unrealized gain (loss) on investment securities. Other foreign currency transactions resulting in realized and unrealized gain (loss) are disclosed separately.
Investment Transactions and Income. For financial reporting purposes, the Fund's investment holdings and NAV include trades executed through the end of the last business day of the period. The NAV per share for processing shareholder transactions is calculated as of the close of business of the New York Stock Exchange (NYSE), normally 4:00 p.m. Eastern time and includes trades executed through the end of the prior business day. Gains and losses on securities sold are determined on the basis of identified cost and include proceeds received from litigation. Dividend income is recorded on the ex-dividend date, except for certain dividends from foreign securities where the ex-dividend date may have passed, which are recorded as soon as the Fund is informed of the ex-dividend date. Non-cash dividends included in dividend income, if any, are recorded at the fair market value of the securities received. Income and capital gain distributions from Fidelity Central Funds, if any, are recorded on the ex-dividend date. Certain distributions received by the Fund represent a return of capital or capital gain. The Fund determines the components of these distributions subsequent to the ex-dividend date, based upon receipt of tax filings or other correspondence relating to the underlying investment. These distributions are recorded as a reduction of cost of investments and/or as a realized gain. Investment income is recorded net of foreign taxes withheld where recovery of such taxes is uncertain.
Class Allocations and Expenses. Investment income, realized and unrealized capital gains and losses, common expenses of the Fund, and certain fund-level expense reductions, if any, are allocated daily on a pro-rata basis to each class based on the relative net assets of each class to the total net assets of the Fund. Each class differs with respect to transfer agent fees incurred. Certain expense reductions may also differ by class. For the reporting period, the allocated portion of income and expenses to each class as a percent of its average net assets may vary due to the timing of recording these transactions in relation to fluctuating net assets of the classes. Expenses directly attributable to a fund are charged to that fund. Expenses attributable to more than one fund are allocated among the respective funds on the basis of relative net assets or other appropriate methods. Expense estimates are accrued in the period to which they relate and adjustments are made when actual amounts are known.
Deferred Trustee Compensation. Under a Deferred Compensation Plan (the Plan) for the Fund, certain independent Trustees have elected to defer receipt of a portion of their annual compensation. Deferred amounts are invested in a cross-section of Fidelity funds, are marked-to-market and remain in the Fund until distributed in accordance with the Plan. The investment of deferred amounts and the offsetting payable to the Trustees of $54 are included in the accompanying Statement of Assets and Liabilities in other receivables and other payables and accrued expenses, respectively.
Income Tax Information and Distributions to Shareholders. Each year, the Fund intends to qualify as a regulated investment company under Subchapter M of the Internal Revenue Code, including distributing substantially all of its taxable income and realized gains. As a result, no provision for U.S. Federal income taxes is required. The Fund files a U.S. federal tax return, in addition to state and local tax returns as required. The Fund's federal income tax returns are subject to examination by the Internal Revenue Service (IRS) for a period of three fiscal years after they are filed. State and local tax returns may be subject to examination for an additional fiscal year depending on the jurisdiction. Foreign taxes are provided for based on the Fund's understanding of the tax rules and rates that exist in the foreign markets in which it invests.
Distributions are declared and recorded on the ex-dividend date. Income and capital gain distributions are declared separately for each class. Income and capital gain distributions are determined in accordance with income tax regulations, which may differ from GAAP.
Capital accounts within the financial statements are adjusted for permanent book-tax differences. These adjustments have no impact on net assets or the results of operations. Capital accounts are not adjusted for temporary book-tax differences which will reverse in a subsequent period.
Book-tax differences are primarily due to futures contracts, foreign currency transactions, market discount, partnerships, deferred trustees compensation and losses deferred due to wash sales.
As of period end, the cost and unrealized appreciation (depreciation) in securities, and derivatives if applicable, for federal income tax purposes were as follows:
| Gross unrealized appreciation | $867,080 |
| Gross unrealized depreciation | (42,599) |
| Net unrealized appreciation (depreciation) | $824,481 |
| Tax cost | $2,719,566 |
Restricted Securities. The Fund may invest in securities that are subject to legal or contractual restrictions on resale. These securities generally may be resold in transactions exempt from registration or to the public if the securities are registered. Disposal of these securities may involve time-consuming negotiations and expense, and prompt sale at an acceptable price may be difficult. Information regarding restricted securities is included at the end of the Fund's Schedule of Investments.
4. Purchases and Sales of Investments.
Purchases and sales of securities, other than short-term securities, aggregated $1,654,738 and $1,884,237, respectively.
5. Fees and Other Transactions with Affiliates.
Management Fee. Fidelity Management & Research Company (the investment adviser) and its affiliates provide the Fund with investment management related services for which the Fund pays a monthly management fee. The management fee is the sum of an individual fund fee rate that is based on an annual rate of .30% of the Fund's average net assets and an annualized group fee rate that averaged .24% during the period. The group fee rate is based upon the average net assets of all the mutual funds advised by the investment adviser, including any mutual funds previously advised by the investment adviser that are currently advised by Fidelity SelectCo, LLC, an affiliate of the investment adviser. The group fee rate decreases as assets under management increase and increases as assets under management decrease. In addition, the management fee is subject to a performance adjustment (up to a maximum of +/- .20% of the Fund's average net assets over a 36 month performance period). The upward or downward adjustment to the management fee is based on the relative investment performance of Independence as compared to its benchmark index, the S&P 500 Index, over the same 36 month performance period. For the reporting period, the total annualized management fee rate, including the performance adjustment, was .45% of the Fund's average net assets. The performance adjustment included in the management fee rate may be higher or lower than the maximum performance adjustment rate due to the difference between the average net assets for the reporting and performance periods.
Transfer Agent Fees. Fidelity Investments Institutional Operations Company, Inc., (FIIOC), an affiliate of the investment adviser, is the transfer, dividend disbursing and shareholder servicing agent for each class of the Fund. FIIOC receives account fees and asset-based fees that vary according to the account size and type of account of the shareholders of Independence, except for Class K. FIIOC receives an asset based fee of Class K's average net assets. FIIOC pays for typesetting, printing and mailing of shareholder reports, except proxy statements.
For the period, transfer agent fees for each class were as follows:
| Amount | % of Class-Level Average Net Assets(a) | |
| Independence | $2,041 | .13 |
| Class K | 63 | .05 |
| $2,104 |
(a) Annualized
Accounting and Security Lending Fees. Fidelity Service Company, Inc. (FSC), an affiliate of the investment adviser, maintains the Fund's accounting records. The accounting fee is based on the level of average net assets for each month. Prior to April 1, 2019, FSC had a separate agreement with the Fund for administration of the security lending program, based on the number and duration of lending transactions. For the period, the total fees paid for accounting and administration of securities lending were equivalent to an annualized rate of .03%.
Brokerage Commissions. The Fund placed a portion of its portfolio transactions with brokerage firms which are affiliates of the investment adviser. Brokerage commissions are included in net realized gain (loss) and change in net unrealized appreciation (depreciation) in the Statement of Operations. The commissions paid to these affiliated firms were $52 for the period.
Interfund Trades. The Fund may purchase from or sell securities to other Fidelity Funds under procedures adopted by the Board. The procedures have been designed to ensure these interfund trades are executed in accordance with Rule 17a-7 of the 1940 Act. Interfund trades are included within the respective purchases and sales amounts shown in the Purchases and Sales of Investments note.
6. Committed Line of Credit.
The Fund participates with other funds managed by the investment adviser or an affiliate in a $4.25 billion credit facility (the "line of credit") to be utilized for temporary or emergency purposes to fund shareholder redemptions or for other short-term liquidity purposes. The Fund has agreed to pay commitment fees on its pro-rata portion of the line of credit, which amounted to $5 and is reflected in Miscellaneous expenses on the Statement of Operations. During the period, the Fund did not borrow on this line of credit.
7. Security Lending.
The Fund lends portfolio securities through a lending agent from time to time in order to earn additional income. For equity securities, a lending agent is used and may loan securities to certain qualified borrowers, including Fidelity Capital Markets (FCM), a broker-dealer affiliated with the Fund. On the settlement date of the loan, the Fund receives collateral (in the form of U.S. Treasury obligations, letters of credit and/or cash) against the loaned securities and maintains collateral in an amount not less than 100% of the market value of the loaned securities during the period of the loan. The market value of the loaned securities is determined at the close of business of the Fund and any additional required collateral is delivered to the Fund on the next business day. The Fund or borrower may terminate the loan at any time, and if the borrower defaults on its obligation to return the securities loaned because of insolvency or other reasons, the Fund may apply collateral received from the borrower against the obligation. The Fund may experience delays and costs in recovering the securities loaned. Any cash collateral received is invested in the Fidelity Securities Lending Cash Central Fund. At period end, there were no security loans outstanding. Security lending income represents the income earned on investing cash collateral, less rebates paid to borrowers and any lending agent fees associated with the loan, plus any premium payments received for lending certain types of securities. Security lending income is presented in the Statement of Operations as a component of income from Fidelity Central Funds. Total security lending income during the period amounted to $5. During the period there were no securities loaned to FCM.
8. Expense Reductions.
Commissions paid to certain brokers with whom the investment adviser, or its affiliates, places trades on behalf of the Fund include an amount in addition to trade execution, which may be rebated back to the Fund to offset certain expenses. This amount totaled $22 for the period. In addition, through arrangements with the Fund's custodian and each class' transfer agent, credits realized as a result of certain uninvested cash balances were used to reduce the Fund's expenses. During the period, these credits reduced the Fund's custody expenses by $1.
During the period, these credits reduced each class' transfer agent expense as noted in the table below.
| Transfer Agent expense reduction | |
| Independence | $8 |
In addition, during the period the investment adviser reimbursed and/or waived a portion of fund-level operating expenses in the amount of $13.
9. Distributions to Shareholders.
Distributions to shareholders of each class were as follows:
| Six months ended May 31, 2019 | Year ended November 30, 2018 | |
| Distributions to shareholders | ||
| Independence | $336,666 | $426,623 |
| Class K | 30,340 | 42,485 |
| Total | $367,006 | $469,108 |
10. Share Transactions.
Share transactions for each class were as follows and may contain automatic conversions between classes or exchanges between affiliated funds:
| Shares | Shares | Dollars | Dollars | |
| Six months ended May 31, 2019 | Year ended November 30, 2018 | Six months ended May 31, 2019 | Year ended November 30, 2018 | |
| Independence | ||||
| Shares sold | 565 | 1,442 | $19,520 | $57,236 |
| Reinvestment of distributions | 10,842 | 11,131 | 328,824 | 416,289 |
| Shares redeemed | (5,229) | (10,563) | (181,273) | (418,873) |
| Net increase (decrease) | 6,178 | 2,010 | $167,071 | $54,652 |
| Class K | ||||
| Shares sold | 400 | 760 | $13,212 | $30,044 |
| Reinvestment of distributions | 1,000 | 1,136 | 30,340 | 42,485 |
| Shares redeemed | (1,851) | (2,539) | (62,326) | (99,775) |
| Net increase (decrease) | (451) | (643) | $(18,774) | $(27,246) |
11. Other.
The Fund's organizational documents provide former and current trustees and officers with a limited indemnification against liabilities arising in connection with the performance of their duties to the Fund. In the normal course of business, the Fund may also enter into contracts that provide general indemnifications. The Fund's maximum exposure under these arrangements is unknown as this would be dependent on future claims that may be made against the Fund. The risk of material loss from such claims is considered remote.
Shareholder Expense Example
As a shareholder of the Fund, you incur two types of costs: (1) transaction costs and (2) ongoing costs, including management fees and other Fund expenses. This Example is intended to help you understand your ongoing costs (in dollars) of investing in the Fund and to compare these costs with the ongoing costs of investing in other mutual funds.
The Example is based on an investment of $1,000 invested at the beginning of the period and held for the entire period (December 1, 2018 to May 31, 2019).
Actual Expenses
The first line of the accompanying table for each class of the Fund provides information about actual account values and actual expenses. You may use the information in this line, together with the amount you invested, to estimate the expenses that you paid over the period. Simply divide your account value by $1,000.00 (for example, an $8,600 account value divided by $1,000.00 = 8.6), then multiply the result by the number in the first line for a class of the Fund under the heading entitled "Expenses Paid During Period" to estimate the expenses you paid on your account during this period. In addition, the Fund, as a shareholder in the underlying Fidelity Central Funds, will indirectly bear its pro-rata share of the fees and expenses incurred by the underlying Fidelity Central Funds. These fees and expenses are not included in the Fund's annualized expense ratio used to calculate the expense estimate in the table below.
Hypothetical Example for Comparison Purposes
The second line of the accompanying table for each class of the Fund provides information about hypothetical account values and hypothetical expenses based on a Class' actual expense ratio and an assumed rate of return of 5% per year before expenses, which is not the Class' actual return. The hypothetical account values and expenses may not be used to estimate the actual ending account balance or expenses you paid for the period. You may use this information to compare the ongoing costs of investing in the Fund and other funds. To do so, compare this 5% hypothetical example with the 5% hypothetical examples that appear in the shareholder reports of the other funds. In addition, the Fund, as a shareholder in the underlying Fidelity Central Funds, will indirectly bear its pro-rata share of the fees and expenses incurred by the underlying Fidelity Central Funds. These fees and expenses are not included in the Fund's annualized expense ratio used to calculate the expense estimate in the table below.
Please note that the expenses shown in the table are meant to highlight your ongoing costs only and do not reflect any transaction costs. Therefore, the second line of the table is useful in comparing ongoing costs only, and will not help you determine the relative total costs of owning different funds.
| Annualized Expense Ratio-A | Beginning Account Value December 1, 2018 | Ending Account Value May 31, 2019 | Expenses Paid During Period-B December 1, 2018 to May 31, 2019 | |
| Independence | .61% | |||
| Actual | $1,000.00 | $1,034.60 | $3.09 | |
| Hypothetical-C | $1,000.00 | $1,021.89 | $3.07 | |
| Class K | .53% | |||
| Actual | $1,000.00 | $1,035.10 | $2.69 | |
| Hypothetical-C | $1,000.00 | $1,022.29 | $2.67 |
A Annualized expense ratio reflects expenses net of applicable fee waivers.
B Expenses are equal to each Class' annualized expense ratio, multiplied by the average account value over the period, multiplied by 182/365 (to reflect the one-half year period).
C 5% return per year before expenses
Board Approval of Investment Advisory Contracts and Management Fees
Fidelity Independence Fund
Each year, the Board of Trustees, including the Independent Trustees (together, the Board), votes on the renewal of the management contract with Fidelity Management & Research Company (FMR) and the sub-advisory agreements (together, the Advisory Contracts) for the fund. FMR and the sub-advisers are referred to herein as the Investment Advisers. The Board, assisted by the advice of fund counsel and Independent Trustees' counsel, requests and considers a broad range of information relevant to the renewal of the Advisory Contracts throughout the year.
The Board meets regularly and, at each of its meetings, covers an extensive agenda of topics and materials and considers factors that are relevant to its annual consideration of the renewal of the fund's Advisory Contracts, including the services and support provided to the fund and its shareholders. The Board has established various standing committees (Committees), each composed of and chaired by Independent Trustees with varying backgrounds, to which the Board has assigned specific subject matter responsibilities in order to enhance effective decision-making by the Board. The Board, acting directly and through its Committees, requests and receives information concerning the annual consideration of the renewal of the fund's Advisory Contracts. The Board also meets as needed to review matters specifically related to the Board's annual consideration of the renewal of the Advisory Contracts. Members of the Board may also meet with trustees of other Fidelity funds through joint ad hoc committees to discuss certain matters relevant to all of the Fidelity funds.
At its January 2019 meeting, the Board unanimously determined to renew the fund's Advisory Contracts. In reaching its determination, the Board considered all factors it believed relevant, including (i) the nature, extent, and quality of the services to be provided to the fund and its shareholders (including the investment performance of the fund); (ii) the competitiveness of the fund's management fee and total expense ratio relative to peer funds; (iii) the total costs of the services to be provided by and the profits to be realized by Fidelity from its relationships with the fund; and (iv) the extent to which, if any, economies of scale exist and would be realized as the fund grows, and whether any economies of scale are appropriately shared with fund shareholders.
In considering whether to renew the Advisory Contracts for the fund, the Board reached a determination, with the assistance of fund counsel and Independent Trustees' counsel and through the exercise of its business judgment, that the renewal of the Advisory Contracts was in the best interests of the fund and its shareholders and that the compensation payable under the Advisory Contracts was fair and reasonable. The Board's decision to renew the Advisory Contracts was not based on any single factor, but rather was based on a comprehensive consideration of all the information provided to the Board at its meetings throughout the year. The Board, in reaching its determination to renew the Advisory Contracts, was aware that shareholders of the fund have a broad range of investment choices available to them, including a wide choice among funds offered by Fidelity's competitors, and that the fund's shareholders, who have the opportunity to review and weigh the disclosure provided by the fund in its prospectus and other public disclosures, have chosen to invest in this fund, which is part of the Fidelity family of funds.
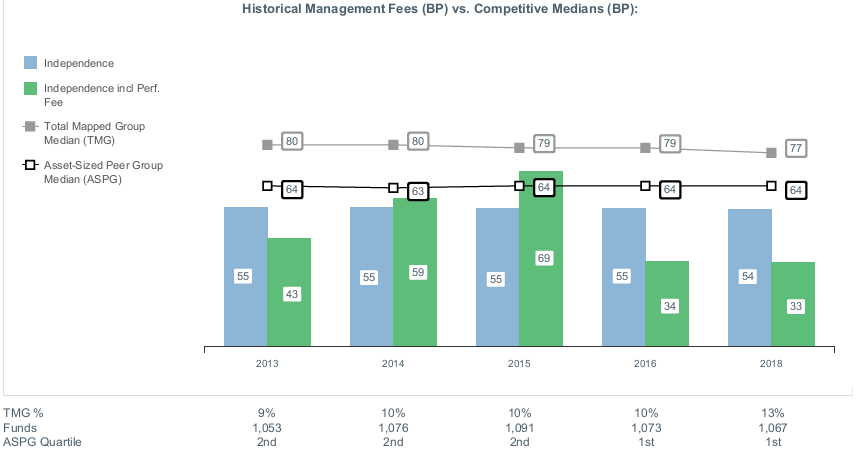
Nature, Extent, and Quality of Services Provided. The Board considered Fidelity's staffing as it relates to the fund, including the backgrounds of investment personnel of Fidelity, and also considered the fund's investment objective, strategies, and related investment philosophy. The Independent Trustees also had discussions with senior management of Fidelity's investment operations and investment groups. The Board considered the structure of the investment personnel compensation program and whether this structure provides appropriate incentives to act in the best interests of the fund. Additionally, the Board considered the portfolio managers' investments, if any, in the funds that they manage.Resources Dedicated to Investment Management and Support Services. The Board and the Fund Oversight and Research Committees reviewed the general qualifications and capabilities of Fidelity's investment staff, including its size, education, experience, and resources, as well as Fidelity's approach to recruiting, training, managing, and compensating investment personnel. The Board noted that Fidelity has continued to increase the resources devoted to non-U.S. offices, including expansion of Fidelity's global investment organization. The Board also noted that Fidelity's analysts have extensive resources, tools and capabilities that allow them to conduct sophisticated quantitative and fundamental analysis, as well as credit analysis of issuers, counterparties and guarantors. Further, the Board considered that Fidelity's investment professionals have sufficient access to global information and data so as to provide competitive investment results over time, and that those professionals also have access to sophisticated tools that permit them to assess portfolio construction and risk and performance attribution characteristics continuously, as well as to transmit new information and research conclusions rapidly around the world. Additionally, in its deliberations, the Board considered Fidelity's trading, risk management, compliance, and technology and operations capabilities and resources, which are integral parts of the investment management process.Shareholder and Administrative Services. The Board considered (i) the nature, extent, quality, and cost of advisory, administrative, and shareholder services performed by the Investment Advisers and their affiliates under the Advisory Contracts and under separate agreements covering transfer agency, pricing and bookkeeping, and securities lending services for the fund; (ii) the nature and extent of the supervision of third party service providers, principally custodians, subcustodians, and pricing vendors; and (iii) the resources devoted to, and the record of compliance with, the fund's compliance policies and procedures. The Board also reviewed the allocation of fund brokerage, including allocations to brokers affiliated with the Investment Advisers, the use of brokerage commissions to pay fund expenses, and the use of "soft" commission dollars to pay for research services.The Board noted that the growth of fund assets over time across the complex allows Fidelity to reinvest in the development of services designed to enhance the value and convenience of the Fidelity funds as investment vehicles. These services include 24-hour access to account information and market information through telephone representatives and over the Internet, investor education materials and asset allocation tools, and the expanded availability of Fidelity Investor Centers.The Board noted that it and the boards of certain other Fidelity funds had formed an ad hoc Committee on Transfer Agency Fees to review the variety of transfer agency fee structures throughout the industry and Fidelity's competitive positioning with respect to industry participants.Investment in a Large Fund Family. The Board considered the benefits to shareholders of investing in a Fidelity fund, including the benefits of investing in a fund that is part of a large family of funds offering a variety of investment disciplines and providing a large variety of mutual fund investor services. The Board noted that Fidelity had taken, or had made recommendations that resulted in the Fidelity funds taking, a number of actions over the previous year that benefited particular funds, including: (i) continuing to dedicate additional resources to Fidelity's investment research process, which includes meetings with management of issuers of securities in which the funds invest, and to the support of the senior management team that oversees asset management; (ii) continuing efforts to enhance Fidelity's global research capabilities; (iii) launching new funds and making other enhancements to meet client needs; (iv) launching new share classes of existing funds; (v) eliminating purchase minimums and broadening eligibility requirements for certain funds and share classes; (vi) reducing management fees and total expenses for certain growth equity funds and index funds; (vii) lowering expense caps for certain existing funds and classes, and converting certain voluntary expense caps to contractual caps, to reduce expenses borne by shareholders; (viii) eliminating short-term redemption fees for funds that had such fees; (ix) rationalizing product lines and gaining increased efficiencies from fund mergers and share class consolidations; (x) continuing to develop, acquire and implement systems and technology to improve services to the funds and shareholders, strengthen information security, and increase efficiency; and (xi) continuing to implement enhancements to further strengthen Fidelity's product line to increase investors' probability of success in achieving their investment goals, including retirement income goals.Investment Performance. The Board considered whether the fund has operated in accordance with its investment objective, as well as its record of compliance with its investment restrictions and its performance history. The Board noted that there were portfolio management changes for the fund in September 2016, December 2016, and June 2017. The Board will continue to monitor closely the fund's performance, taking into account the portfolio manager changes.The Board took into account discussions that occur at Board meetings throughout the year with representatives of the Investment Advisers about fund investment performance. In this regard the Board noted that as part of regularly scheduled fund reviews and other reports to the Board on fund performance, the Board considers annualized return information for the fund for different time periods, measured against an appropriate securities market index ("benchmark index") and a peer group of funds with similar objectives ("peer group"), if any. In its evaluation of fund investment performance, the Board gave particular attention to information indicating changes in performance of certain Fidelity funds for specific time periods and discussed with the Investment Advisers the reasons for any overperformance or underperformance.In addition to reviewing absolute and relative fund performance, the Independent Trustees periodically consider the appropriateness of fund performance metrics in evaluating the results achieved. In general, the Independent Trustees believe that fund performance should be evaluated based on net performance (after fees and expenses) of both the highest performing and lowest performing fund share classes, where applicable, compared to appropriate benchmark indices, over appropriate time periods that may include full market cycles, and compared to peer groups, as applicable, over the same periods, taking into account relevant factors including the following: general market conditions; issuer-specific information; and fund cash flows and other factors.The Independent Trustees recognize that shareholders evaluate performance on a net basis over their own holding periods, for which one-, three-, and five-year periods are often used as a proxy. For this reason, the performance information reviewed by the Board also included net cumulative total return information for the fund and an appropriate benchmark index and peer group for the most recent one-, three-, and five-year periods ended June 30, 2018, as shown below. Returns are shown compared to the 25th percentile (top of box, 75% beaten) and 75th percentile (bottom of box, 25% beaten) of the peer universe.Fidelity Independence Fund

Fidelity Independence Fund
![]()
FRE-SANN-0719
1.479485.121
Fidelity® Convertible Securities Fund Semi-Annual Report May 31, 2019 Includes Fidelity and Fidelity Advisor share classes |
|
Beginning on January 1, 2021, as permitted by regulations adopted by the Securities and Exchange Commission, paper copies of a fund’s shareholder reports will no longer be sent by mail, unless you specifically request paper copies of the reports from the fund or from your financial intermediary, such as a financial advisor, broker-dealer or bank. Instead, the reports will be made available on a website, and you will be notified by mail each time a report is posted and provided with a website link to access the report.
If you already elected to receive shareholder reports electronically, you will not be affected by this change and you need not take any action. You may elect to receive shareholder reports and other communications from a fund electronically, by contacting your financial intermediary. For Fidelity customers, visit Fidelity's web site or call Fidelity using the contact information listed below.
You may elect to receive all future reports in paper free of charge. If you wish to continue receiving paper copies of your shareholder reports, you may contact your financial intermediary or, if you are a Fidelity customer, visit Fidelity’s website, or call Fidelity at the applicable toll-free number listed below. Your election to receive reports in paper will apply to all funds held with the fund complex/your financial intermediary.
| Account Type | Website | Phone Number |
| Brokerage, Mutual Fund, or Annuity Contracts: | fidelity.com/mailpreferences | 1-800-343-3548 |
| Employer Provided Retirement Accounts: | netbenefits.fidelity.com/preferences (choose 'no' under Required Disclosures to continue to print) | 1-800-343-0860 |
| Advisor Sold Accounts Serviced Through Your Financial Intermediary: | Contact Your Financial Intermediary | Your Financial Intermediary's phone number |
| Advisor Sold Accounts Serviced by Fidelity: | institutional.fidelity.com | 1-877-208-0098 |
Contents
Board Approval of Investment Advisory Contracts and Management Fees |
To view a fund's proxy voting guidelines and proxy voting record for the 12-month period ended June 30, visit http://www.fidelity.com/proxyvotingresults or visit the Securities and Exchange Commission's (SEC) web site at http://www.sec.gov.
You may also call 1-800-544-8544 if you’re an individual investing directly with Fidelity, call 1-800-835-5092 if you’re a plan sponsor or participant with Fidelity as your recordkeeper or call 1-877-208-0098 on institutional accounts or if you’re an advisor or invest through one to request a free copy of the proxy voting guidelines.
Standard & Poor's, S&P and S&P 500 are registered service marks of The McGraw-Hill Companies, Inc. and have been licensed for use by Fidelity Distributors Corporation.
Other third-party marks appearing herein are the property of their respective owners.
All other marks appearing herein are registered or unregistered trademarks or service marks of FMR LLC or an affiliated company. © 2019 FMR LLC. All rights reserved.
This report and the financial statements contained herein are submitted for the general information of the shareholders of the Fund. This report is not authorized for distribution to prospective investors in the Fund unless preceded or accompanied by an effective prospectus.
A fund files its complete schedule of portfolio holdings with the SEC for the first and third quarters of each fiscal year on Form N-PORT. Forms N-PORT are available on the SEC’s web site at http://www.sec.gov. A fund's Forms N-PORT may be reviewed and copied at the SEC’s Public Reference Room in Washington, DC. Information regarding the operation of the SEC's Public Reference Room may be obtained by calling 1-800-SEC-0330.
For a complete list of a fund's portfolio holdings, view the most recent holdings listing, semiannual report, or annual report on Fidelity's web site at http://www.fidelity.com, http://www.institutional.fidelity.com, or http://www.401k.com, as applicable.
NOT FDIC INSURED •MAY LOSE VALUE •NO BANK GUARANTEE
Neither the Fund nor Fidelity Distributors Corporation is a bank.
Investment Summary (Unaudited)
Top Ten Investments as of May 31, 2019
| (excluding cash equivalents) | % of fund's net assets |
| DISH Network Corp. 3.375% 8/15/26 | 2.2 |
| Wells Fargo & Co. 7.50% | 2.1 |
| Caesars Entertainment Corp. 5% 10/1/24 | 1.8 |
| Bank of America Corp. Series L, 7.25% | 1.8 |
| Liberty Media Corp. 1.375% 10/15/23 | 1.7 |
| Becton, Dickinson & Co. Series A, 6.125% | 1.6 |
| Microchip Technology, Inc. 1.625% 2/15/25 | 1.6 |
| Advanced Micro Devices, Inc. 2.125% 9/1/26 | 1.6 |
| Vistra Energy Corp. 7.00% | 1.5 |
| Microchip Technology, Inc. 1.625% 2/15/27 | 1.4 |
| 17.3 |
Top Five Market Sectors as of May 31, 2019
| % of fund's net assets | |
| Information Technology | 36.6 |
| Health Care | 14.8 |
| Communication Services | 12.0 |
| Financials | 6.5 |
| Consumer Discretionary | 6.4 |
Asset Allocation (% of fund's net assets)
| As of May 31, 2019 * | ||
| Convertible Securities | 88.2% | |
| Stocks | 7.1% | |
| Short-Term Investments and Net Other Assets (Liabilities) | 4.7% | |

* Foreign investments - 9.5%
Schedule of Investments May 31, 2019 (Unaudited)
Showing Percentage of Net Assets
| Convertible Bonds - 72.1% | |||
| Principal Amount (000s) | Value (000s) | ||
| COMMUNICATION SERVICES - 10.8% | |||
| Diversified Telecommunication Services - 0.3% | |||
| Intelsat SA 4.5% 6/15/25 (a) | $4,075 | $5,332 | |
| Entertainment - 1.5% | |||
| iQIYI, Inc.: | |||
| 2% 4/1/25 (a) | 2,000 | 1,815 | |
| 3.75% 12/1/23 (a) | 1,699 | 1,726 | |
| Live Nation Entertainment, Inc. 2.5% 3/15/23 | 5,050 | 5,734 | |
| Pandora Media, Inc. 1.75% 12/1/23 | 4,943 | 5,412 | |
| World Wrestling Entertainment, Inc. 3.375% 12/15/23 | 2,245 | 6,744 | |
| 21,431 | |||
| Interactive Media & Services - 1.3% | |||
| Twitter, Inc. 0.25% 6/15/24 (a) | 14,822 | 14,476 | |
| Weibo Corp. 1.25% 11/15/22 | 799 | 697 | |
| Zillow Group, Inc.: | |||
| 1.5% 7/1/23 | 2,000 | 1,921 | |
| 2% 12/1/21 | 1,900 | 2,088 | |
| 19,182 | |||
| Media - 7.3% | |||
| DISH Network Corp.: | |||
| 2.375% 3/15/24 | 11,065 | 9,600 | |
| 3.375% 8/15/26 | 33,847 | 31,104 | |
| Gannett Co., Inc. 4.75% 4/15/24 | 1,450 | 1,437 | |
| GCI Liberty, Inc. 1.75% 9/30/46 (a) | 10,375 | 11,698 | |
| Liberty Media Corp.: | |||
| 1% 1/30/23 | 7,520 | 8,740 | |
| 1.375% 10/15/23 | 22,771 | 24,934 | |
| 2.125% 3/31/48 (a) | 2,830 | 2,685 | |
| 2.25% 9/30/46 | 15,500 | 7,866 | |
| 2.25% 12/1/48 (a) | 1,300 | 1,400 | |
| 3.5% 1/15/31 | 7,240 | 5,818 | |
| 105,282 | |||
| Wireless Telecommunication Services - 0.4% | |||
| Boingo Wireless, Inc. 1% 10/1/23 (a) | 6,550 | 5,540 | |
| TOTAL COMMUNICATION SERVICES | 156,767 | ||
| CONSUMER DISCRETIONARY - 5.9% | |||
| Auto Components - 0.1% | |||
| Veoneer, Inc. 4% 6/1/24 | 1,500 | 1,458 | |
| Automobiles - 0.0% | |||
| Tesla, Inc.: | |||
| 1.25% 3/1/21 | 175 | 156 | |
| 2% 5/15/24 | 162 | 142 | |
| 2.375% 3/15/22 | 156 | 141 | |
| 439 | |||
| Diversified Consumer Services - 0.2% | |||
| Chegg, Inc.: | |||
| 0.125% 3/15/25 (a) | 1,600 | 1,556 | |
| 0.25% 5/15/23 | 990 | 1,481 | |
| 3,037 | |||
| Hotels, Restaurants & Leisure - 2.5% | |||
| Caesars Entertainment Corp. 5% 10/1/24 | 18,414 | 26,123 | |
| Marriott Vacations Worldwide Corp. 1.5% 9/15/22 | 2,200 | 2,070 | |
| Sea Ltd. 2.25% 7/1/23 (a) | 5,062 | 8,099 | |
| 36,292 | |||
| Internet & Direct Marketing Retail - 2.9% | |||
| Baozun, Inc. 1.625% 5/1/24 (a) | 1,500 | 1,470 | |
| Etsy, Inc. 0% 3/1/23 | 4,505 | 8,240 | |
| Liberty Expedia Holdings, Inc. 1% 6/30/47 (a) | 1,480 | 1,449 | |
| MercadoLibre, Inc. 2% 8/15/28 (a) | 8,748 | 12,756 | |
| Quotient Technology, Inc. 1.75% 12/1/22 | 2,720 | 2,624 | |
| The Booking Holdings, Inc.: | |||
| 0.35% 6/15/20 | 5,906 | 7,618 | |
| 0.9% 9/15/21 | 6,635 | 7,232 | |
| Wayfair LLC: | |||
| 0.375% 9/1/22 | 110 | 165 | |
| 1.125% 11/1/24 (a) | 120 | 172 | |
| 41,726 | |||
| Specialty Retail - 0.2% | |||
| Guess?, Inc. 2% 4/15/24 (a) | 3,000 | 2,766 | |
| TOTAL CONSUMER DISCRETIONARY | 85,718 | ||
| CONSUMER STAPLES - 0.1% | |||
| Personal Products - 0.1% | |||
| Herbalife Nutrition Ltd.: | |||
| 2% 8/15/19 | 596 | 613 | |
| 2.625% 3/15/24 | 169 | 159 | |
| 772 | |||
| ENERGY - 2.0% | |||
| Energy Equipment & Services - 0.2% | |||
| Ensco Jersey Finance Ltd. 3% 1/31/24 | 883 | 667 | |
| Oil States International, Inc. 1.5% 2/15/23 | 1,275 | 1,107 | |
| Transocean, Inc. 0.5% 1/30/23 | 800 | 774 | |
| Vantage Drilling Co. 5.5% 7/15/43 (a)(b)(c) | 20,000 | 600 | |
| 3,148 | |||
| Oil, Gas & Consumable Fuels - 1.8% | |||
| Chesapeake Energy Corp. 5.5% 9/15/26 | 4,682 | 3,792 | |
| Oasis Petroleum, Inc. 2.625% 9/15/23 | 2,405 | 2,165 | |
| PDC Energy, Inc. 1.125% 9/15/21 | 1,716 | 1,566 | |
| Scorpio Tankers, Inc. 3% 5/15/22 | 12,649 | 12,215 | |
| Ship Finance International Ltd. 4.875% 5/1/23 | 1,600 | 1,596 | |
| SM Energy Co. 1.5% 7/1/21 | 3,500 | 3,150 | |
| Teekay Corp. 5% 1/15/23 | 1,180 | 932 | |
| 25,416 | |||
| TOTAL ENERGY | 28,564 | ||
| FINANCIALS - 2.6% | |||
| Banks - 0.1% | |||
| Hope Bancorp, Inc. 2% 5/15/38 (a) | 700 | 616 | |
| Diversified Financial Services - 1.5% | |||
| Alteryx, Inc. 0.5% 6/1/23 (a) | 1,600 | 3,285 | |
| IAC FinanceCo 2, Inc.: | |||
| 0.875% 6/15/26 (a) | 6,420 | 6,404 | |
| 2% 1/15/30 (a) | 6,420 | 6,500 | |
| IAC Financeco, Inc. 0.875% 10/1/22 (a) | 3,860 | 5,898 | |
| 22,087 | |||
| Insurance - 0.5% | |||
| AXA SA 7.25% 5/15/21 (a) | 6,880 | 6,978 | |
| Mortgage Real Estate Investment Trusts - 0.1% | |||
| Starwood Property Trust, Inc. 4.375% 4/1/23 | 1,000 | 999 | |
| Thrifts & Mortgage Finance - 0.4% | |||
| LendingTree, Inc. 0.625% 6/1/22 | 3,250 | 6,141 | |
| TOTAL FINANCIALS | 36,821 | ||
| HEALTH CARE - 12.1% | |||
| Biotechnology - 3.9% | |||
| Acorda Therapeutics, Inc. 1.75% 6/15/21 | 2,800 | 2,443 | |
| Alder Biopharmaceuticals, Inc. 2.5% 2/1/25 | 2,500 | 2,192 | |
| Array BioPharma, Inc. 2.625% 12/1/24 (a) | 1,625 | 3,040 | |
| BioMarin Pharmaceutical, Inc.: | |||
| 0.599% 8/1/24 | 640 | 647 | |
| 1.5% 10/15/20 | 565 | 624 | |
| Clovis Oncology, Inc. 2.5% 9/15/21 | 4,929 | 4,289 | |
| Exact Sciences Corp.: | |||
| 0.375% 3/15/27 | 5,450 | 6,284 | |
| 1% 1/15/25 | 5,400 | 8,454 | |
| Flexion Therapeutics, Inc. 3.375% 5/1/24 | 1,330 | 1,122 | |
| Intercept Pharmaceuticals, Inc.: | |||
| 2% 5/15/26 | 724 | 732 | |
| 3.25% 7/1/23 | 999 | 913 | |
| Ironwood Pharmaceuticals, Inc. 2.25% 6/15/22 | 2,850 | 3,032 | |
| Neurocrine Biosciences, Inc. 2.25% 5/15/24 | 5,290 | 6,963 | |
| PTC Therapeutics, Inc. 3% 8/15/22 | 600 | 642 | |
| Repligen Corp. 2.125% 6/1/21 | 1,575 | 3,467 | |
| Retrophin, Inc. 2.5% 9/15/25 | 2,200 | 1,920 | |
| Sarepta Therapeutics, Inc. 1.5% 11/15/24 | 5,726 | 10,136 | |
| 56,900 | |||
| Health Care Equipment & Supplies - 2.6% | |||
| CONMED Corp. 2.625% 2/1/24 (a) | 2,350 | 2,562 | |
| DexCom, Inc.: | |||
| 0.75% 5/15/22 | 5,110 | 6,996 | |
| 0.75% 12/1/23 (a) | 6,275 | 6,617 | |
| Insulet Corp. 1.375% 11/15/24 | 3,440 | 4,584 | |
| Nevro Corp. 1.75% 6/1/21 | 850 | 856 | |
| NuVasive, Inc. 2.25% 3/15/21 | 3,250 | 3,662 | |
| Wright Medical Group NV 2.25% 11/15/21 | 2,800 | 4,241 | |
| Wright Medical Group, Inc. 1.625% 6/15/23 (a) | 6,815 | 7,587 | |
| 37,105 | |||
| Health Care Providers & Services - 0.7% | |||
| Molina Healthcare, Inc. 1.125% 1/15/20 | 667 | 2,320 | |
| WellPoint, Inc. 2.75% 10/15/42 | 2,199 | 8,454 | |
| 10,774 | |||
| Health Care Technology - 0.8% | |||
| Tabula Rasa HealthCare, Inc. 1.75% 2/15/26 (a) | 2,270 | 2,165 | |
| Teladoc Health, Inc.: | |||
| 1.375% 5/15/25 | 3,425 | 4,586 | |
| 3% 12/15/22 | 2,865 | 4,407 | |
| 11,158 | |||
| Life Sciences Tools & Services - 1.4% | |||
| Accelerate Diagnostics, Inc. 2.5% 3/15/23 | 4,600 | 3,595 | |
| Illumina, Inc.: | |||
| 0% 8/15/23 (a) | 5,859 | 6,247 | |
| 0.5% 6/15/21 | 8,183 | 11,114 | |
| 20,956 | |||
| Pharmaceuticals - 2.7% | |||
| Dermira, Inc. 3% 5/15/22 | 3,920 | 3,388 | |
| Innoviva, Inc.: | |||
| 2.125% 1/15/23 | 2,000 | 2,033 | |
| 2.5% 8/15/25 | 1,150 | 1,219 | |
| Isis Pharmaceuticals, Inc. 1% 11/15/21 | 5,224 | 6,246 | |
| Jazz Investments I Ltd.: | |||
| 1.5% 8/15/24 | 7,500 | 7,087 | |
| 1.875% 8/15/21 | 8,690 | 8,538 | |
| Pacira Biosciences, Inc. 2.375% 4/1/22 | 1,900 | 1,939 | |
| Supernus Pharmaceuticals, Inc. 0.625% 4/1/23 | 4,330 | 4,069 | |
| The Medicines Co.: | |||
| 2.75% 7/15/23 | 1,129 | 1,089 | |
| 3.5% 1/15/24 (a) | 380 | 600 | |
| Theravance Biopharma, Inc. 3.25% 11/1/23 | 2,570 | 2,172 | |
| 38,380 | |||
| TOTAL HEALTH CARE | 175,273 | ||
| INDUSTRIALS - 3.2% | |||
| Aerospace & Defense - 0.3% | |||
| Aerojet Rocketdyne Holdings, Inc. 2.25% 12/15/23 | 2,890 | 4,584 | |
| Air Freight & Logistics - 0.2% | |||
| Echo Global Logistics, Inc. 2.5% 5/1/20 | 3,050 | 2,991 | |
| Building Products - 0.2% | |||
| Patrick Industries, Inc. 1% 2/1/23 | 3,180 | 2,748 | |
| Construction & Engineering - 0.3% | |||
| Dycom Industries, Inc. 0.75% 9/15/21 | 3,958 | 3,797 | |
| Electrical Equipment - 0.7% | |||
| Fortive Corp. 0.875% 2/15/22 (a) | 10,177 | 10,293 | |
| SolarCity Corp. 1.625% 11/1/19 | 150 | 140 | |
| 10,433 | |||
| Machinery - 0.4% | |||
| Chart Industries, Inc. 1% 11/15/24 (a) | 3,300 | 4,700 | |
| Greenbrier Companies, Inc. 2.875% 2/1/24 | 1,211 | 1,143 | |
| Meritor, Inc. 3.25% 10/15/37 | 634 | 617 | |
| 6,460 | |||
| Professional Services - 1.0% | |||
| FTI Consulting, Inc. 2% 8/15/23 (a) | 12,911 | 13,750 | |
| Trading Companies & Distributors - 0.1% | |||
| Kaman Corp. 3.25% 5/1/24 | 1,900 | 2,024 | |
| TOTAL INDUSTRIALS | 46,787 | ||
| INFORMATION TECHNOLOGY - 32.9% | |||
| Communications Equipment - 1.3% | |||
| Applied Optoelectronics, Inc. 5% 3/15/24 (a) | 1,514 | 1,277 | |
| CalAmp Corp. 2% 8/1/25 (a) | 1,500 | 1,152 | |
| InterDigital, Inc.: | |||
| 1.5% 3/1/20 | 2,950 | 3,043 | |
| 2% 6/1/24 (a) | 2,460 | 2,484 | |
| Liberty Interactive LLC 1.75% 9/30/46 (a) | 4,859 | 5,886 | |
| Lumentum Holdings, Inc. 0.25% 3/15/24 | 4,062 | 4,092 | |
| Viavi Solutions, Inc.: | |||
| 1% 3/1/24 | 400 | 441 | |
| 1.75% 6/1/23 (a) | 400 | 438 | |
| 18,813 | |||
| Electronic Equipment & Components - 0.3% | |||
| II-VI, Inc. 0.25% 9/1/22 | 400 | 394 | |
| Knowles Corp. 3.25% 11/1/21 | 1,900 | 2,096 | |
| TTM Technologies, Inc. 1.75% 12/15/20 | 1,505 | 1,599 | |
| 4,089 | |||
| IT Services - 4.6% | |||
| Akamai Technologies, Inc. 0.125% 5/1/25 | 9,800 | 10,066 | |
| Carbonite, Inc. 2.5% 4/1/22 | 1,700 | 1,942 | |
| Euronet Worldwide, Inc. 0.75% 3/15/49 (a) | 2,800 | 3,234 | |
| KBR, Inc. 2.5% 11/1/23 (a) | 3,200 | 3,491 | |
| MongoDB, Inc. 0.75% 6/15/24 (a) | 2,450 | 5,205 | |
| Okta, Inc. 0.25% 2/15/23 | 4,539 | 10,882 | |
| Perficient, Inc. 2.375% 9/15/23 (a) | 760 | 782 | |
| Square, Inc.: | |||
| 0.375% 3/1/22 | 1,541 | 4,177 | |
| 0.5% 5/15/23 (a) | 7,202 | 7,900 | |
| Twilio, Inc. 0.25% 6/1/23 | 4,664 | 9,098 | |
| Unisys Corp. 5.5% 3/1/21 | 1,700 | 2,072 | |
| Wix.com Ltd. 0% 7/1/23 (a) | 6,206 | 7,462 | |
| 66,311 | |||
| Semiconductors & Semiconductor Equipment - 10.7% | |||
| Advanced Micro Devices, Inc. 2.125% 9/1/26 | 6,387 | 22,387 | |
| Cree, Inc. 0.875% 9/1/23 (a) | 7,987 | 9,097 | |
| Cypress Semiconductor Corp.: | |||
| 2% 2/1/23 | 660 | 714 | |
| 4.5% 1/15/22 | 5,980 | 8,425 | |
| Inphi Corp.: | |||
| 0.75% 9/1/21 | 1,950 | 2,056 | |
| 1.125% 12/1/20 | 1,650 | 2,023 | |
| Intel Corp. 3.25% 8/1/39 | 2,355 | 5,096 | |
| Microchip Technology, Inc.: | |||
| 1.625% 2/15/25 | 13,869 | 22,457 | |
| 1.625% 2/15/27 | 18,737 | 20,433 | |
| 2.25% 2/15/37 | 7,336 | 7,962 | |
| Micron Technology, Inc. 3.125% 5/1/32 | 1,800 | 5,880 | |
| Novellus Systems, Inc. 2.625% 5/15/41 | 2,272 | 12,194 | |
| NXP Semiconductors NV 1% 12/1/19 | 9,010 | 9,224 | |
| ON Semiconductor Corp.: | |||
| 1% 12/1/20 | 6,369 | 7,232 | |
| 1.625% 10/15/23 | 6,783 | 7,704 | |
| Rambus, Inc. 1.375% 2/1/23 | 1,580 | 1,502 | |
| Silicon Laboratories, Inc. 1.375% 3/1/22 | 120 | 140 | |
| Synaptics, Inc. 0.5% 6/15/22 | 1,800 | 1,583 | |
| Teradyne, Inc. 1.25% 12/15/23 | 5,623 | 8,258 | |
| 154,367 | |||
| Software - 14.9% | |||
| 8x8, Inc. 0.5% 2/1/24 (a) | 1,260 | 1,425 | |
| Atlassian, Inc. 0.625% 5/1/23 | 8,250 | 13,519 | |
| Avaya Holdings Corp. 2.25% 6/15/23 (a) | 5,400 | 4,822 | |
| Benefitfocus, Inc. 1.25% 12/15/23 (a) | 2,958 | 2,677 | |
| Coupa Software, Inc. 0.375% 1/15/23 (a) | 3,449 | 8,554 | |
| DocuSign, Inc. 0.5% 9/15/23 (a) | 5,350 | 5,691 | |
| Everbridge, Inc. 1.5% 11/1/22 | 1,720 | 4,069 | |
| FireEye, Inc.: | |||
| 0.875% 6/1/24 (a) | 6,800 | 6,609 | |
| 1.625% 6/1/35 | 5,840 | 5,475 | |
| Five9, Inc. 0.125% 5/1/23 | 3,250 | 4,499 | |
| Guidewire Software, Inc. 1.25% 3/15/25 | 2,950 | 3,245 | |
| HubSpot, Inc. 0.25% 6/1/22 | 3,420 | 6,416 | |
| j2 Global, Inc. 3.25% 6/15/29 | 3,200 | 4,281 | |
| LivePerson, Inc. 0.75% 3/1/24 (a) | 7,822 | 7,898 | |
| New Relic, Inc. 0.5% 5/1/23 | 6,400 | 7,323 | |
| Nice Systems, Inc. 1.25% 1/15/24 | 4,015 | 6,922 | |
| Nuance Communications, Inc.: | |||
| 1% 12/15/35 | 3,690 | 3,467 | |
| 1.25% 4/1/25 | 683 | 684 | |
| Nutanix, Inc. 0% 1/15/23 | 8,351 | 7,942 | |
| Palo Alto Networks, Inc. 0.75% 7/1/23 (a) | 12,176 | 12,593 | |
| Pluralsight, Inc. 0.375% 3/1/24 (a) | 4,700 | 5,076 | |
| PROS Holdings, Inc.: | |||
| 1% 5/15/24 (a) | 2,520 | 2,716 | |
| 2% 6/1/47 | 2,000 | 2,514 | |
| Q2 Holdings, Inc. 0.75% 2/15/23 | 2,100 | 2,884 | |
| Rapid7, Inc. 1.25% 8/1/23 (a) | 2,145 | 3,028 | |
| RealPage, Inc. 1.5% 11/15/22 | 2,800 | 4,179 | |
| Red Hat, Inc. 0.25% 10/1/19 | 550 | 1,376 | |
| RingCentral, Inc. 0% 3/15/23 | 4,635 | 7,223 | |
| ServiceNow, Inc. 0% 6/1/22 | 8,921 | 17,557 | |
| Splunk, Inc.: | |||
| 0.5% 9/15/23 (a) | 10,645 | 11,110 | |
| 1.125% 9/15/25 (a) | 7,818 | 8,327 | |
| Verint Systems, Inc. 1.5% 6/1/21 | 2,600 | 2,829 | |
| Workday, Inc.: | |||
| 0.25% 10/1/22 | 11,768 | 17,495 | |
| 1.5% 7/15/20 | 1,749 | 4,381 | |
| Zendesk, Inc. 0.25% 3/15/23 | 4,840 | 7,100 | |
| 215,906 | |||
| Technology Hardware, Storage & Peripherals - 1.1% | |||
| Electronics for Imaging, Inc. 2.25% 11/15/23 (a) | 700 | 824 | |
| Pure Storage, Inc. 0.125% 4/15/23 | 4,920 | 4,701 | |
| Western Digital Corp. 1.5% 2/1/24 (a) | 12,619 | 10,793 | |
| 16,318 | |||
| TOTAL INFORMATION TECHNOLOGY | 475,804 | ||
| MATERIALS - 1.2% | |||
| Metals & Mining - 1.2% | |||
| Allegheny Technologies, Inc. 4.75% 7/1/22 | 1,870 | 3,071 | |
| Cleveland-Cliffs, Inc. 1.5% 1/15/25 | 2,424 | 3,001 | |
| Endeavour Mining Corp. 3% 2/15/23 (a) | 3,160 | 2,988 | |
| Royal Gold, Inc. 2.875% 6/15/19 | 2,500 | 2,497 | |
| SSR Mining, Inc.: | |||
| 2.5% 4/1/39 (a) | 2,360 | 2,282 | |
| 2.875% 2/1/33 | 3,285 | 3,246 | |
| 17,085 | |||
| REAL ESTATE - 0.5% | |||
| Equity Real Estate Investment Trusts (REITs) - 0.1% | |||
| Starwood Waypoint Homes 3.5% 1/15/22 | 1,900 | 2,248 | |
| Real Estate Management & Development - 0.4% | |||
| Extra Space Storage LP 3.125% 10/1/35 (a) | 2,700 | 3,208 | |
| Redfin Corp. 1.75% 7/15/23 | 2,270 | 1,993 | |
| 5,201 | |||
| TOTAL REAL ESTATE | 7,449 | ||
| UTILITIES - 0.8% | |||
| Independent Power and Renewable Electricity Producers - 0.8% | |||
| NextEra Energy Partners LP 1.5% 9/15/20 (a) | 2,850 | 2,789 | |
| NRG Energy, Inc. 2.75% 6/1/48 (a) | 8,997 | 9,292 | |
| 12,081 | |||
| TOTAL CONVERTIBLE BONDS | |||
| (Cost $989,424) | 1,043,121 | ||
| Shares | Value (000s) | ||
| Common Stocks - 7.1% | |||
| COMMUNICATION SERVICES - 1.2% | |||
| Interactive Media & Services - 0.5% | |||
| Alphabet, Inc. Class A (d) | 6,400 | 7,082 | |
| Wireless Telecommunication Services - 0.7% | |||
| T-Mobile U.S., Inc. (d) | 133,984 | 9,840 | |
| TOTAL COMMUNICATION SERVICES | 16,922 | ||
| CONSUMER DISCRETIONARY - 0.5% | |||
| Internet & Direct Marketing Retail - 0.5% | |||
| Amazon.com, Inc. (d) | 3,900 | 6,923 | |
| CONSUMER STAPLES - 0.4% | |||
| Food & Staples Retailing - 0.4% | |||
| Walmart, Inc. | 51,400 | 5,214 | |
| ENERGY - 1.0% | |||
| Oil, Gas & Consumable Fuels - 1.0% | |||
| DHT Holdings, Inc. | 1,040,000 | 5,782 | |
| Scorpio Tankers, Inc. | 361,300 | 9,405 | |
| 15,187 | |||
| INFORMATION TECHNOLOGY - 3.7% | |||
| Communications Equipment - 0.7% | |||
| Telefonaktiebolaget LM Ericsson (B Shares) sponsored ADR (e) | 1,036,800 | 10,026 | |
| Electronic Equipment & Components - 0.4% | |||
| Corning, Inc. | 178,400 | 5,145 | |
| IT Services - 0.2% | |||
| Euronet Worldwide, Inc. (d) | 22,597 | 3,503 | |
| Semiconductors & Semiconductor Equipment - 1.5% | |||
| Lam Research Corp. | 22,950 | 4,007 | |
| NXP Semiconductors NV | 50,000 | 4,408 | |
| Qualcomm, Inc. | 189,900 | 12,689 | |
| 21,104 | |||
| Software - 0.7% | |||
| Microsoft Corp. | 83,400 | 10,315 | |
| Technology Hardware, Storage & Peripherals - 0.2% | |||
| Apple, Inc. | 20,300 | 3,554 | |
| TOTAL INFORMATION TECHNOLOGY | 53,647 | ||
| REAL ESTATE - 0.3% | |||
| Equity Real Estate Investment Trusts (REITs) - 0.3% | |||
| Simon Property Group, Inc. | 26,500 | 4,295 | |
| TOTAL COMMON STOCKS | |||
| (Cost $98,114) | 102,188 | ||
| Convertible Preferred Stocks - 16.1% | |||
| CONSUMER STAPLES - 1.2% | |||
| Food Products - 1.2% | |||
| Bunge Ltd. 4.875% | 177,900 | 17,360 | |
| ENERGY - 0.0% | |||
| Energy Equipment & Services - 0.0% | |||
| Nabors Industries, Inc. Series A, 6.00% | 4,100 | 82 | |
| FINANCIALS - 3.9% | |||
| Banks - 3.9% | |||
| Bank of America Corp. Series L, 7.25% | 19,520 | 26,021 | |
| Wells Fargo & Co. 7.50% | 23,059 | 30,599 | |
| 56,620 | |||
| HEALTH CARE - 2.7% | |||
| Health Care Equipment & Supplies - 2.7% | |||
| Becton, Dickinson & Co. Series A, 6.125% | 400,300 | 23,265 | |
| Danaher Corp. 4.75% | 15,200 | 15,940 | |
| 39,205 | |||
| INDUSTRIALS - 2.3% | |||
| Electrical Equipment - 0.7% | |||
| Fortive Corp. Series A, 5.00% | 10,690 | 10,546 | |
| Machinery - 0.9% | |||
| Colfax Corp. 5.75% | 41,400 | 4,800 | |
| Rexnord Corp. Series A, 5.75% | 41,837 | 2,298 | |
| Stanley Black & Decker, Inc. 5.375% | 57,400 | 5,376 | |
| 12,474 | |||
| Trading Companies & Distributors - 0.7% | |||
| Avantor, Inc. Series A 6.25% | 156,100 | 9,578 | |
| TOTAL INDUSTRIALS | 32,598 | ||
| MATERIALS - 0.5% | |||
| Chemicals - 0.5% | |||
| International Flavors & Fragrances, Inc. 6.00% | 132,400 | 6,845 | |
| REAL ESTATE - 1.4% | |||
| Equity Real Estate Investment Trusts (REITs) - 1.4% | |||
| Crown Castle International Corp. Series A, 6.875% | 16,207 | 19,158 | |
| QTS Realty Trust, Inc. 6.50% | 13,000 | 1,445 | |
| 20,603 | |||
| UTILITIES - 4.1% | |||
| Electric Utilities - 2.4% | |||
| American Electric Power Co., Inc. 6.125% | 56,000 | 2,948 | |
| NextEra Energy, Inc. 6.123% | 167,600 | 10,652 | |
| Vistra Energy Corp. 7.00% | 220,000 | 21,076 | |
| 34,676 | |||
| Gas Utilities - 0.0% | |||
| South Jersey Industries, Inc. 7.25% | 14,600 | 744 | |
| Multi-Utilities - 1.4% | |||
| CenterPoint Energy, Inc.: | |||
| 2.00% ZENS (d) | 31,450 | 1,486 | |
| Series B, 7.00% | 71,100 | 3,559 | |
| Dominion Resources, Inc. Series A, 6.75% | 59,800 | 2,954 | |
| DTE Energy Co. 6.50% | 18,000 | 1,002 | |
| Sempra Energy: | |||
| 6.75% | 6,700 | 732 | |
| Series A, 6.00% | 96,600 | 10,534 | |
| 20,267 | |||
| Water Utilities - 0.3% | |||
| Aqua America, Inc. 6.00% | 74,500 | 4,124 | |
| TOTAL UTILITIES | 59,811 | ||
| TOTAL CONVERTIBLE PREFERRED STOCKS | |||
| (Cost $217,047) | 233,124 | ||
| Money Market Funds - 5.8% | |||
| Fidelity Cash Central Fund, 2.41% (f) | 83,432,347 | 83,449 | |
| Fidelity Securities Lending Cash Central Fund 2.42% (f)(g) | 270,974 | 271 | |
| TOTAL MONEY MARKET FUNDS | |||
| (Cost $83,720) | 83,720 | ||
| TOTAL INVESTMENT IN SECURITIES - 101.1% | |||
| (Cost $1,388,305) | 1,462,153 | ||
| NET OTHER ASSETS (LIABILITIES) - (1.1)% | (15,707) | ||
| NET ASSETS - 100% | $1,446,446 |
Values shown as $0 in the Schedule of Investments may reflect amounts less than $500.
Legend
(a) Security exempt from registration under Rule 144A of the Securities Act of 1933. These securities may be resold in transactions exempt from registration, normally to qualified institutional buyers. At the end of the period, the value of these securities amounted to $321,892,000 or 22.3% of net assets.
(b) Non-income producing - Security is in default.
(c) Level 3 security
(d) Non-income producing
(e) Security or a portion of the security is on loan at period end.
(f) Affiliated fund that is generally available only to investment companies and other accounts managed by Fidelity Investments. The rate quoted is the annualized seven-day yield of the fund at period end. A complete unaudited listing of the fund's holdings as of its most recent quarter end is available upon request. In addition, each Fidelity Central Fund's financial statements are available on the SEC's website or upon request.
(g) Investment made with cash collateral received from securities on loan.
Affiliated Central Funds
Information regarding fiscal year to date income earned by the Fund from investments in Fidelity Central Funds is as follows:
| Fund | Income earned |
| (Amounts in thousands) | |
| Fidelity Cash Central Fund | $170 |
| Fidelity Securities Lending Cash Central Fund | 0 |
| Total | $170 |
Amounts in the income column in the above table include any capital gain distributions from underlying funds, which are presented in the corresponding line-item in the Statement of Operations, if applicable.
Investment Valuation
The following is a summary of the inputs used, as of May 31, 2019, involving the Fund's assets and liabilities carried at fair value. The inputs or methodology used for valuing securities may not be an indication of the risk associated with investing in those securities. For more information on valuation inputs, and their aggregation into the levels used below, please refer to the Investment Valuation section in the accompanying Notes to Financial Statements.
| Valuation Inputs at Reporting Date: | ||||
| Description | Total | Level 1 | Level 2 | Level 3 |
| (Amounts in thousands) | ||||
| Investments in Securities: | ||||
| Equities: | ||||
| Communication Services | $16,922 | $16,922 | $-- | $-- |
| Consumer Discretionary | 6,923 | 6,923 | -- | -- |
| Consumer Staples | 22,574 | 5,214 | 17,360 | -- |
| Energy | 15,269 | 15,187 | 82 | -- |
| Financials | 56,620 | -- | 56,620 | -- |
| Health Care | 39,205 | -- | 39,205 | -- |
| Industrials | 32,598 | -- | 32,598 | -- |
| Information Technology | 53,647 | 53,647 | -- | -- |
| Materials | 6,845 | -- | 6,845 | -- |
| Real Estate | 24,898 | 4,295 | 20,603 | -- |
| Utilities | 59,811 | 5,126 | 54,685 | -- |
| Corporate Bonds | 1,043,121 | -- | 1,042,521 | 600 |
| Money Market Funds | 83,720 | 83,720 | -- | -- |
| Total Investments in Securities: | $1,462,153 | $191,034 | $1,270,519 | $600 |
Other Information
The composition of credit quality ratings as a percentage of Total Net Assets is as follows (Unaudited):
| AAA,AA,A | 2.0% |
| BBB | 3.7% |
| BB | 8.9% |
| B | 7.1% |
| CCC,CC,C | 0.3% |
| Not Rated | 50.1% |
| Equities | 23.2% |
| Short-Term Investments and Net Other Assets | 4.7% |
| 100% |
We have used ratings from Moody's Investors Service, Inc. Where Moody's® ratings are not available, we have used S&P® ratings. All ratings are as of the date indicated and do not reflect subsequent changes.
See accompanying notes which are an integral part of the financial statements.
Financial Statements
Statement of Assets and Liabilities
| Amounts in thousands (except per-share amounts) | May 31, 2019 (Unaudited) | |
| Assets | ||
| Investment in securities, at value (including securities loaned of $262) — See accompanying schedule: Unaffiliated issuers (cost $1,304,585) | $1,378,433 | |
| Fidelity Central Funds (cost $83,720) | 83,720 | |
| Total Investment in Securities (cost $1,388,305) | $1,462,153 | |
| Receivable for investments sold | 2,903 | |
| Receivable for fund shares sold | 346 | |
| Dividends receivable | 936 | |
| Interest receivable | 3,785 | |
| Distributions receivable from Fidelity Central Funds | 48 | |
| Other receivables | 9 | |
| Total assets | 1,470,180 | |
| Liabilities | ||
| Payable for investments purchased | $21,984 | |
| Payable for fund shares redeemed | 821 | |
| Accrued management fee | 381 | |
| Distribution and service plan fees payable | 20 | |
| Other affiliated payables | 223 | |
| Other payables and accrued expenses | 34 | |
| Collateral on securities loaned | 271 | |
| Total liabilities | 23,734 | |
| Net Assets | $1,446,446 | |
| Net Assets consist of: | ||
| Paid in capital | $1,356,609 | |
| Total distributable earnings (loss) | 89,837 | |
| Net Assets | $1,446,446 | |
| Net Asset Value and Maximum Offering Price | ||
| Class A: | ||
| Net Asset Value and redemption price per share ($21,406 ÷ 766.90 shares)(a) | $27.91 | |
| Maximum offering price per share (100/94.25 of $27.91) | $29.61 | |
| Class M: | ||
| Net Asset Value and redemption price per share ($5,962 ÷ 213.43 shares)(a) | $27.93 | |
| Maximum offering price per share (100/96.50 of $27.93) | $28.94 | |
| Class C: | ||
| Net Asset Value and offering price per share ($15,694 ÷ 565.88 shares)(a) | $27.73 | |
| Convertible Securities: | ||
| Net Asset Value, offering price and redemption price per share ($1,352,021 ÷ 48,240.51 shares) | $28.03 | |
| Class I: | ||
| Net Asset Value, offering price and redemption price per share ($48,944 ÷ 1,749.20 shares) | $27.98 | |
| Class Z: | ||
| Net Asset Value, offering price and redemption price per share ($2,419 ÷ 86.44 shares) | $27.98 |
(a) Redemption price per share is equal to net asset value less any applicable contingent deferred sales charge.
See accompanying notes which are an integral part of the financial statements.
Statement of Operations
| Amounts in thousands | Six months ended May 31, 2019 (Unaudited) | |
| Investment Income | ||
| Dividends | $5,840 | |
| Interest | 8,719 | |
| Income from Fidelity Central Funds | 170 | |
| Total income | 14,729 | |
| Expenses | ||
| Management fee | ||
| Basic fee | $3,069 | |
| Performance adjustment | (1,114) | |
| Transfer agent fees | 1,055 | |
| Distribution and service plan fees | 120 | |
| Accounting and security lending fees | 221 | |
| Custodian fees and expenses | 11 | |
| Independent trustees' fees and expenses | 4 | |
| Registration fees | 108 | |
| Audit | 46 | |
| Legal | 2 | |
| Interest | 2 | |
| Miscellaneous | 4 | |
| Total expenses before reductions | 3,528 | |
| Expense reductions | (25) | |
| Total expenses after reductions | 3,503 | |
| Net investment income (loss) | 11,226 | |
| Realized and Unrealized Gain (Loss) | ||
| Net realized gain (loss) on: | ||
| Investment securities: | ||
| Unaffiliated issuers | 30,206 | |
| Total net realized gain (loss) | 30,206 | |
| Change in net unrealized appreciation (depreciation) on investment securities | 44,912 | |
| Net gain (loss) | 75,118 | |
| Net increase (decrease) in net assets resulting from operations | $86,344 |
See accompanying notes which are an integral part of the financial statements.
Statement of Changes in Net Assets
| Amounts in thousands | Six months ended May 31, 2019 (Unaudited) | Year ended November 30, 2018 |
| Increase (Decrease) in Net Assets | ||
| Operations | ||
| Net investment income (loss) | $11,226 | $42,376 |
| Net realized gain (loss) | 30,206 | 107,250 |
| Change in net unrealized appreciation (depreciation) | 44,912 | (92,594) |
| Net increase (decrease) in net assets resulting from operations | 86,344 | 57,032 |
| Distributions to shareholders | (84,561) | (76,808) |
| Share transactions - net increase (decrease) | 91,572 | (154,490) |
| Total increase (decrease) in net assets | 93,355 | (174,266) |
| Net Assets | ||
| Beginning of period | 1,353,091 | 1,527,357 |
| End of period | $1,446,446 | $1,353,091 |
See accompanying notes which are an integral part of the financial statements.
Financial Highlights
Fidelity Convertible Securities Fund Class A
| Six months ended (Unaudited) May 31, | Years endedNovember 30, | |||||
| 2019 | 2018 | 2017 | 2016 | 2015 | 2014 | |
| Selected Per–Share Data | ||||||
| Net asset value, beginning of period | $28.07 | $28.49 | $26.85 | $29.56 | $33.42 | $30.79 |
| Income from Investment Operations | ||||||
| Net investment income (loss)A | .18 | .76B | .75 | .81C | .66 | .51 |
| Net realized and unrealized gain (loss) | 1.40 | .25 | 2.02D | (.69) | (2.81) | 2.81E |
| Total from investment operations | 1.58 | 1.01 | 2.77 | .12 | (2.15) | 3.32 |
| Distributions from net investment income | (.23) | (.85) | (.71) | (.83) | (.61) | (.48) |
| Distributions from net realized gain | (1.51) | (.58) | (.42) | (2.00) | (1.10) | (.21) |
| Total distributions | (1.74) | (1.43) | (1.13) | (2.83) | (1.71) | (.69) |
| Net asset value, end of period | $27.91 | $28.07 | $28.49 | $26.85 | $29.56 | $33.42 |
| Total ReturnF,G,H | 6.41% | 3.60% | 10.57%D | .83% | (6.60)% | 10.95%E |
| Ratios to Average Net AssetsI,J | ||||||
| Expenses before reductions | .78%K | .75% | .74% | .73% | .84% | .86% |
| Expenses net of fee waivers, if any | .78%K | .75% | .74% | .73% | .84% | .85% |
| Expenses net of all reductions | .78%K | .75% | .74% | .73% | .84% | .85% |
| Net investment income (loss) | 1.32%K | 2.66%B | 2.71% | 3.08%C | 2.09% | 1.60% |
| Supplemental Data | ||||||
| Net assets, end of period (in millions) | $21 | $19 | $21 | $29 | $56 | $150 |
| Portfolio turnover rateL | 179%K | 176% | 110% | 112% | 19% | 23% |
A Calculated based on average shares outstanding during the period.
B Net investment income per share reflects a large, non-recurring dividend which amounted to $.19 per share. Excluding this non-recurring dividend, the ratio of net investment income (loss) to average net assets would have been 1.99%.
C Net investment income per share reflects a large, non-recurring dividend which amounted to $.10 per share. Excluding this non-recurring dividend, the ratio of net investment income (loss) to average net assets would have been 2.71%.
D Net realized and unrealized gain (loss) per share reflects proceeds received from litigation which amounted to $.08 per share. Excluding these litigation proceeds, the total return would have been 10.28%
E Net realized and unrealized gain (loss) per share reflects proceeds received from litigation which amounted to $.12 per share. Excluding these litigation proceeds, the total return would have been 10.58.%
F Total returns for periods of less than one year are not annualized.
G Total returns would have been lower if certain expenses had not been reduced during the applicable periods shown.
H Total returns do not include the effect of the sales charges.
I Fees and expenses of any underlying Fidelity Central Funds are not included in the Fund's expense ratio. The Fund indirectly bears its proportionate share of the expenses of any underlying Fidelity Central Funds.
J Expense ratios reflect operating expenses of the class. Expenses before reductions do not reflect amounts reimbursed by the investment adviser or reductions from brokerage service arrangements or reductions from other expense offset arrangements and do not represent the amount paid by the class during periods when reimbursements or reductions occur. Expenses net of fee waivers reflect expenses after reimbursement by the investment adviser but prior to reductions from brokerage service arrangements or other expense offset arrangements. Expenses net of all reductions represent the net expenses paid by the class.
K Annualized
L Amount does not include the portfolio activity of any underlying Fidelity Central Funds.
See accompanying notes which are an integral part of the financial statements.
Fidelity Convertible Securities Fund Class M
| Six months ended (Unaudited) May 31, | Years endedNovember 30, | |||||
| 2019 | 2018 | 2017 | 2016 | 2015 | 2014 | |
| Selected Per–Share Data | ||||||
| Net asset value, beginning of period | $28.09 | $28.47 | $26.86 | $29.56 | $33.44 | $30.80 |
| Income from Investment Operations | ||||||
| Net investment income (loss)A | .14 | .68B | .68 | .73C | .57 | .42 |
| Net realized and unrealized gain (loss) | 1.40 | .25 | 2.01D | (.68) | (2.82) | 2.82E |
| Total from investment operations | 1.54 | .93 | 2.69 | .05 | (2.25) | 3.24 |
| Distributions from net investment income | (.19) | (.73) | (.66) | (.75) | (.53) | (.39) |
| Distributions from net realized gain | (1.51) | (.58) | (.42) | (2.00) | (1.10) | (.21) |
| Total distributions | (1.70) | (1.31) | (1.08) | (2.75) | (1.63) | (.60) |
| Net asset value, end of period | $27.93 | $28.09 | $28.47 | $26.86 | $29.56 | $33.44 |
| Total ReturnF,G,H | 6.25% | 3.31% | 10.26%D | .53% | (6.91)% | 10.67%E |
| Ratios to Average Net AssetsI,J | ||||||
| Expenses before reductions | 1.07%K | 1.04% | 1.01% | 1.04% | 1.12% | 1.14% |
| Expenses net of fee waivers, if any | 1.06%K | 1.04% | 1.01% | 1.04% | 1.12% | 1.14% |
| Expenses net of all reductions | 1.06%K | 1.03% | 1.01% | 1.04% | 1.12% | 1.14% |
| Net investment income (loss) | 1.04%K | 2.38%B | 2.44% | 2.77%C | 1.81% | 1.32% |
| Supplemental Data | ||||||
| Net assets, end of period (in millions) | $6 | $6 | $14 | $7 | $9 | $14 |
| Portfolio turnover rateL | 179%K | 176% | 110% | 112% | 19% | 23% |
A Calculated based on average shares outstanding during the period.
B Net investment income per share reflects a large, non-recurring dividend which amounted to $.19 per share. Excluding this non-recurring dividend, the ratio of net investment income (loss) to average net assets would have been 1.71%.
C Net investment income per share reflects a large, non-recurring dividend which amounted to $.10 per share. Excluding this non-recurring dividend, the ratio of net investment income (loss) to average net assets would have been 2.40%.
D Net realized and unrealized gain (loss) per share reflects proceeds received from litigation which amounted to $.08 per share. Excluding these litigation proceeds, the total return would have been 9.97%.
E Net realized and unrealized gain (loss) per share reflects proceeds received from litigation which amounted to $.12 per share. Excluding these litigation proceeds, the total return would have been 10.30%.
F Total returns for periods of less than one year are not annualized.
G Total returns would have been lower if certain expenses had not been reduced during the applicable periods shown.
H Total returns do not include the effect of the sales charges.
I Fees and expenses of any underlying Fidelity Central Funds are not included in the Fund's expense ratio. The Fund indirectly bears its proportionate share of the expenses of any underlying Fidelity Central Funds.
J Expense ratios reflect operating expenses of the class. Expenses before reductions do not reflect amounts reimbursed by the investment adviser or reductions from brokerage service arrangements or reductions from other expense offset arrangements and do not represent the amount paid by the class during periods when reimbursements or reductions occur. Expenses net of fee waivers reflect expenses after reimbursement by the investment adviser but prior to reductions from brokerage service arrangements or other expense offset arrangements. Expenses net of all reductions represent the net expenses paid by the class.
K Annualized
L Amount does not include the portfolio activity of any underlying Fidelity Central Funds.
See accompanying notes which are an integral part of the financial statements.
Fidelity Convertible Securities Fund Class C
| Six months ended (Unaudited) May 31, | Years endedNovember 30, | |||||
| 2019 | 2018 | 2017 | 2016 | 2015 | 2014 | |
| Selected Per–Share Data | ||||||
| Net asset value, beginning of period | $27.89 | $28.31 | $26.68 | $29.37 | $33.23 | $30.63 |
| Income from Investment Operations | ||||||
| Net investment income (loss)A | .08 | .54B | .54 | .60C | .42 | .27 |
| Net realized and unrealized gain (loss) | 1.39 | .25 | 2.01D | (.67) | (2.80) | 2.80E |
| Total from investment operations | 1.47 | .79 | 2.55 | (.07) | (2.38) | 3.07 |
| Distributions from net investment income | (.12) | (.63) | (.50) | (.62) | (.38) | (.26) |
| Distributions from net realized gain | (1.51) | (.58) | (.42) | (2.00) | (1.10) | (.21) |
| Total distributions | (1.63) | (1.21) | (.92) | (2.62) | (1.48) | (.47) |
| Net asset value, end of period | $27.73 | $27.89 | $28.31 | $26.68 | $29.37 | $33.23 |
| Total ReturnF,G,H | 6.01% | 2.82% | 9.75%D | .09% | (7.35)% | 10.13%E |
| Ratios to Average Net AssetsI,J | ||||||
| Expenses before reductions | 1.53%K | 1.50% | 1.50% | 1.50% | 1.60% | 1.62% |
| Expenses net of fee waivers, if any | 1.52%K | 1.50% | 1.49% | 1.49% | 1.60% | 1.62% |
| Expenses net of all reductions | 1.52%K | 1.49% | 1.49% | 1.49% | 1.59% | 1.62% |
| Net investment income (loss) | .58%K | 1.92%B | 1.96% | 2.32%C | 1.33% | .84% |
| Supplemental Data | ||||||
| Net assets, end of period (in millions) | $16 | $17 | $19 | $24 | $39 | $48 |
| Portfolio turnover rateL | 179%K | 176% | 110% | 112% | 19% | 23% |
A Calculated based on average shares outstanding during the period.
B Net investment income per share reflects a large, non-recurring dividend which amounted to $.19 per share. Excluding this non-recurring dividend, the ratio of net investment income (loss) to average net assets would have been 1.25%.
C Net investment income per share reflects a large, non-recurring dividend which amounted to $.10 per share. Excluding this non-recurring dividend, the ratio of net investment income (loss) to average net assets would have been 1.95%.
D Net realized and unrealized gain (loss) per share reflects proceeds received from litigation which amounted to $.08 per share. Excluding these litigation proceeds, the total return would have been 9.46%.
E Net realized and unrealized gain (loss) per share reflects proceeds received from litigation which amounted to $.12 per share. Excluding these litigation proceeds, the total return would have been 9.76%.
F Total returns for periods of less than one year are not annualized.
G Total returns would have been lower if certain expenses had not been reduced during the applicable periods shown.
H Total returns do not include the effect of the contingent deferred sales charge.
I Fees and expenses of any underlying Fidelity Central Funds are not included in the Fund's expense ratio. The Fund indirectly bears its proportionate share of the expenses of any underlying Fidelity Central Funds.
J Expense ratios reflect operating expenses of the class. Expenses before reductions do not reflect amounts reimbursed by the investment adviser or reductions from brokerage service arrangements or reductions from other expense offset arrangements and do not represent the amount paid by the class during periods when reimbursements or reductions occur. Expenses net of fee waivers reflect expenses after reimbursement by the investment adviser but prior to reductions from brokerage service arrangements or other expense offset arrangements. Expenses net of all reductions represent the net expenses paid by the class.
K Annualized
L Amount does not include the portfolio activity of any underlying Fidelity Central Funds.
See accompanying notes which are an integral part of the financial statements.
Fidelity Convertible Securities Fund
| Six months ended (Unaudited) May 31, | Years endedNovember 30, | |||||
| 2019 | 2018 | 2017 | 2016 | 2015 | 2014 | |
| Selected Per–Share Data | ||||||
| Net asset value, beginning of period | $28.18 | $28.59 | $26.95 | $29.66 | $33.56 | $30.90 |
| Income from Investment Operations | ||||||
| Net investment income (loss)A | .22 | .85B | .83 | .88C | .75 | .60 |
| Net realized and unrealized gain (loss) | 1.41 | .25 | 2.02D | (.68) | (2.83) | 2.83E |
| Total from investment operations | 1.63 | 1.10 | 2.85 | .20 | (2.08) | 3.43 |
| Distributions from net investment income | (.27) | (.93) | (.80) | (.92) | (.72) | (.56) |
| Distributions from net realized gain | (1.51) | (.58) | (.42) | (2.00) | (1.10) | (.21) |
| Total distributions | (1.78) | (1.51) | (1.21)F | (2.91)G | (1.82) | (.77) |
| Net asset value, end of period | $28.03 | $28.18 | $28.59 | $26.95 | $29.66 | $33.56 |
| Total ReturnH,I | 6.58% | 3.93% | 10.88%D | 1.13% | (6.38)% | 11.28%E |
| Ratios to Average Net AssetsJ,K | ||||||
| Expenses before reductions | .48%L | .46% | .45% | .45% | .56% | .58% |
| Expenses net of fee waivers, if any | .48%L | .46% | .45% | .45% | .56% | .58% |
| Expenses net of all reductions | .48%L | .45% | .45% | .45% | .56% | .58% |
| Net investment income (loss) | 1.62%L | 2.96%B | 3.00% | 3.36%C | 2.37% | 1.88% |
| Supplemental Data | ||||||
| Net assets, end of period (in millions) | $1,352 | $1,278 | $1,432 | $1,490 | $1,823 | $2,307 |
| Portfolio turnover rateM | 179%L | 176% | 110% | 112% | 19% | 23% |
A Calculated based on average shares outstanding during the period.
B Net investment income per share reflects a large, non-recurring dividend which amounted to $.19 per share. Excluding this non-recurring dividend, the ratio of net investment income (loss) to average net assets would have been 2.29%.
C Net investment income per share reflects a large, non-recurring dividend which amounted to $.10 per share. Excluding this non-recurring dividend, the ratio of net investment income (loss) to average net assets would have been 2.99%.
D Net realized and unrealized gain (loss) per share reflects proceeds received from litigation which amounted to $.08 per share. Excluding these litigation proceeds, the total return would have been 10.59%.
E Net realized and unrealized gain (loss) per share reflects proceeds received from litigation which amounted to $.12 per share. Excluding these litigation proceeds, the total return would have been 10.91%.
F Total distributions of $1.21 per share is comprised of distributions from net investment income of $.799 and distributions from net realized gain of $.415 per share.
G Total distributions of $2.91 per share is comprised of distributions from net investment income of $.916 and distributions from net realized gain of $1.997 per share.
H Total returns for periods of less than one year are not annualized.
I Total returns would have been lower if certain expenses had not been reduced during the applicable periods shown.
J Fees and expenses of any underlying Fidelity Central Funds are not included in the Fund's expense ratio. The Fund indirectly bears its proportionate share of the expenses of any underlying Fidelity Central Funds.
K Expense ratios reflect operating expenses of the class. Expenses before reductions do not reflect amounts reimbursed by the investment adviser or reductions from brokerage service arrangements or reductions from other expense offset arrangements and do not represent the amount paid by the class during periods when reimbursements or reductions occur. Expenses net of fee waivers reflect expenses after reimbursement by the investment adviser but prior to reductions from brokerage service arrangements or other expense offset arrangements. Expenses net of all reductions represent the net expenses paid by the class.
L Annualized
M Amount does not include the portfolio activity of any underlying Fidelity Central Funds.
See accompanying notes which are an integral part of the financial statements.
Fidelity Convertible Securities Fund Class I
| Six months ended (Unaudited) May 31, | Years endedNovember 30, | |||||
| 2019 | 2018 | 2017 | 2016 | 2015 | 2014 | |
| Selected Per–Share Data | ||||||
| Net asset value, beginning of period | $28.13 | $28.55 | $26.91 | $29.62 | $33.51 | $30.86 |
| Income from Investment Operations | ||||||
| Net investment income (loss)A | .22 | .84B | .83 | .88C | .74 | .59 |
| Net realized and unrealized gain (loss) | 1.41 | .24 | 2.02D | (.68) | (2.82) | 2.83E |
| Total from investment operations | 1.63 | 1.08 | 2.85 | .20 | (2.08) | 3.42 |
| Distributions from net investment income | (.27) | (.92) | (.79) | (.91) | (.71) | (.56) |
| Distributions from net realized gain | (1.51) | (.58) | (.42) | (2.00) | (1.10) | (.21) |
| Total distributions | (1.78) | (1.50) | (1.21) | (2.91) | (1.81) | (.77) |
| Net asset value, end of period | $27.98 | $28.13 | $28.55 | $26.91 | $29.62 | $33.51 |
| Total ReturnF,G | 6.59% | 3.87% | 10.87%D | 1.11% | (6.39)% | 11.25%E |
| Ratios to Average Net AssetsH,I | ||||||
| Expenses before reductions | .49%J | .47% | .47% | .47% | .58% | .61% |
| Expenses net of fee waivers, if any | .49%J | .47% | .47% | .47% | .58% | .61% |
| Expenses net of all reductions | .49%J | .47% | .47% | .47% | .58% | .61% |
| Net investment income (loss) | 1.61%J | 2.94%B | 2.98% | 3.35%C | 2.35% | 1.85% |
| Supplemental Data | ||||||
| Net assets, end of period (in millions) | $49 | $32 | $41 | $68 | $128 | $159 |
| Portfolio turnover rateK | 179%J | 176% | 110% | 112% | 19% | 23% |
A Calculated based on average shares outstanding during the period.
B Net investment income per share reflects a large, non-recurring dividend which amounted to $.19 per share. Excluding this non-recurring dividend, the ratio of net investment income (loss) to average net assets would have been 2.27%.
C Net investment income per share reflects a large, non-recurring dividend which amounted to $.10 per share. Excluding this non-recurring dividend, the ratio of net investment income (loss) to average net assets would have been 2.98%.
D Net realized and unrealized gain (loss) per share reflects proceeds received from litigation which amounted to $.08 per share. Excluding these litigation proceeds, the total return would have been 10.58%.
E Net realized and unrealized gain (loss) per share reflects proceeds received from litigation which amounted to $.12 per share. Excluding these litigation proceeds, the total return would have been 10.88%.
F Total returns for periods of less than one year are not annualized.
G Total returns would have been lower if certain expenses had not been reduced during the applicable periods shown.
H Fees and expenses of any underlying Fidelity Central Funds are not included in the Fund's expense ratio. The Fund indirectly bears its proportionate share of the expenses of any underlying Fidelity Central Funds.
I Expense ratios reflect operating expenses of the class. Expenses before reductions do not reflect amounts reimbursed by the investment adviser or reductions from brokerage service arrangements or reductions from other expense offset arrangements and do not represent the amount paid by the class during periods when reimbursements or reductions occur. Expenses net of fee waivers reflect expenses after reimbursement by the investment adviser but prior to reductions from brokerage service arrangements or other expense offset arrangements. Expenses net of all reductions represent the net expenses paid by the class.
J Annualized
K Amount does not include the portfolio activity of any underlying Fidelity Central Funds.
See accompanying notes which are an integral part of the financial statements.
Fidelity Convertible Securities Fund Class Z
| Six months ended (Unaudited) May 31, | Year endedNovember 30, | |
| 2019 | 2018 A | |
| Selected Per–Share Data | ||
| Net asset value, beginning of period | $28.14 | $29.30 |
| Income from Investment Operations | ||
| Net investment income (loss)B | .24 | .10 |
| Net realized and unrealized gain (loss) | 1.40 | (.90) |
| Total from investment operations | 1.64 | (.80) |
| Distributions from net investment income | (.29) | (.36) |
| Distributions from net realized gain | (1.51) | – |
| Total distributions | (1.80) | (.36) |
| Net asset value, end of period | $27.98 | $28.14 |
| Total ReturnC,D | 6.62% | (2.74)% |
| Ratios to Average Net AssetsE,F | ||
| Expenses before reductions | .38%G | .37%G |
| Expenses net of fee waivers, if any | .38%G | .37%G |
| Expenses net of all reductions | .38%G | .36%G |
| Net investment income (loss) | 1.72%G | 2.35%G |
| Supplemental Data | ||
| Net assets, end of period (in millions) | $2 | $1 |
| Portfolio turnover rateH | 179%G | 176% |
A For the period October 2, 2018 (commencement of sale of shares) to November 30, 2018.
B Calculated based on average shares outstanding during the period.
C Total returns for periods of less than one year are not annualized.
D Total returns would have been lower if certain expenses had not been reduced during the applicable periods shown.
E Fees and expenses of any underlying Fidelity Central Funds are not included in the Fund's expense ratio. The Fund indirectly bears its proportionate share of the expenses of any underlying Fidelity Central Funds.
F Expense ratios reflect operating expenses of the class. Expenses before reductions do not reflect amounts reimbursed by the investment adviser or reductions from brokerage service arrangements or reductions from other expense offset arrangements and do not represent the amount paid by the class during periods when reimbursements or reductions occur. Expense ratios before reductions for start-up periods may not be representative of longer-term operating periods. Expenses net of fee waivers reflect expenses after reimbursement by the investment adviser but prior to reductions from brokerage service arrangements or other expense offset arrangements. Expenses net of all reductions represent the net expenses paid by the class.
G Annualized
H Amount does not include the portfolio activity of any underlying Fidelity Central Funds.
See accompanying notes which are an integral part of the financial statements.
Notes to Financial Statements (Unaudited)
For the period ended May 31, 2019
(Amounts in thousands except percentages)
1. Organization.
Fidelity Convertible Securities Fund (the Fund) is a fund of Fidelity Financial Trust (the Trust) and is authorized to issue an unlimited number of shares. The Trust is registered under the Investment Company Act of 1940, as amended (the 1940 Act), as an open-end management investment company organized as a Massachusetts business trust. The Fund offers Class A, Class M, Class C, Convertible Securities, Class I and Class Z shares, each of which has equal rights as to assets and voting privileges. Each class has exclusive voting rights with respect to matters that affect that class. Effective March 1, 2019, Class C shares will automatically convert to Class A shares after a holding period of ten years from the initial date of purchase, with certain exceptions.
2. Investments in Fidelity Central Funds.
The Fund invests in Fidelity Central Funds, which are open-end investment companies generally available only to other investment companies and accounts managed by the investment adviser and its affiliates. The Fund's Schedule of Investments lists each of the Fidelity Central Funds held as of period end, if any, as an investment of the Fund, but does not include the underlying holdings of each Fidelity Central Fund. As an Investing Fund, the Fund indirectly bears its proportionate share of the expenses of the underlying Fidelity Central Funds.
The Money Market Central Funds seek preservation of capital and current income and are managed by Fidelity Investments Money Management, Inc. (FIMM), an affiliate of the investment adviser. Annualized expenses of the Money Market Central Funds as of their most recent shareholder report date ranged from less than .005% to .01%.
A complete unaudited list of holdings for each Fidelity Central Fund is available upon request or at the Securities and Exchange Commission (the SEC) website at www.sec.gov. In addition, the financial statements of the Fidelity Central Funds are available on the SEC website or upon request.
3. Significant Accounting Policies.
The Fund is an investment company and applies the accounting and reporting guidance of the Financial Accounting Standards Board (FASB) Accounting Standards Codification Topic 946 Financial Services – Investments Companies. The financial statements have been prepared in conformity with accounting principles generally accepted in the United States of America (GAAP), which require management to make certain estimates and assumptions at the date of the financial statements. Actual results could differ from those estimates. Subsequent events, if any, through the date that the financial statements were issued have been evaluated in the preparation of the financial statements. The following summarizes the significant accounting policies of the Fund:
Investment Valuation. Investments are valued as of 4:00 p.m. Eastern time on the last calendar day of the period. The Board of Trustees (the Board) has delegated the day to day responsibility for the valuation of the Fund's investments to the Fair Value Committee (the Committee) established by the Fund's investment adviser. In accordance with valuation policies and procedures approved by the Board, the Fund attempts to obtain prices from one or more third party pricing vendors or brokers to value its investments. When current market prices, quotations or currency exchange rates are not readily available or reliable, investments will be fair valued in good faith by the Committee, in accordance with procedures adopted by the Board. Factors used in determining fair value vary by investment type and may include market or investment specific events, changes in interest rates and credit quality. The frequency with which these procedures are used cannot be predicted and they may be utilized to a significant extent. The Committee oversees the Fund's valuation policies and procedures and reports to the Board on the Committee's activities and fair value determinations. The Board monitors the appropriateness of the procedures used in valuing the Fund's investments and ratifies the fair value determinations of the Committee.
The Fund categorizes the inputs to valuation techniques used to value its investments into a disclosure hierarchy consisting of three levels as shown below:
- Level 1 – quoted prices in active markets for identical investments
- Level 2 – other significant observable inputs (including quoted prices for similar investments, interest rates, prepayment speeds, etc.)
- Level 3 – unobservable inputs (including the Fund's own assumptions based on the best information available)
Valuation techniques used to value the Fund's investments by major category are as follows:
Equity securities, including restricted securities, for which market quotations are readily available, are valued at the last reported sale price or official closing price as reported by a third party pricing vendor on the primary market or exchange on which they are traded and are categorized as Level 1 in the hierarchy. In the event there were no sales during the day or closing prices are not available, securities are valued at the last quoted bid price or may be valued using the last available price and are generally categorized as Level 2 in the hierarchy. For foreign equity securities, when market or security specific events arise, comparisons to the valuation of American Depositary Receipts (ADRs), futures contracts, Exchange-Traded Funds (ETFs) and certain indexes as well as quoted prices for similar securities may be used and would be categorized as Level 2 in the hierarchy. For equity securities, including restricted securities, where observable inputs are limited, assumptions about market activity and risk are used and these securities may be categorized as Level 3 in the hierarchy.
Debt securities, including restricted securities, are valued based on evaluated prices received from third party pricing vendors or from brokers who make markets in such securities. Corporate bonds are valued by pricing vendors who utilize matrix pricing which considers yield or price of bonds of comparable quality, coupon, maturity and type or by broker-supplied prices. When independent prices are unavailable or unreliable, debt securities may be valued utilizing pricing methodologies which consider similar factors that would be used by third party pricing vendors. Debt securities are generally categorized as Level 2 in the hierarchy but may be Level 3 depending on the circumstances.
Investments in open-end mutual funds, including the Fidelity Central Funds, are valued at their closing net asset value (NAV) each business day and are categorized as Level 1 in the hierarchy.
Changes in valuation techniques may result in transfers in or out of an assigned level within the disclosure hierarchy. The aggregate value of investments by input level as of May 31, 2019 is included at the end of the Fund's Schedule of Investments.
Investment Transactions and Income. For financial reporting purposes, the Fund's investment holdings and NAV include trades executed through the end of the last business day of the period. The NAV per share for processing shareholder transactions is calculated as of the close of business of the New York Stock Exchange (NYSE), normally 4:00 p.m. Eastern time and includes trades executed through the end of the prior business day. Gains and losses on securities sold are determined on the basis of identified cost and include proceeds received from litigation. Dividend income is recorded on the ex-dividend date, except for certain dividends from foreign securities where the ex-dividend date may have passed, which are recorded as soon as the Fund is informed of the ex-dividend date. Non-cash dividends included in dividend income, if any, are recorded at the fair market value of the securities received. Income and capital gain distributions from Fidelity Central Funds, if any, are recorded on the ex-dividend date. Certain distributions received by the Fund represent a return of capital or capital gain. The Fund determines the components of these distributions subsequent to the ex-dividend date, based upon receipt of tax filings or other correspondence relating to the underlying investment. These distributions are recorded as a reduction of cost of investments and/or as a realized gain. Interest income is accrued as earned and includes coupon interest and amortization of premium and accretion of discount on debt securities as applicable. Debt obligations may be placed on non-accrual status and related interest income may be reduced by ceasing current accruals and writing off interest receivables when the collection of all or a portion of interest has become doubtful based on consistently applied procedures. A debt obligation is removed from non-accrual status when the issuer resumes interest payments or when collectability of interest is reasonably assured.
Class Allocations and Expenses. Investment income, realized and unrealized capital gains and losses, common expenses of the Fund, and certain fund-level expense reductions, if any, are allocated daily on a pro-rata basis to each class based on the relative net assets of each class to the total net assets of the Fund. Each class differs with respect to transfer agent and distribution and service plan fees incurred. Certain expense reductions may also differ by class. For the reporting period, the allocated portion of income and expenses to each class as a percent of its average net assets may vary due to the timing of recording these transactions in relation to fluctuating net assets of the classes. Expenses directly attributable to a fund are charged to that fund. Expenses attributable to more than one fund are allocated among the respective funds on the basis of relative net assets or other appropriate methods. Expense estimates are accrued in the period to which they relate and adjustments are made when actual amounts are known.
Income Tax Information and Distributions to Shareholders. Each year, the Fund intends to qualify as a regulated investment company under Subchapter M of the Internal Revenue Code, including distributing substantially all of its taxable income and realized gains. As a result, no provision for U.S. Federal income taxes is required. The Fund files a U.S. federal tax return, in addition to state and local tax returns as required. The Fund's federal income tax returns are subject to examination by the Internal Revenue Service (IRS) for a period of three fiscal years after they are filed. State and local tax returns may be subject to examination for an additional fiscal year depending on the jurisdiction.
Distributions are declared and recorded on the ex-dividend date. Income and capital gain distributions are declared separately for each class. Income and capital gain distributions are determined in accordance with income tax regulations, which may differ from GAAP.
Capital accounts within the financial statements are adjusted for permanent book-tax differences. These adjustments have no impact on net assets or the results of operations. Capital accounts are not adjusted for temporary book-tax differences which will reverse in a subsequent period.
Book-tax differences are primarily due to foreign currency transactions, market discount, contingent interest, equity-debt classifications, deferred trustees compensation, capital loss carryforwards, partnerships and losses deferred due to wash sales.
As of period end, the cost and unrealized appreciation (depreciation) in securities, and derivatives if applicable, for federal income tax purposes were as follows:
| Gross unrealized appreciation | $129,037 |
| Gross unrealized depreciation | (59,189) |
| Net unrealized appreciation (depreciation) | $69,848 |
| Tax cost | $1,392,305 |
Restricted Securities. The Fund may invest in securities that are subject to legal or contractual restrictions on resale. These securities generally may be resold in transactions exempt from registration or to the public if the securities are registered. Disposal of these securities may involve time-consuming negotiations and expense, and prompt sale at an acceptable price may be difficult. Information regarding restricted securities is included at the end of the Fund's Schedule of Investments.
4. Purchases and Sales of Investments.
Purchases and sales of securities, other than short-term securities and U.S. government securities, aggregated $977,958 and $907,702, respectively.
5. Fees and Other Transactions with Affiliates.
Management Fee. Fidelity Management & Research Company (the investment adviser) and its affiliates provide the Fund with investment management related services for which the Fund pays a monthly management fee. The management fee is the sum of an individual fund fee rate that is based on an annual rate of .20% of the Fund's average net assets and an annualized group fee rate that averaged .24% during the period. The group fee rate is based upon the average net assets of all the mutual funds advised by the investment adviser, including any mutual funds previously advised by the investment adviser that are currently advised by Fidelity SelectCo, LLC, an affiliate of the investment adviser. The group fee rate decreases as assets under management increase and increases as assets under management decrease. In addition, the management fee is subject to a performance adjustment (up to a maximum of +/- .15% of the Fund's average net assets over a 36 month performance period). The upward or downward adjustment to the management fee is based on the relative investment performance of Convertible Securities as compared to its benchmark index, the ICE® BofAML® All US Convertibles Index, over the same 36 month performance period. For the reporting period, the total annualized management fee rate, including the performance adjustment, was .28% of the Fund's average net assets. The performance adjustment included in the management fee rate may be higher or lower than the maximum performance adjustment rate due to the difference between the average net assets for the reporting and performance periods.
Distribution and Service Plan Fees. In accordance with Rule 12b-1 of the 1940 Act, the Fund has adopted separate Distribution and Service Plans for each class of shares. Certain classes pay Fidelity Distributors Corporation (FDC), an affiliate of the investment adviser, separate Distribution and Service Fees, each of which is based on an annual percentage of each class' average net assets. In addition, FDC may pay financial intermediaries for selling shares of the Fund and providing shareholder support services. For the period, the Distribution and Service Fee rates, total fees and amounts retained by FDC were as follows:
| Distribution Fee | Service Fee | Total Fees | Retained by FDC | |
| Class A | -% | .25% | $25 | $1 |
| Class M | .25% | .25% | 15 | –(a) |
| Class C | .75% | .25% | 80 | 6 |
| $120 | $7 |
(a) In the amount of less than five hundred dollars.
Sales Load. FDC may receive a front-end sales charge of up to 5.75% for selling Class A shares and 3.50% for selling Class M shares, some of which is paid to financial intermediaries for selling shares of the Fund. Depending on the holding period, FDC may receive contingent deferred sales charges levied on Class A, Class M and Class C redemptions. The deferred sales charges are 1.00% for Class C shares, 1.00% for certain purchases of Class A shares and .25% for certain purchases of Class M shares.
For the period, sales charge amounts retained by FDC were as follows:
| Retained by FDC | |
| Class A | $6 |
| Class M | –(a) |
| Class C(b) | 1 |
| $7 |
(a) In the amount of less than five hundred dollars.
(b) When Class C shares are initially sold, FDC pays commissions from its own resources to financial intermediaries through which the sales are made.
Transfer Agent Fees. Fidelity Investments Institutional Operations Company, Inc., (FIIOC), an affiliate of the investment adviser, is the transfer, dividend disbursing and shareholder servicing agent for each class of the Fund. FIIOC receives account fees and asset-based fees that vary according to the account size and type of account of the shareholders of the respective classes of the Fund, except for Class Z. FIIOC receives an asset-based fee of Class Z's average net assets. FIIOC pays for typesetting, printing and mailing of shareholder reports, except proxy statements.
For the period, transfer agent fees for each class were as follows:
| Amount | % of Class-Level Average Net Assets(a) | |
| Class A | $19 | .20 |
| Class M | 7 | .23 |
| Class C | 15 | .19 |
| Convertible Securities | 982 | .15 |
| Class I | 31 | .16 |
| Class Z | 1 | .05 |
| $1,055 |
(a) Annualized
Accounting and Security Lending Fees. Fidelity Service Company, Inc. (FSC), an affiliate of the investment adviser, maintains the Fund's accounting records. The accounting fee is based on the level of average net assets for each month. Prior to April 1, 2019, FSC had a separate agreement with the Fund for administration of the security lending program, based on the number and duration of lending transactions. For the period, the total fees paid for accounting and administration of securities lending were equivalent to an annualized rate of .03%.
Brokerage Commissions. The Fund placed a portion of its portfolio transactions with brokerage firms which are affiliates of the investment adviser. Brokerage commissions are included in net realized gain (loss) and change in net unrealized appreciation (depreciation) in the Statement of Operations. The commissions paid to these affiliated firms were $4 for the period.
Interfund Lending Program. Pursuant to an Exemptive Order issued by the SEC, the Fund, along with other registered investment companies having management contracts with Fidelity Management & Research Company (FMR) or other affiliated entities of FMR, may participate in an interfund lending program. This program provides an alternative credit facility allowing the funds to borrow from, or lend money to, other participating affiliated funds. At period end, there were no interfund loans outstanding. The Fund's activity in this program during the period for which loans were outstanding was as follows:
| Borrower or Lender | Average Loan Balance | Weighted Average Interest Rate | Interest Expense |
| Borrower | $3,498 | 2.49% | $2 |
Interfund Trades. The Fund may purchase from or sell securities to other Fidelity Funds under procedures adopted by the Board. The procedures have been designed to ensure these interfund trades are executed in accordance with Rule 17a-7 of the 1940 Act. Interfund trades are included within the respective purchases and sales amounts shown in the Purchases and Sales of Investments note.
6. Committed Line of Credit.
The Fund participates with other funds managed by the investment adviser or an affiliate in a $4.25 billion credit facility (the "line of credit") to be utilized for temporary or emergency purposes to fund shareholder redemptions or for other short-term liquidity purposes. The Fund has agreed to pay commitment fees on its pro-rata portion of the line of credit, which amounted to $2 and is reflected in Miscellaneous expenses on the Statement of Operations. During the period, the Fund did not borrow on this line of credit.
7. Security Lending.
The Fund lends portfolio securities through a lending agent from time to time in order to earn additional income. For equity securities, a lending agent is used and may loan securities to certain qualified borrowers, including Fidelity Capital Markets (FCM), a broker-dealer affiliated with the Fund. On the settlement date of the loan, the Fund receives collateral (in the form of U.S. Treasury obligations, letters of credit and/or cash) against the loaned securities and maintains collateral in an amount not less than 100% of the market value of the loaned securities during the period of the loan. The market value of the loaned securities is determined at the close of business of the Fund and any additional required collateral is delivered to the Fund on the next business day. The Fund or borrower may terminate the loan at any time, and if the borrower defaults on its obligation to return the securities loaned because of insolvency or other reasons, the Fund may apply collateral received from the borrower against the obligation. The Fund may experience delays and costs in recovering the securities loaned. Any cash collateral received is invested in the Fidelity Securities Lending Cash Central Fund. The value of loaned securities and cash collateral at period end are disclosed on the Fund's Statement of Assets and Liabilities. Security lending income represents the income earned on investing cash collateral, less rebates paid to borrowers and any lending agent fees associated with the loan, plus any premium payments received for lending certain types of securities. Security lending income is presented in the Statement of Operations as a component of income from Fidelity Central Funds. Total security lending income during the period amounted to less than five hundred dollars. During the period, there were no securities loaned to FCM.
8. Expense Reductions.
Through arrangements with the Fund's custodian, credits realized as a result of certain uninvested cash balances were used to reduce the Fund's expenses. During the period, these credits reduced the Fund's custody expenses by $2. During the period, credits reduced each class' transfer agent expense as noted in the table below.
| Transfer Agent expense reduction | |
| Convertible Securities | $2 |
In addition, during the period the investment adviser reimbursed and/or waived a portion of fund-level operating expenses in the amount of $5 and a portion of class-level operating expenses as follows:
| Amount | |
| Class A | $–(a) |
| Class M | –(a) |
| Class C | –(a) |
| Convertible Securities | 15 |
| Class I | –(a) |
| Class Z | –(a) |
| $16 |
(a) In the amount of less than five hundred dollars.
9. Distributions to Shareholders.
Distributions to shareholders of each class were as follows:
| Six months ended May 31, 2019 | Year ended November 30, 2018(a) | |
| Distributions to shareholders | ||
| Class A | $1,155 | $1,018 |
| Class M | 363 | 500 |
| Class C | 973 | 778 |
| Convertible Securities | 79,924 | 72,625 |
| Class I | 2,045 | 1,886 |
| Class Z | 101 | 1 |
| Total | $84,561 | $76,808 |
(a) Distributions for Class Z are for the period October 2, 2018 (commencement of sale of shares) to November 30, 2018.
10. Share Transactions.
Share transactions for each class were as follows and may contain automatic conversions between classes or exchanges between affiliated funds:
| Shares | Shares | Dollars | Dollars | |
| Six months ended May 31, 2019 | Year ended November 30, 2018(a) | Six months ended May 31, 2019 | Year ended November 30, 2018(a) | |
| Class A | ||||
| Shares sold | 154 | 99 | $4,260 | $2,856 |
| Reinvestment of distributions | 44 | 35 | 1,102 | 971 |
| Shares redeemed | (101) | (203) | (2,737) | (5,783) |
| Net increase (decrease) | 97 | (69) | $2,625 | $(1,956) |
| Class M | ||||
| Shares sold | 11 | 75 | $292 | $2,133 |
| Reinvestment of distributions | 14 | 18 | 358 | 496 |
| Shares redeemed | (26) | (388) | (687) | (10,794) |
| Net increase (decrease) | (1) | (295) | $(37) | $(8,165) |
| Class C | ||||
| Shares sold | 60 | 76 | $1,653 | $2,156 |
| Reinvestment of distributions | 37 | 26 | 913 | 731 |
| Shares redeemed | (134) | (181) | (3,654) | (5,103) |
| Net increase (decrease) | (37) | (79) | $(1,088) | $(2,216) |
| Convertible Securities | ||||
| Shares sold | 3,791 | 1,930 | $104,152 | $55,256 |
| Reinvestment of distributions | 2,788 | 2,239 | 69,623 | 63,197 |
| Shares redeemed | (3,701) | (8,880) | (101,430) | (253,754) |
| Net increase (decrease) | 2,878 | (4,711) | $72,345 | $(135,301) |
| Class I | ||||
| Shares sold | 890 | 353 | $24,621 | $10,075 |
| Reinvestment of distributions | 79 | 61 | 1,984 | 1,710 |
| Shares redeemed | (357) | (703) | (9,871) | (19,963) |
| Net increase (decrease) | 612 | (289) | $16,734 | $(8,178) |
| Class Z | ||||
| Shares sold | 61 | 48 | $1,631 | $1,327 |
| Reinvestment of distributions | 3 | –(b) | 86 | 1 |
| Shares redeemed | (26) | –(b) | (724) | (2) |
| Net increase (decrease) | 38 | 48 | $993 | $1,326 |
(a) Share transactions for Class Z are for the period October 2, 2018 (commencement of sale of shares) to November 30, 2018
(b) Amount is less than five hundred shares.
11. Other.
The Fund's organizational documents provide former and current trustees and officers with a limited indemnification against liabilities arising in connection with the performance of their duties to the Fund. In the normal course of business, the Fund may also enter into contracts that provide general indemnifications. The Fund's maximum exposure under these arrangements is unknown as this would be dependent on future claims that may be made against the Fund. The risk of material loss from such claims is considered remote.
Shareholder Expense Example
As a shareholder of the Fund, you incur two types of costs: (1) transaction costs, including sales charges (loads) on purchase payments or redemption proceeds, and (2) ongoing costs, including management fees, distribution and/or service (12b-1) fees and other Fund expenses. This Example is intended to help you understand your ongoing costs (in dollars) of investing in the Fund and to compare these costs with the ongoing costs of investing in other mutual funds.
The Example is based on an investment of $1,000 invested at the beginning of the period and held for the entire period (December 1, 2018 to May 31, 2019).
Actual Expenses
The first line of the accompanying table for each class of the Fund provides information about actual account values and actual expenses. You may use the information in this line, together with the amount you invested, to estimate the expenses that you paid over the period. Simply divide your account value by $1,000.00 (for example, an $8,600 account value divided by $1,000.00 = 8.6), then multiply the result by the number in the first line for a class of the Fund under the heading entitled "Expenses Paid During Period" to estimate the expenses you paid on your account during this period. In addition, the Fund, as a shareholder in the underlying Fidelity Central Funds, will indirectly bear its pro-rata share of the fees and expenses incurred by the underlying Fidelity Central Funds. These fees and expenses are not included in the Fund's annualized expense ratio used to calculate the expense estimate in the table below.
Hypothetical Example for Comparison Purposes
The second line of the accompanying table for each class of the Fund provides information about hypothetical account values and hypothetical expenses based on a Class' actual expense ratio and an assumed rate of return of 5% per year before expenses, which is not the Class' actual return. The hypothetical account values and expenses may not be used to estimate the actual ending account balance or expenses you paid for the period. You may use this information to compare the ongoing costs of investing in the Fund and other funds. To do so, compare this 5% hypothetical example with the 5% hypothetical examples that appear in the shareholder reports of the other funds. In addition, the Fund, as a shareholder in the underlying Fidelity Central Funds, will indirectly bear its pro-rata share of the fees and expenses incurred by the underlying Fidelity Central Funds. These fees and expenses are not included in the Fund's annualized expense ratio used to calculate the expense estimate in the table below.
Please note that the expenses shown in the table are meant to highlight your ongoing costs only and do not reflect any transaction costs. Therefore, the second line of the table is useful in comparing ongoing costs only, and will not help you determine the relative total costs of owning different funds. In addition, if these transactional costs were included, your costs would have been higher.
| Annualized Expense Ratio-A | Beginning Account Value December 1, 2018 | Ending Account Value May 31, 2019 | Expenses Paid During Period-B December 1, 2018 to May 31, 2019 | |
| Class A | .78% | |||
| Actual | $1,000.00 | $1,064.10 | $4.01 | |
| Hypothetical-C | $1,000.00 | $1,021.04 | $3.93 | |
| Class M | 1.06% | |||
| Actual | $1,000.00 | $1,062.50 | $5.45 | |
| Hypothetical-C | $1,000.00 | $1,019.65 | $5.34 | |
| Class C | 1.52% | |||
| Actual | $1,000.00 | $1,060.10 | $7.81 | |
| Hypothetical-C | $1,000.00 | $1,017.35 | $7.64 | |
| Convertible Securities | .48% | |||
| Actual | $1,000.00 | $1,065.80 | $2.47 | |
| Hypothetical-C | $1,000.00 | $1,022.54 | $2.42 | |
| Class I | .49% | |||
| Actual | $1,000.00 | $1,065.90 | $2.52 | |
| Hypothetical-C | $1,000.00 | $1,022.49 | $2.47 | |
| Class Z | .38% | |||
| Actual | $1,000.00 | $1,066.20 | $1.96 | |
| Hypothetical-C | $1,000.00 | $1,023.04 | $1.92 |
A Annualized expense ratio reflects expenses net of applicable fee waivers.
B Expenses are equal to each Class' annualized expense ratio, multiplied by the average account value over the period, multiplied by 182/365 (to reflect the one-half year period).
C 5% return per year before expenses
Board Approval of Investment Advisory Contracts and Management Fees
Fidelity Convertible Securities Fund
Each year, the Board of Trustees, including the Independent Trustees (together, the Board), votes on the renewal of the management contract with Fidelity Management & Research Company (FMR) and the sub-advisory agreements (together, the Advisory Contracts) for the fund. FMR and the sub-advisers are referred to herein as the Investment Advisers. The Board, assisted by the advice of fund counsel and Independent Trustees' counsel, requests and considers a broad range of information relevant to the renewal of the Advisory Contracts throughout the year.
The Board meets regularly and, at each of its meetings, covers an extensive agenda of topics and materials and considers factors that are relevant to its annual consideration of the renewal of the fund's Advisory Contracts, including the services and support provided to the fund and its shareholders. The Board has established various standing committees (Committees), each composed of and chaired by Independent Trustees with varying backgrounds, to which the Board has assigned specific subject matter responsibilities in order to enhance effective decision-making by the Board. The Board, acting directly and through its Committees, requests and receives information concerning the annual consideration of the renewal of the fund's Advisory Contracts. The Board also meets as needed to review matters specifically related to the Board's annual consideration of the renewal of the Advisory Contracts. Members of the Board may also meet with trustees of other Fidelity funds through joint ad hoc committees to discuss certain matters relevant to all of the Fidelity funds.
At its January 2019 meeting, the Board unanimously determined to renew the fund's Advisory Contracts. In reaching its determination, the Board considered all factors it believed relevant, including (i) the nature, extent, and quality of the services to be provided to the fund and its shareholders (including the investment performance of the fund); (ii) the competitiveness of the fund's management fee and total expense ratio relative to peer funds; (iii) the total costs of the services to be provided by and the profits to be realized by Fidelity from its relationships with the fund; and (iv) the extent to which, if any, economies of scale exist and would be realized as the fund grows, and whether any economies of scale are appropriately shared with fund shareholders.
In considering whether to renew the Advisory Contracts for the fund, the Board reached a determination, with the assistance of fund counsel and Independent Trustees' counsel and through the exercise of its business judgment, that the renewal of the Advisory Contracts was in the best interests of the fund and its shareholders and that the compensation payable under the Advisory Contracts was fair and reasonable. The Board's decision to renew the Advisory Contracts was not based on any single factor, but rather was based on a comprehensive consideration of all the information provided to the Board at its meetings throughout the year. The Board, in reaching its determination to renew the Advisory Contracts, was aware that shareholders of the fund have a broad range of investment choices available to them, including a wide choice among funds offered by Fidelity's competitors, and that the fund's shareholders, who have the opportunity to review and weigh the disclosure provided by the fund in its prospectus and other public disclosures, have chosen to invest in this fund, which is part of the Fidelity family of funds.
Nature, Extent, and Quality of Services Provided. The Board considered Fidelity's staffing as it relates to the fund, including the backgrounds of investment personnel of Fidelity, and also considered the fund's investment objective, strategies, and related investment philosophy. The Independent Trustees also had discussions with senior management of Fidelity's investment operations and investment groups. The Board considered the structure of the investment personnel compensation program and whether this structure provides appropriate incentives to act in the best interests of the fund. Additionally, the Board considered the portfolio managers' investments, if any, in the funds that they manage.Resources Dedicated to Investment Management and Support Services. The Board and the Fund Oversight and Research Committees reviewed the general qualifications and capabilities of Fidelity's investment staff, including its size, education, experience, and resources, as well as Fidelity's approach to recruiting, training, managing, and compensating investment personnel. The Board noted that Fidelity has continued to increase the resources devoted to non-U.S. offices, including expansion of Fidelity's global investment organization. The Board also noted that Fidelity's analysts have extensive resources, tools and capabilities that allow them to conduct sophisticated quantitative and fundamental analysis, as well as credit analysis of issuers, counterparties and guarantors. Further, the Board considered that Fidelity's investment professionals have sufficient access to global information and data so as to provide competitive investment results over time, and that those professionals also have access to sophisticated tools that permit them to assess portfolio construction and risk and performance attribution characteristics continuously, as well as to transmit new information and research conclusions rapidly around the world. Additionally, in its deliberations, the Board considered Fidelity's trading, risk management, compliance, and technology and operations capabilities and resources, which are integral parts of the investment management process.Shareholder and Administrative Services. The Board considered (i) the nature, extent, quality, and cost of advisory, administrative, and shareholder services performed by the Investment Advisers and their affiliates under the Advisory Contracts and under separate agreements covering transfer agency, pricing and bookkeeping, and securities lending services for the fund; (ii) the nature and extent of the supervision of third party service providers, principally custodians, subcustodians, and pricing vendors; and (iii) the resources devoted to, and the record of compliance with, the fund's compliance policies and procedures. The Board also reviewed the allocation of fund brokerage, including allocations to brokers affiliated with the Investment Advisers, the use of brokerage commissions to pay fund expenses, and the use of "soft" commission dollars to pay for research services.The Board noted that the growth of fund assets over time across the complex allows Fidelity to reinvest in the development of services designed to enhance the value and convenience of the Fidelity funds as investment vehicles. These services include 24-hour access to account information and market information through telephone representatives and over the Internet, investor education materials and asset allocation tools, and the expanded availability of Fidelity Investor Centers.The Board noted that it and the boards of certain other Fidelity funds had formed an ad hoc Committee on Transfer Agency Fees to review the variety of transfer agency fee structures throughout the industry and Fidelity's competitive positioning with respect to industry participants.Investment in a Large Fund Family. The Board considered the benefits to shareholders of investing in a Fidelity fund, including the benefits of investing in a fund that is part of a large family of funds offering a variety of investment disciplines and providing a large variety of mutual fund investor services. The Board noted that Fidelity had taken, or had made recommendations that resulted in the Fidelity funds taking, a number of actions over the previous year that benefited particular funds, including: (i) continuing to dedicate additional resources to Fidelity's investment research process, which includes meetings with management of issuers of securities in which the funds invest, and to the support of the senior management team that oversees asset management; (ii) continuing efforts to enhance Fidelity's global research capabilities; (iii) launching new funds and making other enhancements to meet client needs; (iv) launching new share classes of existing funds; (v) eliminating purchase minimums and broadening eligibility requirements for certain funds and share classes; (vi) reducing management fees and total expenses for certain growth equity funds and index funds; (vii) lowering expense caps for certain existing funds and classes, and converting certain voluntary expense caps to contractual caps, to reduce expenses borne by shareholders; (viii) eliminating short-term redemption fees for funds that had such fees; (ix) rationalizing product lines and gaining increased efficiencies from fund mergers and share class consolidations; (x) continuing to develop, acquire and implement systems and technology to improve services to the funds and shareholders, strengthen information security, and increase efficiency; and (xi) continuing to implement enhancements to further strengthen Fidelity's product line to increase investors' probability of success in achieving their investment goals, including retirement income goals.Investment Performance. The Board considered whether the fund has operated in accordance with its investment objective, as well as its record of compliance with its investment restrictions and its performance history. The fund had a portfolio manager change in May 2016. The Board will continue to monitor closely the fund's performance, taking into account the portfolio manager changes.The Board took into account discussions that occur at Board meetings throughout the year with representatives of the Investment Advisers about fund investment performance. In this regard the Board noted that as part of regularly scheduled fund reviews and other reports to the Board on fund performance, the Board considers annualized return information for the fund for different time periods, measured against an appropriate securities market index ("benchmark index") and a peer group of funds with similar objectives ("peer group"), if any. In its evaluation of fund investment performance, the Board gave particular attention to information indicating changes in performance of certain Fidelity funds for specific time periods and discussed with the Investment Advisers the reasons for any overperformance or underperformance.In addition to reviewing absolute and relative fund performance, the Independent Trustees periodically consider the appropriateness of fund performance metrics in evaluating the results achieved. In general, the Independent Trustees believe that fund performance should be evaluated based on net performance (after fees and expenses) of both the highest performing and lowest performing fund share classes, where applicable, compared to appropriate benchmark indices, over appropriate time periods that may include full market cycles, and compared to peer groups, as applicable, over the same periods, taking into account relevant factors including the following: general market conditions; issuer-specific information; and fund cash flows and other factors.The Independent Trustees recognize that shareholders evaluate performance on a net basis over their own holding periods, for which one-, three-, and five-year periods are often used as a proxy. For this reason, the performance information reviewed by the Board also included net cumulative total return information for the fund and an appropriate benchmark index and peer group for the most recent one-, three-, and five-year periods ended June 30, 2018, as shown below. Returns are shown compared to the 25th percentile (top of box, 75% beaten) and 75th percentile (bottom of box, 25% beaten) of the peer universe.Fidelity Convertible Securities Fund

Fidelity Convertible Securities Fund
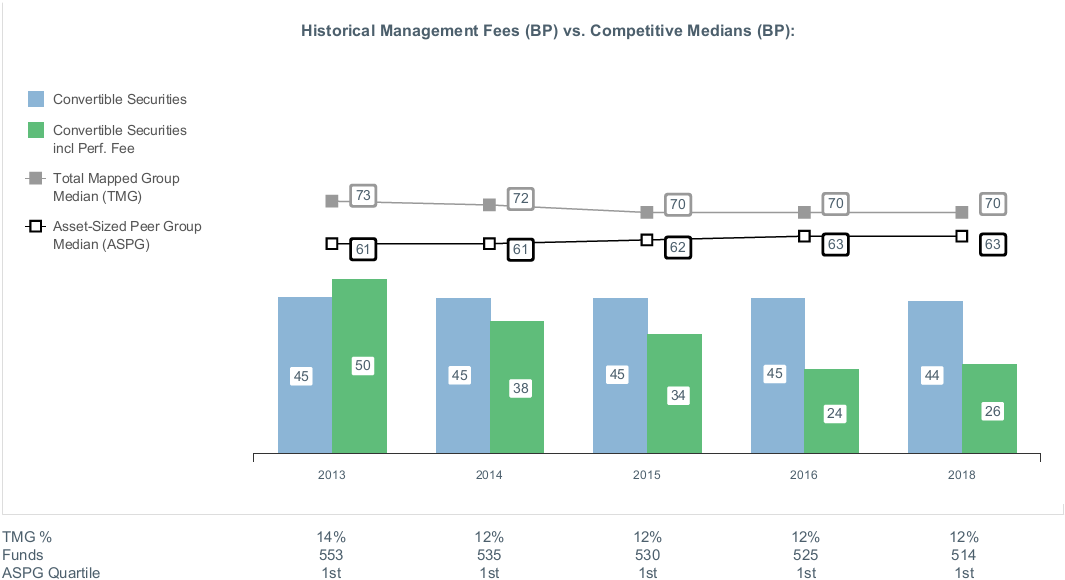
![]()
CVS-SANN-0719
1.704534.121
Fidelity® Equity Dividend Income Fund Semi-Annual Report May 31, 2019 |
|
Beginning on January 1, 2021, as permitted by regulations adopted by the Securities and Exchange Commission, paper copies of a fund’s shareholder reports will no longer be sent by mail, unless you specifically request paper copies of the reports from the fund or from your financial intermediary, such as a financial advisor, broker-dealer or bank. Instead, the reports will be made available on a website, and you will be notified by mail each time a report is posted and provided with a website link to access the report.
If you already elected to receive shareholder reports electronically, you will not be affected by this change and you need not take any action. You may elect to receive shareholder reports and other communications from a fund electronically, by contacting your financial intermediary. For Fidelity customers, visit Fidelity's web site or call Fidelity using the contact information listed below.
You may elect to receive all future reports in paper free of charge. If you wish to continue receiving paper copies of your shareholder reports, you may contact your financial intermediary or, if you are a Fidelity customer, visit Fidelity’s website, or call Fidelity at the applicable toll-free number listed below. Your election to receive reports in paper will apply to all funds held with the fund complex/your financial intermediary.
| Account Type | Website | Phone Number |
| Brokerage, Mutual Fund, or Annuity Contracts: | fidelity.com/mailpreferences | 1-800-343-3548 |
| Employer Provided Retirement Accounts: | netbenefits.fidelity.com/preferences (choose 'no' under Required Disclosures to continue to print) | 1-800-343-0860 |
| Advisor Sold Accounts Serviced Through Your Financial Intermediary: | Contact Your Financial Intermediary | Your Financial Intermediary's phone number |
| Advisor Sold Accounts Serviced by Fidelity: | institutional.fidelity.com | 1-877-208-0098 |
Contents
Board Approval of Investment Advisory Contracts and Management Fees |
To view a fund's proxy voting guidelines and proxy voting record for the 12-month period ended June 30, visit http://www.fidelity.com/proxyvotingresults or visit the Securities and Exchange Commission's (SEC) web site at http://www.sec.gov.
You may also call 1-800-544-8544 if you’re an individual investing directly with Fidelity, call 1-800-835-5092 if you’re a plan sponsor or participant with Fidelity as your recordkeeper or call 1-877-208-0098 on institutional accounts or if you’re an advisor or invest through one to request a free copy of the proxy voting guidelines.
Standard & Poor's, S&P and S&P 500 are registered service marks of The McGraw-Hill Companies, Inc. and have been licensed for use by Fidelity Distributors Corporation.
Other third-party marks appearing herein are the property of their respective owners.
All other marks appearing herein are registered or unregistered trademarks or service marks of FMR LLC or an affiliated company. © 2019 FMR LLC. All rights reserved.
This report and the financial statements contained herein are submitted for the general information of the shareholders of the Fund. This report is not authorized for distribution to prospective investors in the Fund unless preceded or accompanied by an effective prospectus.
A fund files its complete schedule of portfolio holdings with the SEC for the first and third quarters of each fiscal year on Form N-PORT. Forms N-PORT are available on the SEC’s web site at http://www.sec.gov. A fund's Forms N-PORT may be reviewed and copied at the SEC’s Public Reference Room in Washington, DC. Information regarding the operation of the SEC's Public Reference Room may be obtained by calling 1-800-SEC-0330.
For a complete list of a fund's portfolio holdings, view the most recent holdings listing, semiannual report, or annual report on Fidelity's web site at http://www.fidelity.com, http://www.institutional.fidelity.com, or http://www.401k.com, as applicable.
NOT FDIC INSURED •MAY LOSE VALUE •NO BANK GUARANTEE
Neither the Fund nor Fidelity Distributors Corporation is a bank.
Investment Summary (Unaudited)
Top Ten Stocks as of May 31, 2019
| % of fund's net assets | |
| Chevron Corp. | 3.6 |
| Wells Fargo & Co. | 3.4 |
| Verizon Communications, Inc. | 3.1 |
| Comcast Corp. Class A | 2.9 |
| United Technologies Corp. | 2.6 |
| General Dynamics Corp. | 2.3 |
| UnitedHealth Group, Inc. | 2.1 |
| Johnson & Johnson | 2.1 |
| Bank of America Corp. | 1.9 |
| Chubb Ltd. | 1.9 |
| 25.9 |
Top Five Market Sectors as of May 31, 2019
| % of fund's net assets | |
| Financials | 20.4 |
| Health Care | 14.4 |
| Communication Services | 11.4 |
| Energy | 9.3 |
| Industrials | 8.8 |
Asset Allocation (% of fund's net assets)
| As of May 31, 2019* | ||
| Stocks | 96.9% | |
| Short-Term Investments and Net Other Assets (Liabilities) | 3.1% | |

* Foreign investments - 16.8%
Schedule of Investments May 31, 2019 (Unaudited)
Showing Percentage of Net Assets
| Common Stocks - 96.9% | |||
| Shares | Value (000s) | ||
| COMMUNICATION SERVICES - 11.4% | |||
| Diversified Telecommunication Services - 3.5% | |||
| AT&T, Inc. | 580,080 | $17,739 | |
| Verizon Communications, Inc. | 2,763,700 | 150,207 | |
| 167,946 | |||
| Entertainment - 2.0% | |||
| Cinemark Holdings, Inc. | 887,400 | 33,712 | |
| The Walt Disney Co. | 450,300 | 59,458 | |
| 93,170 | |||
| Media - 5.9% | |||
| Comcast Corp. Class A | 3,337,400 | 136,833 | |
| Informa PLC | 3,614,601 | 35,489 | |
| Interpublic Group of Companies, Inc. | 2,026,100 | 42,994 | |
| Omnicom Group, Inc. | 851,400 | 65,864 | |
| 281,180 | |||
| TOTAL COMMUNICATION SERVICES | 542,296 | ||
| CONSUMER DISCRETIONARY - 3.3% | |||
| Automobiles - 0.5% | |||
| Subaru Corp. | 1,010,100 | 23,341 | |
| Hotels, Restaurants & Leisure - 1.2% | |||
| Six Flags Entertainment Corp. | 543,100 | 26,807 | |
| Wyndham Destinations, Inc. | 793,300 | 31,557 | |
| 58,364 | |||
| Household Durables - 0.4% | |||
| Whirlpool Corp. | 169,100 | 19,426 | |
| Textiles, Apparel & Luxury Goods - 1.2% | |||
| Rattler Midstream LP | 259,700 | 4,862 | |
| Tapestry, Inc. | 1,741,200 | 49,729 | |
| 54,591 | |||
| TOTAL CONSUMER DISCRETIONARY | 155,722 | ||
| CONSUMER STAPLES - 8.6% | |||
| Beverages - 0.6% | |||
| Molson Coors Brewing Co. Class B | 540,500 | 29,717 | |
| Food & Staples Retailing - 1.0% | |||
| Kroger Co. | 1,294,900 | 29,537 | |
| Sysco Corp. | 224,200 | 15,429 | |
| 44,966 | |||
| Food Products - 2.3% | |||
| General Mills, Inc. | 1,184,350 | 58,554 | |
| The J.M. Smucker Co. | 424,100 | 51,554 | |
| 110,108 | |||
| Household Products - 0.8% | |||
| Reckitt Benckiser Group PLC | 482,900 | 38,760 | |
| Personal Products - 0.7% | |||
| Unilever NV (NY Reg.) | 565,700 | 34,010 | |
| Tobacco - 3.2% | |||
| Altria Group, Inc. | 749,200 | 36,756 | |
| British American Tobacco PLC sponsored ADR | 2,621,500 | 90,887 | |
| Imperial Tobacco Group PLC | 877,537 | 21,246 | |
| 148,889 | |||
| TOTAL CONSUMER STAPLES | 406,450 | ||
| ENERGY - 9.3% | |||
| Oil, Gas & Consumable Fuels - 9.3% | |||
| BP PLC sponsored ADR | 1,285,100 | 52,329 | |
| Chevron Corp. | 1,492,570 | 169,929 | |
| Enterprise Products Partners LP | 2,037,600 | 56,829 | |
| Suncor Energy, Inc. | 1,310,300 | 40,377 | |
| Targa Resources Corp. | 300,200 | 11,546 | |
| The Williams Companies, Inc. | 2,540,800 | 67,026 | |
| Valero Energy Corp. | 633,300 | 44,584 | |
| 442,620 | |||
| FINANCIALS - 20.4% | |||
| Banks - 10.0% | |||
| Bank of America Corp. | 3,481,300 | 92,603 | |
| Bank OZK | 1,109,600 | 32,067 | |
| BB&T Corp. | 809,400 | 37,839 | |
| First Hawaiian, Inc. | 750,200 | 18,672 | |
| Huntington Bancshares, Inc. | 2,929,300 | 37,056 | |
| JPMorgan Chase & Co. | 219,422 | 23,250 | |
| PNC Financial Services Group, Inc. | 553,200 | 70,400 | |
| Wells Fargo & Co. | 3,649,908 | 161,946 | |
| 473,833 | |||
| Capital Markets - 3.2% | |||
| Apollo Global Management LLC Class A | 1,937,300 | 56,976 | |
| Lazard Ltd. Class A | 994,400 | 30,986 | |
| Northern Trust Corp. | 355,900 | 30,437 | |
| OM Asset Management Ltd. | 360,500 | 3,872 | |
| State Street Corp. | 521,000 | 28,785 | |
| 151,056 | |||
| Consumer Finance - 1.9% | |||
| Capital One Financial Corp. | 712,800 | 61,208 | |
| Synchrony Financial | 809,700 | 27,230 | |
| 88,438 | |||
| Insurance - 4.4% | |||
| Chubb Ltd. | 623,479 | 91,072 | |
| FNF Group | 702,400 | 27,078 | |
| Principal Financial Group, Inc. | 570,100 | 29,400 | |
| The Travelers Companies, Inc. | 412,300 | 60,019 | |
| 207,569 | |||
| Mortgage Real Estate Investment Trusts - 0.9% | |||
| AGNC Investment Corp. | 1,581,100 | 25,930 | |
| Starwood Property Trust, Inc. | 884,600 | 19,505 | |
| 45,435 | |||
| TOTAL FINANCIALS | 966,331 | ||
| HEALTH CARE - 14.4% | |||
| Biotechnology - 0.9% | |||
| Amgen, Inc. | 271,200 | 45,209 | |
| Health Care Equipment & Supplies - 0.9% | |||
| Becton, Dickinson & Co. | 182,700 | 42,649 | |
| Health Care Providers & Services - 6.0% | |||
| AmerisourceBergen Corp. | 449,900 | 35,029 | |
| Anthem, Inc. | 60,000 | 16,679 | |
| CVS Health Corp. | 935,826 | 49,009 | |
| McKesson Corp. | 344,800 | 42,114 | |
| Quest Diagnostics, Inc. | 415,600 | 39,860 | |
| UnitedHealth Group, Inc. | 414,900 | 100,323 | |
| 283,014 | |||
| Pharmaceuticals - 6.6% | |||
| Bristol-Myers Squibb Co. | 1,593,500 | 72,297 | |
| GlaxoSmithKline PLC | 1,912,875 | 36,930 | |
| Johnson & Johnson | 757,266 | 99,315 | |
| Roche Holding AG (participation certificate) | 170,997 | 44,913 | |
| Sanofi SA sponsored ADR | 1,419,900 | 57,407 | |
| 310,862 | |||
| TOTAL HEALTH CARE | 681,734 | ||
| INDUSTRIALS - 8.8% | |||
| Aerospace & Defense - 5.3% | |||
| General Dynamics Corp. | 682,200 | 109,711 | |
| Northrop Grumman Corp. | 59,500 | 18,043 | |
| United Technologies Corp. | 968,730 | 122,351 | |
| 250,105 | |||
| Industrial Conglomerates - 1.2% | |||
| General Electric Co. | 5,890,697 | 55,608 | |
| Machinery - 1.5% | |||
| Allison Transmission Holdings, Inc. | 285,900 | 11,833 | |
| Deere & Co. | 173,700 | 24,348 | |
| Stanley Black & Decker, Inc. | 262,600 | 33,408 | |
| 69,589 | |||
| Professional Services - 0.6% | |||
| Intertrust NV (a) | 1,623,500 | 30,760 | |
| Road & Rail - 0.2% | |||
| Union Pacific Corp. | 66,600 | 11,108 | |
| TOTAL INDUSTRIALS | 417,170 | ||
| INFORMATION TECHNOLOGY - 7.3% | |||
| Communications Equipment - 0.5% | |||
| Cisco Systems, Inc. | 448,400 | 23,330 | |
| Electronic Equipment & Components - 0.5% | |||
| TE Connectivity Ltd. | 275,300 | 23,189 | |
| IT Services - 4.1% | |||
| Amdocs Ltd. | 1,388,100 | 82,481 | |
| Capgemini SA | 467,600 | 52,290 | |
| Cognizant Technology Solutions Corp. Class A | 549,000 | 34,000 | |
| Sabre Corp. | 1,224,000 | 24,823 | |
| 193,594 | |||
| Semiconductors & Semiconductor Equipment - 0.5% | |||
| Qualcomm, Inc. | 329,451 | 22,014 | |
| Software - 1.3% | |||
| Citrix Systems, Inc. | 128,700 | 12,113 | |
| Microsoft Corp. | 396,426 | 49,030 | |
| 61,143 | |||
| Technology Hardware, Storage & Peripherals - 0.4% | |||
| Apple, Inc. | 122,200 | 21,394 | |
| TOTAL INFORMATION TECHNOLOGY | 344,664 | ||
| MATERIALS - 3.7% | |||
| Chemicals - 1.6% | |||
| Dow, Inc. (b) | 387,332 | 18,112 | |
| DowDuPont, Inc. | 1,536,598 | 46,897 | |
| Westlake Chemical Corp. | 208,700 | 11,956 | |
| 76,965 | |||
| Containers & Packaging - 2.1% | |||
| Graphic Packaging Holding Co. | 4,097,100 | 53,262 | |
| Silgan Holdings, Inc. | 653,200 | 18,936 | |
| WestRock Co. | 830,931 | 27,088 | |
| 99,286 | |||
| TOTAL MATERIALS | 176,251 | ||
| REAL ESTATE - 3.8% | |||
| Equity Real Estate Investment Trusts (REITs) - 3.8% | |||
| Brandywine Realty Trust (SBI) | 2,007,700 | 30,336 | |
| CorePoint Lodging, Inc. | 632,800 | 7,670 | |
| Corporate Office Properties Trust (SBI) | 953,400 | 26,543 | |
| Potlatch Corp. | 1,103,300 | 37,126 | |
| SL Green Realty Corp. | 414,700 | 35,664 | |
| VEREIT, Inc. | 5,029,000 | 44,658 | |
| 181,997 | |||
| UTILITIES - 5.9% | |||
| Electric Utilities - 4.3% | |||
| Duke Energy Corp. | 862,400 | 73,830 | |
| Exelon Corp. | 1,848,200 | 88,861 | |
| PPL Corp. | 1,373,300 | 40,869 | |
| 203,560 | |||
| Independent Power and Renewable Electricity Producers - 0.4% | |||
| NRG Yield, Inc. Class C | 1,132,300 | 16,985 | |
| Multi-Utilities - 1.2% | |||
| CenterPoint Energy, Inc. | 2,063,300 | 58,680 | |
| TOTAL UTILITIES | 279,225 | ||
| TOTAL COMMON STOCKS | |||
| (Cost $4,446,312) | 4,594,460 | ||
| Money Market Funds - 3.1% | |||
| Fidelity Cash Central Fund 2.41% (c) | |||
| (Cost $145,839) | 145,809,575 | 145,839 | |
| TOTAL INVESTMENT IN SECURITIES - 100.0% | |||
| (Cost $4,592,151) | 4,740,299 | ||
| NET OTHER ASSETS (LIABILITIES) - 0.0% | 842 | ||
| NET ASSETS - 100% | $4,741,141 |
Legend
(a) Security exempt from registration under Rule 144A of the Securities Act of 1933. These securities may be resold in transactions exempt from registration, normally to qualified institutional buyers. At the end of the period, the value of these securities amounted to $30,760,000 or 0.6% of net assets.
(b) Non-income producing
(c) Affiliated fund that is generally available only to investment companies and other accounts managed by Fidelity Investments. The rate quoted is the annualized seven-day yield of the fund at period end. A complete unaudited listing of the fund's holdings as of its most recent quarter end is available upon request. In addition, each Fidelity Central Fund's financial statements are available on the SEC's website or upon request.
Affiliated Central Funds
Information regarding fiscal year to date income earned by the Fund from investments in Fidelity Central Funds is as follows:
| Fund | Income earned |
| (Amounts in thousands) | |
| Fidelity Cash Central Fund | $1,262 |
| Fidelity Securities Lending Cash Central Fund | 5 |
| Total | $1,267 |
Amounts in the income column in the above table include any capital gain distributions from underlying funds, which are presented in the corresponding line-item in the Statement of Operations, if applicable.
Investment Valuation
The following is a summary of the inputs used, as of May 31, 2019, involving the Fund's assets and liabilities carried at fair value. The inputs or methodology used for valuing securities may not be an indication of the risk associated with investing in those securities. For more information on valuation inputs, and their aggregation into the levels used below, please refer to the Investment Valuation section in the accompanying Notes to Financial Statements.
| Valuation Inputs at Reporting Date: | ||||
| Description | Total | Level 1 | Level 2 | Level 3 |
| (Amounts in thousands) | ||||
| Investments in Securities: | ||||
| Equities: | ||||
| Communication Services | $542,296 | $542,296 | $-- | $-- |
| Consumer Discretionary | 155,722 | 132,381 | 23,341 | -- |
| Consumer Staples | 406,450 | 367,690 | 38,760 | -- |
| Energy | 442,620 | 442,620 | -- | -- |
| Financials | 966,331 | 966,331 | -- | -- |
| Health Care | 681,734 | 599,891 | 81,843 | -- |
| Industrials | 417,170 | 417,170 | -- | -- |
| Information Technology | 344,664 | 344,664 | -- | -- |
| Materials | 176,251 | 176,251 | -- | -- |
| Real Estate | 181,997 | 181,997 | -- | -- |
| Utilities | 279,225 | 279,225 | -- | -- |
| Money Market Funds | 145,839 | 145,839 | -- | -- |
| Total Investments in Securities: | $4,740,299 | $4,596,355 | $143,944 | $-- |
Other Information
Distribution of investments by country or territory of incorporation, as a percentage of Total Net Assets, is as follows (Unaudited):
| United States of America | 83.2% |
| United Kingdom | 5.9% |
| Switzerland | 3.4% |
| France | 2.3% |
| Bailiwick of Guernsey | 1.8% |
| Netherlands | 1.3% |
| Others (Individually Less Than 1%) | 2.1% |
| 100.0% |
See accompanying notes which are an integral part of the financial statements.
Financial Statements
Statement of Assets and Liabilities
| Amounts in thousands (except per-share amounts) | May 31, 2019 (Unaudited) | |
| Assets | ||
| Investment in securities, at value — See accompanying schedule: Unaffiliated issuers (cost $4,446,312) | $4,594,460 | |
| Fidelity Central Funds (cost $145,839) | 145,839 | |
| Total Investment in Securities (cost $4,592,151) | $4,740,299 | |
| Cash | 138 | |
| Foreign currency held at value (cost $679) | 679 | |
| Receivable for investments sold | 30,221 | |
| Receivable for fund shares sold | 928 | |
| Dividends receivable | 15,831 | |
| Distributions receivable from Fidelity Central Funds | 302 | |
| Prepaid expenses | 1 | |
| Other receivables | 83 | |
| Total assets | 4,788,482 | |
| Liabilities | ||
| Payable for investments purchased | $41,275 | |
| Payable for fund shares redeemed | 3,556 | |
| Accrued management fee | 1,802 | |
| Other affiliated payables | 662 | |
| Other payables and accrued expenses | 46 | |
| Total liabilities | 47,341 | |
| Net Assets | $4,741,141 | |
| Net Assets consist of: | ||
| Paid in capital | $4,435,371 | |
| Total distributable earnings (loss) | 305,770 | |
| Net Assets | $4,741,141 | |
| Net Asset Value and Maximum Offering Price | ||
| Equity Dividend Income: | ||
| Net Asset Value, offering price and redemption price per share ($4,553,300 �� 192,159 shares) | $23.70 | |
| Class K: | ||
| Net Asset Value, offering price and redemption price per share ($187,841 ÷ 7,928 shares) | $23.69 |
See accompanying notes which are an integral part of the financial statements.
Statement of Operations
| Amounts in thousands | Six months ended May 31, 2019 (Unaudited) | |
| Investment Income | ||
| Dividends | $79,161 | |
| Income from Fidelity Central Funds | 1,267 | |
| Total income | 80,428 | |
| Expenses | ||
| Management fee | $10,664 | |
| Transfer agent fees | 3,371 | |
| Accounting and security lending fees | 538 | |
| Custodian fees and expenses | 39 | |
| Independent trustees' fees and expenses | 13 | |
| Registration fees | 47 | |
| Audit | 39 | |
| Legal | 7 | |
| Miscellaneous | 21 | |
| Total expenses before reductions | 14,739 | |
| Expense reductions | (88) | |
| Total expenses after reductions | 14,651 | |
| Net investment income (loss) | 65,777 | |
| Realized and Unrealized Gain (Loss) | ||
| Net realized gain (loss) on: | ||
| Investment securities: | ||
| Unaffiliated issuers | 156,847 | |
| Fidelity Central Funds | 5 | |
| Foreign currency transactions | (63) | |
| Total net realized gain (loss) | 156,789 | |
| Change in net unrealized appreciation (depreciation) on: | ||
| Investment securities: | ||
| Unaffiliated issuers | (304,604) | |
| Assets and liabilities in foreign currencies | 15 | |
| Total change in net unrealized appreciation (depreciation) | (304,589) | |
| Net gain (loss) | (147,800) | |
| Net increase (decrease) in net assets resulting from operations | $(82,023) |
See accompanying notes which are an integral part of the financial statements.
Statement of Changes in Net Assets
| Amounts in thousands | Six months ended May 31, 2019 (Unaudited) | Year ended November 30, 2018 |
| Increase (Decrease) in Net Assets | ||
| Operations | ||
| Net investment income (loss) | $65,777 | $129,318 |
| Net realized gain (loss) | 156,789 | 480,864 |
| Change in net unrealized appreciation (depreciation) | (304,589) | (552,742) |
| Net increase (decrease) in net assets resulting from operations | (82,023) | 57,440 |
| Distributions to shareholders | (525,180) | (534,622) |
| Share transactions - net increase (decrease) | 246,160 | (6,630) |
| Total increase (decrease) in net assets | (361,043) | (483,812) |
| Net Assets | ||
| Beginning of period | 5,102,184 | 5,585,996 |
| End of period | $4,741,141 | $5,102,184 |
See accompanying notes which are an integral part of the financial statements.
Financial Highlights
Fidelity Equity Dividend Income Fund
| Six months ended (Unaudited) May 31, | Years endedNovember 30, | |||||
| 2019 | 2018 | 2017 | 2016 | 2015 | 2014 | |
| Selected Per–Share Data | ||||||
| Net asset value, beginning of period | $27.18 | $29.62 | $27.50 | $26.01 | $26.99 | $24.15 |
| Income from Investment Operations | ||||||
| Net investment income (loss)A | .33 | .66 | .65 | .57 | .64 | .70B |
| Net realized and unrealized gain (loss) | (1.00) | (.27) | 3.20 | 2.26 | (.95)C | 2.77 |
| Total from investment operations | (.67) | .39 | 3.85 | 2.83 | (.31) | 3.47 |
| Distributions from net investment income | (.32) | (.66) | (.63) | (.51) | (.58) | (.63) |
| Distributions from net realized gain | (2.49) | (2.18) | (1.10) | (.83) | (.08) | – |
| Total distributions | (2.81) | (2.83)D | (1.73) | (1.34) | (.67)E | (.63) |
| Net asset value, end of period | $23.70 | $27.18 | $29.62 | $27.50 | $26.01 | $26.99 |
| Total ReturnF,G | (1.47)% | 1.28% | 14.61% | 11.60% | (1.13)%C | 14.60% |
| Ratios to Average Net AssetsH,I | ||||||
| Expenses before reductions | .61%J | .61% | .62% | .63% | .63% | .63% |
| Expenses net of fee waivers, if any | .61%J | .61% | .62% | .63% | .63% | .63% |
| Expenses net of all reductions | .61%J | .60% | .61% | .62% | .62% | .63% |
| Net investment income (loss) | 2.70%J | 2.39% | 2.35% | 2.23% | 2.42% | 2.78%B |
| Supplemental Data | ||||||
| Net assets, end of period (in millions) | $4,553 | $4,882 | $5,351 | $5,296 | $4,819 | $5,253 |
| Portfolio turnover rateK | 44%J | 56% | 52% | 55% | 49% | 52% |
A Calculated based on average shares outstanding during the period.
B Net investment income per share reflects a large, non-recurring dividend which amounted to $.12 per share. Excluding this non-recurring dividend, the ratio of net investment income (loss) to average net assets would have been 2.31%.
C Net realized and unrealized gain (loss) per share reflects proceeds received from litigation which amounted to $.02 per share. Excluding these litigation proceeds, the total return would have been (1.22)%
D Total distributions of $2.83 per share is comprised of distributions from net investment income of $.658 and distributions from net realized gain of $2.176 per share.
E Total distributions of $.67 per share is comprised of distributions from net investment income of $.582 and distributions from net realized gain of $.084 per share.
F Total returns for periods of less than one year are not annualized.
G Total returns would have been lower if certain expenses had not been reduced during the applicable periods shown.
H Fees and expenses of any underlying Fidelity Central Funds are not included in the Fund's expense ratio. The Fund indirectly bears its proportionate share of the expenses of any underlying Fidelity Central Funds.
I Expense ratios reflect operating expenses of the class. Expenses before reductions do not reflect amounts reimbursed by the investment adviser or reductions from brokerage service arrangements or reductions from other expense offset arrangements and do not represent the amount paid by the class during periods when reimbursements or reductions occur. Expenses net of fee waivers reflect expenses after reimbursement by the investment adviser but prior to reductions from brokerage service arrangements or other expense offset arrangements. Expenses net of all reductions represent the net expenses paid by the class.
J Annualized
K Amount does not include the portfolio activity of any underlying Fidelity Central Funds.
See accompanying notes which are an integral part of the financial statements.
Fidelity Equity Dividend Income Fund Class K
| Six months ended (Unaudited) May 31, | Years endedNovember 30, | |||||
| 2019 | 2018 | 2017 | 2016 | 2015 | 2014 | |
| Selected Per–Share Data | ||||||
| Net asset value, beginning of period | $27.18 | $29.62 | $27.50 | $26.01 | $26.99 | $24.15 |
| Income from Investment Operations | ||||||
| Net investment income (loss)A | .34 | .69 | .68 | .59 | .67 | .73B |
| Net realized and unrealized gain (loss) | (1.00) | (.27) | 3.20 | 2.27 | (.96)C | 2.76 |
| Total from investment operations | (.66) | .42 | 3.88 | 2.86 | (.29) | 3.49 |
| Distributions from net investment income | (.33) | (.69) | (.66) | (.54) | (.61) | (.65) |
| Distributions from net realized gain | (2.49) | (2.18) | (1.10) | (.83) | (.08) | – |
| Total distributions | (2.83)D | (2.86)E | (1.76) | (1.37) | (.69) | (.65) |
| Net asset value, end of period | $23.69 | $27.18 | $29.62 | $27.50 | $26.01 | $26.99 |
| Total ReturnF,G | (1.46)% | 1.39% | 14.73% | 11.72% | (1.03)%C | 14.72% |
| Ratios to Average Net AssetsH,I | ||||||
| Expenses before reductions | .51%J | .51% | .52% | .52% | .52% | .52% |
| Expenses net of fee waivers, if any | .51%J | .51% | .52% | .52% | .52% | .52% |
| Expenses net of all reductions | .51%J | .50% | .51% | .52% | .52% | .52% |
| Net investment income (loss) | 2.80%J | 2.49% | 2.45% | 2.33% | 2.52% | 2.89%B |
| Supplemental Data | ||||||
| Net assets, end of period (in millions) | $188 | $220 | $235 | $298 | $277 | $394 |
| Portfolio turnover rateK | 44%J | 56% | 52% | 55% | 49% | 52% |
A Calculated based on average shares outstanding during the period.
B Net investment income per share reflects a large, non-recurring dividend which amounted to $.12 per share. Excluding this non-recurring dividend, the ratio of net investment income (loss) to average net assets would have been 2.42%.
C Net realized and unrealized gain (loss) per share reflects proceeds received from litigation which amounted to $.02 per share. Excluding these litigation proceeds, the total return would have been (1.12)%
D Total distributions of $2.83 per share is comprised of distributions from net investment income of $.334 and distributions from net realized gain of $2.491 per share.
E Total distributions of $2.86 per share is comprised of distributions from net investment income of $.686 and distributions from net realized gain of $2.176 per share.
F Total returns for periods of less than one year are not annualized.
G Total returns would have been lower if certain expenses had not been reduced during the applicable periods shown.
H Fees and expenses of any underlying Fidelity Central Funds are not included in the Fund's expense ratio. The Fund indirectly bears its proportionate share of the expenses of any underlying Fidelity Central Funds.
I Expense ratios reflect operating expenses of the class. Expenses before reductions do not reflect amounts reimbursed by the investment adviser or reductions from brokerage service arrangements or reductions from other expense offset arrangements and do not represent the amount paid by the class during periods when reimbursements or reductions occur. Expenses net of fee waivers reflect expenses after reimbursement by the investment adviser but prior to reductions from brokerage service arrangements or other expense offset arrangements. Expenses net of all reductions represent the net expenses paid by the class.
J Annualized
K Amount does not include the portfolio activity of any underlying Fidelity Central Funds.
See accompanying notes which are an integral part of the financial statements.
Notes to Financial Statements (Unaudited)
For the period ended May 31, 2019
(Amounts in thousands except percentages)
1. Organization.
Fidelity Equity Dividend Income Fund (the Fund) is a fund of Fidelity Financial Trust (the Trust) and is authorized to issue an unlimited number of shares. The Trust is registered under the Investment Company Act of 1940, as amended (the 1940 Act), as an open-end management investment company organized as a Massachusetts business trust. The Fund offers Equity Dividend Income and Class K shares, each of which has equal rights as to assets and voting privileges. Each class has exclusive voting rights with respect to matters that affect that class.
2. Investments in Fidelity Central Funds.
The Fund invests in Fidelity Central Funds, which are open-end investment companies generally available only to other investment companies and accounts managed by the investment adviser and its affiliates. The Fund's Schedule of Investments lists each of the Fidelity Central Funds held as of period end, if any, as an investment of the Fund, but does not include the underlying holdings of each Fidelity Central Fund. As an Investing Fund, the Fund indirectly bears its proportionate share of the expenses of the underlying Fidelity Central Funds.
The Money Market Central Funds seek preservation of capital and current income and are managed by Fidelity Investments Money Management, Inc. (FIMM), an affiliate of the investment adviser. Annualized expenses of the Money Market Central Funds as of their most recent shareholder report date ranged from less than .005% to .01%.
A complete unaudited list of holdings for each Fidelity Central Fund is available upon request or at the Securities and Exchange Commission (the SEC) website at www.sec.gov. In addition, the financial statements of the Fidelity Central Funds are available on the SEC website or upon request.
3. Significant Accounting Policies.
The Fund is an investment company and applies the accounting and reporting guidance of the Financial Accounting Standards Board (FASB) Accounting Standards Codification Topic 946 Financial Services – Investments Companies. The financial statements have been prepared in conformity with accounting principles generally accepted in the United States of America (GAAP), which require management to make certain estimates and assumptions at the date of the financial statements. Actual results could differ from those estimates. Subsequent events, if any, through the date that the financial statements were issued have been evaluated in the preparation of the financial statements. The following summarizes the significant accounting policies of the Fund:
Investment Valuation. Investments are valued as of 4:00 p.m. Eastern time on the last calendar day of the period. The Board of Trustees (the Board) has delegated the day to day responsibility for the valuation of the Fund's investments to the Fair Value Committee (the Committee) established by the Fund's investment adviser. In accordance with valuation policies and procedures approved by the Board, the Fund attempts to obtain prices from one or more third party pricing vendors or brokers to value its investments. When current market prices, quotations or currency exchange rates are not readily available or reliable, investments will be fair valued in good faith by the Committee, in accordance with procedures adopted by the Board. Factors used in determining fair value vary by investment type and may include market or investment specific events. The frequency with which these procedures are used cannot be predicted and they may be utilized to a significant extent. The Committee oversees the Fund's valuation policies and procedures and reports to the Board on the Committee's activities and fair value determinations. The Board monitors the appropriateness of the procedures used in valuing the Fund's investments and ratifies the fair value determinations of the Committee.
The Fund categorizes the inputs to valuation techniques used to value its investments into a disclosure hierarchy consisting of three levels as shown below:
- Level 1 – quoted prices in active markets for identical investments
- Level 2 – other significant observable inputs (including quoted prices for similar investments, interest rates, prepayment speeds, etc.)
- Level 3 – unobservable inputs (including the Fund's own assumptions based on the best information available)
Valuation techniques used to value the Fund's investments by major category are as follows:
Equity securities, including restricted securities, for which market quotations are readily available, are valued at the last reported sale price or official closing price as reported by a third party pricing vendor on the primary market or exchange on which they are traded and are categorized as Level 1 in the hierarchy. In the event there were no sales during the day or closing prices are not available, securities are valued at the last quoted bid price or may be valued using the last available price and are generally categorized as Level 2 in the hierarchy. For foreign equity securities, when market or security specific events arise, comparisons to the valuation of American Depositary Receipts (ADRs), futures contracts, Exchange-Traded Funds (ETFs) and certain indexes as well as quoted prices for similar securities may be used and would be categorized as Level 2 in the hierarchy. For equity securities, including restricted securities, where observable inputs are limited, assumptions about market activity and risk are used and these securities may be categorized as Level 3 in the hierarchy.
Investments in open-end mutual funds, including the Fidelity Central Funds, are valued at their closing net asset value (NAV) each business day and are categorized as Level 1 in the hierarchy.
Changes in valuation techniques may result in transfers in or out of an assigned level within the disclosure hierarchy. The aggregate value of investments by input level as of May 31, 2019 is included at the end of the Fund's Schedule of Investments.
Foreign Currency. The Fund may use foreign currency contracts to facilitate transactions in foreign-denominated securities. Gains and losses from these transactions may arise from changes in the value of the foreign currency or if the counterparties do not perform under the contracts' terms.
Foreign-denominated assets, including investment securities, and liabilities are translated into U.S. dollars at the exchange rates at period end. Purchases and sales of investment securities, income and dividends received and expenses denominated in foreign currencies are translated into U.S. dollars at the exchange rate in effect on the transaction date.
The effects of exchange rate fluctuations on investments are included with the net realized and unrealized gain (loss) on investment securities. Other foreign currency transactions resulting in realized and unrealized gain (loss) are disclosed separately.
Investment Transactions and Income. For financial reporting purposes, the Fund's investment holdings and NAV include trades executed through the end of the last business day of the period. The NAV per share for processing shareholder transactions is calculated as of the close of business of the New York Stock Exchange (NYSE), normally 4:00 p.m. Eastern time and includes trades executed through the end of the prior business day. Gains and losses on securities sold are determined on the basis of identified cost and include proceeds received from litigation. Dividend income is recorded on the ex-dividend date, except for certain dividends from foreign securities where the ex-dividend date may have passed, which are recorded as soon as the Fund is informed of the ex-dividend date. Non-cash dividends included in dividend income, if any, are recorded at the fair market value of the securities received. Income and capital gain distributions from Fidelity Central Funds, if any, are recorded on the ex-dividend date. Certain distributions received by the Fund represent a return of capital or capital gain. The Fund determines the components of these distributions subsequent to the ex-dividend date, based upon receipt of tax filings or other correspondence relating to the underlying investment. These distributions are recorded as a reduction of cost of investments and/or as a realized gain. Investment income is recorded net of foreign taxes withheld where recovery of such taxes is uncertain.
Class Allocations and Expenses. Investment income, realized and unrealized capital gains and losses, common expenses of the Fund, and certain fund-level expense reductions, if any, are allocated daily on a pro-rata basis to each class based on the relative net assets of each class to the total net assets of the Fund. Each class differs with respect to transfer agent fees incurred. Certain expense reductions may also differ by class. For the reporting period, the allocated portion of income and expenses to each class as a percent of its average net assets may vary due to the timing of recording these transactions in relation to fluctuating net assets of the classes. Expenses directly attributable to a fund are charged to that fund. Expenses attributable to more than one fund are allocated among the respective funds on the basis of relative net assets or other appropriate methods. Expense estimates are accrued in the period to which they relate and adjustments are made when actual amounts are known.
Income Tax Information and Distributions to Shareholders. Each year, the Fund intends to qualify as a regulated investment company under Subchapter M of the Internal Revenue Code, including distributing substantially all of its taxable income and realized gains. As a result, no provision for U.S. Federal income taxes is required. The Fund files a U.S. federal tax return, in addition to state and local tax returns as required. The Fund's federal income tax returns are subject to examination by the Internal Revenue Service (IRS) for a period of three fiscal years after they are filed. State and local tax returns may be subject to examination for an additional fiscal year depending on the jurisdiction. Foreign taxes are provided for based on the Fund's understanding of the tax rules and rates that exist in the foreign markets in which it invests.
Distributions are declared and recorded on the ex-dividend date. Income and capital gain distributions are declared separately for each class. Income and capital gain distributions are determined in accordance with income tax regulations, which may differ from GAAP.
Capital accounts within the financial statements are adjusted for permanent book-tax differences. These adjustments have no impact on net assets or the results of operations. Capital accounts are not adjusted for temporary book-tax differences which will reverse in a subsequent period.
Book-tax differences are primarily due to foreign currency transactions, partnerships, deferred trustees compensation and losses deferred due to wash sales.
As of period end, the cost and unrealized appreciation (depreciation) in securities, and derivatives if applicable, for federal income tax purposes were as follows:
| Gross unrealized appreciation | $520,675 |
| Gross unrealized depreciation | (391,448) |
| Net unrealized appreciation (depreciation) | $129,227 |
| Tax cost | $4,611,072 |
Restricted Securities. The Fund may invest in securities that are subject to legal or contractual restrictions on resale. These securities generally may be resold in transactions exempt from registration or to the public if the securities are registered. Disposal of these securities may involve time-consuming negotiations and expense, and prompt sale at an acceptable price may be difficult. Information regarding restricted securities is included at the end of the Fund's Schedule of Investments.
4. Purchases and Sales of Investments.
Purchases and sales of securities, other than short-term securities, aggregated $1,047,248 and $1,279,283, respectively.
5. Fees and Other Transactions with Affiliates.
Management Fee. Fidelity Management & Research Company (the investment adviser) and its affiliates provide the Fund with investment management related services for which the Fund pays a monthly management fee. The management fee is the sum of an individual fund fee rate that is based on an annual rate of .20% of the Fund's average net assets and an annualized group fee rate that averaged .24% during the period. The group fee rate is based upon the average net assets of all the mutual funds advised by the investment adviser, including any mutual funds previously advised by the investment adviser that are currently advised by Fidelity SelectCo, LLC, an affiliate of the investment adviser. The group fee rate decreases as assets under management increase and increases as assets under management decrease. For the reporting period, the total annualized management fee rate was .44% of the Fund's average net assets.
Transfer Agent Fees. Fidelity Investments Institutional Operations Company, Inc., (FIIOC), an affiliate of the investment adviser, is the transfer, dividend disbursing and shareholder servicing agent for each class of the Fund. FIIOC receives account fees and asset-based fees that vary according to the account size and type of account of the shareholders of Equity Dividend Income, except for Class K. FIIOC receives an asset-based fee of Class K's average net assets. FIIOC pays for typesetting, printing and mailing of shareholder reports, except proxy statements.
For the period, transfer agent fees for each class were as follows:
| Amount | % of Class-Level Average Net Assets(a) | |
| Equity Dividend Income | $3,326 | .14 |
| Class K | 45 | .05 |
| $3,371 |
(a) Annualized
Accounting and Security Lending Fees. Fidelity Service Company, Inc. (FSC), an affiliate of the investment adviser, maintains the Fund's accounting records. The accounting fee is based on the level of average net assets for each month. Prior to April 1, 2019, FSC had a separate agreement with the Fund for administration of the security lending program, based on the number and duration of lending transactions. For the period, the total fees paid for accounting and administration of securities lending were equivalent to an annualized rate of .02%.
Brokerage Commissions. The Fund placed a portion of its portfolio transactions with brokerage firms which are affiliates of the investment adviser. Brokerage commissions are included in net realized gain (loss) and change in net unrealized appreciation (depreciation) in the Statement of Operations. The commissions paid to these affiliated firms were $27 for the period.
Interfund Trades. The Fund may purchase from or sell securities to other Fidelity Funds under procedures adopted by the Board. The procedures have been designed to ensure these interfund trades are executed in accordance with Rule 17a-7 of the 1940 Act. Interfund trades are included within the respective purchases and sales amounts shown in the Purchases and Sales of Investments note.
6. Committed Line of Credit.
The Fund participates with other funds managed by the investment adviser or an affiliate in a $4.25 billion credit facility (the "line of credit") to be utilized for temporary or emergency purposes to fund shareholder redemptions or for other short-term liquidity purposes. The Fund has agreed to pay commitment fees on its pro-rata portion of the line of credit, which amounted to $7 and is reflected in Miscellaneous expenses on the Statement of Operations. During the period, the Fund did not borrow on this line of credit.
7. Security Lending.
The Fund lends portfolio securities through a lending agent from time to time in order to earn additional income. For equity securities, a lending agent is used and may loan securities to certain qualified borrowers, including Fidelity Capital Markets (FCM), a broker-dealer affiliated with the Fund. On the settlement date of the loan, the Fund receives collateral (in the form of U.S. Treasury obligations, letters of credit and/or cash) against the loaned securities and maintains collateral in an amount not less than 100% of the market value of the loaned securities during the period of the loan. The market value of the loaned securities is determined at the close of business of the Fund and any additional required collateral is delivered to the Fund on the next business day. The Fund or borrower may terminate the loan at any time, and if the borrower defaults on its obligation to return the securities loaned because of insolvency or other reasons, the Fund may apply collateral received from the borrower against the obligation. The Fund may experience delays and costs in recovering the securities loaned. Any cash collateral received is invested in the Fidelity Securities Lending Cash Central Fund. At period end, there were no security loans outstanding. Security lending income represents the income earned on investing cash collateral, less rebates paid to borrowers and any lending agent fees associated with the loan, plus any premium payments received for lending certain types of securities. Security lending income is presented in the Statement of Operations as a component of income from Fidelity Central Funds. Total security lending income during the period amounted to $5. During the period, there were no securities loaned to FCM.
8. Expense Reductions.
Commissions paid to certain brokers with whom the investment adviser, or its affiliates, places trades on behalf of the Fund include an amount in addition to trade execution, which may be rebated back to the Fund to offset certain expenses. This amount totaled $62 for the period. In addition, through arrangements with the Fund's custodian and each class' transfer agent, credits realized as a result of certain uninvested cash balances were used to reduce the Fund's expenses. During the period, these credits reduced the Fund's custody expenses by $1. During the period, credits reduced each class' transfer agent expense as noted in the table below.
| Transfer Agent expense reduction | |
| Equity Dividend Income | $6 |
In addition, during the period the investment adviser reimbursed and/or waived a portion of fund-level operating expenses in the amount of $19.
9. Distributions to Shareholders.
Distributions to shareholders of each class were as follows:
| Six months ended May 31, 2019 | Year ended November 30, 2018 | |
| Distributions to shareholders | ||
| Equity Dividend Income | $502,583 | $511,773 |
| Class K | 22,597 | 22,849 |
| Total | $525,180 | $534,622 |
10. Share Transactions.
Share transactions for each class were as follows and may contain automatic conversions between classes or exchanges between affiliated funds:
| Shares | Shares | Dollars | Dollars | |
| Six months ended May 31, 2019 | Year ended November 30, 2018 | Six months ended May 31, 2019 | Year ended November 30, 2018 | |
| Equity Dividend Income | ||||
| Shares sold | 3,890 | 14,802 | $94,154 | $413,851 |
| Reinvestment of distributions | 21,667 | 17,294 | 471,355 | 479,230 |
| Shares redeemed | (13,035) | (33,103) | (313,592) | (905,388) |
| Net increase (decrease) | 12,522 | (1,007) | $251,917 | $(12,307) |
| Class K | ||||
| Shares sold | 578 | 1,531 | $14,045 | $42,769 |
| Reinvestment of distributions | 1,039 | 825 | 22,597 | 22,849 |
| Shares redeemed | (1,802) | (2,178) | (42,399) | (59,941) |
| Net increase (decrease) | (185) | 178 | $(5,757) | $5,677 |
11. Other.
The Fund's organizational documents provide former and current trustees and officers with a limited indemnification against liabilities arising in connection with the performance of their duties to the Fund. In the normal course of business, the Fund may also enter into contracts that provide general indemnifications. The Fund's maximum exposure under these arrangements is unknown as this would be dependent on future claims that may be made against the Fund. The risk of material loss from such claims is considered remote.
Shareholder Expense Example
As a shareholder of the Fund, you incur two types of costs: (1) transaction costs and (2) ongoing costs, including management fees and other Fund expenses. This Example is intended to help you understand your ongoing costs (in dollars) of investing in the Fund and to compare these costs with the ongoing costs of investing in other mutual funds.
The Example is based on an investment of $1,000 invested at the beginning of the period and held for the entire period (December 1, 2018 to May 31, 2019).
Actual Expenses
The first line of the accompanying table for each class of the Fund provides information about actual account values and actual expenses. You may use the information in this line, together with the amount you invested, to estimate the expenses that you paid over the period. Simply divide your account value by $1,000.00 (for example, an $8,600 account value divided by $1,000.00 = 8.6), then multiply the result by the number in the first line for a class of the Fund under the heading entitled "Expenses Paid During Period" to estimate the expenses you paid on your account during this period. In addition, the Fund, as a shareholder in the underlying Fidelity Central Funds, will indirectly bear its pro-rata share of the fees and expenses incurred by the underlying Fidelity Central Funds. These fees and expenses are not included in the Fund's annualized expense ratio used to calculate the expense estimate in the table below.
Hypothetical Example for Comparison Purposes
The second line of the accompanying table for each class of the Fund provides information about hypothetical account values and hypothetical expenses based on a Class' actual expense ratio and an assumed rate of return of 5% per year before expenses, which is not the Class' actual return. The hypothetical account values and expenses may not be used to estimate the actual ending account balance or expenses you paid for the period. You may use this information to compare the ongoing costs of investing in the Fund and other funds. To do so, compare this 5% hypothetical example with the 5% hypothetical examples that appear in the shareholder reports of the other funds. In addition, the Fund, as a shareholder in the underlying Fidelity Central Funds, will indirectly bear its pro-rata share of the fees and expenses incurred by the underlying Fidelity Central Funds. These fees and expenses are not included in the Fund's annualized expense ratio used to calculate the expense estimate in the table below.
Please note that the expenses shown in the table are meant to highlight your ongoing costs only and do not reflect any transaction costs. Therefore, the second line of the table is useful in comparing ongoing costs only, and will not help you determine the relative total costs of owning different funds.
| Annualized Expense Ratio-A | Beginning Account Value December 1, 2018 | Ending Account Value May 31, 2019 | Expenses Paid During Period-B December 1, 2018 to May 31, 2019 | |
| Equity Dividend Income | .61% | |||
| Actual | $1,000.00 | $985.30 | $3.02 | |
| Hypothetical-C | $1,000.00 | $1,021.89 | $3.07 | |
| Class K | .51% | |||
| Actual | $1,000.00 | $985.40 | $2.52 | |
| Hypothetical-C | $1,000.00 | $1,022.39 | $2.57 |
A Annualized expense ratio reflects expenses net of applicable fee waivers.
B Expenses are equal to each Class' annualized expense ratio, multiplied by the average account value over the period, multiplied by 182/365 (to reflect the one-half year period).
C 5% return per year before expenses
Board Approval of Investment Advisory Contracts and Management Fees
Fidelity Equity Dividend Income Fund
Each year, the Board of Trustees, including the Independent Trustees (together, the Board), votes on the renewal of the management contract with Fidelity Management & Research Company (FMR) and the sub-advisory agreements (together, the Advisory Contracts) for the fund. FMR and the sub-advisers are referred to herein as the Investment Advisers. The Board, assisted by the advice of fund counsel and Independent Trustees' counsel, requests and considers a broad range of information relevant to the renewal of the Advisory Contracts throughout the year.
The Board meets regularly and, at each of its meetings, covers an extensive agenda of topics and materials and considers factors that are relevant to its annual consideration of the renewal of the fund's Advisory Contracts, including the services and support provided to the fund and its shareholders. The Board has established various standing committees (Committees), each composed of and chaired by Independent Trustees with varying backgrounds, to which the Board has assigned specific subject matter responsibilities in order to enhance effective decision-making by the Board. The Board, acting directly and through its Committees, requests and receives information concerning the annual consideration of the renewal of the fund's Advisory Contracts. The Board also meets as needed to review matters specifically related to the Board's annual consideration of the renewal of the Advisory Contracts. Members of the Board may also meet with trustees of other Fidelity funds through joint ad hoc committees to discuss certain matters relevant to all of the Fidelity funds.
At its January 2019 meeting, the Board unanimously determined to renew the fund's Advisory Contracts. In reaching its determination, the Board considered all factors it believed relevant, including (i) the nature, extent, and quality of the services to be provided to the fund and its shareholders (including the investment performance of the fund); (ii) the competitiveness of the fund's management fee and total expense ratio relative to peer funds; (iii) the total costs of the services to be provided by and the profits to be realized by Fidelity from its relationships with the fund; and (iv) the extent to which, if any, economies of scale exist and would be realized as the fund grows, and whether any economies of scale are appropriately shared with fund shareholders.
In considering whether to renew the Advisory Contracts for the fund, the Board reached a determination, with the assistance of fund counsel and Independent Trustees' counsel and through the exercise of its business judgment, that the renewal of the Advisory Contracts was in the best interests of the fund and its shareholders and that the compensation payable under the Advisory Contracts was fair and reasonable. The Board's decision to renew the Advisory Contracts was not based on any single factor, but rather was based on a comprehensive consideration of all the information provided to the Board at its meetings throughout the year. The Board, in reaching its determination to renew the Advisory Contracts, was aware that shareholders of the fund have a broad range of investment choices available to them, including a wide choice among funds offered by Fidelity's competitors, and that the fund's shareholders, who have the opportunity to review and weigh the disclosure provided by the fund in its prospectus and other public disclosures, have chosen to invest in this fund, which is part of the Fidelity family of funds.
Nature, Extent, and Quality of Services Provided. The Board considered Fidelity's staffing as it relates to the fund, including the backgrounds of investment personnel of Fidelity, and also considered the fund's investment objective, strategies, and related investment philosophy. The Independent Trustees also had discussions with senior management of Fidelity's investment operations and investment groups. The Board considered the structure of the investment personnel compensation program and whether this structure provides appropriate incentives to act in the best interests of the fund. Additionally, the Board considered the portfolio managers' investments, if any, in the funds that they manage.Resources Dedicated to Investment Management and Support Services. The Board and the Fund Oversight and Research Committees reviewed the general qualifications and capabilities of Fidelity's investment staff, including its size, education, experience, and resources, as well as Fidelity's approach to recruiting, training, managing, and compensating investment personnel. The Board noted that Fidelity has continued to increase the resources devoted to non-U.S. offices, including expansion of Fidelity's global investment organization. The Board also noted that Fidelity's analysts have extensive resources, tools and capabilities that allow them to conduct sophisticated quantitative and fundamental analysis, as well as credit analysis of issuers, counterparties and guarantors. Further, the Board considered that Fidelity's investment professionals have sufficient access to global information and data so as to provide competitive investment results over time, and that those professionals also have access to sophisticated tools that permit them to assess portfolio construction and risk and performance attribution characteristics continuously, as well as to transmit new information and research conclusions rapidly around the world. Additionally, in its deliberations, the Board considered Fidelity's trading, risk management, compliance, and technology and operations capabilities and resources, which are integral parts of the investment management process.Shareholder and Administrative Services. The Board considered (i) the nature, extent, quality, and cost of advisory, administrative, and shareholder services performed by the Investment Advisers and their affiliates under the Advisory Contracts and under separate agreements covering transfer agency, pricing and bookkeeping, and securities lending services for the fund; (ii) the nature and extent of the supervision of third party service providers, principally custodians, subcustodians, and pricing vendors; and (iii) the resources devoted to, and the record of compliance with, the fund's compliance policies and procedures. The Board also reviewed the allocation of fund brokerage, including allocations to brokers affiliated with the Investment Advisers, the use of brokerage commissions to pay fund expenses, and the use of "soft" commission dollars to pay for research services.The Board noted that the growth of fund assets over time across the complex allows Fidelity to reinvest in the development of services designed to enhance the value and convenience of the Fidelity funds as investment vehicles. These services include 24-hour access to account information and market information through telephone representatives and over the Internet, investor education materials and asset allocation tools, and the expanded availability of Fidelity Investor Centers.The Board noted that it and the boards of certain other Fidelity funds had formed an ad hoc Committee on Transfer Agency Fees to review the variety of transfer agency fee structures throughout the industry and Fidelity's competitive positioning with respect to industry participants.Investment in a Large Fund Family. The Board considered the benefits to shareholders of investing in a Fidelity fund, including the benefits of investing in a fund that is part of a large family of funds offering a variety of investment disciplines and providing a large variety of mutual fund investor services. The Board noted that Fidelity had taken, or had made recommendations that resulted in the Fidelity funds taking, a number of actions over the previous year that benefited particular funds, including: (i) continuing to dedicate additional resources to Fidelity's investment research process, which includes meetings with management of issuers of securities in which the funds invest, and to the support of the senior management team that oversees asset management; (ii) continuing efforts to enhance Fidelity's global research capabilities; (iii) launching new funds and making other enhancements to meet client needs; (iv) launching new share classes of existing funds; (v) eliminating purchase minimums and broadening eligibility requirements for certain funds and share classes; (vi) reducing management fees and total expenses for certain growth equity funds and index funds; (vii) lowering expense caps for certain existing funds and classes, and converting certain voluntary expense caps to contractual caps, to reduce expenses borne by shareholders; (viii) eliminating short-term redemption fees for funds that had such fees; (ix) rationalizing product lines and gaining increased efficiencies from fund mergers and share class consolidations; (x) continuing to develop, acquire and implement systems and technology to improve services to the funds and shareholders, strengthen information security, and increase efficiency; and (xi) continuing to implement enhancements to further strengthen Fidelity's product line to increase investors' probability of success in achieving their investment goals, including retirement income goals.Investment Performance. The Board considered whether the fund has operated in accordance with its investment objective, as well as its record of compliance with its investment restrictions and its performance history. The fund had a portfolio manager change in April 2017 and January 2018. The Board will continue to monitor closely the fund's performance, taking into account the portfolio manager changes.The Board took into account discussions that occur at Board meetings throughout the year with representatives of the Investment Advisers about fund investment performance. In this regard the Board noted that as part of regularly scheduled fund reviews and other reports to the Board on fund performance, the Board considers annualized return information for the fund for different time periods, measured against an appropriate securities market index ("benchmark index") and a peer group of funds with similar objectives ("peer group"), if any. In its evaluation of fund investment performance, the Board gave particular attention to information indicating changes in performance of certain Fidelity funds for specific time periods and discussed with the Investment Advisers the reasons for any overperformance or underperformance.In addition to reviewing absolute and relative fund performance, the Independent Trustees periodically consider the appropriateness of fund performance metrics in evaluating the results achieved. In general, the Independent Trustees believe that fund performance should be evaluated based on net performance (after fees and expenses) of both the highest performing and lowest performing fund share classes, where applicable, compared to appropriate benchmark indices, over appropriate time periods that may include full market cycles, and compared to peer groups, as applicable, over the same periods, taking into account relevant factors including the following: general market conditions; issuer-specific information; and fund cash flows and other factors.The Independent Trustees recognize that shareholders evaluate performance on a net basis over their own holding periods, for which one-, three-, and five-year periods are often used as a proxy. For this reason, the performance information reviewed by the Board also included net cumulative total return information for the fund and an appropriate benchmark index and peer group for the most recent one-, three-, and five-year periods ended June 30, 2018, as shown below. Returns are shown compared to the 25th percentile (top of box, 75% beaten) and 75th percentile (bottom of box, 25% beaten) of the peer universe.Fidelity Equity Dividend Income Fund

Fidelity Equity Dividend Income Fund

![]()
EII-SANN-0719
1.704739.121
Item 2.
Code of Ethics
Not applicable.
Item 3.
Audit Committee Financial Expert
Not applicable.
Item 4.
Principal Accountant Fees and Services
Not applicable.
Item 5.
Audit Committee of Listed Registrants
Not applicable.
Item 6.
Investments
(a)
Not applicable.
(b)
Not applicable
Item 7.
Disclosure of Proxy Voting Policies and Procedures for Closed-End Management Investment Companies
Not applicable.
Item 8.
Portfolio Managers of Closed-End Management Investment Companies
Not applicable.
Item 9.
Purchase of Equity Securities by Closed-End Management Investment Company and Affiliated Purchasers
Not applicable.
Item 10.
Submission of Matters to a Vote of Security Holders
There were no material changes to the procedures by which shareholders may recommend nominees to the Fidelity Financial Trust’s Board of Trustees.
Item 11.
Controls and Procedures
(a)(i) The President and Treasurer and the Chief Financial Officer have concluded that the Fidelity Financial Trust’s (the “Trust”) disclosure controls and procedures (as defined in Rule 30a-3(c) under the Investment Company Act) provide reasonable assurances that material information relating to the Trust is made known to them by the appropriate persons, based on their evaluation of these controls and procedures as of a date within 90 days of the filing date of this report.
(a)(ii) There was no change in the Trust’s internal control over financial reporting (as defined in Rule 30a-3(d) under the Investment Company Act) that occurred during the period covered by this report that has materially affected, or is reasonably likely to materially affect, the Trust’s internal control over financial reporting.
Item 12.
Disclosure of Securities Lending Activities for Closed-End Management
Investment Companies
Not applicable.
Item 13.
Exhibits
(a) | (1) | Not applicable. |
(a) | (2) | Certification pursuant to Rule 30a-2(a) under the Investment Company Act of 1940 (17 CFR 270.30a-2(a)) is filed and attached hereto as Exhibit 99.CERT. |
(a) | (3) | Not applicable. |
(b) | Certification pursuant to Rule 30a-2(b) under the Investment Company Act of 1940 (17 CFR 270.30a-2(b)) is furnished and attached hereto as Exhibit 99.906CERT. |
SIGNATURES
Pursuant to the requirements of the Securities Exchange Act of 1934 and the Investment Company Act of 1940, the registrant has duly caused this report to be signed on its behalf by the undersigned, thereunto duly authorized.
Fidelity Financial Trust
By: | /s/Stacie M. Smith |
Stacie M. Smith | |
President and Treasurer | |
Date: | July 24, 2019 |
Pursuant to the requirements of the Securities Exchange Act of 1934 and the Investment Company Act of 1940, this report has been signed below by the following persons on behalf of the registrant and in the capacities and on the dates indicated.
By: | /s/Stacie M. Smith |
Stacie M. Smith | |
President and Treasurer | |
Date: | July 24, 2019 |
By: | /s/John J. Burke III |
John J. Burke III | |
Chief Financial Officer | |
Date: | July 24, 2019 |