UNITED STATES
SECURITIES AND EXCHANGE COMMISSION
Washington, D.C. 20549
Form N-CSR
CERTIFIED SHAREHOLDER REPORT OF REGISTERED
MANAGEMENT INVESTMENT COMPANIES
Investment Company Act File Number: 811-03591
CALVERT VARIABLE SERIES, INC.
(Exact Name of Registrant as Specified in Charter)
1825 Connecticut Avenue NW, Suite 400, Washington, DC 20009
(Address of Principal Executive Offices)
Maureen A. Gemma
Two International Place, Boston, Massachusetts 02110
(Name and Address of Agent for Services)
(202) 238-2200
(Registrant’s Telephone Number)
December 31
Date of Fiscal Year End
December 31, 2020
Date of Reporting Period
| Item 1. | Reports to Stockholders |


| % Average Annual Total Returns1,2 | Class Inception Date | Performance Inception Date | One Year | Five Years | Ten Years |
| Class I at NAV | 09/02/1986 | 09/02/1986 | 15.26% | 10.94% | 9.40% |
| Class F at NAV | 10/18/2013 | 09/02/1986 | 14.76 | 10.59 | 9.14 |
| Russell 1000® Index | — | — | 20.96% | 15.58% | 14.00% |
| Bloomberg Barclays U.S. Aggregate Bond Index | — | — | 7.51 | 4.43 | 3.84 |
| Balanced Blended Benchmark | — | — | 16.29 | 11.35 | 10.11 |
| % Total Annual Operating Expense Ratios3 | Class I | Class F |
| 0.62% | 0.86% |
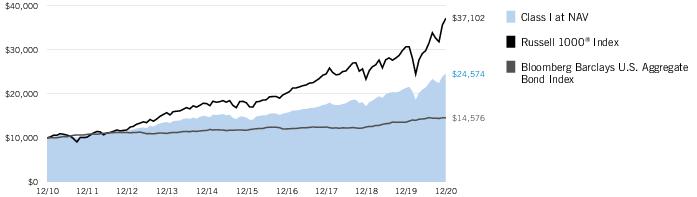
| Growth of Investment2 | Amount Invested | Period Beginning | At NAV | With Maximum Sales Charge |
| Class F | $10,000 | 12/31/2010 | $24,002 | N.A. |


| † | The views expressed in this report are those of the portfolio manager(s) and are current only through the date stated at the top of this page. These views are subject to change at any time based upon market or other conditions, and Calvert and the Fund(s) disclaim any responsibility to update such views. These views may not be relied upon as investment advice and, because investment decisions are based on many factors, may not be relied upon as an indication of trading intent on behalf of any Calvert fund. This commentary may contain statements that are not historical facts, referred to as “forward-looking statements.” The Fund’s actual future results may differ significantly from those stated in any forward-looking statement, depending on factors such as changes in securities or financial markets or general economic conditions, the volume of sales and purchases of Fund shares, the continuation of investment advisory, administrative and service contracts, and other risks discussed from time to time in the Fund’s filings with the Securities and Exchange Commission. |
| 1 | Russell 1000® Index is an unmanaged index of 1,000 U.S. large-cap stocks. Bloomberg Barclays U.S. Aggregate Bond Index is an unmanaged index of domestic investment-grade bonds, including corporate, government and mortgage-backed securities. The Balanced Blended Benchmark is an internally constructed benchmark comprised of a blend of 60% Russell 1000® Index and 40% Bloomberg Barclays U.S. Aggregate Bond Index, and is rebalanced monthly. Prior to 11/1/15, the fixed-income component was the Bloomberg Barclays U.S. Credit Index. Unless otherwise stated, index returns do not reflect the effect of any applicable sales charges, commissions, expenses, taxes or leverage, as applicable. It is not possible to invest directly in an index. |
| 2 | There is no sales charge. Insurance-related charges are not included in the calculation of returns. If such charges were reflected, the returns would be lower. Please refer to the report for your insurance contract for performance data reflecting insurance-related charges.Performance prior to the inception date of a class may be linked to the performance of an older class of the Fund. This linked performance is adjusted for any applicable sales charge, but is not adjusted for class expense differences. If adjusted for such differences, the performance would be different. The performance of Class F is linked to Class I. Performance presented in the Financial Highlights included in the financial statements is not linked.Calvert Research and Management became the investment adviser to the Fund on December 31, 2016. Performance reflected prior to such date is that of the Fund’s former investment adviser. |
| 3 | Source: Fund prospectus. The expense ratios for the current reporting period can be found in the Financial Highlights section of this report. |
| Fund profile subject to change due to active management. | |
| Additional Information | |
| S&P 500® Index is an unmanaged index of large-cap stocks commonly used as a measure of U.S. stock market performance. Dow Jones Industrial Average® is a price-weighted average of 30 blue-chip stocks that are generally the leaders in their industry. S&P Dow Jones Indices are a product of S&P Dow Jones Indices LLC (“S&P DJI”) and have been licensed for use. S&P® and S&P 500® are registered trademarks of S&P DJI; Dow Jones® is a registered trademark of Dow Jones Trademark Holdings LLC (“Dow Jones”); S&P DJI, Dow Jones and their respective affiliates do not sponsor, endorse, sell or promote the Fund, will not have any liability with respect thereto and do not have any liability for any errors, omissions, or interruptions of the S&P Dow Jones Indices. Nasdaq Composite Index is a market capitalization-weighted index of all domestic and international securities listed on Nasdaq. Source: Nasdaq, Inc. The information is provided by Nasdaq (with its affiliates, are referred to as the “Corporations”) and Nasdaq’s third party licensors on an “as is” basis and the Corporations make no guarantees and bear no liability of any kind with respect to the information or the Fund. Russell 2000® Index is an unmanaged index of 2,000 U.S. small- cap stocks. Bloomberg Barclays U.S. Corporate Bond Index measures the performance of investment-grade U.S. corporate securities with a maturity of one year or more. Bloomberg Barclays U.S. Corporate High Yield Index measures USD-denominated, non-investment grade corporate securities. | |
| Duration is a measure of the expected change in price of a bond — in percentage terms — given a one percent change in interest rates, all else being constant. Securities with lower durations tend to be less sensitive to interest rate changes. |
| Beginning Account Value (7/1/20) | Ending Account Value (12/31/20) | Expenses Paid During Period* (7/1/20 – 12/31/20) | Annualized Expense Ratio | |
| Actual | ||||
| Class I | $1,000.00 | $1,147.60 | $3.29 | 0.61% |
| Class F | $1,000.00 | $1,147.60 | $4.64 | 0.86% |
| Hypothetical | ||||
| (5% return per year before expenses) | ||||
| Class I | $1,000.00 | $1,022.07 | $3.10 | 0.61% |
| Class F | $1,000.00 | $1,020.81 | $4.37 | 0.86% |
| * | Expenses are equal to the Fund's annualized expense ratio for the indicated Class, multiplied by the average account value over the period, multiplied by 184/366 (to reflect the one-half year period). The Example assumes that the $1,000 was invested at the net asset value per share determined at the close of business on June 30, 2020. Expenses shown do not include insurance-related charges. |
| Asset-Backed Securities — 5.3% |
| Security | Principal Amount (000's omitted) | Value | |
| Adams Outdoor Advertising, L.P., Series 2018-1, Class A, 4.81%, 11/15/48(1) | $ | 163 | $ 171,901 |
| Business Jet Securities, LLC, Series 2020-1A, Class A, 2.981%, 11/15/35(1) | 97 | 98,638 | |
| Coinstar Funding, LLC, Series 2017-1A, Class A2, 5.216%, 4/25/47(1) | 917 | 896,060 | |
| Conn's Receivables Funding, LLC: | |||
| Series 2019-A, Class A, 3.40%, 10/16/23(1) | 74 | 74,385 | |
| Series 2019-A, Class B, 4.36%, 10/16/23(1) | 114 | 114,040 | |
| Series 2019-B, Class A, 2.66%, 6/17/24(1) | 86 | 86,161 | |
| Series 2019-B, Class B, 3.62%, 6/17/24(1) | 135 | 135,475 | |
| Series 2020-A, Class B, 4.27%, 6/16/25(1) | 100 | 100,476 | |
| DB Master Finance, LLC, Series 2017-1A, Class A2II, 4.03%, 11/20/47(1) | 83 | 87,884 | |
| DRB Prime Student Loan Trust, Series 2016-B, Class A2, 2.89%, 6/25/40(1) | 50 | 50,884 | |
| Driven Brands Funding, LLC: | |||
| Series 2018-1A, Class A2, 4.739%, 4/20/48(1) | 62 | 66,500 | |
| Series 2019-2A, Class A2, 3.981%, 10/20/49(1) | 139 | 146,082 | |
| ExteNet, LLC: | |||
| Series 2019-1A, Class A2, 3.204%, 7/26/49(1) | 345 | 358,526 | |
| Series 2019-1A, Class B, 4.14%, 7/26/49(1) | 30 | 30,698 | |
| FOCUS Brands Funding, LLC: | |||
| Series 2017-1A, Class A2I, 3.857%, 4/30/47(1) | 569 | 571,451 | |
| Series 2017-1A, Class A2II, 5.093%, 4/30/47(1) | 174 | 167,185 | |
| Hardee's Funding, LLC, Series 2020-1A, Class A2, 3.981%, 12/20/50(1) | 180 | 185,456 | |
| InSite Issuer, LLC: | |||
| Series 2016-1A, Class A, 2.883%, 11/15/46(1) | 140 | 144,795 | |
| Series 2016-1A, Class C, 6.414%, 11/15/46(1) | 25 | 26,960 | |
| Jack in the Box Funding, LLC, Series 2019-1A, Class A2I, 3.982%, 8/25/49(1) | 402 | 413,961 | |
| Jersey Mike's Funding, Series 2019-1A, Class A2, 4.433%, 2/15/50(1) | 281 | 301,960 | |
| Marlette Funding Trust, Series 2020-2A, Class B, 1.83%, 9/16/30(1) | 175 | 177,006 | |
| Mosaic Solar Loan Trust: | |||
| Series 2019-1A, Class A, 4.37%, 12/21/43(1) | 297 | 319,814 | |
| Series 2019-2A, Class B, 3.28%, 9/20/40(1) | 820 | 850,970 | |
| Series 2020-1A, Class A, 2.10%, 4/20/46(1) | 89 | 91,393 | |
| Series 2020-1A, Class B, 3.10%, 4/20/46(1) | 89 | 93,587 | |
| Series 2020-2A, Class A, 1.44%, 8/20/46(1) | 156 | 155,569 | |
| Series 2020-2A, Class B, 2.21%, 8/20/46(1) | 186 | 184,856 | |
| OneMain Financial Issuance Trust: | |||
| Series 2016-3A, Class A, 3.83%, 6/18/31(1) | 300 | 306,206 | |
| Series 2017-1A, Class A1, 2.37%, 9/14/32(1) | 108 | 108,357 | |
| Security | Principal Amount (000's omitted) | Value | |
| Oportun Funding IX, LLC, Series 2018-B, Class A, 3.91%, 7/8/24(1) | $ | 404 | $ 407,138 |
| Oportun Funding VIII, LLC, Series 2018-A, Class A, 3.61%, 3/8/24(1) | 706 | 706,000 | |
| Planet Fitness Master Issuer, LLC: | |||
| Series 2018-1A, Class A2I, 4.262%, 9/5/48(1) | 494 | 494,706 | |
| Series 2018-1A, Class A2II, 4.666%, 9/5/48(1) | 68 | 68,480 | |
| Series 2019-1A, Class A2, 3.858%, 12/5/49(1) | 277 | 262,459 | |
| Prosper Marketplace Issuance Trust, Series 2017-1A, Class C, 5.80%, 6/15/23(1) | 19 | 18,816 | |
| RenewFund Receivables Trust, Series 2015-1, Class A, 3.51%, 4/15/25(1) | 10 | 10,206 | |
| ServiceMaster Funding, LLC: | |||
| Series 2020-1, Class A2I, 2.841%, 1/30/51(1) | 161 | 165,053 | |
| Series 2020-1, Class A2II, 3.337%, 1/30/51(1) | 182 | 186,244 | |
| SERVPRO Master Issuer, LLC, Series 2019-1A, Class A2, 3.882%, 10/25/49(1) | 1,145 | 1,227,917 | |
| Small Business Lending Trust: | |||
| Series 2019-A, Class A, 2.85%, 7/15/26(1) | 113 | 112,153 | |
| Series 2020-A, Class A, 2.62%, 12/15/26(1) | 125 | 124,682 | |
| SolarCity LMC Series I, LLC, Series 2013-1, Class A, 4.80%, 11/20/38(1) | 295 | 290,215 | |
| SolarCity LMC Series II, LLC, Series 2014-1, Class A, 4.59%, 4/20/44(1) | 184 | 182,735 | |
| SolarCity LMC Series III, LLC: | |||
| Series 2014-2, Class A, 4.02%, 7/20/44(1) | 526 | 536,353 | |
| Series 2014-2, Class B, 5.44%, 7/20/44(1) | 847 | 867,351 | |
| Sonic Capital, LLC, Series 2020-1A, Class A2I, 3.845%, 1/20/50(1) | 717 | 768,967 | |
| SpringCastle America Funding, LLC, Series 2020-AA, Class A, 1.97%, 9/25/37(1) | 490 | 494,680 | |
| Spruce ABS Trust, Series 2016-E1, Class A, 4.32%, 6/15/28(1) | 17 | 17,515 | |
| Stack Infrastructure Issuer, LLC: | |||
| Series 2019-1A, Class A2, 4.54%, 2/25/44(1) | 2,233 | 2,397,376 | |
| Series 2019-2A, Class A2, 3.08%, 10/25/44(1) | 175 | 182,159 | |
| Sunnova Sol II Issuer, LLC, Series 2020-2A, Class A, 2.73%, 11/1/55(1) | 575 | 579,941 | |
| Sunnova Sol Issuer, LLC, Series 2020-1A, Class A, 3.35%, 2/1/55(1) | 103 | 109,762 | |
| Sunrun Atlas Issuer, LLC, Series 2019-2, Class A, 3.61%, 2/1/55(1) | 215 | 230,160 | |
| Sunrun Callisto Issuer, LLC, Series 2015-1A, Class B, 5.38%, 7/20/45(1) | 316 | 313,273 | |
| Sunrun Xanadu Issuer, LLC, Series 2019-1A, Class A, 3.98%, 6/30/54(1) | 188 | 198,658 | |
| TES, LLC, Series 2017-1A, Class A, 4.33%, 10/20/47(1) | 368 | 378,439 | |
| Tesla Auto Lease Trust: | |||
| Series 2018-B, Class A, 3.71%, 8/20/21(1) | 319 | 321,671 | |
| Series 2019-A, Class A2, 2.13%, 4/20/22(1) | 102 | 102,818 | |
| Security | Principal Amount (000's omitted) | Value | |
| Tesla Auto Lease Trust: (continued) | |||
| Series 2019-A, Class A3, 2.16%, 10/20/22(1) | $ | 815 | $ 832,929 |
| Series 2019-A, Class A4, 2.20%, 11/21/22(1) | 170 | 174,316 | |
| Series 2020-A, Class A3, 0.68%, 12/20/23(1) | 65 | 65,406 | |
| Series 2020-A, Class A4, 0.78%, 12/20/23(1) | 81 | 81,598 | |
| United States Small Business Administration, Series 2017-20E, Class 1, 2.88%, 5/1/37 | 634 | 690,363 | |
| Vantage Data Centers Issuer, LLC: | |||
| Series 2018-2A, Class A2, 4.196%, 11/16/43(1) | 78 | 81,472 | |
| Series 2019-1A, Class A2, 3.188%, 7/15/44(1) | 518 | 543,368 | |
| Series 2020-2A, Class A2, 1.992%, 9/15/45(1) | 570 | 576,110 | |
| Vivint Solar Financing VII, LLC, Series 2020-1A, Class A, 2.21%, 7/31/51(1) | 410 | 423,394 | |
| Willis Engine Structured Trust V, Series 2020-A, Class B, 4.212%, 3/15/45(1) | 237 | 177,359 | |
| Total Asset-Backed Securities (identified cost $21,431,605) | $ 21,919,478 | ||
| Collateralized Mortgage-Backed Obligations — 1.7% |
| Security | Principal Amount (000's omitted) | Value | |
| Federal Home Loan Mortgage Corp. Structured Agency Credit Risk Debt Notes: | |||
| Series 2015-HQ2, Class M3, 3.398%, (1 mo. USD LIBOR + 3.25%), 5/25/25(2) | $ | 471 | $ 480,436 |
| Series 2017-DNA3, Class M2, 2.648%, (1 mo. USD LIBOR + 2.50%), 3/25/30(2) | 600 | 608,731 | |
| Series 2018-DNA1, Class M2, 1.948%, (1 mo. USD LIBOR + 1.80%), 7/25/30(2) | 264 | 261,590 | |
| Series 2018-DNA1, Class M2AT, 1.198%, (1 mo. USD LIBOR + 1.05%), 7/25/30(2) | 343 | 342,452 | |
| Series 2019-DNA2, Class M2, 2.598%, (1 mo. USD LIBOR + 2.45%), 3/25/49(1)(2) | 67 | 67,288 | |
| Series 2019-DNA3, Class M2, 2.198%, (1 mo. USD LIBOR + 2.05%), 7/25/49(1)(2) | 757 | 752,809 | |
| Series 2019-DNA4, Class M2, 2.098%, (1 mo. USD LIBOR + 1.95%), 10/25/49(1)(2) | 319 | 318,699 | |
| Series 2019-HQA2, Class M2, 2.198%, (1 mo. USD LIBOR + 2.05%), 4/25/49(1)(2) | 34 | 33,888 | |
| Series 2020-DNA1, Class M1, 0.848%, (1 mo. USD LIBOR + 0.70%), 1/25/50(1)(2) | 47 | 47,140 | |
| Series 2020-DNA2, Class M1, 0.898%, (1 mo. USD LIBOR + 0.75%), 2/25/50(1)(2) | 242 | 242,253 | |
| Series 2020-DNA4, Class M1, 1.648%, (1 mo. USD LIBOR + 1.50%), 8/25/50(1)(2) | 102 | 102,872 | |
| Series 2020-DNA4, Class M2, 3.898%, (1 mo. USD LIBOR + 3.75%), 8/25/50(1)(2) | 35 | 35,399 | |
| Series 2020-DNA5, Class M1, 1.377%, (SOFR + 1.30%), 10/25/50(1)(2) | 165 | 165,834 | |
| Security | Principal Amount (000's omitted) | Value | |
| Federal Home Loan Mortgage Corp. Structured Agency Credit Risk Debt Notes: (continued) | |||
| Series 2020-DNA5, Class M2, 2.877%, (SOFR + 2.80%), 10/25/50(1)(2) | $ | 130 | $ 131,709 |
| Series 2020-DNA6, Class B1, 3.077%, (SOFR + 3.00%), 12/25/50(1)(2) | 25 | 25,145 | |
| Series 2020-DNA6, Class M2, 2.077%, (SOFR + 2.00%), 12/25/50(1)(2) | 280 | 280,409 | |
| Series 2020-HQA1, Class M1, 0.898%, (1 mo. USD LIBOR + 0.75%), 1/25/50(1)(2) | 27 | 27,100 | |
| Federal National Mortgage Association Connecticut Avenue Securities: | |||
| Series 2013-C01, Class M2, 5.398%, (1 mo. USD LIBOR + 5.25%), 10/25/23(2) | 262 | 268,118 | |
| Series 2014-C02, Class 1M2, 2.748%, (1 mo. USD LIBOR + 2.60%), 5/25/24(2) | 502 | 489,901 | |
| Series 2014-C02, Class 2M2, 2.748%, (1 mo. USD LIBOR + 2.60%), 5/25/24(2) | 122 | 120,689 | |
| Series 2014-C03, Class 1M2, 3.148%, (1 mo. USD LIBOR + 3.00%), 7/25/24(2) | 304 | 299,101 | |
| Series 2014-C03, Class 2M2, 3.048%, (1 mo. USD LIBOR + 2.90%), 7/25/24(2) | 194 | 194,275 | |
| Series 2014-C04, Class 1M2, 5.048%, (1 mo. USD LIBOR + 4.90%), 11/25/24(2) | 403 | 414,000 | |
| Series 2017-C05, Class 1M2, 2.348%, (1 mo. USD LIBOR + 2.20%), 1/25/30(2) | 146 | 145,906 | |
| Series 2017-C06, Class 1M2, 2.798%, (1 mo. USD LIBOR + 2.65%), 2/25/30(2) | 238 | 239,792 | |
| Series 2018-C06, Class 1M2, 2.148%, (1 mo. USD LIBOR + 2.00%), 3/25/31(2) | 23 | 23,015 | |
| Series 2018-R07, Class 1M2, 2.548%, (1 mo. USD LIBOR + 2.40%), 4/25/31(1)(2) | 263 | 263,452 | |
| Series 2019-R02, Class 1M2, 2.448%, (1 mo. USD LIBOR + 2.30%), 8/25/31(1)(2) | 30 | 29,502 | |
| Series 2019-R05, Class 1M2, 2.148%, (1 mo. USD LIBOR + 2.00%), 7/25/39(1)(2) | 73 | 72,570 | |
| Series 2020-R01, Class 1M1, 0.948%, (1 mo. USD LIBOR + 0.80%), 1/25/40(1)(2) | 145 | 145,535 | |
| Federal National Mortgage Association Grantor Trust, Series 2017-T1, Class A, 2.898%, 6/25/27 | 274 | 304,051 | |
| Toorak Mortgage Corp., Ltd.: | |||
| Series 2018-1, Class A1, 4.336% to 4/25/21, 8/25/21(1)(3) | 71 | 71,190 | |
| Series 2020-1, Class A1, 2.734% to 1/25/23, 3/25/23(1)(3) | 250 | 253,451 | |
| Total Collateralized Mortgage-Backed Obligations (identified cost $7,288,126) | $ 7,258,302 | ||
| Commercial Mortgage-Backed Securities — 4.9% |
| Security | Principal Amount (000's omitted) | Value | |
| BAMLL Commercial Mortgage Securities Trust: | |||
| Series 2019-BPR, Class DNM, 3.719%, 11/5/32(1)(4) | $ | 695 | $ 593,225 |
| Security | Principal Amount (000's omitted) | Value | |
| BAMLL Commercial Mortgage Securities Trust: (continued) | |||
| Series 2019-BPR, Class ENM, 3.719%, 11/5/32(1)(4) | $ | 325 | $ 265,788 |
| Series 2019-BPR, Class FNM, 3.719%, 11/5/32(1)(4) | 485 | 357,662 | |
| BX Commercial Mortgage Trust: | |||
| Series 2019-XL, Class A, 1.079%, (1 mo. USD LIBOR + 0.92%), 10/15/36(1)(2) | 660 | 662,478 | |
| Series 2019-XL, Class B, 1.239%, (1 mo. USD LIBOR + 1.08%), 10/15/36(1)(2) | 313 | 313,989 | |
| Citigroup Commercial Mortgage Trust, Series 2017-MDRC, Class D, 2.409%, (1 mo. USD LIBOR + 2.25%), 7/15/30(1)(2) | 235 | 218,692 | |
| Federal Home Loan Mortgage Corp. Multifamily Structured Pass Through Certificates: | |||
| Series KG02, Class A2, 2.412%, 8/25/29 | 1,440 | 1,560,871 | |
| Series KG03, Class A2, 1.297%, 6/25/30(4) | 305 | 306,276 | |
| Series KSG1, Class A2, 1.503%, 9/25/30 | 278 | 286,797 | |
| Series KW06, Class A2, 3.80%, 6/25/28(4) | 530 | 623,088 | |
| Series W5FX, Class AFX, 3.214%, 4/25/28(4) | 192 | 215,677 | |
| Federal National Mortgage Association: | |||
| Series 2017-M2, Class A1, 2.801%, 2/25/27(4) | 97 | 100,298 | |
| Series 2017-M13, Class A2, 2.939%, 9/25/27(4) | 675 | 765,796 | |
| Series 2018-M4, Class A2, 3.045%, 3/25/28(4) | 1,526 | 1,741,901 | |
| Series 2018-M8, Class A2, 3.325%, 6/25/28(4) | 459 | 530,847 | |
| Series 2018-M13, Class A2, 3.697%, 9/25/30(4) | 1,680 | 2,034,460 | |
| Series 2019-M1, Class A2, 3.555%, 9/25/28(4) | 785 | 928,446 | |
| Series 2019-M9, Class A2, 2.937%, 4/25/29 | 291 | 329,797 | |
| Series 2019-M22, Class A2, 2.522%, 8/25/29 | 3,100 | 3,439,127 | |
| Series 2020-M1, Class A2, 2.444%, 10/25/29 | 963 | 1,062,930 | |
| Series 2020-M20, Class A2, 1.435%, 10/25/29 | 605 | 622,556 | |
| Federal National Mortgage Association Multifamily Connecticut Avenue Securities Trust: | |||
| Series 2019-01, Class M10, 3.398%, (1 mo. USD LIBOR + 3.25%), 10/15/49(1)(2) | 55 | 51,695 | |
| Series 2020-01, Class M10, 3.898%, (1 mo. USD LIBOR + 3.75%), 3/25/50(1)(2) | 395 | 387,483 | |
| JPMorgan Chase Commercial Mortgage Securities Trust: | |||
| Series 2014-DSTY, Class A, 3.429%, 6/10/27(1) | 100 | 61,631 | |
| Series 2014-DSTY, Class B, 3.771%, 6/10/27(1) | 300 | 103,276 | |
| Series 2014-DSTY, Class C, 3.805%, 6/10/27(1)(4) | 100 | 20,192 | |
| Morgan Stanley Capital I Trust: | |||
| Series 2017-CLS, Class A, 0.859%, (1 mo. USD LIBOR + 0.70%), 11/15/34(1)(2) | 545 | 545,286 | |
| Series 2019-BPR, Class A, 1.559%, (1 mo. USD LIBOR + 1.40%), 5/15/36(1)(2) | 650 | 627,390 | |
| Series 2019-BPR, Class B, 2.259%, (1 mo. USD LIBOR + 2.10%), 5/15/36(1)(2) | 241 | 205,440 | |
| Series 2019-BPR, Class C, 3.209%, (1 mo. USD LIBOR + 3.05%), 5/15/36(1)(2) | 100 | 73,595 | |
| Security | Principal Amount (000's omitted) | Value | |
| Motel 6 Trust: | |||
| Series 2017-MTL6, Class C, 1.559%, (1 mo. USD LIBOR + 1.40%), 8/15/34(1)(2) | $ | 627 | $ 624,915 |
| Series 2017-MTL6, Class D, 2.309%, (1 mo. USD LIBOR + 2.15%), 8/15/34(1)(2) | 188 | 187,082 | |
| Series 2017-MTL6, Class E, 3.409%, (1 mo. USD LIBOR + 3.25%), 8/15/34(1)(2) | 67 | 65,734 | |
| RETL Trust: | |||
| Series 2019-RVP, Class B, 1.709%, (1 mo. USD LIBOR + 1.55%), 3/15/36(1)(2) | 4 | 4,269 | |
| Series 2019-RVP, Class C, 2.259%, (1 mo. USD LIBOR + 2.10%), 3/15/36(1)(2) | 73 | 70,550 | |
| WFLD Mortgage Trust, Series 2014-MONT, Class C, 3.755%, 8/10/31(1)(4) | 450 | 389,206 | |
| Total Commercial Mortgage-Backed Securities (identified cost $19,670,223) | $ 20,378,445 | ||
| Common Stocks — 64.5% |
| Security | Shares | Value | |
| Banks — 3.3% | |||
| JPMorgan Chase & Co. | 60,000 | $ 7,624,200 | |
| PNC Financial Services Group, Inc. (The) | 40,700 | 6,064,300 | |
| $ 13,688,500 | |||
| Beverages — 1.7% | |||
| PepsiCo, Inc. | 46,256 | $ 6,859,765 | |
| $ 6,859,765 | |||
| Biotechnology — 2.0% | |||
| AbbVie, Inc. | 53,123 | $ 5,692,129 | |
| Vertex Pharmaceuticals, Inc.(5) | 11,900 | 2,812,446 | |
| $ 8,504,575 | |||
| Building Products — 1.1% | |||
| Trane Technologies PLC | 31,700 | $ 4,601,572 | |
| $ 4,601,572 | |||
| Capital Markets — 3.6% | |||
| BlackRock, Inc. | 7,100 | $ 5,122,934 | |
| Intercontinental Exchange, Inc. | 45,000 | 5,188,050 | |
| Tradeweb Markets, Inc., Class A | 77,403 | 4,833,817 | |
| $ 15,144,801 | |||
| Commercial Services & Supplies — 0.8% | |||
| Waste Management, Inc. | 28,316 | $ 3,339,306 | |
| $ 3,339,306 | |||
| Security | Shares | Value | |
| Communications Equipment — 0.8% | |||
| Cisco Systems, Inc. | 72,700 | $ 3,253,325 | |
| $ 3,253,325 | |||
| Containers & Packaging — 0.7% | |||
| AptarGroup, Inc. | 21,700 | $ 2,970,513 | |
| $ 2,970,513 | |||
| Diversified Telecommunication Services — 0.0%(6) | |||
| Verizon Communications, Inc. | 584 | $ 34,310 | |
| $ 34,310 | |||
| Electrical Equipment — 1.3% | |||
| AMETEK, Inc. | 44,300 | $ 5,357,642 | |
| $ 5,357,642 | |||
| Energy Equipment & Services — 1.1% | |||
| Baker Hughes Co. | 225,100 | $ 4,693,335 | |
| $ 4,693,335 | |||
| Entertainment — 1.6% | |||
| Walt Disney Co. (The)(5) | 36,400 | $ 6,594,952 | |
| $ 6,594,952 | |||
| Equity Real Estate Investment Trusts (REITs) — 1.2% | |||
| American Tower Corp. | 23,100 | $ 5,185,026 | |
| $ 5,185,026 | |||
| Food & Staples Retailing — 1.5% | |||
| Sysco Corp. | 83,800 | $ 6,222,988 | |
| $ 6,222,988 | |||
| Food Products — 1.1% | |||
| Mondelez International, Inc., Class A | 79,212 | $ 4,631,526 | |
| $ 4,631,526 | |||
| Health Care Equipment & Supplies — 3.8% | |||
| Abbott Laboratories | 48,500 | $ 5,310,265 | |
| Boston Scientific Corp.(5) | 124,600 | 4,479,370 | |
| Danaher Corp. | 26,400 | 5,864,496 | |
| $ 15,654,131 | |||
| Health Care Providers & Services — 1.4% | |||
| Anthem, Inc. | 18,000 | $ 5,779,620 | |
| $ 5,779,620 | |||
| Security | Shares | Value | |
| Hotels, Restaurants & Leisure — 1.1% | |||
| Marriott International, Inc., Class A | 35,100 | $ 4,630,392 | |
| $ 4,630,392 | |||
| Independent Power and Renewable Electricity Producers — 1.0% | |||
| NextEra Energy Partners, L.P. | 60,906 | $ 4,083,747 | |
| $ 4,083,747 | |||
| Insurance — 0.8% | |||
| Travelers Cos., Inc. (The) | 24,800 | $ 3,481,176 | |
| $ 3,481,176 | |||
| Interactive Media & Services — 3.7% | |||
| Alphabet, Inc., Class C(5) | 7,190 | $ 12,596,017 | |
| Match Group, Inc.(5) | 18,872 | 2,853,258 | |
| $ 15,449,275 | |||
| Internet & Direct Marketing Retail — 4.0% | |||
| Amazon.com, Inc.(5) | 5,129 | $ 16,704,794 | |
| $ 16,704,794 | |||
| IT Services — 6.4% | |||
| Automatic Data Processing, Inc. | 22,600 | $ 3,982,120 | |
| Cognizant Technology Solutions Corp., Class A | 61,700 | 5,056,315 | |
| Fidelity National Information Services, Inc. | 24,200 | 3,423,332 | |
| PayPal Holdings, Inc.(5) | 23,100 | 5,410,020 | |
| Visa, Inc., Class A | 40,900 | 8,946,057 | |
| $ 26,817,844 | |||
| Life Sciences Tools & Services — 1.3% | |||
| Thermo Fisher Scientific, Inc. | 11,518 | $ 5,364,854 | |
| $ 5,364,854 | |||
| Machinery — 1.6% | |||
| Ingersoll Rand, Inc.(5) | 68,200 | $ 3,107,192 | |
| Stanley Black & Decker, Inc. | 20,800 | 3,714,048 | |
| $ 6,821,240 | |||
| Multi-Utilities — 0.7% | |||
| Sempra Energy | 22,308 | $ 2,842,262 | |
| $ 2,842,262 | |||
| Pharmaceuticals — 0.7% | |||
| Zoetis, Inc. | 16,800 | $ 2,780,400 | |
| $ 2,780,400 | |||
| Security | Shares | Value | |
| Road & Rail — 1.0% | |||
| Union Pacific Corp. | 19,100 | $ 3,977,002 | |
| $ 3,977,002 | |||
| Semiconductors & Semiconductor Equipment — 2.1% | |||
| Taiwan Semiconductor Manufacturing Co., Ltd. ADR | 41,000 | $ 4,470,640 | |
| Texas Instruments, Inc. | 25,851 | 4,242,925 | |
| $ 8,713,565 | |||
| Software — 5.3% | |||
| Intuit, Inc. | 6,652 | $ 2,526,762 | |
| Microsoft Corp. | 79,793 | 17,747,559 | |
| nCino, Inc.(5) | 25,578 | 1,852,103 | |
| $ 22,126,424 | |||
| Specialty Retail — 2.5% | |||
| Lowe's Cos., Inc. | 33,500 | $ 5,377,085 | |
| TJX Cos., Inc. (The) | 74,200 | 5,067,118 | |
| $ 10,444,203 | |||
| Technology Hardware, Storage & Peripherals — 4.2% | |||
| Apple, Inc. | 130,588 | $ 17,327,722 | |
| $ 17,327,722 | |||
| Wireless Telecommunication Services — 1.1% | |||
| T-Mobile US, Inc.(5) | 32,830 | $ 4,427,126 | |
| $ 4,427,126 | |||
| Total Common Stocks (identified cost $183,700,542) | $268,507,913 | ||
| Convertible Bonds — 0.1% |
| Security | Principal Amount (000's omitted) | Value | |
| Technology — 0.1% | |||
| Western Digital Corp., 1.50%, 2/1/24 | $ | 281 | $ 280,704 |
| Total Convertible Bonds (identified cost $271,111) | $ 280,704 | ||
| Convertible Preferred Stocks — 0.0%(6) |
| Security | Shares | Value | |
| Health Care Equipment & Supplies — 0.0%(6) | |||
| Becton Dickinson and Co., Series B, 6.00%(7) | 500 | $ 27,565 | |
| Total Convertible Preferred Stocks (identified cost $27,325) | $ 27,565 | ||
| Corporate Bonds — 15.6% |
| Security | Principal Amount (000's omitted)* | Value | |
| Basic Materials — 0.3% | |||
| Ecolab, Inc., 2.125%, 8/15/50 | 263 | $ 252,262 | |
| LG Chem, Ltd.: | |||
| 3.25%, 10/15/24(1) | 550 | 595,594 | |
| 3.625%, 4/15/29(1) | 250 | 282,236 | |
| $ 1,130,092 | |||
| Communications — 1.4% | |||
| Alphabet, Inc., 1.10%, 8/15/30 | 349 | $ 344,138 | |
| AT&T, Inc.: | |||
| 2.30%, 6/1/27 | 1 | 1,067 | |
| 3.10%, 2/1/43 | 80 | 81,168 | |
| 3.30%, 2/1/52 | 44 | 43,627 | |
| 3.65%, 6/1/51 | 717 | 750,802 | |
| 3.65%, 9/15/59(1) | 53 | 53,264 | |
| 3.80%, 12/1/57(1) | 326 | 339,940 | |
| 4.30%, 2/15/30 | 577 | 689,757 | |
| 4.90%, 6/15/42 | 300 | 374,226 | |
| Charter Communications Operating, LLC/Charter Communications Operating Capital, 4.80%, 3/1/50 | 930 | 1,111,511 | |
| Comcast Corp., 2.45%, 8/15/52 | 481 | 468,560 | |
| Crown Castle Towers, LLC, 3.663%, 5/15/45(1) | 250 | 269,959 | |
| Discovery Communications, LLC, 5.20%, 9/20/47 | 326 | 424,685 | |
| NBCUniversal Media, LLC, 4.45%, 1/15/43 | 200 | 262,102 | |
| Sprint Corp., 7.25%, 9/15/21 | 75 | 78,131 | |
| T-Mobile USA, Inc.: | |||
| 2.25%, 11/15/31(1) | 64 | 65,806 | |
| 2.55%, 2/15/31(1) | 147 | 154,544 | |
| 4.50%, 4/15/50(1) | 342 | 422,459 | |
| $ 5,935,746 | |||
| Consumer, Cyclical — 1.3% | |||
| American Airlines Pass-Through Trust: | |||
| 4.40%, 9/22/23 | 107 | $ 81,508 | |
| 5.25%, 1/15/24 | 211 | 179,268 | |
| Aptiv PLC, 5.40%, 3/15/49 | 58 | 72,464 | |
| Security | Principal Amount (000's omitted)* | Value | |
| Consumer, Cyclical (continued) | |||
| Delta Air Lines, Inc.: | |||
| 3.625%, 3/15/22 | 299 | $ 307,690 | |
| 7.375%, 1/15/26 | 506 | 578,374 | |
| Ford Motor Credit Co., LLC: | |||
| 1.044%, (3 mo. USD LIBOR + 0.81%), 4/5/21(2) | 200 | 199,148 | |
| 1.104%, (3 mo. USD LIBOR + 0.88%), 10/12/21(2) | 313 | 309,305 | |
| 1.296%, (3 mo. USD LIBOR + 1.08%), 8/3/22(2) | 250 | 243,840 | |
| 2.979%, 8/3/22 | 1,070 | 1,089,207 | |
| 3.087%, 1/9/23 | 200 | 203,864 | |
| 4.14%, 2/15/23 | 200 | 206,500 | |
| Macy's Retail Holdings, LLC: | |||
| 2.875%, 2/15/23 | 480 | 462,000 | |
| 3.625%, 6/1/24 | 160 | 152,544 | |
| 3.875%, 1/15/22 | 321 | 320,198 | |
| Magna International, Inc., 2.45%, 6/15/30 | 250 | 269,107 | |
| Nordstrom, Inc.: | |||
| 4.375%, 4/1/30(7) | 360 | 355,291 | |
| 5.00%, 1/15/44 | 453 | 425,342 | |
| Tesla, Inc., 5.30%, 8/15/25(1) | 56 | 58,450 | |
| $ 5,514,100 | |||
| Consumer, Non-cyclical — 1.3% | |||
| Ashtead Capital, Inc., 4.25%, 11/1/29(1) | 384 | $ 421,379 | |
| Becton Dickinson and Co., 2.894%, 6/6/22 | 197 | 203,661 | |
| Block Financial, LLC, 3.875%, 8/15/30(7) | 386 | 417,098 | |
| Centene Corp.: | |||
| 3.375%, 2/15/30 | 199 | 209,677 | |
| 4.25%, 12/15/27 | 208 | 220,962 | |
| 4.625%, 12/15/29 | 36 | 40,014 | |
| Coca-Cola Femsa SAB de CV, 1.85%, 9/1/32 | 255 | 255,701 | |
| Conservation Fund (The), Green Bonds, 3.474%, 12/15/29 | 285 | 308,715 | |
| CVS Health Corp.: | |||
| 0.95%, (3 mo. USD LIBOR + 0.72%), 3/9/21(2) | 44 | 44,052 | |
| 3.00%, 8/15/26 | 615 | 681,919 | |
| 4.30%, 3/25/28 | 296 | 352,543 | |
| CVS Pass-Through Trust, 6.036%, 12/10/28 | 361 | 419,831 | |
| Doris Duke Charitable Foundation (The), 2.345%, 7/1/50 | 678 | 655,645 | |
| Ford Foundation (The), 2.415%, 6/1/50 | 435 | 444,685 | |
| Kraft Heinz Foods Co., 4.375%, 6/1/46 | 349 | 377,614 | |
| Royalty Pharma PLC, 3.55%, 9/2/50(1) | 33 | 35,289 | |
| Smithfield Foods, Inc.: | |||
| 3.00%, 10/15/30(1) | 77 | 81,616 | |
| 5.20%, 4/1/29(1) | 45 | 53,601 | |
| $ 5,224,002 | |||
| Security | Principal Amount (000's omitted)* | Value | |
| Energy — 0.4% | |||
| NuStar Logistics, L.P.: | |||
| 5.75%, 10/1/25 | 46 | $ 49,059 | |
| 6.00%, 6/1/26 | 198 | 214,479 | |
| 6.375%, 10/1/30 | 137 | 155,450 | |
| TerraForm Power Operating, LLC: | |||
| 4.75%, 1/15/30(1) | 319 | 342,035 | |
| 5.00%, 1/31/28(1) | 743 | 836,265 | |
| $ 1,597,288 | |||
| Financial — 7.4% | |||
| AerCap Ireland Capital DAC/AerCap Global Aviation Trust: | |||
| 4.50%, 9/15/23 | 291 | $ 315,684 | |
| 4.625%, 7/1/22(7) | 150 | 169,988 | |
| 6.50%, 7/15/25 | 175 | 209,329 | |
| Affiliated Managers Group, Inc., 3.30%, 6/15/30 | 466 | 506,582 | |
| Aflac, Inc., 3.60%, 4/1/30 | 170 | 200,224 | |
| Air Lease Corp., 2.875%, 1/15/26 | 355 | 375,901 | |
| Alliance Data Systems Corp., 4.75%, 12/15/24(1) | 371 | 375,406 | |
| Andrew W. Mellon Foundation (The), 0.947%, 8/1/27 | 335 | 334,963 | |
| Australia & New Zealand Banking Group, Ltd., 2.95% to 7/22/25, 7/22/30(1)(8) | 458 | 483,444 | |
| Bank of America Corp.: | |||
| 0.981% to 9/25/24, 9/25/25(8) | 445 | 450,312 | |
| 1.197% to 10/24/25, 10/24/26(8) | 646 | 654,759 | |
| 1.389%, (3 mo. USD LIBOR + 1.18%), 10/21/22(2) | 118 | 118,975 | |
| 1.898% to 7/23/30, 7/23/31(8) | 590 | 596,275 | |
| 1.922% to 10/24/30, 10/24/31(8) | 412 | 417,571 | |
| 2.456% to 10/22/24, 10/22/25(8) | 655 | 698,508 | |
| 2.676% to 6/19/40, 6/19/41(8) | 605 | 631,302 | |
| 3.499% to 5/17/21, 5/17/22(8) | 704 | 712,363 | |
| 3.593% to 7/21/27, 7/21/28(8) | 690 | 784,009 | |
| Series Z, 6.50% to 10/23/24(7)(8)(9) | 37 | 42,365 | |
| Bank of Montreal, 2.05%, 11/1/22 | 822 | 848,697 | |
| Bank of Nova Scotia (The): | |||
| 1.625%, 5/1/23 | 418 | 430,149 | |
| 2.375%, 1/18/23 | 600 | 625,127 | |
| BankUnited, Inc., 5.125%, 6/11/30 | 309 | 362,189 | |
| BBVA Bancomer S.A./Texas, 1.875%, 9/18/25(1) | 262 | 264,948 | |
| Capital One Financial Corp.: | |||
| 3.30%, 10/30/24 | 209 | 229,677 | |
| 3.75%, 7/28/26 | 138 | 156,532 | |
| 4.20%, 10/29/25 | 190 | 216,934 | |
| Charles Schwab Corp. (The), 4.00% to 12/1/30(8)(9) | 82 | 86,715 | |
| Citigroup, Inc.: | |||
| 0.776% to 10/30/23, 10/30/24(8) | 630 | 634,393 | |
| Security | Principal Amount (000's omitted)* | Value | |
| Financial (continued) | |||
| Citigroup, Inc.: (continued) | |||
| 1.296%, (3 mo. USD LIBOR + 1.07%), 12/8/21(2) | 150 | $ 151,141 | |
| 1.678% to 5/15/23, 5/15/24(8) | 745 | 767,831 | |
| 2.666% to 1/29/30, 1/29/31(8) | 760 | 815,877 | |
| 3.106% to 4/8/25, 4/8/26(8) | 319 | 348,950 | |
| 3.887% to 1/10/27, 1/10/28(8) | 1,081 | 1,242,325 | |
| 4.00% to 12/10/25(8)(9) | 310 | 318,913 | |
| Citizens Bank NA, 2.55%, 5/13/21 | 200 | 201,240 | |
| Citizens Financial Group, Inc., 2.375%, 7/28/21 | 170 | 171,653 | |
| Commonwealth Bank of Australia: | |||
| 2.50%, 9/18/22(1) | 270 | 280,165 | |
| 3.61% to 9/12/29, 9/12/34(1)(8) | 206 | 226,626 | |
| Digital Realty Trust, L.P., 4.75%, 10/1/25 | 260 | 304,619 | |
| Discover Bank: | |||
| 2.70%, 2/6/30 | 250 | 265,644 | |
| 4.682% to 8/9/23, 8/9/28(8) | 270 | 287,230 | |
| Discover Financial Services: | |||
| 3.95%, 11/6/24 | 90 | 100,025 | |
| 6.125% to 6/23/25(8)(9) | 319 | 360,869 | |
| HAT Holdings I, LLC/HAT Holdings II, LLC: | |||
| 5.25%, 7/15/24(1) | 391 | 407,414 | |
| 6.00%, 4/15/25(1) | 228 | 244,245 | |
| Iron Mountain, Inc.: | |||
| 4.50%, 2/15/31(1) | 283 | 296,796 | |
| 5.00%, 7/15/28(1) | 91 | 96,790 | |
| JPMorgan Chase & Co.: | |||
| 2.522% to 4/22/30, 4/22/31(8) | 530 | 570,073 | |
| 2.739% to 10/15/29, 10/15/30(8) | 217 | 236,324 | |
| 2.956% to 5/13/30, 5/13/31(8) | 146 | 160,248 | |
| Series S, 6.75% to 2/1/24(8)(9) | 112 | 125,778 | |
| KKR Group Finance Co. VII, LLC, 3.625%, 2/25/50(1) | 301 | 335,967 | |
| Lloyds Banking Group PLC, 2.438% to 2/5/25, 2/5/26(8) | 356 | 376,249 | |
| Macquarie Bank, Ltd., 3.624%, 6/3/30(1) | 255 | 279,570 | |
| Morgan Stanley: | |||
| 0.777%, (SOFR + 0.70%), 1/20/23(2) | 964 | 967,873 | |
| 1.615%, (3 mo. USD LIBOR + 1.40%), 10/24/23(2) | 260 | 265,007 | |
| Series J, 4.047%, (3 mo. USD LIBOR + 3.81%) to 4/15/21(2)(9) | 185 | 184,129 | |
| National Australia Bank, Ltd., 3.625%, 6/20/23(7) | 275 | 297,237 | |
| National Bank of Canada, 0.55% to 11/15/23, 11/15/24(8) | 301 | 302,036 | |
| Nationwide Building Society, 3.96% to 7/18/29, 7/18/30(1)(8) | 293 | 341,570 | |
| Newmark Group, Inc., 6.125%, 11/15/23 | 110 | 119,709 | |
| PNC Financial Services Group, Inc. (The), 2.20%, 11/1/24 | 2,244 | 2,385,686 | |
| Radian Group, Inc.: | |||
| 4.875%, 3/15/27 | 476 | 523,933 | |
| Security | Principal Amount (000's omitted)* | Value | |
| Financial (continued) | |||
| Radian Group, Inc.: (continued) | |||
| 6.625%, 3/15/25 | 37 | $ 41,972 | |
| SBA Tower Trust, 3.722%, 4/9/48(1) | 660 | 678,580 | |
| SITE Centers Corp., 3.625%, 2/1/25 | 259 | 269,265 | |
| Standard Chartered PLC: | |||
| 1.319% to 10/14/22, 10/14/23(1)(8) | 203 | 205,304 | |
| 6.00% to 7/26/25(1)(8)(9) | 233 | 249,601 | |
| Stifel Financial Corp., 4.00%, 5/15/30 | 390 | 446,286 | |
| Synovus Bank/Columbus, GA: | |||
| 2.289% to 2/10/22, 2/10/23(8) | 529 | 535,886 | |
| 4.00% to 10/29/25, 10/29/30(8) | 250 | 264,793 | |
| Synovus Financial Corp.: | |||
| 3.125%, 11/1/22 | 156 | 162,041 | |
| 5.90% to 2/7/24, 2/7/29(8) | 35 | 37,751 | |
| Truist Financial Corp., 5.10% to 3/1/30(8)(9) | 409 | 468,309 | |
| UBS Group AG, 1.364% to 1/30/26, 1/30/27(1)(8) | 200 | 202,340 | |
| UniCredit SpA, 5.459% to 6/30/30, 6/30/35(1)(8) | 200 | 220,420 | |
| Visa, Inc., 2.00%, 8/15/50 | 318 | 303,725 | |
| Welltower, Inc., 2.75%, 1/15/31 | 249 | 265,871 | |
| Westpac Banking Corp., 2.668% to 11/15/30, 11/15/35(8) | 220 | 226,910 | |
| $ 30,872,117 | |||
| Government - Multinational — 0.6% | |||
| Asian Development Bank, 3.125%, 9/26/28 | 540 | $ 633,430 | |
| International Bank for Reconstruction & Development, 3.125%, 11/20/25 | 1,200 | 1,355,200 | |
| International Finance Corp., 7.50%, 5/9/22 | BRL | 395 | 80,906 |
| Nordic Investment Bank, 2.25%, 9/30/21 | 271 | 275,253 | |
| $ 2,344,789 | |||
| Industrial — 1.2% | |||
| FedEx Corp., 4.55%, 4/1/46 | 290 | $ 373,100 | |
| Flowserve Corp., 3.50%, 10/1/30 | 194 | 207,139 | |
| Jabil, Inc.: | |||
| 3.00%, 1/15/31 | 709 | 755,424 | |
| 3.60%, 1/15/30 | 531 | 591,504 | |
| 4.70%, 9/15/22 | 569 | 606,380 | |
| nVent Finance S.a.r.l., 4.55%, 4/15/28 | 855 | 929,691 | |
| Owens Corning: | |||
| 3.95%, 8/15/29 | 669 | 772,021 | |
| 4.30%, 7/15/47 | 101 | 121,607 | |
| 4.40%, 1/30/48 | 10 | 12,063 | |
| SMBC Aviation Capital Finance DAC, 2.65%, 7/15/21(1) | 260 | 262,761 | |
| Security | Principal Amount (000's omitted)* | Value | |
| Industrial (continued) | |||
| Valmont Industries, Inc.: | |||
| 5.00%, 10/1/44 | 55 | $ 63,829 | |
| 5.25%, 10/1/54 | 265 | 312,390 | |
| $ 5,007,909 | |||
| Other Revenue — 0.2% | |||
| BlueHub Loan Fund, Inc., 3.099%, 1/1/30 | 675 | $ 677,855 | |
| $ 677,855 | |||
| Technology — 0.5% | |||
| DXC Technology Co.: | |||
| 4.00%, 4/15/23 | 340 | $ 361,878 | |
| 4.125%, 4/15/25 | 266 | 294,222 | |
| 4.75%, 4/15/27 | 84 | 96,208 | |
| Seagate HDD Cayman: | |||
| 3.375%, 7/15/31(1) | 200 | 201,457 | |
| 4.091%, 6/1/29(1) | 354 | 379,946 | |
| 4.875%, 3/1/24 | 235 | 255,775 | |
| 5.75%, 12/1/34 | 180 | 212,358 | |
| Western Digital Corp., 4.75%, 2/15/26 | 394 | 435,862 | |
| $ 2,237,706 | |||
| Utilities — 1.0% | |||
| AES Corp. (The), 2.45%, 1/15/31(1) | 533 | $ 540,346 | |
| American Water Capital Corp., 2.95%, 9/1/27 | 370 | 409,531 | |
| Avangrid, Inc.: | |||
| 3.15%, 12/1/24 | 667 | 727,698 | |
| 3.80%, 6/1/29 | 590 | 677,311 | |
| Consolidated Edison Co. of New York, Inc., 3.35%, 4/1/30 | 171 | 196,159 | |
| Enel Finance International NV, 2.65%, 9/10/24(1) | 530 | 564,964 | |
| MidAmerican Energy Co.: | |||
| 3.15%, 4/15/50 | 215 | 247,589 | |
| 4.25%, 7/15/49 | 250 | 335,673 | |
| NextEra Energy Operating Partners, L.P., 4.25%, 9/15/24(1) | 34 | 36,422 | |
| Niagara Mohawk Power Corp., 1.96%, 6/27/30(1) | 233 | 240,312 | |
| Pattern Energy Operations, L.P./Pattern Energy Operations, Inc., 4.50%, 8/15/28(1) | 18 | 19,272 | |
| Public Service Co. of Colorado, 3.70%, 6/15/28 | 258 | 301,103 | |
| Sempra Energy, 4.875% to 10/15/25(8)(9) | 79 | 84,629 | |
| $ 4,381,009 | |||
| Total Corporate Bonds (identified cost $61,102,852) | $ 64,922,613 | ||
| Preferred Stocks — 0.4% |
| Security | Shares | Value | |
| Mortgage Real Estate Investment Trusts (REITs) — 0.0%(6) | |||
| AGNC Investment Corp., Series F, 6.125% to 4/15/25(8) | 7,600 | $ 181,564 | |
| $ 181,564 | |||
| Oil, Gas & Consumable Fuels — 0.1% | |||
| NuStar Energy, L.P., Series B, 7.625% to 6/15/22(8) | 12,563 | $ 225,883 | |
| $ 225,883 | |||
| Real Estate Management & Development — 0.1% | |||
| Brookfield Property Partners, L.P.: | |||
| Series A, 5.75% | 13,670 | $ 292,538 | |
| Series A2, 6.375% | 12,000 | 278,280 | |
| $ 570,818 | |||
| Wireless Telecommunication Services — 0.2% | |||
| United States Cellular Corp.: | |||
| 5.50% | 23,600 | $ 594,956 | |
| 6.25% | 2,200 | 58,410 | |
| $ 653,366 | |||
| Total Preferred Stocks (identified cost $1,744,386) | $ 1,631,631 | ||
| Senior Floating-Rate Loans — 0.8%(10) |
| Security | Principal Amount (000's omitted) | Value | |
| Building and Development — 0.1% | |||
| Cushman & Wakefield U.S. Borrower, LLC, Term Loan, 2.897%, (1 mo. USD LIBOR + 2.75%), 8/21/25 | $ | 294 | $ 288,699 |
| $ 288,699 | |||
| Drugs — 0.1% | |||
| Jaguar Holding Company II, Term Loan, 3.50%, (1 mo. USD LIBOR + 2.50%, Floor 1.00%), 8/18/22 | $ | 429 | $ 427,718 |
| $ 427,718 | |||
| Electronics/Electrical — 0.2% | |||
| Go Daddy Operating Company, LLC, Term Loan, 1.897%, (1 mo. USD LIBOR + 1.75%), 2/15/24 | $ | 121 | $ 121,334 |
| Hyland Software, Inc., Term Loan, 4.25%, (1 mo. USD LIBOR + 3.50%, Floor 0.75%), 7/1/24 | 207 | 207,995 | |
| MA FinanceCo., LLC, Term Loan, 2.897%, (1 mo. USD LIBOR + 2.75%), 6/21/24 | 19 | 18,324 | |
| Seattle Spinco, Inc., Term Loan, 2.897%, (1 mo. USD LIBOR + 2.75%), 6/21/24 | 125 | 123,748 | |
| Security | Principal Amount (000's omitted) | Value | |
| Electronics/Electrical (continued) | |||
| SolarWinds Holdings, Inc., Term Loan, 2.897%, (1 mo. USD LIBOR + 2.75%), 2/5/24 | $ | 78 | $ 75,200 |
| SS&C European Holdings S.a.r.l., Term Loan, 4/16/25(11) | 37 | 36,283 | |
| SS&C Technologies, Inc., Term Loan, 4/16/25(11) | 48 | 47,907 | |
| Ultimate Software Group, Inc. (The), Term Loan, 5/4/26(11) | 250 | 250,250 | |
| $ 881,041 | |||
| Equipment Leasing — 0.0%(6) | |||
| Avolon TLB Borrower 1 (US), LLC, Term Loan, 2.50%, (1 mo. USD LIBOR + 1.75%, Floor 0.75%), 1/15/25 | $ | 147 | $ 146,200 |
| $ 146,200 | |||
| Health Care — 0.1% | |||
| Change Healthcare Holdings, LLC, Term Loan, 3.50%, (USD LIBOR + 2.50%, Floor 1.00%), 3/1/24(12) | $ | 322 | $ 321,408 |
| $ 321,408 | |||
| Insurance — 0.1% | |||
| Asurion, LLC: | |||
| Term Loan, 12/23/26(11) | $ | 60 | $ 59,512 |
| Term Loan, 3.147%, (1 mo. USD LIBOR + 3.00%), 11/3/23 | 120 | 119,480 | |
| USI, Inc., Term Loan, 5/16/24(11) | 229 | 226,114 | |
| $ 405,106 | |||
| Leisure Goods/Activities/Movies — 0.0%(6) | |||
| Bombardier Recreational Products, Inc., Term Loan, 2.147%, (1 mo. USD LIBOR + 2.00%), 5/24/27 | $ | 69 | $ 67,947 |
| $ 67,947 | |||
| Lodging and Casinos — 0.0%(6) | |||
| ESH Hospitality, Inc., Term Loan, 2.147%, (1 mo. USD LIBOR + 2.00%), 9/18/26 | $ | 40 | $ 39,409 |
| $ 39,409 | |||
| Telecommunications — 0.2% | |||
| CenturyLink, Inc., Term Loan, 2.397%, (1 mo. USD LIBOR + 2.25%), 3/15/27 | $ | 324 | $ 321,119 |
| Level 3 Financing, Inc., Term Loan, 1.897%, (1 mo. USD LIBOR + 1.75%), 3/1/27 | 74 | 73,205 | |
| Ziggo Financing Partnership, Term Loan, 2.659%, (1 mo. USD LIBOR + 2.50%), 4/30/28 | 325 | 322,766 | |
| $ 717,090 | |||
| Total Senior Floating-Rate Loans (identified cost $3,310,089) | $ 3,294,618 | ||
| Sovereign Government Bonds — 0.3% |
| Security | Principal Amount (000's omitted) | Value | |
| Kreditanstalt fuer Wiederaufbau: | |||
| 0.75%, 9/30/30 | $ | 235 | $ 229,938 |
| 2.00%, 9/29/22 | 540 | 557,196 | |
| Kuntarahoitus Oyj, 1.375%, 9/21/21(1) | 200 | 201,618 | |
| Nederlandse Waterschapsbank NV, 2.125%, 11/15/21(1) | 230 | 233,801 | |
| Total Sovereign Government Bonds (identified cost $1,226,790) | $ 1,222,553 | ||
| Taxable Municipal Obligations — 1.8% |
| Security | Principal Amount (000's omitted) | Value | |
| General Obligations — 0.5% | |||
| Los Angeles Unified School District, CA, 5.75%, 7/1/34(13) | $ | 450 | $ 635,445 |
| Massachusetts, Green Bonds, 3.277%, 6/1/46 | 435 | 505,279 | |
| New York City, NY, 5.206%, 10/1/31(13) | 470 | 593,102 | |
| San Francisco City and County, CA, (Social Bonds - Affordable Housing, 2016), 3.921%, 6/15/39 | 285 | 321,115 | |
| $ 2,054,941 | |||
| Special Tax Revenue — 0.7% | |||
| California Health Facilities Financing Authority, (No Place Like Home Program): | |||
| 2.361%, 6/1/26 | $ | 405 | $ 433,087 |
| 2.484%, 6/1/27 | 290 | 311,683 | |
| 2.534%, 6/1/28 | 360 | 386,607 | |
| 2.584%, 6/1/29 | 200 | 214,936 | |
| 2.984%, 6/1/33 | 220 | 235,924 | |
| Connecticut, Special Tax Revenue, 5.459%, 11/1/30(13) | 300 | 371,502 | |
| New York City Transitional Finance Authority, NY, Future Tax Secured Revenue Bonds, 5.767%, 8/1/36(13) | 600 | 782,574 | |
| $ 2,736,313 | |||
| Water and Sewer — 0.6% | |||
| District of Columbia Water & Sewer Authority, Green Bonds, 4.814%, 10/1/2114 | $ | 130 | $ 193,791 |
| Narragansett Bay Commission, RI, Wastewater System Revenue, Green Bonds: | |||
| 2.094%, 9/1/30 | 170 | 179,315 | |
| 2.184%, 9/1/31 | 140 | 144,798 | |
| 2.264%, 9/1/32 | 125 | 128,836 | |
| 2.344%, 9/1/33 | 135 | 139,443 | |
| San Diego County Water Authority, CA: | |||
| Green Bonds, 1.531%, 5/1/30 | 145 | 147,971 | |
| Green Bonds, 1.701%, 5/1/31 | 130 | 133,388 | |
| Security | Principal Amount (000's omitted) | Value | |
| Water and Sewer (continued) | |||
| San Diego County Water Authority, CA: (continued) | |||
| Green Bonds, 1.951%, 5/1/34 | $ | 75 | $ 76,370 |
| San Francisco City and County Public Utilities Commission, CA, Water Revenue, Green Bonds, 3.303%, 11/1/39 | 1,440 | 1,538,323 | |
| $ 2,682,235 | |||
| Total Taxable Municipal Obligations (identified cost $6,790,214) | $ 7,473,489 | ||
| U.S. Government Agencies and Instrumentalities — 0.5% |
| Security | Principal Amount (000's omitted) | Value | |
| U.S. Department of Housing and Urban Development: | |||
| 2.547%, 8/1/22 | $ | 137 | $ 142,149 |
| 2.618%, 8/1/23 | ��� 69 | 73,088 | |
| 2.668%, 8/1/24 | 240 | 257,946 | |
| 2.738%, 8/1/25 | 240 | 264,763 | |
| 3.435%, 8/1/34 | 220 | 255,346 | |
| 3.485%, 8/1/35 | 125 | 145,731 | |
| 3.585%, 8/1/37 | 225 | 264,138 | |
| U.S. International Development Finance Corp.: | |||
| 3.22%, 9/15/29 | 388 | 434,019 | |
| 3.52%, 9/20/32 | 370 | 426,300 | |
| Total U.S. Government Agencies and Instrumentalities (identified cost $2,069,493) | $ 2,263,480 | ||
| U.S. Government Agency Mortgage-Backed Securities — 3.9% |
| Security | Principal Amount (000's omitted) | Value | |
| Federal Home Loan Mortgage Corp., 3.50%, 3/1/48 | $ | 234 | $ 248,732 |
| Federal National Mortgage Association: | |||
| 30-Year, 2.00%, TBA(14) | 1,547 | 1,608,389 | |
| 30-Year, 2.50%, TBA(14) | 5,675 | 5,985,128 | |
| 30-Year, 3.00%, TBA(14) | 6,050 | 6,339,497 | |
| Pool #AN1879, 2.65%, 6/1/26 | 323 | 352,021 | |
| Pool #AN1909, 2.68%, 7/1/26 | 350 | 383,155 | |
| Pool #BM3990, 4.00%, 3/1/48 | 541 | 580,600 | |
| Pool #MA3149, 4.00%, 10/1/47 | 741 | 794,292 | |
| Total U.S. Government Agency Mortgage-Backed Securities (identified cost $16,151,585) | $ 16,291,814 | ||
| U.S. Treasury Obligations — 2.1% |
| Security | Principal Amount (000's omitted) | Value | |
| U.S. Treasury Bonds: | |||
| 1.125%, 8/15/40 | $ | 99 | $ 93,601 |
| 1.375%, 8/15/50 | 255 | 238,345 | |
| 2.00%, 2/15/50 | 124 | 134,429 | |
| U.S. Treasury Inflation-Protected Bond, 0.25%, 2/15/50(15) | 1,242 | 1,482,008 | |
| U.S. Treasury Inflation-Protected Notes: | |||
| 0.125%, 4/15/25(15) | 88 | 94,372 | |
| 0.75%, 7/15/28(15) | 4,344 | 5,054,527 | |
| U.S. Treasury Notes: | |||
| 0.25%, 6/30/25 | 89 | 88,764 | |
| 0.25%, 10/31/25 | 232 | 230,976 | |
| 0.625%, 8/15/30 | 270 | 263,124 | |
| 0.875%, 11/15/30 | 941 | 937,471 | |
| Total U.S. Treasury Obligations (identified cost $7,905,844) | $ 8,617,617 | ||
| Short-Term Investments — 2.0% | |||
| Other — 1.9% | |||
| Description | Units | Value | |
| Calvert Cash Reserves Fund, LLC, 0.12%(16) | 7,856,022 | $ 7,856,807 | |
| Total Other (identified cost $7,856,850) | $ 7,856,807 | ||
| Securities Lending Collateral — 0.1% | |||
| Security | Shares | Value | |
| State Street Navigator Securities Lending Government Money Market Portfolio, 0.08%(17) | 305,813 | $ 305,813 | |
| Total Securities Lending Collateral (identified cost $305,813) | $ 305,813 | ||
| Total Short-Term Investments (identified cost $8,162,663) | $ 8,162,620 | ||
| Total Investments — 103.9% (identified cost $340,852,848) | $432,252,842 | ||
| Other Assets, Less Liabilities — (3.9)% | $ (16,133,767) | ||
| Net Assets — 100.0% | $416,119,075 | ||
| The percentage shown for each investment category in the Schedule of Investments is based on net assets. | ||
| * | In U.S. dollars unless otherwise indicated. | |
| (1) | Security exempt from registration under Rule 144A of the Securities Act of 1933, as amended. These securities may be sold in certain transactions in reliance on an exemption from registration (normally to qualified institutional buyers). At December 31, 2020, the aggregate value of these securities is $42,007,460 or 10.1% of the Fund's net assets. | |
| (2) | Variable rate security. The stated interest rate represents the rate in effect at December 31, 2020. | |
| (3) | Step coupon security. Interest rate represents the rate in effect at December 31, 2020. | |
| (4) | Weighted average fixed-rate coupon that changes/updates monthly. Rate shown is the rate at December 31, 2020. | |
| (5) | Non-income producing security. | |
| (6) | Amount is less than 0.05%. | |
| (7) | All or a portion of this security was on loan at December 31, 2020. The aggregate market value of securities on loan at December 31, 2020 was $572,495. | |
| (8) | Security converts to variable rate after the indicated fixed-rate coupon period. | |
| (9) | Perpetual security with no stated maturity date but may be subject to calls by the issuer. | |
| (10) | Senior floating-rate loans (Senior Loans) often require prepayments from excess cash flows or permit the borrowers to repay at their election. The degree to which borrowers repay, whether as a contractual requirement or at their election, cannot be predicted with accuracy. As a result, the actual remaining maturity may be substantially less than the stated maturities shown. However, Senior Loans will typically have an expected average life of approximately two to four years. Senior Loans typically have rates of interest which are redetermined periodically by reference to a base lending rate, plus a spread. These base lending rates are primarily the London Interbank Offered Rate ("LIBOR") and secondarily, the prime rate offered by one or more major United States banks (the "Prime Rate"). Base lending rates may be subject to a floor, or minimum rate. Senior Loans are generally subject to contractual restrictions that must be satisfied before they can be bought or sold. | |
| (11) | This Senior Loan will settle after December 31, 2020, at which time the interest rate will be determined. |
| (12) | The stated interest rate represents the weighted average interest rate at December 31, 2020 of contracts within the senior loan facility. Interest rates on contracts are primarily redetermined either weekly, monthly or quarterly by reference to the indicated base lending rate and spread and the reset period. |
| (13) | Build America Bond. Represents taxable municipal obligation issued pursuant to the American Recovery and Reinvestment Act of 2009 or other legislation providing for the issuance of taxable municipal debt on which the issuer receives federal support. |
| (14) | TBA (To Be Announced) securities are purchased on a forward commitment basis with an approximate principal amount and maturity date. The actual principal amount and maturity date are determined upon settlement. |
| (15) | Inflation-linked security whose principal is adjusted for inflation based on changes in the U.S. Consumer Price Index. Interest is calculated based on the inflation-adjusted principal. |
| (16) | Affiliated investment company, available to Calvert portfolios and funds, which invests in high quality, U.S. dollar denominated money market instruments. The rate shown is the annualized seven-day yield as of December 31, 2020. |
| (17) | Represents investment of cash collateral received in connection with securities lending. |
| Description | Number of Contracts | Position | Expiration Date | Notional Amount | Value/ Unrealized Appreciation (Depreciation) |
| Interest Rate Futures | |||||
| U.S. 2-Year Treasury Note | 19 | Long | 3/31/21 | $ 4,198,555 | $ 4,125 |
| U.S. 5-Year Treasury Note | 1 | Long | 3/31/21 | 126,164 | 287 |
| U.S. Long Treasury Bond | 9 | Long | 3/22/21 | 1,558,688 | (3,736) |
| U.S. Ultra-Long Treasury Bond | 29 | Long | 3/22/21 | 6,193,313 | (86,093) |
| U.S. 5-Year Treasury Note | (33) | Short | 3/31/21 | (4,163,414) | (9,854) |
| U.S. Long Treasury Bond | (2) | Short | 3/22/21 | (346,375) | 1,028 |
| U.S. Ultra 10-Year Treasury Note | (168) | Short | 3/22/21 | (26,268,375) | 80,100 |
| U.S. Ultra-Long Treasury Bond | (3) | Short | 3/22/21 | (640,688) | 4,916 |
| $ (9,227) |
| Abbreviations: | |
| ADR | – American Depositary Receipt |
| LIBOR | – London Interbank Offered Rate |
| SOFR | – Secured Overnight Financing Rate |
| TBA | – To Be Announced |
| Currency Abbreviations: | |
| BRL | – Brazilian Real |
| USD | – United States Dollar |
| December 31, 2020 | |
| Assets | |
| Investments in securities of unaffiliated issuers, at value (identified cost $332,995,998) - including $572,495 of securities on loan | $ 424,396,035 |
| Investments in securities of affiliated issuers, at value (identified cost $7,856,850) | 7,856,807 |
| Cash | 623,871 |
| Deposits at broker for futures contracts | 238,416 |
| Receivable for capital shares sold | 476,730 |
| Dividends and interest receivable | 979,358 |
| Dividends receivable - affiliated | 784 |
| Securities lending income receivable | 164 |
| Tax reclaims receivable | 25,162 |
| Directors' deferred compensation plan | 65,340 |
| Total assets | $434,662,667 |
| Liabilities | |
| Payable for variation margin on open futures contracts | $ 14,829 |
| Payable for investments purchased | 3,382,281 |
| Payable for when-issued/delayed delivery/forward commitment securities | 13,884,667 |
| Payable for capital shares redeemed | 540,334 |
| Deposits for securities loaned | 305,813 |
| Payable to affiliates: | |
| Investment advisory fee | 142,479 |
| Administrative fee | 41,701 |
| Distribution and service fees | 1,575 |
| Sub-transfer agency fee | 180 |
| Directors' deferred compensation plan | 65,340 |
| Accrued expenses | 164,393 |
| Total liabilities | $ 18,543,592 |
| Net Assets | $416,119,075 |
| Sources of Net Assets | |
| Paid-in capital | $ 306,973,870 |
| Distributable earnings | 109,145,205 |
| Total | $416,119,075 |
| Class I Shares | |
| Net Assets | $ 408,223,209 |
| Shares Outstanding | 161,740,886 |
| Net Asset Value, Offering Price and Redemption Price Per Share (net assets ÷ shares of beneficial interest outstanding) | $ 2.52 |
| Class F Shares | |
| Net Assets | $ 7,895,866 |
| Shares Outstanding | 3,127,758 |
| Net Asset Value, Offering Price and Redemption Price Per Share (net assets ÷ shares of beneficial interest outstanding) | $ 2.52 |
| Year Ended | |
| December 31, 2020 | |
| Investment Income | |
| Dividend income (net of foreign taxes withheld of $34,042) | $ 3,260,176 |
| Dividend income - affiliated issuers | 6,824 |
| Interest and other income (net of foreign taxes withheld of $69) | 4,183,579 |
| Securities lending income, net | 3,989 |
| Total investment income | $ 7,454,568 |
| Expenses | |
| Investment advisory fee | $ 1,512,457 |
| Administrative fee | 442,670 |
| Distribution and service fees: | |
| Class F | 15,459 |
| Directors' fees and expenses | 19,065 |
| Custodian fees | 13,105 |
| Transfer agency fees and expenses | 57,215 |
| Accounting fees | 144,665 |
| Professional fees | 41,119 |
| Reports to shareholders | 39,922 |
| Miscellaneous | 38,110 |
| Total expenses | $ 2,323,787 |
| Net investment income | $ 5,130,781 |
| Realized and Unrealized Gain (Loss) | |
| Net realized gain (loss): | |
| Investment securities | $ 12,788,147 |
| Investment securities - affiliated issuers | 778 |
| Futures contracts | 68,984 |
| Foreign currency transactions | (3,338) |
| Net realized gain | $12,854,571 |
| Change in unrealized appreciation (depreciation): | |
| Investment securities | $ 36,198,411 |
| Investment securities - affiliated issuers | (43) |
| Futures contracts | 113,820 |
| Foreign currency | 186 |
| Net change in unrealized appreciation (depreciation) | $36,312,374 |
| Net realized and unrealized gain | $49,166,945 |
| Net increase in net assets from operations | $54,297,726 |
| Year Ended December 31, | ||
| 2020 | 2019 | |
| Increase (Decrease) in Net Assets | ||
| From operations: | ||
| Net investment income | $ 5,130,781 | $ 5,646,608 |
| Net realized gain | 12,854,571 | 12,550,060 |
| Net change in unrealized appreciation (depreciation) | 36,312,374 | 53,518,070 |
| Net increase in net assets from operations | $ 54,297,726 | $ 71,714,738 |
| Distributions to shareholders: | ||
| Class I | $ (17,095,943) | $ (17,324,508) |
| Class F | (305,549) | (195,158) |
| Total distributions to shareholders | $ (17,401,492) | $ (17,519,666) |
| Capital share transactions: | ||
| Class I | $ 9,550,261 | $ 12,319,228 |
| Class F | 2,257,686 | 2,635,364 |
| Net increase in net assets from capital share transactions | $ 11,807,947 | $ 14,954,592 |
| Net increase in net assets | $ 48,704,181 | $ 69,149,664 |
| Net Assets | ||
| At beginning of year | $ 367,414,894 | $ 298,265,230 |
| At end of year | $416,119,075 | $367,414,894 |
| Class I | |||||
| Year Ended December 31, | |||||
| 2020 | 2019 | 2018 | 2017 | 2016 | |
| Net asset value — Beginning of year | $ 2.29 | $ 1.94 | $ 2.23 | $ 2.05 | $ 2.00 |
| Income (Loss) From Operations | |||||
| Net investment income(1) | $ 0.03 | $ 0.04 | $ 0.04 | $ 0.04 | $ 0.04 |
| Net realized and unrealized gain (loss) | 0.31 | 0.43 | (0.08) | 0.20 | 0.11 |
| Total income (loss) from operations | $ 0.34 | $ 0.47 | $ (0.04) | $ 0.24 | $ 0.15 |
| Less Distributions | |||||
| From net investment income | $ (0.04) | $ (0.04) | $ (0.04) | $ (0.04) | $ (0.04) |
| From net realized gain | (0.07) | (0.08) | (0.21) | (0.02) | (0.06) |
| Total distributions | $ (0.11) | $ (0.12) | $ (0.25) | $ (0.06) | $ (0.10) |
| Net asset value — End of year | $ 2.52 | $ 2.29 | $ 1.94 | $ 2.23 | $ 2.05 |
| Total Return(2) | 15.26% | 24.40% | (2.67)% | 12.16% | 7.58% |
| Ratios/Supplemental Data | |||||
| Net assets, end of year (000’s omitted) | $408,223 | $362,392 | $296,345 | $329,060 | $325,638 |
| Ratios (as a percentage of average daily net assets):(3) | |||||
| Total expenses | 0.63% | 0.62% | 0.72% | 0.69% | 0.75% |
| Net expenses | 0.63% | 0.62% | 0.70% | 0.68% | 0.70% |
| Net investment income | 1.39% | 1.68% | 1.66% | 1.73% | 2.06% |
| Portfolio Turnover | 104% (4) | 70% (4) | 77% | 132% | 129% |
| (1) | Computed using average shares outstanding. |
| (2) | Returns are historical and are calculated by determining the percentage change in net asset value with all distributions reinvested and do not reflect fees and expenses imposed by variable annuity contracts or variable life insurance policies. If included, total return would be lower. |
| (3) | Total expenses do not reflect amounts reimbursed and/or waived by the adviser and certain of its affiliates, if applicable. Net expenses are net of all reductions and represent the net expenses paid by the Fund. |
| (4) | Includes the effect of To-Be-Announced (TBA) transactions. |
| Class F | |||||
| Year Ended December 31, | |||||
| 2020 | 2019 | 2018 | 2017 | 2016 | |
| Net asset value — Beginning of year | $ 2.30 | $ 1.95 | $ 2.24 | $ 2.08 | $ 2.03 |
| Income (Loss) From Operations | |||||
| Net investment income(1) | $ 0.03 | $ 0.03 | $ 0.03 | $ 0.03 | $ 0.03 |
| Net realized and unrealized gain (loss) | 0.30 | 0.44 | (0.07) | 0.19 | 0.12 |
| Total income (loss) from operations | $ 0.33 | $ 0.47 | $ (0.04) | $ 0.22 | $ 0.15 |
| Less Distributions | |||||
| From net investment income | $ (0.04) | $ (0.04) | $ (0.04) | $ (0.04) | $ (0.04) |
| From net realized gain | (0.07) | (0.08) | (0.21) | (0.02) | (0.06) |
| Total distributions | $ (0.11) | $ (0.12) | $ (0.25) | $ (0.06) | $(0.10) |
| Net asset value — End of year | $ 2.52 | $ 2.30 | $ 1.95 | $ 2.24 | $ 2.08 |
| Total Return(2) | 14.76% | 24.28% | (2.65)% | 11.01% | 7.14% |
| Ratios/Supplemental Data | |||||
| Net assets, end of year (000’s omitted) | $ 7,896 | $ 5,023 | $1,920 | $ 1,540 | $ 588 |
| Ratios (as a percentage of average daily net assets):(3) | |||||
| Total expenses | 0.88% | 0.86% | 0.96% | 1.40% | 1.40% |
| Net expenses | 0.88% | 0.86% | 0.96% | 1.08% | 1.10% |
| Net investment income | 1.13% | 1.44% | 1.40% | 1.30% | 1.65% |
| Portfolio Turnover | 104% (4) | 70% (4) | 77% | 132% | 129% |
| (1) | Computed using average shares outstanding. |
| (2) | Returns are historical and are calculated by determining the percentage change in net asset value with all distributions reinvested and do not reflect fees and expenses imposed by variable annuity contracts or variable life insurance policies. If included, total return would be lower. |
| (3) | Total expenses do not reflect amounts reimbursed and/or waived by the adviser and certain of its affiliates, if applicable. Net expenses are net of all reductions and represent the net expenses paid by the Fund. |
| (4) | Includes the effect of To-Be-Announced (TBA) transactions. |
| Asset Description | Level 1 | Level 2 | Level 3 | Total |
| Asset-Backed Securities | $ — | $ 21,919,478 | $ — | $ 21,919,478 |
| Collateralized Mortgage-Backed Obligations | — | 7,258,302 | — | 7,258,302 |
| Commercial Mortgage-Backed Securities | — | 20,378,445 | — | 20,378,445 |
| Common Stocks | 268,507,913 (1) | — | — | 268,507,913 |
| Convertible Bonds | — | 280,704 | — | 280,704 |
| Convertible Preferred Stocks | 27,565 | — | — | 27,565 |
| Corporate Bonds | — | 64,922,613 | — | 64,922,613 |
| Preferred Stocks | 1,631,631 | — | — | 1,631,631 |
| Senior Floating-Rate Loans | — | 3,294,618 | — | 3,294,618 |
| Sovereign Government Bonds | — | 1,222,553 | — | 1,222,553 |
| Taxable Municipal Obligations | — | 7,473,489 | — | 7,473,489 |
| U.S. Government Agencies and Instrumentalities | — | 2,263,480 | — | 2,263,480 |
| U.S. Government Agency Mortgage-Backed Securities | — | 16,291,814 | — | 16,291,814 |
| U.S. Treasury Obligations | — | 8,617,617 | — | 8,617,617 |
| Short-Term Investments: | ||||
| Other | — | 7,856,807 | — | 7,856,807 |
| Securities Lending Collateral | 305,813 | — | — | 305,813 |
| Total Investments | $270,472,922 | $161,779,920 | $ — | $432,252,842 |
| Futures Contracts | $ 90,456 | $ — | $ — | $ 90,456 |
| Total | $270,563,378 | $161,779,920 | $ — | $432,343,298 |
| Liability Description | ||||
| Futures Contracts | $ (99,683) | $ — | $ — | $ (99,683) |
| Total | $ (99,683) | $ — | $ — | $ (99,683) |
| (1) | The level classification by major category of investments is the same as the category presentation in the Schedule of Investments. |
| Year Ended December 31, | ||
| 2020 | 2019 | |
| Ordinary income | $10,120,796 | $ 6,318,568 |
| Long-term capital gains | $ 7,280,696 | $11,201,098 |
| Undistributed ordinary income | $ 6,878,813 |
| Undistributed long-term capital gains | $11,713,590 |
| Net unrealized appreciation | $90,552,802 |
| Aggregate cost | $341,700,249 |
| Gross unrealized appreciation | $ 92,153,038 |
| Gross unrealized depreciation | (1,600,445) |
| Net unrealized appreciation | $ 90,552,593 |
| Derivative | Statement of Assets and Liabilities Caption | Assets | Liabilities | |
| Futures contracts | Distributable earnings | $90,456 (1) | $(99,683) (1) | |
| (1) | Only the current day's variation margin is reported within the Statement of Assets and Liabilities as Receivable or Payable for variation margin on open futures contracts, as applicable. |
| Statement of Operations Caption | |
| Net realized gain (loss): | |
| Investment securities(1) | $ 522 |
| Futures contracts | 68,984 |
| Total | $ 69,506 |
| Change in unrealized appreciation (depreciation): | |
| Futures contracts | $ 113,820 |
| Total | $113,820 |
| (1) | Relates to purchased options. |
| Remaining Contractual Maturity of the Transactions | |||||
| Overnight and Continuous | <30 days | 30 to 90 days | >90 days | Total | |
| Convertible Preferred Stocks | $ 27,720 | $ — | $ — | $ — | $ 27,720 |
| Corporate Bonds | 278,093 | — | — | — | 278,093 |
| Total | $305,813 | $ — | $ — | $ — | $305,813 |
| Name | Value, beginning of period | Purchases | Sales proceeds | Net realized gain (loss) | Change in unrealized appreciation (depreciation) | Value, end of period | Dividend income | Units, end of period |
| Short-Term Investments | ||||||||
| Calvert Cash Reserves Fund, LLC | $ — | $65,720,678 | $(57,864,606) | $778 | $(43) | $7,856,807 | $6,824 | 7,856,022 |
| Year Ended December 31, 2020 | Year Ended December 31, 2019 | ||||
| Shares | Amount | Shares | Amount | ||
| Class I | |||||
| Shares sold | 13,186,923 | $ 30,978,919 | 12,781,947 | $ 28,405,842 | |
| Reinvestment of distributions | 7,305,959 | 17,095,943 | 8,057,911 | 17,324,508 | |
| Shares redeemed | (16,928,416) | (38,524,601) | (15,289,150) | (33,411,122) | |
| Net increase | 3,564,466 | $ 9,550,261 | 5,550,708 | $ 12,319,228 | |
| Year Ended December 31, 2020 | Year Ended December 31, 2019 | ||||
| Shares | Amount | Shares | Amount | ||
| Class F | |||||
| Shares sold | 1,508,379 | $ 3,492,301 | 1,299,569 | $ 2,854,861 | |
| Reinvestment of distributions | 130,576 | 305,549 | 90,351 | 195,158 | |
| Shares redeemed | (698,255) | (1,540,164) | (186,707) | (414,655) | |
| Net increase | 940,700 | $ 2,257,686 | 1,203,213 | $ 2,635,364 | |
Calvert Variable Series, Inc.:

February 18, 2021
| Fund | Investment Adviser | Investment Sub-Adviser |
| Calvert VP SRI Balanced Portfolio | Calvert Research and Management | None |
| Name and Year of Birth | Position(s) with the Corporation | Position Start Date | Principal Occupation(s) and Directorships During Past Five Years and Other Relevant Experience |
| Interested Director | |||
| John H. Streur(1) 1960 | Director and President | 2015 | President and Chief Executive Officer of Calvert Research and Management (since December 31, 2016). President and Chief Executive Officer of Calvert Investments, Inc. (January 2015 - December 2016); Chief Executive Officer of Calvert Investment Distributors, Inc. (August 2015 - December 2016); Chief Compliance Officer of Calvert Investment Management, Inc. (August 2015 - April 2016); President and Director, Portfolio 21 Investments, Inc. (through October 2014); President, Chief Executive Officer and Director, Managers Investment Group LLC (through January 2012); President and Director, The Managers Funds and Managers AMG Funds (through January 2012). Other Directorships in the Last Five Years. Portfolio 21 Investments, Inc. (asset management) (through October 2014); Managers Investment Group LLC (asset management) (through January 2012); The Managers Funds (asset management) (through January 2012); Managers AMG Funds (asset management) (through January 2012); Calvert Impact Capital, Inc. |
| Independent Directors | |||
| Richard L. Baird, Jr. 1948 | Director | 2016 | Regional Disaster Recovery Lead, American Red Cross of Greater Pennsylvania (since 2017). Volunteer, American Red Cross (since 2015). Former President and CEO of Adagio Health Inc. (retired in 2014) in Pittsburgh, PA. Other Directorships in the Last Five Years. None. |
| Alice Gresham Bullock 1950 | Chair and Director | 2016 (Chair); 2008 (Director) | Professor Emerita at Howard University School of Law. Dean Emerita of Howard University School of Law and Deputy Director of the Association of American Law Schools (1992-1994). Other Directorships in the Last Five Years. None. |
| Cari M. Dominguez 1949 | Director | 2016 | Former Chair of the U.S. Equal Employment Opportunity Commission. Other Directorships in the Last Five Years. Manpower, Inc. (employment agency); Triple S Management Corporation (managed care); National Association of Corporate Directors. |
| John G. Guffey, Jr. 1948 | Director | 2016 | President of Aurora Press Inc., a privately held publisher of trade paperbacks (since January 1997). Other Directorships in the Last Five Years. Calvert Impact Capital, Inc. (through December 31, 2018); Calvert Ventures, LLC. |
| Miles D. Harper, III 1962 | Director | 2016 | Partner, Carr Riggs & Ingram (public accounting firm) since October 2014. Partner, Gainer Donnelly & Desroches (public accounting firm) (now Carr Riggs & Ingram), (November 1999 - September 2014). Other Directorships in the Last Five Years. Bridgeway Funds (9) (asset management). |
| Joy V. Jones 1950 | Director | 2016 | Attorney. Other Directorships in the Last Five Years. Conduit Street Restaurants SUD 2 Limited; Palm Management Restaurant Corporation. |
| Name and Year of Birth | Position(s) with the Corporation | Position Start Date | Principal Occupation(s) and Directorships During Past Five Years and Other Relevant Experience |
| Independent Directors (continued) | |||
| Anthony A. Williams 1951 | Director | 2016 | CEO and Executive Director of the Federal City Council (July 2012 to present); Senior Adviser and Independent Consultant for King and Spalding LLP (September 2015 to present); Executive Director of Global Government Practice at the Corporate Executive Board (January 2010 to January 2012). Other Directorships in the Last Five Years. Freddie Mac; Evoq Properties/Meruelo Maddux Properties, Inc. (real estate management); Weston Solutions, Inc. (environmental services); Bipartisan Policy Center’s Debt Reduction Task Force; Chesapeake Bay Foundation; Catholic University of America; Urban Institute (research organization). |
| Name and Year of Birth | Position(s) with the Corporation | Position Start Date | Principal Occupation(s) During Past Five Years |
| Principal Officers who are not Directors | |||
| Hope L. Brown 1973 | Chief Compliance Officer | 2014 | Chief Compliance Officer of 39 registered investment companies advised by CRM (since 2014). Vice President and Chief Compliance Officer, Wilmington Funds (2012-2014). |
| Maureen A. Gemma(2) 1960 | Vice President, Secretary and Chief Legal Officer | 2016 | Vice President of CRM and officer of 39 registered investment companies advised by CRM (since 2016). Also Vice President of Eaton Vance and certain of its affiliates and officer of 144 registered investment companies advised or administered by Eaton Vance. |
| James F. Kirchner(2) 1967 | Treasurer | 2016 | Vice President of CRM and officer of 39 registered investment companies advised by CRM (since 2016). Also Vice President of Eaton Vance and certain of its affiliates and officer of 144 registered investment companies advised or administered by Eaton Vance. |
| (1) Mr. Streur is an interested person of the Fund because of his positions with the Fund’s adviser and certain affiliates. | |||
| (2) The business address for Ms. Gemma and Mr. Kirchner is Two International Place, Boston, MA 02110. | |||
| • | At the time of opening an account, Eaton Vance generally requires you to provide us with certain information such as name, address, social security number, tax status, account numbers, and account balances. This information is necessary for us to both open an account for you and to allow us to satisfy legal requirements such as applicable anti-money laundering reviews and know-your-customer requirements. |
| • | On an ongoing basis, in the normal course of servicing your account, Eaton Vance may share your information with unaffiliated third parties that perform various services for Eaton Vance and/or your account. These third parties include transfer agents, custodians, broker/dealers and our professional advisers including auditors, accountants, and legal counsel. Eaton Vance may share your personal information with our affiliates. Eaton Vance may also share your information as required or permitted by applicable law. |
| • | We have adopted a Privacy Program we believe is reasonably designed to protect the confidentiality of your personal information and to prevent unauthorized access to your information. |
| • | We reserve the right to change our Privacy Program at any time upon proper notification to you. You may want to review our Privacy Program periodically for changes by accessing the link on our homepage: www.calvert.com. |


| % Average Annual Total Returns1,2 | Inception Date | Performance Inception Date | One Year | Five Years | Ten Years |
| Fund at NAV | 07/16/1991 | 07/16/1991 | 12.24% | 11.02% | 10.59% |
| Russell Midcap® Index | — | — | 17.10% | 13.38% | 12.40% |
| % Total Annual Operating Expense Ratios3 | |
| Gross | 1.00% |
| Net | 0.99 |


| Top 10 Holdings (% of net assets)* | |
| ANSYS, Inc. | 2.5% |
| Coca-Cola European Partners PLC | 2.3 |
| Broadridge Financial Solutions, Inc. | 2.3 |
| AMETEK, Inc. | 2.3 |
| Agilent Technologies, Inc. | 2.1 |
| Zebra Technologies Corp., Class A | 2.1 |
| WEX, Inc. | 2.1 |
| Black Knight, Inc. | 2.1 |
| Terminix Global Holdings, Inc. | 2.0 |
| Stanley Black & Decker, Inc. | 2.0 |
| Total | 21.8% |
| * | Excludes cash and cash equivalents. |
| † | The views expressed in this report are those of the portfolio manager(s) and are current only through the date stated at the top of this page. These views are subject to change at any time based upon market or other conditions, and Calvert and the Fund(s) disclaim any responsibility to update such views. These views may not be relied upon as investment advice and, because investment decisions are based on many factors, may not be relied upon as an indication of trading intent on behalf of any Calvert fund. This commentary may contain statements that are not historical facts, referred to as “forward-looking statements.” The Fund’s actual future results may differ significantly from those stated in any forward-looking statement, depending on factors such as changes in securities or financial markets or general economic conditions, the volume of sales and purchases of Fund shares, the continuation of investment advisory, administrative and service contracts, and other risks discussed from time to time in the Fund’s filings with the Securities and Exchange Commission. |
| 1 | Russell Midcap® Index is an unmanaged index of U.S. mid-cap stocks. Unless otherwise stated, index returns do not reflect the effect of any applicable sales charges, commissions, expenses, taxes or leverage, as applicable. It is not possible to invest directly in an index. |
| 2 | There is no sales charge. Insurance-related charges are not included in the calculation of returns. If such charges were reflected, the returns would be lower. Please refer to the report for your insurance contract for performance data reflecting insurance-related charges.Calvert Research and Management became the investment adviser to the Fund on December 31, 2016. Performance reflected prior to such date is that of the Fund’s former investment adviser. |
| 3 | Source: Fund prospectus. Net expense ratio reflects a contractual expense reimbursement that continues through 4/30/21. Without the reimbursement, performance would have been lower. The expense ratios for the current reporting period can be found in the Financial Highlights section of this report. |
| Fund profile subject to change due to active management. | |
| Additional Information | |
| S&P 500® Index is an unmanaged index of large-cap stocks commonly used as a measure of U.S. stock market performance. Dow Jones Industrial Average® is a price-weighted average of 30 blue-chip stocks that are generally the leaders in their industry. S&P Dow Jones Indices are a product of S&P Dow Jones Indices LLC (“S&P DJI”) and have been licensed for use. S&P® and S&P 500® are registered trademarks of S&P DJI; Dow Jones® is a registered trademark of Dow Jones Trademark Holdings LLC (“Dow Jones”); S&P DJI, Dow Jones and their respective affiliates do not sponsor, endorse, sell or promote the Fund, will not have any liability with respect thereto and do not |
| Beginning Account Value (7/1/20) | Ending Account Value (12/31/20) | Expenses Paid During Period* (7/1/20 – 12/31/20) | Annualized Expense Ratio | |
| Actual | ||||
| $1,000.00 | $1,243.90 | $5.58 | 0.99% | |
| Hypothetical | ||||
| (5% return per year before expenses) | ||||
| $1,000.00 | $1,020.16 | $5.03 | 0.99% |
| * | Expenses are equal to the Fund's annualized expense ratio, multiplied by the average account value over the period, multiplied by 184/366 (to reflect the one-half year period). The Example assumes that the $1,000 was invested at the net asset value per share determined at the close of business on June 30, 2020. Expenses shown do not include insurance-related charges. |
| Common Stocks — 99.7% |
| Security | Shares | Value | |
| Auto Components — 1.8% | |||
| Aptiv PLC | 4,948 | $ 644,675 | |
| $ 644,675 | |||
| Banks — 2.1% | |||
| Commerce Bancshares, Inc. | 5,671 | $ 372,585 | |
| First Republic Bank | 2,564 | 376,728 | |
| $ 749,313 | |||
| Beverages — 2.3% | |||
| Coca-Cola European Partners PLC | 16,397 | $ 817,063 | |
| $ 817,063 | |||
| Biotechnology — 1.9% | |||
| Emergent BioSolutions, Inc.(1) | 4,887 | $ 437,875 | |
| Neurocrine Biosciences, Inc.(1) | 2,664 | 255,345 | |
| $ 693,220 | |||
| Building Products — 2.8% | |||
| AZEK Co., Inc. (The)(1) | 9,215 | $ 354,317 | |
| Trane Technologies PLC | 2,153 | 312,530 | |
| Trex Co., Inc.(1) | 4,156 | 347,940 | |
| $ 1,014,787 | |||
| Capital Markets — 5.2% | |||
| Morningstar, Inc. | 1,221 | $ 282,747 | |
| MSCI, Inc. | 777 | 346,954 | |
| Northern Trust Corp. | 5,784 | 538,722 | |
| Tradeweb Markets, Inc., Class A | 11,223 | 700,876 | |
| $ 1,869,299 | |||
| Commercial Services & Supplies — 2.8% | |||
| GFL Environmental, Inc. | 18,371 | $ 535,586 | |
| Tetra Tech, Inc. | 3,998 | 462,889 | |
| $ 998,475 | |||
| Communications Equipment — 1.7% | |||
| Motorola Solutions, Inc. | 3,588 | $ 610,175 | |
| $ 610,175 | |||
| Consumer Finance — 1.6% | |||
| Ally Financial, Inc. | 16,435 | $ 586,072 | |
| $ 586,072 | |||
| Security | Shares | Value | |
| Containers & Packaging — 4.5% | |||
| AptarGroup, Inc. | 5,242 | $ 717,577 | |
| Ball Corp. | 5,153 | 480,157 | |
| Packaging Corp. of America | 2,890 | 398,560 | |
| $ 1,596,294 | |||
| Diversified Consumer Services — 2.0% | |||
| Terminix Global Holdings, Inc.(1) | 14,338 | $ 731,381 | |
| $ 731,381 | |||
| Electric Utilities — 1.9% | |||
| Xcel Energy, Inc. | 10,067 | $ 671,167 | |
| $ 671,167 | |||
| Electrical Equipment — 2.3% | |||
| AMETEK, Inc. | 6,724 | $ 813,201 | |
| $ 813,201 | |||
| Electronic Equipment, Instruments & Components — 2.1% | |||
| Zebra Technologies Corp., Class A(1) | 1,989 | $ 764,432 | |
| $ 764,432 | |||
| Entertainment — 1.9% | |||
| Electronic Arts, Inc. | 4,800 | $ 689,280 | |
| $ 689,280 | |||
| Equity Real Estate Investment Trusts (REITs) — 5.8% | |||
| Digital Realty Trust, Inc. | 3,689 | $ 514,653 | |
| Extra Space Storage, Inc. | 3,583 | 415,126 | |
| Lamar Advertising Co., Class A | 8,607 | 716,275 | |
| Mid-America Apartment Communities, Inc. | 3,364 | 426,185 | |
| $ 2,072,239 | |||
| Food & Staples Retailing — 1.6% | |||
| Performance Food Group Co.(1) | 12,330 | $ 587,031 | |
| $ 587,031 | |||
| Food Products — 0.9% | |||
| Nomad Foods, Ltd.(1) | 13,160 | $ 334,527 | |
| $ 334,527 | |||
| Health Care Equipment & Supplies — 5.0% | |||
| Cooper Cos., Inc. (The) | 1,680 | $ 610,378 | |
| Haemonetics Corp.(1) | 4,657 | 553,019 | |
| Teleflex, Inc. | 1,569 | 645,753 | |
| $ 1,809,150 | |||
| Security | Shares | Value | |
| Health Care Providers & Services — 2.3% | |||
| Centene Corp.(1) | 7,350 | $ 441,220 | |
| Chemed Corp. | 721 | 384,012 | |
| $ 825,232 | |||
| Health Care Technology — 1.6% | |||
| Accolade, Inc.(1) | 13,130 | $ 571,155 | |
| $ 571,155 | |||
| Independent Power and Renewable Electricity Producers — 1.7% | |||
| NextEra Energy Partners, L.P. | 6,775 | $ 454,264 | |
| Sunnova Energy International, Inc.(1) | 3,071 | 138,594 | |
| $ 592,858 | |||
| Insurance — 3.8% | |||
| Assurant, Inc. | 2,865 | $ 390,270 | |
| RLI Corp. | 3,439 | 358,172 | |
| Travelers Cos., Inc. (The) | 4,252 | 596,853 | |
| $ 1,345,295 | |||
| Interactive Media & Services — 1.6% | |||
| IAC/InterActiveCorp. (1) | 1,837 | $ 347,836 | |
| Match Group, Inc.(1) | 1,564 | 236,461 | |
| $ 584,297 | |||
| IT Services — 8.3% | |||
| Black Knight, Inc.(1) | 8,395 | $ 741,698 | |
| Broadridge Financial Solutions, Inc. | 5,330 | 816,556 | |
| Cognizant Technology Solutions Corp., Class A | 7,942 | 650,847 | |
| WEX, Inc.(1) | 3,683 | 749,601 | |
| $ 2,958,702 | |||
| Leisure Products — 0.6% | |||
| Brunswick Corp. | 2,717 | $ 207,144 | |
| $ 207,144 | |||
| Life Sciences Tools & Services — 2.1% | |||
| Agilent Technologies, Inc. | 6,476 | $ 767,341 | |
| $ 767,341 | |||
| Machinery — 3.5% | |||
| Colfax Corp.(1) | 14,100 | $ 539,184 | |
| Stanley Black & Decker, Inc. | 4,066 | 726,025 | |
| $ 1,265,209 | |||
| Security | Shares | Value | |
| Multi-Utilities — 1.8% | |||
| Sempra Energy | 4,971 | $ 633,355 | |
| $ 633,355 | |||
| Pharmaceuticals — 1.1% | |||
| Jazz Pharmaceuticals PLC(1) | 2,437 | $ 402,227 | |
| $ 402,227 | |||
| Professional Services — 3.8% | |||
| Dun & Bradstreet Holdings, Inc.(1) | 13,706 | $ 341,279 | |
| IHS Markit, Ltd. | 5,349 | 480,501 | |
| Verisk Analytics, Inc. | 2,537 | 526,656 | |
| $ 1,348,436 | |||
| Semiconductors & Semiconductor Equipment — 4.3% | |||
| NXP Semiconductors NV | 2,844 | $ 452,224 | |
| Skyworks Solutions, Inc. | 3,598 | 550,062 | |
| Teradyne, Inc. | 4,375 | 524,519 | |
| $ 1,526,805 | |||
| Software — 4.8% | |||
| ANSYS, Inc.(1) | 2,417 | $ 879,305 | |
| Bill.com Holdings, Inc.(1) | 3,877 | 529,210 | |
| nCino, Inc.(1) | 4,475 | 324,035 | |
| $ 1,732,550 | |||
| Specialty Retail — 6.6% | |||
| Best Buy Co., Inc. | 5,134 | $ 512,322 | |
| National Vision Holdings, Inc.(1) | 14,972 | 678,082 | |
| Ross Stores, Inc. | 5,510 | 676,683 | |
| Ulta Beauty, Inc.(1) | 1,751 | 502,817 | |
| $ 2,369,904 | |||
| Textiles, Apparel & Luxury Goods — 1.6% | |||
| Gildan Activewear, Inc. | 21,024 | $ 588,882 | |
| $ 588,882 | |||
| Total Common Stocks (identified cost $26,800,227) | $35,771,173 | ||
| Short-Term Investments — 0.3% | |||
| Description | Units | Value | |
| Calvert Cash Reserves Fund, LLC, 0.12%(2) | 118,041 | $ 118,053 | |
| Total Short-Term Investments (identified cost $118,053) | $ 118,053 | ||
| Total Investments — 100.0% (identified cost $26,918,280) | $35,889,226 | ||
| Other Assets, Less Liabilities — (0.0)%(3) | $ (16,406) | ||
| Net Assets — 100.0% | $35,872,820 | ||
| The percentage shown for each investment category in the Schedule of Investments is based on net assets. | ||
| (1) | Non-income producing security. | |
| (2) | Affiliated investment company, available to Calvert portfolios and funds, which invests in high quality, U.S. dollar denominated money market instruments. The rate shown is the annualized seven-day yield as of December 31, 2020. | |
| (3) | Amount is less than (0.05)%. | |
| December 31, 2020 | |
| Assets | |
| Investments in securities of unaffiliated issuers, at value (identified cost $26,800,227) | $ 35,771,173 |
| Investments in securities of affiliated issuers, at value (identified cost $118,053) | 118,053 |
| Receivable for capital shares sold | 15,814 |
| Dividends receivable | 28,901 |
| Dividends receivable - affiliated | 23 |
| Securities lending income receivable | 25 |
| Directors' deferred compensation plan | 7,930 |
| Total assets | $35,941,919 |
| Liabilities | |
| Payable for capital shares redeemed | $ 485 |
| Payable to affiliates: | |
| Investment advisory fee | 19,433 |
| Administrative fee | 3,588 |
| Sub-transfer agency fee | 54 |
| Directors' deferred compensation plan | 7,930 |
| Other | 2,175 |
| Accrued expenses | 35,434 |
| Total liabilities | $ 69,099 |
| Net Assets | $35,872,820 |
| Sources of Net Assets | |
| Paid-in capital | $ 25,339,730 |
| Distributable earnings | 10,533,090 |
| Total | $35,872,820 |
| Net Assets | $ 35,872,820 |
| Shares Outstanding | 1,051,953 |
| Net Asset Value, Offering Price and Redemption Price Per Share (net assets ÷ shares of beneficial interest outstanding) | $ 34.10 |
| Year Ended | |
| December 31, 2020 | |
| Investment Income | |
| Dividend income (net of foreign taxes withheld of $671) | $ 400,762 |
| Dividend income - affiliated issuers | 157 |
| Interest income | 183 |
| Securities lending income, net | 3,327 |
| Total investment income | $ 404,429 |
| Expenses | |
| Investment advisory fee | $ 209,778 |
| Administrative fee | 38,728 |
| Directors' fees and expenses | 1,649 |
| Custodian fees | 1,175 |
| Transfer agency fees and expenses | 18,601 |
| Accounting fees | 6,450 |
| Professional fees | 22,059 |
| Reports to shareholders | 13,630 |
| Miscellaneous | 8,036 |
| Total expenses | $ 320,106 |
| Waiver and/or reimbursement of expenses by affiliate | (529) |
| Net expenses | $ 319,577 |
| Net investment income | $ 84,852 |
| Realized and Unrealized Gain (Loss) | |
| Net realized gain (loss): | |
| Investment securities | $ 1,525,826 |
| Investment securities - affiliated issuers | 83 |
| Foreign currency transactions | (921) |
| Net realized gain | $1,524,988 |
| Change in unrealized appreciation (depreciation): | |
| Investment securities | $ 2,076,519 |
| Foreign currency | 2 |
| Net change in unrealized appreciation (depreciation) | $2,076,521 |
| Net realized and unrealized gain | $3,601,509 |
| Net increase in net assets from operations | $3,686,361 |
| Year Ended December 31, | ||
| 2020 | 2019 | |
| Increase (Decrease) in Net Assets | ||
| From operations: | ||
| Net investment income | $ 84,852 | $ 156,332 |
| Net realized gain | 1,524,988 | 2,302,061 |
| Net change in unrealized appreciation (depreciation) | 2,076,521 | 7,010,427 |
| Net increase in net assets from operations | $ 3,686,361 | $ 9,468,820 |
| Distributions to shareholders | $ (2,484,214) | $ (3,090,268) |
| Net decrease in net assets from capital share transactions | $ (1,395,328) | $ (2,241,471) |
| Net increase (decrease) in net assets | $ (193,181) | $ 4,137,081 |
| Net Assets | ||
| At beginning of year | $ 36,066,001 | $ 31,928,920 |
| At end of year | $35,872,820 | $36,066,001 |
| Year Ended December 31, | |||||
| 2020 | 2019 | 2018 | 2017 | 2016 | |
| Net asset value — Beginning of year | $ 32.89 | $ 27.48 | $ 31.96 | $ 28.82 | $ 31.01 |
| Income (Loss) From Operations | |||||
| Net investment income(1) | $ 0.08 | $ 0.14 | $ 0.15 | $ 0.15 | $ 0.21 |
| Net realized and unrealized gain (loss) | 3.63 | 8.21 | (1.09) | 3.20 | 2.05 |
| Total income (loss) from operations | $ 3.71 | $ 8.35 | $ (0.94) | $ 3.35 | $ 2.26 |
| Less Distributions | |||||
| From net investment income | $ (0.14) | $ (0.15) | $ (0.18) | $ (0.21) | $ — |
| From net realized gain | (2.36) | (2.79) | (3.36) | — | (4.45) |
| Total distributions | $ (2.50) | $ (2.94) | $ (3.54) | $ (0.21) | $ (4.45) |
| Net asset value — End of year | $ 34.10 | $ 32.89 | $ 27.48 | $ 31.96 | $ 28.82 |
| Total Return(2) | 12.24% | 31.36% | (4.43)% | 11.65% | 7.27% |
| Ratios/Supplemental Data | |||||
| Net assets, end of year (000’s omitted) | $35,873 | $36,066 | $31,929 | $41,239 | $45,473 |
| Ratios (as a percentage of average daily net assets):(3) | |||||
| Total expenses | 0.99% | 1.00% | 1.01% | 1.04% | 1.07% |
| Net expenses | 0.99% | 0.99% | 0.99% | 0.99% | 0.99% |
| Net investment income | 0.26% | 0.44% | 0.46% | 0.49% | 0.68% |
| Portfolio Turnover | 82% | 72% | 62% | 159% | 170% |
| (1) | Computed using average shares outstanding. |
| (2) | Returns are historical and are calculated by determining the percentage change in net asset value with all distributions reinvested and do not reflect fees and expenses imposed by variable annuity contracts or variable life insurance policies. If included, total return would be lower. |
| (3) | Total expenses do not reflect amounts reimbursed and/or waived by the adviser and certain of its affiliates, if applicable. Net expenses are net of all reductions and represent the net expenses paid by the Fund. |
| Asset Description | Level 1 | Level 2 | Level 3 | Total |
| Common Stocks | $ 35,771,173(1) | $ — | $ — | $ 35,771,173 |
| Short-Term Investments | — | 118,053 | — | 118,053 |
| Total Investments | $35,771,173 | $118,053 | $ — | $35,889,226 |
| (1) | The level classification by major category of investments is the same as the category presentation in the Schedule of Investments. |
| Year Ended December 31, | ||
| 2020 | 2019 | |
| Ordinary income | $ 229,081 | $1,712,623 |
| Long-term capital gains | $2,255,133 | $1,377,645 |
| Undistributed ordinary income | $ 72,732 |
| Undistributed long-term capital gains | $1,569,567 |
| Net unrealized appreciation | $8,890,791 |
| Aggregate cost | $26,998,435 |
| Gross unrealized appreciation | $ 8,924,078 |
| Gross unrealized depreciation | (33,287) |
| Net unrealized appreciation | $ 8,890,791 |
| Name | Value, beginning of period | Purchases | Sales proceeds | Net realized gain (loss) | Change in unrealized appreciation (depreciation) | Value, end of period | Dividend income | Units, end of period |
| Short-Term Investments | ||||||||
| Calvert Cash Reserves Fund, LLC | $ — | $4,531,271 | $(4,413,301) | $83 | $ — | $118,053 | $157 | 118,041 |
| Year Ended December 31, 2020 | Year Ended December 31, 2019 | ||||
| Shares | Amount | Shares | Amount | ||
| Shares sold | 60,897 | $ 1,863,023 | 58,178 | $ 1,852,303 | |
| Reinvestment of distributions | 82,150 | 2,484,214 | 102,530 | 3,090,268 | |
| Shares redeemed | (187,494) | (5,742,565) | (226,020) | (7,184,042) | |
| Net decrease | (44,447) | $(1,395,328) | (65,312) | $(2,241,471) | |
Calvert Variable Series Inc.:

February 18, 2021
| Fund | Investment Adviser | Investment Sub-Adviser |
| Calvert VP SRI Mid Cap Portfolio | Calvert Research and Management | None |
| Name and Year of Birth | Position(s) with the Corporation | Position Start Date | Principal Occupation(s) and Directorships During Past Five Years and Other Relevant Experience |
| Interested Director | |||
| John H. Streur(1) 1960 | Director and President | 2015 | President and Chief Executive Officer of Calvert Research and Management (since December 31, 2016). President and Chief Executive Officer of Calvert Investments, Inc. (January 2015 - December 2016); Chief Executive Officer of Calvert Investment Distributors, Inc. (August 2015 - December 2016); Chief Compliance Officer of Calvert Investment Management, Inc. (August 2015 - April 2016); President and Director, Portfolio 21 Investments, Inc. (through October 2014); President, Chief Executive Officer and Director, Managers Investment Group LLC (through January 2012); President and Director, The Managers Funds and Managers AMG Funds (through January 2012). Other Directorships in the Last Five Years. Portfolio 21 Investments, Inc. (asset management) (through October 2014); Managers Investment Group LLC (asset management) (through January 2012); The Managers Funds (asset management) (through January 2012); Managers AMG Funds (asset management) (through January 2012); Calvert Impact Capital, Inc. |
| Independent Directors | |||
| Richard L. Baird, Jr. 1948 | Director | 2016 | Regional Disaster Recovery Lead, American Red Cross of Greater Pennsylvania (since 2017). Volunteer, American Red Cross (since 2015). Former President and CEO of Adagio Health Inc. (retired in 2014) in Pittsburgh, PA. Other Directorships in the Last Five Years. None. |
| Alice Gresham Bullock 1950 | Chair and Director | 2016 (Chair); 2008 (Director) | Professor Emerita at Howard University School of Law. Dean Emerita of Howard University School of Law and Deputy Director of the Association of American Law Schools (1992-1994). Other Directorships in the Last Five Years. None. |
| Cari M. Dominguez 1949 | Director | 2016 | Former Chair of the U.S. Equal Employment Opportunity Commission. Other Directorships in the Last Five Years. Manpower, Inc. (employment agency); Triple S Management Corporation (managed care); National Association of Corporate Directors. |
| John G. Guffey, Jr. 1948 | Director | 2016 | President of Aurora Press Inc., a privately held publisher of trade paperbacks (since January 1997). Other Directorships in the Last Five Years. Calvert Impact Capital, Inc. (through December 31, 2018); Calvert Ventures, LLC. |
| Miles D. Harper, III 1962 | Director | 2016 | Partner, Carr Riggs & Ingram (public accounting firm) since October 2014. Partner, Gainer Donnelly & Desroches (public accounting firm) (now Carr Riggs & Ingram), (November 1999 - September 2014). Other Directorships in the Last Five Years. Bridgeway Funds (9) (asset management). |
| Joy V. Jones 1950 | Director | 2016 | Attorney. Other Directorships in the Last Five Years. Conduit Street Restaurants SUD 2 Limited; Palm Management Restaurant Corporation. |
| Name and Year of Birth | Position(s) with the Corporation | Position Start Date | Principal Occupation(s) and Directorships During Past Five Years and Other Relevant Experience |
| Independent Directors (continued) | |||
| Anthony A. Williams 1951 | Director | 2016 | CEO and Executive Director of the Federal City Council (July 2012 to present); Senior Adviser and Independent Consultant for King and Spalding LLP (September 2015 to present); Executive Director of Global Government Practice at the Corporate Executive Board (January 2010 to January 2012). Other Directorships in the Last Five Years. Freddie Mac; Evoq Properties/Meruelo Maddux Properties, Inc. (real estate management); Weston Solutions, Inc. (environmental services); Bipartisan Policy Center’s Debt Reduction Task Force; Chesapeake Bay Foundation; Catholic University of America; Urban Institute (research organization). |
| Name and Year of Birth | Position(s) with the Corporation | Position Start Date | Principal Occupation(s) During Past Five Years |
| Principal Officers who are not Directors | |||
| Hope L. Brown 1973 | Chief Compliance Officer | 2014 | Chief Compliance Officer of 39 registered investment companies advised by CRM (since 2014). Vice President and Chief Compliance Officer, Wilmington Funds (2012-2014). |
| Maureen A. Gemma(2) 1960 | Vice President, Secretary and Chief Legal Officer | 2016 | Vice President of CRM and officer of 39 registered investment companies advised by CRM (since 2016). Also Vice President of Eaton Vance and certain of its affiliates and officer of 144 registered investment companies advised or administered by Eaton Vance. |
| James F. Kirchner(2) 1967 | Treasurer | 2016 | Vice President of CRM and officer of 39 registered investment companies advised by CRM (since 2016). Also Vice President of Eaton Vance and certain of its affiliates and officer of 144 registered investment companies advised or administered by Eaton Vance. |
| (1) Mr. Streur is an interested person of the Fund because of his positions with the Fund’s adviser and certain affiliates. | |||
| (2) The business address for Ms. Gemma and Mr. Kirchner is Two International Place, Boston, MA 02110. | |||
| • | At the time of opening an account, Eaton Vance generally requires you to provide us with certain information such as name, address, social security number, tax status, account numbers, and account balances. This information is necessary for us to both open an account for you and to allow us to satisfy legal requirements such as applicable anti-money laundering reviews and know-your-customer requirements. |
| • | On an ongoing basis, in the normal course of servicing your account, Eaton Vance may share your information with unaffiliated third parties that perform various services for Eaton Vance and/or your account. These third parties include transfer agents, custodians, broker/dealers and our professional advisers including auditors, accountants, and legal counsel. Eaton Vance may share your personal information with our affiliates. Eaton Vance may also share your information as required or permitted by applicable law. |
| • | We have adopted a Privacy Program we believe is reasonably designed to protect the confidentiality of your personal information and to prevent unauthorized access to your information. |
| • | We reserve the right to change our Privacy Program at any time upon proper notification to you. You may want to review our Privacy Program periodically for changes by accessing the link on our homepage: www.calvert.com. |

| Item 2. | Code of Ethics |
The registrant has adopted a code of ethics applicable to its Principal Executive Officer, Principal Financial Officer and Principal Accounting Officer. The registrant undertakes to provide a copy of such code of ethics to any person upon request, without charge, by calling 1-800-368-2745. The registrant has not amended the code of ethics as described in Form N-CSR during the period covered by this report. The registrant has not granted any waiver, including an implicit waiver, from a provision of the code of ethics as described in Form N-CSR during the period covered by this report.
| Item 3. | Audit Committee Financial Expert |
The registrant’s Board of Directors has determined that Miles D. Harper III, an “independent” Director serving on the registrant’s audit committee, is an “audit committee financial expert,” as defined in Item 3 of Form N-CSR. Under applicable securities laws, a person who is determined to be an audit committee financial expert will not be deemed an “expert” for any purpose, including without limitation for the purposes of Section 11 of the Securities Act of 1933, as a result of being designated or identified as an audit committee financial expert.
The designation or identification of a person as an audit committee financial expert does not impose on such person any duties, obligations, or liabilities that are greater than the duties, obligations, and liabilities imposed on such person as a member of the audit committee and Board of Directors in the absence of such designation or identification.
| Item 4. | Principal Accountant Fees and Services |
(a) –(d)
The following table presents the aggregate fees billed to the registrant for the registrant’s fiscal years ended December 31, 2019 and December 31, 2020 by KPMG for professional services rendered for the audit of the registrant’s annual financial statements and fees billed for other services rendered by KPMG during such periods.
Fiscal Years Ended | 12/31/19 | %* | 12/31/20 | %* | ||||||||||||
Audit Fees | $ | 47,431 | 0 | % | $ | 47,257 | 0 | % | ||||||||
Audit-Related Fees(1) | $ | 0 | 0 | % | $ | 0 | 0 | % | ||||||||
Tax Fees(2) | $ | 7,700 | 0 | % | $ | 7,800 | 0 | % | ||||||||
All Other Fees(3) | $ | 0 | 0 | % | $ | 0 | 0 | % | ||||||||
|
|
|
|
|
|
|
| |||||||||
Total | $ | 55,131 | 0 | % | $ | 55,057 | 0 | % | ||||||||
|
|
|
|
|
|
|
| |||||||||
| * | Percentage of fees approved by the Audit Committee pursuant to (c)(7)(i)(C) of Rule 2-01 of Reg. S-X (statutory de minimis waiver of Committee’s requirement to pre-approve). |
| (1) | Audit-related fees consist of the aggregate fees billed for assurance and related services that are reasonably related to the performance of the audit of the registrant’s financial statements and are not reported under the category of audit fees. |
| (2) | Tax fees consist of the aggregate fees billed for professional services rendered by the principal accountant relating to tax compliance, tax advice, and tax planning and specifically include fees for tax return preparation and other related tax compliance/planning matters. |
| (3) | All other fees consist of the aggregate fees billed for products and services provided by the principal accountant other than audit, audit-related, and tax services. |
(e) The Audit Committee is required to pre-approve all audit and non-audit services provided to the registrant by the auditors, and to the registrant’s investment adviser, and any entity controlling, controlled by, or under common control with the adviser that provides ongoing services to the registrant. In determining whether to pre-approve non-audit services, the Audit Committee considers whether the services are consistent with maintaining the independence of the auditors. The Committee may delegate its authority to pre-approve certain matters to one or more of its members. In this regard, the Committee has delegated authority jointly to the Audit Committee Chair together with another Committee member with respect to non-audit services not exceeding $25,000 in each instance. In addition, the Committee has pre-approved the retention of the auditors to provide tax-related services related to the tax treatment and tax accounting of newly acquired securities, upon request by the investment adviser in each instance.
(f) Not applicable.
(g) Aggregate non-audit fees billed by the registrant’s accountant for services rendered to the registrant, and rendered to the registrant’s investment adviser, and any entity controlling, controlled by, or under common control with the adviser that provides ongoing services to the registrant for each of the last two fiscal years of the registrant:
Fiscal Year ended 12/31/19 | Fiscal Year ended 12/31/20 | |||||||||
$ | %* | $ | %* | |||||||
| $7,700 | 0 | % | $7,800 | 0 | % | |||||
| * | Percentage of fees approved by the Audit Committee pursuant to (c)(7)(i)(C) of Rule 2-01 of Reg. S-X (statutory de minimis waiver of Committee’s requirement to pre-approve) |
(h) The registrant’s audit committee has considered whether the provision by the registrant’s principal accountant of non-audit services to the registrant’s investment adviser and any entity controlling, controlled by, or under common control with the adviser that provides ongoing services to the registrant that were not pre-approved pursuant to Rule 2-01(c)(7)(ii) of Regulation S-X is compatible with maintaining the principal accountant’s independence.
| Item 5. | Audit Committee of Listed Registrants |
Not applicable.
| Item 6. | Schedule of Investments |
Please see schedule of investments contained in the Report to Stockholders included under Item 1 of this Form N-CSR.
| Item 7. | Disclosure of Proxy Voting Policies and Procedures for Closed-End Management Investment Companies |
Not applicable.
| Item 8. | Portfolio Managers of Closed-End Management Investment Companies |
Not applicable.
| Item 9. | Purchases of Equity Securities by Closed-End Management Investment Company and Affiliated Purchasers |
Not applicable.
| Item 10. | Submission of Matters to a Vote of Security Holders |
No material changes.
| Item 11. | Controls and Procedures |
(a) The registrant’s principal executive and principal financial officers have concluded that the registrant’s disclosure controls and procedures (as defined in Rule 30a-3(c) under the Investment Company Act of 1940 Act, as amended (the “1940 Act”) are effective, based on the evaluation of these controls and procedures required by Rule 30a-3(b) under the 1940 Act and Rules 13a-15(b) or 15d-15(b) under the Securities Exchange Act of 1934 (“Exchange Act”), as of a date within 90 days of the filing date of this report.
(b) There was no change in the registrant’s internal control over financial reporting (as defined in Rule 30a-3(d) under the 1940 Act) that occurred during the period covered by this report that has materially affected, or is reasonably likely to materially affect, the registrant’s internal control over financial reporting.
| Item 12. | Disclosure of Securities Lending Activities for Closed-End Management Investment Companies. |
Not applicable.
| Item 13. | Exhibits |
(a)(1) | Registrant’s Code of Ethics – Not applicable (please see Item 2). | |
| Treasurer’s Section 302 certification. | ||
| President’s Section 302 certification. | ||
| Combined Section 906 certification. | ||
Signatures
Pursuant to the requirements of the Securities Exchange Act of 1934 and the Investment Company Act of 1940, the registrant has duly caused this report to be signed on its behalf by the undersigned, thereunto duly authorized.
CALVERT VARIABLE SERIES, INC.
| By: | /s/ John H. Streur | |
| John H. Streur | ||
| President | ||
| Date: | February 24, 2021 | |
Pursuant to the requirements of the Securities Exchange Act of 1934 and the Investment Company Act of 1940, this report has been signed below by the following persons on behalf of the registrant and in the capacities and on the dates indicated.
By: | /s/ James F. Kirchner | |
| James F. Kirchner | ||
| Treasurer | ||
Date: | February 24, 2021 | |
By: | /s/ John H. Streur | |
| John H. Streur | ||
| President | ||
Date: | February 24, 2021 | |