SECURITIES AND EXCHANGE COMMISSION
FORM N-CSR
CERTIFIED SHAREHOLDER REPORT
OF
REGISTERED MANAGEMENT INVESTMENT COMPANIES
Investment Company Act file number: 811-03599
Name of Registrant: The Royce Fund
Address of Registrant: 745 Fifth Avenue
New York, NY 10151
| Name and address of agent for service: | John E. Denneen, Esq. | |
| 745 Fifth Avenue | ||
| New York, NY 10151 |
Registrant’s telephone number, including area code: (212) 508-4500
Date of fiscal year end: December 31, 2013
Date of reporting period: January 1, 2014 – June 30, 2014
Item 1. Reports to Shareholders.
|

SEMIANNUAL
REVIEW AND REPORT
TO SHAREHOLDERS
Royce Pennsylvania Mutual Fund Royce Micro-Cap Fund Royce Premier Fund Royce Low-Priced Stock Fund Royce Total Return Fund Royce Heritage Fund Royce Opportunity Fund Royce Special Equity Fund Royce Value Fund Royce Value Plus Fund Royce 100 Fund Royce Dividend Value Fund Royce Global Value Fund Royce International Smaller-Companies Fund Royce Special Equity Multi-Cap Fund | ||
www.roycefunds.com |  | |
| www.roycefunds.com |
 |
eDelivery Saves! Sign Up Now. eDelivery saves paper, time, and fund expenses.1 Sign up now to view statements, prospectuses, financial reports, and tax forms online. > www.roycefunds.com/edelivery 1 Any direct Royce Funds IRA investor who chooses eDelivery of prospectuses, financial reports, and RWord will be exempt from the $15 annual IRA maintenance fee. (We will continue to also waive the fee for investors with more than $20,000 invested in Royce IRAs at the time the fee is charged, and for new transfer and rollover accounts in their first year.) Stay Informed Follow us on Twitter, connect with us on LinkedIn, watch us on YouTube, subscribe to our RSS feed, and sign up for our monthly eWord newsletter to stay up to date on the latest from The Royce Funds.  www.twitter.com/roycefunds www.twitter.com/roycefunds www.linkedin.com/roycefunds www.linkedin.com/roycefunds www.youtube.com/roycefunds www.youtube.com/roycefunds www.roycefunds.com/eword www.roycefunds.com/eword |
| This page is not part of the 2014 Semiannual Report to Shareholders |
| Table of Contents | |
| Semiannual Review | |
| Royce Featured Fund Guide | 2 |
| Portfolio Characteristics | 4 |
| Performance and Expenses | 5 |
| U.S. Small-Cap Market Cycle and Risk Adjusted Performance | 6 |
| Letter to Our Shareholders | 7 |
| Fund Focus | 14 |
| 2014 In Quotes | 135 |
| Postscript: There’s No Such Thing as a Sure Thing | Inside Back Cover |
| Semiannual Report to Shareholders | 15 |
 | |
| This page is not part of the 2014 Semiannual Report to Shareholders | 1 |
| Royce Fund Guide |
| VALUE-ORIENTED SMALL-CAP OFFERINGS TAILORED TO SPECIFIC INVESTOR NEEDS |
The size and diversity of the small-company universe make it a unique and fertile area for investment. For more than 40 years, it has been our primary area of focus. Over that time, this universe has evolved into an established asset class used by a wide range of investors, including institutions, consultants, advisors, and individuals. Today, there are numerous small-cap and micro-cap indexes and ETFs. Importantly, the continuous regeneration of the asset class, through the entrance of new companies, spin-offs, and IPOs, makes it an evergreen source of investment opportunities. This is why we have elected to focus on the smaller-company universe and believe it is ideally suited for a variety of distinct offerings. |
| INVESTMENT UNIVERSE BREAKDOWN1 |

Market Cap |
| The Royce Funds, other than Royce Special Equity Multi-Cap Fund, invest primarily in micro-cap, small-cap, and/or mid-cap stocks, which may involve considerably more risk than investing in larger-cap stocks (please see “Primary Risks for Fund Investors” in the prospectus). Each Fund may invest a portion of its net assets in foreign securities, which may involve political, economic, currency, and other risks not encountered in U.S. investments (please see “Investing in Foreign Securities” in the prospectus). |
| 2 | This page is not part of the 2014 Semiannual Report to Shareholders |
This guide is designed to help investors better understand both the different approaches and the common ground among our portfolios. Looking closely at our Featured Funds allows investors to see other important differences—in levels of volatility, sector orientation, and investment themes. We think that understanding these differences can inform asset allocation decisions, especially when investors incorporate more than one Royce offering within their portfolios. Listed below are our Funds arranged by average market cap. For a complete listing of our Funds and their attributes please visit our website at www.roycefunds.com. |
| Fund Tools Go online for more tools to help you better understand our Funds. Compare Funds > www.roycefunds.com/compare Prices & Performance > www.roycefunds.com/prices |
 |
1 Only available to existing investors and relationships. |
2 Geometric Average. This weighted calculation uses each portfolio holding’s market cap in a way designed to not skew the effect of very large or small holdings; instead, it aims to better identify the portfolio’s center, which Royce believes offers a more accurate measure of average market cap than a simple mean or median. |
| This page is not part of the 2014 Semiannual Report to Shareholders | 3 |
| Portfolio Characteristics | Through June 30, 2014 |
| Longevity | Average | 2013 | % of | ||||||||||||||||||||||||
| of Fund | Market | Number of | Turnover | Non-U.S. | |||||||||||||||||||||||
| Fund | Portfolio Manager(s) | (in years) | Cap1 | Holdings | Rate | Securities | |||||||||||||||||||||
| Royce Pennsylvania Mutual Fund | Chuck Royce | 41 | $ | 1,922 | 461 | 26 | % | 9.6 | % | ||||||||||||||||||
| Royce Micro-Cap Fund | Jenifer Taylor | 22 | 433 | 205 | 22 | 14.6 | |||||||||||||||||||||
| Royce Premier Fund | Chuck Royce, Whitney George | 22 | 2,895 | 71 | 11 | 12.3 | |||||||||||||||||||||
| Royce Low-Priced Stock Fund | Whitney George | 20 | 1,299 | 100 | 16 | 37.5 | |||||||||||||||||||||
| Royce Total Return Fund | Chuck Royce, Jay Kaplan | 20 | 2,306 | 510 | 21 | 12.2 | |||||||||||||||||||||
| Royce Heritage Fund | Chuck Royce, Jim Harvey, Steven McBoyle | 18 | 3,000 | 206 | 79 | 24.1 | |||||||||||||||||||||
| Royce Opportunity Fund | Buzz Zaino, Bill Hench | 17 | 833 | 323 | 39 | 4.2 | |||||||||||||||||||||
| Royce Special Equity Fund | Charlie Dreifus | 16 | 1,846 | 43 | 28 | 0.0 | |||||||||||||||||||||
| Royce Value Fund | Jay Kaplan | 13 | 2,706 | 63 | 51 | 8.7 | |||||||||||||||||||||
| Royce Value Plus Fund | Chip Skinner | 13 | 1,830 | 97 | 45 | 13.6 | |||||||||||||||||||||
| Royce 100 Fund | Chuck Royce, Lauren Romeo | 11 | 1,828 | 97 | 31 | 7.6 | |||||||||||||||||||||
| Royce Dividend Value Fund | Chuck Royce, Jay Kaplan | 10 | 3,366 | 269 | 36 | 24.9 | |||||||||||||||||||||
| Royce Global Value Fund | Whitney George | 7 | 1,773 | 61 | 41 | 71.8 | |||||||||||||||||||||
| Royce International Smaller-Companies Fund | David Nadel | 6 | 1,013 | 100 | 64 | 95.5 | |||||||||||||||||||||
| Royce Special Equity Multi-Cap Fund | Charlie Dreifus | 3 | 26,524 | 28 | 44 | 0.0 | |||||||||||||||||||||
| 4 | This page is not part of the 2014 Semiannual Report to Shareholders |
| Performance and Expenses | Through June 30, 2014 |
| Average Annual Total Returns | ||||||||||||||||||||||||||||||||||||
| Gross Annual | Net Annual | |||||||||||||||||||||||||||||||||||
| 40-Year or Since | Inception | Operating | Operating | |||||||||||||||||||||||||||||||||
| Fund | Year-to-Date1 | 1-Year | 5-Year | 10-Year | 20-Year | Inception | Date | Expenses | Expenses | |||||||||||||||||||||||||||
| Royce Pennsylvania Mutual Fund | 2.04 | % | 23.70 | % | 18.77 | % | 9.41 | % | 11.61 | % | 15.18 | % | n.a. | 0.93 | % | 0.93 | % | |||||||||||||||||||
| Royce Micro-Cap Fund | 1.02 | 18.91 | 14.13 | 8.24 | 11.49 | 12.43 | 12/31/91 | 1.56 | 1.56 | |||||||||||||||||||||||||||
| Royce Premier Fund | 7.33 | 27.08 | 18.57 | 11.07 | 12.62 | 12.73 | 12/31/91 | 1.09 | 1.09 | |||||||||||||||||||||||||||
| Royce Low-Priced Stock Fund | 9.03 | 24.64 | 13.69 | 7.38 | 12.36 | 11.82 | 12/15/93 | 1.51 | 1.49 | |||||||||||||||||||||||||||
| Royce Total Return Fund | 2.74 | 20.87 | 18.28 | 8.72 | 11.92 | 11.57 | 12/15/93 | 1.18 | 1.18 | |||||||||||||||||||||||||||
| Royce Heritage Fund | 2.90 | 18.49 | 16.91 | 9.43 | n.a. | 13.78 | 12/27/95 | 1.49 | 1.49 | |||||||||||||||||||||||||||
| Royce Opportunity Fund | 3.02 | 24.76 | 23.48 | 9.53 | n.a. | 13.62 | 11/19/96 | 1.17 | 1.17 | |||||||||||||||||||||||||||
| Royce Special Equity Fund | 0.16 | 15.27 | 16.16 | 8.61 | n.a. | 10.03 | 5/1/98 | 1.13 | 1.13 | |||||||||||||||||||||||||||
| Royce Value Fund | 3.41 | 21.81 | 16.02 | 10.08 | n.a. | 11.57 | 6/14/01 | 1.48 | 1.48 | |||||||||||||||||||||||||||
| Royce Value Plus Fund | 4.08 | 22.74 | 15.84 | 8.42 | n.a. | 12.69 | 6/14/01 | 1.49 | 1.49 | |||||||||||||||||||||||||||
| Royce 100 Fund | 2.79 | 21.66 | 16.64 | 10.39 | n.a. | 11.70 | 6/30/03 | 1.51 | 1.51 | |||||||||||||||||||||||||||
| Royce Dividend Value Fund | 3.35 | 21.85 | 19.38 | 10.34 | n.a. | 10.24 | 5/3/04 | 1.52 | 1.52 | |||||||||||||||||||||||||||
| Royce Global Value Fund | 11.04 | 23.93 | 13.76 | n.a. | n.a. | 6.53 | 12/29/06 | 1.84 | 1.70 | |||||||||||||||||||||||||||
| Royce International Smaller-Companies Fund | 6.59 | 21.02 | 13.15 | n.a. | n.a. | 7.56 | 6/30/08 | 2.08 | 1.70 | |||||||||||||||||||||||||||
| Royce Special Equity Multi-Cap Fund | 5.35 | 21.85 | n.a. | n.a. | n.a. | 16.73 | 12/31/10 | 1.46 | 1.24 | |||||||||||||||||||||||||||
| INDEX | ||||||||||||||||||||||||||||||||||||
| Russell 2000 Index | 3.19 | 23.64 | 20.21 | 8.70 | 9.81 | n.a. | n.a. | n.a. | n.a. | |||||||||||||||||||||||||||
| Russell Microcap Index | 1.56 | 24.98 | 20.03 | 6.67 | n.a. | n.a. | n.a. | n.a. | n.a. | |||||||||||||||||||||||||||
| Russell Global Small Cap Index | 5.72 | 23.60 | 15.93 | 9.02 | n.a. | n.a. | n.a. | n.a. | n.a. | |||||||||||||||||||||||||||
| Russell Global ex-U.S. Small Cap Index | 7.54 | 23.86 | 13.88 | 9.67 | n.a. | n.a. | n.a. | n.a. | n.a. | |||||||||||||||||||||||||||
| Russell 1000 Index | 7.27 | 25.35 | 19.25 | 8.19 | 10.00 | n.a. | n.a. | n.a. | n.a. | |||||||||||||||||||||||||||
| 1 Not Annualized | ||||||||||||||||||||||||||||||||||||
Important Performance, Expense, and Risk Information
All performance information in this Review and Report reflects past performance, is presented on a total return basis, reflects the reinvestment of distributions, and does not reflect the deduction of taxes a shareholder would pay on fund distributions or the redemption of fund shares. Past performance is no guarantee of future results. Investment return and principal value of an investment will fluctuate, so that shares may be worth more or less than their original cost when redeemed. Shares of Royce Global Value and International Smaller-Companies Funds redeemed within 180 days of purchase may be subject to a 2% redemption fee payable to The Royce Funds. Shares of all other Funds redeemed within 180 days of purchase may be subject to a 1% redemption fee payable to the Fund. Redemption fees are not reflected in the performance shown above; if they were, performance would be lower. Current performance may be higher or lower than performance quoted. Current month-end performance may be obtained at www.roycefunds.com. All performance and expense information reflects results of the Fund’s oldest share Class (Investment Class or Service Class, as the case may be). Price and total return information is based on net asset values calculated for shareholder transactions. Price and total return information is based on net asset values calculated for shareholder transactions. Gross annual operating expenses reflect the Fund’s gross total annual operating expenses and include management fees, any 12b-1 distribution and service fees, other expenses, and any applicable acquired fund fees and expenses. Net annual operating expenses reflect contractual fee waivers and/or reimbursements. All expense information is reported as of the Fund’s most current prospectus. Royce & Associates has contractually agreed to waive fees and/or reimburse operating expenses, (excluding brokerage commissions, taxes, interest litigation expenses, acquired fund fees and expenses, and other expenses not borne in the ordinary course of business), and to the extent necessary to maintain net operating expenses at or below: 1.24% for Royce Special Equity Multi-Cap Fund; 1.49% for Royce Low-Priced Stock Fund; 1.69% for Royce Global Value and International Smaller-Companies Funds through April 30, 2015; and at or below 1.99% for Royce International Smaller-Companies Fund through April 30, 2024. Acquired fund fees and expenses reflect the estimated amount of fees and expenses incurred indirectly by the Fund through its investments in mutual funds, hedge funds, private equity funds, and other investment companies. Shares of the Funds’ Service, Consultant, R, and K Classes bear an annual distribution expense that is not borne by the Funds’ Investment Class. Investments in securities of micro-cap, small-cap, and/or mid-cap companies may involve considerably more risk than investments in securities of larger-cap companies. (Please see “Primary Risks for Fund Investors” in the prospectus.) Royce Global Value and International Smaller-Companies Funds invest a significant portion of their respective assets in foreign companies which may be subject to different risks than investments in securities of U.S. companies, including adverse political, social, economic, or other developments that are unique to a particular country or region. (Please see “Investing in foreign securities” in the prospectus.) Therefore, the prices of securities of foreign companies in particular countries or regions may, at times, move in a different direction than those of securities of U.S. companies. (Please see “Primary Risk of Fund Investors” in the prospectus.) Please read the prospectus carefully before investing or sending money. Russell Investment Group is the source and owner of the trademarks, service marks, and copyrights related to the Russell Indexes. Russell® is a trademark of Russell Investment Group. The Russell 2000 Index is an unmanaged, capitalization-weighted index of domestic small-cap stocks. It measures the performance of the 2,000 smallest publicly traded U.S. companies in the Russell 3000 Index. The Russell Microcap Index includes 1,000 of the smallest securities in the Russell 2000 Index, along with the next smallest eligible securities as determined by Russell. The Russell Global Small Cap Index is an index of global small-cap stocks. The Russell Global ex-U.S. Small Cap Index is an index of global small-cap stocks, excluding the United States. The Russell 1000 is an unmanaged, capitalization-weighted index of domestic large-cap stocks. It measures the performance of the 1,000 largest publicly traded U.S. companies in the Russell 3,000 Index. The performance of an index does not represent exactly any particular investment, as you cannot invest directly in an index. Distributor: Royce Fund Services, Inc. |
| This page is not part of the 2014 Semiannual Report to Shareholders | 5 |
| U.S. Small-Cap Market Cycle and Risk Adjusted Performance |
We believe strongly in the idea that a long-term investment perspective is crucial for determining the success of a particular investment approach. While flourishing in an up market is wonderful, surviving a bear market by losing less (or not at all) is at least as good. However, the true test of a portfolio’s mettle is performance over full market cycle periods, which include both an up and down market periods. |
| Since the inception of the Russell 2000 index on 12/31/78, there have been 10 full market cycles, with the most recent peaking on 4/29/11. Market cycles are defined as those that have retreated at least 15% from a previous market peak and have rebounded to establish a new peak above the previous one. Each market cycle contains a peak-to-trough and a trough-to-peak period. Interestingly, over the small-cap index’s 30+ year history, each style index—the Russell 2000 Value Index and the Russell 2000 Growth Index—outperformed in five of the 10 full market cycles. In fact, leadership has alternated between growth and value over the last six cycles. If history were to adhere to this pattern, value would lead in the current cycle that began on 4/29/11. |
RISK / RETURN PROFILE 10-YEAR PERIOD ENDED JUNE 30, 2014 |
 |
 | For the 10-year period ended 6/30/14, eight out of 12 Royce Funds with 10 years of history outperformed the Russell 2000, while eight of the 12 did so with better risk-adjusted returns and Sharpe ratios. | |
| In addition, for the 10-year period ended 6/30/14, five of the 12 Royce Funds outperformed the Russell 2000 with lower volatility. |
SMALL-CAP MARKET CYCLE: RUSSELL 2000 INDEXES TOTAL RETURNS |
 |
| ROYCE U.S. EQUITY FUNDS VS. RUSSELL 2000 INDEX: | ||||||||||||
| MARKET CYCLE RESULTS | ||||||||||||
| Peak-to- | Peak-to- | Peak-to- | ||||||||||
| Peak | Peak | Current | ||||||||||
| 3/9/00– | 7/13/07– | 4/29/11 | ||||||||||
| Fund | 7/13/07 | 4/29/11 | 6/30/14 | |||||||||
| Royce Pennsylvania Mutual Fund | 207.1 | % | 11.6 | % | 35.8 | % | ||||||
| Royce Micro-Cap Fund | 197.4 | 24.9 | 5.9 | |||||||||
| Royce Premier Fund | 198.1 | 29.9 | 34.3 | |||||||||
| Royce Low-Priced Stock Fund | 198.9 | 27.2 | 0.7 | |||||||||
| Royce Total Return Fund | 193.9 | 6.8 | 41.3 | |||||||||
| Royce Heritage Fund | 150.4 | 25.3 | 21.7 | |||||||||
| Royce Opportunity Fund | 191.8 | 6.9 | 46.3 | |||||||||
| Royce Special Equity Fund | 227.4 | 20.8 | 39.4 | |||||||||
| Royce Value Fund | n.a. | 17.4 | 19.8 | |||||||||
| Royce Value Plus Fund | n.a. | -3.0 | 30.4 | |||||||||
| Royce 100 Fund | n.a. | 27.6 | 27.1 | |||||||||
| Royce Dividend Value Fund | n.a. | 21.6 | 39.4 | |||||||||
| INDEX | ||||||||||||
| Russell 2000 | 54.8 | 6.6 | 44.2 | |||||||||
| Russell 2000 Value | 189.4 | -1.4 | 44.4 | |||||||||
| Russell 2000 Growth | -14.8 | 14.3 | 44.0 | |||||||||
| All performance information above reflects past performance, is presented on a total return basis, reflects the reinvestment of distributions, and does not reflect the deduction of taxes that a shareholder would pay on fund distributions or the redemption of fund shares. Past performance is no guarantee of future results. Please see page 5 for 1-, 5-, and 10-year average annual total return information. |
| 6 | This page is not part of the 2014 Semiannual Report to Shareholders |
| Letter to Our Shareholders |
 |
No Drama |
Whatever other opinions we may all hold about the stock market’s behavior over the last six years, we think everyone can agree that it has certainly been dramatic. The action began in earnest in the fall of 2008, although it is important to recall that small-cap stock prices had actually been falling for more than a year prior to that—the peak for the Russell 2000 Index having been established on July 13, 2007. Yet the full effects of the bear were unleashed by the events of the Financial Crisis, which keyed the dangerously precipitous nosedive of share prices in the fall of 2008. The tumult lasted until small-caps finally hit a bottom on March 9, 2009. The fear and anxiety the descent created, however, reached into the next several years. The feeling of extraordinary fragility that characterized the early days of the recovery in the spring of 2009 did not magically evaporate when markets began to find their feet again. In fact, one could argue that these emotions dominated the behavior of investors at least until the end of 2012. The three years from 2010 through 2012 were eventful, even if the stress and excitement they generated did not equal that of the first six months of 2009. In fact, much of the market’s most extreme moves in that entire four-year span (2009-2012) took place in the first six months of those years, driven in large part by events both actual and potential. The recession in the U.S., debt issues in Europe, and slow growth in China were all very real, while a double-dip recession here at home, default in Europe, and implosion in China fortunately failed to materialize. By the end of 2012, with the stock market climbing and the economy expanding, investors seemed to recognize that, in spite of high volatility and political uncertainty, equity returns had been solidly positive since the March 2009 bottom. This improved confidence helped to spur a different kind of dramatic arc. The long, slow recovery entered a new phase in 2013—a heady, and |
| This page is not part of the 2014 Semiannual Report to Shareholders | 7 |
 Charles M. Royce, President The long-running, and probably unresolvable, debate about active versus passive investment strategies has taken on new life in the years since the onset of the Financial Crisis, often to the detriment of active approaches. To take one example, Morningstar compiled data showing that inflows into equity mutual funds have been dwarfed by those into equity ETFs (exchange traded funds) measuring from the momentous year of 2008. For the six calendar years from 2008-2013, traditional equity funds have taken in $5.52 billion while ETFs have attracted $389.08 billion. That’s quite a disparity. It seems to be no secret that many active managers have struggled to keep pace with their respective equity indexes in these often eventful years. These years have also seen a raft of studies purporting to show that most investment managers are unable to consistently beat the market, i.e., regularly outperform a relevant index such as the Russell 2000 or S&P 500 Indexes. Perhaps unsurprisingly, we would offer two caveats before one embraces uncritically the notion that passive Continued on page 10... | Letter to Our Shareholders virtually correction-free, bull run in which returns for each of the major domestic stock indexes topped 30%. The curtain opened on 2014, then, on the heels of one of the better calendar-year performances in the history of domestic equities, which followed four consecutive years of mostly rising stock prices in an uncertain economy. So the question now is, what is the next act for equities? Some argue that the economy is not strong enough to really take flight. They worry about the rich valuations sported by large numbers of stocks. Others see the relative absence of volatility as a sign of complacency and fret that stocks are about to enter a destructive bear phase. There are those who point to increasingly unsettled international situations, such as in Ukraine, Syria, and Iraq, and argue that the market cannot continue to pretend that events in these nations take place far offstage, not in an increasingly intertwined global economy. We, however, are in accord with the more widespread consensus that sees the U.S. economy as gradually normalizing. As evidence we would point to the following: The deficit continues to fall, the Fed continues to wind down the rate of its monthly bond purchases, and interest rates, though they remain close to zero, look likely to rise again in the near future as they did last year between May and December. Inflation is tame, commodity prices stable. Volatility, as measured by the VIX, finished the first half of 2014 at low levels not seen since 2007. Add an increasingly robust M&A market, and it seems to us that the recipe for ongoing growth—and bullishness, however mild, at least compared to last year—seems almost complete. And this process of normalization looks likely to accelerate as the Fed’s role recedes further and further into the background, setting the stage for a more dynamic pace of growth. So while there remain voices who insist that stocks are overvalued, we think the case for additional gains, which could include a correction along the way, remains persuasive. It seems to us that the relatively lower returns of the first half of 2014 indicate not an end to a bull phase, but a chance for the market to catch its breath and assess its surroundings. It may be that investors need a break from all the drama, a respite from the unrelenting pace of the last six years. So the desire to stand back for a moment and evaluate what is happening seems eminently reasonable. How many investors have enjoyed more than a few moments of true calm since before the recession began back in 2007? Ultimately, we suspect that both the expanding economy and slower pace of returns will result in more fundamentally focused investors. Indeed, the indications that the strength of companies and the businesses they manage are beginning to matter more than indexes and the macro events that move them go back to the spring of 2012, when quality stocks—those with high returns on invested capital—enjoyed a brief run of outperformance. This nascent phenomenon re-started—again, briefly—in May 2013 when the 10-year Treasury rate reached a bottom. Quality companies, particularly those in our chosen small-cap space, have not yet emerged as leaders, but they have inched closer over the last two years. Correlation levels throughout the market are falling. These are excellent conditions, in our view, for disciplined active management approaches, especially those with a long-term investment horizon. | ||
| 8 | This page is not part of the 2014 Semiannual Report to Shareholders |
| No Direction Home |
U.S. stocks turned in a respectable performance in the first half of 2014. If results were not as lofty as they were in the first half of 2013 (and they were not), they were achieved in a more tranquil domestic environment than in the first halves of 2010, 2011, or 2012. One consequence of the more relaxed atmosphere of the first half was that stocks did not seem to know quite what to do with themselves. While the overvalued/not-quite-overvalued-yet argument goes on, the market has not established a clear direction so far in 2014. The bull has so far remained in place during the current cycle; he simply slowed his run to a brisk walk in the first half. For the year-to-date period ended June 30, 2014, the major domestic indexes remained in the black. The small-cap Russell 2000 Index gained 3.2%, taking a back seat to the more tech-oriented Nasdaq Composite, which advanced 5.5% in the first half, and the large-cap S&P 500 and Russell 1000 Indexes, which scored respective gains of 7.1% and 7.3% for the year-to-date period ended June 30, 2014. The year began on a more moderate note following a red-hot second half of 2013. Nevertheless, 2014’s opening quarter was the seventh consecutive quarter of positive performance for the Russell 2000, which rose 1.1%. Large-caps led for the quarter—the S&P 500 and Russell 1000 gained 1.8% and 2.0%, respectively, while the Nasdaq Composite rose 0.5%. Small-caps reached a first-half high on March 4, and the only correction so far this year was the 9.1% drop for the Russell 2000 from that date through May 15, 2014. April was thus the cruelest month, but a series of mini-rallies from mid-May through the end of June made the second quarter mostly positive. The Russell 2000 posted its eighth consecutive positive quarter, up 2.0%. Once again, large-cap outperformed, with the S&P 500 advancing 5.2% and the Russell 1000 up 5.1% for the second quarter. The Nasdaq bounced back strong as well, climbing 5.0% in the second quarter and leaving only the small-cap index out of the five-percent club. Small-cap held onto leadership outside the U.S. In the first quarter, the Russell Global ex-U.S. Small Cap Index was up 3.2% while the Russell Global ex-U.S. Large Cap Index rose 0.8%. Results were stronger in the second quarter and, as in the first, closer to their domestic counterparts than we have seen in a while. For the second quarter, the Russell Global ex-U.S. Small Cap was up 4.2% versus 5.0% for the Russell Global ex-U.S. Large Cap. Year-to-date, non-U.S. small-caps had the edge, with the Russell Global ex-U.S. Small Cap returning 7.5% versus a gain of 5.8% for the Russell Global ex-U.S. Large Cap. After a challenging first quarter, many Asian equities bounced back in the second and finished closer to the European indexes, most of which had been on a tear prior to cooling off in the second quarter. Moving back to the U.S., mid-cap and micro-caps were equally solid in the first quarter. The Russell Midcap Index was up 3.5% versus a gain of 3.0% for the Russell Microcap Index in 2014’s first three months. This pattern broke down around the time of the March 4 small-cap high and can be seen in the second-quarter results for each index. | Quality companies, particularly those in our chosen small-cap space, have not yet emerged as leaders, but they have inched closer over the last two years. Correlation levels throughout the market are falling. These are excellent conditions, in our view, for disciplined active management approaches, especially those with a long-term investment horizon. U.S. stocks turned in a respectable performance in the first half of 2014. If results were not as lofty as they were in the first half of 2013 (and they were not), they were achieved in a more tranquil domestic environment than in the first halves of 2010, 2011, or 2012. | |||
| This page is not part of the 2014 Semiannual Report to Shareholders | 9 |
| investing is always better: First, a number of managers have consistently outperformed the market over long-term periods and especially within the small-cap asset category. In fact, we believe strongly in the idea that it is not necessary for all managers to beat the market in order for active management to be validated as an approach. Our second note of caution relates to time periods. While it would be nice to outperform an index every year, it is just as unrealistic to expect that as it would be to expect an index to outperform active management every year. It is also unrealistic to expect a high degree of outperformance in the long term without experiencing some short-term underperformance periods. A willingness to stick to one’s approach, regardless of market movements and trends, is critical to long-term outperformance in our opinion. This is especially important during market extremes because there are active managers who exhibit style drift or other changes in their discipline when their investment style falls out of favor or is stressed, such as during the tech bubble. Successful active management also entails a willingness to think independently in terms of sector and industry weightings. It is not unusual for the most successful managers to be significantly out of sync relative to a Continued on page 12... | |||
| Letter to Our Shareholders | ||
The Russell Midcap continued its notable 2014 performance, rising 5.0% in the second quarter. This gave mid-caps an impressive 8.7% advance on a year-to-date basis. In contrast, micro-caps struggled in the second quarter, suffering more in the brief downturn than their larger cousins. The Russell Microcap Index fell 1.4% for the quarter and was up only 1.6% for the year-to-date period ended June 30, 2014. Many mid-cap stocks have demonstrated strong records of growth over the last few years, and their success throughout the entire post-Financial Crisis cycle has not been a surprise to us. In fact, mid-caps have been an area of significant interest to us for years now. The small- and micro-cap spaces have, by contrast, high numbers of very speculative companies and are typically more volatile—sometimes much more so in the case of micro-caps. They have also enjoyed very strong results over the last several years. The three- and five-year annualized returns through the end of June for the Russell 2000 and Russell Microcap Indexes were terrific on an absolute basis. With equity investors acting more cautiously, if not always consistently, so far in 2014, the relative breather for small- and micro-cap stocks—and we do not think it’s any more than a breather—was also not a surprise. | ||
No Excuses Each of our Featured Funds enjoyed strong absolute performance in the first half. We were also pleased with both the year-to-date and one-year results for several portfolios, though we recognize fully that more needs to be done with regard to relative performance, especially over more intermediate-term periods. Six portfolios outpaced their respective benchmarks for the year-to-date period ended June 30, 2014—Royce Premier, Low-Priced Stock, Value Plus, Dividend Value, Value, and Global Value Funds. In addition, Royce Pennsylvania Mutual, Premier, Low-Priced Stock, Opportunity, and Global Value Funds beat their respective benchmarks for the one-year period ended June 30, 2014. This was welcome news because, with a few exceptions, shorter-term performance advantages have been elusive over the last few years. Of course short-term outperformance must always be kept in perspective as exactly that—short term. We are hopeful, however, having seen many of our Featured Funds narrow the gap in their respective one-, three-, and five-year results versus their respective benchmarks over the last three to four quarters. Featured Funds with more than 10 years of history have also generally held their relative edge for periods of a decade or longer. Yet we still have work to do. As encouraged as we have been about the recent short spates of leadership for quality stocks and the likelihood that a strengthening, less Fed-dependent economy will benefit active small-cap approaches, lower quality small-caps again assumed leadership when prices were rallying in June. Investors are still working out their preferences. Profitable companies—as well those with high returns on invested capital—led through the downturn before falling behind in the up phase. The market thus remained a peculiar place in the first half. This may be because we still have a very active Fed at work in an economy that arguably has not needed the extra help in at least a year. | ||
| 10 | This page is not part of the 2014 Semiannual Report to Shareholders |
| 2014 YEAR-TO-DATE TOTAL RETURN FOR THE ROYCE FUNDS VS. BENCHMARK INDEXES As of 6/30/14 | ||
 | ||
No Worries We are very bullish about the prospects for active small-cap management. We have an obvious bias in favor of active approaches here at Royce, but we think that over the last 14 months—dating back to the low for the 10-year Treasury in May of last year—we have reached a point at which active management in small-cap stocks simply makes more sense, especially for long-term investors. Since that May 2013 low, company fundamentals have gradually become more important as drivers of share-price success. Rather than invest in a small-cap index vehicle in which approximately 25% of the companies are losing money (as was the case for the Russell 2000 for the 12 months ended May 31, 2014), we think it is smarter for investors to consider portfolios that look for well-run, financially strong companies with attractive long-term prospects. So while quality has not yet seized small-cap leadership, we suspect that the reign of low-quality stocks is coming to an end. In our view, the next phase will be one in which companies with attractive characteristics such as strong balance sheets and high returns on invested capital should begin to lead. In spite of not showing as much strength when the market was recovering in May and June, many | We are very bullish about the prospects for active small-cap management... we have reached a point at which active management in small-cap stocks simply makes more sense, especially for long-term investors. | |
| This page is not part of the 2014 Semiannual Report to Shareholders | 11 |
| benchmark index with respect to industry and sector weightings (commonly referred to as tracking error). In addition, active managers are not required to invest cash inflows at the time of receipt when market conditions or prices may not be conducive. They may screen for quality and use buy/sell triggers as a means of reducing risk. While a passive manager must own everything, an active manager has the freedom to look for attractive stocks across a targeted universe. All of this helps to explain why we remain so fond of small-caps and so confident in the effectiveness and value of active approaches in the asset class. Active small-cap managers can capture valuation opportunities beyond their respective indexes—an opportunity that would be lost if one were limited to owning only the constituents that make up an index. For example, the Russell 2000, while quite broad, only includes about 2,000 of the more than 4,100 companies1 that make up the domestic small-cap universe (those with market caps up to $2.5 billion). While self-serving, we nevertheless think that the small-cap asset class is ideally suited for active management given its enormous size, lack of institutional focus, and limited research availability. 1 Source: Reuters as of 6/30/14 | |
| Letter to Our Shareholders |
 |
did well enough to lead the small-cap pack from the 2014 high in March through the end of the first half. We would expect something like this pattern to continue at least through the end of the year as the market continues to adjust to the growing normalization of the economy. With diverse small-cap sectors such as Consumer Discretionary, Health Care, and Information Technology showing sizable declines since the end of February, we have been looking closely there (and elsewhere) for what we think are attractively priced, fundamentally strong small-cap businesses. As always, volatility in the small-cap market is something that we seek to use to our advantage, even when it is in short supply. Know This We feel somewhat fortunate in that we do not need to choose a side in the “overvalued versus ongoing bull market” debate. Rather than trying to make a correct market call, our attention has been focused on those potential opportunities that can materialize even in a widespread bull market. Corrections can arrive at any time, of course, and it has been a while since we have seen one of any significance. The last downturn of more than 10% for the Russell 2000 occurred in the fall of 2012. And share prices recovered so quickly from the 9.1% March-May decline this year that the down phase barely registered. This might lead one to argue that the market is being set up for at least a decent-sized pullback. Our sense, however, is that we are more likely to see smaller ones in the 5-10% range as part of the ongoing bull phase. Against the backdrop of an economy that looks poised for faster growth, a Fed tapering at a healthy clip, and an interest-rate environment in which a steady rate of increase is much more of a “when” than an “if,” less severe downturns look more likely. Small-cap valuations on the whole are above average, though not unreasonably so given near-zero interest rates and low inflation. A number of anomalies remain in the market, and in many cases we see a wide disparity between what look to us like expensive stocks |
| 12 | This page is not part of the 2014 Semiannual Report to Shareholders |
and those that look inexpensive on an absolute basis. The market seems to be in the process of sorting that out—certainly those areas of the market that do not interest us, and that did well in 2012 and 2013, have been more volatile so far in 2014. In addition, we are still seeing companies that look attractively valued to us based on their fundamentals. All in all, it is looking more and more like a stock-picker’s market to us. We could see the second half of the year being pretty similar to the first in terms of the overall returns for stocks. More important, we think there are still enough opportunities out there to keep returns in positive territory through the end of 2014. This could make the market’s next act a very happy one for active small-cap managers. | |||||
Sincerely, | |||||
 |  |  | |||
| Charles M. Royce | Christopher D. Clark | Francis D. Gannon | |||
| President | Co-Chief Investment Officer, Royce & Associates | Co-Chief Investment Officer, Royce & Associates | |||
| July 31, 2014 | |||||
| This page is not part of the 2014 Semiannual Report to Shareholders | 13 |
| Fund Focus | |
Here at Royce, we are happily contrarian. We look for what we deem to be high-quality companies trading at a discount to our estimate of their intrinsic worth as businesses. Quality, of course, can take many forms. For us, it generally consists of a suite of attributes that includes a strong balance sheet, high returns on invested capital, and the ability to generate free cash flow. There is another ingredient that we also see as an excellent measure of a business’s underlying quality—the practice of paying dividends. (A whitepaper detailing performance and volatility history for small-cap dividend payers is available on our website, roycefunds.com/dividends.) While there is no guarantee that companies that pay them will continue to do so in the future, dividends offer a number of potential portfolio merits, most crucially as a potentially mitigating factor against market volatility. To our way of thinking, a steady stream of income is always a good thing, but it can be particularly helpful for investors trying to more comfortably navigate market extremes. This opinion is not always widely shared in the small-cap world. Many investors tend to think of “dividend-paying small-cap company” as an oxymoron, if they think of it at all. This fact is borne out by Morningstar data. Of the 516 small-cap objective funds identified by Morningstar as of June 30, 2014, only six funds have dividend, income, or total return in their respective names—and two of them are Royce Funds. Royce Dividend Value Fund (RDV), which debuted in May 2004, is one of those portfolios. It seeks long-term growth of capital and current income. In its security selection criteria, we first look for what we think are fundamentally strong, high-quality companies trading at attractive discounts to our estimate of their intrinsic worth. We then add the additional criteria that the bulk of the portfolio selections must also pay a dividend. Royce Dividend Value Fund ranges a little higher in market capitalization than many other Royce Funds. RDV may invest in small-cap and mid-cap companies with market caps up to $15 billion. The Fund may also invest up to 25% of its net assets in foreign securities because we like the opportunity presented by non-U.S. dividend-paying companies. We are pleased with the Fund’s absolute performance and its historically low volatility. (For more information on RDV’s historical volatility scores, please see page 39.) We think the Fund offers an attractive option for a risk-conscious investor seeking exposure to smaller companies, especially those that pay dividends. | |
 | |
| Jay Kaplan Portfolio Manager since 2007 | Chuck Royce Lead Portfolio Manager since 2004 |
| Royce Dividend Value Fund—Measuring for Quality: Performance and Expense Information Through June 30, 2014 |
| Average Annual Total Returns | Royce Dividend Value Fund | Russell 2000 | ||
| Year-to-Date1 | 3.35% | 3.19% | ||
| One-Year | 21.85 | 23.64 | ||
| Three-Year | 12.97 | 14.57 | ||
| Five-Year | 19.38 | 20.21 | ||
| Ten-Year | 10.34 | 8.70 | ||
| Since Inception (5/3/2004) | 10.24 | 9.06 | ||
| Annual Operating Expenses | 1.52 | n.a. | ||
| Important Performance and Expense Information All performance information reflects past performance, is presented on a total return basis and reflects the reinvestment of distributions. Past performance is no guarantee of future results. Investment return and principal value of an investment will fluctuate, so that shares may be worth more or less than their original cost when redeemed. Shares redeemed within 180 days of purchase may be subject to a 1% redemption fee payable to the Fund, which is not reflected in the performance shown above; if it were, performance would be lower. Current performance may be higher or lower than performance quoted. Current month-end performance may be obtained at www.roycefunds.com. Operating expenses reflect Royce Dividend Value Fund’s total annual operating expenses for the Service Class as of the Fund’s most current prospectus and include management fees, other expenses, and acquired fund fees and expenses. Acquired fund fees and expenses are those incurred indirectly as a result of investment in one or more acquired funds, including mutual funds, hedge funds, private equity funds, and other pooled investment vehicles. The Fund invests primarily in small-cap and/or mid-cap stocks, which may involve considerably more risk than investing in larger-cap stocks (Please see “Primary Risks for Fund Investors” in the prospectus). The Fund may invest up to 25% of its net assets (at the time of investment) in foreign securities, which may involve political, economic, currency, and other risks not encountered in U.S. investments (Please see “Investing in Foreign Securities” in the prospectus). |
| 14 | This page is not part of the 2014 Semiannual Report to Shareholders |
| Table of Contents |
| Semiannual Report to Shareholders | ||||||||||
| Managers’ Discussions of Fund Performance | ||||||||||
| Royce Pennsylvania Mutual Fund | 16 | |||||||||
| Royce Micro-Cap Fund | 18 | |||||||||
| Royce Premier Fund | 20 | |||||||||
| Royce Low-Priced Stock Fund | 22 | |||||||||
| Royce Total Return Fund | 24 | |||||||||
| Royce Heritage Fund | 26 | |||||||||
| Royce Opportunity Fund | 28 | |||||||||
| Royce Special Equity Fund | 30 | |||||||||
| Royce Value Fund | 32 | |||||||||
| Royce Value Plus Fund | 34 | |||||||||
| Royce 100 Fund | 36 | |||||||||
| Royce Dividend Value Fund | 38 | |||||||||
| Royce Global Value Fund | 40 | |||||||||
| Royce International Smaller-Companies Fund | 42 | |||||||||
| Royce Special Equity Multi-Cap Fund | 44 | |||||||||
| Schedules of Investments and Financial Statements | 46 | |||||||||
| Notes to Financial Statements | 114 | |||||||||
| Understanding Your Fund’s Expenses | 127 | |||||||||
| Trustees and Officers | 130 | |||||||||
| Board Approval of Investment Advisory Agreements | 131 | |||||||||
| Notes to Performance and Other Important Information | 134 | |||||||||
| The Royce Funds 2014 Semiannual Report to Shareholders | 15 |
| Royce Pennsylvania Mutual Fund |
| ||||||||||||
| AVERAGE ANNUAL TOTAL RETURNS Through 6/30/14 | ||||||||||||
| January–June 20141 | 2.04 | % | ||||||||||
| One-Year | 23.70 | |||||||||||
| Three-Year | 12.25 | |||||||||||
| Five-Year | 18.77 | |||||||||||
| 10-Year | 9.41 | |||||||||||
| 15-Year | 11.00 | |||||||||||
| 20-Year | 11.61 | |||||||||||
| 25-Year | 10.98 | |||||||||||
| 30-Year | 11.93 | |||||||||||
| 35-Year | 13.08 | |||||||||||
| 40-Year | 15.18 | |||||||||||
| ANNUAL EXPENSE RATIO | ||||||||||||
| Operating Expenses | 0.93 | % | ||||||||||
| 1 Not Annualized | ||||||||||||
| CALENDAR YEAR TOTAL RETURNS | ||||||||||||
| Year | PMF | Year | PMF | |||||||||
| 2013 | 35.3 | % | 2005 | 12.5 | % | |||||||
| 2012 | 14.6 | 2004 | 20.2 | |||||||||
| 2011 | -4.2 | 2003 | 40.3 | |||||||||
| 2010 | 23.9 | 2002 | -9.2 | |||||||||
| 2009 | 36.3 | 2001 | 18.4 | |||||||||
| 2008 | -34.8 | 2000 | 18.3 | |||||||||
| 2007 | 2.8 | 1999 | 6.0 | |||||||||
| 2006 | 14.8 | 1998 | 4.2 | |||||||||
| TOP 10 POSITIONS % of Net Assets | ||||||||||||
| Reliance Steel & Aluminum | 1.1 | % | ||||||||||
| NVR | 1.0 | |||||||||||
| Unit Corporation | 1.0 | |||||||||||
| Federated Investors Cl. B | 0.9 | |||||||||||
| Pason Systems | 0.8 | |||||||||||
| Genesco | 0.8 | |||||||||||
| Nu Skin Enterprises Cl. A | 0.7 | |||||||||||
| Thor Industries | 0.7 | |||||||||||
| Tennant Company | 0.7 | |||||||||||
| Helmerich & Payne | 0.7 | |||||||||||
| PORTFOLIO SECTOR BREAKDOWN % of Net Assets | ||||||||||||
| Industrials | 23.8 | % | ||||||||||
| Information Technology | 20.7 | |||||||||||
| Consumer Discretionary | 14.9 | |||||||||||
| Materials | 10.8 | |||||||||||
| Financials | 10.7 | |||||||||||
| Energy | 7.2 | |||||||||||
| Health Care | 6.6 | |||||||||||
| Consumer Staples | 2.1 | |||||||||||
| Diversified Investment Companies | 0.4 | |||||||||||
| Telecommunication Services | 0.2 | |||||||||||
| Utilities | 0.0 | |||||||||||
| Miscellaneous | 1.4 | |||||||||||
| Cash and Cash Equivalents | 1.2 | |||||||||||
 |
Manager’s Discussion Our flagship, Royce Pennsylvania Mutual Fund (PMF), was up 2.0% for the year-to-date period ended June 30, 2014, finishing the first half behind its small-cap benchmark, the Russell 2000 Index, which gained 3.2% for the same period. This was somewhat disappointing because the market has at times been more hospitable to disciplined and active investment approaches over the last 14 months, dating back to the May 2, 2013 low for the 10-Year Treasury. This occasional strength could be seen in PMF’s results from the second half of 2013, when it outperformed its benchmark. Unlike the previous four years, 2014 got off to a slow, though still positive, start. This was not terribly surprising in the context of a highly bullish 2013, a year that saw no major corrections and enjoyed a particularly dynamic second half. The result was a nondescript opening quarter in which the Fund was up 0.3% versus a gain of 1.1% for the Russell 2000. The second quarter seemed similarly uninspired, though it was more volatile. Equities failed to establish any clear direction as the economy continued to grow slowly and a still-unresolved debate went on about whether or not stocks are overvalued or still have some room to run. This argument has so far been a low-intensity dispute, at least insofar as it has affected share prices. The same could be said for volatility, which has been low. Small-caps reached a first-half high on March 4, declining 9.1% through May 15. This was as close to a correction as stocks have come so far in 2014. Markets began to rally in May and continued doing so through the end of June. For the second quarter, PMF rose 1.7% while the Russell 2000 was up 2.0%. We have been very pleased to see value-oriented styles such as our own gradually narrow the performance gap over the last several months with their respective benchmarks and the passively managed portfolios and ETFs that mirror the indexes. While the Fund’s first-half results did not show this growing strength to the degree that we would like, results over the one-year period ended June 30, 2014 were more encouraging. We therefore remain resolute about PMF’s approach and optimistic about its long-term prospects. We were also happy that its longer-term performance advantages remained in place. The Fund outpaced the Russell 2000 for the one-, 10-, 15-, 20-, 25-, 30-, and 35-year periods ended June 30, 2014. PMF’s average annual total return for the 40-year period—all under the management of Chuck Royce—was 15.2%. We take great pride in this four-decade result. |
| GOOD IDEAS THAT WORKED Top Contributors to Performance Year-to-Date through 6/30/141 | ||
| Helmerich & Payne | 0.33% | |
| Unit Corporation | 0.29 | |
| Pason Systems | 0.22 | |
| Myriad Genetics | 0.19 | |
| Westlake Chemical | 0.18 | |
| 1 Includes dividends. | ||
Important Performance and Expense Information All performance information in this Report reflects past performance, is presented on a total return basis, reflects the reinvestment of distributions, and does not reflect the deduction of taxes that a shareholder would pay on fund distributions or the redemption of fund shares. Past performance is no guarantee of future results. Investment return and principal value of an investment will fluctuate, so that shares may be worth more or less than their original cost when redeemed. Shares redeemed within 180 days of purchase may be subject to a 1% redemption fee payable to the Fund, which is not reflected in the performance shown above; if it were, performance would be lower. Current month-end performance may be higher or lower than performance quoted and may be obtained at www.roycefunds.com. All performance and risk information reflects results of the Investment Class (its oldest class). Operating expenses reflect the Fund’s total annual operating expenses for the Investment Class as of the Fund’s most current prospectus and include management fees, other expenses, and acquired fund fees and expenses. Acquired fund fees and expenses reflect the estimated amount of the fees and expenses incurred indirectly by the Fund through its investment in mutual funds, hedge funds, private equity funds, and other investment companies. Shares of PMF’s Service, Consultant, R, and K Classes bear an annual distribution expense that is not borne by the Investment Class. Regarding the two “Good Ideas” tables shown above, the sum of all contributors to, and all detractors from, performance for all securities in the portfolio would approximate the Fund’s year-to-date performance for 2014. |
16 | The Royce Funds 2014 Semiannual Report to Shareholders
Performance and Portfolio Review Although net losses were relatively light, the portfolio held a number of detractors clustered in the Industrials sector, a cyclical area that has seen some recovery in the small-cap market and where the Fund was overweight in the first half compared to the Russell 2000. Global supply chain logistics services and solutions company UTi Worldwide suffered from weaker freight-forwarding volumes and pricing. Combined with delays collecting receivables due to the implementation of a major new IT system in the U.S., this caused the company to violate its debt covenants, forcing an expensive and dilutive recapitalization. Liking its chances for a turnaround, we built our position in the first half. KBR, a Houston-based engineering and construction firm with global operations, saw its fiscal 2014 outlook reduced by cancellations and losses on some engineering and construction bids, as well as on pushed out start dates for certain LNG (liquefied natural gas) projects. We also liked its prospects for reversing its fortunes and added shares as its price slipped. As for those sectors that made a positive contribution in the first half, Energy stocks led by a wide margin, followed by solid net gains for Materials, Health Care, and Financials. Holdings in the Energy sector accounted for three of PMF’s five, five of its 10, and eight of its 20 top contributors. Helmerich & Payne, Unit Corporation, and Pason Systems are all long-term holdings. Along with other strong performers in the sector, they benefited from a revival of interest in energy stocks. Helmerich & Payne saw growth in demand for new rigs, confirming that its technologically superior offerings are driving market share gains for companies eager to reduce drilling costs by upgrading to its more efficient rigs. Unit Corporation operates as a contract driller and exploration and production company, among other energy-related businesses. Double-digit production growth, the introduction of a new advanced drilling rig, and continued strong performance from its midstream operations all helped to draw investors to its stock. | |||
| Along with Industrials, Consumer Discretionary also had a small net loss in the first half. We increased our position in multiline women’s fashion business Ascena Retail Group as it endured a generally awful market for retail businesses. The company was more specifically challenged by depressed holiday results that did not improve as the year went on, particularly at Justice, a brand in the promotion-driven teen fashion space. The company is aiming for better results in the second half with revamped products for, and reduced inventory lead times at, Justice, increasing profitability from their plus-size brands, and cost reduction realizations. | |||
GOOD IDEAS AT THE TIME | |
| UTi Worldwide | -0.17% |
| Ascena Retail Group | -0.14 |
| Advisory Board (The) | -0.12 |
| KBR | -0.12 |
| Barrett Business Services | -0.11 |
| 1 Net of dividends. | |
| ROYCE PENNSYLVANIA MUTUAL FUND VS. RUSSELL 2000 Value of $10,000 Invested on 12/31/78 (Russell 2000 Inception) | |
 |
| Includes reinvestment of distributions. | |||
| PORTFOLIO DIAGNOSTICS | |||
| Fund Net Assets | $6,813 million | ||
| Number of Holdings | 461 | ||
| Turnover Rate | 13% | ||
| Average Market Capitalization1 | $1,922 million | ||
| Weighted Average P/E Ratio2,3 | 20.7x | ||
| Weighted Average P/B Ratio2 | 2.2x | ||
| U.S. Investments (% of Net Assets) | 89.2% | ||
| Non-U.S. Investments (% of Net Assets) | 9.6% | ||
| Symbol | |||
| Investment Class | PENNX | ||
| Service Class | RYPFX | ||
| Consultant Class | RYPCX | ||
| Institutional Class | RPMIX | ||
| R Class | RPMRX | ||
| K Class | RPMKX | ||
1 Geometric Average. This weighted calculation uses each portfolio holding’s market cap in a way designed to not skew the effect of very large or small holdings; instead, it aims to better identify the portfolio’s center, which Royce believes offers a more accurate measure of average market cap than a simple mean or median. | |||
| MORNINGSTAR STATISTICAL MEASURES1 | |||
| Sharpe Ratio | Standard Deviation | ||
| PMF | 1.09 | 17.16 | |
| Russell 2000 | 1.10 | 18.23 | |
| Category Median | 1.13 | 17.71 | |
| Best Quartile Breakpoint | 1.20 | 16.80 | |
1Five years ended 6/30/14. Category Median and Best Quartile Breakpoint based on 357 small-cap objective funds (oldest class only) with at least five years of history. | |||
The Fund produced lower volatility than the Russell 2000 and 50% of small-cap objective funds, as shown by its standard deviation. | |||
DOWN MARKET PERFORMANCE COMPARISON | |||
 | |||
The Royce Funds 2014 Semiannual Report to Shareholders | 17
| Royce Micro-Cap Fund |
| AVERAGE ANNUAL TOTAL RETURNS Through 6/30/14 | ||||||||||
| January–June 20141 | 1.02 | % | ||||||||
| One-Year | 18.91 | |||||||||
| Three-Year | 4.17 | |||||||||
| Five-Year | 14.13 | |||||||||
| 10-Year | 8.24 | |||||||||
| 15-Year | 11.23 | |||||||||
| 20-Year | 11.49 | |||||||||
| Since Inception (12/31/91) | 12.43 | |||||||||
| ANNUAL EXPENSE RATIO | ||||||||||
| Operating Expenses | 1.56 | % | ||||||||
| 1 Not Annualized | ||||||||||
| CALENDAR YEAR TOTAL RETURNS | ||||||||||
| Year | RMC | Year | RMC | |||||||
| 2013 | 21.3 | % | 2005 | 11.5 | % | |||||
| 2012 | 8.0 | 2004 | 15.8 | |||||||
| 2011 | -12.1 | 2003 | 52.6 | |||||||
| 2010 | 30.1 | 2002 | -13.4 | |||||||
| 2009 | 55.7 | 2001 | 23.1 | |||||||
| 2008 | -40.9 | 2000 | 16.7 | |||||||
| 2007 | 7.1 | 1999 | 13.7 | |||||||
| 2006 | 22.3 | 1998 | -3.3 | |||||||
| TOP 10 POSITIONS % of Net Assets | ||||||||||
| Total Energy Services | 1.4 | % | ||||||||
| Patriot Transportation Holding | 1.4 | |||||||||
| Kennedy-Wilson Holdings | 1.3 | |||||||||
| Foster (L.B.) Company | 1.2 | |||||||||
| Resources Connection | 1.2 | |||||||||
| Universal Stainless & Alloy Products | 1.1 | |||||||||
| Tesco Corporation | 1.1 | |||||||||
| Stein Mart | 1.1 | |||||||||
| Marten Transport | 1.1 | |||||||||
| Gulf Island Fabrication | 1.1 | |||||||||
| PORTFOLIO SECTOR BREAKDOWN % of Net Assets | ||||||||||
| Industrials | 25.5 | % | ||||||||
| Consumer Discretionary | 14.9 | |||||||||
| Information Technology | 14.4 | |||||||||
| Health Care | 9.8 | |||||||||
| Materials | 9.1 | |||||||||
| Energy | 8.9 | |||||||||
| Financials | 8.3 | |||||||||
| Consumer Staples | 1.0 | |||||||||
| Utilities | 0.1 | |||||||||
| Miscellaneous | 4.8 | |||||||||
| Cash and Cash Equivalents | 3.2 | |||||||||
 |
Manager’s Discussion Royce Micro-Cap Fund (RMC) finished the year-to-date period ended June 30, 2014 with an advance of 1.0% versus respective gains of 1.6% for its benchmark, the Russell Microcap Index, and 3.2% for the small-cap Russell 2000 Index for the same period. Following a wonderfully bullish 2013, stocks as a group cooled down in the opening months of 2014, though returns for the most part remained solidly in the black. The Fund’s participation was more limited than we would prefer. The year began with many share prices accelerating at a slower pace than they did in the torrid second half of 2013. The Fund, however, fell out of step with the market as a whole—and micro-caps more specifically—during both that highly bullish phase and the more moderate market that ushered in 2014. The Fund was down 0.8% in the first quarter versus a gain of 3.0% for the Russell Microcap and 1.1% for the Russell 2000. The Fund’s results improved in the second quarter, which saw the year’s only correction so far. In fact, its performance from the interim small-cap high on March 4 through the end of June was better than both the micro-cap and small-cap indexes. This relative edge over the indexes played a major role in giving a boost to quarterly results. For the second quarter, RMC advanced 1.8% compared to a decline of 1.4% for the Russell Microcap and an increase of 2.0% for the Russell 2000. A look at longer-term periods showed a healthier advantage. The Fund outpaced the Russell Microcap for the 10-year period ended June 30, 2014. (Data for this index only goes back to June 30, 2000.) RMC also beat the Russell 2000 for the 15-, 20-year, and since inception (12/31/91) periods ended June 30, 2014. The Fund’s average annual total return since inception was 12.4%. We remain proud of RMC’s long-term performance record. The Fund’s overweight in Energy was a factor as 2014 wore on—the sector’s strong second-quarter results made it the portfolio’s top-performing sector for the year-to-date period ended June 30, 2014. In the micro-cap space we have invested in a larger number of E&P (exploration & production) companies and energy services businesses. While the former are often more volatile, we have found a number of conservatively capitalized services companies that we think are well-managed businesses. We believe that Triangle Petroleum offers an interesting high risk/high reward example in the E&P space. A Denver-based E&P business, its share price was volatile through much of the first half, |
| GOOD IDEAS THAT WORKED Top Contributors to Performance Year-to-Date through 6/30/141 | |||||||||||
| Furiex Pharmaceuticals | 0.43% | ||||||||||
| VASCO Data Security International | 0.40 | ||||||||||
| Super Micro Computer | 0.33 | ||||||||||
| Triangle Petroleum | 0.32 | ||||||||||
| Kennedy-Wilson Holdings | 0.27 | ||||||||||
| 1 Includes dividends. | |||||||||||
Important Performance and Expense Information All performance information in this Report reflects past performance, is presented on a total return basis, reflects the reinvestment of distributions, and does not reflect the deduction of taxes that a shareholder would pay on fund distributions or the redemption of fund shares. Past performance is no guarantee of future results. Investment return and principal value of an investment will fluctuate, so that shares may be worth more or less than their original cost when redeemed. Shares redeemed within 180 days of purchase may be subject to a 1% redemption fee payable to the Fund, which is not reflected in the performance shown above; if it were, performance would be lower. Current month-end performance may be higher or lower than performance quoted and may be obtained at www.roycefunds.com. All performance and risk information reflects results of the Investment Class (its oldest class). Price and total return information is based on net asset values calculated for shareholder transactions. Certain immaterial adjustments were made to the net assets of Royce Micro-Cap Fund at 12/30/11 for financial reporting purposes, and as a result the net asset values for shareholder transactions on that date and the calendar year total returns based on those net asset values differ from the adjusted net asset values and calendar year total returns reported in the Financial Highlights. Operating expenses reflect the Fund’s total annual operating expenses for the Investment Class as of the Fund’s most current prospectus and include management fees, other expenses, and acquired fund fees and expenses. Acquired fund fees and expenses reflect the estimated amount of the fees and expenses incurred indirectly by the fund through its investments in mutual funds, hedge funds, private equity funds, and other investment companies. Shares of RMC’s Service and Consultant Classes bear an annual distribution expense that is not borne by the Investment Class. Regarding the two “Good Ideas” tables shown above, the sum of all contributors to, and all detractors from, performance for all securities in the portfolio would approximate the Fund’s year-to-date performance for 2014. | |||||||||||
18 | The Royce Funds 2014 Semiannual Report to Shareholders
Performance and Portfolio Review |
| though its overall direction was up. Moving quickly, in just two years, from exploration to production helped attract interest in the stock. We liked its prospects going forward, modestly trimming our shares in the first half. The Fund’s top performer was Furiex Pharmaceuticals, which was acquired by Forest Laboratories at a healthy premium. The announcement came in April, when we sold our position. We were drawn first to its royalty and revenues on two approved drugs and to promising results for an IBS (irritable bowel syndrome) drug. VASCO Data Security International specializes in bank security and develops security systems to secure and manage access to user digital assets. Its stock made two significant upticks in the first half. In February, its shares rose on better-than-expected fourth quarter of 2013 earnings and a strong outlook for fiscal 2014. Increased revenues and ongoing earnings strength saw the shares getting another major boost late in April, especially with HSBC, USA, its customer, offering VASCO authentication solutions to its retail customers. A disappointing holiday season and a miserably cold winter spelled tough times for many consumer stocks in both the Discretionary and Staples sectors. Seeing better times ahead, we held onto our shares of Shoe Carnival, a family footwear retailer based in Indiana. The company has a history of strong top-line growth and what we think are reasonable and intelligent plans to both grow and improve its business. It was RMC’s eleventh-largest holding at the end of June. After a very successful 2013, we were not shocked to see some pullback for transportation and real estate business Patriot Transportation Holding. The stock is thinly traded and tightly held, so transactions tend to have an outsized effect on its shares. Earnings cooled down a bit during the first half, but we think its core strategic business realignment remains on track. Over the past several years, we have been finding some of the most attractive micro-cap valuations in more economically sensitive sectors. Two of the Fund’s three larger sector weightings at the end of the period reflected this, with Industrials at 25.5% and Information Technology at 14.4%. The portfolio also remained overweight versus the Russell Microcap in other cyclical sectors, most notably Energy and Materials. Our view is that many portfolio holdings in these (and other) sectors can benefit from a faster-growing economy in which the Fed’s quantitative easing program comes to a close and interest rates are rising. Such an environment is likely to reward disciplined active approaches that focus on fundamentals such as strong balance sheets and high returns on invested capital. So while we remain frustrated by the Fund’s recent performance record, we are confident in its prospects going forward. |
| GOOD IDEAS AT THE TIME Top Detractors from Performance Year-to-Date through 6/30/141 | |
| Shoe Carnival | -0.39% |
| Patriot Transportation Holding | -0.25 |
| Destination Maternity | -0.24 |
| TGC Industries | -0.24 |
| Global Power Equipment Group | -0.23 |
| 1 Net of dividends. | |
| ROYCE MICRO-CAP FUND VS. RUSSELL MICROCAP AND RUSSELL 2000 Value of $10,000 Invested on 6/30/00 (Russell Microcap Inception) | |
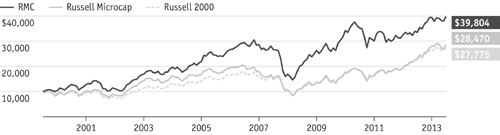 |
| Includes reinvestment of distributions. |
| PORTFOLIO DIAGNOSTICS | ||||
| Fund Net Assets | $736 million | |||
| Number of Holdings | 205 | |||
| Turnover Rate | 10% | |||
| Average Market Capitalization1 | $433 million | |||
| Weighted Average P/E Ratio2,3 | 22.0x | |||
| Weighted Average P/B Ratio2 | 1.7x | |||
| U.S. Investments (% of Net Assets) | 82.2% | |||
| Non-U.S. Investments (% of Net Assets) | 14.6% | |||
| Symbol | ||||
| Investment Class | RYOTX | |||
| Service Class | RMCFX | |||
| Consultant Class | RYMCX | |||
1 Geometric Average. This weighted calculation uses each portfolio holding’s market cap in a way designed to not skew the effect of very large or small holdings; instead, it aims to better identify the portfolio’s center, which Royce believes offers a more accurate measure of average market cap than a simple mean or median. | ||||
2 Harmonic Average. This weighted calculation evaluates a portfolio as if it were a single stock and measures it overall. It compares the total market value of the portfolio to the portfolio’s share in the earnings or book value, as the case may be, of its underlying stocks. | ||||
3 The Fund’s P/E ratio calculation excludes companies with zero or negative earnings (25% of portfolio holdings as of 6/30/14). | ||||
| MORNINGSTAR STATISTICAL MEASURES1 | ||||
| Sharpe Ratio | Standard Deviation | |||
| RMC | 0.83 | 17.86 | ||
| Russell Microcap | 1.04 | 19.40 | ||
| Category Median | 1.07 | 18.88 | ||
| Best Quartile Breakpoint | 1.19 | 17.24 | ||
1Five years ended 6/30/14. Category Median and Best Quartile Breakpoint based on 18 micro-cap objective funds (oldest class only) with at least five years of history. | ||||
DOWN MARKET PERFORMANCE COMPARISON All Down Periods of 7.5% or Greater Over the Last 7 Years, in Percentages(%)  | ||||
The Royce Funds 2014 Semiannual Report to Shareholders | 19
| Royce Premier Fund |
| AVERAGE ANNUAL TOTAL RETURNS Through 6/30/14 | ||||||||||
| January–June 20141 | 7.33 | % | ||||||||
| One-Year | 27.08 | |||||||||
| Three-Year | 11.63 | |||||||||
| Five-Year | 18.57 | |||||||||
| 10-Year | 11.07 | |||||||||
| 15-Year | 12.07 | |||||||||
| 20-Year | 12.62 | |||||||||
| Since Inception (12/31/91) | 12.73 | |||||||||
| ANNUAL EXPENSE RATIO | ||||||||||
| Operating Expenses | 1.09 | % | ||||||||
| 1 Not Annualized | ||||||||||
| CALENDAR YEAR TOTAL RETURNS | ||||||||||
| Year | RPR | Year | RPR | |||||||
| 2013 | 27.7 | % | 2005 | 17.1 | % | |||||
| 2012 | 11.4 | 2004 | 22.8 | |||||||
| 2011 | -0.9 | 2003 | 38.7 | |||||||
| 2010 | 26.5 | 2002 | -7.8 | |||||||
| 2009 | 33.3 | 2001 | 9.6 | |||||||
| 2008 | -28.3 | 2000 | 17.1 | |||||||
| 2007 | 12.7 | 1999 | 11.5 | |||||||
| 2006 | 8.8 | 1998 | 6.7 | |||||||
| TOP 10 POSITIONS % of Net Assets | ||||||||||
| Myriad Genetics | 3.6 | % | ||||||||
| Thor Industries | 3.4 | |||||||||
| Alleghany Corporation | 2.9 | |||||||||
| Lincoln Electric Holdings | 2.8 | |||||||||
| Woodward | 2.8 | |||||||||
| Unit Corporation | 2.6 | |||||||||
| Kennedy-Wilson Holdings | 2.1 | |||||||||
| Westlake Chemical | 2.0 | |||||||||
| Trican Well Service | 2.0 | |||||||||
| Cirrus Logic | 2.0 | |||||||||
| PORTFOLIO SECTOR BREAKDOWN % of Net Assets | ||||||||||
| Industrials | 24.2 | % | ||||||||
| Information Technology | 18.2 | |||||||||
| Materials | 11.0 | |||||||||
| Consumer Discretionary | 10.6 | |||||||||
| Financials | 10.3 | |||||||||
| Energy | 9.8 | |||||||||
| Health Care | 8.0 | |||||||||
| Consumer Staples | 4.8 | |||||||||
| Miscellaneous | 0.9 | |||||||||
| Cash and Cash Equivalents | 2.2 | |||||||||
 | ||||||
Managers’ Discussion The kind of well-run, fundamentally solid, and profitable companies that we typically seek for the portfolio of Royce Premier Fund (RPR) have not been consistent market leaders over the last several years. But you wouldn’t know that by looking at the Fund’s first-half results. For the year-to-date period ended June 30, 2014, RPR increased 7.3%, more than doubling the 3.2% gain of its small-cap benchmark, the Russell 2000 Index, over the same period. We refer to stocks with the characteristics listed above as quality companies, and they have been performing better by fits and starts dating back to the spring of 2012. Most rallies over that same period, however, have generally been better for lower-quality, faster-growing stocks or those with high yields. That held true for the small-cap market through 2014’s first six months, though RPR’s first-quarter advantage and, more important, its strong showing through the year’s only correction allowed it to cruise past its benchmark. The first quarter saw an extension of the bull run that made 2013 such a terrific year for equities in general, though the pace was much slower. The Fund beat the small-cap index in the year’s opening quarter, up 1.8% compared to a 1.1% gain for the benchmark. The Russell 2000 reached its year-to-date high on March 4, falling 9.1% through May 15. This made April a bearish month for the index, but the Fund escaped 2014’s cruelest month with a small gain. When small-caps began to reverse course in mid-May, RPR continued to advance. Although it slightly trailed the index in May and June, the Fund easily outpaced the Russell 2000 in the second quarter, gaining 5.5% versus 2.0% for the benchmark. RPR’s strong first half helped to create an advantage over the small-cap index for the one-year period ended June 30, 2014 (+27.1% versus +23.6%). While the Fund lagged the Russell 2000 through recent market cycles as well as for the three- and five-year periods ended June 30, 2014, we are confident that this pattern is beginning to shift. Based on the normalization and expansion of the economy, we believe stocks are entering a more congenial phase for active managers who focus on quality companies and have a long-term investment horizon. RPR outperformed the Russell 2000 for the 10-, 15-, 20-year, and since inception (12/31/91) periods ended June 30, 2014. The Fund’s average annual total return for the since inception period was 12.7%, a long-term record in which we take great pride. | ||||||
| GOOD IDEAS THAT WORKED Top Contributors to Performance Year-to-Date through 6/30/141 | |||||||||||
| Myriad Genetics | 1.80% | ||||||||||
| Zebra Technologies Cl. A | 0.78 | ||||||||||
| Westlake Chemical | 0.77 | ||||||||||
| Unit Corporation | 0.75 | ||||||||||
| Trican Well Service | 0.57 | ||||||||||
| 1 Includes dividends. | |||||||||||
Important Performance and Expense Information All performance information in this Report reflects past performance, is presented on a total return basis, reflects the reinvestment of distributions, and does not reflect the deduction of taxes that a shareholder would pay on fund distributions or the redemption of fund shares. Past performance is no guarantee of future results. Investment return and principal value of an investment will fluctuate, so that shares may be worth more or less than their original cost when redeemed. Shares redeemed within 180 days of purchase may be subject to a 1% redemption fee payable to the Fund, which is not reflected in the performance shown above; if it were, performance would be lower. Current month-end performance may be higher or lower than performance quoted and may be obtained at www.roycefunds.com. All performance and risk information reflects results of the Investment Class (its oldest class). Operating expenses reflect the Fund’s total annual operating expenses for the Investment Class as of the Fund’s most current prospectus and include management fees and other expenses. Shares of RPR’s Service, Consultant, R, and K Classes bear an annual distribution expense that is not borne by the Investment Class. Regarding the two “Good Ideas” tables shown above, the sum of all contributors to, and all detractors from, performance for all securities in the portfolio would approximate the Fund’s year-to-date performance for 2014. | |||||||||||
20 | The Royce Funds 2014 Semiannual Report to Shareholders
Performance and Portfolio Review |
| Even in a strong performance period, not everything goes well—small net losses came from the Consumer Discretionary and Consumer Staples sectors. Housed in the latter sector, Nu Skin Enterprises makes and distributes personal care products and was the Fund’s top contributor in 2013. In the first half of 2014, however, it led all of the portfolio’s detractors by a sizable margin. The company encountered trouble when a report in a Chinese newspaper alleged that it was running a pyramid scheme back in January. Nu Skin then voluntarily suspended promotional meetings and new sales representative signups before paying modest fines to Chinese regulators in March. The firm also tightened its training procedures. Its shares recovered a bit before falling again in May, as opinion seemed divided as to whether this episode would register a short- or long-term effect on its global business, about a third of which is based in China. We were hopeful at the end of June that the company could eventually return to its former condition. Six equity sectors made net contributions to first-half returns, with Health Care out in front, driven in large part by the terrific results for molecular diagnostic company Myriad Genetics, which was among the portfolio’s five largest detractors in 2013 when we substantially increased our position. The company specializes in genetic testing for cancer and ended last year facing increased competition, particularly in breast cancer screening tests, and some still unresolved reimbursement issues that remained under federal review at the end of December. It was also facing skepticism from some quarters about the fallout from a June 2013 Supreme Court decision that genes could not be patented. Our take was that neither the high court ruling nor the increased competition would hurt the firm’s long-term health. We see the quality of its predictive tests as the industry’s gold standard, so we were quite pleased to see it continue to execute successfully (and profitably), as well as make a savvy acquisition of Crescendo Bioscience, in the first half. The acquisition diversifies Myriad’s already promising pipeline. It was the Fund’s largest holding at the end of June. The Energy, Information Technology, Materials, and Financials sectors also posted solid net gains in the first half. Zebra Technologies manufactures specialized printers, including direct thermal and thermal transfer label printers and radio frequency identification (RFID) printers and encoders. The firm announced strong fiscal fourth-quarter results early in 2014 that showed accelerating demand for its bar code printers and consumables after a period of channel destocking. It’s shares jumped again in April on news of Zebra’s announcement of its intent to purchase Motorola Solutions’ enterprise business, which adds mobile computing and data capture to the firm’s existing portfolio of technologies. We were happy to hold a good-sized stake in the stock at the end of the period. |
GOOD IDEAS AT THE TIME | |
| Nu Skin Enterprises Cl. A | -1.16% |
| Medicines Company (The) | -0.44 |
| UTi Worldwide | -0.39 |
| Towers Watson & Co. Cl. A | -0.27 |
| Wolverine World Wide | -0.22 |
| 1 Net of dividends. | |
| ROYCE PREMIER FUND VS. RUSSELL 2000 Value of $10,000 Invested on 12/31/91 | |
 |
| Includes reinvestment of distributions. |
| PORTFOLIO DIAGNOSTICS | |||||
| Fund Net Assets | $6,914 million | ||||
| Number of Holdings | 71 | ||||
| Turnover Rate | 4% | ||||
| Average Market Capitalization1 | $2,895 million | ||||
| Weighted Average P/E Ratio2,3 | 21.4x | ||||
| Weighted Average P/B Ratio2 | 2.4x | ||||
| U.S. Investments (% of Net Assets) | 85.5% | ||||
| Non-U.S. Investments (% of Net Assets) | 12.3% | ||||
| Symbol | |||||
| Investment Class | RYPRX | ||||
| Service Class | RPFFX | ||||
| Consultant Class | RPRCX | ||||
| Institutional Class | RPFIX | ||||
| W Class | RPRWX | ||||
| R Class | RPRRX | ||||
| K Class | RPRKX | ||||
1 Geometric Average. This weighted calculation uses each portfolio holding’s market cap in a way designed to not skew the effect of very large or small holdings; instead, it aims to better identify the portfolio’s center, which Royce believes offers a more accurate measure of average market cap than a simple mean or median. | 2 Harmonic Average. This weighted calculation evaluates a portfolio as if it were a single stock and measures it overall. It compares the total market value of the portfolio to the portfolio’s share in the earnings or book value, as the case may be, of its underlying stocks. | ||||
3 The Fund’s P/E ratio calculation excludes companies with zero or negative earnings (13% of portfolio holdings as of 6/30/14). | |||||
| MORNINGSTAR STATISTICAL MEASURES1 | |||||
| Sharpe Ratio | Standard Deviation | ||||
| RPR | 1.11 | 16.67 | |||
| Russell 2000 | 1.10 | 18.23 | |||
| Category Median | 1.13 | 17.71 | |||
| Best Quartile Breakpoint | 1.20 | 16.80 | |||
1Five years ended 6/30/14. Category Median and Best Quartile Breakpoint based on 357 small-cap objective funds (lowest expense class only) with at least five years of history. | |||||
| DOWN MARKET PERFORMANCE COMPARISON All Down Periods of 7.5% or Greater Over the Last 7 Years, in Percentages(%) | |||||
 | |||||
The Royce Funds 2014 Semiannual Report to Shareholders | 21
| Royce Low-Priced Stock Fund |
AVERAGE ANNUAL TOTAL RETURNS Through 6/30/14 | ||||||||||
| January–June 20141 | 9.03 | % | ||||||||
| One-Year | 24.64 | |||||||||
| Three-Year | 2.08 | |||||||||
| Five-Year | 13.69 | |||||||||
| 10-Year | 7.38 | |||||||||
| 15-Year | 10.66 | |||||||||
| 20-Year | 12.36 | |||||||||
| Since Inception (12/15/93) | 11.82 | |||||||||
| ANNUAL EXPENSE RATIOS | ||||||||||
| Gross Operating Expenses | 1.51 | % | ||||||||
| Net Operating Expenses | 1.49 | |||||||||
| 1 Not Annualized | ||||||||||
| CALENDAR YEAR TOTAL RETURNS | ||||||||||
| Year | RLP | Year | RLP | |||||||
| 2013 | 12.9 | % | 2005 | 9.7 | % | |||||
| 2012 | 4.5 | 2004 | 13.6 | |||||||
| 2011 | -14.6 | 2003 | 44.0 | |||||||
| 2010 | 31.5 | 2002 | -16.3 | |||||||
| 2009 | 53.6 | 2001 | 25.1 | |||||||
| 2008 | -36.0 | 2000 | 24.0 | |||||||
| 2007 | 2.3 | 1999 | 29.8 | |||||||
| 2006 | 19.0 | 1998 | 2.4 | |||||||
| TOP 10 POSITIONS % of Net Assets | ||||||||||
| Acacia Research | 2.0 | % | ||||||||
| Value Partners Group | 2.0 | |||||||||
| Ashmore Group | 2.0 | |||||||||
| Kennedy-Wilson Holdings | 2.0 | |||||||||
| Unit Corporation | 1.9 | |||||||||
| Medicines Company (The) | 1.9 | |||||||||
| Calfrac Well Services | 1.9 | |||||||||
| MKS Instruments | 1.9 | |||||||||
| Cirrus Logic | 1.9 | |||||||||
| Myriad Genetics | 1.9 | |||||||||
| PORTFOLIO SECTOR BREAKDOWN % of Net Assets | ||||||||||
| Information Technology | 21.4 | % | ||||||||
| Materials | 15.5 | |||||||||
| Industrials | 15.3 | |||||||||
| Consumer Discretionary | 12.9 | |||||||||
| Energy | 12.4 | |||||||||
| Financials | 12.1 | |||||||||
| Health Care | 3.9 | |||||||||
| Consumer Staples | 3.3 | |||||||||
| Utilities | 0.3 | |||||||||
| Miscellaneous | 1.7 | |||||||||
| Cash and Cash Equivalents | 1.2 | |||||||||
 |
Manager’s Discussion We were very pleased with the strong first half enjoyed by Royce Low-Priced Stock Fund (RLP) on both an absolute and relative basis. The Fund gained an impressive 9.0% for the year-to-date period ended June 30, 2014, almost tripling the 3.2% increase for its small-cap benchmark, the Russell 2000 Index, for the same period. The Fund got off to a strong start that slackened only briefly when small-caps were enduring their only correction of the year thus far between March 4 (the year-to-date high for the Russell 2000) and May 15. Otherwise, it was smooth sailing, a welcome and encouraging development after several years of relative performance disappointments for the portfolio. After a magnificently bullish 2013, the pace of equity returns slowed as 2014 got under way. RLP was up 2.1% in the first quarter, outpacing the small-cap index, which rose 1.1%. The down phase that began in early March gave many investors pause, wondering what the effects might be of awful winter weather, a new Federal Reserve chair, and worrisome geopolitical happenings. As it happens, stocks as a whole rallied and small-cap results were largely positive from mid-May through the end of June. For the second quarter, which included the bulk of the brief corrective phase, RLP advanced 6.8% while the Russell 2000 was up 2.0%. We were happy to see the Fund rebound at a time when the economy is both growing and returning to something like the “Old Normal” with the role of the Fed gradually diminishing. Such an environment looks promising in our view for active and disciplined managers who emphasize long-term time spans and absolute returns. RLP outpaced the Russell 2000 for the 15-, 20-year, and since inception (12/15/93) periods ended June 30, 2014. The Fund’s average annual total return since inception was 11.8%. We remain proud of RLP’s long-term performance record. Over the last five years, we have been building positions in several economically sensitive, cyclical sectors, including Energy, Industrials, Materials, and InformationTechnology. Going back as far as 2009 in some instances, many stocks in these areas looked strong to us on both an absolute and relative basis, in particular based upon balance sheet strength, returns on invested capital, and P/E ratios. Through the first half of 2013, many of the companies that |
| GOOD IDEAS THAT WORKED Top Contributors to Performance Year-to-Date through 6/30/141 | |||||||||||
| Myriad Genetics | 1.36% | ||||||||||
| Pretium Resources | 0.81 | ||||||||||
| Trican Well Service | 0.64 | ||||||||||
| Industrias Bachoco ADR | 0.62 | ||||||||||
| Unit Corporation | 0.60 | ||||||||||
| 1 Includes dividends. | |||||||||||
Important Performance and Expense Information All performance information in this Report reflects past performance, is presented on a total return basis, reflects the reinvestment of distributions, and does not reflect the deduction of taxes that a shareholder would pay on fund distributions or the redemption of fund shares. Past performance is no guarantee of future results. Investment return and principal value of an investment will fluctuate, so that shares may be worth more or less than their original cost when redeemed. Shares redeemed within 180 days of purchase may be subject to a 1% redemption fee payable to the Fund, which is not reflected in the performance shown above; if it were, performance would be lower. Current month-end performance may be higher or lower than performance quoted and may be obtained at www.roycefunds.com. All performance and risk information reflects results of the Service Class (its oldest class). Price and total return information is based on net asset values for shareholder transactions. Certain immaterial adjustments were made to the net assets of Royce Low-Priced Stock Fund at 6/30/13 for financial reporting purposes, and as a result the net asset values for shareholder transactions and the calendar year total returns based on those net asset values differ from the adjusted net asset values and calendar year total returns reported in the Financial Highlights. Gross operating expenses reflect the Fund’s gross total annual operating expenses for the Service Class, including management fees, 12b-1 distribution and service fees, and other expenses. Net operating expenses reflect contractual fee waivers and/or expense reimbursements. All expense information is reported as of the Fund’s most current prospectus. Royce & Associates has contractually agreed to waive fees and/or reimburse operating expenses to the extent necessary to maintain the Service Class’s net annual operating expenses, (excluding brokerage commissions, taxes, interest litigation expenses, acquired fund fees and expenses, and other expenses not borne in the ordinary course of business), at or below 1.49% through April 30, 2015. Shares of RLP’s R Class bear an annual distribution expense that is higher than that of the Service Class. Regarding the two “Good Ideas” tables shown above, the sum of all contributors to, and all detractors from, performance for all securities in the portfolio would approximate the Fund’s year-to-date performance for 2014. | |||||||||||
| 22 | The Royce Funds 2014 Semiannual Report to Shareholders |
Performance and Portfolio Review |
| we liked in these sectors, such as Canadian energy services businesses, had not yet seen much, if any, share price recovery. This began to turn around in the second half of last year. Coupled with declining correlation levels across all equity asset classes, these developments left us feeling very confident in the ongoing prospects for many of our holdings in cyclical sectors. The four sectors previously mentioned made the greatest net contributions to results for the year-to-date period. Energy led by a good-sized margin, driven by robust results for several long-term holdings in the energy equipment & services industry, where the bulk of the portfolio’s positions in that sector are slotted. Trican Well Service is the largest pressure pumping service provider in Canada and a leading fracturing company in Russia, with growing operations in the U.S., Kazakhstan, Algeria, Saudi Arabia, Colombia, and Australia. RLP’s twelfth largest holding at the end of June, the company benefited from a recovery in the demand for its services in Canada and the U.S. for fracking and other well-related services. We have long liked the diversified business of top-five position Unit Corporation, which is involved in exploring for oil and natural gas, acquiring oil and gas properties, contract drilling of onshore oil and natural gas wells, and the gathering and processing of natural gas. Its broad-based activities have historically made it hard to pigeonhole as most energy businesses focus on only one of these endeavors. Unit has shown over the years that it can be successful at all of them, and its steady execution across each business line made it an attractive target when Energy stocks began to show signs of life in 2013. Outside of the Energy sector, we were very pleased with the comeback of Myriad Genetics. A molecular diagnostic company that specializes in genetic testing for cancer, its share price fell rapidly in the wake of a mixed ruling from the Supreme Court in June 2013, which held that human genes cannot be patented. Many investors were concerned that the company would struggle to compete or be profitable in the light of this decision. The stock began to recover in the first quarter of 2014. Though its price was a bit volatile during the second quarter, we remain confident. It remains, in our view, a leader in genetic testing with a variety of industry-standard tools for detecting hereditary cancer risk. Fiscal third-quarter revenues, announced in May, were up, helping to make fiscal 2014 nicely profitable. As for those holdings that struggled, we also remain confident in the long-term prospects for personal skin care product maker and distributor Nu Skin Enterprises. The company resolved some distribution issues in China, which accounts for about a third of its growing global business, by paying a small fine. |
GOOD IDEAS AT THE TIME | |
| Nu Skin Enterprises Cl. A | -0.69% |
| E-House (China) Holdings ADR | -0.58 |
| Medicines Company (The) | -0.50 |
| Alamos Gold | -0.34 |
| Luk Fook Holdings (International) | -0.30 |
| 1 Net of dividends. | |
| ROYCE LOW-PRICED STOCK FUND VS. RUSSELL 2000 Value of $10,000 Invested on 12/15/93 | |
 |
| Includes reinvestment of distributions. |
| PORTFOLIO DIAGNOSTICS | |||||
| Fund Net Assets | $1,100 million | ||||
| Number of Holdings | 100 | ||||
| Turnover Rate | 4% | ||||
| Average Market Capitalization1 | $1,299 million | ||||
| Weighted Average P/E Ratio2,3 | 21.1x | ||||
| Weighted Average P/B Ratio2 | 1.8x | ||||
| U.S. Investments (% of Net Assets) | 61.3% | ||||
| Non-U.S. Investments (% of Net Assets) | 37.5% | ||||
| Symbol | |||||
| Investment Class | RLPHX | ||||
| Service Class | RYLPX | ||||
| Institutional Class | RLPIX | ||||
| R Class | RLPRX | ||||
| K Class | RLPKX | ||||
1 Geometric Average. This weighted calculation uses each portfolio holding’s market cap in a way designed to not skew the effect of very large or small holdings; instead, it aims to better identify the portfolio’s center, which Royce believes offers a more accurate measure of average market cap than a simple mean or median. | |||||
2 Harmonic Average. This weighted calculation evaluates a portfolio as if it were a single stock and measures it overall. It compares the total market value of the portfolio to the portfolio’s share in the earnings or book value, as the case may be, of its underlying stocks. | |||||
3 The Fund’s P/E ratio calculation excludes companies with zero or negative earnings (26% of portfolio holdings as of 6/30/14). | |||||
| MORNINGSTAR STATISTICAL MEASURES1 | |||||
| Sharpe Ratio | Standard Deviation | ||||
| RLP | 0.74 | 19.80 | |||
| Russell 2000 | 1.10 | 18.23 | |||
| Category Median | 1.13 | 17.71 | |||
| Best Quartile Breakpoint | 1.20 | 16.80 | |||
1 Five years ended 6/30/14. Category Median and Best Quartile Breakpoint based on 357 small-cap objective funds (oldest class only) with at least five years of history. | |||||
DOWN MARKET PERFORMANCE COMPARISON All Down Periods of 7.5% or Greater Over the Last 7 Years, in Percentages(%)  | |||||
| The Royce Funds 2014 Semiannual Report to Shareholders | 23 |
| Royce Total Return Fund |
AVERAGE ANNUAL TOTAL RETURNS Through 6/30/14 | |||||||||||
| January–June 20141 | 2.74 | % | |||||||||
| One-Year | 20.87 | ||||||||||
| Three-Year | 13.34 | ||||||||||
| Five-Year | 18.28 | ||||||||||
| 10-Year | 8.72 | ||||||||||
| 15-Year | 10.19 | ||||||||||
| 20-Year | 11.92 | ||||||||||
| Since Inception (12/15/93) | 11.57 | ||||||||||
| ANNUAL EXPENSE RATIO | |||||||||||
| Operating Expenses | 1.18 | % | |||||||||
| 1 Not Annualized | |||||||||||
| CALENDAR YEAR TOTAL RETURNS | |||||||||||
| Year | RTR | Year | RTR | ||||||||
| 2013 | 32.8 | % | 2005 | 8.2 | % | ||||||
| 2012 | 14.4 | 2004 | 17.5 | ||||||||
| 2011 | -1.7 | 2003 | 30.0 | ||||||||
| 2010 | 23.5 | 2002 | -1.6 | ||||||||
| 2009 | 26.2 | 2001 | 14.8 | ||||||||
| 2008 | -31.2 | 2000 | 19.4 | ||||||||
| 2007 | 2.4 | 1999 | 1.5 | ||||||||
| 2006 | 14.5 | 1998 | 4.8 | ||||||||
| TOP 10 POSITIONS % of Net Assets | |||||||||||
| E-L Financial | 1.0 | % | |||||||||
| Bank of Hawaii | 0.9 | ||||||||||
| Trinity Industries | 0.9 | ||||||||||
| Federated Investors Cl. B | 0.9 | ||||||||||
| AllianceBernstein Holding L.P. | 0.9 | ||||||||||
| Cabot Corporation | 0.9 | ||||||||||
| Tennant Company | 0.9 | ||||||||||
| Markel Corporation | 0.9 | ||||||||||
| HEICO Corporation | 0.8 | ||||||||||
| Alleghany Corporation | 0.8 | ||||||||||
| PORTFOLIO SECTOR BREAKDOWN % of Net Assets | |||||||||||
| Financials | 25.8 | % | |||||||||
| Industrials | 19.8 | ||||||||||
| Consumer Discretionary | 12.2 | ||||||||||
| Materials | 10.2 | ||||||||||
| Information Technology | 8.3 | ||||||||||
| Health Care | 6.0 | ||||||||||
| Energy | 4.9 | ||||||||||
| Utilities | 3.2 | ||||||||||
| Consumer Staples | 2.6 | ||||||||||
| Telecommunication Services | 0.8 | ||||||||||
| Diversified Investment Companies | 0.1 | ||||||||||
| Miscellaneous | 1.8 | ||||||||||
| Cash and Cash Equivalents | 4.3 | ||||||||||
 | |||||||||
Managers’ Discussion By doing largely what we would expect it to do, Royce Total Return Fund (RTR) finished the first half of 2014 with a solid absolute result that nonetheless fell short of its benchmark. The Fund gained 2.7% for the year-to-date period ended June 30, 2014 versus a 3.2% increase for its small-cap benchmark, the Russell 2000 Index, for the same period. For the majority of small-caps, performance in the first half was more muted than it was in 2013, which was as dynamic a year as we have seen for stocks since the initial phase of the post-Financial Crisis recovery in 2009. Following last year’s very bullish second half, the slackening of the pace in 2014’s first quarter was not surprising. However, we were disappointed that small- and micro-cap dividend payers did not perform better. RTR rose 0.5% in the first quarter. Volatility, which has been quite low throughout the last 18 months, returned briefly to the small-cap market in early March and persisted through mid-May, making the second quarter a relatively more unsettled period. Equities rallied through the end of May and all of June, undoing the bearish effect. We were pleased to see the Fund narrowly outpace its benchmark during the second quarter, up 2.2% versus 2.0% for the small-cap index. RTR’s pronounced advantage from the 2014 small-cap high on March 4 through the end of June was key to this advantage. (More market cycle results can be found on page 6.) We have been pleased with the Fund’s performance in more volatile markets over the last two-plus years even as we acknowledge that returns for dividend-paying small-caps during this otherwise mostly bullish period have lagged those for small companies that do not, as well as for the small-cap benchmark as a whole. Small-cap stocks are an asset class in which volatility can be high while dividends are often ignored. We take a typically contrarian view, seeing dividends as a key link on a company’s capital allocation chain. We also see the potential attraction for the sort of conservatively capitalized, dividend-paying small-cap companies that we seek for RTR’s portfolio going forward: As the Fed’s quantitative easing winds down and interest rates begin to rise, we expect economic growth to pick up speed with a consequent focus on fundamentals from investors. For periods ended June 30, 2014, the long-term performance advantage remained with dividend payers in the small-cap asset class, as did lower overall volatility as measured by | |||||||||
| GOOD IDEAS THAT WORKED Top Contributors to Performance Year-to-Date through 6/30/141 | |||||||||||
| Trinity Industries | 0.41% | ||||||||||
| Helmerich & Payne | 0.25 | ||||||||||
| AllianceBernstein Holding L.P. | 0.19 | ||||||||||
| Franco-Nevada Corporation | 0.18 | ||||||||||
| Chemed Corporation | 0.17 | ||||||||||
| 1 Includes dividends. | |||||||||||
Important Performance and Expense Information All performance information in this Report reflects past performance, is presented on a total return basis, reflects the reinvestment of distributions, and does not reflect the deduction of taxes that a shareholder would pay on fund distributions or the redemption of fund shares. Past performance is no guarantee of future results. Investment return and principal value of an investment will fluctuate, so that shares may be worth more or less than their original cost when redeemed. Shares redeemed within 180 days of purchase may be subject to a 1% redemption fee payable to the Fund, which is not reflected in the performance shown above; if it were, performance would be lower. Current month-end performance may be higher or lower than performance quoted and may be obtained at www.roycefunds.com. All performance and risk information reflects results of the Investment Class (its oldest class). Operating expenses reflect the Fund’s total annual operating expenses for the Investment Class as of the Fund’s most current prospectus and include management fees, other expenses, and acquired fund fees and expenses. Acquired fund fees and expenses reflect the estimated amount of the fees and expenses incurred indirectly by the Fund through its investments in mutual funds, hedge funds, private equity funds, and other investment companies. Shares of RTR’s Service, Consultant, R, and K Classes bear an annual distribution expense that is not borne by the Investment Class. Regarding the two “Good Ideas” tables shown above, the sum of all contributors to, and all detractors from, performance for all securities in the portfolio would approximate the Fund’s year-to-date performance for 2014. | |||||||||||
| 24 | The Royce Funds 2014 Semiannual Report to Shareholders |
Performance and Portfolio Review standard deviation. It was unsurprising, then, that RTR outperformed the Russell 2000 for the 10-, 15-, 20-year, and since inception (12/15/93) periods ended June 30, 2014. The Fund’s average annual total return since inception was 11.6%, a long-term record that gives us great pride. Nine of RTR’s 11 equity sectors finished the first half in the black. Financials and Energy led all of the Fund’s sectors while Consumer Discretionary and Consumer Staples holdings as a whole detracted from first-half results. Contributions at the industry level were broad based. Machinery led by a good-sized margin, its results driven by Trinity Industries, a mid-cap company that was RTR’s top-performing holding for the semiannual period. Trinity provides products and services for the energy, transportation, chemical, and construction industries in the U.S., Canada, Mexico, the U.K., Singapore, and Sweden. Liking its core business and dividend, we have owned shares since 2001. Pleased to watch its share price rise more or less steadily over the last five years, we particularly enjoyed the boosts its stock received at different points in the first half when the firm announced some canny acquisitions, record fiscal fourth-quarter and full-year 2013 earnings, an increase in its dividend, and a 2-for-1 stock split. We began to take gains in May. Helmerich & Payne is an oil and gas contract driller that provides drilling rigs, equipment, personnel, and camps on a contract basis. It’s a long-time holding that we have owned for more than a decade in RTR’s portfolio. Its edge lies in the superiority of its drilling fleet, which has helped the firm to remain profitable even in periods that were more challenging for the energy industry than the first half of 2014. We reduced our stake while its stock price was gushing. Improved operating results, better portfolio performances, and increased assets under management all helped the share price of investment manager AllianceBernstein Holding L.P., another long-term holding, to shine in the first half. Individual stock losses were mostly modest. Nu Skin Enterprises was embroiled in allegations made in January by a Chinese newspaper that it was running a pyramid scheme. Although by March the firm had paid a small fine and revamped its training procedures, short-term results were challenged. We were re-evaluating our long-term outlook for this personal product manufacturer and distributor, hopeful that its global business could eventually resume its formerly healthy pace of growth. We built our position in Ascena Retail Group, a multiline women’s fashion retailer. Like many in its industry, the firm endured lousy results owing to poor holiday sales and frigid winter weather. We believe that it can rebound. |
GOOD IDEAS AT THE TIME | |
| Nu Skin Enterprises Cl. A | -0.23% |
| Ascena Retail Group | -0.14 |
| Balchem Corporation | -0.13 |
| Ethan Allen Interiors | -0.12 |
| American Eagle Outfitters | -0.12 |
| 1 Net of dividends. | |
| ROYCE TOTAL RETURN FUND VS. RUSSELL 2000 Value of $10,000 Invested on 12/15/93 | |
 |
| Includes reinvestment of distributions. | |||
| PORTFOLIO DIAGNOSTICS | |||
| Fund Net Assets | $5,219 million | ||
| Number of Holdings | 510 | ||
| Turnover Rate | 9% | ||
| Average Market Capitalization1 | $2,306 million | ||
| Weighted Average P/E Ratio2,3 | 18.4x | ||
| Weighted Average P/B Ratio2 | 2.0x | ||
| U.S. Investments (% of Net Assets) | 83.5% | ||
| Non-U.S. Investments (% of Net Assets) | 12.2% | ||
| Symbol | |||
| Investment Class | RYTRX | ||
| Service Class | RYTFX | ||
| Consultant Class | RYTCX | ||
| Institutional Class | RTRIX | ||
| W Class | RTRWX | ||
| R Class | RTRRX | ||
| K Class | RTRKX | ||
1 Geometric Average. This weighted calculation uses each portfolio holding’s market cap in a way designed to not skew the effect of very large or small holdings; instead, it aims to better identify the portfolio’s center, which Royce believes offers a more accurate measure of average market cap than a simple mean or median. | |||
2 Harmonic Average. This weighted calculation evaluates a portfolio as if it were a single stock and measures it overall. It compares the total market value of the portfolio to the portfolio’s share in the earnings or book value, as the case may be, of its underlying stocks. | |||
| MORNINGSTAR STATISTICAL MEASURES1 | |||
| Sharpe Ratio | Standard Deviation | ||
| RTR | 1.25 | 14.20 | |
| Russell 2000 | 1.10 | 18.23 | |
| Category Median | 1.13 | 17.71 | |
| Best Decile Breakpoint | 1.28 | 15.64 | |
1 Five years ended 6/30/14. Category Median and Best Decile Breakpoint based on 357 small-cap objective funds (oldest class only) with at least five years of history. | |||
The Fund beat the Russell 2000 and performed within the top 50% of small-cap objective funds on a risk-adjusted basis, as shown by its Sharpe ratio. In addition, the Fund produced lower volatility than the Russell 2000 and 90% of small-cap objective funds, as shown by its standard deviation. | |||
DOWN MARKET PERFORMANCE COMPARISON | |||
 | |||
| The Royce Funds 2014 Semiannual Report to Shareholders | 25 |
| Royce Heritage Fund |
AVERAGE ANNUAL TOTAL RETURNS Through 6/30/14 | |||||||||||
| January–June 20141 | 2.90 | % | |||||||||
| One-Year | 18.49 | ||||||||||
| Three-Year | 8.57 | ||||||||||
| Five-Year | 16.91 | ||||||||||
| 10-Year | 9.43 | ||||||||||
| 15-Year | 11.24 | ||||||||||
| Since Inception (12/27/95) | 13.78 | ||||||||||
| ANNUAL EXPENSE RATIO | |||||||||||
| Operating Expenses | 1.49 | % | |||||||||
| 1 Not Annualized | |||||||||||
| CALENDAR YEAR TOTAL RETURNS | |||||||||||
| Year | RHF | Year | RHF | ||||||||
| 2013 | 26.0 | % | 2005 | 8.7 | % | ||||||
| 2012 | 14.3 | 2004 | 20.4 | ||||||||
| 2011 | -9.3 | 2003 | 38.1 | ||||||||
| 2010 | 27.5 | 2002 | -18.9 | ||||||||
| 2009 | 51.8 | 2001 | 20.5 | ||||||||
| 2008 | -36.2 | 2000 | 11.7 | ||||||||
| 2007 | 1.2 | 1999 | 41.7 | ||||||||
| 2006 | 22.6 | 1998 | 19.5 | ||||||||
| TOP 10 POSITIONS % of Net Assets | |||||||||||
| Copart | 2.4 | % | |||||||||
| KKR & Co. L.P. | 1.5 | ||||||||||
| Reliance Steel & Aluminum | 1.4 | ||||||||||
| Expeditors International of Washington | 1.4 | ||||||||||
| DENTSPLY International | 1.3 | ||||||||||
| Ritchie Bros. Auctioneers | 1.2 | ||||||||||
| Transocean | 1.1 | ||||||||||
| Diodes | 1.1 | ||||||||||
| Rogers Corporation | 1.0 | ||||||||||
| Coherent | 1.0 | ||||||||||
| PORTFOLIO SECTOR BREAKDOWN % of Net Assets | |||||||||||
| Industrials | 24.9 | % | |||||||||
| Information Technology | 18.0 | ||||||||||
| Financials | 15.4 | ||||||||||
| Materials | 10.5 | ||||||||||
| Consumer Discretionary | 9.4 | ||||||||||
| Energy | 5.1 | ||||||||||
| Health Care | 4.8 | ||||||||||
| Consumer Staples | 0.6 | ||||||||||
| Utilities | 0.1 | ||||||||||
| Miscellaneous | 4.4 | ||||||||||
| Cash and Cash Equivalents | 6.8 | ||||||||||
 | |||||||||
Managers’ Discussion In 2013, Royce Heritage Fund (RHF) did fine on an absolute basis but disappointed on a relative basis. During the first half of 2014, it did much the same, though it managed to slightly narrow the gap with its benchmark. The Fund rose 2.9% for the year-to-date period ended June 30, 2014, trailing its benchmark, the small-cap Russell 2000 Index, which gained 3.2% for the same period. The first quarter, in which RHF rose 0.5%, was positive for most equities. However, the pace of returns slowed considerably following the fast-paced bull run that lasted through most of 2013, particularly during its last seven months. A new Fed chair, miserable winter weather through much of the eastern part of the U.S., and ongoing concerns about the pace of economic growth all gave investors pause at one point or another in 2014’s opening months. There was not enough anxiety, however, to reverse the course of the upswing—it only caused the bull to slow his pace. Small-caps reached an interim high on March 4 and the ensuing correction lasted into mid-May before shares began to rally again. We were pleased that the Fund outpaced the Russell 2000 from this early March high through the end of June. (More market cycle results can be found on page 6.) The Fund climbed 2.4% compared to a 2.0% increase for the Russell 2000 for the second quarter. The market rewarded lower-quality companies in the first quarter and during the low-key rally that closed out the first half, while higher-quality companies (mostly in the form of profitability and/or high returns on invested capital) led during the short correction. We think investors are attempting to sort out both the present and future in an economic climate in which the Fed is gradually stepping back. To us, the economy looks poised for faster growth. We believe this should benefit disciplined active approaches such as our own that emphasize absolute returns and a long-term investment horizon. We were pleased that the Fund stayed ahead of the Russell 2000 for longer-term periods. RHF beat its benchmark for the 10-, 15-year, and since inception (12/27/95) periods ended June 30, 2014. The Fund’s average annual total return since inception was 13.8%, a long-term record in which we take great pride. | |||||||||
| GOOD IDEAS THAT WORKED Top Contributors to Performance Year-to-Date through 6/30/141 | |||||||||||
| Helmerich & Payne | 0.30% | ||||||||||
| Pan American Silver | 0.25 | ||||||||||
| Pason Systems | 0.24 | ||||||||||
| Signet Jewelers | 0.22 | ||||||||||
| AllianceBernstein Holding L.P. | 0.22 | ||||||||||
| 1 Includes dividends. | |||||||||||
Important Performance and Expense Information All performance information in this Report reflects past performance, is presented on a total return basis, reflects the reinvestment of distributions, and does not reflect the deduction of taxes that a shareholder would pay on fund distributions or the redemption of fund shares. Past performance is no guarantee of future results. Investment return and principal value of an investment will fluctuate, so that shares may be worth more or less than their original cost when redeemed. Shares redeemed within 180 days of purchase may be subject to a 1% redemption fee payable to the Fund, which is not reflected in the performance shown above; if it were, performance would be lower. Current month-end performance may be higher or lower than performance quoted and may be obtained at www.roycefunds.com. All performance and risk information reflects results of the Service Class (its oldest class). Price and total return information is based on net asset values calculated for shareholder transactions. Certain immaterial adjustments were made to the net assets of Royce Heritage Fund at 12/30/11 for financial reporting purposes, and as a result the net asset values for shareholder transactions on that date and the calendar year total returns based on those net asset values differ from the adjusted net asset values and calendar year total returns reported in the Financial Highlights. Operating expenses reflect the Fund’s total annual operating expenses for the Service Class as of the Fund’s most current prospectus and include management fees, 12b-1 distribution and service fees, other expenses, and acquired fund fees and expenses. Shares of RHF’s Consultant and R Classes bear an annual distribution expense that is higher than that of the Service Class. Acquired fund fees and expenses reflect the estimated amount of the fees and expenses incurred indirectly by the Fund through its investments in mutual funds, hedge funds, private equity funds, and other investment companies. Regarding the two “Good Ideas” tables shown above, the sum of all contributors to, and all detractors from, performance for all securities in the portfolio would approximate the Fund’s year-to-date performance for 2014. | |||||||||||
| 26 | The Royce Funds 2014 Semiannual Report to Shareholders |
Performance and Portfolio Review Effective May 1, 2014, the Fund may now invest in companies with market capitalizations up to $15 billion (up from $5 billion). This offers more potential exposure to the full range of mid-cap securities, an area of the market in which we have taken more interest over the last several years. The precious metals mining industry suffered through a brutal 2013, with respective declines of 36% and 28% in silver and gold prices conspiring with rising operational costs to make things truly awful. Valuations for several companies dropped to levels comparable to or lower than those of the market bottom in early 2009. All of this made us very pleased to see the industry rebound strongly during the first half of 2014. Dividend-paying silver miner Pan American Silver was the standout in the group. This still short-term recovery—along with nicely positive results for chemical companies—helped to give Materials top honors among the portfolio’s sector performances in the first half of 2014. Financials, Information Technology, and Energy also posted notable net gains for the semiannual period. The top-performing industry groups were energy equipment & services and capital markets, two areas of near-perennial interest to us. Two companies with what we regard as distinct technological advantages were major contributors in the energy equipment & services group. Helmerich & Payne is a contract driller with a specialty in high-tech drilling rigs that were in increasingly high demand as drilling activity picked up. Pason Systems makes instrumentation systems for on-land and offshore rigs that relay data, which improves drilling efficiency. More drilling activity and improved daily rental rates for its rig connectivity and remote diagnostics products were keys to its first-half success, as was the favorable outlook based on its pipeline of new products. Asset manager AllianceBernstein Holding L.P., which saw improvements in both portfolio performance and assets under management, was the leader in capital markets. UTi Worldwide is a global supply chain logistics services and solutions company. The firm suffered through a series of problems, including the violation of its debt covenants, which led to an expensive and dilutive recapitalization. We held our shares in the hopes of a rebound. We also made a modest trim to our stake in engineering and construction business KBR during the first quarter in the belief that the company can recover from cancellations and losses of projects as well as the pushed-out start dates for some of its LNG (liquefied natural gas) ventures. We sold our stake in cloud-based technology services and software business Support.com after management embarked on shifts in strategy which had us question our original investment thesis. We were content to hold shares of footwear retailer Wolverine World Wide as many retailers were faced with declining business owing to poor retail traffic that we deemed temporary in nature. |
GOOD IDEAS AT THE TIME | |
| UTi Worldwide | -0.29% |
| KBR | -0.22 |
| Support.com | -0.19 |
| Wolverine World Wide | -0.18 |
| Patriot Transportation Holding | -0.16 |
| 1 Net of dividends. | |
| ROYCE HERITAGE FUND VS. RUSSELL 2000 Value of $10,000 Invested on 12/27/95 | |
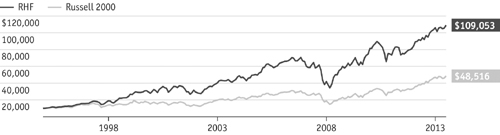 |
| Includes reinvestment of distributions. | |||
| PORTFOLIO DIAGNOSTICS | |||
| Fund Net Assets | $378 million | ||
| Number of Holdings | 206 | ||
| Turnover Rate | 18% | ||
| Average Market Capitalization1 | $3,000 million | ||
| Weighted Average P/E Ratio2,3 | 21.8x | ||
| Weighted Average P/B Ratio2 | 2.6x | ||
| U.S. Investments (% of Net Assets) | 69.1% | ||
| Non-U.S. Investments (% of Net Assets) | 24.1% | ||
| Symbol | |||
| Investment Class | RHFHX | ||
| Service Class | RGFAX | ||
| Consultant Class | RYGCX | ||
| R Class | RHFRX | ||
| K Class | RHFKX | ||
1 Geometric Average. This weighted calculation uses each portfolio holding’s market cap in a way designed to not skew the effect of very large or small holdings; instead, it aims to better identify the portfolio’s center, which Royce believes offers a more accurate measure of average market cap than a simple mean or median. | |||
2 Harmonic Average. This weighted calculation evaluates a portfolio as if it were a single stock and measures it overall. It compares the total market value of the portfolio to the portfolio’s share in the earnings or book value, as the case may be, of its underlying stocks. | |||
| MORNINGSTAR STATISTICAL MEASURES1 | |||
| Sharpe Ratio | Standard Deviation | ||
| RHF | 0.98 | 17.53 | |
| Russell 2000 | 1.10 | 18.23 | |
| Category Median | 1.13 | 17.71 | |
| Best Quartile Breakpoint | 1.20 | 16.80 | |
1 Five years ended 6/30/14. Category Median and Best Quartile Breakpoint based on 357 small-cap objective funds (oldest class only) with at least five years of history. | |||
DOWN MARKET PERFORMANCE COMPARISON | |||
 | |||
| The Royce Funds 2014 Semiannual Report to Shareholders | 27 |
| Royce Opportunity Fund |
AVERAGE ANNUAL TOTAL RETURNS Through 6/30/14 | ||||||||||
| January–June 20141 | 3.02 | % | ||||||||
| One-Year | 24.76 | |||||||||
| Three-Year | 15.43 | |||||||||
| Five-Year | 23.48 | |||||||||
| 10-Year | 9.53 | |||||||||
| 15-Year | 12.89 | |||||||||
| Since Inception (11/19/96) | 13.62 | |||||||||
| ANNUAL EXPENSE RATIO | ||||||||||
| Operating Expenses | 1.17 | % | ||||||||
| 1 Not Annualized | ||||||||||
| CALENDAR YEAR TOTAL RETURNS | ||||||||||
| Year | ROF | Year | ROF | |||||||
| 2013 | 43.5 | % | 2005 | 4.8 | % | |||||
| 2012 | 22.6 | 2004 | 17.5 | |||||||
| 2011 | -13.0 | 2003 | 72.9 | |||||||
| 2010 | 33.8 | 2002 | -17.0 | |||||||
| 2009 | 62.1 | 2001 | 17.3 | |||||||
| 2008 | -45.7 | 2000 | 19.8 | |||||||
| 2007 | -2.0 | 1999 | 32.3 | |||||||
| 2006 | 18.8 | 1998 | 4.9 | |||||||
| TOP 10 POSITIONS % of Net Assets | ||||||||||
| Sanmina Corporation | 0.9 | % | ||||||||
| NCI Building Systems | 0.8 | |||||||||
| Microsemi Corporation | 0.7 | |||||||||
| OM Group | 0.7 | |||||||||
| Commercial Metals | 0.7 | |||||||||
| Dana Holding Corporation | 0.7 | |||||||||
| Kaiser Aluminum | 0.7 | |||||||||
| Ingram Micro Cl. A | 0.7 | |||||||||
| International Rectifier | 0.7 | |||||||||
| RTI International Metals | 0.7 | |||||||||
| PORTFOLIO SECTOR BREAKDOWN % of Net Assets | ||||||||||
| Information Technology | 26.9 | % | ||||||||
| Industrials | 19.2 | |||||||||
| Consumer Discretionary | 13.0 | |||||||||
| Financials | 10.6 | |||||||||
| Materials | 8.6 | |||||||||
| Energy | 5.8 | |||||||||
| Health Care | 4.6 | |||||||||
| Consumer Staples | 0.9 | |||||||||
| Telecommunication Services | 0.6 | |||||||||
| Miscellaneous | 3.1 | |||||||||
| Cash and Cash Equivalents | 6.7 | |||||||||
  | |||||||||
Managers’ Discussion After a record of terrific results on both an absolute and relative basis over the last several years, Royce Opportunity Fund (ROF) took a slight breather, at least on a relative basis, in the first half of 2014. The Fund advanced 3.0% for the year-to-date period ended June 30, 2014, slightly underperforming its small-cap benchmark, the Russell 2000 Index, which rose 3.2% for the same period. This was not a matter of great concern to us, considering both the narrow gap in first-half results between ROF and the small-cap index and the fact that the correction that hit the market between the 2014 small-cap high on March 4 and May 15 presented some buying opportunities, particularly among micro-cap stocks that were hurt more than many larger small-cap businesses. The year began on the same bullish note on which 2013 ended, though in a much softer tone. For the first quarter, the Fund was up 3.5%. This strong performance helped to mitigate the effect of the subsequent down phase. The correction that began in early March was tougher on the Fund than on its benchmark, though it was consistent with much of what was happening with micro-cap companies. ROF thus yielded ground to the small-cap index in the second quarter, when it fell 0.5% while the Russell 2000 rose 2.0%. This did nothing to hurt the Fund’s relative advantage over longer time periods. ROF beat the Russell 2000 for the one-, three-, five-, 10-, 15-year, and since inception (11/19/96) periods ended June 30, 2014. The Fund also held a performance edge through recent market cycle periods. (Market cycle results can be found on page 6.) ROF’s average annual total return since inception was 13.6%. We remain quite proud of the Fund’s long-term results on both an absolute and relative basis. Our historical practice has been to act in a very deliberate and disciplined manner in managing the portfolio’s assets. In the first half, this meant selling many of the portfolio’s strong performers to more momentum-based investors. We think this is a prudent strategy, as it allows us to purchase companies at the attractively low P/B and price-to-sales ratios that make holdings statistically valid for the portfolio. Many of these newer holdings (or additional shares of existing holdings that have not yet reversed course) endured tough times throughout the second quarter. While disappointing on a short-term basis, we were | |||||||||
| GOOD IDEAS THAT WORKED Top Contributors to Performance Year-to-Date through 6/30/141 | |||||||||||
| SunEdison | 0.42% | ||||||||||
| Albany Molecular Research | 0.36 | ||||||||||
| Tower International | 0.35 | ||||||||||
| Basic Energy Services | 0.30 | ||||||||||
| Sanmina Corporation | 0.26 | ||||||||||
| 1 Includes dividends. | |||||||||||
Important Performance and Expense Information All performance information in this Report reflects past performance, is presented on a total return basis, reflects the reinvestment of distributions, and does not reflect the deduction of taxes that a shareholder would pay on fund distributions or the redemption of fund shares. Past performance is no guarantee of future results. Investment return and principal value of an investment will fluctuate, so that shares may be worth more or less than their original cost when redeemed. Shares redeemed within 180 days of purchase may be subject to a 1% redemption fee payable to the Fund, which is not reflected in the performance shown above; if it were, performance would be lower. Current month-end performance may be higher or lower than performance quoted and may be obtained at www.roycefunds.com. All performance and risk information reflects results of the Investment Class (its oldest class). Operating expenses reflect the Fund’s total annual operating expenses for the Investment Class as of the Fund’s most current prospectus and include management fees, other expenses, and acquired fund fees and expenses. Acquired fund fees and expenses reflect the estimated amount of the fees and expenses incurred indirectly by the Fund through its investments in mutual funds, hedge funds, private equity funds, and other investment companies. Shares of ROF’s Service, Consultant, R, and K Classes bear an annual distribution expense that is not borne by the Investment Class. Regarding the two “Good Ideas” tables shown above, the sum of all contributors to, and all detractors from, performance for all securities in the portfolio would approximate the Fund’s year-to-date performance for 2014. | |||||||||||
| 28 | The Royce Funds 2014 Semiannual Report to Shareholders |
Performance and Portfolio Review comfortable with these decisions. It is always important to pare back portfolio successes and use those proceeds in an attempt to set the portfolio up for future growth. Another related reason behind this approach is the absolute importance of maintaining what we believe is a reasonable valuation level for the portfolio taken as a whole. Many of these purchases were in technology, housing, and non-residential construction, including M.D.C. Holdings, William Lyon Homes, M/I Homes, and TRI Pointe Homes. Information Technology was the Fund’s largest sector weighting at the end of June and its largest net gainer for the semiannual period. We remain confident in the prospects for many tech-based industries. Higher corporate profitability looks likely to trigger a round of long-overdue CAPEX spending. The market for PCs has been improving of late. There are also a number of new devices and related technologies due for release in the next year or so on the already robust tablet and mobile fronts. This could result in simultaneously strong markets for PCs, mobile devices, and tablets, which would be excellent news for much of the sector—and many of our holdings within it. The housing market continues to grow and looks to us as though it is in an extended cycle while non-residential construction looks poised for a long-term recovery following pretty dismal results in 2013, with building activity on the rise so far in 2014. Two of 2013’s top contributors continued their winning ways in the first half. SunEdison produces electronic-grade polysilicon used for electronics, solar cells, and film devices while also developing solar power projects. The demand for solar technology keeps heating up, with improved technological efficiency helping to lower costs. Tower International runs a global business manufacturing metal automotive components for OEMs (original equipment manufacturers). Demand has held up well worldwide and is rapidly growing in Asia, helping its share price to keep accelerating. Albany Molecular Research benefited from the growing trend toward outsourcing medical research. As for those holdings that struggled in the first half, we chose to hold shares of Quiksilver, a youth-oriented apparel and footwear maker that operates under its own brand name as well as Roxy and DC. Like so many retailers, it suffered through an awful first half. We like the way it handled the challenges it faced and its new management. Walter Energy produces metallurgical coal and continued to suffer in the wake of China’s sluggish economy, which led us to reduce our position. |
GOOD IDEAS AT THE TIME | |
| Quiksilver | -0.36% |
| Walter Energy | -0.21 |
| Extreme Networks | -0.19 |
| VOXX International Cl. A | -0.19 |
| Molycorp | -0.17 |
| 1 Net of dividends. | |
| ROYCE OPPORTUNITY FUND VS. RUSSELL 2000 Value of $10,000 Invested on 11/19/96 | |
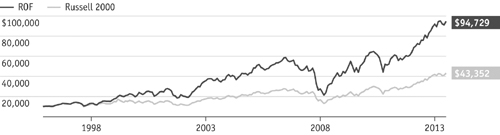 |
| Includes reinvestment of distributions. | |||
| PORTFOLIO DIAGNOSTICS | |||
| Fund Net Assets | $2,595 million | ||
| Number of Holdings | 323 | ||
| Turnover Rate | 19% | ||
| Average Market Capitalization1 | $833 million | ||
| Weighted Average P/B Ratio2 | 1.5x | ||
| U.S. Investments (% of Net Assets) | 89.1% | ||
| Non-U.S. Investments (% of Net Assets) | 4.2% | ||
| Symbol | |||
| Investment Class | RYPNX | ||
| Service Class | RYOFX | ||
| Consultant Class | ROFCX | ||
| Institutional Class | ROFIX | ||
| R Class | ROFRX | ||
| K Class | ROFKX | ||
1 Geometric Average. This weighted calculation uses each portfolio holding’s market cap in a way designed to not skew the effect of very large or small holdings; instead, it aims to better identify the portfolio’s center, which Royce believes offers a more accurate measure of average market cap than a simple mean or median. | |||
2 Harmonic Average. This weighted calculation evaluates a portfolio as if it were a single stock and measures it overall. It compares the total market value of the portfolio to the portfolio’s share in the earnings or book value, as the case may be, of its underlying stocks. | |||
| MORNINGSTAR STATISTICAL MEASURES1 | |||
| Sharpe Ratio | Standard Deviation | ||
| ROF | 1.06 | 22.37 | |
| Russell 2000 | 1.10 | 18.23 | |
| Category Median | 1.13 | 17.71 | |
| Best Quartile Breakpoint | 1.20 | 16.80 | |
1 Five years ended 6/30/14 Category Median and Best Quartile Breakpoint based on 357 small-cap objective funds (oldest class only) with at least five years of history. | |||
DOWN MARKET PERFORMANCE COMPARISON | |||
 | |||
| The Royce Funds 2014 Semiannual Report to Shareholders | 29 |
| Royce Special Equity Fund |
AVERAGE ANNUAL TOTAL RETURNS Through 6/30/14 | |||||||||||
| January–June 20141 | 0.16 | % | |||||||||
| One-Year | 15.27 | ||||||||||
| Three-Year | 13.21 | ||||||||||
| Five-Year | 16.16 | ||||||||||
| 10-Year | 8.61 | ||||||||||
| 15-Year | 11.23 | ||||||||||
| Since Inception (5/1/98) | 10.03 | ||||||||||
| ANNUAL EXPENSE RATIO | |||||||||||
| Operating Expenses | 1.13 | % | |||||||||
| 1 Not Annualized | |||||||||||
| CALENDAR YEAR TOTAL RETURNS | |||||||||||
| Year | RSE | Year | RSE | ||||||||
| 2013 | 29.4 | % | 2005 | -1.0 | % | ||||||
| 2012 | 15.4 | 2004 | 13.9 | ||||||||
| 2011 | 0.1 | 2003 | 27.6 | ||||||||
| 2010 | 19.6 | 2002 | 15.3 | ||||||||
| 2009 | 28.4 | 2001 | 30.7 | ||||||||
| 2008 | -19.6 | 2000 | 16.3 | ||||||||
| 2007 | 4.7 | 1999 | -9.6 | ||||||||
| 2006 | 14.0 | ||||||||||
| TOP 10 POSITIONS % of Net Assets | |||||||||||
| Minerals Technologies | 5.4 | % | |||||||||
| UniFirst Corporation | 4.9 | ||||||||||
| Finish Line (The) Cl. A | 4.4 | ||||||||||
| AVX Corporation | 4.2 | ||||||||||
| Bed Bath & Beyond | 3.9 | ||||||||||
| Schweitzer-Mauduit International | 3.5 | ||||||||||
| EnerSys | 3.4 | ||||||||||
| Plantronics | 3.3 | ||||||||||
| Children’s Place | 3.2 | ||||||||||
| Standard Motor Products | 3.0 | ||||||||||
| PORTFOLIO SECTOR BREAKDOWN % of Net Assets | |||||||||||
| Consumer Discretionary | 28.5 | % | |||||||||
| Industrials | 21.6 | ||||||||||
| Information Technology | 15.2 | ||||||||||
| Materials | 12.3 | ||||||||||
| Consumer Staples | 7.0 | ||||||||||
| Health Care | 3.1 | ||||||||||
| Cash and Cash Equivalents | 12.3 | ||||||||||
 | |||||||||
Manager’s Discussion First-half results for Royce Special Equity Fund (RSE) were somewhat disappointing on a relative basis. The Fund was up 0.2% for the year-to-date period ended June 30, 2014 compared to a gain of 3.2% for its small-cap benchmark, the Russell 2000 Index, during the same period. In the context of a market in which many companies with no earnings, no dividend, and other lower-quality attributes continued to outperform, this was not entirely surprising. The strength of low quality was particularly evident in the first quarter. Although equity performance was generally positive, returns were well off the pace established in 2013, especially in last year’s second half. The Fund, however, had little participation and was down in the first quarter, falling 0.8% versus a gain of 1.1% for the Russell 2000. Several specialty retailers headed up the list of detractors in the Consumer Discretionary sector. The sector’s negative effect on first-quarter returns was exacerbated by its significant overweight versus the Russell 2000. However, as the economy continues to improve (as we believe it will), this will change, perhaps dramatically. The outlook for consumer spending looks healthy as a result of tame inflation, still restrained mortgage rates, rising household net worth, repaired household balance sheets, and improved consumer confidence. In addition, capacity utilization in the U.S. is inching towards the 80% rate; at this level we should start to see more hires and capital expenditures, reigniting the economy. The second quarter was going well for RSE until June. The Fund outperformed during the April decline and the modest gain in May and posted better relative performance than its benchmark from the 2014 small-cap high on March 4 through the end of June. RSE did lose ground, however, when the small-cap index gained 5.3% in June. As is often typical of that kind of move, it favored stocks without earnings or dividends, low returns on equity, and high betas. For the second quarter RSE advanced 0.9%. RSE outperformed its benchmark for the 15-year and since inception (5/1/98) periods ended June 30, 2014. The Fund’s average annual total return since inception was 10.0%. Numerous concerns began to register in the first quarter: the change in leadership at the Federal Reserve, the implications this change will have on the central bank’s policies, China’s shadow banking system, and harsh weather in much of the U.S. On March 19, 2014, Janet Yellen, the then-new Chair of the Board of Governors of the Federal Reserve | |||||||||
| GOOD IDEAS THAT WORKED Top Contributors to Performance Year-to-Date through 6/30/141 | |||||||||||
| Standard Motor Products | 0.58% | ||||||||||
| Minerals Technologies | 0.46 | ||||||||||
| Teradyne | 0.41 | ||||||||||
| Hubbell Cl. B | 0.34 | ||||||||||
| Finish Line (The) Cl. A | 0.30 | ||||||||||
| 1 Includes dividends. | |||||||||||
Important Performance and Expense Information All performance information in this Report reflects past performance, is presented on a total return basis, reflects the reinvestment of distributions, and does not reflect the deduction of taxes that a shareholder would pay on fund distributions or the redemption of fund shares. Past performance is no guarantee of future results. Investment return and principal value of an investment will fluctuate, so that shares may be worth more or less than their original cost when redeemed. Shares redeemed within 180 days of purchase may be subject to a 1% redemption fee payable to the Fund, which is not reflected in the performance shown above; if it were, performance would be lower. Current month-end performance may be higher or lower than performance quoted and may be obtained at www.roycefunds.com. All performance and risk information reflects results of the Investment Class (its oldest class). Operating expenses reflect the Fund’s total annual operating expenses for the Investment Class as of the Fund’s most current prospectus and include management fees and other expenses. Shares of RSE’s Service and Consultant Classes bear an annual distribution expense that is not borne by the Investment Class. Regarding the two “Good Ideas” tables shown above, the sum of all contributors to, and all detractors from, performance for all securities in the portfolio would approximate the Fund’s year-to-date performance for 2014. | |||||||||||
| 30 | The Royce Funds 2014 Semiannual Report to Shareholders |
Performance and Portfolio Review System, mentioned that interest rates could rise “in six months or so” following the end of quantitative easing. Was it intentional to release this negative assessment at that time to get it out of the way? Yellen significantly reduced uncertainties (intentionally or not) when she mentioned this “six months or so” time frame. Investors have now passed three consecutive psychological hurdles: Fed tapering, the end of QE3 (the third round of quantitative easing), and the time frame of rate hikes. We think this good news can continue to lift equities. Consumer Discretionary stocks remained the portfolio’s most significant detractors for the entire first half, its largest net losses coming from specialty retail. In fact, the sector’s losses as a whole were mitigated by revved-up results for the Fund’s top-performing industry, auto components. Bed, Bath & Beyond led all of the Fund’s detractors. We increased our position in this New Jersey-based retailer of a wide variety of domestic merchandise. It was RSE’s fifth-largest holding at the end of June. We added shares of top-10 position Children’s Place, another NJ-based retailer, which sells children’s specialty apparel throughout North America. Another top-10 holding, Schweitzer-Maudit International, runs a global business from Georgia manufacturing paper and reconstituted tobacco products for the tobacco industry. We increased our stake during the first half. Industrials contributed most to first-half gains, led by solid results from the electrical equipment and machinery industries. The best-performing stock in the first half was Standard Motor Products, RSE’s tenth-largest position at the end of June. The Queens, New York-based company manufactures and distributes replacement parts for motor vehicles in the automotive aftermarket industry and operates in two segments, engine management and temperature control. Treasury rates have not risen as of yet. This is an interesting point, as it suggests that rising rates, due to stronger economic activity, will not weigh down the market. We believe we are close to a move towards greater cyclical exposure in the marketplace. We think that investors will increasingly abandon their obsession with counter-cyclicals and start to embrace anything with economic leverage in the U.S. An economic outcome that we increasingly believe in resembles Bill Gross’s “new neutral:” Slower but more consistent growth than we have seen in the past with resulting lower-than-expected inflation and interest rates. This is a variation of the “Goldilocks” outcome—not too hot or too cold. If this is indeed the case, we believe P/E multiples will likely stay at current levels and possibly even increase. |
GOOD IDEAS AT THE TIME | |
| Bed Bath & Beyond | -1.38% |
| Schweitzer-Mauduit International | -0.52 |
| Children’s Place | -0.45 |
| Buckle (The) | -0.34 |
| Weis Markets | -0.23 |
| 1 Net of dividends. | |
| ROYCE SPECIAL EQUITY FUND VS. RUSSELL 2000 Value of $10,000 Invested on 5/1/98 | |
 |
| Includes reinvestment of distributions. | |||
| PORTFOLIO DIAGNOSTICS | |||
| Fund Net Assets | $3,336 million | ||
| Number of Holdings | 43 | ||
| Turnover Rate | 11% | ||
| Average Market Capitalization1 | $1,846 million | ||
| Weighted Average P/E Ratio2,3 | 18.9x | ||
| Weighted Average P/B Ratio2 | 2.1x | ||
| U.S. Investments (% of Net Assets) | 87.7% | ||
| Non-U.S. Investments (% of Net Assets) | 0.0% | ||
| Symbol | |||
| Investment Class | RYSEX | ||
| Service Class | RSEFX | ||
| Consultant Class | RSQCX | ||
| Institutional Class | RSEIX | ||
1 Geometric Average. This weighted calculation uses each portfolio holding’s market cap in a way designed to not skew the effect of very large or small holdings; instead, it aims to better identify the portfolio’s center, which Royce believes offers a more accurate measure of average market cap than a simple mean or median. | |||
2 Harmonic Average. This weighted calculation evaluates a portfolio as if it were a single stock and measures it overall. It compares the total market value of the portfolio to the portfolio’s share in the earnings or book value, as the case may be, of its underlying stocks. | |||
| MORNINGSTAR STATISTICAL MEASURES1 | |||
| Sharpe Ratio | Standard Deviation | ||
| RSE | 1.13 | 14.17 | |
| Russell 2000 | 1.10 | 18.23 | |
| Category Median | 1.13 | 17.71 | |
| Best Decile Breakpoint | 1.28 | 15.64 | |
1 Five years ended 6/30/14 Category Median and Best Decile Breakpoint based on 357 small-cap objective funds (oldest class only) with at least five years of history. | |||
The Fund beat the Russell 2000 on a risk-adjusted basis, as shown by its Sharpe ratio. In addition, the Fund produced lower volatility than the Russell 2000 and 90% of small-cap objective funds, as shown by its standard deviation. | |||
DOWN MARKET PERFORMANCE COMPARISON | |||
 | |||
| The Royce Funds 2014 Semiannual Report to Shareholders | 31 |
| Royce Value Fund |
AVERAGE ANNUAL TOTAL RETURNS Through 6/30/14 | ||||||||||
| January–June 20141 | 3.41 | % | ||||||||
| One-Year | 21.81 | |||||||||
| Three-Year | 8.08 | |||||||||
| Five-Year | 16.02 | |||||||||
| 10-Year | 10.08 | |||||||||
| Since Inception (6/14/01) | 11.57 | |||||||||
| ANNUAL EXPENSE RATIO | ||||||||||
| Operating Expenses | 1.48 | % | ||||||||
| 1 Not Annualized | ||||||||||
| CALENDAR YEAR TOTAL RETURNS | ||||||||||
| Year | RVV | Year | RVV | |||||||
| 2013 | 27.8 | % | 2007 | 3.8 | % | |||||
| 2012 | 9.6 | 2006 | 16.8 | |||||||
| 2011 | -7.4 | 2005 | 17.2 | |||||||
| 2010 | 25.0 | 2004 | 30.9 | |||||||
| 2009 | 44.7 | 2003 | 54.3 | |||||||
| 2008 | -34.2 | 2002 | -23.5 | |||||||
| TOP 10 POSITIONS % of Net Assets | ||||||||||
| Vishay Intertechnology | 3.0 | % | ||||||||
| Genesco | 3.0 | |||||||||
| Unit Corporation | 3.0 | |||||||||
| Reinsurance Group of America | 3.0 | |||||||||
| GameStop Corporation Cl. A | 2.9 | |||||||||
| Steven Madden | 2.9 | |||||||||
| Nu Skin Enterprises Cl. A | 2.8 | |||||||||
| Plantronics | 2.8 | |||||||||
| NETGEAR | 2.7 | |||||||||
| Buckle (The) | 2.7 | |||||||||
| PORTFOLIO SECTOR BREAKDOWN % of Net Assets | ||||||||||
| Consumer Discretionary | 28.8 | % | ||||||||
| Information Technology | 21.1 | |||||||||
| Financials | 12.7 | |||||||||
| Energy | 9.8 | |||||||||
| Materials | 8.8 | |||||||||
| Industrials | 6.5 | |||||||||
| Health Care | 4.8 | |||||||||
| Consumer Staples | 2.8 | |||||||||
| Miscellaneous | 1.9 | |||||||||
| Cash and Cash Equivalents | 2.8 | |||||||||
 | |||||||||
Manager’s Discussion Quality small-cap stocks—those with strong balance sheets, high returns on invested capital, and the ability to generate free cash flow—have not yet seized market leadership. However, several holdings with these characteristics did well enough in Royce Value Fund (RVV) to provide a small relative edge in the first half of the year. The Fund gained 3.4% for the year-to-date period ended June 30, 2014, narrowly ahead of its small-cap benchmark, the Russell 2000 Index, which was up 3.2% for the same period. Stocks as a whole had a slower start to the year, which was not a surprise considering the breakneck pace of returns in 2013. Returns remained mostly positive, however, and for the first quarter RVV rose 1.0%. The Russell 2000 reached its year-to-date high before the quarter ended on March 4, and the index declined 9.1% from that date through May 15. Investors seemed to be trying to determine the effects on the market of a new Fed chair, a miserable winter, and potentially dangerous international situations in Ukraine and Syria. The verdict was apparently that the first of these was a positive (or at least not a negative), the second temporary, and the third not worth selling stocks over. Small-caps rallied from mid-May through the end of June. For the second quarter, RVV climbed 2.3% (just ahead of the 2.0% gain for the Russell 2000). The bulk of the Fund’s admittedly small advantage in the first half was the result of better performance following the March 4 interim high. We are hopeful that these more encouraging returns can help the Fund to close the relative performance gap over long-term and market cycle periods. (Market cycle results can be found on page 6.) RVV outpaced the small-cap index for the 10-year and since inception (6/14/01) periods ended June 30, 2014. The Fund’s average annual total return since inception was 11.6%. The market over the last few years has presented numerous challenges for risk-conscious, value-oriented investors. Our preference for companies with strong balance sheets, high returns on invested capital, and attractively low stock prices has been mostly out of favor. The unintended consequences of the Fed’s easy money and zero-interest-rate policies have heightened the charms of fast-growing and/or higher-yielding companies while crimping the appeal of the more conservatively capitalized, steadily growing businesses that we seek for RVV’s portfolio. We have also had a virtually correction-free market over the last 18-plus months; the Russell 2000 has not experienced a decline of more than 10% since the autumn of 2012. This has resulted in a relative dearth of compelling purchase opportunities. So | |||||||||
| GOOD IDEAS THAT WORKED Top Contributors to Performance Year-to-Date through 6/30/141 | |||||||||||
| Helmerich & Payne | 1.08% | ||||||||||
| Unit Corporation | 0.93 | ||||||||||
| Chemed Corporation | 0.61 | ||||||||||
| Westlake Chemical | 0.60 | ||||||||||
| Vishay Intertechnology | 0.53 | ||||||||||
| 1 Includes dividends. | |||||||||||
Important Performance and Expense Information All performance information in this Report reflects past performance, is presented on a total return basis, reflects the reinvestment of distributions, and does not reflect the deduction of taxes that a shareholder would pay on fund distributions or the redemption of fund shares. Past performance is no guarantee of future results. Investment return and principal value of an investment will fluctuate, so that shares may be worth more or less than their original cost when redeemed. Shares redeemed within 180 days of purchase may be subject to a 1% redemption fee payable to the Fund, which is not reflected in the performance shown above; if it were, performance would be lower. Current month-end performance may be higher or lower than performance quoted and may be obtained at www.roycefunds.com. All performance and risk information reflects results of the Service Class (its oldest class). Operating expenses reflect the Fund’s total annual operating expenses for the Service Class as of the Fund’s most current prospectus and include management fees, 12b-1 distribution and service fees, and other expenses. Shares of RVV’s Consultant and R Classes bear an annual distribution expense that is higher than that of the Service Class. Regarding the two “Good Ideas” tables shown above, the sum of all contributors to, and all detractors from, performance for all securities in the portfolio would approximate the Fund’s year-to-date performance for 2014. | |||||||||||
| 32 | The Royce Funds 2014 Semiannual Report to Shareholders |
Performance and Portfolio Review while we were pleased with the Fund’s first-half showing, we are looking forward to a more pronounced shift in sentiment toward companies with strong fundamentals. We suspect this may develop as the economy continues to gain momentum. RVV’s dual consumer sectors were the only ones to detract from performance year-to-date through June 30, 2014. Net losses in the specialty retail group, part of Consumer Discretionary, created the largest drag on results. Problems for the industry began with poorer-than-expected holiday sales and continued as the wet and chilly winter kept shoppers out of the stores. For the most part, we opted to build, hold, or slightly trim positions because we believe that the best-run retailers will recover. Of the portfolio’s most significant detractors in the specialty retail category—GameStop Corporation, Buckle (The), Ascena Retail Group, and American Eagle Outfitters—only the last of these was not among its largest 15 positions at the end of June. We were reasonably confident at the end of June in the rebound potential for Nu Skin Enterprises. The Utah-based manufacturer and distributor of personal products endured accusations in China of being a pyramid scheme back in January. The firm quickly resolved the problem, paying a modest fine to the Chinese government in March while buttoning up some training procedures. Solid fiscal first-quarter results failed to convince other investors that the company’s problems were behind it. Two companies from the top-performing Energy sector led other holdings by a wide margin. Helmerich & Payne provides contract drilling of oil and gas wells in the Gulf of Mexico and South America and operates land and platform rigs. The company has long enjoyed an advantage in its industry by making higher-quality, technologically superior rigs. In late April, the firm reported record quarterly revenues and rig activity, part of a longer-term string of successes that helped to drive its share price higher. It was RVV’s twelfth-largest holding at the end of June. The Energy sector traditionally separates oil and gas producers from those companies that provide services. Unit Corporation has always been an anomaly because it offers some of both. It’s a stock that we have liked for years because it has been historically successful in all of its related businesses while its unique status in its industry has often led to its full value being misunderstood. During the first half, it saw accelerated production growth and introduced new drilling rigs, with continued success in its midstream operations. It was the Fund’s third-largest position at the end of June. |
GOOD IDEAS AT THE TIME | |
| Nu Skin Enterprises Cl. A | -0.81% |
| Ascena Retail Group | -0.60 |
| American Eagle Outfitters | -0.48 |
| Buckle (The) | -0.42 |
| GameStop Corporation Cl. A | -0.35 |
| 1 Net of dividends. | |
| ROYCE VALUE FUND VS. RUSSELL 2000 Value of $10,000 Invested on 6/14/01 | |
 |
| Includes reinvestment of distributions. | |||
| PORTFOLIO DIAGNOSTICS | |||
| Fund Net Assets | $1,050 million | ||
| Number of Holdings | 63 | ||
| Turnover Rate | 18% | ||
| Average Market Capitalization1 | $2,706 million | ||
| Weighted Average P/E Ratio2,3 | 16.4x | ||
| Weighted Average P/B Ratio2 | 1.9x | ||
| U.S. Investments (% of Net Assets) | 88.5% | ||
| Non-U.S. Investments (% of Net Assets) | 8.7% | ||
| Symbol | |||
| Investment Class | RVVHX | ||
| Service Class | RYVFX | ||
| Consultant Class | RVFCX | ||
| Institutional Class | RVFIX | ||
| R Class | RVVRX | ||
| K Class | RVFKX | ||
1 Geometric Average. This weighted calculation uses each portfolio holding’s market cap in a way designed to not skew the effect of very large or small holdings; instead, it aims to better identify the portfolio’s center, which Royce believes offers a more accurate measure of average market cap than a simple mean or median. | |||
| MORNINGSTAR STATISTICAL MEASURES1 | |||
| Sharpe Ratio | Standard Deviation | ||
| RVV | 0.92 | 17.91 | |
| Russell 2000 | 1.10 | 18.23 | |
| Category Median | 1.13 | 17.71 | |
| Best Quartile Breakpoint | 1.20 | 16.80 | |
1 Five years ended 6/30/14. Category Median and Best Quartile Breakpoint based on 357 small-cap objective funds (oldest class only) with at least five years of history. | |||
DOWN MARKET PERFORMANCE COMPARISON | |||
 | |||
| The Royce Funds 2014 Semiannual Report to Shareholders | 33 |
| Royce Value Plus Fund |
AVERAGE ANNUAL TOTAL RETURNS Through 6/30/14 | ||||||||||
| January–June 20141 | 4.08 | % | ||||||||
| One-Year | 22.74 | |||||||||
| Three-Year | 11.19 | |||||||||
| Five-Year | 15.84 | |||||||||
| 10-Year | 8.42 | |||||||||
| Since Inception (6/14/01) | 12.69 | |||||||||
| ANNUAL EXPENSE RATIO | ||||||||||
| Operating Expenses | 1.49 | % | ||||||||
| 1 Not Annualized | ||||||||||
| CALENDAR YEAR TOTAL RETURNS | ||||||||||
| Year | RVP | Year | RVP | |||||||
| 2013 | 32.5 | % | 2007 | 3.2 | % | |||||
| 2012 | 15.3 | 2006 | 19.3 | |||||||
| 2011 | -10.0 | 2005 | 13.2 | |||||||
| 2010 | 19.7 | 2004 | 28.2 | |||||||
| 2009 | 41.4 | 2003 | 79.9 | |||||||
| 2008 | -41.1 | 2002 | -14.7 | |||||||
| TOP 10 POSITIONS % of Net Assets | ||||||||||
| Rogers Corporations | 2.4 | % | ||||||||
| Myriad Genetics | 2.2 | |||||||||
| Mobile Mini | 2.1 | |||||||||
| Rockwood Holdings | 2.1 | |||||||||
| Worthington Industries | 1.9 | |||||||||
| EnerSys | 1.7 | |||||||||
| Actelion | 1.7 | |||||||||
| Infinera Corporation | 1.6 | |||||||||
| PTC | 1.6 | |||||||||
| Zumiez | 1.6 | |||||||||
| PORTFOLIO SECTOR BREAKDOWN % of Net Assets | ||||||||||
| Information Technology | 27.2 | % | ||||||||
| Industrials | 16.9 | |||||||||
| Health Care | 11.7 | |||||||||
| Consumer Discretionary | 11.4 | |||||||||
| Materials | 9.1 | |||||||||
| Financials | 7.9 | |||||||||
| Energy | 7.7 | |||||||||
| Consumer Staples | 3.1 | |||||||||
| Miscellaneous | 4.5 | |||||||||
| Cash and Cash Equivalents | 0.5 | |||||||||
 |
Manager’s Discussion In a market that could not quite figure out if it was interested more in fast growth or high quality during the first half, Royce Value Plus Fund (RVP), which looks for elements of both, acquitted itself quite nicely. The Fund gained 4.1% for the year-to-date period ended June 30, 2014, ahead of the 3.2% gain for its small-cap benchmark, the Russell 2000 Index, for the same period. The Fund remains unique among our portfolio offerings. Its approach differs from most traditional value approaches, including those used in many Royce-managed portfolios, because growth prospects are usually not a critical factor in the stock-selection process. In fact, they may not be a factor at all. However, this approach also contrasts with most growth approaches because we continue to look closely at a company’s valuation as part of the security analysis process, a process that is generally an afterthought, if it is considered at all, in many growth funds. In essence a growth-oriented approach with a value overlay, it stood the Fund in mostly good stead in a market that had trouble establishing a clear direction through much of the year’s first six months. The first quarter was a much more low-key bull phase than what stocks experienced through much of the red-hot 2013. RVP gained 3.4% in the year’s opening quarter, outpacing the small-cap index, which picked up 1.1% for the same period. The year-to-date high for the Russell 2000 came on March 4. While small-caps rallied through the last two weeks of May and through much of June, they could not push past that late winter summit. RVP struggled a bit on a relative basis through the correction that lasted from March 4 through May 15, though its strength in the first quarter and June rally allowed it to stay ahead of the benchmark for the year-to-date period. The Fund was up 0.6% in the second quarter. While RVP has not yet pulled ahead of the small-cap index for recent longer-term and market cycle periods, we were pleased with its first-half performance. (Market cycle results can be found on page 6.) The Fund outperformed the Russell 2000 for the since inception (6/14/01) period ended June 30, 2014. RVP’s average annual total return since inception was 12.7%. As might be expected in a solid performance period, net losses at the sector, industry, and position level were fairly modest. Three sectors detracted from performance—Information Technology, Consumer Discretionary, and Financials. A sliding share price led us to |
| GOOD IDEAS THAT WORKED Top Contributors to Performance Year-to-Date through 6/30/141 | |||||||||||
| Furiex Pharmaceuticals | 1.44% | ||||||||||
| Myriad Genetics | 1.23 | ||||||||||
| InterMune | 0.97 | ||||||||||
| U.S. Silica Holdings | 0.71 | ||||||||||
| Actelion | 0.61 | ||||||||||
| 1 Includes dividends. | |||||||||||
Important Performance and Expense Information All performance information in this Report reflects past performance, is presented on a total return basis, reflects the reinvestment of distributions, and does not reflect the deduction of taxes that a shareholder would pay on fund distributions or the redemption of fund shares. Past performance is no guarantee of future results. Investment return and principal value of an investment will fluctuate, so that shares may be worth more or less than their original cost when redeemed. Shares redeemed within 180 days of purchase may be subject to a 1% redemption fee payable to the Fund, which is not reflected in the performance shown above; if it were, performance would be lower. Current month-end performance may be higher or lower than performance quoted and may be obtained at www.roycefunds.com. All performance and risk information reflects results of the Service Class (its oldest class). Operating expenses reflect the Fund’s total annual operating expenses for the Service Class as of the Fund’s most current prospectus and include management fees, 12b-1 distribution and service fees, other expenses, and acquired fund fees and expenses. Acquired fund fees and expenses reflect the estimated amount of fees and expenses incurred indirectly by the Fund through its investments in mutual funds, hedge funds, private equity funds, and other investment companies. Shares of RVP’s Consultant and R Classes bear an annual distribution expense that is higher than that of the Service Class. Regarding the two “Good Ideas” tables shown above, the sum of all contributors to, and all detractors from, performance for all securities in the portfolio would approximate the Fund’s year-to-date performance for 2014. | |||||||||||
| 34 | The Royce Funds 2014 Semiannual Report to Shareholders |
| Performance and Portfolio Review |
| increase our stake in SciQuest during the first half. The company provides procurements and spending management software on a subscription basis. SciQuest provides automated purchasing primarily to universities, hospitals, and local and state governments, though it has expanded its focus to include more commercial sectors. Its earnings pattern has been erratic, almost consistently inconsistent, and some recent misses drove investors to sell, though we like the growth potential of its core business and expect earnings to improve. It was the Fund’s eleventh-largest position at the end of June. RVP’s twelfth-largest contributor in 2013, California-based Cerus Corporation makes the INTERCEPT blood system, a pathogen inactivation technology. Already selling INTERCEPT in Europe, the company has submitted its application for FDA approval for distribution here in the U.S., which could arrive as early as this fall. After doing fine in 2013, the company’s stock performance was more challenged in the first half. Other Health Care holdings enjoyed better times, with four of the top five contributors in the first half calling the sector home. Furiex Pharmaceuticals first saw strong results in phase III clinical trials for an IBS treatment before being acquired at a healthy premium, the announcement of which in April prompted us to sell our shares. In February the stock price of InterMune soared on news of positive phase III trial results for a drug that treats IPF (idiopathic pulmonary fibrosis), a chronic and ultimately fatal condition that leads to a decline in lung function. Top-10 holding Actelion rose during the first quarter around the launch of a PAH (pulmonary arterial hypertension) drug. It is the dominant player in this pharmaceutical niche. Myriad Genetics made a significant leap for us in the first half. After detracting most from 2013 results, it was RVP’s second-best contributor for the semiannual period. The company faced several headwinds last year: reimbursement change concerns from payers, a Supreme Court decision in June that held that human genes cannot be patented, and new competition in the breast cancer gene testing market. This led its stock to fall, though the company retained some of its patents on certain genetic testing processes. Its shares then came back strong in the first half. The reimbursement issues were resolved at a rate that was more favorable than many investors were expecting, the firm has demonstrated an impressive rate of growth, while competition, especially in the breast cancer genetic screening area, has not materialized to the degree many were anticipating. It was the Fund’s second-largest position at the end of June. |
GOOD IDEAS AT THE TIME | |
| SciQuest | -0.68% |
| Cerus Corporation | -0.46 |
| TearLab Corporation | -0.34 |
| Medicines Company (The) | -0.31 |
| Tractor Supply | -0.29 |
| 1 Net of dividends. | |
| ROYCE VALUE PLUS FUND VS. RUSSELL 2000 Value of $10,000 Invested on 6/14/01 | |
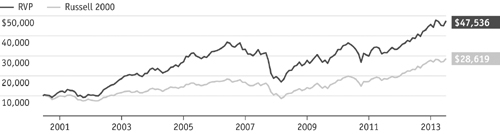 |
| Includes reinvestment of distributions. |
| PORTFOLIO DIAGNOSTICS | |||||
| Fund Net Assets | $1,102 million | ||||
| Number of Holdings | 97 | ||||
| Turnover Rate | 27% | ||||
| Average Market Capitalization1 | $1,830 million | ||||
| Weighted Average P/E Ratio2,3 | 27.9x | ||||
| Weighted Average P/B Ratio2 | 2.8x | ||||
| U.S. Investments (% of Net Assets) | 85.9% | ||||
| Non-U.S. Investments (% of Net Assets) | 13.6% | ||||
| Symbol | |||||
| Investment Class | RVPHX | ||||
| Service Class | RYVPX | ||||
| Consultant Class | RVPCX | ||||
| Institutional Class | RVPIX | ||||
| R Class | RVPRX | ||||
| K Class | RVPKX | ||||
1 Geometric Average. This weighted calculation uses each portfolio holding’s market cap in a way designed to not skew the effect of very large or small holdings; instead, it aims to better identify the portfolio’s center, which Royce believes offers a more accurate measure of average market cap than a simple mean or median. | |||||
2 Harmonic Average. This weighted calculation evaluates a portfolio as if it were a single stock and measures it overall. It compares the total market value of the portfolio to the portfolio’s share in the earnings or book value, as the case may be, of its underlying stocks. | |||||
3 The Fund’s P/E ratio calculation excludes companies with zero or negative earnings (25% of portfolio holdings as of 6/30/14). | |||||
| MORNINGSTAR STATISTICAL MEASURES1 | |||||
| Sharpe Ratio | Standard Deviation | ||||
| RVP | 0.89 | 18.27 | |||
| Russell 2000 | 1.10 | 18.23 | |||
| Category Median | 1.13 | 17.71 | |||
| Best Quartile Breakpoint | 1.20 | 16.80 | |||
1 Five years ended 6/30/14. Category Median and Best Quartile Breakpoint based on 357 small-cap objective funds (oldest class only) with at least five years of history. | |||||
DOWN MARKET PERFORMANCE COMPARISON All Down Periods of 7.5% or Greater Over the Last 7 Years, in Percentages(%)  | |||||
| The Royce Funds 2014 Semiannual Report to Shareholders | 35 |
| Royce 100 Fund |
AVERAGE ANNUAL TOTAL RETURNS Through 6/30/14 | |||||||||||
| January–June 20141 | 2.79 | % | |||||||||
| One-Year | 21.66 | ||||||||||
| Three-Year | 10.01 | ||||||||||
| Five-Year | 16.64 | ||||||||||
| 10-Year | 10.39 | ||||||||||
| Since Inception (6/30/03) | 11.70 | ||||||||||
ANNUAL EXPENSE RATIO | |||||||||||
| Operating Expenses | 1.51 | % | |||||||||
| 1 Not Annualized | |||||||||||
| CALENDAR YEAR TOTAL RETURNS | |||||||||||
| Year | ROH | Year | ROH | ||||||||
| 2013 | 30.9 | % | 2008 | -29.2 | % | ||||||
| 2012 | 11.5 | 2007 | 7.3 | ||||||||
| 2011 | -6.5 | 2006 | 13.7 | ||||||||
| 2010 | 24.8 | 2005 | 14.9 | ||||||||
| 2009 | 38.0 | 2004 | 27.2 | ||||||||
| TOP 10 POSITIONS % of Net Assets | |||||||||||
| Federated Investors Cl. B | 2.1 | % | |||||||||
| Unit Corporation | 1.7 | ||||||||||
| Pason Systems | 1.7 | ||||||||||
| Reliance Steel & Aluminum | 1.7 | ||||||||||
| CIRCOR International | 1.6 | ||||||||||
| Haynes International | 1.5 | ||||||||||
| Globe Specialty Metals | 1.4 | ||||||||||
| Trican Well Service | 1.4 | ||||||||||
| Diebold | 1.4 | ||||||||||
| Heritage-Crystal Clean | 1.3 | ||||||||||
| PORTFOLIO SECTOR BREAKDOWN % of Net Assets | |||||||||||
| Industrials | 25.8 | % | |||||||||
| Information Technology | 23.3 | ||||||||||
| Materials | 10.2 | ||||||||||
| Energy | 8.4 | ||||||||||
| Consumer Discretionary | 8.1 | ||||||||||
| Financials | 6.6 | ||||||||||
| Health Care | 5.3 | ||||||||||
| Consumer Staples | 2.1 | ||||||||||
| Miscellaneous | 4.3 | ||||||||||
| Cash and Cash Equivalents | 5.9 | ||||||||||
 | |||||||||
Managers’ Discussion Companies with strong balance sheets, high returns on invested capital, and the ability to generate free cash flow have only been intermittently favored by investors over the last few years. This inconsistency had an effect on the first-half results for Royce 100 Fund (ROH). The Fund advanced 2.8% for the year-to-date period ended June 30, 2014 versus 3.2% for the Fund’s small-cap benchmark, the Russell 2000 Index, for the same period. The first quarter was a period of mostly low positive returns for stocks. It followed in the wake of a highly robust bull phase that ran with particular speed through the second half of 2013. ROH rose 0.2% in the first quarter while the Russell 2000 gained 1.1%. Stock prices became more volatile before the end of the quarter. Small-caps reached their first-half high on March 4, and the Russell 2000 fell 9.1% between that date and May 15, giving 2014 its only correction so far. The Fund outpaced the benchmark for that period and from that same interim high through the end of June. These better down market results drove the Fund’s advantage over the Russell 2000 for the second quarter. ROH increased 2.6% between the beginning of April and the end of June versus a 2.0% advance for the small-cap index. This left us mostly pleased with the Fund’s first-half results. We say this is in the context of recognizing that, while the environment has been slowly improving for the sort of companies we seek for the portfolio, the market has still seen fit to reward fast-growing, often unprofitable businesses more than it has the high-quality businesses that we prefer. We were also encouraged by the Fund’s longer-term edge over the Russell 2000. ROH outpaced the small-cap index for the 10-year and since inception (6/30/03) periods ended June 30, 2014. The Fund’s average annual total return since inception was 11.7%. Pason Systems was both a top performer and the top contributor in the Energy sector, which led all the Fund’s sector groups by a considerable margin in the first half. In general, positions in Energy attracted more investors as oil prices rose and drilling activity picked up. The difficult winter weather also helped by stoking demand for home heating oil and natural gas. Pason Systems sells and rents instrumentation systems for both land and offshore drill rigs in the oil and gas industry. Its products gather data and help to improve | |||||||||
| GOOD IDEAS THAT WORKED Top Contributors to Performance Year-to-Date through 6/30/141 | |||||||||||
| Pason Systems | 0.52% | ||||||||||
| Helmerich & Payne | 0.47 | ||||||||||
| Unit Corporation | 0.44 | ||||||||||
| Trican Well Service | 0.38 | ||||||||||
| JTH Holding Cl. A | 0.34 | ||||||||||
| 1 Includes dividends. | |||||||||||
Important Performance and Expense Information All performance information in this Report reflects past performance, is presented on a total return basis, reflects the reinvestment of distributions, and does not reflect the deduction of taxes that a shareholder would pay on fund distributions or the redemption of fund shares. Past performance is no guarantee of future results. Investment return and principal value of an investment will fluctuate, so that shares may be worth more or less than their original cost when redeemed. Shares redeemed within 180 days of purchase may be subject to a 1% redemption fee payable to the Fund, which is not reflected in the performance shown above; if it were, performance would be lower. Current month-end performance may be higher or lower than performance quoted and may be obtained at www.roycefunds.com. All performance and risk information reflects results of the Service Class (its oldest class). Operating expenses reflect the Fund’s gross total annual operating expenses for the Service Class as of the Fund’s most current prospectus, and include management fees, 12b-1 distribution and service fees, other expenses, and acquired fund fees and expenses. Acquired fund fees and expenses reflect the estimated amount of the fees and expenses incurred indirectly by the fund through its investments in mutual funds, hedge funds, private equity funds, and other investment companies. Shares of ROH’s R Class bear an annual distribution expense that is higher than that of the Service Class. Regarding the two “Good Ideas” tables shown above, the sum of all contributors to, and all detractors from, performance for all securities in the portfolio would approximate the Fund’s year-to-date performance for 2014. | |||||||||||
| 36 | The Royce Funds 2014 Semiannual Report to Shareholders |
Performance and Portfolio Review the efficiency of drilling. Increases in both drilling activity and daily rental rates for its rig connectivity and remote diagnostics products boosted its results. The company also provided a favorable outlook based on its pipeline of new products that should continue to grow its rental dollar content-per-rig over the long run. It was ROH’s third-largest position at the end of June. Renewed demand also helped Helmerich & Payne, a company we have long admired for its status as a leader in manufacturing technologically superior rigs and related equipment. Other energy businesses are seeing the benefit in using Helmerich’s wares, as upgrading to its more efficient rigs helps to drive down drilling costs. Unit Corporation, the Fund’s second-largest holding at the end of June, explores for oil and natural gas, acquires oil and gas properties, offers contract drilling services, and processes natural gas. Its ability to do each of these jobs well makes it something of an anomaly in an otherwise rigidly specialized industry. Unit seemed to impress investors with double-digit production growth, the introduction of a new advanced drilling rig, and ongoing success in its midstream operations. Net losses at the sector and position levels were fairly modest, though a number of detractors from the Industrials sector disappointed. The sector is one of those economically sensitive areas in which we have invested heavily over the last few years. At the end of June the portfolio also had a substantial overweight in Industrials compared to its small-cap benchmark. UTi Worldwide is a global supply chain logistics services and solutions company that operates on multiple platforms helping a variety of industries. Its business was hurt by lower freight-forwarding volumes and pricing as well as by delays in collecting receivables. All of this caused the company to violate its debt covenants, resulting in an expensive and dilutive recapitalization. These discouraging developments led us to sell our shares in ROH’s portfolio in March. The stock price of KBR fell throughout the first half. The company struggled with the cancellation of some engineering and construction projects and losses on a few others while also contending with pushed-out start dates for certain LNG (liquefied natural gas) ventures. Believing that this Houston-based engineering and construction firm with global operations can ultimately turn things around, we held our shares. |
GOOD IDEAS AT THE TIME | |
| UTi Worldwide | -0.52% |
| KBR | -0.34 |
| Jacobs Engineering Group | -0.26 |
| ADTRAN | -0.25 |
| Medicines Company (The) | -0.22 |
| 1 Net of dividends. | |
| ROYCE 100 FUND VS. RUSSELL 2000 Value of $10,000 Invested on 6/30/03 | |
 |
| Includes reinvestment of distributions. | |||
| PORTFOLIO DIAGNOSTICS | |||
| Fund Net Assets | $285 million | ||
| Number of Holdings | 97 | ||
| Turnover Rate | 17% | ||
| Average Market Capitalization1 | $1,828 million | ||
| Weighted Average P/E Ratio2,3 | 24.7x | ||
| Weighted Average P/B Ratio2 | 2.3x | ||
| U.S. Investments (% of Net Assets) | 86.5% | ||
| Non-U.S. Investments (% of Net Assets) | 7.6% | ||
| Symbol | |||
| Investment Class | ROHHX | ||
| Service Class | RYOHX | ||
| R Class | ROHRX | ||
| K Class | ROHKX | ||
1 Geometric Average. This weighted calculation uses each portfolio holding’s market cap in a way designed to not skew the effect of very large or small holdings; instead, it aims to better identify the portfolio’s center, which Royce believes offers a more accurate measure of average market cap than a simple mean or median. | |||
2 Harmonic Average. This weighted calculation evaluates a portfolio as if it were a single stock and measures it overall. It compares the total market value of the portfolio to the portfolio’s share in the earnings or book value, as the case may be, of its underlying stocks. | |||
| MORNINGSTAR STATISTICAL MEASURES1 | |||
| Sharpe Ratio | Standard Deviation | ||
| ROH | 0.96 | 17.71 | |
| Russell 2000 | 1.10 | 18.23 | |
| Category Median | 1.13 | 17.71 | |
| Best Quartile Breakpoint | 1.20 | 16.80 | |
1 Five years ended 6/30/14. Category Median and Best Quartile Breakpoint based on 357 small-cap objective funds (oldest class only) with at least five years of history. | |||
The Fund produced lower volatility than the Russell 2000, as shown by its standard deviation. | |||
DOWN MARKET PERFORMANCE COMPARISON | |||
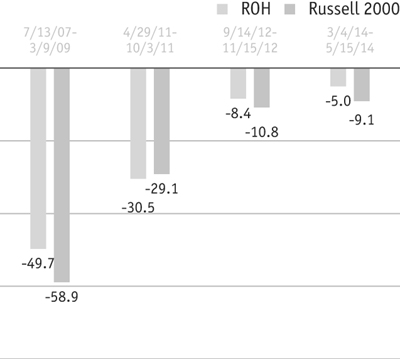 | |||
| The Royce Funds 2014 Semiannual Report to Shareholders | 37 |
| Royce Dividend Value Fund |
AVERAGE ANNUAL TOTAL RETURNS Through 6/30/14 | |||||||||||
| January–June 20141 | 3.35 | % | |||||||||
| One-Year | 21.85 | ||||||||||
| Three-Year | 12.97 | ||||||||||
| Five-Year | 19.38 | ||||||||||
| 10-Year | 10.34 | ||||||||||
| Since Inception (5/3/04) | 10.24 | ||||||||||
ANNUAL EXPENSE RATIO | |||||||||||
| Operating Expenses | 1.52 | % | |||||||||
| 1 Not Annualized | |||||||||||
| CALENDAR YEAR TOTAL RETURNS | |||||||||||
| Year | RDV | Year | RDV | ||||||||
| 2013 | 30.7 | % | 2008 | -31.5 | % | ||||||
| 2012 | 16.9 | 2007 | 0.0 | ||||||||
| 2011 | -4.5 | 2006 | 19.9 | ||||||||
| 2010 | 30.1 | 2005 | 7.3 | ||||||||
| 2009 | 37.7 | ||||||||||
| TOP 10 POSITIONS % of Net Assets | |||||||||||
| KKR & Co. L.P. | 2.0 | % | |||||||||
| Reliance Steel & Aluminum | 1.6 | ||||||||||
| Transocean | 1.5 | ||||||||||
| FLIR Systems | 1.4 | ||||||||||
| Agnico Eagle Mines | 1.2 | ||||||||||
| Carpenter Technology | 1.2 | ||||||||||
| State Street | 1.1 | ||||||||||
| Helmerich & Payne | 1.1 | ||||||||||
| Vishay Intertechnology | 1.1 | ||||||||||
| Genesco | 1.1 | ||||||||||
| PORTFOLIO SECTOR BREAKDOWN % of Net Assets | |||||||||||
| Financials | 25.7 | % | |||||||||
| Industrials | 17.0 | ||||||||||
| Materials | 16.5 | ||||||||||
| Information Technology | 11.6 | ||||||||||
| Consumer Discretionary | 9.7 | ||||||||||
| Energy | 5.9 | ||||||||||
| Health Care | 3.8 | ||||||||||
| Consumer Staples | 2.7 | ||||||||||
| Telecommunication Services | 1.0 | ||||||||||
| Utilities | 0.5 | ||||||||||
| Miscellaneous | 2.7 | ||||||||||
| Cash and Cash Equivalents | 2.9 | ||||||||||
| |||||||||
Managers’ Discussion Our penchant for dividend-paying small- and mid-cap stocks remains strong, even though many investors in the current market cycle have not consistently favored them. We were therefore pleased to see Royce Dividend Value Fund (RDV) slightly outpace its small-cap benchmark, the Russell 2000, for the year-to-date period ended June 30, 2014, up 3.3% compared to 3.2% for the small-cap index. After the market’s extraordinary run in 2013, it was not surprising to see the pace of equity returns slow. This was certainly the case in the first quarter of 2014, when the Fund increased 0.2%. The Russell 2000 reached its year-to-date high on March 4, with investors concerned, if only briefly, about a possibly overheated stock market, a new chair at the Federal Reserve, and the economic effects of the cold and stormy winter. Small-cap share prices mostly fell into mid-May before moving upward again through the end of June. It was during this brief, mostly benign downturn, in which the Russell 2000 fell 9.1%, that the Fund gained its advantage. For the second quarter, RDV gained 3.2% versus a 2.0% advance for its benchmark. The Fund remained behind the small-cap index for the one-, three-, and five-year periods ended June 30, 2014. (Market results can be found on page 6.) However, RDV outperformed the Russell 2000 for the 10-year and since inception (5/3/04) periods ended June 30, 2014. The Fund’s average annual total return since inception was 10.2%. The post-Financial Crisis period has often been immensely frustrating, though we have been seeing signs of a turnaround for our disciplined and active approach, which seeks fundamentally strong dividend-paying companies trading for less than what we believe they are worth. In RDV, we try to select companies with good or especially promising cash flow profiles, those that allow the business to return cash to shareholders for a solid total return as opposed to a big coupon. We also see dividends as an excellent indicator of effective capital allocation. This belief has not been popular in the market over the last five or six years. However, we still look at dividends and growth as not being mutually exclusive. In our view, companies that generate free cash flow can reinvest in their businesses, do what they need to do to grow, and still return cash to shareholders. While the market has shown a marked preference for higher-yielding and/or faster-growing vehicles, we continue to focus on what we regard as well-run businesses that pay dividends. We suspect that the growing economy will result in more investors focusing on the attributes that we seek. Effective May 1, 2014, the Fund | |||||||||
| GOOD IDEAS THAT WORKED Top Contributors to Performance Year-to-Date through 6/30/141 | |||||||||||
| Helmerich & Payne | 0.43% | ||||||||||
| Agnico Eagle Mines | 0.39 | ||||||||||
| Randgold Resources ADR | 0.29 | ||||||||||
| Allegheny Technologies | 0.22 | ||||||||||
| Pan American Silver | 0.19 | ||||||||||
| 1 Includes dividends. | |||||||||||
Important Performance and Expense Information All performance information in this Report reflects past performance, is presented on a total return basis, reflects the reinvestment of distributions, and does not reflect the deduction of taxes that a shareholder would pay on fund distributions or the redemption of fund shares. Past performance is no guarantee of future results. Investment return and principal value of an investment will fluctuate, so that shares may be worth more or less than their original cost when redeemed. Shares redeemed within 180 days of purchase may be subject to a 1% redemption fee payable to the Fund, which is not reflected in the performance shown above; if it were, performance would be lower. Current month-end performance may be higher or lower than performance quoted and may be obtained at www.roycefunds.com. All performance and risk information reflects results of the Service Class (its oldest class). Operating expenses reflect the Fund’s gross total annual operating expenses for the Service Class as of the Fund’s most current prospectus and include management fees, 12b-1 distribution and service fees, other expenses, and acquired fund fees and expenses. Acquired fund fees and expenses reflect the estimated amount of the fees and expenses incurred indirectly by the Fund through its investments in mutual funds, hedge funds, private equity funds, and other investment companies. Regarding the two “Good Ideas” tables shown above, the sum of all contributors to, and all detractors from, performance for all securities in the portfolio would approximate the Fund’s year-to-date performance for 2014. | |||||||||||
| 38 | The Royce Funds 2014 Semiannual Report to Shareholders |
Performance and Portfolio Review invests primarily in undervalued dividend-paying companies with market capitalizations up to $15 billion (up from $5 billion). The Fund’s best-performing sector in the first half was Materials, which was dominated by the resurgence of metals & mining companies, primarily those involved in gold and silver mining. Holdings in this industry were among RDV’s largest detractors in 2013, so the rebound was satisfying. We initiated or built most of our positions in this industry late in 2012 or in 2013 when it seemed to us that they were at or near rock-bottom valuations. They roared back in the first half of this year mostly owing to a recovery in commodity prices, historically the driver of mining businesses’ fortunes. Gold and silver miners Agnico Eagle Mines and Randgold Resources ADR were top-20 positions at the end of June while dividend-paying Pan American Silver was among the top-60. Specialty metals supplier Allegheny Technologies saw gradual improvements in the industrial metals industry that helped to galvanize its shares. From outside the metals & mining group, long-time Royce favorite and top-five position Helmerich & Payne experienced a steadily rising share price. The company specializes in technologically advanced drilling rigs and equipment that were in high demand during the first half. Net losses were mild across the portfolio. Both Consumer sectors were underwater in the first half, and the specialty retail group (from Consumer Discretionary) posted the highest net losses for the semiannual period. The first half was particularly difficult for many retailers. It started with a disappointing holiday season and was made worse by the grim winter, which kept shoppers indoors and unwilling to spend. Still, we have every confidence that this important industry will bounce back. We held a good-sized position in Ascena Retail Group, which specializes in apparel for women and ’tween girls and boys. The company operates under various brands, including Justice, Lane Bryant, maurices, and dressbarn. We also increased our stake in Buckle (The), which sells casual apparel, footwear, and accessories for young men and women here in the U.S. We have long liked the firm’s approach in its highly competitive industry and think it has handled its most recent challenges effectively. It was a top-20 holding at the end of June. Nu Skin Enterprises, from the Consumer Staples sector, makes personal care products and distributes them across the globe. One of last year’s top contributors, its momentum was blunted by allegations in a Chinese newspaper back in January that it was running a pyramid scheme. The firm moved quickly and, we think, effectively to deal with the issue. However, its recent solid results showed that other investors are still not convinced. |
GOOD IDEAS AT THE TIME | |
| Nu Skin Enterprises Cl. A | -0.20% |
| Ascena Retail Group | -0.18 |
| Brink’s Company (The) | -0.17 |
| Buckle (The) | -0.15 |
| Towers Watson & Co. Cl. A | -0.15 |
| 1 Net of dividends. | |
| ROYCE DIVIDEND VALUE FUND VS. RUSSELL 2000 Value of $10,000 Invested on 5/3/04 | |
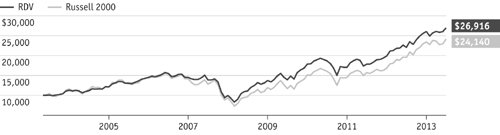 |
| Includes reinvestment of distributions. | |||
| PORTFOLIO DIAGNOSTICS | |||
| Fund Net Assets | $625 million | ||
| Number of Holdings | 269 | ||
| Turnover Rate | 14% | ||
| Average Market Capitalization1 | $3,366 million | ||
| Weighted Average P/E Ratio2,3 | 18.1x | ||
| Weighted Average P/B Ratio2 | 2.3x | ||
| U.S. Investments (% of Net Assets) | 72.2% | ||
| Non-U.S. Investments (% of Net Assets) | 24.9% | ||
| Symbol | |||
| Investment Class | RDVIX | ||
| Service Class | RYDVX | ||
| Consultant Class | RDVCX | ||
| Institutional Class | RDIIX | ||
1 Geometric Average. This weighted calculation uses each portfolio holding’s market cap in a way designed to not skew the effect of very large or small holdings; instead, it aims to better identify the portfolio’s center, which Royce believes offers a more accurate measure of average market cap than a simple mean or median. | |||
2 Harmonic Average. This weighted calculation evaluates a portfolio as if it were a single stock and measures it overall. It compares the total market value of the portfolio to the portfolio’s share in the earnings or book value, as the case may be, of its underlying stocks. | |||
| MORNINGSTAR STATISTICAL MEASURES1 | |||
| Sharpe Ratio | Standard Deviation | ||
| RDV | 1.22 | 15.54 | |
| Russell 2000 | 1.10 | 18.23 | |
| Category Median | 1.13 | 17.71 | |
| Best Decile Breakpoint | 1.28 | 15.64 | |
1 Five years ended 6/30/14. Category Median and Best Decile Breakpoint based on 357 small-cap objective funds (oldest class only) with at least five years of history. | |||
| The Fund beat the Russell 2000 and performed within the top 50% of small-cap objective funds on a risk-adjusted basis, as shown by its Sharpe ratio. In addition, the Fund produced lower volatility than the Russell 2000 and 90% of small-cap objective funds, as shown by its standard deviation. | |||
DOWN MARKET PERFORMANCE COMPARISON | |||
 | |||
| The Royce Funds 2014 Semiannual Report to Shareholders | 39 |
| Royce Global Value Fund |
AVERAGE ANNUAL TOTAL RETURNS Through 6/30/14 | |||||||||||
| January–June 20141 | 11.04 | % | |||||||||
| One-Year | 23.93 | ||||||||||
| Three-Year | 0.86 | ||||||||||
| Five-Year | 13.76 | ||||||||||
| Since Inception (12/29/06) | 6.53 | ||||||||||
ANNUAL EXPENSE RATIOS | |||||||||||
| Gross Operating Expenses | 1.84 | % | |||||||||
| Net Operating Expenses | 1.70 | ||||||||||
| 1Not Annualized | |||||||||||
| CALENDAR YEAR TOTAL RETURNS | |||||||||||
| Year | RGV | Year | RGV | ||||||||
| 2013 | 6.3 | % | 2009 | 61.9 | % | ||||||
| 2012 | 11.0 | 2008 | -39.9 | ||||||||
| 2011 | -18.7 | 2007 | 14.3 | ||||||||
| 2010 | 35.7 | ||||||||||
| TOP 10 POSITIONS % of Net Assets | |||||||||||
| Semperit AG Holding | 3.9 | % | |||||||||
| Western Digital | 3.7 | ||||||||||
| Myriad Genetics | 3.5 | ||||||||||
| Mayr-Melnhof Karton | 3.2 | ||||||||||
| Kennedy-Wilson Holdings | 3.1 | ||||||||||
| Ashmore Group | 3.0 | ||||||||||
| Cirrus Logic | 2.8 | ||||||||||
| Trican Well Service | 2.6 | ||||||||||
| TGS-NOPEC Geophysical | 2.6 | ||||||||||
| Pan American Silver | 2.4 | ||||||||||
| PORTFOLIO SECTOR BREAKDOWN % of Net Assets | |||||||||||
| Financials | 16.8 | % | |||||||||
| Materials | 16.6 | ||||||||||
| Industrials | 15.3 | ||||||||||
| Information Technology | 11.7 | ||||||||||
| Energy | 11.1 | ||||||||||
| Health Care | 10.1 | ||||||||||
| Consumer Discretionary | 9.9 | ||||||||||
| Consumer Staples | 6.2 | ||||||||||
| Cash and Cash Equivalents | 2.3 | ||||||||||
PORTFOLIO COUNTRY BREAKDOWN1,2 % of Net Assets | |||||||||||
| United States | 25.9 | % | |||||||||
| Japan | 11.7 | ||||||||||
| Canada | 10.1 | ||||||||||
| Austria | 7.1 | ||||||||||
| United Kingdom | 6.8 | ||||||||||
| Hong Kong | 6.4 | ||||||||||
| France | 3.8 | ||||||||||
| Norway | 3.5 | ||||||||||
| India | 3.2 | ||||||||||
| Mexico | 3.0 | ||||||||||
| 1 Represents countries that are 3% or more of net assets. | |||||||||||
| 2 Securities are categorized by their country of headquarters. | |||||||||||
| |||||||||
Manager’s Discussion Royce Global Value Fund (RGV) climbed 11.0% for the year-to-date period ended June 30, 2014, easily outpacing its benchmark, the Russell Global Small Cap Index, which was up 5.7% for the same period. It is much too early to begin talk of a comeback, but the Fund’s rebound was a strong performance that bolstered our confidence in its prospects for better results going forward on both an absolute and relative basis. Although most non-U.S. markets did not match the feverish pace of their small-cap stateside cousins in 2013, they did fine on an absolute basis before going on to enjoy a stronger first half of 2014. For the first quarter, the Fund rose 4.3% while its global small-cap benchmark advanced 2.3%. A strengthening Europe helped to compensate for a generally less robust Asia during the first few months of 2014. There were a few trouble spots for the portfolio based on national exposure. Holdings in two significant countries—Canada and China—struggled while a few nations to which we had less exposure had an outsized negative impact, including the United Arab Emirates, Australia, and India. For the second quarter, returns were stronger both here in the U.S. and abroad, the latter helped by a sterling recovery for many Asian companies. This was most notable for positions headquartered in India, which pushed past earlier net losses to post a solid contribution for the semiannual period. Portfolio holdings in Canada also rebounded impressively in the second quarter, helped in large part by robust results for stocks in the Energy sector, such as long-time Royce favorite Trican Well Service. RGV was thus able to take full advantage of the market’s growing strength, increasing 6.4% for the second quarter while the Russell Global Small Cap grew 3.3%. We were also happy to see RGV ahead of the Russell Global Small Cap for the one-year and since inception (12/29/06) periods ended June 30, 2014. Seven of the Fund’s eight equity sectors finished the first half in positive territory, with Energy making the largest positive contribution. It was followed by more-than-respectable results from Materials and Health Care and solid net gains from Information Technology and Industrials. Financials was the lone sector to detract from performance, but its net loss was minimal. At the industry level, energy equipment & services led, followed by the metals | |||||||||
| GOOD IDEAS THAT WORKED Top Contributors to Performance Year-to-Date through 6/30/141 | |||||||||||
| Myriad Genetics | 2.29% | ||||||||||
| Helmerich & Payne | 1.33 | ||||||||||
| Maharashtra Seamless | 1.12 | ||||||||||
| Semperit AG Holding | 0.94 | ||||||||||
| Trican Well Service | 0.80 | ||||||||||
| 1 Includes dividends. | |||||||||||
Important Performance and Expense Information All performance information in this Report reflects past performance, is presented on a total return basis, reflects the reinvestment of distributions, and does not reflect the deduction of taxes that a shareholder would pay on fund distributions or the redemption of fund shares. Past performance is no guarantee of future results. Investment return and principal value of an investment will fluctuate, so that shares may be worth more or less than their original cost when redeemed. Shares redeemed within 180 days of purchase may be subject to a 2% redemption fee payable to the Fund, which is not reflected in the performance shown above; if it were, performance would be lower. Current month-end performance may be higher or lower than performance quoted and may be obtained at www.roycefunds.com. All performance and risk information reflects results of the Service Class (its oldest class). Price and total return information is based on net asset values calculated for shareholder transactions. Certain immaterial adjustments were made to the net assets of Royce Global Value Fund at 12/31/13 for financial reporting purposes, and as a result the net asset values for shareholder transactions on that date and the total returns based on those net asset values differ from the adjusted net asset values and total returns reported in the Financial Highlights. Gross operating expenses reflect gross total annual operating expenses for the Service Class and include management fees, 12b-1 distribution and service fees, other expenses, and acquired fund fees and expenses. Acquired fund fees and expenses reflect the estimated amount of the fees and expenses incurred indirectly by the Fund through its investments in mutual funds, hedge funds, private equity funds, and other investment companies. Net operating expenses reflect contractual fee waivers and/or reimbursements. All expense information is reported as of the Fund’s most current prospectus. Royce & Associates has contractually agreed to waive fees and/or reimburse operating expenses to the extent necessary to maintain the Fund’s net annual operating expenses, (excluding brokerage commissions, taxes, interest litigation expenses, acquired fund fees and expenses, and other expenses not borne in the ordinary course of business), at or below 1.69% through April 30, 2015. Regarding the two “Good Ideas” tables shown above, the sum of all contributors to, and all detractors from, performance for all securities in the portfolio would approximate the Fund’s year-to-date performance for 2014. | |||||||||||
| 40 | The Royce Funds 2014 Semiannual Report to Shareholders |
Performance and Portfolio Review & mining group. The latter began to show signs of life with a recovery for commodity prices in the first half after a few very challenging years for the industry. A molecular diagnostic company that specializes in genetic testing for cancer, Myriad Genetics was the Fund’s best-performing position by a considerable margin. In 2013 its stock price was hammered following a June 2013 ruling from the Supreme Court, which held that human genes cannot be patented. Many investors fled the stock for fear that Myriad would be facing increased competition and might have trouble remaining profitable. We thought otherwise and built our position in June and October 2013. The stock began to look healthy again in the first quarter of 2014. Through much of this time, we thought management was deploying capital productively, first by buying back stock late in 2013 and then in February by acquiring Crescendo Bioscience, which diversifies Myriad’s pipeline and gives the firm a potentially billion-dollar market for disease monitoring tests (initially for rheumatoid arthritis). The company also posted strong breast cancer diagnostic test volumes, with its MyRisk panel test meeting initial sales targets. We took gains in the first half. The top performer in metals & mining was Indian specialty pipe and tube maker Maharashtra Seamless. In 2013 the slow-growing Indian economy and ongoing pipe dumping in that country led to a steep decline in demand and order inflow. Following the recent elections, the economy and markets have picked up. Oil pipeline replacements in certain areas are likely, as is nationwide pipe connectivity for natural gas, both of which would benefit Maharashtra. The company is also expanding into China, Mexico, Sri Lanka, and Canada, among other places. After building a position in 2013, we took gains in the first half as its share price rose. Renewed demand here in the U.S. helped Tulsa-based Helmerich & Payne, the top net gainer in the Energy sector. It’s a company we have long admired for its status as a leader in manufacturing technologically superior rigs and related equipment. Other energy businesses are seeing the benefit in using Helmerich’s wares, as upgrading to its more efficient rigs helps to drive down drilling costs. E-House (China) Holdings ADR is a leading real estate services company in China with a diverse range of services, including primary sales agency services, online real estate services, and consulting services. It struggled through a difficult year for China’s real estate market, leading us to add shares in April in anticipation of a turnaround for the industry. A similar company in a different part of the world, Brasil Brokers Participacoes offers real estate brokerage services and markets residential real estate through its subsidiaries to all income segments of Brazil’s population. It suffered along with much of the rest of Brazil’s bearish market in the first half, when we increased our stake. |
GOOD IDEAS AT THE TIME | |
| E-House (China) Holdings ADR | -0.63% |
| Brasil Brokers Participacoes | -0.61 |
| Luk Fook Holdings (International) | -0.54 |
| New World Department Store China | -0.45 |
| Medicines Company (The) | -0.36 |
| 1Net of dividends. | |
| ROYCE GLOBAL VALUE FUND VS. RUSSELL GLOBAL SMALL CAP Value of $10,000 Invested on 12/29/06 | |
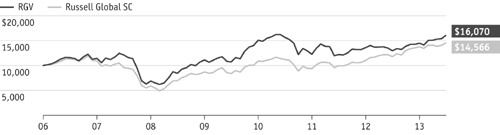 |
| Includes reinvestment of distributions. | |||
| PORTFOLIO DIAGNOSTICS | |||
| Fund Net Assets | $211 million | ||
| Number of Holdings | 61 | ||
| Turnover Rate | 17% | ||
| Average Market Capitalization1 | $1,773 million | ||
| Weighted Average P/E Ratio2,3 | 16.5x | ||
| Weighted Average P/B Ratio2 | 2.0x | ||
| Symbol | |||
| Investment Class | RGVIX | ||
| Service Class | RIVFX | ||
| Consultant Class | RGVHX | ||
| R Class | RGVRX | ||
| K Class | RGVKX | ||
1 Geometric Average. This weighted calculation uses each portfolio holding’s market cap in a way designed to not skew the effect of very large or small holdings; instead, it aims to better identify the portfolio’s center, which Royce believes offers a more accurate measure of average market cap than a simple mean or median. | |||
2 Harmonic Average. This weighted calculation evaluates a portfolio as if it were a single stock and measures it overall. It compares the total market value of the portfolio to the portfolio’s share in the earnings or book value, as the case may be, of its underlying stocks. | |||
| MORNINGSTAR STATISTICAL MEASURES1 | |||
| Sharpe Ratio | Standard Deviation | ||
| RGV | 0.81 | 17.95 | |
| Russell Global Small Cap | 0.99 | 16.34 | |
| Category Median | 0.95 | 16.58 | |
| Best Quartile Breakpoint | 1.06 | 16.23 | |
1 Five years ended 6/30/14. Category Median and Best Quartile Breakpoint based on 17 world stock small-cap objective funds (oldest class only) with at least five years of history. | |||
DOWN MARKET PERFORMANCE COMPARISON | |||
 | |||
| The Royce Funds 2014 Semiannual Report to Shareholders | 41 |
| Royce International Smaller-Companies Fund |
AVERAGE ANNUAL TOTAL RETURNS Through 6/30/14 | ||||||||||
| January–June 20141 | 6.59 | % | ||||||||
| One-Year | 21.02 | |||||||||
| Three-Year | 4.04 | |||||||||
| Five-Year | 13.15 | |||||||||
| Since Inception (6/30/08) | 7.56 | |||||||||
ANNUAL EXPENSE RATIOS | ||||||||||
| Gross Operating Expenses | 2.08 | % | ||||||||
| Net Operating Expenses | 1.70 | |||||||||
| 1 Not Annualized | ||||||||||
| CALENDAR YEAR TOTAL RETURNS | ||||||||||
| Year | RIS | Year | RIS | |||||||
| 2013 | 12.7 | % | 2010 | 26.5 | % | |||||
| 2012 | 19.4 | 2009 | 50.3 | |||||||
| 2011 | -18.7 | |||||||||
| TOP 10 POSITIONS% of Net Assets | ||||||||||
| Semperit AG Holding | 1.7 | % | ||||||||
| EPS Corporation | 1.5 | |||||||||
| Consort Medical | 1.5 | |||||||||
| Ashmore Group | 1.5 | |||||||||
| Lundin Petroleum | 1.4 | |||||||||
| CETIP - Mercados Organizados | 1.4 | |||||||||
| Mayr-Melnhof Karton | 1.4 | |||||||||
| Kennedy Wilson Europe Real Estate | 1.3 | |||||||||
| Magellan Aerospace | 1.3 | |||||||||
| KWS Saat | 1.3 | |||||||||
| PORTFOLIO SECTOR BREAKDOWN % of Net Assets | ||||||||||
| Consumer Discretionary | 20.9 | % | ||||||||
| Industrials | 17.9 | |||||||||
| Financials | 14.2 | |||||||||
| Health Care | 13.8 | |||||||||
| Materials | 9.4 | |||||||||
| Information Technology | 9.2 | |||||||||
| Consumer Staples | 4.4 | |||||||||
| Energy | 4.4 | |||||||||
| Diversified Investment Companies | 1.3 | |||||||||
| Cash and Cash Equivalents | 4.5 | |||||||||
| PORTFOLIO COUNTRY BREAKDOWN1,2 % of Net Assets | ||||||||||
| Japan | 15.4 | % | ||||||||
| United Kingdom | 9.2 | |||||||||
| Hong Kong | 8.5 | |||||||||
| France | 8.4 | |||||||||
| India | 5.7 | |||||||||
| South Africa | 4.1 | |||||||||
| Switzerland | 4.1 | |||||||||
| Malaysia | 4.0 | |||||||||
| Germany | 3.8 | |||||||||
| Brazil | 3.2 | |||||||||
| Austria | 3.1 | |||||||||
| China | 3.0 | |||||||||
| 1 Represents countries that are 3% or more of net assets. | ||||||||||
| 2 Securities are categorized by the country of their headquarters. | ||||||||||
 |
Manager’s Discussion Non-U.S. small-cap indexes frequently trailed their domestic peers over the last several years. This was somewhat rectified by a stronger first half for many international small-cap companies. Royce International Smaller-Companies Fund (RIS) advanced 6.6% for the year-to-date period ended June 30, 2014, trailing its benchmark, the Russell Global ex-U.S. Small Cap Index, which rose 7.5% for the same period. We were satisfied with RIS’s first-half results on an absolute basis. Small-caps outside the U.S. enjoyed fine results in 2013, though they finished the year well shy of the heady returns for U.S. small-caps. Returns for both U.S. and non-U.S. small-caps were lower in 2014’s opening quarter, though international small-cap performance was stronger in general. For the first quarter, RIS was up 2.3% versus a gain of 3.2% for the international small-cap index. Equity performance throughout Europe remained mostly robust in the year’s opening quarter, though many Asian markets corrected and a number of the Fund’s holdings based in Hong Kong, Japan, and South Korea endured a bearish first quarter while holdings in India and China were on the whole positive contributors. Holdings in Germany, Cyprus, and South Africa also endured a difficult first quarter. The second quarter saw Europe slow a bit (the Russell European Small Cap Index fell 1.0%) while there were solid recoveries in many parts of Asia. The Fund essentially tied its benchmark for the quarter, each up 4.2%. Holdings in India remained strong to the point of near dominance, while several Japanese companies rebounded to post a strong net contribution from that nation in the portfolio. Holdings in China, France, and Belgium led the list of detractors based on country. We remain disappointed with the Fund’s intermediate and long-term relative results. We were pleased, however, to see RIS outpace the Russell Global ex-U.S. Small Cap for the since inception (6/30/08) period ended June 30, 2014. Each of the Fund’s nine equity sectors finished the first half in the black, with Industrials leading and Health Care, Materials, and Consumer Discretionary also showing strength. Three Indian companies were among the portfolio’s top five contributors, each benefiting from the May election of Prime Minister Narenda Modi, who won a rare single-party majority that gave his party a mandate for a more pro-business, anti-bureaucracy direction. FAG Bearings India is one of the two key foreign-linked ball-bearings manufacturers in India. We like its strong balance sheet and rising profits, though we reduced our position |
| GOOD IDEAS THAT WORKED Top Contributors to Performance Year-to-Date through 6/30/141 | |||||||||||
| FAG Bearings India | 0.57% | ||||||||||
| CETIP - Mercados Organizados | 0.52 | ||||||||||
| AIA Engineering | 0.47 | ||||||||||
| Shriram Transport Finance | 0.46 | ||||||||||
| De’Longhi | 0.44 | ||||||||||
| 1 Includes dividends. | |||||||||||
Important Performance and Expense Information All performance information in this Report reflects past performance, is presented on a total return basis, reflects the reinvestment of distributions, and does not reflect the deduction of taxes that a shareholder would pay on fund distributions or the redemption of fund shares. Past performance is no guarantee of future results. Investment return and principal value of an investment will fluctuate, so that shares may be worth more or less than their original cost when redeemed. Shares redeemed within 180 days of purchase may be subject to a 2% redemption fee payable to the Fund, which is not reflected in the performance shown above; if it were, performance would be lower. Current month-end performance may be higher or lower than performance quoted and may be obtained at www.roycefunds.com. Gross operating expenses reflect total gross annual operating expenses and include management fees, 12b-1 distribution and service fees, other expenses, and acquired fund fees and expenses. Acquired fund fees and expenses reflect the estimated amount of the fees and expenses incurred indirectly by any applicable Fund through its investments in mutual funds, hedge funds, private equity funds, and other investment companies. Net operating expenses reflect contractual fee waivers and/or expense reimbursements. All expense information is reported as of the Fund’s most current prospectus. Royce & Associates has contractually agreed to waive its fees and/or reimburse operating expenses to the extent necessary to maintain the Fund’s net annual operating expenses, (excluding brokerage commissions, taxes, interest litigation expenses, acquired fund fees and expenses, and other expenses not borne in the ordinary course of business), at or below 1.69% through April 30, 2015 and at or below 1.99% through April 30, 2024. Regarding the two “Good Ideas” tables shown above, the sum of all contributors to, and all detractors from, performance for all securities in the portfolio would approximate the Fund’s year-to-date performance for 2014. | |||||||||||
| 42 | The Royce Funds 2014 Semiannual Report to Shareholders |
Performance and Portfolio Review |
| as its stock price climbed. AIA Engineering makes grinding balls used in mining and in the production of cement. Its fiscal fourth-quarter results, reported in late May, showed a significant increase in after-tax profit year-over-year that was driven by margin expansion, as its mining business showed the benefits of scale. We took some gains in the second quarter. Shriram Transport Finance is the leading lender to the used-truck market, a play on higher freight rates and an overall improved business climate in India. Its shares had been slowed by regulatory changes and India’s economic slump. The influential local broker Edelweiss initiated coverage on the company with a buy rating in June, giving its stock price a boost. All three companies are considered “NaMo” stocks—economically sensitive, pro-cyclical businesses that are expected to flourish under the administration of the new prime minister. Italian company De’Longhi manufactures a wide variety of small appliances, including coffee makers, electric ovens, kettles, toasters, and food processors. Rising revenues and solid earnings kept investors interested. Net losses were mostly modest at the industry and position level. Pico Far East Holdings is a Hong Kong-based business that makes displays for companies presenting at conventions and creates other visual identity solutions for clients such as Mercedes Benz, Lexus, Citibank, and Singapore Airlines. We like the way that its management keeps a close eye on costs and runs a lean organization. Its business was hurt by the slowdown in the Chinese economy, which prompted us to build our position throughout the first half. A softening rubber price had a predictably negative effect on the stock price of Societé Internationale de Plantations d’Heveas, a French firm that produces natural rubber and operates rubber tree plantations in French-speaking Africa. We added shares as its price fell. Brasil Brokers Participacoes is one of Brazil’s two leading real estate brokerages. Its business has been hurt by poor consumer sentiment (the worst since 2008) and possibly some modest erosion in market share. We built our stake during the first half. One Brazilian company, however, bucked that nation’s bearish trend and enjoyed success in the first half. CETIP-Mercados Organizados organizes the over-the-counter (OTC) markets in Brazil. The company offers an electronic platform for conducting online transactions, such as auctions and government bond trading, corporate bonds, and fixed income securities. CETIP also provides central securities depository, outsourcing, market data, and risk management services. Its shares rose on what we suspect was a flight to company quality in Brazil’s first-half bear market. |
| GOOD IDEAS AT THE TIME Top Detractors from Performance Year-to-Date through 6/30/141 | |||||||||||
| Pico Far East Holdings | -0.43% | ||||||||||
| Societe Internationale de Plantations d’Heveas | -0.36 | ||||||||||
| Brasil Brokers Participacoes | -0.33 | ||||||||||
| New World Department Store China | -0.33 | ||||||||||
| Globaltrans Investment GDR | -0.30 | ||||||||||
| 1 Net of dividends. | |||||||||||
| ROYCE INTERNATIONAL SMALLER-COMPANIES FUND VS. RUSSELL GLOBAL EX-U.S. SMALL CAP Value of $10,000 Invested on 6/30/08 | |||
 | |||
| Includes reinvestment of distributions. | |||
| PORTFOLIO DIAGNOSTICS | |||||
| Fund Net Assets | $55 million | ||||
| Number of Holdings | 100 | ||||
| Turnover Rate | 29% | ||||
| Average Market Capitalization1 | $1,013 million | ||||
| Weighted Average P/E Ratio2,3 | 15.1x | ||||
| Weighted Average P/B Ratio2 | 1.8x | ||||
| Symbol | |||||
| Investment Class | RISNX | ||||
| Service Class | RYGSX | ||||
| Institutional Class | RISIX | ||||
1 Geometric Average. This weighted calculation uses each portfolio holding’s market cap in a way designed to not skew the effect of very large or small holdings; instead, it aims to better identify the portfolio’s center, which Royce believes offers a more accurate measure of average market cap than a simple mean or median. | |||||
2 Harmonic Average. This weighted calculation evaluates a portfolio as if it were a single stock and measures it overall. It compares the total market value of the portfolio to the portfolio’s share in the earnings or book value, as the case may be, of its underlying stocks. | |||||
| MORNINGSTAR STATISTICAL MEASURES1 | |||||
| Sharpe Ratio | Standard Deviation | ||||
| RIS | 0.83 | 16.42 | |||
| Russell Global ex-U.S. Small Cap | 0.87 | 16.54 | |||
| Category Median | 0.98 | 17.11 | |||
| Best Quartile Breakpoint | 1.09 | 16.01 | |||
1 Five years ended 6/30/14. Category Median and Best Quartile Breakpoint based on 59 foreign small/mid objective funds (oldest class only) with at least Five years of history. | |||||
| The Royce Funds 2014 Semiannual Report to Shareholders | 43 |
| Royce Special Equity Multi-Cap Fund |
| AVERAGE ANNUAL TOTAL RETURNS Through 6/30/14 | ||||||||||
| January–June 20141 | 5.35 | % | ||||||||
| One-Year | 21.85 | |||||||||
| Three-Year | 16.83 | |||||||||
| Since Inception (12/31/10) | 16.73 | |||||||||
ANNUAL EXPENSE RATIOS | ||||||||||
| Gross Operating Expenses | 1.46 | % | ||||||||
| Net Operating Expenses | 1.24 | |||||||||
| 1 Not Annualized | ||||||||||
| CALENDAR YEAR TOTAL RETURNS | ||||||||||
| Year | RSM | Year | RSM | |||||||
| 2013 | 36.3 | % | 2011 | 7.2 | % | |||||
| 2012 | 11.6 | |||||||||
| TOP 10 POSITIONS % of Net Assets | ||||||||||
| KLA-Tencor | 4.9 | % | ||||||||
| Occidental Petroleum | 4.8 | |||||||||
| Microsoft Corporation | 4.7 | |||||||||
| Franklin Resources | 4.5 | |||||||||
| Bed Bath & Beyond | 4.5 | |||||||||
| Nordstrom | 4.4 | |||||||||
| Cisco Systems | 4.4 | |||||||||
| Emerson Electric | 4.4 | |||||||||
| Gap (The) | 4.4 | |||||||||
| Helmerich & Payne | 4.2 | |||||||||
| PORTFOLIO SECTOR BREAKDOWN % of Net Assets | ||||||||||
| Consumer Discretionary | 26.3 | % | ||||||||
| Information Technology | 22.9 | |||||||||
| Industrials | 17.2 | |||||||||
| Energy | 9.1 | |||||||||
| Health Care | 8.4 | |||||||||
| Financials | 7.1 | |||||||||
| Cash and Cash Equivalents | 9.0 | |||||||||
|
Manager’s Discussion A relatively slow start to 2014 led Royce Special Equity Multi-Cap Fund (RSM) to lose some ground to its benchmark in the first half. The Fund advanced 5.3% for the year-to-date period ended June 30, 2014, trailing its benchmark, the Russell 1000 Index, which increased 7.3% for the same period. The second half of 2013 was a highly bullish period, though one in which leadership remained with lower-quality stocks. This has mostly remained the case so far in 2014. For the first quarter, RSM was up 0.6% versus a gain of 2.0% for its benchmark. The Fund’s underweight in Utilities and overweight in Consumer Discretionary had a negative impact on first-quarter returns. It has not been pleasant to be overweight in the latter sector so far in 2014. However, we believe that as the economy continues to improve (as we believe it will), results should improve, perhaps dramatically. The outlook for consumer spending looks healthy as a result of tame inflation, still restrained mortgage rates, rising household net worth, repaired household balance sheets, and improved consumer confidence. In addition, capacity utilization in the U.S. is inching towards the 80% rate; at this level we should start to see more hires and capital expenditures, reigniting the economy. Large-cap performance was in general more consistent in the first half, not correcting as small-caps did from early March through mid-May. For the second quarter, the Fund gained 4.7%. In addition to posting strong results on an absolute basis, RSM continued to hold a relative advantage over its benchmark for the three-year and since inception (12/31/10) periods ended June 30, 2014. The Fund’s average annual total return since inception was 16.7%. The market is much narrower than it has been in the recent past, with greater stock selection at work, which should help the Fund’s results in time. Through April 24, the top 10 contributors in the S&P 500 equaled 99.3% of the large-cap index’s advance, while for the same period last year it was only 25.3%, which shows the narrower focus. Many have observed that for a validation of the improving prospects for the economy, rates on Treasuries should be rising. They have not as of yet. This is an interesting point, as it suggests that rising rates, due to stronger economic activity, will not weigh down the market. |
| GOOD IDEAS THAT WORKED Top Contributors to Performance Year-to-Date through 6/30/141 | |||||||||||
| Helmerich & Payne | 1.44% | ||||||||||
| SanDisk Corporation | 1.03 | ||||||||||
| KLA-Tencor | 0.69 | ||||||||||
| Microsoft Corporation | 0.65 | ||||||||||
| Nordstrom | 0.61 | ||||||||||
| 1 Includes dividends. | |||||||||||
Important Performance and Expense Information All performance information in this Report reflects past performance, is presented on a total return basis, reflects the reinvestment of distributions, and does not reflect the deduction of taxes that a shareholder would pay on fund distributions or the redemption of fund shares. Past performance is no guarantee of future results. Investment return and principal value of an investment will fluctuate, so that shares may be worth more or less than their original cost when redeemed. Shares redeemed within 180 days of purchase may be subject to a 1% redemption fee payable to the Fund, which is not reflected in the performance shown above; if it were, performance would be lower. Current month-end performance may be higher or lower than performance quoted and may be obtained at www.roycefunds.com. All performance and risk information reflects results of the Service Class (its oldest class). Gross operating expenses reflect gross total annual operating expenses for the Service Class and include management fees, 12b-1 distribution and service fees, other expenses, and acquired fund fees and expenses. Acquired fund fees and expenses reflect the estimated amount of the fees and expenses incurred indirectly by the Fund through its investments in mutual funds, hedge funds, private equity funds, and other investment companies. Net operating expenses reflect contractual fee waivers and/or reimbursements. All expense information is reported as of the Fund’s most current prospectus. Royce & Associates has contractually agreed to waive fees and/or reimburse operating expenses to the extent necessary to maintain the Service Classes’s net annual operating expenses, (excluding brokerage commissions, taxes, interest litigation expenses, acquired fund fees and expenses, and other expenses not borne in the ordinary course of business), at or below 1.24% through April 30, 2015. Regarding the two “Good Ideas” tables shown above, the sum of all contributors to, and all detractors from, performance for all securities in the portfolio would approximate the Fund’s year-to-date performance for 2014. | |||||||||||
| 44 | The Royce Funds 2014 Semiannual Report to Shareholders |
Performance and Portfolio Review |
| We believe we are close to a move towards greater cyclical exposure in the marketplace. We think that investors will increasingly abandon their obsession with counter-cyclicals and start to embrace anything with economic leverage in the U.S. Consumer Discretionary stocks remained the portfolio’s most significant detractors for the entire first half, its largest net losses coming from the specialty retail industry. The sector’s losses as a whole were mitigated by robust results for multiline retailer Nordstrom, which bucked the trend for its own industry as well as that of specialty retailers, and Lear Corporation, a maker of automotive seating, electrical distribution systems, and related components primarily to automotive original equipment manufacturers. Each of these companies was among the Fund’s larger positions at the end of the first half. RSM’s fifth-largest holding at the end of June, Bed, Bath & Beyond led all detractors. We increased our position throughout the first half in this New Jersey-based retailer of a wide variety of domestic merchandise. Office products retailer Staples was also a large detractor from performance through the end of June, hurt by poor sales. While holdings in the Energy and Health Care sectors posted more-than-respectable net gains in the first half, the Information Technology sector was a source of particular strength, contributing most to results for the semiannual period. Four tech-based names stood out with impressive net gains—SanDisk Corporation, KLA-Tencor, Microsoft Corporation, and Cisco Systems. The stock making the most significant positive impact, however, came from the Energy sector. Helmerich & Payne is a contract drilling company in North and South America that provides drilling rigs, equipment, personnel, and camps on a contract basis. The stock of this Tulsa, Oklahoma-based business appeared to benefit from growing demand for its services in a brisk market for energy services companies. An economic outcome that we increasingly believe in resembles Bill Gross’s “new neutral:” Slower but more consistent growth than we have seen in the past with resulting lower-than-expected inflation and interest rates. This is a variation of the “Goldilocks” outcome—not too hot or too cold. If this is indeed the case, P/E multiples will likely stay at current levels and possibly even increase. |
GOOD IDEAS AT THE TIME | |
| Bed Bath & Beyond | -1.57% |
| Staples | -1.24 |
| Coach | -0.34 |
| Emerson Electric | -0.26 |
| Parker Hannifin | -0.10 |
| 1 Net of dividends. | |
| ROYCE SPECIAL EQUITY MULTI-CAP FUND VS. RUSSELL 1000 Value of $10,000 Invested on 12/31/10 | |
 |
| Includes reinvestment of distributions. |
| PORTFOLIO DIAGNOSTICS | ||||
| Fund Net Assets | $219 million | |||
| Number of Holdings | 28 | |||
| Turnover Rate | 19% | |||
| Average Market Capitalization1 | $26,524 million | |||
| Weighted Average P/E Ratio2,3 | 17.1x | |||
| Weighted Average P/B Ratio2 | 3.1x | |||
| U.S. Investments (% of Net Assets) | 91.0% | |||
| Non-U.S. Investments (% of Net Assets) | 0.0% | |||
| Symbol | ||||
| Investment Class | RSMCX | |||
| Service Class | RSEMX | |||
| Consultant Class | RSMLX | |||
| Institutional Class | RMUIX | |||
1 Geometric Average. This weighted calculation uses each portfolio holding’s market cap in a way designed to not skew the effect of very large or small holdings; instead, it aims to better identify the portfolio’s center, which Royce believes offers a more accurate measure of average market cap than a simple mean or median. | ||||
2 Harmonic Average. This weighted calculation evaluates a portfolio as if it were a single stock and measures it overall. It compares the total market value of the portfolio to the portfolio’s share in the earnings or book value, as the case may be, of its underlying stocks. | ||||
3 The Fund’s P/E ratio calculation excludes companies with zero or negative earnings (0% of portfolio holdings as of 6/30/14). | ||||
| MORNINGSTAR STATISTICAL MEASURES1 | |||
| Sharpe Ratio | Standard Deviation | ||
| RSM | 1.30 | 12.62 | |
| Russell 1000 | 1.29 | 12.57 | |
| Category Median | 1.12 | 13.43 | |
| Best Quartile Breakpoint | 1.26 | 12.34 | |
1 Three years ended 6/30/14. Category Median and Best Quartile Breakpoint based on 1,094 large-cap objective funds (oldest class only) with at least three years of history. | |||
The Fund beat the Russell 1000 and performed within the top 25% of large-cap objective funds on a risk-adjusted basis, as shown by its Sharpe ratio. In addition, the Fund produced lower volatility than 50% of large-cap objective funds, as shown by its standard deviation. | |||
| The Royce Funds 2014 Semiannual Report to Shareholders | 45 |
| Schedules of Investments |
| Royce Pennsylvania Mutual Fund |
| SHARES | VALUE | |||||||
| COMMON STOCKS – 98.8% | ||||||||
| Consumer Discretionary – 14.9% | ||||||||
Auto Components - 1.4% | ||||||||
Dorman Products 1 | 336,600 | $ | 16,601,112 | |||||
Drew Industries | 639,988 | 32,005,800 | ||||||
Gentex Corporation | 787,337 | 22,903,633 | ||||||
Standard Motor Products | 81,643 | 3,646,993 | ||||||
STRATTEC SECURITY | 150,000 | 9,673,500 | ||||||
Superior Industries International | 488,000 | 10,062,560 | ||||||
| 94,893,598 | ||||||||
| Automobiles - 1.0% | ||||||||
Thor Industries | 782,950 | 44,526,367 | ||||||
Winnebago Industries 1 | 890,000 | 22,410,200 | ||||||
| 66,936,567 | ||||||||
| Distributors - 0.9% | ||||||||
Core-Mark Holding Company | 695,842 | 31,751,271 | ||||||
Genuine Parts | 2,500 | 219,500 | ||||||
Pool Corporation | 248,300 | 14,043,848 | ||||||
Weyco Group 2 | 590,500 | 16,185,605 | ||||||
| 62,200,224 | ||||||||
| Diversified Consumer Services - 0.7% | ||||||||
Capella Education | 29 | 1,577 | ||||||
| 200,000 | 1,408,000 | |||||||
| 520,227 | 17,328,762 | |||||||
Sotheby’s | 423,600 | 17,786,964 | ||||||
Universal Technical Institute | 753,700 | 9,149,918 | ||||||
| 45,675,221 | ||||||||
| Hotels, Restaurants & Leisure - 0.0% | ||||||||
Biglari Holdings 1 | 1,760 | 744,427 | ||||||
| Household Durables - 2.4% | ||||||||
Ethan Allen Interiors | 1,106,588 | 27,376,987 | ||||||
Garmin | 3,700 | 225,330 | ||||||
Harman International Industries | 207,800 | 22,323,954 | ||||||
La-Z-Boy | 689,500 | 15,975,715 | ||||||
Mohawk Industries 1 | 166,700 | 23,061,278 | ||||||
NVR 1 | 62,052 | 71,397,032 | ||||||
| 181,584 | 1,677,836 | |||||||
| 162,038,132 | ||||||||
| Internet & Catalog Retail - 0.1% | ||||||||
FTD Companies 1 | 237,760 | 7,558,390 | ||||||
| Leisure Products - 0.1% | ||||||||
Arctic Cat | 129,993 | 5,124,324 | ||||||
Callaway Golf | 250,000 | 2,080,000 | ||||||
| 73,400 | 539,490 | |||||||
Nautilus 1 | 134,800 | 1,494,932 | ||||||
| 9,238,746 | ||||||||
| Media - 1.6% | ||||||||
| 448,600 | 10,434,436 | |||||||
E.W. Scripps Company Cl. A 1 | 206,100 | 4,361,076 | ||||||
Harte-Hanks | 212,600 | 1,528,594 | ||||||
Morningstar | 442,400 | 31,768,744 | ||||||
Rentrak Corporation 1 | 260,765 | 13,677,124 | ||||||
Saga Communications Cl. A | 168,600 | 7,202,592 | ||||||
Scholastic Corporation | 393,900 | 13,428,051 | ||||||
Wiley (John) & Sons Cl. A | 375,593 | 22,757,180 | ||||||
| 105,157,797 | ||||||||
| Multiline Retail - 0.1% | ||||||||
Dollar Tree 1 | 3,900 | 212,394 | ||||||
Tuesday Morning 1 | 495,233 | 8,825,052 | ||||||
| 9,037,446 | ||||||||
| Specialty Retail - 4.8% | ||||||||
Advance Auto Parts | 3,500 | 472,220 | ||||||
American Eagle Outfitters | 1,559,491 | 17,497,489 | ||||||
| 711,516 | 28,140,458 | |||||||
Ascena Retail Group 1 | 2,512,149 | 42,957,748 | ||||||
Buckle (The) | 722,200 | 32,036,792 | ||||||
Cato Corporation (The) Cl. A | 665,163 | 20,553,537 | ||||||
Destination Maternity | 602,759 | 13,724,822 | ||||||
DSW Cl. A | 48,500 | 1,355,090 | ||||||
Finish Line (The) Cl. A | 16,200 | 481,788 | ||||||
GameStop Corporation Cl. A | 769,200 | 31,129,524 | ||||||
Genesco 1 | 672,602 | 55,240,802 | ||||||
Guess? | 398,135 | 10,749,645 | ||||||
Monro Muffler Brake | 308,400 | 16,403,796 | ||||||
Penske Automotive Group | 389,200 | 19,265,400 | ||||||
Ross Stores | 2,400 | 158,712 | ||||||
Shoe Carnival | 895,041 | 18,482,597 | ||||||
Stein Mart | 1,473,242 | 20,463,331 | ||||||
| 329,113,751 | ||||||||
| Textiles, Apparel & Luxury Goods - 1.8% | ||||||||
Barry (R.G.) | 171,656 | 3,252,881 | ||||||
Columbia Sportswear | 10,100 | 834,765 | ||||||
Crocs 1 | 670,620 | 10,079,418 | ||||||
| 294,087 | 25,388,531 | |||||||
G-III Apparel Group 1 | 253,544 | 20,704,403 | ||||||
Movado Group | 310,636 | 12,944,202 | ||||||
Steven Madden 1 | 882,347 | 30,264,502 | ||||||
| 279,980 | 6,123,163 | |||||||
Wolverine World Wide | 387,200 | 10,090,432 | ||||||
| 119,682,297 | ||||||||
| Total (Cost $634,894,305) | 1,012,276,596 | |||||||
| Consumer Staples – 2.1% | ||||||||
| Food & Staples Retailing - 0.1% | ||||||||
Village Super Market Cl. A | 152,461 | 3,602,653 | ||||||
| Food Products - 0.8% | ||||||||
Cal-Maine Foods | 149,021 | 11,075,241 | ||||||
Farmer Bros. 1 | 107,277 | 2,318,256 | ||||||
Industrias Bachoco ADR | 122,586 | 6,591,449 | ||||||
Sanderson Farms | 331,800 | 32,250,960 | ||||||
Seneca Foods Cl. A 1 | 113,589 | 3,475,823 | ||||||
Seneca Foods Cl. B 1 | 7,197 | 214,471 | ||||||
SunOpta 1 | 104,819 | 1,475,851 | ||||||
| 57,402,051 | ||||||||
| Household Products - 0.2% | ||||||||
Harbinger Group 1 | 1,009,600 | 12,821,920 | ||||||
| 46 | The Royce Funds 2014 Semiannual Report to Shareholders | THE ACCOMPANYING NOTES ARE AN INTEGRAL PART OF THESE FINANCIAL STATEMENTS. |
| June 30, 2014 (unaudited) |
| SHARES | VALUE | |||||||
| Consumer Staples (continued) | ||||||||
| Personal Products - 1.0% | ||||||||
Inter Parfums | 554,036 | $ | 16,371,764 | |||||
Nu Skin Enterprises Cl. A | 621,858 | 45,992,618 | ||||||
Nutraceutical International 1 | 312,500 | 7,456,250 | ||||||
| 69,820,632 | ||||||||
| Total (Cost $90,248,241) | 143,647,256 | |||||||
| Diversified Investment Companies – 0.4% | ||||||||
| Closed-End Funds - 0.4% | ||||||||
British Empire Securities and General | ||||||||
Trust | 183,727 | 1,562,719 | ||||||
RIT Capital Partners | 1,042,300 | 23,474,703 | ||||||
| Total (Cost $23,094,444) | 25,037,422 | |||||||
| Energy – 7.2% | ||||||||
| Energy Equipment & Services - 6.8% | �� | |||||||
Atwood Oceanics 1 | 417,621 | 21,916,750 | ||||||
C&J Energy Services 1 | 121,977 | 4,120,383 | ||||||
CARBO Ceramics | 119,000 | 18,340,280 | ||||||
Ensign Energy Services | 1,710,100 | 26,555,791 | ||||||
Era Group 1 | 721,840 | 20,702,371 | ||||||
Exterran Holdings | 784,700 | 35,303,653 | ||||||
Geospace Technologies 1 | 12,400 | 682,992 | ||||||
Helmerich & Payne | 382,983 | 44,468,156 | ||||||
ION Geophysical 1 | 816,700 | 3,446,474 | ||||||
Matrix Service 1 | 83,594 | 2,741,047 | ||||||
Newpark Resources 1 | 176,200 | 2,195,452 | ||||||
Oceaneering International | 2,300 | 179,699 | ||||||
Oil States International 1 | 513,577 | 32,915,150 | ||||||
Pason Systems | 2,036,500 | 57,255,986 | ||||||
Patterson-UTI Energy | 419,800 | 14,667,812 | ||||||
RPC | 1,280,475 | 30,078,358 | ||||||
SEACOR Holdings 1 | 372,636 | 30,649,311 | ||||||
TGS-NOPEC Geophysical | 496,900 | 15,885,959 | ||||||
Tidewater | 119,000 | 6,681,850 | ||||||
Total Energy Services | 247,750 | 5,393,592 | ||||||
Trican Well Service | 1,283,200 | 20,720,244 | ||||||
Unit Corporation 1 | 1,017,213 | 70,014,771 | ||||||
| 464,916,081 | ||||||||
| Oil, Gas & Consumable Fuels - 0.4% | ||||||||
Cimarex Energy | 116,000 | 16,641,360 | ||||||
SM Energy | 14,000 | 1,177,400 | ||||||
Sprott Resource 1 | 2,688,200 | 7,960,932 | ||||||
VAALCO Energy 1 | 151,900 | 1,098,237 | ||||||
World Fuel Services | 4,600 | 226,458 | ||||||
WPX Energy 1 | 66,000 | 1,578,060 | ||||||
| 28,682,447 | ||||||||
| Total (Cost $223,644,502) | 493,598,528 | |||||||
| Financials – 10.7% | ||||||||
| Banks - 0.5% | ||||||||
Camden National | 154,788 | 5,999,583 | ||||||
City Holding Company | 230,370 | 10,394,294 | ||||||
First Citizens BancShares Cl. A | 58,526 | 14,338,870 | ||||||
| 30,732,747 | ||||||||
| Capital Markets - 4.4% | ||||||||
AllianceBernstein Holding L.P. | 1,528,960 | 39,569,485 | ||||||
Artisan Partners Asset Management Cl. A | 10,400 | 589,472 | ||||||
ASA Gold and Precious Metals | 88,100 | 1,290,665 | ||||||
Cohen & Steers | 488,904 | 21,208,656 | ||||||
Cowen Group 1 | 2,152,377 | 9,083,031 | ||||||
Diamond Hill Investment Group | 161,817 | 20,667,267 | ||||||
Federated Investors Cl. B | 2,011,682 | 62,201,207 | ||||||
FXCM Cl. A | 110,860 | 1,658,466 | ||||||
GFI Group | 580,000 | 1,925,600 | ||||||
INTL FCStone 1 | 61,217 | 1,219,443 | ||||||
Lazard Cl. A | 402,827 | 20,769,760 | ||||||
Manning & Napier Cl. A | 677,292 | 11,690,060 | ||||||
MVC Capital | 20,000 | 259,000 | ||||||
Paris Orleans | 178,346 | 4,200,399 | ||||||
Reinet Investments 1 | 228,296 | 5,254,903 | ||||||
Reinet Investments DR 1 | 1,300,000 | 3,092,619 | ||||||
RHJ International 1 | 20,000 | 97,412 | ||||||
SEI Investments | 1,263,500 | 41,404,895 | ||||||
Sprott | 2,740,500 | 7,781,936 | ||||||
Stifel Financial 1 | 38,000 | 1,799,300 | ||||||
Waddell & Reed Financial Cl. A | 315,627 | 19,755,094 | ||||||
Westwood Holdings Group | 392,335 | 23,555,793 | ||||||
| 180,000 | 2,224,800 | |||||||
| 301,299,263 | ||||||||
| Consumer Finance - 0.0% | ||||||||
EZCORP Cl. A 1 | 66,600 | 769,230 | ||||||
| Diversified Financial Services - 1.0% | ||||||||
Bolsa Mexicana de Valores | 6,502,000 | 13,777,314 | ||||||
| 1,319,011 | 31,339,701 | |||||||
Sofina | 209,000 | 24,285,554 | ||||||
| 69,402,569 | ||||||||
| Insurance - 3.4% | ||||||||
Alleghany Corporation 1 | 11,800 | 5,169,816 | ||||||
Allied World Assurance Company | ||||||||
Holdings | 468,858 | 17,825,981 | ||||||
Aspen Insurance Holdings | 185,058 | 8,405,334 | ||||||
Brown & Brown | 41,000 | 1,259,110 | ||||||
E-L Financial | 59,500 | 39,088,609 | ||||||
Erie Indemnity Cl. A | 293,500 | 22,088,810 | ||||||
Greenlight Capital Re Cl. A 1 | 1,156,104 | 38,082,066 | ||||||
MBIA 1 | 2,115,177 | 23,351,554 | ||||||
PartnerRe | 192,981 | 21,075,455 | ||||||
Primerica | 41,000 | 1,961,850 | ||||||
ProAssurance Corporation | 40,400 | 1,793,760 | ||||||
Reinsurance Group of America | 402,421 | 31,751,017 | ||||||
RLI Corp. | 380,681 | 17,427,576 | ||||||
Validus Holdings | 116,700 | 4,462,608 | ||||||
| 233,743,546 | ||||||||
| Real Estate Management & Development - 0.7% | ||||||||
AV Homes 1 | 45,500 | 743,925 | ||||||
Jones Lang LaSalle | 169,500 | 21,423,105 | ||||||
| THE ACCOMPANYING NOTES ARE AN INTEGRAL PART OF THESE FINANCIAL STATEMENTS. | The Royce Funds 2014 Semiannual Report to Shareholders | 47 |
| Schedules of Investments |
| Royce Pennsylvania Mutual Fund (continued) |
| SHARES | VALUE | |||||||
| Financials (continued) | ||||||||
| Real Estate Management & Development (continued) | ||||||||
Kennedy-Wilson Holdings | 310,100 | $ | 8,316,882 | |||||
| 105,000 | 2,670,150 | |||||||
Tejon Ranch 1 | 534,823 | 17,215,952 | ||||||
Tejon Ranch (Warrants) 1 | 4,915 | 14,401 | ||||||
| 50,384,415 | ||||||||
| Thrifts & Mortgage Finance - 0.7% | ||||||||
Genworth MI Canada | 863,377 | 30,754,847 | ||||||
TrustCo Bank Corp. NY | 2,175,051 | 14,529,341 | ||||||
| 45,284,188 | ||||||||
| Total (Cost $556,948,976) | 731,615,958 | |||||||
| Health Care – 6.6% | ||||||||
| Biotechnology - 0.4% | �� | |||||||
| 141,250 | 899,762 | |||||||
| 1,522,400 | 2,451,064 | |||||||
| 626,200 | 24,371,704 | |||||||
| 27,722,530 | ||||||||
| Health Care Equipment & Supplies - 1.7% | ||||||||
Analogic Corporation | 307,000 | 24,019,680 | ||||||
Atrion Corporation | 4,465 | 1,455,590 | ||||||
DENTSPLY International | 10,100 | 478,235 | ||||||
IDEXX Laboratories 1 | 217,800 | 29,091,546 | ||||||
Invacare Corporation | 152,600 | 2,803,262 | ||||||
Merit Medical Systems 1 | 534,586 | 8,072,249 | ||||||
STERIS Corporation | 521,700 | 27,900,516 | ||||||
SurModics 1 | 346,900 | 7,430,598 | ||||||
Thoratec Corporation 1 | 348,300 | 12,141,738 | ||||||
Trinity Biotech ADR Cl. A | 67,600 | 1,556,828 | ||||||
| 114,950,242 | ||||||||
| Health Care Providers & Services - 1.9% | ||||||||
| 38,300 | 1,157,426 | |||||||
Chemed Corporation | 267,148 | 25,037,111 | ||||||
HealthSouth Corporation | 796,313 | 28,563,747 | ||||||
Landauer 2 | 518,700 | 21,785,400 | ||||||
Magellan Health 1 | 95,624 | 5,951,638 | ||||||
MEDNAX 1 | 114,534 | 6,660,152 | ||||||
Owens & Minor | 775,894 | 26,364,878 | ||||||
U.S. Physical Therapy | 492,158 | 16,826,882 | ||||||
| 132,347,234 | ||||||||
| Life Sciences Tools & Services - 2.3% | ||||||||
Bio-Rad Laboratories Cl. A 1 | 98,312 | 11,768,929 | ||||||
Covance 1 | 293,000 | 25,074,940 | ||||||
ICON 1 | 210,200 | 9,902,522 | ||||||
Mettler-Toledo International 1 | 96,100 | 24,330,598 | ||||||
PAREXEL International 1 | 270,000 | 14,266,800 | ||||||
PerkinElmer | 758,120 | 35,510,341 | ||||||
Techne Corporation | 345,200 | 31,955,164 | ||||||
| 152,809,294 | ||||||||
| Pharmaceuticals - 0.3% | ||||||||
Lannett Company 1 | 115,300 | 5,721,186 | ||||||
Medicines Company (The) 1 | 486,132 | 14,126,996 | ||||||
| 19,848,182 | ||||||||
| Total (Cost $284,960,353) | 447,677,482 | |||||||
| Industrials – 23.8% | ||||||||
| Aerospace & Defense - 1.4% | ||||||||
Astronics Corporation 1 | 10,120 | 571,274 | ||||||
Cubic Corporation | 136,363 | 6,069,517 | ||||||
Curtiss-Wright | 265,420 | 17,400,935 | ||||||
HEICO Corporation | 702,735 | 36,500,056 | ||||||
HEICO Corporation Cl. A | 189,940 | 7,711,564 | ||||||
Kratos Defense & Security Solutions 1 | 95,578 | 745,509 | ||||||
Teledyne Technologies 1 | 277,000 | 26,916,090 | ||||||
| 95,914,945 | ||||||||
| Air Freight & Logistics - 1.4% | ||||||||
Echo Global Logistics 1 | 104,489 | 2,003,054 | ||||||
Forward Air | 829,000 | 39,667,650 | ||||||
Hub Group Cl. A 1 | 247,500 | 12,474,000 | ||||||
UTi Worldwide 1 | 3,415,600 | 35,317,304 | ||||||
| 237,292 | 6,791,297 | |||||||
| 96,253,305 | ||||||||
| Building Products - 1.5% | ||||||||
AAON | 1,057,975 | 35,463,322 | ||||||
American Woodmark 1 | 410,774 | 13,091,367 | ||||||
Gibraltar Industries 1 | 615,120 | 9,540,511 | ||||||
Insteel Industries | 308,567 | 6,063,342 | ||||||
NCI Building Systems 1 | 29,626 | 575,633 | ||||||
Simpson Manufacturing | 1,017,200 | 36,985,392 | ||||||
WaterFurnace Renewable Energy | 45,700 | 1,298,128 | ||||||
| 103,017,695 | ||||||||
| Commercial Services & Supplies - 2.6% | ||||||||
Brady Corporation Cl. A | 518,900 | 15,499,543 | ||||||
Brink’s Company (The) | 510,500 | 14,406,310 | ||||||
Copart 1 | 1,197,152 | 43,049,586 | ||||||
Healthcare Services Group | 677,275 | 19,938,976 | ||||||
Heritage-Crystal Clean 1 | 257,656 | 5,057,787 | ||||||
Ritchie Bros. Auctioneers | 1,776,400 | 43,788,260 | ||||||
Team 1 | 551,898 | 22,638,856 | ||||||
UniFirst Corporation | 109,726 | 11,630,956 | ||||||
| 176,010,274 | ||||||||
| Construction & Engineering - 1.1% | ||||||||
Chicago Bridge & Iron | 22,056 | 1,504,219 | ||||||
Comfort Systems USA | 553,491 | 8,745,158 | ||||||
EMCOR Group | 682,200 | 30,378,366 | ||||||
KBR | 1,430,572 | 34,119,142 | ||||||
| 74,746,885 | ||||||||
| Electrical Equipment - 2.1% | ||||||||
AZZ | 215,958 | 9,951,344 | ||||||
Encore Wire | 295,479 | 14,490,290 | ||||||
EnerSys | 128,200 | 8,818,878 | ||||||
Franklin Electric | 789,200 | 31,828,436 | ||||||
Global Power Equipment Group | 764,400 | 12,352,704 | ||||||
| 1,762,106 | 18,431,629 | |||||||
| 48 | The Royce Funds 2014 Semiannual Report to Shareholders | THE ACCOMPANYING NOTES ARE AN INTEGRAL PART OF THESE FINANCIAL STATEMENTS. |
| June 30, 2014 (unaudited) |
| SHARES | VALUE | |||||||
| Industrials (continued) | ||||||||
| Electrical Equipment (continued) | ||||||||
Powell Industries | 386,431 | $ | 25,264,859 | |||||
Preformed Line Products 2 | 352,478 | 18,973,891 | ||||||
| 140,112,031 | ||||||||
| Industrial Conglomerates - 0.4% | ||||||||
Carlisle Companies | 42,100 | 3,646,702 | ||||||
Raven Industries | 783,570 | 25,967,510 | ||||||
| 29,614,212 | ||||||||
| Machinery - 7.9% | ||||||||
AGCO Corporation | 3,600 | 202,392 | ||||||
Alamo Group | 312,457 | 16,900,799 | ||||||
Chart Industries 1 | 19,500 | 1,613,430 | ||||||
CIRCOR International | 507,852 | 39,170,625 | ||||||
CLARCOR | 517,500 | 32,007,375 | ||||||
Columbus McKinnon | 166,550 | 4,505,178 | ||||||
Donaldson Company | 717,400 | 30,360,368 | ||||||
Foster (L.B.) Company | 181,898 | 9,844,320 | ||||||
Gorman-Rupp Company (The) | 62,166 | 2,198,811 | ||||||
Graco | 412,749 | 32,227,442 | ||||||
Graham Corporation | 39,498 | 1,374,925 | ||||||
Harsco Corporation | 100,000 | 2,663,000 | ||||||
IDEX Corporation | 30,000 | 2,422,200 | ||||||
John Bean Technologies | 1,015,250 | 31,462,598 | ||||||
Kadant | 74,800 | 2,876,060 | ||||||
Kennametal | 915,098 | 42,350,735 | ||||||
Lincoln Electric Holdings | 364,860 | 25,496,417 | ||||||
Lindsay Corporation | 158,000 | 13,346,260 | ||||||
Miller Industries | 181,425 | 3,733,727 | ||||||
Mueller Industries | 8,000 | 235,280 | ||||||
Mueller Water Products Cl. A | 16,200 | 139,968 | ||||||
Nordson Corporation | 284,600 | 22,822,074 | ||||||
| 75,110 | 6,153,011 | |||||||
RBC Bearings | 675,100 | 43,240,155 | ||||||
Semperit AG Holding | 33,497 | 2,052,568 | ||||||
Standex International | 33,100 | 2,465,288 | ||||||
Sun Hydraulics | 651,710 | 26,459,426 | ||||||
Tennant Company | 583,300 | 44,517,456 | ||||||
Timken Company (The) | 78,000 | 5,291,520 | ||||||
Valmont Industries | 291,100 | 44,232,645 | ||||||
WABCO Holdings 1 | 140,800 | 15,040,256 | ||||||
Wabtec Corporation | 364,622 | 30,114,131 | ||||||
| 537,520,440 | ||||||||
| Professional Services - 2.7% | ||||||||
Acacia Research | 1,396,516 | 24,788,159 | ||||||
Advisory Board (The) 1 | 665,923 | 34,494,811 | ||||||
Barrett Business Services | 160,800 | 7,557,600 | ||||||
Corporate Executive Board | 95,600 | 6,521,832 | ||||||
CRA International 1 | 390,931 | 9,010,960 | ||||||
Exponent | 269,639 | 19,982,946 | ||||||
Franklin Covey 1 | 120,200 | 2,419,626 | ||||||
GP Strategies 1 | 96,615 | 2,500,396 | ||||||
Huron Consulting Group 1 | 1,800 | 127,476 | ||||||
ICF International 1 | 163,135 | 5,768,454 | ||||||
ManpowerGroup | 357,305 | 30,317,329 | ||||||
Navigant Consulting 1 | 50,000 | 872,500 | ||||||
On Assignment 1 | 34,595 | 1,230,544 | ||||||
Robert Half International | 341,200 | 16,288,888 | ||||||
RPX Corporation 1 | 215,900 | 3,832,225 | ||||||
Towers Watson & Co. Cl. A | 129,000 | 13,445,670 | ||||||
TrueBlue 1 | 241,405 | 6,655,536 | ||||||
| 185,814,952 | ||||||||
| Road & Rail - 1.1% | ||||||||
Contrans Group Cl. A | 70,000 | 937,445 | ||||||
Knight Transportation | 321,000 | 7,630,170 | ||||||
Landstar System | 571,800 | 36,595,200 | ||||||
Patriot Transportation Holding 1 | 254,400 | 8,896,368 | ||||||
Universal Truckload Services | 775,784 | 19,673,882 | ||||||
| 73,733,065 | ||||||||
| Trading Companies & Distributors - 1.3% | ||||||||
Aceto Corporation | 363,900 | 6,601,146 | ||||||
Air Lease Cl. A | 26,000 | 1,003,080 | ||||||
Applied Industrial Technologies | 858,543 | 43,553,887 | ||||||
MSC Industrial Direct Cl. A | 392,480 | 37,536,787 | ||||||
| 88,694,900 | ||||||||
| Transportation Infrastructure - 0.3% | ||||||||
Wesco Aircraft Holdings 1 | 1,141,187 | 22,778,092 | ||||||
| Total (Cost $910,797,978) | 1,624,210,796 | |||||||
| Information Technology – 20.7% | ||||||||
| Communications Equipment - 2.1% | ||||||||
ADTRAN | 1,324,615 | 29,883,314 | ||||||
Bel Fuse Cl. B | 11,874 | 304,806 | ||||||
Black Box | 142,502 | 3,340,247 | ||||||
Brocade Communications Systems | 2,126,619 | 19,564,895 | ||||||
CalAmp Corporation 1 | 50,600 | 1,095,996 | ||||||
Digi International 1 | 388,644 | 3,661,026 | ||||||
| 74,000 | 1,461,500 | |||||||
NETGEAR 1 | 1,163,418 | 40,452,044 | ||||||
Oplink Communications 1 | 68,467 | 1,161,885 | ||||||
Plantronics | 568,602 | 27,321,326 | ||||||
Polycom 1 | 165,000 | 2,067,450 | ||||||
TESSCO Technologies | 275,481 | 8,741,012 | ||||||
| 139,055,501 | ||||||||
| Electronic Equipment, Instruments & Components - 9.1% | ||||||||
Anixter International | 321,964 | 32,218,937 | ||||||
Avnet | 8,300 | 367,773 | ||||||
AVX Corporation | 1,454,621 | 19,317,367 | ||||||
Badger Meter | 273,514 | 14,400,512 | ||||||
Benchmark Electronics 1 | 918,700 | 23,408,476 | ||||||
Cognex Corporation 1 | 835,590 | 32,086,656 | ||||||
Coherent 1 | 644,050 | 42,616,789 | ||||||
Dolby Laboratories Cl. A 1 | 543,550 | 23,481,360 | ||||||
| 1,069,829 | 19,695,552 | |||||||
Fabrinet 1 | 1,604,544 | 33,053,606 | ||||||
FARO Technologies 1 | 378,900 | 18,611,568 | ||||||
FLIR Systems | 954,000 | 33,132,420 | ||||||
Hollysys Automation Technologies 1 | 415,400 | 10,173,146 | ||||||
IPG Photonics 1 | 495,930 | 34,119,984 | ||||||
| 697,835 | 7,313,311 | |||||||
| THE ACCOMPANYING NOTES ARE AN INTEGRAL PART OF THESE FINANCIAL STATEMENTS. | The Royce Funds 2014 Semiannual Report to Shareholders | 49 |
| Schedules of Investments |
| Royce Pennsylvania Mutual Fund (continued) |
| SHARES | VALUE | |||||||
| Information Technology (continued) | ||||||||
| Electronic Equipment, Instruments & Components (continued) | ||||||||
Methode Electronics | 469,350 | $ | 17,933,864 | |||||
MTS Systems | 528,874 | 35,836,502 | ||||||
National Instruments | 1,266,700 | 41,028,413 | ||||||
Newport Corporation 1 | 1,636,722 | 30,279,357 | ||||||
Park Electrochemical | 32,200 | 908,362 | ||||||
PC Connection | 759,823 | 15,713,140 | ||||||
Plexus Corporation 1 | 748,800 | 32,415,552 | ||||||
Richardson Electronics | 157,551 | 1,649,559 | ||||||
Rofin-Sinar Technologies 1 | 965,621 | 23,213,529 | ||||||
Rogers Corporation 1 | 292,481 | 19,406,114 | ||||||
TTM Technologies 1 | 375,000 | 3,075,000 | ||||||
Vishay Intertechnology | 2,087,309 | 32,332,416 | ||||||
Zebra Technologies Cl. A 1 | 288,230 | 23,727,094 | ||||||
| 621,516,359 | ||||||||
| Internet Software & Services - 0.4% | ||||||||
Blucora 1 | 50,000 | 943,500 | ||||||
Envestnet 1 | 322,401 | 15,771,857 | ||||||
j2 Global | 55,000 | 2,797,300 | ||||||
Move 1 | 99,100 | 1,465,689 | ||||||
Support.com 1 | 650,300 | 1,762,313 | ||||||
| 277,900 | 6,569,556 | |||||||
Xoom Corporation 1 | 25,000 | 659,000 | ||||||
| 29,969,215 | ||||||||
| IT Services - 2.6% | ||||||||
Computer Task Group | 526,272 | 8,662,437 | ||||||
Convergys Corporation | 945,293 | 20,267,082 | ||||||
CoreLogic 1 | 319,000 | 9,684,840 | ||||||
Fiserv 1 | 5,000 | 301,600 | ||||||
Forrester Research | 312,400 | 11,833,712 | ||||||
Innodata 1 | 87,960 | 283,231 | ||||||
ManTech International Cl. A | 830,470 | 24,515,474 | ||||||
MAXIMUS | 696,500 | 29,963,430 | ||||||
MoneyGram International 1 | 1,011,539 | 14,899,970 | ||||||
| 15,700 | 408,514 | |||||||
Sapient Corporation 1 | 2,011,700 | 32,690,125 | ||||||
| 815,761 | 4,731,414 | |||||||
Sykes Enterprises 1 | 238,902 | 5,191,340 | ||||||
Syntel 1 | 138,400 | 11,896,864 | ||||||
Teradata Corporation 1 | 3,000 | 120,600 | ||||||
| 175,450,633 | ||||||||
| Semiconductors & Semiconductor Equipment - 3.5% | ||||||||
Advanced Energy Industries 1 | 697,414 | 13,425,220 | ||||||
Brooks Automation | 405,700 | 4,369,389 | ||||||
Cabot Microelectronics 1 | 520,900 | 23,258,185 | ||||||
Diodes 1 | 1,286,000 | 37,242,560 | ||||||
Entropic Communications 1 | 19,953 | 66,443 | ||||||
Exar Corporation 1 | 824,441 | 9,316,183 | ||||||
Fairchild Semiconductor International 1 | 1,151,800 | 17,968,080 | ||||||
Integrated Silicon Solution 1 | 293,833 | 4,339,913 | ||||||
International Rectifier 1 | 810,900 | 22,624,110 | ||||||
IXYS Corporation | 434,105 | 5,348,174 | ||||||
Kulicke & Soffa Industries 1 | 140,200 | 1,999,252 | ||||||
Lam Research | 3,500 | 236,530 | ||||||
Micrel | 1,080,800 | 12,191,424 | ||||||
MKS Instruments | 1,061,025 | 33,146,421 | ||||||
Nanometrics 1 | 284,971 | 5,200,721 | ||||||
OmniVision Technologies 1 | 301,700 | 6,631,366 | ||||||
Photronics 1 | 266,660 | 2,293,276 | ||||||
Rudolph Technologies 1 | 101,722 | 1,005,013 | ||||||
Silicon Motion Technology ADR | 99,500 | 2,032,785 | ||||||
Skyworks Solutions | 5,900 | 277,064 | ||||||
Synaptics 1 | 63,500 | 5,755,640 | ||||||
Teradyne | 635,196 | 12,449,842 | ||||||
Tessera Technologies | 104,300 | 2,302,944 | ||||||
| 363,000 | 13,525,380 | |||||||
| 237,005,915 | ||||||||
| Software - 2.1% | ||||||||
ACI Worldwide 1 | 467,300 | 26,089,359 | ||||||
Blackbaud | 626,691 | 22,397,936 | ||||||
| 177,700 | 5,531,801 | |||||||
ePlus 1 | 293,028 | 17,054,230 | ||||||
Fair Isaac | 481,600 | 30,706,816 | ||||||
Manhattan Associates 1 | 219,396 | 7,553,804 | ||||||
Mentor Graphics | 7,900 | 170,403 | ||||||
MICROS Systems 1 | 4,600 | 312,340 | ||||||
Monotype Imaging Holdings | 668,400 | 18,828,828 | ||||||
Rovi Corporation 1 | 537,884 | 12,887,701 | ||||||
| 141,533,218 | ||||||||
| Technology Hardware, Storage & Peripherals - 0.9% | ||||||||
Diebold | 941,832 | 37,833,391 | ||||||
| 393,551 | 3,785,961 | |||||||
| 178,200 | 20,248,866 | |||||||
Western Digital | 2,300 | 212,290 | ||||||
| 62,080,508 | ||||||||
| Total (Cost $989,598,415) | 1,406,611,349 | |||||||
| Materials – 10.8% | ||||||||
| Chemicals - 3.5% | ||||||||
Balchem Corporation | 732,100 | 39,211,276 | ||||||
Cabot Corporation | 491,800 | 28,519,482 | ||||||
FutureFuel Corporation | 824,656 | 13,681,043 | ||||||
Hawkins | 29,617 | 1,099,975 | ||||||
Innophos Holdings | 76,294 | 4,392,246 | ||||||
Innospec | 932,080 | 40,237,894 | ||||||
| 118,000 | 1,977,680 | |||||||
Minerals Technologies | 264,037 | 17,315,546 | ||||||
OM Group | 112,000 | 3,632,160 | ||||||
Quaker Chemical | 389,088 | 29,878,067 | ||||||
Rockwood Holdings | 4,800 | 364,752 | ||||||
Schulman (A.) | 269,690 | 10,437,003 | ||||||
Sensient Technologies | 19,200 | 1,069,824 | ||||||
Stepan Company | 318,614 | 16,841,936 | ||||||
Westlake Chemical | 391,900 | 32,825,544 | ||||||
| 241,484,428 | ||||||||
| Construction Materials - 0.2% | ||||||||
Ash Grove Cement 4 | 50,018 | 11,504,140 | ||||||
| Containers & Packaging - 0.9% | ||||||||
AptarGroup | 493,000 | 33,035,930 | ||||||
| 50 | The Royce Funds 2014 Semiannual Report to Shareholders | THE ACCOMPANYING NOTES ARE AN INTEGRAL PART OF THESE FINANCIAL STATEMENTS. |
| June 30, 2014 (unaudited) |
| SHARES | VALUE | |||||||
| Materials (continued) | ||||||||
| Containers & Packaging (continued) | ||||||||
Greif Cl. A | 518,468 | $ | 28,287,614 | |||||
UFP Technologies 1 | 9,819 | 236,540 | ||||||
| 61,560,084 | ||||||||
| Metals & Mining - 5.4% | ||||||||
Allegheny Technologies | 613,046 | 27,648,375 | ||||||
Carpenter Technology | 42,900 | 2,713,425 | ||||||
Commercial Metals | 1,103,700 | 19,105,047 | ||||||
Compass Minerals International | 193,826 | 18,556,901 | ||||||
Franco-Nevada Corporation | 66,200 | 3,795,908 | ||||||
Globe Specialty Metals | 1,441,803 | 29,960,666 | ||||||
Gold Fields ADR | 520,000 | 1,934,400 | ||||||
Haynes International | 583,795 | 33,036,959 | ||||||
Hecla Mining | 228,300 | 787,635 | ||||||
Horsehead Holding Corporation 1 | 588,700 | 10,749,662 | ||||||
IAMGOLD Corporation 1 | 160,000 | 659,200 | ||||||
Major Drilling Group International | 2,281,200 | 16,611,147 | ||||||
Materion Corporation | 50,000 | 1,849,500 | ||||||
Olympic Steel | 29,000 | 717,750 | ||||||
Pan American Silver | 1,183,100 | 18,160,585 | ||||||
| 2,053,787 | 16,995,398 | |||||||
Reliance Steel & Aluminum | 1,009,520 | 74,411,719 | ||||||
RTI International Metals 1 | 249,792 | 6,641,969 | ||||||
Schnitzer Steel Industries Cl. A | 750,410 | 19,563,189 | ||||||
Seabridge Gold 1 | 1,930,404 | 18,107,190 | ||||||
Sims Metal Management 1 | 1,807,445 | 16,497,911 | ||||||
Steel Dynamics | 383,521 | 6,884,202 | ||||||
Universal Stainless & Alloy Products 1 | 20,000 | 649,600 | ||||||
Victoria Gold 1 | 190,000 | 24,038 | ||||||
Worthington Industries | 523,733 | 22,541,468 | ||||||
| 368,603,844 | ||||||||
| Paper & Forest Products - 0.8% | ||||||||
Glatfelter | 13,200 | 350,196 | ||||||
Schweitzer-Mauduit International | 476,984 | 20,825,122 | ||||||
Stella-Jones | 1,180,300 | 32,409,718 | ||||||
| 53,585,036 | ||||||||
| Total (Cost $537,747,053) | 736,737,532 | |||||||
| Telecommunication Services – 0.2% | ||||||||
| Diversified Telecommunication Services - 0.1% | ||||||||
Premiere Global Services 1 | 601,500 | 8,030,025 | ||||||
| Wireless Telecommunication Services - 0.1% | ||||||||
Telephone and Data Systems | 142,000 | 3,707,620 | ||||||
| Total (Cost $8,885,345) | 11,737,645 | |||||||
| Utilities – 0.0% | ||||||||
| Gas Utilities - 0.0% | ||||||||
UGI Corporation | 7,500 | 378,750 | ||||||
| Total (Cost $311,190) | 378,750 | |||||||
| Miscellaneous 5 – 1.4% | ||||||||
| Total (Cost $68,837,686) | 95,776,036 | |||||||
| TOTAL COMMON STOCKS | ||||||||
(Cost $4,329,968,488) | $ | 6,729,305,350 | ||||||
| REPURCHASE AGREEMENT – 3.0% | ||||||||
| Fixed Income Clearing Corporation, | ||||||||
0.00% dated 6/30/14, due 7/1/14, | ||||||||
maturity value $202,919,000 (collateralized | ||||||||
by obligations of various U.S. Government | ||||||||
Agencies, 2.00% due 9/30/20, valued at | ||||||||
$206,980,594) | ||||||||
(Cost $202,919,000) | 202,919,000 | |||||||
| COLLATERAL RECEIVED FOR SECURITIES | ||||||||
LOANED – 1.1% | ||||||||
| Money Market Funds | ||||||||
Federated Government Obligations Fund | ||||||||
(7 day yield-0.0099%) | ||||||||
(Cost $77,437,178) | 77,437,178 | |||||||
| TOTAL INVESTMENTS – 102.9% | ||||||||
(Cost $4,610,324,666) | 7,009,661,528 | |||||||
| LIABILITIES LESS CASH | ||||||||
AND OTHER ASSETS – (2.9)% | (196,719,282 | ) | ||||||
| NET ASSETS – 100.0% | $ | 6,812,942,246 | ||||||
| THE ACCOMPANYING NOTES ARE AN INTEGRAL PART OF THESE FINANCIAL STATEMENTS. | The Royce Funds 2014 Semiannual Report to Shareholders | 51 |
| Schedules of Investments |
| Royce Micro-Cap Fund |
| SHARES | VALUE | |||||||
| COMMON STOCKS – 96.8% | ||||||||
| Consumer Discretionary – 14.9% | ||||||||
| Auto Components - 0.9% | ||||||||
Drew Industries | 129,378 | $ | 6,470,194 | |||||
| Diversified Consumer Services - 3.4% | ||||||||
American Public Education 1 | 193,930 | 6,667,313 | ||||||
Capella Education | 126,951 | 6,904,865 | ||||||
JTH Holding Cl. A 1 | 176,281 | 5,871,920 | ||||||
Lincoln Educational Services 2 | 1,200,543 | 5,390,438 | ||||||
| 24,834,536 | ||||||||
| Household Durables - 0.9% | ||||||||
Cavco Industries 1 | 79,910 | 6,816,323 | ||||||
| Internet & Catalog Retail - 0.3% | ||||||||
Vitacost.com 1 | 353,400 | 2,212,284 | ||||||
| Leisure Products - 1.3% | ||||||||
Black Diamond 1 | 88,619 | 994,305 | ||||||
LeapFrog Enterprises Cl. A 1 | 479,200 | 3,522,120 | ||||||
| 350,165 | 5,091,399 | |||||||
| 9,607,824 | ||||||||
| Specialty Retail - 7.3% | ||||||||
Buckle (The) | 121,275 | 5,379,759 | ||||||
Cato Corporation (The) Cl. A | 208,250 | 6,434,925 | ||||||
Citi Trends 1 | 188,524 | 4,045,725 | ||||||
Destination Maternity | 265,356 | 6,042,156 | ||||||
| 202,747 | 2,061,937 | |||||||
Kirkland’s 1 | 384,838 | 7,138,745 | ||||||
Shoe Carnival | 376,114 | 7,766,754 | ||||||
Stein Mart | 597,484 | 8,299,053 | ||||||
Zumiez 1 | 241,700 | 6,668,503 | ||||||
| 53,837,557 | ||||||||
| Textiles, Apparel & Luxury Goods - 0.8% | ||||||||
Culp | 194,874 | 3,392,756 | ||||||
Perry Ellis International 1 | 131,361 | 2,290,936 | ||||||
| 5,683,692 | ||||||||
| Total (Cost $83,815,985) | 109,462,410 | |||||||
| Consumer Staples – 1.0% | ||||||||
| Beverages - 0.1% | ||||||||
| 191,900 | 976,771 | |||||||
| Food Products - 0.7% | ||||||||
Asian Citrus Holdings | 4,092,900 | 918,875 | ||||||
Sipef | 36,748 | 3,139,908 | ||||||
| 2,760,860 | 1,049,127 | |||||||
| 5,107,910 | ||||||||
| Personal Products - 0.2% | ||||||||
Medifast 1 | 34,100 | 1,036,981 | ||||||
| Total (Cost $5,142,628) | 7,121,662 | |||||||
| Energy – 8.9% | ||||||||
| Energy Equipment & Services - 6.5% | ||||||||
Canadian Energy Services & Technology | 61,600 | 1,929,312 | ||||||
Dawson Geophysical | 125,333 | 3,590,791 | ||||||
| 45,740 | 2,519,359 | |||||||
Gulf Island Fabrication | 370,389 | 7,970,771 | ||||||
Natural Gas Services Group 1 | 228,387 | 7,550,474 | ||||||
Tesco Corporation | 395,200 | 8,433,568 | ||||||
TGC Industries 1 | 973,772 | 5,307,057 | ||||||
Total Energy Services | 477,400 | 10,393,142 | ||||||
| 47,694,474 | ||||||||
| Oil, Gas & Consumable Fuels - 2.4% | ||||||||
Ardmore Shipping | 75,675 | 1,046,585 | ||||||
Contango Oil & Gas 1 | 45,073 | 1,907,039 | ||||||
| 99,500 | 1,736,275 | |||||||
Sprott Resource 1 | 1,612,800 | 4,776,204 | ||||||
Synergy Resources 1 | 201,200 | 2,665,900 | ||||||
| 501,363 | 5,891,015 | |||||||
| 18,023,018 | ||||||||
| Total (Cost $37,494,502) | 65,717,492 | |||||||
| Financials – 8.3% | ||||||||
| Banks - 1.2% | ||||||||
BCB Holdings 1 | 2,760,860 | 626,054 | ||||||
| 64,700 | 1,180,775 | |||||||
Pacific Continental | 296,897 | 4,076,396 | ||||||
TriState Capital Holdings 1 | 229,157 | 3,237,988 | ||||||
| 9,121,213 | ||||||||
| Capital Markets - 4.0% | ||||||||
FBR & Co. 1 | 196,834 | 5,340,106 | ||||||
Gluskin Sheff + Associates | 70,100 | �� | 2,091,733 | |||||
GMP Capital | 436,600 | 3,486,090 | ||||||
INTL FCStone 1 | 299,055 | 5,957,176 | ||||||
JMP Group | 348,749 | 2,640,030 | ||||||
Silvercrest Asset Management Group Cl. A | 170,200 | 2,929,142 | ||||||
U.S. Global Investors Cl. A | 381,749 | 1,343,756 | ||||||
Westwood Holdings Group | 87,372 | 5,245,815 | ||||||
| 29,033,848 | ||||||||
| Diversified Financial Services - 0.4% | ||||||||
PICO Holdings 1 | 133,823 | 3,179,635 | ||||||
| Insurance - 0.6% | ||||||||
Blue Capital Reinsurance Holdings | 115,800 | 2,281,260 | ||||||
Navigators Group 1 | 34,164 | 2,290,696 | ||||||
| 4,571,956 | ||||||||
| Real Estate Management & Development - 2.1% | ||||||||
AV Homes 1 | 161,500 | 2,640,525 | ||||||
Kennedy-Wilson Holdings | 361,481 | 9,694,920 | ||||||
Midland Holdings 1 | 6,057,400 | 3,048,083 | ||||||
| 15,383,528 | ||||||||
| Total (Cost $45,591,729) | 61,290,180 | |||||||
| Health Care – 9.8% | ||||||||
| Biotechnology - 0.8% | ||||||||
BioSpecifics Technologies 1 | 60,300 | 1,625,688 | ||||||
Dyax Corporation 1 | 215,219 | 2,066,103 | ||||||
| 98,669 | 1,031,091 | |||||||
| 52 | The Royce Funds 2014 Semiannual Report to Shareholders | THE ACCOMPANYING NOTES ARE AN INTEGRAL PART OF THESE FINANCIAL STATEMENTS. |
| June 30, 2014 (unaudited) |
| SHARES | VALUE | |||||||
| Health Care (continued) | ||||||||
| Biotechnology (continued) | ||||||||
Lexicon Pharmaceuticals 1 | 778,771 | $ | 1,253,821 | |||||
| 5,976,703 | ||||||||
| Health Care Equipment & Supplies - 5.1% | ||||||||
| 699,061 | 2,901,103 | |||||||
CryoLife | 253,155 | 2,265,737 | ||||||
Cynosure Cl. A 1 | 146,269 | 3,108,216 | ||||||
| 572,400 | 892,944 | |||||||
Exactech 1 | 117,748 | 2,970,782 | ||||||
Merit Medical Systems 1 | 227,320 | 3,432,532 | ||||||
| 34,121 | 562,314 | |||||||
Orthofix International 1 | 31,900 | 1,156,375 | ||||||
RTI Surgical 1 | 461,500 | 2,007,525 | ||||||
STAAR Surgical 1 | 135,451 | 2,275,577 | ||||||
SurModics 1 | 230,722 | 4,942,065 | ||||||
Symmetry Medical 1 | 182,984 | 1,621,238 | ||||||
Synergetics USA 1 | 586,862 | 1,819,272 | ||||||
Syneron Medical 1 | 520,790 | 5,374,553 | ||||||
Trinity Biotech ADR Cl. A | 86,376 | 1,989,240 | ||||||
| 37,319,473 | ||||||||
| Health Care Providers & Services - 2.4% | ||||||||
| 91,734 | 2,772,201 | |||||||
CorVel Corporation 1 | 115,565 | 5,221,227 | ||||||
PDI 1 | 422,219 | 1,849,319 | ||||||
U.S. Physical Therapy | 223,740 | 7,649,671 | ||||||
| 17,492,418 | ||||||||
| Life Sciences Tools & Services - 0.3% | ||||||||
Harvard Bioscience 1 | 473,479 | 2,154,330 | ||||||
| Pharmaceuticals - 1.2% | ||||||||
| 144,882 | 1,263,371 | |||||||
| 56,000 | 1,785,280 | |||||||
Unichem Laboratories | 475,518 | 1,785,218 | ||||||
Vetoquinol | 65,712 | 3,255,457 | ||||||
| 416,400 | 836,964 | |||||||
| 8,926,290 | ||||||||
| Total (Cost $46,198,005) | 71,869,214 | |||||||
| Industrials – 25.5% | ||||||||
| Aerospace & Defense - 1.1% | ||||||||
AeroVironment 1 | 102,000 | 3,243,600 | ||||||
American Science and Engineering | 42,418 | 2,951,869 | ||||||
CPI Aerostructures 1 | 128,362 | 1,626,346 | ||||||
| 7,821,815 | ||||||||
| Building Products - 2.4% | ||||||||
AAON | 139,466 | 4,674,900 | ||||||
Quanex Building Products | 300,000 | 5,361,000 | ||||||
WaterFurnace Renewable Energy | 254,900 | 7,240,541 | ||||||
| 17,276,441 | ||||||||
| Commercial Services & Supplies - 2.3% | ||||||||
Courier Corporation | 196,782 | 2,935,987 | ||||||
Ennis | 381,751 | 5,825,520 | ||||||
Heritage-Crystal Clean 1 | 122,931 | 2,413,136 | ||||||
| 450,904 | 1,303,113 | |||||||
Team 1 | 57,500 | 2,358,650 | ||||||
US Ecology | 45,200 | 2,212,540 | ||||||
| 17,048,946 | ||||||||
| Construction & Engineering - 2.3% | ||||||||
Layne Christensen 1 | 272,260 | 3,621,058 | ||||||
MYR Group 1 | 218,700 | 5,539,671 | ||||||
Severfield 1 | 4,339,658 | 4,121,924 | ||||||
Sterling Construction 1 | 420,875 | 3,947,807 | ||||||
| 17,230,460 | ||||||||
| Electrical Equipment - 3.0% | ||||||||
Global Power Equipment Group | 475,312 | 7,681,042 | ||||||
Graphite India | 2,161,592 | 3,786,245 | ||||||
LSI Industries | 840,136 | 6,704,285 | ||||||
Powell Industries | 62,300 | 4,073,174 | ||||||
| 22,244,746 | ||||||||
| Machinery - 6.8% | ||||||||
AIA Engineering | 103,687 | 1,337,786 | ||||||
CIRCOR International | 25,759 | 1,986,792 | ||||||
Foster (L.B.) Company | 160,856 | 8,705,527 | ||||||
FreightCar America | 295,109 | 7,389,529 | ||||||
Gorman-Rupp Company (The) | 86,713 | 3,067,039 | ||||||
Graham Corporation | 190,788 | 6,641,330 | ||||||
Kadant | 167,616 | 6,444,835 | ||||||
| 370,814 | 4,568,428 | |||||||
RBC Bearings | 64,869 | 4,154,859 | ||||||
Semperit AG Holding | 98,178 | 6,015,974 | ||||||
| 50,312,099 | ||||||||
| Marine - 0.4% | ||||||||
Clarkson | 68,500 | 2,807,680 | ||||||
| Professional Services - 4.2% | ||||||||
CRA International 1 | 283,483 | 6,534,283 | ||||||
Exponent | 48,435 | 3,589,518 | ||||||
GP Strategies 1 | 245,818 | 6,361,770 | ||||||
Kforce | 284,358 | 6,156,351 | ||||||
Resources Connection | 646,279 | 8,472,717 | ||||||
| 31,114,639 | ||||||||
| Road & Rail - 2.5% | ||||||||
Marten Transport | 358,656 | 8,015,962 | ||||||
Patriot Transportation Holding 1 | 296,869 | 10,381,509 | ||||||
| 18,397,471 | ||||||||
| Trading Companies & Distributors - 0.5% | ||||||||
Houston Wire & Cable | 297,600 | 3,693,216 | ||||||
| Total (Cost $138,358,756) | 187,947,513 | |||||||
| Information Technology – 14.4% | ||||||||
| Communications Equipment - 1.7% | ||||||||
| 322,931 | 820,245 | |||||||
COM DEV International | 423,800 | 1,695,915 | ||||||
Digi International 1 | 384,834 | 3,625,136 | ||||||
KVH Industries 1 | 373,300 | 4,864,099 | ||||||
NumereX Corporation Cl. A 1 | 102,332 | 1,175,794 | ||||||
| 12,181,189 | ||||||||
| THE ACCOMPANYING NOTES ARE AN INTEGRAL PART OF THESE FINANCIAL STATEMENTS. | The Royce Funds 2014 Semiannual Report to Shareholders | 53 |
| Schedules of Investments |
| Royce Micro-Cap Fund (continued) |
| SHARES | VALUE | |||||||
| Information Technology (continued) | ||||||||
| Electronic Equipment, Instruments & Components - 3.0% | ||||||||
CUI Global 1 | 346,038 | $ | 2,906,719 | |||||
Electro Rent | 190,400 | 3,185,392 | ||||||
Fabrinet 1 | 308,045 | 6,345,727 | ||||||
GSI Group 1 | 439,000 | 5,588,470 | ||||||
| 302,396 | 946,500 | |||||||
Pure Technologies | 60,000 | 402,043 | ||||||
Vishay Precision Group 1 | 177,100 | 2,915,066 | ||||||
| 22,289,917 | ||||||||
| Internet Software & Services - 0.6% | ||||||||
QuinStreet 1 | 505,200 | 2,783,652 | ||||||
Zix Corporation 1 | 546,400 | 1,868,688 | ||||||
| 4,652,340 | ||||||||
| IT Services - 0.4% | ||||||||
EPAM Systems 1 | 52,317 | 2,288,869 | ||||||
ServiceSource International 1 | 54,000 | 313,200 | ||||||
| 2,602,069 | ||||||||
| Semiconductors & Semiconductor Equipment - 5.0% | ||||||||
Advanced Energy Industries 1 | 239,074 | 4,602,174 | ||||||
AXT 1 | 1,187,720 | 2,541,721 | ||||||
Brooks Automation | 603,400 | 6,498,618 | ||||||
Cascade Microtech 1 | 78,088 | 1,066,682 | ||||||
| 776,061 | 4,625,324 | |||||||
Integrated Silicon Solution 1 | 465,900 | 6,881,343 | ||||||
Photronics 1 | 333,600 | 2,868,960 | ||||||
Rudolph Technologies 1 | 203,351 | 2,009,108 | ||||||
Ultra Clean Holdings 1 | 136,700 | 1,237,135 | ||||||
Xcerra Corporation 1 | 491,961 | 4,476,845 | ||||||
| 36,807,910 | ||||||||
| Software - 3.1% | ||||||||
ePlus 1 | 105,567 | 6,143,999 | ||||||
| 118,548 | 2,269,009 | |||||||
Monotype Imaging Holdings | 199,187 | 5,611,098 | ||||||
TeleNav 1 | 464,900 | 2,645,281 | ||||||
VASCO Data Security International 1 | 550,009 | 6,380,104 | ||||||
| 23,049,491 | ||||||||
| Technology Hardware, Storage & Peripherals - 0.6% | ||||||||
| 183,843 | 1,360,438 | |||||||
Super Micro Computer 1 | 131,946 | 3,334,276 | ||||||
| 4,694,714 | ||||||||
| Total (Cost $87,180,678) | 106,277,630 | |||||||
| Materials – 9.1% | ||||||||
| Chemicals - 2.1% | ||||||||
| 97,012 | 965,269 | |||||||
Burcon NutraScience 1 | 284,697 | 1,127,400 | ||||||
C. Uyemura & Co. | 29,000 | 1,477,124 | ||||||
FutureFuel Corporation | 256,700 | 4,258,653 | ||||||
Quaker Chemical | 73,260 | 5,625,635 | ||||||
Societe Internationale de Plantations d’Heveas | 36,037 | 1,729,066 | ||||||
| 15,183,147 | ||||||||
| Metals & Mining - 7.0% | ||||||||
Alamos Gold | 212,400 | 2,147,787 | ||||||
Argonaut Gold 1 | 351,600 | 1,456,419 | ||||||
Endeavour Mining 1 | 950,000 | 738,953 | ||||||
Endeavour Silver 1 | 593,100 | 3,238,326 | ||||||
Geodrill 1 | 1,912,300 | 1,469,553 | ||||||
| 1,290,000 | 1,019,100 | |||||||
Goldgroup Mining 1 | 1,340,000 | 213,486 | ||||||
Haynes International | 103,930 | 5,881,399 | ||||||
Horsehead Holding Corporation 1 | 358,171 | 6,540,202 | ||||||
Imdex 1 | 2,194,065 | 1,303,402 | ||||||
| 1,347,704 | 3,881,388 | |||||||
Olympic Steel | 261,059 | 6,461,210 | ||||||
Pilot Gold 1 | 2,228,100 | 3,048,616 | ||||||
Silvercorp Metals | 715,200 | 1,516,224 | ||||||
Synalloy Corporation | 175,942 | 2,888,968 | ||||||
Universal Stainless & Alloy Products 1 | 260,252 | 8,452,985 | ||||||
Western Copper and Gold 1 | 1,441,000 | 1,109,570 | ||||||
| 51,367,588 | ||||||||
| Total (Cost $57,051,944) | 66,550,735 | |||||||
| Utilities – 0.1% | ||||||||
| Independent Power & Renewable Electricity Producer - 0.1% | ||||||||
Alterra Power 1 | 2,498,900 | 819,657 | ||||||
| Total (Cost $2,855,169) | 819,657 | |||||||
| Miscellaneous 5 – 4.8% | ||||||||
| Total (Cost $34,302,583) | 35,202,416 | |||||||
| TOTAL COMMON STOCKS | ||||||||
(Cost $537,991,979) | 712,258,909 | |||||||
| REPURCHASE AGREEMENT – 3.9% | ||||||||
| Fixed Income Clearing Corporation, | ||||||||
0.00% dated 6/30/14, due 7/1/14, | ||||||||
maturity value $28,566,000 (collateralized | ||||||||
by obligations of various U.S. Government | ||||||||
Agencies, due 12/2/14, valued at $29,140,000) | ||||||||
(Cost $28,566,000) | 28,566,000 | |||||||
| COLLATERAL RECEIVED FOR SECURITIES | ||||||||
LOANED – 3.6% | ||||||||
| Money Market Funds | ||||||||
Federated Government Obligations Fund | ||||||||
(7 day yield-0.0099%) | ||||||||
(Cost $26,867,184) | 26,867,184 | |||||||
| TOTAL INVESTMENTS – 104.3% | ||||||||
(Cost $593,425,163) | 767,692,093 | |||||||
| LIABILITIES LESS CASH | ||||||||
AND OTHER ASSETS – (4.3)% | (31,557,607 | ) | ||||||
| NET ASSETS – 100.0% | $ | 736,134,486 | ||||||
| 54 | The Royce Funds 2014 Semiannual Report to Shareholders | THE ACCOMPANYING NOTES ARE AN INTEGRAL PART OF THESE FINANCIAL STATEMENTS. |
| June 30, 2014 (unaudited) | ||
| Royce Premier Fund | ||
| SHARES | VALUE | |||||||
| COMMON STOCKS – 97.8% | ||||||||
| Consumer Discretionary – 10.6% | ||||||||
| Automobiles - 3.4% | ||||||||
Thor Industries 2 | 4,166,757 | $ | 236,963,470 | |||||
| Distributors - 1.1% | ||||||||
Pool Corporation | 1,290,300 | 72,979,368 | ||||||
| Diversified Consumer Services - 1.8% | ||||||||
Sotheby’s | 1,654,267 | 69,462,671 | ||||||
| 1,018,485 | 53,480,648 | |||||||
| 122,943,319 | ||||||||
| Media - 1.2% | ||||||||
Morningstar | 1,171,500 | 84,125,415 | ||||||
| Specialty Retail - 1.2% | ||||||||
Buckle (The) | 1,820,836 | 80,772,285 | ||||||
| Textiles, Apparel & Luxury Goods - 1.9% | ||||||||
Columbia Sportswear | 1,071,813 | 88,585,345 | ||||||
Wolverine World Wide | 1,779,074 | 46,362,668 | ||||||
| 134,948,013 | ||||||||
| Total (Cost $491,822,329) | 732,731,870 | |||||||
| Consumer Staples – 4.8% | ||||||||
| Food Products - 3.6% | ||||||||
Cal-Maine Foods 2 | 1,671,686 | 124,239,703 | ||||||
Sanderson Farms 2 | 1,259,008 | 122,375,578 | ||||||
| 246,615,281 | ||||||||
| Personal Products - 1.2% | ||||||||
Nu Skin Enterprises Cl. A | 1,150,494 | 85,090,536 | ||||||
| Total (Cost $100,670,074) | 331,705,817 | |||||||
| Energy – 9.8% | ||||||||
| Energy Equipment & Services - 9.8% | ||||||||
Ensign Energy Services | 7,128,000 | 110,689,246 | ||||||
Pason Systems | 4,066,300 | 114,323,603 | ||||||
SEACOR Holdings 1 | 735,065 | 60,459,096 | ||||||
Tidewater | 1,199,127 | 67,330,981 | ||||||
Trican Well Service 2 | 8,627,100 | 139,304,562 | ||||||
| 2,640,073 | 181,716,225 | |||||||
| Total (Cost $370,891,726) | 673,823,713 | |||||||
| Financials – 10.3% | ||||||||
| Capital Markets - 3.6% | ||||||||
Artisan Partners Asset Management Cl. A | 400,536 | 22,702,380 | ||||||
Federated Investors Cl. B | 3,939,300 | 121,803,156 | ||||||
Stifel Financial 1 | 2,124,877 | 100,612,926 | ||||||
| 245,118,462 | ||||||||
| Insurance - 2.9% | ||||||||
Alleghany Corporation 1 | 459,525 | 201,327,093 | ||||||
| Real Estate Management & Development - 3.8% | ||||||||
Jones Lang LaSalle | 959,603 | 121,284,223 | ||||||
Kennedy-Wilson Holdings 2 | 5,379,014 | 144,265,156 | ||||||
| 265,549,379 | ||||||||
| Total (Cost $433,113,660) | 711,994,934 | |||||||
| Health Care – 8.0% | ||||||||
| Biotechnology - 3.6% | ||||||||
| 6,343,965 | 246,907,118 | |||||||
| Health Care Equipment & Supplies - 1.5% | ||||||||
IDEXX Laboratories 1 | 777,200 | 103,810,604 | ||||||
| Life Sciences Tools & Services - 1.3% | ||||||||
PerkinElmer | 1,983,200 | 92,893,088 | ||||||
| Pharmaceuticals - 1.6% | ||||||||
| 3,856,288 | 112,063,729 | |||||||
| Total (Cost $317,686,335) | 555,674,539 | |||||||
| Industrials – 24.2% | ||||||||
| Air Freight & Logistics - 1.2% | ||||||||
Forward Air | 1,388,628 | 66,445,850 | ||||||
UTi Worldwide 1 | 1,642,400 | 16,982,416 | ||||||
| 83,428,266 | ||||||||
| Building Products - 1.4% | ||||||||
Simpson Manufacturing 2 | 2,685,933 | 97,660,524 | ||||||
| Commercial Services & Supplies - 3.8% | ||||||||
Brady Corporation Cl. A | 752,163 | 22,467,109 | ||||||
Copart 1 | 3,158,100 | 113,565,276 | ||||||
Ritchie Bros. Auctioneers | 5,253,363 | 129,495,398 | ||||||
| 265,527,783 | ||||||||
| Construction & Engineering - 1.4% | ||||||||
EMCOR Group | 2,241,400 | 99,809,542 | ||||||
| Electrical Equipment - 0.9% | ||||||||
GrafTech International 1 | 5,771,167 | 60,366,407 | ||||||
| Machinery - 9.9% | ||||||||
Kennametal | 1,563,500 | 72,358,780 | ||||||
Lincoln Electric Holdings | 2,772,370 | 193,733,216 | ||||||
Semperit AG Holding 2 | 1,952,496 | 119,641,512 | ||||||
Valmont Industries | 697,800 | 106,030,710 | ||||||
Woodward 2 | 3,806,024 | 190,986,284 | ||||||
| 682,750,502 | ||||||||
| Professional Services - 2.0% | ||||||||
Acacia Research 2 | 3,701,351 | 65,698,980 | ||||||
Towers Watson & Co. Cl. A | 676,721 | 70,534,630 | ||||||
| 136,233,610 | ||||||||
| Road & Rail - 1.6% | ||||||||
Landstar System | 1,675,300 | 107,219,200 | ||||||
| Trading Companies & Distributors - 2.0% | ||||||||
Air Lease Cl. A | 1,204,760 | 46,479,641 | ||||||
MSC Industrial Direct Cl. A | 952,284 | 91,076,441 | ||||||
| 137,556,082 | ||||||||
| Total (Cost $869,009,805) | 1,670,551,916 | |||||||
| Information Technology – 18.2% | ||||||||
| Communications Equipment - 0.8% | ||||||||
ADTRAN | 2,569,434 | 57,966,431 | ||||||
| Electronic Equipment, Instruments & Components - 7.7% | ||||||||
Anixter International | 747,600 | 74,812,332 | ||||||
| 2,843,900 | 72,462,572 | |||||||
Cognex Corporation 1 | 3,494,914 | 134,204,698 | ||||||
National Instruments | 4,151,901 | 134,480,073 | ||||||
| THE ACCOMPANYING NOTES ARE AN INTEGRAL PART OF THESE FINANCIAL STATEMENTS. | The Royce Funds 2014 Semiannual Report to Shareholders | 55 |
| Schedules of Investments |
| Royce Premier Fund (continued) |
| SHARES | VALUE | |||||||
| Information Technology (continued) | ||||||||
| Electronic Equipment, Instruments & Components (continued) | ||||||||
Zebra Technologies Cl. A 1 | 1,423,094 | $ | 117,149,098 | |||||
| 533,108,773 | ||||||||
| IT Services - 1.9% | ||||||||
Gartner 1 | 750,600 | 52,932,312 | ||||||
Jack Henry & Associates | 1,336,640 | 79,436,515 | ||||||
| 132,368,827 | ||||||||
| Semiconductors & Semiconductor Equipment - 6.2% | ||||||||
| 1,493,474 | 66,683,614 | |||||||
| 5,960,200 | 135,534,948 | |||||||
Fairchild Semiconductor International 1 | 4,781,229 | 74,587,172 | ||||||
MKS Instruments 2 | 3,296,910 | 102,995,469 | ||||||
Veeco Instruments 1 | 1,268,164 | 47,251,791 | ||||||
| 427,052,994 | ||||||||
| Software - 1.6% | ||||||||
Fair Isaac 2 | 1,732,600 | 110,470,576 | ||||||
| Total (Cost $742,112,500) | 1,260,967,601 | |||||||
| Materials – 11.0% | ||||||||
| Chemicals - 3.4% | ||||||||
Cabot Corporation | 1,675,800 | 97,179,642 | ||||||
Westlake Chemical | 1,686,110 | 141,228,574 | ||||||
| 238,408,216 | ||||||||
| Metals & Mining - 7.1% | ||||||||
Alamos Gold | 2,309,427 | 23,352,905 | ||||||
Globe Specialty Metals 2 | 5,682,472 | 118,081,768 | ||||||
Pan American Silver 2 | 8,625,597 | 132,402,914 | ||||||
Reliance Steel & Aluminum | 1,824,800 | 134,506,008 | ||||||
Schnitzer Steel Industries Cl. A 2 | 2,008,038 | 52,349,551 | ||||||
Silver Standard Resources 1 | 3,515,069 | 30,440,497 | ||||||
| 491,133,643 | ||||||||
| Paper & Forest Products - 0.5% | ||||||||
Stella-Jones | 1,139,212 | 31,281,488 | ||||||
| Total (Cost $536,108,998) | 760,823,347 | |||||||
| Miscellaneous 5 – 0.9% | ||||||||
| Total (Cost $59,473,497) | 59,091,059 | |||||||
| TOTAL COMMON STOCKS | ||||||||
(Cost $3,920,888,924) | 6,757,364,796 | |||||||
| REPURCHASE AGREEMENT – 1.2% | ||||||||
| Fixed Income Clearing Corporation, | ||||||||
0.00% dated 6/30/14, due 7/1/14, | ||||||||
maturity value $84,296,000 (collateralized | ||||||||
by obligations of various U.S. Government | ||||||||
Agencies, 0.07% due 10/16/14-11/21/14, | ||||||||
valued at $85,985,000) | ||||||||
(Cost $84,296,000) | 84,296,000 | |||||||
| PRINCIPAL | |||||||||
| AMOUNT | VALUE | ||||||||
| COLLATERAL RECEIVED FOR SECURITIES | |||||||||
LOANED – 3.9% | |||||||||
| U.S. Treasury Notes | |||||||||
0.75%-2.25% | |||||||||
due 7/31/16-4/30/21 | $ | 23,642 | $ | 23,734 | |||||
| Money Market Funds | |||||||||
Federated Government Obligations Fund | |||||||||
(7 day yield-0.0099%) | 271,429,954 | ||||||||
| TOTAL COLLATERAL RECEIVED FOR | |||||||||
SECURITIES LOANED | |||||||||
(Cost $271,453,688) | 271,453,688 | ||||||||
| TOTAL INVESTMENTS – 102.9% | |||||||||
(Cost $4,276,638,612) | 7,113,114,484 | ||||||||
| LIABILITIES LESS CASH | |||||||||
AND OTHER ASSETS – (2.9)% | (199,541,325 | ) | |||||||
| NET ASSETS – 100.0% | $ | 6,913,573,159 | |||||||
| 56 | The Royce Funds 2014 Semiannual Report to Shareholders | THE ACCOMPANYING NOTES ARE AN INTEGRAL PART OF THESE FINANCIAL STATEMENTS. |
| June 30, 2014 (unaudited) |
| Royce Low-Priced Stock Fund |
| SHARES | VALUE | ||||||
| COMMON STOCKS – 98.8% | |||||||
| Consumer Discretionary – 12.9% | |||||||
| Automobiles - 1.9% | |||||||
Thor Industries | 346,803 | $ | 19,722,687 | ||||
Winnebago Industries 1 | 25,000 | 629,500 | |||||
| 20,352,187 | |||||||
| Diversified Consumer Services - 1.4% | |||||||
Universal Technical Institute 2 | 1,279,151 | 15,528,893 | |||||
| Leisure Products - 0.3% | |||||||
| 239,500 | 3,482,330 | ||||||
| Media - 0.6% | |||||||
Pico Far East Holdings | 30,000,000 | 6,967,382 | |||||
| Specialty Retail - 8.7% | |||||||
Buckle (The) | 444,575 | 19,721,347 | |||||
Cato Corporation (The) Cl. A | 452,350 | 13,977,615 | |||||
Chico’s FAS | 781,000 | 13,245,760 | |||||
Finish Line (The) Cl. A | 297,400 | 8,844,676 | |||||
GameStop Corporation Cl. A | 440,000 | 17,806,800 | |||||
Lewis Group 3 | 1,043,747 | 6,359,643 | |||||
Luk Fook Holdings (International) | 3,977,800 | 11,650,503 | |||||
| 126,000 | 3,476,340 | ||||||
| 95,082,684 | |||||||
| Total (Cost $93,173,200) | 141,413,476 | ||||||
| Consumer Staples – 3.3% | |||||||
| Food Products - 2.1% | |||||||
Asian Citrus Holdings | 15,918,000 | 3,573,663 | |||||
Industrias Bachoco ADR | 365,606 | 19,658,635 | |||||
| 23,232,298 | |||||||
| Personal Products - 1.2% | |||||||
Nu Skin Enterprises Cl. A | 174,729 | 12,922,957 | |||||
| Total (Cost $19,233,780) | 36,155,255 | ||||||
| Energy – 12.4% | |||||||
| Energy Equipment & Services - 11.6% | |||||||
C&J Energy Services 1 | 196,246 | 6,629,190 | |||||
Calfrac Well Services | 1,115,000 | 20,846,493 | |||||
Pason Systems | 462,550 | 13,004,545 | |||||
Tesco Corporation | 709,216 | 15,134,669 | |||||
TGS-NOPEC Geophysical | 435,000 | 13,907,008 | |||||
Total Energy Services | 751,700 | 16,364,736 | |||||
Trican Well Service | 1,259,800 | 20,342,396 | |||||
Unit Corporation 1 | 309,600 | 21,309,768 | |||||
| 127,538,805 | |||||||
| Oil, Gas & Consumable Fuels - 0.8% | |||||||
Sprott Resource 1 | 2,980,100 | 8,825,375 | |||||
| Total (Cost $53,383,918) | 136,364,180 | ||||||
| Financials – 12.1% | |||||||
| Capital Markets - 8.5% | |||||||
Ashmore Group | 3,430,363 | 21,721,674 | |||||
Federated Investors Cl. B | 526,800 | 16,288,656 | |||||
INTL FCStone 1 | 309,900 | 6,173,208 | |||||
Jupiter Fund Management | 1,121,349 | 7,666,710 | |||||
Sprott | 6,950,400 | 19,736,387 | |||||
Value Partners Group | 32,626,500 | 21,848,103 | |||||
| 93,434,738 | |||||||
| Real Estate Management & Development - 3.6% | |||||||
Brasil Brokers Participacoes | 2,000,000 | 3,177,189 | |||||
E-House (China) Holdings ADR | 977,072 | 8,451,673 | |||||
Gladstone Land 2 | 501,200 | 6,510,588 | |||||
Kennedy-Wilson Holdings | 800,830 | 21,478,261 | |||||
| 39,617,711 | |||||||
| Total (Cost $107,925,064) | 133,052,449 | ||||||
| Health Care – 3.9% | |||||||
| Biotechnology - 1.8% | |||||||
| 529,969 | 20,626,393 | ||||||
| Health Care Providers & Services - 0.2% | |||||||
| 64,900 | 1,961,278 | ||||||
| Pharmaceuticals - 1.9% | |||||||
Medicines Company (The) 1 | 719,132 | 20,897,976 | |||||
| Total (Cost $21,564,168) | 43,485,647 | ||||||
| Industrials – 15.3% | |||||||
| Aerospace & Defense - 1.4% | |||||||
Orbital Sciences 1 | 522,523 | 15,440,555 | |||||
| Building Products - 1.4% | |||||||
WaterFurnace Renewable Energy | 514,500 | 14,614,587 | |||||
| Commercial Services & Supplies - 2.3% | |||||||
Ennis | 665,562 | 10,156,476 | |||||
Moshi Moshi Hotline | 1,558,100 | 15,349,527 | |||||
| 25,506,003 | |||||||
| Construction & Engineering - 0.6% | |||||||
Raubex Group | 3,068,901 | 6,536,023 | |||||
| Electrical Equipment - 1.4% | |||||||
| 1,429,830 | 14,956,022 | ||||||
| Marine - 1.6% | |||||||
Clarkson | 435,731 | 17,859,753 | |||||
| Professional Services - 6.5% | |||||||
Acacia Research | 1,255,605 | 22,286,989 | |||||
Heidrick & Struggles International | 264,592 | 4,894,952 | |||||
Kforce | 448,774 | 9,715,957 | |||||
Korn/Ferry International 1 | 427,740 | 12,562,724 | |||||
Navigant Consulting 1 | 146,900 | 2,563,405 | |||||
Resources Connection | 132,300 | 1,734,453 | |||||
RPX Corporation 1 | 607,200 | 10,777,800 | |||||
TrueBlue 1 | 262,494 | 7,236,959 | |||||
| 71,773,239 | |||||||
| Road & Rail - 0.1% | |||||||
Heartland Express | 56,545 | 1,206,670 | |||||
| Total (Cost $128,808,291) | 167,892,852 | ||||||
| Information Technology – 21.4% | |||||||
| Communications Equipment - 3.4% | |||||||
ADTRAN | 600,463 | 13,546,445 | |||||
Brocade Communications Systems | 300,000 | 2,760,000 | |||||
| THE ACCOMPANYING NOTES ARE AN INTEGRAL PART OF THESE FINANCIAL STATEMENTS. | The Royce Funds 2014 Semiannual Report to Shareholders | 57 |
| Schedules of Investments |
| Royce Low-Priced Stock Fund (continued) |
| SHARES | VALUE | |||||||
| Information Technology (continued) | ||||||||
| Communications Equipment (continued) | ||||||||
| 400,000 | $ | 3,680,000 | ||||||
KVH Industries 1 | 539,615 | 7,031,184 | ||||||
NETGEAR 1 | 289,300 | 10,058,961 | ||||||
| 37,076,590 | ||||||||
| Electronic Equipment, Instruments & Components - 3.4% | ||||||||
AVX Corporation | 678,578 | 9,011,516 | ||||||
GSI Group 1 | 113,285 | 1,442,118 | ||||||
TTM Technologies 1 | 1,409,124 | 11,554,817 | ||||||
Vishay Intertechnology | 996,550 | 15,436,559 | ||||||
| 37,445,010 | ||||||||
| IT Services - 3.3% | ||||||||
Convergys Corporation | 705,611 | 15,128,300 | ||||||
Neurones | 480,000 | 9,582,911 | ||||||
TeleTech Holdings 1 | 415,301 | 12,039,576 | ||||||
| 36,750,787 | ||||||||
| Semiconductors & Semiconductor Equipment - 11.2% | ||||||||
Advanced Energy Industries 1 | 446,983 | 8,604,423 | ||||||
| 101,990 | 1,482,935 | |||||||
Brooks Automation | 506,482 | 5,454,811 | ||||||
| 908,300 | 20,654,742 | |||||||
Fairchild Semiconductor International 1 | 978,439 | 15,263,648 | ||||||
International Rectifier 1 | 562,213 | 15,685,743 | ||||||
Lam Research | 98,800 | 6,676,904 | ||||||
MKS Instruments | 662,627 | 20,700,467 | ||||||
OmniVision Technologies 1 | 620,191 | 13,631,798 | ||||||
Teradyne | 792,975 | 15,542,310 | ||||||
| 123,697,781 | ||||||||
| Software - 0.1% | ||||||||
Mentor Graphics | 25,700 | 554,349 | ||||||
Progress Software 1 | 20,000 | 480,800 | ||||||
| 1,035,149 | ||||||||
| Total (Cost $157,445,838) | 236,005,317 | |||||||
| Materials – 15.5% | ||||||||
| Chemicals - 0.7% | �� | |||||||
| 454,700 | 7,620,772 | |||||||
| Construction Materials - 0.5% | ||||||||
Mardin Cimento Sanayii | 2,473,100 | 5,953,370 | ||||||
| Metals & Mining - 14.3% | ||||||||
Alamos Gold | 1,629,300 | 16,475,467 | ||||||
Centamin 1 | 6,032,800 | 6,445,239 | ||||||
Endeavour Mining 1 | 550,000 | 427,815 | ||||||
Globe Specialty Metals | 867,863 | 18,034,193 | ||||||
Hochschild Mining 1 | 6,623,161 | 18,107,465 | ||||||
Horsehead Holding Corporation 1 | 359,535 | 6,565,109 | ||||||
Major Drilling Group International | 2,029,100 | 14,775,415 | ||||||
| 4,991,618 | 14,375,860 | |||||||
Pan American Silver | 702,876 | 10,789,147 | ||||||
Pretium Resources 1 | 1,855,800 | 15,357,026 | ||||||
Schnitzer Steel Industries Cl. A | 177,100 | 4,616,997 | ||||||
Seabridge Gold 1 | 2,183,616 | 20,482,318 | ||||||
| 1,228,611 | 10,639,771 | |||||||
| 157,091,822 | ||||||||
| Total (Cost $162,443,084) | 170,665,964 | |||||||
| Utilities – 0.3% | ||||||||
| Independent Power & Renewable Electricity Producer - 0.3% | ||||||||
Alterra Power 1 | 9,632,900 | 3,159,660 | ||||||
| Total (Cost $12,398,276) | 3,159,660 | |||||||
| Miscellaneous 5 – 1.7% | ||||||||
| Total (Cost $16,725,640) | 18,458,308 | |||||||
| TOTAL COMMON STOCKS | ||||||||
(Cost $773,101,259) | 1,086,653,108 | |||||||
| REPURCHASE AGREEMENT – 2.1% | ||||||||
| Fixed Income Clearing Corporation, | ||||||||
0.00% dated 6/30/14, due 7/1/14, | ||||||||
maturity value $23,729,000 (collateralized | ||||||||
by obligations of various U.S. Government | ||||||||
Agencies, due 12/2/14, valued at $24,205,000) | ||||||||
(Cost $23,729,000) | 23,729,000 | |||||||
| COLLATERAL RECEIVED FOR SECURITIES | ||||||||
LOANED – 6.4% | ||||||||
| Money Market Funds | ||||||||
Federated Government Obligations Fund | ||||||||
(7 day yield-0.0099%) | ||||||||
(Cost $70,410,418) | 70,410,418 | |||||||
| TOTAL INVESTMENTS – 107.3% | ||||||||
(Cost $867,240,677) | 1,180,792,526 | |||||||
| LIABILITIES LESS CASH | ||||||||
AND OTHER ASSETS – (7.3)% | (80,691,079 | ) | ||||||
| NET ASSETS – 100.0% | $ | 1,100,101,447 | ||||||
| 58 | The Royce Funds 2014 Semiannual Report to Shareholders | THE ACCOMPANYING NOTES ARE AN INTEGRAL PART OF THESE FINANCIAL STATEMENTS. |
| June 30, 2014 (unaudited) |
| Royce Total Return Fund |
| SHARES | VALUE | ||||||
| COMMON STOCKS – 95.7% | |||||||
| Consumer Discretionary – 12.2% | |||||||
| Auto Components - 0.8% | |||||||
Autoliv | 23,213 | $ | 2,474,042 | ||||
Gentex Corporation | 1,154,670 | 33,589,350 | |||||
Lear Corporation | 4,200 | 375,144 | |||||
Spartan Motors | 39,457 | 179,135 | |||||
Standard Motor Products | 89,606 | 4,002,700 | |||||
| 40,620,371 | |||||||
| Automobiles - 0.6% | |||||||
Thor Industries | 586,474 | 33,352,776 | |||||
| Distributors - 0.1% | |||||||
Weyco Group | 282,000 | 7,729,620 | |||||
| Diversified Consumer Services - 0.2% | |||||||
Benesse Holdings | 17,500 | 759,217 | |||||
DeVry Education Group | 57,400 | 2,430,316 | |||||
Regis Corporation 1 | 551,500 | 7,765,120 | |||||
Sotheby’s | 3,800 | 159,562 | |||||
| 21,000 | 1,102,710 | ||||||
| 12,216,925 | |||||||
| Hotels, Restaurants & Leisure - 0.6% | |||||||
Abu Dhabi National Hotels | 1,200,000 | 947,506 | |||||
Bob Evans Farms | 430,573 | 21,550,178 | |||||
Cheesecake Factory | 45,400 | 2,107,468 | |||||
Churchill Downs | 10,000 | 901,100 | |||||
DineEquity | 58,130 | 4,620,754 | |||||
Ruth’s Hospitality Group | 38,400 | 474,240 | |||||
| 30,601,246 | |||||||
| Household Durables - 0.7% | |||||||
De’Longhi | 45,000 | 973,572 | |||||
Ekornes | 60,000 | 799,661 | |||||
Ethan Allen Interiors | 1,173,150 | 29,023,731 | |||||
Forbo Holding | 1,500 | 1,599,290 | |||||
Garmin | 8,200 | 499,380 | |||||
Harman International Industries | 2,200 | 236,346 | |||||
La-Z-Boy | 60,020 | 1,390,663 | |||||
Leggett & Platt | 30,803 | 1,055,927 | |||||
PulteGroup | 40,600 | 818,496 | |||||
| 36,397,066 | |||||||
| Internet & Catalog Retail - 0.1% | |||||||
FTD Companies 1 | 25,655 | 815,572 | |||||
HSN | 2,800 | 165,872 | |||||
Manutan International | 8,300 | 531,095 | |||||
Nutrisystem | 16,860 | 288,475 | |||||
PetMed Express | 351,500 | 4,738,220 | |||||
Takkt | 20,000 | 366,699 | |||||
| 6,905,933 | |||||||
| Leisure Products - 0.3% | |||||||
Arctic Cat | 109,965 | 4,334,820 | |||||
Callaway Golf | 962,900 | 8,011,328 | |||||
Hasbro | 9,538 | 505,991 | |||||
Polaris Industries | 5,900 | 768,416 | |||||
| 13,620,555 | |||||||
| Media - 0.6% | |||||||
CTC Media | 200,799 | 2,210,797 | |||||
Harte-Hanks | 618,563 | 4,447,468 | |||||
Meredith Corporation | 73,320 | 3,545,755 | |||||
Morningstar | 30,201 | 2,168,734 | |||||
Saga Communications Cl. A | 190,758 | 8,149,182 | |||||
Scholastic Corporation | 44,599 | 1,520,380 | |||||
Television Broadcasts | 90,000 | 584,099 | |||||
Wiley (John) & Sons Cl. A | 100,000 | 6,059,000 | |||||
World Wrestling Entertainment Cl. A | 29,571 | 352,782 | |||||
| 29,038,197 | |||||||
| Multiline Retail - 0.1% | |||||||
Dillard’s Cl. A | 22,886 | 2,668,736 | |||||
New World Department Store China | 1,993,300 | 802,423 | |||||
| 3,471,159 | |||||||
| Specialty Retail - 6.0% | |||||||
Aaron’s | 62,500 | 2,227,500 | |||||
Abercrombie & Fitch Cl. A | 36,100 | 1,561,325 | |||||
American Eagle Outfitters | 2,124,623 | 23,838,270 | |||||
Ascena Retail Group 1 | 1,992,363 | 34,069,407 | |||||
Big 5 Sporting Goods | 16,400 | 201,228 | |||||
Buckle (The) | 777,846 | 34,505,249 | |||||
Cato Corporation (The) Cl. A | 1,297,947 | 40,106,562 | |||||
Chico’s FAS | 144,400 | 2,449,024 | |||||
Destination Maternity | 4,900 | 111,573 | |||||
DSW Cl. A | 100,234 | 2,800,538 | |||||
Foot Locker | 60,992 | 3,093,514 | |||||
GameStop Corporation Cl. A | 952,641 | 38,553,381 | |||||
Genesco 1 | 431,067 | 35,403,533 | |||||
Guess? | 567,699 | 15,327,873 | |||||
Lewis Group | 50,000 | 304,655 | |||||
Men’s Wearhouse (The) | 176,539 | 9,850,876 | |||||
Monro Muffler Brake | 430,000 | 22,871,700 | |||||
PetSmart | 11,900 | 711,620 | |||||
Pier 1 Imports | 35,927 | 553,635 | |||||
| 138,642 | 137,380 | ||||||
Rent-A-Center | 393,629 | 11,289,280 | |||||
Shoe Carnival | 676,696 | 13,973,773 | |||||
Signet Jewelers | 8,000 | 884,720 | |||||
Stage Stores | 30,000 | 560,700 | |||||
Stein Mart | 1,028,666 | 14,288,171 | |||||
Systemax 1 | 277,979 | 3,994,558 | |||||
Williams-Sonoma | 6,000 | 430,680 | |||||
| 314,100,725 | |||||||
| Textiles, Apparel & Luxury Goods - 2.1% | |||||||
Barry (R.G.) 2 | 959,902 | 18,190,143 | |||||
Columbia Sportswear | 67,582 | 5,585,652 | |||||
Crocs 1 | 465,666 | 6,998,960 | |||||
G-III Apparel Group 1 | 277,985 | 22,700,255 | |||||
Gildan Activewear | 29,100 | 1,713,408 | |||||
Movado Group | 37,827 | 1,576,251 | |||||
Pacific Textiles Holdings | 750,000 | 941,564 | |||||
Stella International Holdings | 125,000 | 340,305 | |||||
Steven Madden 1 | 1,076,092 | 36,909,956 | |||||
Van de Velde | 9,064 | 482,180 | |||||
| 498,256 | 10,896,859 | ||||||
| THE ACCOMPANYING NOTES ARE AN INTEGRAL PART OF THESE FINANCIAL STATEMENTS. | The Royce Funds 2014 Semiannual Report to Shareholders | 59 |
| Schedules of Investments |
| Royce Total Return Fund (continued) |
| SHARES | VALUE | ||||||
| Consumer Discretionary (continued) | |||||||
| Textiles, Apparel & Luxury Goods (continued) | |||||||
Wolverine World Wide | 62,575 | $ | 1,630,705 | ||||
| 107,966,238 | |||||||
| Total (Cost $469,330,258) | 636,020,811 | ||||||
| Consumer Staples – 2.6% | |||||||
| Beverages - 0.0% | |||||||
| 43,380 | 392,155 | ||||||
| Food & Staples Retailing - 0.3% | |||||||
Village Super Market Cl. A | 687,754 | 16,251,627 | |||||
| Food Products - 1.5% | |||||||
Cal-Maine Foods | 55,298 | 4,109,747 | |||||
Farmer Bros. 1 | 382,300 | 8,261,503 | |||||
Flowers Foods | 1,058,900 | 22,321,612 | |||||
Fresh Del Monte Produce | 241,700 | 7,408,105 | |||||
Hershey Creamery 4 | 882 | 2,341,710 | |||||
Lancaster Colony | 109,700 | 10,439,052 | |||||
Sanderson Farms | 6,100 | 592,920 | |||||
Tootsie Roll Industries | 701,291 | 20,646,007 | |||||
| 76,120,656 | |||||||
| Household Products - 0.0% | |||||||
WD-40 Company | 17,911 | 1,347,266 | |||||
| Personal Products - 0.8% | |||||||
Inter Parfums | 46,265 | 1,367,131 | |||||
Nu Skin Enterprises Cl. A | 500,704 | 37,032,068 | |||||
| 38,399,199 | |||||||
| Tobacco - 0.0% | |||||||
Universal Corporation | 23,664 | 1,309,802 | |||||
| Total (Cost $110,451,901) | 133,820,705 | ||||||
| Diversified Investment Companies – 0.1% | |||||||
| Closed-End Funds - 0.1% | |||||||
British Empire Securities and General Trust | 601,182 | 5,113,448 | |||||
RIT Capital Partners | 100,000 | 2,252,202 | |||||
| Total (Cost $5,994,466) | 7,365,650 | ||||||
| Energy – 4.9% | |||||||
| Energy Equipment & Services - 3.6% | |||||||
CARBO Ceramics | 208,146 | 32,079,461 | |||||
Era Group 1 | 239,080 | 6,856,814 | |||||
Exterran Partners L.P. | 819,700 | 23,181,116 | |||||
Helmerich & Payne | 279,242 | 32,422,789 | |||||
Nabors Industries | 23,300 | 684,321 | |||||
Oceaneering International | 7,101 | 554,801 | |||||
Oil States International 1 | 188,743 | 12,096,539 | |||||
Pason Systems | 1,016,000 | 28,564,735 | |||||
Patterson-UTI Energy | 52,265 | 1,826,139 | |||||
Precision Drilling | 594,250 | 8,414,580 | |||||
RPC | 132,820 | 3,119,942 | |||||
SEACOR Holdings 1 | 297,477 | 24,467,483 | |||||
Tidewater | 150,000 | 8,422,500 | |||||
Total Energy Services | 190,355 | 4,144,086 | |||||
| 186,835,306 | |||||||
| Oil, Gas & Consumable Fuels - 1.3% | |||||||
Arch Coal | 87,418 | 319,076 | |||||
Baytex Energy | 33,400 | 1,541,410 | |||||
Cimarex Energy | 156,790 | 22,493,093 | |||||
Delek US Holdings | 11,903 | 336,022 | |||||
Energy XXI (Bermuda) | 19,800 | 467,874 | |||||
GasLog | 20,400 | 650,556 | |||||
Hugoton Royalty Trust | 558,500 | 6,132,330 | |||||
Natural Resource Partners L.P. | 225,900 | 3,743,163 | |||||
NuStar GP Holdings LLC | 369,200 | 14,439,412 | |||||
Panhandle Oil & Gas Cl. A | 8,200 | 459,446 | |||||
Pengrowth Energy | 134,757 | 967,555 | |||||
Penn Virginia 1 | 633,760 | 10,742,232 | |||||
SM Energy | 18,342 | 1,542,562 | |||||
W&T Offshore | 77,700 | 1,271,949 | |||||
Western Refining | 100,000 | 3,755,000 | |||||
| 68,861,680 | |||||||
| Total (Cost $140,488,590) | 255,696,986 | ||||||
| Financials – 25.8% | |||||||
| Banks - 4.1% | |||||||
Ames National | 402,514 | 9,314,174 | |||||
Associated Banc-Corp | 336,700 | 6,087,536 | |||||
Banco Latinoamericano de Comercio Exterior Cl. E | 86,275 | 2,559,779 | |||||
Bank of Hawaii | 832,001 | 48,830,139 | |||||
Bank of Kentucky Financial | 155,699 | 5,416,768 | |||||
BLOM Bank GDR | 684,500 | 6,400,075 | |||||
BOK Financial | 453,968 | 30,234,269 | |||||
Camden National | 194,540 | 7,540,370 | |||||
Canadian Western Bank | 933,200 | 34,886,227 | |||||
City Holding Company | 411,466 | 18,565,346 | |||||
Farmers & Merchants Bank of Long Beach 4 | 479 | 2,767,662 | |||||
First Citizens BancShares Cl. A | 82,526 | 20,218,870 | |||||
First National Bank Alaska 4 | 3,110 | 5,395,819 | |||||
Peapack-Gladstone Financial 2 | 604,692 | 12,825,517 | |||||
Sun Bancorp 1 | 284,428 | 1,140,556 | |||||
| 212,183,107 | |||||||
| Capital Markets - 6.6% | |||||||
AGF Management Cl. B | 815,600 | 9,539,092 | |||||
AllianceBernstein Holding L.P. | 1,750,400 | 45,300,352 | |||||
Apollo Global Management LLC Cl. A | 492,400 | 13,649,328 | |||||
Apollo Investment | 1,161,400 | 9,999,654 | |||||
ASA Gold and Precious Metals | 578,892 | 8,480,768 | |||||
Ashmore Group | 180,000 | 1,139,792 | |||||
Banca Generali | 86,000 | 2,366,973 | |||||
Cohen & Steers | 285,337 | 12,377,919 | |||||
Coronation Fund Managers | 1,315,000 | 11,809,652 | |||||
Edmond de Rothschild (Suisse) | 205 | 3,340,381 | |||||
Egyptian Financial Group-Hermes Holding Company 1 | 1,032,032 | 2,221,379 | |||||
Egyptian Financial Group-Hermes Holding Company GDR 1 | 90,000 | 369,000 | |||||
Federated Investors Cl. B | 1,475,615 | 45,626,016 | |||||
| 60 | The Royce Funds 2014 Semiannual Report to Shareholders | THE ACCOMPANYING NOTES ARE AN INTEGRAL PART OF THESE FINANCIAL STATEMENTS. |
| June 30, 2014 (unaudited) |
| SHARES | VALUE | ||||||
| Financials (continued) | |||||||
| Capital Markets (continued) | |||||||
Fortress Investment Group LLC Cl. A | 87,100 | $ | 648,024 | ||||
GAMCO Investors Cl. A | 278,300 | 23,112,815 | |||||
Investec | 118,000 | 1,088,485 | |||||
Janus Capital Group | 110,109 | 1,374,160 | |||||
KKR & Co. L.P. | 1,315,600 | 32,008,548 | |||||
Lazard Cl. A | 212,090 | 10,935,360 | |||||
Monroe Capital | 20,991 | 278,551 | |||||
MVC Capital | 475,000 | 6,151,250 | |||||
Oppenheimer Holdings Cl. A | 221,512 | 5,314,073 | |||||
Paris Orleans | 523,921 | 12,339,369 | |||||
Partners Group Holding | 9,000 | 2,460,081 | |||||
Raymond James Financial | 418,525 | 21,231,773 | |||||
Schroders | 111,100 | 4,764,821 | |||||
SEI Investments | 1,020,270 | 33,434,248 | |||||
Teton Advisors Cl. A 4 | 1,297 | 53,177 | |||||
Value Partners Group | 1,500,000 | 1,004,464 | |||||
Vontobel Holding | 150,400 | 5,249,075 | |||||
Waddell & Reed Financial Cl. A | 201,200 | 12,593,108 | |||||
Westwood Holdings Group | 45,895 | 2,755,536 | |||||
| 343,017,224 | |||||||
| Consumer Finance - 0.0% | |||||||
Cash America International | 53,200 | 2,363,676 | |||||
Nelnet Cl. A | 15,516 | 642,828 | |||||
| 3,006,504 | |||||||
| Diversified Financial Services - 0.9% | |||||||
Leucadia National | 141,659 | 3,714,299 | |||||
NASDAQ OMX Group (The) | 7,300 | 281,926 | |||||
Sofina | 279,572 | 32,485,937 | |||||
TMX Group | 184,000 | 10,147,978 | |||||
| 46,630,140 | |||||||
| Insurance - 10.1% | |||||||
Alleghany Corporation 1 | 99,522 | 43,602,579 | |||||
Allied World Assurance Company Holdings | 741,178 | 28,179,587 | |||||
American Equity Investment Life Holding Company | 18,200 | 447,720 | |||||
American Financial Group | 155,186 | 9,242,878 | |||||
American National Insurance | 159,593 | 18,225,521 | |||||
AmTrust Financial Services | 21,138 | 883,780 | |||||
Argo Group International Holdings | 10,300 | 526,433 | |||||
Aspen Insurance Holdings | 274,920 | 12,486,866 | |||||
Assurant | 27,412 | 1,796,857 | |||||
Assured Guaranty | 204,542 | 5,011,279 | |||||
Baldwin & Lyons Cl. B | 345,943 | 8,973,761 | |||||
Berkley (W.R.) | 12,546 | 581,005 | |||||
Cincinnati Financial | 280,000 | 13,451,200 | |||||
Crawford & Company Cl. B | 35,841 | 361,277 | |||||
E-L Financial | 82,488 | 54,190,608 | |||||
EMC Insurance Group | 85,455 | 2,630,305 | |||||
Employers Holdings | 81,321 | 1,722,379 | |||||
Erie Indemnity Cl. A | 571,900 | 43,041,194 | |||||
Everest Re Group | 9,800 | 1,572,802 | |||||
Fidelity National Financial | 1,022,711 | 33,504,012 | |||||
First American Financial | 221,361 | 6,151,622 | |||||
Gallagher (Arthur J.) & Co. | 792,400 | 36,925,840 | |||||
HCI Group | 20,300 | 824,180 | |||||
Infinity Property & Casualty | 153,762 | 10,337,419 | |||||
Lancashire Holdings | 100,000 | 1,119,255 | |||||
Markel Corporation 1 | 67,900 | 44,517,956 | |||||
Mercury General | 185,100 | 8,707,104 | |||||
Montpelier Re Holdings | 66,707 | 2,131,289 | |||||
National Western Life Insurance Cl. A | 3,600 | 897,876 | |||||
Old Republic International | 779,720 | 12,896,569 | |||||
PartnerRe | 312,846 | 34,165,912 | |||||
Platinum Underwriters Holdings | 182,606 | 11,841,999 | |||||
Primerica | 20,097 | 961,641 | |||||
Reinsurance Group of America | 454,086 | 35,827,385 | |||||
RenaissanceRe Holdings | 14,009 | 1,498,963 | |||||
RLI Corp. | 234,870 | 10,752,349 | |||||
StanCorp Financial Group | 7,200 | 460,800 | |||||
State Auto Financial | 392,000 | 9,184,560 | |||||
Stewart Information Services | 61,400 | 1,904,014 | |||||
Symetra Financial | 319,744 | 7,270,979 | |||||
Torchmark Corporation | 30,400 | 2,490,368 | |||||
United Fire Group | 94,074 | 2,758,250 | |||||
Validus Holdings | 25,000 | 956,000 | |||||
White Mountains Insurance Group | 3,534 | 2,150,227 | |||||
| 527,164,600 | |||||||
| Real Estate Investment Trusts (REITs) - 2.4% | |||||||
Colony Financial | 1,744,149 | 40,499,140 | |||||
Cousins Properties | 421,710 | 5,250,290 | |||||
DCT Industrial Trust | 1,121,600 | 9,208,336 | |||||
Hannon Armstrong Sustainable Infrastructure Capital | 200,000 | 2,868,000 | |||||
Lexington Realty Trust | 707,006 | 7,784,136 | |||||
MFA Financial | 692,000 | 5,681,320 | |||||
National Health Investors | 159,570 | 9,982,699 | |||||
National Retail Properties | 650,000 | 24,173,500 | |||||
PS Business Parks | 118,500 | 9,893,565 | |||||
Rayonier | 315,000 | 11,198,250 | |||||
| 126,539,236 | |||||||
| Real Estate Management & Development - 0.6% | |||||||
Alexander & Baldwin | 694,700 | 28,795,315 | |||||
Midland Holdings 1 | 1,500,000 | 754,800 | |||||
| 29,550,115 | |||||||
| Thrifts & Mortgage Finance - 1.1% | |||||||
Genworth MI Canada | 946,670 | 33,721,875 | |||||
TrustCo Bank Corp. NY | 3,691,044 | 24,656,174 | |||||
| 58,378,049 | |||||||
| Total (Cost $865,407,616) | 1,346,468,975 | ||||||
| Health Care – 6.0% | |||||||
| Health Care Equipment & Supplies - 2.6% | |||||||
Analogic Corporation | 235,500 | 18,425,520 | |||||
Atrion Corporation | 1,422 | 463,572 | |||||
bioMerieux | 8,500 | 915,993 | |||||
Cantel Medical | 56,413 | 2,065,844 | |||||
Carl Zeiss Meditec | 50,000 | 1,533,616 | |||||
Cooper Companies | 3,100 | 420,143 | |||||
| THE ACCOMPANYING NOTES ARE AN INTEGRAL PART OF THESE FINANCIAL STATEMENTS. | The Royce Funds 2014 Semiannual Report to Shareholders | 61 |
| Schedules of Investments |
| Royce Total Return Fund (continued) |
| SHARES | VALUE | ||||||
| Health Care (continued) | |||||||
| Health Care Equipment & Supplies (continued) | |||||||
DiaSorin | 30,000 | $ | 1,257,018 | ||||
Hill-Rom Holdings | 521,470 | 21,646,220 | |||||
IDEXX Laboratories 1 | 141,400 | 18,886,798 | |||||
Invacare Corporation | 37,794 | 694,276 | |||||
Meridian Bioscience | 16,100 | 332,304 | |||||
ResMed | 48,333 | 2,447,100 | |||||
STERIS Corporation | 637,608 | 34,099,276 | |||||
Straumann Holding | 7,420 | 1,718,615 | |||||
Teleflex | 309,700 | 32,704,320 | |||||
| 137,610,615 | |||||||
| Health Care Providers & Services - 2.5% | |||||||
Chemed Corporation | 427,569 | 40,071,767 | |||||
Ensign Group (The) | 14,115 | 438,694 | |||||
Landauer | 449,700 | 18,887,400 | |||||
Magellan Health 1 | 65,371 | 4,068,691 | |||||
MEDNAX 1 | 280,432 | 16,307,121 | |||||
National HealthCare | 3,409 | 191,893 | |||||
Omnicare | 56,599 | 3,767,795 | |||||
Owens & Minor | 1,135,750 | 38,592,785 | |||||
U.S. Physical Therapy | 240,364 | 8,218,045 | |||||
| 130,544,191 | |||||||
| Health Care Technology - 0.0% | |||||||
Computer Programs and Systems | 7,000 | 445,200 | |||||
| Life Sciences Tools & Services - 0.7% | |||||||
PerkinElmer | 712,600 | 33,378,184 | |||||
Techne Corporation | 5,800 | 536,906 | |||||
| 33,915,090 | |||||||
| Pharmaceuticals - 0.2% | |||||||
Boiron | 27,500 | 2,391,517 | |||||
Questcor Pharmaceuticals | 31,000 | 2,867,190 | |||||
Recordati | 110,000 | 1,849,651 | |||||
Santen Pharmaceutical | 15,000 | 843,986 | |||||
Stallergenes | 10,445 | 805,079 | |||||
Vetoquinol | 35,912 | 1,779,127 | |||||
Virbac | 3,500 | 808,503 | |||||
| 11,345,053 | |||||||
| Total (Cost $161,785,158) | 313,860,149 | ||||||
| Industrials – 19.8% | |||||||
| Aerospace & Defense - 1.5% | |||||||
AAR Corporation | 30,600 | 843,336 | |||||
American Science and Engineering | 204,234 | 14,212,644 | |||||
Cubic Corporation | 261,474 | 11,638,208 | |||||
HEICO Corporation | 464,843 | 24,143,945 | |||||
HEICO Corporation Cl. A | 488,666 | 19,839,840 | |||||
National Presto Industries | 52,026 | 3,789,574 | |||||
Triumph Group | 18,076 | 1,262,066 | |||||
| 75,729,613 | |||||||
| Air Freight & Logistics - 0.8% | |||||||
Aramex | 1,600,000 | 1,306,905 | |||||
C. H. Robinson Worldwide | 256,000 | 16,330,240 | |||||
Expeditors International of Washington | 458,400 | 20,242,944 | |||||
UTi Worldwide 1 | 588,900 | 6,089,226 | |||||
| 43,969,315 | |||||||
| Building Products - 0.5% | |||||||
A. O. Smith Corporation | 465,188 | 23,064,021 | |||||
AAON | 20,300 | 680,456 | |||||
Insteel Industries | 72,000 | 1,414,800 | |||||
| 25,159,277 | |||||||
| Commercial Services & Supplies - 3.2% | |||||||
ABM Industries | 649,000 | 17,510,020 | |||||
Brady Corporation Cl. A | 1,154,035 | 34,471,026 | |||||
Ennis | 377,444 | 5,759,795 | |||||
Healthcare Services Group | 201,064 | 5,919,324 | |||||
HNI Corporation | 468,373 | 18,318,068 | |||||
Horizon North Logistics | 53,600 | 384,777 | |||||
Kaba Holding | 4,000 | 1,977,898 | |||||
Kimball International Cl. B | 724,600 | 12,115,312 | |||||
McGrath RentCorp | 291,300 | 10,705,275 | |||||
Progressive Waste Solutions | 6,900 | 177,123 | |||||
Ritchie Bros. Auctioneers | 1,476,820 | 36,403,613 | |||||
UniFirst Corporation | 156,904 | 16,631,824 | |||||
US Ecology | 42,705 | 2,090,410 | |||||
Viad Corporation | 208,906 | 4,980,319 | |||||
| 167,444,784 | |||||||
| Construction & Engineering - 0.4% | |||||||
Comfort Systems USA | 208,931 | 3,301,110 | |||||
EMCOR Group | 53,239 | 2,370,733 | |||||
Granite Construction | 196,075 | 7,054,778 | |||||
KBR | 351,764 | 8,389,571 | |||||
URS Corporation | 44,700 | 2,049,495 | |||||
| 23,165,687 | |||||||
| Electrical Equipment - 1.8% | |||||||
Acuity Brands | 11,668 | 1,613,101 | |||||
AZZ | 7,860 | 362,189 | |||||
EnerSys | 18,600 | 1,279,494 | |||||
Franklin Electric | 733,800 | 29,594,154 | |||||
Hubbell Cl. B | 301,621 | 37,144,626 | |||||
LSI Industries | 1,084,161 | 8,651,605 | |||||
Preformed Line Products | 255,671 | 13,762,770 | |||||
| 92,407,939 | |||||||
| Industrial Conglomerates - 0.2% | |||||||
Raven Industries | 302,902 | 10,038,172 | |||||
| Machinery - 8.1% | |||||||
Actuant Corporation Cl. A | 18,500 | 639,545 | |||||
AGCO Corporation | 18,400 | 1,034,448 | |||||
Alamo Group | 404,076 | 21,856,471 | |||||
Altra Industrial Motion | 21,800 | 793,302 | |||||
American Railcar Industries | 281,809 | 19,098,196 | |||||
Briggs & Stratton | 640,740 | 13,109,540 | |||||
Burckhardt Compression Holding | 5,000 | 2,695,083 | |||||
CIRCOR International | 12,400 | 956,412 | |||||
CLARCOR | 247,400 | 15,301,690 | |||||
Crane Company | 290,000 | 21,564,400 | |||||
Donaldson Company | 48,902 | 2,069,533 | |||||
Foster (L.B.) Company | 7,400 | 400,488 | |||||
| 62 | The Royce Funds 2014 Semiannual Report to Shareholders | THE ACCOMPANYING NOTES ARE AN INTEGRAL PART OF THESE FINANCIAL STATEMENTS. |
| June 30, 2014 (unaudited) |
| SHARES | VALUE | ||||||
| Industrials (continued) | |||||||
| Machinery (continued) | |||||||
FreightCar America | 8,039 | $ | 201,297 | ||||
Gorman-Rupp Company (The) | 720,791 | 25,494,378 | |||||
Hillenbrand | 243,625 | 7,947,047 | |||||
IDEX Corporation | 2,200 | 177,628 | |||||
Joy Global | 27,000 | 1,662,660 | |||||
Kadant | 3,200 | 123,040 | |||||
Kennametal | 156,075 | 7,223,151 | |||||
Lincoln Electric Holdings | 179,499 | 12,543,390 | |||||
Lindsay Corporation | 224,082 | 18,928,206 | |||||
Miller Industries | 306,620 | 6,310,240 | |||||
| 116,700 | 4,900,233 | ||||||
Mueller Industries | 766,224 | 22,534,648 | |||||
Nordson Corporation | 254,500 | 20,408,355 | |||||
Oshkosh Corporation | 11,574 | 642,704 | |||||
Pfeiffer Vacuum Technology | 5,000 | 551,349 | |||||
Semperit AG Holding | 25,000 | 1,531,905 | |||||
Spirax-Sarco Engineering | 9,568 | 447,520 | |||||
Standex International | 42,731 | 3,182,605 | |||||
Starrett (L.S.) Company (The) Cl. A 2 | 529,400 | 8,142,172 | |||||
Sun Hydraulics | 930,449 | 37,776,229 | |||||
Tennant Company | 591,796 | 45,165,871 | |||||
Timken Company (The) | 32,332 | 2,193,403 | |||||
Toro Company (The) | 259,364 | 16,495,550 | |||||
Trinity Industries | 1,084,574 | 47,417,575 | |||||
Valmont Industries | 4,700 | 714,165 | |||||
Wabtec Corporation | 7,600 | 627,684 | |||||
Woodward | 609,200 | 30,569,656 | |||||
| 423,431,769 | |||||||
| Marine - 0.3% | |||||||
Matson | 594,700 | 15,961,748 | |||||
| Professional Services - 1.7% | |||||||
Acacia Research | 25,000 | 443,750 | |||||
Corporate Executive Board | 236,000 | 16,099,920 | |||||
Exponent | 26,296 | 1,948,796 | |||||
Heidrick & Struggles International | 116,298 | 2,151,513 | |||||
Kelly Services Cl. A | 634,200 | 10,889,214 | |||||
ManpowerGroup | 470,352 | 39,909,367 | |||||
Michael Page International | 200,000 | 1,475,227 | |||||
Nihon M&A Center | 60,000 | 1,712,847 | |||||
Resources Connection | 79,333 | 1,040,056 | |||||
Robert Half International | 28,400 | 1,355,816 | |||||
Towers Watson & Co. Cl. A | 103,600 | 10,798,228 | |||||
| 87,824,734 | |||||||
| Road & Rail - 0.3% | |||||||
ArcBest Corporation | 239,681 | 10,428,520 | |||||
Knight Transportation | 221,765 | 5,271,354 | |||||
| 15,699,874 | |||||||
| Trading Companies & Distributors - 1.0% | |||||||
Aceto Corporation | 293,769 | 5,328,970 | |||||
Applied Industrial Technologies | 521,445 | 26,452,905 | |||||
Houston Wire & Cable 2 | 1,402,225 | 17,401,612 | |||||
MISUMI Group | 20,500 | 563,975 | |||||
Watsco | 8,602 | 883,942 | |||||
| 50,631,404 | |||||||
| Total (Cost $500,035,853) | 1,031,464,316 | ||||||
| Information Technology – 8.3% | |||||||
| Communications Equipment - 2.1% | |||||||
ADTRAN | 387,429 | 8,740,398 | |||||
Bel Fuse Cl. A | 22,350 | 549,363 | |||||
Bel Fuse Cl. B | 74,000 | 1,899,580 | |||||
Black Box | 329,568 | 7,725,074 | |||||
Comtech Telecommunications | 95,784 | 3,575,617 | |||||
EVS Broadcast Equipment | 15,000 | 745,173 | |||||
InterDigital | 17,800 | 850,840 | |||||
NETGEAR 1 | 1,029,299 | 35,788,726 | |||||
Plantronics | 805,754 | 38,716,480 | |||||
TESSCO Technologies | 347,959 | 11,040,739 | |||||
| 109,631,990 | |||||||
| Electronic Equipment, Instruments & Components - 2.7% | |||||||
AVX Corporation | 1,741,910 | 23,132,565 | |||||
Belden | 14,603 | 1,141,370 | |||||
Cognex Corporation 1 | 711,100 | 27,306,240 | |||||
Daktronics | 61,927 | 738,170 | |||||
Domino Printing Sciences | 110,000 | 1,129,524 | |||||
Electro Rent | 348,647 | 5,832,864 | |||||
FEI Company | 19,900 | 1,805,527 | |||||
FLIR Systems | 136,100 | 4,726,753 | |||||
Littelfuse | 61,423 | 5,709,268 | |||||
Methode Electronics | 611,996 | 23,384,367 | |||||
MTS Systems | 77,241 | 5,233,850 | |||||
Nam Tai Property | 580,500 | 4,376,970 | |||||
Park Electrochemical | 82,028 | 2,314,010 | |||||
Vishay Intertechnology | 2,293,538 | 35,526,904 | |||||
| 142,358,382 | |||||||
| Internet Software & Services - 0.0% | |||||||
EarthLink Holdings | 100,652 | 374,425 | |||||
j2 Global | 37,000 | 1,881,820 | |||||
United Online 1 | 33,357 | 346,913 | |||||
| 2,603,158 | |||||||
| IT Services - 1.9% | |||||||
Amdocs | 47,500 | 2,200,675 | |||||
Broadridge Financial Solutions | 596,700 | 24,846,588 | |||||
Calian Technologies | 253,204 | 4,650,952 | |||||
Convergys Corporation | 1,229,389 | 26,358,100 | |||||
Forrester Research | 56,526 | 2,141,205 | |||||
Global Payments | 4,146 | 302,036 | |||||
Jack Henry & Associates | 20,800 | 1,236,144 | |||||
ManTech International Cl. A | 893,769 | 26,384,061 | |||||
MAXIMUS | 103,020 | 4,431,921 | |||||
Syntel 1 | 9,400 | 808,024 | |||||
Total System Services | 171,595 | 5,389,799 | |||||
| 98,749,505 | |||||||
| Semiconductors & Semiconductor Equipment - 0.7% | |||||||
Brooks Automation | 84,881 | 914,168 | |||||
Marvell Technology Group | 181,900 | 2,606,627 | |||||
| THE ACCOMPANYING NOTES ARE AN INTEGRAL PART OF THESE FINANCIAL STATEMENTS. | The Royce Funds 2014 Semiannual Report to Shareholders | 63 |
| Schedules of Investments |
| Royce Total Return Fund (continued) |
| SHARES | VALUE | ||||||
| Information Technology (continued) | |||||||
| Semiconductors & Semiconductor Equipment (continued) | |||||||
Micrel | 126,160 | $ | 1,423,085 | ||||
MKS Instruments | 816,035 | 25,492,933 | |||||
Power Integrations | 2,018 | 116,116 | |||||
Teradyne | 219,046 | 4,293,302 | |||||
| 34,846,231 | |||||||
| Software - 0.3% | |||||||
Ebix | 111,145 | 1,590,485 | |||||
FactSet Research Systems | 24,200 | 2,910,776 | |||||
Fair Isaac | 171,157 | 10,912,970 | |||||
Mentor Graphics | 9,800 | 211,386 | |||||
Pegasystems | 107,408 | 2,268,457 | |||||
| 17,894,074 | |||||||
| Technology Hardware, Storage & Peripherals - 0.6% | |||||||
Diebold | 727,018 | 29,204,313 | |||||
| Total (Cost $338,439,976) | 435,287,653 | ||||||
| Materials – 10.2% | |||||||
| Chemicals - 4.8% | |||||||
Albemarle Corporation | 452,500 | 32,353,750 | |||||
Balchem Corporation | 647,649 | 34,688,080 | |||||
Cabot Corporation | 781,000 | 45,290,190 | |||||
Chase Corporation 2 | 773,974 | 26,423,472 | |||||
FutureFuel Corporation | 187,847 | 3,116,382 | |||||
H.B. Fuller Company | 7,222 | 347,378 | |||||
Innophos Holdings | 22,078 | 1,271,031 | |||||
Innospec | 598,046 | 25,817,646 | |||||
International Flavors & Fragrances | 127,600 | 13,306,128 | |||||
Methanex Corporation | 310,710 | 19,195,664 | |||||
Minerals Technologies | 44,993 | 2,950,641 | |||||
NewMarket Corporation | 8,626 | 3,382,341 | |||||
Olin Corporation | 13,900 | 374,188 | |||||
Quaker Chemical | 431,429 | 33,129,433 | |||||
Stepan Company | 20,000 | 1,057,200 | |||||
Victrex | 70,000 | 2,038,962 | |||||
Westlake Chemical | 59,699 | 5,000,388 | |||||
| 249,742,874 | |||||||
| Construction Materials - 0.2% | |||||||
Ash Grove Cement 4 | 39,610 | 9,110,300 | |||||
| Containers & Packaging - 1.4% | |||||||
AptarGroup | 88,100 | 5,903,581 | |||||
Bemis Company | 514,800 | 20,931,768 | |||||
Greif Cl. A | 586,801 | 32,015,863 | |||||
Mayr-Melnhof Karton | 13,100 | 1,560,771 | |||||
Myers Industries | 42,900 | 861,861 | |||||
Packaging Corporation of America | 18,700 | 1,336,863 | |||||
Sonoco Products | 305,778 | 13,432,827 | |||||
| 76,043,534 | |||||||
| Metals & Mining - 2.9% | |||||||
Agnico Eagle Mines | 697,000 | 26,695,100 | |||||
Alamos Gold | 90,000 | 910,079 | |||||
Ampco-Pittsburgh | 180,306 | 4,136,220 | |||||
Carpenter Technology | 291,075 | 18,410,494 | |||||
Cliffs Natural Resources | 500,000 | 7,525,000 | |||||
Commercial Metals | 85,000 | 1,471,350 | |||||
Franco-Nevada Corporation | 171,000 | 9,805,140 | |||||
Globe Specialty Metals | 20,000 | 415,600 | |||||
Gold Fields ADR | 1,136,200 | 4,226,664 | |||||
IAMGOLD Corporation 1 | 896,620 | 3,694,074 | |||||
Olympic Steel | 30,247 | 748,613 | |||||
Pan American Silver | 1,112,100 | 17,070,735 | |||||
Reliance Steel & Aluminum | 459,113 | 33,841,219 | |||||
| 1,000,000 | 9,127,753 | ||||||
Worthington Industries | 308,300 | 13,269,232 | |||||
| 151,347,273 | |||||||
| Paper & Forest Products - 0.9% | |||||||
Deltic Timber | 172,000 | 10,392,240 | |||||
Domtar Corporation | 421,000 | 18,039,850 | |||||
Schweitzer-Mauduit International | 427,154 | 18,649,544 | |||||
| 47,081,634 | |||||||
| Total (Cost $325,381,064) | 533,325,615 | ||||||
| Telecommunication Services – 0.8% | |||||||
| Diversified Telecommunication Services - 0.3% | |||||||
Atlantic Tele-Network | 280,703 | 16,280,774 | |||||
| Wireless Telecommunication Services - 0.5% | |||||||
Telephone and Data Systems | 822,190 | 21,467,381 | |||||
USA Mobility | 119,266 | 1,836,696 | |||||
| 23,304,077 | |||||||
| Total (Cost $28,579,277) | 39,584,851 | ||||||
| Utilities – 3.2% | |||||||
| Electric Utilities - 1.1% | |||||||
ALLETE | 190,047 | 9,758,913 | |||||
ITC Holdings | 750,000 | 27,360,000 | |||||
PNM Resources | 638,900 | 18,738,937 | |||||
| 55,857,850 | |||||||
| Gas Utilities - 1.4% | |||||||
AGL Resources | 312,558 | 17,200,067 | |||||
National Fuel Gas | 48,026 | 3,760,436 | |||||
Piedmont Natural Gas | 539,500 | 20,182,695 | |||||
UGI Corporation | 660,076 | 33,333,838 | |||||
| 74,477,036 | |||||||
| Water Utilities - 0.7% | |||||||
Aqua America | 1,024,707 | 26,867,817 | |||||
Consolidated Water | 17,927 | 211,001 | |||||
SJW | 400,400 | 10,890,880 | |||||
| 37,969,698 | |||||||
| Total (Cost $92,417,651) | 168,304,584 | ||||||
| Miscellaneous 5 – 1.8% | |||||||
| Total (Cost $78,432,121) | 91,002,689 | ||||||
| TOTAL COMMON STOCKS | |||||||
(Cost $3,116,743,931) | 4,992,202,984 | ||||||
| 64 | The Royce Funds 2014 Semiannual Report to Shareholders | THE ACCOMPANYING NOTES ARE AN INTEGRAL PART OF THESE FINANCIAL STATEMENTS. |
| June 30, 2014 (unaudited) |
| VALUE | |||||||
| REPURCHASE AGREEMENT – 4.8% | |||||||
Fixed Income Clearing Corporation, | $ | 252,862,000 | |||||
| COLLATERAL RECEIVED FOR SECURITIES | |||||||
LOANED – 0.0% | |||||||
Money Market Funds | |||||||
Federated Government Obligations Fund | |||||||
(7 day yield-0.0099%) | |||||||
(Cost $2,154,041) | 2,154,041 | ||||||
| TOTAL INVESTMENTS – 100.5% | |||||||
(Cost $3,371,759,972) | 5,247,219,025 | ||||||
| LIABILITIES LESS CASH | |||||||
AND OTHER ASSETS – (0.5)% | (28,394,628 | ) | |||||
NET ASSETS – 100.0% | $ | 5,218,824,397 | |||||
| Royce Heritage Fund |
| SHARES | VALUE | ||||||
| COMMON STOCKS – 93.2% | |||||||
| Consumer Discretionary – 9.4% | |||||||
| Auto Components - 1.8% | |||||||
Drew Industries | 46,800 | $ | 2,340,468 | ||||
Nokian Renkaat | 28,000 | 1,092,702 | |||||
Selamat Sempurna | 4,228,900 | 1,585,614 | |||||
Standard Motor Products | 38,783 | 1,732,437 | |||||
| 6,751,221 | |||||||
| Automobiles - 0.6% | |||||||
Thor Industries | 39,450 | 2,243,522 | |||||
| Distributors - 1.0% | |||||||
Core-Mark Holding Company | 73,600 | 3,358,368 | |||||
Genuine Parts | 4,720 | 414,416 | |||||
| 3,772,784 | |||||||
| Diversified Consumer Services - 0.2% | |||||||
| 91,700 | 645,568 | ||||||
| Household Durables - 2.3% | |||||||
Ethan Allen Interiors | 55,900 | 1,382,966 | |||||
Forbo Holding | 1,000 | 1,066,193 | |||||
Garmin | 10,600 | 645,540 | |||||
Harman International Industries | 13,300 | 1,428,819 | |||||
Mohawk Industries 1 | 17,900 | 2,476,286 | |||||
NVR 1 | 1,425 | 1,639,605 | |||||
| 8,639,409 | |||||||
| Internet & Catalog Retail - 0.3% | |||||||
FTD Companies 1 | 10,000 | 317,900 | |||||
Trade Me | 233,100 | 718,751 | |||||
| 1,036,651 | |||||||
| Multiline Retail - 0.4% | |||||||
Dollar Tree 1 | 11,200 | 609,952 | |||||
New World Department Store China | 2,405,000 | 968,156 | |||||
| 1,578,108 | |||||||
| Specialty Retail - 2.1% | |||||||
Advance Auto Parts | 4,961 | 669,338 | |||||
Barnes & Noble 1 | 15,000 | 341,850 | |||||
Destination Maternity | 61,700 | 1,404,909 | |||||
Luk Fook Holdings (International) | 250,000 | 732,220 | |||||
Matas | 54,400 | 1,543,624 | |||||
Monro Muffler Brake | 33,400 | 1,776,546 | |||||
USS | 86,300 | 1,472,906 | |||||
| 7,941,393 | |||||||
| Textiles, Apparel & Luxury Goods - 0.7% | |||||||
Forus | 166,000 | 687,395 | |||||
Wolverine World Wide | 80,000 | 2,084,800 | |||||
| 2,772,195 | |||||||
| Total (Cost $26,819,488) | 35,380,851 | ||||||
| Consumer Staples – 0.6% | |||||||
| Food & Staples Retailing - 0.1% | |||||||
FamilyMart | 6,900 | 297,305 | |||||
| Food Products - 0.5% | |||||||
Darling Ingredients 1 | 95,500 | 1,995,950 | |||||
| Total (Cost $1,463,374) | 2,293,255 | ||||||
| THE ACCOMPANYING NOTES ARE AN INTEGRAL PART OF THESE FINANCIAL STATEMENTS. | The Royce Funds 2014 Semiannual Report to Shareholders | 65 |
| Schedules of Investments |
| Royce Heritage Fund (continued) |
| SHARES | VALUE | ||||||
| Energy – 5.1% | |||||||
| Energy Equipment & Services - 4.9% | |||||||
Ensign Energy Services | 24,800 | $ | 385,114 | ||||
Helmerich & Payne | 20,600 | 2,391,866 | |||||
Oil States International 1 | 19,300 | 1,236,937 | |||||
Pason Systems | 121,700 | 3,421,583 | |||||
TGS-NOPEC Geophysical | 90,700 | 2,899,691 | |||||
Tidewater | 30,600 | 1,718,190 | |||||
Transocean | 95,900 | 4,318,377 | |||||
Trican Well Service | 137,600 | 2,221,871 | |||||
| 18,593,629 | |||||||
| Oil, Gas & Consumable Fuels - 0.2% | |||||||
World Fuel Services | 12,800 | 630,144 | |||||
| Total (Cost $13,449,752) | 19,223,773 | ||||||
| Financials – 15.4% | |||||||
| Capital Markets - 11.7% | |||||||
AllianceBernstein Holding L.P. | 139,641 | 3,613,909 | |||||
ARA Asset Management | 955,000 | 1,363,301 | |||||
Artisan Partners Asset Management Cl. A | 38,960 | 2,208,253 | |||||
Ashmore Group | 389,600 | 2,467,017 | |||||
Blackstone Group L.P. | 60,000 | 2,006,400 | |||||
CETIP - Mercados Organizados | 47,700 | 678,961 | |||||
Charles Schwab | 75,700 | 2,038,601 | |||||
Coronation Fund Managers | 200,000 | 1,796,145 | |||||
Egyptian Financial Group-Hermes Holding Company 1 | 298,500 | 642,501 | |||||
Federated Investors Cl. B | 60,600 | 1,873,752 | |||||
Invesco | 32,400 | 1,223,100 | |||||
Jupiter Fund Management | 435,900 | 2,980,267 | |||||
KKR & Co. L.P. | 233,100 | 5,671,323 | |||||
Lazard Cl. A | 39,500 | 2,036,620 | |||||
Partners Group Holding | 2,300 | 628,687 | |||||
SEI Investments | 88,100 | 2,887,037 | |||||
Sprott | 640,000 | 1,817,347 | |||||
State Street | 45,900 | 3,087,234 | |||||
TD Ameritrade Holding Corporation | 50,600 | 1,586,310 | |||||
Value Partners Group | 3,165,000 | 2,119,420 | |||||
Waddell & Reed Financial Cl. A | 26,600 | 1,664,894 | |||||
| 44,391,079 | |||||||
| Consumer Finance - 0.4% | |||||||
Shriram Transport Finance | 92,000 | 1,378,203 | |||||
| Diversified Financial Services - 1.6% | |||||||
Bolsa Mexicana de Valores | 930,000 | 1,970,609 | |||||
JSE | 74,000 | 667,287 | |||||
Moody’s Corporation | 21,800 | 1,910,988 | |||||
Warsaw Stock Exchange | 114,000 | 1,460,990 | |||||
| 6,009,874 | |||||||
| Insurance - 0.7% | |||||||
Marsh & McLennan | 53,900 | 2,793,098 | |||||
| Real Estate Management & Development - 1.0% | |||||||
Brasil Brokers Participacoes | 546,800 | 868,644 | |||||
Jones Lang LaSalle | 4,900 | 619,311 | |||||
Kennedy-Wilson Holdings | 56,300 | 1,509,966 | |||||
LPS Brasil Consultoria de Imoveis | 167,400 | 757,637 | |||||
| 3,755,558 | |||||||
| Total (Cost $42,140,071) | 58,327,812 | ||||||
| Health Care – 4.8% | |||||||
| Biotechnology - 0.0% | |||||||
| 5,000 | 194,600 | ||||||
| Health Care Equipment & Supplies - 2.6% | |||||||
Analogic Corporation | 22,560 | 1,765,094 | |||||
Atrion Corporation | 5,087 | 1,658,362 | |||||
DENTSPLY International | 107,300 | 5,080,655 | |||||
Vascular Solutions 1 | 52,000 | 1,153,880 | |||||
| 9,657,991 | |||||||
| Health Care Providers & Services - 0.2% | |||||||
Raffles Medical Group | 240,000 | 783,383 | |||||
| Life Sciences Tools & Services - 1.6% | |||||||
Bio-Rad Laboratories Cl. A 1 | 6,400 | 766,144 | |||||
Mettler-Toledo International 1 | 8,200 | 2,076,076 | |||||
Techne Corporation | 20,200 | 1,869,914 | |||||
Waters Corporation 1 | 13,250 | 1,383,830 | |||||
| 6,095,964 | |||||||
| Pharmaceuticals - 0.4% | |||||||
Recordati | 86,000 | 1,446,091 | |||||
| Total (Cost $14,996,746) | 18,178,029 | ||||||
| Industrials – 24.9% | |||||||
| Aerospace & Defense - 0.6% | |||||||
Curtiss-Wright | 4,800 | 314,688 | |||||
HEICO Corporation | 34,178 | 1,775,205 | |||||
| 2,089,893 | |||||||
| Air Freight & Logistics - 2.6% | |||||||
Expeditors International of Washington | 115,600 | 5,104,896 | |||||
Forward Air | 66,200 | 3,167,670 | |||||
UTi Worldwide 1 | 136,600 | 1,412,444 | |||||
| 9,685,010 | |||||||
| Building Products - 0.4% | |||||||
AAON | 39,475 | 1,323,202 | |||||
| Commercial Services & Supplies - 5.5% | |||||||
Blue Label Telecoms | 878,300 | 706,934 | |||||
Cintas Corporation | 22,600 | 1,436,004 | |||||
Copart 1 | 247,980 | 8,917,361 | |||||
Healthcare Services Group | 39,800 | 1,171,712 | |||||
Heritage-Crystal Clean 1 | 124,327 | 2,440,539 | |||||
Kaba Holding | 2,400 | 1,186,739 | |||||
Moshi Moshi Hotline | 53,000 | 522,126 | |||||
Ritchie Bros. Auctioneers | 186,100 | 4,587,365 | |||||
| 20,968,780 | |||||||
| Construction & Engineering - 1.4% | |||||||
Fluor Corporation | 17,100 | 1,314,990 | |||||
Jacobs Engineering Group 1 | 34,000 | 1,811,520 | |||||
KBR | 94,020 | 2,242,377 | |||||
| 5,368,887 | |||||||
| 66 | The Royce Funds 2014 Semiannual Report to Shareholders | THE ACCOMPANYING NOTES ARE AN INTEGRAL PART OF THESE FINANCIAL STATEMENTS. |
| June 30, 2014 (unaudited) |
| SHARES | VALUE | ||||||
| Industrials (continued) | |||||||
| Electrical Equipment - 0.6% | |||||||
EnerSys | 15,000 | $ | 1,031,850 | ||||
Graphite India | 350,000 | 613,060 | |||||
Powell Industries | 12,400 | 810,712 | |||||
| 2,455,622 | |||||||
| Industrial Conglomerates - 1.0% | |||||||
Carlisle Companies | 22,600 | 1,957,612 | |||||
Raven Industries | 50,400 | 1,670,256 | |||||
| 3,627,868 | |||||||
| Machinery - 6.9% | |||||||
AGCO Corporation | 10,300 | 579,066 | |||||
Burckhardt Compression Holding | 2,000 | 1,078,033 | |||||
CIRCOR International | 21,000 | 1,619,730 | |||||
Donaldson Company | 84,300 | 3,567,576 | |||||
Foster (L.B.) Company | 33,700 | 1,823,844 | |||||
Graco | 30,400 | 2,373,632 | |||||
Kennametal | 68,700 | 3,179,436 | |||||
Mueller Industries | 4,900 | 144,109 | |||||
Pfeiffer Vacuum Technology | 12,000 | 1,323,237 | |||||
RBC Bearings | 49,800 | 3,189,690 | |||||
Rotork | 20,000 | 913,888 | |||||
Semperit AG Holding | 23,300 | 1,427,735 | |||||
Sun Hydraulics | 60,185 | 2,443,511 | |||||
Valmont Industries | 14,170 | 2,153,132 | |||||
| 16,600 | 347,604 | ||||||
| 26,164,223 | |||||||
| Marine - 0.3% | |||||||
Clarkson | 28,100 | 1,151,764 | |||||
| Professional Services - 3.6% | |||||||
Advisory Board (The) 1 | 34,200 | 1,771,560 | |||||
Equifax | 24,150 | 1,751,841 | |||||
Exponent | 5,700 | 422,427 | |||||
Franklin Covey 1 | 19,800 | 398,574 | |||||
ManpowerGroup | 40,691 | 3,452,631 | |||||
RPX Corporation 1 | 46,500 | 825,375 | |||||
Towers Watson & Co. Cl. A | 29,500 | 3,074,785 | |||||
Verisk Analytics Cl. A 1 | 30,800 | 1,848,616 | |||||
| 13,545,809 | |||||||
| Road & Rail - 1.4% | |||||||
Landstar System | 42,000 | 2,688,000 | |||||
Patriot Transportation Holding 1 | 79,512 | 2,780,535 | |||||
| 5,468,535 | |||||||
| Trading Companies & Distributors - 0.6% | |||||||
Applied Industrial Technologies | 27,700 | 1,405,221 | |||||
MSC Industrial Direct Cl. A | 8,570 | 819,635 | |||||
| 2,224,856 | |||||||
| Total (Cost $72,451,318) | 94,074,449 | ||||||
| Information Technology – 18.0% | |||||||
| Communications Equipment - 0.5% | |||||||
ADTRAN | 43,350 | 977,976 | |||||
Plantronics | 22,100 | 1,061,905 | |||||
| 2,039,881 | |||||||
| Electronic Equipment, Instruments & Components - 8.6% | |||||||
Amphenol Corporation Cl. A | 21,900 | 2,109,846 | |||||
Anixter International | 26,800 | 2,681,876 | |||||
AVX Corporation | 211,963 | 2,814,869 | |||||
Badger Meter | 21,000 | 1,105,650 | |||||
Coherent 1 | 56,600 | 3,745,222 | |||||
Domino Printing Sciences | 84,000 | 862,546 | |||||
E2V Technologies | 362,000 | 1,034,610 | |||||
FEI Company | 31,100 | 2,821,703 | |||||
FLIR Systems | 92,800 | 3,222,944 | |||||
IPG Photonics 1 | 26,214 | 1,803,523 | |||||
LPKF Laser & Electronics | 30,000 | 619,471 | |||||
National Instruments | 104,850 | 3,396,092 | |||||
Rogers Corporation 1 | 57,407 | 3,808,954 | |||||
Trimble Navigation 1 | 44,200 | 1,633,190 | |||||
Vaisala Cl. A | 27,500 | 901,855 | |||||
| 32,562,351 | |||||||
| Internet Software & Services - 0.6% | |||||||
Envestnet 1 | 30,200 | 1,477,384 | |||||
| 28,500 | 673,740 | ||||||
| 2,151,124 | |||||||
| IT Services - 2.8% | |||||||
Computer Task Group | 53,400 | 878,964 | |||||
eClerx Services | 72,000 | 1,391,038 | |||||
Fiserv 1 | 43,860 | 2,645,635 | |||||
MAXIMUS | 52,200 | 2,245,644 | |||||
Metrofile Holdings | 2,718,296 | 1,226,876 | |||||
Sapient Corporation 1 | 119,800 | 1,946,750 | |||||
Teradata Corporation 1 | 4,300 | 172,860 | |||||
| 10,507,767 | |||||||
| Semiconductors & Semiconductor Equipment - 2.5% | |||||||
Diodes 1 | 137,400 | 3,979,104 | |||||
Lam Research | 10,000 | 675,800 | |||||
Silicon Image 1 | 133,900 | 674,856 | |||||
Skyworks Solutions | 16,900 | 793,624 | |||||
Teradyne | 107,450 | 2,106,020 | |||||
Veeco Instruments 1 | 27,400 | 1,020,924 | |||||
| 9,250,328 | |||||||
| Software - 1.6% | |||||||
Mentor Graphics | 26,000 | 560,820 | |||||
MICROS Systems 1 | 12,200 | 828,380 | |||||
Rovi Corporation 1 | 75,000 | 1,797,000 | |||||
Silverlake Axis | 522,000 | 502,366 | |||||
Totvs | 143,200 | 2,462,820 | |||||
| 6,151,386 | |||||||
| Technology Hardware, Storage & Peripherals - 1.4% | |||||||
†Diebold | 82,000 | 3,293,940 | |||||
Western Digital | 21,165 | 1,953,529 | |||||
| 5,247,469 | |||||||
| Total (Cost $49,955,762) | 67,910,306 | ||||||
| Materials – 10.5% | |||||||
| Chemicals - 4.0% | |||||||
Airgas | 9,200 | 1,001,972 | |||||
| THE ACCOMPANYING NOTES ARE AN INTEGRAL PART OF THESE FINANCIAL STATEMENTS. | The Royce Funds 2014 Semiannual Report to Shareholders | 67 |
| Schedules of Investments | |
| Royce Heritage Fund (continued) |
| SHARES | VALUE | ||||||
| Materials (continued) | |||||||
| Chemicals (continued) | |||||||
Cabot Corporation | 48,700 | $ | 2,824,113 | ||||
Innospec | 53,465 | 2,308,084 | |||||
Minerals Technologies | 15,100 | 990,258 | |||||
Rockwood Holdings | 33,200 | 2,522,868 | |||||
Stepan Company | 7,700 | 407,022 | |||||
Tronox Cl. A | 39,800 | 1,070,620 | |||||
Victrex | 35,700 | 1,039,871 | |||||
Westlake Chemical | 33,090 | 2,771,618 | |||||
| 14,936,426 | |||||||
| Containers & Packaging - 0.8% | |||||||
Greif Cl. A | 57,800 | 3,153,568 | |||||
| Metals & Mining - 4.7% | |||||||
Compass Minerals International | 29,600 | 2,833,904 | |||||
Fresnillo | 48,000 | 716,323 | |||||
Major Drilling Group International | 203,900 | 1,484,750 | |||||
Pan American Silver | 239,200 | 3,671,720 | |||||
Randgold Resources ADR | 31,600 | 2,673,360 | |||||
Reliance Steel & Aluminum | 71,880 | 5,298,275 | |||||
| 131,800 | 1,203,038 | ||||||
| 17,881,370 | |||||||
| Paper & Forest Products - 1.0% | |||||||
Glatfelter | 37,858 | 1,004,373 | |||||
Stella-Jones | 98,500 | 2,704,700 | |||||
| 3,709,073 | |||||||
| Total (Cost $33,679,159) | 39,680,437 | ||||||
| Utilities – 0.1% | |||||||
| Gas Utilities - 0.1% | |||||||
UGI Corporation | 10,100 | 510,050 | |||||
| Total (Cost $329,649) | 510,050 | ||||||
| Miscellaneous 5 – 4.4% | |||||||
| Total (Cost $14,410,513) | 16,468,623 | ||||||
| TOTAL COMMON STOCKS | |||||||
(Cost $269,695,832) | 352,047,585 | ||||||
| REPURCHASE AGREEMENT – 7.7% | |||||||
| Fixed Income Clearing Corporation, | |||||||
0.00% dated 6/30/14, due 7/1/14, | |||||||
maturity value $29,236,000 (collateralized | |||||||
by obligations of various U.S. Government | |||||||
Agencies, 2.00% due 9/30/20, valued at | |||||||
$29,825,250) | |||||||
(Cost $29,236,000) | 29,236,000 | ||||||
COLLATERAL RECEIVED FOR SECURITIES | |||||||
| Money Market Funds | |||||||
Federated Government Obligations Fund | |||||||
(7 day yield-0.0099%) | |||||||
(Cost $1,589,589) | $ | 1,589,589 | |||||
| TOTAL INVESTMENTS – 101.3% | |||||||
(Cost $300,521,421) | 382,873,174 | ||||||
| LIABILITIES LESS CASH | |||||||
AND OTHER ASSETS – (1.3)% | (5,033,923 | ) | |||||
NET ASSETS – 100.0% | $ | 377,839,251 | |||||
| 68 | The Royce Funds 2014 Semiannual Report to Shareholders | THE ACCOMPANYING NOTES ARE AN INTEGRAL PART OF THESE FINANCIAL STATEMENTS. |
| June 30, 2014 (unaudited) |
| Royce Opportunity Fund |
| SHARES | VALUE | |||||||
| COMMON STOCKS – 93.3% | ||||||||
Consumer Discretionary – 13.0% | ||||||||
Auto Components - 2.3% | ||||||||
Cooper Tire & Rubber | 237,300 | $ | 7,119,000 | |||||
Dana Holding Corporation | 751,436 | 18,350,067 | ||||||
Fuel Systems Solutions 1 | 427,900 | 4,766,806 | ||||||
Spartan Motors | 800,817 | 3,635,709 | ||||||
Tower International 1 | 462,654 | 17,044,174 | ||||||
Visteon Corporation 1 | 76,000 | 7,372,760 | ||||||
| 58,288,516 | ||||||||
Distributors - 0.1% | ||||||||
VOXX International Cl. A 1 | 286,513 | 2,696,087 | ||||||
Diversified Consumer Services - 0.4% | ||||||||
DeVry Education Group | 135,000 | 5,715,900 | ||||||
ITT Educational Services 1 | 295,700 | 4,935,233 | ||||||
| 10,651,133 | ||||||||
Hotels, Restaurants & Leisure - 1.5% | ||||||||
Carrols Restaurant Group 1 | 1,059,605 | 7,544,387 | ||||||
Isle of Capri Casinos 1 | 668,135 | 5,719,236 | ||||||
Jamba 1 | 253,450 | 3,066,745 | ||||||
Orient-Express Hotels Cl. A 1 | 939,819 | 13,664,968 | ||||||
Ruby Tuesday 1 | 1,066,600 | 8,095,494 | ||||||
| 38,090,830 | ||||||||
Household Durables - 2.2% | ||||||||
| 659,490 | 784,793 | |||||||
Dixie Group 1 | 763,553 | 8,086,026 | ||||||
Ethan Allen Interiors | 194,400 | 4,809,456 | ||||||
| 1,092,396 | 5,625,839 | |||||||
M.D.C. Holdings | 352,150 | 10,666,624 | ||||||
M/I Homes 1 | 337,500 | 8,191,125 | ||||||
| 1,025,800 | 8,821,880 | |||||||
| 393,872 | 6,191,668 | |||||||
| 820,981 | 4,457,927 | |||||||
| 57,635,338 | ||||||||
Internet & Catalog Retail - 0.8% | ||||||||
| 1,889,835 | 1,455,551 | |||||||
Gaiam Cl.A 1 | 841,162 | 6,460,124 | ||||||
ValueVision Media 1 | 1,199,579 | 5,985,899 | ||||||
Vitacost.com 1 | 1,225,422 | 7,671,142 | ||||||
| 21,572,716 | ||||||||
Leisure Products - 0.3% | ||||||||
| 463,139 | 5,196,420 | |||||||
Callaway Golf | 288,426 | 2,399,704 | ||||||
| 7,596,124 | ||||||||
Media - 1.5% | ||||||||
Ballantyne Strong 1 | 591,346 | 2,471,826 | ||||||
Entravision Communications Cl. A | 1,023,900 | 6,368,658 | ||||||
Martha Stewart Living Omnimedia Cl. A 1 | 1,702,557 | 8,002,018 | ||||||
| 2,132,754 | 11,836,785 | |||||||
| 196,800 | 4,040,304 | |||||||
New York Times Cl. A | 418,999 | 6,372,975 | ||||||
| 39,092,566 | ||||||||
Multiline Retail - 0.8% | ||||||||
Bon-Ton Stores (The) | 334,265 | 3,446,272 | ||||||
Dillard’s Cl. A | 14,400 | 1,679,184 | ||||||
Hudson’s Bay | 407,200 | 6,453,073 | ||||||
| 1,107,331 | 10,021,346 | |||||||
| 21,599,875 | ||||||||
Specialty Retail - 2.0% | ||||||||
| 457,983 | 1,598,361 | |||||||
bebe stores | 1,116,221 | 3,404,474 | ||||||
| 629,500 | 1,013,495 | |||||||
Destination Maternity | 263,037 | 5,989,352 | ||||||
MarineMax 1 | 478,950 | 8,017,623 | ||||||
New York & Company 1 | 1,091,717 | 4,028,436 | ||||||
| 728,801 | 1,734,546 | |||||||
| 505,500 | 500,900 | |||||||
Rent-A-Center | 308,406 | 8,845,084 | ||||||
| 274,300 | 5,889,221 | |||||||
West Marine 1 | 973,126 | 9,984,273 | ||||||
| 1,206,936 | 1,098,312 | |||||||
| 52,104,077 | ||||||||
Textiles, Apparel & Luxury Goods - 1.1% | ||||||||
| 657,260 | 696,696 | |||||||
Quiksilver 1 | 1,227,082 | 4,392,953 | ||||||
Skechers U.S.A. Cl. A 1 | 173,558 | 7,931,601 | ||||||
Unifi 1 | 557,234 | 15,340,652 | ||||||
| 28,361,902 | ||||||||
Total (Cost $276,199,591) | 337,689,164 | |||||||
Consumer Staples – 0.9% | ||||||||
Food & Staples Retailing - 0.3% | ||||||||
SUPERVALU 1 | 956,100 | 7,859,142 | ||||||
Household Products - 0.4% | ||||||||
Central Garden & Pet 1 | 868,364 | 7,902,112 | ||||||
Central Garden & Pet Cl. A 1 | 172,100 | 1,583,320 | ||||||
| 9,485,432 | ||||||||
Personal Products - 0.2% | ||||||||
Elizabeth Arden 1 | 312,325 | 6,690,002 | ||||||
Total (Cost $22,419,125) | 24,034,576 | |||||||
Energy – 5.8% | ||||||||
Energy Equipment & Services - 3.1% | ||||||||
Basic Energy Services 1 | 371,795 | 10,863,850 | ||||||
C&J Energy Services 1 | 378,400 | 12,782,352 | ||||||
| 1,385,831 | 1,829,297 | |||||||
| 1,230,200 | 4,945,404 | |||||||
Key Energy Services 1 | 1,000,500 | 9,144,570 | ||||||
Matrix Service 1 | 28 | 918 | ||||||
McDermott International 1 | 514,800 | 4,164,732 | ||||||
Newpark Resources 1 | 822,431 | 10,247,490 | ||||||
Parker Drilling 1 | 734,600 | 4,789,592 | ||||||
Patterson-UTI Energy | 371,700 | 12,987,198 | ||||||
Willbros Group 1 | 711,300 | 8,784,555 | ||||||
| 80,539,958 | ||||||||
Oil, Gas & Consumable Fuels - 2.7% | ||||||||
| 316,000 | 7,182,680 | |||||||
| 306,300 | 8,453,880 | |||||||
| THE ACCOMPANYING NOTES ARE AN INTEGRAL PART OF THESE FINANCIAL STATEMENTS. | The Royce Funds 2014 Semiannual Report to Shareholders | 69 |
| Schedules of Investments |
| Royce Opportunity Fund (continued) |
| SHARES | VALUE | |||||||
| Energy (continued) | ||||||||
Oil, Gas & Consumable Fuels (continued) | ||||||||
Matador Resources 1 | 223,136 | $ | 6,533,422 | |||||
Pengrowth Energy | 1,764,700 | 12,670,546 | ||||||
Scorpio Tankers | 803,926 | 8,175,927 | ||||||
| 375,218 | 4,420,068 | |||||||
StealthGas 1 | 891,345 | 9,893,930 | ||||||
| 845,351 | 10,972,656 | |||||||
| 68,303,109 | ||||||||
Total (Cost $113,751,601) | 148,843,067 | |||||||
Financials – 10.6% | ||||||||
Banks - 4.3% | ||||||||
BancorpSouth | 205,800 | 5,056,506 | ||||||
BankUnited | 257,398 | 8,617,685 | ||||||
Boston Private Financial Holdings | 890,246 | 11,964,906 | ||||||
Capital Bank Financial Cl. A 1 | 292,700 | 6,910,647 | ||||||
CenterState Banks | 300,441 | 3,364,939 | ||||||
Columbia Banking System | 218,800 | 5,756,628 | ||||||
Fidelity Southern | 225,140 | 2,924,569 | ||||||
First Bancorp | 172,408 | 3,163,687 | ||||||
First Internet Bancorp | 92,200 | 1,899,320 | ||||||
Guaranty Bancorp | 250,230 | 3,478,197 | ||||||
Independent Bank Group | 69,900 | 3,891,333 | ||||||
Old National Bancorp | 350,800 | 5,009,424 | ||||||
South State | 128,926 | 7,864,486 | ||||||
Southern National Bancorp of Virginia | 215,615 | 2,406,263 | ||||||
State Bank Financial | 384,259 | 6,497,820 | ||||||
Trustmark Corporation | 467,400 | 11,540,106 | ||||||
Umpqua Holdings | 537,700 | 9,635,584 | ||||||
United Bankshares | 272,839 | 8,820,885 | ||||||
Valley National Bancorp | 357,668 | 3,544,490 | ||||||
| 112,347,475 | ||||||||
Capital Markets - 0.1% | ||||||||
Harris & Harris Group 1 | 932,997 | 2,966,930 | ||||||
Consumer Finance - 0.9% | ||||||||
Cash America International | 305,400 | 13,568,922 | ||||||
| 769,992 | 8,893,408 | |||||||
| 22,462,330 | ||||||||
Insurance - 1.9% | ||||||||
Ambac Financial Group 1 | 351,391 | 9,596,488 | ||||||
Assured Guaranty | 618,100 | 15,143,450 | ||||||
Hilltop Holdings 1 | 493,676 | 10,495,552 | ||||||
Kemper Corporation | 63,000 | 2,322,180 | ||||||
Kingstone Companies | 197,377 | 1,316,504 | ||||||
MBIA 1 | 943,300 | 10,414,032 | ||||||
| 49,288,206 | ||||||||
Real Estate Investment Trusts (REITs) - 1.9% | ||||||||
BRT Realty Trust 1 | 98,309 | 725,520 | ||||||
LaSalle Hotel Properties | 344,900 | 12,171,521 | ||||||
Mack-Cali Realty | 550,450 | 11,823,666 | ||||||
PennyMac Mortgage Investment Trust | 215,900 | 4,736,846 | ||||||
RAIT Financial Trust | 324,000 | 2,679,480 | ||||||
Rouse Properties | 561,733 | 9,611,252 | ||||||
Ryman Hospitality Properties | 132,400 | 6,375,060 | ||||||
| 48,123,345 | ||||||||
Real Estate Management & Development - 0.0% | ||||||||
Maui Land & Pineapple 1 | 101,893 | 698,986 | ||||||
Thrifts & Mortgage Finance - 1.5% | ||||||||
Berkshire Hills Bancorp | 196,100 | 4,553,442 | ||||||
Brookline Bancorp | 338,700 | 3,173,619 | ||||||
| 977,385 | 9,031,038 | |||||||
Radian Group | 583,100 | 8,635,711 | ||||||
Walker & Dunlop 1 | 327,712 | 4,624,016 | ||||||
Washington Federal | 392,400 | 8,801,532 | ||||||
| 38,819,358 | ||||||||
Total (Cost $216,124,252) | 274,706,630 | |||||||
Health Care – 4.6% | ||||||||
Health Care Equipment & Supplies - 2.5% | ||||||||
| 936,300 | 8,239,440 | |||||||
Alere 1 | 397,800 | 14,885,676 | ||||||
AngioDynamics 1 | 579,040 | 9,455,723 | ||||||
Exactech 1 | 287,900 | 7,263,717 | ||||||
Invacare Corporation | 739,585 | 13,586,177 | ||||||
Merit Medical Systems 1 | 556,200 | 8,398,620 | ||||||
RTI Surgical 1 | 884,948 | 3,849,524 | ||||||
| 65,678,877 | ||||||||
Health Care Providers & Services - 0.7% | ||||||||
Kindred Healthcare | 323,400 | 7,470,540 | ||||||
Owens & Minor | 78,200 | 2,657,236 | ||||||
Select Medical Holdings | 572,214 | 8,926,538 | ||||||
| 19,054,314 | ||||||||
Health Care Technology - 0.4% | ||||||||
Allscripts Healthcare Solutions 1 | 656,600 | 10,538,430 | ||||||
Life Sciences Tools & Services - 1.0% | ||||||||
Albany Molecular Research 1 | 777,010 | 15,633,441 | ||||||
Cambrex Corporation 1 | 450,254 | 9,320,258 | ||||||
| 24,953,699 | ||||||||
Total (Cost $70,769,083) | 120,225,320 | |||||||
Industrials – 19.2% | ||||||||
Aerospace & Defense - 0.7% | ||||||||
Kratos Defense & Security Solutions 1 | 1,220,702 | 9,521,475 | ||||||
| 702,435 | 9,187,850 | |||||||
| 18,709,325 | ||||||||
Air Freight & Logistics - 0.9% | ||||||||
Atlas Air Worldwide Holdings 1 | 298,400 | 10,996,040 | ||||||
| 404,700 | 11,582,514 | |||||||
| 22,578,554 | ||||||||
Airlines - 0.8% | ||||||||
| 474,899 | 6,510,865 | |||||||
| 852,000 | 9,244,200 | |||||||
Republic Airways Holdings 1 | 515,934 | 5,592,725 | ||||||
| 21,347,790 | ||||||||
| 70 | The Royce Funds 2014 Semiannual Report to Shareholders | THE ACCOMPANYING NOTES ARE AN INTEGRAL PART OF THESE FINANCIAL STATEMENTS. |
| June 30, 2014 (unaudited) |
| SHARES | VALUE | |||||||
| Industrials (continued) | ||||||||
| Building Products - 3.1% | ||||||||
Apogee Enterprises | 392,961 | $ | 13,698,620 | |||||
Builders FirstSource 1 | 690,956 | 5,168,351 | ||||||
Gibraltar Industries 1 | 273,087 | 4,235,579 | ||||||
Griffon Corporation | 626,200 | 7,764,880 | ||||||
Insteel Industries | 441,927 | 8,683,865 | ||||||
NCI Building Systems 1 | 1,123,590 | 21,831,354 | ||||||
PGT 1 | 660,208 | 5,591,962 | ||||||
Quanex Building Products | 781,286 | 13,961,581 | ||||||
| 80,936,192 | ||||||||
Commercial Services & Supplies - 1.3% | ||||||||
ABM Industries | 297,600 | 8,029,248 | ||||||
Interface | 738,524 | 13,913,792 | ||||||
| 1,725,526 | 10,732,772 | |||||||
| 32,675,812 | ||||||||
Construction & Engineering - 2.3% | ||||||||
Aegion Corporation 1 | 667,053 | 15,522,323 | ||||||
| 401,399 | 2,821,835 | |||||||
Furmanite Corporation 1 | 956,730 | 11,136,337 | ||||||
| 728,812 | 9,693,200 | |||||||
Northwest Pipe 1 | 372,983 | 15,042,405 | ||||||
Pike Corporation 1 | 609,621 | 5,462,204 | ||||||
| 59,678,304 | ||||||||
Electrical Equipment - 0.8% | ||||||||
| 132,280 | 1,130,994 | |||||||
General Cable | 587,644 | 15,078,945 | ||||||
| 187,063 | 4,461,453 | |||||||
| 20,671,392 | ||||||||
Machinery - 6.4% | ||||||||
Accuride Corporation 1 | 830,400 | 4,060,656 | ||||||
Albany International Cl. A | 455,250 | 17,281,290 | ||||||
Astec Industries | 391,328 | 17,171,473 | ||||||
Barnes Group | 215,149 | 8,291,842 | ||||||
Commercial Vehicle Group 1 | 1,227,740 | 12,326,510 | ||||||
Dynamic Materials | 451,703 | 9,996,187 | ||||||
Federal Signal | 1,139,879 | 16,699,227 | ||||||
Hardinge 2 | 642,571 | 8,128,523 | ||||||
Hurco Companies | 211,991 | 5,978,146 | ||||||
Lydall 1 | 274,700 | 7,518,539 | ||||||
Meritor 1 | 1,025,121 | 13,367,578 | ||||||
Mueller Industries | 571,321 | 16,802,551 | ||||||
Mueller Water Products Cl. A | 1,804,229 | 15,588,539 | ||||||
NN | 487,683 | 12,474,931 | ||||||
| 165,685,992 | ||||||||
Marine - 0.8% | ||||||||
Baltic Trading | 821,600 | 4,913,168 | ||||||
Diana Shipping 1 | 770,800 | 8,394,012 | ||||||
Navios Maritime Holdings | 832,787 | 8,427,804 | ||||||
| 21,734,984 | ||||||||
Professional Services - 0.6% | ||||||||
| 530,920 | 4,964,102 | |||||||
| 661,107 | 4,118,696 | |||||||
Hudson Global 1 | 682,344 | 2,681,612 | ||||||
Kelly Services Cl. A | 302,100 | 5,187,057 | ||||||
| 16,951,467 | ||||||||
| Road & Rail - 0.7% | ||||||||
ArcBest Corporation | 159,439 | 6,937,191 | ||||||
Swift Transportation Cl. A 1 | 416,734 | 10,514,199 | ||||||
| 17,451,390 | ||||||||
Trading Companies & Distributors - 0.5% | ||||||||
Aceto Corporation | 5,400 | 97,956 | ||||||
Kaman Corporation | 266,531 | 11,388,870 | ||||||
| 26,400 | 434,544 | |||||||
| 11,921,370 | ||||||||
Transportation Infrastructure - 0.3% | ||||||||
Wesco Aircraft Holdings 1 | 371,000 | 7,405,160 | ||||||
Total (Cost $348,292,785) | 497,747,732 | |||||||
Information Technology – 26.9% | ||||||||
Communications Equipment - 3.2% | ||||||||
ARRIS Group 1 | 362,700 | 11,798,631 | ||||||
| 2,090,084 | 2,675,308 | |||||||
| 487,600 | 10,561,416 | |||||||
| 345,834 | 3,399,548 | |||||||
Comtech Telecommunications | 200,000 | 7,466,000 | ||||||
| 704,300 | 2,901,716 | |||||||
Emulex Corporation 1 | 979,425 | 5,582,722 | ||||||
Extreme Networks 1 | 1,861,547 | 8,265,269 | ||||||
| 203,855 | 4,026,136 | |||||||
Harmonic 1 | 623,777 | 4,653,376 | ||||||
| 412,503 | 1,786,138 | |||||||
| 1,191,077 | 2,620,369 | |||||||
Oplink Communications 1 | 621,536 | 10,547,466 | ||||||
| 1,053,207 | 3,085,897 | |||||||
| 939,204 | 2,301,050 | |||||||
| 81,671,042 | ||||||||
Electronic Equipment, Instruments & Components - 7.6% | ||||||||
Benchmark Electronics 1 | 663,400 | 16,903,432 | ||||||
CTS Corporation | 406,709 | 7,605,458 | ||||||
Daktronics | 647,325 | 7,716,114 | ||||||
| 1,289,386 | 3,133,208 | |||||||
Frequency Electronics 1 | 223,663 | 2,753,292 | ||||||
GSI Group 1 | 438,550 | 5,582,741 | ||||||
| 292,563 | 3,238,672 | |||||||
II-VI 1 | 764,314 | 11,051,980 | ||||||
Ingram Micro Cl. A 1 | 612,400 | 17,888,204 | ||||||
KEMET Corporation 1 | 1,944,954 | 11,183,486 | ||||||
Maxwell Technologies 1 | 565,260 | 8,552,384 | ||||||
Mercury Systems 1 | 697,578 | 7,910,535 | ||||||
Newport Corporation 1 | 769,284 | 14,231,754 | ||||||
Park Electrochemical | 353,834 | 9,981,657 | ||||||
PCM 1 | 390,489 | 4,162,613 | ||||||
Perceptron | 14,513 | 185,041 | ||||||
| 1,614,099 | 3,954,543 | |||||||
| 1,260,898 | 4,400,534 | |||||||
Sanmina Corporation 1 | 1,047,923 | 23,871,686 | ||||||
| 341,372 | 4,116,946 | |||||||
TTM Technologies 1 | 848,925 | 6,961,185 | ||||||
Viasystems Group 1 | 317,947 | 3,462,443 | ||||||
Vishay Intertechnology | 1,063,023 | 16,466,226 | ||||||
| THE ACCOMPANYING NOTES ARE AN INTEGRAL PART OF THESE FINANCIAL STATEMENTS. | The Royce Funds 2014 Semiannual Report to Shareholders | 71 |
| Schedules of Investments |
| Royce Opportunity Fund (continued) |
| SHARES | VALUE | |||||||
| Information Technology (continued) | ||||||||
| Electronic Equipment, Instruments & Components (continued) | ||||||||
Vishay Precision Group 1 | 171,742 | $ | 2,826,873 | |||||
| 198,141,007 | ||||||||
Internet Software & Services - 2.0% | ||||||||
Bankrate 1 | 410,908 | 7,207,326 | ||||||
Blucora 1 | 331,430 | 6,254,084 | ||||||
| 123,191 | 3,129,052 | |||||||
Digital River 1 | 338,103 | 5,216,929 | ||||||
EarthLink Holdings | 1,794,200 | 6,674,424 | ||||||
Monster Worldwide 1 | 1,653,000 | 10,810,620 | ||||||
Perficient 1 | 252,926 | 4,924,469 | ||||||
QuinStreet 1 | 1,088,439 | 5,997,299 | ||||||
| 698,897 | 1,894,011 | |||||||
| 52,108,214 | ||||||||
IT Services - 0.8% | ||||||||
CIBER 1 | 1,603,273 | 7,920,169 | ||||||
Computer Task Group | 341,346 | 5,618,555 | ||||||
Datalink Corporation 1 | 746,009 | 7,460,090 | ||||||
| 20,998,814 | ||||||||
Semiconductors & Semiconductor Equipment - 10.6% | ||||||||
Advanced Energy Industries 1 | 824,151 | 15,864,907 | ||||||
Alpha & Omega Semiconductor 1 | 1,025,172 | 9,503,344 | ||||||
| 2,642,214 | 2,138,080 | |||||||
Audience 1 | 461,278 | 5,516,885 | ||||||
Axcelis Technologies 1 | 1,345,794 | 2,691,588 | ||||||
AXT 1 | 611,830 | 1,309,316 | ||||||
Brooks Automation | 1,325,800 | 14,278,866 | ||||||
| 739,941 | 2,419,607 | |||||||
Cohu | 528,826 | 5,658,438 | ||||||
Exar Corporation 1 | 985,137 | 11,132,048 | ||||||
Fairchild Semiconductor International 1 | 1,027,220 | 16,024,632 | ||||||
FormFactor 1 | 989,361 | 8,231,483 | ||||||
| 403,859 | 171,640 | |||||||
Integrated Silicon Solution 1 | 297,775 | 4,398,137 | ||||||
International Rectifier 1 | 635,702 | 17,736,086 | ||||||
Intersil Corporation Cl. A | 999,399 | 14,941,015 | ||||||
Kulicke & Soffa Industries 1 | 711,400 | 10,144,564 | ||||||
Mattson Technology 1 | 598,400 | 1,310,496 | ||||||
Microsemi Corporation 1 | 722,954 | 19,346,249 | ||||||
Nanometrics 1 | 641,571 | 11,708,671 | ||||||
NeoPhotonics Corporation 1 | 1,056,755 | 4,396,101 | ||||||
OmniVision Technologies 1 | 237,211 | 5,213,898 | ||||||
| 1,439,417 | 13,012,330 | |||||||
RF Micro Devices 1 | 990,500 | 9,498,895 | ||||||
| 882,184 | 7,719,110 | |||||||
Rudolph Technologies 1 | 660,911 | 6,529,801 | ||||||
| 1,313,240 | 1,339,505 | |||||||
Spansion Cl. A 1 | 608,100 | 12,812,667 | ||||||
| 668,200 | 421,634 | |||||||
| 652,109 | 14,737,663 | |||||||
| 143,053 | 5,862,312 | |||||||
Ultra Clean Holdings 1 | 586,106 | 5,304,259 | ||||||
| 927,978 | 3,201,524 | |||||||
Xcerra Corporation 1 | 1,271,605 | 11,571,605 | ||||||
| 276,147,356 | ||||||||
Software - 0.9% | ||||||||
Actuate Corporation 1 | 859,783 | 4,101,165 | ||||||
| 1,287,636 | 3,206,213 | |||||||
Mentor Graphics | 494,419 | 10,664,618 | ||||||
SeaChange International 1 | 375,000 | 3,003,750 | ||||||
| 1,169,703 | 1,216,491 | |||||||
| 22,192,237 | ||||||||
Technology Hardware, Storage & Peripherals - 1.8% | ||||||||
| 896,746 | 6,635,920 | |||||||
Cray 1 | 459,067 | 12,211,182 | ||||||
Dot Hill Systems 1 | 1,426,471 | 6,704,414 | ||||||
Intevac 1 | 630,947 | 5,053,886 | ||||||
QLogic Corporation 1 | 812,500 | 8,198,125 | ||||||
| 779,900 | 7,502,638 | |||||||
| 46,306,165 | ||||||||
Total (Cost $587,372,021) | 697,564,835 | |||||||
Materials – 8.6% | ||||||||
Chemicals - 2.6% | ||||||||
Chemtura Corporation 1 | 492,769 | 12,876,054 | ||||||
Ferro Corporation 1 | 709,811 | 8,915,226 | ||||||
Kraton Performance Polymers 1 | 491,700 | 11,009,163 | ||||||
OM Group | 591,328 | 19,176,767 | ||||||
Schulman (A.) | 379,219 | 14,675,776 | ||||||
| 66,652,986 | ||||||||
Metals & Mining - 5.6% | ||||||||
| 853,832 | 9,426,305 | |||||||
| 1,165,800 | 9,279,768 | |||||||
Carpenter Technology | 202,236 | 12,791,427 | ||||||
Century Aluminum 1 | 1,089,000 | 17,075,520 | ||||||
Commercial Metals | 1,073,861 | 18,588,534 | ||||||
Haynes International | 236,281 | 13,371,142 | ||||||
Kaiser Aluminum | 249,600 | 18,188,352 | ||||||
| 1,600,400 | 4,113,028 | |||||||
Noranda Aluminum Holding Corporation | 1,783,183 | 6,294,636 | ||||||
Pan American Silver | 785,300 | 12,054,355 | ||||||
RTI International Metals 1 | 652,969 | 17,362,446 | ||||||
Synalloy Corporation | 306,418 | 5,031,383 | ||||||
Walter Energy | 417,300 | 2,274,285 | ||||||
| 145,851,181 | ||||||||
Paper & Forest Products - 0.4% | ||||||||
Louisiana-Pacific Corporation 1 | 728,600 | 10,943,572 | ||||||
Total (Cost $174,664,759) | 223,447,739 | |||||||
Telecommunication Services – 0.6% | ||||||||
Diversified Telecommunication Services - 0.5% | ||||||||
| 1,419,106 | 12,005,637 | |||||||
Wireless Telecommunication Services - 0.1% | ||||||||
Boingo Wireless 1 | 381,959 | 2,608,780 | ||||||
Total (Cost $13,080,470) | 14,614,417 | |||||||
| 72 | The Royce Funds 2014 Semiannual Report to Shareholders | THE ACCOMPANYING NOTES ARE AN INTEGRAL PART OF THESE FINANCIAL STATEMENTS. |
| June 30, 2014 (unaudited) |
| VALUE | ||||||||
| Miscellaneous 5 – 3.1% | ||||||||
| Total (Cost $79,007,170) | $ | 81,320,668 | ||||||
| TOTAL COMMON STOCKS | ||||||||
(Cost $1,901,680,857) | 2,420,194,148 | |||||||
| REPURCHASE AGREEMENT – 6.6% | ||||||||
| Fixed Income Clearing Corporation, | ||||||||
0.00% dated 6/30/14, due 7/1/14, | ||||||||
maturity value $172,123,000 (collateralized | ||||||||
by obligations of various U.S. Government | ||||||||
Agencies, 1.625%-2.00% due 4/30/19-9/30/20, | ||||||||
valued at $175,568,500) | ||||||||
(Cost $172,123,000) | 172,123,000 | |||||||
| PRINCIPAL | ||||||||
| AMOUNT | ||||||||
| COLLATERAL RECEIVED FOR SECURITIES | ||||||||
LOANED – 7.9% | ||||||||
| U.S. Treasury Bonds | ||||||||
4.50%-6.75% | ||||||||
due 8/15/26-8/15/39 | $ | 5,704 | 5,777 | |||||
| U.S. Treasury Notes | ||||||||
0.375%-2.25% | ||||||||
due 11/15/14-12/31/18 | 345,011 | 345,433 | ||||||
| Money Market Funds | ||||||||
Federated Government Obligations Fund | ||||||||
(7 day yield-0.0099%) | 205,744,477 | |||||||
| TOTAL COLLATERAL RECEIVED FOR | ||||||||
SECURITIES LOANED | ||||||||
(Cost $206,095,687) | 206,095,687 | |||||||
| TOTAL INVESTMENTS – 107.8% | ||||||||
(Cost $2,279,899,544) | 2,798,412,835 | |||||||
| LIABILITIES LESS CASH | ||||||||
AND OTHER ASSETS – (7.8)% | (203,369,476 | ) | ||||||
| NET ASSETS – 100.0% | $ | 2,595,043,359 | ||||||
| Royce Special Equity Fund | ||||||||
| SHARES | VALUE | |||||||
| COMMON STOCKS – 87.7% | ||||||||
| Consumer Discretionary – 28.5% | ||||||||
| Auto Components - 6.0% | ||||||||
†Dana Holding Corporation | 4,024,000 | $ | 98,266,080 | |||||
Standard Motor Products 2 | 2,268,000 | 101,311,560 | ||||||
| 199,577,640 | ||||||||
Hotels, Restaurants & Leisure - 0.5% | ||||||||
Bowl America Cl. A 2 | 343,048 | 5,317,244 | ||||||
Frisch’s Restaurants 2 | 505,100 | 11,920,360 | ||||||
| 17,237,604 | ||||||||
Household Durables - 0.8% | ||||||||
CSS Industries 2 | 974,000 | 25,684,380 | ||||||
Leisure Products - 1.4% | ||||||||
| 6,352,200 | 46,688,670 | |||||||
Media - 5.8% | ||||||||
Meredith Corporation | 1,972,000 | 95,365,920 | ||||||
Scholastic Corporation 2 | 2,910,000 | 99,201,900 | ||||||
| 194,567,820 | ||||||||
Specialty Retail - 14.0% | ||||||||
Bed Bath & Beyond 1 | 2,287,200 | 131,239,536 | ||||||
Buckle (The) | 1,713,000 | 75,988,680 | ||||||
Children’s Place 2 | 2,170,000 | 107,697,100 | ||||||
Finish Line (The) Cl. A 2 | 4,958,000 | 147,450,920 | ||||||
†Haverty Furniture | 144,500 | 3,631,285 | ||||||
| 466,007,521 | ||||||||
Total (Cost $789,345,898) | 949,763,635 | |||||||
Consumer Staples – 7.0% | ||||||||
Food & Staples Retailing - 1.9% | ||||||||
Weis Markets 2 | 1,389,830 | 63,556,926 | ||||||
Food Products - 2.7% | ||||||||
J&J Snack Foods | 185,000 | 17,412,200 | ||||||
Lancaster Colony | 738,100 | 70,237,596 | ||||||
| 87,649,796 | ||||||||
Tobacco - 2.4% | ||||||||
Universal Corporation 2 | 1,459,700 | 80,794,395 | ||||||
Total (Cost $167,982,071) | 232,001,117 | |||||||
Health Care – 3.1% | ||||||||
Health Care Equipment & Supplies - 1.4% | ||||||||
Atrion Corporation 2 | 145,000 | 47,270,000 | ||||||
Life Sciences Tools & Services - 1.7% | ||||||||
Bio-Rad Laboratories Cl. A 1 | 481,000 | 57,580,510 | ||||||
Total (Cost $45,158,797) | 104,850,510 | |||||||
Industrials – 21.6% | ||||||||
Aerospace & Defense - 1.4% | ||||||||
National Presto Industries 2 | 656,500 | 47,819,460 | ||||||
Commercial Services & Supplies - 4.9% | ||||||||
UniFirst Corporation 2 | 1,542,278 | 163,481,468 | ||||||
Electrical Equipment - 7.2% | ||||||||
EnerSys | 1,670,500 | 114,913,695 | ||||||
Hubbell Cl. B | 712,000 | 87,682,800 | ||||||
| THE ACCOMPANYING NOTES ARE AN INTEGRAL PART OF THESE FINANCIAL STATEMENTS. | The Royce Funds 2014 Semiannual Report to Shareholders | 73 |
| Schedules of Investments |
| Royce Special Equity Fund (continued) |
| SHARES | VALUE | |||||||
| Industrials (continued) | ||||||||
| Electrical Equipment (continued) | ||||||||
Regal-Beloit | 468,800 | $ | 36,828,928 | |||||
| 239,425,423 | ||||||||
Industrial Conglomerates - 1.3% | ||||||||
Carlisle Companies | 504,000 | 43,656,480 | ||||||
Machinery - 4.5% | ||||||||
Foster (L.B.) Company 2 | 1,000,000 | 54,120,000 | ||||||
Hurco Companies 2 | 471,000 | 13,282,200 | ||||||
Standex International | 170,774 | 12,719,248 | ||||||
Valmont Industries | 460,100 | 69,912,195 | ||||||
| 150,033,643 | ||||||||
Trading Companies & Distributors - 2.3% | ||||||||
Applied Industrial Technologies | 1,529,040 | 77,568,199 | ||||||
Total (Cost $420,448,737) | 721,984,673 | |||||||
Information Technology – 15.2% | ||||||||
Communications Equipment - 3.3% | ||||||||
Plantronics 2 | 2,290,057 | 110,037,239 | ||||||
Electronic Equipment, Instruments & Components - 9.5% | ||||||||
AVX Corporation 2 | 10,535,000 | 139,904,800 | ||||||
Littelfuse | 509,200 | 47,330,140 | ||||||
Park Electrochemical 2 | 1,890,000 | 53,316,900 | ||||||
| 2,011,447 | 76,595,901 | |||||||
| 317,147,741 | ||||||||
Semiconductors & Semiconductor Equipment - 2.4% | ||||||||
Teradyne | 4,111,900 | 80,593,240 | ||||||
Total (Cost $406,948,992) | 507,778,220 | |||||||
Materials – 12.3% | ||||||||
Chemicals - 7.5% | ||||||||
Hawkins 2 | 840,000 | 31,197,600 | ||||||
Minerals Technologies 2 | 2,752,342 | 180,498,588 | ||||||
Schulman (A.) | 565,957 | 21,902,536 | ||||||
Stepan Company | 320,200 | 16,925,772 | ||||||
| 250,524,496 | ||||||||
Metals & Mining - 0.1% | ||||||||
Central Steel & Wire 4 | 6,055 | 4,510,975 | ||||||
Paper & Forest Products - 4.7% | ||||||||
†Neenah Paper | 736,100 | 39,123,715 | ||||||
Schweitzer-Mauduit International 2 | 2,688,913 | 117,397,942 | ||||||
| 156,521,657 | ||||||||
Total (Cost $288,192,203) | 411,557,128 | |||||||
TOTAL COMMON STOCKS | ||||||||
(Cost $2,118,076,698) | 2,927,935,283 | |||||||
| REPURCHASE AGREEMENT – 12.4% | ||||||||
| Fixed Income Clearing Corporation, | ||||||||
0.00% dated 6/30/14, due 7/1/14, | ||||||||
maturity value $412,898,000 (collateralized | ||||||||
by obligations of various U.S. Government | ||||||||
Agencies, 0.75%-3.875% due 12/2/14-4/30/19, | ||||||||
valued at $421,156,888) | ||||||||
(Cost $412,898,000) | 412,898,000 | |||||||
| COLLATERAL RECEIVED FOR SECURITIES | ||||||||
LOANED – 0.3% | ||||||||
| Money Market Funds | ||||||||
Federated Government Obligations Fund | ||||||||
(7 day yield-0.0099%) | ||||||||
(Cost $9,207,927) | 9,207,927 | |||||||
| TOTAL INVESTMENTS – 100.4% | ||||||||
(Cost $2,540,182,625) | 3,350,041,210 | |||||||
| LIABILITIES LESS CASH | ||||||||
AND OTHER ASSETS – (0.4)% | (14,035,060 | ) | ||||||
| NET ASSETS – 100.0% | $ | 3,336,006,150 | ||||||
| 74 | The Royce Funds 2014 Semiannual Report to Shareholders | THE ACCOMPANYING NOTES ARE AN INTEGRAL PART OF THESE FINANCIAL STATEMENTS. |
| June 30, 2014 (unaudited) |
| Royce Value Fund |
| SHARES | VALUE | |||||||
| COMMON STOCKS – 97.2% | ||||||||
| Consumer Discretionary – 28.8% | ||||||||
| Auto Components - 1.6% | ||||||||
Gentex Corporation | 586,053 | $ | 17,048,282 | |||||
Automobiles - 1.7% | ||||||||
Thor Industries | 321,260 | 18,270,056 | ||||||
Household Durables - 2.5% | ||||||||
NVR 1 | 22,327 | 25,689,446 | ||||||
Media - 0.1% | ||||||||
Saga Communications Cl. A | 18,040 | 770,669 | ||||||
Specialty Retail - 13.9% | ||||||||
American Eagle Outfitters | 1,746,386 | 19,594,451 | ||||||
Ascena Retail Group 1 | 1,561,164 | 26,695,904 | ||||||
Buckle (The) | 644,547 | 28,592,105 | ||||||
GameStop Corporation Cl. A | 762,007 | 30,838,423 | ||||||
Genesco 1 | 386,912 | 31,777,083 | ||||||
Guess? | 274,749 | 7,418,223 | ||||||
Stein Mart | 60,375 | 838,609 | ||||||
| 145,754,798 | ||||||||
Textiles, Apparel & Luxury Goods - 9.0% | ||||||||
Crocs 1 | 418,670 | 6,292,610 | ||||||
Deckers Outdoor 1 | 280,517 | 24,217,033 | ||||||
G-III Apparel Group 1 | 312,414 | 25,511,727 | ||||||
Steven Madden 1 | 891,705 | 30,585,481 | ||||||
| 360,353 | 7,880,920 | |||||||
| 94,487,771 | ||||||||
Total (Cost $225,958,754) | 302,021,022 | |||||||
Consumer Staples – 2.8% | ||||||||
Personal Products - 2.8% | ||||||||
Nu Skin Enterprises Cl. A | 400,907 | 29,651,082 | ||||||
Total (Cost $27,466,942) | 29,651,082 | |||||||
Energy – 9.8% | ||||||||
Energy Equipment & Services - 9.1% | ||||||||
Atwood Oceanics 1 | 446,628 | 23,439,037 | ||||||
Helmerich & Payne | 230,099 | 26,716,795 | ||||||
Oil States International 1 | 223,177 | 14,303,414 | ||||||
Unit Corporation 1 | 461,626 | 31,773,718 | ||||||
| 96,232,964 | ||||||||
Oil, Gas & Consumable Fuels - 0.7% | ||||||||
Cimarex Energy | 49,692 | 7,128,814 | ||||||
Total (Cost $59,112,407) | 103,361,778 | |||||||
Financials – 12.7% | ||||||||
Capital Markets - 2.3% | ||||||||
Federated Investors Cl. B | 783,726 | 24,232,808 | ||||||
Insurance - 7.9% | ||||||||
Allied World Assurance Company Holdings | 582,623 | 22,151,326 | ||||||
Aspen Insurance Holdings | 66,667 | 3,028,015 | ||||||
PartnerRe | 236,574 | 25,836,247 | ||||||
Reinsurance Group of America | 398,109 | 31,410,800 | ||||||
| 82,426,388 | ||||||||
Thrifts & Mortgage Finance - 2.5% | ||||||||
Genworth MI Canada | 737,700 | 26,278,035 | ||||||
Total (Cost $86,582,352) | 132,937,231 | |||||||
Health Care – 4.8% | ||||||||
Health Care Providers & Services - 4.8% | ||||||||
Chemed Corporation | 297,379 | 27,870,360 | ||||||
Magellan Health 1 | 127,625 | 7,943,380 | ||||||
MEDNAX 1 | 255,128 | 14,835,693 | ||||||
Total (Cost $27,547,582) | 50,649,433 | |||||||
Industrials – 6.5% | ||||||||
Aerospace & Defense - 0.6% | ||||||||
Cubic Corporation | 139,258 | 6,198,374 | ||||||
Commercial Services & Supplies - 1.7% | ||||||||
| 238,012 | 5,957,440 | |||||||
UniFirst Corporation | 109,820 | 11,640,920 | ||||||
| 17,598,360 | ||||||||
Machinery - 0.7% | ||||||||
Kennametal | 160,193 | 7,413,732 | ||||||
Road & Rail - 1.2% | ||||||||
Knight Transportation | 531,500 | 12,633,755 | ||||||
Trading Companies & Distributors - 2.3% | ||||||||
Applied Industrial Technologies | 478,998 | 24,299,568 | ||||||
Total (Cost $49,993,058) | 68,143,789 | |||||||
Information Technology – 21.1% | ||||||||
Communications Equipment - 7.5% | ||||||||
†Brocade Communications Systems | 2,258,700 | 20,780,040 | ||||||
NETGEAR 1 | 823,954 | 28,648,880 | ||||||
Plantronics | 605,533 | 29,095,861 | ||||||
| 78,524,781 | ||||||||
Electronic Equipment, Instruments & Components - 4.8% | ||||||||
| 669,593 | 13,793,616 | |||||||
MTS Systems | 66,021 | 4,473,583 | ||||||
Vishay Intertechnology | 2,053,743 | 31,812,479 | ||||||
| 50,079,678 | ||||||||
IT Services - 4.8% | ||||||||
Convergys Corporation | 1,240,005 | 26,585,707 | ||||||
ManTech International Cl. A | 821,068 | 24,237,928 | ||||||
| 50,823,635 | ||||||||
Semiconductors & Semiconductor Equipment - 4.0% | ||||||||
Cabot Microelectronics 1 | 78,968 | 3,525,921 | ||||||
MKS Instruments | 760,607 | 23,761,363 | ||||||
Synaptics 1 | 58,432 | 5,296,276 | ||||||
Teradyne | 509,361 | 9,983,476 | ||||||
| 42,567,036 | ||||||||
Total (Cost $194,497,458) | 221,995,130 | |||||||
Materials – 8.8% | ||||||||
Chemicals - 5.0% | ||||||||
Innophos Holdings | 90,188 | 5,192,123 | ||||||
Innospec | 599,319 | 25,872,601 | ||||||
| THE ACCOMPANYING NOTES ARE AN INTEGRAL PART OF THESE FINANCIAL STATEMENTS. | The Royce Funds 2014 Semiannual Report to Shareholders | 75 |
| Schedules of Investments |
| Royce Value Fund (continued) |
| SHARES | VALUE | |||||||
| Materials (continued) | ||||||||
| Chemicals (continued) | ||||||||
Westlake Chemical | 249,226 | $ | 20,875,170 | |||||
| 51,939,894 | ||||||||
| Metals & Mining - 2.4% | ||||||||
Reliance Steel & Aluminum | 341,043 | 25,138,280 | ||||||
| Paper & Forest Products - 1.4% | ||||||||
Schweitzer-Mauduit International | 340,100 | 14,848,766 | ||||||
| Total (Cost $66,410,288) | 91,926,940 | |||||||
| Miscellaneous 5 – 1.9% | ||||||||
| Total (Cost $19,376,625) | 19,655,536 | |||||||
| TOTAL COMMON STOCKS | ||||||||
(Cost $756,945,466) | 1,020,341,941 | |||||||
| REPURCHASE AGREEMENT – 2.0% | ||||||||
| Fixed Income Clearing Corporation, | ||||||||
0.00% dated 6/30/14, due 7/1/14, | ||||||||
maturity value $20,940,000 (collateralized | ||||||||
by obligations of various U.S. Government | ||||||||
Agencies, 1.625% due 4/30/19, valued at | ||||||||
$21,361,275) | ||||||||
(Cost $20,940,000) | 20,940,000 | |||||||
| COLLATERAL RECEIVED FOR SECURITIES | ||||||||
LOANED – 0.4% | ||||||||
| Money Market Funds | ||||||||
Federated Government Obligations Fund | ||||||||
(7 day yield-0.0099%) | ||||||||
(Cost $4,542,570) | 4,542,570 | |||||||
| TOTAL INVESTMENTS – 99.6% | ||||||||
(Cost $782,428,036) | 1,045,824,511 | |||||||
| CASH AND OTHER ASSETS | ||||||||
LESS LIABILITIES – 0.4% | 4,315,557 | |||||||
| NET ASSETS – 100.0% | $ | 1,050,140,068 | ||||||
Royce Value Plus Fund | ||||||||
| SHARES | VALUE | |||||||
| COMMON STOCKS – 99.5% | ||||||||
| Consumer Discretionary – 11.4% | ||||||||
| Hotels, Restaurants & Leisure - 2.1% | ||||||||
Buffalo Wild Wings 1 | 76,900 | $ | 12,743,099 | |||||
Red Robin Gourmet Burgers 1 | 143,000 | 10,181,600 | ||||||
| 22,924,699 | ||||||||
Household Durables - 1.7% | ||||||||
| 267,000 | 10,933,650 | |||||||
UCP Cl. A 1 | 580,000 | 7,928,600 | ||||||
| 18,862,250 | ||||||||
Internet & Catalog Retail - 1.4% | ||||||||
HomeAway 1 | 426,500 | 14,850,730 | ||||||
Specialty Retail - 4.4% | ||||||||
| 200,000 | 5,556,000 | |||||||
| 106,000 | 5,742,020 | |||||||
Monro Muffler Brake | 176,000 | 9,361,440 | ||||||
Tractor Supply | 172,000 | 10,388,800 | ||||||
Zumiez 1 | 636,000 | 17,547,240 | ||||||
| 48,595,500 | ||||||||
Textiles, Apparel & Luxury Goods - 1.8% | ||||||||
Carter’s | 163,800 | 11,290,734 | ||||||
Gildan Activewear | 149,833 | 8,822,167 | ||||||
| 20,112,901 | ||||||||
Total (Cost $78,957,577) | 125,346,080 | |||||||
Consumer Staples – 3.1% | ||||||||
Food & Staples Retailing - 0.8% | ||||||||
United Natural Foods 1 | 133,517 | 8,691,957 | ||||||
Food Products - 2.0% | ||||||||
Snyder’s-Lance | 275,000 | 7,276,500 | ||||||
SunOpta 1 | 1,076,000 | 15,150,080 | ||||||
| 22,426,580 | ||||||||
Personal Products - 0.3% | ||||||||
Female Health | 556,000 | 3,063,560 | ||||||
Total (Cost $25,140,511) | 34,182,097 | |||||||
Energy – 7.7% | ||||||||
Energy Equipment & Services - 5.5% | ||||||||
†Canadian Energy Services & Technology | 327,000 | 10,241,638 | ||||||
Helmerich & Payne | 94,000 | 10,914,340 | ||||||
Pason Systems | 539,000 | 15,153,929 | ||||||
Trican Well Service | 539,200 | 8,706,636 | ||||||
Unit Corporation 1 | 222,400 | 15,307,792 | ||||||
| 60,324,335 | ||||||||
Oil, Gas & Consumable Fuels - 2.2% | ||||||||
| 177,000 | 10,122,630 | |||||||
Sprott Resource 1 | 1,515,000 | 4,486,575 | ||||||
| 833,600 | 9,794,800 | |||||||
| 24,404,005 | ||||||||
Total (Cost $62,024,555) | 84,728,340 | |||||||
| 76 | The Royce Funds 2014 Semiannual Report to Shareholders | THE ACCOMPANYING NOTES ARE AN INTEGRAL PART OF THESE FINANCIAL STATEMENTS. |
| June 30, 2014 (unaudited) |
| SHARES | VALUE | |||||||
| Financials – 7.9% | ||||||||
| Banks - 3.5% | ||||||||
Associated Banc-Corp | 566,500 | $ | 10,242,320 | |||||
Columbia Banking System | 287,500 | 7,564,125 | ||||||
Enterprise Financial Services | 561,500 | 10,140,690 | ||||||
Umpqua Holdings | 608,900 | 10,911,488 | ||||||
| 38,858,623 | ||||||||
Capital Markets - 1.5% | ||||||||
Northern Trust | 177,000 | 11,365,170 | ||||||
Oaktree Capital Group LLC Cl. A | 112,800 | 5,638,872 | ||||||
| 17,004,042 | ||||||||
Diversified Financial Services - 1.4% | ||||||||
PICO Holdings 1 | 656,222 | 15,591,835 | ||||||
Real Estate Management & Development - 1.1% | ||||||||
Jones Lang LaSalle | 91,000 | 11,501,490 | ||||||
Thrifts & Mortgage Finance - 0.4% | ||||||||
Berkshire Hills Bancorp | 198,192 | 4,602,018 | ||||||
Total (Cost $72,645,558) | 87,558,008 | |||||||
Health Care – 11.7% | ||||||||
Biotechnology - 6.5% | ||||||||
Actelion | 143,800 | 18,193,911 | ||||||
| 865,000 | 1,548,350 | |||||||
Cubist Pharmaceuticals 1 | 209,000 | 14,592,380 | ||||||
| 278,000 | 12,273,700 | |||||||
| 634,893 | 24,710,035 | |||||||
| 71,318,376 | ||||||||
Health Care Equipment & Supplies - 2.0% | ||||||||
| 2,479,500 | 10,289,925 | |||||||
| 107,355 | 2,421,929 | |||||||
Thoratec Corporation 1 | 274,600 | 9,572,556 | ||||||
| 22,284,410 | ||||||||
Health Care Technology - 0.6% | ||||||||
Quality Systems | 432,000 | 6,933,600 | ||||||
Pharmaceuticals - 2.6% | ||||||||
Medicines Company (The) 1 | 476,000 | 13,832,560 | ||||||
UCB | 169,000 | 14,308,189 | ||||||
| 28,140,749 | ||||||||
Total (Cost $92,884,169) | 128,677,135 | |||||||
Industrials – 16.9% | ||||||||
Building Products - 1.1% | ||||||||
Apogee Enterprises | 349,198 | 12,173,042 | ||||||
Commercial Services & Supplies - 2.1% | ||||||||
Mobile Mini | 485,000 | 23,226,650 | ||||||
Electrical Equipment - 5.0% | ||||||||
Acuity Brands | 91,095 | 12,593,884 | ||||||
Capstone Turbine 1 | 4,685,000 | 7,074,350 | ||||||
EnerSys | 267,000 | 18,366,930 | ||||||
| 432,000 | 8,069,760 | |||||||
Powell Industries | 131,462 | 8,594,985 | ||||||
| 54,699,909 | ||||||||
Industrial Conglomerates - 1.5% | ||||||||
Carlisle Companies | 193,900 | 16,795,618 | ||||||
Machinery - 3.8% | ||||||||
Hyster-Yale Materials Handling Cl. A | 152,100 | 13,466,934 | ||||||
Tennant Company | 155,937 | 11,901,112 | ||||||
Valmont Industries | 10,400 | 1,580,280 | ||||||
Wabtec Corporation | 181,464 | 14,987,112 | ||||||
| 41,935,438 | ||||||||
Professional Services - 1.3% | ||||||||
| 672,570 | 14,547,689 | |||||||
Road & Rail - 0.9% | ||||||||
Celadon Group | 439,600 | 9,372,272 | ||||||
Trading Companies & Distributors - 1.2% | ||||||||
Watsco | 127,100 | 13,060,796 | ||||||
Total (Cost $130,013,537) | 185,811,414 | |||||||
Information Technology – 27.2% | ||||||||
Communications Equipment - 5.0% | ||||||||
| 2,247,234 | 10,786,723 | |||||||
Infinera Corporation 1 | 1,926,533 | 17,724,104 | ||||||
NumereX Corporation Cl. A 1 | 999,900 | 11,488,851 | ||||||
| 718,500 | 14,492,145 | |||||||
| 54,491,823 | ||||||||
Electronic Equipment, Instruments & Components - 10.3% | ||||||||
FLIR Systems | 478,900 | 16,632,197 | ||||||
| 661,400 | 15,007,166 | |||||||
IPG Photonics 1 | 245,132 | 16,865,082 | ||||||
Littelfuse | 132,744 | 12,338,555 | ||||||
Mercury Systems 1 | 1,226,749 | 13,911,334 | ||||||
Methode Electronics | 310,605 | 11,868,217 | ||||||
Rogers Corporation 1 | 402,693 | 26,718,680 | ||||||
| 113,341,231 | ||||||||
Internet Software & Services - 3.1% | ||||||||
| 813,000 | 16,804,710 | |||||||
SciQuest 1 | 961,877 | 17,015,604 | ||||||
| 33,820,314 | ||||||||
IT Services - 0.3% | ||||||||
Acxiom Corporation 1 | 162,000 | 3,513,780 | ||||||
Semiconductors & Semiconductor Equipment - 3.5% | ||||||||
| 329,000 | 16,338,140 | |||||||
International Rectifier 1 | 528,048 | 14,732,540 | ||||||
Ultratech 1 | 356,740 | 7,912,493 | ||||||
| 38,983,173 | ||||||||
Software - 4.1% | ||||||||
Absolute Software | 1,082,200 | 6,997,966 | ||||||
| 1,276,000 | 10,973,600 | |||||||
Manhattan Associates 1 | 292,000 | 10,053,560 | ||||||
PTC 1 | 454,000 | 17,615,200 | ||||||
| 45,640,326 | ||||||||
Technology Hardware, Storage & Peripherals - 0.9% | ||||||||
Immersion Corporation 1 | 805,595 | 10,247,168 | ||||||
Total (Cost $225,004,609) | 300,037,815 | |||||||
Materials – 9.1% | ||||||||
Chemicals - 2.1% | ||||||||
Rockwood Holdings | 302,000 | 22,948,980 | ||||||
| THE ACCOMPANYING NOTES ARE AN INTEGRAL PART OF THESE FINANCIAL STATEMENTS. | The Royce Funds 2014 Semiannual Report to Shareholders | 77 |
| Schedules of Investments |
| Royce Value Plus Fund (continued) |
| SHARES | VALUE | |||||||
| Materials (continued) | ||||||||
| Construction Materials - 1.5% | ||||||||
Eagle Materials | 169,000 | $ | 15,933,320 | |||||
| Metals & Mining - 5.5% | ||||||||
Horsehead Holding Corporation 1 | 835,653 | 15,259,024 | ||||||
Reliance Steel & Aluminum | 165,100 | 12,169,521 | ||||||
U.S. Silica Holdings | 232,500 | 12,889,800 | ||||||
Worthington Industries | 482,466 | 20,765,336 | ||||||
| 61,083,681 | ||||||||
| Total (Cost $59,107,498) | 99,965,981 | |||||||
| Miscellaneous 5 – 4.5% | ||||||||
| Total (Cost $46,338,128) | 49,769,318 | |||||||
| TOTAL COMMON STOCKS | ||||||||
(Cost $792,116,142) | 1,096,076,188 | |||||||
| REPURCHASE AGREEMENT – 3.2% | ||||||||
| Fixed Income Clearing Corporation, | ||||||||
0.00% dated 6/30/14, due 7/1/14, | ||||||||
maturity value $34,950,000 (collateralized | ||||||||
by obligations of various U.S. Government | ||||||||
Agencies, 2.125% due 8/31/20, valued at | ||||||||
$35,653,200) | ||||||||
(Cost $34,950,000) | 34,950,000 | |||||||
| COLLATERAL RECEIVED FOR SECURITIES | ||||||||
LOANED – 9.5% | ||||||||
| Money Market Funds | ||||||||
Federated Government Obligations Fund | ||||||||
(7 day yield-0.0099%) | ||||||||
(Cost $104,981,188) | 104,981,188 | |||||||
| TOTAL INVESTMENTS – 112.2% | ||||||||
(Cost $932,047,330) | 1,236,007,376 | |||||||
| LIABILITIES LESS CASH | ||||||||
AND OTHER ASSETS – (12.2)% | (134,257,139 | ) | ||||||
| NET ASSETS – 100.0% | $ | 1,101,750,237 | ||||||
Royce 100 Fund | ||||||||
SHARES | VALUE | |||||||
| COMMON STOCKS – 94.1% | ||||||||
| Consumer Discretionary – 8.1% | ||||||||
| Auto Components - 0.6% | ||||||||
Drew Industries | 35,356 | $ | 1,768,154 | |||||
Diversified Consumer Services - 1.3% | ||||||||
| 110,629 | 3,685,052 | |||||||
Household Durables - 0.9% | ||||||||
Ethan Allen Interiors | 108,910 | 2,694,433 | ||||||
Internet & Catalog Retail - 1.1% | ||||||||
FTD Companies 1 | 94,100 | 2,991,439 | ||||||
Media - 1.2% | ||||||||
Morningstar | 21,072 | 1,513,180 | ||||||
Wiley (John) & Sons Cl. A | 32,000 | 1,938,880 | ||||||
| 3,452,060 | ||||||||
Specialty Retail - 1.9% | ||||||||
Ascena Retail Group 1 | 167,500 | 2,864,250 | ||||||
Destination Maternity | 107,100 | 2,438,667 | ||||||
| 5,302,917 | ||||||||
Textiles, Apparel & Luxury Goods - 1.1% | ||||||||
†Movado Group | 77,900 | 3,246,093 | ||||||
Total (Cost $17,751,458) | 23,140,148 | |||||||
Consumer Staples – 2.1% | ||||||||
Food Products - 2.1% | ||||||||
Darling Ingredients 1 | 178,000 | 3,720,200 | ||||||
Sanderson Farms | 24,100 | 2,342,520 | ||||||
Total (Cost $2,997,573) | 6,062,720 | |||||||
Energy – 8.4% | ||||||||
Energy Equipment & Services - 8.4% | ||||||||
Ensign Energy Services | 182,000 | 2,826,240 | ||||||
Helmerich & Payne | 26,225 | 3,044,985 | ||||||
Oil States International 1 | 28,400 | 1,820,156 | ||||||
Pason Systems | 172,000 | 4,835,762 | ||||||
SEACOR Holdings 1 | 31,500 | 2,590,875 | ||||||
Trican Well Service | 245,000 | 3,956,094 | ||||||
Unit Corporation 1 | 71,800 | 4,941,994 | ||||||
Total (Cost $11,833,386) | 24,016,106 | |||||||
Financials – 6.6% | ||||||||
Capital Markets - 6.6% | ||||||||
AllianceBernstein Holding L.P. | 128,769 | 3,332,542 | ||||||
Federated Investors Cl. B | 190,200 | 5,880,984 | ||||||
Lazard Cl. A | 43,300 | 2,232,548 | ||||||
SEI Investments | 76,000 | 2,490,520 | ||||||
Silvercrest Asset Management Group Cl. A | 115,000 | 1,979,150 | ||||||
Westwood Holdings Group | 47,400 | 2,845,896 | ||||||
Total (Cost $13,826,167) | 18,761,640 | |||||||
Health Care – 5.3% | ||||||||
Health Care Equipment & Supplies - 1.7% | ||||||||
Analogic Corporation | 25,800 | 2,018,592 | ||||||
| 78 | The Royce Funds 2014 Semiannual Report to Shareholders | THE ACCOMPANYING NOTES ARE AN INTEGRAL PART OF THESE FINANCIAL STATEMENTS. |
| June 30, 2014 (unaudited) |
| SHARES | VALUE | |||||||
| Health Care (continued) | ||||||||
| Health Care Equipment & Supplies (continued) | ||||||||
Atrion Corporation | 8,400 | $ | 2,738,400 | |||||
| 4,756,992 | ||||||||
Life Sciences Tools & Services - 2.7% | ||||||||
Bio-Rad Laboratories Cl. A 1 | 20,000 | 2,394,200 | ||||||
PerkinElmer | 47,400 | 2,220,216 | ||||||
Techne Corporation | 33,300 | 3,082,581 | ||||||
| 7,696,997 | ||||||||
Pharmaceuticals - 0.9% | ||||||||
Medicines Company (The) 1 | 89,300 | 2,595,058 | ||||||
Total (Cost $12,521,118) | 15,049,047 | |||||||
Industrials – 25.8% | ||||||||
Aerospace & Defense - 0.8% | ||||||||
HEICO Corporation Cl. A | 52,650 | 2,137,590 | ||||||
Air Freight & Logistics - 2.6% | ||||||||
Expeditors International of Washington | 82,800 | 3,656,448 | ||||||
Forward Air | 78,314 | 3,747,325 | ||||||
| 7,403,773 | ||||||||
Building Products - 1.0% | ||||||||
Simpson Manufacturing | 81,200 | 2,952,432 | ||||||
Commercial Services & Supplies - 1.3% | ||||||||
Heritage-Crystal Clean 1 | 196,008 | 3,847,637 | ||||||
Construction & Engineering - 2.1% | ||||||||
Jacobs Engineering Group 1 | 57,800 | 3,079,584 | ||||||
KBR | 118,800 | 2,833,380 | ||||||
| 5,912,964 | ||||||||
Electrical Equipment - 2.8% | ||||||||
Global Power Equipment Group | 175,883 | 2,842,269 | ||||||
| 273,300 | 2,858,718 | |||||||
Regal-Beloit | 29,100 | 2,286,096 | ||||||
| 7,987,083 | ||||||||
Machinery - 8.7% | ||||||||
CIRCOR International | 58,218 | 4,490,354 | ||||||
Hyster-Yale Materials Handling Cl. A | 37,100 | 3,284,834 | ||||||
John Bean Technologies | 109,300 | 3,387,207 | ||||||
Kadant | 39,300 | 1,511,085 | ||||||
Kennametal | 60,000 | 2,776,800 | ||||||
Sun Hydraulics | 59,200 | 2,403,520 | ||||||
Tennant Company | 36,800 | 2,808,576 | ||||||
Valmont Industries | 15,300 | 2,324,835 | ||||||
Wabtec Corporation | 20,600 | 1,701,354 | ||||||
| 24,688,565 | ||||||||
Professional Services - 3.8% | ||||||||
Advisory Board (The) 1 | 24,182 | 1,252,628 | ||||||
ICF International 1 | 67,100 | 2,372,656 | ||||||
ManpowerGroup | 41,066 | 3,484,450 | ||||||
Robert Half International | 40,400 | 1,928,696 | ||||||
Towers Watson & Co. Cl. A | 18,400 | 1,917,832 | ||||||
| 10,956,262 | ||||||||
Trading Companies & Distributors - 2.7% | ||||||||
Air Lease Cl. A | 42,100 | 1,624,218 | ||||||
Applied Industrial Technologies | 70,000 | 3,551,100 | ||||||
MSC Industrial Direct Cl. A | 25,800 | 2,467,512 | ||||||
| 7,642,830 | ||||||||
Total (Cost $47,956,095) | 73,529,136 | |||||||
Information Technology – 23.3% | ||||||||
Communications Equipment - 1.2% | ||||||||
ADTRAN | 157,400 | 3,550,944 | ||||||
Electronic Equipment, Instruments & Components - 10.7% | ||||||||
Coherent 1 | 44,200 | 2,924,714 | ||||||
FARO Technologies 1 | 43,187 | 2,121,346 | ||||||
FLIR Systems | 95,000 | 3,299,350 | ||||||
IPG Photonics 1 | 35,600 | 2,449,280 | ||||||
Littelfuse | 26,400 | 2,453,880 | ||||||
MTS Systems | 30,600 | 2,073,456 | ||||||
National Instruments | 95,200 | 3,083,528 | ||||||
Orbotech 1 | 203,400 | 3,087,612 | ||||||
Plexus Corporation 1 | 79,800 | 3,454,542 | ||||||
Rofin-Sinar Technologies 1 | 115,600 | 2,779,024 | ||||||
Rogers Corporation 1 | 40,100 | 2,660,635 | ||||||
| 30,387,367 | ||||||||
Internet Software & Services - 0.8% | ||||||||
Envestnet 1 | 44,600 | 2,181,832 | ||||||
IT Services - 1.0% | ||||||||
Sapient Corporation 1 | 182,300 | 2,962,375 | ||||||
Semiconductors & Semiconductor Equipment - 6.8% | ||||||||
†Brooks Automation | 252,600 | 2,720,502 | ||||||
Cabot Microelectronics 1 | 44,900 | 2,004,785 | ||||||
Diodes 1 | 103,500 | 2,997,360 | ||||||
Fairchild Semiconductor International 1 | 131,500 | 2,051,400 | ||||||
International Rectifier 1 | 80,300 | 2,240,370 | ||||||
MKS Instruments | 85,200 | 2,661,648 | ||||||
Nanometrics 1 | 159,160 | 2,904,670 | ||||||
Veeco Instruments 1 | 49,800 | 1,855,548 | ||||||
| 19,436,283 | ||||||||
Software - 1.4% | ||||||||
ANSYS 1 | 15,500 | 1,175,210 | ||||||
| 46,647 | 2,714,855 | |||||||
| 3,890,065 | ||||||||
Technology Hardware, Storage & Peripherals - 1.4% | ||||||||
Diebold | 97,900 | 3,932,643 | ||||||
Total (Cost $46,305,786) | 66,341,509 | |||||||
Materials – 10.2% | ||||||||
Chemicals - 1.0% | ||||||||
Innospec | 70,000 | 3,021,900 | ||||||
Containers & Packaging - 1.3% | ||||||||
Greif Cl. A | 67,800 | 3,699,168 | ||||||
Metals & Mining - 7.9% | ||||||||
Compass Minerals International | 24,500 | 2,345,630 | ||||||
Globe Specialty Metals | 194,900 | 4,050,022 | ||||||
Haynes International | 77,133 | 4,364,957 | ||||||
Major Drilling Group International | 317,000 | 2,308,317 | ||||||
Randgold Resources ADR | 26,900 | 2,275,740 | ||||||
| THE ACCOMPANYING NOTES ARE AN INTEGRAL PART OF THESE FINANCIAL STATEMENTS. | The Royce Funds 2014 Semiannual Report to Shareholders | 79 |
| Schedules of Investments |
| Royce 100 Fund (continued) |
| SHARES | VALUE | |||||||
| Materials (continued) | ||||||||
| Metals & Mining (continued) | ||||||||
Reliance Steel & Aluminum | 64,900 | $ | 4,783,779 | |||||
Steel Dynamics | 129,200 | 2,319,140 | ||||||
| 22,447,585 | ||||||||
| Total (Cost $21,371,977) | 29,168,653 | |||||||
| Miscellaneous 5 – 4.3% | ||||||||
| Total (Cost $10,616,011) | 12,264,662 | |||||||
| TOTAL COMMON STOCKS | ||||||||
(Cost $185,179,571) | 268,333,621 | |||||||
| REPURCHASE AGREEMENT – 6.5% | ||||||||
| Fixed Income Clearing Corporation, | ||||||||
0.00% dated 6/30/14, due 7/1/14, | ||||||||
maturity value $18,652,000 (collateralized | ||||||||
by obligations of various U.S. Government | ||||||||
Agencies, 2.125% due 8/31/20, valued at | ||||||||
$19,027,250) | ||||||||
(Cost $18,652,000) | 18,652,000 | |||||||
| COLLATERAL RECEIVED FOR SECURITIES | ||||||||
LOANED – 0.3% | ||||||||
| Money Market Funds | ||||||||
Federated Government Obligations Fund | ||||||||
(7 day yield-0.0099%) | ||||||||
(Cost $982,550) | 982,550 | |||||||
| TOTAL INVESTMENTS – 100.9% | ||||||||
(Cost $204,814,121) | 287,968,171 | |||||||
| LIABILITIES LESS CASH | ||||||||
AND OTHER ASSETS – (0.9)% | (2,658,133 | ) | ||||||
| NET ASSETS – 100.0% | $ | 285,310,038 | ||||||
Royce Dividend Value Fund | ||||||||
SHARES | VALUE | |||||||
| COMMON STOCKS – 97.1% | ||||||||
| Consumer Discretionary – 9.7% | ||||||||
| Auto Components - 0.8% | ||||||||
Autoliv | 33,300 | $ | 3,549,114 | |||||
Gentex Corporation | 47,348 | 1,377,353 | ||||||
Selamat Sempurna | 911,800 | 341,877 | ||||||
| 5,268,344 | ||||||||
Automobiles - 0.2% | ||||||||
Thor Industries | 16,740 | 952,004 | ||||||
Diversified Consumer Services - 0.1% | ||||||||
Benesse Holdings | 4,000 | 173,536 | ||||||
| 23,500 | 473,995 | |||||||
| 647,531 | ||||||||
Hotels, Restaurants & Leisure - 0.1% | ||||||||
Abu Dhabi National Hotels | 642,000 | 506,916 | ||||||
EIH | 118,500 | 188,453 | ||||||
| 695,369 | ||||||||
Household Durables - 0.3% | ||||||||
Forbo Holding | 250 | 266,548 | ||||||
Harman International Industries | 3,000 | 322,290 | ||||||
Hunter Douglas | 27,600 | 1,322,744 | ||||||
| 1,911,582 | ||||||||
Internet & Catalog Retail - 0.0% | ||||||||
Trade Me | 29,100 | 89,728 | ||||||
Leisure Products - 0.1% | ||||||||
Photo-Me International | 194,000 | 463,986 | ||||||
Media - 0.3% | ||||||||
Global Mediacom | 650,000 | 116,512 | ||||||
Media Chinese International | 322,600 | 96,448 | ||||||
Media Prima | 155,000 | 124,541 | ||||||
Pico Far East Holdings | 544,400 | 126,435 | ||||||
Saga Communications Cl. A | 21,966 | 938,387 | ||||||
Television Broadcasts | 26,600 | 172,634 | ||||||
| 1,574,957 | ||||||||
Multiline Retail - 0.0% | ||||||||
Golden Eagle Retail Group | 67,100 | 80,170 | ||||||
New World Department Store China | 240,000 | 96,614 | ||||||
| 176,784 | ||||||||
Specialty Retail - 6.1% | ||||||||
American Eagle Outfitters | 308,200 | 3,458,004 | ||||||
Ascena Retail Group 1 | 260,084 | 4,447,436 | ||||||
Buckle (The) | 142,879 | 6,338,113 | ||||||
Cato Corporation (The) Cl. A | 43,810 | 1,353,729 | ||||||
Fielmann | 3,200 | 461,619 | ||||||
GameStop Corporation Cl. A | 134,530 | 5,444,429 | ||||||
Genesco 1 | 85,249 | 7,001,500 | ||||||
Guess? | 74,000 | 1,998,000 | ||||||
Lewis Group | 196,000 | 1,194,245 | ||||||
Luk Fook Holdings (International) | 458,500 | 1,342,892 | ||||||
Shoe Carnival | 58,228 | 1,202,408 | ||||||
Signet Jewelers | 3,300 | 364,947 | ||||||
Stein Mart | 187,696 | 2,607,098 | ||||||
USS | 70,000 | 1,194,709 | ||||||
| 38,409,129 | ||||||||
| 80 | The Royce Funds 2014 Semiannual Report to Shareholders | THE ACCOMPANYING NOTES ARE AN INTEGRAL PART OF THESE FINANCIAL STATEMENTS. |
| June 30, 2014 (unaudited) |
| SHARES | VALUE | |||||||
| Consumer Discretionary (continued) | ||||||||
| Textiles, Apparel & Luxury Goods - 1.7% | ||||||||
Crocs 1 | 31,884 | $ | 479,217 | |||||
Pandora | 34,000 | 2,607,051 | ||||||
Stella International Holdings | 604,000 | 1,644,354 | ||||||
Steven Madden 1 | 131,708 | 4,517,584 | ||||||
| 70,020 | 1,531,337 | |||||||
| 10,779,543 | ||||||||
Total (Cost $54,327,950) | 60,968,957 | |||||||
Consumer Staples – 2.7% | ||||||||
Food & Staples Retailing - 0.3% | ||||||||
FamilyMart | 16,850 | 726,028 | ||||||
Village Super Market Cl. A | 56,167 | 1,327,226 | ||||||
| 2,053,254 | ||||||||
Food Products - 1.6% | ||||||||
AVI | 86,500 | 498,178 | ||||||
First Resources | 71,000 | 135,520 | ||||||
Hormel Foods | 140,700 | 6,943,545 | ||||||
Industrias Bachoco ADR | 6,100 | 327,997 | ||||||
J&J Snack Foods | 10,300 | 969,436 | ||||||
Lancaster Colony | 3,000 | 285,480 | ||||||
McLeod Russel India | 37,200 | 196,654 | ||||||
Super Group | 566,800 | 640,940 | ||||||
| 9,997,750 | ||||||||
Personal Products - 0.8% | ||||||||
Nu Skin Enterprises Cl. A | 63,945 | 4,729,372 | ||||||
Total (Cost $13,014,761) | 16,780,376 | |||||||
Energy – 5.9% | ||||||||
Energy Equipment & Services - 5.2% | ||||||||
Ensco Cl. A | 66,600 | 3,700,962 | ||||||
Ensign Energy Services | 25,300 | 392,878 | ||||||
Helmerich & Payne | 60,754 | 7,054,147 | ||||||
Oil States International 1 | 66,000 | 4,229,940 | ||||||
TGS-NOPEC Geophysical | 105,600 | 3,376,046 | ||||||
Tidewater | 76,500 | 4,295,475 | ||||||
Total Energy Services | 17,679 | 384,877 | ||||||
Transocean | 209,400 | 9,429,282 | ||||||
| 32,863,607 | ||||||||
Oil, Gas & Consumable Fuels - 0.7% | ||||||||
Cimarex Energy | 4,100 | 588,186 | ||||||
HollyFrontier Corporation | 67,900 | 2,966,551 | ||||||
Natural Resource Partners L.P. | 37,500 | 621,375 | ||||||
| 4,176,112 | ||||||||
Total (Cost $30,159,452) | 37,039,719 | |||||||
Financials – 25.7% | ||||||||
Banks - 1.7% | ||||||||
Ames National | 34,039 | 787,662 | ||||||
Bank of Hawaii | 70,700 | 4,149,383 | ||||||
Bank of Kentucky Financial | 20,701 | 720,188 | ||||||
BLOM Bank GDR | 63,000 | 589,050 | ||||||
BOK Financial | 2,114 | 140,792 | ||||||
Camden National | 15,422 | 597,757 | ||||||
City Holding Company | 21,601 | 974,637 | ||||||
First Republic Bank | 48,100 | 2,645,019 | ||||||
| 10,604,488 | ||||||||
Capital Markets - 14.7% | ||||||||
Alaris Royalty | 33,000 | 894,391 | ||||||
AllianceBernstein Holding L.P. | 155,100 | 4,013,988 | ||||||
Apollo Global Management LLC Cl. A | 81,900 | 2,270,268 | ||||||
ARA Asset Management | 1,388,200 | 1,981,712 | ||||||
Artisan Partners Asset Management Cl. A | 87,200 | 4,942,496 | ||||||
Ashmore Group | 464,250 | 2,939,714 | ||||||
Aurelius | 2,700 | 98,639 | ||||||
CETIP - Mercados Organizados | 12,000 | 170,808 | ||||||
Close Brothers Group | 18,000 | 393,690 | ||||||
Coronation Fund Managers | 518,000 | 4,652,015 | ||||||
Diamond Hill Investment Group | 32,500 | 4,150,900 | ||||||
Egyptian Financial Group-Hermes Holding Company 1 | 159,000 | 342,237 | ||||||
Federated Investors Cl. B | 218,600 | 6,759,112 | ||||||
Gluskin Sheff + Associates | 32,200 | 960,825 | ||||||
GMP Capital | 296,000 | 2,363,451 | ||||||
Invesco | 79,600 | 3,004,900 | ||||||
Investec | 88,500 | 816,363 | ||||||
Jupiter Fund Management | 550,000 | 3,760,373 | ||||||
KKR & Co. L.P. | 503,058 | 12,239,401 | ||||||
Lazard Cl. A | 67,700 | 3,490,612 | ||||||
Oaktree Capital Group LLC Cl. A | 32,900 | 1,644,671 | ||||||
Och-Ziff Capital Management Group LLC Cl. A | 108,100 | 1,495,023 | ||||||
SEI Investments | 146,600 | 4,804,082 | ||||||
Sprott | 735,700 | 2,089,097 | ||||||
State Street | 105,300 | 7,082,478 | ||||||
T. Rowe Price Group | 9,100 | 768,131 | ||||||
Value Partners Group | 4,597,000 | 3,078,348 | ||||||
VZ Holding | 8,300 | 1,389,885 | ||||||
Waddell & Reed Financial Cl. A | 72,210 | 4,519,624 | ||||||
Westwood Holdings Group | 78,473 | 4,711,519 | ||||||
| 91,828,753 | ||||||||
Consumer Finance - 0.1% | ||||||||
| 15,100 | 361,041 | |||||||
Shriram Transport Finance | 7,400 | 110,855 | ||||||
| 471,896 | ||||||||
Diversified Financial Services - 1.0% | ||||||||
Bolsa Mexicana de Valores | 753,000 | 1,595,558 | ||||||
CRISIL | 5,700 | 168,692 | ||||||
Hellenic Exchanges - Athens Stock Exchange | 158,000 | 1,795,701 | ||||||
Inversiones La Construccion | 7,500 | 89,509 | ||||||
Singapore Exchange | 140,000 | 780,335 | ||||||
Warsaw Stock Exchange | 135,400 | 1,735,246 | ||||||
| 6,165,041 | ||||||||
Insurance - 5.9% | ||||||||
Allied World Assurance Company Holdings | 67,394 | 2,562,320 | ||||||
Aspen Insurance Holdings | 3,424 | 155,518 | ||||||
| THE ACCOMPANYING NOTES ARE AN INTEGRAL PART OF THESE FINANCIAL STATEMENTS. | The Royce Funds 2014 Semiannual Report to Shareholders | 81 |
| Schedules of Investments |
| Royce Dividend Value Fund (continued) |
| SHARES | VALUE | |||||||
| Financials (continued) | ||||||||
| Insurance (continued) | ||||||||
Brasil Insurance Participacoes e Administracao | 12,000 | $ | 58,384 | |||||
Cincinnati Financial | 46,700 | 2,243,468 | ||||||
E-L Financial | 7,000 | 4,598,660 | ||||||
Erie Indemnity Cl. A | 24,200 | 1,821,292 | ||||||
Marsh & McLennan | 85,900 | 4,451,338 | ||||||
Montpelier Re Holdings | 4,397 | 140,484 | ||||||
PartnerRe | 35,571 | 3,884,709 | ||||||
Reinsurance Group of America | 87,955 | 6,939,650 | ||||||
Symetra Financial | 181,100 | 4,118,214 | ||||||
Willis Group Holdings | 139,400 | 6,036,020 | ||||||
| 37,010,057 | ||||||||
Real Estate Investment Trusts (REITs) - 0.6% | ||||||||
DCT Industrial Trust | 98,400 | 807,864 | ||||||
Essex Property Trust | 8,000 | 1,479,280 | ||||||
National Health Investors | 19,300 | 1,207,408 | ||||||
| 3,494,552 | ||||||||
Real Estate Management & Development - 0.5% | ||||||||
Brasil Brokers Participacoes | 61,500 | 97,699 | ||||||
Midland Holdings 1 | 5,750,000 | 2,893,399 | ||||||
Relo Holdings | 2,300 | 148,255 | ||||||
| 3,139,353 | ||||||||
Thrifts & Mortgage Finance - 1.2% | ||||||||
Genworth MI Canada | 163,348 | 5,818,713 | ||||||
TrustCo Bank Corp. NY | 305,660 | 2,041,809 | ||||||
| 7,860,522 | ||||||||
Total (Cost $116,504,161) | 160,574,662 | |||||||
Health Care – 3.8% | ||||||||
Health Care Equipment & Supplies - 1.4% | ||||||||
Atrion Corporation | 13,200 | 4,303,200 | ||||||
Carl Zeiss Meditec | 2,200 | 67,479 | ||||||
DENTSPLY International | 92,500 | 4,379,875 | ||||||
| 8,750,554 | ||||||||
Health Care Providers & Services - 1.9% | ||||||||
Chemed Corporation | 51,758 | 4,850,760 | ||||||
MEDNAX 1 | 26,300 | 1,529,345 | ||||||
OdontoPrev | 38,400 | 165,105 | ||||||
Owens & Minor | 150,800 | 5,124,184 | ||||||
| 11,669,394 | ||||||||
Life Sciences Tools & Services - 0.0% | ||||||||
EPS Corporation | 10,000 | 128,424 | ||||||
Pharmaceuticals - 0.5% | ||||||||
Hikma Pharmaceuticals | 11,000 | 315,890 | ||||||
Recordati | 91,800 | 1,543,618 | ||||||
Santen Pharmaceutical | 18,100 | 1,018,410 | ||||||
Unichem Laboratories | 35,000 | 131,399 | ||||||
| 3,009,317 | ||||||||
Total (Cost $17,207,146) | 23,557,689 | |||||||
Industrials – 17.0% | ||||||||
Aerospace & Defense - 0.8% | ||||||||
American Science and Engineering | 49,545 | 3,447,837 | ||||||
Cubic Corporation | 3,794 | 168,871 | ||||||
HEICO Corporation Cl. A | 36,132 | 1,466,959 | ||||||
| 5,083,667 | ||||||||
Air Freight & Logistics - 1.7% | ||||||||
Aramex | 37,464 | 30,601 | ||||||
Expeditors International of Washington | 156,600 | 6,915,456 | ||||||
Forward Air | 70,400 | 3,368,640 | ||||||
| 10,314,697 | ||||||||
Building Products - 1.1% | ||||||||
AAON | 92,525 | 3,101,438 | ||||||
Geberit | 1,000 | 351,037 | ||||||
Simpson Manufacturing | 57,600 | 2,094,336 | ||||||
TOTO | 74,000 | 997,088 | ||||||
Zehnder Group | 3,600 | 154,263 | ||||||
| 6,698,162 | ||||||||
Commercial Services & Supplies - 1.6% | ||||||||
Blue Label Telecoms | 133,300 | 107,292 | ||||||
Brink’s Company (The) | 100 | 2,822 | ||||||
Cintas Corporation | 103,500 | 6,576,390 | ||||||
Collection House | 60,000 | 106,365 | ||||||
Kaba Holding | 2,100 | 1,038,396 | ||||||
Ritchie Bros. Auctioneers | 9,000 | 221,850 | ||||||
Societe BIC | 6,600 | 903,015 | ||||||
UniFirst Corporation | 12,455 | 1,320,230 | ||||||
| 10,276,360 | ||||||||
Construction & Engineering - 0.4% | ||||||||
KBR | 100,000 | 2,385,000 | ||||||
Electrical Equipment - 1.8% | ||||||||
AZZ | 64,100 | 2,953,728 | ||||||
Hubbell Cl. B | 45,700 | 5,627,955 | ||||||
Regal-Beloit | 36,000 | 2,828,160 | ||||||
| 11,409,843 | ||||||||
Machinery - 6.4% | ||||||||
Alamo Group | 15,002 | 811,458 | ||||||
Burckhardt Compression Holding | 3,000 | 1,617,050 | ||||||
CB Industrial Product Holding | 100,000 | 136,406 | ||||||
China Metal International Holdings | 352,000 | 130,801 | ||||||
CLARCOR | 75,200 | 4,651,120 | ||||||
Donaldson Company | 111,000 | 4,697,520 | ||||||
Flowserve Corporation | 20,100 | 1,494,435 | ||||||
Freund Corporation | 6,200 | 86,600 | ||||||
Graco | 65,400 | 5,106,432 | ||||||
IDEX Corporation | 44,500 | 3,592,930 | ||||||
John Bean Technologies | 97,356 | 3,017,063 | ||||||
Kennametal | 32,314 | 1,495,492 | ||||||
Lincoln Electric Holdings | 30,050 | 2,099,894 | ||||||
Lindsay Corporation | 32,800 | 2,770,616 | ||||||
Miller Industries | 31,814 | 654,732 | ||||||
Pfeiffer Vacuum Technology | 13,500 | 1,488,642 | ||||||
Spirax-Sarco Engineering | 35,148 | 1,643,962 | ||||||
Tennant Company | 18,400 | 1,404,288 | ||||||
Valmont Industries | 20,600 | 3,130,170 | ||||||
| 82 | The Royce Funds 2014 Semiannual Report to Shareholders | THE ACCOMPANYING NOTES ARE AN INTEGRAL PART OF THESE FINANCIAL STATEMENTS. |
| June 30, 2014 (unaudited) |
| SHARES | VALUE | |||||||
| Industrials (continued) | ||||||||
| Machinery (continued) | ||||||||
Zuiko Corporation | 1,700 | $ | 96,155 | |||||
| 40,125,766 | ||||||||
Marine - 0.4% | ||||||||
Clarkson | 54,600 | 2,237,946 | ||||||
Professional Services - 1.3% | ||||||||
ManpowerGroup | 52,300 | 4,437,655 | ||||||
Towers Watson & Co. Cl. A | 36,400 | 3,793,972 | ||||||
| 8,231,627 | ||||||||
Road & Rail - 0.8% | ||||||||
Globaltrans Investment GDR | 10,400 | 119,080 | ||||||
Knight Transportation | 13,700 | 325,649 | ||||||
Landstar System | 66,300 | 4,243,200 | ||||||
| 4,687,929 | ||||||||
Trading Companies & Distributors - 0.7% | ||||||||
Applied Industrial Technologies | 92,325 | 4,683,647 | ||||||
Total (Cost $69,252,345) | 106,134,644 | |||||||
Information Technology – 11.6% | ||||||||
Communications Equipment - 0.9% | ||||||||
Ellies Holdings 1 | 171,900 | 59,805 | ||||||
Plantronics | 93,608 | 4,497,864 | ||||||
TESSCO Technologies | 31,249 | 991,531 | ||||||
| 5,549,200 | ||||||||
Electronic Equipment, Instruments & Components - 5.7% | ||||||||
Amphenol Corporation Cl. A | 31,400 | 3,025,076 | ||||||
AVX Corporation | 142,300 | 1,889,744 | ||||||
Cognex Corporation 1 | 20,000 | 768,000 | ||||||
Domino Printing Sciences | 115,000 | 1,180,866 | ||||||
FLIR Systems | 255,100 | 8,859,623 | ||||||
Littelfuse | 32,063 | 2,980,256 | ||||||
LPKF Laser & Electronics | 5,800 | 119,764 | ||||||
MTS Systems | 50,293 | 3,407,854 | ||||||
National Instruments | 155,100 | 5,023,689 | ||||||
Vaisala Cl. A | 48,000 | 1,574,148 | ||||||
Vishay Intertechnology | 453,088 | 7,018,333 | ||||||
| 35,847,353 | ||||||||
IT Services - 3.2% | ||||||||
Broadridge Financial Solutions | 99,100 | 4,126,524 | ||||||
Calian Technologies | 23,896 | 438,931 | ||||||
Convergys Corporation | 172,515 | 3,698,722 | ||||||
eClerx Services | 116,700 | 2,254,641 | ||||||
Jack Henry & Associates | 32,300 | 1,919,589 | ||||||
ManTech International Cl. A | 73,936 | 2,182,591 | ||||||
Metrofile Holdings | 500,000 | 225,670 | ||||||
Western Union | 300,900 | 5,217,606 | ||||||
| 20,064,274 | ||||||||
Semiconductors & Semiconductor Equipment - 0.3% | ||||||||
Eugene Technology | 7,725 | 145,445 | ||||||
MKS Instruments | 36,100 | 1,127,764 | ||||||
Regent Manner International Holdings | 619,000 | 134,975 | ||||||
Teradyne | 20,000 | 392,000 | ||||||
| 1,800,184 | ||||||||
| Software - 0.7% | ||||||||
Computer Modelling Group | 8,100 | 224,846 | ||||||
Cyient | 36,700 | 219,669 | ||||||
Silverlake Axis | 135,000 | 129,922 | ||||||
Totvs | 239,500 | 4,119,032 | ||||||
| 4,693,469 | ||||||||
Technology Hardware, Storage & Peripherals - 0.8% | ||||||||
Diebold | 118,000 | 4,740,060 | ||||||
Total (Cost $57,272,342) | 72,694,540 | |||||||
Materials – 16.5% | ||||||||
Chemicals - 4.2% | ||||||||
Balchem Corporation | 50,150 | 2,686,034 | ||||||
Cabot Corporation | 98,393 | 5,705,810 | ||||||
Huchems Fine Chemical | 5,000 | 117,118 | ||||||
Innospec | 90,000 | 3,885,300 | ||||||
International Flavors & Fragrances | 27,100 | 2,825,988 | ||||||
Quaker Chemical | 28,800 | 2,211,552 | ||||||
†Rockwood Holdings | 58,900 | 4,475,811 | ||||||
Stepan Company | 60,600 | 3,203,316 | ||||||
Victrex | 7,500 | 218,460 | ||||||
Westlake Chemical | 7,500 | 628,200 | ||||||
| 25,957,589 | ||||||||
Containers & Packaging - 1.9% | ||||||||
AptarGroup | 86,200 | 5,776,262 | ||||||
Greif Cl. A | 115,400 | 6,296,224 | ||||||
Nampak | 30,000 | 103,780 | ||||||
| 12,176,266 | ||||||||
Metals & Mining - 10.1% | ||||||||
Agnico Eagle Mines | 195,000 | 7,468,500 | ||||||
Allegheny Technologies | 134,200 | 6,052,420 | ||||||
Carpenter Technology | 116,100 | 7,343,325 | ||||||
Commercial Metals | 18,700 | 323,697 | ||||||
Compass Minerals International | 47,900 | 4,585,946 | ||||||
Franco-Nevada Corporation | 2,400 | 137,616 | ||||||
Fresnillo | 254,000 | 3,790,545 | ||||||
Hecla Mining | 135,000 | 465,750 | ||||||
Hi-Crush Partners L.P. | 20,000 | 1,311,200 | ||||||
Imdex 1 | 125,000 | 74,257 | ||||||
Major Drilling Group International | 409,400 | 2,981,152 | ||||||
Pan American Silver | 284,000 | 4,359,400 | ||||||
Randgold Resources ADR | 75,300 | 6,370,380 | ||||||
Reliance Steel & Aluminum | 139,006 | 10,246,132 | ||||||
Royal Gold | 2,200 | 167,464 | ||||||
| 240,000 | 2,190,661 | |||||||
Steel Dynamics | 21,000 | 376,950 | ||||||
Vale Indonesia | 389,700 | 116,861 | ||||||
Worthington Industries | 103,800 | 4,467,552 | ||||||
| 62,829,808 | ||||||||
Paper & Forest Products - 0.3% | ||||||||
Schweitzer-Mauduit International | 43,900 | 1,916,674 | ||||||
Total (Cost $86,942,170) | 102,880,337 | |||||||
| THE ACCOMPANYING NOTES ARE AN INTEGRAL PART OF THESE FINANCIAL STATEMENTS. | The Royce Funds 2014 Semiannual Report to Shareholders | 83 |
| Schedules of Investments |
| Royce Dividend Value Fund (continued) |
| SHARES | VALUE | |||||||
| Telecommunication Services – 1.0% | ||||||||
| Diversified Telecommunication Services - 0.5% | ||||||||
Inmarsat | 265,000 | $ | 3,390,069 | |||||
| Wireless Telecommunication Services - 0.5% | ||||||||
Telephone and Data Systems | 109,200 | 2,851,212 | ||||||
| Total (Cost $5,448,785) | 6,241,281 | |||||||
| Utilities – 0.5% | ||||||||
| Water Utilities - 0.5% | ||||||||
Aqua America | 125,000 | 3,277,500 | ||||||
| Total (Cost $3,005,880) | 3,277,500 | |||||||
| Miscellaneous 5 – 2.7% | ||||||||
| Total (Cost $13,032,663) | 16,807,403 | |||||||
| TOTAL COMMON STOCKS | ||||||||
(Cost $466,167,655) | 606,957,108 | |||||||
| REPURCHASE AGREEMENT – 2.6% | ||||||||
| Fixed Income Clearing Corporation, | ||||||||
0.00% dated 6/30/14, due 7/1/14, | ||||||||
maturity value $16,436,000 (collateralized | ||||||||
by obligations of various U.S. Government | ||||||||
Agencies, 2.125% due 8/31/20, valued at | ||||||||
$16,768,400) | ||||||||
(Cost $16,436,000) | 16,436,000 | |||||||
| COLLATERAL RECEIVED FOR SECURITIES | ||||||||
LOANED – 0.4% | ||||||||
| Money Market Funds | ||||||||
Federated Government Obligations Fund | ||||||||
(7 day yield-0.0099%) | ||||||||
(Cost $2,424,305) | 2,424,305 | |||||||
| TOTAL INVESTMENTS – 100.1% | ||||||||
(Cost $485,027,960) | 625,817,413 | |||||||
| LIABILITIES LESS CASH | ||||||||
AND OTHER ASSETS – (0.1)% | (773,259 | ) | ||||||
| NET ASSETS – 100.0% | $ | 625,044,154 | ||||||
Royce Global Value Fund | ||||||||
SHARES | VALUE | |||||||
| COMMON STOCKS – 97.7% | ||||||||
| Austria – 7.1% | ||||||||
Mayr-Melnhof Karton | 56,000 | $ | 6,671,998 | |||||
Semperit AG Holding | 135,000 | 8,272,285 | ||||||
Total (Cost $14,184,798) | 14,944,283 | |||||||
Belgium – 1.8% | ||||||||
Sipef | 45,000 | 3,844,995 | ||||||
Total (Cost $4,446,945) | 3,844,995 | |||||||
Brazil – 2.9% | ||||||||
Brasil Brokers Participacoes | 2,000,000 | 3,177,189 | ||||||
CETIP - Mercados Organizados | 200,000 | 2,846,798 | ||||||
Total (Cost $7,740,215) | 6,023,987 | |||||||
Canada – 10.1% | ||||||||
Major Drilling Group International | 418,000 | 3,043,775 | ||||||
Pan American Silver | 330,000 | 5,065,500 | ||||||
Pason Systems | 125,000 | 3,514,362 | ||||||
Sprott | 1,450,000 | 4,117,427 | ||||||
Trican Well Service | 345,000 | 5,570,826 | ||||||
Total (Cost $33,817,969) | 21,311,890 | |||||||
Chile – 0.8% | ||||||||
Inversiones La Construccion | 135,000 | 1,611,168 | ||||||
Total (Cost $1,862,460) | 1,611,168 | |||||||
China – 2.6% | ||||||||
Daphne International Holdings 3 | 5,500,000 | 2,157,308 | ||||||
E-House (China) Holdings ADR | 375,000 | 3,243,750 | ||||||
Total (Cost $8,956,280) | 5,401,058 | |||||||
France – 3.8% | ||||||||
Alten | 75,000 | 3,564,118 | ||||||
Societe Internationale de Plantations d’Heveas | 24,900 | 1,194,709 | ||||||
Stallergenes | 42,822 | 3,300,630 | ||||||
Total (Cost $8,704,715) | 8,059,457 | |||||||
Hong Kong – 6.4% | ||||||||
Luk Fook Holdings (International) | 1,300,000 | 3,807,545 | ||||||
New World Department Store China | 7,250,000 | 2,918,559 | ||||||
Television Broadcasts | 510,000 | 3,309,894 | ||||||
Value Partners Group | 5,050,000 | 3,381,696 | ||||||
Total (Cost $14,423,439) | 13,417,694 | |||||||
India – 3.2% | ||||||||
Graphite India | 2,100,000 | 3,678,360 | ||||||
Maharashtra Seamless | 600,000 | 3,103,999 | ||||||
Total (Cost $8,587,179) | 6,782,359 | |||||||
| 84 | The Royce Funds 2014 Semiannual Report to Shareholders | THE ACCOMPANYING NOTES ARE AN INTEGRAL PART OF THESE FINANCIAL STATEMENTS. |
| June 30, 2014 (unaudited) |
| SHARES | VALUE | |||||||
| Italy – 1.0% | ||||||||
Recordati | 130,000 | $ | 2,185,951 | |||||
Total (Cost $907,642) | 2,185,951 | |||||||
Japan – 11.7% | ||||||||
Benesse Holdings | 40,000 | 1,735,353 | ||||||
C. Uyemura & Co. | 50,000 | 2,546,765 | ||||||
EPS Corporation | 260,000 | 3,339,026 | ||||||
FamilyMart | 45,000 | 1,938,947 | ||||||
Miraial | 120,000 | 2,179,557 | ||||||
MISUMI Group | 66,000 | 1,815,725 | ||||||
Moshi Moshi Hotline | 246,500 | 2,428,380 | ||||||
†Obara Group | 30,000 | 1,300,034 | ||||||
Santen Pharmaceutical | 25,000 | 1,406,643 | ||||||
USS | 145,000 | 2,474,754 | ||||||
Zuiko Corporation | 63,000 | 3,563,398 | ||||||
Total (Cost $22,129,557) | 24,728,582 | |||||||
Jersey – 1.4% | ||||||||
Randgold Resources ADR | 34,200 | 2,893,320 | ||||||
Total (Cost $2,450,135) | 2,893,320 | |||||||
Mexico – 3.0% | ||||||||
Fresnillo | 100,000 | 1,492,341 | ||||||
Industrias Bachoco ADR | 90,000 | 4,839,300 | ||||||
Total (Cost $3,415,221) | 6,331,641 | |||||||
Norway – 3.5% | ||||||||
Spectrum | 271,802 | 1,861,096 | ||||||
TGS-NOPEC Geophysical | 170,000 | 5,434,923 | ||||||
Total (Cost $5,865,679) | 7,296,019 | |||||||
Singapore – 1.1% | ||||||||
Silverlake Axis | 2,350,000 | 2,261,609 | ||||||
Total (Cost $1,581,598) | 2,261,609 | |||||||
South Africa – 2.2% | ||||||||
Lewis Group | 400,000 | 2,437,236 | ||||||
Raubex Group | 1,000,000 | 2,129,760 | ||||||
Total (Cost $6,589,320) | 4,566,996 | |||||||
Switzerland – 1.0% | ||||||||
Garmin | 34,500 | 2,101,050 | ||||||
Total (Cost $1,148,998) | 2,101,050 | |||||||
Turkey – 1.4% | ||||||||
Mardin Cimento Sanayii | 1,265,900 | 3,047,338 | ||||||
Total (Cost $5,311,766) | 3,047,338 | |||||||
United Kingdom – 6.8% | ||||||||
Ashmore Group | 1,000,000 | 6,332,179 | ||||||
Clarkson | 85,060 | 3,486,442 | ||||||
Hochschild Mining 1 | 925,000 | 2,528,914 | ||||||
Jupiter Fund Management | 305,000 | 2,085,298 | ||||||
Total (Cost $14,667,043) | 14,432,833 | |||||||
United States – 25.9% | ||||||||
†Artisan Partners Asset Management Cl. A | 37,500 | 2,125,500 | ||||||
| 255,000 | 5,798,700 | |||||||
†Globe Specialty Metals | 160,000 | 3,324,800 | ||||||
Helmerich & Payne | 43,000 | 4,992,730 | ||||||
Kennedy-Wilson Holdings | 239,600 | 6,426,072 | ||||||
Lindsay Corporation | 31,000 | 2,618,570 | ||||||
Medicines Company (The) 1 | 122,500 | 3,559,850 | ||||||
| 191,471 | 7,452,051 | |||||||
Nu Skin Enterprises Cl. A | 34,000 | 2,514,640 | ||||||
Teradyne | 148,000 | 2,900,800 | ||||||
Unit Corporation 1 | 30,000 | 2,064,900 | ||||||
Valmont Industries | 19,100 | 2,902,245 | ||||||
Western Digital | 85,000 | 7,845,500 | ||||||
Total (Cost $41,050,659) | 54,526,358 | |||||||
TOTAL COMMON STOCKS | ||||||||
(Cost $207,841,618) | 205,768,588 | |||||||
REPURCHASE AGREEMENT – 3.1% | ||||||||
Fixed Income Clearing Corporation, | ||||||||
0.00% dated 6/30/14, due 7/1/14, | ||||||||
maturity value $6,528,000 (collateralized | ||||||||
by obligations of various U.S. Government | ||||||||
Agencies, 0.07% due 11/21/14, valued at | ||||||||
$6,660,000) | ||||||||
(Cost $6,528,000) | 6,528,000 | |||||||
COLLATERAL RECEIVED FOR SECURITIES | ||||||||
LOANED – 4.9% | ||||||||
Money Market Funds | ||||||||
Federated Government Obligations Fund | ||||||||
(7 day yield-0.0099%) | ||||||||
(Cost $10,383,344) | 10,383,344 | |||||||
TOTAL INVESTMENTS – 105.7% | ||||||||
(Cost $224,752,962) | 222,679,932 | |||||||
LIABILITIES LESS CASH | ||||||||
AND OTHER ASSETS – (5.7)% | (12,026,983 | ) | ||||||
NET ASSETS – 100.0% | $ | 210,652,949 | ||||||
| THE ACCOMPANYING NOTES ARE AN INTEGRAL PART OF THESE FINANCIAL STATEMENTS. | The Royce Funds 2014 Semiannual Report to Shareholders | 85 |
| Schedules of Investments |
| Royce International Smaller-Companies Fund |
| SHARES | VALUE | |||||||
| COMMON STOCKS – 95.5% | ||||||||
| Australia – 0.7% | ||||||||
†Programmed Maintenance Services | 150,000 | $ | 397,453 | |||||
Total (Cost $388,333) | 397,453 | |||||||
Austria – 3.1% | ||||||||
Mayr-Melnhof Karton | 6,500 | 774,428 | ||||||
Semperit AG Holding | 15,000 | 919,143 | ||||||
Total (Cost $1,382,892) | 1,693,571 | |||||||
Brazil – 3.2% | ||||||||
Brasil Brokers Participacoes | 360,000 | 571,894 | ||||||
CETIP - Mercados Organizados | 55,000 | 782,869 | ||||||
Eternit | 116,000 | 445,730 | ||||||
Total (Cost $1,945,031) | 1,800,493 | |||||||
Canada – 2.9% | ||||||||
†Magellan Aerospace | 66,000 | 728,626 | ||||||
Major Drilling Group International | 37,000 | 269,425 | ||||||
†MTY Food Group | 12,000 | 339,628 | ||||||
Sprott | 95,000 | 269,762 | ||||||
Total (Cost $1,417,306) | 1,607,441 | |||||||
Chile – 1.2% | ||||||||
Inversiones La Construccion | 57,500 | 686,238 | ||||||
Total (Cost $766,496) | 686,238 | |||||||
China – 3.0% | ||||||||
Daphne International Holdings | 1,140,000 | 447,151 | ||||||
E-House (China) Holdings ADR | 46,000 | 397,900 | ||||||
Pacific Online | 725,000 | 400,367 | ||||||
Xtep International Holdings | 940,000 | 396,599 | ||||||
Total (Cost $1,968,858) | 1,642,017 | |||||||
Cyprus – 1.0% | ||||||||
Globaltrans Investment GDR | 51,000 | 583,950 | ||||||
Total (Cost $690,020) | 583,950 | |||||||
Finland – 1.0% | ||||||||
F-Secure | 160,000 | 563,056 | ||||||
Total (Cost $425,662) | 563,056 | |||||||
France – 8.4% | ||||||||
Audika Groupe 1 | 25,500 | 493,729 | ||||||
Boiron | 4,250 | 369,598 | ||||||
Gaztransport Et Technigaz | 6,800 | 443,308 | ||||||
Manutan International | 9,000 | 575,887 | ||||||
†Nexity | 12,800 | 587,419 | ||||||
Parrot 1 | 16,000 | 408,599 | ||||||
Societe Internationale de Plantations d’Heveas | 9,200 | 441,419 | ||||||
Stallergenes | 8,500 | 655,162 | ||||||
Vetoquinol | 13,400 | 663,853 | ||||||
Total (Cost $4,146,460) | 4,638,974 | |||||||
Germany – 3.8% | ||||||||
Bertrandt | 3,500 | 556,894 | ||||||
KWS Saat | 2,030 | 715,767 | ||||||
LPKF Laser & Electronics | 19,850 | 409,884 | ||||||
PUMA | 1,500 | 428,249 | ||||||
Total (Cost $1,948,448) | 2,110,794 | |||||||
Hong Kong – 8.5% | ||||||||
I.T | 1,520,000 | 533,443 | ||||||
Luk Fook Holdings (International) | 156,500 | 458,370 | ||||||
Midland Holdings 1 | 1,220,000 | 613,904 | ||||||
New World Department Store China | 1,600,000 | 644,096 | ||||||
Pico Far East Holdings | 2,908,400 | 675,464 | ||||||
Stella International Holdings | 212,500 | 578,519 | ||||||
Television Broadcasts | 92,500 | 600,324 | ||||||
Value Partners Group | 920,000 | 616,071 | ||||||
Total (Cost $4,746,165) | 4,720,191 | |||||||
India – 5.7% | ||||||||
AIA Engineering | 30,000 | 387,065 | ||||||
FAG Bearings India | 8,000 | 332,516 | ||||||
Graphite India | 250,000 | 437,900 | ||||||
Ipca Laboratories | 40,000 | 582,592 | ||||||
†KPIT Technologies | 150,000 | 429,961 | ||||||
Shriram Transport Finance | 35,000 | 524,316 | ||||||
Thomas Cook (India) | 225,000 | 442,556 | ||||||
Total (Cost $2,227,603) | 3,136,906 | |||||||
Indonesia – 0.8% | ||||||||
Selamat Sempurna | 1,191,800 | 446,862 | ||||||
Total (Cost $337,453) | 446,862 | |||||||
Italy – 1.9% | ||||||||
De’Longhi | 21,500 | 465,151 | ||||||
DiaSorin | 14,400 | 603,369 | ||||||
Total (Cost $859,052) | 1,068,520 | |||||||
Japan – 15.4% | ||||||||
Asahi Company | 34,500 | 496,871 | ||||||
Benesse Holdings | 14,700 | 637,742 | ||||||
BML | 13,300 | 514,644 | ||||||
C. Uyemura & Co. | 11,300 | 575,569 | ||||||
EPS Corporation | 66,100 | 848,883 | ||||||
FamilyMart | 14,700 | 633,389 | ||||||
Milbon | 15,800 | 533,399 | ||||||
Miraial | 37,700 | 684,744 | ||||||
MISUMI Group | 17,200 | 473,189 | ||||||
Moshi Moshi Hotline | 63,500 | 625,566 | ||||||
†Obara Group | 11,500 | 498,347 | ||||||
| 86 | The Royce Funds 2014 Semiannual Report to Shareholders | THE ACCOMPANYING NOTES ARE AN INTEGRAL PART OF THESE FINANCIAL STATEMENTS. |
| June 30, 2014 (unaudited) |
| SHARES | VALUE | |||||||
| Japan (continued) | ||||||||
†Relo Holdings | 5,600 | $ | 360,969 | |||||
Santen Pharmaceutical | 11,700 | 658,309 | ||||||
†Trancom | 12,000 | 471,448 | ||||||
Zuiko Corporation | 9,500 | 537,338 | ||||||
Total (Cost $7,643,716) | 8,550,407 | |||||||
Jersey – 0.7% | ||||||||
Randgold Resources ADR | 4,300 | 363,780 | ||||||
Total (Cost $297,682) | 363,780 | |||||||
Malaysia – 4.0% | ||||||||
CB Industrial Product Holding | 395,000 | 538,804 | ||||||
Media Chinese International | 1,700,000 | 508,253 | ||||||
Media Prima | 850,000 | 682,965 | ||||||
Padini Holdings | 775,000 | 475,475 | ||||||
Total (Cost $1,985,911) | 2,205,497 | |||||||
Mexico – 2.1% | ||||||||
Grupo SIMEC Ser. B 1 | 130,000 | 602,528 | ||||||
Industrias Bachoco ADR | 10,500 | 564,585 | ||||||
Total (Cost $771,758) | 1,167,113 | |||||||
Netherlands – 0.7% | ||||||||
†Exact Holding | 11,000 | 391,620 | ||||||
Total (Cost $376,317) | 391,620 | |||||||
Norway – 1.6% | ||||||||
†Eltek | 112,063 | 173,561 | ||||||
Spectrum | 10,096 | 69,130 | ||||||
TGS-NOPEC Geophysical | 19,550 | 625,016 | ||||||
Total (Cost $704,059) | 867,707 | |||||||
Singapore – 2.0% | ||||||||
ARA Asset Management | 350,000 | 499,639 | ||||||
Biosensors International Group | 800,000 | 599,888 | ||||||
Total (Cost $1,032,679) | 1,099,527 | |||||||
Slovenia – 0.9% | ||||||||
†Krka d.d., Novo mesto | 5,000 | 479,255 | ||||||
Total (Cost $469,104) | 479,255 | |||||||
South Africa – 4.1% | ||||||||
Adcock Ingram Holdings 1 | 60,000 | 299,803 | ||||||
Blue Label Telecoms | 850,000 | 684,156 | ||||||
Ellies Holdings 1 | 700,000 | 243,536 | ||||||
Lewis Group | 105,000 | 639,774 | ||||||
Raubex Group | 187,500 | 399,330 | ||||||
Total (Cost $2,529,362) | 2,266,599 | |||||||
| South Korea – 1.2% | ||||||||
Handsome | 23,500 | 642,197 | ||||||
Total (Cost $615,295) | 642,197 | |||||||
Sweden – 2.4% | ||||||||
†Industrivarden Cl. C | 26,500 | 523,531 | ||||||
Lundin Petroleum 1 | 39,500 | 799,276 | ||||||
Total (Cost $1,253,414) | 1,322,807 | |||||||
Switzerland – 4.1% | ||||||||
Forbo Holding | 420 | 447,801 | ||||||
Kaba Holding | 1,100 | 543,922 | ||||||
VZ Holding | 3,700 | 619,587 | ||||||
Zehnder Group | 15,000 | 642,761 | ||||||
Total (Cost $1,902,629) | 2,254,071 | |||||||
Turkey – 1.9% | ||||||||
Koza Altin Isletmeleri | 44,100 | 503,739 | ||||||
Mardin Cimento Sanayii | 225,000 | 541,631 | ||||||
Total (Cost $1,168,950) | 1,045,370 | |||||||
United Kingdom – 9.2% | ||||||||
Ashmore Group | 130,000 | 823,183 | ||||||
Consort Medical | 51,500 | 840,828 | ||||||
Domino Printing Sciences | 35,000 | 359,394 | ||||||
E2V Technologies | 215,000 | 614,478 | ||||||
Elementis | 82,500 | 367,519 | ||||||
EnQuest 1 | 210,000 | 507,464 | ||||||
Hochschild Mining 1 | 105,000 | 287,066 | ||||||
Kennedy Wilson Europe Real Estate 1 | 39,000 | 734,190 | ||||||
Spirent Communications | 365,000 | 593,116 | ||||||
Total (Cost $4,704,140) | 5,127,238 | |||||||
TOTAL COMMON STOCKS | ||||||||
(Cost $48,704,795) | 52,879,654 | |||||||
| REPURCHASE AGREEMENT – 4.3% | ||||||||
| Fixed Income Clearing Corporation, | ||||||||
0.00% dated 6/30/14, due 7/1/14, | ||||||||
maturity value $2,405,000 (collateralized | ||||||||
by obligations of various U.S. Government | ||||||||
Agencies, 2.125% due 8/31/20, valued at | ||||||||
$2,457,263) | ||||||||
(Cost $2,405,000) | 2,405,000 | |||||||
| TOTAL INVESTMENTS – 99.8% | ||||||||
(Cost $51,109,795) | 55,284,654 | |||||||
| CASH AND OTHER ASSETS | ||||||||
LESS LIABILITIES – 0.2% | 113,072 | |||||||
| NET ASSETS – 100.0% | $ | 55,397,726 | ||||||
| THE ACCOMPANYING NOTES ARE AN INTEGRAL PART OF THESE FINANCIAL STATEMENTS. | The Royce Funds 2014 Semiannual Report to Shareholders | 87 |
| Schedules of Investments |
| Royce Special Equity Multi-Cap Fund |
| SHARES | VALUE | |||||||
| COMMON STOCKS – 91.0% | ||||||||
| Consumer Discretionary – 26.3% | ||||||||
Auto Components - 4.2% | ||||||||
Lear Corporation | 103,200 | $ | 9,217,824 | |||||
Distributors - 2.9% | ||||||||
Genuine Parts | 72,600 | 6,374,280 | ||||||
Media - 2.7% | ||||||||
Scripps Networks Interactive Cl. A | 74,200 | 6,020,588 | ||||||
Multiline Retail - 4.5% | ||||||||
Nordstrom | 143,500 | 9,747,955 | ||||||
Specialty Retail - 12.0% | ||||||||
Bed Bath & Beyond 1 | 171,600 | 9,846,408 | ||||||
Gap (The) | 230,000 | 9,561,100 | ||||||
Staples | 629,600 | 6,824,864 | ||||||
| 26,232,372 | ||||||||
Total (Cost $50,947,896) | 57,593,019 | |||||||
Energy – 9.1% | ||||||||
Energy Equipment & Services - 4.2% | ||||||||
Helmerich & Payne | 80,000 | 9,288,800 | ||||||
Oil, Gas & Consumable Fuels - 4.9% | ||||||||
Occidental Petroleum | 103,500 | 10,622,205 | ||||||
Total (Cost $15,365,171) | 19,911,005 | |||||||
Financials – 7.1% | ||||||||
Capital Markets - 7.1% | ||||||||
Franklin Resources | 172,000 | 9,948,480 | ||||||
†T. Rowe Price Group | 65,800 | 5,554,178 | ||||||
Total (Cost $13,877,608) | 15,502,658 | |||||||
Health Care – 8.4% | ||||||||
Health Care Equipment & Supplies - 4.4% | ||||||||
Medtronic | 51,800 | 3,302,768 | ||||||
Stryker Corporation | 73,900 | 6,231,248 | ||||||
| 9,534,016 | ||||||||
Health Care Providers & Services - 4.0% | ||||||||
Quest Diagnostics | 150,500 | 8,832,845 | ||||||
Total (Cost $14,649,979) | 18,366,861 | |||||||
Industrials – 17.2% | ||||||||
Aerospace & Defense - 0.6% | ||||||||
Raytheon Company | 13,500 | 1,245,375 | ||||||
Construction & Engineering - 2.4% | ||||||||
Fluor Corporation | 70,300 | 5,406,070 | ||||||
Electrical Equipment - 4.4% | ||||||||
Emerson Electric | 145,000 | 9,622,200 | ||||||
Industrial Conglomerates - 1.5% | ||||||||
3M | 22,500 | 3,222,900 | ||||||
Machinery - 8.3% | ||||||||
Dover Corporation | 49,000 | 4,456,550 | ||||||
Illinois Tool Works | 69,800 | 6,111,688 | ||||||
Parker Hannifin | 61,000 | 7,669,530 | ||||||
| 18,237,768 | ||||||||
Total (Cost $27,271,443) | 37,734,313 | |||||||
Information Technology – 22.9% | ||||||||
Communications Equipment - 4.4% | ||||||||
Cisco Systems | 390,000 | 9,691,500 | ||||||
Semiconductors & Semiconductor Equipment - 6.6% | ||||||||
Intel Corporation | 120,600 | 3,726,540 | ||||||
KLA-Tencor | 148,000 | 10,750,720 | ||||||
| 14,477,260 | ||||||||
Software - 7.2% | ||||||||
Microsoft Corporation | 245,000 | 10,216,500 | ||||||
†Symantec Corporation | 248,000 | 5,679,200 | ||||||
| 15,895,700 | ||||||||
Technology Hardware, Storage & Peripherals - 4.7% | ||||||||
†Apple | 35,300 | 3,280,429 | ||||||
†SanDisk Corporation | 66,600 | 6,955,038 | ||||||
| 10,235,467 | ||||||||
Total (Cost $38,679,882) | 50,299,927 | |||||||
TOTAL COMMON STOCKS | ||||||||
(Cost $160,791,979) | 199,407,783 | |||||||
| REPURCHASE AGREEMENT – 8.5% | ||||||||
| Fixed Income Clearing Corporation, | ||||||||
0.00% dated 6/30/14, due 7/1/14, | ||||||||
maturity value $18,706,000 (collateralized | ||||||||
by obligations of various U.S. Government | ||||||||
Agencies, 2.125% due 8/31/20, valued at | ||||||||
$19,083,213) | ||||||||
(Cost $18,706,000) | 18,706,000 | |||||||
| TOTAL INVESTMENTS – 99.5% | ||||||||
(Cost $179,497,979) | 218,113,783 | |||||||
| CASH AND OTHER ASSETS | ||||||||
LESS LIABILITIES – 0.5% | 1,031,717 | |||||||
| NET ASSETS – 100.0% | $ | 219,145,500 | ||||||
| 88 | The Royce Funds 2014 Semiannual Report to Shareholders | THE ACCOMPANYING NOTES ARE AN INTEGRAL PART OF THESE FINANCIAL STATEMENTS. |
| June 30, 2014 (unaudited) |
| THE ACCOMPANYING NOTES ARE AN INTEGRAL PART OF THESE FINANCIAL STATEMENTS. | The Royce Funds 2014 Semiannual Report to Shareholders | 89 |
| Statements of Assets and Liabilities |
| Royce | Royce | Royce | Royce | |||||||||||||
| Pennsylvania | Micro-Cap | Premier | Low-Priced | |||||||||||||
| Mutual Fund | Fund | Fund | Stock Fund | |||||||||||||
| ASSETS: | ||||||||||||||||
| Investments at value (including collateral on loaned securities) | ||||||||||||||||
Non-Affiliated Companies | $ | 6,663,308,610 | $ | 728,190,456 | $ | 4,402,533,583 | $ | 1,135,024,045 | ||||||||
Affiliated Companies | 143,433,918 | 10,935,637 | 2,626,284,901 | 22,039,481 | ||||||||||||
| Repurchase agreements (at cost and value) | 202,919,000 | 28,566,000 | 84,296,000 | 23,729,000 | ||||||||||||
| Cash and foreign currency | – | 93,589 | 2,812,433 | 25,827 | ||||||||||||
| Receivable for investments sold | 8,841,899 | 1,878,161 | 80,432,568 | 3,003,537 | ||||||||||||
| Receivable for capital shares sold | 4,141,822 | 371,085 | 3,227,270 | 599,686 | ||||||||||||
| Receivable for dividends and interest | 3,110,208 | 553,117 | 5,631,865 | 560,823 | ||||||||||||
| Prepaid expenses and other assets | 2,205,311 | 4,664 | 64,293 | 2,089 | ||||||||||||
Total Assets | 7,027,960,768 | 770,592,709 | 7,205,282,913 | 1,184,984,488 | ||||||||||||
| LIABILITIES: | ||||||||||||||||
| Payable for collateral on loaned securities | 77,437,178 | 26,867,184 | 271,453,688 | 70,410,418 | ||||||||||||
| Payable for investments purchased | 38,245,009 | 2,073,949 | 5,289,011 | 1,450,813 | ||||||||||||
| Payable for capital shares redeemed | 90,024,759 | 4,226,200 | 7,091,684 | 10,503,971 | ||||||||||||
| Payable to custodian for overdrawn balance | 1,943,406 | – | – | – | ||||||||||||
| Payable for investment advisory fees | 4,235,398 | 783,505 | 5,259,665 | 1,028,613 | ||||||||||||
| Accrued expenses | 3,132,772 | 507,385 | 2,615,706 | 1,489,226 | ||||||||||||
Total Liabilities | 215,018,522 | 34,458,223 | 291,709,754 | 84,883,041 | ||||||||||||
Net Assets | $ | 6,812,942,246 | $ | 736,134,486 | $ | 6,913,573,159 | $ | 1,100,101,447 | ||||||||
| ANALYSIS OF NET ASSETS: | ||||||||||||||||
| Paid-in capital | $ | 3,848,107,033 | $ | 520,258,987 | $ | 3,542,460,380 | $ | 650,432,687 | ||||||||
| Undistributed net investment income (loss) | 5,091,301 | (5,439,590 | ) | 14,863,885 | (2,203,307 | ) | ||||||||||
| Accumulated net realized gain (loss) on investments and | ||||||||||||||||
foreign currency | 560,398,757 | 47,045,586 | 519,725,903 | 138,317,987 | ||||||||||||
| Net unrealized appreciation (depreciation) on investments and | ||||||||||||||||
foreign currency | 2,399,345,155 | 174,269,503 | 2,836,522,991 | 313,554,080 | ||||||||||||
Net Assets | $ | 6,812,942,246 | $ | 736,134,486 | $ | 6,913,573,159 | $ | 1,100,101,447 | ||||||||
Investment Class | $ | 4,616,189,818 | $ | 559,538,270 | $ | 5,000,748,576 | $ | 63,475,551 | ||||||||
Service Class | 537,676,542 | 67,082,601 | 292,996,119 | 876,420,192 | ||||||||||||
Consultant Class | 759,523,948 | 109,513,615 | 67,065,263 | |||||||||||||
Institutional Class | 847,749,388 | 980,809,573 | 154,734,937 | |||||||||||||
W Class | 530,917,773 | |||||||||||||||
R Class | 41,155,237 | 33,387,106 | 2,547,506 | |||||||||||||
K Class | 10,647,313 | 7,648,749 | 2,923,261 | |||||||||||||
| SHARES OUTSTANDING (unlimited number of $.001 par value): | ||||||||||||||||
Investment Class | 307,201,363 | 33,205,047 | 210,770,187 | 4,274,037 | ||||||||||||
Service Class | 35,929,325 | 4,029,721 | 12,608,011 | 59,000,294 | ||||||||||||
Consultant Class | 57,753,534 | 7,522,770 | 3,209,318 | |||||||||||||
Institutional Class | 56,293,438 | 40,954,815 | 10,414,922 | |||||||||||||
W Class | 22,334,540 | |||||||||||||||
R Class | 2,837,304 | 1,469,048 | 176,241 | |||||||||||||
K Class | 802,260 | 888,369 | 389,022 | |||||||||||||
| NET ASSET VALUES (Net Assets ÷ Shares Outstanding): | ||||||||||||||||
Investment Class1 | $15.03 | $16.85 | $23.73 | $14.85 | ||||||||||||
Service Class1 | 14.96 | 16.65 | 23.24 | 14.85 | ||||||||||||
Consultant Class2 | 13.15 | 14.56 | 20.90 | |||||||||||||
Institutional Class3 | 15.06 | 23.95 | 14.86 | |||||||||||||
W Class3 | 23.77 | |||||||||||||||
R Class3 | 14.51 | 22.73 | 14.45 | |||||||||||||
K Class3 | 13.27 | 8.61 | 7.51 | |||||||||||||
Investments at identified cost | $ | 4,407,405,666 | $ | 564,859,163 | $ | 4,192,342,612 | $ | 843,511,677 | ||||||||
Market value of loaned securities | 75,579,274 | 25,837,749 | 265,737,979 | 68,401,091 | ||||||||||||
| 90 | The Royce Funds 2014 Semiannual Report to Shareholders | THE ACCOMPANYING NOTES ARE AN INTEGRAL PART OF THESE FINANCIAL STATEMENTS. |
| June 30, 2014 (unaudited) |
| Royce | Royce | Royce | Royce | |||||||||||||
| Total Return | Heritage | Opportunity | Special Equity | |||||||||||||
| Fund | Fund | Fund | Fund | |||||||||||||
| ASSETS: | ||||||||||||||||
| Investments at value (including collateral on loaned securities) | ||||||||||||||||
Non-Affiliated Companies | $ | 4,906,473,876 | $ | 353,637,174 | $ | 2,563,103,937 | $ | 1,212,597,657 | ||||||||
Affiliated Companies | 87,883,149 | – | 63,185,898 | 1,724,545,553 | ||||||||||||
| Repurchase agreements (at cost and value) | 252,862,000 | 29,236,000 | 172,123,000 | 412,898,000 | ||||||||||||
| Cash and foreign currency | 826 | 54 | – | 740 | ||||||||||||
| Receivable for investments sold | 6,914,715 | – | 11,736,972 | 5,586,612 | ||||||||||||
| Receivable for capital shares sold | 5,115,001 | 78,292 | 17,316,949 | 2,268,735 | ||||||||||||
| Receivable for dividends and interest | 5,244,674 | 236,994 | 956,688 | 849,306 | ||||||||||||
| Prepaid expenses and other assets | 55,856 | 3,745 | 26,437 | 39,324 | ||||||||||||
Total Assets | 5,264,550,097 | 383,192,259 | 2,828,449,881 | 3,358,785,927 | ||||||||||||
| LIABILITIES: | ||||||||||||||||
| Payable for collateral on loaned securities | 2,154,041 | 1,589,589 | 206,095,687 | 9,207,927 | ||||||||||||
| Payable for investments purchased | 20,457,969 | 2,968,484 | 4,941,672 | 5,419,413 | ||||||||||||
| Payable for capital shares redeemed | 16,595,555 | 152,352 | 19,251,915 | 4,156,908 | ||||||||||||
| Payable to custodian for overdrawn balance | – | – | 354,697 | – | ||||||||||||
| Payable for investment advisory fees | 4,072,331 | 306,280 | 2,080,078 | 2,674,554 | ||||||||||||
| Accrued expenses | 2,445,804 | 194,156 | 682,473 | 1,320,975 | ||||||||||||
| Deferred capital gains tax | – | 142,147 | – | – | ||||||||||||
Total Liabilities | 45,725,700 | 5,353,008 | 233,406,522 | 22,779,777 | ||||||||||||
Net Assets | $ | 5,218,824,397 | $ | 377,839,251 | $ | 2,595,043,359 | $ | 3,336,006,150 | ||||||||
| ANALYSIS OF NET ASSETS: | ||||||||||||||||
| Paid-in capital | $ | 2,866,124,871 | $ | 282,445,008 | $ | 1,825,057,094 | $ | 2,282,617,179 | ||||||||
| Undistributed net investment income (loss) | (2,809,224 | ) | 856,747 | (4,137,521 | ) | 10,556,368 | ||||||||||
| Accumulated net realized gain (loss) on investments and | ||||||||||||||||
foreign currency | 480,043,574 | 12,325,791 | 255,609,677 | 232,974,018 | ||||||||||||
| Net unrealized appreciation (depreciation) on investments and | ||||||||||||||||
foreign currency | 1,875,465,176 | 82,211,705 | 518,514,109 | 809,858,585 | ||||||||||||
Net Assets | $ | 5,218,824,397 | $ | 377,839,251 | $ | 2,595,043,359 | $ | 3,336,006,150 | ||||||||
Investment Class | $ | 3,443,640,323 | $ | 143,631,877 | $ | 1,445,137,858 | $ | 2,279,591,416 | ||||||||
Service Class | 293,883,573 | 206,853,678 | 191,135,789 | 291,145,822 | ||||||||||||
Consultant Class | 396,523,108 | 15,385,998 | 18,877,444 | 68,768,050 | ||||||||||||
Institutional Class | 624,814,444 | 885,706,818 | 696,500,862 | |||||||||||||
W Class | 260,678,873 | |||||||||||||||
R Class | 68,358,926 | 5,420,796 | 31,361,262 | |||||||||||||
K Class | 130,925,150 | 6,546,902 | 22,824,188 | |||||||||||||
| SHARES OUTSTANDING (unlimited number of $.001 par value): | ||||||||||||||||
Investment Class | 204,308,525 | 8,579,500 | 90,288,111 | 90,976,300 | ||||||||||||
Service Class | 17,292,070 | 12,407,580 | 12,466,565 | 11,659,174 | ||||||||||||
Consultant Class | 23,249,418 | 1,194,444 | 1,314,933 | 2,927,685 | ||||||||||||
Institutional Class | 37,337,315 | 54,729,338 | 27,939,895 | |||||||||||||
W Class | 15,485,068 | |||||||||||||||
R Class | 3,992,263 | 453,881 | 2,073,414 | |||||||||||||
K Class | 10,315,875 | 544,038 | 1,620,403 | |||||||||||||
| NET ASSET VALUES (Net Assets ÷ Shares Outstanding): | ||||||||||||||||
Investment Class1 | $16.86 | $16.74 | $16.01 | $25.06 | ||||||||||||
Service Class1 | 17.00 | 16.67 | 15.33 | 24.97 | ||||||||||||
Consultant Class2 | 17.06 | 12.88 | 14.36 | 23.49 | ||||||||||||
Institutional Class3 | 16.73 | 16.18 | 24.93 | |||||||||||||
W Class3 | 16.83 | |||||||||||||||
R Class3 | 17.12 | 11.94 | 15.13 | |||||||||||||
K Class3 | 12.69 | 12.03 | 14.09 | |||||||||||||
Investments at identified cost | $ | 3,118,897,972 | $ | 271,285,421 | $ | 2,107,776,544 | $ | 2,127,284,625 | ||||||||
Market value of loaned securities | 2,110,956 | 1,556,902 | 199,303,387 | 8,733,248 | ||||||||||||
| THE ACCOMPANYING NOTES ARE AN INTEGRAL PART OF THESE FINANCIAL STATEMENTS. | The Royce Funds 2014 Semiannual Report to Shareholders | 91 |
| Statements of Assets and Liabilities |
| Royce | Royce | Royce | Royce | |||||||||||||
| Value | Value Plus | 100 | Dividend | |||||||||||||
| Fund | Fund | Fund | Value Fund | |||||||||||||
| ASSETS: | ||||||||||||||||
| Investments at value (including collateral on loaned securities) | ||||||||||||||||
Non-Affiliated Companies | $ | 1,024,884,511 | $ | 1,201,057,376 | $ | 269,316,171 | $ | 609,381,413 | ||||||||
| Repurchase agreements (at cost and value) | 20,940,000 | 34,950,000 | 18,652,000 | 16,436,000 | ||||||||||||
| Cash and foreign currency | – | 691 | 326 | 12,795 | ||||||||||||
| Receivable for investments sold | 15,922,079 | 5,756,411 | 706,280 | 1,139,834 | ||||||||||||
| Receivable for capital shares sold | 1,365,106 | 561,409 | 278,790 | 1,865,565 | ||||||||||||
| Receivable for dividends and interest | 526,430 | 440,536 | 173,532 | 486,319 | ||||||||||||
| Prepaid expenses and other assets | 6,727 | 2,629 | 1,882 | 8,006 | ||||||||||||
Total Assets | 1,063,644,853 | 1,242,769,052 | 289,128,981 | 629,329,932 | ||||||||||||
| LIABILITIES: | ||||||||||||||||
| Payable for collateral on loaned securities | 4,542,570 | 104,981,188 | 982,550 | 2,424,305 | ||||||||||||
| Payable for investments purchased | 5,943,802 | 1,590,757 | 1,695,382 | 215,825 | ||||||||||||
| Payable for capital shares redeemed | 1,368,706 | 32,474,507 | 716,976 | 765,440 | ||||||||||||
| Payable to custodian for overdrawn balance | 9 | – | – | – | ||||||||||||
| Payable for investment advisory fees | 856,090 | 918,964 | 231,935 | 494,274 | ||||||||||||
| Accrued expenses | 793,608 | 1,053,399 | 192,100 | 288,761 | ||||||||||||
| Deferred capital gains tax | – | – | – | 97,173 | ||||||||||||
Total Liabilities | 13,504,785 | 141,018,815 | 3,818,943 | 4,285,778 | ||||||||||||
Net Assets | $ | 1,050,140,068 | $ | 1,101,750,237 | $ | 285,310,038 | $ | 625,044,154 | ||||||||
| ANALYSIS OF NET ASSETS: | ||||||||||||||||
| Paid-in capital | $ | 703,117,249 | $ | 644,190,412 | $ | 181,569,455 | $ | 460,872,017 | ||||||||
| Undistributed net investment income (loss) | 527,724 | (4,306,104 | ) | (490,598 | ) | 2,168,898 | ||||||||||
| Accumulated net realized gain (loss) on investments and | ||||||||||||||||
foreign currency | 83,098,621 | 157,904,576 | 21,076,338 | 21,308,119 | ||||||||||||
| Net unrealized appreciation (depreciation) on investments and | ||||||||||||||||
foreign currency | 263,396,474 | 303,961,353 | 83,154,843 | 140,695,120 | ||||||||||||
Net Assets | $ | 1,050,140,068 | $ | 1,101,750,237 | $ | 285,310,038 | $ | 625,044,154 | ||||||||
Investment Class | $ | 148,807,409 | $ | 254,604,293 | $ | 61,512,858 | $ | 195,622,628 | ||||||||
Service Class | 606,986,089 | 753,558,975 | 219,772,557 | 385,623,082 | ||||||||||||
Consultant Class | 29,922,811 | 20,930,717 | 120,228 | |||||||||||||
Institutional Class | 215,764,063 | 70,258,766 | 43,678,216 | |||||||||||||
R Class | 36,445,095 | 1,438,638 | 2,969,700 | |||||||||||||
K Class | 12,214,601 | 958,848 | 1,054,923 | |||||||||||||
| SHARES OUTSTANDING (unlimited number of $.001 par value): | ||||||||||||||||
Investment Class | 10,627,437 | 14,348,287 | 5,909,478 | 21,357,409 | ||||||||||||
Service Class | 43,547,333 | 42,765,250 | 21,282,615 | 41,706,318 | ||||||||||||
Consultant Class | 2,290,294 | 1,262,319 | 11,626 | |||||||||||||
Institutional Class | 15,386,192 | 3,941,421 | 4,781,000 | |||||||||||||
R Class | 2,675,046 | 84,274 | 228,542 | |||||||||||||
K Class | 1,109,918 | 77,051 | 79,994 | |||||||||||||
| NET ASSET VALUES (Net Assets ÷ Shares Outstanding): | ||||||||||||||||
Investment Class1 | $14.00 | $17.74 | $10.41 | $9.16 | ||||||||||||
Service Class1 | 13.94 | �� | 17.62 | 10.33 | 9.25 | |||||||||||
Consultant Class2 | 13.07 | 16.58 | 10.34 | |||||||||||||
Institutional Class3 | 14.02 | 17.83 | 9.14 | |||||||||||||
R Class3 | 13.62 | 17.07 | 12.99 | |||||||||||||
K Class3 | 11.00 | 12.44 | 13.19 | |||||||||||||
Investments at identified cost | $ | 761,488,036 | $ | 897,097,330 | $ | 186,162,121 | $ | 468,591,960 | ||||||||
Market value of loaned securities | 4,415,378 | 102,981,183 | 956,044 | 2,348,597 | ||||||||||||
| 92 | The Royce Funds 2014 Semiannual Report to Shareholders | THE ACCOMPANYING NOTES ARE AN INTEGRAL PART OF THESE FINANCIAL STATEMENTS. |
| June 30, 2014 (unaudited) |
| Royce | Royce | Royce | ||||||||||
| Global | International Smaller- | Special Equity | ||||||||||
| Value Fund | Companies Fund | Multi-Cap Fund | ||||||||||
| ASSETS: | ||||||||||||
| Investments at value (including collateral on loaned securities) | ||||||||||||
Non-Affiliated Companies | $ | 216,151,932 | $ | 52,879,654 | $ | 199,407,783 | ||||||
| Repurchase agreements (at cost and value) | 6,528,000 | 2,405,000 | 18,706,000 | |||||||||
| Cash and foreign currency | 41,256 | 36,623 | 769 | |||||||||
| Receivable for investments sold | 1,013,018 | 397,674 | 395,043 | |||||||||
| Receivable for capital shares sold | 430,621 | 44,364 | 1,324,360 | |||||||||
| Receivable for dividends and interest | 532,254 | 63,996 | 280,530 | |||||||||
| Prepaid expenses and other assets | 1,023 | 501 | 2,704 | |||||||||
Total Assets | 224,698,104 | 55,827,812 | 220,117,189 | |||||||||
| LIABILITIES: | ||||||||||||
| Payable for collateral on loaned securities | 10,383,344 | – | – | |||||||||
| Payable for investments purchased | 3,108,572 | 236,544 | 687,737 | |||||||||
| Payable for capital shares redeemed | 102,934 | 23,241 | 54,044 | |||||||||
| Payable for investment advisory fees | 211,715 | 54,579 | 148,551 | |||||||||
| Accrued expenses | 169,306 | 10,302 | 81,357 | |||||||||
| Deferred capital gains tax | 69,284 | 105,420 | – | |||||||||
Total Liabilities | 14,045,155 | 430,086 | 971,689 | |||||||||
Net Assets | $ | 210,652,949 | $ | 55,397,726 | $ | 219,145,500 | ||||||
| ANALYSIS OF NET ASSETS: | ||||||||||||
| Paid-in capital | $ | 252,724,157 | $ | 48,602,996 | $ | 167,735,071 | ||||||
| Undistributed net investment income (loss) | 1,871,046 | 354,068 | 862,531 | |||||||||
| Accumulated net realized gain (loss) on investments and | ||||||||||||
foreign currency | (41,808,193 | ) | 2,369,938 | 11,932,095 | ||||||||
| Net unrealized appreciation (depreciation) on investments and foreign currency | (2,134,061 | ) | 4,070,724 | 38,615,803 | ||||||||
Net Assets | $ | 210,652,949 | $ | 55,397,726 | $ | 219,145,500 | ||||||
Investment Class | $ | 139,171,554 | $ | 731,101 | $ | 70,498,348 | ||||||
Service Class | 43,999,943 | 51,567,280 | 95,385,527 | |||||||||
Consultant Class | 27,330,276 | 4,703,924 | ||||||||||
Institutional Class | 3,099,345 | 48,557,701 | ||||||||||
R Class | 124,531 | |||||||||||
K Class | 26,645 | |||||||||||
| SHARES OUTSTANDING (unlimited number of $.001 par value): | ||||||||||||
Investment Class | 9,211,102 | 68,688 | 4,479,494 | |||||||||
Service Class | 2,897,039 | 4,034,349 | 6,051,324 | |||||||||
Consultant Class | 1,824,558 | 424,322 | ||||||||||
Institutional Class | 284,769 | 3,083,450 | ||||||||||
R Class | 11,070 | |||||||||||
K Class | 2,366 | |||||||||||
| NET ASSET VALUES (Net Assets ÷ Shares Outstanding): | ||||||||||||
Investment Class1 | $15.11 | $10.64 | $15.74 | |||||||||
Service Class1 | 15.19 | 12.78 | 15.76 | |||||||||
Consultant Class2 | 14.98 | 11.09 | ||||||||||
Institutional Class3 | 10.88 | 15.75 | ||||||||||
R Class3 | 11.25 | |||||||||||
K Class3 | 11.26 | |||||||||||
Investments at identified cost | $ | 218,224,962 | $ | 48,704,795 | $ | 160,791,979 | ||||||
Market value of loaned securities | 9,954,687 | |||||||||||
| THE ACCOMPANYING NOTES ARE AN INTEGRAL PART OF THESE FINANCIAL STATEMENTS. | The Royce Funds 2014 Semiannual Report to Shareholders | 93 |
| Statements of Changes in Net Assets |
| Royce Pennsylvania | ||||||||||||||||||||||||
| Mutual Fund | Royce Micro-Cap Fund | Royce Premier Fund | ||||||||||||||||||||||
| Six months ended | Six months ended | Six months ended | ||||||||||||||||||||||
| 6/30/14 | Year ended | 6/30/14 | Year ended | 6/30/14 | Year ended | |||||||||||||||||||
| (unaudited) | 12/31/13 | (unaudited) | 12/31/13 | (unaudited) | 12/31/13 | |||||||||||||||||||
| INVESTMENT OPERATIONS: | ||||||||||||||||||||||||
| Net investment income (loss) | $ | 7,090,222 | $ | 7,661,265 | $ | (2,411,734 | ) | $ | (5,870,665 | ) | $ | 14,863,887 | $ | (452,026 | ) | |||||||||
| Net realized gain (loss) on investments and | ||||||||||||||||||||||||
foreign currency | 450,225,892 | 471,075,967 | 38,723,654 | 80,848,944 | 356,480,583 | 873,083,934 | ||||||||||||||||||
| Net change in unrealized appreciation | ||||||||||||||||||||||||
(depreciation) on investments and | ||||||||||||||||||||||||
foreign currency | (333,850,571 | ) | 1,515,290,678 | (31,097,404 | ) | 90,069,276 | 101,535,452 | 820,330,897 | ||||||||||||||||
| Net increase (decrease) in net assets from | ||||||||||||||||||||||||
investment operations | 123,465,543 | 1,994,027,910 | 5,214,516 | 165,047,555 | 472,879,922 | 1,692,962,805 | ||||||||||||||||||
| DISTRIBUTIONS: | ||||||||||||||||||||||||
| Net investment income | ||||||||||||||||||||||||
Investment Class | – | (431,367 | ) | – | (699,816 | ) | – | – | ||||||||||||||||
Service Class | – | – | – | – | – | – | ||||||||||||||||||
Consultant Class | – | – | – | – | – | – | ||||||||||||||||||
Institutional Class | – | (937,016 | ) | – | – | |||||||||||||||||||
W Class | – | – | ||||||||||||||||||||||
R Class | – | – | – | – | ||||||||||||||||||||
K Class | – | – | – | – | ||||||||||||||||||||
| Net realized gain on investments and | ||||||||||||||||||||||||
foreign currency | ||||||||||||||||||||||||
Investment Class | – | (260,021,200 | ) | – | (45,125,296 | ) | – | (488,208,024 | ) | |||||||||||||||
Service Class | – | (31,628,047 | ) | – | (5,609,190 | ) | – | (46,637,769 | ) | |||||||||||||||
Consultant Class | – | (45,624,009 | ) | – | (9,087,282 | ) | – | (6,977,329 | ) | |||||||||||||||
Institutional Class | – | (41,396,200 | ) | – | (90,956,054 | ) | ||||||||||||||||||
W Class | – | (52,811,951 | ) | |||||||||||||||||||||
R Class | – | (2,317,940 | ) | – | (3,194,633 | ) | ||||||||||||||||||
K Class | – | (689,970 | ) | – | (1,877,675 | ) | ||||||||||||||||||
| Total distributions | – | (383,045,749 | ) | – | (60,521,584 | ) | – | (690,663,435 | ) | |||||||||||||||
| CAPITAL SHARE TRANSACTIONS: | ||||||||||||||||||||||||
| Net capital share transactions | ||||||||||||||||||||||||
Investment Class | (503,398,416 | ) | (353,912,164 | ) | (95,583,875 | ) | (172,590,098 | ) | (438,145,355 | ) | (240,379,249 | ) | ||||||||||||
Service Class | (62,653,882 | ) | (15,357,868 | ) | (13,300,979 | ) | (39,264,005 | ) | (45,477,850 | ) | (309,788,929 | ) | ||||||||||||
Consultant Class | (39,274,756 | ) | (29,907,854 | ) | (8,445,483 | ) | (15,225,756 | ) | (3,927,884 | ) | (1,639,240 | ) | ||||||||||||
Institutional Class | 12,632,233 | 181,494,950 | (75,931,499 | ) | (11,316,540 | ) | ||||||||||||||||||
W Class | (58,491,411 | ) | (61,008,076 | ) | ||||||||||||||||||||
R Class | (3,559,302 | ) | 1,818,243 | (1,322,938 | ) | (437,535 | ) | |||||||||||||||||
K Class | (1,200,517 | ) | 482,011 | (1,476,098 | ) | (1,286,771 | ) | |||||||||||||||||
| Shareholder redemption fees | ||||||||||||||||||||||||
Investment Class | 45,128 | 75,224 | 4,160 | 35,746 | 48,380 | 190,877 | ||||||||||||||||||
Service Class | 26,531 | 52,548 | 45,352 | 27,157 | 3,705 | 8,112 | ||||||||||||||||||
| Net increase (decrease) in net assets from | ||||||||||||||||||||||||
capital share transactions | (597,382,981 | ) | (215,254,910 | ) | (117,280,825 | ) | (227,016,956 | ) | (624,720,950 | ) | (625,657,351 | ) | ||||||||||||
| NET INCREASE (DECREASE) IN NET ASSETS | (473,917,438 | ) | 1,395,727,251 | (112,066,309 | ) | (122,490,985 | ) | (151,841,028 | ) | 376,642,019 | ||||||||||||||
| NET ASSETS: | ||||||||||||||||||||||||
Beginning of period | 7,286,859,684 | 5,891,132,433 | 848,200,795 | 970,691,780 | 7,065,414,187 | 6,688,772,168 | ||||||||||||||||||
End of period | $ | 6,812,942,246 | $ | 7,286,859,684 | $ | 736,134,486 | $ | 848,200,795 | $ | 6,913,573,159 | $ | 7,065,414,187 | ||||||||||||
| UNDISTRIBUTED NET INVESTMENT INCOME | ||||||||||||||||||||||||
(LOSS) AT END OF PERIOD | $ | 5,091,301 | $ | (1,998,921 | ) | $ | (5,439,590 | ) | $ | (3,027,856 | ) | $ | 14,863,885 | $ | (2 | ) | ||||||||
| 94 | The Royce Funds 2014 Semiannual Report to Shareholders | THE ACCOMPANYING NOTES ARE AN INTEGRAL PART OF THESE FINANCIAL STATEMENTS. |
| Royce Low-Priced Stock Fund | Royce Total Return Fund | Royce Heritage Fund | ||||||||||||||||||||||
| Six months ended | Six months ended | Six months ended | ||||||||||||||||||||||
| 6/30/14 | Year ended | 6/30/14 | Year ended | 6/30/14 | Year ended | |||||||||||||||||||
| (unaudited) | 12/31/13 | (unaudited) | 12/31/13 | (unaudited) | 12/31/13 | |||||||||||||||||||
| INVESTMENT OPERATIONS: | ||||||||||||||||||||||||
| Net investment income (loss) | $ | 1,541,850 | $ | 1,768,327 | $ | 19,825,868 | $ | 46,503,739 | $ | 811,338 | $ | 107,612 | ||||||||||||
| Net realized gain (loss) on investments and | ||||||||||||||||||||||||
foreign currency | 121,758,837 | 338,510,647 | 344,315,302 | 516,234,642 | 9,061,326 | 42,713,139 | ||||||||||||||||||
| Net change in unrealized appreciation | ||||||||||||||||||||||||
(depreciation) on investments and | ||||||||||||||||||||||||
foreign currency | (23,286,414 | ) | (105,343,208 | ) | (234,023,683 | ) | 895,364,319 | 1,170,297 | 28,856,933 | |||||||||||||||
| Net increase (decrease) in net assets from | ||||||||||||||||||||||||
investment operations | 100,014,273 | 234,935,766 | 130,117,487 | 1,458,102,700 | 11,042,961 | 71,677,684 | ||||||||||||||||||
| DISTRIBUTIONS: | ||||||||||||||||||||||||
| Net investment income | ||||||||||||||||||||||||
Investment Class | – | (323,323 | ) | (12,689,444 | ) | (30,314,036 | ) | – | (349,578 | ) | ||||||||||||||
Service Class | – | (379,805 | ) | (703,003 | ) | (2,207,261 | ) | – | (47,427 | ) | ||||||||||||||
Consultant Class | – | – | – | – | ||||||||||||||||||||
Institutional Class | – | (1,777,124 | ) | (2,537,485 | ) | (6,005,663 | ) | |||||||||||||||||
W Class | (917,718 | ) | (1,936,210 | ) | ||||||||||||||||||||
R Class | – | – | (41,367 | ) | (134,138 | ) | – | – | ||||||||||||||||
K Class | – | (6,881 | ) | (251,613 | ) | (751,220 | ) | – | – | |||||||||||||||
| Net realized gain on investments and | ||||||||||||||||||||||||
foreign currency | ||||||||||||||||||||||||
Investment Class | – | (12,723,954 | ) | – | (295,570,600 | ) | – | (12,211,788 | ) | |||||||||||||||
Service Class | – | (131,337,387 | ) | – | (42,384,314 | ) | – | (23,990,047 | ) | |||||||||||||||
Consultant Class | – | (31,920,900 | ) | – | (2,187,387 | ) | ||||||||||||||||||
Institutional Class | – | (63,367,740 | ) | – | (47,200,579 | ) | ||||||||||||||||||
W Class | – | (19,766,304 | ) | |||||||||||||||||||||
R Class | – | (414,282 | ) | – | (5,693,320 | ) | – | (994,363 | ) | |||||||||||||||
K Class | – | (832,746 | ) | – | (20,859,671 | ) | – | (1,055,146 | ) | |||||||||||||||
| Total distributions | – | (211,163,242 | ) | (17,140,630 | ) | (504,744,216 | ) | – | (40,835,736 | ) | ||||||||||||||
| CAPITAL SHARE TRANSACTIONS: | ||||||||||||||||||||||||
| Net capital share transactions | ||||||||||||||||||||||||
Investment Class | (31,578,098 | ) | (170,583,797 | ) | (289,929,546 | ) | (16,146,326 | ) | 21,632,698 | 73,588,985 | ||||||||||||||
Service Class | (207,110,957 | ) | (804,469,884 | ) | (202,926,096 | ) | 147,512,588 | (22,344,680 | ) | (4,880,969 | ) | |||||||||||||
Consultant Class | (16,439,427 | ) | 4,827,235 | (913,730 | ) | 899,381 | ||||||||||||||||||
Institutional Class | (209,004,699 | ) | (631,338,844 | ) | (11,669,232 | ) | 118,224,237 | |||||||||||||||||
W Class | 5,547,613 | 38,979,851 | ||||||||||||||||||||||
R Class | (796,681 | ) | (2,714,812 | ) | (5,802,070 | ) | 12,568,863 | (1,529,944 | ) | 1,571,248 | ||||||||||||||
K Class | (1,158,135 | ) | (2,166,084 | ) | (67,864,251 | ) | 2,762,456 | (55,121 | ) | (1,331,961 | ) | |||||||||||||
| Shareholder redemption fees | ||||||||||||||||||||||||
Investment Class | 2,033 | 17,171 | 38,073 | 75,527 | 57 | 669 | ||||||||||||||||||
Service Class | 4,345 | 48,913 | 12,916 | 45,568 | 1,556 | 11,734 | ||||||||||||||||||
| Net increase (decrease) in net assets from | ||||||||||||||||||||||||
capital share transactions | (449,642,192 | ) | (1,611,207,337 | ) | (589,032,020 | ) | 308,849,999 | (3,209,164 | ) | 69,859,087 | ||||||||||||||
| NET INCREASE (DECREASE) IN NET ASSETS | (349,627,919 | ) | (1,587,434,813 | ) | (476,055,163 | ) | 1,262,208,483 | 7,833,797 | 100,701,035 | |||||||||||||||
| NET ASSETS: | ||||||||||||||||||||||||
Beginning of period | 1,449,729,366 | 3,037,164,179 | 5,694,879,560 | 4,432,671,077 | 370,005,454 | 269,304,419 | ||||||||||||||||||
End of period | $ | 1,100,101,447 | $ | 1,449,729,366 | $ | 5,218,824,397 | $ | 5,694,879,560 | $ | 377,839,251 | $ | 370,005,454 | ||||||||||||
| UNDISTRIBUTED NET INVESTMENT INCOME | ||||||||||||||||||||||||
(LOSS) AT END OF PERIOD | $ | (2,203,307 | ) | $ | (3,745,157 | ) | $ | (2,809,224 | ) | $ | (5,494,463 | ) | $ | 856,747 | $ | 45,409 | ||||||||
| THE ACCOMPANYING NOTES ARE AN INTEGRAL PART OF THESE FINANCIAL STATEMENTS. | The Royce Funds 2014 Semiannual Report to Shareholders | 95 |
| Statements of Changes in Net Assets |
| Royce Opportunity Fund | Royce Special Equity Fund | Royce Value Fund | ||||||||||||||||||||||
| Six months ended | Six months ended | Six months ended | ||||||||||||||||||||||
| 6/30/14 | Year ended | 6/30/14 | Year ended | 6/30/14 | Year ended | |||||||||||||||||||
| (unaudited) | 12/31/13 | (unaudited) | 12/31/13 | (unaudited) | 12/31/13 | |||||||||||||||||||
| INVESTMENT OPERATIONS: | ||||||||||||||||||||||||
| Net investment income (loss) | $ | (4,163,091 | ) | $ | (8,323,304 | ) | $ | 10,556,367 | $ | 3,797,163 | $ | 533,091 | $ | (1,046,544 | ) | |||||||||
| Net realized gain (loss) on investments and | ||||||||||||||||||||||||
foreign currency | 191,259,147 | 324,683,300 | 168,337,104 | 366,833,496 | 66,503,387 | 104,447,215 | ||||||||||||||||||
| Net change in unrealized appreciation | ||||||||||||||||||||||||
(depreciation) on investments and | ||||||||||||||||||||||||
foreign currency | (112,712,063 | ) | 492,429,616 | (181,684,865 | ) | 485,484,439 | (33,452,300 | ) | 192,266,104 | |||||||||||||||
| Net increase (decrease) in net assets from | ||||||||||||||||||||||||
investment operations | 74,383,993 | 808,789,612 | (2,791,394 | ) | 856,115,098 | 33,584,178 | 295,666,775 | |||||||||||||||||
| DISTRIBUTIONS: | ||||||||||||||||||||||||
| Net investment income | ||||||||||||||||||||||||
Investment Class | – | – | – | (2,784,704 | ) | – | (430,335 | ) | ||||||||||||||||
Service Class | – | – | – | – | – | – | ||||||||||||||||||
Consultant Class | – | – | – | – | – | – | ||||||||||||||||||
Institutional Class | – | (506,976 | ) | – | (1,484,535 | ) | – | (801,517 | ) | |||||||||||||||
R Class | – | – | – | – | ||||||||||||||||||||
K Class | – | – | – | – | ||||||||||||||||||||
| Net realized gain on investments and | ||||||||||||||||||||||||
foreign currency | ||||||||||||||||||||||||
Investment Class | – | (115,737,752 | ) | – | (205,169,213 | ) | – | (13,405,198 | ) | |||||||||||||||
Service Class | – | (33,239,063 | ) | – | (27,558,217 | ) | – | (47,070,978 | ) | |||||||||||||||
Consultant Class | – | (1,843,343 | ) | – | (6,115,330 | ) | – | (2,278,341 | ) | |||||||||||||||
Institutional Class | – | (77,841,147 | ) | – | (57,360,331 | ) | – | (14,980,670 | ) | |||||||||||||||
R Class | – | (2,051,002 | ) | – | (2,587,581 | ) | ||||||||||||||||||
K Class | – | (1,712,998 | ) | – | (1,401,823 | ) | ||||||||||||||||||
| Total distributions | – | (232,932,281 | ) | – | (300,472,330 | ) | – | (82,956,443 | ) | |||||||||||||||
| CAPITAL SHARE TRANSACTIONS: | ||||||||||||||||||||||||
| Net capital share transactions | ||||||||||||||||||||||||
Investment Class | (22,909,037 | ) | 214,071,968 | (228,360,049 | ) | 74,313,256 | (53,093,894 | ) | (42,051,102 | ) | ||||||||||||||
Service Class | (22,671,852 | ) | (59,230,398 | ) | (43,387,303 | ) | 36,500,115 | (92,562,878 | ) | (280,452,969 | ) | |||||||||||||
Consultant Class | (211,459 | ) | 3,337,411 | (2,259,084 | ) | 3,787,713 | (2,531,255 | ) | (6,913,766 | ) | ||||||||||||||
Institutional Class | 6,636,748 | (49,903,561 | ) | (5,110,959 | ) | 19,319,756 | (11,240,666 | ) | (19,355,348 | ) | ||||||||||||||
R Class | 7,827,957 | 13,341,482 | (2,106,194 | ) | (6,762,442 | ) | ||||||||||||||||||
K Class | 4,279,872 | 6,241,844 | (4,413,301 | ) | (4,715,820 | ) | ||||||||||||||||||
| Shareholder redemption fees | ||||||||||||||||||||||||
Investment Class | 21,922 | 33,487 | 77,308 | 98,785 | 3,349 | 5,728 | ||||||||||||||||||
Service Class | 48,360 | 21,097 | 6,553 | 20,039 | 8,007 | 28,188 | ||||||||||||||||||
| Net increase (decrease) in net assets from | ||||||||||||||||||||||||
capital share transactions | (26,977,489 | ) | 127,913,330 | (279,033,534 | ) | 134,039,664 | (165,936,832 | ) | (360,217,531 | ) | ||||||||||||||
| NET INCREASE (DECREASE) IN NET ASSETS | 47,406,504 | 703,770,661 | (281,824,928 | ) | 689,682,432 | (132,352,654 | ) | (147,507,199 | ) | |||||||||||||||
| NET ASSETS: | ||||||||||||||||||||||||
Beginning of period | 2,547,636,855 | 1,843,866,194 | 3,617,831,078 | 2,928,148,646 | 1,182,492,722 | 1,329,999,921 | ||||||||||||||||||
End of period | $ | 2,595,043,359 | $ | 2,547,636,855 | $ | 3,336,006,150 | $ | 3,617,831,078 | $ | 1,050,140,068 | $ | 1,182,492,722 | ||||||||||||
| UNDISTRIBUTED NET INVESTMENT INCOME | ||||||||||||||||||||||||
(LOSS) AT END OF PERIOD | $ | (4,137,521 | ) | $ | 25,570 | $ | 10,556,368 | $ | – | $ | 527,724 | $ | (5,366 | ) | ||||||||||
| 96 | The Royce Funds 2014 Semiannual Report to Shareholders | THE ACCOMPANYING NOTES ARE AN INTEGRAL PART OF THESE FINANCIAL STATEMENTS. |
| Royce Value Plus Fund | Royce 100 Fund | Royce Dividend Value Fund | ||||||||||||||||||||||
| Six months ended | Six months ended | Six months ended | ||||||||||||||||||||||
| 6/30/14 | Year ended | 6/30/14 | Year ended | 6/30/14 | Year ended | |||||||||||||||||||
| (unaudited) | 12/31/13 | (unaudited) | 12/31/13 | (unaudited) | 12/31/13 | |||||||||||||||||||
| INVESTMENT OPERATIONS: | ||||||||||||||||||||||||
| Net investment income (loss) | $ | (2,981,900 | ) | $ | (8,792,263 | ) | $ | (480,496 | ) | $ | (899,035 | ) | $ | 3,210,518 | $ | 5,283,336 | ||||||||
| Net realized gain (loss) on investments and | ||||||||||||||||||||||||
foreign currency | 113,142,029 | 236,175,134 | 17,675,748 | 42,762,789 | 15,674,751 | 37,699,702 | ||||||||||||||||||
| Net change in unrealized appreciation | ||||||||||||||||||||||||
(depreciation) on investments and | ||||||||||||||||||||||||
foreign currency | (67,646,693 | ) | 163,082,996 | (9,662,139 | ) | 37,488,379 | 566,124 | 100,268,425 | ||||||||||||||||
| Net increase (decrease) in net assets from | ||||||||||||||||||||||||
investment operations | 42,513,436 | 390,465,867 | 7,533,113 | 79,352,133 | 19,451,393 | 143,251,463 | ||||||||||||||||||
| DISTRIBUTIONS: | ||||||||||||||||||||||||
| Net investment income | ||||||||||||||||||||||||
Investment Class | – | (47,920 | ) | – | (171,769 | ) | (884,203 | ) | (2,101,030 | ) | ||||||||||||||
Service Class | – | – | – | (134,400 | ) | (1,292,027 | ) | (2,644,407 | ) | |||||||||||||||
Consultant Class | – | – | (45 | ) | ||||||||||||||||||||
Institutional Class | – | (426,647 | ) | (207,106 | ) | (395,915 | ) | |||||||||||||||||
R Class | – | – | – | – | ||||||||||||||||||||
K Class | – | (525 | ) | – | – | |||||||||||||||||||
| Net realized gain on investments and | ||||||||||||||||||||||||
foreign currency | ||||||||||||||||||||||||
Investment Class | – | (18,415,039 | ) | – | (7,553,032 | ) | – | (12,036,485 | ) | |||||||||||||||
Service Class | – | (67,233,777 | ) | – | (29,276,357 | ) | – | (23,009,857 | ) | |||||||||||||||
Consultant Class | – | (1,776,890 | ) | – | ||||||||||||||||||||
Institutional Class | – | (11,711,029 | ) | – | (1,765,841 | ) | ||||||||||||||||||
R Class | – | (124,722 | ) | – | (287,743 | ) | ||||||||||||||||||
K Class | – | (102,394 | ) | – | (232,789 | ) | ||||||||||||||||||
| Total distributions | – | (99,838,943 | ) | – | (37,656,090 | ) | (2,383,381 | ) | (41,953,535 | ) | ||||||||||||||
| CAPITAL SHARE TRANSACTIONS: | ||||||||||||||||||||||||
| Net capital share transactions | ||||||||||||||||||||||||
Investment Class | 949,658 | (32,018,470 | ) | (503,210 | ) | (17,441,016 | ) | (21,118,671 | ) | 60,601,532 | ||||||||||||||
Service Class | (110,421,601 | ) | (327,083,427 | ) | (17,715,503 | ) | (20,217,752 | ) | (32,471,232 | ) | 91,250,464 | |||||||||||||
Consultant Class | (2,425,614 | ) | (921,317 | ) | 117,482 | |||||||||||||||||||
Institutional Class | (76,366,957 | ) | (116,016,594 | ) | 11,020,001 | 2,508,270 | ||||||||||||||||||
R Class | (223,351 | ) | 101,478 | 88,805 | (129,512 | ) | ||||||||||||||||||
K Class | (42,100 | ) | 376,308 | (1,261,075 | ) | (1,936,637 | ) | |||||||||||||||||
| Shareholder redemption fees | ||||||||||||||||||||||||
Investment Class | 1,928 | 18,252 | 1,024 | 3,349 | 1,900 | 9,399 | ||||||||||||||||||
Service Class | 6,770 | 27,203 | 4,549 | 10,454 | 2,791 | 33,408 | ||||||||||||||||||
| Net increase (decrease) in net assets from | ||||||||||||||||||||||||
| capital share transactions | (188,521,267 | ) | (475,516,567 | ) | (19,385,410 | ) | (39,711,114 | ) | (42,447,729 | ) | 154,403,073 | |||||||||||||
| NET INCREASE (DECREASE) IN NET ASSETS | (146,007,831 | ) | (184,889,643 | ) | (11,852,297 | ) | 1,984,929 | (25,379,717 | ) | 255,701,001 | ||||||||||||||
| NET ASSETS: | ||||||||||||||||||||||||
Beginning of period | 1,247,758,068 | 1,432,647,711 | 297,162,335 | 295,177,406 | 650,423,871 | 394,722,870 | ||||||||||||||||||
End of period | $ | 1,101,750,237 | $ | 1,247,758,068 | $ | 285,310,038 | $ | 297,162,335 | $ | 625,044,154 | $ | 650,423,871 | ||||||||||||
| UNDISTRIBUTED NET INVESTMENT INCOME | ||||||||||||||||||||||||
(LOSS) AT END OF PERIOD | $ | (4,306,104 | ) | $ | (1,324,204 | ) | $ | (490,598 | ) | $ | (10,102 | ) | $ | 2,168,898 | $ | 1,341,761 | ||||||||
| THE ACCOMPANYING NOTES ARE AN INTEGRAL PART OF THESE FINANCIAL STATEMENTS. | The Royce Funds 2014 Semiannual Report to Shareholders | 97 |
| Statements of Changes in Net Assets |
| Royce International Smaller- | Royce Special Equity | |||||||||||||||||||||||
| Royce Global Value Fund | Companies Fund | Multi-Cap Fund | ||||||||||||||||||||||
| Six months ended | Six months ended | Six months ended | ||||||||||||||||||||||
| 6/30/14 | Year ended | 6/30/14 | Year ended | 6/30/14 | Year ended | |||||||||||||||||||
| (unaudited) | 12/31/13 | (unaudited) | 12/31/13 | (unaudited) | 12/31/13 | |||||||||||||||||||
| INVESTMENT OPERATIONS: | ||||||||||||||||||||||||
| Net investment income (loss) | $ | 1,694,657 | $ | 2,504,441 | $ | 373,569 | $ | 358,526 | $ | 859,740 | $ | 1,342,234 | ||||||||||||
| Net realized gain (loss) on investments and | ||||||||||||||||||||||||
foreign currency | 12,171,197 | (6,776,633 | ) | 2,255,505 | 2,832,920 | 8,398,960 | 12,335,278 | |||||||||||||||||
| Net change in unrealized appreciation | ||||||||||||||||||||||||
(depreciation) on investments and | ||||||||||||||||||||||||
foreign currency | 6,885,356 | 18,965,587 | 966,882 | 847,718 | 2,196,939 | 32,879,863 | ||||||||||||||||||
| Net increase (decrease) in net assets from | ||||||||||||||||||||||||
investment operations | 20,751,210 | 14,693,395 | 3,595,956 | 4,039,164 | 11,455,639 | 46,557,375 | ||||||||||||||||||
| DISTRIBUTIONS: | ||||||||||||||||||||||||
| Net investment income | ||||||||||||||||||||||||
Investment Class | – | (1,815,601 | ) | – | – | (479,420 | ) | |||||||||||||||||
Service Class | – | (410,885 | ) | – | (426,886 | ) | – | (469,302 | ) | |||||||||||||||
Consultant Class | – | (89,199 | ) | – | ||||||||||||||||||||
Institutional Class | – | – | (408,331 | ) | ||||||||||||||||||||
R Class | – | (1,123 | ) | |||||||||||||||||||||
K Class | – | (603 | ) | |||||||||||||||||||||
| Net realized gain on investments and | ||||||||||||||||||||||||
foreign currency | ||||||||||||||||||||||||
Investment Class | – | – | – | – | (3,236,281 | ) | ||||||||||||||||||
Service Class | – | – | – | (1,677,475 | ) | – | (4,025,428 | ) | ||||||||||||||||
Consultant Class | – | – | – | |||||||||||||||||||||
Institutional Class | – | – | (2,507,671 | ) | ||||||||||||||||||||
R Class | – | – | ||||||||||||||||||||||
K Class | – | – | ||||||||||||||||||||||
| Total distributions | – | (2,317,411 | ) | – | (2,104,361 | ) | – | (11,126,433 | ) | |||||||||||||||
| CAPITAL SHARE TRANSACTIONS: | ||||||||||||||||||||||||
| Net capital share transactions | ||||||||||||||||||||||||
Investment Class | (33,662,971 | ) | (27,207,321 | ) | 683,837 | 4,523,525 | 16,706,332 | |||||||||||||||||
Service Class | (8,856,749 | ) | (53,137,199 | ) | 10,206,397 | 9,745,965 | 12,263,454 | 21,021,702 | ||||||||||||||||
Consultant Class | (992,199 | ) | 1,094,999 | 4,412,264 | ||||||||||||||||||||
Institutional Class | 2,847,692 | (2,197,934 | ) | 6,547,957 | ||||||||||||||||||||
R Class | 13,000 | 17,056 | ||||||||||||||||||||||
K Class | (20,000 | ) | 603 | |||||||||||||||||||||
| Shareholder redemption fees | ||||||||||||||||||||||||
Investment Class | 1,468 | 162,054 | 723 | 668 | 1,051 | |||||||||||||||||||
Service Class | 1,859 | 14,010 | 3,988 | 7,479 | 4,822 | 5,239 | ||||||||||||||||||
| Net increase (decrease) in net assets from | ||||||||||||||||||||||||
capital share transactions | (43,515,592 | ) | (79,055,798 | ) | 13,742,637 | 9,753,444 | 19,006,799 | 44,282,281 | ||||||||||||||||
| NET INCREASE (DECREASE) IN NET ASSETS | (22,764,382 | ) | (66,679,814 | ) | 17,338,593 | 11,688,247 | 30,462,438 | 79,713,223 | ||||||||||||||||
| NET ASSETS: | ||||||||||||||||||||||||
Beginning of period | 233,417,331 | 300,097,145 | 38,059,133 | 26,370,886 | 188,683,062 | 108,969,839 | ||||||||||||||||||
End of period | $ | 210,652,949 | $ | 233,417,331 | $ | 55,397,726 | $ | 38,059,133 | $ | 219,145,500 | $ | 188,683,062 | ||||||||||||
| UNDISTRIBUTED NET INVESTMENT INCOME | ||||||||||||||||||||||||
(LOSS) AT END OF PERIOD | $ | 1,871,046 | $ | 176,389 | $ | 354,068 | $ | (19,501 | ) | $ | 862,531 | $ | 2,791 | |||||||||||
| 98 | The Royce Funds 2014 Semiannual Report to Shareholders | THE ACCOMPANYING NOTES ARE AN INTEGRAL PART OF THESE FINANCIAL STATEMENTS. |
| Statements of Operations | Six Months Ended June 30, 2014 (unaudited) | |
| Royce | Royce | Royce | Royce | Royce | ||||||||||||||||
| Pennsylvania | Micro-Cap | Premier | Low-Priced | Total Return | ||||||||||||||||
| Mutual Fund | Fund | Fund | Stock Fund | Fund | ||||||||||||||||
| INVESTMENT INCOME: | ||||||||||||||||||||
| Income: | ||||||||||||||||||||
Dividends | ||||||||||||||||||||
Non-Affiliated Companies | $ | 41,604,684 | $ | 3,830,597 | $ | 32,521,095 | $ | 9,335,875 | $ | 51,914,267 | ||||||||||
Affiliated Companies | 930,046 | 168,076 | 15,107,598 | 702,209 | 923,062 | |||||||||||||||
Foreign withholding tax | (725,763 | ) | (128,606 | ) | (1,665,367 | ) | (577,000 | ) | (903,954 | ) | ||||||||||
Interest | – | – | – | – | 32,500 | |||||||||||||||
Securities lending | 878,904 | 159,021 | 5,598,247 | 693,016 | 151,154 | |||||||||||||||
| Total income | 42,687,871 | 4,029,088 | 51,561,573 | 10,154,100 | 52,117,029 | |||||||||||||||
| Expenses: | ||||||||||||||||||||
Investment advisory fees | 26,052,274 | 5,012,316 | 31,590,867 | 6,898,971 | 25,257,317 | |||||||||||||||
Distribution fees | 4,570,988 | 634,914 | 782,401 | 1,123,967 | 2,803,165 | |||||||||||||||
Shareholder servicing | 3,385,433 | 459,580 | 2,616,382 | 977,012 | 2,750,823 | |||||||||||||||
Shareholder reports | 581,165 | 167,704 | 696,211 | 235,077 | 619,709 | |||||||||||||||
Administrative and office facilities | 378,337 | 48,429 | 386,889 | 101,332 | 295,541 | |||||||||||||||
Custody | 283,833 | 65,140 | 274,721 | 127,424 | 248,469 | |||||||||||||||
Trustees’ fees | 147,331 | 17,783 | 146,450 | 34,988 | 114,822 | |||||||||||||||
Registration | 48,608 | 22,576 | 52,457 | 24,762 | 70,165 | |||||||||||||||
Audit | 36,863 | 20,247 | 37,405 | 24,162 | 42,141 | |||||||||||||||
Legal | 28,269 | 3,572 | 28,764 | 7,077 | 22,118 | |||||||||||||||
Other expenses | 85,306 | 11,925 | 85,788 | 28,443 | 67,877 | |||||||||||||||
| Total expenses | 35,598,407 | 6,464,186 | 36,698,335 | 9,583,215 | 32,292,147 | |||||||||||||||
| Compensating balance credits | (758 | ) | (192 | ) | (649 | ) | (118 | ) | (986 | ) | ||||||||||
| Fees waived by distributor | – | – | ��� | (44,563 | ) | – | ||||||||||||||
| Expenses reimbursed by investment adviser | – | (23,172 | ) | – | (926,284 | ) | – | |||||||||||||
| Net expenses | 35,597,649 | 6,440,822 | 36,697,686 | 8,612,250 | 32,291,161 | |||||||||||||||
| Net investment income (loss) | 7,090,222 | (2,411,734 | ) | 14,863,887 | 1,541,850 | 19,825,868 | ||||||||||||||
| REALIZED AND UNREALIZED GAIN (LOSS) ON INVESTMENTS AND FOREIGN CURRENCY: | ||||||||||||||||||||
| Net realized gain (loss): | ||||||||||||||||||||
Investments in Non-Affiliated Companies | 462,131,834 | 39,438,038 | 361,444,007 | 122,150,909 | 344,043,937 | |||||||||||||||
Investments in Affiliated Companies | (11,882,296 | ) | (707,621 | ) | (4,959,619 | ) | (365,657 | ) | 316,744 | |||||||||||
Foreign currency transactions | (23,646 | ) | (6,763 | ) | (3,805 | ) | (26,415 | ) | (45,379 | ) | ||||||||||
| Net change in unrealized appreciation (depreciation): | ||||||||||||||||||||
Investments and foreign currency translations | (333,861,652 | ) | (31,092,649 | ) | 101,543,052 | (23,291,257 | ) | (234,024,923 | ) | |||||||||||
Other assets and liabilities denominated in foreign currency | 11,081 | (4,755 | ) | (7,600 | ) | 4,843 | 1,240 | |||||||||||||
| Net realized and unrealized gain (loss) on investments and foreign currency | 116,375,321 | 7,626,250 | 458,016,035 | 98,472,423 | 110,291,619 | |||||||||||||||
| NET INCREASE (DECREASE) IN NET ASSETS | ||||||||||||||||||||
FROM INVESTMENT OPERATIONS | $ | 123,465,543 | $ | 5,214,516 | $ | 472,879,922 | $ | 100,014,273 | $ | 130,117,487 | ||||||||||
| THE ACCOMPANYING NOTES ARE AN INTEGRAL PART OF THESE FINANCIAL STATEMENTS. | The Royce Funds 2014 Semiannual Report to Shareholders | 99 |
| Statements of Operations | Six Months Ended June 30, 2014 (unaudited) | |
| Royce | Royce | Royce | Royce | Royce | ||||||||||||||||
| Heritage | Opportunity | Special Equity | Value | Value Plus | ||||||||||||||||
| Fund | Fund | Fund | Fund | Fund | ||||||||||||||||
| INVESTMENT INCOME: | ||||||||||||||||||||
| Income: | ||||||||||||||||||||
Dividends | ||||||||||||||||||||
Non-Affiliated Companies | $ | 3,351,816 | $ | 9,285,883 | $ | 9,137,088 | $ | 7,968,913 | $ | 4,260,742 | ||||||||||
Affiliated Companies | – | 25,443 | 20,655,772 | – | – | |||||||||||||||
Foreign withholding tax | (144,147 | ) | (87,049 | ) | – | (34,716 | ) | (130,168 | ) | |||||||||||
Securities lending | 32,721 | 1,093,756 | 37,928 | 69,207 | 1,089,959 | |||||||||||||||
| Total income | 3,240,390 | 10,318,033 | 29,830,788 | 8,003,404 | 5,220,533 | |||||||||||||||
| Expenses: | ||||||||||||||||||||
Investment advisory fees | 1,803,943 | 12,581,702 | 16,474,798 | 5,381,629 | 5,768,517 | |||||||||||||||
Distribution fees | 356,243 | 439,633 | 721,352 | 1,029,538 | 1,079,250 | |||||||||||||||
Shareholder servicing | 144,516 | 919,845 | 1,340,388 | 695,711 | 974,564 | |||||||||||||||
Shareholder reports | 38,566 | 139,007 | 283,471 | 144,728 | 224,631 | |||||||||||||||
Administrative and office facilities | 18,137 | 131,476 | 189,472 | 66,676 | 74,755 | |||||||||||||||
Custody | 49,636 | 118,676 | 131,117 | 55,536 | 63,452 | |||||||||||||||
Trustees’ fees | 7,298 | 52,177 | 73,264 | 24,470 | 26,579 | |||||||||||||||
Registration | 21,845 | 33,068 | 43,158 | 30,141 | 30,266 | |||||||||||||||
Audit | 18,142 | 26,217 | 31,720 | 20,508 | 20,493 | |||||||||||||||
Legal | 1,363 | 10,937 | 14,167 | 4,915 | 5,498 | |||||||||||||||
Other expenses | 5,088 | 28,749 | 40,497 | 16,687 | 18,606 | |||||||||||||||
| Total expenses | 2,464,777 | 14,481,487 | 19,343,404 | 7,470,539 | 8,286,611 | |||||||||||||||
| Compensating balance credits | (170 | ) | (363 | ) | (816 | ) | (226 | ) | (101 | ) | ||||||||||
| Fees waived by distributor | (30,964 | ) | – | – | – | (77,225 | ) | |||||||||||||
| Expenses reimbursed by investment adviser | (4,591 | ) | – | (68,167 | ) | – | (6,852 | ) | ||||||||||||
| Net expenses | 2,429,052 | 14,481,124 | 19,274,421 | 7,470,313 | 8,202,433 | |||||||||||||||
| Net investment income (loss) | 811,338 | (4,163,091 | ) | 10,556,367 | 533,091 | (2,981,900 | ) | |||||||||||||
| REALIZED AND UNREALIZED GAIN (LOSS) ON INVESTMENTS AND FOREIGN CURRENCY: | ||||||||||||||||||||
| Net realized gain (loss): | ||||||||||||||||||||
Investments in Non-Affiliated Companies | 9,066,266 | 195,142,155 | 113,693,330 | 66,502,042 | 113,152,821 | |||||||||||||||
Investments in Affiliated Companies | – | (3,884,492 | ) | 54,643,774 | – | (12,580 | ) | |||||||||||||
Foreign currency transactions | (4,940 | ) | 1,484 | – | 1,345 | 1,788 | ||||||||||||||
| Net change in unrealized appreciation (depreciation): | ||||||||||||||||||||
Investments and foreign currency translations | 1,271,098 | (112,712,712 | ) | (181,684,865 | ) | (33,449,706 | ) | (67,644,942 | ) | |||||||||||
Other assets and liabilities denominated in foreign currency | (100,801 | ) | 649 | – | (2,594 | ) | (1,751 | ) | ||||||||||||
| Net realized and unrealized gain (loss) on investments and foreign currency | 10,231,623 | 78,547,084 | (13,347,761 | ) | 33,051,087 | 45,495,336 | ||||||||||||||
| NET INCREASE (DECREASE) IN NET ASSETS | ||||||||||||||||||||
FROM INVESTMENT OPERATIONS | $ | 11,042,961 | $ | 74,383,993 | $ | (2,791,394 | ) | $ | 33,584,178 | $ | 42,513,436 | |||||||||
| 100 | The Royce Funds 2014 Semiannual Report to Shareholders | THE ACCOMPANYING NOTES ARE AN INTEGRAL PART OF THESE FINANCIAL STATEMENTS. |
| Statements of Operations | Six Months Ended June 30, 2014 (unaudited) | |
| Royce | Royce | Royce | Royce International | Royce | ||||||||||||||||
| 100 | Dividend | Global | Smaller- | Special Equity | ||||||||||||||||
| Fund | Value Fund | Value Fund | Companies Fund | Multi-Cap Fund | ||||||||||||||||
| INVESTMENT INCOME: | ||||||||||||||||||||
| Income: | ||||||||||||||||||||
Dividends | $ | 1,537,627 | $ | 7,497,484 | $ | 3,453,372 | $ | 854,852 | $ | 1,923,389 | ||||||||||
Foreign withholding tax | (23,812 | ) | (203,398 | ) | (309,662 | ) | (67,484 | ) | – | |||||||||||
Securities lending | 3,389 | 38,983 | 256,321 | – | – | |||||||||||||||
| Total income | 1,517,204 | 7,333,069 | 3,400,031 | 787,368 | 1,923,389 | |||||||||||||||
| Expenses: | ||||||||||||||||||||
Investment advisory fees | 1,419,837 | 3,095,102 | 1,280,863 | 310,090 | 838,872 | |||||||||||||||
Distribution fees | 283,708 | 482,064 | 185,836 | 58,084 | 116,145 | |||||||||||||||
Shareholder servicing | 176,322 | 319,817 | 135,754 | 31,967 | 56,513 | |||||||||||||||
Shareholder reports | 71,671 | 95,573 | 38,363 | 4,802 | 40,639 | |||||||||||||||
Administrative and office facilities | 16,529 | 31,598 | 14,146 | 1,971 | 9,219 | |||||||||||||||
Custody | 15,971 | 69,073 | 64,164 | 35,828 | 13,144 | |||||||||||||||
Trustees’ fees | 6,225 | 12,776 | 4,955 | 817 | 3,776 | |||||||||||||||
Registration | 16,469 | 33,612 | 24,349 | 24,315 | 28,681 | |||||||||||||||
Audit | 16,394 | 21,540 | 15,159 | 11,186 | 16,739 | |||||||||||||||
Legal | 1,223 | 2,385 | 1,043 | 672 | 960 | |||||||||||||||
Other expenses | 4,646 | 7,467 | 5,090 | 1,414 | 2,886 | |||||||||||||||
| Total expenses | 2,028,995 | 4,171,007 | 1,769,722 | 481,146 | 1,127,574 | |||||||||||||||
| Compensating balance credits | (35 | ) | (410 | ) | (35 | ) | (5 | ) | (13 | ) | ||||||||||
| Fees waived by investment adviser and distributor | (21,979 | ) | (32,051 | ) | – | (10,381 | ) | (9,756 | ) | |||||||||||
| Expenses reimbursed by investment adviser | (9,281 | ) | (15,995 | ) | (64,313 | ) | (56,961 | ) | (54,156 | ) | ||||||||||
| Net expenses | 1,997,700 | 4,122,551 | 1,705,374 | 413,799 | 1,063,649 | |||||||||||||||
| Net investment income (loss) | (480,496 | ) | 3,210,518 | 1,694,657 | 373,569 | 859,740 | ||||||||||||||
| REALIZED AND UNREALIZED GAIN (LOSS) ON INVESTMENTS AND FOREIGN CURRENCY: | ||||||||||||||||||||
| Net realized gain (loss): | ||||||||||||||||||||
Investments | 17,674,435 | 15,734,178 | 12,198,657 | 2,322,757 | 8,398,960 | |||||||||||||||
Foreign currency transactions | 1,313 | (59,427 | ) | (27,460 | ) | (67,252 | ) | – | ||||||||||||
| Net change in unrealized appreciation (depreciation): | ||||||||||||||||||||
Investments and foreign currency translations | (9,662,574 | ) | 624,574 | 6,955,367 | 1,063,317 | 2,196,939 | ||||||||||||||
Other assets and liabilities denominated in foreign currency | 435 | (58,450 | ) | (70,011 | ) | (96,435 | ) | – | ||||||||||||
| Net realized and unrealized gain (loss) on investments and foreign currency | 8,013,609 | 16,240,875 | 19,056,553 | 3,222,387 | 10,595,899 | |||||||||||||||
| NET INCREASE (DECREASE) IN NET ASSETS | ||||||||||||||||||||
FROM INVESTMENT OPERATIONS | $ | 7,533,113 | $ | 19,451,393 | $ | 20,751,210 | $ | 3,595,956 | $ | 11,455,639 | ||||||||||
| THE ACCOMPANYING NOTES ARE AN INTEGRAL PART OF THESE FINANCIAL STATEMENTS. | The Royce Funds 2014 Semiannual Report to Shareholders | 101 |
|
Financial Highlights |
|
| |||||||||||||||||||||||||||||||||||||||||||||||||||||||||
|
| Net Asset |
| Net |
| Net Realized and Unrealized |
|
| Distributions |
| Distributions from Net |
|
|
|
|
|
|
|
|
| Ratio of Expenses to Average Net Assets |
| Ratio of Net Investment |
|
| ||||||||||||||||||||||||||||||||
|
| Value, |
| Investment |
| Gain (Loss) on |
| Total from Investment Operations |
| from Net Investment Income |
| Realized Gain on |
| Distributions |
| Total Distributions |
| Shareholder Redemption Fees |
| Net Asset |
| Total Return |
| Net Assets, |
| Prior to Fee |
| Prior |
| Net of |
| Income (Loss) |
| Portfolio Turnover Rate |
| ||||||||||||||||||||||
|
|
|
|
|
|
|
|
|
|
|
|
|
|
|
|
|
|
|
|
|
|
|
|
|
|
|
|
|
|
|
|
|
|
|
|
|
|
|
|
|
|
|
|
|
|
|
|
|
|
|
|
|
|
|
|
|
|
Royce Pennsylvania Mutual Fund – Investment Class | |||||||||||||||||||||||||||||||||||||||||||||||||||||||||
†2014 |
| $ | 14.73 |
| $ | 0.02 |
| $ | 0.28 |
| $ | 0.30 |
| $ | – |
| $ | – |
| $ | – |
| $ | – |
| $ | – |
| $ | 15.03 |
|
| 2.04 | %1 | $ | 4,616,190 |
|
| 0.90 | %2 |
|
| 0.90 | %2 |
|
| 0.90 | %2 |
|
| 0.33 | %2 |
|
| 13 | % |
|
2013 |
|
| 11.50 |
|
| 0.03 |
|
| 3.99 |
|
| 4.02 |
|
| (0.00 | ) |
| (0.79 | ) |
| – |
|
| (0.79 | ) |
| – |
|
| 14.73 |
|
| 35.25 |
|
| 5,033,318 |
|
| 0.92 |
|
|
| 0.92 |
|
|
| 0.92 |
|
|
| 0.24 |
|
|
| 26 |
|
|
2012 |
|
| 10.76 |
|
| 0.15 |
|
| 1.39 |
|
| 1.54 |
|
| (0.15 | ) |
| (0.65 | ) |
| – |
|
| (0.80 | ) |
| – |
|
| 11.50 |
|
| 14.58 |
|
| 4,232,988 |
|
| 0.89 |
|
|
| 0.89 |
|
|
| 0.89 |
|
|
| 1.19 |
|
|
| 22 |
|
|
2011 |
|
| 11.65 |
|
| 0.01 |
|
| (0.50 | ) |
| (0.49 | ) |
| (0.02 | ) |
| (0.38 | ) |
| – |
|
| (0.40 | ) |
| – |
|
| 10.76 |
|
| (4.17 | ) |
| 4,266,754 |
|
| 0.90 |
|
|
| 0.90 |
|
|
| 0.90 |
|
|
| 0.11 |
|
|
| 20 |
|
|
2010 |
|
| 9.45 |
|
| 0.06 |
|
| 2.19 |
|
| 2.25 |
|
| (0.05 | ) |
| – |
|
| – |
|
| (0.05 | ) |
| – |
|
| 11.65 |
|
| 23.86 |
|
| 4,735,403 |
|
| 0.90 |
|
|
| 0.90 |
|
|
| 0.90 |
|
|
| 0.63 |
|
|
| 25 |
|
|
2009 |
|
| 6.94 |
|
| 0.02 |
|
| 2.50 |
|
| 2.52 |
|
| (0.01 | ) |
| – |
|
| – |
|
| (0.01 | ) |
| – |
|
| 9.45 |
|
| 36.28 |
|
| 3,555,507 |
|
| 0.92 |
|
|
| 0.92 |
|
|
| 0.92 |
|
|
| 0.33 |
|
|
| 23 |
|
|
Royce Pennsylvania Mutual Fund – Service Class | |||||||||||||||||||||||||||||||||||||||||||||||||||||||||
†2014 |
| $ | 14.69 |
| $ | 0.00 |
| $ | 0.27 |
| $ | 0.27 |
| $ | – |
| $ | – |
| $ | – |
| $ | – |
| $ | – |
| $ | 14.96 |
|
| 1.84 | %1 | $ | 537,677 |
|
| 1.22 | %2 |
|
| 1.22 | %2 |
|
| 1.22 | %2 |
|
| 0.01 | %2 |
|
| 13 | % |
|
2013 |
|
| 11.51 |
|
| (0.01 | ) |
| 3.98 |
|
| 3.97 |
|
| – |
|
| (0.79 | ) |
| – |
|
| (0.79 | ) |
| – |
|
| 14.69 |
|
| 34.77 |
|
| 591,534 |
|
| 1.25 |
|
|
| 1.25 |
|
|
| 1.25 |
|
|
| (0.08 | ) |
|
| 26 |
|
|
2012 |
|
| 10.75 |
|
| 0.10 |
|
| 1.40 |
|
| 1.50 |
|
| (0.09 | ) |
| (0.65 | ) |
| – |
|
| (0.74 | ) |
| – |
|
| 11.51 |
|
| 14.15 |
|
| 473,624 |
|
| 1.24 |
|
|
| 1.24 |
|
|
| 1.24 |
|
|
| 0.90 |
|
|
| 22 |
|
|
2011 |
|
| 11.65 |
|
| (0.02 | ) |
| (0.50 | ) |
| (0.52 | ) |
| – |
|
| (0.38 | ) |
| – |
|
| (0.38 | ) |
| – |
|
| 10.75 |
|
| (4.42 | ) |
| 406,052 |
|
| 1.19 |
|
|
| 1.19 |
|
|
| 1.19 |
|
|
| (0.18 | ) |
|
| 20 |
|
|
2010 |
|
| 9.41 |
|
| 0.02 |
|
| 2.20 |
|
| 2.22 |
|
| – |
|
| – |
|
| – |
|
| – |
|
| 0.02 |
|
| 11.65 |
|
| 23.80 |
|
| 448,784 |
|
| 1.27 |
|
|
| 1.27 |
|
|
| 1.25 |
|
|
| 0.18 |
|
|
| 25 |
|
|
2009 |
|
| 6.90 |
|
| (0.00 | ) |
| 2.49 |
|
| 2.49 |
|
| – |
|
| – |
|
| – |
|
| – |
|
| 0.02 |
|
| 9.41 |
|
| 36.38 |
|
| 609,445 |
|
| 1.31 |
|
|
| 1.31 |
|
|
| 1.29 |
|
|
| (0.05 | ) |
|
| 23 |
|
|
Royce Pennsylvania Mutual Fund – Consultant Class | |||||||||||||||||||||||||||||||||||||||||||||||||||||||||
†2014 |
| $ | 12.96 |
| $ | (0.04 | ) | $ | 0.23 |
| $ | 0.19 |
| $ | – |
| $ | – |
| $ | – |
| $ | – |
| $ | – |
| $ | 13.15 |
|
| 1.47 | %1 | $ | 759,524 |
|
| 1.90 | %2 |
|
| 1.90 | %2 |
|
| 1.90 | %2 |
|
| (0.67 | )%2 |
|
| 13 | % |
|
2013 |
|
| 10.29 |
|
| (0.09 | ) |
| 3.55 |
|
| 3.46 |
|
| – |
|
| (0.79 | ) |
| – |
|
| (0.79 | ) |
| – |
|
| 12.96 |
|
| 33.94 |
|
| 788,017 |
|
| 1.94 |
|
|
| 1.94 |
|
|
| 1.94 |
|
|
| (0.78 | ) |
|
| 26 |
|
|
2012 |
|
| 9.69 |
|
| 0.01 |
|
| 1.25 |
|
| 1.26 |
|
| (0.01 | ) |
| (0.65 | ) |
| – |
|
| (0.66 | ) |
| – |
|
| 10.29 |
|
| 13.27 |
|
| 654,642 |
|
| 1.97 |
|
|
| 1.97 |
|
|
| 1.97 |
|
|
| 0.12 |
|
|
| 22 |
|
|
2011 |
|
| 10.61 |
|
| (0.09 | ) |
| (0.45 | ) |
| (0.54 | ) |
| – |
|
| (0.38 | ) |
| – |
|
| (0.38 | ) |
| – |
|
| 9.69 |
|
| (5.05 | ) |
| 664,778 |
|
| 1.85 |
|
|
| 1.85 |
|
|
| 1.85 |
|
|
| (0.85 | ) |
|
| 20 |
|
|
2010 |
|
| 8.65 |
|
| (0.03 | ) |
| 1.99 |
|
| 1.96 |
|
| – |
|
| – |
|
| – |
|
| – |
|
| – |
|
| 10.61 |
|
| 22.66 |
|
| 841,525 |
|
| 1.87 |
|
|
| 1.87 |
|
|
| 1.87 |
|
|
| (0.36 | ) |
|
| 25 |
|
|
2009 |
|
| 6.40 |
|
| (0.05 | ) |
| 2.30 |
|
| 2.25 |
|
| – |
|
| – |
|
| – |
|
| – |
|
| – |
|
| 8.65 |
|
| 35.16 |
|
| 757,734 |
|
| 1.89 |
|
|
| 1.89 |
|
|
| 1.89 |
|
|
| (0.64 | ) |
|
| 23 |
|
|
Royce Pennsylvania Mutual Fund – Institutional Class a | |||||||||||||||||||||||||||||||||||||||||||||||||||||||||
†2014 |
| $ | 14.75 |
| $ | 0.03 |
| $ | 0.28 |
| $ | 0.31 |
| $ | – |
| $ | – |
| $ | – |
| $ | – |
| $ | – |
| $ | 15.06 |
|
| 2.10 | %1 | $ | 847,749 |
|
| 0.79 | %2 |
|
| 0.79 | %2 |
|
| 0.79 | %2 |
|
| 0.45 | %2 |
|
| 13 | % |
|
2013 |
|
| 11.52 |
|
| 0.05 |
|
| 3.99 |
|
| 4.04 |
|
| (0.02 | ) |
| (0.79 | ) |
| – |
|
| (0.81 | ) |
| – |
|
| 14.75 |
|
| 35.34 |
|
| 818,212 |
|
| 0.79 |
|
|
| 0.79 |
|
|
| 0.79 |
|
|
| 0.40 |
|
|
| 26 |
|
|
2012 |
|
| 10.79 |
|
| 0.13 |
|
| 1.43 |
|
| 1.56 |
|
| (0.18 | ) |
| (0.65 | ) |
| – |
|
| (0.83 | ) |
| – |
|
| 11.52 |
|
| 14.72 |
|
| 488,052 |
|
| 0.80 |
|
|
| 0.80 |
|
|
| 0.80 |
|
|
| 1.53 |
|
|
| 22 |
|
|
2011 |
|
| 12.19 |
|
| 0.03 |
|
| (1.05 | ) |
| (1.02 | ) |
| – |
|
| (0.38 | ) |
| – |
|
| (0.38 | ) |
| – |
|
| 10.79 |
|
| (8.33 | )1 |
| 241,951 |
|
| 0.78 |
|
| 0.78 |
|
| 0.78 |
|
| 0.46 |
|
| 20 |
|
| ||||
Royce Pennsylvania Mutual Fund – R Class | |||||||||||||||||||||||||||||||||||||||||||||||||||||||||
†2014 |
| $ | 14.26 |
| $ | (0.02 | ) | $ | 0.27 |
| $ | 0.25 |
| $ | – |
| $ | – |
| $ | – |
| $ | – |
| $ | – |
| $ | 14.51 |
|
| 1.75 | %1 | $ | 41,155 |
|
| 1.50 | %2 |
|
| 1.50 | %2 |
|
| 1.50 | %2 |
|
| (0.27 | )%2 |
|
| 13 | % |
|
2013 |
|
| 11.22 |
|
| (0.05 | ) |
| 3.88 |
|
| 3.83 |
|
| – |
|
| (0.79 | ) |
| – |
|
| (0.79 | ) |
| – |
|
| 14.26 |
|
| 34.42 |
|
| 44,094 |
|
| 1.56 |
|
|
| 1.56 |
|
|
| 1.56 |
|
|
| (0.39 | ) |
|
| 26 |
|
|
2012 |
|
| 10.50 |
|
| 0.07 |
|
| 1.35 |
|
| 1.42 |
|
| (0.05 | ) |
| (0.65 | ) |
| – |
|
| (0.70 | ) |
| – |
|
| 11.22 |
|
| 13.79 |
|
| 32,977 |
|
| 1.50 |
|
|
| 1.50 |
|
|
| 1.50 |
|
|
| 0.70 |
|
|
| 22 |
|
|
2011 |
|
| 11.43 |
|
| (0.05 | ) |
| (0.50 | ) |
| (0.55 | ) |
| – |
|
| (0.38 | ) |
| – |
|
| (0.38 | ) |
| – |
|
| 10.50 |
|
| (4.77 | ) |
| 22,542 |
|
| 1.51 |
|
|
| 1.51 |
|
|
| 1.51 |
|
|
| (0.47 | ) |
|
| 20 |
|
|
2010 |
|
| 9.28 |
|
| 0.01 |
|
| 2.14 |
|
| 2.15 |
|
| (0.00 | ) |
| – |
|
| – |
|
| (0.00 | ) |
| – |
|
| 11.43 |
|
| 23.21 |
|
| 17,868 |
|
| 1.51 |
|
|
| 1.51 |
|
|
| 1.51 |
|
|
| 0.06 |
|
|
| 25 |
|
|
2009 |
|
| 6.87 |
|
| (0.05 | ) |
| 2.46 |
|
| 2.41 |
|
| – |
|
| – |
|
| – |
|
| – |
|
| – |
|
| 9.28 |
|
| 35.08 |
|
| 9,808 |
|
| 1.95 |
|
|
| 1.95 |
|
|
| 1.84 |
|
|
| (0.61 | ) |
|
| 23 |
|
|
Royce Pennsylvania Mutual Fund – K Class | |||||||||||||||||||||||||||||||||||||||||||||||||||||||||
†2014 |
| $ | 13.04 |
| $ | (0.00 | ) | $ | 0.23 |
| $ | 0.23 |
| $ | – |
| $ | – |
| $ | – |
| $ | – |
| $ | – |
| $ | 13.27 |
|
| 1.76 | %1 | $ | 10,647 |
|
| 1.31 | %2 |
|
| 1.31 | %2 |
|
| 1.31 | %2 |
|
| (0.08 | )%2 |
|
| 13 | % |
|
2013 |
|
| 10.29 |
|
| (0.02 | ) |
| 3.56 |
|
| 3.54 |
|
| – |
|
| (0.79 | ) |
| – |
|
| (0.79 | ) |
| – |
|
| 13.04 |
|
| 34.72 |
|
| 11,685 |
|
| 1.37 |
|
|
| 1.37 |
|
|
| 1.37 |
|
|
| (0.19 | ) |
|
| 26 |
|
|
2012 |
|
| 9.68 |
|
| 0.09 |
|
| 1.24 |
|
| 1.33 |
|
| (0.07 | ) |
| (0.65 | ) |
| – |
|
| (0.72 | ) |
| – |
|
| 10.29 |
|
| 14.04 |
|
| 8,849 |
|
| 1.26 |
|
|
| 1.26 |
|
|
| 1.26 |
|
|
| 0.94 |
|
|
| 22 |
|
|
2011 |
|
| 10.57 |
|
| (0.05 | ) |
| (0.46 | ) |
| (0.51 | ) |
| – |
|
| (0.38 | ) |
| – |
|
| (0.38 | ) |
| – |
|
| 9.68 |
|
| (4.78 | ) |
| 5,800 |
|
| 1.55 |
|
|
| 1.55 |
|
|
| 1.55 |
|
|
| (0.49 | ) |
|
| 20 |
|
|
2010 |
|
| 8.59 |
|
| 0.00 |
|
| 1.98 |
|
| 1.98 |
|
| (0.00 | ) |
| – |
|
| – |
|
| (0.00 | ) |
| – |
|
| 10.57 |
|
| 23.11 |
|
| 3,760 |
|
| 1.61 |
|
|
| 1.61 |
|
|
| 1.59 |
|
|
| 0.01 |
|
|
| 25 |
|
|
2009 |
|
| 6.34 |
|
| (0.02 | ) |
| 2.27 |
|
| 2.25 |
|
| – |
|
| – |
|
| – |
|
| – |
|
| – |
|
| 8.59 |
|
| 35.49 |
|
| 1,920 |
|
| 1.79 |
|
|
| 1.79 |
|
|
| 1.59 |
|
|
| (0.34 | ) |
|
| 23 |
|
|
| 102 | The Royce Funds 2014 Semiannual Report to Shareholders | THE ACCOMPANYING NOTES ARE AN INTEGRAL PART OF THESE FINANCIAL STATEMENTS. |
|
Financial Highlights |
|
| |||||||||||||||||||||||||||||||||||||||||||||||||||||||||
|
| Net Asset |
| Net |
| Net Realized and Unrealized |
|
| Distributions |
| Distributions from Net |
|
|
|
|
|
|
|
|
| Ratio of Expenses to Average Net Assets |
| Ratio of Net Investment |
|
| ||||||||||||||||||||||||||||||||
|
| Value, |
| Investment |
| Gain (Loss) on |
| Total from Investment Operations |
| from Net Investment Income |
| Realized Gain on |
| Distributions |
| Total Distributions |
| Shareholder Redemption Fees |
| Net Asset |
| Total Return |
| Net Assets, |
| Prior to Fee |
| Prior |
| Net of |
| Income (Loss) |
| Portfolio Turnover Rate |
| ||||||||||||||||||||||
|
|
|
|
|
|
|
|
|
|
|
|
|
|
|
|
|
|
|
|
|
|
|
|
|
|
|
|
|
|
|
|
|
|
|
|
|
|
|
|
|
|
|
|
|
|
|
|
|
|
|
|
|
|
|
|
|
|
Royce Micro-Cap Fund – Investment Class | |||||||||||||||||||||||||||||||||||||||||||||||||||||||||
†2014 |
| $ | 16.68 |
| $ | (0.04 | ) | $ | 0.21 |
| $ | 0.17 |
| $ | – |
| $ | – |
| $ | – |
| $ | – |
| $ | – |
| $ | 16.85 |
|
| 1.02 | %1 | $ | 559,538 |
|
| 1.52 | %2 |
|
| 1.52 | %2 |
|
| 1.52 | %2 |
|
| (0.47 | )%2 |
|
| 10 | % |
|
2013 |
|
| 14.78 |
|
| (0.08 | ) |
| 3.19 |
|
| 3.11 |
|
| (0.02 | ) |
| (1.19 | ) |
| – |
|
| (1.21 | ) |
| – |
|
| 16.68 |
|
| 21.29 |
|
| 650,773 |
|
| 1.53 |
|
|
| 1.53 |
|
|
| 1.53 |
|
|
| (0.52 | ) |
|
| 22 |
|
|
2012 |
|
| 14.55 |
|
| 0.05 |
|
| 1.07 |
|
| 1.12 |
|
| (0.01 | ) |
| (0.88 | ) |
| – |
|
| (0.89 | ) |
| – |
|
| 14.78 |
|
| 7.93 |
|
| 740,364 |
|
| 1.47 |
|
|
| 1.47 |
|
|
| 1.47 |
|
|
| 0.29 |
|
|
| 15 |
|
|
2011 |
|
| 17.57 |
|
| (0.07 | ) |
| (2.05 | ) |
| (2.12 | ) |
| (0.20 | ) |
| (0.70 | ) |
| – |
|
| (0.90 | ) |
| – |
|
| 14.55 |
|
| (12.04 | ) |
| 904,168 |
|
| 1.50 |
|
|
| 1.50 |
|
|
| 1.50 |
|
|
| (0.50 | ) |
|
| 35 |
|
|
2010 |
|
| 13.71 |
|
| (0.03 | ) |
| 4.14 |
|
| 4.11 |
|
| (0.25 | ) |
| – |
|
| – |
|
| (0.25 | ) |
| – |
|
| 17.57 |
|
| 30.06 |
|
| 1,085,782 |
|
| 1.50 |
|
|
| 1.50 |
|
|
| 1.50 |
|
|
| (0.27 | ) |
|
| 36 |
|
|
2009 |
|
| 8.93 |
|
| (0.06 | ) |
| 5.02 |
|
| 4.96 |
|
| (0.18 | ) |
| – |
|
| – |
|
| (0.18 | ) |
| – |
|
| 13.71 |
|
| 55.67 |
|
| 844,859 |
|
| 1.54 |
|
|
| 1.54 |
|
|
| 1.54 |
|
|
| (0.41 | ) |
|
| 34 |
|
|
Royce Micro-Cap Fund – Service Class | |||||||||||||||||||||||||||||||||||||||||||||||||||||||||
†2014 |
| $ | 16.48 |
| $ | (0.05 | ) | $ | 0.21 |
| $ | 0.16 |
| $ | – |
| $ | – |
| $ | – |
| $ | – |
| $ | 0.01 |
| $ | 16.65 |
|
| 1.03 | %1 | $ | 67,082 |
|
| 1.73 | %2 |
|
| 1.73 | %2 |
|
| 1.66 | %2 |
|
| (0.62 | )%2 |
|
| 10 | % |
|
2013 |
|
| 14.61 |
|
| (0.10 | ) |
| 3.16 |
|
| 3.06 |
|
| – |
|
| (1.19 | ) |
| – |
|
| (1.19 | ) |
| – |
|
| 16.48 |
|
| 21.20 |
|
| 79,890 |
|
| 1.74 |
|
|
| 1.74 |
|
|
| 1.66 |
|
|
| (0.66 | ) |
|
| 22 |
|
|
2012 |
|
| 14.41 |
|
| 0.02 |
|
| 1.06 |
|
| 1.08 |
|
| – |
|
| (0.88 | ) |
| – |
|
| (0.88 | ) |
| – |
|
| 14.61 |
|
| 7.76 |
|
| 109,457 |
|
| 1.74 |
|
|
| 1.74 |
|
|
| 1.66 |
|
|
| 0.14 |
|
|
| 15 |
|
|
2011 |
|
| 17.43 |
|
| (0.10 | ) |
| (2.04 | ) |
| (2.14 | ) |
| (0.18 | ) |
| (0.70 | ) |
| – |
|
| (0.88 | ) |
| – |
|
| 14.41 |
|
| (12.23 | ) |
| 122,479 |
|
| 1.76 |
|
|
| 1.76 |
|
|
| 1.66 |
|
|
| (0.65 | ) |
|
| 35 |
|
|
2010 |
|
| 13.61 |
|
| (0.08 | ) |
| 4.14 |
|
| 4.06 |
|
| (0.24 | ) |
| – |
|
| – |
|
| (0.24 | ) |
| – |
|
| 17.43 |
|
| 29.85 |
|
| 139,911 |
|
| 1.78 |
|
|
| 1.78 |
|
|
| 1.66 |
|
|
| (0.41 | ) |
|
| 36 |
|
|
2009 |
|
| 8.87 |
|
| (0.10 | ) |
| 5.01 |
|
| 4.91 |
|
| (0.18 | ) |
| – |
|
| – |
|
| (0.18 | ) |
| 0.01 |
|
| 13.61 |
|
| 55.49 |
|
| 84,771 |
|
| 1.77 |
|
|
| 1.77 |
|
|
| 1.66 |
|
|
| (0.53 | ) |
|
| 34 |
|
|
Royce Micro-Cap Fund – Consultant Class | |||||||||||||||||||||||||||||||||||||||||||||||||||||||||
†2014 |
| $ | 14.48 |
| $ | (0.10 | ) | $ | 0.18 |
| $ | 0.08 |
| $ | – |
| $ | – |
| $ | – |
| $ | – |
| $ | – |
| $ | 14.56 |
|
| 0.55 | %1 | $ | 109,514 |
|
| 2.49 | %2 |
|
| 2.49 | %2 |
|
| 2.49 | %2 |
|
| (1.44 | )%2 |
|
| 10 | % |
|
2013 |
|
| 13.08 |
|
| (0.21 | ) |
| 2.80 |
|
| 2.59 |
|
| – |
|
| (1.19 | ) |
| – |
|
| (1.19 | ) |
| – |
|
| 14.48 |
|
| 20.08 |
|
| 117,538 |
|
| 2.52 |
|
|
| 2.52 |
|
|
| 2.52 |
|
|
| (1.51 | ) |
|
| 22 |
|
|
2012 |
|
| 13.11 |
|
| (0.10 | ) |
| 0.95 |
|
| 0.85 |
|
| – |
|
| (0.88 | ) |
| – |
|
| (0.88 | ) |
| – |
|
| 13.08 |
|
| 6.77 |
|
| 120,871 |
|
| 2.55 |
|
|
| 2.55 |
|
|
| 2.55 |
|
|
| (0.77 | ) |
|
| 15 |
|
|
2011 |
|
| 15.91 |
|
| (0.21 | ) |
| (1.84 | ) |
| (2.05 | ) |
| (0.05 | ) |
| (0.70 | ) |
| – |
|
| (0.75 | ) |
| – |
|
| 13.11 |
|
| (12.86 | ) |
| 134,752 |
|
| 2.42 |
|
|
| 2.42 |
|
|
| 2.42 |
|
|
| (1.41 | ) |
|
| 35 |
|
|
2010 |
|
| 12.45 |
|
| (0.15 | ) |
| 3.74 |
|
| 3.59 |
|
| (0.13 | ) |
| – |
|
| – |
|
| (0.13 | ) |
| – |
|
| 15.91 |
|
| 28.85 |
|
| 181,746 |
|
| 2.43 |
|
|
| 2.43 |
|
|
| 2.43 |
|
|
| (1.20 | ) |
|
| 36 |
|
|
2009 |
|
| 8.14 |
|
| (0.13 | ) |
| 4.53 |
|
| 4.40 |
|
| (0.09 | ) |
| – |
|
| – |
|
| (0.09 | ) |
| – |
|
| 12.45 |
|
| 54.14 |
|
| 149,454 |
|
| 2.46 |
|
|
| 2.46 |
|
|
| 2.46 |
|
|
| (1.30 | ) |
|
| 34 |
|
|
Royce Premier Fund – Investment Class | |||||||||||||||||||||||||||||||||||||||||||||||||||||||||
†2014 |
| $ | 22.11 |
| $ | 0.05 |
| $ | 1.57 |
| $ | 1.62 |
| $ | – |
| $ | – |
| $ | – |
| $ | – |
| $ | – |
| $ | 23.73 |
|
| 7.33 | %1 | $ | 5,000,749 |
|
| 1.07 | %2 |
|
| 1.07 | %2 |
|
| 1.07 | %2 |
|
| 0.46 | %2 |
|
| 4 | % |
|
2013 |
|
| 19.16 |
|
| 0.00 |
|
| 5.22 |
|
| 5.22 |
|
| – |
|
| (2.27 | ) |
| – |
|
| (2.27 | ) |
| – |
|
| 22.11 |
|
| 27.73 |
|
| 5,096,793 |
|
| 1.09 |
|
|
| 1.09 |
|
|
| 1.09 |
|
|
| 0.02 |
|
|
| 11 |
|
|
2012 |
|
| 18.52 |
|
| 0.24 |
|
| 1.85 |
|
| 2.09 |
|
| (0.24 | ) |
| (1.21 | ) |
| – |
|
| (1.45 | ) |
| – |
|
| 19.16 |
|
| 11.45 |
|
| 4,629,272 |
|
| 1.06 |
|
|
| 1.06 |
|
|
| 1.06 |
|
|
| 1.19 |
|
|
| 7 |
|
|
2011 |
|
| 20.35 |
|
| (0.02 | ) |
| (0.17 | ) |
| (0.19 | ) |
| (0.05 | ) |
| (1.59 | ) |
| – |
|
| (1.64 | ) |
| – |
|
| 18.52 |
|
| (0.86 | ) |
| 4,539,127 |
|
| 1.09 |
|
|
| 1.09 |
|
|
| 1.09 |
|
|
| (0.11 | ) |
|
| 18 |
|
|
2010 |
|
| 16.31 |
|
| (0.01 | ) |
| 4.32 |
|
| 4.31 |
|
| – |
|
| (0.27 | ) |
| – |
|
| (0.27 | ) |
| – |
|
| 20.35 |
|
| 26.46 |
|
| 4,961,891 |
|
| 1.12 |
|
|
| 1.12 |
|
|
| 1.12 |
|
|
| (0.07 | ) |
|
| 10 |
|
|
2009 |
|
| 12.24 |
|
| (0.02 | ) |
| 4.09 |
|
| 4.07 |
|
| – |
|
| – |
|
| – |
|
| – |
|
| – |
|
| 16.31 |
|
| 33.25 |
|
| 3,911,502 |
|
| 1.15 |
|
|
| 1.15 |
|
|
| 1.15 |
|
|
| (0.14 | ) |
|
| 14 |
|
|
Royce Premier Fund – Service Class | |||||||||||||||||||||||||||||||||||||||||||||||||||||||||
†2014 |
| $ | 21.70 |
| $ | 0.01 |
| $ | 1.53 |
| $ | 1.54 |
| $ | – |
| $ | – |
| $ | – |
| $ | – |
| $ | – |
| $ | 23.24 |
|
| 7.10 | %1 | $ | 292,996 |
|
| 1.44 | %2 |
|
| 1.44 | %2 |
|
| 1.44 | %2 |
|
| 0.10 | %2 |
|
| 4 | % |
|
2013 |
|
| 18.89 |
|
| (0.07 | ) |
| 5.15 |
|
| 5.08 |
|
| – |
|
| (2.27 | ) |
| – |
|
| (2.27 | ) |
| – |
|
| 21.70 |
|
| 27.39 |
|
| 318,860 |
|
| 1.38 |
|
|
| 1.38 |
|
|
| 1.38 |
|
|
| (0.33 | ) |
|
| 11 |
|
|
2012 |
|
| 18.23 |
|
| 0.19 |
|
| 1.81 |
|
| 2.00 |
|
| (0.13 | ) |
| (1.21 | ) |
| – |
|
| (1.34 | ) |
| – |
|
| 18.89 |
|
| 11.14 |
|
| 560,553 |
|
| 1.33 |
|
|
| 1.33 |
|
|
| 1.32 |
|
|
| 0.92 |
|
|
| 7 |
|
|
2011 |
|
| 20.07 |
|
| (0.07 | ) |
| (0.16 | ) |
| (0.23 | ) |
| (0.02 | ) |
| (1.59 | ) |
| – |
|
| (1.61 | ) |
| – |
|
| 18.23 |
|
| (1.07 | ) |
| 628,824 |
|
| 1.34 |
|
|
| 1.34 |
|
|
| 1.32 |
|
|
| (0.33 | ) |
|
| 18 |
|
|
2010 |
|
| 16.12 |
|
| (0.05 | ) |
| 4.27 |
|
| 4.22 |
|
| – |
|
| (0.27 | ) |
| – |
|
| (0.27 | ) |
| – |
|
| 20.07 |
|
| 26.22 |
|
| 584,817 |
|
| 1.39 |
|
|
| 1.39 |
|
|
| 1.37 |
|
|
| (0.30 | ) |
|
| 10 |
|
|
2009 |
|
| 12.14 |
|
| (0.06 | ) |
| 4.04 |
|
| 3.98 |
|
| – |
|
| – |
|
| – |
|
| – |
|
| – |
|
| 16.12 |
|
| 32.78 |
|
| 377,079 |
|
| 1.44 |
|
|
| 1.44 |
|
|
| 1.43 |
|
|
| (0.41 | ) |
|
| 14 |
|
|
Royce Premier Fund – Consultant Class | |||||||||||||||||||||||||||||||||||||||||||||||||||||||||
†2014 |
| $ | 19.58 |
| $ | (0.06 | ) | $ | 1.38 |
| $ | 1.32 |
| $ | – |
| $ | – |
| $ | – |
| $ | – |
| $ | – |
| $ | 20.90 |
|
| 6.74 | %1 | $ | 67,065 |
|
| 2.10 | %2 |
|
| 2.10 | %2 |
|
| 2.10 | %2 |
|
| (0.57 | )%2 |
|
| 4 | % |
|
2013 |
|
| 17.35 |
|
| (0.20 | ) |
| 4.70 |
|
| 4.50 |
|
| – |
|
| (2.27 | ) |
| – |
|
| (2.27 | ) |
| – |
|
| 19.58 |
|
| 26.47 |
|
| 66,712 |
|
| 2.13 |
|
|
| 2.13 |
|
|
| 2.13 |
|
|
| (1.02 | ) |
|
| 11 |
|
|
2012 |
|
| 16.87 |
|
| 0.02 |
|
| 1.69 |
|
| 1.71 |
|
| (0.02 | ) |
| (1.21 | ) |
| – |
|
| (1.23 | ) |
| – |
|
| 17.35 |
|
| 10.24 |
|
| 60,568 |
|
| 2.12 |
|
|
| 2.12 |
|
|
| 2.12 |
|
|
| 0.13 |
|
|
| 7 |
|
|
2011 |
|
| 18.81 |
|
| (0.21 | ) |
| (0.14 | ) |
| (0.35 | ) |
| – |
|
| (1.59 | ) |
| – |
|
| (1.59 | ) |
| – |
|
| 16.87 |
|
| (1.80 | ) |
| 59,766 |
|
| 2.05 |
|
|
| 2.05 |
|
|
| 2.05 |
|
|
| (1.07 | ) |
|
| 18 |
|
|
2010 |
|
| 15.24 |
|
| (0.17 | ) |
| 4.01 |
|
| 3.84 |
|
| – |
|
| (0.27 | ) |
| – |
|
| (0.27 | ) |
| – |
|
| 18.81 |
|
| 25.24 |
|
| 71,686 |
|
| 2.08 |
|
|
| 2.08 |
|
|
| 2.08 |
|
|
| (1.04 | ) |
|
| 10 |
|
|
2009 |
|
| 11.55 |
|
| (0.15 | ) |
| 3.84 |
|
| 3.69 |
|
| – |
|
| – |
|
| – |
|
| – |
|
| – |
|
| 15.24 |
|
| 31.95 |
|
| 58,241 |
|
| 2.14 |
|
|
| 2.14 |
|
|
| 2.14 |
|
|
| (1.13 | ) |
|
| 14 |
|
|
| THE ACCOMPANYING NOTES ARE AN INTEGRAL PART OF THESE FINANCIAL STATEMENTS. | The Royce Funds 2014 Semiannual Report to Shareholders | 103 |
|
Financial Highlights |
|
| |||||||||||||||||||||||||||||||||||||||||||||||||||||||||
|
| Net Asset |
| Net |
| Net Realized and Unrealized |
|
| Distributions |
| Distributions from Net |
|
|
|
|
|
|
|
|
| Ratio of Expenses to Average Net Assets |
| Ratio of Net Investment |
|
| ||||||||||||||||||||||||||||||||
|
| Value, |
| Investment |
| Gain (Loss) on |
| Total from Investment Operations |
| from Net Investment Income |
| Realized Gain on |
| Distributions |
| Total Distributions |
| Shareholder Redemption Fees |
| Net Asset |
| Total Return |
| Net Assets, |
| Prior to Fee |
| Prior |
| Net of |
| Income (Loss) |
| Portfolio Turnover Rate |
| ||||||||||||||||||||||
|
|
|
|
|
|
|
|
|
|
|
|
|
|
|
|
|
|
|
|
|
|
|
|
|
|
|
|
|
|
|
|
|
|
|
|
|
|
|
|
|
|
|
|
|
|
|
|
|
|
|
|
|
|
|
|
|
|
Royce Premier Fund – Institutional Class | |||||||||||||||||||||||||||||||||||||||||||||||||||||||||
†2014 |
| $ | 22.31 |
| $ | 0.06 |
| $ | 1.58 |
| $ | 1.64 |
| $ | – |
| $ | – |
| $ | – |
| $ | – |
| $ | – |
| $ | 23.95 |
|
| 7.35 | %1 | $ | 980,809 |
|
| 0.98 | %2 |
|
| 0.98 | %2 |
|
| 0.98 | %2 |
|
| 0.56 | %2 |
|
| 4 | % |
|
2013 |
|
| 19.30 |
|
| 0.03 |
|
| 5.25 |
|
| 5.28 |
|
| – |
|
| (2.27 | ) |
| – |
|
| (2.27 | ) |
| – |
|
| 22.31 |
|
| 27.85 |
|
| 989,100 |
|
| 0.98 |
|
|
| 0.98 |
|
|
| 0.98 |
|
|
| 0.13 |
|
|
| 11 |
|
|
2012 |
|
| 18.66 |
|
| 0.26 |
|
| 1.87 |
|
| 2.13 |
|
| (0.28 | ) |
| (1.21 | ) |
| – |
|
| (1.49 | ) |
| – |
|
| 19.30 |
|
| 11.57 |
|
| 866,277 |
|
| 0.98 |
|
|
| 0.98 |
|
|
| 0.98 |
|
|
| 1.30 |
|
|
| 7 |
|
|
2011 |
|
| 20.49 |
|
| 0.00 |
|
| (0.16 | ) |
| (0.16 | ) |
| (0.08 | ) |
| (1.59 | ) |
| – |
|
| (1.67 | ) |
| – |
|
| 18.66 |
|
| (0.73 | ) |
| 813,837 |
|
| 0.97 |
|
|
| 0.97 |
|
|
| 0.97 |
|
|
| 0.02 |
|
|
| 18 |
|
|
2010 |
|
| 16.40 |
|
| 0.01 |
|
| 4.35 |
|
| 4.36 |
|
| – |
|
| (0.27 | ) |
| – |
|
| (0.27 | ) |
| – |
|
| 20.49 |
|
| 26.62 |
|
| 706,870 |
|
| 0.99 |
|
|
| 0.99 |
|
|
| 0.99 |
|
|
| 0.07 |
|
|
| 10 |
|
|
2009 |
|
| 12.30 |
|
| (0.00 | ) |
| 4.10 |
|
| 4.10 |
|
| – |
|
| – |
|
| – |
|
| – |
|
| – |
|
| 16.40 |
|
| 33.33 |
|
| 516,900 |
|
| 1.03 |
|
|
| 1.03 |
|
|
| 1.03 |
|
|
| (0.01 | ) |
|
| 14 |
|
|
Royce Premier Fund – W Class | |||||||||||||||||||||||||||||||||||||||||||||||||||||||||
†2014 |
| $ | 22.16 |
| $ | 0.05 |
| $ | 1.56 |
| $ | 1.61 |
| $ | – |
| $ | – |
| $ | – |
| $ | – |
| $ | – |
| $ | 23.77 |
|
| 7.27 | %1 | $ | 530,918 |
|
| 1.08 | %2 |
|
| 1.08 | %2 |
|
| 1.08 | %2 |
|
| 0.46 | %2 |
|
| 4 | % |
|
2013 |
|
| 19.20 |
|
| 0.00 |
|
| 5.23 |
|
| 5.23 |
|
| – |
|
| (2.27 | ) |
| – |
|
| (2.27 | ) |
| – |
|
| 22.16 |
|
| 27.73 |
|
| 552,732 |
|
| 1.09 |
|
|
| 1.09 |
|
|
| 1.09 |
|
|
| 0.01 |
|
|
| 11 |
|
|
2012 |
|
| 18.57 |
|
| 0.25 |
|
| 1.85 |
|
| 2.10 |
|
| (0.26 | ) |
| (1.21 | ) |
| – |
|
| (1.47 | ) |
| – |
|
| 19.20 |
|
| 11.46 |
|
| 533,763 |
|
| 1.05 |
|
|
| 1.05 |
|
|
| 1.05 |
|
|
| 1.19 |
|
|
| 7 |
|
|
2011 |
|
| 20.40 |
|
| (0.01 | ) |
| (0.15 | ) |
| (0.16 | ) |
| (0.08 | ) |
| (1.59 | ) |
| – |
|
| (1.67 | ) |
| – |
|
| 18.57 |
|
| (0.75 | ) |
| 549,648 |
|
| 1.00 |
|
|
| 1.00 |
|
|
| 1.00 |
|
|
| (0.01 | ) |
|
| 18 |
|
|
2010 |
|
| 16.33 |
|
| 0.01 |
|
| 4.33 |
|
| 4.34 |
|
| – |
|
| (0.27 | ) |
| – |
|
| (0.27 | ) |
| – |
|
| 20.40 |
|
| 26.61 |
|
| 425,397 |
|
| 1.02 |
|
|
| 1.02 |
|
|
| 1.02 |
|
|
| 0.04 |
|
|
| 10 |
|
|
2009 |
|
| 12.25 |
|
| (0.01 | ) |
| 4.09 |
|
| 4.08 |
|
| – |
|
| – |
|
| – |
|
| – |
|
| – |
|
| 16.33 |
|
| 33.31 |
|
| 319,120 |
|
| 1.07 |
|
|
| 1.07 |
|
|
| 1.07 |
|
|
| (0.06 | ) |
|
| 14 |
|
|
Royce Premier Fund – R Class | |||||||||||||||||||||||||||||||||||||||||||||||||||||||||
†2014 |
| $ | 21.25 |
| $ | (0.02 | ) | $ | 1.50 |
| $ | 1.48 |
| $ | – |
| $ | – |
| $ | – |
| $ | – |
| $ | – |
| $ | 22.73 |
|
| 6.96 | %1 | $ | 33,387 |
|
| 1.72 | %2 |
|
| 1.72 | %2 |
|
| 1.72 | %2 |
|
| (0.19 | )%2 |
|
| 4 | % |
|
2013 |
|
| 18.61 |
|
| (0.13 | ) |
| 5.04 |
|
| 4.91 |
|
| – |
|
| (2.27 | ) |
| – |
|
| (2.27 | ) |
| – |
|
| 21.25 |
|
| 26.88 |
|
| 32,577 |
|
| 1.74 |
|
|
| 1.74 |
|
|
| 1.74 |
|
|
| (0.63 | ) |
|
| 11 |
|
|
2012 |
|
| 17.99 |
|
| 0.11 |
|
| 1.80 |
|
| 1.91 |
|
| (0.08 | ) |
| (1.21 | ) |
| – |
|
| (1.29 | ) |
| – |
|
| 18.61 |
|
| 10.75 |
|
| 28,632 |
|
| 1.68 |
|
|
| 1.68 |
|
|
| 1.68 |
|
|
| 0.57 |
|
|
| 7 |
|
|
2011 |
|
| 19.91 |
|
| (0.14 | ) |
| (0.15 | ) |
| (0.29 | ) |
| (0.04 | ) |
| (1.59 | ) |
| – |
|
| (1.63 | ) |
| – |
|
| 17.99 |
|
| (1.38 | ) |
| 23,653 |
|
| 1.66 |
|
|
| 1.66 |
|
|
| 1.66 |
|
|
| (0.63 | ) |
|
| 18 |
|
|
2010 |
|
| 16.07 |
|
| (0.11 | ) |
| 4.22 |
|
| 4.11 |
|
| – |
|
| (0.27 | ) |
| – |
|
| (0.27 | ) |
| – |
|
| 19.91 |
|
| 25.61 |
|
| 10,185 |
|
| 1.78 |
|
|
| 1.78 |
|
|
| 1.78 |
|
|
| (0.64 | ) |
|
| 10 |
|
|
2009 |
|
| 12.15 |
|
| (0.12 | ) |
| 4.04 |
|
| 3.92 |
|
| – |
|
| – |
|
| – |
|
| – |
|
| – |
|
| 16.07 |
|
| 32.26 |
|
| 2,634 |
|
| 2.26 |
|
|
| 2.26 |
|
|
| 1.84 |
|
|
| (0.83 | ) |
|
| 14 |
|
|
Royce Premier Fund – K Class | |||||||||||||||||||||||||||||||||||||||||||||||||||||||||
†2014 |
| $ | 8.04 |
| $ | (0.00 | ) | $ | 0.57 |
| $ | 0.57 |
| $ | – |
| $ | – |
| $ | – |
| $ | – |
| $ | – |
| $ | 8.61 |
|
| 7.09 | %1 | $ | 7,649 |
|
| 1.56 | %2 |
|
| 1.56 | %2 |
|
| 1.56 | %2 |
|
| (0.02 | )%2 |
|
| 4 | % |
|
2013 |
|
| 8.19 |
|
| (0.04 | ) |
| 2.16 |
|
| 2.12 |
|
| – |
|
| (2.27 | ) |
| – |
|
| (2.27 | ) |
| – |
|
| 8.04 |
|
| 27.01 |
|
| 8,640 |
|
| 1.59 |
|
|
| 1.59 |
|
|
| 1.59 |
|
|
| (0.50 | ) |
|
| 11 |
|
|
2012 |
|
| 8.67 |
|
| 0.08 |
|
| 0.85 |
|
| 0.93 |
|
| (0.20 | ) |
| (1.21 | ) |
| – |
|
| (1.41 | ) |
| – |
|
| 8.19 |
|
| 11.00 |
|
| 9,707 |
|
| 1.47 |
|
|
| 1.47 |
|
|
| 1.47 |
|
|
| 0.79 |
|
|
| 7 |
|
|
2011 |
|
| 10.46 |
|
| (0.05 | ) |
| (0.09 | ) |
| (0.14 | ) |
| (0.06 | ) |
| (1.59 | ) |
| – |
|
| (1.65 | ) |
| – |
|
| 8.67 |
|
| (1.20 | ) |
| 8,776 |
|
| 1.49 |
|
|
| 1.49 |
|
|
| 1.49 |
|
|
| (0.46 | ) |
|
| 18 |
|
|
2010 |
|
| 8.53 |
|
| (0.04 | ) |
| 2.24 |
|
| 2.20 |
|
| – |
|
| (0.27 | ) |
| – |
|
| (0.27 | ) |
| – |
|
| 10.46 |
|
| 25.86 |
|
| 3,845 |
|
| 1.63 |
|
|
| 1.63 |
|
|
| 1.59 |
|
|
| (0.47 | ) |
|
| 10 |
|
|
2009 |
|
| 6.44 |
|
| (0.05 | ) |
| 2.14 |
|
| 2.09 |
|
| – |
|
| – |
|
| – |
|
| – |
|
| – |
|
| 8.53 |
|
| 32.45 |
|
| 1,551 |
|
| 2.39 |
|
|
| 2.39 |
|
|
| 1.59 |
|
|
| (0.60 | ) |
|
| 14 |
|
|
Royce Low-Priced Stock Fund – Investment Class | |||||||||||||||||||||||||||||||||||||||||||||||||||||||||
†2014 |
| $ | 13.60 |
| $ | 0.03 |
| $ | 1.22 |
| $ | 1.25 |
| $ | – |
| $ | – |
| $ | – |
| $ | – |
| $ | – |
| $ | 14.85 |
|
| 9.19 | %1 | $ | 63,476 |
|
| 1.46 | %2 |
|
| 1.46 | %2 |
|
| 1.24 | %2 |
|
| 0.45 | %2 |
|
| 4 | % |
|
2013 |
|
| 13.83 |
|
| 0.05 |
|
| 1.71 |
|
| 1.76 |
|
| (0.05 | ) |
| (1.94 | ) |
| – |
|
| (1.99 | ) |
| – |
|
| 13.60 |
|
| 13.17 |
|
| 88,568 |
|
| 1.37 |
|
|
| 1.37 |
|
|
| 1.24 |
|
|
| 0.18 |
|
|
| 16 |
|
|
2012 |
|
| 14.34 |
|
| 0.15 |
|
| 0.50 |
|
| 0.65 |
|
| (0.25 | ) |
| (0.91 | ) |
| – |
|
| (1.16 | ) |
| – |
|
| 13.83 |
|
| 4.79 |
|
| 255,335 |
|
| 1.26 |
|
|
| 1.26 |
|
|
| 1.24 |
|
|
| 0.86 |
|
|
| 8 |
|
|
2011 |
|
| 18.31 |
|
| (0.06 | ) |
| (2.57 | ) |
| (2.63 | ) |
| (0.14 | ) |
| (1.20 | ) |
| – |
|
| (1.34 | ) |
| – |
|
| 14.34 |
|
| (14.37 | ) |
| 276,247 |
|
| 1.26 |
|
|
| 1.26 |
|
|
| 1.24 |
|
|
| (0.15 | ) |
|
| 22 |
|
|
2010 |
|
| 14.08 |
|
| (0.03 | ) |
| 4.50 |
|
| 4.47 |
|
| (0.10 | ) |
| (0.14 | ) |
| – |
|
| (0.24 | ) |
| – |
|
| 18.31 |
|
| 31.77 |
|
| 148,144 |
|
| 1.26 |
|
|
| 1.26 |
|
|
| 1.24 |
|
|
| (0.10 | ) |
|
| 24 |
|
|
2009 |
|
| 9.17 |
|
| (0.01 | ) |
| 4.96 |
|
| 4.95 |
|
| (0.04 | ) |
| – |
|
| – |
|
| (0.04 | ) |
| – |
|
| 14.08 |
|
| 54.04 |
|
| 94,966 |
|
| 1.27 |
|
|
| 1.27 |
|
|
| 1.24 |
|
|
| (0.14 | ) |
|
| 22 |
|
|
Royce Low-Priced Stock Fund – Service Class | |||||||||||||||||||||||||||||||||||||||||||||||||||||||||
†2014 |
| $ | 13.62 |
| $ | 0.02 |
| $ | 1.21 |
| $ | 1.23 |
| $ | – |
| $ | – |
| $ | – |
| $ | – |
| $ | – |
| $ | 14.85 |
|
| 9.03 | %1 | $ | 876,420 |
|
| 1.69 | %2 |
|
| 1.69 | %2 |
|
| 1.49 | %2 |
|
| 0.22 | %2 |
|
| 4 | % |
|
2013 |
|
| 13.84 |
|
| (0.00 | ) |
| 1.72 |
|
| 1.72 |
|
| (0.00 | ) |
| (1.94 | ) |
| – |
|
| (1.94 | ) |
| – |
|
| 13.62 |
|
| 12.91 |
|
| 1,008,207 |
|
| 1.65 |
|
|
| 1.65 |
|
|
| 1.49 |
|
|
| (0.02 | ) |
|
| 16 |
|
|
2012 |
|
| 14.31 |
|
| 0.11 |
|
| 0.49 |
|
| 0.60 |
|
| (0.16 | ) |
| (0.91 | ) |
| – |
|
| (1.07 | ) |
| – |
|
| 13.84 |
|
| 4.48 |
|
| 1,800,089 |
|
| 1.57 |
|
|
| 1.57 |
|
|
| 1.49 |
|
|
| 0.54 |
|
|
| 8 |
|
|
2011 |
|
| 18.26 |
|
| (0.06 | ) |
| (2.60 | ) |
| (2.66 | ) |
| (0.09 | ) |
| (1.20 | ) |
| – |
|
| (1.29 | ) |
| – |
|
| 14.31 |
|
| (14.58 | ) |
| 2,489,189 |
|
| 1.56 |
|
|
| 1.56 |
|
|
| 1.49 |
|
|
| (0.39 | ) |
|
| 22 |
|
|
2010 |
|
| 14.05 |
|
| (0.05 | ) |
| 4.47 |
|
| 4.42 |
|
| (0.07 | ) |
| (0.14 | ) |
| – |
|
| (0.21 | ) |
| – |
|
| 18.26 |
|
| 31.49 |
|
| 3,456,142 |
|
| 1.60 |
|
|
| 1.60 |
|
|
| 1.49 |
|
|
| (0.37 | ) |
|
| 24 |
|
|
2009 |
|
| 9.16 |
|
| (0.04 | ) |
| 4.95 |
|
| 4.91 |
|
| (0.02 | ) |
| – |
|
| – |
|
| (0.02 | ) |
| – |
|
| 14.05 |
|
| 53.58 |
|
| 2,669,235 |
|
| 1.60 |
|
|
| 1.60 |
|
|
| 1.49 |
|
|
| (0.38 | ) |
|
| 22 |
|
|
| 104 | The Royce Funds 2014 Semiannual Report to Shareholders | THE ACCOMPANYING NOTES ARE AN INTEGRAL PART OF THESE FINANCIAL STATEMENTS. |
|
Financial Highlights |
|
| |||||||||||||||||||||||||||||||||||||||||||||||||||||||||
|
| Net Asset |
| Net |
| Net Realized and Unrealized |
|
| Distributions |
| Distributions from Net |
|
|
|
|
|
|
|
|
| Ratio of Expenses to Average Net Assets |
| Ratio of Net Investment |
|
| ||||||||||||||||||||||||||||||||
|
| Value, |
| Investment |
| Gain (Loss) on |
| Total from Investment Operations |
| from Net Investment Income |
| Realized Gain on |
| Distributions |
| Total Distributions |
| Shareholder Redemption Fees |
| Net Asset |
| Total Return |
| Net Assets, |
| Prior to Fee |
| Prior |
| Net of |
| Income (Loss) |
| Portfolio Turnover Rate |
| ||||||||||||||||||||||
|
|
|
|
|
|
|
|
|
|
|
|
|
|
|
|
|
|
|
|
|
|
|
|
|
|
|
|
|
|
|
|
|
|
|
|
|
|
|
|
|
|
|
|
|
|
|
|
|
|
|
|
|
|
|
|
|
|
Royce Low-Priced Stock Fund – Institutional Class | |||||||||||||||||||||||||||||||||||||||||||||||||||||||||
†2014 |
| $ | 13.61 |
| $ | 0.02 |
| $ | 1.23 |
| $ | 1.25 |
| $ | – |
| $ | – |
| $ | – |
| $ | – |
| $ | – |
| $ | 14.86 |
|
| 9.18 | %1 | $ | 154,735 |
|
| 1.28 | %2 |
|
| 1.28 | %2 |
|
| 1.28 | %2 |
|
| 0.33 | %2 |
|
| 4 | % |
|
2013 |
|
| 13.84 |
|
| 0.05 |
|
| 1.71 |
|
| 1.76 |
|
| (0.05 | ) |
| (1.94 | ) |
| – |
|
| (1.99 | ) |
| – |
|
| 13.61 |
|
| 13.20 |
|
| 345,983 |
|
| 1.22 |
|
|
| 1.22 |
|
|
| 1.22 |
|
|
| 0.26 |
|
|
| 16 |
|
|
2012 |
|
| 14.36 |
|
| 0.16 |
|
| 0.49 |
|
| 0.65 |
|
| (0.26 | ) |
| (0.91 | ) |
| – |
|
| (1.17 | ) |
| – |
|
| 13.84 |
|
| 4.81 |
|
| 969,664 |
|
| 1.20 |
|
|
| 1.20 |
|
|
| 1.20 |
|
|
| 0.92 |
|
|
| 8 |
|
|
2011 |
|
| 18.33 |
|
| (0.01 | ) |
| (2.61 | ) |
| (2.62 | ) |
| (0.15 | ) |
| (1.20 | ) |
| – |
|
| (1.35 | ) |
| – |
|
| 14.36 |
|
| (14.35 | ) |
| 991,706 |
|
| 1.17 |
|
|
| 1.17 |
|
|
| 1.17 |
|
|
| (0.07 | ) |
|
| 22 |
|
|
2010 |
|
| 14.09 |
|
| (0.02 | ) |
| 4.50 |
|
| 4.48 |
|
| (0.10 | ) |
| (0.14 | ) |
| – |
|
| (0.24 | ) |
| – |
|
| 18.33 |
|
| 31.82 |
|
| 1,077,659 |
|
| 1.18 |
|
|
| 1.18 |
|
|
| 1.18 |
|
|
| (0.04 | ) |
|
| 24 |
|
|
2009 |
|
| 9.18 |
|
| (0.01 | ) |
| 4.96 |
|
| 4.95 |
|
| (0.04 | ) |
| – |
|
| – |
|
| (0.04 | ) |
| – |
|
| 14.09 |
|
| 53.97 |
|
| 673,846 |
|
| 1.24 |
|
|
| 1.24 |
|
|
| 1.24 |
|
|
| (0.15 | ) |
|
| 22 |
|
|
| Royce Low-Priced Stock Fund – R Class | |||||||||||||||||||||||||||||||||||||||||||||||||||||||||
†2014 |
| $ | 13.27 |
| $ | (0.01 | ) | $ | 1.19 |
| $ | 1.18 |
| $ | – |
| $ | – |
| $ | – |
| $ | – |
| $ | – |
| $ | 14.45 |
|
| 8.89 | %1 | $ | 2,547 |
|
| 2.38 | %2 |
|
| 2.38 | %2 |
|
| 1.84 | %2 |
|
| (0.13 | )%2 |
|
| 4 | % |
|
| 2013 | 13.58 | (0.05 | ) | 1.68 |
| 1.63 |
| – |
| (1.94 | ) | – | (1.94 | ) | – | 13.27 | 12.44 |
| 3,130 | 2.21 |
| 2.21 |
| 1.84 |
| (0.37 | ) | 16 | |||||||||||||||||||||||||||||
| 2012 | 14.05 | 0.04 |
| 0.50 |
| 0.54 |
| (0.10 | ) | (0.91 | ) | – | (1.01 | ) | ��� | 13.58 | 4.10 | 5,823 | 2.05 | 2.05 | 1.84 | 0.22 | 8 | ||||||||||||||||||||||||||||||||||
| 2011 | 18.05 | (0.19 | ) | (2.49 | ) | (2.68 | ) | (0.12 | ) | (1.20 | ) | – | (1.32 | ) | – | 14.05 | (14.86 | ) | 7,337 | 1.95 | 1.95 | 1.84 | (0.72 | ) | 22 | ||||||||||||||||||||||||||||||||
| 2010 | 13.95 | (0.12 | ) | 4.44 | 4.32 | (0.08 | ) | (0.14 | ) | – | (0.22 | ) | – | 18.05 | 31.00 | 2,925 | 2.21 | 2.21 | 1.84 | (0.67 | ) | 24 | |||||||||||||||||||||||||||||||||||
| 2009 | 9.11 | (0.09 | ) | 4.92 | 4.83 | (0.00 | ) | – | – | (0.00 | ) | 0.01 | 13.95 | 53.13 | 1,134 | 3.02 | 3.02 | 1.84 | (0.76 | ) | 22 | ||||||||||||||||||||||||||||||||||||
| Royce Low-Priced Stock Fund – K Class | |||||||||||||||||||||||||||||||||||||||||||||||||||||||||
†2014 |
| $ | 6.89 |
| $ | 0.00 |
| $ | 0.62 |
| $ | 0.62 |
| $ | – |
| $ | – |
| $ | – |
| $ | – |
| $ | – |
| $ | 7.51 |
|
| 9.00 | %1 | $ | 2,923 |
|
| 2.12 | %2 |
|
| 2.12 | %2 |
|
| 1.59 | %2 |
|
| 0.14 | %2 |
|
| 4 | % |
|
| 2013 | 7.90 | (0.00 | ) | 0.94 |
| 0.94 |
| (0.01 | ) | (1.94 | ) | – | (1.95 | ) | – | 6.89 | 12.74 |
| 3,841 | 1.92 |
| 1.92 |
| 1.59 |
| (0.12 | ) | 16 | |||||||||||||||||||||||||||||
| 2012 | 8.65 | 0.07 |
| 0.27 |
| 0.34 |
| (0.18 | ) | (0.91 | ) | – | (1.09 | ) | – | 7.90 | 4.42 | 6,253 | 1.71 | 1.71 | 1.59 | 0.40 | 8 | ||||||||||||||||||||||||||||||||||
| 2011 | 11.70 | (0.08 | ) | (1.63 | ) | (1.71 | ) | (0.14 | ) | (1.20 | ) | – | (1.34 | ) | – | 8.65 | (14.71 | ) | 8,719 | 1.68 | 1.68 | 1.59 | (0.48 | ) | 22 | ||||||||||||||||||||||||||||||||
| 2010 | 9.09 | (0.08 | ) | 2.93 | 2.85 | (0.10 | ) | (0.14 | ) | – | (0.24 | ) | – | 11.70 | 31.44 | 4,782 | 1.78 | 1.78 | 1.59 | (0.40 | ) | 24 | |||||||||||||||||||||||||||||||||||
| 2009 | 5.95 | (0.10 | ) | 3.28 | 3.18 | (0.04 | ) | – | – | (0.04 | ) | – | 9.09 | 53.45 | 676 | 4.75 | 4.75 | 1.59 | (0.44 | ) | 22 | ||||||||||||||||||||||||||||||||||||
| Royce Total Return Fund – Investment Class | |||||||||||||||||||||||||||||||||||||||||||||||||||||||||
†2014 |
| $ | 16.47 |
| $ | 0.07 |
| $ | 0.38 |
| $ | 0.45 |
| $ | (0.06 | ) | $ | – |
| $ | – |
| $ | (0.06 | ) | $ | – |
| $ | 16.86 |
|
| 2.74 | %1 | $ | 3,443,640 |
|
| 1.11 | %2 |
|
| 1.11 | %2 |
|
| 1.11 | %2 |
|
| 0.86 | %2 |
|
| 9 | % |
|
| 2013 | 13.63 | 0.16 | 4.24 |
| 4.40 |
| (0.14 | ) | (1.42 | ) | – | (1.56 | ) | – | 16.47 | 32.76 | 3,657,904 | 1.13 | 1.13 | 1.13 | 1.00 | 21 | |||||||||||||||||||||||||||||||||||
| 2012 | 12.68 | 0.26 | 1.54 |
| 1.80 |
| (0.23 | ) | (0.62 | ) | – | (0.85 | ) | – | 13.63 | 14.42 | 3,044,664 | 1.10 | 1.10 | 1.10 | 1.89 | 17 | |||||||||||||||||||||||||||||||||||
| 2011 | 13.17 | 0.15 | (0.37 | ) | (0.22 | ) | (0.12 | ) | (0.15 | ) | – | (0.27 | ) | – | 12.68 | (1.68 | ) | 3,106,208 | 1.12 | 1.12 | 1.12 | 1.10 | 21 | ||||||||||||||||||||||||||||||||||
| 2010 | 10.81 | 0.19 | 2.32 | 2.51 | (0.15 | ) | – | – | (0.15 | ) | – | 13.17 | 23.47 | 3,562,002 | 1.14 | 1.14 | 1.14 | 1.64 | 15 | ||||||||||||||||||||||||||||||||||||||
| 2009 | 8.70 | 0.16 | 2.09 | 2.25 | (0.14 | ) | – | – | (0.14 | ) | – | 10.81 | 26.22 | 3,077,099 | 1.17 | 1.17 | 1.17 | 1.74 | 20 | ||||||||||||||||||||||||||||||||||||||
| Royce Total Return Fund – Service Class | |||||||||||||||||||||||||||||||||||||||||||||||||||||||||
†2014 |
| $ | 16.61 |
| $ | 0.04 |
| $ | 0.38 |
| $ | 0.42 |
| $ | (0.03 | ) | $ | – |
| $ | – |
| $ | (0.03 | ) | $ | – |
| $ | 17.00 |
|
| 2.53 | %1 | $ | 293,884 |
|
| 1.51 | %2 |
|
| 1.51 | %2 |
|
| 1.51 | %2 |
|
| 0.42 | %2 |
|
| 9 | % |
|
| 2013 | 13.72 | 0.11 | 4.27 | 4.38 | (0.07 | ) | (1.42 | ) | – | (1.49 | ) | – | 16.61 | 32.38 | 493,111 | 1.48 | 1.48 | 1.48 | 0.68 | 21 | |||||||||||||||||||||||||||||||||||||
| 2012 | 12.71 | 0.22 | 1.55 | 1.77 | (0.14 | ) | (0.62 | ) | – | (0.76 | ) | – | 13.72 | 14.11 | 264,528 | 1.39 | 1.39 | 1.39 | 1.58 | 17 | |||||||||||||||||||||||||||||||||||||
| 2011 | 13.19 | 0.11 | (0.38 | ) | (0.27 | ) | (0.06 | ) | (0.15 | ) | – | (0.21 | ) | – | 12.71 | (2.01 | ) | 282,704 | 1.41 | 1.41 | 1.41 | 0.82 | 21 | ||||||||||||||||||||||||||||||||||
| 2010 | 10.81 | 0.16 | 2.32 | 2.48 | (0.10 | ) | – | – | (0.10 | ) | – | 13.19 | 23.11 | 295,656 | 1.42 | 1.42 | 1.42 | 1.39 | 15 | ||||||||||||||||||||||||||||||||||||||
| 2009 | 8.67 | 0.14 | 2.09 | 2.23 | (0.10 | ) | – | – | (0.10 | ) | 0.01 | 10.81 | 26.16 | 215,939 | 1.42 | 1.42 | 1.42 | 1.49 | 20 | ||||||||||||||||||||||||||||||||||||||
| Royce Total Return Fund – Consultant Class | |||||||||||||||||||||||||||||||||||||||||||||||||||||||||
†2014 |
| $ | 16.68 |
| $ | (0.01 | ) | $ | 0.39 |
| $ | 0.38 |
| $ | – |
| $ | – |
| $ | – |
| $ | – |
| $ | – |
| $ | 17.06 |
|
| 2.28 | %1 | $ | 396,523 |
|
| 2.11 | %2 |
|
| 2.11 | %2 |
|
| 2.11 | %2 |
|
| (0.13 | )%2 |
|
| 9 | % |
|
| 2013 | 13.81 | (0.00 | ) | 4.29 | 4.29 | – | (1.42 | ) | – | (1.42 | ) | – | 16.68 | 31.38 | 404,498 | 2.15 | 2.15 | 2.15 | (0.02 | ) | 21 | ||||||||||||||||||||||||||||||||||||
| 2012 | 12.77 | 0.11 | 1.56 | 1.67 | (0.01 | ) | (0.62 | ) | – | (0.63 | ) | – | 13.81 | 13.19 | 331,116 | 2.20 | 2.20 | 2.20 | 0.80 | 17 | |||||||||||||||||||||||||||||||||||||
| 2011 | 13.27 | 0.02 | (0.37 | ) | (0.35 | ) | – | (0.15 | ) |
| – | (0.15 | ) | – | 12.77 | (2.64 | ) | 328,610 | 2.07 | 2.07 | 2.07 | 0.15 | 21 | ||||||||||||||||||||||||||||||||||
| 2010 | 10.90 | 0.08 | 2.33 | 2.41 | (0.04 | ) | – |
| – | (0.04 | ) | – | 13.27 | 22.18 | 391,886 | 2.09 | 2.09 | 2.09 | 0.68 | 15 | |||||||||||||||||||||||||||||||||||||
| 2009 | 8.76 | 0.07 | 2.12 | 2.19 | (0.05 | ) | – |
| – | (0.05 | ) | – | 10.90 | 25.12 | 366,367 | 2.12 | 2.12 | 2.12 | 0.78 | 20 | |||||||||||||||||||||||||||||||||||||
| THE ACCOMPANYING NOTES ARE AN INTEGRAL PART OF THESE FINANCIAL STATEMENTS. | The Royce Funds 2014 Semiannual Report to Shareholders | 105 |
|
Financial Highlights |
|
| |||||||||||||||||||||||||||||||||||||||||||||||||||||||||||||||
|
| Net Asset |
| Net |
| Net Realized and Unrealized |
|
| Distributions |
| Distributions from Net |
|
|
|
|
|
|
|
|
| Ratio of Expenses to Average Net Assets |
| Ratio of Net Investment |
|
| ||||||||||||||||||||||||||||||||||||||
|
| Value, |
| Investment |
| Gain (Loss) on |
| Total from Investment Operations |
| from Net Investment Income |
| Realized Gain on |
| Distributions |
| Total Distributions |
| Shareholder Redemption Fees |
| Net Asset |
| Total Return |
| Net Assets, |
| Prior to Fee |
| Prior |
| Net of |
| Income (Loss) |
| Portfolio Turnover Rate |
| ||||||||||||||||||||||||||||
|
|
|
|
|
|
|
|
|
|
|
|
|
|
|
|
|
|
|
|
|
|
|
|
|
|
|
|
|
|
|
|
|
|
|
|
|
|
|
|
|
|
|
|
|
|
|
|
|
|
|
|
|
|
|
|
|
| ||||||
| Royce Total Return Fund – Institutional Class | |||||||||||||||||||||||||||||||||||||||||||||||||||||||||||||||
†2014 |
| $ | 16.35 |
| $ | 0.08 |
| $ | 0.37 |
| $ | 0.45 |
| $ | (0.07 | ) | $ | – |
| $ | – |
| $ | (0.07 | ) | $ | – |
| $ | 16.73 |
|
| 2.76 | %1 | $ | 624,814 |
|
| 1.00 | %2 |
|
| 1.00 | %2 |
|
| 1.00 | %2 |
|
| 0.99 | %2 |
|
| 9 | % |
| ||||||
| 2013 | 13.55 | 0.18 | 4.21 | 4.39 | (0.17 | ) | (1.42 | ) | – | (1.59 | ) | – | 16.35 | 32.93 | 621,447 | 1.00 | 1.00 | 1.00 | 1.15 | 21 | |||||||||||||||||||||||||||||||||||||||||||
| 2012 | 12.64 | 0.27 | 1.54 | 1.81 | (0.28 | ) | (0.62 | ) | – | (0.90 | ) | – | 13.55 | 14.48 | 408,551 | 1.02 | 1.02 | 1.02 | 2.02 | 17 | |||||||||||||||||||||||||||||||||||||||||||
| 2011 | 13.14 | 0.16 | (0.37 | ) | (0.21 | ) | (0.14 | ) | (0.15 | ) |
| – | (0.29 | ) | – | 12.64 | (1.55 | ) | 390,277 | 1.00 | 1.00 | 1.00 | 1.26 | 21 | |||||||||||||||||||||||||||||||||||||||
| 2010 | 10.80 | 0.21 | 2.31 | 2.52 | (0.18 | ) | – |
| – | (0.18 | ) | – | 13.14 | 23.56 | 356,038 | 1.01 | 1.01 | 1.01 | 1.79 | 15 | |||||||||||||||||||||||||||||||||||||||||||
| 2009 | 8.70 | 0.17 | 2.09 | 2.26 | (0.16 | ) | – |
| – | (0.16 | ) | – | 10.80 | 26.41 | 264,041 | 1.04 | 1.04 | 1.04 | 1.87 | 20 | |||||||||||||||||||||||||||||||||||||||||||
| Royce Total Return Fund – W Class | |||||||||||||||||||||||||||||||||||||||||||||||||||||||||||||||
†2014 |
| $ | 16.45 |
| $ | 0.07 |
| $ | 0.37 |
| $ | 0.44 |
| $ | (0.06 | ) | $ | – |
| $ | – |
| $ | (0.06 | ) | $ | – |
| $ | 16.83 |
|
| 2.68 | %1 | $ | 260,679 |
|
| 1.12 | %2 |
|
| 1.12 | %2 |
|
| 1.12 | %2 |
|
| 0.87 | %2 |
|
| 9 | % |
| ||||||
| 2013 | 13.62 | 0.16 | 4.23 | 4.39 | (0.14 | ) | (1.42 | ) | – | (1.56 | ) | – | 16.45 | 32.71 | 249,035 | 1.15 | 1.15 | 1.15 | 0.99 | 21 | |||||||||||||||||||||||||||||||||||||||||||
| 2012 | 12.69 | 0.26 | 1.54 | 1.80 | (0.25 | ) | (0.62 | ) | – | (0.87 | ) | – | 13.62 | 14.41 | 171,603 | 1.12 | 1.12 | 1.12 | 1.97 | 17 | |||||||||||||||||||||||||||||||||||||||||||
| 2011 | 13.19 | 0.16 | (0.37 | ) | (0.21 | ) | (0.14 | ) | (0.15 | ) |
| – | (0.29 | ) | – | 12.69 | (1.58 | ) | 132,488 | 1.05 | 1.05 | 1.05 | 1.27 | 21 | |||||||||||||||||||||||||||||||||||||||
| 2010 | 10.83 | 0.20 | 2.32 | 2.52 | (0.16 | ) | – |
| – | (0.16 | ) | – | 13.19 | 23.44 | 75,063 | 1.09 | 1.09 | 1.09 | 1.74 | 15 | |||||||||||||||||||||||||||||||||||||||||||
| 2009 | 8.71 | 0.16 | 2.10 | 2.26 | (0.14 | ) | – |
| – | (0.14 | ) | – | 10.83 | 26.28 | 48,058 | 1.13 | 1.13 | 1.13 | 1.78 | 20 | |||||||||||||||||||||||||||||||||||||||||||
| Royce Total Return Fund – R Class | |||||||||||||||||||||||||||||||||||||||||||||||||||||||||||||||
†2014 |
| $ | 16.73 |
| $ | 0.02 |
| $ | 0.38 |
| $ | 0.40 |
| $ | (0.01 | ) | $ | – |
| $ | – |
| $ | (0.01 | ) | $ | – |
| $ | 17.12 |
|
| 2.39 | %1 | $ | 68,359 |
|
| 1.70 | %2 |
|
| 1.70 | %2 |
|
| 1.70 | %2 |
|
| 0.28 | %2 |
|
| 9 | % |
| ||||||
| 2013 | 13.82 | 0.06 | 4.30 | 4.36 | (0.03 | ) | (1.42 | ) | – | (1.45 | ) | – | 16.73 | 31.95 | 72,541 | 1.75 | 1.75 | 1.75 | 0.39 | 21 | |||||||||||||||||||||||||||||||||||||||||||
| 2012 | 12.79 | 0.18 | 1.55 | 1.73 | (0.08 | ) | (0.62 | ) | – | (0.70 | ) | – | 13.82 | 13.66 | 48,797 | 1.74 | 1.74 | 1.74 | 1.36 | 17 | |||||||||||||||||||||||||||||||||||||||||||
| 2011 | 13.28 | 0.08 | (0.38 | ) | (0.30 | ) | (0.04 | ) | (0.15 | ) | – | (0.19 | ) | – | 12.79 | (2.23 | ) | 34,695 | 1.68 | 1.68 | 1.68 | 0.62 | 21 | ||||||||||||||||||||||||||||||||||||||||
| 2010 | 10.88 | 0.15 | 2.32 | 2.47 | (0.07 | ) | – | – | (0.07 | ) | – | 13.28 | 22.76 | 20,011 | 1.71 | 1.71 | 1.71 | 1.20 | 15 | ||||||||||||||||||||||||||||||||||||||||||||
| 2009 | 8.74 | 0.10 | 2.10 | 2.20 | (0.06 | ) | – | – | (0.06 | ) | – | 10.88 | 25.43 | 6,450 | 1.85 | 1.85 | 1.84 | 1.05 | 20 | ||||||||||||||||||||||||||||||||||||||||||||
| Royce Total Return Fund – K Class | |||||||||||||||||||||||||||||||||||||||||||||||||||||||||||||||
†2014 |
| $ | 12.40 |
| $ | 0.03 |
| $ | 0.28 |
| $ | 0.31 |
| $ | (0.02 | ) | $ | – |
| $ | – |
| $ | (0.02 | ) | $ | – |
| $ | 12.69 |
|
| 2.50 | %1 | $ | 130,925 |
|
| 1.50 | %2 |
|
| 1.50 | %2 |
|
| 1.50 | %2 |
|
| 0.44 | %2 |
|
| 9 | % |
| ||||||
| 2013 | 10.53 | 0.07 | 3.27 | 3.34 | (0.05 | ) | (1.42 | ) | – | (1.47 | ) | – | 12.40 | 32.20 | 196,344 | 1.50 | 1.50 | 1.50 | 0.62 | 21 | |||||||||||||||||||||||||||||||||||||||||||
| 2012 | 9.90 | 0.17 | 1.21 | 1.38 | (0.13 | ) | (0.62 | ) | – | (0.75 | ) | – | 10.53 | 14.08 | 163,412 | 1.43 | 1.43 | 1.43 | 1.51 | 17 | |||||||||||||||||||||||||||||||||||||||||||
| 2011 | 10.31 | 0.09 | (0.30 | ) | (0.21 | ) | (0.05 | ) | (0.15 | ) | – | (0.20 | ) | – | 9.90 | (1.97 | ) | 177,812 | 1.44 | 1.44 | 1.44 | 0.90 | 21 | ||||||||||||||||||||||||||||||||||||||||
| 2010 | 8.47 | 0.13 | 1.81 | 1.94 | (0.10 | ) | – | – | (0.10 | ) | – | 10.31 | 23.08 | 95,319 | 1.43 | 1.43 | 1.43 | 1.46 | 15 | ||||||||||||||||||||||||||||||||||||||||||||
| 2009 | 6.81 | 0.11 | 1.63 | 1.74 | (0.08 | ) | – | – | (0.08 | ) | – | 8.47 | 25.89 | 43,281 | 1.42 | 1.42 | 1.42 | 1.44 | 20 | ||||||||||||||||||||||||||||||||||||||||||||
| Royce Heritage Fund – Investment Class | |||||||||||||||||||||||||||||||||||||||||||||||||||||||||||||||
†2014 |
| $ | 16.24 |
| $ | 0.06 |
| $ | 0.44 |
| $ | 0.50 |
| $ | – |
| $ | – |
| $ | – |
| $ | – |
| $ | – |
| $ | 16.74 |
|
| 3.08 | %1 | $ | 143,632 |
|
| 1.09 | %2 |
|
| 1.09 | %2 |
|
| 1.09 | %2 |
|
| 0.74 | %2 |
|
| 18 | % |
| ||||||
| 2013 | 14.48 | 0.03 | 3.71 | 3.74 | (0.05 | ) | (1.93 | ) | – | (1.98 | ) | – | 16.24 | 26.37 | 117,306 | 1.13 | 1.13 | 1.13 | 0.36 | 79 | |||||||||||||||||||||||||||||||||||||||||||
| 2012 | 13.07 | 0.10 | 1.80 | 1.90 | (0.13 | ) | (0.36 | ) | – | (0.49 | ) | – | 14.48 | 14.70 | 40,374 | 1.20 | 1.20 | 1.20 | 0.94 | 39 | |||||||||||||||||||||||||||||||||||||||||||
| 2011 | 15.10 | 0.01 | (1.41 | ) | (1.40 | ) | (0.05 | ) | (0.59 | ) | – | (0.64 | ) | 0.01 | 13.07 | (9.16 | ) | 21,088 | 1.22 | 1.22 | 1.22 | 0.15 | 51 | ||||||||||||||||||||||||||||||||||||||||
| 2010 | 12.12 | 0.04 | 3.31 | 3.35 | (0.08 | ) | (0.29 | ) | – | (0.37 | ) | – | 15.10 | 27.71 | 13,313 | 1.25 | 1.25 | 1.24 | 0.35 | 66 | |||||||||||||||||||||||||||||||||||||||||||
| 2009 | 7.97 | 0.02 | 4.13 | 4.15 | – | – | – | – | – | 12.12 | 52.07 | 10,052 | 1.34 | 1.34 | 1.24 | 0.19 | 59 | ||||||||||||||||||||||||||||||||||||||||||||||
| Royce Heritage Fund – Service Class | |||||||||||||||||||||||||||||||||||||||||||||||||||||||||||||||
†2014 |
| $ | 16.20 |
| $ | 0.03 |
| $ | 0.44 |
| $ | 0.47 |
| $ | – |
| $ | – |
| $ | – |
| $ | – |
| $ | – |
| $ | 16.67 |
|
| 2.90 | %1 | $ | 206,853 |
|
| 1.44 | %2 |
|
| 1.44 | %2 |
|
| 1.41 | %2 |
|
| 0.37 | %2 |
|
| 18 | % |
| ||||||
| 2013 | 14.45 | 0.00 | 3.68 | 3.68 | (0.00 | ) | (1.93 | ) | – | (1.93 | ) | – | 16.20 | 25.99 | 223,533 | 1.45 | 1.45 | 1.42 | 0.02 | 79 | |||||||||||||||||||||||||||||||||||||||||||
| 2012 | 13.00 | 0.08 | 1.78 | 1.86 | (0.05 | ) | (0.36 | ) | – | (0.41 | ) | – | 14.45 | 14.39 | 203,112 | 1.46 | 1.46 | 1.45 | 0.56 | 39 | |||||||||||||||||||||||||||||||||||||||||||
| 2011 | 15.03 | (0.01 | ) | (1.40 | ) | (1.41 | ) | (0.03 | ) | (0.59 | ) | – | (0.62 | ) | – | 13.00 | (9.39 | ) | 218,770 | 1.47 | 1.47 | 1.44 | (0.07 | ) | 51 | ||||||||||||||||||||||||||||||||||||||
| 2010 | 12.07 | 0.03 | 3.28 | 3.31 | (0.06 | ) | (0.29 | ) | – | (0.35 | ) | – | 15.03 | 27.50 | 243,822 | 1.47 | 1.47 | 1.38 | 0.21 | 66 | |||||||||||||||||||||||||||||||||||||||||||
| 2009 | 7.95 | (0.00 | ) | 4.12 | 4.12 | – | – | – | – | – | 12.07 | 51.82 | 182,690 | 1.51 | 1.51 | 1.42 | (0.02 | ) | 59 | ||||||||||||||||||||||||||||||||||||||||||||
| 106 | The Royce Funds 2014 Semiannual Report to Shareholders | THE ACCOMPANYING NOTES ARE AN INTEGRAL PART OF THESE FINANCIAL STATEMENTS. |
|
Financial Highlights |
|
| |||||||||||||||||||||||||||||||||||||||||||||||||||||||||
|
| Net |
| Net |
| Net Realized and Unrealized |
|
| Distributions |
| Distributions from Net |
|
|
|
|
|
|
|
|
| Ratio of Expenses to Average Net Assets |
| Ratio of Net Investment |
|
| ||||||||||||||||||||||||||||||||
|
| Asset Value, |
| Investment |
| Gain (Loss) on |
| Total from Investment Operations |
| from Net Investment Income |
| Realized Gain on |
| Distributions |
| Total Distributions |
| Shareholder Redemption Fees |
| Net Asset |
| Total Return |
| Net Assets, |
| Prior to Fee |
| Prior |
| Net of |
| Income (Loss) |
| Portfolio Turnover Rate |
| ||||||||||||||||||||||
|
|
|
|
|
|
|
|
|
|
|
|
|
|
|
|
|
|
|
|
|
|
|
|
|
|
|
|
|
|
|
|
|
|
|
|
|
|
|
|
|
|
|
|
|
|
|
|
|
|
|
|
|
|
|
|
|
|
| Royce Heritage Fund – Consultant Class | |||||||||||||||||||||||||||||||||||||||||||||||||||||||||
†2014 |
| $ | 12.57 |
| $ | (0.03 | ) | $ | 0.34 |
| $ | 0.31 |
| $ | – |
| $ | – |
| $ | – |
| $ | – |
| $ | – |
| $ | 12.88 |
|
| 2.47 | %1 | $ | 15,386 |
|
| 2.33 | %2 |
|
| 2.33 | %2 |
|
| 2.33 | %2 |
|
| (0.54 | )%2 |
|
| 18 | % |
|
| 2013 | 11.68 | (0.12 | ) | 2.94 | 2.82 | – | (1.93 | ) | – | (1.93 | ) | – | 12.57 | 24.73 | 15,942 | 2.37 | 2.37 | 2.37 | (0.93 | ) | 79 | ||||||||||||||||||||||||||||||||||||
| 2012 | 10.64 | (0.04 | ) | 1.44 | 1.40 | – | (0.36 | ) | – | (0.36 | ) | – | 11.68 | 13.30 | 13,909 | 2.41 | 2.41 | 2.41 | (0.39 | ) | 39 | ||||||||||||||||||||||||||||||||||||
| 2011 | 12.50 | (0.11 | ) | (1.16 | ) | (1.27 | ) | – | (0.59 | ) | – | (0.59 | ) | – | 10.64 | (10.14 | ) | 13,850 | 2.28 | 2.28 | 2.28 | (0.91 | ) | 51 | |||||||||||||||||||||||||||||||||
| 2010 | 10.14 | (0.08 | ) | 2.73 | 2.65 | – | (0.29 | ) | – | (0.29 | ) | – | 12.50 | 26.22 | 12,801 | 2.36 | 2.36 | 2.36 | (0.77 | ) | 66 | ||||||||||||||||||||||||||||||||||||
| 2009 | 6.75 | (0.09 | ) | 3.48 | 3.39 | – | – | – | – | – | 10.14 | 50.22 | 7,485 | 2.55 | 2.55 | 2.49 | (1.05 | ) | 59 | ||||||||||||||||||||||||||||||||||||||
| Royce Heritage Fund – R Class | |||||||||||||||||||||||||||||||||||||||||||||||||||||||||
†2014 |
| $ | 11.63 |
| $ | (0.01 | ) | $ | 0.32 |
| $ | 0.31 |
| $ | – |
| $ | – |
| $ | – |
| $ | – |
| $ | – |
| $ | 11.94 |
|
| 2.67 | %1 | $ | 5,421 |
|
| 1.89 | %2 |
|
| 1.89 | %2 |
|
| 1.84 | %2 |
|
| (0.10 | )%2 |
|
| 18 | % |
|
| 2013 | 10.86 | (0.05 | ) | 2.75 | 2.70 | – |
| (1.93 | ) | – | (1.93 | ) | – | 11.63 | 25.51 | 6,805 | 1.90 | 1.90 | 1.84 | (0.39 | ) | 79 | |||||||||||||||||||||||||||||||||||
| 2012 | 9.87 | 0.02 | 1.34 | 1.36 | (0.01 | ) | (0.36 | ) | – | (0.37 | ) | – | 10.86 | 13.88 | 4,832 | 1.95 | 1.95 | 1.84 | 0.17 | 39 | |||||||||||||||||||||||||||||||||||||
| 2011 | 11.63 | (0.06 | ) | (1.07 | ) | (1.13 | ) | (0.04 | ) | (0.59 | ) | – | (0.63 | ) | – | 9.87 | (9.73 | ) | 4,081 | 1.90 | 1.90 | 1.84 | (0.45 | ) | 51 | ||||||||||||||||||||||||||||||||
| 2010 | 9.43 | (0.03 | ) | 2.55 | 2.52 | (0.03 | ) | (0.29 | ) | – | (0.32 | ) | – | 11.63 | 26.84 | 1,909 | 2.22 | 2.22 | 1.84 | (0.25 | ) | 66 | |||||||||||||||||||||||||||||||||||
| 2009 | 6.23 | (0.05 | ) | 3.25 | 3.20 | – | – | – | – | – | 9.43 | 51.36 | 832 | 4.03 | 4.03 | 1.84 | (0.56 | ) | 59 | ||||||||||||||||||||||||||||||||||||||
| Royce Heritage Fund – K Class | |||||||||||||||||||||||||||||||||||||||||||||||||||||||||
†2014 |
| $ | 11.70 |
| $ | 0.01 |
| $ | 0.32 |
| $ | 0.33 |
| $ | – |
| $ | – |
| $ | – |
| $ | – |
| $ | – |
| $ | 12.03 |
|
| 2.82 | %1 | $ | 6,547 |
|
| 1.69 | %2 |
|
| 1.69 | %2 |
|
| 1.59 | %2 |
|
| 0.20 | %2 |
|
| 18 | % |
|
| 2013 | 10.90 | (0.02 | ) | 2.75 | 2.73 | – |
| (1.93 | ) | – | (1.93 | ) | – | 11.70 | 25.69 | 6,419 | 1.70 | 1.70 | 1.59 | (0.15 | ) | 79 | |||||||||||||||||||||||||||||||||||
| 2012 | 9.93 | 0.04 | 1.36 | 1.40 | (0.07 | ) | (0.36 | ) | – | (0.43 | ) | – | 10.90 | 14.22 | 7,077 | 1.61 | 1.61 | 1.59 | 0.42 | 39 | |||||||||||||||||||||||||||||||||||||
| 2011 | 11.68 | (0.04 | ) | (1.08 | ) | (1.12 | ) | (0.04 | ) | (0.59 | ) | – | (0.63 | ) | – | 9.93 | (9.53 | ) | 7,787 | 1.66 | 1.66 | 1.59 | (0.24 | ) | 51 | ||||||||||||||||||||||||||||||||
| 2010 | 9.46 | (0.03 | ) | 2.60 | 2.57 | (0.06 | ) | (0.29 | ) | – | (0.35 | ) | – | 11.68 | 27.29 | 5,214 | 1.67 | 1.67 | 1.59 | (0.00 | ) | 66 | |||||||||||||||||||||||||||||||||||
| 2009 | 6.24 | (0.02 | ) | 3.24 | 3.22 | – | – | – | – | – | 9.46 | 51.60 | 287 | 5.82 | 5.82 | 1.59 | (0.26 | ) | 59 | ||||||||||||||||||||||||||||||||||||||
| Royce Opportunity Fund – Investment Class | |||||||||||||||||||||||||||||||||||||||||||||||||||||||||
†2014 |
| $ | 15.54 |
| $ | (0.02 | ) | $ | 0.49 |
| $ | 0.47 |
| $ | – |
| $ | – |
| $ | – |
| $ | – |
| $ | – |
| $ | 16.01 |
|
| 3.02 | %1 | $ | 1,445,138 |
|
| 1.12 | %2 |
|
| 1.12 | %2 |
|
| 1.12 | %2 |
|
| (0.31 | )%2 |
|
| 19 | % |
|
| 2013 | 11.95 | (0.05 | ) | 5.18 | 5.13 | – |
| (1.54 | ) | – | (1.54 | ) | – | 15.54 | 43.50 | 1,426,214 | 1.16 | 1.16 | 1.16 | (0.36 | ) | 39 | |||||||||||||||||||||||||||||||||||
| 2012 | 10.32 | 0.00 | 2.30 | 2.30 | – | (0.67 | ) | – | (0.67 | ) | – | 11.95 | 22.59 | 921,473 | 1.13 | 1.13 | 1.13 | 0.02 | 34 | ||||||||||||||||||||||||||||||||||||||
| 2011 | 12.08 | (0.04 | ) | (1.53 | ) | (1.57 | ) | – | (0.19 | ) | – | (0.19 | ) | – | 10.32 | (12.95 | ) | 878,824 | 1.16 | 1.16 | 1.16 | (0.38 | ) | 35 | |||||||||||||||||||||||||||||||||
| 2010 | 9.03 | (0.04 | ) | 3.09 | 3.05 | – | – | – | – | – | 12.08 | 33.78 | 1,170,607 | 1.17 | 1.17 | 1.17 | (0.44 | ) | 47 | ||||||||||||||||||||||||||||||||||||||
| 2009 | 5.57 | (0.03 | ) | 3.49 | 3.46 | (0.00 | ) | – | – | (0.00 | ) | – | 9.03 | 62.14 | 836,268 | 1.22 | 1.22 | 1.22 | (0.43 | ) | 44 | ||||||||||||||||||||||||||||||||||||
| Royce Opportunity Fund – Service Class | |||||||||||||||||||||||||||||||||||||||||||||||||||||||||
†2014 |
| $ | 14.92 |
| $ | (0.06 | ) | $ | 0.47 |
| $ | 0.41 |
| $ | – |
| $ | – |
| $ | – |
| $ | – |
| $ | – |
| $ | 15.33 |
|
| 2.75 | %1 | $ | 191,136 |
|
| 1.56 | %2 |
|
| 1.56 | %2 |
|
| 1.56 | %2 |
|
| (0.75 | )%2 |
|
| 19 | % |
|
| 2013 | 11.55 | (0.09 | ) | 5.00 | 4.91 | – |
| (1.54 | ) | – | (1.54 | ) | – | 14.92 | 43.10 | 208,237 | 1.47 | 1.47 | 1.47 | (0.67 | ) | 39 | |||||||||||||||||||||||||||||||||||
| 2012 | 10.03 | (0.04 | ) | 2.23 | 2.19 | – | (0.67 | ) | – | (0.67 | ) | – | 11.55 | 22.14 | 205,084 | 1.46 | 1.46 | 1.46 | (0.32 | ) | 34 | ||||||||||||||||||||||||||||||||||||
| 2011 | 11.78 | (0.08 | ) | (1.49 | ) | (1.57 | ) | – | (0.19 | ) | – | (0.19 | ) | 0.01 | 10.03 | (13.20 | ) | 160,496 | 1.48 | 1.48 | 1.48 | (0.73 | ) | 35 | |||||||||||||||||||||||||||||||||
| 2010 | 8.83 | (0.08 | ) | 3.03 | 2.95 | – | – | – | – | – | 11.78 | 33.41 | 312,728 | 1.46 | 1.46 | 1.46 | (0.78 | ) | 47 | ||||||||||||||||||||||||||||||||||||||
| 2009 | 5.46 | (0.05 | ) | 3.42 | 3.37 | – | – | – | – | – | 8.83 | 61.72 | 298,410 | 1.47 | 1.47 | 1.47 | (0.69 | ) | 44 | ||||||||||||||||||||||||||||||||||||||
| Royce Opportunity Fund – Consultant Class | |||||||||||||||||||||||||||||||||||||||||||||||||||||||||
†2014 |
| $ | 14.02 |
| $ | (0.10 | ) | $ | 0.44 |
| $ | 0.34 |
| $ | – |
| $ | – |
| $ | – |
| $ | – |
| $ | – |
| $ | 14.36 |
|
| 2.43 | %1 | $ | 18,877 |
|
| 2.23 | %2 |
|
| 2.23 | %2 |
|
| 2.23 | %2 |
|
| (1.42 | )%2 |
|
| 19 | % |
|
| 2013 | 11.01 | (0.20 | ) | 4.75 | 4.55 | – |
| (1.54 | ) | – | (1.54 | ) | – | 14.02 | 41.93 | 18,643 | 2.31 | 2.31 | 2.31 | (1.51 | ) | 39 | |||||||||||||||||||||||||||||||||||
| 2012 | 9.67 | (0.13 | ) | 2.14 | 2.01 | – | (0.67 | ) | – | (0.67 | ) | – | 11.01 | 21.09 | 11,930 | 2.36 | 2.36 | 2.36 | (1.22 | ) | 34 | ||||||||||||||||||||||||||||||||||||
| 2011 | 11.46 | (0.15 | ) | (1.45 | ) | (1.60 | ) | – | (0.19 | ) | – | (0.19 | ) | – | 9.67 | (13.91 | ) | 11,884 | 2.24 | 2.24 | 2.24 | (1.44 | ) | 35 | |||||||||||||||||||||||||||||||||
| 2010 | 8.66 | (0.15 | ) | 2.95 | 2.80 | – | – | – | – | – | 11.46 | 32.33 | 13,126 | 2.29 | 2.29 | 2.29 | (1.56 | ) | 47 | ||||||||||||||||||||||||||||||||||||||
| 2009 | 5.42 | (0.11 | ) | 3.35 | 3.24 | – | – | – | – | – | 8.66 | 59.78 | 7,500 | 2.45 | 2.45 | 2.45 | (1.66 | ) | 44 | ||||||||||||||||||||||||||||||||||||||
| THE ACCOMPANYING NOTES ARE AN INTEGRAL PART OF THESE FINANCIAL STATEMENTS. | The Royce Funds 2014 Semiannual Report to Shareholders | 107 |
|
Financial Highlights |
|
| |||||||||||||||||||||||||||||||||||||||||||||||||||||||||
|
| Net Asset |
| Net |
| Net Realized and Unrealized |
|
| Distributions |
| Distributions from Net |
|
|
|
|
|
|
|
|
| Ratio of Expenses to Average Net Assets |
| Ratio of Net Investment |
|
| ||||||||||||||||||||||||||||||||
|
| Value, |
| Investment |
| Gain (Loss) on |
| Total from Investment Operations |
| from Net Investment Income |
| Realized Gain on |
| Distributions |
| Total Distributions |
| Shareholder Redemption Fees |
| Net Asset |
| Total Return |
| Net Assets, |
| Prior to Fee |
| Prior |
| Net of |
| Income (Loss) |
| Portfolio Turnover Rate |
| ||||||||||||||||||||||
|
|
|
|
|
|
|
|
|
|
|
|
|
|
|
|
|
|
|
|
|
|
|
|
|
|
|
|
|
|
|
|
|
|
|
|
|
|
|
|
|
|
|
|
|
|
|
|
|
|
|
|
|
|
|
|
|
|
| Royce Opportunity Fund – Institutional Class | |||||||||||||||||||||||||||||||||||||||||||||||||||||||||
†2014 |
| $ | 15.71 |
| $ | (0.02 | ) | $ | 0.49 |
| $ | 0.47 |
| $ | – |
| $ | – |
| $ | – |
| $ | – |
| $ | – |
| $ | 16.18 |
|
| 2.99 | %1 | $ | 885,707 |
|
| 1.02 | %2 |
|
| 1.02 | %2 |
|
| 1.02 | %2 |
|
| (0.21 | )%2 |
|
| 19 | % |
|
| 2013 | 12.06 | (0.03 | ) | 5.23 | 5.20 | (0.01 | ) | (1.54 | ) | – | (1.55 | ) | – | 15.71 | 43.69 | 853,886 | 1.03 | 1.03 | 1.03 | (0.23 | ) | 39 | |||||||||||||||||||||||||||||||||||
| 2012 | 10.40 | 0.01 |
| 2.32 | 2.33 | – | (0.67 | ) | – | (0.67 | ) | – | 12.06 | 22.70 | 689,939 | 1.04 | 1.04 | 1.04 | 0.11 | 34 | |||||||||||||||||||||||||||||||||||||
| 2011 | 12.16 | (0.03 | ) | (1.54 | ) | (1.57 | ) | – | (0.19 | ) | – | (0.19 | ) | – | 10.40 | (12.86 | ) | 574,826 | 1.03 | 1.03 | 1.03 | (0.24 | ) | 35 | |||||||||||||||||||||||||||||||||
| 2010 | 9.07 | (0.03 | ) | 3.12 | 3.09 | – | – | – | – | – | 12.16 | 34.07 | 702,220 | 1.04 | 1.04 | 1.04 | (0.32 | ) | 47 | ||||||||||||||||||||||||||||||||||||||
| 2009 | 5.60 | (0.02 | ) | 3.50 | 3.48 | (0.01 | ) | – | – | (0.01 | ) | – | 9.07 | 62.23 | 502,300 | 1.04 | 1.04 | 1.04 | (0.26 | ) | 44 | ||||||||||||||||||||||||||||||||||||
Royce Opportunity Fund – R Class | |||||||||||||||||||||||||||||||||||||||||||||||||||||||||
†2014 |
| $ | 14.73 |
| $ | (0.06 | ) | $ | 0.46 |
| $ | 0.40 |
| $ | – |
| $ | – |
| $ | – |
| $ | – |
| $ | – |
| $ | 15.13 |
|
| 2.72 | %1 | $ | 31,361 |
|
| 1.68 | %2 |
|
| 1.68 | %2 |
|
| 1.68 | %2 |
|
| (0.87 | )%2 |
|
| 19 | % |
|
| 2013 | 11.46 | (0.14 | ) | 4.95 | 4.81 | – | (1.54 | ) | – | (1.54 | ) | – | 14.73 | 42.56 | 22,730 | 1.82 | 1.82 | 1.82 | (1.02 | ) | 39 | ||||||||||||||||||||||||||||||||||||
2012 |
|
| 9.98 |
|
| (0.07 | ) |
| 2.22 |
|
| 2.15 |
|
| – |
|
| (0.67 | ) |
| – |
|
| (0.67 | ) |
| – |
|
| 11.46 |
|
| 21.85 |
|
| 6,612 |
|
| 2.01 |
|
|
| 2.01 |
|
|
| 1.84 |
|
|
| (0.62 | ) |
|
| 34 |
|
|
2011 |
|
| 11.78 |
|
| (0.10 | ) |
| (1.51 | ) |
| (1.61 | ) |
| – |
|
| (0.19 | ) |
| – |
|
| (0.19 | ) |
| – |
|
| 9.98 |
|
| (13.62 | ) |
| 3,088 |
|
| 2.03 |
|
|
| 2.03 |
|
|
| 1.84 |
|
|
| (0.98 | ) |
|
| 35 |
|
|
2010 |
|
| 8.86 |
|
| (0.11 | ) |
| 3.03 |
|
| 2.92 |
|
| – |
|
| – |
|
| – |
|
| – |
|
| – |
|
| 11.78 |
|
| 32.96 |
|
| 1,407 |
|
| 2.88 |
|
|
| 2.88 |
|
|
| 1.84 |
|
|
| (1.06 | ) |
|
| 47 |
|
|
2009 |
|
| 5.50 |
|
| (0.07 | ) |
| 3.43 |
|
| 3.36 |
|
| – |
|
| – |
|
| – |
|
| – |
|
| – |
|
| 8.86 |
|
| 61.09 |
|
| 341 |
|
| 9.91 |
|
|
| 9.91 |
|
|
| 1.84 |
|
|
| (1.05 | ) |
|
| 44 |
|
|
Royce Opportunity Fund – K Class | |||||||||||||||||||||||||||||||||||||||||||||||||||||||||
†2014 |
| $ | 13.70 |
| $ | (0.04 | ) | $ | 0.43 |
| $ | 0.39 |
| $ | – |
| $ | – |
| $ | – |
| $ | – |
| $ | – |
| $ | 14.09 |
|
| 2.85 | %1 | $ | 22,824 |
|
| 1.37 | %2 |
|
| 1.37 | %2 |
|
| 1.37 | %2 |
|
| (0.56 | )%2 |
|
| 19 | % |
|
| 2013 | 10.70 | (0.08 | ) | 4.62 | 4.54 | – | (1.54 | ) | – | (1.54 | ) | – | 13.70 | 43.07 | 17,927 | 1.46 | 1.46 | 1.46 | (0.65 | ) | 39 | ||||||||||||||||||||||||||||||||||||
2012 |
|
| 9.33 |
|
| (0.04 | ) |
| 2.08 |
|
| 2.04 |
|
| – |
|
| (0.67 | ) |
| – |
|
| (0.67 | ) |
| – |
|
| 10.70 |
|
| 22.19 |
|
| 8,828 |
|
| 1.52 |
|
|
| 1.52 |
|
|
| 1.52 |
|
|
| (0.36 | ) |
|
| 34 |
|
|
2011 |
|
| 10.98 |
|
| (0.07 | ) |
| (1.39 | ) |
| (1.46 | ) |
| – |
|
| (0.19 | ) |
| – |
|
| (0.19 | ) |
| – |
|
| 9.33 |
|
| (13.25 | ) |
| 6,484 |
|
| 1.46 |
|
|
| 1.46 |
|
|
| 1.46 |
|
|
| (0.68 | ) |
|
| 35 |
|
|
2010 |
|
| 8.24 |
|
| (0.07 | ) |
| 2.81 |
|
| 2.74 |
|
| – |
|
| – |
|
| – |
|
| – |
|
| – |
|
| 10.98 |
|
| 33.25 |
|
| 6,657 |
|
| 1.63 |
|
|
| 1.63 |
|
|
| 1.59 |
|
|
| (0.76 | ) |
|
| 47 |
|
|
2009 |
|
| 5.11 |
|
| (0.06 | ) |
| 3.19 |
|
| 3.13 |
|
| – |
|
| – |
|
| – |
|
| – |
|
| – |
|
| 8.24 |
|
| 61.25 |
|
| 286 |
|
| 6.85 |
|
|
| 6.85 |
|
|
| 1.59 |
|
|
| (0.86 | ) |
|
| 44 |
|
|
Royce Special Equity Fund – Investment Class | |||||||||||||||||||||||||||||||||||||||||||||||||||||||||
†2014 |
| $ | 25.02 |
| $ | 0.08 |
| $ | (0.04 | ) | $ | 0.04 |
| $ | – |
| $ | – |
| $ | – |
| $ | – |
| $ | – |
| $ | 25.06 |
|
| 0.16 | %1 | $ | 2,279,591 |
|
| 1.12 | %2 |
|
| 1.12 | %2 |
|
| 1.12 | %2 |
|
| 0.65 | %2 |
|
| 11 | % |
|
| 2013 | 21.13 | 0.03 |
| 6.09 | 6.12 | (0.03 | ) | (2.20 | ) | – | (2.23 | ) | – | 25.02 | 29.36 | 2,510,346 | 1.13 | 1.13 | 1.13 | 0.13 | 28 | ||||||||||||||||||||||||||||||||||||
2012 |
|
| 19.70 |
|
| 0.46 |
|
| 2.53 |
|
| 2.99 |
|
| (0.46 | ) |
| (1.10 | ) |
| – |
|
| (1.56 | ) |
| – |
|
| 21.13 |
|
| 15.36 |
|
| 2,048,091 |
|
| 1.13 |
|
|
| 1.13 |
|
|
| 1.13 |
|
|
| 2.20 |
|
|
| 31 |
|
|
2011 |
|
| 20.87 |
|
| 0.05 |
|
| (0.05 | ) |
| 0.00 |
|
| (0.09 | ) |
| (1.08 | ) |
| – |
|
| (1.17 | ) |
| – |
|
| 19.70 |
|
| 0.08 |
|
| 1,677,393 |
|
| 1.15 |
|
|
| 1.15 |
|
|
| 1.15 |
|
|
| 0.23 |
|
|
| 23 |
|
|
2010 |
|
| 17.50 |
|
| 0.14 |
|
| 3.29 |
|
| 3.43 |
|
| (0.06 | ) |
| – |
|
| – |
|
| (0.06 | ) |
| – |
|
| 20.87 |
|
| 19.61 |
|
| 1,487,632 |
|
| 1.17 |
|
|
| 1.16 |
|
|
| 1.16 |
|
|
| 0.78 |
|
|
| 21 |
|
|
2009 |
|
| 13.69 |
|
| 0.07 |
|
| 3.80 |
|
| 3.87 |
|
| (0.07 | ) |
| – |
|
| – |
|
| (0.07 | ) |
| 0.01 |
|
| 17.50 |
|
| 28.38 |
|
| 842,678 |
|
| 1.17 |
|
|
| 1.17 |
|
|
| 1.17 |
|
|
| 0.62 |
|
|
| 10 |
|
|
Royce Special Equity Fund – Service Class | |||||||||||||||||||||||||||||||||||||||||||||||||||||||||
†2014 |
| $ | 24.97 |
| $ | 0.05 |
| $ | (0.05 | ) | $ | 0.00 |
| $ | – |
| $ | – |
| $ | – |
| $ | – |
| $ | – |
| $ | 24.97 |
|
| 0.00 | %1 | $ | 291,146 |
|
| 1.43 | %2 |
|
| 1.43 | %2 |
|
| 1.39 | %2 |
|
| 0.39 | %2 |
|
| 11 | % |
|
| 2013 | 21.12 | (0.03 | ) | 6.08 | 6.05 | – | (2.20 | ) | – | (2.20 | ) | – | 24.97 | 29.04 | 335,952 | 1.45 | 1.45 | 1.39 | (0.13 | ) | 28 | ||||||||||||||||||||||||||||||||||||
2012 |
|
| 19.66 |
|
| 0.42 |
|
| 2.52 |
|
| 2.94 |
|
| (0.38 | ) |
| (1.10 | ) |
| – |
|
| (1.48 | ) |
| – |
|
| 21.12 |
|
| 15.10 |
|
| 250,915 |
|
| 1.43 |
|
|
| 1.43 |
|
|
| 1.39 |
|
|
| 1.90 |
|
|
| 31 |
|
|
2011 |
|
| 20.83 |
|
| 0.00 |
|
| (0.05 | ) |
| (0.05 | ) |
| (0.05 | ) |
| (1.08 | ) |
| – |
|
| (1.13 | ) |
| 0.01 |
|
| 19.66 |
|
| (0.12 | ) |
| 216,143 |
|
| 1.45 |
|
|
| 1.45 |
|
|
| 1.39 |
|
|
| 0.00 |
|
|
| 23 |
|
|
2010 |
|
| 17.48 |
|
| 0.10 |
|
| 3.27 |
|
| 3.37 |
|
| (0.03 | ) |
| – |
|
| – |
|
| (0.03 | ) |
| 0.01 |
|
| 20.83 |
|
| 19.33 |
|
| 160,870 |
|
| 1.48 |
|
|
| 1.48 |
|
|
| 1.39 |
|
|
| 0.56 |
|
|
| 21 |
|
|
2009 |
|
| 13.69 |
|
| (0.00 | ) |
| 3.84 |
|
| 3.84 |
|
| (0.06 | ) |
| – |
|
| – |
|
| (0.06 | ) |
| 0.01 |
|
| 17.48 |
|
| 28.11 |
|
| 72,360 |
|
| 1.52 |
|
|
| 1.52 |
|
|
| 1.39 |
|
|
| 0.29 |
|
|
| 10 |
|
|
Royce Special Equity Fund – Consultant Class | |||||||||||||||||||||||||||||||||||||||||||||||||||||||||
†2014 |
| $ | 23.57 |
| $ | (0.04 | ) | $ | (0.04 | ) | $ | (0.08 | ) | $ | – |
| $ | – |
| $ | – |
| $ | – |
| $ | – |
| $ | 23.49 |
|
| (0.34 | )%1 | $ | 68,768 |
|
| 2.14 | %2 |
|
| 2.14 | %2 |
|
| 2.14 | %2 |
|
| (0.37 | )%2 |
|
| 11 | % |
|
2013 |
|
| 20.20 |
|
| (0.21 | ) |
| 5.78 |
|
| 5.57 |
|
| – |
|
| (2.20 | ) |
| – |
|
| (2.20 | ) |
| – |
|
| 23.57 |
|
| 27.97 |
|
| 71,333 |
|
| 2.17 |
|
|
| 2.17 |
|
|
| 2.17 |
|
|
| (0.90 | ) |
|
| 28 |
|
|
2012 |
|
| 18.88 |
|
| 0.23 |
|
| 2.42 |
|
| 2.65 |
|
| (0.23 | ) |
| (1.10 | ) |
| – |
|
| (1.33 | ) |
| – |
|
| 20.20 |
|
| 14.20 |
|
| 57,755 |
|
| 2.18 |
|
|
| 2.18 |
|
|
| 2.18 |
|
|
| 1.13 |
|
|
| 31 |
|
|
2011 |
|
| 20.16 |
|
| (0.15 | ) |
| (0.05 | ) |
| (0.20 | ) |
| – |
|
| (1.08 | ) |
| – |
|
| (1.08 | ) |
| – |
|
| 18.88 |
|
| (0.93 | ) |
| 50,253 |
|
| 2.16 |
|
|
| 2.16 |
|
|
| 2.16 |
|
|
| (0.77 | ) |
|
| 23 |
|
|
2010 |
|
| 17.03 |
|
| (0.04 | ) |
| 3.17 |
|
| 3.13 |
|
| – |
|
| – |
|
| – |
|
| – |
|
| – |
|
| 20.16 |
|
| 18.38 |
|
| 38,497 |
|
| 2.17 |
|
|
| 2.17 |
|
|
| 2.17 |
|
|
| (0.22 | ) |
|
| 21 |
|
|
2009 |
|
| 13.42 |
|
| (0.06 | ) |
| 3.67 |
|
| 3.61 |
|
| – |
|
| – |
|
| – |
|
| – |
|
| – |
|
| 17.03 |
|
| 26.90 |
|
| 20,891 |
|
| 2.23 |
|
|
| 2.23 |
|
|
| 2.23 |
|
|
| (0.41 | ) |
|
| 10 |
|
|
| 108 | The Royce Funds 2014 Semiannual Report to Shareholders | THE ACCOMPANYING NOTES ARE AN INTEGRAL PART OF THESE FINANCIAL STATEMENTS. |
|
Financial Highlights |
|
| |||||||||||||||||||||||||||||||||||||||||||||||||||||||||||||||
|
| Net Asset |
| Net |
| Net Realized and Unrealized |
|
| Distributions |
| Distributions from Net |
|
|
|
|
|
|
|
|
| Ratio of Expenses to Average Net Assets |
| Ratio of Net Investment |
|
| ||||||||||||||||||||||||||||||||||||||
|
| Value, |
| Investment |
| Gain (Loss) on |
| Total from Investment Operations |
| from Net Investment Income |
| Realized Gain on |
| Distributions |
| Total Distributions |
| Shareholder Redemption Fees |
| Net Asset |
| Total Return |
| Net Assets, |
| Prior to Fee |
| Prior |
| Net of |
| Income (Loss) |
| Portfolio Turnover Rate |
| ||||||||||||||||||||||||||||
|
|
|
|
|
|
|
|
|
|
|
|
|
|
|
|
|
|
|
|
|
|
|
|
|
|
|
|
|
|
|
|
|
|
|
|
|
|
|
|
|
|
|
|
|
|
|
|
|
|
|
|
|
|
|
|
|
| ||||||
Royce Special Equity Fund – Institutional Class | |||||||||||||||||||||||||||||||||||||||||||||||||||||||||||||||
†2014 |
| $ | 24.88 |
| $ | 0.09 |
| $ | (0.04 | ) | $ | 0.05 |
| $ | – |
| $ | – |
| $ | – |
| $ | – |
| $ | – |
| $ | 24.93 |
|
| 0.20 | %1 | $ | 696,501 |
|
| 1.01 | %2 |
|
| 1.01 | %2 |
|
| 1.01 | %2 |
|
| 0.75 | %2 |
|
| 11 | % |
| ||||||
2013 |
|
| 21.02 |
|
| 0.06 |
|
| 6.06 |
|
| 6.12 |
|
| (0.06 | ) |
| (2.20 | ) |
| – |
|
| (2.26 | ) |
| – |
|
| 24.88 |
|
| 29.51 |
|
| 700,200 |
|
| 1.01 |
|
|
| 1.01 |
|
|
| 1.01 |
|
|
| 0.26 |
|
|
| 28 |
|
| ||||||
2012 |
|
| 19.63 |
|
| 0.49 |
|
| 2.51 |
|
| 3.00 |
|
| (0.51 | ) |
| (1.10 | ) |
| – |
|
| (1.61 | ) |
| – |
|
| 21.02 |
|
| 15.46 |
|
| 571,388 |
|
| 1.02 |
|
|
| 1.02 |
|
|
| 1.02 |
|
|
| 2.28 |
|
|
| 31 |
|
| ||||||
2011 |
|
| 20.79 |
|
| 0.07 |
|
| (0.03 | ) |
| 0.04 |
|
| (0.12 | ) |
| (1.08 | ) |
| – |
|
| (1.20 | ) |
| – |
|
| 19.63 |
|
| 0.25 |
|
| 481,855 |
|
| 1.03 |
|
|
| 1.03 |
|
|
| 1.03 |
|
|
| 0.36 |
|
|
| 23 |
|
| ||||||
2010 |
|
| 17.44 |
|
| 0.16 |
|
| 3.27 |
|
| 3.43 |
|
| (0.08 | ) |
| – |
|
| – |
|
| (0.08 | ) |
| – |
|
| 20.79 |
|
| 19.69 |
|
| 445,168 |
|
| 1.04 |
|
|
| 1.04 |
|
|
| 1.04 |
|
|
| 0.91 |
|
|
| 21 |
|
| ||||||
2009 |
|
| 13.65 |
|
| 0.11 |
|
| 3.77 |
|
| 3.88 |
|
| (0.09 | ) |
| – |
|
| – |
|
| (0.09 | ) |
| – |
|
| 17.44 |
|
| 28.42 |
|
| 280,253 |
|
| 1.05 |
|
|
| 1.05 |
|
|
| 1.05 |
|
|
| 0.81 |
|
|
| 10 |
|
| ||||||
Royce Value Fund – Investment Class | |||||||||||||||||||||||||||||||||||||||||||||||||||||||||||||||
†2014 |
| $ | 13.52 |
| $ | 0.02 |
| $ | 0.46 |
| $ | 0.48 |
| $ | – |
| $ | – |
| $ | – |
| $ | – |
| $ | – |
| $ | 14.00 |
|
| 3.55 | %1 | $ | 148,807 |
|
| 1.20 | %2 |
|
| 1.20 | %2 |
|
| 1.20 | %2 |
|
| 0.27 | %2 |
|
| 18 | % |
| ||||||
2013 |
|
| 11.37 |
|
| 0.02 |
|
| 3.13 |
|
| 3.15 |
|
| (0.03 | ) |
| (0.97 | ) |
| – |
|
| (1.00 | ) |
| – |
|
| 13.52 |
|
| 28.06 |
|
| 196,854 |
|
| 1.21 |
|
|
| 1.21 |
|
|
| 1.21 |
|
|
| 0.11 |
|
|
| 51 |
|
| ||||||
2012 |
|
| 10.97 |
|
| 0.15 |
|
| 0.92 |
|
| 1.07 |
|
| (0.14 | ) |
| (0.53 | ) |
| – |
|
| (0.67 | ) |
| – |
|
| 11.37 |
|
| 9.88 |
|
| 206,316 |
|
| 1.19 |
|
|
| 1.19 |
|
|
| 1.19 |
|
|
| 1.22 |
|
|
| 25 |
|
| ||||||
2011 |
|
| 12.70 |
|
| 0.00 |
|
| (0.92 | ) |
| (0.92 | ) |
| (0.07 | ) |
| (0.75 | ) |
| – |
|
| (0.82 | ) |
| 0.01 |
|
| 10.97 |
|
| (7.17 | ) |
| 218,126 |
|
| 1.17 |
|
|
| 1.17 |
|
|
| 1.17 |
|
|
| 0.09 |
|
|
| 35 |
|
| ||||||
2010 |
|
| 10.16 |
|
| 0.03 |
|
| 2.55 |
|
| 2.58 |
|
| (0.04 | ) |
| – |
|
| – |
|
| (0.04 | ) |
| – |
|
| 12.70 |
|
| 25.42 |
|
| 115,007 |
|
| 1.16 |
|
|
| 1.16 |
|
|
| 1.16 |
|
|
| 0.32 |
|
|
| 35 |
|
| ||||||
2009 |
|
| 7.00 |
|
| 0.01 |
|
| 3.15 |
|
| 3.16 |
|
| – |
|
| – |
|
| – |
|
| – |
|
| – |
|
| 10.16 |
|
| 45.14 |
|
| 67,249 |
|
| 1.14 |
|
|
| 1.14 |
|
|
| 1.14 |
|
|
| 0.06 |
|
|
| 49 |
|
| ||||||
Royce Value Fund – Service Class | |||||||||||||||||||||||||||||||||||||||||||||||||||||||||||||||
†2014 |
| $ | 13.48 |
| $ | 0.00 |
| $ | 0.46 |
| $ | 0.46 |
| $ | – |
| $ | – |
| $ | – |
| $ | – |
| $ | – |
| $ | 13.94 |
|
| 3.41 | %1 | $ | 606,986 |
|
| 1.48 | %2 |
|
| 1.48 | %2 |
|
| 1.48 | %2 |
|
| 0.01 | %2 |
|
| 18 | % |
| ||||||
2013 |
|
| 11.34 |
|
| (0.02 | ) |
| 3.13 |
|
| 3.11 |
|
| – |
|
| (0.97 | ) |
| – |
|
| (0.97 | ) |
| – |
|
| 13.48 |
|
| 27.76 |
|
| 680,674 |
|
| 1.48 |
|
|
| 1.48 |
|
|
| 1.48 |
|
|
| (0.17 | ) |
|
| 51 |
|
| ||||||
2012 |
|
| 10.94 |
|
| 0.12 |
|
| 0.91 |
|
| 1.03 |
|
| (0.10 | ) |
| (0.53 | ) |
| – |
|
| (0.63 | ) |
| – |
|
| 11.34 |
|
| 9.56 |
|
| 831,673 |
|
| 1.45 |
|
|
| 1.45 |
|
|
| 1.45 |
|
|
| 0.90 |
|
|
| 25 |
|
| ||||||
2011 |
|
| 12.65 |
|
| (0.03 | ) |
| (0.92 | ) |
| (0.95 | ) |
| (0.02 | ) |
| (0.75 | ) |
| – |
|
| (0.77 | ) |
| 0.01 |
|
| 10.94 |
|
| (7.41 | ) |
| 1,083,903 |
|
| 1.45 |
|
|
| 1.45 |
|
|
| 1.44 |
|
|
| (0.23 | ) |
|
| 35 |
|
| ||||||
2010 |
|
| 10.13 |
|
| 0.00 |
|
| 2.53 |
|
| 2.53 |
|
| (0.01 | ) |
| – |
|
| – |
|
| (0.01 | ) |
| – |
|
| 12.65 |
|
| 24.97 |
|
| 1,415,766 |
|
| 1.46 |
|
|
| 1.46 |
|
|
| 1.44 |
|
|
| 0.04 |
|
|
| 35 |
|
| ||||||
2009 |
|
| 7.00 |
|
| (0.03 | ) |
| 3.16 |
|
| 3.13 |
|
| – |
|
| – |
|
| – |
|
| – |
|
| – |
|
| 10.13 |
|
| 44.71 |
|
| 1,178,806 |
|
| 1.47 |
|
|
| 1.47 |
|
|
| 1.45 |
|
|
| (0.31 | ) |
|
| 49 |
|
| ||||||
Royce Value Fund – Consultant Class | |||||||||||||||||||||||||||||||||||||||||||||||||||||||||||||||
†2014 |
| $ | 12.68 |
| $ | (0.05 | ) | $ | 0.44 |
| $ | 0.39 |
| $ | – |
| $ | – |
| $ | – |
| $ | – |
| $ | – |
| $ | 13.07 |
|
| 3.08 | %1 | $ | 29,923 |
|
| 2.25 | %2 |
|
| 2.25 | %2 |
|
| 2.25 | %2 |
|
| (0.76 | )%2 |
|
| 18 | % |
| ||||||
2013 |
|
| 10.81 |
|
| (0.12 | ) |
| 2.96 |
|
| 2.84 |
|
| – |
|
| (0.97 | ) |
| – |
|
| (0.97 | ) |
| – |
|
| 12.68 |
|
| 26.61 |
|
| 31,604 |
|
| 2.29 |
|
|
| 2.29 |
|
|
| 2.29 |
|
|
| (0.97 | ) |
|
| 51 |
|
| ||||||
2012 |
|
| 10.46 |
|
| 0.02 |
|
| 0.89 |
|
| 0.91 |
|
| (0.03 | ) |
| (0.53 | ) |
| – |
|
| (0.56 | ) |
| – |
|
| 10.81 |
|
| 8.77 |
|
| 33,480 |
|
| 2.26 |
|
|
| 2.26 |
|
|
| 2.26 |
|
|
| 0.15 |
|
|
| 25 |
|
| ||||||
2011 |
|
| 12.21 |
|
| (0.11 | ) |
| (0.89 | ) |
| (1.00 | ) |
| – |
|
| (0.75 | ) |
| – |
|
| (0.75 | ) |
| – |
|
| 10.46 |
|
| (8.20 | ) |
| 36,104 |
|
| 2.17 |
|
|
| 2.17 |
|
|
| 2.17 |
|
|
| (0.94 | ) |
|
| 35 |
|
| ||||||
2010 |
|
| 9.84 |
|
| (0.07 | ) |
| 2.44 |
|
| 2.37 |
|
| – |
|
| – |
|
| – |
|
| – |
|
| – |
|
| 12.21 |
|
| 24.09 |
|
| 35,167 |
|
| 2.18 |
|
|
| 2.18 |
|
|
| 2.18 |
|
|
| (0.69 | ) |
|
| 35 |
|
| ||||||
2009 |
|
| 6.85 |
|
| (0.09 | ) |
| 3.08 |
|
| 2.99 |
|
| – |
|
| – |
|
| – |
|
| – |
|
| – |
|
| 9.84 |
|
| 43.65 |
|
| 27,625 |
|
| 2.23 |
|
|
| 2.23 |
|
|
| 2.23 |
|
|
| (1.09 | ) |
|
| 49 |
|
| ||||||
Royce Value Fund – Institutional Class | |||||||||||||||||||||||||||||||||||||||||||||||||||||||||||||||
†2014 |
| $ | 13.53 |
| $ | 0.03 |
| $ | 0.46 |
| $ | 0.49 |
| $ | – |
| $ | – |
| $ | – |
| $ | – |
| $ | – |
| $ | 14.02 |
|
| 3.62 | %1 | $ | 215,764 |
|
| 1.05 | %2 |
|
| 1.05 | %2 |
|
| 1.05 | %2 |
|
| 0.45 | %2 |
|
| 18 | % |
| ||||||
2013 |
|
| 11.38 |
|
| 0.04 |
|
| 3.13 |
|
| 3.17 |
|
| (0.05 | ) |
| (0.97 | ) |
| – |
|
| (1.02 | ) |
| – |
|
| 13.53 |
|
| 28.22 |
|
| 219,667 |
|
| 1.05 |
|
|
| 1.05 |
|
|
| 1.05 |
|
|
| 0.27 |
|
|
| 51 |
|
| ||||||
2012 |
|
| 10.98 |
|
| 0.17 |
|
| 0.92 |
|
| 1.09 |
|
| (0.16 | ) |
| (0.53 | ) |
| – |
|
| (0.69 | ) |
| – |
|
| 11.38 |
|
| 10.04 |
|
| 202,643 |
|
| 1.05 |
|
|
| 1.05 |
|
|
| 1.05 |
|
|
| 1.41 |
|
|
| 25 |
|
| ||||||
2011 |
|
| 12.71 |
|
| 0.03 |
|
| (0.94 | ) |
| (0.91 | ) |
| (0.07 | ) |
| (0.75 | ) |
| – |
|
| (0.82 | ) |
| – |
|
| 10.98 |
|
| (7.12 | ) |
| 190,591 |
|
| 1.04 |
|
|
| 1.04 |
|
|
| 1.04 |
|
|
| 0.19 |
|
|
| 35 |
|
| ||||||
2010 |
|
| 10.17 |
|
| 0.05 |
|
| 2.54 |
|
| 2.59 |
|
| (0.05 | ) |
| – |
|
| – |
|
| (0.05 | ) |
| – |
|
| 12.71 |
|
| 25.52 |
|
| 219,111 |
|
| 1.04 |
|
|
| 1.04 |
|
|
| 1.04 |
|
|
| 0.45 |
|
|
| 35 |
|
| ||||||
2009 |
|
| 7.00 |
|
| 0.01 |
|
| 3.16 |
|
| 3.17 |
|
| – |
|
| – |
|
| – |
|
| – |
|
| – |
|
| 10.17 |
|
| 45.29 |
|
| 167,215 |
|
| 1.04 |
|
|
| 1.04 |
|
|
| 1.04 |
|
|
| 0.10 |
|
|
| 49 |
|
| ||||||
Royce Value Fund – R Class | |||||||||||||||||||||||||||||||||||||||||||||||||||||||||||||||
†2014 |
| $ | 13.19 |
| $ | (0.02 | ) | $ | 0.45 |
| $ | 0.43 |
| $ | – |
| $ | – |
| $ | – |
| $ | – |
| $ | – |
| $ | 13.62 |
|
| 3.26 | %1 | $ | 36,445 |
|
| 1.79 | %2 |
|
| 1.79 | %2 |
|
| 1.79 | %2 |
|
| (0.30 | )%2 |
|
| 18 | % |
| ||||||
2013 |
|
| 11.16 |
|
| (0.06 | ) |
| 3.06 |
|
| 3.00 |
|
| – |
|
| (0.97 | ) |
| – |
|
| (0.97 | ) |
| – |
|
| 13.19 |
|
| 27.21 |
|
| 37,409 |
|
| 1.83 |
|
|
| 1.83 |
|
|
| 1.83 |
|
|
| (0.52 | ) |
|
| 51 |
|
| ||||||
2012 |
|
| 10.78 |
|
| 0.07 |
|
| 0.91 |
|
| 0.98 |
|
| (0.07 | ) |
| (0.53 | ) |
| – |
|
| (0.60 | ) |
| – |
|
| 11.16 |
|
| 9.18 |
|
| 37,679 |
|
| 1.85 |
|
|
| 1.85 |
|
|
| 1.85 |
|
|
| 0.59 |
|
|
| 25 |
|
| ||||||
2011 |
|
| 12.54 |
|
| (0.06 | ) |
| (0.91 | ) |
| (0.97 | ) |
| (0.04 | ) |
| (0.75 | ) |
| – |
|
| (0.79 | ) |
| – |
|
| 10.78 |
|
| (7.75 | ) |
| 34,151 |
|
| 1.68 |
|
|
| 1.68 |
|
|
| 1.68 |
|
|
| (0.44 | ) |
|
| 35 |
|
| ||||||
2010 |
|
| 10.05 |
|
| (0.02 | ) |
| 2.51 |
|
| 2.49 |
|
| (0.00 | ) |
| – |
|
| – |
|
| (0.00 | ) |
| – |
|
| 12.54 |
|
| 24.81 |
|
| 26,524 |
|
| 1.68 |
|
|
| 1.67 |
|
|
| 1.67 |
|
|
| (0.16 | ) |
|
| 35 |
|
| ||||||
2009 |
|
| 6.97 |
|
| (0.06 | ) |
| 3.14 |
|
| 3.08 |
|
| – |
|
| – |
|
| – |
|
| – |
|
| – |
|
| 10.05 |
|
| 44.19 |
|
| 6,114 |
|
| 2.08 |
|
|
| 2.08 |
|
|
| 1.84 |
|
|
| (0.68 | ) |
|
| 49 |
|
| ||||||
| THE ACCOMPANYING NOTES ARE AN INTEGRAL PART OF THESE FINANCIAL STATEMENTS. | The Royce Funds 2014 Semiannual Report to Shareholders | 109 |
|
Financial Highlights |
|
| |||||||||||||||||||||||||||||||||||||||||||||||||||||||||
|
| Net |
| Net |
| Net Realized and Unrealized |
|
| Distributions |
| Distributions from Net |
|
|
|
|
|
|
|
|
| Ratio of Expenses to Average Net Assets |
| Ratio of Net Investment |
|
| ||||||||||||||||||||||||||||||||
|
| Asset Value, |
| Investment |
| Gain (Loss) on |
| Total from Investment Operations |
| from Net Investment Income |
| Realized Gain on |
| Distributions |
| Total Distributions |
| Shareholder Redemption Fees |
| Net Asset |
| Total Return |
| Net Assets, |
| Prior to Fee |
| Prior |
| Net of |
| Income (Loss) |
| Portfolio Turnover Rate |
| ||||||||||||||||||||||
|
|
|
|
|
|
|
|
|
|
|
|
|
|
|
|
|
|
|
|
|
|
|
|
|
|
|
|
|
|
|
|
|
|
|
|
|
|
|
|
|
|
|
|
|
|
|
|
|
|
|
|
|
|
|
|
|
|
Royce Value Fund – K Class | |||||||||||||||||||||||||||||||||||||||||||||||||||||||||
†2014 |
| $ | 10.65 |
| $ | (0.01 | ) | $ | 0.36 |
| $ | 0.35 |
| $ | – |
| $ | – |
| $ | – |
| $ | – |
| $ | – |
| $ | 11.00 |
|
| 3.29 | %1 | $ | 12,215 |
|
| 1.63 | %2 |
|
| 1.63 | %2 |
|
| 1.63 | %2 |
|
| (0.15 | )%2 |
|
| 18 | % |
|
2013 |
|
| 9.14 |
|
| (0.03 | ) |
| 2.51 |
|
| 2.48 |
|
| – |
|
| (0.97 | ) |
| – |
|
| (0.97 | ) |
| – |
|
| 10.65 |
|
| 27.55 |
|
| 16,285 |
|
| 1.62 |
|
|
| 1.62 |
|
|
| 1.62 |
|
|
| (0.30 | ) |
|
| 51 |
|
|
2012 |
|
| 8.95 |
|
| 0.09 |
|
| 0.75 |
|
| 0.84 |
|
| (0.12 | ) |
| (0.53 | ) |
| – |
|
| (0.65 | ) |
| – |
|
| 9.14 |
|
| 9.49 |
|
| 18,209 |
|
| 1.53 |
|
|
| 1.53 |
|
|
| 1.53 |
|
|
| 0.98 |
|
|
| 25 |
|
|
2011 |
|
| 10.54 |
|
| (0.03 | ) |
| (0.77 | ) |
| (0.80 | ) |
| (0.04 | ) |
| (0.75 | ) |
| – |
|
| (0.79 | ) |
| – |
|
| 8.95 |
|
| (7.54 | ) |
| 14,079 |
|
| 1.54 |
|
|
| 1.54 |
|
|
| 1.54 |
|
|
| (0.33 | ) |
|
| 35 |
|
|
2010 |
|
| 8.46 |
|
| (0.00 | ) |
| 2.10 |
|
| 2.10 |
|
| (0.02 | ) |
| – |
|
| – |
|
| (0.02 | ) |
| – |
|
| 10.54 |
|
| 24.82 |
|
| 13,195 |
|
| 1.50 |
|
|
| 1.50 |
|
|
| 1.50 |
|
|
| 0.01 |
|
|
| 35 |
|
|
2009 |
|
| 5.91 |
|
| (0.03 | ) |
| 2.58 |
|
| 2.55 |
|
| – |
|
| – |
|
| – |
|
| – |
|
| – |
|
| 8.46 |
|
| 43.15 |
|
| 4,721 |
|
| 1.73 |
|
|
| 1.73 |
|
|
| 1.59 |
|
|
| (0.43 | ) |
|
| 49 |
|
|
Royce Value Plus Fund – Investment Class | |||||||||||||||||||||||||||||||||||||||||||||||||||||||||
†2014 |
| $ | 17.03 |
| $ | (0.03 | ) | $ | 0.74 |
| $ | 0.71 |
| $ | – |
| $ | – |
| $ | – |
| $ | – |
| $ | – |
| $ | 17.74 |
|
| 4.17 | %1 | $ | 254,604 |
|
| 1.32 | %2 |
|
| 1.32 | %2 |
|
| 1.32 | %2 |
|
| (0.41 | )%2 |
|
| 27 | % |
|
2013 |
|
| 13.90 |
|
| (0.09 | ) |
| 4.57 |
|
| 4.48 |
|
| (0.00 | ) |
| (1.35 | ) |
| – |
|
| (1.35 | ) |
| – |
|
| 17.03 |
|
| 32.59 |
|
| 244,269 |
|
| 1.37 |
|
|
| 1.37 |
|
|
| 1.37 |
|
|
| (0.59 | ) |
|
| 45 |
|
|
2012 |
|
| 12.04 |
|
| (0.02 | ) |
| 1.88 |
|
| 1.86 |
|
| – |
|
| – |
|
| – |
|
| – |
|
| – |
|
| 13.90 |
|
| 15.45 |
|
| 228,016 |
|
| 1.27 |
|
|
| 1.27 |
|
|
| 1.27 |
|
|
| (0.14 | ) |
|
| 32 |
|
|
2011 |
|
| 13.52 |
|
| (0.06 | ) |
| (1.27 | ) |
| (1.33 | ) |
| (0.15 | ) |
| – |
|
| – |
|
| (0.15 | ) |
| – |
|
| 12.04 |
|
| (9.79 | ) |
| 298,073 |
|
| 1.13 |
|
|
| 1.13 |
|
|
| 1.13 |
|
|
| (0.42 | ) |
|
| 49 |
|
|
2010 |
|
| 11.31 |
|
| (0.02 | ) |
| 2.31 |
|
| 2.29 |
|
| (0.08 | ) |
| – |
|
| – |
|
| (0.08 | ) |
| – |
|
| 13.52 |
|
| 20.25 |
|
| 305,161 |
|
| 1.08 |
|
|
| 1.08 |
|
|
| 1.08 |
|
|
| (0.14 | ) |
|
| 48 |
|
|
2009 |
|
| 7.97 |
|
| 0.01 |
|
| 3.33 |
|
| 3.34 |
|
| – |
|
| – |
|
| – |
|
| – |
|
| – |
|
| 11.31 |
|
| 41.91 |
|
| 261,906 |
|
| 1.06 |
|
|
| 1.06 |
|
|
| 1.06 |
|
|
| 0.13 |
|
|
| 39 |
|
|
Royce Value Plus Fund – Service Class | |||||||||||||||||||||||||||||||||||||||||||||||||||||||||
†2014 |
| $ | 16.93 |
| $ | (0.05 | ) | $ | 0.74 |
| $ | 0.69 |
| $ | – |
| $ | – |
| $ | – |
| $ | – |
| $ | – |
| $ | 17.62 |
|
| 4.08 | %1 | $ | 753,559 |
|
| 1.50 | %2 |
|
| 1.50 | %2 |
|
| 1.48 | %2 |
|
| (0.57 | )%2 |
|
| 27 | % |
|
2013 |
|
| 13.83 |
|
| (0.11 | ) |
| 4.56 |
|
| 4.45 |
|
| – |
|
| (1.35 | ) |
| – |
|
| (1.35 | ) |
| – |
|
| 16.93 |
|
| 32.52 |
|
| 835,379 |
|
| 1.48 |
|
|
| 1.48 |
|
|
| 1.46 |
|
|
| (0.69 | ) |
|
| 45 |
|
|
2012 |
|
| 12.00 |
|
| (0.04 | ) |
| 1.87 |
|
| 1.83 |
|
| – |
|
| – |
|
| – |
|
| – |
|
| – |
|
| 13.83 |
|
| 15.25 |
|
| 966,735 |
|
| 1.45 |
|
|
| 1.45 |
|
|
| 1.44 |
|
|
| (0.33 | ) |
|
| 32 |
|
|
2011 |
|
| 13.42 |
|
| (0.08 | ) |
| (1.26 | ) |
| (1.34 | ) |
| (0.08 | ) |
| – |
|
| – |
|
| (0.08 | ) |
| – |
|
| 12.00 |
|
| (9.98 | ) |
| 1,417,973 |
|
| 1.44 |
|
|
| 1.44 |
|
|
| 1.42 |
|
|
| (0.74 | ) |
|
| 49 |
|
|
2010 |
|
| 11.24 |
|
| (0.06 | ) |
| 2.27 |
|
| 2.21 |
|
| (0.03 | ) |
| – |
|
| – |
|
| (0.03 | ) |
| – |
|
| 13.42 |
|
| 19.70 |
|
| 2,454,325 |
|
| 1.44 |
|
|
| 1.44 |
|
|
| 1.42 |
|
|
| (0.53 | ) |
|
| 48 |
|
|
2009 |
|
| 7.95 |
|
| (0.02 | ) |
| 3.31 |
|
| 3.29 |
|
| – |
|
| – |
|
| – |
|
| – |
|
| – |
|
| 11.24 |
|
| 41.38 |
|
| 2,505,017 |
|
| 1.47 |
|
|
| 1.47 |
|
|
| 1.45 |
|
|
| (0.25 | ) |
|
| 39 |
|
|
Royce Value Plus Fund – Consultant Class | |||||||||||||||||||||||||||||||||||||||||||||||||||||||||
†2014 |
| $ | 15.99 |
| $ | (0.11 | ) | $ | 0.70 |
| $ | 0.59 |
| $ | – |
| $ | – |
| $ | – |
| $ | – |
| $ | – |
| $ | 16.58 |
|
| 3.69 | %1 | $ | 20,931 |
|
| 2.30 | %2 |
|
| 2.30 | %2 |
|
| 2.30 | %2 |
|
| (1.40 | )%2 |
|
| 27 | % |
|
2013 |
|
| 13.24 |
|
| (0.24 | ) |
| 4.34 |
|
| 4.10 |
|
| – |
|
| (1.35 | ) |
| – |
|
| (1.35 | ) |
| – |
|
| 15.99 |
|
| 31.31 |
|
| 22,614 |
|
| 2.36 |
|
|
| 2.36 |
|
|
| 2.36 |
|
|
| (1.58 | ) |
|
| 45 |
|
|
2012 |
|
| 11.60 |
|
| (0.15 | ) |
| 1.79 |
|
| 1.64 |
|
| – |
|
| – |
|
| – |
|
| – |
|
| – |
|
| 13.24 |
|
| 14.14 |
|
| 19,618 |
|
| 2.37 |
|
|
| 2.37 |
|
|
| 2.37 |
|
|
| (1.21 | ) |
|
| 32 |
|
|
2011 |
|
| 12.99 |
|
| (0.19 | ) |
| (1.20 | ) |
| (1.39 | ) |
| – |
|
| – |
|
| – |
|
| – |
|
| – |
|
| 11.60 |
|
| (10.70 | ) |
| 20,245 |
|
| 2.19 |
|
|
| 2.19 |
|
|
| 2.19 |
|
|
| (1.50 | ) |
|
| 49 |
|
|
2010 |
|
| 10.93 |
|
| (0.14 | ) |
| 2.20 |
|
| 2.06 |
|
| – |
|
| – |
|
| – |
|
| – |
|
| – |
|
| 12.99 |
|
| 18.85 |
|
| 30,279 |
|
| 2.16 |
|
|
| 2.16 |
|
|
| 2.16 |
|
|
| (1.26 | ) |
|
| 48 |
|
|
2009 |
|
| 7.79 |
|
| (0.09 | ) |
| 3.23 |
|
| 3.14 |
|
| – |
|
| – |
|
| – |
|
| – |
|
| – |
|
| 10.93 |
|
| 40.31 |
|
| 31,154 |
|
| 2.20 |
|
|
| 2.20 |
|
|
| 2.20 |
|
|
| (0.98 | ) |
|
| 39 |
|
|
Royce Value Plus Fund – Institutional Class | |||||||||||||||||||||||||||||||||||||||||||||||||||||||||
†2014 |
| $ | 17.09 |
| $ | (0.02 | ) | $ | 0.76 |
| $ | 0.74 |
| $ | – |
| $ | – |
| $ | – |
| $ | – |
| $ | – |
| $ | 17.83 |
|
| 4.33 | %1 | $ | 70,259 |
|
| 1.09 | %2 |
|
| 1.09 | %2 |
|
| 1.09 | %2 |
|
| (0.20 | )%2 |
|
| 27 | % |
|
2013 |
|
| 13.94 |
|
| (0.03 | ) |
| 4.57 |
|
| 4.54 |
|
| (0.04 | ) |
| (1.35 | ) |
| – |
|
| (1.39 | ) |
| – |
|
| 17.09 |
|
| 32.99 |
|
| 142,923 |
|
| 1.07 |
|
|
| 1.07 |
|
|
| 1.07 |
|
|
| (0.30 | ) |
|
| 45 |
|
|
2012 |
|
| 12.05 |
|
| 0.01 |
|
| 1.88 |
|
| 1.89 |
|
| – |
|
| – |
|
| – |
|
| – |
|
| – |
|
| 13.94 |
|
| 15.68 |
|
| 216,572 |
|
| 1.06 |
|
|
| 1.06 |
|
|
| 1.06 |
|
|
| 0.08 |
|
|
| 32 |
|
|
2011 |
|
| 13.52 |
|
| (0.01 | ) |
| (1.30 | ) |
| (1.31 | ) |
| (0.16 | ) |
| – |
|
| – |
|
| (0.16 | ) |
| – |
|
| 12.05 |
|
| (9.70 | ) |
| 261,425 |
|
| 1.05 |
|
|
| 1.05 |
|
|
| 1.05 |
|
|
| (0.36 | ) |
|
| 49 |
|
|
2010 |
|
| 11.31 |
|
| (0.01 | ) |
| 2.30 |
|
| 2.29 |
|
| (0.08 | ) |
| – |
|
| – |
|
| (0.08 | ) |
| – |
|
| 13.52 |
|
| 20.25 |
|
| 425,911 |
|
| 1.04 |
|
|
| 1.04 |
|
|
| 1.04 |
|
|
| (0.12 | ) |
|
| 48 |
|
|
2009 |
|
| 7.97 |
|
| 0.01 |
|
| 3.33 |
|
| 3.34 |
|
| – |
|
| – |
|
| – |
|
| – |
|
| – |
|
| 11.31 |
|
| 41.91 |
|
| 357,734 |
|
| 1.06 |
|
|
| 1.06 |
|
|
| 1.06 |
|
|
| 0.08 |
|
|
| 39 |
|
|
Royce Value Plus Fund – R Class | |||||||||||||||||||||||||||||||||||||||||||||||||||||||||
†2014 |
| $ | 16.43 |
| $ | (0.08 | ) | $ | 0.72 |
| $ | 0.64 |
| $ | – |
| $ | – |
| $ | – |
| $ | – |
| $ | – |
| $ | 17.07 |
|
| 3.90 | %1 | $ | 1,438 |
|
| 2.32 | %2 |
|
| 2.32 | %2 |
|
| 1.84 | %2 |
|
| (0.94 | )%2 |
|
| 27 | % |
|
2013 |
|
| 13.51 |
|
| (0.16 | ) |
| 4.43 |
|
| 4.27 |
|
| – |
|
| (1.35 | ) |
| – |
|
| (1.35 | ) |
| – |
|
| 16.43 |
|
| 31.95 |
|
| 1,605 |
|
| 2.41 |
|
|
| 2.41 |
|
|
| 1.84 |
|
|
| (1.06 | ) |
|
| 45 |
|
|
2012 |
|
| 11.77 |
|
| (0.09 | ) |
| 1.83 |
|
| 1.74 |
|
| – |
|
| – |
|
| – |
|
| – |
|
| – |
|
| 13.51 |
|
| 14.78 |
|
| 1,221 |
|
| 2.35 |
|
|
| 2.35 |
|
|
| 1.84 |
|
|
| (0.66 | ) |
|
| 32 |
|
|
2011 |
|
| 13.24 |
|
| (0.15 | ) |
| (1.23 | ) |
| (1.38 | ) |
| (0.09 | ) |
| – |
|
| – |
|
| (0.09 | ) |
| – |
|
| 11.77 |
|
| (10.40 | ) |
| 1,079 |
|
| 2.45 |
|
|
| 2.45 |
|
|
| 1.84 |
|
|
| (1.12 | ) |
|
| 49 |
|
|
2010 |
|
| 11.13 |
|
| (0.11 | ) |
| 2.26 |
|
| 2.15 |
|
| (0.04 | ) |
| – |
|
| – |
|
| (0.04 | ) |
| – |
|
| 13.24 |
|
| 19.34 |
|
| 942 |
|
| 2.75 |
|
|
| 2.75 |
|
|
| 1.84 |
|
|
| (0.90 | ) |
|
| 48 |
|
|
2009 |
|
| 7.91 |
|
| (0.06 | ) |
| 3.28 |
|
| 3.22 |
|
| – |
|
| – |
|
| – |
|
| – |
|
| – |
|
| 11.13 |
|
| 40.71 |
|
| 642 |
|
| 3.76 |
|
|
| 3.76 |
|
|
| 1.84 |
|
|
| (0.70 | ) |
|
| 39 |
|
|
| 110 | The Royce Funds 2014 Semiannual Report to Shareholders | THE ACCOMPANYING NOTES ARE AN INTEGRAL PART OF THESE FINANCIAL STATEMENTS. |
Financial Highlights |
|
| |||||||||||||||||||||||||||||||||||||||||||||||||||||||||||||||
|
| Net |
| Net |
| Net Realized and Unrealized |
|
| Distributions |
| Distributions from Net |
|
|
|
|
|
|
|
|
| Ratio of Expenses to Average Net Assets |
| Ratio of Net Investment |
|
| ||||||||||||||||||||||||||||||||||||||
|
| Asset Value, |
| Investment |
| Gain (Loss) on |
| Total from Investment Operations |
| from Net Investment Income |
| Realized Gain on |
| Distributions |
| Total Distributions |
| Shareholder Redemption Fees |
| Net Asset |
| Total Return |
| Net Assets, |
| Prior to Fee |
| Prior |
| Net of |
| Income (Loss) |
| Portfolio Turnover Rate |
| ||||||||||||||||||||||||||||
|
|
|
|
|
|
|
|
|
|
|
|
|
|
|
|
|
|
|
|
|
|
|
|
|
|
|
|
|
|
|
|
|
|
|
|
|
|
|
|
|
|
|
|
|
|
|
|
|
|
|
|
|
|
|
|
|
| ||||||
Royce Value Plus Fund – K Class | |||||||||||||||||||||||||||||||||||||||||||||||||||||||||||||||
†2014 |
| $ | 11.96 |
| $ | (0.04 | ) | $ | 0.52 |
| $ | 0.48 |
| $ | – |
| $ | – |
| $ | – |
| $ | – |
| $ | – |
| $ | 12.44 |
|
| 4.01 | %1 | $ | 959 |
|
| 2.28 | %2 |
|
| 2.28 | %2 |
|
| 1.59 | %2 |
|
| (0.68 | )%2 |
|
| 27 | % |
| ||||||
2013 |
|
| 10.10 |
|
| (0.10 | ) |
| 3.31 |
|
| 3.21 |
|
| (0.00 | ) |
| (1.35 | ) |
| – |
|
| (1.35 | ) |
| – |
|
| 11.96 |
|
| 32.31 |
|
| 968 |
|
| 2.62 |
|
|
| 2.62 |
|
|
| 1.59 |
|
|
| (0.82 | ) |
|
| 45 |
|
| ||||||
2012 |
|
| 8.78 |
|
| (0.04 | ) |
| 1.36 |
|
| 1.32 |
|
| – |
|
| – |
|
| – |
|
| – |
|
| – |
|
| 10.10 |
|
| 15.03 |
|
| 486 |
|
| 2.96 |
|
|
| 2.96 |
|
|
| 1.59 |
|
|
| (0.45 | ) |
|
| 32 |
|
| ||||||
2011 |
|
| 9.77 |
|
| (0.08 | ) |
| (0.91 | ) |
| (0.99 | ) |
| – |
|
| – |
|
| – |
|
| – |
|
| – |
|
| 8.78 |
|
| (10.13 | ) |
| 501 |
|
| 1.86 |
|
|
| 1.86 |
|
|
| 1.59 |
|
|
| (0.86 | ) |
|
| 49 |
|
| ||||||
2010 |
|
| 8.22 |
|
| (0.06 | ) |
| 1.67 |
|
| 1.61 |
|
| (0.06 | ) |
| – |
|
| – |
|
| (0.06 | ) |
| – |
|
| 9.77 |
|
| 19.55 |
|
| 1,851 |
|
| 1.88 |
|
|
| 1.88 |
|
|
| 1.59 |
|
|
| (0.67 | ) |
|
| 48 |
|
| ||||||
2009 |
|
| 5.82 |
|
| (0.03 | ) |
| 2.43 |
|
| 2.40 |
|
| – |
|
| – |
|
| – |
|
| – |
|
| – |
|
| 8.22 |
|
| 41.24 |
|
| 1,363 |
|
| 2.46 |
|
|
| 2.45 |
|
|
| 1.59 |
|
|
| (0.38 | ) |
|
| 39 |
|
| ||||||
Royce 100 Fund – Investment Class | |||||||||||||||||||||||||||||||||||||||||||||||||||||||||||||||
†2014 |
| $ | 10.11 |
| $ | (0.01 | ) | $ | 0.31 |
| $ | 0.30 |
| $ | – |
| $ | – |
| $ | – |
| $ | – |
| $ | – |
| $ | 10.41 |
|
| 2.97 | %1 | $ | 61,513 |
|
| 1.18 | %2 |
|
| 1.18 | %2 |
|
| 1.18 | %2 |
|
| (0.10 | )%2 |
|
| 17 | % |
| ||||||
2013 |
|
| 8.85 |
|
| (0.00 | ) |
| 2.71 |
|
| 2.71 |
|
| (0.03 | ) |
| (1.42 | ) |
| – |
|
| (1.45 | ) |
| – |
|
| 10.11 |
|
| 31.24 |
|
| 60,156 |
|
| 1.20 |
|
|
| 1.20 |
|
|
| 1.20 |
|
|
| (0.07 | ) |
|
| 31 |
|
| ||||||
2012 |
|
| 8.74 |
|
| 0.12 |
|
| 0.88 |
|
| 1.00 |
|
| (0.15 | ) |
| (0.74 | ) |
| – |
|
| (0.89 | ) |
| – |
|
| 8.85 |
|
| 11.78 |
|
| 68,395 |
|
| 1.19 |
|
|
| 1.19 |
|
|
| 1.19 |
|
|
| 1.31 |
|
|
| 13 |
|
| ||||||
2011 |
|
| 9.82 |
|
| (0.03 | ) |
| (0.60 | ) |
| (0.63 | ) |
| (0.00 | ) |
| (0.45 | ) |
| – |
|
| (0.45 | ) |
| – |
|
| 8.74 |
|
| (6.31 | ) |
| 63,012 |
|
| 1.17 |
|
|
| 1.17 |
|
|
| 1.17 |
|
|
| (0.27 | ) |
|
| 27 |
|
| ||||||
2010 |
|
| 7.94 |
|
| 0.03 |
|
| 1.96 |
|
| 1.99 |
|
| – |
|
| (0.11 | ) |
| – |
|
| (0.11 | ) |
| – |
|
| 9.82 |
|
| 25.06 |
|
| 66,011 |
|
| 1.17 |
|
|
| 1.17 |
|
|
| 1.17 |
|
|
| 0.33 |
|
|
| 27 |
|
| ||||||
2009 |
|
| 5.74 |
|
| 0.00 |
|
| 2.20 |
|
| 2.20 |
|
| – |
|
| – |
|
| – |
|
| – |
|
| – |
|
| 7.94 |
|
| 38.33 |
|
| 35,165 |
|
| 1.22 |
|
|
| 1.22 |
|
|
| 1.22 |
|
|
| 0.03 |
|
|
| 42 |
|
| ||||||
Royce 100 Fund – Service Class | |||||||||||||||||||||||||||||||||||||||||||||||||||||||||||||||
†2014 |
| $ | 10.05 |
| $ | (0.02 | ) | $ | 0.30 |
| $ | 0.28 |
| $ | – |
| $ | – |
| $ | – |
| $ | – |
| $ | – |
| $ | 10.33 |
|
| 2.79 | %1 | $ | 219,772 |
|
| 1.48 | %2 |
|
| 1.48 | %2 |
|
| 1.46 | %2 |
|
| (0.40 | )%2 |
|
| 17 | % |
| ||||||
2013 |
|
| 8.81 |
|
| (0.04 | ) |
| 2.70 |
|
| 2.66 |
|
| (0.00 | ) |
| (1.42 | ) |
| – |
|
| (1.42 | ) |
| – |
|
| 10.05 |
|
| 30.85 |
|
| 231,879 |
|
| 1.50 |
|
|
| 1.50 |
|
|
| 1.48 |
|
|
| (0.36 | ) |
|
| 31 |
|
| ||||||
2012 |
|
| 8.67 |
|
| 0.11 |
|
| 0.86 |
|
| 0.97 |
|
| (0.09 | ) |
| (0.74 | ) |
| – |
|
| (0.83 | ) |
| – |
|
| 8.81 |
|
| 11.52 |
|
| 220,674 |
|
| 1.46 |
|
|
| 1.46 |
|
|
| 1.42 |
|
|
| 1.03 |
|
|
| 13 |
|
| ||||||
2011 |
|
| 9.76 |
|
| (0.05 | ) |
| (0.59 | ) |
| (0.64 | ) |
| – |
|
| (0.45 | ) |
| – |
|
| (0.45 | ) |
| – |
|
| 8.67 |
|
| (6.52 | ) |
| 310,825 |
|
| 1.47 |
|
|
| 1.47 |
|
|
| 1.42 |
|
|
| (0.53 | ) |
|
| 27 |
|
| ||||||
2010 |
|
| 7.91 |
|
| 0.00 |
|
| 1.96 |
|
| 1.96 |
|
| – |
|
| (0.11 | ) |
| – |
|
| (0.11 | ) |
| – |
|
| 9.76 |
|
| 24.77 |
|
| 366,184 |
|
| 1.50 |
|
|
| 1.50 |
|
|
| 1.46 |
|
|
| 0.03 |
|
|
| 27 |
|
| ||||||
2009 |
|
| 5.73 |
|
| (0.01 | ) |
| 2.19 |
|
| 2.18 |
|
| – |
|
| – |
|
| – |
|
| – |
|
| – |
|
| 7.91 |
|
| 38.05 |
|
| 197,607 |
|
| 1.54 |
|
|
| 1.54 |
|
|
| 1.49 |
|
|
| (0.19 | ) |
|
| 42 |
|
| ||||||
Royce 100 Fund – R Class | |||||||||||||||||||||||||||||||||||||||||||||||||||||||||||||||
†2014 |
| $ | 12.67 |
| $ | (0.05 | ) | $ | 0.37 |
| $ | 0.32 |
| $ | – |
| $ | – |
| $ | – |
| $ | – |
| $ | – |
| $ | 12.99 |
|
| 2.53 | %1 | $ | 2,970 |
|
| 2.18 | %2 |
|
| 2.17 | %2 |
|
| 1.84 | %2 |
|
| (0.76 | )%2 |
|
| 17 | % |
| ||||||
2013 |
|
| 10.84 |
|
| (0.09 | ) |
| 3.34 |
|
| 3.25 |
|
| – |
|
| (1.42 | ) |
| – |
|
| (1.42 | ) |
| – |
|
| 12.67 |
|
| 30.45 |
|
| 2,807 |
|
| 2.28 |
|
|
| 2.28 |
|
|
| 1.84 |
|
|
| (0.72 | ) |
|
| 31 |
|
| ||||||
2012 |
|
| 10.46 |
|
| 0.05 |
|
| 1.07 |
|
| 1.12 |
|
| – |
|
| (0.74 | ) |
| – |
|
| (0.74 | ) |
| – |
|
| 10.84 |
|
| 10.95 |
|
| 2,554 |
|
| 2.57 |
|
|
| 2.57 |
|
|
| 1.84 |
|
|
| 0.46 |
|
|
| 13 |
|
| ||||||
2011 |
|
| 11.72 |
|
| (0.10 | ) |
| (0.71 | ) |
| (0.81 | ) |
| – |
|
| (0.45 | ) |
| – |
|
| (0.45 | ) |
| – |
|
| 10.46 |
|
| (6.88 | ) |
| 3,469 |
|
| 2.70 |
|
|
| 2.69 |
|
|
| 1.84 |
|
|
| (0.88 | ) |
|
| 27 |
| |||||||
2010 |
|
| 9.52 |
|
| (0.03 | ) |
| 2.34 |
|
| 2.31 |
|
| – |
|
| (0.11 | ) |
| – |
|
| (0.11 | ) |
| – |
|
| 11.72 |
|
| 24.26 |
|
| 1,358 |
|
| 2.22 |
|
|
| 2.21 |
|
|
| 1.84 |
|
|
| (0.29 | ) |
|
| 27 |
|
| ||||||
2009 |
|
| 6.93 |
|
| (0.05 | ) |
| 2.64 |
|
| 2.59 |
|
| – |
|
| – |
|
| – |
|
| – |
|
| – |
|
| 9.52 |
|
| 37.37 |
|
| 296 |
|
| 6.58 |
|
|
| 6.57 |
|
|
| 1.84 |
|
|
| (0.56 | ) |
|
| 42 |
|
| ||||||
Royce 100 Fund – K Class | |||||||||||||||||||||||||||||||||||||||||||||||||||||||||||||||
†2014 |
| $ | 12.84 |
| $ | (0.04 | ) | $ | 0.39 |
| $ | 0.35 |
| $ | – |
| $ | – |
| $ | – |
| $ | – |
| $ | – |
| $ | 13.19 |
|
| 2.73 | %1 | $ | 1,055 |
|
| 2.14 | %2 |
|
| 2.14 | %2 |
|
| 1.59 | %2 |
|
| (0.60 | )%2 |
|
| 17 | % |
| ||||||
2013 |
|
| 10.95 |
|
| (0.06 | ) |
| 3.37 |
|
| 3.31 |
|
| – |
|
| (1.42 | ) |
| – |
|
| (1.42 | ) |
| – |
|
| 12.84 |
|
| 30.69 |
|
| 2,320 |
|
| 1.78 |
|
|
| 1.78 |
|
|
| 1.59 |
|
|
| (0.50 | ) |
|
| 31 |
|
| ||||||
2012 |
| 10.56 |
|
| 0.11 |
|
| 1.06 |
|
| 1.17 |
|
| (0.04 | ) |
| (0.74 | ) |
| – |
|
| (0.78 | ) |
| – |
|
| 10.95 |
|
| 11.37 |
|
| 3,554 |
|
| 1.68 |
|
|
| 1.68 |
|
|
| 1.59 |
|
|
| 0.88 |
|
|
| 13 |
|
| |||||||
2011 |
|
| 11.81 |
|
| (0.08 | ) |
| (0.72 | ) |
| (0.80 | ) |
| – |
|
| (0.45 | ) |
| – |
|
| (0.45 | ) |
| – |
|
| 10.56 |
|
| (6.75 | ) |
| 4,447 |
|
| 1.66 |
|
|
| 1.66 |
|
|
| 1.59 |
|
|
| (0.68 | ) |
|
| 27 |
|
| ||||||
2010 |
|
| 9.57 |
|
| 0.02 |
|
| 2.33 |
|
| 2.35 |
|
| – |
|
| (0.11 | ) |
| – |
|
| (0.11 | ) |
| – |
|
| 11.81 |
|
| 24.55 |
|
| 2,915 |
|
| 1.89 |
|
|
| 1.89 |
|
|
| 1.59 |
|
|
| 0.20 |
|
|
| 27 |
|
| ||||||
2009 |
|
| 6.94 |
|
| (0.03 | ) |
| 2.66 |
|
| 2.63 |
|
| – |
|
| – |
|
| – |
|
| – |
|
| – |
|
| 9.57 |
|
| 37.90 |
|
| 186 |
|
| 5.78 |
|
|
| 5.78 |
|
|
| 1.59 |
|
|
| (0.41 | ) |
|
| 42 |
|
| ||||||
| Royce Dividend Value Fund – Investment Class | |||||||||||||||||||||||||||||||||||||||||||||||||||||||||||||||
†2014 |
| $ | 8.90 |
| $ | 0.05 |
| $ | 0.25 |
| $ | 0.30 |
| $ | (0.04 | ) | $ | – |
| $ | – |
| $ | (0.04 | ) | $ | – |
| $ | 9.16 |
|
| 3.38 | %1 | $ | 195,623 |
|
| 1.19 | %2 |
|
| 1.19 | %2 |
|
| 1.19 | %2 |
|
| 1.18 | %2 |
|
| 14 | % |
| ||||||
2013 |
| 7.29 |
| 0.09 |
| 2.15 |
| 2.24 |
| (0.10 | ) | (0.53 | ) | – |
| (0.63 | ) | – |
| 8.90 |
|
| 31.23 |
| 211,589 |
|
| 1.21 |
|
|
| 1.21 |
|
|
| 1.21 |
|
|
| 1.13 |
|
|
| 36 |
|
| |||||||||||||||||
2012 |
|
| 6.34 |
|
| 0.14 |
|
| 0.95 |
|
| 1.09 |
|
| (0.12 | ) |
| (0.02 | ) |
| – |
|
| (0.14 | ) |
| – |
|
| 7.29 |
|
| 17.26 |
|
| 118,820 |
|
| 1.19 |
|
|
| 1.19 |
|
|
| 1.19 |
|
|
| 1.99 |
|
|
| 28 |
|
| ||||||
| 2011 | 6.80 | 0.07 | (0.37 | ) | (0.30 | ) | (0.07 | ) | (0.09 | ) |
| – |
| (0.16 | ) | – | 6.34 | (4.46 | ) | 85,188 | 1.20 |
| 1.20 |
| 1.20 |
| 1.14 |
| 14 |
| |||||||||||||||||||||||||||||||||
| 2010 | 5.31 | 0.09 | 1.51 | 1.60 | (0.08 | ) | (0.03 | ) |
| – |
| (0.11 | ) | – | 6.80 | 30.46 | 35,626 | 1.38 |
| 1.38 |
| 1.24 |
| 1.56 |
| 21 |
| ||||||||||||||||||||||||||||||||||||
| 2009 | 3.90 | 0.07 | 1.40 | 1.47 | (0.06 | ) | – |
| – |
| (0.06 | ) | – | 5.31 | 38.22 | 13,208 | 1.69 |
| 1.69 |
| 1.24 |
| 1.70 |
| 43 |
| |||||||||||||||||||||||||||||||||||||
| THE ACCOMPANYING NOTES ARE AN INTEGRAL PART OF THESE FINANCIAL STATEMENTS. | The Royce Funds 2014 Semiannual Report to Shareholders | 111 |
Financial Highlights |
|
| ||||||||||||||||||||||||||||||||||||||||||||||||||||||||||||
|
| Net |
| Net |
| Net Realized and Unrealized |
|
| Distributions |
| Distributions from Net |
|
|
|
|
|
|
|
|
| Ratio of Expenses to Average Net Assets |
| Ratio of Net Investment |
|
| |||||||||||||||||||||||||||||||||||
|
| Asset Value, |
| Investment |
| Gain (Loss) on |
| Total from Investment Operations |
| from Net Investment Income |
| Realized Gain on |
| Distributions |
| Total Distributions |
| Shareholder Redemption Fees |
| Net Asset |
| Total Return |
| Net Assets, |
| Prior to Fee |
| Prior |
| Net of |
| Income (Loss) |
| Portfolio Turnover Rate |
| |||||||||||||||||||||||||
|
|
|
|
|
|
|
|
|
|
|
|
|
|
|
|
|
|
|
|
|
|
|
|
|
|
|
|
|
|
|
|
|
|
|
|
|
|
|
|
|
|
|
|
|
|
|
|
|
|
|
|
|
|
|
|
|
| |||
| Royce Dividend Value Fund – Service Class | ||||||||||||||||||||||||||||||||||||||||||||||||||||||||||||
†2014 |
| $ | 8.98 |
| $ | 0.04 |
| $ | 0.26 |
| $ | 0.30 |
| $ | (0.03 | ) | $ | – |
| $ | – |
| $ | (0.03 | ) | $ | – |
| $ | 9.25 |
|
| 3.35 | %1 | $ | 385,623 |
|
| 1.45 | %2 |
|
| 1.45 | %2 |
|
| 1.43 | %2 |
|
| 0.94 | %2 |
|
| 14 | % |
| |||
2013 |
| 7.35 |
| 0.07 |
| 2.16 |
| 2.23 |
| (0.07 | ) | (0.53 | ) | – |
| (0.60 | ) | – |
| 8.98 |
|
| 30.74 |
| 407,599 |
|
| 1.48 |
|
|
| 1.48 |
|
|
| 1.46 |
|
|
| 0.87 |
|
|
| 36 |
|
| ||||||||||||||
2012 |
|
| 6.38 |
|
| 0.12 |
|
| 0.95 |
|
| 1.07 |
|
| (0.08 | ) |
| (0.02 | ) |
| – |
|
| (0.10 | ) |
| – |
|
| 7.35 |
|
| 16.95 |
|
| 252,443 |
|
| 1.48 |
|
|
| 1.48 |
|
|
| 1.46 |
|
|
| 1.74 |
|
|
| 28 |
|
| |||
| 2011 | 6.82 | 0.05 | (0.36 | ) | (0.31 | ) | (0.04 | ) | (0.09 | ) |
| – |
| (0.13 | ) | – | 6.38 | (4.55 | ) | 201,634 | 1.48 |
| 1.48 |
| 1.46 |
| 0.84 |
| 14 |
| ||||||||||||||||||||||||||||||
| 2010 | 5.33 | 0.08 | 1.51 | 1.59 | (0.07 | ) | (0.03 | ) |
| – |
| (0.10 | ) | – | 6.82 | 30.11 | 117,304 | 1.56 |
| 1.56 |
| 1.49 |
| 1.32 |
| 21 |
| |||||||||||||||||||||||||||||||||
| 2009 | 3.92 | 0.07 | 1.39 | 1.46 | (0.05 | ) | – |
| – |
| (0.05 | ) | – | 5.33 | 37.73 | 16,107 | 2.04 |
| 2.04 |
| 1.49 |
| 1.45 |
| 43 |
| ||||||||||||||||||||||||||||||||||
| Royce Dividend Value Fund – Consultant Class b | ||||||||||||||||||||||||||||||||||||||||||||||||||||||||||||
†2014 |
| $ | 10.00 |
| $ | 0.01 |
| $ | 0.34 |
| $ | 0.35 |
| $ | (0.01 | ) | $ | – |
| $ | – |
| $ | (0.01 | ) | $ | – |
| $ | 10.34 |
|
| 3.45 | %1 | $ | 120 |
|
| 42.96 | %2 |
|
| 42.96 | %2 |
|
| 2.24 | %2 |
|
| 0.29 | %2 |
|
| 14 | % |
| |||
| Royce Dividend Value Fund – Institutional Class c | ||||||||||||||||||||||||||||||||||||||||||||||||||||||||||||
†2014 |
| $ | 8.88 |
| $ | 0.06 |
| $ | 0.25 |
| $ | 0.31 |
| $ | (0.05 | ) | $ | – |
| $ | – |
| $ | (0.05 | ) | $ | – |
| $ | 9.14 |
|
| 3.51 | %1 | $ | 43,678 |
|
| 1.09 | %2 |
|
| 1.09 | %2 |
|
| 1.04 | %2 |
|
| 1.35 | %2 |
|
| 14 | % |
| |||
2013 |
| 7.28 |
| 0.11 |
| 2.14 |
| 2.25 |
| (0.12 | ) | (0.53 | ) | – |
| (0.65 | ) | – |
| 8.88 |
|
| 31.46 |
| 31,236 |
|
| 1.11 |
|
|
| 1.11 |
|
|
| 1.04 |
|
|
| 1.29 |
|
|
| 36 |
|
| ||||||||||||||
2012 |
|
| 6.80 |
|
| 0.08 |
|
| 0.50 |
|
| 0.58 |
|
| (0.08 | ) |
| (0.02 | ) |
| – |
|
| (0.10 | ) |
| – |
|
| 7.28 |
|
| 8.51 |
| 23,460 |
|
| 1.33 |
|
| 1.33 |
|
| 1.04 |
|
| 3.48 |
|
| 28 |
|
| ||||||||
Royce Global Value Fund – Investment Class d | ||||||||||||||||||||||||||||||||||||||||||||||||||||||||||||
†2014 |
| $ | 13.60 |
| $ | 0.13 |
| $ | 1.38 |
| $ | 1.51 |
| $ | – |
| $ | – |
| $ | – |
| $ | – |
| $ | – |
| $ | 15.11 |
|
| 11.10 | %1 | $ | 139,172 |
|
| 1.51 | %2 |
|
| 1.51 | %2 |
|
| 1.51 | %2 |
|
| 1.81 | %2 |
|
| 17 | % |
| |||
2013 |
| 12.91 |
| 0.16 |
| 0.68 |
| 0.84 |
| (0.16 | ) | – |
| – |
| (0.16 | ) | 0.01 |
| 13.60 |
|
| 6.59 |
| 159,366 |
|
| 1.49 |
|
|
| 1.49 |
|
|
| 1.49 |
|
|
| 1.08 |
|
|
| 41 |
|
| ||||||||||||||
2012 |
|
| 11.74 |
|
| 0.14 |
|
| 1.19 |
|
| 1.33 |
|
| (0.16 | ) |
| – |
|
| – |
|
| (0.16 | ) |
| – |
|
| 12.91 |
|
| 11.37 |
|
| 178,319 |
|
| 1.47 |
|
|
| 1.47 |
|
|
| 1.44 |
|
|
| 1.16 |
|
|
| 36 |
|
| |||
2011 |
|
| 14.54 |
|
| 0.13 |
|
| (2.82 | ) |
| (2.69 | ) |
| (0.12 | ) |
| – |
|
| – |
|
| (0.12 | ) |
| 0.01 |
|
| 11.74 |
|
| (18.48 | ) |
| 141,180 |
|
| 1.42 |
|
|
| 1.42 |
|
|
| 1.42 |
|
|
| 0.80 |
|
|
| 77 |
|
| |||
2010 |
|
| 11.02 |
|
| (0.06 | ) |
| 3.68 |
|
| 3.62 |
|
| (0.10 | ) |
| – |
|
| – |
|
| (0.10 | ) |
| – |
|
| 14.54 |
|
| 32.88 |
| 6,626 |
|
| 2.07 |
|
| 2.07 |
|
| 1.44 |
|
| (0.58 | )2 |
|
| 42 |
|
| |||||||
Royce Global Value Fund – Service Class | ||||||||||||||||||||||||||||||||||||||||||||||||||||||||||||
†2014 |
| $ | 13.68 |
| $ | 0.11 |
| $ | 1.40 |
| $ | 1.51 |
| $ | – |
| $ | – |
| $ | – |
| $ | – |
| $ | – |
| $ | 15.19 |
|
| 11.04 | %1 | $ | 44,000 |
|
| 1.90 | %2 |
|
| 1.90 | %2 |
|
| 1.69 | %2 |
|
| 1.60 | %2 |
|
| 17 | % |
| |||
2013 |
| 12.98 |
| 0.15 |
| 0.66 |
| 0.81 |
| (0.11 | ) | – |
| – |
| (0.11 | ) | – |
| 13.68 |
|
| 6.28 |
| 48,244 |
|
| 1.83 |
|
|
| 1.83 |
|
|
| 1.69 |
|
|
| 0.84 |
|
|
| 41 |
|
| ||||||||||||||
2012 |
|
| 11.77 |
|
| 0.12 |
|
| 1.18 |
|
| 1.30 |
|
| (0.09 | ) |
| – |
|
| – |
|
| (0.09 | ) |
| – |
|
| 12.98 |
|
| 11.03 |
|
| 98,274 |
|
| 1.80 |
|
|
| 1.80 |
|
|
| 1.69 |
|
|
| 0.88 |
|
|
| 36 |
|
| |||
2011 |
|
| 14.56 |
|
| 0.07 |
|
| (2.80 | ) |
| (2.73 | ) |
| (0.07 | ) |
| – |
|
| – |
|
| (0.07 | ) |
| 0.01 |
|
| 11.77 |
|
| (18.69 | ) |
| 122,574 |
|
| 1.77 |
|
|
| 1.77 |
|
|
| 1.69 |
|
|
| 0.41 |
|
|
| 77 |
|
| |||
2010 |
|
| 10.79 |
|
| (0.03 | ) |
| 3.87 |
|
| 3.84 |
|
| (0.08 | ) |
| – |
|
| – |
|
| (0.08 | ) |
| 0.01 |
|
| 14.56 |
|
| 35.69 |
|
| 141,992 |
|
| 1.84 |
|
|
| 1.84 |
|
|
| 1.69 |
|
|
| 0.01 |
|
|
| 42 |
|
| |||
2009 |
|
| 6.70 |
|
| 0.01 |
|
| 4.13 |
|
| 4.14 |
|
| (0.06 | ) |
| – |
|
| – |
|
| (0.06 | ) |
| 0.01 |
|
| 10.79 |
|
| 61.89 |
|
| 50,946 |
|
| 1.88 |
|
|
| 1.88 |
|
|
| 1.69 |
|
|
| 0.11 |
|
|
| 71 |
|
| |||
Royce Global Value Fund – Consultant Class e | ||||||||||||||||||||||||||||||||||||||||||||||||||||||||||||
†2014 |
| $ | 13.54 |
| $ | 0.07 |
| $ | 1.37 |
| $ | 1.44 |
| $ | – |
| $ | – |
| $ | – |
| $ | – |
| $ | – |
| $ | 14.98 |
|
| 10.64 | %1 | $ | 27,330 |
|
| 2.52 | %2 |
|
| 2.52 | %2 |
|
| 2.44 | %2 |
|
| 0.94 | %2 |
|
| 17 | % |
| |||
2013 |
| 12.88 |
| 0.01 |
| 0.70 |
| 0.71 |
| (0.05 | ) | – |
| – |
| (0.05 | ) | – |
| 13.54 |
|
| 5.50 |
| 25,663 |
|
| 2.53 |
|
|
| 2.53 |
|
|
| 2.44 |
|
|
| 0.11 |
|
|
| 41 |
|
| ||||||||||||||
2012 |
|
| 11.71 |
|
| 0.02 |
|
| 1.17 |
|
| 1.19 |
|
| (0.02 | ) |
| – |
|
| – |
|
| (0.02 | ) |
| – |
|
| 12.88 |
|
| 10.13 |
|
| 23,383 |
|
| 2.55 |
|
|
| 2.55 |
|
|
| 2.44 |
|
|
| 0.16 |
|
|
| 36 |
|
| |||
2011 |
|
| 15.66 |
|
| (0.09 | ) |
| (3.80 | ) |
| (3.89 | ) |
| (0.06 | ) |
| – |
|
| – |
|
| (0.06 | ) |
| – |
|
| 11.71 |
|
| (24.82 | )1 |
| 18,585 |
|
| 2.64 |
|
| 2.64 |
|
| 2.44 |
|
| (0.77 | )2 |
|
| 77 |
| |||||||
Royce Global Value Fund – R Class f | ||||||||||||||||||||||||||||||||||||||||||||||||||||||||||||
†2014 |
| $ | 10.15 |
| $ | 0.08 |
| $ | 1.02 |
| $ | 1.10 |
| $ | – |
| $ | – |
| $ | – |
| $ | – |
| $ | – |
| $ | 11.25 |
|
| 10.84 | %1 | $ | 124 |
|
| 8.32 | %2 |
|
| 8.32 | %2 |
|
| 1.99 | %2 |
|
| 1.50 | %2 |
|
| 17 | % |
| |||
2013 |
| 9.69 |
| 0.05 |
| 0.53 |
| 0.58 |
| (0.12 | ) | – |
| – |
| (0.12 | ) | – |
| 10.15 |
|
| 5.98 |
| 100 |
|
| 9.50 |
|
|
| 9.50 |
|
|
| 1.99 |
|
|
| 0.48 |
|
|
| 41 |
|
| ||||||||||||||
2012 |
|
| 10.00 |
|
| 0.02 |
|
| (0.21 | ) |
| (0.19 | ) |
| (0.12 | ) |
| – |
|
| – |
|
| (0.12 | ) |
| – |
|
| 9.69 |
|
| (1.90 | )1 |
| 80 |
|
| 19.19 |
|
| 19.19 |
|
| 1.99 |
|
| 0.70 |
|
| 36 |
|
| |||||||
| Royce Global Value Fund – K Class f | ||||||||||||||||||||||||||||||||||||||||||||||||||||||||||||
†2014 |
| $ | 10.15 |
| $ | 0.07 |
| $ | 1.04 |
| $ | 1.11 |
| $ | – |
| $ | – |
| $ | – |
| $ | – |
| $ | – |
| $ | 11.26 |
|
| 10.94 | %1 | $ | 27 |
|
| 27.57 | %2 |
|
| 27.57 | %2 |
|
| 1.74 | %2 |
|
| 1.38 | %2 |
|
| 17 | % |
| |||
2013 |
| 9.69 |
| 0.08 |
| 0.52 |
| 0.60 |
| (0.14 | ) | – |
| – |
| (0.14 | ) | – |
| 10.15 |
|
| 6.24 |
| 44 |
|
| 19.21 |
|
|
| 19.21 |
|
|
| 1.74 |
|
|
| 0.80 |
|
|
| 41 |
|
| ||||||||||||||
2012 |
|
| 10.00 |
|
| 0.09 |
|
| (0.27 | ) |
| (0.18 | ) |
| (0.13 | ) |
| – |
|
| – |
|
| (0.13 | ) |
| – |
|
| 9.69 |
|
| (1.74 | )1 |
| 41 |
|
| 29.99 |
|
| 29.98 |
|
| 1.74 |
|
| 1.20 |
|
| 36 |
|
| |||||||
| Royce International Smaller-Companies Fund – Investment Class g | ||||||||||||||||||||||||||||||||||||||||||||||||||||||||||||
†2014 |
| $ | 10.00 |
| $ | 0.08 |
| $ | 0.55 |
| $ | 0.63 |
| $ | – |
| $ | – |
| $ | – |
| $ | – |
| $ | 0.01 |
| $ | 10.64 |
|
| 6.40 | %1 | $ | 731 |
|
| 4.55 | %2 |
|
| 4.55 | %2 |
|
| 1.44 | %2 |
|
| 1.78 | %2 |
|
| 29 | % |
| |||
| 112 | The Royce Funds 2014 Semiannual Report to Shareholders | THE ACCOMPANYING NOTES ARE AN INTEGRAL PART OF THESE FINANCIAL STATEMENTS. |
Financial Highlights |
|
| ||||||||||||||||||||||||||||||||||||||||||||||||||||||||||||
|
| Net |
| Net |
| Net Realized and Unrealized |
|
| Distributions |
| Distributions from Net |
|
|
|
|
|
|
|
|
| Ratio of Expenses to Average Net Assets |
| Ratio of Net Investment |
|
| |||||||||||||||||||||||||||||||||||
|
| Asset Value, |
| Investment |
| Gain (Loss) on |
| Total from Investment Operations |
| from Net Investment Income |
| Realized Gain on |
| Distributions |
| Total Distributions |
| Shareholder Redemption Fees |
| Net Asset |
| Total Return |
| Net Assets, |
| Prior to Fee |
| Prior |
| Net of |
| Income (Loss) |
| Portfolio Turnover Rate |
| |||||||||||||||||||||||||
|
|
|
|
|
|
|
|
|
|
|
|
|
|
|
|
|
|
|
|
|
|
|
|
|
|
|
|
|
|
|
|
|
|
|
|
|
|
|
|
|
|
|
|
|
|
|
|
|
|
|
|
|
|
|
|
|
| |||
| Royce International Smaller-Companies Fund – Service Class | ||||||||||||||||||||||||||||||||||||||||||||||||||||||||||||
†2014 |
| $ | 11.99 |
| $ | 0.09 |
| $ | 0.70 |
| $ | 0.79 |
| $ | – |
| $ | – |
| $ | – |
| $ | – |
| $ | – |
| $ | 12.78 |
|
| 6.59 | %1 | $ | 51,567 |
|
| 1.89 | %2 |
|
| 1.89 | %2 |
|
| 1.68 | %2 |
|
| 1.48 | %2 |
|
| 29 | % |
| |||
2013 |
| 11.28 |
| 0.12 |
| 1.30 |
| 1.42 |
| (0.15 | ) | (0.56 | ) | – |
| (0.71 | ) | – |
| 11.99 |
|
| 12.73 |
| 38,059 |
|
| 2.07 |
|
|
| 2.07 |
|
|
| 1.69 |
|
|
| 1.13 |
|
|
| 64 |
|
| ||||||||||||||
2012 |
|
| 9.58 |
|
| 0.14 |
|
| 1.70 |
|
| 1.84 |
|
| (0.15 | ) |
| – |
|
| – |
|
| (0.15 | ) |
| 0.01 |
|
| 11.28 |
|
| 19.39 |
|
| 26,371 |
|
| 2.13 |
|
|
| 2.13 |
|
|
| 1.69 |
|
|
| 1.29 |
|
|
| 44 |
|
| |||
| 2011 | 12.85 | 0.10 | (2.51 | ) | (2.41 | ) | (0.08 | ) | (0.78 | ) |
| (0.01 | ) | (0.87 | ) | 0.01 |
| 9.58 | (18.75 | ) | 20,103 | 2.15 |
| 2.15 |
| 1.69 |
| 0.88 |
| 38 |
| |||||||||||||||||||||||||||||
| 2010 | 10.49 | 0.03 | 2.72 | 2.75 | (0.10 | ) | (0.30 | ) |
| – |
| (0.40 | ) | 0.01 |
| 12.85 | 26.45 | 18,297 | 2.35 |
| 2.35 |
| 1.69 |
| 0.45 |
| 55 |
| ||||||||||||||||||||||||||||||||
| 2009 | 6.99 | (0.02 | ) | 3.53 | 3.51 | (0.02 | ) | – |
| – |
| (0.02 | ) | 0.01 |
| 10.49 | 50.31 | 7,871 | 3.01 |
| 3.01 |
| 1.69 |
| (0.18 | ) |
| 38 |
| |||||||||||||||||||||||||||||||
| Royce International Smaller-Companies Fund – Institutional Class h | ||||||||||||||||||||||||||||||||||||||||||||||||||||||||||||
†2014 |
| $ | 10.00 |
| $ | 0.09 |
| $ | 0.79 |
| $ | 0.88 |
| $ | – |
| $ | – |
| $ | – |
| $ | – |
| $ | – |
| $ | 10.88 |
|
| 8.80 | %1 | $ | 3,100 |
|
| 2.24 | %2 |
|
| 2.24 | %2 |
|
| 1.44 | %2 |
|
| 1.96 | %2 |
|
| 29 | % |
| |||
| Royce Special Equity Multi-Cap Fund – Investment Class i | ||||||||||||||||||||||||||||||||||||||||||||||||||||||||||||
†2014 |
| $ | 14.92 |
| $ | 0.07 |
| $ | 0.75 |
| $ | 0.82 |
| $ | – |
| $ | – |
| $ | – |
| $ | – |
| $ | – |
| $ | 15.74 |
|
| 5.50 | %1 | $ | 70,498 |
|
| 0.97 | %2 |
|
| 0.97 | %2 |
|
| 0.97 | %2 |
|
| 0.98 | %2 |
|
| 19 | % |
| |||
2013 |
| 11.64 |
| 0.12 |
| 4.11 |
| 4.23 |
| (0.12 | ) | (0.83 | ) | – |
| (0.95 | ) | – |
| 14.92 |
|
| 36.62 |
| 62,387 |
|
| 1.16 |
|
|
| 1.16 |
|
|
| 1.15 |
|
|
| 0.93 |
|
|
| 44 |
|
| ||||||||||||||
2012 |
|
| 11.54 |
|
| 0.12 |
|
| 0.22 |
|
| 0.34 |
|
| (0.14 | ) |
| (0.10 | ) |
| – |
|
| (0.24 | ) |
| – |
|
| 11.64 |
|
| 3.00 |
| 34,375 |
|
| 1.19 |
|
| 1.19 |
|
| 1.16 |
|
| 1.55 |
|
| 14 |
|
| ||||||||
| Royce Special Equity Multi-Cap Fund – Service Class j | ||||||||||||||||||||||||||||||||||||||||||||||||||||||||||||
†2014 |
| $ | 14.96 |
| $ | 0.05 |
| $ | 0.75 |
| $ | 0.80 |
| $ | – |
| $ | – |
| $ | – |
| $ | – |
| $ | – |
| $ | 15.76 |
|
| 5.35 | %1 | $ | 95,386 |
|
| 1.34 | %2 |
|
| 1.34 | %2 |
|
| 1.24 | %2 |
|
| 0.71 | %2 |
|
| 19 | % |
| |||
2013 |
| 11.68 |
| 0.09 |
| 4.12 |
| 4.21 |
| (0.10 | ) | (0.83 | ) | – |
| (0.93 | ) | – |
| 14.96 |
|
| 36.26 |
| 78,233 |
|
| 1.61 |
|
|
| 1.61 |
|
|
| 1.38 |
|
|
| 0.69 |
|
|
| 44 |
|
| ||||||||||||||
2012 |
|
| 10.64 |
|
| 0.13 |
|
| 1.10 |
|
| 1.23 |
|
| (0.09 | ) |
| (0.10 | ) |
| – |
|
| (0.19 | ) |
| – |
|
| 11.68 |
|
| 11.62 |
|
| 43,690 |
|
| 1.51 |
|
| 1.51 |
|
| 1.36 |
|
| 1.15 |
|
| 14 |
|
| |||||||
2011 |
|
| 10.00 |
|
| 0.06 |
|
| 0.65 |
|
| 0.71 |
|
| (0.06 | ) |
| (0.02 | ) |
| – |
|
| (0.08 | ) |
| 0.01 |
|
| 10.64 |
|
| 7.20 |
| 36,811 |
|
| 1.97 |
|
| 1.97 |
|
| 1.39 |
|
| 1.45 |
|
| 5 |
|
| ||||||||
Royce Special Equity Multi-Cap Fund – Consultant Class h | ||||||||||||||||||||||||||||||||||||||||||||||||||||||||||||
†2014 |
| $ | 10.00 |
| $ | 0.00 |
| $ | 1.09 |
| $ | 1.09 |
| $ | – |
| $ | – |
| $ | – |
| $ | – |
| $ | – |
| $ | 11.09 |
|
| 10.90 | %1 | $ | 4,704 |
|
| 2.83 | %2 |
|
| 2.83 | %2 |
|
| 1.99 | %2 |
|
| 0.09 | %2 |
|
| 19 | % |
| |||
Royce Special Equity Multi-Cap Fund – Institutional Class k | ||||||||||||||||||||||||||||||||||||||||||||||||||||||||||||
†2014 |
| $ | 14.92 |
| $ | 0.08 |
| $ | 0.75 |
| $ | 0.83 |
| $ | – |
| $ | – |
| $ | – |
| $ | – |
| $ | – |
| $ | 15.75 |
|
| 5.56 | %1 | $ | 48,558 |
|
| 0.94 | %2 |
|
| 0.94 | %2 |
|
| 0.89 | %2 |
|
| 1.04 | %2 |
|
| 19 | % |
| |||
2013 |
| 11.64 |
| 0.15 |
| 4.10 |
| 4.25 |
| (0.14 | ) | (0.83 | ) | – |
| (0.97 | ) | – |
| 14.92 |
|
| 36.73 |
| 48,063 |
|
| 1.10 |
|
|
| 1.10 |
|
|
| 1.04 |
|
|
| 1.02 |
|
|
| 44 |
|
| ||||||||||||||
2012 |
|
| 11.83 |
|
| 0.10 |
|
| (0.03 | ) |
| 0.07 |
|
| (0.16 | ) |
| (0.10 | ) |
| – |
|
| (0.26 | ) |
| – |
|
| 11.64 |
|
| 0.61 |
| 30,905 |
|
| 1.21 |
|
| 1.21 |
|
| 1.04 |
|
| 1.76 |
|
| 14 |
|
| ||||||||
| THE ACCOMPANYING NOTES ARE AN INTEGRAL PART OF THESE FINANCIAL STATEMENTS. | The Royce Funds 2014 Semiannual Report to Shareholders | 113 |
| Notes to Financial Statements (unaudited) |
Various inputs are used in determining the value of each Fund’s investments, as noted above. These inputs are summarized in the three broad levels below: | |||||
Level 1 | – | quoted prices in active markets for identical securities. | |||
Level 2 | – | other significant observable inputs (including quoted prices for similar securities, foreign securities that may be fair valued and repurchase agreements). The table below includes all Level 2 securities. Level 2 securities with values based on quoted prices for similar securities are noted in the Schedules of Investments. | |||
Level 3 | – | significant unobservable inputs (including last trade price before trading was suspended, or at a discount thereto for lack of marketability or otherwise, market price information regarding other securities, information received from the company and/or published documents, including SEC filings and financial statements, or other publicly available information). | |||
The inputs or methodology used for valuing securities are not necessarily an indication of the risk associated with investing in those securities. | |||||
The following is a summary of the inputs used to value each Fund’s investments as of June 30, 2014. For a detailed breakout of common stocks by sector classification or country, please refer to the Schedules of Investments. | |||||
| Level 1 | Level 2 | Level 3 | Total | |||||||||||||
| Royce Pennsylvania Mutual Fund | ||||||||||||||||
| Common Stocks | $ | 6,717,801,210 | $ | 11,504,140 | $ | – | $ | 6,729,305,350 | ||||||||
| Cash Equivalents | 77,437,178 | 202,919,000 | – | 280,356,178 | ||||||||||||
| Royce Micro-Cap Fund | ||||||||||||||||
| Common Stocks | 708,668,569 | 2,541,213 | 1,049,127 | 712,258,909 | ||||||||||||
| Cash Equivalents | 26,867,184 | 28,566,000 | – | 55,433,184 | ||||||||||||
| Royce Premier Fund | ||||||||||||||||
| Common Stocks | 6,757,364,796 | – | – | 6,757,364,796 | ||||||||||||
| Cash Equivalents | 271,453,688 | 84,296,000 | – | 355,749,688 | ||||||||||||
| 114 | The Royce Funds 2014 Semiannual Report to Shareholders |
| Valuation of Investments (continued): | ||||||||||||||||
| Level 1 | Level 2 | Level 3 | Total | |||||||||||||
| Royce Low-Priced Stock Fund | ||||||||||||||||
| Common Stocks | $ | 1,086,653,108 | $ | – | $ | – | $ | 1,086,653,108 | ||||||||
| Cash Equivalents | 70,410,418 | 23,729,000 | – | 94,139,418 | ||||||||||||
| Royce Total Return Fund | ||||||||||||||||
| Common Stocks | 4,967,241,928 | 24,961,056 | – | 4,992,202,984 | ||||||||||||
| Cash Equivalents | 2,154,041 | 252,862,000 | – | 255,016,041 | ||||||||||||
| Royce Heritage Fund | ||||||||||||||||
| Common Stocks | 352,047,585 | – | – | 352,047,585 | ||||||||||||
| Cash Equivalents | 1,589,589 | 29,236,000 | – | 30,825,589 | ||||||||||||
| Royce Opportunity Fund | ||||||||||||||||
| Common Stocks | 2,413,136,593 | 7,057,555 | – | 2,420,194,148 | ||||||||||||
| Cash Equivalents | 206,095,687 | 172,123,000 | – | 378,218,687 | ||||||||||||
| Royce Special Equity Fund | ||||||||||||||||
| Common Stocks | 2,923,424,308 | 4,510,975 | – | 2,927,935,283 | ||||||||||||
| Cash Equivalents | 9,207,927 | 412,898,000 | – | 422,105,927 | ||||||||||||
| Royce Value Fund | ||||||||||||||||
| Common Stocks | 1,020,341,941 | – | – | 1,020,341,941 | ||||||||||||
| Cash Equivalents | 4,542,570 | 20,940,000 | – | 25,482,570 | ||||||||||||
| Royce Value Plus Fund | ||||||||||||||||
| Common Stocks | 1,096,076,188 | – | – | 1,096,076,188 | ||||||||||||
| Cash Equivalents | 104,981,188 | 34,950,000 | – | 139,931,188 | ||||||||||||
| Royce 100 Fund | ||||||||||||||||
| Common Stocks | 268,333,621 | – | – | 268,333,621 | ||||||||||||
| Cash Equivalents | 982,550 | 18,652,000 | – | 19,634,550 | ||||||||||||
| Royce Dividend Value Fund | ||||||||||||||||
| Common Stocks | 606,957,108 | – | – | 606,957,108 | ||||||||||||
| Cash Equivalents | 2,424,305 | 16,436,000 | – | 18,860,305 | ||||||||||||
| Royce Global Value Fund | ||||||||||||||||
| Common Stocks | 205,768,588 | – | – | 205,768,588 | ||||||||||||
| Cash Equivalents | 10,383,344 | 6,528,000 | – | 16,911,344 | ||||||||||||
| Royce International Smaller-Companies Fund | ||||||||||||||||
| Common Stocks | 52,879,654 | – | – | 52,879,654 | ||||||||||||
| Cash Equivalents | – | 2,405,000 | – | 2,405,000 | ||||||||||||
| Royce Special Equity Multi-Cap Fund | ||||||||||||||||
| Common Stocks | 199,407,783 | – | – | 199,407,783 | ||||||||||||
| Cash Equivalents | – | 18,706,000 | – | 18,706,000 | ||||||||||||
For the six months ended June 30, 2014, certain securities have transferred in and out of Level 1 and Level 2 measurements as a result of the fair value pricing procedures for international equities. The Funds recognize transfers between levels as of the end of the reporting period. At June 30, 2014, the following Funds had securities transfer from Level 1 to Level 2 within the fair value hierarchy:
| Transfers from Level 1 to Level 2 | |||
| Royce Micro-Cap Fund | $1,360,438 | ||
| Royce Total Return Fund | 5,395,819 | ||
| Royce Opportunity Fund | 6,635,920 | ||
Level 3 Reconciliation:
| Balance as of 12/31/13 | Unrealized Gain (Loss) 1 | Balance as of 6/30/14 | |||||||
| Royce Micro-Cap Fund | |||||||||
| Common Stocks | $411,368 | $637,759 | $1,049,127 |
| The Royce Funds 2014 Semiannual Report to Shareholders | 115 |
| Notes to Financial Statements (unaudited) (continued) |
| Gross Amount of Assets and | ||||||||||||
| Liabilities in the Statements of | ||||||||||||
| Assets and Liabilities1 | Collateral Received and Pledged | Net Amount | ||||||||||
| Royce Pennsylvania Mutual Fund | ||||||||||||
| Securities on Loan/Collateral on Loaned Securities | $ | 77,437,178 | $ | (77,437,178 | ) | $ | – | |||||
| Royce Micro-Cap Fund | ||||||||||||
| Securities on Loan/Collateral on Loaned Securities | 26,867,184 | (26,867,184 | ) | – | ||||||||
| Royce Premier Fund | ||||||||||||
| Securities on Loan/Collateral on Loaned Securities | 271,453,688 | (271,453,688 | ) | – | ||||||||
| Royce Low-Priced Stock Fund | ||||||||||||
| Securities on Loan/Collateral on Loaned Securities | 70,410,418 | (70,410,418 | ) | – | ||||||||
| Royce Total Return Fund | ||||||||||||
| Securities on Loan/Collateral on Loaned Securities | 2,154,041 | (2,154,041 | ) | – | ||||||||
| Royce Heritage Fund | ||||||||||||
| Securities on Loan/Collateral on Loaned Securities | 1,589,589 | (1,589,589 | ) | – | ||||||||
| Royce Opportunity Fund | ||||||||||||
| Securities on Loan/Collateral on Loaned Securities | 206,095,687 | (206,095,687 | ) | – | ||||||||
| Royce Special Equity Fund | ||||||||||||
| Securities on Loan/Collateral on Loaned Securities | 9,207,927 | (9,207,927 | ) | – | ||||||||
| Royce Value Fund | ||||||||||||
| Securities on Loan/Collateral on Loaned Securities | 4,542,570 | (4,542,570 | ) | – | ||||||||
| Royce Value Plus Fund | ||||||||||||
| Securities on Loan/Collateral on Loaned Securities | 104,981,188 | (104,981,188 | ) | – | ||||||||
| Royce 100 Fund | ||||||||||||
| Securities on Loan/Collateral on Loaned Securities | 982,550 | (982,550 | ) | – | ||||||||
| Royce Dividend Value Fund | ||||||||||||
| Securities on Loan/Collateral on Loaned Securities | 2,424,305 | (2,424,305 | ) | – | ||||||||
| Royce Global Value Fund | ||||||||||||
| Securities on Loan/Collateral on Loaned Securities | 10,383,344 | (10,383,344 | ) | – | ||||||||
| 1 | Absent an event of default, assets and liabilities are presented gross and not offset in the Statements of Assets and Liabilities. |
| 116 | The Royce Funds 2014 Semiannual Report to Shareholders |
Capital Share Transactions (in dollars):
| Shares issued for | Net increase (decrease) from | |||||||||||||||||||||||||||||||||||||||
| Shares sold | reinvestment of distributions | Shares redeemed | capital share transactions | |||||||||||||||||||||||||||||||||||||
| Period ended | Period ended | Period ended | Period ended | |||||||||||||||||||||||||||||||||||||
| 6/30/14 | Period ended | 6/30/14 | Period ended | 6/30/14 | Period ended | 6/30/14 | Period ended | |||||||||||||||||||||||||||||||||
| (unaudited) | 12/31/13 | (unaudited) | 12/31/13 | (unaudited) | 12/31/13 | (unaudited) | 12/31/13 | |||||||||||||||||||||||||||||||||
| Royce Pennsylvania Mutual Fund | ||||||||||||||||||||||||||||||||||||||||
Investment Class | $ | 232,933,606 | $ | 605,005,254 | $ | – | $ | 240,617,073 | $ | (736,332,022 | ) | $ | (1,199,534,491 | ) | $ | (503,398,416 | ) | $ | (353,912,164 | ) | ||||||||||||||||||||
Service Class | 57,184,241 | 158,543,673 | – | 31,528,901 | (119,838,123 | ) | (205,430,442 | ) | (62,653,882 | ) | (15,357,868 | ) | ||||||||||||||||||||||||||||
Consultant Class | 16,456,444 | 35,995,184 | – | 44,509,769 | (55,731,200 | ) | (110,412,807 | ) | (39,274,756 | ) | (29,907,854 | ) | ||||||||||||||||||||||||||||
Institutional Class | 159,792,928 | 227,429,558 | – | 42,182,078 | (147,160,695 | ) | (88,116,686 | ) | 12,632,233 | 181,494,950 | ||||||||||||||||||||||||||||||
R Class | 4,405,949 | 12,175,418 | – | 2,317,814 | (7,965,251 | ) | (12,674,989 | ) | (3,559,302 | ) | 1,818,243 | |||||||||||||||||||||||||||||
K Class | 967,132 | 3,353,854 | – | 615,573 | (2,167,649 | ) | (3,487,416 | ) | (1,200,517 | ) | 482,011 | |||||||||||||||||||||||||||||
| Royce Micro-Cap Fund | ||||||||||||||||||||||||||||||||||||||||
Investment Class | 15,683,200 | 98,858,542 | – | 43,274,805 | (111,267,075 | ) | (314,723,445 | ) | (95,583,875 | ) | (172,590,098 | ) | ||||||||||||||||||||||||||||
Service Class | 5,701,687 | 24,900,898 | – | 5,561,270 | (19,002,666 | ) | (69,726,173 | ) | (13,300,979 | ) | (39,264,005 | ) | ||||||||||||||||||||||||||||
Consultant Class | 1,343,110 | 4,190,480 | – | 8,921,529 | (9,788,593 | ) | (28,337,765 | ) | (8,445,483 | ) | (15,225,756 | ) | ||||||||||||||||||||||||||||
| Royce Premier Fund | ||||||||||||||||||||||||||||||||||||||||
Investment Class | 164,287,812 | 643,271,846 | – | 461,289,856 | (602,433,167 | ) | (1,344,940,951 | ) | (438,145,355 | ) | (240,379,249 | ) | ||||||||||||||||||||||||||||
Service Class | 22,483,203 | 91,471,655 | – | 46,476,184 | (67,961,053 | ) | (447,736,768 | ) | (45,477,850 | ) | (309,788,929 | ) | ||||||||||||||||||||||||||||
Consultant Class | 1,200,768 | 3,234,960 | – | 6,793,623 | (5,128,652 | ) | (11,667,823 | ) | (3,927,884 | ) | (1,639,240 | ) | ||||||||||||||||||||||||||||
Institutional Class | 53,943,671 | 171,612,186 | – | 88,971,062 | (129,875,170 | ) | (271,899,788 | ) | (75,931,499 | ) | (11,316,540 | ) | ||||||||||||||||||||||||||||
W Class | 21,988,881 | 67,696,518 | – | 41,113,353 | (80,480,292 | ) | (169,817,947 | ) | (58,491,411 | ) | (61,008,076 | ) | ||||||||||||||||||||||||||||
R Class | 2,640,787 | 7,171,068 | – | 3,194,633 | (3,963,725 | ) | (10,803,236 | ) | (1,322,938 | ) | (437,535 | ) | ||||||||||||||||||||||||||||
K Class | 536,737 | 1,843,765 | – | 1,872,975 | (2,012,835 | ) | (5,003,511 | ) | (1,476,098 | ) | (1,286,771 | ) | ||||||||||||||||||||||||||||
| The Royce Funds 2014 Semiannual Report to Shareholders | 117 |
| Notes to Financial Statements (unaudited) (continued) |
Capital Share Transactions (in dollars) (continued):
| Shares issued for | Net increase (decrease) from | |||||||||||||||||||||||||||||||||||||||
| Shares sold | reinvestment of distributions | Shares redeemed | capital share transactions | |||||||||||||||||||||||||||||||||||||
| Period ended | Period ended | Period ended | Period ended | |||||||||||||||||||||||||||||||||||||
| 6/30/14 | Period ended | 6/30/14 | Period ended | 6/30/14 | Period ended | 6/30/14 | Period ended | |||||||||||||||||||||||||||||||||
| (unaudited) | 12/31/13 | (unaudited) | 12/31/13 | (unaudited) | 12/31/13 | (unaudited) | 12/31/13 | |||||||||||||||||||||||||||||||||
| Royce Low-Priced Stock Fund | ||||||||||||||||||||||||||||||||||||||||
Investment Class | $ | 5,857,403 | $ | 25,018,884 | $ | – | $ | 11,573,545 | $ | (37,435,501 | ) | $ | (207,176,226 | ) | $ | (31,578,098 | ) | $ | (170,583,797 | ) | ||||||||||||||||||||
Service Class | 24,304,251 | 96,303,157 | – | 129,195,821 | (231,415,208 | ) | (1,029,968,862 | ) | (207,110,957 | ) | (804,469,884 | ) | ||||||||||||||||||||||||||||
Institutional Class | 12,019,474 | 52,909,521 | – | 65,125,731 | (221,024,173 | ) | (749,374,096 | ) | (209,004,699 | ) | (631,338,844 | ) | ||||||||||||||||||||||||||||
R Class | 198,389 | 710,708 | – | 412,286 | (995,070 | ) | (3,837,806 | ) | (796,681 | ) | (2,714,812 | ) | ||||||||||||||||||||||||||||
K Class | 147,180 | 1,531,364 | – | 838,644 | (1,305,315 | ) | (4,536,092 | ) | (1,158,135 | ) | (2,166,084 | ) | ||||||||||||||||||||||||||||
| Royce Total Return Fund | ||||||||||||||||||||||||||||||||||||||||
Investment Class | 197,717,700 | 528,999,533 | 11,823,734 | 304,734,722 | (499,470,980 | ) | (849,880,581 | ) | (289,929,546 | ) | (16,146,326 | ) | ||||||||||||||||||||||||||||
Service Class | 44,063,238 | 269,258,191 | 697,995 | 44,274,371 | (247,687,329 | ) | (166,019,974 | ) | (202,926,096 | ) | 147,512,588 | |||||||||||||||||||||||||||||
Consultant Class | 9,369,688 | 28,057,748 | – | 30,943,470 | (25,809,115 | ) | (54,173,983 | ) | (16,439,427 | ) | 4,827,235 | |||||||||||||||||||||||||||||
Institutional Class | 91,395,774 | 215,408,392 | 2,418,920 | 52,099,575 | (105,483,926 | ) | (149,283,730 | ) | (11,669,232 | ) | 118,224,237 | |||||||||||||||||||||||||||||
W Class | 31,029,446 | 74,148,184 | 913,108 | 21,587,603 | (26,394,941 | ) | (56,755,936 | ) | 5,547,613 | 38,979,851 | ||||||||||||||||||||||||||||||
R Class | 7,308,789 | 21,893,247 | 41,367 | 5,827,458 | (13,152,226 | ) | (15,151,842 | ) | (5,802,070 | ) | 12,568,863 | |||||||||||||||||||||||||||||
K Class | 31,069,222 | 107,190,612 | 251,613 | 21,610,891 | (99,185,086 | ) | (126,039,047 | ) | (67,864,251 | ) | 2,762,456 | |||||||||||||||||||||||||||||
| Royce Heritage Fund | ||||||||||||||||||||||||||||||||||||||||
Investment Class | 25,161,496 | 66,008,028 | – | 12,527,322 | (3,528,798 | ) | (4,946,365 | ) | 21,632,698 | 73,588,985 | ||||||||||||||||||||||||||||||
Service Class | 6,282,920 | 14,757,297 | – | 23,773,697 | (28,627,600 | ) | (43,411,963 | ) | (22,344,680 | ) | (4,880,969 | ) | ||||||||||||||||||||||||||||
Consultant Class | 299,267 | 1,263,011 | – | 2,151,535 | (1,212,997 | ) | (2,515,165 | ) | (913,730 | ) | 899,381 | |||||||||||||||||||||||||||||
R Class | 231,210 | 1,847,167 | – | 992,495 | (1,761,154 | ) | (1,268,414 | ) | (1,529,944 | ) | 1,571,248 | |||||||||||||||||||||||||||||
K Class | 435,029 | 1,250,136 | – | 1,055,146 | (490,150 | ) | (3,637,243 | ) | (55,121 | ) | (1,331,961 | ) | ||||||||||||||||||||||||||||
| Royce Opportunity Fund | ||||||||||||||||||||||||||||||||||||||||
Investment Class | 118,324,441 | 332,616,686 | – | 109,717,251 | (141,233,478 | ) | (228,261,969 | ) | (22,909,037 | ) | 214,071,968 | |||||||||||||||||||||||||||||
Service Class | 28,423,417 | 143,463,729 | – | 33,163,722 | (51,095,269 | ) | (235,857,849 | ) | (22,671,852 | ) | (59,230,398 | ) | ||||||||||||||||||||||||||||
Consultant Class | 2,070,915 | 4,118,375 | – | 1,776,385 | (2,282,374 | ) | (2,557,349 | ) | (211,459 | ) | 3,337,411 | |||||||||||||||||||||||||||||
Institutional Class | 84,053,756 | 166,839,476 | – | 73,390,855 | (77,417,008 | ) | (290,133,892 | ) | 6,636,748 | (49,903,561 | ) | |||||||||||||||||||||||||||||
R Class | 9,233,491 | 13,143,525 | – | 2,051,002 | (1,405,534 | ) | (1,853,045 | ) | 7,827,957 | 13,341,482 | ||||||||||||||||||||||||||||||
K Class | 8,151,688 | 8,593,690 | – | 1,712,998 | (3,871,816 | ) | (4,064,844 | ) | 4,279,872 | 6,241,844 | ||||||||||||||||||||||||||||||
| Royce Special Equity Fund | ||||||||||||||||||||||||||||||||||||||||
Investment Class | 156,929,076 | 493,764,184 | – | 187,724,022 | (385,289,125 | ) | (607,174,950 | ) | (228,360,049 | ) | 74,313,256 | |||||||||||||||||||||||||||||
Service Class | 25,466,694 | 80,216,174 | – | 25,988,233 | (68,853,997 | ) | (69,704,292 | ) | (43,387,303 | ) | 36,500,115 | |||||||||||||||||||||||||||||
Consultant Class | 2,401,525 | 5,375,063 | – | 6,011,027 | (4,660,609 | ) | (7,598,377 | ) | (2,259,084 | ) | 3,787,713 | |||||||||||||||||||||||||||||
Institutional Class | 48,278,440 | 125,908,328 | – | 56,838,996 | (53,389,399 | ) | (163,427,568 | ) | (5,110,959 | ) | 19,319,756 | |||||||||||||||||||||||||||||
| Royce Value Fund | ||||||||||||||||||||||||||||||||||||||||
Investment Class | 11,290,599 | 39,278,557 | – | 13,139,768 | (64,384,493 | ) | (94,469,427 | ) | (53,093,894 | ) | (42,051,102 | ) | ||||||||||||||||||||||||||||
Service Class | 18,983,507 | 57,608,008 | – | 46,173,865 | (111,546,385 | ) | (384,234,842 | ) | (92,562,878 | ) | (280,452,969 | ) | ||||||||||||||||||||||||||||
Consultant Class | 1,264,115 | 2,142,085 | – | 2,179,045 | (3,795,370 | ) | (11,234,896 | ) | (2,531,255 | ) | (6,913,766 | ) | ||||||||||||||||||||||||||||
Institutional Class | 8,805,703 | 25,750,530 | – | 15,708,560 | (20,046,369 | ) | (60,814,438 | ) | (11,240,666 | ) | (19,355,348 | ) | ||||||||||||||||||||||||||||
R Class | 2,735,850 | 8,633,738 | – | 2,587,581 | (4,842,044 | ) | (17,983,761 | ) | (2,106,194 | ) | (6,762,442 | ) | ||||||||||||||||||||||||||||
K Class | 1,955,862 | 5,372,313 | – | 1,401,823 | (6,369,163 | ) | (11,489,956 | ) | (4,413,301 | ) | (4,715,820 | ) | ||||||||||||||||||||||||||||
| Royce Value Plus Fund | ||||||||||||||||||||||||||||||||||||||||
Investment Class | 43,077,256 | 45,014,700 | – | 17,699,284 | (42,127,598 | ) | (94,732,454 | ) | 949,658 | (32,018,470 | ) | |||||||||||||||||||||||||||||
Service Class | 42,673,021 | 72,297,178 | – | 65,183,044 | (153,094,622 | ) | (464,563,649 | ) | (110,421,601 | ) | (327,083,427 | ) | ||||||||||||||||||||||||||||
Consultant Class | 331,085 | 1,097,991 | – | 1,733,762 | (2,756,699 | ) | (3,753,070 | ) | (2,425,614 | ) | (921,317 | ) | ||||||||||||||||||||||||||||
Institutional Class | 7,777,927 | 25,026,020 | – | 10,959,037 | (84,144,884 | ) | (152,001,651 | ) | (76,366,957 | ) | (116,016,594 | ) | ||||||||||||||||||||||||||||
R Class | 105,561 | 998,626 | – | 124,721 | (328,912 | ) | (1,021,869 | ) | (223,351 | ) | 101,478 | |||||||||||||||||||||||||||||
K Class | 139,053 | 453,654 | – | 102,901 | (181,153 | ) | (180,247 | ) | (42,100 | ) | 376,308 | |||||||||||||||||||||||||||||
| Royce 100 Fund | ||||||||||||||||||||||||||||||||||||||||
Investment Class | 7,232,208 | 18,939,455 | – | 7,654,869 | (7,735,418 | ) | (44,035,340 | ) | (503,210 | ) | (17,441,016 | ) | ||||||||||||||||||||||||||||
Service Class | 15,740,502 | 33,984,238 | – | 28,928,569 | (33,456,005 | ) | (83,130,559 | ) | (17,715,503 | ) | (20,217,752 | ) | ||||||||||||||||||||||||||||
R Class | 564,645 | 1,077,565 | – | 287,743 | (475,840 | ) | (1,494,820 | ) | 88,805 | (129,512 | ) | |||||||||||||||||||||||||||||
K Class | 189,015 | 1,143,767 | – | 231,871 | (1,450,090 | ) | (3,312,275 | ) | (1,261,075 | ) | (1,936,637 | ) | ||||||||||||||||||||||||||||
| Royce Dividend Value Fund | ||||||||||||||||||||||||||||||||||||||||
Investment Class | 22,914,283 | 95,594,378 | 860,238 | 13,847,962 | (44,893,192 | ) | (48,840,808 | ) | (21,118,671 | ) | 60,601,532 | |||||||||||||||||||||||||||||
Service Class | 25,522,586 | 133,082,533 | 1,145,067 | 23,778,109 | (59,138,885 | ) | (65,610,178 | ) | (32,471,232 | ) | 91,250,464 | |||||||||||||||||||||||||||||
Consultant Class | 117,441 | 41 | – | 117,482 | ||||||||||||||||||||||||||||||||||||
Institutional Class | 11,877,040 | 2,037,602 | 207,106 | 2,161,756 | (1,064,145 | ) | (1,691,088 | ) | 11,020,001 | 2,508,270 | ||||||||||||||||||||||||||||||
| 118 | The Royce Funds 2014 Semiannual Report to Shareholders |
Capital Share Transactions (in dollars) (continued):
| Shares issued for | Net increase (decrease) from | |||||||||||||||||||||||||||||||||||||||
| Shares sold | reinvestment of distributions | Shares redeemed | capital share transactions | |||||||||||||||||||||||||||||||||||||
| Period ended | Period ended | Period ended | Period ended | |||||||||||||||||||||||||||||||||||||
| 6/30/14 | Period ended | 6/30/14 | Period ended | 6/30/14 | Period ended | 6/30/14 | Period ended | |||||||||||||||||||||||||||||||||
| (unaudited) | 12/31/13 | (unaudited) | 12/31/13 | (unaudited) | 12/31/13 | (unaudited) | 12/31/13 | |||||||||||||||||||||||||||||||||
| Royce Global Value Fund | ||||||||||||||||||||||||||||||||||||||||
Investment Class | $ | 17,259,022 | $ | 52,876,116 | $ | – | $ | 1,615,070 | $ | (50,921,993 | ) | $ | (81,698,507 | ) | $ | (33,662,971 | ) | $ | (27,207,321 | ) | ||||||||||||||||||||
Service Class | 3,282,580 | 11,030,665 | – | 397,892 | (12,139,329 | ) | (64,565,756 | ) | (8,856,749 | ) | (53,137,199 | ) | ||||||||||||||||||||||||||||
Consultant Class | 1,132,638 | 5,883,100 | – | 85,042 | (2,124,837 | ) | (4,873,143 | ) | (992,199 | ) | 1,094,999 | |||||||||||||||||||||||||||||
R Class | 13,000 | 48,059 | – | 1,123 | – | (32,126 | ) | 13,000 | 17,056 | |||||||||||||||||||||||||||||||
K Class | – | – | – | 603 | (20,000 | ) | – | (20,000 | ) | 603 | ||||||||||||||||||||||||||||||
| Royce International Smaller-Companies Fund | ||||||||||||||||||||||||||||||||||||||||
Investment Class | 787,137 | – | (103,300 | ) | 683,837 | |||||||||||||||||||||||||||||||||||
Service Class | 19,566,046 | 15,275,210 | – | 2,054,964 | (9,359,649 | ) | (7,584,209 | ) | 10,206,397 | 9,745,965 | ||||||||||||||||||||||||||||||
Institutional Class | 2,847,692 | – | – | 2,847,692 | ||||||||||||||||||||||||||||||||||||
| Royce Special Equity Multi-Cap Fund | ||||||||||||||||||||||||||||||||||||||||
Investment Class | 13,800,747 | 19,293,138 | – | 3,704,628 | (9,277,222 | ) | (6,291,434 | ) | 4,523,525 | 16,706,332 | ||||||||||||||||||||||||||||||
Service Class | 19,509,940 | 27,040,616 | – | 4,412,868 | (7,246,486 | ) | (10,431,782 | ) | 12,263,454 | 21,021,702 | ||||||||||||||||||||||||||||||
Consultant Class | 4,433,204 | – | (20,940 | ) | 4,412,264 | |||||||||||||||||||||||||||||||||||
Institutional Class | 7,507,045 | 10,145,425 | – | 2,916,002 | (9,704,979 | ) | (6,513,470 | ) | (2,197,934 | ) | 6,547,957 | |||||||||||||||||||||||||||||
Capital Share Transactions (in shares):
| Shares issued for | Net increase (decrease) in | |||||||||||||||||||||||||||||||||||||||
| Shares sold | reinvestment of distributions | Shares redeemed | shares outstanding | |||||||||||||||||||||||||||||||||||||
| Period ended | Period ended | Period ended | Period ended | |||||||||||||||||||||||||||||||||||||
| 6/30/14 | Period ended | 6/30/14 | Period ended | 6/30/14 | Period ended | 6/30/14 | Period ended | |||||||||||||||||||||||||||||||||
| (unaudited) | 12/31/13 | (unaudited) | 12/31/13 | (unaudited) | 12/31/13 | (unaudited) | 12/31/13 | |||||||||||||||||||||||||||||||||
| Royce Pennsylvania Mutual Fund | ||||||||||||||||||||||||||||||||||||||||
Investment Class | 16,061,767 | 46,226,486 | – | 16,992,836 | (50,580,736 | ) | (89,595,361 | ) | (34,518,969 | ) | (26,376,039 | ) | ||||||||||||||||||||||||||||
Service Class | 3,951,538 | 12,154,062 | – | 2,231,345 | (8,286,064 | ) | (15,280,852 | ) | (4,334,526 | ) | (895,445 | ) | ||||||||||||||||||||||||||||
Consultant Class | 1,293,415 | 3,060,812 | – | 3,572,100 | (4,366,003 | ) | (9,417,039 | ) | (3,072,588 | ) | (2,784,127 | ) | ||||||||||||||||||||||||||||
Institutional Class | 10,834,237 | 16,645,215 | – | 2,974,759 | (9,998,571 | ) | (6,539,897 | ) | 835,666 | 13,080,077 | ||||||||||||||||||||||||||||||
R Class | 312,771 | 954,600 | – | 168,937 | (567,536 | ) | (969,814 | ) | (254,765 | ) | 153,723 | |||||||||||||||||||||||||||||
K Class | 75,223 | 277,728 | – | 49,089 | (169,344 | ) | (290,287 | ) | (94,121 | ) | 36,530 | |||||||||||||||||||||||||||||
| Royce Micro-Cap Fund | ||||||||||||||||||||||||||||||||||||||||
Investment Class | 959,952 | 6,259,092 | – | 2,671,284 | (6,772,131 | ) | (20,014,977 | ) | (5,812,179 | ) | (11,084,601 | ) | ||||||||||||||||||||||||||||
Service Class | 354,377 | 1,576,795 | – | 347,362 | (1,172,961 | ) | (4,567,474 | ) | (818,584 | ) | (2,643,317 | ) | ||||||||||||||||||||||||||||
Consultant Class | 94,691 | 305,187 | – | 633,631 | (689,801 | ) | (2,064,361 | ) | (595,110 | ) | (1,125,543 | ) | ||||||||||||||||||||||||||||
| Royce Premier Fund | ||||||||||||||||||||||||||||||||||||||||
Investment Class | 7,400,481 | 30,376,140 | – | 21,769,221 | (27,107,781 | ) | (63,250,311 | ) | (19,707,300 | ) | (11,104,950 | ) | ||||||||||||||||||||||||||||
Service Class | 1,034,007 | 4,393,188 | – | 2,235,507 | (3,120,413 | ) | (21,601,163 | ) | (2,086,406 | ) | (14,972,468 | ) | ||||||||||||||||||||||||||||
Consultant Class | 61,012 | 172,593 | – | 361,940 | (259,457 | ) | (616,805 | ) | (198,445 | ) | (82,272 | ) | ||||||||||||||||||||||||||||
Institutional Class | 2,394,073 | 8,056,109 | – | 4,163,363 | (5,771,873 | ) | (12,779,832 | ) | (3,377,800 | ) | (560,360 | ) | ||||||||||||||||||||||||||||
W Class | 986,140 | 3,209,870 | – | 1,936,569 | (3,598,259 | ) | (8,004,577 | ) | (2,612,119 | ) | (2,858,138 | ) | ||||||||||||||||||||||||||||
R Class | 121,666 | 355,469 | – | 156,830 | (185,584 | ) | (518,060 | ) | (63,918 | ) | (5,761 | ) | ||||||||||||||||||||||||||||
K Class | 66,577 | 207,939 | – | 242,928 | (252,242 | ) | (562,131 | ) | (185,665 | ) | (111,264 | ) | ||||||||||||||||||||||||||||
| Royce Low-Priced Stock Fund | ||||||||||||||||||||||||||||||||||||||||
Investment Class | 422,556 | 1,774,622 | – | 879,449 | (2,661,732 | ) | (14,606,981 | ) | (2,239,176 | ) | (11,952,910 | ) | ||||||||||||||||||||||||||||
Service Class | 1,759,562 | 6,805,969 | – | 9,802,415 | (16,795,343 | ) | (72,626,280 | ) | (15,035,781 | ) | (56,017,896 | ) | ||||||||||||||||||||||||||||
Institutional Class | 870,508 | 3,751,445 | – | 4,945,006 | (15,883,451 | ) | (53,328,942 | ) | (15,012,943 | ) | (44,632,491 | ) | ||||||||||||||||||||||||||||
R Class | 14,796 | 51,145 | – | 32,085 | (74,344 | ) | (276,221 | ) | (59,548 | ) | (192,991 | ) | ||||||||||||||||||||||||||||
K Class | 21,087 | 185,404 | – | 125,734 | (189,393 | ) | (545,525 | ) | (168,306 | ) | (234,387 | ) | ||||||||||||||||||||||||||||
| Royce Total Return Fund | ||||||||||||||||||||||||||||||||||||||||
Investment Class | 12,155,747 | 34,008,791 | 715,492 | 19,177,169 | (30,707,115 | ) | (54,422,666 | ) | (17,835,876 | ) | (1,236,706 | ) | ||||||||||||||||||||||||||||
Service Class | 2,692,909 | 18,008,716 | 41,849 | 2,760,845 | (15,138,600 | ) | (10,349,897 | ) | (12,403,842 | ) | 10,419,664 | |||||||||||||||||||||||||||||
Consultant Class | 569,942 | 1,777,940 | – | 1,916,004 | (1,565,028 | ) | (3,421,705 | ) | (995,086 | ) | 272,239 | |||||||||||||||||||||||||||||
Institutional Class | 5,692,937 | 14,208,470 | 147,453 | 3,302,136 | (6,513,666 | ) | (9,643,829 | ) | (673,276 | ) | 7,866,777 | |||||||||||||||||||||||||||||
W Class | 1,909,619 | 4,762,342 | 55,323 | 1,360,229 | (1,622,033 | ) | (3,582,702 | ) | 342,909 | 2,539,869 | ||||||||||||||||||||||||||||||
R Class | 441,569 | 1,406,109 | 2,463 | 360,304 | (788,691 | ) | (960,345 | ) | (344,659 | ) | 806,068 | |||||||||||||||||||||||||||||
K Class | 2,526,216 | 8,917,924 | 20,208 | 1,801,787 | (8,067,290 | ) | (10,408,606 | ) | (5,520,866 | ) | 311,105 | |||||||||||||||||||||||||||||
| The Royce Funds 2014 Semiannual Report to Shareholders | 119 |
| Notes to Financial Statements (unaudited) (continued) |
Capital Share Transactions (in shares) (continued):
| Shares issued for | Net increase (decrease) in | |||||||||||||||||||||||||||||||||||||||
| Shares sold | reinvestment of distributions | Shares redeemed | shares outstanding | |||||||||||||||||||||||||||||||||||||
| Period ended | Period ended | Period ended | Period ended | |||||||||||||||||||||||||||||||||||||
| 6/30/14 | Period ended | 6/30/14 | Period ended | 6/30/14 | Period ended | 6/30/14 | Period ended | |||||||||||||||||||||||||||||||||
| (unaudited) | 12/31/13 | (unaudited) | 12/31/13 | (unaudited) | 12/31/13 | (unaudited) | 12/31/13 | |||||||||||||||||||||||||||||||||
| Royce Heritage Fund | ||||||||||||||||||||||||||||||||||||||||
Investment Class | 1,571,989 | 3,942,621 | – | 800,468 | (217,104 | ) | (306,338 | ) | 1,354,885 | 4,436,751 | ||||||||||||||||||||||||||||||
Service Class | 390,906 | 922,749 | – | 1,522,989 | (1,785,520 | ) | (2,701,430 | ) | (1,394,614 | ) | (255,692 | ) | ||||||||||||||||||||||||||||
Consultant Class | 24,131 | 97,007 | – | 177,373 | (97,703 | ) | (197,298 | ) | (73,572 | ) | 77,082 | |||||||||||||||||||||||||||||
R Class | 19,993 | 157,302 | – | 88,537 | (151,360 | ) | (105,420 | ) | (131,367 | ) | 140,419 | |||||||||||||||||||||||||||||
K Class | 37,618 | 103,658 | – | 93,541 | (42,187 | ) | (298,103 | ) | (4,569 | ) | (100,904 | ) | ||||||||||||||||||||||||||||
| Royce Opportunity Fund | ||||||||||||||||||||||||||||||||||||||||
Investment Class | 7,567,087 | 23,132,726 | – | 7,393,346 | (9,039,348 | ) | (15,864,897 | ) | (1,472,261 | ) | 14,661,175 | |||||||||||||||||||||||||||||
Service Class | 1,893,119 | 10,451,801 | – | 2,327,279 | (3,385,732 | ) | (16,570,321 | ) | (1,492,613 | ) | (3,791,241 | ) | ||||||||||||||||||||||||||||
Consultant Class | 147,489 | 311,452 | – | 132,566 | (162,428 | ) | (197,400 | ) | (14,939 | ) | 246,618 | |||||||||||||||||||||||||||||
Institutional Class | 5,295,923 | 11,676,520 | – | 4,892,724 | (4,926,076 | ) | (19,424,495 | ) | 369,847 | (2,855,251 | ) | |||||||||||||||||||||||||||||
R Class | 625,571 | 956,791 | – | 145,771 | (95,371 | ) | (136,455 | ) | 530,200 | 966,107 | ||||||||||||||||||||||||||||||
K Class | 595,108 | 657,201 | – | 130,963 | (283,661 | ) | (304,568 | ) | 311,447 | 483,596 | ||||||||||||||||||||||||||||||
| Royce Special Equity Fund | ||||||||||||||||||||||||||||||||||||||||
Investment Class | 6,452,976 | 20,852,805 | – | 7,776,472 | (15,814,969 | ) | (25,209,775 | ) | (9,361,993 | ) | 3,419,502 | |||||||||||||||||||||||||||||
Service Class | 1,052,703 | 3,403,756 | – | 1,078,798 | (2,849,473 | ) | (2,906,242 | ) | (1,796,770 | ) | 1,576,312 | |||||||||||||||||||||||||||||
Consultant Class | 105,042 | 237,789 | – | 264,105 | (203,466 | ) | (335,357 | ) | (98,424 | ) | 166,537 | |||||||||||||||||||||||||||||
Institutional Class | 1,995,413 | 5,326,316 | – | 2,368,292 | (2,201,108 | ) | (6,731,297 | ) | (205,695 | ) | 963,311 | |||||||||||||||||||||||||||||
| Royce Value Fund | ||||||||||||||||||||||||||||||||||||||||
Investment Class | 842,609 | 3,135,123 | – | 1,007,651 | (4,774,536 | ) | (7,726,784 | ) | (3,931,927 | ) | (3,584,010 | ) | ||||||||||||||||||||||||||||
Service Class | 1,426,241 | 4,676,686 | – | 3,551,836 | (8,379,587 | ) | (31,037,970 | ) | (6,953,346 | ) | (22,809,448 | ) | ||||||||||||||||||||||||||||
Consultant Class | 100,676 | 183,439 | – | 178,027 | (302,382 | ) | (967,471 | ) | (201,706 | ) | (606,005 | ) | ||||||||||||||||||||||||||||
Institutional Class | 655,981 | 2,092,657 | – | 1,203,721 | (1,504,062 | ) | (4,871,428 | ) | (848,081 | ) | (1,575,050 | ) | ||||||||||||||||||||||||||||
R Class | 210,338 | 708,108 | – | 203,266 | (370,439 | ) | (1,452,191 | ) | (160,101 | ) | (540,817 | ) | ||||||||||||||||||||||||||||
K Class | 185,742 | 541,528 | – | 136,497 | (604,930 | ) | (1,140,643 | ) | (419,188 | ) | (462,618 | ) | ||||||||||||||||||||||||||||
| Royce Value Plus Fund | ||||||||||||||||||||||||||||||||||||||||
Investment Class | 2,464,587 | 2,851,911 | – | 1,079,225 | (2,458,413 | ) | (5,994,135 | ) | 6,174 | (2,062,999 | ) | |||||||||||||||||||||||||||||
Service Class | 2,452,525 | 4,643,803 | – | 3,998,960 | (9,042,898 | ) | (29,187,654 | ) | (6,590,373 | ) | (20,544,891 | ) | ||||||||||||||||||||||||||||
Consultant Class | 20,688 | 72,690 | – | 112,509 | (172,415 | ) | (252,539 | ) | (151,727 | ) | (67,340 | ) | ||||||||||||||||||||||||||||
Institutional Class | 452,115 | 1,576,410 | – | 666,203 | (4,874,279 | ) | (9,418,226 | ) | (4,422,164 | ) | (7,175,613 | ) | ||||||||||||||||||||||||||||
R Class | 6,428 | 66,892 | – | 7,884 | (19,858 | ) | (67,496 | ) | (13,430 | ) | 7,280 | |||||||||||||||||||||||||||||
K Class | 11,278 | 39,389 | – | 8,932 | (15,140 | ) | (15,469 | ) | (3,862 | ) | 32,852 | |||||||||||||||||||||||||||||
| Royce 100 Fund | ||||||||||||||||||||||||||||||||||||||||
Investment Class | 734,701 | 1,918,300 | – | 786,729 | (773,506 | ) | (4,481,066 | ) | (38,805 | ) | (1,776,037 | ) | ||||||||||||||||||||||||||||
Service Class | 1,579,421 | 3,419,533 | – | 2,991,579 | (3,377,227 | ) | (8,383,582 | ) | (1,797,806 | ) | (1,972,470 | ) | ||||||||||||||||||||||||||||
R Class | 45,162 | 85,981 | – | 23,585 | (38,228 | ) | (123,506 | ) | 6,934 | (13,940 | ) | |||||||||||||||||||||||||||||
K Class | 14,835 | 92,262 | – | 18,760 | (115,562 | ) | (254,841 | ) | (100,727 | ) | (143,819 | ) | ||||||||||||||||||||||||||||
| Royce Dividend Value Fund | ||||||||||||||||||||||||||||||||||||||||
Investment Class | 2,597,978 | 11,682,957 | 96,396 | 1,624,572 | (5,119,041 | ) | (5,819,566 | ) | (2,424,667 | ) | 7,487,963 | |||||||||||||||||||||||||||||
Service Class | 2,875,472 | 15,995,933 | 127,028 | 2,758,492 | (6,676,180 | ) | (7,734,636 | ) | (3,673,680 | ) | 11,019,789 | |||||||||||||||||||||||||||||
Consultant Class | 11,622 | 4 | – | 11,626 | ||||||||||||||||||||||||||||||||||||
Institutional Class | 1,361,316 | 245,393 | 23,248 | 254,395 | (121,724 | ) | (202,230 | ) | 1,262,840 | 297,558 | ||||||||||||||||||||||||||||||
| Royce Global Value Fund | ||||||||||||||||||||||||||||||||||||||||
Investment Class | 1,218,149 | 4,055,905 | – | 122,354 | (3,729,385 | ) | (6,270,310 | ) | (2,511,236 | ) | (2,092,051 | ) | ||||||||||||||||||||||||||||
Service Class | 232,746 | 840,469 | – | 29,962 | (862,980 | ) | (4,915,611 | ) | (630,234 | ) | (4,045,180 | ) | ||||||||||||||||||||||||||||
Consultant Class | 81,081 | 452,132 | – | 6,467 | (151,758 | ) | (378,187 | ) | (70,677 | ) | 80,412 | |||||||||||||||||||||||||||||
R Class | 1,240 | 4,926 | – | 114 | – | (3,429 | ) | 1,240 | 1,611 | |||||||||||||||||||||||||||||||
K Class | – | – | – | 61 | (1,992 | ) | – | (1,992 | ) | 61 | ||||||||||||||||||||||||||||||
| Royce International Smaller-Companies Fund | ||||||||||||||||||||||||||||||||||||||||
Investment Class | 78,688 | – | (10,000 | ) | 68,688 | |||||||||||||||||||||||||||||||||||
Service Class | 1,636,848 | 1,306,197 | – | 176,089 | (775,804 | ) | (646,447 | ) | 861,044 | 835,839 | ||||||||||||||||||||||||||||||
Institutional Class | 284,769 | – | – | 284,769 | ||||||||||||||||||||||||||||||||||||
| Royce Special Equity Multi-Cap Fund | ||||||||||||||||||||||||||||||||||||||||
Investment Class | 919,852 | 1,419,512 | – | 256,021 | (622,824 | ) | (446,425 | ) | 297,028 | 1,229,108 | ||||||||||||||||||||||||||||||
Service Class | 1,309,073 | 1,938,884 | – | 303,917 | (487,562 | ) | (754,027 | ) | 821,511 | 1,488,774 | ||||||||||||||||||||||||||||||
Consultant Class | 426,322 | – | (2,000 | ) | 424,322 | |||||||||||||||||||||||||||||||||||
Institutional Class | 516,269 | 791,666 | – | 201,381 | (654,138 | ) | (426,933 | ) | (137,869 | ) | 566,114 | |||||||||||||||||||||||||||||
| 120 | The Royce Funds 2014 Semiannual Report to Shareholders |
Investment Adviser and Distributor:
Investment Adviser: Under the Trust’s investment advisory agreements with Royce, Royce is entitled to receive Investment Advisory fees that are computed daily and payable monthly. Royce’s commitment to waive its fees and reimburse class-specific expenses to the extent necessary to maintain certain Funds’ net annual operating expense ratios at specified levels through April 30, 2015, is shown below to the extent that it impacted net expenses for the six months ended June 30, 2014. See the Prospectus for contractual waiver expiration dates.
| Annual contractual | Period ended | |||||||||||||||||||||||||||||||||||||||
| advisory fee as a | Committed net annual operating expense ratio cap | June 30, 2014 | ||||||||||||||||||||||||||||||||||||||
| percentage of | Investment | Service | Consultant | Institutional | Net advisory | Advisory | ||||||||||||||||||||||||||||||||||
| average net assets1 | Class4 | Class4 | Class4 | Class4 | W Class4 | R Class4 | K Class4 | fees | fees waived | |||||||||||||||||||||||||||||||
Royce Pennsylvania Mutual Fund | 0.75 | %2 | N/A | N/A | N/A | N/A | N/A | N/A | N/A | $ | 26,052,274 | $ | – | |||||||||||||||||||||||||||
Royce Micro-Cap Fund | 1.30 | % | N/A | 1.66 | % | N/A | N/A | N/A | N/A | N/A | 5,012,316 | – | ||||||||||||||||||||||||||||
Royce Premier Fund | 0.94 | % | N/A | N/A | N/A | N/A | N/A | N/A | N/A | 31,590,867 | – | |||||||||||||||||||||||||||||
Royce Low-Priced Stock Fund | 1.15 | %3 | 1.24 | % | 1.49 | % | N/A | N/A | N/A | 1.84 | % | 1.59 | % | 6,898,971 | – | |||||||||||||||||||||||||
Royce Total Return Fund | 0.96 | % | N/A | N/A | N/A | N/A | N/A | N/A | N/A | 25,257,317 | – | |||||||||||||||||||||||||||||
Royce Heritage Fund | 1.00 | % | N/A | N/A | N/A | N/A | N/A | 1.84 | % | 1.59 | % | 1,803,943 | – | |||||||||||||||||||||||||||
Royce Opportunity Fund | 0.99 | % | N/A | N/A | N/A | N/A | N/A | N/A | N/A | 12,581,702 | – | |||||||||||||||||||||||||||||
Royce Special Equity Fund | 0.98 | % | N/A | 1.39 | % | N/A | N/A | N/A | N/A | N/A | 16,474,798 | – | ||||||||||||||||||||||||||||
Royce Value Fund | 1.00 | % | N/A | N/A | N/A | N/A | N/A | N/A | N/A | 5,381,629 | – | |||||||||||||||||||||||||||||
Royce Value Plus Fund | 1.00 | % | N/A | N/A | N/A | N/A | N/A | 1.84 | % | 1.59 | % | 5,768,517 | – | |||||||||||||||||||||||||||
Royce 100 Fund | 1.00 | % | N/A | N/A | N/A | N/A | N/A | 1.84 | % | 1.59 | % | 1,419,837 | – | |||||||||||||||||||||||||||
Royce Dividend Value Fund | 1.00 | % | N/A | N/A | 2.24 | % | 1.04 | % | N/A | N/A | N/A | 3,082,326 | 12,776 | |||||||||||||||||||||||||||
Royce Global Value Fund | 1.25 | % | N/A | 1.69 | % | 2.44 | % | N/A | N/A | 1.99 | % | 1.74 | % | 1,280,863 | – | |||||||||||||||||||||||||
Royce International | 1.25 | % | 1.44 | % | 1.69 | % | N/A | 1.44 | % | N/A | N/A | N/A | 299,709 | 10,381 | ||||||||||||||||||||||||||
Royce Special Equity Multi-Cap Fund | 0.85 | % | N/A | 1.24 | % | 1.99 | % | 0.89 | % | N/A | N/A | N/A | 837,484 | 1,388 | ||||||||||||||||||||||||||
Distributor: Royce Fund Services, Inc. (“RFS”), the distributor of the Trust’s shares, is a wholly owned subsidiary of Royce. RFS is entitled to receive distribution fees that are computed daily and payable monthly.
| Period ended June 30, 2014 | |||||||||||||
| Annual contractual distribution fee as | Net distribution | Distribution fees | |||||||||||
| a percentage of average net assets | fees | waived | |||||||||||
| Royce Pennsylvania Mutual Fund – Service Class | 0.25 | % | $ | 697,081 | $ | – | |||||||
| Royce Pennsylvania Mutual Fund – Consultant Class | 1.00 | % | 3,754,875 | – | |||||||||
| Royce Pennsylvania Mutual Fund – R Class | 0.50 | % | 105,500 | – | |||||||||
| Royce Pennsylvania Mutual Fund – K Class | 0.25 | % | 13,532 | – | |||||||||
| Royce Micro-Cap Fund – Service Class | 0.25 | % | 86,160 | – | |||||||||
| Royce Micro-Cap Fund – Consultant Class | 1.00 | % | 548,754 | – | |||||||||
| Royce Premier Fund – Service Class | 0.25 | % | 369,668 | – | |||||||||
| Royce Premier Fund – Consultant Class | 1.00 | % | 324,462 | – | |||||||||
| Royce Premier Fund – R Class | 0.50 | % | 78,739 | – | |||||||||
| Royce Premier Fund – K Class | 0.25 | % | 9,532 | – | |||||||||
| Royce Low-Priced Stock Fund – Service Class | 0.25 | % | 1,069,514 | 44,563 | |||||||||
| Royce Low-Priced Stock Fund – R Class | 0.50 | % | 6,246 | – | |||||||||
| Royce Low-Priced Stock Fund – K Class | 0.25 | % | 3,644 | – | |||||||||
| Royce Total Return Fund – Service Class | 0.25 | % | 485,604 | – | |||||||||
| Royce Total Return Fund – Consultant Class | 1.00 | % | 1,945,578 | – | |||||||||
| Royce Total Return Fund – R Class | 0.50 | % | 170,524 | – | |||||||||
| Royce Total Return Fund – K Class | 0.25 | % | 201,459 | – | |||||||||
| Royce Heritage Fund – Service Class | 0.25 | % | 227,069 | 30,964 | |||||||||
| Royce Heritage Fund – Consultant Class | 1.00 | % | 75,581 | – | |||||||||
| Royce Heritage Fund – R Class | 0.50 | % | 14,676 | – | |||||||||
| Royce Heritage Fund – K Class | 0.25 | % | 7,953 | – | |||||||||
| Royce Opportunity Fund – Service Class | 0.25 | % | 254,839 | – | |||||||||
| Royce Opportunity Fund – Consultant Class | 1.00 | % | 92,867 | – | |||||||||
| Royce Opportunity Fund – R Class | 0.50 | % | 66,584 | – | |||||||||
| Royce Opportunity Fund – K Class | 0.25 | % | 25,343 | – | |||||||||
| The Royce Funds 2014 Semiannual Report to Shareholders | 121 |
| Notes to Financial Statements (unaudited) (continued) |
| Distributor (continued): | |||||||||||||
| Period ended June 30, 2014 | |||||||||||||
| Annual contractual distribution fee as | Net distribution | Distribution fees | |||||||||||
| a percentage of average net assets | fees | waived | |||||||||||
| Royce Special Equity Fund – Service Class | 0.25 | % | $ | 382,047 | $ | – | |||||||
| Royce Special Equity Fund – Consultant Class | 1.00 | % | 339,305 | – | |||||||||
| Royce Value Fund – Service Class | 0.25 | % | 772,816 | – | |||||||||
| Royce Value Fund – Consultant Class | 1.00 | % | 149,823 | – | |||||||||
| Royce Value Fund – R Class | 0.50 | % | 89,579 | – | |||||||||
| Royce Value Fund – K Class | 0.25 | % | 17,320 | – | |||||||||
| Royce Value Plus Fund – Service Class | 0.25 | % | 888,085 | 77,225 | |||||||||
| Royce Value Plus Fund – Consultant Class | 1.00 | % | 109,044 | – | |||||||||
| Royce Value Plus Fund – R Class | 0.50 | % | 3,717 | – | |||||||||
| Royce Value Plus Fund – K Class | 0.25 | % | 1,179 | – | |||||||||
| Royce 100 Fund – Service Class | 0.25 | % | 252,759 | 21,979 | |||||||||
| Royce 100 Fund – R Class | 0.50 | % | 6,821 | – | |||||||||
| Royce 100 Fund – K Class | 0.25 | % | 2,149 | – | |||||||||
| Royce Dividend Value Fund – Service Class | 0.25 | % | 462,597 | 19,275 | |||||||||
| Royce Dividend Value Fund – Consultant Class | 1.00 | % | 192 | – | |||||||||
| Royce Global Value Fund – Service Class | 0.25 | % | 56,002 | – | |||||||||
| Royce Global Value Fund – Consultant Class | 1.00 | % | 129,520 | – | |||||||||
| Royce Global Value Fund – R Class | 0.50 | % | 279 | – | |||||||||
| Royce Global Value Fund – K Class | 0.25 | % | 35 | – | |||||||||
| Royce International Smaller-Companies Fund – Service Class | 0.25 | % | 58,084 | – | |||||||||
| Royce Special Equity Multi-Cap Fund – Service Class | 0.25 | % | 96,238 | 8,368 | |||||||||
| Royce Special Equity Multi-Cap Fund – Consultant Class | 1.00 | % | 11,539 | – | |||||||||
Purchases and Sales of Investment Securities:
For the six months ended June 30, 2014, the costs of purchases and the proceeds from sales of investment securities, other than short-term securities and collateral received for securities loaned, were as follows:
| Purchases | Sales | |||||||
| Royce Pennsylvania Mutual Fund | $ | 870,655,760 | $ | 1,369,407,669 | ||||
| Royce Micro-Cap Fund | 76,306,340 | 185,139,646 | ||||||
| Royce Premier Fund | 257,657,649 | 781,182,684 | ||||||
| Royce Low-Priced Stock Fund | 53,554,303 | 498,279,226 | ||||||
| Royce Total Return Fund | 429,423,330 | 876,894,321 | ||||||
| Royce Heritage Fund | 76,823,064 | 61,136,723 | ||||||
| Royce Opportunity Fund | 463,856,552 | 480,657,488 | ||||||
| Royce Special Equity Fund | 328,151,622 | 561,314,469 | ||||||
| Royce Value Fund | 195,050,444 | 364,206,102 | ||||||
| Royce Value Plus Fund | 305,088,862 | 424,169,589 | ||||||
| Royce 100 Fund | 45,710,647 | 51,938,335 | ||||||
| Royce Dividend Value Fund | 86,185,865 | 92,693,370 | ||||||
| Royce Global Value Fund | 34,301,647 | 74,833,586 | ||||||
| Royce International Smaller-Companies Fund | 27,313,284 | 13,652,277 | ||||||
| Royce Special Equity Multi-Cap Fund | 45,683,343 | 35,420,315 | ||||||
Class Specific Expenses:
Class specific expenses were as follows for the period ended June 30, 2014:
| Class Level | |||||||||||||||||||||||||||||
| Transfer | Expenses | ||||||||||||||||||||||||||||
| Net | Agent | Reimbursed by | |||||||||||||||||||||||||||
| Distribution | Shareholder | Shareholder | Balance | Investment | |||||||||||||||||||||||||
| Fees | Servicing | Reports | Registration | Credits | Total | Adviser | |||||||||||||||||||||||
Royce Pennsylvania Mutual Fund – Investment Class | $ | – | $ | 2,507,711 | $ | 386,608 | $ | 25,201 | $ | (294 | ) | $ | 2,919,226 | $ | – | ||||||||||||||
Royce Pennsylvania Mutual Fund – Service Class | 697,081 | 446,021 | 82,164 | 7,429 | (11 | ) | 1,232,684 | – | |||||||||||||||||||||
Royce Pennsylvania Mutual Fund – Consultant Class | 3,754,875 | 371,001 | 88,825 | 7,301 | (65 | ) | 4,221,937 | – | |||||||||||||||||||||
Royce Pennsylvania Mutual Fund – Institutional Class | – | 3,721 | 19,606 | 7,487 | (1 | ) | 30,813 | – | |||||||||||||||||||||
Royce Pennsylvania Mutual Fund – R Class | 105,500 | 43,492 | 3,004 | 595 | (10 | ) | 152,581 | – | |||||||||||||||||||||
Royce Pennsylvania Mutual Fund – K Class | 13,532 | 13,487 | 958 | 595 | (1 | ) | 28,571 | – | |||||||||||||||||||||
| 4,570,988 | 3,385,433 | 581,165 | 48,608 | (382 | ) | ||||||||||||||||||||||||
Royce Micro-Cap Fund – Investment Class | – | 373,887 | 137,430 | 10,837 | (86 | ) | 522,068 | – | |||||||||||||||||||||
Royce Micro-Cap Fund – Service Class | 86,160 | 24,784 | 15,998 | 5,660 | (8 | ) | 132,594 | 23,172 | |||||||||||||||||||||
Royce Micro-Cap Fund – Consultant Class | 548,754 | 60,909 | 14,276 | 6,079 | (17 | ) | 630,001 | – | |||||||||||||||||||||
| 634,914 | 459,580 | 167,704 | 22,576 | (111 | ) | 23,172 | |||||||||||||||||||||||
| 122 | The Royce Funds 2014 Semiannual Report to Shareholders |
Class Specific Expenses (continued):
| Class Level | |||||||||||||||||||||||||||||
| Transfer | Expenses | ||||||||||||||||||||||||||||
| Net | Agent | Reimbursed by | |||||||||||||||||||||||||||
| Distribution | Shareholder | Shareholder | Balance | Investment | |||||||||||||||||||||||||
| Fees | Servicing | Reports | Registration | Credits | Total | Adviser | |||||||||||||||||||||||
Royce Premier Fund – Investment Class | $ | – | $ | 2,049,678 | $ | 535,519 | $ | 22,618 | $ | (262 | ) | $ | 2,607,553 | $ | – | ||||||||||||||
Royce Premier Fund – Service Class | 369,668 | 278,159 | 45,123 | 6,018 | (24 | ) | 698,944 | – | |||||||||||||||||||||
Royce Premier Fund – Consultant Class | 324,462 | 29,851 | 7,100 | 5,458 | (9 | ) | 366,862 | – | |||||||||||||||||||||
Royce Premier Fund – Institutional Class | – | 5,189 | 34,173 | 7,388 | (2 | ) | 46,748 | – | |||||||||||||||||||||
Royce Premier Fund – W Class | – | 207,598 | 68,540 | 9,784 | (44 | ) | 285,878 | – | |||||||||||||||||||||
Royce Premier Fund – R Class | 78,739 | 33,880 | 5,143 | 595 | (2 | ) | 118,355 | – | |||||||||||||||||||||
Royce Premier Fund – K Class | 9,532 | 12,027 | 613 | 596 | – | 22,768 | – | ||||||||||||||||||||||
| 782,401 | 2,616,382 | 696,211 | 52,457 | (343 | ) | ||||||||||||||||||||||||
Royce Low-Priced Stock Fund – Investment Class | – | 81,011 | 11,717 | 6,279 | (2 | ) | 99,005 | 85,624 | |||||||||||||||||||||
Royce Low-Priced Stock Fund – Service Class | 1,069,514 | 876,865 | 141,081 | 9,881 | (104 | ) | 2,097,237 | 826,212 | |||||||||||||||||||||
Royce Low-Priced Stock Fund – Institutional Class | – | 3,731 | 80,801 | 7,411 | (1 | ) | 91,942 | – | |||||||||||||||||||||
Royce Low-Priced Stock Fund – R Class | 6,246 | 7,039 | 801 | 596 | (1 | ) | 14,681 | 6,755 | |||||||||||||||||||||
Royce Low-Priced Stock Fund – K Class | 3,644 | 8,366 | 677 | 595 | – | 13,282 | 7,693 | ||||||||||||||||||||||
| 1,079,404 | 977,012 | 235,077 | 24,762 | (108 | ) | 926,284 | |||||||||||||||||||||||
Royce Total Return Fund – Investment Class | – | 1,818,565 | 354,674 | 16,872 | (254 | ) | 2,189,857 | – | |||||||||||||||||||||
Royce Total Return Fund – Service Class | 485,604 | 342,160 | 157,077 | 26,861 | (10 | ) | 1,011,692 | – | |||||||||||||||||||||
Royce Total Return Fund – Consultant Class | 1,945,578 | 193,231 | 44,976 | 7,381 | (45 | ) | 2,191,121 | – | |||||||||||||||||||||
Royce Total Return Fund – Institutional Class | – | 6,127 | 18,223 | 7,333 | (3 | ) | 31,680 | – | |||||||||||||||||||||
Royce Total Return Fund – W Class | – | 114,290 | 36,158 | 10,526 | (2 | ) | 160,972 | – | |||||||||||||||||||||
Royce Total Return Fund – R Class | 170,524 | 68,758 | 4,398 | 595 | (7 | ) | 244,268 | – | |||||||||||||||||||||
Royce Total Return Fund – K Class | 201,459 | 207,692 | 4,203 | 597 | (2 | ) | 413,949 | – | |||||||||||||||||||||
| 2,803,165 | 2,750,823 | 619,709 | 70,165 | (323 | ) | ||||||||||||||||||||||||
Royce Heritage Fund – Investment Class | – | 11,615 | 1,979 | 6,330 | (2 | ) | 19,922 | – | |||||||||||||||||||||
Royce Heritage Fund – Service Class | 227,069 | 102,335 | 30,799 | 9,040 | (56 | ) | 369,187 | – | |||||||||||||||||||||
Royce Heritage Fund – Consultant Class | 75,581 | 11,609 | 3,839 | 5,283 | (5 | ) | 96,307 | – | |||||||||||||||||||||
Royce Heritage Fund – R Class | 14,676 | 8,338 | 823 | 596 | (1 | ) | 24,432 | 1,346 | |||||||||||||||||||||
Royce Heritage Fund – K Class | 7,953 | 10,619 | 1,126 | 596 | – | 20,294 | 3,245 | ||||||||||||||||||||||
| 325,279 | 144,516 | 38,566 | 21,845 | (64 | ) | 4,591 | |||||||||||||||||||||||
Royce Opportunity Fund – Investment Class | – | 613,218 | 88,104 | 12,338 | (138 | ) | 713,522 | – | |||||||||||||||||||||
Royce Opportunity Fund – Service Class | 254,839 | 262,542 | 29,938 | 6,455 | (5 | ) | 553,769 | – | |||||||||||||||||||||
Royce Opportunity Fund – Consultant Class | 92,867 | 12,008 | 2,692 | 5,400 | (4 | ) | 112,963 | – | |||||||||||||||||||||
Royce Opportunity Fund – Institutional Class | – | 3,675 | 16,061 | 7,687 | (2 | ) | 27,421 | – | |||||||||||||||||||||
Royce Opportunity Fund – R Class | 66,584 | 19,193 | 1,373 | 594 | (2 | ) | 87,742 | – | |||||||||||||||||||||
Royce Opportunity Fund – K Class | 25,343 | 9,209 | 839 | 594 | (1 | ) | 35,984 | – | |||||||||||||||||||||
| 439,633 | 919,845 | 139,007 | 33,068 | (152 | ) | ||||||||||||||||||||||||
Royce Special Equity Fund – Investment Class | – | 1,091,710 | 221,475 | 22,641 | (119 | ) | 1,335,707 | – | |||||||||||||||||||||
Royce Special Equity Fund – Service Class | 382,047 | 212,953 | 49,745 | 7,827 | (86 | ) | 652,486 | 68,167 | |||||||||||||||||||||
Royce Special Equity Fund – Consultant Class | 339,305 | 31,419 | 7,568 | 5,592 | (8 | ) | 383,876 | – | |||||||||||||||||||||
Royce Special Equity Fund – Institutional Class | – | 4,306 | 4,683 | 7,098 | (1 | ) | 16,086 | – | |||||||||||||||||||||
| 721,352 | 1,340,388 | 283,471 | 43,158 | (214 | ) | 68,167 | |||||||||||||||||||||||
Royce Value Fund – Investment Class | – | 98,345 | 35,593 | 6,474 | (64 | ) | 140,348 | – | |||||||||||||||||||||
Royce Value Fund – Service Class | 772,816 | 506,829 | 99,460 | 10,876 | (87 | ) | 1,389,894 | – | |||||||||||||||||||||
Royce Value Fund – Consultant Class | 149,823 | 22,388 | 4,458 | 5,218 | (2 | ) | 181,885 | – | |||||||||||||||||||||
Royce Value Fund – Institutional Class | – | 3,561 | 742 | 6,382 | – | 10,685 | – | ||||||||||||||||||||||
Royce Value Fund – R Class | 89,579 | 43,666 | 1,870 | 596 | (3 | ) | 135,708 | – | |||||||||||||||||||||
Royce Value Fund – K Class | 17,320 | 20,922 | 2,605 | 595 | (1 | ) | 41,441 | – | |||||||||||||||||||||
| 1,029,538 | 695,711 | 144,728 | 30,141 | (157 | ) | ||||||||||||||||||||||||
Royce Value Plus Fund – Investment Class | – | 284,775 | 57,732 | 7,532 | (2 | ) | 350,037 | – | |||||||||||||||||||||
Royce Value Plus Fund – Service Class | 888,085 | 656,816 | 143,901 | 10,583 | (85 | ) | 1,699,300 | – | |||||||||||||||||||||
Royce Value Plus Fund – Consultant Class | 109,044 | 20,155 | 3,923 | 5,135 | (3 | ) | 138,254 | – | |||||||||||||||||||||
Royce Value Plus Fund – Institutional Class | – | 4,110 | 18,431 | 5,826 | (1 | ) | 28,366 | – | |||||||||||||||||||||
Royce Value Plus Fund – R Class | 3,717 | 4,820 | 423 | 595 | – | 9,555 | 3,583 | ||||||||||||||||||||||
Royce Value Plus Fund – K Class | 1,179 | 3,888 | 221 | 595 | – | 5,883 | 3,269 | ||||||||||||||||||||||
| 1,002,025 | 974,564 | 224,631 | 30,266 | (91 | ) | 6,852 | |||||||||||||||||||||||
Royce 100 Fund – Investment Class | – | 28,620 | 6,096 | 6,259 | – | 40,975 | – | ||||||||||||||||||||||
Royce 100 Fund – Service Class | 252,759 | 134,547 | 63,979 | 9,023 | (32 | ) | 460,276 | – | |||||||||||||||||||||
Royce 100 Fund – R Class | 6,821 | 6,875 | 1,159 | 592 | (3 | ) | 15,444 | 4,569 | |||||||||||||||||||||
Royce 100 Fund – K Class | 2,149 | 6,280 | 437 | 595 | – | 9,461 | 4,712 | ||||||||||||||||||||||
| 261,729 | 176,322 | 71,671 | 16,469 | (35 | ) | 9,281 | |||||||||||||||||||||||
| The Royce Funds 2014 Semiannual Report to Shareholders | 123 |
| Notes to Financial Statements (unaudited) (continued) |
Class Specific Expenses (continued):
| Class Level | |||||||||||||||||||||||||||||
| Transfer | Expenses | ||||||||||||||||||||||||||||
| Net | Agent | Reimbursed by | |||||||||||||||||||||||||||
| Distribution | Shareholder | Shareholder | Balance | Investment | |||||||||||||||||||||||||
| Fees | Servicing | Reports | Registration | Credits | Total | Adviser | |||||||||||||||||||||||
Royce Dividend Value Fund – Investment Class | $ | – | $ | 105,304 | $ | 26,886 | $ | 8,584 | $ | (4 | ) | $ | 140,770 | $ | – | ||||||||||||||
Royce Dividend Value Fund – Service Class | 462,597 | 209,221 | 68,522 | 14,453 | (314 | ) | 754,479 | – | |||||||||||||||||||||
Royce Dividend Value Fund – Consultant Class | 192 | 2,336 | 37 | 5,497 | – | 8,062 | 7,833 | ||||||||||||||||||||||
Royce Dividend Value Fund – Institutional Class | – | 2,956 | 128 | 5,078 | – | 8,162 | 8,162 | ||||||||||||||||||||||
| 462,789 | 319,817 | 95,573 | 33,612 | (318 | ) | 15,995 | |||||||||||||||||||||||
Royce Global Value Fund – Investment Class | – | 70,356 | 22,434 | 10,546 | (1 | ) | 103,335 | – | |||||||||||||||||||||
Royce Global Value Fund – Service Class | 56,002 | 46,863 | 13,003 | 7,015 | (17 | ) | 122,866 | 47,336 | |||||||||||||||||||||
Royce Global Value Fund – Consultant Class | 129,520 | 12,608 | 2,822 | 5,604 | (7 | ) | 150,547 | 9,858 | |||||||||||||||||||||
Royce Global Value Fund – R Class | 279 | 2,966 | 55 | 592 | – | 3,892 | 3,535 | ||||||||||||||||||||||
Royce Global Value Fund – K Class | 35 | 2,961 | 49 | 592 | – | 3,637 | 3,584 | ||||||||||||||||||||||
| 185,836 | 135,754 | 38,363 | 24,349 | (25 | ) | 64,313 | |||||||||||||||||||||||
Royce International Smaller-Companies Fund – | |||||||||||||||||||||||||||||
Investment Class | – | 3,433 | 51 | 6,586 | – | 10,070 | 10,070 | ||||||||||||||||||||||
Royce International Smaller-Companies Fund – | |||||||||||||||||||||||||||||
Service Class | 58,084 | 25,144 | 4,702 | 11,197 | (5 | ) | 99,122 | 36,921 | |||||||||||||||||||||
Royce International Smaller-Companies Fund – | |||||||||||||||||||||||||||||
Institutional Class | – | 3,390 | 49 | 6,532 | – | 9,971 | 9,970 | ||||||||||||||||||||||
| 58,084 | 31,967 | 4,802 | 24,315 | (5 | ) | 56,961 | |||||||||||||||||||||||
Royce Special Equity Multi-Cap Fund – | |||||||||||||||||||||||||||||
Investment Class | – | 8,148 | 8,348 | 7,171 | (1 | ) | 23,666 | – | |||||||||||||||||||||
Royce Special Equity Multi-Cap Fund – | |||||||||||||||||||||||||||||
Service Class | 96,238 | 41,968 | 32,072 | 7,944 | (5 | ) | 178,217 | 35,056 | |||||||||||||||||||||
Royce Special Equity Multi-Cap Fund – | |||||||||||||||||||||||||||||
Consultant Class | 11,539 | 3,392 | 52 | 7,200 | – | 22,183 | 9,562 | ||||||||||||||||||||||
Royce Special Equity Multi-Cap Fund – | |||||||||||||||||||||||||||||
Institutional Class | – | 3,005 | 167 | 6,366 | – | 9,538 | 9,538 | ||||||||||||||||||||||
| 107,777 | 56,513 | 40,639 | 28,681 | (6 | ) | 54,156 | |||||||||||||||||||||||
| Net Unrealized | Gross Unrealized | ||||||||||||||
| Appreciation | |||||||||||||||
| Tax Basis Cost | (Depreciation) | Appreciation | Depreciation | ||||||||||||
| Royce Pennsylvania Mutual Fund | $ | 4,619,486,049 | $ | 2,390,175,479 | $ | 2,517,310,385 | $ | 127,134,906 | |||||||
| Royce Micro-Cap Fund | 593,446,224 | 174,245,869 | 222,726,835 | 48,480,966 | |||||||||||
| Royce Premier Fund | 4,276,745,971 | 2,836,368,513 | 3,024,153,456 | 187,784,943 | |||||||||||
| Royce Low-Priced Stock Fund | 867,240,677 | 313,551,849 | 392,644,292 | 79,092,443 | |||||||||||
| Royce Total Return Fund | 3,376,335,962 | 1,870,883,063 | 1,994,076,904 | 123,193,841 | |||||||||||
| Royce Heritage Fund | 300,884,727 | 81,988,447 | 88,188,938 | 6,200,491 | |||||||||||
| Royce Opportunity Fund | 2,287,155,865 | 511,256,970 | 667,024,017 | 155,767,047 | |||||||||||
| Royce Special Equity Fund | 2,540,205,789 | 809,835,421 | 819,311,829 | 9,476,408 | |||||||||||
| Royce Value Fund | 782,740,902 | 263,083,609 | 288,592,363 | 25,508,754 | |||||||||||
| Royce Value Plus Fund | 932,138,808 | 303,868,568 | 338,462,013 | 34,593,445 | |||||||||||
| Royce 100 Fund | 204,948,078 | 83,020,093 | 84,296,484 | 1,276,391 | |||||||||||
| Royce Dividend Value Fund | 485,189,093 | 140,628,320 | 152,163,407 | 11,535,087 | |||||||||||
| Royce Global Value Fund | 225,373,526 | (2,693,594 | ) | 32,289,364 | 34,982,958 | ||||||||||
| Royce International Smaller-Companies Fund | 51,136,073 | 4,148,581 | 6,573,067 | 2,424,486 | |||||||||||
| Royce Special Equity Multi-Cap Fund | 179,515,719 | 38,598,064 | 40,901,201 | 2,303,137 | |||||||||||
The primary difference between book and tax basis cost is the timing of the recognition of losses on securities sold.
| 124 | The Royce Funds 2014 Semiannual Report to Shareholders |
| Market | Realized | Market | ||||||||||||||||||||||||||||||
| Shares | Value | Cost of | Cost of | Gain | Dividend | Shares | Value | |||||||||||||||||||||||||
| Affiliated Company | 12/31/13 | 12/31/13 | Purchases | Sales | (Loss) | Income | 6/30/14 | 6/30/14 | ||||||||||||||||||||||||
Royce Pennsylvania Mutual Fund | ||||||||||||||||||||||||||||||||
America’s Car-Mart | 711,516 | $ | 30,047,321 | $ | – | $ | – | $ | – | $ | – | 711,516 | $ | 28,140,458 | ||||||||||||||||||
DTS | 1,044,829 | 25,054,999 | 454,185 | – | – | – | 1,069,829 | 19,695,552 | ||||||||||||||||||||||||
Fabrinet1 | 1,727,113 | 35,509,443 | 3,582,301 | 6,158,629 | 446,842 | – | ||||||||||||||||||||||||||
Key Tronic | 697,735 | 7,689,040 | 1,117 | – | – | – | 697,835 | 7,313,311 | ||||||||||||||||||||||||
Landauer | 492,200 | 25,894,642 | 1,375,615 | – | – | 570,570 | 518,700 | 21,785,400 | ||||||||||||||||||||||||
PICO Holdings | 1,056,784 | 24,422,278 | 6,427,984 | – | – | – | 1,319,011 | 31,339,701 | ||||||||||||||||||||||||
Preformed Line Products | 349,478 | 25,567,810 | 182,411 | – | – | 140,991 | 352,478 | 18,973,891 | ||||||||||||||||||||||||
Stanley Furniture1 | 962,235 | 3,694,982 | – | 14,879,061 | (12,329,138 | ) | – | |||||||||||||||||||||||||
Weyco Group | 590,500 | 17,378,415 | – | – | – | 218,485 | 590,500 | 16,185,605 | ||||||||||||||||||||||||
| 195,258,930 | (11,882,296 | ) | 930,046 | 143,433,918 | ||||||||||||||||||||||||||||
Royce Micro-Cap Fund | ||||||||||||||||||||||||||||||||
Key Technology | 370,814 | 5,313,765 | – | – | – | – | 370,814 | 4,568,428 | ||||||||||||||||||||||||
Lincoln Educational Services | 1,295,222 | 6,450,206 | – | 1,203,160 | (707,621 | ) | 168,076 | 1,200,543 | 5,390,438 | |||||||||||||||||||||||
Truett-Hurst Cl. A | 191,900 | 800,223 | – | – | – | – | 191,900 | 976,771 | ||||||||||||||||||||||||
| 12,564,194 | (707,621 | ) | 168,076 | 10,935,637 | ||||||||||||||||||||||||||||
Royce Premier Fund | ||||||||||||||||||||||||||||||||
Acacia Research | 3,152,289 | 45,834,282 | 8,271,457 | – | – | 894,088 | 3,701,351 | 65,698,980 | ||||||||||||||||||||||||
Benchmark Electronics | 2,843,900 | 65,637,212 | – | – | – | – | 2,843,900 | 72,462,572 | ||||||||||||||||||||||||
Cabot Microelectronics | 1,720,272 | 78,616,431 | – | 6,765,913 | 2,843,436 | – | 1,493,474 | 66,683,614 | ||||||||||||||||||||||||
Cal-Maine Foods | 1,721,686 | 103,697,148 | – | 1,514,351 | 1,618,242 | 1,609,495 | 1,671,686 | 124,239,703 | ||||||||||||||||||||||||
Cirrus Logic | 4,420,181 | 90,304,298 | 29,263,088 | – | – | – | 5,960,200 | 135,534,948 | ||||||||||||||||||||||||
Fair Isaac | 1,732,600 | 108,876,584 | – | – | – | 69,304 | 1,732,600 | 110,470,576 | ||||||||||||||||||||||||
Fairchild Semiconductor International1 | 6,833,112 | 91,222,045 | – | 33,486,957 | (3,799,667 | ) | – | |||||||||||||||||||||||||
Globe Specialty Metals | 5,532,472 | 99,639,821 | 2,875,611 | – | – | 841,121 | 5,682,472 | 118,081,768 | ||||||||||||||||||||||||
Kennedy-Wilson Holdings | 3,073,344 | 68,381,904 | 54,497,466 | – | – | 910,560 | 5,379,014 | 144,265,156 | ||||||||||||||||||||||||
Medicines Company (The) | 2,753,525 | 106,341,135 | 31,672,063 | – | – | – | 3,856,288 | 112,063,729 | ||||||||||||||||||||||||
MKS Instruments | 3,071,910 | 91,972,985 | 6,800,500 | – | – | 1,043,246 | 3,296,910 | 102,995,469 | ||||||||||||||||||||||||
Myriad Genetics | 6,343,965 | 133,096,386 | – | – | – | – | 6,343,965 | 246,907,118 | ||||||||||||||||||||||||
Pan American Silver | 8,194,097 | 95,870,935 | 6,059,630 | – | – | 1,811,689 | 8,625,597 | 132,402,914 | ||||||||||||||||||||||||
Sanderson Farms | 1,329,008 | 96,127,148 | – | 3,498,957 | 2,021,330 | 517,603 | 1,259,008 | 122,375,578 | ||||||||||||||||||||||||
Schnitzer Steel Industries Cl. A | 2,008,038 | 65,602,602 | – | – | – | 753,014 | 2,008,038 | 52,349,551 | ||||||||||||||||||||||||
Semperit AG Holding | 1,917,496 | 94,951,140 | 1,948,267 | – | – | 2,753,011 | 1,952,496 | 119,641,512 | ||||||||||||||||||||||||
Silver Standard Resources1 | 4,115,069 | 28,640,880 | – | 16,612,481 | (11,501,908 | ) | – | |||||||||||||||||||||||||
Simpson Manufacturing | 2,705,933 | 99,388,919 | – | 527,013 | 178,074 | 338,242 | 2,685,933 | 97,660,524 | ||||||||||||||||||||||||
Strayer Education | 1,018,485 | 35,107,178 | – | – | – | – | 1,018,485 | 53,480,648 | ||||||||||||||||||||||||
Thor Industries | 4,216,757 | 232,891,489 | – | 1,734,222 | 1,419,442 | 1,928,208 | 4,166,757 | 236,963,470 | ||||||||||||||||||||||||
Trican Well Service | 8,077,100 | 98,696,878 | 6,725,525 | – | – | 1,029,053 | 8,627,100 | 139,304,562 | ||||||||||||||||||||||||
Unit Corporation | 2,810,073 | 145,055,968 | – | 8,903,487 | 2,261,432 | – | 2,640,073 | 181,716,225 | ||||||||||||||||||||||||
Woodward | 3,806,024 | 173,592,755 | – | – | – | 608,964 | 3,806,024 | 190,986,284 | ||||||||||||||||||||||||
| 2,249,546,123 | (4,959,619 | ) | 15,107,598 | 2,626,284,901 | ||||||||||||||||||||||||||||
Royce Low-Priced Stock Fund | ||||||||||||||||||||||||||||||||
Gladstone Land | 501,200 | 8,119,440 | – | – | – | 90,216 | 501,200 | 6,510,588 | ||||||||||||||||||||||||
Seabridge Gold1 | 2,476,592 | 18,079,122 | – | 3,013,014 | (467,019 | ) | – | |||||||||||||||||||||||||
Universal Technical Institute | 1,468,679 | 20,429,325 | – | 3,612,222 | (1,132,343 | ) | 265,830 | 1,279,151 | 15,528,893 | |||||||||||||||||||||||
WaterFurnace Renewable Energy1 | 814,500 | 18,394,780 | – | 7,251,895 | 1,233,705 | 346,163 | ||||||||||||||||||||||||||
| 65,022,667 | (365,657 | ) | 702,209 | 22,039,481 | ||||||||||||||||||||||||||||
Royce Total Return Fund | ||||||||||||||||||||||||||||||||
Barry (R.G.) | 1,045,808 | 20,184,094 | – | 1,016,046 | 635,977 | 104,581 | 959,902 | 18,190,143 | ||||||||||||||||||||||||
Chase Corporation | 773,974 | 27,321,282 | – | – | – | – | 773,974 | 26,423,472 | ||||||||||||||||||||||||
Houston Wire & Cable | 1,216,073 | 16,271,057 | 2,633,615 | 224,044 | (34,646 | ) | 305,088 | 1,402,225 | 17,401,612 | |||||||||||||||||||||||
Mueller (Paul) Company | 116,700 | 3,571,020 | – | – | – | – | 116,700 | 4,900,233 | ||||||||||||||||||||||||
Peapack-Gladstone Financial | 604,692 | 11,549,617 | – | – | – | 60,469 | 604,692 | 12,825,517 | ||||||||||||||||||||||||
Starrett (L.S.) Company (The) Cl. A | 529,400 | 7,713,358 | – | – | – | 105,880 | 529,400 | 8,142,172 | ||||||||||||||||||||||||
Village Super Market Cl. A1 | 732,024 | 22,700,064 | – | 1,480,048 | (284,587 | ) | 347,044 | |||||||||||||||||||||||||
| 109,310,492 | 316,744 | 923,062 | 87,883,149 | |||||||||||||||||||||||||||||
The Royce Funds 2014 Semiannual Report to Shareholders | 125
| Notes to Financial Statements (unaudited) (continued) |
| Transactions in Affiliated Companies (continued): |
| Market | Realized | Market | ||||||||||||||||||||||||||||||
| Shares | Value | Cost of | Cost of | Gain | Dividend | Shares | Value | |||||||||||||||||||||||||
| Affiliated Company | 12/31/13 | 12/31/13 | Purchases | Sales | (Loss) | Income | 6/30/14 | 6/30/14 | ||||||||||||||||||||||||
Royce Opportunity Fund | ||||||||||||||||||||||||||||||||
BTU International | 723,141 | $ | 2,111,572 | $ | 51,975 | $ | – | $ | – | $ | – | 739,941 | $ | 2,419,607 | ||||||||||||||||||
CTPartners Executive Search | 483,837 | 2,709,487 | 391,356 | – | – | – | 530,920 | 4,964,102 | ||||||||||||||||||||||||
Dixie Group1 | 802,653 | 10,595,020 | 119,589 | 720,637 | 45,387 | – | ||||||||||||||||||||||||||
Hardinge | 629,571 | 9,109,892 | 165,052 | – | – | 25,443 | 642,571 | 8,128,523 | ||||||||||||||||||||||||
Interphase Corporation | 384,001 | 1,488,004 | 137,699 | – | – | – | 412,503 | 1,786,138 | ||||||||||||||||||||||||
Kid Brands1 | 1,202,959 | 1,227,018 | – | 3,981,741 | (3,784,318 | ) | – | |||||||||||||||||||||||||
LMI Aerospace | 651,335 | 9,600,678 | 704,874 | – | – | – | 702,435 | 9,187,850 | ||||||||||||||||||||||||
Magnetek | 166,017 | 3,971,127 | 409,939 | – | – | – | 187,063 | 4,461,453 | ||||||||||||||||||||||||
Pericom Semiconductor | 1,380,517 | 12,231,381 | 494,953 | – | – | – | 1,439,417 | 13,012,330 | ||||||||||||||||||||||||
Planar Systems | 1,625,599 | 4,129,021 | – | 142,608 | (111,248 | ) | – | 1,614,099 | 3,954,543 | |||||||||||||||||||||||
SigmaTron International | 354,872 | 3,140,617 | – | 195,671 | (34,313 | ) | – | 341,372 | 4,116,946 | |||||||||||||||||||||||
Spire Corporation | 660,120 | 316,924 | 5,807 | – | – | – | 668,200 | 421,634 | ||||||||||||||||||||||||
TRC Companies | 1,712,926 | 12,230,292 | 61,821 | – | – | – | 1,725,526 | 10,732,772 | ||||||||||||||||||||||||
| 72,861,033 | (3,884,492 | ) | 25,443 | 63,185,898 | ||||||||||||||||||||||||||||
Royce Special Equity Fund | ||||||||||||||||||||||||||||||||
Arden Group Cl. A1 | 243,000 | 30,741,930 | – | 17,835,615 | 12,903,784 | – | ||||||||||||||||||||||||||
Atrion Corporation | 167,000 | 49,473,750 | – | 4,156,449 | 2,690,882 | 198,664 | 145,000 | 47,270,000 | ||||||||||||||||||||||||
AVX Corporation | 9,298,500 | 129,528,105 | 16,229,657 | – | – | 1,913,336 | 10,535,000 | 139,904,800 | ||||||||||||||||||||||||
Bowl America Cl. A | 343,047 | 4,912,433 | 14 | – | – | 113,206 | 343,048 | 5,317,244 | ||||||||||||||||||||||||
Children’s Place | 2,100,000 | 119,637,000 | 3,703,448 | – | – | 573,725 | 2,170,000 | 107,697,100 | ||||||||||||||||||||||||
CSS Industries | 974,000 | 27,934,320 | – | – | – | 292,200 | 974,000 | 25,684,380 | ||||||||||||||||||||||||
EnerSys1 | 2,391,000 | 167,585,190 | 570,479 | 29,445,906 | 21,334,703 | 563,768 | ||||||||||||||||||||||||||
Finish Line (The) Cl. A | 4,958,000 | 139,666,860 | – | – | – | 793,280 | 4,958,000 | 147,450,920 | ||||||||||||||||||||||||
Foster (L.B.) Company | 1,000,000 | 47,290,000 | – | – | – | 60,000 | 1,000,000 | 54,120,000 | ||||||||||||||||||||||||
Frisch’s Restaurants | 505,100 | 12,945,713 | – | – | – | 181,836 | 505,100 | 11,920,360 | ||||||||||||||||||||||||
Hawkins | 989,000 | 36,780,910 | – | 5,994,135 | (532,069 | ) | 344,765 | 840,000 | 31,197,600 | |||||||||||||||||||||||
Hurco Companies | 471,000 | 11,779,710 | – | – | – | 65,940 | 471,000 | 13,282,200 | ||||||||||||||||||||||||
LeapFrog Enterprises Cl. A | 4,100,000 | 32,554,000 | 16,337,274 | – | – | – | 6,352,200 | 46,688,670 | ||||||||||||||||||||||||
Minerals Technologies | 3,075,000 | 184,715,250 | 417,912 | 13,727,329 | 7,255,113 | 301,805 | 2,752,342 | 180,498,588 | ||||||||||||||||||||||||
National Presto Industries | 656,500 | 52,848,250 | – | – | – | 3,315,325 | 656,500 | 47,819,460 | ||||||||||||||||||||||||
Park Electrochemical | 2,011,000 | 57,755,920 | – | 3,802,442 | (378,343 | ) | 5,222,728 | 1,890,000 | 53,316,900 | |||||||||||||||||||||||
Plantronics | 2,215,000 | 102,886,750 | 3,182,875 | – | – | 567,491 | 2,290,057 | 110,037,239 | ||||||||||||||||||||||||
ScanSource | 930,000 | 39,459,900 | 41,343,197 | – | – | – | 2,011,447 | 76,595,901 | ||||||||||||||||||||||||
Scholastic Corporation | 2,910,000 | 98,969,100 | – | – | – | 873,000 | 2,910,000 | 99,201,900 | ||||||||||||||||||||||||
Schulman (A.)1 | 1,487,000 | 52,431,620 | – | 21,749,761 | 11,364,009 | 536,814 | ||||||||||||||||||||||||||
Schweitzer-Mauduit International | 2,638,557 | 135,806,529 | 2,118,151 | – | – | 1,905,947 | 2,688,913 | 117,397,942 | ||||||||||||||||||||||||
Standard Motor Products | 2,250,000 | 82,800,000 | 625,137 | – | – | 587,340 | 2,268,000 | 101,311,560 | ||||||||||||||||||||||||
UniFirst Corporation | 1,481,570 | 158,527,990 | 5,827,556 | – | – | 113,601 | 1,542,278 | 163,481,468 | ||||||||||||||||||||||||
Universal Corporation | 1,296,000 | 70,761,600 | 8,832,406 | 176,421 | 5,695 | 1,352,686 | 1,459,700 | 80,794,395 | ||||||||||||||||||||||||
Weis Markets | 1,144,500 | 60,154,920 | 11,608,401 | – | – | 778,315 | 1,389,830 | 63,556,926 | ||||||||||||||||||||||||
| 1,907,947,750 | 54,643,774 | 20,655,772 | 1,724,545,553 | |||||||||||||||||||||||||||||
Royce Value Plus Fund | ||||||||||||||||||||||||||||||||
NumereX Corporation Cl. A1 | 1,030,200 | 13,341,090 | – | 362,809 | (12,580 | ) | – | |||||||||||||||||||||||||
| 13,341,090 | (12,580 | ) | – | |||||||||||||||||||||||||||||
| 1 Not an Affiliated Company at June 30, 2014. | ||||||||||||||||||||||||||||||||
126 | The Royce Funds 2014 Semiannual Report to Shareholders
As a shareholder of a mutual fund, you pay ongoing expenses, including management fees and other Fund expenses including, for some funds, distribution and/or service (12b-1) fees. Using the information below, you can estimate how these ongoing expenses (in dollars) affect your investment and compare them with the ongoing expenses of other funds. You may also incur one-time transaction expenses, including redemption fees, which are not shown in this section and would result in higher total costs. The example is based on an investment of $1,000 invested at January 1, 2014, and held for the entire six-month period ended June 30, 2014. Service, Consultant, R and K Class shares are generally available only through certain brokers or retirement plan administrators who receive distribution and/or service fees from the Fund for services that they perform. Institutional and W Class shares are generally available only to institutions or intermediaries with a minimum account size of $1 million.
| Actual | Hypothetical (5% per year return before expenses) | |||||||||||||||||||||||||||||
| Beginning | Ending | Expenses Paid | Beginning | Ending | Expenses Paid | Annualized | ||||||||||||||||||||||||
| Account Value | Account Value | During the | Account Value | Account Value | During the | Expense | ||||||||||||||||||||||||
| 1/1/14 | 6/30/14 | Period1 | 1/1/14 | 6/30/14 | Period1 | Ratio2 | ||||||||||||||||||||||||
Investment Class | ||||||||||||||||||||||||||||||
Royce Pennsylvania Mutual Fund | $ | 1,000.00 | $ | 1,020.37 | $ | 4.51 | $ | 1,000.00 | $ | 1,020.33 | $ | 4.51 | 0.90 | % | ||||||||||||||||
Royce Micro-Cap Fund | 1,000.00 | 1,010.19 | 7.58 | 1,000.00 | 1,017.26 | 7.60 | 1.52 | % | ||||||||||||||||||||||
Royce Premier Fund | 1,000.00 | 1,073.27 | 5.50 | 1,000.00 | 1,019.49 | 5.36 | 1.07 | % | ||||||||||||||||||||||
Royce Low-Priced Stock Fund | 1,000.00 | 1,091.91 | 6.43 | 1,000.00 | 1,018.65 | 6.21 | 1.24 | % | ||||||||||||||||||||||
Royce Total Return Fund | 1,000.00 | 1,027.40 | 5.58 | 1,000.00 | 1,019.29 | 5.56 | 1.11 | % | ||||||||||||||||||||||
Royce Heritage Fund3 | 1,000.00 | 1,030.79 | 5.49 | 1,000.00 | 1,019.39 | 5.46 | 1.09 | % | ||||||||||||||||||||||
Royce Opportunity Fund | 1,000.00 | 1,030.24 | 5.64 | 1,000.00 | 1,019.24 | 5.61 | 1.12 | % | ||||||||||||||||||||||
Royce Special Equity Fund | 1,000.00 | 1,001.60 | 5.56 | 1,000.00 | 1,019.24 | 5.61 | 1.12 | % | ||||||||||||||||||||||
Royce Value Fund | 1,000.00 | 1,035.50 | 6.06 | 1,000.00 | 1,018.84 | 6.01 | 1.20 | % | ||||||||||||||||||||||
Royce Value Plus Fund | 1,000.00 | 1,041.69 | 6.68 | 1,000.00 | 1,018.25 | 6.61 | 1.32 | % | ||||||||||||||||||||||
Royce 100 Fund | 1,000.00 | 1,029.67 | 5.94 | 1,000.00 | 1,018.94 | 5.91 | 1.18 | % | ||||||||||||||||||||||
Royce Dividend Value Fund | 1,000.00 | 1,033.83 | 6.00 | 1,000.00 | 1,018.89 | 5.96 | 1.19 | % | ||||||||||||||||||||||
Royce Global Value Fund | 1,000.00 | 1,111.03 | 7.90 | 1,000.00 | 1,017.31 | 7.55 | 1.51 | % | ||||||||||||||||||||||
Royce International Smaller-Companies Fund | 1,000.00 | 1,064.00 | 6.51 | 1,000.00 | 1,015.61 | 6.36 | 1.44 | % | ||||||||||||||||||||||
Royce Special Equity Multi-Cap Fund | 1,000.00 | 1,054.96 | 4.94 | 1,000.00 | 1,019.98 | 4.86 | 0.97 | % | ||||||||||||||||||||||
Service Class | ||||||||||||||||||||||||||||||
Royce Pennsylvania Mutual Fund | 1,000.00 | 1,018.38 | 6.11 | 1,000.00 | 1,018.74 | 6.11 | 1.22 | % | ||||||||||||||||||||||
Royce Micro-Cap Fund | 1,000.00 | 1,010.32 | 8.27 | 1,000.00 | 1,016.56 | 8.30 | 1.66 | % | ||||||||||||||||||||||
Royce Premier Fund | 1,000.00 | 1,070.97 | 7.39 | 1,000.00 | 1,017.65 | 7.20 | 1.44 | % | ||||||||||||||||||||||
Royce Low-Priced Stock Fund | 1,000.00 | 1,090.31 | 7.72 | 1,000.00 | 1,017.41 | 7.45 | 1.49 | % | ||||||||||||||||||||||
Royce Total Return Fund | 1,000.00 | 1,025.32 | 7.58 | 1,000.00 | 1,017.31 | 7.55 | 1.51 | % | ||||||||||||||||||||||
Royce Heritage Fund3 | 1,000.00 | 1,029.01 | 7.09 | 1,000.00 | 1,017.80 | 7.05 | 1.41 | % | ||||||||||||||||||||||
Royce Opportunity Fund | 1,000.00 | 1,027.48 | 7.84 | 1,000.00 | 1,017.06 | 7.80 | 1.56 | % | ||||||||||||||||||||||
Royce Special Equity Fund | 1,000.00 | 1,000.00 | 6.89 | 1,000.00 | 1,017.90 | 6.95 | 1.39 | % | ||||||||||||||||||||||
Royce Value Fund | 1,000.00 | 1,034.12 | 7.46 | 1,000.00 | 1,017.46 | 7.40 | 1.48 | % | ||||||||||||||||||||||
Royce Value Plus Fund | 1,000.00 | 1,040.76 | 7.49 | 1,000.00 | 1,017.46 | 7.40 | 1.48 | % | ||||||||||||||||||||||
Royce 100 Fund | 1,000.00 | 1,027.86 | 7.34 | 1,000.00 | 1,017.55 | 7.30 | 1.46 | % | ||||||||||||||||||||||
Royce Dividend Value Fund | 1,000.00 | 1,033.50 | 7.21 | 1,000.00 | 1,017.70 | 7.15 | 1.43 | % | ||||||||||||||||||||||
Royce Global Value Fund | 1,000.00 | 1,110.38 | 8.84 | 1,000.00 | 1,016.41 | 8.45 | 1.69 | % | ||||||||||||||||||||||
The Royce Funds 2014 Semiannual Report to Shareholders | 127
| Actual | Hypothetical (5% per year return before expenses) | |||||||||||||||||||||||||||||
| Beginning | Ending | Expenses Paid | Beginning | Ending | Expenses Paid | Annualized | ||||||||||||||||||||||||
| Account Value | Account Value | During the | Account Value | Account Value | During the | Expense | ||||||||||||||||||||||||
| 1/1/14 | 6/30/14 | Period1 | 1/1/14 | 6/30/14 | Period1 | Ratio2 | ||||||||||||||||||||||||
| Service Class (continued) | ||||||||||||||||||||||||||||||
Royce International Smaller-Companies Fund | $ | 1,000.00 | $ | 1,065.89 | $ | 8.61 | $ | 1,000.00 | $ | 1,016.46 | $ | 8.40 | 1.68 | % | ||||||||||||||||
Royce Special Equity Multi-Cap Fund | 1,000.00 | 1,053.48 | 6.31 | 1,000.00 | 1,018.65 | 6.21 | 1.24 | % | ||||||||||||||||||||||
Consultant Class | ||||||||||||||||||||||||||||||
Royce Pennsylvania Mutual Fund | 1,000.00 | 1,014.66 | 9.49 | 1,000.00 | 1,015.37 | 9.49 | 1.90 | % | ||||||||||||||||||||||
Royce Micro-Cap Fund | 1,000.00 | 1,005.52 | 12.38 | 1,000.00 | 1,012.45 | 12.42 | 2.49 | % | ||||||||||||||||||||||
Royce Premier Fund | 1,000.00 | 1,067.42 | 10.76 | 1,000.00 | 1,014.38 | 10.49 | 2.10 | % | ||||||||||||||||||||||
Royce Total Return Fund | 1,000.00 | 1,022.78 | 10.58 | 1,000.00 | 1,014.33 | 10.54 | 2.11 | % | ||||||||||||||||||||||
Royce Heritage Fund3 | 1,000.00 | 1,024.66 | 11.70 | 1,000.00 | 1,013.24 | 11.63 | 2.33 | % | ||||||||||||||||||||||
Royce Opportunity Fund | 1,000.00 | 1,024.25 | 11.19 | 1,000.00 | 1,013.74 | 11.13 | 2.23 | % | ||||||||||||||||||||||
Royce Special Equity Fund | 1,000.00 | 996.61 | 10.59 | 1,000.00 | 1,014.18 | 10.69 | 2.14 | % | ||||||||||||||||||||||
Royce Value Fund | 1,000.00 | 1,030.76 | 11.33 | 1,000.00 | 1,013.64 | 11.23 | 2.25 | % | ||||||||||||||||||||||
Royce Value Plus Fund | 1,000.00 | 1,036.90 | 11.62 | 1,000.00 | 1,013.39 | 11.48 | 2.30 | % | ||||||||||||||||||||||
Royce Dividend Value Fund | 1,000.00 | 1,034.51 | 6.37 | 1,000.00 | 1,007.71 | 6.28 | 2.24 | % | ||||||||||||||||||||||
Royce Global Value Fund | 1,000.00 | 1,106.35 | 12.74 | 1,000.00 | 1,012.69 | 12.18 | 2.44 | % | ||||||||||||||||||||||
Royce Special Equity Multi-Cap Fund | 1,000.00 | 1,109.00 | 8.91 | 1,000.00 | 1,012.78 | 8.50 | 1.99 | % | ||||||||||||||||||||||
Institutional Class | ||||||||||||||||||||||||||||||
Royce Pennsylvania Mutual Fund | 1,000.00 | 1,021.02 | 3.96 | 1,000.00 | 1,020.88 | 3.96 | 0.79 | % | ||||||||||||||||||||||
Royce Premier Fund | 1,000.00 | 1,073.51 | 5.04 | 1,000.00 | 1,019.93 | 4.91 | 0.98 | % | ||||||||||||||||||||||
Royce Low-Priced Stock Fund | 1,000.00 | 1,091.84 | 6.64 | 1,000.00 | 1,018.45 | 6.41 | 1.28 | % | ||||||||||||||||||||||
Royce Total Return Fund | 1,000.00 | 1,027.61 | 5.03 | 1,000.00 | 1,019.84 | 5.01 | 1.00 | % | ||||||||||||||||||||||
Royce Opportunity Fund | 1,000.00 | 1,029.92 | 5.13 | 1,000.00 | 1,019.74 | 5.11 | 1.02 | % | ||||||||||||||||||||||
Royce Special Equity Fund | 1,000.00 | 1,002.01 | 5.01 | 1,000.00 | 1,019.79 | 5.06 | 1.01 | % | ||||||||||||||||||||||
Royce Value Fund | 1,000.00 | 1,036.22 | 5.30 | 1,000.00 | 1,019.59 | 5.26 | 1.05 | % | ||||||||||||||||||||||
Royce Value Plus Fund | 1,000.00 | 1,043.30 | 5.52 | 1,000.00 | 1,019.39 | 5.46 | 1.09 | % | ||||||||||||||||||||||
Royce Dividend Value Fund | 1,000.00 | 1,035.07 | 5.25 | 1,000.00 | 1,019.64 | 5.21 | 1.04 | % | ||||||||||||||||||||||
Royce International Smaller-Companies Fund | 1,000.00 | 1,088.00 | 6.38 | 1,000.00 | 1,015.12 | 6.16 | 1.44 | % | ||||||||||||||||||||||
Royce Special Equity Multi-Cap Fund | 1,000.00 | 1,055.63 | 4.54 | 1,000.00 | 1,020.38 | 4.46 | 0.89 | % | ||||||||||||||||||||||
W Class | ||||||||||||||||||||||||||||||
Royce Premier Fund | 1,000.00 | 1,072.65 | 5.55 | 1,000.00 | 1,019.44 | 5.41 | 1.08 | % | ||||||||||||||||||||||
Royce Total Return Fund | 1,000.00 | 1,026.82 | 5.63 | 1,000.00 | 1,019.24 | 5.61 | 1.12 | % | ||||||||||||||||||||||
R Class | ||||||||||||||||||||||||||||||
Royce Pennsylvania Mutual Fund | 1,000.00 | 1,017.53 | 7.50 | 1,000.00 | 1,017.36 | 7.50 | 1.50 | % | ||||||||||||||||||||||
Royce Premier Fund | 1,000.00 | 1,069.65 | 8.83 | 1,000.00 | 1,016.27 | 8.60 | 1.72 | % | ||||||||||||||||||||||
Royce Low-Priced Stock Fund | 1,000.00 | 1,088.92 | 9.53 | 1,000.00 | 1,015.67 | 9.20 | 1.84 | % | ||||||||||||||||||||||
Royce Total Return Fund | 1,000.00 | 1,023.92 | 8.53 | 1,000.00 | 1,016.36 | 8.50 | 1.70 | % | ||||||||||||||||||||||
Royce Heritage Fund | 1,000.00 | 1,026.66 | 9.25 | 1,000.00 | 1,015.67 | 9.20 | 1.84 | % | ||||||||||||||||||||||
Royce Opportunity Fund | 1,000.00 | 1,027.16 | 8.44 | 1,000.00 | 1,016.46 | 8.40 | 1.68 | % | ||||||||||||||||||||||
Royce Value Fund | 1,000.00 | 1,032.60 | 9.02 | 1,000.00 | 1,015.92 | 8.95 | 1.79 | % | ||||||||||||||||||||||
Royce Value Plus Fund | 1,000.00 | 1,038.95 | 9.30 | 1,000.00 | 1,015.67 | 9.20 | 1.84 | % | ||||||||||||||||||||||
Royce 100 Fund | 1,000.00 | 1,025.26 | 9.24 | 1,000.00 | 1,015.67 | 9.20 | 1.84 | % | ||||||||||||||||||||||
Royce Global Value Fund | 1,000.00 | 1,108.37 | 10.40 | 1,000.00 | 1,014.93 | 9.94 | 1.99 | % | ||||||||||||||||||||||
K Class | ||||||||||||||||||||||||||||||
Royce Pennsylvania Mutual Fund | 1,000.00 | 1,017.64 | 6.55 | 1,000.00 | 1,018.30 | 6.56 | 1.31 | % | ||||||||||||||||||||||
Royce Premier Fund | 1,000.00 | 1,070.90 | 8.01 | 1,000.00 | 1,017.06 | 7.80 | 1.56 | % | ||||||||||||||||||||||
Royce Low-Priced Stock Fund | 1,000.00 | 1,089.99 | 8.24 | 1,000.00 | 1,016.91 | 7.95 | 1.59 | % | ||||||||||||||||||||||
Royce Total Return Fund | 1,000.00 | 1,025.03 | 7.53 | 1,000.00 | 1,017.36 | 7.50 | 1.50 | % | ||||||||||||||||||||||
Royce Heritage Fund | 1,000.00 | 1,028.21 | 8.00 | 1,000.00 | 1,016.91 | 7.95 | 1.59 | % | ||||||||||||||||||||||
Royce Opportunity Fund | 1,000.00 | 1,028.47 | 6.89 | 1,000.00 | 1,018.00 | 6.85 | 1.37 | % | ||||||||||||||||||||||
128 | The Royce Funds 2014 Semiannual Report to Shareholders
| Actual | Hypothetical (5% per year return before expenses) | ||||||||||||||||||||||||||||||
| Beginning | Ending | Expenses Paid | Beginning | Ending | Expenses Paid | Annualized | |||||||||||||||||||||||||
| Account Value | Account Value | During the | Account Value | Account Value | During the | Expense | |||||||||||||||||||||||||
| 1/1/14 | 6/30/14 | Period1 | 1/1/14 | 6/30/14 | Period1 | Ratio2 | |||||||||||||||||||||||||
K Class (continued) | |||||||||||||||||||||||||||||||
Royce Value Fund | $ | 1,000.00 | $ | 1,032.86 | $ | 8.22 | $ | 1,000.00 | $ | 1,016.71 | $ | 8.15 | 1.63 | % | |||||||||||||||||
Royce Value Plus Fund | 1,000.00 | 1,040.13 | 8.04 | 1,000.00 | 1,016.91 | 7.95 | 1.59 | % | |||||||||||||||||||||||
Royce 100 Fund | 1,000.00 | 1,027.26 | 7.99 | 1,000.00 | 1,016.91 | 7.95 | 1.59 | % | |||||||||||||||||||||||
Royce Global Value Fund | 1,000.00 | 1,109.36 | 9.10 | 1,000.00 | 1,016.17 | 8.70 | 1.74 | % | |||||||||||||||||||||||
The Royce Funds 2014 Semiannual Report to Shareholders | 129
| Trustees and Officers |
| All Trustees and Officers may be reached c/o The Royce Funds, 745 Fifth Avenue, New York, NY 10151 |
Charles M. Royce, Trustee1, President
Age: 74 | Number of Funds Overseen: 34 | Tenure: Since 1982
Non-Royce Directorships: Director of TICC Capital Corp.
Principal Occupation(s) During Past Five Years: Chief Executive Officer and Chairman of Board of Managers of Royce & Associates, LLC (“Royce”), the Trust’s investment adviser.
W. Whitney George, Trustee1, Vice President
Age: 56 | Number of Funds Overseen: 34 | Tenure: Since 2013
Non-Royce Directorships: None
Principal Occupation(s) During Past Five Years: Managing Director and Vice President of Royce, having been employed by Royce since October 1991.
Patricia W. Chadwick, Trustee
Age: 65 | Number of Funds Overseen: 34 | Tenure: Since 2009
Non-Royce Directorships: Trustee of ING Mutual Funds and Director of Wisconsin Energy Corp.
Principal Occupation(s) During Past 5 Years: Consultant and President of Ravengate Partners LLC (since 2000).
Richard M. Galkin, Trustee
Age: 76 | Number of Funds Overseen: 34 | Tenure: Since 1982
Non-Royce Directorships: None
Principal Occupation(s) During Past Five Years: Private investor. Mr. Galkin’s prior business experience includes having served as President of Richard M. Galkin Associates, Inc., telecommunications consultants, President of Manhattan Cable Television (a subsidiary of Time, Inc.), President of Haverhills Inc. (another Time, Inc. subsidiary), President of Rhode Island Cable Television, and Senior Vice President of Satellite Television Corp. (a subsidiary of Comsat).
Stephen L. Isaacs, Trustee
Age: 74 | Number of Funds Overseen: 34 | Tenure: Since 1989
Non-Royce Directorships: None
Principal Occupation(s) During Past Five Years: Attorney and President of Health Policy Associates, Inc., consultants. Mr. Isaacs’s prior business experience includes having served as President of the Center for Health and Social Policy (from 1996 to 2012); Director of Columbia University Development Law and Policy Program and Professor at Columbia University (until August 1996).
Arthur S. Mehlman, Trustee
Age: 72 | Number of Funds Overseen: 52 | Tenure: Since 2004
Non-Royce Directorships: Director/Trustee of registered investment companies constituting the 18 Legg Mason Funds.
Principal Occupation(s) During Past Five Years: Director of The League for People with Disabilities, Inc.; Director of University of Maryland Foundation (non-profits). Formerly: Director of Municipal Mortgage & Equity, LLC (from October 2004 to April 1, 2011); Director of University of Maryland College Park Foundation (non-profit) (from 1998 to 2005); Partner, KPMG LLP (international accounting firm) (from 1972 to 2002); Director of Maryland Business Roundtable for Education (from July 1984 to June 2002).
David L. Meister, Trustee
Age: 74 | Number of Funds Overseen: 34 | Tenure: Since 1982
Non-Royce Directorships: None
Principal Occupation(s) During Past Five Years: Consultant. Chairman and Chief Executive Officer of The Tennis Channel (from June 2000 to March 2005). Mr. Meister’s prior business experience includes having served as Chief Executive Officer of Seniorlife.com, a consultant to the communications industry, President of Financial News Network, Senior Vice President of HBO, President of Time-Life Films, and Head of Broadcasting for Major League Baseball.
G. Peter O’Brien, Trustee
Age: 68 | Number of Funds Overseen: 52 | Tenure: Since 2001
Non-Royce Directorships: Director/Trustee of registered investment companies constituting the 18 Legg Mason Funds; Director of TICC Capital Corp.
Principal Occupation(s) During Past Five Years: Trustee Emeritus of Colgate University (since 2005); Board Member of Hill House, Inc. (since 1999); Formerly: Trustee of Colgate University (from 1996 to 2005), President of Hill House, Inc. (from 2001 to 2005) and Managing Director/Equity Capital Markets Group of Merrill Lynch & Co. (from 1971 to 1999).
John D. Diederich, Vice President and Treasurer
Age: 62 | Tenure: Since 2001
Principal Occupation(s) During Past Five Years: Chief Operating Officer, Managing Director and member of the Board of Managers of Royce; Chief Financial Officer of Royce; Director of Administration of the Trust; and President of RFS, having been employed by Royce since April 1993.
Jack E. Fockler, Jr., Vice President
Age: 55 | Tenure: Since 1995
Principal Occupation(s) During Past Five Years: Managing Director and Vice President of Royce, and Vice President of RFS, having been employed by Royce since October 1989.
Daniel A. O’Byrne, Vice President and Assistant Secretary
Age: 52 | Tenure: Since 1994
Principal Occupation(s) During Past Five Years: Principal and Vice President of Royce, having been employed by Royce since October 1986.
John E. Denneen, Secretary and Chief Legal Officer
Age: 47 | Tenure: 1996-2001 and Since April 2002
Principal Occupation(s) During Past Five Years: General Counsel, Principal, Chief Legal and Compliance Officer, and Secretary of Royce; Secretary and Chief Legal Officer of The Royce Funds.
Lisa Curcio, Chief Compliance Officer
Age: 54 | Tenure: Since 2004
Principal Occupation(s) During Past Five Years: Chief Compliance Officer of The Royce Funds (since October 2004) and Compliance Officer of Royce (since June 2004).
Trustees will hold office until their successors have been duly elected and qualified or until their earlier resignation or removal. The Statement of Additional Information, which contains additional information about the Trust’s trustees and officers, is available and can be obtained without charge at www.roycefunds.com or by calling (800) 221-4268.
| 130 | The Royce Funds 2014 Semiannual Report to Shareholders |
| Board Approval of Investment Advisory Agreements |
At meetings held on June 4-5, 2014, the Board of Trustees of The Royce Fund (the “Board”), including all of the non-interested trustees, approved the continuance of the Investment Advisory Agreements between Royce & Associates, LLC (“R&A”) and The Royce Fund (“TRF”) relating to each of Royce Pennsylvania Mutual Fund, Royce Micro-Cap Fund, Royce Total Return Fund, Royce Low-Priced Stock Fund, Royce Heritage Fund, Royce Opportunity Fund, Royce Value Plus Fund, Royce Dividend Value Fund, Royce International Smaller-Companies Fund, Royce Premier Fund, Royce Special Equity Fund, Royce Value Fund, Royce 100 Fund, Royce Global Value Fund, and Royce Special Equity Multi-Cap Fund (each, a “Fund” and collectively, the “Funds”). In reaching these decisions, the Board reviewed, among other things, information prepared internally by R&A and independently by Morningstar Associates, LLC (“Morningstar”) containing detailed expense ratio and investment performance comparisons for each Fund with other mutual funds in its “peer group” and “category”, information regarding the past performance of the Funds and other registered investment companies managed by R&A and a memorandum outlining the legal duties of the Board prepared by independent counsel to the non-interested trustees. R&A also provided the trustees with an analysis of its profitability with respect to providing investment advisory services to each Fund. In addition, the Board took into account information furnished throughout the year at regular Board meetings, including reports on investment performance, shareholder services, distribution fees and expenses, regulatory compliance, brokerage commissions and research, brokerage and other execution products and services provided to the Funds. The Board also considered other matters it deemed important to the approval process, such as allocation of Fund brokerage commissions, “soft dollar” research services R&A receives, payments made to affiliates of R&A, as well as payments made by R&A, relating to distribution of Fund shares and other direct and indirect benefits to R&A and its affiliates from their relationship with the Funds. The trustees also met throughout the year with investment advisory personnel from R&A. The Board, in its deliberations, recognized that, for many of the Funds’ shareholders, the decision to purchase Fund shares included a decision to select R&A as the investment adviser and that there was a strong association in the minds of Fund shareholders between R&A and each of the Funds. In considering factors relating to the approval of the continuance of the Investment Advisory Agreements, the non-interested trustees received assistance and advice from, and met separately with, their independent counsel. While the Investment Advisory Agreements for the Funds were considered at the same Board meeting, the trustees dealt with each agreement separately. Among other factors, the trustees considered the following:
The nature, extent and quality of services provided by R&A:
The Board considered the following factors to be of fundamental importance to its consideration of whether to approve the continuance of the Funds’ Investment Advisory Agreements: (i) R&A’s more than 40 years of value investing experience and track record; (ii) the history of long-tenured R&A portfolio managers managing many of the Funds; (iii) R&A’s focus on mid-cap, small-cap and micro-cap value investing; (iv) the consistency of R&A’s approach to managing open-end mutual funds and closed-end funds over more than 40 years; (v) the integrity and high ethical standards adhered to at R&A; (vi) R&A’s specialized experience in the area of trading small- and micro-cap securities; (vii) R&A’s historical ability to attract and retain portfolio management talent; and (viii) R&A’s focus on shareholder interests as exemplified by capping expenses on smaller funds, closing funds to new investors when R&A believed such closings were in the best interests of existing shareholders, establishing breakpoints for a number of funds and providing expansive shareholder reporting and communications. The trustees reviewed the services that R&A provides to each Fund, including, but not limited to, managing each Fund’s investments in accordance with the stated policies of each Fund. The Board considered the fact that R&A provided certain administrative services to the Funds at cost pursuant to the Administration Agreement between TRF and R&A which went into effect on January 1, 2008. The Board determined that the services to be provided to the Funds by R&A would be the same as those that it previously provided to the Funds. The Board also took into consideration the histories, reputations and backgrounds of R&A’s portfolio managers for the Funds, finding that these would likely have an impact on the continued success of the Funds. Lastly, the trustees noted R&A’s ability to attract and retain quality and experienced personnel. The trustees concluded that the investment advisory services provided by R&A to each Fund compared favorably to services provided by R&A to other R&A client accounts, including other funds, in both nature and quality, and that the scope of services provided by R&A would continue to be suitable for each Fund.
Investment performance of the Funds and R&A:
In light of R&A’s risk-averse approach to investing, the trustees believe that risk-adjusted performance continues to be the most appropriate measure of each Fund’s investment performance. One measure of risk-adjusted performance the trustees have historically used in their review of each Fund’s performance is the Sharpe Ratio. The Sharpe Ratio is a risk-adjusted measure of performance developed by Nobel Laureate William Sharpe. It is calculated by dividing a fund’s annualized excess returns by its annualized standard deviation to determine reward per unit of risk. The higher the Sharpe Ratio, the better a fund’s historical risk-adjusted performance. The Board attaches primary importance to risk-adjusted performance over relatively long periods of time, typically 3 to 10 years. The Sharpe Ratios for Royce Total Return Fund (“RTR”), Royce Special Equity Fund (“RSE”), and Royce Special Equity Multi-Cap Fund (“RSM”), ranked in the 1st or 2nd quartile within their respective Morningstar categories and the small-cap universe for the 3-year, 5-year, and 10-year periods, as applicable, ended December 31, 2013.
The Board noted that the highest leveraged companies within the Russell 2000 Index significantly outperformed their lowest leveraged counterparts from late August 2011 (beginning of Federal Reserve’s “QE2” program and “Operation Twist”) to May 2013 (initial public discussion by Federal Reserve officials of tapering of quantitative easing efforts). This trend significantly contributed to the relative underperformance of the Funds referenced below for the 3-year and 5-year periods ended December 31, 2013 to the extent they focused on high quality companies (e.g., those with solid balance sheets, low leverage, the ability to generate and effectively allocate free cash flow, and strong returns on invested capital). The Board did note, however, that this trend appeared to have reversed course with the Federal Reserve’s tapering discussions and the subsequent reductions in its bond buying programs as the lowest leveraged companies within the Russell 2000 Index have outperformed their highest leveraged counterparts during recent periods.
| The Royce Funds 2014 Semiannual Report to Shareholders | 131 |
| Board Approval of Investment Advisory Agreements (continued) |
Each of Royce Pennsylvania Mutual Fund (“PMF”) and Royce Premier Fund (“RPR”) ranked in the 3rd and 4th quartile within its Morningstar category for the 3-year and 5-year periods, respectively, ended December 31, 2013. However, PMF placed in the 2nd quartile and RPR in the 1st quartile within their respective Morningstar categories for the relevant 10-year period. Likewise, the Sharpe Ratios for Royce 100 Fund (“ROH”) and Royce Heritage Fund (“RHF”) ranked in the 4th quartile within their respective Morningstar categories for the 3-year period ended December 31, 2013 but in the top quartile (ROH) and 2nd quartile (RHF) for the relevant 10-year period. Royce Opportunity Fund ranked in the 4th, 2nd, and 3rd quartiles within the Small Value category assigned by Morningstar for the 3-year, 5-year, and 10-year periods, respectively, ended December 31, 2013. Similar trends manifested themselves for certain Funds with shorter performance records. The Sharpe Ratio for Royce Dividend Value Fund (“RDV”) ranked in the 3rd quartile within its Morningstar category for the 3-year period ended December 31, 2013. However, over the relevant 5-year period, RDV placed in the top quartile of its Morningstar category.
The Sharpe Ratio for each of Royce Low-Priced Stock Fund (“RLP”), Royce Micro-Cap Fund (“RMC”), and Royce Value Fund (“RVV”) ranked in the 4th quartile within the relevant Morningstar category for the 3-year period ended December 31, 2013. In recent years, each of these Funds had overweightings in materials companies, particularly Canadian gold and silver mining companies, while RMC and RVV also maintained significant positions in international companies. These holdings contributed, in part, to the Funds’ recent relative underperformance. The Board did note, however, that RVV’s Sharpe Ratio fell in the 2nd quartile within the Mid-Cap Blend category assigned by Morningstar for the relevant 10-year period. The Board further noted the reductions in the contractual management fee rates for RLP that became effective July 1, 2014.
The Board noted that Royce International Smaller-Companies Fund (“RIS”) struggled in recent periods due, in part, to its overweighting of emerging market equities. This resulted in a 4th quartile Sharpe Ratio within the Foreign Small/Mid Blend category assigned by Morningstar for the 3-year and 5-year periods ended December 31, 2013.
The Board noted that Royce Value Plus Fund (“RVP”) has struggled during the recent market cycles as its portfolio manager had taken a more defensive portfolio approach going into the strong up-market beginning with the March 2009 market low, leading to a 4th quartile Sharpe Ratio performance for the 3-year and 5-year periods ended December 31, 2013. RVP, however, ranked in the 2nd quartile for the relevant 10-year period. The Board also noted that the Sharpe Ratio for Royce Global Value Fund (“RGV”) fell in the 4th quartile within the World Stock category assigned by Morningstar for the 3-year and 5-year periods ended December 31, 2013.
In addition to each Fund’s risk–adjusted performance, the Board also reviewed and considered each Fund’s absolute total returns, down market performance and for Funds in existence for such periods, long-term performance records over periods of 10 years or longer. The Board also considered it important to look beyond the current snapshot of performance as of December 31, 2013 and therefore examined extended performance histories for each Fund using monthly rolling average return periods through March 31, 2014.
The Board noted that R&A manages a number of funds that invest in small-cap and micro-cap issuers, many of which were outperforming their benchmark indices and their competitors. Although the Board recognized that past performance is not necessarily an indicator of future results, it found that R&A had the necessary qualifications, experience and track record in managing equity mutual funds to manage each Fund. The Board determined that R&A continued to be an appropriate investment adviser for each Fund and concluded that each Fund’s performance supported the continuation of its Investment Advisory Agreement.
Cost of the services provided and profits realized by R&A from its relationship with each Fund:
The Board considered the cost of the services provided by R&A and the profits realized by R&A from its relationship with each Fund. As part of the analysis, the Board discussed with R&A its methodology in allocating its costs to each Fund and concluded that its allocations were reasonable. The Board noted that at times R&A had closed certain of the Funds to new investors because of the rate of growth in Fund assets. The Board concluded that R&A’s profits were reasonable in relation to the nature and quality of services provided.
The extent to which economies of scale would be realized as the Funds grow and whether fee levels would reflect such economies of scale:
The Board considered whether there have been economies of scale in respect of the management of each Fund, whether each Fund has appropriately benefited from any economies of scale and whether there is potential for realization of any further economies of scale. The Board noted the time and effort involved in managing portfolios of small- and micro-cap stocks and that they did not involve the same efficiencies as do portfolios of large-cap stocks. The trustees noted that in 2004 breakpoints had been added to the investment advisory fees for each Fund except PMF (PMF’s fee schedule already had breakpoints). They also noted the new proposed lower fee structures with breakpoints for RLP. The trustees concluded that the current fee structure for each Fund other than RLP, and the new proposed fee structure for RLP, were reasonable and that the relevant shareholders sufficiently participated in economies of scale.
Comparison of services to be rendered and fees to be paid to those under other investment advisory contracts, such as contracts of the same and other investment advisers or other clients:
The Board reviewed the investment advisory fee paid by each Fund and compared both the services to be rendered and the fees to be paid under the Investment Advisory Agreements to other contracts of R&A and to contracts of other investment advisers to registered investment companies investing in small- and micro-cap stocks, as provided by Morningstar. The Board noted the importance of the net expense ratio in measuring a fund’s efficiency, particularly in light of the variations in the mutual fund industry as to who is responsible for which expenses. The net expense ratio for PMF ranked within the first quartile among its Morningstar peers, while the net expense ratios for RTR, ROF, and RSE ranked within the second quartile among their Morningstar peers. The Board noted that the net expense ratio for RPR fell in the 4th quartile among its peers, but such expense ratio was only nine basis points higher than its peer group median and seven basis points above its category median. RMC placed in the 4th
| 132 | The Royce Funds 2014 Semiannual Report to Shareholders |
| Board Approval of Investment Advisory Agreements (continued) |
quartile within its peer group, 13 basis points higher than its peer group median. RMC’s net expense ratio is below the average net expense ratio for the 21 non-institutional, non-ETF, domestic stock funds in the Morningstar database that invest primarily in issuers with market caps below $500 million and 12b-1 fees equal to or less than 0.25%. The Board noted that RLP’s expense ratio ranked in the 4th quartile among its peers, 23 basis points higher than its peer group median and 10 basis points higher than its category median. RLP’s higher management fee, reflecting the Fund’s use of low-priced and micro-cap stocks, accounts for this difference. RLP’s net expense ratio is eight basis points higher than the mean for all 166 small-cap category funds (non-institutional, non-index, non-ETF) with 12b-1 fees of 25 basis points. The trustees also noted the reduction in RLP’s contractual management fee schedule that became effective July 1, 2014. The Board noted that RHF’s net expense ratio ranked in the 3rd quartile among its Morningstar peers, three basis points higher than its peer group median and one basis point higher than its category median.
The trustees noted that RVP’s net expense ratio placed in the 4th quartile within its peer group, 20 basis points higher than its peer group median and five basis points higher than its category median, while RVV’s net expense ratio ranked in the 4th quartile, 27 basis points higher than its peer group median and 13 basis points higher than its category median. The management fees for RVP and RVV, which are 26 and 25 basis points, respectively, higher than their peer group medians, account for much of these differentials. The Board noted, however, that the management fees for RVP and RVV are consistent with other Royce open-end funds and that the net expense ratios for RVP and RVV are equal to, or approximate, the 1.41% mean for all 166 small-cap category funds (non-institutional, non-index, non-ETF) with 12b-1 fees of 25 basis points.
Each of ROH’s and RDV’s expense ratios placed in the 4th quartile, 12 basis points higher than its peer group median, as their management fees were 13 and 12 basis points higher, respectively, than the relevant peer group median. The management fees for ROH and RDV are consistent with other Royce open-end funds and their net expense ratios approximate the 1.41% mean for all 166 small-cap category funds (non-institutional, non-index, non-ETF) with 12b-1 fees of 25 basis points.
The Board noted that most of RGV’s peers are in large-cap style boxes per the Morningstar data. After taking into consideration that the level of work necessary to invest in small-cap international securities is significantly greater than that necessary to invest in larger-cap securities, the Board noted that the basis point differentials in management fees, which give rise to the generally higher expense ratios, were appropriate for this Fund.
RSM’s net expense ratio fell in the 4th quartile within its peer group, 13 basis points higher than its peer group median. It was noted that RSM’s portfolio had a weighted average market capitalization that was the 5th lowest of its peer group. The trustees also noted that RSM’s net expense ratio would have ranked in the 2nd quartile among its peer group had its recently reduced contractual management fee rate been in effect during 2013.
The Board further noted that R&A has waived advisory fees for numerous Funds in order to maintain expense ratios at competitive levels and acknowledged R&A’s intention to continue this expense limitation practice. The Board also considered fees charged by R&A to institutional and other clients and noted that, given the greater levels of services that R&A provides to registered investment companies such as the Funds as compared to other accounts, each Fund’s advisory fees compared favorably to these other accounts.
It was noted that no single factor was cited as determinative to the decision of the trustees. Rather, after weighing all of the considerations and conclusions discussed above, the entire Board, including all of the non-interested trustees, determined to approve the continuance of the existing Investment Advisory Agreements for all of the Funds except RLP, and determined to approve the amended and restated Investment Advisory Agreement with the reduced fee schedule for RLP, concluding that contract continuations on the existing terms for all of the Funds other than RLP, and on the amended terms for RLP, were in the best interest of the shareholders of the respective Funds and that each investment advisory fee rate was reasonable in relation to the services provided.
| The Royce Funds 2014 Semiannual Report to Shareholders | 133 |
| Notes to Performance and Other Important Information |
The thoughts expressed in this report concerning recent market movements and future prospects for small company stocks are solely the opinion of Royce at June 30, 2014, and, of course, historical market trends are not necessarily indicative of future market movements. Statements regarding the future prospects for particular securities held in the Funds’ portfolios and Royce’s investment intentions with respect to those securities reflect Royce’s opinions as of June 30, 2014 and are subject to change at any time without notice. There can be no assurance that securities mentioned in this report will be included in any Royce-managed portfolio in the future. Sector weightings are determined using the Global Industry Classification Standard (“GICS”). GICS was developed by, and is the exclusive property of, Standard & Poor’s Financial Services LLC (“S&P”) and MSCI Inc. (“MSCI”). GICS is the trademark of S&P and MSCI. “Global Industry Classification Standard (GICS)” and “GICS Direct” are service marks of S&P and MSCI. All indexes referred to are unmanaged and capitalization weighted. Each index’s returns include net reinvested dividends and/or interest income. Russell Investment Group is the source and owner of the trademarks, service marks, and copyrights related to the Russell Indexes. Russell® is a trademark of Russell Investment Group. The Russell 2000 is an index of domestic small-cap stocks. It measures the performance of the 2,000 smallest publicly traded U.S. companies in the Russell 3000 Index. The Russell 1000 Index is an index of domestic large-cap stocks. It measures the performance of the 1,000 largest publicly traded U.S. companies in the Russell 3000 Index. The Russell Microcap Index includes 1,000 of the smallest securities in the Russell 2000 Index, along with the next smallest eligible securities as determined by Russell. The Russell 2500 is an index of domestic small- to mid-cap stocks. It includes approximately 2,500 of the smallest securities in the Russell 3000 Index. The Russell Midcap Index measures the performance of the mid-cap segment of the U.S. equity universe. It includes approximately 800 of the smallest securities in the Russell 1000 Index. The Russell Global Small Cap Index is an index of global small-cap stocks. The Russell Global ex-U.S. Small Cap Index is an index of global small-cap stocks, excluding the United States. The Russell Global ex-U.S. Large Cap Index is an index of global large-cap stocks, excluding the United States. The CBOE Volatility Index (VIX) measures market expectations of near-term volatility conveyed by S&P 500 Stock index option prices. The S&P 500 is an index of U.S. large-cap stocks, selected by Standard & Poor’s based on market size, liquidity, and industry grouping, among other factors. The Nasdaq Composite is an index of the more than 3,000 common equities listed on the Nasdaq stock exchange. The performance of an index does not represent exactly any particular investment, as you cannot invest directly in an index. Returns for the market indexes used in this report were based on information supplied to Royce by Russell Investments. Royce has not independently verified the above described information. The Price-Earnings, or P/E, Ratio is calculated by dividing a company’s share price by its trailing 12-month earnings-per share (EPS). The Price-to-Book, or P/B, Ratio is calculated by dividing a company’s share price by its book value per share. The Sharpe Ratio is calculated for a specified period by dividing a fund’s annualized excess returns by its annualized standard deviation. The higher the Sharpe Ratio, the better the fund’s historical risk-adjusted performance. Standard deviation is a statistical measure within which a fund’s total returns have varied over time. The greater the standard deviation, the greater a fund’s volatility. The Royce Funds is a service mark of The Royce Funds. Distributor: Royce Fund Services, Inc. Investments in securities of micro-cap, small-cap and/or mid-cap companies may involve considerably more risk than investments in securities of larger-cap companies. (Please see “Primary Risks for Fund Investors” in the prospectus.) Certain Royce Funds may invest up to 25% (100% for Royce Global Value and International Smaller-Companies Funds, 35% of Heritage and Low-Priced Stock Funds, 10% of Opportunity Fund, and 5% of Special Equity Fund) of their respective assets measured at the time of investment in foreign securities, which generally may involve political, economic, currency, and other risks not encountered in U.S. investments. (Please see “Investing in Foreign Securities” in the prospectus.) Please read the prospectus carefully before investing or sending money. A copy of the Funds’ current prospectus and Statement of Additional Information may be obtained by calling (800) 221-4268 or by visiting www.roycefunds.com. All publicly released material Fund information is disclosed by the Funds on their website at www.roycefunds.com. |
| Forward-Looking Statements | |
This material contains forward-looking statements within the meaning of the Securities Exchange Act of 1934, as amended (the “Exchange Act”), that involve risks and uncertainties, including, among others, statements as to: | |
| • | the Funds’ future operating results, |
| • | the prospects of the Funds’ portfolio companies, |
| • | the impact of investments that the Funds have made or may make, |
| • | the dependence of the Funds’ future success on the general economy and its impact on the companies and industries in which the Funds invest, and |
| • | the ability of the Funds’ portfolio companies to achieve their objectives. |
This review and report use words such as “anticipates,” “believes,” “expects,” “future,” “intends,” and similar expressions to identify forward-looking statements. Actual results may differ materially from those projected in the forward-looking statements for any reason. | |
The Royce Funds have based the forward-looking statements included in this review and report on information available to us on the date of the report, and we assume no obligation to update any such forward-looking statements. Although The Royce Funds undertake no obligation to revise or update any forward-looking statements, whether as a result of new information, future events, or otherwise, you are advised to consult any additional disclosures that we may make through future shareholder communications or reports. | |
| Proxy Voting | ||
A copy of the policies and procedures that The Royce Funds use to determine how to vote proxies relating to portfolio securities and information regarding how each of The Royce Funds voted proxies relating to portfolio securities during the most recent 12-month period ended June 30 is available, without charge, on The Royce Funds’ website at www.roycefunds.com, by calling (800) 221-4268 (toll-free) and on the website of the Securities and Exchange Commission (“SEC”) at www.sec.gov. | ||
| Form N-Q Filing | ||
The Funds file their complete schedules of investments with the SEC for the first and third quarters of each fiscal year on Form N-Q. The Funds’ Forms N-Q are available on the SEC’s website at www.sec.gov. The Royce Funds’ holdings are also on the Funds’ website approximately 15 to 20 days after each calendar quarter end and remain available until the next quarter’s holdings are posted. The Funds’ Forms N-Q may also be reviewed and copied at the SEC’s Public Reference Room in Washington, D.C. To find out more about this public service, call the SEC at (202) 942-8090. The Funds’ complete schedules of investments are updated quarterly and are available at www.roycefunds.com. | ||
| 134 | The Royce Funds 2014 Semiannual Report to Shareholders |
| 2014 In Quotes |
Points to Ponder
“It’s not a stock market; it’s a market of stocks,” is accurate and always at work. Even though many investors own index funds, the basis remains the valuation of each stock.
—John S. Tobey, Forbes.com, February 4, 2014
New records also bring out old arguments. Market bears point to CAPE—cyclically adjusted P/Es—as a sign of an overheated U.S. market. Briefly, the measure tries to smooth economic cycles by looking at a 10-year earnings path. We think it ignores a low-rate and low-inflation environment, a shift to lower-tax non-U.S. profits and the fact that the last 10 years, as we all know, was hardly a typical economic cycle. It’s a fair debate, however, but it misses the bigger point: There are opportunities at the individual stock level.
—Janus Funds, Market Perspectives Series, First Quarter 2014
Investors should diversify emotionally as well as financially.
—Terrance Odean, wsj.com, January 27, 2014
During the past 13 months, stock funds have seen nearly 1,000 managers come and more than 1,200 go, 17 have reopened to new investors, and countless others have changed their styles in ways big and small. The difficult part is determining whether these changes are signs of trouble—or just noise to be tuned out.
—Ben Levisohn, Barron’s, April 5, 2014
My pension is invested for the next 25 years or more but I have little interest in (or control over) whether my chosen active managers outperform next year or not. I encourage investors to reject the illusion of control, embrace ‘inconsistent persistence’ and accept bad years are all part and parcel of talented fund managers’ long-term value generation.
—David Smith, ft.com, May 25, 2014
During every boom there are always some who lose sight of what a stock really is. They talk about “beta,” “growth stories” and “blue sky valuations,” forgetting that a stock is simply a claim on a company’s future cash flows. The less you pay for those cash flows, the better the deal. The more you pay, the worse the deal. Decades of research shows that those who invest by this principle earn superior returns with lower risk. Stocks that are cheap in relation to their net assets, per-share earnings and dividends have proved the best investments over time.
—Brett Arends, The Wall Street Journal, June 21, 2014
In Absolute Agreement
Far more money has been lost by investors preparing for corrections, or trying to anticipate corrections, than has been lost in corrections themselves.
—Peter Lynch, nytimes.com, January 28, 2014
Our job is to find those undervalued companies, understand their business and the industry, and understand what it’s going to take for these headwinds that have caused the stock to be cheap to turn to tailwinds to unlock that value. And that usually takes about a two- to three-year investment horizon. You must be patient.
—Brad Evans, morningstar.com, January 31, 2014
Unconventional behavior is the only road to superior investment results, but it isn’t for everyone. In addition to superior skill, successful investing requires the ability to look wrong for a while and survive some mistakes.
—Howard Marks, Barron’s, April 9, 2014
We bring a private-equity perspective to public-equity investing. By that, I mean we take the very long-term time horizon that private equity firms typically take, and try to anticipate how investors might view a company differently five years from now.
—Bill Nygren, Barron’s, June 3, 2014
Cocktail Conversation
The U.S. economy is growing, albeit with bumps in the road. With a confrontation unlikely in Congress over raising the federal debt ceiling, business and consumer psychology should continue to improve.
—Mario Gabelli, Barron’s, February 1, 2014
Market efficiency is only a half-truth. You can profit from irrational exuberance.
—Robert Shiller
One attitudinal difference between Asian investors I talked with and their American counterparts is their fear that a geopolitical event will send equities tumbling everywhere. American investors are more complacent. I certainly hope the Asians are wrong.
—Byron Wien, Barron’s, April 29, 2014
Timeless Tidbits
Those who want freedom from concern must accept lower returns.
—Benjamin Graham
Culture eats strategy for breakfast.
—Peter Drucker
Long ago, Ben Graham taught me that ‘Price is what you pay; value is what you get.’ Whether we’re talking about socks or stocks, I like buying quality merchandise when it is marked down.
—Warren Buffett
| The thoughts expressed above represent solely the opinions of the persons quoted and, of course, there can be no assurance of future market trends or performance. |
| This page is not part of the 2014 Semiannual Report to Shareholders | 135 |
| This page is intentionally left blank. |
| 136 | This page is not part of the 2014 Semiannual Report to Shareholders |
| There’s No Such Thing as a Sure Thing |
There was extraordinary excitement surrounding this year’s Kentucky Derby. This anticipation was well rewarded by a dramatic and electrifying contest. The favorite, California Chrome, took the lead roughly halfway through the race and never looked back, winning by almost two lengths. The same horse’s victory in the Preakness Stakes two weeks later was, if anything, even more decisive. This set up the tantalizing possibility of a Triple Crown winner, the first since Affirmed took the prize more than 35 years ago in 1978. (At the time we managed but a single mutual fund.)
Indeed, as the date of the Belmont Stakes crept closer, more and more people began to talk as if the coveted and rarely won Triple Crown was in the bag. California Chrome’s dominance seemed to increase with each win. His ability to pick up speed as the race progressed was commonly cited as the likely key to victory because the Belmont boasts the longest track of the three legs that constitute the Triple Crown. Then a funny thing happened. California Chrome, the “sure thing,” ran a solid race, but failed to secure victory, finishing fourth. The winning horse, Tonalist, had not run in either the Derby or the Preakness, making him a dark horse in at least the figural sense.
The wake of the upset led us to reexamine the vagaries of performance-based contests. Thinking through the implications of what occurred, we made a rough count of the numerous times when other sure things had failed to achieve the ultimate prize and an upset winner was crowned instead. Interestingly, this happens quite often and occurs in numerous endeavors, including sports, popular culture, the arts, and even asset management.
More important, it gave us an opportunity to reflect on our own experiences investing in small-cap stocks and managing mutual funds. There have been times during our 40-plus years of history when value-rooted small-cap approaches have been the barely acknowledged underdog as well as the prohibitive favorite. There have also been long stretches where our methodology and our asset class were thought of, if we were thought of at all, as being among the middle of the pack.
In this business, every asset manager must live with the reality of the scorecard. Here at Royce we measure our performance against appropriate benchmarks, competitors, and—most crucially—our own absolute standard. We take these measurements over market-cycle and other long-term periods. We make strenuous efforts to learn from our mistakes in several dimensions—at the most critical level individual stocks, of course, but also in terms of sector and industry weightings, country exposure, risk tolerance, and overall portfolio performance. We are also aware that there are influential sources that rate, grade, and rank both fund and portfolio management records.
Indeed, the various methods of evaluating portfolio performance, and the sheer number of people willing to do that for us, make our own internal standards that much more significant. When buying stocks, we attempt to tune out the Wall Street noise and come to our own independent conclusions regarding the companies we are considering for inclusion in our portfolios. We attempt to do the same when it comes to evaluating portfolio performance. That is, we focus on the job that we need to do successfully to help our shareholders (and ourselves, since we are among the largest individual shareholders in the Funds we manage) build wealth over the long run. As Chuck Royce has often said, you can only eat from the table of absolute performance.
Sometimes approaches like ours are considered in vogue, other times out of favor, and still other times somewhere in between. Our task is to run the best race we can, always trying to improve, and focus on what is important. And as we think about it, that’s how we started out, not long before another horse, Secretariat, broke records and won the Triple Crown in 1973.
| The thoughts in this essay concerning the stock market are solely those of Royce & Associates, LLC and, of course, there can be no assurance with regard to future market movements. |
| This page is not part of the 2014 Semiannual Report to Shareholders |
 | |||||||||||||||||||
 | |||||||||||||||||||
About The Royce Funds Wealth of Experience With approximately $38 billion in total assets under management, Royce & Associates is committed to the same investment principles that have served us well for over 40 years. Chuck Royce, our Chief Executive Officer, enjoys one of the longest tenures of any active mutual fund manager. Royce’s investment staff also includes 23 portfolio managers and analysts and nine traders. Multiple Funds, Common Focus Our goal is to offer both individual and institutional investors the best available micro-cap, small-cap, and/or mid-cap portfolios. We have chosen to concentrate on smaller-company investing by providing investors with a range of funds that take full advantage of this large and diverse sector. Consistent Discipline Our approach emphasizes paying close attention to risk and maintaining the same discipline, regardless of market movements and trends. The price we pay for a security must be significantly below our appraisal of its current worth. This requires a thorough analysis of the financial and business dynamics of an enterprise, as though we were purchasing the entire company. Co-Ownership of Funds It is important that our employees and shareholders share a common financial goal. Our officers, employees, and their families currently have more than $215 million invested in The Royce Funds and are often among the largest individual shareholders. | |||||||||||||||||||
| Contact Us | |||||||||||||||||||
| General Information Additional Report Copies and Prospectus Inquiries (800) 221-4268 | RIA/BD Services Fund Materials and Performance Updates (800) 33-ROYCE (337-6923) | Shareholder Services Transactions and Account Inquiries (800) 841-1180 | Royce InfoLine 24-Hour Automated Telephone Service (800) 78-ROYCE (787-6923) |  | |||||||||||||||
|

SEMIANNUAL
REVIEW AND REPORT
TO SHAREHOLDERS
Royce Select Fund I Royce Select Fund II Royce Enterprise Select Fund Royce Opportunity Select Fund Royce Micro-Cap Discovery Fund Royce Financial Services Fund Royce SMid-Cap Value Fund Royce Partners Fund Royce European Smaller-Companies Fund Royce Global Dividend Value Fund Royce International Micro-Cap Fund Royce International Premier Fund Royce Focus Value Fund | ||
www.roycefunds.com |  | |
| www.roycefunds.com |
 |
eDelivery Saves! Sign Up Now. eDelivery saves paper, time, and fund expenses.1 Sign up now to view statements, prospectuses, financial reports, and tax forms online. > www.roycefunds.com/edelivery 1 Any direct Royce Funds IRA investor who chooses eDelivery of prospectuses, financial reports, and RWord will be exempt from the $15 annual IRA maintenance fee. (We will continue to also waive the fee for investors with more than $20,000 invested in Royce IRAs at the time the fee is charged, and for new transfer and rollover accounts in their first year.) Stay Informed Follow us on Twitter, connect with us on LinkedIn, watch us on YouTube, subscribe to our RSS feed, and sign up for our monthly eWord newsletter to stay up to date on the latest from The Royce Funds.  www.twitter.com/roycefunds www.twitter.com/roycefunds www.linkedin.com/roycefunds www.linkedin.com/roycefunds www.youtube.com/roycefunds www.youtube.com/roycefunds www.roycefunds.com/eword www.roycefunds.com/eword |
| This page is not part of the 2014 Semiannual Report to Shareholders |
| Table of Contents | |
| Semiannual Review | |
| Fund Guide | 2 |
| Portfolio Characteristics | 4 |
| Performance and Expenses | 5 |
| Letter to Our Shareholders | 6 |
| Semiannual Report to Shareholders | 13 |
 | |
| This page is not part of the 2014 Semiannual Report to Shareholders | 1 |
| Royce Fund Guide |
| VALUE-ORIENTED SMALL-CAP OFFERINGS TAILORED TO SPECIFIC INVESTOR NEEDS |
| The size and diversity of the small-company universe make it a unique and fertile area for investment. For more than 40 years, it has been our primary area of focus. Over that time, this universe has evolved into an established asset class used by a wide range of investors, including institutions, consultants, advisors, and individuals. Today, there are numerous small-cap and micro-cap indexes and ETFs. Importantly, the continuous regeneration of the asset class, through the entrance of new companies, spin-offs, and IPOs, makes it an evergreen source of investment opportunities. This is why we have elected to focus on the smaller-company universe and believe it is ideally suited for a variety of distinct offerings. |
| INVESTMENT UNIVERSE BREAKDOWN1 |

Market Cap |
| The Royce Funds, other than Royce Special Equity Multi-Cap Fund, invest primarily in micro-cap, small-cap, and/or mid-cap stocks, which may involve considerably more risk than investing in larger-cap stocks (please see “Primary Risks for Fund Investors” in the prospectus). Each Fund may invest a portion of its net assets in foreign securities, which may involve political, economic, currency, and other risks not encountered in U.S. investments (please see “Investing in Foreign Securities” in the prospectus). |
| 2 | This page is not part of the 2014 Semiannual Report to Shareholders |
This guide is designed to help investors better understand both the different approaches and the common ground among our portfolios. Looking closely at our Fund Guide allows investors to see other important differences—in levels of volatility, sector orientation, and investment themes. We think that understanding these differences can inform asset allocation decisions, especially when investors incorporate more than one Royce offering within their portfolios. Listed below are the Royce Funds included in this Semiannual Report, arranged by average market cap. For a complete listing of our Funds and their attributes please visit our website at www.roycefunds.com. |
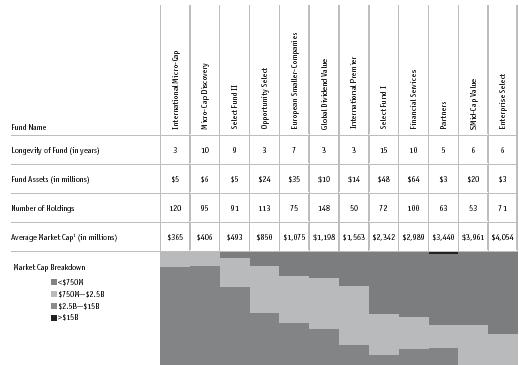 |
| Fund Tools Go online for more tools to help you better understand our Funds. Compare Funds > www.roycefunds.com/compare Prices & Performance > www.roycefunds.com/prices |
1 Geometric Average. This weighted calculation uses each portfolio holding’s market cap in a way designed to not skew the effect of very large or small holdings; instead, it aims to better identify the portfolio’s center, which Royce believes offers a more accurate measure of average market cap than a simple mean or median. |
| This page is not part of the 2014 Semiannual Report to Shareholders | 3 |
| Portfolio Characteristics | Through June 30, 2014 |
| Longevity | Average | 2013 | % of | ||||||||||||||||||||||||
| of Fund | Market | Number of | Turnover | Non-U.S. | |||||||||||||||||||||||
| Fund | Portfolio Manager(s) | (in years) | Cap1 | Holdings | Rate | Securities | |||||||||||||||||||||
| Royce Select Fund I | Lauren Romeo | 15 | $ | 2,342 | 72 | 56 | % | 8.6 | % | ||||||||||||||||||
| Royce Select Fund II | Jim Harvey | 9 | 493 | 91 | 159 | 65.4 | 2 | ||||||||||||||||||||
| Royce Enterprise Select Fund | Steven McBoyle | 6 | 4,054 | 71 | 154 | 8.7 | |||||||||||||||||||||
| Royce Opportunity Select Fund | Bill Hench | 3 | 850 | 113 | 129 | 4.7 | 2 | ||||||||||||||||||||
| Royce Micro-Cap Discovery Fund | George Necakov, Jim Harvey | 10 | 406 | 95 | 81 | 6.4 | |||||||||||||||||||||
| Royce Financial Services Fund | Chuck Royce | 10 | 2,989 | 100 | 23 | 28.0 | |||||||||||||||||||||
| Royce SMid-Cap Value Fund | Steven McBoyle, Whitney George | 6 | 3,961 | 53 | 31 | 26.0 | |||||||||||||||||||||
| Royce Partners Fund | Chuck Royce | 5 | 3,440 | 63 | 53 | 29.9 | |||||||||||||||||||||
| Royce European Smaller-Companies Fund | David Nadel, Mark Rayner | 7 | 1,075 | 75 | 53 | 94.1 | |||||||||||||||||||||
| Royce Global Dividend Value Fund | Chuck Royce | 3 | 1,198 | 148 | 82 | 88.4 | |||||||||||||||||||||
| Royce International Micro-Cap Fund | Jim Harvey, Dilip Badlani | 3 | 365 | 120 | 103 | 93.0 | |||||||||||||||||||||
| Royce International Premier Fund | David Nadel | 3 | 1,563 | 50 | 51 | 96.5 | |||||||||||||||||||||
| 4 | This page is not part of the 2014 Semiannual Report to Shareholders |
| Performance and Expenses | Through June 30, 2014 |
| Average Annual Total Returns | ||||||||||||||||||||||||||||||||||||
| Since | Gross Annual | Net Annual | ||||||||||||||||||||||||||||||||||
| Since | Inception | Operating | Operating | |||||||||||||||||||||||||||||||||
| Fund | Year-to-Date1 | 1-Year | 3-Year | 5-Year | 10-Year | Inception | Date | Expenses | Expenses | |||||||||||||||||||||||||||
| Royce Select Fund I | 6.61 | % | 25.86 | % | 11.24 | % | 16.60 | % | 10.75 | % | 14.16 | % | 11/18/98 | 1.20 | % | 1.20 | % | |||||||||||||||||||
| Royce Select Fund II | 6.53 | 23.70 | 10.03 | 14.28 | n.a. | 8.56 | 6/30/05 | 3.30 | 1.62 | |||||||||||||||||||||||||||
| Royce Enterprise Select Fund | 5.78 | 22.09 | 14.23 | 16.93 | n.a. | 8.30 | 9/28/07 | 3.08 | 1.24 | |||||||||||||||||||||||||||
| Royce Opportunity Select Fund | 3.29 | 26.72 | 19.16 | n.a. | n.a. | 22.46 | 8/31/10 | 1.78 | 1.29 | |||||||||||||||||||||||||||
| Royce Micro-Cap Discovery Fund | 0.00 | 20.54 | 9.92 | 13.46 | 5.30 | 6.69 | 10/3/03 | 2.50 | 1.49 | |||||||||||||||||||||||||||
| Royce Financial Services Fund | 3.62 | 23.76 | 15.37 | 16.71 | 9.25 | 8.90 | 12/31/03 | 1.97 | 1.57 | |||||||||||||||||||||||||||
| Royce SMid-Cap Value Fund | 13.70 | 33.34 | 10.82 | 16.94 | n.a. | 7.59 | 9/28/07 | 2.20 | 1.35 | |||||||||||||||||||||||||||
| Royce Partners Fund | 2.77 | 21.18 | 11.55 | 14.16 | n.a. | 14.21 | 4/27/09 | 3.97 | 1.26 | |||||||||||||||||||||||||||
| Royce European Smaller-Companies Fund | 4.59 | 23.52 | 5.58 | 16.72 | n.a. | 5.04 | 12/29/06 | 2.27 | 1.70 | |||||||||||||||||||||||||||
| Royce Global Dividend Value Fund | 5.38 | 19.66 | 7.34 | n.a. | n.a. | 6.96 | 12/31/10 | 2.99 | 1.70 | |||||||||||||||||||||||||||
| Royce International Micro-Cap Fund | 7.87 | 28.90 | 4.00 | n.a. | n.a. | 3.92 | 12/31/10 | 3.88 | 1.71 | |||||||||||||||||||||||||||
| Royce International Premier Fund | 3.26 | 16.80 | 6.43 | n.a. | n.a. | 6.71 | 12/31/10 | 2.82 | 1.69 | |||||||||||||||||||||||||||
| 1 Not Annualized | ||||||||||||||||||||||||||||||||||||
Important Performance, Expense, and Risk Information
All performance information in this Review and Report reflects past performance, is presented on a total return basis, reflects the reinvestment of distributions, and does not reflect the deduction of taxes a shareholder would pay on fund distributions or the redemption of fund shares. Past performance is no guarantee of future results. Investment return and principal value of an investment will fluctuate, so that shares may be worth more or less than their original cost when redeemed. Shares redeemed within 180 days of purchase may be subject to a 1% redemption fee payable to the Fund (2% for Royce Select II, European Smaller-Companies, Global Dividend Value, International Micro-Cap, and International Premier Funds). Redemption fees are not reflected in the performance shown above; if they were, performance would be lower. Current performance may be higher or lower than performance quoted. Current month-end performance may be obtained at www.roycefunds.com. All performance and expense information reflects results of the Fund’s oldest share Class (Investment Class or Service Class, as the case may be). Price and total return information is based on net asset values calculated for shareholder transactions. Certain immaterial adjustments were made to the net assets of Royce International Premier Fund as of 6/30/14 for financial reporting purposes, and as a result the net asset values for shareholder transactions on that date and the total returns based on those net asset values differ from the adjusted net asset values and total returns reported in the financial highlights. Gross annual operating expenses reflect the Fund’s gross total annual operating expenses and include management fees, any 12b-1 distribution and service fees, other expenses, and any applicable acquired fund fees and expenses. Net annual operating expenses reflect contractual fee waivers and/or reimbursements. All expense information is reported as of the Fund’s most current prospectus. Royce & Associates has contractually agreed to waive fees and/or reimburse operating expenses, (excluding brokerage commissions, taxes, interest, litigation expenses, acquired fund fees and expenses, and other expenses not borne in the ordinary course of business), to the extent necessary to maintain net operating expenses at or below: 1.20% for Royce Partners Fund; 1.49% for Royce Micro-Cap Discovery and Financial Services Funds; and 1.69% for Royce European Smaller-Companies, Global Dividend Value, International Micro-Cap, and International Premier Funds: 1.24% for Royce Enterprise Select and Opportunity Select Funds; and 1.49% for Royce Select Fund II through April 30, 2015 at or below: 1.84% for Royce Partners Fund, 1.99% for Royce Select Fund II, Enterprise Select, Opportunity Select, Micro-Cap Discovery, Partners, European Smaller-Companies, Global Dividend Value, International Micro-Cap, and International Premier Funds through April 30, 2024. Acquired fund fees and expenses reflect the estimated amount of fees and expenses incurred indirectly by the Fund through its investments in mutual funds, hedge funds, private equity funds, and other investment companies. Shares of the Funds’ Service Class bear an annual distribution expense that is not borne by the Funds’ Investment Class. Investments in securities of micro-cap, small-cap, and/or mid-cap companies may involve considerably more risk than investments in securities of larger-cap companies. (Please see “Primary Risks for Fund Investors” in the prospectus.) Royce Select I, Select II, Enterprise Select, and Opportunity Select Funds may sell securities short which involves selling a security it does not own in anticipation that the security’s price will decline. Short sales present unlimited risk on an individual stock basis since the Fund may be required to buy a security sold short at a time when the security has appreciated in value. Royce European Smaller-Companies, Global Dividend Value, International Micro-Cap, and International Premier Funds invest a significant portion of their respective assets in foreign companies that may be subject to different risks than investments in securities of U.S. companies, including adverse political, social, economic, or other developments that are unique to a particular country or region. (Please see “Investing in Foreign Securities” in the prospectus.) Therefore, the prices of securities of foreign companies in particular countries or regions may, at times, move in a different direction than those of securities of U.S. companies. (Please see “Primary Risk of Fund Investors” in the prospectus.) Please read the prospectus carefully before investing or sending money. Distributor: Royce Fund Services, Inc. |
| This page is not part of the 2014 Semiannual Report to Shareholders | 5 |
 Charles M. Royce, President The long-running, and probably unresolvable, debate about active versus passive investment strategies has taken on new life in the years since the onset of the Financial Crisis, often to the detriment of active approaches. To take one example, Morningstar compiled data showing that inflows into equity mutual funds have been dwarfed by those into equity ETFs (exchange traded funds) measuring from the momentous year of 2008. For the six calendar years from 2008-2013, traditional equity funds have taken in $5.52 billion while ETFs have attracted $389.08 billion. That’s quite a disparity. It seems to be no secret that many active managers have struggled to keep pace with their respective equity indexes in these often eventful years. These years have also seen a raft of studies purporting to show that most investment managers are unable to consistently beat the market, i.e., regularly outperform a relevant index such as the Russell 2000 or S&P 500 Indexes. Continued on page 8... | Letter to Our Shareholders No Drama | |
| 6 | This page is not part of the 2014 Semiannual Report to Shareholders |
and virtually correction-free, bull run in which returns for each of the major domestic stock indexes topped 30%. The curtain opened on 2014, then, on the heels of one of the better calendar-year performances in the history of domestic equities, which followed four consecutive years of mostly rising stock prices in an uncertain economy. So the question now is, what is the next act for equities? Some argue that the economy is not strong enough to really take flight. They worry about the rich valuations sported by large numbers of stocks. Others see the relative absence of volatility as a sign of complacency and fret that stocks are about to enter a destructive bear phase. There are those who point to increasingly unsettled international situations, such as in Ukraine, Syria, and Iraq, and argue that the market cannot continue to pretend that events in these nations take place far offstage, not in an increasingly intertwined global economy. We, however, are in accord with the more widespread consensus that sees the U.S. economy as gradually normalizing. As evidence we would point to the following: The deficit continues to fall, the Fed continues to wind down the rate of its monthly bond purchases, and interest rates, though they remain close to zero, look likely to rise again in the near future as they did last year between May and December. Inflation is tame, commodity prices stable. Volatility, as measured by the VIX, finished the first half of 2014 at low levels not seen since 2007. Add an increasingly robust M&A market, and it seems to us that the recipe for ongoing growth—and bullishness, however mild, at least compared to last year—seems almost complete. And this process of normalization looks likely to accelerate as the Fed’s role recedes further and further into the background, setting the stage for a more dynamic pace of growth. So while there remain voices who insist that stocks are overvalued, we think the case for additional gains, which could include a correction along the way, remains persuasive. It seems to us that the relatively lower returns of the first half of 2014 indicate not an end to a bull phase, but a chance for the market to catch its breath and assess its surroundings. It may be that investors need a break from all the drama, a respite from the unrelenting pace of the last six years. So the desire to stand back for a moment and evaluate what is happening seems eminently reasonable. How many investors have enjoyed more than a few moments of true calm since before the recession began back in 2007? Ultimately, we suspect that both the expanding economy and slower pace of returns will result in more fundamentally focused investors. Indeed, the indications that the strength of companies and the businesses they manage are beginning to matter more than indexes and the macro events that move them go back to the spring of 2012, when quality stocks—those with high returns on invested capital—enjoyed a brief run of outperformance. This nascent phenomenon re-started—again, briefly—in May 2013 when the 10-year Treasury rate reached a bottom. Quality companies, particularly those in our chosen small-cap space, have not yet emerged as leaders, but they have inched closer over the last two years. Correlation levels throughout the market are falling. These are excellent conditions, in our view, for disciplined active management approaches, especially those with a long-term investment horizon. | Quality companies, particularly those in our chosen small-cap space, have not yet emerged as leaders, but they have inched closer over the last two years. Correlation levels throughout the market are falling. These are excellent conditions, in our view, for disciplined active management approaches, especially those with a long-term investment horizon. | |||
| This page is not part of the 2014 Semiannual Report to Shareholders | 7 |
| Perhaps unsurprisingly, we would offer two caveats before one embraces uncritically the notion that passive investing is always better: First, a number of managers have consistently outperformed the market over long- term periods and especially within the small-cap asset category. In fact, we believe strongly in the idea that it is not necessary for all managers to beat the market in order for active management to be validated as an approach. Our second note of caution relates to time periods. While it would be nice to outperform an index every year, it is just as unrealistic to expect that as it would be to expect an index to outperform active management every year. It is also unrealistic to expect a high degree of outperformance in the long term without experiencing some short-term underperformance periods. A willingness to stick to one’s approach, regardless of market movements and trends, is critical to long-term outperformance in our opinion. This is especially important during market extremes because there are active managers who exhibit style drift or other changes in their discipline when their investment style falls out of favor or is stressed, such as during the tech bubble. Continued on page 10... | |
| Letter to Our Shareholders |
| No Direction Home |
U.S. stocks turned in a respectable performance in the first half of 2014. If results were not as lofty as they were in the first half of 2013 (and they were not), they were achieved in a more tranquil domestic environment than in the first halves of 2010, 2011, or 2012. One consequence of the more relaxed atmosphere of the first half was that stocks did not seem to know quite what to do with themselves. While the overvalued/not-quite-overvalued-yet argument goes on, the market has not established a clear direction so far in 2014. The bull has so far remained in place during the current cycle; he simply slowed his run to a brisk walk in the first half. For the year-to-date period ended June 30, 2014, the major domestic indexes remained in the black. The small-cap Russell 2000 Index gained 3.2%, taking a back seat to the more tech-oriented Nasdaq Composite, which advanced 5.5% in the first half, and the large-cap S&P 500 and Russell 1000 Indexes, which scored respective gains of 7.1% and 7.3% for the year-to-date period ended June 30, 2014. The year began on a more moderate note following a red-hot second half of 2013. Nevertheless, 2014’s opening quarter was the seventh consecutive quarter of positive performance for the Russell 2000, which rose 1.1%. Large-caps led for the quarter—the S&P 500 and Russell 1000 gained 1.8% and 2.0%, respectively, while the Nasdaq Composite rose 0.5%. Small-caps reached a first-half high on March 4, and the only correction so far this year was the 9.1% drop for the Russell 2000 from that date through May 15, 2014. April was thus the cruelest month, but a series of mini-rallies from mid-May through the end of June made the second quarter mostly positive. The Russell 2000 posted its eighth consecutive positive quarter, up 2.0%. Once again, large-cap outperformed, with the S&P 500 advancing 5.2% and the Russell 1000 up 5.1% for the second quarter. The Nasdaq bounced back strong as well, climbing 5.0% in the second quarter and leaving only the small-cap index out of the five-percent club. Small-cap held onto leadership outside the U.S. In the first quarter, the Russell Global ex-U.S. Small Cap Index was up 3.2% while the Russell Global ex-U.S. Large Cap Index rose 0.8%. Results were stronger in the second quarter and, as in the first, closer to their domestic counterparts than we have seen in a while. For the second quarter, the Russell Global ex-U.S. Small Cap was up 4.2% versus 5.0% for the Russell Global ex-U.S. Large Cap. Year-to-date, non-U.S. small-caps had the edge, with the Russell Global ex-U.S. Small Cap returning 7.5% versus a gain of 5.8% for the Russell Global ex-U.S. Large Cap. After a challenging first quarter, many Asian equities bounced back in the second and finished closer to the European indexes, most of which had been on a tear prior to cooling off in the second quarter. Moving back to the U.S., mid-cap and micro-caps were equally solid in the first quarter. The Russell Midcap Index was up 3.5% versus a gain of 3.0% for the Russell Microcap Index in 2014’s first three months. This pattern broke down around the time of the March 4 small-cap high and can be seen in the second-quarter results for each index. The Russell Midcap continued its notable 2014 performance, rising 5.0% in the |
| 8 | This page is not part of the 2014 Semiannual Report to Shareholders |
second quarter. This gave mid-caps an impressive 8.7% advance on a year-to-date basis. In contrast, micro-caps struggled in the second quarter, suffering more in the brief downturn than their larger cousins. The Russell Microcap Index fell 1.4% for the quarter and was up only 1.6% for the year-to-date period ended June 30, 2014. Many mid-cap stocks have demonstrated strong records of growth over the last few years, and their success throughout the entire post-Financial Crisis cycle has not been a surprise to us. In fact, mid-caps have been an area of significant interest to us for years now. The small- and micro-cap spaces have, by contrast, high numbers of very speculative companies and are typically more volatile—sometimes much more so in the case of micro-caps. They have also enjoyed very strong results over the last several years. The three- and five-year annualized returns through the end of June for the Russell 2000 and Russell Microcap Indexes were terrific on an absolute basis. With equity investors acting more cautiously, if not always consistently, so far in 2014, the relative breather for small- and micro-cap stocks—and we do not think it’s any more than a breather—was also not a surprise. No Excuses Most of The Royce Funds in this Semiannual Review and Report enjoyed strong absolute performance in the first half. We were pleased with both the year-to-date and one-year results for several portfolios, though we recognize fully that more needs to be done with regard to relative performance, especially over more intermediate-term periods. Five portfolios outpaced their respective benchmarks for the year-to-date period ended June 30, 2014—Royce Select Fund I, Select Fund II, Opportunity Select, SMid-Cap Value, and International Micro-Cap Funds. Along with Royce Financial Services Funds, these same five portfolios also beat their respective benchmarks for the one-year period ended June 30, 2014. This was welcome news because, with a few exceptions, shorter-term performance advantages have been elusive over the last few years. Of course short-term outperformance must always be kept in perspective as exactly that—short term. We are hopeful, however, having seen a number of these portfolios narrow the gap in their respective one-, three-, and five-year results versus their respective benchmarks over the last few quarters. Yet we still have work to do. As encouraged as we have been about the recent short spates of leadership for quality stocks and the likelihood that a strengthening, less Fed-dependent economy will benefit active small-cap approaches, lower-quality small-caps again assumed leadership when prices were rallying in June. Investors are still working out their preferences. Profitable companies—as well those with high returns on invested capital—led through the downturn before falling behind in the up phase. The market thus remained a peculiar place in the first half. This may be because we still have a very active Fed at work in an economy that arguably has not needed the extra help in at least a year. | U.S. stocks turned in a respectable performance in the first half of 2014. If results were not as lofty as they were in the first half of 2013 (and they were not), they were achieved in a more tranquil domestic environment than in the first halves of 2010, 2011, or 2012. We are very bullish about the prospects for active small-cap management... we have reached a point at which active management in small-cap stocks simply makes more sense, especially for long-term investors. | |
| This page is not part of the 2014 Semiannual Report to Shareholders | 9 |
| Successful active management also entails a willingness to think independently in terms of sector and industry weightings. It is not unusual for the most successful managers to be significantly out of sync relative to a benchmark index with respect to industry and sector weightings (commonly referred to as tracking error). In addition, active managers are not required to invest cash inflows at the time of receipt when market conditions or prices may not be conducive. They may screen for quality and use buy/sell triggers as a means of reducing risk. While a passive manager must own everything, an active manager has the freedom to look for attractive stocks across the targeted universe. All of this helps to explain why we remain so fond of small-caps and so confident in the effectiveness and value of active approaches in the asset class. Active small-cap managers can capture valuation opportunities beyond their respective indexes—an opportunity that would be lost if one were limited to owning only the constituents that make up the index. | |
| Letter to Our Shareholders |
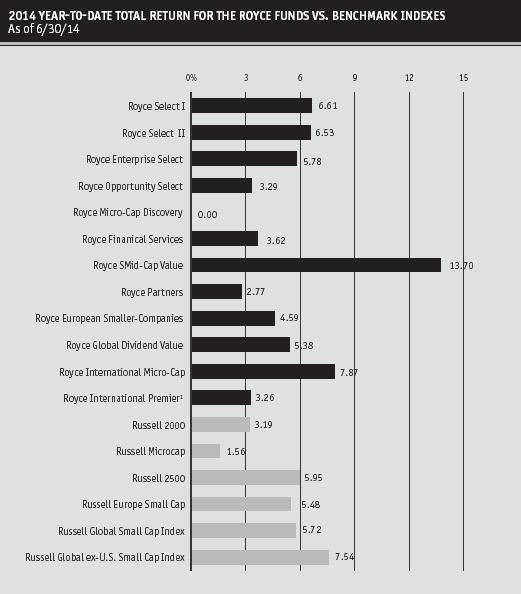 |
1Price and total return information is based on net asset values calculated for shareholder transactions. Certain immaterial adjustments were made to the net assets of Royce International Premier Fund at 6/30/14 for financial reporting purposes, and as a result the net asset values for shareholder transactions on that date and the total returns based on those net asset values differ from the adjusted net asset values and total returns reported in the Financial Highlights. No Worries We are very bullish about the prospects for active small-cap management. We have an obvious bias in favor of active approaches here at Royce, but we think that over the last 14 months—dating back to the low for the 10-year Treasury in May of last year—we have reached a point at which active management in small-cap stocks simply makes more sense, especially for long-term investors. Since that May 2013 low, company fundamentals have gradually become more important as drivers of share-price success. Rather than invest in a small-cap index vehicle in which approximately 25% of the companies are losing money (as was the case for the Russell 2000 for the 12 months ended May 31, 2014), we think it is smarter for investors to consider portfolios that look for well-run, financially strong companies with attractive long-term prospects. So while quality has not yet seized small-cap leadership, we suspect that the reign of low-quality stocks is coming to an end. In our view, the next phase will be one in which companies with attractive characteristics such as strong balance sheets and |
| 10 | This page is not part of the 2014 Semiannual Report to Shareholders |
 | ||
high returns on invested capital should begin to lead. In spite of not showing as much strength when the market was recovering in May and June, many did well enough to lead the small-cap pack from the 2014 high in March through the end of the first half. We would expect something like this pattern to continue at least through the end of the year as the market continues to adjust to the growing normalization of the economy. With small-cap companies in diverse sectors such as Consumer Discretionary, Health Care, and Information Technology showing sizable declines since the end of February, we have been looking closely there (and elsewhere) for what we think are attractively priced, fundamentally strong small-cap businesses. As always, volatility in the small-cap market is something that we seek to use to our advantage, even when it is in short supply. Know This We feel somewhat fortunate in that we do not need to choose a side in the “overvalued versus ongoing bull market” debate. Rather than trying to make a correct market call, our attention has been focused on those potential opportunities that can materialize even in a widespread bull market. Corrections can arrive at any time, of course, and it has been a while since we have seen one of any significance. The last downturn of more than 10% for the Russell 2000 occurred in the fall of 2012. And share prices recovered so quickly from the 9.1% March-May decline this year that the down phase barely registered. This might lead one to argue that the market is being set up for at least a decent-sized pullback. Our sense, however, is that we are more likely to see smaller ones in the 5-10% range as part of the ongoing bull phase. Against the backdrop of an economy that looks poised for faster growth, a Fed tapering at a healthy clip, and an interest-rate environment in which a steady rate of increase is much more of a “when” than an “if,” less severe downturns look more likely. Small-cap valuations on the whole are above average, though not unreasonably so given near-zero interest rates and low inflation. A number of anomalies remain in the market, | All in all, it is looking more and more like a stock-picker’s market to us... which could make the market’s next act a very happy one for active small-cap managers. | |
| This page is not part of the 2014 Semiannual Report to Shareholders | 11 |
| For example, the Russell 2000, while quite broad, only includes about 2,000 of the more than 4,100 companies1 that make up the domestic small-cap universe (those with market caps up to $2.5 billion). While self-serving, we nevertheless think that the small-cap asset class is ideally suited for active management given its enormous size, lack of institutional focus, and limited research availability. 1Source: Reuters as of 6/30/14 | |
| and in many cases we see a wide disparity between what look to us like expensive stocks and those that look inexpensive on an absolute basis. The market seems to be in the process of sorting that out—certainly those areas of the market that do not interest us, and that did well in 2012 and 2013, have been more volatile so far in 2014. In addition, we are still seeing companies that look attractively valued to us based on their fundamentals. All in all, it is looking more and more like a stock-picker’s market to us. We could see the second half of the year being pretty similar to the first in terms of the overall returns for stocks. More important, we think there are still enough opportunities out there to keep returns in positive territory through the end of 2014. This could make the market’s next act a very happy one for active small-cap managers. | |||||
Sincerely, | |||||
 |  |  | |||
| Charles M. Royce | Christopher D. Clark | Francis D. Gannon | |||
| President | Co-Chief Investment Officer, Royce & Associates | Co-Chief Investment Officer Royce & Associates | |||
| July 31, 2014 | |||||
| 12 | This page is not part of the 2014 Semiannual Report to Shareholders |
| Table of Contents | ||||||||||
| Semiannual Report to Shareholders | ||||||||||
| Managers’ Discussions of Fund Performance | ||||||||||
| Royce Select Fund I | 14 | |||||||||
| Royce Select Fund II | 16 | |||||||||
| Royce Enterprise Select Fund | 18 | |||||||||
| Royce Opportunity Select Fund | 20 | |||||||||
| Royce Micro-Cap Discovery Fund | 22 | |||||||||
| Royce Financial Services Fund. | 24 | |||||||||
| Royce SMid-Cap Value Fund | 26 | |||||||||
| Royce Partners Fund | 28 | |||||||||
| Royce European Smaller-Companies Fund | 30 | |||||||||
| Royce Global Dividend Value Fund | 32 | |||||||||
| Royce International Micro-Cap Fund. | 34 | |||||||||
| Royce International Premier Fund | 36 | |||||||||
| Royce Focus Value Fund | 38 | |||||||||
| Schedules of Investments and Financial Statements | 39 | |||||||||
| Notes to Financial Statements | 77 | |||||||||
| Understanding Your Fund’s Expenses | 84 | |||||||||
| Trustees and Officers | 85 | |||||||||
| Board Approval of Investment Advisory Agreements | 86 | |||||||||
| Notes to Performance and Other Important Information | Inside Back Cover | |||||||||
| The Royce Funds 2014 Semiannual Report to Shareholders | 13 |
| Royce Select Fund I |
AVERAGE ANNUAL TOTAL RETURNS Through 6/30/14 | |||||||||||
| January–June 20141 | 6.61 | % | |||||||||
| One-Year | 25.86 | ||||||||||
| Three-Year | 11.24 | ||||||||||
| Five-Year | 16.60 | ||||||||||
| 10-Year | 10.75 | ||||||||||
| 15-Year | 12.68 | ||||||||||
| Since Inception (11/18/98) | 14.16 | ||||||||||
| ANNUAL EXPENSE RATIO | |||||||||||
| Operating Expenses | 1.20 | % | |||||||||
| 1 Not Annualized | |||||||||||
| CALENDAR YEAR TOTAL RETURNS | |||||||||||
| Year | RS1 | Year | RS1 | ||||||||
| 2013 | 26.0 | % | 2005 | 10.9 | % | ||||||
| 2012 | 13.7 | 2004 | 19.1 | ||||||||
| 2011 | -3.6 | 2003 | 48.7 | ||||||||
| 2010 | 18.2 | 2002 | -15.8 | ||||||||
| 2009 | 39.6 | 2001 | 24.5 | ||||||||
| 2008 | -25.9 | 2000 | 15.0 | ||||||||
| 2007 | 10.7 | 1999 | 35.4 | ||||||||
| 2006 | 15.0 | ||||||||||
| TOP 10 POSITIONS % of Net Assets | |||||||||||
| Unit Corporation | 3.2 | % | |||||||||
| Federated Investors Cl. B | 2.8 | ||||||||||
| MKS Instruments | 2.7 | ||||||||||
| CIRCOR International | 2.6 | ||||||||||
| Nu Skin Enterprises Cl. A | 2.3 | ||||||||||
| TGS-NOPEC Geophysical | 2.1 | ||||||||||
| Genesco | 2.0 | ||||||||||
| Myriad Genetics | 2.0 | ||||||||||
| Alleghany Corporation | 2.0 | ||||||||||
| Reliance Steel & Aluminum | 1.9 | ||||||||||
| PORTFOLIO SECTOR BREAKDOWN % of Net Assets | |||||||||||
| Industrials | 21.3 | % | |||||||||
| Information Technology | 17.1 | ||||||||||
| Energy | 11.4 | ||||||||||
| Consumer Discretionary | 10.1 | ||||||||||
| Financials | 9.4 | ||||||||||
| Health Care | 8.2 | ||||||||||
| Materials | 7.4 | ||||||||||
| Consumer Staples | 3.3 | ||||||||||
| Miscellaneous | 2.2 | ||||||||||
| Cash and Cash Equivalents | 9.6 | ||||||||||
 |
Manager’s Discussion The sort of well-run, conservatively capitalized small-cap companies that we look for in Royce Select Fund I (RS1) have often trailed their faster-growing and/or higher-yielding peers over the last few years. There have been signs of a shift over the last two years, though leadership for quality has typically been short lived. We were very pleased, then, with the strong relative and absolute results for the Fund in the first half of 2014. For the year-to-date period ended June 30, 2014, RS1 gained 6.6%, more than doubling the 3.2% increase for its small-cap benchmark, the Russell 2000 Index, during the same period. The Fund’s relative performance edge was especially welcome after it finished behind the small-cap index for two consecutive calendar years. During much of the post-Financial Crisis market, in particular during the years of QE (quantitative easing) and zero interest rates, many small-caps that we think possess high quality were out of favor. For the most part, these companies were not neglected or forgotten by investors—they were simply not seeing the same high level of interest as faster-growing or higher-yielding securities. These two areas typically do not interest us because the long-term financial strength that we crave in the form of strong balance sheets, positive free cash flow, and high returns on invested capital are usually in short supply. Our practice during these years has been to keep looking for what we saw as undervalued quality while we waited for the economy to resume growing at a faster pace. A livelier economic expansion should result in a much-diminished role for the Fed and more attention to business fundamentals from investors. While this shift is not yet complete, we have seen encouraging signs, most recently during the brief correction for small-caps in the first half, which lasted from the year-to-date small-cap high on March 4 through May 15. During this time, quality small-caps outpaced their small-cap siblings. For the first quarter, RS1 substantially outpaced the Russell 2000, rising 4.3% versus 1.1% for the benchmark. The down phase began before the end of the quarter, but April saw the worst of it. A robust round of buying from mid-May through the end of June brought small-cap returns back into the black for the second quarter, when RS1 advanced 2.2%. The Fund outperformed its benchmark for the one-, 10-, 15-year, and since inception (11/18/98) periods ended June 30, 2014. RS1’s average annual total return since inception was 14.2%, a long-term record that gives us great pride. Seven of the Fund’s eight equity sectors finished the year-to-date period in the black and net losses in the Materials sector were very modest. Energy led all of RS1’s sector groups by a wide margin while Health Care also posted notable net gains. It was not |
| GOOD IDEAS THAT WORKED Top Contributors to Performance Year-to-Date through 6/30/141 | |||||||||||
| Myriad Genetics | 1.55% | ||||||||||
| Helmerich & Payne | 1.05 | ||||||||||
| Unit Corporation | 1.02 | ||||||||||
| Pason Systems | 0.61 | ||||||||||
| TGS-NOPEC Geophysical | 0.44 | ||||||||||
| 1 Includes dividends. | |||||||||||
Important Performance and Expense Information All performance information in this Report reflects past performance, is presented on a total return basis, reflects the reinvestment of distributions, and does not reflect the deduction of taxes that a shareholder would pay on fund distributions or the redemption of fund shares. Past performance is no guarantee of future results. Investment return and principal value of an investment will fluctuate, so that shares may be worth more or less than their original cost when redeemed. Shares redeemed within 180 days of purchase may be subject to a 1% redemption fee payable to the Fund, which is not reflected in performance shown above. Current month-end performance may be higher or lower than performance quoted and may be obtained at www.roycefunds.com. Operating expenses reflect the Fund’s total annual operating expenses for the Investment Class as of the Fund’s most current prospectus and include management fees, and other expenses. Regarding the two “Good Ideas” tables shown above, the sum of all contributors to, and all detractors from, performance for all securities in the portfolio would approximate the Fund’s year-to-date performance for 2014. | |||||||||||
| 14 | The Royce Funds 2014 Semiannual Report to Shareholders |
Performance and Portfolio Review surprising, then, that the Fund’s two best-performing industries in the first half were energy equipment & services and biotechnology while semiconductors & semiconductor equipment companies were also a source of strength. As was the case with sectors, net losses at the industry level were small. Four of the portfolio’s five best performers for the period were energy equipment & services businesses—contract driller Helmerich & Payne, contract driller and oil & gas exploration and production firm Unit Corporation, drill rig instrumentation systems maker Pason Systems and TGS NoPEC Geophysical provides geoscientific data products and services to the oil and gas industry. Each was a top-20 holding at the end of June. The Fund’s top performer by a sizable margin was Myriad Genetics, a molecular diagnostic company that specializes in genetic testing for cancer. Its share price slipped dramatically in 2013 after the Supreme Court issued a ruling that human genes cannot be patented. It was also challenged by a reimbursement change from payers (ultimately resolved on better terms) and faced the prospect of new competition in the breast cancer gene testing market. All of this caused many investors to abandon its stock, though we were optimistic that the quality of its diagnostics database and pipeline of additional oncology tests would allow it to remain a leader in molecular testing. The stock began to revive in 2014’s first quarter. Through much of this late 2013-early 2014 timeframe, we thought management was deploying capital productively, first by buying back stock late in 2013 and then in February by acquiring Crescendo Bioscience, which diversified Myriad’s pipeline and gives it a potential billion-dollar market for disease monitoring tests (initially for rheumatoid arthritis). The company also posted strong breast cancer diagnostic test volumes, with its MyRisk panel test meeting initial sales targets. We sold some shares as its price soared in the first half, though it was RS1’s eighth-largest position at the end of the period. We increased our position in multiline women’s fashion business Ascena Retail Group. In addition to the generally awful market for retailers, the company was specifically challenged by depressed holiday results that did not improve as the year went on, particularly at Justice, a brand in the promotion-driven teen fashion space. The company is aiming for better results in the second half with revamped products for, and reduced inventory lead times at Justice, increasing profitability from their plus-size brands, and cost reduction realizations. |
GOOD IDEAS AT THE TIME | |
| Ascena Retail Group | -0.40% |
| Medicines Company (The) | -0.34 |
| Silicon Graphics International | -0.27 |
| Global Power Equipment Group | -0.25 |
| ADTRAN | -0.22 |
| 1 Net of dividends | |
| ROYCE SELECT FUND I VS. RUSSELL 2000 Value of $10,000 Invested on 11/18/98 | |
 |
| Includes reinvestment of distributions. | |||
| PORTFOLIO DIAGNOSTICS | |||
| Fund Net Assets | $48 million | ||
| Number of Holdings | 72 | ||
| Turnover Rate | 21% | ||
| Average Market Capitalization1 | $2,342 million | ||
| Weighted Average P/E Ratio2,3 | 20.5x | ||
| Weighted Average P/B Ratio2 | 2.2x | ||
| U.S. Investments (% of Net Assets) | 81.8% | ||
| Non-U.S. Investments (% of Net Assets) | 8.6% | ||
| Symbol | RYSFX | ||
1 Geometric Average. This weighted calculation uses each portfolio holding’s market cap in a way designed to not skew the effect of very large or small holdings; instead, it aims to better identify the portfolio’s center, which Royce believes offers a more accurate measure of average market cap than a simple mean or median. | |||
2 Harmonic Average. This weighted calculation evaluates a portfolio as if it were a single stock and measures it overall. It compares the total market value of the portfolio to the portfolio’s share in the earnings or book value, as the case may be, of its underlying stocks. | |||
3 The Fund’s P/E calculation excludes companies with zero or negative earnings (8% of portfolio holdings as of 6/30/14). | |||
| MORNINGSTAR STATISTICAL MEASURES1 | |||
| Sharpe Ratio | Standard Deviation | ||
| RS1 | 1.00 | 16.70 | |
| Russell 2000 | 1.10 | 18.23 | |
| Category Median | 1.13 | 17.71 | |
| Best Quartile Breakpoint | 1.20 | 16.80 | |
1 Five years ended 6/30/14. Category Median and Best Quartile Breakpoint based on 357 small-cap objective funds (oldest class) with at least five years of history. | |||
The Fund produced lower volatility than the Russell 2000 and 75% of small-cap objective funds, as shown by its standard deviation. | |||
DOWN MARKET PERFORMANCE COMPARISON | |||
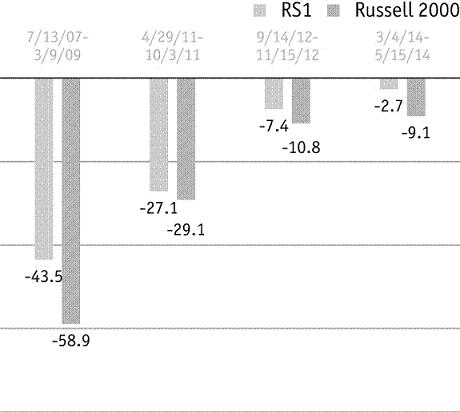 | |||
| The Royce Funds 2014 Semiannual Report to Shareholders | 15 |
| Royce Select Fund II |
AVERAGE ANNUAL TOTAL RETURNS Through 6/30/14 | |||||||||||
| January–June 20141 | 6.53 | % | |||||||||
| One-Year | 23.70 | ||||||||||
| Three-Year | 10.03 | ||||||||||
| Five-Year | 14.28 | ||||||||||
| Since Inception (6/30/05) | 8.56 | ||||||||||
| ANNUAL EXPENSE RATIOS | |||||||||||
| Gross Operating Expenses | 3.30 | % | |||||||||
| Net Operating Expenses | 1.62 | ||||||||||
| 1 Not Annualized | |||||||||||
| CALENDAR YEAR TOTAL RETURNS | |||||||||||
| Year | RS2 | Year | RS2 | ||||||||
| 2013 | 23.5 | % | 2009 | 66.6 | % | ||||||
| 2012 | 13.8 | 2008 | -33.4 | ||||||||
| 2011 | -14.0 | 2007 | -5.5 | ||||||||
| 2010 | 21.0 | 2006 | 19.8 | ||||||||
| TOP 10 LONG POSITIONS % of Net Assets | |||||||||||
| Acacia Research | 3.0 | % | |||||||||
| Freund Corporation | 2.4 | ||||||||||
| Computer Task Group | 2.3 | ||||||||||
| New World Department Store China | 2.3 | ||||||||||
| Zuiko Corporation | 2.3 | ||||||||||
| Brooks Automation | 2.2 | ||||||||||
| YAMADA Consulting Group | 1.9 | ||||||||||
| Destination Maternity | 1.8 | ||||||||||
| Trancom | 1.8 | ||||||||||
| Parkson Retail Asia | 1.7 | ||||||||||
| SHORT POSITIONS % of Net Assets | |||||||||||
| VelocityShares Daily Inverse VIX Short-Term ETN | -3.4 | % | |||||||||
| Control4 Corporation | -1.2 | ||||||||||
| Middleby Corporation | -1.0 | ||||||||||
| PORTFOLIO SECTOR BREAKDOWN1 % of Net Assets | |||||||||||
| Consumer Discretionary | 28.5 | % | |||||||||
| Industrials | 24.9 | ||||||||||
| Information Technology | 23.7 | ||||||||||
| Financials | 8.6 | ||||||||||
| Health Care | 3.6 | ||||||||||
| Materials | 3.6 | ||||||||||
| Energy | 2.6 | ||||||||||
| Consumer Staples | 2.0 | ||||||||||
| Miscellaneous | 4.6 | ||||||||||
| Cash and Cash Equivalents | -2.1 | ||||||||||
| 1Long positions only. | |||||||||||
 |
Manager’s Discussion Royce Select Fund II (RS2) gained 6.5% for the year-to-date period ended June 30, 2014, outpacing both the long-only global small-cap index, the Russell Global Small Cap, and the long-only domestic small-cap index, the Russell 2000, which gained 5.7% and 3.2%, respectively, for the same period. This performance period left us pleased with RS2’s performance on a relative and absolute basis. The Fund takes a global approach and may invest in both U.S. and foreign companies, which served it well in the first half. Non-U.S. markets had a strong 2013, despite being unable to keep up with the feverish pace of domestic equities. In the first half of 2014, however, they continued to rally in spite of many Asian markets correcting. For the first-quarter, the Fund returned 4.6%, outpacing the global small-cap’s 2.3% advance and the Russell 2000’s 1.1% gain by a healthy margin. Holdings in Canada, Brazil, Indonesia, and Israel made a positive impact on firstquarter results, while holdings in Hong Kong detracted most. Second-quarter portfolio results were stronger for U.S., Canadian, and many Asian companies. Although holdings headquartered in Singapore, Malaysia, Taiwan, Israel, India, and Indonesia enjoyed positive second-quarter performance, positions in Japan made the most significant contribution to quarterly and first-half results. Japan was also the Fund’s second-largest country weighting at the end of June. (Holdings in Hong Kong, on the other hand, continued to struggle.) For the second quarter, RS2 advanced 1.9% versus gains of 2.0% and 3.3% for the domestic small-cap index and the Russell Global Small Cap, respectively. The Fund outperformed the Russell 2000 for the one-year period and outpaced its global small-cap benchmark for the one-, three-year, and since inception (6/30/05) periods ended June 30, 2014. Five of the Fund’s nine equity sectors finished the first half in the black. Industrials led by a wide margin, with Consumer Staples also posting strong net gains. They were followed by Information Technology, Materials and Energy. Holdings in the Consumer |
| GOOD IDEAS THAT WORKED Top Contributors to Performance Year-to-Date through 6/30/141 | |||||||||||
| Premier Marketing PCL | 1.82% | ||||||||||
| CETIP - Mercados Organizados | 0.74 | ||||||||||
| Magellan Aerospace | 0.68 | ||||||||||
| Selamat Sempurna | 0.62 | ||||||||||
| Sarin Technologies | 0.58 | ||||||||||
| 1 Includes dividends. | |||||||||||
Important Performance and Expense Information All performance information in this Report reflects past performance, is presented on a total return basis, reflects the reinvestment distributions, and does not reflect the deduction of taxes that a shareholder would pay on fund distributions or the redemption of fund shares. Past performance is no guarantee of future results. Investment return and principal value of an investment will fluctuate, so that shares may be worth more or less than their original cost when redeemed. Shares redeemed within 180 days of purchase may be subject to a 2% redemption fee, payable to the Fund, which is not reflected in the performance shown above; if it were, performance would be lower. Current month-end performance may be higher or lower than performance quoted and may be obtained at www.roycefunds.com. Price and total return information is based on net asset values calculated for shareholder transactions. Certain immaterial adjustments were made to the net assets of Royce Select Fund II at 12/30/11 for financial reporting purposes, and as a result the net asset values for shareholder transactions on that date and the calendar-year total returns based on those net asset values differ from the adjusted net asset values and calendar-year total returns reported in the Financial Highlights. Gross operating expenses reflect the Fund’s total gross annual operating expenses and include management fees, other expenses, and acquired fund fees and expenses. Net operating expenses reflect contractual fee waivers and/or expense reimbursements. All expense information is reported as of the Fund’s most current prospectus. Royce & Associates has contractually agreed to waive fees and/or reimburse operating expenses to the extent necessary to maintain the Fund’s net annual operating expenses, (excluding dividend and interest expenses relating to short sale activities, brokerage commissions, taxes, interest, litigation expenses, acquired fund fees and expenses, and other expenses not borne in the ordinary course of business), at or below 1.49% through April 30, 2015 and at or below 1.99% through April 30, 2024. Acquired fund fees and expenses reflect the estimated amount of the fees and expenses incurred indirectly by the Fund through its investments in mutual funds, hedge funds, private equity funds, and other investment companies. Regarding the two “Good Ideas” tables shown above, the sum of all contributors to, and all detractors from, performance for all securities in the portfolio would approximate the Fund’s year-to-date performance for 2014. | |||||||||||
| 16 | The Royce Funds 2014 Semiannual Report to Shareholders |
Performance and Portfolio Review |
| Discretionary and Financials sectors detracted from first-half results, though their net losses were modest. At the industry level, food & staples retailing helped to drive performance, as did semiconductors & semiconductor equipment, machinery, and professional services. The latter two groups are slotted in the top-performing Industrials sector. Real estate management & development, specialty retail, and media led those groups that hampered first-half returns. The Fund’s top-performing stock was Thailand-based Premier Marketing PCL, which distributes snacks, beverages, confectionaries, and personal care products. Its share price began to gradually climb early in 2014, which led us to sell our stake in May. Brazil-based CETIP-Mercados Organizados offers an electronic platform for conducting online transactions, such as auctions and government bond trading, corporate bonds, and fixed-income securities. CETIP also provides central securities depository, outsourcing, market data, and risk management services. Its shares rose on what we suspect was a flight to company quality in Brazil’s first-half bear market. We began to reduce our position in April as its stock price was rising. Magellan Aerospace is an Ontario-based company that serves the civil aerospace and defense market. We like the business’s unlevered balance sheet and that management runs the business with a long-term focus similar to our own. The company’s share price was basically flat into the second quarter, dipping briefly in mid-March before the stock gradually climbed. This seemed to be the result of management executing effectively and the market beginning to take more notice of the business. New York City-based Cache is a mall-centered and online women’s apparel store. Poor winter weather put a damper on sales for many retailers. Cache also had to contend with store closings and a decision not to move forward with casual and accessories offerings. We like the company’s long-term prospects and are confident in management’s ability to steer the business back in a positive direction by focusing on dresses and other historically profitable items. We added shares in March and April. We also built our position in SeaChange International, a Massachusetts-based software firm that provides multi-screen video services to television operators and telecommunications companies. Lower-than-expected revenues and earnings hurt the stock. |
GOOD IDEAS AT THE TIME | |
| Cache | -0.78% |
| SeaChange International | -0.73 |
| Brasil Brokers Participacoes | -0.57 |
| Destination Maternity | -0.44 |
| Parametric Sound | -0.35 |
| 1 Net of dividends | |
| ROYCE SELECT FUND II VS. RUSSELL 2000 AND RUSSELL GLOBAL SMALL CAP Value of $10,000 Invested on 6/30/05 | |
 |
| Includes reinvestment of distributions. |
| PORTFOLIO DIAGNOSTICS | |||||
| Fund Net Assets | $5 million | ||||
| Number of Holdings | 91 | ||||
| Turnover Rate | 108% | ||||
| Average Market Capitalization1,4 | $493 million | ||||
| Weighted Average P/E Ratio2,3,4 | 14.4x | ||||
| Weighted Average P/B Ratio2,4 | 1.7x | ||||
| Symbol | RSFDX | ||||
1 Geometric Average. This weighted calculation uses each portfolio holding’s market cap in a way designed to not skew the effect of very large or small holdings; instead, it aims to better identify the portfolio’s center, which Royce believes offers a more accurate measure of average market cap than a simple mean or median. | |||||
2 Harmonic Average. This weighted calculation evaluates a portfolio as if it were a single stock and measures it overall. It compares the total market value of the portfolio to the portfolio’s share in the earnings or book value, as the case may be, of its underlying stocks. | |||||
3 The Fund’s P/E calculation excludes ETF’s and companies with zero or negative earnings (20% of portfolio holdings as of 6/30/14). | |||||
| MORNINGSTAR STATISTICAL MEASURES1 | |||||
| Sharpe Ratio | Standard Deviation | ||||
| RS2 | 0.90 | 16.23 | |||
| Russell 2000 | 1.10 | 18.23 | |||
| Category Median | 1.13 | 17.71 | |||
| Best Quartile Breakpoint | 1.20 | 16.80 | |||
1 Five years ended 6/30/14. Category Median and Best Quartile Breakpoint based on 357 small-cap objective funds (oldest class) with at least five years of history. | |||||
| |||||
PORTFOLIO COUNTRY BREAKDOWN1,2 % of Net Assets | |||||
| United States | 36.7% | ||||
| Japan | 16.5 | ||||
| Hong Kong | 8.4 | ||||
| Canada | 6.5 | ||||
| China | 5.8 | ||||
| Brazil | 4.3 | ||||
| United Kingdom | 3.8 | ||||
| Australia | 3.3 | ||||
1 Represents countries that are 3% or more of net assets. | |||||
2 Long positions only are represented above and except in the case of ETF’s securities are categorized by the country of their headquarters. | |||||
DOWN MARKET PERFORMANCE COMPARISON All Down Periods of 7.5% or Greater Over the Last 7 Years, in Percentages (%)  | |||||
| The Royce Funds 2014 Semiannual Report to Shareholders | 17 |
| Royce Enterprise Select Fund |
AVERAGE ANNUAL TOTAL RETURNS Through 6/30/14 | ||||||||||
| January–June 20141 | 5.78 | % | ||||||||
| One-Year | 22.09 | |||||||||
| Three-Year | 14.23 | |||||||||
| Five-Year | 16.93 | |||||||||
| Since Inception (9/28/07) | 8.30 | |||||||||
ANNUAL EXPENSE RATIOS | ||||||||||
| Gross Operating Expenses | 3.08 | % | ||||||||
| Net Operating Expenses | 1.24 | |||||||||
| 1 Not Annualized | ||||||||||
| CALENDAR YEAR TOTAL RETURNS | ||||||||||
| Year | RSS | Year | RSS | |||||||
| 2013 | 28.7 | % | 2010 | 17.2 | % | |||||
| 2012 | 15.7 | 2009 | 23.1 | |||||||
| 2011 | 0.7 | 2008 | -25.5 | |||||||
| TOP 10 POSITIONS % of Net Assets | ||||||||||
| Thor Industries | 2.8 | % | ||||||||
| Kennedy-Wilson Holdings | 2.4 | |||||||||
| Markit | 2.2 | |||||||||
| Copart | 1.9 | |||||||||
| EnerSys | 1.8 | |||||||||
| Carlisle Companies | 1.8 | |||||||||
| Mohawk Industries | 1.8 | |||||||||
| DENTSPLY International | 1.8 | |||||||||
| iShares 1-3 Year Treasury Bond ETF | 1.7 | |||||||||
| ManpowerGroup | 1.7 | |||||||||
| PORTFOLIO SECTOR BREAKDOWN % of Net Assets | ||||||||||
| Industrials | 20.8 | % | ||||||||
| Consumer Discretionary | 16.6 | |||||||||
| Information Technology | 11.5 | |||||||||
| Materials | 8.0 | |||||||||
| Financials | 4.9 | |||||||||
| Energy | 3.8 | |||||||||
| Health Care | 3.2 | |||||||||
| Utilities | 1.6 | |||||||||
| Miscellaneous | 1.5 | |||||||||
| Government Bonds | 1.7 | |||||||||
| Cash and Cash Equivalents | 26.4 | |||||||||
 | |||||||||
Manager’s Discussion Royce Enterprise Select Fund (RSS) enjoyed a strong first half on an absolute basis.The Fund rose 5.8% for the year-to-date period ended June 30, 2014 compared to the 5.9% gain for its small- and mid-cap benchmark, the Russell 2500 Index, for the same period. As the year began, there was a lot of speculation as to what direction equities would take. Considering the breakneck pace of returns in 2013, many market watchers argued that valuations were unsustainably high. Others held that with interest rates still basically at zero and the economy growing slowly but steadily, the case for a “melt up” remained strong. Returns for most stocks continued to climb in the first quarter, though overall results were far more muted. The Fund participated in this lower key-up phase, gaining 1.7% for the first quarter. The arrival of spring saw many markets pausing and trying to make sense of a terrible winter, a new Federal Reserve chair, and some alarming events in Syria and Ukraine. These worries proved short-lived, though they did create a bit more volatility than we saw in the earlier part of the year. For the second quarter, we were pleased that RSS outpaced the Russell 2500, increasing 4.0% versus 3.6%. The Fund’s average annual total return since inception (9/28/07) was 8.3%. Although it was not a stalwart performer in the market as a whole, the Consumer Discretionary sector was the portfolio’s top contributor during the first half, helped by strong results from the auto components, specialty retail, and household durables industries. Effective stock picking was critical to the sector’s net gains. Standard Motor Products manufactures and distributes replacement automotive parts. Its business has benefited from the aging of U.S. vehicles as well as its vertical integration strategy of acquiring suppliers, which included buying some eight companies over the last three years. To a lesser extent, its temperature control replacement parts segment, which serves the HVAC marketplace, has managed well through unfavorable weather that seemed to be turning for the better by the end of June. From the Energy sector, Helmerich & Payne provides contract drilling of oil and gas wells in the Gulf of Mexico and South America and operates land and platform rigs. The company has long enjoyed an advantage in its industry by making higher-quality, technologically superior rigs. In late April, the firm | |||||||||
| GOOD IDEAS THAT WORKED Top Contributors to Performance Year-to-Date through 6/30/141 | |||||||||||
| Helmerich & Payne | 0.67% | ||||||||||
| Skyworks Solutions | 0.65 | ||||||||||
| Standard Motor Products | 0.56 | ||||||||||
| Kennedy-Wilson Holdings | 0.46 | ||||||||||
| Westlake Chemical | 0.41 | ||||||||||
| 1 Includes dividends. | |||||||||||
Important Performance and Expense Information All performance information in this Report reflects past performance, is presented on a total return basis, reflects the reinvestment of distributions, and does not reflect the deduction of taxes that a shareholder would pay on fund distributions or the redemption of fund shares. Past performance is no guarantee of future results. Investment return and principal value of an investment will fluctuate, so that shares may be worth more or less than their original cost when redeemed. Shares redeemed within 180 days of purchase may be subject to a 1% redemption fee, payable to the Fund, which is not reflected in the performance shown above; if it were, performance would be lower. Current month-end performance may be higher or lower than performance quoted and may be obtained at www.roycefunds.com. Gross operating expenses reflect the Fund’s total gross annual operating expenses and include management fees and other expenses. Net operating expenses reflect contractual fee waivers and/or expense reimbursements. All expense information is reported as of the Fund’s most current prospectus. Royce & Associates has contractually agreed to waive fees and/or reimburse operating expenses to the extent necessary to maintain the Fund’s net annual operating expenses, (excluding dividend and interest expenses relating to short sale activities, brokerage commissions, taxes, interest, litigation expenses, acquired fund fees and expenses, and other expenses not borne in the ordinary course of business), at or below 1.24% through April 30, 2015 and at or below 1.99% through April 30, 2024. Regarding the two “Good Ideas” tables shown above, the sum of all contributors to, and all detractors from, performance for all securities in the portfolio would approximate the Fund’s year-to-date performance for 2014. | |||||||||||
| 18 | The Royce Funds 2014 Semiannual Report to Shareholders |
Performance and Portfolio Review reported record quarterly revenues and rig activity, part of a longer-term string of success that helped to push its share price higher. Its technologically superior offerings are driving market share gains for companies eager to reduce drilling costs by upgrading to its more efficient rigs. Information Technology business Skyworks Solutions is a leading supplier of radio frequency (RF) chips to wireless smartphones. Its success has been driven by three industry tailwinds: continued smartphone adoption on a global basis, 4G network build outs in Europe and China, and increased RF chip content in 4G networks compared to 3G. We also like its diversification strategy into industrial, home automation, smart metering, and automotive applications. Individual stock losses were modest. We chose to hold our shares of Mohawk Industries in spite of its volatile, downward sloping stock price. The company designs, manufactures, and distributes flooring for the residential and commercial markets. The company offers carpet, ceramic tile, laminate, wood, stone, vinyl, and rugs. The domestic carpet business continues to struggle even as housing has rebounded. Mohawk, however, has managed to grow revenues and operating income in part by what we think was a savvy strategy of diversifying into a number of other flooring types, such as wood and laminate. It has also held onto market share and cut costs. We reduced our position in AVX Corporation in the first quarter for valuation reasons. The company makes a variety of passive electronic components, including ceramic and tantalum capacitors that are used in many electronic products to store, filter, or regulate electric energy. We continue to be more disposed toward (and thus positioned in) cyclical sectors. Industrial companies remain an area of focus, with particular attention on areas that are positioned to take advantage of the U.S.’s edge in feedstock for natural gas and derivatives, whether in the form of capital equipment businesses and/or specialty chemical companies that benefit from our country’s current structural advantage in energy. Technology also remains an area of high interest. Our preference remains with companies that are levered for ongoing smartphone penetration globally. More specifically, we are focused on the massive build out of 4G telecom networks around the world, including top-15 position Rogers Corporation and Skyworks Solutions. More recently, we have also been building positions in certain Consumer Discretionary names, such as Dollar Tree and Finish Line (The). |
GOOD IDEAS AT THE TIME | |
| Mohawk Industries | -0.16% |
| AVX Corporation | -0.16 |
| SEACOR Holdings | -0.14 |
| Support.com | -0.13 |
| Kennametal | -0.12 |
| 1 Net of dividends. | |
| ROYCE ENTERPRISE SELECT FUND VS. RUSSELL 2500 Value of $10,000 Invested on 9/28/07 | |
 |
| Includes reinvestment of distributions. | |||
| PORTFOLIO DIAGNOSTICS | |||
| Fund Net Assets | $3 million | ||
| Number of Holdings | 71 | ||
| Turnover Rate | 45% | ||
| Average Market Capitalization1 | $4,054 million | ||
| Weighted Average P/E Ratio2,3 | 21.7x | ||
| Weighted Average P/B Ratio2 | 2.7x | ||
| U.S. Investments (% of Net Assets) | 64.9% | ||
| Non-U.S. Investments (% of Net Assets) | 8.7% | ||
| Symbol | RMISX | ||
1 Geometric Average. This This weighted calculation uses each portfolio holding’s market cap in a way designed to not skew the effect of very large or small holdings; instead, it aims to better identify the portfolio’s center, which Royce believes offers a more accurate measure of average market cap than a simple mean or median. | |||
2 Harmonic Average. This weighted calculation evaluates a portfolio as if it were a single stock and measures it overall. It compares the total market value of the portfolio to the portfolio’s share in the earnings or book value, as the case may be, of its underlying stocks. | |||
| MORNINGSTAR STATISTICAL MEASURES1 | |||
| Sharpe Ratio | Standard Deviation | ||
| RSS | 1.23 | 13.49 | |
| Russell 2500 | 1.24 | 17.03 | |
| Category Median | 1.20 | 16.22 | |
| Best Decile Breakpoint | 1.35 | 14.17 | |
1 Five years ended 6/30/14. Category Median and Best Decile Breakpoint based on 284 mid-cap objective funds (oldest class) with at least five years of history. | |||
The Fund performed within the top 50% of mid-cap objective funds on a risk-adjusted basis, as shown by its Sharpe ratio. In addition, the Fund produced lower volatility than the Russell 2500 and 90% of mid-cap objective funds, as shown by its standard deviation. | |||
DOWN MARKET PERFORMANCE COMPARISON | |||
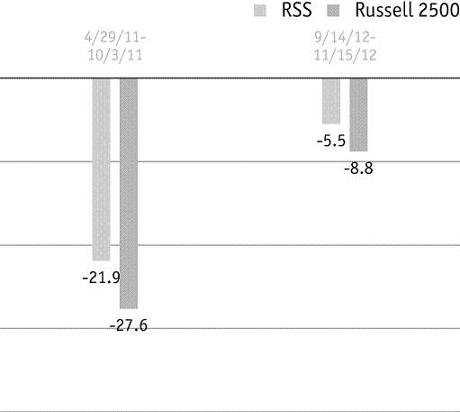 | |||
| The Royce Funds 2014 Semiannual Report to Shareholders | 19 |
| Royce Opportunity Select Fund |
AVERAGE ANNUAL TOTAL RETURNS Through 6/30/14 | |||||||||||
| January–June 20141 | 3.29 | % | |||||||||
| One-Year | 26.72 | ||||||||||
| Three-Year | 19.16 | ||||||||||
| Since Inception (8/31/10) | 22.46 | ||||||||||
| ANNUAL EXPENSE RATIOS | |||||||||||
| Gross Operating Expenses | 1.78 | % | |||||||||
| Net Operating Expenses | 1.29 | ||||||||||
| 1 Not Annualized | |||||||||||
| CALENDAR YEAR TOTAL RETURNS | |||||||||||
| Year | ROS | Year | ROS | ||||||||
| 2013 | 44.6 | % | 2011 | -17.1 | % | ||||||
| 2012 | 35.1 | ||||||||||
| TOP 10 LONG POSITIONS % of Net Assets | |||||||||||
| Extreme Networks | 2.1 | % | |||||||||
| M.D.C. Holdings | 2.1 | ||||||||||
| AK Steel Holding Corporation | 1.9 | ||||||||||
| Air Lease Cl. A | 1.9 | ||||||||||
| OM Group | 1.8 | ||||||||||
| Swift Energy | 1.8 | ||||||||||
| RTI International Metals | 1.8 | ||||||||||
| Orient-Express Hotels Cl. A | 1.6 | ||||||||||
| Louisiana-Pacific Corporation | 1.6 | ||||||||||
| Kennedy-Wilson Holdings | 1.6 | ||||||||||
| TOP 10 SHORT POSITIONS % of Net Assets | |||||||||||
| Lumber Liquidators Holdings | -0.6 | % | |||||||||
| Vitamin Shoppe | -0.6 | ||||||||||
| CF Industries Holdings | -0.5 | ||||||||||
| Popeyes Louisiana Kitchen | -0.5 | ||||||||||
| Life Time Fitness | -0.4 | ||||||||||
| Fresh Market (The) | -0.4 | ||||||||||
| iShares Russell 2000 ETF | -0.3 | ||||||||||
| Buffalo Wild Wings | -0.3 | ||||||||||
| Zillow Cl. A | -0.3 | ||||||||||
| Fiesta Restaurant Group | -0.3 | ||||||||||
PORTFOLIO SECTOR BREAKDOWN1 % of Net Assets | |||||||||||
| Information Technology | 29.1 | % | |||||||||
| Industrials | 18.6 | ||||||||||
| Consumer Discretionary | 12.5 | ||||||||||
| Materials | 11.3 | ||||||||||
| Energy | 10.1 | ||||||||||
| Financials | 9.3 | ||||||||||
| Health Care | 4.0 | ||||||||||
| Miscellaneous | 4.4 | ||||||||||
| Cash and Cash Equivalents | 0.7 | ||||||||||
| 1 Long positions only. | |||||||||||
 |
Manager’s Discussion Over the last two calendar years, Royce Opportunity Select Fund (ROS) put together a record of terrific results on both an absolute and relative basis. This trend continued in the first half of 2014.The Fund advanced 3.3% for the year-to-date period ended June 30, 2014, slightly outpacing its small-cap benchmark, the Russell 2000 Index, which rose 3.2% for the same period. The year began on the same bullish note on which 2013 ended, though in far less dynamic fashion. For the first quarter, the Fund gained 5.9%, a strong performance that helped to mitigate the effect of the subsequent down phase. The correction that began in early March was tougher on ROS than on its benchmark. It put the Fund out of sync with many larger small-caps, though it was consistent with what was happening with micro-cap companies. The Fund fell 2.5% in the second quarter. However, second-quarter underperformance did nothing to hurt the portfolio’s relative advantage over longer time periods. ROS beat the Russell 2000 for the one-, three-year, and since inception (8/31/10) periods ended June 30, 2014. ROS’s average annual total return since inception was 22.5%. We remain quite pleased with Fund’s absolute and relative long-term results. Information Technology was the Fund’s largest sector at the end of June and a net gainer for the semiannual period. Higher corporate profitability looks likely to trigger a round of long-overdue CAPEX spending. The market for PCs has been also improving of late, and there are a number of new devices and related technologies due for release in the next year or so on the already robust tablet and mobile device fronts. This could result in simultaneously strong markets for PCs, mobile, and tablets, which would be excellent news for much of the sector—and many of our holdings within it. In addition, the housing market continues to grow and looks to us as though it is in an extended cycle while non-residential construction looks poised for a long-term recovery following pretty dismal results in 2013. Building activity has been on the rise so far in 2014. Many retailers suffered through the first half, pushing stock prices down to attractively cheap levels. Six of ROS’s eight equity sectors posted net gains in the first half. Energy was the portfolio’s top performer, followed by Industrials. The Fund’s leading industries were the semiconductors & semiconductor equipment groups and oil, gas & consumable fuels |
| GOOD IDEAS THAT WORKED Top Contributors to Performance Year-to-Date through 6/30/141 | |||||||||||
| RF Micro Devices | 0.84% | ||||||||||
| Goodrich Petroleum | 0.76 | ||||||||||
| Tower International | 0.67 | ||||||||||
| SunEdison | 0.63 | ||||||||||
| Warren Resources | 0.55 | ||||||||||
| 1 Includes dividends. | |||||||||||
Important Performance and Expense Information All performance information in this Report reflects past performance, is presented on a total return basis, reflects the reinvestment of distributions, and does not reflect the deduction of taxes that a shareholder would pay on fund distributions or the redemption of fund shares. Past performance is no guarantee of future results. Investment return and principal value of an investment will fluctuate, so that shares may be worth more or less than their original cost when redeemed. Shares redeemed within 180 days of purchase may be subject to a 1% redemption fee, payable to the Fund, which is not reflected in the performance shown above; if it were, performance would be lower. Current month-end performance may be higher or lower than performance quoted and may be obtained at www.roycefunds.com. Gross operating expenses reflect the Fund’s total gross annual operating expenses and include management fees and other expenses. Net operating expenses reflect contractual fee waivers and/or expense reimbursements. All expense information is reported as of the Funds most current prospectus. Royce & Associates has contractually agreed to waive fees and/or reimburse operating expenses to the extent necessary to maintain the Fund’s net annual operating expenses, (excluding dividend and interest expenses relating to short sale activities, brokerage commissions, taxes, interest, litigation expenses, acquired fund fees and expenses, and other expenses not borne in the ordinary course of business), at or below 1.24% through April 30, 2015. Regarding the two “Good Ideas” tables shown above, the sum of all contributors to, and all detractors from, performance for all securities in the portfolio would approximate the Fund’s year-to-date performance for 2014. | |||||||||||
| 20 | The Royce Funds 2014 Semiannual Report to Shareholders |
Performance and Portfolio Review |
| stocks. The first of these was home to two of the portfolio’s top performers year-to-date through the end of June. RF Micro Devices makes radio frequency (or RF) chips primarily for wireless applications. Its performance is often in line with the tech business cycle, though it has historically shown increased volatility based on the presence or absence of hot-selling new devices. We built our stake when its price was falling in order to gain exposure to the fast-growing wireless flash niche. SunEdison, which was 2013’s top contributor, produces electronic-grade polysilicon used for electronics, solar cells, and film devices while also developing solar power projects. The demand for solar technology keeps heating up, with improved technological efficiency helping to lower costs. Oil and natural gas company Goodrich Petroleum benefited from the sharp increase in drilling activity in Texas and North Dakota. We substantially increased our position in Extreme Networks, which provides switching solutions for local area networks (LAN). Disappointing earnings, based in part on lower-than-expected sales to government entities, and revised guidance drove investors away. We like its recent acquisition of a complementary business, which we think can help the company to achieve a solid earnings stream. Quiksilver is a youth-oriented apparel and footwear maker that operates under its own brand name as well as Roxy and DC. Like many retailers, it suffered through an awful first half. We like the way it handled the challenges it faced and its new management. We typically act in a very deliberate and disciplined manner in managing the portfolio’s assets. In the first half, this meant selling many strong performers to more momentum-based investors. We think this is a prudent strategy, as it allows us to refresh the portfolio with companies trading at attractively low P/B and price-to-sales ratios. Many of these newer holdings (or additional shares of existing holdings that have not yet reversed course) endured tough times throughout the second quarter. While disappointing on a short-term basis, we were comfortable with these decisions. It is important to pare back portfolio successes and reposition the proceeds in an attempt to set the portfolio up for future growth. We also want to maintain what we believe is a reasonable valuation level for the portfolio taken as a whole. Many of these purchases were in technology, housing, retail, and non-residential construction, including M.D.C. Holdings, Louisiana-Pacific Corporation, and J.C. Penney Company. |
GOOD IDEAS AT THE TIME | |
| Extreme Networks | -0.80% |
| Quiksilver | -0.79 |
| PowerSecure International | -0.58 |
| Hercules Offshore | -0.56 |
| NeoPhotonics Corporation | -0.51 |
| 1 Net of dividends. | |
| ROYCE OPPORTUNITY SELECT FUND VS. RUSSELL 2000 Value of $10,000 Invested on 8/31/10 | |
 |
| Includes reinvestment of distributions. |
| PORTFOLIO DIAGNOSTICS | |||||
| Fund Net Assets | $24 million | ||||
| Number of Holdings | 113 | ||||
| Turnover Rate | 51% | ||||
| Average Market Capitalization1,3 | $850 million | ||||
| Weighted Average P/B Ratio2,3 | 1.7x | ||||
| U.S. Investments3 (% of Net Assets) | 94.6% | ||||
| Non-U.S. Investments3 (% of Net Assets) | 4.7% | ||||
| Symbol | |||||
| Investment Class | ROSFX | ||||
| Service Class | ROSSX | ||||
1 Geometric Average. This weighted calculation uses each portfolio holding’s market cap in a way designed to not skew the effect of very large or small holdings; instead, it aims to better identify the portfolio’s center, which Royce believes offers a more accurate measure of average market cap than a simple mean or median. | |||||
2 Harmonic Average. This weighted calculation evaluates a portfolio as if it were a single stock and measures it overall. It compares the total market value of the portfolio to the portfolio’s share in the earnings or book value, as the case may be, of its underlying stocks. | |||||
| MORNINGSTAR STATISTICAL MEASURES1 | |||||
| Sharpe Ratio | Standard Deviation | ||||
| ROS | 0.99 | 19.70 | |||
| Russell 2000 | 0.88 | 16.98 | |||
| Category Median | 0.87 | 16.86 | |||
| Best Quartile Breakpoint | 0.96 | 15.97 | |||
1 Three years ended 6/30/14. Category Median and Best Quartile Breakpoint based on 386 small-cap objective funds (oldest class) with at least three years of history. | |||||
| |||||
DOWN MARKET PERFORMANCE COMPARISON All Down Periods of 7.5% or Greater in Percentages (%) 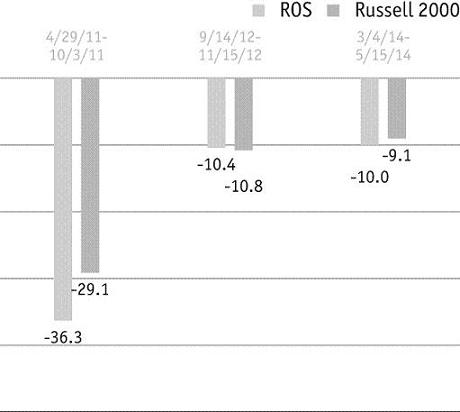 | |||||
| The Royce Funds 2014 Semiannual Report to Shareholders | 21 |
| Royce Micro-Cap Discovery Fund |
AVERAGE ANNUAL TOTAL RETURNS Through 6/30/14 | ||||||||||
| January–June 20141 | 0.00 | % | ||||||||
| One-Year | 20.54 | |||||||||
| Three-Year | 9.92 | |||||||||
| Five-Year | 13.46 | |||||||||
| 10-Year | 5.30 | |||||||||
| Since Inception (10/3/03) | 6.69 | |||||||||
ANNUAL EXPENSE RATIOS | ||||||||||
| Gross Operating Expenses | 2.50 | % | ||||||||
| Net Operating Expenses | 1.49 | |||||||||
| 1 Not Annualized | ||||||||||
| CALENDAR YEAR TOTAL RETURNS | ||||||||||
| Year | RDF | Year | RDF | |||||||
| 2013 | 35.3 | % | 2008 | -35.1 | % | |||||
| 2012 | 3.1 | 2007 | -7.4 | |||||||
| 2011 | -2.2 | 2006 | 16.8 | |||||||
| 2010 | 19.6 | 2005 | 7.6 | |||||||
| 2009 | 25.9 | 2004 | 13.3 | |||||||
| TOP 10 POSITIONS % of Net Assets | ||||||||||
| Computer Task Group | 2.4 | % | ||||||||
| Comtech Telecommunications | 2.2 | |||||||||
| Miller Industries | 2.1 | |||||||||
| National HealthCare | 2.1 | |||||||||
| John B. Sanfilippo & Son | 2.1 | |||||||||
| Invacare Corporation | 2.1 | |||||||||
| Alamo Group | 2.0 | |||||||||
| Village Super Market Cl. A | 1.9 | |||||||||
| United States Lime & Minerals | 1.8 | |||||||||
| MYR Group | 1.8 | |||||||||
| PORTFOLIO SECTOR BREAKDOWN % of Net Assets | ||||||||||
| Information Technology | 21.4 | % | ||||||||
| Industrials | 19.4 | |||||||||
| Health Care | 15.5 | |||||||||
| Consumer Discretionary | 11.3 | |||||||||
| Materials | 8.3 | |||||||||
| Financials | 7.6 | |||||||||
| Consumer Staples | 4.8 | |||||||||
| Energy | 3.8 | |||||||||
| Miscellaneous | 4.6 | |||||||||
| Cash and Cash Equivalents | 3.3 | |||||||||
 | |||||||||
Managers’ Discussion Royce Micro-Cap Discovery Fund (RDF) was flat for the year-to-date period ended June 30, 2014 compared to a 1.6% gain for its benchmark, the Russell Microcap Index, for the same period. Micro-cap stocks have been among the equity market’s best-performing asset classes over the last several years. For example, the Russell Microcap outpaced its small-cap peers (as represented by the Russell 2000 Index) in four of the last five calendar year periods and their large-cap counterparts (as represented by the Russell 1000 Index) in three of the previous five. In addition, 2013 was the second-best calendar-year result for the Russell Microcap since its inception on June 30, 2000. A slackening of the pace of returns was therefore not unexpected, and this is exactly what took place in the first half of 2014. Equities failed to establish any clear direction as the economy continued to grow slowly and a still unresolved debate went on about whether or not stocks are overvalued or still have some room to run. This argument has so far been a low-intensity dispute, at least insofar as it has affected share prices. For the first quarter RDF advanced 0.4%. A new Fed chair, miserable winter weather through much of the eastern part of the U.S., and ongoing concerns about the pace of economic growth all gave investors pause at one point or another in 2014’s opening months. Volatility, which has been quite low throughout the last 18 months, returned briefly to the small-cap market in early March and persisted through mid-May, making the second quarter a relatively more unsettled period. Equities rallied through the end of May and all of June, undoing the bearish effect. For the second quarter the Fund fell slightly, down 0.4%, losing less than its benchmark, which declined 1.4% for the same period. To enhance the detection of potential portfolio candidates, RDF’s portfolio managers combine a proprietary quantitative screening model—first developed by George Necakov more than a decade ago—with traditional fundamental analysis to aid them in their effort to find companies that exhibit these characteristics. There are several key pieces to the | |||||||||
| GOOD IDEAS THAT WORKED Top Contributors to Performance Year-to-Date through 6/30/141 | |||||||||||
| VASCO Data Security International | 0.61% | ||||||||||
| Standex International | 0.60 | ||||||||||
| Lydall | 0.59 | ||||||||||
| VSE Corporation | 0.56 | ||||||||||
| Comtech Telecommunications | 0.51 | ||||||||||
| 1 Includes dividends. | |||||||||||
Important Performance and Expense Information All performance information in this Report reflects past performance, is presented on a total return basis, reflects the reinvestment of distributions, and does not reflect the deduction of taxes that a shareholder would pay on fund distributions or the redemption of fund shares. Past performance is no guarantee of future results. Investment return and principal value of an investment will fluctuate, so that shares may be worth more or less than their original cost when redeemed. Shares redeemed within 180 days of purchase may be subject to a 1% redemption fee payable to the Fund, which is not reflected in the performance shown above; if it were, performance would be lower. Current month-end performance may be higher or lower than performance quoted and may be obtained at www.roycefunds.com. Price and total return information is based on net asset values calculated for shareholder transactions. Certain immaterial adjustments were made to the net assets of Royce Micro-Cap Discovery Fund at 6/29/12 for financial reporting purposes, and as a result the net asset values for shareholder transactions on that date and calendar-year total returns based on those net asset values differ from the adjusted net asset values and calendar-year total returns reported in the Financial Highlights. Gross operating expenses reflect the Fund’s gross total annual operating expenses for the Service Class and include management fees, 12b-1 distribution and service fees, and other expenses. Net operating expenses reflect contractual fee waivers and/or expense reimbursements. All expense information is reported as of the Fund’s most current prospectus. Royce & Associates has contractually agreed to waive fees and/or reimburse operating expenses to the extent necessary to maintain the Service Class’s net annual operating expenses, (excluding brokerage commissions, taxes, interest, litigation expenses, acquired fund fees and expenses, and other expenses not borne in the ordinary course of business), at or below 1.49% through April 30, 2015 and at or below 1.99% through April 30, 2024. Regarding the two “Good Ideas” tables shown above, the sum of all contributors to, and all detractors from, performance for all securities in the portfolio would approximate the Fund’s year-to-date performance for 2014. | |||||||||||
| 22 | The Royce Funds 2014 Semiannual Report to Shareholders |
Performance and Portfolio Review fund’s proprietary model: First, relative sector valuations are an important element in understanding outperformance patterns. The model’s output is sector adjusted so that companies are evaluated relative to their sector peers. Second, the model has historically been more effective in discriminating between over and undervalued companies as one moves down the market cap scale, which explains RDF’s emphasis on micro-cap stocks. Finally, the efficacy of each of the three attributes can vary depending on what stage we are in within a particular economic cycle. While we believe the model is effective at generating a list of micro-cap investment candidates, fundamental scrutiny adds a level of refinement that does not exist in purely quantitative approaches. Six of the Fund’s nine equity sectors finished the first half with net gains, with Industrials leading by a large margin. Within the sector, the best-performing industries were machinery companies and professional services stocks. Two holdings in the machinery group were among the portfolio’s five top contributors. Standex International makes a variety of products, including food merchandising and display cases, reusable and expendable space launch vehicles, and magnetic components and connectors. Its shares rose when the company reported record results for its fiscal third quarter with all five operating groups reporting increased year-over-year sales and operating income as well as an optimistic outlook. We sold our shares of Lydall in the second quarter as its price climbed. The company manufactures engineered specialty papers, automotive heat shields, acoustical barriers, and medical filtration and bioprocessing components for original equipment manufacturers. VASCO Data Security International was RDF’s best-performing position in the first half. The company specializes in bank security and develops security systems to secure and manage access to user digital assets. Its stock made two significant upticks in the first half. In February, its shares rose on better-than-expected fourth quarter of 2013 earnings and a strong outlook for fiscal 2014. Increased revenues and ongoing earnings strength saw the shares getting another major boost late in April. We reduced our position in June. We parted ways with Liquidity Services in the first half, though we reinitiated a position in July. The company runs online auctions for wholesale, surplus, and salvage assets. We also sold our shares of Big 5 Sporting Goods, an owner and operator of sporting goods stores in the Western U.S. Each posted larger losses in the first half than we were prepared to live with. |
GOOD IDEAS AT THE TIME | |
| Liquidity Services | -0.56% |
| Big 5 Sporting Goods | -0.50 |
| Village Super Market Cl. A | -0.44 |
| Actuate Corporation | -0.39 |
| Employers Holdings | -0.37 |
| 1 Net of dividends. | |
| ROYCE MICRO-CAP DISCOVERY FUND VS. RUSSELL MICROCAP Value of $10,000 Invested on 6/30/00 (Russell Microcap Inception) | |
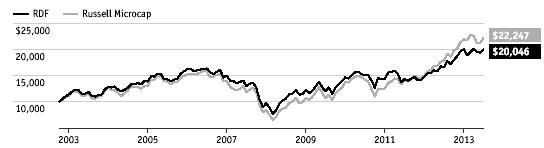 |
| Includes reinvestment of distributions. | |||
| PORTFOLIO DIAGNOSTICS | |||
| Fund Net Assets | $6 million | ||
| Number of Holdings | 95 | ||
| Turnover Rate | 47% | ||
| Average Market Capitalization1 | $406 million | ||
| Weighted Average P/E Ratio2,3 | 17.2x | ||
| Weighted Average P/B Ratio2 | 1.5x | ||
| U.S. Investments (% of Net Assets) | 90.3% | ||
| Non-U.S. Investments (% of Net Assets) | 6.4% | ||
| Symbol | RYDFX | ||
1 Geometric Average. This weighted calculation uses each portfolio holding’s market cap in a way designed to not skew the effect of very large or small holdings; instead, it aims to better identify the portfolio’s center, which Royce believes offers a more accurate measure of average market cap than a simple mean or median. | |||
2 Harmonic Average. This weighted calculation evaluates a portfolio as if it were a single stock and measures it overall. It compares the total market value of the portfolio to the portfolio’s share in the earnings or book value, as the case may be, of its underlying stocks. | |||
| MORNINGSTAR STATISTICAL MEASURES1 | |||
| Sharpe Ratio | Standard Deviation | ||
| RDF | 0.79 | 18.07 | |
| Russell Microcap | 1.04 | 19.40 | |
| Category Median | 1.07 | 18.88 | |
| Best Quartile Breakpoint | 1.19 | 17.24 | |
1 Five years ended 6/30/14. Category Median and Best Quartile Breakpoint based on 18 micro-cap objective funds (oldest class only) with at least five years of history. | |||
The Fund produced lower volatility than the Russell Microcap and 50% of micro-cap objective funds, as shown by its standard deviation. | |||
DOWN MARKET PERFORMANCE COMPARISON | |||
 | |||
| The Royce Funds 2014 Semiannual Report to Shareholders | 23 |
| Royce Financial Services Fund |
AVERAGE ANNUAL TOTAL RETURNS Through 6/30/14 | ||||||||||
| January–June 20141 | 3.62 | % | ||||||||
| One-Year | 23.76 | |||||||||
| Three-Year | 15.37 | |||||||||
| Five-Year | 16.71 | |||||||||
| 10-Year | 9.25 | |||||||||
| Since Inception (12/31/03) | 8.90 | |||||||||
| ANNUAL EXPENSE RATIOS | ||||||||||
| Gross Operating Expenses | 1.97 | % | ||||||||
| Net Operating Expenses | 1.57 | |||||||||
| 1 Not Annualized | ||||||||||
| CALENDAR YEAR TOTAL RETURNS | ||||||||||
| Year | RFS | Year | RFS | |||||||
| 2013 | 42.0 | % | 2008 | -35.4 | % | |||||
| 2012 | 20.7 | 2007 | -4.7 | |||||||
| 2011 | -11.3 | 2006 | 24.8 | |||||||
| 2010 | 18.5 | 2005 | 12.2 | |||||||
| 2009 | 32.1 | 2004 | 15.1 | |||||||
| TOP 10 POSITIONS % of Net Assets | ||||||||||
| Charles Schwab | 2.2 | % | ||||||||
| State Street | 2.1 | |||||||||
| RLI Corp. | 1.8 | |||||||||
| Alleghany Corporation | 1.8 | |||||||||
| Sprott | 1.7 | |||||||||
| Federated Investors Cl. B | 1.7 | |||||||||
| Diamond Hill Investment Group | 1.7 | |||||||||
| Moody’s Corporation | 1.7 | |||||||||
| CIT Group | 1.6 | |||||||||
| Financial Engines | 1.6 | |||||||||
| PORTFOLIO INDUSTRY BREAKDOWN % of Net Assets | ||||||||||
| Capital Markets | 54.8 | % | ||||||||
| Diversified Financial Services | 10.4 | |||||||||
| Insurance | 10.2 | |||||||||
| Banks | 5.0 | |||||||||
| IT Services | 3.1 | |||||||||
| Professional Services | 2.1 | |||||||||
| Internet Software & Services | 1.9 | |||||||||
| Software | 1.7 | |||||||||
| Consumer Finance | 1.6 | |||||||||
| Real Estate Management & Development | 1.5 | |||||||||
| Closed-End Funds | 1.2 | |||||||||
| Trading Companies & Distributors | 0.9 | |||||||||
| Media | 0.5 | |||||||||
| Hotel, Restaurants & Leisure | 0.1 | |||||||||
| Miscellaneous | 2.6 | |||||||||
| Cash and Cash Equivalents | 2.4 | |||||||||
 | |||||||||
Manager’s Discussion For the year-to-date period ended June 30, 2014, Royce Financial Services Fund (RFS) gained 3.6%, which was ahead of the small-cap Russell 2000 Index, which was up 3.2%, but trailed the Russell 2500 Financial Services Index, which rose 5.8% for the same period. The market remained in a bull phase as 2014 began, though it moved at a much slower pace following the speedway clip of the previous year. Equity returns thus remained mostly positive amidst a lot of talk about whether or not valuations were unreasonably high. RFS gained 1.5% in the first quarter versus respective gains of 1.1% for the Russell 2000 and 2.7% for the Russell 2500 Financial Services Index. We were not overly concerned about these results considering both the short time period and the Fund’s wide relative advantage over both benchmarks coming into 2014. The second quarter was in general a more challenging period for small-cap stocks. The Russell 2000 reached its year-to-date high on March 4 and mostly fell through May 15. The Fund outpaced both indexes from that early March interim high through the end of June. For the second quarter, RFS essentially tied the small-cap index—both advanced 2.0%—while the financial services component of the Russell 2500 rose 3.1% for the same period. We remained pleased with the Fund’s longer-term results. RFS outpaced both indexes for the one- and 10-year periods ended June 30, 2014. The Fund also beat the Russell 2000 for the three-year period ended June 30, 2014. In addition, RFS outperformed the Russell 2500 Financial Services Index for the since inception (12/31/03) period ended June 30, 2014. The Fund’s average annual total return since inception was 8.9%. We are seldom surprised when RFS is out of sync with the financial services companies in the Russell 2500 Index. (Being a sector fund, RFS has also frequently moved in a different direction than the Russell 2000.) Our preference is for conservatively capitalized, fundamentally strong financial services businesses that we believe are well run and trading at attractively low valuations based on our estimate of the company’s intrinsic worth. This has historically resulted in a significant underweight in banking stocks, which, regardless of their other merits, typically lack the balance-sheet strength that is so important to us. This bias toward strong balance-sheets and other metrics indicating financial health, such as high returns on invested capital, free | |||||||||
| GOOD IDEAS THAT WORKED Top Contributors to Performance Year-to-Date through 6/30/141 | |||||||||||
| CRISIL | 0.47% | ||||||||||
| U.S. Global Investors Cl. A | 0.47 | ||||||||||
| Egyptian Financial Group-Hermes Holding Company | 0.44 | ||||||||||
| CETIP - Mercados Organizados | 0.39 | ||||||||||
| Sprott | 0.38 | ||||||||||
| 1 Includes dividends. | |||||||||||
Important Performance and Expense Information All performance information in this Report reflects past performance, is presented on a total return basis, reflects the reinvestment of distributions, and does not reflect the deduction of taxes that a shareholder would pay on fund distributions or the redemption of fund shares. Past performance is no guarantee of future results. Investment return and principal value of an investment will fluctuate, so that shares may be worth more or less than their original cost when redeemed. Shares redeemed within 180 days of purchase may be subject to a 1% redemption fee payable to the Fund, which is not reflected in the performance shown above; if it were, performance would be lower. Current month-end performance may be higher or lower than performance quoted and may be obtained at www.roycefunds.com. Gross operating expenses reflect the Fund’s gross total annual operating expenses for the Service Class and include management fees, 12b-1 distribution and service fees, other expenses, and acquired fund fees and expenses. Net operating expenses reflect contractual fee waivers and/or expense reimbursements. All expense information is reported as of the Fund’s most current prospectus. Royce & Associates has contractually agreed to waive fees and/or reimburse expenses to the extent necessary to maintain the Fund’s net annual operating expenses, (excluding brokerage commissions, taxes, interest, litigation expenses, acquired fund fees and expenses, and other expenses not borne in the ordinary course of business), at or below 1.49% through April 30, 2015. Acquired fund fees and expenses reflect the estimated amount of the fees and expenses incurred indirectly by the Fund through its investments in mutual funds, hedge funds, private equity funds, and other investment companies. Regarding the two “Good Ideas” tables shown above, the sum of all contributors to, and all detractors from, performance for all securities in the portfolio would approximate the Fund’s year-to-date performance for 2014. | |||||||||||
| 24 | The Royce Funds 2014 Semiannual Report to Shareholders |
Performance and Portfolio Review cash flow generation, and a history of earnings, has also led us historically to overweight asset management businesses as well as invest in an ample number of insurance companies and tech-related financial services businesses. The ongoing bull market for stocks was obviously a factor in the robust results for many investment management firms. The fact that the much-discussed mass exodus from bonds into equities has not yet occurred to any notable degree helped those companies with more fixed income exposure. A recovery in precious metal commodity prices, however, was among the factors driving success for two asset managers—U.S. Global Investors and top-5 position Sprott. The latter is a Canadian investment management company that has been in business since 1981 and has expertise in natural resource and commodity-based investing. U.S. Global Investors is an American investment advisory firm that specializes in natural resources and emerging markets. While a recovery for the second of these groups has been spotty, the first improved enough to renew interest in its stock. We built a position in both when their respective share prices were declining in 2013. Two non-U.S. capital markets companies enjoyed a strong first half. Egyptian Financial Group-Hermes Holding Company is the leading investment bank in the Arab world and provides services such as asset management, securities brokerage, research, and private equity. Improved revenues seemed to draw more investors to its stock. CETIP-Mercados Organizados organizes the over-the-counter (OTC) markets in Brazil. The company offers an electronic platform for conducting online transactions, such as auctions and government bond trading, corporate bonds, and fixed-income securities. CETIP also provides central securities depository, outsourcing, market data, and risk management services. Its shares rose on what we suspect was a flight to company quality in Brazil’s first-half bear market. CRISIL, RFS’s top performer in the first half, comes from outside the capital markets group. An India-based global analytical company providing ratings, research, and risk and policy advisory services, its shares seemed to rise on an improved economic and market climate in India. We added shares of ETF specialist WisdomTree Investments as its share price slipped while we slightly trimmed our stake in Towers Watson & Co., a benefits consultant whose shares seemed to correct on profit taking following a run-up in 2013 and a slight slowdown in its business during the first half. |
GOOD IDEAS AT THE TIME | |
| WisdomTree Investments | -0.34% |
| Towers Watson & Co. Cl. A | -0.25 |
| Financial Engines | -0.24 |
| Waddell & Reed Financial Cl. A | -0.22 |
| Japan Exchange Group | -0.19 |
| 1 Net of dividends. | |
| ROYCE FINANCIAL SERVICES FUND VS. RUSSELL 2000 AND RUSSELL 2500 FINANCIAL SERVICES Value of $10,000 Invested on 12/31/03 | |
 |
| Includes reinvestment of distributions. | |||
| PORTFOLIO DIAGNOSTICS | |||
| Fund Net Assets | $64 million | ||
| Number of Holdings | 100 | ||
| Turnover Rate | 16% | ||
| Average Market Capitalization1 | $2,989 million | ||
| Weighted Average P/E Ratio2,3 | 18.3x | ||
| Weighted Average P/B Ratio1 | 2.0x | ||
| U.S. Investments (% of Net Assets) | 69.6% | ||
| Non-U.S. Investments (% of Net Assets) | 28.0% | ||
| Symbol | RYFSX | ||
1 Geometric Average. This weighted calculation uses each portfolio holding’s market cap in a way designed to not skew the effect of very large or small holdings; instead, it aims to better identify the portfolio’s center, which Royce believes offers a more accurate measure of average market cap than a simple mean or median. | |||
| MORNINGSTAR STATISTICAL MEASURES1 | |||
| Sharpe Ratio | Standard Deviation | ||
| RFS | 1.02 | 16.54 | |
| Russell 2000 | 1.10 | 18.23 | |
| Category Median | 0.91 | 17.84 | |
| Best Quartile Breakpoint | 1.02 | 16.24 | |
1 Five years ended 6/30/14. Category Median and Best Quartile Breakpoint based on 27 financial services objective funds (oldest class only) with at least five years of history. | |||
The Fund performed within the top 50% of financial services objective funds on a risk-adjusted basis, as shown by its Sharpe ratio. In addition, the Fund produced lower volatility than the Russell 2000 and 50% of financial services objective funds, as shown by its standard deviation. | |||
| DOWN MARKET PERFORMANCE COMPARISON All Down Periods of 7.5% or Greater Over the Last 7 Years, in Percentages(%) | |||||||
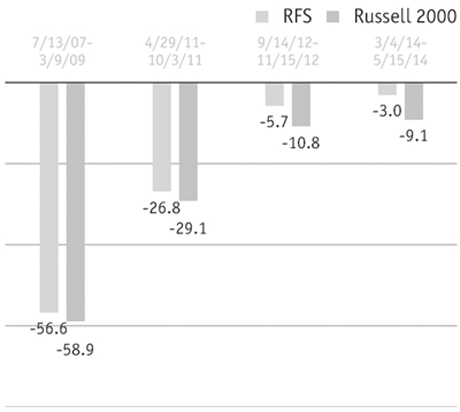 | |||||||
| The Royce Funds 2014 Semiannual Report to Shareholders | 25 |
| Royce SMid-Cap Value Fund |
AVERAGE ANNUAL TOTAL RETURNS Through 6/30/14 | |||||||||||
| January–June 20141 | 13.70 | % | |||||||||
| One-Year | 33.34 | ||||||||||
| Three-Year | 10.82 | ||||||||||
| Five-Year | 16.94 | ||||||||||
| Since Inception (9/28/07) | 7.59 | ||||||||||
| ANNUAL EXPENSE RATIOS | |||||||||||
| Gross Operating Expenses | 2.20 | % | |||||||||
| Net Operating Expenses | 1.35 | ||||||||||
| 1 Not Annualized | |||||||||||
| CALENDAR YEAR TOTAL RETURNS | |||||||||||
| Year | RSV | Year | RSV | ||||||||
| 2013 | 22.9 | % | 2010 | 26.0 | % | ||||||
| 2012 | 15.4 | 2009 | 28.7 | ||||||||
| 2011 | -11.6 | 2008 | -29.3 | ||||||||
| TOP 10 POSITIONS % of Net Assets | |||||||||||
| Semperit AG Holding | 3.5 | % | |||||||||
| Kennedy-Wilson Holdings | 3.4 | ||||||||||
| Myriad Genetics | 3.4 | ||||||||||
| Western Digital | 3.2 | ||||||||||
| SanDisk Corporation | 3.2 | ||||||||||
| Cirrus Logic | 3.1 | ||||||||||
| Westlake Chemical | 3.1 | ||||||||||
| Globe Specialty Metals | 3.0 | ||||||||||
| Ashmore Group | 3.0 | ||||||||||
| AGCO Corporation | 3.0 | ||||||||||
| PORTFOLIO SECTOR BREAKDOWN % of Net Assets | |||||||||||
| Materials | 16.4 | % | |||||||||
| Industrials | 15.7 | ||||||||||
| Information Technology | 14.7 | ||||||||||
| Energy | 14.0 | ||||||||||
| Financials | 12.0 | ||||||||||
| Consumer Discretionary | 8.2 | ||||||||||
| Health Care | 6.7 | ||||||||||
| Consumer Staples | 3.8 | ||||||||||
| Cash and Cash Equivalents | 8.5 | ||||||||||
 | |||||||||
Managers’ Discussion Royce SMid-Cap Value Fund (RSV) enjoyed an excellent first half, posting the highest return among all of our open-end portfolios. The Fund advanced an impressive 13.7% for the year-to-date period ended June 30, 2014, more than doubling the return of its small- and mid-cap benchmark, the Russell 2500 Index, which was up 5.9% for the same period. As the year began, there was a lot of speculation as to what direction equities would take. Considering the breakneck pace of returns in 2013, many market watchers argued that valuations were unsustainably high. Others held that with rates still basically at zero and the economy growing slowly but steadily, the case for a “melt up” remained strong. Returns for most stocks continued to climb in the first quarter, though results were far more muted overall. The Fund more than participated in this lower key-up phase, gaining 7.1% for the first quarter, well ahead of the Russell 2500, which rose 2.3% for the same period. The small- and mid-cap index endured a bearish April before rallying in May and June, while the Fund finished each of those months in the black. For the second quarter, RSV again outpaced the benchmark, increasing 6.1% compared to 3.6% for the Russell 2500. It appears that we are returning to a more historically typical performance cycle in which company fundamentals matter. This began more than a year ago when we first heard taper talk and interest rates started to rise. Around this same time it became fairly clear that legislative agendas were being closed down in Washington, creating a gridlock that seems to have removed some uncertainty. Businesses no longer need to guess what might happen politically because it has become almost impossible to get anything done. This does not seem likely to change until after this year’s mid-term elections at the earliest. These developments, along with the ongoing decline in correlation levels across all asset classes, are a series of signs pointing to a better market for active management overall. All of the Fund’s eight equity sectors posted net gains in the first half. Net losses at the industry and position level were comparatively minor. The Medicines Company provides acute and intensive care medications. Its stock plummeted on news of a negative patent ruling that would allow a competitor to produce a generic version of its highest revenue- | |||||||||
| GOOD IDEAS THAT WORKED Top Contributors to Performance Year-to-Date through 6/30/141 | |||||||||||
| Myriad Genetics | 2.80% | ||||||||||
| Helmerich & Payne | 1.61 | ||||||||||
| SanDisk Corporation | 1.10 | ||||||||||
| Westlake Chemical | 0.99 | ||||||||||
| Semperit AG Holding | 0.86 | ||||||||||
| 1 Includes dividends. | |||||||||||
Important Performance and Expense Information All performance information in this Report reflects past performance, is presented on a total return basis, reflects the reinvestment of distributions, and does not reflect the deduction of taxes that a shareholder would pay on fund distributions or the redemption of fund shares. Past performance is no guarantee of future results. Investment return and principal value of an investment will fluctuate, so that shares may be worth more or less than their original cost when redeemed. Shares redeemed within 180 days of purchase may be subject to a 1% redemption fee payable to the Fund, which is not reflected in the performance shown above; if it were, performance would be lower. Current month-end performance may be higher or lower than performance quoted and may be obtained at www.roycefunds.com. Gross operating expenses reflect gross total annual operating expenses for the Service Class and include management fees, 12b-1 distribution and service fees, and other expenses. Net operating expenses reflect contractual fee waivers and/or expense reimbursements. All expense information is reported as of the Fund’s most current prospectus. Royce & Associates has contractually agreed to waive fees and/or reimburse operating expenses to the extent necessary to maintain the Service Class’s net annual operating expenses, (excluding brokerage commissions, taxes, interest, litigation expenses, acquired fund fees and expenses, and other expenses not borne in the ordinary course of business), at or below 1.35% through April 30, 2015 and at or below 1.99% through April 30, 2024. Regarding the two “Good Ideas” tables shown above, the sum of all contributors to, and all detractors from, performance for all securities in the portfolio would approximate the Fund’s year-to-date performance for 2014. | |||||||||||
| 26 | The Royce Funds 2014 Semiannual Report to Shareholders |
Performance and Portfolio Review producing drug in the second half of 2015. (The company is appealing the decision.) Uneven trial results for one of the six new drugs in its pipeline also helped to keep investors away. Jacobs Engineering Group continued to struggle with trying to convert its backlog of business into revenue. It also endured a mining industry-driven shortfall in results from a recently acquired company and losses on a few key projects. All of this led management to reduce guidance for the current fiscal year. Thus rattled, investors fled. However, the company is also set to unveil a cost reduction program that could help its margins to recover in 2015 and beyond. The Energy sector led by quite a wide margin in the first half, with Materials, Information Technology, and Health Care also posting notable net gains. A long-time Royce favorite, the portfolio’s major contributor in the Energy sector, and the Fund’s twelfth-largest holding at the end of the semiannual period, Helmerich & Payne is a contract driller that specializes in high-tech rigs that were in increasingly high demand as drilling activity picked up. Top-five position SanDisk Corporation provides data storage products and solutions, including flash memory, proprietary controller and firmware technologies, as well as USB drives, digital media players, and other components. Capacity concerns have abated and global demand has been growing, both of which helped its shares to rise in the first half. Molecular diagnostic company Myriad Genetics was one of RSV’s five largest detractors in 2013 (when we added shares) before winding up as the top net gainer for the first half of 2014. The company specializes in genetic testing for cancer and ended last year facing increased competition, particularly in breast cancer screening tests, and some still unresolved reimbursement issues that remained under federal review at the end of December. It was also confronted with skepticism from some quarters about the fallout from a June 2013 Supreme Court decision which held that genes could not be patented. Our take was that neither the high court ruling nor the increased competition would hurt the firm’s long-term health. We see the quality of its predictive tests as the industry’s gold standard, so we were quite pleased to see it continue to execute successfully (and profitably), as well as make a savvy acquisition of Crescendo Bioscience, in the first half. The acquisition diversifies Myriad’s already promising pipeline. It was the Fund’s third-largest holding at the end of June. |
GOOD IDEAS AT THE TIME | |
| Medicines Company (The) | -0.36% |
| Jacobs Engineering Group | -0.27 |
| Alamos Gold | -0.26 |
| Value Partners Group | -0.21 |
| HollyFrontier Corporation | -0.20 |
| 1 Net of dividends. | |
| ROYCE SMID-CAP VALUE FUND VS. RUSSELL 2500 Value of $10,000 Invested on 9/28/07 | |
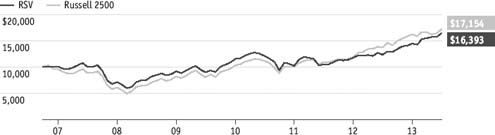 |
| Includes reinvestment of distributions. |
| PORTFOLIO DIAGNOSTICS | |||||
| Fund Net Assets | $20 million | ||||
| Number of Holdings | 53 | ||||
| Turnover Rate | 13% | ||||
| Average Market Capitalization1 | $3,961 million | ||||
| Weighted Average P/E Ratio2,3 | 19.5x | ||||
| Weighted Average P/B Ratio2 | 2.4x | ||||
| U.S. Investments (% of Net Assets) | 65.5% | ||||
| Non-U.S. Investments (% of Net Assets) | 26.0% | ||||
| Symbol | RMVSX | ||||
1 Geometric Average. This weighted calculation uses each portfolio holding’s market cap in a way designed to not skew the effect of very large or small holdings; instead, it aims to better identify the portfolio’s center, which Royce believes offers a more accurate measure of average market cap than a simple mean or median. | |||||
2 Harmonic Average. This weighted calculation evaluates a portfolio as if it were a single stock and measures it overall. It compares the total market value of the portfolio to the portfolio’s share in the earnings or book value, as the case may be, of its underlying stocks. | |||||
| MORNINGSTAR STATISTICAL MEASURES1 | |||||
| Sharpe Ratio | Standard Deviation | ||||
| RSV | 0.98 | 17.64 | |||
| Russell 2500 | 1.24 | 17.03 | |||
| Category Median | 1.20 | 16.22 | |||
| Best Quartile Breakpoint | 1.29 | 15.33 | |||
1 Five years ended 6/30/14. Category Median and Best Quartile Breakpoint based on 284 mid-cap objective funds (oldest class only) with at least five years of history. | |||||
DOWN MARKET PERFORMANCE COMPARISON | |||||
 | |||||
| The Royce Funds 2014 Semiannual Report to Shareholders | 27 |
| Royce Partners Fund |
| AVERAGE ANNUAL TOTAL RETURNS Through 6/30/14 | |||||||||||
| January–June 20141 | 2.77 | % | |||||||||
| One-Year | 21.18 | ||||||||||
| Three-Year | 11.55 | ||||||||||
| Five-Year | 14.16 | ||||||||||
| Since Inception (4/27/09) | 14.21 | ||||||||||
| ANNUAL EXPENSE RATIOS | |||||||||||
| Gross Operating Expenses | 3.97 | % | |||||||||
| Net Operating Expenses | 1.26 | ||||||||||
| 1 Not Annualized | |||||||||||
| CALENDAR YEAR TOTAL RETURNS | |||||||||||
| Year | PTR | Year | PTR | ||||||||
| 2013 | 32.2 | % | 2011 | -11.7 | % | ||||||
| 2012 | 20.7 | 2010 | 18.7 | ||||||||
| TOP 10 POSITIONS % of Net Assets | |||||||||||
| E-L Financial | 2.7 | % | |||||||||
| Atrion Corporation | 2.2 | ||||||||||
| State Street | 2.1 | ||||||||||
| Value Partners Group | 1.9 | ||||||||||
| Reliance Steel & Aluminum | 1.9 | ||||||||||
| MasterCard Cl. A | 1.8 | ||||||||||
| Sprott | 1.8 | ||||||||||
| Bank of New York Mellon (The) | 1.8 | ||||||||||
| Ashmore Group | 1.8 | ||||||||||
| Jupiter Fund Management | 1.7 | ||||||||||
| PORTFOLIO SECTOR BREAKDOWN % of Net Assets | |||||||||||
| Financials | 30.6 | % | |||||||||
| Industrials | 19.0 | ||||||||||
| Information Technology | 10.6 | ||||||||||
| Materials | 9.5 | ||||||||||
| Energy | 5.9 | ||||||||||
| Health Care | 4.2 | ||||||||||
| Consumer Discretionary | 2.2 | ||||||||||
| Consumer Staples | 1.0 | ||||||||||
| Miscellaneous | 1.3 | ||||||||||
| Cash and Cash Equivalents | 15.7 | ||||||||||
 | |||||||||
Manager’s Discussion While we were pleased with the absolute results for Royce Partners Fund (PTR) in the first half of 2014, we were nonetheless frustrated that the Fund was unable to keep pace with its benchmark. The Fund gained 2.8% for the year-to-date period ended June 30, 2014 versus the 5.9% advance for the Russell 2500 Index, the Fund’s benchmark, for the same period. After the feverish pace of returns in 2013, especially in the second half, the bull market cooled to kick off the year. In the first quarter of 2014, PTR gained 0.3%, a modest gain that put the Fund far behind its benchmark’s 2.3% return. Volatility shook small-cap share prices throughout much of the second quarter of 2014, though a rebound late in May and throughout June was strong enough to steer results back into positive territory. In the second quarter, the Fund’s 2.5% advance was not enough to give it an advantage over its benchmark, which rose 3.6%. Despite more muted performance in the first half of the year, equity returns were generally positive, with the economy showing signs of both growth and normalization. Equally important, we continue to see, albeit in fits and starts, the market gravitating from low quality to high-quality companies—those with strong balance sheets and high returns on invested capital. We believe this environment will reward active and disciplined managers with a long-term focus. The Fund’s average annual total return since inception (4/27/09) was 14.2%. Seven of the Fund’s nine equity sectors were positive contributors to first-half performance. Financials led all sectors by a wide margin, followed by Materials and Health Care. Myriad Genetics, a molecular diagnostic company that specializes in genetic testing for cancer, made a strong comeback in the first half of the year. After the Supreme Court ruled that human genes cannot be patented in June 2013, its share price declined rapidly as investors grew concerned that Myriad would struggle to compete or be profitable in the wake of the Court’s decision. The company remains a leader in genetic testing with a variety of industry-standard tools for detecting hereditary cancer risk. The stock recovered in the first quarter of 2014, and though its price has been volatile more recently, we continue to believe in the company. | |||||||||
| GOOD IDEAS THAT WORKED Top Contributors to Performance Year-to-Date through 6/30/141 | |||||||||||
| Myriad Genetics | 0.59% | ||||||||||
| BBVA Banco Frances ADR | 0.57 | ||||||||||
| Pan American Silver | 0.45 | ||||||||||
| GTT Communications | 0.36 | ||||||||||
| Zebra Technologies Cl. A | 0.31 | ||||||||||
| 1 Includes dividends. | |||||||||||
Important Performance and Expense Information All performance information in this Report reflects past performance, is presented on a total return basis, reflects the reinvestment of distributions, and does not reflect the deduction of taxes that a shareholder would pay on fund distributions or the redemption of fund shares. Past performance is no guarantee of future results. Investment return and principal value of an investment will fluctuate, so that shares may be worth more or less than their original cost when redeemed. Shares redeemed within 180 days of purchase may be subject to a 1% redemption fee payable to the Fund, which is not reflected in the performance shown above; if it were, performance would be lower. Current month-end performance may be higher or lower than performance quoted and may be obtained at www.roycefunds.com. Gross operating expenses reflect total gross annual operating expenses and include management fees, 12b-1 distribution and service fees, other expenses, and acquired fund fees and expenses. Net operating expenses reflect contractual fee waivers and/or reimbursements. All expense information is reported as of the Fund’s most current prospectus. Royce & Associates has contractually agreed to waive its fees and/or reimburse operating expenses to the extent necessary to maintain the Fund’s net annual operating expenses, (excluding brokerage commissions, taxes, interest, litigation expenses, acquired fund fees and expenses, and other expenses not borne in the ordinary course of business), at or below 1.20% through April 30, 2015 and 1.84% through April 30, 2024. Acquired fund fees and expenses reflect the estimated amount of the fees and expenses incurred indirectly by the Fund through its investments in mutual funds, hedge funds, private equity funds, and other investment companies. Regarding the two “Good Ideas” tables shown above, the sum of all contributors to, and all detractors from, performance for all securities in the portfolio would approximate the Fund’s year-to-date performance for 2014. | |||||||||||
| 28 | The Royce Funds 2014 Semiannual Report to Shareholders |
Performance and Portfolio Review BBVA Banco Frances ADR is a financial services company that caters to corporations, medium and small companies, and individual customers in Argentina. It is the oldest private bank in Argentina and the nation’s third largest. It has posted both strong earnings and given an improved outlook so far in 2014, both of which seemed to attract more investors to its shares. After suffering a harsh 2013, the precious metals & mining industry rebounded strongly during the first half of 2014. We were pleased to see Pan American Silver, the portfolio’s eleventh-largest holding, benefit from this recovery. In January we sold our shares in GTT Communications as its price was beginning to rise on increased revenues. The company is a cloud-based technology business that designs and integrates data transfer and connectivity solutions. We also sold our position in Zebra Technologies in April. The company makes specialized printers, including direct thermal and thermal transfer label printers and radio frequency identification (RFID) printers and encoders. The firm announced strong fiscal fourth-quarter results early in 2014 that showed accelerating demand for its bar code printers and consumables after a period of channel destocking. Its shares jumped again in April on news of Zebra’s announcement of its intent to purchase Motorola Solutions’ enterprise business, which adds mobile computing and data-capture to the firm’s existing portfolio of technologies. Towers Watson & Co., one of the Fund’s largest contributors to performance at the end of 2013, is a benefits consultant and a leading provider and manager of private health insurance exchanges. Its business slowed during the first half after a fantastic run-up in 2013. We like the company’s shareholder-friendly capital allocation and are holding our position after selling shares late last year. Hong Kong-based asset managers Value Partners Group’s stock was volatile throughout the first half of 2014. The fourth-largest holding in the portfolio, the company has largely suffered from China’s economic troubles and slow growth. We like the company’s value orientation and the fact that it has been making investments in China’s domestic market. We held our shares in the first half. |
GOOD IDEAS AT THE TIME | |
| Towers Watson & Co. Cl. A | -0.34% |
| Value Partners Group | -0.30 |
| MasterCard Cl. A | -0.29 |
| Patriot Transportation Holding | -0.24 |
| FARO Technologies | -0.21 |
| 1 Net of dividends. | |
| ROYCE PARTNERS FUND VS. RUSSELL 2500 Value of $10,000 Invested on 4/27/09 | |
 |
| Includes reinvestment of distributions. | |||
| PORTFOLIO DIAGNOSTICS | |||
| Fund Net Assets | $3 million | ||
| Number of Holdings | 63 | ||
| Turnover Rate | 5% | ||
| Average Market Capitalization1 | $3,440 million | ||
| Weighted Average P/E Ratio2,3 | 16.1x | ||
| Weighted Average P/B Ratio2 | 2.1x | ||
| U.S. Investments (% of Net Assets) | 54.4% | ||
| Non-U.S. Investments (% of Net Assets) | 29.9% | ||
| Symbol | RPTRX | ||
1 Geometric Average. This weighted calculation uses each portfolio holding’s market cap in a way designed to not skew the effect of very large or small holdings; instead, it aims to better identify the portfolio’s center, which Royce believes offers a more accurate measure of average market cap than a simple mean or median. | |||
2 Harmonic Average. This weighted calculation evaluates a portfolio as if it were a single stock and measures it overall. It compares the total market value of the portfolio to the portfolio’s share in the earnings or book value, as the case may be, of its underlying stocks. | |||
| MORNINGSTAR STATISTICAL MEASURES1 | |||
| Sharpe Ratio | Standard Deviation | ||
| PTR | 0.93 | 15.53 | |
| Russell 2500 | 1.24 | 17.03 | |
| Category Median | 1.20 | 16.22 | |
| Best Quartile Breakpoint | 1.29 | 15.33 | |
1 Five years ended 6/30/14. Category Median and Best Quartile Breakpoint based on 284 mid-cap objective funds (oldest class only) with at least five years of history. | |||
DOWN MARKET PERFORMANCE COMPARISON | |||
 | |||
| The Royce Funds 2014 Semiannual Report to Shareholders | 29 |
| Royce European Smaller-Companies Fund |
AVERAGE ANNUAL TOTAL RETURNS Through 6/30/14 | |||||||||||
| January–June 20141 | 4.59 | % | |||||||||
| One-Year | 23.52 | ||||||||||
| Three-Year | 5.58 | ||||||||||
| Five-Year | 16.72 | ||||||||||
| Since Inception (12/29/06) | 5.04 | ||||||||||
| ANNUAL EXPENSE RATIOS | |||||||||||
| Gross Operating Expenses | 2.27 | % | |||||||||
| Net Operating Expenses | 1.70 | ||||||||||
| 1 Not Annualized | |||||||||||
| CALENDAR YEAR TOTAL RETURNS | |||||||||||
| Year | RES | Year | RES | ||||||||
| 2013 | 20.8 | % | 2009 | 57.7 | % | ||||||
| 2012 | 23.8 | 2008 | -46.4 | ||||||||
| 2011 | -20.3 | 2007 | 1.4 | ||||||||
| 2010 | 35.2 | ||||||||||
| TOP 10 POSITIONS % of Net Assets | |||||||||||
| Ashmore Group | 2.5 | % | |||||||||
| KWS Saat | 2.5 | ||||||||||
| Semperit AG Holding | 2.4 | ||||||||||
| Consort Medical | 2.3 | ||||||||||
| Mayr-Melnhof Karton | 2.3 | ||||||||||
| Zehnder Group | 1.9 | ||||||||||
| Stallergenes | 1.9 | ||||||||||
| Latchways | 1.8 | ||||||||||
| Nokian Renkaat | 1.8 | ||||||||||
| DiaSorin | 1.8 | ||||||||||
| PORTFOLIO SECTOR BREAKDOWN % of Net Assets | |||||||||||
| Industrials | 22.0 | % | |||||||||
| Information Technology | 16.8 | ||||||||||
| Health Care | 15.7 | ||||||||||
| Consumer Discretionary | 10.7 | ||||||||||
| Energy | 8.9 | ||||||||||
| Financials | 7.7 | ||||||||||
| Materials | 6.9 | ||||||||||
| Consumer Staples | 3.8 | ||||||||||
| Diversified Investment Companies | 1.6 | ||||||||||
| Cash and Cash Equivalents | 5.9 | ||||||||||
| PORTFOLIO COUNTRY BREAKDOWN1,2 % of Net Assets | |||||||||||
| United Kingdom | 25.9 | % | |||||||||
| France | 18.4 | ||||||||||
| Germany | 12.8 | ||||||||||
| Norway | 5.6 | ||||||||||
| Italy | 4.8 | ||||||||||
| Switzerland | 4.8 | ||||||||||
| Austria | 4.7 | ||||||||||
| Finland | 3.0 | ||||||||||
| 1 Represents countries that are 3% or more of net assets. | |||||||||||
| 2 Securities are categorized by the country of their headquarters. | |||||||||||
  | |||||||||
Managers’ Discussion After mounting a strong comeback and generally outperforming its domestic peers during the last two quarters of 2013, European indexes remained fairly competitive before beginning to lose steam towards the end of the first half of 2014. We were slightly disappointed in Royce European Smaller-Companies Fund’s (RES) relative first-half results. The Fund gained 4.6% for the year-to-date period ended June 30, 2014, trailing its benchmark, the Russell Europe Small Cap Index, which advanced 5.5% for the same period. The Russell Europe Small Cap Index narrowed the performance gap at the end of 2013, finishing the year with a 36.6% gain versus the domestic small-cap Russell 2000 Index’s 38.8% advance. While equities in the U.S. and abroad moderated in the first quarter of 2014, European markets assumed leadership. RES participated in this rally, rising 3.9% versus a gain of 6.5% for its benchmark. European equity performance slowed a bit in the second quarter, most notably in June as the Russell Europe Small Cap Index fell into the red while international, domestic (save micro-caps), and global markets were in the black. We were pleased that RES gained 0.6% in the second quarter, outperforming its benchmark’s 1.0% decline. We were also pleased that the Fund was able to outpace the Russell Europe Small Cap Index for the since inception (12/29/06) period ended June 30, 2014. Eight of the Fund’s 10 equity sectors finished the first half in positive territory. Health Care made the largest positive contribution to performance, leading by a sizable margin. It was followed by solid net gains for Consumer Discretionary and Industrials. Materials was the Fund’s biggest detractor from performance, though its net loss was minimal. Pharmaceuticals led at the industry level, with household durables and software also posting significant net gains. Net losses at the industry level were modest. At the country level, holdings headquartered in France, the U.K., Norway, and Italy made the most significant contributions while the portfolio’s limited exposure to companies in Cyprus, Spain, and Belgium detracted from first-half results. | |||||||||
| GOOD IDEAS THAT WORKED Top Contributors to Performance Year-to-Date through 6/30/141 | |||||||||||
| Semperit AG Holding | 0.55% | ||||||||||
| De’Longhi | 0.54 | ||||||||||
| F-Secure | 0.49 | ||||||||||
| Forbo Holding | 0.48 | ||||||||||
| Eltek | 0.48 | ||||||||||
| 1 Includes dividends. | |||||||||||
Important Performance and Expense Information All performance information in this Report reflects past performance, is presented on a total return basis, reflects the reinvestment of distributions, and does not reflect the deduction of taxes that a shareholder would pay on fund distributions or the redemption of fund shares. Past performance is no guarantee of future results. Investment return and principal value of an investment will fluctuate, so that shares may be worth more or less than their original cost when redeemed. Shares redeemed within 180 days of purchase may be subject to a 2% redemption fee payable to the Fund, which is not reflected in the performance shown above; if it were, performance would be lower. Current month end performance may be higher or lower than performance quoted and may be obtained at www.roycefunds.com. Gross operating expenses reflect total gross annual operating expenses and include management fees, 12b-1 distribution and service fees, other expenses, and acquired fund fees and expenses. Net operating expenses reflect contractual fee waivers and/or expense reimbursements. All expense information is reported as of the Fund’s most current prospectus. Royce & Associates has contractually agreed to waive its fees and/or reimburse operating expenses to the extent necessary to maintain the Fund’s net annual operating expenses, (excluding brokerage commissions, taxes, interest, litigation expenses, acquired fund fees and expenses, and other expenses not borne in the ordinary course of business), at or below 1.69% through April 30, 2015 and at or below 1.99% through April 30, 2024. Acquired fund fees and expenses reflect the estimated amount of the fees and expenses incurred indirectly by the Fund through its investments in mutual funds, hedge funds, private equity funds, and other investment companies. Regarding the two “Good Ideas” tables shown above, the sum of all contributors to, and all detractors from, performance for all securities in the portfolio would approximate the Fund’s year-to-date performance for 2014. | |||||||||||
| 30 | The Royce Funds 2014 Semiannual Report to Shareholders |
Performance and Portfolio Review Top-three position and Austria-based Semperit AG Holding manufactures specialized rubber products. In late March the company reported record revenues for fiscal 2013. It then made moves to expand its production capacity at its Kamunting, Malaysia site with the construction of a new glove factory late in the second quarter. We added to our stake in the first half. De’Longhi is an Italian company that owns a collection of consumer brands in the domestic appliance market, such as coffee makers, food processors, electric ovens, kettles, toasters, and more. Its stock performance in the first half of 2014 was largely generated in the first quarter after reporting solid earnings for 2013. It also benefited from investors’ generally increased risk appetite for Italian stocks. We sold some shares late in the first half. F-Secure is a Finnish company that develops software for internet security and content back-up on the cloud. A combination of better-than-expected earnings as well as an announcement in May that it would be providing its services to Facebook helped its stock price to climb. We took some gains that same month. Forbo Holding is a Swiss firm with a global business in flooring and movement systems. Its shares moved higher when the firm reported an optimistic outlook for fiscal 2014. We reduced our position in the first half. We built our position in Eltek into April after first buying shares in February. This Norwegian business makes power systems and solutions for telecommunications and datacenters, power utilities, railway and metro, marine and offshore, solar, and other industries. Individual stock net losses were modest. French firm Societé Internationale de Plantations d’Heveas produces natural rubber and operates rubber tree plantations in French-speaking Africa. Declining rubber prices had a negative effect on the stock, which prompted us to begin adding shares early in March. Globaltrans Investment GDR runs a private freight rail transportation business that was hit hard by concerns over Russia’s actions in the Ukraine, mixed macroeconomic data, and softer leasing rates. We view most of those issues as temporary, and have been adding to the position based on of its free cash flow generation and market position. Nokian Renkaat is a long established Finnish company that manufactures and sells winter tires. The stock was hit hard by geopolitical concerns in Russia, which accounts for more than half of its profits. We view this as a shorter-term stock-price weakness. The decline created an opportunity to build our stake in what we regard as a first-class business model at attractive valuations. |
GOOD IDEAS AT THE TIME | |
| Societe Internationale de Plantations d’Heveas | -0.48% |
| Globaltrans Investment GDR | -0.39 |
| Nokian Renkaat | -0.26 |
| LPKF Laser & Electronics | -0.25 |
| EVS Broadcast Equipment | -0.25 |
| 1 Net of dividends. | |
| ROYCE EUROPEAN SMALLER-COMPANIES FUND VS. RUSSELL EUROPE SMALL CAP Value of $10,000 Invested on 12/29/06 | |
 |
| Includes reinvestment of distributions. | |||
| PORTFOLIO DIAGNOSTICS | |||
| Fund Net Assets | $35 million | ||
| Number of Holdings | 75 | ||
| Turnover Rate | 26% | ||
| Average Market Capitalization1 | $1,075 million | ||
| Weighted Average P/E Ratio2,3 | 17.8x | ||
| Weighted Average P/B Ratio2 | 2.2x | ||
| Symbol | |||
Service Class | RISCX | ||
Investment Class | RESNX | ||
1 Geometric Average. This weighted calculation uses each portfolio holding’s market cap in a way designed to not skew the effect of very large or small holdings; instead, it aims to better identify the portfolio’s center, which Royce believes offers a more accurate measure of average market cap than a simple mean or median. | |||
2 Harmonic Average. This weighted calculation evaluates a portfolio as if it were a single stock and measures it overall. It compares the total market value of the portfolio to the portfolio’s share in the earnings or book value, as the case may be, of its underlying stocks. | |||
| MORNINGSTAR STATISTICAL MEASURES1 | |||
| Sharpe Ratio | Standard Deviation | ||
| RES | 0.95 | 18.04 | |
| Russell Europe Small Cap | 0.87 | 20.95 | |
| Category Median | 0.77 | 19.48 | |
| Best Quartile Breakpoint | 0.88 | 18.19 | |
1 Five years ended 6/30/14. Category Median and Best Quartile Breakpoint based on 20 European stock objective funds (oldest class only) with at least five years of history. | |||
| The Fund beat the Russell Europe Small Cap and performed within the top 25% of European stock objective funds on a risk-adjusted basis, as shown by its Sharpe ratio. In addition, the Fund produced lower volatility than the Russell Europe Small Cap and 75% of European stock objective funds, as shown by its standard deviation. | |||
DOWN MARKET PERFORMANCE COMPARISON | |||
 | |||
| The Royce Funds 2014 Semiannual Report to Shareholders | 31 |
| Royce Global Dividend Value Fund |
AVERAGE ANNUAL TOTAL RETURNS Through 6/30/14 | ||||||||||
| January–June 20141 | 5.38 | % | ||||||||
| One-Year | 19.66 | |||||||||
| Three-Year | 7.34 | |||||||||
| Since Inception (12/31/10) | 6.96 | |||||||||
| ANNUAL EXPENSE RATIOS | ||||||||||
| Gross Operating Expenses | 2.99 | % | ||||||||
| Net Operating Expenses | 1.70 | |||||||||
| 1 Not Annualized | ||||||||||
| CALENDAR YEAR TOTAL RETURNS | ||||||||||
| Year | RGD | Year | RGD | |||||||
| 2013 | 15.8 | % | 2011 | -15.4 | % | |||||
| 2012 | 22.5 | |||||||||
| TOP 10 POSITIONS % of Net Assets | ||||||||||
| Totvs | 1.6 | % | ||||||||
| FLIR Systems | 1.1 | |||||||||
| Ashmore Group | 1.1 | |||||||||
| Silverlake Axis | 1.1 | |||||||||
| Semperit AG Holding | 1.1 | |||||||||
| Forbo Holding | 1.1 | |||||||||
| Stella-Jones | 1.1 | |||||||||
| CB Industrial Product Holding | 1.0 | |||||||||
| Graphite India | 1.0 | |||||||||
| Fresnillo | 1.0 | |||||||||
| PORTFOLIO SECTOR BREAKDOWN % of Net Assets | ||||||||||
| Consumer Discretionary | 20.6 | % | ||||||||
| Industrials | 18.8 | |||||||||
| Information Technology | 17.5 | |||||||||
| Financials | 17.0 | |||||||||
| Materials | 10.7 | |||||||||
| Health Care | 6.0 | |||||||||
| Energy | 3.9 | |||||||||
| Consumer Staples | 2.7 | |||||||||
| Diversified Investment Companies | 0.2 | |||||||||
| Cash and Cash Equivalents | 2.6 | |||||||||
| PORTFOLIO COUNTRY BREAKDOWN1,2 % of Net Assets | ||||||||||
| United Kingdom | 11.3 | % | ||||||||
| Hong Kong | 10.7 | |||||||||
| United States | 9.0 | |||||||||
| Canada | 8.3 | |||||||||
| South Africa | 6.8 | |||||||||
| Japan | 5.6 | |||||||||
| Brazil | 5.4 | |||||||||
| Switzerland | 5.0 | |||||||||
| Singapore | 3.7 | |||||||||
| France | 3.6 | |||||||||
| Malaysia | 3.2 | |||||||||
| 1 Represents countries that are 3% or more of net assets. | ||||||||||
| 2 Securities are categorized by the country of their headquarters. | ||||||||||
|
Manager’s Discussion For the year-to-date period ended June 30, 2014, Royce Global Dividend Value Fund (RGD) gained 5.4%, just behind its benchmark, the Russell Global Small Cap Index, which rose 5.7% for the same period. While strong on an absolute level, most non-U.S. markets lagged their domestic small-cap peers in 2013, though they mounted a furious comeback in the latter half of the year. Europe’s strength would continue into the first few months of 2014, while many Asian companies would struggle a bit. Within RGD’s portfolio, exposure to holdings in Hong Kong and Japan in particular had a negative impact on performance in the first quarter. During this period, the Fund rose 1.4% compared to the global small-cap benchmark’s 2.3% advance. Returns were stronger both abroad and stateside in the second quarter, with the former largely driven by a recovery for many Asian companies. While the struggles for holdings in China continued, the portfolio benefited from its substantial weighting in Japan. For the second quarter, RGD was able to outpace the Russell Global Small Cap Index, advancing 3.9% versus 3.3%. Eight of the Fund’s nine equity sectors were positive contributors to first-half performance, with Information Technology leading by a wide margin. Consumer Discretionary was the Fund’s lone detractor. At the industry level, software and capital markets led the pack, with pharmaceuticals and machinery providing respectable results as well. Results for capital markets companies were driven by strong performance for asset managers and other financial services companies, two areas that we think we know well and in which we have taken a great interest for many years. Net losses at the industry level were modest, with three groups from Consumer Discretionary detracting most—textiles, apparel & luxury goods; media; and multiline retail. At the country level, Hong Kong-based holdings detracted most from first-half performance while strong net gains came from positions headquartered in Canada, Malaysia, the U.K., South Africa, France, and Japan. CB Industrial Product Holding is a Malaysian investment holding company that through its subsidiaries manufactures, markets, and trades palm oil mill equipment and related parts. The company is also involved in engineering support and contract work |
| GOOD IDEAS THAT WORKED Top Contributors to Performance Year-to-Date through 6/30/141 | |||||||||||
| CB Industrial Product Holding | 0.34% | ||||||||||
| Silverlake Axis | 0.33 | ||||||||||
| CETIP - Mercados Organizados | 0.33 | ||||||||||
| Graphite India | 0.31 | ||||||||||
| F-Secure | 0.26 | ||||||||||
| 1 Includes dividends. | |||||||||||
Important Performance and Expense Information All performance information in this Report reflects past performance, is presented on a total return basis, reflects the reinvestment of distributions, and does not reflect the deduction of taxes that a shareholder would pay on fund distributions or the redemption of fund shares. Past performance is no guarantee of future results. Investment return and principal value of an investment will fluctuate, so that shares may be worth more or less than their original cost when redeemed. Shares redeemed within 180 days of purchase may be subject to a 2% redemption fee payable to the Fund, which is not reflected in the performance shown above; if it were, performance would be lower. Current month-end performance may be higher or lower than performance quoted and may be obtained at www.roycefunds.com. Gross operating expenses reflect total gross annual operating expenses and include management fees, 12b-1 distribution and service fees, other expenses, and acquired fund fees and expenses. Net operating expenses reflect contractual fee waivers and/or expense reimbursements. All expense information is reported as of the Fund’s most current prospectus. Royce & Associates has contractually agreed to waive its fees and/or reimburse operating expenses to the extent necessary to maintain the Fund’s net annual operating expenses, (excluding brokerage commissions, taxes, interest, litigation expenses, acquired fund fees and expenses, and other expenses not borne in the ordinary course of business), at or below 1.69% through April 30, 2015 and at or below 1.99% through April 30, 2024. Acquired fund fees and expenses reflect the estimated amount of the fees and expenses incurred indirectly by the Fund through its investments in mutual funds, hedge funds, private equity funds, and other investment companies. Regarding the two “Good Ideas” tables shown above, the sum of all contributors to, and all detractors from, performance for all securities in the portfolio would approximate the Fund’s year-to-date performance for 2014. | |||||||||||
| 32 | The Royce Funds 2014 Semiannual Report to Shareholders |
Performance and Portfolio Review |
| for palm oil mills. Its share price was pretty volatile during the first half, but was mostly on the ascent. Growth in its business, keyed by expansion into Central America and Africa, and earnings improvement seemed to attract investors. Its rising stock price helped to make it RGD’s eighth-largest position at the end of June. Another top-10 holding, Singapore-based Silverlake Axis provides customized software solutions to the banking and insurance industries. Its stock was generally flat for most of the second half. Late in May the stock began to take off, the key driver being a more than 25% increase in year-over-year fiscal third-quarter revenues. This improvement was mostly the result of a higher contribution from software licensing, maintenance and enhancement services, as well as the sale of software and hardware products. Brazil-based CETIP-Mercados Organizados offers an electronic platform for conducting online transactions, such as auctions and government bond trading, corporate bonds, and fixed-income securities. CETIP also provides central securities depository, outsourcing, market data, and risk management services. Its shares rose on what we suspect was a flight to company quality in Brazil’s first-half bear market. Graphite India is the largest Indian producer of graphite electrodes and also makes carbon and graphite specialty products. Its shares rose on improved operating profits and related margin expansion, which was no mean feat in the depressed market for its industry. The surge was also part of the general recovery for Indian stocks following the May election of Prime Minister Narenda Modi. Brasil Brokers Participacoes is one of the two leading real estate brokerages in Brazil. Poor consumer sentiment in the country, not seen since 2008, hurt its business. We purchased more shares at the end of the second quarter. Hong Kong-based Pico Far East Holdings makes displays for companies when they present at conventions. The more challenging economic climate in China, which includes diminished consumer demand, put pressure on its stock. We like the long-term view that management maintains for its business and that major global brands such as Mercedes Benz, Citibank, and Singapore Airlines trust the company with their brand imaging. We increased our stake in the middle of the second quarter. |
GOOD IDEAS AT THE TIME | |
| Brasil Brokers Participacoes | -0.33% |
| Pico Far East Holdings | -0.22 |
| KBR | -0.19 |
| New World Department Store China | -0.18 |
| Pacific Textiles Holdings | -0.16 |
| 1 Net of dividends. | |
| ROYCE GLOBAL DIVIDEND VALUE FUND VS. RUSSELL GLOBAL SMALL CAP Value of $10,000 Invested on 12/31/10 | |
 |
| Includes reinvestment of distributions. |
| PORTFOLIO DIAGNOSTICS | ||||
| Fund Net Assets | $10 million | |||
| Number of Holdings | 148 | |||
| Turnover Rate | 9% | |||
| Average Market Capitalization1 | $1,198 million | |||
| Weighted Average P/E Ratio2,3 | 16.1x | |||
| Weighted Average P/B Ratio2 | 2.1x | |||
| Symbol | RGVDX | |||
1 Geometric Average. This weighted calculation uses each portfolio holding’s market cap in a way designed to not skew the effect of very large or small holdings; instead, it aims to better identify the portfolio’s center, which Royce believes offers a more accurate measure of average market cap than a simple mean or median. | ||||
2 Harmonic Average. This weighted calculation evaluates a portfolio as if it were a single stock and measures it overall. It compares the total market value of the portfolio to the portfolio’s share in the earnings or book value, as the case may be, of its underlying stocks. | ||||
| MORNINGSTAR STATISTICAL MEASURES1 | ||||||||||
| Sharpe Ratio | Standard Deviation | |||||||||
| RGD | 0.51 | 16.33 | ||||||||
| Russell Global Small Cap | 0.63 | 15.89 | ||||||||
| Category Median | 0.71 | 15.97 | ||||||||
| Best Quartile Breakpoint | 0.77 | 15.74 | ||||||||
1 Three years ended 6/30/14. Category Median and Best Quartile Breakpoint based on 18 world stock small-cap objective funds (oldest class only) with at least three years of history. | ||||||||||
| The Royce Funds 2014 Semiannual Report to Shareholders | 33 |
| Royce International Micro-Cap Fund |
AVERAGE ANNUAL TOTAL RETURNS Through 6/30/14 | ||||||||||
| January–June 20141 | 7.87 | % | ||||||||
| One-Year | 28.90 | |||||||||
| Three-Year | 4.00 | |||||||||
| Since Inception (12/31/10) | 3.92 | |||||||||
| ANNUAL EXPENSE RATIOS | ||||||||||
| Gross Operating Expenses | 3.88 | % | ||||||||
| Net Operating Expenses | 1.71 | |||||||||
| 1 Not Annualized | ||||||||||
| CALENDAR YEAR TOTAL RETURNS | ||||||||||
| Year | RMI | Year | RMI | |||||||
| 2013 | 18.9 | % | 2011 | -21.5 | % | |||||
| 2012 | 13.6 | |||||||||
| TOP 10 POSITIONS % of Net Assets | ||||||||||
| Magellan Aerospace | 2.5 | % | ||||||||
| Trancom | 2.1 | |||||||||
| Zuiko Corporation | 1.9 | |||||||||
| Huvis Corporation | 1.6 | |||||||||
| Collection House | 1.5 | |||||||||
| Pico Far East Holdings | 1.5 | |||||||||
| TFS Corporation | 1.4 | |||||||||
| Miraial | 1.4 | |||||||||
| E-House (China) Holdings ADR | 1.3 | |||||||||
| Nishikawa Rubber | 1.2 | |||||||||
| PORTFOLIO SECTOR BREAKDOWN % of Net Assets | ||||||||||
| Industrials | 28.7 | % | ||||||||
| Consumer Discretionary | 24.5 | |||||||||
| Information Technology | 17.5 | |||||||||
| Financials | 7.0 | |||||||||
| Materials | 5.3 | |||||||||
| Consumer Staples | 4.2 | |||||||||
| Health Care | 3.6 | |||||||||
| Energy | 2.2 | |||||||||
| Cash and Cash Equivalents | 7.0 | |||||||||
| PORTFOLIO COUNTRY BREAKDOWN1,2 % of Net Assets | ||||||||||
| Japan | 17.8 | % | ||||||||
| Hong Kong | 12.1 | |||||||||
| Canada | 8.1 | |||||||||
| China | 5.7 | |||||||||
| United Kingdom | 5.4 | |||||||||
| Australia | 5.4 | |||||||||
| India | 4.1 | |||||||||
| South Korea | 4.0 | |||||||||
| Malaysia | 3.8 | |||||||||
| 1 Represents countries that are 3% or more of net assets. | ||||||||||
| 12 Securities are categorized by the country of their headquarters. | ||||||||||
  |
Managers’ Discussion We were very pleased with the relative and absolute performance from Royce International Micro-Cap Fund (RMI) in the first half of 2014. The Fund climbed 7.9% for the year-to-date period ended June 30, 2014, beating its benchmark, the Russell Global ex-U.S. Small Cap Index, which returned 7.5% for the same period. Whereas in the first quarter of 2013 domestic small-cap indexes generally outpaced their non-U.S. peers, the first quarter of 2014 saw signs of a reversal of leadership and the start of a strong comeback for many non-U.S. small-caps. In the first quarter of 2014, RMI posted an impressive 3.0% gain, just shy of its benchmark’s 3.2% gain. The Fund’s exposure to holdings in Hong Kong—which, like most Asian markets in the first quarter, struggled to keep pace with their Western peers—was a significant detractor to first-quarter performance. Holdings in Japan, as well as Brazil, also hurt performance. While European markets pulled back, many parts of Asia made a recovery in the second quarter. Holdings in Japan, India, and South Korea also made significant contributions to second-quarter performance. During this period, RMI rose 4.7% versus a gain of 4.2% for the Russell Global ex-U.S. Small Cap. The Fund also outperformed the index in the one-year period ended June 30, 2014. Six of RMI’s eight equity sectors were positive contributors to first-half performance. Industrials made the largest impact by a wide margin, with Information Technology and Materials also making sizable impacts. Detracting from performance at the sector level were Consumer Discretionary and Financials. At the industry level, machinery, semiconductors & semiconductor equipment, and software were top contributors to performance, while media detracted. Pico Far East Holdings is a Hong Kong-based business that makes displays for companies presenting at conventions. We like that major global brands such as Mercedes Benz, Lexus, and Citibank trust the company to build signs and displays that accurately portray their brand images. The slowdown in China’s economy hurt Pico Far East’s business, but management keeps a close eye on costs and focuses on the long term. We increased our stake in January. |
| GOOD IDEAS THAT WORKED Top Contributors to Performance Year-to-Date through 6/30/141 | |||||||||||
| Magellan Aerospace | 1.01% | ||||||||||
| TFS Corporation | 0.68 | ||||||||||
| RIB Software | 0.64 | ||||||||||
| CB Industrial Product Holding | 0.42 | ||||||||||
| Obara Group | 0.42 | ||||||||||
| 1 Includes dividends. | |||||||||||
Important Performance and Expense Information All performance information in this Report reflects past performance, is presented on a total return basis, reflects the reinvestment of distributions, and does not reflect the deduction of taxes that a shareholder would pay on fund distributions or the redemption of fund shares. Past performance is no guarantee of future results. Investment return and principal value of an investment will fluctuate, so that shares may be worth more or less than their original cost when redeemed. Shares redeemed within 180 days of purchase may be subject to a 2% redemption fee payable to the Fund, which is not reflected in the performance shown above; if it were, performance would be lower. Current month-end performance may be higher or lower than performance quoted and may be obtained at www.roycefunds.com. Gross operating expenses reflect total gross annual operating expenses and include management fees, 12b-1 distribution and service fees, other expenses, and acquired fund fees and expenses. Net operating expenses reflect contractual fee waivers and/or expense reimbursements. All expense information is reported as of the Fund’s most current prospectus. Royce & Associates has contractually agreed to waive its fees and/or reimburse operating expenses, to the extent necessary to maintain the Fund’s net annual operating expenses, (excluding brokerage commissions, taxes, interest, litigation expenses, acquired fund fees and expenses, and other expenses not borne in the ordinary course of business), at or below 1.69% through April 30, 2015 and at or below 1.99% though April 30, 2024. Acquired fund fees and expenses reflect the estimated amount of the fees and expenses incurred indirectly by the Fund through its investments in mutual funds, hedge funds, private equity funds, and other investment companies. Regarding the two “Good Ideas” tables shown above, the sum of all contributors to, and all detractors from, performance for all securities in the portfolio would approximate the Fund’s year-to-date performance for 2014. | |||||||||||
| 34 | The Royce Funds 2014 Semiannual Report to Shareholders |
Performance and Portfolio Review |
| Anxin-China Holdings is a Hong Kong-based provider of safety monitoring hardware and software. The stock declined throughout the first half, the fall driven largely due to a slowdown in the number of government projects being awarded as a result of a nationwide corruption probe. Brazil’s stock market suffered through a miserable first half, which helped two holdings earn spots on RMI’s list of detractors. Brasil Brokers Participacoes is one of the country’s two leading real estate brokerages. Its business has been hurt by poor consumer sentiment (the worst since 2008) and possibly some modest erosion in market share. We built our stake during the first half while initially choosing to part ways with another, similarly named Brazilian company Brasil Insurance Participacoes e Administracao, which operates insurance brokerages. In July, we re-evaluated the situation and reinitiated a position. The nosedive in its share price in the spring created greater losses than we were prepared to accept. Top holding and largest contributor to year-to-date performance Magellan Aerospace is an Ontario-based company that serves the civil aerospace and defense market. We like the business’s unlevered balance sheet and that management runs the business with a long-term focus similar to our own. The company’s share price was basically flat going into the second quarter, dipping briefly in mid-March before the stock gradually ascended. This seemed to be the result of management executing effectively and the market beginning to take more notice of the business. We started reducing our position in April. Australia-based TFS Corporation owns and manages sustainable sandalwood plantations. We first bought shares three years ago when negative news surrounded the company’s management. During these hard times the CEO was buying shares, which helped to bolster our confidence in what we thought was a good business. In late February the stock significantly climbed after the announcement of an exclusive long-term supply agreement with a global pharmaceutical company that wanted to use sandalwood for dermatology treatments. RIB Software makes specialized software for the construction industry. Based in Stuttgart, the company enjoyed a more or less steadily rising share price during the first half, driven in large part by the announcement in March of strong revenue growth in fiscal 2013. We began to sell our shares in January. |
GOOD IDEAS AT THE TIME | |
| Pico Far East Holdings | -0.58% |
| Anxin-China Holdings | -0.42 |
| Brasil Brokers Participacoes | -0.38 |
| Brasil Insurance Participacoes e Administracao | -0.31 |
| EPS Corporation | -0.30 |
| 1 Net of dividends. | |
| ROYCE INTERNATIONAL MICRO-CAP FUND VS. RUSSELL GLOBAL EX-U.S. SMALL CAP Value of $10,000 Invested on 12/31/10 | |
 |
| Includes reinvestment of distributions. |
| PORTFOLIO DIAGNOSTICS | ||||
| Fund Net Assets | $5 million | |||
| Number of Holdings | 120 | |||
| Turnover Rate | 45% | |||
| Average Market Capitalization1 | $365 million | |||
| Weighted Average P/E Ratio2,3 | 13.0x | |||
| Weighted Average P/B Ratio2 | 1.4x | |||
| Symbol | ROIMX | |||
1 Geometric Average. This weighted calculation uses each portfolio holding’s market cap in a way designed to not skew the effect of very large or small holdings; instead, it aims to better identify the portfolio’s center, which Royce believes offers a more accurate measure of average market cap than a simple mean or median. | ||||
2 Harmonic Average. This weighted calculation evaluates a portfolio as if it were a single stock and measures it overall. It compares the total market value of the portfolio to the portfolio’s share in the earnings or book value, as the case may be, of its underlying stocks. | ||||
| MORNINGSTAR STATISTICAL MEASURES1 | |||
| Sharpe Ratio | Standard Deviation | ||
| RMI | 0.31 | 17.69 | |
| Russell Global ex-U.S. Small Cap | 0.46 | 16.42 | |
| Category Median | 0.65 | 16.31 | |
| Best Quartile Breakpoint | 0.76 | 14.93 | |
1 Three years ended 6/30/14. Category Median and Best Quartile Breakpoint based on 72 foreign small/mid objective funds (oldest class only) with at least three years of history. | |||
| The Royce Funds 2014 Semiannual Report to Shareholders | 35 |
| Royce International Premier Fund |
AVERAGE ANNUAL TOTAL RETURNS Through 6/30/14 | ||||||||||
| January–June 20141 | 3.26 | % | ||||||||
| One-Year | 16.80 | |||||||||
| Three-Year | 6.43 | |||||||||
| Since Inception (12/31/10) | 6.71 | |||||||||
| ANNUAL EXPENSE RATIOS | ||||||||||
| Gross Operating Expenses | 2.82 | % | ||||||||
| Net Operating Expenses | 1.69 | |||||||||
| 1 Not Annualized | ||||||||||
| CALENDAR YEAR TOTAL RETURNS | ||||||||||
| Year | RIP | Year | RIP | |||||||
| 2013 | 18.3 | % | 2011 | -16.8 | % | |||||
| 2012 | 23.4 | |||||||||
| TOP 10 POSITIONS % of Net Assets | ||||||||||
| Consort Medical | 2.9 | % | ||||||||
| Ashmore Group | 2.6 | |||||||||
| Clarkson | 2.6 | |||||||||
| Semperit AG Holding | 2.6 | |||||||||
| KWS Saat | 2.5 | |||||||||
| Stella International Holdings | 2.5 | |||||||||
| Totvs | 2.3 | |||||||||
| Latchways | 2.3 | |||||||||
| CETIP - Mercados Organizados | 2.3 | |||||||||
| Forbo Holding | 2.3 | |||||||||
| PORTFOLIO SECTOR BREAKDOWN % of Net Assets | ||||||||||
| Consumer Discretionary | 20.3 | % | ||||||||
| Industrials | 17.7 | |||||||||
| Information Technology | 16.6 | |||||||||
| Health Care | 14.8 | |||||||||
| Financials | 14.1 | |||||||||
| Consumer Staples | 6.0 | |||||||||
| Materials | 5.2 | |||||||||
| Energy | 1.8 | |||||||||
| Cash and Cash Equivalents | 3.5 | |||||||||
| PORTFOLIO COUNTRY BREAKDOWN1,2 % of Net Assets | ||||||||||
| United Kingdom | 25.6 | % | ||||||||
| Switzerland | 12.9 | |||||||||
| Germany | 7.9 | |||||||||
| Hong Kong | 6.6 | |||||||||
| Brazil | 6.4 | |||||||||
| France | 6.3 | |||||||||
| Japan | 5.6 | |||||||||
| Austria | 4.8 | |||||||||
| Malaysia | 3.9 | |||||||||
| India | 3.3 | |||||||||
| 1 Represents countries that are 3% or more of net assets. | ||||||||||
| 2 Securities are categorized by the country of their headquarters. | ||||||||||
|
Manager’s Discussion We were disappointed with Royce International Premier Fund’s (RIP) first-half performance on a relative basis. For the year-to-date period ended June 30, 2014, RIP gained 3.3%, trailing its benchmark, the Russell Global ex-U.S. Small Cap Index, which returned 7.5% for the same period. While small-cap returns for both U.S. and non-U.S. companies were more subdued in 2014’s opening quarter, international small-cap performance assumed leadership over its domestic peers. This was partially driven by Europe’s ongoing strength in the first quarter, which outweighed corrections for many Asian markets. For the first quarter, RIP rose 0.9% versus a gain of 3.2% for the international small-cap index. Many of the Fund’s portfolio holdings headquartered in Hong Kong, China, Malaysia, and Japan struggled during this time period—which detracted from the Fund’s first-quarter performance—while holdings in India were generally positive. Holdings in the UK and Finland were also met with difficulty in the first quarter. European small-cap performance fell slightly into the red in the second quarter while certain key Asian markets mounted a recovery. Holdings in Hong Kong and Japan made an impressive rebound, though China continued to struggle. India remained a stalwart contributor to Fund performance. As a result, the Fund posted stronger returns in the second quarter, advancing 2.4%. However, RIP was unable to gain an advantage over its benchmark, as the Russell Global ex-U.S. Small Cap returned 4.2% in the second quarter. We were pleased, however, to see the Fund outpace its benchmark index for the since inception (12/31/10) period ended June 30, 2014. Six of the Fund’s eight equity sectors finished the first half in positive territory. Consumer Discretionary led, followed by Industrials. Health Care also made a solid contribution to first-half performance. Information Technology and Consumer Staples were the Fund’s lone sector detractors, though each made only a modest negative impact. At the industry level, specialty retail led by a considerable margin. The software, pharmaceuticals, machinery, and capital markets groups also posted respectable net |
| GOOD IDEAS THAT WORKED Top Contributors to Performance Year-to-Date through 6/30/141 | |||||||||||
| CETIP - Mercados Organizados | 0.81% | ||||||||||
| Signet Jewelers | 0.68 | ||||||||||
| Semperit AG Holding | 0.60 | ||||||||||
| Clarkson | 0.57 | ||||||||||
| Silverlake Axis | 0.56 | ||||||||||
| 1 Includes dividends. | |||||||||||
Important Performance and Expense Information All performance information in this Report reflects past performance, is presented on a total return basis, reflects the reinvestment of distributions, and does not reflect the deduction of taxes that a shareholder would pay on fund distributions or the redemption of fund shares. Past performance is no guarantee of future results. Investment return and principal value of an investment will fluctuate, so that shares may be worth more or less than their original cost when redeemed. Shares redeemed within 180 days of purchase may be subject to a 2% redemption fee payable to the Fund, which is not reflected in the performance shown above; if it were, performance would be lower. Current month-end performance may be higher or lower than performance quoted and may be obtained at www.roycefunds.com. Price and total return information is based on net asset values for shareholder transactions. Certain immaterial adjustments were made to the net assets of Royce International Premier Fund at 6/30/14 for financial reporting purposes, and as a result the net asset values for shareholder transactions and the calendar year total returns based on those net assets values differ from the adjusted net values and calendar year total returns reported in the Financial Highlights. Gross operating expenses reflect total gross annual operating expenses and include management fees, 12b-1 distribution and service fees, and other expenses. Net operating expenses reflect contractual fee waivers and/or expense reimbursements. All expense information is reported as of the Fund’s most current prospectus. Royce & Associates has contractually agreed to waive its fees and/or reimburse operating expenses to the extent necessary to maintain the Fund’s net annual operating expenses, (excluding brokerage commissions, taxes, interest, litigation expenses, acquired fund fees and expenses, and other expenses not borne in the ordinary course of business), at or below 1.69% through April 30, 2015 and at or below 1.99% through April 30, 2024. Regarding the two “Good Ideas” tables shown above, the sum of all contributors to, and all detractors from, performance for all securities in the portfolio would approximate the Fund’s year-to-date performance for 2014. | |||||||||||
| 36 | The Royce Funds 2014 Semiannual Report to Shareholders |
Performance and Portfolio Review |
| gains. The only significant detractor among the portfolio’s industries was the electronic equipment, instruments & components group. Brazil-based CETIP-Mercados Organizados offers an electronic platform for conducting online transactions, such as auctions and government bond trading, corporate bonds, and fixed-income securities. Its shares rose on what we suspect was a flight to company quality in Brazil’s first-half bear market. Based in Hamilton, Bermuda, Signet Jewelers is a specialty jewelry retailer with operations in the U.S., U.K., and Canada. Signet’s share price made a dramatic jump late in February after news that the company agreed to buy Zales for approximately $1.4 billion. We began trimming our position shortly after the announcement and sold the last of our shares in May. The Fund’s fourth-largest position, Semperit AG Holding is an Austrian business that focuses on specialized rubber products and is the globe’s top supplier of escalator hand rails. In the second half, the company’s two earnings announcements were well in excess of market expectations, helping to drive the stock to new highs. London-based Clarkson is an investment holding company whose subsidiaries provide integrated shipping services worldwide. Its stock price, while volatile, enjoyed mostly strong results through 2013 before really taking off in March of 2014 and then cooling off a bit from its May 2014 high through the end of June. UK-based Oxford Instruments produces advanced instrumentation equipment used for scientific research, diagnostic imaging, semiconductor processing, and patient monitoring. Coming off a strong second half of 2013, its share price began to decline early in the year. Demand slackened during the latter part of 2013 and early in 2014, mostly the result of a slowdown in government-funded research. We trimmed our shares at the end of June but were otherwise optimistic about its long-term prospects. Pico Far East Holdings is a Hong Kong-based business that makes displays for companies presenting at conventions. We like that major global brands such as Mercedes Benz, Lexus, and Citibank trust the company to build signs and displays that accurately portray their brand images. The slowdown in China’s economy hurt its business, but we remain confident in management’s long-term plans. We entered into a position in February and added shares throughout the first half. |
GOOD IDEAS AT THE TIME | |
| Oxford Instruments | -0.49% |
| Pico Far East Holdings | -0.42 |
| LPS Brasil Consultoria de Imoveis | -0.41 |
| Abcam | -0.37 |
| Nokian Renkaat | -0.36 |
| 1 Net of dividends. | |
| ROYCE INTERNATIONAL PREMIER FUND VS. RUSSELL GLOBAL EX-U.S. SMALL CAP Value of $10,000 Invested on 12/31/10 | |
 |
| Includes reinvestment of distributions. |
| PORTFOLIO DIAGNOSTICS | ||||
| Fund Net Assets | $14 million | |||
| Number of Holdings | 50 | |||
| Turnover Rate | 18% | |||
| Average Market Capitalization1 | $1,563 million | |||
| Weighted Average P/E Ratio2,3 | 18.0x | |||
| Weighted Average P/B Ratio2 | 2.9x | |||
| Symbol | ||||
| Service Class | RYIPX | |||
| Investment Class | RIPNX | |||
1 Geometric Average. This weighted calculation uses each portfolio holding’s market cap in a way designed to not skew the effect of very large or small holdings; instead, it aims to better identify the portfolio’s center, which Royce believes offers a more accurate measure of average market cap than a simple mean or median. | ||||
2 Harmonic Average. This weighted calculation evaluates a portfolio as if it were a single stock and measures it overall. It compares the total market value of the portfolio to the portfolio’s share in the earnings or book value, as the case may be, of its underlying stocks. | ||||
| MORNINGSTAR STATISTICAL MEASURES1 | |||
| Sharpe Ratio | Standard Deviation | ||
| RIP | 0.47 | 15.75 | |
| Russell Global ex-U.S. Small Cap | 0.46 | 16.42 | |
| Category Median | 0.65 | 16.31 | |
| Best Quartile Breakpoint | 0.76 | 14.93 | |
1 Three years ended 6/30/14. Category Median and Best Quartile Breakpoint based on 72 foreign small/mid objective funds (oldest class only) with at least three years of history. | |||
| The Fund beat the Russell Global ex-U.S. Small Cap on a risk-adjusted basis, as shown by its Sharpe ratio. In addition, the Fund produced lower volatility than the Russell Global ex-U.S. Small Cap and 50% of foreign small/mid objective funds, as shown by its standard deviation. | |||
| The Royce Funds 2014 Semiannual Report to Shareholders | 37 |
| Royce Focus Value Fund |
| AVERAGE ANNUAL TOTAL RETURNS Through 6/30/14 | ||||||||||
| January–June 20141 | 4.28 | % | ||||||||
| One-Year | 23.61 | |||||||||
| Three-Year | 6.35 | |||||||||
| Five-Year | 10.85 | |||||||||
| Since Inception (2/27/09) | 15.34 | |||||||||
| ANNUAL EXPENSE RATIOS | ||||||||||
| Gross Operating Expenses | 1.96 | % | ||||||||
| Net Operating Expenses | 1.21 | |||||||||
| 1 Not Annualized | ||||||||||
| CALENDAR YEAR TOTAL RETURNS | ||||||||||
| Year | RFV | Year | RFV | |||||||
| 2013 | 23.8 | % | 2011 | -13.9 | % | |||||
| 2012 | 9.2 | 2010 | 15.2 | |||||||
 | |||||||||
Manager’s Discussion Royce Focus Value Fund concluded the year-to-date period ended June 30, 2014 with a return of 4.3% compared to a gain of 5.9% for its small- and mid-cap benchmark, the Russell 2500 Index, for the same period. The Fund advanced 2.7% in the first quarter before rising 1.5% in the second. Returns in the last two weeks of June were affected by beginning to move most of the portfolio’s equity investments to cash in anticipation of a full liquidation of the Fund. The Royce Fund’s Board of Trustees approved a plan of liquidation for the Fund, to be effective on July 31, 2014. The Fund is being liquidated primarily because it did not attract and maintain assets at a sufficient level for it to be viable. A distribution was paid on June 26, 2014 to shareholders of record on June 25, 2014. Six of the Fund’s nine equity sectors finished the first half in the black, led by Financials, Energy, and Consumer Staples. Detracting from first-half results were Consumer Discretionary, Health Care, and Telecommunication Services, with the latter two sectors posting only modest net losses. Two groups led at the industry level by sizable margins—diversified financial services and food products. Oil, gas & consumable fuels stocks and semiconductors & semiconductor equipment companies also posted notable net gains for the semiannual period. Of those industries that had a net loss in the first half, internet software & services, specialty retail, IT services, and road & rail detracted the most. Dallas-based Texas Pacific Land Trust, which holds title to tracts of land in the state of Texas, was RFV’s top performer for the semiannual period by a good-sized margin. Its rise was keyed by improved earnings. Micron Technology makes memory chip semiconductors for data storage and other applications. It has diversified its business and expanded margins over the last year. As for positions that detracted from performance, Medicines Company (The) provides acute and intensive care medications. Its stock plummeted on news of a negative patent ruling that would allow a competitor to produce a generic version of its highest revenue-producing drug in the second half of 2015. (The company is appealing the decision.) Uneven trial results for one of the six new drugs in its pipeline also helped to keep investors away. QuinStreet specializes in vertical marketing and media on the Internet, with the bulk of its clients in the education and financial services industries. Its shares began to decline in February when the company reported lower-than-expected revenues. | |||||||||
Important Performance and Expense Information All performance information in this Report reflects past performance, is presented on a total return basis, reflects the reinvestment of distributions, and does not reflect the deduction of taxes that a shareholder would pay on fund distributions or the redemption of fund shares. Past performance is no guarantee of future results. Investment return and principal value of an investment will fluctuate, so that shares may be worth more or less than their original cost when redeemed. Shares redeemed within 180 days of purchase may be subject to a 1% redemption fee payable to the Fund, which is not reflected in the performance shown above; if it were, performance would be lower. Current month-end performance may be higher or lower than performance quoted and may be obtained at www.roycefunds.com. Gross operating expenses reflect total gross annual operating expenses and include management fees, 12b-1 distribution and service fees, other expenses, and acquired fund fees and expenses. Net operating expenses reflect contractual fee waivers and/or reimbursements. All expense information is reported as of the Fund’s most current prospectus. Royce & Associates has contractually agreed to waive its fees and/or reimburse operating expenses to the extent necessary to maintain the Fund’s net annual operating expenses, (excluding brokerage commissions, taxes, interest, litigation expenses, acquired fund fees and expenses, and other expenses not borne in the ordinary course of business), at or below 1.20% through April 30, 2015. Acquired fund fees and expenses reflect the estimated amount of the fees and expenses incurred indirectly by the Fund through its investments in mutual funds, hedge funds, private equity funds, and other investment companies. | |||||
| 38 | The Royce Funds 2014 Semiannual Report to Shareholders |
| Schedules of Investments | June 30, 2014 (unaudited) | |
| Royce Select Fund I | ||
| SHARES | VALUE | ||||||
| COMMON STOCKS – 90.4% | |||||||
| Consumer Discretionary – 10.1% | |||||||
| Auto Components - 1.6% | |||||||
Drew Industries | 4,896 | $ | 244,849 | ||||
Gentex Corporation | 17,875 | 519,984 | |||||
| 764,833 | |||||||
| Automobiles - 0.9% | |||||||
Thor Industries | 8,000 | 454,960 | |||||
| Household Durables - 1.7% | |||||||
NVR 1 | 700 | 805,420 | |||||
| Media - 1.3% | |||||||
E.W. Scripps Company Cl. A 1 | 17,500 | 370,300 | |||||
Wiley (John) & Sons Cl. A | 3,900 | 236,301 | |||||
| 606,601 | |||||||
| Specialty Retail - 3.7% | |||||||
Ascena Retail Group 1 | 46,100 | 788,310 | |||||
Genesco 1 | 11,725 | 962,974 | |||||
| 1,751,284 | |||||||
| Textiles, Apparel & Luxury Goods - 0.9% | |||||||
†Movado Group | 10,311 | 429,659 | |||||
| Total (Cost $3,849,295) | 4,812,757 | ||||||
| Consumer Staples – 3.3% | |||||||
| Food Products - 1.0% | |||||||
Cal-Maine Foods | 6,439 | 478,546 | |||||
| Personal Products - 2.3% | |||||||
†Nu Skin Enterprises Cl. A | 15,025 | 1,111,249 | |||||
| Total (Cost $1,286,553) | 1,589,795 | ||||||
| Energy – 11.4% | |||||||
| Energy Equipment & Services - 11.4% | |||||||
Helmerich & Payne | 7,200 | 835,992 | |||||
Oil States International 1 | 8,000 | 512,720 | |||||
Pason Systems | 30,675 | 862,424 | |||||
SEACOR Holdings 1 | 5,499 | 452,293 | |||||
Superior Energy Services | 5,900 | 213,226 | |||||
TGS-NOPEC Geophysical | 31,675 | 1,012,654 | |||||
Unit Corporation 1 | 22,450 | 1,545,234 | |||||
| Total (Cost $3,170,523) | 5,434,543 | ||||||
| Financials – 9.4% | |||||||
| Capital Markets - 5.9% | |||||||
Federated Investors Cl. B | 42,800 | 1,323,376 | |||||
Lazard Cl. A | 16,100 | 830,116 | |||||
SEI Investments | 19,875 | 651,304 | |||||
| 2,804,796 | |||||||
| Insurance - 3.5% | |||||||
Alleghany Corporation 1 | 2,155 | 944,148 | |||||
Validus Holdings | 18,700 | 715,088 | |||||
| 1,659,236 | |||||||
| Total (Cost $2,978,783) | 4,464,032 | ||||||
| Health Care – 8.2% | |||||||
| Biotechnology - 2.0% | |||||||
Myriad Genetics 1 | 24,700 | 961,324 | |||||
| Life Sciences Tools & Services - 3.4% | |||||||
Bio-Rad Laboratories Cl. A 1 | 6,600 | 790,086 | |||||
Techne Corporation | 9,214 | 852,940 | |||||
| 1,643,026 | |||||||
| Pharmaceuticals - 2.8% | |||||||
| 9,600 | 476,352 | ||||||
Medicines Company (The) 1 | 28,825 | 837,655 | |||||
| 1,314,007 | |||||||
| Total (Cost $3,127,979) | 3,918,357 | ||||||
| Industrials – 21.3% | |||||||
| Aerospace & Defense - 0.5% | |||||||
Cubic Corporation | 4,700 | 209,197 | |||||
| Electrical Equipment - 3.5% | |||||||
EnerSys | 9,875 | 679,301 | |||||
Global Power Equipment Group | 29,918 | 483,475 | |||||
GrafTech International 1 | 49,396 | 516,682 | |||||
| 1,679,458 | |||||||
| Industrial Conglomerates - 1.1% | |||||||
Carlisle Companies | 6,100 | 528,382 | |||||
| Machinery - 11.2% | |||||||
Astec Industries | 3,134 | 137,520 | |||||
CIRCOR International | 15,819 | 1,220,119 | |||||
Columbus McKinnon | 23,700 | 641,085 | |||||
John Bean Technologies | 28,519 | 883,804 | |||||
Kennametal | 9,000 | 416,520 | |||||
Timken Company (The) | 12,500 | 848,000 | |||||
Valmont Industries | 5,585 | 848,641 | |||||
Wabtec Corporation | 4,168 | 344,235 | |||||
| 5,339,924 | |||||||
| Professional Services - 3.6% | |||||||
CRA International 1 | 5,436 | 125,300 | |||||
ICF International 1 | 20,178 | 713,494 | |||||
Robert Half International | 9,903 | 472,769 | |||||
Towers Watson & Co. Cl. A | 3,500 | 364,805 | |||||
TrueBlue 1 | 1,943 | 53,569 | |||||
| 1,729,937 | |||||||
| Trading Companies & Distributors - 1.4% | |||||||
MSC Industrial Direct Cl. A | 6,902 | 660,107 | |||||
| Total (Cost $7,490,019) | 10,147,005 | ||||||
| Information Technology – 17.1% | |||||||
| Communications Equipment - 1.6% | |||||||
ADTRAN | 33,114 | 747,052 | |||||
Electronic Equipment, Instruments & Components - 3.3% | |||||||
Coherent 1 | 4,181 | 276,657 | |||||
Dolby Laboratories Cl. A 1 | 5,200 | 224,640 | |||||
FEI Company | 2,052 | 186,178 | |||||
IPG Photonics 1 | 7,290 | 501,552 | |||||
Rofin-Sinar Technologies 1 | 17,132 | 411,853 | |||||
| 1,600,880 | |||||||
| THE ACCOMPANYING NOTES ARE AN INTEGRAL PART OF THESE FINANCIAL STATEMENTS. | The Royce Funds 2014 Semiannual Report to Shareholders | 39 |
| Schedules of Investments | ||
| Royce Select Fund I (continued) | ||
| SHARES | VALUE | |||||
| Information Technology (continued) | ||||||
| Internet Software & Services - 1.0% | ||||||
†j2 Global | 9,100 | $ | 462,826 | |||
| IT Services - 1.8% | ||||||
Sykes Enterprises 1 | 39,525 | 858,878 | ||||
Semiconductors & Semiconductor Equipment - 8.7% | ||||||
Cabot Microelectronics 1 | 6,391 | 285,358 | ||||
Integrated Silicon Solution 1 | 40,089 | 592,115 | ||||
MKS Instruments | 40,700 | 1,271,468 | ||||
Nanometrics 1 | 38,888 | 709,706 | ||||
Teradyne | 29,000 | 568,400 | ||||
Tessera Technologies | 12,000 | 264,960 | ||||
Veeco Instruments 1 | 12,500 | 465,750 | ||||
| 4,157,757 | ||||||
| Technology Hardware, Storage & Peripherals - 0.7% | ||||||
Silicon Graphics International 1 | 34,000 | 327,080 | ||||
| Total (Cost $6,475,007) | 8,154,473 | |||||
| Materials – 7.4% | ||||||
| Chemicals - 4.1% | ||||||
Innospec | 18,182 | 784,917 | ||||
Minerals Technologies | 11,316 | 742,103 | ||||
OM Group | 13,100 | 424,833 | ||||
| 1,951,853 | ||||||
| Metals & Mining - 2.4% | ||||||
Major Drilling Group International | 36,000 | 262,143 | ||||
Reliance Steel & Aluminum | 12,250 | 902,948 | ||||
| 1,165,091 | ||||||
| Paper & Forest Products - 0.9% | ||||||
Schweitzer-Mauduit International | 10,070 | 439,656 | ||||
| Total (Cost $2,686,660) | 3,556,600 | |||||
| Miscellaneous3 – 2.2% | ||||||
| Total (Cost $971,260) | 1,034,005 | |||||
| TOTAL COMMON STOCKS | ||||||
(Cost $32,036,079) | 43,111,567 | |||||
| REPURCHASE AGREEMENT – 10.8% | ||||||
| Fixed Income Clearing Corporation, | ||||||
0.00% dated 6/30/14, due 7/1/14, | ||||||
maturity value $5,154,000 (collateralized | ||||||
by obligations of various U.S. Government | ||||||
Agencies, due 7/23/14, valued at $5,257,370) | ||||||
(Cost $5,154,000) | 5,154,000 | |||||
| TOTAL INVESTMENTS – 101.2% | ||||||
(Cost $37,190,079) | 48,265,567 | |||||
| LIABILITIES LESS CASH | ||||||
AND OTHER ASSETS – (1.2)% | (568,001 | ) | ||||
| NET ASSETS – 100.0% | $ | 47,697,566 | ||||
| Royce Micro-Cap Discovery Fund | ||||||
| SHARES | VALUE | |||||
| COMMON STOCKS – 96.7% | ||||||
| Consumer Discretionary – 11.3% | ||||||
| Auto Components - 1.4% | ||||||
Standard Motor Products | 1,800 | $ | 80,406 | |||
| Distributors - 0.5% | ||||||
VOXX International Cl. A 1 | 3,100 | 29,171 | ||||
| Diversified Consumer Services - 2.0% | ||||||
Capella Education | 571 | 31,057 | ||||
Steiner Leisure 1 | 1,900 | 82,251 | ||||
| 113,308 | ||||||
| Hotels, Restaurants & Leisure - 0.8% | ||||||
Monarch Casino & Resort 1 | 3,000 | 45,420 | ||||
| Household Durables - 0.6% | ||||||
Lifetime Brands | 2,087 | 32,807 | ||||
| Leisure Products - 1.3% | ||||||
Arctic Cat | 1,843 | 72,651 | ||||
| Media - 2.4% | ||||||
Global Sources 1 | 8,314 | 68,840 | ||||
Harte-Hanks | 8,800 | 63,272 | ||||
| 132,112 | ||||||
| Multiline Retail - 0.7% | ||||||
Fred’s Cl. A | 2,500 | 38,225 | ||||
| Specialty Retail - 0.8% | ||||||
Sears Hometown and Outlet Stores 1 | 2,200 | 47,234 | ||||
| Textiles, Apparel & Luxury Goods - 0.8% | ||||||
Culp | 2,400 | 41,784 | ||||
| Total (Cost $609,707) | 633,118 | |||||
| Consumer Staples – 4.8% | ||||||
| Food & Staples Retailing - 1.9% | ||||||
Village Super Market Cl. A | 4,500 | 106,335 | ||||
| Food Products - 2.1% | ||||||
John B. Sanfilippo & Son | 4,400 | 116,468 | ||||
| Household Products - 0.8% | ||||||
Oil-Dri Corporation of America | 1,600 | 48,912 | ||||
| Total (Cost $271,555) | 271,715 | |||||
| Energy – 3.8% | ||||||
| Energy Equipment & Services - 2.1% | ||||||
†Gulf Island Fabrication | 2,000 | 43,040 | ||||
Matrix Service 1 | 500 | 16,395 | ||||
Newpark Resources 1 | 4,800 | 59,808 | ||||
| 119,243 | ||||||
| Oil, Gas & Consumable Fuels - 1.7% | ||||||
Renewable Energy Group 1 | 5,300 | 60,791 | ||||
VAALCO Energy 1 | 4,800 | 34,704 | ||||
| 95,495 | ||||||
| Total (Cost $179,665) | 214,738 | |||||
| Financials – 7.6% | ||||||
| Capital Markets - 0.8% | ||||||
FBR & Co. 1 | 1,700 | 46,121 | ||||
| Consumer Finance - 1.2% | ||||||
| 4,200 | 64,974 | |||||
| 40 | The Royce Funds 2014 Semiannual Report to Shareholders | THE ACCOMPANYING NOTES ARE AN INTEGRAL PART OF THESE FINANCIAL STATEMENTS. |
| June 30, 2014 (unaudited) |
| SHARES | VALUE | |||||
| Financials (continued) | ||||||
| Insurance - 5.6% | ||||||
Baldwin & Lyons Cl. B | 2,100 | $ | 54,474 | |||
EMC Insurance Group | 1,500 | 46,170 | ||||
Employers Holdings | 2,800 | 59,304 | ||||
†Investors Title Company | 800 | 53,904 | ||||
Kansas City Life Insurance | 500 | 22,740 | ||||
Safety Insurance Group | 700 | 35,966 | ||||
United Fire Group | 1,400 | 41,048 | ||||
| 313,606 | ||||||
| Total (Cost $404,966) | 424,701 | |||||
| Health Care – 15.5% | ||||||
| Health Care Equipment & Supplies - 11.1% | ||||||
AngioDynamics 1 | 4,600 | 75,118 | ||||
Anika Therapeutics 1 | 1,300 | 60,229 | ||||
Atrion Corporation | 200 | 65,200 | ||||
CryoLife | 5,200 | 46,540 | ||||
Exactech 1 | 1,400 | 35,322 | ||||
Invacare Corporation | 6,300 | 115,731 | ||||
PhotoMedex 1 | 5,900 | 72,275 | ||||
Symmetry Medical 1 | 6,900 | 61,134 | ||||
Utah Medical Products | 1,800 | 92,592 | ||||
| 624,141 | ||||||
| Health Care Providers & Services - 3.4% | ||||||
National HealthCare | 2,100 | 118,209 | ||||
PharMerica Corporation 1 | 2,500 | 71,475 | ||||
| 189,684 | ||||||
| Pharmaceuticals - 1.0% | ||||||
SciClone Pharmaceuticals 1 | 10,100 | 53,126 | ||||
| Total (Cost $733,869) | 866,951 | |||||
| Industrials – 19.4% | ||||||
| Aerospace & Defense - 1.5% | ||||||
American Science and Engineering | 500 | 34,795 | ||||
National Presto Industries | 700 | 50,988 | ||||
| 85,783 | ||||||
| Building Products - 0.8% | ||||||
American Woodmark 1 | 1,500 | 47,805 | ||||
| Commercial Services & Supplies - 0.7% | ||||||
Courier Corporation | 2,500 | 37,300 | ||||
| Construction & Engineering - 3.1% | ||||||
Comfort Systems USA | 4,489 | 70,926 | ||||
MYR Group 1 | 4,000 | 101,320 | ||||
| 172,246 | ||||||
| Electrical Equipment - 0.9% | ||||||
| 1,800 | 53,100 | |||||
| Machinery - 5.6% | ||||||
Alamo Group | 2,100 | 113,589 | ||||
Miller Industries | 5,820 | 119,776 | ||||
Standex International | 1,100 | 81,928 | ||||
| 315,293 | ||||||
| Professional Services - 4.5% | ||||||
CDI Corporation | 3,200 | 46,112 | ||||
Heidrick & Struggles International | 1,600 | 29,600 | ||||
ICF International 1 | 1,200 | 42,432 | ||||
Resources Connection | 2,800 | 36,708 | ||||
VSE Corporation | 1,400 | 98,448 | ||||
| 253,300 | ||||||
| Trading Companies & Distributors - 2.3% | ||||||
Aceto Corporation | 3,600 | 65,304 | ||||
Willis Lease Finance 1 | 2,500 | 61,300 | ||||
| 126,604 | ||||||
| Total (Cost $918,007) | 1,091,431 | |||||
| Information Technology – 21.4% | ||||||
| Communications Equipment - 4.3% | ||||||
Comtech Telecommunications | 3,300 | 123,189 | ||||
PCTEL | 6,300 | 50,967 | ||||
TESSCO Technologies | 2,100 | 66,633 | ||||
| 240,789 | ||||||
Electronic Equipment, Instruments & Components - 5.9% | ||||||
Daktronics | 5,600 | 66,752 | ||||
Fabrinet 1 | 2,900 | 59,740 | ||||
Nam Tai Property | 9,000 | 67,860 | ||||
PC Connection | 3,700 | 76,516 | ||||
Richardson Electronics | 5,700 | 59,679 | ||||
| 330,547 | ||||||
| Internet Software & Services - 1.2% | ||||||
United Online 1 | 6,800 | 70,720 | ||||
| IT Services - 3.7% | ||||||
Computer Task Group | 8,100 | 133,326 | ||||
†Hackett Group (The) | 5,700 | 34,029 | ||||
Sykes Enterprises 1 | 1,900 | 41,287 | ||||
| 208,642 | ||||||
| Semiconductors & Semiconductor Equipment - 1.0% | ||||||
Kulicke & Soffa Industries 1 | 3,800 | 54,188 | ||||
| Software - 4.4% | ||||||
Actuate Corporation 1 | 10,000 | 47,700 | ||||
American Software Cl. A | 5,042 | 49,815 | ||||
Ebix | 2,600 | 37,206 | ||||
ePlus 1 | 1,000 | 58,200 | ||||
VASCO Data Security International 1 | 4,600 | 53,360 | ||||
| 246,281 | ||||||
| Technology Hardware, Storage & Peripherals - 0.9% | ||||||
QLogic Corporation 1 | 5,100 | 51,459 | ||||
| Total (Cost $1,042,083) | 1,202,626 | |||||
| Materials – 8.3% | ||||||
| Chemicals - 2.6% | ||||||
FutureFuel Corporation | 4,100 | 68,019 | ||||
KMG Chemicals | 1,100 | 19,778 | ||||
Trecora Resources 1 | 4,900 | 58,016 | ||||
| 145,813 | ||||||
| Construction Materials - 1.8% | ||||||
United States Lime & Minerals | 1,600 | 103,680 | ||||
| THE ACCOMPANYING NOTES ARE AN INTEGRAL PART OF THESE FINANCIAL STATEMENTS. | The Royce Funds 2014 Semiannual Report to Shareholders | 41 |
| Schedules of Investments | ||
| Royce Micro-Cap Discovery Fund (continued) | ||
| SHARES | VALUE | |||||
| Materials (continued) | ||||||
| Containers & Packaging - 0.6% | ||||||
| 1,440 | $ | 34,690 | ||||
| Metals & Mining - 3.3% | ||||||
Ampco-Pittsburgh | 1,300 | 29,822 | ||||
Haynes International | 1,400 | 79,226 | ||||
Materion Corporation | 1,200 | 44,388 | ||||
Universal Stainless & Alloy Products 1 | 900 | 29,232 | ||||
| 182,668 | ||||||
| Total (Cost $386,209) | 466,851 | |||||
| Miscellaneous3 – 4.6% | ||||||
| Total (Cost $253,879) | 255,422 | |||||
| TOTAL COMMON STOCKS | ||||||
(Cost $4,799,940) | 5,427,553 | |||||
| REPURCHASE AGREEMENT – 3.6% | ||||||
| Fixed Income Clearing Corporation, | ||||||
0.00% dated 6/30/14, due 7/1/14, | ||||||
maturity value $201,000 (collateralized | ||||||
by obligations of various U.S. Government | ||||||
Agencies, due 7/23/14, valued at $209,895) | ||||||
(Cost $201,000) | 201,000 | |||||
| TOTAL INVESTMENTS – 100.3% | ||||||
(Cost $5,000,940) | 5,628,553 | |||||
| LIABILITIES LESS CASH | ||||||
AND OTHER ASSETS – (0.3)% | (16,332 | ) | ||||
| NET ASSETS – 100.0% | $ | 5,612,221 | ||||
| Royce Financial Services Fund | ||||||
| SHARES | VALUE | |||||
| COMMON STOCKS – 97.6% | ||||||
| Banks - 5.0% | ||||||
BLOM Bank GDR | 8,000 | $ | 74,800 | |||
CIT Group | 22,500 | 1,029,600 | ||||
First Citizens BancShares Cl. A | 1,900 | 465,500 | ||||
First Republic Bank | 11,600 | 637,884 | ||||
†PNC Financial Services Group | 10,900 | 970,645 | ||||
| Total (Cost $2,887,005) | 3,178,429 | |||||
| Capital Markets - 54.8% | ||||||
AllianceBernstein Holding L.P. | 16,500 | 427,020 | ||||
Apollo Global Management LLC Cl. A | 33,400 | 925,848 | ||||
†ARA Asset Management | 470,000 | 670,944 | ||||
Artisan Partners Asset Management Cl. A | 15,900 | 901,212 | ||||
Ashmore Group | 145,000 | 918,166 | ||||
CETIP - Mercados Organizados | 40,700 | 579,323 | ||||
Charles Schwab | 52,200 | 1,405,746 | ||||
Citadel Capital 1 | 150,000 | 79,090 | ||||
Coronation Fund Managers | 62,000 | 556,805 | ||||
Cowen Group 1 | 117,600 | 496,272 | ||||
Diamond Hill Investment Group | 8,600 | 1,098,392 | ||||
| 42,100 | 677,830 | |||||
Edmond de Rothschild (Suisse) | 20 | 325,891 | ||||
Egyptian Financial Group-Hermes Holding | ||||||
Company 1 | 255,000 | 548,870 | ||||
Federated Investors Cl. B | 35,600 | 1,100,752 | ||||
Financial Engines | 22,400 | 1,014,272 | ||||
GMP Capital | 108,000 | 862,340 | ||||
Invesco | 22,800 | 860,700 | ||||
IOOF Holdings | 11,528 | 91,311 | ||||
Jupiter Fund Management | 147,000 | 1,005,045 | ||||
KKR & Co. L.P. | 40,600 | 987,798 | ||||
Lazard Cl. A | 15,100 | 778,556 | ||||
Manning & Napier Cl. A | 15,800 | 272,708 | ||||
Monroe Capital | 58,050 | 770,323 | ||||
MVC Capital | 47,100 | 609,945 | ||||
Northern Trust | 14,900 | 956,729 | ||||
Oaktree Capital Group LLC Cl. A | 4,700 | 234,953 | ||||
Och-Ziff Capital Management Group | ||||||
LLC Cl. A | 73,300 | 1,013,739 | ||||
Oppenheimer Holdings Cl. A | 24,900 | 597,351 | ||||
Partners Group Holding | 1,000 | 273,342 | ||||
Piper Jaffray 1 | 19,200 | 993,984 | ||||
Raymond James Financial | 18,300 | 928,359 | ||||
Reinet Investments 1 | 5,500 | 126,599 | ||||
RHJ International 1 | 94,000 | 457,837 | ||||
SEI Investments | 28,400 | 930,668 | ||||
SHUAA Capital 1 | 580,000 | 161,076 | ||||
Silvercrest Asset Management | ||||||
Group Cl. A | 41,600 | 715,936 | ||||
Sprott | 391,500 | 1,111,705 | ||||
State Street | 20,300 | 1,365,378 | ||||
Stifel Financial 1 | 17,873 | 846,287 | ||||
TD Ameritrade Holding Corporation | 27,600 | 865,260 | ||||
Tokai Tokyo Financial Holdings | 9,400 | 73,118 | ||||
| 42 | The Royce Funds 2014 Semiannual Report to Shareholders | THE ACCOMPANYING NOTES ARE AN INTEGRAL PART OF THESE FINANCIAL STATEMENTS. |
| June 30, 2014 (unaudited) | ||
| SHARES | VALUE | |||||
| Capital Markets (continued) | ||||||
U.S. Global Investors Cl. A | 225,200 | $ | 792,704 | |||
UOB-Kay Hian Holdings | 99,122 | 128,781 | ||||
Value Partners Group | 1,176,000 | 787,500 | ||||
Virtus Investment Partners 1 | 3,400 | 719,950 | ||||
Vontobel Holding | 16,500 | 575,863 | ||||
Waddell & Reed Financial Cl. A | 11,400 | 713,526 | ||||
Westwood Holdings Group | 15,000 | 900,600 | ||||
WisdomTree Investments 1 | 80,400 | 993,744 | ||||
| Total (Cost $29,537,127) | 35,230,148 | |||||
| Closed-End Funds - 1.2% | ||||||
RIT Capital Partners | 33,500 | 754,488 | ||||
| Total (Cost $682,554) | 754,488 | |||||
| Consumer Finance - 1.6% | ||||||
| 38,200 | 913,362 | |||||
Credit Acceptance 1 | 848 | 104,389 | ||||
| Total (Cost $938,586) | 1,017,751 | |||||
| Diversified Financial Services - 10.4% | ||||||
Bolsa Mexicana de Valores | 121,000 | 256,391 | ||||
Bolsas y Mercados Espanoles | 15,500 | 740,193 | ||||
Bursa Malaysia | 160,000 | 386,671 | ||||
CRISIL | 28,000 | 828,664 | ||||
Hellenic Exchanges - Athens Stock | ||||||
Exchange | 36,000 | 409,147 | ||||
Interactive Brokers Group Cl. A | 12,800 | 298,112 | ||||
JSE | 61,000 | 550,061 | ||||
Leucadia National | 23,801 | 624,062 | ||||
†MarketAxess Holdings | 9,200 | 497,352 | ||||
Moody’s Corporation | 12,300 | 1,078,218 | ||||
MSCI 1 | 8,700 | 398,895 | ||||
Singapore Exchange | 63,000 | 351,151 | ||||
Warsaw Stock Exchange | 19,000 | 243,498 | ||||
| Total (Cost $5,309,810) | 6,662,415 | |||||
| Hotels, Restaurants & Leisure - 0.1% | ||||||
Thomas Cook (India) | 30,600 | 60,187 | ||||
| Total (Cost $28,633) | 60,187 | |||||
| Insurance - 10.2% | ||||||
Alleghany Corporation 1 | 2,600 | 1,139,112 | ||||
E-L Financial | 800 | 525,561 | ||||
First American Financial | 5,000 | 138,950 | ||||
Greenlight Capital Re Cl. A 1 | 18,600 | 612,684 | ||||
Infinity Property & Casualty | 10,000 | 672,300 | ||||
Jardine Lloyd Thompson Group | 11,900 | 211,803 | ||||
Marsh & McLennan | 17,800 | 922,396 | ||||
Platinum Underwriters Holdings | 5,500 | 356,675 | ||||
RLI Corp. | 25,800 | 1,181,124 | ||||
State Auto Financial | 33,800 | 791,934 | ||||
| Total (Cost $5,644,462) | 6,552,539 | |||||
| Internet Software & Services - 1.9% | ||||||
| 15,200 | 743,584 | |||||
Xoom Corporation 1 | 16,900 | 445,484 | ||||
| Total (Cost $1,111,644) | 1,189,068 | |||||
| IT Services - 3.1% | ||||||
Broadridge Financial Solutions | 21,900 | 911,916 | ||||
Vantiv Cl. A 1 | 10,000 | 336,200 | ||||
Western Union | 44,600 | 773,364 | ||||
| Total (Cost $1,580,712) | 2,021,480 | |||||
| Media - 0.5% | ||||||
Morningstar | 4,600 | 330,326 | ||||
| Total (Cost $181,190) | 330,326 | |||||
| Professional Services - 2.1% | ||||||
Towers Watson & Co. Cl. A | 5,500 | 573,265 | ||||
Verisk Analytics Cl. A 1 | 12,800 | 768,256 | ||||
| Total (Cost $1,006,145) | 1,341,521 | |||||
| Real Estate Management & Development - 1.5% | ||||||
Kennedy-Wilson Holdings | 19,676 | 527,710 | ||||
Midland Holdings 1 | 800,000 | 402,560 | ||||
| 223,459 | 60,580 | |||||
| Total (Cost $608,828) | 990,850 | |||||
| Software - 1.7% | ||||||
Fair Isaac | 7,400 | 471,824 | ||||
| 14,200 | 627,924 | |||||
| Total (Cost $783,892) | 1,099,748 | |||||
| Trading Companies & Distributors - 0.9% | ||||||
Air Lease Cl. A | 15,700 | 605,706 | ||||
| Total (Cost $356,874) | 605,706 | |||||
| Miscellaneous3 - 2.6% | ||||||
| Total (Cost $1,603,219) | 1,690,276 | |||||
| TOTAL COMMON STOCKS | ||||||
(Cost $52,260,681) | 62,724,932 | |||||
| REPURCHASE AGREEMENT – 2.4% | ||||||
| Fixed Income Clearing Corporation, | ||||||
0.00% dated 6/30/14, due 7/1/14, | ||||||
maturity value $1,541,000 (collateralized | ||||||
by obligations of various U.S. Government | ||||||
Agencies, due 7/23/14, valued at $1,574,213) | ||||||
(Cost $1,541,000) | 1,541,000 | |||||
| THE ACCOMPANYING NOTES ARE AN INTEGRAL PART OF THESE FINANCIAL STATEMENTS. | The Royce Funds 2014 Semiannual Report to Shareholders | 43 |
| Schedules of Investments | ||
| Royce Financial Services Fund (continued) | ||
| VALUE | ||||
| TOTAL INVESTMENTS – 100.0% | ||||
(Cost $53,801,681) | $ | 64,265,932 | ||
| LIABILITIES LESS CASH | ||||
AND OTHER ASSETS – (0.0)% | (3,073 | ) | ||
| NET ASSETS – 100.0% | $ | 64,262,859 | ||
| Royce Select Fund II |
| SHARES | VALUE | |||||
| COMMON STOCKS – 102.1% | ||||||
| Consumer Discretionary – 28.5% | ||||||
| Auto Components - 3.7% | ||||||
Automodular Corporation | 6,300 | $ | 12,989 | |||
†Nishikawa Rubber | 4,100 | 71,231 | ||||
Selamat Sempurna | 147,600 | 55,342 | ||||
Standard Motor Products | �� | 1,100 | 49,137 | |||
| 188,699 | ||||||
| Diversified Consumer Services - 1.5% | ||||||
Lincoln Educational Services | 16,800 | 75,432 | ||||
| Household Durables - 1.0% | ||||||
| 5,516 | 50,968 | |||||
| Internet & Catalog Retail - 3.0% | ||||||
| 2,832 | 79,296 | |||||
†Trade Me | 24,500 | 75,544 | ||||
| 154,840 | ||||||
| Leisure Products - 1.0% | ||||||
Nautilus 1 | 4,400 | 48,796 | ||||
| Media - 2.6% | ||||||
| 1,700 | 48,416 | |||||
†Pico Far East Holdings | 366,500 | 85,118 | ||||
| 133,534 | ||||||
| Multiline Retail - 5.2% | ||||||
Golden Eagle Retail Group | 51,400 | 61,412 | ||||
New World Department Store China | 298,800 | 120,285 | ||||
†Parkson Retail Asia | 135,800 | 87,128 | ||||
| 268,825 | ||||||
| Specialty Retail - 6.8% | ||||||
Cache 1 | 14,300 | 23,023 | ||||
Destination Maternity 5 | 4,141 | 94,291 | ||||
DSW Cl. A | 2,000 | 55,880 | ||||
Luk Fook Holdings (International) | 9,000 | 26,360 | ||||
Oriental Watch Holdings | 242,200 | 56,875 | ||||
Padini Holdings | 71,100 | 43,621 | ||||
†Sa Sa International Holdings | 75,000 | 51,771 | ||||
| 351,821 | ||||||
| Textiles, Apparel & Luxury Goods - 3.7% | ||||||
Daphne International Holdings | 218,800 | 85,822 | ||||
†Forus | 12,200 | 50,519 | ||||
†Xtep International Holdings | 130,000 | 54,849 | ||||
| 191,190 | ||||||
| Total (Cost $1,546,034) | 1,464,105 | |||||
| Consumer Staples – 2.0% | ||||||
| Food Products - 2.0% | ||||||
Farmer Bros. 1 | 3,023 | 65,327 | ||||
| 2,681 | 37,748 | |||||
| Total (Cost $78,860) | 103,075 | |||||
| Energy – 2.6% | ||||||
| Energy Equipment & Services - 2.0% | ||||||
Newpark Resources 1 | 5,300 | 66,038 | ||||
Total Energy Services | 1,600 | 34,833 | ||||
| 100,871 | ||||||
| 44 | The Royce Funds 2014 Semiannual Report to Shareholders | THE ACCOMPANYING NOTES ARE AN INTEGRAL PART OF THESE FINANCIAL STATEMENTS. |
| June 30, 2014 (unaudited) | ||
| SHARES | VALUE | |||||
| Energy (continued) | ||||||
| Oil, Gas & Consumable Fuels - 0.6% | ||||||
Lundin Petroleum 1 | 1,500 | $ | 30,352 | |||
| Total (Cost $110,141) | 131,223 | |||||
| Financials – 8.6% | ||||||
| Capital Markets - 4.6% | ||||||
CETIP - Mercados Organizados | 2,600 | 37,008 | ||||
†FXCM Cl. A | 5,200 | 77,792 | ||||
†Partners Group Holding | 200 | 54,669 | ||||
†Tokai Tokyo Financial Holdings | 9,000 | 70,006 | ||||
| 239,475 | ||||||
| Real Estate Management & Development - 4.0% | ||||||
Brasil Brokers Participacoes | 54,300 | 86,261 | ||||
E-House (China) Holdings ADR | 6,500 | 56,225 | ||||
†LPS Brasil Consultoria de Imoveis | 13,600 | 61,552 | ||||
| 204,038 | ||||||
| Total (Cost $464,330) | 443,513 | |||||
| Health Care – 3.6% | ||||||
| Health Care Equipment & Supplies - 2.6% | ||||||
Analogic Corporation | 600 | 46,944 | ||||
Invacare Corporation 5 | 4,600 | 84,502 | ||||
| 131,446 | ||||||
| Health Care Providers & Services - 1.0% | ||||||
Addus HomeCare 1 | 2,400 | 53,952 | ||||
| Total (Cost $179,458) | 185,398 | |||||
| Industrials – 24.9% | ||||||
| Aerospace & Defense - 1.3% | ||||||
†Magellan Aerospace | 6,000 | 66,239 | ||||
| Air Freight & Logistics - 1.1% | ||||||
Aramex | 71,300 | 58,239 | ||||
| Commercial Services & Supplies - 5.4% | ||||||
Blue Label Telecoms | 43,700 | 35,174 | ||||
†Collection House | 45,000 | 79,773 | ||||
†Latchways | 2,800 | 51,513 | ||||
†Programmed Maintenance Services | 19,700 | 52,199 | ||||
†Steelcase Cl. A | 3,800 | 57,494 | ||||
| 276,153 | ||||||
| Machinery - 8.5% | ||||||
Freund Corporation | 8,700 | 121,519 | ||||
†Nitto Kohki | 4,000 | 82,010 | ||||
Obara Group | 1,600 | 69,335 | ||||
Sun Hydraulics 5 | 1,100 | 44,660 | ||||
Zuiko Corporation | 2,100 | 118,780 | ||||
| 436,304 | ||||||
| Marine - 0.7% | ||||||
Clarkson | 800 | 32,790 | ||||
| Professional Services - 6.1% | ||||||
Acacia Research 5 | 8,750 | 155,313 | ||||
Nihon M&A Center | 2,200 | 62,804 | ||||
†YAMADA Consulting Group | 3,800 | 97,377 | ||||
| 315,494 | ||||||
| Road & Rail - 1.8% | ||||||
†Trancom | 2,400 | 94,290 | ||||
| Total (Cost $1,161,009) | 1,279,509 | |||||
| Information Technology – 23.7% | ||||||
| Communications Equipment - 2.1% | ||||||
Comba Telecom Systems Holdings 1 | 200,000 | 63,997 | ||||
| 125,000 | 43,488 | |||||
| 107,485 | ||||||
| Internet Software & Services - 1.3% | ||||||
| 2,900 | 68,556 | |||||
| IT Services - 5.2% | ||||||
Computer Task Group 5 | 7,329 | 120,635 | ||||
| 20,000 | 64,400 | |||||
Metrofile Holdings | 125,400 | 56,598 | ||||
Syntel 1 | 300 | 25,788 | ||||
| 267,421 | ||||||
| Semiconductors & Semiconductor Equipment - 9.5% | ||||||
| 7,000 | 85,610 | |||||
Brooks Automation | 10,700 | 115,239 | ||||
Eugene Technology | 2,308 | 43,455 | ||||
Kulicke & Soffa Industries 1 | 4,200 | 59,892 | ||||
Miraial | 3,300 | 59,938 | ||||
| 7,940 | 68,284 | |||||
Silicon Motion Technology ADR | 2,800 | 57,204 | ||||
| 489,622 | ||||||
| Software - 5.6% | ||||||
American Software Cl. A 5 | 4,756 | 46,989 | ||||
†Cyient | 6,300 | 37,709 | ||||
| 50,000 | 47,705 | |||||
†KPIT Technologies | 14,100 | 40,416 | ||||
SeaChange International 1 | 9,600 | 76,896 | ||||
Totvs | 2,200 | 37,837 | ||||
| 287,552 | ||||||
| Total (Cost $1,147,099) | 1,220,636 | |||||
| Materials – 3.6% | ||||||
| Chemicals - 1.9% | ||||||
†AirBoss of America | 6,200 | 53,397 | ||||
Fufeng Group | 110,300 | 41,414 | ||||
| 94,811 | ||||||
| Metals & Mining - 0.7% | ||||||
Imdex 1 | 63,500 | 37,723 | ||||
| Paper & Forest Products - 1.0% | ||||||
†Western Forest Products | 24,300 | 50,784 | ||||
| Total (Cost $167,848) | 183,318 | |||||
| Miscellaneous3 – 4.6% | ||||||
| Total (Cost $259,481) | 238,883 | |||||
| TOTAL COMMON STOCKS | ||||||
(Cost $5,114,260) | 5,249,660 | |||||
| THE ACCOMPANYING NOTES ARE AN INTEGRAL PART OF THESE FINANCIAL STATEMENTS. | The Royce Funds 2014 Semiannual Report to Shareholders | 45 |
| Schedules of Investments | ||
Royce Select Fund II (continued) | ||
| SHARES | VALUE | |||||
| REPURCHASE AGREEMENT – 3.9% | ||||||
| Fixed Income Clearing Corporation, | ||||||
0.00% dated 6/30/14, due 7/1/14, | ||||||
maturity value $201,000 (collateralized | ||||||
by obligations of various U.S. Government | ||||||
Agencies, due 8/5/14, valued at $209,895) | ||||||
(Cost $201,000) | $ | 201,000 | ||||
| TOTAL INVESTMENTS – 106.0% | ||||||
(Cost $5,315,260) | 5,450,660 | |||||
| LIABILITIES LESS CASH | ||||||
AND OTHER ASSETS – (6.0)% | (307,305 | ) | ||||
| NET ASSETS – 100.0% | $ | 5,143,355 | ||||
| SECURITIES SOLD SHORT | ||||||
| COMMON STOCKS – 5.6% | ||||||
| Diversified Investment Companies – 3.4% | ||||||
| Exchange Traded Funds - 3.4% | ||||||
VelocityShares Daily Inverse VIX Short- | ||||||
Term ETN | 3,900 | $ | 175,422 | |||
| Total (Proceeds $148,321) | 175,422 | |||||
| Industrials – 1.0% | ||||||
| Machinery - 1.0% | ||||||
Middleby Corporation | 600 | 49,632 | ||||
| Total (Proceeds $49,821) | 49,632 | |||||
| Information Technology – 1.2% | ||||||
| Electronic Equipment, Instruments & Components - 1.2% | ||||||
Control4 Corporation | 3,200 | 62,592 | ||||
| Total (Proceeds $59,266) | 62,592 | |||||
| TOTAL SECURITIES SOLD SHORT | ||||||
(Proceeds $257,408) | $ | 287,646 | ||||
| Royce European Smaller-Companies Fund | ||||||
| SHARES | VALUE | |||||
| COMMON STOCKS – 94.1% | ||||||
| Austria – 4.7% | ||||||
Mayr-Melnhof Karton | 6,800 | $ | 810,171 | |||
Semperit AG Holding | 14,000 | 857,867 | ||||
| Total (Cost $1,406,672) | 1,668,038 | |||||
| Belgium – 2.1% | ||||||
Sipef | 5,500 | 469,944 | ||||
Van de Velde | 5,000 | 265,986 | ||||
| Total (Cost $704,438) | 735,930 | |||||
| Cyprus – 1.7% | ||||||
Globaltrans Investment GDR | 52,500 | 601,125 | ||||
| Total (Cost $712,759) | 601,125 | |||||
| Denmark – 0.6% | ||||||
| 16,600 | 213,413 | |||||
| Total (Cost $219,936) | 213,413 | |||||
| Finland – 3.0% | ||||||
F-Secure | 120,000 | 422,292 | ||||
Nokian Renkaat | 16,500 | �� | 643,914 | |||
| Total (Cost $997,138) | 1,066,206 | |||||
| France – 18.4% | ||||||
Altamir | 21,300 | 331,035 | ||||
Alten | 7,200 | 342,155 | ||||
Audika Groupe 1 | 25,000 | 484,048 | ||||
Beneteau 1 | 12,500 | 227,903 | ||||
bioMerieux | 3,300 | 355,621 | ||||
Boiron | 4,500 | 391,339 | ||||
Gaztransport Et Technigaz | 5,100 | 332,481 | ||||
†Lectra | 20,500 | 217,267 | ||||
Manutan International | 7,000 | 447,912 | ||||
†Nexity | 8,700 | 399,261 | ||||
Parrot 1 | 20,000 | 510,749 | ||||
†SEB | 5,000 | 442,627 | ||||
Societe Internationale de Plantations | ||||||
d’Heveas | 8,500 | 407,833 | ||||
Stallergenes | 8,500 | 655,162 | ||||
Vetoquinol | 9,500 | 470,642 | ||||
Virbac | 2,100 | 485,102 | ||||
| Total (Cost $5,995,787) | 6,501,137 | |||||
| Germany – 12.8% | ||||||
Aixtron 1 | 19,500 | 282,233 | ||||
Amadeus Fire | 3,500 | 267,952 | ||||
Bertrandt | 2,000 | 318,225 | ||||
†GFT Technologies | 22,500 | 305,936 | ||||
| 20,000 | 312,200 | |||||
KWS Saat | 2,500 | 881,487 | ||||
LPKF Laser & Electronics | 27,500 | 567,849 | ||||
Mobotix | 15,000 | 249,555 | ||||
PUMA | 1,700 | 485,349 | ||||
| 46 | The Royce Funds 2014 Semiannual Report to Shareholders | THE ACCOMPANYING NOTES ARE AN INTEGRAL PART OF THESE FINANCIAL STATEMENTS. |
| June 30, 2014 (unaudited) | ||
| SHARES | VALUE | |||||
| Germany (continued) | ||||||
SMT Scharf | 12,500 | $ | 304,669 | |||
SNP Schneider-Neureither & Partner | 17,500 | 335,359 | ||||
Takkt | 11,000 | 201,684 | ||||
| Total (Cost $4,484,070) | 4,512,498 | |||||
| Ireland – 0.9% | ||||||
| 240,000 | 326,535 | |||||
| Total (Cost $331,952) | 326,535 | |||||
| Italy – 4.8% | ||||||
Azimut Holding | 8,500 | 219,047 | ||||
De’Longhi | 17,500 | 378,611 | ||||
DiaSorin | 15,000 | 628,509 | ||||
Recordati | 27,500 | 462,413 | ||||
| Total (Cost $1,082,637) | 1,688,580 | |||||
| Netherlands – 2.8% | ||||||
Beter Bed Holding | 10,000 | 237,094 | ||||
†Exact Holding | 10,000 | 356,018 | ||||
Fugro | 7,128 | 408,130 | ||||
| Total (Cost $944,591) | 1,001,242 | |||||
| Norway – 5.6% | ||||||
†Eltek | 380,000 | 588,537 | ||||
Fred. Olsen Energy | 20,000 | 567,344 | ||||
Spectrum | 45,000 | 308,126 | ||||
TGS-NOPEC Geophysical | 16,000 | 511,522 | ||||
| Total (Cost $1,818,234) | 1,975,529 | |||||
| Poland – 1.2% | ||||||
†Elektrobudowa | 14,000 | 402,358 | ||||
| Total (Cost $395,043) | 402,358 | |||||
| Slovenia – 1.7% | ||||||
Krka d.d., Novo mesto | 6,100 | 584,691 | ||||
| Total (Cost $515,549) | 584,691 | |||||
| Sweden – 1.7% | ||||||
Lundin Petroleum 1 | 30,000 | 607,045 | ||||
| Total (Cost $616,297) | 607,045 | |||||
| Switzerland – 4.8% | ||||||
Forbo Holding | 400 | 426,477 | ||||
VZ Holding | 3,500 | 586,096 | ||||
Zehnder Group | 15,500 | 664,186 | ||||
| Total (Cost $1,398,486) | 1,676,759 | |||||
| Turkey – 1.4% | ||||||
Mardin Cimento Sanayii | 200,000 | 481,450 | ||||
| Total (Cost $526,085) | 481,450 | |||||
| United Kingdom – 25.9% | ||||||
Ashmore Group | 140,000 | 886,505 | ||||
AVEVA Group | 11,500 | 401,101 | ||||
Clarkson | 14,000 | 573,832 | ||||
Consort Medical | 50,000 | 816,338 | ||||
Domino Printing Sciences | 37,500 | 385,065 | ||||
E2V Technologies | 200,000 | 571,608 | ||||
Elementis | 100,000 | 445,477 | ||||
EnQuest 1 | 170,000 | 410,804 | ||||
†Hyder Consulting | 69,000 | 546,150 | ||||
Jupiter Fund Management | 45,000 | 307,667 | ||||
Kennedy Wilson Europe Real Estate 1 | 30,000 | 564,762 | ||||
Latchways | 35,000 | 643,914 | ||||
| 70,000 | 299,495 | |||||
Rotork | 7,000 | 319,861 | ||||
Sepura | 70,000 | 179,697 | ||||
Severfield 1 | 520,000 | 493,910 | ||||
Spirax-Sarco Engineering | 4,815 | 225,210 | ||||
Spirent Communications | 325,000 | 528,117 | ||||
Victrex | 9,500 | 276,716 | ||||
†Xaar | 30,000 | 267,492 | ||||
| Total (Cost $7,794,710) | 9,143,721 | |||||
| TOTAL COMMON STOCKS | ||||||
(Cost $29,944,384) | 33,186,257 | |||||
| REPURCHASE AGREEMENT – 7.8% | ||||||
| Fixed Income Clearing Corporation, | ||||||
0.00% dated 6/30/14, due 7/1/14, | ||||||
maturity value $2,742,000 (collateralized | ||||||
by obligations of various U.S. Government | ||||||
Agencies, due 10/16/14, valued at $2,800,000) | ||||||
(Cost $2,742,000) | 2,742,000 | |||||
| TOTAL INVESTMENTS – 101.9% | ||||||
(Cost $32,686,384) | 35,928,257 | |||||
| LIABILITIES LESS CASH | ||||||
AND OTHER ASSETS – (1.9)% | (673,713 | ) | ||||
| NET ASSETS – 100.0% | $ | 35,254,544 | ||||
| THE ACCOMPANYING NOTES ARE AN INTEGRAL PART OF THESE FINANCIAL STATEMENTS. | The Royce Funds 2014 Semiannual Report to Shareholders | 47 |
| Schedules of Investments |
Royce Enterprise Select Fund |
| SHARES | VALUE | |||||
| COMMON STOCKS – 71.9% | ||||||
| Consumer Discretionary – 16.6% | ||||||
| Auto Components - 1.5% | ||||||
Standard Motor Products | 962 | $ | 42,972 | |||
| Automobiles - 2.8% | ||||||
Thor Industries | 1,400 | 79,618 | ||||
| Distributors - 1.6% | ||||||
Core-Mark Holding Company | 530 | 24,184 | ||||
Genuine Parts | 260 | 22,828 | ||||
| 47,012 | ||||||
| Household Durables - 4.0% | ||||||
Garmin | 480 | 29,232 | ||||
Mohawk Industries 1 | 370 | 51,186 | ||||
NVR 1 | 30 | 34,518 | ||||
| 114,936 | ||||||
| Media - 2.3% | ||||||
| 2,400 | 64,752 | |||||
| Multiline Retail - 0.7% | ||||||
Dollar Tree 1 | 390 | 21,239 | ||||
| Specialty Retail - 3.7% | ||||||
Advance Auto Parts | 340 | 45,873 | ||||
Finish Line (The) Cl. A | 1,600 | 47,584 | ||||
Ross Stores | 200 | 13,226 | ||||
| 106,683 | ||||||
| Total (Cost $387,009) | 477,212 | |||||
| Energy – 3.8% | ||||||
| Energy Equipment & Services - 3.1% | ||||||
Helmerich & Payne | 190 | 22,061 | ||||
SEACOR Holdings 1 | 220 | 18,095 | ||||
†TGS-NOPEC Geophysical | 1,500 | 47,955 | ||||
| 88,111 | ||||||
| Oil, Gas & Consumable Fuels - 0.7% | ||||||
†World Fuel Services | 430 | 21,169 | ||||
| Total (Cost $96,538) | 109,280 | |||||
| Financials – 4.9% | ||||||
| Capital Markets - 1.5% | ||||||
Artisan Partners Asset Management Cl. A | 240 | 13,603 | ||||
| 1,145 | 29,209 | |||||
| 42,812 | ||||||
| Real Estate Management & Development - 3.4% | ||||||
Jones Lang LaSalle | 220 | 27,806 | ||||
Kennedy-Wilson Holdings | 2,600 | 69,732 | ||||
| 97,538 | ||||||
| Total (Cost $101,507) | 140,350 | |||||
| Health Care – 3.2% | ||||||
| Health Care Equipment & Supplies - 3.2% | ||||||
Analogic Corporation | 200 | 15,648 | ||||
DENTSPLY International | 1,070 | 50,664 | ||||
IDEXX Laboratories 1 | 200 | 26,714 | ||||
| Total (Cost $80,146) | 93,026 | |||||
| Industrials – 20.8% | ||||||
| Aerospace & Defense - 0.9% | ||||||
Curtiss-Wright | 370 | 24,257 | ||||
| Commercial Services & Supplies - 4.4% | ||||||
Copart 1 | 1,500 | 53,940 | ||||
Ritchie Bros. Auctioneers | 1,600 | 39,440 | ||||
UniFirst Corporation | 140 | 14,840 | ||||
†Waste Connections | 400 | 19,420 | ||||
| 127,640 | ||||||
| Electrical Equipment - 3.8% | ||||||
EnerSys | 770 | 52,968 | ||||
Powell Industries | 430 | 28,114 | ||||
| 600 | 28,068 | |||||
| 109,150 | ||||||
| Industrial Conglomerates - 1.8% | ||||||
Carlisle Companies | 600 | 51,972 | ||||
| Machinery - 5.9% | ||||||
AGCO Corporation | 430 | 24,175 | ||||
Donaldson Company | 691 | 29,243 | ||||
Kennametal | 520 | 24,066 | ||||
Mueller Industries | 780 | 22,940 | ||||
Mueller Water Products Cl. A | 1,550 | 13,392 | ||||
†Semperit AG Holding | 650 | 39,829 | ||||
Valmont Industries | 100 | 15,195 | ||||
| 168,840 | ||||||
| Professional Services - 1.7% | ||||||
ManpowerGroup | 580 | 49,213 | ||||
| Road & Rail - 1.3% | ||||||
†Union Pacific | 380 | 37,905 | ||||
| Trading Companies & Distributors - 1.0% | ||||||
MSC Industrial Direct Cl. A | 300 | 28,692 | ||||
| Total (Cost $545,647) | 597,669 | |||||
| Information Technology – 11.5% | ||||||
| Communications Equipment - 0.5% | ||||||
ADTRAN | 550 | 12,408 | ||||
Plantronics | 70 | 3,363 | ||||
| 15,771 | ||||||
| Electronic Equipment, Instruments & Components - 5.1% | ||||||
Avnet | 800 | 35,448 | ||||
AVX Corporation | 1,660 | 22,045 | ||||
Coherent 1 | 600 | 39,702 | ||||
Rogers Corporation 1 | 726 | 48,170 | ||||
| 145,365 | ||||||
| IT Services - 0.8% | ||||||
Fiserv 1 | 400 | 24,128 | ||||
| Semiconductors & Semiconductor Equipment - 2.1% | ||||||
Diodes 1 | 400 | 11,584 | ||||
Lam Research | 300 | 20,274 | ||||
| 48 | The Royce Funds 2014 Semiannual Report to Shareholders | THE ACCOMPANYING NOTES ARE AN INTEGRAL PART OF THESE FINANCIAL STATEMENTS. |
| June 30, 2014 (unaudited) | ||
| SHARES | VALUE | |||||
| Information Technology (continued) | ||||||
| Semiconductors & Semiconductor Equipment (continued) | ||||||
Skyworks Solutions | 600 | $ | 28,176 | |||
| 60,034 | ||||||
| Software - 1.6% | ||||||
Mentor Graphics | 750 | 16,178 | ||||
MICROS Systems 1 | 440 | 29,876 | ||||
| 46,054 | ||||||
| Technology Hardware, Storage & Peripherals - 1.4% | ||||||
Diebold | 700 | 28,119 | ||||
Western Digital | 130 | 11,999 | ||||
| 40,118 | ||||||
| Total (Cost $275,972) | 331,470 | |||||
| Materials – 8.0% | ||||||
| Chemicals - 6.4% | ||||||
Cabot Corporation | 591 | 34,272 | ||||
Minerals Technologies | 284 | 18,625 | ||||
Rockwood Holdings | 500 | 37,995 | ||||
†Sensient Technologies | 550 | 30,646 | ||||
Stepan Company | 250 | 13,215 | ||||
Westlake Chemical | 570 | 47,743 | ||||
| 182,496 | ||||||
| Metals & Mining - 0.4% | ||||||
Reliance Steel & Aluminum | 170 | 12,531 | ||||
| Paper & Forest Products - 1.2% | ||||||
Glatfelter | 1,323 | 35,099 | ||||
| Total (Cost $199,599) | 230,126 | |||||
| Utilities – 1.6% | ||||||
| Gas Utilities - 1.6% | ||||||
UGI Corporation | 900 | 45,450 | ||||
| Total (Cost $28,437) | 45,450 | |||||
| Miscellaneous3 – 1.5% | ||||||
| Total (Cost $45,096) | 44,253 | |||||
| TOTAL COMMON STOCKS | ||||||
(Cost $1,759,951) | 2,068,836 | |||||
| FIXED INCOME – 1.7% | ||||||
| Government Bonds – 1.7% | ||||||
iShares 1-3 Year Treasury Bond ETF | 590 | 49,891 | ||||
| TOTAL FIXED INCOME | ||||||
(Cost $49,848) | 49,891 | |||||
| REPURCHASE AGREEMENT – 25.7% | ||||
| Fixed Income Clearing Corporation, | ||||
0.00% dated 6/30/14, due 7/1/14, | ||||
maturity value $740,000 (collateralized | ||||
by obligations of various U.S. Government | ||||
Agencies, 0.07% due 11/21/14, valued at $755,000) | ||||
(Cost $740,000) | 740,000 | |||
| TOTAL INVESTMENTS – 99.3% | ||||
(Cost $2,549,799) | 2,858,727 | |||
| CASH AND OTHER ASSETS | ||||
LESS LIABILITIES – 0.7% | 19,885 | |||
| NET ASSETS – 100.0% | $ | 2,878,612 | ||
| THE ACCOMPANYING NOTES ARE AN INTEGRAL PART OF THESE FINANCIAL STATEMENTS. | The Royce Funds 2014 Semiannual Report to Shareholders | 49 |
| Schedules of Investments |
Royce SMid-Cap Value Fund |
| SHARES | VALUE | |||||
| COMMON STOCKS – 91.5% | ||||||
| Consumer Discretionary – 8.2% | ||||||
| Auto Components - 0.2% | ||||||
Autoliv | 370 | $ | 39,434 | |||
| Automobiles - 2.9% | ||||||
Thor Industries | 10,200 | 580,074 | ||||
| Household Durables - 0.9% | ||||||
Garmin | 3,100 | 188,790 | ||||
| Specialty Retail - 4.2% | ||||||
Chico’s FAS | 8,600 | 145,856 | ||||
†Finish Line (The) Cl. A | 11,200 | 333,088 | ||||
GameStop Corporation Cl. A | 6,000 | 242,820 | ||||
Signet Jewelers | 1,220 | 134,920 | ||||
| 856,684 | ||||||
| Total (Cost $1,325,278) | 1,664,982 | |||||
| Consumer Staples – 3.8% | ||||||
| Food Products - 2.4% | ||||||
Cal-Maine Foods | 3,000 | 222,960 | ||||
Sanderson Farms | 2,700 | 262,440 | ||||
| 485,400 | ||||||
| Personal Products - 1.4% | ||||||
†Nu Skin Enterprises Cl. A | 3,800 | 281,048 | ||||
| Total (Cost $680,050) | 766,448 | |||||
| Energy – 14.0% | ||||||
| Energy Equipment & Services - 12.2% | ||||||
Helmerich & Payne | 5,000 | 580,550 | ||||
Pason Systems | 11,000 | 309,264 | ||||
†TGS-NOPEC Geophysical | 18,600 | 594,645 | ||||
Trican Well Service | 29,700 | 479,575 | ||||
Unit Corporation 1 | 7,200 | 495,576 | ||||
| 2,459,610 | ||||||
| Oil, Gas & Consumable Fuels - 1.8% | ||||||
HollyFrontier Corporation | 8,500 | 371,365 | ||||
| Total (Cost $2,276,543) | 2,830,975 | |||||
| Financials – 12.0% | ||||||
| Capital Markets - 8.0% | ||||||
Artisan Partners Asset Management Cl. A | 5,000 | 283,400 | ||||
Ashmore Group | 96,100 | 608,522 | ||||
Federated Investors Cl. B | 6,000 | 185,520 | ||||
Sprott | 89,800 | 254,997 | ||||
Value Partners Group | 434,000 | 290,625 | ||||
| 1,623,064 | ||||||
| Real Estate Management & Development - 4.0% | ||||||
Jones Lang LaSalle | 830 | 104,904 | ||||
Kennedy-Wilson Holdings | 25,800 | 691,956 | ||||
| 796,860 | ||||||
| Total (Cost $2,160,123) | 2,419,924 | |||||
| Health Care – 6.7% | ||||||
| Biotechnology - 4.3% | ||||||
Cubist Pharmaceuticals 1 | 2,600 | 181,532 | ||||
Myriad Genetics 1 | 17,700 | 688,884 | ||||
| 870,416 | ||||||
| Pharmaceuticals - 2.4% | ||||||
Medicines Company (The) 1 | 16,800 | 488,208 | ||||
| Total (Cost $1,103,432) | 1,358,624 | |||||
| Industrials – 15.7% | ||||||
| Construction & Engineering - 1.2% | ||||||
Jacobs Engineering Group 1 | 4,400 | 234,432 | ||||
| Machinery - 10.9% | ||||||
AGCO Corporation | 10,800 | 607,176 | ||||
Kennametal | 3,200 | 148,096 | ||||
Lincoln Electric Holdings | 1,500 | 104,820 | ||||
Lindsay Corporation | 2,600 | 219,622 | ||||
Semperit AG Holding | 11,700 | 716,931 | ||||
Valmont Industries | 2,445 | 371,518 | ||||
Wabtec Corporation | 400 | 33,036 | ||||
| 2,201,199 | ||||||
| Marine - 1.2% | ||||||
†Clarkson | 4,000 | 163,952 | ||||
Kirby Corporation 1 | 700 | 81,998 | ||||
| 245,950 | ||||||
| Professional Services - 2.4% | ||||||
ManpowerGroup | 5,700 | 483,645 | ||||
| Total (Cost $2,685,562) | 3,165,226 | |||||
| Information Technology – 14.7% | ||||||
| Electronic Equipment, Instruments & Components - 0.8% | ||||||
AVX Corporation | 12,200 | 162,016 | ||||
| Semiconductors & Semiconductor Equipment - 7.5% | ||||||
Cirrus Logic 1 | 27,400 | 623,076 | ||||
International Rectifier 1 | 8,942 | 249,482 | ||||
Lam Research | 5,000 | 337,900 | ||||
Teradyne | 15,550 | 304,780 | ||||
| 1,515,238 | ||||||
| Technology Hardware, Storage & Peripherals - 6.4% | ||||||
SanDisk Corporation | 6,100 | 637,023 | ||||
Western Digital | 7,000 | 646,100 | ||||
| 1,283,123 | ||||||
| Total (Cost $2,129,260) | 2,960,377 | |||||
| Materials – 16.4% | ||||||
| Chemicals - 4.0% | ||||||
†Rockwood Holdings | 2,500 | 189,975 | ||||
Westlake Chemical | 7,400 | 619,824 | ||||
| 809,799 | ||||||
| Metals & Mining - 11.6% | ||||||
†Franco-Nevada Corporation | 5,100 | 292,434 | ||||
†Fresnillo | 13,200 | 196,989 | ||||
Globe Specialty Metals | 29,400 | 610,932 | ||||
Pan American Silver | 34,000 | 521,900 | ||||
Randgold Resources ADR | 3,300 | 279,180 | ||||
| 50 | The Royce Funds 2014 Semiannual Report to Shareholders | THE ACCOMPANYING NOTES ARE AN INTEGRAL PART OF THESE FINANCIAL STATEMENTS. |
| June 30, 2014 (unaudited) | ||
| SHARES | VALUE | |||||
| Materials (continued) | ||||||
| Metals & Mining (continued) | ||||||
Reliance Steel & Aluminum | 5,900 | $ | 434,889 | |||
| 2,336,324 | ||||||
| Paper & Forest Products - 0.8% | ||||||
Stella-Jones | 6,300 | 172,991 | ||||
| Total (Cost $2,676,607) | 3,319,114 | |||||
| TOTAL COMMON STOCKS | ||||||
(Cost $15,036,855) | 18,485,670 | |||||
| REPURCHASE AGREEMENT – 8.3% | ||||||
| Fixed Income Clearing Corporation, | ||||||
0.00% dated 6/30/14, due 7/1/14, | ||||||
maturity value $1,675,000 (collateralized | ||||||
by obligations of various U.S. Government | ||||||
Agencies, 2.125% due 8/31/20, valued at | ||||||
$1,709,400) | ||||||
(Cost $1,675,000) | 1,675,000 | |||||
| TOTAL INVESTMENTS – 99.8% | ||||||
(Cost $16,711,855) | 20,160,670 | |||||
| CASH AND OTHER ASSETS | ||||||
LESS LIABILITIES – 0.2% | 46,201 | |||||
| NET ASSETS – 100.0% | $ | 20,206,871 | ||||
| Royce Partners Fund | ||||||
| SHARES | VALUE | |||||
| COMMON STOCKS – 84.3% | ||||||
| Consumer Discretionary – 2.2% | ||||||
| Household Durables - 1.0% | ||||||
Hunter Douglas | 600 | $ | 28,755 | |||
| Media - 1.2% | ||||||
Morningstar | 480 | 34,469 | ||||
| Total (Cost $38,308) | 63,224 | |||||
| Consumer Staples – 1.0% | ||||||
| Food Products - 1.0% | ||||||
†Fresh Del Monte Produce | 1,000 | 30,650 | ||||
| Total (Cost $25,212) | 30,650 | |||||
| Energy – 5.9% | ||||||
| Energy Equipment & Services - 5.0% | ||||||
Ensco Cl. A | 560 | 31,119 | ||||
Schlumberger | 288 | 33,970 | ||||
Tidewater | 720 | 40,428 | ||||
Transocean | 900 | 40,527 | ||||
| 146,044 | ||||||
| Oil, Gas & Consumable Fuels - 0.9% | ||||||
†Cameco Corporation | 1,300 | 25,493 | ||||
| Total (Cost $145,207) | 171,537 | |||||
| Financials – 30.6% | ||||||
| Banks - 1.3% | ||||||
| 3,300 | 38,412 | |||||
| Capital Markets - 22.5% | ||||||
ASA Gold and Precious Metals | 2,700 | 39,555 | ||||
Ashmore Group | 8,000 | 50,658 | ||||
Aurelius | 900 | 32,880 | ||||
Bank of New York Mellon (The) | 1,360 | 50,973 | ||||
Charles Schwab | 1,656 | 44,596 | ||||
Coronation Fund Managers | 4,300 | 38,617 | ||||
Jupiter Fund Management | 7,300 | 49,910 | ||||
KKR & Co. L.P. | 1,040 | 25,303 | ||||
Monroe Capital | 3,390 | 44,985 | ||||
Northern Trust | 448 | 28,766 | ||||
RHJ International 1 | 8,000 | 38,965 | ||||
SEI Investments | 1,152 | 37,751 | ||||
Sprott | 18,200 | 51,681 | ||||
State Street | 886 | 59,592 | ||||
Value Partners Group | 84,000 | 56,250 | ||||
| 650,482 | ||||||
| Diversified Financial Services - 1.6% | ||||||
Moody’s Corporation | 525 | 46,021 | ||||
| Insurance - 2.7% | ||||||
E-L Financial | 120 | 78,834 | ||||
| Real Estate Management & Development - 2.5% | ||||||
Jones Lang LaSalle | 320 | 40,445 | ||||
| THE ACCOMPANYING NOTES ARE AN INTEGRAL PART OF THESE FINANCIAL STATEMENTS. | The Royce Funds 2014 Semiannual Report to Shareholders | 51 |
| Schedules of Investments |
Royce Partners Fund (continued) |
| SHARES | VALUE | |||||
| Financials (continued) | ||||||
| Real Estate Management & Development (continued) | ||||||
Midland Holdings 1 | 64,000 | $ | 32,205 | |||
| 72,650 | ||||||
| Total (Cost $658,408) | 886,399 | |||||
| Health Care – 4.2% | ||||||
| Biotechnology - 1.2% | ||||||
Myriad Genetics 1 | 880 | 34,250 | ||||
| Health Care Equipment & Supplies - 2.3% | ||||||
Atrion Corporation | 200 | 65,200 | ||||
| Health Care Providers & Services - 0.7% | ||||||
Landauer | 500 | 21,000 | ||||
| Total (Cost $96,536) | 120,450 | |||||
| Industrials – 19.0% | ||||||
| Air Freight & Logistics - 1.6% | ||||||
Expeditors International of | ||||||
Washington | 1,040 | 45,927 | ||||
| Commercial Services & Supplies - 1.6% | ||||||
Heritage-Crystal Clean 1 | 2,400 | 47,112 | ||||
| Machinery - 6.5% | ||||||
Foster (L.B.) Company | 640 | 34,637 | ||||
Graco | 576 | 44,974 | ||||
RBC Bearings | 560 | 35,868 | ||||
Spirax-Sarco Engineering | 770 | 36,015 | ||||
Valmont Industries | 240 | 36,468 | ||||
| 187,962 | ||||||
| Professional Services - 5.6% | ||||||
Acacia Research | 1,700 | 30,175 | ||||
ManpowerGroup | 560 | 47,516 | ||||
Towers Watson & Co. Cl. A | 392 | 40,858 | ||||
Verisk Analytics Cl. A 1 | 698 | 41,894 | ||||
| 160,443 | ||||||
| Road & Rail - 2.6% | ||||||
Landstar System | 640 | 40,960 | ||||
Patriot Transportation Holding 1 | 960 | 33,571 | ||||
| 74,531 | ||||||
| Trading Companies & Distributors - 1.1% | ||||||
Applied Industrial Technologies | 640 | 32,467 | ||||
| Total (Cost $356,806) | 548,442 | |||||
| Information Technology – 10.6% | ||||||
| Electronic Equipment, Instruments & Components - 7.5% | ||||||
Amphenol Corporation Cl. A | 300 | 28,902 | ||||
Anixter International | 400 | 40,028 | ||||
FARO Technologies 1 | 600 | 29,472 | ||||
IPG Photonics 1 | 440 | 30,272 | ||||
National Instruments | 1,200 | 38,868 | ||||
Orbotech 1 | 1,000 | 15,180 | ||||
Sutron Corporation 1 | 6,700 | 34,371 | ||||
| 217,093 | ||||||
| IT Services - 1.8% | ||||||
MasterCard Cl. A | 710 | 52,164 | ||||
| Technology Hardware, Storage & Peripherals - 1.3% | ||||||
Western Digital | 400 | 36,920 | ||||
| Total (Cost $189,365) | 306,177 | |||||
| Materials – 9.5% | ||||||
| Chemicals - 0.6% | ||||||
Airgas | 160 | 17,426 | ||||
| Containers & Packaging - 2.9% | ||||||
Greif Cl. A | 704 | 38,410 | ||||
Mayr-Melnhof Karton | 375 | 44,679 | ||||
| 83,089 | ||||||
| Metals & Mining - 4.7% | ||||||
Fresnillo | 2,000 | 29,847 | ||||
Pan American Silver | 3,200 | 49,120 | ||||
Reliance Steel & Aluminum | 760 | 56,019 | ||||
| 134,986 | ||||||
| Paper & Forest Products - 1.3% | ||||||
Stella-Jones | 1,400 | 38,442 | ||||
| Total (Cost $232,747) | 273,943 | |||||
| Miscellaneous3 – 1.3% | ||||||
| Total (Cost $34,180) | 38,052 | |||||
| TOTAL COMMON STOCKS | ||||||
(Cost $1,776,769) | 2,438,874 | |||||
| REPURCHASE AGREEMENT – 15.8% | ||||||
| Fixed Income Clearing Corporation, | ||||||
0.00% dated 6/30/14, due 7/1/14, | ||||||
maturity value $457,000 (collateralized | ||||||
by obligations of various U.S. Government | ||||||
Agencies, 2.125% due 8/31/20, valued at $468,050) | ||||||
(Cost $457,000) | 457,000 | |||||
| TOTAL INVESTMENTS – 100.1% | ||||||
(Cost $2,233,769) | 2,895,874 | |||||
| LIABILITIES LESS CASH | ||||||
AND OTHER ASSETS – (0.1)% | (3,563 | ) | ||||
| NET ASSETS – 100.0% | $ | 2,892,311 | ||||
| 52 | The Royce Funds 2014 Semiannual Report to Shareholders | THE ACCOMPANYING NOTES ARE AN INTEGRAL PART OF THESE FINANCIAL STATEMENTS. |
| June 30, 2014 (unaudited) | ||
| Royce Opportunity Select Fund | ||
| SHARES | VALUE | |||||
| COMMON STOCKS – 99.3% | ||||||
| Consumer Discretionary – 12.5% | ||||||
| Auto Components - 1.2% | ||||||
Tower International 1 | 7,500 | $ | 276,300 | |||
| Hotels, Restaurants & Leisure - 1.6% | ||||||
Orient-Express Hotels Cl. A 1 | 27,000 | 392,580 | ||||
| Household Durables - 5.3% | ||||||
| 13,000 | 137,670 | |||||
| 20,000 | 245,000 | |||||
M.D.C. Holdings | 16,500 | 499,785 | ||||
| 20,000 | 282,600 | |||||
ZAGG 1 | 20,000 | 108,600 | ||||
| 1,273,655 | ||||||
| Media - 1.4% | ||||||
| 25,000 | 104,500 | |||||
| 40,000 | 222,000 | |||||
| 326,500 | ||||||
| Multiline Retail - 1.6% | ||||||
J.C. Penney Company 1 | 42,000 | 380,100 | ||||
| Specialty Retail - 1.2% | ||||||
| 20,000 | 47,600 | |||||
Zumiez 1 | 9,000 | 248,310 | ||||
| 295,910 | ||||||
| Textiles, Apparel & Luxury Goods - 0.2% | ||||||
Quiksilver 1 | 14,500 | 51,910 | ||||
| Total (Cost $2,679,682) | 2,996,955 | |||||
| Energy – 10.1% | ||||||
| Energy Equipment & Services - 3.6% | ||||||
| 4,500 | 152,010 | |||||
Hercules Offshore 1 | 62,000 | 249,240 | ||||
McDermott International 1 | 31,500 | 254,835 | ||||
Patterson-UTI Energy | 5,800 | 202,652 | ||||
| 858,737 | ||||||
| Oil, Gas & Consumable Fuels - 6.5% | ||||||
Goodrich Petroleum 1 | 13,300 | 367,080 | ||||
| 10,000 | 292,800 | |||||
Scorpio Tankers | 23,500 | 238,995 | ||||
Swift Energy 1 | 33,000 | 428,340 | ||||
Warren Resources 1 | 37,000 | 229,400 | ||||
| 1,556,615 | ||||||
| Total (Cost $1,907,346) | 2,415,352 | |||||
| �� | ||||||
| Financials – 9.3% | ||||||
| Banks - 4.5% | ||||||
First NBC Bank Holding Company 1 | 7,600 | 254,676 | ||||
Independent Bank Group 5 | 6,400 | 356,288 | ||||
TriState Capital Holdings 1 | 16,000 | 226,080 | ||||
Trustmark Corporation | 9,600 | 237,024 | ||||
| 1,074,068 | ||||||
| Insurance - 1.3% | ||||||
MBIA 1 | 28,000 | 309,120 | ||||
| Real Estate Investment Trusts (REITs) - 1.9% | ||||||
| 40,000 | 242,000 | |||||
RAIT Financial Trust | 25,000 | 206,750 | ||||
| 448,750 | ||||||
| Real Estate Management & Development - 1.6% | ||||||
Kennedy-Wilson Holdings | 14,500 | 388,890 | ||||
| Total (Cost $1,852,187) | 2,220,828 | |||||
| Health Care – 4.0% | ||||||
| Health Care Equipment & Supplies - 2.5% | ||||||
| 30,000 | 264,000 | |||||
| 38,000 | 327,180 | |||||
| 591,180 | ||||||
| Health Care Providers & Services - 1.5% | ||||||
†Owens & Minor | 10,500 | 356,790 | ||||
| Total (Cost $770,702) | 947,970 | |||||
| Industrials – 18.6% | ||||||
| Aerospace & Defense - 1.5% | ||||||
Kratos Defense & Security Solutions 1 | 46,000 | 358,800 | ||||
| Air Freight & Logistics - 1.0% | ||||||
XPO Logistics 1 | 8,000 | 228,960 | ||||
| Airlines - 0.8% | ||||||
JetBlue Airways 1 | 18,000 | 195,300 | ||||
| Building Products - 3.6% | ||||||
Builders FirstSource 1 | 27,000 | 201,960 | ||||
NCI Building Systems 1 | 17,000 | 330,310 | ||||
Quanex Building Products | 18,000 | 321,660 | ||||
| 853,930 | ||||||
| Construction & Engineering - 0.3% | ||||||
Ameresco Cl. A 1 | 12,000 | 84,360 | ||||
| Electrical Equipment - 1.3% | ||||||
General Cable | 12,000 | 307,920 | ||||
| Machinery - 5.7% | ||||||
Accuride Corporation 1 | 70,500 | 344,745 | ||||
Commercial Vehicle Group 1 | 27,500 | 276,100 | ||||
Hardinge | 13,600 | 172,040 | ||||
Meritor 1 | 19,000 | 247,760 | ||||
Mueller Water Products Cl. A | 36,000 | 311,040 | ||||
| 1,351,685 | ||||||
| Marine - 0.7% | ||||||
Baltic Trading | 30,000 | 179,400 | ||||
| Road & Rail - 1.9% | ||||||
ArcBest Corporation 5 | 5,000 | 217,550 | ||||
Swift Transportation Cl. A 1 | 9,000 | 227,070 | ||||
| 444,620 | ||||||
| Trading Companies & Distributors - 1.8% | ||||||
Air Lease Cl. A | 11,500 | 443,670 | ||||
| Total (Cost $3,534,021) | 4,448,645 | |||||
| Information Technology – 29.1% | ||||||
| Communications Equipment - 3.0% | ||||||
Extreme Networks 1 | 114,500 | 508,380 | ||||
Interphase Corporation 1 | 11,500 | 49,795 | ||||
Oclaro 1 | 35,000 | 77,000 | ||||
| THE ACCOMPANYING NOTES ARE AN INTEGRAL PART OF THESE FINANCIAL STATEMENTS. | The Royce Funds 2014 Semiannual Report to Shareholders | 53 |
| Schedules of Investments |
| Royce Opportunity Select Fund (continued) |
| SHARES | VALUE | |||||
| Information Technology (continued) | ||||||
| Communications Equipment (continued) | ||||||
Westell Technologies Cl. A 1 | 27,500 | $ | 67,375 | |||
| 702,550 | ||||||
| Electronic Equipment, Instruments & Components - 4.3% | ||||||
II-VI 1 | 16,000 | 231,360 | ||||
| 8,800 | 270,512 | |||||
Newport Corporation 1 | 19,000 | 351,500 | ||||
| 50,000 | 174,500 | |||||
| 1,027,872 | ||||||
| Internet Software & Services - 2.6% | ||||||
Carbonite 1 | 22,000 | 263,340 | ||||
†EarthLink Holdings | 80,000 | 297,600 | ||||
Limelight Networks 1 | 15,000 | 45,900 | ||||
| 606,840 | ||||||
| IT Services - 1.5% | ||||||
CIBER 1 | 31,000 | 153,140 | ||||
Datalink Corporation 1 | 20,600 | 206,000 | ||||
| 359,140 | ||||||
| Semiconductors & Semiconductor Equipment - 14.3% | ||||||
| 15,000 | 139,050 | |||||
Audience 1 | 16,000 | 191,360 | ||||
Exar Corporation 1 | 24,500 | 276,850 | ||||
Fairchild Semiconductor International 1 | 19,800 | 308,880 | ||||
FormFactor 1 | 11,500 | 95,680 | ||||
| 14,000 | 205,520 | |||||
Integrated Silicon Solution 1 | 15,300 | 225,981 | ||||
International Rectifier 1 | 9,500 | 265,050 | ||||
Intersil Corporation Cl. A | 18,000 | 269,100 | ||||
Mattson Technology 1 | 88,000 | 192,720 | ||||
NeoPhotonics Corporation 1 | 32,500 | 135,200 | ||||
OmniVision Technologies 1 | 5,000 | 109,900 | ||||
| 37,000 | 354,830 | |||||
Rubicon Technology 1 | 12,500 | 109,375 | ||||
| 29,000 | 286,520 | |||||
| 36,000 | 22,716 | |||||
SunEdison 1 | 10,000 | 226,000 | ||||
| 3,414,732 | ||||||
| Software - 1.3% | ||||||
†Mentor Graphics | 13,000 | 280,410 | ||||
| 35,000 | 36,400 | |||||
| 316,810 | ||||||
| Technology Hardware, Storage & Peripherals - 2.1% | ||||||
Logitech International | 29,000 | 377,870 | ||||
QLogic Corporation 1 | 13,000 | 131,170 | ||||
| 509,040 | ||||||
| Total (Cost $6,253,321) | 6,936,984 | |||||
| Materials – 11.3% | ||||||
| Chemicals - 3.5% | ||||||
Kraton Performance Polymers 1 | 17,300 | 387,347 | ||||
OM Group | 13,500 | 437,805 | ||||
| 825,152 | ||||||
| Metals & Mining - 6.2% | ||||||
| 58,000 | 461,680 | |||||
Carpenter Technology | 5,200 | 328,900 | ||||
Commercial Metals | 15,000 | 259,650 | ||||
RTI International Metals 1 | 16,000 | 425,440 | ||||
| 1,475,670 | ||||||
| Paper & Forest Products - 1.6% | ||||||
Louisiana-Pacific Corporation 1 | 26,000 | 390,520 | ||||
| Total (Cost $2,609,654) | 2,691,342 | |||||
| Miscellaneous3 – 4.4% | ||||||
| Total (Cost $1,042,341) | 1,052,470 | |||||
| TOTAL COMMON STOCKS | ||||||
(Cost $20,649,254) | 23,710,546 | |||||
| REPURCHASE AGREEMENT – 2.8% | ||||||
| Fixed Income Clearing Corporation, | ||||||
0.00% dated 6/30/14, due 7/1/14, | ||||||
maturity value $654,000 (collateralized | ||||||
by obligations of various U.S. Government | ||||||
Agencies, 2.125% due 8/31/20, valued at $671,550) | ||||||
(Cost $654,000) | 654,000 | |||||
| TOTAL INVESTMENTS – 102.1% | ||||||
(Cost $21,303,254) | 24,364,546 | |||||
| LIABILITIES LESS CASH | ||||||
AND OTHER ASSETS – (2.1)% | (492,921 | ) | ||||
| NET ASSETS – 100.0% | $ | 23,871,625 | ||||
| SECURITIES SOLD SHORT | ||||||
| COMMON STOCKS – 5.1% | ||||||
| Consumer Discretionary – 3.2% | ||||||
| Hotels, Restaurants & Leisure - 1.5% | ||||||
Buffalo Wild Wings | 500 | $ | 82,855 | |||
Fiesta Restaurant Group | 1,500 | 69,615 | ||||
Life Time Fitness | 1,800 | 87,732 | ||||
Popeyes Louisiana Kitchen | 2,500 | 109,275 | ||||
| 349,477 | ||||||
| Specialty Retail - 1.7% | ||||||
Lumber Liquidators Holdings | 2,000 | 151,900 | ||||
Men’s Wearhouse (The) | 1,000 | 55,800 | ||||
Sonic Automotive Cl. A | 2,000 | 53,360 | ||||
Vitamin Shoppe | 3,500 | 150,570 | ||||
| 411,630 | ||||||
| Total (Proceeds $769,142) | 761,107 | |||||
| Consumer Staples – 0.6% | ||||||
| Food & Staples Retailing - 0.6% | ||||||
Fresh Market (The) | 2,500 | 83,675 | ||||
Sprouts Farmers Markets | 2,000 | 65,440 | ||||
| Total (Proceeds $181,481) | 149,115 | |||||
| 54 | The Royce Funds 2014 Semiannual Report to Shareholders | THE ACCOMPANYING NOTES ARE AN INTEGRAL PART OF THESE FINANCIAL STATEMENTS. |
| June 30, 2014 (unaudited) | ||
| SHARES | VALUE | |||||
| Diversified Investment Companies – 0.3% | ||||||
| Exchange Traded Funds - 0.3% | ||||||
iShares Russell 2000 ETF | 700 | $ | 83,167 | |||
| Total (Proceeds $80,177) | 83,167 | |||||
| Industrials – 0.2% | ||||||
| Building Products - 0.2% | ||||||
Trex Company | 1,500 | 43,230 | ||||
| Total (Proceeds $55,701) | 43,230 | |||||
| Information Technology – 0.3% | ||||||
| Internet Software & Services - 0.3% | ||||||
Zillow Cl. A | 500 | 71,465 | ||||
| Total (Proceeds $40,310) | 71,465 | |||||
| Materials – 0.5% | ||||||
| Chemicals - 0.5% | ||||||
CF Industries Holdings | 500 | 120,265 | ||||
| Total (Proceeds $115,606) | 120,265 | |||||
| TOTAL SECURITIES SOLD SHORT | ||||||
(Proceeds $1,242,417) | $ | 1,228,349 | ||||
| Royce Global Dividend Value Fund | ||||||
| SHARES | VALUE | |||||
| COMMON STOCKS – 97.4% | ||||||
| Australia – 0.5% | ||||||
Imdex 1 | 80,000 | $ | 47,525 | |||
| Total (Cost $78,336) | 47,525 | |||||
| Austria – 1.9% | ||||||
Mayr-Melnhof Karton | 700 | 83,400 | ||||
Semperit AG Holding | 1,800 | 110,297 | ||||
| Total (Cost $175,116) | 193,697 | |||||
| Brazil – 5.4% | ||||||
Brasil Brokers Participacoes | 46,250 | 73,473 | ||||
CETIP - Mercados Organizados | 6,600 | 93,944 | ||||
Eternit | 14,000 | 53,795 | ||||
Grendene | 9,000 | 56,253 | ||||
Iguatemi Empresa de Shopping Centers | 4,000 | 40,407 | ||||
MAHLE Metal Leve | 6,200 | 64,511 | ||||
Totvs | 9,000 | 154,786 | ||||
| Total (Cost $592,726) | 537,169 | |||||
| Canada – 8.3% | ||||||
Aimia | 3,000 | 52,519 | ||||
Alaris Royalty | 2,000 | 54,205 | ||||
Canadian Energy Services & Technology | 1,209 | 37,866 | ||||
Computer Modelling Group | 2,700 | 74,949 | ||||
E-L Financial | 70 | 45,986 | ||||
Gluskin Sheff + Associates | 1,800 | 53,711 | ||||
GMP Capital | 11,000 | 87,831 | ||||
KP Tissue | 3,000 | 44,450 | ||||
Major Drilling Group International | 7,500 | 54,613 | ||||
Pan American Silver | 5,700 | 87,495 | ||||
Sprott | 22,500 | 63,891 | ||||
Stella-Jones | 3,840 | 105,442 | ||||
Trican Well Service | 4,200 | 67,819 | ||||
| Total (Cost $800,612) | 830,777 | |||||
| Chile – 1.7% | ||||||
Forus | 15,000 | 62,114 | ||||
Inversiones La Construccion | 5,000 | 59,673 | ||||
Sonda | 20,000 | 47,015 | ||||
| Total (Cost $210,131) | 168,802 | |||||
| China – 1.7% | ||||||
Daphne International Holdings | 125,000 | 49,030 | ||||
Pacific Online | 105,000 | 57,984 | ||||
Xtep International Holdings | 150,000 | 63,287 | ||||
| Total (Cost $206,693) | 170,301 | |||||
| Cyprus – 0.9% | ||||||
Globaltrans Investment GDR | 7,600 | 87,020 | ||||
| Total (Cost $91,622) | 87,020 | |||||
| THE ACCOMPANYING NOTES ARE AN INTEGRAL PART OF THESE FINANCIAL STATEMENTS. | The Royce Funds 2014 Semiannual Report to Shareholders | 55 |
| Schedules of Investments |
| Royce Global Dividend Value Fund (continued) |
| SHARES | VALUE | |||||
| Denmark – 0.7% | ||||||
Matas | 2,600 | $ | 73,776 | |||
| Total (Cost $63,396) | 73,776 | |||||
| Finland – 2.1% | ||||||
F-Secure | 20,000 | 70,382 | ||||
Nokian Renkaat | 1,700 | 66,343 | ||||
Tieto | 2,500 | 73,976 | ||||
| Total (Cost $181,293) | 210,701 | |||||
| France – 3.6% | ||||||
Alten | 1,400 | 66,530 | ||||
bioMerieux | 400 | 43,106 | ||||
Gaztransport Et Technigaz | 900 | 58,673 | ||||
†Nexity | 2,200 | 100,963 | ||||
Vetoquinol | 1,900 | 94,128 | ||||
| Total (Cost $319,517) | 363,400 | |||||
| Germany – 2.5% | ||||||
Amadeus Fire | 800 | 61,246 | ||||
Aurelius | 1,900 | 69,413 | ||||
Nemetschek | 700 | 67,584 | ||||
Pfeiffer Vacuum Technology | 430 | 47,416 | ||||
| Total (Cost $199,405) | 245,659 | |||||
| Hong Kong – 10.7% | ||||||
Bonjour Holdings | 236,500 | 36,923 | ||||
Bosideng International Holdings | 224,000 | 33,526 | ||||
Dickson Concepts (International) | 105,000 | 64,081 | ||||
†Giordano International | 40,000 | 23,586 | ||||
Goldlion Holdings | 80,000 | 32,411 | ||||
Le Saunda Holdings | 120,000 | 60,229 | ||||
Lung Kee (Bermuda) Holdings | 150,000 | 53,804 | ||||
Midland Holdings 1 | 185,000 | 93,092 | ||||
New World Department Store China | 135,000 | 54,346 | ||||
Oriental Watch Holdings | 207,000 | 48,609 | ||||
Pacific Textiles Holdings | 52,500 | 65,909 | ||||
Pico Far East Holdings | 250,000 | 58,061 | ||||
Regent Manner International Holdings | 437,000 | 95,289 | ||||
Stella International Holdings | 35,000 | 95,285 | ||||
Television Broadcasts | 15,000 | 97,350 | ||||
Value Partners Group | 120,000 | 80,357 | ||||
VTech Holdings | 3,000 | 39,908 | ||||
Win Hanverky Holdings | 276,000 | 38,104 | ||||
| Total (Cost $1,063,742) | 1,070,870 | |||||
| India – 1.0% | ||||||
Graphite India | 58,000 | 101,593 | ||||
| Total (Cost $79,747) | 101,593 | |||||
| Indonesia – 0.8% | ||||||
Selamat Sempurna | 200,000 | 74,989 | ||||
| Total (Cost $30,635) | 74,989 | |||||
| Israel – 0.9% | ||||||
Hilan | 10,000 | 85,181 | ||||
| Total (Cost $73,037) | 85,181 | |||||
| Italy – 1.0% | ||||||
DiaSorin | 1,500 | 62,851 | ||||
Recordati | 2,000 | 33,630 | ||||
| Total (Cost $80,641) | 96,481 | |||||
| Japan – 5.6% | ||||||
Dr.Ci:Labo | 1,600 | 60,412 | ||||
EPS Corporation | 6,000 | 77,054 | ||||
Hogy Medical | 1,100 | 59,612 | ||||
Miraial | 3,500 | 63,570 | ||||
Moshi Moshi Hotline | 7,500 | 73,886 | ||||
Santen Pharmaceutical | 1,500 | 84,399 | ||||
TOTO | 4,000 | 53,897 | ||||
USS | 5,000 | 85,336 | ||||
| Total (Cost $441,523) | 558,166 | |||||
| Malaysia – 3.2% | ||||||
CB Industrial Product Holding | 75,000 | 102,305 | ||||
Media Chinese International | 225,000 | 67,269 | ||||
Media Prima | 85,000 | 68,296 | ||||
Padini Holdings | 125,000 | 76,689 | ||||
| Total (Cost $261,046) | 314,559 | |||||
| Mexico – 2.4% | ||||||
Bolsa Mexicana de Valores | 40,000 | 84,758 | ||||
Fresnillo | 6,800 | 101,479 | ||||
Industrias Bachoco ADR | 1,000 | 53,770 | ||||
| Total (Cost $219,344) | 240,007 | |||||
| Netherlands – 1.1% | ||||||
Exact Holding | 2,000 | 71,204 | ||||
Hunter Douglas | 900 | 43,133 | ||||
| Total (Cost $87,892) | 114,337 | |||||
| New Zealand – 0.4% | ||||||
†Trade Me | 14,000 | 43,168 | ||||
| Total (Cost $47,303) | 43,168 | |||||
| Norway – 2.1% | ||||||
Fred. Olsen Energy | 2,500 | 70,918 | ||||
Oslo Bors VPS Holding | 5,000 | 59,506 | ||||
TGS-NOPEC Geophysical | 2,500 | 79,925 | ||||
| Total (Cost $189,717) | 210,349 | |||||
| Poland – 0.5% | ||||||
Warsaw Stock Exchange | 4,000 | 51,263 | ||||
| Total (Cost $57,360) | 51,263 | |||||
| Singapore – 3.7% | ||||||
ARA Asset Management | 39,050 | 55,745 | ||||
| 56 | The Royce Funds 2014 Semiannual Report to Shareholders | THE ACCOMPANYING NOTES ARE AN INTEGRAL PART OF THESE FINANCIAL STATEMENTS. |
| June 30, 2014 (unaudited) |
| SHARES | VALUE | |||||
| Singapore (continued) | ||||||
ComfortDelGro Corporation | 40,000 | $ | 80,199 | |||
CSE Global | 80,000 | 39,137 | ||||
Pan-United Corporation | 94,000 | 81,041 | ||||
Silverlake Axis | 115,000 | 110,675 | ||||
| Total (Cost $286,699) | 366,797 | |||||
| South Africa – 6.8% | ||||||
Afrimat | 55,600 | 79,989 | ||||
AVI | 6,400 | 36,860 | ||||
Blue Label Telecoms | 100,000 | 80,489 | ||||
Cashbuild | 5,500 | 64,645 | ||||
Coronation Fund Managers | 11,200 | 100,584 | ||||
Foschini Group (The) | 6,000 | 62,906 | ||||
Gold Fields ADR | 12,200 | 45,384 | ||||
JSE | 8,700 | 78,451 | ||||
Lewis Group | 8,500 | 51,791 | ||||
Raubex Group | 36,000 | 76,671 | ||||
| Total (Cost $652,914) | 677,770 | |||||
| South Korea – 0.8% | ||||||
GS Home Shopping | 135 | 32,182 | ||||
Hanssem | 600 | 46,136 | ||||
| Total (Cost $36,656) | 78,318 | |||||
| Sweden – 0.3% | ||||||
Bjoern Borg | 9,100 | 30,644 | ||||
| Total (Cost $40,976) | 30,644 | |||||
| Switzerland – 5.0% | ||||||
Belimo Holding | 20 | 53,947 | ||||
Forbo Holding | 100 | 106,619 | ||||
Kaba Holding | 150 | 74,171 | ||||
LEM Holding | 80 | 69,373 | ||||
Transocean | 1,600 | 72,048 | ||||
VZ Holding | 335 | 56,098 | ||||
Zehnder Group | 1,500 | 64,276 | ||||
| Total (Cost $397,604) | 496,532 | |||||
| Turkey – 0.7% | ||||||
Mardin Cimento Sanayii | 30,000 | 72,218 | ||||
| Total (Cost $98,421) | 72,218 | |||||
| United Arab Emirates – 0.8% | ||||||
Aramex | 92,000 | 75,147 | ||||
| Total (Cost $57,210) | 75,147 | |||||
| United Kingdom – 11.3% | ||||||
Ashmore Group | 17,500 | 110,813 | ||||
AVEVA Group | 1,312 | 45,760 | ||||
Clarkson | 1,900 | 77,877 | ||||
Close Brothers Group | 1,200 | 26,246 | ||||
Consort Medical | 5,000 | 81,634 | ||||
De La Rue | 2,700 | 37,428 | ||||
Diploma | 2,500 | 27,425 | ||||
Domino Printing Sciences | 7,000 | 71,879 | ||||
E2V Technologies | 21,500 | 61,448 | ||||
Fidessa Group | 1,800 | 68,203 | ||||
Homeserve | 14,000 | 77,150 | ||||
†Hyder Consulting | 7,500 | 59,364 | ||||
Investec | 5,000 | 46,122 | ||||
Jupiter Fund Management | 12,900 | 88,198 | ||||
Latchways | 4,000 | 73,590 | ||||
Michael Page International | 3,500 | 25,817 | ||||
Rathbone Brothers | 700 | 23,720 | ||||
RIT Capital Partners | 1,000 | 22,522 | ||||
Spirax-Sarco Engineering | 950 | 44,434 | ||||
Victrex | 2,000 | 58,256 | ||||
| Total (Cost $874,119) | 1,127,886 | |||||
| United States – 9.0% | ||||||
Cabot Corporation | 1,000 | 57,990 | ||||
Commercial Metals | 3,825 | 66,211 | ||||
†Diebold | 1,300 | 52,221 | ||||
Expeditors International of Washington | 1,100 | 48,576 | ||||
FLIR Systems | 3,250 | 112,872 | ||||
Fresh Del Monte Produce | 2,300 | 70,495 | ||||
†Globe Specialty Metals | 4,645 | 96,523 | ||||
Haynes International | 900 | 50,931 | ||||
KBR | 2,200 | 52,470 | ||||
†Lindsay Corporation | 900 | 76,023 | ||||
National Instruments | 2,000 | 64,780 | ||||
| 1,600 | 62,464 | |||||
Western Union | 4,700 | 81,498 | ||||
| Total (Cost $812,719) | 893,054 | |||||
| TOTAL COMMON STOCKS | ||||||
(Cost $8,808,152) | 9,708,156 | |||||
| REPURCHASE AGREEMENT – 2.9% | ||||||
| Fixed Income Clearing Corporation, | ||||||
0.00% dated 6/30/14, due 7/1/14, | ||||||
maturity value $290,000 (collateralized | ||||||
by obligations of various U.S. Government | ||||||
Agencies, due 7/23/14, valued at $299,850) | ||||||
(Cost $290,000) | 290,000 | |||||
| TOTAL INVESTMENTS – 100.3% | ||||||
(Cost $9,098,152) | 9,998,156 | |||||
| LIABILITIES LESS CASH | ||||||
AND OTHER ASSETS – (0.3)% | (31,476 | ) | ||||
| NET ASSETS – 100.0% | $ | 9,966,680 | ||||
| THE ACCOMPANYING NOTES ARE AN INTEGRAL PART OF THESE FINANCIAL STATEMENTS. | The Royce Funds 2014 Semiannual Report to Shareholders | 57 |
| Schedules of Investments |
| Royce International Micro-Cap Fund |
| SHARES | VALUE | |||||
| COMMON STOCKS – 93.0% | ||||||
| Australia – 5.4% | ||||||
Collection House | 46,400 | $ | 82,255 | |||
Imdex 1 | 76,000 | 45,148 | ||||
Programmed Maintenance Services | 23,700 | 62,798 | ||||
TFS Corporation | 48,851 | 76,006 | ||||
†Webjet | 9,700 | 22,135 | ||||
| Total (Cost $273,889) | 288,342 | |||||
| Austria – 0.8% | ||||||
†Zumtobel | 1,800 | 42,048 | ||||
| Total (Cost $33,964) | 42,048 | |||||
| Bahamas – 0.9% | ||||||
| 1,100 | 47,619 | |||||
| Total (Cost $52,896) | 47,619 | |||||
| Belgium – 0.8% | ||||||
| 1,800 | 28,394 | |||||
Picanol Group 1 | 400 | 15,281 | ||||
| Total (Cost $37,972) | 43,675 | |||||
| Bermuda – 1.3% | ||||||
| 14,000 | 31,111 | |||||
Northern Offshore | 22,600 | 37,950 | ||||
| Total (Cost $68,853) | 69,061 | |||||
| Brazil – 2.4% | ||||||
Brasil Brokers Participacoes | 34,000 | 54,012 | ||||
†Contax Participacoes | 20,000 | 25,074 | ||||
†LPS Brasil Consultoria de Imoveis | 11,300 | 51,143 | ||||
| Total (Cost $169,281) | 130,229 | |||||
| Canada – 8.1% | ||||||
AirBoss of America | 6,200 | 53,398 | ||||
†COM DEV International | 8,200 | 32,814 | ||||
Contrans Group Cl. A | 3,600 | 48,211 | ||||
| 40,000 | 12,745 | |||||
HNZ Group | 1,600 | 34,518 | ||||
Lassonde Industries Cl. A | 210 | 21,255 | ||||
Magellan Aerospace | 12,300 | 135,789 | ||||
MTY Food Group | 2,000 | 56,605 | ||||
Total Energy Services | 1,800 | 39,186 | ||||
| Total (Cost $359,045) | 434,521 | |||||
| Chile – 0.8% | ||||||
†Forus | 10,700 | 44,308 | ||||
| Total (Cost $46,223) | 44,308 | |||||
| China – 5.7% | ||||||
Daphne International Holdings | 151,900 | 59,581 | ||||
E-House (China) Holdings ADR | 8,000 | 69,200 | ||||
†Fufeng Group | 121,000 | 45,431 | ||||
†Hopefluent Group Holdings | 76,000 | 21,965 | ||||
Pacific Online | 110,000 | 60,745 | ||||
| 41,000 | 529 | |||||
†SinoMedia Holdings | 30,000 | 23,225 | ||||
Xtep International Holdings | 60,000 | 25,315 | ||||
| Total (Cost $314,581) | 305,991 | |||||
| Denmark – 0.5% | ||||||
| 1,900 | 24,427 | |||||
| Total (Cost $26,722) | 24,427 | |||||
| France – 1.8% | ||||||
Aufeminin.com 1 | 600 | 26,118 | ||||
Neurones | 1,800 | 35,936 | ||||
| 1,600 | 19,126 | |||||
Tessi | 130 | 17,801 | ||||
| Total (Cost $82,791) | 98,981 | |||||
| Germany – 1.7% | ||||||
Amadeus Fire | 300 | 22,967 | ||||
Bertrandt | 200 | 31,823 | ||||
†GFT Technologies | 1,900 | 25,835 | ||||
RIB Software | 700 | 12,604 | ||||
| Total (Cost $64,959) | 93,229 | |||||
| Greece – 0.7% | ||||||
| 3,500 | 38,850 | |||||
| Total (Cost $40,181) | 38,850 | |||||
| Hong Kong – 12.1% | ||||||
Anxin-China Holdings | 156,000 | 20,732 | ||||
China Metal International Holdings | 145,000 | 53,881 | ||||
| 201,100 | 64,349 | |||||
Embry Holdings | 35,000 | 20,276 | ||||
I.T | 175,000 | 61,416 | ||||
Le Saunda Holdings | 82,100 | 41,207 | ||||
†Luen Thai Holdings | 110,000 | 30,373 | ||||
Lung Kee (Bermuda) Holdings | 92,000 | 33,000 | ||||
Midland Holdings 1 | 72,000 | 36,230 | ||||
†New World Department Store China | 72,500 | 29,185 | ||||
Oriental Watch Holdings | 260,800 | 61,243 | ||||
Pico Far East Holdings | 338,000 | 78,499 | ||||
Regent Manner International Holdings | 250,000 | 54,513 | ||||
†Sitoy Group Holdings | 60,000 | 36,463 | ||||
Tse Sui Luen Jewellery (International) | 61,000 | 23,769 | ||||
| Total (Cost $705,708) | 645,136 | |||||
| India – 4.1% | ||||||
Cyient | 9,900 | 59,257 | ||||
eClerx Services | 2,700 | 52,164 | ||||
†KPIT Technologies | 14,600 | 41,850 | ||||
McLeod Russel India | 6,900 | 36,476 | ||||
| 58 | The Royce Funds 2014 Semiannual Report to Shareholders | THE ACCOMPANYING NOTES ARE AN INTEGRAL PART OF THESE FINANCIAL STATEMENTS. |
| June 30, 2014 (unaudited) |
| SHARES | VALUE | |||||
| India (continued) | ||||||
†Persistent Systems | 1,600 | $ | 28,677 | |||
| Total (Cost $204,035) | 218,424 | |||||
| Indonesia – 0.5% | ||||||
Selamat Sempurna | 11,700 | 4,387 | ||||
Sri Rejeki Isman | 1,335,000 | 20,157 | ||||
| Total (Cost $31,177) | 24,544 | |||||
| Ireland – 0.5% | ||||||
| 20,000 | 27,211 | |||||
| Total (Cost $27,837) | 27,211 | |||||
| Israel – 0.4% | ||||||
| 600 | 20,160 | |||||
| Total (Cost $20,080) | 20,160 | |||||
| Japan – 17.8% | ||||||
Asahi Company | 3,200 | 46,087 | ||||
BML | 1,000 | 38,695 | ||||
Freund Corporation | 4,700 | 65,648 | ||||
G-Tekt Corporation | 2,400 | 31,390 | ||||
†Itoki Corporation | 5,300 | 40,860 | ||||
Mandom Corporation | 900 | 32,027 | ||||
Milbon | 900 | 30,384 | ||||
Miraial | 4,000 | 72,652 | ||||
Nishikawa Rubber | 3,800 | 66,018 | ||||
Nitto Kohki | 2,600 | 53,306 | ||||
Obara Group | 1,466 | 63,528 | ||||
Relo Holdings | 700 | 45,121 | ||||
Ryobi | 7,000 | 23,632 | ||||
†Takata Corporation | 1,300 | 27,924 | ||||
Tokai Corporation/Gifu | 1,400 | 38,792 | ||||
Trancom | 2,900 | 113,933 | ||||
†YAMADA Consulting Group | 2,300 | 58,939 | ||||
Zuiko Corporation | 1,800 | 101,811 | ||||
| Total (Cost $883,740) | 950,747 | |||||
| Malaysia – 3.8% | ||||||
Asia Brands | 32,200 | 37,405 | ||||
CB Industrial Product Holding | 30,100 | 41,058 | ||||
Coastal Contracts | 21,300 | 33,167 | ||||
Media Chinese International | 126,800 | 37,910 | ||||
†NTPM Holdings | 95,000 | 25,000 | ||||
Padini Holdings | 50,000 | 30,676 | ||||
| Total (Cost $159,081) | 205,216 | |||||
| Netherlands – 0.7% | ||||||
Exact Holding | 1,000 | 35,602 | ||||
| Total (Cost $22,955) | 35,602 | |||||
| Norway – 1.0% | ||||||
†Borregaard | 3,000 | 21,716 | ||||
†Oslo Bors VPS Holding | 2,600 | 30,943 | ||||
| Total (Cost $49,993) | 52,659 | |||||
| Philippines – 1.5% | ||||||
†Asian Terminals | 108,100 | 26,747 | ||||
GMA Holdings PDR | 306,000 | 51,876 | ||||
| Total (Cost $77,214) | 78,623 | |||||
| Poland – 0.6% | ||||||
Elektrobudowa | 1,100 | 31,614 | ||||
| Total (Cost $28,495) | 31,614 | |||||
| Singapore – 2.0% | ||||||
Hour Glass (The) | 13,000 | 18,714 | ||||
†Parkson Retail Asia | 71,000 | 45,553 | ||||
Sheng Siong Group | 80,000 | 41,704 | ||||
| Total (Cost $107,793) | 105,971 | |||||
| South Africa – 2.5% | ||||||
Blue Label Telecoms | 48,000 | 38,634 | ||||
Ellies Holdings 1 | 80,900 | 28,146 | ||||
Metrofile Holdings | 144,000 | 64,993 | ||||
| Total (Cost $161,551) | 131,773 | |||||
| South Korea – 4.0% | ||||||
Eugene Technology | 2,302 | 43,342 | ||||
†Hankuk Carbon | 5,400 | 41,576 | ||||
Handsome | 1,500 | 40,991 | ||||
Huvis Corporation | 7,700 | 86,756 | ||||
| Total (Cost $188,129) | 212,665 | |||||
| Sri Lanka – 0.7% | ||||||
Distilleries Company of Sri Lanka | 25,000 | 39,708 | ||||
| Total (Cost $31,459) | 39,708 | |||||
| Sweden – 0.7% | ||||||
Nolato Cl. B | 1,700 | 38,674 | ||||
| Total (Cost $35,976) | 38,674 | |||||
| Switzerland – 1.3% | ||||||
VZ Holding | 200 | 33,491 | ||||
Zehnder Group | 800 | 34,281 | ||||
| Total (Cost $54,673) | 67,772 | |||||
| Taiwan – 1.7% | ||||||
Makalot Industrial | 7,500 | 40,567 | ||||
Silicon Motion Technology ADR | 2,500 | 51,075 | ||||
| Total (Cost $52,751) | 91,642 | |||||
| THE ACCOMPANYING NOTES ARE AN INTEGRAL PART OF THESE FINANCIAL STATEMENTS. | The Royce Funds 2014 Semiannual Report to Shareholders | 59 |
| Schedules of Investments | ||
| Royce International Micro-Cap Fund (continued) |
| SHARES | VALUE | |||||
| United Arab Emirates – 0.8% | ||||||
Aramex | 52,000 | $ | 42,474 | |||
| Total (Cost $25,530) | 42,474 | |||||
| United Kingdom – 5.4% | ||||||
Consort Medical | 4,000 | 65,307 | ||||
E2V Technologies | 17,400 | 49,730 | ||||
Games Workshop Group | 3,900 | 41,515 | ||||
| 40,000 | 38,164 | |||||
Hogg Robinson Group | 12,200 | 15,085 | ||||
Hyder Consulting | 2,500 | 19,788 | ||||
Latchways | 3,300 | 60,712 | ||||
| Total (Cost $265,246) | 290,301 | |||||
| TOTAL COMMON STOCKS | ||||||
(Cost $4,704,780) | 4,972,197 | |||||
| REPURCHASE AGREEMENT – 6.9% | ||||||
| Fixed Income Clearing Corporation, | ||||||
0.00% dated 6/30/14, due 7/1/14, | ||||||
maturity value $366,000 (collateralized | ||||||
by obligations of various U.S. Government | ||||||
Agencies, due 7/23/14, valued at $374,813) | ||||||
(Cost $366,000) | 366,000 | |||||
| TOTAL INVESTMENTS – 99.9% | ||||||
(Cost $5,070,780) | 5,338,197 | |||||
| CASH AND OTHER ASSETS | ||||||
LESS LIABILITIES – 0.1% | 3,733 | |||||
| NET ASSETS – 100.0% | $ | 5,341,930 | ||||
| Royce International Premier Fund | ||||||
| SHARES | VALUE | |||||
| COMMON STOCKS – 96.5% | ||||||
| Austria – 4.8% | ||||||
Mayr-Melnhof Karton | 2,550 | $ | 303,814 | |||
Semperit AG Holding | 5,800 | 355,402 | ||||
| Total (Cost $551,252) | 659,216 | |||||
| Brazil – 6.4% | ||||||
CETIP - Mercados Organizados | 22,500 | 320,265 | ||||
LPS Brasil Consultoria de Imoveis | 55,000 | 248,925 | ||||
Totvs | 18,800 | 323,331 | ||||
| Total (Cost $858,342) | 892,521 | |||||
| China – 1.8% | ||||||
Daphne International Holdings | 650,000 | 254,955 | ||||
| Total (Cost $440,368) | 254,955 | |||||
| Finland – 2.1% | ||||||
Nokian Renkaat | 7,300 | 284,883 | ||||
| Total (Cost $330,097) | 284,883 | |||||
| France – 6.3% | ||||||
†Societe BIC | 2,125 | 290,743 | ||||
Stallergenes | 4,000 | 308,312 | ||||
Virbac | 1,200 | 277,201 | ||||
| Total (Cost $742,535) | 876,256 | |||||
| Germany – 7.9% | ||||||
Carl Zeiss Meditec | 8,110 | 248,752 | ||||
KWS Saat | 1,000 | 352,595 | ||||
LPKF Laser & Electronics | 9,300 | 192,036 | ||||
STRATEC Biomedical | 5,700 | 294,210 | ||||
| Total (Cost $979,194) | 1,087,593 | |||||
| Hong Kong – 6.6% | ||||||
†Pico Far East Holdings | 1,370,800 | 318,363 | ||||
Stella International Holdings | 125,000 | 340,305 | ||||
Television Broadcasts | 40,000 | 259,599 | ||||
| Total (Cost $952,088) | 918,267 | |||||
| India – 3.3% | ||||||
Bajaj Finance | 8,000 | 265,359 | ||||
†Motherson Sumi Systems | 35,000 | 188,544 | ||||
| Total (Cost $371,467) | 453,903 | |||||
| Italy – 1.8% | ||||||
Recordati | 15,000 | 252,225 | ||||
| Total (Cost $131,645) | 252,225 | |||||
| Japan – 5.6% | ||||||
FamilyMart | 5,300 | 228,365 | ||||
MISUMI Group | 9,000 | 247,599 | ||||
| 60 | The Royce Funds 2014 Semiannual Report to Shareholders | THE ACCOMPANYING NOTES ARE AN INTEGRAL PART OF THESE FINANCIAL STATEMENTS. |
| June 30, 2014 (unaudited) |
| SHARES | VALUE | |||||
| Japan (continued) | ||||||
USS | 17,500 | $ | 298,677 | |||
| Total (Cost $667,496) | 774,641 | |||||
| Malaysia – 3.9% | ||||||
Media Chinese International | 900,000 | 269,075 | ||||
Media Prima | 341,800 | 274,632 | ||||
| Total (Cost $570,972) | 543,707 | |||||
| Norway – 1.8% | ||||||
†TGS-NOPEC Geophysical | 7,600 | 242,973 | ||||
| Total (Cost $189,190) | 242,973 | |||||
| Singapore – 1.7% | ||||||
Silverlake Axis | 250,000 | 240,597 | ||||
| Total (Cost $167,213) | 240,597 | |||||
| South Africa – 2.1% | ||||||
Metrofile Holdings | 630,000 | 284,344 | ||||
| Total (Cost $289,630) | 284,344 | |||||
| South Korea – 1.9% | ||||||
Binggrae | 3,000 | 256,474 | ||||
| Total (Cost $253,947) | 256,474 | |||||
| Switzerland – 12.9% | ||||||
Belimo Holding | 95 | 256,247 | ||||
Forbo Holding | 300 | 319,858 | ||||
†Inficon Holding | 490 | 159,687 | ||||
Kaba Holding | 600 | 296,685 | ||||
LEM Holding | 253 | 219,392 | ||||
Partners Group Holding | 1,000 | 273,342 | ||||
VZ Holding | 1,600 | 267,930 | ||||
| Total (Cost $1,454,439) | 1,793,141 | |||||
| United Kingdom – 25.6% | ||||||
Abcam | 40,000 | 260,133 | ||||
Ashmore Group | 57,500 | 364,100 | ||||
AVEVA Group | 8,000 | 279,027 | ||||
Clarkson | 8,700 | 356,596 | ||||
Consort Medical | 25,000 | 408,169 | ||||
Domino Printing Sciences | 25,000 | 256,710 | ||||
Elementis | 55,000 | 245,012 | ||||
Fidessa Group | 4,500 | 170,507 | ||||
Lancashire Holdings | 18,500 | 207,062 | ||||
Latchways | 17,500 | 321,957 | ||||
Oxford Instruments | 8,000 | 177,986 | ||||
Rotork | 4,000 | 182,777 | ||||
Spirax-Sarco Engineering | 3,200 | 149,672 | ||||
Victrex | 6,000 | 174,768 | ||||
| Total (Cost $3,249,084) | 3,554,476 | |||||
| TOTAL COMMON STOCKS | ||||||
(Cost $12,198,959) | 13,370,172 | |||||
| REPURCHASE AGREEMENT – 2.6% | ||||||
| Fixed Income Clearing Corporation, | ||||||
0.00% dated 6/30/14, due 7/1/14, | ||||||
maturity value $366,000 (collateralized | ||||||
by obligations of various U.S. Government | ||||||
Agencies, due 7/23/14, valued at $374,813) | ||||||
(Cost $366,000) | 366,000 | |||||
| TOTAL INVESTMENTS – 99.1% | ||||||
(Cost $12,564,959) | 13,736,172 | |||||
| CASH AND OTHER ASSETS | ||||||
LESS LIABILITIES – 0.9% | 128,455 | |||||
| NET ASSETS – 100.0% | $ | 13,864,627 | ||||
| THE ACCOMPANYING NOTES ARE AN INTEGRAL PART OF THESE FINANCIAL STATEMENTS. | The Royce Funds 2014 Semiannual Report to Shareholders | 61 |
| Statements of Assets and Liabilities |
| Royce | Royce Micro-Cap | Royce | Royce | ||||||||||||
| Select | Discovery | Financial | Select | ||||||||||||
| Fund I | Fund | Services Fund | Fund II | ||||||||||||
| ASSETS: | |||||||||||||||
| Investments at value | $ | 43,111,567 | $ | 5,427,553 | $ | 62,724,932 | $ | 5,249,660 | |||||||
| Repurchase agreements (at cost and value) | 5,154,000 | 201,000 | 1,541,000 | 201,000 | |||||||||||
| Deposits with brokers for securities sold short | – | – | – | 35,926 | |||||||||||
| Cash and foreign currency | 224 | 419 | 6,092 | 2,263 | |||||||||||
| Receivable for investments sold | 116,617 | – | 58,643 | 3,871 | |||||||||||
| Receivable for capital shares sold | 18,536 | 103 | 116,159 | 4,100 | |||||||||||
| Receivable for dividends and interest | 8,576 | 4,160 | 55,416 | 3,192 | |||||||||||
| Prepaid expenses and other assets | 633 | 62 | 658 | 54 | |||||||||||
Total Assets | 48,410,153 | 5,633,297 | 64,502,900 | 5,500,066 | |||||||||||
| LIABILITIES: | |||||||||||||||
| Securities sold short, at fair value | – | – | – | 287,646 | |||||||||||
| Payable for investments purchased | 650,073 | – | – | 60,801 | |||||||||||
| Payable for capital shares redeemed | – | – | 93,361 | – | |||||||||||
| Payable for investment advisory fees | 38,613 | 594 | 50,642 | – | |||||||||||
| Accrued expenses | 23,901 | 20,482 | 46,636 | 7,450 | |||||||||||
| Deferred capital gains tax | – | – | 49,402 | 814 | |||||||||||
Total Liabilities | 712,587 | 21,076 | 240,041 | 356,711 | |||||||||||
Net Assets | $ | 47,697,566 | $ | 5,612,221 | $ | 64,262,859 | $ | 5,143,355 | |||||||
| ANALYSIS OF NET ASSETS: | |||||||||||||||
| Paid-in capital | $ | 31,559,345 | $ | 4,429,222 | $ | 51,198,268 | $ | 4,110,066 | |||||||
| Undistributed net investment income (loss) | (35,521 | ) | (4,033 | ) | 344,324 | 4,537 | |||||||||
| Accumulated net realized gain (loss) on investments and | |||||||||||||||
foreign currency | 5,098,170 | 559,419 | 2,304,998 | 924,390 | |||||||||||
| Net unrealized appreciation (depreciation) on investments and | |||||||||||||||
foreign currency | 11,075,572 | 627,613 | 10,415,269 | 104,362 | |||||||||||
Net Assets | $ | 47,697,566 | $ | 5,612,221 | $ | 64,262,859 | $ | 5,143,355 | |||||||
Investment Class | $ | 47,697,566 | $ | 5,143,355 | |||||||||||
Service Class | $ | 5,612,221 | $ | 64,262,859 | |||||||||||
| SHARES OUTSTANDING (unlimited number of $.001 par value): | |||||||||||||||
Investment Class | 2,275,757 | 409,472 | |||||||||||||
Service Class | 816,509 | 6,404,215 | |||||||||||||
| NET ASSET VALUES (Net Assets ÷ Shares Outstanding): | |||||||||||||||
Investment Class1 | $20.96 | $12.56 | |||||||||||||
Service Class1 | $6.87 | $10.03 | |||||||||||||
Investments at identified cost | $ | 32,036,079 | $ | 4,799,940 | $ | 52,260,681 | $ | 5,114,260 | |||||||
Proceeds of short sales | – | – | – | 257,408 | |||||||||||
Aggregate value of segregated securities | – | – | – | 570,880 | |||||||||||
1 Offering and redemption price per share; shares held less than 180 days may be subject to a 1% redemption fee, or a 2% redemption fee (Royce Select Fund II), payable to the Fund.
| 62 | The Royce Funds 2014 Semiannual Report to Shareholders | THE ACCOMPANYING NOTES ARE AN INTEGRAL PART OF THESE FINANCIAL STATEMENTS. |
| June 30, 2014 (unaudited) |
| Royce | Royce | Royce | Royce | ||||||||||||
| European Smaller- | Enterprise Select | SMid-Cap | Focus Value | ||||||||||||
| Companies Fund | Fund | Value Fund | Fund | ||||||||||||
| ASSETS: | |||||||||||||||
| Investments at value | $ | 33,186,257 | $ | 2,118,727 | $ | 18,485,670 | $ | – | |||||||
| Repurchase agreements (at cost and value) | 2,742,000 | 740,000 | 1,675,000 | – | |||||||||||
| Cash and foreign currency | 186 | 61 | 630 | 10,467,679 | |||||||||||
| Receivable for investments sold | 210,897 | 30,875 | – | – | |||||||||||
| Receivable for capital shares sold | 70,128 | – | 112,301 | – | |||||||||||
| Receivable for dividends and interest | 71,486 | 1,414 | 17,298 | 5,404 | |||||||||||
| Prepaid expenses and other assets | 319 | 36 | 115 | 119 | |||||||||||
Total Assets | 36,281,273 | 2,891,113 | 20,291,014 | 10,473,202 | |||||||||||
| LIABILITIES: | |||||||||||||||
| Payable for investments purchased | 958,141 | – | – | – | |||||||||||
| Payable for capital shares redeemed | 19,240 | – | 34,490 | 1,346,878 | |||||||||||
| Payable for investment advisory fees | 33,108 | – | 10,993 | 8,834 | |||||||||||
| Accrued expenses | 16,240 | 12,501 | 38,660 | 21,036 | |||||||||||
Total Liabilities | 1,026,729 | 12,501 | 84,143 | 1,376,748 | |||||||||||
Net Assets | $ | 35,254,544 | $ | 2,878,612 | $ | 20,206,871 | $ | 9,096,454 | |||||||
| ANALYSIS OF NET ASSETS: | |||||||||||||||
| Paid-in capital | $ | 32,198,309 | $ | 2,353,342 | $ | 21,677,859 | $ | 9,085,757 | |||||||
| Undistributed net investment income (loss) | 128,831 | (5,260 | ) | 41,192 | (64,695 | ) | |||||||||
| Accumulated net realized gain (loss) on investments and | |||||||||||||||
foreign currency | (314,942 | ) | 221,604 | (4,961,132 ) | 75,316 | ||||||||||
| Net unrealized appreciation (depreciation) on investments and | |||||||||||||||
foreign currency | 3,242,346 | 308,926 | 3,448,952 | 76 | |||||||||||
Net Assets | $ | 35,254,544 | $ | 2,878,612 | $ | 20,206,871 | $ | 9,096,454 | |||||||
Investment Class | $ | 2,371,534 | $ | 2,878,612 | |||||||||||
Service Class | 32,883,010 | $ | 20,206,871 | $ | 9,096,454 | ||||||||||
| SHARES OUTSTANDING (unlimited number of $.001 par value): | |||||||||||||||
Investment Class | 228,931 | 224,536 | |||||||||||||
Service Class | 2,530,829 | 1,241,655 | 690,979 | ||||||||||||
| NET ASSET VALUES (Net Assets ÷ Shares Outstanding): | |||||||||||||||
Investment Class1 | $10.36 | $12.82 | |||||||||||||
Service Class1 | 12.99 | $16.27 | $13.16 | ||||||||||||
Investments at identified cost | $ | 29,944,384 | $ | 1,809,799 | $ | 15,036,855 | – | ||||||||
1 Offering and redemption price per share; shares held less than 180 days may be subject to a 2% redemption fee (Royce European Smaller-Companies Fund), or a 1% redemption fee, payable to the Fund.
| THE ACCOMPANYING NOTES ARE AN INTEGRAL PART OF THESE FINANCIAL STATEMENTS. | The Royce Funds 2014 Semiannual Report to Shareholders | 63 |
| Statements of Assets and Liabilities |
| Royce | Royce | Royce | |||||||||
| Partners | Opportunity | Global Dividend | |||||||||
| Fund | Select Fund | Value Fund | |||||||||
| ASSETS: | |||||||||||
| Investments at value | $ | 2,438,874 | $ | 23,710,546 | $ | 9,708,156 | |||||
| Repurchase agreements (at cost and value) | 457,000 | 654,000 | 290,000 | ||||||||
| Deposits with brokers for securities sold short | – | 761,698 | – | ||||||||
| Cash and foreign currency | 622 | 289 | 1,734 | ||||||||
| Receivable for investments sold | 10,279 | 174,692 | – | ||||||||
| Receivable for capital shares sold | 36 | 10,290 | 175 | ||||||||
| Receivable for dividends and interest | 2,617 | 7,300 | 16,461 | ||||||||
| Prepaid expenses and other assets | 33 | 12,676 | 114 | ||||||||
Total Assets | 2,909,461 | 25,331,491 | 10,016,640 | ||||||||
| LIABILITIES: | |||||||||||
| Securities sold short, at fair value | – | 1,228,349 | – | ||||||||
| Payable for investments purchased | – | 205,155 | 12,699 | ||||||||
| Payable for capital shares redeemed | – | 2,866 | 2,471 | ||||||||
| Payable for dividends and interest | – | 50 | – | ||||||||
| Payable for investment advisory fees | – | 19,252 | 4,010 | ||||||||
| Accrued expenses | 17,150 | 4,194 | 29,515 | ||||||||
| Deferred capital gains tax | – | – | 1,265 | ||||||||
Total Liabilities | 17,150 | 1,459,866 | 49,960 | ||||||||
Net Assets | $ | 2,892,311 | $ | 23,871,625 | $ | 9,966,680 | |||||
| ANALYSIS OF NET ASSETS: | |||||||||||
| Paid-in capital | $ | 2,110,398 | $ | 20,263,788 | $ | 8,908,162 | |||||
| Undistributed net investment income (loss) | 9,382 | (74,345 | ) | (13,517 | ) | ||||||
| Accumulated net realized gain (loss) on investments and | |||||||||||
foreign currency | 110,371 | 606,819 | 172,912 | ||||||||
| Net unrealized appreciation (depreciation) on investments and | |||||||||||
foreign currency | 662,160 | 3,075,363 | 899,123 | ||||||||
Net Assets | $ | 2,892,311 | $ | 23,871,625 | $ | 9,966,680 | |||||
Investment Class | $ | 23,727,151 | |||||||||
Service Class | $ | 2,892,311 | 144,474 | $ | 9,966,680 | ||||||
| SHARES OUTSTANDING (unlimited number of $.001 par value): | |||||||||||
Investment Class | 1,281,459 | ||||||||||
Service Class | 194,666 | 14,967 | 850,957 | ||||||||
| NET ASSET VALUES (Net Assets ÷ Shares Outstanding): | |||||||||||
Investment Class1 | $18.52 | ||||||||||
Service Class1 | $14.86 | 9.65 | $11.71 | ||||||||
Investments at identified cost | $ | 1,776,769 | $ | 20,649,254 | $ | 8,808,152 | |||||
Proceeds of short sales | – | 1,242,417 | – | ||||||||
Aggregate value of segregated securities | – | 2,744,672 | – | ||||||||
1 Offering and redemption price per share; shares held less than 180 days may be subject to a 1% redemption fee, or a 2% redemption fee (Royce Global Dividend Value Fund), payable to the Fund.
| 64 | The Royce Funds 2014 Semiannual Report to Shareholders | THE ACCOMPANYING NOTES ARE AN INTEGRAL PART OF THESE FINANCIAL STATEMENTS. |
| June 30, 2014 (unaudited) |
| Royce | Royce | ||||||
| International | International | ||||||
| Micro-Cap Fund | Premier Fund | ||||||
| ASSETS: | |||||||
| Investments at value | $ | 4,972,197 | $ | 13,370,172 | |||
| Repurchase agreements (at cost and value) | 366,000 | 366,000 | |||||
| Cash and foreign currency | 3,252 | 928 | |||||
| Receivable for investments sold | – | 153,291 | |||||
| Receivable for capital shares sold | 60,525 | 7,556 | |||||
| Receivable for dividends and interest | 8,521 | 25,878 | |||||
| Receivable due from investment advisor | – | 13,942 | |||||
| Prepaid expenses and other assets | 54 | 165 | |||||
Total Assets | 5,410,549 | 13,937,932 | |||||
| LIABILITIES: | |||||||
| Payable for investments purchased | 27,712 | 52,065 | |||||
| Payable for capital shares redeemed | 19,245 | 2,420 | |||||
| Accrued expenses | 18,210 | 5,949 | |||||
| Deferred capital gains tax | 3,452 | 12,871 | |||||
Total Liabilities | 68,619 | 73,305 | |||||
Net Assets | $ | 5,341,930 | $ | 13,864,627 | |||
| ANALYSIS OF NET ASSETS: | |||||||
| Paid-in capital | $ | 5,517,586 | $ | 12,472,194 | |||
| Undistributed net investment income (loss) | (10,144 | ) | 56,205 | ||||
| Accumulated net realized gain (loss) on investments and | |||||||
foreign currency | (429,645 | ) | 176,695 | ||||
| Net unrealized appreciation (depreciation) on investments and | |||||||
foreign currency | 264,133 | 1,159,533 | |||||
Net Assets | $ | 5,341,930 | $ | 13,864,627 | |||
Investment Class | $ | 5,010,893 | |||||
Service Class | $ | 5,341,930 | 8,853,734 | ||||
| SHARES OUTSTANDING (unlimited number of $.001 par value): | |||||||
Investment Class | 486,175 | ||||||
Service Class | 493,037 | 733,281 | |||||
| NET ASSET VALUES (Net Assets ÷ Shares Outstanding): | |||||||
Investment Class1 | $10.31 | ||||||
Service Class1 | $10.83 | 12.07 | |||||
Investments at identified cost | $ | 4,704,780 | $ | 12,198,959 | |||
1 Offering and redemption price per share; shares held less than 180 days may be subject to a 2% redemption fee, payable to the Fund.
| THE ACCOMPANYING NOTES ARE AN INTEGRAL PART OF THESE FINANCIAL STATEMENTS. | The Royce Funds 2014 Semiannual Report to Shareholders | 65 |
| Royce Micro-Cap | ||||||||||||||||||||||||||||||
| Royce Select Fund I | Discovery Fund | Royce Financial Services Fund | ||||||||||||||||||||||||||||
| Six months ended | Six months ended | Six months ended | ||||||||||||||||||||||||||||
| 6/30/14 | Year ended | 6/30/14 | Year ended | 6/30/14 | Year ended | |||||||||||||||||||||||||
| (unaudited) | 12/31/13 | (unaudited) | 12/31/13 | (unaudited) | 12/31/13 | |||||||||||||||||||||||||
| INVESTMENT OPERATIONS: | ||||||||||||||||||||||||||||||
| Net investment income (loss) | $ | (35,399 | ) | $ | (173,025 | ) | $ | (4,033 | ) | $ | (17,307 | ) | $ | 215,403 | $ | 174,781 | ||||||||||||||
| Net realized gain (loss) on investments and | ||||||||||||||||||||||||||||||
foreign currency | 4,756,015 | 5,751,191 | 412,572 | 751,485 | 1,214,266 | 1,875,121 | ||||||||||||||||||||||||
| Net change in unrealized appreciation | ||||||||||||||||||||||||||||||
(depreciation) on investments and | ||||||||||||||||||||||||||||||
foreign currency | (1,755,314 | ) | 5,364,056 | (410,126 | ) | 853,810 | 959,060 | 7,876,724 | ||||||||||||||||||||||
| Net increase (decrease) in net assets from | ||||||||||||||||||||||||||||||
investment operations | 2,965,302 | 10,942,222 | (1,587 | ) | 1,587,988 | 2,388,729 | 9,926,626 | |||||||||||||||||||||||
| DISTRIBUTIONS: | ||||||||||||||||||||||||||||||
| Net investment income | ||||||||||||||||||||||||||||||
Investment Class | – | (6,345 | ) | |||||||||||||||||||||||||||
Service Class | – | – | – | (82,981 | ) | |||||||||||||||||||||||||
| Net realized gain on investments and | ||||||||||||||||||||||||||||||
foreign currency | ||||||||||||||||||||||||||||||
Investment Class | – | (4,865,772 | ) | |||||||||||||||||||||||||||
Service Class | – | (164,762 | ) | – | – | |||||||||||||||||||||||||
| Total distributions | – | (4,872,117 | ) | – | (164,762 | ) | – | (82,981 | ) | |||||||||||||||||||||
| CAPITAL SHARE TRANSACTIONS: | ||||||||||||||||||||||||||||||
| Net capital share transactions | ||||||||||||||||||||||||||||||
Investment Class | (2,506,704 | ) | (8,691,735 | ) | ||||||||||||||||||||||||||
Service Class | (203,483 | ) | (75,668 | ) | 14,262,622 | 20,843,034 | ||||||||||||||||||||||||
| Shareholder redemption fees | ||||||||||||||||||||||||||||||
Investment Class | 1,127 | 3,350 | ||||||||||||||||||||||||||||
Service Class | 1,093 | 414 | 18,691 | 17,751 | ||||||||||||||||||||||||||
| Net increase (decrease) in net assets from | ||||||||||||||||||||||||||||||
capital share transactions | (2,505,577 | ) | (8,688,385 | ) | (202,390 | ) | (75,254 | ) | 14,281,313 | 20,860,785 | ||||||||||||||||||||
| NET INCREASE (DECREASE) IN NET ASSETS | 459,725 | (2,618,280 | ) | (203,977 | ) | 1,347,972 | 16,670,042 | 30,704,430 | ||||||||||||||||||||||
| NET ASSETS: | ||||||||||||||||||||||||||||||
Beginning of period | 47,237,841 | 49,856,121 | 5,816,198 | 4,468,226 | 47,592,817 | 16,888,387 | ||||||||||||||||||||||||
End of period | $ | 47,697,566 | $ | 47,237,841 | $ | 5,612,221 | $ | 5,816,198 | $ | 64,262,859 | $ | 47,592,817 | ||||||||||||||||||
| UNDISTRIBUTED NET INVESTMENT INCOME | ||||||||||||||||||||||||||||||
(LOSS) AT END OF PERIOD | $ | (35,521 | ) | $ | (122 | ) | $ | (4,033 | ) | $ | – | $ | 344,324 | $ | 128,921 | |||||||||||||||
| 66 | The Royce Funds 2014 Semiannual Report to Shareholders | THE ACCOMPANYING NOTES ARE AN INTEGRAL PART OF THESE FINANCIAL STATEMENTS. |
| Royce European Smaller- | ||||||||||||||||||||||||||||||
| Royce Select Fund II | Companies Fund | Royce Enterprise Select Fund | ||||||||||||||||||||||||||||
| Six months ended | Six months ended | Six months ended | ||||||||||||||||||||||||||||
| 6/30/14 | Year ended | 6/30/14 | Year ended | 6/30/14 | Year ended | |||||||||||||||||||||||||
| (unaudited) | 12/31/13 | (unaudited) | 12/31/13 | (unaudited) | 12/31/13 | |||||||||||||||||||||||||
| INVESTMENT OPERATIONS: | ||||||||||||||||||||||||||||||
| Net investment income (loss) | $ | 30,689 | $ | 38,380 | $ | 312,793 | $ | 119,035 | $ | (4,376 | ) | $ | (8,011 | ) | ||||||||||||||||
| Net realized gain (loss) on investments and | ||||||||||||||||||||||||||||||
foreign currency | 642,214 | 710,266 | 1,110,368 | 1,143,566 | 153,141 | 301,701 | ||||||||||||||||||||||||
| Net change in unrealized appreciation | ||||||||||||||||||||||||||||||
(depreciation) on investments and | ||||||||||||||||||||||||||||||
foreign currency | (358,454 | ) | 163,490 | (60,468 | ) | 2,645,740 | 6,269 | 192,389 | ||||||||||||||||||||||
| Net increase (decrease) in net assets from | ||||||||||||||||||||||||||||||
investment operations | 314,449 | 912,136 | 1,362,693 | 3,908,341 | 155,034 | 486,079 | ||||||||||||||||||||||||
| DISTRIBUTIONS: | ||||||||||||||||||||||||||||||
| Net investment income | ||||||||||||||||||||||||||||||
Investment Class | – | (85,215 | ) | – | – | (2,071 | ) | |||||||||||||||||||||||
Service Class | – | (232,856 | ) | |||||||||||||||||||||||||||
| Net realized gain on investments and | ||||||||||||||||||||||||||||||
foreign currency | ||||||||||||||||||||||||||||||
Investment Class | – | (416,296 | ) | – | – | (228,780 | ) | |||||||||||||||||||||||
Service Class | – | – | ||||||||||||||||||||||||||||
| Total distributions | – | (501,511 | ) | – | (232,856 | ) | – | (230,851 | ) | |||||||||||||||||||||
| CAPITAL SHARE TRANSACTIONS: | ||||||||||||||||||||||||||||||
| Net capital share transactions | ||||||||||||||||||||||||||||||
Investment Class | (53,141 | ) | 850,978 | 2,349,401 | 93,646 | 1,075,981 | ||||||||||||||||||||||||
Service Class | 3,489,615 | 8,500,963 | ||||||||||||||||||||||||||||
| Shareholder redemption fees | ||||||||||||||||||||||||||||||
Investment Class | 352 | 34 | – | – | – | |||||||||||||||||||||||||
Service Class | 6,865 | 15,318 | ||||||||||||||||||||||||||||
| Net increase (decrease) in net assets from | ||||||||||||||||||||||||||||||
capital share transactions | (52,789 | ) | 851,012 | 5,845,881 | 8,516,281 | 93,646 | 1,075,981 | |||||||||||||||||||||||
| NET INCREASE (DECREASE) IN NET ASSETS | 261,660 | 1,261,637 | 7,208,574 | 12,191,766 | 248,680 | 1,331,209 | ||||||||||||||||||||||||
| NET ASSETS: | ||||||||||||||||||||||||||||||
Beginning of period | 4,881,695 | 3,620,058 | 28,045,970 | 15,854,204 | 2,629,932 | 1,298,723 | ||||||||||||||||||||||||
End of period | $ | 5,143,355 | $ | 4,881,695 | $ | 35,254,544 | $ | 28,045,970 | $ | 2,878,612 | $ | 2,629,932 | ||||||||||||||||||
| UNDISTRIBUTED NET INVESTMENT INCOME | ||||||||||||||||||||||||||||||
(LOSS) AT END OF PERIOD | $ | 4,537 | $ | (26,152 | ) | $ | 128,831 | $ | (183,963 | ) | $ | (5,260 | ) | $ | (884 | ) | ||||||||||||||
| THE ACCOMPANYING NOTES ARE AN INTEGRAL PART OF THESE FINANCIAL STATEMENTS. | The Royce Funds 2014 Semiannual Report to Shareholders | 67 |
| Royce SMid-Cap Value Fund | Royce Focus Value Fund | Royce Partners Fund | ||||||||||||||||||||||||||||
| Six months ended | Six months ended | Six months ended | ||||||||||||||||||||||||||||
| 6/30/14 | Year ended | 6/30/14 | Year ended | 6/30/14 | Year ended | |||||||||||||||||||||||||
| (unaudited) | 12/31/13 | (unaudited) | 12/31/13 | (unaudited) | 12/31/13 | |||||||||||||||||||||||||
| INVESTMENT OPERATIONS: | ||||||||||||||||||||||||||||||
| Net investment income (loss) | $ | 41,193 | $ | 15,704 | $ | 7,051 | $ | (8,319 | ) | $ | 9,148 | $ | 16,343 | |||||||||||||||||
| Net realized gain (loss) on investments and | ||||||||||||||||||||||||||||||
foreign currency | 494,833 | 488,966 | 3,063,517 | 833,397 | 61,832 | 276,797 | ||||||||||||||||||||||||
| Net change in unrealized appreciation | ||||||||||||||||||||||||||||||
(depreciation) on investments and | ||||||||||||||||||||||||||||||
foreign currency | 1,423,488 | 1,788,073 | (2,579,655 | ) | 1,405,566 | 8,188 | 389,385 | |||||||||||||||||||||||
| Net increase (decrease) in net assets from | ||||||||||||||||||||||||||||||
investment operations | 1,959,514 | 2,292,743 | 490,913 | 2,230,644 | 79,168 | 682,525 | ||||||||||||||||||||||||
| DISTRIBUTIONS: | ||||||||||||||||||||||||||||||
| Net investment income | ||||||||||||||||||||||||||||||
Service Class | – | (16,014 | ) | (7,378 | ) | (3,516 | ) | – | (20,237 | ) | ||||||||||||||||||||
| Net realized gain on investments and | ||||||||||||||||||||||||||||||
foreign currency | ||||||||||||||||||||||||||||||
Service Class | – | – | (3,157,167 | ) | (480,474 | ) | – | (225,475 | ) | |||||||||||||||||||||
| Total distributions | – | (16,014 | ) | (3,164,545 | ) | (483,990 | ) | – | (245,712 | ) | ||||||||||||||||||||
| CAPITAL SHARE TRANSACTIONS: | ||||||||||||||||||||||||||||||
| Net capital share transactions | ||||||||||||||||||||||||||||||
Service Class | 6,726,596 | (1,897,564 | ) | (63,619 | ) | 1,211,969 | 12,110 | 280,953 | ||||||||||||||||||||||
| Shareholder redemption fees | ||||||||||||||||||||||||||||||
Service Class | 508 | 647 | 98 | 41 | – | 218 | ||||||||||||||||||||||||
| Net increase (decrease) in net assets from | ||||||||||||||||||||||||||||||
capital share transactions | 6,727,104 | (1,896,917 | ) | (63,521 | ) | 1,212,010 | 12,110 | 281,171 | ||||||||||||||||||||||
| NET INCREASE (DECREASE) IN NET ASSETS | 8,686,618 | 379,812 | (2,737,153 | ) | 2,958,664 | 91,278 | 717,984 | |||||||||||||||||||||||
| NET ASSETS: | ||||||||||||||||||||||||||||||
Beginning of period | 11,520,253 | 11,140,441 | 11,833,607 | 8,874,943 | 2,801,033 | 2,083,049 | ||||||||||||||||||||||||
End of period | $ | 20,206,871 | $ | 11,520,253 | $ | 9,096,454 | $ | 11,833,607 | $ | 2,892,311 | $ | 2,801,033 | ||||||||||||||||||
| UNDISTRIBUTED NET INVESTMENT INCOME | ||||||||||||||||||||||||||||||
(LOSS) AT END OF PERIOD | $ | 41,192 | $ | – | $ | (64,695 | ) | $ | (64,367 | ) | $ | 9,382 | $ | 235 | ||||||||||||||||
| 68 | The Royce Funds 2014 Semiannual Report to Shareholders | THE ACCOMPANYING NOTES ARE AN INTEGRAL PART OF THESE FINANCIAL STATEMENTS. |
| Royce Global Dividend | |||||||||||||||||
| Royce Opportunity Select Fund | Value Fund | ||||||||||||||||
| Six months ended | Six months ended | ||||||||||||||||
| 6/30/14 | Year ended | 6/30/14 | Year ended | ||||||||||||||
| (unaudited) | 12/31/13 | (unaudited) | 12/31/13 | ||||||||||||||
| INVESTMENT OPERATIONS: | |||||||||||||||||
| Net investment income (loss) | $ | (74,639 | ) | $ | (66,078 | ) | $ | 112,476 | $ | 144,174 | |||||||
| Net realized gain (loss) on investments and foreign currency | 423,399 | 755,058 | 169,455 | 319,945 | |||||||||||||
| Net change in unrealized appreciation (depreciation) on investments and foreign | |||||||||||||||||
currency | 274,526 | 2,394,936 | 229,528 | 726,373 | |||||||||||||
| Net increase (decrease) in net assets from investment operations | 623,286 | 3,083,916 | 511,459 | 1,190,492 | |||||||||||||
| DISTRIBUTIONS: | |||||||||||||||||
| Net investment income | |||||||||||||||||
Investment Class | – | – | |||||||||||||||
Service Class | – | (67,489 | ) | (207,184 | ) | ||||||||||||
| Net realized gain on investments and foreign currency | |||||||||||||||||
Investment Class | – | (510,854 | ) | ||||||||||||||
Service Class | – | – | (182,756 | ) | |||||||||||||
| Total distributions | – | (510,854 | ) | (67,489 | ) | (389,940 | ) | ||||||||||
| CAPITAL SHARE TRANSACTIONS: | |||||||||||||||||
| Net capital share transactions | |||||||||||||||||
Investment Class | 5,632,526 | 11,683,077 | |||||||||||||||
Service Class | 144,408 | (33,723 | ) | 2,041,765 | |||||||||||||
| Shareholder redemption fees | |||||||||||||||||
Investment Class | 10,290 | 6,573 | |||||||||||||||
Service Class | – | 4 | 5,944 | ||||||||||||||
| Net increase (decrease) in net assets from capital share transactions | 5,787,224 | 11,689,650 | (33,719 | ) | 2,047,709 | ||||||||||||
| NET INCREASE (DECREASE) IN NET ASSETS | 6,410,510 | 14,262,712 | 410,251 | 2,848,261 | |||||||||||||
| NET ASSETS: | |||||||||||||||||
Beginning of period | 17,461,115 | 3,198,403 | 9,556,429 | 6,708,168 | |||||||||||||
End of period | $ | 23,871,625 | $ | 17,461,115 | $ | 9,966,680 | $ | 9,556,429 | |||||||||
| UNDISTRIBUTED NET INVESTMENT INCOME (LOSS) AT END OF PERIOD | $ | (74,345 | ) | $ | 294 | $ | (13,517 | ) | $ | (58,505 | ) | ||||||
| THE ACCOMPANYING NOTES ARE AN INTEGRAL PART OF THESE FINANCIAL STATEMENTS. | The Royce Funds 2014 Semiannual Report to Shareholders | 69 |
| Royce International | Royce International | ||||||||||||||||
| Micro-Cap Fund | Premier Fund | ||||||||||||||||
| Six months ended | Six months ended | ||||||||||||||||
| 6/30/14 | Year ended | 6/30/14 | Year ended | ||||||||||||||
| (unaudited) | 12/31/13 | (unaudited) | 12/31/13 | ||||||||||||||
| INVESTMENT OPERATIONS: | |||||||||||||||||
| Net investment income (loss) | $ | 23,816 | $ | 56,707 | $ | 131,329 | $ | 81,523 | |||||||||
| Net realized gain (loss) on investments and foreign currency | 358,736 | 186,907 | 335,427 | 340,325 | |||||||||||||
| Net change in unrealized appreciation (depreciation) on investments and foreign | |||||||||||||||||
currency | 9,491 | 556,066 | (3,538 | ) | 852,808 | ||||||||||||
| Net increase (decrease) in net assets from investment operations | 392,043 | 799,680 | 463,218 | 1,274,656 | |||||||||||||
| DISTRIBUTIONS: | |||||||||||||||||
| Net investment income | |||||||||||||||||
Investment Class | – | ||||||||||||||||
Service Class | – | (100,087 | ) | – | (129,813 | ) | |||||||||||
| Net realized gain on investments and foreign currency | |||||||||||||||||
Investment Class | – | ||||||||||||||||
Service Class | – | – | – | – | |||||||||||||
| Total distributions | – | (100,087 | ) | – | (129,813 | ) | |||||||||||
| CAPITAL SHARE TRANSACTIONS: | |||||||||||||||||
| Net capital share transactions | |||||||||||||||||
Investment Class | 4,982,363 | ||||||||||||||||
Service Class | (259,531 | ) | (98,141 | ) | (1,050,859 | ) | 1,879,090 | ||||||||||
| Shareholder redemption fees | |||||||||||||||||
Investment Class | 103 | ||||||||||||||||
Service Class | 756 | 3,765 | 222 | 1,734 | |||||||||||||
| Net increase (decrease) in net assets from capital share transactions | (258,775 | ) | (94,376 | ) | 3,931,829 | 1,880,824 | |||||||||||
| NET INCREASE (DECREASE) IN NET ASSETS | 133,268 | 605,217 | 4,395,047 | 3,025,667 | |||||||||||||
| NET ASSETS: | |||||||||||||||||
Beginning of period | 5,208,662 | 4,603,445 | 9,469,580 | 6,443,913 | |||||||||||||
End of period | $ | 5,341,930 | $ | 5,208,662 | $ | 13,864,627 | $ | 9,469,580 | |||||||||
| UNDISTRIBUTED NET INVESTMENT INCOME (LOSS) AT END OF PERIOD | $ | (10,144 | ) | $ | (33,960 | ) | $ | 56,205 | $ | (75,124 | ) | ||||||
| 70 | The Royce Funds 2014 Semiannual Report to Shareholders | THE ACCOMPANYING NOTES ARE AN INTEGRAL PART OF THESE FINANCIAL STATEMENTS. |
| Statements of Operations | Six Months Ended June 30, 2014 (unaudited) |
| Royce | Royce | Royce | Royce | Royce | |||||||||||||||||
| Select | Micro-Cap | Financial | Select | European Smaller- | |||||||||||||||||
| Fund I | Discovery Fund | Services Fund | Fund II | Companies Fund | |||||||||||||||||
| INVESTMENT INCOME: | |||||||||||||||||||||
| Income: | |||||||||||||||||||||
Dividends | $ | 254,955 | $ | 36,625 | $ | 669,411 | $ | 71,778 | $ | 678,464 | |||||||||||
Foreign withholding tax | (13,318 | ) | – | (22,435 | ) | (3,110 | ) | (98,783 | ) | ||||||||||||
| Total income | 241,637 | 36,625 | 646,976 | 68,668 | 579,681 | ||||||||||||||||
| Expenses: | |||||||||||||||||||||
Investment advisory fees | 228,334 | 27,287 | 289,640 | 30,499 | 200,840 | ||||||||||||||||
Distribution fees | – | 6,822 | 72,410 | – | 38,336 | ||||||||||||||||
Shareholder servicing | 13,271 | 6,354 | 23,302 | 3,734 | 20,201 | ||||||||||||||||
Audit | 8,629 | 7,446 | 8,761 | 9,010 | 9,143 | ||||||||||||||||
Registration | 7,939 | 7,806 | 11,161 | 4,849 | 16,265 | ||||||||||||||||
Custody | 7,486 | 4,467 | 20,837 | 19,166 | 23,498 | ||||||||||||||||
Shareholder reports | 6,726 | 3,554 | 25,655 | 403 | 13,548 | ||||||||||||||||
Administrative and office facilities | 2,637 | 298 | 2,041 | 253 | 1,300 | ||||||||||||||||
Trustees’ fees | 995 | 117 | 945 | 101 | 561 | ||||||||||||||||
Legal | 196 | 22 | 157 | 18 | 360 | ||||||||||||||||
Dividends on securities sold short | – | – | – | 599 | – | ||||||||||||||||
Interest expense | – | – | – | 1,026 | – | ||||||||||||||||
Other expenses | 829 | 337 | 696 | 4,851 | 775 | ||||||||||||||||
| Total expenses | 277,042 | 64,510 | 455,605 | 74,509 | 324,827 | ||||||||||||||||
| Compensating balance credits | (6 | ) | (3 | ) | (24 | ) | – | (20 | ) | ||||||||||||
| Fees waived by investment adviser and distributor | – | (23,849 | ) | (24,008 | ) | (30,499 | ) | (10,638 | ) | ||||||||||||
| Expenses reimbursed by investment adviser | – | – | – | (6,031 | ) | (47,281 | ) | ||||||||||||||
| Net expenses | 277,036 | 40,658 | 431,573 | 37,979 | 266,888 | ||||||||||||||||
| Net investment income (loss) | (35,399 | ) | (4,033 | ) | 215,403 | 30,689 | 312,793 | ||||||||||||||
| REALIZED AND UNREALIZED GAIN (LOSS) ON INVESTMENTS AND FOREIGN CURRENCY: | |||||||||||||||||||||
| Net realized gain (loss): | |||||||||||||||||||||
Investments | 4,755,943 | 412,572 | 1,254,273 | 648,074 | 1,116,775 | ||||||||||||||||
Foreign currency transactions | 72 | – | (40,007 | ) | (5,860 | ) | (6,407 | ) | |||||||||||||
| Net change in unrealized appreciation (depreciation): | |||||||||||||||||||||
Investments and foreign currency translations | (1,755,387 | ) | (410,126 | ) | 986,165 | (357,648 | ) | (61,300 | ) | ||||||||||||
Other assets and liabilities denominated in foreign currency | 73 | – | (27,105 | ) | (806 | ) | 832 | ||||||||||||||
| Net realized and unrealized gain (loss) on investments and foreign currency | 3,000,701 | 2,446 | 2,173,326 | 283,760 | 1,049,900 | ||||||||||||||||
| NET INCREASE (DECREASE) IN NET ASSETS | |||||||||||||||||||||
FROM INVESTMENT OPERATIONS | $ | 2,965,302 | $ | (1,587 | ) | $ | 2,388,729 | $ | 314,449 | $ | 1,362,693 | ||||||||||
| THE ACCOMPANYING NOTES ARE AN INTEGRAL PART OF THESE FINANCIAL STATEMENTS. | The Royce Funds 2014 Semiannual Report to Shareholders | 71 |
| Statements of Operations | Six Months Ended June 30, 2014 (unaudited) |
| Royce | Royce | Royce | Royce | Royce | |||||||||||||||||
| Enterprise Select | SMid-Cap | Focus Value | Partners | Opportunity | |||||||||||||||||
| Fund | Value Fund | Fund | Fund | Select Fund | |||||||||||||||||
| INVESTMENT INCOME: | |||||||||||||||||||||
| Income: | |||||||||||||||||||||
Dividends | $ | 12,922 | $ | 147,996 | $ | 77,446 | $ | 27,271 | $ | 57,783 | |||||||||||
Foreign withholding tax | (715 | ) | (11,673 | ) | (961 | ) | (1,379 | ) | (42 | ) | |||||||||||
| Total income | 12,207 | 136,323 | 76,485 | 25,892 | 57,741 | ||||||||||||||||
| Expenses: | |||||||||||||||||||||
Investment advisory fees | 13,372 | 70,466 | 49,181 | 11,860 | 103,884 | ||||||||||||||||
Distribution fees | – | 17,617 | 14,465 | 3,488 | 47 | ||||||||||||||||
Shareholder servicing | 3,114 | 7,345 | 5,990 | 4,275 | 6,864 | ||||||||||||||||
Audit | 7,455 | 7,450 | 2,000 | 8,311 | 7,448 | ||||||||||||||||
Registration | 3,822 | 9,201 | 10,041 | 3,978 | 13,042 | ||||||||||||||||
Custody | 4,739 | 13,449 | 11,655 | 12,758 | 9,413 | ||||||||||||||||
Shareholder reports | 525 | 7,693 | 2,977 | 1,698 | 2,108 | ||||||||||||||||
Administrative and office facilities | 120 | 635 | 670 | 143 | 730 | ||||||||||||||||
Trustees’ fees | 51 | 246 | 267 | 59 | 319 | ||||||||||||||||
Legal | 9 | 48 | 51 | 10 | 65 | ||||||||||||||||
Dividends on securities sold short | – | – | – | – | 2,312 | ||||||||||||||||
Interest expense | 1 | – | – | – | 1,204 | ||||||||||||||||
Other expenses | 306 | 410 | 720 | 314 | 3,252 | ||||||||||||||||
| Total expenses | 33,514 | 134,560 | 98,017 | 46,894 | 150,688 | ||||||||||||||||
| Compensating balance credits | (1 | ) | (6 | ) | (3 | ) | (3 | ) | (6 | ) | |||||||||||
| Fees waived by investment adviser and distributor | (13,372 | ) | (39,424 | ) | (28,580 | ) | (11,860 | ) | (5,227 | ) | |||||||||||
| Expenses reimbursed by investment adviser | (3,558 | ) | – | – | (18,287 | ) | (13,075 | ) | |||||||||||||
| Net expenses | 16,583 | 95,130 | 69,434 | 16,744 | 132,380 | ||||||||||||||||
| Net investment income (loss) | (4,376 | ) | 41,193 | 7,051 | 9,148 | (74,639 | ) | ||||||||||||||
| REALIZED AND UNREALIZED GAIN (LOSS) ON INVESTMENTS AND FOREIGN CURRENCY: | |||||||||||||||||||||
| Net realized gain (loss): | |||||||||||||||||||||
Investments | 153,311 | 497,029 | 3,061,455 | 62,052 | 423,399 | ||||||||||||||||
Foreign currency transactions | (170 | ) | (2,196 | ) | 2,062 | (220 | ) | – | |||||||||||||
| Net change in unrealized appreciation (depreciation): | |||||||||||||||||||||
Investments and foreign currency translations | 6,271 | 1,423,500 | (2,579,677 | ) | 8,160 | 274,522 | |||||||||||||||
Other assets and liabilities denominated in foreign currency | (2 | ) | (12 | ) | 22 | 28 | 4 | ||||||||||||||
| Net realized and unrealized gain (loss) on investments and foreign currency | 159,410 | 1,918,321 | 483,862 | 70,020 | 697,925 | ||||||||||||||||
| NET INCREASE (DECREASE) IN NET ASSETS | |||||||||||||||||||||
FROM INVESTMENT OPERATIONS | $ | 155,034 | $ | 1,959,514 | $ | 490,913 | $ | 79,168 | $ | 623,286 | |||||||||||
| 72 | The Royce Funds 2014 Semiannual Report to Shareholders | THE ACCOMPANYING NOTES ARE AN INTEGRAL PART OF THESE FINANCIAL STATEMENTS. |
| Statements of Operations | Six Months Ended June 30, 2014 (unaudited) |
| Royce | Royce | Royce | |||||||||||
| Global Dividend | International | International | |||||||||||
| Value Fund | Micro-Cap Fund | Premier Fund | |||||||||||
| INVESTMENT INCOME: | |||||||||||||
| Income: | |||||||||||||
Dividends | $ | 211,878 | $ | 71,402 | $ | 240,981 | |||||||
Foreign withholding tax | (18,966 | ) | (4,555 | ) | (18,506 | ) | |||||||
| Total income | 192,912 | 66,847 | 222,475 | ||||||||||
| Expenses: | |||||||||||||
Investment advisory fees | 59,495 | 33,101 | 83,455 | ||||||||||
Distribution fees | 11,899 | 6,366 | 15,641 | ||||||||||
Shareholder servicing | 7,790 | 5,149 | 10,590 | ||||||||||
Audit | 8,562 | 7,601 | 9,245 | ||||||||||
Registration | 9,440 | 9,411 | 16,041 | ||||||||||
Custody | 20,392 | 25,272 | 20,056 | ||||||||||
Shareholder reports | 6,743 | 2,820 | 2,732 | ||||||||||
Administrative and office facilities | 480 | 270 | 514 | ||||||||||
Trustees’ fees | 193 | 109 | 232 | ||||||||||
Legal | 36 | 20 | 301 | ||||||||||
Other expenses | 376 | 379 | 617 | ||||||||||
| Total expenses | 125,406 | 90,498 | 159,424 | ||||||||||
| Compensating balance credits | (1 | ) | (9 | ) | (5 | ) | |||||||
| Fees waived by investment adviser and distributor | (44,969 | ) | (33,356 | ) | (28,929 | ) | |||||||
| Expenses reimbursed by investment adviser | – | (14,102 | ) | (39,344 | ) | ||||||||
| Net expenses | 80,436 | 43,031 | 91,146 | ||||||||||
| Net investment income (loss) | 112,476 | 23,816 | 131,329 | ||||||||||
| REALIZED AND UNREALIZED GAIN (LOSS) ON INVESTMENTS AND FOREIGN CURRENCY: | |||||||||||||
| Net realized gain (loss): | |||||||||||||
Investments | 171,187 | 367,912 | 341,899 | ||||||||||
Foreign currency transactions | (1,732 | ) | (9,176 | ) | (6,472 | ) | |||||||
| Net change in unrealized appreciation (depreciation): | |||||||||||||
Investments and foreign currency translations | 230,456 | 9,702 | 7,526 | ||||||||||
Other assets and liabilities denominated in foreign currency | (928 | ) | (211 | ) | (11,064 | ) | |||||||
| Net realized and unrealized gain (loss) on investments and foreign currency | 398,983 | 368,227 | 331,889 | ||||||||||
| NET INCREASE (DECREASE) IN NET ASSETS | |||||||||||||
FROM INVESTMENT OPERATIONS | $ | 511,459 | $ | 392,043 | $ | 463,218 | |||||||
| THE ACCOMPANYING NOTES ARE AN INTEGRAL PART OF THESE FINANCIAL STATEMENTS. | The Royce Funds 2014 Semiannual Report to Shareholders | 73 |
|
Financial Highlights |
| |||||||||||||||||||||||||||||||||||||||||||||||||||||||||
|
|
|
| Net Realized |
|
|
| Distributions |
|
|
|
|
|
|
|
|
| Ratio of Expenses to Average Net Assets |
| Ratio of Net |
|
| |||||||||||||||||||||||||||||||||||
|
| Net Asset |
| Net |
| and Unrealized |
| Total from Investment Operations |
| Distributions |
| from Net |
| Distributions |
| Total Distributions |
| Shareholder Redemption Fees |
| Net Asset |
| Total |
| Net Assets, |
| Prior to Fee |
| Prior to Fee |
| Net of Fee |
| Investment |
| Portfolio Turnover Rate |
| ||||||||||||||||||||||
|
|
|
|
|
|
|
|
|
|
|
|
|
|
|
|
|
|
|
|
|
|
|
|
|
|
|
|
|
|
|
|
|
|
|
|
|
|
|
|
|
|
|
|
|
|
|
|
|
|
|
|
|
|
|
|
|
|
Royce Select Fund I – Investment Class | |||||||||||||||||||||||||||||||||||||||||||||||||||||||||
†2014 |
| $ | 19.66 |
| $ | (0.02 | ) | $ | 1.32 |
| $ | 1.30 |
| $ | – |
| $ | – |
| $ | – |
| $ | – |
| $ | – |
| $ | 20.96 |
|
| 6.61 | %1 | $ | 47,698 |
|
| 1.21 | %2 |
|
| 1.21 | %2 |
|
| 1.21 | %2 |
|
| (0.16 | )%2 |
|
| 21 | % |
|
2013 |
|
| 17.40 |
|
| (0.07 | ) |
| 4.48 |
|
| 4.41 |
|
| (0.00 | ) |
| (2.15 | ) |
| – |
|
| (2.15 | ) |
| – |
|
| 19.66 |
|
| 25.99 |
|
| 47,238 |
|
| 1.20 |
|
|
| 1.20 |
|
|
| 1.20 |
|
|
| (0.36 | ) |
|
| 56 |
|
|
2012 |
|
| 16.93 |
|
| 0.31 |
|
| 1.95 |
|
| 2.26 |
|
| (0.30 | ) |
| (1.49 | ) |
| – |
|
| (1.79 | ) |
| – |
|
| 17.40 |
|
| 13.68 |
|
| 49,856 |
|
| 0.00 |
|
|
| 0.00 |
|
|
| 0.00 |
|
|
| 1.68 |
|
|
| 54 |
|
|
2011 |
|
| 20.32 |
|
| (0.16 | ) |
| (0.67 | ) |
| (0.83 | ) |
| – |
|
| (2.56 | ) |
| – |
|
| (2.56 | ) |
| – |
|
| 16.93 |
|
| (3.61 | ) |
| 47,345 |
|
| 1.45 |
|
|
| 1.45 |
|
|
| 1.45 |
|
|
| (0.78 | ) |
|
| 63 |
|
|
2010 |
|
| 17.42 |
|
| (0.23 | ) |
| 3.39 |
|
| 3.16 |
|
| – |
|
| (0.26 | ) |
| – |
|
| (0.26 | ) |
| – |
|
| 20.32 |
|
| 18.15 |
|
| 58,788 |
|
| 2.37 |
|
|
| 2.37 |
|
|
| 2.37 |
|
|
| (1.26 | ) |
|
| 49 |
|
|
2009 |
|
| 12.59 |
|
| 0.15 |
|
| 4.83 |
|
| 4.98 |
|
| (0.15 | ) |
| – |
|
| – |
|
| (0.15 | ) |
| – |
|
| 17.42 |
|
| 39.59 |
|
| 33,896 |
|
| 0.01 |
|
|
| 0.01 |
|
|
| 0.01 |
|
|
| 1.28 |
|
|
| 80 |
|
|
Royce Micro-Cap Discovery Fund – Service Class | |||||||||||||||||||||||||||||||||||||||||||||||||||||||||
†2014 |
| $ | 6.87 |
| $ | (0.00 | ) | $ | – |
| $ | (0.00 | ) | $ | – |
| $ | – |
| $ | – |
| $ | – |
| $ | – |
| $ | 6.87 |
|
| 0.00 | %1 | $ | 5,612 |
|
| 2.36 | %2 |
|
| 2.36 | %2 |
|
| 1.49 | %2 |
|
| (0.15 | )%2 |
|
| 47 | % |
|
2013 |
|
| 5.23 |
|
| (0.02 | ) |
| 1.86 |
|
| 1.84 |
|
| – |
|
| (0.20 | ) |
| – |
|
| (0.20 | ) |
| – |
|
| 6.87 |
|
| 35.29 |
|
| 5,816 |
|
| 2.50 |
|
|
| 2.50 |
|
|
| 1.49 |
|
|
| (0.33 | ) |
|
| 81 |
|
|
2012 |
|
| 5.12 |
|
| 0.04 |
|
| 0.12 |
|
| 0.16 |
|
| (0.05 | ) |
| – |
|
| – |
|
| (0.05 | ) |
| – |
|
| 5.23 |
|
| 3.10 |
|
| 4,468 |
|
| 2.94 |
|
|
| 2.94 |
|
|
| 1.49 |
|
|
| 0.85 |
|
|
| 87 |
|
|
2011 |
|
| 5.24 |
|
| (0.04 | ) |
| (0.09 | ) |
| (0.13 | ) |
| (0.00 | ) |
| – |
|
| – |
|
| (0.00 | ) |
| 0.01 |
|
| 5.12 |
|
| (2.24 | ) |
| 3,621 |
|
| 2.99 |
|
|
| 2.99 |
|
|
| 1.49 |
|
|
| (0.71 | ) |
|
| 72 |
|
|
2010 |
|
| 4.38 |
|
| (0.01 | ) |
| 0.87 |
|
| 0.86 |
|
| – |
|
| – |
|
| – |
|
| – |
|
| – |
|
| 5.24 |
|
| 19.63 |
|
| 3,637 |
|
| 3.04 |
|
|
| 3.04 |
|
|
| 1.49 |
|
|
| (0.19 | ) |
|
| 105 |
|
|
2009 |
|
| 3.48 |
|
| (0.01 | ) |
| 0.91 |
|
| 0.90 |
|
| – |
|
| – |
|
| – |
|
| – |
|
| – |
|
| 4.38 |
|
| 25.86 |
|
| 2,910 |
|
| 3.56 |
|
|
| 3.56 |
|
|
| 1.49 |
|
|
| (0.30 | ) |
|
| 13 |
|
|
Royce Financial Services Fund – Service Class | |||||||||||||||||||||||||||||||||||||||||||||||||||||||||
†2014 |
| $ | 9.68 |
| $ | 0.04 |
| $ | 0.31 |
| $ | 0.35 |
| $ | – |
| $ | – |
| $ | – |
| $ | – |
| $ | – |
| $ | 10.03 |
|
| 3.62 | %1 | $ | 64,263 |
|
| 1.57 | %2 |
|
| 1.57 | %2 |
|
| 1.49 | %2 |
|
| 0.74 | %2 |
|
| 16 | % |
|
2013 |
|
| 6.83 |
|
| 0.04 |
|
| 2.82 |
|
| 2.86 |
|
| (0.02 | ) |
| – |
|
| – |
|
| (0.02 | ) |
| 0.01 |
|
| 9.68 |
|
| 42.00 |
|
| 47,593 |
|
| 1.89 |
|
|
| 1.89 |
|
|
| 1.49 |
|
|
| 0.59 |
|
|
| 23 |
|
|
2012 |
|
| 5.71 |
|
| 0.10 |
|
| 1.08 |
|
| 1.18 |
|
| (0.06 | ) |
| – |
|
| – |
|
| (0.06 | ) |
| – |
|
| 6.83 |
|
| 20.72 |
|
| 16,888 |
|
| 1.87 |
|
|
| 1.87 |
|
|
| 1.49 |
|
|
| 1.53 |
|
|
| 26 |
|
|
2011 |
|
| 6.50 |
|
| 0.05 |
|
| (0.78 | ) |
| (0.73 | ) |
| (0.06 | ) |
| – |
|
| – |
|
| (0.06 | ) |
| – |
|
| 5.71 |
|
| (11.29 | ) |
| 14,096 |
|
| 1.84 |
|
|
| 1.84 |
|
|
| 1.49 |
|
|
| 0.73 |
|
|
| 23 |
|
|
2010 |
|
| 5.57 |
|
| 0.07 |
|
| 0.96 |
|
| 1.03 |
|
| (0.10 | ) |
| – |
|
| – |
|
| (0.10 | ) |
| – |
|
| 6.50 |
|
| 18.45 |
|
| 14,688 |
|
| 1.94 |
|
|
| 1.94 |
|
|
| 1.49 |
|
|
| 1.14 |
|
|
| 16 |
|
|
2009 |
|
| 4.25 |
|
| 0.04 |
|
| 1.31 |
|
| 1.35 |
|
| (0.04 | ) |
| – |
|
| – |
|
| (0.04 | ) |
| 0.01 |
|
| 5.57 |
|
| 32.13 |
|
| 13,525 |
|
| 2.06 |
|
|
| 2.06 |
|
|
| 1.49 |
|
|
| 0.90 |
|
|
| 34 |
|
|
Royce Select Fund II – Investment Class | |||||||||||||||||||||||||||||||||||||||||||||||||||||||||
†2014 |
| $ | 11.79 |
| $ | 0.08 |
| $ | 0.69 |
| $ | 0.77 |
| $ | – |
| $ | – |
| $ | – |
| $ | – |
| $ | – |
| $ | 12.56 |
|
| 6.53 | %1 | $ | 5,143 |
|
| 3.05 | %2 |
|
| 3.05 | %2 |
|
| 1.56 | %2 |
|
| 1.26 | %2 |
|
| 108 | % |
|
2013 |
|
| 10.68 |
|
| 0.10 |
|
| 2.35 |
|
| 2.45 |
|
| (0.23 | ) |
| (1.11 | ) |
| – |
|
| (1.34 | ) |
| – |
|
| 11.79 |
|
| 23.51 |
|
| 4,882 |
|
| 1.65 |
|
|
| 1.65 |
|
|
| 0.91 |
|
|
| 0.89 |
|
|
| 159 |
|
|
2012 |
|
| 9.95 |
|
| 0.20 |
|
| 1.19 |
|
| 1.39 |
|
| (0.17 | ) |
| (0.49 | ) |
| – |
|
| (0.66 | ) |
| – |
|
| 10.68 |
|
| 14.23 |
|
| 3,620 |
|
| 0.19 |
|
|
| 0.19 |
|
|
| 0.19 |
|
|
| 1.86 |
|
|
| 123 |
|
|
2011 |
|
| 13.90 |
|
| (0.01 | ) |
| (2.04 | ) |
| (2.05 | ) |
| – |
|
| (1.90 | ) |
| – |
|
| (1.90 | ) |
| – |
|
| 9.95 |
|
| (14.35 | ) |
| 3,420 |
|
| 1.29 |
|
|
| 1.29 |
|
|
| 1.29 |
|
|
| (0.09 | ) |
|
| 153 |
|
|
2010 |
|
| 11.62 |
|
| (0.18 | ) |
| 2.60 |
|
| 2.42 |
|
| (0.00 | ) |
| (0.15 | ) |
| – |
|
| (0.15 | ) |
| 0.01 |
|
| 13.90 |
|
| 20.96 |
|
| 5,141 |
|
| 2.77 |
|
|
| 2.77 |
|
|
| 2.77 |
|
|
| (1.47 | ) |
|
| 126 |
|
|
2009 |
|
| 7.02 |
|
| 0.03 |
|
| 4.64 |
|
| 4.67 |
|
| (0.07 | ) |
| – |
|
| – |
|
| (0.07 | ) |
| – |
|
| 11.62 |
|
| 66.58 |
|
| 4,109 |
|
| 0.67 |
|
|
| 0.67 |
|
|
| 0.67 |
|
|
| 0.53 |
|
|
| 114 |
|
|
Royce European Smaller-Companies Fund – Investment Class a | |||||||||||||||||||||||||||||||||||||||||||||||||||||||||
†2014 |
| $ | 10.00 |
| $ | 0.15 |
| $ | 0.21 |
| $ | 0.36 |
| $ | – |
| $ | – |
| $ | – |
| $ | – |
| $ | – |
| $ | 10.36 |
|
| 3.60 | %1 | $ | 2,372 |
|
| 2.85 | %2 |
|
| 2.85 | %2 |
|
| 1.44 | %2 |
|
| 3.32 | %2 |
|
| 26 | % |
|
Royce European Smaller-Companies Fund – Service Class | |||||||||||||||||||||||||||||||||||||||||||||||||||||||||
†2014 |
| $ | 12.42 |
| $ | 0.12 |
| $ | 0.45 |
| $ | 0.57 |
| $ | – |
| $ | – |
| $ | – |
| $ | – |
| $ | – |
| $ | 12.99 |
|
| 4.59 | %1 | $ | 32,883 |
|
| 1.98 | %2 |
|
| 1.98 | %2 |
|
| 1.67 | %2 |
|
| 1.88 | %2 |
|
| 26 | % |
|
2013 |
|
| 10.37 |
|
| 0.04 |
|
| 2.11 |
|
| 2.15 |
|
| (0.11 | ) |
| – |
|
| – |
|
| (0.11 | ) |
| 0.01 |
|
| 12.42 |
|
| 20.83 |
|
| 28,046 |
|
| 2.26 |
|
|
| 2.26 |
|
|
| 1.69 |
|
|
| 0.58 |
|
|
| 53 |
|
|
2012 |
|
| 8.50 |
|
| 0.14 |
|
| 1.88 |
|
| 2.02 |
|
| (0.15 | ) |
| – |
|
| – |
|
| (0.15 | ) |
| – |
|
| 10.37 |
|
| 23.83 |
|
| 15,854 |
|
| 2.13 |
|
|
| 2.13 |
|
|
| 1.69 |
|
|
| 1.29 |
|
|
| 22 |
|
|
2011 |
|
| 10.79 |
|
| 0.10 |
|
| (2.31 | ) |
| (2.21 | ) |
| (0.10 | ) |
| – |
|
| – |
|
| (0.10 | ) |
| 0.02 |
|
| 8.50 |
|
| (20.32 | ) |
| 15,918 |
|
| 2.09 |
|
|
| 2.09 |
|
|
| 1.69 |
|
|
| 0.95 |
|
|
| 36 |
|
|
2010 |
|
| 8.06 |
|
| 0.03 |
|
| 2.79 |
|
| 2.82 |
|
| (0.10 | ) |
| – |
|
| – |
|
| (0.10 | ) |
| 0.01 |
|
| 10.79 |
|
| 35.20 |
|
| 15,369 |
|
| 2.57 |
|
|
| 2.57 |
|
|
| 1.69 |
|
|
| 0.70 |
|
|
| 32 |
|
|
2009 |
|
| 5.19 |
|
| 0.06 |
|
| 2.93 |
|
| 2.99 |
|
| (0.12 | ) |
| – |
|
| – |
|
| (0.12 | ) |
| – |
|
| 8.06 |
|
| 57.69 |
|
| 6,887 |
|
| 3.21 |
|
|
| 3.21 |
|
|
| 1.69 |
|
|
| 1.11 |
|
|
| 51 |
|
|
| 74 | The Royce Funds 2014 Semiannual Report to Shareholders | THE ACCOMPANYING NOTES ARE AN INTEGRAL PART OF THESE FINANCIAL STATEMENTS. |
|
Financial Highlights |
| |||||||||||||||||||||||||||||||||||||||||||||||||||||||||
|
|
|
| Net Realized |
|
|
| Distributions |
|
|
|
|
|
|
|
|
| Ratio of Expenses to Average Net Assets |
| Ratio of Net |
|
| |||||||||||||||||||||||||||||||||||
|
| Net Asset |
| Net |
| and Unrealized |
| Total from Investment Operations |
| Distributions |
| from Net |
| Distributions |
| Total Distributions |
| Shareholder Redemption Fees |
| Net Asset |
| Total |
| Net Assets, |
| Prior to Fee |
| Prior to Fee |
| Net of Fee |
| Investment |
| Portfolio Turnover Rate |
| ||||||||||||||||||||||
|
|
|
|
|
|
|
|
|
|
|
|
|
|
|
|
|
|
|
|
|
|
|
|
|
|
|
|
|
|
|
|
|
|
|
|
|
|
|
|
|
|
|
|
|
|
|
|
|
|
|
|
|
|
|
|
|
|
Royce Enterprise Select Fund – Investment Class | |||||||||||||||||||||||||||||||||||||||||||||||||||||||||
†2014 |
| $ | 12.12 |
| $ | (0.02 | ) | $ | 0.72 |
| $ | 0.70 |
| $ | – |
| $ | – |
| $ | – |
| $ | – |
| $ | – |
| $ | 12.82 |
|
| 5.78 | %1 | $ | 2,879 |
|
| 2.51 | %2 |
|
| 2.51 | %2 |
|
| 1.24 | %2 |
|
| (0.33 | )%2 |
|
| 45 | % |
|
2013 |
|
| 10.36 |
|
| (0.05 | ) |
| 2.98 |
|
| 2.93 |
|
| (0.01 | ) |
| (1.16 | ) |
| – |
|
| (1.17 | ) |
| – |
|
| 12.12 |
|
| 28.68 |
|
| 2,630 |
|
| 3.08 |
|
|
| 3.08 |
|
|
| 1.24 |
|
|
| (0.40 | ) |
|
| 154 |
|
|
2012 |
|
| 9.88 |
|
| 0.02 |
|
| 1.51 |
|
| 1.53 |
|
| (0.00 | ) |
| (1.05 | ) |
| – |
|
| (1.05 | ) |
| – |
|
| 10.36 |
|
| 15.68 |
|
| 1,299 |
|
| 0.98 |
|
| 0.98 |
|
| 0.81 |
|
| 0.18 |
|
| 127 |
|
| ||||
2011 |
|
| 10.43 |
|
| (0.04 | ) |
| 0.09 |
|
| 0.05 |
|
| – |
|
| (0.60 | ) |
| – |
|
| (0.60 | ) |
| – |
|
| 9.88 |
|
| 0.66 |
|
| 1,123 |
|
| 1.31 |
|
|
| 1.31 |
|
|
| 1.31 |
|
|
| (0.42 | ) |
|
| 136 |
|
|
2010 |
|
| 8.95 |
|
| 0.05 |
|
| 1.49 |
|
| 1.54 |
|
| (0.06 | ) |
| – |
|
| – |
|
| (0.06 | ) |
| – |
|
| 10.43 |
|
| 17.22 |
|
| 1,158 |
|
| 0.70 |
|
|
| 0.70 |
|
|
| 0.70 |
|
|
| 0.50 |
|
|
| 166 |
|
|
2009 |
|
| 7.33 |
|
| 0.07 |
|
| 1.62 |
|
| 1.69 |
|
| (0.07 | ) |
| – |
|
| – |
|
| (0.07 | ) |
| – |
|
| 8.95 |
|
| 23.13 |
|
| 1,150 |
|
| 0.03 |
|
|
| 0.03 |
|
|
| 0.03 |
|
|
| 0.88 |
|
|
| 415 |
|
|
Royce SMid-Cap Value Fund – Service Class | |||||||||||||||||||||||||||||||||||||||||||||||||||||||||
†2014 |
| $ | 14.31 |
| $ | 0.04 |
| $ | 1.92 |
| $ | 1.96 |
| $ | – |
| $ | – |
| $ | – |
| $ | – |
| $ | – |
| $ | 16.27 |
|
| 13.70 | %1 | $ | 20,207 |
|
| 1.91 | %2 |
|
| 1.91 | %2 |
|
| 1.35 | %2 |
|
| 0.58 | %2 |
|
| 13 | % |
|
2013 |
|
| 11.66 |
|
| 0.02 |
|
| 2.65 |
|
| 2.67 |
|
| (0.02 | ) |
| – |
|
| – |
|
| (0.02 | ) |
| – |
|
| 14.31 |
|
| 22.91 |
|
| 11,520 |
|
| 2.20 |
|
|
| 2.20 |
|
|
| 1.35 |
|
|
| 0.14 |
|
|
| 31 |
|
|
2012 |
|
| 10.10 |
|
| (0.00 | ) |
| 1.55 |
|
| 1.55 |
|
| – |
|
| – |
|
| – |
|
| – |
|
| 0.01 |
|
| 11.66 |
|
| 15.45 |
|
| 11,140 |
|
| 1.90 |
|
|
| 1.90 |
|
|
| 1.35 |
|
|
| (0.03 | ) |
|
| 46 |
|
|
2011 |
|
| 11.44 |
|
| (0.06 | ) |
| (1.27 | ) |
| (1.33 | ) |
| (0.02 | ) |
| – |
|
| – |
|
| (0.02 | ) |
| 0.01 |
|
| 10.10 |
|
| (11.57 | ) |
| 10,327 |
|
| 1.95 |
|
|
| 1.95 |
|
|
| 1.49 |
|
|
| (0.54 | ) |
|
| 54 |
|
|
2010 |
|
| 9.08 |
|
| (0.03 | ) |
| 2.39 |
|
| 2.36 |
|
| – |
|
| – |
|
| – |
|
| – |
|
| – |
|
| 11.44 |
|
| 25.99 |
|
| 6,195 |
|
| 2.40 |
|
|
| 2.40 |
|
|
| 1.49 |
|
|
| (0.26 | ) |
|
| 126 |
|
|
2009 |
|
| 7.06 |
|
| (0.01 | ) |
| 2.03 |
|
| 2.02 |
|
| (0.01 | ) |
| – |
|
| – |
|
| (0.01 | ) |
| 0.01 |
|
| 9.08 |
|
| 28.75 |
|
| 7,365 |
|
| 2.03 |
|
|
| 2.03 |
|
|
| 1.49 |
|
|
| (0.20 | ) |
|
| 216 |
|
|
Royce Focus Value Fund – Service Class b | |||||||||||||||||||||||||||||||||||||||||||||||||||||||||
†2014 |
| $ | 17.47 |
| $ | 0.01 |
| $ | 0.74 |
| $ | 0.75 |
| $ | (0.01 | ) | $ | (5.05 | ) | $ | – |
| $ | (5.06 | ) | $ | – |
| $ | 13.16 |
|
| 4.28 | %1 | $ | 9,096 |
|
| 1.69 | %2 |
|
| 1.69 | %2 |
|
| 1.20 | %2 |
|
| 0.12 | %2 |
|
| 190 | % |
|
2013 |
|
| 14.74 |
|
| (0.01 | ) |
| 3.48 |
|
| 3.47 |
|
| (0.00 | ) |
| (0.74 | ) |
| – |
|
| (0.74 | ) |
| – |
|
| 17.47 |
|
| 23.77 |
|
| 11,834 |
|
| 2.10 |
|
|
| 2.10 |
|
|
| 1.35 |
|
|
| (0.08 | ) |
|
| 167 |
|
|
2012 |
|
| 13.75 |
|
| 0.06 |
|
| 1.20 |
|
| 1.26 |
|
| (0.27 | ) |
| (0.00 | ) |
| – |
|
| (0.27 | ) |
| – |
|
| 14.74 |
|
| 9.20 |
|
| 8,875 |
|
| 2.05 |
|
|
| 2.05 |
|
|
| 1.35 |
|
|
| 0.35 |
|
|
| 21 |
|
|
2011 |
|
| 16.59 |
|
| (0.05 | ) |
| (2.25 | ) |
| (2.30 | ) |
| – |
|
| (0.54 | ) |
| – |
|
| (0.54 | ) |
| – |
|
| 13.75 |
|
| (13.88 | ) |
| 8,727 |
|
| 1.97 |
|
|
| 1.97 |
|
|
| 1.49 |
|
|
| (0.31 | ) |
|
| 25 |
|
|
2010 |
|
| 14.82 |
|
| (0.06 | ) |
| 2.30 |
|
| 2.24 |
|
| (0.06 | ) |
| (0.41 | ) |
| – |
|
| (0.47 | ) |
| – |
|
| 16.59 |
|
| 15.16 |
|
| 8,942 |
|
| 1.95 |
|
|
| 1.95 |
|
|
| 1.49 |
|
|
| (0.32 | ) |
|
| 31 |
|
|
2009 |
|
| 10.00 |
|
| 0.00 |
|
| 5.31 |
|
| 5.31 |
|
| (0.05 | ) |
| (0.44 | ) |
| – |
|
| (0.49 | ) |
| – |
|
| 14.82 |
|
| 53.27 | 1 |
| 4,796 |
|
| 2.97 |
|
| 2.97 |
|
| 1.49 |
|
| 0.17 |
|
| 21 |
|
| ||||
Royce Partners Fund – Service Class c | |||||||||||||||||||||||||||||||||||||||||||||||||||||||||
†2014 |
| $ | 14.46 |
| $ | 0.05 |
| $ | 0.35 |
| $ | 0.40 |
| $ | – |
| $ | – |
| $ | – |
| $ | – |
| $ | – |
| $ | 14.86 |
|
| 2.77 | %1 | $ | 2,892 |
|
| 3.36 | %2 |
|
| 3.36 | %2 |
|
| 1.20 | %2 |
|
| 0.66 | %2 |
|
| 5 | % |
|
2013 |
|
| 12.04 |
|
| 0.09 |
|
| 3.73 |
|
| 3.82 |
|
| (0.12 | ) |
| (1.28 | ) |
| – |
|
| (1.40 | ) |
| – |
|
| 14.46 |
|
| 32.22 |
|
| 2,801 |
|
| 4.06 |
|
|
| 4.06 |
|
|
| 1.35 |
|
|
| 0.66 |
|
|
| 53 |
|
|
2012 |
|
| 10.37 |
|
| 0.04 |
|
| 2.10 |
|
| 2.14 |
|
| (0.01 | ) |
| (0.46 | ) |
| – |
|
| (0.47 | ) |
| – |
|
| 12.04 |
|
| 20.74 |
|
| 2,083 |
|
| 4.83 |
|
|
| 4.83 |
|
|
| 1.35 |
|
|
| 0.33 |
|
|
| 31 |
|
|
2011 |
|
| 13.15 |
|
| (0.03 | ) |
| (1.52 | ) |
| (1.55 | ) |
| (0.05 | ) |
| (1.18 | ) |
| – |
|
| (1.23 | ) |
| – |
|
| 10.37 |
|
| (11.66 | ) |
| 1,682 |
|
| 4.25 |
|
|
| 4.25 |
|
|
| 1.49 |
|
|
| (0.25 | ) |
|
| 44 |
|
|
2010 |
|
| 11.56 |
|
| 0.01 |
|
| 2.14 |
|
| 2.15 |
|
| (0.16 | ) |
| (0.41 | ) |
| – |
|
| (0.57 | ) |
| 0.01 |
|
| 13.15 |
|
| 18.74 |
|
| 1,771 |
|
| 3.72 |
|
|
| 3.72 |
|
|
| 1.49 |
|
|
| 0.10 |
|
|
| 38 |
|
|
2009 |
|
| 10.00 |
|
| (0.05 | ) |
| 1.61 |
|
| 1.56 |
|
| – |
|
| – |
|
| – |
|
| – |
|
| – |
|
| 11.56 |
|
| 15.60 |
| 1,501 |
|
| 5.27 |
|
| 5.27 |
|
| 1.49 |
|
| (0.71 | )2 |
|
| 14 |
|
| ||||
Royce Opportunity Select Fund – Investment Class d | |||||||||||||||||||||||||||||||||||||||||||||||||||||||||
†2014 |
| $ | 17.93 |
| $ | (0.06 | ) | $ | 0.64 |
| $ | 0.58 |
| $ | – |
| $ | – |
| $ | – |
| $ | – |
| $ | 0.01 |
| $ | 18.52 |
|
| 3.29 | %1 | $ | 23,727 |
|
| 1.36 | %2 |
|
| 1.36 | %2 |
|
| 1.27 | %2 |
|
| (0.72 | )%2 |
|
| 51 | % |
|
2013 |
|
| 12.81 |
|
| (0.13 | ) |
| 5.79 |
|
| 5.66 |
|
| – |
|
| (0.55 | ) |
| – |
|
| (0.55 | ) |
| 0.01 |
|
| 17.93 |
|
| 44.61 |
|
| 17,461 |
|
| 1.78 |
|
|
| 1.78 |
|
|
| 1.29 |
|
|
| (0.80 | ) |
|
| 129 |
|
|
2012 |
|
| 10.33 |
|
| 0.07 |
|
| 3.50 |
|
| 3.57 |
|
| (0.13 | ) |
| (0.96 | ) |
| – |
|
| (1.09 | ) |
| – |
|
| 12.81 |
|
| 35.14 |
|
| 3,198 |
|
| 0.29 |
|
| 0.29 |
|
| 0.25 |
|
| 0.64 |
|
| 196 |
|
| ||||
2011 |
|
| 12.99 |
|
| 0.01 |
|
| (2.26 | ) |
| (2.25 | ) |
| (0.02 | ) |
| (0.39 | ) |
| – |
|
| (0.41 | ) |
| – |
|
| 10.33 |
|
| (17.14 | ) |
| 2,102 |
|
| 1.14 |
|
|
| 1.14 |
|
|
| 1.14 |
|
|
| 0.08 |
|
|
| 299 |
|
|
2010 |
|
| 10.00 |
|
| (0.43 | ) |
| 3.42 |
|
| 2.99 |
|
| – |
|
| – |
|
| – |
|
| – |
|
| – |
|
| 12.99 |
|
| 29.90 | 1 |
| 1,913 |
|
| 4.01 | 1 |
|
| 4.01 | 1 |
|
| 4.01 | 1 |
|
| (3.79 | )1 |
|
| 95 |
|
|
Royce Opportunity Select Fund – Service Class e | |||||||||||||||||||||||||||||||||||||||||||||||||||||||||
†2014 |
| $ | 10.00 |
| $ | (0.02 | ) | $ | (0.33 | ) | $ | (0.35 | ) | $ | – |
| $ | – |
| $ | – |
| $ | – |
| $ | – |
| $ | 9.65 |
|
| (3.50 | )%1 | $ | 145 |
|
| 51.23 | %2 |
|
| 51.23 | %2 |
|
| 1.52 | %2 |
|
| (0.87 | )%2 |
|
| 51 | % |
|
| THE ACCOMPANYING NOTES ARE AN INTEGRAL PART OF THESE FINANCIAL STATEMENTS. | The Royce Funds 2014 Semiannual Report to Shareholders | 75 |
|
Financial Highlights |
| |||||||||||||||||||||||||||||||||||||||||||||||||||||||||
|
|
|
| Net Realized |
|
|
| Distributions |
|
|
|
|
|
|
|
|
| Ratio of Expenses to Average Net Assets |
| Ratio of Net |
|
| |||||||||||||||||||||||||||||||||||
|
| Net Asset |
| Net |
| and Unrealized |
| Total from Investment Operations |
| Distributions |
| from Net |
| Distributions |
| Total Distributions |
| Shareholder Redemption Fees |
| Net Asset |
| Total |
| Net Assets, |
| Prior to Fee |
| Prior to Fee |
| Net of Fee |
| Investment |
| Portfolio Turnover Rate |
| ||||||||||||||||||||||
|
|
|
|
|
|
|
|
|
|
|
|
|
|
|
|
|
|
|
|
|
|
|
|
|
|
|
|
|
|
|
|
|
|
|
|
|
|
|
|
|
|
|
|
|
|
|
|
|
|
|
|
|
|
|
|
|
|
Royce Global Dividend Value Fund – Service Class f | |||||||||||||||||||||||||||||||||||||||||||||||||||||||||
†2014 |
| $ | 11.19 |
| $ | 0.13 |
| $ | 0.47 |
| $ | 0.60 |
| $ | (0.08 | ) | $ | – |
| $ | – |
| $ | (0.08 | ) | $ | – |
| $ | 11.71 |
|
| 5.38 | %1 | $ | 9,967 |
|
| 2.63 | %2 |
|
| 2.63 | %2 |
|
| 1.69 | %2 |
|
| 2.36 | %2 |
|
| 9 | % |
|
2013 |
|
| 10.10 |
|
| 0.18 |
|
| 1.38 |
|
| 1.56 |
|
| (0.26 | ) |
| (0.22 | ) |
| – |
|
| (0.48 | ) |
| 0.01 |
|
| 11.19 |
|
| 15.78 |
|
| 9,556 |
|
| 2.98 |
|
|
| 2.98 |
|
|
| 1.69 |
|
|
| 1.75 |
|
|
| 82 |
|
|
2012 |
|
| 8.39 |
|
| 0.17 |
|
| 1.71 |
|
| 1.88 |
|
| (0.17 | ) |
| – |
|
| – |
|
| (0.17 | ) |
| – |
|
| 10.10 |
|
| 22.52 |
|
| 6,708 |
|
| 2.86 |
|
|
| 2.86 |
|
|
| 1.69 |
|
|
| 1.72 |
|
|
| 36 |
|
|
2011 |
|
| 10.00 |
|
| 0.08 |
|
| (1.62 | ) |
| (1.54 | ) |
| (0.07 | ) |
| (0.01 | ) |
| – |
|
| (0.08 | ) |
| 0.01 |
|
| 8.39 |
|
| (15.37 | )1 |
| 6,135 |
|
| 3.47 |
|
| 3.47 |
|
| 1.69 |
|
| 1.10 |
|
| 20 |
|
| ||||
Royce International Micro-Cap Fund – Service Class f | |||||||||||||||||||||||||||||||||||||||||||||||||||||||||
†2014 |
| $ | 10.04 |
| $ | 0.05 |
| $ | 0.74 |
| $ | 0.79 |
| $ | – |
| $ | – |
| $ | – |
| $ | – |
| $ | – |
| $ | 10.83 |
|
| 7.87 | %1 | $ | 5,342 |
|
| 3.55 | %2 |
|
| 3.55 | %2 |
|
| 1.69 | %2 |
|
| 0.94 | %2 |
|
| 45 | % |
|
2013 |
|
| 8.61 |
|
| 0.11 |
|
| 1.51 |
|
| 1.62 |
|
| (0.20 | ) |
| – |
|
| – |
|
| (0.20 | ) |
| 0.01 |
|
| 10.04 |
|
| 18.95 |
|
| 5,209 |
|
| 3.86 |
|
|
| 3.86 |
|
|
| 1.69 |
|
|
| 1.22 |
|
|
| 103 |
|
|
2012 |
|
| 7.72 |
|
| 0.13 |
|
| 0.92 |
|
| 1.05 |
|
| (0.16 | ) |
| – |
|
| – |
|
| (0.16 | ) |
| – |
|
| 8.61 |
|
| 13.59 |
|
| 4,603 |
|
| 3.90 |
|
|
| 3.90 |
|
|
| 1.69 |
|
|
| 1.63 |
|
|
| 62 |
|
|
2011 |
|
| 10.00 |
|
| 0.10 |
|
| (2.26 | ) |
| (2.16 | ) |
| (0.12 | ) |
| – |
|
| (0.01 | ) |
| (0.13 | ) |
| 0.01 |
|
| 7.72 |
|
| (21.51 | )1 |
| 3,572 |
|
| 3.92 |
|
| 3.92 |
|
| 1.69 |
|
| 1.08 |
|
| 71 |
|
| ||||
Royce International Premier Fund – Investment Class a | |||||||||||||||||||||||||||||||||||||||||||||||||||||||||
†2014 |
| $ | 10.00 |
| $ | 0.08 |
| $ | 0.23 |
| $ | 0.31 |
| $ | – |
| $ | – |
| $ | – |
| $ | – |
| $ | – |
| $ | 10.31 |
|
| 3.10 | %1 | $ | 5,011 |
|
| 4.18 | %2 |
|
| 4.18 | %2 |
|
| 1.44 | %2 |
|
| 1.75 | %2 |
|
| 18 | % |
|
Royce International Premier Fund – Service Class g | |||||||||||||||||||||||||||||||||||||||||||||||||||||||||
†2014 |
| $ | 11.67 |
| $ | 0.11 |
| $ | 0.29 |
| $ | 0.40 |
| $ | – |
| $ | – |
| $ | – |
| $ | – |
| $ | – |
| $ | 12.07 |
|
| 3.43 | %1 | $ | 8,854 |
|
| 2.27 | %2 |
|
| 2.27 | %2 |
|
| 1.36 | %2 |
|
| 1.98 | %2 |
|
| 18 | % |
|
2013 |
|
| 10.01 |
|
| 0.10 |
|
| 1.73 |
|
| 1.83 |
|
| (0.17 | ) |
| – |
|
| – |
|
| (0.17 | ) |
| – |
|
| 11.67 |
|
| 18.31 |
|
| 9,470 |
|
| 2.82 |
|
|
| 2.82 |
|
|
| 1.69 |
|
|
| 1.09 |
|
|
| 51 |
|
|
2012 |
|
| 8.26 |
|
| 0.12 |
|
| 1.81 |
|
| 1.93 |
|
| (0.18 | ) |
| – |
|
| – |
|
| (0.18 | ) |
| – |
|
| 10.01 |
|
| 23.40 |
|
| 6,444 |
|
| 3.54 |
|
|
| 3.54 |
|
|
| 1.69 |
|
|
| 1.18 |
|
|
| 103 |
|
|
2011 |
|
| 10.00 |
|
| 0.05 |
|
| (1.73 | ) |
| (1.68 | ) |
| (0.06 | ) |
| (0.00 | ) |
| (0.01 | ) |
| (0.07 | ) |
| 0.01 |
|
| 8.26 |
|
| (16.75 | )1 |
| 4,090 |
|
| 3.77 |
|
| 3.77 |
|
| 1.69 |
|
| 0.67 |
|
| 42 |
|
| ||||
| 76 | The Royce Funds 2014 Semiannual Report to Shareholders | THE ACCOMPANYING NOTES ARE AN INTEGRAL PART OF THESE FINANCIAL STATEMENTS. |
| Notes to Financial Statements (unaudited) |
| Royce Select Fund I | 15 | % | Royce Focus Value Fund | 79 | % | |||
| Royce Micro-Cap Discovery Fund | 70 | % | Royce Partners Fund | 78 | % | |||
| Royce Select Fund II | 44 | % | Royce Opportunity Select Fund | 17 | % | |||
| Royce Enterprise Select Fund | 50 | % | Royce Global Dividend Value Fund | 14 | % | |||
| Royce SMid-Cap Value Fund | 32 | % | Royce International Micro-Cap Fund | 32 | % |
Various inputs are used in determining the value of each Fund’s investments, as noted above. These inputs are summarized in the three broad levels below: | |||||
Level 1 | – | quoted prices in active markets for identical securities. | |||
Level 2 | – | other significant observable inputs (including quoted prices for similar securities, foreign securities that may be fair valued and repurchase agreements). The table below includes all Level 2 securities. Level 2 securities with values based on quoted prices for similar securities are noted in the Schedules of Investments. | |||
Level 3 | – | significant unobservable inputs (including last trade price before trading was suspended, or at a discount thereto for lack of marketability or otherwise, market price information regarding other securities, information received from the company and/or published documents, including SEC filings and financial statements, or other publicly available information). | |||
The inputs or methodology used for valuing securities are not necessarily an indication of the risk associated with investing in those securities. | |||||
The following is a summary of the inputs used to value each Fund’s investments as of June 30, 2014. For a detailed breakout of common stocks by sector classification or country, please refer to the Schedules of Investments. | |||||
| Level 1 | Level 2 | Level 3 | Total | |||||||||||||
| Royce Select Fund I | ||||||||||||||||
| Common Stocks | $ | 43,111,567 | $ | – | $ | – | $ | 43,111,567 | ||||||||
| Cash Equivalents | – | 5,154,000 | – | 5,154,000 | ||||||||||||
| Royce Micro-Cap Discovery Fund | ||||||||||||||||
| Common Stocks | 5,427,553 | – | – | 5,427,553 | ||||||||||||
| Cash Equivalents | – | 201,000 | – | 201,000 | ||||||||||||
| The Royce Funds 2014 Semiannual Report to Shareholders | 77 |
| Notes to Financial Statements (unaudited) (continued) |
| Valuation of Investments (continued): | ||||||||||||||||
| Level 1 | Level 2 | Level 3 | Total | |||||||||||||
| Royce Financial Services Fund | ||||||||||||||||
| Common Stocks | $ | 62,664,352 | $ | 60,580 | $ | – | $ | 62,724,932 | ||||||||
| Cash Equivalents | – | 1,541,000 | – | 1,541,000 | ||||||||||||
| Royce Select Fund II | ||||||||||||||||
| Common Stocks | 5,249,660 | – | – | 5,249,660 | ||||||||||||
| Cash Equivalents | – | 201,000 | – | 201,000 | ||||||||||||
| Royce European Smaller-Companies Fund | ||||||||||||||||
| Common Stocks | 33,186,257 | – | – | 33,186,257 | ||||||||||||
| Cash Equivalents | – | 2,742,000 | – | 2,742,000 | ||||||||||||
| Royce Enterprise Select Fund | ||||||||||||||||
| Common Stocks | 2,068,836 | – | – | 2,068,836 | ||||||||||||
| Fixed Income | 49,891 | – | – | 49,891 | ||||||||||||
| Cash Equivalents | – | 740,000 | – | 740,000 | ||||||||||||
| Royce SMid-Cap Value Fund | ||||||||||||||||
| Common Stocks | 18,485,670 | – | – | 18,485,670 | ||||||||||||
| Cash Equivalents | – | 1,675,000 | – | 1,675,000 | ||||||||||||
| Royce Partners Fund | ||||||||||||||||
| Common Stocks | 2,438,874 | – | – | 2,438,874 | ||||||||||||
| Cash Equivalents | – | 457,000 | – | 457,000 | ||||||||||||
| Royce Opportunity Select Fund | ||||||||||||||||
| Common Stocks | 23,687,830 | 22,716 | – | 23,710,546 | ||||||||||||
| Cash Equivalents | – | 654,000 | – | 654,000 | ||||||||||||
| Royce Global Dividend Value Fund | ||||||||||||||||
| Common Stocks | 9,708,156 | – | – | 9,708,156 | ||||||||||||
| Cash Equivalents | – | 290,000 | – | 290,000 | ||||||||||||
| Royce International Micro-Cap Fund | ||||||||||||||||
| Common Stocks | 4,971,668 | – | 529 | 4,972,197 | ||||||||||||
| Cash Equivalents | – | 366,000 | – | 366,000 | ||||||||||||
| Royce International Premier Fund | ||||||||||||||||
| Common Stocks | 13,370,172 | – | – | 13,370,172 | ||||||||||||
| Cash Equivalents | – | 366,000 | – | 366,000 | ||||||||||||
Short positions:
| Level 1 | Level 2 | Level 3 | Total | |||||||||||||
| Royce Select Fund II | ||||||||||||||||
| Common Stocks | $ | (287,646 | ) | $ | – | $ | – | $ | (287,646 | ) | ||||||
| Royce Opportunity Select Fund | ||||||||||||||||
| Common Stocks | (1,228,349 | ) | – | – | (1,228,349 | ) | ||||||||||
| Level 3 Reconciliation: | ||||||||||||||||
| Realized and Unrealized | ||||||||||||||||
| Balance as of 12/31/13 | Sales | Gain (Loss)1 | Balance as of 6/30/14 | |||||||||||||
| Royce Financial Services Fund | ||||||||||||||||
| Common Stocks | $ | 0 | $ | 0 | $ | 0 | $ | – | ||||||||
| Royce International Micro-Cap Fund | ||||||||||||||||
| Common Stocks | 529 | – | – | 529 | ||||||||||||
| 78 | The Royce Funds 2014 Semiannual Report to Shareholders |
Royce Global Dividend Value Fund pays any dividends from net investment income quarterly and makes any distributions from net realized gains annually in December. The other Funds pay any dividends and capital gain distributions annually in December. Dividends from net investment income are determined at a class level and distributions from capital gains are determined at a Fund level. Because federal income tax regulations differ from generally accepted accounting principles, income and capital gain distributions determined in accordance with tax regulations may differ from net investment income and realized gains recognized for financial reporting purposes. Accordingly, the character of distributions and composition of net assets for tax purposes differ from those reflected in the accompanying financial statements.
| Capital Share Transactions (in dollars): | ||||||||||||||||||||||||||||
| Shares sold | Shares issued for reinvestment of distributions | Shares redeemed | Net increase (decrease) from capital share transactions | |||||||||||||||||||||||||
| Period ended | Period ended | Period ended | Period ended | |||||||||||||||||||||||||
| 6/30/14 | Period ended | 6/30/14 | Period ended | 6/30/14 | Period ended | 6/30/14 | Period ended | |||||||||||||||||||||
| (unaudited) | 12/31/13 | (unaudited) | 12/31/13 | (unaudited) | 12/31/13 | (unaudited) | 12/31/13 | |||||||||||||||||||||
| Royce Select Fund I | ||||||||||||||||||||||||||||
Investment Class | $ | 1,917,249 | $ | 4,142,661 | $ | – | $ | 4,632,626 | $ | (4,423,953 | ) | $ | (17,467,022 | ) | $ | (2,506,704 | ) | $ | (8,691,735 | ) | ||||||||
| Royce Micro-Cap Discovery Fund | ||||||||||||||||||||||||||||
Service Class | 98,525 | 1,631,092 | – | 158,366 | (302,008 | ) | (1,865,126 | ) | (203,483 | ) | (75,668 | ) | ||||||||||||||||
| The Royce Funds 2014 Semiannual Report to Shareholders | 79 |
| Capital Share Transactions (in dollars) (continued): | ||||||||||||||||||||||||||||||||
| Shares issued for | Net increase (decrease) from | |||||||||||||||||||||||||||||||
| Shares sold | reinvestment of distributions | Shares redeemed | capital share transactions | |||||||||||||||||||||||||||||
| Period ended | Period ended | Period ended | Period ended | |||||||||||||||||||||||||||||
| 6/30/14 | Period ended | 6/30/14 | Period ended | 6/30/14 | Period ended | 6/30/14 | Period ended | |||||||||||||||||||||||||
| (unaudited) | 12/31/13 | (unaudited) | (12/31/13) | (unaudited) | 12/31/13) | (unaudited) | 12/31/13 | |||||||||||||||||||||||||
| Royce Financial Services Fund | ||||||||||||||||||||||||||||||||
Service Class | $ | 22,693,022 | $ | 26,878,008 | $ | – | $ | 81,782 | $ | (8,430,400 | ) | $ | (6,116,756 | ) | $ | 14,262,622 | $ | 20,843,034 | ||||||||||||||
| Royce Select Fund II | ||||||||||||||||||||||||||||||||
Investment Class | 18,900 | 962,146 | – | 484,786 | (72,041 | ) | (595,954 | ) | (53,141 | ) | 850,978 | |||||||||||||||||||||
| Royce European Smaller-Companies Fund | ||||||||||||||||||||||||||||||||
Investment Class | 2,438,433 | – | (89,032 | ) | 2,349,401 | |||||||||||||||||||||||||||
Service Class | 8,917,876 | 12,749,215 | – | 225,822 | (5,428,261 | ) | (4,474,074 | ) | 3,489,615 | 8,500,963 | ||||||||||||||||||||||
| Royce Enterprise Select Fund | ||||||||||||||||||||||||||||||||
Investment Class | 115,765 | 1,042,236 | – | 230,142 | (22,119 | ) | (196,397 | ) | 93,646 | 1,075,981 | ||||||||||||||||||||||
| Royce SMid-Cap Value Fund | ||||||||||||||||||||||||||||||||
Service Class | 7,597,927 | 918,483 | – | 15,362 | (871,331 | ) | (2,831,409 | ) | 6,726,596 | (1,897,564 | ) | |||||||||||||||||||||
| Royce Focus Value Fund | ||||||||||||||||||||||||||||||||
Service Class | 449,850 | 2,098,908 | 2,214,987 | 481,464 | (2,728,456 | ) | (1,368,403 | ) | (63,619 | ) | 1,211,969 | |||||||||||||||||||||
| Royce Partners Fund | ||||||||||||||||||||||||||||||||
Service Class | 69,541 | 159,415 | – | 243,024 | (57,431 | ) | (121,486 | ) | 12,110 | 280,953 | ||||||||||||||||||||||
| Royce Opportunity Select Fund | ||||||||||||||||||||||||||||||||
Investment Class | 7,479,626 | 12,259,644 | – | 502,868 | (1,847,100 | ) | (1,079,435 | ) | 5,632,526 | 11,683,077 | ||||||||||||||||||||||
Service Class | 146,946 | – | (2,538 | ) | 144,408 | |||||||||||||||||||||||||||
| Royce Global Dividend Value Fund | ||||||||||||||||||||||||||||||||
Service Class | 655,499 | 3,160,309 | 66,962 | 387,794 | (756,184 | ) | (1,506,338 | ) | (33,723 | ) | 2,041,765 | |||||||||||||||||||||
| Royce International Micro-Cap Fund | ||||||||||||||||||||||||||||||||
Service Class | 941,769 | 1,892,877 | – | 98,903 | (1,201,300 | ) | (2,089,921 | ) | (259,531 | ) | (98,141 | ) | ||||||||||||||||||||
| Royce International Premier Fund | ||||||||||||||||||||||||||||||||
Investment Class | 5,089,742 | – | (107,379 | ) | 4,982,363 | |||||||||||||||||||||||||||
Service Class | 5,702,733 | 2,799,696 | – | 128,291 | (6,753,592 | ) | (1,048,897 | ) | (1,050,859 | ) | 1,879,090 | |||||||||||||||||||||
| Capital Share Transactions (in shares): | ||||||||||||||||||||||||||||||||
| Shares issued for | Net increase (decrease) in | |||||||||||||||||||||||||||||||
| Shares sold | reinvestment of distributions | Shares redeemed | shares outstanding | |||||||||||||||||||||||||||||
| Period ended | Period ended | Period ended | Period ended | |||||||||||||||||||||||||||||
| 6/30/14 | Period ended | 6/30/14 | Period ended | 6/30/14 | Period ended | 6/30/14 | Period ended | |||||||||||||||||||||||||
| (unaudited) | 12/31/13 | (unaudited) | 12/31/13 | (unaudited) | 12/31/13 | (unaudited) | 12/31/13 | |||||||||||||||||||||||||
| Royce Select Fund I | ||||||||||||||||||||||||||||||||
Investment Class | 95,340 | 220,662 | – | 247,999 | (221,902 | ) | (931,946 | ) | (126,562 | ) | (463,285 | ) | ||||||||||||||||||||
| Royce Micro-Cap Discovery Fund | ||||||||||||||||||||||||||||||||
Service Class | 14,637 | 272,296 | – | 23,995 | (44,690 | ) | (304,432 | ) | (30,053 | ) | (8,141 | ) | ||||||||||||||||||||
| Royce Financial Services Fund | ||||||||||||||||||||||||||||||||
Service Class | 2,361,888 | 3,162,045 | – | 8,765 | (873,837 | ) | (728,338 | ) | 1,488,051 | 2,442,472 | ||||||||||||||||||||||
| Royce Select Fund II | ||||||||||||||||||||||||||||||||
Investment Class | 1,542 | 82,539 | – | 42,863 | (6,150 | ) | (50,269 | ) | (4,608 | ) | 75,133 | |||||||||||||||||||||
| Royce European Smaller-Companies Fund | ||||||||||||||||||||||||||||||||
Investment Class | 237,546 | – | (8,615 | ) | 228,931 | |||||||||||||||||||||||||||
Service Class | 697,115 | 1,112,607 | – | 18,850 | (424,071 | ) | (403,204 | ) | 273,044 | 728,253 | ||||||||||||||||||||||
| Royce Enterprise Select Fund | ||||||||||||||||||||||||||||||||
Investment Class | 9,416 | 88,545 | – | 19,654 | (1,846 | ) | (16,561 | ) | 7,570 | 91,638 | ||||||||||||||||||||||
| Royce SMid-Cap Value Fund | ||||||||||||||||||||||||||||||||
Service Class | 494,713 | 69,873 | – | 1,118 | (58,033 | ) | (221,303 | ) | 436,680 | (150,312 | ) | |||||||||||||||||||||
| Royce Focus Value Fund | ||||||||||||||||||||||||||||||||
Service Class | 25,782 | 136,032 | 168,185 | 28,675 | (180,282 | ) | (89,541 | ) | 13,685 | 75,166 | ||||||||||||||||||||||
80 | The Royce Funds 2014 Semiannual Report to Shareholders
| Capital Share Transactions (in shares) (continued): | ||||||||||||||||||||||||||
| Shares issued for | Net increase (decrease) in | |||||||||||||||||||||||||
| Shares sold | reinvestment of distributions | Shares redeemed | shares outstanding | |||||||||||||||||||||||
| Period ended | Period ended | Period ended | Period ended | |||||||||||||||||||||||
| 6/30/14 | Period ended | 6/30/14 | Period ended | 6/30/14 | Period ended | 6/30/14 | Period ended | |||||||||||||||||||
| (unaudited) | 12/31/13 | (unaudited) | 12/31/13 | (unaudited) | 12/31/13 | (unaudited) | 12/31/13 | |||||||||||||||||||
| Royce Partners Fund | ||||||||||||||||||||||||||
Service Class | 4,853 | 11,894 | – | 17,559 | (3,952 | ) | (8,706 | ) | 901 | 20,747 | ||||||||||||||||
| Royce Opportunity Select Fund | ||||||||||||||||||||||||||
Investment Class | 408,672 | 763,033 | – | 30,076 | (101,060 | ) | (68,900 | ) | 307,612 | 724,209 | ||||||||||||||||
Service Class | 15,230 | – | (263 | ) | 14,967 | |||||||||||||||||||||
| Royce Global Dividend Value Fund | ||||||||||||||||||||||||||
Service Class | 58,254 | 294,486 | 5,857 | 35,717 | (67,006 | ) | (140,394 | ) | (2,895 | ) | 189,809 | |||||||||||||||
| Royce International Micro-Cap Fund | ||||||||||||||||||||||||||
Service Class | 90,284 | 205,642 | – | 10,123 | (116,229 | ) | (231,571 | ) | (25,945 | ) | (15,806 | ) | ||||||||||||||
| Royce International Premier Fund | ||||||||||||||||||||||||||
Investment Class | 496,723 | – | (10,548 | ) | 486,175 | |||||||||||||||||||||
Service Class | 487,545 | 254,662 | – | 11,434 | (565,940 | ) | (97,880 | ) | (78,395 | ) | 168,216 | |||||||||||||||
Investment Adviser and Distributor:
Investment Adviser: Under the Trust’s investment advisory agreements with Royce, Royce is entitled to receive Investment Advisory fees that are computed daily and payable monthly. Royce’s commitment to waive its fees and reimburse class-specific expenses to the extent necessary to maintain certain Funds’ net annual operating expense ratios at specified levels through April 30, 2015, is shown below to the extent that it impacted net expenses for the period ended June 30, 2014. See the Prospectus for contractual waiver expiration dates.
| Annual contractual advisory fee as a percentage of | Committed net annual operating expense ratio cap | Period ended June 30, 2014 | ||||||||||||||||||
| Investment | Service | Net advisory | Advisory fees | |||||||||||||||||
| average net assets1 | Class2 | Class2 | fees | waived | ||||||||||||||||
| Royce Select Fund I | 1.00% | N/A | N/A | $ | 228,334 | $ | – | |||||||||||||
| Royce Micro-Cap Discovery Fund | 1.00% | N/A | 1.49% | 3,438 | 23,849 | |||||||||||||||
| Royce Financial Services Fund | 1.00% | N/A | 1.49% | 271,425 | 18,215 | |||||||||||||||
| Royce Select Fund II | 1.25% | 1.49% | N/A | – | 30,499 | |||||||||||||||
| Royce European Smaller-Companies Fund | 1.25% | 1.44% | 1.69% | 190,202 | 10,638 | |||||||||||||||
| Royce Enterprise Select Fund | 1.00% | 1.24% | N/A | – | 13,372 | |||||||||||||||
| Royce SMid-Cap Value Fund | 1.00% | N/A | 1.35% | 31,042 | 39,424 | |||||||||||||||
| Royce Focus Value Fund | 0.85% | N/A | 1.20% | 20,601 | 28,580 | |||||||||||||||
| Royce Partners Fund | 0.85% | N/A | 1.20% | – | 11,860 | |||||||||||||||
| Royce Opportunity Select Fund | 1.00% | 1.24% | 1.49% | 98,657 | 5,227 | |||||||||||||||
| Royce Global Dividend Value Fund | 1.25% | N/A | 1.69% | 14,526 | 44,969 | |||||||||||||||
| Royce International Micro-Cap Fund | 1.30% | N/A | 1.69% | – | 33,101 | |||||||||||||||
| Royce International Premier Fund | 1.25% | 1.44% | 1.69% | 56,403 | 27,052 | |||||||||||||||
Distributor: Royce Fund Services, Inc. (“RFS”), the distributor of the Trust’s shares, is a wholly owned subsidiary of Royce. RFS is entitled to receive distribution fees that are computed daily and payable monthly.
| Period ended June 30, 2014 | |||||||||||||
| Annual contractual distribution fee as | Net distribution | Distribution fees | |||||||||||
| a percentage of average net assets | fees | waived | |||||||||||
| Royce Micro-Cap Discovery Fund – Service Class | 0.25% | $ | 6,822 | $ | – | ||||||||
| Royce Financial Services Fund – Service Class | 0.25% | 66,617 | 5,793 | ||||||||||
| Royce European Smaller-Companies Fund – Service Class | 0.25% | 38,336 | – | ||||||||||
| Royce SMid-Cap Value Fund – Service Class | 0.25% | 17,617 | – | ||||||||||
| Royce Focus Value Fund – Service Class | 0.25% | 14,465 | – | ||||||||||
| Royce Partners Fund – Service Class | 0.25% | 3,488 | – | ||||||||||
| Royce Opportunity Select Fund – Service Class | 0.25% | 47 | – | ||||||||||
| The Royce Funds 2014 Semiannual Report to Shareholders | 81 |
| Notes to Financial Statements (unaudited) (continued) |
| Distributor (continued): | ||||||||||
| Period ended June 30, 2014 | ||||||||||
| Annual contractual distribution fee as | Net distribution | Distribution fees | ||||||||
| a percentage of average net assets | fees | waived | ||||||||
| Royce Global Dividend Value Fund – Service Class | 0.25% | $ | 11,899 | $ | – | |||||
| Royce International Micro-Cap Fund – Service Class | 0.25% | 6,111 | 255 | |||||||
| Royce International Premier Fund – Service Class | 0.25% | 13,764 | 1,877 | |||||||
| Short | Purchases to | ||||||||||||
| Purchases | Sales | Sales | Cover Short Sales | ||||||||||
| Royce Select Fund I | $ | 8,974,871 | $ | 13,927,802 | $ | – | $ | – | |||||
| Royce Micro-Cap Discovery Fund | 2,503,191 | 2,566,188 | – | – | |||||||||
| Royce Financial Services Fund | 29,270,003 | 7,818,779 | – | – | |||||||||
| Royce Select Fund II | 4,496,527 | 4,551,197 | 523,793 | 646,962 | |||||||||
| Royce European Smaller-Companies Fund | 13,700,009 | 7,838,602 | – | – | |||||||||
| Royce Enterprise Select Fund | 895,251 | 901,475 | – | – | |||||||||
| Royce SMid-Cap Value Fund | 7,667,245 | 1,772,145 | – | – | |||||||||
| Royce Focus Value Fund | 18,470,605 | 30,534,700 | – | – | |||||||||
| Royce Partners Fund | 122,336 | 176,400 | – | – | |||||||||
| Royce Opportunity Select Fund | 11,661,991 | 6,019,105 | 3,847,355 | 3,915,696 | |||||||||
| Royce Global Dividend Value Fund | 1,743,323 | 819,497 | – | – | |||||||||
| Royce International Micro-Cap Fund | 2,193,840 | 2,506,386 | – | – | |||||||||
| Royce International Premier Fund | 6,334,982 | 2,234,817 | – | – | |||||||||
| Class Level | |||||||||||||||||||||||
| Transfer | Expenses | ||||||||||||||||||||||
| Net | Agent | Reimbursed by | |||||||||||||||||||||
| Distribution | Shareholder | Shareholder | Balance | Investment | |||||||||||||||||||
| Fees | Servicing | Reports | Registration | Credits | Total | Adviser | |||||||||||||||||
| Royce European Smaller-Companies Fund – | |||||||||||||||||||||||
| Investment Class | $ | – | $ | 3,433 | $ | 51 | $ | 6,699 | $ | – | $ | 10,183 | $ | 10,182 | |||||||||
| Royce European Smaller-Companies Fund – | |||||||||||||||||||||||
| Service Class | 38,336 | 16,768 | 13,497 | 9,566 | (4 | ) | 78,163 | 37,099 | |||||||||||||||
| 38,336 | 20,201 | 13,548 | 16,265 | (4 | ) | 47,281 | |||||||||||||||||
| Royce Opportunity Select Fund – Investment Class | – | 4,528 | 2,071 | 6,066 | (2 | ) | 12,663 | 3,732 | |||||||||||||||
| Royce Opportunity Select Fund – Service Class | 47 | 2,336 | 37 | 6,976 | – | 9,396 | 9,343 | ||||||||||||||||
| 47 | 6,864 | 2,108 | 13,042 | (2 | ) | 13,075 | |||||||||||||||||
| Royce International Premier Fund – Investment Class | – | 3,430 | 49 | 6,645 | – | 10,124 | 10,124 | ||||||||||||||||
| Royce International Premier Fund – Service Class | 13,764 | 7,160 | 2,683 | 9,396 | (1 | ) | 33,002 | 29,220 | |||||||||||||||
| 13,764 | 10,590 | 2,732 | 16,041 | (1 | ) | 39,344 | |||||||||||||||||
| Net Unrealized | |||||||||||||||
| Appreciation | Gross Unrealized | ||||||||||||||
| Tax Basis Cost | (Depreciation) | Appreciation | Depreciation | ||||||||||||
| Royce Select Fund I | $ | 37,201,905 | $ | 11,063,662 | $ | 11,576,225 | $ | 512,563 | |||||||
| Royce Micro-Cap Discovery Fund | 5,001,000 | 627,553 | 795,730 | 168,177 | |||||||||||
| Royce Financial Services Fund | 53,824,349 | 10,441,583 | 11,439,435 | 997,852 | |||||||||||
| Royce Select Fund II | 5,057,852 | 105,162 | 476,103 | 370,941 | |||||||||||
| Royce European Smaller-Companies Fund | 32,769,434 | 3,158,823 | 4,325,380 | 1,166,557 | |||||||||||
| Royce Enterprise Select Fund | 2,550,448 | 308,279 | 314,741 | 6,462 | |||||||||||
| Royce SMid-Cap Value Fund | 16,720,088 | 3,440,582 | 3,838,030 | 397,448 | |||||||||||
| Royce Focus Value Fund | – | – | – | – | |||||||||||
| Royce Partners Fund | 2,233,772 | 662,102 | 690,454 | 28,352 | |||||||||||
| Royce Opportunity Select Fund | 20,094,627 | 3,041,570 | 3,809,203 | 767,633 | |||||||||||
| 82 | The Royce Funds 2014 Semiannual Report to Shareholders |
| Tax Information (continued): | |||||||||||||
| Net Unrealized | |||||||||||||
| Appreciation | Gross Unrealized | ||||||||||||
| Tax Basis Cost | (Depreciation) | Appreciation | Depreciation | ||||||||||
| Royce Global Dividend Value Fund | $ | 9,111,806 | $ | 886,350 | $1,548,971 | $662,621 | |||||||
| Royce International Micro-Cap Fund | 5,080,804 | 257,393 | 589,830 | 332,437 | |||||||||
| Royce International Premier Fund | 12,565,520 | 1,170,652 | 1,666,224 | 495,572 | |||||||||
The primary difference between book and tax basis cost is the timing of the recognition of losses on securities sold.
| The Royce Funds 2014 Semiannual Report to Shareholders | 83 |
| Understanding Your Fund’s Expenses (unaudited) |
As a shareholder of a mutual fund, you pay ongoing expenses, including management fees and other Fund expenses including, for some funds, distribution and/or service (12b-1) fees. Using the information below, you can estimate how these ongoing expenses (in dollars) affect your investment and compare them with the ongoing expenses of other funds. You may also incur one-time transaction expenses, including redemption fees, which are not shown in this section and would result in higher total costs. The example is based on an investment of $1,000 invested at January 1, 2014, and held for the entire six-month period ended June 30, 2014. Service Class shares are generally available only through certain brokers or retirement plan administrators who receive distribution and/or service fees from the Fund for services that they perform.
Actual Expenses
The first part of the table below provides information about actual account values and actual expenses. You may use the information in this section, together with the amount you invested, to estimate the expenses that you paid over the period. Simply divide your account value at June 30, 2014, by $1,000 (for example, an $8,600 account value divided by $1,000 = 8.6), then multiply the result by the number under the heading entitled “Expenses Paid During the Period” to estimate the expenses you paid on your account during this period.
Hypothetical Example for Comparison Purposes
The second part of the table below provides information about hypothetical account values and hypothetical expenses based on the Fund’s actual expense ratio and an assumed rate of return of 5% per year before expenses, which is not the Fund’s actual return. The hypothetical account values and expenses may not be used to estimate the actual ending account balance or expenses you paid for the period. You may use this information to compare the ongoing costs of investing in the Fund and other funds. To do so, compare this 5% hypothetical example with the 5% hypothetical examples that appear in the shareholder reports of the other funds.
Please note that the expenses shown in the table are meant to highlight your ongoing costs only and do not reflect any transactional costs, such as sales charges (loads), redemption fees, or exchange fees. Therefore, this section is useful in comparing ongoing costs only, and will not help you determine the relative total costs of owning different funds. In addition, if these transactional costs were included, your costs would have been higher.
| Actual | Hypothetical (5% per year return before expenses) | |||||||||||||||||||||||
| Beginning | Ending | Expenses Paid | Beginning | Ending | Expenses Paid | Annualized | ||||||||||||||||||
| Account Value | Account Value | During the | Account Value | Account Value | During the | Expense | ||||||||||||||||||
| 1/1/14 | 6/30/14 | Period1 | 1/1/14 | 6/30/14 | Period1 | Ratio 2 | ||||||||||||||||||
Investment Class | ||||||||||||||||||||||||
Royce Select Fund I | $ | 1,000.00 | $ | 1,066.12 | $ | 6.20 | $ | 1,000.00 | $ | 1,018.79 | $ | 6.06 | 1.21 | % | ||||||||||
Royce Select Fund II | 1,000.00 | 1,065.31 | 7.99 | 1,000.00 | 1,017.06 | 7.80 | 1.56 | % | ||||||||||||||||
Royce European Smaller- | ||||||||||||||||||||||||
Companies Fund | 1,000.00 | 1,036.00 | 6.43 | 1,000.00 | 1,015.61 | 6.36 | 1.44 | % | ||||||||||||||||
Royce Enterprise Select Fund | 1,000.00 | 1,057.76 | 6.33 | 1,000.00 | 1,018.65 | 6.21 | 1.24 | % | ||||||||||||||||
Royce Opportunity Select Fund | 1,000.00 | 1,032.91 | 6.40 | 1,000.00 | 1,018.50 | 6.36 | 1.27 | % | ||||||||||||||||
Royce International Premier Fund | 1,000.00 | 1,031.00 | 6.41 | 1,000.00 | 1,015.61 | 6.36 | 1.44 | % | ||||||||||||||||
Service Class | ||||||||||||||||||||||||
Royce Micro-Cap Discovery Fund | 1,000.00 | 1,000.00 | 7.39 | 1,000.00 | 1,017.41 | 7.45 | 1.49 | % | ||||||||||||||||
Royce Financial Services Fund | 1,000.00 | 1,036.16 | 7.52 | 1,000.00 | 1,017.41 | 7.45 | 1.49 | % | ||||||||||||||||
Royce European Smaller- | ||||||||||||||||||||||||
Companies Fund | 1,000.00 | 1,045.89 | 8.47 | 1,000.00 | 1,016.51 | 8.35 | 1.67 | % | ||||||||||||||||
Royce SMid-Cap Value Fund | 1,000.00 | 1,136.97 | 7.15 | 1,000.00 | 1,018.10 | 6.76 | 1.35 | % | ||||||||||||||||
Royce Focus Value Fund | 1,000.00 | 1,042.77 | 6.08 | 1,000.00 | 1,018.84 | 6.01 | 1.20 | % | ||||||||||||||||
Royce Partners Fund | 1,000.00 | 1,027.66 | 6.03 | 1,000.00 | 1,018.84 | 6.01 | 1.20 | % | ||||||||||||||||
Royce Opportunity Select Fund | 1,000.00 | 965.00 | 4.17 | 1,000.00 | 1,009.72 | 4.27 | 1.52 | % | ||||||||||||||||
Royce Global Dividend Value Fund | 1,000.00 | 1,053.81 | 8.61 | 1,000.00 | 1,016.41 | 8.45 | 1.69 | % | ||||||||||||||||
Royce International Micro- | ||||||||||||||||||||||||
Cap Fund | 1,000.00 | 1,078.69 | 8.71 | 1,000.00 | 1,016.41 | 8.45 | 1.69 | % | ||||||||||||||||
Royce International Premier Fund | 1,000.00 | 1,034.28 | 6.86 | 1,000.00 | 1,018.05 | 6.80 | 1.36 | % | ||||||||||||||||
| 84 | The Royce Funds 2014 Semiannual Report to Shareholders |
| Trustees and Officers |
All Trustees and Officers may be reached c/o The Royce Funds, 745 Fifth Avenue, New York, NY 10151
Charles M. Royce, Trustee1, President
Age: 74 | Number of Funds Overseen: 34 | Tenure: Since 1982
Non-Royce Directorships: Director of TICC Capital Corp.
Principal Occupation(s) During Past Five Years: Chief Executive Officer and Chairman of Board of Managers of Royce & Associates, LLC (“Royce”), the Trust’s investment adviser.
W. Whitney George, Trustee1, Vice President
Age: 56 | Number of Funds Overseen: 34 | Tenure: Since 2013
Non-Royce Directorships: None
Principal Occupation(s) During Past Five Years: Managing Director and Vice President of Royce, having been employed by Royce since October 1991.
Patricia W. Chadwick, Trustee
Age: 65 | Number of Funds Overseen: 34 | Tenure: Since 2009
Non-Royce Directorships: Trustee of ING Mutual Funds and Director of Wisconsin Energy Corp.
Principal Occupation(s) During Past 5 Years: Consultant and President of Ravengate Partners LLC (since 2000).
Richard M. Galkin, Trustee
Age: 76 | Number of Funds Overseen: 34 | Tenure: Since 1982
Non-Royce Directorships: None
Principal Occupation(s) During Past Five Years: Private investor. Mr. Galkin’s prior business experience includes having served as President of Richard M. Galkin Associates, Inc., telecommunications consultants, President of Manhattan Cable Television (a subsidiary of Time, Inc.), President of Haverhills Inc. (another Time, Inc. subsidiary), President of Rhode Island Cable Television, and Senior Vice President of Satellite Television Corp. (a subsidiary of Comsat).
Stephen L. Isaacs, Trustee
Age: 74 | Number of Funds Overseen: 34 | Tenure: Since 1989
Non-Royce Directorships: None
Principal Occupation(s) During Past Five Years: Attorney and President of Health Policy Associates, Inc., consultants. Mr. Isaacs’s prior business experience includes having served as President of the Center for Health and Social Policy (from 1996 to 2012); Director of Columbia University Development Law and Policy Program and Professor at Columbia University (until August 1996).
Arthur S. Mehlman, Trustee
Age: 72 | Number of Funds Overseen: 52 | Tenure: Since 2004
Non-Royce Directorships: Director/Trustee of registered investment companies constituting the 18 Legg Mason Funds.
Principal Occupation(s) During Past Five Years: Director of The League for People with Disabilities, Inc.; Director of University of Maryland Foundation (non-profits). Formerly: Director of Municipal Mortgage & Equity, LLC (from October 2004 to April 1, 2011); Director of University of Maryland College Park Foundation (non-profit) (from 1998 to 2005); Partner, KPMG LLP (international accounting firm) (from 1972 to 2002); Director of Maryland Business Roundtable for Education (from July 1984 to June 2002).
David L. Meister, Trustee
Age: 74 | Number of Funds Overseen: 34 | Tenure: Since 1982
Non-Royce Directorships: None
Principal Occupation(s) During Past Five Years: Consultant. Chairman and Chief Executive Officer of The Tennis Channel (from June 2000 to March 2005). Mr. Meister’s prior business experience includes having served as Chief Executive Officer of Seniorlife.com, a consultant to the communications industry, President of Financial News Network, Senior Vice President of HBO, President of Time-Life Films, and Head of Broadcasting for Major League Baseball.
G. Peter O’Brien, Trustee
Age: 68 | Number of Funds Overseen: 52 | Tenure: Since 2001
Non-Royce Directorships: Director/Trustee of registered investment companies constituting the 18 Legg Mason Funds; Director of TICC Capital Corp.
Principal Occupation(s) During Past Five Years: Trustee Emeritus of Colgate University (since 2005); Board Member of Hill House, Inc. (since 1999); Formerly: Trustee of Colgate University (from 1996 to 2005), President of Hill House, Inc. (from 2001 to 2005) and Managing Director/Equity Capital Markets Group of Merrill Lynch & Co. (from 1971 to 1999).
John D. Diederich, Vice President and Treasurer
Age: 62 | Tenure: Since 2001
Principal Occupation(s) During Past Five Years: Chief Operating Officer, Managing Director and member of the Board of Managers of Royce; Chief Financial Officer of Royce; Director of Administration of the Trust; and President of RFS, having been employed by Royce since April 1993.
Jack E. Fockler, Jr., Vice President
Age: 55 | Tenure: Since 1995
Principal Occupation(s) During Past Five Years: Managing Director and Vice President of Royce, and Vice President of RFS, having been employed by Royce since October 1989.
Daniel A. O’Byrne, Vice President and Assistant Secretary
Age: 52 | Tenure: Since 1994
Principal Occupation(s) During Past Five Years: Principal and Vice President of Royce, having been employed by Royce since October 1986.
John E. Denneen, Secretary and Chief Legal Officer
Age: 47 | Tenure: 1996-2001 and Since April 2002
Principal Occupation(s) During Past Five Years: General Counsel, Principal, Chief Legal and Compliance Officer, and Secretary of Royce; Secretary and Chief Legal Officer of The Royce Funds.
Lisa Curcio, Chief Compliance Officer
Age: 54 | Tenure: Since 2004
Principal Occupation(s) During Past Five Years: Chief Compliance Officer of The Royce Funds (since October 2004) and Compliance Officer of Royce (since June 2004).
| The Royce Funds 2014 Semiannual Report to Shareholders | 85 |
| Board Approval of Investment Advisory Agreements |
At meetings held on June 4-5, 2014, the Board of Trustees of The Royce Fund (the “Board”), including all of the non-interested trustees, approved the continuance of the Investment Advisory Agreements between Royce & Associates, LLC (“R&A”) and The Royce Fund (“TRF”) relating to each of Royce Select Fund I, Royce Select Fund II, Royce Enterprise Select Fund, Royce Opportunity Select Fund, Royce Micro-Cap Discovery Fund, Royce Financial Services Fund, Royce SMid-Cap Value Fund, Royce Focus Value Fund, Royce Partners Fund, Royce European Smaller-Companies Fund, Royce Global Dividend Fund, Royce International Micro-Cap Fund, and Royce International Premier Fund (each, a “Fund” and collectively, the “Funds”). In reaching these decisions, the Board reviewed, among other things, information prepared internally by R&A and independently by Morningstar Associates, LLC (“Morningstar”) containing detailed expense ratio and investment performance comparisons for each Fund with other mutual funds in its “peer group” and “category”, information regarding the past performance of the Funds and other registered investment companies managed by R&A and a memorandum outlining the legal duties of the Board prepared by independent counsel to the non-interested trustees. R&A also provided the trustees with an analysis of its profitability with respect to providing investment advisory services to each Fund. In addition, the Board took into account information furnished throughout the year at regular Board meetings, including reports on investment performance, shareholder services, distribution fees and expenses, regulatory compliance, brokerage commissions and research, brokerage and other execution products and services provided to the Funds. The Board also considered other matters it deemed important to the approval process such as allocation of Fund brokerage commissions, “soft dollar” research services R&A receives, payments made to affiliates of R&A, as well as payments made by R&A, relating to distribution of Fund shares and other direct and indirect benefits to R&A and its affiliates from their relationship with the Funds. The trustees also met throughout the year with investment advisory personnel from R&A. The Board, in its deliberations, recognized that, for many of the Funds’ shareholders, the decision to purchase Fund shares included a decision to select R&A as the investment adviser and that there was a strong association in the minds of Fund shareholders between R&A and each of the Funds. In considering factors relating to the approval of the continuance of the Investment Advisory Agreements, the non-interested trustees received assistance and advice from, and met separately with, their independent counsel. While the Investment Advisory Agreements for the Funds were considered at the same Board meeting, the trustees dealt with each agreement separately. Among other factors, the trustees considered the following:
The nature, extent and quality of services provided by R&A:
The Board considered the following factors to be of fundamental importance to their consideration of whether to approve the continuance of the Funds’ Investment Advisory Agreements: (i) R&A’s more than 40 years of value investing experience and track record; (ii) the history of long-tenured R&A portfolio managers managing many of the Funds; (iii) R&A’s focus on mid-cap, small-cap and micro-cap value investing; (iv) the consistency of R&A’s approach to managing open-end mutual funds and closed-end funds over more than 40 years; (v) the integrity and high ethical standards adhered to at R&A; (vi) R&A’s specialized experience in the area of trading small- and micro-cap securities; (vii) R&A’s historical ability to attract and retain portfolio management talent; and (viii) R&A’s focus on shareholder interests as exemplified by capping expenses on smaller funds, closing funds to new investors when R&A believed such closings were in the best interests of existing shareholders, establishing breakpoints for a number of funds and providing expansive shareholder reporting and communications. The trustees reviewed the services that R&A provides to each Fund, including, but not limited to, managing each Fund’s investments in accordance with the stated policies of each Fund. The Board considered the fact that R&A provided certain administrative services to the Funds at cost pursuant to the Administration Agreement between TRF and R&A which went into effect on January 1, 2008. The Board determined that the services to be provided to each Fund by R&A would be the same as those that it previously provided to each Fund. The Board also took into consideration the histories, reputations and backgrounds of R&A’s portfolio managers for the Funds, finding that these would likely have an impact on the continued success of the Funds. Lastly, the trustees noted R&A’s ability to attract and retain quality and experienced personnel. The trustees concluded that the investment advisory services provided by R&A to each Fund compared favorably to services provided by R&A to other R&A client accounts, including other funds, in both nature and quality, and that the scope of services provided by R&A would continue to be suitable for each Fund.
Investment performance of the Funds and R&A:
In light of R&A’s risk-averse approach to investing, the trustees believe that risk-adjusted performance continues to be the most appropriate measure of each Fund’s investment performance. One measure of risk-adjusted performance the trustees have historically used in their review of each Fund’s performance is the Sharpe Ratio. The Sharpe Ratio is a risk-adjusted measure of performance developed by Nobel Laureate William Sharpe. It is calculated by dividing a fund’s annualized excess returns by its annualized standard deviation to determine reward per unit of risk. The higher the Sharpe Ratio, the better a fund’s historical risk-adjusted performance. The Board attaches primary importance to risk-adjusted performance over relatively long periods of time, typically 3 to 10 years. The Sharpe Ratios for Royce Financial Services Fund (“RFS”) and Royce Enterprise Select Fund (“RSS”) ranked in the 1st or 2nd quartile within their respective Morningstar categories and the small-cap universe for the 3-year, 5-year, and 10-year periods, as applicable, ended December 31, 2013.
The Board noted that the highest leveraged companies within the Russell 2000 Index significantly outperformed their lowest leveraged counterparts from late August 2011 (beginning of Federal Reserve’s “QE2” program and “Operation Twist”) to May 2013 (initial public discussion by Federal Reserve officials of tapering of quantitative easing efforts). This trend significantly contributed to the relative underperformance of the Funds referenced below for the 3-year and 5-year periods ended December 31, 2013 to the extent they focused on high quality companies (e.g., those with solid balance sheets, low leverage, the ability to generate and effectively allocate free cash flow, and strong returns on invested capital). The Board did note, however, that this trend appeared to have reversed course with the Federal Reserve’s tapering discussions and the subsequent reductions in its bond buying programs as the lowest leveraged companies within the Russell 2000 Index have outperformed their highest leveraged counterparts during recent periods.
The Sharpe Ratio for Royce Select Fund I (“RS1”) ranked in the 4th quartile within its Morningstar category for the 3-year period ended
| 86 | The Royce Funds 2014 Semiannual Report to Shareholders |
| Board Approval of Investment Advisory Agreements (continued) |
December 31, 2013 but in the top quartile for the relevant 10-year period. Similar trends manifested themselves for certain Funds with shorter performance records. The Sharpe Ratio for Royce European Smaller-Companies Fund (“RES”) and Royce Select Fund II (“RS2”) placed in the 4th quartile within their respective Morningstar categories for the 3-year period ended December 31, 2013. However, over the relevant 5-year period, RES placed in the top quartile of the Europe Stock category while RS2 placed in the 2nd quartile of the World Stock category.
The Sharpe Ratio for Royce SMid-Cap Value Fund (“RSV”) and Royce Focus Value Fund (“RFV”) ranked in the 4th quartile within the relevant Morningstar category for the 3-year period ended December 31, 2013. In recent years, each of these Funds had overweightings in materials companies, particularly Canadian gold and silver mining companies. These holdings contributed, in part, to each Fund’s recent relative underperformance. The Board also noted that the Sharpe Ratio for Royce Partners Fund (“PTR”) ranked in the 3rd quartile within the Mid-Cap Growth category assigned by Morningstar category for the 3-year period ended December 31, 2013. The Board further noted the reductions in the contractual management fee rates for PTR and RFV that became effective January 1, 2014.
The Sharpe Ratio for Royce Micro-Cap Discovery Fund (“DSC”) fell in the 4th quartile within the Small Blend category assigned by Morningstar for the 3-year, 5-year, and 10-year periods ended December 31, 2013. The Board noted the impact of the addition of an active management component layered onto DSC’s quantitative structure in August 2010. In addition, the Board noted DSC’s overweight to micro-cap value stocks adversely affected its relative performance during recent periods. The Board further noted that, other than a net 31 basis point fee received in 2007, R&A has not received a management fee on DSC since its 2003 inception.
Although Royce Opportunity Select Fund (“ROS”), Royce International Micro-Cap (“RMI”), Royce International Premier (“RIP”), and Royce Global Dividend Value (“RGD”) are among the newer open-end funds managed by R&A, the Board noted that these funds now have more than 3 years of performance. R&A’s general process of investing net inflows over longer periods of time led to larger cash positions and market lagging performance for most of these newer funds in their initial periods of operation. The Board noted that ROS placed in the middle quintile, RIP ranked in the 3rd quartile, and RMI and RGD placed in the 4th quartile within their respective Morningstar categories on the basis of their Sharpe Ratios for the 3-year period ended December 31, 2013.
In addition to each Fund’s risk-adjusted performance, the Board also reviewed and considered each Fund’s absolute total returns, down market performance and for the Funds in existence for such periods, long-term performance records over periods of 10 years or longer. The Board also considered it important to look beyond the current snapshot of performance as of December 31, 2013 and therefore examined extended performance histories for each Fund using monthly rolling average return periods through March 31, 2014.
The Board noted that R&A manages a number of funds that invest in small-cap and micro-cap issuers, many of which were outperforming their benchmark indices and their competitors. Although the Board recognized that past performance is not necessarily an indicator of future results, it found that R&A had the necessary qualifications, experience and track record in managing equity mutual funds to manage each Fund. The Board determined that R&A continued to be an appropriate investment adviser for each Fund and concluded that each Fund’s performance supported the continuation of its Investment Advisory Agreement.
Cost of the services provided and profits realized by R&A from its relationship with each Fund:
The Board considered the cost of the services provided by R&A and the profits realized by R&A from its relationship with each Fund. As part of the analysis, the Board discussed with R&A its methodology in allocating its costs to each Fund and concluded that its allocations were reasonable. The Board noted that at times R&A had closed certain of the Funds to new investors because of the rate of growth in Fund assets. The Board concluded that R&A’s profits were reasonable in relation to the nature and quality of services provided.
The extent to which economies of scale would be realized as the Funds grow and whether fee levels would reflect such economies of scale:
The Board considered whether there have been economies of scale in respect of the management of each Fund, whether each Fund has appropriately benefited from any economies of scale and whether there is potential for realization of any further economies of scale. The Board noted the time and effort involved in managing portfolios of small- and micro-cap stocks and that they did not involve the same efficiencies as do portfolios of large-cap stocks. The trustees noted that in 2004 breakpoints had been added to the investment advisory fees for all of the Funds. The Board concluded that the current fee structure for each Fund was reasonable and that shareholders sufficiently participated in economies of scale.
Comparison of services to be rendered and fees to be paid to those under other investment advisory contracts, such as contracts of the same and other investment advisers or other clients:
The Board reviewed the investment advisory fee paid by each Fund and compared both the services to be rendered and the fees to be paid under the Investment Advisory Agreements to other contracts of R&A and to contracts of other investment advisers to registered investment companies investing in small- and micro-cap stocks, as provided by Morningstar. The Board noted the importance of the net expense ratio in measuring a fund’s efficiency, particularly in light of the variations in the mutual fund industry as to who is responsible for which expenses. The net expense ratio for RS2 ranked within the first quartile among its Morningstar peers, while the net expense ratios for DSC, RSV, RFV, and RSS ranked within the second quartile among their Morningstar peers. The Board also noted that RFV’s net expense ratio would have ranked in the top quartile among its peer group had its recently reduced contractual management fee rate been in effect during 2013. The Board further noted that RFS, PTR, and ROS placed in the middle quintile within their respective peer group as selected by Morningstar. The trustees also noted that PTR’s net expense ratio would have ranked in the 2nd quartile among its peer group had its recently reduced contractual management fee rate been in effect during 2013. RS1’s net expense ratio also ranked in the 3rd quartile among its Morningstar peers, four basis points higher than its peer group median and six basis points higher than its category median.
| The Royce Funds 2014 Semiannual Report to Shareholders | 87 |
| Board Approval of Investment Advisory Agreements (continued) |
The Board noted that most of RES’s peers are in large-cap style boxes per the Morningstar data. After taking into consideration that the level of work necessary to invest in small-cap international securities is significantly greater than that necessary to invest in larger-cap securities, the trustees noted that the basis point differentials in management fees, which give rise to the generally higher expense ratios, were appropriate for this Fund. The Board noted that the net expense ratios for RIS, RMI, RIP, and RGD placed in the 4th quartile within their respective peer groups due to their higher management fees. It was also noted that the weighted average market capitalizations for these Funds were lower than those of the majority of their peer group counterparts.
The Board further noted that R&A has waived advisory fees for numerous Funds in order to maintain expense ratios at competitive levels and acknowledged R&A’s intention to continue this expense limitation practice. The Board also considered fees charged by R&A to institutional and other clients and noted that, given the greater levels of services that R&A provides to registered investment companies such as the Funds as compared to other accounts, each Fund’s advisory fees compared favorably to these other accounts.
It was noted that no single factor was cited as determinative to the decision of the trustees. Rather, after weighing all of the considerations and conclusions discussed above, the entire Board, including all of the non-interested trustees, determined to approve the continuance of all of the existing Investment Advisory Agreements for the Funds, concluding that a contract continuation on the existing terms for all of the Funds was in the best interest of the shareholders of each Fund and that each investment advisory fee rate was reasonable in relation to the services provided.
| 88 | The Royce Funds 2014 Semiannual Report to Shareholders |
| Notes to Performance and Other Important Information |
The thoughts expressed in this report concerning recent market movements and future prospects for small company stocks are solely the opinion of Royce at June 30, 2014, and, of course, historical market trends are not necessarily indicative of future market movements. Statements regarding the future prospects for particular securities held in the Funds’ portfolios and Royce’s investment intentions with respect to those securities reflect Royce’s opinions as of June 30, 2014 and are subject to change at any time without notice. There can be no assurance that securities mentioned in this report will be included in any Royce-managed portfolio in the future.
Sector weightings are determined using the Global Industry Classification Standard (“GICS”). GICS was developed by, and is the exclusive property of, Standard & Poor’s Financial Services LLC (“S&P”) and MSCI Inc. (“MSCI”). GICS is the trademark of S&P and MSCI. “Global Industry Classification Standard (GICS)” and “GICS Direct” are service marks of S&P and MSCI.
All indexes referred to are unmanaged and capitalization weighted. Each index’s returns include net reinvested dividends and/or interest income. Russell Investment Group is the source and owner of the trademarks, service marks, and copyrights related to the Russell Indexes. Russell® is a trademark of Russell Investment Group. The Russell 2000 is an index of domestic small-cap stocks. It measures the performance of the 2,000 smallest publicly traded U.S. companies in the Russell 3000 Index. The Russell 1000 Index is an index of domestic large-cap stocks. It measures the performance of the 1,000 largest publicly traded U.S. companies in the Russell 3000 Index. The Russell Microcap Index includes 1,000 of the smallest securities in the Russell 2000 Index, along with the next smallest eligible securities as determined by Russell. The Russell 2500 is an index of domestic small- to mid-cap stocks. It includes approximately 2,500 of the smallest securities in the Russell 3000 Index. The returns for the Russell 2500—Financial Services Sector represent those of the financial services companies within the Russell 2500 Index. The Russell Midcap Index measures the performance of the mid-cap segment of the U.S. equity universe. It includes approximately 800 of the smallest securities in the Russell 1000 Index. The Russell Global Small Cap Index is an index of global small-cap stocks. The Russell Global ex-U.S. Large Cap Index is an index of global large-cap stocks, excluding the United States. The Russell Global ex-U.S. Small Cap Index is an index of global small-cap stocks, excluding the United States. The S&P 500 is an index of U.S. large-cap stocks, selected by Standard & Poor’s based on market size, liquidity, and industry grouping, among other factors. The Russell Europe Small Cap Index is an index of European small-cap stocks. The CBOE Volatility Index (VIX) measures market expectations of near-term volatility conveyed by S&P 500 Stock Index option prices. The Nasdaq Composite is an index of the more than 3,000 common equities listed on the Nasdaq stock exchange. The performance of an index does not represent exactly any particular investment, as you cannot invest directly in an index. Returns for the market indexes used in this report were based on information supplied to Royce by Russell Investments. Royce has not independently verified the above described information.
The Price-Earnings, or P/E, Ratio is calculated by dividing a company’s share price by its trailing 12-month earnings-per share (EPS). The Price-to-Book, or P/B, Ratio is calculated by dividing a company’s share price by its book value per share. The Sharpe Ratio is calculated for a specified period by dividing a fund’s annualized excess returns by its annualized standard deviation. The higher the Sharpe Ratio, the better the fund’s historical risk-adjusted performance. Standard deviation is a statistical measure within which a fund’s total returns have varied over time. The greater the standard deviation, the greater a fund’s volatility. The Royce Funds is a service mark of The Royce Funds. Distributor: Royce Fund Services, Inc.
Investments in securities of micro-cap, small-cap and/or mid-cap companies may involve considerably more risk than investments in securities of larger-cap companies. (Please see “Primary Risks for Fund Investors” in the prospectus.) Certain Royce Funds may invest up to 25% (100% for Royce Select Fund II, European Smaller-Companies, Global Dividend Value, International Micro-Cap, and International Premier Fund, 35% of Focus Value, Partners, Financial Services and SMid-Cap Value Funds, 10% of Select Fund I and 5% of Special Equity Fund) of their respective assets in foreign securities, which generally may involve political, economic, currency and other risks not encountered in U.S. investments. (Please see “Investing in Foreign Securities” in the prospectus.) Royce Select I, Select II, Enterprise Select, and Opportunity Select Funds may sell securities short which involves selling a security it does not own in anticipation that the security’s price will decline. Short sales present unlimited risk on an individual stock basis since the Fund may be required to buy security sold short at a time when the security has appreciated in value. Please read the prospectus carefully before investing or sending money. A copy of the Funds’ current prospectus and Statement of Additional Information may be obtained by calling (800) 221-4268, or by visiting www.roycefunds.com. All publicly released material Fund information is disclosed by the Funds on their website at www.roycefunds.com.
Forward-Looking Statements
| • | the Funds’ future operating results, | |||
| • | the prospects of the Funds’ portfolio companies, | |||
| • | the impact of investments that the Funds have made or may make, | |||
| • | the dependence of the Funds’ future success on the general economy and its impact on the companies and industries in which the Funds invest, and | |||
| • | the ability of the Funds’ portfolio companies to achieve their objectives. |
This review and report use words such as “anticipates,” “believes,” “expects,” “future,” “intends,” and similar expressions to identify forward-looking statements. Actual results may differ materially from those projected in the forward-looking statements for any reason.
The Royce Funds have based the forward-looking statements included in this review and report on information available to us on the date of the report, and we assume no obligation to update any such forward-looking statements. Although The Royce Funds undertake no obligation to revise or update any forward-looking statements, whether as a result of new information, future events or otherwise, you are advised to consult any additional disclosures that we may make through future shareholder communications or reports.
Proxy Voting
A copy of the policies and procedures that The Royce Funds use to determine how to vote proxies relating to portfolio securities and information regarding how each of The Royce Funds voted proxies relating to portfolio securities during the most recent 12-month period ended June 30 is available, without charge, on The Royce Funds’ website at www.roycefunds.com, by calling (800) 221-4268 (toll-free) and on the website of the Securities and Exchange Commission (“SEC”), at www.sec.gov.
Form N-Q Filing
The Funds file their complete schedules of investments with the SEC for the first and third quarters of each fiscal year on Form N-Q. The Funds’ Forms N-Q are available on the SEC’s website at www.sec.gov. The Royce Funds’ holdings are also on the Funds’ website approximately 15 to 20 days after each calendar quarter end and remain available until the next quarter’s holdings are posted. The Funds’ Forms N-Q may also be reviewed and copied at the SEC’s Public Reference Room in Washington, D.C. To find out more about this public service, call the SEC at (202) 942-8090. The Funds’ complete schedules of investments are updated quarterly, and are available at www.roycefunds.com.
| The Royce Funds 2014 Semiannual Report to Shareholders |
 | ||||||||||||||||
 | ||||||||||||||||
About The Royce Funds Wealth of Experience With approximately $38 billion in total assets under management, Royce & Associates is committed to the same investment principles that have served us well for over 40 years. Chuck Royce, our Chief Executive Officer, enjoys one of the longest tenures of any active mutual fund manager. Royce’s investment staff also includes 23 portfolio managers and analysts and nine traders. Multiple Funds, Common Focus Our goal is to offer both individual and institutional investors the best available micro-cap, small-cap, and/ or mid-cap portfolios. We have chosen to concentrate on smaller-company investing by providing investors with a range of funds that take full advantage of this large and diverse sector. Consistent Discipline Our approach emphasizes paying close attention to risk and maintaining the same discipline, regardless of market movements and trends. The price we pay for a security must be significantly below our appraisal of its current worth. This requires a thorough analysis of the financial and business dynamics of an enterprise, as though we were purchasing the entire company. Co-Ownership of Funds It is important that our employees and shareholders share a common financial goal. Our officers, employees, and their families currently have more than $215 million invested in The Royce Funds and are often among the largest individual shareholders. | ||||||||||||||||
| Contact Us | ||||||||||||||||
| General Information Additional Report Copies and Prospectus Inquiries (800) 221-4268 | RIA Services Fund Materials and Performance Updates (800) 33-ROYCE (337-6923) | Broker/Dealer Services Fund Materials and Performance Updates (800) 59-ROYCE (597-6923) | Shareholder Services Transactions and Account Inquiries (800) 841-1180 | Royce InfoLine 24-Hour Automated Telephone Service (800) 78-ROYCE (787-6923) |  | |||||||||||
Item 2. Code(s) of Ethics. Not applicable to this semi-annual report.
Item 3. Audit Committee Financial Expert. Not applicable to this semi-annual report.
Item 4. Principal Accountant Fees and Services. Not applicable to this semi-annual report.
Item 5. Audit Committee of Listed Registrants. Not Applicable.
Item 6. Investments.
(a) See Item 1.
(b) Not Applicable
Item 7. Disclosure of Proxy Voting Policies and Procedures for Closed-End Management Investment Companies. Not Applicable.
Item 8. Portfolio Managers of Closed-End Management Investment Companies. Not Applicable.
Item 9. Purchases of Equity Securities by Closed-End Management Investment Company and Affiliated Purchasers. Not Applicable
Item 10. Submission of Matters to a Vote of Security Holders. Not Applicable.
Item 11. Controls and Procedures.
(a) Disclosure Controls and Procedures. The Principal Executive and Financial Officers concluded that the Registrant’s Disclosure Controls and Procedures are effective based on their evaluation of the Disclosure Controls and Procedures as of a date within 90 days of the filing date of this report.
(b) Internal Control over Financial Reporting. There were no significant changes in Registrant’s internal control over financial reporting or in other factors that could significantly affect this control subsequent to the date of the evaluation, including any corrective actions with regard to significant deficiencies and material weaknesses during the second fiscal quarter of the period covered by this report.
Item 12. Exhibits. Attached hereto.
(a)(1) Not applicable to this semi-annual report.
(a)(2) Separate certifications by the Registrant’s Principal Executive Officer and Principal Financial Officer as required by Rule 30a-2(a) under the Investment Company Act of 1940.
(a)(3) Not Applicable
(b) Separate certifications by the Registrant’s Principal Executive Officer and Principal Financial Officer, pursuant to Section 906 of the Sarbanes-Oxley Act of 2002 and required by Rule 30a-2(b) under the Investment Company Act of 1940.
Pursuant to the requirements of the Securities Exchange Act of 1934 and the Investment Company Act of 1940, the registrant has duly caused this report to be signed on its behalf by the undersigned, thereunto duly authorized.
THE ROYCE FUND
| BY: | /s/ Charles M. Royce |
| Charles M. Royce | |
| President |
Date: August 27, 2014
Pursuant to the requirements of the Securities Exchange Act of 1934 and the Investment Company Act of 1940, this report has been signed below by the following persons on behalf of the registrant and in the capacities and on the dates indicated.
| THE ROYCE FUND | THE ROYCE FUND | ||
| BY: | /s/ Charles M. Royce | BY: | /s/ John D. Diederich |
| Charles M. Royce | John D. Diederich | ||
| President | Chief Financial Officer | ||
| Date: August 27, 2014 | Date: August 27, 2014 | ||