UNITED STATES
SECURITIES AND EXCHANGE COMMISSION
Washington, D.C. 20549
FORM N-CSR
CERTIFIED SHAREHOLDER REPORT
OF
REGISTERED MANAGEMENT INVESTMENT COMPANIES
Investment Company Act file number: 811-03599
Name of Registrant: The Royce Fund
Address of Registrant: 745 Fifth Avenue
New York, NY 10151
| Name and address of agent for service: | John E. Denneen, Esq. | ||
| 745 Fifth Avenue | |||
| New York, NY 10151 |
Registrant’s telephone number, including area code: (212) 508-4500
Date of fiscal year end: December 31, 2016
Date of reporting period: January 1, 2016 – June 30, 2016
Item 1. Reports to Shareholders.
 |
| JUNE 30, 2016 | ||
| 2016 Semiannual | ||
| Review and Report to Shareholders | ||
| Royce Dividend Value Fund | |||
| Royce Global Financial Services Fund | |||
| Royce Heritage Fund | |||
| Royce International Micro-Cap Fund | |||
| Royce International Premier Fund | |||
| Royce International Small-Cap Fund | |||
| Royce Low-Priced Stock Fund | |||
| Royce Micro-Cap Fund | |||
| Royce Micro-Cap Opportunity Fund | |||
| Royce Opportunity Fund | |||
| Royce Pennsylvania Mutual Fund | |||
| Royce Premier Fund | |||
| Royce Small-Cap Leaders Fund | |||
| Royce Small-Cap Value Fund | |||
| Royce Smaller-Companies Growth Fund | |||
| Royce Special Equity Fund | |||
| Royce Special Equity Multi-Cap Fund | |||
| Royce Total Return Fund | |||
| roycefunds.com |  | ||
| Table of Contents | |||
| Semiannual Review | |||
| Letter to Our Shareholders | 2 | ||
| Performance and Expenses | 6 | ||
| The Royce Funds and Rolling Returns | 7 | ||
| Semiannual Report to Shareholders | |||
| Managers’ Discussions of Fund Performance | |||
Royce Dividend Value Fund | 8 | ||
Royce Global Financial Services Fund | 10 | ||
Royce Heritage Fund | 12 | ||
Royce International Micro-Cap Fund | 14 | ||
Royce International Premier Fund | 16 | ||
Royce International Small-Cap Fund | 18 | ||
Royce Low-Priced Stock Fund | 20 | ||
Royce Micro-Cap Fund | 22 | ||
Royce Micro-Cap Opportunity Fund | 24 | ||
Royce Opportunity Fund | 26 | ||
Royce Pennsylvania Mutual Fund | 28 | ||
Royce Premier Fund | 30 | ||
Royce Small-Cap Leaders Fund | 32 | ||
Royce Small-Cap Value Fund | 34 | ||
Royce Smaller-Companies Growth Fund | 36 | ||
Royce Special Equity Fund | 38 | ||
Royce Special Equity Multi-Cap Fund | 40 | ||
Royce Total Return Fund | 42 | ||
| Schedules of Investments and Financial Statements | 44 | ||
| Notes to Financial Statements | 114 | ||
| Understanding Your Fund’s Expenses | 129 | ||
| Results of Shareholder Meetings | 131 | ||
| Trustees and Officers | 132 | ||
| Board Approval of Investment Advisory Agreements | 133 | ||
| Notes to Performance and Other Important Information | 136 |

| This page is not part of the 2016 Semiannual Report to Shareholders | 1 |
Letter to Our Shareholders

A BEAR, A BREXIT, AND A WELCOME START TO 2016
| We were happy to greet 2016 with a spirited “Hello” in the hope that certain emerging trends in the small-cap world would gain a firmer foothold in the new year. We were very pleased, then, to see the market’s pronounced shift toward companies with attractive to reasonable valuations, solid balance sheets, and strong profitability—attributes found in many of our portfolio holdings—arrive in the year’s first half. And though domestic small-caps did modestly well in the first half, an achievement that looks more commendable in the context of the high levels of volatility that all equities faced in the first half of 2016, many active managers, ourselves included, did even better. This was a welcome change. |
Both the absolute and relative health of domestic equities was in evidence during the first half of 2016. The Nasdaq Composite, which is home to a large number of biotechnology companies that corrected sharply in the first half after leading the market last year, was the only major U.S. index to finish the year-to-date period ended June 30, 2016 in the red. A few non-U.S. indexes remained marginally positive in the first half, but most concluded the semiannual period with at least minor net losses. Among those that fell further behind was one that did notably well in 2015—European small-caps, whose more diminutive size made them most vulnerable |
| to the post-Brexit sell-off. But to participate in these strong first-half results for U.S. equities, investors needed the stomach for a wild ride that started with a steep and speedy initial drop followed by a far smoother, robust recovery. The year began with a more dramatic extension of last year’s decline, and we initially failed to grasp that 2015 would, in the manner of Shakespeare’s best-known stage direction, “Exit, pursued by a bear.” From the June 23, 2015 small-cap peak through its year-to-date low on February 11, 2016 the Russell 2000 Index fell 25.7%, a truly ursine decline. |
This seems to have been a remarkably quiet double-digit correction—a stealth bear market, as it were. Few outside the small-cap world have acknowledged it, never mind analyzed or discussed it. Yet it was the ninth biggest decline since the Russell 2000’s inception at the end of 1978, and the worst for small-caps since 2011. It included many of the signs that typically accompany a bottoming-out process—panic selling in a number of sectors (most notably within the bio-pharma complex), small-caps losing more than large-caps, and greater resilience from value stocks—to us, the most significant development in the down phase. This heightened volatility was triggered by the ongoing implosion of oil prices, struggles for other commodities, anxiety over possible bank defaults, and the devaluation of currency in China. Together, these factors led to a few sessions in which hysteria |
| 2 | This page is not part of the 2016 Semiannual Report to Shareholders |
LETTER TO OUR SHAREHOLDERS
| We were very pleased, then, to see the market’s pronounced shift toward companies with attractive to reasonable valuations, solid balance sheets, and strong profitability—attributes found in many of our portfolio holdings—arrive in the year’s first half. |
| ruled the equity markets. Like many bear markets (and unlike that of the more closely correlated collapse in 2011), it also solidified a rotation in leadership from small-cap growth to small-cap value. |
| Having invested through many previous small-cap declines (some pre-dating the Russell 2000), we sought to turn the downdraft to our advantage by looking for bargain-priced opportunities amid the volatility and to stay invested for the eventual recovery. Our commitment was rewarded as the Russell 2000 rebounded sharply from its early February low, rising 21.6% by the end of June. During these tumultuous days, a shift in leadership could be seen clearly in the earnings outlook. We first saw evidence for it in October 2015 and noted it again in February 2016. Many companies, including several of our holdings, reported decent earnings while also not revising guidance downward. This was viewed as a positive in that expectations had been so low, particularly for companies in more economically sensitive sectors, that “pretty good” or “not that bad” was in several instances much better news than people were expecting. The general lack of downward earnings revisions both last fall and in the first half of this year has allowed for some recovery for these companies’ shares. Brexit, of course, tossed an already highly uncertain global economy into even stormier seas. While we see the vote as more of a political event for the United Kingdom and the European Union than an important economic event for the U.S., there’s no question it has made the already tenuous prospects for global growth that much shakier. Still, we do not see it having a lasting or meaningful impact on U.S. small-caps. |
| For the global economy, however, Brexit and other risks look likely to persist. At this writing, there are negative rates for long-term sovereign debt in Germany and Japan, ominous signals from the banks in Italy, and in both the U.K. and eurozone a political and economic situation that it would be an understatement to call “unsettled.” Here at home, we have seen record lows for both 10- and 30-year Treasury |
| yields. These more recent developments can be added to the older—that is, mid-June’s—list of concerns about the pace of growth in China and other important emerging markets, stabilizing but still volatile commodity prices, and the ambiguous state of the U.S. economy, in which housing and autos remain strong but consumer confidence, manufacturing, and the job market have been more mixed. It is a daunting set of challenges, to be sure. Where we differ from some observers, however, is in our belief in the strength and resilience of the economy. This is rooted in our long-established practice of giving more weight to what we are hearing from the management teams we speak to every day than we do to fatalistic headlines and dire—or overly sunny—prognostications. The corporate managers with whom we have been meeting are far more cautious and uncertain than pessimistic. Well aware of the fragility of current conditions, they have also offered some measured optimism in terms of growth picking up, however gradually or in fits and starts. In terms of now widespread recession concerns, we also want to stress that, over its long history, the stock market has seldom, if ever, offered false positives—that is, shares do not rise when economic growth is about to contract. And in all the tumult of the first half, most U.S. indexes rose, however modestly. The upshot is that, in the midst of heightened global uncertainty, the U.S. economy and markets look far healthier to us than what the rest of the globe has to offer. |
| SIGNS O’ THE TIMES—THE SIGNIFICANT SHIFT |
| Most notable to us as small-cap specialists with a value orientation was how thoroughly style drove results. The Russell 2000 Value Index outpaced the large- and mid-cap indexes year-to-date through the end of June, while the Russell 2000 trailed them, and the Russell 2000 Growth was negative. Value indexes in fact did better up and down the market cap range, from micro- to large-cap, in the first half. Although small-cap leadership began to rotate following June 2015’s small-cap peak, the widening performance gap between small-cap value and growth has been the critical development within small-cap so far in 2016. This could be seen in both bear and bull phases during the first half. The Russell 2000 Value lost far less than its growth counterpart from the end of 2015 through the February 11th small-cap low (-12.9% versus -18.9%); it was |
| This page is not part of the 2016 Semiannual Report to Shareholders | 3 |
LETTER TO OUR SHAREHOLDERS
| then essentially tied with the Russell 2000 Growth from that low through the end of June (+21.8% vs +21.4%). In prior years (2009-2015), value led in many downdrafts but lagged in up markets. This renewed up market strength is a major reason behind our optimism for value stocks. |
| Another reason, related to value’s emergent leadership, has been the relative strength of many stocks in economically sensitive, cyclical sectors. Defensive areas led within small-cap, with Utilities, Consumer Staples, Telecommunication Services, and REITs enjoying strong first halves. Unlike 2015, however, they were joined by strong turns for Materials, Industrials, and certain non-REIT areas in Financials, with the first particularly strong. Along with Information Technology and Energy, these have been areas of collective investment interest for us over the last several years. Yet even with the recent shift in investor preferences, which eventually sparked the turnaround for many of our holdings, expectations for many of these cyclical businesses remain low. In many cases, stocks were so deeply oversold during the winter months that, even after having experienced some recovery, their valuations still look attractive to us. Several looked even cheaper in late June. |
| WHAT A LONG STRANGE TRIP IT’S BEEN |
| We could use this title to describe the first half of 2016, the entire post-Financial Crisis period, and, perhaps most fitting, the peculiar span from 2011-2015, when QE (quantitative easing) and zero (or near zero) interest rate policies inflated many asset values but also created a barbell-shaped range of small-cap returns, with bouts of leadership from defensive, typically high-yield stocks at one extreme and fast-growing healthcare and/or tech issues at the other. Most |
| We remain confident that an extended period of even slow economic growth should be enough to boost the shares of many companies in sectors such as Industrials, Financials, Information Technology, Materials, and Energy—all of which are home to cyclical businesses with earnings and, in some cases, high ROIC. |
| companies in the middle spent the period struggling to catch up. This was bad news for active small-cap management, as comparative returns during this otherwise robust five-year period make clear. In what seemed at times like a perverse inversion of the usual patterns of stock market behavior, there were penalties in the form of lower relative returns for those managers who, like us, generally emphasize qualities such as earnings, profitability, low leverage, and steady dividends (as distinct from high yields). |
| We are pleased to say that so far in 2016, things have changed. Investors have been showing greater interest in the attributes that had been out of fashion for too long—steady dividends, profits, and effective capital allocation, to name a few. And as share prices began to rise following the February low, these qualities stayed in demand. We remain confident that an extended period of even slow economic growth should be enough to boost the shares of many companies in sectors such as Industrials, Financials, Information Technology, Materials, and Energy—all of which are home to cyclical businesses with earnings and, in some cases, high ROIC (returns on invested capital). Those that also have reasonable to attractive valuations are the companies that we expect to lead small-cap going forward. Recent data from Furey Research Partners reinforces this point. It showed that at the end of June 2016 small-caps were the cheapest they have been versus large-caps in the last 13 years, that value is cheap relative to growth, and that cyclicals are cheap compared with defensive stocks. In addition, we have seen anomalous markets before—including the large-cap led “Nifty Fifty” of the 1970s, the sudden crash in 1987, and the Tech Bubble in 2000. As challenging as each of these was, the stock market eventually resumed more historically typical performance patterns. These resumptions often signaled better times |
| Equity Indexes as of June 30, 2016 (%) | |||||||||||
| YTD1 | 1-YR | 3-YR | 5-YR | 10-YR | |||||||
| Russell 2000 | 2.22 | -6.73 | 7.09 | 8.35 | 6.20 | ||||||
| Russell 2000 Value | 6.08 | -2.58 | 6.36 | 8.15 | 5.15 | ||||||
| Russell 2000 Growth | -1.59 | -10.75 | 7.74 | 8.51 | 7.14 | ||||||
| S&P 500 | 3.84 | 3.99 | 11.66 | 12.10 | 7.42 | ||||||
| Russell 1000 | 3.74 | 2.93 | 11.48 | 11.88 | 7.51 | ||||||
| Nasdaq Composite | -3.29 | -2.89 | 12.48 | 11.79 | 8.35 | ||||||
| Russell Midcap | 5.50 | 0.56 | 10.80 | 10.90 | 8.07 | ||||||
| Russell Microcap | -1.68 | -12.06 | 5.95 | 8.20 | 4.31 | ||||||
| Russell Global ex-U.S. Small Cap | 1.01 | -5.77 | 4.06 | 1.91 | 3.82 | ||||||
| Russell Global ex-U.S. Large Cap | -1.16 | -9.94 | 1.63 | 0.36 | 2.17 | ||||||
| 1 Not annualized. For details on The Royce Funds’ performance in the period, please turn to the Managers’ Discussions that begin on page 8. |
| 4 | This page is not part of the 2016 Semiannual Report to Shareholders |
LETTER TO OUR SHAREHOLDERS

| for risk-conscious, research-driven small-cap investors as well. So we feel as though there are many reasons to feel good about the long-term potential for both profitable small companies and small-cap value. |
| Not that the equity world is without very real risks. The added layer of Brexit-bred uncertainty to an environment in which interest rates are still historically low could continue to push small-cap investors to safety and/or high yield at one extreme and lead to a fresh run at speculative growth at the other. We see four factors, however, that in our view should prevent a repeat of the pattern that dominated 2011-2015. First is the first-half success for cyclicals, particularly during the recovery phase when many helped to give small-cap value its post-bottom lift. Second, valuations for many defensive stocks look stretched to us, which should enhance the appeal of many of our holdings. Third, credit spreads remain wider than they were a year ago at this time, even with the 10-year Treasury making new lows. As long as the cost of capital remains higher, it should help profitable, lower leverage businesses. Finally, there is |
| reversion to the mean—the middle of 2015 marked a two standard deviation event in terms of a performance edge for the Russell 2000 Growth versus its small-cap value sibling. |
| On balance, then, we see ongoing leadership for small-cap value—and we recently did some research, posted on roycefunds.com, which shows that the kind of sustained advantage growth previously enjoyed is rare. Over the life of the small-cap style indexes, value still owns a compelling relative edge. The Russell 2000 Value beat the Russell 2000 Growth in 65% of monthly rolling three-year periods, 73% of monthly rolling five-year periods, and 83% of monthly rolling 10-year periods ended June 30, 2016 (see roycefunds.com/connection for more details). And this same research showed that when small-cap value beat growth, active management did better as well. So while we still expect returns for stocks to be low, we also think that leadership for value—now in place for more than a year—has ample room to run. We will be tireless in our collective efforts to run with it. |
| Sincerely, |
 |  |  | ||
| Charles M. Royce | Christopher D. Clark | Francis D. Gannon | ||
| Chairman, | President, Chief Executive Officer, and | Co-Chief Investment Officer, | ||
| Royce & Associates, LP | Co-Chief Investment Officer, | Royce & Associates, LP | ||
| Royce & Associates, LP | ||||
| August 1, 2016 |
| This page is not part of the 2016 Semiannual Report to Shareholders | 5 |
Performance and Expenses
| Performance and Expenses | AVERAGE ANNUAL TOTAL RETURNS (%) | ANNUAL OPERATING EXPENSES (%) | |||||||||||||||||||
| YTD1 | 1-YR | 5-YR | 10-YR | 15-YR | 20-YR | 40-YR/SINCE INCEPTION | INCEPTION DATE | GROSS | NET | ||||||||||||
| Royce Dividend Value Fund | 4.39 | -4.03 | 6.08 | 6.79 | N/A | N/A | 7.86 | 5/3/04 | 1.39 | 1.39 | |||||||||||
| Royce Global Financial Services Fund | 0.50 | -10.68 | 7.98 | 5.19 | N/A | N/A | 7.04 | 12/31/03 | 1.85 | 1.69 | |||||||||||
| Royce Heritage Fund | 5.30 | -2.67 | 3.89 | 5.53 | 7.28 | 11.59 | 12.05 | 12/27/95 | 1.37 | 1.37 | |||||||||||
| Royce International Micro-Cap Fund | 0.21 | -7.67 | 0.20 | N/A | N/A | N/A | 0.49 | 12/31/10 | 3.11 | 1.64 | |||||||||||
| Royce International Premier Fund | 0.77 | 3.00 | 4.65 | N/A | N/A | N/A | 4.98 | 12/31/10 | 2.35 | 1.44 | |||||||||||
| Royce International Small-Cap Fund | -1.59 | -7.46 | -1.08 | N/A | N/A | N/A | 3.36 | 6/30/08 | 1.92 | 1.45 | |||||||||||
| Royce Low-Priced Stock Fund | -2.45 | -14.87 | -3.80 | 2.04 | 4.85 | 8.38 | 9.47 | 12/15/93 | 1.50 | 1.50 | |||||||||||
| Royce Micro-Cap Fund | -0.72 | -12.74 | -1.58 | 2.89 | 6.40 | 8.59 | 10.44 | 12/31/91 | 1.50 | 1.50 | |||||||||||
| Royce Micro-Cap Opportunity Fund | 3.17 | -16.89 | 6.18 | N/A | N/A | N/A | 9.89 | 8/31/10 | 1.39 | 1.25 | |||||||||||
| Royce Opportunity Fund | 3.22 | -11.38 | 5.80 | 5.43 | 8.13 | N/A | 11.30 | 11/19/96 | 1.17 | 1.17 | |||||||||||
| Royce Pennsylvania Mutual Fund | 7.61 | -4.76 | 5.58 | 5.57 | 7.97 | 9.80 | 13.02 | N/A | 0.93 | 0.93 | |||||||||||
| Royce Premier Fund | 6.51 | -5.61 | 4.28 | 6.61 | 9.12 | 10.44 | 11.08 | 12/31/91 | 1.13 | 1.13 | |||||||||||
| Royce Small-Cap Leaders Fund | 5.96 | -7.18 | 3.04 | 5.61 | N/A | N/A | 8.67 | 6/30/03 | 1.54 | 1.49 | |||||||||||
| Royce Small-Cap Value Fund | 3.33 | -9.48 | 2.22 | 4.86 | 8.81 | N/A | 9.06 | 6/14/01 | 1.48 | 1.48 | |||||||||||
| Royce Smaller-Companies Growth Fund | -3.48 | -13.00 | 5.39 | 4.35 | 10.15 | N/A | 10.51 | 6/14/01 | 1.48 | 1.48 | |||||||||||
| Royce Special Equity Fund | 8.31 | -4.58 | 6.81 | 7.24 | 9.46 | N/A | 8.62 | 5/1/98 | 1.15 | 1.15 | |||||||||||
| Royce Special Equity Multi-Cap Fund | -0.48 | -11.27 | 7.29 | N/A | N/A | N/A | 8.06 | 12/31/10 | 1.29 | 1.24 | |||||||||||
| Royce Total Return Fund | 8.62 | 0.07 | 7.68 | 6.16 | 7.94 | 9.54 | 10.46 | 12/15/93 | 1.22 | 1.22 | |||||||||||
| INDEX | |||||||||||||||||||||
| Russell 2000 Index | 2.22 | -6.73 | 8.35 | 6.20 | 6.96 | 7.61 | N/A | N/A | N/A | N/A | |||||||||||
| Russell Microcap Index | -1.68 | -12.06 | 8.20 | 4.31 | 6.46 | N/A | N/A | N/A | N/A | N/A | |||||||||||
| Russell 1000 Index | 3.74 | 2.93 | 11.88 | 7.51 | 6.02 | 8.03 | N/A | N/A | N/A | N/A | |||||||||||
| Russell Global ex-U.S. Small Cap Index | 1.01 | -5.77 | 1.91 | 3.82 | 8.64 | N/A | N/A | N/A | N/A | N/A | |||||||||||
Important Performance, Expense, and Risk Information
All performance information in this Review and Report reflects past performance, is presented on a total return basis, reflects the reinvestment of distributions, and does not reflect the deduction of taxes a shareholder would pay on fund distributions or the redemption of fund shares. Past performance is no guarantee of future results. Investment return and principal value of an investment will fluctuate, so that shares may be worth more or less than their original cost when redeemed. Investment and Service Class shares redeemed within 30 days of purchase may be subject to a 1% redemption fee payable to the Fund (2% for Royce International Micro-Cap, International Premier, and International Small-Cap Funds). Redemption fees are not reflected in the performance shown above; if they were, performance would be lower. Current performance may be higher or lower than performance quoted. Current month-end performance may be obtained at www.roycefunds.com. All performance and expense information reflects results of the Funds’ oldest share Class (Investment Class or Service Class, as the case may be). Price and total return information is based on net asset values calculated for shareholder transactions. Gross annual operating expenses reflect the Fund’s gross total annual operating expenses and include management fees, any 12b-1 distribution and service fees, other expenses, and any applicable acquired fund fees and expenses. Net annual operating expenses reflect contractual fee waivers and/or reimbursements. All expense information is reported as of the Fund’s most current prospectus. Royce & Associates has contractually agreed to waive fees and/or reimburse operating expenses, excluding brokerage commissions, taxes, interest litigation expenses, acquired fund fees and expenses, and other expenses not borne in the ordinary course of business, to the extent necessary to maintain net operating expenses at or below: 1.49% for Royce Global Financial Services and Small-Cap Leaders Funds; 1.64% for Royce International Micro-Cap Fund; 1.44% for Royce International Premier and International Small-Cap Funds; 1.24% for Royce Micro-Cap Opportunity and Special Equity Multi-Cap Funds through April 30, 2017; at or below: 1.99% for Royce International Micro-Cap and International Premier Funds through April 30, 2026. Acquired fund fees and expenses reflect the estimated amount of fees and expenses incurred indirectly by the Fund through its investments in mutual funds, hedge funds, private equity funds, and other investment companies.
Service Class shares bear an annual distribution expense that is not borne by the Funds’ Investment Class. If such distribution expenses had been reflected for Funds showing Investment Class performance, returns would have been lower. Investments in securities of micro-cap, small-cap, and/or mid-cap companies may involve considerably more risk than investments in securities of larger-cap companies. (Please see “Primary Risks for Fund Investors” in the prospectus.) Certain Funds invest a significant portion of their respective assets in foreign companies that may be subject to different risks than investments in securities of U.S. companies, including adverse political, social, economic, or other developments that are unique to a particular country or region. (Please see “Investing in Foreign Securities” in the prospectus.) Therefore, the prices of securities of foreign companies in particular countries or regions may, at times, move in a different direction than those of securities of U.S. companies. (Please see “Primary Risk of Fund Investors” in the prospectus.) Certain Funds generally invest a significant portion of their assets in a limited number of stocks, which may involve considerably more risk than a more broadly diversified portfolio because a decline in the value of any of these stocks would cause their overall value to decline to a greater degree. A broadly diversified portfolio, however, does not ensure a profit or guarantee against loss. This Review and Report must be preceded or accompanied by a prospectus. Please read the prospectus carefully before investing or sending money. Russell Investment Group is the source and owner of the trademarks, service marks, and copyrights related to the Russell Indexes. Russell® is a trademark of Russell Investment Group. The Russell 2000 Index is an unmanaged, capitalization-weighted index of domestic small-cap stocks. It measures the performance of the 2,000 smallest publicly traded U.S. companies in the Russell 3000 Index. The Russell Microcap Index includes 1,000 of the smallest securities in the small-cap Russell 2000 Index along with the next smallest eligible securities as determined by Russell. The Russell 1000 is an unmanaged, capitalization-weighted index of domestic large-cap stocks. It measures the performance of the 1,000 largest publicly traded U.S. companies in the Russell 3,000 Index. The Russell Global ex-U.S. Small Cap Index is an index of global small-cap stocks, excluding the United States. The performance of an index does not represent exactly any particular investment as you cannot invest directly in an index. Distributor: Royce Fund Services, Inc.
| 6 | This page is not part of the 2016 Semiannual Report to Shareholders |
The Royce Funds and Rolling Returns
We believe strongly in the idea that a long-term perspective is crucial for determining the success of an investment approach. Flourishing in an up market is wonderful, but surviving a bear market by losing less (or not at all) is equally desirable. In any case, the true tests of a portfolio’s mettle are results over bull and bear periods. This is why we prefer to examine results that include up and down market phases—primarily by looking at rolling return periods.
| When evaluating fund performance, it is common practice to review results for the most recent year (often the calendar year) along with its related longer-term trailing periods. However, a calendar-year return is not necessarily any more or less important to consider than any other 12-month period (or related trailing period) during a manager’s tenure. It is also true that few investors buy mutual funds on New Year’s Eve and then sell exactly five or 10 years later. Of course, the reality is that trailing returns ending last month or last quarter are the most commonly available and easily comparable results, so these otherwise arbitrary periods often drive investor decisions and flows. |
| Keeping in mind that investors will buy and sell at any time throughout any given year, we think it makes sense to examine performance over a larger series of dates. We believe rolling returns offer a more effective measure because they provide a more accurate and in-depth picture of a portfolio’s performance. Rather than “point-in-time” results anchored by the end of the month or quarter, |
| rolling returns account for the fact that investors typically do not invest at the beginning of the current five- or 10-year period but instead are in fact investing over many periods. |
| So instead of assuming that an investment was made on January 1, rolling returns calculate all of the periods starting not only in January, but also in February, March, April, etc. For example, a monthly five-year rolling return accounts for all of the five-year returns beginning at a given inception date and advancing one month sequentially. This method allows an investor to evaluate the consistency of a fund’s performance over time—including the ups and downs of market cycles, which are an important test of a manager’s skill. |
| We believe that rolling returns provide a particularly robust analytical tool for evaluating manager performance, especially during volatile periods when simply shifting the performance date range one or two months in either direction can paint a very different picture. |
| Royce Funds1 vs. The Benchmark2 |
| Monthly Rolling Average Annual Return Periods and Relative Results Since Fund Inception or Most Recent 20 Years through June 30, 2016 |
| Average Annual 10-Year Rolling Return | Average Annual 5-Year Rolling Return | ||||||||||||||||||||||||||
| FUND | PERIODS BEATING THE INDEX | FUND AVG (%)3 | INDEX AVG (%)3 | PERIODS BEATING THE INDEX | FUND AVG (%)3 | INDEX AVG (%)3 | |||||||||||||||||||||
| U.S. EQUITY | |||||||||||||||||||||||||||
| Dividend Value | 25/26 | 96% | 8.2 | 7.5 | 57/86 | 66% | 8.7 | 7.6 | |||||||||||||||||||
| Heritage | 111/121 | 92% | 10.6 | 7.0 | 151/181 | 83% | 11.2 | 7.4 | |||||||||||||||||||
| Low-Priced Stock | 78/121 | 64% | 9.6 | 7.0 | 131/181 | 72% | 9.9 | 7.4 | |||||||||||||||||||
| Micro-Cap | 60/73 | 82% | 8.7 | 6.3 | 92/133 | 69% | 9.0 | 7.4 | |||||||||||||||||||
| Opportunity | 103/116 | 89% | 10.4 | 6.9 | 137/176 | 78% | 11.6 | 7.4 | |||||||||||||||||||
| Pennsylvania Mutual | 103/121 | 85% | 9.7 | 7.0 | 139/181 | 77% | 10.3 | 7.4 | |||||||||||||||||||
| Premier | 120/121 | 99% | 11.1 | 7.0 | 143/181 | 79% | 11.2 | 7.4 | |||||||||||||||||||
| Small-Cap Leaders | 25/37 | 68% | 8.7 | 7.9 | 61/97 | 63% | 7.9 | 6.9 | |||||||||||||||||||
| Small-Cap Value | 44/61 | 72% | 9.8 | 8.0 | 76/121 | 63% | 10.0 | 8.2 | |||||||||||||||||||
| Smaller-Companies Growth | 37/61 | 61% | 9.3 | 8.0 | 54/121 | 45% | 9.7 | 8.2 | |||||||||||||||||||
| Special Equity | 84/98 | 86% | 9.5 | 6.7 | 106/158 | 67% | 10.7 | 8.0 | |||||||||||||||||||
| Total Return | 84/121 | 69% | 8.8 | 7.0 | 127/181 | 70% | 9.5 | 7.4 | |||||||||||||||||||
| GLOBAL/INTERNATIONAL EQUITY | |||||||||||||||||||||||||||
| Global Financial Services | 19/31 | 61% | 7.7 | 7.7 | 28/91 | 31% | 6.4 | 6.9 | |||||||||||||||||||
| 1 Included are all Royce Funds with at least 12 years of history. |
| 2 The Russell 2000 Index is the benchmark for most funds. Royce Micro-Cap Fund is compared to the Russell Microcap Index from the inception of that index. |
| 3 Average return shown is the average of all month-end trailing five- and 10-year total returns. |
| Past performance is no guarantee of future results. For more information on performance please see page 4. |
| This page is not part of the 2016 Semiannual Report to Shareholders | 7 |
| MANAGERS’ DISCUSSION |
| Royce Dividend Value Fund (RDV) |
 |
| Chuck Royce Jay Kaplan, CFA |
| FUND PERFORMANCE |
| Royce Dividend Value Fund advanced 4.4% for the year-to-date period ended June 30, 2016, doubling the 2.2% return for its benchmark, the Russell 2000 Index, for the same period. While the year began with an alarming correction that reached into mid-February, the Fund bounced back strongly after a period of underperformance with one of its strongest relative quarterly showings in a number of years, gaining 5.0% versus a loss of 1.5% for the small-cap index in the first quarter. In this highly volatile period, the portfolio benefited from the long-awaited shift in the small-cap market towards companies with current earnings, below-average risk profiles, and lower valuations, which all fit well with the Fund’s strategy. |
| The second quarter featured an environment that was both more mixed and more challenging for the Fund. While many of the cyclical businesses in sectors as diverse as Industrials, Information Technology, and Materials continued to do well, they ceded overall leadership to defensive areas such as REITs, utilities, and staples. More pointedly, the Fund suffered most from its significantly higher exposure to capital markets companies, many of which demonstrated little or no recovery in the wake of Brexit. The upshot was a step back for the portfolio, which finished the second quarter with a modest decline of 0.6% while the Russell 2000 rose 3.8%. We were nonetheless pleased by the Fund’s strong first half overall and believe that leadership for small-cap value, which stretches back to the most recent peak for the Russell 2000 on June 23, 2015, should be long lasting. We were also happy that Dividend Value outpaced its benchmark for the one-, 10-year and since inception (5/3/04) periods ended June 30, 2016. |
| WHAT WORKED... AND WHAT DIDN’T |
| Nine of the Fund’s 10 equity sectors finished the first half with net gains—as was also the case for the Russell 2000. Leading the portfolio by a comfortable margin was Materials, followed by strong net gains for Industrials and Financials. The net loss for Telecommunications Services, by contrast, was small. Metals & mining (from Materials) was the leading industry group, followed by machinery and air freight & logistics, both from the Industrials sector. Materials was also home to the Fund’s top three contributors for the semiannual period. Reliance Steel & Aluminum benefited from a sharp rise in steel and other base metals prices. Strong demand from the auto and aerospace sectors, as well as incremental improvement in commercial construction, continues to underpin solid volume trends, while distributor inventories are lean, with extended mill lead times for some products. Franco-Nevada Corporation is a Toronto-based business that owns royalties and streams in gold mining and other commodity and natural resource investments. The company benefited from a surge in gold prices and paid down debt during the first half while also increasing its dividend and offering upward earnings revisions. Worthington Industries is a global diversified metals manufacturing company. It was able to keep earnings positive in spite of sales declines earlier in the year and then reaped the benefit of record fiscal fourth quarter earnings per share. We held good-sized positions in all three companies at the end of June. |
| We have long liked the core businesses of investment processing, management, and operations solutions specialist, SEI Investments. The portfolio’s biggest detractor in the first half, it continued to execute well but saw its stock price hurt by market volatility, though its shares were recovering at the end of June. Staffing and workforce solutions specialist ManpowerGroup saw its shares plummet in the wake of Brexit. Its inability to share in the subsequent recovery was largely related to the company’s significant exposure to the European labor market. We chose to hold our shares in the belief that the market overreacted to what remains a business with impressive revenues, positive earnings, and a steady dividend. It was the Fund’s seventeenth largest holding at the end of June. Relative to its benchmark, the Fund was helped most by both its underweight in Health Care and better stock picking in that sector’s pharmaceuticals industry. Our larger weighting in Materials, especially in the aforementioned metals & mining group, also boosted outperformance. Conversely, the portfolio’s slight exposure to Utilities and stock selection in Financials hampered relative results. |
| Top Contributors to Performance | |||
| Year-to-Date Through 6/30/16 (%)1 | |||
| Reliance Steel & Aluminum | 0.68 | ||
| Franco-Nevada Corporation | 0.57 | ||
| Worthington Industries | 0.50 | ||
| Ritchie Bros. Auctioneers | 0.37 | ||
| Helmerich & Payne | 0.30 | ||
| 1 Includes dividends | |||
| Top Detractors from Performance | |||
| Year-to-Date Through 6/30/16 (%)2 | |||
| SEI Investments | -0.46 | ||
| ManpowerGroup | -0.36 | ||
| Inmarsat | -0.26 | ||
| Diebold | -0.25 | ||
| KBR | -0.21 | ||
| 2 Net of dividends | |||
| CURRENT POSITIONING AND OUTLOOK |
| Portfolio positioning remained largely unchanged at the end of June. We continue to see the most attractive values in cyclically sensitive areas, particularly those involved in capital markets and industrial activity, as our large weightings in Financials and Industrials demonstrate. Moreover, with Treasury Bond yields at historic lows and interest-rate sensitive stock valuations looking rich, we are comfortable with the portfolio’s lack of exposure to defensive areas—the Fund rarely holds REITs and has little exposure to Utilities and Telecommunication Services companies. Our much larger weighting in capital markets is based on our belief that asset managers, investment banks, and niche vendors are potentially profitable investments because of their high returns on invested capital and ability to differentiate themselves. In addition, their often complex business models and the companies’ cyclical earnings patterns often lead to them being misunderstood—and thus mispriced—by investors, which we believe can create opportunities for us. |
| 8 | The Royce Funds 2016 Semiannual Report to Shareholders |
| PERFORMANCE AND PORTFOLIO REVIEW | TICKER SYMBOLS RYDVX RDVIX RDIIX RDVCX |
| Performance and Expenses Average Annual Total Return (%) Through 6/30/16 | ||||||||||||
| JAN-JUN 20161 | 1-YR | 3-YR | 5-YR | 10-YR | SINCE INCEPTION (5/3/04) | |||||||
| RDV | 4.39 | -4.03 | 4.33 | 6.08 | 6.79 | 7.86 | ||||||
| Annual Operating Expenses: 1.39% | ||||||||||||
| 1 Not Annualized | ||||||||||||
| Relative Risk Adjusted Returns: Monthly Rolling Sharpe Ratios Since Inception Through 6/30/16 On a monthly rolling risk-adjusted basis, the Fund outperformed the Russell 2000 in 100% of all 10-year periods and 76% of all 5-year periods. | ||||||||||||
| PERIODS BEATING THE INDEX | FUND AVG (%)1 | INDEX AVG (%)1 | ||||||||||||
| 10-year | 26/26 | 100% | 0.48 | 0.40 | ||||||||||
| 5-year | 65/86 | 76% | 0.51 | 0.43 | ||||||||||
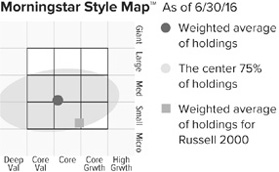
The Morningstar Style Map is the Morningstar Style Box™ with the center 75% of fund holdings plotted as the Morningstar Ownership Zone™. The Morningstar Style Box is designed to reveal a fund’s investment strategy. The Morningstar Ownership Zone provides detail about a portfolio’s investment style by showing the range of stock sizes and styles. The Ownership Zone is derived by plotting each stock in the portfolio within the proprietary Morningstar Style Box. Over time, the shape and location of a fund’s ownership zone may vary. See page 136 for additional information. |
Value of $10,000

| Top 10 Positions | |||
| % of Net Assets | |||
| Reliance Steel & Aluminum | 2.0 | ||
| FLIR Systems | 1.9 | ||
| Expeditors International of Washington | 1.8 | ||
| National Instruments | 1.7 | ||
| AllianceBernstein Holding L.P. | 1.7 | ||
| Federated Investors Cl. B | 1.6 | ||
| Diebold | 1.6 | ||
| Worthington Industries | 1.6 | ||
| Oaktree Capital Group LLC Cl. A | 1.6 | ||
| Aqua America | 1.5 | ||
| Portfolio Sector Breakdown | |||
| % of Net Assets | |||
| Financials | 29.6 | ||
| Industrials | 23.5 | ||
| Information Technology | 11.1 | ||
| Materials | 10.5 | ||
| Consumer Discretionary | 10.0 | ||
| Health Care | 3.8 | ||
| Consumer Staples | 2.9 | ||
| Energy | 1.7 | ||
| Telecommunication Services | 1.6 | ||
| Utilities | 1.5 | ||
| Miscellaneous | 1.3 | ||
| Corporate Bond | 0.1 | ||
| Cash and Cash Equivalents | 2.4 | ||
| Calendar Year Total Returns (%) | |||
| YEAR | RDV | ||
| 2015 | -5.7 | ||
| 2014 | -2.1 | ||
| 2013 | 30.7 | ||
| 2012 | 16.9 | ||
| 2011 | -4.5 | ||
| 2010 | 30.1 | ||
| 2009 | 37.7 | ||
| 2008 | -31.5 | ||
| 2007 | -0.0 | ||
| 2006 | 19.9 | ||
| 2005 | 7.3 | ||
| Upside/Downside Capture Ratios | |||
| Periods Ended 6/30/16 (%) | |||
| UPSIDE | DOWNSIDE | |||
| 10-Year | 89 | 81 | ||
| From 6/30/04 (Start of Fund’s First Full Quarter) | 88 | 76 | ||
| Portfolio Diagnostics | |||
| Fund Net Assets | $244 million | ||
| Number of Holdings | 142 | ||
| Turnover Rate | 16% | ||
| Average Market Capitalization1 | $3,115 million | ||
| Weighted Average P/E Ratio2,3 | 17.5x | ||
| Weighted Average P/B Ratio2 | 2.4x | ||
| Active Share4 | 97% | ||
| U.S. Investments (% of Net Assets) | 73.8% | ||
| Non-U.S. Investments (% of Net Assets) | 23.8% | ||
| 1 | Geometric Average. This weighted calculation uses each portfolio holding’s market cap in a way designed to not skew the effect of very large or small holdings; instead, it aims to better identify the portfolio’s center, which Royce believes offers a more accurate measure of average market cap than a simple mean or median. |
| 2 | Harmonic Average. This weighted calculation evaluates a portfolio as if it were a single stock and measures it overall. It compares the total market value of the portfolio to the portfolio’s share in the earnings or book value, as the case may be, of its underlying stocks. |
| 3 | The Fund’s P/E ratio calculation excludes companies with zero or negative earnings (3% of portfolio holdings as of 6/30/16). |
| 4 | Active Share is the sum of the absolute values of the different weightings of each holding in the Fund versus each holding in the benchmark, divided by two. |
| Important Performance and Expense Information |
All performance information in this Report reflects past performance, is presented on a total return basis, reflects the reinvestment of distributions, and does not reflect the deduction of taxes that a shareholder would pay on fund distributions or the redemption of fund shares. Past performance is no guarantee of future results. Investment return and principal value of an investment will fluctuate, so that shares may be worth more or less than their original cost when redeemed. Shares redeemed within 30 days of purchase may be subject to a 1% redemption fee payable to the Fund, which is not reflected in the performance shown above; if it were, performance would be lower. Current month-end performance may be higher or lower than performance quoted and may be obtained at www.roycefunds.com. All performance and risk information reflects results of the Service Class (its oldest class). Certain immaterial adjustments were made to the net assets of Royce Dividend Value Fund at 6/30/15 for financial reporting purposes, and as a result the net asset values for shareholder transactions on that date and the calendar year Total Returns (%) based on those net asset values differ from the adjusted net asset values and calendar year total returns reported in the Financial Highlights. Operating expenses reflect the Fund’s gross total annual operating expenses for the Service Class as of the Fund’s most current prospectus and include management fees, 12b-1 distribution and service fees, other expenses, and acquired fund fees and expenses. Acquired fund fees and expenses reflect the estimated amount of the fees and expenses incurred indirectly by the Fund through its investments in mutual funds, hedge funds, private equity funds, and other investment companies. Regarding the “Top Contributors” and “Top Detractors” tables shown above, the sum of all contributors to, and all detractors from, performance for all securities in the portfolio would approximate the Fund’s year-to-date performance for 2016. The Sharpe Ratio is calculated for a specified period by dividing a fund’s annualized excess returns by its annualized standard deviation. The higher the Sharpe ratio, the better the fund’s historical risk-adjusted performance. Upside Capture Ratio measures a manager’s performance in up markets relative to the Fund’s benchmark. It is calculated by measuring the Fund’s performance in quarters when the benchmark went up and dividing it by the benchmark’s return in those quarters. Downside Capture Ratio measures a manager’s performance in down markets relative to the Fund’s benchmark (Russell 2000). It is calculated by measuring the Fund’s performance in quarters when the benchmark goes down and dividing it by the benchmark’s return in those quarters. |
| The Royce Funds 2016 Semiannual Report to Shareholders | 9 |
| MANAGERS’ DISCUSSION |
| Royce Global Financial Services (RFS) |
 |
| Chuck Royce Chris Flynn |
| FUND PERFORMANCE |
| Royce Global Financial Services Fund advanced 0.5% for the year-to-date period ended June 30, 2016, compared to a gain of 2.2% for its small-cap benchmark, the Russell 2000 Index, and an increase of 5.0% for the financial services component of the Russell 2500 Index for the same period. Small-cap share prices started 2016 in a dizzying decline through their year-to-date low on February 11. Stocks then rallied through the end of the first quarter. The Fund gained 1.9% in this volatile period outpacing both the Russell 2000, which fell 1.5%, and the Russell 2500 financial services companies, which were up 0.3%. |
| The second quarter saw an extension of the rally, but with some important sector and industry leadership shifts within small-cap. REITs and Utilities—two of the more resilient and successful areas within the Russell 2000 over the last couple of years—maintained their strong runs as other areas either decelerated or failed to participate. The Fund fell behind both indexes in the second quarter, down 1.4% versus respective gains of 3.8% and 4.7% for the Russell 2000 and the financial services component of the Russell 2500. This was primarily due to poor second-quarter results for capital markets, by far the portfolio’s largest industry and a perennial area of investment focus, which were disproportionately affected by Brexit. Its effects elsewhere in the U.S. equity market were otherwise more quickly shaken off. |
| WHAT WORKED... AND WHAT DIDN’T |
| The Fund’s significant overweight in capital markets was therefore the biggest factor in relative underperformance. We view the capital markets industry as highly diverse, which is one reason we frequently find attractive opportunities there. The portfolio’s holdings in this industry include both domestic and international traditional asset managers, alternative asset managers, investment banks, wealth management firms, and specialist vendors to the industry. While we remain confident in the long-term prospects of our holdings, shorter-term periods, especially volatile ones, can affect these stocks disproportionately. Discount brokerage leader The Charles Schwab Corporation was the Fund’s biggest detractor in the first half, mostly the result of the post-Brexit expectation that interest rates will remain low for an extended period, which could create a challenge for Schwab as its profits could be expected to improve with rising rates. Based in the United Kingdom, Jupiter Fund Management is an asset manager with a focus on retail investors. Its shares fell sharply after the Brexit vote, though that did little to alter our view of Jupiter as one of the U.K.’s better asset management firms. Och-Ziff Capital Management Group is an institutional alternative asset manager that offers multi-strategy, credit, equity, and real estate funds. Its stock declined as the company worked through poor short-term investment performance in key funds and an ongoing Department of Justice investigation into certain international fundraising activities. We believe that investment performance will rebound and that the DOJ investigation will conclude with manageable civil fines. |
| The Fund’s best performer in the first half was Franco-Nevada Corporation, a Canadian gold-focused royalty company with a large and diversified portfolio of cash-flow producing assets. The company paid down debt, increased its dividend, and offered upward earnings revisions, all as gold prices surged during the first half. Two stock exchange operators were among the top first-half contributors. Brazil’s BM&FBOVESPA is a top-10 holding that bought rival Cetip in April, creating the largest exchange in Latin America, with a presence from Mexico to Chile. Its stock rose on the news as well as on fiscal first quarter revenue, margin, and earnings improvements. TMX Group owns and operates the Toronto Stock Exchange. The company reported decent earnings and offered evidence of transforming its business model to a lower cost base with a broader base of revenue streams. |
| Top Contributors to Performance | |||
| Year-to-Date Through 6/30/16 (%)1 | |||
| Franco-Nevada Corporation | 1.05 | ||
| BM&FBOVESPA | 0.95 | ||
| TMX Group | 0.70 | ||
| U.S. Global Investors Cl. A | 0.65 | ||
| FirstService Corporation | 0.56 | ||
| 1 Includes dividends | |||
| Top Detractors from Performance | |||
| Year-to-Date Through 6/30/16 (%)2 | |||
| Charles Schwab (The) Corporation | -0.52 | ||
| Jupiter Fund Management | -0.50 | ||
| Och-Ziff Capital Management Group LLC Cl. A | -0.39 | ||
| Stifel Financial | -0.33 | ||
| Financial Engines | -0.33 | ||
| 2 Net of dividends | |||
| CURRENT POSITIONING AND OUTLOOK |
| At the end of the semiannual period, the U.S., Canada, and the U.K. were our largest country exposures, accounting for about 75% of net assets. However, highlighting the geographic reach of the portfolio, we held positions located in another 20 countries, none of which individually amounted to 3% of net assets. Based on our proprietary classification we held about two-thirds of the portfolio in five categories: traditional asset managers, alternative asset managers, specialist vendors, exchanges, and banks. During the first half, we reduced our weighting in traditional asset managers in favor of credit-focused alternative asset managers, trimmed our exposure to U.S.-based wealth managers, and increased our investments in selected real estate-related firms headquartered outside the U.S. We have constructed a portfolio of what we consider to be differentiated franchises with attractive business models and low capital requirements in a specialized area where we think our experience gives us an analytical advantage. We believe the long-term outlook for these companies is promising. |
| 10 | The Royce Funds 2016 Semiannual Report to Shareholders |
| PERFORMANCE AND PORTFOLIO REVIEW | TICKER SYMBOLS RYFSX RGFIX |
| Performance and Expenses | ||||||||||||||
| Average Annual Total Return (%) Through 6/30/16 | ||||||||||||||
| JAN-JUN 20161 | 1-YR | 3-YR | 5-YR | 10-YR | SINCE INCEPTION (12/31/03) | |||||||||
| RFS | 0.50 | -10.68 | 5.77 | 7.98 | 5.19 | 7.04 | ||||||||
| Annual Gross Operating Expenses: 1.85% Annual Net Operating Expenses: 1.69% | ||||||||||||||
| 1 Not Annualized | ||||||||||||||

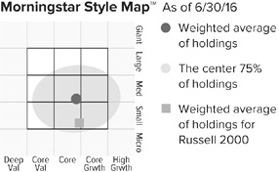
The Morningstar Style Map is the Morningstar Style Box™ with the center 75% of fund holdings plotted as the Morningstar Ownership Zone™. The Morningstar Style Box is designed to reveal a fund’s investment strategy. The Morningstar Ownership Zone provides detail about a portfolio’s investment style by showing the range of stock sizes and styles. The Ownership Zone is derived by plotting each stock in the portfolio within the proprietary Morningstar Style Box. Over time, the shape and location of a fund’s ownership zone may vary. See page 136 for additional information. |
Value of $10,000

| Top 10 Positions | ||
| % of Net Assets | ||
| Ashmore Group | 2.5 | |
| FirstService Corporation | 2.4 | |
| BM&FBOVESPA | 2.3 | |
| Ares Management L.P. | 2.2 | |
| First Citizens BancShares Cl. A | 2.1 | |
| Federated Investors Cl. B | 2.1 | |
| BOK Financial | 1.8 | |
| Popular | 1.8 | |
| Fair Isaac | 1.8 | |
| ARA Asset Management | 1.7 | |
| Portfolio Industry Breakdown | ||
| % of Net Assets (Subject to Change) | ||
| Capital Markets | 46.6 | |
| Diversified Financial Services | 14.8 | |
| Banks | 12.1 | |
| IT Services | 4.6 | |
| Insurance | 4.1 | |
| Software | 3.5 | |
| Real Estate Management & Development | 2.9 | |
| Metals & Mining | 1.3 | |
| Investment Companies | 1.2 | |
| Marine | 1.1 | |
| Professional Services | 1.1 | |
| Consumer Finance | 1.0 | |
| Trading Companies & Distributors | 0.9 | |
| Hotels, Restaurants & Leisure | 0.2 | |
| Internet Software & Services | 0.0 | |
| Miscellaneous | 2.9 | |
| Cash and Cash Equivalents | 1.7 | |
| Upside/Downside Capture Ratios | ||||
| Periods Ended 6/30/16 (%) | ||||
| UPSIDE | DOWNSIDE | |||
| 10-Year | 87 | 90 | ||
| Fund’s First Full Quarter (12/31/03) | 86 | 81 | ||
| Calendar Year Total Returns (%) | ||
| YEAR | RFS | |
| 2015 | -4.7 | |
| 2014 | 3.5 | |
| 2013 | 42.0 | |
| 2012 | 20.7 | |
| 2011 | -11.3 | |
| 2010 | 18.5 | |
| 2009 | 32.1 | |
| 2008 | -35.4 | |
| 2007 | -4.7 | |
| 2006 | 24.8 | |
| 2005 | 12.2 | |
| 2004 | 15.1 | |
| Portfolio Country Breakdown1,2 | ||
| % of Net Assets | ||
| United States | 55.6 | |
| Canada | 10.7 | |
| United Kingdom | 9.1 | |
| 1 | Represents countries that are 3% or more of net assets. |
| 2 | Securities are categorized by the country of their headquarters. |
| Portfolio Diagnostics | ||
| Fund Net Assets | $47 million | |
| Number of Holdings | 99 | |
| Turnover Rate | 22% | |
| Average Market Capitalization1 | $1,778 million | |
| Weighted Average P/E Ratio2,3 | 17.2x | |
| Weighted Average P/B Ratio2 | 2.1x | |
| Active Share4 | 99% | |
| 1 | Geometric Average. This weighted calculation uses each portfolio holding’s market cap in a way designed to not skew the effect of very large or small holdings; instead, it aims to better identify the portfolio’s center, which Royce believes offers a more accurate measure of average market cap than a simple mean or median. |
| 2 | Harmonic Average. This weighted calculation evaluates a portfolio as if it were a single stock and measures it overall. It compares the total market value of the portfolio to the portfolio’s share in the earnings or book value, as the case may be, of its underlying stocks. |
| 3 | The Fund’s P/E ratio calculation excludes companies with zero or negative earnings (10% of portfolio holdings as of 6/30/16). |
| 4 | Active Share is the sum of the absolute values of the different weightings of each holding in the Fund versus each holding in the benchmark, divided by two. |
| Important Performance and Expense Information All performance information in this Report reflects past performance, is presented on a total return basis, reflects the reinvestment of distributions, and does not reflect the deduction of taxes that a shareholder would pay on fund distributions or the redemption of fund shares. Past performance is no guarantee of future results. Investment return and principal value of an investment will fluctuate, so that shares may be worth more or less than their original cost when redeemed. Shares redeemed within 30 days of purchase may be subject to a 1% redemption fee payable to the Fund, which is not reflected in the performance shown above; if it were, performance would be lower. Current month-end performance may be higher or lower than performance quoted and may be obtained at www.roycefunds.com. Gross operating expenses reflect the Fund’s gross total annual operating expenses for the Service Class and include management fees, 12b-1 distribution and service fees, other expenses and acquired fund fees and expenses. Net operating expenses reflect contractual fee waivers and/or expense reimbursements. All expense information is reported as of the Fund’s most current prospectus. Royce & Associates has contractually agreed to waive fees and/or reimburse expenses to the extent necessary to maintain the Fund’s net annual operating expenses, (excluding brokerage commissions, taxes, interest, litigation expenses, acquired fund fees and expenses, and other expenses not borne in the ordinary course of business), at or below 1.49% through April 30, 2017. Acquired fund fees and expenses reflect the estimated amount of the fees and expenses incurred indirectly by the Fund through its investments in mutual funds, hedge funds, private equity funds, and other investment companies. Regarding the “Top Contributors” and “Top Detractors” tables shown above, the sum of all contributors to, and all detractors from, performance for all securities in the portfolio would approximate the Fund’s year-to-date performance for 2016. Upside Capture Ratio measures a manager’s performance in up markets relative to the Fund’s benchmark. It is calculated by measuring the Fund’s performance in quarters when the benchmark went up and dividing it by the benchmark’s return in those quarters. Downside Capture Ratio measures a manager’s performance in down markets relative to the Fund’s benchmark (Russell 2000). It is calculated by measuring the Fund’s performance in quarters when the benchmark goes down and dividing it by the benchmark’s return in those quarters. |
| The Royce Funds 2016 Semiannual Report to Shareholders | 11 |
| MANAGER’S DISCUSSION | ||
| Royce Heritage Fund (RHF) |
 |
| Steven McBoyle, CPA, CA |
| FUND PERFORMANCE Royce Heritage Fund gained 5.3% for the year-to-date period ended June 30, 2016, well ahead of the 2.2% increase for its small-cap benchmark, the Russell 2000 Index, for the same period. We were pleased to see the Fund hold its value more effectively than its benchmark when prices were falling during the bearish phase and to see it participate fully in the initial stage of the rebound after small-caps made a low on February 11. This made for a strong first quarter on an absolute and relative basis, with Heritage up 4.8% versus a loss of 1.5% for the Russell 2000. During the second quarter small-cap sector and industry leadership began to shift somewhat, with renewed strength for defensive areas such as utilities and REITs and ongoing vigor for discrete pockets of cyclical businesses, most notably in Industrials and Materials. This led the Fund to lose some ground to the Russell 2000. Heritage finished the second quarter with a modest gain of 0.4% compared to a 3.8% increase for the small-cap index. We were pleased that Heritage outpaced the Russell 2000 for the one-, 15-, 20-year, and since inception (12/27/95) periods ended June 30, 2016. The Fund’s average annual total return since inception was 12.0%. We remain very proud of this long-term performance record. |
| WHAT WORKED... AND WHAT DIDN’T |
| Industrials led the list of the Fund’s six (of nine) equity sectors to finish the first half in the black, followed by solid contributions from Consumer Discretionary and Materials. Of the three sectors that detracted from performance, only Financials had a significant negative impact. At the industry level, there was an interesting symmetry. Two groups made relatively large contributions—commercial services & supplies (Industrials) and auto components (Consumer Discretionary)—while two others, both of which came from Financials, had comparably sizable net losses—real estate management & development and capital markets. |
| Each of the portfolio’s five biggest contributors were also top-10 positions at the end of June. Copart has what we see as a strong niche providing vehicle suppliers, primarily insurance companies, with services to process and sell salvage vehicles through auctions. It has benefited from favorable industry tailwinds, including aging vehicle fleets and the increased cost and complexity of car repairs due to the greater number of computerized parts, which has created higher salvage volumes. Reliance Steel & Aluminum was helped by a sharp rise in steel and other base metals prices. Strong demand from the auto and aerospace sectors, as well as incremental improvement in commercial construction, continues to underpin solid volume trends, while distributor inventories are lean, with extended mill lead times for some products. UGI Corporation distributes propane, as well as natural gas and electricity, while also selling related products and services. The company has been managing well enough in a volatile energy market to have raised guidance for fiscal 2016 in May, further igniting an already fast-rising stock price. Drew Industries supplies components for manufactured homes and recreational vehicles (RVs). The company enjoyed record sales growth for fiscal 2015, fueled by accretive acquisitions, a new supply agreement for electronics, and innovative new products and features for RVs. 2016’s fiscal first quarter saw additional acquisitions and earnings improvement. |
| As for detractors, we sold our shares of Signet Jewelers in June. The company, which operates the Jared, Kay, and Zales chains, was hurt by financing concerns that were followed by allegations of precious stone-swapping by its employees. Two real estate management & development stocks disappointed in the first half, though we took advantage of lower prices and added to both positions. Global real estate investment company Kennedy-Wilson Holdings and Jones Lang LaSalle, which provides real estate brokerage and property management services, have continued to execute well but a deceleration in commercial real estate transaction volumes—mostly related to volatile capital markets in the first half—hurt results for the latter while the former mostly suffered in the wake of Brexit. |
| The Fund gained most versus its benchmark by our lack of exposure to biotechnology stocks, successful stock picking in Consumer Discretionary, and a combination of our overweight and stock selection in Industrials. Hurting relative results most was ineffective stock picking in Financials, specifically in the aforementioned real estate management & development industry. |
| Top Contributors to Performance Year-to-Date Through 6/30/16 (%)1 | |||
| Copart | 0.72 | ||
| Reliance Steel & Aluminum | 0.68 | ||
| UGI Corporation | 0.68 | ||
| Drew Industries | 0.68 | ||
| Minerals Technologies | 0.48 | ||
| 1 Includes dividends | |||
| Top Detractors from Performance Year-to-Date Through 6/30/16 (%)2 | |||
| Signet Jewelers | -0.61 | ||
| Jones Lang LaSalle | -0.45 | ||
| Kennedy-Wilson Holdings | -0.45 | ||
| ManpowerGroup | -0.45 | ||
| Westlake Chemical | -0.44 | ||
| 2 Net of dividends | |||
| CURRENT POSITIONING AND OUTLOOK |
| We anticipate higher market volatility and lower returns, with the result that investors will continue to be more discriminating. For these reasons, among others, we believe our bottom-up, quality-oriented process has the potential to do well, particularly during downdrafts. During the first half, we continued to reduce the total number of names in the Fund while increasing its domestic focus. Portfolio positioning has otherwise remained largely intact. Our largest sector weightings at the end of June were Industrials and Consumer Discretionary. We also had a larger weight in Materials and lower exposure to Information Technology, Health Care, Financials, Consumer Staples, and Utilities. Finally, the portfolio had no exposure to Energy and Telecommunication Services. |
| 12 | The Royce Funds 2016 Semiannual Report to Shareholders |
| PERFORMANCE AND PORTFOLIO REVIEW | TICKER SYMBOLS RGFAX RHFHX RYGCX RHFRX RHFKX |
| Performance and Expenses | ||||||||||||||||
| Average Annual Total Return (%) Through 6/30/16 | ||||||||||||||||
| JAN-JUN 20161 | 1-YR | 3-YR | 5-YR | 10-YR | 15-YR | 20-YR | SINCE INCEPTION (12/27/95) | |||||||||
| RHF | 5.30 | -2.67 | 3.86 | 3.89 | 5.53 | 7.28 | 11.59 | 12.05 | ||||||||
| Annual Operating Expenses: 1.37% | ||||||||||||||||
| 1 Not Annualized | ||||||||||||||||
Relative Returns: Monthly Rolling Average Annual Return Periods
| On a monthly rolling basis, the Fund outperformed the Russell 2000 in 92% of all 10-year periods; 83% of all 5-year periods; and 62% of all 1-year periods. |
| PERIODS BEATING THE INDEX | FUND AVG (%)1 | INDEX AVG (%)1 | ||||||||||||
| 10-year | 111/121 | 92% | 10.6 | 7.0 | ||||||||||
| 5-year | 151/181 | 83% | 11.2 | 7.4 | ||||||||||
| 1-year | 143/229 | 62% | 13.8 | 9.7 | ||||||||||
The Morningstar Style Map is the Morningstar Style Box™ with the center 75% of fund holdings plotted as the Morningstar Ownership Zone™. The Morningstar Style Box is designed to reveal a fund’s investment strategy. The Morningstar Ownership Zone provides detail about a portfolio’s investment style by showing the range of stock sizes and styles. The Ownership Zone is derived by plotting each stock in the portfolio within the proprietary Morningstar Style Box. Over time, the shape and location of a fund’s ownership zone may vary. See page 136 for additional information. |
Invested on 12/27/95 as of 6/30/16 ($)

| Top 10 Positions | ||
| % of Net Assets | ||
| Standard Motor Products | 2.7 | |
| Copart | 2.7 | |
| Alleghany Corporation | 2.6 | |
| LKQ Corporation | 2.5 | |
| Reliance Steel & Aluminum | 2.4 | |
| Thor Industries | 2.3 | |
| Drew Industries | 2.2 | |
| Minerals Technologies | 2.1 | |
| UGI Corporation | 2.1 | |
| Neenah Paper | 2.0 | |
| Portfolio Sector Breakdown | ||
| % of Net Assets | ||
| Industrials | 27.9 | |
| Consumer Discretionary | 20.1 | |
| Financials | 13.5 | |
| Materials | 11.8 | |
| Information Technology | 7.4 | |
| Utilities | 2.1 | |
| Health Care | 1.0 | |
| Consumer Staples | 0.7 | |
| Miscellaneous | 2.2 | |
| Cash and Cash Equivalents | 13.3 | |
| Calendar Year Total Returns (%) | ||
| YEAR | RHF | |
| 2015 | -6.5 | |
| 2014 | -1.1 | |
| 2013 | 26.0 | |
| 2012 | 14.3 | |
| 2011 | -9.3 | |
| 2010 | 27.5 | |
| 2009 | 51.8 | |
| 2008 | -36.2 | |
| 2007 | 1.2 | |
| 2006 | 22.6 | |
| 2005 | 8.7 | |
| 2004 | 20.4 | |
| 2003 | 38.1 | |
| 2002 | -18.9 | |
| 2001 | 20.5 | |
| Upside/Downside Capture Ratios | ||||||||||||||
| Periods Ended 6/30/16 (%) | ||||||||||||||
| UPSIDE | DOWNSIDE | |||||||||||||
| 10-Year | 92 | 93 | ||||||||||||
| From 12/31/95 (Start of Fund’s First Full Quarter) | 110 | 87 | ||||||||||||
| Portfolio Diagnostics | ||
| Fund Net Assets | $229 million | |
| Number of Holdings | 90 | |
| Turnover Rate | 42% | |
| Average Market Capitalization1 | $4,146 million | |
| Weighted Average P/E Ratio2,3 | 18.0x | |
| Weighted Average P/B Ratio2 | 2.5x | |
| Active Share4 | 97% | |
| U.S. Investments (% of Net Assets) | 80.3% | |
| Non-U.S. Investments (% of Net Assets) | 6.4% | |
| 1 | Geometric Average. This weighted calculation uses each portfolio holding’s market cap in a way designed to not skew the effect of very large or small holdings; instead, it aims to better identify the portfolio’s center, which Royce believes offers a more accurate measure of average market cap than a simple mean or median. |
| 2 | Harmonic Average. This weighted calculation evaluates a portfolio as if it were a single stock and measures it overall. It compares the total market value of the portfolio to the portfolio’s share in the earnings or book value, as the case may be, of its underlying stocks. |
| 3 | The Fund’s P/E ratio calculation excludes companies with zero or negative earnings (4% of portfolio holdings as of 6/30/16). |
| 4 | Active Share is the sum of the absolute values of the different weightings of each holding in the Fund versus each holding in the benchmark, divided by two. |
| Important Performance and Expense Information |
All performance information in this Report reflects past performance, is presented on a total return basis, reflects the reinvestment of distributions, and does not reflect the deduction of taxes that a shareholder would pay on fund distributions or the redemption of fund shares. Past performance is no guarantee of future results. Investment return and principal value of an investment will fluctuate, so that shares may be worth more or less than their original cost when redeemed. Shares redeemed within 30 days of purchase may be subject to a 1% redemption fee payable to the Fund, which is not reflected in the performance shown above; if it were, performance would be lower. Current month-end performance may be higher or lower than performance quoted and may be obtained at www.roycefunds.com. All performance and risk information reflects results of the Service Class (its oldest class). Price and total return information is based on net asset values calculated for shareholder transactions. Certain immaterial adjustments were made to the net assets of Royce Heritage Fund at 12/30/11 for financial reporting purposes, and as a result the net asset values for shareholder transactions on that date and the calendar year total returns based on those net asset values differ from the adjusted net asset values and calendar year total returns reported in the Financial Highlights. Operating expenses reflect the Fund’s total annual operating expenses for the Service Class as of the Fund’s most current prospectus and include management fees, 12b-1 distribution and service fees, other expenses, and acquired fund fees and expenses. Acquired fund fees and expenses reflect the estimated amount of the fees and expenses incurred indirectly by the Fund through its investments in mutual funds, hedge funds, private equity funds, and other investment companies. Regarding the “Top Contributors” and “Top Detractors” tables shown above, the sum of all contributors to, and all detractors from, performance for all securities in the portfolio would approximate the Fund’s year-to-date performance for 2016. Upside Capture Ratio measures a manager’s performance in up markets relative to the Fund’s benchmark. It is calculated by measuring the Fund’s performance in quarters when the benchmark went up and dividing it by the benchmark’s return in those quarters. Downside Capture Ratio measures a manager’s performance in down markets relative to the Fund’s benchmark (Russell 2000). It is calculated by measuring the Fund’s performance in quarters when the benchmark goes down and dividing it by the benchmark’s return in those quarters. |
| The Royce Funds 2016 Semiannual Report to Shareholders | 13 |
| MANAGERS’ DISCUSSION | ||
| Royce International Micro-Cap Fund (RMI) |
 |
| Jim Harvey, CFA Dilip Badlani, CFA |
| FUND PERFORMANCE Royce International Micro-Cap Fund increased 0.2% for the year-to-date period ended June 30, 2016, trailing its benchmark, the Russell Global ex-U.S. Small Cap Index, which rose 1.0% for the same period. During the first quarter, results for non-U.S. micro- and small-caps were mixed, though mostly muted, with one of 2015’s strongest groups—those in developed Europe—correcting most sharply. Although the portfolio’s exposure to Western Europe was higher than that of its benchmark, International Micro-Cap nonetheless outperformed, advancing 2.5% compared to a 0.9% gain for the Russell Global ex-U.S. Small Cap. Holdings in Canada and Brazil contributed most to quarterly performance. The second quarter looked mildly bullish until the Brexit decision upended many markets, particularly those in the eurozone. By the end of June, most had still not recovered, unlike many of their counterparts in other regions of the globe. The Fund underperformed the Russell Global ex-U.S. Small Cap in the second quarter, down 2.2% compared to a 0.1% advance for its benchmark. The entirety of its second-quarter loss came during the final week of June—a disappointing end to what had been a modestly positive quarter prior to the Brexit decision. We were pleased, however, that the Fund outperformed its benchmark for the three-year period ended June 30, 2016. |
| WHAT WORKED... AND WHAT DIDN’T |
| Six of the Fund’s eight equity sectors finished the first half with net gains. The biggest contributions came from Consumer Discretionary, Financials, and Materials while Energy and Consumer Staples detracted. The top industry group was media (Consumer Discretionary), followed by real estate management & development (Financials) and semiconductors & semiconductor equipment (Information Technology). The Fund’s three largest detractors at the industry level were oil, gas & consumable fuels (Energy), specialty retail (Consumer Discretionary), and banks (Financials). |
| Banca Sistema is an Italian bank specializing in financing and managing trade receivables owed by the Italian Public Administrations. Despite its unique business model and attractive growth profile, it has been caught up in the widespread downdraft for Italian banks, considered one of the more vulnerable areas of European finance in the aftermath of Brexit. While we suspect there may be increased volatility in the short run, we added shares based on our confidence in its long-term prospects. Ardmore Shipping owns and operates shipping tankers, primarily for chemicals. With shipping index volumes bouncing along all-time lows during the first half of the year, its stock was not spared. However, the fact that it was trading at about half its book value near the end of June made Ardmore worth holding as we await a recovery for its industry. |
| Top-10 position T4F Entretenimento is a Brazilian company that operates at multiple levels of the entertainment industry, including venue operation, ticketing, food & beverage, merchandise sales, and corporate sponsorships. The company has exceeded earnings-per-share expectations for the past three quarters. Recent share price appreciation notwithstanding, we think it continues to be vastly undervalued relative to its global peers, mainly because most of its business is in Brazil, which has had political and economic uncertainty over the last couple of years. Manappuram Finance is an Indian finance company that makes small loans to consumers collateralized by gold. Its shares more than doubled between March and the end of June, mainly the result of achieving synergies from past branch expansion just as gold prices soared. Morneau Shepell is a Canadian pension and human resource consultant that saw new business boosting revenues and earnings in its fiscal first quarter. |
| Holdings based in Canada had by far the biggest positive impact on first-half results, followed by Brazil, India, and Japan, while the largest detractor by far on a country basis was the United Kingdom (with Brexit obviously hurting a great deal), followed by Italy. In addition to Morneau Shepell, Magellan Aerospace, which serves the civil aerospace and defense markets, was a strong Canadian contributor. |
| Relative to the Russell Global ex-U.S. Small Cap, the Fund was hurt most by ineffective stock selection in the previously mentioned oil, gas & consumable fuels group and our lighter weighting in the metals & mining industry within Materials. Stock picking and our underweight in Consumer Staples were also factors in underperformance. Conversely, stock picking was a substantial strength in media (Consumer Discretionary), real estate management & development (Financials), and professional services (Industrials). |
| Top Contributors to Performance Year-to-Date Through 6/30/16 (%)1 | |||
| T4F Entretenimento | 1.10 | ||
| Manappuram Finance | 0.52 | ||
| Morneau Shepell | 0.51 | ||
| Magellan Aerospace | 0.39 | ||
| Webjet 1 | 0.35 | ||
| 1 Includes dividends | |||
| Top Detractors from Performance Year-to-Date Through 6/30/16 (%)2 | |||
| Banca Sistema | -0.66 | ||
| Ardmore Shipping | -0.51 | ||
| Zealand Pharma | -0.41 | ||
| Pendragon | -0.36 | ||
| SPARX Group | -0.34 | ||
| 2 Net of dividends | |||
| CURRENT POSITIONING AND OUTLOOK |
| Despite continued market volatility, we see pockets of opportunity in several regions. Recent events in the U.K. have led to wide dislocations between the business value and stock price in many European micro-caps. In Japan, negative interest rates, as well ongoing urbanization, have created a positive tailwind for real estate companies while India remains the sole global economy growing in the high single digits. Its finance market is also still relatively immature and should continue to see positive momentum. In addition, we are finding discrete opportunities in businesses affected by the slowdown of the Chinese economy that have used the opportunity to right-size their cost bases to reflect more realistic growth assumptions. |
| 14 | The Royce Funds 2016 Semiannual Report to Shareholders |
| PERFORMANCE AND PORTFOLIO REVIEW | TICKER SYMBOL ROIMX |
| Performance and Expenses | ||||||||||||
| Average Annual Total Return (%) Through 6/30/16 | ||||||||||||
| JAN-JUN 20161 | 1-YR | 3-YR | 5-YR | SINCE INCEPTION (12/31/10) | ||||||||
| RMI | 0.21 | -7.67 | 5.00 | 0.20 | 0.49 | |||||||
| Annual Gross Operating Expenses: 3.11% Annual Net Operating Expenses: 1.64% | ||||||||||||
| 1 Not Annualized | ||||||||||||
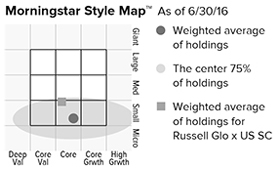
The Morningstar Style Map is the Morningstar Style Box™ with the center 75% of fund holdings plotted as the Morningstar Ownership Zone™. The Morningstar Style Box is designed to reveal a fund’s investment strategy. The Morningstar Ownership Zone provides detail about a portfolio’s investment style by showing the range of stock sizes and styles. The Ownership Zone is derived by plotting each stock in the portfolio within the proprietary Morningstar Style Box. Over time, the shape and location of a fund’s ownership zone may vary. See page 136 for additional information. |
Value of $10,000

| Top 10 Positions | ||
| % of Net Assets | ||
| Magellan Aerospace | 2.1 | |
| Pico Far East Holdings | 1.7 | |
| Webjet | 1.4 | |
| Hilton Food Group | 1.3 | |
| Leopalace21 Corporation | 1.3 | |
| Koh Young Technology | 1.3 | |
| Century Casinos | 1.3 | |
| EMIS Group | 1.2 | |
| China Metal International Holdings | 1.2 | |
| T4F Entretenimento | 1.1 | |
| Portfolio Sector Breakdown | ||
| % of Net Assets | ||
| Information Technology | 23.0 | |
| Consumer Discretionary | 22.7 | |
| Industrials | 17.6 | |
| Financials | 14.8 | |
| Consumer Staples | 5.4 | |
| Health Care | 5.1 | |
| Materials | 4.8 | |
| Energy | 2.0 | |
| Cash and Cash Equivalents | 4.6 | |
| Calendar Year Total Returns (%) | ||
| YEAR | RMI | |
| 2015 | -1.0 | |
| 2014 | -2.4 | |
| 2013 | 18.9 | |
| 2012 | 13.6 | |
| 2011 | -21.5 | |
| Portfolio Country Breakdown1,2 | ||
| % of Net Assets | ||
| United Kingdom | 15.0 | |
| Japan | 9.4 | |
| Canada | 8.2 | |
| Taiwan | 7.6 | |
| Hong Kong | 6.7 | |
| Germany | 6.6 | |
| France | 5.3 | |
| Australia | 3.9 | |
| South Korea | 3.2 | |
| 1 | Represents countries that are 3% or more of net assets. |
| 2 | Securities are categorized by the country of their headquarters. |
| Portfolio Diagnostics | ||
| Fund Net Assets | $6 million | |
| Number of Holdings | 129 | |
| Turnover Rate | 53% | |
| Average Market Capitalization1 | $354 million | |
| Weighted Average P/E Ratio2,3 | 12.5x | |
| Weighted Average P/B Ratio2 | 1.7x | |
| Active Share4 | 99% | |
| 1 | Geometric Average. This weighted calculation uses each portfolio holding’s market cap in a way designed to not skew the effect of very large or small holdings; instead, it aims to better identify the portfolio’s center, which Royce believes offers a more accurate measure of average market cap than a simple mean or median. |
| 2 | Harmonic Average. This weighted calculation evaluates a portfolio as if it were a single stock and measures it overall. It compares the total market value of the portfolio to the portfolio’s share in the earnings or book value, as the case may be, of its underlying stocks. |
| 3 | The Fund’s P/E ratio calculation excludes companies with zero or negative earnings (4% of portfolio holdings as of 6/30/16). |
| 4 | Active Share is the sum of the absolute values of the different weightings of each holding in the Fund versus each holding in the benchmark, divided by two. |
| Important Performance and Expense Information |
All performance information in this Report reflects past performance, is presented on a total return basis, reflects the reinvestment of distributions, and does not reflect the deduction of taxes that a shareholder would pay on fund distributions or the redemption of fund shares. Past performance is no guarantee of future results. Investment return and principal value of an investment will fluctuate, so that shares may be worth more or less than their original cost when redeemed. Shares redeemed within 30 days of purchase may be subject to a 2% redemption fee payable to the Fund, which is not reflected in the performance shown above; if it were, performance would be lower. Current month-end performance may be higher or lower than performance quoted and may be obtained at www.roycefunds.com. Gross operating expenses reflect total gross annual operating expenses and include management fees, 12b-1 distribution and service fees, and other expenses. Net operating expenses reflect contractual fee waivers and/or expense reimbursements. All expense information is reported as of the Fund’s most current prospectus. Royce & Associates has contractually agreed to waive its fees and/or reimburse operating expenses, to the extent necessary to maintain the Fund’s net annual operating expenses, (excluding brokerage commissions, taxes, interest, litigation expenses, acquired fund fees and expenses, and other expenses not borne in the ordinary course of business), at or below 1.64% through April 30, 2017 and at or below 1.99% through April 30, 2026. Regarding the “Top Contributors” and “Top Detractors” tables shown above, the sum of all contributors to, and all detractors from, performance for all securities in the portfolio would approximate the Fund’s year-to-date performance for 2016. |
| The Royce Funds 2016 Semiannual Report to Shareholders | 15 |
| MANAGERS’ DISCUSSION | ||
| Royce International Premier Fund (RIP) |
 |
| David Nadel Mark Rayner, CA |
| FUND PERFORMANCE Royce International Premier Fund gained 0.8% for the year-to-date period ended June 30, 2016, slightly trailing its benchmark, the Russell Global ex-U.S. Small Cap Index, which rose 1.0% for the same period. During the first quarter, results for non-U.S. small-caps were mixed. Those in developed Europe—the strongest international small-cap group in 2015—corrected most sharply. Considering that more than half of the portfolio’s net assets were invested in companies headquartered in this region, we were not surprised that the Fund fell behind its international small-cap benchmark for the quarter, when International Premier lost 1.2% versus an advance of 0.9% for the benchmark. The second quarter was moving along in a less volatile, more bullish fashion until the Brexit decision upended many markets, particularly those in the eurozone. By the end of June, most had still not recovered, unlike many of their counterparts in other regions of the globe. The Fund managed well during this highly volatile period, outpacing the Russell Global ex-U.S. Small Cap in the second quarter, up 2.0% compared to a 0.1% advance for its benchmark. We were also pleased that the portfolio held on to its longer-term relative performance edge. International Premier outperformed the Russell Global ex-U.S. Small Cap for the one-, three-, five-year, and since inception (12/31/10) periods ended June 30, 2016. |
| WHAT WORKED... AND WHAT DIDN’T |
| Five of the Fund’s eight equity sectors made positive contributions to first-half results. Health Care led by a wide margin, followed by a strong net gain for Financials while the Materials, Consumer Discretionary, and Energy sectors were the detractors. Two industry groups in Health Care made outsized net gains—health care equipment & supplies and health care providers & services. Among the industry groups that detracted, the biggest net losses came from pharmaceuticals (also in Health Care), chemicals (Materials), and oil, gas & consumable fuels (Energy). |
| Health Care was the Fund’s second-largest sector weighting at the end of June. A large and diverse area, it is also home to many companies that fit the most desirable of our four business models—what we call “perennials,” businesses with high levels of recurring revenues and reasonable to attractive valuations. OdontoPrev is a dental benefits and technology company in Brazil, which has one of the largest dentistry markets in the world. Its business was helped by strong earnings and increased membership, as well as the recovery of Brazil’s stock market and currency during the first half. We took some gains in June as its price climbed. Carl Zeiss Meditec is a German medical technology company with a global business that focuses on ophthalmological treatments and therapeutic systems. Currency tailwinds and strong growth in its surgical ophthalmology segment helped its shares to rise in the first half. We reduced our stake in the second quarter. |
| Virbac is a French firm that makes vaccines, antibiotics, and other veterinary medications. Its shares suffered mostly from the negative results of a 2014 FDA investigation of its U.S. plant in St. Louis that were released earlier this year. We were confident that the company had dealt effectively with these issues—it was the portfolio’s fifteenth-largest position at the end of June. Gaztransport Et Technigaz is a French engineering company that specializes in cargo containment systems and land storage for liquefied natural gas carriers. Its shares looked less attractive when the Fair Trade Commission of South Korea—a major hub of its business—announced it would investigate whether or not the company was in violation of fair trade laws, which led us to sell our shares in the first quarter. We also parted ways with Motherson Sumi Systems, an Indian business that makes mirrors, wiring harnesses, and other automotive components due to what we saw as more compelling opportunities elsewhere. |
| The Fund’s most significant disadvantage versus its benchmark was its lack of exposure to the metals & mining group while we had stock selection advantages in the two aforementioned healthcare industries, capital markets (Financials), and electronic equipment, instruments & components (Information Technology). The countries with the greatest positive impact on first-half results were Switzerland, Brazil, and Japan; holdings in France and the U.K. detracted most. |
| Top Contributors to Performance Year-to-Date Through 6/30/16 (%)1 | |||
| OdontoPrev | 1.29 | ||
| Carl Zeiss Meditec | 0.68 | ||
| MISUMI Group | 0.62 | ||
| Partners Group Holding | 0.50 | ||
| Fidessa Group | 0.45 | ||
| 1 Includes dividends | |||
| Top Detractors from Performance Year-to-Date Through 6/30/16 (%)2 | |||
| Virbac | -0.77 | ||
| Gaztransport Et Technigaz | -0.67 | ||
| Motherson Sumi Systems | -0.51 | ||
| Victrex | -0.50 | ||
| Azimut Holding | -0.46 | ||
| 2 Net of dividends | |||
| CURRENT POSITIONING AND OUTLOOK |
| At the end of June, our largest country exposures were to Japan, the U.K., Switzerland, and Germany, and our biggest sector weightings were in Industrials, Health Care, Information Technology, and Financials. In the wake of Brexit, our core discipline, which emphasizes companies with notable strengths in industry structure, competitive positioning, operational efficiency, financial track record, and corporate governance, remains unchanged. We believe that the U.K. is more likely to move, however slowly and fitfully, toward Norway’s model—with negotiated access to the common market. In addition, after initial stumbles, political matters in the country are coming together more effectively. So while volatility—both in the U.K. and the eurozone—seems likely to remain high in the short run, our confidence in the long-term prospects for our European (and other) holdings remains strong. |
| 16 | The Royce Funds 2016 Semiannual Report to Shareholders |
| PERFORMANCE AND PORTFOLIO REVIEW | TICKER SYMBOLS RYIPX RIPNX RINRX RIPKX RINPX |
| Performance and Expenses | ||||||||||
| Average Annual Total Return (%) Through 6/30/16 | ||||||||||
| JAN-JUN 20161 | 1-YR | 3-YR | 5-YR | SINCE INCEPTION (12/31/10) | ||||||
| RIP | 0.77 | 3.00 | 6.73 | 4.65 | 4.98 | |||||
| Annual Gross Operating Expenses: 2.35% Annual Net Operating Expenses: 1.44% | ||||||||||
| 1 Not Annualized | ||||||||||

The Morningstar Style Map is the Morningstar Style Box™ with the center 75% of fund holdings plotted as the Morningstar Ownership Zone™. The Morningstar Style Box is designed to reveal a fund’s investment strategy. The Morningstar Ownership Zone provides detail about a portfolio’s investment style by showing the range of stock sizes and styles. The Ownership Zone is derived by plotting each stock in the portfolio within the proprietary Morningstar Style Box. Over time, the shape and location of a fund's ownership zone may vary. See page 136 for additional information. |
Value of $10,000
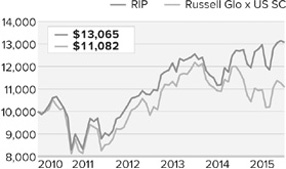
| Top 10 Positions | ||
| % of Net Assets | ||
| VZ Holding | 3.3 | |
| Mayr-Melnhof Karton | 3.2 | |
| USS | 3.1 | |
| Meitec Corporation | 3.1 | |
| Bajaj Finance | 2.8 | |
| MISUMI Group | 2.8 | |
| Partners Group Holding | 2.7 | |
| OdontoPrev | 2.7 | |
| Thermador Groupe | 2.7 | |
| Santen Pharmaceutical | 2.6 | |
| Portfolio Sector Breakdown | ||
| % of Net Assets | ||
| Industrials | 31.9 | |
| Health Care | 21.5 | |
| Information Technology | 13.8 | |
| Financials | 12.9 | |
| Materials | 7.4 | |
| Consumer Discretionary | 6.7 | |
| Consumer Staples | 2.2 | |
| Cash and Cash Equivalents | 3.6 | |
| Upside/Downside Capture Ratios | ||||||||||||||
| Periods Ended 6/30/16 (%) | ||||||||||||||
| UPSIDE | DOWNSIDE | |||||||||||||
| Fund’s First Full Quarter (12/31/10) | 104 | 77 | ||||||||||||
| Calendar Year Total Returns (%) | ||
| YEAR | RIP | |
| 2015 | 16.2 | |
| 2014 | -8.2 | |
| 2013 | 18.3 | |
| 2012 | 23.4 | |
| 2011 | -16.8 | |
| Portfolio Country Breakdown1,2 | ||
| % of Net Assets | ||
| Japan | 22.3 | |
| United Kingdom | 19.4 | |
| Switzerland | 12.9 | |
| Germany | 10.8 | |
| France | 4.9 | |
| Austria | 3.2 | |
| Sweden | 3.0 | |
| 1 | Represents countries that are 3% or more of net assets. |
| 2 | Securities are categorized by the country of their headquarters. |
| Portfolio Diagnostics | ||
| Fund Net Assets | $73 million | |
| Number of Holdings | 48 | |
| Turnover Rate | 41% | |
| Average Market Capitalization1 | $2,022 million | |
| Weighted Average P/E Ratio2,3 | 20.7x | |
| Weighted Average P/B Ratio2 | 3.4x | |
| Active Share4 | 99% | |
| 1 | Geometric Average. This weighted calculation uses each portfolio holding’s market cap in a way designed to not skew the effect of very large or small holdings; instead, it aims to better identify the portfolio’s center, which Royce believes offers a more accurate measure of average market cap than a simple mean or median. |
| 2 | Harmonic Average. This weighted calculation evaluates a portfolio as if it were a single stock and measures it overall. It compares the total market value of the portfolio to the portfolio’s share in the earnings or book value, as the case may be, of its underlying stocks. |
| 3 | The Fund’s P/E ratio calculation excludes companies with zero or negative earnings (0% of portfolio holdings as of 6/30/16). |
| 4 | Active Share is the sum of the absolute values of the different weightings of each holding in the Fund versus each holding in the benchmark, divided by two. |
| Important Performance and Expense Information All performance information in this Report reflects past performance, is presented on a total return basis, reflects the reinvestment of distributions, and does not reflect the deduction of taxes that a shareholder would pay on fund distributions or the redemption of fund shares. Past performance is no guarantee of future results. Investment return and principal value of an investment will fluctuate, so that shares may be worth more or less than their original cost when redeemed. Shares redeemed within 30 days of purchase may be subject to a 2% redemption fee payable to the Fund, which is not reflected in the performance shown above; if it were, performance would be lower. Current month-end performance may be higher or lower than performance quoted and may be obtained at www.roycefunds.com. All performance and risk information reflects results of the Service Class (its oldest class). Price and total return information is based on net asset values for shareholder transactions. Certain immaterial adjustments were made to the net assets of Royce International Premier Fund at 6/30/14 for financial reporting purposes, and as a result the net asset values for shareholder transactions and the calendar year total returns based on those net assets values differ from the adjusted net values and calendar year total returns reported in the Financial Highlights. Gross operating expenses reflect total gross annual operating expenses and include management fees, 12b-1 distribution and service fees, and other expenses. Net operating expenses reflect contractual fee waivers and/or expense reimbursements. All expense information is reported as of the Fund’s most current prospectus. Royce & Associates has contractually agreed to waive its fees and/or reimburse operating expenses to the extent necessary to maintain the Fund’s net annual operating expenses, (excluding brokerage commissions, taxes, interest, litigation expenses, acquired fund fees and expenses, and other expenses not borne in the ordinary course of business), at or below 1.44% through April 30, 2017 and at or below 1.99% through April 30, 2026. Regarding the “Top Contributors” and “Top Detractors” tables shown above, the sum of all contributors to, and all detractors from, performance for all securities in the portfolio would approximate the Fund’s year-to-date performance for 2016. Upside Capture Ratio measures a manager’s performance in up markets relative to the Fund’s benchmark. It is calculated by measuring the Fund’s performance in quarters when the benchmark went up and dividing it by the benchmark’s return in those quarters. Downside Capture Ratio measures a manager’s performance in down markets relative to the Fund’s benchmark (Russell Global ex-U.S. Small Cap). It is calculated by measuring the Fund’s performance in quarters when the benchmark goes down and dividing it by the benchmark’s return in those quarters. |
| The Royce Funds 2016 Semiannual Report to Shareholders | 17 |
| MANAGERS’ DISCUSSION | ||
| Royce International Small-Cap Fund (RIS) |
 |
| Dilip Badlani, CFA Jim Harvey, CFA |
| FUND PERFORMANCE Royce International Small-Cap Fund was down 1.6% for the year-to-date period ended June 30, 2016, trailing its benchmark, the Russell Global ex-U.S. Small Cap Index, which rose 1.0% for the same period. During the first quarter, results for non-U.S. small-caps were mixed, with one of 2015’s strongest groups—those in developed Europe—correcting most sharply. International Small-Cap outperformed, advancing 2.1% compared to a 0.9% gain for the Russell Global ex-U.S. Small Cap. Holdings in Canada and Japan contributed most to first-quarter performance. The second quarter looked mildly bullish until the Brexit decision upended many markets, particularly those in the eurozone. By the end of June, most had still not recovered, unlike many of their counterparts in other regions of the globe. The Fund underperformed the Russell Global ex-U.S. Small Cap in the second quarter, down 3.6% compared to a 0.1% advance for its benchmark. The entirety of its second-quarter loss came during the final week of June—a disappointing end to what had been a strong quarter on both an absolute and relative basis. International Small-Cap outperformed the Russell Global ex-U.S. Small Cap for the since inception (6/30/08) period ended June 30, 2016. |
| WHAT WORKED... AND WHAT DIDN’T |
| Six of the Fund’s 10 equity sectors finished the first half in the black, with the largest contributions coming from Financials, Consumer Discretionary, and Industrials. Of the four sectors with net losses, only Information Technology detracted meaningfully from first-half results. The portfolio’s top-performing industry was real estate management & development (Financials), a group that more than doubled the respective impacts of auto components and media, the next-best performing groups, which are slotted in the Consumer Discretionary sector. That same sector was home to one the Fund’s three biggest detractors at the industry level, specialty retail. IT services and electronic equipment, instruments & components, both from Information Technology, also posted decent-sized net losses. Banca Sistema is an Italian bank specializing in financing and managing trade receivables owed by the Italian Public Administrations. Despite its unique business model and attractive growth profile, it has been caught up in the widespread downdraft for Italian banks, considered one of the more vulnerable areas of European finance in the aftermath of Brexit. We trimmed our position in the first half. While we have confidence in its long-term prospects, we also anticipate increased volatility in the short run. We felt less confident in the long-term prospects for Wasion Group Holdings, a Hong Kong-based company that provides smart power, water, heat, and gas meters. Recent earnings have been unsteady primarily due to its reliance on the Chinese government’s budgeting, which influenced our decision to move on. Minth Group was the Fund’s largest holding at the end of June and its best-performing holding for the semiannual period. This Chinese auto supplier has seen a steady increase in operating earnings as investments geared toward greater manufacturing efficiencies have paid off. T4F Entretenimento, another top-10 position, is a Brazilian company that operates at multiple levels of the entertainment industry, including venue operation, ticketing, food & beverage, merchandise sales, and corporate sponsorships. The company has exceeded earnings-per-share expectations for the past three quarters. We think it continues to be vastly undervalued relative to its global peers, mainly because most of its business is in Brazil, which has been going through political and economic difficulties. Holdings based in Canada had by far the biggest positive impact on first-half results, followed by Brazil, Japan, and China, while the largest detractors on a country basis were the United Kingdom (with Brexit obviously hurting a great deal) and Hong Kong. Strong Canadian contributors included pension and human resource consultant Morneau Shepell and Magellan Aerospace, which serves the civil aerospace and defense markets. Relative to the Russell Global ex-U.S. Small Cap, the Fund was hurt most by ineffective stock selection in two Information Technology industries—the previously cited electronic equipment, instruments & components and software—and in food & staples retailing and food products, both in Consumer Staples. Conversely, stock picking was a strength in thrifts & mortgage finance (Financials) as well as in auto components and textiles, apparel & luxury goods, both in Consumer Discretionary, and in several groups in the Industrials sector. |
| Top Contributors to Performance Year-to-Date Through 6/30/16 (%)1 | ||||
| Minth Group | 0.97 | |||
| T4F Entretenimento | 0.85 | |||
| Morneau Shepell | 0.58 | |||
| Manappuram Finance | 0.53 | |||
| Magellan Aerospace | 0.48 | |||
| 1 Includes dividends | ||||
| Top Detractors from Performance Year-to-Date Through 6/30/16 (%)2 | ||||
| Banca Sistema | -0.62 | |||
| Wasion Group Holdings | -0.50 | |||
| Texwinca Holdings | -0.47 | |||
| SPARX Group | -0.34 | |||
| Net 1 UEPS Technologies | -0.34 | |||
| 2 Net of dividends | ||||
| CURRENT POSITIONING AND OUTLOOK |
| Despite continued market volatility, we see pockets of opportunity in several regions. Recent events in the U.K. have led to wide dislocations between the business value and stock price in many European small-caps. In Japan, negative interest rates, as well as ongoing urbanization, have created a positive tailwind for real estate companies while India remains the sole global economy growing in the high single digits. Its finance market is also still relatively immature and should continue to see positive momentum. In addition, we are finding discrete opportunities in businesses affected by the slowdown of the Chinese economy that have used the opportunity to right-size their cost bases to reflect more realistic growth assumptions. |
| 18 | The Royce Funds 2016 Semiannual Report to Shareholders |
| PERFORMANCE AND PORTFOLIO REVIEW | TICKER SYMBOLS RYGSX RISNX RISIX |
| Performance and Expenses | ||||||||||
| Average Annual Total Return (%) Through 6/30/16 | ||||||||||
| JAN-JUN 20161 | 1-YR | 3-YR | 5-YR | SINCE INCEPTION (6/30/08) | ||||||
| RIS | -1.59 | -7.46 | 0.59 | -1.08 | 3.36 | |||||
| Annual Gross Operating Expenses: 1.92% Annual Net Operating Expenses: 1.45% | ||||||||||
| 1 Not Annualized | ||||||||||

The Morningstar Style Map is the Morningstar Style Box™ with the center 75% of fund holdings plotted as the Morningstar Ownership Zone™. The Morningstar Style Box is designed to reveal a fund’s investment strategy. The Morningstar Ownership Zone provides detail about a portfolio’s investment style by showing the range of stock sizes and styles. The Ownership Zone is derived by plotting each stock in the portfolio within the proprietary Morningstar Style Box. Over time, the shape and location of a fund's ownership zone may vary. See page 136 for additional information. |
Value of $10,000

| Top 10 Positions | ||
| % of Net Assets | ||
| Minth Group | 2.1 | |
| Magellan Aerospace | 2.1 | |
| T4F Entretenimento | 1.9 | |
| McBride | 1.5 | |
| Leopalace21 Corporation | 1.4 | |
| AURELIUS | 1.4 | |
| Industrias Bachoco ADR | 1.3 | |
| Koh Young Technology | 1.3 | |
| Computacenter | 1.3 | |
| MISUMI Group | 1.3 | |
| Portfolio Sector Breakdown | ||
| % of Net Assets | ||
| Consumer Discretionary | 21.7 | |
| Financials | 17.3 | |
| Industrials | 16.5 | |
| Information Technology | 13.6 | |
| Consumer Staples | 7.1 | |
| Materials | 3.5 | |
| Health Care | 3.4 | |
| Telecommunication Services | 1.1 | |
| Energy | 0.6 | |
| Utilities | 0.5 | |
| Cash and Cash Equivalents | 14.7 | |
| Upside/Downside Capture Ratios | ||||
| Periods Ended 6/30/16 (%) | ||||
| UPSIDE | DOWNSIDE | |||
| From 6/30/08 (Start of Fund’s First Full Quarter) | 92 | 88 | ||
| Calendar Year Total Returns (%) | ||
| YEAR | RIS | |
| 2015 | -1.7 | |
| 2014 | -7.3 | |
| 2013 | 12.7 | |
| 2012 | 19.4 | |
| 2011 | -18.7 | |
| 2010 | 26.5 | |
| 2009 | 50.3 | |
| Portfolio Country Breakdown1,2 % of Net Assets | ||
| Japan | 14.3 | |
| United Kingdom | 12.0 | |
| Hong Kong | 10.0 | |
| China | 6.9 | |
| Canada | 6.0 | |
| Germany | 5.5 | |
| South Korea | 5.4 | |
| India | 3.5 | |
| Taiwan | 3.1 | |
| 1 | Represents countries that are 3% or more of net assets. |
| 2 | Securities are categorized by the country of their headquarters. |
| Portfolio Diagnostics | ||
| Fund Net Assets | $8 million | |
| Number of Holdings | 99 | |
| Turnover Rate | 57% | |
| Average Market Capitalization1 | $845 million | |
| Weighted Average P/E Ratio2,3 | 14.9x | |
| Weighted Average P/B Ratio2 | 2.0x | |
| Active Share4 | 98% | |
| 1 | Geometric Average. This weighted calculation uses each portfolio holding’s market cap in a way designed to not skew the effect of very large or small holdings; instead, it aims to better identify the portfolio’s center, which Royce believes offers a more accurate measure of average market cap than a simple mean or median. |
| 2 | Harmonic Average. This weighted calculation evaluates a portfolio as if it were a single stock and measures it overall. It compares the total market value of the portfolio to the portfolio’s share in the earnings or book value, as the case may be, of its underlying stocks. |
| 3 | The Fund’s P/E ratio calculation excludes companies with zero or negative earnings (4% of portfolio holdings as of 6/30/16). |
| 4 | Active Share is the sum of the absolute values of the different weightings of each holding in the Fund versus each holding in the benchmark, divided by two. |
| Important Performance and Expense Information All performance information in this Report reflects past performance, is presented on a total return basis, reflects the reinvestment of distributions, and does not reflect the deduction of taxes that a shareholder would pay on fund distributions or the redemption of fund shares. Past performance is no guarantee of future results. Investment return and principal value of an investment will fluctuate, so that shares may be worth more or less than their original cost when redeemed. Shares redeemed within 30 days of purchase may be subject to a 2% redemption fee payable to the Fund, which is not reflected in the performance shown above; if it were, performance would be lower. Current month-end performance may be higher or lower than performance quoted and may be obtained at www.roycefunds.com. All performance and risk information reflects results of the Service Class (its oldest class). Gross operating expenses reflect total gross annual operating expenses and include management fees, 12b-1 distribution and service fees, and other expenses, and acquired fund fees and expenses. Net operating expenses reflect contractual fee waivers and/or expense reimbursements. All expense information is reported as of the Fund’s most current prospectus. Royce & Associates has contractually agreed to waive its fees and/or reimburse operating expenses to the extent necessary to maintain the Fund’s net annual operating expenses, (excluding brokerage commissions, taxes, interest litigation expenses, acquired fund fees and expenses, and other expenses not borne in the ordinary course of business), at or below 1.44% through April 30, 2017. Acquired fund fees and expenses reflect the estimated amount of the fees and expenses incurred indirectly by the Fund through its investments in mutual funds, hedge funds, private equity funds, and other investment companies. Regarding the “Top Contributors” and “Top Detractors” tables shown above, the sum of all contributors to, and all detractors from, performance for all securities in the portfolio would approximate the Fund’s year-to-date performance for 2016. Upside Capture Ratio measures a manager’s performance in up markets relative to the Fund’s benchmark. It is calculated by measuring the Fund’s performance in quarters when the benchmark went up and dividing it by the benchmark’s return in those quarters. Downside Capture Ratio measures a manager’s performance in down markets relative to the Fund’s benchmark (Russell Global ex-U.S. Small Cap). It is calculated by measuring the Fund’s performance in quarters when the benchmark goes down and dividing it by the benchmark’s return in those quarters. |
| The Royce Funds 2016 Semiannual Report to Shareholders | 19 |
| MANAGER’S DISCUSSION | ||
| Royce Low-Priced Stock Fund (RLP) |
 |
| Jim Stoeffel |
| FUND PERFORMANCE We were disappointed in first-half results for Royce Low-Priced Stock Fund. The Fund fell 2.5% for the year-to-date period ended June 30, 2016, underperforming its small-cap benchmark, the Russell 2000 Index, which gained 2.2% for the same period. Small-cap stocks began the year with a significant decline that intensified the downward trend that began following the Russell 2000’s peak on June 23, 2015. This made for a highly volatile first quarter in which we were pleased to see the Fund hold its value better than its benchmark. Low-Priced Stock lost 0.8% in the year’s opening quarter versus a decline of 1.5% for the Russell 2000. The second quarter, however, saw the Fund unable to participate in the modest recovery for stocks of all asset classes that even the seismic shock of Brexit did little to deter, at least here in the U.S. So while there were recoveries for defensive areas such as REITs and Utilities, rebounds for pockets of high growth, and ongoing success for certain cyclicals, the Fund did not keep pace. For the second quarter, Low-Priced Stock was down 1.7% while the Russell 2000 gained 3.8%. Needless to say, this was a frustrating end to the semiannual period. The Fund outperformed the small-cap index for the 20-year and since inception (12/15/93) periods ended June 30, 2016. Low-Priced Stock’s average annual total return since inception was 9.5%. |
| WHAT WORKED... AND WHAT DIDN’T |
| Although there was balance in the fact that five of the Fund’s 10 equity sectors posted net losses and five posted net gains, the impact of the detractors was markedly greater, particularly for Health Care and Industrials. At the position level, the biggest net loss was SeaChange International, which provides video on demand software to cable television and telecommunications operators. Its shares fell as its efforts to offer a similar turnkey video solution to over-the-top video providers such as Netflix are proving to be a longer-term project than we and other investors had originally anticipated, which resulted in an unexpected CEO change. However, we like its inexpensive valuation and long-term prospects for success. We added shares in the first half. We also liked the combination of inexpensive valuation and long-term prospects for Ardmore Shipping, which operates mostly oil-based chemical tankers. Although we see the tanker market as moving from oversupplied to undersupplied, the uncertain global economic picture has made the transition less smooth than we initially suspected. In Health Care, the largest detractor was Lipocine, a specialty pharmaceuticals business whose stock was hurt by a delay in approval of its orally induced testosterone drug. While we are unsure about the ultimate approval of this drug, we cautiously added to our position in the first half based on Lipocine’s strong pipeline and the fact that it was trading close to the value of cash on its balance sheet. We chose to hold our shares of ZAIS Group Holdings, an investment manager that focuses primarily on structured credits. Turmoil in the credit markets pushed its investment performance below various high watermarks, which had a negative effect on both profitability and near-term growth. In January, we built our stake in BioAmber, an industrial biotechnology company that focuses on the use of renewable feedstocks. Its shares have been hurt by the kind of start-up issues that are typical with a first-of-its-kind fermentation plant. However, we see ample commercial potential for its products. On the positive side, the two top contributors came from the metals & mining industry—the portfolio’s second-best industry group behind semiconductors & semiconductor equipment. Alamos Gold and Pretium Resources are both precious metals exploration and production companies that had been trading at valuations well below our estimate of the intrinsic value of their respective resources. Each benefited from the sharp gain in precious metals prices during the first half. We have been trimming both positions as their shares vastly outperformed the change in the underlying asset price, thus closing some of the valuation gap we found in our original investment thesis. Relative to the Russell 2000, results were hampered most meaningfully by ineffective stock picking in the Industrials sector, especially in professional services and construction & engineering. Stock selection was also an issue in Financials, as was our overweight in capital markets and an underweight in REITs in the same sector. Conversely, stock selection was a strength in Information Technology. |
| Top Contributors to Performance Year-to-Date Through 6/30/16 (%)1 | ||||
| Alamos Gold Cl. A | 0.59 | |||
| Pretium Resources | 0.47 | |||
| Newport Corporation | 0.34 | |||
| Cirrus Logic | 0.33 | |||
| J.C. Penney Company | 0.33 | |||
| 1 Includes dividends | ||||
| Top Detractors from Performance Year-to-Date Through 6/30/16 (%)2 | ||||
| SeaChange International | -0.56 | |||
| Ardmore Shipping | -0.48 | |||
| Lipocine | -0.47 | |||
| ZAIS Group Holdings Cl. A | -0.45 | |||
| BioAmber | -0.38 | |||
| 2 Net of dividends | ||||
| CURRENT POSITIONING AND OUTLOOK |
| Our approach continues to swim against the tide of highly unusual circumstances, including negative interest rates in developing countries such as Germany and Japan, Brexit, and extremely volatile commodity prices. Notwithstanding these, we remain cautiously constructive on the outlook for the U.S. economy. This is reflected in sector overweights in Information Technology, Consumer Discretionary, and Industrials where we have been finding an intriguing overlap of relatively solid fundamentals and attractive valuations. We also see many exciting themes, particularly in technology, that provide numerous investment opportunities for valuation-conscious small-cap investors. Finally, we have also begun to selectively add to Health Care as that sector has significantly corrected. |
| 20 | The Royce Funds 2016 Semiannual Report to Shareholders |
| PERFORMANCE AND PORTFOLIO REVIEW | TICKER SYMBOLS RYLPX RLPHX RLPIX RLPRX RLPKX |
| Performance and Expenses | ||||||||||||||||||
| Average Annual Total Return (%) Through 6/30/16 | ||||||||||||||||||
| JAN-JUN 20161 | 1-YR | 3-YR | 5-YR | 10-YR | 15-YR | 20-YR | SINCE INCEPTION (12/15/93) | |||||||||||
| RLP | -2.45 | -14.87 | -1.17 | -3.80 | 2.04 | 4.85 | 8.38 | 9.47 | ||||||||||
| Annual Operating Expenses: 1.50% | ||||||||||||||||||
| 1 Not Annualized | ||||||||||||||||||
Relative Returns: Monthly Rolling Average Annual Return Periods
| On a monthly rolling basis, the Fund outperformed the Russell 2000 in 64% of all 10-year periods; 72% of all 5-year periods; and 55% of all 1-year periods. |
| PERIODS BEATING THE INDEX | FUND AVG (%)1 | INDEX AVG (%)1 | |||||||||
| 10-year | 78/121 | 64% | 9.6 | 7.0 | |||||||
| 5-year | 131/181 | 72% | 9.9 | 7.4 | |||||||
| 1-year | 126/229 | 55% | 11.3 | 9.7 | |||||||

The Morningstar Style Map is the Morningstar Style Box™ with the center 75% of fund holdings plotted as the Morningstar Ownership Zone™. The Morningstar Style Box is designed to reveal a fund’s investment strategy. The Morningstar Ownership Zone provides detail about a portfolio’s investment style by showing the range of stock sizes and styles. The Ownership Zone is derived by plotting each stock in the portfolio within the proprietary Morningstar Style Box. Over time, the shape and location of a fund’s ownership zone may vary. See page 136 for additional information. |
Value of $10,000
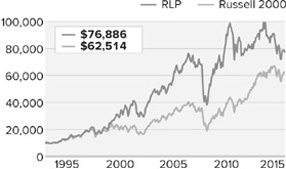
| Top 10 Positions | ||
| % of Net Assets | ||
| Resources Connection | 1.1 | |
| American Eagle Outfitters | 1.0 | |
| Cirrus Logic | 1.0 | |
| TTM Technologies | 0.9 | |
| Navigant Consulting | 0.9 | |
| MKS Instruments | 0.9 | |
| PDF Solutions | 0.9 | |
| Stein Mart | 0.9 | |
| AV Homes | 0.9 | |
| Lam Research | 0.9 | |
| Portfolio Sector Breakdown | ||
| % of Net Assets | ||
| Information Technology | 25.1 | |
| Consumer Discretionary | 18.0 | |
| Industrials | 17.1 | |
| Financials | 15.1 | |
| Health Care | 7.1 | |
| Energy | 6.4 | |
| Materials | 4.2 | |
| Consumer Staples | 1.1 | |
| Telecommunication Services | 0.5 | |
| Miscellaneous | 4.4 | |
| Cash and Cash Equivalents | 1.0 | |
| Calendar Year Total Returns (%) | ||
| YEAR | RLP | |
| 2015 | -10.4 | |
| 2014 | -3.4 | |
| 2013 | 12.9 | |
| 2012 | 4.5 | |
| 2011 | -14.6 | |
| 2010 | 31.5 | |
| 2009 | 53.6 | |
| 2008 | -36.0 | |
| 2007 | 2.3 | |
| 2006 | 19.0 | |
| 2005 | 9.7 | |
| 2004 | 13.6 | |
| 2003 | 44.0 | |
| 2002 | -16.3 | |
| 2001 | 25.1 | |
| Upside/Downside Capture Ratios | ||||
| Periods Ended 6/30/16 (%) | ||||
| UPSIDE | DOWNSIDE | |||
| 10-Year | 86 | 111 | ||
| From 12/31/93 (Start of the Fund’s First Full Quarter) | 101 | 94 | ||
| Portfolio Diagnostics | ||
| Fund Net Assets | $309 million | |
| Number of Holdings | 161 | |
| Turnover Rate | 20% | |
| Average Market Capitalization1 | $567 million | |
| Weighted Average P/E Ratio2,3 | 17.9x | |
| Weighted Average P/B Ratio2 | 1.6x | |
| Active Share4 | 96% | |
| U.S. Investments (% of Net Assets) | 83.8% | |
| Non-U.S. Investments (% of Net Assets) | 15.2% | |
| 1 | Geometric Average. This weighted calculation uses each portfolio holding’s market cap in a way designed to not skew the effect of very large or small holdings; instead, it aims to better identify the portfolio’s center, which Royce believes offers a more accurate measure of average market cap than a simple mean or median. |
| 2 | Harmonic Average. This weighted calculation evaluates a portfolio as if it were a single stock and measures it overall. It compares the total market value of the portfolio to the portfolio’s share in the earnings or book value, as the case may be, of its underlying stocks. |
| 3 | The Fund’s P/E ratio calculation excludes companies with zero or negative earnings (29% of portfolio holdings as of 6/30/16). |
| 4 | Active Share is the sum of the absolute values of the different weightings of each holding in the Fund versus each holding in the benchmark, divided by two. |
| Important Performance and Expense Information All performance information in this Report reflects past performance, is presented on a total return basis, reflects the reinvestment of distributions, and does not reflect the deduction of taxes that a shareholder would pay on fund distributions or the redemption of fund shares. Past performance is no guarantee of future results. Investment return and principal value of an investment will fluctuate, so that shares may be worth more or less than their original cost when redeemed. Shares redeemed within 30 days of purchase may be subject to a 1% redemption fee payable to the Fund, which is not reflected in the performance shown above; if it were, performance would be lower. Current month-end performance may be higher or lower than performance quoted and may be obtained at www.roycefunds.com. All performance and risk information reflects results of the Service Class (its oldest class). Price and total return information is based on net asset values for shareholder transactions. Certain immaterial adjustments were made to the net assets of Royce Low-Priced Stock Fund at 6/30/13 for financial reporting purposes, and as a result the net asset values for shareholder transactions and the calendar year total returns based on those net asset values differ from the adjusted net asset values and calendar year total returns reported in the Financial Highlights. Operating expenses reflect the Fund’s gross total annual operating expenses for the Service Class as of the Fund’s most current prospectus, including management fees, 12b-1 distribution and service fees, other expenses, and acquired fund fees and expenses. Acquired fund fees and expenses reflect the estimated amount of the fees and expenses incurred indirectly by the Fund through its investments in mutual funds, hedge funds, private equity funds, and other investment companies. Regarding the “Top Contributors” and “Top Detractors” tables shown above, the sum of all contributors to, and all detractors from, performance for all securities in the portfolio would approximate the Fund’s year-to-date performance for 2016. Upside Capture Ratio measures a manager’s performance in up markets relative to the Fund’s benchmark. It is calculated by measuring the Fund’s performance in quarters when the benchmark went up and dividing it by the benchmark’s return in those quarters. Downside Capture Ratio measures a manager’s performance in down markets relative to the Fund’s benchmark (Russell 2000). It is calculated by measuring the Fund’s performance in quarters when the benchmark goes down and dividing it by the benchmark’s return in those quarters. |
| The Royce Funds 2016 Semiannual Report to Shareholders | 21 |
| MANAGERS’ DISCUSSION | ||
| Royce Micro-Cap Fund (RMC) |
 |
| Jim Stoeffel Brendan Hartman |
| FUND PERFORMANCE Royce Micro-Cap Fund finished the year-to-date period ended June 30, 2016 with a loss of 0.7%, outperforming its benchmark, the Russell Microcap Index, which was down 1.7%, while trailing the small-cap Russell 2000 Index, which rose 2.2% for the same period. The first quarter was encouraging in its marked leadership shift to micro- and small-cap value even as its sudden share price plunges made things challenging. The Fund held its value relatively better in this highly volatile period, losing 1.1% in the first quarter compared to respective declines of 5.4% and 1.5% for Russell’s micro- and small-cap indexes. The second quarter, marked by a slow and steady recovery for equities both before and after the market-rocking Brexit vote, was less rewarding on a relative basis. The Fund was up 0.4% for the quarter versus a 4.0% gain for the Russell Microcap and a 3.8% advance for the Russell 2000. Royce Micro-Cap outperformed the Russell 2000 for the 20-year and since inception (12/31/91) periods ended June 30, 2016. (Data for the Russell Microcap only goes back to June 30, 2000.) The Fund’s average annual total return since inception was 10.4%. |
| WHAT WORKED... AND WHAT DIDN’T |
| Seven of the Fund’s 10 equity sectors were in the black at the end of June, with the most significant contributors coming from Information Technology and Consumer Discretionary while Materials also made a solid contribution. Three industry groups made impressive contributions to first-half results—electronic equipment, instruments & components, semiconductors & semiconductor equipment (both from Information Technology), and metals & mining (Materials). That last industry was home to the portfolio’s top performer for the semiannual period, Olympic Steel. A leading steel and metal distributor, the company benefited from both sharply higher steel prices and increasing volumes in its service centers. We exited our position in the second quarter as it exceeded our sell-price targets. Taiwan’s Silicon Motion Technology provides software-based controllers used in mobile storage media and multimedia systems on a chip. As the leading merchant supplier, the firm is gaining business from the ongoing replacement of hard disk drives (HDDs) by flash memory while also gaining significant market share. We held our shares as we see both the HDD replacement cycle and the company’s market share gains as still in the early innings of growth. |
| On a sector basis, Health Care had the largest net losses in the first half, followed by Energy. Biotechnology and pharmaceuticals were the Fund’s two biggest detracting industry groups and endured significant downturns within both the micro- and small-cap indexes. Lipocine, among the Fund’s loss-leading positions in the first half, is a specialty pharmaceuticals business whose stock was hurt by a delay in approval of its orally induced testosterone drug. While we are unsure about the ultimate approval of this drug, we cautiously added to our position in the first half based on Lipocine’s strong pipeline and the fact that it was trading close to the value of cash on its balance sheet. We also increased our stake in SeaChange International, which provides video-on-demand software to cable television and telecommunications operators. Its shares fell as its efforts to offer a similar turnkey video solution to over-the-top video providers such as Netflix are proving to be a longer-term project than we and other investors had originally anticipated, which resulted in an unexpected CEO change. However, we like its inexpensive valuation and long-term prospects for success. We also liked the combination of inexpensive valuation and long-term prospects for Ardmore Shipping, which operates mostly oil-based chemical tankers. Although we see the tanker market as moving from oversupplied to undersupplied, the uncertain global economic picture has made the transition less smooth than we initially suspected. |
| On a relative basis, the Fund was rewarded for its significant underweight, as well as effective stock selection, in the Health Care sector as we had comparatively lower exposure to correcting biotechnology stocks. Savvy stock picking was a significant relative contributor in the aforementioned electronic equipment, instruments & components and semiconductors & semiconductor equipment industries. Conversely, relative results were hampered in the first half by our much lower exposure to Financials, particularly REITs, which did very well, and ineffective stock selection in the real estate management & development industry. |
| Top Contributors to Performance Year-to-Date Through 6/30/16 (%)1 | ||||
| Olympic Steel | 0.45 | |||
| Silicon Motion Technology ADR | 0.41 | |||
| Pretium Resources | 0.40 | |||
| McEwen Mining | 0.35 | |||
| Fabrinet | 0.34 | |||
| 1 Includes dividends | ||||
| Top Detractors from Performance Year-to-Date Through 6/30/16 (%)2 | ||||
| SeaChange International | -0.46 | |||
| Ardmore Shipping | -0.44 | |||
| Lipocine | -0.37 | |||
| BioAmber | -0.33 | |||
| Gulf Island Fabrication | -0.31 | |||
| 2 Net of dividends | ||||
| CURRENT POSITIONING AND OUTLOOK |
| Sector weightings remained largely unchanged from the end of 2015. The ongoing effects of Brexit, our strange election season, and volatile commodity prices all notwithstanding, we remain cautiously constructive on the outlook for the U.S. economy. This is reflected in our overweight positions in Information Technology, Industrials, and Consumer Discretionary, where we have been finding an intriguing overlap of relatively solid fundamentals and attractive valuations. We have also been selectively adding names in Health Care, as the biopharma segment has corrected, and select bank and other financial stocks as we wait—and wait—for the eventual normalization of interest rates. We have been researching and investing in micro-cap stocks for more than two decades and believe that our experience in this asset class can be a differentiator as the markets also continue to normalize. |
| 22 | The Royce Funds 2016 Semiannual Report to Shareholders |
| PERFORMANCE AND PORTFOLIO REVIEW | TICKER SYMBOLS RYOTX RMCFX RYMCX |
| Performance and Expenses | ||||||||||||||||
| Average Annual Total Return (%) Through 6/30/16 | ||||||||||||||||
| JAN-JUN 20161 | 1-YR | 3-YR | 5-YR | 10-YR | 15-YR | 20-YR | SINCE INCEPTION (12/31/91) | |||||||||
| RMC | -0.72 | -12.74 | -0.97 | -1.58 | 2.89 | 6.40 | 8.59 | 10.44 | ||||||||
| Annual Operating Expenses: 1.50% | ||||||||||||||||
| 1 Not Annualized | ||||||||||||||||
Relative Returns: Monthly Rolling Average Annual Return Periods
| On a monthly rolling basis, the Fund outperformed the Russell Microcap in 82% of all 10-year periods; 69% of all 5-year periods; and 54% of all 1-year periods. |
| PERIODS BEATING THE INDEX | FUND AVG (%)1 | INDEX AVG (%)1 | ||||||||||||
| 10-year | 60/73 | 82% | 8.7 | 6.3 | ||||||||||
| 5-year | 92/133 | 69% | 9.0 | 7.4 | ||||||||||
| 1-year | 98/181 | 54% | 10.2 | 9.9 | ||||||||||

The Morningstar Style Map is the Morningstar Style Box™ with the center 75% of fund holdings plotted as the Morningstar Ownership Zone™. The Morningstar Style Box is designed to reveal a fund’s investment strategy. The Morningstar Ownership Zone provides detail about a portfolio’s investment style by showing the range of stock sizes and styles. The Ownership Zone is derived by plotting each stock in the portfolio within the proprietary Morningstar Style Box. Over time, the shape and location of a fund's ownership zone may vary. See page 136 for additional information. |
Value of $10,000
Inception) as of 6/30/16 ($)

| Top 10 Positions | ||
| % of Net Assets | ||
| ePlus | 1.1 | |
| Resources Connection | 1.1 | |
| Standard Motor Products | 1.0 | |
| Kadant | 1.0 | |
| DTS | 0.9 | |
| Stein Mart | 0.9 | |
| PC Connection | 0.9 | |
| PDF Solutions | 0.9 | |
| Navigant Consulting | 0.9 | |
| Landauer | 0.9 | |
| Portfolio Sector Breakdown | ||
| % of Net Assets | ||
| Information Technology | 22.6 | |
| Industrials | 18.9 | |
| Consumer Discretionary | 15.5 | |
| Financials | 11.9 | |
| Health Care | 11.2 | |
| Energy | 4.6 | |
| Materials | 3.6 | |
| Consumer Staples | 0.9 | |
| Telecommunication Services | 0.5 | |
| Miscellaneous | 4.2 | |
| Cash and Cash Equivalents | 6.1 | |
| Calendar Year Total Returns (%) | ||
| YEAR | RMC | |
| 2015 | -13.3 | |
| 2014 | -4.1 | |
| 2013 | 21.3 | |
| 2012 | 8.0 | |
| 2011 | -12.1 | |
| 2010 | 30.1 | |
| 2009 | 55.7 | |
| 2008 | -40.9 | |
| 2007 | 7.1 | |
| 2006 | 22.3 | |
| 2005 | 11.5 | |
| 2004 | 15.8 | |
| 2003 | 52.6 | |
| 2002 | -13.4 | |
| 2001 | 23.1 | |
| Upside/Downside Capture Ratios | ||||||||||||||
| Periods Ended 6/30/16 (%) | ||||||||||||||
| UPSIDE | DOWNSIDE | |||||||||||||
| 10-Year | 81 | 86 | ||||||||||||
| From 6/30/00 (Russell Microcap Index Inception) | 91 | 81 | ||||||||||||
| Portfolio Diagnostics | ||
| Fund Net Assets | $232 million | |
| Number of Holdings | 171 | |
| Turnover Rate | 19% | |
| Average Market Capitalization1 | $383 million | |
| Weighted Average P/E Ratio2,3 | 17.9x | |
| Weighted Average P/B Ratio2 | 1.7x | |
| Active Share4 | 90% | |
| U.S. Investments (% of Net Assets) | 82.1% | |
| Non-U.S. Investments (% of Net Assets) | 11.8% | |
| 1 | Geometric Average. This weighted calculation uses each portfolio holding’s market cap in a way designed to not skew the effect of very large or small holdings; instead, it aims to better identify the portfolio’s center, which Royce believes offers a more accurate measure of average market cap than a simple mean or median. |
| 2 | Harmonic Average. This weighted calculation evaluates a portfolio as if it were a single stock and measures it overall. It compares the total market value of the portfolio to the portfolio’s share in the earnings or book value, as the case may be, of its underlying stocks. |
| 3 | The Fund’s P/E ratio calculation excludes companies with zero or negative earnings (21% of portfolio holdings as of 6/30/16). |
| 4 | Active Share is the sum of the absolute values of the different weightings of each holding in the Fund versus each holding in the benchmark, divided by two. |
| Important Performance and Expense Information |
All performance information in this Report reflects past performance, is presented on a total return basis, reflects the reinvestment of distributions, and does not reflect the deduction of taxes that a shareholder would pay on fund distributions or the redemption of fund shares. Past performance is no guarantee of future results. Investment return and principal value of an investment will fluctuate, so that shares may be worth more or less than their original cost when redeemed. Shares redeemed within 30 days of purchase may be subject to a 1% redemption fee payable to the Fund, which is not reflected in the performance shown above; if it were, performance would be lower. Current month-end performance may be higher or lower than performance quoted and may be obtained at www.roycefunds.com. All performance and risk information reflects results of the Investment Class (its oldest class). Price and total return information is based on net asset values calculated for shareholder transactions. Certain immaterial adjustments were made to the net assets of Royce Micro-Cap Fund at 12/30/11 for financial reporting purposes, and as a result the net asset values for shareholder transactions on that date and the calendar year Total Returns (%) based on those net asset values differ from the adjusted net asset values and calendar year total returns reported in the Financial Highlights. Operating expenses reflect the Fund’s total annual operating expenses for the Investment Class as of the Fund’s most current prospectus and include management fees, other expenses, and acquired fund fees and expenses. Acquired fund fees and expenses reflect the estimated amount of the fees and expenses incurred indirectly by the fund through its investments in mutual funds, hedge funds, private equity funds, and other investment companies. Regarding the “Top Contributors” and “Top Detractors” tables shown above, the sum of all contributors to, and all detractors from, performance for all securities in the portfolio would approximate the Fund’s year-to-date performance for 2016. Upside Capture Ratio measures a manager’s performance in up markets relative to the Fund’s benchmark. It is calculated by measuring the Fund’s performance in quarters when the benchmark went up and dividing it by the benchmark’s return in those quarters. Downside Capture Ratio measures a manager’s performance in down markets relative to the Fund’s benchmark (Russell Microcap Index). It is calculated by measuring the Fund’s performance in quarters when the benchmark goes down and dividing it by the benchmark’s return in those quarters. |
| The Royce Funds 2016 Semiannual Report to Shareholders | 23 |
| MANAGERS’ DISCUSSION | ||
| Royce Micro-Cap Opportunity Fund (ROS) |
 |
| Bill Hench Buzz Zaino |
| FUND PERFORMANCE Royce Micro-Cap Opportunity Fund advanced 3.2% for the year-to-date period ended June 30, 2016, outperforming its benchmark, the Russell Microcap Index, which lost 1.7% for the same period. As micro- and small-cap stocks entered bear territory in mid-February before coming back strong to finish the first quarter, market leadership shifted more definitively from growth to value. These dramatic moves helped the Fund to outperform its benchmark in the first quarter (-0.9% versus -5.4%), as investors moved away from the narrow areas that were successful in 2015 and began to focus on areas that had been mostly overlooked. The second quarter offered its own drama in the form of Brexit, but the modestly bullish pace of returns was impeded only briefly before resuming through the end of June. The Fund gained a bit more ground on its micro-cap benchmark in this period, gaining 4.1% compared to 4.0% for the Russell Microcap. We remain confident in the portfolio’s theme-driven deep value approach as we look out to the rest of 2016 and beyond. We were also pleased with the Fund’s 9.9% average annual total return since inception (8/31/10). |
| WHAT WORKED... AND WHAT DIDN’T |
| Four of the Fund’s nine equity sectors finished the first half in the black. Information Technology—the portfolio’s largest sector—posted net gains well in excess of Industrials, the next-best performer. Of the five sectors in the red at the end of June, only Health Care detracted meaningfully from first-half performance. The electronic equipment, instruments & components group led all of the portfolio’s industries by a sizable margin, followed by semiconductors & semiconductor equipment (both from Information Technology), and aerospace & defense (Industrials). Health Care was home to three of the Fund’s four biggest detracting industry groups—health care providers & services, health care equipment & supplies, and biotechnology. Software rounded out the top four. Net losses at the industry level were comparatively modest. |
| Amber Road, the Fund’s top performing—and largest—holding in the first half, is a software company with a compelling niche. It develops single platforms to automate and streamline global trades, offering import and export, global logistics, and trade agreement management solutions. We first bought shares in 2014 on the understanding that its turnaround would take time and patience. In the first half of 2016, investors seemed to be anticipating greater acceptance of its product, driving up the value of its shares. Newport Corporation became one of several acquisition targets in the portfolio when MKS Instruments announced in February that it would be buying the business of this specialty electronic component maker for a significant premium. We sold our shares shortly after the announcement. KEYW Holding Corporation is another top-10 position that enjoyed a strong first half. The company makes software that collects, processes, and analyses intelligence data and information in cyberspace. We see cybersecurity as a major growth area and were pleased to see this largely underfollowed company command attention as it sold off a business to better focus on what we see as its core strength. |
| As for positions that detracted from performance, the most impactful was SunEdison, which makes semiconductors and solar energy technology. After the company suffered through months of disappointing developments dating back to 2015, we decided to sell our position during February and March of this year. We had the opposite view about the long-term prospects for Civitas Solutions, which provides home and community based health and human services to people with intellectual, developmental, physical or behavioral disabilities, and other special needs. We thought its valuation looked highly attractive when we gradually began to build our position in the spring of 2015. Its share price proceeded to appreciate through the second half of 2015 before correcting dramatically earlier this year, giving us a buying opportunity. We like its niche in what we see as a healthcare segment with ample growth potential. |
| Relative to the Russell Microcap, the Fund benefited significantly from superior stock selection in Information Technology, particularly in the aforementioned electronic equipment, instruments & components group and in communications equipment. Better stock picking also helped in Industrials, especially in the overweighted aerospace & defense and machinery groups. In addition, the Fund’s lower exposure to biotechnology stocks was a source of relative outperformance in Health Care, where stock selection also helped. Ineffective stock selection hampered relative results in two areas of Consumer Discretionary—hotels, restaurants & leisure and household durables—while the portfolio’s lack of exposure to Utilities also hurt. |
| Top Contributors to Performance Year-to-Date Through 6/30/16 (%)1 | ||||
| Amber Road | 1.10 | |||
| Newport Corporation | 0.95 | |||
| KEYW Holding Corporation | 0.83 | |||
| Pengrowth Energy | 0.82 | |||
| Spartan Motors | 0.81 | |||
| 1 Includes dividends | ||||
| Top Detractors from Performance Year-to-Date Through 6/30/16 (%)2 | ||||
| SunEdison | -0.58 | |||
| Civitas Solutions | -0.55 | |||
| TRC Companies | -0.55 | |||
| Monster Worldwide | -0.55 | |||
| CareDx | -0.55 | |||
| 2 Net of dividends | ||||
| CURRENT POSITIONING AND OUTLOOK |
| The Fund’s largest weightings at the end of June were Information Technology and Industrials. We also had relatively larger weightings in Consumer Discretionary and Materials. These positions were consistent with our belief that the U.S. economy will continue to grow, and our industry focus has been on areas such as residential and non-residential construction, defense, and discrete consumer industries, where we think positive trends in employment and wage growth should ultimately prove rewarding for these companies. |
| 24 | The Royce Funds 2016 Semiannual Report to Shareholders |
| PERFORMANCE AND PORTFOLIO REVIEW | TICKER SYMBOLS ROSFX ROSSX |
| Performance and Expenses | ||||||||||
| Average Annual Total Return (%) Through 6/30/16 | ||||||||||
| JAN-JUN 20161 | 1-YR | 3-YR | 5-YR | SINCE INCEPTION (8/31/10) | ||||||
| ROS | 3.17 | -16.89 | 0.35 | 6.18 | 9.89 | |||||
| Annual Gross Operating Expenses: 1.39% Annual Net Operating Expenses: 1.25% | ||||||||||
| 1 Not Annualized | ||||||||||

The Morningstar Style Map is the Morningstar Style Box™ with the center 75% of fund holdings plotted as the Morningstar Ownership Zone™. The Morningstar Style Box is designed to reveal a fund’s investment strategy. The Morningstar Ownership Zone provides detail about a portfolio’s investment style by showing the range of stock sizes and styles. The Ownership Zone is derived by plotting each stock in the portfolio within the proprietary Morningstar Style Box. Over time, the shape and location of a fund's ownership zone may vary. See page 136 for additional information. |
Value of $10,000

| Top 10 Positions | ||
| % of Net Assets | ||
| Amber Road | 3.0 | |
| Power Solutions International | 2.6 | |
| TravelCenters of America LLC | 1.7 | |
| KEYW Holding Corporation | 1.7 | |
| Beazer Homes USA | 1.6 | |
| Spartan Motors | 1.6 | |
| Nanometrics | 1.6 | |
| Gencor Industries | 1.6 | |
| Exactech | 1.6 | |
| Boise Cascade | 1.6 | |
| Portfolio Sector Breakdown | ||
| % of Net Assets | ||
| Information Technology | 30.7 | |
| Industrials | 18.9 | |
| Consumer Discretionary | 14.3 | |
| Health Care | 12.9 | |
| Materials | 8.3 | |
| Financials | 4.3 | |
| Energy | 3.3 | |
| Consumer Staples | 0.5 | |
| Miscellaneous | 2.6 | |
| Cash and Cash Equivalents | 4.2 | |
| Calendar Year Total Returns (%) | ||
| YEAR | ROS | |
| 2015 | -16.0 | |
| 2014 | -5.0 | |
| 2013 | 44.6 | |
| 2012 | 35.1 | |
| 2011 | -17.1 | |
| Portfolio Diagnostics | ||
| Fund Net Assets | $39 million | |
| Number of Holdings | 101 | |
| Turnover Rate | 47% | |
| Average Market Capitalization1 | $380 million | |
| Weighted Average P/B Ratio2 | 1.5x | |
| Weighted Average P/S Ratio3 | 0.9x | |
| Active Share4 | 95% | |
| U.S. Investments (% of Net Assets) | 91.6% | |
| Non-U.S. Investments (% of Net Assets) | 4.2% | |
| 1 | Geometric Average. This weighted calculation uses each portfolio holding’s market cap in a way designed to not skew the effect of very large or small holdings; instead, it aims to better identify the portfolio’s center, which Royce believes offers a more accurate measure of average market cap than a simple mean or median. |
| 2 | Harmonic Average. This weighted calculation evaluates a portfolio as if it were a single stock and measures it overall. It compares the total market value of the portfolio to the portfolio’s share in the earnings or book value, as the case may be, of its underlying stocks. |
| 3 | Price to Sales is calculated by dividing the company’s market cap by the revenue in the most recent year. |
| 4 | Active Share is the sum of the absolute values of the different weightings of each holding in the Fund versus each holding in the benchmark, divided by two. |
| Important Performance and Expense Information All performance information in this Report reflects past performance, is presented on a total return basis, reflects the reinvestment of distributions, and does not reflect the deduction of taxes that a shareholder would pay on fund distributions or the redemption of fund shares. Past performance is no guarantee of future results. Investment return and principal value of an investment will fluctuate, so that shares may be worth more or less than their original cost when redeemed. Shares redeemed within 30 days of purchase may be subject to a 1% redemption fee, payable to the Fund, which is not reflected in the performance shown above; if it were, performance would be lower. Current month-end performance may be higher or lower than performance quoted and may be obtained at www.roycefunds.com. Gross operating expenses reflect the Fund’s total gross annual operating expenses and include management fees and other expenses. Net operating expenses reflect contractual fee waivers and/or expense reimbursements. All expense information is reported as of the Funds most current prospectus. Royce & Associates has contractually agreed to waive fees and/or reimburse operating expenses to the extent necessary to maintain the Fund’s net annual operating expenses, (excluding dividend and interest expenses relating to short sale activities, brokerage commissions, taxes, interest, litigation expenses, acquired fund fees and expenses, and other expenses not borne in the ordinary course of business), at or below 1.24% through April 30, 2017. Regarding the “Top Contributors” and “Top Detractors” tables shown above, the sum of all contributors to, and all detractors from, performance for all securities in the portfolio would approximate the Fund’s year-to-date performance for 2016. |
| The Royce Funds 2016 Semiannual Report to Shareholders | 25 |
| MANAGERS’ DISCUSSION | ||
| Royce Opportunity Fund (ROF) |
 |
| Buzz Zaino, CFA Bill Hench |
| FUND PERFORMANCE Royce Opportunity Fund advanced 3.2% for the year-to-date period ended June 30, 2016, outperforming its small-cap benchmark, the Russell 2000 Index, which was up 2.2% for the same period. As small-cap stocks entered bear territory in mid- February before coming back strong to end the first quarter, market leadership shifted more definitively from growth to value. These dramatic moves helped the Fund to outperform its benchmark in the first quarter (+2.1% versus -1.5%), as investors shifted away from the narrow areas that were successful in 2015 and began to focus on areas that had been mostly overlooked. The second quarter offered its own drama in the form of Brexit, but the modestly bullish pace of returns was impeded only briefly. The Fund gave up some ground to its small-cap benchmark in this period, underperforming in the second quarter with a gain of 1.1% compared to 3.8% for the Russell 2000. We remain confident in the portfolio’s theme-driven deep value approach as we look out to the rest of 2016 and beyond. We were also pleased that Opportunity Fund outpaced the small-cap index for the 15-year and since inception (11/19/96) periods ended June 30, 2016. The Fund’s average annual total return since inception was 11.3%. |
| WHAT WORKED... AND WHAT DIDN’T |
| Six of the Fund’s 10 equity sectors made contributions to first-half performance, while a seventh—Utilities, where we typically have very little exposure—was flat. Materials and Industrials led by a wide margin, followed by Information Technology. Health Care and Consumer Discretionary detracted most, while net losses in Energy were comparatively modest. Five industry groups posted significant net gains—metals & mining, chemicals (both from Materials), electronic equipment, instruments & components, semiconductors & semiconductor equipment (both from Information Technology), and machinery (Industrials). Net losses at the industry level were relatively small, with Internet software & services, IT services (both from Information Technology), specialty retail (Consumer Discretionary), and communications equipment (Information Technology) detracting most. |
| Most of the portfolio’s successes in the first half were the result of opportunities we pursued in 2015 or earlier, when valuations looked attractively low and the potential for earnings recovery was promising. As is always the case, we were prepared to wait for growth catalysts, usually in the form of earnings improvement, to take effect. Kraton Performance Polymers produces engineered polymers, styrenic block copolymers, and specialty products primarily derived from renewable sources. We first bought shares in 2013, gradually building our stake as its management engineered a turnaround. Two consecutive quarters of better-than-expected earnings and an accretive acquisition in January 2016 helped to fuel the right reaction from investors. We reduced our position throughout the first half. In February, Newport Corporation became one of several acquisition targets in the portfolio when MKS Instruments announced it would be buying the business of this specialty electronic component maker for a significant premium. We began to sell our shares shortly after the announcement. Astec Industries makes and finances equipment and components used primarily in road building and related construction activities. Its shares cruised on improved earnings and an increased backlog of business helped by a federal highway bill. We trimmed our shares in the first half. |
| We were still waiting for improvements to revenues and/or earnings for the portfolio’s biggest detractors at the position level. Monster Worldwide is a global online employment solutions company. Its shares declined precipitously in February after it announced strong earnings on disappointing revenues, especially on some of the firm’s newer products. TRC Companies provides technical, financial risk management, and construction services to the public and private sectors. Its acquisition of an oil and gas pipeline services company was made when energy prices were still falling, and the market’s response was predictably negative. After some trimming, we still held shares in both stocks at the end of June. We chose to add to our position in Albany Molecular Research. Its stock was volatile but mostly down in the first half, thanks to disappointing losses. Its earnings history has historically been fairly lumpy, and we feel strongly about the growth potential in its niche offering various contract chemical research and development services. |
| Relative to its benchmark, the Fund benefited from both its overweight and effective stock selection in Materials, specifically its larger exposure to metals & mining companies and more successful picks in chemical companies. Our lack of exposure to biotechnology stocks was also a significant source of relative outperformance. Ineffective stock selection hampered relative results in two areas of Consumer Discretionary—household durables and specialty retail—while the portfolio’s lack of exposure to Utilities also hurt. |
| Top Contributors to Performance Year-to-Date Through 6/30/16 (%)1 | ||||
| Kraton Performance Polymers | 0.60 | |||
| Newport Corporation | 0.49 | |||
| Astec Industries | 0.37 | |||
| Pan American Silver | 0.36 | |||
| Mueller Water Products Cl. A | 0.35 | |||
| 1 Includes dividends | ||||
| Top Detractors from Performance Year-to-Date Through 6/30/16 (%)2 | ||||
| Monster Worldwide | -0.45 | |||
| TRC Companies | -0.36 | |||
| Albany Molecular Research | -0.32 | |||
| Invacare Corporation | -0.31 | |||
| CIBER | -0.30 | |||
| 2 Net of dividends | ||||
| CURRENT POSITIONING AND OUTLOOK |
| Our large weightings in Information Technology and Industrials, as well as in Consumer Discretionary and Materials, were consistent with our belief that the U.S. economy will continue to grow. Our industry focus has been on areas such as residential and non-residential construction, defense, and discrete consumer industries, where we think positive trends in employment and wage growth should ultimately prove rewarding for these companies. |
| 26 | The Royce Funds 2016 Semiannual Report to Shareholders |
| PERFORMANCE AND PORTFOLIO REVIEW | TICKER SYMBOLS RYPNX RYOFX ROFCX ROFIX ROFRX ROFKX |
| Performance and Expenses | ||||||||||||||
| Average Annual Total Return (%) Through 6/30/16 | ||||||||||||||
| JAN-JUN 20161 | 1-YR | 3-YR | 5-YR | 10-YR | 15-YR | SINCE INCEPTION (11/19/96) | ||||||||
| ROF | 3.22 | -11.38 | 2.45 | 5.80 | 5.43 | 8.13 | 11.30 | |||||||
| Annual Operating Expenses: 1.17% | ||||||||||||||
| 1 Not Annualized | ||||||||||||||
Relative Returns: Monthly Rolling Average Annual Return Periods
| On a monthly rolling basis, the Fund outperformed the Russell 2000 in 89% of all 10-year periods; 78% of all 5-year periods; and 65% of all 1-year periods. |
| PERIODS BEATING THE INDEX | FUND AVG (%)1 | INDEX AVG (%)1 | |||||||||
| 10-year | 103/116 | 89% | 10.4 | 6.9 | |||||||
| 5-year | 137/176 | 78% | 11.6 | 7.4 | |||||||
| 1-year | 146/224 | 65% | 14.5 | 9.3 | |||||||
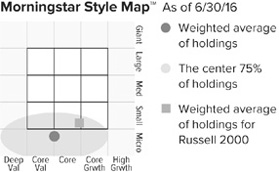
The Morningstar Style Map is the Morningstar Style Box™ with the center 75% of fund holdings plotted as the Morningstar Ownership Zone™. The Morningstar Style Box is designed to reveal a fund’s investment strategy. The Morningstar Ownership Zone provides detail about a portfolio’s investment style by showing the range of stock sizes and styles. The Ownership Zone is derived by plotting each stock in the portfolio within the proprietary Morningstar Style Box. Over time, the shape and location of a fund's ownership zone may vary. See page 136 for additional information. |
Value of $10,000

| Top 10 Positions | ||
| % of Net Assets | ||
| Kraton Performance Polymers | 1.2 | |
| Mueller Water Products Cl. A | 1.2 | |
| Mueller Industries | 1.1 | |
| Mercury Systems | 1.1 | |
| Commercial Metals | 1.1 | |
| Brooks Automation | 1.0 | |
| NCI Building Systems | 1.0 | |
| Encore Wire | 1.0 | |
| Astec Industries | 1.0 | |
| Advanced Energy Industries | 1.0 | |
| Portfolio Sector Breakdown | ||
| % of Net Assets | ||
| Information Technology | 29.8 | |
| Industrials | 23.9 | |
| Consumer Discretionary | 14.7 | |
| Materials | 9.9 | |
| Financials | 6.2 | |
| Health Care | 4.1 | |
| Energy | 2.3 | |
| Consumer Staples | 1.5 | |
| Telecommunication Services | 0.7 | |
| Utilities | 0.2 | |
| Miscellaneous | 1.2 | |
| Corporate Bond | 0.0 | |
| Cash and Cash Equivalents | 5.5 | |
| Calendar Year Total Returns (%) | ||
| YEAR | ROF | |
| 2015 | -13.6 | |
| 2014 | -0.5 | |
| 2013 | 43.5 | |
| 2012 | 22.6 | |
| 2011 | -13.0 | |
| 2010 | 33.8 | |
| 2009 | 62.1 | |
| 2008 | -45.7 | |
| 2007 | -2.0 | |
| 2006 | 18.8 | |
| 2005 | 4.8 | |
| 2004 | 17.5 | |
| 2003 | 72.9 | |
| 2002 | -17.0 | |
| 2001 | 17.3 | |
| Upside/Downside Capture Ratios | ||||
| Periods Ended 6/30/16 (%) | ||||
| UPSIDE | DOWNSIDE | |||
| 10-Year | 117 | 128 | ||
| From 12/31/96 (Start of Fund’s First Full Quarter) | 123 | 110 | ||
| Portfolio Diagnostics | ||
| Fund Net Assets | $1,391 million | |
| Number of Holdings | 247 | |
| Turnover Rate | 14% | |
| Average Market Capitalization1 | $626 million | |
| Weighted Average P/B Ratio2 | 1.4x | |
| Weighted Average P/S Ratio3 | 0.7x | |
| Active Share4 | 92% | |
| U.S. Investments (% of Net Assets) | 90.9% | |
| Non-U.S. Investments (% of Net Assets) | 3.6% | |
| 1 | Geometric Average. This weighted calculation uses each portfolio holding’s market cap in a way designed to not skew the effect of very large or small holdings; instead, it aims to better identify the portfolio’s center, which Royce believes offers a more accurate measure of average market cap than a simple mean or median. |
| 2 | Harmonic Average. This weighted calculation evaluates a portfolio as if it were a single stock and measures it overall. It compares the total market value of the portfolio to the portfolio’s share in the earnings or book value, as the case may be, of its underlying stocks. |
| 3 | Price to Sales is calculated by dividing the company’s market cap by the revenue in the most recent year. |
| 4 | Active Share is the sum of the absolute values of the different weightings of each holding in the Fund versus each holding in the benchmark, divided by two. |
| Important Performance and Expense Information All performance information in this Report reflects past performance, is presented on a total return basis, reflects the reinvestment of distributions, and does not reflect the deduction of taxes that a shareholder would pay on fund distributions or the redemption of fund shares. Past performance is no guarantee of future results. Investment return and principal value of an investment will fluctuate, so that shares may be worth more or less than their original cost when redeemed. Shares redeemed within 30 days of purchase may be subject to a 1% redemption fee payable to the Fund, which is not reflected in the performance shown above; if it were, performance would be lower. Current month-end performance may be higher or lower than performance quoted and may be obtained at www.roycefunds.com. All performance and risk information reflects results of the Investment Class (its oldest class). Operating expenses reflect the Fund’s total annual operating expenses for the Investment Class as of the Fund’s most current prospectus and include management fees and other expenses. Regarding the “Top Contributors” and “Top Detractors” tables shown above, the sum of all contributors to, and all detractors from, performance for all securities in the portfolio would approximate the Fund’s year-to-date performance for 2016. Upside Capture Ratio measures a manager’s performance in up markets relative to the Fund’s benchmark. It is calculated by measuring the Fund’s performance in quarters when the benchmark went up and dividing it by the benchmark’s return in those quarters. Downside Capture Ratio measures a manager’s performance in down markets relative to the Fund’s benchmark (Russell 2000). It is calculated by measuring the Fund’s performance in quarters when the benchmark goes down and dividing it by the benchmark’s return in those quarters. |
| The Royce Funds 2016 Semiannual Report to Shareholders | 27 |
| MANAGERS’ DISCUSSION | ||
| Royce Pennsylvania Mutual Fund® (PMF) |
 |
| Chuck Royce Lauren Romeo, CFA Jay Kaplan, CFA |
| FUND PERFORMANCE For the year-to-date period ended June 30, 2016, Royce Pennsylvania Mutual Fund handily outperformed its small-cap benchmark, the Russell 2000 Index, up 7.6% versus 2.2%. In the midst of considerable uncertainty and volatility, the first half was generally a good time for both value approaches and active small-cap management, including the more eclectic core approach that we use in Penn, which focuses on fundamentals such as low leverage and high ROIC (returns on invested capital) while also seeking companies with what we think are excellent long-term growth prospects. Small-caps felt the brunt of the downturn that kicked off 2016, and we were pleased to see Penn show down market resilience, as it often has throughout its long history. The Fund significantly outperformed the Russell 2000 in the first quarter, up 6.2% versus a loss of 1.5% for the small-cap index. The second quarter was mostly a period of gradual recovery that favored more defensive areas, such as REITs and utilities. Some of the growth stocks that had been hurt in the winter sell-off also rebounded, while cyclical areas within Materials, Industrials, and Energy continued to do well, in sharp contrast to what we experienced in 2015. The wave of volatility that hit the markets in the wake of the Brexit vote wound up doing little to impede this low-key bullish phase. Having very little exposure to defensive stocks, Penn understandably lost some ground to the Russell 2000 during the second quarter, gaining 1.3% versus 3.8% for its benchmark. We were pleased that Penn outperformed the Russell 2000 for the one-, 15-, 20-, 25-, 30-, and 35-year periods ended June 30, 2016. The Fund’s average annual total return for the 40-year period ended June 30, 2016 was 13.0%, all under the management of Chuck Royce. |
| WHAT WORKED... AND WHAT DIDN’T |
| Each of the Fund’s nine equity sectors finished 2016’s first half with net gains. The resurgent Industrials sector led by a sizable margin while meaningful net contributions also came from Information Technology, Materials, and Consumer Discretionary. Four industry groups from three different sectors dominated performance—electronic equipment, instruments & components (Information Technology), metals & mining (Materials), machinery, and commercial services & supplies (both from Industrials). Net losses at the industry level, where the leading detractors were capital markets (Financials) and professional services (Industrials), were comparatively modest. Long-time holding Drew Industries, which supplies components for manufactured homes and recreational vehicles, was Penn’s top contributor in the first half and its largest holding at the end of June. In addition to posting impressive net sales and continuing to increase content per RV, the company has made three acquisitions so far in 2016, which it sees as adding ample potential profitability. Investors seemed to concur. Franco-Nevada Corporation is a Toronto-based business that owns royalties and streams in gold mining and other commodity and natural resource investments. The company benefited from a surge in gold prices and paid down debt during the first half while also increasing its dividend and offering upward earnings revisions. The stock price of Newport Corporation climbed by more than 50% in February after the company, which specializes in photonics technology, agreed to be acquired by MKS Instruments, prompting us to begin selling our position. As for those holdings that detracted from performance, we chose to hold our shares in The Advisory Board, which provides best practice research and analysis to the health care industry, after its decelerating core healthcare business and warnings of lower revenues sank its shares. We like its niche business and long-term prospects in an industry still undergoing large-scale changes. We opted to sell our position in Liberty Tax, a tax preparation services company, after another earnings disappointment. On a relative basis, the Fund benefited most from both its underweight and effective stock selection in Health Care, its overweight and stock selection in Industrials, and strong stock picking in Information Technology and Consumer Discretionary. It was hurt somewhat by not holding any Utilities and REITs, two of the strongest sectors in the Russell 2000 in the first half, as well as from its larger exposure to capital markets in the Financials sector. |
| Top Contributors to Performance Year-to-Date Through 6/30/16 (%)1 | ||||
| Drew Industries | 0.44 | |||
| Franco-Nevada Corporation | 0.43 | |||
| Newport Corporation | 0.43 | |||
| Ritchie Bros. Auctioneers | 0.42 | |||
| Coherent | 0.35 | |||
| 1 Includes dividends | ||||
| Top Detractors from Performance Year-to-Date Through 6/30/16 (%)2 | ||||
| Advisory Board (The) | -0.28 | |||
| Liberty Tax Cl. A | -0.26 | |||
| MTS Systems | -0.19 | |||
| comScore | -0.19 | |||
| Diebold | -0.16 | |||
| 2 Net of dividends | ||||
| CURRENT POSITIONING AND OUTLOOK |
| While we are watching the corporate earnings picture quite carefully, we are cautiously optimistic about Penn’s near- and long-term prospects, basing our belief primarily on two factors—the growing strength of small-cap value and the relatively attractive valuation and earnings picture for many cyclical stocks. We continue to believe that an extended period of slow growth should be enough to keep profitable cyclicals climbing, especially after factoring in the ways in which low expectations and—for some industries—oversold conditions depressed the stock prices of so many small-caps that we see as attractive—that is, solidly profitable—businesses. In many cases, it appears that the market has just begun to reward steady earnings and high profitability and is only gradually recognizing how low valuations had become for many cyclicals. Going forward, we remain confident that earnings, profitability, and low leverage will matter more and more to investors through what we expect should be a long-running cycle. |
| 28 | The Royce Funds 2016 Semiannual Report to Shareholders |
| PERFORMANCE AND PORTFOLIO REVIEW | TICKER SYMBOLS PENNX RYPFX RPMIX RYPCX RPMRX RPMKX |
| Performance and Expenses | ||||||||||||||||||||||
| Average Annual Total Return (%) Through 6/30/16 | ||||||||||||||||||||||
| JAN-JUN 20161 | 1-YR | 3-YR | 5-YR | 10-YR | 15-YR | 20-YR | 25-YR | 30-YR | 35-YR | 40-YR | ||||||||||||
| PMF | 7.61 | -4.76 | 4.69 | 5.58 | 5.57 | 7.97 | 9.80 | 10.20 | 9.92 | 11.28 | 13.02 | |||||||||||
| Annual Operating Expenses: 0.93% | ||||||||||||||||||||||
| 1 Not Annualized | ||||||||||||||||||||||
Relative Returns: Monthly Rolling Average Annual Return Periods
20 Years Through 6/30/16
| On a monthly rolling basis, the Fund outperformed the Russell 2000 in 85% of all 10-year periods; 77% of all 5-year periods; and 55% of all 1-year periods. |
| PERIODS BEATING THE INDEX | FUND AVG (%)1 | INDEX AVG (%)1 | |||||||||
| 10-year | 103/121 | 85% | 9.7 | 7.0 | |||||||
| 5-year | 139/181 | 77% | 10.3 | 7.4 | |||||||
| 1-year | 126/229 | 55% | 11.5 | 9.7 | |||||||

The Morningstar Style Map is the Morningstar Style Box™ with the center 75% of fund holdings plotted as the Morningstar Ownership Zone™. The Morningstar Style Box is designed to reveal a fund’s investment strategy. The Morningstar Ownership Zone provides detail about a portfolio’s investment style by showing the range of stock sizes and styles. The Ownership Zone is derived by plotting each stock in the portfolio within the proprietary Morningstar Style Box. Over time, the shape and location of a fund's ownership zone may vary. See page 136 for additional information. |
Value of $10,000
as of 6/30/16 ($)

| Top 10 Positions | ||
| % of Net Assets | ||
| Drew Industries | 1.4 | |
| Ritchie Bros. Auctioneers | 1.3 | |
| Quaker Chemical | 1.2 | |
| HEICO Corporation | 1.2 | |
| Copart | 1.1 | |
| Ethan Allen Interiors | 1.1 | |
| Landstar System | 1.0 | |
| Bio-Techne | 1.0 | |
| Coherent | 1.0 | |
| RBC Bearings | 0.9 | |
| Portfolio Sector Breakdown | ||
| % of Net Assets | ||
| Industrials | 28.8 | |
| Information Technology | 18.5 | |
| Consumer Discretionary | 14.9 | |
| Financials | 14.1 | |
| Materials | 8.8 | |
| Health Care | 6.9 | |
| Energy | 3.8 | |
| Consumer Staples | 1.5 | |
| Telecommunication Services | 0.2 | |
| Miscellaneous | 0.8 | |
| Cash and Cash Equivalents | 1.7 | |
| Calendar Year Total Returns (%) | ||
| YEAR | PMF | |
| 2015 | -11.4 | |
| 2014 | -0.7 | |
| 2013 | 35.3 | |
| 2012 | 14.6 | |
| 2011 | -4.2 | |
| 2010 | 23.9 | |
| 2009 | 36.3 | |
| 2008 | -34.8 | |
| 2007 | 2.8 | |
| 2006 | 14.8 | |
| 2005 | 12.5 | |
| 2004 | 20.2 | |
| 2003 | 40.3 | |
| 2002 | -9.2 | |
| 2001 | 18.4 | |
| Upside/Downside Capture Ratios | ||||
| Periods Ended 6/30/16 (%) | ||||
| UPSIDE | DOWNSIDE | |||
| 10-Year | 93 | 95 | ||
| From 12/31/78 (Russell 2000 Inception) | 89 | 71 | ||
| Portfolio Diagnostics | ||
| Fund Net Assets | $2,627 million | |
| Number of Holdings | 308 | |
| Turnover Rate | 9% | |
| Average Market Capitalization1 | $1,605 million | |
| Weighted Average P/E Ratio2,3 | 19.9x | |
| Weighted Average P/B Ratio2 | 2.2x | |
| Active Share4 | 88% | |
| U.S. Investments (% of Net Assets) | 87.6% | |
| Non-U.S. Investments (% of Net Assets) | 10.7% | |
| 1 | Geometric Average. This weighted calculation uses each portfolio holding’s market cap in a way designed to not skew the effect of very large or small holdings; instead, it aims to better identify the portfolio’s center, which Royce believes offers a more accurate measure of average market cap than a simple mean or median. |
| 2 | Harmonic Average. This weighted calculation evaluates a portfolio as if it were a single stock and measures it overall. It compares the total market value of the portfolio to the portfolio’s share in the earnings or book value, as the case may be, of its underlying stocks. |
| 3 | The Fund’s P/E ratio calculation excludes companies with zero or negative earnings (9% of portfolio holdings as of 6/30/16). |
| 4 | Active Share is the sum of the absolute values of the different weightings of each holding in the Fund versus each holding in the benchmark, divided by two. |
| Important Performance and Expense Information All performance information in this Report reflects past performance, is presented on a total return basis, reflects the reinvestment of distributions, and does not reflect the deduction of taxes that a shareholder would pay on fund distributions or the redemption of fund shares. Past performance is no guarantee of future results. Investment return and principal value of an investment will fluctuate, so that shares may be worth more or less than their original cost when redeemed. Shares redeemed within 30 days of purchase may be subject to a 1% redemption fee payable to the Fund, which is not reflected in the performance shown above; if it were, performance would be lower. Current month-end performance may be higher or lower than performance quoted and may be obtained at www.roycefunds.com. All performance and risk information reflects results of the Investment Class (its oldest class). Operating expenses reflect the Fund’s total annual operating expenses for the Investment Class as of the Fund’s most current prospectus and include management fees, other expenses, and acquired fund fees and expenses. Acquired fund fees and expenses reflect the estimated amount of the fees and expenses incurred indirectly by the Fund through its investment in mutual funds, hedge funds, private equity funds, and other investment companies. Regarding the “Top Contributors” and “Top Detractors” tables shown above, the sum of all contributors to, and all detractors from, performance for all securities in the portfolio would approximate the Fund’s year-to-date performance for 2016. Upside Capture Ratio measures a manager’s performance in up markets relative to the Fund’s benchmark. It is calculated by measuring the Fund’s performance in quarters when the benchmark went up and dividing it by the benchmark’s return in those quarters. Downside Capture Ratio measures a manager’s performance in down markets relative to the Fund’s benchmark (Russell 2000). It is calculated by measuring the Fund’s performance in quarters when the benchmark goes down and dividing it by the benchmark’s return in those quarters. |
| The Royce Funds 2016 Semiannual Report to Shareholders | 29 |
| MANAGERS’ DISCUSSION | ||
| Royce Premier Fund (RPR) |
 |
| Chuck Royce Lauren Romeo, CFA Steven McBoyle, CPA, CA |
| FUND PERFORMANCE Royce Premier Fund was up 6.5% for the year-to-date period ended June 30, 2016, more than doubling the 2.2% gain for the Russell 2000 Index, its small-cap benchmark, for the same period. Particularly in the volatile first quarter, the Fund benefited from long-awaited market reversals in favor of companies with positive earnings, better balance sheets, and higher profitability, all of which fit well with the Fund’s strategy. Premier gained 4.4% in the first quarter compared to a decline of 1.5% for the small-cap index. The second quarter saw a brief but powerful burst of high volatility in the aftermath of the Brexit vote before the U.S. equity markets resumed their placidly bullish pace. The Fund was up 2.0% in the second quarter compared to a 3.8% gain for the Russell 2000. Longer-term results remained strong—and encouraging given our belief that the capital markets are slowly but surely returning to what we regard as normal. The Fund outperformed its benchmark for the one-, 10-, 15-, 20-year, and since inception (12/31/91) periods ended June 30, 2016. Premier’s average annual total return since inception was 11.1%—a long-term record in which we take great pride. |
| WHAT WORKED... AND WHAT DIDN’T |
| Notwithstanding the high volatility in the first half, seven of the Fund’s eight equity sectors finished the semiannual period with net gains. Only Energy detracted, and its net loss was modest. Industrials led by a wide margin, more than doubling the contribution from Consumer Discretionary, the portfolio’s second-best performing sector. Three of the top-five contributing industry groups came from Industrials—commercial services & supplies, machinery, and construction & engineering—as did three of the portfolio’s best performing positions. Ritchie Bros. Auctioneers is a long-time holding that we first bought in Premier’s portfolio in 2000. This leading auctioneer of used industrial equipment continued to benefit from management’s ongoing efforts to improve profitability as well as robust auction volumes from its construction segment and market share gains in newer target areas such as transportation and agriculture. Although we took some gains as its shares rose, it was the Fund’s second-largest position at the end of June. Copart was the portfolio’s largest holding and another top contributor from the Industrials sector. The company has what we think is a strong niche providing vehicle suppliers, primarily insurance companies, with services to process and sell salvage vehicles through auctions. During the first half, it benefited from favorable industry tailwinds, including aging vehicle fleets and the increased cost and complexity of car repairs due to the greater number of computerized parts, which created higher salvage volumes. Valmont Industries makes specialty metal products and coatings for lighting, communication, and utility markets as well as agricultural irrigation products. We like the way its management has reduced costs in the face of prolonged depressed demand, which should allow the company to see improved operating margins this year, though we are keeping an eye on the potential partial offset of rising steel prices. Speaking of steel, and moving outside Industrials, Reliance Steel & Aluminum benefited from a sharp rise in steel and other base metals prices. Strong demand from the auto and aerospace sectors, as well as incremental improvement in commercial construction, continues to underpin solid volume trends, while distributor inventories are lean, with extended mill lead times for some products. The Industrials sector was also home to the Fund’s biggest detractor in the first half. The Advisory Board provides best practice research and analysis to the health care industry. We reduced our position as business in its core healthcare segment decelerated, with below-rate subscriptions signings likely to impact the company through the end of the year. Jones Lang LaSalle provides real estate brokerage and property management services. It continues to execute well but a deceleration in commercial real estate transaction volumes—mostly related to volatile capital markets in the first half—have hurt its results. We think the market’s reaction was extreme and we held shares at the end of June. Relative to the Russell 2000, the Fund was helped most by its underweight and stock selection in Health Care, with the latter factor strongest in life sciences tools & services and health care equipment & supplies. The Industrials sector was also a major source of outperformance, thanks to our overweight and effective stock picks in commercial services & supplies and marine. Conversely, our lack of exposure to REITs and the Utilities sector negatively affected first-half performance as these interest-rate sensitive stocks rallied as bond yields fell. |
| Top Contributors to Performance Year-to-Date Through 6/30/16 (%)1 | ||||
| Ritchie Bros. Auctioneers | 0.96 | |||
| Reliance Steel & Aluminum | 0.70 | |||
| Copart | 0.70 | |||
| Cognex Corporation | 0.68 | |||
| Valmont Industries | 0.64 | |||
| 1 Includes dividends | ||||
| Top Detractors from Performance Year-to-Date Through 6/30/16 (%)2 | ||||
| Advisory Board (The) | -0.83 | |||
| Jones Lang LaSalle | -0.62 | |||
| Myriad Genetics | -0.48 | |||
| Westlake Chemical | -0.45 | |||
| Stifel Financial | -0.44 | |||
| 2 Net of dividends | ||||
| CURRENT POSITIONING AND OUTLOOK |
| Portfolio positioning remains largely intact, although in Industrials we lowered our exposure to machinery and increased it in construction & engineering. We continue to see the greatest values in leading companies in cyclically sensitive areas, particularly those within the industrial part of the economy, which can be seen in our largest sector weightings in Industrials and Information Technology. Moreover, while the Fund rarely has holdings among REITs, Utilities, and Telecommunication Services stocks, with Treasury Bond yields at historic lows, we are very comfortable with the Fund’s lack of exposure in those areas. |
| 30 | The Royce Funds 2016 Semiannual Report to Shareholders |
| PERFORMANCE AND PORTFOLIO REVIEW | TICKER SYMBOLS RYPRX RPFFX RPFIX RPRCX RPRRX RPRKX RPRWX |
| Performance and Expenses | ||||||||||||||||
| Average Annual Total Return (%) Through 6/30/16 | ||||||||||||||||
| JAN-JUN 20161 | 1-YR | 3-YR | 5-YR | 10-YR | 15-YR | 20-YR | SINCE INCEPTION (12/31/91) | |||||||||
| RPR | 6.51 | -5.61 | 4.05 | 4.28 | 6.61 | 9.12 | 10.44 | 11.08 | ||||||||
| Annual Operating Expenses: 1.13% | ||||||||||||||||
| 1 Not Annualized | ||||||||||||||||
Relative Returns: Monthly Rolling Average Annual Return Periods
| On a monthly rolling basis, the Fund outperformed the Russell 2000 in 99% of all 10-year periods; 79% of all 5-year periods; and 62% of all 1-year periods. |
| PERIODS BEATING THE INDEX | FUND AVG (%)1 | INDEX AVG (%)1 | |||||||||
| 10-year | 120/121 | 99% | 11.1 | 7.0 | |||||||
| 5-year | 143/181 | 79% | 11.2 | 7.4 | |||||||
| 1-year | 142/229 | 62% | 11.8 | 9.7 | |||||||

The Morningstar Style Map is the Morningstar Style Box™ with the center 75% of fund holdings plotted as the Morningstar Ownership Zone™. The Morningstar Style Box is designed to reveal a fund’s investment strategy. The Morningstar Ownership Zone provides detail about a portfolio’s investment style by showing the range of stock sizes and styles. The Ownership Zone is derived by plotting each stock in the portfolio within the proprietary Morningstar Style Box. Over time, the shape and location of a fund's ownership zone may vary. See page 136 for additional information. |
Value of $10,000
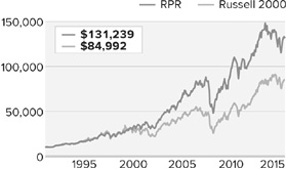
| Top 10 Positions | ||
| % of Net Assets | ||
| Copart | 3.0 | |
| Ritchie Bros. Auctioneers | 2.9 | |
| Cognex Corporation | 2.8 | |
| MKS Instruments | 2.8 | |
| Woodward | 2.6 | |
| Valmont Industries | 2.6 | |
| Alleghany Corporation | 2.6 | |
| Lincoln Electric Holdings | 2.6 | |
| Landstar System | 2.5 | |
| Federated Investors Cl. B | 2.5 | |
| Portfolio Sector Breakdown | ||
| % of Net Assets | ||
| Industrials | 33.9 | |
| Information Technology | 21.3 | |
| Financials | 15.5 | |
| Consumer Discretionary | 10.1 | |
| Materials | 6.9 | |
| Health Care | 4.9 | |
| Energy | 3.2 | |
| Consumer Staples | 1.9 | |
| Miscellaneous | 0.5 | |
| Cash and Cash Equivalents | 1.8 | |
| Calendar Year Total Returns (%) | ||
| YEAR | RPR | |
| 2015 | -9.9 | |
| 2014 | -0.9 | |
| 2013 | 27.7 | |
| 2012 | 11.4 | |
| 2011 | -0.9 | |
| 2010 | 26.5 | |
| 2009 | 33.3 | |
| 2008 | -28.3 | |
| 2007 | 12.7 | |
| 2006 | 8.8 | |
| 2005 | 17.1 | |
| 2004 | 22.8 | |
| 2003 | 38.7 | |
| 2002 | -7.8 | |
| 2001 | 9.6 | |
| Upside/Downside Capture Ratios | ||||
| Periods Ended 6/30/16 (%) | ||||
| UPSIDE | DOWNSIDE | |||
| 10-Year | 92 | 87 | ||
| From 12/31/91 (Start of Fund’s First Full Quarter) | 92 | 72 | ||
| Portfolio Diagnostics | ||
| Fund Net Assets | $2,245 million | |
| Number of Holdings | 60 | |
| Turnover Rate | 11% | |
| Average Market Capitalization1 | $2,901 million | |
| Weighted Average P/E Ratio2,3 | 20.2x | |
| Weighted Average P/B Ratio2 | 2.5x | |
| Active Share4 | 97% | |
| U.S. Investments (% of Net Assets) | 85.4% | |
| Non-U.S. Investments (% of Net Assets) | 12.8% | |
| 1 | Geometric Average. This weighted calculation uses each portfolio holding’s market cap in a way designed to not skew the effect of very large or small holdings; instead, it aims to better identify the portfolio’s center, which Royce believes offers a more accurate measure of average market cap than a simple mean or median. |
| 2 | Harmonic Average. This weighted calculation evaluates a portfolio as if it were a single stock and measures it overall. It compares the total market value of the portfolio to the portfolio’s share in the earnings or book value, as the case may be, of its underlying stocks. |
| 3 | The Fund’s P/E ratio calculation excludes companies with zero or negative earnings (6% of portfolio holdings as of 6/30/16). |
| 4 | Active Share is the sum of the absolute values of the different weightings of each holding in the Fund versus each holding in the benchmark, divided by two. |
| Important Performance and Expense Information All performance information in this Report reflects past performance, is presented on a total return basis, reflects the reinvestment of distributions, and does not reflect the deduction of taxes that a shareholder would pay on fund distributions or the redemption of fund shares. Past performance is no guarantee of future results. Investment return and principal value of an investment will fluctuate, so that shares may be worth more or less than their original cost when redeemed. Shares redeemed within 30 days of purchase may be subject to a 1% redemption fee payable to the Fund, which is not reflected in the performance shown above; if it were, performance would be lower. Current month-end performance may be higher or lower than performance quoted and may be obtained at www.roycefunds.com. All performance and risk information reflects results of the Investment Class (its oldest class). Operating expenses reflect the Fund’s total annual operating expenses for the Investment Class as of the Fund’s most current prospectus and include management fees and other expenses. Regarding the “Top Contributors” and “Top Detractors” tables shown above, the sum of all contributors to, and all detractors from, performance for all securities in the portfolio would approximate the Fund’s year-to-date performance for 2016. Upside Capture Ratio measures a manager’s performance in up markets relative to the Fund’s benchmark. It is calculated by measuring the Fund’s performance in quarters when the benchmark went up and dividing it by the benchmark’s return in those quarters. Downside Capture Ratio measures a manager’s performance in down markets relative to the Fund’s benchmark (Russell 2000). It is calculated by measuring the Fund’s performance in quarters when the benchmark goes down and dividing it by the benchmark’s return in those quarters. |
| The Royce Funds 2016 Semiannual Report to Shareholders | 31 |
| MANAGER’S DISCUSSION | ||
| Royce Small-Cap Leaders Fund (ROH) |
 |
| Lauren Romeo, CFA |
| FUND PERFORMANCE Royce Small-Cap Leaders Fund advanced 6.0% for the year-to-date period ended June 30, 2016, ahead of its small-cap benchmark, the Russell 2000 Index, which was up 2.2% for the same period. The Fund held up especially well during the first quarter when small-caps experienced long-awaited reversals in favor of companies with positive earnings, better balance sheets, and higher profitability, all of which fit well with the Fund’s strategy. Small-Cap Leaders gained 5.2% in the first quarter compared to a decline of 1.5% for the small-cap index. Late in the second quarter, the Brexit decision generated a quick surge of volatility for markets across the globe before the U.S. equity markets resumed their previously slow, steady pace of growth. The Fund was up 0.8% in the second quarter compared to 3.8% for the Russell 2000. We remain encouraged about the potential for the Fund’s quality-centric approach, which focuses on what we think are leading small-cap companies that have strong business models and competitive positions, superior balance sheets, and attractive prospects for growth. Small-Cap Leaders’ average annual total return for the since inception (6/30/03) period ended June 30, 2016 was 8.7%. |
| WHAT WORKED... AND WHAT DIDN’T |
| Industrials and Information Technology led seven of the Fund’s eight equity sectors that finished the first half in the black. Three industry groups posted notable net gains—electronic equipment, instruments & components, semiconductors & semiconductor equipment, both Information Technology areas, and thrifts & mortgage finance from Financials. That third industry is home to Genworth MI Canada, that country’s leading residential mortgage insurance provider. Its stock rebounded with consecutive quarters of strong results which were driven by a loss ratio that remains below the low end of its guidance. This has eased investor anxieties about the impact of lower oil prices in resource-rich Alberta, where about 20% of its policies are written. The recovery in oil prices also helped its shares to surge. Even with its recovery, the company was still recently priced below tangible book value and has a nearly 5% dividend yield. Other top performers included Minerals Technologies, a beneficiary of improved investor sentiment toward global industrials following the Russell 2000’s first-half low on February 11. The company continues to build a pipeline of exclusive deals to supply precipitated calcium carbonate to paper producers, primarily in China, while the recent pick-up in steel prices bodes well for its refractories sales. Management also continues to do an exceptional job managing costs and improving the profitability of several acquired businesses. Negative sentiment toward the end of 2015 weighed down the prices of trucking stocks, including less-than-truckload provider Saia, a top-10 holding. The company has subsequently delivered better-than-industry results thanks to its ongoing rate improvement and fleet management moves. Fabrinet is one of the few contract manufacturers focused exclusively on optical networking communications equipment. The company has reported excellent results as its key customers—telecomm service providers and data center operators—are upgrading their infrastructure with optical components to handle the explosive growth in Internet data traffic. Three asset managers headed the list of positions that detracted. Virtus Investment Partners had to cope with the departure of a key portfolio manager from one of its best-performing and asset-attracting funds. While no doubt a loss, the magnitude of outflows may prove less severe than the market has priced in. We think the portfolio at issue remains in highly capable hands—the right-hand man of the departed manager—along with a strong analytical team. We added shares in the first half. Both the downdraft early in 2016 and the Brexit-bred volatility in late June pressured the shares of Lazard as increased uncertainty about global growth slowed the pace of merger and acquisition activity that is one of its key specialties. Investors also seemed sensitive to the firm’s greater exposure to international and, more specifically, emerging market funds. The same waves of volatility hurt Artisan Partners Asset Management, stoking concerns about the impact on earnings of slower or negative net fund flows and reduced assets under management. We like each company’s long-term prospects. The Fund’s relative advantages versus the Russell 2000 included our significant underweight in Health Care and superior stock selection in that sector’s life sciences tools & sciences group. We were also helped by better stock picking in our two leading industries in Information Technology and the road & rail group in Industrials. Conversely, we were hurt in the first half by our much larger weighting in capital markets. Also hampering relative returns was our lack of exposure to REITs and the Utilities sector as these interest-rate sensitive stocks rallied as bond yields fell. |
| Top Contributors to Performance Year-to-Date Through 6/30/16 (%)1 | ||||
| Genworth MI Canada | 1.05 | |||
| Minerals Technologies | 0.70 | |||
| Saia | 0.65 | |||
| Fabrinet | 0.62 | |||
| Bio-Techne | 0.62 | |||
| 1 Includes dividends | ||||
| Top Detractors from Performance Year-to-Date Through 6/30/16 (%)2 | ||||
| Virtus Investment Partners | -1.13 | |||
| Lazard Cl. A | -0.87 | |||
| Artisan Partners Asset Management Cl. A | -0.60 | |||
| TrueBlue | -0.48 | |||
| Federal Signal | -0.42 | |||
| 2 Net of dividends | ||||
| CURRENT POSITIONING AND OUTLOOK |
| Portfolio positioning remains largely intact. We continue to see the greatest values in leading companies in cyclically sensitive areas, particularly those within the industrial part of the economy. Our largest sector weightings in Industrials and Information Technology reflect this view. Moreover, while the Fund rarely has holdings among REITs, Utilities, and Telecommunication Services stocks, with Treasury Bond yields at historic lows, we are very comfortable with the Fund’s lack of exposure here. |
| 32 | The Royce Funds 2016 Semiannual Report to Shareholders |
| PERFORMANCE AND PORTFOLIO REVIEW | TICKER SYMBOLS RYOHX ROHHX ROHRX ROHKX |
| Performance and Expenses | ||||||||||||
| Average Annual Total Return (%) Through 6/30/16 | ||||||||||||
| JAN-JUN 20161 | 1-YR | 3-YR | 5-YR | 10-YR | SINCE INCEPTION (6/30/03) | |||||||
| ROH | 5.96 | -7.18 | 2.01 | 3.04 | 5.61 | 8.67 | ||||||
| Annual Gross Operating Expenses: 1.54% Annual Net Operating Expenses: 1.49% | ||||||||||||
| 1 Not Annualized | ||||||||||||
Relative Returns: Monthly Rolling Average Annual Return Periods
| On a monthly rolling basis, the Fund outperformed the Russell 2000 in 68% of all 10-year periods; 63% of all 5-year periods; and 45% of all 1-year periods. |
| PERIODS BEATING THE INDEX | FUND AVG (%)1 | INDEX AVG (%)1 | |||||||||
| 10-year | 25/37 | 68% | 8.7 | 7.9 | |||||||
| 5-year | 61/97 | 63% | 7.9 | 6.9 | |||||||
| 1-year | 65/145 | 45% | 9.8 | 9.6 | |||||||

The Morningstar Style Map is the Morningstar Style Box™ with the center 75% of fund holdings plotted as the Morningstar Ownership Zone™. The Morningstar Style Box is designed to reveal a fund’s investment strategy. The Morningstar Ownership Zone provides detail about a portfolio’s investment style by showing the range of stock sizes and styles. The Ownership Zone is derived by plotting each stock in the portfolio within the proprietary Morningstar Style Box. Over time, the shape and location of a fund’s ownership zone may vary. See page 136 for additional information. |
Value of $10,000

| Top 10 Positions | ||
| % of Net Assets | ||
| Genworth MI Canada | 2.9 | |
| Marcus & Millichap | 2.9 | |
| Buckle (The) | 2.6 | |
| Saia | 2.6 | |
| Federated Investors Cl. B | 2.6 | |
| MKS Instruments | 2.5 | |
| Deckers Outdoor | 2.5 | |
| Gentex Corporation | 2.4 | |
| Bio-Techne | 2.4 | |
| j2 Global | 2.3 | |
| Portfolio Sector Breakdown | ||
| % of Net Assets | ||
| Industrials | 22.5 | |
| Information Technology | 21.3 | |
| Consumer Discretionary | 17.8 | |
| Financials | 14.5 | |
| Health Care | 6.2 | |
| Energy | 5.2 | |
| Consumer Staples | 4.1 | |
| Materials | 3.3 | |
| Cash and Cash Equivalents | 5.1 | |
| Calendar Year Total Returns (%) | ||
| YEAR | ROH | |
| 2015 | -12.5 | |
| 2014 | -3.3 | |
| 2013 | 30.9 | |
| 2012 | 11.5 | |
| 2011 | -6.5 | |
| 2010 | 24.8 | |
| 2009 | 38.0 | |
| 2008 | -29.2 | |
| 2007 | 7.3 | |
| 2006 | 13.7 | |
| 2005 | 14.9 | |
| 2004 | 27.2 | |
| Upside/Downside Capture Ratios | ||||
| Periods Ended 6/30/16 (%) | ||||
| UPSIDE | DOWNSIDE | |||
| 10-Year | 91 | 93 | ||
| From 6/30/03 (Start of Fund’s First Full Quarter) | 94 | 93 | ||
| Portfolio Diagnostics | ||
| Fund Net Assets | $96 million | |
| Number of Holdings | 73 | |
| Turnover Rate | 26% | |
| Average Market Capitalization1 | $1,602 million | |
| Weighted Average P/E Ratio2,3 | 15.8x | |
| Weighted Average P/B Ratio2 | 2.2x | |
| Active Share4 | 97% | |
| U.S. Investments (% of Net Assets) | 80.5% | |
| Non-U.S. Investments (% of Net Assets) | 14.4% | |
| 1 | Geometric Average. This weighted calculation uses each portfolio holding’s market cap in a way designed to not skew the effect of very large or small holdings; instead, it aims to better identify the portfolio’s center, which Royce believes offers a more accurate measure of average market cap than a simple mean or median. |
| 2 | Harmonic Average. This weighted calculation evaluates a portfolio as if it were a single stock and measures it overall. It compares the total market value of the portfolio to the portfolio’s share in the earnings or book value, as the case may be, of its underlying stocks. |
| 3 | The Fund’s P/E ratio calculation excludes companies with zero or negative earnings (7% of portfolio holdings as of 6/30/16). |
| 4 | Active Share is the sum of the absolute values of the different weightings of each holding in the Fund versus each holding in the benchmark, divided by two. |
| Important Performance and Expense Information All performance information in this Report reflects past performance, is presented on a total return basis, reflects the reinvestment of distributions, and does not reflect the deduction of taxes that a shareholder would pay on fund distributions or the redemption of fund shares. Past performance is no guarantee of future results. Investment return and principal value of an investment will fluctuate, so that shares may be worth more or less than their original cost when redeemed. Shares redeemed within 30 days of purchase may be subject to a 1% redemption fee payable to the Fund, which is not reflected in the performance shown above; if it were, performance would be lower. Current month-end performance may be higher or lower than performance quoted and may be obtained at www.roycefunds.com. All performance and risk information reflects results of the Service Class (its oldest class). Gross operating expenses reflect the Fund’s gross total annual operating expenses for the Service Class and include management fees, 12b-1 distribution and service fees, and other expenses. Net operating expenses reflect contractual fee waivers and/or expense reimbursements. All expense information is reported as of the Fund’s most current prospectus. Royce & Associates has contractually agreed to waive fees and/or reimburse operating expenses to the extent necessary to maintain the Service Class’s net annual operating expenses, (excluding brokerage commissions, taxes, interest, litigation expenses, acquired fund fees and expenses, and other expenses not borne in the ordinary course of business), at or below 1.49% through April 30, 2017. Regarding the “Top Contributors” and “Top Detractors” tables shown above, the sum of all contributors to, and all detractors from, performance for all securities in the portfolio would approximate the Fund’s year-to-date performance for 2016. Upside Capture Ratio measures a manager’s performance in up markets relative to the Fund’s benchmark. It is calculated by measuring the Fund’s performance in quarters when the benchmark went up and dividing it by the benchmark’s return in those quarters. Downside Capture Ratio measures a manager’s performance in down markets relative to the Fund’s benchmark (Russell 2000). It is calculated by measuring the Fund’s performance in quarters when the benchmark goes down and dividing it by the benchmark’s return in those quarters. |
| The Royce Funds 2016 Semiannual Report to Shareholders | 33 |
| MANAGER’S DISCUSSION | ||
| Royce Small-Cap Value Fund (RVV) |
 |
| Jay Kaplan, CFA |
| FUND PERFORMANCE Royce Small-Cap Value Fund was up 3.3% for the year-to-date period ended June 30, 2016, outpacing its small-cap benchmark, the Russell 2000 Index, which advanced 2.2% for the same period. Featuring a significant correction and increased volatility, the first quarter proved rewarding for strategies focused on valuation, profitability, and out-of-favor companies. Small-cap value cemented its leadership over small-cap growth, and the Fund handily outperformed its benchmark, up 9.3% versus a loss of 1.5%. The second quarter then reversed some—though by no means all—of this encouraging trend, as defensive areas such as REITs and utilities roared back (along with certain high-growth and cyclical areas) while small-cap retailers, where the portfolio was significantly overweight, suffered a major correction. The result was a loss of 5.5% for the Fund while the Russell 2000 came back with a 3.8% gain in the second quarter. So while we were pleased with first-half performance overall, the second quarter was a frustrating period. We were also pleased that the Fund beat the Russell 2000 for the 15-year and since inception (6/14/01) periods ended June 30, 2016. Royce Small-Cap Value’s average annual total return since inception was 9.1%. |
| WHAT WORKED... AND WHAT DIDN’T |
| Four of the Fund’s eight equity sectors made positive contributions to first-half performance. Information Technology made by far the biggest impact, more than doubling the net gain of Financials, the portfolio’s next-best performer. Consumer Staples also made a solid contribution. The electronic equipment, instruments & components group led all of the portfolio’s industry groups, thanks largely to terrific results for Fabrinet, which provides outsourced manufacturing to original equipment manufacturers of fiber optical communications and other components. The company has benefited from a vibrant cycle for fiber-driven telecommunications upgrades, most recently spurred by the growth of data centers and cloud computing. We reduced our position as its stock price climbed. One of 2015’s biggest detractors, Genworth MI Canada, saw some welcome recovery in the first half. A residential mortgage insurer, its shares often move with the direction of energy prices. Mortgage losses in energy-dominated western Canada proved to be not nearly as dire as many were anticipating, which helped to bring buyers back to its stock. We trimmed our stake in the first half, though we think its recovery is still in its early stages. Alamo Group has been executing very effectively, helping its shares to rise. The company makes heavy-duty tractor-mounted mowing and vegetation maintenance equipment and replacement parts for industrial and agricultural end-users. Its industrial and municipal businesses have been doing well—the budgets of many states, cities, and towns are stable or growing a bit—while its agricultural business has been sound on an absolute basis but strong in relation to its competitors. All of this helped to give it record-setting net sales and income in the fiscal first quarter. The business of Korn/Ferry International, which provides executive recruiting and other related services, decelerated amid concerns that the robust hiring cycle was turning and the uncertain global outlook in the wake of Brexit. We like its core business and believe its shares were oversold. Matrix Service is slotted in Energy, though we see it as more of an industrial engineering and construction company. Though it has a sizable exposure to energy that centers on large-scale construction projects, and often trades in tandem with oil and gas price sentiment, it also serves other industries. However, its shares mostly felt the effects of revised downward guidance issued in May and a series of write-offs the firm did for project overruns. We held our shares. Matrix has a strong backlog of business in infrastructure and physical plant projects that we think can create shareholder value in the months ahead. Relative to the Russell 2000, the Fund benefited most from effective stock selection in Information Technology and its underweight in biotechnology stocks. Stock picking was also a relative strength in thrifts & mortgage finance and food & staples retailing. Conversely, ineffective stock picks hurt in professional services (Industrials) and multiline retail while our lack of exposure to Utilities (a strong performer in the index) and our overweight in Consumer Discretionary also hampered relative results. |
| Top Contributors to Performance Year-to-Date Through 6/30/16 (%)1 | ||||
| Fabrinet | 0.94 | |||
| Genworth MI Canada | 0.93 | |||
| Alamo Group | 0.60 | |||
| Super Micro Computer | 0.50 | |||
| Fresh Market (The) | 0.48 | |||
| 1 Includes dividends | ||||
| Top Detractors from Performance Year-to-Date Through 6/30/16 (%)2 | ||||
| Matrix Service | -0.67 | |||
| Korn/Ferry International | -0.62 | |||
| Moelis & Company Cl. A | -0.51 | |||
| Express | -0.51 | |||
| Federal Signal | -0.49 | |||
| 2 Net of dividends | ||||
| CURRENT POSITIONING AND OUTLOOK |
| We believe there will continue to be higher volatility and low returns for stocks. Earnings growth will remain challenging. The U.S. economy continues to limp along while the strengthening U.S. dollar hurts exporters already facing heightened economic uncertainty in Europe. This helps to explain why the yield curve continues to flatten, with the 10-year Treasury making new lows—the bond market is not excited about the U.S. economy. Small-cap valuations no longer look cheap except in underperforming areas such as specialty retail in Consumer Discretionary, where we continue to invest and remained overweight at the end of June. We think the current low-expectation environment can create more long-term opportunities for our contrarian approach. It should therefore come as no surprise to our investors that our activities have centered on building our exposure to other out-of-favor areas such as professional services, road & rail (both in Industrials), and banks. |
| 34 | The Royce Funds 2016 Semiannual Report to Shareholders |
| PERFORMANCE AND PORTFOLIO REVIEW | TICKER SYMBOLS RYVFX RVVHX RVFIX RVFCX RVVRX RVFKX |
| Performance and Expenses | ||||||||||||||
| Average Annual Total Return (%) Through 6/30/16 | ||||||||||||||
| JAN-JUN 20161 | 1-YR | 3-YR | 5-YR | 10-YR | 15-YR | SINCE INCEPTION (6/14/01) | ||||||||
| RVV | 3.33 | -9.48 | 2.50 | 2.22 | 4.86 | 8.81 | 9.06 | |||||||
| Annual Operating Expenses: 1.48% | ||||||||||||||
| 1 Not Annualized | ||||||||||||||
Relative Returns: Monthly Rolling Average Annual Return Periods
| On a monthly rolling basis, the Fund outperformed the Russell 2000 in 72% of all 10-year periods; 63% of all 5-year periods; and 58% of all 1-year periods. |
| PERIODS BEATING THE INDEX | FUND AVG (%)1 | INDEX AVG (%)1 | |||||||||
| 10-year | 44/61 | 72% | 9.8 | 8.0 | |||||||
| 5-year | 76/121 | 63% | 10.0 | 8.2 | |||||||
| 1-year | 98/169 | 58% | 11.6 | 9.9 | |||||||
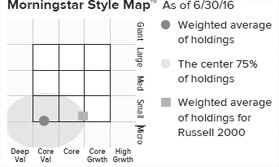
The Morningstar Style Map is the Morningstar Style Box™ with the center 75% of fund holdings plotted as the Morningstar Ownership Zone™. The Morningstar Style Box is designed to reveal a fund’s investment strategy. The Morningstar Ownership Zone provides detail about a portfolio’s investment style by showing the range of stock sizes and styles. The Ownership Zone is derived by plotting each stock in the portfolio within the proprietary Morningstar Style Box. Over time, the shape and location of a fund’s ownership zone may vary. See page 136 for additional information. |
Value of $10,000

| Top 10 Positions | ||
| % of Net Assets | ||
| Genworth MI Canada | 3.0 | |
| PC Connection | 3.0 | |
| Spirit Airlines | 2.9 | |
| Vishay Intertechnology | 2.8 | |
| Shoe Carnival | 2.8 | |
| Gentex Corporation | 2.6 | |
| TrustCo Bank Corp. NY | 2.6 | |
| Matrix Service | 2.6 | |
| Express | 2.5 | |
| Buckle (The) | 2.5 | |
| Portfolio Sector Breakdown | ||
| % of Net Assets | ||
| Consumer Discretionary | 29.5 | |
| Industrials | 19.0 | |
| Financials | 18.2 | |
| Information Technology | 15.4 | |
| Energy | 4.4 | |
| Consumer Staples | 2.5 | |
| Health Care | 2.2 | |
| Miscellaneous | 0.6 | |
| Cash and Cash Equivalents | 8.2 | |
| Calendar Year Total Returns (%) | ||
| YEAR | RVV | |
| 2015 | -11.5 | |
| 2014 | -0.0 | |
| 2013 | 27.8 | |
| 2012 | 9.6 | |
| 2011 | -7.4 | |
| 2010 | 25.0 | |
| 2009 | 44.7 | |
| 2008 | -34.2 | |
| 2007 | 3.8 | |
| 2006 | 16.8 | |
| 2005 | 17.2 | |
| 2004 | 30.9 | |
| 2003 | 54.3 | |
| 2002 | -23.5 | |
| Upside/Downside Capture Ratios | ||||
| Periods Ended 6/30/16 (%) | ||||
| UPSIDE | DOWNSIDE | |||
| 10-Year | 90 | 95 | ||
| From 6/30/01 (Start of Fund’s First Full Quarter) | 102 | 91 | ||
| Portfolio Diagnostics | ||
| Fund Net Assets | $477 million | |
| Number of Holdings | 64 | |
| Turnover Rate | 27% | |
| Average Market Capitalization1 | $1,126 million | |
| Weighted Average P/E Ratio2,3 | 14.0x | |
| Weighted Average P/B Ratio2 | 1.6x | |
| Active Share4 | 97% | |
| U.S. Investments (% of Net Assets) | 88.2% | |
| Non-U.S. Investments (% of Net Assets) | 3.6% | |
| 1 | Geometric Average. This weighted calculation uses each portfolio holding’s market cap in a way designed to not skew the effect of very large or small holdings; instead, it aims to better identify the portfolio’s center, which Royce believes offers a more accurate measure of average market cap than a simple mean or median. |
| 2 | Harmonic Average. This weighted calculation evaluates a portfolio as if it were a single stock and measures it overall. It compares the total market value of the portfolio to the portfolio’s share in the earnings or book value, as the case may be, of its underlying stocks. |
| 3 | The Fund’s P/E ratio calculation excludes companies with zero or negative earnings (4% of portfolio holdings as of 6/30/16). |
| 4 | Active Share is the sum of the absolute values of the different weightings of each holding in the Fund versus each holding in the benchmark, divided by two. |
| Important Performance and Expense Information All performance information in this Report reflects past performance, is presented on a total return basis, reflects the reinvestment of distributions, and does not reflect the deduction of taxes that a shareholder would pay on fund distributions or the redemption of fund shares. Past performance is no guarantee of future results. Investment return and principal value of an investment will fluctuate, so that shares may be worth more or less than their original cost when redeemed. Shares redeemed within 30 days of purchase may be subject to a 1% redemption fee payable to the Fund, which is not reflected in the performance shown above; if it were, performance would be lower. Current month-end performance may be higher or lower than performance quoted and may be obtained at www.roycefunds.com. All performance and risk information reflects results of the Service Class (its oldest class). Certain immaterial adjustments were made to the net assets of Royce Small-Cap Value Fund at 6/30/16 for financial reporting purposes, and as a result the net asset values for shareholder transactions on that date and the calendar year Total Returns (%) based on those net asset values differ from the adjusted net asset values and calendar year total returns reported in the Financial Highlights. Operating expenses reflect the Fund’s total annual operating expenses for the Service Class as of the Fund’s most current prospectus and include management fees, 12b-1 distribution and service fees, and other expenses. Regarding the “Top Contributors” and “Top Detractors” tables shown above, the sum of all contributors to, and all detractors from, performance for all securities in the portfolio would approximate the Fund’s year-to-date performance for 2016. Upside Capture Ratio measures a manager’s performance in up markets relative to the Fund’s benchmark. It is calculated by measuring the Fund’s performance in quarters when the benchmark went up and dividing it by the benchmark’s return in those quarters. Downside Capture Ratio measures a manager’s performance in down markets relative to the Fund’s benchmark (Russell 2000). It is calculated by measuring the Fund’s performance in quarters when the benchmark goes down and dividing it by the benchmark’s return in those quarters. |
| The Royce Funds 2016 Semiannual Report to Shareholders | 35 |
| MANAGERS’ DISCUSSION | ||
| Royce Smaller–Companies Growth Fund (RVP) |
 |
| Chip Skinner, CFA Carl Brown |
| FUND PERFORMANCE Royce Smaller-Companies Growth Fund was down 3.5% for the year-to-date period ended June 30, 2016, trailing its small-cap benchmark, the Russell 2000 Index, which was up 2.2% for the same period. Steep corrections for biotechnology and other growth industries where the Fund typically invests impacted small-caps earlier this year. The Fund was behind its benchmark in the first quarter, down 4.4% versus a decline of 1.5%. Less expected, and therefore more frustrating, was the Fund’s less robust participation in the mildly bullish, wildly volatile second quarter. The period saw comebacks for REITs, utilities, and other defensive areas while it also featured rebounds for certain high-growth stocks and continued strength for a discrete selection of cyclical businesses. The choppy nature of returns definitely created challenges for our GARP (“growth at a reasonable price”) approach. For the second quarter, the Fund advanced 0.9% compared to a 3.8% gain for the Russell 2000. We were more pleased with longer-term results. Royce Smaller-Companies Growth outperformed its benchmark for the 15-year and since inception (6/14/01) periods ended June 30, 2016. The Fund’s average annual total return since inception was 10.5%. |
| WHAT WORKED… AND WHAT DIDN’T |
| Five of the Fund’s nine equity sectors were in the red at the end of the first half. The most significant net losses came from the Health Care and Information Technology sectors. Two industry groups within Health Care were the portfolio’s biggest detractors in the first half—biotechnology and pharmaceuticals, both of which corrected sharply. Each industry was also home to one of the Fund’s loss leaders at the position level. Lipocine is an early stage pharmaceuticals company whose shares declined markedly after it failed to receive FDA approval for its lead product candidate, an oral testosterone replacement therapy. We sold our position while awaiting more clarity on any potential progress with the FDA before potentially revisiting the stock. Zealand Pharma is a Danish biotechnology company whose share price decline was mostly driven by the sell-off in its industry. While we remain optimistic about its long-term growth potential, based in part on the company’s partnership with Sanofi in developing a diabetes drug, we reduced our position based on the risks associated with Zealand’s increasing dependence on this partnership. |
| The Container Store Group posted the largest net loss at the position level in the first half. We were once confident that the company, a retailer of storage and organizational products, could benefit from its store expansion efforts in an economy with improving employment numbers, confident consumers, low energy prices, and higher levels of new household formation. We sold our position, however, when it became clear to us that management was struggling to make good on this potential in the face of weakening store traffic and the need for a more effective online presence. SPS Commerce, the biggest detractor in Information Technology, makes cloud-based supply chain management software. A solid contributor in 2015, the company warned of a disappointing revenue outlook for 2016, causing its shares to plummet. We sold our position in March and April. |
| On the positive side, the Fund’s top-contributing position was ORBCOMM, which operates low earth orbit satellites and ground infrastructure that facilitate mobile and other communications. We were pleased to see a successful satellite launch late in 2015, along with solid growth in its business. We reduced our position as its price rose in the first half. A rising share price also led us to trim our shares of Mercury Systems, which over the last few years has grown into more of a pure play in the defense technology area. The company makes real-time digital signal processors that can transform sensor-generated data into information which can be displayed as images for human interpretation and analysis. Rising revenues and earnings helped attract more interest in its stock. |
| Relative to the Russell 2000, the Fund was hurt most by ineffective stock picking in Information Technology, with the Internet software & services group and software industry making the biggest negative impact. Financials also hampered relative performance by way of an overweight in capital markets and an underweight in REITs. Conversely, stock picking was a strength in Industrials, Materials, and Energy. |
| Top Contributors to Performance Year-to-Date Through 6/30/16 (%)1 | ||||
| ORBCOMM | 0.67 | |||
| Mercury Systems | 0.66 | |||
| BioTelemetry | 0.58 | |||
| Albemarle Corporation | 0.51 | |||
| PowerSecure International | 0.49 | |||
| 1 Includes dividends | ||||
| Top Detractors from Performance Year-to-Date Through 6/30/16 (%)2 | ||||
| Container Store Group (The) | -0.94 | |||
| Lipocine | -0.74 | |||
| SPS Commerce | -0.68 | |||
| Zealand Pharma | -0.59 | |||
| comScore | -0.58 | |||
| 2 Net of dividends | ||||
| CURRENT POSITIONING AND OUTLOOK |
| We are more cautious than we have been in some time as we face a number of geopolitical risks, all made more acute by the Brexit vote—Europe is uncertain, China’s banking system looks very weak, and Russia continues to rattle its saber. Here in the U.S., the economy is bobbing up and down at the 1-2% level, the Fed is out of stimulative policy ammunition, and the electorate is showing increasing signs of anger and frustration with the political and corporate status quo. In addition, valuations for many growth issues looked stretched to us at the end of June. However, offsetting these concerns to some extent are the following: we also have the globe’s steadiest banking system, are seen as a safe haven for investment and, even at its slow pace, a growing economy. During the first half, we increased our weighting in Energy, believing that commodity prices have bottomed, and added to select positions in Health Care and software. In spite of our near-term concerns, we believe that identifying fast-growing, reasonably priced smaller companies can reward investors over the long term. |
| 36 | The Royce Funds 2016 Semiannual Report to Shareholders |
| PERFORMANCE AND PORTFOLIO REVIEW | TICKER SYMBOLS RYVPX RVPHX RVPCX RVPIX RVPRX RVPKX |
| Performance and Expenses | ||||||||||||||
| Average Annual Total Return (%) Through 6/30/16 | ||||||||||||||
| JAN-JUN 20161 | 1-YR | 3-YR | 5-YR | 10-YR | 15-YR | SINCE INCEPTION (6/14/01) | ||||||||
| RVP | -3.48 | -13.00 | 5.10 | 5.39 | 4.35 | 10.15 | 10.51 | |||||||
| Annual Operating Expenses: 1.48% | ||||||||||||||
| 1 Not Annualized | ||||||||||||||
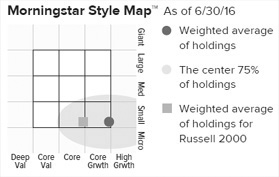
The Morningstar Style Map is the Morningstar Style Box™ with the center 75% of fund holdings plotted as the Morningstar Ownership Zone™. The Morningstar Style Box is designed to reveal a fund’s investment strategy. The Morningstar Ownership Zone provides detail about a portfolio’s investment style by showing the range of stock sizes and styles. The Ownership Zone is derived by plotting each stock in the portfolio within the proprietary Morningstar Style Box. Over time, the shape and location of a fund’s ownership zone may vary. See page 136 for additional information. |
Value of $10,000

| Top 10 Positions | ||
| % of Net Assets | ||
| Paylocity Holding Corporation | 2.4 | |
| Mercury Systems | 2.0 | |
| Inogen | 1.7 | |
| Orocobre | 1.7 | |
| Enterprise Financial Services | 1.6 | |
| BioTelemetry | 1.6 | |
| Carter’s | 1.6 | |
| Texas Roadhouse | 1.6 | |
| Albemarle Corporation | 1.6 | |
| Cambrex Corporation | 1.5 | |
| Portfolio Sector Breakdown | ||
| % of Net Assets | ||
| Information Technology | 23.7 | |
| Health Care | 14.6 | |
| Industrials | 12.0 | |
| Consumer Discretionary | 11.8 | |
| Financials | 10.5 | |
| Energy | 6.7 | |
| Materials | 4.5 | |
| Consumer Staples | 2.4 | |
| Telecommunication Services | 1.2 | |
| Miscellaneous | 4.5 | |
| Cash and Cash Equivalents | 8.1 | |
| Calendar Year Total Returns (%) | ||
| YEAR | RVP | |
| 2015 | -1.8 | |
| 2014 | 3.9 | |
| 2013 | 32.5 | |
| 2012 | 15.3 | |
| 2011 | -10.0 | |
| 2010 | 19.7 | |
| 2009 | 41.4 | |
| 2008 | -41.1 | |
| 2007 | 3.2 | |
| 2006 | 19.3 | |
| 2005 | 13.2 | |
| 2004 | 28.2 | |
| 2003 | 79.9 | |
| 2002 | -14.7 | |
| Upside/Downside Capture Ratios | ||||
| Periods Ended 6/30/16 (%) | ||||
| UPSIDE | DOWNSIDE | |||
| 10-Year | 96 | 107 | ||
| From 6/30/01 (Start of Fund’s First Full Quarter) | 115 | 100 | ||
| Portfolio Diagnostics | ||
| Fund Net Assets | $489 million | |
| Number of Holdings | 98 | |
| Turnover Rate | 34% | |
| Average Market Capitalization1 | $1,286 million | |
| Weighted Average P/B Ratio2 | 2.9x | |
| 3-5 Year EPS Growth (est.)3 | 18.7% | |
| Active Share4 | 96% | |
| U.S. Investments (% of Net Assets) | 80.0% | |
| Non-U.S. Investments (% of Net Assets) | 11.9% | |
| 1 | Geometric Average. This weighted calculation uses each portfolio holding’s market cap in a way designed to not skew the effect of very large or small holdings; instead, it aims to better identify the portfolio’s center, which Royce believes offers a more accurate measure of average market cap than a simple mean or median. |
| 2 | Harmonic Average. This weighted calculation evaluates a portfolio as if it were a single stock and measures it overall. It compares the total market value of the portfolio to the portfolio’s share in the earnings or book value, as the case may be, of its underlying stocks. |
| 3 | The 3-5 Year EPS Growth (est.) is calculated as a simple weighted average of the pre-calculated mean long-term EPS growth rate estimates by brokerage analysts. Long Term Growth (LTG) is the annual EPS growth that the company can sustain over the next 3 or 5 years. Source: Factset |
| 4 | Active Share is the sum of the absolute values of the different weightings of each holding in the Fund versus each holding in the benchmark, divided by two. |
| Important Performance and Expense Information All performance information in this Report reflects past performance, is presented on a total return basis, reflects the reinvestment of distributions, and does not reflect the deduction of taxes that a shareholder would pay on fund distributions or the redemption of fund shares. Past performance is no guarantee of future results. Investment return and principal value of an investment will fluctuate, so that shares may be worth more or less than their original cost when redeemed. Shares redeemed within 30 days of purchase may be subject to a 1% redemption fee payable to the Fund, which is not reflected in the performance shown above; if it were, performance would be lower. Current month-end performance may be higher or lower than performance quoted and may be obtained at www.roycefunds.com. All performance and risk information reflects results of the Service Class (its oldest class). Operating expenses reflect the Fund’s total annual operating expenses for the Service Class as of the Fund’s most current prospectus and include management fees, 12b-1 distribution and service fees, other expenses, and acquired fund fees and expenses. Acquired fund fees and expenses reflect the estimated amount of fees and expenses incurred indirectly by the Fund through its investments in mutual funds, hedge funds, private equity funds, and other investment companies. Regarding the “Top Contributors” and “Top Detractors” tables shown above, the sum of all contributors to, and all detractors from, performance for all securities in the portfolio would approximate the Fund’s year-to-date performance for 2016. Upside Capture Ratio measures a manager’s performance in up markets relative to the Fund’s benchmark. It is calculated by measuring the Fund’s performance in quarters when the benchmark went up and dividing it by the benchmark’s return in those quarters. Downside Capture Ratio measures a manager’s performance in down markets relative to the Fund’s benchmark (Russell 2000). It is calculated by measuring the Fund’s performance in quarters when the benchmark goes down and dividing it by the benchmark’s return in those quarters. |
| The Royce Funds 2016 Semiannual Report to Shareholders | 37 |
| MANAGERS’ DISCUSSION | ||
| Royce Special Equity Fund (RSE) |
 |
| Charlie Dreifus, CFA Steven McBoyle, CPA, CA |
| FUND PERFORMANCE Royce Special Equity Fund gained 8.3% for the year-to-date period ended June 30, 2016, more than tripling the 2.2% return for its benchmark, the Russell 2000 Index, for the same period. The small-cap shift from growth to value benefited companies with earnings, higher ROE (return on equity), and dividends in the first quarter. This reversal was both welcome and, in our estimation, long overdue. We were pleased to see the Fund substantially outperform its benchmark in the year’s opening quarter, climbing 5.6% versus a loss of 1.5% for its benchmark. The second quarter saw some of these trends stall or reverse, with most of the market’s strength coming from REITs, Utilities, and Consumer Staples, as well as low ROE, highly levered, and/or high sales growth companies—not the kind of businesses typically found in the portfolio. Still, Special Equity posted a modest positive return in the second quarter, advancing 2.5% compared to 3.8% for the Russell 2000. We were very pleased with Special Equity’s strong first half on both an absolute and relative basis and were also happy to see the Fund maintain longer-term relative advantages. The Fund beat the Russell 2000 for the one-, 10-, 15-year, and since inception (5/01/98) periods ended June 30, 2016. Special Equity’s average annual total return since inception was 8.6%. |
| WHAT WORKED… AND WHAT DIDN’T |
| Five of the Fund’s six equity sectors posted net gains in the first half. Consumer Discretionary led by a sizable margin, followed by a strong contribution for Industrials. Materials, Consumer Staples, and Information Technology rounded out the list while Financials, the portfolio’s lone detractor, posted comparatively minor net losses. The Consumer Discretionary sector was home to both our two top-performing industry groups—specialty retail and media—as well as household durables, its biggest detractor. The commercial services & supplies (Industrials), paper & forest products (Materials), and electronic equipment, instruments & components (Information Technology) groups also did well in the first half, while other groups with net losses, such as semiconductors & semiconductor equipment (Information Technology) and capital markets (Financials), made a much smaller impact. |
| The Fund’s top performing contributor by a wide margin was The Children’s Place, which retails value-priced apparel and accessories for newborn to 12-year-old children. Meredith Corporation, an Iowa-based diversified media company involved mainly in publishing and broadcasting, also made a strong contribution, as did South Carolina’s AVX Corporation, which manufactures passive electronic components and related products. UniFirst Corporation provides workplace uniforms and protective clothing while Neenah Paper is a global manufacturer of performance-based papers and specialty products used in a variety of applications. |
| As for those positions that detracted, Hooker Furniture and Haverty Furniture sell home furnishings; we added shares of each in the first half. We chose to sell our shares of Minerals Technologies, which provides specialty chemicals, early in 2016. We also parted ways with housewares retailer Bed, Bath & Beyond (along with retailers The Buckle and The Finish Line) while making a modest trim to our position in Teradyne, which makes semiconductor test products and provides related services primarily for the military and aerospace industries. |
| Relative to the Russell 2000, the Fund’s strengths were significantly better stock picking in Consumer Discretionary, an underweight in Health Care, effective stock picks in Materials, and an overweight and strong stock selection in Industrials. Conversely, we were hurt by having no exposure to Utilities and, within Financials, REITs—both of these interest-rate sensitive areas did well when bond yields fell. |
| Top Contributors to Performance Year-to-Date Through 6/30/16 (%)1 | ||||
| Children’s Place | 1.93 | |||
| Meredith Corporation | 1.11 | |||
| AVX Corporation | 0.92 | |||
| UniFirst Corporation | 0.86 | |||
| Neenah Paper | 0.77 | |||
| 1 Includes dividends | ||||
| Top Detractors from Performance Year-to-Date Through 6/30/16 (%)2 | ||||
| Hooker Furniture | -0.39 | |||
| Haverty Furniture | -0.27 | |||
| Minerals Technologies | -0.24 | |||
| Bed Bath & Beyond | -0.22 | |||
| Teradyne | -0.18 | |||
| 2 Net of dividends | ||||
| CURRENT POSITIONING AND OUTLOOK |
| In the wake of Brexit, we see interest rates staying low longer and think investors will continue to favor stocks that look like bonds (based on yield and dividend growth) and/or possess attributes that remain scarce, such as stability, free cash flow generation, and good revenue profiles. Clearly, as always, uncertainty and fear allow for opportunistic purchases, and we intend to make our share. However, we also remain mindful that the overall market is subject to additional Black Swan events, in Japan and China especially, and stocks are far from inexpensive, except perhaps in comparison to sovereign alternatives. Small-caps, of course, are generally more U.S.-centric and therefore less exposed to the global economy. In this environment, we have seen opportunities in a number of cyclical sectors. Three of the Fund’s four largest at the end of June—Consumer Discretionary, Industrials, and Materials—were also substantially overweighted versus the Russell 2000. The exception was Information Technology, where our good-sized exposure was nonetheless lower than that of the benchmark. |
| In this era of unknown unknowns, unprecedented events, and obviously heightened uncertainty, we strongly believe our contrarian, skeptical view of things can be beneficial. We see year-over-year dividend growth as a strong signal of managements’ outlook in a slow-growth world. Obviously, the increases have to be internally funded. Total return and the importance of compounding remain critical in generating strong long-term results. To try to achieve this, we use a low volatility strategy. |
| 38 | The Royce Funds 2016 Semiannual Report to Shareholders |
| PERFORMANCE AND PORTFOLIO REVIEW | TICKER SYMBOLS RYSEX RSEFX RSEIX RSQCX |
| Performance and Expenses | ||||||||||||||
| Average Annual Total Return (%) Through 6/30/16 | ||||||||||||||
| JAN-JUN 20161 | 1-YR | 3-YR | 5-YR | 10-YR | 15-YR | SINCE INCEPTION (5/1/98) | ||||||||
| RSE | 8.31 | -4.58 | 3.36 | 6.81 | 7.24 | 9.46 | 8.62 | |||||||
| Annual Operating Expenses: 1.15% | ||||||||||||||
| 1 Not Annualized | ||||||||||||||
Relative Risk Adjusted Returns: Monthly Rolling Sharpe Ratios
| On a monthly rolling risk-adjusted basis, the Fund outperformed the Russell 2000 in 100% of all 10-year periods and 80% of all 5-year periods. |
| PERIODS BEATING THE INDEX | FUND AVG (%)1 | INDEX AVG (%)1 | |||||||||
| 10-year | 98/98 | 100% | 0.55 | 0.32 | |||||||
| 5-year | 126/158 | 80% | 0.68 | 0.42 | |||||||

The Morningstar Style Map is the Morningstar Style Box™ with the center 75% of fund holdings plotted as the Morningstar Ownership Zone™. The Morningstar Style Box is designed to reveal a fund’s investment strategy. The Morningstar Ownership Zone provides detail about a portfolio’s investment style by showing the range of stock sizes and styles. The Ownership Zone is derived by plotting each stock in the portfolio within the proprietary Morningstar Style Box. Over time, the shape and location of a fund’s ownership zone may vary. See page 136 for additional information. |
Value of $10,000

| Top 10 Positions | ||
| % of Net Assets | ||
| UniFirst Corporation | 7.1 | |
| AVX Corporation | 6.8 | |
| Meredith Corporation | 5.3 | |
| Standard Motor Products | 5.1 | |
| Neenah Paper | 4.8 | |
| Scholastic Corporation | 4.6 | |
| Hubbell Cl. B | 4.3 | |
| Weis Markets | 4.0 | |
| Children’s Place | 3.9 | |
| Teradyne | 3.5 | |
| Portfolio Sector Breakdown | ||
| % of Net Assets | ||
| Consumer Discretionary | 34.1 | |
| Industrials | 25.6 | |
| Information Technology | 15.0 | |
| Materials | 10.9 | |
| Consumer Staples | 4.2 | |
| Financials | 1.4 | |
| Cash and Cash Equivalents | 8.8 | |
| Calendar Year Total Returns (%) | ||
| YEAR | RSE | |
| 2015 | -12.4 | |
| 2014 | 1.1 | |
| 2013 | 29.4 | |
| 2012 | 15.4 | |
| 2011 | 0.1 | |
| 2010 | 19.6 | |
| 2009 | 28.4 | |
| 2008 | -19.6 | |
| 2007 | 4.7 | |
| 2006 | 14.0 | |
| 2005 | -1.0 | |
| 2004 | 13.9 | |
| 2003 | 27.6 | |
| 2002 | 15.3 | |
| 2001 | 30.7 | |
| Upside/Downside Capture Ratios | ||||
| Periods Ended 6/30/16 (%) | ||||
| UPSIDE | DOWNSIDE | |||
| 10-Year | 79 | 64 | ||
| From 6/30/98 (Start of Fund’s First Full Quarter) | 72 | 48 | ||
| Portfolio Diagnostics | ||
| Fund Net Assets | $1,445 million | |
| Number of Holdings | 41 | |
| Turnover Rate | 17% | |
| Average Market Capitalization1 | $1,233 million | |
| Weighted Average P/E Ratio2,3 | 16.1x | |
| Weighted Average P/B Ratio2 | 1.8x | |
| Active Share4 | 98% | |
| U.S. Investments (% of Net Assets) | 91.2% | |
| Non-U.S. Investments (% of Net Assets) | 0.0% | |
| 1 | Geometric Average. This weighted calculation uses each portfolio holding’s market cap in a way designed to not skew the effect of very large or small holdings; instead, it aims to better identify the portfolio’s center, which Royce believes offers a more accurate measure of average market cap than a simple mean or median. |
| 2 | Harmonic Average. This weighted calculation evaluates a portfolio as if it were a single stock and measures it overall. It compares the total market value of the portfolio to the portfolio’s share in the earnings or book value, as the case may be, of its underlying stocks. |
| 3 | The Fund’s P/E ratio calculation excludes companies with zero or negative earnings (4% of portfolio holdings as of 6/30/16). |
| 4 | Active Share is the sum of the absolute values of the different weightings of each holding in the Fund versus each holding in the benchmark, divided by two. |
| Important Performance and Expense Information All performance information in this Report reflects past performance, is presented on a total return basis, reflects the reinvestment of distributions, and does not reflect the deduction of taxes that a shareholder would pay on fund distributions or the redemption of fund shares. Past performance is no guarantee of future results. Investment return and principal value of an investment will fluctuate, so that shares may be worth more or less than their original cost when redeemed. Shares redeemed within 30 days of purchase may be subject to a 1% redemption fee payable to the Fund, which is not reflected in the performance shown above; if it were, performance would be lower. Current month-end performance may be higher or lower than performance quoted and may be obtained at www.roycefunds.com. All performance and risk information reflects results of the Investment Class (its oldest class). Operating expenses reflect the Fund’s total annual operating expenses for the Investment Class as of the Fund’s most current prospectus and include management fees and other expenses. The Sharpe Ratio is calculated for a specified period by dividing a fund’s annualized excess returns by its annualized standard deviation. The higher the Sharpe ratio, the better the fund’s historical risk-adjusted performance. Regarding the “Top Contributors” and “Top Detractors” tables shown above, the sum of all contributors to, and all detractors from, performance for all securities in the portfolio would approximate the Fund’s year-to-date performance for 2016. Upside Capture Ratio measures a manager’s performance in up markets relative to the Fund’s benchmark. It is calculated by measuring the Fund’s performance in quarters when the benchmark went up and dividing it by the benchmark’s return in those quarters. Downside Capture Ratio measures a manager’s performance in down markets relative to the Fund’s benchmark (Russell 2000). It is calculated by measuring the Fund’s performance in quarters when the benchmark goes down and dividing it by the benchmark’s return in those quarters. |
| The Royce Funds 2016 Semiannual Report to Shareholders | 39 |
| MANAGERS’ DISCUSSION | ||
| Royce Special Equity Multi-Cap Fund (RSM) |
 |
| Charlie Dreifus, CFA Steven McBoyle, CPA, CA |
| FUND PERFORMANCE Royce Special Equity Multi-Cap Fund’s highly concentrated portfolio was down 0.5% for the year-to-date period ended June 30, 2016, trailing its large-cap benchmark, the Russell 1000 Index, which was up 3.7% for the same period. Our frustration was rooted not only in underperformance but also in the way in which the semiannual period played out. The first quarter saw investors begin to focus on the kind of attributes we seek—low leverage, high ROIC (returns on invested capital), and strong cash flows. This was a long overdue development in our view, and we were pleased to see the Fund outpace its benchmark for the quarter, advancing 6.1% versus 1.2% for the Russell 1000. Unfortunately, much of this reversed in the second quarter, which, along with a steep correction for retailers, combined to undo all of the first quarter’s gains, and then some. Most of the market’s strength came from REITs, Utilities, and Consumer Staples, as well as from low ROE (return on equity), highly levered, and/or high sales growth companies—not the kind of businesses typically found in the portfolio. For the second quarter, the Fund fell 6.2% while the large-cap index increased 2.5%. The Fund’s average annual total return since inception (12/31/10) was 8.1%. |
| WHAT WORKED… AND WHAT DIDN’T |
| The bulk of the portfolio’s performance in the first half came from Industrials, which posted net gains more than five times greater than those in Financials, its second-best performing sector. Four of the six top-contributing industry groups came from Industrials. Machinery led by a substantial margin, boosted by strong results for Illinois Tool Works, which produces industrial fluids and adhesives, tooling for specialty applications, welding products, and measurement equipment and systems. Parker Hannifin, a maker of motion control products, also enjoyed a strong first half. From the trading companies & distributors group, W.W. Grainger distributes motors, HVAC equipment, lighting, hand and power tools, pumps, and electrical equipment. For all the strength exhibited from Industrials, the portfolio’s two biggest contributors were Consumer Discretionary holdings. Genuine Parts distributes automotive and industrial replacement parts, office products, and electrical and electronic materials. Sporting goods retailer Dicks Sporting Goods operates stores primarily in the eastern and central U.S. selling a broad selection of brand name sporting goods equipment, apparel, and footwear. |
| Both Industrials and Consumer Discretionary were also home to the portfolio’s largest detractors. Staffing and workforce solutions specialist ManpowerGroup saw its shares plummet in the wake of Brexit, mostly due to the company’s significant exposure to the European labor market. Robert Half International is in a similar business; it provides temporary and permanent staffing for several professions, including accounting and finance, information technology, advertising, and legal. Many specialty and multiline retailers endured a very challenging second quarter, and core holding Nordstrom, a fashion retailer of apparel, shoes, and accessories for men, women, and children, was no exception. Lear Corporation makes automobile parts, including seating systems, wiring harnesses, and body control electronics. Ralph Lauren designs and distributes men’s, women’s and children’s apparel, accessories, fragrances, and home furnishings. |
| Hurting relative results in the first half were ineffective stock selection in Industrials, a combination of our overweight and poor stock selection in Consumer Discretionary, and our lack of exposure to Consumer Staples, Utilities, Energy, and Telecommunication Services. Conversely, our lack of exposure to Health Care helped, as did our underweight and, to a lesser extent, stock picking in Financials. |
| Top Contributors to Performance Year-to-Date Through 6/30/16 (%)1 | ||||
| Genuine Parts | 1.24 | |||
| Dicks Sporting Goods | 0.95 | |||
| Illinois Tool Works | 0.69 | |||
| Grainger (W.W.) | 0.46 | |||
| Parker Hannifin | 0.46 | |||
| 1 Includes dividends | ||||
| Top Detractors from Performance Year-to-Date Through 6/30/16 (%)2 | ||||
| ManpowerGroup | -1.65 | |||
| Nordstrom | -1.32 | |||
| Lear Corporation | -0.90 | |||
| Robert Half International | -0.69 | |||
| Ralph Lauren Cl. A | -0.57 | |||
| 2 Net of dividends | ||||
| CURRENT POSITIONING AND OUTLOOK |
| In the wake of Brexit, we see interest rates staying low longer and think investors will continue to favor stocks that look like bonds (based on yield and dividend growth) and/or possess attributes that remain scarce, such as stability, free cash flow generation, and good revenue profiles. Clearly, as always, uncertainty and fear allow for opportunistic purchases, and we intend to make our share. However, we also remain mindful that the overall market is subject to additional Black Swan events, in Japan and China especially, and stocks are far from inexpensive, except perhaps in comparison to sovereign alternatives. In this environment, the Fund’s two largest sectors at the end of June—Industrials and Consumer Discretionary—were also significantly overweighted compared to the Russell 1000. We also had a good-sized exposure to Information Technology, though the portfolio’s exposure was lower than that of its benchmark. We held no positions in Consumer Staples, Energy, Health Care, Materials, Telecommunication Services, or Utilities and had only modest exposure to Financials. |
| In this era of unknown unknowns, unprecedented events, and obviously heightened uncertainty, we strongly believe our contrarian, skeptical view of things can be beneficial. We see year-over-year dividend growth as a strong signal of managements’ outlook in a slow-growth world. Obviously, the increases have to be internally funded. Yield and total return, along with the importance of compounding, remain critical to generating solid long-term results. To do this, one needs to avoid the free fall and seek low volatility strategies. |
| 40 | The Royce Funds 2016 Semiannual Report to Shareholders |
| PERFORMANCE AND PORTFOLIO REVIEW | TICKER SYMBOLS RSEMX RSMCX RMUIX RSMLX |
| Performance and Expenses | ||||||||||||||
| Average Annual Total Return (%) Through 6/30/16 | ||||||||||||||
| JAN-JUN 20161 | 1-YR | 3-YR | 5-YR | SINCE INCEPTION (12/31/10) | ||||||||||
| RSM | -0.48 | -11.27 | 2.80 | 7.29 | 8.06 | |||||||||
| Annual Gross Operating Expenses: 1.29% Annual Net Operating Expenses: 1.24% | ||||||||||||||
| 1 Not Annualized | ||||||||||||||

The Morningstar Style Map is the Morningstar Style Box™ with the center 75% of fund holdings plotted as the Morningstar Ownership Zone™. The Morningstar Style Box is designed to reveal a fund’s investment strategy. The Morningstar Ownership Zone provides detail about a portfolio’s investment style by showing the range of stock sizes and styles. The Ownership Zone is derived by plotting each stock in the portfolio within the proprietary Morningstar Style Box. Over time, the shape and location of a fund’s ownership zone may vary. See page 136 for additional information. |
Value of $10,000
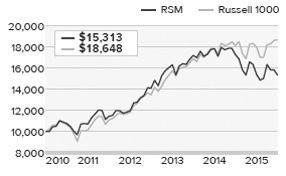
| Top 10 Positions | ||
| % of Net Assets | ||
| Genuine Parts | 7.5 | |
| Apple | 7.3 | |
| Illinois Tool Works | 6.1 | |
| ManpowerGroup | 5.8 | |
| Robert Half International | 5.6 | |
| Nordstrom | 5.1 | |
| T. Rowe Price Group | 4.9 | |
| Cisco Systems | 4.8 | |
| Dicks Sporting Goods | 4.6 | |
| Parker Hannifin | 4.6 | |
| Portfolio Sector Breakdown | ||
| % of Net Assets | ||
| Industrials | 41.5 | |
| Consumer Discretionary | 26.0 | |
| Information Technology | 15.1 | |
| Financials | 4.9 | |
| Cash and Cash Equivalents | 12.5 | |
| Calendar Year Total Returns (%) | ||
| YEAR | RSM | |
| 2015 | -13.6 | |
| 2014 | 9.3 | |
| 2013 | 36.3 | |
| 2012 | 11.6 | |
| 2011 | 7.2 | |
| Portfolio Diagnostics | ||
| Fund Net Assets | $118 million | |
| Number of Holdings | 23 | |
| Turnover Rate | 14% | |
| Average Market Capitalization1 | $17,585 million | |
| Weighted Average P/E Ratio2,3 | 15.0x | |
| Weighted Average P/B Ratio2 | 3.3x | |
| Active Share4 | 95% | |
| U.S. Investments (% of Net Assets) | 87.5% | |
| Non-U.S. Investments (% of Net Assets) | 0.0% | |
| 1 | Geometric Average. This weighted calculation uses each portfolio holding’s market cap in a way designed to not skew the effect of very large or small holdings; instead, it aims to better identify the portfolio’s center, which Royce believes offers a more accurate measure of average market cap than a simple mean or median. |
| 2 | Harmonic Average. This weighted calculation evaluates a portfolio as if it were a single stock and measures it overall. It compares the total market value of the portfolio to the portfolio’s share in the earnings or book value, as the case may be, of its underlying stocks. |
| 3 | The Fund’s P/E ratio calculation excludes companies with zero or negative earnings (0% of portfolio holdings as of 6/30/16). |
| 4 | Active Share is the sum of the absolute values of the different weightings of each holding in the Fund versus each holding in the benchmark, divided by two. |
| Important Performance and Expense Information All performance information in this Report reflects past performance, is presented on a total return basis, reflects the reinvestment of distributions, and does not reflect the deduction of taxes that a shareholder would pay on fund distributions or the redemption of fund shares. Past performance is no guarantee of future results. Investment return and principal value of an investment will fluctuate, so that shares may be worth more or less than their original cost when redeemed. Shares redeemed within 30 days of purchase may be subject to a 1% redemption fee payable to the Fund, which is not reflected in the performance shown above; if it were, performance would be lower. Current month-end performance may be higher or lower than performance quoted and may be obtained at www.roycefunds.com. All performance and risk information reflects results of the Service Class (its oldest class). Gross operating expenses reflect gross total annual operating expenses for the Service Class and include management fees, 12b-1 distribution and service fees and other expenses. Net operating expenses reflect contractual fee waivers and/or reimbursements. All expense information is reported as of the Fund’s most current prospectus. Royce & Associates has contractually agreed to waive fees and/or reimburse operating expenses to the extent necessary to maintain the Service Classes’s net annual operating expenses, (excluding brokerage commissions, taxes, interest litigation expenses, acquired fund fees and expenses, and other expenses not borne in the ordinary course of business), at or below 1.24% through April 30, 2017. Regarding the “Top Contributors” and “Top Detractors” tables shown above, the sum of all contributors to, and all detractors from, performance for all securities in the portfolio would approximate the Fund’s year-to-date performance for 2016. |
| The Royce Funds 2016 Semiannual Report to Shareholders | 41 |
| MANAGERS’ DISCUSSION | ||
| Royce Total Return Fund (RTR) |
 |
| Chuck Royce Jay Kaplan, CFA |
| FUND PERFORMANCE Royce Total Return Fund gained 8.6% for the year-to-date period ended June 30, 2016, well ahead of the 2.2% increase for its small-cap benchmark, the Russell 2000 Index, for the same period. The Fund benefited in the first quarter from the long-awaited shift in the small-cap market towards companies with current earnings, below-average risk profiles, and lower valuations. For the first quarter, Total Return rose 5.2% while the small-cap index fell 1.5%. The second quarter saw recoveries for many areas of the small-cap market that had been hardest hit in the first-quarter downdraft, and the Fund lost a small bit of ground to the benchmark, up 3.3%, while the Russell 2000 gained 3.8%. We were pleased that the Fund maintained a relative edge in longer-term periods. Total Return outpaced the Russell 2000 for the one-, 15-, 20-year, and since inception (12/15/93) periods ended June 30, 2016. Its average annual total return since inception was 10.5%, a notable result that makes us quite proud. |
| WHAT WORKED… AND WHAT DIDN’T |
| We were also pleased to see each of the Fund’s 10 equity sectors finish the semiannual period with net gains, which is a little better than the index, in which nine of 10 sectors contributed. While three of the Fund’s sectors posted notable net gains, Materials led by a substantial margin, followed by Industrials and Financials. Similarly, three industry groups made relatively outsized contributions—commercial services & supplies (Industrials), chemicals, and metals & mining (both from Materials). Unsurprisingly, net losses at the industry level were modest, with capital markets (Financials) and professional services (Industrials) detracting most. |
| Long-time holding Ritchie Bros. Auctioneers was the Fund’s top performer in the first half. The company runs what we have long believed is an attractive niche business auctioning industrial equipment in the construction, transportation, and agricultural industries. Impressive revenue growth has driven earnings improvement. We like its dividend, ability to generate free cash flow, global reach, and growing online presence. It was the Fund’s largest holding at the end of June. Top-20 holding Chase Corporation manufactures protective coatings and tape products for various industrial applications. Earnings and operating results have gradually improved so far in 2016, with increased demand spurring growth. Albemarle Corporation is another chemical business that enjoyed a strong first half. The Fund’s eleventh largest holding at the end of June, the company produces specialty chemicals mostly for plastics and polymers. While revenue growth has been challenged, earnings improved steadily over the last four fiscal quarters, attracting more investors to the stock. The leading contributor in the Financials sector, TMX Group owns and operates the Toronto Stock Exchange. The company lowered operating expenses to offset lower revenues, which helped to boost profits in its fiscal first quarter. |
| Net losses at the position level were comparatively modest. Shares of staffing specialist ManpowerGroup were hurt by Brexit. Its stock then enjoyed little of the recovery that lifted many other U.S. companies later in June, largely owing to the company’s significant exposure to the European labor market. Thinking it was oversold, we held a good-sized position at the end of the first half. SEI Investments is an asset manager that also provides technology solutions. We have long liked its core businesses, but saw what we thought was better value elsewhere and exited our position in March. |
| Relative to the Russell 2000, the Fund’s strongest sector was Health Care, thanks to our significant underweight in biotechnology and, to a lesser degree, effective stock picking in health care equipment & supplies. Our greater exposure to Materials also gave the Fund a relative advantage, most notably in the metals & mining and aforementioned chemicals industries. Stock selection in Energy and Consumer Discretionary also provided a relative edge. Conversely, the Fund’s lower exposure to the Utilities sector hurt relative performance, as did our overweight in capital markets and our underweight in REITs, the last of which enjoyed a strong first half. Both industries are in the Financials sector. |
| Top Contributors to Performance Year-to-Date Through 6/30/16 (%)1 | ||||
| Ritchie Bros. Auctioneers | 0.48 | |||
| Chase Corporation | 0.45 | |||
| TMX Group | 0.40 | |||
| Albemarle Corporation | 0.36 | |||
| Teleflex | 0.33 | |||
| 1 Includes dividends | ||||
| Top Detractors from Performance Year-to-Date Through 6/30/16 (%)2 | ||||
| ManpowerGroup | -0.28 | |||
| SEI Investments | -0.18 | |||
| Korn/Ferry International | -0.17 | |||
| KKR & Co. L.P. | -0.16 | |||
| Diebold | -0.16 | |||
| 2 Net of dividends | ||||
| CURRENT POSITIONING AND OUTLOOK |
| Financials was the portfolio’s largest sector at the end of June. However, our weightings deviate from the ways in which traditional dividend-oriented portfolios often invest in this sector. The two largest industry weightings were insurance—largely via property and casualty underwriters—and capital markets, where the emphasis is on both traditional and alternative asset managers. These weightings give the Fund much less interest rate sensitivity than the index’s largest two industries in the sector, REITs and banks. With interest rates near all-time lows, we are very comfortable with the Fund’s lower exposure to these industries. More generally, we continue to believe that an extended period of slow growth should be enough to keep profitable cyclicals climbing, especially after factoring in the ways in which low expectations and—for some industries—oversold conditions depressed the stock prices of so many small-caps that we see as well-managed, conservatively capitalized businesses. |
| 42 | The Royce Funds 2016 Semiannual Report to Shareholders |
| PERFORMANCE AND PORTFOLIO REVIEW | TICKER SYMBOLS RYTRX RYTFX RTRIX RYTCX RTRRX RTRKX RTRWX |
| Performance and Expenses | |||||||||||||||||
| Average Annual Total Return (%) Through 6/30/16 | |||||||||||||||||
| JAN-JUN 20161 | 1-YR | 3-YR | 5-YR | 10-YR | 15-YR | 20-YR | SINCE INCEPTION (12/15/93) | ||||||||||
| RTR | 8.62 | 0.07 | 6.32 | 7.68 | 6.16 | 7.94 | 9.54 | 10.46 | |||||||||
| Annual Operating Expenses: 1.22% | |||||||||||||||||
| 1 Not Annualized | |||||||||||||||||
Relative Risk Adjusted Returns: Monthly Rolling Sharpe Ratios
| On a monthly rolling risk-adjusted basis, the Fund outperformed the Russell 2000 in 98% of all 10-year periods and 92% of all 5-year periods. |
| PERIODS BEATING THE INDEX | FUND AVG (%)1 | INDEX AVG (%)1 | |||||||||
| 10-year | 118/121 | 98% | 0.50 | 0.32 | |||||||
| 5-year | 167/181 | 92% | 0.60 | 0.37 | |||||||

The Morningstar Style Map is the Morningstar Style Box™ with the center 75% of fund holdings plotted as the Morningstar Ownership Zone™. The Morningstar Style Box is designed to reveal a fund’s investment strategy. The Morningstar Ownership Zone provides detail about a portfolio’s investment style by showing the range of stock sizes and styles. The Ownership Zone is derived by plotting each stock in the portfolio within the proprietary Morningstar Style Box. Over time, the shape and location of a fund’s ownership zone may vary. See page 136 for additional information. |
Value of $10,000

| Top 10 Positions | ||
| % of Net Assets | ||
| Ritchie Bros. Auctioneers | 1.5 | |
| E-L Financial | 1.5 | |
| HEICO Corporation | 1.4 | |
| Erie Indemnity Cl. A | 1.3 | |
| Quaker Chemical | 1.3 | |
| Markel Corporation | 1.2 | |
| Balchem Corporation | 1.2 | |
| Woodward | 1.2 | |
| Teleflex | 1.1 | |
| Thor Industries | 1.1 | |
| Portfolio Sector Breakdown | ||
| % of Net Assets | ||
| Financials | 26.5 | |
| Industrials | 23.0 | |
| Consumer Discretionary | 12.7 | |
| Materials | 11.8 | |
| Information Technology | 7.2 | |
| Health Care | 6.3 | |
| Consumer Staples | 4.3 | |
| Energy | 3.0 | |
| Utilities | 2.1 | |
| Telecommunication Services | 1.1 | |
| Miscellaneous | 1.1 | |
| Corporate Bond | 0.1 | |
| Cash and Cash Equivalents | 0.8 | |
| Calendar Year Total Returns (%) | ||
| YEAR | RTR | |
| 2015 | -7.2 | |
| 2014 | 1.3 | |
| 2013 | 32.8 | |
| 2012 | 14.4 | |
| 2011 | -1.7 | |
| 2010 | 23.5 | |
| 2009 | 26.2 | |
| 2008 | -31.2 | |
| 2007 | 2.4 | |
| 2006 | 14.5 | |
| 2005 | 8.2 | |
| 2004 | 17.5 | |
| 2003 | 30.0 | |
| 2002 | -1.6 | |
| 2001 | 14.8 | |
| Upside/Downside Capture Ratios | ||||
| Periods Ended 6/30/16 (%) | ||||
| UPSIDE | DOWNSIDE | |||
| 10-Year | 84 | 79 | ||
| From 12/31/93 (Start of Fund’s First Full Quarter) | 81 | 55 | ||
| Portfolio Diagnostics | ||
| Fund Net Assets | $2,807 million | |
| Number of Holdings | 296 | |
| Turnover Rate | 8% | |
| Average Market Capitalization1 | $1,932 million | |
| Weighted Average P/E Ratio2,3 | 18.5x | |
| Weighted Average P/B Ratio2 | 1.9x | |
| Active Share4 | 90% | |
| U.S. Investments (% of Net Assets) | 86.8% | |
| Non-U.S. Investments (% of Net Assets) | 12.4% | |
| 1 | Geometric Average. This weighted calculation uses each portfolio holding’s market cap in a way designed to not skew the effect of very large or small holdings; instead, it aims to better identify the portfolio’s center, which Royce believes offers a more accurate measure of average market cap than a simple mean or median. |
| 2 | Harmonic Average. This weighted calculation evaluates a portfolio as if it were a single stock and measures it overall. It compares the total market value of the portfolio to the portfolio’s share in the earnings or book value, as the case may be, of its underlying stocks. |
| 3 | The Fund’s P/E ratio calculation excludes companies with zero or negative earnings (5% of portfolio holdings as of 6/30/16). |
| 4 | Active Share is the sum of the absolute values of the different weightings of each holding in the Fund versus each holding in the benchmark, divided by two. |
| Important Performance and Expense Information All performance information in this Report reflects past performance, is presented on a total return basis, reflects the reinvestment of distributions, and does not reflect the deduction of taxes that a shareholder would pay on fund distributions or the redemption of fund shares. Past performance is no guarantee of future results. Investment return and principal value of an investment will fluctuate, so that shares may be worth more or less than their original cost when redeemed. Shares redeemed within 30 days of purchase may be subject to a 1% redemption fee payable to the Fund, which is not reflected in the performance shown above; if it were, performance would be lower. Current month-end performance may be higher or lower than performance quoted and may be obtained at www.roycefunds.com. All performance and risk information reflects results of the Investment Class (its oldest class). Operating expenses reflect the Fund’s total annual operating expenses for the Investment Class as of the Fund’s most current prospectus and include management fees, other expenses, and acquired fund fees and expenses. Acquired fund fees and expenses reflect the estimated amount of the fees and expenses incurred indirectly by the Fund through its investments in mutual funds, hedge funds, private equity funds, and other investment companies. Regarding the “Top Contributors” and “Top Detractors” tables shown above, the sum of all contributors to, and all detractors from, performance for all securities in the portfolio would approximate the Fund’s year-to-date performance for 2016. The Sharpe Ratio is calculated for a specified period by dividing a fund’s annualized excess returns by its annualized standard deviation. The higher the Sharpe ratio, the better the fund’s historical risk-adjusted performance. Upside Capture Ratio measures a manager’s performance in up markets relative to the Fund’s benchmark. It is calculated by measuring the Fund’s performance in quarters when the benchmark went up and dividing it by the benchmark’s return in those quarters. Downside Capture Ratio measures a manager’s performance in down markets relative to the Fund’s benchmark (Russell 2000). It is calculated by measuring the Fund’s performance in quarters when the benchmark goes down and dividing it by the benchmark’s return in those quarters. |
| The Royce Funds 2016 Semiannual Report to Shareholders | 43 |
Schedules of Investments
| Royce Dividend Value Fund | |||||||
| Common Stocks – 97.5% | |||||||
| SHARES | VALUE | ||||||
| CONSUMER DISCRETIONARY – 10.0% | |||||||
| AUTO COMPONENTS - 2.2% | |||||||
Autoliv | 9,600 | $ | 1,031,520 | ||||
Gentex Corporation | 133,696 | 2,065,603 | |||||
Nokian Renkaat | 52,500 | 1,875,318 | |||||
STRATTEC SECURITY | 9,629 | 392,575 | |||||
| 5,365,016 | |||||||
| AUTOMOBILES - 0.4% | |||||||
Thor Industries | 15,940 | 1,031,955 | |||||
| HOUSEHOLD DURABLES - 0.7% | |||||||
Flexsteel Industries | 9,100 | 360,542 | |||||
Hunter Douglas | 27,600 | 1,310,118 | |||||
| 1,670,660 | |||||||
| MEDIA - 0.3% | |||||||
Saga Communications Cl. A | 18,835 | 744,736 | |||||
| MULTILINE RETAIL - 0.6% | |||||||
Dillard’s Cl. A | 25,600 | 1,551,360 | |||||
| SPECIALTY RETAIL - 4.9% | |||||||
American Eagle Outfitters | 98,000 | 1,561,140 | |||||
Buckle (The) | 54,879 | 1,426,306 | |||||
Cato Corporation (The) Cl. A | 40,610 | 1,531,809 | |||||
DSW Cl. A | 72,049 | 1,525,998 | |||||
Fielmann | 6,400 | 467,799 | |||||
Genesco 1 | 23,049 | 1,482,281 | |||||
Shoe Carnival | 62,168 | 1,557,930 | |||||
Stein Mart | 166,296 | 1,283,805 | |||||
USS | 70,000 | 1,148,108 | |||||
| 11,985,176 | |||||||
| TEXTILES, APPAREL & LUXURY GOODS - 0.9% | |||||||
Movado Group | 38,300 | 830,344 | |||||
Stella International Holdings | 100,000 | 176,474 | |||||
Steven Madden 1 | 30,808 | 1,053,018 | |||||
| 2,059,836 | |||||||
| Total (Cost $24,045,014) | 24,408,739 | ||||||
| CONSUMER STAPLES – 2.9% | |||||||
| FOOD & STAPLES RETAILING - 0.8% | |||||||
FamilyMart | 6,000 | 364,463 | |||||
Village Super Market Cl. A | 55,167 | 1,593,774 | |||||
| 1,958,237 | |||||||
| FOOD PRODUCTS - 1.6% | |||||||
Hormel Foods | 95,800 | 3,506,280 | |||||
Industrias Bachoco ADR | 6,100 | 301,340 | |||||
| 3,807,620 | |||||||
| PERSONAL PRODUCTS - 0.5% | |||||||
Nu Skin Enterprises Cl. A | 27,081 | 1,250,872 | |||||
| Total (Cost $4,371,194) | 7,016,729 | ||||||
| ENERGY – 1.7% | |||||||
| ENERGY EQUIPMENT & SERVICES - 1.4% | |||||||
Helmerich & Payne | 28,154 | 1,889,978 | |||||
TGS-NOPEC Geophysical | 100,900 | 1,649,926 | |||||
| 3,539,904 | |||||||
| OIL, GAS & CONSUMABLE FUELS - 0.3% | |||||||
Gaztransport Et Technigaz | 22,700 | 697,568 | |||||
| Total (Cost $5,160,083) | 4,237,472 | ||||||
| FINANCIALS – 29.6% | |||||||
| BANKS - 5.0% | |||||||
Ames National | 35,044 | 939,880 | |||||
†BGEO Group | 58,000 | 2,052,279 | |||||
BLOM Bank GDR | 63,000 | 633,150 | |||||
BOK Financial | 22,114 | 1,386,548 | |||||
Camden National | 32,622 | 1,370,124 | |||||
City Holding Company | 19,689 | 895,259 | |||||
CNB Financial | 29,200 | 519,760 | |||||
Codorus Valley Bancorp | 6,635 | 135,155 | |||||
First Republic Bank | 44,700 | 3,128,553 | |||||
National Bankshares | 17,100 | 597,132 | |||||
Northrim BanCorp | 24,700 | 649,363 | |||||
| 12,307,203 | |||||||
| CAPITAL MARKETS - 18.9% | |||||||
AllianceBernstein Holding L.P. | 174,300 | 4,061,190 | |||||
Apollo Global Management LLC Cl. A | 157,300 | 2,383,095 | |||||
ARA Asset Management | 1,961,500 | 2,020,246 | |||||
Ashmore Group | 624,000 | 2,526,291 | |||||
AURELIUS | 9,000 | 529,083 | |||||
Carlyle Group L.P. | 141,000 | 2,288,430 | |||||
Coronation Fund Managers | 266,000 | 1,207,287 | |||||
Federated Investors Cl. B | 138,300 | 3,980,274 | |||||
Gluskin Sheff + Associates | 51,700 | 667,084 | |||||
Interactive Brokers Group Cl. A | 22,600 | 800,040 | |||||
Jupiter Fund Management | 509,500 | 2,511,886 | |||||
KKR & Co. L.P. | 288,000 | 3,553,920 | |||||
Lazard Cl. A | 94,200 | 2,805,276 | |||||
Moelis & Company Cl. A | 60,000 | 1,350,000 | |||||
Northern Trust | 25,000 | 1,656,500 | |||||
Oaktree Capital Group LLC Cl. A | 85,000 | 3,804,600 | |||||
SEI Investments | 53,000 | 2,549,830 | |||||
Sprott | 735,700 | 1,463,485 | |||||
State Street | 27,900 | 1,504,368 | |||||
†TD Ameritrade Holding Corporation | 74,100 | 2,109,998 | |||||
Value Partners Group | 2,527,200 | 2,344,821 | |||||
| 46,117,704 | |||||||
| DIVERSIFIED FINANCIAL SERVICES - 2.0% | |||||||
†BM&FBOVESPA | 402,000 | 2,252,591 | |||||
Bolsa Mexicana de Valores | 1,443,000 | 2,223,394 | |||||
Singapore Exchange | 70,000 | 398,768 | |||||
| 4,874,753 | |||||||
| INSURANCE - 2.2% | |||||||
Allied World Assurance Company Holdings | 11,694 | 410,927 | |||||
Erie Indemnity Cl. A | 12,100 | 1,202,014 | |||||
Marsh & McLennan | 30,800 | 2,108,568 | |||||
Reinsurance Group of America | 16,455 | 1,595,971 | |||||
| 5,317,480 | |||||||
| REAL ESTATE MANAGEMENT & DEVELOPMENT - 0.2% | |||||||
Relo Holdings | 2,300 | 403,099 | |||||
| THRIFTS & MORTGAGE FINANCE - 1.3% | |||||||
Genworth MI Canada | 60,948 | 1,563,386 | |||||
Southern Missouri Bancorp | 2,500 | 58,825 | |||||
TrustCo Bank Corp. NY | 243,760 | 1,562,502 | |||||
| 3,184,713 | |||||||
| Total (Cost $62,976,943) | 72,204,952 | ||||||
| HEALTH CARE – 3.8% | |||||||
| HEALTH CARE EQUIPMENT & SUPPLIES - 1.4% | |||||||
Dentsply Sirona | 56,000 | 3,474,240 | |||||
| 44 | The Royce Funds 2016 Semiannual Report to Shareholders | THE ACCOMPANYING NOTES ARE AN INTEGRAL PART OF THESE FINANCIAL STATEMENTS |
| June 30, 2016 (unaudited) |
| Royce Dividend Value Fund (continued) | |||||||
| SHARES | VALUE | ||||||
| HEALTH CARE (continued) | |||||||
| HEALTH CARE PROVIDERS & SERVICES - 0.9% | |||||||
Aceto Corporation | 18,800 | $ | 411,532 | ||||
Ensign Group (The) | 32,400 | 680,724 | |||||
Owens & Minor | 28,500 | 1,065,330 | |||||
| 2,157,586 | |||||||
| HEALTH CARE TECHNOLOGY - 0.1% | |||||||
CompuGroup Medical | 7,300 | 303,562 | |||||
| PHARMACEUTICALS - 1.4% | |||||||
Recordati | 82,300 | 2,474,453 | |||||
Santen Pharmaceutical | 52,000 | 810,939 | |||||
| 3,285,392 | |||||||
| Total (Cost $5,722,022) | 9,220,780 | ||||||
| INDUSTRIALS – 23.5% | |||||||
| AEROSPACE & DEFENSE - 0.8% | |||||||
HEICO Corporation Cl. A | 36,132 | 1,938,482 | |||||
| AIR FREIGHT & LOGISTICS - 2.8% | |||||||
C. H. Robinson Worldwide | 33,500 | 2,487,375 | |||||
Expeditors International of Washington | 90,600 | 4,443,024 | |||||
| 6,930,399 | |||||||
| BUILDING PRODUCTS - 0.8% | |||||||
Geberit | 1,000 | 377,755 | |||||
TOTO | 37,000 | 1,466,091 | |||||
| 1,843,846 | |||||||
| COMMERCIAL SERVICES & SUPPLIES - 2.0% | |||||||
Ritchie Bros. Auctioneers | 90,092 | 3,043,308 | |||||
Societe BIC | 6,600 | 933,272 | |||||
UniFirst Corporation | 8,655 | 1,001,556 | |||||
| 4,978,136 | |||||||
| CONSTRUCTION & ENGINEERING - 0.8% | |||||||
KBR | 136,900 | 1,812,556 | |||||
| ELECTRICAL EQUIPMENT - 1.5% | |||||||
Hubbell Cl. B | 18,200 | 1,919,554 | |||||
Regal Beloit | 30,200 | 1,662,510 | |||||
| 3,582,064 | |||||||
| MACHINERY - 9.4% | |||||||
Alamo Group | 19,408 | 1,280,346 | |||||
CLARCOR | 54,800 | 3,333,484 | |||||
Donaldson Company | 88,300 | 3,033,988 | |||||
Federal Signal | 99,729 | 1,284,509 | |||||
Flowserve Corporation | 20,100 | 907,917 | |||||
Graco | 26,100 | 2,061,639 | |||||
IDEX Corporation | 37,300 | 3,062,330 | |||||
KUKA | 5,100 | 603,958 | |||||
Lincoln Electric Holdings | 30,050 | 1,775,354 | |||||
Lindsay Corporation | 27,500 | 1,866,150 | |||||
Miller Industries | 48,214 | 992,726 | |||||
Pfeiffer Vacuum Technology | 13,500 | 1,263,992 | |||||
Spirax-Sarco Engineering | 30,492 | 1,522,098 | |||||
| 22,988,491 | |||||||
| MARINE - 0.8% | |||||||
Clarkson | 67,400 | 1,997,480 | |||||
| PROFESSIONAL SERVICES - 1.8% | |||||||
Korn/Ferry International | 49,400 | 1,022,580 | |||||
ManpowerGroup | 49,700 | 3,197,698 | |||||
Robert Half International | 2,600 | 99,216 | |||||
| 4,319,494 | |||||||
| ROAD & RAIL - 1.8% | |||||||
Amerco | 8,442 | 3,161,951 | |||||
Werner Enterprises | 56,300 | 1,293,211 | |||||
| 4,455,162 | |||||||
| TRADING COMPANIES & DISTRIBUTORS - 1.0% | |||||||
Applied Industrial Technologies | 53,700 | 2,424,018 | |||||
| Total (Cost $44,258,182) | 57,270,128 | ||||||
| INFORMATION TECHNOLOGY – 11.1% | |||||||
| COMMUNICATIONS EQUIPMENT - 0.7% | |||||||
Brocade Communications Systems | 136,382 | 1,251,987 | |||||
TESSCO Technologies | 32,879 | 456,689 | |||||
| 1,708,676 | |||||||
| ELECTRONIC EQUIPMENT, INSTRUMENTS & COMPONENTS - 5.5% | |||||||
Amphenol Corporation Cl. A | 52,600 | 3,015,558 | |||||
FLIR Systems | 149,700 | 4,633,215 | |||||
National Instruments | 155,400 | 4,257,960 | |||||
Vishay Intertechnology | 119,788 | 1,484,173 | |||||
| 13,390,906 | |||||||
| IT SERVICES - 1.4% | |||||||
Western Union | 181,900 | 3,488,842 | |||||
| SEMICONDUCTORS & SEMICONDUCTOR EQUIPMENT - 0.6% | |||||||
MKS Instruments | 32,608 | 1,404,101 | |||||
| SOFTWARE - 1.3% | |||||||
Computer Modelling Group | 140,000 | 1,120,477 | |||||
SimCorp | 7,000 | 343,488 | |||||
TOTVS | 180,000 | 1,711,297 | |||||
| 3,175,262 | |||||||
| TECHNOLOGY HARDWARE, STORAGE & PERIPHERALS - 1.6% | |||||||
Diebold | 160,000 | 3,972,800 | |||||
| Total (Cost $26,100,889) | 27,140,587 | ||||||
| MATERIALS – 10.5% | |||||||
| CHEMICALS - 1.1% | |||||||
Quaker Chemical | 26,800 | 2,390,560 | |||||
Victrex | 10,000 | 201,685 | |||||
| 2,592,245 | |||||||
| CONTAINERS & PACKAGING - 2.0% | |||||||
AptarGroup | 41,200 | 3,260,156 | |||||
Greif Cl. A | 46,300 | 1,725,601 | |||||
| 4,985,757 | |||||||
| METALS & MINING - 7.4% | |||||||
Carpenter Technology | 69,300 | 2,282,049 | |||||
Compass Minerals International | 38,100 | 2,826,639 | |||||
Franco-Nevada Corporation | 36,000 | 2,738,160 | |||||
Reliance Steel & Aluminum | 63,000 | 4,844,700 | |||||
Royal Gold | 19,900 | 1,433,198 | |||||
Worthington Industries | 92,900 | 3,929,670 | |||||
| 18,054,416 | |||||||
| Total (Cost $19,761,461) | 25,632,418 | ||||||
| TELECOMMUNICATION SERVICES – 1.6% | |||||||
| DIVERSIFIED TELECOMMUNICATION SERVICES - 0.5% | |||||||
Inmarsat | 105,000 | 1,127,016 | |||||
| WIRELESS TELECOMMUNICATION SERVICES - 1.1% | |||||||
Telephone and Data Systems | 91,500 | 2,713,890 | |||||
| Total (Cost $3,264,044) | 3,840,906 | ||||||
| THE ACCOMPANYING NOTES ARE AN INTEGRAL PART OF THESE FINANCIAL STATEMENTS | The Royce Funds 2016 Semiannual Report to Shareholders | 45 |
Schedules of Investments
| Royce Dividend Value Fund (continued) | |||||||
| SHARES | VALUE | ||||||
| UTILITIES – 1.5% | |||||||
| WATER UTILITIES - 1.5% | |||||||
Aqua America | 104,800 | $ | 3,737,168 | ||||
| Total (Cost $2,517,093) | 3,737,168 | ||||||
| MISCELLANEOUS2 – 1.3% | |||||||
| Total (Cost $3,139,262) | 3,036,267 | ||||||
| TOTAL COMMON STOCKS | |||||||
| (Cost $201,316,187) | 237,746,146 | ||||||
| PRINCIPAL | |||||||
| AMOUNT | |||||||
| CORPORATE BOND– 0.1% | |||||||
Unit Corporation 6.625% due 5/15/21 | |||||||
| (Cost $370,312) | $ | 458,000 | 353,805 | ||||
| REPURCHASE AGREEMENT– 2.6% | |||||||
| Fixed Income Clearing Corporation, 0.03% dated 6/30/16, due 7/1/16, maturity value $6,318,005 (collateralized by obligations of various U.S. Government Agencies, 0.125% due 4/15/19, valued at $6,447,863) | |||||||
| (Cost $6,318,000) | 6,318,000 | ||||||
| TOTAL INVESTMENTS – 100.2% | |||||||
| (Cost $208,004,499) | 244,417,951 | ||||||
| LIABILITIES LESS CASH AND OTHER ASSETS – (0.2)% | (452,147 | ) | |||||
| NET ASSETS – 100.0% | $ | 243,965,804 | |||||
| Royce Global Financial Services Fund | |||||||
| Common Stocks – 98.3% | |||||||
| SHARES | VALUE | ||||||
| BANKS - 12.1% | |||||||
BankUnited | 4,100 | $ | 125,952 | ||||
BLOM Bank GDR | 8,000 | 80,400 | |||||
BOK Financial | 13,530 | 848,331 | |||||
Capital City Bank Group | 29,822 | 415,122 | |||||
Chemung Financial | 14,512 | 425,927 | |||||
First Citizens BancShares Cl. A | 3,850 | 996,804 | |||||
First Republic Bank | 10,400 | 727,896 | |||||
Investors Bancorp | 25,300 | 280,324 | |||||
Live Oak Bancshares | 45,000 | 634,950 | |||||
Popular | 28,900 | 846,770 | |||||
Umpqua Holdings | 17,400 | 269,178 | |||||
| Total (Cost $5,506,698) | 5,651,654 | ||||||
| CAPITAL MARKETS - 46.6% | |||||||
AllianceBernstein Holding L.P. | 16,500 | 384,450 | |||||
Apollo Global Management LLC Cl. A | 32,700 | 495,405 | |||||
ARA Asset Management | 793,320 | 817,080 | |||||
Ares Management L.P. | 73,400 | 1,034,206 | |||||
Ashmore Group | 290,000 | 1,174,078 | |||||
Associated Capital Group Cl. A | 14,084 | 403,929 | |||||
Carlyle Group L.P. | 41,700 | 676,791 | |||||
Charles Schwab (The) Corporation | 29,400 | �� | 744,114 | ||||
Citadel Capital 1 | 150,000 | 16,554 | |||||
Coronation Fund Managers | 68,000 | 308,630 | |||||
Cowen Group 1 | 49,900 | 147,704 | |||||
Dundee Corporation Cl. A 1 | 90,000 | 531,522 | |||||
Edmond de Rothschild (Suisse) | 20 | 287,558 | |||||
Egyptian Financial Group-Hermes Holding Company 1 | 246,390 | 293,283 | |||||
Federated Investors Cl. B | 33,800 | 972,764 | |||||
Financial Engines | 18,400 | 476,008 | |||||
Fortress Investment Group LLC Cl. A | 102,600 | 453,492 | |||||
Gluskin Sheff + Associates | 60,500 | 780,630 | |||||
GMP Capital 1 | 108,000 | 439,707 | |||||
INTL FCStone 1 | 15,000 | 409,350 | |||||
IOOF Holdings | 20,000 | 117,750 | |||||
Jupiter Fund Management | 165,000 | 813,467 | |||||
KKR & Co. L.P. | 23,900 | 294,926 | |||||
Lazard Cl. A | 10,000 | 297,800 | |||||
Medley Management Cl. A | 89,302 | 525,096 | |||||
MVC Capital | 47,100 | 378,684 | |||||
Northern Trust | 10,900 | 722,234 | |||||
Oaktree Capital Group LLC Cl. A | 13,400 | 599,784 | |||||
Och-Ziff Capital Management Group LLC Cl. A 1 | 66,000 | 250,800 | |||||
Partners Group Holding | 670 | 287,293 | |||||
Reinet Investments | 7,200 | 154,186 | |||||
Rothschild & Co | 23,500 | 562,096 | |||||
SEI Investments | 16,600 | 798,626 | |||||
Silvercrest Asset Management Group Cl. A | 41,600 | 509,184 | |||||
SPARX Group | 220,000 | 392,007 | |||||
Sprott | 385,000 | 765,858 | |||||
TD Ameritrade Holding Corporation | 12,715 | 362,060 | |||||
Tokai Tokyo Financial Holdings | 9,400 | 39,880 | |||||
U.S. Global Investors Cl. A | 368,373 | 626,234 | |||||
UOB-Kay Hian Holdings | 129,000 | 125,947 | |||||
Value Partners Group | 672,000 | 623,504 | |||||
Virtu Financial Cl. A | 18,100 | 325,800 | |||||
| 46 | The Royce Funds 2016 Semiannual Report to Shareholders | THE ACCOMPANYING NOTES ARE AN INTEGRAL PART OF THESE FINANCIAL STATEMENTS |
| June 30, 2016 (unaudited) |
| Royce Global Financial Services Fund (continued) | |||||||
| SHARES | VALUE | ||||||
| CAPITAL MARKETS (continued) | |||||||
VZ Holding | 1,850 | $ | 551,946 | ||||
Westwood Holdings Group | 12,700 | 657,860 | |||||
WisdomTree Investments | 18,000 | 176,220 | |||||
| Total (Cost $23,984,077) | 21,806,497 | ||||||
| CONSUMER FINANCE - 1.0% | |||||||
Discover Financial Services | 2,800 | 150,052 | |||||
Unifin Financiera | 120,000 | 300,680 | |||||
| Total (Cost $458,727) | 450,732 | ||||||
| DIVERSIFIED FINANCIAL SERVICES - 14.8% | |||||||
BM&FBOVESPA | 196,000 | 1,098,278 | |||||
Bolsa Mexicana de Valores | 465,000 | 716,478 | |||||
Bolsas y Mercados Espanoles | 10,500 | 293,471 | |||||
Bursa Malaysia | 192,000 | 408,229 | |||||
CRISIL | 14,000 | 417,529 | |||||
Hellenic Exchanges - Athens Stock Exchange | 50,000 | 238,218 | |||||
JSE | 51,000 | 637,061 | |||||
MarketAxess Holdings | 4,600 | 668,840 | |||||
Markit 1 | 14,000 | 456,400 | |||||
Morningstar | 8,000 | 654,240 | |||||
MSCI | 4,300 | 331,616 | |||||
NZX | 440,000 | 314,994 | |||||
SHUAA Capital 1 | 580,000 | 102,884 | |||||
Singapore Exchange | 75,000 | 427,251 | |||||
Warsaw Stock Exchange | 19,000 | 159,430 | |||||
| Total (Cost $5,782,310) | 6,924,919 | ||||||
| HOTELS, RESTAURANTS & LEISURE - 0.2% | |||||||
Thomas Cook (India) | 30,600 | 99,266 | |||||
| Total (Cost $28,633) | 99,266 | ||||||
| INSURANCE - 4.1% | |||||||
E-L Financial | 1,400 | 743,372 | |||||
Jardine Lloyd Thompson Group | 11,900 | 149,689 | |||||
MBIA 1 | 95,300 | 650,899 | |||||
State Auto Financial | 17,100 | 374,661 | |||||
| Total (Cost $2,024,604) | 1,918,621 | ||||||
| INTERNET SOFTWARE & SERVICES - 0.0% | |||||||
| 223,459 | 13,855 | ||||||
| Total (Cost $101,010) | 13,855 | ||||||
| INVESTMENT COMPANIES - 1.2% | |||||||
RIT Capital Partners | 25,100 | 550,342 | |||||
| Total (Cost $503,343) | 550,342 | ||||||
| IT SERVICES - 4.6% | |||||||
Cass Information Systems | 7,600 | 392,920 | |||||
GBST Holdings | 105,000 | 325,899 | |||||
PayPal Holdings 1 | 12,800 | 467,328 | |||||
Vantiv Cl. A 1 | 10,000 | 566,000 | |||||
Western Union | 19,800 | 379,764 | |||||
| Total (Cost $1,715,944) | 2,131,911 | ||||||
| MARINE - 1.1% | |||||||
Clarkson | 18,000 | 533,452 | |||||
| Total (Cost $667,597) | 533,452 | ||||||
| METALS & MINING - 1.3% | |||||||
Franco-Nevada Corporation | 7,850 | 597,071 | |||||
| Total (Cost $314,604) | 597,071 | ||||||
| PROFESSIONAL SERVICES - 1.1% | |||||||
Verisk Analytics 1 | 6,400 | 518,912 | |||||
| Total (Cost $237,159) | 518,912 | ||||||
| REAL ESTATE MANAGEMENT & DEVELOPMENT - 2.9% | |||||||
†FirstService Corporation | 25,000 | 1,145,750 | |||||
Midland Holdings 1 | 800,000 | 220,641 | |||||
| Total (Cost $1,220,485) | 1,366,391 | ||||||
| SOFTWARE - 3.5% | |||||||
Bottomline Technologies 1 | 13,600 | 292,808 | |||||
Fair Isaac | 7,400 | 836,274 | |||||
SS&C Technologies Holdings | 19,000 | 533,520 | |||||
| Total (Cost $983,937) | 1,662,602 | ||||||
| TRADING COMPANIES & DISTRIBUTORS - 0.9% | |||||||
Air Lease Cl. A | 16,300 | 436,514 | |||||
| Total (Cost $644,258) | 436,514 | ||||||
| MISCELLANEOUS2 - 2.9% | |||||||
| Total (Cost $1,496,351) | 1,351,470 | ||||||
| TOTAL COMMON STOCKS | |||||||
| (Cost $45,669,737) | 46,014,209 | ||||||
| REPURCHASE AGREEMENT– 1.5% | |||||||
| Fixed Income Clearing Corporation, 0.03% dated 6/30/16, due 7/1/16, maturity value $729,001 (collateralized by obligations of various U.S. Government Agencies, 0.125% due 4/15/19, valued at $745,388) | |||||||
| (Cost $729,000) | 729,000 | ||||||
| TOTAL INVESTMENTS – 99.8% | |||||||
| (Cost $46,398,737) | 46,743,209 | ||||||
| CASH AND OTHER ASSETS LESS LIABILITIES – 0.2% | 75,305 | ||||||
| NET ASSETS – 100.0% | $ | 46,818,514 | |||||
| THE ACCOMPANYING NOTES ARE AN INTEGRAL PART OF THESE FINANCIAL STATEMENTS | The Royce Funds 2016 Semiannual Report to Shareholders | 47 |
Schedules of Investments
| Royce Heritage Fund | |||||||
| Common Stocks – 86.7% | |||||||
| SHARES | VALUE | ||||||
| CONSUMER DISCRETIONARY – 20.1% | |||||||
| AUTO COMPONENTS - 7.4% | |||||||
Dorman Products 1 | 30,017 | $ | 1,716,972 | ||||
Drew Industries | 60,609 | 5,142,068 | |||||
Gentex Corporation | 262,635 | 4,057,711 | |||||
Standard Motor Products | 155,030 | 6,167,093 | |||||
| 17,083,844 | |||||||
| AUTOMOBILES - 2.3% | |||||||
Thor Industries | 80,487 | 5,210,728 | |||||
| DISTRIBUTORS - 3.5% | |||||||
Genuine Parts | 23,849 | 2,414,711 | |||||
LKQ Corporation 1 | 177,947 | 5,640,920 | |||||
| 8,055,631 | |||||||
| DIVERSIFIED CONSUMER SERVICES - 0.3% | |||||||
Capella Education | 11,870 | 624,837 | |||||
| HOUSEHOLD DURABLES - 1.8% | |||||||
Ethan Allen Interiors | 29,668 | 980,231 | |||||
Forbo Holding | 700 | 831,501 | |||||
NVR 1 | 1,318 | 2,346,488 | |||||
| 4,158,220 | |||||||
| MEDIA - 1.4% | |||||||
Media General 1 | 117,272 | 2,015,906 | |||||
Meredith Corporation | 23,103 | 1,199,277 | |||||
| 3,215,183 | |||||||
| MULTILINE RETAIL - 0.6% | |||||||
Dollar Tree 1 | 14,207 | 1,338,868 | |||||
| SPECIALTY RETAIL - 1.0% | |||||||
†Dicks Sporting Goods | 37,000 | 1,667,220 | |||||
USS | 36,100 | 592,096 | |||||
| 2,259,316 | |||||||
| TEXTILES, APPAREL & LUXURY GOODS - 1.8% | |||||||
Coach | 37,400 | 1,523,676 | |||||
Gildan Activewear | 22,300 | 654,059 | |||||
Wolverine World Wide | 100,222 | 2,036,511 | |||||
| 4,214,246 | |||||||
| Total (Cost $35,557,383) | 46,160,873 | ||||||
| CONSUMER STAPLES – 0.7% | |||||||
| FOOD PRODUCTS - 0.7% | |||||||
Sanderson Farms | 18,350 | 1,589,844 | |||||
| Total (Cost $1,498,931) | 1,589,844 | ||||||
| FINANCIALS – 13.5% | |||||||
| CAPITAL MARKETS - 3.4% | |||||||
Affiliated Managers Group 1 | 2,230 | 313,917 | |||||
Evercore Partners Cl. A | 11,300 | 499,347 | |||||
Federated Investors Cl. B | 75,300 | 2,167,134 | |||||
Lazard Cl. A | 81,210 | 2,418,434 | |||||
Oaktree Capital Group LLC Cl. A | 28,587 | 1,279,554 | |||||
SEI Investments | 12,000 | 577,320 | |||||
Westwood Holdings Group | 11,900 | 616,420 | |||||
| 7,872,126 | |||||||
| DIVERSIFIED FINANCIAL SERVICES - 2.2% | |||||||
Berkshire Hathaway Cl. B 1 | 30,347 | 4,393,942 | |||||
TMX Group | 16,000 | 665,660 | |||||
| 5,059,602 | |||||||
| INSURANCE - 2.6% | |||||||
Alleghany Corporation 1 | 10,664 | 5,860,721 | |||||
| REAL ESTATE MANAGEMENT & DEVELOPMENT - 5.3% | |||||||
Colliers International Group | 22,600 | 771,564 | |||||
Jones Lang LaSalle | 36,440 | 3,551,078 | |||||
Kennedy Wilson Europe Real Estate | 156,000 | 2,005,475 | |||||
Kennedy-Wilson Holdings | 220,047 | 4,172,091 | |||||
Marcus & Millichap 1 | 67,850 | 1,724,069 | |||||
| 12,224,277 | |||||||
| Total (Cost $32,089,563) | 31,016,726 | ||||||
| HEALTH CARE – 1.0% | |||||||
| HEALTH CARE EQUIPMENT & SUPPLIES - 0.3% | |||||||
Dentsply Sirona | 10,000 | 620,400 | |||||
| LIFE SCIENCES TOOLS & SERVICES - 0.3% | |||||||
Waters Corporation 1 | 5,047 | 709,861 | |||||
| PHARMACEUTICALS - 0.4% | |||||||
Recordati | 29,000 | 871,921 | |||||
| Total (Cost $1,153,091) | 2,202,182 | ||||||
| INDUSTRIALS – 27.9% | |||||||
| AEROSPACE & DEFENSE - 1.2% | |||||||
HEICO Corporation | 41,900 | 2,799,339 | |||||
| AIR FREIGHT & LOGISTICS - 0.5% | |||||||
Forward Air | 25,500 | 1,135,515 | |||||
| BUILDING PRODUCTS - 1.0% | |||||||
Simpson Manufacturing | 57,600 | 2,302,272 | |||||
| COMMERCIAL SERVICES & SUPPLIES - 4.9% | |||||||
Cintas Corporation | 18,600 | 1,825,218 | |||||
Copart 1 | 125,660 | 6,158,597 | |||||
Ritchie Bros. Auctioneers | 76,660 | 2,589,575 | |||||
Waste Connections | 7,948 | 572,653 | |||||
| 11,146,043 | |||||||
| CONSTRUCTION & ENGINEERING - 2.0% | |||||||
Valmont Industries | 33,945 | 4,591,740 | |||||
| ELECTRICAL EQUIPMENT - 1.5% | |||||||
Hubbell Cl. B | 32,522 | 3,430,095 | |||||
| INDUSTRIAL CONGLOMERATES - 1.1% | |||||||
Carlisle Companies | 23,300 | 2,462,344 | |||||
| MACHINERY - 5.4% | |||||||
Franklin Electric | 57,328 | 1,894,691 | |||||
Lincoln Electric Holdings | 13,600 | 803,488 | |||||
Mueller Industries | 53,944 | 1,719,735 | |||||
Pfeiffer Vacuum Technology | 7,000 | 655,403 | |||||
RBC Bearings 1 | 31,700 | 2,298,250 | |||||
Wabtec Corporation | 47,300 | 3,321,879 | |||||
†Watts Water Technologies Cl. A | 28,340 | 1,651,088 | |||||
| 12,344,534 | |||||||
| MARINE - 2.0% | |||||||
Kirby Corporation 1 | 73,000 | 4,554,470 | |||||
| PROFESSIONAL SERVICES - 4.4% | |||||||
Dun & Bradstreet | 9,500 | 1,157,480 | |||||
Equifax | 23,712 | 3,044,621 | |||||
IHS Cl. A 1 | 16,552 | 1,913,577 | |||||
ManpowerGroup | 61,618 | 3,964,502 | |||||
| 10,080,180 | |||||||
| ROAD & RAIL - 2.0% | |||||||
Landstar System | 26,400 | 1,812,624 | |||||
†Union Pacific | 33,114 | 2,889,196 | |||||
| 4,701,820 | |||||||
| TRADING COMPANIES & DISTRIBUTORS - 1.9% | |||||||
Air Lease Cl. A | 45,721 | 1,224,409 | |||||
| 48 | The Royce Funds 2016 Semiannual Report to Shareholders | THE ACCOMPANYING NOTES ARE AN INTEGRAL PART OF THESE FINANCIAL STATEMENTS |
| June 30, 2016 (unaudited) |
| Royce Heritage Fund (continued) | |||||||
| SHARES | VALUE | ||||||
| INDUSTRIALS (continued) | |||||||
| TRADING COMPANIES & DISTRIBUTORS (continued) | |||||||
Diploma | 114,300 | $ | 1,272,649 | ||||
MSC Industrial Direct Cl. A | 15,400 | 1,086,624 | |||||
Watsco | 6,400 | 900,416 | |||||
| 4,484,098 | |||||||
| Total (Cost $50,799,507) | 64,032,450 | ||||||
| INFORMATION TECHNOLOGY – 7.4% | |||||||
| ELECTRONIC EQUIPMENT, INSTRUMENTS & COMPONENTS - 3.8% | |||||||
AVX Corporation | 114,483 | 1,554,679 | |||||
Coherent 1 | 28,950 | 2,657,031 | |||||
FLIR Systems | 22,900 | 708,755 | |||||
National Instruments | 9,100 | 249,340 | |||||
Rogers Corporation 1 | 57,389 | 3,506,468 | |||||
| 8,676,273 | |||||||
| IT SERVICES - 2.3% | |||||||
DST Systems | 34,766 | 4,047,805 | |||||
Fiserv 1 | 11,700 | 1,272,141 | |||||
| 5,319,946 | |||||||
| SEMICONDUCTORS & SEMICONDUCTOR EQUIPMENT - 1.3% | |||||||
Lam Research | 36,500 | 3,068,190 | |||||
| Total (Cost $13,927,300) | 17,064,409 | ||||||
| MATERIALS – 11.8% | |||||||
| CHEMICALS - 6.2% | |||||||
Innospec | 8,600 | 395,514 | |||||
Minerals Technologies | 83,611 | 4,749,105 | |||||
Quaker Chemical | 18,200 | 1,623,440 | |||||
RPM International | 22,900 | 1,143,855 | |||||
Sensient Technologies | 33,749 | 2,397,529 | |||||
Westlake Chemical | 89,380 | 3,836,189 | |||||
| 14,145,632 | |||||||
| METALS & MINING - 3.3% | |||||||
Kaiser Aluminum | 21,820 | 1,972,746 | |||||
Reliance Steel & Aluminum | 71,832 | 5,523,881 | |||||
| 7,496,627 | |||||||
| PAPER & FOREST PRODUCTS - 2.3% | |||||||
Neenah Paper | 64,690 | 4,681,616 | |||||
Stella-Jones | 18,000 | 670,289 | |||||
| 5,351,905 | |||||||
| Total (Cost $25,411,902) | 26,994,164 | ||||||
| UTILITIES – 2.1% | |||||||
| GAS UTILITIES - 2.1% | |||||||
UGI Corporation | 104,923 | 4,747,766 | |||||
| Total (Cost $3,267,751) | 4,747,766 | ||||||
| MISCELLANEOUS2 – 2.2% | |||||||
| Total (Cost $4,964,869) | 5,035,941 | ||||||
| TOTAL COMMON STOCKS | |||||||
| (Cost $168,670,297) | 198,844,355 | ||||||
| REPURCHASE AGREEMENT– 16.7% | |||||||
| Fixed Income Clearing Corporation, 0.03% dated 6/30/16, due 7/1/16, maturity value $38,362,032 (collateralized by obligations of various U.S. Government Agencies, 0.125% due 4/15/19, valued at $39,130,238) | |||||||
| (Cost $38,362,000) | $ | 38,362,000 | |||||
| TOTAL INVESTMENTS – 103.4% | |||||||
| (Cost $207,032,297) | 237,206,355 | ||||||
| LIABILITIES LESS CASH AND OTHER ASSETS – (3.4)% | (7,738,382 | ) | |||||
| NET ASSETS – 100.0% | $ | 229,467,973 | |||||
| THE ACCOMPANYING NOTES ARE AN INTEGRAL PART OF THESE FINANCIAL STATEMENTS | The Royce Funds 2016 Semiannual Report to Shareholders | 49 |
Schedules of Investments
| Royce International Micro-Cap Fund | |||||||
| Common Stocks – 95.4% | |||||||
| SHARES | VALUE | ||||||
| AUSTRALIA – 3.9% | |||||||
Austal 4 | 43,200 | $ | 38,985 | ||||
Imdex 1 | 114,300 | 17,830 | |||||
| 679,200 | 26,022 | ||||||
TFS Corporation | 55,748 | 58,685 | |||||
Webjet | 15,370 | 81,953 | |||||
| Total (Cost $268,309) | 223,475 | ||||||
| AUSTRIA – 1.3% | |||||||
S&T | 4,300 | 34,768 | |||||
UBM Development | 1,300 | 42,604 | |||||
| Total (Cost $77,246) | 77,372 | ||||||
| BELGIUM – 0.7% | |||||||
†Roularta Media Group | 1,400 | 39,681 | |||||
| Total (Cost $38,061) | 39,681 | ||||||
| BRAZIL – 1.1% | |||||||
T4F Entretenimento | 31,800 | 65,336 | |||||
| Total (Cost $70,825) | 65,336 | ||||||
| CANADA – 8.2% | |||||||
Exco Technologies | 4,100 | 38,717 | |||||
goeasy | 4,100 | 58,361 | |||||
Intertape Polymer Group | 2,400 | 39,159 | |||||
Magellan Aerospace | 8,700 | 121,279 | |||||
Morneau Shepell | 4,200 | 57,671 | |||||
RDM Corporation | 13,000 | 43,771 | |||||
| 13,300 | 59,318 | ||||||
Solium Capital 1 | 12,100 | 55,632 | |||||
| Total (Cost $444,922) | 473,908 | ||||||
| CHINA – 2.2% | |||||||
Daqo New Energy ADR 1 | 1,700 | 38,369 | |||||
| 189,800 | 40,803 | ||||||
Xtep International Holdings | 86,400 | 46,643 | |||||
| Total (Cost $119,159) | 125,815 | ||||||
| DENMARK – 0.7% | |||||||
Columbus | 33,400 | 41,831 | |||||
| Total (Cost $31,351) | 41,831 | ||||||
| FINLAND – 1.2% | |||||||
BasWare 1 | 700 | 26,881 | |||||
Powerflute | 47,900 | 44,852 | |||||
| Total (Cost $95,634) | 71,733 | ||||||
| FRANCE – 5.3% | |||||||
| 5,600 | 29,809 | ||||||
Cegedim 1 | 700 | 21,367 | |||||
Chargeurs | 3,300 | 36,498 | |||||
†Groupe Crit | 600 | 40,027 | |||||
HighCo | 4,100 | 40,662 | |||||
†Linedata Services | 700 | 31,846 | |||||
Manutan International | 600 | 32,438 | |||||
Neurones | 1,650 | 36,156 | |||||
†Synergie | 1,300 | 37,141 | |||||
| Total (Cost $281,343) | 305,944 | ||||||
| GERMANY – 6.6% | |||||||
ADLER Real Estate 1 | 3,800 | 48,143 | |||||
| 3,800 | 0 | ||||||
Allgeier | 1,500 | 27,487 | |||||
AURELIUS | 1,000 | 58,787 | |||||
†CANCOM | 1,000 | 49,685 | |||||
HolidayCheck Group 1 | 10,300 | 26,951 | |||||
msg life 1 | 10,500 | 28,348 | |||||
mutares | 1,500 | 21,661 | |||||
PNE Wind | 18,700 | 44,030 | |||||
VIB Vermoegen | 1,700 | 36,648 | |||||
| 220 | 41,792 | ||||||
| Total (Cost $374,777) | 383,532 | ||||||
| GREECE – 0.9% | |||||||
Aegean Marine Petroleum Network | 3,800 | 20,900 | |||||
StealthGas 1 | 7,800 | 29,484 | |||||
| Total (Cost $109,954) | 50,384 | ||||||
| HONG KONG – 6.7% | |||||||
China Metal International Holdings | 209,800 | 67,705 | |||||
Esprit Holdings 1 | 30,500 | 22,777 | |||||
I.T | 186,500 | 55,481 | |||||
Le Saunda Holdings | 134,860 | 28,775 | |||||
Oriental Watch Holdings | 384,800 | 45,854 | |||||
Pico Far East Holdings | 340,000 | 96,171 | |||||
†Value Partners Group | 29,700 | 27,557 | |||||
VST Holdings | 157,500 | 45,066 | |||||
| Total (Cost $476,857) | 389,386 | ||||||
| INDIA – 2.6% | |||||||
CCL Products India | 11,000 | 40,459 | |||||
eClerx Services | 2,666 | 56,789 | |||||
†Manappuram Finance | 51,400 | 52,803 | |||||
| Total (Cost $95,004) | 150,051 | ||||||
| INDONESIA – 0.7% | |||||||
Selamat Sempurna | 118,100 | 41,807 | |||||
| Total (Cost $42,184) | 41,807 | ||||||
| IRELAND – 2.6% | |||||||
Ardmore Shipping | 3,800 | 25,726 | |||||
†Irish Continental Group | 6,700 | 31,349 | |||||
†Irish Residential Properties REIT | 28,930 | 35,796 | |||||
Trinity Biotech ADR Cl. A 1 | 5,200 | 58,968 | |||||
| Total (Cost $206,032) | 151,839 | ||||||
| ISRAEL – 1.1% | |||||||
Nova Measuring Instruments 1 | 5,650 | 61,811 | |||||
| Total (Cost $61,207) | 61,811 | ||||||
| ITALY – 1.5% | |||||||
Banca Sistema | 23,700 | 53,836 | |||||
†Gruppo MutuiOnline | 3,700 | 32,335 | |||||
| Total (Cost $99,592) | 86,171 | ||||||
| JAPAN – 9.4% | |||||||
GCA Savvian | 7,100 | 59,971 | |||||
†kabu.com Securities | 19,500 | 62,722 | |||||
Leopalace21 Corporation | 10,900 | 76,142 | |||||
Mandom Corporation | 900 | 41,208 | |||||
Pressance Corporation | 1,200 | 45,145 | |||||
SPARX Group | 34,600 | 61,652 | |||||
Sun Frontier Fudousan | 5,600 | 56,889 | |||||
| 50 | The Royce Funds 2016 Semiannual Report to Shareholders | THE ACCOMPANYING NOTES ARE AN INTEGRAL PART OF THESE FINANCIAL STATEMENTS |
| June 30, 2016 (unaudited) |
| Royce International Micro-Cap Fund (continued) | |||||||
| SHARES | VALUE | ||||||
| JAPAN (continued) | |||||||
Takara Leben | 5,600 | $ | 42,666 | ||||
Trancom | 900 | 59,244 | |||||
Zuiko Corporation | 900 | 38,359 | |||||
| Total (Cost $520,967) | 543,998 | ||||||
| MALAYSIA – 1.2% | |||||||
CB Industrial Product Holding | 60,700 | 30,744 | |||||
Kossan Rubber Industries | 22,500 | 38,274 | |||||
| Total (Cost $58,137) | 69,018 | ||||||
| MEXICO – 1.0% | |||||||
Consorcio ARA | 165,300 | 59,402 | |||||
| Total (Cost $63,925) | 59,402 | ||||||
| NETHERLANDS – 0.3% | |||||||
| 3,400 | 15,946 | ||||||
| Total (Cost $14,049) | 15,946 | ||||||
| NEW ZEALAND – 1.2% | |||||||
New Zealand Refining | 22,600 | 39,242 | |||||
†Summerset Group Holdings | 10,000 | 31,334 | |||||
| Total (Cost $79,125) | 70,576 | ||||||
| NORWAY – 1.6% | |||||||
Kongsberg Automotive 1 | 34,900 | 22,850 | |||||
Medistim | 5,600 | 38,108 | |||||
| 5,000 | 31,506 | ||||||
| Total (Cost $92,412) | 92,464 | ||||||
| PHILIPPINES – 0.6% | |||||||
†Integrated Micro-Electronics | 311,800 | 37,414 | |||||
| Total (Cost $38,498) | 37,414 | ||||||
| SINGAPORE – 0.7% | |||||||
CSE Global | 130,000 | 42,417 | |||||
| Total (Cost $42,691) | 42,417 | ||||||
| SOUTH AFRICA – 0.9% | |||||||
Net 1 UEPS Technologies 1 | 5,200 | 51,948 | |||||
| Total (Cost $83,320) | 51,948 | ||||||
| SOUTH KOREA – 3.2% | |||||||
Eugene Technology | 2,489 | 35,488 | |||||
Huvis Corporation | 2,750 | 18,701 | |||||
ISC | 1,104 | 25,436 | |||||
Koh Young Technology | 2,100 | 74,677 | |||||
†Modetour Network | 1,400 | 33,919 | |||||
| Total (Cost $197,443) | 188,221 | ||||||
| SPAIN – 0.6% | |||||||
Atento 1 | 3,800 | 33,858 | |||||
| Total (Cost $38,413) | 33,858 | ||||||
| SWEDEN – 2.2% | |||||||
| 3,400 | 24,647 | ||||||
Dustin Group | 9,800 | 65,178 | |||||
Proact IT Group | 3,100 | 39,967 | |||||
| Total (Cost $143,864) | 129,792 | ||||||
| TAIWAN – 7.6% | |||||||
†Chipbond Technology | 21,600 | 27,676 | |||||
| 9,700 | 46,705 | ||||||
Flytech Technology | 18,224 | 57,852 | |||||
King’s Town Bank | 39,600 | 26,270 | |||||
Kinik Company | 28,000 | 46,797 | |||||
Lumax International | 38,300 | 55,340 | |||||
†Posiflex Technology | 6,300 | 30,377 | |||||
Shih Her Technologies | 36,800 | 35,340 | |||||
Sporton International | 8,400 | 43,352 | |||||
UDE Corporation | 36,100 | 32,375 | |||||
†United Orthopedic | 14,500 | 40,380 | |||||
| Total (Cost $536,525) | 442,464 | ||||||
| THAILAND – 0.6% | |||||||
MC Group | 82,900 | 31,688 | |||||
| Total (Cost $31,753) | 31,688 | ||||||
| UNITED ARAB EMIRATES – 0.7% | |||||||
Aramex | 48,300 | 42,672 | |||||
| Total (Cost $23,700) | 42,672 | ||||||
| UNITED KINGDOM – 15.0% | |||||||
†BGEO Group | 900 | 31,846 | |||||
BrainJuicer Group | 4,100 | 18,766 | |||||
Character Group | 4,700 | 29,802 | |||||
†Connect Group | 28,200 | 55,601 | |||||
Conviviality | 24,600 | 59,931 | |||||
†dotdigital group | 84,500 | 45,501 | |||||
†EMIS Group | 5,500 | 67,800 | |||||
†Epwin Group | 19,200 | 28,212 | |||||
Finsbury Food Group | 35,700 | 51,613 | |||||
†Hilton Food Group | 10,600 | 77,946 | |||||
†Inspired Energy | 180,300 | 29,156 | |||||
†McBride | 20,400 | 42,383 | |||||
Norcros | 27,670 | 63,108 | |||||
Pendragon | 57,900 | 21,775 | |||||
†Rank Group | 8,600 | 24,780 | |||||
Real Estate Investors | 42,500 | 32,626 | |||||
Severfield | 58,000 | 38,139 | |||||
†Treatt | 18,800 | 41,067 | |||||
Trifast | 30,500 | 55,915 | |||||
Vertu Motors | 24,600 | 13,794 | |||||
Zeal Network | 1,100 | 38,369 | |||||
| Total (Cost $1,015,699) | 868,130 | ||||||
| UNITED STATES – 1.3% | |||||||
Century Casinos 1 | 11,800 | 73,514 | |||||
| Total (Cost $66,992) | 73,514 | ||||||
| TOTAL COMMON STOCKS | |||||||
| (Cost $5,939,970) | 5,533,598 | ||||||
| THE ACCOMPANYING NOTES ARE AN INTEGRAL PART OF THESE FINANCIAL STATEMENTS | The Royce Funds 2016 Semiannual Report to Shareholders | 51 |
Schedules of Investments
| Royce International Micro-Cap Fund (continued) | |||||||
| VALUE | |||||||
| REPURCHASE AGREEMENT– 4.8% | |||||||
| Fixed Income Clearing Corporation, 0.03% dated 6/30/16, due 7/1/16, maturity value $281,000 (collateralized by obligations of various U.S. Government Agencies, 0.125% due 4/15/19, valued at $286,688) | |||||||
| (Cost $281,000) | $ | 281,000 | |||||
| TOTAL INVESTMENTS – 100.2% | |||||||
| (Cost $6,220,970) | 5,814,598 | ||||||
| LIABILITIES LESS CASH AND OTHER ASSETS – (0.2)% | (12,271 | ) | |||||
| NET ASSETS – 100.0% | $ | 5,802,327 | |||||
| Royce International Premier Fund | |||||||
| Common Stocks – 96.4% | |||||||
| SHARES | VALUE | ||||||
| AUSTRALIA – 1.5% | |||||||
Cochlear | 12,500 | $ | 1,133,768 | ||||
| Total (Cost $963,014) | 1,133,768 | ||||||
| AUSTRIA – 3.2% | |||||||
Mayr-Melnhof Karton | 21,500 | 2,342,837 | |||||
| Total (Cost $2,506,519) | 2,342,837 | ||||||
| BRAZIL – 2.7% | |||||||
†OdontoPrev | 475,000 | 1,968,138 | |||||
| Total (Cost $1,312,151) | 1,968,138 | ||||||
| CANADA – 2.3% | |||||||
†Morneau Shepell | 70,000 | 961,183 | |||||
†Winpak | 20,000 | 734,858 | |||||
| Total (Cost $1,680,957) | 1,696,041 | ||||||
| CHINA – 1.6% | |||||||
TravelSky Technology | 610,000 | 1,179,675 | |||||
| Total (Cost $877,175) | 1,179,675 | ||||||
| DENMARK – 1.8% | |||||||
SimCorp | 27,000 | 1,324,881 | |||||
| Total (Cost $1,365,813) | 1,324,881 | ||||||
| FRANCE – 4.9% | |||||||
Thermador Groupe | 22,500 | 1,944,927 | |||||
Virbac 1 | 9,000 | 1,637,578 | |||||
| Total (Cost $3,971,771) | 3,582,505 | ||||||
| GERMANY – 10.8% | |||||||
Bertrandt | 19,000 | 1,859,482 | |||||
Carl Zeiss Meditec | 41,500 | 1,678,227 | |||||
Fielmann | 17,500 | 1,279,138 | |||||
KWS Saat | 4,900 | 1,620,156 | |||||
STRATEC Biomedical | 25,000 | 1,443,834 | |||||
| Total (Cost $7,496,298) | 7,880,837 | ||||||
| HONG KONG – 2.0% | |||||||
Value Partners Group | 1,550,000 | 1,438,142 | |||||
| Total (Cost $1,538,714) | 1,438,142 | ||||||
| INDIA – 2.8% | |||||||
Bajaj Finance | 17,500 | 2,077,560 | |||||
| Total (Cost $1,444,902) | 2,077,560 | ||||||
| ITALY – 1.7% | |||||||
DiaSorin | 20,000 | 1,227,248 | |||||
| Total (Cost $829,305) | 1,227,248 | ||||||
| JAPAN – 22.3% | |||||||
Horiba | 32,500 | 1,421,046 | |||||
Meitec Corporation | 67,500 | 2,281,092 | |||||
MISUMI Group | 115,000 | 2,059,514 | |||||
Nihon Kohden | 57,500 | 1,611,156 | |||||
†Omron Corporation | 45,000 | 1,458,084 | |||||
†Relo Holdings | 9,000 | 1,577,346 | |||||
Santen Pharmaceutical | 120,000 | 1,871,398 | |||||
Trend Micro | 50,000 | 1,780,785 | |||||
USS | 140,000 | 2,296,216 | |||||
| Total (Cost $14,311,079) | 16,356,637 | ||||||
| 52 | The Royce Funds 2016 Semiannual Report to Shareholders | THE ACCOMPANYING NOTES ARE AN INTEGRAL PART OF THESE FINANCIAL STATEMENTS |
| June 30, 2016 (unaudited) |
| Royce International Premier Fund (continued) | |||||||
| SHARES | VALUE | ||||||
| NEW ZEALAND – 2.1% | |||||||
Fisher & Paykel Healthcare | 215,000 | $ | 1,543,266 | ||||
| Total (Cost $1,231,099) | 1,543,266 | ||||||
| SINGAPORE – 1.4% | |||||||
XP Power | 48,000 | 995,602 | |||||
| Total (Cost $1,071,852) | 995,602 | ||||||
| SWEDEN – 3.0% | |||||||
Addtech Cl. B | 100,000 | 1,254,856 | |||||
†Bravida Holding | 160,000 | 959,950 | |||||
| Total (Cost $2,289,985) | 2,214,806 | ||||||
| SWITZERLAND – 12.9% | |||||||
Burckhardt Compression Holding | 4,800 | 1,493,042 | |||||
dorma+kaba Holding | 2,000 | 1,395,358 | |||||
Inficon Holding | 2,800 | 951,790 | |||||
LEM Holding | 1,350 | 1,215,193 | |||||
Partners Group Holding | 4,650 | 1,993,899 | |||||
VZ Holding | 8,000 | 2,386,794 | |||||
| Total (Cost $7,724,788) | 9,436,076 | ||||||
| UNITED KINGDOM – 19.4% | |||||||
Berendsen | 75,000 | 1,221,867 | |||||
Clarkson | 35,000 | 1,037,267 | |||||
Consort Medical | 115,000 | 1,604,770 | |||||
Diploma | 120,000 | 1,336,115 | |||||
Elementis | 249,100 | 664,023 | |||||
Exova Group | 500,000 | 1,203,676 | |||||
†FDM Group Holdings | 132,500 | 795,397 | |||||
ITE Group | 700,000 | 1,334,303 | |||||
Rotork | 325,000 | 933,013 | |||||
Senior | 430,000 | 1,181,171 | |||||
Spirax-Sarco Engineering | 25,000 | 1,247,948 | |||||
Victrex | 83,500 | 1,684,072 | |||||
| Total (Cost $15,907,347) | 14,243,622 | ||||||
| TOTAL COMMON STOCKS | |||||||
| (Cost $66,522,769) | 70,641,641 | ||||||
| REPURCHASE AGREEMENT– 3.8% | |||||||
| Fixed Income Clearing Corporation, 0.03% dated 6/30/16, due 7/1/16, maturity value $2,826,002 (collateralized by obligations of various U.S. Government Agencies, 0.125% due 4/15/19, valued at $2,887,725) | |||||||
| (Cost $2,826,000) | 2,826,000 | ||||||
| TOTAL INVESTMENTS – 100.2% | |||||||
| (Cost $69,348,769) | 73,467,641 | ||||||
| LIABILITIES LESS CASH AND OTHER ASSETS – (0.2)% | (176,623 | ) | |||||
| NET ASSETS – 100.0% | $ | 73,291,018 | |||||
| Royce International Small-Cap Fund | |||||||
| Common Stocks – 85.3% | |||||||
| SHARES | VALUE | ||||||
| AUSTRALIA – 1.1% | |||||||
| 52,700 | $ | 47,557 | |||||
TFS Corporation | 40,000 | 42,108 | |||||
| Total (Cost $105,309) | 89,665 | ||||||
| AUSTRIA – 1.5% | |||||||
Mayr-Melnhof Karton | 500 | 54,485 | |||||
UBM Development | 2,000 | 65,544 | |||||
| Total (Cost $130,743) | 120,029 | ||||||
| BRAZIL – 1.9% | |||||||
T4F Entretenimento | 75,100 | 154,301 | |||||
| Total (Cost $93,949) | 154,301 | ||||||
| CANADA – 6.0% | |||||||
Exco Technologies | 6,400 | 60,436 | |||||
Intertape Polymer Group | 3,700 | 60,371 | |||||
Just Energy Group | 6,700 | 40,736 | |||||
Magellan Aerospace | 12,400 | 172,858 | |||||
Morneau Shepell | 5,500 | 75,521 | |||||
| 18,600 | 82,956 | ||||||
| Total (Cost $419,095) | 492,878 | ||||||
| CHINA – 6.9% | |||||||
†China Lesso Group Holdings | 118,900 | 63,655 | |||||
China Medical System Holdings | 38,400 | 58,956 | |||||
| 146,400 | 57,552 | ||||||
| 268,600 | 57,742 | ||||||
Haitian International Holdings | 50,005 | 89,621 | |||||
Minth Group | 53,453 | 173,098 | |||||
Xtep International Holdings | 124,200 | 67,050 | |||||
| Total (Cost $578,939) | 567,674 | ||||||
| FINLAND – 0.4% | |||||||
BasWare 1 | 800 | 30,721 | |||||
| Total (Cost $37,496) | 30,721 | ||||||
| FRANCE – 1.6% | |||||||
†Groupe Crit | 600 | 40,027 | |||||
†Synergie | 1,200 | 34,283 | |||||
Technicolor | 9,418 | 58,429 | |||||
| Total (Cost $151,506) | 132,739 | ||||||
| GERMANY – 5.5% | |||||||
ADLER Real Estate 1 | 4,332 | 54,884 | |||||
| 10,932 | 0 | ||||||
AURELIUS | 1,901 | 111,754 | |||||
†CANCOM | 1,700 | 84,465 | |||||
Hella KGaA Hueck & Co. | 1,737 | 55,596 | |||||
Hornbach Holding AG & Co. KGaA | 400 | 27,098 | |||||
PNE Wind | 9,641 | 22,700 | |||||
Takkt | 2,900 | 57,079 | |||||
| 200 | 37,993 | ||||||
| Total (Cost $487,076) | 451,569 | ||||||
| HONG KONG – 10.0% | |||||||
Esprit Holdings 1 | 43,100 | 32,186 | |||||
†HKBN | 85,600 | 90,075 | |||||
I.T | 253,100 | 75,294 | |||||
†Kerry Logistics Network | 35,600 | 45,996 | |||||
Man Wah Holdings | 63,825 | 91,887 | |||||
Pacific Textiles Holdings | 69,935 | 87,513 | |||||
| THE ACCOMPANYING NOTES ARE AN INTEGRAL PART OF THESE FINANCIAL STATEMENTS | The Royce Funds 2016 Semiannual Report to Shareholders | 53 |
Schedules of Investments
| Royce International Small-Cap Fund (continued) | |||||||
| SHARES | VALUE | ||||||
| HONG KONG (continued) | |||||||
†Skyworth Digital Holdings | 117,700 | $ | 97,732 | ||||
Texwinca Holdings | 131,141 | 97,450 | |||||
†Tongda Group Holdings | 311,100 | 61,282 | |||||
Value Partners Group | 65,534 | 60,805 | |||||
VST Holdings | 283,300 | 81,062 | |||||
| Total (Cost $891,491) | 821,282 | ||||||
| INDIA – 3.5% | |||||||
†CCL Products India | 14,800 | 54,436 | |||||
†Cholamandalam Investment and Finance | 5,400 | 75,720 | |||||
†Manappuram Finance | 70,200 | 72,116 | |||||
Thomas Cook (India) | 26,000 | 84,344 | |||||
| Total (Cost $185,557) | 286,616 | ||||||
| INDONESIA – 1.1% | |||||||
Selamat Sempurna | 263,400 | 93,243 | |||||
| Total (Cost $94,230) | 93,243 | ||||||
| IRELAND – 1.0% | |||||||
†Irish Continental Group | 7,900 | 36,964 | |||||
†Irish Residential Properties REIT | 36,900 | 45,657 | |||||
| Total (Cost $91,860) | 82,621 | ||||||
| ITALY – 2.3% | |||||||
Banca Sistema | 27,100 | 61,560 | |||||
Cerved Information Solutions | 10,728 | 84,585 | |||||
†Gruppo MutuiOnline | 4,600 | 40,200 | |||||
| Total (Cost $202,796) | 186,345 | ||||||
| JAPAN – 14.3% | |||||||
GCA Savvian | 10,800 | 91,223 | |||||
kabu.com Securities | 30,900 | 99,390 | |||||
Kakaku.com | 3,000 | 59,139 | |||||
Kenedix | 21,800 | 81,383 | |||||
Leopalace21 Corporation | 16,400 | 114,562 | |||||
Mandom Corporation | 1,200 | 54,945 | |||||
Meitec Corporation | 1,800 | 60,829 | |||||
MISUMI Group | 5,800 | 103,871 | |||||
Nifco | 1,700 | 88,498 | |||||
Relo Holdings | 400 | 70,104 | |||||
SPARX Group | 57,700 | 102,813 | |||||
Sun Frontier Fudousan | 9,200 | 93,460 | |||||
Takara Leben | 8,700 | 66,285 | |||||
Trancom | 1,400 | 92,157 | |||||
| Total (Cost $1,165,221) | 1,178,659 | ||||||
| MALAYSIA – 0.6% | |||||||
Kossan Rubber Industries | 31,400 | 53,413 | |||||
| Total (Cost $48,595) | 53,413 | ||||||
| MEXICO – 2.1% | |||||||
Consorcio ARA | 187,200 | 67,272 | |||||
Industrias Bachoco ADR | 2,183 | 107,840 | |||||
| Total (Cost $187,248) | 175,112 | ||||||
| NEW ZEALAND – 1.2% | |||||||
New Zealand Refining | 30,400 | 52,786 | |||||
†Summerset Group Holdings | 13,900 | 43,554 | |||||
| Total (Cost $112,277) | 96,340 | ||||||
| SOUTH KOREA – 5.4% | |||||||
CJ Korea Express 1 | 500 | 94,243 | |||||
Eugene Technology | 3,437 | 49,005 | |||||
Hanssem | 700 | 96,633 | |||||
Koh Young Technology | 3,000 | 106,681 | |||||
†Modetour Network | 3,900 | 94,488 | |||||
| Total (Cost $454,554) | 441,050 | ||||||
| SPAIN – 1.3% | |||||||
Atento 1 | 7,324 | 65,257 | |||||
†Papeles y Cartones de Europa | 8,600 | 45,581 | |||||
| Total (Cost $144,258) | 110,838 | ||||||
| SWEDEN – 1.7% | |||||||
†Dustin Group | 12,400 | 82,470 | |||||
†Indutrade | 3,000 | 59,183 | |||||
| Total (Cost $142,575) | 141,653 | ||||||
| TAIWAN – 3.1% | |||||||
| 15,000 | 72,225 | ||||||
Flytech Technology | 24,100 | 76,506 | |||||
†Posiflex Technology | 8,800 | 42,431 | |||||
Sporton International | 11,600 | 59,867 | |||||
| Total (Cost $265,363) | 251,029 | ||||||
| UNITED ARAB EMIRATES – 0.8% | |||||||
Aramex | 73,085 | 64,569 | |||||
| Total (Cost $59,368) | 64,569 | ||||||
| UNITED KINGDOM – 12.0% | |||||||
†BGEO Group | 1,000 | 35,384 | |||||
Computacenter | 10,700 | 106,090 | |||||
Consort Medical | 2,300 | 32,095 | |||||
Conviviality | 36,700 | 89,409 | |||||
†dotdigital group | 119,000 | 64,078 | |||||
†Electrocomponents | 10,300 | 35,802 | |||||
EMIS Group | 7,209 | 88,867 | |||||
†Epwin Group | 16,154 | 23,737 | |||||
Finsbury Food Group | 44,300 | 64,046 | |||||
Halma | 4,600 | 62,431 | |||||
†Hilton Food Group | 13,000 | 95,594 | |||||
†McBride | 57,800 | 120,085 | |||||
†Micro Focus International | 4,100 | 88,687 | |||||
Pendragon | 112,900 | 42,459 | |||||
†SIG | 27,600 | 41,497 | |||||
| Total (Cost $1,129,550) | 990,261 | ||||||
| TOTAL COMMON STOCKS | |||||||
| (Cost $7,179,056) | 7,012,607 | ||||||
| 54 | The Royce Funds 2016 Semiannual Report to Shareholders | THE ACCOMPANYING NOTES ARE AN INTEGRAL PART OF THESE FINANCIAL STATEMENTS |
| June 30, 2016 (unaudited) |
| Royce International Small-Cap Fund (continued) | |||||||
| VALUE | |||||||
| REPURCHASE AGREEMENT– 63.3% | |||||||
| Fixed Income Clearing Corporation, 0.03% dated 6/30/16, due 7/1/16, maturity value $5,200,004 (collateralized by obligations of various U.S. Government Agencies, 0.125% due 4/15/19, valued at $5,306,325) | |||||||
| (Cost $5,200,000) | $ | 5,200,000 | |||||
| TOTAL INVESTMENTS – 148.6% | |||||||
| (Cost $12,379,056) | 12,212,607 | ||||||
| LIABILITIES LESS CASH AND OTHER ASSETS – (48.6)% | (3,992,770 | ) | |||||
| NET ASSETS – 100.0% | $ | 8,219,837 | |||||
| Royce Low-Priced Stock Fund | |||||||
| Common Stocks – 99.0% | |||||||
| SHARES | VALUE | ||||||
| CONSUMER DISCRETIONARY – 18.0% | |||||||
| AUTO COMPONENTS - 1.9% | |||||||
Fox Factory Holding 1 | 129,000 | $ | 2,240,730 | ||||
Stoneridge 1 | 136,200 | 2,034,828 | |||||
Unique Fabricating | 129,589 | 1,735,197 | |||||
| 6,010,755 | |||||||
| AUTOMOBILES - 0.8% | |||||||
Thor Industries | 36,303 | 2,350,256 | |||||
| DISTRIBUTORS - 0.4% | |||||||
| 330,800 | 1,300,044 | ||||||
| HOTELS, RESTAURANTS & LEISURE - 1.3% | |||||||
Belmond Cl. A 1 | 194,200 | 1,922,580 | |||||
Century Casinos 1 | 355,000 | 2,211,650 | |||||
| 4,134,230 | |||||||
| HOUSEHOLD DURABLES - 0.7% | |||||||
TRI Pointe Group 1 | 188,700 | 2,230,434 | |||||
| INTERNET & CATALOG RETAIL - 0.4% | |||||||
Gaiam Cl. A 1 | 168,300 | 1,302,642 | |||||
| LEISURE PRODUCTS - 2.0% | |||||||
MCBC Holdings | 158,100 | 1,747,005 | |||||
Nautilus 1 | 115,113 | 2,053,616 | |||||
| 81,400 | 2,212,452 | ||||||
| 6,013,073 | |||||||
| MEDIA - 1.1% | |||||||
Harte-Hanks | 803,400 | 1,277,406 | |||||
New Media Investment Group | 109,300 | 1,975,051 | |||||
| 3,252,457 | |||||||
| MULTILINE RETAIL - 0.5% | |||||||
| 185,000 | 1,642,800 | ||||||
| SPECIALTY RETAIL - 8.2% | |||||||
American Eagle Outfitters | 199,600 | 3,179,628 | |||||
| 266,200 | 1,860,738 | ||||||
Boot Barn Holdings 1 | 197,000 | 1,698,140 | |||||
Buckle (The) | 84,275 | 2,190,307 | |||||
Build-A-Bear Workshop 1 | 129,500 | 1,737,890 | |||||
Cato Corporation (The) Cl. A | 59,850 | 2,257,542 | |||||
Chico’s FAS | 219,300 | 2,348,703 | |||||
Kirkland’s 1 | 136,600 | 2,005,288 | |||||
Shoe Carnival | 65,000 | 1,628,900 | |||||
Stein Mart | 374,200 | 2,888,824 | |||||
TravelCenters of America LLC 1 | 186,900 | 1,525,104 | |||||
West Marine 1 | 243,300 | 2,041,287 | |||||
| 25,362,351 | |||||||
| TEXTILES, APPAREL & LUXURY GOODS - 0.7% | |||||||
Vera Bradley 1 | 142,200 | 2,014,974 | |||||
| Total (Cost $53,105,668) | 55,614,016 | ||||||
| CONSUMER STAPLES – 1.1% | |||||||
| FOOD PRODUCTS - 1.1% | |||||||
| 140,000 | 1,093,400 | ||||||
Landec Corporation 1 | 217,500 | 2,340,300 | |||||
| Total (Cost $3,780,824) | 3,433,700 | ||||||
| ENERGY – 6.4% | |||||||
| ENERGY EQUIPMENT & SERVICES - 4.8% | |||||||
Gulf Island Fabrication | 195,700 | 1,358,158 | |||||
Newpark Resources 1 | 333,500 | 1,930,965 | |||||
Pason Systems | 193,150 | 2,670,118 | |||||
| 1,214,651 | 1,348,263 | ||||||
Tesco Corporation 1 | 323,816 | 2,166,329 | |||||
| THE ACCOMPANYING NOTES ARE AN INTEGRAL PART OF THESE FINANCIAL STATEMENTS | The Royce Funds 2016 Semiannual Report to Shareholders | 55 |
Schedules of Investments
| Royce Low-Priced Stock Fund (continued) | |||||||
| SHARES | VALUE | ||||||
| ENERGY (continued) | |||||||
| ENERGY EQUIPMENT & SERVICES (continued) | |||||||
TGS-NOPEC Geophysical | 92,000 | $ | 1,504,392 | ||||
Total Energy Services | 210,100 | 2,107,586 | |||||
Unit Corporation 1 | 117,700 | 1,831,412 | |||||
| 14,917,223 | |||||||
| OIL, GAS & CONSUMABLE FUELS - 1.6% | |||||||
Ardmore Shipping | 324,700 | 2,198,219 | |||||
Panhandle Oil & Gas Cl. A | 80,600 | 1,343,602 | |||||
Synergy Resources 1 | 203,500 | 1,355,310 | |||||
| 4,897,131 | |||||||
| Total (Cost $19,094,259) | 19,814,354 | ||||||
| FINANCIALS – 15.1% | |||||||
| BANKS - 2.2% | |||||||
Blue Hills Bancorp | 163,000 | 2,405,880 | |||||
Boston Private Financial Holdings | 188,000 | 2,214,640 | |||||
Park Sterling | 302,500 | 2,144,725 | |||||
| 6,765,245 | |||||||
| CAPITAL MARKETS - 7.1% | |||||||
Ashmore Group | 515,363 | 2,086,470 | |||||
| 463,400 | 1,371,664 | ||||||
Dundee Corporation Cl. A 1 | 372,800 | 2,201,683 | |||||
Federated Investors Cl. B | 76,900 | 2,213,182 | |||||
Jupiter Fund Management | 280,349 | 1,382,149 | |||||
Medley Management Cl. A | 214,998 | 1,264,188 | |||||
Newtek Business Services | 144,300 | 1,835,496 | |||||
Pzena Investment Management Cl. A | 183,800 | 1,398,718 | |||||
Silvercrest Asset Management Group Cl. A | 182,500 | 2,233,800 | |||||
Sprott | 1,179,400 | 2,346,111 | |||||
Value Partners Group | 3,015,100 | 2,797,511 | |||||
| 265,800 | 746,898 | ||||||
| 21,877,870 | |||||||
| DIVERSIFIED FINANCIAL SERVICES - 0.6% | |||||||
GAIN Capital Holdings | 317,400 | 2,005,968 | |||||
| INSURANCE - 1.6% | |||||||
eHealth 1 | 196,500 | 2,754,930 | |||||
MBIA 1 | 304,500 | 2,079,735 | |||||
| 4,834,665 | |||||||
| REAL ESTATE MANAGEMENT & DEVELOPMENT - 1.4% | |||||||
| 229,100 | 2,799,602 | ||||||
Kennedy-Wilson Holdings | 86,430 | 1,638,713 | |||||
| 4,438,315 | |||||||
| THRIFTS & MORTGAGE FINANCE - 2.2% | |||||||
Beneficial Bancorp 1 | 155,000 | 1,971,600 | |||||
Clifton Bancorp | 160,000 | 2,411,200 | |||||
Kearny Financial | 183,300 | 2,305,914 | |||||
| 6,688,714 | |||||||
| Total (Cost $47,871,952) | 46,610,777 | ||||||
| HEALTH CARE – 7.1% | |||||||
| BIOTECHNOLOGY - 1.8% | |||||||
Myriad Genetics 1 | 42,369 | 1,296,492 | |||||
Progenics Pharmaceuticals 1 | 433,350 | 1,828,737 | |||||
Zealand Pharma 1 | 137,500 | 2,465,299 | |||||
| 5,590,528 | |||||||
| HEALTH CARE EQUIPMENT & SUPPLIES - 2.0% | |||||||
| 148,100 | 1,766,833 | ||||||
CryoLife | 201,000 | 2,373,810 | |||||
Syneron Medical 1 | 247,700 | 1,904,813 | |||||
| 6,045,456 | |||||||
| HEALTH CARE PROVIDERS & SERVICES - 0.4% | |||||||
| 597,800 | 1,333,094 | ||||||
| HEALTH CARE TECHNOLOGY - 0.8% | |||||||
Allscripts Healthcare Solutions 1 | 205,300 | 2,607,310 | |||||
| LIFE SCIENCES TOOLS & SERVICES - 0.4% | |||||||
Harvard Bioscience 1 | 468,100 | 1,338,766 | |||||
| PHARMACEUTICALS - 1.7% | |||||||
| 484,200 | 1,142,712 | ||||||
| 200,200 | 608,608 | ||||||
Medicines Company (The) 1 | 50,232 | 1,689,302 | |||||
| 93,000 | 1,720,500 | ||||||
| 5,161,122 | |||||||
| Total (Cost $23,001,308) | 22,076,276 | ||||||
| INDUSTRIALS – 17.1% | |||||||
| AEROSPACE & DEFENSE - 1.0% | |||||||
CPI Aerostructures 1 | 248,166 | 1,526,221 | |||||
Kratos Defense & Security Solutions 1 | 365,200 | 1,497,320 | |||||
| 3,023,541 | |||||||
| COMMERCIAL SERVICES & SUPPLIES - 2.3% | |||||||
| 180,600 | 1,609,146 | ||||||
Heritage-Crystal Clean 1 | 157,900 | 1,927,959 | |||||
Hudson Technologies 1 | 513,300 | 1,847,880 | |||||
Steelcase Cl. A | 135,000 | 1,831,950 | |||||
| 7,216,935 | |||||||
| CONSTRUCTION & ENGINEERING - 1.9% | |||||||
Ameresco Cl. A 1 | 400,500 | 1,750,185 | |||||
IES Holdings 1 | 129,800 | 1,612,116 | |||||
KBR | 175,000 | 2,317,000 | |||||
| 5,679,301 | |||||||
| ELECTRICAL EQUIPMENT - 0.9% | |||||||
LSI Industries | 251,600 | 2,785,212 | |||||
| INDUSTRIAL CONGLOMERATES - 0.8% | |||||||
†Raven Industries | 131,200 | 2,484,928 | |||||
| MACHINERY - 2.4% | |||||||
Key Technology 1 | 133,698 | 1,231,359 | |||||
Mueller Water Products Cl. A | 217,500 | 2,483,850 | |||||
Porvair | 407,000 | 1,906,019 | |||||
Wabash National 1 | 130,000 | 1,651,000 | |||||
| 7,272,228 | |||||||
| MARINE - 0.7% | |||||||
Clarkson | 75,831 | 2,247,342 | |||||
| PROFESSIONAL SERVICES - 6.1% | |||||||
Acacia Research 1 | 341,905 | 1,504,382 | |||||
Heidrick & Struggles International | 121,740 | 2,054,971 | |||||
Kforce | 160,374 | 2,708,717 | |||||
Korn/Ferry International | 97,840 | 2,025,288 | |||||
Navigant Consulting 1 | 180,923 | 2,921,906 | |||||
Resources Connection | 239,200 | 3,535,376 | |||||
RPX Corporation 1 | 213,900 | 1,961,463 | |||||
TrueBlue 1 | 116,794 | 2,209,743 | |||||
| 18,921,846 | |||||||
| ROAD & RAIL - 0.5% | |||||||
Werner Enterprises | 70,000 | 1,607,900 | |||||
| 56 | The Royce Funds 2016 Semiannual Report to Shareholders | THE ACCOMPANYING NOTES ARE AN INTEGRAL PART OF THESE FINANCIAL STATEMENTS |
| June 30, 2016 (unaudited) |
| Royce Low-Priced Stock Fund (continued) | |||||||
| SHARES | VALUE | ||||||
| INDUSTRIALS (continued) | |||||||
| TRANSPORTATION INFRASTRUCTURE - 0.5% | |||||||
Wesco Aircraft Holdings 1 | 116,600 | $ | 1,564,772 | ||||
| Total (Cost $57,370,630) | 52,804,005 | ||||||
| INFORMATION TECHNOLOGY – 25.1% | |||||||
| COMMUNICATIONS EQUIPMENT - 3.0% | |||||||
Brocade Communications Systems | 285,100 | 2,617,218 | |||||
| 375,000 | 1,068,750 | ||||||
Infinera Corporation 1 | 197,200 | 2,224,416 | |||||
Ixia 1 | 166,200 | 1,632,084 | |||||
KVH Industries 1 | 237,015 | 1,825,016 | |||||
| 9,367,484 | |||||||
| ELECTRONIC EQUIPMENT, INSTRUMENTS & COMPONENTS - 4.4% | |||||||
AVX Corporation | 162,378 | 2,205,093 | |||||
| 710,500 | 1,037,330 | ||||||
Novanta 1 | 161,200 | 2,442,180 | |||||
Orbotech 1 | 108,500 | 2,772,175 | |||||
TTM Technologies 1 | 388,958 | 2,928,854 | |||||
Vishay Intertechnology | 169,150 | 2,095,768 | |||||
| 13,481,400 | |||||||
| INTERNET SOFTWARE & SERVICES - 3.5% | |||||||
| 271,400 | 2,092,494 | ||||||
Carbonite 1 | 198,100 | 1,927,513 | |||||
EarthLink Holdings | 277,700 | 1,777,280 | |||||
Intralinks Holdings 1 | 306,600 | 1,992,900 | |||||
QuinStreet 1 | 780,900 | 2,772,195 | |||||
| 481,800 | 365,466 | ||||||
| 10,927,848 | |||||||
| IT SERVICES - 0.5% | |||||||
Computer Task Group | 310,000 | 1,540,700 | |||||
| SEMICONDUCTORS & SEMICONDUCTOR EQUIPMENT - 10.9% | |||||||
Axcelis Technologies 1 | 179,800 | 483,662 | |||||
Brooks Automation | 195,582 | 2,194,430 | |||||
Cirrus Logic 1 | 77,600 | 3,010,104 | |||||
Exar Corporation 1 | 192,000 | 1,545,600 | |||||
Inphi Corporation 1 | 45,900 | 1,470,177 | |||||
IXYS Corporation | 240,000 | 2,460,000 | |||||
Lam Research | 33,300 | 2,799,198 | |||||
MKS Instruments | 67,627 | 2,912,018 | |||||
Nanometrics 1 | 122,192 | 2,540,372 | |||||
PDF Solutions 1 | 207,100 | 2,897,329 | |||||
Photronics 1 | 258,600 | 2,304,126 | |||||
Rudolph Technologies 1 | 156,500 | 2,430,445 | |||||
Sigma Designs 1 | 278,000 | 1,787,540 | |||||
Teradyne | 138,275 | 2,722,635 | |||||
Xcerra Corporation 1 | 352,000 | 2,024,000 | |||||
| 33,581,636 | |||||||
| SOFTWARE - 1.7% | |||||||
Computer Modelling Group | 210,900 | 1,687,919 | |||||
Rubicon Project 1 | 148,700 | 2,029,755 | |||||
SeaChange International 1 | 521,575 | 1,663,824 | |||||
| 5,381,498 | |||||||
| TECHNOLOGY HARDWARE, STORAGE & PERIPHERALS - 1.1% | |||||||
Silicon Graphics International 1 | 332,000 | 1,669,960 | |||||
Super Micro Computer 1 | 72,100 | 1,791,685 | |||||
| 3,461,645 | |||||||
| Total (Cost $70,103,642) | 77,742,211 | ||||||
| MATERIALS – 4.2% | |||||||
| CHEMICALS - 1.6% | |||||||
| 383,200 | 1,141,936 | ||||||
Trecora Resources 1 | 203,200 | 2,119,376 | |||||
Victrex | 80,000 | 1,613,482 | |||||
| 4,874,794 | |||||||
| METALS & MINING - 2.6% | |||||||
Alamos Gold Cl. A | 187,800 | 1,614,968 | |||||
Ferroglobe | 215,763 | 1,857,719 | |||||
NovaGold Resources 1 | 100,000 | 612,000 | |||||
| 600,000 | 2,167,699 | ||||||
Pretium Resources 1 | 156,000 | 1,746,012 | |||||
| 7,998,398 | |||||||
| Total (Cost $14,029,347) | 12,873,192 | ||||||
| TELECOMMUNICATION SERVICES – 0.5% | |||||||
| DIVERSIFIED TELECOMMUNICATION SERVICES - 0.5% | |||||||
ORBCOMM 1 | 173,500 | 1,726,325 | |||||
| Total (Cost $1,022,198) | 1,726,325 | ||||||
| MISCELLANEOUS2 – 4.4% | |||||||
| Total (Cost $12,878,464) | 13,615,063 | ||||||
| TOTAL COMMON STOCKS | |||||||
| (Cost $302,258,292) | 306,309,919 | ||||||
| REPURCHASE AGREEMENT– 2.4% | |||||||
| Fixed Income Clearing Corporation, 0.03% dated 6/30/16, due 7/1/16, maturity value $7,386,006 (collateralized by obligations of various U.S. Government Agencies, 0.125% due 4/15/19, valued at $7,537,275) | |||||||
| (Cost $7,386,000) | 7,386,000 | ||||||
| COLLATERAL RECEIVED FOR SECURITIES LOANED – 4.8% | |||||||
| Money Market Funds | |||||||
Federated Government Obligations Fund (7 day yield-0.2459%) | |||||||
| (Cost $15,056,726) | 15,056,726 | ||||||
| TOTAL INVESTMENTS – 106.2% | |||||||
| (Cost $324,701,018) | 328,752,645 | ||||||
| LIABILITIES LESS CASH AND OTHER ASSETS – (6.2)% | (19,319,819 | ) | |||||
| NET ASSETS – 100.0% | $ | 309,432,826 | |||||
| THE ACCOMPANYING NOTES ARE AN INTEGRAL PART OF THESE FINANCIAL STATEMENTS | The Royce Funds 2016 Semiannual Report to Shareholders | 57 |
Schedules of Investments
| Royce Micro-Cap Fund | |||||||
| Common Stocks – 93.9% | |||||||
| SHARES | VALUE | ||||||
| CONSUMER DISCRETIONARY – 15.5% | |||||||
| AUTO COMPONENTS - 3.8% | |||||||
Drew Industries | 15,878 | $ | 1,347,089 | ||||
Fox Factory Holding 1 | 94,900 | 1,648,413 | |||||
Standard Motor Products | 59,600 | 2,370,888 | |||||
Stoneridge 1 | 85,800 | 1,281,852 | |||||
Superior Industries International | 55,100 | 1,475,578 | |||||
Unique Fabricating | 59,400 | 795,366 | |||||
| 8,919,186 | |||||||
| DISTRIBUTORS - 0.4% | |||||||
Fenix Parts 1 | 220,900 | 868,137 | |||||
| DIVERSIFIED CONSUMER SERVICES - 0.8% | |||||||
American Public Education 1 | 30 | 843 | |||||
Capella Education | 36,051 | 1,897,725 | |||||
| 1,898,568 | |||||||
| HOUSEHOLD DURABLES - 0.8% | |||||||
Cavco Industries 1 | 18,610 | 1,743,757 | |||||
| INTERNET & CATALOG RETAIL - 0.4% | |||||||
Gaiam Cl. A 1 | 122,262 | 946,308 | |||||
| LEISURE PRODUCTS - 1.6% | |||||||
Malibu Boats Cl. A 1 | 118,000 | 1,425,440 | |||||
MCBC Holdings | 67,400 | 744,770 | |||||
Smith & Wesson Holding Corporation 1 | 54,665 | 1,485,795 | |||||
| 3,656,005 | |||||||
| MEDIA - 0.7% | |||||||
New Media Investment Group | 95,500 | 1,725,685 | |||||
| SPECIALTY RETAIL - 5.8% | |||||||
Boot Barn Holdings 1 | 139,000 | 1,198,180 | |||||
Buckle (The) | 44,275 | 1,150,707 | |||||
Build-A-Bear Workshop 1 | 87,000 | 1,167,540 | |||||
Cato Corporation (The) Cl. A | 30,450 | 1,148,574 | |||||
Citi Trends | 128,724 | 1,999,084 | |||||
Container Store Group (The) 1 | 130,800 | 699,780 | |||||
Kirkland’s 1 | 128,340 | 1,884,031 | |||||
Shoe Carnival | 80,714 | 2,022,693 | |||||
Stein Mart | 278,934 | 2,153,370 | |||||
| 13,423,959 | |||||||
| TEXTILES, APPAREL & LUXURY GOODS - 1.2% | |||||||
Culp | 58,474 | 1,615,637 | |||||
Vera Bradley 1 | 87,800 | 1,244,126 | |||||
| 2,859,763 | |||||||
| Total (Cost $30,684,687) | 36,041,368 | ||||||
| CONSUMER STAPLES – 0.9% | |||||||
| FOOD PRODUCTS - 0.9% | |||||||
Limoneira Company | 69,530 | 1,225,118 | |||||
| 2,760,860 | 773,041 | ||||||
| Total (Cost $2,206,232) | 1,998,159 | ||||||
| ENERGY – 4.6% | |||||||
| ENERGY EQUIPMENT & SERVICES - 3.5% | |||||||
Gulf Island Fabrication | 203,918 | 1,415,191 | |||||
Natural Gas Services Group 1 | 68,087 | 1,559,192 | |||||
Newpark Resources 1 | 223,000 | 1,291,170 | |||||
| 763,312 | 847,276 | ||||||
Tesco Corporation 1 | 215,200 | 1,439,688 | |||||
Total Energy Services | 151,900 | 1,523,762 | |||||
| 8,076,279 | |||||||
| OIL, GAS & CONSUMABLE FUELS - 1.1% | |||||||
Ardmore Shipping | 235,675 | 1,595,520 | |||||
Panhandle Oil & Gas Cl. A | 58,700 | 978,529 | |||||
| 2,574,049 | |||||||
| Total (Cost $12,536,017) | 10,650,328 | ||||||
| FINANCIALS – 11.9% | |||||||
| BANKS - 2.2% | |||||||
Blue Hills Bancorp | 76,500 | 1,129,140 | |||||
Caribbean Investment Holdings 1 | 1,858,170 | 185,526 | |||||
County Bancorp | 40,800 | 841,296 | |||||
| 20,040 | 322,243 | ||||||
Park Sterling | 157,200 | 1,114,548 | |||||
TriState Capital Holdings 1 | 101,157 | 1,388,886 | |||||
| 4,981,639 | |||||||
| CAPITAL MARKETS - 3.3% | |||||||
FBR & Co. | 62,842 | 938,231 | |||||
Gluskin Sheff + Associates | 122,400 | 1,579,324 | |||||
Newtek Business Services | 87,249 | 1,109,807 | |||||
Pzena Investment Management Cl. A | 132,100 | 1,005,281 | |||||
Silvercrest Asset Management Group Cl. A | 133,300 | 1,631,592 | |||||
Westwood Holdings Group | 26,172 | 1,355,710 | |||||
| 7,619,945 | |||||||
| DIVERSIFIED FINANCIAL SERVICES - 0.6% | |||||||
GAIN Capital Holdings | 223,200 | 1,410,624 | |||||
| INSURANCE - 1.6% | |||||||
Atlas Financial Holdings 1 | 60,500 | 1,041,810 | |||||
Blue Capital Reinsurance Holdings | 51,300 | 949,563 | |||||
eHealth 1 | 122,800 | 1,721,656 | |||||
| 3,713,029 | |||||||
| REAL ESTATE MANAGEMENT & DEVELOPMENT - 1.4% | |||||||
AV Homes 1 | 156,950 | 1,917,929 | |||||
FRP Holdings 1 | 39,275 | 1,354,988 | |||||
| 3,272,917 | |||||||
| THRIFTS & MORTGAGE FINANCE - 2.8% | |||||||
Beneficial Bancorp 1 | 101,400 | 1,289,808 | |||||
Clifton Bancorp | 96,200 | 1,449,734 | |||||
HomeStreet 1 | 59,400 | 1,183,248 | |||||
Meridian Bancorp | 105,600 | 1,560,768 | |||||
Westfield Financial | 137,700 | 1,060,290 | |||||
| 6,543,848 | |||||||
| Total (Cost $26,923,067) | 27,542,002 | ||||||
| HEALTH CARE – 11.2% | |||||||
| BIOTECHNOLOGY - 2.5% | |||||||
BioSpecifics Technologies 1 | 28,500 | 1,138,290 | |||||
| 61,300 | 893,754 | ||||||
Genomic Health 1 | 36,900 | 955,525 | |||||
Progenics Pharmaceuticals 1 | 265,300 | 1,119,566 | |||||
Zealand Pharma 1 | 87,200 | 1,563,448 | |||||
| 5,670,583 | |||||||
| HEALTH CARE EQUIPMENT & SUPPLIES - 4.6% | |||||||
AtriCure 1 | 64,900 | 917,037 | |||||
Avinger 1 | 99,600 | 1,188,228 | |||||
| 90,200 | 633,204 | ||||||
CryoLife | 157,155 | 1,856,000 | |||||
| 77,621 | 763,791 | ||||||
Orthofix International 1 | 28,800 | 1,221,120 | |||||
SurModics 1 | 62,822 | 1,475,061 | |||||
| 196,684 | 37,370 | ||||||
| 58 | The Royce Funds 2016 Semiannual Report to Shareholders | THE ACCOMPANYING NOTES ARE AN INTEGRAL PART OF THESE FINANCIAL STATEMENTS |
| June 30, 2016 (unaudited) |
| Royce Micro-Cap Fund (continued) | |||||||
| SHARES | VALUE | ||||||
| HEALTH CARE (continued) | |||||||
| HEALTH CARE EQUIPMENT & SUPPLIES (continued) | |||||||
Syneron Medical 1 | 180,690 | $ | 1,389,506 | ||||
| 110,176 | 1,249,396 | ||||||
| 10,730,713 | |||||||
| HEALTH CARE PROVIDERS & SERVICES - 1.3% | |||||||
Landauer | 49,400 | 2,033,304 | |||||
| 389,500 | 868,585 | ||||||
| 2,901,889 | |||||||
| LIFE SCIENCES TOOLS & SERVICES - 0.5% | |||||||
Harvard Bioscience 1 | 435,679 | 1,246,042 | |||||
| PHARMACEUTICALS - 2.3% | |||||||
Agile Therapeutics 1 | 129,582 | 986,119 | |||||
| 351,400 | 829,304 | ||||||
Intersect ENT 1 | 68,700 | 888,291 | |||||
| 147,800 | 449,312 | ||||||
| 59,800 | 1,106,300 | ||||||
| 50,700 | 1,150,383 | ||||||
| 5,409,709 | |||||||
| Total (Cost $27,564,869) | 25,958,936 | ||||||
| INDUSTRIALS – 18.9% | |||||||
| AEROSPACE & DEFENSE - 0.9% | |||||||
CPI Aerostructures 1 | 147,418 | 906,621 | |||||
Vectrus 1 | 44,100 | 1,256,409 | |||||
| 2,163,030 | |||||||
| COMMERCIAL SERVICES & SUPPLIES - 1.2% | |||||||
Heritage-Crystal Clean 1 | 116,374 | 1,420,927 | |||||
Hudson Technologies 1 | 358,004 | 1,288,814 | |||||
| 2,709,741 | |||||||
| CONSTRUCTION & ENGINEERING - 1.2% | |||||||
MYR Group 1 | 49,400 | 1,189,552 | |||||
Northwest Pipe 1 | 150,400 | 1,621,312 | |||||
| 2,810,864 | |||||||
| ELECTRICAL EQUIPMENT - 1.6% | |||||||
LSI Industries | 171,136 | 1,894,476 | |||||
Power Solutions International 1 | 50,300 | 897,855 | |||||
| 162,000 | 1,001,160 | ||||||
| 3,793,491 | |||||||
| INDUSTRIAL CONGLOMERATES - 0.8% | |||||||
Raven Industries | 92,900 | 1,759,526 | |||||
| MACHINERY - 6.9% | |||||||
CIRCOR International | 33,659 | 1,918,226 | |||||
FreightCar America | 80,709 | 1,133,961 | |||||
Gorman-Rupp Company (The) | 37,913 | 1,039,195 | |||||
Graham Corporation | 97,488 | 1,795,729 | |||||
Kadant | 45,576 | 2,347,620 | |||||
Key Technology 1 | 96,714 | 890,736 | |||||
Lindsay Corporation | 21,400 | 1,452,204 | |||||
Lydall 1 | 43,900 | 1,692,784 | |||||
RBC Bearings 1 | 17,369 | 1,259,253 | |||||
Sun Hydraulics | 39,600 | 1,175,724 | |||||
Tennant Company | 24,900 | 1,341,363 | |||||
| 16,046,795 | |||||||
| MARINE - 0.7% | |||||||
Clarkson | 54,500 | 1,615,173 | |||||
| PROFESSIONAL SERVICES - 4.4% | |||||||
CRA International 1 | 62,383 | 1,573,299 | |||||
GP Strategies 1 | 41,718 | 904,863 | |||||
Heidrick & Struggles International | 76,200 | 1,286,256 | |||||
Kforce | 107,058 | 1,808,210 | |||||
Navigant Consulting 1 | 127,400 | 2,057,510 | |||||
Resources Connection | 169,052 | 2,498,589 | |||||
| 10,128,727 | |||||||
| ROAD & RAIL - 1.2% | |||||||
Marten Transport | 86,033 | 1,703,453 | |||||
Patriot Transportation Holding 1 | 54,358 | 1,057,263 | |||||
| 2,760,716 | |||||||
| Total (Cost $37,535,106) | 43,788,063 | ||||||
| INFORMATION TECHNOLOGY – 22.6% | |||||||
| COMMUNICATIONS EQUIPMENT - 1.8% | |||||||
CalAmp Corporation 1 | 97,600 | 1,445,456 | |||||
Digi International 1 | 128,183 | 1,375,403 | |||||
KVH Industries 1 | 172,700 | 1,329,790 | |||||
| 4,150,649 | |||||||
| ELECTRONIC EQUIPMENT, INSTRUMENTS & COMPONENTS - 7.8% | |||||||
CUI Global 1 | 139,274 | 703,334 | |||||
DTS 1 | 82,700 | 2,187,415 | |||||
ePlus 1 | 31,967 | 2,614,581 | |||||
Fabrinet 1 | 47,649 | 1,768,731 | |||||
Mesa Laboratories | 11,600 | 1,426,800 | |||||
| 551,996 | 805,914 | ||||||
Novanta 1 | 117,942 | 1,786,821 | |||||
Orbotech 1 | 68,800 | 1,757,840 | |||||
PC Connection | 89,200 | 2,122,960 | |||||
Rogers Corporation 1 | 19,200 | 1,173,120 | |||||
Vishay Precision Group 1 | 128,200 | 1,720,444 | |||||
| 18,067,960 | |||||||
| INTERNET SOFTWARE & SERVICES - 1.4% | |||||||
Intralinks Holdings 1 | 158,300 | 1,028,950 | |||||
QuinStreet 1 | 532,104 | 1,888,969 | |||||
UrtheCast Corporation 1 | 243,100 | 184,402 | |||||
| 3,102,321 | |||||||
| IT SERVICES - 1.1% | |||||||
Cass Information Systems | 28,100 | 1,452,770 | |||||
Computer Task Group | 223,710 | 1,111,839 | |||||
| 2,564,609 | |||||||
| SEMICONDUCTORS & SEMICONDUCTOR EQUIPMENT - 6.7% | |||||||
Axcelis Technologies 1 | 131,700 | 354,273 | |||||
Brooks Automation | 143,800 | 1,613,436 | |||||
Nanometrics 1 | 80,500 | 1,673,595 | |||||
NeoPhotonics Corporation 1 | 127,400 | 1,214,122 | |||||
PDF Solutions 1 | 150,400 | 2,104,096 | |||||
Photronics 1 | 176,300 | 1,570,833 | |||||
Rudolph Technologies 1 | 115,251 | 1,789,848 | |||||
Sigma Designs 1 | 171,700 | 1,104,031 | |||||
Silicon Motion Technology ADR | 35,400 | 1,692,120 | |||||
Ultra Clean Holdings 1 | 172,100 | 979,249 | |||||
Xcerra Corporation 1 | 257,361 | 1,479,826 | |||||
| 15,575,429 | |||||||
| SOFTWARE - 3.0% | |||||||
| 127,400 | 1,186,094 | ||||||
Computer Modelling Group | 154,100 | 1,233,325 | |||||
QAD Cl. A | 66,300 | 1,277,601 | |||||
Rubicon Project 1 | 109,500 | 1,494,675 | |||||
SeaChange International 1 | 309,107 | 986,051 | |||||
| THE ACCOMPANYING NOTES ARE AN INTEGRAL PART OF THESE FINANCIAL STATEMENTS | The Royce Funds 2016 Semiannual Report to Shareholders | 59 |
Schedules of Investments
| Royce Micro-Cap Fund (continued) | |||||||
| SHARES | VALUE | ||||||
| INFORMATION TECHNOLOGY (continued) | |||||||
| SOFTWARE (continued) | |||||||
Zix Corporation 1 | 215,800 | $ | 809,250 | ||||
| 6,986,996 | |||||||
| TECHNOLOGY HARDWARE, STORAGE & PERIPHERALS - 0.8% | |||||||
Avid Technology 1 | 129,100 | 750,071 | |||||
Super Micro Computer 1 | 46,246 | 1,149,213 | |||||
| 1,899,284 | |||||||
| Total (Cost $53,722,115) | 52,347,248 | ||||||
| MATERIALS – 3.6% | |||||||
| CHEMICALS - 2.2% | |||||||
| 236,912 | 705,998 | ||||||
FutureFuel Corporation | 131,900 | 1,435,072 | |||||
Quaker Chemical | 19,160 | 1,709,072 | |||||
Trecora Resources 1 | 123,100 | 1,283,933 | |||||
| 5,134,075 | |||||||
| METALS & MINING - 1.4% | |||||||
Haynes International | 54,730 | 1,755,739 | |||||
McEwen Mining | 206,804 | 796,195 | |||||
Richmont Mines 1 | 78,100 | 719,301 | |||||
| 3,271,235 | |||||||
| Total (Cost $9,018,417) | 8,405,310 | ||||||
| TELECOMMUNICATION SERVICES – 0.5% | |||||||
| DIVERSIFIED TELECOMMUNICATION SERVICES - 0.5% | |||||||
ORBCOMM 1 | 122,400 | 1,217,880 | |||||
| Total (Cost $722,698) | 1,217,880 | ||||||
| MISCELLANEOUS2 – 4.2% | |||||||
| Total (Cost $9,220,447) | 9,844,093 | ||||||
| TOTAL COMMON STOCKS | |||||||
| (Cost $210,133,655) | 217,793,387 | ||||||
| REPURCHASE AGREEMENT– 6.7% | |||||||
| Fixed Income Clearing Corporation, 0.03% dated 6/30/16, due 7/1/16, maturity value $15,475,013 (collateralized by obligations of various U.S. Government Agencies, 1.625% due 4/30/19, valued at $15,785,380) | |||||||
| (Cost $15,475,000) | 15,475,000 | ||||||
| COLLATERAL RECEIVED FOR SECURITIES LOANED – 3.4% | |||||||
| Money Market Funds | |||||||
Federated Government Obligations Fund (7 day yield-0.2459%) | |||||||
| (Cost $7,953,641) | 7,953,641 | ||||||
| TOTAL INVESTMENTS – 104.0% | |||||||
| (Cost $233,562,296) | 241,222,028 | ||||||
| LIABILITIES LESS CASH AND OTHER ASSETS – (4.0)% | (9,329,355 | ) | |||||
| NET ASSETS – 100.0% | $ | 231,892,673 | |||||
| Royce Micro-Cap Opportunity Fund | |||||||
| Common Stocks – 95.8% | |||||||
| SHARES | VALUE | ||||||
| CONSUMER DISCRETIONARY – 14.3% | |||||||
| AUTO COMPONENTS - 1.6% | |||||||
Spartan Motors | 100,288 | $ | 627,803 | ||||
| HOTELS, RESTAURANTS & LEISURE - 2.3% | |||||||
Belmond Cl. A 1 | 25,000 | 247,500 | |||||
| 8,000 | 379,440 | ||||||
Ruby Tuesday 1 | 77,900 | 281,219 | |||||
| 908,159 | |||||||
| HOUSEHOLD DURABLES - 6.0% | |||||||
Beazer Homes USA 1 | 82,500 | 639,375 | |||||
Dixie Group 1 | 61,918 | 220,428 | |||||
Installed Building Products 1 | 13,729 | 498,226 | |||||
M.D.C. Holdings | 17,000 | 413,780 | |||||
New Home 1 | 56,010 | 534,335 | |||||
| 2,306,144 | |||||||
| MEDIA - 0.7% | |||||||
McClatchy Company (The) Cl. A 1 | 19,006 | 277,868 | |||||
| SPECIALTY RETAIL - 3.5% | |||||||
Guess? | 12,000 | 180,600 | |||||
| 20,000 | 427,600 | ||||||
TravelCenters of America LLC 1 | 82,000 | 669,120 | |||||
West Marine 1 | 8,090 | 67,875 | |||||
| 1,345,195 | |||||||
| TEXTILES, APPAREL & LUXURY GOODS - 0.2% | |||||||
Vince Holding 1 | 12,591 | 68,998 | |||||
| Total (Cost $6,436,012) | 5,534,167 | ||||||
| CONSUMER STAPLES – 0.5% | |||||||
| FOOD PRODUCTS - 0.5% | |||||||
Landec Corporation 1 | 20,011 | 215,318 | |||||
| Total (Cost $220,699) | 215,318 | ||||||
| ENERGY – 3.3% | |||||||
| ENERGY EQUIPMENT & SERVICES - 1.9% | |||||||
Helix Energy Solutions Group 1 | 70,000 | 473,200 | |||||
Newpark Resources 1 | 50,000 | 289,500 | |||||
| 762,700 | |||||||
| OIL, GAS & CONSUMABLE FUELS - 1.4% | |||||||
Pengrowth Energy 1 | 290,000 | 533,600 | |||||
| Total (Cost $1,133,143) | 1,296,300 | ||||||
| FINANCIALS – 4.3% | |||||||
| BANKS - 1.8% | |||||||
State Bank Financial | 24,000 | 488,400 | |||||
TriState Capital Holdings 1 | 16,041 | 220,243 | |||||
| 708,643 | |||||||
| INSURANCE - 0.8% | |||||||
James River Group Holdings | 9,006 | 305,844 | |||||
| REAL ESTATE INVESTMENT TRUSTS (REITS) - 0.3% | |||||||
RAIT Financial Trust | 38,002 | 118,946 | |||||
| THRIFTS & MORTGAGE FINANCE - 1.4% | |||||||
BofI Holding 1 | 17,500 | 309,925 | |||||
NMI Holdings Cl. A 1 | 43,050 | 235,914 | |||||
| 545,839 | |||||||
| Total (Cost $1,570,899) | 1,679,272 | ||||||
| HEALTH CARE – 12.9% | |||||||
| BIOTECHNOLOGY - 1.1% | |||||||
CareDx 1 | 94,934 | 410,115 | |||||
| HEALTH CARE EQUIPMENT & SUPPLIES - 5.8% | |||||||
Accuray 1 | 115,000 | 596,850 | |||||
| 60 | The Royce Funds 2016 Semiannual Report to Shareholders | THE ACCOMPANYING NOTES ARE AN INTEGRAL PART OF THESE FINANCIAL STATEMENTS |
| June 30, 2016 (unaudited) |
| Royce Micro-Cap Opportunity Fund (continued) | |||||||
| SHARES | VALUE | ||||||
| HEALTH CARE (continued) | |||||||
| HEALTH CARE EQUIPMENT & SUPPLIES (continued) | |||||||
Derma Sciences 1 | 50,021 | $ | 197,083 | ||||
Exactech 1 | 23,055 | 616,490 | |||||
OraSure Technologies 1 | 55,000 | 325,050 | |||||
Trinity Biotech ADR Cl. A 1 | 46,900 | 531,846 | |||||
| 2,267,319 | |||||||
| HEALTH CARE PROVIDERS & SERVICES - 2.7% | |||||||
Alliance HealthCare Services 1 | 23,549 | 146,946 | |||||
Civitas Solutions 1 | 29,189 | 608,007 | |||||
Kindred Healthcare | 26,000 | 293,540 | |||||
| 1,048,493 | |||||||
| LIFE SCIENCES TOOLS & SERVICES - 1.8% | |||||||
| 32,000 | 430,080 | ||||||
Cambrex Corporation 1 | 5,000 | 258,650 | |||||
| 688,730 | |||||||
| PHARMACEUTICALS - 1.5% | |||||||
| 52,559 | 576,572 | ||||||
| Total (Cost $5,330,510) | 4,991,229 | ||||||
| INDUSTRIALS – 18.9% | |||||||
| AEROSPACE & DEFENSE - 3.8% | |||||||
Aerojet Rocketdyne Holdings 1 | 12,500 | 228,500 | |||||
| 65,097 | 647,064 | ||||||
Kratos Defense & Security Solutions 1 | 142,500 | 584,250 | |||||
| 1,459,814 | |||||||
| AIR FREIGHT & LOGISTICS - 1.1% | |||||||
Atlas Air Worldwide Holdings 1 | 10,000 | 414,200 | |||||
| BUILDING PRODUCTS - 1.6% | |||||||
Builders FirstSource 1 | 30,000 | 337,500 | |||||
PGT 1 | 26,000 | 267,800 | |||||
| 605,300 | |||||||
| COMMERCIAL SERVICES & SUPPLIES - 1.0% | |||||||
TRC Companies 1 | 64,021 | 404,613 | |||||
| CONSTRUCTION & ENGINEERING - 0.8% | |||||||
Great Lakes Dredge & Dock 1 | 40,000 | 174,400 | |||||
Northwest Pipe 1 | 14,000 | 150,920 | |||||
| 325,320 | |||||||
| ELECTRICAL EQUIPMENT - 4.9% | |||||||
Encore Wire | 13,500 | 503,280 | |||||
General Cable | 32,500 | 413,075 | |||||
Power Solutions International 1 | 56,000 | 999,600 | |||||
| 1,915,955 | |||||||
| MACHINERY - 5.7% | |||||||
Astec Industries | 7,300 | 409,895 | |||||
†FreightCar America | 37,500 | 526,875 | |||||
| 40,039 | 621,405 | ||||||
Hyster-Yale Materials Handling Cl. A | 5,300 | 315,297 | |||||
Meritor 1 | 8,500 | 61,200 | |||||
Mueller Water Products Cl. A | 22,592 | 258,001 | |||||
| 2,192,673 | |||||||
| Total (Cost $7,487,718) | 7,317,875 | ||||||
| INFORMATION TECHNOLOGY – 30.7% | |||||||
| COMMUNICATIONS EQUIPMENT - 2.6% | |||||||
Aerohive Networks 1 | 70,000 | 463,400 | |||||
Applied Optoelectronics 1 | 12,000 | 133,800 | |||||
Aviat Networks 1 | 9,025 | 70,214 | |||||
Comtech Telecommunications | 16,015 | 205,633 | |||||
EMCORE Corporation 1 | 25,000 | 148,500 | |||||
| 1,021,547 | |||||||
| ELECTRONIC EQUIPMENT, INSTRUMENTS & COMPONENTS - 4.3% | |||||||
Electro Scientific Industries 1 | 82,592 | 482,337 | |||||
KEMET Corporation 1 | 153,500 | 449,755 | |||||
PCM 1 | 52,488 | 584,717 | |||||
TTM Technologies 1 | 20,000 | 150,600 | |||||
| 1,667,409 | |||||||
| INTERNET SOFTWARE & SERVICES - 6.8% | |||||||
Amber Road 1 | 150,002 | 1,156,515 | |||||
Angie’s List 1 | 30,016 | 195,404 | |||||
EarthLink Holdings | 68,000 | 435,200 | |||||
Limelight Networks 1 | 147,583 | 219,899 | |||||
MINDBODY Cl. A 1 | 23,551 | 380,113 | |||||
Tremor Video 1 | 130,452 | 240,032 | |||||
| 2,627,163 | |||||||
| IT SERVICES - 0.7% | |||||||
Datalink Corporation 1 | 36,508 | 273,810 | |||||
| SEMICONDUCTORS & SEMICONDUCTOR EQUIPMENT - 11.3% | |||||||
Alpha & Omega Semiconductor 1 | 35,094 | 488,859 | |||||
Exar Corporation 1 | 35,000 | 281,750 | |||||
FormFactor 1 | 62,840 | 564,932 | |||||
Inphi Corporation 1 | 8,000 | 256,240 | |||||
Kopin Corporation 1 | 110,096 | 244,413 | |||||
MaxLinear Cl. A 1 | 18,000 | 323,640 | |||||
Nanometrics 1 | 30,038 | 624,490 | |||||
NeoPhotonics Corporation 1 | 25,741 | 245,312 | |||||
Rudolph Technologies 1 | 28,003 | 434,887 | |||||
Sigma Designs 1 | 57,756 | 371,371 | |||||
SunEdison Semiconductor 1 | 89,094 | 528,327 | |||||
| 4,364,221 | |||||||
| SOFTWARE - 2.4% | |||||||
A10 Networks 1 | 28,500 | 184,395 | |||||
Bottomline Technologies 1 | 14,000 | 301,420 | |||||
Datawatch Corporation 1 | 82,863 | 459,061 | |||||
| 944,876 | |||||||
| TECHNOLOGY HARDWARE, STORAGE & PERIPHERALS - 2.6% | |||||||
Intevac 1 | 39,586 | 224,849 | |||||
| 43,000 | 342,280 | ||||||
Silicon Graphics International 1 | 85,075 | 427,927 | |||||
| 995,056 | |||||||
| Total (Cost $10,944,043) | 11,894,082 | ||||||
| MATERIALS – 8.3% | |||||||
| CHEMICALS - 4.8% | |||||||
Axiall Corporation | 5,000 | 163,050 | |||||
Calgon Carbon | 30,073 | 395,460 | |||||
Ferro Corporation 1 | 20,000 | 267,600 | |||||
Intrepid Potash 1 | 45,000 | 64,800 | |||||
Kraton Performance Polymers 1 | 22,000 | 614,460 | |||||
Schulman (A.) | 14,500 | 354,090 | |||||
| 1,859,460 | |||||||
| CONSTRUCTION MATERIALS - 1.2% | |||||||
U.S. Concrete 1 | 7,400 | 450,734 | |||||
| METALS & MINING - 0.7% | |||||||
A. M. Castle & Co. 1 | 177,000 | 290,280 | |||||
| THE ACCOMPANYING NOTES ARE AN INTEGRAL PART OF THESE FINANCIAL STATEMENTS | The Royce Funds 2016 Semiannual Report to Shareholders | 61 |
Schedules of Investments
| Royce Micro-Cap Opportunity Fund (continued) | |||||||
| SHARES | VALUE | ||||||
| MATERIALS (continued) | |||||||
| PAPER & FOREST PRODUCTS - 1.6% | |||||||
| 26,800 | $ | 615,060 | |||||
| Total (Cost $3,081,296) | 3,215,534 | ||||||
| MISCELLANEOUS2 – 2.6% | |||||||
| Total (Cost $933,793) | 1,009,656 | ||||||
| TOTAL COMMON STOCKS | |||||||
| (Cost $37,138,113) | 37,153,433 | ||||||
| REPURCHASE AGREEMENT– 5.8% | |||||||
| Fixed Income Clearing Corporation, 0.03% dated 6/30/16, due 7/1/16, maturity value $2,245,002 (collateralized by obligations of various U.S. Government Agencies, 0.125% due 4/15/19, valued at $2,293,500) | |||||||
| (Cost $2,245,000) | 2,245,000 | ||||||
| TOTAL INVESTMENTS – 101.6% | |||||||
| (Cost $39,383,113) | 39,398,433 | ||||||
| LIABILITIES LESS CASH AND OTHER ASSETS – (1.6)% | (603,325 | ) | |||||
| NET ASSETS – 100.0% | $ | 38,795,108 | |||||
| Royce Opportunity Fund | |||||||
| Common Stocks – 94.5% | |||||||
| SHARES | VALUE | ||||||
| CONSUMER DISCRETIONARY – 14.7% | |||||||
| AUTO COMPONENTS - 2.0% | |||||||
Dana Holding Corporation | 788,236 | $ | 8,323,772 | ||||
Spartan Motors | 1,090,134 | 6,824,239 | |||||
Tower International | 587,554 | 12,091,861 | |||||
| 27,239,872 | |||||||
| AUTOMOBILES - 0.5% | |||||||
Winnebago Industries | 316,677 | 7,258,237 | |||||
| DISTRIBUTORS - 0.2% | |||||||
VOXX International Cl. A 1 | 1,081,427 | 3,017,181 | |||||
| DIVERSIFIED CONSUMER SERVICES - 0.1% | |||||||
Houghton Mifflin Harcourt 1 | 131,300 | 2,052,219 | |||||
| HOTELS, RESTAURANTS & LEISURE - 1.3% | |||||||
Belmond Cl. A 1 | 779,519 | 7,717,238 | |||||
Carrols Restaurant Group 1 | 314,605 | 3,743,800 | |||||
| 612,136 | 954,932 | ||||||
Ruby Tuesday 1 | 1,371,431 | 4,950,866 | |||||
| 17,366,836 | |||||||
| HOUSEHOLD DURABLES - 3.0% | |||||||
| 829,079 | 6,425,362 | ||||||
| 876,235 | 3,119,397 | ||||||
M.D.C. Holdings | 381,550 | 9,286,927 | |||||
M/I Homes 1 | 395,100 | 7,439,733 | |||||
| 241,334 | 2,302,326 | ||||||
TRI Pointe Group 1 | 407,572 | 4,817,501 | |||||
| 515,741 | 8,313,745 | ||||||
| 41,704,991 | |||||||
| INTERNET & CATALOG RETAIL - 0.5% | |||||||
EVINE Live 1 | 29,593 | 48,829 | |||||
Gaiam Cl. A 1 | 695,707 | 5,384,772 | |||||
| 83,300 | 1,367,786 | ||||||
| 6,801,387 | |||||||
| LEISURE PRODUCTS - 0.2% | |||||||
Black Diamond 1 | 746,333 | 3,089,819 | |||||
| MEDIA - 1.3% | |||||||
Ballantyne Strong 1 | 684,737 | 3,581,175 | |||||
Entravision Communications Cl. A | 688,200 | 4,624,704 | |||||
| 312,205 | 4,564,437 | ||||||
New York Times Cl. A | 380,899 | 4,608,878 | |||||
Sizmek 1 | 365,550 | 837,109 | |||||
| 18,216,303 | |||||||
| MULTILINE RETAIL - 0.5% | |||||||
| 497,396 | 701,328 | ||||||
| 702,941 | 6,242,116 | ||||||
| 6,943,444 | |||||||
| SPECIALTY RETAIL - 4.0% | |||||||
American Eagle Outfitters | 348,500 | 5,551,605 | |||||
Ascena Retail Group 1 | 926,692 | 6,477,577 | |||||
bebe stores 1 | 1,221,256 | 614,414 | |||||
Chico’s FAS | 365,800 | 3,917,718 | |||||
Destination Maternity | 195,837 | 1,151,522 | |||||
DSW Cl. A | 164,500 | 3,484,110 | |||||
Guess? | 231,500 | 3,484,075 | |||||
| 94,800 | 1,461,816 | ||||||
New York & Company 1 | 654,517 | 975,230 | |||||
Rent-A-Center | 651,706 | 8,002,950 | |||||
| 166,900 | 4,786,692 | ||||||
Sears Hometown and Outlet Stores 1 | 348,245 | 2,347,171 | |||||
TravelCenters of America LLC 1 | 852,314 | 6,954,882 | |||||
| 62 | The Royce Funds 2016 Semiannual Report to Shareholders | THE ACCOMPANYING NOTES ARE AN INTEGRAL PART OF THESE FINANCIAL STATEMENTS |
| June 30, 2016 (unaudited) |
| Royce Opportunity Fund (continued) | |||||||
| SHARES | VALUE | ||||||
| CONSUMER DISCRETIONARY (continued) | |||||||
| SPECIALTY RETAIL (continued) | |||||||
West Marine 1 | 813,405 | $ | 6,824,468 | ||||
| 56,034,230 | |||||||
| TEXTILES, APPAREL & LUXURY GOODS - 1.1% | |||||||
Unifi 1 | 400,967 | 10,918,331 | |||||
Vince Holding 1 | 677,931 | 3,715,062 | |||||
| 14,633,393 | |||||||
| Total (Cost $249,960,552) | 204,357,912 | ||||||
| CONSUMER STAPLES – 1.5% | |||||||
| FOOD & STAPLES RETAILING - 0.3% | |||||||
SUPERVALU 1 | 803,600 | 3,792,992 | |||||
| FOOD PRODUCTS - 0.7% | |||||||
| 236,102 | 1,843,957 | ||||||
Landec Corporation 1 | 431,502 | 4,642,961 | |||||
SunOpta 1 | 892,690 | 3,740,371 | |||||
| 10,227,289 | |||||||
| HOUSEHOLD PRODUCTS - 0.5% | |||||||
Central Garden & Pet 1 | 294,048 | 6,713,116 | |||||
| Total (Cost $21,073,503) | 20,733,397 | ||||||
| ENERGY – 2.3% | |||||||
| ENERGY EQUIPMENT & SERVICES - 1.1% | |||||||
Matrix Service 1 | 318,308 | 5,248,899 | |||||
Newpark Resources 1 | 1,208,631 | 6,997,973 | |||||
Parker Drilling 1 | 363,300 | 831,957 | |||||
| 756,409 | 1,913,715 | ||||||
| 14,992,544 | |||||||
| OIL, GAS & CONSUMABLE FUELS - 1.2% | |||||||
Ardmore Shipping | 331,600 | 2,244,932 | |||||
| 307,100 | 1,962,369 | ||||||
| 77,900 | 1,542,420 | ||||||
| 2,284,100 | 4,202,744 | ||||||
Scorpio Tankers | 848,426 | 3,563,389 | |||||
StealthGas 1 | 975,321 | 3,686,714 | |||||
| 17,202,568 | |||||||
| Total (Cost $52,366,072) | 32,195,112 | ||||||
| FINANCIALS – 6.2% | |||||||
| BANKS - 2.9% | |||||||
BankUnited | 84,998 | 2,611,138 | |||||
Boston Private Financial Holdings | 814,046 | 9,589,462 | |||||
Brookline Bancorp | 128,300 | 1,415,149 | |||||
CenterState Banks | 324,241 | 5,106,796 | |||||
Fidelity Southern | 130,840 | 2,050,263 | |||||
First Bancorp | 41,408 | 727,952 | |||||
Guaranty Bancorp | 247,660 | 4,135,922 | |||||
Southern National Bancorp of Virginia | 153,415 | 1,863,992 | |||||
State Bank Financial | 402,159 | 8,183,936 | |||||
Umpqua Holdings | 322,500 | 4,989,075 | |||||
| 40,673,685 | |||||||
| CONSUMER FINANCE - 0.5% | |||||||
Enova International 1 | 1,002,095 | 7,375,419 | |||||
| INSURANCE - 1.2% | |||||||
Ambac Financial Group 1 | 309,846 | 5,100,065 | |||||
Assured Guaranty | 166,300 | 4,219,031 | |||||
MBIA 1 | 1,024,676 | 6,998,537 | |||||
| 16,317,633 | |||||||
| INVESTMENT COMPANIES - 0.1% | |||||||
BlackRock Resources & Commodities Strategy Trust | 105,100 | 809,270 | |||||
| REAL ESTATE INVESTMENT TRUSTS (REITS) - 0.5% | |||||||
BRT Realty Trust 1 | 159,557 | 1,140,833 | |||||
Mack-Cali Realty | 237,166 | 6,403,482 | |||||
| 7,544,315 | |||||||
| REAL ESTATE MANAGEMENT & DEVELOPMENT - 0.5% | |||||||
Tejon Ranch 1 | 270,953 | 6,405,329 | |||||
| THRIFTS & MORTGAGE FINANCE - 0.5% | |||||||
| 108,400 | 1,919,764 | ||||||
MGIC Investment 1 | 348,585 | 2,074,081 | |||||
Radian Group | 67,300 | 701,266 | |||||
Walker & Dunlop 1 | 128,937 | 2,937,185 | |||||
| 7,632,296 | |||||||
| Total (Cost $87,081,768) | 86,757,947 | ||||||
| HEALTH CARE – 4.1% | |||||||
| HEALTH CARE EQUIPMENT & SUPPLIES - 1.8% | |||||||
Accuray 1 | 756,600 | 3,926,754 | |||||
Analogic Corporation | 55,666 | 4,422,107 | |||||
AngioDynamics 1 | 461,341 | 6,629,470 | |||||
Exactech 1 | 46,987 | 1,256,432 | |||||
Invacare Corporation | 498,125 | 6,042,256 | |||||
RTI Surgical 1 | 618,055 | 2,218,818 | |||||
| 24,495,837 | |||||||
| HEALTH CARE PROVIDERS & SERVICES - 0.8% | |||||||
Brookdale Senior Living 1 | 269,960 | 4,168,183 | |||||
Healthways 1 | 578,104 | 6,677,101 | |||||
| 10,845,284 | |||||||
| HEALTH CARE TECHNOLOGY - 0.8% | |||||||
Allscripts Healthcare Solutions 1 | 909,636 | 11,552,377 | |||||
| LIFE SCIENCES TOOLS & SERVICES - 0.7% | |||||||
| 725,604 | 9,752,118 | ||||||
| Total (Cost $52,540,904) | 56,645,616 | ||||||
| INDUSTRIALS – 23.9% | |||||||
| AEROSPACE & DEFENSE - 2.9% | |||||||
Aerojet Rocketdyne Holdings 1 | 406,140 | 7,424,239 | |||||
| 471,400 | 4,685,716 | ||||||
| 1,688,224 | 6,921,719 | ||||||
| 841,330 | 6,764,293 | ||||||
Mercury Systems 1 | 606,878 | 15,086,987 | |||||
| 40,882,954 | |||||||
| BUILDING PRODUCTS - 4.1% | |||||||
Builders FirstSource 1 | 290,394 | 3,266,932 | |||||
Gibraltar Industries 1 | 29,187 | 921,434 | |||||
Griffon Corporation | 384,900 | 6,489,414 | |||||
Insteel Industries | 246,868 | 7,057,956 | |||||
NCI Building Systems 1 | 872,600 | 13,952,874 | |||||
PGT 1 | 696,183 | 7,170,685 | |||||
Ply Gem Holdings 1 | 567,092 | 8,262,530 | |||||
Quanex Building Products | 513,586 | 9,547,564 | |||||
| 56,669,389 | |||||||
| COMMERCIAL SERVICES & SUPPLIES - 2.8% | |||||||
ABM Industries | 191,900 | 7,000,512 | |||||
Herman Miller | 243,300 | 7,272,237 | |||||
Interface | 647,716 | 9,877,669 | |||||
Kimball International Cl. B | 218,424 | 2,485,665 | |||||
| THE ACCOMPANYING NOTES ARE AN INTEGRAL PART OF THESE FINANCIAL STATEMENTS | The Royce Funds 2016 Semiannual Report to Shareholders | 63 |
Schedules of Investments
| Royce Opportunity Fund (continued) | |||||||
| SHARES | VALUE | ||||||
| INDUSTRIALS (continued) | |||||||
| COMMERCIAL SERVICES & SUPPLIES (continued) | |||||||
Steelcase Cl. A | 280,342 | $ | 3,804,241 | ||||
TRC Companies 1 | 1,437,745 | 9,086,548 | |||||
| 39,526,872 | |||||||
| CONSTRUCTION & ENGINEERING - 2.6% | |||||||
Aegion Corporation 1 | 572,489 | 11,169,261 | |||||
| 935,212 | 7,575,217 | ||||||
MasTec 1 | 522,800 | 11,668,896 | |||||
| 509,994 | 5,497,735 | ||||||
| 35,911,109 | |||||||
| ELECTRICAL EQUIPMENT - 2.3% | |||||||
Encore Wire | 372,403 | 13,883,184 | |||||
General Cable | 1,024,374 | 13,019,794 | |||||
| 242,075 | 4,321,039 | ||||||
| 94,713 | 585,326 | ||||||
| 31,809,343 | |||||||
| MACHINERY - 7.4% | |||||||
Albany International Cl. A | 166,550 | 6,650,342 | |||||
Astec Industries | 245,816 | 13,802,568 | |||||
Commercial Vehicle Group 1 | 675,240 | 3,511,248 | |||||
Dynamic Materials | 396,362 | 4,260,892 | |||||
Federal Signal | 532,232 | 6,855,148 | |||||
Hardinge | 560,297 | 5,636,588 | |||||
Hurco Companies | 202,073 | 5,623,692 | |||||
Hyster-Yale Materials Handling Cl. A | 114,086 | 6,786,976 | |||||
Meritor 1 | 572,019 | 4,118,537 | |||||
Mueller Industries | 479,621 | 15,290,317 | |||||
Mueller Water Products Cl. A | 1,472,976 | 16,821,386 | |||||
NN | 591,907 | 8,280,779 | |||||
| 3,244,490 | 5,418,298 | ||||||
| 103,056,771 | |||||||
| MARINE - 0.2% | |||||||
Diana Shipping 1 | 724,780 | 1,761,215 | |||||
Genco Shipping & Trading 1 | 15,839 | 9,028 | |||||
Navios Maritime Holdings 1 | 1,210,449 | 980,464 | |||||
| 136,390 | 380,528 | ||||||
| 3,131,235 | |||||||
| TRADING COMPANIES & DISTRIBUTORS - 0.8% | |||||||
Kaman Corporation | 71,931 | 3,058,506 | |||||
Univar 1 | 383,839 | 7,258,396 | |||||
| 10,316,902 | |||||||
| TRANSPORTATION INFRASTRUCTURE - 0.8% | |||||||
Wesco Aircraft Holdings 1 | 811,700 | 10,893,014 | |||||
| Total (Cost $304,898,526) | 332,197,589 | ||||||
| INFORMATION TECHNOLOGY – 29.8% | |||||||
| COMMUNICATIONS EQUIPMENT - 2.7% | |||||||
| 325,400 | 3,628,210 | ||||||
ARRIS International 1 | 377,760 | 7,917,850 | |||||
| 257,070 | 2,000,005 | ||||||
Ciena Corporation 1 | 166,600 | 3,123,750 | |||||
Comtech Telecommunications | 574,404 | 7,375,347 | |||||
EMCORE Corporation 1 | 603,668 | 3,585,788 | |||||
Extreme Networks 1 | 1,087,941 | 3,688,120 | |||||
| 1,050,777 | 2,994,714 | ||||||
Oclaro 1 | 529,175 | 2,582,374 | |||||
Westell Technologies Cl. A 1 | 753,068 | 527,148 | |||||
| 37,423,306 | |||||||
| ELECTRONIC EQUIPMENT, INSTRUMENTS & COMPONENTS - 7.3% | |||||||
Benchmark Electronics 1 | 341,100 | 7,214,265 | |||||
Daktronics | 431,325 | 2,695,781 | |||||
Echelon Corporation 1,5,6 | 230,152 | 1,095,524 | |||||
Electro Scientific Industries 1 | 812,307 | 4,743,873 | |||||
Frequency Electronics 1 | 229,179 | 2,131,365 | |||||
| 364,410 | 652,294 | ||||||
II-VI 1 | 417,237 | 7,827,366 | |||||
| 2,355,353 | 6,901,184 | ||||||
| 378,977 | 5,184,405 | ||||||
Maxwell Technologies 1 | 1,082,042 | 5,713,182 | |||||
Novanta 1 | 523,916 | 7,937,327 | |||||
Park Electrochemical | 213,234 | 3,098,290 | |||||
| 596,852 | 6,648,931 | ||||||
Perceptron 1 | 444,326 | 2,079,446 | |||||
RadiSys Corporation 1 | 623,278 | 2,792,285 | |||||
Sanmina Corporation 1 | 436,923 | 11,713,906 | |||||
| 347,772 | 2,114,454 | ||||||
Systemax 1 | 57,800 | 493,034 | |||||
TTM Technologies 1 | 844,025 | 6,355,508 | |||||
Vishay Intertechnology | 828,123 | 10,260,444 | |||||
Vishay Precision Group 1 | 242,842 | 3,258,940 | |||||
| 100,911,804 | |||||||
| INTERNET SOFTWARE & SERVICES - 3.4% | |||||||
Amber Road 1 | 462,471 | 3,565,652 | |||||
Blucora 1 | 917,640 | 9,506,750 | |||||
Care.com 1 | 740,037 | 8,643,632 | |||||
EarthLink Holdings | 1,694,258 | 10,843,251 | |||||
Limelight Networks 1 | 894,069 | 1,332,163 | |||||
| 589,044 | 1,384,253 | ||||||
Monster Worldwide 1 | 1,346,600 | 3,218,374 | |||||
QuinStreet 1 | 1,180,139 | 4,189,494 | |||||
Support.com 1 | 856,797 | 720,566 | |||||
| 998,221 | 1,836,727 | ||||||
| 474,280 | 1,745,350 | ||||||
| 46,986,212 | |||||||
| IT SERVICES - 1.4% | |||||||
CIBER 1 | 1,895,073 | 2,842,609 | |||||
Computer Task Group | 603,248 | 2,998,143 | |||||
Datalink Corporation 1 | 513,838 | 3,853,785 | |||||
Unisys Corporation 1 | 1,259,924 | 9,172,247 | |||||
| 18,866,784 | |||||||
| SEMICONDUCTORS & SEMICONDUCTOR EQUIPMENT - 12.5% | |||||||
| Advanced Energy Industries 1 | 351,533 | 13,344,193 | |||||
Alpha & Omega Semiconductor 1 | 309,415 | 4,310,151 | |||||
| 778,861 | 4,649,800 | ||||||
Axcelis Technologies 1 | 668,894 | 1,799,325 | |||||
AXT 1 | 406,192 | 1,295,752 | |||||
Brooks Automation | 1,252,900 | 14,057,538 | |||||
Cohu | 631,806 | 6,855,095 | |||||
| 342,600 | 8,373,144 | ||||||
Cypress Semiconductor | 483,100 | 5,096,705 | |||||
Exar Corporation 1 | 1,012,694 | 8,152,187 | |||||
FormFactor 1 | 861,852 | 7,748,049 | |||||
Intersil Corporation Cl. A | 496,593 | 6,723,869 | |||||
IXYS Corporation | 812,468 | 8,327,797 | |||||
Kopin Corporation 1 | 1,125,122 | 2,497,771 | |||||
Kulicke & Soffa Industries 1 | 908,488 | 11,056,299 | |||||
MaxLinear Cl. A 1 | 645,422 | 11,604,688 | |||||
| 64 | The Royce Funds 2016 Semiannual Report to Shareholders | THE ACCOMPANYING NOTES ARE AN INTEGRAL PART OF THESE FINANCIAL STATEMENTS |
| June 30, 2016 (unaudited) |
| Royce Opportunity Fund (continued) | |||||||
| SHARES | VALUE | ||||||
| INFORMATION TECHNOLOGY (continued) | |||||||
| SEMICONDUCTORS & SEMICONDUCTOR EQUIPMENT (continued) | |||||||
Microsemi Corporation 1 | 385,354 | $ | 12,593,369 | ||||
Nanometrics 1 | 637,839 | 13,260,673 | |||||
NeoPhotonics Corporation 1 | 444,396 | 4,235,094 | |||||
| 998,928 | 679,271 | ||||||
Rudolph Technologies 1 | 539,416 | 8,377,130 | |||||
| 89,478 | 167,324 | ||||||
Sigma Designs 1 | 670,782 | 4,313,128 | |||||
SunEdison Semiconductor 1 | 785,532 | 4,658,205 | |||||
Ultra Clean Holdings 1 | 826,738 | 4,704,139 | |||||
Xcerra Corporation 1 | 927,654 | 5,334,010 | |||||
| 174,214,706 | |||||||
| SOFTWARE - 0.8% | |||||||
A10 Networks 1 | 769,399 | 4,978,011 | |||||
Mentor Graphics | 204,119 | 4,339,570 | |||||
SeaChange International 1 | 773,100 | 2,466,189 | |||||
| 11,783,770 | |||||||
| TECHNOLOGY HARDWARE, STORAGE & PERIPHERALS - 1.7% | |||||||
Avid Technology 1 | 514,880 | 2,991,453 | |||||
Cray 1 | 235,232 | 7,038,141 | |||||
Intevac 1 | 962,891 | 5,469,221 | |||||
Silicon Graphics International 1 | 1,708,984 | 8,596,190 | |||||
| 24,095,005 | |||||||
| Total (Cost $453,001,424) | 414,281,587 | ||||||
| MATERIALS – 9.9% | |||||||
| CHEMICALS - 4.9% | |||||||
Calgon Carbon | 363,685 | 4,782,458 | |||||
Ferro Corporation 1 | 992,411 | 13,278,459 | |||||
H.B. Fuller Company | 74,200 | 3,264,058 | |||||
Huntsman Corporation | 657,200 | 8,839,340 | |||||
Intrepid Potash 1 | 21,203 | 30,532 | |||||
Kraton Performance Polymers 1 | 607,418 | 16,965,185 | |||||
Olin Corporation | 500,900 | 12,442,356 | |||||
Schulman (A.) | 341,140 | 8,330,639 | |||||
| 67,933,027 | |||||||
| METALS & MINING - 4.4% | |||||||
| 1,824,498 | 2,992,176 | ||||||
| 1,138,300 | 5,304,478 | ||||||
Allegheny Technologies | 563,812 | 7,188,603 | |||||
Carpenter Technology | 188,441 | 6,205,362 | |||||
| 971,703 | 6,150,880 | ||||||
Commercial Metals | 873,361 | 14,759,801 | |||||
Haynes International | 276,450 | 8,868,516 | |||||
Hecla Mining | 512,200 | 2,612,220 | |||||
Pan American Silver | 110,700 | 1,821,015 | |||||
Synalloy Corporation | 369,633 | 2,831,389 | |||||
TimkenSteel Corporation 1 | 270,158 | 2,598,920 | |||||
| 61,333,360 | |||||||
| PAPER & FOREST PRODUCTS - 0.6% | |||||||
Louisiana-Pacific Corporation 1 | 525,300 | 9,113,955 | |||||
| Total (Cost $135,983,646) | 138,380,342 | ||||||
| TELECOMMUNICATION SERVICES – 0.7% | |||||||
| DIVERSIFIED TELECOMMUNICATION SERVICES - 0.6% | |||||||
| 949,050 | 8,427,564 | ||||||
| WIRELESS TELECOMMUNICATION SERVICES - 0.1% | |||||||
Boingo Wireless 1 | 248,704 | 2,218,440 | |||||
| Total (Cost $8,297,037) | 10,646,004 | ||||||
| UTILITIES – 0.2% | |||||||
| WATER UTILITIES - 0.2% | |||||||
Pure Cycle 1 | 520,799 | 2,452,963 | |||||
| Total (Cost $2,176,940) | 2,452,963 | ||||||
| MISCELLANEOUS2 – 1.2% | |||||||
| Total (Cost $12,421,864) | 16,543,520 | ||||||
| �� | |||||||
| TOTAL COMMON STOCKS | |||||||
| (Cost $1,379,802,236) | 1,315,191,989 | ||||||
| PRINCIPAL | |||||||
| AMOUNT | |||||||
| CORPORATE BOND– 0.0% | |||||||
McClatchy Company (The) 9.00% due 12/15/22 5 | |||||||
| (Cost $376,474) | $ | 400,000 | 390,000 | ||||
| REPURCHASE AGREEMENT– 5.9% | |||||||
| Fixed Income Clearing Corporation, 0.03% dated 6/30/16, due 7/1/16, maturity value $81,981,068 (collateralized by obligations of various U.S. Government Agencies, 1.625% due 4/30/19, valued at $83,623,461) | |||||||
| (Cost $81,981,000) | 81,981,000 | ||||||
| COLLATERAL RECEIVED FOR SECURITIES LOANED – 5.4% | |||||||
| U.S. Treasury Notes | |||||||
0.125%-2.375% | |||||||
due 4/15/19-8/15/24 | 2,589 | 2,596 | |||||
| Money Market Funds | |||||||
Federated Government Obligations Fund (7 day yield-0.2459%) | 75,221,321 | ||||||
| TOTAL COLLATERAL RECEIVED FOR SECURITIES LOANED | |||||||
| (Cost $75,223,917) | 75,223,917 | ||||||
| TOTAL INVESTMENTS – 105.8% | |||||||
| (Cost $1,537,383,627) | 1,472,786,906 | ||||||
| LIABILITIES LESS CASH AND OTHER ASSETS – (5.8)% | (81,293,465 | ) | |||||
| NET ASSETS – 100.0% | $ | 1,391,493,441 | |||||
| THE ACCOMPANYING NOTES ARE AN INTEGRAL PART OF THESE FINANCIAL STATEMENTS | The Royce Funds 2016 Semiannual Report to Shareholders | 65 |
Schedules of Investments
| Royce Pennsylvania Mutual Fund | |||||||
| Common Stocks – 98.3% | |||||||
| SHARES | VALUE | ||||||
| CONSUMER DISCRETIONARY – 14.9% | |||||||
| AUTO COMPONENTS - 3.9% | |||||||
Dorman Products 1 | 343,741 | $ | 19,661,985 | ||||
Drew Industries | 445,773 | 37,819,382 | |||||
Gentex Corporation | 1,088,334 | 16,814,760 | |||||
Motorcar Parts of America 1 | 75,000 | 2,038,500 | |||||
Standard Motor Products | 96,451 | 3,836,821 | |||||
STRATTEC SECURITY 6 | 250,247 | 10,202,570 | |||||
Superior Industries International | 422,900 | 11,325,262 | |||||
| 101,699,280 | |||||||
| AUTOMOBILES - 0.9% | |||||||
Thor Industries | 149,981 | 9,709,770 | |||||
Winnebago Industries | 639,700 | 14,661,924 | |||||
| 24,371,694 | |||||||
| DISTRIBUTORS - 1.4% | |||||||
Core-Mark Holding Company | 473,460 | 22,186,335 | |||||
| 25,000 | 98,250 | ||||||
Weyco Group | 504,800 | 14,023,344 | |||||
| 36,307,929 | |||||||
| DIVERSIFIED CONSUMER SERVICES - 0.0% | |||||||
DeVry Education Group | 46,000 | 820,640 | |||||
| 24,000 | 379,440 | ||||||
| 1,200,080 | |||||||
| HOTELS, RESTAURANTS & LEISURE - 0.1% | |||||||
| 200,000 | 1,926,000 | ||||||
MTY Food Group | 28,600 | 960,971 | |||||
| 2,886,971 | |||||||
| HOUSEHOLD DURABLES - 1.6% | |||||||
Cavco Industries 1 | 13,600 | 1,274,320 | |||||
Ethan Allen Interiors | 838,688 | 27,710,252 | |||||
Flexsteel Industries | 94,800 | 3,755,976 | |||||
NVR 1 | 4,830 | 8,599,042 | |||||
| 41,339,590 | |||||||
| INTERNET & CATALOG RETAIL - 0.3% | |||||||
Blue Nile | 46,368 | 1,269,556 | |||||
FTD Companies 1 | 298,014 | 7,438,429 | |||||
| 8,707,985 | |||||||
| LEISURE PRODUCTS - 0.1% | |||||||
Nautilus 1 | 91,000 | 1,623,440 | |||||
| MEDIA - 0.7% | |||||||
E.W. Scripps Company Cl. A 1 | 290,767 | 4,605,749 | |||||
Loral Space & Communications 1 | 19,715 | 695,348 | |||||
Saga Communications Cl. A | 137,934 | 5,453,911 | |||||
Wiley (John) & Sons Cl. A | 127,283 | 6,641,627 | |||||
| 17,396,635 | |||||||
| MULTILINE RETAIL - 0.4% | |||||||
Dillard’s Cl. A | 177,100 | 10,732,260 | |||||
| SPECIALTY RETAIL - 4.3% | |||||||
American Eagle Outfitters | 677,791 | 10,797,210 | |||||
America’s Car-Mart 1 | 375,100 | 10,592,824 | |||||
Barnes & Noble | 106,000 | 1,203,100 | |||||
Buckle (The) | 599,313 | 15,576,145 | |||||
Caleres | 146,600 | 3,549,186 | |||||
Cato Corporation (The) Cl. A | 248,664 | 9,379,606 | |||||
Destination Maternity 5 | 180,191 | 1,059,523 | |||||
DSW Cl. A | 423,300 | 8,965,494 | |||||
Genesco 1 | 180,923 | 11,635,158 | |||||
Kirkland’s 1 | 47,100 | 691,428 | |||||
Monro Muffler Brake | 321,600 | 20,440,896 | |||||
Shoe Carnival | 467,795 | 11,722,943 | |||||
Stein Mart | 1,000,618 | 7,724,771 | |||||
| 113,338,284 | |||||||
| TEXTILES, APPAREL & LUXURY GOODS - 1.2% | |||||||
Deckers Outdoor 1 | 227,480 | 13,084,650 | |||||
G-III Apparel Group 1 | 214,200 | 9,793,224 | |||||
Movado Group | 272,642 | 5,910,878 | |||||
Steven Madden 1 | 80,746 | 2,759,898 | |||||
| 31,548,650 | |||||||
| Total (Cost $253,429,034) | 391,152,798 | ||||||
| CONSUMER STAPLES – 1.5% | |||||||
| FOOD & STAPLES RETAILING - 0.2% | |||||||
Village Super Market Cl. A | 203,111 | 5,867,877 | |||||
| FOOD PRODUCTS - 0.5% | |||||||
Cal-Maine Foods | 36,470 | 1,616,350 | |||||
Farmer Bros. 1 | 47,777 | 1,531,731 | |||||
Industrias Bachoco ADR | 102,460 | 5,061,524 | |||||
John B. Sanfilippo & Son | 19,300 | 822,759 | |||||
Seneca Foods Cl. A 1 | 105,142 | 3,807,192 | |||||
Seneca Foods Cl. B 1 | 7,197 | 259,452 | |||||
SunOpta 1 | 80,739 | 338,296 | |||||
| 13,437,304 | |||||||
| PERSONAL PRODUCTS - 0.8% | |||||||
Inter Parfums | 346,900 | 9,910,933 | |||||
Nu Skin Enterprises Cl. A | 107,304 | 4,956,372 | |||||
Nutraceutical International 1 | 243,700 | 5,641,655 | |||||
| 20,508,960 | |||||||
| Total (Cost $25,192,909) | 39,814,141 | ||||||
| ENERGY – 3.8% | |||||||
| ENERGY EQUIPMENT & SERVICES - 3.7% | |||||||
CARBO Ceramics 1 | 22,000 | 288,200 | |||||
| 162,000 | 3,941,460 | ||||||
Era Group 1 | 314,840 | 2,959,496 | |||||
Forum Energy Technologies 1 | 152,301 | 2,636,330 | |||||
Frank’s International | 114,000 | 1,665,540 | |||||
Helmerich & Payne | 107,680 | 7,228,558 | |||||
Matrix Service 1 | 625,767 | 10,318,898 | |||||
Oil States International 1 | 53,273 | 1,751,616 | |||||
Pason Systems | 1,412,020 | 19,519,855 | |||||
| 550,175 | 8,544,218 | ||||||
SEACOR Holdings 1 | 363,409 | 21,059,552 | |||||
TGS-NOPEC Geophysical | 776,085 | 12,690,611 | |||||
Unit Corporation 1 | 248,884 | 3,872,635 | |||||
| 96,476,969 | |||||||
| OIL, GAS & CONSUMABLE FUELS - 0.1% | |||||||
| 49,700 | 350,385 | ||||||
San Juan Basin Royalty Trust | 252,033 | 1,832,280 | |||||
World Fuel Services | 32,700 | 1,552,923 | |||||
WPX Energy 1 | 66,000 | 614,460 | |||||
| 4,350,048 | |||||||
| Total (Cost $84,315,553) | 100,827,017 | ||||||
| FINANCIALS – 14.1% | |||||||
| BANKS - 1.9% | |||||||
Ames National | 26,798 | 718,722 | |||||
Blue Hills Bancorp | 201,490 | 2,973,992 | |||||
BOK Financial | 24,500 | 1,536,150 | |||||
Camden National | 169,088 | 7,101,696 | |||||
| 66 | The Royce Funds 2016 Semiannual Report to Shareholders | THE ACCOMPANYING NOTES ARE AN INTEGRAL PART OF THESE FINANCIAL STATEMENTS |
| June 30, 2016 (unaudited) |
| Royce Pennsylvania Mutual Fund (continued) | |||||||
| SHARES | VALUE | ||||||
| FINANCIALS (continued) | |||||||
| BANKS (continued) | |||||||
City Holding Company | 64,770 | $ | 2,945,092 | ||||
CNB Financial | 93,400 | 1,662,520 | |||||
Codorus Valley Bancorp | 33,490 | 682,191 | |||||
First Citizens BancShares Cl. A | 90,026 | 23,308,632 | |||||
National Bankshares | 81,300 | 2,838,996 | |||||
Northrim BanCorp | 99,206 | 2,608,126 | |||||
Popular | 73,300 | 2,147,690 | |||||
| 48,523,807 | |||||||
| CAPITAL MARKETS - 5.5% | |||||||
AllianceBernstein Holding L.P. | 411,200 | 9,580,960 | |||||
Artisan Partners Asset Management Cl. A | 100,770 | 2,789,314 | |||||
Citadel Capital 1 | 6,165,715 | 680,454 | |||||
Cowen Group 1 | 1,531,257 | 4,532,521 | |||||
Diamond Hill Investment Group | 114,017 | 21,483,083 | |||||
Federated Investors Cl. B | 808,507 | 23,268,831 | |||||
Lazard Cl. A | 344,557 | 10,260,907 | |||||
Moelis & Company Cl. A | 361,300 | 8,129,250 | |||||
Reinet Investments | 238,550 | 5,108,497 | |||||
Reinet Investments DR | 1,300,000 | 3,066,193 | |||||
Rothschild & Co | 328,346 | 7,853,695 | |||||
SEI Investments | 353,650 | 17,014,102 | |||||
Sprott | 4,805,100 | 9,558,502 | |||||
Virtus Investment Partners | 50,670 | 3,606,691 | |||||
Westwood Holdings Group | 336,235 | 17,416,973 | |||||
| 144,349,973 | |||||||
| DIVERSIFIED FINANCIAL SERVICES - 1.3% | |||||||
Bolsa Mexicana de Valores | 4,446,700 | 6,851,535 | |||||
Morningstar | 245,095 | 20,043,869 | |||||
PICO Holdings 1 | 637,841 | 6,033,976 | |||||
Sofina | 14,207 | 1,882,955 | |||||
| 34,812,335 | |||||||
| INSURANCE - 2.0% | |||||||
Alleghany Corporation 1 | 4,790 | 2,632,488 | |||||
Allied World Assurance Company Holdings | 31,270 | 1,098,828 | |||||
E-L Financial | 41,100 | 21,823,290 | |||||
Greenlight Capital Re Cl. A 1 | 26,000 | 524,160 | |||||
MBIA 1 | 601,577 | 4,108,771 | |||||
ProAssurance Corporation | 30,000 | 1,606,500 | |||||
Reinsurance Group of America | 81,621 | 7,916,421 | |||||
RLI Corp. | 194,281 | 13,362,647 | |||||
| 53,073,105 | |||||||
| INVESTMENT COMPANIES - 0.4% | |||||||
British Empire Trust | 183,727 | 1,220,717 | |||||
RIT Capital Partners | 366,500 | 8,035,875 | |||||
| 9,256,592 | |||||||
| REAL ESTATE MANAGEMENT & DEVELOPMENT - 1.7% | |||||||
| 81,000 | 989,820 | ||||||
FRP Holdings 1 | 493,012 | 17,008,914 | |||||
Marcus & Millichap 1 | 281,600 | 7,155,456 | |||||
| 105,000 | 1,860,600 | ||||||
Tejon Ranch 1 | 704,385 | 16,651,662 | |||||
| 43,666,452 | |||||||
| THRIFTS & MORTGAGE FINANCE - 1.3% | |||||||
Genworth MI Canada | 936,757 | 24,028,892 | |||||
Southern Missouri Bancorp | 11,100 | 261,183 | |||||
TrustCo Bank Corp. NY | 1,698,451 | 10,887,071 | |||||
| 35,177,146 | |||||||
| Total (Cost $304,759,789) | 368,859,410 | ||||||
| HEALTH CARE – 6.9% | |||||||
| BIOTECHNOLOGY - 0.1% | |||||||
| 121,250 | 896,038 | ||||||
Myriad Genetics 1 | 16,760 | 512,856 | |||||
Progenics Pharmaceuticals 1 | 264,600 | 1,116,612 | |||||
Zealand Pharma 1 | 73,337 | 1,314,892 | |||||
| 3,840,398 | |||||||
| HEALTH CARE EQUIPMENT & SUPPLIES - 2.2% | |||||||
Analogic Corporation | 202,100 | 16,054,824 | |||||
Atrion Corporation | 9,500 | 4,064,670 | |||||
IDEXX Laboratories 1 | 234,490 | 21,774,741 | |||||
Merit Medical Systems 1 | 627,786 | 12,448,996 | |||||
Neogen Corporation 1 | 34,550 | 1,943,438 | |||||
| 91,100 | 1,033,074 | ||||||
| 57,319,743 | |||||||
| HEALTH CARE PROVIDERS & SERVICES - 1.9% | |||||||
Aceto Corporation | 230,366 | 5,042,712 | |||||
Ensign Group (The) | 200,900 | 4,220,909 | |||||
HealthSouth Corporation | 183,713 | 7,131,738 | |||||
Landauer | 399,400 | 16,439,304 | |||||
U.S. Physical Therapy | 290,500 | 17,491,005 | |||||
| 50,325,668 | |||||||
| HEALTH CARE TECHNOLOGY - 0.3% | |||||||
Medidata Solutions 1 | 148,165 | 6,944,494 | |||||
| LIFE SCIENCES TOOLS & SERVICES - 2.4% | |||||||
Bio-Rad Laboratories Cl. A 1 | 71,822 | 10,271,982 | |||||
Bio-Techne | 235,040 | 26,505,461 | |||||
| 143,700 | 10,060,437 | ||||||
PAREXEL International 1 | 237,000 | 14,902,560 | |||||
| 61,740,440 | |||||||
| Total (Cost $113,435,856) | 180,170,743 | ||||||
| INDUSTRIALS – 28.8% | |||||||
| AEROSPACE & DEFENSE - 1.7% | |||||||
HEICO Corporation | 379,835 | 25,376,776 | |||||
HEICO Corporation Cl. A | 123,040 | 6,601,096 | |||||
Teledyne Technologies 1 | 136,600 | 13,530,230 | |||||
| 45,508,102 | |||||||
| AIR FREIGHT & LOGISTICS - 1.2% | |||||||
Forward Air | 529,500 | 23,578,635 | |||||
Hub Group Cl. A 1 | 185,000 | 7,098,450 | |||||
| 30,677,085 | |||||||
| AIRLINES - 0.5% | |||||||
Spirit Airlines 1 | 293,438 | 13,166,563 | |||||
| BUILDING PRODUCTS - 1.5% | |||||||
AAON | 219,462 | 6,037,400 | |||||
Apogee Enterprises | 141,500 | 6,558,525 | |||||
Gibraltar Industries 1 | 302,920 | 9,563,184 | |||||
Insteel Industries | 46,559 | 1,331,122 | |||||
Simpson Manufacturing | 375,900 | 15,024,723 | |||||
| 38,514,954 | |||||||
| COMMERCIAL SERVICES & SUPPLIES - 4.2% | |||||||
Copart 1 | 615,652 | 30,173,105 | |||||
Healthcare Services Group | 320,200 | 13,249,876 | |||||
Heritage-Crystal Clean 1 | 242,158 | 2,956,749 | |||||
Kimball International Cl. B | 40,400 | 459,752 | |||||
Mobile Mini | 334,400 | 11,583,616 | |||||
Ritchie Bros. Auctioneers | 1,040,620 | 35,152,144 | |||||
Steelcase Cl. A | 275,870 | 3,743,556 | |||||
Team 1 | 286,082 | 7,103,416 | |||||
| THE ACCOMPANYING NOTES ARE AN INTEGRAL PART OF THESE FINANCIAL STATEMENTS | The Royce Funds 2016 Semiannual Report to Shareholders | 67 |
Schedules of Investments
| Royce Pennsylvania Mutual Fund (continued) | |||||||
| SHARES | VALUE | ||||||
| INDUSTRIALS (continued) | |||||||
| COMMERCIAL SERVICES & SUPPLIES (continued) | |||||||
UniFirst Corporation | 46,856 | $ | 5,422,176 | ||||
US Ecology | 10,000 | 459,500 | |||||
| 110,303,890 | |||||||
| CONSTRUCTION & ENGINEERING - 1.9% | |||||||
EMCOR Group | 194,900 | 9,600,774 | |||||
IES Holdings 1 | 150,000 | 1,863,000 | |||||
Jacobs Engineering Group 1 | 54,000 | 2,689,740 | |||||
KBR | 565,800 | 7,491,192 | |||||
MYR Group 1 | 202,684 | 4,880,631 | |||||
Valmont Industries | 181,175 | 24,507,542 | |||||
| 51,032,879 | |||||||
| ELECTRICAL EQUIPMENT - 1.0% | |||||||
AZZ | 69,652 | 4,177,727 | |||||
Encore Wire | 245,879 | 9,166,369 | |||||
Preformed Line Products 6 | 290,278 | 11,724,329 | |||||
| 25,068,425 | |||||||
| INDUSTRIAL CONGLOMERATES - 0.6% | |||||||
Raven Industries | 777,945 | 14,734,278 | |||||
| MACHINERY - 9.0% | |||||||
Alamo Group | 112,362 | 7,412,521 | |||||
CIRCOR International | 399,079 | 22,743,512 | |||||
CLARCOR | 274,600 | 16,703,918 | |||||
Colfax Corporation 1 | 74,543 | 1,972,408 | |||||
Columbus McKinnon | 92,975 | 1,315,596 | |||||
Federal Signal | 792,194 | 10,203,459 | |||||
Flowserve Corporation | 30,000 | 1,355,100 | |||||
Franklin Electric | 476,200 | 15,738,410 | |||||
Gorman-Rupp Company (The) | 56,666 | 1,553,215 | |||||
Graco | 184,849 | 14,601,222 | |||||
Hyster-Yale Materials Handling Cl. A | 10,410 | 619,291 | |||||
John Bean Technologies | 368,683 | 22,570,773 | |||||
Kadant | 110,100 | 5,671,251 | |||||
Lincoln Electric Holdings | 220,919 | 13,051,895 | |||||
Lindsay Corporation | 106,600 | 7,233,876 | |||||
Lydall 1 | 80,393 | 3,099,954 | |||||
Miller Industries | 254,032 | 5,230,519 | |||||
Nordson Corporation | 173,600 | 14,514,696 | |||||
| 5,025 | 289,239 | ||||||
RBC Bearings 1 | 339,400 | 24,606,500 | |||||
Sun Hydraulics | 684,287 | 20,316,481 | |||||
Tennant Company | 454,900 | 24,505,463 | |||||
Wabtec Corporation | 19,157 | 1,345,396 | |||||
| 236,654,695 | |||||||
| MARINE - 0.3% | |||||||
Diana Shipping 1 | 201,900 | 490,617 | |||||
Kirby Corporation 1 | 130,800 | 8,160,612 | |||||
| 8,651,229 | |||||||
| PROFESSIONAL SERVICES - 2.8% | |||||||
Advisory Board (The) 1 | 478,223 | 16,924,312 | |||||
Exponent | 393,578 | 22,988,891 | |||||
Franklin Covey 1 | 60,400 | 925,932 | |||||
ICF International 1 | 27,370 | 1,119,433 | |||||
Korn/Ferry International | 240,800 | 4,984,560 | |||||
ManpowerGroup | 204,905 | 13,183,588 | |||||
Robert Half International | 74,230 | 2,832,617 | |||||
RPX Corporation 1 | 140,052 | 1,284,277 | |||||
TrueBlue 1 | 544,120 | 10,294,750 | |||||
| 74,538,360 | |||||||
| ROAD & RAIL - 2.3% | |||||||
Amerco | 1,405 | 526,243 | |||||
Knight Transportation | 49,625 | 1,319,032 | |||||
Landstar System | 387,960 | 26,637,333 | |||||
Patriot Transportation Holding 1 | 101,504 | 1,974,253 | |||||
Saia 1 | 560,043 | 14,079,481 | |||||
Universal Logistics Holdings | 586,484 | 7,565,644 | |||||
Werner Enterprises | 328,100 | 7,536,457 | |||||
| 59,638,443 | |||||||
| TRADING COMPANIES & DISTRIBUTORS - 1.3% | |||||||
Air Lease Cl. A | 34,840 | 933,015 | |||||
Applied Industrial Technologies | 271,300 | 12,246,482 | |||||
MSC Industrial Direct Cl. A | 230,650 | 16,274,664 | |||||
Richelieu Hardware | 292,800 | 5,745,176 | |||||
| 35,199,337 | |||||||
| TRANSPORTATION INFRASTRUCTURE - 0.5% | |||||||
Wesco Aircraft Holdings 1 | 1,006,596 | 13,508,518 | |||||
| Total (Cost $443,877,038) | 757,196,758 | ||||||
| INFORMATION TECHNOLOGY – 18.5% | |||||||
| COMMUNICATIONS EQUIPMENT - 0.7% | |||||||
ADTRAN | 69,200 | 1,290,580 | |||||
Brocade Communications Systems | 822,250 | 7,548,255 | |||||
Digi International 1 | 354,544 | 3,804,257 | |||||
NetScout Systems 1 | 87,600 | 1,949,100 | |||||
TESSCO Technologies | 194,717 | 2,704,619 | |||||
| 17,296,811 | |||||||
| ELECTRONIC EQUIPMENT, INSTRUMENTS & COMPONENTS - 9.6% | |||||||
Anixter International 1 | 121,100 | 6,452,208 | |||||
Badger Meter | 227,514 | 16,615,347 | |||||
Benchmark Electronics 1 | 361,683 | 7,649,596 | |||||
Cognex Corporation | 545,060 | 23,492,086 | |||||
Coherent 1 | 279,550 | 25,657,099 | |||||
Dolby Laboratories Cl. A | 289,451 | 13,850,230 | |||||
DTS 1 | 866,529 | 22,919,692 | |||||
Fabrinet 1 | 139,477 | 5,177,386 | |||||
FARO Technologies 1 | 368,493 | 12,466,118 | |||||
FEI Company | 17,000 | 1,816,960 | |||||
| 208,800 | 2,551,536 | ||||||
FLIR Systems | 770,700 | 23,853,165 | |||||
HollySys Automation Technologies 1 | 139,100 | 2,416,167 | |||||
IPG Photonics 1 | 196,505 | 15,720,400 | |||||
Methode Electronics | 95,160 | 3,257,327 | |||||
MTS Systems | 68,774 | 3,015,052 | |||||
National Instruments | 772,100 | 21,155,540 | |||||
Orbotech 1 | 64,800 | 1,655,640 | |||||
PC Connection | 553,621 | 13,176,180 | |||||
Plexus Corporation 1 | 253,600 | 10,955,520 | |||||
Richardson Electronics | 157,551 | 830,294 | |||||
Rofin-Sinar Technologies 1 | 18,446 | 589,165 | |||||
ScanSource 1 | 159,787 | 5,929,696 | |||||
Vishay Intertechnology | 874,541 | 10,835,563 | |||||
| 252,037,967 | |||||||
| INTERNET SOFTWARE & SERVICES - 0.5% | |||||||
comScore 1 | 307,909 | 7,352,867 | |||||
j2 Global | 85,950 | 5,429,461 | |||||
Stamps.com 1 | 10,600 | 926,652 | |||||
| 13,708,980 | |||||||
| 68 | The Royce Funds 2016 Semiannual Report to Shareholders | THE ACCOMPANYING NOTES ARE AN INTEGRAL PART OF THESE FINANCIAL STATEMENTS |
| June 30, 2016 (unaudited) |
| Royce Pennsylvania Mutual Fund (continued) | |||||||
| SHARES | VALUE | ||||||
| INFORMATION TECHNOLOGY (continued) | |||||||
| IT SERVICES - 0.1% | |||||||
Computer Task Group | 323,471 | $ | 1,607,651 | ||||
| SEMICONDUCTORS & SEMICONDUCTOR EQUIPMENT - 3.3% | |||||||
Advanced Energy Industries 1 | 490,914 | 18,635,095 | |||||
Brooks Automation | 247,000 | 2,771,340 | |||||
Cabot Microelectronics | 297,630 | 12,601,654 | |||||
Cirrus Logic 1 | 236,988 | 9,192,765 | |||||
Diodes 1 | 524,158 | 9,848,929 | |||||
Himax Technologies ADR | 70,000 | 578,200 | |||||
IXYS Corporation | 284,900 | 2,920,225 | |||||
Kulicke & Soffa Industries 1 | 100,100 | 1,218,217 | |||||
MKS Instruments | 445,435 | 19,180,431 | |||||
Nanometrics 1 | 218,481 | 4,542,220 | |||||
Photronics 1 | 148,560 | 1,323,670 | |||||
Teradyne | 13,020 | 256,364 | |||||
Tessera Technologies | 155,730 | 4,771,567 | |||||
| 87,840,677 | |||||||
| SOFTWARE - 3.3% | |||||||
ACI Worldwide 1 | 829,000 | 16,173,790 | |||||
AVG Technologies 1 | 108,280 | 2,056,237 | |||||
Blackbaud | 263,391 | 17,884,249 | |||||
Computer Modelling Group | 774,400 | 6,197,837 | |||||
Enghouse Systems | 19,600 | 831,212 | |||||
Fair Isaac | 145,500 | 16,442,955 | |||||
Mentor Graphics | 228,290 | 4,853,445 | |||||
Monotype Imaging Holdings | 728,896 | 17,952,709 | |||||
PTC 1 | 110,700 | 4,160,106 | |||||
| 86,552,540 | |||||||
| TECHNOLOGY HARDWARE, STORAGE & PERIPHERALS - 1.0% | |||||||
Diebold | 743,732 | 18,466,866 | |||||
| 70,300 | 1,609,167 | ||||||
Super Micro Computer 1 | 303,500 | 7,541,975 | |||||
| 27,618,008 | |||||||
| Total (Cost $327,213,389) | 486,662,634 | ||||||
| MATERIALS – 8.8% | |||||||
| CHEMICALS - 2.9% | |||||||
Balchem Corporation | 350,700 | 20,919,255 | |||||
FutureFuel Corporation | 712,056 | 7,747,169 | |||||
Innospec | 117,278 | 5,393,615 | |||||
Intrepid Potash 1 | 313,798 | 451,869 | |||||
Minerals Technologies | 64,502 | 3,663,714 | |||||
Quaker Chemical | 365,800 | 32,629,360 | |||||
Sensient Technologies | 6,600 | 468,864 | |||||
Umicore | 94,000 | 4,843,593 | |||||
| 76,117,439 | |||||||
| CONSTRUCTION MATERIALS - 0.3% | |||||||
Ash Grove Cement 3 | 38,418 | 8,759,304 | |||||
| CONTAINERS & PACKAGING - 0.8% | |||||||
AptarGroup | 260,400 | 20,605,452 | |||||
| METALS & MINING - 3.9% | |||||||
Commercial Metals | 598,100 | 10,107,890 | |||||
Compass Minerals International | 128,426 | 9,527,925 | |||||
Ferroglobe | 76,200 | 656,082 | |||||
Franco-Nevada Corporation | 292,800 | 22,270,368 | |||||
Gold Fields ADR | 415,000 | 2,033,500 | |||||
Haynes International | 10,393 | 333,407 | |||||
Hecla Mining | 173,300 | 883,830 | |||||
Major Drilling Group International 1 | 1,546,250 | 9,359,244 | |||||
Pretium Resources 1 | 108,600 | 1,215,493 | |||||
Reliance Steel & Aluminum | 302,610 | 23,270,709 | |||||
Schnitzer Steel Industries Cl. A | 58,200 | 1,024,320 | |||||
Steel Dynamics | 265,421 | 6,502,815 | |||||
Worthington Industries | 360,733 | 15,259,006 | |||||
| 102,444,589 | |||||||
| PAPER & FOREST PRODUCTS - 0.9% | |||||||
Neenah Paper | 6,700 | 484,879 | |||||
Stella-Jones | 618,500 | 23,031,878 | |||||
| 23,516,757 | |||||||
| Total (Cost $130,857,217) | 231,443,541 | ||||||
| TELECOMMUNICATION SERVICES – 0.2% | |||||||
| WIRELESS TELECOMMUNICATION SERVICES - 0.2% | |||||||
Telephone and Data Systems | 162,000 | 4,804,920 | |||||
| Total (Cost $4,308,624) | 4,804,920 | ||||||
| MISCELLANEOUS2 – 0.8% | |||||||
| Total (Cost $22,054,372) | 20,580,778 | ||||||
| TOTAL COMMON STOCKS | |||||||
| (Cost $1,709,443,781) | 2,581,512,740 | ||||||
| REPURCHASE AGREEMENT– 1.6% | |||||||
| Fixed Income Clearing Corporation, 0.03% dated 6/30/16, due 7/1/16, maturity value $41,365,034 (collateralized by obligations of various U.S. Government Agencies, 1.625% due 7/31/19, valued at $42,193,723) | |||||||
| (Cost $41,365,000) | 41,365,000 | ||||||
| COLLATERAL RECEIVED FOR SECURITIES LOANED – 0.8% | |||||||
| Money Market Funds | |||||||
Federated Government Obligations Fund (7 day yield-0.2459%) | |||||||
| (Cost $21,504,952) | 21,504,952 | ||||||
| TOTAL INVESTMENTS – 100.7% | |||||||
| (Cost $1,772,313,733) | 2,644,382,692 | ||||||
| LIABILITIES LESS CASH AND OTHER ASSETS – (0.7)% | (17,257,689 | ) | |||||
| NET ASSETS – 100.0% | $ | 2,627,125,003 | |||||
| THE ACCOMPANYING NOTES ARE AN INTEGRAL PART OF THESE FINANCIAL STATEMENTS | The Royce Funds 2016 Semiannual Report to Shareholders | 69 |
Schedules of Investments
| Royce Premier Fund | |||||||
| Common Stocks – 98.2% | |||||||
| SHARES | VALUE | ||||||
| CONSUMER DISCRETIONARY – 10.1% | |||||||
| AUTO COMPONENTS - 2.1% | |||||||
Dorman Products 1 | 811,400 | $ | 46,412,080 | ||||
| AUTOMOBILES - 1.6% | |||||||
Thor Industries | 569,100 | 36,843,534 | |||||
| DISTRIBUTORS - 1.5% | |||||||
Pool Corporation | 344,500 | 32,393,335 | |||||
| DIVERSIFIED CONSUMER SERVICES - 0.9% | |||||||
| 747,300 | 20,476,020 | ||||||
| SPECIALTY RETAIL - 1.2% | |||||||
Buckle (The) | 1,055,836 | 27,441,178 | |||||
| TEXTILES, APPAREL & LUXURY GOODS - 2.8% | |||||||
Columbia Sportswear | 642,072 | 36,944,823 | |||||
Wolverine World Wide | 1,285,964 | 26,130,788 | |||||
| 63,075,611 | |||||||
| Total (Cost $130,027,342) | 226,641,758 | ||||||
| CONSUMER STAPLES – 1.9% | |||||||
| FOOD PRODUCTS - 1.9% | |||||||
Cal-Maine Foods | 259,300 | 11,492,176 | |||||
Sanderson Farms | 363,542 | 31,497,279 | |||||
| Total (Cost $14,836,558) | 42,989,455 | ||||||
| ENERGY – 3.2% | |||||||
| ENERGY EQUIPMENT & SERVICES - 3.2% | |||||||
Pason Systems | 3,337,600 | 46,139,197 | |||||
SEACOR Holdings 1 | 335,602 | 19,448,136 | |||||
TGS-NOPEC Geophysical | 408,690 | 6,682,935 | |||||
| Total (Cost $75,165,627) | 72,270,268 | ||||||
| FINANCIALS – 15.5% | |||||||
| CAPITAL MARKETS - 6.1% | |||||||
Ares Management L.P. | 2,621,376 | 36,935,188 | |||||
Ashmore Group | 6,232,500 | 25,232,550 | |||||
Federated Investors Cl. B | 1,923,100 | 55,346,818 | |||||
†Lazard Cl. A | 662,100 | 19,717,338 | |||||
| 137,231,894 | |||||||
| DIVERSIFIED FINANCIAL SERVICES - 3.2% | |||||||
Morningstar | 595,500 | 48,699,990 | |||||
TMX Group | 526,600 | 21,908,549 | |||||
| 70,608,539 | |||||||
| INSURANCE - 2.6% | |||||||
Alleghany Corporation 1 | 107,260 | 58,947,951 | |||||
| REAL ESTATE MANAGEMENT & DEVELOPMENT - 1.6% | |||||||
Jones Lang LaSalle | 186,600 | 18,184,170 | |||||
Kennedy-Wilson Holdings | 988,036 | 18,733,163 | |||||
| 36,917,333 | |||||||
| THRIFTS & MORTGAGE FINANCE - 2.0% | |||||||
Genworth MI Canada | 1,720,700 | 44,137,929 | |||||
| Total (Cost $248,987,365) | 347,843,646 | ||||||
| HEALTH CARE – 4.9% | |||||||
| BIOTECHNOLOGY - 1.0% | |||||||
Myriad Genetics 1 | 733,800 | 22,454,280 | |||||
| HEALTH CARE EQUIPMENT & SUPPLIES - 2.0% | |||||||
IDEXX Laboratories 1 | 489,900 | 45,492,114 | |||||
| LIFE SCIENCES TOOLS & SERVICES - 1.9% | |||||||
Bio-Techne | 366,800 | 41,364,036 | |||||
| Total (Cost $52,405,344) | 109,310,430 | ||||||
| INDUSTRIALS – 33.9% | |||||||
| AIR FREIGHT & LOGISTICS - 2.2% | |||||||
Forward Air | 1,123,228 | 50,017,343 | |||||
| BUILDING PRODUCTS - 1.3% | |||||||
Simpson Manufacturing | 743,033 | 29,699,029 | |||||
| COMMERCIAL SERVICES & SUPPLIES - 5.9% | |||||||
Copart 1 | 1,353,000 | 66,310,530 | |||||
Ritchie Bros. Auctioneers | 1,928,800 | 65,154,864 | |||||
| 131,465,394 | |||||||
| CONSTRUCTION & ENGINEERING - 3.8% | |||||||
EMCOR Group | 522,100 | 25,718,646 | |||||
Valmont Industries | 436,200 | 59,004,774 | |||||
| 84,723,420 | |||||||
| MACHINERY - 10.7% | |||||||
CIRCOR International | 666,632 | 37,991,358 | |||||
Lincoln Electric Holdings | 982,600 | 58,052,008 | |||||
Lindsay Corporation | 468,875 | 31,817,857 | |||||
RBC Bearings 1 | 385,400 | 27,941,500 | |||||
Sun Hydraulics | 822,727 | 24,426,764 | |||||
Woodward | 1,027,101 | 59,202,102 | |||||
| 239,431,589 | |||||||
| MARINE - 3.0% | |||||||
| 663,200 | 19,654,727 | ||||||
Kirby Corporation 1 | 772,500 | 48,196,275 | |||||
| 67,851,002 | |||||||
| PROFESSIONAL SERVICES - 0.6% | |||||||
Advisory Board (The) 1 | 384,900 | 13,621,611 | |||||
| ROAD & RAIL - 2.5% | |||||||
Landstar System | 831,800 | 57,111,388 | |||||
| TRADING COMPANIES & DISTRIBUTORS - 3.9% | |||||||
Air Lease Cl. A | 1,651,060 | 44,215,387 | |||||
MSC Industrial Direct Cl. A | 616,000 | 43,464,960 | |||||
| 87,680,347 | |||||||
| Total (Cost $419,261,982) | 761,601,123 | ||||||
| INFORMATION TECHNOLOGY – 21.3% | |||||||
| ELECTRONIC EQUIPMENT, INSTRUMENTS & COMPONENTS - 8.9% | |||||||
Anixter International 1 | 596,300 | 31,770,864 | |||||
Cognex Corporation | 1,474,414 | 63,547,244 | |||||
| 434,600 | 34,768,000 | ||||||
National Instruments | 1,966,544 | 53,883,306 | |||||
Zebra Technologies Cl. A 1 | 333,894 | 16,728,089 | |||||
| 200,697,503 | |||||||
| IT SERVICES - 4.2% | |||||||
Gartner 1 | 464,100 | 45,207,981 | |||||
Jack Henry & Associates | 571,200 | 49,848,624 | |||||
| 95,056,605 | |||||||
| SEMICONDUCTORS & SEMICONDUCTOR EQUIPMENT - 3.8% | |||||||
Cabot Microelectronics | 517,374 | 21,905,615 | |||||
MKS Instruments | 1,449,900 | 62,432,694 | |||||
| 84,338,309 | |||||||
| SOFTWARE - 4.3% | |||||||
Fair Isaac | 401,600 | 45,384,816 | |||||
PTC 1 | 1,334,000 | 50,131,720 | |||||
| 95,516,536 | |||||||
| TECHNOLOGY HARDWARE, STORAGE & PERIPHERALS - 0.1% | |||||||
Diebold | 88,800 | 2,204,904 | |||||
| Total (Cost $231,181,777) | 477,813,857 | ||||||
| 70 | The Royce Funds 2016 Semiannual Report to Shareholders | THE ACCOMPANYING NOTES ARE AN INTEGRAL PART OF THESE FINANCIAL STATEMENTS |
| June 30, 2016 (unaudited) |
| Royce Premier Fund (continued) | |||||||
| SHARES | VALUE | ||||||
| MATERIALS – 6.9% | |||||||
| CHEMICALS - 3.0% | |||||||
Minerals Technologies | 605,600 | $ | 34,398,080 | ||||
Westlake Chemical | 765,700 | 32,863,844 | |||||
| 67,261,924 | |||||||
| METALS & MINING - 2.2% | |||||||
Reliance Steel & Aluminum | 652,300 | 50,161,870 | |||||
| PAPER & FOREST PRODUCTS - 1.7% | |||||||
Stella-Jones | 1,017,212 | 37,879,229 | |||||
| Total (Cost $82,374,370) | 155,303,023 | ||||||
| MISCELLANEOUS2 – 0.5% | |||||||
| Total (Cost $7,503,832) | 9,703,019 | ||||||
| TOTAL COMMON STOCKS | |||||||
| (Cost $1,261,744,197) | 2,203,476,579 | ||||||
| REPURCHASE AGREEMENT– 0.3% | |||||||
| Fixed Income Clearing Corporation, 0.03% dated 6/30/16, due 7/1/16, maturity value $7,461,006 (collateralized by obligations of various U.S. Government Agencies, 1.625% due 4/30/19, valued at $7,615,213) | |||||||
| (Cost $7,461,000) | 7,461,000 | ||||||
| COLLATERAL RECEIVED FOR SECURITIES LOANED – 1.1% | |||||||
| Money Market Funds | |||||||
Federated Government Obligations Fund (7 day yield-0.2459%) | |||||||
| (Cost $25,197,111) | 25,197,111 | ||||||
| TOTAL INVESTMENTS – 99.6% | |||||||
| (Cost $1,294,402,308) | 2,236,134,690 | ||||||
| CASH AND OTHER ASSETS LESS LIABILITIES – 0.4% | 8,794,268 | ||||||
| NET ASSETS – 100.0% | $ | 2,244,928,958 | |||||
| Royce Small-Cap Leaders Fund | |||||||
| Common Stocks – 94.9% | |||||||
| SHARES | VALUE | ||||||
| CONSUMER DISCRETIONARY – 17.8% | |||||||
| AUTO COMPONENTS - 3.2% | |||||||
Drew Industries | 9,432 | $ | 800,211 | ||||
Gentex Corporation | 150,334 | 2,322,660 | |||||
| 3,122,871 | |||||||
| AUTOMOBILES - 1.5% | |||||||
Thor Industries | 22,805 | 1,476,396 | |||||
| MEDIA - 2.2% | |||||||
E.W. Scripps Company Cl. A 1 | 107,790 | 1,707,393 | |||||
Wiley (John) & Sons Cl. A | 7,050 | 367,869 | |||||
| 2,075,262 | |||||||
| SPECIALTY RETAIL - 5.8% | |||||||
Buckle (The) | 97,756 | 2,540,679 | |||||
†Caleres | 62,600 | 1,515,546 | |||||
Genesco 1 | 24,175 | 1,554,694 | |||||
| 5,610,919 | |||||||
| TEXTILES, APPAREL & LUXURY GOODS - 5.1% | |||||||
Deckers Outdoor 1 | 41,120 | 2,365,222 | |||||
| 20,700 | 946,404 | ||||||
Movado Group | 72,832 | 1,578,998 | |||||
| 4,890,624 | |||||||
| Total (Cost $17,735,982) | 17,176,072 | ||||||
| CONSUMER STAPLES – 4.1% | |||||||
| FOOD PRODUCTS - 3.3% | |||||||
Cal-Maine Foods | 15,558 | 689,530 | |||||
Industrias Bachoco ADR | 38,190 | 1,886,586 | |||||
Sanderson Farms | 6,790 | 588,286 | |||||
| 3,164,402 | |||||||
| PERSONAL PRODUCTS - 0.8% | |||||||
Inter Parfums | 28,170 | 804,817 | |||||
| Total (Cost $3,259,839) | 3,969,219 | ||||||
| ENERGY – 5.2% | |||||||
| ENERGY EQUIPMENT & SERVICES - 5.2% | |||||||
Helmerich & Payne | 11,985 | 804,553 | |||||
Oil States International 1 | 22,740 | 747,691 | |||||
Pason Systems | 159,540 | 2,205,491 | |||||
TGS-NOPEC Geophysical | 74,690 | 1,221,338 | |||||
| Total (Cost $3,651,728) | 4,979,073 | ||||||
| FINANCIALS – 14.5% | |||||||
| CAPITAL MARKETS - 8.7% | |||||||
Artisan Partners Asset Management Cl. A | 42,980 | 1,189,686 | |||||
Federated Investors Cl. B | 85,560 | 2,462,417 | |||||
Lazard Cl. A | 61,520 | 1,832,066 | |||||
Virtus Investment Partners | 21,860 | 1,555,995 | |||||
Westwood Holdings Group | 25,600 | 1,326,080 | |||||
| 8,366,244 | |||||||
| REAL ESTATE MANAGEMENT & DEVELOPMENT - 2.9% | |||||||
Marcus & Millichap 1 | 109,350 | 2,778,583 | |||||
| THRIFTS & MORTGAGE FINANCE - 2.9% | |||||||
Genworth MI Canada | 109,760 | 2,815,470 | |||||
| Total (Cost $14,143,269) | 13,960,297 | ||||||
| HEALTH CARE – 6.2% | |||||||
| BIOTECHNOLOGY - 0.5% | |||||||
Zealand Pharma 1 | 25,830 | 463,118 | |||||
| HEALTH CARE EQUIPMENT & SUPPLIES - 0.6% | |||||||
Atrion Corporation | 1,430 | 611,840 | |||||
| THE ACCOMPANYING NOTES ARE AN INTEGRAL PART OF THESE FINANCIAL STATEMENTS | The Royce Funds 2016 Semiannual Report to Shareholders | 71 |
Schedules of Investments
| Royce Small-Cap Leaders Fund (continued) | |||||||
| SHARES | VALUE | ||||||
| HEALTH CARE (continued) | |||||||
| HEALTH CARE PROVIDERS & SERVICES - 0.9% | |||||||
†Aceto Corporation | 39,600 | $ | 866,844 | ||||
| LIFE SCIENCES TOOLS & SERVICES - 4.2% | |||||||
Bio-Rad Laboratories Cl. A 1 | 12,225 | 1,748,419 | |||||
Bio-Techne | 20,144 | 2,271,639 | |||||
| 4,020,058 | |||||||
| Total (Cost $4,385,225) | 5,961,860 | ||||||
| INDUSTRIALS – 22.5% | |||||||
| BUILDING PRODUCTS - 1.1% | |||||||
Apogee Enterprises | 22,400 | 1,038,240 | |||||
| COMMERCIAL SERVICES & SUPPLIES - 3.7% | |||||||
Ritchie Bros. Auctioneers | 33,934 | 1,146,290 | |||||
Steelcase Cl. A | 117,610 | 1,595,968 | |||||
UniFirst Corporation | 6,800 | 786,896 | |||||
| 3,529,154 | |||||||
| CONSTRUCTION & ENGINEERING - 1.6% | |||||||
Valmont Industries | 11,295 | 1,527,875 | |||||
| MACHINERY - 8.1% | |||||||
CIRCOR International | 27,870 | 1,588,311 | |||||
Federal Signal | 132,320 | 1,704,281 | |||||
Hyster-Yale Materials Handling Cl. A | 4,545 | 270,382 | |||||
John Bean Technologies | 9,609 | 588,263 | |||||
Kadant | 20,660 | 1,064,197 | |||||
Lydall 1 | 34,660 | 1,336,490 | |||||
RBC Bearings 1 | 11,180 | 810,550 | |||||
Wabtec Corporation | 6,488 | 455,652 | |||||
| 7,818,126 | |||||||
| PROFESSIONAL SERVICES - 2.9% | |||||||
ICF International 1 | 11,643 | 476,199 | |||||
Robert Half International | 13,003 | 496,194 | |||||
TrueBlue 1 | 94,790 | 1,793,427 | |||||
| 2,765,820 | |||||||
| ROAD & RAIL - 4.4% | |||||||
Landstar System | 25,720 | 1,765,935 | |||||
Saia 1 | 98,020 | 2,464,223 | |||||
| 4,230,158 | |||||||
| TRADING COMPANIES & DISTRIBUTORS - 0.7% | |||||||
MSC Industrial Direct Cl. A | 9,877 | 696,921 | |||||
| Total (Cost $19,290,724) | 21,606,294 | ||||||
| INFORMATION TECHNOLOGY – 21.3% | |||||||
| COMMUNICATIONS EQUIPMENT - 0.9% | |||||||
NetScout Systems 1 | 37,700 | 838,825 | |||||
| ELECTRONIC EQUIPMENT, INSTRUMENTS & COMPONENTS - 5.4% | |||||||
Cognex Corporation | 12,440 | 536,164 | |||||
Fabrinet 1 | 20,050 | 744,256 | |||||
FARO Technologies 1 | 9,060 | 306,500 | |||||
FEI Company | 4,700 | 502,336 | |||||
IPG Photonics 1 | 4,040 | 323,200 | |||||
Littelfuse | 3,840 | 453,850 | |||||
Methode Electronics | 40,650 | 1,391,449 | |||||
Orbotech 1 | 26,890 | 687,039 | |||||
Rofin-Sinar Technologies 1 | 7,640 | 244,022 | |||||
| 5,188,816 | |||||||
| INTERNET SOFTWARE & SERVICES - 2.3% | |||||||
j2 Global | 35,324 | 2,231,417 | |||||
| SEMICONDUCTORS & SEMICONDUCTOR EQUIPMENT - 7.9% | |||||||
Brooks Automation | 39,790 | 446,444 | |||||
Cabot Microelectronics | 25,136 | 1,064,258 | |||||
MKS Instruments | 56,145 | 2,417,604 | |||||
Nanometrics 1 | 93,348 | 1,940,705 | |||||
Tessera Technologies | 57,310 | 1,755,978 | |||||
| 7,624,989 | |||||||
| SOFTWARE - 4.8% | |||||||
| 46,400 | 881,136 | ||||||
Mentor Graphics | 87,480 | 1,859,825 | |||||
Monotype Imaging Holdings | 74,860 | 1,843,802 | |||||
| 4,584,763 | |||||||
| Total (Cost $16,651,440) | 20,468,810 | ||||||
| MATERIALS – 3.3% | |||||||
| CHEMICALS - 2.2% | |||||||
Minerals Technologies | 27,656 | 1,570,861 | |||||
Quaker Chemical | 6,190 | 552,148 | |||||
| 2,123,009 | |||||||
| METALS & MINING - 1.1% | |||||||
Compass Minerals International | 6,910 | 512,653 | |||||
Reliance Steel & Aluminum | 7,060 | 542,914 | |||||
| 1,055,567 | |||||||
| Total (Cost $2,536,040) | 3,178,576 | ||||||
| TOTAL COMMON STOCKS | |||||||
| (Cost $81,654,247) | 91,300,201 | ||||||
| REPURCHASE AGREEMENT– 6.3% | |||||||
| Fixed Income Clearing Corporation, 0.03% dated 6/30/16, due 7/1/16, maturity value $6,059,005 (collateralized by obligations of various U.S. Government Agencies, 0.125% due 4/15/19, valued at $6,182,025) | |||||||
| (Cost $6,059,000) | 6,059,000 | ||||||
| TOTAL INVESTMENTS – 101.2% | |||||||
| (Cost $87,713,247) | 97,359,201 | ||||||
| LIABILITIES LESS CASH AND OTHER ASSETS – (1.2)% | (1,185,139 | ) | |||||
| NET ASSETS – 100.0% | $ | 96,174,062 | |||||
| 72 | The Royce Funds 2016 Semiannual Report to Shareholders | THE ACCOMPANYING NOTES ARE AN INTEGRAL PART OF THESE FINANCIAL STATEMENTS |
| June 30, 2016 (unaudited) |
| Royce Small-Cap Value Fund | |||||||
| Common Stocks – 91.8% | |||||||
| SHARES | VALUE | ||||||
| CONSUMER DISCRETIONARY – 29.5% | |||||||
| AUTO COMPONENTS - 3.9% | |||||||
Dorman Products 1 | 39,853 | $ | 2,279,592 | ||||
Gentex Corporation | 810,756 | 12,526,180 | |||||
STRATTEC SECURITY | 88,638 | 3,613,771 | |||||
| 18,419,543 | |||||||
| HOUSEHOLD DURABLES - 0.8% | |||||||
Flexsteel Industries | 94,400 | 3,740,128 | |||||
| MEDIA - 0.7% | |||||||
Saga Communications Cl. A | 79,702 | 3,151,417 | |||||
| MULTILINE RETAIL - 2.2% | |||||||
Dillard’s Cl. A | 177,200 | 10,738,320 | |||||
| SPECIALTY RETAIL - 17.5% | |||||||
American Eagle Outfitters | 734,986 | 11,708,327 | |||||
Buckle (The) | 459,567 | 11,944,146 | |||||
Cato Corporation (The) Cl. A | 239,794 | 9,045,030 | |||||
DSW Cl. A | 516,202 | 10,933,158 | |||||
| 831,302 | 12,062,192 | ||||||
Genesco 1 | 97,914 | 6,296,849 | |||||
Shoe Carnival | 538,197 | 13,487,217 | |||||
Stein Mart | 1,038,522 | 8,017,390 | |||||
| 83,494,309 | |||||||
| TEXTILES, APPAREL & LUXURY GOODS - 4.4% | |||||||
Deckers Outdoor 1 | 164,085 | 9,438,169 | |||||
G-III Apparel Group 1 | 151,901 | 6,944,914 | |||||
Movado Group | 40,632 | 880,902 | |||||
Steven Madden 1 | 106,295 | 3,633,163 | |||||
| 20,897,148 | |||||||
| Total (Cost $151,313,585) | 140,440,865 | ||||||
| CONSUMER STAPLES – 2.5% | |||||||
| FOOD & STAPLES RETAILING - 0.8% | |||||||
Village Super Market Cl. A | 127,104 | 3,672,034 | |||||
| PERSONAL PRODUCTS - 1.7% | |||||||
Nu Skin Enterprises Cl. A | 179,367 | 8,284,962 | |||||
| Total (Cost $9,956,868) | 11,956,996 | ||||||
| ENERGY – 4.4% | |||||||
| ENERGY EQUIPMENT & SERVICES - 4.4% | |||||||
Helmerich & Payne | 79,599 | 5,343,481 | |||||
Matrix Service 1 | 738,755 | 12,182,070 | |||||
Unit Corporation 1 | 217,378 | 3,382,402 | |||||
| Total (Cost $23,835,878) | 20,907,953 | ||||||
| FINANCIALS – 18.2% | |||||||
| BANKS - 6.2% | |||||||
Ames National | 117,448 | 3,149,955 | |||||
Camden National | 196,712 | 8,261,904 | |||||
City Holding Company | 95,727 | 4,352,707 | |||||
CNB Financial | 156,753 | 2,790,203 | |||||
Codorus Valley Bancorp | 53,820 | 1,096,313 | |||||
National Bankshares | 150,437 | 5,253,260 | |||||
Northrim BanCorp | 176,643 | 4,643,945 | |||||
| 29,548,287 | |||||||
| CAPITAL MARKETS - 3.8% | |||||||
Federated Investors Cl. B | 228,149 | 6,566,128 | |||||
Moelis & Company Cl. A | 515,957 | 11,609,033 | |||||
| 18,175,161 | |||||||
| INSURANCE - 2.3% | |||||||
Allied World Assurance Company Holdings | 37,223 | 1,308,016 | |||||
Reinsurance Group of America | 97,135 | 9,421,124 | |||||
| 10,729,140 | |||||||
| THRIFTS & MORTGAGE FINANCE - 5.9% | |||||||
Genworth MI Canada | 553,800 | 14,205,605 | |||||
Southern Missouri Bancorp | 67,500 | 1,588,275 | |||||
TrustCo Bank Corp. NY | 1,923,804 | 12,331,584 | |||||
| 28,125,464 | |||||||
| Total (Cost $81,458,574) | 86,578,052 | ||||||
| HEALTH CARE – 2.2% | |||||||
| HEALTH CARE PROVIDERS & SERVICES - 2.2% | |||||||
Aceto Corporation | 225,966 | 4,946,396 | |||||
Ensign Group (The) | 253,300 | 5,321,833 | |||||
| Total (Cost $10,502,415) | 10,268,229 | ||||||
| INDUSTRIALS – 19.0% | |||||||
| AIRLINES - 2.9% | |||||||
| 305,062 | 13,688,132 | ||||||
| BUILDING PRODUCTS - 0.9% | |||||||
†Apogee Enterprises | 99,500 | 4,611,825 | |||||
| COMMERCIAL SERVICES & SUPPLIES - 0.8% | |||||||
UniFirst Corporation | 33,356 | 3,859,956 | |||||
| CONSTRUCTION & ENGINEERING - 1.3% | |||||||
MYR Group 1 | 251,321 | 6,051,810 | |||||
| MACHINERY - 5.0% | |||||||
Alamo Group | 140,051 | 9,239,164 | |||||
Federal Signal | 720,210 | 9,276,305 | |||||
Miller Industries | 262,574 | 5,406,399 | |||||
| 23,921,868 | |||||||
| PROFESSIONAL SERVICES - 3.1% | |||||||
Korn/Ferry International | 331,000 | 6,851,700 | |||||
TrueBlue 1 | 421,467 | 7,974,155 | |||||
| 14,825,855 | |||||||
| ROAD & RAIL - 5.0% | |||||||
| 71,100 | 4,288,041 | ||||||
Saia 1 | 433,003 | 10,885,696 | |||||
Werner Enterprises | 373,988 | 8,590,504 | |||||
| 23,764,241 | |||||||
| Total (Cost $96,971,414) | 90,723,687 | ||||||
| INFORMATION TECHNOLOGY – 15.4% | |||||||
| COMMUNICATIONS EQUIPMENT - 2.0% | |||||||
Brocade Communications Systems | 1,031,711 | 9,471,107 | |||||
| ELECTRONIC EQUIPMENT, INSTRUMENTS & COMPONENTS - 9.7% | |||||||
Benchmark Electronics 1 | 439,744 | 9,300,586 | |||||
Fabrinet 1 | 47,709 | 1,770,958 | |||||
| 263,300 | 3,217,526 | ||||||
PC Connection | 595,918 | 14,182,848 | |||||
ScanSource 1 | 116,432 | 4,320,792 | |||||
Vishay Intertechnology | 1,090,457 | 13,510,762 | |||||
| 46,303,472 | |||||||
| SEMICONDUCTORS & SEMICONDUCTOR EQUIPMENT - 1.7% | |||||||
MKS Instruments | 193,047 | 8,312,604 | |||||
| TECHNOLOGY HARDWARE, STORAGE & PERIPHERALS - 2.0% | |||||||
Super Micro Computer 1 | 380,849 | 9,464,097 | |||||
| Total (Cost $66,983,376) | 73,551,280 | ||||||
| THE ACCOMPANYING NOTES ARE AN INTEGRAL PART OF THESE FINANCIAL STATEMENTS | The Royce Funds 2016 Semiannual Report to Shareholders | 73 |
Schedules of Investments
| Royce Small-Cap Value Fund (continued) | |||||||
| VALUE | |||||||
| MISCELLANEOUS2 – 0.6% | |||||||
| Total (Cost $3,090,733) | $ | 3,093,221 | |||||
| TOTAL COMMON STOCKS | |||||||
| (Cost $444,112,843) | 437,520,283 | ||||||
| REPURCHASE AGREEMENT– 8.5% | |||||||
| Fixed Income Clearing Corporation, 0.03% dated 6/30/16, due 7/1/16, maturity value $40,721,034 (collateralized by obligations of various U.S. Government Agencies, 1.625% due 7/31/19, valued at $41,537,675) | |||||||
| (Cost $40,721,000) | 40,721,000 | ||||||
| COLLATERAL RECEIVED FOR SECURITIES LOANED – 0.5% | |||||||
| Money Market Funds | |||||||
Federated Government Obligations Fund (7 day yield-0.2459%) | |||||||
| (Cost $2,138,400) | 2,138,400 | ||||||
| TOTAL INVESTMENTS – 100.8% | |||||||
| (Cost $486,972,243) | 480,379,683 | ||||||
| LIABILITIES LESS CASH AND OTHER ASSETS – (0.8)% | (3,691,421 | ) | |||||
| NET ASSETS – 100.0% | $ | 476,688,262 | |||||
| Royce Smaller-Companies Growth Fund | |||||||
| Common Stocks – 91.9% | |||||||
| SHARES | VALUE | ||||||
| CONSUMER DISCRETIONARY – 11.8% | |||||||
| AUTO COMPONENTS - 1.1% | |||||||
Drew Industries | 62,000 | $ | 5,260,080 | ||||
| HOTELS, RESTAURANTS & LEISURE - 2.7% | |||||||
| 117,000 | 5,474,430 | ||||||
Texas Roadhouse | 167,000 | 7,615,200 | |||||
| 13,089,630 | |||||||
| HOUSEHOLD DURABLES - 1.1% | |||||||
| 156,000 | 5,472,480 | ||||||
| MEDIA - 0.3% | |||||||
IMAX Corporation 1 | 50,000 | 1,474,000 | |||||
| SPECIALTY RETAIL - 3.3% | |||||||
Boot Barn Holdings 1 | 831,600 | 7,168,392 | |||||
Monro Muffler Brake | 31,000 | 1,970,360 | |||||
Tractor Supply | 79,000 | 7,203,220 | |||||
| 16,341,972 | |||||||
| TEXTILES, APPAREL & LUXURY GOODS - 3.3% | |||||||
Carter’s | 71,900 | 7,655,193 | |||||
Columbia Sportswear | 84,000 | 4,833,360 | |||||
Gildan Activewear | 123,666 | 3,627,124 | |||||
| 16,115,677 | |||||||
| Total (Cost $40,316,215) | 57,753,839 | ||||||
| CONSUMER STAPLES – 2.4% | |||||||
| FOOD & STAPLES RETAILING - 2.4% | |||||||
| 345,000 | 4,502,250 | ||||||
United Natural Foods 1 | 150,617 | 7,048,875 | |||||
| Total (Cost $13,150,785) | 11,551,125 | ||||||
| ENERGY– 6.7% | |||||||
| ENERGY EQUIPMENT & SERVICES - 4.3% | |||||||
Canadian Energy Services & Technology | 842,000 | 2,652,533 | |||||
Dril-Quip 1 | 45,000 | 2,629,350 | |||||
Helmerich & Payne | 63,000 | 4,229,190 | |||||
Pason Systems | 378,000 | 5,225,496 | |||||
Unit Corporation 1 | 400,200 | 6,227,112 | |||||
| 20,963,681 | |||||||
| OIL, GAS & CONSUMABLE FUELS - 2.4% | |||||||
Navigator Holdings 1 | 346,000 | 3,979,000 | |||||
Parsley Energy Cl. A 1 | 116,000 | 3,138,960 | |||||
| 113,000 | 3,942,570 | ||||||
Sprott Resource 1 | 1,299,000 | 603,274 | |||||
| 11,663,804 | |||||||
| Total (Cost $41,714,604) | 32,627,485 | ||||||
| FINANCIALS – 10.5% | |||||||
| BANKS - 3.8% | |||||||
Enterprise Financial Services | 288,500 | 8,046,265 | |||||
F.N.B. Corporation | 231,000 | 2,896,740 | |||||
Live Oak Bancshares | 240,700 | 3,396,277 | |||||
ServisFirst Bancshares | 89,000 | 4,395,710 | |||||
| 18,734,992 | |||||||
| CAPITAL MARKETS - 4.2% | |||||||
Financial Engines | 209,800 | 5,427,526 | |||||
Northern Trust | 71,000 | 4,704,460 | |||||
Oaktree Capital Group LLC Cl. A | 108,800 | 4,869,888 | |||||
WisdomTree Investments | 539,000 | 5,276,810 | |||||
| 20,278,684 | |||||||
| REAL ESTATE INVESTMENT TRUSTS (REITS) - 2.5% | |||||||
CubeSmart | 166,000 | 5,126,080 | |||||
| 74 | The Royce Funds 2016 Semiannual Report to Shareholders | THE ACCOMPANYING NOTES ARE AN INTEGRAL PART OF THESE FINANCIAL STATEMENTS |
| June 30, 2016 (unaudited) |
| Royce Smaller-Companies Growth Fund (continued) | |||||||
| SHARES | VALUE | ||||||
| FINANCIALS (continued) | |||||||
| REAL ESTATE INVESTMENT TRUSTS (REITS) (continued) | |||||||
CyrusOne | 126,000 | $ | 7,013,160 | ||||
| 12,139,240 | |||||||
| Total (Cost $44,507,408) | 51,152,916 | ||||||
| HEALTH CARE – 14.6% | |||||||
| BIOTECHNOLOGY - 3.0% | |||||||
Myriad Genetics 1 | 75,240 | 2,302,344 | |||||
Progenics Pharmaceuticals 1 | 513,200 | 2,165,704 | |||||
| 159,000 | 4,350,240 | ||||||
Zealand Pharma 1 | 337,799 | 6,056,550 | |||||
| 14,874,838 | |||||||
| HEALTH CARE EQUIPMENT & SUPPLIES - 3.6% | |||||||
AtriCure 1 | 228,000 | 3,221,640 | |||||
| 200,764 | 2,395,114 | ||||||
Inogen 1 | 164,755 | 8,255,873 | |||||
Masimo Corporation 1 | 65,000 | 3,413,475 | |||||
Penumbra 1 | 1,000 | 59,500 | |||||
| 17,345,602 | |||||||
| HEALTH CARE PROVIDERS & SERVICES - 2.7% | |||||||
BioTelemetry 1 | 487,000 | 7,938,100 | |||||
| 172,000 | 5,226,220 | ||||||
| 13,164,320 | |||||||
| HEALTH CARE TECHNOLOGY - 0.8% | |||||||
HealthStream 1 | 141,000 | 3,739,320 | |||||
| LIFE SCIENCES TOOLS & SERVICES - 2.6% | |||||||
Cambrex Corporation 1 | 145,500 | 7,526,715 | |||||
NeoGenomics 1 | 654,000 | 5,258,160 | |||||
| 12,784,875 | |||||||
| PHARMACEUTICALS - 1.9% | |||||||
Intersect ENT 1 | 265,000 | 3,426,450 | |||||
| 326,000 | 6,031,000 | ||||||
| 9,457,450 | |||||||
| Total (Cost $56,360,033) | 71,366,405 | ||||||
| INDUSTRIALS – 12.0% | |||||||
| AEROSPACE & DEFENSE - 2.0% | |||||||
Mercury Systems 1 | 387,749 | 9,639,440 | |||||
| AIR FREIGHT & LOGISTICS - 1.2% | |||||||
Forward Air | 137,000 | 6,100,610 | |||||
| BUILDING PRODUCTS - 1.3% | |||||||
DIRTT Environmental Solutions 1 | 1,511,000 | 6,292,179 | |||||
| COMMERCIAL SERVICES & SUPPLIES - 1.2% | |||||||
Mobile Mini | 164,213 | 5,688,338 | |||||
| CONSTRUCTION & ENGINEERING - 1.4% | |||||||
NV5 Holdings 1 | 241,885 | 6,879,209 | |||||
| ELECTRICAL EQUIPMENT - 0.4% | |||||||
| 280,295 | 1,934,036 | ||||||
| MACHINERY - 2.1% | |||||||
KUKA | 40,900 | 4,843,509 | |||||
Tennant Company | 60,937 | 3,282,676 | |||||
Woodward | 38,000 | 2,190,320 | |||||
| 10,316,505 | |||||||
| MARINE - 1.2% | |||||||
Clarkson | 206,976 | 6,133,982 | |||||
| PROFESSIONAL SERVICES - 1.2% | |||||||
†Insperity | 74,000 | 5,715,020 | |||||
| Total (Cost $48,746,507) | 58,699,319 | ||||||
| INFORMATION TECHNOLOGY – 23.7% | |||||||
| COMMUNICATIONS EQUIPMENT - 0.9% | |||||||
Infinera Corporation 1 | 380,233 | 4,289,028 | |||||
| ELECTRONIC EQUIPMENT, INSTRUMENTS & COMPONENTS - 4.9% | |||||||
ePlus 1 | 71,000 | 5,807,090 | |||||
Fabrinet 1 | 81,000 | 3,006,720 | |||||
FARO Technologies 1 | 122,000 | 4,127,260 | |||||
FLIR Systems | 178,600 | 5,527,670 | |||||
IPG Photonics 1 | 72,444 | 5,795,520 | |||||
| 24,264,260 | |||||||
| INTERNET SOFTWARE & SERVICES - 4.6% | |||||||
| 361,000 | 4,411,420 | ||||||
| 178,071 | 4,252,335 | ||||||
| 204,000 | 5,716,080 | ||||||
| 55,000 | 1,691,800 | ||||||
| 214,348 | 6,303,975 | ||||||
| 22,375,610 | |||||||
| IT SERVICES - 0.6% | |||||||
Unisys Corporation 1 | 423,000 | 3,079,440 | |||||
| SEMICONDUCTORS & SEMICONDUCTOR EQUIPMENT - 3.1% | |||||||
Inphi Corporation 1 | 142,000 | 4,548,260 | |||||
Integrated Device Technology 1 | 282,100 | 5,678,673 | |||||
| 144,000 | 4,749,120 | ||||||
| 14,976,053 | |||||||
| SOFTWARE - 8.6% | |||||||
| 76,000 | 3,299,920 | ||||||
| 90,000 | 3,870,900 | ||||||
| 4,000 | 184,560 | ||||||
Paylocity Holding Corporation 1 | 275,786 | 11,913,955 | |||||
QAD Cl. A | 228,000 | 4,393,560 | |||||
RingCentral Cl. A 1 | 269,000 | 5,304,680 | |||||
Rubicon Project 1 | 385,000 | 5,255,250 | |||||
| 234,000 | 3,299,400 | ||||||
Silver Spring Networks 1 | 396,000 | 4,811,400 | |||||
| 42,333,625 | |||||||
| TECHNOLOGY HARDWARE, STORAGE & PERIPHERALS - 1.0% | |||||||
Immersion Corporation 1 | 640,595 | 4,701,968 | |||||
| Total (Cost $100,593,267) | 116,019,984 | ||||||
| MATERIALS – 4.5% | |||||||
| CHEMICALS - 2.3% | |||||||
Albemarle Corporation | 96,000 | 7,613,760 | |||||
| 136,000 | 3,798,480 | ||||||
| 11,412,240 | |||||||
| CONSTRUCTION MATERIALS - 0.6% | |||||||
Eagle Materials | 35,000 | 2,700,250 | |||||
| METALS & MINING - 1.6% | |||||||
Orocobre 1 | 2,235,000 | 8,074,680 | |||||
| Total (Cost $15,366,853) | 22,187,170 | ||||||
| TELECOMMUNICATION SERVICES – 1.2% | |||||||
| DIVERSIFIED TELECOMMUNICATION SERVICES - 1.2% | |||||||
ORBCOMM 1 | 576,000 | 5,731,200 | |||||
| Total (Cost $3,474,355) | 5,731,200 | ||||||
| MISCELLANEOUS2 – 4.5% | |||||||
| Total (Cost $21,291,467) | 22,274,510 | ||||||
| TOTAL COMMON STOCKS | |||||||
| (Cost $385,521,494) | 449,363,953 | ||||||
| THE ACCOMPANYING NOTES ARE AN INTEGRAL PART OF THESE FINANCIAL STATEMENTS | The Royce Funds 2016 Semiannual Report to Shareholders | 75 |
Schedules of Investments
| Royce Smaller-Companies Growth Fund (continued) | |||||||
| VALUE | |||||||
| REPURCHASE AGREEMENT– 8.2% | |||||||
| Fixed Income Clearing Corporation, 0.03% dated 6/30/16, due 7/1/16, maturity value $40,030,033 (collateralized by obligations of various U.S. Government Agencies, 0.125% due 4/15/19, valued at $40,834,725) | |||||||
| (Cost $40,030,000) | $ | 40,030,000 | |||||
| COLLATERAL RECEIVED FOR SECURITIES LOANED – 5.7% | |||||||
| Money Market Funds | |||||||
Federated Government Obligations Fund (7 day yield-0.2459%) | |||||||
| (Cost $28,142,552) | 28,142,552 | ||||||
| TOTAL INVESTMENTS – 105.8% | |||||||
| (Cost $453,694,046) | 517,536,505 | ||||||
| LIABILITIES LESS CASH AND OTHER ASSETS – (5.8)% | (28,391,719 | ) | |||||
| NET ASSETS – 100.0% | $ | 489,144,786 | |||||
| Royce Special Equity Fund | |||||||
| Common Stocks – 91.2% | |||||||
| SHARES | VALUE | ||||||
| CONSUMER DISCRETIONARY – 34.1% | |||||||
| AUTO COMPONENTS - 6.1% | |||||||
†Gentex Corporation | 960,000 | $ | 14,832,000 | ||||
Standard Motor Products 6 | 1,855,000 | 73,791,900 | |||||
| 88,623,900 | |||||||
| AUTOMOBILES - 1.9% | |||||||
Winnebago Industries | 1,212,000 | 27,779,040 | |||||
| DIVERSIFIED CONSUMER SERVICES - 3.5% | |||||||
Capella Education 6 | 698,000 | 36,742,720 | |||||
DeVry Education Group | 755,000 | 13,469,200 | |||||
| 50,211,920 | |||||||
| HOTELS, RESTAURANTS & LEISURE - 0.4% | |||||||
Bowl America Cl. A 6 | 343,000 | 4,904,900 | |||||
| HOUSEHOLD DURABLES - 6.5% | |||||||
Bassett Furniture Industries 6 | 575,000 | 13,765,500 | |||||
CSS Industries 6 | 885,000 | 23,726,850 | |||||
Ethan Allen Interiors | 410,000 | 13,546,400 | |||||
Flexsteel Industries 6 | 481,000 | 19,057,220 | |||||
Hooker Furniture 6 | 1,110,000 | 23,853,900 | |||||
| 93,949,870 | |||||||
| LEISURE PRODUCTS - 0.4% | |||||||
†Brunswick Corporation | 135,000 | 6,118,200 | |||||
| MEDIA - 9.9% | |||||||
Meredith Corporation | 1,470,000 | 76,307,700 | |||||
Scholastic Corporation | 1,683,000 | 66,663,630 | |||||
| 142,971,330 | |||||||
| SPECIALTY RETAIL - 5.4% | |||||||
Children’s Place | 705,000 | 56,526,900 | |||||
Haverty Furniture 6 | 1,209,200 | 21,801,876 | |||||
| 78,328,776 | |||||||
| Total (Cost $403,099,675) | 492,887,936 | ||||||
| CONSUMER STAPLES – 4.2% | |||||||
| FOOD & STAPLES RETAILING - 4.1% | |||||||
Weis Markets | 1,155,000 | 58,385,250 | |||||
| HOUSEHOLD PRODUCTS - 0.1% | |||||||
†Oil-Dri Corporation of America | 41,987 | 1,449,811 | |||||
| Total (Cost $46,946,219) | 59,835,061 | ||||||
| FINANCIALS – 1.4% | |||||||
| REAL ESTATE MANAGEMENT & DEVELOPMENT - 1.4% | |||||||
Marcus & Millichap 1 | 775,000 | 19,692,750 | |||||
| Total (Cost $20,813,317) | 19,692,750 | ||||||
| INDUSTRIALS – 25.6% | |||||||
| AEROSPACE & DEFENSE - 2.9% | |||||||
National Presto Industries 6 | 450,000 | 42,457,500 | |||||
| COMMERCIAL SERVICES & SUPPLIES - 8.6% | |||||||
Herman Miller | 710,000 | 21,221,900 | |||||
UniFirst Corporation | 890,000 | 102,990,800 | |||||
| 124,212,700 | |||||||
| ELECTRICAL EQUIPMENT - 6.9% | |||||||
EnerSys | 520,000 | 30,924,400 | |||||
Hubbell Cl. B | 595,000 | 62,754,650 | |||||
Regal Beloit | 96,000 | 5,284,800 | |||||
| 98,963,850 | |||||||
| INDUSTRIAL CONGLOMERATES - 0.3% | |||||||
Carlisle Companies | 47,000 | 4,966,960 | |||||
| MACHINERY - 2.3% | |||||||
Hurco Companies 6 | 525,000 | 14,610,750 | |||||
| 76 | The Royce Funds 2016 Semiannual Report to Shareholders | THE ACCOMPANYING NOTES ARE AN INTEGRAL PART OF THESE FINANCIAL STATEMENTS |
| June 30, 2016 (unaudited) |
| Royce Special Equity Fund (continued) | |||||||
| SHARES | VALUE | ||||||
| INDUSTRIALS (continued) | |||||||
| MACHINERY (continued) | |||||||
†Kadant | 368,000 | $ | 18,955,680 | ||||
| 33,566,430 | |||||||
| PROFESSIONAL SERVICES - 2.0% | |||||||
Kelly Services Cl. A | 565,000 | 10,718,050 | |||||
†Resources Connection | 1,210,000 | 17,883,800 | |||||
| 28,601,850 | |||||||
| TRADING COMPANIES & DISTRIBUTORS - 2.6% | |||||||
Applied Industrial Technologies | 775,000 | 34,983,500 | |||||
Central Steel & Wire 3 | 6,421 | 2,581,242 | |||||
| 37,564,742 | |||||||
| Total (Cost $209,252,446) | 370,334,032 | ||||||
| INFORMATION TECHNOLOGY – 15.0% | |||||||
| ELECTRONIC EQUIPMENT, INSTRUMENTS & COMPONENTS - 9.7% | |||||||
AVX Corporation | 7,200,000 | 97,776,000 | |||||
Park Electrochemical 6 | 1,950,000 | 28,333,500 | |||||
Vishay Intertechnology | 1,150,000 | 14,248,500 | |||||
| 140,358,000 | |||||||
| IT SERVICES - 1.8% | |||||||
Computer Services 3 | 700,000 | 26,215,000 | |||||
| SEMICONDUCTORS & SEMICONDUCTOR EQUIPMENT - 3.5% | |||||||
Teradyne | 2,570,000 | 50,603,300 | |||||
| Total (Cost $206,001,166) | 217,176,300 | ||||||
| MATERIALS – 10.9% | |||||||
| CHEMICALS - 2.8% | |||||||
Hawkins 6 | 940,000 | 40,805,400 | |||||
| METALS & MINING - 2.4% | |||||||
Kaiser Aluminum | 380,000 | 34,355,800 | |||||
| PAPER & FOREST PRODUCTS - 5.7% | |||||||
Neenah Paper 6 | 965,000 | 69,837,050 | |||||
Schweitzer-Mauduit International | 370,000 | 13,053,600 | |||||
| 82,890,650 | |||||||
| Total (Cost $116,976,850) | 158,051,850 | ||||||
| TOTAL COMMON STOCKS | |||||||
| (Cost $1,003,089,673) | 1,317,977,929 | ||||||
| REPURCHASE AGREEMENT– 9.1% | |||||||
| Fixed Income Clearing Corporation, 0.03% dated 6/30/16, due 7/1/16, maturity value $131,699,110 (collateralized by obligations of various U.S. Government Agencies, 1.625% due 4/30/19-7/31/19, valued at $134,338,030) | |||||||
| (Cost $131,699,000) | 131,699,000 | ||||||
| TOTAL INVESTMENTS – 100.3% | |||||||
| (Cost $1,134,788,673) | 1,449,676,929 | ||||||
| LIABILITIES LESS CASH AND OTHER ASSETS – (0.3)% | (4,994,017 | ) | |||||
| NET ASSETS – 100.0% | $ | 1,444,682,912 | |||||
| Royce Special Equity Multi-Cap Fund | |||||||
| Common Stocks – 87.5% | |||||||
| SHARES | VALUE | ||||||
| CONSUMER DISCRETIONARY – 26.0% | |||||||
| AUTO COMPONENTS - 1.9% | |||||||
Lear Corporation | 22,500 | $ | 2,289,600 | ||||
| DISTRIBUTORS - 7.5% | |||||||
Genuine Parts | 87,500 | 8,859,375 | |||||
| MEDIA - 2.9% | |||||||
Viacom Cl. B | 83,000 | 3,442,010 | |||||
| MULTILINE RETAIL - 5.1% | |||||||
Nordstrom | 158,000 | 6,011,900 | |||||
| SPECIALTY RETAIL - 4.6% | |||||||
Dicks Sporting Goods | 120,000 | 5,407,200 | |||||
| TEXTILES, APPAREL & LUXURY GOODS - 4.0% | |||||||
Ralph Lauren Cl. A | 53,100 | 4,758,822 | |||||
| Total (Cost $30,996,520) | 30,768,907 | ||||||
| FINANCIALS – 4.9% | |||||||
| CAPITAL MARKETS - 4.9% | |||||||
T. Rowe Price Group | 79,000 | 5,764,630 | |||||
| Total (Cost $6,208,505) | 5,764,630 | ||||||
| INDUSTRIALS – 41.5% | |||||||
| AEROSPACE & DEFENSE - 1.1% | |||||||
United Technologies | 13,000 | 1,333,150 | |||||
| ELECTRICAL EQUIPMENT - 5.1% | |||||||
Emerson Electric | 44,000 | 2,295,040 | |||||
Rockwell Automation | 32,500 | 3,731,650 | |||||
| 6,026,690 | |||||||
| INDUSTRIAL CONGLOMERATES - 1.5% | |||||||
3M | 10,000 | 1,751,200 | |||||
| MACHINERY - 18.2% | |||||||
Cummins | 7,500 | 843,300 | |||||
Dover Corporation | 23,000 | 1,594,360 | |||||
Illinois Tool Works | 69,500 | 7,239,120 | |||||
Lincoln Electric Holdings | 56,000 | 3,308,480 | |||||
Parker Hannifin | 50,000 | 5,402,500 | |||||
†Wabtec Corporation | 45,000 | 3,160,350 | |||||
| 21,548,110 | |||||||
| PROFESSIONAL SERVICES - 11.5% | |||||||
ManpowerGroup | 107,000 | 6,884,380 | |||||
Robert Half International | 175,300 | 6,689,448 | |||||
| 13,573,828 | |||||||
| TRADING COMPANIES & DISTRIBUTORS - 4.1% | |||||||
Grainger (W.W.) | 21,500 | 4,885,875 | |||||
| Total (Cost $44,408,363) | 49,118,853 | ||||||
| INFORMATION TECHNOLOGY – 15.1% | |||||||
| COMMUNICATIONS EQUIPMENT - 4.8% | |||||||
Cisco Systems | 200,000 | 5,738,000 | |||||
| ELECTRONIC EQUIPMENT, INSTRUMENTS & COMPONENTS - 3.0% | |||||||
Avnet | 89,000 | 3,605,390 | |||||
| TECHNOLOGY HARDWARE, STORAGE & PERIPHERALS - 7.3% | |||||||
Apple | 90,000 | 8,604,000 | |||||
| Total (Cost $15,866,829) | 17,947,390 | ||||||
| TOTAL COMMON STOCKS | |||||||
| (Cost $97,480,217) | 103,599,780 | ||||||
| THE ACCOMPANYING NOTES ARE AN INTEGRAL PART OF THESE FINANCIAL STATEMENTS | The Royce Funds 2016 Semiannual Report to Shareholders | 77 |
Schedules of Investments
| Royce Special Equity Multi-Cap Fund (continued) | |||||||
| VALUE | |||||||
| REPURCHASE AGREEMENT– 12.5% | |||||||
| Fixed Income Clearing Corporation, 0.03% dated 6/30/16, due 7/1/16, maturity value $14,797,012 (collateralized by obligations of various U.S. Government Agencies, 0.125% due 4/15/19, valued at $15,095,400) | |||||||
| (Cost $14,797,000) | $ | 14,797,000 | |||||
| TOTAL INVESTMENTS – 100.0% | |||||||
| (Cost $112,277,217) | 118,396,780 | ||||||
| CASH AND OTHER ASSETS LESS LIABILITIES – 0.0% | 56,309 | ||||||
| NET ASSETS – 100.0% | $ | 118,453,089 | |||||
| Royce Total Return Fund | |||||||
| Common Stocks – 99.1% | |||||||
| SHARES | VALUE | ||||||
| CONSUMER DISCRETIONARY – 12.7% | |||||||
| AUTO COMPONENTS - 1.6% | |||||||
Gentex Corporation | 1,967,748 | $ | 30,401,707 | ||||
Nokian Renkaat | 172,000 | 6,143,899 | |||||
Standard Motor Products | 97,506 | 3,878,789 | |||||
STRATTEC SECURITY | 98,934 | 4,033,539 | |||||
| 44,457,934 | |||||||
| AUTOMOBILES - 1.2% | |||||||
Thor Industries | 493,474 | 31,947,507 | |||||
Winnebago Industries | 48,939 | 1,121,682 | |||||
| 33,069,189 | |||||||
| DISTRIBUTORS - 0.3% | |||||||
Weyco Group | 282,000 | 7,833,960 | |||||
| DIVERSIFIED CONSUMER SERVICES - 0.1% | |||||||
Capella Education | 35,701 | 1,879,301 | |||||
| HOTELS, RESTAURANTS & LEISURE - 0.3% | |||||||
Bob Evans Farms | 139,000 | 5,275,050 | |||||
DineEquity | 46,840 | 3,971,095 | |||||
| 9,246,145 | |||||||
| HOUSEHOLD DURABLES - 1.2% | |||||||
Ethan Allen Interiors | 867,599 | 28,665,471 | |||||
Flexsteel Industries | 102,292 | 4,052,809 | |||||
La-Z-Boy | 77,820 | 2,164,952 | |||||
| 34,883,232 | |||||||
| INTERNET & CATALOG RETAIL - 0.3% | |||||||
PetMed Express | 401,500 | 7,532,140 | |||||
| MEDIA - 1.1% | |||||||
Meredith Corporation | 277,300 | 14,394,643 | |||||
Saga Communications Cl. A | 186,925 | 7,391,015 | |||||
Wiley (John) & Sons Cl. A | 180,739 | 9,430,961 | |||||
| 31,216,619 | |||||||
| MULTILINE RETAIL - 0.6% | |||||||
Big Lots | 18,661 | 935,103 | |||||
Dillard’s Cl. A | 259,322 | 15,714,913 | |||||
| 16,650,016 | |||||||
| SPECIALTY RETAIL - 4.8% | |||||||
Aaron’s | 40,334 | 882,911 | |||||
American Eagle Outfitters | 1,001,094 | 15,947,427 | |||||
Buckle (The) | 628,551 | 16,336,040 | |||||
Caleres | 34,778 | 841,975 | |||||
Cato Corporation (The) Cl. A | 566,819 | 21,380,413 | |||||
Children’s Place | 71,243 | 5,712,264 | |||||
DSW Cl. A | 691,498 | 14,645,928 | |||||
GameStop Corporation Cl. A | 90,200 | 2,397,516 | |||||
Genesco 1 | 230,818 | 14,843,906 | |||||
Monro Muffler Brake | 210,100 | 13,353,956 | |||||
Shoe Carnival | 679,330 | 17,024,010 | |||||
Stein Mart | 1,435,148 | 11,079,343 | |||||
| 134,445,689 | |||||||
| TEXTILES, APPAREL & LUXURY GOODS - 1.2% | |||||||
Columbia Sportswear | 108,258 | 6,229,165 | |||||
J.G. Boswell Company 3 | 1,170 | 748,578 | |||||
Movado Group | 453,840 | 9,839,251 | |||||
Steven Madden 1 | 310,479 | 10,612,172 | |||||
Wolverine World Wide | 370,100 | 7,520,432 | |||||
| 34,949,598 | |||||||
| Total (Cost $294,090,637) | 356,163,823 | ||||||
| 78 | The Royce Funds 2016 Semiannual Report to Shareholders | THE ACCOMPANYING NOTES ARE AN INTEGRAL PART OF THESE FINANCIAL STATEMENTS |
| June 30, 2016 (unaudited) |
| Royce Total Return Fund (continued) | |||||||
| SHARES | VALUE | ||||||
| CONSUMER STAPLES – 4.3% | |||||||
| BEVERAGES - 0.2% | |||||||
Compania Cervecerias Unidas ADR | 264,000 | $ | 6,161,760 | ||||
| FOOD & STAPLES RETAILING - 0.6% | |||||||
Village Super Market Cl. A | 555,400 | 16,045,506 | |||||
| FOOD PRODUCTS - 2.9% | |||||||
Cal-Maine Foods | 31,496 | 1,395,903 | |||||
Farmer Bros. 1 | 366,000 | 11,733,960 | |||||
Flowers Foods | 548,700 | 10,288,125 | |||||
Fresh Del Monte Produce | 234,400 | 12,758,392 | |||||
Hershey Creamery 3 | 847 | 2,372,447 | |||||
Lancaster Colony | 126,100 | 16,091,621 | |||||
Sanderson Farms | 23,934 | 2,073,642 | |||||
Tootsie Roll Industries | 637,833 | 24,575,705 | |||||
| 81,289,795 | |||||||
| HOUSEHOLD PRODUCTS - 0.0% | |||||||
WD-40 Company | 10,211 | 1,199,282 | |||||
| PERSONAL PRODUCTS - 0.6% | |||||||
Nu Skin Enterprises Cl. A | 375,049 | 17,323,513 | |||||
| Total (Cost $81,121,478) | 122,019,856 | ||||||
| ENERGY – 3.0% | |||||||
| ENERGY EQUIPMENT & SERVICES - 2.4% | |||||||
| 135,909 | 1,701,581 | ||||||
CARBO Ceramics 1 | 92,000 | 1,205,200 | |||||
| 338,614 | 8,238,479 | ||||||
Frank’s International | 67,439 | 985,284 | |||||
Helmerich & Payne | 151,070 | 10,141,329 | |||||
Pason Systems | 998,200 | 13,799,181 | |||||
SEACOR Holdings 1 | 501,090 | 29,038,165 | |||||
Superior Energy Services | 40,300 | 741,923 | |||||
| 65,851,142 | |||||||
| OIL, GAS & CONSUMABLE FUELS - 0.6% | |||||||
Boardwalk Pipeline Partners L.P. | 201,000 | 3,507,450 | |||||
Dorchester Minerals L.P. | 260,820 | 3,761,024 | |||||
Permian Basin Royalty Trust | 941,445 | 6,900,792 | |||||
San Juan Basin Royalty Trust | 502,530 | 3,653,393 | |||||
| 17,822,659 | |||||||
| Total (Cost $82,351,390) | 83,673,801 | ||||||
| FINANCIALS – 26.5% | |||||||
| BANKS - 5.9% | |||||||
Ames National | 423,873 | 11,368,274 | |||||
Associated Banc-Corp | 493,700 | 8,466,955 | |||||
Bank of Hawaii | 323,701 | 22,270,629 | |||||
BLOM Bank GDR | 261,500 | 2,628,075 | |||||
BOK Financial | 354,468 | 22,225,143 | |||||
Camden National | 326,883 | 13,729,086 | |||||
Canadian Western Bank | 650,000 | 12,401,796 | |||||
City Holding Company | 235,091 | 10,689,588 | |||||
CNB Financial | 299,720 | 5,335,016 | |||||
Codorus Valley Bancorp | 61,479 | 1,252,327 | |||||
Farmers & Merchants Bank of Long Beach 3 | 479 | 2,945,850 | |||||
First Citizens BancShares Cl. A | 97,026 | 25,121,002 | |||||
First National Bank Alaska 3 | 3,110 | 4,665,000 | |||||
National Bankshares | 161,752 | 5,648,380 | |||||
Northrim BanCorp | 216,577 | 5,693,809 | |||||
Peapack-Gladstone Financial | 562,058 | 10,403,693 | |||||
| 164,844,623 | |||||||
| CAPITAL MARKETS - 6.9% | |||||||
AllianceBernstein Holding L.P. | 433,100 | 10,091,230 | |||||
Apollo Global Management LLC Cl. A | 466,100 | 7,061,415 | |||||
Ares Management L.P. | 339,600 | 4,784,964 | |||||
Artisan Partners Asset Management Cl. A | 437,700 | 12,115,536 | |||||
Ashmore Group | 3,094,700 | 12,529,029 | |||||
Associated Capital Group Cl. A | 204,362 | 5,861,102 | |||||
Citadel Capital 1 | 19,355,000 | 2,136,037 | |||||
Cohen & Steers | 335,337 | 13,561,028 | |||||
Coronation Fund Managers | 1,315,000 | 5,968,356 | |||||
Edmond de Rothschild (Suisse) | 244 | 3,508,203 | |||||
Egyptian Financial Group-Hermes Holding Company 1 | 1,182,708 | 1,407,803 | |||||
Federated Investors Cl. B | 789,866 | 22,732,343 | |||||
Fifth Street Finance | 300,000 | 1,455,000 | |||||
Fortress Investment Group LLC Cl. A | 492,580 | 2,177,204 | |||||
GAMCO Investors Cl. A | 269,656 | 8,836,627 | |||||
Greenhill & Co. | 250,000 | 4,025,000 | |||||
KKR & Co. L.P. | 1,436,600 | 17,727,644 | |||||
Moelis & Company Cl. A | 606,781 | 13,652,573 | |||||
MVC Capital | 475,000 | 3,819,000 | |||||
Oppenheimer Holdings Cl. A | 246,512 | 3,811,076 | |||||
Rothschild & Co | 581,675 | 13,913,061 | |||||
Teton Advisors Cl. A 3 | 1,297 | 55,771 | |||||
Value Partners Group | 11,628,400 | 10,789,222 | |||||
Vontobel Holding | 150,400 | 6,469,575 | |||||
Waddell & Reed Financial Cl. A | 33,600 | 578,592 | |||||
Westwood Holdings Group | 86,129 | 4,461,482 | |||||
| 193,528,873 | |||||||
| CONSUMER FINANCE - 0.1% | |||||||
Nelnet Cl. A | 48,216 | 1,675,506 | |||||
| DIVERSIFIED FINANCIAL SERVICES - 1.6% | |||||||
Bolsa Mexicana de Valores | 6,479,000 | 9,982,931 | |||||
First Pacific | 740,000 | 535,977 | |||||
Leucadia National | 141,659 | 2,454,950 | |||||
Morningstar | 34,801 | 2,846,026 | |||||
Sofina | 37,497 | 4,969,744 | |||||
TMX Group | 616,000 | 25,627,927 | |||||
| 46,417,555 | |||||||
| INSURANCE - 10.4% | |||||||
Alleghany Corporation 1 | 53,300 | 29,292,614 | |||||
Allied World Assurance Company Holdings | 104,137 | 3,659,374 | |||||
American Financial Group | 112,500 | 8,317,125 | |||||
Argo Group International Holdings | 20,086 | 1,042,464 | |||||
Aspen Insurance Holdings | 24,600 | 1,140,948 | |||||
Assured Guaranty | 430,392 | 10,919,045 | |||||
Baldwin & Lyons Cl. B | 298,238 | 7,354,549 | |||||
Cincinnati Financial | 188,300 | 14,101,787 | |||||
E-L Financial | 78,788 | 41,834,876 | |||||
Employers Holdings | 168,139 | 4,879,394 | |||||
Erie Indemnity Cl. A | 376,000 | 37,351,840 | |||||
First American Financial | 84,900 | 3,414,678 | |||||
Gallagher (Arthur J.) & Co. | 384,200 | 18,287,920 | |||||
HCI Group | 39,500 | 1,077,560 | |||||
Horace Mann Educators | 45,000 | 1,520,550 | |||||
Infinity Property & Casualty | 71,443 | 5,762,592 | |||||
Markel Corporation 1 | 35,800 | 34,109,524 | |||||
Mercury General | 171,000 | 9,090,360 | |||||
National Western Life Group Cl. A | 5,900 | 1,152,093 | |||||
| THE ACCOMPANYING NOTES ARE AN INTEGRAL PART OF THESE FINANCIAL STATEMENTS | The Royce Funds 2016 Semiannual Report to Shareholders | 79 |
Schedules of Investments
| Royce Total Return Fund (continued) | |||||||
| SHARES | VALUE | ||||||
| FINANCIALS (continued) | |||||||
| INSURANCE (continued) | |||||||
Old Republic International | 619,000 | $ | 11,940,510 | ||||
ProAssurance Corporation | 182,000 | 9,746,100 | |||||
Reinsurance Group of America | 166,484 | 16,147,283 | |||||
RLI Corp. | 141,380 | 9,724,117 | |||||
Selective Insurance Group | 28,078 | 1,072,860 | |||||
State Auto Financial | 202,003 | 4,425,886 | |||||
United Fire Group | 29,517 | 1,252,406 | |||||
United Insurance Holdings | 13,000 | 212,940 | |||||
Universal Insurance Holdings | 101,200 | 1,880,296 | |||||
White Mountains Insurance Group | 2,534 | 2,133,628 | |||||
| 292,845,319 | |||||||
| INVESTMENT COMPANIES - 0.2% | |||||||
British Empire Trust | 601,182 | 3,994,365 | |||||
RIT Capital Partners | 95,500 | 2,093,932 | |||||
| 6,088,297 | |||||||
| REAL ESTATE INVESTMENT TRUSTS (REITS) - 0.2% | |||||||
Lexington Realty Trust | 607,006 | 6,136,831 | |||||
| THRIFTS & MORTGAGE FINANCE - 1.2% | |||||||
Genworth MI Canada | 640,020 | 16,417,247 | |||||
Southern Missouri Bancorp | 19,391 | 456,270 | |||||
TrustCo Bank Corp. NY | 2,556,768 | 16,388,883 | |||||
| 33,262,400 | |||||||
| Total (Cost $537,370,092) | 744,799,404 | ||||||
| HEALTH CARE – 6.3% | |||||||
| HEALTH CARE EQUIPMENT & SUPPLIES - 3.6% | |||||||
Analogic Corporation | 231,000 | 18,350,640 | |||||
Atrion Corporation | 9,684 | 4,143,396 | |||||
Hill-Rom Holdings | 368,576 | 18,594,659 | |||||
Meridian Bioscience | 48,300 | 941,850 | |||||
STERIS | 368,883 | 25,360,707 | |||||
Teleflex | 181,800 | 32,234,958 | |||||
| 99,626,210 | |||||||
| HEALTH CARE PROVIDERS & SERVICES - 2.6% | |||||||
Aceto Corporation | 253,817 | 5,556,054 | |||||
Chemed Corporation | 56,100 | 7,646,991 | |||||
Ensign Group (The) | 323,986 | 6,806,946 | |||||
Landauer 6 | 515,300 | 21,209,748 | |||||
Owens & Minor | 789,350 | 29,505,903 | |||||
U.S. Physical Therapy | 17,925 | 1,079,264 | |||||
| 71,804,906 | |||||||
| HEALTH CARE TECHNOLOGY - 0.0% | |||||||
Computer Programs and Systems | 26,726 | 1,066,902 | |||||
| PHARMACEUTICALS - 0.1% | |||||||
Recordati | 110,000 | 3,307,288 | |||||
| Total (Cost $107,764,767) | 175,805,306 | ||||||
| INDUSTRIALS – 23.0% | |||||||
| AEROSPACE & DEFENSE - 1.4% | |||||||
Curtiss-Wright | 11,727 | 987,999 | |||||
HEICO Corporation | 225,443 | 15,061,847 | |||||
HEICO Corporation Cl. A | 454,966 | 24,408,926 | |||||
| 40,458,772 | |||||||
| AIR FREIGHT & LOGISTICS - 1.3% | |||||||
C. H. Robinson Worldwide | 226,500 | 16,817,625 | |||||
Expeditors International of Washington | 429,700 | 21,072,488 | |||||
| 37,890,113 | |||||||
| BUILDING PRODUCTS - 1.1% | |||||||
A. O. Smith Corporation | 267,500 | 23,569,425 | |||||
Apogee Enterprises | 129,153 | 5,986,242 | |||||
| 29,555,667 | |||||||
| COMMERCIAL SERVICES & SUPPLIES - 4.7% | |||||||
ABM Industries | 514,200 | 18,758,016 | |||||
Deluxe Corporation | 35,787 | 2,375,183 | |||||
Ennis | 73,953 | 1,418,419 | |||||
Healthcare Services Group | 5,264 | 217,824 | |||||
HNI Corporation | 415,684 | 19,325,149 | |||||
Kimball International Cl. B | 785,039 | 8,933,744 | |||||
McGrath RentCorp | 320,400 | 9,801,036 | |||||
MSA Safety | 220,812 | 11,599,254 | |||||
Ritchie Bros. Auctioneers | 1,249,020 | 42,191,896 | |||||
UniFirst Corporation | 99,742 | 11,542,144 | |||||
Viad Corporation | 203,666 | 6,313,646 | |||||
| 132,476,311 | |||||||
| CONSTRUCTION & ENGINEERING - 0.6% | |||||||
Comfort Systems USA | 119,531 | 3,893,125 | |||||
EMCOR Group | 96,989 | 4,777,678 | |||||
KBR | 440,000 | 5,825,600 | |||||
Valmont Industries | 27,600 | 3,733,452 | |||||
| 18,229,855 | |||||||
| ELECTRICAL EQUIPMENT - 1.7% | |||||||
EnerSys | 21,800 | 1,296,446 | |||||
Hubbell Cl. B | 247,900 | 26,146,013 | |||||
LSI Industries | 999,401 | 11,063,369 | |||||
Preformed Line Products | 234,679 | 9,478,685 | |||||
| 47,984,513 | |||||||
| INDUSTRIAL CONGLOMERATES - 0.4% | |||||||
Raven Industries | 570,626 | 10,807,656 | |||||
| MACHINERY - 8.5% | |||||||
Alamo Group | 191,744 | 12,649,352 | |||||
American Railcar Industries | 189,100 | 7,463,777 | |||||
CLARCOR | 127,000 | 7,725,410 | |||||
Federal Signal | 1,059,745 | 13,649,516 | |||||
Franklin Electric | 683,300 | 22,583,065 | |||||
Gorman-Rupp Company (The) | 586,000 | 16,062,260 | |||||
Kadant | 26,300 | 1,354,713 | |||||
Lincoln Electric Holdings | 164,200 | 9,700,936 | |||||
Lindsay Corporation | 166,649 | 11,308,801 | |||||
Miller Industries | 413,793 | 8,519,998 | |||||
| 116,700 | 3,022,530 | ||||||
Mueller Industries | 387,448 | 12,351,842 | |||||
Nordson Corporation | 244,600 | 20,451,006 | |||||
Standex International | 49,531 | 4,092,747 | |||||
Starrett (L.S.) Company (The) Cl. A 6 | 509,400 | 6,066,954 | |||||
Sun Hydraulics | 204,848 | 6,081,937 | |||||
Tennant Company | 544,396 | 29,326,612 | |||||
Timken Company (The) | 6,832 | 209,469 | |||||
Trinity Industries | 639,174 | 11,869,461 | |||||
Woodward | 567,300 | 32,699,172 | |||||
| 237,189,558 | |||||||
| MARINE - 0.4% | |||||||
Clarkson | 343,900 | 10,191,889 | |||||
| PROFESSIONAL SERVICES - 2.3% | |||||||
CEB | 202,400 | 12,484,032 | |||||
Exponent | 74,792 | 4,368,601 | |||||
Heidrick & Struggles International | 59,817 | 1,009,711 | |||||
| 80 | The Royce Funds 2016 Semiannual Report to Shareholders | THE ACCOMPANYING NOTES ARE AN INTEGRAL PART OF THESE FINANCIAL STATEMENTS |
| June 30, 2016 (unaudited) |
| Royce Total Return Fund (continued) | |||||||
| SHARES | VALUE | ||||||
| INDUSTRIALS (continued) | |||||||
| PROFESSIONAL SERVICES (continued) | |||||||
Kelly Services Cl. A | 434,200 | $ | 8,236,774 | ||||
Korn/Ferry International | 508,532 | 10,526,612 | |||||
ManpowerGroup | 398,752 | 25,655,704 | |||||
Resources Connection | 5,800 | 85,724 | |||||
Robert Half International | 29,245 | 1,115,989 | |||||
| 63,483,147 | |||||||
| ROAD & RAIL - 0.4% | |||||||
Werner Enterprises | 546,740 | 12,558,618 | |||||
| TRADING COMPANIES & DISTRIBUTORS - 0.2% | |||||||
Applied Industrial Technologies | 50,000 | 2,257,000 | |||||
Houston Wire & Cable | 728,861 | 3,826,520 | |||||
| 6,083,520 | |||||||
| Total (Cost $328,272,182) | 646,909,619 | ||||||
| INFORMATION TECHNOLOGY – 7.2% | |||||||
| COMMUNICATIONS EQUIPMENT - 0.7% | |||||||
ADTRAN | 147,029 | 2,742,091 | |||||
Bel Fuse Cl. A | 22,350 | 336,814 | |||||
Brocade Communications Systems | 1,374,615 | 12,618,966 | |||||
TESSCO Technologies | 340,540 | 4,730,100 | |||||
| 20,427,971 | |||||||
| ELECTRONIC EQUIPMENT, INSTRUMENTS & COMPONENTS - 3.3% | |||||||
AVX Corporation | 1,463,065 | 19,868,423 | |||||
Cognex Corporation | 293,005 | 12,628,515 | |||||
Electro Rent | 126,847 | 1,954,712 | |||||
FEI Company | 26,952 | 2,880,630 | |||||
FLIR Systems | 107,275 | 3,320,161 | |||||
Kimball Electronics 1 | 543,450 | 6,765,952 | |||||
Littelfuse | 24,750 | 2,925,203 | |||||
Methode Electronics | 485,496 | 16,618,528 | |||||
National Instruments | 277,274 | 7,597,308 | |||||
Systemax 1 | 226,400 | 1,931,192 | |||||
Vishay Intertechnology | 1,409,190 | 17,459,864 | |||||
| 93,950,488 | |||||||
| IT SERVICES - 0.3% | |||||||
Forrester Research | 42,804 | 1,577,756 | |||||
MAXIMUS | 104,420 | 5,781,735 | |||||
| 7,359,491 | |||||||
| SEMICONDUCTORS & SEMICONDUCTOR EQUIPMENT - 1.2% | |||||||
MKS Instruments | 678,783 | 29,228,396 | |||||
Power Integrations | 22,204 | 1,111,754 | |||||
Teradyne | 58,700 | 1,155,803 | |||||
Tessera Technologies | 64,590 | 1,979,038 | |||||
| 33,474,991 | |||||||
| SOFTWARE - 0.9% | |||||||
Ebix | 82,997 | 3,975,556 | |||||
Fair Isaac | 145,400 | 16,431,654 | |||||
Pegasystems | 208,713 | 5,624,816 | |||||
| 26,032,026 | |||||||
| TECHNOLOGY HARDWARE, STORAGE & PERIPHERALS - 0.8% | |||||||
Diebold | 824,718 | 20,477,748 | |||||
Logitech International | 59,589 | 970,109 | |||||
| 21,447,857 | |||||||
| Total (Cost $151,293,032) | 202,692,824 | ||||||
| MATERIALS – 11.8% | |||||||
| CHEMICALS - 5.7% | |||||||
Albemarle Corporation | 400,100 | 31,731,931 | |||||
Balchem Corporation | 557,949 | 33,281,658 | |||||
Cabot Corporation | 363,600 | 16,601,976 | |||||
Chase Corporation | 440,755 | 26,035,398 | |||||
FutureFuel Corporation | 188,959 | 2,055,874 | |||||
Innophos Holdings | 13,785 | 581,865 | |||||
Innospec | 32,613 | 1,499,872 | |||||
Quaker Chemical | 406,129 | 36,226,707 | |||||
Umicore | 206,000 | 10,614,682 | |||||
| 158,629,963 | |||||||
| CONSTRUCTION MATERIALS - 0.3% | |||||||
Ash Grove Cement 3 | 39,610 | 9,031,080 | |||||
| CONTAINERS & PACKAGING - 2.6% | |||||||
AptarGroup | 115,500 | 9,139,515 | |||||
Bemis Company | 378,200 | 19,473,518 | |||||
Greif Cl. A | 591,544 | 22,046,845 | |||||
Mayr-Melnhof Karton | 60,000 | 6,538,149 | |||||
Sonoco Products | 327,578 | 16,267,523 | |||||
| 73,465,550 | |||||||
| METALS & MINING - 2.3% | |||||||
Agnico Eagle Mines | 79,000 | 4,226,500 | |||||
Alamos Gold Cl. A | 330,000 | 2,837,803 | |||||
Allegheny Technologies | 243,246 | 3,101,386 | |||||
Ampco-Pittsburgh | 170,306 | 1,926,161 | |||||
Carpenter Technology | 159,875 | 5,264,684 | |||||
Commercial Metals | 134,860 | 2,279,134 | |||||
Ferroglobe | 569,803 | 4,906,004 | |||||
Franco-Nevada Corporation | 102,000 | 7,758,120 | |||||
Gold Fields ADR | 1,697,643 | 8,318,451 | |||||
Reliance Steel & Aluminum | 30,400 | 2,337,760 | |||||
Schnitzer Steel Industries Cl. A | 269,782 | 4,748,163 | |||||
Worthington Industries | 374,700 | 15,849,810 | |||||
| 63,553,976 | |||||||
| PAPER & FOREST PRODUCTS - 0.9% | |||||||
Deltic Timber | 162,000 | 10,875,060 | |||||
Domtar Corporation | 246,200 | 8,619,462 | |||||
KapStone Paper and Packaging | 25,000 | 325,250 | |||||
Neenah Paper | 39,200 | 2,836,904 | |||||
Pope Resources L.P. | 13,900 | 882,650 | |||||
Resolute Forest Products 1 | 100,000 | 529,000 | |||||
Schweitzer-Mauduit International | 41,400 | 1,460,592 | |||||
| 25,528,918 | |||||||
| Total (Cost $178,810,993) | 330,209,487 | ||||||
| TELECOMMUNICATION SERVICES – 1.1% | |||||||
| DIVERSIFIED TELECOMMUNICATION SERVICES - 0.6% | |||||||
ATN International | 208,326 | 16,209,846 | |||||
| WIRELESS TELECOMMUNICATION SERVICES - 0.5% | |||||||
Telephone and Data Systems | 529,190 | 15,695,776 | |||||
| Total (Cost $17,407,792) | 31,905,622 | ||||||
| UTILITIES – 2.1% | |||||||
| ELECTRIC UTILITIES - 0.7% | |||||||
ALLETE | 165,567 | 10,700,595 | |||||
ITC Holdings | 170,300 | 7,973,446 | |||||
| 18,674,041 | |||||||
| WATER UTILITIES - 1.4% | |||||||
Aqua America | 503,307 | 17,947,928 | |||||
SJW | 400,400 | 15,767,752 | |||||
| THE ACCOMPANYING NOTES ARE AN INTEGRAL PART OF THESE FINANCIAL STATEMENTS | The Royce Funds 2016 Semiannual Report to Shareholders | 81 |
| Schedules of Investments | June 30, 2016 (unaudited) |
| Royce Total Return Fund (continued) | |||||||
| SHARES | VALUE | ||||||
| UTILITIES (continued) | |||||||
| WATER UTILITIES (continued) | |||||||
York Water | 166,630 | $ | 5,338,825 | ||||
| 39,054,505 | |||||||
| Total (Cost $22,732,282) | 57,728,546 | ||||||
| MISCELLANEOUS2 – 1.1% | |||||||
| Total (Cost $27,503,412) | 30,236,983 | ||||||
| TOTAL COMMON STOCKS | |||||||
| (Cost $1,828,718,057) | 2,782,145,271 | ||||||
| PRINCIPAL | |||||||
| AMOUNT | |||||||
| CORPORATE BOND– 0.1% | |||||||
Unit Corporation 6.625% due 5/15/21 | |||||||
| (Cost $3,417,702) | $ | 4,227,000 | 3,265,357 | ||||
| REPURCHASE AGREEMENT– 0.9% | |||||||
| Fixed Income Clearing Corporation, 0.03% dated 6/30/16, due 7/1/16, maturity value $24,287,020 (collateralized by obligations of various U.S. Government Agencies, 0.125% due 4/15/19, valued at $24,775,013) | |||||||
| (Cost $24,287,000) | 24,287,000 | ||||||
| COLLATERAL RECEIVED FOR SECURITIES LOANED – 0.4% | |||||||
| Money Market Funds | |||||||
Federated Government Obligations Fund (7 day yield-0.2459%) | |||||||
| (Cost $9,652,360) | 9,652,360 | ||||||
| TOTAL INVESTMENTS – 100.5% | |||||||
| (Cost $1,866,075,119) | 2,819,349,988 | ||||||
| LIABILITIES LESS CASH AND OTHER ASSETS – (0.5)% | (12,804,481 | ) | |||||
| NET ASSETS – 100.0% | $ | 2,806,545,507 | |||||
| † | New additions in 2016. |
| 1 | Non-income producing. |
| 2 | Includes securities first acquired in 2016 and less than 1% of net assets. |
| 3 | These securities are defined as Level 2 securities due to fair value being based on quoted prices for similar securities. See Notes to Financial Statements. |
| 4 | Securities for which market quotations are not readily available represent 0.7%, 0.6% and 0.3% of net assets for Royce International Micro-Cap Fund, Royce International Small-Cap Fund and Royce Micro-Cap Fund. These securities have been valued at their fair value under procedures approved by the Fund’s Board of Trustees. These securities are defined as Level 3 securities due to the use of significant unobservable inputs in the determination of fair value. See Notes to Financial Statements. |
| 5 | All or a portion of these securities were on loan at June 30, 2016. |
| 6 | At June 30, 2016, the Fund owned 5% or more of the Company’s outstanding voting securities thereby making the Company an Affiliated Company as that term is defined in the Investment Company Act of 1940. See Notes to Financial Statements. |
| Securities of Global/International Funds are categorized by the country of their headquarters, with the exception of exchange-traded funds. | |
Bold indicates a Fund’s 20 largest equity holdings in terms of June 30, 2016, market value. | |
| 82 | The Royce Funds 2016 Semiannual Report to Shareholders | THE ACCOMPANYING NOTES ARE AN INTEGRAL PART OF THESE FINANCIAL STATEMENTS |
| Statements of Assets and Liabilities | June 30, 2016 (unaudited) |
| Royce Global | ||||||||||||||||
| Royce Dividend | Financial Services | Royce Heritage | Royce International | |||||||||||||
| Value Fund | Fund | Fund | Micro-Cap Fund | |||||||||||||
| ASSETS: | ||||||||||||||||
| Investments at value | ||||||||||||||||
Non-Affiliated Companies | $ | 238,099,951 | $ | 46,014,209 | $ | 198,844,355 | $ | 5,533,598 | ||||||||
| Repurchase agreements (at cost and value) | 6,318,000 | 729,000 | 38,362,000 | 281,000 | ||||||||||||
| Cash and foreign currency | 7,362 | 2,772 | 264,847 | 6,983 | ||||||||||||
| Receivable for investments sold | 217,096 | 65,320 | 560,479 | – | ||||||||||||
| Receivable for capital shares sold | 203,417 | 111,962 | 3,354 | 8,235 | ||||||||||||
| Receivable for dividends and interest | 207,948 | 65,627 | 164,268 | 7,980 | ||||||||||||
| Prepaid expenses and other assets | 4,450 | 699 | 2,657 | 69 | ||||||||||||
| Total Assets | 245,058,224 | 46,989,589 | 238,201,960 | 5,837,865 | ||||||||||||
| LIABILITIES: | ||||||||||||||||
| Payable for investments purchased | 154,802 | – | 8,375,033 | – | ||||||||||||
| Payable for capital shares redeemed | 550,409 | 88,835 | 82,604 | 7,462 | ||||||||||||
| Payable for investment advisory fees | 161,305 | 34,610 | 161,471 | – | ||||||||||||
| Payable for trustees’ fees | 8,049 | 1,083 | 6,128 | 132 | ||||||||||||
| Accrued expenses | 217,855 | 46,547 | 108,751 | 19,725 | ||||||||||||
| Deferred capital gains tax | – | – | – | 8,219 | ||||||||||||
| Total Liabilities | 1,092,420 | 171,075 | 8,733,987 | 35,538 | ||||||||||||
| Net Assets | $ | 243,965,804 | $ | 46,818,514 | $ | 229,467,973 | $ | 5,802,327 | ||||||||
| ANALYSIS OF NET ASSETS: | ||||||||||||||||
| Paid-in capital | $ | 189,906,346 | $ | 46,530,885 | $ | 200,516,867 | $ | 6,779,401 | ||||||||
| Undistributed net investment income (loss) | 6,057 | 98,805 | (318,864 | ) | 12,765 | |||||||||||
Accumulated net realized gain (loss) on investments and foreign currency | 17,642,753 | (153,611 | ) | (900,690 | ) | (574,829 | ) | |||||||||
Net unrealized appreciation (depreciation) on investments and foreign currency | 36,410,648 | 342,435 | 30,170,660 | (415,010 | ) | |||||||||||
| Net Assets | $ | 243,965,804 | $ | 46,818,514 | $ | 229,467,973 | $ | 5,802,327 | ||||||||
Investment Class | $ | 104,421,788 | $ | 95,369,377 | ||||||||||||
Service Class | 137,430,657 | $ | 41,070,687 | 117,467,599 | $ | 5,802,327 | ||||||||||
Consultant Class | 1,402,636 | 10,784,329 | ||||||||||||||
Institutional Class | 710,723 | 5,747,827 | ||||||||||||||
R Class | 2,141,051 | |||||||||||||||
K Class | 3,705,617 | |||||||||||||||
| SHARES OUTSTANDING (unlimited number of $.001 par value): | ||||||||||||||||
Investment Class | 14,734,920 | 7,027,653 | ||||||||||||||
Service Class | 19,068,223 | 5,116,650 | 8,686,376 | 607,057 | ||||||||||||
Consultant Class | 171,467 | 1,098,112 | ||||||||||||||
Institutional Class | 101,280 | 560,952 | ||||||||||||||
R Class | 237,986 | |||||||||||||||
K Class | 406,976 | |||||||||||||||
| NET ASSET VALUES (Net Assets ÷ Shares Outstanding): | ||||||||||||||||
Investment Class1 | $7.09 | $13.57 | ||||||||||||||
Service Class1 | 7.21 | $ 8.03 | 13.52 | $9.56 | ||||||||||||
Consultant Class2 | 8.18 | 9.82 | ||||||||||||||
Institutional Class3 | 7.02 | 10.25 | ||||||||||||||
R Class3 | 9.00 | |||||||||||||||
K Class3 | 9.11 | |||||||||||||||
| Investments at identified cost | $ | 201,686,499 | $ | 45,669,737 | $ | 168,670,297 | $ | 5,939,970 | ||||||||
| 1 | Offering and redemption price per share; shares held less than 30 days may be subject to a 1% redemption fee, or a 2% redemption fee (Royce International Micro-Cap Fund), payable to the Fund. |
| 2 | Offering and redemption price per share; shares held less than 365 days may be subject to a 1% contingent deferred sales charge, payable to Royce Fund Services, Inc. |
| 3 | Offering and redemption price per share. |
| THE ACCOMPANYING NOTES ARE AN INTEGRAL PART OF THESE FINANCIAL STATEMENTS | The Royce Funds 2016 Semiannual Report to Shareholders | 83 |
| Statements of Assets and Liabilities |
| Royce International | Royce International | Royce Low-Priced | Royce Micro-Cap | |||||||||||||
| Premier Fund | Small-Cap Fund | Stock Fund | Fund | |||||||||||||
| ASSETS: | ||||||||||||||||
Investments at value (including collateral on loaned securities) | ||||||||||||||||
Non-Affiliated Companies | $ | 70,641,641 | $ | 7,012,607 | $ | 321,366,645 | $ | 225,747,028 | ||||||||
| Repurchase agreements (at cost and value) | 2,826,000 | 5,200,000 | 7,386,000 | 15,475,000 | ||||||||||||
| Cash and foreign currency | 391,437 | 384,041 | 612 | 768 | ||||||||||||
| Receivable for investments sold | 304,801 | 3,692,869 | 3,242,514 | 922,364 | ||||||||||||
| Receivable for capital shares sold | 20,853 | 219 | 14,973 | 52,877 | ||||||||||||
| Receivable for dividends and interest | 329,650 | 37,163 | 249,218 | 277,501 | ||||||||||||
| Prepaid expenses and other assets | 228 | 263 | – | 586 | ||||||||||||
| Total Assets | 74,514,610 | 16,327,162 | 332,259,962 | 242,476,124 | ||||||||||||
| LIABILITIES: | ||||||||||||||||
| Payable for collateral on loaned securities | – | – | 15,056,726 | 7,953,641 | ||||||||||||
| Payable for investments purchased | 926,140 | 49,487 | 1,011,150 | 1,436,369 | ||||||||||||
| Payable for capital shares redeemed | 130,717 | 8,001,391 | 5,832,330 | 663,553 | ||||||||||||
| Payable for investment advisory fees | 58,381 | 4,948 | 265,014 | 242,381 | ||||||||||||
| Payable for trustees’ fees | 2,432 | 536 | 9,161 | 7,924 | ||||||||||||
| Accrued expenses | 49,876 | 43,981 | 652,755 | 279,583 | ||||||||||||
| Deferred capital gains tax | 56,046 | 6,982 | – | – | ||||||||||||
| Total Liabilities | 1,223,592 | 8,107,325 | 22,827,136 | 10,583,451 | ||||||||||||
| Net Assets | $ | 73,291,018 | $ | 8,219,837 | $ | 309,432,826 | $ | 231,892,673 | ||||||||
| ANALYSIS OF NET ASSETS: | ||||||||||||||||
| Paid-in capital | $ | 68,636,121 | $ | 13,146,189 | $ | 276,010,051 | $ | 200,484,770 | ||||||||
| Undistributed net investment income (loss) | 271,759 | 11,630 | 494,412 | (314,335 | ) | |||||||||||
Accumulated net realized gain (loss) on investments and foreign currency | 344,518 | (4,768,211 | ) | 28,876,845 | 24,085,379 | |||||||||||
Net unrealized appreciation (depreciation) on investments and foreign currency | 4,038,620 | (169,771 | ) | 4,051,518 | 7,636,859 | |||||||||||
| Net Assets | $ | 73,291,018 | $ | 8,219,837 | $ | 309,432,826 | $ | 231,892,673 | ||||||||
Investment Class | $ | 24,159,836 | $ | 333,350 | $ | 22,925,440 | $ | 182,495,145 | ||||||||
Service Class | 42,631,547 | 5,855,834 | 270,798,097 | 15,469,751 | ||||||||||||
Consultant Class | 6,434,081 | 33,927,777 | ||||||||||||||
Institutional Class | 2,030,653 | 13,417,433 | ||||||||||||||
R Class | 42,321 | 1,096,329 | ||||||||||||||
K Class | 23,233 | 1,195,527 | ||||||||||||||
| SHARES OUTSTANDING (unlimited number of $.001 par value): | ||||||||||||||||
Investment Class | 2,438,753 | 44,781 | 3,018,425 | 16,582,803 | ||||||||||||
Service Class | 3,635,751 | 630,964 | 35,798,284 | 1,431,352 | ||||||||||||
Consultant Class | 505,567 | 3,803,500 | ||||||||||||||
Institutional Class | 265,519 | 1,764,896 | ||||||||||||||
R Class | 4,452 | 152,395 | ||||||||||||||
K Class | 2,473 | 638,702 | ||||||||||||||
| NET ASSET VALUES (Net Assets ÷ Shares Outstanding): | ||||||||||||||||
Investment Class1 | $ 9.91 | $7.44 | $7.60 | $11.01 | ||||||||||||
Service Class1 | 11.73 | 9.28 | 7.56 | 10.81 | ||||||||||||
Consultant Class2 | 12.73 | 8.92 | ||||||||||||||
Institutional Class3 | 7.65 | 7.60 | ||||||||||||||
R Class3 | 9.51 | 7.19 | ||||||||||||||
K Class3 | 9.39 | 1.87 | ||||||||||||||
| Investments at identified cost | $ | 66,522,769 | $ | 7,179,056 | $ | 317,315,018 | $ | 218,087,296 | ||||||||
| Market value of loaned securities | – | – | 14,402,784 | 7,612,610 | ||||||||||||
| 1 | Offering and redemption price per share; shares held less than 30 days may be subject to a 2% redemption fee, or a 1% redemption fee (Royce Low-Priced Stock Fund and Royce Micro-Cap Fund), payable to the Fund. |
| 2 | Offering and redemption price per share; shares held less than 365 days may be subject to a 1% contingent deferred sales charge, payable to Royce Fund Services, Inc. |
| 3 | Offering and redemption price per share. |
| 84 | The Royce Funds 2016 Semiannual Report to Shareholders | THE ACCOMPANYING NOTES ARE AN INTEGRAL PART OF THESE FINANCIAL STATEMENTS |
| June 30, 2016 (unaudited) |
| Royce Micro-Cap | Royce Opportunity | Royce Pennsylvania | Royce Premier | |||||||||||||
| Opportunity Fund | Fund | Mutual Fund | Fund | |||||||||||||
| ASSETS: | ||||||||||||||||
Investments at value (including collateral on loaned securities) | ||||||||||||||||
Non-Affiliated Companies | $ | 37,153,433 | $ | 1,351,022,412 | $ | 2,581,090,793 | $ | 2,228,673,690 | ||||||||
Affiliated Companies | – | 39,783,494 | 21,926,899 | – | ||||||||||||
| Repurchase agreements (at cost and value) | 2,245,000 | 81,981,000 | 41,365,000 | 7,461,000 | ||||||||||||
| Cash and foreign currency | 549 | – | 60,920 | 436 | ||||||||||||
| Receivable for investments sold | 519,875 | 2,983,507 | 29,817,018 | 41,597,299 | ||||||||||||
| Receivable for capital shares sold | 79 | 272,565 | 828,998 | 848,334 | ||||||||||||
| Receivable for dividends and interest | 6,082 | 597,789 | 1,762,478 | 2,851,950 | ||||||||||||
| Prepaid expenses and other assets | 342 | 16,238 | 2,338,546 | 20,426 | ||||||||||||
| Total Assets | 39,925,360 | 1,476,657,005 | 2,679,190,652 | 2,281,453,135 | ||||||||||||
| LIABILITIES: | ||||||||||||||||
| Payable for collateral on loaned securities | – | 75,223,917 | 21,504,952 | 25,197,111 | ||||||||||||
| Payable for investments purchased | 717,947 | 3,428,781 | 4,619,051 | 3,237,462 | ||||||||||||
| Payable for capital shares redeemed | 357,245 | 4,707,236 | 22,687,675 | 4,184,915 | ||||||||||||
| Payable to custodian for overdrawn balance | – | 135,990 | – | – | ||||||||||||
| Payable for investment advisory fees | 32,155 | 1,169,599 | 1,673,540 | 1,858,511 | ||||||||||||
| Payable for trustees’ fees | 535 | 38,962 | 86,245 | 81,842 | ||||||||||||
| Accrued expenses | 22,370 | 459,079 | 1,494,186 | 1,964,336 | ||||||||||||
| Total Liabilities | 1,130,252 | 85,163,564 | 52,065,649 | 36,524,177 | ||||||||||||
| Net Assets | $ | 38,795,108 | $ | 1,391,493,441 | $ | 2,627,125,003 | $ | 2,244,928,958 | ||||||||
| ANALYSIS OF NET ASSETS: | ||||||||||||||||
| Paid-in capital | $ | 41,218,613 | $ | 1,390,176,890 | $ | 1,613,567,753 | $ | 1,002,825,192 | ||||||||
| Undistributed net investment income (loss) | (106,181 | ) | (1,154,832 | ) | (6,624,959 | ) | 5,175,428 | |||||||||
Accumulated net realized gain (loss) on investments and foreign currency | (2,332,645 | ) | 67,068,104 | 148,115,521 | 295,395,530 | |||||||||||
Net unrealized appreciation (depreciation) on investments and foreign currency | 15,321 | (64,596,721 | ) | 872,066,688 | 941,532,808 | |||||||||||
| Net Assets | $ | 38,795,108 | $ | 1,391,493,441 | $ | 2,627,125,003 | $ | 2,244,928,958 | ||||||||
Investment Class | $ | 37,731,044 | $ | 688,466,868 | $ | 1,624,961,853 | $ | 1,734,204,525 | ||||||||
Service Class | 1,064,064 | 76,202,128 | 82,352,070 | 45,056,955 | ||||||||||||
Consultant Class | 19,897,015 | 389,434,995 | 31,123,422 | |||||||||||||
Institutional Class | 566,985,098 | 510,723,411 | 255,150,671 | |||||||||||||
W Class | 162,939,911 | |||||||||||||||
R Class | 33,647,714 | 16,777,052 | 14,482,050 | |||||||||||||
K Class | 6,294,618 | 2,875,622 | 1,971,424 | |||||||||||||
| SHARES OUTSTANDING (unlimited number of $.001 par value): | ||||||||||||||||
Investment Class | 2,635,348 | 63,120,875 | 161,887,635 | 114,038,927 | ||||||||||||
Service Class | 147,327 | 7,427,538 | 8,204,391 | 3,030,845 | ||||||||||||
Consultant Class | 2,150,095 | 47,264,044 | 2,471,140 | |||||||||||||
Institutional Class | 51,139,793 | 50,785,309 | 16,576,621 | |||||||||||||
W Class | 10,683,631 | |||||||||||||||
R Class | 3,365,247 | 1,758,741 | 1,011,333 | |||||||||||||
K Class | 688,822 | 341,718 | 1,091,279 | |||||||||||||
| NET ASSET VALUES (Net Assets ÷ Shares Outstanding): | ||||||||||||||||
Investment Class1 | $14.32 | $10.91 | $10.04 | $15.21 | ||||||||||||
Service Class1 | 7.22 | 10.26 | 10.04 | 14.87 | ||||||||||||
Consultant Class2 | 9.25 | 8.24 | 12.59 | |||||||||||||
Institutional Class3 | 11.09 | 10.06 | 15.39 | |||||||||||||
W Class3 | 15.25 | |||||||||||||||
R Class3 | 10.00 | 9.54 | 14.32 | |||||||||||||
K Class3 | 9.14 | 8.42 | 1.81 | |||||||||||||
| Investments at identified cost | $ | 37,138,113 | $ | 1,455,402,627 | $ | 1,730,948,733 | $ | 1,286,941,308 | ||||||||
| Market value of loaned securities | – | 74,084,698 | 21,293,221 | 24,506,360 | ||||||||||||
| �� | ||||||||||||||||
| 1 | Offering and redemption price per share; shares held less than 30 days may be subject to a 1% redemption fee, payable to the Fund. |
| 2 | Offering and redemption price per share; shares held less than 365 days may be subject to a 1% contingent deferred sales charge, payable to Royce Fund Services, Inc. |
| 3 | Offering and redemption price per share. |
| THE ACCOMPANYING NOTES ARE AN INTEGRAL PART OF THESE FINANCIAL STATEMENTS | The Royce Funds 2016 Semiannual Report to Shareholders | 85 |
| Statements of Assets and Liabilities |
| Royce Smaller- | ||||||||||||||||
| Royce Small-Cap | Royce Small-Cap | Companies Growth | Royce Special Equity | |||||||||||||
| Leaders Fund | Value Fund | Fund | Fund | |||||||||||||
| ASSETS: | ||||||||||||||||
Investments at value (including collateral on loaned securities) | ||||||||||||||||
Non-Affiliated Companies | $ | 91,300,201 | $ | 439,658,683 | $ | 477,506,505 | $ | 904,288,863 | ||||||||
Affiliated Companies | – | – | – | 413,689,066 | ||||||||||||
| Repurchase agreements (at cost and value) | 6,059,000 | 40,721,000 | 40,030,000 | 131,699,000 | ||||||||||||
| Cash and foreign currency | 226 | 581 | 900 | 631 | ||||||||||||
| Receivable for investments sold | 251,970 | 2,981,261 | 1,082,178 | 3,768,053 | ||||||||||||
| Receivable for capital shares sold | 16,585 | 132,890 | 117,232 | 1,321,924 | ||||||||||||
| Receivable for dividends and interest | 54,869 | 395,156 | 205,151 | 944,000 | ||||||||||||
| Prepaid expenses and other assets | 277 | 1,257 | 1,207 | 18,295 | ||||||||||||
| Total Assets | 97,683,128 | 483,890,828 | 518,943,173 | 1,455,729,832 | ||||||||||||
| LIABILITIES: | ||||||||||||||||
| Payable for collateral on loaned securities | – | 2,138,400 | 28,142,552 | – | ||||||||||||
| Payable for investments purchased | 662,945 | 3,180,568 | – | 3,086,387 | ||||||||||||
| Payable for capital shares redeemed | 632,277 | 1,142,535 | 800,488 | 6,009,161 | ||||||||||||
| Payable for investment advisory fees | 80,374 | 395,603 | 407,243 | 1,191,186 | ||||||||||||
| Payable for trustees’ fees | 3,753 | 14,434 | 16,117 | 44,109 | ||||||||||||
| Accrued expenses | 129,717 | 331,026 | 431,987 | 716,077 | ||||||||||||
| Total Liabilities | 1,509,066 | 7,202,566 | 29,798,387 | 11,046,920 | ||||||||||||
| Net Assets | $ | 96,174,062 | $ | 476,688,262 | $ | 489,144,786 | $ | 1,444,682,912 | ||||||||
| ANALYSIS OF NET ASSETS: | ||||||||||||||||
| Paid-in capital | $ | 74,870,592 | $ | 455,900,905 | $ | 377,729,341 | $ | 1,094,455,748 | ||||||||
| Undistributed net investment income (loss) | 360,957 | 1,659,421 | (1,450,841 | ) | 8,442,711 | |||||||||||
Accumulated net realized gain (loss) on investments and foreign currency | 11,296,559 | 25,720,495 | 49,023,816 | 26,896,197 | ||||||||||||
Net unrealized appreciation (depreciation) on investments and foreign currency | 9,645,954 | (6,592,559 | ) | 63,842,470 | 314,888,256 | |||||||||||
| Net Assets | $ | 96,174,062 | $ | 476,688,262 | $ | 489,144,786 | $ | 1,444,682,912 | ||||||||
Investment Class | $ | 45,159,184 | $ | 72,137,987 | $ | 114,240,166 | $ | 1,093,649,535 | ||||||||
Service Class | 49,099,521 | 213,541,029 | 333,575,226 | 109,577,917 | ||||||||||||
Consultant Class | 16,610,204 | 12,165,435 | 42,808,204 | |||||||||||||
Institutional Class | 152,786,881 | 28,178,561 | 198,647,256 | |||||||||||||
R Class | 1,498,825 | 16,895,791 | 748,026 | |||||||||||||
K Class | 416,532 | 4,716,370 | 237,372 | |||||||||||||
| SHARES OUTSTANDING (unlimited number of $.001 par value): | ||||||||||||||||
Investment Class | 6,775,795 | 7,984,564 | 10,403,614 | 56,279,850 | ||||||||||||
Service Class | 7,458,809 | 23,767,060 | 30,845,039 | 5,651,019 | ||||||||||||
Consultant Class | 2,046,389 | 1,263,306 | 2,397,103 | |||||||||||||
Institutional Class | 16,903,257 | 2,537,838 | 10,296,502 | |||||||||||||
R Class | 169,287 | 1,948,018 | 73,425 | |||||||||||||
K Class | 45,924 | 742,037 | 40,309 | |||||||||||||
| NET ASSET VALUES (Net Assets ÷ Shares Outstanding): | ||||||||||||||||
Investment Class1 | $6.66 | $9.03 | $10.98 | $19.43 | ||||||||||||
Service Class1 | 6.58 | 8.98 | 10.81 | 19.39 | ||||||||||||
Consultant Class2 | 8.12 | 9.63 | 17.86 | |||||||||||||
Institutional Class3 | 9.04 | 11.10 | 19.29 | |||||||||||||
R Class3 | 8.85 | 8.67 | 10.19 | |||||||||||||
K Class3 | 9.07 | 6.36 | 5.89 | |||||||||||||
| Investments at identified cost | $ | 81,654,247 | $ | 446,251,243 | $ | 413,664,046 | $ | 1,003,089,673 | ||||||||
| Market value of loaned securities | – | 2,090,500 | 27,390,483 | – | ||||||||||||
| 1 | Offering and redemption price per share; shares held less than 30 days may be subject to a 1% redemption fee, payable to the Fund. |
| 2 | Offering and redemption price per share; shares held less than 365 days may be subject to a 1% contingent deferred sales charge, payable to Royce Fund Services, Inc. |
| 3 | Offering and redemption price per share. |
| 86 | The Royce Funds 2016 Semiannual Report to Shareholders | THE ACCOMPANYING NOTES ARE AN INTEGRAL PART OF THESE FINANCIAL STATEMENTS |
| June 30, 2016 (unaudited) |
| Royce Special Equity | Royce Total Return | |||||||
| Multi-Cap Fund | Fund | |||||||
| ASSETS: | ||||||||
| Investments at value (including collateral on loaned securities) | ||||||||
Non-Affiliated Companies | $ | 103,599,780 | $ | 2,764,763,756 | ||||
Affiliated Companies | – | 30,299,232 | ||||||
| Repurchase agreements (at cost and value) | 14,797,000 | 24,287,000 | ||||||
| Cash and foreign currency | 129 | 141,321 | ||||||
| Receivable for investments sold | 808,981 | 5,142,878 | ||||||
| Receivable for capital shares sold | 17,287 | 3,566,625 | ||||||
| Receivable for dividends and interest | 191,576 | 2,538,741 | ||||||
| Prepaid expenses and other assets | 3,477 | 28,839 | ||||||
| Total Assets | 119,418,230 | 2,830,768,392 | ||||||
| LIABILITIES: | ||||||||
| Payable for collateral on loaned securities | – | 9,652,360 | ||||||
| Payable for investments purchased | 425,465 | 4,124,417 | ||||||
| Payable for capital shares redeemed | 401,861 | 6,691,079 | ||||||
| Payable for investment advisory fees | 80,014 | 2,278,426 | ||||||
| Payable for trustees’ fees | 4,834 | 78,063 | ||||||
| Accrued expenses | 52,967 | 1,398,540 | ||||||
| Total Liabilities | 965,141 | 24,222,885 | ||||||
| Net Assets | $ | 118,453,089 | $ | 2,806,545,507 | ||||
| ANALYSIS OF NET ASSETS: | ||||||||
| Paid-in capital | $ | 113,910,805 | $ | 1,649,363,361 | ||||
| Undistributed net investment income (loss) | 795,637 | (3,325,838 | ) | |||||
| Accumulated net realized gain (loss) on investments and foreign currency | (2,372,917 | ) | 207,250,866 | |||||
| Net unrealized appreciation (depreciation) on investments and foreign currency | 6,119,564 | 953,257,118 | ||||||
| Net Assets | $ | 118,453,089 | $ | 2,806,545,507 | ||||
Investment Class | $ | 44,201,887 | $ | 1,712,161,596 | ||||
Service Class | 37,033,913 | 124,572,720 | ||||||
Consultant Class | 4,626,972 | 256,457,762 | ||||||
Institutional Class | 32,590,317 | 479,268,389 | ||||||
W Class | 120,911,936 | |||||||
R Class | 50,253,317 | |||||||
K Class | 62,919,787 | |||||||
| SHARES OUTSTANDING (unlimited number of $.001 par value): | ||||||||
Investment Class | 3,595,309 | 133,070,388 | ||||||
Service Class | 3,005,558 | 9,509,554 | ||||||
Consultant Class | 572,343 | 19,532,655 | ||||||
Institutional Class | 2,651,078 | 37,625,314 | ||||||
W Class | 9,413,607 | |||||||
R Class | 3,814,321 | |||||||
K Class | 7,108,017 | |||||||
| NET ASSET VALUES (Net Assets ÷ Shares Outstanding): | ||||||||
Investment Class1 | $12.29 | $12.87 | ||||||
Service Class1 | 12.32 | 13.10 | ||||||
Consultant Class2 | 8.08 | 13.13 | ||||||
Institutional Class3 | 12.29 | 12.74 | ||||||
W Class3 | 12.84 | |||||||
R Class3 | 13.17 | |||||||
K Class3 | 8.85 | |||||||
| Investments at identified cost | $ | 97,480,217 | $ | 1,841,788,119 | ||||
| Market value of loaned securities | – | 9,404,818 | ||||||
| 1 | Offering and redemption price per share; shares held less than 30 days may be subject to a 1% redemption fee, payable to the Fund. |
| 2 | Offering and redemption price per share; shares held less than 365 days may be subject to a 1% contingent deferred sales charge, payable to Royce Fund Services, Inc. |
| 3 | Offering and redemption price per share. |
| THE ACCOMPANYING NOTES ARE AN INTEGRAL PART OF THESE FINANCIAL STATEMENTS | The Royce Funds 2016 Semiannual Report to Shareholders | 87 |
| Statements of Changes in Net Assets |
| Royce Global Financial | ||||||||||||||||||||||||
| Royce Dividend Value Fund | Services Fund | Royce Heritage Fund | ||||||||||||||||||||||
| Six Months Ended | Six Months Ended | Six Months Ended | ||||||||||||||||||||||
| 6/30/16 (unaudited) | Year Ended 12/31/15 | 6/30/16 (unaudited) | Year Ended 12/31/15 | 6/30/16 (unaudited) | Year Ended 12/31/15 | |||||||||||||||||||
| INVESTMENT OPERATIONS: | ||||||||||||||||||||||||
| Net investment income (loss) | $ | 2,113,659 | $ | 5,615,411 | $ | 366,123 | $ | 661,280 | $ | 45,041 | $ | 1,105,158 | ||||||||||||
| Net realized gain (loss) on investments and | ||||||||||||||||||||||||
foreign currency | 13,095,715 | 22,090,713 | (209,852 | ) | 3,106,606 | (134,181 | ) | 21,906,988 | ||||||||||||||||
Net change in unrealized appreciation | (5,735,721 | ) | (46,727,540 | ) | 136,483 | (7,341,479 | ) | 11,711,684 | (40,815,691 | ) | ||||||||||||||
Net increase (decrease) in net assets | 9,473,653 | (19,021,416 | ) | 292,754 | (3,573,593 | ) | 11,622,544 | (17,803,545 | ) | |||||||||||||||
| DISTRIBUTIONS: | ||||||||||||||||||||||||
| Net investment income | ||||||||||||||||||||||||
Investment Class | (905,568 | ) | (2,391,709 | ) | – | (723,765 | ) | |||||||||||||||||
Service Class | (1,127,640 | ) | (2,678,378 | ) | – | (666,857 | ) | – | (662,286 | ) | ||||||||||||||
Consultant Class | (5,146 | ) | (3,857 | ) | – | – | ||||||||||||||||||
Institutional Class | (6,447 | ) | (508,091 | ) | – | |||||||||||||||||||
R Class | – | (9,229 | ) | |||||||||||||||||||||
K Class | – | (24,990 | ) | |||||||||||||||||||||
Net realized gain on investments and | ||||||||||||||||||||||||
Investment Class | – | (10,918,322 | ) | – | (7,909,857 | ) | ||||||||||||||||||
Service Class | – | (15,975,223 | ) | – | (4,550,611 | ) | – | (10,861,670 | ) | |||||||||||||||
Consultant Class | – | (84,309 | ) | – | (1,306,228 | ) | ||||||||||||||||||
Institutional Class | – | (60,739 | ) | – | ||||||||||||||||||||
R Class | – | (314,617 | ) | |||||||||||||||||||||
K Class | – | (506,200 | ) | |||||||||||||||||||||
| Total distributions | (2,044,801 | ) | (32,620,628 | ) | – | (5,217,468 | ) | – | (22,318,842 | ) | ||||||||||||||
| CAPITAL SHARE TRANSACTIONS: | ||||||||||||||||||||||||
| Net capital share transactions | ||||||||||||||||||||||||
Investment Class | (14,773,849 | ) | (39,499,647 | ) | 601,771 | (54,256,776 | ) | |||||||||||||||||
Service Class | (34,000,344 | ) | (98,629,025 | ) | (10,724,432 | ) | 7,093,134 | (8,736,920 | ) | (35,002,503 | ) | |||||||||||||
Consultant Class | (480,115 | ) | 1,137,696 | (1,091,098 | ) | 243,363 | ||||||||||||||||||
Institutional Class | 28,806 | (39,025,158 | ) | 5,237,087 | ||||||||||||||||||||
R Class | (295,256 | ) | (875,916 | ) | ||||||||||||||||||||
K Class | (404,420 | ) | (732,966 | ) | ||||||||||||||||||||
| Shareholder redemption fees | ||||||||||||||||||||||||
Investment Class | 149 | 770 | 2 | 13 | ||||||||||||||||||||
Service Class | 295 | 3,353 | 590 | 3,413 | – | 404 | ||||||||||||||||||
Net increase (decrease) in net assets | (49,225,058 | ) | (176,012,011 | ) | (5,486,755 | ) | 7,096,547 | (9,925,921 | ) | (90,624,381 | ) | |||||||||||||
| Net Increase (Decrease) In Net Assets | (41,796,206 | ) | (227,654,055 | ) | (5,194,001 | ) | (1,694,514 | ) | 1,696,623 | (130,746,768 | ) | |||||||||||||
| NET ASSETS: | ||||||||||||||||||||||||
| Beginning of period | 285,762,010 | 513,416,065 | 52,012,515 | 53,707,029 | 227,771,350 | 358,518,118 | ||||||||||||||||||
| End of period | $ | 243,965,804 | $ | 285,762,010 | $ | 46,818,514 | $ | 52,012,515 | $ | 229,467,973 | $ | 227,771,350 | ||||||||||||
| Undistributed Net Investment Income (Loss) | ||||||||||||||||||||||||
at End of Period | $ | 6,057 | $ | (62,801 | ) | $ | 98,805 | $ | (267,318 | ) | $ | (318,864 | ) | $ | (363,905 | ) | ||||||||
| 88 | The Royce Funds 2016 Semiannual Report to Shareholders | THE ACCOMPANYING NOTES ARE AN INTEGRAL PART OF THESE FINANCIAL STATEMENTS |
| Royce International | Royce International | Royce International | ||||||||||||||||||||||
| Micro-Cap Fund | Premier Fund | Small-Cap Fund | ||||||||||||||||||||||
| Six Months Ended | Six Months Ended | Six Months Ended | ||||||||||||||||||||||
| 6/30/16 (unaudited) | Year Ended 12/31/15 | 6/30/16 (unaudited) | Year Ended 12/31/15 | 6/30/16 (unaudited) | Year Ended 12/31/15 | |||||||||||||||||||
| INVESTMENT OPERATIONS: | ||||||||||||||||||||||||
| Net investment income (loss) | $ | 27,955 | $ | 28,861 | $ | 438,715 | $ | 112,963 | $ | 82,926 | $ | 336,108 | ||||||||||||
Net realized gain (loss) on investments and | (58,628 | ) | (85,484 | ) | 740,786 | 284,340 | (1,064,909 | ) | (737,386 | ) | ||||||||||||||
Net change in unrealized appreciation | 46,604 | 15,857 | 5,202,175 | 933,734 | 637,646 | 346,448 | ||||||||||||||||||
Net increase (decrease) in net assets | 15,931 | (40,766 | ) | 6,381,676 | 1,331,037 | (344,337 | ) | (54,830 | ) | |||||||||||||||
| DISTRIBUTIONS: | ||||||||||||||||||||||||
| Net investment income | ||||||||||||||||||||||||
Investment Class | – | (94,094 | ) | – | (11,969 | ) | ||||||||||||||||||
Service Class | – | (15,066 | ) | – | (226,237 | ) | – | (366,611 | ) | |||||||||||||||
Consultant Class | – | |||||||||||||||||||||||
Institutional Class | – | (58,335 | ) | |||||||||||||||||||||
R Class | – | |||||||||||||||||||||||
K Class | – | |||||||||||||||||||||||
Net realized gain on investments and foreign currency | ||||||||||||||||||||||||
Investment Class | – | – | – | (5 | ) | |||||||||||||||||||
Service Class | – | – | – | – | – | (187 | ) | |||||||||||||||||
Consultant Class | – | |||||||||||||||||||||||
Institutional Class | – | (25 | ) | |||||||||||||||||||||
R Class | – | |||||||||||||||||||||||
K Class | – | |||||||||||||||||||||||
| Total distributions | – | (15,066 | ) | – | (320,331 | ) | – | (437,132 | ) | |||||||||||||||
| CAPITAL SHARE TRANSACTIONS: | ||||||||||||||||||||||||
| Net capital share transactions | ||||||||||||||||||||||||
Investment Class | (3,897,130 | ) | (416,753 | ) | 13,651 | (804,287 | ) | |||||||||||||||||
Service Class | (315,968 | ) | (252,087 | ) | (4,202,269 | ) | 4,517,740 | (11,227,819 | ) | (11,759,515 | ) | |||||||||||||
Consultant Class | (452,958 | ) | ||||||||||||||||||||||
Institutional Class | 7,416 | (255,663 | ) | |||||||||||||||||||||
R Class | – | |||||||||||||||||||||||
K Class | – | |||||||||||||||||||||||
Value of shares issued in connection with the merger of Royce European Small-Cap Fund and Royce Global Value Fund | 62,822,434 | |||||||||||||||||||||||
| Shareholder redemption fees | ||||||||||||||||||||||||
Investment Class | 758 | 84 | – | – | ||||||||||||||||||||
Service Class | 2 | 331 | 258 | 9 | 2 | 4 | ||||||||||||||||||
Net increase (decrease) in net assets | (315,966 | ) | (251,756 | ) | 54,271,093 | 4,101,080 | (11,206,750 | ) | (12,819,461 | ) | ||||||||||||||
| Net Increase (Decrease) In Net Assets | (300,035 | ) | (307,588 | ) | 60,652,769 | 5,111,786 | (11,551,087 | ) | (13,311,423 | ) | ||||||||||||||
| NET ASSETS: | ||||||||||||||||||||||||
| Beginning of period | 6,102,362 | 6,409,950 | 12,638,249 | 7,526,463 | 19,770,924 | 33,082,347 | ||||||||||||||||||
| End of period | $ | 5,802,327 | $ | 6,102,362 | $ | 73,291,018 | $ | 12,638,249 | $ | 8,219,837 | $ | 19,770,924 | ||||||||||||
Undistributed Net Investment Income (Loss) | $ | 12,765 | $ | (15,189 | ) | $ | 271,759 | $ | (166,956 | ) | $ | 11,630 | $ | (71,296 | ) | |||||||||
| THE ACCOMPANYING NOTES ARE AN INTEGRAL PART OF THESE FINANCIAL STATEMENTS | The Royce Funds 2016 Semiannual Report to Shareholders | 89 |
| Statements of Changes in Net Assets |
| Royce Low-Priced Stock Fund | Royce Micro-Cap Fund | Royce Micro-Cap Opportunity Fund | ||||||||||||||||||||||
| Six Months Ended | Six Months Ended | Six Months Ended | ||||||||||||||||||||||
| 6/30/16 (unaudited) | Year Ended 12/31/15 | 6/30/16 (unaudited) | Year Ended 12/31/15 | 6/30/16 (unaudited) | Year Ended 12/31/15 | |||||||||||||||||||
| INVESTMENT OPERATIONS: | ||||||||||||||||||||||||
| Net investment income (loss) | $ | 726,308 | $ | (749,288 | ) | $ | (175,932 | ) | $ | (48,824 | ) | $ | (106,132 | ) | $ | (157,402 | ) | |||||||
Net realized gain (loss) on investments and | 19,701,473 | 50,049,069 | 14,654,099 | 27,865,387 | (1,320,313 | ) | (839,817 | ) | ||||||||||||||||
Net change in unrealized appreciation | (32,072,703 | ) | (98,725,108 | ) | (19,007,953 | ) | (80,342,626 | ) | 2,922,714 | (4,189,900 | ) | |||||||||||||
Net increase (decrease) in net assets | (11,644,922 | ) | (49,425,327 | ) | (4,529,786 | ) | (52,526,063 | ) | 1,496,269 | (5,187,119 | ) | |||||||||||||
| DISTRIBUTIONS: | ||||||||||||||||||||||||
| Net investment income | ||||||||||||||||||||||||
Investment Class | – | – | – | – | – | – | ||||||||||||||||||
Service Class | – | – | – | – | – | – | ||||||||||||||||||
Consultant Class | – | – | ||||||||||||||||||||||
Institutional Class | – | (19,349 | ) | |||||||||||||||||||||
R Class | – | – | ||||||||||||||||||||||
K Class | – | – | ||||||||||||||||||||||
Net realized gain on investments and | ||||||||||||||||||||||||
Investment Class | – | (2,528,780 | ) | – | (26,296,259 | ) | – | (829 | ) | |||||||||||||||
Service Class | – | (27,485,797 | ) | – | (2,534,611 | ) | – | (52 | ) | |||||||||||||||
Consultant Class | – | (5,795,052 | ) | |||||||||||||||||||||
Institutional Class | – | (3,485,225 | ) | |||||||||||||||||||||
R Class | – | (100,299 | ) | |||||||||||||||||||||
K Class | – | (409,904 | ) | |||||||||||||||||||||
| Total distributions | – | (34,029,354 | ) | – | (34,625,922 | ) | – | (881 | ) | |||||||||||||||
| CAPITAL SHARE TRANSACTIONS: | ||||||||||||||||||||||||
| Net capital share transactions | ||||||||||||||||||||||||
Investment Class | (4,954,047 | ) | (15,345,048 | ) | (33,289,086 | ) | (128,962,401 | ) | 1,802,908 | 21,161,499 | ||||||||||||||
Service Class | (37,120,714 | ) | (136,462,314 | ) | (4,703,277 | ) | (11,015,702 | ) | (153,001 | ) | 514,293 | |||||||||||||
Consultant Class | (6,419,205 | ) | (20,670,449 | ) | ||||||||||||||||||||
Institutional Class | (23,417,306 | ) | (54,117,605 | ) | ||||||||||||||||||||
R Class | (9,746 | ) | (519,308 | ) | ||||||||||||||||||||
K Class | (266,303 | ) | 87,347 | |||||||||||||||||||||
| Shareholder redemption fees | ||||||||||||||||||||||||
Investment Class | – | – | 39 | 1,183 | 412 | 299 | ||||||||||||||||||
Service Class | 61 | 4,987 | – | 110 | – | 90 | ||||||||||||||||||
Net increase (decrease) in net assets | (65,768,055 | ) | (206,351,941 | ) | (44,411,529 | ) | (160,647,259 | ) | 1,650,319 | 21,676,181 | ||||||||||||||
| Net Increase (Decrease) In Net Assets | (77,412,977 | ) | (289,806,622 | ) | (48,941,315 | ) | (247,799,244 | ) | 3,146,588 | 16,488,181 | ||||||||||||||
| NET ASSETS: | ||||||||||||||||||||||||
| Beginning of period | 386,845,803 | 676,652,425 | 280,833,988 | 528,633,232 | 35,648,520 | 19,160,339 | ||||||||||||||||||
| End of period | $ | 309,432,826 | $ | 386,845,803 | $ | 231,892,673 | $ | 280,833,988 | $ | 38,795,108 | $ | 35,648,520 | ||||||||||||
Undistributed Net Investment Income (Loss) | $ | 494,412 | $ | (231,897 | ) | $ | (314,335 | ) | $ | (138,403 | ) | $ | (106,181 | ) | $ | (48 | ) | |||||||
| 90 | The Royce Funds 2016 Semiannual Report to Shareholders | THE ACCOMPANYING NOTES ARE AN INTEGRAL PART OF THESE FINANCIAL STATEMENTS |
| Royce Opportunity Fund | Royce Pennsylvania Mutual Fund | Royce Premier Fund | ||||||||||||||||||||||
| Six Months Ended | Six Months Ended | Six Months Ended | ||||||||||||||||||||||
| 6/30/16 (unaudited) | Year Ended 12/31/15 | 6/30/16 (unaudited) | Year Ended 12/31/15 | 6/30/16 (unaudited) | Year Ended 12/31/15 | |||||||||||||||||||
| INVESTMENT OPERATIONS: | ||||||||||||||||||||||||
| Net investment income (loss) | $ | (1,150,390 | ) | $ | (5,300,020 | ) | $ | 4,892,276 | $ | 19,385,314 | $ | 4,873,113 | $ | 20,471,996 | ||||||||||
Net realized gain (loss) on investments and | 39,333,511 | 162,734,316 | 112,995,626 | 490,135,537 | 142,845,404 | 812,018,660 | ||||||||||||||||||
Net change in unrealized appreciation | 3,040,345 | (416,427,869 | ) | 65,688,989 | (985,585,796 | ) | (18,248,177 | ) | (1,203,711,621 | ) | ||||||||||||||
| Net increase (decrease) in net assets | ||||||||||||||||||||||||
from investment operations | 41,223,466 | (258,993,573 | ) | 183,576,891 | (476,064,945 | ) | 129,470,340 | (371,220,965 | ) | |||||||||||||||
| DISTRIBUTIONS: | ||||||||||||||||||||||||
| Net investment income | ||||||||||||||||||||||||
Investment Class | – | – | – | (17,117,756 | ) | – | (16,221,798 | ) | ||||||||||||||||
Service Class | – | – | – | (194,886 | ) | – | (130,119 | ) | ||||||||||||||||
Consultant Class | – | – | – | – | – | – | ||||||||||||||||||
Institutional Class | – | – | – | (5,113,765 | ) | – | (2,635,988 | ) | ||||||||||||||||
W Class | – | (1,657,941 | ) | |||||||||||||||||||||
R Class | – | – | – | – | – | – | ||||||||||||||||||
K Class | – | – | – | – | – | (59,934 | ) | |||||||||||||||||
| Net realized gain on investments and | ||||||||||||||||||||||||
foreign currency | ||||||||||||||||||||||||
Investment Class | – | (70,548,435 | ) | – | (368,819,105 | ) | – | (408,845,681 | ) | |||||||||||||||
Service Class | – | (9,927,530 | ) | – | (19,955,149 | ) | – | (12,422,397 | ) | |||||||||||||||
Consultant Class | – | (2,017,485 | ) | – | (94,833,647 | ) | – | (7,902,444 | ) | |||||||||||||||
Institutional Class | – | (54,433,028 | ) | – | (92,030,063 | ) | – | (55,307,608 | ) | |||||||||||||||
W Class | – | (41,880,612 | ) | |||||||||||||||||||||
R Class | – | (3,175,783 | ) | – | (3,584,148 | ) | – | (3,169,817 | ) | |||||||||||||||
K Class | – | (1,032,939 | ) | – | (1,005,956 | ) | – | (2,027,347 | ) | |||||||||||||||
| Total distributions | – | (141,135,200 | ) | – | (602,654,475 | ) | – | (552,261,686 | ) | |||||||||||||||
| CAPITAL SHARE TRANSACTIONS: | ||||||||||||||||||||||||
| Net capital share transactions | ||||||||||||||||||||||||
Investment Class | (78,615,299 | ) | (334,454,709 | ) | (417,665,699 | ) | (1,247,856,329 | ) | (379,849,924 | ) | (1,369,730,313 | ) | ||||||||||||
Service Class | (26,263,533 | ) | (26,205,974 | ) | (25,809,529 | ) | (191,134,871 | ) | (19,432,046 | ) | (90,207,188 | ) | ||||||||||||
Consultant Class | (111,950 | ) | 4,226,458 | (53,234,620 | ) | (94,088,549 | ) | (3,634,902 | ) | (11,030,216 | ) | |||||||||||||
Institutional Class | (50,993,034 | ) | (46,228,790 | ) | (21,216,864 | ) | (135,653,362 | ) | (55,549,536 | ) | (202,700,432 | ) | ||||||||||||
W Class | (39,686,741 | ) | (181,056,608 | ) | ||||||||||||||||||||
R Class | 137,211 | 7,219,677 | (2,937,800 | ) | (11,293,119 | ) | (2,466,180 | ) | (5,916,080 | ) | ||||||||||||||
K Class | (3,567,859 | ) | (10,131,487 | ) | (1,421,886 | ) | (4,790,179 | ) | (990,650 | ) | (990,304 | ) | ||||||||||||
| Shareholder redemption fees | ||||||||||||||||||||||||
Investment Class | 506 | 17,647 | 22,110 | 20,843 | 2,743 | 18,204 | ||||||||||||||||||
Service Class | 118 | 476 | 1,455 | 6,189 | – | 2,449 | ||||||||||||||||||
Net increase (decrease) in net assets | (159,413,840 | ) | (405,556,702 | ) | (522,262,833 | ) | (1,684,789,377 | ) | (501,607,236 | ) | (1,861,610,488 | ) | ||||||||||||
| Net Increase (Decrease) In Net Assets | (118,190,374 | ) | (805,685,475 | ) | (338,685,942 | ) | (2,763,508,797 | ) | (372,136,896 | ) | (2,785,093,139 | ) | ||||||||||||
| NET ASSETS: | ||||||||||||||||||||||||
| Beginning of period | 1,509,683,815 | 2,315,369,290 | 2,965,810,945 | 5,729,319,742 | 2,617,065,854 | 5,402,158,993 | ||||||||||||||||||
| End of period | $ | 1,391,493,441 | $ | 1,509,683,815 | $ | 2,627,125,003 | $ | 2,965,810,945 | $ | 2,244,928,958 | $ | 2,617,065,854 | ||||||||||||
| Undistributed Net Investment Income (Loss) | ||||||||||||||||||||||||
at End of Period | $ | (1,154,832 | ) | $ | (4,442 | ) | $ | (6,624,959 | ) | $ | (11,517,236 | ) | $ | 5,175,428 | $ | 302,315 | ||||||||
| THE ACCOMPANYING NOTES ARE AN INTEGRAL PART OF THESE FINANCIAL STATEMENTS | The Royce Funds 2016 Semiannual Report to Shareholders | 91 |
| Statements of Changes in Net Assets |
| Royce Smaller-Companies | ||||||||||||||||||||||||
| Royce Small-Cap Leaders Fund | Royce Small-Cap Value Fund | Growth Fund | ||||||||||||||||||||||
| Six Months Ended | Six Months Ended | Six Months Ended | ||||||||||||||||||||||
| 6/30/16 (unaudited) | Year Ended 12/31/15 | 6/30/16 (unaudited) | Year Ended 12/31/15 | 6/30/16 (unaudited) | Year Ended 12/31/15 | |||||||||||||||||||
| INVESTMENT OPERATIONS: | ||||||||||||||||||||||||
| Net investment income (loss) | $ | 360,957 | $ | 409,540 | $ | 1,354,299 | $ | 3,900,575 | $ | (1,509,128 | ) | $ | (4,227,601 | ) | ||||||||||
Net realized gain (loss) on investments and | 6,615,727 | 23,376,472 | 12,430,226 | 96,681,216 | 27,567,421 | 116,596,023 | ||||||||||||||||||
Net change in unrealized appreciation | (1,272,801 | ) | (42,012,914 | ) | 3,293,453 | (176,217,796 | ) | (51,354,137 | ) | (111,759,438 | ) | |||||||||||||
Net increase (decrease) in net assets | 5,703,883 | (18,226,902 | ) | 17,077,978 | (75,636,005 | ) | (25,295,844 | ) | 608,984 | |||||||||||||||
| DISTRIBUTIONS: | ||||||||||||||||||||||||
| Net investment income | ||||||||||||||||||||||||
Investment Class | – | (299,189 | ) | – | (713,642 | ) | – | – | ||||||||||||||||
Service Class | – | (69,461 | ) | – | (1,412,063 | ) | – | – | ||||||||||||||||
Consultant Class | – | – | – | – | ||||||||||||||||||||
Institutional Class | – | (1,708,384 | ) | – | – | |||||||||||||||||||
R Class | – | – | – | (37,389 | ) | – | – | |||||||||||||||||
K Class | – | – | – | (29,293 | ) | – | – | |||||||||||||||||
Net realized gain on investments and | ||||||||||||||||||||||||
Investment Class | – | (9,499,943 | ) | – | (13,129,734 | ) | – | (30,123,120 | ) | |||||||||||||||
Service Class | – | (11,237,795 | ) | – | (42,541,960 | ) | – | (84,976,623 | ) | |||||||||||||||
Consultant Class | – | (3,205,916 | ) | – | (3,101,929 | ) | ||||||||||||||||||
Institutional Class | – | (25,005,908 | ) | – | (7,731,654 | ) | ||||||||||||||||||
R Class | – | (233,440 | ) | – | (3,171,360 | ) | – | (184,149 | ) | |||||||||||||||
K Class | – | (42,755 | ) | – | (1,271,691 | ) | – | (96,698 | ) | |||||||||||||||
| Total distributions | – | (21,382,583 | ) | – | (92,227,340 | ) | – | (126,214,173 | ) | |||||||||||||||
| CAPITAL SHARE TRANSACTIONS: | ||||||||||||||||||||||||
| Net capital share transactions | ||||||||||||||||||||||||
Investment Class | (7,898,252 | ) | (21,274,592 | ) | (8,075,797 | ) | (36,675,861 | ) | (20,100,240 | ) | (131,135,648 | ) | ||||||||||||
Service Class | (11,586,435 | ) | (70,473,027 | ) | (46,089,964 | ) | (143,714,621 | ) | (58,693,773 | ) | (74,835,663 | ) | ||||||||||||
Consultant Class | (2,286,981 | ) | (2,376,947 | ) | (1,631,553 | ) | 673,082 | |||||||||||||||||
Institutional Class | (2,655,266 | ) | (1,225,100 | ) | (9,095,201 | ) | 9,313,200 | |||||||||||||||||
R Class | (259,419 | ) | 185,838 | (2,769,570 | ) | (5,896,346 | ) | (102,012 | ) | (274,728 | ) | |||||||||||||
K Class | 54,365 | (237,762 | ) | (1,431,045 | ) | (1,161,875 | ) | (57,005 | ) | (90,382 | ) | |||||||||||||
Value of shares issued in connection with | 20,278,826 | |||||||||||||||||||||||
| Shareholder redemption fees | ||||||||||||||||||||||||
Investment Class | – | 74 | 1,133 | 797 | 29,774 | 954 | ||||||||||||||||||
Service Class | 66 | 1,268 | 548 | 3,553 | 141 | 859 | ||||||||||||||||||
Net increase (decrease) in net assets | (19,689,675 | ) | (71,519,375 | ) | (63,306,942 | ) | (191,046,400 | ) | (89,649,869 | ) | (196,348,326 | ) | ||||||||||||
Net Increase (Decrease) In Net Assets | (13,985,792 | ) | (111,128,860 | ) | (46,228,964 | ) | (358,909,745 | ) | (114,945,713 | ) | (321,953,515 | ) | ||||||||||||
| NET ASSETS: | ||||||||||||||||||||||||
| Beginning of period | 110,159,854 | 221,288,714 | 522,917,226 | 881,826,971 | 604,090,499 | 926,044,014 | ||||||||||||||||||
| End of period | $ | 96,174,062 | $ | 110,159,854 | $ | 476,688,262 | $ | 522,917,226 | $ | 489,144,786 | $ | 604,090,499 | ||||||||||||
Undistributed Net Investment Income (Loss) | $ | 360,957 | $ | – | $ | 1,659,421 | $ | 305,122 | $ | (1,450,841 | ) | $ | 58,287 | |||||||||||
| 92 | The Royce Funds 2016 Semiannual Report to Shareholders | THE ACCOMPANYING NOTES ARE AN INTEGRAL PART OF THESE FINANCIAL STATEMENTS |
| Royce Special Equity | ||||||||||||||||||||||||
| Royce Special Equity Fund | Multi-Cap Fund | Royce Total Return Fund | ||||||||||||||||||||||
| Six Months Ended | Six Months Ended | Six Months Ended | ||||||||||||||||||||||
| 6/30/16 (unaudited) | Year Ended 12/31/15 | 6/30/16 (unaudited) | Year Ended 12/31/15 | 6/30/16 (unaudited) | Year Ended 12/31/15 | |||||||||||||||||||
| INVESTMENT OPERATIONS: | ||||||||||||||||||||||||
| Net investment income (loss) | $ | 8,225,750 | $ | 17,741,992 | $ | 778,122 | $ | 3,460,388 | $ | 13,112,652 | $ | 42,181,172 | ||||||||||||
Net realized gain (loss) on investments and | 29,365,115 | 204,400,312 | 2,297,070 | (4,660,482 | ) | 124,553,323 | 344,246,993 | |||||||||||||||||
Net change in unrealized appreciation | 76,433,748 | (467,531,429 | ) | (3,575,885 | ) | (30,552,462 | ) | 81,813,663 | (644,769,544 | ) | ||||||||||||||
Net increase (decrease) in net assets | 114,024,613 | (245,389,125 | ) | (500,693 | ) | (31,752,556 | ) | 219,479,638 | (258,341,379 | ) | ||||||||||||||
| DISTRIBUTIONS: | ||||||||||||||||||||||||
| Net investment income | ||||||||||||||||||||||||
Investment Class | – | (13,685,417 | ) | – | (1,202,059 | ) | (9,296,497 | ) | (22,091,406 | ) | ||||||||||||||
Service Class | – | (1,017,084 | ) | – | (1,139,180 | ) | (447,451 | ) | (1,206,038 | ) | ||||||||||||||
Consultant Class | – | (75,049 | ) | – | (177,836 | ) | (99,265 | ) | (449,082 | ) | ||||||||||||||
Institutional Class | – | (3,153,305 | ) | – | (1,027,324 | ) | (2,214,889 | ) | (5,010,012 | ) | ||||||||||||||
W Class | (583,294 | ) | (1,569,255 | ) | ||||||||||||||||||||
R Class | (97,504 | ) | (233,738 | ) | ||||||||||||||||||||
K Class | (214,575 | ) | (500,451 | ) | ||||||||||||||||||||
Net realized gain on investments and foreign | ||||||||||||||||||||||||
Investment Class | – | (106,125,451 | ) | – | (2,737,673 | ) | – | (236,598,179 | ) | |||||||||||||||
Service Class | – | (11,014,959 | ) | – | (2,876,421 | ) | – | (17,422,849 | ) | |||||||||||||||
Consultant Class | – | (4,478,322 | ) | – | (556,760 | ) | – | (32,205,826 | ) | |||||||||||||||
Institutional Class | – | (21,819,175 | ) | – | (2,139,347 | ) | – | (47,290,489 | ) | |||||||||||||||
W Class | – | (15,056,748 | ) | |||||||||||||||||||||
R Class | – | (6,132,531 | ) | |||||||||||||||||||||
K Class | – | (10,750,317 | ) | |||||||||||||||||||||
| Total distributions | – | (161,368,762 | ) | – | (11,856,600 | ) | (12,953,475 | ) | (396,516,921 | ) | ||||||||||||||
| CAPITAL SHARE TRANSACTIONS: | ||||||||||||||||||||||||
| Net capital share transactions | ||||||||||||||||||||||||
Investment Class | (90,171,161 | ) | (544,893,604 | ) | 608,905 | (61,315,258 | ) | (265,697,829 | ) | (798,531,569 | ) | |||||||||||||
Service Class | (11,055,470 | ) | (88,375,278 | ) | (10,632,171 | ) | (33,511,548 | ) | (22,099,911 | ) | (63,653,645 | ) | ||||||||||||
Consultant Class | (2,654,557 | ) | (9,721,161 | ) | (2,070,382 | ) | (377,731 | ) | (25,214,470 | ) | (36,593,875 | ) | ||||||||||||
Institutional Class | (27,283,006 | ) | (376,173,828 | ) | (4,270,334 | ) | (29,458,527 | ) | 71,863,868 | (113,660,287 | ) | |||||||||||||
W Class | (6,504,150 | ) | (119,767,078 | ) | ||||||||||||||||||||
R Class | (4,242,614 | ) | (3,800,528 | ) | ||||||||||||||||||||
K Class | (4,124,062 | ) | (11,885,110 | ) | ||||||||||||||||||||
| Shareholder redemption fees | ||||||||||||||||||||||||
Investment Class | 21,902 | 7,435 | 30 | 1,076 | 1,395 | 28,213 | ||||||||||||||||||
Service Class | 583 | 7,935 | 79 | 1,547 | 20 | 723 | ||||||||||||||||||
Net increase (decrease) in net assets | (131,141,709 | ) | (1,019,148,501 | ) | (16,363,873 | ) | (124,660,441 | ) | (256,017,753 | ) | (1,147,863,156 | ) | ||||||||||||
Net Increase (Decrease) In Net Assets | (17,117,096 | ) | (1,425,906,388 | ) | (16,864,566 | ) | (168,269,597 | ) | (49,491,590 | ) | (1,802,721,456 | ) | ||||||||||||
| NET ASSETS: | ||||||||||||||||||||||||
| Beginning of period | 1,461,800,008 | 2,887,706,396 | 135,317,655 | 303,587,252 | 2,856,037,097 | 4,658,758,553 | ||||||||||||||||||
| End of period | $ | 1,444,682,912 | $ | 1,461,800,008 | $ | 118,453,089 | $ | 135,317,655 | $ | 2,806,545,507 | $ | 2,856,037,097 | ||||||||||||
Undistributed Net Investment Income (Loss) | $ | 8,442,711 | $ | 216,962 | $ | 795,637 | $ | 17,514 | $ | (3,325,838 | ) | $ | (3,485,015 | ) | ||||||||||
| THE ACCOMPANYING NOTES ARE AN INTEGRAL PART OF THESE FINANCIAL STATEMENTS | The Royce Funds 2016 Semiannual Report to Shareholders | 93 |
| Statements of Operations |
| Royce Global | ||||||||||||||||
| Royce Dividend | Financial | Royce Heritage | Royce International | |||||||||||||
| Value Fund | Services Fund | Fund | Micro-Cap Fund | |||||||||||||
| INVESTMENT INCOME: | ||||||||||||||||
| INCOME: | ||||||||||||||||
| Dividends | $ | 3,906,370 | $ | 747,157 | $ | 1,470,369 | $ | 82,551 | ||||||||
| Foreign withholding tax | (117,013 | ) | (28,160 | ) | (13,278 | ) | (6,406 | ) | ||||||||
| Interest | 22,409 | 152 | 3,998 | 40 | ||||||||||||
| Securities lending | 6,041 | – | 6,236 | – | ||||||||||||
| Total income | 3,817,807 | 719,149 | 1,467,325 | 76,185 | ||||||||||||
| EXPENSES: | ||||||||||||||||
| Investment advisory fees | 1,208,829 | 243,732 | 1,059,306 | 36,761 | ||||||||||||
| Distribution fees | 190,883 | 55,312 | 209,081 | 7,352 | ||||||||||||
| Shareholder servicing | 194,023 | 41,866 | 81,461 | 6,353 | ||||||||||||
| Shareholder reports | 67,075 | 17,521 | 31,643 | 1,155 | ||||||||||||
| Custody | 41,650 | 16,451 | 30,129 | 19,858 | ||||||||||||
| Administrative and office facilities | 35,765 | 5,520 | 27,450 | 671 | ||||||||||||
| Registration | 29,770 | 20,509 | 29,962 | 9,400 | ||||||||||||
| Audit | 20,550 | 15,035 | 18,892 | 14,253 | ||||||||||||
| Trustees’ fees | 14,601 | 2,379 | 11,761 | 289 | ||||||||||||
| Legal | 2,732 | 750 | 2,199 | 55 | ||||||||||||
| Other expenses | 10,203 | 1,629 | 8,216 | 434 | ||||||||||||
| Total expenses | 1,816,081 | 420,704 | 1,510,100 | 96,581 | ||||||||||||
| Compensating balance credits | (493 | ) | (15 | ) | (103 | ) | (3 | ) | ||||||||
| Fees waived by investment adviser and distributor | (73,626 | ) | (39,025 | ) | (63,552 | ) | (39,114 | ) | ||||||||
| Expenses reimbursed by investment adviser | (37,814 | ) | (28,638 | ) | (24,161 | ) | (9,234 | ) | ||||||||
| Net expenses | 1,704,148 | 353,026 | 1,422,284 | 48,230 | ||||||||||||
| Net investment income (loss) | 2,113,659 | 366,123 | 45,041 | 27,955 | ||||||||||||
REALIZED AND UNREALIZED GAIN (LOSS) ON INVESTMENTS | ||||||||||||||||
| NET REALIZED GAIN (LOSS): | ||||||||||||||||
| Investments | 13,042,060 | (213,367 | ) | (124,083 | ) | (62,287 | ) | |||||||||
| Foreign currency transactions | 53,655 | 3,515 | (10,098 | ) | 3,659 | |||||||||||
NET CHANGE IN UNREALIZED APPRECIATION | ||||||||||||||||
| Investments and foreign currency translations | (5,737,990 | ) | 136,114 | 11,706,870 | 55,111 | |||||||||||
| Other assets and liabilities denominated in foreign currency | 2,269 | 369 | 4,814 | (8,507 | ) | |||||||||||
Net realized and unrealized gain (loss) on investments and | 7,359,994 | (73,369 | ) | 11,577,503 | (12,024 | ) | ||||||||||
NET INCREASE (DECREASE) IN NET ASSETS FROM | $ | 9,473,653 | $ | 292,754 | $ | 11,622,544 | $ | 15,931 | ||||||||
| 94 | The Royce Funds 2016 Semiannual Report to Shareholders | THE ACCOMPANYING NOTES ARE AN INTEGRAL PART OF THESE FINANCIAL STATEMENTS |
| Six Months Ended June 30, 2016 (unaudited) |
| Royce International | Royce International | Royce Low-Priced | Royce Micro-Cap | |||||||||||||
| Premier Fund | Small-Cap Fund | Stock Fund | Fund | |||||||||||||
| INVESTMENT INCOME: | ||||||||||||||||
| INCOME: | ||||||||||||||||
| Dividends | $ | 900,948 | $ | 218,781 | $ | 3,035,152 | $ | 1,746,597 | ||||||||
| Foreign withholding tax | (65,370 | ) | (17,015 | ) | (34,028 | ) | (14,130 | ) | ||||||||
| Interest | 240 | 113 | 24,365 | 1,910 | ||||||||||||
| Securities lending | – | – | 110,568 | 105,638 | ||||||||||||
| Total income | 835,818 | 201,879 | 3,136,057 | 1,840,015 | ||||||||||||
| EXPENSES: | ||||||||||||||||
| Investment advisory fees | 280,203 | 84,611 | 1,658,089 | 1,516,754 | ||||||||||||
| Distribution fees | 63,653 | 18,247 | 355,711 | 202,759 | ||||||||||||
| Shareholder servicing | 34,574 | 19,562 | 266,037 | 152,815 | ||||||||||||
| Shareholder reports | 26,178 | 3,749 | 76,403 | 79,948 | ||||||||||||
| Custody | 27,591 | 25,080 | 27,274 | 29,426 | ||||||||||||
| Administrative and office facilities | 7,578 | 2,332 | 46,138 | 33,849 | ||||||||||||
| Registration | 18,046 | 19,942 | 30,221 | 21,725 | ||||||||||||
| Audit | 16,900 | 18,801 | 18,547 | 25,046 | ||||||||||||
| Trustees’ fees | 3,450 | 975 | 18,670 | 14,047 | ||||||||||||
| Legal | 612 | 185 | 3,537 | 2,641 | ||||||||||||
| Other expenses | 2,435 | 1,474 | 14,345 | 9,598 | ||||||||||||
| Total expenses | 481,220 | 194,958 | 2,514,972 | 2,088,608 | ||||||||||||
| Compensating balance credits | (165 | ) | (8 | ) | (224 | ) | (141 | ) | ||||||||
| Fees waived by investment adviser and distributor | (9,586 | ) | (34,668 | ) | (28,116 | ) | – | |||||||||
| Expenses reimbursed by investment adviser | (74,366 | ) | (41,329 | ) | (76,883 | ) | (72,520 | ) | ||||||||
| Net expenses | 397,103 | 118,953 | 2,409,749 | 2,015,947 | ||||||||||||
| Net investment income (loss) | 438,715 | 82,926 | 726,308 | (175,932 | ) | |||||||||||
REALIZED AND UNREALIZED GAIN (LOSS) ON INVESTMENTS AND FOREIGN CURRENCY: | ||||||||||||||||
| NET REALIZED GAIN (LOSS): | ||||||||||||||||
| Investments | 732,514 | (1,094,290 | ) | 19,730,134 | 14,667,334 | |||||||||||
| Foreign currency transactions | 8,272 | 29,381 | (28,661 | ) | (13,235 | ) | ||||||||||
NET CHANGE IN UNREALIZED APPRECIATION (DEPRECIATION): | ||||||||||||||||
| Investments and foreign currency translations | 5,270,262 | 637,038 | (32,073,307 | ) | (19,011,337 | ) | ||||||||||
| Other assets and liabilities denominated in foreign currency | (68,087 | ) | 608 | 604 | 3,384 | |||||||||||
Net realized and unrealized gain (loss) on investments and foreign currency | 5,942,961 | (427,263 | ) | (12,371,230 | ) | (4,353,854 | ) | |||||||||
NET INCREASE (DECREASE) IN NET ASSETS FROM INVESTMENT OPERATIONS | $ | 6,381,676 | $ | (344,337 | ) | $ | (11,644,922 | ) | $ | (4,529,786 | ) | |||||
| THE ACCOMPANYING NOTES ARE AN INTEGRAL PART OF THESE FINANCIAL STATEMENTS | The Royce Funds 2016 Semiannual Report to Shareholders | 95 |
| Statements of Operations |
| Royce | ||||||||||||||||
| Royce Micro-Cap | Royce Opportunity | Pennsylvania | Royce Premier | |||||||||||||
| Opportunity Fund | Fund | Mutual Fund | Fund | |||||||||||||
| INVESTMENT INCOME: | ||||||||||||||||
| INCOME: | ||||||||||||||||
| Dividends | ||||||||||||||||
Non-Affiliated Companies | $ | 118,343 | $ | 6,402,669 | $ | 19,641,531 | $ | 17,435,986 | ||||||||
Affiliated Companies | – | – | 181,227 | 1,176,378 | ||||||||||||
| Foreign withholding tax | – | (1,487 | ) | (414,073 | ) | (573,136 | ) | |||||||||
| Interest | 367 | 38,393 | 74,566 | 31,334 | ||||||||||||
| Securities lending | – | 812,030 | 192,905 | 883,139 | ||||||||||||
| Total income | 118,710 | 7,251,605 | 19,676,156 | 18,953,701 | ||||||||||||
| EXPENSES: | ||||||||||||||||
| Investment advisory fees | 180,334 | 7,007,979 | 10,179,936 | 11,468,532 | ||||||||||||
| Distribution fees | 1,228 | 291,269 | 2,106,488 | 256,552 | ||||||||||||
| Shareholder servicing | 20,242 | 559,139 | 1,259,764 | 1,157,462 | ||||||||||||
| Shareholder reports | 1,337 | 129,120 | 356,185 | 429,521 | ||||||||||||
| Custody | 9,671 | 74,997 | �� | 142,577 | 118,963 | |||||||||||
| Administrative and office facilities | 3,400 | 175,671 | 376,111 | 345,306 | ||||||||||||
| Registration | 14,845 | 44,788 | 57,661 | 53,035 | ||||||||||||
| Audit | 12,999 | 18,841 | 24,885 | 23,273 | ||||||||||||
| Trustees’ fees | 1,495 | 74,874 | 153,707 | 139,309 | ||||||||||||
| Legal | 282 | 13,854 | 28,596 | 26,248 | ||||||||||||
| Other expenses | 1,100 | 43,367 | 99,139 | 93,199 | ||||||||||||
| Total expenses | 246,933 | 8,433,899 | 14,785,049 | 14,111,400 | ||||||||||||
| Compensating balance credits | (8 | ) | (234 | ) | (1,169 | ) | (805 | ) | ||||||||
| Expenses reimbursed by investment adviser | (22,083 | ) | (31,670 | ) | – | (30,007 | ) | |||||||||
| Net expenses | 224,842 | 8,401,995 | 14,783,880 | 14,080,588 | ||||||||||||
| Net investment income (loss) | (106,132 | ) | (1,150,390 | ) | 4,892,276 | 4,873,113 | ||||||||||
REALIZED AND UNREALIZED GAIN (LOSS) ON INVESTMENTS | ||||||||||||||||
| NET REALIZED GAIN (LOSS): | ||||||||||||||||
| Investments in Non-Affiliated Companies | (1,320,313 | ) | 47,315,951 | 113,850,623 | 153,806,640 | |||||||||||
| Investments in Affiliated Companies | – | (7,982,440 | ) | (832,843 | ) | (11,068,640 | ) | |||||||||
| Foreign currency transactions | – | – | (22,154 | ) | 107,404 | |||||||||||
NET CHANGE IN UNREALIZED APPRECIATION | ||||||||||||||||
| Investments and foreign currency translations | 2,922,714 | 3,040,345 | 65,731,112 | (18,296,050 | ) | |||||||||||
| Other assets and liabilities denominated in foreign currency | – | – | (42,123 | ) | 47,873 | |||||||||||
Net realized and unrealized gain (loss) on investments and | 1,602,401 | 42,373,856 | 178,684,615 | 124,597,227 | ||||||||||||
NET INCREASE (DECREASE) IN NET ASSETS FROM | $ | 1,496,269 | $ | 41,223,466 | $ | 183,576,891 | $ | 129,470,340 | ||||||||
| 96 | The Royce Funds 2016 Semiannual Report to Shareholders | THE ACCOMPANYING NOTES ARE AN INTEGRAL PART OF THESE FINANCIAL STATEMENTS |
| Six Months Ended June 30, 2016 (unaudited) |
| Royce Smaller- | ||||||||||||||||
| Royce Small-Cap | Royce Small-Cap | Companies Growth | Royce Special | |||||||||||||
| Leaders Fund | Value Fund | Fund | Equity Fund | |||||||||||||
| INVESTMENT INCOME: | ||||||||||||||||
| INCOME: | ||||||||||||||||
| Dividends | ||||||||||||||||
Non-Affiliated Companies | $ | 1,076,352 | $ | 4,822,413 | $ | 1,853,761 | $ | 8,293,969 | ||||||||
Affiliated Companies | – | – | – | 8,200,878 | ||||||||||||
| Foreign withholding tax | (28,754 | ) | (64,773 | ) | (40,116 | ) | – | |||||||||
| Interest | 742 | 3,723 | 4,743 | 15,645 | ||||||||||||
| Securities lending | 4,073 | 2,905 | 306,216 | 360,616 | ||||||||||||
| Total income | 1,052,413 | 4,764,268 | 2,124,604 | 16,871,108 | ||||||||||||
| EXPENSES: | ||||||||||||||||
| Investment advisory fees | 501,042 | 2,481,790 | 2,538,692 | 7,096,263 | ||||||||||||
| Distribution fees | 69,260 | 423,391 | 498,773 | 338,751 | ||||||||||||
| Shareholder servicing | 78,101 | 298,103 | 399,992 | 673,440 | ||||||||||||
| Shareholder reports | 35,527 | 69,082 | 109,453 | 157,342 | ||||||||||||
| Custody | 12,468 | 30,564 | 36,927 | 63,615 | ||||||||||||
| Administrative and office facilities | 14,564 | 65,662 | 69,677 | 193,626 | ||||||||||||
| Registration | 25,165 | 38,229 | 38,149 | 43,143 | ||||||||||||
| Audit | 14,087 | 16,988 | 17,032 | 18,606 | ||||||||||||
| Trustees’ fees | 5,926 | 27,272 | 29,264 | 79,418 | ||||||||||||
| Legal | 1,108 | 5,027 | 5,498 | 14,755 | ||||||||||||
| Other expenses | 3,562 | 17,264 | 18,886 | 49,926 | ||||||||||||
| Total expenses | 760,810 | 3,473,372 | 3,762,343 | 8,728,885 | ||||||||||||
| Compensating balance credits | (90 | ) | (228 | ) | (185 | ) | (512 | ) | ||||||||
| Fees waived by distributor | (5,214 | ) | – | (34,705 | ) | – | ||||||||||
| Expenses reimbursed by investment adviser | (64,050 | ) | (63,175 | ) | (93,721 | ) | (83,015 | ) | ||||||||
| Net expenses | 691,456 | 3,409,969 | 3,633,732 | 8,645,358 | ||||||||||||
| Net investment income (loss) | 360,957 | 1,354,299 | (1,509,128 | ) | 8,225,750 | |||||||||||
REALIZED AND UNREALIZED GAIN (LOSS) ON INVESTMENTS | ||||||||||||||||
| NET REALIZED GAIN (LOSS): | ||||||||||||||||
| Investments in Non-Affiliated Companies | 6,615,084 | 12,439,041 | 27,556,828 | 765,182 | ||||||||||||
| Investments in Affiliated Companies | – | – | – | 28,599,933 | ||||||||||||
| Foreign currency transactions | 643 | (8,815 | ) | 10,593 | – | |||||||||||
NET CHANGE IN UNREALIZED APPRECIATION | ||||||||||||||||
| Investments and foreign currency translations | (1,271,693 | ) | 3,292,408 | (51,354,407 | ) | 76,433,748 | ||||||||||
| Other assets and liabilities denominated in foreign currency | (1,108 | ) | 1,045 | 270 | – | |||||||||||
Net realized and unrealized gain (loss) on investments and | 5,342,926 | 15,723,679 | (23,786,716 | ) | 105,798,863 | |||||||||||
NET INCREASE (DECREASE) IN NET ASSETS FROM | $ | 5,703,883 | $ | 17,077,978 | $ | (25,295,844 | ) | $ | 114,024,613 | |||||||
| THE ACCOMPANYING NOTES ARE AN INTEGRAL PART OF THESE FINANCIAL STATEMENTS | The Royce Funds 2016 Semiannual Report to Shareholders | 97 |
| Statements of Operations | Six Months Ended June 30, 2016 (unaudited) |
| Royce Special | ||||||||
| Equity Multi-Cap | Royce Total Return | |||||||
| Fund | Fund | |||||||
| INVESTMENT INCOME: | ||||||||
| INCOME: | ||||||||
| Dividends | ||||||||
Non-Affiliated Companies | $ | 1,472,035 | $ | 30,850,839 | ||||
Affiliated Companies | – | 385,295 | ||||||
| Foreign withholding tax | – | (601,612 | ) | |||||
| Interest | 1,380 | 227,837 | ||||||
| Securities lending | – | 34,371 | ||||||
| Total income | 1,473,415 | 30,896,730 | ||||||
| EXPENSES: | ||||||||
| Investment advisory fees | 538,953 | 13,474,338 | ||||||
| Distribution fees | 78,452 | 1,616,145 | ||||||
| Shareholder servicing | 56,075 | 1,503,428 | ||||||
| Shareholder reports | 9,637 | 344,445 | ||||||
| Custody | 10,441 | 152,281 | ||||||
| Administrative and office facilities | 19,685 | 346,609 | ||||||
| Registration | 27,876 | 64,075 | ||||||
| Audit | 13,165 | 24,259 | ||||||
| Trustees’ fees | 8,013 | 147,123 | ||||||
| Legal | 1,474 | 27,387 | ||||||
| Other expenses | 6,362 | 86,211 | ||||||
| Total expenses | 770,133 | 17,786,301 | ||||||
| Compensating balance credits | (28 | ) | (473 | ) | ||||
| Fees waived by investment adviser and distributor | (42,414 | ) | – | |||||
| Expenses reimbursed by investment adviser | (32,398 | ) | (1,750 | ) | ||||
| Net expenses | 695,293 | 17,784,078 | ||||||
| Net investment income (loss) | 778,122 | 13,112,652 | ||||||
| REALIZED AND UNREALIZED GAIN (LOSS) ON INVESTMENTS AND FOREIGN CURRENCY: | ||||||||
| NET REALIZED GAIN (LOSS): | ||||||||
| Investments in Non-Affiliated Companies | 2,297,070 | 115,203,691 | ||||||
| Investments in Affiliated Companies | – | 9,369,869 | ||||||
| Foreign currency transactions | – | (20,237 | ) | |||||
NET CHANGE IN UNREALIZED APPRECIATION (DEPRECIATION): | ||||||||
| Investments and foreign currency translations | (3,575,885 | ) | 81,805,116 | |||||
| Other assets and liabilities denominated in foreign currency | – | 8,547 | ||||||
| Net realized and unrealized gain (loss) on investments and foreign currency | (1,278,815 | ) | 206,366,986 | |||||
| NET INCREASE (DECREASE) IN NET ASSETS FROM INVESTMENT OPERATIONS | $ | (500,693 | ) | $ | 219,479,638 | |||
| 98 | The Royce Funds 2016 Semiannual Report to Shareholders | THE ACCOMPANYING NOTES ARE AN INTEGRAL PART OF THESE FINANCIAL STATEMENTS |
Financial Highlights
This table is presented to show selected data for a share outstanding throughout each period and to assist shareholders in evaluating a Fund’s performance for the periods presented. Per share amounts have been determined on the basis of the weighted average number of shares outstanding during the period.
| Ratio of Expenses to Average Net Assets | Ratio of Net | |||||||||||||||||||||||||||||||||||||||||||||||||||||||||||||||||||
| Net Asset | Net Realized and | Distributions | Distributions from | Prior to Fee | Investment | |||||||||||||||||||||||||||||||||||||||||||||||||||||||||||||||
| Value, | Unrealized Gain (Loss) | Total from | from Net | Net Realized Gain | Distributions | Shareholder | Net Asset | Net Assets, | Waivers and | Income (Loss) to | ||||||||||||||||||||||||||||||||||||||||||||||||||||||||||
| Beginning of | Net Investment | on Investments and | Investment | Investment | on Investments and | from Return of | Total | Redemption | Value, End of | End of Period | Balance | Prior to Fee | Net of Fee | Average Net | Portfolio | |||||||||||||||||||||||||||||||||||||||||||||||||||||
| Period | Income (Loss) | Foreign Currency | Operations | Income | Foreign Currency | Capital | Distributions | Fees | Period | Total Return | (in thousands) | Credits | Waivers | Waivers | Assets | Turnover Rate | ||||||||||||||||||||||||||||||||||||||||||||||||||||
| Royce Dividend Value Fund–Investment Class | ||||||||||||||||||||||||||||||||||||||||||||||||||||||||||||||||||||
| 2016† | $ | 6.84 | $ | 0.06 | $ | 0.25 | $ | 0.31 | $ | (0.06 | ) | $ | – | $ | – | $ | (0.06 | ) | $ | – | $ | 7.09 | 4.54 | %1 | $ | 104,422 | 1.25 | %2 | 1.25 | %2 | 1.19 | %2 | 1.82 | %2 | 16 | % | ||||||||||||||||||||||||||||||||
| 2015 | 8.12 | 0.12 | (0.57 | ) | (0.45 | ) | (0.13 | ) | (0.70 | ) | – | (0.83 | ) | – | 6.84 | (5.54 | ) | 116,053 | 1.24 | 1.24 | 1.22 | 1.49 | 14 | |||||||||||||||||||||||||||||||||||||||||||||
| 2014 | 8.90 | 0.11 | (0.29 | ) | (0.18 | ) | (0.10 | ) | (0.50 | ) | – | (0.60 | ) | – | 8.12 | (1.90 | ) | 176,002 | 1.21 | 1.21 | 1.19 | 1.25 | 22 | |||||||||||||||||||||||||||||||||||||||||||||
| 2013 | 7.29 | 0.09 | 2.15 | 2.24 | (0.10 | ) | (0.53 | ) | – | (0.63 | ) | – | 8.90 | 31.23 | 211,589 | 1.21 | 1.21 | 1.21 | 1.13 | 36 | ||||||||||||||||||||||||||||||||||||||||||||||||
| 2012 | 6.34 | 0.14 | 0.95 | 1.09 | (0.12 | ) | (0.02 | ) | – | (0.14 | ) | – | 7.29 | 17.26 | 118,820 | 1.19 | 1.19 | 1.19 | 1.99 | 28 | ||||||||||||||||||||||||||||||||||||||||||||||||
| 2011 | 6.80 | 0.07 | (0.37 | ) | (0.30 | ) | (0.07 | ) | (0.09 | ) | – | (0.16 | ) | – | 6.34 | (4.46 | ) | 85,188 | 1.20 | 1.20 | 1.20 | 1.14 | 14 | |||||||||||||||||||||||||||||||||||||||||||||
| Royce Dividend Value Fund–Service Class | ||||||||||||||||||||||||||||||||||||||||||||||||||||||||||||||||||||
| 2016† | $ | 6.96 | $ | 0.06 | $ | 0.25 | $ | 0.31 | $ | (0.06 | ) | $ | – | $ | – | $ | (0.06 | ) | $ | – | $ | 7.21 | 4.39 | %1 | $ | 137,431 | 1.53 | %2 | 1.53 | %2 | 1.44 | %2 | 1.56 | %2 | 16 | % | ||||||||||||||||||||||||||||||||
| 2015 | 8.22 | 0.10 | (0.57 | ) | (0.47 | ) | (0.09 | ) | (0.70 | ) | – | (0.79 | ) | – | 6.96 | (5.72 | ) | 167,165 | 1.49 | 1.49 | 1.47 | 1.25 | 14 | |||||||||||||||||||||||||||||||||||||||||||||
| 2014 | 8.98 | 0.09 | (0.29 | ) | (0.20 | ) | (0.06 | ) | (0.50 | ) | – | (0.56 | ) | – | 8.22 | (2.14 | ) | 295,560 | 1.47 | 1.47 | 1.44 | 0.98 | 22 | |||||||||||||||||||||||||||||||||||||||||||||
| 2013 | 7.35 | 0.07 | 2.16 | 2.23 | (0.07 | ) | (0.53 | ) | – | (0.60 | ) | – | 8.98 | 30.74 | 407,599 | 1.48 | 1.48 | 1.46 | 0.87 | 36 | ||||||||||||||||||||||||||||||||||||||||||||||||
| 2012 | 6.38 | 0.12 | 0.95 | 1.07 | (0.08 | ) | (0.02 | ) | – | (0.10 | ) | – | 7.35 | 16.95 | 252,443 | 1.48 | 1.48 | 1.46 | 1.74 | 28 | ||||||||||||||||||||||||||||||||||||||||||||||||
| 2011 | 6.82 | 0.05 | (0.36 | ) | (0.31 | ) | (0.04 | ) | (0.09 | ) | – | (0.13 | ) | – | 6.38 | (4.55 | ) | 201,634 | 1.48 | 1.48 | 1.46 | 0.84 | 14 | |||||||||||||||||||||||||||||||||||||||||||||
| Royce Dividend Value Fund–Consultant Class a | ||||||||||||||||||||||||||||||||||||||||||||||||||||||||||||||||||||
| 2016† | $ | 7.90 | $ | 0.03 | $ | 0.28 | $ | 0.31 | $ | (0.03 | ) | $ | – | $ | – | $ | (0.03 | ) | $ | – | $ | 8.18 | 3.92 | %1 | $ | 1,402 | 3.38 | %2 | 3.38 | %2 | 2.19 | %2 | 0.78 | %2 | 16 | % | ||||||||||||||||||||||||||||||||
| 2015 | 9.22 | 0.04 | (0.63 | ) | (0.59 | ) | (0.03 | ) | (0.70 | ) | – | (0.73 | ) | – | 7.90 | (6.39 | ) | 1,886 | 3.78 | 3.78 | 2.24 | 0.46 | 14 | |||||||||||||||||||||||||||||||||||||||||||||
| 2014 | 10.00 | 0.01 | (0.27 | ) | (0.26 | ) | (0.02 | ) | (0.50 | ) | – | (0.52 | ) | – | 9.22 | (2.43 | )1 | 912 | 9.25 | 2 | 9.25 | 2 | 2.24 | 2 | 0.45 | 2 | 22 | |||||||||||||||||||||||||||||||||||||||||
| Royce Dividend Value Fund–Institutional Class b | ||||||||||||||||||||||||||||||||||||||||||||||||||||||||||||||||||||
| 2016† | $ | 6.78 | $ | 0.07 | $ | 0.24 | $ | 0.31 | $ | (0.07 | ) | $ | – | $ | – | $ | (0.07 | ) | $ | – | $ | 7.02 | 4.51 | %1 | $ | 711 | 3.58 | %2 | 3.58 | %2 | 0.99 | %2 | 2.05 | %2 | 16 | % | ||||||||||||||||||||||||||||||||
| 2015 | 8.09 | 0.17 | (0.62 | ) | (0.45 | ) | (0.16 | ) | (0.70 | ) | – | (0.86 | ) | – | 6.78 | (5.61 | ) | 658 | 1.11 | 1.11 | 1.04 | 1.60 | 14 | |||||||||||||||||||||||||||||||||||||||||||||
| 2014 | 8.88 | 0.12 | (0.29 | ) | (0.17 | ) | (0.12 | ) | (0.50 | ) | – | (0.62 | ) | – | 8.09 | (1.76 | ) | 40,942 | 1.10 | 1.10 | 1.04 | 1.42 | 22 | |||||||||||||||||||||||||||||||||||||||||||||
| 2013 | 7.28 | 0.11 | 2.14 | 2.25 | (0.12 | ) | (0.53 | ) | – | (0.65 | ) | – | 8.88 | 31.46 | 31,236 | 1.11 | 1.11 | 1.04 | 1.29 | 36 | ||||||||||||||||||||||||||||||||||||||||||||||||
| 2012 | 6.80 | 0.08 | 0.50 | 0.58 | (0.08 | ) | (0.02 | ) | – | (0.10 | ) | – | 7.28 | 8.51 | 1 | 23,460 | 1.33 | 2 | 1.33 | 2 | 1.04 | 2 | 3.48 | 2 | 28 | |||||||||||||||||||||||||||||||||||||||||||
| Royce Global Financial Services Fund–Service Class | ||||||||||||||||||||||||||||||||||||||||||||||||||||||||||||||||||||
| 2016† | $ | 7.99 | $ | 0.06 | $ | (0.02 | ) | $ | 0.04 | $ | – | $ | – | $ | – | $ | – | $ | – | $ | 8.03 | 0.50 | %1 | $ | 41,071 | 1.72 | %2 | 1.72 | %2 | 1.49 | %2 | 1.43 | %2 | 22 | % | |||||||||||||||||||||||||||||||||
| 2015 | 9.28 | 0.11 | (0.55 | ) | (0.44 | ) | (0.11 | ) | (0.74 | ) | – | (0.85 | ) | – | 7.99 | (4.71 | ) | 52,013 | 1.65 | 1.65 | 1.49 | 1.19 | 46 | |||||||||||||||||||||||||||||||||||||||||||||
| 2014 | 9.68 | 0.09 | 0.22 | 0.31 | (0.06 | ) | (0.65 | ) | – | (0.71 | ) | – | 9.28 | 3.45 | 53,707 | 1.68 | 1.68 | 1.49 | 0.91 | 41 | ||||||||||||||||||||||||||||||||||||||||||||||||
| 2013 | 6.83 | 0.04 | 2.82 | 2.86 | (0.02 | ) | – | – | (0.02 | ) | 0.01 | 9.68 | 42.00 | 47,593 | 1.89 | 1.89 | 1.49 | 0.59 | 23 | |||||||||||||||||||||||||||||||||||||||||||||||||
| 2012 | 5.71 | 0.10 | 1.08 | 1.18 | (0.06 | ) | – | – | (0.06 | ) | – | 6.83 | 20.72 | 16,888 | 1.87 | 1.87 | 1.49 | 1.53 | 26 | |||||||||||||||||||||||||||||||||||||||||||||||||
| 2011 | 6.50 | 0.05 | (0.78 | ) | (0.73 | ) | (0.06 | ) | – | – | (0.06 | ) | – | 5.71 | (11.29 | ) | 14,096 | 1.84 | 1.84 | 1.49 | 0.73 | 23 | ||||||||||||||||||||||||||||||||||||||||||||||
| Royce Global Financial Services Fund–Institutional Class c | ||||||||||||||||||||||||||||||||||||||||||||||||||||||||||||||||||||
| 2016† | $ | 10.00 | $ | 0.11 | $ | 0.14 | $ | 0.25 | $ | – | $ | – | $ | – | $ | – | $ | – | $ | 10.25 | 2.50 | %1 | $ | 5,748 | 1.77 | %2 | 1.77 | %2 | 1.04 | %2 | 2.24 | %2 | 22 | % | ||||||||||||||||||||||||||||||||||
| THE ACCOMPANYING NOTES ARE AN INTEGRAL PART OF THESE FINANCIAL STATEMENTS | The Royce Funds 2016 Semiannual Report to Shareholders | 99 |
Financial Highlights
This table is presented to show selected data for a share outstanding throughout each period and to assist shareholders in evaluating a Fund’s performance for the periods presented. Per share amounts have been determined on the basis of the weighted average number of shares outstanding during the period.
| Ratio of Expenses to Average Net Assets | Ratio of Net | |||||||||||||||||||||||||||||||||||||||||||||||||||||||||||||||||||
| Net Asset | Net Realized and | Distributions | Distributions from | Prior to Fee | Investment | |||||||||||||||||||||||||||||||||||||||||||||||||||||||||||||||
| Value, | Unrealized Gain (Loss) | Total from | from Net | Net Realized Gain | Distributions | Shareholder | Net Asset | Net Assets, | Waivers and | Income (Loss) to | ||||||||||||||||||||||||||||||||||||||||||||||||||||||||||
| Beginning of | Net Investment | on Investments and | Investment | Investment | on Investments and | from Return of | Total | Redemption | Value, End of | End of Period | Balance | Prior to Fee | Net of Fee | Average Net | Portfolio | |||||||||||||||||||||||||||||||||||||||||||||||||||||
| Period | Income (Loss) | Foreign Currency | Operations | Income | Foreign Currency | Capital | Distributions | Fees | Period | Total Return | (in thousands) | Credits | Waivers | Waivers | Assets | Turnover Rate | ||||||||||||||||||||||||||||||||||||||||||||||||||||
| Royce Heritage Fund–Investment Class | ||||||||||||||||||||||||||||||||||||||||||||||||||||||||||||||||||||
| 2016† | $ | 12.87 | $ | 0.02 | $ | 0.68 | $ | 0.70 | $ | – | $ | – | $ | – | $ | – | $ | – | $ | 13.57 | 5.44 | %1 | $ | 95,369 | 1.08 | %2 | 1.08 | %2 | 1.08 | %2 | 0.24 | %2 | 42 | % | ||||||||||||||||||||||||||||||||||
| 2015 | 15.21 | 0.12 | (1.09 | ) | (0.97 | ) | (0.11 | ) | (1.26 | ) | – | (1.37 | ) | – | 12.87 | (6.33 | ) | 89,766 | 1.10 | 1.10 | 1.10 | 0.54 | 66 | |||||||||||||||||||||||||||||||||||||||||||||
| 2014 | 16.24 | 0.10 | (0.25 | ) | (0.15 | ) | (0.05 | ) | (0.83 | ) | – | (0.88 | ) | – | 15.21 | (0.81 | ) | 160,558 | 1.09 | 1.09 | 1.09 | 0.66 | 35 | |||||||||||||||||||||||||||||||||||||||||||||
| 2013 | 14.48 | 0.03 | 3.71 | 3.74 | (0.05 | ) | (1.93 | ) | – | (1.98 | ) | – | 16.24 | 26.37 | 117,306 | 1.13 | 1.13 | 1.13 | 0.36 | 79 | ||||||||||||||||||||||||||||||||||||||||||||||||
| 2012 | 13.07 | 0.10 | 1.80 | 1.90 | (0.13 | ) | (0.36 | ) | – | (0.49 | ) | – | 14.48 | 14.70 | 40,374 | 1.20 | 1.20 | 1.20 | 0.94 | 39 | ||||||||||||||||||||||||||||||||||||||||||||||||
| 2011 | 15.10 | 0.01 | (1.41 | ) | (1.40 | ) | (0.05 | ) | (0.59 | ) | – | (0.64 | ) | 0.01 | 13.07 | (9.16 | ) | 21,088 | 1.22 | 1.22 | 1.22 | 0.15 | 51 | |||||||||||||||||||||||||||||||||||||||||||||
| Royce Heritage Fund–Service Class | ||||||||||||||||||||||||||||||||||||||||||||||||||||||||||||||||||||
| 2016† | $ | 12.84 | $ | (0.00 | ) | $ | 0.68 | $ | 0.68 | $ | – | $ | – | $ | – | $ | – | $ | – | $ | 13.52 | 5.30 | %1 | $ | 117,468 | 1.43 | %2 | 1.43 | %2 | 1.32 | %2 | (0.01 | )%2 | 42 | % | |||||||||||||||||||||||||||||||||
| 2015 | 15.17 | 0.05 | (1.05 | ) | (1.00 | ) | (0.07 | ) | (1.26 | ) | – | (1.33 | ) | – | 12.84 | (6.53 | ) | 120,381 | 1.46 | 1.46 | 1.35 | 0.31 | 66 | |||||||||||||||||||||||||||||||||||||||||||||
| 2014 | 16.20 | 0.05 | (0.25 | ) | (0.20 | ) | – | (0.83 | ) | – | (0.83 | ) | – | 15.17 | (1.14 | ) | 175,433 | 1.43 | 1.43 | 1.40 | 0.32 | 35 | ||||||||||||||||||||||||||||||||||||||||||||||
| 2013 | 14.45 | 0.00 | 3.68 | 3.68 | (0.00 | ) | (1.93 | ) | – | (1.93 | ) | – | 16.20 | 25.99 | 223,533 | 1.45 | 1.45 | 1.42 | 0.02 | 79 | ||||||||||||||||||||||||||||||||||||||||||||||||
| 2012 | 13.00 | 0.08 | 1.78 | 1.86 | (0.05 | ) | (0.36 | ) | – | (0.41 | ) | – | 14.45 | 14.39 | 203,112 | 1.46 | 1.46 | 1.45 | 0.56 | 39 | ||||||||||||||||||||||||||||||||||||||||||||||||
| 2011 | 15.03 | (0.01 | ) | (1.40 | ) | (1.41 | ) | (0.03 | ) | (0.59 | ) | – | (0.62 | ) | – | 13.00 | (9.39 | ) | 218,770 | 1.47 | 1.47 | 1.44 | (0.07 | ) | 51 | |||||||||||||||||||||||||||||||||||||||||||
| Royce Heritage Fund–Consultant Class | ||||||||||||||||||||||||||||||||||||||||||||||||||||||||||||||||||||
| 2016† | $ | 9.37 | $ | (0.04 | ) | $ | 0.49 | $ | 0.45 | $ | – | $ | – | $ | – | $ | – | $ | – | $ | 9.82 | 4.80 | %1 | $ | 10,784 | 2.38 | %2 | 2.38 | %2 | 2.19 | %2 | (0.88 | )%2 | 42 | % | |||||||||||||||||||||||||||||||||
| 2015 | 11.47 | (0.06 | ) | (0.78 | ) | (0.84 | ) | – | (1.26 | ) | – | (1.26 | ) | – | 9.37 | (7.31 | ) | 11,369 | 2.41 | 2.41 | 2.24 | (0.58 | ) | 66 | ||||||||||||||||||||||||||||||||||||||||||||
| 2014 | 12.57 | (0.07 | ) | (0.20 | ) | (0.27 | ) | – | (0.83 | ) | – | (0.83 | ) | – | 11.47 | (2.02 | ) | 13,338 | 2.31 | 2.31 | 2.31 | (0.59 | ) | 35 | ||||||||||||||||||||||||||||||||||||||||||||
| 2013 | 11.68 | (0.12 | ) | 2.94 | 2.82 | – | (1.93 | ) | – | (1.93 | ) | – | 12.57 | 24.73 | 15,942 | 2.37 | 2.37 | 2.37 | (0.93 | ) | 79 | |||||||||||||||||||||||||||||||||||||||||||||||
| 2012 | 10.64 | (0.04 | ) | 1.44 | 1.40 | – | (0.36 | ) | – | (0.36 | ) | – | 11.68 | 13.30 | 13,909 | 2.41 | 2.41 | 2.41 | (0.39 | ) | 39 | |||||||||||||||||||||||||||||||||||||||||||||||
| 2011 | 12.50 | (0.11 | ) | (1.16 | ) | (1.27 | ) | – | (0.59 | ) | – | (0.59 | ) | – | 10.64 | (10.14 | ) | 13,850 | 2.28 | 2.28 | 2.28 | (0.91 | ) | 51 | ||||||||||||||||||||||||||||||||||||||||||||
| Royce Heritage Fund–R Class | ||||||||||||||||||||||||||||||||||||||||||||||||||||||||||||||||||||
| 2016† | $ | 8.56 | $ | (0.02 | ) | $ | 0.46 | $ | 0.44 | $ | – | $ | – | $ | – | $ | – | $ | – | $ | 9.00 | 5.14 | %1 | $ | 2,141 | 2.35 | %2 | 2.35 | %2 | 1.79 | %2 | (0.49 | )%2 | 42 | % | |||||||||||||||||||||||||||||||||
| 2015 | 10.60 | (0.02 | ) | (0.73 | ) | (0.75 | ) | (0.03 | ) | (1.26 | ) | – | (1.29 | ) | – | 8.56 | (7.00 | ) | 2,339 | 2.20 | 2.20 | 1.84 | (0.19 | ) | 66 | |||||||||||||||||||||||||||||||||||||||||||
| 2014 | 11.63 | (0.02 | ) | (0.18 | ) | (0.20 | ) | – | (0.83 | ) | – | (0.83 | ) | – | 10.60 | (1.59 | ) | 3,727 | 1.89 | 1.89 | 1.84 | (0.14 | ) | 35 | ||||||||||||||||||||||||||||||||||||||||||||
| 2013 | 10.86 | (0.05 | ) | 2.75 | 2.70 | – | (1.93 | ) | – | (1.93 | ) | – | 11.63 | 25.51 | 6,805 | 1.90 | 1.90 | 1.84 | (0.39 | ) | 79 | |||||||||||||||||||||||||||||||||||||||||||||||
| 2012 | 9.87 | 0.02 | 1.34 | 1.36 | (0.01 | ) | (0.36 | ) | – | (0.37 | ) | – | 10.86 | 13.88 | 4,832 | 1.95 | 1.95 | 1.84 | 0.17 | 39 | ||||||||||||||||||||||||||||||||||||||||||||||||
| 2011 | 11.63 | (0.06 | ) | (1.07 | ) | (1.13 | ) | (0.04 | ) | (0.59 | ) | – | (0.63 | ) | – | 9.87 | (9.73 | ) | 4,081 | 1.90 | 1.90 | 1.84 | (0.45 | ) | 51 | |||||||||||||||||||||||||||||||||||||||||||
| Royce Heritage Fund–K Class | ||||||||||||||||||||||||||||||||||||||||||||||||||||||||||||||||||||
| 2016† | $ | 8.66 | $ | (0.01 | ) | $ | 0.46 | $ | 0.45 | $ | – | $ | – | $ | – | $ | – | $ | – | $ | 9.11 | 5.20 | %1 | $ | 3,706 | 1.96 | %2 | 1.96 | %2 | 1.54 | %2 | (0.23 | )%2 | 42 | % | |||||||||||||||||||||||||||||||||
| 2015 | 10.70 | 0.02 | (0.74 | ) | (0.72 | ) | (0.06 | ) | (1.26 | ) | – | (1.32 | ) | – | 8.66 | (6.69 | ) | 3,916 | 1.91 | 1.91 | 1.59 | 0.06 | 66 | |||||||||||||||||||||||||||||||||||||||||||||
| 2014 | 11.70 | 0.02 | (0.19 | ) | (0.17 | ) | – | (0.83 | ) | – | (0.83 | ) | – | 10.70 | (1.32 | ) | 5,462 | 1.87 | 1.87 | 1.59 | 0.14 | 35 | ||||||||||||||||||||||||||||||||||||||||||||||
| 2013 | 10.90 | (0.02 | ) | 2.75 | 2.73 | – | (1.93 | ) | – | (1.93 | ) | – | 11.70 | 25.69 | 6,419 | 1.70 | 1.70 | 1.59 | (0.15 | ) | 79 | |||||||||||||||||||||||||||||||||||||||||||||||
| 2012 | 9.93 | 0.04 | 1.36 | 1.40 | (0.07 | ) | (0.36 | ) | – | (0.43 | ) | – | 10.90 | 14.22 | 7,077 | 1.61 | 1.61 | 1.59 | 0.42 | 39 | ||||||||||||||||||||||||||||||||||||||||||||||||
| 2011 | 11.68 | (0.04 | ) | (1.08 | ) | (1.12 | ) | (0.04 | ) | (0.59 | ) | – | (0.63 | ) | – | 9.93 | (9.53 | ) | 7,787 | 1.66 | 1.66 | 1.59 | (0.24 | ) | 51 | |||||||||||||||||||||||||||||||||||||||||||
| 100 | The Royce Funds 2016 Semiannual Report to Shareholders | THE ACCOMPANYING NOTES ARE AN INTEGRAL PART OF THESE FINANCIAL STATEMENTS |
Financial Highlights
This table is presented to show selected data for a share outstanding throughout each period and to assist shareholders in evaluating a Fund’s performance for the periods presented. Per share amounts have been determined on the basis of the weighted average number of shares outstanding during the period.
| Ratio of Expenses to Average Net Assets | Ratio of Net | |||||||||||||||||||||||||||||||||||||||||||||||||||||||||||||||||||
| Net Asset | Net Realized and | Distributions | Distributions from | Prior to Fee | Investment | |||||||||||||||||||||||||||||||||||||||||||||||||||||||||||||||
| Value, | Unrealized Gain (Loss) | Total from | from Net | Net Realized Gain | Distributions | Shareholder | Net Asset | Net Assets, | Waivers and | Income (Loss) to | ||||||||||||||||||||||||||||||||||||||||||||||||||||||||||
| Beginning of | Net Investment | on Investments and | Investment | Investment | on Investments and | from Return of | Total | Redemption | Value, End of | End of Period | Balance | Prior to Fee | Net of Fee | Average Net | Portfolio | |||||||||||||||||||||||||||||||||||||||||||||||||||||
| Period | Income (Loss) | Foreign Currency | Operations | Income | Foreign Currency | Capital | Distributions | Fees | Period | Total Return | (in thousands) | Credits | Waivers | Waivers | Assets | Turnover Rate | ||||||||||||||||||||||||||||||||||||||||||||||||||||
| Royce International Micro-Cap Fund–Service Class d | ||||||||||||||||||||||||||||||||||||||||||||||||||||||||||||||||||||
| 2016† | $ | 9.54 | $ | 0.04 | $ | (0.02 | ) | $ | 0.02 | $ | – | $ | – | $ | – | $ | – | $ | – | $ | 9.56 | 0.21 | %1 | $ | 5,802 | 3.28 | %2 | 3.28 | %2 | 1.64 | %2 | 0.95 | %2 | 53 | % | |||||||||||||||||||||||||||||||||
| 2015 | 9.66 | 0.04 | (0.14 | ) | (0.10 | ) | (0.02 | ) | – | – | (0.02 | ) | – | 9.54 | (0.99 | ) | 6,102 | 3.14 | 3.14 | 1.67 | 0.44 | 94 | ||||||||||||||||||||||||||||||||||||||||||||||
| 2014 | 10.04 | 0.06 | (0.30 | ) | (0.24 | ) | (0.14 | ) | – | – | (0.14 | ) | – | 9.66 | (2.37 | ) | 6,410 | 3.51 | 3.51 | 1.69 | 0.82 | 91 | ||||||||||||||||||||||||||||||||||||||||||||||
| 2013 | 8.61 | 0.11 | 1.51 | 1.62 | (0.20 | ) | – | – | (0.20 | ) | 0.01 | 10.04 | 18.95 | 5,209 | 3.86 | 3.86 | 1.69 | 1.22 | 103 | |||||||||||||||||||||||||||||||||||||||||||||||||
| 2012 | 7.72 | 0.13 | 0.92 | 1.05 | (0.16 | ) | – | – | (0.16 | ) | – | 8.61 | 13.59 | 4,603 | 3.90 | 3.90 | 1.69 | 1.63 | 62 | |||||||||||||||||||||||||||||||||||||||||||||||||
| 2011 | 10.00 | 0.10 | (2.26 | ) | (2.16 | ) | (0.12 | ) | – | (0.01 | ) | (0.13 | ) | 0.01 | 7.72 | (21.51 | )1 | 3,572 | 3.92 | 2 | 3.92 | 2 | 1.69 | 2 | 1.08 | 2 | 71 | |||||||||||||||||||||||||||||||||||||||||
| Royce International Premier Fund–Investment Class e | ||||||||||||||||||||||||||||||||||||||||||||||||||||||||||||||||||||
| 2016† | $ | 9.82 | $ | 0.09 | $ | – | $ | 0.09 | $ | – | $ | – | $ | – | $ | – | $ | – | $ | 9.91 | 0.92 | %1 | $ | 24,160 | 1.43 | %2 | 1.43 | %2 | 1.19 | %2 | 1.81 | %2 | 41 | % | ||||||||||||||||||||||||||||||||||
| 2015 | 8.71 | 0.16 | 1.27 | 1.43 | (0.32 | ) | – | – | (0.32 | ) | – | 9.82 | 16.42 | 3,623 | 2.80 | 2.80 | 1.38 | 1.72 | 67 | |||||||||||||||||||||||||||||||||||||||||||||||||
| 2014 | 10.00 | 0.03 | (0.85 | ) | (0.82 | ) | (0.16 | ) | (0.31 | ) | – | (0.47 | ) | – | 8.71 | (8.16 | )1 | 3,481 | 3.17 | 2 | 3.17 | 2 | 1.44 | 2 | 1.00 | 2 | 62 | |||||||||||||||||||||||||||||||||||||||||
| Royce International Premier Fund–Service Class f | ||||||||||||||||||||||||||||||||||||||||||||||||||||||||||||||||||||
| 2016† | $ | 11.64 | $ | 0.08 | $ | 0.01 | $ | 0.09 | $ | – | $ | – | $ | – | $ | – | $ | – | $ | 11.73 | 0.77 | %1 | $ | 42,632 | 1.69 | %2 | 1.69 | %2 | 1.44 | %2 | 1.51 | %2 | 41 | % | ||||||||||||||||||||||||||||||||||
| 2015 | 10.28 | (0.00 | ) | 1.66 | 1.66 | (0.30 | ) | – | – | (0.30 | ) | – | 11.64 | 16.22 | 9,015 | 2.65 | 2.65 | 1.60 | 1.10 | 67 | ||||||||||||||||||||||||||||||||||||||||||||||||
| 2014 | 11.67 | 0.17 | (1.13 | ) | (0.96 | ) | (0.12 | ) | (0.31 | ) | – | (0.43 | ) | – | 10.28 | (8.22 | ) | 4,045 | 2.45 | 2.45 | 1.69 | 1.26 | 62 | |||||||||||||||||||||||||||||||||||||||||||||
| 2013 | 10.01 | 0.10 | 1.73 | 1.83 | (0.17 | ) | – | – | (0.17 | ) | – | 11.67 | 18.31 | 9,470 | 2.82 | 2.82 | 1.69 | 1.09 | 51 | |||||||||||||||||||||||||||||||||||||||||||||||||
| 2012 | 8.26 | 0.12 | 1.81 | 1.93 | (0.18 | ) | – | – | (0.18 | ) | – | 10.01 | 23.40 | 6,444 | 3.54 | 3.54 | 1.69 | 1.18 | 103 | |||||||||||||||||||||||||||||||||||||||||||||||||
| 2011 | 10.00 | 0.05 | (1.73 | ) | (1.68 | ) | (0.06 | ) | (0.00 | ) | (0.01 | ) | (0.07 | ) | 0.01 | 8.26 | (16.75 | )1 | 4,090 | 3.77 | 2 | 3.77 | 2 | 1.69 | 2 | 0.67 | 2 | 42 | ||||||||||||||||||||||||||||||||||||||||
| Royce International Premier Fund–Consultant Class g | ||||||||||||||||||||||||||||||||||||||||||||||||||||||||||||||||||||
| 2016† | $ | 11.59 | $ | 0.04 | $ | 1.10 | $ | 1.14 | $ | – | $ | – | $ | – | $ | – | $ | – | $ | 12.73 | 9.84 | %1 | $ | 6,434 | 2.73 | %2 | 2.73 | %2 | 2.19 | %2 | 0.93 | %2 | 41 | % | ||||||||||||||||||||||||||||||||||
| Royce International Premier Fund–R Class g | ||||||||||||||||||||||||||||||||||||||||||||||||||||||||||||||||||||
| 2016† | $ | 8.64 | $ | 0.04 | $ | 0.83 | $ | 0.87 | $ | – | $ | – | $ | – | $ | – | $ | – | $ | 9.51 | 10.07 | %1 | $ | 42 | 25.95 | %2 | 25.95 | %2 | 1.74 | %2 | 1.38 | %2 | 41 | % | ||||||||||||||||||||||||||||||||||
| Royce International Premier Fund–K Class g | ||||||||||||||||||||||||||||||||||||||||||||||||||||||||||||||||||||
| 2016† | $ | 8.53 | $ | 0.05 | $ | 0.81 | $ | 0.86 | $ | – | $ | – | $ | – | $ | – | $ | – | $ | 9.39 | 10.08 | %1 | $ | 23 | 51.19 | %2 | 51.19 | %2 | 1.49 | %2 | 1.63 | %2 | 41 | % | ||||||||||||||||||||||||||||||||||
| Royce International Small-Cap Fund–Investment Class e | ||||||||||||||||||||||||||||||||||||||||||||||||||||||||||||||||||||
| 2016† | $ | 7.55 | $ | 0.05 | $ | (0.16 | ) | $ | (0.11 | ) | $ | – | $ | – | $ | – | $ | – | $ | – | $ | 7.44 | (1.46 | )%1 | $ | 333 | 7.32 | %2 | 7.32 | %2 | 1.19 | %2 | 1.36 | %2 | 57 | % | ||||||||||||||||||||||||||||||||
| 2015 | 7.91 | 0.17 | (0.30 | ) | (0.13 | ) | (0.23 | ) | (0.00 | ) | – | (0.23 | ) | – | 7.55 | (1.64 | ) | 326 | 4.17 | 4.17 | 1.38 | 1.06 | 116 | |||||||||||||||||||||||||||||||||||||||||||||
| 2014 | 10.00 | 0.14 | (0.91 | ) | (0.77 | ) | (0.26 | ) | (1.07 | ) | – | (1.33 | ) | 0.01 | 7.91 | (7.31 | )1 | 1,119 | 5.53 | 2 | 5.53 | 2 | 1.44 | 2 | 1.45 | 2 | 78 | |||||||||||||||||||||||||||||||||||||||||
| Royce International Small-Cap Fund–Service Class | ||||||||||||||||||||||||||||||||||||||||||||||||||||||||||||||||||||
| 2016† | $ | 9.43 | $ | 0.04 | $ | (0.19 | ) | $ | (0.15 | ) | $ | – | $ | – | $ | – | $ | – | $ | – | $ | 9.28 | (1.59 | )%1 | $ | 5,856 | 2.17 | %2 | 2.17 | %2 | 1.44 | %2 | 0.93 | %2 | 57 | % | ||||||||||||||||||||||||||||||||
| 2015 | 9.80 | 0.17 | (0.34 | ) | (0.17 | ) | (0.20 | ) | (0.00 | ) | – | (0.20 | ) | – | 9.43 | (1.74 | ) | 17,392 | 2.10 | 2.10 | 1.63 | 1.24 | 116 | |||||||||||||||||||||||||||||||||||||||||||||
| 2014 | 11.99 | 0.21 | (1.11 | ) | (0.90 | ) | (0.22 | ) | (1.07 | ) | – | (1.29 | ) | – | 9.80 | (7.29 | ) | 29,610 | 1.99 | 1.99 | 1.69 | 1.20 | 78 | |||||||||||||||||||||||||||||||||||||||||||||
| 2013 | 11.28 | 0.12 | 1.30 | 1.42 | (0.15 | ) | (0.56 | ) | – | (0.71 | ) | – | 11.99 | 12.73 | 38,059 | 2.07 | 2.07 | 1.69 | 1.13 | 64 | ||||||||||||||||||||||||||||||||||||||||||||||||
| 2012 | 9.58 | 0.14 | 1.70 | 1.84 | (0.15 | ) | – | – | (0.15 | ) | 0.01 | 11.28 | 19.39 | 26,371 | 2.13 | 2.13 | 1.69 | 1.29 | 44 | |||||||||||||||||||||||||||||||||||||||||||||||||
| 2011 | 12.85 | 0.10 | (2.51 | ) | (2.41 | ) | (0.08 | ) | (0.78 | ) | (0.01 | ) | (0.87 | ) | 0.01 | 9.58 | (18.75 | ) | 20,103 | 2.15 | 2.15 | 1.69 | 0.88 | 38 | ||||||||||||||||||||||||||||||||||||||||||||
| Royce International Small-Cap Fund–Institutional Class h | ||||||||||||||||||||||||||||||||||||||||||||||||||||||||||||||||||||
| 2016† | $ | 7.76 | $ | 0.05 | $ | (0.16 | ) | $ | (0.11 | ) | $ | – | $ | – | $ | – | $ | – | $ | – | $ | 7.65 | (1.42 | )%1 | $ | 2,031 | 2.48 | %2 | 2.48 | %2 | 1.19 | %2 | 1.31 | %2 | 57 | % | ||||||||||||||||||||||||||||||||
| 2015 | 8.12 | 0.12 | (0.25 | ) | (0.13 | ) | (0.23 | ) | (0.00 | ) | – | (0.23 | ) | – | 7.76 | (1.59 | ) | 2,053 | 2.35 | 2.35 | 1.37 | 1.40 | 116 | |||||||||||||||||||||||||||||||||||||||||||||
| 2014 | 10.00 | 0.17 | (0.72 | ) | (0.55 | ) | (0.26 | ) | (1.07 | ) | – | (1.33 | ) | – | 8.12 | (5.22 | )1 | 2,353 | 2.63 | 2 | 2.63 | 2 | 1.44 | 2 | 1.58 | 2 | 78 | |||||||||||||||||||||||||||||||||||||||||
| THE ACCOMPANYING NOTES ARE AN INTEGRAL PART OF THESE FINANCIAL STATEMENTS | The Royce Funds 2016 Semiannual Report to Shareholders | 101 |
Financial Highlights
This table is presented to show selected data for a share outstanding throughout each period and to assist shareholders in evaluating a Fund’s performance for the periods presented. Per share amounts have been determined on the basis of the weighted average number of shares outstanding during the period.
| Ratio of Expenses to Average Net Assets | Ratio of Net | |||||||||||||||||||||||||||||||||||||||||||||||||||||||||||||||||||
| Net Asset | Net Realized and | Distributions | Distributions from | Prior to Fee | Investment | |||||||||||||||||||||||||||||||||||||||||||||||||||||||||||||||
| Value, | Unrealized Gain (Loss) | Total from | from Net | Net Realized Gain | Distributions | Shareholder | Net Asset | Net Assets, | Waivers and | Income (Loss) to | ||||||||||||||||||||||||||||||||||||||||||||||||||||||||||
| Beginning of | Net Investment | on Investments and | Investment | Investment | on Investments and | from Return of | Total | Redemption | Value, End of | End of Period | Balance | Prior to Fee | Net of Fee | Average Net | Portfolio | |||||||||||||||||||||||||||||||||||||||||||||||||||||
| Period | Income (Loss) | Foreign Currency | Operations | Income | Foreign Currency | Capital | Distributions | Fees | Period | Total Return | (in thousands) | Credits | Waivers | Waivers | Assets | Turnover Rate | ||||||||||||||||||||||||||||||||||||||||||||||||||||
| Royce Low-Priced Stock Fund–Investment Class | ||||||||||||||||||||||||||||||||||||||||||||||||||||||||||||||||||||
| 2016† | $ | 7.77 | $ | 0.02 | $ | (0.19 | ) | $ | (0.17 | ) | $ | – | $ | – | $ | – | $ | – | $ | – | $ | 7.60 | (2.19 | )%1 | $ | 22,926 | 1.33 | %2 | 1.33 | %2 | 1.24 | %2 | 0.65 | %2 | 20 | % | ||||||||||||||||||||||||||||||||
| 2015 | 9.46 | 0.00 | (0.97 | ) | (0.97 | ) | – | (0.72 | ) | – | (0.72 | ) | – | 7.77 | (10.21 | ) | 28,732 | 1.28 | 1.28 | 1.24 | 0.03 | 53 | ||||||||||||||||||||||||||||||||||||||||||||||
| 2014 | 13.60 | 0.06 | (0.58 | ) | (0.52 | ) | (0.01 | ) | (3.61 | ) | – | (3.62 | ) | – | 9.46 | (3.15 | ) | 50,371 | 1.25 | 1.25 | 1.24 | 0.46 | 29 | |||||||||||||||||||||||||||||||||||||||||||||
| 2013 | 13.83 | 0.05 | 1.71 | 1.76 | (0.05 | ) | (1.94 | ) | – | (1.99 | ) | – | 13.60 | 13.17 | 88,568 | 1.37 | 1.37 | 1.24 | 0.18 | 16 | ||||||||||||||||||||||||||||||||||||||||||||||||
| 2012 | 14.34 | 0.15 | 0.50 | 0.65 | (0.25 | ) | (0.91 | ) | – | (1.16 | ) | – | 13.83 | 4.79 | 255,335 | 1.26 | 1.26 | 1.24 | 0.86 | 8 | ||||||||||||||||||||||||||||||||||||||||||||||||
| 2011 | 18.31 | (0.06 | ) | (2.57 | ) | (2.63 | ) | (0.14 | ) | (1.20 | ) | – | (1.34 | ) | – | 14.34 | (14.37 | ) | 276,247 | 1.26 | 1.26 | 1.24 | (0.15 | ) | 22 | |||||||||||||||||||||||||||||||||||||||||||
| Royce Low-Priced Stock Fund–Service Class | ||||||||||||||||||||||||||||||||||||||||||||||||||||||||||||||||||||
| 2016† | $ | 7.75 | $ | 0.02 | $ | (0.21 | ) | $ | (0.19 | ) | $ | – | $ | – | $ | – | $ | – | $ | – | $ | 7.56 | (2.45 | )%1 | $ | 270,798 | 1.55 | %2 | 1.55 | %2 | 1.49 | %2 | 0.41 | %2 | 20 | % | ||||||||||||||||||||||||||||||||
| 2015 | 9.46 | (0.02 | ) | (0.97 | ) | (0.99 | ) | – | (0.72 | ) | – | (0.72 | ) | – | 7.75 | (10.42 | ) | 316,475 | 1.49 | 1.49 | 1.47 | (0.20 | ) | 53 | ||||||||||||||||||||||||||||||||||||||||||||
| 2014 | 13.62 | 0.03 | (0.58 | ) | (0.55 | ) | – | (3.61 | ) | – | (3.61 | ) | – | 9.46 | (3.37 | ) | 520,905 | 1.55 | 1.55 | 1.49 | 0.21 | 29 | ||||||||||||||||||||||||||||||||||||||||||||||
| 2013 | 13.84 | (0.00 | ) | 1.72 | 1.72 | (0.00 | ) | (1.94 | ) | – | (1.94 | ) | – | 13.62 | 12.91 | 1,008,207 | 1.65 | 1.65 | 1.49 | (0.02 | ) | 16 | ||||||||||||||||||||||||||||||||||||||||||||||
| 2012 | 14.31 | 0.11 | 0.49 | 0.60 | (0.16 | ) | (0.91 | ) | – | (1.07 | ) | – | 13.84 | 4.48 | 1,800,089 | 1.57 | 1.57 | 1.49 | 0.54 | 8 | ||||||||||||||||||||||||||||||||||||||||||||||||
| 2011 | 18.26 | (0.06 | ) | (2.60 | ) | (2.66 | ) | (0.09 | ) | (1.20 | ) | – | (1.29 | ) | – | 14.31 | (14.58 | ) | 2,489,189 | 1.56 | 1.56 | 1.49 | (0.39 | ) | 22 | |||||||||||||||||||||||||||||||||||||||||||
| Royce Low-Priced Stock Fund–Institutional Class | ||||||||||||||||||||||||||||||||||||||||||||||||||||||||||||||||||||
| 2016† | $ | 7.78 | $ | 0.02 | $ | (0.20 | ) | $ | (0.18 | ) | $ | – | $ | – | $ | – | $ | – | $ | – | $ | 7.60 | (2.31 | )%1 | $ | 13,417 | 1.21 | %2 | 1.21 | %2 | 1.21 | %2 | 0.55 | %2 | 20 | % | ||||||||||||||||||||||||||||||||
| 2015 | 9.46 | 0.01 | (0.97 | ) | (0.96 | ) | (0.00 | ) | (0.72 | ) | – | (0.72 | ) | – | 7.78 | (10.05 | ) | 39,004 | 1.11 | 1.11 | 1.11 | 0.14 | 53 | |||||||||||||||||||||||||||||||||||||||||||||
| 2014 | 13.61 | 0.08 | (0.58 | ) | (0.50 | ) | (0.04 | ) | (3.61 | ) | – | (3.65 | ) | – | 9.46 | (3.01 | ) | 101,473 | 1.16 | 1.16 | 1.16 | 0.47 | 29 | |||||||||||||||||||||||||||||||||||||||||||||
| 2013 | 13.84 | 0.05 | 1.71 | 1.76 | (0.05 | ) | (1.94 | ) | – | (1.99 | ) | – | 13.61 | 13.20 | 345,983 | 1.22 | 1.22 | 1.22 | 0.26 | 16 | ||||||||||||||||||||||||||||||||||||||||||||||||
| 2012 | 14.36 | 0.16 | 0.49 | 0.65 | (0.26 | ) | (0.91 | ) | – | (1.17 | ) | – | 13.84 | 4.81 | 969,664 | 1.20 | 1.20 | 1.20 | 0.92 | 8 | ||||||||||||||||||||||||||||||||||||||||||||||||
| 2011 | 18.33 | (0.01 | ) | (2.61 | ) | (2.62 | ) | (0.15 | ) | (1.20 | ) | – | (1.35 | ) | – | 14.36 | (14.35 | ) | 991,706 | 1.17 | 1.17 | 1.17 | (0.07 | ) | 22 | |||||||||||||||||||||||||||||||||||||||||||
| Royce Low-Priced Stock Fund–R Class | ||||||||||||||||||||||||||||||||||||||||||||||||||||||||||||||||||||
| 2016† | $ | 7.38 | $ | 0.00 | $ | (0.19 | ) | $ | (0.19 | ) | $ | – | $ | – | $ | – | $ | – | $ | – | $ | 7.19 | (2.57 | )%1 | $ | 1,096 | 2.94 | %2 | 2.94 | %2 | 1.84 | %2 | 0.08 | %2 | 20 | % | ||||||||||||||||||||||||||||||||
| 2015 | 9.08 | (0.05 | ) | (0.93 | ) | (0.98 | ) | – | (0.72 | ) | – | (0.72 | ) | – | 7.38 | (10.74 | ) | 1,132 | 2.78 | 2.78 | 1.84 | (0.58 | ) | 53 | ||||||||||||||||||||||||||||||||||||||||||||
| 2014 | 13.27 | (0.02 | ) | (0.56 | ) | (0.58 | ) | – | (3.61 | ) | – | (3.61 | ) | – | 9.08 | (3.72 | ) | 1,892 | 2.21 | 2.21 | 1.84 | (0.15 | ) | 29 | ||||||||||||||||||||||||||||||||||||||||||||
| 2013 | 13.58 | (0.05 | ) | 1.68 | 1.63 | – | (1.94 | ) | – | (1.94 | ) | – | 13.27 | 12.44 | 3,130 | 2.21 | 2.21 | 1.84 | (0.37 | ) | 16 | |||||||||||||||||||||||||||||||||||||||||||||||
| 2012 | 14.05 | 0.04 | 0.50 | 0.54 | (0.10 | ) | (0.91 | ) | – | (1.01 | ) | – | 13.58 | 4.10 | 5,823 | 2.05 | 2.05 | 1.84 | 0.22 | 8 | ||||||||||||||||||||||||||||||||||||||||||||||||
| 2011 | 18.05 | (0.19 | ) | (2.49 | ) | (2.68 | ) | (0.12 | ) | (1.20 | ) | – | (1.32 | ) | – | 14.05 | (14.86 | ) | 7,337 | 1.95 | 1.95 | 1.84 | (0.72 | ) | 22 | |||||||||||||||||||||||||||||||||||||||||||
| Royce Low-Priced Stock Fund–K Class | ||||||||||||||||||||||||||||||||||||||||||||||||||||||||||||||||||||
| 2016† | $ | 1.92 | $ | 0.00 | $ | (0.05 | ) | $ | (0.05 | ) | $ | – | $ | – | $ | – | $ | – | $ | – | $ | 1.87 | (2.60 | )%1 | $ | 1,196 | 2.94 | %2 | 2.94 | %2 | 1.59 | %2 | 0.31 | %2 | 20 | % | ||||||||||||||||||||||||||||||||
| 2015 | 2.95 | (0.01 | ) | (0.30 | ) | (0.31 | ) | – | (0.72 | ) | – | (0.72 | ) | – | 1.92 | (10.36 | ) | 1,503 | 2.49 | 2.49 | 1.59 | (0.32 | ) | 53 | ||||||||||||||||||||||||||||||||||||||||||||
| 2014 | 6.89 | 0.01 | (0.34 | ) | (0.33 | ) | – | (3.61 | ) | – | (3.61 | ) | – | 2.95 | (3.55 | ) | 2,011 | 2.33 | 2.33 | 1.59 | 0.11 | 29 | ||||||||||||||||||||||||||||||||||||||||||||||
| 2013 | 7.90 | (0.00 | ) | 0.94 | 0.94 | (0.01 | ) | (1.94 | ) | – | (1.95 | ) | – | 6.89 | 12.74 | 3,841 | 1.92 | 1.92 | 1.59 | (0.12 | ) | 16 | ||||||||||||||||||||||||||||||||||||||||||||||
| 2012 | 8.65 | 0.07 | 0.27 | 0.34 | (0.18 | ) | (0.91 | ) | – | (1.09 | ) | – | 7.90 | 4.42 | 6,253 | 1.71 | 1.71 | 1.59 | 0.40 | 8 | ||||||||||||||||||||||||||||||||||||||||||||||||
| 2011 | 11.70 | (0.08 | ) | (1.63 | ) | (1.71 | ) | (0.14 | ) | (1.20 | ) | – | (1.34 | ) | – | 8.65 | (14.71 | ) | 8,719 | 1.68 | 1.68 | 1.59 | (0.48 | ) | 22 | |||||||||||||||||||||||||||||||||||||||||||
| 102 | The Royce Funds 2016 Semiannual Report to Shareholders | THE ACCOMPANYING NOTES ARE AN INTEGRAL PART OF THESE FINANCIAL STATEMENTS |
Financial Highlights
This table is presented to show selected data for a share outstanding throughout each period and to assist shareholders in evaluating a Fund’s performance for the periods presented. Per share amounts have been determined on the basis of the weighted average number of shares outstanding during the period.
| Ratio of Expenses to Average Net Assets | Ratio of Net | |||||||||||||||||||||||||||||||||||||||||||||||||||||||||||||||||||
| Net Asset | Net Realized and | Distributions | Distributions from | Prior to Fee | Investment | |||||||||||||||||||||||||||||||||||||||||||||||||||||||||||||||
| Value, | Unrealized Gain (Loss) | Total from | from Net | Net Realized Gain | Distributions | Shareholder | Net Asset | Net Assets, | Waivers and | Income (Loss) to | ||||||||||||||||||||||||||||||||||||||||||||||||||||||||||
| Beginning of | Net Investment | on Investments and | Investment | Investment | on Investments and | from Return of | Total | Redemption | Value, End of | End of Period | Balance | Prior to Fee | Net of Fee | Average Net | Portfolio | |||||||||||||||||||||||||||||||||||||||||||||||||||||
| Period | Income (Loss) | Foreign Currency | Operations | Income | Foreign Currency | Capital | Distributions | Fees | Period | Total Return | (in thousands) | Credits | Waivers | Waivers | Assets | Turnover Rate | ||||||||||||||||||||||||||||||||||||||||||||||||||||
| Royce Micro-Cap Fund–Investment Class | ||||||||||||||||||||||||||||||||||||||||||||||||||||||||||||||||||||
| 2016† | $ | 11.09 | $ | 0.00 | $ | (0.08 | ) | $ | (0.08 | ) | $ | – | $ | – | $ | – | $ | – | $ | – | $ | 11.01 | (0.72 | )%1 | $ | 182,495 | 1.54 | %2 | 1.54 | %2 | 1.49 | %2 | 0.03 | %2 | 19 | % | ||||||||||||||||||||||||||||||||
| 2015 | 14.47 | 0.02 | (1.96 | ) | (1.94 | ) | – | (1.44 | ) | – | (1.44 | ) | – | 11.09 | (13.32 | ) | 219,272 | 1.51 | 1.51 | 1.51 | 0.15 | 41 | ||||||||||||||||||||||||||||||||||||||||||||||
| 2014 | 16.68 | (0.08 | ) | (0.65 | ) | (0.73 | ) | – | (1.48 | ) | – | (1.48 | ) | – | 14.47 | (4.13 | ) | 414,120 | 1.52 | 1.52 | 1.52 | (0.49 | ) | 18 | ||||||||||||||||||||||||||||||||||||||||||||
| 2013 | 14.78 | (0.08 | ) | 3.19 | 3.11 | (0.02 | ) | (1.19 | ) | – | (1.21 | ) | – | 16.68 | 21.29 | 650,773 | 1.53 | 1.53 | 1.53 | (0.52 | ) | 22 | ||||||||||||||||||||||||||||||||||||||||||||||
| 2012 | 14.55 | 0.05 | 1.07 | 1.12 | (0.01 | ) | (0.88 | ) | – | (0.89 | ) | – | 14.78 | 7.93 | 740,364 | 1.47 | 1.47 | 1.47 | 0.29 | 15 | ||||||||||||||||||||||||||||||||||||||||||||||||
| 2011 | 17.57 | (0.07 | ) | (2.05 | ) | (2.12 | ) | (0.20 | ) | (0.70 | ) | – | (0.90 | ) | – | 14.55 | (12.04 | ) | 904,168 | 1.50 | 1.50 | 1.50 | (0.50 | ) | 35 | |||||||||||||||||||||||||||||||||||||||||||
| Royce Micro-Cap Fund–Service Class | ||||||||||||||||||||||||||||||||||||||||||||||||||||||||||||||||||||
| 2016† | $ | 10.90 | $ | (0.01 | ) | $ | (0.08 | ) | $ | (0.09 | ) | $ | – | $ | – | $ | – | $ | – | $ | – | $ | 10.81 | (0.83 | )%1 | $ | 15,470 | 1.88 | %2 | 1.88 | %2 | 1.61 | %2 | (0.11 | )%2 | 19 | % | |||||||||||||||||||||||||||||||
| 2015 | 14.26 | 0.00 | (1.92 | ) | (1.92 | ) | – | (1.44 | ) | – | (1.44 | ) | – | 10.90 | (13.37 | ) | 20,538 | 1.80 | 1.80 | 1.63 | 0.01 | 41 | ||||||||||||||||||||||||||||||||||||||||||||||
| 2014 | 16.48 | (0.10 | ) | (0.65 | ) | (0.75 | ) | – | (1.48 | ) | – | (1.48 | ) | 0.01 | 14.26 | (4.24 | ) | 38,645 | 1.77 | 1.77 | 1.66 | (0.63 | ) | 18 | ||||||||||||||||||||||||||||||||||||||||||||
| 2013 | 14.61 | (0.10 | ) | 3.16 | 3.06 | – | (1.19 | ) | – | (1.19 | ) | – | 16.48 | 21.20 | 79,890 | 1.74 | 1.74 | 1.66 | (0.66 | ) | 22 | |||||||||||||||||||||||||||||||||||||||||||||||
| 2012 | 14.41 | 0.02 | 1.06 | 1.08 | – | (0.88 | ) | – | (0.88 | ) | – | 14.61 | 7.76 | 109,457 | 1.74 | 1.74 | 1.66 | 0.14 | 15 | |||||||||||||||||||||||||||||||||||||||||||||||||
| 2011 | 17.43 | (0.10 | ) | (2.04 | ) | (2.14 | ) | (0.18 | ) | (0.70 | ) | – | (0.88 | ) | – | 14.41 | (12.23 | ) | 122,479 | 1.76 | 1.76 | 1.66 | (0.65 | ) | 35 | |||||||||||||||||||||||||||||||||||||||||||
| Royce Micro-Cap Fund–Consultant Class | ||||||||||||||||||||||||||||||||||||||||||||||||||||||||||||||||||||
| 2016† | $ | 9.04 | $ | (0.05 | ) | $ | (0.07 | ) | $ | (0.12 | ) | $ | – | $ | – | $ | – | $ | – | $ | – | $ | 8.92 | (1.33 | )%1 | $ | 33,928 | 2.58 | %2 | 2.58 | %2 | 2.58 | %2 | (1.07 | )%2 | 19 | % | |||||||||||||||||||||||||||||||
| 2015 | 12.23 | (0.10 | ) | (1.65 | ) | (1.75 | ) | – | (1.44 | ) | – | (1.44 | ) | – | 9.04 | (14.21 | ) | 41,024 | 2.54 | 2.54 | 2.54 | (0.90 | ) | 41 | ||||||||||||||||||||||||||||||||||||||||||||
| 2014 | 14.48 | (0.20 | ) | (0.57 | ) | (0.77 | ) | – | (1.48 | ) | – | (1.48 | ) | – | 12.23 | (5.03 | ) | 75,868 | 2.48 | 2.48 | 2.48 | (1.45 | ) | 18 | ||||||||||||||||||||||||||||||||||||||||||||
| 2013 | 13.08 | (0.21 | ) | 2.80 | 2.59 | – | (1.19 | ) | – | (1.19 | ) | – | 14.48 | 20.08 | 117,538 | 2.52 | 2.52 | 2.52 | (1.51 | ) | 22 | |||||||||||||||||||||||||||||||||||||||||||||||
| 2012 | 13.11 | (0.10 | ) | 0.95 | 0.85 | – | (0.88 | ) | – | (0.88 | ) | – | 13.08 | 6.77 | 120,871 | 2.55 | 2.55 | 2.55 | (0.77 | ) | 15 | |||||||||||||||||||||||||||||||||||||||||||||||
| 2011 | 15.91 | (0.21 | ) | (1.84 | ) | (2.05 | ) | (0.05 | ) | (0.70 | ) | – | (0.75 | ) | – | 13.11 | (12.86 | ) | 134,752 | 2.42 | 2.42 | 2.42 | (1.41 | ) | 35 | |||||||||||||||||||||||||||||||||||||||||||
| Royce Micro-Cap Opportunity Fund–Investment Class | ||||||||||||||||||||||||||||||||||||||||||||||||||||||||||||||||||||
| 2016† | $ | 13.88 | $ | (0.04 | ) | $ | 0.48 | $ | 0.44 | $ | – | $ | – | $ | – | $ | – | $ | – | $ | 14.32 | 3.17 | %1 | $ | 37,731 | 1.31 | %2 | 1.31 | %2 | 1.24 | %2 | (0.58 | )%2 | 47 | % | |||||||||||||||||||||||||||||||||
| 2015 | 16.52 | (0.09 | ) | (2.55 | ) | (2.64 | ) | – | (0.00 | ) | – | (0.00 | ) | – | 13.88 | (15.98 | ) | 34,437 | 1.39 | 1.39 | 1.25 | (0.58 | ) | 105 | ||||||||||||||||||||||||||||||||||||||||||||
| 2014 | 17.93 | (0.11 | ) | (0.81 | ) | (0.92 | ) | – | (0.51 | ) | – | (0.51 | ) | 0.02 | 16.52 | (4.97 | ) | 18,221 | 1.56 | 1.56 | 1.28 | (0.60 | ) | 131 | ||||||||||||||||||||||||||||||||||||||||||||
| 2013 | 12.81 | (0.13 | ) | 5.79 | 5.66 | – | (0.55 | ) | – | (0.55 | ) | 0.01 | 17.93 | 44.61 | 17,461 | 1.78 | 1.78 | 1.29 | (0.80 | ) | 129 | |||||||||||||||||||||||||||||||||||||||||||||||
| 2012 | 10.33 | 0.07 | 3.50 | 3.57 | (0.13 | ) | (0.96 | ) | – | (1.09 | ) | – | 12.81 | 35.14 | 3,198 | 0.29 | 2 | 0.29 | 2 | 0.25 | 2 | 0.64 | 2 | 196 | ||||||||||||||||||||||||||||||||||||||||||||
| 2011 | 12.99 | 0.01 | (2.26 | ) | (2.25 | ) | (0.02 | ) | (0.39 | ) | – | (0.41 | ) | – | 10.33 | (17.14 | ) | 2,102 | 1.14 | 1.14 | 1.14 | 0.08 | 299 | |||||||||||||||||||||||||||||||||||||||||||||
| Royce Micro-Cap Opportunity Fund–Service Class a | ||||||||||||||||||||||||||||||||||||||||||||||||||||||||||||||||||||
| 2016† | $ | 7.01 | $ | (0.03 | ) | $ | 0.24 | $ | 0.21 | $ | – | $ | – | $ | – | $ | – | $ | – | $ | 7.22 | 3.00 | %1 | $ | 1,064 | 3.49 | %2 | 3.49 | %2 | 1.49 | %2 | (0.83 | )%2 | 47 | % | |||||||||||||||||||||||||||||||||
| 2015 | 8.37 | (0.07 | ) | (1.29 | ) | (1.36 | ) | – | (0.00 | ) | – | (0.00 | ) | – | 7.01 | (16.24 | ) | 1,212 | 3.22 | 3.22 | 1.51 | (0.86 | ) | 105 | ||||||||||||||||||||||||||||||||||||||||||||
| 2014 | 10.00 | (0.04 | ) | (1.11 | ) | (1.15 | ) | – | (0.51 | ) | – | (0.51 | ) | 0.03 | 8.37 | (11.11 | )1 | 939 | 10.50 | 2 | 10.50 | 2 | 1.53 | 2 | (0.65 | )2 | 131 | |||||||||||||||||||||||||||||||||||||||||
| Royce Opportunity Fund–Investment Class | ||||||||||||||||||||||||||||||||||||||||||||||||||||||||||||||||||||
| 2016† | $ | 10.57 | $ | (0.01 | ) | $ | 0.35 | $ | 0.34 | $ | – | $ | – | $ | – | $ | – | $ | – | $ | 10.91 | 3.22 | %1 | $ | 688,467 | 1.20 | %2 | 1.20 | %2 | 1.20 | %2 | (0.17 | )%2 | 14 | % | |||||||||||||||||||||||||||||||||
| 2015 | 13.46 | (0.03 | ) | (1.80 | ) | (1.83 | ) | – | (1.06 | ) | – | (1.06 | ) | – | 10.57 | (13.57 | ) | 746,052 | 1.17 | 1.17 | 1.17 | (0.27 | ) | 27 | ||||||||||||||||||||||||||||||||||||||||||||
| 2014 | 15.54 | (0.05 | ) | (0.09 | ) | (0.14 | ) | – | (1.94 | ) | – | (1.94 | ) | – | 13.46 | (0.48 | ) | 1,284,044 | 1.14 | 1.14 | 1.14 | (0.30 | ) | 36 | ||||||||||||||||||||||||||||||||||||||||||||
| 2013 | 11.95 | (0.05 | ) | 5.18 | 5.13 | – | (1.54 | ) | – | (1.54 | ) | – | 15.54 | 43.50 | 1,426,214 | 1.16 | 1.16 | 1.16 | (0.36 | ) | 39 | |||||||||||||||||||||||||||||||||||||||||||||||
| 2012 | 10.32 | 0.00 | 2.30 | 2.30 | – | (0.67 | ) | – | (0.67 | ) | – | 11.95 | 22.59 | 921,473 | 1.13 | 1.13 | 1.13 | 0.02 | 34 | |||||||||||||||||||||||||||||||||||||||||||||||||
| 2011 | 12.08 | (0.04 | ) | (1.53 | ) | (1.57 | ) | – | (0.19 | ) | – | (0.19 | ) | – | 10.32 | (12.95 | ) | 878,824 | 1.16 | 1.16 | 1.16 | (0.38 | ) | 35 | ||||||||||||||||||||||||||||||||||||||||||||
| THE ACCOMPANYING NOTES ARE AN INTEGRAL PART OF THESE FINANCIAL STATEMENTS | The Royce Funds 2016 Semiannual Report to Shareholders | 103 |
Financial Highlights
This table is presented to show selected data for a share outstanding throughout each period and to assist shareholders in evaluating a Fund’s performance for the periods presented. Per share amounts have been determined on the basis of the weighted average number of shares outstanding during the period.
| Ratio of Expenses to Average Net Assets | Ratio of Net | |||||||||||||||||||||||||||||||||||||||||||||||||||||||||||||||||||
| Net Asset | Net Realized and | Distributions | Distributions from | Prior to Fee | Investment | |||||||||||||||||||||||||||||||||||||||||||||||||||||||||||||||
| Value, | Unrealized Gain (Loss) | Total from | from Net | Net Realized Gain | Distributions | Shareholder | Net Asset | Net Assets, | Waivers and | Income (Loss) to | ||||||||||||||||||||||||||||||||||||||||||||||||||||||||||
| Beginning of | Net Investment | on Investments and | Investment | Investment | on Investments and | from Return of | Total | Redemption | Value, End of | End of Period | Balance | Prior to Fee | Net of Fee | Average Net | Portfolio | |||||||||||||||||||||||||||||||||||||||||||||||||||||
| Period | Income (Loss) | Foreign Currency | Operations | Income | Foreign Currency | Capital | Distributions | Fees | Period | Total Return | (in thousands) | Credits | Waivers | Waivers | Assets | Turnover Rate | ||||||||||||||||||||||||||||||||||||||||||||||||||||
| Royce Opportunity Fund–Service Class | ||||||||||||||||||||||||||||||||||||||||||||||||||||||||||||||||||||
| 2016† | $ | 9.95 | $ | (0.02 | ) | $ | 0.33 | $ | 0.31 | $ | – | $ | – | $ | – | $ | – | $ | – | $ | 10.26 | 3.12 | %1 | $ | 76,202 | 1.56 | %2 | 1.56 | %2 | 1.49 | %2 | (0.46 | )%2 | 14 | % | |||||||||||||||||||||||||||||||||
| 2015 | 12.80 | (0.07 | ) | (1.72 | ) | (1.79 | ) | – | (1.06 | ) | – | (1.06 | ) | – | 9.95 | (13.96 | ) | 100,918 | 1.49 | 1.49 | 1.49 | (0.59 | ) | 27 | ||||||||||||||||||||||||||||||||||||||||||||
| 2014 | 14.92 | (0.09 | ) | (0.09 | ) | (0.18 | ) | – | (1.94 | ) | – | (1.94 | ) | – | 12.80 | (0.74 | ) | 155,085 | 1.47 | 1.47 | 1.47 | (0.64 | ) | 36 | ||||||||||||||||||||||||||||||||||||||||||||
| 2013 | 11.55 | (0.09 | ) | 5.00 | 4.91 | – | (1.54 | ) | – | (1.54 | ) | – | 14.92 | 43.10 | 208,237 | 1.47 | 1.47 | 1.47 | (0.67 | ) | 39 | |||||||||||||||||||||||||||||||||||||||||||||||
| 2012 | 10.03 | (0.04 | ) | 2.23 | 2.19 | – | (0.67 | ) | – | (0.67 | ) | – | 11.55 | 22.14 | 205,084 | 1.46 | 1.46 | 1.46 | (0.32 | ) | 34 | |||||||||||||||||||||||||||||||||||||||||||||||
| 2011 | 11.78 | (0.08 | ) | (1.49 | ) | (1.57 | ) | – | (0.19 | ) | – | (0.19 | ) | 0.01 | 10.03 | (13.20 | ) | 160,496 | 1.48 | 1.48 | 1.48 | (0.73 | ) | 35 | ||||||||||||||||||||||||||||||||||||||||||||
| Royce Opportunity Fund–Consultant Class | ||||||||||||||||||||||||||||||||||||||||||||||||||||||||||||||||||||
| 2016† | $ | 9.01 | $ | (0.05 | ) | $ | 0.29 | $ | 0.24 | $ | – | $ | – | $ | – | $ | – | $ | – | $ | 9.25 | 2.66 | %1 | $ | 19,897 | 2.28 | %2 | 2.28 | %2 | 2.28 | %2 | (1.25 | )%2 | 14 | % | |||||||||||||||||||||||||||||||||
| 2015 | 11.79 | (0.15 | ) | (1.57 | ) | (1.72 | ) | – | (1.06 | ) | – | (1.06 | ) | – | 9.01 | (14.56 | ) | 19,464 | 2.26 | 2.26 | 2.26 | (1.34 | ) | 27 | ||||||||||||||||||||||||||||||||||||||||||||
| 2014 | 14.02 | (0.19 | ) | (0.10 | ) | (0.29 | ) | – | (1.94 | ) | – | (1.94 | ) | – | 11.79 | (1.61 | ) | 20,518 | 2.24 | 2.24 | 2.24 | (1.40 | ) | 36 | ||||||||||||||||||||||||||||||||||||||||||||
| 2013 | 11.01 | (0.20 | ) | 4.75 | 4.55 | – | (1.54 | ) | – | (1.54 | ) | – | 14.02 | 41.93 | 18,643 | 2.31 | 2.31 | 2.31 | (1.51 | ) | 39 | |||||||||||||||||||||||||||||||||||||||||||||||
| 2012 | 9.67 | (0.13 | ) | 2.14 | 2.01 | – | (0.67 | ) | – | (0.67 | ) | – | 11.01 | 21.09 | 11,930 | 2.36 | 2.36 | 2.36 | (1.22 | ) | 34 | |||||||||||||||||||||||||||||||||||||||||||||||
| 2011 | 11.46 | (0.15 | ) | (1.45 | ) | (1.60 | ) | – | (0.19 | ) | – | (0.19 | ) | – | 9.67 | (13.91 | ) | 11,884 | 2.24 | 2.24 | 2.24 | (1.44 | ) | 35 | ||||||||||||||||||||||||||||||||||||||||||||
| Royce Opportunity Fund–Institutional Class | ||||||||||||||||||||||||||||||||||||||||||||||||||||||||||||||||||||
| 2016† | $ | 10.74 | $ | (0.00 | ) | $ | 0.35 | $ | 0.35 | $ | – | $ | – | $ | – | $ | – | $ | – | $ | 11.09 | 3.26 | %1 | $ | 566,985 | 1.07 | %2 | 1.07 | %2 | 1.07 | %2 | (0.03 | )%2 | 14 | % | |||||||||||||||||||||||||||||||||
| 2015 | 13.64 | (0.02 | ) | (1.82 | ) | (1.84 | ) | – | (1.06 | ) | – | (1.06 | ) | – | 10.74 | (13.46 | ) | 600,945 | 1.05 | 1.05 | 1.05 | (0.15 | ) | 27 | ||||||||||||||||||||||||||||||||||||||||||||
| 2014 | 15.71 | (0.03 | ) | (0.10 | ) | (0.13 | ) | – | (1.94 | ) | – | (1.94 | ) | – | 13.64 | (0.41 | ) | 799,131 | 1.03 | 1.03 | 1.03 | (0.20 | ) | 36 | ||||||||||||||||||||||||||||||||||||||||||||
| 2013 | 12.06 | (0.03 | ) | 5.23 | 5.20 | (0.01 | ) | (1.54 | ) | – | (1.55 | ) | – | 15.71 | 43.69 | 853,886 | 1.03 | 1.03 | 1.03 | (0.23 | ) | 39 | ||||||||||||||||||||||||||||||||||||||||||||||
| 2012 | 10.40 | 0.01 | 2.32 | 2.33 | – | (0.67 | ) | – | (0.67 | ) | – | 12.06 | 22.70 | 689,939 | 1.04 | 1.04 | 1.04 | 0.11 | 34 | |||||||||||||||||||||||||||||||||||||||||||||||||
| 2011 | 12.16 | (0.03 | ) | (1.54 | ) | (1.57 | ) | – | (0.19 | ) | – | (0.19 | ) | – | 10.40 | (12.86 | ) | 574,826 | 1.03 | 1.03 | 1.03 | (0.24 | ) | 35 | ||||||||||||||||||||||||||||||||||||||||||||
| Royce Opportunity Fund–R Class | ||||||||||||||||||||||||||||||||||||||||||||||||||||||||||||||||||||
| 2016† | $ | 9.72 | $ | (0.04 | ) | $ | 0.32 | $ | 0.28 | $ | – | $ | – | $ | – | $ | – | $ | – | $ | 10.00 | $ | 2.88 | %1 | $ | 33,648 | 1.83 | %2 | 1.83 | %2 | 1.83 | %2 | (0.80 | )%2 | 14 | % | ||||||||||||||||||||||||||||||||
| 2015 | 12.56 | (0.11 | ) | (1.67 | ) | (1.78 | ) | – | (1.06 | ) | – | (1.06 | ) | – | 9.72 | (14.15 | ) | 32,599 | 1.82 | 1.82 | 1.82 | (0.90 | ) | 27 | ||||||||||||||||||||||||||||||||||||||||||||
| 2014 | 14.73 | (0.13 | ) | (0.10 | ) | (0.23 | ) | – | (1.94 | ) | – | (1.94 | ) | – | 12.56 | (1.12 | ) | 33,699 | 1.78 | 1.78 | 1.78 | (0.93 | ) | 36 | ||||||||||||||||||||||||||||||||||||||||||||
| 2013 | 11.46 | (0.14 | ) | 4.95 | 4.81 | – | (1.54 | ) | – | (1.54 | ) | – | 14.73 | 42.56 | 22,730 | 1.82 | 1.82 | 1.82 | (1.02 | ) | 39 | |||||||||||||||||||||||||||||||||||||||||||||||
| 2012 | 9.98 | (0.07 | ) | 2.22 | 2.15 | – | (0.67 | ) | – | (0.67 | ) | – | 11.46 | 21.85 | 6,612 | 2.01 | 2.01 | 1.84 | (0.62 | ) | 34 | |||||||||||||||||||||||||||||||||||||||||||||||
| 2011 | 11.78 | (0.10 | ) | (1.51 | ) | (1.61 | ) | – | (0.19 | ) | – | (0.19 | ) | – | 9.98 | (13.62 | ) | 3,088 | 2.03 | 2.03 | 1.84 | (0.98 | ) | 35 | ||||||||||||||||||||||||||||||||||||||||||||
| Royce Opportunity Fund–K Class | ||||||||||||||||||||||||||||||||||||||||||||||||||||||||||||||||||||
| 2016† | $ | 8.88 | $ | (0.03 | ) | $ | 0.29 | $ | 0.26 | $ | – | $ | – | $ | – | $ | – | $ | – | $ | 9.14 | 2.93 | %1 | $ | 6,294 | 1.82 | %2 | 1.82 | %2 | 1.82 | %2 | (0.79 | )%2 | 14 | % | |||||||||||||||||||||||||||||||||
| 2015 | 11.57 | (0.08 | ) | (1.55 | ) | (1.63 | ) | – | (1.06 | ) | – | (1.06 | ) | – | 8.88 | (14.06 | ) | 9,706 | 1.62 | 1.62 | 1.62 | (0.73 | ) | 27 | ||||||||||||||||||||||||||||||||||||||||||||
| 2014 | 13.70 | (0.10 | ) | (0.09 | ) | (0.19 | ) | – | (1.94 | ) | – | (1.94 | ) | – | 11.57 | (0.90 | ) | 22,892 | 1.59 | 1.59 | 1.59 | (0.75 | ) | 36 | ||||||||||||||||||||||||||||||||||||||||||||
| 2013 | 10.70 | (0.08 | ) | 4.62 | 4.54 | – | (1.54 | ) | – | (1.54 | ) | – | 13.70 | 43.07 | 17,927 | 1.46 | 1.46 | 1.46 | (0.65 | ) | 39 | |||||||||||||||||||||||||||||||||||||||||||||||
| 2012 | 9.33 | (0.04 | ) | 2.08 | 2.04 | – | (0.67 | ) | – | (0.67 | ) | – | 10.70 | 22.19 | 8,828 | 1.52 | 1.52 | 1.52 | (0.36 | ) | 34 | |||||||||||||||||||||||||||||||||||||||||||||||
| 2011 | 10.98 | (0.07 | ) | (1.39 | ) | (1.46 | ) | – | (0.19 | ) | – | (0.19 | ) | – | 9.33 | (13.25 | ) | 6,484 | 1.46 | 1.46 | 1.46 | (0.68 | ) | 35 | ||||||||||||||||||||||||||||||||||||||||||||
| 104 | The Royce Funds 2016 Semiannual Report to Shareholders | THE ACCOMPANYING NOTES ARE AN INTEGRAL PART OF THESE FINANCIAL STATEMENTS |
Financial Highlights
This table is presented to show selected data for a share outstanding throughout each period and to assist shareholders in evaluating a Fund’s performance for the periods presented. Per share amounts have been determined on the basis of the weighted average number of shares outstanding during the period.
| Ratio of Expenses to Average Net Assets | Ratio of Net | |||||||||||||||||||||||||||||||||||||||||||||||||||||||||||||||||||
| Net Asset | Net Realized and | Distributions | Distributions from | Prior to Fee | Investment | |||||||||||||||||||||||||||||||||||||||||||||||||||||||||||||||
| Value, | Unrealized Gain (Loss) | Total from | from Net | Net Realized Gain | Distributions | Shareholder | Net Asset | Net Assets, | Waivers and | Income (Loss) to | ||||||||||||||||||||||||||||||||||||||||||||||||||||||||||
| Beginning of | Net Investment | on Investments and | Investment | Investment | on Investments and | from Return of | Total | Redemption | Value, End of | End of Period | Balance | Prior to Fee | Net of Fee | Average Net | Portfolio | |||||||||||||||||||||||||||||||||||||||||||||||||||||
| Period | Income (Loss) | Foreign Currency | Operations | Income | Foreign Currency | Capital | Distributions | Fees | Period | Total Return | (in thousands) | Credits | Waivers | Waivers | Assets | Turnover Rate | ||||||||||||||||||||||||||||||||||||||||||||||||||||
| Royce Pennsylvania Mutual Fund–Investment Class | ||||||||||||||||||||||||||||||||||||||||||||||||||||||||||||||||||||
| 2016† | $ | 9.33 | $ | 0.02 | $ | 0.69 | $ | 0.71 | $ | – | $ | – | $ | – | $ | – | $ | – | $ | 10.04 | 7.61 | %1 | $ | 1,624,962 | 0.95 | %2 | 0.95 | %2 | 0.95 | %2 | 0.51 | %2 | 9 | % | ||||||||||||||||||||||||||||||||||
| 2015 | 13.00 | 0.09 | (1.58 | ) | (1.49 | ) | (0.10 | ) | (2.08 | ) | – | (2.18 | ) | – | 9.33 | (11.43 | ) | 1,925,419 | 0.92 | 0.92 | 0.92 | 0.58 | 21 | |||||||||||||||||||||||||||||||||||||||||||||
| 2014 | 14.73 | 0.06 | (0.21 | ) | (0.15 | ) | (0.04 | ) | (1.54 | ) | – | (1.58 | ) | – | 13.00 | (0.70 | ) | 3,869,579 | 0.91 | 0.91 | 0.91 | 0.35 | 21 | |||||||||||||||||||||||||||||||||||||||||||||
| 2013 | 11.50 | 0.03 | 3.99 | 4.02 | (0.00 | ) | (0.79 | ) | – | (0.79 | ) | – | 14.73 | 35.25 | 5,033,318 | 0.92 | 0.92 | 0.92 | 0.24 | 26 | ||||||||||||||||||||||||||||||||||||||||||||||||
| 2012 | 10.76 | 0.15 | 1.39 | 1.54 | (0.15 | ) | (0.65 | ) | – | (0.80 | ) | – | 11.50 | 14.58 | 4,232,988 | 0.89 | 0.89 | 0.89 | 1.19 | 22 | ||||||||||||||||||||||||||||||||||||||||||||||||
| 2011 | 11.65 | 0.01 | (0.50 | ) | (0.49 | ) | (0.02 | ) | (0.38 | ) | – | (0.40 | ) | – | 10.76 | (4.17 | ) | 4,266,754 | 0.90 | 0.90 | 0.90 | 0.11 | 20 | |||||||||||||||||||||||||||||||||||||||||||||
| Royce Pennsylvania Mutual Fund–Service Class | ||||||||||||||||||||||||||||||||||||||||||||||||||||||||||||||||||||
| 2016† | $ | 9.35 | $ | 0.01 | $ | 0.68 | $ | 0.69 | $ | – | $ | – | $ | – | $ | – | $ | – | $ | 10.04 | 7.38 | %1 | $ | 82,352 | 1.34 | %2 | 1.34 | %2 | 1.34 | %2 | 0.12 | %2 | 9 | % | ||||||||||||||||||||||||||||||||||
| 2015 | 12.96 | 0.05 | (1.56 | ) | (1.51 | ) | (0.02 | ) | (2.08 | ) | – | (2.10 | ) | – | 9.35 | (11.57 | ) | 102,341 | 1.23 | 1.23 | 1.23 | 0.29 | 21 | |||||||||||||||||||||||||||||||||||||||||||||
| 2014 | 14.69 | 0.00 | (0.19 | ) | (0.19 | ) | – | (1.54 | ) | – | (1.54 | ) | – | 12.96 | (1.04 | ) | 333,548 | 1.23 | 1.23 | 1.23 | 0.03 | 21 | ||||||||||||||||||||||||||||||||||||||||||||||
| 2013 | 11.51 | (0.01 | ) | 3.98 | 3.97 | – | (0.79 | ) | – | (0.79 | ) | – | 14.69 | 34.77 | 591,534 | 1.25 | 1.25 | 1.25 | (0.08 | ) | 26 | |||||||||||||||||||||||||||||||||||||||||||||||
| 2012 | 10.75 | 0.10 | 1.40 | 1.50 | (0.09 | ) | (0.65 | ) | – | (0.74 | ) | – | 11.51 | 14.15 | 473,624 | 1.24 | 1.24 | 1.24 | 0.90 | 22 | ||||||||||||||||||||||||||||||||||||||||||||||||
| 2011 | 11.65 | (0.02 | ) | (0.50 | ) | (0.52 | ) | – | (0.38 | ) | – | (0.38 | ) | – | 10.75 | (4.42 | ) | 406,052 | 1.19 | 1.19 | 1.19 | (0.18 | ) | 20 | ||||||||||||||||||||||||||||||||||||||||||||
| Royce Pennsylvania Mutual Fund–Consultant Class | ||||||||||||||||||||||||||||||||||||||||||||||||||||||||||||||||||||
| 2016† | $ | 7.70 | $ | (0.02 | ) | $ | 0.56 | $ | 0.54 | $ | – | $ | – | $ | – | $ | – | $ | – | $ | 8.24 | 7.01 | %1 | $ | 389,435 | 1.97 | %2 | 1.97 | %2 | 1.97 | %2 | (0.50 | )%2 | 9 | % | |||||||||||||||||||||||||||||||||
| 2015 | 11.16 | (0.05 | ) | (1.33 | ) | (1.38 | ) | – | (2.08 | ) | – | (2.08 | ) | – | 7.70 | (12.31 | ) | 416,862 | 1.94 | 1.94 | 1.94 | (0.44 | ) | 21 | ||||||||||||||||||||||||||||||||||||||||||||
| 2014 | 12.96 | (0.08 | ) | (0.18 | ) | (0.26 | ) | – | (1.54 | ) | – | (1.54 | ) | – | 11.16 | (1.72 | ) | 676,347 | 1.91 | 1.91 | 1.91 | (0.64 | ) | 21 | ||||||||||||||||||||||||||||||||||||||||||||
| 2013 | 10.29 | (0.09 | ) | 3.55 | 3.46 | – | (0.79 | ) | – | (0.79 | ) | – | 12.96 | 33.94 | 788,017 | 1.94 | 1.94 | 1.94 | (0.78 | ) | 26 | |||||||||||||||||||||||||||||||||||||||||||||||
| 2012 | 9.69 | 0.01 | 1.25 | 1.26 | (0.01 | ) | (0.65 | ) | – | (0.66 | ) | – | 10.29 | 13.27 | 654,642 | 1.97 | 1.97 | 1.97 | 0.12 | 22 | ||||||||||||||||||||||||||||||||||||||||||||||||
| 2011 | 10.61 | (0.09 | ) | (0.45 | ) | (0.54 | ) | – | (0.38 | ) | – | (0.38 | ) | – | 9.69 | (5.05 | ) | 664,778 | 1.85 | 1.85 | 1.85 | (0.85 | ) | 20 | ||||||||||||||||||||||||||||||||||||||||||||
| Royce Pennsylvania Mutual Fund–Institutional Class i | ||||||||||||||||||||||||||||||||||||||||||||||||||||||||||||||||||||
| 2016† | $ | 9.34 | $ | 0.03 | $ | 0.69 | $ | 0.72 | $ | – | $ | – | $ | – | $ | – | $ | – | $ | 10.06 | 7.71 | %1 | $ | 510,723 | 0.84 | %2 | 0.84 | %2 | 0.84 | %2 | 0.63 | %2 | 9 | % | ||||||||||||||||||||||||||||||||||
| 2015 | 13.02 | 0.11 | (1.60 | ) | (1.49 | ) | (0.11 | ) | (2.08 | ) | – | (2.19 | ) | – | 9.34 | (11.34 | ) | 498,374 | 0.81 | 0.81 | 0.81 | 0.68 | 21 | |||||||||||||||||||||||||||||||||||||||||||||
| 2014 | 14.75 | 0.07 | (0.20 | ) | (0.13 | ) | (0.06 | ) | (1.54 | ) | – | (1.60 | ) | – | 13.02 | (0.58 | ) | 802,517 | 0.79 | 0.79 | 0.79 | 0.48 | 21 | |||||||||||||||||||||||||||||||||||||||||||||
| 2013 | 11.52 | 0.05 | 3.99 | 4.04 | (0.02 | ) | (0.79 | ) | – | (0.81 | ) | – | 14.75 | 35.34 | 818,212 | 0.79 | 0.79 | 0.79 | 0.40 | 26 | ||||||||||||||||||||||||||||||||||||||||||||||||
| 2012 | 10.79 | 0.13 | 1.43 | 1.56 | (0.18 | ) | (0.65 | ) | – | (0.83 | ) | – | 11.52 | 14.72 | 488,052 | 0.80 | 0.80 | 0.80 | 1.53 | 22 | ||||||||||||||||||||||||||||||||||||||||||||||||
| 2011 | 12.19 | 0.03 | (1.05 | ) | (1.02 | ) | – | (0.38 | ) | – | (0.38 | ) | – | 10.79 | (8.33 | )1 | 241,951 | 0.78 | 2 | 0.78 | 2 | 0.78 | 2 | 0.46 | 2 | 20 | ||||||||||||||||||||||||||||||||||||||||||
| Royce Pennsylvania Mutual Fund–R Class | ||||||||||||||||||||||||||||||||||||||||||||||||||||||||||||||||||||
| 2016† | $ | 8.90 | $ | (0.01 | ) | $ | 0.65 | $ | 0.64 | $ | – | $ | – | $ | – | $ | – | $ | – | $ | 9.54 | 7.19 | %1 | $ | 16,777 | 1.67 | %2 | 1.67 | %2 | 1.67 | %2 | (0.21 | )%2 | 9 | % | |||||||||||||||||||||||||||||||||
| 2015 | 12.50 | (0.02 | ) | (1.50 | ) | (1.52 | ) | – | (2.08 | ) | – | (2.08 | ) | – | 8.90 | (12.10 | ) | 18,675 | 1.65 | 1.65 | 1.65 | (0.15 | ) | 21 | ||||||||||||||||||||||||||||||||||||||||||||
| 2014 | 14.26 | (0.03 | ) | (0.19 | ) | (0.22 | ) | – | (1.54 | ) | – | (1.54 | ) | – | 12.50 | (1.28 | ) | 36,622 | 1.48 | 1.48 | 1.48 | (0.21 | ) | 21 | ||||||||||||||||||||||||||||||||||||||||||||
| 2013 | 11.22 | (0.05 | ) | 3.88 | 3.83 | – | (0.79 | ) | – | (0.79 | ) | – | 14.26 | 34.42 | 44,094 | 1.56 | 1.56 | 1.56 | (0.39 | ) | 26 | |||||||||||||||||||||||||||||||||||||||||||||||
| 2012 | 10.50 | 0.07 | 1.35 | 1.42 | (0.05 | ) | (0.65 | ) | – | (0.70 | ) | – | 11.22 | 13.79 | 32,977 | 1.50 | 1.50 | 1.50 | 0.70 | 22 | ||||||||||||||||||||||||||||||||||||||||||||||||
| 2011 | 11.43 | (0.05 | ) | (0.50 | ) | (0.55 | ) | – | (0.38 | ) | – | (0.38 | ) | – | 10.50 | (4.77 | ) | 22,542 | 1.51 | 1.51 | 1.51 | (0.47 | ) | 20 | ||||||||||||||||||||||||||||||||||||||||||||
| THE ACCOMPANYING NOTES ARE AN INTEGRAL PART OF THESE FINANCIAL STATEMENTS | The Royce Funds 2016 Semiannual Report to Shareholders | 105 |
Financial Highlights
This table is presented to show selected data for a share outstanding throughout each period and to assist shareholders in evaluating a Fund’s performance for the periods presented. Per share amounts have been determined on the basis of the weighted average number of shares outstanding during the period.
| Ratio of Expenses to Average Net Assets | Ratio of Net | |||||||||||||||||||||||||||||||||||||||||||||||||||||||||||||||||||
| Net Asset | Net Realized and | Distributions | Distributions from | Prior to Fee | Investment | |||||||||||||||||||||||||||||||||||||||||||||||||||||||||||||||
| Value, | Unrealized Gain (Loss) | Total from | from Net | Net Realized Gain | Distributions | Shareholder | Net Asset | Net Assets, | Waivers and | Income (Loss) to | ||||||||||||||||||||||||||||||||||||||||||||||||||||||||||
| Beginning of | Net Investment | on Investments and | Investment | Investment | on Investments and | from Return of | Total | Redemption | Value, End of | End of Period | Balance | Prior to Fee | Net of Fee | Average Net | Portfolio | |||||||||||||||||||||||||||||||||||||||||||||||||||||
| Period | Income (Loss) | Foreign Currency | Operations | Income | Foreign Currency | Capital | Distributions | Fees | Period | Total Return | (in thousands) | Credits | Waivers | Waivers | Assets | Turnover Rate | ||||||||||||||||||||||||||||||||||||||||||||||||||||
| Royce Pennsylvania Mutual Fund–K Class | ||||||||||||||||||||||||||||||||||||||||||||||||||||||||||||||||||||
| 2016† | $ | 7.86 | $ | (0.02 | ) | $ | 0.58 | $ | 0.56 | $ | – | $ | – | $ | – | $ | – | $ | – | $ | 8.42 | 7.12 | %1 | $ | 2,876 | 1.91 | %2 | 1.91 | %2 | 1.91 | %2 | (0.44 | )%2 | 9 | % | |||||||||||||||||||||||||||||||||
| 2015 | 11.30 | (0.00 | ) | (1.36 | ) | (1.36 | ) | – | (2.08 | ) | – | (2.08 | ) | – | 7.86 | (11.95 | ) | 4,140 | 1.51 | 1.51 | 1.51 | (0.01 | ) | 21 | ||||||||||||||||||||||||||||||||||||||||||||
| 2014 | 13.04 | (0.02 | ) | (0.18 | ) | (0.20 | ) | – | (1.54 | ) | – | (1.54 | ) | – | 11.30 | (1.24 | ) | 10,707 | 1.42 | 1.42 | 1.42 | (0.15 | ) | 21 | ||||||||||||||||||||||||||||||||||||||||||||
| 2013 | 10.29 | (0.02 | ) | 3.56 | 3.54 | – | (0.79 | ) | – | (0.79 | ) | – | 13.04 | 34.72 | 11,685 | 1.37 | 1.37 | 1.37 | (0.19 | ) | 26 | |||||||||||||||||||||||||||||||||||||||||||||||
| 2012 | 9.68 | 0.09 | 1.24 | 1.33 | (0.07 | ) | (0.65 | ) | – | (0.72 | ) | – | 10.29 | 14.04 | 8,849 | 1.26 | 1.26 | 1.26 | 0.94 | 22 | ||||||||||||||||||||||||||||||||||||||||||||||||
| 2011 | 10.57 | (0.05 | ) | (0.46 | ) | (0.51 | ) | – | (0.38 | ) | – | (0.38 | ) | – | 9.68 | (4.78 | ) | 5,800 | 1.55 | 1.55 | 1.55 | (0.49 | ) | 20 | ||||||||||||||||||||||||||||||||||||||||||||
| Royce Premier Fund–Investment Class | ||||||||||||||||||||||||||||||||||||||||||||||||||||||||||||||||||||
| 2016† | $ | 14.28 | $ | 0.03 | $ | 0.90 | $ | 0.93 | $ | – | $ | – | $ | – | $ | – | $ | – | $ | 15.21 | 6.51 | %1 | $ | 1,734,205 | 1.21 | %2 | 1.21 | %2 | 1.21 | %2 | 0.43 | %2 | 11 | % | ||||||||||||||||||||||||||||||||||
| 2015 | 19.72 | 0.13 | (2.11 | ) | (1.98 | ) | (0.13 | ) | (3.33 | ) | – | (3.46 | ) | – | 14.28 | (9.90 | ) | 2,015,905 | 1.13 | 1.13 | 1.13 | 0.49 | 13 | |||||||||||||||||||||||||||||||||||||||||||||
| 2014 | 22.11 | 0.08 | (0.32 | ) | (0.24 | ) | (0.08 | ) | (2.07 | ) | – | (2.15 | ) | – | 19.72 | (0.86 | ) | 4,097,961 | 1.10 | 1.10 | 1.10 | 0.34 | 9 | |||||||||||||||||||||||||||||||||||||||||||||
| 2013 | 19.16 | 0.00 | 5.22 | 5.22 | – | (2.27 | ) | – | (2.27 | ) | – | 22.11 | 27.73 | 5,096,793 | 1.09 | 1.09 | 1.09 | 0.02 | 11 | |||||||||||||||||||||||||||||||||||||||||||||||||
| 2012 | 18.52 | 0.24 | 1.85 | 2.09 | (0.24 | ) | (1.21 | ) | – | (1.45 | ) | – | 19.16 | 11.45 | 4,629,272 | 1.06 | 1.06 | 1.06 | 1.19 | 7 | ||||||||||||||||||||||||||||||||||||||||||||||||
| 2011 | 20.35 | (0.02 | ) | (0.17 | ) | (0.19 | ) | (0.05 | ) | (1.59 | ) | – | (1.64 | ) | – | 18.52 | (0.86 | ) | 4,539,127 | 1.09 | 1.09 | 1.09 | (0.11 | ) | 18 | |||||||||||||||||||||||||||||||||||||||||||
| Royce Premier Fund–Service Class | ||||||||||||||||||||||||||||||||||||||||||||||||||||||||||||||||||||
| 2016† | $ | 13.98 | $ | 0.01 | $ | 0.88 | $ | 0.89 | $ | – | $ | – | $ | – | $ | – | $ | – | $ | 14.87 | 6.37 | %1 | $ | 45,057 | 1.60 | %2 | 1.60 | %2 | 1.49 | %2 | 0.15 | %2 | 11 | % | ||||||||||||||||||||||||||||||||||
| 2015 | 19.33 | 0.06 | (2.04 | ) | (1.98 | ) | (0.04 | ) | (3.33 | ) | – | (3.37 | ) | – | 13.98 | (10.13 | ) | 61,969 | 1.44 | 1.43 | 1.43 | 0.23 | 13 | |||||||||||||||||||||||||||||||||||||||||||||
| 2014 | 21.70 | 0.01 | (0.31 | ) | (0.30 | ) | – | (2.07 | ) | – | (2.07 | ) | – | 19.33 | (1.16 | ) | 172,810 | 1.38 | 1.38 | 1.38 | 0.05 | 9 | ||||||||||||||||||||||||||||||||||||||||||||||
| 2013 | 18.89 | (0.07 | ) | 5.15 | 5.08 | – | (2.27 | ) | – | (2.27 | ) | – | 21.70 | 27.39 | 318,860 | 1.38 | 1.38 | 1.38 | (0.33 | ) | 11 | |||||||||||||||||||||||||||||||||||||||||||||||
| 2012 | 18.23 | 0.19 | 1.81 | 2.00 | (0.13 | ) | (1.21 | ) | – | (1.34 | ) | – | 18.89 | 11.14 | 560,553 | 1.33 | 1.33 | 1.32 | 0.92 | 7 | ||||||||||||||||||||||||||||||||||||||||||||||||
| 2011 | 20.07 | (0.07 | ) | (0.16 | ) | (0.23 | ) | (0.02 | ) | (1.59 | ) | – | (1.61 | ) | – | 18.23 | (1.07 | ) | 628,824 | 1.34 | 1.34 | 1.32 | (0.33 | ) | 18 | |||||||||||||||||||||||||||||||||||||||||||
| Royce Premier Fund–Consultant Class | ||||||||||||||||||||||||||||||||||||||||||||||||||||||||||||||||||||
| 2016† | $ | 11.89 | $ | (0.04 | ) | $ | 0.74 | $ | 0.70 | $ | – | $ | – | $ | – | $ | – | $ | – | $ | 12.59 | 5.89 | %1 | $ | 31,123 | 2.25 | %2 | 2.25 | %2 | 2.25 | %2 | (0.61 | )%2 | 11 | % | |||||||||||||||||||||||||||||||||
| 2015 | 17.09 | (0.09 | ) | (1.78 | ) | (1.87 | ) | – | (3.33 | ) | – | (3.33 | ) | – | 11.89 | (10.80 | ) | 32,982 | 2.17 | 2.17 | 2.17 | (0.55 | ) | 13 | ||||||||||||||||||||||||||||||||||||||||||||
| 2014 | 19.58 | (0.13 | ) | (0.29 | ) | (0.42 | ) | – | (2.07 | ) | – | (2.07 | ) | – | 17.09 | (1.92 | ) | 56,884 | 2.10 | 2.10 | 2.10 | (0.66 | ) | 9 | ||||||||||||||||||||||||||||||||||||||||||||
| 2013 | 17.35 | (0.20 | ) | 4.70 | 4.50 | – | (2.27 | ) | – | (2.27 | ) | – | 19.58 | 26.47 | 66,712 | 2.13 | 2.13 | 2.13 | (1.02 | ) | 11 | |||||||||||||||||||||||||||||||||||||||||||||||
| 2012 | 16.87 | 0.02 | 1.69 | 1.71 | (0.02 | ) | (1.21 | ) | – | (1.23 | ) | – | 17.35 | 10.24 | 60,568 | 2.12 | 2.12 | 2.12 | 0.13 | 7 | ||||||||||||||||||||||||||||||||||||||||||||||||
| 2011 | 18.81 | (0.21 | ) | (0.14 | ) | (0.35 | ) | – | (1.59 | ) | – | (1.59 | ) | – | 16.87 | (1.80 | ) | 59,766 | 2.05 | 2.05 | 2.05 | (1.07 | ) | 18 | ||||||||||||||||||||||||||||||||||||||||||||
| Royce Premier Fund–Institutional Class | ||||||||||||||||||||||||||||||||||||||||||||||||||||||||||||||||||||
| 2016† | $ | 14.44 | $ | 0.04 | $ | 0.91 | $ | 0.95 | $ | – | $ | – | $ | – | $ | – | $ | – | $ | 15.39 | 6.58 | %1 | $ | 255,151 | 1.09 | %2 | 1.09 | %2 | 1.09 | %2 | 0.56 | %2 | 11 | % | ||||||||||||||||||||||||||||||||||
| 2015 | 19.91 | 0.16 | (2.14 | ) | (1.98 | ) | (0.16 | ) | (3.33 | ) | – | (3.49 | ) | – | 14.44 | (9.82 | ) | 294,477 | 1.02 | 1.02 | 1.02 | 0.60 | 13 | |||||||||||||||||||||||||||||||||||||||||||||
| 2014 | 22.31 | 0.12 | (0.34 | ) | (0.22 | ) | (0.11 | ) | (2.07 | ) | – | (2.18 | ) | – | 19.91 | (0.79 | ) | 594,463 | 0.98 | 0.98 | 0.98 | 0.45 | 9 | |||||||||||||||||||||||||||||||||||||||||||||
| 2013 | 19.30 | 0.03 | 5.25 | 5.28 | – | (2.27 | ) | – | (2.27 | ) | – | 22.31 | 27.85 | 989,100 | 0.98 | 0.98 | 0.98 | 0.13 | 11 | |||||||||||||||||||||||||||||||||||||||||||||||||
| 2012 | 18.66 | 0.26 | 1.87 | 2.13 | (0.28 | ) | (1.21 | ) | – | (1.49 | ) | – | 19.30 | 11.57 | 866,277 | 0.98 | 0.98 | 0.98 | 1.30 | 7 | ||||||||||||||||||||||||||||||||||||||||||||||||
| 2011 | 20.49 | 0.00 | (0.16 | ) | (0.16 | ) | (0.08 | ) | (1.59 | ) | – | (1.67 | ) | – | 18.66 | (0.73 | ) | 813,837 | 0.97 | 0.97 | 0.97 | 0.02 | 18 | |||||||||||||||||||||||||||||||||||||||||||||
| 106 | The Royce Funds 2016 Semiannual Report to Shareholders | THE ACCOMPANYING NOTES ARE AN INTEGRAL PART OF THESE FINANCIAL STATEMENTS |
Financial Highlights
This table is presented to show selected data for a share outstanding throughout each period and to assist shareholders in evaluating a Fund’s performance for the periods presented. Per share amounts have been determined on the basis of the weighted average number of shares outstanding during the period.
| Ratio of Expenses to Average Net Assets | Ratio of Net | |||||||||||||||||||||||||||||||||||||||||||||||||||||||||||||||||||
| Net Asset | Net Realized and | Distributions | Distributions from | Prior to Fee | Investment | |||||||||||||||||||||||||||||||||||||||||||||||||||||||||||||||
| Value, | Unrealized Gain (Loss) | Total from | from Net | Net Realized Gain | Distributions | Shareholder | Net Asset | Net Assets, | Waivers and | Income (Loss) to | ||||||||||||||||||||||||||||||||||||||||||||||||||||||||||
| Beginning of | Net Investment | on Investments and | Investment | Investment | on Investments and | from Return of | Total | Redemption | Value, End of | End of Period | Balance | Prior to Fee | Net of Fee | Average Net | Portfolio | |||||||||||||||||||||||||||||||||||||||||||||||||||||
| Period | Income (Loss) | Foreign Currency | Operations | Income | Foreign Currency | Capital | Distributions | Fees | Period | Total Return | (in thousands) | Credits | Waivers | Waivers | Assets | Turnover Rate | ||||||||||||||||||||||||||||||||||||||||||||||||||||
| Royce Premier Fund–W Class | ||||||||||||||||||||||||||||||||||||||||||||||||||||||||||||||||||||
| 2016† | $ | 14.32 | $ | 0.03 | $ | 0.90 | $ | 0.93 | $ | – | $ | – | $ | – | $ | – | $ | – | $ | 15.25 | 6.49 | %1 | $ | 162,940 | 1.21 | %2 | 1.21 | %2 | 1.21 | %2 | 0.44 | %2 | 11 | % | ||||||||||||||||||||||||||||||||||
| 2015 | 19.76 | 0.14 | (2.12 | ) | (1.98 | ) | (0.13 | ) | (3.33 | ) | – | (3.46 | ) | – | 14.32 | (9.88 | ) | 192,785 | 1.12 | 1.12 | 1.12 | 0.51 | 13 | |||||||||||||||||||||||||||||||||||||||||||||
| 2014 | 22.16 | 0.09 | (0.33 | ) | (0.24 | ) | (0.09 | ) | (2.07 | ) | – | (2.16 | ) | – | 19.76 | (0.89 | ) | 446,380 | 1.07 | 1.07 | 1.07 | 0.36 | 9 | |||||||||||||||||||||||||||||||||||||||||||||
| 2013 | 19.20 | 0.00 | 5.23 | 5.23 | – | (2.27 | ) | – | (2.27 | ) | – | 22.16 | 27.73 | 552,732 | 1.09 | 1.09 | 1.09 | 0.01 | 11 | |||||||||||||||||||||||||||||||||||||||||||||||||
| 2012 | 18.57 | 0.25 | 1.85 | 2.10 | (0.26 | ) | (1.21 | ) | – | (1.47 | ) | – | 19.20 | 11.46 | 533,763 | 1.05 | 1.05 | 1.05 | 1.19 | 7 | ||||||||||||||||||||||||||||||||||||||||||||||||
| 2011 | 20.40 | (0.01 | ) | (0.15 | ) | (0.16 | ) | (0.08 | ) | (1.59 | ) | – | (1.67 | ) | – | 18.57 | (0.75 | ) | 549,648 | 1.00 | 1.00 | 1.00 | (0.01 | ) | 18 | |||||||||||||||||||||||||||||||||||||||||||
| Royce Premier Fund–R Class | ||||||||||||||||||||||||||||||||||||||||||||||||||||||||||||||||||||
| 2016† | $ | 13.49 | $ | (0.02 | ) | $ | 0.85 | $ | 0.83 | $ | – | $ | – | $ | – | $ | – | $ | – | $ | 14.32 | 6.15 | %1 | $ | 14,482 | 1.87 | %2 | 1.87 | %2 | 1.87 | %2 | (0.23 | )%2 | 11 | % | |||||||||||||||||||||||||||||||||
| 2015 | 18.82 | (0.03 | ) | (1.97 | ) | (2.00 | ) | – | (3.33 | ) | – | (3.33 | ) | – | 13.49 | (10.50 | ) | 16,129 | 1.78 | 1.78 | 1.78 | (0.16 | ) | 13 | ||||||||||||||||||||||||||||||||||||||||||||
| 2014 | 21.25 | (0.06 | ) | (0.30 | ) | (0.36 | ) | – | (2.07 | ) | – | (2.07 | ) | – | 18.82 | (1.48 | ) | 27,355 | 1.71 | 1.71 | 1.71 | (0.28 | ) | 9 | ||||||||||||||||||||||||||||||||||||||||||||
| 2013 | 18.61 | (0.13 | ) | 5.04 | 4.91 | – | (2.27 | ) | – | (2.27 | ) | – | 21.25 | 26.88 | 32,577 | 1.74 | 1.74 | 1.74 | (0.63 | ) | 11 | |||||||||||||||||||||||||||||||||||||||||||||||
| 2012 | 17.99 | 0.11 | 1.80 | 1.91 | (0.08 | ) | (1.21 | ) | – | (1.29 | ) | – | 18.61 | 10.75 | 28,632 | 1.68 | 1.68 | 1.68 | 0.57 | 7 | ||||||||||||||||||||||||||||||||||||||||||||||||
| 2011 | 19.91 | (0.14 | ) | (0.15 | ) | (0.29 | ) | (0.04 | ) | (1.59 | ) | – | (1.63 | ) | – | 17.99 | (1.38 | ) | 23,653 | 1.66 | 1.66 | 1.66 | (0.63 | ) | 18 | |||||||||||||||||||||||||||||||||||||||||||
| Royce Premier Fund–K Class | ||||||||||||||||||||||||||||||||||||||||||||||||||||||||||||||||||||
| 2016† | $ | 1.70 | $ | (0.00 | ) | $ | 0.11 | $ | 0.11 | $ | – | $ | – | $ | – | $ | – | $ | – | $ | 1.81 | 6.47 | %1 | $ | 1,971 | 2.25 | %2 | 2.25 | %2 | 1.99 | %2 | (0.35 | )%2 | 11 | % | |||||||||||||||||||||||||||||||||
| 2015 | 5.76 | 0.02 | (0.65 | ) | (0.63 | ) | (0.10 | ) | (3.33 | ) | – | (3.43 | ) | – | 1.70 | (10.58 | ) | 2,819 | 1.84 | 1.84 | 1.84 | (0.21 | ) | 13 | ||||||||||||||||||||||||||||||||||||||||||||
| 2014 | 8.04 | (0.01 | ) | (0.15 | ) | (0.16 | ) | (0.05 | ) | (2.07 | ) | – | (2.12 | ) | – | 5.76 | (1.50 | ) | 6,306 | 1.69 | 1.69 | 1.69 | (0.25 | ) | 9 | |||||||||||||||||||||||||||||||||||||||||||
| 2013 | 8.19 | (0.04 | ) | 2.16 | 2.12 | – | (2.27 | ) | – | (2.27 | ) | – | 8.04 | 27.01 | 8,640 | 1.59 | 1.59 | 1.59 | (0.50 | ) | 11 | |||||||||||||||||||||||||||||||||||||||||||||||
| 2012 | 8.67 | 0.08 | 0.85 | 0.93 | (0.20 | ) | (1.21 | ) | – | (1.41 | ) | – | 8.19 | 11.00 | 9,707 | 1.47 | 1.47 | 1.47 | 0.79 | 7 | ||||||||||||||||||||||||||||||||||||||||||||||||
| 2011 | 10.46 | (0.05 | ) | (0.09 | ) | (0.14 | ) | (0.06 | ) | (1.59 | ) | – | (1.65 | ) | – | 8.67 | (1.20 | ) | 8,776 | 1.49 | 1.49 | 1.49 | (0.46 | ) | 18 | |||||||||||||||||||||||||||||||||||||||||||
| Royce Small-Cap Leaders Fund–Investment Class | ||||||||||||||||||||||||||||||||||||||||||||||||||||||||||||||||||||
| 2016† | $ | 6.28 | $ | 0.03 | $ | 0.35 | $ | 0.38 | $ | – | $ | – | $ | – | $ | – | $ | – | $ | 6.66 | 6.05 | %1 | $ | 45,159 | 1.28 | %2 | 1.28 | %2 | 1.24 | %2 | 0.85 | %2 | 26 | % | ||||||||||||||||||||||||||||||||||
| 2015 | 8.74 | 0.03 | (1.09 | ) | (1.06 | ) | (0.04 | ) | (1.36 | ) | – | (1.40 | ) | – | 6.28 | (12.21 | ) | 50,410 | 1.24 | 1.24 | 1.24 | 0.40 | 64 | |||||||||||||||||||||||||||||||||||||||||||||
| 2014 | 10.11 | (0.00 | ) | (0.32 | ) | (0.32 | ) | – | (1.05 | ) | – | (1.05 | ) | – | 8.74 | (2.95 | ) | 68,898 | 1.22 | 1.22 | 1.22 | (0.03 | ) | 39 | ||||||||||||||||||||||||||||||||||||||||||||
| 2013 | 8.85 | (0.00 | ) | 2.71 | 2.71 | (0.03 | ) | (1.42 | ) | – | (1.45 | ) | – | 10.11 | 31.24 | 60,156 | 1.20 | 1.20 | 1.20 | (0.07 | ) | 31 | ||||||||||||||||||||||||||||||||||||||||||||||
| 2012 | 8.74 | 0.12 | 0.88 | 1.00 | (0.15 | ) | (0.74 | ) | – | (0.89 | ) | – | 8.85 | 11.78 | 68,395 | 1.19 | 1.19 | 1.19 | 1.31 | 13 | ||||||||||||||||||||||||||||||||||||||||||||||||
| 2011 | 9.82 | (0.03 | ) | (0.60 | ) | (0.63 | ) | (0.00 | ) | (0.45 | ) | – | (0.45 | ) | – | 8.74 | (6.31 | ) | 63,012 | 1.17 | 1.17 | 1.17 | (0.27 | ) | 27 | |||||||||||||||||||||||||||||||||||||||||||
| Royce Small-Cap Leaders Fund–Service Class | ||||||||||||||||||||||||||||||||||||||||||||||||||||||||||||||||||||
| 2016† | $ | 6.21 | $ | 0.02 | $ | 0.35 | $ | 0.37 | $ | – | $ | – | $ | – | $ | – | $ | – | $ | 6.58 | 5.96 | %1 | $ | 49,099 | 1.66 | %2 | 1.66 | %2 | 1.49 | %2 | 0.62 | %2 | 26 | % | ||||||||||||||||||||||||||||||||||
| 2015 | 8.65 | 0.02 | (1.09 | ) | (1.07 | ) | (0.01 | ) | (1.36 | ) | – | (1.37 | ) | – | 6.21 | (12.50 | ) | 57,729 | 1.54 | 1.54 | 1.49 | 0.18 | 64 | |||||||||||||||||||||||||||||||||||||||||||||
| 2014 | 10.05 | (0.04 | ) | (0.31 | ) | (0.35 | ) | – | (1.05 | ) | – | (1.05 | ) | – | 8.65 | (3.26 | ) | 149,736 | 1.52 | 1.52 | 1.50 | (0.39 | ) | 39 | ||||||||||||||||||||||||||||||||||||||||||||
| 2013 | 8.81 | (0.04 | ) | 2.70 | 2.66 | (0.00 | ) | (1.42 | ) | – | (1.42 | ) | – | 10.05 | 30.85 | 231,879 | 1.50 | 1.50 | 1.48 | (0.36 | ) | 31 | ||||||||||||||||||||||||||||||||||||||||||||||
| 2012 | 8.67 | 0.11 | 0.86 | 0.97 | (0.09 | ) | (0.74 | ) | – | (0.83 | ) | – | 8.81 | 11.52 | 220,674 | 1.46 | 1.46 | 1.42 | 1.03 | 13 | ||||||||||||||||||||||||||||||||||||||||||||||||
| 2011 | 9.76 | (0.05 | ) | (0.59 | ) | (0.64 | ) | – | (0.45 | ) | – | (0.45 | ) | – | 8.67 | (6.52 | ) | 310,825 | 1.47 | 1.47 | 1.42 | (0.53 | ) | 27 | ||||||||||||||||||||||||||||||||||||||||||||
| THE ACCOMPANYING NOTES ARE AN INTEGRAL PART OF THESE FINANCIAL STATEMENTS | The Royce Funds 2016 Semiannual Report to Shareholders | 107 |
Financial Highlights
This table is presented to show selected data for a share outstanding throughout each period and to assist shareholders in evaluating a Fund’s performance for the periods presented. Per share amounts have been determined on the basis of the weighted average number of shares outstanding during the period.
| Ratio of Expenses to Average Net Assets | Ratio of Net | |||||||||||||||||||||||||||||||||||||||||||||||||||||||||||||||||||
| Net Asset | Net Realized and | Distributions | Distributions from | Prior to Fee | Investment | |||||||||||||||||||||||||||||||||||||||||||||||||||||||||||||||
| Value, | Unrealized Gain (Loss) | Total from | from Net | Net Realized Gain | Distributions | Shareholder | Net Asset | Net Assets, | Waivers and | Income (Loss) to | ||||||||||||||||||||||||||||||||||||||||||||||||||||||||||
| Beginning of | Net Investment | on Investments and | Investment | Investment | on Investments and | from Return of | Total | Redemption | Value, End of | End of Period | Balance | Prior to Fee | Net of Fee | Average Net | Portfolio | |||||||||||||||||||||||||||||||||||||||||||||||||||||
| Period | Income (Loss) | Foreign Currency | Operations | Income | Foreign Currency | Capital | Distributions | Fees | Period | Total Return | (in thousands) | Credits | Waivers | Waivers | Assets | Turnover Rate | ||||||||||||||||||||||||||||||||||||||||||||||||||||
| Royce Small-Cap Leaders Fund–R Class | ||||||||||||||||||||||||||||||||||||||||||||||||||||||||||||||||||||
| 2016† | $ | 8.36 | $ | 0.01 | $ | 0.48 | $ | 0.49 | $ | – | $ | – | $ | – | $ | – | $ | – | $ | 8.85 | 5.86 | %1 | $ | 1,499 | 2.96 | %2 | 2.96 | %2 | 1.84 | %2 | 0.24 | %2 | 26 | % | ||||||||||||||||||||||||||||||||||
| 2015 | 11.14 | (0.02 | ) | (1.40 | ) | (1.42 | ) | – | (1.36 | ) | – | (1.36 | ) | – | 8.36 | (12.84 | ) | 1,681 | 2.75 | 2.75 | 1.84 | (0.22 | ) | 64 | ||||||||||||||||||||||||||||||||||||||||||||
| 2014 | 12.67 | (0.09 | ) | (0.39 | ) | (0.48 | ) | – | (1.05 | ) | – | (1.05 | ) | – | 11.14 | (3.61 | ) | 1,983 | 2.23 | 2.23 | 1.84 | (0.73 | ) | 39 | ||||||||||||||||||||||||||||||||||||||||||||
| 2013 | 10.84 | (0.09 | ) | 3.34 | 3.25 | – | (1.42 | ) | – | (1.42 | ) | – | 12.67 | 30.45 | 2,807 | 2.28 | 2.28 | 1.84 | (0.72 | ) | 31 | |||||||||||||||||||||||||||||||||||||||||||||||
| 2012 | 10.46 | 0.05 | 1.07 | 1.12 | – | (0.74 | ) | – | (0.74 | ) | – | 10.84 | 10.95 | 2,554 | 2.57 | 2.57 | 1.84 | 0.46 | 13 | |||||||||||||||||||||||||||||||||||||||||||||||||
| 2011 | 11.72 | (0.10 | ) | (0.71 | ) | (0.81 | ) | – | (0.45 | ) | – | (0.45 | ) | – | 10.46 | (6.88 | ) | 3,469 | 2.70 | 2.69 | 1.84 | (0.88 | ) | 27 | ||||||||||||||||||||||||||||||||||||||||||||
| Royce Small-Cap Leaders Fund–K Class | ||||||||||||||||||||||||||||||||||||||||||||||||||||||||||||||||||||
| 2016† | $ | 8.56 | $ | 0.02 | $ | 0.49 | $ | 0.51 | $ | – | $ | – | $ | – | $ | – | $ | – | $ | 9.07 | 5.96 | %1 | $ | 417 | 6.35 | %2 | 6.35 | %2 | 1.59 | %2 | 0.45 | %2 | 26 | % | ||||||||||||||||||||||||||||||||||
| 2015 | 11.34 | 0.01 | (1.43 | ) | (1.42 | ) | – | (1.36 | ) | – | (1.36 | ) | – | 8.56 | (12.60 | ) | 340 | 5.02 | 5.02 | 1.59 | 0.05 | 64 | ||||||||||||||||||||||||||||||||||||||||||||||
| 2014 | 12.84 | (0.07 | ) | (0.38 | ) | (0.45 | ) | – | (1.05 | ) | – | (1.05 | ) | – | 11.34 | (3.33 | ) | 672 | 2.98 | 2.98 | 1.59 | (0.53 | ) | 39 | ||||||||||||||||||||||||||||||||||||||||||||
| 2013 | 10.95 | (0.06 | ) | 3.37 | 3.31 | – | (1.42 | ) | – | (1.42 | ) | – | 12.84 | 30.69 | 2,320 | 1.78 | 1.78 | 1.59 | (0.50 | ) | 31 | |||||||||||||||||||||||||||||||||||||||||||||||
| 2012 | 10.56 | 0.11 | 1.06 | 1.17 | (0.04 | ) | (0.74 | ) | – | (0.78 | ) | – | 10.95 | 11.37 | 3,554 | 1.68 | 1.68 | 1.59 | 0.88 | 13 | ||||||||||||||||||||||||||||||||||||||||||||||||
| 2011 | 11.81 | (0.08 | ) | (0.72 | ) | (0.80 | ) | – | (0.45 | ) | – | (0.45 | ) | – | 10.56 | (6.75 | ) | 4,447 | 1.66 | 1.66 | 1.59 | (0.68 | ) | 27 | ||||||||||||||||||||||||||||||||||||||||||||
| Royce Small-Cap Value Fund–Investment Class | ||||||||||||||||||||||||||||||||||||||||||||||||||||||||||||||||||||
| 2016† | $ | 8.74 | $ | 0.03 | $ | 0.26 | $ | 0.29 | $ | – | $ | – | $ | – | $ | – | $ | – | $ | 9.03 | 3.32 | %1 | $ | 72,138 | 1.27 | %2 | 1.27 | %2 | 1.24 | %2 | 0.67 | %2 | 27 | % | ||||||||||||||||||||||||||||||||||
| 2015 | 11.81 | 0.10 | (1.43 | ) | (1.33 | ) | (0.09 | ) | (1.65 | ) | – | (1.74 | ) | – | 8.74 | (11.25 | ) | 77,821 | 1.23 | 1.23 | 1.23 | 0.69 | 60 | |||||||||||||||||||||||||||||||||||||||||||||
| 2014 | 13.52 | 0.04 | (0.05 | ) | (0.01 | ) | (0.03 | ) | (1.67 | ) | – | (1.70 | ) | – | 11.81 | 0.27 | 140,163 | 1.18 | 1.18 | 1.18 | 0.32 | 38 | ||||||||||||||||||||||||||||||||||||||||||||||
| 2013 | 11.37 | 0.02 | 3.13 | 3.15 | (0.03 | ) | (0.97 | ) | – | (1.00 | ) | – | 13.52 | 28.06 | 196,854 | 1.21 | 1.21 | 1.21 | 0.11 | 51 | ||||||||||||||||||||||||||||||||||||||||||||||||
| 2012 | 10.97 | 0.15 | 0.92 | 1.07 | (0.14 | ) | (0.53 | ) | – | (0.67 | ) | – | 11.37 | 9.88 | 206,316 | 1.19 | 1.19 | 1.19 | 1.22 | 25 | ||||||||||||||||||||||||||||||||||||||||||||||||
| 2011 | 12.70 | 0.00 | (0.92 | ) | (0.92 | ) | (0.07 | ) | (0.75 | ) | – | (0.82 | ) | 0.01 | 10.97 | (7.17 | ) | 218,126 | 1.17 | 1.17 | 1.17 | 0.09 | 35 | |||||||||||||||||||||||||||||||||||||||||||||
| Royce Small-Cap Value Fund–Service Class | ||||||||||||||||||||||||||||||||||||||||||||||||||||||||||||||||||||
| 2016† | $ | 8.70 | $ | 0.02 | $ | 0.26 | $ | 0.28 | $ | – | $ | – | $ | – | $ | – | $ | – | $ | 8.98 | 3.22 | %1 | $ | 213,541 | 1.54 | %2 | 1.54 | %2 | 1.49 | %2 | 0.43 | %2 | 27 | % | ||||||||||||||||||||||||||||||||||
| 2015 | 11.76 | 0.06 | (1.41 | ) | (1.35 | ) | (0.06 | ) | (1.65 | ) | – | (1.71 | ) | – | 8.70 | (11.51 | ) | 252,814 | 1.48 | 1.48 | 1.48 | 0.45 | 60 | |||||||||||||||||||||||||||||||||||||||||||||
| 2014 | 13.48 | 0.01 | (0.06 | ) | (0.05 | ) | – | (1.67 | ) | – | (1.67 | ) | – | 11.76 | (0.02 | ) | 477,999 | 1.45 | 1.45 | 1.45 | 0.04 | 38 | ||||||||||||||||||||||||||||||||||||||||||||||
| 2013 | 11.34 | (0.02 | ) | 3.13 | 3.11 | – | (0.97 | ) | – | (0.97 | ) | – | 13.48 | 27.76 | 680,674 | 1.48 | 1.48 | 1.48 | (0.17 | ) | 51 | |||||||||||||||||||||||||||||||||||||||||||||||
| 2012 | 10.94 | 0.12 | 0.91 | 1.03 | (0.10 | ) | (0.53 | ) | – | (0.63 | ) | – | 11.34 | 9.56 | 831,673 | 1.45 | 1.45 | 1.45 | 0.90 | 25 | ||||||||||||||||||||||||||||||||||||||||||||||||
| 2011 | 12.65 | (0.03 | ) | (0.92 | ) | (0.95 | ) | (0.02 | ) | (0.75 | ) | – | (0.77 | ) | 0.01 | 10.94 | (7.41 | ) | 1,083,903 | 1.45 | 1.45 | 1.44 | (0.23 | ) | 35 | |||||||||||||||||||||||||||||||||||||||||||
| Royce Small-Cap Value Fund–Consultant Class | ||||||||||||||||||||||||||||||||||||||||||||||||||||||||||||||||||||
| 2016† | $ | 7.89 | $ | (0.02 | ) | $ | 0.25 | $ | 0.23 | $ | – | $ | – | $ | – | $ | – | $ | – | $ | 8.12 | 2.92 | %1 | $ | 16,610 | 2.31 | %2 | 2.31 | %2 | 2.31 | %2 | (0.39 | )%2 | 27 | % | |||||||||||||||||||||||||||||||||
| 2015 | 10.87 | (0.04 | ) | (1.29 | ) | (1.33 | ) | – | (1.65 | ) | – | (1.65 | ) | – | 7.89 | (12.24 | ) | 18,404 | 2.27 | 2.27 | 2.27 | (0.36 | ) | 60 | ||||||||||||||||||||||||||||||||||||||||||||
| 2014 | 12.68 | (0.09 | ) | (0.05 | ) | (0.14 | ) | – | (1.67 | ) | – | (1.67 | ) | – | 10.87 | (0.74 | ) | 26,716 | 2.21 | 2.21 | 2.21 | (0.71 | ) | 38 | ||||||||||||||||||||||||||||||||||||||||||||
| 2013 | 10.81 | (0.12 | ) | 2.96 | 2.84 | – | (0.97 | ) | – | (0.97 | ) | – | 12.68 | 26.61 | 31,604 | 2.29 | 2.29 | 2.29 | (0.97 | ) | 51 | |||||||||||||||||||||||||||||||||||||||||||||||
| 2012 | 10.46 | 0.02 | 0.89 | 0.91 | (0.03 | ) | (0.53 | ) | – | (0.56 | ) | – | 10.81 | 8.77 | 33,480 | 2.26 | 2.26 | 2.26 | 0.15 | 25 | ||||||||||||||||||||||||||||||||||||||||||||||||
| 2011 | 12.21 | (0.11 | ) | (0.89 | ) | (1.00 | ) | – | (0.75 | ) | – | (0.75 | ) | – | 10.46 | (8.20 | ) | 36,104 | 2.17 | 2.17 | 2.17 | (0.94 | ) | 35 | ||||||||||||||||||||||||||||||||||||||||||||
| 108 | The Royce Funds 2016 Semiannual Report to Shareholders | THE ACCOMPANYING NOTES ARE AN INTEGRAL PART OF THESE FINANCIAL STATEMENTS |
Financial Highlights
This table is presented to show selected data for a share outstanding throughout each period and to assist shareholders in evaluating a Fund’s performance for the periods presented. Per share amounts have been determined on the basis of the weighted average number of shares outstanding during the period.
| Ratio of Expenses to Average Net Assets | Ratio of Net | |||||||||||||||||||||||||||||||||||||||||||||||||||||||||||||||||||
| Net Asset | Net Realized and | Distributions | Distributions from | Prior to Fee | Investment | |||||||||||||||||||||||||||||||||||||||||||||||||||||||||||||||
| Value, | Unrealized Gain (Loss) | Total from | from Net | Net Realized Gain | Distributions | Shareholder | Net Asset | Net Assets, | Waivers and | Income (Loss) to | ||||||||||||||||||||||||||||||||||||||||||||||||||||||||||
| Beginning of | Net Investment | on Investments and | Investment | Investment | on Investments and | from Return of | Total | Redemption | Value, End of | End of Period | Balance | Prior to Fee | Net of Fee | Average Net | Portfolio | |||||||||||||||||||||||||||||||||||||||||||||||||||||
| Period | Income (Loss) | Foreign Currency | Operations | Income | Foreign Currency | Capital | Distributions | Fees | Period | Total Return | (in thousands) | Credits | Waivers | Waivers | Assets | Turnover Rate | ||||||||||||||||||||||||||||||||||||||||||||||||||||
| Royce Small-Cap Value Fund–Institutional Class | ||||||||||||||||||||||||||||||||||||||||||||||||||||||||||||||||||||
| 2016† | $ | 8.74 | $ | 0.04 | $ | 0.26 | $ | 0.30 | $ | – | $ | – | $ | – | $ | – | $ | – | $ | 9.04 | 3.43 | %1 | $ | 152,787 | 1.08 | %2 | 1.08 | %2 | 1.08 | %2 | 0.85 | %2 | 27 | % | ||||||||||||||||||||||||||||||||||
| 2015 | 11.81 | 0.10 | (1.40 | ) | (1.30 | ) | (0.12 | ) | (1.65 | ) | – | (1.77 | ) | – | 8.74 | (11.05 | ) | 148,652 | 1.06 | 1.06 | 1.06 | 0.83 | 60 | |||||||||||||||||||||||||||||||||||||||||||||
| 2014 | 13.53 | 0.06 | (0.06 | ) | 0.00 | (0.05 | ) | (1.67 | ) | – | (1.72 | ) | – | 11.81 | 0.35 | 196,543 | 1.05 | 1.05 | 1.05 | 0.46 | 38 | |||||||||||||||||||||||||||||||||||||||||||||||
| 2013 | 11.38 | 0.04 | 3.13 | 3.17 | (0.05 | ) | (0.97 | ) | – | (1.02 | ) | – | 13.53 | 28.22 | 219,667 | 1.05 | 1.05 | 1.05 | 0.27 | 51 | ||||||||||||||||||||||||||||||||||||||||||||||||
| 2012 | 10.98 | 0.17 | 0.92 | 1.09 | (0.16 | ) | (0.53 | ) | – | (0.69 | ) | – | 11.38 | 10.04 | 202,643 | 1.05 | 1.05 | 1.05 | 1.41 | 25 | ||||||||||||||||||||||||||||||||||||||||||||||||
| 2011 | 12.71 | 0.03 | (0.94 | ) | (0.91 | ) | (0.07 | ) | (0.75 | ) | – | (0.82 | ) | – | 10.98 | (7.12 | ) | 190,591 | 1.04 | 1.04 | 1.04 | 0.19 | 35 | |||||||||||||||||||||||||||||||||||||||||||||
| Royce Small-Cap Value Fund–R Class | ||||||||||||||||||||||||||||||||||||||||||||||||||||||||||||||||||||
| 2016† | $ | 8.42 | $ | 0.00 | $ | 0.25 | $ | 0.25 | $ | – | $ | – | $ | – | $ | – | $ | – | $ | 8.67 | 2.97 | %1 | $ | 16,896 | 1.88 | %2 | 1.88 | %2 | 1.88 | %2 | 0.03 | %2 | 27 | % | ||||||||||||||||||||||||||||||||||
| 2015 | 11.43 | 0.01 | (1.35 | ) | (1.34 | ) | (0.02 | ) | (1.65 | ) | – | (1.67 | ) | – | 8.42 | (11.71 | ) | 19,200 | 1.83 | 1.83 | 1.83 | 0.09 | 60 | |||||||||||||||||||||||||||||||||||||||||||||
| 2014 | 13.19 | (0.03 | ) | (0.06 | ) | (0.09 | ) | – | (1.67 | ) | – | (1.67 | ) | – | 11.43 | (0.34 | ) | 31,043 | 1.77 | 1.77 | 1.77 | (0.26 | ) | 38 | ||||||||||||||||||||||||||||||||||||||||||||
| 2013 | 11.16 | (0.06 | ) | 3.06 | 3.00 | – | (0.97 | ) | – | (0.97 | ) | – | 13.19 | 27.21 | 37,409 | 1.83 | 1.83 | 1.83 | (0.52 | ) | 51 | |||||||||||||||||||||||||||||||||||||||||||||||
| 2012 | 10.78 | 0.07 | 0.91 | 0.98 | (0.07 | ) | (0.53 | ) | – | (0.60 | ) | – | 11.16 | 9.18 | 37,679 | 1.85 | 1.85 | 1.85 | 0.59 | 25 | ||||||||||||||||||||||||||||||||||||||||||||||||
| 2011 | 12.54 | (0.06 | ) | (0.91 | ) | (0.97 | ) | (0.04 | ) | (0.75 | ) | – | (0.79 | ) | – | 10.78 | (7.75 | ) | 34,151 | 1.68 | 1.68 | 1.68 | (0.44 | ) | 35 | |||||||||||||||||||||||||||||||||||||||||||
| Royce Small-Cap Value Fund–K Class | ||||||||||||||||||||||||||||||||||||||||||||||||||||||||||||||||||||
| 2016† | $ | 6.17 | $ | (0.00 | ) | $ | 0.19 | $ | 0.19 | $ | – | $ | – | $ | – | $ | – | $ | – | $ | 6.36 | 3.08 | %1 | $ | 4,716 | 1.98 | %2 | 1.98 | %2 | 1.98 | %2 | (0.06 | )%2 | 27 | % | |||||||||||||||||||||||||||||||||
| 2015 | 8.90 | 0.02 | (1.06 | ) | (1.04 | ) | (0.04 | ) | (1.65 | ) | – | (1.69 | ) | – | �� | 6.17 | (11.69 | ) | 6,026 | 1.80 | 1.80 | 1.80 | 0.11 | 60 | ||||||||||||||||||||||||||||||||||||||||||||
| 2014 | 10.65 | (0.02 | ) | (0.06 | ) | (0.08 | ) | – | (1.67 | ) | – | (1.67 | ) | – | 8.90 | (0.32 | ) | 9,363 | 1.67 | 1.67 | 1.67 | (0.18 | ) | 38 | ||||||||||||||||||||||||||||||||||||||||||||
| 2013 | 9.14 | (0.03 | ) | 2.51 | 2.48 | – | (0.97 | ) | – | (0.97 | ) | – | 10.65 | 27.55 | 16,285 | 1.62 | 1.62 | 1.62 | (0.30 | ) | 51 | |||||||||||||||||||||||||||||||||||||||||||||||
| 2012 | 8.95 | 0.09 | 0.75 | 0.84 | (0.12 | ) | (0.53 | ) | – | (0.65 | ) | – | 9.14 | 9.49 | 18,209 | 1.53 | 1.53 | 1.53 | 0.98 | 25 | ||||||||||||||||||||||||||||||||||||||||||||||||
| 2011 | 10.54 | (0.03 | ) | (0.77 | ) | (0.80 | ) | (0.04 | ) | (0.75 | ) | – | (0.79 | ) | – | 8.95 | (7.54 | ) | 14,079 | 1.54 | 1.54 | 1.54 | (0.33 | ) | 35 | |||||||||||||||||||||||||||||||||||||||||||
| Royce Smaller-Companies Growth Fund–Investment Class | ||||||||||||||||||||||||||||||||||||||||||||||||||||||||||||||||||||
| 2016† | $ | 11.36 | $ | (0.02 | ) | $ | (0.36 | ) | $ | (0.38 | ) | $ | – | $ | – | $ | – | $ | – | $ | – | $ | 10.98 | (3.35 | )%1 | $ | 114,240 | 1.30 | %2 | 1.30 | %2 | 1.24 | %2 | (0.40 | )%2 | 34 | % | |||||||||||||||||||||||||||||||
| 2015 | 14.36 | (0.06 | ) | (0.19 | ) | (0.25 | ) | – | (2.75 | ) | – | (2.75 | ) | – | 11.36 | (1.59 | ) | 139,979 | 1.32 | 1.32 | 1.24 | (0.38 | ) | 45 | ||||||||||||||||||||||||||||||||||||||||||||
| 2014 | 17.03 | (0.07 | ) | 0.68 | 0.61 | – | (3.28 | ) | – | (3.28 | ) | – | 14.36 | 4.04 | 295,412 | 1.33 | 1.33 | 1.33 | (0.40 | ) | 52 | |||||||||||||||||||||||||||||||||||||||||||||||
| 2013 | 13.90 | (0.09 | ) | 4.57 | 4.48 | (0.00 | ) | (1.35 | ) | – | (1.35 | ) | – | 17.03 | 32.59 | 244,269 | 1.37 | 1.37 | 1.37 | (0.59 | ) | 45 | ||||||||||||||||||||||||||||||||||||||||||||||
| 2012 | 12.04 | (0.02 | ) | 1.88 | 1.86 | – | – | – | – | – | 13.90 | 15.45 | 228,016 | 1.27 | 1.27 | 1.27 | (0.14 | ) | 32 | |||||||||||||||||||||||||||||||||||||||||||||||||
| 2011 | 13.52 | (0.06 | ) | (1.27 | ) | (1.33 | ) | (0.15 | ) | – | – | (0.15 | ) | – | 12.04 | (9.79 | ) | 298,073 | 1.13 | 1.13 | 1.13 | (0.42 | ) | 49 | ||||||||||||||||||||||||||||||||||||||||||||
| Royce Smaller-Companies Growth Fund–Service Class | ||||||||||||||||||||||||||||||||||||||||||||||||||||||||||||||||||||
| 2016† | $ | 11.20 | $ | (0.03 | ) | $ | (0.36 | ) | $ | (0.39 | ) | $ | – | $ | – | $ | – | $ | – | $ | – | $ | 10.81 | (3.48 | )%1 | $ | 333,575 | 1.53 | %2 | 1.53 | %2 | 1.49 | %2 | (0.65 | )%2 | 34 | % | |||||||||||||||||||||||||||||||
| 2015 | 14.23 | (0.08 | ) | (0.20 | ) | (0.28 | ) | – | (2.75 | ) | – | (2.75 | ) | – | 11.20 | (1.82 | ) | 408,744 | 1.47 | 1.47 | 1.45 | (0.58 | ) | 45 | ||||||||||||||||||||||||||||||||||||||||||||
| 2014 | 16.93 | (0.09 | ) | 0.67 | 0.58 | – | (3.28 | ) | – | (3.28 | ) | – | 14.23 | 3.89 | 572,899 | 1.44 | 1.44 | 1.42 | (0.51 | ) | 52 | |||||||||||||||||||||||||||||||||||||||||||||||
| 2013 | 13.83 | (0.11 | ) | 4.56 | 4.45 | – | (1.35 | ) | – | (1.35 | ) | – | 16.93 | 32.52 | 835,379 | 1.48 | 1.48 | 1.46 | (0.69 | ) | 45 | |||||||||||||||||||||||||||||||||||||||||||||||
| 2012 | 12.00 | (0.04 | ) | 1.87 | 1.83 | – | – | – | – | – | 13.83 | 15.25 | 966,735 | 1.45 | 1.45 | 1.44 | (0.33 | ) | 32 | |||||||||||||||||||||||||||||||||||||||||||||||||
| 2011 | 13.42 | (0.08 | ) | (1.26 | ) | (1.34 | ) | (0.08 | ) | – | – | (0.08 | ) | – | 12.00 | (9.98 | ) | 1,417,973 | 1.44 | 1.44 | 1.42 | (0.74 | ) | 49 | ||||||||||||||||||||||||||||||||||||||||||||
| THE ACCOMPANYING NOTES ARE AN INTEGRAL PART OF THESE FINANCIAL STATEMENTS | The Royce Funds 2016 Semiannual Report to Shareholders | 109 |
Financial Highlights
This table is presented to show selected data for a share outstanding throughout each period and to assist shareholders in evaluating a Fund’s performance for the periods presented. Per share amounts have been determined on the basis of the weighted average number of shares outstanding during the period.
| Ratio of Expenses to Average Net Assets | Ratio of Net | |||||||||||||||||||||||||||||||||||||||||||||||||||||||||||||||||||
| Net Asset | Net Realized and | Distributions | Distributions from | Prior to Fee | Investment | |||||||||||||||||||||||||||||||||||||||||||||||||||||||||||||||
| Value, | Unrealized Gain (Loss) | Total from | from Net | Net Realized Gain | Distributions | Shareholder | Net Asset | Net Assets, | Waivers and | Income (Loss) to | ||||||||||||||||||||||||||||||||||||||||||||||||||||||||||
| Beginning of | Net Investment | on Investments and | Investment | Investment | on Investments and | from Return of | Total | Redemption | Value, End of | End of Period | Balance | Prior to Fee | Net of Fee | Average Net | Portfolio | |||||||||||||||||||||||||||||||||||||||||||||||||||||
| Period | Income (Loss) | Foreign Currency | Operations | Income | Foreign Currency | Capital | Distributions | Fees | Period | Total Return | (in thousands) | Credits | Waivers | Waivers | Assets | Turnover Rate | ||||||||||||||||||||||||||||||||||||||||||||||||||||
| Royce Smaller-Companies Growth Fund–Consultant Class | ||||||||||||||||||||||||||||||||||||||||||||||||||||||||||||||||||||
| 2016† | $ | 10.01 | $ | (0.06 | ) | $ | (0.32 | ) | $ | (0.38 | ) | $ | – | $ | – | $ | – | $ | – | $ | – | $ | 9.63 | (3.80 | )%1 | $ | 12,166 | 2.37 | %2 | 2.37 | %2 | 2.24 | %2 | (1.40 | )%2 | 34 | % | |||||||||||||||||||||||||||||||
| 2015 | 13.12 | (0.18 | ) | (0.18 | ) | (0.36 | ) | – | (2.75 | ) | – | (2.75 | ) | – | 10.01 | (2.61 | ) | 14,411 | 2.32 | 2.32 | 2.24 | (1.36 | ) | 45 | ||||||||||||||||||||||||||||||||||||||||||||
| 2014 | 15.99 | (0.22 | ) | 0.63 | 0.41 | – | (3.28 | ) | – | (3.28 | ) | – | 13.12 | 3.05 | 17,158 | 2.29 | 2.29 | 2.29 | (1.37 | ) | 52 | |||||||||||||||||||||||||||||||||||||||||||||||
| 2013 | 13.24 | (0.24 | ) | 4.34 | 4.10 | – | (1.35 | ) | – | (1.35 | ) | – | 15.99 | 31.31 | 22,614 | 2.36 | 2.36 | 2.36 | (1.58 | ) | 45 | |||||||||||||||||||||||||||||||||||||||||||||||
| 2012 | 11.60 | (0.15 | ) | 1.79 | 1.64 | – | – | – | – | – | 13.24 | 14.14 | 19,618 | 2.37 | 2.37 | 2.37 | (1.21 | ) | 32 | |||||||||||||||||||||||||||||||||||||||||||||||||
| 2011 | 12.99 | (0.19 | ) | (1.20 | ) | (1.39 | ) | – | – | – | – | – | 11.60 | (10.70 | ) | 20,245 | 2.19 | 2.19 | 2.19 | (1.50 | ) | 49 | ||||||||||||||||||||||||||||||||||||||||||||||
| Royce Smaller-Companies Growth Fund–Institutional Class | ||||||||||||||||||||||||||||||||||||||||||||||||||||||||||||||||||||
| 2016† | $ | 11.48 | $ | (0.02 | ) | $ | (0.36 | ) | $ | (0.38 | ) | $ | – | $ | – | $ | – | $ | – | $ | – | $ | 11.10 | (3.31 | )%1 | $ | 28,179 | 1.14 | %2 | 1.14 | %2 | 1.14 | %2 | (0.31 | )%2 | 34 | % | |||||||||||||||||||||||||||||||
| 2015 | 14.46 | (0.03 | ) | (0.20 | ) | (0.23 | ) | – | (2.75 | ) | – | (2.75 | ) | – | 11.48 | (1.45 | ) | 39,763 | 1.10 | 1.10 | 1.10 | (0.22 | ) | 45 | ||||||||||||||||||||||||||||||||||||||||||||
| 2014 | 17.09 | (0.03 | ) | 0.68 | 0.65 | – | (3.28 | ) | – | (3.28 | ) | – | 14.46 | 4.26 | 38,718 | 1.06 | 1.06 | 1.06 | (0.16 | ) | 52 | |||||||||||||||||||||||||||||||||||||||||||||||
| 2013 | 13.94 | (0.03 | ) | 4.57 | 4.54 | (0.04 | ) | (1.35 | ) | – | (1.39 | ) | – | 17.09 | 32.99 | 142,923 | 1.07 | 1.07 | 1.07 | (0.30 | ) | 45 | ||||||||||||||||||||||||||||||||||||||||||||||
| 2012 | 12.05 | 0.01 | 1.88 | 1.89 | – | – | – | – | – | 13.94 | 15.68 | 216,572 | 1.06 | 1.06 | 1.06 | 0.08 | 32 | |||||||||||||||||||||||||||||||||||||||||||||||||||
| 2011 | 13.52 | (0.01 | ) | (1.30 | ) | (1.31 | ) | (0.16 | ) | – | – | (0.16 | ) | – | 12.05 | (9.70 | ) | 261,425 | 1.05 | 1.05 | 1.05 | (0.36 | ) | 49 | ||||||||||||||||||||||||||||||||||||||||||||
| Royce Smaller-Companies Growth Fund–R Class | ||||||||||||||||||||||||||||||||||||||||||||||||||||||||||||||||||||
| 2016† | $ | 10.57 | $ | (0.05 | ) | $ | (0.33 | ) | $ | (0.38 | ) | $ | – | $ | – | $ | – | $ | – | $ | – | $ | 10.19 | (3.60 | )%1 | $ | 748 | 3.51 | %2 | 3.51 | %2 | 1.84 | %2 | (1.00 | )%2 | 34 | % | |||||||||||||||||||||||||||||||
| 2015 | 13.64 | (0.14 | ) | (0.18 | ) | (0.32 | ) | – | (2.75 | ) | – | (2.75 | ) | – | 10.57 | (2.20 | ) | 886 | 2.99 | 2.99 | 1.84 | (0.97 | ) | 45 | ||||||||||||||||||||||||||||||||||||||||||||
| 2014 | 16.43 | (0.15 | ) | 0.64 | 0.49 | – | (3.28 | ) | – | (3.28 | ) | – | 13.64 | 3.45 | 1,360 | 2.35 | 2.35 | 1.84 | (0.93 | ) | 52 | |||||||||||||||||||||||||||||||||||||||||||||||
| 2013 | 13.51 | (0.16 | ) | 4.43 | 4.27 | – | (1.35 | ) | – | (1.35 | ) | – | 16.43 | 31.95 | 1,605 | 2.41 | 2.41 | 1.84 | (1.06 | ) | 45 | |||||||||||||||||||||||||||||||||||||||||||||||
| 2012 | 11.77 | (0.09 | ) | 1.83 | 1.74 | – | – | – | – | – | 13.51 | 14.78 | 1,221 | 2.35 | 2.35 | 1.84 | (0.66 | ) | 32 | |||||||||||||||||||||||||||||||||||||||||||||||||
| 2011 | 13.24 | (0.15 | ) | (1.23 | ) | (1.38 | ) | (0.09 | ) | – | – | (0.09 | ) | – | 11.77 | (10.40 | ) | 1,079 | 2.45 | 2.45 | 1.84 | (1.12 | ) | 49 | ||||||||||||||||||||||||||||||||||||||||||||
| Royce Smaller-Companies Growth Fund–K Class | ||||||||||||||||||||||||||||||||||||||||||||||||||||||||||||||||||||
| 2016† | $ | 6.10 | $ | (0.02 | ) | $ | (0.19 | ) | $ | (0.21 | ) | $ | – | $ | – | $ | – | $ | – | $ | – | $ | 5.89 | (3.44 | )%1 | $ | 237 | 7.84 | %2 | 7.84 | %2 | 1.59 | %2 | (0.75 | )%2 | 34 | % | |||||||||||||||||||||||||||||||
| 2015 | 9.05 | (0.07 | ) | (0.13 | ) | (0.20 | ) | – | (2.75 | ) | – | (2.75 | ) | – | 6.10 | (1.99 | ) | 307 | 5.44 | 5.44 | 1.59 | (0.72 | ) | 45 | ||||||||||||||||||||||||||||||||||||||||||||
| 2014 | 11.96 | (0.08 | ) | 0.45 | 0.37 | – | (3.28 | ) | – | (3.28 | ) | – | 9.05 | 3.75 | 497 | 3.63 | 3.63 | 1.59 | (0.67 | ) | 52 | |||||||||||||||||||||||||||||||||||||||||||||||
| 2013 | 10.10 | (0.10 | ) | 3.31 | 3.21 | (0.00 | ) | (1.35 | ) | – | (1.35 | ) | – | 11.96 | 32.31 | 968 | 2.62 | 2.62 | 1.59 | (0.82 | ) | 45 | ||||||||||||||||||||||||||||||||||||||||||||||
| 2012 | 8.78 | (0.04 | ) | 1.36 | 1.32 | – | – | – | – | – | 10.10 | 15.03 | 486 | 2.96 | 2.96 | 1.59 | (0.45 | ) | 32 | |||||||||||||||||||||||||||||||||||||||||||||||||
| 2011 | 9.77 | (0.08 | ) | (0.91 | ) | (0.99 | ) | – | – | – | – | – | 8.78 | (10.13 | ) | 501 | 1.86 | 1.86 | 1.59 | (0.86 | ) | 49 | ||||||||||||||||||||||||||||||||||||||||||||||
| Royce Special Equity Fund–Investment Class | ||||||||||||||||||||||||||||||||||||||||||||||||||||||||||||||||||||
| 2016† | $ | 17.94 | $ | 0.11 | $ | 1.38 | $ | 1.49 | $ | – | $ | – | $ | – | $ | – | $ | – | $ | 19.43 | 8.31 | %1 | $ | 1,093,650 | 1.19 | %2 | 1.19 | %2 | 1.19 | %2 | 1.18 | %2 | 17 | % | ||||||||||||||||||||||||||||||||||
| 2015 | 22.86 | 0.22 | (3.04 | ) | (2.82 | ) | (0.24 | ) | (1.86 | ) | – | (2.10 | ) | – | 17.94 | (12.36 | ) | 1,098,106 | 1.15 | 1.15 | 1.15 | 0.80 | 15 | |||||||||||||||||||||||||||||||||||||||||||||
| 2014 | 25.02 | 0.13 | 0.09 | 0.22 | (0.12 | ) | (2.26 | ) | – | (2.38 | ) | – | 22.86 | 1.09 | 1,950,211 | 1.12 | 1.12 | 1.12 | 0.47 | 21 | ||||||||||||||||||||||||||||||||||||||||||||||||
| 2013 | 21.13 | 0.03 | 6.09 | 6.12 | (0.03 | ) | (2.20 | ) | – | (2.23 | ) | – | 25.02 | 29.36 | 2,510,346 | 1.13 | 1.13 | 1.13 | 0.13 | 28 | ||||||||||||||||||||||||||||||||||||||||||||||||
| 2012 | 19.70 | 0.46 | 2.53 | 2.99 | (0.46 | ) | (1.10 | ) | – | (1.56 | ) | – | 21.13 | 15.36 | 2,048,091 | 1.13 | 1.13 | 1.13 | 2.20 | 31 | ||||||||||||||||||||||||||||||||||||||||||||||||
| 2011 | 20.87 | 0.05 | (0.05 | ) | 0.00 | (0.09 | ) | (1.08 | ) | – | (1.17 | ) | – | 19.70 | 0.08 | 1,677,393 | 1.15 | 1.15 | 1.15 | 0.23 | 23 | |||||||||||||||||||||||||||||||||||||||||||||||
| 110 | The Royce Funds 2016 Semiannual Report to Shareholders | THE ACCOMPANYING NOTES ARE AN INTEGRAL PART OF THESE FINANCIAL STATEMENTS |
Financial Highlights
This table is presented to show selected data for a share outstanding throughout each period and to assist shareholders in evaluating a Fund’s performance for the periods presented. Per share amounts have been determined on the basis of the weighted average number of shares outstanding during the period.
| Ratio of Expenses to Average Net Assets | Ratio of Net | |||||||||||||||||||||||||||||||||||||||||||||||||||||||||||||||||||
| Net Asset | Net Realized and | Distributions | Distributions from | Prior to Fee | Investment | |||||||||||||||||||||||||||||||||||||||||||||||||||||||||||||||
| Value, | Unrealized Gain (Loss) | Total from | from Net | Net Realized Gain | Distributions | Shareholder | Net Asset | Net Assets, | Waivers and | Income (Loss) to | ||||||||||||||||||||||||||||||||||||||||||||||||||||||||||
| Beginning of | Net Investment | on Investments and | Investment | Investment | on Investments and | from Return of | Total | Redemption | Value, End of | End of Period | Balance | Prior to Fee | Net of Fee | Average Net | Portfolio | |||||||||||||||||||||||||||||||||||||||||||||||||||||
| Period | Income (Loss) | Foreign Currency | Operations | Income | Foreign Currency | Capital | Distributions | Fees | Period | Total Return | (in thousands) | Credits | Waivers | Waivers | Assets | Turnover Rate | ||||||||||||||||||||||||||||||||||||||||||||||||||||
| Royce Special Equity Fund–Service Class | ||||||||||||||||||||||||||||||||||||||||||||||||||||||||||||||||||||
| 2016† | $ | 17.92 | $ | 0.09 | $ | 1.38 | $ | 1.47 | $ | – | $ | – | $ | – | $ | – | $ | – | $ | 19.39 | 8.20 | %1 | $ | 109,578 | 1.55 | %2 | 1.54 | %2 | 1.39 | %2 | 0.99 | %2 | 17 | % | ||||||||||||||||||||||||||||||||||
| 2015 | 22.81 | 0.17 | (3.03 | ) | (2.86 | ) | (0.17 | ) | (1.86 | ) | – | (2.03 | ) | – | 17.92 | (12.55 | ) | 112,315 | 1.47 | 1.47 | 1.39 | 0.57 | 15 | |||||||||||||||||||||||||||||||||||||||||||||
| 2014 | 24.97 | 0.06 | 0.09 | 0.15 | (0.05 | ) | (2.26 | ) | – | (2.31 | ) | – | 22.81 | 0.80 | 233,791 | 1.44 | 1.44 | 1.39 | 0.20 | 21 | ||||||||||||||||||||||||||||||||||||||||||||||||
| 2013 | 21.12 | (0.03 | ) | 6.08 | 6.05 | – | (2.20 | ) | – | (2.20 | ) | – | 24.97 | 29.04 | 335,952 | 1.45 | 1.45 | 1.39 | (0.13 | ) | 28 | |||||||||||||||||||||||||||||||||||||||||||||||
| 2012 | 19.66 | 0.42 | 2.52 | 2.94 | (0.38 | ) | (1.10 | ) | – | (1.48 | ) | – | 21.12 | 15.10 | 250,915 | 1.43 | 1.43 | 1.39 | 1.90 | 31 | ||||||||||||||||||||||||||||||||||||||||||||||||
| 2011 | 20.83 | 0.00 | (0.05 | ) | (0.05 | ) | (0.05 | ) | (1.08 | ) | – | (1.13 | ) | 0.01 | 19.66 | (0.12 | ) | 216,143 | 1.45 | 1.45 | 1.39 | 0.00 | 23 | |||||||||||||||||||||||||||||||||||||||||||||
| Royce Special Equity Fund–Consultant Class | ||||||||||||||||||||||||||||||||||||||||||||||||||||||||||||||||||||
| 2016† | $ | 16.57 | $ | 0.01 | $ | 1.28 | $ | 1.29 | $ | – | $ | – | $ | – | $ | – | $ | – | $ | 17.86 | 7.79 | %1 | $ | 42,808 | 2.22 | %2 | 2.22 | %2 | 2.22 | %2 | 0.16 | %2 | 17 | % | ||||||||||||||||||||||||||||||||||
| 2015 | 21.27 | (0.05 | ) | (2.76 | ) | (2.81 | ) | (0.03 | ) | (1.86 | ) | – | (1.89 | ) | – | 16.57 | (13.23 | ) | 42,427 | 2.18 | 2.18 | 2.18 | (0.24 | ) | 15 | |||||||||||||||||||||||||||||||||||||||||||
| 2014 | 23.57 | (0.13 | ) | 0.09 | (0.04 | ) | – | (2.26 | ) | – | (2.26 | ) | – | 21.27 | 0.04 | 63,981 | 2.14 | 2.14 | 2.14 | (0.56 | ) | 21 | ||||||||||||||||||||||||||||||||||||||||||||||
| 2013 | 20.20 | (0.21 | ) | 5.78 | 5.57 | – | (2.20 | ) | – | (2.20 | ) | – | 23.57 | 27.97 | 71,333 | 2.17 | 2.17 | 2.17 | (0.90 | ) | 28 | |||||||||||||||||||||||||||||||||||||||||||||||
| 2012 | 18.88 | 0.23 | 2.42 | 2.65 | (0.23 | ) | (1.10 | ) | – | (1.33 | ) | – | 20.20 | 14.20 | 57,755 | 2.18 | 2.18 | 2.18 | 1.13 | 31 | ||||||||||||||||||||||||||||||||||||||||||||||||
| 2011 | 20.16 | (0.15 | ) | (0.05 | ) | (0.20 | ) | – | (1.08 | ) | – | (1.08 | ) | – | 18.88 | (0.93 | ) | 50,253 | 2.16 | 2.16 | 2.16 | (0.77 | ) | 23 | ||||||||||||||||||||||||||||||||||||||||||||
| Royce Special Equity Fund–Institutional Class | ||||||||||||||||||||||||||||||||||||||||||||||||||||||||||||||||||||
| 2016† | $ | 17.80 | $ | 0.12 | $ | 1.37 | $ | 1.49 | $ | – | $ | – | $ | – | $ | – | $ | – | $ | 19.29 | 8.37 | %1 | $ | 198,647 | 1.07 | %2 | 1.07 | %2 | 1.07 | %2 | 1.32 | %2 | 17 | % | ||||||||||||||||||||||||||||||||||
| 2015 | 22.71 | 0.33 | (3.12 | ) | (2.79 | ) | (0.26 | ) | (1.86 | ) | – | (2.12 | ) | – | 17.80 | (12.27 | ) | 208,952 | 1.04 | 1.04 | 1.04 | 1.02 | 15 | |||||||||||||||||||||||||||||||||||||||||||||
| 2014 | 24.88 | 0.14 | 0.10 | 0.24 | (0.15 | ) | (2.26 | ) | – | (2.41 | ) | – | 22.71 | 1.17 | 639,723 | 1.02 | 1.02 | 1.02 | 0.56 | 21 | ||||||||||||||||||||||||||||||||||||||||||||||||
| 2013 | 21.02 | 0.06 | 6.06 | 6.12 | (0.06 | ) | (2.20 | ) | – | (2.26 | ) | – | 24.88 | 29.51 | 700,200 | 1.01 | 1.01 | 1.01 | 0.26 | 28 | ||||||||||||||||||||||||||||||||||||||||||||||||
| 2012 | 19.63 | 0.49 | 2.51 | 3.00 | (0.51 | ) | (1.10 | ) | – | (1.61 | ) | – | 21.02 | 15.46 | 571,388 | 1.02 | 1.02 | 1.02 | 2.28 | 31 | ||||||||||||||||||||||||||||||||||||||||||||||||
| 2011 | 20.79 | 0.07 | (0.03 | ) | 0.04 | (0.12 | ) | (1.08 | ) | – | (1.20 | ) | – | 19.63 | 0.25 | 481,855 | 1.03 | 1.03 | 1.03 | 0.36 | 23 | |||||||||||||||||||||||||||||||||||||||||||||||
| Royce Special Equity Multi-Cap Fund–Investment Class j | ||||||||||||||||||||||||||||||||||||||||||||||||||||||||||||||||||||
| 2016† | $ | 12.34 | $ | 0.08 | $ | (0.13 | ) | $ | (0.05 | ) | $ | – | $ | – | $ | – | $ | – | $ | – | $ | 12.29 | (0.41 | )%1 | $ | 44,202 | 1.07 | %2 | 1.07 | %2 | 1.02 | %2 | 1.31 | %2 | 14 | % | ||||||||||||||||||||||||||||||||
| 2015 | 15.55 | 0.40 | (2.48 | ) | (2.08 | ) | (0.35 | ) | (0.78 | ) | – | (1.13 | ) | – | 12.34 | (13.40 | ) | 43,999 | 1.01 | 1.01 | 0.99 | 1.49 | 31 | |||||||||||||||||||||||||||||||||||||||||||||
| 2014 | 14.92 | 0.10 | 1.30 | 1.40 | (0.11 | ) | (0.66 | ) | – | (0.77 | ) | – | 15.55 | 9.53 | 123,545 | 0.97 | 0.97 | 0.96 | 0.95 | 39 | ||||||||||||||||||||||||||||||||||||||||||||||||
| 2013 | 11.64 | 0.12 | 4.11 | 4.23 | (0.12 | ) | (0.83 | ) | – | (0.95 | ) | – | 14.92 | 36.62 | 62,387 | 1.16 | 1.16 | 1.15 | 0.93 | 44 | ||||||||||||||||||||||||||||||||||||||||||||||||
| 2012 | 11.54 | 0.12 | 0.22 | 0.34 | (0.14 | ) | (0.10 | ) | – | (0.24 | ) | – | 11.64 | 3.00 | 1 | 34,375 | 1.19 | 2 | 1.19 | 2 | 1.16 | 2 | 1.55 | 2 | 14 | |||||||||||||||||||||||||||||||||||||||||||
| Royce Special Equity Multi-Cap Fund–Service Class f | ||||||||||||||||||||||||||||||||||||||||||||||||||||||||||||||||||||
| 2016† | $ | 12.38 | $ | 0.07 | $ | (0.13 | ) | $ | (0.06 | ) | $ | – | $ | – | $ | – | $ | – | $ | – | $ | 12.32 | (0.48 | )%1 | $ | 37,034 | 1.40 | %2 | 1.40 | %2 | 1.24 | %2 | 1.08 | %2 | 14 | % | ||||||||||||||||||||||||||||||||
| 2015 | 15.60 | 0.26 | (2.39 | ) | (2.13 | ) | (0.31 | ) | (0.78 | ) | – | (1.09 | ) | – | 12.38 | (13.64 | ) | 47,630 | 1.29 | 1.29 | 1.23 | 1.21 | 31 | |||||||||||||||||||||||||||||||||||||||||||||
| 2014 | 14.96 | 0.10 | 1.27 | 1.37 | (0.07 | ) | (0.66 | ) | – | (0.73 | ) | – | 15.60 | 9.28 | 94,878 | 1.34 | 1.34 | 1.24 | 0.66 | 39 | ||||||||||||||||||||||||||||||||||||||||||||||||
| 2013 | 11.68 | 0.09 | 4.12 | 4.21 | (0.10 | ) | (0.83 | ) | – | (0.93 | ) | – | 14.96 | 36.26 | 78,233 | 1.61 | 1.61 | 1.38 | 0.69 | 44 | ||||||||||||||||||||||||||||||||||||||||||||||||
| 2012 | 10.64 | 0.13 | 1.10 | 1.23 | (0.09 | ) | (0.10 | ) | – | (0.19 | ) | – | 11.68 | 11.62 | 43,690 | 1.51 | 1.51 | 1.36 | 1.15 | 14 | ||||||||||||||||||||||||||||||||||||||||||||||||
| 2011 | 10.00 | 0.06 | 0.65 | 0.71 | (0.06 | ) | (0.02 | ) | – | (0.08 | ) | 0.01 | 10.64 | 7.20 | 1 | 36,811 | 1.97 | 2 | 1.97 | 2 | 1.39 | 2 | 1.45 | 2 | 5 | |||||||||||||||||||||||||||||||||||||||||||
| Royce Special Equity Multi-Cap Fund–Consultant Class h | ||||||||||||||||||||||||||||||||||||||||||||||||||||||||||||||||||||
| 2016† | $ | 8.15 | $ | 0.01 | $ | (0.08 | ) | $ | (0.07 | ) | $ | – | $ | – | $ | – | $ | – | $ | – | $ | 8.08 | (0.86 | )%1 | $ | 4,627 | 2.35 | %2 | 2.35 | %2 | 1.99 | %2 | 0.30 | %2 | 14 | % | ||||||||||||||||||||||||||||||||
| 2015 | 10.72 | 0.09 | (1.63 | ) | (1.54 | ) | (0.25 | ) | (0.78 | ) | – | (1.03 | ) | – | 8.15 | (14.35 | ) | 6,825 | 2.19 | 2.19 | 1.99 | 0.50 | 31 | |||||||||||||||||||||||||||||||||||||||||||||
| 2014 | 10.00 | (0.04 | ) | 1.48 | 1.44 | (0.06 | ) | (0.66 | ) | – | (0.72 | ) | – | 10.72 | 14.57 | 1 | 9,223 | 2.54 | 2 | 2.54 | 2 | 1.99 | 2 | (0.05 | )2 | 39 | ||||||||||||||||||||||||||||||||||||||||||
| THE ACCOMPANYING NOTES ARE AN INTEGRAL PART OF THESE FINANCIAL STATEMENTS | The Royce Funds 2016 Semiannual Report to Shareholders | 111 |
Financial Highlights
This table is presented to show selected data for a share outstanding throughout each period and to assist shareholders in evaluating a Fund’s performance for the periods presented. Per share amounts have been determined on the basis of the weighted average number of shares outstanding during the period.
| Ratio of Expenses to Average Net Assets | Ratio of Net | |||||||||||||||||||||||||||||||||||||||||||||||||||||||||||||||||||
| Net Asset | Net Realized and | Distributions | Distributions from | Prior to Fee | Investment | |||||||||||||||||||||||||||||||||||||||||||||||||||||||||||||||
| Value, | Unrealized Gain (Loss) | Total from | from Net | Net Realized Gain | Distributions | Shareholder | Net Asset | Net Assets, | Waivers and | Income (Loss) to | ||||||||||||||||||||||||||||||||||||||||||||||||||||||||||
| Beginning of | Net Investment | on Investments and | Investment | Investment | on Investments and | from Return of | Total | Redemption | Value, End of | End of Period | Balance | Prior to Fee | Net of Fee | Average Net | Portfolio | |||||||||||||||||||||||||||||||||||||||||||||||||||||
| Period | Income (Loss) | Foreign Currency | Operations | Income | Foreign Currency | Capital | Distributions | Fees | Period | Total Return | (in thousands) | Credits | Waivers | Waivers | Assets | Turnover Rate | ||||||||||||||||||||||||||||||||||||||||||||||||||||
| Royce Special Equity Multi-Cap Fund–Institutional Class k | ||||||||||||||||||||||||||||||||||||||||||||||||||||||||||||||||||||
| 2016† | $ | 12.33 | $ | 0.09 | $ | (0.13 | ) | $ | (0.04 | ) | $ | – | $ | – | $ | – | $ | – | $ | – | $ | 12.29 | (0.32 | )%1 | $ | 32,590 | 1.00 | %2 | 1.00 | %2 | 0.89 | %2 | 1.42 | %2 | 14 | % | ||||||||||||||||||||||||||||||||
| 2015 | 15.56 | 0.34 | (2.41 | ) | (2.07 | ) | (0.38 | ) | (0.78 | ) | – | (1.16 | ) | – | 12.33 | (13.32 | ) | 36,864 | 0.94 | 0.94 | 0.89 | 1.56 | 31 | |||||||||||||||||||||||||||||||||||||||||||||
| 2014 | 14.92 | 0.12 | 1.30 | 1.42 | (0.12 | ) | (0.66 | ) | – | (0.78 | ) | – | 15.56 | 9.64 | 75,941 | 0.93 | 0.93 | 0.89 | 1.01 | 39 | ||||||||||||||||||||||||||||||||||||||||||||||||
| 2013 | 11.64 | 0.15 | 4.10 | 4.25 | (0.14 | ) | (0.83 | ) | – | (0.97 | ) | – | 14.92 | 36.73 | 48,063 | 1.10 | 1.10 | 1.04 | 1.02 | 44 | ||||||||||||||||||||||||||||||||||||||||||||||||
| 2012 | 11.83 | 0.10 | (0.03 | ) | 0.07 | (0.16 | ) | (0.10 | ) | – | (0.26 | ) | – | 11.64 | 0.61 | 1 | 30,905 | 1.21 | 2 | 1.21 | 2 | 1.04 | 2 | 1.76 | 2 | 14 | ||||||||||||||||||||||||||||||||||||||||||
| Royce Total Return Fund–Investment Class | ||||||||||||||||||||||||||||||||||||||||||||||||||||||||||||||||||||
| 2016† | $ | 11.91 | $ | 0.06 | $ | 0.97 | $ | 1.03 | $ | (0.07 | ) | $ | – | $ | – | $ | (0.07 | ) | $ | – | $ | 12.87 | 8.62 | %1 | $ | 1,712,162 | 1.20 | %2 | 1.20 | %2 | 1.20 | %2 | 1.06 | %2 | 8 | % | ||||||||||||||||||||||||||||||||
| 2015 | 14.74 | 0.17 | (1.23 | ) | (1.06 | ) | (0.12 | ) | (1.65 | ) | – | (1.77 | ) | – | 11.91 | (7.19 | ) | 1,850,309 | 1.15 | 1.15 | 1.15 | 1.18 | 11 | |||||||||||||||||||||||||||||||||||||||||||||
| 2014 | 16.47 | 0.17 | 0.00 | 0.17 | (0.28 | ) | (1.62 | ) | – | (1.90 | ) | – | 14.74 | 1.34 | 3,077,951 | 1.13 | 1.13 | 1.13 | 0.95 | 18 | ||||||||||||||||||||||||||||||||||||||||||||||||
| 2013 | 13.63 | 0.16 | 4.24 | 4.40 | (0.14 | ) | (1.42 | ) | – | (1.56 | ) | – | 16.47 | 32.76 | 3,657,904 | 1.13 | 1.13 | 1.13 | 1.00 | 21 | ||||||||||||||||||||||||||||||||||||||||||||||||
| 2012 | 12.68 | 0.26 | 1.54 | 1.80 | (0.23 | ) | (0.62 | ) | – | (0.85 | ) | – | 13.63 | 14.42 | 3,044,664 | 1.10 | 1.10 | 1.10 | 1.89 | 17 | ||||||||||||||||||||||||||||||||||||||||||||||||
| 2011 | 13.17 | 0.15 | (0.37 | ) | (0.22 | ) | (0.12 | ) | (0.15 | ) | – | (0.27 | ) | – | 12.68 | (1.68 | ) | 3,106,208 | 1.12 | 1.12 | 1.12 | 1.10 | 21 | |||||||||||||||||||||||||||||||||||||||||||||
| Royce Total Return Fund–Service Class | ||||||||||||||||||||||||||||||||||||||||||||||||||||||||||||||||||||
| 2016† | $ | 12.12 | $ | 0.05 | $ | 0.98 | $ | 1.03 | $ | (0.05 | ) | $ | – | $ | – | $ | (0.05 | ) | $ | – | $ | 13.10 | 8.47 | %1 | $ | 124,573 | 1.49 | %2 | 1.49 | %2 | 1.49 | %2 | 0.76 | %2 | 8 | % | ||||||||||||||||||||||||||||||||
| 2015 | 14.98 | 0.13 | (1.25 | ) | (1.12 | ) | (0.09 | ) | (1.65 | ) | – | (1.74 | ) | – | 12.12 | (7.48 | ) | 137,594 | 1.43 | 1.43 | 1.43 | 0.90 | 11 | |||||||||||||||||||||||||||||||||||||||||||||
| 2014 | 16.61 | 0.12 | 0.01 | 0.13 | (0.14 | ) | (1.62 | ) | – | (1.76 | ) | – | 14.98 | 1.08 | 232,814 | 1.42 | 1.42 | 1.42 | 0.60 | 18 | ||||||||||||||||||||||||||||||||||||||||||||||||
| 2013 | 13.72 | 0.11 | 4.27 | 4.38 | (0.07 | ) | (1.42 | ) | – | (1.49 | ) | – | 16.61 | 32.38 | 493,111 | 1.48 | 1.48 | 1.48 | 0.68 | 21 | ||||||||||||||||||||||||||||||||||||||||||||||||
| 2012 | 12.71 | 0.22 | 1.55 | 1.77 | (0.14 | ) | (0.62 | ) | – | (0.76 | ) | – | 13.72 | 14.11 | 264,528 | 1.39 | 1.39 | 1.39 | 1.58 | 17 | ||||||||||||||||||||||||||||||||||||||||||||||||
| 2011 | 13.19 | 0.11 | (0.38 | ) | (0.27 | ) | (0.06 | ) | (0.15 | ) | – | (0.21 | ) | – | 12.71 | (2.01 | ) | 282,704 | 1.41 | 1.41 | 1.41 | 0.82 | 21 | |||||||||||||||||||||||||||||||||||||||||||||
| Royce Total Return Fund–Consultant Class | ||||||||||||||||||||||||||||||||||||||||||||||||||||||||||||||||||||
| 2016† | $ | 12.15 | $ | 0.01 | $ | 0.98 | $ | 0.99 | $ | (0.01 | ) | $ | – | $ | – | $ | (0.01 | ) | $ | – | $ | 13.13 | 8.11 | %1 | $ | 256,458 | 2.18 | %2 | 2.18 | %2 | 2.18 | %2 | 0.08 | %2 | 8 | % | ||||||||||||||||||||||||||||||||
| 2015 | 15.05 | 0.03 | (1.26 | ) | (1.23 | ) | (0.02 | ) | (1.65 | ) | – | (1.67 | ) | – | 12.15 | (8.15 | ) | 262,131 | 2.16 | 2.16 | 2.16 | 0.18 | 11 | |||||||||||||||||||||||||||||||||||||||||||||
| 2014 | 16.68 | (0.00 | ) | 0.02 | 0.02 | (0.03 | ) | (1.62 | ) | – | (1.65 | ) | – | 15.05 | 0.37 | 356,731 | 2.12 | 2.12 | 2.12 | (0.04 | ) | 18 | ||||||||||||||||||||||||||||||||||||||||||||||
| 2013 | 13.81 | (0.00 | ) | 4.29 | 4.29 | – | (1.42 | ) | – | (1.42 | ) | – | 16.68 | 31.38 | 404,498 | 2.15 | 2.15 | 2.15 | (0.02 | ) | 21 | |||||||||||||||||||||||||||||||||||||||||||||||
| 2012 | 12.77 | 0.11 | 1.56 | 1.67 | (0.01 | ) | (0.62 | ) | – | (0.63 | ) | – | 13.81 | 13.19 | 331,116 | 2.20 | 2.20 | 2.20 | 0.80 | 17 | ||||||||||||||||||||||||||||||||||||||||||||||||
| 2011 | 13.27 | 0.02 | (0.37 | ) | (0.35 | ) | – | (0.15 | ) | – | (0.15 | ) | – | 12.77 | (2.64 | ) | 328,610 | 2.07 | 2.07 | 2.07 | 0.15 | 21 | ||||||||||||||||||||||||||||||||||||||||||||||
| Royce Total Return Fund–Institutional Class | ||||||||||||||||||||||||||||||||||||||||||||||||||||||||||||||||||||
| 2016† | $ | 11.78 | $ | 0.07 | $ | 0.96 | $ | 1.03 | $ | (0.07 | ) | $ | – | $ | – | $ | (0.07 | ) | $ | – | $ | 12.74 | 8.76 | %1 | $ | 479,268 | 1.06 | %2 | 1.06 | %2 | 1.06 | %2 | 1.21 | %2 | 8 | % | ||||||||||||||||||||||||||||||||
| 2015 | 14.61 | 0.18 | (1.22 | ) | (1.04 | ) | (0.14 | ) | (1.65 | ) | – | (1.79 | ) | – | 11.78 | (7.17 | ) | 374,555 | 1.03 | 1.03 | 1.03 | 1.28 | 11 | |||||||||||||||||||||||||||||||||||||||||||||
| 2014 | 16.35 | 0.18 | 0.02 | 0.20 | (0.32 | ) | (1.62 | ) | – | (1.94 | ) | – | 14.61 | 1.51 | 572,662 | 1.00 | 1.00 | 1.00 | 1.09 | 18 | ||||||||||||||||||||||||||||||||||||||||||||||||
| 2013 | 13.55 | 0.18 | 4.21 | 4.39 | (0.17 | ) | (1.42 | ) | – | (1.59 | ) | – | 16.35 | 32.93 | 621,447 | 1.00 | 1.00 | 1.00 | 1.15 | 21 | ||||||||||||||||||||||||||||||||||||||||||||||||
| 2012 | 12.64 | 0.27 | 1.54 | 1.81 | (0.28 | ) | (0.62 | ) | – | (0.90 | ) | – | 13.55 | 14.48 | 408,551 | 1.02 | 1.02 | 1.02 | 2.02 | 17 | ||||||||||||||||||||||||||||||||||||||||||||||||
| 2011 | 13.14 | 0.16 | (0.37 | ) | (0.21 | ) | (0.14 | ) | (0.15 | ) | – | (0.29 | ) | – | 12.64 | (1.55 | ) | 390,277 | 1.00 | 1.00 | 1.00 | 1.26 | 21 | |||||||||||||||||||||||||||||||||||||||||||||
| 112 | The Royce Funds 2016 Semiannual Report to Shareholders | THE ACCOMPANYING NOTES ARE AN INTEGRAL PART OF THESE FINANCIAL STATEMENTS |
Financial Highlights
This table is presented to show selected data for a share outstanding throughout each period and to assist shareholders in evaluating a Fund’s performance for the periods presented. Per share amounts have been determined on the basis of the weighted average number of shares outstanding during the period.
| Ratio of Expenses to Average Net Assets | Ratio of Net | |||||||||||||||||||||||||||||||||||||||||||||||||||||||||||||||||||
| Net Asset | Net Realized and | Distributions | Distributions from | Prior to Fee | Investment | |||||||||||||||||||||||||||||||||||||||||||||||||||||||||||||||
| Value, | Unrealized Gain (Loss) | Total from | from Net | Net Realized Gain | Distributions | Shareholder | Net Asset | Net Assets, | Waivers and | Income (Loss) to | ||||||||||||||||||||||||||||||||||||||||||||||||||||||||||
| Beginning of | Net Investment | on Investments and | Investment | Investment | on Investments and | from Return of | Total | Redemption | Value, End of | End of Period | Balance | Prior to Fee | Net of Fee | Average Net | Portfolio | |||||||||||||||||||||||||||||||||||||||||||||||||||||
| Period | Income (Loss) | Foreign Currency | Operations | Income | Foreign Currency | Capital | Distributions | Fees | Period | Total Return | (in thousands) | Credits | Waivers | Waivers | Assets | Turnover Rate | ||||||||||||||||||||||||||||||||||||||||||||||||||||
| Royce Total Return Fund–W Class | ||||||||||||||||||||||||||||||||||||||||||||||||||||||||||||||||||||
| 2016† | $ | 11.88 | $ | 0.06 | $ | 0.96 | $ | 1.02 | $ | (0.06 | ) | $ | – | $ | – | $ | (0.06 | ) | $ | – | $ | 12.84 | 8.60 | %1 | $ | 120,912 | 1.22 | %2 | 1.22 | %2 | 1.22 | %2 | 1.05 | %2 | 8 | % | ||||||||||||||||||||||||||||||||
| 2015 | 14.72 | 0.16 | (1.23 | ) | (1.07 | ) | (0.12 | ) | (1.65 | ) | – | (1.77 | ) | – | 11.88 | (7.28 | ) | 118,167 | 1.18 | 1.18 | 1.18 | 1.17 | 11 | |||||||||||||||||||||||||||||||||||||||||||||
| 2014 | 16.45 | 0.15 | 0.03 | 0.18 | (0.29 | ) | (1.62 | ) | – | (1.91 | ) | – | 14.72 | 1.35 | 261,829 | 1.13 | 1.13 | 1.13 | 0.97 | 18 | ||||||||||||||||||||||||||||||||||||||||||||||||
| 2013 | 13.62 | 0.16 | 4.23 | 4.39 | (0.14 | ) | (1.42 | ) | – | (1.56 | ) | – | 16.45 | 32.71 | 249,035 | 1.15 | 1.15 | 1.15 | 0.99 | 21 | ||||||||||||||||||||||||||||||||||||||||||||||||
| 2012 | 12.69 | 0.26 | 1.54 | 1.80 | (0.25 | ) | (0.62 | ) | – | (0.87 | ) | – | 13.62 | 14.41 | 171,603 | 1.12 | 1.12 | 1.12 | 1.97 | 17 | ||||||||||||||||||||||||||||||||||||||||||||||||
| 2011 | 13.19 | 0.16 | (0.37 | ) | (0.21 | ) | (0.14 | ) | (0.15 | ) | – | (0.29 | ) | – | 12.69 | (1.58 | ) | 132,488 | 1.05 | 1.05 | 1.05 | 1.27 | 21 | |||||||||||||||||||||||||||||||||||||||||||||
| Royce Total Return Fund–R Class | ||||||||||||||||||||||||||||||||||||||||||||||||||||||||||||||||||||
| 2016† | $ | 12.19 | $ | 0.03 | $ | 0.98 | $ | 1.01 | $ | (0.03 | ) | $ | – | $ | – | $ | (0.03 | ) | $ | – | $ | 13.17 | 8.25 | %1 | $ | 50,253 | 1.80 | %2 | 1.80 | %2 | 1.80 | %2 | 0.46 | %2 | 8 | % | ||||||||||||||||||||||||||||||||
| 2015 | 15.07 | 0.08 | (1.25 | ) | (1.17 | ) | (0.06 | ) | (1.65 | ) | – | (1.71 | ) | – | 12.19 | (7.79 | ) | 50,684 | 1.77 | 1.77 | 1.77 | 0.56 | 11 | |||||||||||||||||||||||||||||||||||||||||||||
| 2014 | 16.73 | 0.07 | 0.01 | 0.08 | (0.12 | ) | (1.62 | ) | – | (1.74 | ) | – | 15.07 | 0.73 | 65,501 | 1.72 | 1.72 | 1.72 | 0.37 | 18 | ||||||||||||||||||||||||||||||||||||||||||||||||
| 2013 | 13.82 | 0.06 | 4.30 | 4.36 | (0.03 | ) | (1.42 | ) | – | (1.45 | ) | – | 16.73 | 31.95 | 72,541 | 1.75 | 1.75 | 1.75 | 0.39 | 21 | ||||||||||||||||||||||||||||||||||||||||||||||||
| 2012 | 12.79 | 0.18 | 1.55 | 1.73 | (0.08 | ) | (0.62 | ) | – | (0.70 | ) | – | 13.82 | 13.66 | 48,797 | 1.74 | 1.74 | 1.74 | 1.36 | 17 | ||||||||||||||||||||||||||||||||||||||||||||||||
| 2011 | 13.28 | 0.08 | (0.38 | ) | (0.30 | ) | (0.04 | ) | (0.15 | ) | – | (0.19 | ) | – | 12.79 | (2.23 | ) | 34,695 | 1.68 | 1.68 | 1.68 | 0.62 | 21 | |||||||||||||||||||||||||||||||||||||||||||||
| Royce Total Return Fund–K Class | ||||||||||||||||||||||||||||||||||||||||||||||||||||||||||||||||||||
| 2016† | $ | 8.19 | $ | 0.03 | $ | 0.66 | $ | 0.69 | $ | (0.03 | ) | $ | – | $ | – | $ | (0.03 | ) | $ | – | $ | 8.85 | 8.43 | %1 | $ | 62,920 | 1.56 | %2 | 1.56 | %2 | 1.56 | %2 | 0.71 | %2 | 8 | % | ||||||||||||||||||||||||||||||||
| 2015 | 10.71 | 0.09 | (0.90 | ) | (0.81 | ) | (0.06 | ) | (1.65 | ) | – | (1.71 | ) | – | 8.19 | (7.54 | ) | 62,597 | 1.49 | 1.49 | 1.49 | 0.85 | 11 | |||||||||||||||||||||||||||||||||||||||||||||
| 2014 | 12.40 | 0.11 | (0.03 | ) | 0.08 | (0.15 | ) | (1.62 | ) | – | (1.77 | ) | – | 10.71 | 1.01 | 91,271 | 1.47 | 1.47 | 1.47 | 0.55 | 18 | |||||||||||||||||||||||||||||||||||||||||||||||
| 2013 | 10.53 | 0.07 | 3.27 | 3.34 | (0.05 | ) | (1.42 | ) | – | (1.47 | ) | – | 12.40 | 32.20 | 196,344 | 1.50 | 1.50 | 1.50 | 0.62 | 21 | ||||||||||||||||||||||||||||||||||||||||||||||||
| 2012 | 9.90 | 0.17 | 1.21 | 1.38 | (0.13 | ) | (0.62 | ) | – | (0.75 | ) | – | 10.53 | 14.08 | 163,412 | 1.43 | 1.43 | 1.43 | 1.51 | 17 | ||||||||||||||||||||||||||||||||||||||||||||||||
| 2011 | 10.31 | 0.09 | (0.30 | ) | (0.21 | ) | (0.05 | ) | (0.15 | ) | – | (0.20 | ) | – | 9.90 | (1.97 | ) | 177,812 | 1.44 | 1.44 | 1.44 | 0.90 | 21 | |||||||||||||||||||||||||||||||||||||||||||||
| † | Period ended June 30, 2016 (unaudited). |
| 1 | Not annualized |
| 2 | Annualized |
| a | The Class commenced operations on March 21, 2014. |
| b | The Class commenced operations on September 4, 2012. |
| c | The Class commenced operations on January 5, 2016. |
| d | The Fund commenced operations on January 3, 2011. |
| e | The Class commenced operations on January 22, 2014. |
| f | The Class commenced operations on January 3, 2011. |
| g | The Class commenced operations on February 26, 2016. |
| h | The Class commenced operations on January 27, 2014. |
| I | The Class commenced operations on June 6, 2011. |
| j | The Class commenced operations on March 1, 2012. |
| k | The Class commenced operations on April 18, 2012. |
| THE ACCOMPANYING NOTES ARE AN INTEGRAL PART OF THESE FINANCIAL STATEMENTS | The Royce Funds 2016 Semiannual Report to Shareholders | 113 |
Notes to Financial Statements (unaudited)
Royce Dividend Value Fund, Royce Global Financial Services Fund, Royce Heritage Fund, Royce International Micro-Cap Fund, Royce International Premier Fund, Royce International Small-Cap Fund, Royce Low-Priced Stock Fund, Royce Micro-Cap Fund, Royce Micro-Cap Opportunity Fund, Royce Opportunity Fund, Royce Pennsylvania Mutual Fund, Royce Premier Fund, Royce Small-Cap Leaders Fund, Royce Small-Cap Value Fund, Royce Smaller-Companies Growth Fund, Royce Special Equity Fund, Royce Special Equity Multi-Cap Fund and Royce Total Return Fund (the “Fund” or “Funds”), are eighteen series of The Royce Fund (the “Trust”), a diversified open-end management investment company organized as a Delaware statutory trust.
| Royce International Micro-Cap Fund | 51% | Royce International Small-Cap Fund | 27% | ||||
| Royce International Premier Fund | 10% | Royce Micro-Cap Opportunity Fund | 14% |
Securities are valued as of the close of trading on the New York Stock Exchange (NYSE) (generally 4:00 p.m. Eastern time) on the valuation date. Securities that trade on an exchange, and securities traded on Nasdaq’s Electronic Bulletin Board, are valued at their last reported sales price or Nasdaq official closing price taken from the primary market in which each security trades or, if no sale is reported for such day, at their highest bid price. Other over-the-counter securities for which market quotations are readily available are valued at their highest bid price, except in the case of some bonds and other fixed income securities which may be valued by reference to other securities with comparable ratings, interest rates and maturities, using established independent pricing services. The Funds value their non-U.S. dollar denominated securities in U.S. dollars daily at the prevailing foreign currency exchange rates as quoted by a major bank. Securities for which market quotations are not readily available are valued at their fair value in accordance with the provisions of the 1940 Act, under procedures approved by the Fund’s Board of Trustees, and are reported as Level 3 securities. As a general principle, the fair value of a security is the amount which the Fund might reasonably expect to receive for the security upon its current sale. However, in light of the judgment involved in fair valuations, there can be no assurance that a fair value assigned to a particular security will be the amount which the Fund might be able to receive upon its current sale. In addition, if, between the time trading ends on a particular security and the close of the customary trading session on the NYSE, events occur that are significant and may make the closing price unreliable, a Fund may fair value the security. The Funds use an independent pricing service to provide fair value estimates for relevant non-U.S. equity securities on days when the U.S. market volatility exceeds a certain threshold. This pricing service uses proprietary correlations it has developed between the movement of prices of non-U.S. equity securities and indices of U.S.-traded securities, futures contracts and other indications to estimate the fair value of relevant non-U.S. securities. When fair value pricing is employed, the prices of securities used by a Fund may differ from quoted or published prices for the same security. Investments in money market funds are valued at net asset value per share.
| Level 1 | – | quoted prices in active markets for identical securities. | ||
| Level 2 | – | other significant observable inputs (including quoted prices for similar securities, foreign securities that may be fair valued and repurchase agreements). The table below includes all Level 2 securities. Level 2 securities with values based on quoted prices for similar securities are noted in the Schedules of Investments. | ||
| Level 3 | – | significant unobservable inputs (including last trade price before trading was suspended, or at a discount thereto for lack of marketability or otherwise, market price information regarding other securities, information received from the company and/or published documents, including SEC filings and financial statements, or other publicly available information). |
114 | The Royce Funds 2016 Semiannual Report to Shareholders
| LEVEL 1 | LEVEL 2 | LEVEL 3 | TOTAL | |||||||||||||||
| Royce Dividend Value Fund Common Stocks | $ | 201,704,630 | $ | 36,041,516 | $ | – | $ | 237,746,146 | ||||||||||
| Corporate Bond | – | 353,805 | – | 353,805 | ||||||||||||||
| Cash Equivalents | – | 6,318,000 | – | 6,318,000 | ||||||||||||||
| Royce Global Financial Services Fund Common Stocks | 34,273,043 | 11,741,166 | – | 46,014,209 | ||||||||||||||
| Cash Equivalents | – | 729,000 | – | 729,000 | ||||||||||||||
| Royce Heritage Fund Common Stocks | 192,615,309 | 6,229,046 | – | 198,844,355 | ||||||||||||||
| Cash Equivalents | – | 38,362,000 | – | 38,362,000 | ||||||||||||||
| Royce International Micro-Cap Fund Common Stocks | 1,009,170 | 4,485,443 | 38,985 | 5,533,598 | ||||||||||||||
| Cash Equivalents | – | 281,000 | – | 281,000 | ||||||||||||||
| Royce International Premier Fund Common Stocks | 3,664,179 | 66,977,462 | – | 70,641,641 | ||||||||||||||
| Cash Equivalents | – | 2,826,000 | – | 2,826,000 | ||||||||||||||
| Royce International Small-Cap Fund Common Stocks | 887,548 | 6,077,502 | 47,557 | 7,012,607 | ||||||||||||||
| Cash Equivalents | – | 5,200,000 | – | 5,200,000 | ||||||||||||||
| Royce Low-Priced Stock Fund Common Stocks | 288,139,555 | 18,170,364 | – | 306,309,919 | ||||||||||||||
| Cash Equivalents | 15,056,726 | 7,386,000 | – | 22,442,726 | ||||||||||||||
| Royce Micro-Cap Fund Common Stocks | 212,794,387 | 4,188,589 | 810,411 | 217,793,387 | ||||||||||||||
| Cash Equivalents | 7,953,641 | 15,475,000 | – | 23,428,641 | ||||||||||||||
| Royce Micro-Cap Opportunity Fund Common Stocks | 37,153,433 | – | – | 37,153,433 | ||||||||||||||
| Cash Equivalents | – | 2,245,000 | – | 2,245,000 | ||||||||||||||
| Royce Opportunity Fund Common Stocks | 1,315,191,989 | – | – | 1,315,191,989 | ||||||||||||||
| Corporate Bond | – | 390,000 | – | 390,000 | ||||||||||||||
| Cash Equivalents | 75,223,917 | 81,981,000 | – | 157,204,917 | ||||||||||||||
| Royce Pennsylvania Mutual Fund Common Stocks | 2,526,055,955 | 55,456,785 | – | 2,581,512,740 | ||||||||||||||
| Cash Equivalents | 21,504,952 | 41,365,000 | – | 62,869,952 | ||||||||||||||
| Royce Premier Fund Common Stocks | 2,151,906,366 | 51,570,213 | – | 2,203,476,579 | ||||||||||||||
| Cash Equivalents | 25,197,111 | 7,461,000 | – | 32,658,111 | ||||||||||||||
| Royce Small-Cap Leaders Fund Common Stocks | 89,615,746 | 1,684,455 | – | 91,300,201 | ||||||||||||||
| Cash Equivalents | – | 6,059,000 | – | 6,059,000 | ||||||||||||||
| Royce Small-Cap Value Fund Common Stocks | 437,520,283 | – | – | 437,520,283 | ||||||||||||||
| Cash Equivalents | 2,138,400 | 40,721,000 | – | 42,859,400 | ||||||||||||||
| Royce Smaller-Companies Growth Fund Common Stocks | 424,255,233 | 25,108,720 | – | 449,363,953 | ||||||||||||||
| Cash Equivalents | 28,142,552 | 40,030,000 | – | 68,172,552 | ||||||||||||||
| Royce Special Equity Fund Common Stocks | 1,289,181,687 | 28,796,242 | – | 1,317,977,929 | ||||||||||||||
| Cash Equivalents | – | 131,699,000 | – | 131,699,000 | ||||||||||||||
| Royce Special Equity Multi-Cap Fund Common Stocks | 103,599,780 | – | – | 103,599,780 | ||||||||||||||
| Cash Equivalents | – | 14,797,000 | – | 14,797,000 | ||||||||||||||
| Royce Total Return Fund Common Stocks | 2,657,701,006 | 124,444,265 | – | 2,782,145,271 | ||||||||||||||
| Corporate Bond | – | 3,265,357 | – | 3,265,357 | ||||||||||||||
| Cash Equivalents | 9,652,360 | 24,287,000 | – | 33,939,360 | ||||||||||||||
The Royce Funds 2016 Semiannual Report to Shareholders | 115
Notes to Financial Statements (unaudited) (continued)
VALUATION OF INVESTMENTS (continued):
Certain securities have transferred in and out of Level 1, Level 2 and Level 3 measurements during the reporting period. The Funds recognize transfers between levels as of the end of the reporting period. For the six months ended June 30, 2016, the following Funds had securities transfer from Level 2 to Level 1 and from Level 2 to Level 3 within the fair value hierarchy:
| TRANSFERS FROM | TRANSFERS FROM | |||||||
| LEVEL 2 TO LEVEL 1 | LEVEL 2 TO LEVEL 3 | |||||||
| Royce Dividend Value Fund | $ | 1,711,297 | $ | – | ||||
| Royce Global Financial Services Fund | 1,098,278 | – | ||||||
| Royce International Micro-Cap Fund | 65,336 | 38,985 | ||||||
| Royce International Small-Cap Fund | 154,301 | – | ||||||
Level 3 Reconciliation:
| REALIZED AND | ||||||||||||||||||||||||
| UNREALIZED | ||||||||||||||||||||||||
| BALANCE AS OF 12/31/15 | PURCHASES | SALES | TRANSFERS IN | GAIN (LOSS)1 | BALANCE AS OF 6/30/16 | |||||||||||||||||||
| Royce International Micro-Cap Fund | ||||||||||||||||||||||||
| Common Stocks | $ | – | $ | 0 | $ | – | $ | 38,985 | $ | – | $ | 38,985 | ||||||||||||
| Royce International Small-Cap Fund | ||||||||||||||||||||||||
| Common Stocks | – | 120,487 | 50,727 | – | (22,203 | ) | 47,557 | |||||||||||||||||
| Royce Micro-Cap Fund | ||||||||||||||||||||||||
| Common Stocks | 810,411 | – | – | – | – | 810,411 | ||||||||||||||||||
| 1 | The net change in unrealized appreciation (depreciation) is included in the accompanying Statement of Operations. Change in unrealized appreciation (depreciation) includes net unrealized appreciation (depreciation) resulting from changes in investment values during the reporting period and the reversal of previously recorded unrealized appreciation (depreciation) when gains or losses are realized. Net realized gain (loss) from investments and foreign currency transactions is included in the accompanying Statement of Operations. |
The following table summarizes the valuation techniques used and unobservable inputs approved by the Valuation Committee to determine the fair value of certain, material Level 3 investments. The table does not include Level 3 investments with values derived utilizing prices from prior transactions or third party pricing information with adjustments (e.g. broker quotes, pricing services, net asset values).
| FAIR VALUE AT | IMPACT TO VALUATION FROM | |||||||||||||||||||
| 6/30/16 | VALUATION TECHNIQUE(S) | UNOBSERVABLE INPUT(S) | RANGE AVERAGE | AN INCREASE IN INPUT1 | ||||||||||||||||
| Royce Micro-Cap Fund | ||||||||||||||||||||
| Common Stocks | $810,411 | Discounted Present Value Balance Sheet Analysis | Liquidity Discount | 30%-40% | Decrease | |||||||||||||||
| 1 | This column represents the directional change in the fair value of the Level 3 investments that would result in an increase from the corresponding unobservable input. A decrease to the unobservable input would have the opposite effect. Significant increases and decreases in these unobservable inputs in isolation could result in significantly higher or lower fair value measurements. |
REPURCHASE AGREEMENTS:
The Funds may enter into repurchase agreements with institutions that the Funds’ investment adviser has determined are creditworthy. Each Fund restricts repurchase agreements to maturities of no more than seven days. Securities pledged as collateral for repurchase agreements, which are held until maturity of the repurchase agreements, are marked-to-market daily and maintained at a value at least equal to the principal amount of the repurchase agreement (including accrued interest). Repurchase agreements could involve certain risks in the event of default or insolvency of the counter-party, including possible delays or restrictions upon the ability of each Fund to dispose of its underlying securities. The remaining contractual maturities of repurchase agreements held by the Funds at June 30, 2016 are overnight and continuous.
FOREIGN CURRENCY:
Net realized foreign exchange gains or losses arise from sales and maturities of short-term securities, sales of foreign currencies, expiration of currency forward contracts, currency gains or losses realized between the trade and settlement dates on securities transactions, and the difference between the amounts of dividends, interest, and foreign withholding taxes recorded on each Fund’s books and the U.S. dollar equivalent of the amounts actually received or paid. Net unrealized foreign exchange gains and losses arise from changes in the value of assets and liabilities, including investments in securities at the end of the reporting period, as a result of changes in foreign currency exchange rates.
SECURITIES LENDING:
The Funds loan securities through a lending agent to qualified institutional investors for the purpose of realizing additional income. Collateral for the Funds on all securities loaned is accepted in cash and cash equivalents and invested temporarily by the custodian. The collateral maintained is at least 100% of the current market value of the loaned securities. The market value of the loaned securities is determined at the close of business of the Funds and any additional required collateral is delivered to the Funds on the next business day. The Funds retain the risk of any loss on the securities on loan as well as incurring the potential loss on investments purchased with cash
116 | The Royce Funds 2016 Semiannual Report to Shareholders
SECURITIES LENDING (continued):
collateral received for securities lending. The Funds’ securities lending income consists of the income earned on investing cash collateral, plus any premium payments received for lending certain securities, less any rebates paid to borrowers and lending agent fees associated with the loan. The lending agent is not affiliated with Royce.
The following table presents by financial instrument, each Fund’s assets and liabilities net of related collateral held by each Fund at June 30, 2016:
| GROSS AMOUNT OF ASSETS AND | |||||||
| LIABILITIES IN THE STATEMENTS OF | |||||||
| ASSETS AND LIABILITIES1,2 | COLLATERAL RECEIVED AND PLEDGED | NET AMOUNT | |||||
| Royce Low-Priced Stock Fund | |||||||
| Securities on Loan/Collateral on Loaned Securities | $ 15,056,726 | $ (15,056,726) | $ | – | |||
| Royce Micro-Cap Fund | |||||||
| Securities on Loan/Collateral on Loaned Securities | 7,953,641 | (7,953,641) | – | ||||
| Royce Opportunity Fund | |||||||
| Securities on Loan/Collateral on Loaned Securities | 75,223,917 | (75,223,917) | – | ||||
| Royce Pennsylvania Mutual Fund | |||||||
| Securities on Loan/Collateral on Loaned Securities | 21,504,952 | (21,504,952) | – | ||||
| Royce Premier Fund | |||||||
| Securities on Loan/Collateral on Loaned Securities | 25,197,111 | (25,197,111) | – | ||||
| Royce Small-Cap Value Fund | |||||||
| Securities on Loan/Collateral on Loaned Securities | 2,138,400 | (2,138,400) | – | ||||
| Royce Smaller-Companies Growth Fund | |||||||
| Securities on Loan/Collateral on Loaned Securities | 28,142,552 | (28,142,552) | – | ||||
| Royce Total Return Fund | |||||||
| Securities on Loan/Collateral on Loaned Securities | 9,652,360 | (9,652,360) | – | ||||
| 1 | Absent an event of default, assets and liabilities are presented gross and not offset in the Statements of Assets and Liabilities. |
| 2 | The remaining contractual maturity of collateral shown is overnight and continuous. |
DISTRIBUTIONS AND TAXES:
As qualified regulated investment companies under Subchapter M of the Internal Revenue Code, the Funds are not subject to income taxes to the extent that each Fund distributes substantially all of its taxable income for its fiscal year.
Royce Dividend Value Fund and Royce Total Return Fund pay any dividends from net investment income quarterly and make any distributions from net realized gains annually in December. The other Funds pay any dividends and capital gain distributions annually in December. Dividends from net investment income are determined at a class level and distributions from capital gains are determined at a Fund level. Because federal income tax regulations differ from generally accepted accounting principles, income and capital gain distributions determined in accordance with tax regulations may differ from net investment income and realized gains recognized for financial reporting purposes. Accordingly, the character of distributions and composition of net assets for tax purposes differ from those reflected in the accompanying financial statements.
CAPITAL GAINS TAXES:
The Funds are subject to a tax imposed on short-term capital gains on securities of issuers domiciled in certain countries. The Funds record an estimated deferred tax liability for these securities that have been held for less than one year. This amount, if any, is reported as deferred capital gains tax in the accompanying Statements of Assets and Liabilities, assuming those positions were disposed of at the end of the period, and accounted for as a reduction in the market value of the security.
INVESTMENT TRANSACTIONS AND RELATED INVESTMENT INCOME:
Investment transactions are accounted for on the trade date. Dividend income is recorded on the ex-dividend date. Non-cash dividend income is recorded at the fair market value of the securities received. Interest income is recorded on an accrual basis. Premiums and discounts on debt securities are amortized using the effective yield-to-maturity method. Realized gains and losses from investment transactions are determined on the basis of identified cost for book and tax purposes.
EXPENSES:
The Funds incur direct and indirect expenses. Expenses directly attributable to a Fund are charged to the Fund’s operations, while expenses applicable to more than one of the Royce Funds are allocated equitably. Certain personnel, occupancy costs and other administrative expenses related to the Funds are allocated by Royce under an administration agreement and are included in administrative and office facilities and legal expenses. The Trust has adopted a deferred fee agreement that allows the Trustees to defer the receipt of all or a portion of trustees’ fees otherwise payable. The deferred fees are invested in certain Royce Funds until distributed in accordance with the agreement.
The Royce Funds 2016 Semiannual Report to Shareholders | 117
Notes to Financial Statements (unaudited) (continued)
COMPENSATING BALANCE CREDITS:
The Funds have arrangements with their custodian bank and transfer agent, whereby a portion of the custodian’s fee and transfer agent’s fee is paid indirectly by credits earned on a Fund’s cash on deposit with the bank and transfer agent. These deposit arrangements are an alternative to purchasing overnight investments. Conversely, a Fund pays interest to the custodian on any cash overdrafts, to the extent they are not offset by credits earned on positive cash balances.
LINE OF CREDIT:
The Funds, along with certain other Royce Funds, participate in a $75 million line of credit (“Credit Agreement”) to be used for temporary or emergency purposes. This revolving Credit Agreement expires on October 14, 2016. Pursuant to the Credit Agreement, each participating Fund is liable only for principal and interest payments related to borrowings made by that Fund. Borrowings under the Credit Agreement bear interest at a rate equal to the higher of the federal funds rate or One-Month LIBOR rate. The Funds did not utilize the line of credit during the six months ended June 30, 2016.
Capital Share Transactions (in dollars):
| SHARES SOLD | SHARES ISSUED FOR REINVESTMENT OF DISTRIBUTIONS | SHARES REDEEMED | NET INCREASE (DECREASE) FROM CAPITAL SHARE TRANSACTIONS | |||||||||||||||||||||||||||||
| Period Ended | Period Ended | Period Ended | Period Ended | |||||||||||||||||||||||||||||
| 6/30/16 (unaudited) | Year Ended 12/31/15 | 6/30/16 (unaudited) | Year Ended 12/31/15 | 6/30/16 (unaudited) | Year Ended 12/31/15 | 6/30/16 (unaudited) | Year Ended 12/31/15 | |||||||||||||||||||||||||
| Royce Dividend Value Fund | ||||||||||||||||||||||||||||||||
Investment Class | $ | 9,769,635 | $ | 23,649,663 | $ | 736,940 | $ | 11,429,125 | $ | (25,280,424 | ) | $ | (74,578,435 | ) | $ | (14,773,849 | ) | $ | (39,499,647 | ) | ||||||||||||
Service Class | 3,886,794 | 16,518,808 | 887,325 | 15,761,498 | (38,774,463 | ) | (130,909,331 | ) | (34,000,344 | ) | (98,629,025 | ) | ||||||||||||||||||||
Consultant Class | 119,757 | 1,097,996 | 4,740 | 85,041 | (604,612 | ) | (45,341 | ) | (480,115 | ) | 1,137,696 | |||||||||||||||||||||
Institutional Class | 35,938 | 2,092,529 | 6,447 | 568,830 | (13,579 | ) | (41,686,517 | ) | 28,806 | (39,025,158 | ) | |||||||||||||||||||||
| Royce Global Financial Services Fund | ||||||||||||||||||||||||||||||||
Service Class | 2,957,172 | 27,686,991 | – | 4,744,775 | (13,681,604 | ) | (25,338,632 | ) | (10,724,432 | ) | 7,093,134 | |||||||||||||||||||||
Institutional Class | 5,237,087 | – | – | 5,237,087 | ||||||||||||||||||||||||||||
| Royce Heritage Fund | ||||||||||||||||||||||||||||||||
Investment Class | 1,984,147 | 66,672,423 | – | 8,519,044 | (1,382,376 | ) | (129,448,243 | ) | 601,771 | (54,256,776 | ) | |||||||||||||||||||||
Service Class | 1,205,147 | 3,444,092 | – | 10,924,772 | (9,942,067 | ) | (49,371,367 | ) | (8,736,920 | ) | (35,002,503 | ) | ||||||||||||||||||||
Consultant Class | 321,779 | 1,237,684 | – | 1,234,787 | (1,412,877 | ) | (2,229,108 | ) | (1,091,098 | ) | 243,363 | |||||||||||||||||||||
R Class | 144,428 | 266,388 | – | 294,942 | (439,684 | ) | (1,437,246 | ) | (295,256 | ) | (875,916 | ) | ||||||||||||||||||||
K Class | 256,370 | 1,103,442 | – | 531,190 | (660,790 | ) | (2,367,598 | ) | (404,420 | ) | (732,966 | ) | ||||||||||||||||||||
| Royce International Micro-Cap Fund | ||||||||||||||||||||||||||||||||
Service Class | 120,441 | 667,982 | – | 14,448 | (436,409 | ) | (934,517 | ) | (315,968 | ) | (252,087 | ) | ||||||||||||||||||||
| Royce International Premier Fund | ||||||||||||||||||||||||||||||||
Investment Class | 3,772,333 | 2,890,985 | – | 56,544 | (7,669,463 | ) | (3,364,282 | ) | (3,897,130 | ) | (416,753 | ) | ||||||||||||||||||||
Service Class | 2,887,878 | 5,213,879 | – | 222,108 | (7,090,147 | ) | (918,247 | ) | (4,202,269 | ) | 4,517,740 | |||||||||||||||||||||
Consultant Class | 159,212 | – | (612,170 | ) | (452,958 | ) | ||||||||||||||||||||||||||
R Class | – | – | – | – | ||||||||||||||||||||||||||||
K Class | – | – | – | – | ||||||||||||||||||||||||||||
| Royce International Small-Cap Fund | ||||||||||||||||||||||||||||||||
Investment Class | 38,903 | 280,040 | – | 9,594 | (25,252 | ) | (1,093,921 | ) | 13,651 | (804,287 | ) | |||||||||||||||||||||
Service Class | 1,359,043 | 11,751,517 | – | 329,669 | (12,586,862 | ) | (23,840,701 | ) | (11,227,819 | ) | (11,759,515 | ) | ||||||||||||||||||||
Institutional Class | 9,503 | 209,934 | – | 58,360 | (2,087 | ) | (523,957 | ) | 7,416 | (255,663 | ) | |||||||||||||||||||||
| Royce Low-Priced Stock Fund | ||||||||||||||||||||||||||||||||
Investment Class | 1,238,860 | 2,852,531 | – | 2,370,662 | (6,192,907 | ) | (20,568,241 | ) | (4,954,047 | ) | (15,345,048 | ) | ||||||||||||||||||||
Service Class | 3,989,058 | 11,754,025 | – | 25,996,096 | (41,109,772 | ) | (174,212,435 | ) | (37,120,714 | ) | (136,462,314 | ) | ||||||||||||||||||||
Institutional Class | 427,170 | 2,861,159 | – | 3,502,604 | (23,844,476 | ) | (60,481,368 | ) | (23,417,306 | ) | (54,117,605 | ) | ||||||||||||||||||||
R Class | 80,823 | 169,716 | – | 100,300 | (90,569 | ) | (789,324 | ) | (9,746 | ) | (519,308 | ) | ||||||||||||||||||||
K Class | 59,782 | 194,279 | – | 408,218 | (326,085 | ) | (515,150 | ) | (266,303 | ) | 87,347 | |||||||||||||||||||||
| Royce Micro-Cap Fund | ||||||||||||||||||||||||||||||||
Investment Class | 3,294,966 | 14,926,416 | – | 22,993,887 | (36,584,052 | ) | (166,882,704 | ) | (33,289,086 | ) | (128,962,401 | ) | ||||||||||||||||||||
Service Class | 2,144,566 | 7,415,593 | – | 2,226,657 | (6,847,843 | ) | (20,657,952 | ) | (4,703,277 | ) | (11,015,702 | ) | ||||||||||||||||||||
Consultant Class | 866,844 | 2,234,748 | – | 5,416,400 | (7,286,049 | ) | (28,321,597 | ) | (6,419,205 | ) | (20,670,449 | ) | ||||||||||||||||||||
| Royce Micro-Cap Opportunity Fund | ||||||||||||||||||||||||||||||||
Investment Class | 4,560,007 | 28,809,329 | – | 796 | (2,757,099 | ) | (7,648,626 | ) | 1,802,908 | 21,161,499 | ||||||||||||||||||||||
Service Class | 198,029 | 1,126,601 | – | 49 | (351,030 | ) | (612,357 | ) | (153,001 | ) | 514,293 | |||||||||||||||||||||
| Royce Opportunity Fund | ||||||||||||||||||||||||||||||||
Investment Class | 36,783,151 | 90,459,880 | – | 61,976,576 | (115,398,450 | ) | (486,891,165 | ) | (78,615,299 | ) | (334,454,709 | ) | ||||||||||||||||||||
Service Class | 7,240,660 | 20,524,236 | – | 9,179,243 | (33,504,193 | ) | (55,909,453 | ) | (26,263,533 | ) | (26,205,974 | ) | ||||||||||||||||||||
Consultant Class | 1,910,807 | 7,052,245 | – | 1,937,381 | (2,022,757 | ) | (4,763,168 | ) | (111,950 | ) | 4,226,458 | |||||||||||||||||||||
Institutional Class | 35,786,772 | 79,316,517 | – | 52,184,260 | (86,779,806 | ) | (177,729,567 | ) | (50,993,034 | ) | (46,228,790 | ) | ||||||||||||||||||||
R Class | 3,338,067 | 9,316,688 | – | 3,171,431 | (3,200,856 | ) | (5,268,442 | ) | 137,211 | 7,219,677 | ||||||||||||||||||||||
K Class | 1,007,215 | 3,218,485 | – | 1,032,939 | (4,575,074 | ) | (14,382,911 | ) | (3,567,859 | ) | (10,131,487 | ) | ||||||||||||||||||||
118 | The Royce Funds 2016 Semiannual Report to Shareholders
Capital Share Transactions (in dollars) (continued):
| SHARES SOLD | SHARES ISSUED FOR REINVESTMENT OF DISTRIBUTIONS | SHARES REDEEMED | NET INCREASE (DECREASE) FROM CAPITAL SHARE TRANSACTIONS | |||||||||||||||||||||||||||||
| Period Ended | Period Ended | Period Ended | Period Ended | |||||||||||||||||||||||||||||
| 6/30/16 (unaudited) | Year Ended 12/31/15 | 6/30/16 (unaudited) | Year Ended 12/31/15 | 6/30/16 (unaudited) | Year Ended 12/31/15 | 6/30/16 (unaudited) | Year Ended 12/31/15 | |||||||||||||||||||||||||
| Royce Pennsylvania Mutual Fund | ||||||||||||||||||||||||||||||||
Investment Class | $ | 54,094,794 | $ | 183,803,935 | $ | – | $ | 333,463,014 | $ | (471,760,493 | ) | $ | (1,765,123,278 | ) | $ | (417,665,699 | ) | $ | (1,247,856,329 | ) | ||||||||||||
Service Class | 6,115,113 | 20,129,821 | – | 14,644,024 | (31,924,642 | ) | (225,908,716 | ) | (25,809,529 | ) | (191,134,871 | ) | ||||||||||||||||||||
Consultant Class | 5,535,776 | 17,170,289 | – | 87,362,626 | (58,770,396 | ) | (198,621,464 | ) | (53,234,620 | ) | (94,088,549 | ) | ||||||||||||||||||||
Institutional Class | 99,325,658 | 101,754,384 | – | 97,120,074 | (120,542,522 | ) | (334,527,820 | ) | (21,216,864 | ) | (135,653,362 | ) | ||||||||||||||||||||
R Class | 1,074,587 | 4,543,292 | – | 3,572,638 | (4,012,387 | ) | (19,409,049 | ) | (2,937,800 | ) | (11,293,119 | ) | ||||||||||||||||||||
K Class | 226,345 | 1,546,689 | – | 1,005,956 | (1,648,231 | ) | (7,342,824 | ) | (1,421,886 | ) | (4,790,179 | ) | ||||||||||||||||||||
| Royce Premier Fund | ||||||||||||||||||||||||||||||||
Investment Class | 59,847,149 | 170,517,972 | – | 348,353,321 | (439,697,073 | ) | (1,888,601,606 | ) | (379,849,924 | ) | (1,369,730,313 | ) | ||||||||||||||||||||
Service Class | 4,968,063 | 17,920,179 | – | 11,888,243 | (24,400,109 | ) | (120,015,610 | ) | (19,432,046 | ) | (90,207,188 | ) | ||||||||||||||||||||
Consultant Class | 672,485 | 1,588,805 | – | 7,392,495 | (4,307,387 | ) | (20,011,516 | ) | (3,634,902 | ) | (11,030,216 | ) | ||||||||||||||||||||
Institutional Class | 12,885,076 | 53,675,035 | – | 56,217,898 | (68,434,612 | ) | (312,593,365 | ) | (55,549,536 | ) | (202,700,432 | ) | ||||||||||||||||||||
W Class | 6,697,557 | 28,318,127 | – | 31,614,224 | (46,384,298 | ) | (240,988,959 | ) | (39,686,741 | ) | (181,056,608 | ) | ||||||||||||||||||||
R Class | 258,974 | 1,611,507 | – | 3,169,817 | (2,725,154 | ) | (10,697,404 | ) | (2,466,180 | ) | (5,916,080 | ) | ||||||||||||||||||||
K Class | 604,641 | 489,271 | – | 2,060,228 | (1,595,291 | ) | (3,539,803 | ) | (990,650 | ) | (990,304 | ) | ||||||||||||||||||||
| Royce Small-Cap Leaders Fund | ||||||||||||||||||||||||||||||||
Investment Class | 1,127,421 | 4,434,512 | – | 8,279,111 | (9,025,673 | ) | (33,988,215 | ) | (7,898,252 | ) | (21,274,592 | ) | ||||||||||||||||||||
Service Class | 1,123,099 | 6,779,522 | – | 10,255,927 | (12,709,534 | ) | (87,508,476 | ) | (11,586,435 | ) | (70,473,027 | ) | ||||||||||||||||||||
R Class | 160,383 | 627,223 | – | 233,440 | (419,802 | ) | (674,825 | ) | (259,419 | ) | 185,838 | |||||||||||||||||||||
K Class | 75,824 | 126,570 | – | 42,291 | (21,459 | ) | (406,623 | ) | 54,365 | (237,762 | ) | |||||||||||||||||||||
| Royce Small-Cap Value Fund | ||||||||||||||||||||||||||||||||
Investment Class | 11,759,941 | 11,708,751 | – | 12,030,880 | (19,835,738 | ) | (60,415,492 | ) | (8,075,797 | ) | (36,675,861 | ) | ||||||||||||||||||||
Service Class | 5,413,955 | 16,785,178 | – | 39,154,518 | (51,503,919 | ) | (199,654,317 | ) | (46,089,964 | ) | (143,714,621 | ) | ||||||||||||||||||||
Consultant Class | 558,176 | 2,018,757 | – | 3,021,011 | (2,845,157 | ) | (7,416,715 | ) | (2,286,981 | ) | (2,376,947 | ) | ||||||||||||||||||||
Institutional Class | 47,146,616 | 39,420,846 | – | 26,023,428 | (49,801,882 | ) | (66,669,374 | ) | (2,655,266 | ) | (1,225,100 | ) | ||||||||||||||||||||
R Class | 1,815,153 | 3,103,823 | – | 3,208,749 | (4,584,723 | ) | (12,208,918 | ) | (2,769,570 | ) | (5,896,346 | ) | ||||||||||||||||||||
K Class | 491,301 | 1,211,209 | – | 1,300,985 | (1,922,346 | ) | (3,674,069 | ) | (1,431,045 | ) | (1,161,875 | ) | ||||||||||||||||||||
| Royce Smaller-Companies Growth Fund | ||||||||||||||||||||||||||||||||
Investment Class | 5,785,877 | 30,013,229 | – | 22,797,506 | (25,886,117 | ) | (183,946,383 | ) | (20,100,240 | ) | (131,135,648 | ) | ||||||||||||||||||||
Service Class | 10,707,297 | 23,912,746 | – | 74,968,068 | (69,401,070 | ) | (173,716,477 | ) | (58,693,773 | ) | (74,835,663 | ) | ||||||||||||||||||||
Consultant Class | 122,649 | 1,404,966 | – | 2,870,073 | (1,754,202 | ) | (3,601,957 | ) | (1,631,553 | ) | 673,082 | |||||||||||||||||||||
Institutional Class | 3,354,895 | 16,958,341 | – | 7,467,312 | (12,450,096 | ) | (15,112,453 | ) | (9,095,201 | ) | 9,313,200 | |||||||||||||||||||||
R Class | 123,139 | 181,933 | – | 184,149 | (225,151 | ) | (640,810 | ) | (102,012 | ) | (274,728 | ) | ||||||||||||||||||||
K Class | 13,833 | 40,233 | – | 96,698 | (70,838 | ) | (227,313 | ) | (57,005 | ) | (90,382 | ) | ||||||||||||||||||||
| Royce Special Equity Fund | ||||||||||||||||||||||||||||||||
Investment Class | 97,557,033 | 160,549,199 | – | 102,536,424 | (187,728,194 | ) | (807,979,227 | ) | (90,171,161 | ) | (544,893,604 | ) | ||||||||||||||||||||
Service Class | 15,774,957 | 21,007,931 | – | 9,324,097 | (26,830,427 | ) | (118,707,306 | ) | (11,055,470 | ) | (88,375,278 | ) | ||||||||||||||||||||
Consultant Class | 2,020,569 | 3,294,653 | – | 4,202,989 | (4,675,126 | ) | (17,218,803 | ) | (2,654,557 | ) | (9,721,161 | ) | ||||||||||||||||||||
Institutional Class | 25,398,955 | 65,500,038 | – | 23,629,501 | (52,681,961 | ) | (465,303,367 | ) | (27,283,006 | ) | (376,173,828 | ) | ||||||||||||||||||||
| Royce Special Equity Multi-Cap Fund | ||||||||||||||||||||||||||||||||
Investment Class | 8,444,630 | 16,321,320 | – | 3,027,028 | (7,835,725 | ) | (80,663,606 | ) | 608,905 | (61,315,258 | ) | |||||||||||||||||||||
Service Class | 779,954 | 3,764,036 | – | 3,486,934 | (11,412,125 | ) | (40,762,518 | ) | (10,632,171 | ) | (33,511,548 | ) | ||||||||||||||||||||
Consultant Class | 154,124 | 1,607,508 | – | 613,517 | (2,224,506 | ) | (2,598,756 | ) | (2,070,382 | ) | (377,731 | ) | ||||||||||||||||||||
Institutional Class | 101,448 | 5,688,196 | – | 3,166,671 | (4,371,782 | ) | (38,313,394 | ) | (4,270,334 | ) | (29,458,527 | ) | ||||||||||||||||||||
| Royce Total Return Fund | ||||||||||||||||||||||||||||||||
Investment Class | 163,012,551 | 223,353,957 | 7,519,787 | 211,097,614 | (436,230,167 | ) | (1,232,983,140 | ) | (265,697,829 | ) | (798,531,569 | ) | ||||||||||||||||||||
Service Class | 12,024,525 | 23,141,848 | 393,031 | 16,518,400 | (34,517,467 | ) | (103,313,893 | ) | (22,099,911 | ) | (63,653,645 | ) | ||||||||||||||||||||
Consultant Class | 5,600,490 | 16,675,424 | 87,068 | 29,482,336 | (30,902,028 | ) | (82,751,635 | ) | (25,214,470 | ) | (36,593,875 | ) | ||||||||||||||||||||
Institutional Class | 134,999,501 | 93,923,141 | 1,961,795 | 48,147,881 | (65,097,428 | ) | (255,731,309 | ) | 71,863,868 | (113,660,287 | ) | |||||||||||||||||||||
W Class | 14,109,792 | 34,272,681 | 338,680 | 13,660,313 | (20,952,622 | ) | (167,700,072 | ) | (6,504,150 | ) | (119,767,078 | ) | ||||||||||||||||||||
R Class | 3,307,458 | 8,425,167 | 97,436 | 6,361,706 | (7,647,508 | ) | (18,587,401 | ) | (4,242,614 | ) | (3,800,528 | ) | ||||||||||||||||||||
K Class | 12,018,098 | 40,335,096 | 214,575 | 11,247,779 | (16,356,735 | ) | (63,467,985 | ) | (4,124,062 | ) | (11,885,110 | ) | ||||||||||||||||||||
The Royce Funds 2016 Semiannual Report to Shareholders | 119
Notes to Financial Statements (unaudited) (continued)
Capital Share Transactions (in shares):
| SHARES SOLD | SHARES ISSUED FOR REINVESTMENT OF DISTRIBUTIONS | SHARES REDEEMED | NET INCREASE (DECREASE) IN SHARES OUTSTANDING | |||||||||||||||||||||||||||||
| Period Ended | Period Ended | Period Ended | Period Ended | |||||||||||||||||||||||||||||
| 6/30/16 (unaudited) | Year Ended 12/31/15 | 6/30/16 (unaudited) | Year Ended 12/31/15 | 6/30/16 (unaudited) | Year Ended 12/31/15 | 6/30/16 (unaudited) | Year Ended 12/31/15 | |||||||||||||||||||||||||
| Royce Dividend Value Fund | ||||||||||||||||||||||||||||||||
Investment Class | 1,421,944 | 2,973,081 | 103,972 | 1,647,017 | (3,748,440 | ) | (9,341,817 | ) | (2,222,524 | ) | (4,721,719 | ) | ||||||||||||||||||||
Service Class | 562,723 | 2,039,493 | 123,817 | 2,235,170 | (5,624,883 | ) | (16,214,484 | ) | (4,938,343 | ) | (11,939,821 | ) | ||||||||||||||||||||
Consultant Class | 15,701 | 134,347 | 576 | 10,715 | (83,482 | ) | (5,251 | ) | (67,205 | ) | 139,811 | |||||||||||||||||||||
Institutional Class | 5,337 | 265,153 | 924 | 72,057 | (2,134 | ) | (5,301,044 | ) | 4,127 | (4,963,834 | ) | |||||||||||||||||||||
| Royce Global Financial Services Fund | ||||||||||||||||||||||||||||||||
Service Class | 380,360 | 2,873,670 | – | 596,827 | (1,772,319 | ) | (2,746,430 | ) | (1,391,959 | ) | 724,067 | |||||||||||||||||||||
Institutional Class | 560,952 | – | – | 560,952 | ||||||||||||||||||||||||||||
| Royce Heritage Fund | ||||||||||||||||||||||||||||||||
Investment Class | 162,816 | 4,505,873 | – | 663,994 | (108,269 | ) | (8,755,831 | ) | 54,547 | (3,585,964 | ) | |||||||||||||||||||||
Service Class | 95,141 | 231,619 | – | 853,498 | (781,199 | ) | (3,279,662 | ) | (686,058 | ) | (2,194,545 | ) | ||||||||||||||||||||
Consultant Class | 33,864 | 123,855 | – | 132,204 | (149,357 | ) | (205,388 | ) | (115,493 | ) | 50,671 | |||||||||||||||||||||
R Class | 16,903 | 25,852 | – | 34,536 | (52,083 | ) | (138,818 | ) | (35,180 | ) | (78,430 | ) | ||||||||||||||||||||
K Class | 29,345 | 104,554 | – | 61,552 | (74,686 | ) | (224,258 | ) | (45,341 | ) | (58,152 | ) | ||||||||||||||||||||
| Royce International Micro-Cap Fund | ||||||||||||||||||||||||||||||||
Service Class | 13,244 | 67,395 | – | 1,540 | (45,790 | ) | (92,723 | ) | (32,546 | ) | (23,788 | ) | ||||||||||||||||||||
| Royce International Premier Fund | ||||||||||||||||||||||||||||||||
Investment Class1 | 2,867,993 | 299,627 | – | 5,770 | (798,115 | ) | (336,327 | ) | 2,069,878 | (30,930 | ) | |||||||||||||||||||||
Service Class1 | 3,479,855 | 442,359 | – | 19,314 | (618,409 | ) | (80,714 | ) | 2,861,446 | 380,959 | ||||||||||||||||||||||
Consultant Class1 | 554,724 | – | (49,157 | ) | 505,567 | |||||||||||||||||||||||||||
R Class1 | 4,452 | – | – | 4,452 | ||||||||||||||||||||||||||||
K Class1 | 2,473 | – | – | 2,473 | ||||||||||||||||||||||||||||
| Royce International Small-Cap Fund | ||||||||||||||||||||||||||||||||
Investment Class | 5,037 | 34,188 | – | 1,290 | (3,399 | ) | (133,814 | ) | 1,638 | (98,336 | ) | |||||||||||||||||||||
Service Class | 152,055 | 1,187,879 | – | 35,525 | (1,366,344 | ) | (2,400,486 | ) | (1,214,289 | ) | (1,177,082 | ) | ||||||||||||||||||||
Institutional Class | 1,262 | 26,702 | – | 7,639 | (292 | ) | (59,659 | ) | 970 | (25,318 | ) | |||||||||||||||||||||
| Royce Low-Priced Stock Fund | ||||||||||||||||||||||||||||||||
Investment Class | 168,686 | 310,850 | – | 306,683 | (847,421 | ) | (2,245,155 | ) | (678,735 | ) | (1,627,622 | ) | ||||||||||||||||||||
Service Class | 541,425 | 1,296,920 | – | 3,371,800 | (5,582,218 | ) | (18,913,111 | ) | (5,040,793 | ) | (14,244,391 | ) | ||||||||||||||||||||
Institutional Class | 56,490 | 309,455 | – | 453,118 | (3,307,450 | ) | (6,476,161 | ) | (3,250,960 | ) | (5,713,588 | ) | ||||||||||||||||||||
R Class | 11,855 | 19,727 | – | 13,665 | (12,826 | ) | (88,296 | ) | (971 | ) | (54,904 | ) | ||||||||||||||||||||
K Class | 33,103 | 68,475 | – | 213,727 | (177,766 | ) | (179,941 | ) | (144,663 | ) | 102,261 | |||||||||||||||||||||
| Royce Micro-Cap Fund | ||||||||||||||||||||||||||||||||
Investment Class | 318,841 | 1,119,726 | – | 2,090,353 | (3,502,610 | ) | (12,065,693 | ) | (3,183,769 | ) | (8,855,614 | ) | ||||||||||||||||||||
Service Class | 206,625 | 549,588 | – | 205,981 | (659,370 | ) | (1,580,785 | ) | (452,745 | ) | (825,216 | ) | ||||||||||||||||||||
Consultant Class | 103,937 | 216,849 | – | 603,835 | (838,398 | ) | (2,488,065 | ) | (734,461 | ) | (1,667,381 | ) | ||||||||||||||||||||
| Royce Micro-Cap Opportunity Fund | ||||||||||||||||||||||||||||||||
Investment Class | 360,100 | 1,882,908 | – | 56 | (205,496 | ) | (504,907 | ) | 154,604 | 1,378,057 | ||||||||||||||||||||||
Service Class | 29,279 | 134,868 | – | 7 | (54,779 | ) | (74,301 | ) | (25,500 | ) | 60,574 | |||||||||||||||||||||
| Royce Opportunity Fund | ||||||||||||||||||||||||||||||||
Investment Class | 3,681,919 | 7,107,529 | – | 5,874,610 | (11,154,919 | ) | (37,759,225 | ) | (7,473,000 | ) | (24,777,086 | ) | ||||||||||||||||||||
Service Class | 753,200 | 1,686,397 | – | 923,465 | (3,463,256 | ) | (4,592,032 | ) | (2,710,056 | ) | (1,982,170 | ) | ||||||||||||||||||||
Consultant Class | 218,173 | 643,557 | – | 215,265 | (227,272 | ) | (439,229 | ) | (9,099 | ) | 419,593 | |||||||||||||||||||||
Institutional Class | 3,314,171 | 6,093,450 | – | 4,867,935 | (8,153,378 | ) | (13,551,380 | ) | (4,839,207 | ) | (2,589,995 | ) | ||||||||||||||||||||
R Class | 352,018 | 786,698 | – | 326,615 | (340,995 | ) | (441,661 | ) | 11,023 | 671,652 | ||||||||||||||||||||||
K Class | 118,559 | 290,724 | – | 116,453 | (522,317 | ) | (1,294,032 | ) | (403,758 | ) | (886,855 | ) | ||||||||||||||||||||
| Royce Pennsylvania Mutual Fund | ||||||||||||||||||||||||||||||||
Investment Class | 5,829,825 | 14,862,269 | – | 35,894,811 | (50,372,619 | ) | (142,082,592 | ) | (44,542,794 | ) | (91,325,512 | ) | ||||||||||||||||||||
Service Class | 648,169 | 1,609,207 | – | 1,574,626 | (3,395,090 | ) | (17,966,775 | ) | (2,746,921 | ) | (14,782,942 | ) | ||||||||||||||||||||
Consultant Class | 721,245 | 1,736,718 | – | 11,390,173 | (7,629,214 | ) | (19,579,852 | ) | (6,907,969 | ) | (6,452,961 | ) | ||||||||||||||||||||
Institutional Class | 10,261,487 | 8,202,043 | – | 10,443,019 | (12,838,677 | ) | (26,930,191 | ) | (2,577,190 | ) | (8,285,129 | ) | ||||||||||||||||||||
R Class | 119,183 | 381,495 | – | 403,232 | (459,338 | ) | (1,615,892 | ) | (340,155 | ) | (831,165 | ) | ||||||||||||||||||||
K Class | 28,753 | 141,199 | – | 128,639 | (213,996 | ) | (690,774 | ) | (185,243 | ) | (420,936 | ) | ||||||||||||||||||||
| 1 | Includes shares issued in connection with the merger of Royce European Small-Cap Fund and Royce Global Value Fund (2,460,873 for Investment Class, 3,226,058 for Service Class, 542,120 for Consultant Class, 4,452 for R Class and 2,473 for K Class, for the period ended 6/30/16). |
120 | The Royce Funds 2016 Semiannual Report to Shareholders
Capital Share Transactions (in shares) (continued):
| SHARES SOLD | SHARES ISSUED FOR REINVESTMENT OF DISTRIBUTIONS | SHARES REDEEMED | NET INCREASE (DECREASE) IN SHARES OUTSTANDING | |||||||||||||||||||||||||||||
| Period Ended | Period Ended | Period Ended | Period Ended | |||||||||||||||||||||||||||||
| 6/30/16 (unaudited) | Year Ended 12/31/15 | 6/30/16 (unaudited) | Year Ended 12/31/15 | 6/30/16 (unaudited) | Year Ended 12/31/15 | 6/30/16 (unaudited) | Year Ended 12/31/15 | |||||||||||||||||||||||||
| Royce Premier Fund | ||||||||||||||||||||||||||||||||
Investment Class | 4,279,549 | 9,168,178 | – | 24,566,525 | (31,441,238 | ) | (100,342,919 | ) | (27,161,689 | ) | (66,608,216 | ) | ||||||||||||||||||||
Service Class | 354,372 | 954,405 | – | 856,502 | (1,757,429 | ) | (6,315,653 | ) | (1,403,057 | ) | (4,504,746 | ) | ||||||||||||||||||||
Consultant Class | 56,778 | 99,248 | – | 625,952 | (360,557 | ) | (1,277,853 | ) | (303,779 | ) | (552,653 | ) | ||||||||||||||||||||
Institutional Class | 904,770 | 2,699,276 | – | 3,920,355 | (4,718,641 | ) | (16,080,233 | ) | (3,813,871 | ) | (9,460,602 | ) | ||||||||||||||||||||
W Class | 468,147 | 1,478,087 | – | 2,223,223 | (3,249,011 | ) | (12,822,686 | ) | (2,780,864 | ) | (9,121,376 | ) | ||||||||||||||||||||
R Class | 19,111 | 94,287 | – | 236,554 | (203,499 | ) | (588,753 | ) | (184,388 | ) | (257,912 | ) | ||||||||||||||||||||
K Class | 344,771 | 99,317 | – | 1,219,070 | (909,915 | ) | (755,894 | ) | (565,144 | ) | 562,493 | |||||||||||||||||||||
| Royce Small-Cap Leaders Fund | ||||||||||||||||||||||||||||||||
Investment Class1 | 183,549 | 2,978,457 | – | 1,309,986 | (1,438,941 | ) | (4,138,621 | ) | (1,255,392 | ) | 149,822 | |||||||||||||||||||||
Service Class | 183,348 | 815,180 | – | 1,640,948 | (2,024,967 | ) | (10,470,520 | ) | (1,841,619 | ) | (8,014,392 | ) | ||||||||||||||||||||
R Class | 18,934 | 58,655 | – | 27,724 | (50,646 | ) | (63,346 | ) | (31,712 | ) | 23,033 | |||||||||||||||||||||
K Class | 8,702 | 12,427 | – | 4,912 | (2,488 | ) | (36,908 | ) | 6,214 | (19,569 | ) | |||||||||||||||||||||
| Royce Small-Cap Value Fund | ||||||||||||||||||||||||||||||||
Investment Class | 1,345,691 | 1,053,004 | – | 1,374,958 | (2,265,493 | ) | (5,393,585 | ) | (919,802 | ) | (2,965,623 | ) | ||||||||||||||||||||
Service Class | 604,640 | 1,465,750 | – | 4,495,352 | (5,889,626 | ) | (17,566,808 | ) | (5,284,986 | ) | (11,605,706 | ) | ||||||||||||||||||||
Consultant Class | 70,210 | 215,591 | – | 381,923 | (355,250 | ) | (724,958 | ) | (285,040 | ) | (127,444 | ) | ||||||||||||||||||||
Institutional Class | 5,582,523 | 3,372,929 | – | 2,974,106 | (5,691,957 | ) | (5,973,204 | ) | (109,434 | ) | 373,831 | |||||||||||||||||||||
R Class | 205,463 | 280,915 | – | 380,634 | (538,495 | ) | (1,095,792 | ) | (333,032 | ) | (434,243 | ) | ||||||||||||||||||||
K Class | 76,543 | 139,957 | – | 210,515 | (311,054 | ) | (425,379 | ) | (234,511 | ) | (74,907 | ) | ||||||||||||||||||||
| Royce Smaller-Companies Growth Fund | ||||||||||||||||||||||||||||||||
Investment Class | 563,807 | 2,101,946 | – | 2,020,717 | (2,486,844 | ) | (12,370,706 | ) | (1,923,037 | ) | (8,248,043 | ) | ||||||||||||||||||||
Service Class | 1,061,216 | 1,642,584 | – | 6,741,732 | (6,708,785 | ) | (12,153,321 | ) | (5,647,569 | ) | (3,769,005 | ) | ||||||||||||||||||||
Consultant Class | 13,399 | 117,001 | – | 288,450 | (189,646 | ) | (273,856 | ) | (176,247 | ) | 131,595 | |||||||||||||||||||||
Institutional Class | 317,854 | 1,145,664 | – | 655,027 | (1,243,121 | ) | (1,014,525 | ) | (925,267 | ) | 786,166 | |||||||||||||||||||||
R Class | 12,304 | 12,908 | – | 17,538 | (22,682 | ) | (46,370 | ) | (10,378 | ) | (15,924 | ) | ||||||||||||||||||||
K Class | 2,469 | 4,290 | – | 15,957 | (12,481 | ) | (24,866 | ) | (10,012 | ) | (4,619 | ) | ||||||||||||||||||||
| Royce Special Equity Fund | ||||||||||||||||||||||||||||||||
Investment Class | 5,452,371 | 7,510,477 | – | 5,715,510 | (10,372,967 | ) | (37,351,257 | ) | (4,920,596 | ) | (24,125,270 | ) | ||||||||||||||||||||
Service Class | 881,711 | 956,841 | – | 520,318 | (1,497,443 | ) | (5,460,300 | ) | (615,732 | ) | (3,983,141 | ) | ||||||||||||||||||||
Consultant Class | 121,778 | 162,016 | – | 253,497 | (284,523 | ) | (863,049 | ) | (162,745 | ) | (447,536 | ) | ||||||||||||||||||||
Institutional Class | 1,450,689 | 3,062,860 | – | 1,327,500 | (2,890,596 | ) | (20,824,726 | ) | (1,439,907 | ) | (16,434,366 | ) | ||||||||||||||||||||
| Royce Special Equity Multi-Cap Fund | ||||||||||||||||||||||||||||||||
Investment Class | 658,230 | 1,107,136 | – | 245,103 | (628,092 | ) | (5,730,289 | ) | 30,138 | (4,378,050 | ) | |||||||||||||||||||||
Service Class | 63,143 | 247,726 | – | 281,431 | (904,220 | ) | (2,764,259 | ) | (841,077 | ) | (2,235,102 | ) | ||||||||||||||||||||
Consultant Class | 19,191 | 169,969 | – | 75,186 | (283,773 | ) | (268,805 | ) | (264,582 | ) | (23,650 | ) | ||||||||||||||||||||
Institutional Class | 8,465 | 369,024 | – | 256,618 | (346,652 | ) | (2,515,703 | ) | (338,187 | ) | (1,890,061 | ) | ||||||||||||||||||||
| Royce Total Return Fund | ||||||||||||||||||||||||||||||||
Investment Class | 13,306,094 | 15,709,131 | 601,912 | 17,555,119 | (36,241,844 | ) | (86,646,668 | ) | (22,333,838 | ) | (53,382,418 | ) | ||||||||||||||||||||
Service Class | 990,842 | 1,592,323 | 30,794 | 1,353,217 | (2,865,039 | ) | (7,132,452 | ) | (1,843,403 | ) | (4,186,912 | ) | ||||||||||||||||||||
Consultant Class | 468,047 | 1,202,972 | 6,616 | 2,425,951 | (2,514,791 | ) | (5,752,764 | ) | (2,040,128 | ) | (2,123,841 | ) | ||||||||||||||||||||
Institutional Class | 11,029,272 | 6,571,596 | 159,335 | 4,027,799 | (5,347,835 | ) | (18,016,463 | ) | 5,840,772 | (7,417,068 | ) | |||||||||||||||||||||
W Class | 1,179,145 | 2,391,393 | 27,221 | 1,135,774 | (1,737,368 | ) | (11,370,962 | ) | (531,002 | ) | (7,843,795 | ) | ||||||||||||||||||||
R Class | 269,579 | 572,835 | 7,505 | 519,876 | (621,019 | ) | (1,279,998 | ) | (343,935 | ) | (187,287 | ) | ||||||||||||||||||||
K Class | 1,434,345 | 3,838,974 | 24,846 | 1,364,520 | (1,992,343 | ) | (6,082,012 | ) | (533,152 | ) | (878,518 | ) | ||||||||||||||||||||
| 1 | Includes shares issued in connection with the merger of Royce Select Fund I (2,425,697 for Investment Class for the year ended 12/31/15). |
The Royce Funds 2016 Semiannual Report to Shareholders | 121
Notes to Financial Statements (unaudited) (continued)
Under the Trust’s investment advisory agreements with Royce, Royce is entitled to receive Investment Advisory fees that are computed daily and payable monthly. Royce’s commitment to waive its fees and reimburse class-specific expenses to the extent necessary to maintain certain Funds’ net annual operating expense ratios at specified levels through April 30, 2017, is shown below to the extent that it impacted net expenses for the six months ended June 30, 2016. See the Prospectus for contractual waiver expiration dates.
| COMMITTED NET ANNUAL OPERATING EXPENSE RATIO CAP | PERIOD ENDED JUNE 30, 2016 | ||||||||||||||||||||||||||||||||||||||
| ANNUAL CONTRACTUAL ADVISORY FEE AS A PERCENTAGE OF AVERAGE NET ASSETS1 | |||||||||||||||||||||||||||||||||||||||
| Investment Class5 | Service Class5 | Consultant Class5 | Institutional Class5 | W Class5 | R Class5 | K Class5 | Net advisory fees | Advisory fees waived | |||||||||||||||||||||||||||||||
| Royce Dividend Value Fund | 0.85%2 | 1.09%6 | 1.34%6 | 2.09%6 | 0.89%6 | N/A | N/A | N/A | $ | 1,135,203 | $ | 73,626 | |||||||||||||||||||||||||||
| Royce Global Financial Services Fund | 1.00% | N/A | 1.49% | N/A | 1.04% | N/A | N/A | N/A | 209,132 | 34,600 | |||||||||||||||||||||||||||||
| Royce Heritage Fund | 0.85%2 | N/A | N/A | 2.09%7 | N/A | N/A | 1.69%7 | 1.44%7 | 1,059,306 | – | |||||||||||||||||||||||||||||
| Royce International Micro-Cap Fund | 1.25% | N/A | 1.64% | N/A | N/A | N/A | N/A | N/A | – | 36,761 | |||||||||||||||||||||||||||||
| Royce International Premier Fund | 1.00%3 | 1.19%8 | 1.44%8 | 2.19% | N/A | N/A | 1.74% | 1.49% | 276,502 | 3,701 | |||||||||||||||||||||||||||||
| Royce International Small-Cap Fund | 1.00%3 | 1.19%9 | 1.44%9 | N/A | 1.19%9 | N/A | N/A | N/A | 49,943 | 34,668 | |||||||||||||||||||||||||||||
| Royce Low-Priced Stock Fund | 1.00% | 1.24% | 1.49% | N/A | N/A | N/A | 1.84% | 1.59% | 1,658,089 | – | |||||||||||||||||||||||||||||
| Royce Micro-Cap Fund | 1.25% | 1.49% | 1.61% | N/A | N/A | N/A | N/A | N/A | 1,516,754 | – | |||||||||||||||||||||||||||||
| Royce Micro-Cap Opportunity Fund | 1.00% | 1.24% | 1.49% | N/A | N/A | N/A | N/A | N/A | 180,334 | – | |||||||||||||||||||||||||||||
| Royce Opportunity Fund | 1.00% | N/A | 1.49% | N/A | N/A | N/A | N/A | N/A | 7,007,979 | – | |||||||||||||||||||||||||||||
| Royce Pennsylvania Mutual Fund | 0.76%4 | N/A | N/A | N/A | N/A | N/A | N/A | N/A | 10,179,936 | – | |||||||||||||||||||||||||||||
| Royce Premier Fund | 0.99% | N/A | 1.49% | N/A | N/A | N/A | N/A | 1.99% | 11,468,532 | – | |||||||||||||||||||||||||||||
| Royce Small-Cap Leaders Fund | 1.00% | 1.24% | 1.49% | N/A | N/A | �� | N/A | 1.84% | 1.59% | 501,042 | – | ||||||||||||||||||||||||||||
| Royce Small-Cap Value Fund | 1.00% | 1.24% | 1.49% | N/A | N/A | N/A | N/A | N/A | 2,481,790 | – | |||||||||||||||||||||||||||||
| Royce Smaller-Companies Growth Fund | 1.00% | 1.24% | 1.49% | 2.24% | N/A | N/A | 1.84% | 1.59% | 2,538,692 | – | |||||||||||||||||||||||||||||
| Royce Special Equity Fund | 1.00% | N/A | 1.39% | N/A | N/A | N/A | N/A | N/A | 7,096,263 | – | |||||||||||||||||||||||||||||
| Royce Special Equity Multi-Cap Fund | 0.85% | N/A | 1.24% | 1.99% | 0.89% | N/A | N/A | N/A | 504,870 | 34,083 | |||||||||||||||||||||||||||||
| Royce Total Return Fund | 0.99% | N/A | 1.49% | N/A | N/A | N/A | N/A | N/A | 13,474,338 | – | |||||||||||||||||||||||||||||
| 1 | From a base annual rate of 1.00% (0.85% for Royce Dividend Value Fund, Royce Heritage Fund and Royce Special Equity Multi-Cap Fund and 1.25% for Royce International Micro-Cap Fund and Royce Micro-Cap Fund), the annual rates of investment advisory fees payable by each of the Funds, other than Royce Pennsylvania Mutual Fund, are reduced by the indicated amount at the following breakpoints applicable to a Fund’s net assets in excess of $2 billion: more than $2 billion to $4 billion – .05% per annum; more than $4 billion to $6 billion – .10% per annum; over $6 billion – .15% per annum. |
| 2 | Royce Dividend Value Fund and Royce Heritage Fund’s base annual contractual advisory fee was reduced from 1.00% to 0.85%, effective May 1, 2016. |
| 3 | Royce International Premier Fund and Royce International Small-Cap Fund’s base annual contractual advisory fee was reduced from 1.10% to 1.00%, effective January 1, 2016. |
| 4 | Royce Pennsylvania Mutual Fund’s fees are calculated at the annual rate of 1.00% of the first $50 million of the Fund’s average net assets, 0.875% of the next $50 million of average net assets and 0.75% of average net assets in excess of $100 million. |
| 5 | Committed net annual operating expense ratio cap excludes acquired fund fees and expenses. |
| 6 | Royce Dividend Value Fund’s committed net annual operating expense ratio cap was reduced from 1.24% to 1.09% for Investment Class, from 1.49% to 1.34% for Service Class, from 2.24% to 2.09% for Consultant Class and from 1.04% to 0.89% for Institutional Class, effective May 1, 2016. |
| 7 | Royce Heritage Fund’s committed net annual operating expense ratio cap was reduced from 2.24% to 2.09% for Consultant Class, from 1.84% to 1.69% for R Class and from 1.59% to 1.44% for K Class, effective May 1, 2016. |
| 8 | Royce International Premier Fund’s committed net annual operating expense ratio cap was reduced from 1.29% to 1.19% for Investment Class and from 1.54% to 1.44% for Service Class, effective January 1, 2016. |
| 9 | Royce International Small-Cap Fund’s committed net annual operating expense ratio cap was reduced from 1.29% to 1.19% for Investment Class and Institutional Class and from 1.54% to 1.44% for Service Class, effective January 1, 2016. |
DISTRIBUTOR:
Royce Fund Services, Inc. (“RFS”), the distributor of the Trust’s shares, is a wholly owned subsidiary of Royce. RFS is entitled to receive distribution fees that are computed daily and payable monthly.
| ANNUAL CONTRACTUAL DISTRIBUTION FEE AS A | PERIOD ENDED JUNE 30, 2016 | |||||||||||||
| PERCENTAGE OF AVERAGE NET ASSETS | Net distribution fees | Distribution fees waived | ||||||||||||
| Royce Dividend Value Fund – Service Class | 0.25% | $ | 183,869 | $ | – | |||||||||
| Royce Dividend Value Fund – Consultant Class | 1.00% | 7,014 | – | |||||||||||
| Royce Global Financial Services Fund – Service Class | 0.25% | 50,887 | 4,425 | |||||||||||
| Royce Heritage Fund – Service Class | 0.25% | 80,884 | 63,552 | |||||||||||
| Royce Heritage Fund – Consultant Class | 1.00% | 54,550 | – | |||||||||||
| Royce Heritage Fund – R Class | 0.50% | 5,407 | – | |||||||||||
| Royce Heritage Fund – K Class | 0.25% | 4,688 | – | |||||||||||
| Royce International Micro-Cap Fund – Service Class | 0.25% | 4,999 | 2,353 | |||||||||||
| Royce International Premier Fund – Service Class | 0.25% | 35,316 | 5,885 | |||||||||||
| Royce International Premier Fund – Consultant Class | 1.00% | 22,362 | – | |||||||||||
| Royce International Premier Fund – R Class | 0.50% | 71 | – | |||||||||||
| Royce International Premier Fund – K Class | 0.25% | 19 | – | |||||||||||
122 | The Royce Funds 2016 Semiannual Report to Shareholders
DISTRIBUTOR (continued):
| ANNUAL CONTRACTUAL DISTRIBUTION FEE AS A | PERIOD ENDED JUNE 30, 2016 | |||||||||||
| PERCENTAGE OF AVERAGE NET ASSETS | Net distribution fees | Distribution fees waived | ||||||||||
| Royce International Small-Cap Fund – Service Class | 0.25% | $ | 18,247 | $ | – | |||||||
| Royce Low-Priced Stock Fund – Service Class | 0.25% | 323,335 | 28,116 | |||||||||
| Royce Low-Priced Stock Fund – R Class | 0.50% | 2,721 | – | |||||||||
| Royce Low-Priced Stock Fund – K Class | 0.25% | 1,539 | – | |||||||||
| Royce Micro-Cap Fund – Service Class | 0.25% | 21,869 | – | |||||||||
| Royce Micro-Cap Fund – Consultant Class | 1.00% | 180,890 | – | |||||||||
| Royce Micro-Cap Opportunity Fund – Service Class | 0.25% | 1,228 | – | |||||||||
| Royce Opportunity Fund – Service Class | 0.25% | 106,057 | – | |||||||||
| Royce Opportunity Fund – Consultant Class | 1.00% | 96,643 | – | |||||||||
| Royce Opportunity Fund – R Class | 0.50% | 79,118 | – | |||||||||
| Royce Opportunity Fund – K Class | 0.25% | 9,451 | – | |||||||||
| Royce Pennsylvania Mutual Fund – Service Class | 0.25% | 110,457 | – | |||||||||
| Royce Pennsylvania Mutual Fund – Consultant Class | 1.00% | 1,950,509 | – | |||||||||
| Royce Pennsylvania Mutual Fund – R Class | 0.50% | 41,498 | – | |||||||||
| Royce Pennsylvania Mutual Fund – K Class | 0.25% | 4,024 | – | |||||||||
| Royce Premier Fund – Service Class | 0.25% | 60,859 | – | |||||||||
| Royce Premier Fund – Consultant Class | 1.00% | 156,063 | – | |||||||||
| Royce Premier Fund – R Class | 0.50% | 36,665 | – | |||||||||
| Royce Premier Fund – K Class | 0.25% | 2,965 | – | |||||||||
| Royce Small-Cap Leaders Fund – Service Class | 0.25% | 59,959 | 5,214 | |||||||||
| Royce Small-Cap Leaders Fund – R Class | 0.50% | 3,651 | – | |||||||||
| Royce Small-Cap Leaders Fund – K Class | 0.25% | 436 | – | |||||||||
| Royce Small-Cap Value Fund – Service Class | 0.25% | 285,436 | – | |||||||||
| Royce Small-Cap Value Fund – Consultant Class | 1.00% | 87,878 | – | |||||||||
| Royce Small-Cap Value Fund – R Class | 0.50% | 43,643 | – | |||||||||
| Royce Small-Cap Value Fund – K Class | 0.25% | 6,434 | – | |||||||||
| Royce Smaller-Companies Growth Fund – Service Class | 0.25% | 399,110 | 34,705 | |||||||||
| Royce Smaller-Companies Growth Fund – Consultant Class | 1.00% | 62,678 | – | |||||||||
| Royce Smaller-Companies Growth Fund – R Class | 0.50% | 1,956 | – | |||||||||
| Royce Smaller-Companies Growth Fund – K Class | 0.25% | 324 | – | |||||||||
| Royce Special Equity Fund – Service Class | 0.25% | 133,929 | – | |||||||||
| Royce Special Equity Fund – Consultant Class | 1.00% | 204,822 | – | |||||||||
| Royce Special Equity Multi-Cap Fund – Service Class | 0.25% | 43,739 | 8,331 | |||||||||
| Royce Special Equity Multi-Cap Fund – Consultant Class | 1.00% | 26,382 | – | |||||||||
| Royce Total Return Fund – Service Class | 0.25% | 156,767 | – | |||||||||
| Royce Total Return Fund – Consultant Class | 1.00% | 1,261,942 | – | |||||||||
| Royce Total Return Fund – R Class | 0.50% | 122,609 | – | |||||||||
| Royce Total Return Fund – K Class | 0.25% | 74,827 | – | |||||||||
Purchases and Sales of Investment Securities:
For the six months ended June 30, 2016, the costs of purchases and the proceeds from sales of investment securities, other than short-term securities and collateral received for securities loaned, were as follows:
| PURCHASES | SALES | |||||||
| Royce Dividend Value Fund | $ | 39,901,955 | $ | 91,705,557 | ||||
| Royce Global Financial Services Fund | 10,461,941 | 15,338,490 | ||||||
| Royce Heritage Fund | 84,516,954 | 92,541,941 | ||||||
| Royce International Micro-Cap Fund | 3,046,851 | 3,396,015 | ||||||
| Royce International Premier Fund | 22,955,655 | 26,066,012 | ||||||
| Royce International Small-Cap Fund | 8,797,836 | 20,771,649 | ||||||
| Royce Low-Priced Stock Fund | 65,238,270 | 121,380,094 | ||||||
| Royce Micro-Cap Fund | 44,777,724 | 95,783,413 | ||||||
| Royce Micro-Cap Opportunity Fund | 17,452,306 | 16,505,634 | ||||||
| Royce Opportunity Fund | 191,340,122 | 359,831,271 | ||||||
| Royce Pennsylvania Mutual Fund | 249,122,796 | 776,712,545 | ||||||
| Royce Premier Fund | 259,609,172 | 783,987,024 | ||||||
| Royce Small-Cap Leaders Fund | 25,438,495 | 45,716,662 | ||||||
The Royce Funds 2016 Semiannual Report to Shareholders | 123
Notes to Financial Statements (unaudited) (continued)
Purchases and Sales of Investment Securities (continued):
| PURCHASES | SALES | |||||||
| Royce Small-Cap Value Fund | $ | 130,861,150 | $ | 224,110,970 | ||||
| Royce Smaller-Companies Growth Fund | 163,975,804 | 284,049,148 | ||||||
| Royce Special Equity Fund | 227,878,753 | 461,669,177 | ||||||
| Royce Special Equity Multi-Cap Fund | 16,988,515 | 40,357,397 | ||||||
| Royce Total Return Fund | 229,410,995 | 476,339,502 | ||||||
Cross trades were executed by the Funds pursuant to Rule 17a-7 under the 1940 Act. Cross trading is the buying or selling of portfolio securities between funds to which Royce serves as investment adviser. At its regularly scheduled quarterly meetings, the Board reviews such transactions as of the most recent calendar quarter for compliance with the requirements and restrictions set forth by Rule 17a-7. Cross trades for the six months ended June 30, 2016, were as follows:
| COST OF PURCHASES | COST OF SALES | REALIZED GAIN (LOSS) | ||||||||||
| Royce Dividend Value Fund | $ | – | $ | 4,179,930 | $ | (126,576 | ) | |||||
| Royce Global Financial Services Fund | 204,390 | – | – | |||||||||
| Royce Heritage Fund | – | – | – | |||||||||
| Royce International Micro-Cap Fund | – | – | – | |||||||||
| Royce International Premier Fund | 314,870 | 1,627,727 | (38,090 | ) | ||||||||
| Royce International Small-Cap Fund | – | – | – | |||||||||
| Royce Low-Priced Stock Fund | – | – | – | |||||||||
| Royce Micro-Cap Fund | – | 135,918 | (2,602 | ) | ||||||||
| Royce Micro-Cap Opportunity Fund | – | – | – | |||||||||
| Royce Opportunity Fund | – | – | – | |||||||||
| Royce Pennsylvania Mutual Fund | 12,859,610 | 47,155,082 | (18,725,766 | ) | ||||||||
| Royce Premier Fund | 3,522,055 | 55,879,645 | (13,484,712 | ) | ||||||||
| Royce Small-Cap Leaders Fund | – | – | – | |||||||||
| Royce Small-Cap Value Fund | 802,104 | – | – | |||||||||
| Royce Smaller-Companies Growth Fund | – | – | – | |||||||||
| Royce Special Equity Fund | 13,302 | – | – | |||||||||
| Royce Special Equity Multi-Cap Fund | – | – | – | |||||||||
| Royce Total Return Fund | 45,947,960 | 14,193,233 | 7,537,103 | |||||||||
Class Specific Expenses:
Class specific expenses, for Funds with multiple classes, were as follows for the period ended June 30, 2016:
| CLASS LEVEL | |||||||||||||||||||||||||||
| EXPENSES | |||||||||||||||||||||||||||
| REIMBURSED BY | |||||||||||||||||||||||||||
| NET DISTRIBUTION | SHAREHOLDER | SHAREHOLDER | TRANSFER AGENT | INVESTMENT | |||||||||||||||||||||||
| FEES | SERVICING | REPORTS | REGISTRATION | BALANCE CREDITS | TOTAL | ADVISER | |||||||||||||||||||||
| Royce Dividend Value Fund – | |||||||||||||||||||||||||||
Investment Class | $ | – | $ | 71,545 | $ | 24,318 | $ | 8,698 | $ | (11 | ) | $ | 104,550 | $ | 59 | ||||||||||||
| Royce Dividend Value Fund – Service Class | 183,869 | 115,770 | 42,421 | 10,335 | (480 | ) | 351,915 | 21,349 | |||||||||||||||||||
| Royce Dividend Value Fund – | |||||||||||||||||||||||||||
Consultant Class | 7,014 | 3,688 | 327 | 5,309 | (2 | ) | 16,336 | 7,949 | |||||||||||||||||||
| Royce Dividend Value Fund – | |||||||||||||||||||||||||||
Institutional Class | – | 3,020 | 9 | 5,428 | – | 8,457 | 8,457 | ||||||||||||||||||||
| 190,883 | 194,023 | 67,075 | 29,770 | (493 | ) | 37,814 | |||||||||||||||||||||
| Royce Global Financial Services Fund – | |||||||||||||||||||||||||||
Institutional Class | – | 3,693 | 8 | 9,449 | – | 13,150 | 13,150 | ||||||||||||||||||||
| Royce Global Financial Services Fund – | |||||||||||||||||||||||||||
Service Class | 50,887 | 38,173 | 17,513 | 11,060 | (15 | ) | 117,618 | 15,488 | |||||||||||||||||||
| 50,887 | 41,866 | 17,521 | 20,509 | (15 | ) | 28,638 | |||||||||||||||||||||
| Royce Heritage Fund – Investment Class | – | 8,945 | 1,565 | 7,517 | (2 | ) | 18,025 | – | |||||||||||||||||||
| Royce Heritage Fund – Service Class | 80,884 | 51,544 | 25,909 | 7,676 | (77 | ) | 165,936 | – | |||||||||||||||||||
| Royce Heritage Fund – Consultant Class | 54,550 | 8,735 | 3,245 | 6,590 | (8 | ) | 73,112 | 10,272 | |||||||||||||||||||
| Royce Heritage Fund – R Class | 5,407 | 5,367 | 494 | 2,891 | (1 | ) | 14,158 | 6,027 | |||||||||||||||||||
| Royce Heritage Fund – K Class | 4,688 | 6,870 | 430 | 5,288 | (1 | ) | 17,275 | 7,862 | |||||||||||||||||||
| 145,529 | 81,461 | 31,643 | 29,962 | (89 | ) | 24,161 | |||||||||||||||||||||
124 | The Royce Funds 2016 Semiannual Report to Shareholders
Class Specific Expenses (continued):
| CLASS LEVEL | |||||||||||||||||||||||||||
| EXPENSES | |||||||||||||||||||||||||||
| REIMBURSED BY | |||||||||||||||||||||||||||
| NET DISTRIBUTION | SHAREHOLDER | SHAREHOLDER | TRANSFER AGENT | INVESTMENT | |||||||||||||||||||||||
| FEES | SERVICING | REPORTS | REGISTRATION | BALANCE CREDITS | TOTAL | ADVISER | |||||||||||||||||||||
Royce International Premier Fund – | $ | – | $ | 7,478 | $ | 6,845 | $ | 7,126 | $ | (10 | ) | $ | 21,439 | $ | 21,439 | ||||||||||||
Royce International Premier Fund – | 35,316 | 13,392 | 16,417 | 7,998 | (93 | ) | 73,030 | 33,844 | |||||||||||||||||||
Royce International Premier Fund – | 22,362 | 8,060 | 2,910 | 1,255 | (17 | ) | 34,570 | 11,782 | |||||||||||||||||||
| Royce International Premier Fund – R Class | 71 | 2,824 | 6 | 613 | – | 3,514 | 3,433 | ||||||||||||||||||||
| Royce International Premier Fund – K Class | 19 | 2,820 | – | 1,054 | – | 3,893 | 3,868 | ||||||||||||||||||||
| 57,768 | 34,574 | 26,178 | 18,046 | (120 | ) | 74,366 | |||||||||||||||||||||
Royce International Small-Cap Fund – | – | 3,245 | 75 | 5,418 | – | 8,738 | 8,738 | ||||||||||||||||||||
Royce International Small-Cap Fund – | 18,247 | 13,300 | 3,660 | 8,897 | (8 | ) | 44,096 | 23,933 | |||||||||||||||||||
Royce International Small-Cap Fund – | – | 3,017 | 14 | 5,627 | – | 8,658 | 8,658 | ||||||||||||||||||||
| 18,247 | 19,562 | 3,749 | 19,942 | (8 | ) | 41,329 | |||||||||||||||||||||
Royce Low-Priced Stock Fund – | – | 20,694 | 4,907 | 5,505 | (6 | ) | 31,100 | 11,130 | |||||||||||||||||||
| Royce Low-Priced Stock Fund – Service Class | 323,335 | 233,420 | 63,457 | 10,609 | (202 | ) | 630,619 | 51,412 | |||||||||||||||||||
Royce Low-Priced Stock Fund – | – | 3,316 | 7,222 | 6,153 | (1 | ) | 16,690 | – | |||||||||||||||||||
| Royce Low-Priced Stock Fund – R Class | 2,721 | 4,131 | 461 | 2,831 | (1 | ) | 10,143 | 6,001 | |||||||||||||||||||
| Royce Low-Priced Stock Fund – K Class | 1,539 | 4,476 | 356 | 5,123 | (1 | ) | 11,493 | 8,340 | |||||||||||||||||||
| 327,595 | 266,037 | 76,403 | 30,221 | (211 | ) | 76,883 | |||||||||||||||||||||
| Royce Micro-Cap Fund – Investment Class | – | 110,110 | 67,498 | 9,227 | (103 | ) | 186,732 | 49,052 | |||||||||||||||||||
| Royce Micro-Cap Fund – Service Class | 21,869 | 14,986 | 3,928 | 5,927 | (3 | ) | 46,707 | 23,468 | |||||||||||||||||||
| Royce Micro-Cap Fund – Consultant Class | 180,890 | 27,719 | 8,522 | 6,571 | (12 | ) | 223,690 | – | |||||||||||||||||||
| 202,759 | 152,815 | 79,948 | 21,725 | (118 | ) | 72,520 | |||||||||||||||||||||
Royce Micro-Cap Opportunity Fund – | – | 15,942 | 1,066 | 9,189 | (5 | ) | 26,192 | 12,251 | |||||||||||||||||||
Royce Micro-Cap Opportunity Fund – | 1,228 | 4,300 | 271 | 5,656 | – | 11,455 | 9,832 | ||||||||||||||||||||
| 1,228 | 20,242 | 1,337 | 14,845 | (5 | ) | 22,083 | |||||||||||||||||||||
| Royce Opportunity Fund – Investment Class | – | 418,093 | 76,401 | 12,538 | (165 | ) | 506,867 | – | |||||||||||||||||||
| Royce Opportunity Fund – Service Class | 106,057 | 75,375 | 28,574 | 6,175 | (7 | ) | 216,174 | 31,670 | |||||||||||||||||||
| Royce Opportunity Fund – Consultant Class | 96,643 | 13,260 | 3,164 | 5,137 | (10 | ) | 118,194 | – | |||||||||||||||||||
| Royce Opportunity Fund – Institutional Class | – | 4,064 | 16,728 | 10,627 | (3 | ) | 31,416 | – | |||||||||||||||||||
| Royce Opportunity Fund – R Class | 79,118 | 35,208 | 2,936 | 5,152 | (4 | ) | 122,410 | – | |||||||||||||||||||
| Royce Opportunity Fund – K Class | 9,451 | 13,139 | 1,317 | 5,159 | (3 | ) | 29,063 | – | |||||||||||||||||||
| 291,269 | 559,139 | 129,120 | 44,788 | (192 | ) | 31,670 | |||||||||||||||||||||
Royce Pennsylvania Mutual Fund – | – | 931,028 | 236,214 | 17,664 | (904 | ) | 1,184,002 | – | |||||||||||||||||||
Royce Pennsylvania Mutual Fund – | 110,457 | 86,979 | 24,908 | 7,717 | (24 | ) | 230,037 | – | |||||||||||||||||||
Royce Pennsylvania Mutual Fund – | 1,950,509 | 207,023 | 75,216 | 8,102 | (217 | ) | 2,240,633 | – | |||||||||||||||||||
Royce Pennsylvania Mutual Fund – | – | 4,333 | 16,534 | 15,173 | (8 | ) | 36,032 | – | |||||||||||||||||||
| Royce Pennsylvania Mutual Fund – R Class | 41,498 | 22,762 | 2,483 | 3,936 | (14 | ) | 70,665 | – | |||||||||||||||||||
| Royce Pennsylvania Mutual Fund – K Class | 4,024 | 7,639 | 830 | 5,069 | (2 | ) | 17,560 | – | |||||||||||||||||||
| 2,106,488 | 1,259,764 | 356,185 | 57,661 | (1,169 | ) | – | |||||||||||||||||||||
The Royce Funds 2016 Semiannual Report to Shareholders | 125
Notes to Financial Statements (unaudited) (continued)
Class Specific Expenses (continued):
| CLASS LEVEL | |||||||||||||||||||||||||||
| EXPENSES | |||||||||||||||||||||||||||
| REIMBURSED BY | |||||||||||||||||||||||||||
| NET DISTRIBUTION | SHAREHOLDER | SHAREHOLDER | TRANSFER AGENT | INVESTMENT | |||||||||||||||||||||||
| FEES | SERVICING | REPORTS | REGISTRATION | BALANCE CREDITS | TOTAL | ADVISER | |||||||||||||||||||||
| Royce Premier Fund – Investment Class | $ | – | $ | 978,379 | $ | 346,660 | $ | 16,617 | $ | (636 | ) | $ | 1,341,020 | $ | – | ||||||||||||
| Royce Premier Fund – Service Class | 60,859 | 49,260 | 16,324 | 5,909 | (44 | ) | 132,308 | 26,916 | |||||||||||||||||||
| Royce Premier Fund – Consultant Class | 156,063 | 17,886 | 5,433 | 5,904 | (23 | ) | 185,263 | – | |||||||||||||||||||
| Royce Premier Fund – Institutional Class | – | 3,899 | 25,595 | 8,082 | (5 | ) | 37,571 | – | |||||||||||||||||||
| Royce Premier Fund – W Class | – | 82,783 | 34,640 | 8,373 | (92 | ) | 125,704 | – | |||||||||||||||||||
| Royce Premier Fund – R Class | 36,665 | 19,282 | 657 | 3,119 | (4 | ) | 59,719 | – | |||||||||||||||||||
| Royce Premier Fund – K Class | 2,965 | 5,973 | 212 | 5,031 | (1 | ) | 14,180 | 3,091 | |||||||||||||||||||
| 256,552 | 1,157,462 | 429,521 | 53,035 | (805 | ) | 30,007 | |||||||||||||||||||||
Royce Small-Cap Leaders Fund – | – | 19,320 | 13,418 | 7,788 | (7 | ) | 40,519 | 8,998 | |||||||||||||||||||
Royce Small-Cap Leaders Fund – | 59,959 | 50,060 | 21,035 | 8,530 | (57 | ) | 139,527 | 38,550 | |||||||||||||||||||
| Royce Small-Cap Leaders Fund – R Class | 3,651 | 5,278 | 944 | 3,712 | (9 | ) | 13,576 | 8,203 | |||||||||||||||||||
| Royce Small-Cap Leaders Fund – K Class | 436 | 3,443 | 130 | 5,135 | – | 9,144 | 8,299 | ||||||||||||||||||||
| 64,046 | 78,101 | 35,527 | 25,165 | (73 | ) | 64,050 | |||||||||||||||||||||
Royce Small-Cap Value Fund – | – | 57,178 | 12,849 | 6,244 | (25 | ) | 76,246 | 11,590 | |||||||||||||||||||
| Royce Small-Cap Value Fund – Service Class | 285,436 | 192,892 | 46,801 | 10,936 | (184 | ) | 535,881 | 51,585 | |||||||||||||||||||
Royce Small-Cap Value Fund – | 87,878 | 12,827 | 3,062 | 5,282 | (8 | ) | 109,041 | – | |||||||||||||||||||
Royce Small-Cap Value Fund – | – | 3,449 | 2,371 | 7,020 | (2 | ) | 12,838 | – | |||||||||||||||||||
| Royce Small-Cap Value Fund – R Class | 43,643 | 22,657 | 1,188 | 3,632 | (7 | ) | 71,113 | – | |||||||||||||||||||
| Royce Small-Cap Value Fund – K Class | 6,434 | 9,100 | 2,811 | 5,115 | (2 | ) | 23,458 | – | |||||||||||||||||||
| 423,391 | 298,103 | 69,082 | 38,229 | (228 | ) | 63,175 | |||||||||||||||||||||
Royce Smaller-Companies Growth Fund – | – | 86,670 | 41,411 | 8,537 | (10 | ) | 136,608 | 35,251 | |||||||||||||||||||
Royce Smaller-Companies Growth Fund – | 399,110 | 291,832 | 63,926 | 10,228 | (100 | ) | 764,996 | 35,887 | |||||||||||||||||||
Royce Smaller-Companies Growth Fund – | 62,678 | 10,758 | 2,682 | 5,181 | (5 | ) | 81,294 | 7,961 | |||||||||||||||||||
Royce Smaller-Companies Growth Fund – | – | 3,395 | 1,001 | 5,942 | (1 | ) | 10,337 | – | |||||||||||||||||||
Royce Smaller-Companies Growth Fund – | 1,956 | 4,041 | 353 | 3,184 | – | 9,534 | 6,520 | ||||||||||||||||||||
Royce Smaller-Companies Growth Fund – | 324 | 3,296 | 80 | 5,077 | – | 8,777 | 8,102 | ||||||||||||||||||||
| 464,068 | 399,992 | 109,453 | 38,149 | (116 | ) | 93,721 | |||||||||||||||||||||
| Royce Special Equity Fund – Investment Class | – | 556,240 | 120,343 | 23,848 | (307 | ) | 700,124 | – | |||||||||||||||||||
| Royce Special Equity Fund – Service Class | 133,929 | 91,889 | 27,836 | 6,542 | (176 | ) | 260,020 | 83,015 | |||||||||||||||||||
| Royce Special Equity Fund – Consultant Class | 204,822 | 20,754 | 6,456 | 5,518 | (24 | ) | 237,526 | – | |||||||||||||||||||
Royce Special Equity Fund – | – | 4,557 | 2,707 | 7,235 | (5 | ) | 14,494 | – | |||||||||||||||||||
| 338,751 | 673,440 | 157,342 | 43,143 | (512 | ) | 83,015 | |||||||||||||||||||||
Royce Special Equity Multi-Cap Fund – | – | 18,111 | 2,963 | 8,068 | (6 | ) | 29,136 | – | |||||||||||||||||||
Royce Special Equity Multi-Cap Fund – | 43,739 | 30,291 | 5,986 | 7,798 | (20 | ) | 87,794 | 14,725 | |||||||||||||||||||
Royce Special Equity Multi-Cap Fund – | 26,382 | 4,622 | 602 | 5,621 | (1 | ) | 37,226 | 8,147 | |||||||||||||||||||
Royce Special Equity Multi-Cap Fund – | – | 3,051 | 86 | 6,389 | – | 9,526 | 9,526 | ||||||||||||||||||||
| 70,121 | 56,075 | 9,637 | 27,876 | (27 | ) | 32,398 | |||||||||||||||||||||
126 | The Royce Funds 2016 Semiannual Report to Shareholders
Class Specific Expenses (continued):
| CLASS LEVEL | |||||||||||||||||||||||||||
| EXPENSES | |||||||||||||||||||||||||||
| REIMBURSED BY | |||||||||||||||||||||||||||
| NET DISTRIBUTION | SHAREHOLDER | SHAREHOLDER | TRANSFER AGENT | INVESTMENT | |||||||||||||||||||||||
| FEES | SERVICING | REPORTS | REGISTRATION | BALANCE CREDITS | TOTAL | ADVISER | |||||||||||||||||||||
| Royce Total Return Fund – Investment Class | $ | – | $ | 1,087,222 | $ | 234,116 | $ | 17,654 | $ | (298 | ) | $ | 1,338,694 | $ | – | ||||||||||||
| Royce Total Return Fund – Service Class | 156,767 | 101,155 | 17,957 | 6,015 | (11 | ) | 281,883 | 1,750 | |||||||||||||||||||
| Royce Total Return Fund – Consultant Class | 1,261,942 | 124,537 | 41,295 | 9,258 | (67 | ) | 1,436,965 | – | |||||||||||||||||||
| Royce Total Return Fund – Institutional Class | – | 4,902 | 10,184 | 13,893 | (7 | ) | 28,972 | – | |||||||||||||||||||
| Royce Total Return Fund – W Class | – | 61,251 | 31,781 | 8,180 | (4 | ) | 101,208 | – | |||||||||||||||||||
| Royce Total Return Fund – R Class | 122,609 | 56,350 | 4,060 | 3,616 | (11 | ) | 186,624 | – | |||||||||||||||||||
| Royce Total Return Fund – K Class | 74,827 | 68,011 | 5,052 | 5,459 | (4 | ) | 153,345 | – | |||||||||||||||||||
| 1,616,145 | 1,503,428 | 344,445 | 64,075 | (402 | ) | 1,750 | |||||||||||||||||||||
Tax Information:
At June 30, 2016, net unrealized appreciation (depreciation) based on identified cost for tax purposes was as follows:
| NET UNREALIZED | GROSS UNREALIZED | |||||||||||||||
| TAX BASIS COST | APPRECIATION (DEPRECIATION) | Appreciation | Depreciation | |||||||||||||
| Royce Dividend Value Fund | $ | 208,250,834 | $ | 36,167,117 | $ | 53,837,592 | $ | 17,670,475 | ||||||||
| Royce Global Financial Services Fund | 46,404,964 | 338,245 | 6,239,803 | 5,901,558 | ||||||||||||
| Royce Heritage Fund | 207,850,772 | 29,355,583 | 34,435,658 | 5,080,075 | ||||||||||||
| Royce International Micro-Cap Fund | 6,234,756 | (420,158 | ) | 408,692 | 828,850 | |||||||||||
| Royce International Premier Fund | 69,444,500 | 4,023,141 | 7,760,800 | 3,737,659 | ||||||||||||
| Royce International Small-Cap Fund | 12,440,905 | (228,298 | ) | 510,801 | 739,099 | |||||||||||
| Royce Low-Priced Stock Fund | 324,920,524 | 3,832,121 | 47,908,198 | 44,076,077 | ||||||||||||
| Royce Micro-Cap Fund | 234,218,407 | 7,003,621 | 39,422,936 | 32,419,315 | ||||||||||||
| Royce Micro-Cap Opportunity Fund | 39,500,478 | (102,045 | ) | 4,536,153 | 4,638,198 | |||||||||||
| Royce Opportunity Fund | 1,546,163,441 | (73,376,535 | ) | 257,615,575 | 330,992,110 | |||||||||||
| Royce Pennsylvania Mutual Fund | 1,778,076,876 | 866,305,816 | 985,395,212 | 119,089,396 | ||||||||||||
| Royce Premier Fund | 1,297,161,035 | 938,973,655 | 968,352,015 | 29,378,360 | ||||||||||||
| Royce Small-Cap Leaders Fund | 88,155,355 | 9,203,846 | 15,466,803 | 6,262,957 | ||||||||||||
| Royce Small-Cap Value Fund | 488,119,793 | (7,740,110 | ) | 34,513,585 | 42,253,695 | |||||||||||
| Royce Smaller-Companies Growth Fund | 455,962,136 | 61,574,369 | 106,458,721 | 44,884,352 | ||||||||||||
| Royce Special Equity Fund | 1,134,883,333 | 314,793,596 | 350,012,035 | 35,218,439 | ||||||||||||
| Royce Special Equity Multi-Cap Fund | 112,280,813 | 6,115,967 | 12,510,301 | 6,394,334 | ||||||||||||
| Royce Total Return Fund | 1,870,049,453 | 949,300,535 | 1,073,436,841 | 124,136,306 | ||||||||||||
Transactions in Affiliated Companies:
An “Affiliated Company,” as defined in the Investment Company Act of 1940, is a company in which a fund owns 5% or more of the company’s outstanding voting securities at any time during the period. The following transactions were effected in shares of such companies for the six months ended June 30, 2016:
| MARKET | REALIZED | MARKET | ||||||||||||||||||||||||||||||
| SHARES | VALUE | COST OF | COST OF | GAIN | DIVIDEND | SHARES | VALUE | |||||||||||||||||||||||||
| AFFILIATED COMPANY | 12/31/15 | 12/31/15 | PURCHASES | SALES | (LOSS) | INCOME | 6/30/16 | 6/30/16 | ||||||||||||||||||||||||
| Royce Opportunity Fund | ||||||||||||||||||||||||||||||||
| A. M. Castle & Co. | 1,736,183 | $ | 2,760,531 | $ | 197,100 | $ | 189,794 | $ | (120,165 | ) | $ | – | 1,824,498 | $ | 2,992,176 | |||||||||||||||||
| Amtech Systems | 743,606 | 4,654,974 | 185,296 | – | – | – | 778,861 | 4,649,800 | ||||||||||||||||||||||||
| Dixie Group | 866,135 | 4,529,886 | 39,588 | – | – | – | 876,235 | 3,119,397 | ||||||||||||||||||||||||
| Echelon Corporation | 163,558 | 922,467 | 369,228 | – | – | – | 230,152 | 1,095,524 | ||||||||||||||||||||||||
| Fuel Systems Solutions1 | 919,302 | 4,495,387 | 146,476 | – | – | – | ||||||||||||||||||||||||||
| KEMET Corporation | 2,221,453 | 5,264,844 | 333,087 | 320,008 | (150,813 | ) | – | 2,355,353 | 6,901,184 | |||||||||||||||||||||||
| LMI Aerospace | 829,530 | 8,353,367 | 107,625 | – | – | – | 841,330 | 6,764,293 | ||||||||||||||||||||||||
| Noranda Aluminum Holding Corporation1 | 541,092 | 173,150 | 15,489 | 7,758,366 | (7,711,462 | ) | – | |||||||||||||||||||||||||
| Northwest Pipe | 509,994 | 5,706,833 | – | – | – | – | 509,994 | 5,497,735 | ||||||||||||||||||||||||
| PCM | 568,244 | 5,642,663 | 275,758 | – | – | – | 596,852 | 6,648,931 | ||||||||||||||||||||||||
| SigmaTron International | 347,772 | 2,618,723 | – | – | – | – | 347,772 | 2,114,454 | ||||||||||||||||||||||||
| 45,122,825 | (7,982,440 | ) | – | 39,783,494 | ||||||||||||||||||||||||||||
| Royce Pennsylvania Mutual Fund | ||||||||||||||||||||||||||||||||
| DTS1 | 910,629 | 20,562,003 | – | 1,056,438 | (137,596 | ) | – | |||||||||||||||||||||||||
| FRP Holdings1 | 518,912 | 17,611,874 | – | 907,536 | (85,566 | ) | – | |||||||||||||||||||||||||
The Royce Funds 2016 Semiannual Report to Shareholders | 127
Notes to Financial Statements (unaudited) (continued)
Transactions in Affiliated Companies (continued):
| MARKET | REALIZED | MARKET | ||||||||||||||||||||||||||||||
| SHARES | VALUE | COST OF | COST OF | GAIN | DIVIDEND | SHARES | VALUE | |||||||||||||||||||||||||
| AFFILIATED COMPANY | 12/31/15 | 12/31/15 | PURCHASES | SALES | (LOSS) | INCOME | 6/30/16 | 6/30/16 | ||||||||||||||||||||||||
| Royce Pennsylvania Mutual Fund (continued) | ||||||||||||||||||||||||||||||||
| Preformed Line Products | 305,178 | $ | 12,847,994 | $ | – | $ | 830,417 | $ | (293,869 | ) | $ | 116,111 | 290,278 | $ | 11,724,329 | |||||||||||||||||
| STRATTEC SECURITY | 260,547 | 14,718,300 | – | 827,680 | (315,812 | ) | 65,116 | 250,247 | 10,202,570 | |||||||||||||||||||||||
| 65,740,171 | (832,843 | ) | 181,227 | 21,926,899 | ||||||||||||||||||||||||||||
| Royce Premier Fund | ||||||||||||||||||||||||||||||||
| Pason Systems1 | 4,219,700 | 59,131,302 | – | 11,401,814 | (1,036,017 | ) | 901,694 | |||||||||||||||||||||||||
| Sun Hydraulics1 | 1,872,426 | 59,412,077 | – | 41,998,564 | (10,032,623 | ) | 274,684 | |||||||||||||||||||||||||
| 118,543,379 | (11,068,640 | ) | 1,176,378 | |||||||||||||||||||||||||||||
| Royce Special Equity Fund | ||||||||||||||||||||||||||||||||
| AVX Corporation1 | 8,450,000 | 102,583,000 | – | 17,427,250 | (2,164,311 | ) | 1,627,500 | |||||||||||||||||||||||||
| Bassett Furniture Industries | 25,139 | 630,486 | 15,338,193 | – | – | 69,126 | 575,000 | 13,765,500 | ||||||||||||||||||||||||
| Bowl America Cl. A | 315,948 | 4,423,272 | 381,090 | – | – | 111,868 | 343,000 | 4,904,900 | ||||||||||||||||||||||||
| Capella Education | 505,000 | 23,341,100 | 9,203,214 | – | – | 490,425 | 698,000 | 36,742,720 | ||||||||||||||||||||||||
| Children’s Place1 | 1,310,000 | 72,312,000 | 2,461,995 | 31,900,191 | 10,653,322 | 276,000 | ||||||||||||||||||||||||||
| CSS Industries | 840,000 | 23,839,200 | 1,226,327 | – | – | 345,000 | 885,000 | 23,726,850 | ||||||||||||||||||||||||
| Finish Line (The) Cl. A1 | 2,467,200 | 44,606,976 | – | 46,745,008 | (543,473 | ) | 123,500 | |||||||||||||||||||||||||
| Flexsteel Industries | 209,850 | 9,271,173 | 11,203,319 | – | – | 155,607 | 481,000 | 19,057,220 | ||||||||||||||||||||||||
| Haverty Furniture | 1,161,200 | 24,896,128 | 1,693,853 | 1,108,479 | (196,483 | ) | 235,111 | 1,209,200 | 21,801,876 | |||||||||||||||||||||||
| Hawkins | 835,000 | 29,867,950 | 4,823,921 | 1,345,679 | 170,916 | 373,638 | 940,000 | 40,805,400 | ||||||||||||||||||||||||
| Hooker Furniture | 622,000 | 15,699,280 | 14,203,835 | – | – | 208,500 | 1,110,000 | 23,853,900 | ||||||||||||||||||||||||
| Hurco Companies | 515,900 | 13,702,304 | 252,973 | – | – | 94,050 | 525,000 | 14,610,750 | ||||||||||||||||||||||||
| National Presto Industries | 450,000 | 37,287,000 | – | – | – | 2,272,500 | 450,000 | 42,457,500 | ||||||||||||||||||||||||
| Neenah Paper | 1,150,000 | 71,794,500 | – | 10,474,687 | 1,833,920 | 726,000 | 965,000 | 69,837,050 | ||||||||||||||||||||||||
| Park Electrochemical | 1,792,000 | 26,987,520 | 2,353,703 | – | – | 384,180 | 1,950,000 | 28,333,500 | ||||||||||||||||||||||||
| Standard Motor Products | 1,840,000 | 70,012,000 | 4,568,109 | 4,141,451 | 736,899 | 633,342 | 1,855,000 | 73,791,900 | ||||||||||||||||||||||||
| UniFirst Corporation1 | 1,360,000 | 141,712,000 | – | 31,529,227 | 18,109,143 | 74,531 | ||||||||||||||||||||||||||
| 712,965,889 | 28,599,933 | 8,200,878 | 413,689,066 | |||||||||||||||||||||||||||||
| Royce Total Return Fund | ||||||||||||||||||||||||||||||||
| Chase Corporation1 | 635,674 | 25,891,002 | 1,887,191 | 3,349,930 | 9,369,869 | – | ||||||||||||||||||||||||||
| Landauer | 515,300 | 16,963,676 | – | – | – | 283,415 | 515,300 | 21,209,748 | ||||||||||||||||||||||||
| Mueller (Paul) Company | 116,700 | 3,034,200 | – | – | – | – | 116,700 | 3,022,530 | ||||||||||||||||||||||||
| Starrett (L.S.) Company (The) Cl. A | 509,400 | 4,951,368 | – | – | – | 101,880 | 509,400 | 6,066,954 | ||||||||||||||||||||||||
| 50,840,246 | 9,369,869 | 385,295 | 30,299,232 | |||||||||||||||||||||||||||||
| 1 Not an Affiliated Company at June 30, 2016. |
On August 10, 2015, Royce Small-Cap Leaders Fund (formerly Royce 100 Fund) acquired all of the assets and assumed all of the liabilities of Royce Select Fund I. Based on the opinion of counsel delivered to Royce Small-Cap Leaders Fund, the acquisition, which was approved by shareholders of Royce Select Fund I on July 27, 2015, qualified as a tax-free reorganization for federal income tax purposes with no gain or loss recognized to the Funds or their shareholders. Royce Select Fund I’s net assets of $20,278,826, including $3,131,917 of unrealized appreciation, were combined with Royce Small-Cap Leaders Fund for total net assets after the acquisition of $155,179,959.
128 | The Royce Funds 2016 Semiannual Report to Shareholders
| Understanding Your Fund’s Expenses (unaudited) |
As a shareholder of a mutual fund, you pay ongoing expenses, including management fees and other Fund expenses including, for some funds, distribution and/or service (12b-1) fees. Using the information below, you can estimate how these ongoing expenses (in dollars) affect your investment and compare them with the ongoing expenses of other funds. You may also incur one-time transaction expenses, including redemption fees, which are not shown in this section and would result in higher total costs. The example is based on an investment of $1,000 invested at January 1, 2016, and held for the entire six-month period ended June 30, 2016. Service, Consultant, R and K Class shares are generally available only through certain brokers or retirement plan administrators who receive distribution and/or service fees from the Fund for services that they perform. Institutional and W Class shares are generally available only to institutions or intermediaries with a minimum account size of $1 million.
| ACTUAL | HYPOTHETICAL (5% PER YEAR RETURN BEFORE EXPENSES) | |||||||||||||||||||||||||||
| Beginning Account | Ending Account Value | Expenses Paid During | Beginning Account | Ending Account Value | Expenses Paid During | Annualized | ||||||||||||||||||||||
| Value 1/1/16 | 6/30/16 | the Period1 | Value 1/1/16 | 6/30/16 | the Period1 | Expense Ratio2 | ||||||||||||||||||||||
| Investment Class | ||||||||||||||||||||||||||||
| Royce Dividend Value Fund | $ | 1,000.00 | $ | 1,045.36 | $ | 6.05 | $ | 1,000.00 | $ | 1,018.95 | $ | 5.97 | 1.19 | % | ||||||||||||||
| Royce Heritage Fund3 | 1,000.00 | 1,054.39 | 5.52 | 1,000.00 | 1,019.49 | 5.42 | 1.08 | % | ||||||||||||||||||||
| Royce International Premier Fund | 1,000.00 | 1,009.16 | 5.94 | 1,000.00 | 1,018.95 | 5.97 | 1.19 | % | ||||||||||||||||||||
| Royce International Small-Cap Fund | 1,000.00 | 985.43 | 5.87 | 1,000.00 | 1,018.95 | 5.97 | 1.19 | % | ||||||||||||||||||||
| Royce Low-Priced Stock Fund | 1,000.00 | 978.12 | 6.10 | 1,000.00 | 1,018.70 | 6.22 | 1.24 | % | ||||||||||||||||||||
| Royce Micro-Cap Fund | 1,000.00 | 992.79 | 7.38 | 1,000.00 | 1,017.45 | 7.47 | 1.49 | % | ||||||||||||||||||||
| Royce Micro-Cap Opportunity Fund | 1,000.00 | 1,031.70 | 6.26 | 1,000.00 | 1,018.70 | 6.22 | 1.24 | % | ||||||||||||||||||||
| Royce Opportunity Fund | 1,000.00 | 1,032.17 | 6.06 | 1,000.00 | 1,018.90 | 6.02 | 1.20 | % | ||||||||||||||||||||
| Royce Pennsylvania Mutual Fund | 1,000.00 | 1,076.10 | 4.90 | 1,000.00 | 1,020.14 | 4.77 | 0.95 | % | ||||||||||||||||||||
| Royce Premier Fund | 1,000.00 | 1,065.13 | 6.21 | 1,000.00 | 1,018.85 | 6.07 | 1.21 | % | ||||||||||||||||||||
| Royce Small-Cap Leaders Fund | 1,000.00 | 1,060.51 | 6.35 | 1,000.00 | 1,018.70 | 6.22 | 1.24 | % | ||||||||||||||||||||
| Royce Small-Cap Value Fund | 1,000.00 | 1,033.18 | 6.27 | 1,000.00 | 1,018.70 | 6.22 | 1.24 | % | ||||||||||||||||||||
| Royce Smaller-Companies Growth Fund | 1,000.00 | 966.55 | 6.06 | 1,000.00 | 1,018.70 | 6.22 | 1.24 | % | ||||||||||||||||||||
| Royce Special Equity Fund | 1,000.00 | 1,083.05 | 6.16 | 1,000.00 | 1,018.95 | 5.97 | 1.19 | % | ||||||||||||||||||||
| Royce Special Equity Multi-Cap Fund | 1,000.00 | 995.95 | 5.06 | 1,000.00 | 1,019.79 | 5.12 | 1.02 | % | ||||||||||||||||||||
| Royce Total Return Fund | 1,000.00 | 1,086.23 | 6.22 | 1,000.00 | 1,018.90 | 6.02 | 1.20 | % | ||||||||||||||||||||
| Service Class | ||||||||||||||||||||||||||||
| Royce Dividend Value Fund | 1,000.00 | 1,043.87 | 7.32 | 1,000.00 | 1,017.70 | 7.22 | 1.44 | % | ||||||||||||||||||||
| Royce Global Financial Services Fund | 1,000.00 | 1,005.01 | 7.43 | 1,000.00 | 1,017.45 | 7.47 | 1.49 | % | ||||||||||||||||||||
| Royce Heritage Fund3 | 1,000.00 | 1,052.96 | 6.74 | 1,000.00 | 1,018.30 | 6.62 | 1.32 | % | ||||||||||||||||||||
| Royce International Micro-Cap Fund | 1,000.00 | 1,002.10 | 8.16 | 1,000.00 | 1,016.71 | 8.22 | 1.64 | % | ||||||||||||||||||||
| Royce International Premier Fund | 1,000.00 | 1,007.73 | 7.19 | 1,000.00 | 1,017.70 | 7.22 | 1.44 | % | ||||||||||||||||||||
| Royce International Small-Cap Fund | 1,000.00 | 984.09 | 7.10 | 1,000.00 | 1,017.70 | 7.22 | 1.44 | % | ||||||||||||||||||||
| Royce Low-Priced Stock Fund | 1,000.00 | 975.48 | 7.32 | 1,000.00 | 1,017.45 | 7.47 | 1.49 | % | ||||||||||||||||||||
| Royce Micro-Cap Fund | 1,000.00 | 991.74 | 7.97 | 1,000.00 | 1,016.86 | 8.07 | 1.61 | % | ||||||||||||||||||||
| Royce Micro-Cap Opportunity Fund | 1,000.00 | 1,029.96 | 7.52 | 1,000.00 | 1,017.45 | 7.47 | 1.49 | % | ||||||||||||||||||||
| Royce Opportunity Fund | 1,000.00 | 1,031.16 | 7.52 | 1,000.00 | 1,017.45 | 7.47 | 1.49 | % | ||||||||||||||||||||
| Royce Pennsylvania Mutual Fund | 1,000.00 | 1,073.80 | 6.91 | 1,000.00 | 1,018.20 | 6.72 | 1.34 | % | ||||||||||||||||||||
| Royce Premier Fund | 1,000.00 | 1,063.66 | 7.65 | 1,000.00 | 1,017.45 | 7.47 | 1.49 | % | ||||||||||||||||||||
| Royce Small-Cap Leaders Fund | 1,000.00 | 1,059.58 | 7.63 | 1,000.00 | 1,017.45 | 7.47 | 1.49 | % | ||||||||||||||||||||
| Royce Small-Cap Value Fund | 1,000.00 | 1,032.18 | 7.53 | 1,000.00 | 1,017.45 | 7.47 | 1.49 | % | ||||||||||||||||||||
| Royce Smaller-Companies Growth Fund | 1,000.00 | 965.18 | 7.28 | 1,000.00 | 1,017.45 | 7.47 | 1.49 | % | ||||||||||||||||||||
| The Royce Funds 2016 Semiannual Report to Shareholders | 129 |
| Understanding Your Fund’s Expenses (unaudited) (continued) |
| ACTUAL | HYPOTHETICAL (5% PER YEAR RETURN BEFORE EXPENSES) | |||||||||||||||||||||||||||
| Beginning Account | Ending Account Value | Expenses Paid During | Beginning Account | Ending Account Value | Expenses Paid During | Annualized | ||||||||||||||||||||||
| Value 1/1/16 | 6/30/16 | the Period1 | Value 1/1/16 | 6/30/16 | the Period1 | Expense Ratio2 | ||||||||||||||||||||||
| Service Class (continued) | ||||||||||||||||||||||||||||
| Royce Special Equity Fund | $ | 1,000.00 | $ | 1,082.03 | $ | 7.20 | $ | 1,000.00 | $ | 1,017.95 | $ | 6.97 | 1.39 | % | ||||||||||||||
| Royce Special Equity Multi-Cap Fund | 1,000.00 | 995.15 | 6.15 | 1,000.00 | 1,018.70 | 6.22 | 1.24 | % | ||||||||||||||||||||
| Royce Total Return Fund | 1,000.00 | 1,084.67 | 7.72 | 1,000.00 | 1,017.45 | 7.47 | 1.49 | % | ||||||||||||||||||||
| Consultant Class | ||||||||||||||||||||||||||||
| Royce Dividend Value Fund | 1,000.00 | 1,039.22 | 11.10 | 1,000.00 | 1,013.97 | 10.97 | 2.19 | % | ||||||||||||||||||||
| Royce Heritage Fund3 | 1,000.00 | 1,048.03 | 11.15 | 1,000.00 | 1,013.97 | 10.97 | 2.19 | % | ||||||||||||||||||||
| Royce International Premier Fund | 1,000.00 | 1,098.36 | 7.85 | 1,000.00 | 1,009.60 | 7.52 | 2.19 | % | ||||||||||||||||||||
| Royce Micro-Cap Fund | 1,000.00 | 986.73 | 12.74 | 1,000.00 | 1,012.03 | 12.91 | 2.58 | % | ||||||||||||||||||||
| Royce Opportunity Fund | 1,000.00 | 1,026.64 | 11.49 | 1,000.00 | 1,013.53 | 11.41 | 2.28 | % | ||||||||||||||||||||
| Royce Pennsylvania Mutual Fund | 1,000.00 | 1,070.13 | 10.14 | 1,000.00 | 1,015.07 | 9.87 | 1.97 | % | ||||||||||||||||||||
| Royce Premier Fund | 1,000.00 | 1,058.87 | 11.52 | 1,000.00 | 1,013.67 | 11.27 | 2.25 | % | ||||||||||||||||||||
| Royce Small-Cap Value Fund | 1,000.00 | 1,029.15 | 11.65 | 1,000.00 | 1,013.38 | 11.56 | 2.31 | % | ||||||||||||||||||||
| Royce Smaller-Companies Growth Fund | 1,000.00 | 962.04 | 10.93 | 1,000.00 | 1,013.72 | 11.22 | 2.24 | % | ||||||||||||||||||||
| Royce Special Equity Fund | 1,000.00 | 1,077.85 | 11.47 | 1,000.00 | 1,013.82 | 11.12 | 2.22 | % | ||||||||||||||||||||
| Royce Special Equity Multi-Cap Fund | 1,000.00 | 991.41 | 9.85 | 1,000.00 | 1,014.97 | 9.97 | 1.99 | % | ||||||||||||||||||||
| Royce Total Return Fund | 1,000.00 | 1,081.07 | 11.28 | 1,000.00 | 1,014.02 | 10.92 | 2.18 | % | ||||||||||||||||||||
| Institutional Class | ||||||||||||||||||||||||||||
| Royce Dividend Value Fund | 1,000.00 | 1,045.07 | 5.03 | 1,000.00 | 1,019.94 | 4.97 | 0.99 | % | ||||||||||||||||||||
| Royce Global Financial Services Fund | 1,000.00 | 1,025.00 | 5.12 | 1,000.00 | 1,019.26 | 5.11 | 1.04 | % | ||||||||||||||||||||
| Royce International Small-Cap Fund | 1,000.00 | 985.82 | 5.88 | 1,000.00 | 1,018.95 | 5.97 | 1.19 | % | ||||||||||||||||||||
| Royce Low-Priced Stock Fund | 1,000.00 | 976.86 | 5.95 | 1,000.00 | 1,018.85 | 6.07 | 1.21 | % | ||||||||||||||||||||
| Royce Opportunity Fund | 1,000.00 | 1,032.59 | 5.41 | 1,000.00 | 1,019.54 | 5.37 | 1.07 | % | ||||||||||||||||||||
| Royce Pennsylvania Mutual Fund | 1,000.00 | 1,077.09 | 4.34 | 1,000.00 | 1,020.69 | 4.22 | 0.84 | % | ||||||||||||||||||||
| Royce Premier Fund | 1,000.00 | 1,065.79 | 5.60 | 1,000.00 | 1,019.44 | 5.47 | 1.09 | % | ||||||||||||||||||||
| Royce Small-Cap Value Fund | 1,000.00 | 1,034.32 | 5.46 | 1,000.00 | 1,019.49 | 5.42 | 1.08 | % | ||||||||||||||||||||
| Royce Smaller-Companies Growth Fund | 1,000.00 | 966.90 | 5.58 | 1,000.00 | 1,019.19 | 5.72 | 1.14 | % | ||||||||||||||||||||
| Royce Special Equity Fund | 1,000.00 | 1,083.71 | 5.54 | 1,000.00 | 1,019.54 | 5.37 | 1.07 | % | ||||||||||||||||||||
| Royce Special Equity Multi-Cap Fund | 1,000.00 | 996.76 | 4.42 | 1,000.00 | 1,020.44 | 4.47 | 0.89 | % | ||||||||||||||||||||
| Royce Total Return Fund | 1,000.00 | 1,087.64 | 5.50 | 1,000.00 | 1,019.59 | 5.32 | 1.06 | % | ||||||||||||||||||||
| W Class | ||||||||||||||||||||||||||||
| Royce Premier Fund | 1,000.00 | 1,064.94 | 6.21 | 1,000.00 | 1,018.85 | 6.07 | 1.21 | % | ||||||||||||||||||||
| Royce Total Return Fund | 1,000.00 | 1,086.03 | 6.33 | 1,000.00 | 1,018.80 | 6.12 | 1.22 | % | ||||||||||||||||||||
| R Class | ||||||||||||||||||||||||||||
| Royce Heritage Fund | 1,000.00 | 1,051.40 | 9.13 | 1,000.00 | 1,015.96 | 8.97 | 1.79 | % | ||||||||||||||||||||
| Royce International Premier Fund | 1,000.00 | 1,100.69 | 6.24 | 1,000.00 | 1,011.13 | 5.98 | 1.74 | % | ||||||||||||||||||||
| Royce Low-Priced Stock Fund | 1,000.00 | 974.25 | 9.03 | 1,000.00 | 1,015.71 | 9.22 | 1.84 | % | ||||||||||||||||||||
| Royce Opportunity Fund | 1,000.00 | 1,028.81 | 9.23 | 1,000.00 | 1,015.76 | 9.17 | 1.83 | % | ||||||||||||||||||||
| Royce Pennsylvania Mutual Fund | 1,000.00 | 1,071.91 | 8.60 | 1,000.00 | 1,016.56 | 8.37 | 1.67 | % | ||||||||||||||||||||
| Royce Premier Fund | 1,000.00 | 1,061.53 | 9.58 | 1,000.00 | 1,015.56 | 9.37 | 1.87 | % | ||||||||||||||||||||
| Royce Small-Cap Leaders Fund | 1,000.00 | 1,058.61 | 9.42 | 1,000.00 | 1,015.71 | 9.22 | 1.84 | % | ||||||||||||||||||||
| Royce Small-Cap Value Fund | 1,000.00 | 1,029.69 | 9.49 | 1,000.00 | 1,015.51 | 9.42 | 1.88 | % | ||||||||||||||||||||
| Royce Smaller-Companies Growth Fund | 1,000.00 | 964.05 | 8.99 | 1,000.00 | 1,015.71 | 9.22 | 1.84 | % | ||||||||||||||||||||
| Royce Total Return Fund | 1,000.00 | 1,082.47 | 9.32 | 1,000.00 | 1,015.91 | 9.02 | 1.80 | % | ||||||||||||||||||||
| K Class | ||||||||||||||||||||||||||||
| Royce Heritage Fund | 1,000.00 | 1,051.96 | 7.86 | 1,000.00 | 1,017.21 | 7.72 | 1.54 | % | ||||||||||||||||||||
| Royce International Premier Fund | 1,000.00 | 1,100.82 | 5.35 | 1,000.00 | 1,011.99 | 5.12 | 1.49 | % | ||||||||||||||||||||
| Royce Low-Priced Stock Fund | 1,000.00 | 973.96 | 7.80 | 1,000.00 | 1,016.96 | 7.97 | 1.59 | % | ||||||||||||||||||||
| Royce Opportunity Fund | 1,000.00 | 1,029.28 | 9.18 | 1,000.00 | 1,015.81 | 9.12 | 1.82 | % | ||||||||||||||||||||
| Royce Pennsylvania Mutual Fund | 1,000.00 | 1,071.25 | 9.84 | 1,000.00 | 1,015.37 | 9.57 | 1.91 | % | ||||||||||||||||||||
| Royce Premier Fund | 1,000.00 | 1,064.71 | 10.22 | 1,000.00 | 1,014.97 | 9.97 | 1.99 | % | ||||||||||||||||||||
| Royce Small-Cap Leaders Fund | 1,000.00 | 1,059.58 | 8.14 | 1,000.00 | 1,016.96 | 7.97 | 1.59 | % | ||||||||||||||||||||
| Royce Small-Cap Value Fund | 1,000.00 | 1,030.79 | 10.00 | 1,000.00 | 1,015.02 | 9.92 | 1.98 | % | ||||||||||||||||||||
| Royce Smaller-Companies Growth Fund | 1,000.00 | 965.57 | 7.77 | 1,000.00 | 1,016.96 | 7.97 | 1.59 | % | ||||||||||||||||||||
| Royce Total Return Fund | 1,000.00 | 1,084.34 | 8.08 | 1,000.00 | 1,017.11 | 7.82 | 1.56 | % | ||||||||||||||||||||
| 1 | Expenses are equal to the Fund’s annualized expense ratio multiplied by the average account value for the period, multiplied by 182 days in the most recent fiscal half-year divided by 366 days (to reflect the half-year period for all classes existing for the full half-year period; Royce International Premier Fund Consultant, R and K Classes multiplied by 125 days; Royce Global Financial Services Fund-Institutional Class multiplied by 178 days). |
| 2 | Annualized expense ratio used to derive figures in the table is based on the most recent fiscal half-year. |
| 3 | GiftShare accounts pay an annual $50 trustee fee to State Street Bank, NA, as trustee. If these fees were included above, your costs would be higher. |
| 130 | The Royce Funds 2016 Semiannual Report to Shareholders |
Results of Shareholder Meetings
Royce European Small-Cap Fund
At a Special Meeting of Shareholders held on January 21, 2016, Royce European Small-Cap Fund’s (“European Small-Cap”) shareholders approved the following:
| PROPOSAL | VOTES FOR | VOTES AGAINST | ABSTAIN | |||
| To approve a Plan of Reorganization of The Royce Fund, on behalf of European Small-Cap and Royce International Premier Fund (“International Premier”), whereby all of the assets of European Small-Cap would be transferred to International Premier in exchange for International Premier’s assumption of all of the liabilities of European Small-Cap and International Premier’s issuance to European Small-Cap shares of beneficial interest of International Premier. | 740,245 | 269,866 | 12,699 | |||
| Royce Global Value Fund | ||||||
At a Special Meeting of Shareholders held on January 21, 2016, Royce Global Value Fund’s (“Global Value”) shareholders approved the following: | ||||||
| PROPOSAL | VOTES FOR | VOTES AGAINST | ABSTAIN | |||
| To approve a Plan of Reorganization of The Royce Fund, on behalf of Global Value and Royce International Premier Fund (“International Premier”), whereby all of the assets of Global Value would be transferred to International Premier in exchange for International Premier’s assumption of all of the liabilities of Global Value and International Premier’s issuance to Global Value shares of beneficial interest of International Premier. | 1,685,542 | 678,529 | 74,395 | |||
| The Royce Funds 2016 Semiannual Report to Shareholders | 131 |
Trustees and Officers
All Trustees and Officers may be reached c/o The Royce Funds, 745 Fifth Avenue, New York, NY 10151
Charles M. Royce, Trustee1
Age: 76 | Number of Funds Overseen: 23 | Tenure: Since 1982
Non-Royce Directorships: Director of TICC Capital Corp.
Principal Occupation(s) During Past Five Years: Chairman of the Board of Managers of Royce & Associates, LP (“Royce”), the Trust’s investment adviser; Chief Executive Officer (July 2014–June 2016), President (1972-July 2014) of Royce.
Christopher D. Clark, Trustee1, President
Age: 51 | Number of Funds Overseen: 23 | Tenure: Since 2014
Principal Occupation(s) During Past Five Years: Chief Executive Officer (since July 2016), President (since July 2014), Co-Chief Investment Officer (Since January 2014), Managing Director and, since June 2015, a Member of the Board of Managers of Royce, having been employed by Royce since May 2007.
Patricia W. Chadwick, Trustee
Age: 67 | Number of Funds Overseen: 23 | Tenure: Since 2009
Non-Royce Directorships: Trustee of ING Mutual Funds and Director of Wisconsin Energy Corp.
Principal Occupation(s) During Past 5 Years: Consultant and President of Ravengate Partners LLC (since 2000).
Stephen L. Isaacs, Trustee
Age: 76 | Number of Funds Overseen: 23 | Tenure: Since 1989
Non-Royce Directorships: None
Principal Occupation(s) During Past Five Years: Attorney and President of Health Policy Associates, Inc., consultants. Mr. Isaacs’s prior business experience includes having served as President of the Center for Health and Social Policy (from 1996 to 2012); Director of Columbia University Development Law and Policy Program and Professor at Columbia University (until August 1996).
Arthur S. Mehlman, Trustee
Age: 74 | Number of Funds Overseen: 44 | Tenure: Since 2004
Non-Royce Directorships: Director/Trustee of registered investment companies constituting the 18 Legg Mason Funds.
Principal Occupation(s) During Past Five Years: Director of The League for People with Disabilities, Inc.; Director of University of Maryland Foundation (non-profits). Formerly: Director of Municipal Mortgage & Equity, LLC (from October 2004 to April 1, 2011); Director of University of Maryland College Park Foundation (non-profit) (from 1998 to 2005); Partner, KPMG LLP (international accounting firm) (from 1972 to 2002); Director of Maryland Business Roundtable for Education (from July 1984 to June 2002).
David L. Meister, Trustee
Age: 76 | Number of Funds Overseen: 23 | Tenure: Since 1982
Non-Royce Directorships: None
Principal Occupation(s) During Past Five Years: Consultant. Chairman and Chief Executive Officer of The Tennis Channel (from June 2000 to March 2005). Mr. Meister’s prior business experience includes having served as Chief Executive Officer of Seniorlife.com, a consultant to the communications industry, President of Financial News Network, Senior Vice President of HBO, President of Time-Life Films, and Head of Broadcasting for Major League Baseball.
G. Peter O’Brien, Trustee
Age: 70 | Number of Funds Overseen: 44 | Tenure: Since 2001
Non-Royce Directorships: Director/Trustee of registered investment companies constituting the 18 Legg Mason Funds; Director of TICC Capital Corp.
Principal Occupation(s) During Past Five Years: Trustee Emeritus of Colgate University (since 2005); Board Member of Hill House, Inc. (since 1999); Formerly: Trustee of Colgate University (from 1996 to 2005), President of Hill House, Inc. (from 2001 to 2005) and Managing Director/Equity Capital Markets Group of Merrill Lynch & Co. (from 1971 to 1999).
Michael K. Shields, Trustee
Age: 58 | Number of Funds Overseen: 23 | Tenure: Since 2015
Principal Occupation(s) During Past Five Years: President and Chief Executive Officer of Piedmont Trust Company, a private North Carolina trust company (since May 2012). Mr. Shields’s prior business experience includes owning Shields Advisors, an investment consulting firm (from April 2010 to June 2012).
Francis D. Gannon, Vice President
Age: 48 | Tenure: Since 2014
Principal Occupation(s) During Past Five Years: Co-Chief Investment Officer (since January 2014) and Managing Director of Royce, having been employed by Royce since September 2006.
Daniel A. O’Byrne, Vice President
Age: 54 | Tenure: Since 1994
Principal Occupation(s) During Past Five Years: Principal and Vice President of Royce, having been employed by Royce since October 1986.
Peter K. Hoglund, Treasurer
Age: 50 | Tenure: Since 2015
Principal Occupation(s) During Past Five Years: Chief Financial Officer, Chief Administrative Officer, and Managing Director of Royce, having been employed by Royce since December 2014. Prior to joining Royce, Mr. Hoglund spent more than 20 years with Munder Capital Management in Birmingham, MI, serving as Managing Director and Chief Financial Officer and overseeing all financial aspects of the firm. He began his career at Munder as a portfolio manager.
John E. Denneen, Secretary and Chief Legal Officer
Age: 49 | Tenure: 1996-2001 and Since 2002
Principal Occupation(s) During Past Five Years: General Counsel, Managing Director, and, since June 2015, a Member of the Board of Managers of Royce; Chief Legal and Compliance Officer and Secretary of Royce; Secretary and Chief Legal Officer of The Royce Funds.
Lisa Curcio, Chief Compliance Officer
Age: 56 | Tenure: Since 2004
Principal Occupation(s) During Past Five Years: Chief Compliance Officer of The Royce Funds (since October 2004) and Compliance Officer of Royce (since June 2004).
| 132 | The Royce Funds 2016 Semiannual Report to Shareholders |
Board Approval of Investment Advisory Agreements
At meetings held on June 2-3, 2016, the Board of Trustees of The Royce Fund (the “Board”), including all of the non-interested trustees, approved the amended and restated Investment Advisory Agreements (each, an “Investment Advisory Agreement” and collectively, the “Investment Advisory Agreements”) between Royce & Associates, LP (formerly Royce & Associates, LLC) (“R&A”) and The Royce Fund (“TRF”) relating to each of Royce Pennsylvania Mutual Fund, Royce Micro-Cap Fund, Royce Premier Fund, Royce Low-Priced Stock Fund, Royce Total Return Fund, Royce Heritage Fund, Royce Opportunity Fund, Royce Special Equity Fund, Royce Small-Cap Value Fund, Royce Smaller-Companies Growth Fund, Royce Small-Cap Leaders Fund, Royce Dividend Value Fund, Royce Micro-Cap Opportunity Fund, Royce Special Equity Multi-Cap Fund, Royce Global Financial Services Fund, Royce International Small-Cap Fund, Royce International Micro-Cap Fund, and Royce International Premier Fund (each, a “Fund” and collectively, the “Funds”). The Investment Advisory Agreements were amended and restated to reflect R&A’s change in organizational form from a limited liability company to a limited partnership; the amended and restated Agreements are substantially identical to the previously existing agreements. In reaching these decisions, the Board reviewed, among other things, information prepared internally by R&A and independently by Morningstar Associates, LLC (“Morningstar“) containing detailed investment advisory fee, expense ratio, and investment performance comparisons for each Fund with other mutual funds in its “peer group” and “category”, information regarding the past performance of the Funds and other registered investment companies managed by R&A and a memorandum outlining the legal duties of the Board prepared by independent counsel to the non-interested trustees. R&A also provided the trustees with an analysis of its profitability with respect to providing investment advisory services to each Fund. In addition, the Board took into account information furnished throughout the year at regular Board meetings, including reports on investment performance, shareholder services, distribution fees and expenses, regulatory compliance, brokerage commissions and research, brokerage and other execution products and services provided to the Funds. The Board also considered other matters it deemed important to the approval process, such as allocation of Fund brokerage commissions, “soft dollar” research services R&A receives, payments made to affiliates of R&A, as well as payments made by R&A relating to distribution of Fund shares and other direct and indirect benefits to R&A and its affiliates from their relationship with the Funds. The trustees also met throughout the year with investment advisory personnel from R&A. The Board, in its deliberations, recognized that, for many of the Funds’ shareholders, the decision to purchase Fund shares included a decision to select R&A as the investment adviser and that there was a strong association in the minds of Fund shareholders between R&A and each of the Funds. In considering factors relating to the approval of the Investment Advisory Agreements, the non-interested trustees received assistance and advice from, and met separately with, their independent counsel. While all of the Investment Advisory Agreements were considered at the same Board meeting, the trustees dealt with each Agreement separately. Among other factors, the trustees considered the following:
The nature, extent and quality of services provided by R&A:
The Board considered the following factors to be of fundamental importance to its consideration of whether to approve the Investment Advisory Agreements: (i) R&A’s more than 40 years of value investing experience and track record; (ii) the history of long-tenured R&A portfolio managers managing many of the Funds; (iii) R&A’s focus on mid-cap, small-cap and micro-cap value investing; (iv) the consistency of R&A’s approach to managing open-end mutual funds and closed-end funds over more than 40 years; (v) the integrity and high ethical standards adhered to at R&A; (vi) R&A’s specialized experience in the area of trading small- and micro-cap securities; (vii) R&A’s historical ability to attract and retain portfolio management talent; and (viii) R&A’s focus on shareholder interests as exemplified by capping expenses on smaller funds, closing funds to new investors when R&A believed such closings were in the best interests of existing shareholders, establishing breakpoints for a number of funds and providing expansive shareholder reporting and communications. The Board also noted that R&A’s compensation policy arrangements strongly encourage portfolio manager investment in each Fund that they manage. The trustees reviewed the services that R&A provides to each Fund, including, but not limited to, managing each Fund’s investments in accordance with the stated policies of each Fund. The Board considered the fact that R&A provided certain administrative services to the Funds at cost pursuant to the Administration Agreement between TRF and R&A. The Board determined that the services to be provided to the Funds by R&A would be the same as those that it previously provided to the Funds. The Board also took into consideration the histories, reputations and backgrounds of R&A’s portfolio managers for the Funds, finding that these would likely have an impact on the continued success of the Funds. The trustees also noted R&A’s ability to attract and retain qualified and experienced personnel. Lastly, the Board noted that R&A officers, employees, and their families had substantial amounts invested in each Fund. The trustees concluded that the investment advisory services provided by R&A to each Fund compared favorably to services provided by R&A to other R&A client accounts, including other funds, in both nature and quality, and that the scope of services provided by R&A would continue to be suitable for each Fund.
Investment performance of the Funds and R&A: In light of R&A’s risk-averse approach to investing, the trustees believe that risk-adjusted performance continues to be the most appropriate measure of each Fund’s investment performance. One measure of risk-adjusted performance the trustees have historically used in their review of each Fund’s performance is the Sharpe Ratio. The Sharpe Ratio is a risk-adjusted measure of performance developed by Nobel Laureate William Sharpe. It is calculated by dividing a Fund’s annualized excess returns by its annualized standard deviation to determine reward per unit of risk. The higher the Sharpe Ratio, the better a Fund’s historical risk-adjusted performance. The Board attaches primary importance to risk-adjusted performance over relatively long periods of time, typically 3 to 10 years.
Overall, the Board noted that the Funds generally underperformed their peers, as evidenced by their respective Sharpe Ratios, during the applicable 3-year, 5-year, and 10-year periods ended December 31, 2015. The trustees noted that, as explained by R&A, the Funds’ focus on high quality (e.g., those with solid balance sheets, low leverage, the ability to generate and effectively allocate free cash flow, and strong returns on invested capital) and cyclical companies had hurt their relative performance during the post-2008 market period that has been marked by historically low interest rates and significant U.S. Federal Reserve market intervention as highly leveraged, non-earning companies and yield-oriented securities (e.g., master limited partnerships, real estate investment trusts, and utilities) have generally outperformed their higher quality and cyclical counterparts during this period. The Board also noted, however, as discussed below, that the relative performance for certain Funds during the more historically customary market cycle preceding the 2008 financial crisis was quite strong.
The trend of weaker relative performance manifested itself for several Funds that have been in existence for more than 10 years. For example, the Sharpe Ratios for Royce Pennsylvania Mutual Fund (“PMF”), Royce Micro-Cap Fund (“RMC”), Royce Premier Fund (“RPR”), Royce Low-Priced Stock Fund (“RLP”), and Royce Small-Cap Value Fund (“RVV”) ranked in the 4th quartile within their respective Morningstar categories for the 3-year, 5-year, and 10-year periods ended December 31, 2015. The Board noted that, in recent years, RLP and RMC had over-weightings in materials companies, particularly Canadian gold and silver mining companies, while RMC also maintained significant positions in international companies. These holdings contributed, in part, to the relative underperformance of RLP and RMC during the
| The Royce Funds 2016 Semiannual Report to Shareholders | 133 |
Board Approval of Investment Advisory Agreements (continued)
applicable periods. Although Royce Heritage Fund (“RHF”), Royce Opportunity Fund (“ROF”), Royce Smaller-Companies Growth Fund (“RVP”), and Royce Small-Cap Leaders Fund (“ROH”) also ranked in the 4th quartile within their respective Morningstar categories for the 3-year and 5-year periods ended December 31, 2015, they did perform better than the above-listed Funds on a relative basis by ranking in the 3rd quartile within their respective Morningstar categories for the relevant 10-year performance period.
Certain Funds that have been in existence for more than 10 years and that ranked in the 4th quartile for the 3-year period ended December 31, 2015 did, however, avoid the above-referenced trend over the relevant 5-year and/or 10-year performance periods, including Royce Total Return Fund (“RTR”) (3rd and 2nd quartiles over the 5-year and 10-year periods, respectively), Royce Dividend Value Fund (“RDV”) (4th and 2nd quartiles over the 5-year and 10-year periods, respectively), and, most notably, Royce Special Equity Fund (“RSE”) (4th and 1st quartiles over the 5-year and 10-year periods, respectively).
Royce Global Financial Services Fund (“RFS”) bucked the above-referenced trends almost entirely, with its Sharpe Ratio ranking in the 3rd, 2nd, and 1st quartiles in its Morningstar category for the 3-year, 5-year, and 10-year periods, respectively, ended December 31, 2015.
The trend of weaker relative performance also manifested itself for several Funds that have been in existence for less than 10 years. For example, the Sharpe Ratios for Royce International Small-Cap Fund (“RIS”), Royce Micro-Cap Opportunity Fund (“ROS”), and Royce Special Equity Multi-Cap Fund (“RSM”) ranked in the 4th quartile within their respective Morningstar categories for the 3-year and 5-year periods ended December 31, 2015. Royce International Micro-Cap (“RMI”) avoided this trend, with its Sharpe Ratio ranking in the 3rd and 2nd quartiles within its Morningstar category for the 3-year and 5-year periods, respectively, ended December 31, 2015. Similarly, the Sharpe Ratio for Royce International Premier Fund (“RIP”) ranked in the 2nd quartile for the relevant 3-year and 5-year performance periods. The Board noted that even though RIS, ROS, RSM, RMI, and RIP now have more than 5 years of performance, R&A’s general process of investing net inflows over longer periods of time led to larger cash positions and market lagging performance for most of these Funds in their initial periods of operation.
The Board also noted that the peer groups included in the Morningstar materials for a number of Funds may not be appropriate for performance comparisons and that R&A had augmented the Morningstar data provided to the Board throughout the years by including performance information for other funds that R&A believes are more comparable to those Funds.
In addition to the risk–adjusted performance of each Fund, the Board also reviewed and considered the absolute total returns for each Fund, down market performance and, for Funds in existence for such periods, long-term performance records over periods of 10 years or longer. The Board also considered it important to look beyond the current snapshot of performance as of December 31, 2015 and therefore examined extended performance histories for each Fund using monthly rolling average return periods through March 31, 2016. The Board also took note of recent financial market trends, including widening high yield credit spreads and more difficult/expensive access to capital for many companies. While the Board recognized that a quarter does not define a trend, it noted that PMF, RPR, RTR, RHF, RSE, RVV, ROH, RFS, RDV, and RSM achieved top decile performance, RIS and RMI achieved 1st quartile performance, and ROF, RVP, and RIP achieved 2nd quartile performance, for the 3-month period ended March 31, 2016. The Board also noted that many of the Funds outperformed their respective benchmarks for at least a majority of the monthly rolling average annual return periods during the 3-year, 5-year, and 10-year periods ended March 31, 2016.
The Board noted that R&A manages a number of funds that invest in micro-cap, small-cap, and mid-cap issuers, many of which had outperformed their benchmark indexes and their competitors during the periods prior to the U.S. Federal Reserve’s near zero interest rate policy and related market interventions. Although the Board recognized that past performance is not necessarily an indicator of future results, it found that R&A had the necessary qualifications, experience and track record in managing equity mutual funds to manage each Fund. The Board determined that R&A continued to be an appropriate investment adviser for each Fund and concluded that each Fund’s performance supported the approval of its Investment Advisory Agreement.
Cost of the services provided and profits realized by R&A from its relationship with each Fund: The Board considered the cost of the services provided by R&A and the profits realized by R&A from its relationship with each Fund. As part of the analysis, the Board discussed with R&A its methodology in allocating its costs to each Fund and concluded that its allocations were reasonable. The Board noted that at times R&A had closed certain of the Funds to new investors because of the rate of growth in Fund assets. The Board noted that certain Funds were not profitable to R&A during the year ended December 31, 2015. The Board concluded that R&A’s profits with respect to each Fund that was profitable were reasonable in relation to the nature and quality of services provided.
The extent to which economies of scale would be realized as the Funds grow and whether fee levels would reflect such economies of scale: The Board considered whether there have been economies of scale in respect of the management of each Fund, whether each Fund has appropriately benefited from any economies of scale and whether there is potential for realization of any further economies of scale. The Board noted the time and effort involved in managing portfolios of small- and micro-cap stocks and that they did not involve the same efficiencies as do portfolios of large-cap stocks. The Board noted that in 2004 breakpoints were added to the investment advisory fees for all of the then-existing Funds except PMF (PMF’s fee schedule already had breakpoints) and that the investment advisory fees for all Funds organized since 2004 included breakpoints. The Board concluded that the current fee structure for each Fund was reasonable and that the relevant shareholders sufficiently participated in economies of scale.
Comparison of services to be rendered and fees to be paid to those under other investment advisory contracts, such as contracts of the same and other investment advisers or other clients: The Board reviewed the investment advisory fee paid by each Fund and compared both the services to be rendered and the fees to be paid under the Investment Advisory Agreements to other contracts of R&A and to contracts of other investment advisers to registered investment companies investing in micro-, small-, and mid-cap stocks, as provided by Morningstar. The Board noted the importance of the net expense ratio in measuring a fund’s efficiency, particularly in light of the variations in the mutual fund industry as to which entity is responsible for particular types of expenses. The Board noted that the net expense ratio for ROS ranked within the 2nd quintile among its Morningstar peers while the net expense ratios for PMF, RHF, and ROF fell within the middle quintile among their respective Morningstar peers. Although the net expense ratios for RIP and RIS ranked within the 4th quartile among their Morningstar peers, the Board noted that such expense ratios would have ranked in the 2nd and 1st quartiles, respectively, had their reduced contractual investment advisory fee rates as of January 1, 2016 been taken into account. Likewise, although the net expense ratio for RDV ranked in the 5th quintile among its Morningstar peers, the Board noted that such expense ratio would have been 10 basis points higher than its peer median and only 2 basis points higher than its category median had RDV’s reduced contractual investment advisory fee rates as of May 1, 2016 been taken into account.
Although the net expense ratios for RPR, RTR, RLP, RSE, RVV, ROH, RFS, and RSM ranked within the 4th quintile among their Morningstar
| 134 | The Royce Funds 2016 Semiannual Report to Shareholders |
Board Approval of Investment Advisory Agreements (continued)
peers, the Board noted that such expense ratios were not significantly higher than their peer medians. For example, the net expense ratio for each of RTR and RSE was 1.15%, only 3 basis points higher than its peer median, while RSM had a net expense ratio of 1.23%, 6 basis points higher than its peer median. In addition, the net expense ratios for RLP and RVV were 1.47%, and 1.48%, respectively, 11 basis points higher than their respective peer medians, while the net expense ratio for each of ROH and RFS was 1.49%, 12 basis points higher than their respective peer medians. Finally, the Board noted that RPR’s net expense ratio of 1.13% was 22 basis points higher than its peer median.
The Board noted that the remaining Funds had fifth quintile net expense ratios. With respect to RMC, the Board noted that RMC’s net expense ratio of 1.51% was 5 basis points higher than the average net expense ratio for the 58 non-institutional, non-ETF, domestic stock funds in the Morningstar database that invest primarily in issuers with market caps below $1 billion and 12b-1 fees of 0.25%. With respect to RVP, the Board noted that RVP’s net expense ratio of 1.45% was 22 basis points higher than its peer group median and 12 basis points higher than its category median. The investment advisory fees for RVP account for much of this differential. The Board further noted, however, that the investment advisory fees for RVP are consistent with other Royce open-end funds and that the net expense ratio for RVP is 7 basis points higher than the 1.38% mean for all 179 small-cap category funds (non-institutional, non-index, non-ETF) with 12b-1 fees of 25 basis points. With respect to RMI, the Board noted that its net expense ratio of 1.67% was 18 basis points higher than its peer medians. The Board also took into account that RMI had a lower weighted average market capitalization than a majority of its peers. After taking into consideration that the level of work necessary to invest in micro- and small-cap international securities is significantly greater than that necessary to invest in larger-cap securities, the Board noted that the basis point differentials in investment advisory fees, which give rise to the generally higher net expense ratio, were appropriate for RMI.
The Board also noted that R&A manages each Fund in an active fashion. The industry accepted metric for measuring how actively an equity portfolio is managed is called “active share.” In particular, active share measures how much the holdings of an equity portfolio differ from the holdings of its appropriate passive benchmark index. At the extremes, a portfolio with no holdings in common with the benchmark would have 100% active share, while a portfolio that is identical to the benchmark would have 0% active share. R&A presented a chart to the Board which demonstrated that mutual funds with high active share scores had higher expense ratios than mutual funds with lower active share scores due to the resources required for the active management of those funds. The Board noted that, for the year ended December 31, 2015, PMF and RMC had active shares of 88% and 89%, respectively, each of ROF, RSM, and RTR had an active share of 91%, and the remainder of the Funds had active shares of 95% or greater.
The Board further noted that R&A has waived investment advisory fees for numerous Funds in order to maintain expense ratios at competitive levels and acknowledged R&A’s intention to continue this expense limitation practice. The Board noted that the contractual investment advisory fee rates for RIS, RIP, RHF, and RDV had been reduced since December 31, 2015 to be more competitive with those of their respective peers. The Board also considered fees charged by R&A to institutional and other clients and noted that, given the greater levels of services that R&A provides to registered investment companies such as the Funds as compared to other accounts, each Fund’s advisory fees compared favorably to these other accounts.
It was noted that no single factor was cited as determinative to the decision of the trustees. Rather, after weighing all of the considerations and conclusions discussed above, the entire Board, including all of the non-interested trustees, approved the amended and restated Investment Advisory Agreements for all of the Funds, concluding that the amended and restated Agreements with substantially identical terms as the previously existing Agreements for all of the Funds were in the best interest of the shareholders of the respective Funds and that each investment advisory fee rate was reasonable in relation to the services provided.
| The Royce Funds 2016 Semiannual Report to Shareholders | 135 |
Notes to Performance and Other Important Information
The thoughts expressed in this report concerning recent market movements and future prospects for small company stocks are solely the opinion of Royce at June 30, 2016, and, of course, historical market trends are not necessarily indicative of future market movements. Statements regarding the future prospects for particular securities held in the Funds’ portfolios and Royce’s investment intentions with respect to those securities reflect Royce’s opinions as of June 30, 2016 and are subject to change at any time without notice. There can be no assurance that securities mentioned in this report will be included in any Royce-managed portfolio in the future.
Sector weightings are determined using the Global Industry Classification Standard (“GICS”). GICS was developed by, and is the exclusive property of, Standard & Poor’s Financial Services LLC (“S&P”) and MSCI Inc. (“MSCI”). GICS is the trademark of S&P and MSCI. “Global Industry Classification Standard (GICS)” and “GICS Direct” are service marks of S&P and MSCI.
All indexes referred to are unmanaged and capitalization weighted. Each index’s returns include net reinvested dividends and/or interest income. Russell Investment Group is the source and owner of the trademarks, service marks, and copyrights related to the Russell Indexes. Russell® is a trademark of Russell Investment Group. The Russell 2000 is an index of domestic small-cap stocks. It measures the performance of the 2,000 smallest publicly traded U.S. companies in the Russell 3000 Index. The Russell 2000 Value and Growth Indexes consist of the respective value and growth stocks within the Russell 2000 as determined by Russell Investments. The Russell 1000 Index is an index of domestic large-cap stocks. It measures the performance of the 1,000 largest publicly traded U.S. companies in the Russell 3000 Index. The Russell Microcap Index includes 1,000 of the smallest securities in the Russell 2000 Index, along with the next smallest eligible securities as determined by Russell. The Russell Midcap Index measures the performance of the mid-cap segment of the U.S. equity universe. It includes approximately 800 of the smallest securities in the Russell 1000 Index. The Russell Global ex-U.S. Small Cap Index is an index of global small-cap stocks, excluding the United States. The Russell Global ex-U.S. Large Cap Index is an index of global large-cap stocks, excluding the United States. The S&P 500 is an index of U.S. large-cap stocks, selected by Standard & Poor’s based on market size, liquidity, and industry grouping, among other factors. The Nasdaq Composite is an index of the more than 3,000 common equities listed on the Nasdaq stock exchange. The performance of an index does not represent exactly any particular investment, as you cannot invest directly in an index. Returns for the market indexes used in this report were based on information supplied to Royce by Russell Investments. Royce has not independently verified the above described information.
The Price-Earnings, or P/E, Ratio is calculated by dividing a company’s share price by its trailing 12-month earnings-per share (EPS). The Price-to-Book, or P/B, Ratio is calculated by dividing a company’s share price by its book value per share. Standard deviation is a statistical measure within which a fund’s total returns have varied over time. The greater the standard deviation, the greater a fund’s volatility. The Morningstar Style Map uses proprietary scores of a stock’s value and growth characteristics to determine its placement in one of the five categories listed on the horizontal axis. These characteristics are then compared to those of other stocks within the same market capitalization band. Each is scored from zero to 100 for both value and growth attributes. The value score is subtracted from the growth score to determine the overall style score. For the vertical, market cap axis, Morningstar subdivides into size groups. Giant-cap stocks are defined as those that account for the top 40% of the capitalization of each style zone; large-cap stocks represent the next 30%; mid-cap stocks the next 20%; small-cap stocks the next 7%; micro-cap stocks the smallest 3%. Investments in securities of micro-cap, small-cap, and/or mid-cap companies may involve considerably more risk than investments in securities of larger-cap companies. (Please see “Primary Risks for Fund Investors” in the prospectus.) Investments in foreign securities, which generally may involve political, economic, currency, and other risks not encountered in U.S. investments. (Please see “Investing in Foreign Securities” in the prospectus.) A Fund that invests a significant portion of its assets in a limited number of stocks may be subject to considerably more risk than a more broadly diversified Fund because a decline in the value of any of these stocks would cause that Fund’s overall value to decline to a greater degree. A broadly diversified portfolio does not, however, ensure a profit for a Fund or guarantee against loss. Please read the prospectus carefully before investing or sending money. A copy of the Funds’ current prospectus and Statement of Additional Information may be obtained by calling (800) 221-4268 or by visiting www.roycefunds.com. All publicly released material Fund information is disclosed by the Funds on their website at www.roycefunds.com. The Royce Funds is a service mark of The Royce Funds. Distributor: Royce Fund Services, Inc.
This material contains forward-looking statements within the meaning of the Securities Exchange Act of 1934, as amended (the “Exchange Act”), that involve risks and uncertainties, including, among others, statements as to:
| • | the Funds’ future operating results, |
| • | the prospects of the Funds’ portfolio companies, |
| • | the impact of investments that the Funds have made or may make, the dependence of the Funds’ future success on the general economy and its impact on the companies and industries in which the Funds invest, and |
| • | the ability of the Funds’ portfolio companies to achieve their objectives. |
This review and report use words such as “anticipates,” “believes,” “expects,” “future,” “intends,” and similar expressions to identify forward-looking statements. Actual results may differ materially from those projected in the forward-looking statements for any reason.
The Royce Funds have based the forward-looking statements included in this review and report on information available to us on the date of the report, and we assume no obligation to update any such forward-looking statements. Although The Royce Funds undertake no obligation to revise or update any forward-looking statements, whether as a result of new information, future events, or otherwise, you are advised to consult any additional disclosures that we may make through future shareholder communications or reports.
Proxy Voting
A copy of the policies and procedures that The Royce Funds use to determine how to vote proxies relating to portfolio securities and information regarding how each of The Royce Funds voted proxies relating to portfolio securities during the most recent 12-month period ended June 30 is available, without charge, on The Royce Funds’ website at www.roycefunds.com, by calling (800) 221-4268 (toll-free) and on the website of the Securities and Exchange Commission (“SEC”) at www.sec.gov.
Form N-Q Filing
The Funds file their complete schedules of investments with the SEC for the first and third quarters of each fiscal year on Form N-Q. The Funds’ Forms N-Q are available on the SEC’s website at www. sec.gov. The Royce Funds’ holdings are also on the Funds’ website approximately 15 to 20 days after each calendar quarter end and remain available until the next quarter’s holdings are posted. The Funds’ Forms N-Q may also be reviewed and copied at the SEC’s Public Reference Room in Washington, D.C. To find out more about this public service, call the SEC at (202) 942-8090. The Funds’ complete schedules of investments are updated quarterly and are available at www.roycefunds.com.
| 136 | The Royce Funds 2016 Semiannual Report to Shareholders |
| roycefunds.com |
| GET THE LATEST INSIGHTS AND NEWS ON THE ROYCE FUNDS |

| CHUCK ROYCE IN BARRON’S |
| Chuck spoke with Ben Levisohn of Barron’s about “an often-overlooked corner of the alternative-investment world: alternative-asset-management companies” and his thoughts on the prospects for active small-cap management, for the paper’s “Alternatives Monthly” pull-out section entitled, “Why Alt Stocks Are a Value Investor’s Dream.” |
 |
| WHY ARE THE MARKETS PRONE TO BLACK SWANS? |
| Portfolio Manager Charlie Dreifus discusses how the current climate of slow growth, high valuations, and interventionist monetary policy makes the markets potentially vulnerable to black swan events. |
 |
| RECENT NEWS |
| Watch Co-CIO Francis Gannon discuss major transitions in the small-cap space with financial journalist and television host Liz Claman. |
| eDELIVERY SAVES! SIGN UP NOW. | STAY INFORMED | ||
| eDelivery saves paper, time, and fund expenses.1 Sign up now to view statements, prospectuses, financial reports, and tax forms online. roycefunds.com/edelivery | Connect with us on LinkedIn, follow us on Twitter, watch us on YouTube and subscribe to our RSS feed. Visit roycefunds.com/subscribe to sign up for our monthly eWord newsletter to stay up to date on the latest from Royce. | ||
 www.twitter.com/roycefunds www.twitter.com/roycefunds |  www.linkedin.com/roycefunds www.linkedin.com/roycefunds |  www.youtube.com/roycefunds www.youtube.com/roycefunds | www.roycefunds.com/eword |
1 Any direct Royce Funds IRA investor who chooses eDelivery of prospectuses, financial reports, and Royce Review will be exempt from the $15 annual IRA maintenance fee. (We will continue to also waive the fee for investors with more than $20,000 invested in Royce IRAs at the time the fee is charged, and for new transfer and rollover accounts in their first year.) | |||
| This page is not part of the 2016 Semiannual Report to Shareholders | 137 |
 | |||||
| About The Royce Funds | Contact Us | ||||
Unparalleled Knowledge + Experience Pioneers in small-cap investing, with 40+ years of experience, depth of knowledge, and focus. Independent Thinking The confidence to go against consensus, the insight to uncover opportunities others might miss, and the tenacity to stay the course through market cycles. | GENERAL INFORMATION General Royce Funds information including: • How to open an account • An overview of our firm and Funds • Ordering literature including Prospectuses (800) 221-4268 | ||||
Specialized Approaches Strategies that use value, core, or growth investment approaches to select micro-cap, small-cap, and mid-cap companies. | ACCOUNT INFORMATION Speak with a representative about: • Your account, transactions, and forms (800) 841-1180 | ||||
| Unwavering Commitment | |||||
Our team of 17 portfolio managers have significant personal investments in the strategies they manage. | FINANCIAL ADVISORS, CONSULTANTS, AND INSTITUTIONS Speak with your regional Royce contact regarding: • Scheduling a meeting or call • Information about our firm, strategies, and funds • Resources for financial professionals, such as portfolio attribution reports (800) 337-6923 | ||||
| AUTOMATED ACCOUNT INFORMATION 24-hour Automated Telephone Service (800) 878-6923 | |||||
 |  |  | |||
Item 2. Code(s) of Ethics. Not applicable to this semi-annual report.
Item 3. Audit Committee Financial Expert. Not applicable to this semi-annual report.
Item 4. Principal Accountant Fees and Services. Not applicable to this semi-annual report.
Item 5. Audit Committee of Listed Registrants. Not Applicable.
Item 6. Investments.
(a) See Item 1.
(b) Not Applicable
Item 7. Disclosure of Proxy Voting Policies and Procedures for Closed-End Management Investment Companies. Not Applicable.
Item 8. Portfolio Managers of Closed-End Management Investment Companies. Not Applicable.
Item 9. Purchases of Equity Securities by Closed-End Management Investment Company and Affiliated Purchasers. Not Applicable
Item 10. Submission of Matters to a Vote of Security Holders. Not Applicable.
Item 11. Controls and Procedures.
(a) Disclosure Controls and Procedures. The Principal Executive and Financial Officers concluded that the Registrant’s Disclosure Controls and Procedures are effective based on their evaluation of the Disclosure Controls and Procedures as of a date within 90 days of the filing date of this report.
(b) Internal Control over Financial Reporting. There were no significant changes in Registrant’s internal control over financial reporting or in other factors that could significantly affect this control subsequent to the date of the evaluation, including any corrective actions with regard to significant deficiencies and material weaknesses during the second fiscal quarter of the period covered by this report.
Item 12. Exhibits. Attached hereto.
(a)(1) Not applicable to this semi-annual report.
(a)(2) Separate certifications by the Registrant’s Principal Executive Officer and Principal Financial Officer as required by Rule 30a-2(a) under the Investment Company Act of 1940.
(a)(3) Not Applicable
(b) Separate certifications by the Registrant���s Principal Executive Officer and Principal Financial Officer, pursuant to Section 906 of the Sarbanes-Oxley Act of 2002 and required by Rule 30a-2(b) under the Investment Company Act of 1940.
Pursuant to the requirements of the Securities Exchange Act of 1934 and the Investment Company Act of 1940, the registrant has duly caused this report to be signed on its behalf by the undersigned, thereunto duly authorized.
| THE ROYCE FUND | |
| BY: | /s/ Christopher D. Clark |
| Christopher D. Clark | |
| President | |
| Date: August 26, 2016 | |
Pursuant to the requirements of the Securities Exchange Act of 1934 and the Investment Company Act of 1940, this report has been signed below by the following persons on behalf of the registrant and in the capacities and on the dates indicated.
| THE ROYCE FUND | THE ROYCE FUND | ||
| BY: | /s/ Christopher D. Clark | BY: | /s/ Peter K. Hoglund |
| Christopher D. Clark | Peter K. Hoglund | ||
| President | Chief Financial Officer | ||
| Date: August 26, 2016 | Date: August 26, 2016 | ||