Special Committee Confidential Discussion Materials Prepared for: Regarding Project Falcon June 26, 2012 STRICTLY CONFIDENTIAL

STRICTLY CONFIDENTIAL Notice to Recipient Confidential “Bank of America Merrill Lynch”is the marketing name for the global banking and global marketsbusinesses of Bank of America Corporation. Lending, derivatives, and other commercial banking activities are performed globally by banking affiliates of Bank of America Corporation, including Bank of America, N.A.,member FDIC. Securities, strategic advisory, and other investment banking activities are performed globally by investment banking affiliates of Bank of America Corporation (“Investment Banking Affiliates”), including, in the United States, Merrill Lynch, Pierce, Fenner & Smith Incorporated and Merrill Lynch Professional Clearing Corp., which are both registered broker dealers and members of FINRA and SIPC, and, in other jurisdictions, by locally registered entities. Investment products offered by Investment Banking Affiliates: Are Not FDIC Insured * May Lose Value * Are Not Bank Guaranteed. These materials have been prepared by one or more subsidiaries of Bank of America Corporation for the client or potential clientto whom such materials are directly addressed and delivered (the “Company”) in connection with an actual or potential mandate or engagement and may not be used or relied upon for any purpose other than as specifically contemplated by a written agreement with us. These materials are based on information provided by or on behalf of the Company and/or other potential transaction participants, from public sources or otherwise reviewed by us. We assume no responsibility for independent investigation or verification of such information (including, without limitation, data from third party suppliers) and have relied on such information being complete and accurate in all material respects. To the extent such information includes estimates andforecasts of future financial performance prepared by or reviewed with the managements of the Company and/or other potential transaction participants or obtained from public sources, wehave assumed that such estimates and forecasts have been reasonably prepared on bases reflecting the best currently available estimates and judgments of such managements (or, with respect to estimates and forecasts obtained from public sources, represent reasonable estimates). No representation or warranty,express or implied, is made as to the accuracy or completeness of such information and nothing contained herein is, or shall be relied upon as, a representation, whether as to the past, the present or the future. These materials were designed for use by specific persons familiar with the business and affairs of the Company and are being furnished and should be considered only inconnection with other information, oral or written, being provided by us in connection herewith. These materials are not intended to provide the sole basis for evaluating, and should not be considered a recommendation with respect to, any transaction or other matter. These materials do not constitute an offer or solicitation to sell or purchase any securities and are not a commitment by Bank of America Corporation or any of its affiliatesto provide or arrange any financing for any transaction or to purchase any security in connection therewith. These materials are for discussion purposes only and are subject to our review and assessment from a legal, compliance, accounting policy and risk perspective, as appropriate, following our discussion with the Company. We assume no obligation to update or otherwise revise these materials. These materials have not been prepared with a view toward public disclosure under applicable securitieslaws or otherwise, are intended for the benefit and use of the Company, and may not be reproduced, disseminated, quoted or referred to, in whole or in part, without our prior written consent. These materials may not reflect information known to otherprofessionals in other business areas of Bank of America Corporation and its affiliates. Bank of America Corporation and its affiliates (collectively, the “BAC Group”) comprise a full service securities firm and commercial bank engaged in securities, commodities and derivatives trading, foreign exchange and other brokerage activities, and principal investing as well as providing investment, corporate andprivate banking, asset and investment management, financing and strategic advisory services and other commercial services and products to a wide range of corporations, governments and individuals, domestically and offshore, from which conflicting interests or duties, or a perception thereof, may arise. In theordinary course of these activities, parts of the BAC Group at any time may invest on a principal basis or manage funds that invest, make or hold long or short positions, finance positions or tradeor otherwise effect transactions, for their own accounts or theaccounts of customers, in debt, equity or other securities or financial instruments (including derivatives, bank loans or other obligations) of the Company, potential counterparties or any other company that may be involved in a transaction. Products and services that may be referenced in the accompanying materials may be provided through one or more affiliates of Bank of America Corporation. We have adopted policies and guidelines designed to preserve the independence of our research analysts. The BAC Group prohibits employees from, directly or indirectly, offering a favorable research rating or specific price target, or offering to change a rating or price target to a subject company as consideration or inducement for the receipt of business or for compensation and the BAC Group prohibits research analysts from being directly compensated for involvement in investment banking transactions. We are required to obtain, verify and record certain information that identifies the Company, which information includes the name and address of the Company and other information that will allow us to identify the Company in accordance, as applicable, with the USA Patriot Act (Title III of Pub. L. 107- 56 (signed into law October 26, 2001)) and such other laws, rules and regulations as applicable within and outside the United States. We do not provide legal, compliance, tax or accounting advice. Accordingly, any statements contained herein as to tax matters were neither written nor intended by us to be used and cannot be used by any taxpayer for the purpose of avoiding tax penalties that may be imposed on such taxpayer. If any person uses or refers to any such tax statement in promoting, marketing or recommending a partnership or other entity, investment plan or arrangement to any taxpayer, then the statement expressed herein is being delivered to support the promotion or marketing of the transaction or matter addressed and the recipient should seek advice based on its particular circumstances from an independent tax advisor. Notwithstanding anything that may appear herein or in other materials to the contrary, the Company shall be permitted to disclose the tax treatment and tax structure of a transaction (including any materials, opinions or analyses relating to such tax treatment or tax structure, but without disclosure of identifying information or, except to the extent relating to such tax structure or tax treatment, any nonpublic commercial or financial information) on and after the earliest to occur of the date of (i) public announcement of discussions relating to such transaction, (ii) public announcement of such transaction or (iii) execution of a definitive agreement (with or without conditions) to enter into such transaction; provided, however, that if such transaction is not consummated for any reason, the provisions of this sentence shall cease to apply.Copyright 2012 Bank of America Corporation.
STRICTLY CONFIDENTIAL Table of Contents Presentation to Special Committee Regarding Project Falcon 1. Proposed Transaction 2. Public Market Perspectives 3. Valuation Summary Appendix

STRICTLY CONFIDENTIAL Proposed Transaction

STRICTLY CONFIDENTIAL Proposed Transaction Overview of Key Terms Transaction Structure A wholly owned subsidiary of Green Dynasty Ltd. (“Parent”) will merge with and into Falcon (the “Company”), with the Company continuing as the surviving corporation and a wholly owned subsidiary of Parent. Parent is a wholly owned subsidiary of Green Dynasty Holdings Ltd. (“Holdco”) Concurrently with the closing, Messrs. Li Fu, Yuyan Zhang and Xin Liu, Wise Sun Investments Limited and Abax Lotus Ltd. (collectively, the “Rollover Holders”) will contribute their shares of the Company’s common stock to Parent in exchange for shares of Holdco $9.50 per each share of Falcon common stock (other than rollovershares) 41.2% premium to closing price on June 22, 2012 and 37.3% premium to 90-day VWAP Price Per Share Treatment of Options / RSUs Outstanding stock options will fully vest and grantees will receive positive difference (if any) between the per share merger consideration and the option exercise price Outstanding restricted stock units will fully vest and grantees will receive the per share merger consideration for each unit Debt and Equity Commitments at Signing An executed debt facility agreement between Parent and China Development Bank (“CDB”) providing for a $[185] million term loan Executed new equity commitment letters from Mr. Fu and Abax for an aggregate amount of $[75] million Financing Holdco and Parent will use commercially reasonable efforts to ensure availability of CDB debt financing The Company is entitled to specific performance if closing conditions have been met, the debt financing is available, and the Company is prepared to close 1 ____________________ Source: Draft dated June 25, 2012 of the Merger Agreement.

STRICTLY CONFIDENTIAL 2 Proposed Transaction Overview of Key Terms (Cont’d) Approval of Merger Agreement by a 60% majority of Falcon disinterested shareholders Regulatory approvals No order enjoining the merger Accuracy of representations and warranties subject to applicablequalification Compliance with covenants Absence of material adverse effect Note: Availability of financing is not a closing condition Key Closing Conditions Termination Termination fees payable under certain circumstances by Falcon $11 million if the Company enters into an alternative acquisition agreement with respect to a superior proposal (or if the Company enters into an acquisition proposal within 12 months of termination of the merger agreement due to the failure to obtain shareholder approval or the expiration of the end dateif an acquisition proposal was made prior to termination) $11 million if the board changes its recommendation or fails to include the recommendation in favor of the merger agreement in the proxy statement $11 million if the Company breaches, and fails to cure, its reps, warranties or covenants Termination fees payable under certain circumstances by Parent $22 million if Parent breaches, and fails to cure, its reps, warranties or covenants $22 million if the closing conditions have been satisfied, the Company is prepared to close, and Parent fails to close Remedies Abax and Chairman will deliver at signing a limited guarantee with respect to certain of Parent’s and Merger Sub’s obligations under the merger agreement ($22 million in the aggregate) Neither Abax’s nor the Chairman’s guarantee is secured See limitation on Company’s specific performance rights above opposite “Financing” No Shop Following signing, the Company may not solicit acquisition proposals from third parties If an unsolicited offer is received, the Company may engage in discussions reasonably expected to lead to a superior proposal The Board (acting on the recommendation of the Special Committee) may change its recommendation if the failure to do so would be reasonably likely to be inconsistent with the exercise of its fiduciary duties. If the Company receives a superior proposal, in addition to changing its recommendation, the Board may terminate the merger agreement Buyer has matching right before the Company can terminate the merger agreement or change its recommendation in connection with a superior proposal [ June 26, 2013 ] No extensions Drop Dead Date ____________________ Source: Draft dated June 25, 2012 of the Merger Agreement.
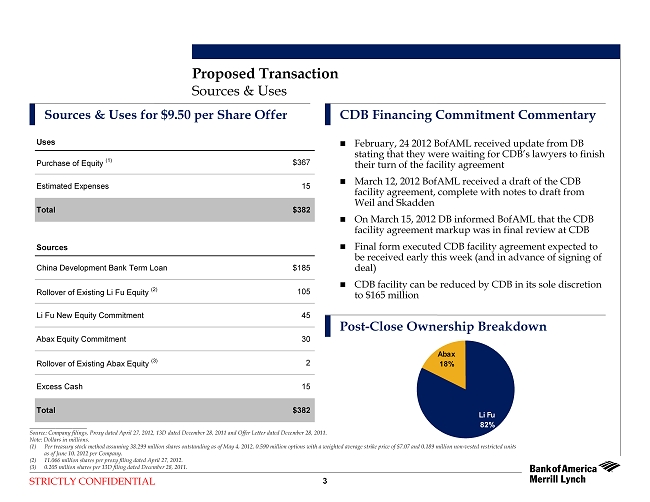
STRICTLY CONFIDENTIAL 3 Proposed Transaction Sources & Uses Sources & Uses for $9.50 per Share Offer CDB Financing Commitment Commentary ____________________ Source: Company filings, Proxy dated April 27, 2012, 13D dated December 28, 2011 and Offer Letter dated December 28, 2011. Note: Dollars in millions. (1) Per treasury stock method assuming 38.299 million shares outstanding as of May 4, 2012, 0.590 million options with a weighted average strike price of $7.07 and 0.189 million non-vested restricted units as of June 10, 2012 per Company. (2) 11.066 million shares per proxy filing dated April 27, 2012. (3) 0.205 million shares per 13D filing dated December 28, 2011. February, 24 2012 BofAML received update from DB stating that they were waiting for CDB’s lawyers to finish their turn of the facility agreement March 12, 2012 BofAML received a draft of the CDB facility agreement, complete with notes to draft from Weil and Skadden On March 15, 2012 DB informed BofAML that the CDB facility agreement markup was in final review at CDB Final form executed CDB facility agreement expected to be received early this week (and in advance of signing of deal) CDB facility can be reduced by CDB in its sole discretion to $165 million Post-Close Ownership Breakdown Abax 18% Li Fu 82% Uses Purchase of Equity (1) $367 Estimated Expenses 15 Total $382 Sources China Development Bank Term Loan $185 Rollover of Existing Li Fu Equity (2) 105 Li Fu New Equity Commitment 45 Abax Equity Commitment 30 Rollover of Existing Abax Equity (3) 2 Excess Cash 15 Total $382
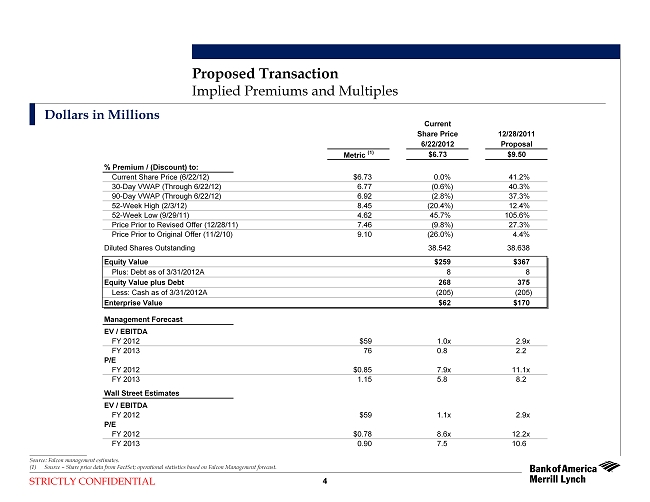
STRICTLY CONFIDENTIAL 4 Proposed Transaction Implied Premiums and Multiples Dollars in Millions ____________________ Source: Falcon management estimates. (1) Source –Share price data from FactSet; operational statistics based on Falcon Management forecast. Current Share Price 12/28/2011 6/22/2012 Proposal Metric (1) $6.73 $9.50 % Premium / (Discount) to: Current Share Price (6/22/12) $6.73 0.0% 41.2% 30-Day VWAP (Through 6/22/12) 6.77 (0.6%) 40.3% 90-Day VWAP (Through 6/22/12) 6.92 (2.8%) 37.3% 52-Week High (2/3/12) 8.45 (20.4%) 12.4% 52-Week Low (9/29/11) 4.62 45.7% 105.6% Price Prior to Revised Offer (12/28/11) 7.46 (9.8%) 27.3% Price Prior to Original Offer (11/2/10) 9.10 (26.0%) 4.4% Diluted Shares Outstanding 38.542 38.638 Equity Value $259 $367 Plus: Debt as of 3/31/2012A 8 8 Equity Value plus Debt 268 375 Less: Cash as of 3/31/2012A (205) (205) Enterprise Value $62 $170 Management Forecast EV / EBITDA FY 2012 $59 1.0x 2.9x FY 2013 76 0.8 2.2 P/E FY 2012 $0.85 7.9x 11.1x FY 2013 1.15 5.8 8.2 Wall Street Estimates EV / EBITDA FY 2012 $59 1.1x 2.9x P/E FY 2012 $0.78 8.6x 12.2x FY 2013 0.90 7.5 10.6
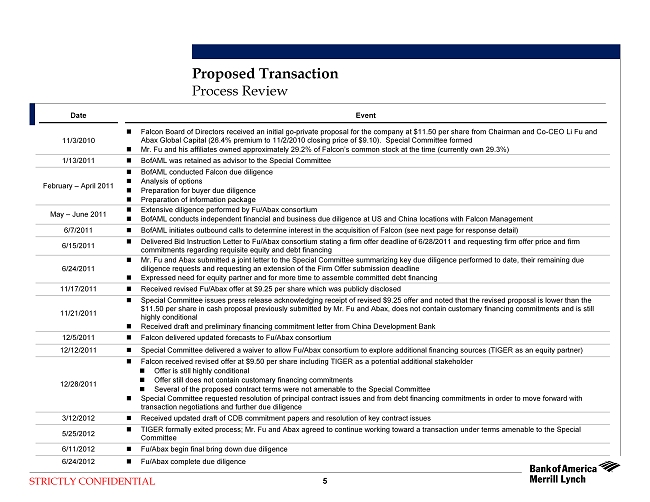
STRICTLY CONFIDENTIAL 5 Proposed Transaction Process Review Date Event 11/3/2010 Falcon Board of Directors received an initial go-private proposal for the company at $11.50 per share from Chairman and Co-CEO Li Fu and Abax Global Capital (26.4% premium to 11/2/2010 closing price of $9.10). Special Committee formed Mr. Fu and his affiliates owned approximately 29.2% of Falcon’s common stock at the time (currently own 29.3%) 1/13/2011 BofAML was retained as advisor to the Special Committee February – April 2011 BofAML conducted Falcon due diligence Analysis of options Preparation for buyer due diligence Preparation of information package May – June 2011 Extensive diligence performed by Fu/Abax consortium BofAML conducts independent financial and business due diligence at US and China locations with Falcon Management 6/7/2011 BofAML initiates outbound calls to determine interest in the acquisition of Falcon (see next page for response detail) 6/15/2011 Delivered Bid Instruction Letter to Fu/Abax consortium stating a firm offer deadline of 6/28/2011 and requesting firm offer price and firm commitments regarding requisite equity and debt financing 6/24/2011 Mr. Fu and Abax submitted a joint letter to the Special Committee summarizing key due diligence performed to date, their remaining due diligence requests and requesting an extension of the Firm Offer submission deadline Expressed need for equity partner and for more time to assemble committed debt financing 11/17/2011 Received revised Fu/Abax offer at $9.25 per share which was publicly disclosed 11/21/2011 Special Committee issues press release acknowledging receipt of revised $9.25 offer and noted that the revised proposal is lower than the $11.50 per share in cash proposal previously submitted by Mr. Fu and Abax, does not contain customary financing commitments and is still highly conditional Received draft and preliminary financing commitment letter from China Development Bank 12/5/2011 Falcon delivered updated forecasts to Fu/Abax consortium 12/12/2011 Special Committee delivered a waiver to allow Fu/Abax consortium to explore additional financing sources (TIGER as an equity partner) 12/28/2011 Falcon received revised offer at $9.50 per share including TIGER as a potential additional stakeholder Offer is still highly conditional Offer still does not contain customary financing commitments Several of the proposed contract terms were not amenable to the Special Committee Special Committee requested resolution of principal contract issues and from debt financing commitments in order to move forward with transaction negotiations and further due diligence 3/12/2012 Received updated draft of CDB commitment papers and resolution of key contract issues 5/25/2012 TIGER formally exited process; Mr. Fu and Abax agreed to continue working toward a transaction under terms amenable to the Special Committee 6/11/2012 Fu/Abax begin final bring down due diligence 6/24/2012 Fu/Abax complete due diligence

STRICTLY CONFIDENTIAL 6 Proposed Transaction Buyers Contacted Teaser Sent NDA Sent NDA Executed Info Supplement & Process Letter Sent Declaration of “no interest” Company A x x -- -- -- Company B x x -- -- -- Company C x x x -- -- Company D x -- -- -- -- Company E x x x -- -- Company F x x x x x Company G x x x -- -- Company H x -- -- -- -- Company I x x x x x Company J x -- -- -- -- Inbound Interest TIGER (Financial Buyer) Inbound -- -- -- -- Written indication of interest at $8.00 - $9.00 per share on June 11, 2011 History of Outbound Calls to Other Potential Buyers Passed due to undesirable end market focus and declining EBITDA trend Liked China HQ, but stated bimetalics would be a challenging new space that did not have sufficient strategic fit or interest
STRICTLY CONFIDENTIAL Public Market Perspectives
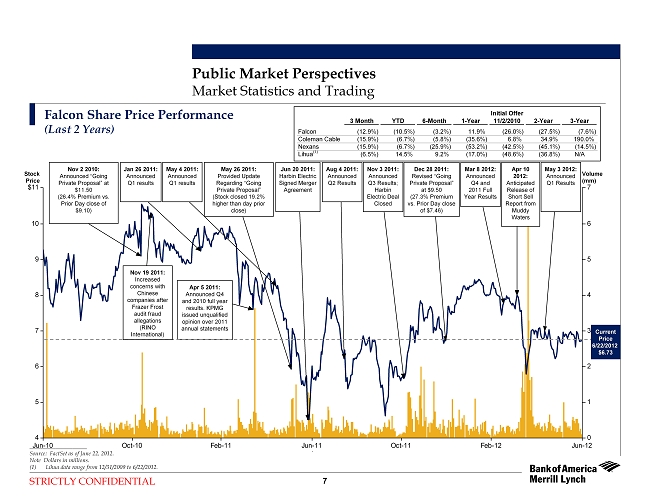
STRICTLY CONFIDENTIAL 7 Public Market Perspectives Market Statistics and Trading Falcon Share Price Performance (Last 2 Years) Jun-10 Oct-10 Feb-11 Jun-11 Oct-11 Feb-12 Jun-12 4 5 6 7 8 9 10 $11 0 1 2 3 4 5 6 7 05/04/2011 11/02/2010 05/03/201203/08/20126/16/20125/26/2011 8/4/2011 11/03/2011 4/10/2012 12/28/2011 04/05/2011 11/19/2010 1/26/11 Nov 2 2010: Announced “Going Private Proposal”at $11.50 (26.4% Premium vs. Prior Day close of $9.10) Apr 5 2011: Announced Q4 and 2010 full year results. KPMG issued unqualified opinion over 2011 annual statements May 4 2011: Announced Q1 results May 26 2011: Provided Update Regarding “Going Private Proposal” (Stock closed 19.2% higher than day prior close) Jun 20 2011: Harbin Electric Signed Merger Agreement Nov 3 2011: Announced Q3 Results; Harbin Electric Deal Closed Mar 8 2012: Announced Q4 and 2011 Full Year Results May 3 2012: Announced Q1 Results Apr 10 2012: Anticipated Release of Short Sell Report from Muddy Waters ____________________ Source: FactSet as of June 22, 2012. Note Dollars in millions. (1) Lihua data range from 12/31/2009 to 6/22/2012. Volume (mm) Current Current Price Price 6/22/2012 6/22/2012 $6.73 $6.73 Dec 28 2011: Revised “Going Private Proposal” at $9.50 (27.3% Premium vs. Prior Day close of $7.46) Stock Price Initial Offer 3 Month YTD 6-Month 1-Year 11/2/2010 2-Year 3-Year Falcon (12.9%) (10.5%) (3.2%) 11.9% (26.0%) (27.5%) (7.6%) Coleman Cable (15.9%) (6.7%) (5.8%) (35.6%) 6.8% 34.9% 190.0% Nexans (15.9%) (6.7%) (25.9%) (53.2%) (42.5%) (45.1%) (14.5%) Lihua (1) (6.5%) 14.5% 9.2% (17.0%) (48.6%) (36.8%) N/A Aug 4 2011: Announced Q2 Results Jan 26 2011: Announced Q1 results Nov 19 2011: Increased concerns with Chinese companies after Frazer Frost audit fraud allegations (RINO International)
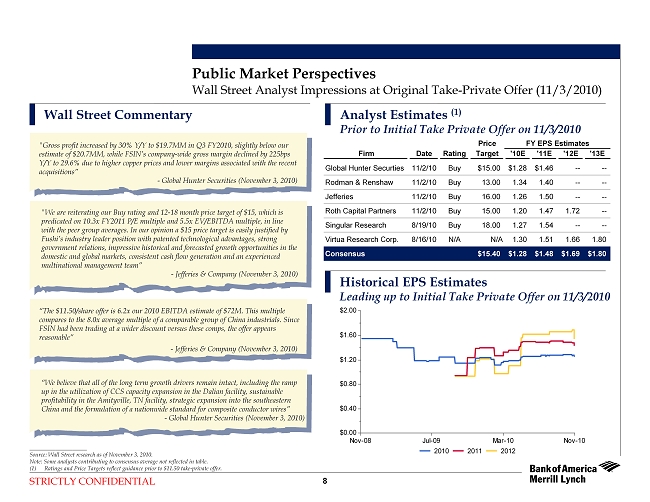
STRICTLY CONFIDENTIAL “The $11.50/share offer is 6.2x our 2010 EBITDA estimate of $72M.This multiple compares to the 8.0x average multiple of a comparable group of China industrials. Since FSIN had been trading at a wider discount versus these comps, the offer appears reasonable” -Jefferies & Company (November 3, 2010) “We believe that all of the long term growth drivers remain intact, including the ramp up in the utilization of CCS capacity expansion in the Dalian facility, sustainable profitability in the Amityville, TN facility, strategic expansion into the southeastern China and the formulation of a nationwide standard for compositeconductor wires” -Global Hunter Securities (November 3, 2010) 8 Wall Street Commentary "We are reiterating our Buy rating and 12-18 month price target of $15, which is predicated on 10.3x FY2011 P/E multiple and 5.5x EV/EBITDA multiple, in line with the peer group averages. In our opinion a $15 price target is easily justified by Fushi’s industry leader position with patented technological advantages, strong government relations, impressive historical and forecasted growth opportunities in the domestic and global markets, consistent cash flow generation andan experienced multinational management team” -Jefferies & Company (November 3, 2010) ____________________ Source: Wall Street research as of November 3, 2010. Note: Some analysts contributing to consensus average not reflected in table. (1) Ratings and Price Targets reflect guidance prior to $11.50 take-private offer. Public Market Perspectives "Gross profit increased by 30% Y/Y to $19.7MM in Q3 FY2010, slightly below our estimate of $20.7MM, while FSIN’s company-wide gross margin declined by 225bps Y/Y to 29.6% due to higher copper prices and lower margins associated with the recent acquisitions” -Global Hunter Securities (November 3, 2010) Wall Street Analyst Impressions at Original Take-Private Offer (11/3/2010) Analyst Estimates (1) Prior to Initial Take Private Offer on 11/3/2010 Historical EPS Estimates Leading up to Initial Take Private Offer on 11/3/2010 Nov-08 Jul-09 Mar-10 Nov-10 $0.00 $0.40 $0.80 $1.20 $1.60 $2.00 2010 2011 2012 Price FY EPS Estimates Firm Date Rating Target '10E '11E '12E '13E Global Hunter Securties 11/2/10 Buy $15.00 $1.28 $1.46 -- -- Rodman & Renshaw 11/2/10 Buy 13.00 1.34 1.40 -- -- Jefferies 11/2/10 Buy 16.00 1.26 1.50 -- -- Roth Capital Partners 11/2/10 Buy 15.00 1.20 1.47 1.72 -- Singular Research 8/19/10 Buy 18.00 1.27 1.54 -- -- Virtua Research Corp. 8/16/10 N/A N/A 1.30 1.51 1.66 1.80 Consensus $15.40 $1.28 $1.48 $1.69 $1.80

STRICTLY CONFIDENTIAL 9 Current Equity Analyst Viewpoints ____________________ Source: Wall Street research. Note: Dollars in millions except for per share amounts. Public Market Perspectives Sales EBITDA EPS '11A-'13E Date Firm Rating 2012E 2013E 2012E 2013E 2012E 2013E EPS CAGR 5/3/2012 Roth Capital Partners Buy $290 -- $60 -- $0.78 -- -- Annual Growth 0.9% NM (4.3%) NM (7.1%) NM EBITDA Margin 20.7% NM 5/3/2012 Jefferies Hold $280 $305 $58 -- $0.78 $0.90 3.5% Annual Growth (2.5%) 9.0% (7.7%) NM (7.1%) 15.4% EBITDA Margin 20.7% NM Average $285 $305 $59 -- $0.78 $0.90 Memo: Management Case Forecast $356 $415 $70 $76 $1.08 $1.15
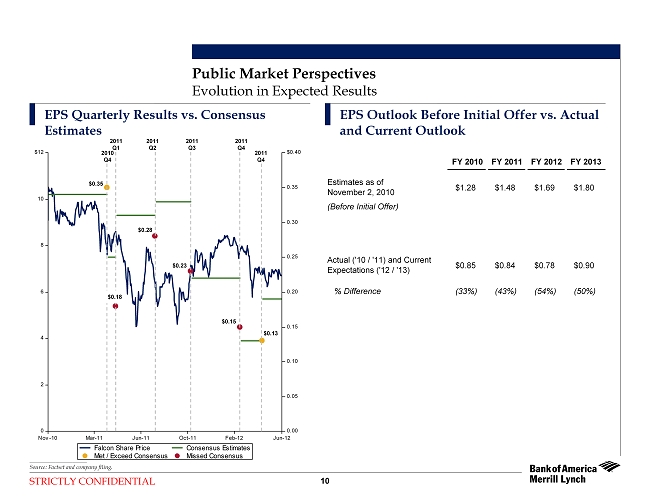
STRICTLY CONFIDENTIAL 10 Public Market Perspectives Evolution in Expected Results EPS Quarterly Results vs. Consensus Estimates EPS Outlook Before Initial Offer vs. Actual and Current Outlook ____________________ Source: Factset and company filing. Nov-10 Mar-11 Jun-11 Oct-11 Feb-12 Jun-12 0 2 4 6 8 10 $12 0.00 0.05 0.10 0.15 0.20 0.25 0.30 0.35 $0.40 Falcon Share Price Consensus Estimates Met / Exceed Consensus Missed Consensus $0.35 $0.28 $0.23 $0.15 $0.13 $0.18 2010 Q4 2011 Q1 2011 Q2 2011 Q3 2011 Q4 2011 Q4 FY 2010 FY 2011 FY 2012 FY 2013 $1.28 $1.48 $1.69 $1.80 (Before Initial Offer) $0.85 $0.84 $0.78 $0.90 % Difference (33%) (43%) (54%) (50%) Actual ('10 / '11) and Current Expectations ('12 / '13) Estimates as of November 2, 2010

STRICTLY CONFIDENTIAL Public Market Perspectives 11 ____________________ Source: Company filings and FactSet as of June 22, 2012 and November 2, 2010. (1) At 11/2/2010 (“Then”), NFY represents fiscal 2011E estimates, at 6/22/2012 (“Now”), NFY represents fiscal 2012E. Then vs. Now: Relative Financial Performance and Stock Price "Then" (11/2/2010) "Now" (6/22/2012) % Change FALCON Lihua Coleman Nexans FALCON Lihua Coleman Nexans FALCON Lihua Coleman Nexans Operating Statistics: 2011E: Revenue $315 $556 $728 $6,559 $287 $637 $867 $8,983 (8.8%) 14.6% 19.1% 37.0% EBITDA 87 84 72 551 63 70 59 509 (27.7%) (17.0%) (18.5%) (7.6%) EPS $1.48 $2.07 $0.92 $5.36 $0.84 $1.66 $1.20 $4.89 (43.4%) (19.8%) 30.4% (8.8%) 2012E Revenue $375 -- -- $6,932 $284 $921 $925 $6,127 (24.4%) -- -- (11.6%) EBITDA 96 -- -- 647 59 86 86 487 (38.4%) -- -- (24.7%) EPS $1.69 -- -- $6.90 $0.79 $2.07 $1.35 $4.15 (53.3%) -- -- (39.9%) Multiples (1) EV / NFY EBITDA 2.9x 2.7x 5.5x 4.1x 1.1x 0.7x 5.1x 3.0x (62.1%) (75.9%) (7.3%) (26.8%) NFY P/E 6.4 5.1 8.3 13.6 8.5 2.6 6.0 9.0 33.1% (48.4%) (27.5%) (33.6%) Share Price $9.10 $10.60 $7.60 $73.03 $6.73 $5.45 $8.12 $37.50 (26.0%) (48.6%) 6.8% (48.7%)
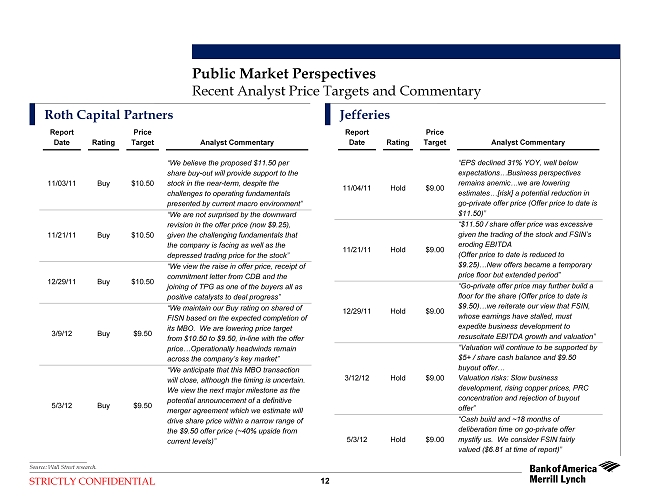
STRICTLY CONFIDENTIAL 12 Public Market Perspectives Recent Analyst Price Targets and Commentary Roth Capital Partners Jefferies Report Date Rating Price Target Analyst Commentary 11/03/11 Buy $10.50 “We believe the proposed $11.50 per share buy-out will provide support to the stock in the near-term, despite the challenges to operating fundamentals presented by current macro environment” 11/21/11 Buy $10.50 “We are not surprised by the downward revision in the offer price (now $9.25), given the challenging fundamentals that the company is facing as well as the depressed trading price for the stock” 12/29/11 Buy $10.50 “We view the raise in offer price, receipt of commitment letter from CDB and the joining of TPG as one of the buyers all as positive catalysts to deal progress” 3/9/12 Buy $9.50 “We maintain our Buy rating on shared of FISN based on the expected completion of its MBO. We are lowering price target from $10.50 to $9.50, in-line with the offer price…Operationally headwinds remain across the company’s key market” 5/3/12 Buy $9.50 “We anticipate that this MBO transaction will close, although the timing is uncertain. We view the next major milestone as the potential announcement of a definitive merger agreement which we estimate will drive share price within a narrow range of the $9.50 offer price (~40% upside from current levels)” Report Date Rating Price Target Analyst Commentary 11/04/11 Hold $9.00 “EPS declined 31% YOY, well below expectations…Business perspectives remains anemic…we are lowering estimates…[risk] a potential reduction in go-private offer price (Offer price to date is $11.50)” 11/21/11 Hold $9.00 “$11.50 / share offer price was excessive given the trading of the stock and FSIN’s eroding EBITDA (Offer price to date is reduced to $9.25)…New offers became a temporary price floor but extended period” 12/29/11 Hold $9.00 “Go-private offer price may further build a floor for the share (Offer price to date is $9.50)…we reiterate our view that FSIN, whose earnings have stalled, must expedite business development to resuscitate EBITDA growth and valuation” 3/12/12 Hold $9.00 “Valuation will continue to be supported by $5+ / share cash balance and $9.50 buyout offer�� Valuation risks: Slow business development, rising copper prices, PRC concentration and rejection of buyout offer” 5/3/12 Hold $9.00 “Cash build and ~18 months of deliberation time on go-private offer mystify us. We consider FSIN fairly valued ($6.81 at time of report)” ____________________ Source: Wall Street research.
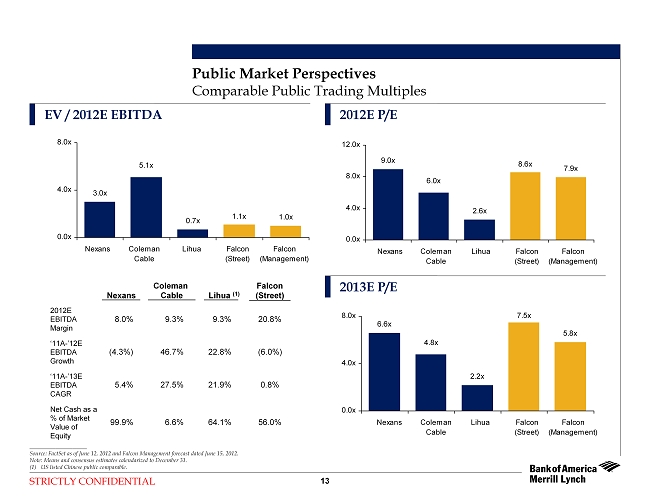
STRICTLY CONFIDENTIAL 2012E EBITDA Margin ‘11A-’12E EBITDA Growth Net Cash as a % of Market Value of Equity Coleman Falcon Cable Nexans Lihua (1) (Street) 9.3%8.0% 9.3% 20.8% 46.7%(4.3%) 22.8% (6.0%) 99.9% 64.1% 56.0%6.6% Comparable Public Trading Multiples 2012E P/E 2013E P/E EV / 2012E EBITDA ____________________ Source: FactSet as of June 12, 2012 and Falcon Management forecast dated June 15, 2012. Note: Means and consensus estimates calendarized to December 31. (1) US listed Chinese public comparable. Public Market Perspectives 9.0x 6.0x 2.6x 8.6x 7.9x 0.0x 4.0x 8.0x 12.0x Nexans Coleman Cable Lihua Falcon (Street) Falcon (Management) 13 6.6x 4.8x 2.2x 7.5x 5.8x 0.0x 4.0x 8.0x Nexans Coleman Cable Lihua Falcon (Street) Falcon (Management) 3.0x 5.1x 0.7x 1.1x 1.0x 0.0x 4.0x 8.0x Nexans Coleman Cable Lihua Falcon (Street) Falcon (Management) ‘11A-’13E EBITDA CAGR 27.5%5.4% 21.9% 0.8%
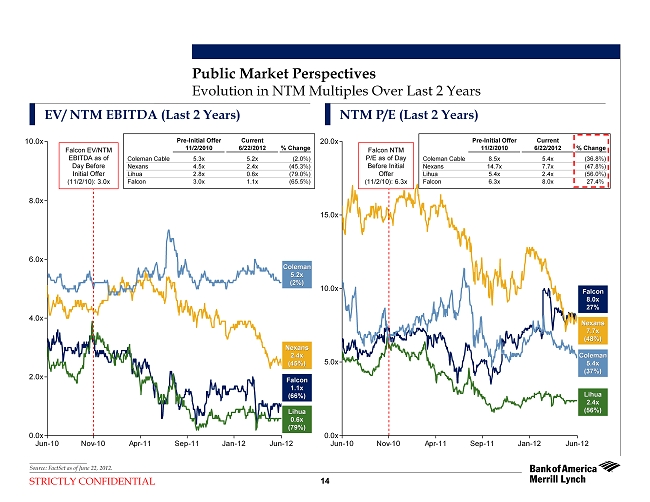
STRICTLY CONFIDENTIAL Jun-10 Nov-10 Apr-11 Sep-11 Jan-12 Jun-12 0.0x 2.0x 4.0x 6.0x 8.0x 10.0x Jun-10 Nov-10 Apr-11 Sep-11 Jan-12 Jun-12 0.0x 5.0x 10.0x 15.0x 20.0x 14 Evolution in NTM Multiples Over Last 2 Years EV/ NTM EBITDA (Last 2 Years) NTM P/E (Last 2 Years) ____________________ Source: FactSet as of June 22, 2012. Coleman Coleman 5.2x 5.2x (2%) (2%) Lihua Lihua 0.6x 0.6x (79%) (79%) Falcon Falcon 1.1x 1.1x (66%) (66%) Nexans Nexans 2.4x 2.4x (45%) (45%) Coleman Coleman 5.4x 5.4x (37%) (37%) Lihua Lihua 2.4x 2.4x (56%) (56%) Falcon Falcon 8.0x 8.0x 27% 27% Nexans Nexans 7.7x 7.7x (48%) (48%) Public Market Perspectives Falcon EV/NTM EBITDA as of Day Before Initial Offer (11/2/10): 3.0x Pre-Initial Offer Current 11/2/2010 6/22/2012 % Change Coleman Cable 5.3x 5.2x (2.0%) Nexans 4.5x 2.4x (45.3%) Lihua 2.8x 0.6x (79.0%) Falcon 3.0x 1.1x (65.5%) Falcon NTM P/E as of Day Before Initial Offer (11/2/10): 6.3x Pre-Initial Offer Current 11/2/2010 6/22/2012 % Change Coleman Cable 8.5x 5.4x (36.8%) Nexans 14.7x 7.7x (47.8%) Lihua 5.4x 2.4x (56.0%) Falcon 6.3x 8.0x 27.4%
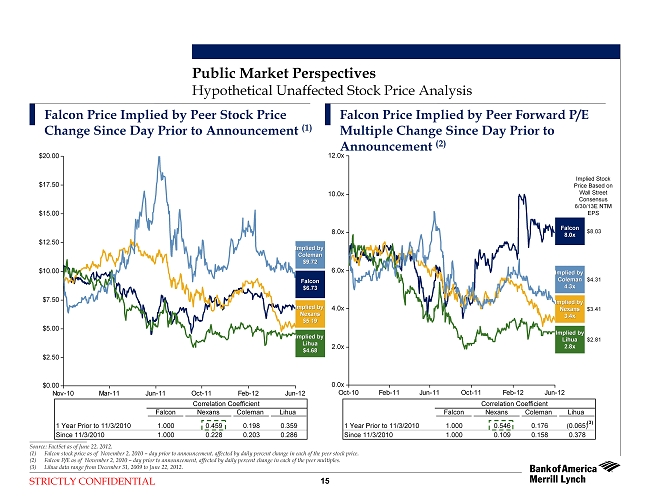
STRICTLY CONFIDENTIAL Correlation Coefficient Falcon Nexans Coleman Lihua 1 Year Prior to 11/3/2010 1.000 0.546 0.176 (0.065) Since 11/3/2010 1.000 0.109 0.158 0.378 Oct-10 Feb-11 Jun-11 Oct-11 Feb-12 Jun-12 0.0x 2.0x 4.0x 6.0x 8.0x 10.0x 12.0x Correlation Coefficient Falcon Nexans Coleman Lihua 1 Year Prior to 11/3/2010 1.000 0.459 0.198 0.359 Since 11/3/2010 1.000 0.228 0.203 0.286 Nov-10 Mar-11 Jun-11 Oct-11 Feb-12 Jun-12 $0.00 $2.50 $5.00 $7.50 $10.00 $12.50 $15.00 $17.50 $20.00 15 Falcon Price Implied by Peer Stock Price Change Since Day Prior to Announcement (1) Falcon Price Implied by Peer Forward P/E Multiple Change Since Day Prior to Announcement (2) ____________________ Source: FactSet as of June 22, 2012. (1) Falcon stock price as of November 2, 2010 –day prior to announcement, affected by daily percent change in each of the peer stock price. (2) Falcon P/E as of November 2, 2010 –day prior to announcement, affected by daily percent change in each of the peer multiples. (3) Lihua data range from December 31, 2009 to June 22, 2012. Implied by Implied by Coleman Coleman $9.72 $9.72 Implied by Implied by Lihua Lihua $4.68 $4.68 Falcon Falcon $6.73 $6.73 Implied by Implied by Nexans Nexans $5.19 $5.19 Implied by Implied by Coleman Coleman 4.3x 4.3x Implied by Implied by Lihua Lihua 2.8x 2.8x Falcon Falcon 8.0x 8.0x Implied by Implied by Nexans Nexans 3.4x 3.4x (3) Implied Stock Price Based on Wall Street Consensus 6/30/13E NTM EPS $8.03 $4.31 $3.41 $2.81 Public Market Perspectives Hypothetical Unaffected Stock Price Analysis

STRICTLY CONFIDENTIAL Shares % of Market Type of Report Shareholder Held O/S Value Manager / Style Date GMT Capital 3,651,152 9.5% $24.6 Hedge Fund / Value 03/31/2012 Royce & Associates 2,048,498 5.3% 13.8 Value / Value 03/31/2012 Fidelity 1,700,000 4.4% 11.4 Generalist / GARP 04/30/2012 Centaurus Capital 1,057,284 2.8% 7.1 Hedge Fund / GARP 03/31/2012 Guerrilla Capital 945,416 2.5% 6.4 Hedge Fund / Deep Value 03/31/2012 UBS 891,673 2.3% 6.0 Generalist / GARP 03/31/2012 First Wilshire Securities 844,769 2.2% 5.7 Value / Value 03/31/2012 Straus Asset Management 615,000 1.6% 4.1 Hedge Fund / Growth 03/31/2012 RENN Capital 602,438 1.6% 4.1 Generalist / Growth 03/31/2011 Shareholder % of O/S Ardsley Advisory Partners 465,000 1.2% 3.1 Hedge Fund / Deep Value 03/31/2012 GMT Capital 9.5% Group One Trading 458,618 1.2% 3.1 Broker/Dealer / Growth 03/31/2012 Centaurus Capital 2.8% Two Sigma Investments 420,003 1.1% 2.8 Hedge Fund / Value 03/31/2012 Guerrilla Capital 2.5% CornerCap Investment Counsel 390,786 1.0% 2.6 Value / Value 03/31/2012 Straus Asset Management 1.6% BlackRock 319,667 0.8% 2.2 Index / Index 03/31/2012 Ardsley Advisory Partners 1.2% Renaissance Technologies 232,902 0.6% 1.6 Hedge Fund / GARP 03/31/2012 Two Sigma Investments 1.1% UBS Securities 225,043 0.6% 1.5 Broker/Dealer / Value 03/31/2012 Renaissance Technologies 0.6% Abax Global Capital 205,050 0.5% 1.4 Hedge Fund / Deep Value 12/28/2011 Abax Global Capital 0.5% Susquehanna Investment 169,585 0.4% 1.1 Generalist / GARP 03/31/2012 Oxford Asset Management 0.2% Schroder 158,243 0.4% 1.1 GARP / Value 03/31/2012 Citadel 0.1% Susquehanna Financial 148,895 0.4% 1.0 Broker/Dealer / GARP 03/31/2012 Top 10 Hedge Fund Ownership 20.1% Top 20 Institutional Ownership 15,550,022 40.6% Memo: Total Insider Ownership 12,037,883 31.4% Memo: Total Li Fu Ownership 11,065,656 28.9% GARP Growth Index Value Yield 2% 57% 29% 2% 10% 16 ____________________ Source: FactSet as of June 22, 2012. (1) Represents institutional shareholders only. Shareholder Profile Public Market Perspectives Ownership Snapshot (1) Top Hedge Funds Top 20 Institutions
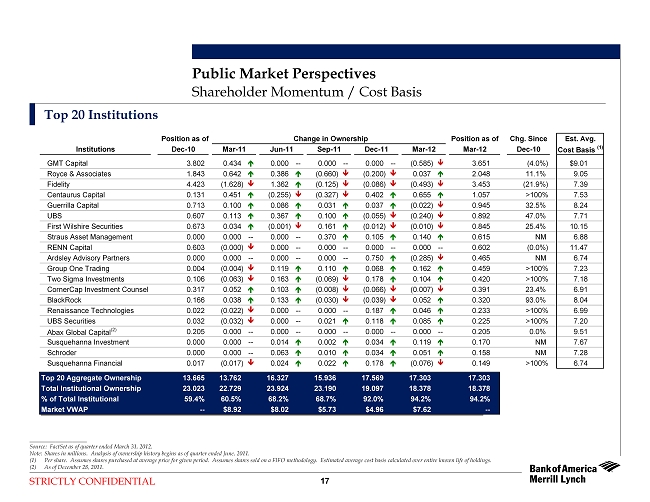
STRICTLY CONFIDENTIAL 17 Top 20 Institutions ____________________ Source: FactSet as of quarter ended March 31, 2012. Note: Shares in millions. Analysis of ownership history begins as of quarter ended June, 2011. (1) Per share. Assumes shares purchased at average price for given period. Assumes shares sold on a FIFO methodology. Estimated average cost basis calculated over entire known life of holdings. (2) As of December 28, 2011. Shareholder Momentum / Cost Basis Public Market Perspectives Position as of Change in Ownership Position as of Chg. Since Est. Avg. Institutions Dec-10 Mar-11 Jun-11 Sep-11 Dec-11 Mar-12 Mar-12 Dec-10 Cost Basis (1) GMT Capital 3.802 0.434 0.000 -- 0.000 -- 0.000 -- (0.585) 3.651 (4.0%) $9.01 Royce & Associates 1.843 0.642 0.386 (0.660) (0.200) 0.037 2.048 11.1% 9.05 Fidelity 4.423 (1.628) 1.362 (0.125) (0.086) (0.493) 3.453 (21.9%) 7.39 Centaurus Capital 0.131 0.451 (0.255) (0.327) 0.402 0.655 1.057 >100% 7.53 Guerrilla Capital 0.713 0.100 0.086 0.031 0.037 (0.022) 0.945 32.5% 8.24 UBS 0.607 0.113 0.367 0.100 (0.055) (0.240) 0.892 47.0% 7.71 First Wilshire Securities 0.673 0.034 (0.001) 0.161 (0.012) (0.010) 0.845 25.4% 10.15 Straus Asset Management 0.000 0.000 -- 0.000 -- 0.370 0.105 0.140 0.615 NM 6.88 RENN Capital 0.603 (0.000) 0.000 -- 0.000 -- 0.000 -- 0.000 -- 0.602 (0.0%) 11.47 Ardsley Advisory Partners 0.000 0.000 -- 0.000 -- 0.000 -- 0.750 (0.285) 0.465 NM 6.74 Group One Trading 0.004 (0.004) 0.119 0.110 0.068 0.162 0.459 >100% 7.23 Two Sigma Investments 0.106 (0.063) 0.163 (0.069) 0.178 0.104 0.420 >100% 7.18 CornerCap Investment Counsel 0.317 0.052 0.103 (0.008) (0.066) (0.007) 0.391 23.4% 6.91 BlackRock 0.166 0.038 0.133 (0.030) (0.039) 0.052 0.320 93.0% 8.04 Renaissance Technologies 0.022 (0.022) 0.000 -- 0.000 -- 0.187 0.046 0.233 >100% 6.99 UBS Securities 0.032 (0.032) 0.000 -- 0.021 0.118 0.085 0.225 >100% 7.20 Abax Global Capital (2) 0.205 0.000 -- 0.000 -- 0.000 -- 0.000 -- 0.000 -- 0.205 0.0% 9.51 Susquehanna Investment 0.000 0.000 -- 0.014 0.002 0.034 0.119 0.170 NM 7.67 Schroder 0.000 0.000 -- 0.063 0.010 0.034 0.051 0.158 NM 7.28 Susquehanna Financial 0.017 (0.017) 0.024 0.022 0.178 (0.076) 0.149 >100% 6.74 Top 20 Aggregate Ownership 13.665 13.762 16.327 15.936 17.569 17.303 17.303 Total Institutional Ownership 23.023 22.729 23.924 23.190 19.097 18.378 18.378 % of Total Institutional 59.4% 60.5% 68.2% 68.7% 92.0% 94.2% 94.2% Market VWAP -- $8.92 $8.02 $5.73 $4.96 $7.62 --
STRICTLY CONFIDENTIAL Valuation Summary
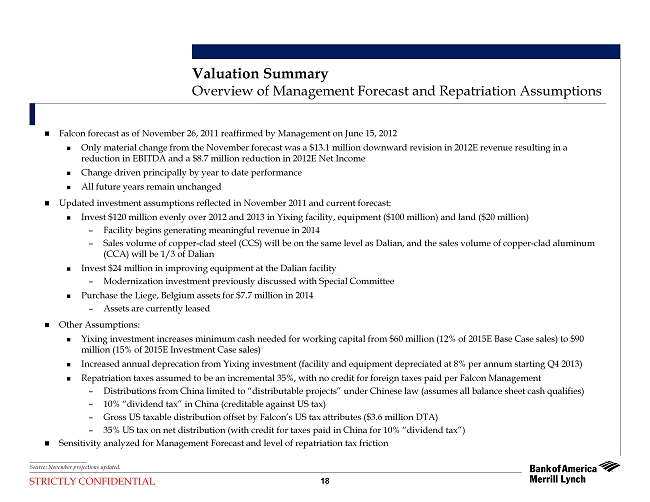
STRICTLY CONFIDENTIAL 18 Valuation Summary Overview of Management Forecast and Repatriation Assumptions Falcon forecast as of November 26, 2011 reaffirmed by Managementon June 15, 2012 Only material change from the November forecast was a $13.1 million downward revision in 2012E revenue resulting in a reduction in EBITDA and a $8.7 million reduction in 2012E Net Income Change driven principally by year to date performance All future years remain unchanged Updated investment assumptions reflected in November 2011 and current forecast: Invest $120 million evenly over 2012 and 2013 in Yixing facility, equipment ($100 million) and land ($20 million) – Facility begins generating meaningful revenue in 2014 – Sales volume of copper-clad steel (CCS) will be on the same level as Dalian, and the sales volume of copper-clad aluminum (CCA) will be 1/3 of Dalian Invest $24 million in improving equipment at the Dalian facility – Modernization investment previously discussed with Special Committee Purchase the Liege, Belgium assets for $7.7 million in 2014 – Assets are currently leased Other Assumptions: Yixing investment increases minimum cash needed for working capital from $60 million (12% of 2015E Base Case sales) to $90 million (15% of 2015E Investment Case sales) Increased annual deprecation from Yixing investment (facility and equipment depreciated at 8% per annum starting Q4 2013) Repatriation taxes assumed to be an incremental 35%, with no credit for foreign taxes paid per Falcon Management – Distributions from China limited to “distributable projects”under Chinese law (assumes all balance sheet cash qualifies) – 10% “dividend tax”in China (creditable against US tax) – Gross US taxable distribution offset by Falcon’s US tax attributes ($3.6 million DTA) – 35% US tax on net distribution (with credit for taxes paid in China for 10% “dividend tax”) Sensitivity analyzed for Management Forecast and level of repatriation tax friction ____________________ Source: November projections updated.

STRICTLY CONFIDENTIAL 19 ____________________ Source: Falcon historical data per public filings and Falcon estimates per Falcon management. Note: Dollars in millions. Management Operating Forecast Valuation Summary Fiscal Year Ending December 31, CAGR 2008A 2009A 2010A 2011A 2012E 2013E 2014E 2015E '11-'15 Revenue $221 $183 $265 $287 $343 $415 $538 $596 20.0% Memo: Wall Street Consensus $285 $305 EBIT $37 $36 $57 $49 $47 $61 $80 $84 14.6% D&A 7 10 12 14 12 14 21 21 EBITDA $44 $47 $70 $63 $59 $76 $101 $106 13.9% Memo: Wall Street Consensus $59 -- EPS $1.10 $0.76 $0.85 $0.84 $0.85 $1.15 $1.51 $1.58 17.2% Memo: Wall Street Consensus $0.78 $0.90 CapEx $20 $5 $19 $1 $57 $69 $17 $11 End of Year Cash Balance 66 61 123 200 139 119 129 186 Revenue % Growth (17.4%) 44.9% 8.5% 19.3% 21.1% 29.5% 10.9% EBIT Margin 16.8% 19.9% 21.7% 17.0% 13.8% 14.7% 14.9% 14.2% D&A % of Revenue 3.1% 5.6% 4.7% 4.8% 3.5% 3.5% 3.9% 3.6% EBITDA % Growth -- 6.0% 49.9% (10.0%) (5.6%) 27.5% 33.9% 4.4% % Margin 19.9% 25.5% 26.4% 21.9% 17.3% 18.2% 18.9% 17.8% CapEx % of Revenue 9.1% 2.8% 7.0% 0.5% 16.6% 16.6% 3.1% 1.9% Book Tax Rate 5.7% 4.1% 42.1% 32.5% 29.6% 26.0% 26.2% 26.2%
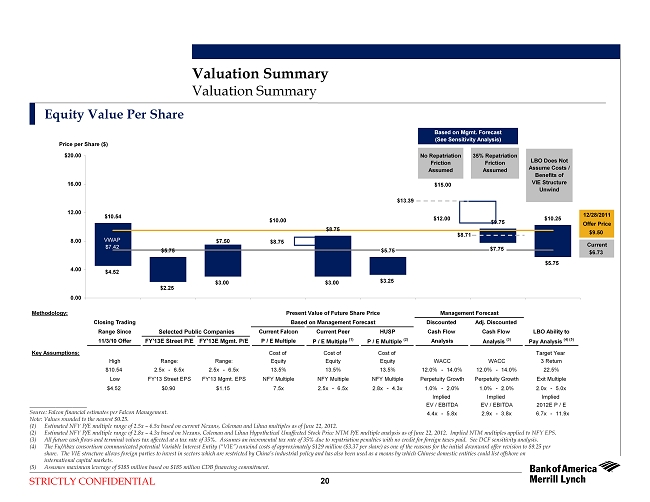
STRICTLY CONFIDENTIAL 20 Valuation Summary Valuation Summary Equity Value Per Share ____________________ Source: Falcon financial estimates per Falcon Management. Note: Values rounded to the nearest $0.25. (1) Estimated NFY P/E multiple range of 2.5x –6.5x based on current Nexans, Coleman and Lihua multiples as ofJune 22, 2012. (2) Estimated NFY P/E multiple range of 2.8x –4.3x based on Nexans, Coleman and Lihua Hypothetical UnaffectedStock Price NTM P/E multiple analysis as of June 22, 2012. Implied NTM multiples applied to NFY EPS. (3) All future cash flows and terminal values tax affected at a tax rate of 35%. Assumes an incremental tax rate of 35% due to repatriation penalties with no credit for foreign taxes paid. See DCF sensitivity analysis. (4) The Fu/Abax consortium communicated potential Variable Interest Entity (“VIE”) unwind costs of approximately $129 million ($3.37 per share) as one of the reasons for the initial downward offer revision to $9.25 per share. The VIE structure allows foreign parties to invest in sectors which are restricted by China’s industrial policy and has also been used as a means by which Chinese domestic entities could list offshore on international capital markets. (5) Assumes maximum leverage of $185 million based on $185 million CDB financing commitment. Price per Share ($) 12/28/2011 Offer Price $9.50 Current $6.73 Methodology: Present Value of Future Share Price Management Forecast Closing Trading Based on Management Forecast Discounted Adj. Discounted Range Since Selected Public Companies Current Falcon Current Peer HUSP Cash Flow Cash Flow LBO Ability to 11/3/10 Offer FY'13E Street P/E FY'13E Mgmt. P/E P / E Multiple P / E Multiple (1) P / E Multiple (2) Analysis Analysis (3) Pay Analysis (4) (5) Key Assumptions: Cost of Cost of Cost of Target Year High Range: Range: Equity Equity Equity WACC WACC 3 Return $10.54 2.5x - 6.5x 2.5x - 6.5x 13.5% 13.5% 13.5% 12.0% - 14.0% 12.0% - 14.0% 22.5% Low FY'13 Street EPS FY'13 Mgmt. EPS NFY Multiple NFY Multiple NFY Multiple Perpetuity Growth Perpetuity Growth Exit Multiple $4.52 $0.90 $1.15 7.5x 2.5x - 6.5x 2.8x - 4.3x 1.0% - 2.0% 1.0% - 2.0% 2.0x - 5.0x Implied Implied Implied EV / EBITDA EV / EBITDA 2012E P / E 4.4x - 5.8x 2.9x - 3.8x 6.7x - 11.9x $10.54 $8.75 $15.00 $9.75 $10.25 $4.52 $3.00 $8.75 $3.25 $12.00 $5.75 $10.00 $5.75 $5.75 $7.50 $7.75 $2.25 $3.00 0.00 4.00 8.00 12.00 16.00 $20.00 VWAP $7.42 No Repatriation Friction Assumed 35% Repatriation Friction Assumed LBO Does Not Assume Costs / Benefits of VIE Structure Unwind Based on Mgmt. Forecast (See Sensitivity Analysis) $13.39 $8.71
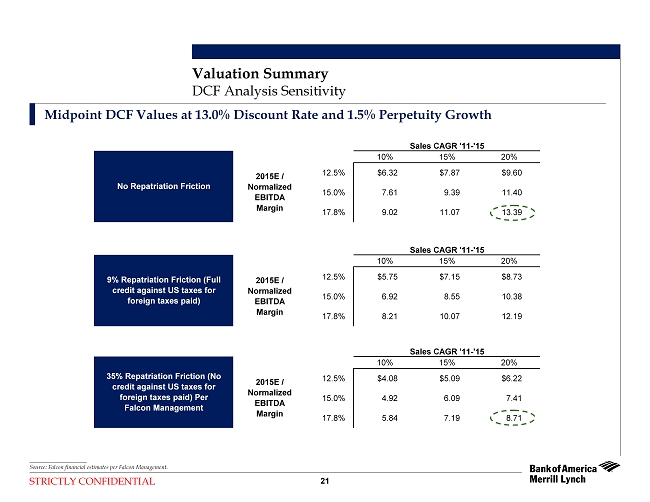
STRICTLY CONFIDENTIAL 21 Midpoint DCF Values at 13.0% Discount Rate and 1.5% Perpetuity Growth Valuation Summary DCF Analysis Sensitivity Sales CAGR '11-'15 Sales CAGR '11-'15 10% 15% 20% 12.5% $6.32 $7.87 $9.60 15.0% 7.61 9.39 11.40 17.8% 9.02 11.07 13.39 Sales CAGR '11-'15 Sales CAGR '11-'15 10% 15% 20% 12.5% $5.75 $7.15 $8.73 15.0% 6.92 8.55 10.38 17.8% 8.21 10.07 12.19 Sales CAGR '11-'15 Sales CAGR '11-'15 10% 15% 20% 12.5% $4.08 $5.09 $6.22 15.0% 4.92 6.09 7.41 17.8% 5.84 7.19 8.71 35% Repatriation Friction (No credit against US taxes for foreign taxes paid) Per Falcon Management 2015E / Normalized EBITDA Margin 2015E / Normalized EBITDA Margin No Repatriation Friction 9% Repatriation Friction (Full credit against US taxes for foreign taxes paid) 2015E / Normalized EBITDA Margin ____________________ Source: Falcon financial estimates per Falcon Management.

STRICTLY CONFIDENTIAL 22 Valuation Summary PV of Projected Future Share Price –Current Falcon Multiple Present Value of Projected Share Price @ 7.5x P/E Multiple (Discounted to Current) (1) Projected Share Price @ 7.5x NFY P/E Multiple ____________________ Source: Falcon financial estimates per Falcon Management. (1) Assumes cost of equity of 13.5%. 7.5x 7.5x 7.5x $8.65 $10.00 $9.21 $8.12 0.00 3.00 6.00 9.00 12.00 $15.00 Current +1 Year +2 Year +3 Year P / E 7.5x 7.5x 7.5x Management Case Forecast NFY EPS $1.15 $1.51 $1.58 $8.65 $11.35 $11.87 $11.87 0.00 5.00 10.00 15.00 $20.00 Current +1 Year +2 Year +3 Year P / E

STRICTLY CONFIDENTIAL 23 Valuation Summary PV of Projected Future Share Price –HUSP Multiple Present Value of Projected Share Price @ 2.8x –4.3x P/E Multiple (Discounted to Current) (1) Projected Share Price @ 2.8x –4.3x NFY P/E Multiple 2.8x - 4.3x 2.8x - 4.3x 2.8x - 4.3x P / E $4.96 $5.73 $5.28 $4.65 $3.23 $3.73 $3.44 $3.03 0.00 3.00 6.00 9.00 12.00 $15.00 Current +1 Year +2 Year +3 Year 2.8x - 4.3x 2.8x - 4.3x 2.8x - 4.3x Management Case Forecast NFY EPS $1.15 $1.51 $1.58 $4.96 $6.51 $6.81 $6.81 $3.23 $4.43 $4.43 $4.24 0.00 5.00 10.00 15.00 $20.00 Current +1 Year +2 Year +3 Year P / E ____________________ Source: Falcon financial estimates per Falcon Management. (1) Assumes cost of equity of 13.5%.
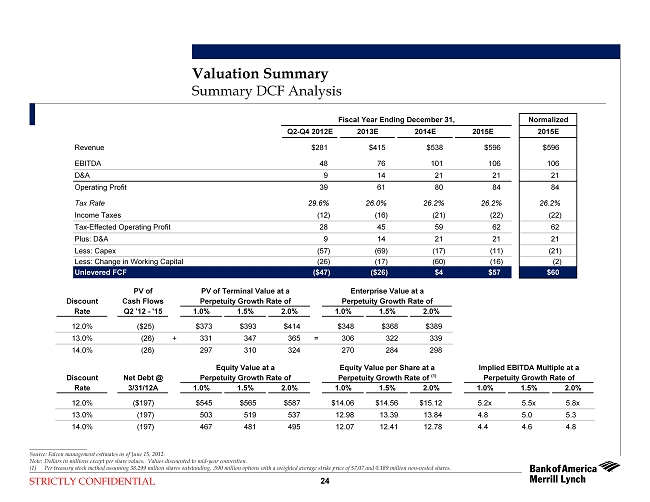
STRICTLY CONFIDENTIAL 24 ____________________ Source: Falcon management estimates as of June 15, 2012. Note: Dollars in millions except per share values. Values discounted to mid-year convention. (1) Per treasury stock method assuming 38.299 million shares outstanding, .590 million options with a weighted average strike price of $7.07 and 0.189 million non-vested shares. Valuation Summary Summary DCF Analysis Fiscal Year Ending December 31, Normalized Q2-Q4 2012E 2013E 2014E 2015E 2015E Revenue $281 $415 $538 $596 $596 EBITDA 48 76 101 106 106 D&A 9 14 21 21 21 Operating Profit 39 61 80 84 84 Tax Rate 29.6% 26.0% 26.2% 26.2% 26.2% Income Taxes (12) (16) (21) (22) (22) Tax-Effected Operating Profit 28 45 59 62 62 Plus: D&A 9 14 21 21 21 Less: Capex (57) (69) (17) (11) (21) Less: Change in Working Capital (26) (17) (60) (16) (2) Unlevered FCF ($47) ($26) $4 $57 $60 PV of PV of Terminal Value at a Enterprise Value at a Discount Cash Flows Perpetuity Growth Rate of Perpetuity Growth Rate of Rate Q2 '12 - '15 1.0% 1.5% 2.0% 1.0% 1.5% 2.0% 12.0% ($25) $373 $393 $414 $348 $368 $389 13.0% (26) + 331 347 365 = 306 322 339 14.0% (26) 297 310 324 270 284 298 Equity Value at a Equity Value per Share at a Implied EBITDA Multiple at a Discount Net Debt @ Perpetuity Growth Rate of Perpetuity Growth Rate of (1) Perpetuity Growth Rate of Rate 3/31/12A 1.0% 1.5% 2.0% 1.0% 1.5% 2.0% 1.0% 1.5% 2.0% 12.0% ($197) $545 $565 $587 $14.06 $14.56 $15.12 5.2x 5.5x 5.8x 13.0% (197) 503 519 537 12.98 13.39 13.84 4.8 5.0 5.3 14.0% (197) 467 481 495 12.07 12.41 12.78 4.4 4.6 4.8

STRICTLY CONFIDENTIAL 25 ____________________ Source: Falcon management estimates as of June 15, 2012. Note: Dollars in millions except per share values. Mid-year convention. All future cash flows and terminal values tax affected at a tax rate of 35%. Net cash balance of $119 million. Assumes an incremental tax rate of 35% due to repatriation penalties, with no credit for foreign taxes paid. See DCF sensitivity analysis. (1) Per treasury stock method assuming 38.299 million shares outstanding, .590 million options with a weighted average strike price of $7.07 and 0.189 million non-vested shares. Valuation Summary Summary Adjusted DCF Analysis Fiscal Year Ending December 31, Normalized Q2-Q4 2012E 2013E 2014E 2015E 2015E Revenue $281 $415 $538 $596 $596 EBITDA 48 76 101 106 106 D&A 9 14 21 21 21 Operating Profit 39 61 80 84 84 Tax Rate 29.6% 26.0% 26.2% 26.2% 26.2% Income Taxes (12) (16) (21) (22) (22) Tax-Effected Operating Profit 28 45 59 62 62 Plus: D&A 9 14 21 21 21 Less: Capex (57) (69) (17) (11) (21) Less: Change in Working Capital (26) (17) (60) (16) (2) Unlevered FCF ($47) ($26) $4 $57 $60 PV of PV of Terminal Value at a Enterprise Value at a Discount Cash Flows Perpetuity Growth Rate of Perpetuity Growth Rate of Rate Q2 '12 - '15 1.0% 1.5% 2.0% 1.0% 1.5% 2.0% 12.0% ($16) $242 $255 $269 $226 $239 $253 13.0% (17) + 215 226 237 = 199 209 221 14.0% (17) 193 201 211 176 184 194 Equity Value at a Equity Value per Share at a Implied EBITDA Multiple at a Discount Net Debt @ Perpetuity Growth Rate of Perpetuity Growth Rate of (1) Perpetuity Growth Rate of Rate 3/31/12A 1.0% 1.5% 2.0% 1.0% 1.5% 2.0% 1.0% 1.5% 2.0% 12.0% ($127) $353 $366 $380 $9.14 $9.47 $9.83 3.4x 3.6x 3.8x 13.0% (127) 326 336 348 8.44 8.71 9.00 3.1 3.3 3.4 14.0% (127) 303 311 321 7.85 8.07 8.31 2.9 3.0 3.2
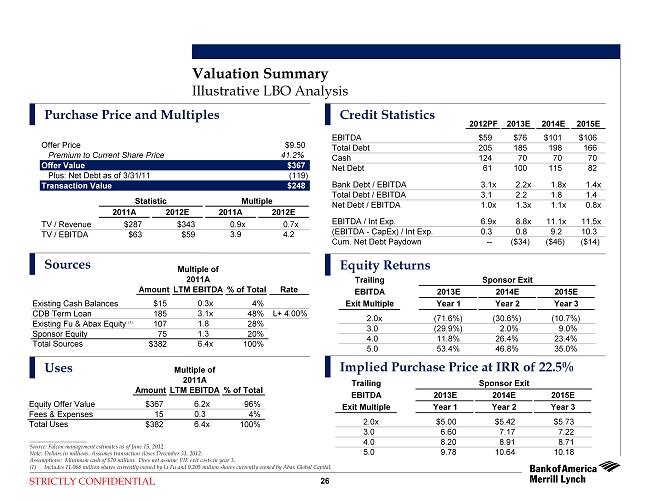
STRICTLY CONFIDENTIAL Credit Statistics Equity Returns Implied Purchase Price at IRR of 22.5% 26 Illustrative LBO Analysis Purchase Price and Multiples Sources Uses Valuation Summary ____________________ Source: Falcon management estimates as of June 15, 2012. Note: Dollars in millions. Assumes transaction closes December 31, 2012. Assumptions: Minimum cash of $70 million. Does not assume VIE exit costs in year 3. (1) Includes 11.066 million shares currently owned by Li Fu and 0.205 million shares currently owned by Abax Global Capital. Offer Price $9.50 Premium to Current Share Price 41.2% Offer Value $367 Plus: Net Debt as of 3/31/11 (119) Transaction Value $248 Statistic Multiple 2011A 2012E 2011A 2012E TV / Revenue $287 $343 0.9x 0.7x TV / EBITDA $63 $59 3.9 4.2 Multiple of 2011A AmountLTM EBITDA % of Total Equity Offer Value $367 6.2x 96% Fees & Expenses 15 0.3 4% Total Uses $382 6.4x 100% Trailing Sponsor Exit EBITDA 2013E 2014E 2015E Exit Multiple Year 1 Year 2 Year 3 2.0x $5.00 $5.42 $5.73 3.0 6.60 7.17 7.22 4.0 8.20 8.91 8.71 5.0 9.78 10.64 10.18 Trailing Sponsor Exit EBITDA 2013E 2014E 2015E Exit Multiple Year 1 Year 2 Year 3 2.0x (71.6%) (30.6%) (10.7%) 3.0 (29.9%) 2.0% 9.0% 4.0 11.8% 26.4% 23.4% 5.0 53.4% 46.8% 35.0% Multiple of 2011A AmountLTM EBITDA % of Total Rate Existing Cash Balances $15 0.3x 4% CDB Term Loan 185 3.1x 48% L+ 4.00% Existing Fu & Abax Equity (1) 107 1.8 28% Sponsor Equity 75 1.3 20% Total Sources $382 6.4x 100% 2012PF 2013E 2014E 2015E EBITDA $59 $76 $101 $106 Total Debt 205 185 198 166 Cash 124 70 70 70 Net Debt 61 100 115 82 Bank Debt / EBITDA 3.1x 2.2x 1.8x 1.4x Total Debt / EBITDA 3.1 2.2 1.8 1.4 Net Debt / EBITDA 1.0x 1.3x 1.1x 0.8x EBITDA / Int Exp. 6.9x 8.8x 11.1x 11.5x (EBITDA - CapEx) / Int Exp. 0.3 0.8 9.2 10.3 Cum. Net Debt Paydown -- ($34) ($46) ($14)

STRICTLY CONFIDENTIAL Appendix
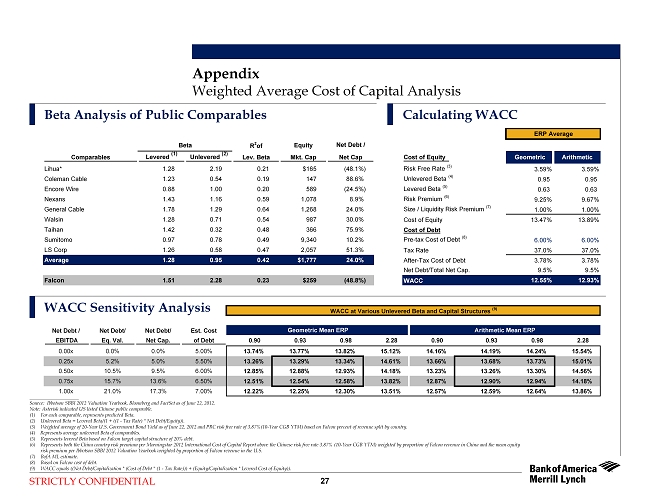
STRICTLY CONFIDENTIAL Appendix Beta Analysis of Public Comparables Calculating WACC 27 WACC Sensitivity Analysis Weighted Average Cost of Capital Analysis ____________________ Source: Ibbotson SBBI 2012 Valuation Yearbook, Bloomberg and FactSet as of June 22, 2012. Note:Asterisk indicated US listed Chinese public comparable. (1) For each comparable, represents predicted Beta. (2) Unlevered Beta = Levered Beta/(1 + ((1 -Tax Rate) * Net Debt/Equity)). (3) Weighted average of 20-Year U.S. Government Bond Yield as of June 22, 2012 and PRC riskfree rate of 3.87%(10-Year CGB YTM) based on Falcon percent of revenue split by country. (4) Represents average unlevered Beta of comparables. (5) Represents levered Beta based on Falcon target capital structure of 20% debt. (6) Represents both the China country risk premium per Morningstar 2012 International Cost of Capital Report above the Chinese risk free rate 3.87% (10-Year CGB YTM) weighted by proportion of Falcon revenue in China and the mean equity risk premium per Ibbotson SBBI 2012 Valuation Yearbook weighted by proportion of Falcon revenue in the U.S. (7) BofA ML estimate. (8) Based on Falcon cost of debt. (9) WACC equals ((Net Debt/Capitalization * (Cost of Debt * (1 -Tax Rate))) + (Equity/Capitalization * Levered Cost of Equity)). WACC at Various Unlevered Beta and Capital Structures (9) Net Debt / Net Debt/ Net Debt/ Est. Cost Geometric Mean ERP Arithmetic Mean ERP EBITDA Eq. Val. Net Cap. of Debt 0.90 0.93 0.98 2.28 0.90 0.93 0.98 2.28 0.00x 0.0% 0.0% 5.00% 13.74% 13.77% 13.82% 15.12% 14.16% 14.19% 14.24% 15.54% 0.25x 5.2% 5.0% 5.50% 13.26% 13.29% 13.34% 14.61% 13.66% 13.68% 13.73% 15.01% 0.50x 10.5% 9.5% 6.00% 12.85% 12.88% 12.93% 14.18% 13.23% 13.26% 13.30% 14.56% 0.75x 15.7% 13.6% 6.50% 12.51% 12.54% 12.58% 13.82% 12.87% 12.90% 12.94% 14.18% 1.00x 21.0% 17.3% 7.00% 12.22% 12.25% 12.30% 13.51% 12.57% 12.59% 12.64% 13.86% Beta R 2 of Equity Net Debt / Comparables Levered (1) Unlevered (2) Lev. Beta Mkt. Cap Net Cap Lihua* 1.28 2.19 0.21 $165 (48.1%) Coleman Cable 1.23 0.54 0.19 147 88.6% Encore Wire 0.88 1.00 0.20 589 (24.5%) Nexans 1.43 1.16 0.59 1,078 8.9% General Cable 1.78 1.29 0.64 1,268 24.0% Walsin 1.28 0.71 0.54 987 30.0% Taihan 1.42 0.32 0.48 366 75.9% Sumitomo 0.97 0.78 0.49 9,340 10.2% LS Corp 1.26 0.58 0.47 2,057 51.3% Average 1.28 0.95 0.42 $1,777 24.0% Falcon 1.51 2.28 0.23 $259 (48.8%) ERP Average Cost of Equity Geometric Arithmetic Risk Free Rate (3) 3.59% 3.59% Unlevered Beta (4) 0.95 0.95 Levered Beta (5) 0.63 0.63 Risk Premium (6) 9.25% 9.67% Size / Liquidity Risk Premium (7) 1.00% 1.00% Cost of Equity 13.47% 13.89% Cost of Debt Pre-tax Cost of Debt (8) 6.00% 6.00% Tax Rate 37.0% 37.0% After-Tax Cost of Debt 3.78% 3.78% Net Debt/Total Net Cap. 9.5% 9.5% WACC 12.55% 12.93%
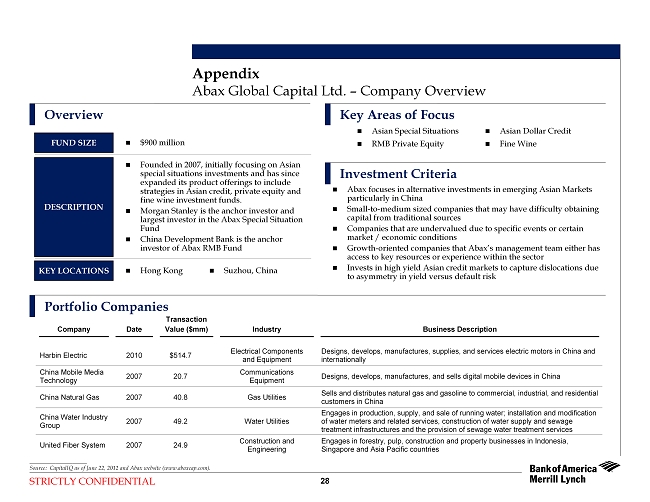
STRICTLY CONFIDENTIAL 28 Appendix Abax Global Capital Ltd. –Company Overview Portfolio Companies Overview Key Areas of Focus Investment Criteria Company Date Transaction Value ($mm) Industry Business Description Harbin Electric 2010 $514.7 Electrical Components and Equipment Designs, develops, manufactures, supplies, and services electric motors in China and internationally China Mobile Media Technology 2007 20.7 Communications Equipment Designs, develops, manufactures, and sells digital mobile devices in China China Natural Gas 2007 40.8 Gas Utilities Sells and distributes natural gas and gasoline to commercial, industrial, and residential customers in China China Water Industry Group 2007 49.2 Water Utilities Engages in production, supply, and sale of running water; installation and modification of water meters and related services, construction of water supply and sewage treatment infrastructures and the provision of sewage water treatment services United Fiber System 2007 24.9 Construction and Engineering Engages in forestry, pulp, construction and property businesses in Indonesia, Singapore and Asia Pacific countries Abax focuses in alternative investments in emerging Asian Markets particularly in China Small-to-medium sized companies that may have difficulty obtaining capital from traditional sources Companies that are undervalued due to specific events or certain market / economic conditions Growth-oriented companies that Abax’s management team either has access to key resources or experience within the sector Invests in high yield Asian credit markets to capture dislocations due to asymmetry in yield versus default risk Asian Special Situations RMB Private Equity Asian Dollar Credit Fine Wine KEY LOCATIONS DESCRIPTION FUND SIZE Founded in 2007, initially focusing on Asian special situations investments and has since expanded its product offerings to include strategies in Asian credit, private equity and fine wine investment funds. Morgan Stanley is the anchor investor and largest investor in the Abax Special Situation Fund China Development Bank is the anchor investor of Abax RMB Fund Hong Kong Suzhou, China $900 million ____________________ Source: CapitalIQ as of June 22, 2012 and Abax website (www.abaxcap.com).
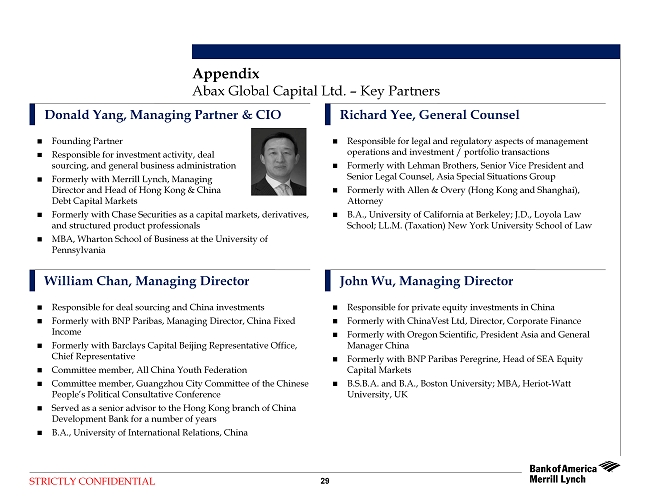
STRICTLY CONFIDENTIAL 29 Appendix Abax Global Capital Ltd. –Key Partners Richard Yee, General Counsel John Wu, Managing Director Donald Yang, Managing Partner & CIO William Chan, Managing Director Founding Partner Responsible for investment activity, deal sourcing, and general business administration Formerly with Merrill Lynch, Managing Director and Head of Hong Kong & China Debt Capital Markets Formerly with Chase Securities as a capital markets, derivatives, and structured product professionals MBA, Wharton School of Business at the University of Pennsylvania Responsible for legal and regulatory aspects of management operations and investment / portfolio transactions Formerly with Lehman Brothers, Senior Vice President and Senior Legal Counsel, Asia Special Situations Group Formerly with Allen & Overy (Hong Kong and Shanghai), Attorney B.A., University of California at Berkeley; J.D., Loyola Law School; LL.M. (Taxation) New York University School of Law Responsible for deal sourcing and China investments Formerly with BNP Paribas, Managing Director, China Fixed Income Formerly with Barclays Capital Beijing Representative Office, Chief Representative Committee member, All China Youth Federation Committee member, Guangzhou City Committee of the Chinese People’s Political Consultative Conference Served as a senior advisor to the Hong Kong branch of China Development Bank for a number of years B.A., University of International Relations, China Responsible for private equity investments in China Formerly with ChinaVest Ltd, Director, Corporate Finance Formerly with Oregon Scientific, President Asia and General Manager China Formerly with BNP Paribas Peregrine, Head of SEA Equity Capital Markets B.S.B.A. and B.A., Boston University; MBA, Heriot-Watt University, UK

STRICTLY CONFIDENTIAL 30 Public Trading Comparables Dollars in Millions Except Per Share Amounts Appendix ____________________ Source: FactSet as of June 22, 2012. Stock Price Company Listed 52 Week Market Enterprise EV / EBITDA EBITDA Growth 2012E EBITDA P/E Debt / 2012E Company (06/22/12) HQ Exchange Hi / Low Value Value CY 2012E CY 2013E 11A-12E 11A-13E CAGR Margin CY 2012E CY 2013E EBITDA U.S. Encore Wire $25.10 McKinney, Texas NASDAQ $30.54 / $20.11 $589 $476 5.3x 6.1x (13.6%) 0.4% 6.7% 11.7x 13.6x NM Coleman Cable 8.12 Waukegan, Illinois NASDAQ $16.83 / $7.60 147 441 5.1x 4.6x 46.7% 27.6% 9.3% 6.0x 4.8x 3.5x China Lihua $5.45 Danyang, Jiangsu NASDAQ $8.71 / $3.95 $165 $59 0.7x 0.6x 22.8% 21.9% 9.3% 2.6x 2.2x NM Asia Sumitomo $11.76 Tokyo, Japan Tokyo $15.22 / $9.47 $9,340 $12,933 5.1x 4.5x 30.3% 20.2% 9.7% 9.9x 8.4x 1.7x LS Corp 74.07 Anyang, South Korea Korea $105.02 / $57.30 2,057 5,807 7.5x 6.7x 52.7% 30.9% 7.0% 8.6x 7.0x 5.1x Walsin 0.28 Taipei, Chinese Taipei Taipei $0.48 / $0.24 987 2,185 NM NM NM NM NM (18.5x) NM NM Taihan 2.48 Seoul, Korea Korea $5.70 / $2.14 366 2,283 NM NM NM NM NM 6.4x 2.0x NM Global General Cable $24.99 Highland Heights, Kentucky NYSE $44.44 / $20.89 $1,268 $1,996 5.1x 4.3x 8.6% 12.7% 6.4% 9.3x 7.2x 2.7x Nexans 37.50 Paris, France Euronext $84.97 / $34.85 1,078 1,464 3.0x 2.6x (4.3%) 5.4% 8.0% 9.0x 6.6x 2.9x Mean 4.5x 4.2x 20.5% 17.0% 8.1% 5.0x 6.5x 3.2x Median 5.1x 4.5x 22.8% 20.2% 8.0% 8.6x 6.8x 2.9x Falcon Current $6.73 NASDAQ $8.45 / $4.62 $259 $62 1.1x -- (6.0%) 0.8% 20.8% 8.6x 7.5x 0.1x