UNITED STATES
SECURITIES AND EXCHANGE COMMISSION
Washington, D.C. 20549
FORM N-CSR
CERTIFIED SHAREHOLDER REPORT OF REGISTERED
MANAGEMENT INVESTMENT COMPANIES
Investment Company Act file number | 811-03706 | |||||
AMERICAN CENTURY CALIFORNIA TAX-FREE AND MUNICIPAL FUNDS | ||||||
(Exact name of registrant as specified in charter) | ||||||
4500 MAIN STREET, KANSAS CITY, MISSOURI | 64111 | |||||
(Address of principal executive offices) | (Zip Code) | |||||
CHARLES A. ETHERINGTON 4500 MAIN STREET, KANSAS CITY, MISSOURI 64111 | ||||||
(Name and address of agent for service) | ||||||
Registrant’s telephone number, including area code: | 816-531-5575 | |||||
Date of fiscal year end: | 08-31 | |||||
Date of reporting period: | 08-31-2013 | |||||
ITEM 1. REPORTS TO STOCKHOLDERS.
ANNUAL REPORT | AUGUST 31, 2013 |


California High-Yield Municipal Fund
Table of Contents |
President’s Letter | 2 |
Market Perspective | 3 |
Performance | 4 |
Portfolio Commentary | 6 |
Fund Characteristics | 8 |
Shareholder Fee Example | 9 |
Schedule of Investments | 11 |
Statement of Assets and Liabilities | 23 |
Statement of Operations | 24 |
Statement of Changes in Net Assets | 25 |
Notes to Financial Statements | 26 |
Financial Highlights | 31 |
Report of Independent Registered Public Accounting Firm | 33 |
Management | 34 |
Approval of Management Agreement | 37 |
Additional Information | 42 |
Any opinions expressed in this report reflect those of the author as of the date of the report, and do not necessarily represent the opinions of American Century Investments® or any other person in the American Century Investments organization. Any such opinions are subject to change at any time based upon market or other conditions and American Century Investments disclaims any responsibility to update such opinions. These opinions may not be relied upon as investment advice and, because investment decisions made by American Century Investments funds are based on numerous factors, may not be relied upon as an indication of trading intent on behalf of any American Century Investments fund. Security examples are used for representational purposes only and are not intended as recommendations to purchase or sell securities. Performance information for comparative indices and securities is provided to American Century Investments by third party vendors. To the best of American Century Investments’ knowledge, such information is accurate at the time of printing.
President’s Letter |

Jonathan Thomas
Dear Investor:
Thank you for reviewing this annual report for the 12 months ended August 31, 2013. It provides investment performance, market analysis, and portfolio information, presented with the expert perspective of our portfolio management team.
Annual reports remain important vehicles for conveying information about fund returns, including key factors that affected fund performance. For additional, updated investment and market insights, we encourage you to visit our website, americancentury.com.
U.S. Government Bond Yields and Stock Indices Soared
U.S. government bond yields and stock indices traced roughly parallel upward paths during the 12 months ended August 31, 2013. The 10-year U.S. Treasury yield began the period at just 1.55%, compressed in large part by the scale of the Federal Reserve’s (the Fed’s) bond-buying program ($85 billion of quantitative easing, or QE, each month).
Hints from the Fed that it might taper QE sent bond yields soaring from early May to the end of August—the 10-year U.S. Treasury yield closed the period at 2.78%. The 10-year U.S. Treasury note and the Barclays U.S. Aggregate Bond Index (representing the broad taxable U.S. bond market) returned –7.52% and –2.47%, respectively, for the 12 months. Municipal bonds generally trailed taxable bonds—the Barclays Municipal Bond Index returned –3.70%.
U.S. stocks also experienced volatility from mid-May to mid-June as a result of the “Taper Tantrum,” but it was a relatively small setback in an otherwise solid 12-month performance period. The S&P 500 Index gained 18.70% as the U.S. economy showed signs of attaining sustainable growth. Improvements in the housing and job markets helped trigger optimism, though absolute levels still remain well below where they were prior to 2008.
Recovery from 2008 remains a major hurdle. Economic growth is still subpar compared with past recession recoveries, and the outlook is uncertain. Therefore, we continue to believe in a disciplined, diversified, long-term investment approach, using professionally managed stock and bond portfolios—as appropriate—for meeting financial goals. We appreciate your continued trust in us in this challenging environment.
Sincerely,

Jonathan Thomas
President and Chief Executive Officer
American Century Investments
Market Perspective |

By David MacEwen, Chief Investment Officer, Fixed Income
Federal Reserve Policy Drove Market Sentiment
The municipal bond (muni) market began the 12-month period on a fairly upbeat note, supported by stable-to-improving credit trends, robust issuance, healthy demand, and an accommodative Federal Reserve (Fed). Early in the period, the Fed also launched its third and most aggressive quantitative easing program (QE3), a strategy to purchase $85 billion of U.S. government securities each month until economic growth and employment improve. The Fed also kept its overnight interest rate target near 0%. These actions supported the U.S. bond market in general at the start of the period.
Beginning in spring 2013, investor sentiment shifted dramatically, as fears of a change in Fed policy triggered a broad market sell-off. Since 2008, the Fed’s massive QE programs have helped keep longer-term interest rates low and encouraged risk-taking. But Fed statements throughout the spring and summer indicated the central bank may start tapering its bond purchases this year. In addition, select economic data modestly improved, fueling further speculation that the Fed would change course. In response, bond yields soared, generating negative returns throughout the fixed income market.
Munis Underperformed Treasuries, Broad Bond Market
Despite outperforming during the first half of the period, munis underperformed their Treasury counterparts and the taxable investment-grade bond market for the entire 12-month period. Overall, market volatility, rising-rate worries, liquidity concerns, and a weaker supply/demand backdrop in the second half drove down 12-month returns. The most-liquid and shortest-duration (least price-sensitive to interest rate changes) fixed-income securities generally fared best.
Additionally, the City of Detroit bankruptcy filing on July 18, 2013, combined with mounting debt problems in Puerto Rico, which is among the largest muni issuers, further pressured the muni market. Although the Detroit bankruptcy was big news, it was not a big surprise, coming after decades of financial mismanagement and population declines. Nevertheless, the negative headlines surrounding the record-setting bankruptcy and growing concerns for Puerto Rico’s debt exacerbated the selling pressures in the muni market and led to additional price deterioration.
U.S. Fixed-Income Total Returns | ||||
For the 12 months ended August 31, 2013 | ||||
Barclays Municipal Market Indices | Barclays U.S. Taxable Market Indices | |||
7 Year Municipal Bond | -1.76% | Aggregate Bond | -2.47% | |
California Tax-Exempt Bond | -3.03% | Treasury Bond | -3.07% | |
Municipal Bond | -3.70% | |||
Municipal High Yield Bond | -3.91% | |||
Long-Term Municipal Bond | -7.43% | |||
Performance |
Total Returns as of August 31, 2013 | ||||||
Average Annual Returns | ||||||
Ticker Symbol | 1 year | 5 years | 10 years | Since Inception | Inception Date | |
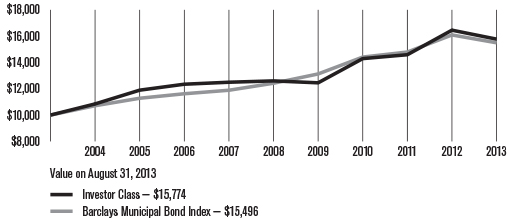
Investor Class | BCHYX | -4.14% | 4.60% | 4.66% | 5.73% | 12/30/86 |
Barclays Municipal | — | -3.70% | 4.52% | 4.47% | 6.10%(1) | — |
Institutional Class | BCHIX | -3.94% | — | — | 5.08% | 3/1/10 |
A Class No sales charge* With sales charge* | CAYAX
| -4.38% -8.70% | 4.34% 3.37% | 4.40% 3.92% | 4.30% 3.85% | 1/31/03
|
C Class | CAYCX | -5.09% | 3.56% | 3.63% | 3.55% | 1/31/03 |
* | Sales charges include initial sales charges and contingent deferred sales charges (CDSCs), as applicable. A Class shares have a 4.50% maximum initial sales charge and may be subject to a maximum CDSC of 1.00%. C Class shares redeemed within 12 months of purchase are subject to a maximum CDSC of 1.00%. The SEC requires that mutual funds provide performance information net of maximum sales charges in all cases where charges could be applied. |
(1) Since 12/31/86, the date nearest the Investor Class’s inception for which data are available.
Data presented reflect past performance. Past performance is no guarantee of future results. Current performance may be higher or lower than the performance shown. Investment return and principal value will fluctuate, and redemption value may be more or less than original cost. To obtain performance data current to the most recent month end, please call 1-800-345-2021 or visit americancentury.com. As interest rates rise, bond values will decline. The fund concentrates its investments in a single state and therefore may have more exposure to credit risk related to the state of California than a fund with a broader geographical diversification. In addition, the lower-rated securities in which the fund invests are subject to greater liquidity risk and credit risk. Investment income may be subject to certain state and local taxes and, depending on your tax status, the federal alternative minimum tax (AMT). Capital gains are not exempt from state and federal income tax.
Unless otherwise indicated, performance reflects Investor Class shares; performance for other share classes will vary due to differences in fee structure. For information about other share classes available, please consult the prospectus. Data assumes reinvestment of dividends and capital gains, and none of the charts reflect the deduction of taxes that a shareholder would pay on fund distributions or the redemption of fund shares. Returns for the index are provided for comparison. The fund’s total returns include operating expenses (such as transaction costs and management fees) that reduce returns, while the total returns of the index do not.
Growth of $10,000 Over 10 Years |
$10,000 investment made August 31, 2003 |
Total Annual Fund Operating Expenses | |||
Investor Class | Institutional Class | A Class | C Class |
0.50% | 0.30% | 0.75% | 1.50% |
The total annual fund operating expenses shown is as stated in the fund’s prospectus current as of the date of this report. The prospectus may vary from the expense ratio shown elsewhere in this report because it is based on a different time period, includes acquired fund fees and expenses, and, if applicable, does not include fee waivers or expense reimbursements.
Data presented reflect past performance. Past performance is no guarantee of future results. Current performance may be higher or lower than the performance shown. Investment return and principal value will fluctuate, and redemption value may be more or less than original cost. To obtain performance data current to the most recent month end, please call 1-800-345-2021 or visit americancentury.com. As interest rates rise, bond values will decline. The fund concentrates its investments in a single state and therefore may have more exposure to credit risk related to the state of California than a fund with a broader geographical diversification. In addition, the lower-rated securities in which the fund invests are subject to greater liquidity risk and credit risk. Investment income may be subject to certain state and local taxes and, depending on your tax status, the federal alternative minimum tax (AMT). Capital gains are not exempt from state and federal income tax.
Unless otherwise indicated, performance reflects Investor Class shares; performance for other share classes will vary due to differences in fee structure. For information about other share classes available, please consult the prospectus. Data assumes reinvestment of dividends and capital gains, and none of the charts reflect the deduction of taxes that a shareholder would pay on fund distributions or the redemption of fund shares. Returns for the index are provided for comparison. The fund’s total returns include operating expenses (such as transaction costs and management fees) that reduce returns, while the total returns of the index do not.
Portfolio Commentary |
Portfolio Managers: Alan Kruss, Joseph Gotelli, and Steven Permut
Performance Summary
California High-Yield Municipal declined -4.14%* for the fiscal year ended August 31, 2013. By comparison, the Barclays Municipal Bond Index (representing national investment-grade municipal bonds) declined -3.70%, while the Barclays Municipal High Yield Bond Index (representing national non-investment-grade municipal bonds) declined -3.91%.** Portfolio returns reflect operating expenses, while index returns do not. (Please see pages 4 and 5 and footnotes below for additional performance comparisons.)
The fund’s absolute return for the reporting period reflected the negative performance of California high-yield municipal bonds (munis). The main detractor from the fund’s performance relative to its broad, investment-grade benchmark was the portfolio’s greater focus on lower-quality securities, which lagged investment-grade munis for the reporting period.
Fiscal and Credit Fundamentals
In general, muni market fundamentals improved during the 12-month period, as many states and municipalities continued to take steps to curb spending and strengthen their budgets. A U.S. Census Bureau report released in June 2013 showed state revenues nationwide increased nearly 7% in the first quarter of 2013, compared with 2012’s first quarter. The report also indicated municipal tax revenues increased for 12 consecutive quarters through the first quarter of 2013.
In California, the state’s fiscal outlook continued to improve due to housing and technology sector gains and growing tax revenues. In November 2012, California voters approved Proposition 30, increasing the state’s sales tax rate for the next four years and marginal income tax rates for high-income taxpayers for the next seven years. Furthermore, a June 2013 Bloomberg article indicated rising home values and lower unemployment led to faster first-quarter-2013 economic growth for California than for the next four-largest states. Together, these factors are projected to help generate a possible surplus in the state’s $96.3 billion budget for fiscal 2014.
Increasing tax revenues and projections of structurally balanced state budgets for the next several years prompted Standard & Poor’s in January 2013 to increase California’s credit rating from “A-” to “A” and issue a stable outlook for the state. Fitch also upgraded the state’s debt in August 2013. Meanwhile, from a nationwide perspective, muni credit-rating downgrades generally outpaced upgrades, but the overall default rate remained low. We believe it’s unlikely any states will default, but select credit ratings may remain under downward pressure.
* | All fund returns referenced in this commentary are for Investor Class shares. |
** | The Barclays Municipal High Yield Bond Index’s average returns were 4.92% and 5.63% for the five- and 10-year periods ended August 31, 2013, respectively. |
Portfolio Positioning
In addition to an emphasis on lower-quality bonds (relative to the investment-grade benchmark), security selection weighed on the fund’s relative performance. Specifically, we continued to favor revenue bonds, including public power, transportation and essential service bonds, with smaller exposure in credit sectors such as tobacco, hospitals, health care, and industrial development/pollution control revenue (IDR/PCR) bonds. Revenue and credit-related bonds generally underperformed general obligation bonds for the 12-month period.
In addition, a small position (1.3%, as of August 31, 2013) in Puerto Rico munis detracted from results. Against a backdrop of general technical weakening in the muni market during the second half of the reporting period (as described on page 3), as well as some weakening in local credit fundamentals, Puerto Rico munis sharply underperformed during the 12-month period. We believe the Puerto Rico market was generally oversold during the period given underlying credit fundamentals that still support many of these bonds.
Within the California high-yield muni universe, we began in early 2013 increasing exposure to securities at the higher end of the credit-quality spectrum. Given the market’s liquidity and quality preferences, this strategy helped offset some of the fund’s underperformance late in the period, when higher-quality munis outpaced their lower-quality counterparts.
Outlook
We believe the recent jump in interest rates—though perhaps a near-term overreaction given still-subpar economic growth—represents the start of a legitimate long-term “normalization” of rates, as the market comes off extreme, artificially low, largely quantitative easing-influenced levels. Given the state’s favorable fiscal trends, we remain optimistic toward the California muni market. As always, we believe our fundamental credit research and risk management capabilities will continue to drive results.
Fund Characteristics |
AUGUST 31, 2013
| |
Portfolio at a Glance | |
Weighted Average Maturity | 20.4 years |
Average Duration (Modified) | 8.3 years |
Top Five Sectors | % of fund investments |
Land Based | 16% |
General Obligation (GO) | 16% |
Hospital Revenue | 11% |
Transportation Revenue | 11% |
Certificates of Participation (COPs)/Leases | 7% |
Types of Investments in Portfolio | % of net assets |
Municipal Securities | 99.1% |
Other Assets and Liabilities | 0.9% |
Shareholder Fee Example |
Fund shareholders may incur two types of costs: (1) transaction costs, including sales charges (loads) on purchase payments and redemption/exchange fees; and (2) ongoing costs, including management fees; distribution and service (12b-1) fees; and other fund expenses. This example is intended to help you understand your ongoing costs (in dollars) of investing in your fund and to compare these costs with the ongoing cost of investing in other mutual funds.
The example is based on an investment of $1,000 made at the beginning of the period and held for the entire period from March 1, 2013 to August 31, 2013.
Actual Expenses
The table provides information about actual account values and actual expenses for each class. You may use the information, together with the amount you invested, to estimate the expenses that you paid over the period. First, identify the share class you own. Then simply divide your account value by $1,000 (for example, an $8,600 account value divided by $1,000 = 8.6), then multiply the result by the number under the heading “Expenses Paid During Period” to estimate the expenses you paid on your account during this period.
If you hold Investor Class shares of any American Century Investments fund, or Institutional Class shares of the American Century Diversified Bond Fund, in an American Century Investments account (i.e., not a financial intermediary or retirement plan account), American Century Investments may charge you a $12.50 semiannual account maintenance fee if the value of those shares is less than $10,000. We will redeem shares automatically in one of your accounts to pay the $12.50 fee. In determining your total eligible investment amount, we will include your investments in all personal accounts (including American Century Investments Brokerage accounts) registered under your Social Security number. Personal accounts include individual accounts, joint accounts, UGMA/UTMA accounts, personal trusts, Coverdell Education Savings Accounts and IRAs (including traditional, Roth, Rollover, SEP-, SARSEP- and SIMPLE-IRAs), and certain other retirement accounts. If you have only business, business retirement, employer-sponsored or American Century Investments Brokerage accounts, you are currently not subject to this fee. If you are subject to the Account Maintenance Fee, your account value could be reduced by the fee amount.
Hypothetical Example for Comparison Purposes
The table also provides information about hypothetical account values and hypothetical expenses based on the actual expense ratio of each class of your fund and an assumed rate of return of 5% per year before expenses, which is not the actual return of a fund’s share class. The hypothetical account values and expenses may not be used to estimate the actual ending account balance or expenses you paid for the period. You may use this information to compare the ongoing costs of investing in your fund and other funds. To do so, compare this 5% hypothetical example with the 5% hypothetical examples that appear in the shareholder reports of the other funds.
Please note that the expenses shown in the table are meant to highlight your ongoing costs only and do not reflect any transactional costs, such as sales charges (loads) or redemption/exchange fees. Therefore, the table is useful in comparing ongoing costs only, and will not help you determine the relative total costs of owning different funds. In addition, if these transactional costs were included, your costs would have been higher.
Beginning 3/1/13 | Ending 8/31/13 | Expenses Paid During Period(1) 3/1/13 - 8/31/13 | Annualized | |
Actual | ||||
Investor Class | $1,000 | $927.70 | $2.43 | 0.50% |
Institutional Class | $1,000 | $928.60 | $1.46 | 0.30% |
A Class | $1,000 | $926.50 | $3.64 | 0.75% |
C Class | $1,000 | $923.00 | $7.27 | 1.50% |
Hypothetical | ||||
Investor Class | $1,000 | $1,022.69 | $2.55 | 0.50% |
Institutional Class | $1,000 | $1,023.69 | $1.53 | 0.30% |
A Class | $1,000 | $1,021.43 | $3.82 | 0.75% |
C Class | $1,000 | $1,017.64 | $7.63 | 1.50% |
(1) | Expenses are equal to the class’s annualized expense ratio listed in the table above, multiplied by the average account value over the period, multiplied by 184, the number of days in the most recent fiscal half-year, divided by 365, to reflect the one-half year period. |
Schedule of Investments |
AUGUST 31, 2013
Principal Amount | Value | |||||
Municipal Securities — 99.1% | ||||||
CALIFORNIA — 95.3% | ||||||
ABAG Finance Authority for Nonprofit Corps. Rev., (Jackson Laboratory), 5.00%, 7/1/37 | $2,000,000 | $1,969,740 | ||||
ABAG Finance Authority for Nonprofit Corps. Rev., Series 2012 C1, (Episcopal Senior Communities), 3.00%, 7/1/19 | 1,835,000 | 1,835,752 | ||||
ABAG Finance Authority for Nonprofit Corps. Rev., Series 2012 C2, (Episcopal Senior Communities), 2.50%, 7/1/19 | 2,625,000 | 2,553,810 | ||||
ABC Unified School District GO, Capital Appreciation, Series 2000 B, 0.00%, 8/1/21 (NATL-RE/FGIC)(1) | 1,000,000 | 729,700 | ||||
Adelanto Public Utility Authority Rev., Series 2009 A, (Utility System), 6.75%, 7/1/39 | 5,225,000 | 5,383,944 | ||||
Alameda Corridor Transportation Authority Rev., Series 2013 A, 5.00%, 10/1/26 | 2,000,000 | 2,130,380 | ||||
Alameda Corridor Transportation Authority Rev., Series 2013 A, 5.00%, 10/1/27 (AGM) | 2,000,000 | 2,097,660 | ||||
Alameda Corridor Transportation Authority Rev., Series 2013 A, 5.00%, 10/1/29 (AGM) | 1,000,000 | 1,023,030 | ||||
Alhambra Rev., Series 2010 A, (Atherton Baptist Homes), 7.50%, 1/1/30 | 1,640,000 | 1,678,638 | ||||
Bay Area Toll Authority Toll Bridge Rev., (San Francisco Bay Area), 5.00%, 4/1/24 | 2,360,000 | 2,629,323 | ||||
Bay Area Toll Authority Toll Bridge Rev., Series 2001 A, (San Francisco Bay Area), VRDN, 1.31%, 9/5/13 | 1,000,000 | 980,070 | ||||
Bay Area Toll Authority Toll Bridge Rev., Series 2007 A1, (San Francisco Bay Area), VRDN, 0.76%, 9/5/13 | 1,450,000 | 1,459,831 | ||||
Bay Area Toll Authority Toll Bridge Rev., Series 2008 G1, (San Francisco Bay Area), VRDN, 1.16%, 9/5/13 | 2,500,000 | 2,510,250 | ||||
Bay Area Toll Authority Toll Bridge Rev., Series 2012 F1, (San Francisco Bay Area), 5.00%, 4/1/31 | $8,500,000 | $8,817,985 | ||||
Bay Area Toll Authority Toll Bridge Rev., Series 2013 S4, (San Francisco Bay Area), 5.00%, 4/1/43 | 1,000,000 | 981,770 | ||||
Beaumont Financing Authority Local Agency Special Tax Rev., Series 2004 D, 5.80%, 9/1/35 | 2,875,000 | 2,850,304 | ||||
Beaumont Financing Authority Local Agency Special Tax Rev., Series 2005 B, 5.40%, 9/1/35 | 1,390,000 | 1,309,866 | ||||
Beaumont Financing Authority Local Agency Special Tax Rev., Series 2005 C, 5.50%, 9/1/29 | 855,000 | 848,716 | ||||
Beaumont Financing Authority Local Agency Special Tax Rev., Series 2005 C, 5.50%, 9/1/35 | 4,000,000 | 3,818,440 | ||||
Beaumont Financing Authority Local Agency Special Tax Rev., Series 2006 A, (Improvement Area No. 19C), 5.35%, 9/1/36 | 2,700,000 | 2,685,852 | ||||
Beaumont Financing Authority Local Agency Special Tax Rev., Series 2008 A, (Improvement Area No. 19C), 6.875%, 9/1/36 | 1,050,000 | 1,092,546 | ||||
Beaumont Unified School District GO, Capital Appreciation, Series 2011 C, (Election of 2008), 0.00%, 8/1/40 (AGM)(1) | 2,000,000 | 392,420 | ||||
Berryessa Union School District GO, Capital Appreciation, Series 2000 A, 0.00%, 8/1/21 (AGM)(1) | 1,190,000 | 862,964 | ||||
Berryessa Union School District GO, Capital Appreciation, Series 2000 A, 0.00%, 8/1/22 (AGM)(1) | 1,220,000 | 826,477 | ||||
Berryessa Union School District GO, Capital Appreciation, Series 2000 A, 0.00%, 8/1/23 (AGM)(1) | 1,000,000 | 637,380 | ||||
California County Tobacco Securitization Agency Rev., 5.65%, 6/1/41 | 1,500,000 | 1,141,245 | ||||
Principal Amount | Value |
California Department of Water Resources Power Supply Rev., Series 2013 AM, (Central Valley), 5.00%, 12/1/25 | $2,000,000 | $2,255,940 | ||||
California Educational Facilities Authority Rev., (Chapman University), 5.00%, 4/1/31 | 1,820,000 | 1,840,530 | ||||
California Educational Facilities Authority Rev., (Pepperdine University), 5.00%, 9/1/33 | 2,000,000 | 2,048,060 | ||||
California Educational Facilities Authority Rev., Series 2009 A, (Pomona College), 5.00%, 1/1/24 | 1,400,000 | 1,526,238 | ||||
California Educational Facilities Authority Rev., Series 2013 U4, (Stanford University), 5.00%, 6/1/43 | 2,250,000 | 2,470,635 | ||||
California GO, 5.00%, 10/1/29 | 4,550,000 | 4,696,419 | ||||
California GO, 5.25%, 2/1/30 | 10,000,000 | 10,513,300 | ||||
California GO, 6.00%, 4/1/38 | 5,000,000 | 5,538,150 | ||||
California GO, 5.00%, 2/1/43 | 5,650,000 | 5,623,897 | ||||
California GO, Series 2012 B, VRN, 0.96%, 9/5/13 | 2,000,000 | 2,011,920 | ||||
California GO, Series 2012 B, VRN, 1.06%, 9/5/13 | 800,000 | 806,736 | ||||
California GO, Series 2012 B, VRN, 1.21%, 9/5/13 | 960,000 | 975,581 | ||||
California GO, Series 2013, 5.00%, 2/1/38 | 4,635,000 | 4,628,326 | ||||
California Health Facilities Financing Authority Rev., (Cedars-Sinai Medical Center), 5.00%, 8/15/39 | 2,000,000 | 1,958,660 | ||||
California Health Facilities Financing Authority Rev., Series 2008 A, (Lucile Salter Packard Children’s Hospital), VRDN, 1.45%, 3/15/17 | 1,000,000 | 994,560 | ||||
California Health Facilities Financing Authority Rev., Series 2008 A, (Scripps Health), 5.50%, 10/1/20(2) | 1,500,000 | 1,728,915 | ||||
California Health Facilities Financing Authority Rev., Series 2008 B, (Lucile Salter Packard Children’s Hospital), VRDN, 1.45%, 3/15/17 | 1,470,000 | 1,462,003 | ||||
California Health Facilities Financing Authority Rev., Series 2008 C, (Lucile Salter Packard Children’s Hospital), VRDN, 1.45%, 3/15/17 | 1,000,000 | 994,560 | ||||
California Health Facilities Financing Authority Rev., Series 2008 C, (Providence Health & Services), 6.50%, 10/1/33 | 1,000,000 | 1,138,750 | ||||
California Health Facilities Financing Authority Rev., Series 2008 G, (Catholic Healthcare West), 5.50%, 7/1/25 | 2,000,000 | 2,149,280 | ||||
California Health Facilities Financing Authority Rev., Series 2009 A, (Catholic Healthcare West), 6.00%, 7/1/39 | 4,300,000 | 4,594,550 | ||||
California Health Facilities Financing Authority Rev., Series 2009 A, (Children’s Hospital of Orange County), 6.50%, 11/1/38 | 3,000,000 | 3,312,210 | ||||
California Health Facilities Financing Authority Rev., Series 2011 D, (Sutter Health), 5.25%, 8/15/31 | 2,900,000 | 3,006,778 | ||||
California Health Facilities Financing Authority Rev., Series 2011 D, (Sutter Health), 5.00%, 8/15/35 | 2,000,000 | 1,958,200 | ||||
California Health Facilities Financing Authority Rev., Series 2012 A, (Children’s Hospital of Los Angeles), 5.00%, 11/15/34 | 625,000 | 583,513 | ||||
California Health Facilities Financing Authority Rev., Series 2012 A, (City of Hope), 5.00%, 11/15/39 | 1,910,000 | 1,814,920 | ||||
California Health Facilities Financing Authority Rev., Series 2012 A, (Stanford Hospital & Clinics), 5.00%, 8/15/51 | 2,500,000 | 2,393,575 | ||||
California Health Facilities Financing Authority Rev., Series 2012 B, (Children’s Hospital of Los Angeles), VRDN, 1.86%, 9/5/13 | 2,015,000 | 2,040,167 | ||||
California Health Facilities Financing Authority Rev., Series 2012 B, (Lucile Salter Packard Children’s Hospital), 5.00%, 8/15/26 | 1,020,000 | 1,085,188 |
Principal Amount | Value |
California Health Facilities Financing Authority Rev., Series 2013 A, (Adventist Health System/West Obligated Group), 4.00%, 3/1/27 | $4,000,000 | $3,681,600 | ||||
California Health Facilities Financing Authority Rev., Series 2013 A, (St. Joseph Health System), 5.00%, 7/1/37 | 445,000 | 431,116 | ||||
California Health Facilities Financing Authority Rev., Series 2013 A, (Sutter Health), 5.00%, 8/15/52 | 1,500,000 | 1,367,820 | ||||
California Infrastructure & Economic Development Bank Rev., Series 2011 A, (J. David Gladstone Institutes), 5.25%, 10/1/34 | 2,000,000 | 1,989,800 | ||||
California Infrastructure & Economic Development Bank Rev., Series 2013 A, (Los Angeles County Museum of Art Project), VRDN, 1.88%, 9/3/13 | 1,000,000 | 1,000,360 | ||||
California Mobilehome Park Financing Authority Rev., Series 2003 B, (Palomar Estates E&W), 7.00%, 9/15/36 | 6,345,000 | 6,376,788 | ||||
California Mobilehome Park Financing Authority Rev., Series 2006 B, (Union City Tropics), 5.50%, 12/15/41 | 2,000,000 | 1,829,000 | ||||
California Municipal Finance Authority Rev., (Biola University), 5.875%, 10/1/34 | 1,000,000 | 1,005,120 | ||||
California Municipal Finance Authority Rev., (Emerson College), 6.00%, 1/1/42 | 3,000,000 | 3,219,150 | ||||
California Municipal Finance Authority Rev., Series 2011 B, (Azusa Pacific University), 8.00%, 4/1/41 | 3,335,000 | 3,668,267 | ||||
California Municipal Finance Authority COP, (Community Hospitals of Central California Obligated Group), 5.50%, 2/1/39 | 1,450,000 | 1,385,968 | ||||
California Pollution Control Financing Authority Rev., 5.00%, 11/21/45 | 3,165,000 | 2,723,704 | ||||
California Public Works Board Lease Rev., Series 1993 D, (Department of Corrections), 5.25%, 6/1/15 (AGM) | 1,295,000 | 1,348,794 | ||||
California Public Works Board Lease Rev., Series 2009 G1, (Various Capital Projects), 5.75%, 10/1/30 | 2,000,000 | 2,149,340 | ||||
California Public Works Board Lease Rev., Series 2010 A1, (Various Capital Projects), 6.00%, 3/1/35 | 1,250,000 | 1,377,325 | ||||
California Public Works Board Lease Rev., Series 2011 C, (State Prisons), 5.75%, 10/1/31 | 1,000,000 | 1,053,410 | ||||
California Public Works Board Lease Rev., Series 2011 D, (Judicial Council Projects), 5.00%, 12/1/31 | 975,000 | 970,310 | ||||
California Public Works Board Lease Rev., Series 2012 A, (Various Capital Projects), 5.00%, 4/1/25 | 1,500,000 | 1,593,510 | ||||
California Public Works Board Lease Rev., Series 2012 A, (Various Capital Projects), 5.00%, 4/1/37 | 5,465,000 | 5,288,317 | ||||
California Public Works Board Lease Rev., Series 2012 G, (Various Capital Projects), 5.00%, 11/1/37 | 2,305,000 | 2,229,511 | ||||
California State University Systemwide Rev., Series 2005 C, 5.00%, 11/1/30 (NATL-RE) | 5,000,000 | 5,159,800 | ||||
California State University Systemwide Rev., Series 2011 A, 5.00%, 11/1/42 | 3,000,000 | 3,001,800 | ||||
California Statewide Communities Development Authority Rev., (Cottage Health Obligation Group), 5.25%, 11/1/30 | 1,250,000 | 1,281,025 | ||||
California Statewide Communities Development Authority Rev., (Episcopal Communities and Services), 5.00%, 5/15/42 | 1,500,000 | 1,278,465 | ||||
California Statewide Communities Development Authority Rev., (Lancer Educational Student Housing), 5.625%, 6/1/33 | 2,500,000 | 2,255,750 |
Principal Amount | Value |
California Statewide Communities Development Authority Rev., (Southern California Presbyterian Homes), 7.25%, 11/15/41 | $2,500,000 | $2,679,050 | ||||
California Statewide Communities Development Authority Rev., (University of California Irvine), 5.375%, 5/15/38 | 2,000,000 | 1,960,960 | ||||
California Statewide Communities Development Authority Rev., Series 2001 C, (Kaiser Permanente), 5.25%, 8/1/31 | 4,000,000 | 4,031,520 | ||||
California Statewide Communities Development Authority Rev., Series 2004 D, (Sutter Health), 5.05%, 8/15/38 (AGM) | 1,650,000 | 1,615,581 | ||||
California Statewide Communities Development Authority Rev., Series 2007 A, (California Baptist University), 5.50%, 11/1/38 | 7,000,000 | 6,337,800 | ||||
California Statewide Communities Development Authority Rev., Series 2011, (Trinity Health Corp.), 5.00%, 12/1/41 | 1,100,000 | 1,059,641 | ||||
California Statewide Communities Development Authority Rev., Series 2012 A, (Kaiser Permanente), 5.00%, 4/1/42 | 9,000,000 | 8,661,960 | ||||
California Statewide Communities Development Authority Rev., Series 2013 A, (American Baptist Homes of the West), 5.00%, 10/1/43 | 1,200,000 | 1,015,416 | ||||
Capistrano Unified School District Special Tax Rev., (Community Facilities District No. 90-2), 6.00%, 9/1/33 | 6,250,000 | 6,251,000 | ||||
Carson Redevelopment Agency Tax Allocation Rev., Series 2009 A, (Project Area No. 1), 7.00%, 10/1/36 | 2,000,000 | 2,190,000 | ||||
Chula Vista Community Facilities District No. 06-1 Area A Special Tax Rev., (Eastlake Woods), 6.20%, 9/1/33 | 3,600,000 | 3,600,576 | ||||
Chula Vista Industrial Development Rev., Series 2004 D, (San Diego Gas), 5.875%, 1/1/34 | 1,000,000 | 1,089,590 | ||||
Chula Vista Municipal Financing Authority Special Tax Rev., Series 2013, (Refunding Bonds), 5.00%, 9/1/34 | 2,000,000 | 1,869,280 | ||||
City of Irvine Improvement Bond Act of 1915 Special Assessment Rev., (Assessment District No. 13-1), 5.00%, 9/2/29 | 700,000 | 687,148 | ||||
City of Irvine Improvement Bond Act of 1915 Special Assessment Rev., (Assessment District No. 13-1), 5.00%, 9/2/30 | 350,000 | 341,005 | ||||
City of Irvine Improvement Bond Act of 1915 Special Assessment Rev., (Assessment District No. 12-1), 5.00%, 9/2/24 | 700,000 | 743,211 | ||||
City of Irvine Improvement Bond Act of 1915 Special Assessment Rev., (Assessment District No. 12-1), 5.00%, 9/2/26 | 600,000 | 618,264 | ||||
Clovis Public Financing Authority Lease Rev., (Corporate Yard), 5.375%, 3/1/20 (Ambac) | 1,780,000 | 1,787,280 | ||||
Clovis Unified School District GO, Series 2013 B, (Election of 2012), 5.00%, 8/1/38 | 3,000,000 | 2,928,870 | ||||
Coast Community College District GO, Series 2013 A, (Election of 2012), 4.00%, 8/1/38 | 960,000 | 819,178 | ||||
Contra Costa Water District Rev., Series 2013 R, 5.00%, 10/1/43 | 1,025,000 | 1,044,485 | ||||
Corcoran COP, 8.75%, 6/1/16(3) | 250,000 | 281,358 | ||||
Duarte Unified School District GO, Capital Appreciation, Series 1999 B, 0.00%, 11/1/23 (AGM)(1) | 1,150,000 | 723,074 | ||||
East Side Union High School District GO, Series 2013, 5.00%, 8/1/29 | 1,050,000 | 1,073,867 | ||||
Eastern Municipal Water District Water and Sewer COP, Series 2008 H, 5.00%, 7/1/33 | 4,000,000 | 4,050,240 |
Principal Amount | Value |
El Camino Community College District GO, Capital Appreciation, Series 2012 C, (Election of 2002), 0.00%, 8/1/33(1) | $10,000,000 | $3,328,200 | ||||
El Dorado County Community Facilities District No. 2001-1 Special Tax Rev., (Promontory Specific), 6.30%, 9/1/31 | 2,500,000 | 2,500,600 | ||||
Escondido Joint Powers Financing Authority Rev., (Water Systems Financing), 5.00%, 9/1/31 | 1,355,000 | 1,369,024 | ||||
Foothill-De Anza Community College District GO, Capital Appreciation, 0.00%, 8/1/21 (NATL-RE)(1) | 3,000,000 | 2,284,710 | ||||
Foothill/Eastern Transportation Corridor Agency Toll Road Rev., Capital Appreciation, 5.875%, 1/15/27 | 5,000,000 | 5,039,750 | ||||
Golden State Tobacco Securitization Corp. Settlement Rev., Series 2007 A2, 5.30%, 6/1/37 | 3,000,000 | 2,119,860 | ||||
Golden State Tobacco Securitization Corp. Settlement Rev., Series 2007 A1, 4.50%, 6/1/27 | 5,000,000 | 4,220,650 | ||||
Golden State Tobacco Securitization Corp. Settlement Rev., Series 2007 A1, 5.125%, 6/1/47 | 7,000,000 | 4,690,770 | ||||
Golden State Tobacco Securitization Corp. Settlement Rev., Series 2007 A1, 5.75%, 6/1/47 | 8,000,000 | 5,908,240 | ||||
Golden State Tobacco Securitization Corp. Settlement Rev., Series 2013 A, 5.00%, 6/1/29 | 1,500,000 | 1,506,780 | ||||
Golden State Tobacco Securitization Corp. Settlement Rev., Series 2013 A, 5.00%, 6/1/30 | 2,500,000 | 2,485,775 | ||||
Hemet Unified School District Special Tax Rev., (Community Facilities District No. 2005-2), 5.25%, 9/1/30 | 2,670,000 | 2,588,271 | ||||
Hesperia Public Financing Authority Tax Allocation Rev., Series 2007 A, (Redevelopment and Housing), 5.50%, 9/1/32 (XLCA) | 3,000,000 | 2,687,370 | ||||
Hesperia Public Financing Authority Tax Allocation Rev., Series 2007 A, (Redevelopment and Housing), 5.50%, 9/1/37 (XLCA) | 2,025,000 | 1,751,989 | ||||
Huntington Beach Community Facilities District Special Tax Rev., (Huntington Center), 5.375%, 9/1/33 | 1,700,000 | 1,656,310 | ||||
Independent Cities Finance Authority Mobile Home Park Rev., (Rancho Feliz and Las Casitasde Sonoma), 5.00%, 10/15/47 | 5,000,000 | 4,394,650 | ||||
Independent Cities Finance Authority Mobile Home Park Rev., Series 2011 A, (Castle Mobile Estates), 6.75%, 8/15/46 | 2,500,000 | 2,598,775 | ||||
Independent Cities Finance Authority Mobile Home Park Rev., Series 2012 A, (Augusta Communities), 5.00%, 5/15/39 | 2,500,000 | 2,332,100 | ||||
Independent Cities Lease Finance Authority Rev., Series 2004 A, (Morgan Hill - Hacienda Valley Mobile Estates), 5.90%, 11/15/34 | 2,235,000 | 2,171,615 | ||||
Independent Cities Lease Finance Authority Rev., Series 2006 B, (San Juan Mobile Estates), 5.55%, 5/15/31 | 500,000 | 469,910 | ||||
Independent Cities Lease Finance Authority Rev., Series 2006 B, (San Juan Mobile Estates), 5.85%, 5/15/41 | 1,150,000 | 1,076,757 | ||||
Independent Cities Lease Finance Authority Rev., Series 2007 A, (Santa Rosa Leisure Mobilehome Park), 5.70%, 11/15/47 | 3,430,000 | 3,188,665 | ||||
Irvine Unified School District Special Tax Rev., (Community Facilities District No. 06-1), 6.70%, 9/1/35 | 515,000 | 548,367 |
Principal Amount | Value |
Jurupa Community Services District Special Tax Rev., Series 2008 A, (Community Facilities District No. 25), 8.875%, 9/1/38 | $2,000,000 | $2,214,480 | ||||
Jurupa Community Services District Special Tax Rev., Series 2013 A, (Community Facilities District No. 31), 5.00%, 9/1/37 | 250,000 | 230,020 | ||||
Jurupa Community Services District Special Tax Rev., Series 2013 A, (Community Facilities District No. 31), 5.00%, 9/1/42 | 1,000,000 | 878,210 | ||||
Kern High School District GO, 5.00%, 8/1/25 | 1,145,000 | 1,245,302 | ||||
Lake Elsinore Unified School District Special Tax Rev., (Community Facilities District No. 2005-1, Improvement Area A), 5.40%, 9/1/35 | 2,245,000 | 2,115,576 | ||||
Liberty Union High School District GO, 5.00%, 8/1/29 | 1,000,000 | 1,037,850 | ||||
Long Beach Bond Finance Authority Natural Gas Purchase Rev., Series 2007 A, 5.50%, 11/15/37 | 1,150,000 | 1,144,871 | ||||
Los Alamitos Unified School District COP, Capital Appreciation, (Capital Projects), 0.00%, 8/1/24(4) | 1,300,000 | 654,355 | ||||
Los Angeles Community College District GO, Series 2008 F1, (Election of 2003), 5.00%, 8/1/27 | 2,000,000 | 2,124,500 | ||||
Los Angeles Community Facilities District No. 3 Special Tax Rev., (Cascades Business Park & Golf Course), 6.40%, 9/1/22 | 1,215,000 | 1,224,477 | ||||
Los Angeles County COP, (Disney Concert Hall), 5.00%, 3/1/23 | 1,000,000 | 1,114,870 | ||||
Los Angeles Department of Airports Rev., Series 2008 C, (Los Angeles International Airport), 5.25%, 5/15/25 | 2,000,000 | 2,147,640 | ||||
Los Angeles Department of Airports Rev., Series 2010 A, (Los Angeles International Airport), 5.00%, 5/15/40 | 2,000,000 | 1,973,720 | ||||
Los Angeles Department of Water & Power Rev., Series 2013 B, 5.00%, 7/1/30 | 3,500,000 | 3,677,415 | ||||
Los Angeles Department of Water & Power Waterworks Rev., Series 2012 A, 5.00%, 7/1/43 | 2,000,000 | 2,032,720 | ||||
Los Angeles Department of Water & Power Waterworks Rev., Series 2012 B, 5.00%, 7/1/43 | 1,430,000 | 1,453,395 | ||||
Los Angeles Unified School District COP, Series 2012 B, (Headquarters Building Project), 5.00%, 10/1/29 | 350,000 | 352,527 | ||||
Los Angeles Unified School District COP, Series 2012 B, (Headquarters Building Project), 5.00%, 10/1/31 | 3,500,000 | 3,434,515 | ||||
Los Angeles Unified School District GO, Series 2011 A1, 5.00%, 7/1/24 | 3,430,000 | 3,798,416 | ||||
Los Angeles Wastewater System Rev., Series 2012 B, 5.00%, 6/1/32 | 3,000,000 | 3,107,340 | ||||
Los Angeles Wastewater System Rev., Series 2013 A, 5.00%, 6/1/33 | 4,425,000 | 4,583,636 | ||||
M-S-R Energy Authority Rev., Series 2009 A, 7.00%, 11/1/34 | 1,700,000 | 1,973,377 | ||||
Milpitas Improvement Bond Act of 1915 Special Assessment Rev., Series 1996 A, (Local Improvement District No. 18), 6.75%, 9/2/16 | 715,000 | 726,912 | ||||
Modesto Irrigation District COP, Series 2009 A, (Capital Improvements), 6.00%, 10/1/39 | 3,000,000 | 3,213,840 | ||||
Montebello Community Redevelopment Agency Tax Allocation Rev., Series 2009 A, (Montebello Hills Redevelopment), 8.10%, 3/1/27 | 2,000,000 | 2,221,520 | ||||
Moorpark Mobile Home Park Rev., Series 2011 A, (Villa Delaware Arroyo), 6.50%, 5/15/41 | 4,000,000 | 4,151,480 | ||||
Moreno Valley Unified School District Special Tax Rev., (Community Facilities District No. 2002-1), 6.20%, 9/1/13, Prerefunded at 101% of Par(5) | 4,000,000 | 4,040,640 |
Principal Amount | Value |
Murrieta Community Facilities District No. 2002-2 Special Tax Rev., Series 2004 A, (The Oaks Improvement Area), 6.00%, 9/1/34 | $1,920,000 | $1,862,093 | ||||
Murrieta Public Financing Authority Special Tax Rev., 5.00%, 9/1/31 | 1,735,000 | 1,646,151 | ||||
Northern California Power Agency Rev., Series 2012 A, (Hydroelectric Project No. 1), 5.00%, 7/1/31 | 1,090,000 | 1,117,315 | ||||
Norwalk-La Mirada Unified School District GO, Capital Appreciation, Series 2009 E, (Election of 2002), 0.00%, 8/1/38 (AGC)(1) | 10,000,000 | 2,248,000 | ||||
Oakland Redevelopment Agency Rev., 5.00%, 9/1/36 (Ambac) | 5,000,000 | 4,632,900 | ||||
Oakland Unified School District Alameda County GO, Series 2009 A, (Election of 2006), 6.125%, 8/1/29 | 2,500,000 | 2,622,900 | ||||
Oakland Unified School District Alameda County GO, Series 2012 A, (Election of 2006), 5.50%, 8/1/32 | 2,150,000 | 2,095,648 | ||||
Oakland-Alameda County Coliseum Authority Lease Rev., Series 2012 A, 5.00%, 2/1/25 | 6,030,000 | 6,312,566 | ||||
Oceanside Community Development Commission Tax Allocation Rev., (Downtown Redevelopment), 5.70%, 9/1/25 | 3,500,000 | 3,499,685 | ||||
Oceanside Community Facilities District No. 2001-1 Special Tax Rev., Series 2002 A, (Morrow Hills Development), 6.20%, 9/1/13, Prerefunded at 100% of Par(5) | 2,365,000 | 2,365,378 | ||||
Orange County Community Facilities District Special Tax Rev., (No. 06-1-Delaware Rio Public Improvements), 6.00%, 10/1/40 | 1,375,000 | 1,384,364 | ||||
Orange County Transportation Authority Rev., (Senior Lien), 5.00%, 8/15/30 | 2,400,000 | 2,460,528 | ||||
Orange County Water District Rev., Series 2013 A, 5.00%, 8/15/33 | 1,900,000 | 1,995,779 | ||||
Oxnard School District GO, Series 2001 A, 5.75%, 8/1/30 (NATL-RE) | 3,000,000 | 3,231,780 | ||||
Palm Springs Financing Authority Lease Rev., Series 2012 B, (Downtown Revitalization Project), 5.00%, 6/1/35 | 4,000,000 | 3,801,240 | ||||
Palomar Pomerado Health Care District COP, 6.75%, 11/1/39 | 2,750,000 | 2,813,552 | ||||
Perris Public Financing Authority Special Tax Rev., Series 2003 A, 6.25%, 9/1/33 | 2,955,000 | 2,971,489 | ||||
Perris Public Financing Authority Special Tax Rev., Series 2004 A, 6.125%, 9/1/34 | 2,995,000 | 3,005,542 | ||||
Perris Public Financing Authority Special Tax Rev., Series 2008 A, (Community Facilities District No. 2005-4), 6.60%, 9/1/38 | 2,140,000 | 2,161,657 | ||||
Pleasant Valley School District/Ventura County GO, Series 2002 A, 5.85%, 8/1/31 (NATL-RE) | 4,835,000 | 5,290,312 | ||||
Poway Unified School District Public Financing Authority Rev., 7.875%, 9/15/39 | 3,870,000 | 4,189,352 | ||||
Poway Unified School District Public Financing Authority Special Tax Rev., Series 2013 B, 5.00%, 9/1/42 | 2,740,000 | 2,494,660 | ||||
Poway Unified School District Special Tax Rev., (Community Facilities District No. 6-4S), 5.00%, 9/1/33 | 1,000,000 | 950,270 | ||||
Poway Unified School District Special Tax Rev., (Community Facilities District No. 6-4S), 5.00%, 9/1/36 | 600,000 | 558,894 | ||||
Redwood City Redevelopment Agency Tax Allocation Rev., Capital Appreciation, Series 2003 A, (Redevelopment Project Area 2), 0.00%, 7/15/28 (Ambac)(1) | 3,405,000 | 1,388,934 |
Principal Amount | Value |
Riverside County Community Facilities Districts Special Tax Rev., (Tax No. 04-2-Lake Hills Crest), 5.00%, 9/1/30 | $1,040,000 | $979,753 | ||||
Riverside County Community Facilities Districts Special Tax Rev., (Tax No. 04-2-Lake Hills Crest), 5.00%, 9/1/35 | 2,530,000 | 2,288,942 | ||||
Riverside County Community Facilities Districts Special Tax Rev., (Tax No. 05-8 Scott Road), 5.00%, 9/1/42 | 3,000,000 | 2,542,950 | ||||
Riverside County Redevelopment Agency Tax Allocation Rev., Series 2010 E, (Interstate 215 Corridor), 6.25%, 10/1/30 | 2,200,000 | 2,332,660 | ||||
Riverside County Transportation Commission Rev., Series 2013 A, (Limited Tax), 5.25%, 6/1/39 | 800,000 | 831,504 | ||||
Riverside County Transportation Commission Rev., Series 2013 A, (Senior Lien), 5.75%, 6/1/44 | 500,000 | 485,910 | ||||
Riverside County Transportation Commission Rev., Capital Appreciation, Series 2013 B, (Senior Lien), 0.00%, 6/1/43(1) | 5,000,000 | 616,450 | ||||
Riverside Unified School District Special Tax Rev., (Community Facilities District No. 13, Improvement Area 1), 5.375%, 9/1/34 | 2,000,000 | 1,773,400 | ||||
Riverside Unified School District Special Tax Rev., Series 2005 A, (Community Facilities School District No. 15, Improvement Area 2), 5.25%, 9/1/30 | 1,000,000 | 969,390 | ||||
Romoland School District Special Tax Rev., (Community Facilities District No. 1, Improvement Area 1), 5.40%, 9/1/36 | 4,000,000 | 3,852,200 | ||||
Romoland School District Special Tax Rev., (Community Facilities District No. 1, Improvement Area 3) 5.00%, 9/1/43 | 2,640,000 | 2,277,924 | ||||
Roseville Community Facilities District No. 1 Special Tax Rev., (The Fountains), 6.125%, 9/1/38 | 2,600,000 | 2,603,874 | ||||
Roseville Finance Authority Electric System Rev., 5.00%, 2/1/37 | 925,000 | 927,479 | ||||
Sacramento Airport System Rev., Series 2009 D, (Grant Revenue Bonds), 6.00%, 7/1/35 | 4,000,000 | 4,436,480 | ||||
Sacramento Municipal Utility District Electric Rev., Series 2012 Y, 5.00%, 8/15/31 | 625,000 | 641,325 | ||||
Sacramento Municipal Utility District Electric Rev., Series 2012 Y, 5.00%, 8/15/33 | 1,000,000 | 1,017,320 | ||||
Sacramento Regional Transit District Rev., (Farebox Revenue), 5.00%, 3/1/42 | 1,300,000 | 1,241,149 | ||||
Sacramento Transportation Authority Sales Tax Rev., (Measure A), 5.00%, 10/1/24 | 1,055,000 | 1,159,340 | ||||
San Buenaventura Rev., (Community Memorial Health System), 7.50%, 12/1/41 | 9,350,000 | 10,093,325 | ||||
San Buenaventura City COP, (Wastewater Revenue), 5.00%, 3/1/14, Prerefunded at 100% of Par (NATL-RE)(5) | 1,975,000 | 2,022,459 | ||||
San Diego County Regional Airport Authority Rev., Series 2013 A, 5.00%, 7/1/24 | 300,000 | 332,421 | ||||
San Diego County Regional Airport Authority Rev., Series 2013 A, 5.00%, 7/1/25 | 500,000 | 545,840 | ||||
San Diego County Regional Airport Authority Rev., Series 2013 A, 5.00%, 7/1/26 | 500,000 | 539,045 | ||||
San Diego County Regional Airport Authority Rev., Series 2013 A, 5.00%, 7/1/43 | 2,500,000 | 2,431,850 | ||||
San Diego County Water Authority Rev., 5.00%, 5/1/33 | 1,500,000 | 1,555,755 | ||||
San Diego County Water Authority Rev., 5.00%, 5/1/34 | 2,000,000 | 2,060,680 | ||||
San Diego Public Facilities Financing Authority Lease Rev., Series 2012 A, (Capital Improvement Projects), 5.00%, 4/15/37 | 2,000,000 | 1,909,200 | ||||
San Diego Redevelopment Agency Tax Allocation Rev., Series 2009 A, (North Park Redevelopment), 7.00%, 11/1/39 | 3,000,000 | 3,288,210 |
Principal Amount | Value |
San Francisco Bay Area Rapid Transit District Rev., Series 2012 A, 5.00%, 7/1/36 | $1,000,000 | $1,022,880 | ||||
San Francisco City and County Airports Commission Rev., Series 2008 34D, (San Francisco International Airport), 5.25%, 5/1/26 | 3,000,000 | 3,299,640 | ||||
San Francisco City and County Airports Commission Rev., Series 2011 D, 5.00%, 5/1/31 | 5,390,000 | 5,492,787 | ||||
San Francisco City and County Redevelopment Financing Authority Tax Allocation Rev., Series 2009 D, (Mission Bay South Redevelopment), 6.625%, 8/1/39 | 2,000,000 | 2,122,000 | ||||
San Francisco City and County Redevelopment Financing Authority Tax Allocation Rev., Series 2011 C, (Mission Bay South Redevelopment), 6.75%, 8/1/41 | 1,000,000 | 1,096,290 | ||||
San Francisco City and County Redevelopment Financing Authority Tax Allocation Rev., Series 2011 D, (Mission Bay South Redevelopment), 7.00%, 8/1/41 | 1,250,000 | 1,321,975 | ||||
San Joaquin Hills Transportation Corridor Agency Rev., Capital Appreciation, Series 1997 A, 0.00%, 1/15/25 (NATL-RE)(1) | 3,090,000 | 1,554,826 | ||||
San Joaquin Hills Transportation Corridor Agency Rev., Capital Appreciation, Series 1997 A, 0.00%, 1/15/29 (NATL-RE)(1) | 165,000 | 62,172 | ||||
San Joaquin Hills Transportation Corridor Agency Rev., Capital Appreciation, Series 1997 A, 0.00%, 1/15/31 (NATL-RE)(1) | 16,000,000 | 5,212,640 | ||||
San Joaquin Hills Transportation Corridor Agency Rev., Capital Appreciation, Series 1997 A, 0.00%, 1/15/32 (NATL-RE)(1) | 290,000 | 87,789 | ||||
San Jose Airport Rev., Series 2011 A2, 5.25%, 3/1/34 | 2,605,000 | 2,633,968 | ||||
San Marcos Public Facilities Authority Special Tax Rev., Series 2012 D, 5.00%, 9/1/32 | 1,000,000 | 959,720 | ||||
San Marcos Public Facilities Authority Special Tax Rev., Series 2012 D, 5.00%, 9/1/36 | 875,000 | 808,631 | ||||
San Mateo Special Tax Rev., (Community Facilities District No. 2008-1-Bay Meadows), 6.00%, 9/1/42 | 500,000 | 514,705 | ||||
Santa Barbara Secondary High School District GO, Series 2011 A, (Election of 2010), 0.00%, 8/1/36(1) | 10,000,000 | 2,567,600 | ||||
Santa Barbara Secondary High School District GO, Series 2011 A, (Election of 2010), 0.00%, 8/1/40(1) | 3,795,000 | 743,441 | ||||
Santa Cruz County Redevelopment Agency Tax Allocation Rev., Series 2009 A, (Live Oak/Soquel Community Improvement), 7.00%, 9/1/36 | 3,000,000 | 3,248,100 | ||||
Santa Margarita Water District Special Tax Rev., Series 2011 B, (Community Facilities District No. 99-1), 5.875%, 9/1/38 | 650,000 | 659,731 | ||||
Santa Margarita Water District Special Tax Rev., Series 2013, (Communities Facilities District No. 2013-1, Village of Sendero), 5.625%, 9/1/43 | 1,250,000 | 1,220,800 | ||||
Santaluz Community Facilities District No. 2 Special Tax Rev., Series 2011 A, (Improvement Area No. 1), 5.10%, 9/1/21, Prerefunded at 103% of Par(5) | 465,000 | 460,308 | ||||
Saugus-Castaic School Facilities Financing Authority Special Tax Rev., (Community Facilities District No. 2006-1C), 6.00%, 9/1/43 | 1,500,000 | 1,428,060 | ||||
Solana Beach School District Special Tax Rev., (Public Financing Authority), 5.00%, 9/1/42 | 3,075,000 | 2,870,236 |
Principal Amount | Value |
Soledad Improvement Bond Act of 1915 District No. 2002-01 Special Assessment Rev., (Diamond Ridge), 6.75%, 9/2/33 | $2,160,000 | $2,160,778 | ||||
Southern California Public Power Authority Rev., (Southern Transmission), 0.00%, 7/1/14 (NATL-RE-IBC)(1) | 2,400,000 | 2,390,688 | ||||
Southern California Public Power Authority Rev., (Southern Transmission), 0.00%, 7/1/15 (NATL-RE-IBC)(1) | 1,250,000 | 1,225,312 | ||||
Southern California Public Power Authority Rev., Series 2007 A, 5.00%, 11/1/33 | 3,755,000 | 3,624,514 | ||||
Southern Mono Health Care District GO, Capital Appreciation, Series 2002 A, (Election of 2001), 0.00%, 8/1/26 (NATL-RE)(1) | 1,800,000 | 840,744 | ||||
Successor Agency to the Redevelopment Agency of the City & County of San Francisco Communities Facilities District No. 6 Special Tax Rev., Capital Appreciation, Series 2013 C, (Mission Bay South Public Improvements), 0.00%, 8/1/43(1) | 5,500,000 | 724,680 | ||||
Sunnyvale Community Facilities District No. 1 Special Tax Rev., 7.75%, 8/1/32 | 6,500,000 | 6,500,975 | ||||
Susanville Public Financing Authority Rev., Series 2010 B, (Utility Enterprises), 6.00%, 6/1/45 | 3,000,000 | 2,964,000 | ||||
Tahoe-Truckee Unified School District GO, Capital Appreciation, Series 1999 A, (Improvement District No. 2), 0.00%, 8/1/22 (NATL-RE/FGIC)(1) | 2,690,000 | 1,822,314 | ||||
Tahoe-Truckee Unified School District GO, Capital Appreciation, Series 1999 A, (Improvement District No. 2), 0.00%, 8/1/23 (NATL-RE/FGIC)(1) | 2,220,000 | 1,414,984 | ||||
Tobacco Securitization Authority of Northern California Settlement Rev., Series 2005 A1, 5.50%, 6/1/45 | 2,000,000 | 1,504,520 | ||||
Tobacco Securitization Authority of Southern California Settlement Rev., Series 2006 A1, 5.00%, 6/1/37 | 2,250,000 | 1,692,427 | ||||
Torrance Rev., Series 2010 A, (Memorial Medical Center), 5.00%, 9/1/40 | 2,000,000 | 1,955,080 | ||||
Tracy Community Facilities District No. 2006-1 Special Tax Rev., (NEI Phase II), 5.75%, 9/1/36 | 3,105,000 | 2,791,519 | ||||
Tri-Dam Power Authority Rev., 4.00%, 5/1/16 | 2,165,000 | 2,267,383 | ||||
Tri-Dam Power Authority Rev., 4.00%, 11/1/16 | 2,165,000 | 2,277,017 | ||||
Tuolumne Wind Project Authority Rev., Series 2009 A, 5.875%, 1/1/29 | 2,000,000 | 2,227,520 | ||||
Turlock Public Financing Authority Tax Allocation Rev., 7.50%, 9/1/39 | 2,770,000 | 2,902,046 | ||||
Tustin Community Facilities District No. 06-1 Special Tax Rev., Series 2007 A, (Tustin Legacy/Columbus Villages), 6.00%, 9/1/36 | 4,945,000 | 4,946,731 | ||||
Tustin Community Facilities District No. 07-1 Special Tax Rev., (Tustin Legacy/Retail Center), 6.00%, 9/1/37 | 1,300,000 | 1,298,362 | ||||
Tustin Unified School District Special Tax Rev., (Community Facilities District No. 06-1), 5.75%, 9/1/30 | 1,000,000 | 1,015,240 | ||||
Tustin Unified School District Special Tax Rev., (Community Facilities District No. 06-1), 6.00%, 9/1/40 | 1,500,000 | 1,512,345 | ||||
Twin Rivers Unified School District COP, (School Facilities Bridge Funding Program), VRDN, 3.20%, 6/1/20 (AGM) | 1,750,000 | 1,690,360 | ||||
Twin Rivers Unified School District COP, (School Facilities Bridge Funding Program), VRDN, 3.20%, 6/1/20 (AGM) | 1,000,000 | 965,920 |
Principal Amount | Value |
University of California System Rev., Series 2012 G, 5.00%, 5/15/37 | $5,000,000 | $5,017,150 | ||||
Val Verde Unified School District Special Tax Rev., (Community Facilities District No. 1, Improvement Area A), 5.40%, 9/1/30 | 2,500,000 | 2,291,650 | ||||
Val Verde Unified School District Special Tax Rev., (Community Facilities District No. 1, Improvement Area A), 5.45%, 9/1/36 | 2,600,000 | 2,287,662 | ||||
Ventura County Community College District GO, Series 2008 C, (Election of 2002), 5.50%, 8/1/33 | 1,600,000 | 1,757,824 | ||||
West Contra Costa Unified School District GO, 5.00%, 8/1/32 | 1,400,000 | 1,363,194 | ||||
West Sacramento Community Facilities District No. 20 Special Tax Rev., 5.30%, 9/1/13, Prerefunded at 102% of Par(5) | 1,740,000 | 1,775,044 | ||||
Yosemite Community College District GO, Capital Appreciation, (Election of 2004), 0.00%, 8/1/16 (AGM)(1) | 3,545,000 | 3,361,723 | ||||
Yuba City Redevelopment Agency Tax Allocation Rev., 5.70%, 9/1/24 | 2,270,000 | 2,268,161 | ||||
Yuba City Unified School District GO, Capital Appreciation, 0.00%, 3/1/25 (NATL-RE/FGIC)(1) | 1,500,000 | 808,440 | ||||
| 598,211,230 | ||||||
GUAM — 1.9% | ||||||
Guam Government Business Privilege Tax Rev., Series 2011 A, 5.125%, 1/1/42 | 1,000,000 | 951,900 | ||||
Guam Government GO, Series 2007 A, 5.25%, 11/15/37 | 3,105,000 | 2,802,045 | ||||
Guam Government GO, Series 2009 A, 7.00%, 11/15/39 | 7,230,000 | 7,591,645 | ||||
Guam Power Authority Rev., Series 2012 A, 5.00%, 10/1/34 | 850,000 | 800,334 | ||||
| 12,145,924 | ||||||
PUERTO RICO — 1.3% | ||||||
Puerto Rico Aqueduct & Sewer Authority Rev., Series 2012 A, (Senior Lien), 6.00%, 7/1/47 | 5,000,000 | 3,629,300 | ||||
Puerto Rico GO, Series 2008 A, 6.00%, 7/1/38 | 2,500,000 | 1,968,225 | ||||
Puerto Rico Sales Tax Financing Corp. Rev., Series 2007 A, VRN, 1.11%, 11/1/13 | 5,000,000 | 2,444,550 | ||||
| 8,042,075 | ||||||
U.S. VIRGIN ISLANDS — 0.6% | ||||||
Virgin Islands Public Finance Authority Rev., Series 2009 A, (Diageo Matching Fund Bonds), 6.75%, 10/1/37 | 2,000,000 | 2,184,340 | ||||
Virgin Islands Public Finance Authority Rev., Series 2010 B, (Subordinated Lien), 5.25%, 10/1/29 | 1,500,000 | 1,491,870 | ||||
| 3,676,210 | ||||||
TOTAL INVESTMENT SECURITIES — 99.1% (Cost $647,002,226) | 622,075,439 | |||||
OTHER ASSETS AND LIABILITIES — 0.9% | 5,635,126 | |||||
TOTAL NET ASSETS — 100.0% | $627,710,565 | |||||
Futures Contracts | ||||
Contracts Sold | Expiration Date | Underlying Face | Unrealized Gain (Loss) | |
89 | U.S. Treasury 30-Year Bonds | December 2013 | $11,739,656 | $(65,879) |
Notes to Schedule of Investments
AGC = Assured Guaranty Corporation
AGM = Assured Guaranty Municipal Corporation
COP = Certificates of Participation
FGIC = Financial Guaranty Insurance Company
GO = General Obligation
NATL-RE = National Public Finance Guarantee Corporation - Reinsured
NATL-RE-IBC = National Public Finance Guarantee Corporation - Reinsured - Insured Bond Certificates
VRDN = Variable Rate Demand Note. Interest reset date is indicated. Rate shown is effective at the period end.
VRN = Variable Rate Note. Interest reset date is indicated. Rate shown is effective at the period end.
XLCA = XL Capital Ltd.
(1) | Security is a zero-coupon bond. Zero-coupon securities are issued at a substantial discount from their value at maturity. |
(2) | Security, or a portion thereof, has been pledged at the custodian bank or with a broker for margin requirements on futures contracts. At the period end, the aggregate value of securities pledged was $357,309. |
(3) | Security was purchased under Rule 144A of the Securities Act of 1933 or is a private placement and, unless registered under the Act or exempted from registration, may only be sold to qualified institutional investors. The aggregate value of these securities at the period end was $281,358, which represented less than 0.05% of total net assets. |
(4) | Coupon rate adjusts periodically based upon a predetermined schedule. Interest reset date is indicated. Rate shown is effective at the period end. |
(5) | Escrowed to maturity in U.S. government securities or state and local government securities. |
See Notes to Financial Statements.
Statement of Assets and Liabilities |
AUGUST 31, 2013 | |||
Assets | |||
Investment securities, at value (cost of $647,002,226) | $622,075,439 | ||
Receivable for investments sold | 1,662,031 | ||
Receivable for capital shares sold | 256,248 | ||
Interest receivable | 10,005,404 | ||
| 633,999,122 | |||
Liabilities | |||
Disbursements in excess of demand deposit cash | 2,587,110 | ||
Payable for investments purchased | 1,644,910 | ||
Payable for capital shares redeemed | 1,438,832 | ||
Payable for variation margin on futures contracts | 19,469 | ||
Accrued management fees | 269,788 | ||
Distribution and service fees payable | 45,934 | ||
Dividends payable | 282,514 | ||
| 6,288,557 | |||
Net Assets | $627,710,565 | ||
Net Assets Consist of: | |||
Capital paid in | $683,135,045 | ||
Accumulated net realized loss | (30,431,814 | ) | |
Net unrealized depreciation | (24,992,666 | ) | |
| $627,710,565 | |||
Net assets | Shares outstanding | Net asset value per share | |
Investor Class | $472,141,042 | 50,593,844 | $9.33 |
Institutional Class | $25,217,189 | 2,703,069 | $9.33 |
A Class | $105,296,309 | 11,282,745 | $9.33* |
C Class | $25,056,025 | 2,684,562 | $9.33 |
*Maximum offering price $9.77 (net asset value divided by 0.955).
See Notes to Financial Statements.
Statement of Operations |
YEAR ENDED AUGUST 31, 2013 | |||
Investment Income (Loss) | |||
Income: | |||
Interest | $32,497,084 | ||
Expenses: | |||
Management fees | 3,532,321 | ||
Distribution and service fees: | |||
A Class | 308,836 | ||
C Class | 307,916 | ||
Trustees’ fees and expenses | 44,620 | ||
Other expenses | 1,976 | ||
| 4,195,669 | |||
Net investment income (loss) | 28,301,415 | ||
Realized and Unrealized Gain (Loss) | |||
Net realized gain (loss) on: | |||
Investment transactions | 6,479,309 | ||
Futures contract transactions | (28,918 | ) | |
| 6,450,391 | |||
Change in net unrealized appreciation (depreciation) on: | |||
Investments | (65,685,127 | ) | |
Futures contracts | (65,879 | ) | |
| (65,751,006 | ) | ||
Net realized and unrealized gain (loss) | (59,300,615 | ) | |
Net Increase (Decrease) in Net Assets Resulting from Operations | $(30,999,200 | ) | |
See Notes to Financial Statements.
Statement of Changes in Net Assets |
YEARS ENDED AUGUST 31, 2013 AND AUGUST 31, 2012 | |||||
Increase (Decrease) in Net Assets | August 31, 2013 | August 31, 2012 | |||
Operations | |||||
Net investment income (loss) | $28,301,415 | $25,549,279 | |||
Net realized gain (loss) | 6,450,391 | 2,510,385 | |||
Change in net unrealized appreciation (depreciation) | (65,751,006 | ) | 39,474,863 | ||
Net increase (decrease) in net assets resulting from operations | (30,999,200 | ) | 67,534,527 | ||
Distributions to Shareholders | |||||
From net investment income: | |||||
Investor Class | (21,644,951 | ) | (19,616,707 | ) | |
Institutional Class | (1,118,657 | ) | (593,034 | ) | |
A Class | (4,615,365 | ) | (4,420,914 | ) | |
B Class | — | (2,781 | ) | ||
C Class | (920,249 | ) | (929,639 | ) | |
Decrease in net assets from distributions | (28,299,222 | ) | (25,563,075 | ) | |
Capital Share Transactions | |||||
Net increase (decrease) in net assets from capital share transactions | 11,772,125 | 135,589,898 | |||
Net increase (decrease) in net assets | (47,526,297 | ) | 177,561,350 | ||
Net Assets | |||||
Beginning of period | 675,236,862 | 497,675,512 | |||
End of period | $627,710,565 | $675,236,862 | |||
Distributions in excess of net investment income | — | $(2,193 | ) | ||
See Notes to Financial Statements.
Notes to Financial Statements |
AUGUST 31, 2013
1. Organization
American Century California Tax-Free and Municipal Funds (the trust) is registered under the Investment Company Act of 1940, as amended (the 1940 Act), as an open-end management investment company and is organized as a Massachusetts business trust. California High-Yield Municipal Fund (the fund) is one fund in a series issued by the trust. The fund is nondiversified as defined under the 1940 Act. The fund’s investment objective is to seek high current income that is exempt from federal and California income taxes.
The fund offers the Investor Class, the Institutional Class, the A Class and the C Class. The A Class may incur an initial sales charge. The A Class and C Class may be subject to a contingent deferred sales charge. The share classes differ principally in their respective sales charges and distribution and shareholder servicing expenses and arrangements. The Institutional Class is made available to institutional shareholders or through financial intermediaries whose clients do not require the same level of shareholder and administrative services as shareholders of other classes. As a result, the Institutional Class is charged a lower unified management fee. On October 21, 2011, all outstanding B Class shares were converted to A Class shares and the fund discontinued offering the B Class.
2. Significant Accounting Policies
The following is a summary of significant accounting policies consistently followed by the fund in preparation of its financial statements. The financial statements are prepared in conformity with accounting principles generally accepted in the United States of America, which may require management to make certain estimates and assumptions at the date of the financial statements. Actual results could differ from these estimates.
Investment Valuations — The fund determines the fair value of its investments and computes its net asset value per share as of the close of regular trading (usually 4 p.m. Eastern time) on the New York Stock Exchange (NYSE) on each day the NYSE is open.
Debt securities maturing in greater than 60 days at the time of purchase are valued at the evaluated mean as provided by independent pricing services or at the mean of the most recent bid and asked prices as provided by investment dealers. Debt securities maturing within 60 days at the time of purchase may be valued at cost, plus or minus any amortized discount or premium or at the evaluated mean as provided by an independent pricing service. Evaluated mean prices are commonly derived through utilization of market models, which may consider, among other factors, trade data, quotations from dealers and active market makers, relevant yield curve and spread data, related sector levels, creditworthiness, and other relevant market information on the same or comparable securities.
Exchange-traded futures contracts are valued at the settlement price as provided by the appropriate clearing corporation.
If the fund determines that the market price for a portfolio security is not readily available or the valuation methods mentioned above do not reflect a security’s fair value, such security is valued as determined in good faith by the Board of Trustees or its designee, in accordance with procedures adopted by the Board of Trustees. Circumstances that may cause the fund to use these procedures to value a security include, but are not limited to: a security has been declared in default; trading in a security has been halted during the trading day; there is a foreign market holiday and no trading occurred; or an event occurred between the close of a foreign exchange and the NYSE that may affect the value of a security.
Security Transactions — Security transactions are accounted for as of the trade date. Net realized gains and losses are determined on the identified cost basis, which is also used for federal income tax purposes.
Investment Income — Interest income is recorded on the accrual basis and includes accretion of discounts and amortization of premiums.
Segregated Assets — In accordance with the 1940 Act, the fund segregates assets on its books and records to cover certain types of investments, including, but not limited to, futures contracts and when-issued securities. American Century Investment Management, Inc. (ACIM) (the investment advisor) monitors, on a daily basis, the securities segregated to ensure the fund designates a sufficient amount of liquid assets, marked-to-market daily. The fund may also receive assets or be required to pledge assets at the custodian bank or with a broker for margin requirements on futures contracts.
Income Tax Status — It is the fund’s policy to distribute substantially all net investment income and net realized gains to shareholders and to otherwise qualify as a regulated investment company under provisions of the Internal Revenue Code. Accordingly, no provision has been made for income taxes. The fund files U.S. federal, state, local and non-U.S. tax returns as applicable. The fund’s tax returns are subject to examination by the relevant taxing authority until expiration of the applicable statute of limitations, which is generally three years from the date of filing but can be longer in certain jurisdictions. At this time, management believes there are no uncertain tax positions which, based on their technical merit, would not be sustained upon examination and for which it is reasonably possible that the total amounts of unrecognized tax benefits will significantly change in the next twelve months.
Multiple Class — All shares of the fund represent an equal pro rata interest in the net assets of the class to which such shares belong, and have identical voting, dividend, liquidation and other rights and the same terms and conditions, except for class specific expenses and exclusive rights to vote on matters affecting only individual classes. Income, non-class specific expenses, and realized and unrealized capital gains and losses of the fund are allocated to each class of shares based on their relative net assets.
Distributions to Shareholders — Distributions from net investment income are declared daily and paid monthly. Distributions from net realized gains, if any, are generally declared and paid annually.
Indemnifications — Under the trust’s organizational documents, its officers and trustees are indemnified against certain liabilities arising out of the performance of their duties to the fund. In addition, in the normal course of business, the fund enters into contracts that provide general indemnifications. The maximum exposure under these arrangements is unknown as this would involve future claims that may be made against a fund. The risk of material loss from such claims is considered by management to be remote.
3. Fees and Transactions with Related Parties
Management Fees — The trust has entered into a management agreement with ACIM, under which ACIM provides the fund with investment advisory and management services in exchange for a single, unified management fee (the fee) per class. The agreement provides that all expenses of managing and operating the fund, except distribution and service fees, brokerage expenses, taxes, interest, fees and expenses of the independent trustees (including legal counsel fees), and extraordinary expenses, will be paid by ACIM. The fee is computed and accrued daily based on each class’s daily net assets and paid monthly in arrears. The fee consists of (1) an Investment Category Fee based on the daily net assets of the fund and certain other accounts managed by the investment advisor that are in the same broad investment category as the fund and (2) a Complex Fee based on the assets of all the funds in the American Century Investments family of funds. The rates for the Investment Category Fee range from 0.1925% to 0.3100%. The rates for the Complex Fee range from 0.2500% to 0.3100% for the Investor Class, A Class and C Class. The Institutional Class is 0.2000% less at each point within the Complex Fee range. The effective annual management fee for each class for the year ended August 31, 2013 was 0.49% for the Investor Class, A Class and C Class and 0.29% for the Institutional Class.
Distribution and Service Fees — The Board of Trustees has adopted a separate Master Distribution and Individual Shareholder Services Plan for each of the A Class and C Class (collectively the plans), pursuant to Rule 12b-1 of the 1940 Act. The plans provide that the A Class will pay American Century Investment Services, Inc. (ACIS) an annual distribution and service fee of 0.25%. The plans provide that the C Class will pay ACIS an annual distribution and service fee of 1.00%, of which 0.25% is paid for individual
shareholder services and 0.75% is paid for distribution services. The fees are computed and accrued daily based on each class’s daily net assets and paid monthly in arrears. The fees are used to pay financial intermediaries for distribution and individual shareholder services. Fees incurred under the plans during the year ended August 31, 2013 are detailed in the Statement of Operations.
Related Parties — Certain officers and trustees of the trust are also officers and/or directors of American Century Companies, Inc. (ACC). The trust’s investment advisor, ACIM, the trust’s distributor, ACIS, and the trust’s transfer agent, American Century Services, LLC are wholly owned, directly or indirectly, by ACC.
4. Investment Transactions
Purchases and sales of investment securities, excluding short-term investments, for the year ended August 31, 2013 were $591,792,064 and $575,265,206, respectively.
5. Capital Share Transactions
Transactions in shares of the fund were as follows (unlimited number of shares authorized):
Year ended August 31, 2013 | Year ended August 31, 2012 | |||||||||||
Shares | Amount | Shares | Amount | |||||||||
Investor Class | ||||||||||||
Sold | 17,005,122 | $173,008,166 | 15,316,795 | $150,686,406 | ||||||||
Issued in reinvestment of distributions | 1,714,688 | 17,237,511 | 1,554,528 | 15,284,626 | ||||||||
Redeemed | (18,118,654 | ) | (180,259,798 | ) | (6,715,012 | ) | (65,654,971 | ) | ||||
| 601,156 | 9,985,879 | 10,156,311 | 100,316,061 | |||||||||
Institutional Class | ||||||||||||
Sold | 1,934,362 | 19,361,935 | 1,267,450 | 12,656,322 | ||||||||
Issued in reinvestment of distributions | 111,151 | 1,117,155 | 60,937 | 593,034 | ||||||||
Redeemed | (1,542,955 | ) | (15,082,812 | ) | (168,968 | ) | (1,641,963 | ) | ||||
| 502,558 | 5,396,278 | 1,159,419 | 11,607,393 | |||||||||
A Class | ||||||||||||
Sold | 4,163,256 | 42,379,719 | 3,449,795 | 33,860,084 | ||||||||
Issued in reinvestment of distributions | 390,551 | 3,923,157 | 351,035 | 3,450,318 | ||||||||
Redeemed | (4,837,063 | ) | (47,976,198 | ) | (1,705,337 | ) | (16,712,440 | ) | ||||
| (283,256 | ) | (1,673,322 | ) | 2,095,493 | 20,597,962 | |||||||
B Class | N/A | |||||||||||
Issued in reinvestment of distributions | 144 | 1,370 | ||||||||||
Redeemed | (51,121 | ) | (483,752 | ) | ||||||||
| (50,977 | ) | (482,382 | ) | |||||||||
C Class | ||||||||||||
Sold | 687,746 | 7,024,022 | 734,788 | 7,238,409 | ||||||||
Issued in reinvestment of distributions | 52,873 | 530,930 | 47,282 | 464,023 | ||||||||
Redeemed | (956,949 | ) | (9,491,662 | ) | (425,205 | ) | (4,151,568 | ) | ||||
| (216,330 | ) | (1,936,710 | ) | 356,865 | 3,550,864 | |||||||
Net increase (decrease) | 604,128 | $11,772,125 | 13,717,111 | $135,589,898 | ||||||||
6. Fair Value Measurements
The fund’s securities valuation process is based on several considerations and may use multiple inputs to determine the fair value of the positions held by the fund. In conformity with accounting principles generally accepted in the United States of America, the inputs used to determine a valuation are classified into three broad levels as follows:
• | Level 1 valuation inputs consist of unadjusted quoted prices in an active market for identical securities; |
• | Level 2 valuation inputs consist of direct or indirect observable market data (including quoted prices for similar securities, evaluations of subsequent market events, interest rates, prepayment speeds, credit risk, etc.); or |
• | Level 3 valuation inputs consist of unobservable data (including a fund’s own assumptions). |
The level classification is based on the lowest level input that is significant to the fair valuation measurement. The valuation inputs are not necessarily an indication of the risks associated with investing in these securities or other financial instruments.
As of period end, the fund’s investment securities and unrealized gain (loss) on futures contracts were classified as Level 2 and Level 1, respectively. The Schedule of Investments provides additional information on the fund’s portfolio holdings.
7. Derivative Instruments
Interest Rate Risk — The fund is subject to interest rate risk in the normal course of pursuing its investment objectives. The value of bonds generally declines as interest rates rise. A fund may enter into futures contracts based on a bond index or a specific underlying security. A fund may purchase futures contracts to gain exposure to increases in market value or sell futures contracts to protect against a decline in market value. Upon entering into a futures contract, a fund will segregate cash, cash equivalents or other appropriate liquid securities on its records in amounts sufficient to meet requirements. Subsequent payments (variation margin) are made or received daily, in cash, by a fund. The variation margin is equal to the daily change in the contract value and is recorded as unrealized gains and losses. A fund recognizes a realized gain or loss when the futures contract is closed or expires. Net realized and unrealized gains or losses occurring during the holding period of futures contracts are a component of net realized gain (loss) on futures contract transactions and change in net unrealized appreciation (depreciation) on futures contracts, respectively. One of the risks of entering into futures contracts is the possibility that the change in value of the contract may not correlate with the changes in value of the underlying securities. The fund regularly purchased and sold interest rate risk derivative instruments throughout the reporting period and the instruments held at period end as disclosed on the Schedule of Investments are indicative of the fund’s typical volume.
The value of interest rate risk derivative instruments as of August 31, 2013, is disclosed on the Statement of Assets and Liabilities as a liability of $19,469 in payable for variation margin on futures contracts.* For the year ended August 31, 2013, the effect of interest rate risk derivative instruments on the Statement of Operations was $(28,918) in net realized gain (loss) on futures contract transactions and $(65,879) in change in net unrealized appreciation (depreciation) on futures contracts.
* Included in the unrealized gain (loss) on futures contracts as reported in the Schedule of Investments.
8. Risk Factors
The fund concentrates its investments in a single state and therefore may have more exposure to credit risk related to the state of California than a fund with a broader geographical diversification. The fund invests in lower-rated debt securities, which are subject to substantial risks including liquidity risk and credit risk.
9. Federal Tax Information
The tax character of distributions paid during the years ended August 31, 2013 and August 31, 2012 were as follows:
2013 | 2012 | |
Distributions Paid From | ||
Exempt income | $28,205,721 | $25,539,518 |
Taxable ordinary income | 93,501 | $23,557 |
Long-term capital gains | — | — |
The book-basis character of distributions made during the year from net investment income or net realized gains may differ from their ultimate characterization for federal income tax purposes. These differences reflect the differing character of certain income items and net realized gains and losses for financial statement and tax purposes, and may result in reclassification among certain capital accounts on the financial statements.
As of August 31, 2013, the federal tax cost of investments and the components of distributable earnings on a tax-basis were as follows:
Federal tax cost of investments | $647,002,226 |
Gross tax appreciation of investments | $13,360,312 |
Gross tax depreciation of investments | (38,287,099) |
Net tax appreciation (depreciation) of investments | $(24,926,787) |
Net tax appreciation (depreciation) on derivatives | — |
Net tax appreciation (depreciation) | $(24,926,787) |
Other book-to-tax adjustments | $(135,407) |
Undistributed tax-exempt income | — |
Accumulated short-term capital losses | $(28,607,717) |
Post-October capital loss deferral | $(1,754,569) |
The cost of investments for federal income tax purposes was the same as the cost for financial reporting purposes. The difference between book-basis and tax-basis unrealized appreciation (depreciation) is attributable primarily to the realization for tax purposes of unrealized gains (losses) on futures contracts. Other book-to-tax adjustments are attributable primarily to the tax deferral of losses on straddle positions.
Accumulated capital losses represent net capital loss carryovers that may be used to offset future realized capital gains for federal income tax purposes. Future capital loss carryover utilization in any given year may be subject to Internal Revenue Code limitations. Capital loss carryovers expire as follows:
2017 | 2018 | 2019 |
$(9,518,848) | $(12,885,340) | $(6,203,529) |
Loss deferrals represent certain qualified losses that the fund has elected to treat as having been incurred in the following fiscal year for federal income tax purposes.
Financial Highlights |
For a Share Outstanding Throughout the Years Ended August 31 (except as noted) | |||||||||||||
Per-Share Data | Ratios and Supplemental Data | ||||||||||||
Income From Investment Operations: | Ratio to Average Net Assets of: | ||||||||||||
Net Asset | Net | Net | Total From | Distributions | Net Asset | Total | Operating | Operating | Net | Net | Portfolio | Net Assets, | |
Investor Class | |||||||||||||
2013 | $10.13 | 0.40(2) | (0.80) | (0.40) | (0.40) | $9.33 | (4.14)% | 0.50% | 0.50% | 3.99% | 3.99% | 81% | $472,141 |
2012 | $9.40 | 0.45(2) | 0.73 | 1.18 | (0.45) | $10.13 | 12.79% | 0.50% | 0.50% | 4.55% | 4.55% | 48% | $506,399 |
2011 | $9.69 | 0.47(2) | (0.29) | 0.18 | (0.47) | $9.40 | 2.07% | 0.49% | 0.51% | 5.10% | 5.08% | 37% | $374,467 |
2010 | $8.88 | 0.47(2) | 0.81 | 1.28 | (0.47) | $9.69 | 14.78% | 0.49% | 0.51% | 5.08% | 5.06% | 17% | $417,503 |
2009 | $9.50 | 0.48 | (0.62) | (0.14) | (0.48) | $8.88 | (1.16)% | 0.52% | 0.52% | 5.56% | 5.56% | 26% | $373,313 |
Institutional Class | |||||||||||||
2013 | $10.13 | 0.42(2) | (0.80) | (0.38) | (0.42) | $9.33 | (3.94)% | 0.30% | 0.30% | 4.19% | 4.19% | 81% | $25,217 |
2012 | $9.40 | 0.46(2) | 0.74 | 1.20 | (0.47) | $10.13 | 13.01% | 0.30% | 0.30% | 4.75% | 4.75% | 48% | $22,287 |
2011 | $9.69 | 0.49(2) | (0.29) | 0.20 | (0.49) | $9.40 | 2.27% | 0.29% | 0.31% | 5.30% | 5.28% | 37% | $9,784 |
2010(3) | $9.28 | 0.25(2) | 0.41 | 0.66 | (0.25) | $9.69 | 7.16% | 0.29%(4) | 0.31%(4) | 5.24%(4) | 5.22%(4) | 17%(5) | $27 |
A Class | |||||||||||||
2013 | $10.13 | 0.38(2) | (0.80) | (0.42) | (0.38) | $9.33 | (4.38)% | 0.75% | 0.75% | 3.74% | 3.74% | 81% | $105,296 |
2012 | $9.40 | 0.42(2) | 0.73 | 1.15 | (0.42) | $10.13 | 12.51% | 0.75% | 0.75% | 4.30% | 4.30% | 48% | $117,162 |
2011 | $9.69 | 0.45(2) | (0.29) | 0.16 | (0.45) | $9.40 | 1.82% | 0.74% | 0.76% | 4.85% | 4.83% | 37% | $89,028 |
2010 | $8.88 | 0.45(2) | 0.81 | 1.26 | (0.45) | $9.69 | 14.50% | 0.74% | 0.76% | 4.83% | 4.81% | 17% | $106,577 |
2009 | $9.50 | 0.46 | (0.62) | (0.16) | (0.46) | $8.88 | (1.41)% | 0.77% | 0.77% | 5.31% | 5.31% | 26% | $101,111 |
For a Share Outstanding Throughout the Years Ended August 31 (except as noted) | |||||||||||||
Per-Share Data | Ratios and Supplemental Data | ||||||||||||
Income From Investment Operations: | Ratio to Average Net Assets of: | ||||||||||||
Net Asset | Net | Net | Total From | Distributions | Net Asset | Total | Operating | Operating | Net | Net | Portfolio | Net Assets, | |
C Class | |||||||||||||
2013 | $10.13 | 0.30(2) | (0.80) | (0.50) | (0.30) | $9.33 | (5.09)% | 1.50% | 1.50% | 2.99% | 2.99% | 81% | $25,056 |
2012 | $9.40 | 0.35(2) | 0.73 | 1.08 | (0.35) | $10.13 | 11.67% | 1.50% | 1.50% | 3.55% | 3.55% | 48% | $29,388 |
2011 | $9.69 | 0.38(2) | (0.29) | 0.09 | (0.38) | $9.40 | 1.06% | 1.49% | 1.51% | 4.10% | 4.08% | 37% | $23,917 |
2010 | $8.88 | 0.38(2) | 0.81 | 1.19 | (0.38) | $9.69 | 13.64% | 1.49% | 1.51% | 4.08% | 4.06% | 17% | $30,286 |
2009 | $9.50 | 0.39 | (0.62) | (0.23) | (0.39) | $8.88 | (2.14)% | 1.52% | 1.52% | 4.56% | 4.56% | 26% | $30,747 |
Notes to Financial Highlights
(1) | Total returns are calculated based on the net asset value of the last business day and do not reflect applicable sales charges, if any. Total returns for periods less than one year are not annualized. |
(2) | Computed using average shares outstanding throughout the period. |
(3) | March 1, 2010 (commencement of sale) through August 31, 2010. |
(4) | Annualized. |
(5) | Portfolio turnover is calculated at the fund level. Percentage indicated was calculated for the year ended August 31, 2010. |
See Notes to Financial Statements.
Report of Independent Registered Public Accounting Firm |
To the Trustees of the American Century California Tax-Free and Municipal Funds and Shareholders of the California High-Yield Municipal Fund:
In our opinion, the accompanying statement of assets and liabilities, including the schedule of investments, and the related statements of operations and of changes in net assets and the financial highlights present fairly, in all material respects, the financial position of the California High-Yield Municipal Fund (one of the four funds in the American Century California Tax-Free and Municipal Funds, hereafter referred to as the “Fund”) at August 31, 2013, the results of its operations for the year then ended, the changes in its net assets for each of the two years in the period then ended and the financial highlights for the periods presented, in conformity with accounting principles generally accepted in the United States of America. These financial statements and financial highlights (hereafter referred to as “financial statements”) are the responsibility of the Fund’s management; our responsibility is to express an opinion on these financial statements based on our audits. We conducted our audits of these financial statements in accordance with the standards of the Public Company Accounting Oversight Board (United States). Those standards require that we plan and perform the audit to obtain reasonable assurance about whether the financial statements are free of material misstatement. An audit includes examining, on a test basis, evidence supporting the amounts and disclosures in the financial statements, assessing the accounting principles used and significant estimates made by management, and evaluating the overall financial statement presentation. We believe that our audits, which included confirmation of securities at August 31, 2013 by correspondence with the custodian, provide a reasonable basis for our opinion.
PricewaterhouseCoopers LLP
Kansas City, Missouri
October 21, 2013
Management |
Board of Trustees
The individuals listed below serve as trustees of the funds. Each trustee will continue to serve in this capacity until death, retirement, resignation or removal from office. The board has adopted a mandatory retirement age for trustees who are not “interested persons,” as that term is defined in the Investment Company Act (independent trustees). Independent trustees shall retire on December 31 of the year in which they reach their 75th birthday; provided, however, that on or after January 1, 2022, independent trustees shall retire on December 31 of the year in which they reach their 76th birthday.
Mr. Thomas is the only trustee who is an “interested person” because he currently serves as President and Chief Executive Officer of American Century Companies, Inc. (ACC), the parent company of American Century Investment Management, Inc. (ACIM or the advisor).
The other trustees (more than three-fourths of the total number) are independent; that is, they have never been employees, directors or officers of, and have no financial interest in, ACC or any of its wholly owned, direct or indirect, subsidiaries, including ACIM, American Century Investment Services, Inc. (ACIS) and American Century Services, LLC (ACS). The trustees serve in this capacity for eight (in the case of Mr. Thomas, 15) registered investment companies in the American Century Investments family of funds.
The following table presents additional information about the trustees. The mailing address for each trustee other than Mr. Thomas is 1665 Charleston Road, Mountain View, California 94043. The mailing address for Mr. Thomas is 4500 Main Street, Kansas City, Missouri 64111.
Name | Position(s) Held with Funds | Length of Time Served | Principal Occupation(s) During Past 5 Years | Number of American Century Portfolios Overseen by Trustee | Other Directorships Held During Past 5 Years | |
Independent Trustees | ||||||
Tanya S. Beder | Trustee | Since 2011 | Chairman, SBCC Group Inc. (independent advisory services) (2006 to present) | 41 | CYS Investments, Inc. (specialty finance company) | |
Jeremy I. Bulow | Trustee | Since 2011 | Professor of Economics, Stanford University, Graduate School of Business (1979 to present) | 41 | None | |
Ronald J. Gilson | Trustee and Chairman of the Board | Since 1995 | Charles J. Meyers Professor of Law and Business, Stanford Law School (1979 to present); Marc and Eva Stern Professor of Law and Business, Columbia University School of Law (1992 to present) | 41 | None | |
Frederick L. A. Grauer | Trustee | Since 2008 | Senior Advisor, BlackRock, Inc. (investment management firm) (2010 to 2011); Senior Advisor, Barclays Global Investors (investment management firm) (2003 to 2009) | 41 | None | |
Name | Position(s) Held with Funds | Length of Time Served | Principal Occupation(s) During Past 5 Years | Number of American Century Portfolios Overseen by Trustee | Other Directorships Held During Past 5 Years | |
Independent Trustees | ||||||
Peter F. Pervere | Trustee | Since 2007 | Retired | 41 | Intraware, Inc. (2003 to 2009) | |
Myron S. Scholes | Trustee | Since 1980 | Chairman, Platinum Grove Asset Management, L.P. (asset manager) (1999 to 2009); Frank E. Buck Professor of Finance-Emeritus, Stanford Graduate School of Business (1996 to present) | 41 | Dimensional Fund Advisors (investment advisor); CME Group, Inc. (futures and options exchange) | |
John B. Shoven | Trustee | Since 2002 | Professor of Economics, Stanford University (1973 to present) | 41 | Cadence Design Systems; Exponent; Financial Engines | |
Interested Trustee | ||||||
Jonathan S. Thomas | Trustee and President | Since 2007 | President and Chief Executive Officer, ACC (March 2007 to present). Also serves as Chief Executive Officer and Manager, ACS; Executive Vice President, ACIM; Director, ACC, ACIM and other ACC subsidiaries | 116 | None | |
Officers
The following table presents certain information about the executive officers of the funds. Each officer serves as an officer for each of the 15 investment companies in the American Century family of funds, unless otherwise noted. No officer is compensated for his or her service as an officer of the funds. The listed officers are interested persons of the funds and are appointed or re-appointed on an annual basis. The mailing address for each of the officers listed below is 4500 Main Street, Kansas City, Missouri 64111.
Name | Offices with the Funds | Principal Occupation(s) During the Past Five Years |
Jonathan S. Thomas | Trustee and President since 2007 | President and Chief Executive Officer, ACC (March 2007 to present). Also serves as Chief Executive Officer and Manager, ACS; Executive Vice President, ACIM; Director, ACC, ACIM and other ACC subsidiaries |
Maryanne L. Roepke | Chief Compliance Officer since 2006 and Senior Vice President since 2000 | Chief Compliance Officer, American Century funds, ACIM and ACS (August 2006 to present). Also serves as Senior Vice President, ACS |
Charles A. Etherington | General Counsel since 2007 and Senior Vice President since 2006 | Attorney, ACC (February 1994 to present); Vice President, ACC (November 2005 to present); General Counsel, ACC (March 2007 to present). Also serves as General Counsel, ACIM, ACS, ACIS and other ACC subsidiaries; and Senior Vice President, ACIM and ACS |
C. Jean Wade | Vice President, Treasurer and Chief Financial Officer since 2012 | Vice President, ACS (February 2000 to present) |
Robert J. Leach | Vice President since 2006 and Assistant Treasurer since 2012 | Vice President, ACS (February 2000 to present) |
David H. Reinmiller | Vice President since 2001 | Attorney, ACC (January 1994 to present); Associate General Counsel, ACC (January 2001 to present). Also serves as Vice President, ACIM and ACS |
Ward D. Stauffer | Secretary since 2005 | Attorney, ACC (June 2003 to present) |
The Statement of Additional Information has additional information about the fund’s trustees and is available without charge, upon request, by calling 1-800-345-2021.
Approval of Management Agreement |
At a meeting held on June 11, 2013, the Fund’s Board of Directors/Trustees unanimously approved the renewal of the management agreement pursuant to which American Century Investment Management, Inc. (the “Advisor”) acts as the investment advisor for the Fund. Under Section 15(c) of the Investment Company Act, contracts for investment advisory services are required to be reviewed, evaluated, and approved by a majority of a fund’s directors/trustees (the “Directors”), including a majority of the independent Directors each year. The Board regards this annual evaluation and renewal as one of its most important responsibilities.
In connection with their annual review and evaluation, the independent Directors memorialized a statement regarding the relationship between their ongoing obligations to oversee and evaluate the performance of the Advisor and their consideration of renewal of the management agreement. In that statement, the independent Directors noted that their assessment of the Advisor’s performance is an ongoing process that takes place over the entire year and is informed by all of the information that the Board and its committees receive and consider over time. This information, together with the materials provided in connection with the review, are central to the Board’s assessment of the Advisor’s performance and its determination whether to renew the Fund’s management agreement.
Prior to its consideration of the renewal of the management agreement, the Board requested and reviewed extensive data and analysis relating to the proposed renewal. This information and analysis was compiled by the Advisor and certain independent providers of evaluation data concerning the Fund and the services provided to the Fund by the Advisor.
In connection with its consideration of the renewal of the management agreement, the Board’s review and evaluation of the services provided by the Advisor included, but was not limited to, the following:
• | the nature, extent, and quality of investment management, shareholder services, and other services provided by the Advisor to the Fund; |
• | the wide range of other programs and services the Advisor provides to the Fund and its shareholders on a routine and non-routine basis; |
• | the investment performance of the Fund, including data comparing the Fund’s performance to appropriate benchmarks and/or a peer group of other mutual funds with similar investment objectives and strategies; |
• | data comparing the cost of owning the Fund to the cost of owning similar funds; |
• | the Advisor’s compliance policies, procedures, and regulatory experience; |
• | financial data showing the cost of services provided to the Fund, the profitability of the Fund to the Advisor, and the overall profitability of the Advisor; |
• | possible economies of scale associated with the Advisor’s management of the Fund and other accounts under its management; |
• | data comparing services provided and charges to other investment management clients of the Advisor; and |
• | consideration of collateral benefits derived by the Advisor from the management of the Fund. |
In keeping with its practice, the Board held two in-person meetings to review and discuss the information provided. The Board also had the benefit of the advice of its independent counsel throughout the period.
Factors Considered
The Directors considered all of the information provided by the Advisor, the independent data providers, and the Board’s independent counsel in connection with the review, and evaluated such information for the Fund. In connection with their review, the Directors did not identify any single factor as being all-important or controlling and each Director may have attributed different levels of importance to different factors. In deciding to renew the management agreement, the Board based its decision on a number of factors, including the following:
Nature, Extent and Quality of Services - Generally. Under the management agreement, the Advisor is responsible for providing or arranging for all services necessary for the operation of the Fund. The Board noted that under the management agreement, the Advisor provides or arranges at its own expense a wide variety of services including:
• | constructing and designing the Fund |
• | portfolio research and security selection |
• | initial capitalization/funding |
• | securities trading |
• | Fund administration |
• | custody of Fund assets |
• | daily valuation of the Fund’s portfolio |
• | shareholder servicing and transfer agency, including shareholder confirmations, recordkeeping, and communications |
• | legal services |
• | regulatory and portfolio compliance |
• | financial reporting |
• | marketing and distribution |
The Board noted that many of these services have expanded over time both in terms of quantity and complexity in response to shareholder demands, competition in the industry, changing distribution channels, and the changing regulatory environment.
Investment Management Services.The nature of the investment management services provided to the Fund is quite complex and allows Fund shareholders access to professional money management, instant diversification of their investments within an asset class, the opportunity to easily diversify among asset classes by investing in or exchanging among various American Century Investments funds, and liquidity. In evaluating investment performance, the Board expects the Advisor to manage the Fund in accordance with its investment objectives and approved strategies. Further, the Directors recognize that the Advisor has an obligation to seek the best execution of fund trades. In providing these services, the Advisor utilizes teams of investment professionals (portfolio managers, analysts, research assistants, and securities traders) who require extensive information technology, research, training, compliance and other systems to conduct their business. The Board, directly and through its Portfolio Committee, regularly reviews investment performance information for the Fund, together with comparative information for appropriate benchmarks and/or peer groups of similarly-managed funds, over different time horizons. The Directors also review detailed performance information during the management agreement approval process. If performance concerns are identified, the Fund receives special reviews until performance improves, during which the Board discusses with the Advisor the reasons for such results (e.g., market conditions, security selection) and any efforts being undertaken to improve performance. The Board found the investment management services provided by the Advisor to the Fund to meet or exceed industry standards. More detailed information about the Fund’s performance can be found in the Performance and Portfolio Commentary sections of this report.
Shareholder and Other Services. Under the management agreement, the Advisor provides the Fund with a comprehensive package of transfer agency, shareholder, and other services. The Board, directly and through various committees of the Board, regularly reviews reports and evaluations of such services at its regular meetings. These reports include, but are not limited to, information regarding the operational efficiency and accuracy of the shareholder and transfer agency services provided, staffing levels, shareholder satisfaction (as measured by external as well as internal sources), technology support, new products and services offered to Fund shareholders, securities trading activities, portfolio valuation services, auditing services, and legal and operational compliance activities. Certain aspects of shareholder and transfer agency service level efficiency and the quality of securities trading activities are measured by independent third party providers and are presented in comparison to other fund groups not managed by the Advisor. The Board found the services provided by the Advisor to the Fund under the management agreement to be competitive and of high quality.
Costs of Services and Profitability. The Advisor provides detailed information concerning its cost of providing various services to the Fund, its profitability in managing the Fund, its overall profitability, and its financial condition. The Directors have reviewed with the Advisor the methodology used to prepare this financial information. The financial information regarding the Advisor is considered in evaluating the Advisor’s financial condition, its ability to continue
to provide services under the management agreement, and the reasonableness of the current management fee. The Board concluded that the Advisor’s profits were reasonable in light of the services provided to the Fund.
Ethics. The Board generally considers the Advisor’s commitment to providing quality services to shareholders and to conducting its business ethically. They noted that the Advisor’s practices generally meet or exceed industry best practices.
Economies of Scale. The Board also reviewed information provided by the Advisor regarding the possible existence of economies of scale in connection with the management of the Fund. The Board concluded that economies of scale are difficult to measure and predict with precision, especially on a fund-by-fund basis. The Board concluded that the Advisor is appropriately sharing economies of scale through its competitive fee structure, offering competitive fees from fund inception, and through reinvestment in its business to provide shareholders additional content and services.
Comparison to Other Funds’ Fees. The management agreement provides that the Fund pay the Advisor a single, all-inclusive (or unified) management fee for providing all services necessary for the management and operation of the Fund, other than brokerage expenses, taxes, interest, extraordinary expenses, and the fees and expenses of the Fund’s independent directors (including their independent legal counsel) and expenses incurred in connection with the provision of shareholder services and distribution services under a plan adopted pursuant to Rule 12b-1 under the 1940 Act. Under the unified fee structure, the Advisor is responsible for providing all investment advisory, custody, audit, administrative, compliance, recordkeeping, marketing and shareholder services, or arranging and supervising third parties to provide such services. By contrast, most other funds are charged a variety of fees, including an investment advisory fee, a transfer agency fee, an administrative fee, distribution charges and other expenses. Other than their investment advisory fees and any applicable Rule 12b-1 distribution fees, all other components of the total fees charged by these other funds may be increased without shareholder approval. The Board believes the unified fee structure is a benefit to Fund shareholders because it clearly discloses to shareholders the cost of owning Fund shares, and, since the unified fee cannot be increased without a vote of Fund shareholders, it shifts to the Advisor the risk of increased costs of operating the Fund and provides a direct incentive to minimize administrative inefficiencies. Part of the Board’s analysis of fee levels involves reviewing certain evaluative data compiled by an independent provider and comparing the Fund’s unified fee to the total expense ratio of other funds in the Fund’s peer group. The Board concluded that the management fee paid by the Fund to the Advisor under the management agreement is reasonable in light of the services provided to the Fund.
Comparison to Fees and Services Provided to Other Clients of the Advisor. The Board also requested and received information from the Advisor concerning the nature of the services, fees, costs and profitability of its advisory services to advisory clients other than the Fund. They observed that these varying types of client accounts require different services and involve different regulatory and entrepreneurial risks than the management of the Fund. The Board analyzed this information and concluded that the fees charged and services provided to the Fund were reasonable by comparison.
Collateral or “Fall-Out” Benefits Derived by the Advisor. The Board considered the existence of collateral benefits the Advisor may receive as a result of its relationship with the Fund. They concluded that the Advisor’s primary business is managing mutual funds and it generally does not use fund or shareholder information to generate profits in other lines of business, and therefore does not derive any significant collateral benefits from them. The Board noted that the Advisor receives proprietary research from broker-dealers that execute fund portfolio transactions and concluded that this research is likely to benefit Fund shareholders. The Board also determined that the Advisor is able to provide investment management services to certain clients other than the Fund, at least in part, due to its existing infrastructure built to serve the fund complex. The Board concluded, however, that the assets of those other clients are not material to the analysis and, where applicable, may be included with the assets of the Fund to determine breakpoints in the management fee schedule.
Existing Relationship. The Board also considered whether there was any reason for not continuing the existing arrangement with the Advisor. In this regard, the Board was mindful of the potential disruptions of the Fund’s operations and various risks, uncertainties, and other effects that could occur as a result of a decision not to continue such relationship. In particular, the Board recognized that most shareholders have invested in the Fund on the strength of the Advisor’s industry standing and reputation and in the expectation that the Advisor will have a continuing role in providing advisory services to the Fund.
Conclusion of the Directors. As a result of this process, the Board, including all of the independent directors and assisted by the advice of independent legal counsel, taking into account all of the factors discussed above and the information provided by the Advisor and others, concluded that the management agreement between the Fund and the Advisor is fair and reasonable in light of the services provided and should be renewed.
Additional Information |
Proxy Voting Guidelines
American Century Investment Management, Inc., the fund’s investment advisor, is responsible for exercising the voting rights associated with the securities purchased and/or held by the fund. A description of the policies and procedures the advisor uses in fulfilling this responsibility is available without charge, upon request, by calling 1-800-345-2021. It is also available on American Century Investments’ website at americancentury.com and on the Securities and Exchange Commission’s website at sec.gov. Information regarding how the investment advisor voted proxies relating to portfolio securities during the most recent 12-month period ended June 30 is available on the “About Us” page at americancentury.com. It is also available at sec.gov.
Quarterly Portfolio Disclosure
The fund files its complete schedule of portfolio holdings with the Securities and Exchange Commission (SEC) for the first and third quarters of each fiscal year on Form N-Q. The fund’s Forms N-Q are available on the SEC’s website at sec.gov, and may be reviewed and copied at the SEC’s Public Reference Room in Washington, DC. Information on the operation of the Public Reference Room may be obtained by calling 1-800-SEC-0330. The fund also makes its complete schedule of portfolio holdings for the most recent quarter of its fiscal year available on its website at americancentury.com and, upon request, by calling 1-800-345-2021.
Other Tax Information
The following information is provided pursuant to provisions of the Internal Revenue Code.
The fund designates $28,228,158 as exempt interest dividends for the fiscal year ended August 31, 2013.
Notes |
Notes |

Contact Us | americancentury.com |
Automated Information Line | 1-800-345-8765 |
Investor Services Representative | 1-800-345-2021 |
Investors Using Advisors | 1-800-378-9878 |
Business, Not-For-Profit, Employer-Sponsored Retirement Plans | 1-800-345-3533 |
Banks and Trust Companies, Broker-Dealers, Financial Professionals, Insurance Companies | 1-800-345-6488 |
Telecommunications Device for the Deaf | 1-800-634-4113 |
American Century California Tax-Free and Municipal Funds
Investment Advisor
American Century Investment Management, Inc.
Kansas City, Missouri
This report and the statements it contains are submitted for the general information of our shareholders. The report is not authorized for distribution to prospective investors unless preceded or accompanied by an effective prospectus.
©2013 American Century Proprietary Holdings, Inc. All rights reserved.
CL-ANN-79623 1310
ANNUAL REPORT | AUGUST 31, 2013 |
California Intermediate-Term Tax-Free Bond Fund
Table of Contents |
President’s Letter | 2 |
Market Perspective | 3 |
Performance | 4 |
Portfolio Commentary | 6 |
Fund Characteristics | 8 |
Shareholder Fee Example | 9 |
Schedule of Investments | 11 |
Statement of Assets and Liabilities | 29 |
Statement of Operations | 30 |
Statement of Changes in Net Assets | 31 |
Notes to Financial Statements | 32 |
Financial Highlights | 37 |
Report of Independent Registered Public Accounting Firm | 39 |
Management | 40 |
Approval of Management Agreement | 43 |
Additional Information | 48 |
Any opinions expressed in this report reflect those of the author as of the date of the report, and do not necessarily represent the opinions of American Century Investments® or any other person in the American Century Investments organization. Any such opinions are subject to change at any time based upon market or other conditions and American Century Investments disclaims any responsibility to update such opinions. These opinions may not be relied upon as investment advice and, because investment decisions made by American Century Investments funds are based on numerous factors, may not be relied upon as an indication of trading intent on behalf of any American Century Investments fund. Security examples are used for representational purposes only and are not intended as recommendations to purchase or sell securities. Performance information for comparative indices and securities is provided to American Century Investments by third party vendors. To the best of American Century Investments’ knowledge, such information is accurate at the time of printing.
President’s Letter |
JonathanThomas
Dear Investor:
Thank you for reviewing this annual report for the 12 months ended August 31, 2013. It provides investment performance, market analysis, and portfolio information, presented with the expert perspective of our portfolio management team.
Annual reports remain important vehicles for conveying information about fund returns, including key factors that affected fund performance. For additional, updated investment and market insights, we encourage you to visit our website, americancentury.com.
U.S. Government Bond Yields and Stock Indices Soared
U.S. government bond yields and stock indices traced roughly parallel upward paths during the 12 months ended August 31, 2013. The 10-year U.S. Treasury yield began the period at just 1.55%, compressed in large part by the scale of the Federal Reserve’s (the Fed’s) bond-buying program ($85 billion of quantitative easing, or QE, each month).
Hints from the Fed that it might taper QE sent bond yields soaring from early May to the end of August—the 10-year U.S. Treasury yield closed the period at 2.78%. The 10-year U.S. Treasury note and the Barclays U.S. Aggregate Bond Index (representing the broad taxable U.S. bond market) returned –7.52% and –2.47%, respectively, for the 12 months. Municipal bonds generally trailed taxable bonds—the Barclays Municipal Bond Index returned –3.70%.
U.S. stocks also experienced volatility from mid-May to mid-June as a result of the “Taper Tantrum,” but it was a relatively small setback in an otherwise solid 12-month performance period. The S&P 500 Index gained 18.70% as the U.S. economy showed signs of attaining sustainable growth. Improvements in the housing and job markets helped trigger optimism, though absolute levels still remain well below where they were prior to 2008.
Recovery from 2008 remains a major hurdle. Economic growth is still subpar compared with past recession recoveries, and the outlook is uncertain. Therefore, we continue to believe in a disciplined, diversified, long-term investment approach, using professionally managed stock and bond portfolios—as appropriate—for meeting financial goals. We appreciate your continued trust in us in this challenging environment.
Sincerely,
Jonathan Thomas
President and Chief Executive Officer
American Century Investments
Market Perspective |
By David MacEwen, Chief Investment Officer, Fixed Income
Federal Reserve Policy Drove Market Sentiment
The municipal bond (muni) market began the 12-month period on a fairly upbeat note, supported by stable-to-improving credit trends, robust issuance, healthy demand, and an accommodative Federal Reserve (Fed). Early in the period, the Fed also launched its third and most aggressive quantitative easing program (QE3), a strategy to purchase $85 billion of U.S. government securities each month until economic growth and employment improve. The Fed also kept its overnight interest rate target near 0%. These actions supported the U.S. bond market in general at the start of the period.
Beginning in spring 2013, investor sentiment shifted dramatically, as fears of a change in Fed policy triggered a broad market sell-off. Since 2008, the Fed’s massive QE programs have helped keep longer-term interest rates low and encouraged risk-taking. But Fed statements throughout the spring and summer indicated the central bank may start tapering its bond purchases this year. In addition, select economic data modestly improved, fueling further speculation that the Fed would change course. In response, bond yields soared, generating negative returns throughout the fixed income market.
Munis Underperformed Treasuries, Broad Bond Market
Despite outperforming during the first half of the period, munis underperformed their Treasury counterparts and the taxable investment-grade bond market for the entire 12-month period. Overall, market volatility, rising-rate worries, liquidity concerns, and a weaker supply/demand backdrop in the second half drove down 12-month returns. The most-liquid and shortest-duration (least price-sensitive to interest rate changes) fixed-income securities generally
fared best.
Additionally, the City of Detroit bankruptcy filing on July 18, 2013, combined with mounting debt problems in Puerto Rico, which is among the largest muni issuers, further pressured the muni market. Although the Detroit bankruptcy was big news, it was not a big surprise, coming after decades of financial mismanagement and population declines. Nevertheless, the negative headlines surrounding the record-setting bankruptcy and growing concerns for Puerto Rico’s debt exacerbated the selling pressures in the muni market and led to additional price deterioration.
U.S. Fixed-Income Total Returns | ||||
For the 12 months ended August 31, 2013 | ||||
Barclays Municipal Market Indices | Barclays U.S. Taxable Market Indices | |||
7 Year Municipal Bond | -1.76% | Aggregate Bond | -2.47% | |
California Tax-Exempt Bond | -3.03% | Treasury Bond | -3.07% | |
Municipal Bond | -3.70% | |||
Municipal High Yield Bond | -3.91% | |||
Long-Term Municipal Bond | -7.43% | |||
Performance |
Total Returns as of August 31, 2013 | ||||||
Average Annual Returns | ||||||
Ticker Symbol | 1 year | 5 years | 10 years | Since Inception | Inception Date | |
Investor Class | BCITX | -2.51% | 4.19% | 3.84% | 5.51% | 11/9/83 |
Barclays 7 Year | — | -1.76% | 4.85% | 4.58% | N/A(1) | — |
Institutional Class | BCTIX | -2.32% | — | — | 3.88% | 3/1/10 |
A Class No sales charge* With sales charge* | BCIAX
| -2.76% -7.11% | — — | — — | 3.41% 2.05% | 3/1/10
|
C Class | BCIYX | -3.56% | — | — | 2.64% | 3/1/10 |
* | Sales charges include initial sales charges and contingent deferred sales charges (CDSCs), as applicable. A Class shares have a 4.50% maximum initial sales charge and may be subject to a maximum CDSC of 1.00%. C Class shares redeemed within 12 months of purchase are subject to a maximum CDSC of 1.00%. The SEC requires that mutual funds provide performance information net of maximum sales charges in all cases where charges could be applied. |
(1) | Benchmark data first available January 1990. |
Data presented reflect past performance. Past performance is no guarantee of future results. Current performance may be higher or lower than the performance shown. Investment return and principal value will fluctuate, and redemption value may be more or less than original cost. To obtain performance data current to the most recent month end, please call 1-800-345-2021 or visit americancentury.com. As interest rates rise, bond values will decline. The fund concentrates its investments in a single state and therefore may have more exposure to credit risk related to the state of California than a fund with a broader geographical diversification. Investment income may be subject to certain state and local taxes and, depending on your tax status, the federal alternative minimum tax (AMT). Capital gains are not exempt from state and federal income tax.
Unless otherwise indicated, performance reflects Investor Class shares; performance for other share classes will vary due to differences in fee structure. For information about other share classes available, please consult the prospectus. Data assumes reinvestment of dividends and capital gains, and none of the charts reflect the deduction of taxes that a shareholder would pay on fund distributions or the redemption of fund shares. Returns for the index are provided for comparison. The fund’s total returns include operating expenses (such as transaction costs and management fees) that reduce returns, while the total returns of the index do not.
Growth of $10,000 Over 10 Years |
$10,000 investment made August 31, 2003 |
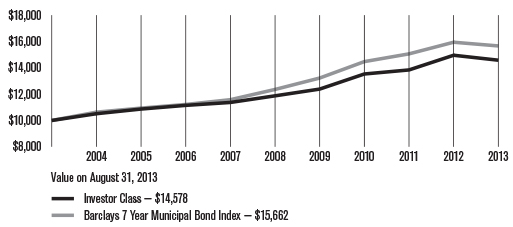
Total Annual Fund Operating Expenses | |||
Investor Class | Institutional Class | A Class | C Class |
0.47% | 0.27% | 0.72% | 1.47% |
The total annual fund operating expenses shown is as stated in the fund’s prospectus current as of the date of this report. The prospectus may vary from the expense ratio shown elsewhere in this report because it is based on a different time period, includes acquired fund fees and expenses, and, if applicable, does not include fee waivers or expense reimbursements.
Data presented reflect past performance. Past performance is no guarantee of future results. Current performance may be higher or lower than the performance shown. Investment return and principal value will fluctuate, and redemption value may be more or less than original cost. To obtain performance data current to the most recent month end, please call 1-800-345-2021 or visit americancentury.com. As interest rates rise, bond values will decline. The fund concentrates its investments in a single state and therefore may have more exposure to credit risk related to the state of California than a fund with a broader geographical diversification. Investment income may be subject to certain state and local taxes and, depending on your tax status, the federal alternative minimum tax (AMT). Capital gains are not exempt from state and federal income tax.
Unless otherwise indicated, performance reflects Investor Class shares; performance for other share classes will vary due to differences in fee structure. For information about other share classes available, please consult the prospectus. Data assumes reinvestment of dividends and capital gains, and none of the charts reflect the deduction of taxes that a shareholder would pay on fund distributions or the redemption of fund shares. Returns for the index are provided for comparison. The fund’s total returns include operating expenses (such as transaction costs and management fees) that reduce returns, while the total returns of the index do not.
Portfolio Commentary |
Portfolio Managers: Joseph Gotelli, Alan Kruss, and Steven Permut
Performance Summary
California Intermediate-Term Tax-Free Bond declined -2.51%* for the fiscal year ended August 31, 2013. By comparison, the Barclays 7 Year Municipal Bond Index declined -1.76%. Portfolio returns reflect operating expenses, while index returns do not. (Please see pages 4 and 5 for additional performance comparisons.)
The fund’s absolute return reflected the negative performance of municipal bond (muni) indices (see page 3) during the 12-month period. The fund’s underperformance relative to its benchmark was due primarily to a longer-maturity bias compared with the index.
Fiscal and Credit Fundamentals
In general, muni market fundamentals improved during the 12-month period, as many states and municipalities continued to take steps to curb spending and strengthen their budgets. A U.S. Census Bureau report released in June 2013 showed state revenues nationwide increased nearly 7% in the first quarter of 2013, compared with 2012’s first quarter. The report also indicated municipal tax revenues increased for 12 consecutive quarters through the first quarter of 2013.
In California, the state’s fiscal outlook continued to improve due to housing and technology sector gains and growing tax revenues. In November 2012, California voters approved Proposition 30, increasing the state’s sales tax rate for the next four years and marginal income tax rates for high-income taxpayers for the next seven years. Furthermore, a June 2013 Bloomberg article indicated rising home values and lower unemployment led to faster first-quarter-2013 economic growth for California than for the next four-largest states. Together, these factors are projected to help generate a possible surplus in the state’s $96.3 billion budget for fiscal 2014.
Increasing tax revenues and projections of structurally balanced state budgets for the next several years prompted Standard & Poor’s in January 2013 to increase California’s credit rating from “A-” to “A” and issue a stable outlook for the state. Fitch also upgraded the state’s debt in August 2013. Meanwhile, from a nationwide perspective, muni credit-rating downgrades generally outpaced upgrades, but the overall default rate remained low. We believe it’s unlikely any states will default, but select credit ratings may remain under downward pressure.
Portfolio Positioning
We continued to emphasize revenue bonds over general obligation (GO) bonds. In particular, the investment team favored essential service (such as water and sewer project) revenue bonds, along with transportation, and sales-tax-secured bonds.
*All fund returns referenced in this commentary are for Investor Class shares.
The fund’s longer maturity and yield-curve positioning appeared to be the primary detractor from relative performance. Specifically, the fund’s national muni benchmark is more “bulleted” (focused on a particular maturity) than the fund, and that portion of the muni yield curve outperformed versus the fund’s broader maturity exposure.
Early in 2013, in anticipation of a steepening yield curve (a greater increase in longer-maturity yields than shorter-maturity), we began reducing the fund’s exposure to longer-maturity securities. We also boosted the fund’s exposure to higher-quality munis. These strategies offset some of the underperformance, as longer-term rates increased at a greater pace than shorter-term rates, and higher-quality munis outperformed lower-quality securities.
Security selection among lower-quality munis (which sharply outperformed higher-quality munis in calendar year 2012 but underperformed during the reporting period) weighed on the fund’s relative performance. In particular, selections within the higher education, industrial development revenue/pollution control revenue (IDR/PCR), and hospital sectors, along with a small (2.1%, as of August 31, 2013) position in Puerto Rico munis, detracted from results.
Against a backdrop of general technical weakening in the muni market during the second half of the reporting period (as described on page 3), as well as some weakening in local credit fundamentals, Puerto Rico munis sharply underperformed during the 12-month period. We believe the Puerto Rico market was generally oversold during the period, given underlying credit fundamentals that still support many of these bonds.
Outlook
We believe the recent jump in interest rates—though perhaps a near-term overreaction given still-subpar economic growth—represents the start of a legitimate long-term “normalization” of rates, as the market comes off extreme, artificially low, largely quantitative easing-influenced levels. Given the state’s favorable fiscal trends, we remain optimistic toward the California muni market. As always, we believe our fundamental credit research and risk management capabilities will continue to drive results.
Fund Characteristics |
AUGUST 31, 2013
| ||
Portfolio at a Glance | ||
Weighted Average Maturity | 9.4 years | |
Average Duration (Modified) | 5.2 years | |
Top Five Sectors | % of fund investments | |
General Obligation (GO) | 20% | |
Electric Revenue | 19% | |
Certificates of Participation (COPs)/Leases | 11% | |
Transportation Revenue | 10% | |
Water/Sewer/Gas Revenue | 9% | |
Types of Investments in Portfolio | % of net assets | |
Municipal Securities | 99.0% | |
Other Assets and Liabilities | 1.0% | |
Shareholder Fee Example |
Fund shareholders may incur two types of costs: (1) transaction costs, including sales charges (loads) on purchase payments and redemption/exchange fees; and (2) ongoing costs, including management fees; distribution and service (12b-1) fees; and other fund expenses. This example is intended to help you understand your ongoing costs (in dollars) of investing in your fund and to compare these costs with the ongoing cost of investing in other mutual funds.
The example is based on an investment of $1,000 made at the beginning of the period and held for the entire period from March 1, 2013 to August 31, 2013.
Actual Expenses
The table provides information about actual account values and actual expenses for each class. You may use the information, together with the amount you invested, to estimate the expenses that you paid over the period. First, identify the share class you own. Then simply divide your account value by $1,000 (for example, an $8,600 account value divided by $1,000 = 8.6), then multiply the result by the number under the heading “Expenses Paid During Period” to estimate the expenses you paid on your account during this period.
If you hold Investor Class shares of any American Century Investments fund, or Institutional Class shares of the American Century Diversified Bond Fund, in an American Century Investments account (i.e., not a financial intermediary or retirement plan account), American Century Investments may charge you a $12.50 semiannual account maintenance fee if the value of those shares is less than $10,000. We will redeem shares automatically in one of your accounts to pay the $12.50 fee. In determining your total eligible investment amount, we will include your investments in all personal accounts (including American Century Investments Brokerage accounts) registered under your Social Security number. Personal accounts include individual accounts, joint accounts, UGMA/UTMA accounts, personal trusts, Coverdell Education Savings Accounts and IRAs (including traditional, Roth, Rollover, SEP-, SARSEP- and SIMPLE-IRAs), and certain other retirement accounts. If you have only business, business retirement, employer-sponsored or American Century Investments Brokerage accounts, you are currently not subject to this fee. If you are subject to the Account Maintenance Fee, your account value could be reduced by the fee amount.
Hypothetical Example for Comparison Purposes
The table also provides information about hypothetical account values and hypothetical expenses based on the actual expense ratio of each class of your fund and an assumed rate of return of 5% per year before expenses, which is not the actual return of a fund’s share class. The hypothetical account values and expenses may not be used to estimate the actual ending account balance or expenses you paid for the period. You may use this information to compare the ongoing costs of investing in your fund and other funds. To do so, compare this 5% hypothetical example with the 5% hypothetical examples that appear in the shareholder reports of the other funds.
Please note that the expenses shown in the table are meant to highlight your ongoing costs only and do not reflect any transactional costs, such as sales charges (loads) or redemption/exchange fees. Therefore, the table is useful in comparing ongoing costs only, and will not help you determine the relative total costs of owning different funds. In addition, if these transactional costs were included, your costs would have been higher.
Beginning 3/1/13 | Ending 8/31/13 | Expenses Paid During Period(1) 3/1/13 – 8/31/13 | Annualized | |
Actual | ||||
Investor Class | $1,000 | $956.90 | $2.32 | 0.47% |
Institutional Class | $1,000 | $957.90 | $1.33 | 0.27% |
A Class | $1,000 | $955.70 | $3.55 | 0.72% |
C Class | $1,000 | $951.30 | $7.23 | 1.47% |
Hypothetical | ||||
Investor Class | $1,000 | $1,022.84 | $2.40 | 0.47% |
Institutional Class | $1,000 | $1,023.84 | $1.38 | 0.27% |
A Class | $1,000 | $1,021.58 | $3.67 | 0.72% |
C Class | $1,000 | $1,017.80 | $7.48 | 1.47% |
(1) | Expenses are equal to the class’s annualized expense ratio listed in the table above, multiplied by the average account value over the period, multiplied by 184, the number of days in the most recent fiscal half-year, divided by 365, to reflect the one-half year period. |
Schedule of Investments |
AUGUST 31, 2013
Principal Amount | Value | |||||
Municipal Securities — 99.0% | ||||||
CALIFORNIA — 96.5% | ||||||
ABAG Finance Authority for Nonprofit Corps. Rev., (899 Charleston LLC), VRDN, 0.10%, 9/3/13 (LOC: Bank of America N.A.) | $2,345,000 | $2,345,000 | ||||
ABAG Finance Authority for Nonprofit Corps. Rev., (Jackson Laboratory), 4.00%, 7/1/15 | 280,000 | 295,641 | ||||
ABAG Finance Authority for Nonprofit Corps. Rev., (Jackson Laboratory), 4.00%, 7/1/16 | 270,000 | 290,663 | ||||
ABAG Finance Authority for Nonprofit Corps. Rev., (Jackson Laboratory), 5.00%, 7/1/17 | 1,000,000 | 1,117,510 | ||||
ABAG Finance Authority for Nonprofit Corps. Rev., (Jackson Laboratory), 5.00%, 7/1/18 | 500,000 | 561,330 | ||||
ABAG Finance Authority for Nonprofit Corps. Rev., Series 2011 A, (Sharp HealthCare), 6.00%, 8/1/30 | 2,500,000 | 2,748,275 | ||||
Alameda Corridor Transportation Authority Rev., Capital Appreciation, Series 1999 A, 0.00%, 10/1/35 (NATL-RE)(1) | 9,000,000 | 2,556,810 | ||||
Alameda Corridor Transportation Authority Rev., Series 2013 A, 5.00%, 10/1/24 | 2,000,000 | 2,193,300 | ||||
Alum Rock Union Elementary School District GO, Series 2013 A, (Election of 2012), 6.00%, 8/1/39 | 1,500,000 | 1,673,280 | ||||
Anaheim Public Financing Authority Rev., Series 2011 A, (Electric System Distribution Facilities), 5.375%, 10/1/36 | 700,000 | 740,026 | ||||
Anaheim Public Financing Authority Rev., Series 2012 A, (Electric System Distribution Facilities), 5.00%, 10/1/23 | 1,200,000 | 1,347,216 | ||||
Anaheim Public Financing Authority Rev., Series 2012 A, (Electric System Distribution Facilities), 5.00%, 10/1/24 | 2,275,000 | 2,510,144 | ||||
Anaheim Public Financing Authority Rev., Series 2012 A, (Electric System Distribution Facilities), 5.00%, 10/1/25 | 4,390,000 | 4,779,130 | ||||
Bay Area Toll Authority Toll Bridge Rev., Series 2001 A, (San Francisco Bay Area), VRDN, 1.31%, 9/5/13 | 5,000,000 | 4,900,350 | ||||
Bay Area Toll Authority Toll Bridge Rev., Series 2007 A1, (San Francisco Bay Area), VRDN, 0.76%, 9/5/13 | 1,450,000 | 1,459,831 | ||||
Bay Area Toll Authority Toll Bridge Rev., Series 2007 F, 5.00%, 4/1/17, Prerefunded at 100% of Par(2) | 2,000,000 | 2,279,620 | ||||
Bay Area Toll Authority Toll Bridge Rev., Series 2008 F1, (San Francisco Bay Area), 5.00%, 4/1/34 | 7,000,000 | 7,143,290 | ||||
Bay Area Toll Authority Toll Bridge Rev., Series 2008 G1, (San Francisco Bay Area), VRDN, 1.16%, 9/5/13 | 2,500,000 | 2,510,250 | ||||
Bay Area Toll Authority Toll Bridge Rev., Series 2009 F1, (San Francisco Bay Area), 5.25%, 4/1/27 | 5,000,000 | 5,552,800 | ||||
Bay Area Toll Authority Toll Bridge Rev., Series 2009 F1, (San Francisco Bay Area), 5.00%, 4/1/34 | 3,500,000 | 3,530,380 | ||||
Bay Area Toll Authority Toll Bridge Rev., Series 2012 F1, (San Francisco Bay Area), 5.00%, 4/1/24 | 1,500,000 | 1,671,180 | ||||
Bay Area Toll Authority Toll Bridge Rev., Series 2012 F1, (San Francisco Bay Area), 5.00%, 4/1/25 | 3,500,000 | 3,848,250 | ||||
Bay Area Toll Authority Toll Bridge Rev., Series 2012 F1, (San Francisco Bay Area), 5.00%, 4/1/28 | 7,185,000 | 7,627,452 | ||||
Bay Area Toll Authority Toll Bridge Rev., Series 2013 S4, (San Francisco Bay Area), 5.00%, 4/1/43 | 5,610,000 | 5,507,730 | ||||
Bay Area Water Supply & Conservation Agency Rev., Series 2013 A, 5.00%, 10/1/26 | 5,000,000 | 5,467,600 | ||||
Principal Amount | Value |
California Department of Water Resources Power Supply Rev., Series 2005 F5, 5.00%, 5/1/22 | $1,800,000 | $2,014,290 | ||||
California Department of Water Resources Power Supply Rev., Series 2005 G4, 5.00%, 5/1/16 | 3,230,000 | 3,603,969 | ||||
California Department of Water Resources Power Supply Rev., Series 2008 H, 5.00%, 5/1/21 | 5,000,000 | 5,659,700 | ||||
California Department of Water Resources Power Supply Rev., Series 2009 AG, (Central Valley), 5.00%, 12/1/25 | 1,000,000 | 1,106,420 | ||||
California Department of Water Resources Power Supply Rev., Series 2010 L, 4.00%, 5/1/15 | 2,290,000 | 2,429,736 | ||||
California Department of Water Resources Power Supply Rev., Series 2010 L, 5.00%, 5/1/15 | 1,000,000 | 1,077,310 | ||||
California Department of Water Resources Power Supply Rev., Series 2010 L, 5.00%, 5/1/16 | 5,000,000 | 5,578,900 | ||||
California Department of Water Resources Power Supply Rev., Series 2010 L, 5.00%, 5/1/17 | 10,875,000 | 12,396,412 | ||||
California Department of Water Resources Power Supply Rev., Series 2010 L, 5.00%, 5/1/18 | 3,000,000 | 3,468,450 | ||||
California Department of Water Resources Power Supply Rev., Series 2010 L, 5.00%, 5/1/19 | 7,000,000 | 8,173,480 | ||||
California Department of Water Resources Power Supply Rev., Series 2010 L, 5.00%, 5/1/21 | 3,000,000 | 3,426,360 | ||||
California Department of Water Resources Power Supply Rev., Series 2010 L, 5.00%, 5/1/22 | 18,000,000 | 20,383,920 | ||||
California Department of Water Resources Power Supply Rev., Series 2010 M, 4.00%, 5/1/15 | 7,275,000 | 7,718,920 | ||||
California Department of Water Resources Power Supply Rev., Series 2010 M, 5.00%, 5/1/15 | 4,000,000 | 4,309,240 | ||||
California Department of Water Resources Power Supply Rev., Series 2010 M, 5.00%, 5/1/16 | 2,000,000 | 2,231,560 | ||||
California Department of Water Resources Power Supply Rev., Series 2011 AJ, (Central Valley), 5.00%, 12/1/20 | 9,665,000 | 11,395,615 | ||||
California Department of Water Resources Power Supply Rev., Series 2011 N, 5.00%, 5/1/20 | 14,215,000 | 16,572,273 | ||||
California Department of Water Resources Power Supply Rev., Series 2011 N, 5.00%, 5/1/21 | 13,300,000 | 15,533,203 | ||||
California Economic Recovery GO, Series 2004 A, 5.25%, 7/1/14 (NATL-RE/FGIC) | 8,460,000 | 8,818,535 | ||||
California Economic Recovery GO, Series 2004 A, 5.25%, 7/1/14(2) | 1,130,000 | 1,176,918 | ||||
California Economic Recovery GO, Series 2004 A, 5.25%, 7/1/14 | 3,870,000 | 4,034,011 | ||||
California Economic Recovery GO, Series 2009 A, 5.00%, 7/1/18 | 7,000,000 | 8,151,220 | ||||
California Economic Recovery GO, Series 2009 A, 5.00%, 7/1/19 | 4,505,000 | 5,269,138 | ||||
California Economic Recovery GO, Series 2009 A, 5.00%, 7/1/20 | 5,000,000 | 5,749,150 | ||||
California Economic Recovery GO, Series 2009 A, 5.00%, 7/1/22 | 2,000,000 | 2,197,300 | ||||
California Economic Recovery GO, Series 2009 B, VRDN, 5.00%, 7/1/14 | 5,000,000 | 5,199,300 | ||||
California Educational Facilities Authority Rev., (Chapman University), 5.00%, 4/1/31 | 1,455,000 | 1,471,412 | ||||
California Educational Facilities Authority Rev., (San Francisco University), 5.00%, 10/1/16 | 1,200,000 | 1,345,884 | ||||
California Educational Facilities Authority Rev., (San Francisco University), 5.00%, 10/1/21 | 750,000 | 837,563 |
Principal Amount | Value |
California Educational Facilities Authority Rev., (Santa Clara University), 5.00%, 4/1/18 | $500,000 | $573,155 | ||||
California Educational Facilities Authority Rev., (Santa Clara University), 5.00%, 4/1/19 | 700,000 | 793,891 | ||||
California Educational Facilities Authority Rev., (Santa Clara University), 5.25%, 4/1/23 | 2,000,000 | 2,190,320 | ||||
California Educational Facilities Authority Rev., (University of the Pacific), 5.00%, 11/1/36 | 1,045,000 | 988,716 | ||||
California Educational Facilities Authority Rev., Series 2008 T4, (Stanford University), 5.00%, 3/15/14 | 5,000,000 | 5,131,400 | ||||
California Educational Facilities Authority Rev., Series 2009 A, (Pomona College), 5.00%, 1/1/24 | 2,100,000 | 2,289,357 | ||||
California Educational Facilities Authority Rev., Series 2009 A, (University of Southern California), 5.00%, 10/1/39 | 2,952,000 | 2,974,258 | ||||
California Educational Facilities Authority Rev., Series 2010 A, (Loyola Marymount University), 5.00%, 10/1/30 | 1,365,000 | 1,384,233 | ||||
California Educational Facilities Authority Rev., Series 2010 B, (Loyola Marymount University), VRN, 0.86%, 9/5/13 | 3,675,000 | 3,678,344 | ||||
California Educational Facilities Authority Rev., Series 2012 A, (University of the Pacific), 4.50%, 11/1/15 | 1,240,000 | 1,338,406 | ||||
California Educational Facilities Authority Rev., Series 2012 A, (University of the Pacific), 4.50%, 11/1/17 | 1,000,000 | 1,116,480 | ||||
California GO, 5.00%, 2/1/14, Prerefunded at 100% of Par(2)(3) | 4,000,000 | 4,081,040 | ||||
California GO, 5.125%, 2/1/14, Prerefunded at 100% of Par(2) | 5,000,000 | 5,103,950 | ||||
California GO, 4.00%, 10/1/14 | 3,000,000 | 3,124,110 | ||||
California GO, 5.00%, 9/1/15 | 9,115,000 | 9,933,527 | ||||
California GO, 5.00%, 11/1/16 (Ambac) | 1,575,000 | 1,780,254 | ||||
California GO, 5.50%, 4/1/18 | 2,535,000 | 2,979,740 | ||||
California GO, 5.00%, 8/1/18 | 2,260,000 | 2,544,037 | ||||
California GO, 5.00%, 9/1/18 | 1,000,000 | 1,161,090 | ||||
California GO, 5.00%, 9/1/19 | 7,645,000 | 8,907,954 | ||||
California GO, 5.25%, 2/1/20 | 2,020,000 | 2,028,181 | ||||
California GO, 5.00%, 3/1/20 | 1,690,000 | 1,875,984 | ||||
California GO, 5.00%, 8/1/20 | 5,000,000 | 5,606,450 | ||||
California GO, 5.25%, 10/1/20 | 5,000,000 | 5,769,350 | ||||
California GO, 5.00%, 3/1/22 | 5,000,000 | 5,418,200 | ||||
California GO, 5.00%, 9/1/22 | 2,000,000 | 2,281,880 | ||||
California GO, 5.50%, 4/1/24 | 4,600,000 | 5,077,112 | ||||
California GO, 5.00%, 8/1/24 | 1,260,000 | 1,395,992 | ||||
California GO, 5.00%, 2/1/27 | 14,000,000 | 14,861,560 | ||||
California GO, 5.00%, 2/1/28 | 5,795,000 | 6,087,937 | ||||
California GO, 5.75%, 4/1/28 | 5,000,000 | 5,410,550 | ||||
California GO, 5.00%, 10/1/29 | 9,000,000 | 9,289,620 | ||||
California GO, 5.75%, 4/1/31 | 5,000,000 | 5,341,100 | ||||
California GO, 5.00%, 11/1/32 | 1,890,000 | 1,924,719 | ||||
California GO, 6.50%, 4/1/33 | 5,000,000 | 5,818,300 | ||||
California GO, 6.00%, 4/1/38 | 3,000,000 | 3,322,890 | ||||
California GO, Series 2012 B, VRN, 0.96%, 9/5/13 | 2,000,000 | 2,011,920 | ||||
California GO, Series 2012 B, VRN, 1.06%, 9/5/13 | 800,000 | 806,736 | ||||
California GO, Series 2012 B, VRN, 1.21%, 9/5/13 | 960,000 | 975,581 | ||||
California Health Facilities Financing Authority Rev., (Cedars-Sinai Medical Center), 5.00%, 8/15/18 | 1,000,000 | 1,154,440 | ||||
California Health Facilities Financing Authority Rev., (Cedars-Sinai Medical Center), 5.00%, 8/15/19 | 735,000 | 848,954 | ||||
California Health Facilities Financing Authority Rev., (NCROC Paradise Valley Estates), 5.70%, 12/1/24 (Ambac/California Mortgage Insurance) | 1,455,000 | 1,577,293 | ||||
California Health Facilities Financing Authority Rev., Series 2008 A, (Lucile Salter Packard Children’s Hospital), VRDN, 1.45%, 3/15/17 | 1,500,000 | 1,491,840 |
Principal Amount | Value |
California Health Facilities Financing Authority Rev., Series 2008 A, (Scripps Health), 5.00%, 10/1/17 | $1,400,000 | $1,597,218 | ||||
California Health Facilities Financing Authority Rev., Series 2008 A, (Sutter Health), 5.50%, 8/15/17 | 1,000,000 | 1,159,180 | ||||
California Health Facilities Financing Authority Rev., Series 2008 A, (Sutter Health), 5.25%, 8/15/22 | 3,335,000 | 3,754,176 | ||||
California Health Facilities Financing Authority Rev., Series 2008 B, (Lucile Salter Packard Children’s Hospital), VRDN, 1.45%, 3/15/17 | 2,200,000 | 2,188,032 | ||||
California Health Facilities Financing Authority Rev., Series 2008 C, (Lucile Salter Packard Children’s Hospital), VRDN, 1.45%, 3/15/17 | 1,500,000 | 1,491,840 | ||||
California Health Facilities Financing Authority Rev., Series 2008 C, (Providence Health & Services), 5.00%, 10/1/14 | 500,000 | 524,535 | ||||
California Health Facilities Financing Authority Rev., Series 2008 C, (Providence Health & Services), 6.50%, 10/1/18, Prerefunded at 100% of Par(2) | 40,000 | 49,653 | ||||
California Health Facilities Financing Authority Rev., Series 2008 C, (Providence Health & Services), 6.25%, 10/1/24 | 3,250,000 | 3,806,140 | ||||
California Health Facilities Financing Authority Rev., Series 2008 C, (Providence Health & Services), 6.50%, 10/1/38 | 2,085,000 | 2,372,209 | ||||
California Health Facilities Financing Authority Rev., Series 2008 H, (Catholic Healthcare West), 5.125%, 7/1/22 | 485,000 | 519,047 | ||||
California Health Facilities Financing Authority Rev., Series 2009 A, (Catholic Healthcare West), 5.00%, 7/1/18 | 3,000,000 | 3,406,950 | ||||
California Health Facilities Financing Authority Rev., Series 2009 A, (Children’s Hospital of Orange County), 6.25%, 11/1/29 | 5,000,000 | 5,524,500 | ||||
California Health Facilities Financing Authority Rev., Series 2009 A, (St. Joseph Health System), 5.50%, 7/1/29 | 1,500,000 | 1,612,680 | ||||
California Health Facilities Financing Authority Rev., Series 2009 A, (St. Joseph Health System), 5.75%, 7/1/39 | 1,000,000 | 1,077,710 | ||||
California Health Facilities Financing Authority Rev., Series 2010 A, (Stanford Hospital), 5.00%, 11/15/25 | 2,000,000 | 2,110,920 | ||||
California Health Facilities Financing Authority Rev., Series 2011 B, (Sutter Health), 6.00%, 8/15/42 | 1,000,000 | 1,101,720 | ||||
California Health Facilities Financing Authority Rev., Series 2011 D, (Sutter Health), 5.00%, 8/15/18 | 1,305,000 | 1,501,833 | ||||
California Health Facilities Financing Authority Rev., Series 2011 D, (Sutter Health), 5.00%, 8/15/22 | 1,650,000 | 1,848,610 | ||||
California Health Facilities Financing Authority Rev., Series 2012 B, (Children’s Hospital of Los Angeles), VRDN, 1.86%, 9/5/13 | 4,025,000 | 4,075,272 | ||||
California Health Facilities Financing Authority Rev., Series 2013 A, (St. Joseph Health System), 5.00%, 7/1/37 | 890,000 | 862,232 | ||||
California Infrastructure & Economic Development Bank Rev., (SRI International), 3.00%, 9/1/14 | 1,110,000 | 1,135,219 | ||||
California Infrastructure & Economic Development Bank Rev., (SRI International), 4.00%, 9/1/15 | 545,000 | 576,539 | ||||
California Infrastructure & Economic Development Bank Rev., (SRI International), 5.00%, 9/1/20 | 1,040,000 | 1,157,510 | ||||
California Infrastructure & Economic Development Bank Rev., (SRI International), 5.00%, 9/1/21 | 1,095,000 | 1,198,631 |
Principal Amount | Value |
California Infrastructure & Economic Development Bank Rev., (SRI International), 5.00%, 9/1/22 | $1,150,000 | $1,256,824 | ||||
California Infrastructure & Economic Development Bank Rev., (SRI International), 5.00%, 9/1/28 | 2,000,000 | 2,042,160 | ||||
California Infrastructure & Economic Development Bank Rev., Series 2000 A, (Scripps Research Institute), 5.625%, 7/1/20 | 895,000 | 898,240 | ||||
California Infrastructure & Economic Development Bank Rev., Series 2003 A, (Bay Area Toll Bridges Seismic Retrofit 1st Lien), 5.125%, 7/1/26, Prerefunded at 100% of Par (Ambac)(2) | 5,000,000 | 5,928,200 | ||||
California Infrastructure & Economic Development Bank Rev., Series 2010 A, (University of California, San Francisco Neuroscience Building), 5.00%, 5/15/22 | 3,735,000 | 4,132,068 | ||||
California Infrastructure & Economic Development Bank Rev., Series 2012 A1, (J. Paul Getty Trust), 4.00%, 10/1/15 | 975,000 | 1,047,735 | ||||
California Infrastructure & Economic Development Bank Rev., Series 2012 B1, (J. Paul Getty Trust), VRDN, 0.36%, 9/5/13 | 7,500,000 | 7,495,275 | ||||
California Infrastructure & Economic Development Bank Rev., Series 2013 A, (Los Angeles County Museum of Art Project), VRDN, 1.88%, 9/3/13 | 3,000,000 | 3,001,080 | ||||
California Municipal Finance Authority Rev., (Biola University), 5.00%, 10/1/18 | 1,000,000 | 1,091,940 | ||||
California Municipal Finance Authority Rev., (Community Hospitals Central), 5.00%, 2/1/17 | 2,000,000 | 2,188,240 | ||||
California Municipal Finance Authority Rev., Series 2007, (Loma Linda University), 5.00%, 4/1/23 | 1,145,000 | 1,188,304 | ||||
California Municipal Finance Authority Rev., Series 2007, (Loma Linda University), 5.00%, 4/1/28 | 2,000,000 | 2,024,780 | ||||
California Municipal Finance Authority Rev., Series 2010 A, (Chevron USA, Inc.), VRDN, 0.04%, 9/3/13 (GA: Chevron Corp.) | 1,800,000 | 1,800,000 | ||||
California Municipal Finance Authority Rev., Series 2010 A, (Eisenhower Medical Center), 5.00%, 7/1/19 | 605,000 | 654,501 | ||||
California Municipal Finance Authority Rev., Series 2010 A, (Eisenhower Medical Center), 5.25%, 7/1/21 | 1,760,000 | 1,863,400 | ||||
California Municipal Finance Authority Rev., Series 2010 A, (University of Louisiana Verne), 5.00%, 6/1/17 | 2,290,000 | 2,495,459 | ||||
California Municipal Finance Authority Rev., Series 2011, (Emerson College), 5.75%, 1/1/33 | 2,250,000 | 2,388,915 | ||||
California Municipal Finance Authority Rev., Series 2011, (Emerson College), 6.00%, 1/1/42 | 1,000,000 | 1,073,050 | ||||
California Public Works Board Lease Rev., Series 2005 A, (Department of General Services – Butterfield), 5.00%, 6/1/14 | 1,800,000 | 1,863,936 | ||||
California Public Works Board Lease Rev., Series 2005 A, (Department of General Services – Butterfield), 5.00%, 6/1/15 | 1,450,000 | 1,560,708 | ||||
California Public Works Board Lease Rev., Series 2006 A, (California State University), 5.00%, 10/1/16 (NATL-RE/FGIC) | 1,500,000 | 1,684,425 | ||||
California Public Works Board Lease Rev., Series 2006 F, (Department of Corrections & Rehabilitation), 5.00%, 11/1/13 (NATL-RE/FGIC) | 2,590,000 | 2,610,875 | ||||
California Public Works Board Lease Rev., Series 2006 F, (Department of Corrections & Rehabilitation), 5.25%, 11/1/19 (NATL-RE/FGIC) | 1,210,000 | 1,408,839 |
Principal Amount | Value |
California Public Works Board Lease Rev., Series 2009 A, (Department of General Services – Building 8 & 9), 6.25%, 4/1/34 | $2,435,000 | $2,761,120 | ||||
California Public Works Board Lease Rev., Series 2009 B, (Department of Education – Riverside Campus), 6.00%, 4/1/27 | 2,130,000 | 2,419,957 | ||||
California Public Works Board Lease Rev., Series 2009 G1, (Various Capital Projects), 5.00%, 10/1/16 | 2,500,000 | 2,807,375 | ||||
California Public Works Board Lease Rev., Series 2009 I1, (Various Capital Projects), 5.00%, 11/1/13 | 2,000,000 | 2,016,120 | ||||
California Public Works Board Lease Rev., Series 2011 A, (Various Capital Projects), 5.00%, 10/1/17 | 6,490,000 | 7,419,498 | ||||
California Public Works Board Lease Rev., Series 2011 D, (Judicial Council Projects), 5.25%, 12/1/26 | 2,000,000 | 2,129,860 | ||||
California Public Works Board Lease Rev., Series 2011 G, (University of California), 5.00%, 12/1/28 | 3,700,000 | 3,925,626 | ||||
California Public Works Board Lease Rev., Series 2012 A, (Various Capital Projects), 5.00%, 4/1/15 | 4,000,000 | 4,279,400 | ||||
California Public Works Board Lease Rev., Series 2012 A, (Various Capital Projects), 5.00%, 4/1/21 | 3,000,000 | 3,372,450 | ||||
California Public Works Board Lease Rev., Series 2012 A, (Various Capital Projects), 5.00%, 4/1/22 | 2,100,000 | 2,340,534 | ||||
California Public Works Board Lease Rev., Series 2012 A, (Various Capital Projects), 5.00%, 4/1/23 | 2,000,000 | 2,194,380 | ||||
California Public Works Board Lease Rev., Series 2012 A, (Various Capital Projects), 5.00%, 4/1/25 | 1,800,000 | 1,912,212 | ||||
California Public Works Board Lease Rev., Series 2012 A, (Various Capital Projects), 5.00%, 4/1/37 | 4,545,000 | 4,398,060 | ||||
California Public Works Board Lease Rev., Series 2012 G, (Various Capital Projects), 5.00%, 11/1/37 | 1,720,000 | 1,663,670 | ||||
California State University Systemwide Rev., Series 2011 A, 5.00%, 11/1/20 | 1,250,000 | 1,456,988 | ||||
California State University Systemwide Rev., Series 2011 A, 5.00%, 11/1/24 | 5,000,000 | 5,531,100 | ||||
California Statewide Communities Development Authority Rev., (Cottage Health Obligation Group), 5.00%, 11/1/16 | 750,000 | 837,315 | ||||
California Statewide Communities Development Authority Rev., (Cottage Health Obligation Group), 5.00%, 11/1/17 | 815,000 | 922,319 | ||||
California Statewide Communities Development Authority Rev., (Cottage Health Obligation Group), 5.00%, 11/1/18 | 515,000 | 586,879 | ||||
California Statewide Communities Development Authority Rev., (John Muir Health), 5.00%, 7/1/20 | 2,225,000 | 2,487,439 | ||||
California Statewide Communities Development Authority Rev., (St. Joseph Remarketing), 5.125%, 7/1/24 (NATL-RE) | 2,000,000 | 2,147,940 | ||||
California Statewide Communities Development Authority Rev., Series 2002 B, (Pooled Financing Program), 5.20%, 10/1/13, Partially Prerefunded at 100% of Par (FSA(2) | 440,000 | 441,531 | ||||
California Statewide Communities Development Authority Rev., Series 2007 A, (California Baptist University), 5.30%, 11/1/18 | 1,820,000 | 1,925,924 | ||||
California Statewide Communities Development Authority Rev., Series 2007 A, (California Baptist University), 5.40%, 11/1/27 | 1,000,000 | 953,270 | ||||
California Statewide Communities Development Authority Rev., Series 2007 A, (Henry Mayo Newhall Memorial Hospital), 5.00%, 10/1/20 (California Mortgage Insurance) | 1,000,000 | 1,085,290 |
Principal Amount | Value |
California Statewide Communities Development Authority Rev., Series 2007 A, (Valleycare Health System), 4.80%, 7/15/17 | $2,530,000 | $2,501,892 | ||||
California Statewide Communities Development Authority Rev., Series 2007 A, (Valleycare Health System), 5.00%, 7/15/22 | 2,460,000 | 2,310,186 | ||||
California Statewide Communities Development Authority Rev., Series 2009 A, (Kaiser Permanente), 5.00%, 4/1/19 | 1,450,000 | 1,669,516 | ||||
California Statewide Communities Development Authority Rev., Series 2012 A, (Kaiser Permanente), 5.00%, 4/1/42 | 5,400,000 | 5,197,176 | ||||
Calleguas-Las Virgenes Public Financing Authority Rev., Series 2007 A, (Municipal Water District), 5.00%, 7/1/20 (NATL-RE/FGIC) | 1,000,000 | 1,079,710 | ||||
Capistrano Unified School District Special Tax Rev., (Community Facilities District No. 87-1), 5.00%, 9/1/18 (Ambac) | 3,115,000 | 3,339,529 | ||||
Chabot-Las Positas Community College District GO, (2016 Crossover), 5.00%, 8/1/29 | 3,980,000 | 4,124,753 | ||||
Chula Vista Rev., Series 2006 A, (San Diego Gas and Electric), 1.65%, 7/1/18 | 8,365,000 | 8,281,601 | ||||
City of Irvine Improvement Bond Act of 1915 Special Assessment Rev., (Assessment District No. 12-1), 4.00%, 9/2/17 | 850,000 | 917,473 | ||||
City of Irvine Improvement Bond Act of 1915 Special Assessment Rev., (Assessment District No. 12-1), 4.00%, 9/2/18 | 875,000 | 942,191 | ||||
City of Irvine Improvement Bond Act of 1915 Special Assessment Rev., (Assessment District No. 12-1), 4.00%, 9/2/19 | 1,400,000 | 1,484,252 | ||||
Clovis Unified School District GO, Capital Appreciation, Series 2004 A, (Election of 2004), 0.00%, 8/1/24 (NATL-RE)(1) | 5,935,000 | 3,552,097 | ||||
Coast Community College District GO, Series 2013 A, (Election of 2012), 4.00%, 8/1/38 | 1,595,000 | 1,361,029 | ||||
Contra Costa Water District Rev., Series 2013 R, 5.00%, 10/1/43 | 2,055,000 | 2,094,066 | ||||
East Bay Municipal Utility District Rev., Series 2012 B, 4.00%, 6/1/15 | 1,185,000 | 1,260,082 | ||||
East Bay Municipal Utility District Rev., Series 2012 B, 5.00%, 6/1/16 | 5,750,000 | 6,430,110 | ||||
East Bay Municipal Utility District Rev., Series 2012 B, 5.00%, 6/1/18 | 4,245,000 | 4,933,454 | ||||
East Side Union High School District GO, Series 2012, 5.00%, 8/1/25 | 1,405,000 | 1,514,056 | ||||
East Side Union High School District GO, Series 2013, 5.00%, 8/1/29 | 2,450,000 | 2,505,688 | ||||
Eastern Municipal Water District Water & Sewer COP, Series 2008 H, 5.00%, 7/1/24 | 1,000,000 | 1,095,080 | ||||
Eastern Municipal Water District Water & Sewer Rev., Series 2011 A, 4.00%, 7/1/14 | 600,000 | 618,906 | ||||
Eastern Municipal Water District Water & Sewer Rev., Series 2011 A, 5.00%, 7/1/15 | 600,000 | 649,686 | ||||
Eastern Municipal Water District Water & Sewer Rev., Series 2011 A, 4.00%, 7/1/16 | 600,000 | 654,258 | ||||
Foothill/Eastern Transportation Corridor Agency Toll Road Rev., Capital Appreciation, 5.80%, 1/15/20 | 2,000,000 | 2,028,180 | ||||
Foothill/Eastern Transportation Corridor Agency Toll Road Rev., Capital Appreciation, 5.85%, 1/15/23 | 3,000,000 | 3,037,200 | ||||
Foothill/Eastern Transportation Corridor Agency Toll Road Rev., Capital Appreciation, 0.00%, 1/15/24(1) | 3,000,000 | 1,546,470 |
Principal Amount | Value |
Foothill/Eastern Transportation Corridor Agency Toll Road Rev., Capital Appreciation, 0.00%, 1/15/25(1) | $8,000,000 | $3,826,400 | ||||
Foothill/Eastern Transportation Corridor Agency Toll Road Rev., Capital Appreciation, 5.875%, 1/15/26 | 1,995,000 | 2,015,269 | ||||
Foothill/Eastern Transportation Corridor Agency Toll Road Rev., Capital Appreciation, 5.875%, 1/15/27 | 1,500,000 | 1,511,925 | ||||
Foothill/Eastern Transportation Corridor Agency Toll Road Rev., Capital Appreciation, 0.00%, 1/15/32(1) | 5,000,000 | 1,452,950 | ||||
Foothill/Eastern Transportation Corridor Agency Toll Road Rev., Capital Appreciation, Series 1995 A, (Senior Lien), 0.00%, 1/1/26(1)(2) | 10,000,000 | 6,323,400 | ||||
Franklin-McKinley School District GO, Series 2005 A, (Election of 2004), 5.00%, 8/1/15, Prerefunded at 100% of Par (FGIC)(2) | 1,150,000 | 1,251,580 | ||||
Golden State Tobacco Securitization Corp. Settlement Rev., Series 2005 A, 5.00%, 6/1/45 | 3,000,000 | 2,754,720 | ||||
Golden State Tobacco Securitization Corp. Settlement Rev., Series 2007 A1, 4.50%, 6/1/27 | 1,365,000 | 1,152,237 | ||||
Golden State Tobacco Securitization Corp. Settlement Rev., Series 2013 A, 5.00%, 6/1/21 | 1,000,000 | 1,111,570 | ||||
Golden State Tobacco Securitization Corp. Settlement Rev., Series 2013 A, 5.00%, 6/1/29 | 2,000,000 | 2,009,040 | ||||
Golden State Tobacco Securitization Corp. Settlement Rev., Series 2013 A, 5.00%, 6/1/30 | 1,650,000 | 1,640,612 | ||||
Golden State Tobacco Securitization Corp. Settlement Rev., Capital Appreciation, Series 2005 A, 0.00%, 6/1/25 (AGM)(1) | 2,000,000 | 1,174,520 | ||||
Grossmont-Cuyamaca Community College District GO, Series 2013 A, (Election of 2012), 5.00%, 8/1/25 | $680,000 | $748,966 | ||||
Grossmont-Cuyamaca Community College District GO, Series 2013 A, (Election of 2012), 5.00%, 8/1/26 | 685,000 | 740,519 | ||||
Grossmont-Cuyamaca Community College District GO, Series 2013 A, (Election of 2012), 5.25%, 8/1/27 | 750,000 | 819,053 | ||||
Huntington Beach Union High School District GO, 5.00%, 8/1/26 | 3,030,000 | 3,327,637 | ||||
Irvine Unified School District Financing Authority Special Tax Rev., Series 2006 A, (Group II), 4.50%, 9/1/13 | 785,000 | 785,071 | ||||
Irvine Unified School District Financing Authority Special Tax Rev., Series 2006 A, (Group II), 4.75%, 9/1/16 | 600,000 | 624,630 | ||||
Irvine Unified School District Financing Authority Special Tax Rev., Series 2006 A, (Group II), 5.00%, 9/1/20 | 745,000 | 767,901 | ||||
Kern High School District GO, 5.00%, 8/1/26 | 1,900,000 | 2,034,691 | ||||
Liberty Union High School District GO, 5.00%, 8/1/29 | 1,985,000 | 2,060,132 | ||||
Long Beach Bond Finance Authority Natural Gas Purchase Rev., Series 2007 A, 5.00%, 11/15/35 | 1,215,000 | 1,147,677 | ||||
Los Alamitos Unified School District COP, Capital Appreciation, (Capital Projects), 0.00%, 8/1/24(4) | 2,100,000 | 1,057,035 | ||||
Los Altos Elementary School District GO, 5.00%, 8/1/16, Prerefunded at 100% of Par (Ambac)(2) | 1,045,000 | 1,174,402 | ||||
Los Altos Elementary School District GO, 5.00%, 8/1/19 (Ambac) | 1,455,000 | 1,617,058 | ||||
Los Angeles Community College District GO, Series 2007 A, (Election of 2001), 5.00%, 8/1/32 (NATL-RE/FGIC) | 2,000,000 | 2,024,100 | ||||
Los Angeles County COP, (Disney Concert Hall), 5.00%, 3/1/21 | 1,195,000 | 1,348,307 | ||||
Los Angeles County COP, (Disney Concert Hall), 5.00%, 3/1/22 | 1,000,000 | 1,122,310 |
Principal Amount | Value |
Los Angeles County COP, (Disney Concert Hall), 5.00%, 3/1/23 | $1,955,000 | $2,179,571 | ||||
Los Angeles County Metropolitan Transportation Authority Sales Tax Rev., Series 2008 B, (Proposal A), 5.00%, 7/1/31 | 1,000,000 | 1,029,910 | ||||
Los Angeles County Metropolitan Transportation Authority Sales Tax Rev., Series 2010 A, (General Union Station), 5.00%, 7/1/20 | 3,000,000 | 3,462,450 | ||||
Los Angeles County Metropolitan Transportation Authority Sales Tax Rev., Series 2013 A, 5.00%, 7/1/20 | 7,000,000 | 8,196,440 | ||||
Los Angeles Department of Airports Rev., Series 2008 C, (Los Angeles International Airport), 5.00%, 5/15/18 | 750,000 | 855,795 | ||||
Los Angeles Department of Airports Rev., Series 2010 A, (Los Angeles International Airport), 5.00%, 5/15/40 | 3,000,000 | 2,960,580 | ||||
Los Angeles Department of Airports Rev., Series 2010 D, (Los Angeles International Airport), 5.00%, 5/15/24 | 3,040,000 | 3,282,653 | ||||
Los Angeles Department of Water & Power Rev., Series 2008 A1, (Power System), 5.25%, 7/1/38 | 5,000,000 | 5,125,450 | ||||
Los Angeles Department of Water & Power Rev., Series 2008 A2, (Power System), 5.25%, 7/1/32 | 3,535,000 | 3,726,243 | ||||
Los Angeles Department of Water & Power Rev., Series 2011 A, (Power System), 5.00%, 7/1/14 | 400,000 | 416,220 | ||||
Los Angeles Department of Water & Power Rev., Series 2011 A, (Power System), 4.00%, 7/1/16 | 1,000,000 | 1,092,210 | ||||
Los Angeles Department of Water & Power Rev., Series 2011 A, (Power System), 5.00%, 7/1/18 | 780,000 | 905,915 | ||||
Los Angeles Department of Water & Power Rev., Series 2012 A, (Power System), 5.00%, 7/1/26 | 1,000,000 | 1,088,140 | ||||
Los Angeles Department of Water & Power Rev., Series 2012 C, 5.00%, 7/1/24 | 1,500,000 | 1,677,555 | ||||
Los Angeles Department of Water & Power Rev., Series 2012 C, (Power System), 5.00%, 1/1/16 | 8,750,000 | 9,565,150 | ||||
Los Angeles Department of Water & Power Rev., Series 2013 B, 5.00%, 7/1/27 | 6,470,000 | 6,997,046 | ||||
Los Angeles Harbor Department Rev., Series 2011 B, 5.00%, 8/1/24 | 1,225,000 | 1,349,987 | ||||
Los Angeles Municipal Improvement Corp. Rev., Series 2012 C, 5.00%, 3/1/25 | 3,000,000 | 3,188,610 | ||||
Los Angeles Unified School District COP, Series 2012 B, (Headquarters Building Project), 5.00%, 10/1/29 | 1,700,000 | 1,712,274 | ||||
Los Angeles Unified School District GO, Series 2006 F, (Election of 2004), 5.00%, 7/1/18 (FGIC) | 1,230,000 | 1,376,887 | ||||
Los Angeles Unified School District GO, Series 2006 F, (Election of 2004), 5.00%, 7/1/30 (FGIC) | 4,000,000 | 4,222,920 | ||||
Los Angeles Unified School District GO, Series 2007 H, (Election of 2004), 5.00%, 7/1/32 (AGM) | 2,000,000 | 2,063,840 | ||||
Los Angeles Unified School District GO, Series 2009 I, (Election of 2004), 5.00%, 7/1/29 | 4,000,000 | 4,157,160 | ||||
Los Angeles Unified School District GO, Series 2010 KRY, 5.25%, 7/1/26 | 3,000,000 | 3,265,230 | ||||
Los Angeles Unified School District GO, Series 2011 A1, 4.00%, 7/1/17 | 1,000,000 | 1,102,100 | ||||
Los Angeles Unified School District GO, Series 2011 A1, 5.00%, 7/1/18 | 2,565,000 | 2,976,426 | ||||
Los Angeles Unified School District GO, Series 2011 A1, 5.00%, 7/1/24 | 5,140,000 | 5,692,087 | ||||
Los Angeles Unified School District GO, Series 2011 A2, 5.00%, 7/1/21 | 3,000,000 | 3,504,000 | ||||
Los Angeles Wastewater System Rev., Series 2009 A, 5.75%, 6/1/34 | 2,975,000 | 3,355,443 | ||||
M-S-R Public Power Agency Rev., Series 2007 K, (San Juan), 5.00%, 7/1/14 (NATL-RE) | 1,000,000 | 1,039,520 |
Principal Amount | Value |
Metropolitan Water District of Southern California Rev., Series 2011 A2, VRDN, 0.21%, 9/5/13 | $2,000,000 | $1,996,520 | ||||
Metropolitan Water District of Southern California Rev., Series 2011 A4, VRDN, 0.21%, 9/5/13 | 2,000,000 | 1,996,520 | ||||
Metropolitan Water District of Southern California Rev., Series 2012 B2, VRDN, 0.41%, 9/5/13 | 13,755,000 | 13,756,375 | ||||
Mount San Antonio Community College District GO, Capital Appreciation, Series 2005 A, (Election of 2001), 0.00%, 8/1/16 (NATL-RE)(1)(2) | 5,000,000 | 4,856,150 | ||||
Mount San Antonio Community College District GO, Series 2013 A, (Election of 2008), 5.00%, 8/1/34 | 2,000,000 | 2,021,760 | ||||
Mountain View COP, (Capital Projects), 5.25%, 8/1/18 | 1,485,000 | 1,491,029 | ||||
Murrieta Public Financing Authority Special Tax Rev., 5.00%, 9/1/17 | 1,000,000 | 1,102,270 | ||||
Murrieta Public Financing Authority Special Tax Rev., 5.00%, 9/1/21 | 1,200,000 | 1,283,736 | ||||
Murrieta Valley Unified School District Public Financing Authority Special Tax Rev., Series 2006 A, 4.00%, 9/1/13 (AGC) | 1,690,000 | 1,690,169 | ||||
Murrieta Valley Unified School District Public Financing Authority Special Tax Rev., Series 2006 A, 4.00%, 9/1/14 (AGC) | 1,085,000 | 1,120,404 | ||||
Newport Beach Rev., Series 2009 A, (Hoag Memorial Hospital Presbyterian), 5.00%, 12/1/18(2) | 1,505,000 | 1,770,964 | ||||
Newport Beach Rev., Series 2011 A, (Hoag Memorial Hospital Presbyterian), 6.00%, 12/1/21, Prerefunded at 100% of Par(2) | 1,000,000 | 1,257,570 | ||||
Northern California Power Agency Rev., Series 2010 A, 4.00%, 7/1/14 | 1,500,000 | 1,547,730 | ||||
Northern California Power Agency Rev., Series 2010 A, 5.00%, 7/1/16 | 1,000,000 | 1,114,550 | ||||
Northern California Power Agency Rev., Series 2010 A, 5.00%, 8/1/19 | 2,000,000 | 2,259,420 | ||||
Northern California Power Agency Rev., Series 2010 A, 5.00%, 8/1/20 | 1,515,000 | 1,694,527 | ||||
Northern California Power Agency Rev., Series 2010 A, 5.00%, 8/1/21 | 2,050,000 | 2,253,729 | ||||
Northern California Power Agency Rev., Series 2010 A, 5.25%, 8/1/22 | 4,250,000 | 4,683,627 | ||||
Northern California Power Agency Rev., Series 2012 A, 5.00%, 7/1/26 | 1,750,000 | 1,860,355 | ||||
Northern California Power Agency Rev., Series 2012 A, 5.00%, 7/1/27 | 2,000,000 | 2,097,420 | ||||
Oakland Unified School District Alameda County GO, (Election of 2000), 5.00%, 8/1/15 (NATL-RE) | 1,000,000 | 1,062,800 | ||||
Oakland Unified School District Alameda County GO, Series 2012 A, (Election of 2006), 5.00%, 8/1/22 | 750,000 | 775,373 | ||||
Oakland Unified School District Alameda County GO, Series 2012 A, (Election of 2006), 5.50%, 8/1/32 | 2,150,000 | 2,095,648 | ||||
Oakland-Alameda County Coliseum Authority Lease Rev., Series 2012 A, 4.00%, 2/1/15 | 1,350,000 | 1,410,021 | ||||
Oakland-Alameda County Coliseum Authority Lease Rev., Series 2012 A, 5.00%, 2/1/16 | 1,000,000 | 1,094,860 | ||||
Oakland-Alameda County Coliseum Authority Lease Rev., Series 2012 A, 5.00%, 2/1/18 | 3,145,000 | 3,532,275 | ||||
Oakland-Alameda County Coliseum Authority Lease Rev., Series 2012 A, 5.00%, 2/1/25 | 4,000,000 | 4,187,440 | ||||
Orange County Improvement Bond Act of 1915 Special Assessment Rev., (Newport Coast Phase IV Assessment District No. 01-1), 4.45%, 9/2/15 | 280,000 | 289,100 |
Principal Amount | Value |
Orange County Improvement Bond Act of 1915 Special Assessment Rev., (Newport Coast Phase IV Assessment District No. 01-1), 4.55%, 9/2/16 | $210,000 | $216,434 | ||||
Orange County Sanitation District COP, Series 2007 B, 5.00%, 2/1/26 (AGM) | 2,750,000 | 2,919,592 | ||||
Orange County Transportation Authority Rev., (Senior Lien 91 Express Lanes), 5.00%, 8/15/24 | 1,000,000 | 1,106,380 | ||||
Orange County Water District Rev., Series 2013 A, 5.00%, 8/15/33 | 4,000,000 | 4,201,640 | ||||
Palm Springs Financing Authority Lease Rev., Series 2012 B, (Downtown Revitalization Project), 4.00%, 6/1/16 | 1,335,000 | 1,429,518 | ||||
Palm Springs Financing Authority Lease Rev., Series 2012 B, (Downtown Revitalization Project), 5.00%, 6/1/23 | 1,230,000 | 1,339,937 | ||||
Palomar Pomerado Health Care District COP, 5.25%, 11/1/21 | 1,000,000 | 1,022,090 | ||||
Palomar Pomerado Health Care District COP, 6.00%, 11/1/41 | 1,120,000 | 1,068,760 | ||||
Palomar Pomerado Health GO, Capital Appreciation, Series 2009 A, (Election of 2004), 0.00%, 8/1/19 (AGC)(4) | 1,660,000 | 1,239,937 | ||||
Peralta Community College District GO, 5.00%, 8/1/17 | 2,085,000 | 2,373,647 | ||||
Peralta Community College District GO, 5.00%, 8/1/22 | 2,145,000 | 2,433,588 | ||||
Port of Oakland Rev., Series 2007 C, 5.00%, 11/1/16 (NATL-RE) | 1,270,000 | 1,434,795 | ||||
Port of Oakland Rev., Series 2007 C, (Intermediate Lien) 5.00%, 11/1/17 (NATL-RE) | 2,375,000 | 2,723,816 | ||||
Port of Oakland Rev., Series 2012 Q, (Senior Lien), 2.00%, 5/1/14 | 1,100,000 | 1,112,936 | ||||
Porterville Public Financing Authority Sewer Rev., 5.625%, 10/1/36 | 2,500,000 | 2,650,525 | ||||
Poway Unified School District Public Financing Authority Special Tax Rev., 5.00%, 9/15/19 (Ambac) | 1,155,000 | 1,225,062 | ||||
Poway Unified School District Public Financing Authority Special Tax Rev., 5.00%, 9/15/20 (Ambac) | 1,210,000 | 1,268,600 | ||||
Poway Unified School District Rev., Capital Appreciation, (School Facilities Improvement), 0.00%, 8/1/41(1) | 2,780,000 | 510,964 | ||||
Rancho Mirage Joint Powers Financing Authority Rev., Series 2007 A, (Eisenhower Medical Center), 5.00%, 7/1/15 | 1,505,000 | 1,601,004 | ||||
Rancho Mirage Joint Powers Financing Authority Rev., Series 2007 A, (Eisenhower Medical Center), 5.00%, 7/1/21 | 1,000,000 | 1,041,700 | ||||
Rancho Santa Fe Community Services District Special Tax Rev., Series 2011 A, (Superior Lien), 5.125%, 9/1/22 | 790,000 | 843,657 | ||||
Rancho Santa Fe Community Services District Special Tax Rev., Series 2011 A, (Superior Lien), 5.25%, 9/1/23 | 1,300,000 | 1,391,962 | ||||
Rancho Santa Fe Community Services District Special Tax Rev., Series 2011 A, (Superior Lien), 5.375%, 9/1/24 | 1,410,000 | 1,499,930 | ||||
Riverside County Asset Leasing Corp. Rev., Series 2013 A, (Public Defender and Probation Building), 5.00%, 11/1/43 | 1,000,000 | 932,260 | ||||
Riverside County COP, Series 2007 A, (Public Safety Communication), 5.00%, 11/1/14 (Ambac) | 50,000 | 52,458 | ||||
Riverside County COP, Series 2007 A, (Public Safety Communication), 5.00%, 11/1/15 (Ambac) | 3,035,000 | 3,289,363 | ||||
Riverside County Palm Desert Financing Authority Rev., Series 2008 A, 5.00%, 5/1/14 | 1,450,000 | 1,494,138 |
Principal Amount | Value |
Riverside County Redevelopment Agency Tax Allocation Rev., Series 2010 E, (Interstate 215 Corridor), 6.50%, 10/1/40 | $935,000 | $983,050 | ||||
Riverside County Transportation Commission Rev., Series 2013 A, (Limited Tax), 5.25%, 6/1/39 | 1,335,000 | 1,387,572 | ||||
Riverside Public Financing Authority Lease Rev., Series 2012 A, 4.00%, 11/1/33 | 1,640,000 | 1,359,872 | ||||
Sacramento City Financing Authority Lease Rev., Series 1993 A, 5.40%, 11/1/20 (Ambac) | 3,000,000 | 3,352,860 | ||||
Sacramento City Financing Authority Rev., 5.00%, 12/1/16 (NATL-RE/FGIC) | 2,500,000 | 2,690,400 | ||||
Sacramento County Airport System Rev., 5.00%, 7/1/20 | 1,000,000 | 1,129,030 | ||||
Sacramento County Airport System Rev., 5.00%, 7/1/23 | 1,000,000 | 1,087,300 | ||||
Sacramento County Airport System Rev., 5.00%, 7/1/24 | 1,000,000 | 1,073,480 | ||||
Sacramento County Airport System Rev., Series 2009 B, 4.25%, 7/1/16 | 1,000,000 | 1,087,720 | ||||
Sacramento County Sanitation Districts Financing Authority Rev., Series 2007 A, 5.25%, 12/1/21 (NATL-RE/FGIC) | 1,000,000 | 1,183,060 | ||||
Sacramento County Sanitation Districts Financing Authority Rev., Series 2007 B, VRN, 0.71%, 9/3/13 (NATL-RE/FGIC) | 2,500,000 | 1,958,525 | ||||
Sacramento Municipal Utility District Electric Rev., Series 1997 K, 5.70%, 7/1/17 (Ambac) | 3,105,000 | 3,606,302 | ||||
Sacramento Municipal Utility District Electric Rev., Series 1997 K, 5.25%, 7/1/24 (Ambac) | 3,000,000 | 3,422,220 | ||||
Sacramento Municipal Utility District Electric Rev., Series 2012 Y, 5.00%, 8/15/24 | 1,500,000 | 1,659,300 | ||||
Sacramento Municipal Utility District Electric Rev., Series 2012 Y, 5.00%, 8/15/25 | 5,000,000 | 5,455,000 | ||||
Sacramento Regional Transit District Rev., (Farebox Revenue), 3.00%, 3/1/15 | 840,000 | 868,098 | ||||
Sacramento Regional Transit District Rev., (Farebox Revenue), 4.00%, 3/1/16 | 440,000 | 472,098 | ||||
Sacramento Regional Transit District Rev., (Farebox Revenue), 4.00%, 3/1/17 | 1,000,000 | 1,080,240 | ||||
Sacramento Regional Transit District Rev., (Farebox Revenue), 5.00%, 3/1/18 | 250,000 | 280,340 | ||||
San Bernardino Community College District GO, Series 2008 A, (Election of 2002), 5.25%, 8/1/18 | 350,000 | 408,114 | ||||
San Bernardino Community College District GO, Series 2008 A, (Election of 2002), 5.50%, 8/1/18, Prerefunded at 100% of Par(2) | 300,000 | 357,867 | ||||
San Bernardino Community College District GO, Series 2008 A, (Election of 2002), 6.25%, 8/1/18, Prerefunded at 100% of Par(2) | 12,045,000 | 14,796,078 | ||||
San Bernardino Community College District GO, Capital Appreciation, Series 2009 B, (Election of 2008), 0.00%, 8/1/19(4) | 9,840,000 | 7,481,057 | ||||
San Buenaventura Rev., (Community Memorial Health System), 8.00%, 12/1/26 | 2,000,000 | 2,281,560 | ||||
San Buenaventura Rev., (Community Memorial Health System), 7.50%, 12/1/41 | 1,200,000 | 1,295,400 | ||||
San Diego Community College District GO, (Election of 2002), 5.00%, 8/1/30 | 3,000,000 | 3,173,010 | ||||
San Diego Convention Center Expansion Financing Authority Rev., Series 2012 A, 4.00%, 4/15/17 | 1,250,000 | 1,348,938 | ||||
San Diego Convention Center Expansion Financing Authority Rev., Series 2012 A, 4.00%, 4/15/18 | 1,160,000 | 1,245,724 | ||||
San Diego County Regional Airport Authority Rev., Series 2010 A, 5.00%, 7/1/19 | 1,290,000 | 1,467,865 | ||||
San Diego County Regional Airport Authority Rev., Series 2010 A, 5.00%, 7/1/21 | 2,000,000 | 2,212,980 | ||||
San Diego County Regional Airport Authority Rev., Series 2010 A, 5.00%, 7/1/34 | 750,000 | 737,558 |
Principal Amount | Value |
San Diego County Regional Airport Authority Rev., Series 2013 A, 4.00%, 7/1/18 | $300,000 | $331,176 | ||||
San Diego County Regional Airport Authority Rev., Series 2013 A, 4.00%, 7/1/19 | 400,000 | 440,736 | ||||
San Diego County Regional Transportation Commission Rev., Series 2012 A, 5.00%, 4/1/21 | 5,940,000 | 6,953,780 | ||||
San Diego County Water Authority Rev., Series 2011 S1, (Subordinate Lien), 5.00%, 7/1/16 | 2,780,000 | 3,097,226 | ||||
San Diego Public Facilities Financing Authority Rev., Series 2009 A, 5.00%, 8/1/21 | 1,000,000 | 1,122,960 | ||||
San Diego Public Facilities Financing Authority Rev., Series 2009 B, 5.00%, 5/15/22 | 3,680,000 | 4,119,466 | ||||
San Diego Public Facilities Financing Authority Tax Allocation Rev., Series 2007 B, (Southcrest and Central Imperial Redevelopment), 5.125%, 10/1/22 (Radian) | 1,230,000 | 1,244,846 | ||||
San Diego Public Facilities Financing Authority Water Rev., Series 2012 A, 5.00%, 8/1/21 | 2,000,000 | 2,336,740 | ||||
San Diego Public Facilities Financing Authority Water Rev., Series 2012 A, 5.00%, 8/1/24 | 2,000,000 | 2,238,800 | ||||
San Diego Public Facilities Financing Sewer Authority Rev., Series 2010 A, 5.25%, 5/15/24 | 3,400,000 | 3,829,658 | ||||
San Diego Unified School District GO, Capital Appreciation, Series 2012 E, 0.00%, 7/1/32(4) | 5,000,000 | 1,531,700 | ||||
San Francisco Bay Area Rapid Transit District Rev., Series 2012 A, 5.00%, 7/1/24 | 500,000 | 557,970 | ||||
San Francisco Bay Area Rapid Transit District Rev., Series 2012 A, 5.00%, 7/1/25 | 500,000 | 550,180 | ||||
San Francisco Bay Area Rapid Transit District Rev., Series 2012 A, 5.00%, 7/1/26 | 1,000,000 | 1,087,360 | ||||
San Francisco City and County Airports Commission Rev., Series 2008-34D, (San Francisco International Airport), 5.00%, 5/1/17 (AGC) | 3,375,000 | 3,841,931 | ||||
San Francisco City and County Airports Commission Rev., Series 2008-34D, (San Francisco International Airport), 5.00%, 5/1/18 (AGC) | 2,000,000 | 2,302,560 | ||||
San Francisco City and County Airports Commission Rev., Series 2009 D, (San Francisco International Airport), 4.00%, 5/1/24 | 1,625,000 | 1,665,170 | ||||
San Francisco City and County Airports Commission Rev., Series 2009 E, (San Francisco International Airport), 5.25%, 5/1/23 | 3,500,000 | 3,976,980 | ||||
San Francisco City and County Airports Commission Rev., Series 2010 C, (San Francisco International Airport), (Governmental Purpose), 5.00%, 5/1/19 | 1,500,000 | 1,736,325 | ||||
San Francisco City and County Airports Commission Rev., Series 2011 D, 5.00%, 5/1/29 | 6,270,000 | 6,458,727 | ||||
San Francisco City and County Airports Commission Rev., Series 2011 D, (San Francisco International Airport), 5.00%, 5/1/24 | 4,025,000 | 4,359,357 | ||||
San Francisco City and County Airports Commission Rev., Series 2012 B, (San Francisco International Airport), 5.00%, 5/1/26 | 1,250,000 | 1,334,475 | ||||
San Francisco City and County COP, Series 2009 A, (Multiple Capital Improvement Projects), 5.00%, 4/1/17 | 2,440,000 | 2,748,953 | ||||
San Francisco City and County COP, Series 2009 A, (Multiple Capital Improvement Projects), 5.00%, 4/1/29 | 1,170,000 | 1,198,571 | ||||
San Francisco City and County COP, Series 2010 A, 5.00%, 10/1/19 | 2,930,000 | 3,359,362 | ||||
San Francisco City and County COP, Series 2011 B, 4.00%, 9/1/14 | 3,000,000 | 3,112,020 |
Principal Amount | Value |
San Francisco City and County Public Utilities Water Commission Rev., Series 2010 A, 5.00%, 10/1/21 | $5,000,000 | $5,812,500 | ||||
San Francisco City and County Public Utilities Water Commission Rev., Series 2010 A, 5.00%, 11/1/28 | 2,780,000 | 2,974,433 | ||||
San Francisco City and County Redevelopment Agency Special Tax Rev., Series 2005 A, VRDN, 0.07%, 9/5/13 (LOC: JPMorgan Chase Bank N.A.) | 1,100,000 | 1,100,000 | ||||
San Francisco City and County Redevelopment Financing Authority Tax Allocation Rev., Series 2011 D, (Mission Bay South Redevelopment), 5.00%, 8/1/15 | 420,000 | 442,991 | ||||
San Francisco City and County Redevelopment Financing Authority Tax Allocation Rev., Series 2011 D, (Mission Bay South Redevelopment), 5.00%, 8/1/16 | 440,000 | 470,430 | ||||
San Francisco City and County Redevelopment Financing Authority Tax Allocation Rev., Series 2011 D, (Mission Bay South Redevelopment), 5.00%, 8/1/17 | 465,000 | 500,298 | ||||
San Francisco City and County Redevelopment Financing Authority Tax Allocation Rev., Series 2011 D, (Mission Bay South Redevelopment), 5.50%, 8/1/18 | 485,000 | 532,035 | ||||
San Francisco City and County Redevelopment Financing Authority Tax Allocation Rev., Series 2011 D, (Mission Bay South Redevelopment), 6.00%, 8/1/19 | 510,000 | 571,108 | ||||
San Francisco City and County Redevelopment Financing Authority Tax Allocation Rev., Series 2011 D, (Mission Bay South Redevelopment), 6.00%, 8/1/20 | 515,000 | 573,931 | ||||
San Joaquin Hills Transportation Corridor Agency Rev., Capital Appreciation, 0.00%, 1/1/17(1)(2) | 1,000,000 | 960,240 | ||||
San Joaquin Hills Transportation Corridor Agency Rev., Capital Appreciation, 0.00%, 1/1/25(1)(2) | 3,290,000 | 2,195,516 | ||||
San Joaquin Hills Transportation Corridor Agency Rev., Capital Appreciation, 0.00%, 1/1/26(1)(2) | 1,400,000 | 885,276 | ||||
San Mateo County Transportation District Sales Tax Rev., Series 1993 A, 5.25%, 6/1/18 (NATL-RE) | 2,680,000 | 3,095,829 | ||||
San Mateo Special Tax Rev., (Community Facilities District No. 2008-1-Bay Meadows), 5.875%, 9/1/32 | 690,000 | 716,117 | ||||
San Mateo Union High School District GO, Capital Appreciation, 0.00%, 2/15/15(1) | 7,090,000 | 7,017,895 | ||||
San Ramon Valley Unified School District GO, (Election of 2002), 5.00%, 8/1/16, Prerefunded at 100% of Par (NATL-RE)(2) | 1,000,000 | 1,122,900 | ||||
Santa Ana Community Redevelopment Agency Tax Allocation Rev., Series 2003 B, (South Main Street Redevelopment), 5.00%, 9/1/13 (NATL-RE/FGIC) | 1,885,000 | 1,885,226 | ||||
Santa Barbara County COP, 5.375%, 10/1/17 (Ambac) | 2,750,000 | 2,756,572 | ||||
Santa Clara County Financing Authority Lease Rev., Series 2012 A, (Capital Projects), 4.00%, 2/1/16 | 4,735,000 | 5,113,705 | ||||
Santa Clara County Financing Authority Lease Rev., Series 2012 A, (Capital Projects), 4.00%, 2/1/17 | 2,055,000 | 2,255,856 | ||||
Santa Clara County Financing Authority Lease Rev., Series 2012 A, (Capital Projects), 5.00%, 2/1/18 | 5,000,000 | 5,735,450 | ||||
Santa Clara Electric Rev., Series 2011 A, 5.00%, 7/1/30 | 1,000,000 | 1,024,020 |
Principal Amount | Value |
Santa Clara Valley Transportation Authority Sales Tax Rev., Series 2010 B, 5.00%, 4/1/18 | $7,645,000 | $8,809,333 | ||||
Santa Clara Valley Transportation Authority Sales Tax Rev., Series 2010 B, 5.00%, 4/1/20 | 4,000,000 | 4,654,520 | ||||
Santa Fe Springs Community Development Commission Tax Allocation Rev., 5.375%, 9/1/16 (NATL-RE) | 430,000 | 431,114 | ||||
Santa Maria Joint Union High School District GO, 5.00%, 8/1/25 | 1,585,000 | 1,730,202 | ||||
Santa Monica Redevelopment Agency Tax Allocation, (Earthquake Recovery Redevelopment), 5.00%, 7/1/42 | 600,000 | 600,342 | ||||
Santa Monica Redevelopment Agency Tax Allocation, (Earthquake Recovery Redevelopment), 5.875%, 7/1/42 | 600,000 | 641,670 | ||||
Santa Rosa Wastewater Rev., Capital Appreciation, Series 2002 B, 0.00%, 9/1/24 (Ambac)(1) | 7,000,000 | 4,170,110 | ||||
Shasta Lake Public Finance Authority Rev., 4.50%, 4/1/15 | 970,000 | 1,014,184 | ||||
Shasta Lake Public Finance Authority Rev., 5.00%, 4/1/19 | 2,400,000 | 2,490,240 | ||||
Shasta Lake Public Finance Authority Rev., 5.00%, 4/1/22 | 2,130,000 | 2,229,130 | ||||
Solano County COP, 5.00%, 11/1/13 (NATL-RE) | 1,135,000 | 1,144,012 | ||||
South Orange County Public Financing Authority Rev., (Juvenile Justice Center), 4.25%, 6/1/17 | 2,000,000 | 2,196,120 | ||||
South Orange County Public Financing Authority Rev., (Juvenile Justice Center), 4.50%, 6/1/18 | 2,700,000 | 3,002,103 | ||||
South Placer Wastewater Authority Rev., Series 2011 D, VRN, 0.89%, 9/5/13 | 4,140,000 | 4,150,391 | ||||
South Tahoe Joint Powers Financing Authority Rev., Series 2005 A, (Redevelopment Project Area No. 1), 5.00%, 10/1/19 (Ambac) | 50,000 | 51,206 | ||||
Southern California Public Power Authority Rev., Series 2008 A, (Southern Transmission), 5.00%, 7/1/22 | 2,875,000 | 3,227,705 | ||||
Southern California Public Power Authority Rev., Series 2008 B, (Southern Transmission), 6.00%, 7/1/27 | 2,000,000 | 2,316,920 | ||||
Southern California Public Power Authority Rev., Series 2011 A, (Southern Transmission), 5.00%, 7/1/21 | 2,780,000 | 3,217,183 | ||||
Southern California Public Power Authority Rev., Series 2012 A, 4.00%, 7/1/16 | 2,055,000 | 2,241,471 | ||||
Southern California Public Power Authority Rev., Series 2012 A, 5.00%, 7/1/17 | 2,685,000 | 3,068,606 | ||||
Southern California Public Power Authority Rev., Series 2012 A, 5.00%, 7/1/18 | 1,880,000 | 2,169,727 | ||||
Southern California Public Power Authority Rev., Series 2013 A, (Southern Transmission), 5.00%, 7/1/18 | 2,000,000 | 2,308,220 | ||||
Southern California Public Power Authority Rev., Series 2013 A, (Southern Transmission), 5.00%, 7/1/20 | 4,000,000 | 4,646,560 | ||||
Tobacco Securitization Authority of Southern California Settlement Rev., Series 2006 A1, 5.00%, 6/1/37 | 1,750,000 | 1,316,333 | ||||
Tri-Dam Power Authority Rev., 4.00%, 11/1/14 | 1,260,000 | 1,293,831 | ||||
Tri-Dam Power Authority Rev., 4.00%, 5/1/15 | 1,285,000 | 1,327,662 | ||||
Tri-Dam Power Authority Rev., 4.00%, 11/1/15 | 1,310,000 | 1,364,077 | ||||
Tuolumne Wind Project Authority Rev., Series 2009 A, 5.625%, 1/1/29 | 1,000,000 | 1,086,890 | ||||
Turlock Health Facility COP, (Emanuel Medical Center, Inc.), 5.50%, 10/15/15 | 690,000 | 728,295 |
Principal Amount | Value |
Turlock Health Facility COP, (Emanuel Medical Center, Inc.), 5.50%, 10/15/16 | $940,000 | $991,709 | ||||
Tustin Unified School District Special Tax Rev., (Community Facilities District No. 07-1), VRDN, 0.08%, 9/3/13 (LOC: Bank of America N.A.) | 7,185,000 | 7,185,000 | ||||
Twin Rivers Unified School District COP, (School Facilities Bridge Funding Program), VRDN, 3.45%, 7/1/18 (AGM) | 3,000,000 | 2,977,410 | ||||
Twin Rivers Unified School District COP, (School Facilities Bridge Funding Program), VRDN, 3.20%, 6/1/20 (AGM) | 3,750,000 | 3,622,200 | ||||
Twin Rivers Unified School District COP, (School Facilities Bridge Funding Program), VRDN, 3.20%, 6/1/20 (AGM) | 2,500,000 | 2,414,800 | ||||
University of California Regents Medical Center Pooled Rev., Series 2008 D, 5.00%, 5/15/27 | 1,000,000 | 1,067,340 | ||||
University of California Rev., Series 2009 Q, 5.25%, 5/15/23 | 2,000,000 | 2,276,580 | ||||
University of California Rev., Series 2010 S, 5.00%, 5/15/20 | 1,405,000 | 1,592,272 | ||||
University of California Rev., Series 2010 S, 5.00%, 5/15/40 | 1,250,000 | 1,255,450 | ||||
University of California Rev., Series 2012 G, 5.00%, 5/15/25 | 6,000,000 | 6,580,800 | ||||
Val Verde Unified School District COP, 5.00%, 1/1/14 (FGIC)(2) | 1,000,000 | 1,016,240 | ||||
Val Verde Unified School District COP, 5.25%, 1/1/15, Prerefunded at 100% of Par (FGIC)(2) | 1,145,000 | 1,219,162 | ||||
Val Verde Unified School District COP, 5.25%, 1/1/15, Prerefunded at 100% of Par (FGIC)(2) | 2,505,000 | 2,667,249 | ||||
Val Verde Unified School District COP, 5.25%, 1/1/15, Prerefunded at 100% of Par (FGIC)(2) | 2,640,000 | 2,810,993 | ||||
Val Verde Unified School District COP, 5.25%, 1/1/15, Prerefunded at 100% of Par (FGIC)(2) | 1,415,000 | 1,506,650 | ||||
Val Verde Unified School District COP, 5.25%, 1/1/15, Prerefunded at 100% of Par (FGIC)(2) | 1,000,000 | 1,064,770 | ||||
Val Verde Unified School District COP, 5.25%, 1/1/15, Prerefunded at 100% of Par (FGIC)(2) | 2,980,000 | 3,173,015 | ||||
West Basin Municipal Water District COP, Series 2008 A1, VRDN, 0.10%, 9/4/13 (SBBPA: Citibank N.A.) | 1,425,000 | 1,425,000 | ||||
West Contra Costa Unified School District GO, 5.00%, 8/1/32 | 3,500,000 | 3,407,985 | ||||
West Sacramento Financing Authority Special Tax Rev., Series 2006 A, 5.00%, 9/1/18 (XLCA) | 1,500,000 | 1,609,200 | ||||
West Sacramento Financing Authority Special Tax Rev., Series 2006 A, 5.00%, 9/1/19 (XLCA) | 1,000,000 | 1,064,700 | ||||
West Sacramento Financing Authority Special Tax Rev., Series 2006 A, 5.00%, 9/1/20 (XLCA) | 1,200,000 | 1,261,548 | ||||
Yosemite Community College District GO, Capital Appreciation, Series 2010 D, (Election of 2004), 0.00%, 8/1/38(1) | 6,000,000 | 1,348,800 | ||||
| 1,175,241,870 | ||||||
GUAM — 0.2% | ||||||
Guam Government GO, Series 2009 A, 6.00%, 11/15/19 | 1,000,000 | 1,022,210 | ||||
Guam Power Authority Rev., Series 2012 A, 5.00%, 10/1/19 (AGM) | 1,000,000 | 1,132,920 | ||||
| 2,155,130 | ||||||
PUERTO RICO — 2.1% | ||||||
Puerto Rico Aqueduct & Sewer Authority Rev., Series 2012 A, (Senior Lien), 5.00%, 7/1/17 | 2,860,000 | 2,788,357 | ||||
Puerto Rico Aqueduct & Sewer Authority Rev., Series 2012 A, (Senior Lien), 5.00%, 7/1/19 | 1,000,000 | 919,600 | ||||
Principal Amount | Value |
Puerto Rico Electric Power Authority Rev., Series 2002 KK, 5.50%, 7/1/14 (AGM) | $3,140,000 | $3,200,162 | ||||
Puerto Rico Electric Power Authority Rev., Series 2010 ZZ, 5.25%, 7/1/22 | 4,950,000 | 4,291,303 | ||||
Puerto Rico GO, Series 2001 A, (Public Improvement), 5.50%, 7/1/17 (XLCA) | 4,000,000 | 4,001,800 | ||||
Puerto Rico GO, Series 2012 A, (Public Improvement), 5.00%, 7/1/41 | 1,000,000 | 667,130 | ||||
Puerto Rico Government Development Bank Rev., 4.75%, 12/1/15 (NATL-RE) | 1,500,000 | 1,512,105 | ||||
Puerto Rico Government Development Bank Rev., Series 2006 B, (Senior Notes), 5.00%, 12/1/14 | 1,510,000 | 1,522,790 | ||||
Puerto Rico Government Development Bank Rev., Series 2006 B, (Senior Notes), 5.00%, 12/1/15 | 5,000,000 | 5,033,900 | ||||
Puerto Rico Public Buildings Authority Rev., Series 2007 M2, (Government Facilities), VRDN, 5.50%, 7/1/17 (Ambac) | 1,000,000 | 978,520 | ||||
Puerto Rico Sales Tax Financing Corp. Rev., Capital Appreciation, Series 2011 A1, 0.00%, 8/1/41(1) | 2,280,000 | 291,088 | ||||
| 25,206,755 | ||||||
U.S. VIRGIN ISLANDS — 0.2% | ||||||
Virgin Islands Public Finance Authority Rev., Series 2004 A, (Virgin Islands Matching Fund Loan Note and Senior Lien), 5.00%, 10/1/14 | 500,000 | 520,050 | ||||
Virgin Islands Public Finance Authority Rev., Series 2004 A, (Virgin Islands Matching Fund Loan Note and Senior Lien), 5.25%, 10/1/15 | 170,000 | 176,502 | ||||
Virgin Islands Public Finance Authority Rev., Series 2004 A, (Virgin Islands Matching Fund Loan Note and Senior Lien), 5.25%, 10/1/16 | 500,000 | 512,865 | ||||
Virgin Islands Public Finance Authority Rev., Series 2004 A, (Virgin Islands Matching Fund Loan Note and Senior Lien), 5.25%, 10/1/20 | 1,000,000 | 1,022,280 | ||||
| 2,231,697 | ||||||
TOTAL INVESTMENT SECURITIES — 99.0% (Cost $1,190,950,072) | 1,204,835,452 | |||||
OTHER ASSETS AND LIABILITIES — 1.0% | 12,142,909 | |||||
TOTAL NET ASSETS — 100.0% | $1,216,978,361 | |||||
Futures Contracts | ||||
Contracts Sold | Expiration Date | Underlying Face Amount at Value | Unrealized Gain (Loss) | |
85 | U.S. Treasury 30-Year Bonds | December 2013 | $11,212,031 | $(62,918) |
Notes to Schedule of Investments
AGC = Assured Guaranty Corporation
AGM = Assured Guaranty Municipal Corporation
COP = Certificates of Participation
FGIC = Financial Guaranty Insurance Company
FSA = Financial Security Assurance, Inc.
GA = Guaranty Agreement
GO = General Obligation
LOC = Letter of Credit
NATL-RE = National Public Finance Guarantee Corporation — Reinsured
SBBPA = Standby Bond Purchase Agreement
VRDN = Variable Rate Demand Note. Interest reset date is indicated. Rate shown is effective at the period end.
VRN = Variable Rate Note. Interest reset date is indicated. Rate shown is effective at the period end.
XLCA = XL Capital Ltd.
(1) | Security is a zero-coupon bond. Zero-coupon securities are issued at a substantial discount from their value at maturity. |
(2) | Escrowed to maturity in U.S. government securities or state and local government securities. |
(3) | Security, or a portion thereof, has been pledged at the custodian bank or with a broker for margin requirements on futures contracts. At the period end, the aggregate value of securities pledged was $280,572. |
(4) | Coupon rate adjusts periodically based upon a predetermined schedule. Interest reset date is indicated. Rate shown is effective at the period end. |
See Notes to Financial Statements.
Statement of Assets and Liabilities |
AUGUST 31, 2013 | |||
Assets | |||
Investment securities, at value (cost of $1,190,950,072) | $1,204,835,452 | ||
Receivable for investments sold | 1,859,875 | ||
Receivable for capital shares sold | 1,499,675 | ||
Interest receivable | 13,573,655 | ||
| 1,221,768,657 | |||
Liabilities | |||
Disbursements in excess of demand deposit cash | 112,299 | ||
Payable for investments purchased | 1,315,928 | ||
Payable for capital shares redeemed | 2,414,410 | ||
Payable for variation margin on futures contracts | 18,594 | ||
Accrued management fees | 460,401 | ||
Distribution and service fees payable | 24,560 | ||
Dividends payable | 444,104 | ||
| 4,790,296 | |||
Net Assets | $1,216,978,361 | ||
Net Assets Consist of: | |||
Capital paid in | $1,203,064,012 | ||
Distributions in excess of net investment income | (1,918 | ) | |
Undistributed net realized gain | 93,805 | ||
Net unrealized appreciation | 13,822,462 | ||
| $1,216,978,361 | |||
Net assets | Shares outstanding | Net asset value per share | |
Investor Class | $1,000,450,018 | 88,030,444 | $11.36 |
Institutional Class | $160,328,763 | 14,105,805 | $11.37 |
A Class | $36,644,168 | 3,224,053 | $11.37* |
C Class | $19,555,412 | 1,719,551 | $11.37 |
*Maximum offering price $11.91 (net asset value divided by 0.955).
See Notes to Financial Statements.
Statement of Operations |
YEAR ENDED AUGUST 31, 2013 | |||
Investment Income (Loss) | |||
Income: | |||
Interest | $37,219,875 | ||
Expenses: | |||
Management fees | 5,605,309 | ||
Distribution and service fees: | |||
A Class | 103,331 | ||
C Class | 186,608 | ||
Trustees’ fees and expenses | 68,868 | ||
Other expenses | 28 | ||
| 5,964,144 | |||
Net investment income (loss) | 31,255,731 | ||
Realized and Unrealized Gain (Loss) | |||
Net realized gain (loss) on: | |||
Investment transactions | 330,102 | ||
Futures contract transactions | 227,846 | ||
| 557,948 | |||
Change in net unrealized appreciation (depreciation) on: | |||
Investments | (66,536,815 | ) | |
Futures contracts | (62,918 | ) | |
| (66,599,733 | ) | ||
Net realized and unrealized gain (loss) | (66,041,785 | ) | |
Net Increase (Decrease) in Net Assets Resulting from Operations | $(34,786,054 | ) | |
See Notes to Financial Statements.
Statement of Changes in Net Assets |
YEARS ENDED AUGUST 31, 2013 AND AUGUST 31, 2012 | |||||
Increase (Decrease) in Net Assets | August 31, 2013 | August 31, 2012 | |||
Operations | |||||
Net investment income (loss) | $31,255,731 | $30,756,885 | |||
Net realized gain (loss) | 557,948 | 8,931,484 | |||
Change in net unrealized appreciation (depreciation) | (66,599,733 | ) | 37,835,103 | ||
Net increase (decrease) in net assets resulting from operations | (34,786,054 | ) | 77,523,472 | ||
Distributions to Shareholders | |||||
From net investment income: | |||||
Investor Class | (26,616,058 | ) | (27,844,638 | ) | |
Institutional Class | (3,438,121 | ) | (2,041,135 | ) | |
A Class | (922,269 | ) | (721,069 | ) | |
C Class | (276,403 | ) | (175,874 | ) | |
From net realized gains: | |||||
Investor Class | (286,816 | ) | — | ||
Institutional Class | (30,906 | ) | — | ||
A Class | (11,424 | ) | — | ||
C Class | (4,604 | ) | — | ||
Decrease in net assets from distributions | (31,586,601 | ) | (30,782,716 | ) | |
Capital Share Transactions | |||||
Net increase (decrease) in net assets from capital share transactions | 118,684,084 | 247,232,687 | |||
Net increase (decrease) in net assets | 52,311,429 | 293,973,443 | |||
Net Assets | |||||
Beginning of period | 1,164,666,932 | 870,693,489 | |||
End of period | $1,216,978,361 | $1,164,666,932 | |||
Distributions in excess of net investment income | $(1,918 | ) | $(4,798 | ) | |
See Notes to Financial Statements.
Notes to Financial Statements |
AUGUST 31, 2013
1. Organization
American Century California Tax-Free and Municipal Funds (the trust) is registered under the Investment Company Act of 1940, as amended (the 1940 Act), as an open-end management investment company and is organized as a Massachusetts business trust. California Intermediate-Term Tax-Free Bond Fund (the fund) is one fund in a series issued by the trust. The fund is diversified as defined under the 1940 Act. The fund’s investment objectives are to seek safety of principal and high current income that is exempt from federal and California income taxes.
The fund offers the Investor Class, the Institutional Class, the A Class and the C Class. The A Class may incur an initial sales charge. The A Class and C Class may be subject to a contingent deferred sales charge. The share classes differ principally in their respective sales charges and distribution and shareholder servicing expenses and arrangements. The Institutional Class is made available to institutional shareholders or through financial intermediaries whose clients do not require the same level of shareholder and administrative services as shareholders of other classes. As a result, the Institutional Class is charged a lower unified management fee.
2. Significant Accounting Policies
The following is a summary of significant accounting policies consistently followed by the fund in preparation of its financial statements. The financial statements are prepared in conformity with accounting principles generally accepted in the United States of America, which may require management to make certain estimates and assumptions at the date of the financial statements. Actual results could differ from these estimates.
Investment Valuations — The fund determines the fair value of its investments and computes its net asset value per share as of the close of regular trading (usually 4 p.m. Eastern time) on the New York Stock Exchange (NYSE) on each day the NYSE is open.
Debt securities maturing in greater than 60 days at the time of purchase are valued at the evaluated mean as provided by independent pricing services or at the mean of the most recent bid and asked prices as provided by investment dealers. Debt securities maturing within 60 days at the time of purchase may be valued at cost, plus or minus any amortized discount or premium or at the evaluated mean as provided by an independent pricing service. Evaluated mean prices are commonly derived through utilization of market models, which may consider, among other factors, trade data, quotations from dealers and active market makers, relevant yield curve and spread data, related sector levels, creditworthiness, and other relevant market information on the same or comparable securities.
Exchange-traded futures contracts are valued at the settlement price as provided by the appropriate clearing corporation.
If the fund determines that the market price for a portfolio security is not readily available or the valuation methods mentioned above do not reflect a security’s fair value, such security is valued as determined in good faith by the Board of Trustees or its designee, in accordance with procedures adopted by the Board of Trustees. Circumstances that may cause the fund to use these procedures to value a security include, but are not limited to: a security has been declared in default; trading in a security has been halted during the trading day; there is a foreign market holiday and no trading occurred; or an event occurred between the close of a foreign exchange and the NYSE that may affect the value of a security.
Security Transactions — Security transactions are accounted for as of the trade date. Net realized gains and losses are determined on the identified cost basis, which is also used for federal income tax purposes.
Investment Income — Interest income is recorded on the accrual basis and includes accretion of discounts and amortization of premiums.
Segregated Assets — In accordance with the 1940 Act, the fund segregates assets on its books and records to cover certain types of investments, including, but not limited to, futures contracts and when-issued securities. American Century Investment Management, Inc. (ACIM) (the investment advisor) monitors, on a daily basis, the securities segregated to ensure the fund designates a sufficient amount of liquid assets, marked-to-market daily. The fund may also receive assets or be required to pledge assets at the custodian bank or with a broker for margin requirements on futures contracts.
Income Tax Status — It is the fund’s policy to distribute substantially all net investment income and net realized gains to shareholders and to otherwise qualify as a regulated investment company under provisions of the Internal Revenue Code. Accordingly, no provision has been made for income taxes. The fund files U.S. federal, state, local and non-U.S. tax returns as applicable. The fund’s tax returns are subject to examination by the relevant taxing authority until expiration of the applicable statute of limitations, which is generally three years from the date of filing but can be longer in certain jurisdictions. At this time, management believes there are no uncertain tax positions which, based on their technical merit, would not be sustained upon examination and for which it is reasonably possible that the total amounts of unrecognized tax benefits will significantly change in the next twelve months.
Multiple Class — All shares of the fund represent an equal pro rata interest in the net assets of the class to which such shares belong, and have identical voting, dividend, liquidation and other rights and the same terms and conditions, except for class specific expenses and exclusive rights to vote on matters affecting only individual classes. Income, non-class specific expenses, and realized and unrealized capital gains and losses of the fund are allocated to each class of shares based on their relative net assets.
Distributions to Shareholders — Distributions from net investment income are declared daily and paid monthly. Distributions from net realized gains, if any, are generally declared and paid annually.
Indemnifications — Under the trust’s organizational documents, its officers and trustees are indemnified against certain liabilities arising out of the performance of their duties to the fund. In addition, in the normal course of business, the fund enters into contracts that provide general indemnifications. The maximum exposure under these arrangements is unknown as this would involve future claims that may be made against a fund. The risk of material loss from such claims is considered by management to be remote.
3. Fees and Transactions with Related Parties
Management Fees — The trust has entered into a management agreement with ACIM, under which ACIM provides the fund with investment advisory and management services in exchange for a single, unified management fee (the fee) per class. The agreement provides that all expenses of managing and operating the fund, except distribution and service fees, brokerage expenses, taxes, interest, fees and expenses of the independent trustees (including legal counsel fees), and extraordinary expenses, will be paid by ACIM. The fee is computed and accrued daily based on each class’s daily net assets and paid monthly in arrears. The fee consists of (1) an Investment Category Fee based on the daily net assets of the fund and certain other accounts managed by the investment advisor that are in the same broad investment category as the fund and (2) a Complex Fee based on the assets of all the funds in the American Century Investments family of funds. The rates for the Investment Category Fee range from 0.1625% to 0.2800%. The rates for the Complex Fee range from 0.2500% to 0.3100% for the Investor Class, A Class and C Class. The Institutional Class is 0.2000% less at each point within the Complex Fee range. The effective annual management fee for each class for the year ended August 31, 2013 was 0.46% for the Investor Class, A Class and C Class and 0.26% for the Institutional Class.
Distribution and Service Fees — The Board of Trustees has adopted a separate Master Distribution and Individual Shareholder Services Plan for each of the A Class and C Class (collectively the plans), pursuant to Rule 12b-1 of the 1940 Act. The plans provide that the A Class will pay American Century Investment Services, Inc. (ACIS) an annual distribution and service fee of 0.25%. The plans provide that the C Class will pay ACIS an annual distribution and service fee of 1.00%, of which 0.25% is paid for individual shareholder services and 0.75% is paid for distribution services. The fees are computed and accrued daily based on each class’s daily net assets and paid monthly in arrears. The fees are used to pay financial intermediaries for distribution and individual shareholder services. Fees incurred under the plans during the year ended August 31, 2013 are detailed in the Statement of Operations.
Related Parties — Certain officers and trustees of the trust are also officers and/or directors of American Century Companies, Inc. (ACC). The trust’s investment advisor, ACIM, the trust’s distributor, ACIS, and the trust’s transfer agent, American Century Services, LLC are wholly owned, directly or indirectly, by ACC.
4. Investment Transactions
Purchases and sales of investment securities, excluding short-term investments, for the year ended August 31, 2013 were $710,124,163 and $576,858,197, respectively.
5. Capital Share Transactions
Transactions in shares of the fund were as follows (unlimited number of shares authorized):
Year ended August 31, 2013 | Year ended August 31, 2012 | ||||||||||
Shares | Amount | Shares | Amount | ||||||||
Investor Class | |||||||||||
Sold | 26,249,346 | $313,038,806 | 26,911,687 | $315,674,175 | |||||||
Issued in reinvestment of distributions | 1,630,412 | 19,349,421 | 1,725,149 | 20,225,527 | |||||||
Redeemed | (25,700,665 | ) | (303,605,745 | ) | (14,134,802 | ) | (165,442,954 | ) | |||
| 2,179,093 | 28,782,482 | 14,502,034 | 170,456,748 | ||||||||
Institutional Class | |||||||||||
Sold | 8,911,433 | 105,871,837 | 4,844,632 | 56,688,404 | |||||||
Issued in reinvestment of distributions | 293,583 | 3,469,027 | 175,448 | 2,041,135 | |||||||
Redeemed | (2,386,988 | ) | (28,170,291 | ) | (1,008,455 | ) | (11,845,700 | ) | |||
| 6,818,028 | 81,170,573 | 4,011,625 | 46,883,839 | ||||||||
A Class | |||||||||||
Sold | 1,783,525 | 21,301,969 | 2,069,462 | 24,234,996 | |||||||
Issued in reinvestment of distributions | 67,419 | 800,039 | 49,639 | 583,486 | |||||||
Redeemed | (1,665,121 | ) | (19,619,173 | ) | (402,156 | ) | (4,728,689 | ) | |||
| 185,823 | 2,482,835 | 1,716,945 | 20,089,793 | ||||||||
C Class | |||||||||||
Sold | 979,409 | 11,647,450 | 912,966 | 10,705,073 | |||||||
Issued in reinvestment of distributions | 16,818 | 199,276 | 10,373 | 122,049 | |||||||
Redeemed | (476,627 | ) | (5,598,532 | ) | (87,505 | ) | (1,024,815 | ) | |||
| 519,600 | 6,248,194 | 835,834 | 9,802,307 | ||||||||
Net increase (decrease) | 9,702,544 | $118,684,084 | 21,066,438 | $247,232,687 | |||||||
6. Fair Value Measurements
The fund’s securities valuation process is based on several considerations and may use multiple inputs to determine the fair value of the positions held by the fund. In conformity with accounting principles generally accepted in the United States of America, the inputs used to determine a valuation are classified into three broad levels as follows:
• | Level 1 valuation inputs consist of unadjusted quoted prices in an active market for identical securities; |
• | Level 2 valuation inputs consist of direct or indirect observable market data (including quoted prices for similar securities, evaluations of subsequent market events, interest rates, prepayment speeds, credit risk, etc.); or |
• | Level 3 valuation inputs consist of unobservable data (including a fund’s own assumptions). |
The level classification is based on the lowest level input that is significant to the fair valuation measurement. The valuation inputs are not necessarily an indication of the risks associated with investing in these securities or other financial instruments.
As of period end, the fund’s investment securities and unrealized gain (loss) on futures contracts were classified as Level 2 and Level 1, respectively. The Schedule of Investments provides additional information on the fund’s portfolio holdings.
7. Derivative Instruments
Interest Rate Risk — The fund is subject to interest rate risk in the normal course of pursuing its investment objectives. The value of bonds generally declines as interest rates rise. A fund may enter into futures contracts based on a bond index or a specific underlying security. A fund may purchase futures contracts to gain exposure to increases in market value or sell futures contracts to protect against a decline in market value. Upon entering into a futures contract, a fund will segregate cash, cash equivalents or other appropriate liquid securities on its records in amounts sufficient to meet requirements. Subsequent payments (variation margin) are made or received daily, in cash, by a fund. The variation margin is equal to the daily change in the contract value and is recorded as unrealized gains and losses. A fund recognizes a realized gain or loss when the futures contract is closed or expires. Net realized and unrealized gains or losses occurring during the holding period of futures contracts are a component of net realized gain (loss) on futures contract transactions and change in net unrealized appreciation (depreciation) on futures contracts, respectively. One of the risks of entering into futures contracts is the possibility that the change in value of the contract may not correlate with the changes in value of the underlying securities. The fund regularly purchased and sold interest rate risk derivative instruments throughout the reporting period and the instruments held at period end as disclosed on the Schedule of Investments are indicative of the fund’s typical volume.
The value of interest rate risk derivative instruments as of August 31, 2013, is disclosed on the Statement of Assets and Liabilities as a liability of $18,594 in payable for variation margin on futures contracts.* For the year ended August 31, 2013, the effect of interest rate risk derivative instruments on the Statement of Operations was $227,846 in net realized gain (loss) on futures contract transactions and $(62,918) in change in net unrealized appreciation (depreciation) on futures contracts.
*Included in the unrealized gain (loss) on futures contracts as reported in the Schedule of Investments.
8. Risk Factors
The fund concentrates its investments in a single state and therefore may have more exposure to credit risk related to the state of California than a fund with a broader geographical diversification.
9. Federal Tax Information
The tax character of distributions paid during the years ended August 31, 2013 and August 31, 2012 were as follows
2013 | 2012 | |
Distributions Paid From | ||
Exempt income | $31,237,679 | $30,693,525 |
Taxable ordinary income | $15,172 | $89,191 |
Long-term capital gains | $333,750 | — |
The book-basis character of distributions made during the year from net investment income or net realized gains may differ from their ultimate characterization for federal income tax purposes. These differences reflect the differing character of certain income items and net realized gains and losses for financial statement and tax purposes, and may result in reclassification among certain capital accounts on the financial statements.
As of August 31, 2013, the federal tax cost of investments and the components of distributable earnings on a tax-basis were as follows:
Federal tax cost of investments | $1,190,950,072 |
Gross tax appreciation of investments | $ 36,013,030 |
Gross tax depreciation of investments | (22,127,650) |
Net tax appreciation (depreciation) of investments | $ 13,885,380 |
Net tax appreciation (depreciation) on derivatives | — |
Net tax appreciation (depreciation) | $13,885,380 |
Other book-to-tax adjustments | $(314,123) |
Undistributed tax-exempt income | — |
Accumulated long-term gains | $343,092 |
The cost of investments for federal income tax purposes was the same as the cost for financial reporting purposes. The difference between book-basis and tax-basis unrealized appreciation (depreciation) is attributable primarily to the realization for tax purposes of unrealized gains (losses) on futures contracts. Other book-to-tax adjustments are attributable primarily to the tax deferral of losses on straddle positions.
Financial Highlights |
For a Share Outstanding Throughout the Years Ended August 31 (except as noted) | |||||||||||||
Per-Share Data | Ratios and Supplemental Data | ||||||||||||
Income From Investment Operations: | Distributions From: | Ratio to Average Net Assets of: | |||||||||||
Net Asset Value, Beginning | Net Income | Net | Total From Investment Operations | Net Income | Net | Total Distributions | Net Asset Value, | Total | Operating Expenses | Net Income | Portfolio Turnover | Net Assets, (in thousands) | |
Investor Class | |||||||||||||
2013 | $11.96 | 0.30(2) | (0.60) | (0.30) | (0.30) | —(3) | (0.30) | $11.36 | (2.51)% | 0.47% | 2.48% | 46% | $1,000,450 |
2012 | $11.41 | 0.36(2) | 0.55 | 0.91 | (0.36) | — | (0.36) | $11.96 | 8.06% | 0.47% | 3.04% | 55% | $1,026,796 |
2011 | $11.56 | 0.40(2) | (0.15) | 0.25 | (0.40) | — | (0.40) | $11.41 | 2.27% | 0.48% | 3.57% | 49% | $814,078 |
2010 | $10.98 | 0.41(2) | 0.59 | 1.00 | (0.42) | — | (0.42) | $11.56 | 9.26% | 0.48% | 3.70% | 11% | $814,105 |
2009 | $10.96 | 0.44 | 0.01 | 0.45 | (0.43) | — | (0.43) | $10.98 | 4.32% | 0.49% | 4.07% | 36% | $596,739 |
Institutional Class | |||||||||||||
2013 | $11.96 | 0.32(2) | (0.59) | (0.27) | (0.32) | —(3) | (0.32) | $11.37 | (2.32)% | 0.27% | 2.68% | 46% | $160,329 |
2012 | $11.41 | 0.38(2) | 0.55 | 0.93 | (0.38) | — | (0.38) | $11.96 | 8.28% | 0.27% | 3.24% | 55% | $87,170 |
2011 | $11.57 | 0.42(2) | (0.16) | 0.26 | (0.42) | — | (0.42) | $11.41 | 2.39% | 0.28% | 3.77% | 49% | $37,381 |
2010(4) | $11.18 | 0.22(2) | 0.39 | 0.61 | (0.22) | — | (0.22) | $11.57 | 5.50% | 0.28%(5) | 3.76%(5) | 11%(6) | $1,683 |
A Class | |||||||||||||
2013 | $11.96 | 0.27(2) | (0.59) | (0.32) | (0.27) | —(3) | (0.27) | $11.37 | (2.76)% | 0.72% | 2.23% | 46% | $36,644 |
2012 | $11.41 | 0.32(2) | 0.56 | 0.88 | (0.33) | — | (0.33) | $11.96 | 7.79% | 0.72% | 2.79% | 55% | $36,341 |
2011 | $11.57 | 0.37(2) | (0.16) | 0.21 | (0.37) | — | (0.37) | $11.41 | 1.93% | 0.73% | 3.32% | 49% | $15,077 |
2010(4) | $11.18 | 0.19(2) | 0.39 | 0.58 | (0.19) | — | (0.19) | $11.57 | 5.27% | 0.73%(5) | 3.37%(5) | 11%(6) | $2,556 |
For a Share Outstanding Throughout the Years Ended August 31 (except as noted) | |||||||||||||
Per-Share Data | Ratios and Supplemental Data | ||||||||||||
Income From Investment Operations: | Distributions From: | Ratio to Average Net Assets of: | |||||||||||
Net Asset Value, Beginning | Net Income | Net | Total From Investment Operations | Net Income | Net | Total Distributions | Net Asset Value, | Total | Operating Expenses | Net Income | Portfolio Turnover | Net Assets, (in thousands) | |
C Class | |||||||||||||
2013 | $11.97 | 0.18(2) | (0.60) | (0.42) | (0.18) | —(3) | (0.18) | $11.37 | (3.56)% | 1.47% | 1.48% | 46% | $19,555 |
2012 | $11.42 | 0.23(2) | 0.56 | 0.79 | (0.24) | — | (0.24) | $11.97 | 6.99% | 1.47% | 2.04% | 55% | $14,361 |
2011 | $11.57 | 0.29(2) | (0.15) | 0.14 | (0.29) | — | (0.29) | $11.42 | 1.27% | 1.48% | 2.57% | 49% | $4,157 |
2010(4) | $11.18 | 0.15(2) | 0.39 | 0.54 | (0.15) | — | (0.15) | $11.57 | 4.87% | 1.48%(5) | 2.65%(5) | 11%(6) | $2,076 |
Notes to Financial Highlights
(1) | Total returns are calculated based on the net asset value of the last business day and do not reflect applicable sales charges, if any. Total returns for periods less than one year are not annualized. |
(2) | Computed using average shares outstanding throughout the period. |
(3) | Per-share amount was less than $0.005. |
(4) | March 1, 2010 (commencement of sale) through August 31, 2010. |
(5) | Annualized. |
(6) | Portfolio turnover is calculated at the fund level. Percentage indicated was calculated for the year ended August 31, 2010. |
See Notes to Financial Statements.
Report of Independent Registered Public Accounting Firm |
To the Trustees of the American Century California Tax-Free and
Municipal Funds and Shareholders of the California Intermediate-Term
Tax-Free Bond Fund:
In our opinion, the accompanying statement of assets and liabilities, including the schedule of investments, and the related statements of operations and of changes in net assets and the financial highlights present fairly, in all material respects, the financial position of the California Intermediate-Term Tax-Free Bond Fund (one of the four funds in the American Century California Tax-Free and Municipal Funds, hereafter referred to as the “Fund”) at August 31, 2013, the results of its operations for the year then ended, the changes in its net assets for each of the two years in the period then ended and the financial highlights for the periods presented, in conformity with accounting principles generally accepted in the United States of America. These financial statements and financial highlights (hereafter referred to as “financial statements”) are the responsibility of the Fund’s management; our responsibility is to express an opinion on these financial statements based on our audits. We conducted our audits of these financial statements in accordance with the standards of the Public Company Accounting Oversight Board (United States). Those standards require that we plan and perform the audit to obtain reasonable assurance about whether the financial statements are free of material misstatement. An audit includes examining, on a test basis, evidence supporting the amounts and disclosures in the financial statements, assessing the accounting principles used and significant estimates made by management, and evaluating the overall financial statement presentation. We believe that our audits, which included confirmation of securities at August 31, 2013 by correspondence with the custodian, provide a reasonable basis for our opinion.
PricewaterhouseCoopers LLP
Kansas City, Missouri
October 21, 2013
Management |
Board of Trustees
The individuals listed below serve as trustees of the funds. Each trustee will continue to serve in this capacity until death, retirement, resignation or removal from office. The board has adopted a mandatory retirement age for trustees who are not “interested persons,” as that term is defined in the Investment Company Act (independent trustees). Independent trustees shall retire on December 31 of the year in which they reach their 75th birthday; provided, however, that on or after January 1, 2022, independent trustees shall retire on December 31 of the year in which they reach their 76th birthday.
Mr. Thomas is the only trustee who is an “interested person” because he currently serves as President and Chief Executive Officer of American Century Companies, Inc. (ACC), the parent company of American Century Investment Management, Inc. (ACIM or the advisor).
The other trustees (more than three-fourths of the total number) are independent; that is, they have never been employees, directors or officers of, and have no financial interest in, ACC or any of its wholly owned, direct or indirect, subsidiaries, including ACIM, American Century Investment Services, Inc. (ACIS) and American Century Services, LLC (ACS). The trustees serve in this capacity for eight (in the case of Mr. Thomas, 15) registered investment companies in the American Century Investments family of funds.
The following table presents additional information about the trustees. The mailing address for each trustee other than Mr. Thomas is 1665 Charleston Road, Mountain View, California 94043. The mailing address for Mr. Thomas is 4500 Main Street, Kansas City, Missouri 64111.
Name | Position(s) Held with Funds | Length Served | Principal Occupation(s) During Past 5 Years | Number of American Century Portfolios Overseen | Other Directorships Held During Past 5 Years | |
Independent Trustees | ||||||
Tanya S. Beder (1955) | Trustee | Since 2011 | Chairman, SBCC Group Inc. (independent advisory services) (2006 to present) | 41 | CYS Investments, Inc. (specialty finance company) | |
Jeremy I. Bulow (1954) | Trustee | Since 2011 | Professor of Economics, Stanford University, Graduate School of Business (1979 to present) | 41 | None | |
Ronald J. Gilson (1946) | Trustee and Chairman of the Board | Since 1995 | Charles J. Meyers Professor of Law and Business, Stanford Law School (1979 to present); Marc and Eva Stern Professor of Law and Business, Columbia University School of Law | 41 | None | |
Frederick L. A. Grauer | Trustee | Since 2008 | Senior Advisor, BlackRock, Inc. (investment management firm) (2010 to 2011); Senior Advisor, Barclays Global Investors (investment management firm) (2003 to 2009) | 41 | None | |
Name | Position(s) Held with Funds | Length Served | Principal Occupation(s) During Past 5 Years | Number of American Century Portfolios Overseen | Other Directorships Held During Past 5 Years | |
Independent Trustees | ||||||
Peter F. Pervere (1947) | Trustee | Since 2007 | Retired | 41 | Intraware, Inc. (2003 to 2009) | |
Myron S. Scholes (1941) | Trustee | Since 1980 | Chairman, Platinum Grove Asset Management, L.P. (asset manager) (1999 to 2009); Frank E. Buck Professor of Finance-Emeritus, Stanford Graduate School of Business (1996 to present) | 41 | Dimensional Fund Advisors (investment advisor); CME Group, Inc. (futures and options exchange) | |
John B. Shoven (1947) | Trustee | Since 2002 | Professor of Economics, Stanford University (1973 to present) | 41 | Cadence Design Systems; Exponent; Financial Engines | |
Interested Trustee | ||||||
Jonathan S. Thomas | Trustee and President | Since 2007 | President and Chief Executive Officer, ACC (March 2007 to present). Also serves as Chief Executive Officer and Manager, ACS; Executive Vice President, ACIM; Director, ACC, ACIM and other ACC subsidiaries | 116 | None | |
Officers
The following table presents certain information about the executive officers of the funds. Each officer serves as an officer for each of the 15 investment companies in the American Century family of funds, unless otherwise noted. No officer is compensated for his or her service as an officer of the funds. The listed officers are interested persons of the funds and are appointed or re-appointed on an annual basis. The mailing address for each of the officers listed below is 4500 Main Street, Kansas City, Missouri 64111.
Name | Offices with the Funds | Principal Occupation(s) During the Past Five Years |
Jonathan S. Thomas | Trustee and President since 2007 | President and Chief Executive Officer, ACC (March 2007 to present). Also serves as Chief Executive Officer and Manager, ACS; Executive Vice President, ACIM; Director, ACC, ACIM and other ACC subsidiaries |
Maryanne L. Roepke | Chief Compliance Officer since 2006 and Senior Vice President since 2000 | Chief Compliance Officer, American Century funds, ACIM and ACS (August 2006 to present). Also serves as Senior Vice President, ACS |
Charles A. Etherington (1957) | General Counsel since 2007 and Senior Vice President since 2006 | Attorney, ACC (February 1994 to present); Vice President, ACC (November 2005 to present); General Counsel, ACC (March 2007 to present). Also serves as General Counsel, ACIM, ACS, ACIS and other ACC subsidiaries; and Senior Vice President, ACIM and ACS |
C. Jean Wade (1964) | Vice President, Treasurer and Chief Financial Officer since 2012 | Vice President, ACS (February 2000 to present) |
Robert J. Leach (1966) | Vice President since 2006 and Assistant Treasurer since 2012 | Vice President, ACS (February 2000 to present) |
David H. Reinmiller (1963) | Vice President since 2001 | Attorney, ACC (January 1994 to present); Associate General Counsel, ACC (January 2001 to present). Also serves as Vice President, ACIM and ACS |
Ward D. Stauffer (1960) | Secretary since 2005 | Attorney, ACC (June 2003 to present) |
The Statement of Additional Information has additional information about the fund’s trustees and is available without charge, upon request, by calling 1-800-345-2021.
Approval of Management Agreement |
At a meeting held on June 11, 2013, the Fund’s Board of Directors/Trustees unanimously approved the renewal of the management agreement pursuant to which American Century Investment Management, Inc. (the “Advisor”) acts as the investment advisor for the Fund. Under Section 15(c) of the Investment Company Act, contracts for investment advisory services are required to be reviewed, evaluated, and approved by a majority of a fund’s directors/trustees (the “Directors”), including a majority of the independent Directors each year. The Board regards this annual evaluation and renewal as one of its most important responsibilities.
In connection with their annual review and evaluation, the independent Directors memorialized a statement regarding the relationship between their ongoing obligations to oversee and evaluate the performance of the Advisor and their consideration of renewal of the management agreement. In that statement, the independent Directors noted that their assessment of the Advisor’s performance is an ongoing process that takes place over the entire year and is informed by all of the information that the Board and its committees receive and consider over time. This information, together with the materials provided in connection with the review, are central to the Board’s assessment of the Advisor’s performance and its determination whether to renew the Fund’s management agreement.
Prior to its consideration of the renewal of the management agreement, the Board requested and reviewed extensive data and analysis relating to the proposed renewal. This information and analysis was compiled by the Advisor and certain independent providers of evaluation data concerning the Fund and the services provided to the Fund by the Advisor.
In connection with its consideration of the renewal of the management agreement, the Board’s review and evaluation of the services provided by the Advisor included, but was not limited to, the following:
• | the nature, extent, and quality of investment management, shareholder services, and other services provided by the Advisor to the Fund; |
• | the wide range of other programs and services the Advisor provides to the Fund and its shareholders on a routine and non-routine basis; |
• | the investment performance of the Fund, including data comparing the Fund’s performance to appropriate benchmarks and/or a peer group of other mutual funds with similar investment objectives and strategies; |
• | data comparing the cost of owning the Fund to the cost of owning similar funds; |
• | the Advisor’s compliance policies, procedures, and regulatory experience; |
• | financial data showing the cost of services provided to the Fund, the profitability of the Fund to the Advisor, and the overall profitability of the Advisor; |
• | possible economies of scale associated with the Advisor’s management of the Fund and other accounts under its management; |
• | data comparing services provided and charges to other investment management clients of the Advisor; and |
• | consideration of collateral benefits derived by the Advisor from the management of the Fund. |
In keeping with its practice, the Board held two in-person meetings to review and discuss the information provided. The Board also had the benefit of the advice of its independent counsel throughout the period.
Factors Considered
The Directors considered all of the information provided by the Advisor, the independent data providers, and the Board’s independent counsel in connection with the review, and evaluated such information for the Fund. In connection with their review, the Directors did not identify any single factor as being all-important or controlling and each Director may have attributed different levels of importance to different factors. In deciding to renew the management agreement, the Board based its decision on a number of factors, including the following:
Nature, Extent and Quality of Services — Generally. Under the management agreement, the Advisor is responsible for providing or arranging for all services necessary for the operation of the Fund. The Board noted that under the management agreement, the Advisor provides or arranges at its own expense a wide variety of services including:
• | constructing and designing the Fund |
• | portfolio research and security selection |
• | initial capitalization/funding |
• | securities trading |
• | Fund administration |
• | custody of Fund assets |
• | daily valuation of the Fund’s portfolio |
• | shareholder servicing and transfer agency, including shareholder confirmations, recordkeeping, and communications |
• | legal services |
• | regulatory and portfolio compliance |
• | financial reporting |
• | marketing and distribution |
The Board noted that many of these services have expanded over time both in terms of quantity and complexity in response to shareholder demands, competition in the industry, changing distribution channels, and the changing regulatory environment.
Investment Management Services. The nature of the investment management services provided to the Fund is quite complex and allows Fund shareholders access to professional money management, instant diversification of their investments within an asset class, the opportunity to easily diversify among asset classes by investing in or exchanging among various American Century Investments funds, and liquidity. In evaluating investment performance, the Board expects the Advisor to manage the Fund in accordance with its investment objectives and approved strategies. Further, the Directors recognize that the Advisor has an obligation to seek the best execution of fund trades. In providing these services, the Advisor utilizes teams of investment professionals (portfolio managers, analysts, research assistants, and securities traders) who require extensive information technology, research, training, compliance and other systems to conduct their business. The Board, directly and through its Portfolio Committee, regularly reviews investment performance information for the Fund, together with comparative information for appropriate benchmarks and/or peer groups of similarly-managed funds, over different time horizons. The Directors also review detailed performance information during the management agreement approval process. If performance concerns are identified, the Fund receives special reviews until performance improves, during which the Board discusses with the Advisor the reasons for such results (e.g., market conditions, security selection) and any efforts being undertaken to improve performance. The Board found the investment management services provided by the Advisor to the Fund to meet or exceed industry standards. More detailed information about the Fund’s performance can be found in the Performance and Portfolio Commentary sections of this report.
Shareholder and Other Services. Under the management agreement, the Advisor provides the Fund with a comprehensive package of transfer agency, shareholder, and other services. The Board, directly and through various committees of the Board, regularly reviews reports and evaluations of such services at its regular meetings. These reports include, but are not limited to, information regarding the operational efficiency and accuracy of the shareholder and transfer agency services provided, staffing levels, shareholder satisfaction (as measured by external as well as internal sources), technology support, new products and services offered to Fund shareholders, securities trading activities, portfolio valuation services, auditing services, and legal and operational compliance activities. Certain aspects of shareholder and transfer agency service level efficiency and the quality of securities trading activities are measured by independent third party providers and are presented in comparison to other fund groups not managed by the Advisor. The Board found the services provided by the Advisor to the Fund under the management agreement to be competitive and of high quality.
Costs of Services and Profitability. The Advisor provides detailed information concerning its cost of providing various services to the Fund, its profitability in managing the Fund, its overall profitability, and its financial condition. The Directors have reviewed with the Advisor the methodology used to prepare this financial information. The financial information regarding the Advisor is considered in evaluating the Advisor’s financial condition, its ability to continue to provide services under the management agreement, and the reasonableness of the current management fee. The Board concluded that the Advisor’s profits were reasonable in light of the services provided to the Fund.
Ethics. The Board generally considers the Advisor’s commitment to providing quality services to shareholders and to conducting its business ethically. They noted that the Advisor’s practices generally meet or exceed industry best practices.
Economies of Scale. The Board also reviewed information provided by the Advisor regarding the possible existence of economies of scale in connection with the management of the Fund. The Board concluded that economies of scale are difficult to measure and predict with precision, especially on a fund-by-fund basis. The Board concluded that the Advisor is appropriately sharing economies of scale through its competitive fee structure, offering competitive fees from fund inception, and through reinvestment in its business to provide shareholders additional content and services.
Comparison to Other Funds’ Fees. The management agreement provides that the Fund pay the Advisor a single, all-inclusive (or unified) management fee for providing all services necessary for the management and operation of the Fund, other than brokerage expenses, taxes, interest, extraordinary expenses, and the fees and expenses of the Fund’s independent directors (including their independent legal counsel) and expenses incurred in connection with the provision of shareholder services and distribution services under a plan adopted pursuant to Rule 12b-1 under the 1940 Act. Under the unified fee structure, the Advisor is responsible for providing all investment advisory, custody, audit, administrative, compliance, recordkeeping, marketing and shareholder services, or arranging and supervising third parties to provide such services. By contrast, most other funds are charged a variety of fees, including an investment advisory fee, a transfer agency fee, an administrative fee, distribution charges and other expenses. Other than their investment advisory fees and any applicable Rule 12b-1 distribution fees, all other components of the total fees charged by these other funds may be increased without shareholder approval. The Board believes the unified fee structure is a benefit to Fund shareholders because it clearly discloses to shareholders the cost of owning Fund shares, and, since the unified fee cannot be increased without a vote of Fund shareholders, it shifts to the Advisor the risk of increased costs of operating the Fund and provides a direct incentive to minimize administrative inefficiencies. Part of the Board’s analysis of fee levels involves reviewing certain evaluative data compiled by an independent provider and comparing the Fund’s unified fee to the total expense ratio of other funds in the Fund’s peer group. The Board concluded that the management fee paid by the Fund to the Advisor under the management agreement is reasonable in light of the services provided to the Fund.
Comparison to Fees and Services Provided to Other Clients of the Advisor. The Board also requested and received information from the Advisor concerning the nature of the services, fees, costs and profitability of its advisory services to advisory clients other than the Fund. They observed that these varying types of client accounts require different services and involve different regulatory and entrepreneurial risks than the management of the Fund. The Board analyzed this information and concluded that the fees charged and services provided to the Fund were reasonable by comparison.
Collateral or “Fall-Out” Benefits Derived by the Advisor. The Board considered the existence of collateral benefits the Advisor may receive as a result of its relationship with the Fund. They concluded that the Advisor’s primary business is managing mutual funds and it generally does not use fund or shareholder information to generate profits in other lines of business, and therefore does not derive any significant collateral benefits from them. The Board noted that the Advisor receives proprietary research from broker-dealers that execute fund portfolio transactions and concluded that this research is likely to benefit Fund shareholders. The Board also determined that the Advisor is able to provide investment management services to certain clients other than the Fund, at least in part, due to its existing infrastructure built to serve the fund complex. The Board concluded, however, that the assets of those other clients are not material to the analysis and, where applicable, may be included with the assets of the Fund to determine breakpoints in the management fee schedule.
Existing Relationship. The Board also considered whether there was any reason for not continuing the existing arrangement with the Advisor. In this regard, the Board was mindful of the potential disruptions of the Fund’s operations and various risks, uncertainties, and other effects that could occur as a result of a decision not to continue such relationship. In particular, the Board recognized that most shareholders have invested in the Fund on the strength of the Advisor’s industry standing and reputation and in the expectation that the Advisor will have a continuing role in providing advisory services to the Fund.
Conclusion of the Directors. As a result of this process, the Board, including all of the independent directors and assisted by the advice of independent legal counsel, taking into account all of the factors discussed above and the information provided by the Advisor and others, concluded that the management agreement between the Fund and the Advisor is fair and reasonable in light of the services provided and should be renewed.
Additional Information |
Proxy Voting Guidelines
American Century Investment Management, Inc., the fund’s investment advisor, is responsible for exercising the voting rights associated with the securities purchased and/or held by the fund. A description of the policies and procedures the advisor uses in fulfilling this responsibility is available without charge, upon request, by calling 1-800-345-2021. It is also available on American Century Investments’ website at americancentury.com and on the Securities and Exchange Commission’s website at sec.gov. Information regarding how the investment advisor voted proxies relating to portfolio securities during the most recent 12-month period ended June 30 is available on the “About Us” page at americancentury.com. It is also available at sec.gov.
Quarterly Portfolio Disclosure
The fund files its complete schedule of portfolio holdings with the Securities and Exchange Commission (SEC) for the first and third quarters of each fiscal year on Form N-Q. The fund’s Forms N-Q are available on the SEC’s website at sec.gov, and may be reviewed and copied at the SEC’s Public Reference Room in Washington, DC. Information on the operation of the Public Reference Room may be obtained by calling 1-800-SEC-0330. The fund also makes its complete schedule of portfolio holdings for the most recent quarter of its fiscal year available on its website at americancentury.com and, upon request, by calling 1-800-345-2021.
Other Tax Information
The following information is provided pursuant to provisions of the Internal Revenue Code.
The fund designates $31,259,865 as exempt interest dividends for the fiscal year ended August 31, 2013.
The fund hereby designates $333,750, or up to the maximum amount allowable, as long-term capital gain distributions for the fiscal year ended August 31, 2013.
Contact Us | americancentury.com |
Automated Information Line | 1-800-345-8765 |
Investor Services Representative | 1-800-345-2021 |
Investors Using Advisors | 1-800-378-9878 |
Business, Not-For-Profit, Employer-Sponsored Retirement Plans | 1-800-345-3533 |
Banks and Trust Companies, Broker-Dealers, Financial Professionals, Insurance Companies | 1-800-345-6488 |
Telecommunications Device for the Deaf | 1-800-634-4113 |
American Century California Tax-Free and Municipal Funds
Investment Advisor:
American Century Investment Management, Inc.
Kansas City, Missouri
This report and the statements it contains are submitted for the general information of our shareholders. The report is not authorized for distribution to prospective investors unless preceded or accompanied by an effective prospectus.
©2013 American Century Proprietary Holdings, Inc. All rights reserved.
CL-ANN-79625 1310
ANNUAL REPORT | AUGUST 31, 2013 |
California Long-Term Tax-Free Fund
Table of Contents |
President’s Letter | 2 |
Market Perspective | 3 |
Performance | 4 |
Portfolio Commentary | 6 |
Fund Characteristics | 8 |
Shareholder Fee Example | 9 |
Schedule of Investments | 11 |
Statement of Assets and Liabilities | 20 |
Statement of Operations | 21 |
Statement of Changes in Net Assets | 22 |
Notes to Financial Statements | 23 |
Financial Highlights | 28 |
Report of Independent Registered Public Accounting Firm | 30 |
Management | 31 |
Approval of Management Agreement | 34 |
Additional Information | 39 |
Any opinions expressed in this report reflect those of the author as of the date of the report, and do not necessarily represent the opinions of American Century Investments® or any other person in the American Century Investments organization. Any such opinions are subject to change at any time based upon market or other conditions and American Century Investments disclaims any responsibility to update such opinions. These opinions may not be relied upon as investment advice and, because investment decisions made by American Century Investments funds are based on numerous factors, may not be relied upon as an indication of trading intent on behalf of any American Century Investments fund. Security examples are used for representational purposes only and are not intended as recommendations to purchase or sell securities. Performance information for comparative indices and securities is provided to American Century Investments by third party vendors. To the best of American Century Investments’ knowledge, such information is accurate at the time of printing.
President’s Letter |
Jonathan Thomas
Dear Investor:
Thank you for reviewing this annual report for the 12 months ended August 31, 2013. It provides investment performance, market analysis, and portfolio information, presented with the expert perspective of our portfolio management team.
Annual reports remain important vehicles for conveying information about fund returns, including key factors that affected fund performance. For additional, updated investment and market insights, we encourage you to visit our website, americancentury.com.
U.S. Government Bond Yields and Stock Indices Soared
U.S. government bond yields and stock indices traced roughly parallel upward paths during the 12 months ended August 31, 2013. The 10-year U.S. Treasury yield began the period at just 1.55%, compressed in large part by the scale of the Federal Reserve’s (the Fed’s) bond-buying program ($85 billion of quantitative easing, or QE, each month).
Hints from the Fed that it might taper QE sent bond yields soaring from early May to the end of August—the 10-year U.S. Treasury yield closed the period at 2.78%. The 10-year U.S. Treasury note and the Barclays U.S. Aggregate Bond Index (representing the broad taxable U.S. bond market) returned –7.52% and –2.47%, respectively, for the 12 months. Municipal bonds generally trailed taxable bonds—the Barclays Municipal Bond Index returned –3.70%.
U.S. stocks also experienced volatility from mid-May to mid-June as a result of the “Taper Tantrum,” but it was a relatively small setback in an otherwise solid 12-month performance period. The S&P 500 Index gained 18.70% as the U.S. economy showed signs of attaining sustainable growth. Improvements in the housing and job markets helped trigger optimism, though absolute levels still remain well below where they were prior to 2008.
Recovery from 2008 remains a major hurdle. Economic growth is still subpar compared with past recession recoveries, and the outlook is uncertain. Therefore, we continue to believe in a disciplined, diversified, long-term investment approach, using professionally managed stock and bond portfolios—as appropriate—for meeting financial goals. We appreciate your continued trust in us in this challenging environment.
Sincerely,
Jonathan Thomas
President and Chief Executive Officer
American Century Investments
Market Perspective |
By David MacEwen, Chief Investment Officer, Fixed Income
Federal Reserve Policy Drove Market Sentiment
The municipal bond (muni) market began the 12-month period on a fairly upbeat note, supported by stable-to-improving credit trends, robust issuance, healthy demand, and an accommodative Federal Reserve (Fed). Early in the period, the Fed also launched its third and most aggressive quantitative easing program (QE3), a strategy to purchase $85 billion of U.S. government securities each month until economic growth and employment improve. The Fed also kept its overnight interest rate target near 0%. These actions supported the U.S. bond market in general at the start of the period.
Beginning in spring 2013, investor sentiment shifted dramatically, as fears of a change in Fed policy triggered a broad market sell-off. Since 2008, the Fed’s massive QE programs have helped keep longer-term interest rates low and encouraged risk-taking. But Fed statements throughout the spring and summer indicated the central bank may start tapering its bond purchases this year. In addition, select economic data modestly improved, fueling further speculation that the Fed would change course. In response, bond yields soared, generating negative returns throughout the fixed income market.
Munis Underperformed Treasuries, Broad Bond Market
Despite outperforming during the first half of the period, munis underperformed their Treasury counterparts and the taxable investment-grade bond market for the entire 12-month period. Overall, market volatility, rising-rate worries, liquidity concerns, and a weaker supply/demand backdrop in the second half drove down 12-month returns. The most-liquid and shortest-duration (least price-sensitive to interest rate changes) fixed-income securities generally fared best.
Additionally, the City of Detroit bankruptcy filing on July 18, 2013, combined with mounting debt problems in Puerto Rico, which is among the largest muni issuers, further pressured the muni market. Although the Detroit bankruptcy was big news, it was not a big surprise, coming after decades of financial mismanagement and population declines. Nevertheless, the negative headlines surrounding the record-setting bankruptcy and growing concerns for Puerto Rico’s debt exacerbated the selling pressures in the muni market and led to additional price deterioration.
U.S. Fixed-Income Total Returns | ||||
For the 12 months ended August 31, 2013 | ||||
Barclays Municipal Market Indices |
| Barclays U.S. Taxable Market Indices | ||
7 Year Municipal Bond | -1.76% | Aggregate Bond | -2.47% | |
California Tax-Exempt Bond | -3.03% | Treasury Bond | -3.07% | |
Municipal Bond | -3.70% | |||
Municipal High Yield Bond | -3.91% | |||
Long-Term Municipal Bond | -7.43% | |||
Performance |
Total Returns as of August 31, 2013 | ||||||
Average Annual Returns | ||||||
Ticker Symbol | 1 year | 5 years | 10 years | Since Inception | Inception Date | |
Investor Class | BCLTX | -3.45% | 4.43% | 4.17% | 6.38% | 11/9/83 |
Barclays Municipal | — | -3.70% | 4.52% | 4.47% | 7.10%(1) | — |
Institutional Class | BCLIX | -3.26% | — | — | 4.53% | 3/1/10 |
A Class No sales charge* With sales charge* | ALTAX | -3.70% -8.02% | 4.17% 3.22% | — — | 3.78% 2.99% | 9/28/07 |
C Class | ALTCX | -4.41% | 3.40% | — | 3.01% | 9/28/07 |
* | Sales charges include initial sales charges and contingent deferred sales charges (CDSCs), as applicable. A Class shares have a 4.50% maximum initial sales charge and may be subject to a maximum CDSC of 1.00%. C Class shares redeemed within 12 months of purchase are subject to a maximum CDSC of 1.00%. The SEC requires that mutual funds provide performance information net of maximum sales charges in all cases where charges could be applied. |
(1) | Since 10/31/83, the date nearest the Investor Class’s inception for which data are available. |
Data presented reflect past performance. Past performance is no guarantee of future results. Current performance may be higher or lower than the performance shown. Investment return and principal value will fluctuate, and redemption value may be more or less than original cost. To obtain performance data current to the most recent month end, please call 1-800-345-2021 or visit americancentury.com. As interest rates rise, bond values will decline. The fund concentrates its investments in a single state and therefore may have more exposure to credit risk related to the state of California than a fund with a broader geographical diversification. Investment income may be subject to certain state and local taxes and, depending on your tax status, the federal alternative minimum tax (AMT). Capital gains are not exempt from state and federal income tax.
Unless otherwise indicated, performance reflects Investor Class shares; performance for other share classes will vary due to differences in fee structure. For information about other share classes available, please consult the prospectus. Data assumes reinvestment of dividends and capital gains, and none of the charts reflect the deduction of taxes that a shareholder would pay on fund distributions or the redemption of fund shares. Returns for the index are provided for comparison. The fund’s total returns include operating expenses (such as transaction costs and management fees) that reduce returns, while the total returns of the index do not.
Growth of $10,000 Over 10 Years |
$10,000 investment made August 31, 2003 |
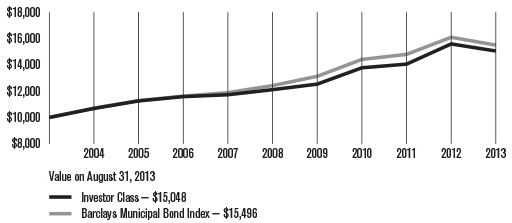
Total Annual Fund Operating Expenses | |||
Investor Class | Institutional Class | A Class | C Class |
0.47% | 0.27% | 0.72% | 1.47% |
The total annual fund operating expenses shown is as stated in the fund’s prospectus current as of the date of this report. The prospectus may vary from the expense ratio shown elsewhere in this report because it is based on a different time period, includes acquired fund fees and expenses, and, if applicable, does not include fee waivers or expense reimbursements.
Data presented reflect past performance. Past performance is no guarantee of future results. Current performance may be higher or lower than the performance shown. Investment return and principal value will fluctuate, and redemption value may be more or less than original cost. To obtain performance data current to the most recent month end, please call 1-800-345-2021 or visit americancentury.com. As interest rates rise, bond values will decline. The fund concentrates its investments in a single state and therefore may have more exposure to credit risk related to the state of California than a fund with a broader geographical diversification. Investment income may be subject to certain state and local taxes and, depending on your tax status, the federal alternative minimum tax (AMT). Capital gains are not exempt from state and federal income tax.
Unless otherwise indicated, performance reflects Investor Class shares; performance for other share classes will vary due to differences in fee structure. For information about other share classes available, please consult the prospectus. Data assumes reinvestment of dividends and capital gains, and none of the charts reflect the deduction of taxes that a shareholder would pay on fund distributions or the redemption of fund shares. Returns for the index are provided for comparison. The fund’s total returns include operating expenses (such as transaction costs and management fees) that reduce returns, while the total returns of the index do not.
Portfolio Commentary |
Portfolio Managers: Joseph Gotelli, Alan Kruss, and Steven Permut
Performance Summary
California Long-Term Tax-Free declined -3.45%* for the fiscal year ended August 31, 2013. By comparison, the Barclays Municipal Bond Index declined -3.70%. Portfolio returns reflect operating expenses, while index returns do not. (Please see pages 4 and 5 for additional performance comparisons.)
The fund’s absolute return reflected the negative performance of municipal bond (muni) indices (see page 3) during the 12-month period. The fund’s outperformance relative to the broad national benchmark was primarily due to regional performance—California munis generally outperformed the nationwide muni market. In addition, the fund’s maturity and quality strategies helped performance on a relative basis.
Fiscal and Credit Fundamentals
In general, muni market fundamentals improved during the 12-month period, as many states and municipalities continued to take steps to curb spending and strengthen their budgets. A U.S. Census Bureau report released in June 2013 showed state revenues nationwide increased nearly 7% in the first quarter of 2013, compared with 2012’s first quarter. The report also indicated municipal tax revenues increased for 12 consecutive quarters through the first quarter of 2013.
In California, the state’s fiscal outlook continued to improve due to housing and technology sector gains and growing tax revenues. In November 2012, California voters approved Proposition 30, increasing the state’s sales tax rate for the next four years and marginal income tax rates for high-income taxpayers for the next seven years. Furthermore, a June 2013 Bloomberg article indicated rising home values and lower unemployment led to faster first-quarter-2013 economic growth for California than for the next four-largest states. Together, these factors are projected to help generate a possible surplus in the state’s $96.3 billion budget for fiscal 2014.
Increasing tax revenues and projections of structurally balanced state budgets for the next several years prompted Standard & Poor’s in January 2013 to increase California’s credit rating from “A-” to “A” and issue a stable outlook for the state. Fitch also upgraded the state’s debt in August 2013. Meanwhile, from a nationwide perspective, muni credit-rating downgrades generally outpaced upgrades, but the overall default rate remained low. We believe it’s unlikely any states will default, but select credit ratings may remain under downward pressure.
*All fund returns referenced in this commentary are for Investor Class shares.
Portfolio Positioning
Improvements in California’s fiscal health generally led to better relative performance for California munis versus their peers during the 12-month period. This contributed to the fund’s outperformance relative to the national muni benchmark—the fund declined less than the index. Additionally, early in 2013, in anticipation of a steepening yield curve (a greater increase in longer-maturity yields than shorter-maturity), we began reducing the fund’s exposure to long-maturity securities. We also boosted exposure to higher-quality munis. These strategies also helped the fund’s relative results, as longer-term rates increased at a greater pace than shorter-term rates, and higher-quality munis outperformed lower-quality securities.
We continued to emphasize revenue bonds over general obligation (GO) bonds. In particular, we favored essential service (such as water and sewer project) revenue bonds, along with transportation, and sales-tax-secured bonds.
Security selection among lower-quality munis (which sharply outperformed higher-quality munis in calendar year 2012 but underperformed during the reporting period) weighed on the fund’s relative performance. In particular, selections within the higher education, industrial development revenue/pollution control revenue (IDR/PCR), and hospital sectors, along with a small (1.1%, as of August 31, 2013) position in Puerto Rico munis, detracted from results.
Against a backdrop of general technical weakening in the muni market during the second half of the reporting period (as described on page 3), as well as some weakening in local credit fundamentals, Puerto Rico munis sharply underperformed during the 12-month period. We believe the Puerto Rico market was generally oversold during the period given underlying credit fundamentals that still support many of these bonds.
Outlook
We believe the recent jump in interest rates—though perhaps a near-term overreaction given still-subpar economic growth—represents the start of a legitimate long-term “normalization” of rates, as the market comes off extreme, artificially low, largely quantitative easing-influenced levels. Given the state’s favorable fiscal trends, the team remains optimistic toward the California muni market. As always, we believe our fundamental credit research and risk management capabilities will continue to drive results.
Fund Characteristics |
AUGUST 31, 2013
| |
Portfolio at a Glance | |
Weighted Average Maturity | 15.3 years |
Average Duration (Modified) | 6.1 years |
Top Five Sectors | % of fund investments |
General Obligation (GO) | 24% |
Transportation Revenue | 13% |
Electric Revenue | 12% |
Hospital Revenue | 11% |
Water/Sewer/Gas Revenue | 11% |
Types of Investments in Portfolio | % of net assets |
Municipal Securities | 98.4% |
Other Assets and Liabilities | 1.6% |
Shareholder Fee Example |
Fund shareholders may incur two types of costs: (1) transaction costs, including sales charges (loads) on purchase payments and redemption/exchange fees; and (2) ongoing costs, including management fees; distribution and service (12b-1) fees; and other fund expenses. This example is intended to help you understand your ongoing costs (in dollars) of investing in your fund and to compare these costs with the ongoing cost of investing in other mutual funds.
The example is based on an investment of $1,000 made at the beginning of the period and held for the entire period from March 1, 2013 to August 31, 2013.
Actual Expenses
The table provides information about actual account values and actual expenses for each class. You may use the information, together with the amount you invested, to estimate the expenses that you paid over the period. First, identify the share class you own. Then simply divide your account value by $1,000 (for example, an $8,600 account value divided by $1,000 = 8.6), then multiply the result by the number under the heading “Expenses Paid During Period” to estimate the expenses you paid on your account during this period.
If you hold Investor Class shares of any American Century Investments fund, or Institutional Class shares of the American Century Diversified Bond Fund, in an American Century Investments account (i.e., not a financial intermediary or retirement plan account), American Century Investments may charge you a $12.50 semiannual account maintenance fee if the value of those shares is less than $10,000. We will redeem shares automatically in one of your accounts to pay the $12.50 fee. In determining your total eligible investment amount, we will include your investments in all personal accounts (including American Century Investments Brokerage accounts) registered under your Social Security number. Personal accounts include individual accounts, joint accounts, UGMA/UTMA accounts, personal trusts, Coverdell Education Savings Accounts and IRAs (including traditional, Roth, Rollover, SEP-, SARSEP- and SIMPLE-IRAs), and certain other retirement accounts. If you have only business, business retirement, employer-sponsored or American Century Investments Brokerage accounts, you are currently not subject to this fee. If you are subject to the Account Maintenance Fee, your account value could be reduced by the fee amount.
Hypothetical Example for Comparison Purposes
The table also provides information about hypothetical account values and hypothetical expenses based on the actual expense ratio of each class of your fund and an assumed rate of return of 5% per year before expenses, which is not the actual return of a fund’s share class. The hypothetical account values and expenses may not be used to estimate the actual ending account balance or expenses you paid for the period. You may use this information to compare the ongoing costs of investing in your fund and other funds. To do so, compare this 5% hypothetical example with the 5% hypothetical examples that appear in the shareholder reports of the other funds.
Please note that the expenses shown in the table are meant to highlight your ongoing costs only and do not reflect any transactional costs, such as sales charges (loads) or redemption/exchange fees. Therefore, the table is useful in comparing ongoing costs only, and will not help you determine the relative total costs of owning different funds. In addition, if these transactional costs were included, your costs would have been higher.
Beginning 3/1/13 | Ending 8/31/13 | Expenses Paid During Period(1) 3/1/13 – 8/31/13 | Annualized | |
Actual | ||||
Investor Class | $1,000 | $939.20 | $2.30 | 0.47% |
Institutional Class | $1,000 | $940.10 | $1.32 | 0.27% |
A Class | $1,000 | $938.00 | $3.52 | 0.72% |
C Class | $1,000 | $934.40 | $7.17 | 1.47% |
Hypothetical | ||||
Investor Class | $1,000 | $1,022.84 | $2.40 | 0.47% |
Institutional Class | $1,000 | $1,023.84 | $1.38 | 0.27% |
A Class | $1,000 | $1,021.58 | $3.67 | 0.72% |
C Class | $1,000 | $1,017.80 | $7.48 | 1.47% |
(1) | Expenses are equal to the class’s annualized expense ratio listed in the table above, multiplied by the average account value over the period, multiplied by 184, the number of days in the most recent fiscal half-year, divided by 365, to reflect the one-half year period. |
Schedule of Investments |
AUGUST 31, 2013
Principal Amount | Value | |||||
Municipal Securities — 98.4% | ||||||
CALIFORNIA — 95.4% | ||||||
ABAG Finance Authority for Nonprofit Corps. Rev., (Sharp HealthCare), 6.25%, 8/1/39 | $1,200,000 | $ 1,303,800 | ||||
ABAG Finance Authority for Nonprofit Corps. Rev., Series 2011 A, (Sharp HealthCare), 6.00%, 8/1/30 | 1,000,000 | 1,099,310 | ||||
Adelanto Public Utility Authority Rev., Series 2009 A, (Utility System), 6.25%, 7/1/26 | 500,000 | 515,695 | ||||
Alameda Corridor Transportation Authority Rev., Capital Appreciation, Series 1999 A, 0.00%, 10/1/32 (NATL-RE)(1) | 1,000,000 | 344,000 | ||||
Alameda Corridor Transportation Authority Rev., Capital Appreciation, Series 1999 A, 0.00%, 10/1/35 (NATL-RE)(1) | 3,750,000 | 1,065,338 | ||||
Alum Rock Union Elementary School District GO, Series 2013 A, (Election of 2012), 6.00%, 8/1/39 | 1,000,000 | 1,115,520 | ||||
Anaheim Public Financing Authority Rev., (Electric System Distribution), 5.25%, 10/1/39 | 2,500,000 | 2,564,650 | ||||
Anaheim Public Financing Authority Rev., Series 2011 A, (Electric System Distribution Facilities), 5.375%, 10/1/36 | 300,000 | 317,154 | ||||
Bay Area Toll Authority Toll Bridge Rev., Series 2001 A, (San Francisco Bay Area), VRDN, 1.31%, 9/5/13 | 1,000,000 | 980,070 | ||||
Bay Area Toll Authority Toll Bridge Rev., Series 2006 F, (San Francisco Bay Area), 5.00%, 4/1/16, Prerefunded at 100% of Par(2)(3) | 3,000,000 | 3,332,880 | ||||
Bay Area Toll Authority Toll Bridge Rev., Series 2007 A1, (San Francisco Bay Area), VRDN, 0.76%, 9/5/13 | 725,000 | 729,916 | ||||
Bay Area Toll Authority Toll Bridge Rev., Series 2008 F1, (San Francisco Bay Area), 5.00%, 4/1/34 | 1,500,000 | 1,530,705 | ||||
Bay Area Toll Authority Toll Bridge Rev., Series 2008 F1, (San Francisco Bay Area), 5.00%, 4/1/39 | 2,135,000 | 2,166,342 | ||||
Bay Area Toll Authority Toll Bridge Rev., Series 2008 G1, (San Francisco Bay Area), VRDN, 1.16%, 9/5/13 | 1,250,000 | 1,255,125 | ||||
Bay Area Toll Authority Toll Bridge Rev., Series 2009 F1, (San Francisco Bay Area), 5.25%, 4/1/27 | 1,500,000 | 1,665,840 | ||||
Bay Area Toll Authority Toll Bridge Rev., Series 2009 F1, (San Francisco Bay Area), 5.00%, 4/1/34 | 1,500,000 | 1,513,020 | ||||
Bay Area Toll Authority Toll Bridge Rev., Series 2012 F1, (San Francisco Bay Area), 5.00%, 4/1/31 | 1,000,000 | 1,037,410 | ||||
Bay Area Toll Authority Toll Bridge Rev., Series 2013 S4, (San Francisco Bay Area), 5.00%, 4/1/43 | 2,500,000 | 2,454,425 | ||||
Bay Area Water Supply & Conservation Agency Rev., Series 2013 A, 5.00%, 10/1/24 | 1,000,000 | 1,127,090 | ||||
Bay Area Water Supply & Conservation Agency Rev., Series 2013 A, 5.00%, 10/1/25 | 2,635,000 | 2,923,849 | ||||
Bay Area Water Supply & Conservation Agency Rev., Series 2013 A, 5.00%, 10/1/26 | 1,000,000 | 1,093,520 | ||||
California Department of Water Resources Power Supply Rev., Series 2005 G4, 5.00%, 5/1/16 | 1,450,000 | 1,617,881 | ||||
California Department of Water Resources Power Supply Rev., Series 2008 H, 5.00%, 5/1/21 | 2,500,000 | 2,829,850 | ||||
California Department of Water Resources Power Supply Rev., Series 2009 AG, (Central Valley), 5.00%, 12/1/25 | 1,000,000 | 1,106,420 | ||||
California Department of Water Resources Power Supply Rev., Series 2010 L, 5.00%, 5/1/15 | 2,000,000 | 2,154,620 | ||||
Principal Amount | Value |
California Department of Water Resources Power Supply Rev., Series 2010 L, 5.00%, 5/1/18 | $2,000,000 | $ 2,312,300 | ||||
California Department of Water Resources Power Supply Rev., Series 2010 L, 5.00%, 5/1/22 | 1,275,000 | 1,443,861 | ||||
California Department of Water Resources Power Supply Rev., Series 2010 M, 5.00%, 5/1/15 | 1,525,000 | 1,642,898 | ||||
California Department of Water Resources Power Supply Rev., Series 2011 N, 5.00%, 5/1/20 | 5,000,000 | 5,829,150 | ||||
California Department of Water Resources Power Supply Rev., Series 2011 N, 5.00%, 5/1/21 | 3,250,000 | 3,795,707 | ||||
California Department of Water Resources Power Supply Rev., Series 2013 AM, (Central Valley), 5.00%, 12/1/25 | 1,000,000 | 1,127,970 | ||||
California Economic Recovery GO, Series 2009 A, 5.00%, 7/1/16 | 1,700,000 | 1,901,093 | ||||
California Educational Facilities Authority Rev., (Harvey Mudd College), 5.25%, 12/1/41 | 2,000,000 | 2,036,020 | ||||
California Educational Facilities Authority Rev., (Santa Clara University), 5.625%, 4/1/37 | 5,000,000 | 5,264,400 | ||||
California Educational Facilities Authority Rev., (University of Pacific), 5.25%, 5/1/34 | 2,000,000 | 2,059,180 | ||||
California Educational Facilities Authority Rev., Series 2007 T1, (Stanford University), 5.00%, 3/15/39 | 450,000 | 491,531 | ||||
California Educational Facilities Authority Rev., Series 2009 A, (University of Southern California), 5.00%, 10/1/39 | 3,953,000 | 3,982,806 | ||||
California Educational Facilities Authority Rev., Series 2010 B, (Loyola Marymount University), VRN, 0.86%, 9/5/13 | 2,455,000 | 2,457,234 | ||||
California Educational Facilities Authority Rev., Series 2013 U4, (Stanford University), 5.00%, 6/1/43 | 1,250,000 | 1,372,575 | ||||
California GO, 4.00%, 10/1/14 | 1,750,000 | 1,822,397 | ||||
California GO, 5.00%, 9/1/15 | 4,560,000 | 4,969,488 | ||||
California GO, 5.00%, 9/1/19 | 1,530,000 | 1,782,756 | ||||
California GO, 5.00%, 2/1/27 | 3,000,000 | 3,184,620 | ||||
California GO, 5.00%, 2/1/28 | 1,000,000 | 1,050,550 | ||||
California GO, 5.00%, 10/1/29 | 2,250,000 | 2,322,405 | ||||
California GO, 5.00%, 6/1/32 | 1,500,000 | 1,525,005 | ||||
California GO, 5.25%, 9/1/32 | 2,000,000 | 2,093,020 | ||||
California GO, 5.00%, 11/1/32 | 1,500,000 | 1,527,555 | ||||
California GO, 6.50%, 4/1/33 | 5,000,000 | 5,818,300 | ||||
California GO, 5.00%, 4/1/38 | 2,500,000 | 2,496,375 | ||||
California GO, 6.00%, 4/1/38 | 2,500,000 | 2,769,075 | ||||
California GO, 6.00%, 11/1/39 | 5,000,000 | 5,582,150 | ||||
California GO, 5.50%, 3/1/40 | 3,000,000 | 3,104,250 | ||||
California GO, 5.00%, 10/1/41 | 2,000,000 | 1,993,920 | ||||
California GO, Series 2003 A1, VRDN, 0.06%, 9/3/13 (LOC: JPMorgan Chase Bank N.A.) | 1,200,000 | 1,200,000 | ||||
California GO, Series 2004 A1, VRDN, 0.04%, 9/3/13 (LOC: Citibank N.A.) | 1,900,000 | 1,900,000 | ||||
California GO, Series 2005 B7, VRDN, 0.05%, 9/3/13 (LOC: JPMorgan Chase Bank N.A.) | 900,000 | 900,000 | ||||
California GO, Series 2012 B, VRN, 0.96%, 9/5/13 | 2,000,000 | 2,011,920 | ||||
California GO, Series 2012 B, VRN, 1.06%, 9/5/13 | 800,000 | 806,736 | ||||
California GO, Series 2012 B, VRN, 1.21%, 9/5/13 | 960,000 | 975,581 | ||||
California Health Facilities Financing Authority Rev., (Cedars-Sinai Medical Center), 5.00%, 8/15/19 | 740,000 | 854,730 | ||||
California Health Facilities Financing Authority Rev., (Cedars-Sinai Medical Center), 5.00%, 8/15/21 | 1,000,000 | 1,144,960 | ||||
California Health Facilities Financing Authority Rev., (Cedars-Sinai Medical Center), 5.00%, 8/15/39 | 1,500,000 | 1,468,995 | ||||
California Health Facilities Financing Authority Rev., Series 1993 C, (St. Francis Memorial Hospital), 5.875%, 11/1/23(3) | 2,000,000 | 2,524,020 | ||||
California Health Facilities Financing Authority Rev., Series 2007 A, (Sutter Health), 5.25%, 11/15/46 | 1,500,000 | 1,444,185 |
Principal Amount | Value |
California Health Facilities Financing Authority Rev., Series 2008 A, (Lucile Salter Packard Children’s Hospital), VRDN, 1.45%, 3/15/17 | $1,000,000 | $ 994,560 | ||||
California Health Facilities Financing Authority Rev., Series 2008 B, (Lucile Salter Packard Children’s Hospital), VRDN, 1.45%, 3/15/17 | 1,470,000 | 1,462,003 | ||||
California Health Facilities Financing Authority Rev., Series 2008 C, (Lucile Salter Packard Children’s Hospital), VRDN, 1.45%, 3/15/17 | 1,000,000 | 994,560 | ||||
California Health Facilities Financing Authority Rev., Series 2008 C, (Providence Health & Services), 6.50%, 10/1/33 | 1,000,000 | 1,138,750 | ||||
California Health Facilities Financing Authority Rev., Series 2009 A, (Catholic Healthcare West), 6.00%, 7/1/39 | 3,400,000 | 3,632,900 | ||||
California Health Facilities Financing Authority Rev., Series 2009 A, (Children’s Hospital of Orange County), 6.50%, 11/1/38 | 5,000,000 | 5,520,350 | ||||
California Health Facilities Financing Authority Rev., Series 2009 A, (St. Joseph Health System), 5.75%, 7/1/39 | 1,000,000 | 1,077,710 | ||||
California Health Facilities Financing Authority Rev., Series 2009 B, (Providence Health & Services), 5.50%, 10/1/39 | 1,000,000 | 1,054,480 | ||||
California Health Facilities Financing Authority Rev., Series 2010 A, (Scripps Memorial Hospital), 5.00%, 11/15/19 | 1,000,000 | 1,142,300 | ||||
California Health Facilities Financing Authority Rev., Series 2011 B, (Sutter Health), 5.50%, 8/15/20 | 1,000,000 | 1,173,440 | ||||
California Health Facilities Financing Authority Rev., Series 2011 B, (Sutter Health), 6.00%, 8/15/42 | 1,500,000 | 1,652,580 | ||||
California Health Facilities Financing Authority Rev., Series 2011 D, (Sutter Health), 5.25%, 8/15/31 | 1,000,000 | 1,036,820 | ||||
California Health Facilities Financing Authority Rev., Series 2012 B, (Children’s Hospital of Los Angeles), VRDN, 1.86%, 9/5/13 | 1,210,000 | 1,225,113 | ||||
California Health Facilities Financing Authority Rev., Series 2013 A, (St. Joseph Health System), 5.00%, 7/1/37 | 180,000 | 174,384 | ||||
California Infrastructure & Economic Development Bank Rev., (SRI International), 5.00%, 9/1/28 | 2,325,000 | 2,374,011 | ||||
California Infrastructure & Economic Development Bank Rev., Series 2012 A1, (J. Paul Getty Trust), 4.00%, 10/1/15 | 325,000 | 349,245 | ||||
California Infrastructure & Economic Development Bank Rev., Series 2013 A, (Los Angeles County Museum of Art Project), VRDN, 1.88%, 9/3/13 | 1,000,000 | 1,000,360 | ||||
California Municipal Finance Authority Rev., Series 2011 (Emerson College), 6.00%, 1/1/42 | 2,000,000 | 2,146,100 | ||||
California Municipal Finance Authority Rev., Series 2010 A, (University of La Verne), 6.25%, 6/1/40 | 1,000,000 | 1,028,670 | ||||
California Municipal Finance Authority Rev., Series 2011 B, (Azusa Pacific University), 8.00%, 4/1/41 | 665,000 | 731,453 | ||||
California Public Works Board Lease Rev., Series 1993 A, (Department of Corrections), 5.00%, 12/1/19 (Ambac) | 2,000,000 | 2,191,300 | ||||
California Public Works Board Lease Rev., Series 2009 G1, (Various Capital Projects), 5.75%, 10/1/30 | 2,000,000 | 2,149,340 | ||||
California Public Works Board Lease Rev., Series 2009 H, (Department of Correction and Rehabilitation), 5.75%, 11/1/29 | 1,685,000 | 1,830,685 | ||||
California Public Works Board Lease Rev., Series 2011 D, (Judicial Council Projects), 5.25%, 12/1/26 | 1,000,000 | 1,064,930 | ||||
California Public Works Board Lease Rev., Series 2011 G, (University of California), 5.00%, 12/1/28 | 2,000,000 | 2,121,960 |
Principal Amount | Value |
California Public Works Board Lease Rev., Series 2012 A, (Various Capital Projects), 5.00%, 4/1/25 | $1,700,000 | $ 1,805,978 | ||||
California Public Works Board Lease Rev., Series 2012 A, (Various Capital Projects), 5.00%, 4/1/37 | 2,170,000 | 2,099,844 | ||||
California Public Works Board Lease Rev., Series 2012 G, (Various Capital Projects), 5.00%, 11/1/37 | 195,000 | 188,614 | ||||
California State Public Works Board Rev., Series 2013 A, (Judicial Council Projects), 5.00%, 3/1/38 | 1,500,000 | 1,448,625 | ||||
California Statewide Communities Development Authority Rev., (Cottage Health Obligation Group), 5.25%, 11/1/30 | 1,000,000 | 1,024,820 | ||||
California Statewide Communities Development Authority Rev., Series 2001 C, (Kaiser Permanente), 5.25%, 8/1/31 | 3,000,000 | 3,023,640 | ||||
California Statewide Communities Development Authority Rev., Series 2005 A, (Thomas Jefferson School of Law), 4.875%, 10/1/15, Prerefunded at 100% of Par(3) | 900,000 | 964,494 | ||||
California Statewide Communities Development Authority Rev., Series 2012 A, (Kaiser Permanente), 5.00%, 4/1/42 | 3,780,000 | 3,638,023 | ||||
California University Systemwide Rev., Series 2009 A, 5.25%, 11/1/34 | 2,230,000 | 2,311,484 | ||||
Capistrano Unified School District Special Tax Rev., (Community Facilities District No. 88-1), 6.50%, 9/1/14 (AGM) | 1,330,000 | 1,366,987 | ||||
City of Irvine Improvement Bond Act of 1915 Special Assessment Rev., (Assessment District No. 12-1), 4.00%, 9/2/17 | 365,000 | 393,974 | ||||
City of Irvine Improvement Bond Act of 1915 Special Assessment Rev., (Assessment District No. 12-1), 4.00%, 9/2/18 | 375,000 | 403,796 | ||||
City of Irvine Improvement Bond Act of 1915 Special Assessment Rev., (Assessment District No. 12-1), 4.00%, 9/2/19 | 600,000 | 636,108 | ||||
Coalinga Public Financing Authority Local Obligation Rev., Series 1998 A, (Senior Lien), 6.375%, 9/15/21 (Ambac) | 1,320,000 | 1,515,545 | ||||
Coast Community College District GO, Series 2013 A, (Election of 2012), 4.00%, 8/1/38 | 640,000 | 546,118 | ||||
East Bay Municipal Utility District Rev., Series 2012 B, 4.00%, 6/1/15 | 4,000,000 | 4,253,440 | ||||
Eastern Municipal Water District Water & Sewer Rev., Series 2011 A, 4.00%, 7/1/14 | 400,000 | 412,604 | ||||
Eastern Municipal Water District Water & Sewer Rev., Series 2011 A, 5.00%, 7/1/15 | 400,000 | 433,124 | ||||
Eastern Municipal Water District Water & Sewer Rev., Series 2011 A, 4.00%, 7/1/16 | 400,000 | 436,172 | ||||
Foothill/Eastern Transportation Corridor Agency Toll Road Rev., Capital Appreciation, 5.80%, 1/15/20 | 1,000,000 | 1,014,090 | ||||
Foothill/Eastern Transportation Corridor Agency Toll Road Rev., Capital Appreciation, 5.85%, 1/15/23 | 1,750,000 | 1,771,700 | ||||
Foothill/Eastern Transportation Corridor Agency Toll Road Rev., Capital Appreciation, 0.00%, 1/15/24(1) | 2,000,000 | 1,030,980 | ||||
Foothill/Eastern Transportation Corridor Agency Toll Road Rev., Capital Appreciation, 0.00%, 1/15/25(1) | 7,000,000 | 3,348,100 | ||||
Foothill/Eastern Transportation Corridor Agency Toll Road Rev., Capital Appreciation, 5.875%, 1/15/27 | 1,500,000 | 1,511,925 | ||||
Foothill/Eastern Transportation Corridor Agency Toll Road Rev., Capital Appreciation, 0.00%, 1/15/32(1) | 5,000,000 | 1,452,950 |
Principal Amount | Value |
Fresno Sewer Rev., Series 1993 A1, 6.25%, 9/1/14 (Ambac) | $ 90,000 | $ 92,396 | ||||
Golden State Tobacco Securitization Corp. Settlement Rev., Series 2005 A, 5.00%, 6/1/38 (FGIC) | 1,000,000 | 940,460 | ||||
Golden State Tobacco Securitization Corp. Settlement Rev., Series 2005 A, 5.00%, 6/1/45 | 3,000,000 | 2,754,720 | ||||
Golden State Tobacco Securitization Corp. Settlement Rev., Series 2007 A1, 4.50%, 6/1/27 | 480,000 | 405,182 | ||||
Golden State Tobacco Securitization Corp. Settlement Rev., Series 2013 A, 5.00%, 6/1/30 | 1,100,000 | 1,093,741 | ||||
Golden State Tobacco Securitization Corp. Settlement Rev., Capital Appreciation, Series 2005 A, 0.00%, 6/1/25 (AGM)(1) | 1,000,000 | 587,260 | ||||
Grossmont Healthcare District GO, Series 2011 B, (Election of 2006), 6.00%, 7/15/34 | 1,000,000 | 1,109,670 | ||||
Long Beach Bond Finance Authority Natural Gas Purchase Rev., Series 2007 A, 5.00%, 11/15/35 | 320,000 | 302,269 | ||||
Long Beach Bond Finance Authority Natural Gas Purchase Rev., Series 2007 A, 5.50%, 11/15/37 | 695,000 | 691,900 | ||||
Los Alamitos Unified School District COP, Capital Appreciation, (Capital Projects), 0.00%, 8/1/24(4) | 1,100,000 | 553,685 | ||||
Los Angeles Community College District GO, Series 2007 A, (Election of 2001), 5.00%, 8/1/32 (NATL-RE/FGIC) | 1,425,000 | 1,442,171 | ||||
Los Angeles County COP, (Disney Concert Hall), 5.00%, 3/1/22 | 1,000,000 | 1,122,310 | ||||
Los Angeles County COP, (Disney Concert Hall), 5.00%, 9/1/22 | 500,000 | 560,905 | ||||
Los Angeles Department of Airports Rev., Series 2008 C, (Los Angeles International Airport), 5.25%, 5/15/21 | 2,120,000 | 2,395,452 | ||||
Los Angeles Department of Airports Rev., Series 2010 A, (Los Angeles International Airport), 5.00%, 5/15/40 | 1,000,000 | 986,860 | ||||
Los Angeles Department of Airports Rev., Series 2010 B, (Los Angeles International Airport), 5.00%, 5/15/40 | 2,000,000 | 2,006,640 | ||||
Los Angeles Department of Water & Power Rev., Series 2008 A1, (Power System), 5.25%, 7/1/38 | 4,000,000 | 4,100,360 | ||||
Los Angeles Department of Water & Power Rev., Series 2012 C, 5.00%, 7/1/24 | 1,000,000 | 1,118,370 | ||||
Los Angeles Department of Water & Power Waterworks Rev., Series 2009 B, 5.00%, 7/1/20 | 3,000,000 | 3,483,330 | ||||
Los Angeles Department of Water & Power Waterworks Rev., Series 2011 A, (Power System), 5.00%, 7/1/19 | 1,000,000 | 1,168,690 | ||||
Los Angeles Harbor Department Rev., Series 2009 A, 5.00%, 8/1/27 | 500,000 | 536,095 | ||||
Los Angeles Harbor Department Rev., Series 2011 B, 5.00%, 8/1/24 | 525,000 | 578,566 | ||||
Los Angeles Unified School District COP, Series 2012 B, (Headquarters Building Project), 5.00%, 10/1/29 | 250,000 | 251,805 | ||||
Los Angeles Unified School District COP, Series 2012 B, (Headquarters Building Project), 5.00%, 10/1/30 | 3,000,000 | 3,002,040 | ||||
Los Angeles Unified School District GO, Series 2006 F, (Election of 2004), 5.00%, 7/1/30 (FGIC) | 2,000,000 | 2,111,460 | ||||
Los Angeles Unified School District GO, Series 2007 H, (Election of 2004), 5.00%, 7/1/32 (AGM) | 1,020,000 | 1,052,558 | ||||
Los Angeles Unified School District GO, Series 2009 I, (Election of 2004), 5.00%, 7/1/29 | 2,000,000 | 2,078,580 | ||||
Los Angeles Unified School District GO, Series 2010 KRY, 5.25%, 7/1/26 | 1,000,000 | 1,088,410 | ||||
Los Angeles Unified School District GO, Series 2011 A1, 4.00%, 7/1/17 | 1,000,000 | 1,102,100 |
Principal Amount | Value |
Los Angeles Unified School District GO, Series 2011 A1, 5.00%, 7/1/18 | $1,280,000 | $ 1,485,312 | ||||
Los Angeles Wastewater System Rev., Series 2012 C, 5.00%, 6/1/26 | 1,000,000 | 1,088,720 | ||||
M-S-R Energy Authority Rev., Series 2009 A, 7.00%, 11/1/34 | 1,000,000 | 1,160,810 | ||||
Manhattan Beach Unified School District GO, Capital Appreciation, Series 2009 A, (Election of 2008), 0.00%, 9/1/29(1) | 5,905,000 | 2,625,363 | ||||
Metropolitan Water District of Southern California Rev., Series 2009 C, 5.00%, 7/1/35 | 1,150,000 | 1,179,452 | ||||
Metropolitan Water District of Southern California Rev., Series 2012 B2, VRDN, 0.41%, 9/5/13 | 5,895,000 | 5,895,589 | ||||
Modesto Irrigation District COP, Series 2009 A, 5.75%, 10/1/34 | 2,500,000 | 2,661,625 | ||||
Mount San Antonio Community College District GO, Series 2013 A, (Election of 2008), 5.00%, 8/1/34 | 1,000,000 | 1,010,880 | ||||
New Haven Unified School District GO, 12.00%, 8/1/18 (AGM) | 880,000 | 1,294,172 | ||||
Newport Beach Rev., Series 2011 A, (Hoag Memorial Hospital Presbyterian), 6.00%, 12/1/21, Prerefunded at 100% of Par(3) | 1,000,000 | 1,257,570 | ||||
Northern California Power Agency Rev., Series 2010 A, 4.00%, 7/1/14 | 1,000,000 | 1,031,820 | ||||
Oakland Redevelopment Agency Tax Allocation Rev., (Central District), 5.50%, 2/1/14 (Ambac) | 1,135,000 | 1,148,109 | ||||
Oakland Unified School District Alameda County GO, Series 2012 A, (Election of 2006), 5.50%, 8/1/32 | 1,000,000 | 974,720 | ||||
Oakland-Alameda County Coliseum Authority Lease Rev., Series 2012 A, 5.00%, 2/1/16 | 1,000,000 | 1,094,860 | ||||
Oceanside Unified School District GO, Series 2012 C, 0.00%, 8/1/51(1) | 3,995,000 | 362,786 | ||||
Orange County Transportation Authority Rev., (Senior Lien), 5.00%, 8/15/25 | 1,000,000 | 1,084,700 | ||||
Palomar Pomerado Health Care District COP, 6.75%, 11/1/39 | 500,000 | 511,555 | ||||
Palomar Pomerado Health Care District COP, 6.00%, 11/1/41 | 750,000 | 715,688 | ||||
Palomar Pomerado Health GO, Capital Appreciation, Series 2009 A, (Election of 2004), 0.00%, 8/1/19 (AGC)(4) | 1,670,000 | 1,247,406 | ||||
Palos Verdes Peninsula Unified School District GO, Series 2009 R, (Election of 2005), 0.00%, 8/1/33(1) | 2,600,000 | 858,650 | ||||
Pomona Unified School District GO, Series 2000 A, 6.55%, 8/1/29 (NATL-RE) | 1,000,000 | 1,175,990 | ||||
Pomona Unified School District GO, Series 2001 A, 6.15%, 8/1/30 (NATL-RE) | 855,000 | 941,894 | ||||
Porterville Public Financing Authority Sewer Rev., 5.625%, 10/1/36 | 1,500,000 | 1,590,315 | ||||
Poway Unified School District Public Financing Authority Rev., 7.875%, 9/15/39 | 1,035,000 | 1,120,408 | ||||
Poway Unified School District Rev., Capital Appreciation, (School Facilities Improvement), 0.00%, 8/1/41(1) | 2,110,000 | 387,818 | ||||
Riverside County Asset Leasing Corp. Rev., Series 2013 A, (Public Defender and Probation Building), 5.00%, 11/1/43 | 1,000,000 | 932,260 | ||||
Riverside County Redevelopment Agency Tax Allocation Rev., Series 2010 E, (Interstate 215 Corridor), 6.50%, 10/1/40 | 625,000 | 657,119 | ||||
Riverside Public Financing Authority Lease Rev., Series 2012 A, 4.00%, 11/1/33 | 570,000 | 472,638 | ||||
Sacramento County Airport System Rev., Series 2009 D, (Grant Revenue Bonds), 5.625%, 7/1/29 | 1,000,000 | 1,088,630 | ||||
Sacramento County Sanitation Districts Financing Authority Rev., Series 2007 B, VRN, 0.71%, 9/3/13 (NATL-RE/FGIC) | 1,500,000 | 1,175,115 | ||||
Sacramento Power Authority Rev., 5.25%, 7/1/14 (Ambac) | 2,000,000 | 2,076,160 |
Principal Amount | Value |
Saddleback Valley Unified School District Public Financing Authority Special Tax Rev., Series 1997 A, 6.00%, 9/1/16 (AGM) | $1,000,000 | $ 1,135,840 | ||||
San Bernardino Community College District GO, Series 2008 A, (Election of 2002), 6.25%, 8/1/18, Prerefunded at 100% of Par(3) | 2,855,000 | 3,507,082 | ||||
San Bernardino Community College District GO, Capital Appreciation, Series 2009 B, (Election of 2008), 0.00%, 8/1/19(4) | 7,400,000 | 5,625,998 | ||||
San Buenaventura Rev., (Community Memorial Health System), 7.50%, 12/1/41 | 1,350,000 | 1,457,325 | ||||
San Diego Community College District GO, (Election of 2002), 5.00%, 8/1/25 | 500,000 | 558,165 | ||||
San Diego County Regional Airport Authority Rev., Series 2010 A, 5.00%, 7/1/40 | 1,500,000 | 1,444,155 | ||||
San Diego County Water Authority Rev., 5.00%, 5/1/34 | 2,000,000 | 2,060,680 | ||||
San Diego County Water Authority Rev., Series 2011 S1, (Subordinate Lien), 5.00%, 7/1/16 | 1,665,000 | 1,854,993 | ||||
San Diego Public Facilities Financing Authority Sewer Rev., Series 2009 A, 5.25%, 5/15/34 | 2,000,000 | 2,066,900 | ||||
San Diego Unified School District GO, Capital Appreciation, Series 2010 C, 0.00%, 7/1/44(1) | 2,880,000 | 433,008 | ||||
San Diego Unified School District GO, Capital Appreciation, Series 2012 E, 0.00%, 7/1/32(4) | 5,000,000 | 1,531,700 | ||||
San Francisco Bay Area Rapid Transit District Rev., Series 2012 A, 5.00%, 7/1/36 | 250,000 | 255,720 | ||||
San Francisco City and County Airports Commission Rev., Series 2009 E, (San Francisco International Airport), 5.25%, 5/1/23 | 3,000,000 | 3,408,840 | ||||
San Francisco City and County Airports Commission Rev., Series 2010 F, (San Francisco International Airport), 5.00%, 5/1/40 | 2,150,000 | 2,121,792 | ||||
San Francisco City and County COP, Series 2009 A, (Multiple Capital Improvement Projects), 5.00%, 4/1/29 | 1,170,000 | 1,198,571 | ||||
San Francisco City and County COP, Series 2011 B, 4.00%, 9/1/14 | 1,100,000 | 1,141,074 | ||||
San Francisco City and County Public Utilities Commission Rev., Series 2011 A, 5.00%, 11/1/41 | 1,000,000 | 1,011,300 | ||||
San Francisco City and County Redevelopment Financing Authority Tax Allocation Rev., Series 2011 D, (Mission Bay South Redevelopment), 6.625%, 8/1/27 | 500,000 | 532,140 | ||||
San Mateo Special Tax Rev., (Community Facilities District No. 2008-1-Bay Meadows), 5.875%, 9/1/32 | 685,000 | 710,927 | ||||
San Mateo Union High School District GO, Capital Appreciation, 0.00%, 2/15/15(1) | 2,665,000 | 2,637,897 | ||||
Santa Clara Electric Rev., Series 2011 A, 5.00%, 7/1/30 | 500,000 | 512,010 | ||||
Santa Margarita-Dana Point Authority Rev., Series 1994 B, (Improvement Districts 3, 3A, 4, 4A), 7.25%, 8/1/14 (NATL-RE) | 2,000,000 | 2,103,200 | ||||
Santa Monica Redevelopment Agency Tax Allocation, (Earthquake Recovery Redevelopment), 5.00%, 7/1/42 | 400,000 | 400,228 | ||||
Santa Monica Redevelopment Agency Tax Allocation, (Earthquake Recovery Redevelopment), 5.875%, 7/1/42 | 400,000 | 427,780 | ||||
Santa Rosa Wastewater Rev., Capital Appreciation, Series 2002 B, 0.00%, 9/1/24 (Ambac)(1) | 2,000,000 | 1,191,460 | ||||
South Placer Wastewater Authority Rev., Series 2011 D, VRN, 0.89%, 9/5/13 | 2,060,000 | 2,065,171 | ||||
Southern California Public Power Authority Rev., Series 2013 A, (Southern Transmission), 5.00%, 7/1/17 | 1,050,000 | 1,200,014 |
Principal Amount | Value |
Susanville Public Financing Authority Rev., Series 2010 B, (Utility Enterprises), 6.00%, 6/1/45 | $1,000,000 | $ 988,000 | ||||
Taft Public Financing Authority Lease Rev., Series 1997 A, (Community Correctional Facility Acquisition), 6.05%, 1/1/17 | 1,410,000 | 1,414,597 | ||||
Tobacco Securitization Authority of Southern California Settlement Rev., Series 2006 A1, 5.00%, 6/1/37 | 500,000 | 376,095 | ||||
Tri-Dam Power Authority Rev., 4.00%, 11/1/13 | 1,210,000 | 1,215,118 | ||||
Tri-Dam Power Authority Rev., 4.00%, 5/1/14 | 1,235,000 | 1,255,513 | ||||
Tuolumne Wind Project Authority Rev., Series 2009 A, 5.625%, 1/1/29 | 1,200,000 | 1,304,268 | ||||
Turlock Health Facility COP, (Emanuel Medical Center, Inc.), 5.50%, 10/15/18 | 465,000 | 490,361 | ||||
Tustin Unified School District Special Tax Rev., (Community Facilities District No. 06-1), 6.00%, 9/1/40 | 2,000,000 | 2,016,460 | ||||
Twin Rivers Unified School District COP, (School Facilities Bridge Funding Program), VRDN, 3.20%, 6/1/20 (AGM) | 2,250,000 | 2,173,320 | ||||
Ventura County Community College District GO, Series 2008 C, (Election of 2002), 5.50%, 8/1/33 | 3,000,000 | 3,295,920 | ||||
West Contra Costa Unified School District GO, 5.00%, 8/1/32 | 1,750,000 | 1,703,992 | ||||
Yosemite Community College District GO, Capital Appreciation, Series 2010 D, (Election of 2004), 0.00%, 8/1/38(1) | 3,000,000 | 674,400 | ||||
| 345,663,420 | ||||||
GUAM — 0.8% | ||||||
Guam Government GO, Series 2009 A, 6.75%, 11/15/29 | 900,000 | 938,232 | ||||
Guam Power Authority Rev., Series 2010 A, 5.50%, 10/1/40 | 2,150,000 | 2,085,135 | ||||
| 3,023,367 | ||||||
PUERTO RICO — 1.1% | ||||||
Puerto Rico Aqueduct & Sewer Authority Rev., Series 2012 A, (Senior Lien), 5.00%, 7/1/17 | 1,910,000 | 1,862,154 | ||||
Puerto Rico Aqueduct & Sewer Authority Rev., Series 2012 A, (Senior Lien), 5.00%, 7/1/19 | 665,000 | 611,534 | ||||
Puerto Rico GO, Series 2012 A, (Public Improvement), 5.00%, 7/1/41 | 300,000 | 200,139 | ||||
Puerto Rico Government Development Bank Rev., Series 2006 B, (Senior Notes), 5.00%, 12/1/16 | 1,250,000 | 1,244,963 | ||||
Puerto Rico Sales Tax Financing Corp. Rev., Capital Appreciation, Series 2011 A1, 0.00%, 8/1/41(1) | 1,145,000 | 146,182 | ||||
| 4,064,972 | ||||||
U.S. VIRGIN ISLANDS — 1.1% | ||||||
Virgin Islands Public Finance Authority Rev., Series 2009 B, (Senior Lien), 5.00%, 10/1/17 | 3,480,000 | 3,805,589 | ||||
TOTAL INVESTMENT SECURITIES — 98.4% (Cost $349,323,469) | 356,557,348 | |||||
OTHER ASSETS AND LIABILITIES — 1.6% | 5,910,844 | |||||
TOTAL NET ASSETS — 100.0% | $362,468,192 | |||||
Futures Contracts | ||||
Contracts Sold | Expiration Date | Underlying Face | Unrealized Gain (Loss) | |
25 | U.S. Treasury 30-Year Bonds | December 2013 | $3,297,656 | $(18,506) |
Notes to Schedule of Investments
AGC = Assured Guaranty Corporation
AGM = Assured Guaranty Municipal Corporation
COP = Certificates of Participation
FGIC = Financial Guaranty Insurance Company
GO = General Obligation
NATL-RE = National Public Finance Guarantee Corporation - Reinsured
VRDN = Variable Rate Demand Note. Interest reset date is indicated. Rate shown is effective at the period end.
VRN = Variable Rate Note. Interest reset date is indicated. Rate shown is effective at the period end.
(1) | Security is a zero-coupon bond. Zero-coupon securities are issued at a substantial discount from their value at maturity. |
(2) | Security, or a portion thereof, has been pledged at the custodian bank or with a broker for margin requirements on futures contracts. At the period end, the aggregate value of securities pledged was $111,096. |
(3) | Escrowed to maturity in U.S. government securities or state and local government securities. |
(4) | Coupon rate adjusts periodically based upon a predetermined schedule. Interest reset date is indicated. Rate shown is effective at the period end. |
See Notes to Financial Statements.
Statement of Assets and Liabilities |
AUGUST 31, 2013 | |||
Assets | |||
Investment securities, at value (cost of $349,323,469) | $356,557,348 | ||
Receivable for investments sold | 1,987,513 | ||
Receivable for capital shares sold | 16,885 | ||
Interest receivable | 4,464,259 | ||
| 363,026,005 | |||
Liabilities | |||
Disbursements in excess of demand deposit cash | 197 | ||
Payable for capital shares redeemed | 187,631 | ||
Payable for variation margin on futures contracts | 5,469 | ||
Accrued management fees | 145,823 | ||
Distribution and service fees payable | 8,563 | ||
Dividends payable | 210,130 | ||
| 557,813 | |||
Net Assets | $362,468,192 | ||
Net Assets Consist of: | |||
Capital paid in | $356,141,947 | ||
Accumulated net realized loss | (889,128 | ) | |
Net unrealized appreciation | 7,215,373 | ||
| $362,468,192 | |||
Net assets | Shares outstanding | Net asset value per share | |
Investor Class | $346,396,076 | 31,673,177 | $10.94 |
Institutional Class | $29,205 | 2,670 | $10.94 |
A Class | $8,571,588 | 783,848 | $10.94* |
C Class | $7,471,323 | 683,072 | $10.94 |
*Maximum offering price $11.46 (net asset value divided by 0.955).
See Notes to Financial Statements.
Statement of Operations |
YEAR ENDED AUGUST 31, 2013 | |||
Investment Income (Loss) | |||
Income: | |||
Interest | $ 15,553,344 | ||
Expenses: | |||
Management fees | 1,974,149 | ||
Distribution and service fees: | |||
A Class | 39,868 | ||
C Class | 108,184 | ||
Trustees’ fees and expenses | 23,653 | ||
Other expenses | 239 | ||
| 2,146,093 | |||
Net investment income (loss) | 13,407,251 | ||
Realized and Unrealized Gain (Loss) | |||
Net realized gain (loss) on: | |||
Investment transactions | 3,211,310 | ||
Futures contract transactions | 144,592 | ||
| 3,355,902 | |||
Change in net unrealized appreciation (depreciation) on: | |||
Investments | (30,008,586 | ) | |
Futures contracts | (18,506 | ) | |
| (30,027,092 | ) | ||
Net realized and unrealized gain (loss) | (26,671,190 | ) | |
| �� | |||
Net Increase (Decrease) in Net Assets Resulting from Operations | $(13,263,939 | ) | |
See Notes to Financial Statements.
Statement of Changes in Net Assets |
YEARS ENDED AUGUST 31, 2013 AND AUGUST 31, 2012 | |||||
Increase (Decrease) in Net Assets | August 31, 2013 | August 31, 2012 | |||
Operations | |||||
Net investment income (loss) | $ 13,407,251 | $ 15,241,449 | |||
Net realized gain (loss) | 3,355,902 | 9,572,320 | |||
Change in net unrealized appreciation (depreciation) | (30,027,092 | ) | 18,554,235 | ||
Net increase (decrease) in net assets resulting from operations | (13,263,939 | ) | 43,368,004 | ||
Distributions to Shareholders | |||||
From net investment income: | |||||
Investor Class | (12,700,407 | ) | (14,584,516 | ) | |
Institutional Class | (1,037 | ) | (1,107 | ) | |
A Class | (468,059 | ) | (445,453 | ) | |
B Class | — | (50 | ) | ||
C Class | (236,886 | ) | (241,707 | ) | |
Decrease in net assets from distributions | (13,406,389 | ) | (15,272,833 | ) | |
Capital Share Transactions | |||||
Net increase (decrease) in net assets from capital share transactions | (51,139,417 | ) | 14,376,961 | ||
Net increase (decrease) in net assets | (77,809,745 | ) | 42,472,132 | ||
Net Assets | |||||
Beginning of period | 440,277,937 | 397,805,805 | |||
End of period | $362,468,192 | $440,277,937 | |||
Distributions in excess of net investment income | — | $(862 | ) | ||
See Notes to Financial Statements.
Notes to Financial Statements |
AUGUST 31, 2013
1. Organization
American Century California Tax-Free and Municipal Funds (the trust) is registered under the Investment Company Act of 1940, as amended (the 1940 Act), as an open-end management investment company and is organized as a Massachusetts business trust. California Long-Term Tax-Free Fund (the fund) is one fund in a series issued by the trust. The fund is diversified as defined under the 1940 Act. The fund’s investment objectives are to seek safety of principal and high current income that is exempt from federal and California income taxes.
The fund offers the Investor Class, the Institutional Class, the A Class and the C Class. The A Class may incur an initial sales charge. The A Class and C Class may be subject to a contingent deferred sales charge. The share classes differ principally in their respective sales charges and distribution and shareholder servicing expenses and arrangements. The Institutional Class is made available to institutional shareholders or through financial intermediaries whose clients do not require the same level of shareholder and administrative services as shareholders of other classes. As a result, the Institutional Class is charged a lower unified management fee. On September 21, 2011, there were no outstanding B Class shares and the fund discontinued offering the B Class.
2. Significant Accounting Policies
The following is a summary of significant accounting policies consistently followed by the fund in preparation of its financial statements. The financial statements are prepared in conformity with accounting principles generally accepted in the United States of America, which may require management to make certain estimates and assumptions at the date of the financial statements. Actual results could differ from these estimates.
Investment Valuations — The fund determines the fair value of its investments and computes its net asset value per share as of the close of regular trading (usually 4 p.m. Eastern time) on the New York Stock Exchange (NYSE) on each day the NYSE is open.
Debt securities maturing in greater than 60 days at the time of purchase are valued at the evaluated mean as provided by independent pricing services or at the mean of the most recent bid and asked prices as provided by investment dealers. Debt securities maturing within 60 days at the time of purchase may be valued at cost, plus or minus any amortized discount or premium or at the evaluated mean as provided by an independent pricing service. Evaluated mean prices are commonly derived through utilization of market models, which may consider, among other factors, trade data, quotations from dealers and active market makers, relevant yield curve and spread data, related sector levels, creditworthiness, and other relevant market information on the same or comparable securities.
Exchange-traded futures contracts are valued at the settlement price as provided by the appropriate clearing corporation.
If the fund determines that the market price for a portfolio security is not readily available or the valuation methods mentioned above do not reflect a security’s fair value, such security is valued as determined in good faith by the Board of Trustees or its designee, in accordance with procedures adopted by the Board of Trustees. Circumstances that may cause the fund to use these procedures to value a security include, but are not limited to: a security has been declared in default; trading in a security has been halted during the trading day; there is a foreign market holiday and no trading occurred; or an event occurred between the close of a foreign exchange and the NYSE that may affect the value of a security.
Security Transactions — Security transactions are accounted for as of the trade date. Net realized gains and losses are determined on the identified cost basis, which is also used for federal income tax purposes.
Investment Income — Interest income is recorded on the accrual basis and includes accretion of discounts and amortization of premiums.
Segregated Assets — In accordance with the 1940 Act, the fund segregates assets on its books and records to cover certain types of investments, including, but not limited to, futures contracts and when-issued securities. American Century Investment Management, Inc. (ACIM) (the investment advisor) monitors, on a daily basis, the securities segregated to ensure the fund designates a sufficient amount of liquid assets, marked-to-market daily. The fund may also receive assets or be required to pledge assets at the custodian bank or with a broker for margin requirements on futures contracts.
Income Tax Status — It is the fund’s policy to distribute substantially all net investment income and net realized gains to shareholders and to otherwise qualify as a regulated investment company under provisions of the Internal Revenue Code. Accordingly, no provision has been made for income taxes. The fund files U.S. federal, state, local and non-U.S. tax returns as applicable. The fund’s tax returns are subject to examination by the relevant taxing authority until expiration of the applicable statute of limitations, which is generally three years from the date of filing but can be longer in certain jurisdictions. At this time, management believes there are no uncertain tax positions which, based on their technical merit, would not be sustained upon examination and for which it is reasonably possible that the total amounts of unrecognized tax benefits will significantly change in the next twelve months.
Multiple Class — All shares of the fund represent an equal pro rata interest in the net assets of the class to which such shares belong, and have identical voting, dividend, liquidation and other rights and the same terms and conditions, except for class specific expenses and exclusive rights to vote on matters affecting only individual classes. Income, non-class specific expenses, and realized and unrealized capital gains and losses of the fund are allocated to each class of shares based on their relative net assets.
Distributions to Shareholders — Distributions from net investment income are declared daily and paid monthly. Distributions from net realized gains, if any, are generally declared and paid annually.
Indemnifications — Under the trust’s organizational documents, its officers and trustees are indemnified against certain liabilities arising out of the performance of their duties to the fund. In addition, in the normal course of business, the fund enters into contracts that provide general indemnifications. The maximum exposure under these arrangements is unknown as this would involve future claims that may be made against a fund. The risk of material loss from such claims is considered by management to be remote.
3. Fees and Transactions with Related Parties
Management Fees — The trust has entered into a management agreement with ACIM, under which ACIM provides the fund with investment advisory and management services in exchange for a single, unified management fee (the fee) per class. The agreement provides that all expenses of managing and operating the fund, except distribution and service fees, brokerage expenses, taxes, interest, fees and expenses of the independent trustees (including legal counsel fees), and extraordinary expenses, will be paid by ACIM. The fee is computed and accrued daily based on each class’s daily net assets and paid monthly in arrears. The fee consists of (1) an Investment Category Fee based on the daily net assets of the fund and certain other accounts managed by the investment advisor that are in the same broad investment category as the fund and (2) a Complex Fee based on the assets of all the funds in the American Century Investments family of funds. The rates for the Investment Category Fee range from 0.1625% to 0.2800%. The rates for the Complex Fee range from 0.2500% to 0.3100% for the Investor Class, A Class and C Class. The Institutional Class is 0.2000% less at each point within the Complex Fee range. The effective annual management fee for each class for the year ended August 31, 2013 was 0.46% for the Investor Class, A Class and C Class and 0.26% for the Institutional Class.
Distribution and Service Fees — The Board of Trustees has adopted a separate Master Distribution and Individual Shareholder Services Plan for each of the A Class and C Class (collectively the plans), pursuant to Rule 12b-1 of the 1940 Act. The plans provide that the A Class will pay American Century Investment Services, Inc. (ACIS) an annual distribution and service fee of 0.25%. The plans provide that the C Class will pay ACIS an annual distribution and service fee of 1.00%, of which 0.25% is paid for individual shareholder services and 0.75% is paid for distribution services. The fees are computed and accrued daily based on each class’s daily net assets and paid monthly in arrears. The fees are used to pay financial intermediaries for distribution and individual shareholder services. Fees incurred under the plans during the year ended August 31, 2013 are detailed in the Statement of Operations.
Related Parties — Certain officers and trustees of the trust are also officers and/or directors of American Century Companies, Inc. (ACC). The trust’s investment advisor, ACIM, the trust’s distributor, ACIS, and the trust’s transfer agent, American Century Services, LLC are wholly owned, directly or indirectly, by ACC.
4. Investment Transactions
Purchases and sales of investment securities, excluding short-term investments, for the year ended August 31, 2013 were $183,278,914 and $233,258,799, respectively.
5. Capital Share Transactions
Transactions in shares of the fund were as follows (unlimited number of shares authorized):
Year ended August 31, 2013 | Year ended August 31, 2012 | ||||||||||
Shares | Amount | Shares | Amount | ||||||||
Investor Class | |||||||||||
Sold | 1,330,085 | $ 15,587,725 | 2,812,874 | $ 31,937,264 | |||||||
Issued in reinvestment of distributions | 798,978 | 9,279,060 | 928,665 | 10,558,264 | |||||||
Redeemed | (5,728,161 | ) | (66,173,957 | ) | (3,160,175 | ) | (35,989,061 | ) | |||
| (3,599,098 | ) | (41,307,172 | ) | 581,364 | 6,506,467 | ||||||
Institutional Class | |||||||||||
Issued in reinvestment of distributions | 89 | 1,037 | 98 | 1,107 | |||||||
A Class | |||||||||||
Sold | 346,831 | 4,084,031 | 472,478 | 5,394,968 | |||||||
Issued in reinvestment of distributions | 37,846 | 441,181 | 36,021 | 410,317 | |||||||
Redeemed | (986,595 | ) | (11,113,459 | ) | (132,097 | ) | (1,503,271 | ) | |||
| (601,918 | ) | (6,588,247 | ) | 376,402 | 4,302,014 | ||||||
B Class | N/A | ||||||||||
Redeemed | (2,596 | ) | (28,631 | ) | |||||||
C Class | |||||||||||
Sold | 103,527 | 1,214,337 | 393,709 | 4,476,524 | |||||||
Issued in reinvestment of distributions | 10,191 | 118,247 | 7,029 | 79,960 | |||||||
Redeemed | (398,074 | ) | (4,577,619 | ) | (83,950 | ) | (960,480 | ) | |||
| (284,356 | ) | (3,245,035 | ) | 316,788 | 3,596,004 | ||||||
Net increase (decrease) | (4,485,283 | ) | $(51,139,417 | ) | 1,272,056 | $ 14,376,961 | |||||
6. Fair Value Measurements
The fund’s securities valuation process is based on several considerations and may use multiple inputs to determine the fair value of the positions held by the fund. In conformity with accounting principles generally accepted in the United States of America, the inputs used to determine a valuation are classified into three broad levels as follows:
• | Level 1 valuation inputs consist of unadjusted quoted prices in an active market for identical securities; |
• | Level 2 valuation inputs consist of direct or indirect observable market data (including quoted prices for similar securities, evaluations of subsequent market events, interest rates, prepayment speeds, credit risk, etc.); or |
• | Level 3 valuation inputs consist of unobservable data (including a fund’s own assumptions). |
The level classification is based on the lowest level input that is significant to the fair valuation measurement. The valuation inputs are not necessarily an indication of the risks associated with investing in these securities or other financial instruments.
As of period end, the fund’s investment securities and unrealized gain (loss) on futures contracts were classified as Level 2 and Level 1, respectively. The Schedule of Investments provides additional information on the fund’s portfolio holdings.
7. Derivative Instruments
Interest Rate Risk — The fund is subject to interest rate risk in the normal course of pursuing its investment objectives. The value of bonds generally declines as interest rates rise. A fund may enter into futures contracts based on a bond index or a specific underlying security. A fund may purchase futures contracts to gain exposure to increases in market value or sell futures contracts to protect against a decline in market value. Upon entering into a futures contract, a fund will segregate cash, cash equivalents or other appropriate liquid securities on its records in amounts sufficient to meet requirements. Subsequent payments (variation margin) are made or received daily, in cash, by a fund. The variation margin is equal to the daily change in the contract value and is recorded as unrealized gains and losses. A fund recognizes a realized gain or loss when the futures contract is closed or expires. Net realized and unrealized gains or losses occurring during the holding period of futures contracts are a component of net realized gain (loss) on futures contract transactions and change in net unrealized appreciation (depreciation) on futures contracts, respectively. One of the risks of entering into futures contracts is the possibility that the change in value of the contract may not correlate with the changes in value of the underlying securities. The fund regularly purchased and sold interest rate risk derivative instruments throughout the reporting period and the instruments held at period end as disclosed on the Schedule of Investments are indicative of the fund’s typical volume.
The value of interest rate risk derivative instruments as of August 31, 2013, is disclosed on the Statement of Assets and Liabilities as a liability of $5,469 in payable for variation margin on futures contracts.* For the year ended August 31, 2013, the effect of interest rate risk derivative instruments on the Statement of Operations was $144,592 in net realized gain (loss) on futures contract transactions and $(18,506) in change in net unrealized appreciation (depreciation) on futures contracts.
*Included in the unrealized gain (loss) on futures contracts as reported in the Schedule of Investments.
8. Risk Factors
The fund concentrates its investments in a single state and therefore may have more exposure to credit risk related to the state of California than a fund with a broader geographical diversification.
9. Federal Tax Information
The tax character of distributions paid during the years ended August 31, 2013 and August 31, 2012 were as follows:
2013 | 2012 | |
Distributions Paid From | ||
Exempt income | $13,396,037 | $15,188,387 |
Taxable ordinary income | $10,352 | $84,446 |
Long-term capital gains | — | — |
The book-basis character of distributions made during the year from net investment income or net realized gains may differ from their ultimate characterization for federal income tax purposes. These differences reflect the differing character of certain income items and net realized gains and losses for financial statement and tax purposes, and may result in reclassification among certain capital accounts on the financial statements.
As of August 31, 2013, the federal tax cost of investments and the components of distributable earnings on a tax-basis were as follows:
Federal tax cost of investments | $349,323,469 |
Gross tax appreciation of investments | $13,792,751 |
Gross tax depreciation of investments | (6,558,872) |
Net tax appreciation (depreciation) of investments | $ 7,233,879 |
Net tax appreciation (depreciation) on derivatives | — |
Net tax appreciation (depreciation) | $ 7,233,879 |
Other book-to-tax adjustments | $(50,646) |
Undistributed tax-exempt income | — |
Accumulated short-term capital losses | $(583,173) |
Post-October capital loss deferral | $(273,815) |
The cost of investments for federal income tax purposes was the same as the cost for financial reporting purposes. The difference between book-basis and tax-basis unrealized appreciation (depreciation) is attributable primarily to the realization for tax purposes of unrealized gains (losses) on futures contracts. Other book-to-tax adjustments are attributable primarily to the tax deferral of losses on straddle positions.
Accumulated capital losses represent net capital loss carryovers that may be used to offset future realized capital gains for federal income tax purposes. Future capital loss carryover utilization in any given year may be subject to Internal Revenue Code limitations. Capital loss carryovers expire in 2019.
Loss deferrals represent certain qualified losses that the fund has elected to treat as having been incurred in the following fiscal year for federal income tax purposes.
Financial Highlights |
For a Share Outstanding Throughout the Years Ended August 31 (except as noted) | |||||||||||||
Per-Share Data | Ratios and Supplemental Data | ||||||||||||
Income From Investment Operations: | Distributions From: | Ratio to Average Net Assets of: | |||||||||||
Net Asset Value, Beginning | Net Income | Net | Total From Investment Operations | Net Income | Net | Total Distributions | Net Asset Value, | Total Return(1) | Operating Expenses | Net Income | Portfolio Turnover | Net Assets, (in thousands) | |
Investor Class | |||||||||||||
2013 | $11.70 | 0.37(2) | (0.76) | (0.39) | (0.37) | — | (0.37) | $10.94 | (3.45)% | 0.47% | 3.19% | 44% | $346,396 |
2012 | $10.94 | 0.41(2) | 0.77 | 1.18 | (0.42) | — | (0.42) | $11.70 | 10.92% | 0.47% | 3.65% | 76% | $412,713 |
2011 | $11.20 | 0.47(2) | (0.27) | 0.20 | (0.46) | — | (0.46) | $10.94 | 2.02% | 0.48% | 4.38% | 63% | $379,586 |
2010 | $10.67 | 0.49(2) | 0.54 | 1.03 | (0.49) | (0.01) | (0.50) | $11.20 | 9.90% | 0.48% | 4.51% | 25% | $426,044 |
2009 | $10.83 | 0.50 | (0.16) | 0.34 | (0.50) | — | (0.50) | $10.67 | 3.47% | 0.49% | 4.90% | 36% | $405,263 |
Institutional Class | |||||||||||||
2013 | $11.70 | 0.40(2) | (0.76) | (0.36) | (0.40) | — | (0.40) | $10.94 | (3.26)% | 0.27% | 3.39% | 44% | $29 |
2012 | $10.94 | 0.44(2) | 0.76 | 1.20 | (0.44) | — | (0.44) | $11.70 | 11.14% | 0.27% | 3.85% | 76% | $30 |
2011 | $11.20 | 0.49(2) | (0.26) | 0.23 | (0.49) | — | (0.49) | $10.94 | 2.22% | 0.28% | 4.58% | 63% | $27 |
2010(3) | $10.79 | 0.26(2) | 0.41 | 0.67 | (0.26) | — | (0.26) | $11.20 | 6.28% | 0.28%(4) | 4.69%(4) | 25%(5) | $27 |
A Class | |||||||||||||
2013 | $11.70 | 0.34(2) | (0.76) | (0.42) | (0.34) | — | (0.34) | $10.94 | (3.70)% | 0.72% | 2.94% | 44% | $8,572 |
2012 | $10.94 | 0.38(2) | 0.77 | 1.15 | (0.39) | — | (0.39) | $11.70 | 10.64% | 0.72% | 3.40% | 76% | $16,214 |
2011 | $11.20 | 0.44(2) | (0.26) | 0.18 | (0.44) | — | (0.44) | $10.94 | 1.77% | 0.73% | 4.13% | 63% | $11,044 |
2010 | $10.67 | 0.47(2) | 0.54 | 1.01 | (0.47) | (0.01) | (0.48) | $11.20 | 9.63% | 0.73% | 4.26% | 25% | $15,173 |
2009 | $10.83 | 0.48 | (0.16) | 0.32 | (0.48) | — | (0.48) | $10.67 | 3.22% | 0.74% | 4.65% | 36% | $10,221 |
For a Share Outstanding Throughout the Years Ended August 31 (except as noted) | |||||||||||||
Per-Share Data | Ratios and Supplemental Data | ||||||||||||
Income From Investment Operations: | Distributions From: | Ratio to Average Net Assets of: | |||||||||||
Net Asset Value, Beginning | Net Income | Net | Total From Investment Operations | Net Income | Net | Total Distributions | Net Asset Value, | Total Return(1) | Operating Expenses | Net Income | Portfolio Turnover | Net Assets, (in thousands) | |
C Class | |||||||||||||
2013 | $11.70 | 0.26(2) | (0.76) | (0.50) | (0.26) | — | (0.26) | $10.94 | (4.41)% | 1.47% | 2.19% | 44% | $7,471 |
2012 | $10.94 | 0.30(2) | 0.76 | 1.06 | (0.30) | — | (0.30) | $11.70 | 9.82% | 1.47% | 2.65% | 76% | $11,321 |
2011 | $11.20 | 0.36(2) | (0.26) | 0.10 | (0.36) | — | (0.36) | $10.94 | 1.01% | 1.48% | 3.38% | 63% | $7,120 |
2010 | $10.67 | 0.38(2) | 0.54 | 0.92 | (0.38) | (0.01) | (0.39) | $11.20 | 8.81% | 1.48% | 3.51% | 25% | $10,641 |
2009 | $10.83 | 0.40 | (0.16) | 0.24 | (0.40) | — | (0.40) | $10.67 | 2.45% | 1.49% | 3.90% | 36% | $6,362 |
Notes to Financial Highlights
(1) | Total returns are calculated based on the net asset value of the last business day and do not reflect applicable sales charges, if any. Total returns for periods less than one year are not annualized. |
(2) | Computed using average shares outstanding throughout the period. |
(3) | March 1, 2010 (commencement of sale) through August 31, 2010. |
(4) | Annualized. |
(5) | Portfolio turnover is calculated at the fund level. Percentage indicated was calculated for the year ended August 31, 2010. |
See Notes to Financial Statements.
Report of Independent Registered Public Accounting Firm |
To the Trustees of the American Century California Tax-Free and Municipal Funds and Shareholders of the California Long-Term Tax-Free Fund:
In our opinion, the accompanying statement of assets and liabilities, including the schedule of investments, and the related statements of operations and of changes in net assets and the financial highlights present fairly, in all material respects, the financial position of the California Long-Term Tax-Free Fund (one of the four funds in the American Century California Tax-Free and Municipal Funds, hereafter referred to as the “Fund”) at August 31, 2013, the results of its operations for the year then ended, the changes in its net assets for each of the two years in the period then ended and the financial highlights for the periods presented, in conformity with accounting principles generally accepted in the United States of America. These financial statements and financial highlights (hereafter referred to as “financial statements”) are the responsibility of the Fund’s management; our responsibility is to express an opinion on these financial statements based on our audits. We conducted our audits of these financial statements in accordance with the standards of the Public Company Accounting Oversight Board (United States). Those standards require that we plan and perform the audit to obtain reasonable assurance about whether the financial statements are free of material misstatement. An audit includes examining, on a test basis, evidence supporting the amounts and disclosures in the financial statements, assessing the accounting principles used and significant estimates made by management, and evaluating the overall financial statement presentation. We believe that our audits, which included confirmation of securities at August 31, 2013 by correspondence with the custodian, provide a reasonable basis for our opinion.
PricewaterhouseCoopers LLP
Kansas City, Missouri
October 21, 2013
Management |
Board of Trustees
The individuals listed below serve as trustees of the funds. Each trustee will continue to serve in this capacity until death, retirement, resignation or removal from office. The board has adopted a mandatory retirement age for trustees who are not “interested persons,” as that term is defined in the Investment Company Act (independent trustees). Independent trustees shall retire on December 31 of the year in which they reach their 75th birthday; provided, however, that on or after January 1, 2022, independent trustees shall retire on December 31 of the year in which they reach their 76th birthday.
Mr. Thomas is the only trustee who is an “interested person” because he currently serves as President and Chief Executive Officer of American Century Companies, Inc. (ACC), the parent company of American Century Investment Management, Inc. (ACIM or the advisor).
The other trustees (more than three-fourths of the total number) are independent; that is, they have never been employees, directors or officers of, and have no financial interest in, ACC or any of its wholly owned, direct or indirect, subsidiaries, including ACIM, American Century Investment Services, Inc. (ACIS) and American Century Services, LLC (ACS). The trustees serve in this capacity for eight (in the case of Mr. Thomas, 15) registered investment companies in the American Century Investments family of funds.
The following table presents additional information about the trustees. The mailing address for each trustee other than Mr. Thomas is 1665 Charleston Road, Mountain View, California 94043. The mailing address for Mr. Thomas is 4500 Main Street, Kansas City, Missouri 64111.
Name | Position(s) Held with Funds | Length of Time Served | Principal Occupation(s) During Past 5 Years | Number of American Century Portfolios Overseen | Other Directorships Held During Past 5 Years | |
Independent Trustees | ||||||
Tanya S. Beder | Trustee | Since 2011 | Chairman, SBCC Group Inc. (independent advisory services) (2006 to present) | 41 | CYS Investments, Inc. (specialty finance company) | |
Jeremy I. Bulow | Trustee | Since 2011 | Professor of Economics, Stanford University, Graduate School of Business (1979 to present) | 41 | None | |
Ronald J. Gilson | Trustee and Chairman of the Board | Since 1995 | Charles J. Meyers Professor of Law and Business, Stanford Law School (1979 to present); Marc and Eva Stern Professor of Law and Business, Columbia University School of Law (1992 to present) | 41 | None | |
Frederick L. A. Grauer | Trustee | Since 2008 | Senior Advisor, BlackRock, Inc. (investment management firm) (2010 to 2011); Senior Advisor, Barclays Global Investors (investment management firm) (2003 to 2009) | 41 | None | |
Name | Position(s) Held with Funds | Length of Time Served | Principal Occupation(s) During Past 5 Years | Number of American Century Portfolios Overseen | Other Directorships Held During Past 5 Years | |
Independent Trustees | ||||||
Peter F. Pervere | Trustee | Since 2007 | Retired | 41 | Intraware, Inc. (2003 to 2009) | |
Myron S. Scholes | Trustee | Since 1980 | Chairman, Platinum Grove Asset Management, L.P. (asset manager) (1999 to 2009); Frank E. Buck Professor of Finance-Emeritus, Stanford Graduate School of Business (1996 to present) | 41 | Dimensional Fund Advisors (investment advisor); CME Group, Inc. (futures and options exchange) | |
John B. Shoven | Trustee | Since 2002 | Professor of Economics, Stanford University (1973 to present) | 41 | Cadence Design Systems; Exponent; Financial Engines | |
Interested Trustee | ||||||
Jonathan S. Thomas | Trustee and President | Since 2007 | President and Chief Executive Officer, ACC (March 2007 to present). Also serves as Chief Executive Officer and Manager, ACS; Executive Vice President, ACIM; Director, ACC, ACIM and other ACC subsidiaries | 116 | None | |
Officers
The following table presents certain information about the executive officers of the funds. Each officer serves as an officer for each of the 15 investment companies in the American Century family of funds, unless otherwise noted. No officer is compensated for his or her service as an officer of the funds. The listed officers are interested persons of the funds and are appointed or re-appointed on an annual basis. The mailing address for each of the officers listed below is 4500 Main Street, Kansas City, Missouri 64111.
Name | Offices with the Funds | Principal Occupation(s) During the Past Five Years |
Jonathan S. Thomas | Trustee and President since 2007 | President and Chief Executive Officer, ACC (March 2007 to present). Also serves as Chief Executive Officer and Manager, ACS; Executive Vice President, ACIM; Director, ACC, ACIM and other ACC subsidiaries |
Maryanne L. Roepke | Chief Compliance Officer since 2006 and Senior Vice President since 2000 | Chief Compliance Officer, American Century funds, ACIM and ACS (August 2006 to present). Also serves as Senior Vice President, ACS |
Charles A. Etherington | General Counsel since 2007 and Senior Vice President since 2006 | Attorney, ACC (February 1994 to present); Vice President, ACC (November 2005 to present); General Counsel, ACC (March 2007 to present). Also serves as General Counsel, ACIM, ACS, ACIS and other ACC subsidiaries; and Senior Vice President, ACIM and ACS |
C. Jean Wade | Vice President, Treasurer and Chief Financial Officer since 2012 | Vice President, ACS (February 2000 to present) |
Robert J. Leach | Vice President since 2006 and Assistant Treasurer since 2012 | Vice President, ACS (February 2000 to present) |
David H. Reinmiller | Vice President since 2001 | Attorney, ACC (January 1994 to present); Associate General Counsel, ACC (January 2001 to present). Also serves as Vice President, ACIM and ACS |
Ward D. Stauffer | Secretary since 2005 | Attorney, ACC (June 2003 to present) |
The Statement of Additional Information has additional information about the fund’s trustees and is available without charge, upon request, by calling 1-800-345-2021.
Approval of Management Agreement |
At a meeting held on June 11, 2013, the Fund’s Board of Directors/Trustees unanimously approved the renewal of the management agreement pursuant to which American Century Investment Management, Inc. (the “Advisor”) acts as the investment advisor for the Fund. Under Section 15(c) of the Investment Company Act, contracts for investment advisory services are required to be reviewed, evaluated, and approved by a majority of a fund’s directors/trustees (the “Directors”), including a majority of the independent Directors each year. The Board regards this annual evaluation and renewal as one of its most important responsibilities.
In connection with their annual review and evaluation, the independent Directors memorialized a statement regarding the relationship between their ongoing obligations to oversee and evaluate the performance of the Advisor and their consideration of renewal of the management agreement. In that statement, the independent Directors noted that their assessment of the Advisor’s performance is an ongoing process that takes place over the entire year and is informed by all of the information that the Board and its committees receive and consider over time. This information, together with the materials provided in connection with the review, are central to the Board’s assessment of the Advisor’s performance and its determination whether to renew the Fund’s management agreement.
Prior to its consideration of the renewal of the management agreement, the Board requested and reviewed extensive data and analysis relating to the proposed renewal. This information and analysis was compiled by the Advisor and certain independent providers of evaluation data concerning the Fund and the services provided to the Fund by the Advisor.
In connection with its consideration of the renewal of the management agreement, the Board’s review and evaluation of the services provided by the Advisor included, but was not limited to, the following:
• | the nature, extent, and quality of investment management, shareholder services, and other services provided by the Advisor to the Fund; |
• | the wide range of other programs and services the Advisor provides to the Fund and its shareholders on a routine and non-routine basis; |
• | the investment performance of the Fund, including data comparing the Fund’s performance to appropriate benchmarks and/or a peer group of other mutual funds with similar investment objectives and strategies; |
• | data comparing the cost of owning the Fund to the cost of owning similar funds; |
• | the Advisor’s compliance policies, procedures, and regulatory experience; |
• | financial data showing the cost of services provided to the Fund, the profitability of the Fund to the Advisor, and the overall profitability of the Advisor; |
• | possible economies of scale associated with the Advisor’s management of the Fund and other accounts under its management; |
• | data comparing services provided and charges to other investment management clients of the Advisor; and |
• | consideration of collateral benefits derived by the Advisor from the management of the Fund. |
In keeping with its practice, the Board held two in-person meetings to review and discuss the information provided. The Board also had the benefit of the advice of its independent counsel throughout the period.
Factors Considered
The Directors considered all of the information provided by the Advisor, the independent data providers, and the Board’s independent counsel in connection with the review, and evaluated such information for the Fund. In connection with their review, the Directors did not identify any single factor as being all-important or controlling and each Director may have attributed different levels of importance to different factors. In deciding to renew the management agreement, the Board based its decision on a number of factors, including the following:
Nature, Extent and Quality of Services — Generally. Under the management agreement, the Advisor is responsible for providing or arranging for all services necessary for the operation of the Fund. The Board noted that under the management agreement, the Advisor provides or arranges at its own expense a wide variety of services including:
• | constructing and designing the Fund |
• | portfolio research and security selection |
• | initial capitalization/funding |
• | securities trading |
• | Fund administration |
• | custody of Fund assets |
• | daily valuation of the Fund’s portfolio |
• | shareholder servicing and transfer agency, including shareholder confirmations, recordkeeping, and communications |
• | legal services |
• | regulatory and portfolio compliance |
• | financial reporting |
• | marketing and distribution |
The Board noted that many of these services have expanded over time both in terms of quantity and complexity in response to shareholder demands, competition in the industry, changing distribution channels, and the changing regulatory environment.
Investment Management Services. The nature of the investment management services provided to the Fund is quite complex and allows Fund shareholders access to professional money management, instant diversification of their investments within an asset class, the opportunity to easily diversify among asset classes by investing in or exchanging among various American Century Investments funds, and liquidity. In evaluating investment performance, the Board expects the Advisor to manage the Fund in accordance with its investment objectives and approved strategies. Further, the Directors recognize that the Advisor has an obligation to seek the best execution of fund trades. In providing these services, the Advisor utilizes teams of investment professionals (portfolio managers, analysts, research assistants, and securities traders) who require extensive information technology, research, training, compliance and other systems to conduct their business. The Board, directly and through its Portfolio Committee, regularly reviews investment performance information for the Fund, together with comparative information for appropriate benchmarks and/or peer groups of similarly-managed funds, over different time horizons. The Directors also review detailed performance information during the management agreement approval process. If performance concerns are identified, the Fund receives special reviews until performance improves, during which the Board discusses with the Advisor the reasons for such results (e.g., market conditions, security selection) and any efforts being undertaken to improve performance. The Board found the investment management services provided by the Advisor to the Fund to meet or exceed industry standards. More detailed information about the Fund’s performance can be found in the Performance and Portfolio Commentary sections of this report.
Shareholder and Other Services. Under the management agreement, the Advisor provides the Fund with a comprehensive package of transfer agency, shareholder, and other services. The Board, directly and through various committees of the Board, regularly reviews reports and evaluations of such services at its regular meetings. These reports include, but are not limited to, information regarding the operational efficiency and accuracy of the shareholder and transfer agency services provided, staffing levels, shareholder satisfaction (as measured by external as well as internal sources), technology support, new products and services offered to Fund shareholders, securities trading activities, portfolio valuation services, auditing services, and legal and operational compliance activities. Certain aspects of shareholder and transfer agency service level efficiency and the quality of securities trading activities are measured by independent third party providers and are presented in comparison to other fund groups not managed by the Advisor. The Board found the services provided by the Advisor to the Fund under the management agreement to be competitive and of high quality.
Costs of Services and Profitability. The Advisor provides detailed information concerning its cost of providing various services to the Fund, its profitability in managing the Fund, its overall profitability, and its financial condition. The Directors have reviewed with the Advisor the methodology used to prepare this financial information. The financial information regarding the Advisor is considered in evaluating the Advisor’s financial condition, its ability to continue
to provide services under the management agreement, and the reasonableness of the current management fee. The Board concluded that the Advisor’s profits were reasonable in light of the services provided to the Fund.
Ethics. The Board generally considers the Advisor’s commitment to providing quality services to shareholders and to conducting its business ethically. They noted that the Advisor’s practices generally meet or exceed industry best practices.
Economies of Scale. The Board also reviewed information provided by the Advisor regarding the possible existence of economies of scale in connection with the management of the Fund. The Board concluded that economies of scale are difficult to measure and predict with precision, especially on a fund-by-fund basis. The Board concluded that the Advisor is appropriately sharing economies of scale through its competitive fee structure, offering competitive fees from fund inception, and through reinvestment in its business to provide shareholders additional content and services.
Comparison to Other Funds’ Fees. The management agreement provides that the Fund pay the Advisor a single, all-inclusive (or unified) management fee for providing all services necessary for the management and operation of the Fund, other than brokerage expenses, taxes, interest, extraordinary expenses, and the fees and expenses of the Fund’s independent directors (including their independent legal counsel) and expenses incurred in connection with the provision of shareholder services and distribution services under a plan adopted pursuant to Rule 12b-1 under the 1940 Act. Under the unified fee structure, the Advisor is responsible for providing all investment advisory, custody, audit, administrative, compliance, recordkeeping, marketing and shareholder services, or arranging and supervising third parties to provide such services. By contrast, most other funds are charged a variety of fees, including an investment advisory fee, a transfer agency fee, an administrative fee, distribution charges and other expenses. Other than their investment advisory fees and any applicable Rule 12b-1 distribution fees, all other components of the total fees charged by these other funds may be increased without shareholder approval. The Board believes the unified fee structure is a benefit to Fund shareholders because it clearly discloses to shareholders the cost of owning Fund shares, and, since the unified fee cannot be increased without a vote of Fund shareholders, it shifts to the Advisor the risk of increased costs of operating the Fund and provides a direct incentive to minimize administrative inefficiencies. Part of the Board’s analysis of fee levels involves reviewing certain evaluative data compiled by an independent provider and comparing the Fund’s unified fee to the total expense ratio of other funds in the Fund’s peer group. The Board concluded that the management fee paid by the Fund to the Advisor under the management agreement is reasonable in light of the services provided to the Fund.
Comparison to Fees and Services Provided to Other Clients of the Advisor. The Board also requested and received information from the Advisor concerning the nature of the services, fees, costs and profitability of its advisory services to advisory clients other than the Fund. They observed that these varying types of client accounts require different services and involve different regulatory and entrepreneurial risks than the management of the Fund. The Board analyzed this information and concluded that the fees charged and services provided to the Fund were reasonable by comparison.
Collateral or “Fall-Out” Benefits Derived by the Advisor. The Board considered the existence of collateral benefits the Advisor may receive as a result of its relationship with the Fund. They concluded that the Advisor’s primary business is managing mutual funds and it generally does not use fund or shareholder information to generate profits in other lines of business, and therefore does not derive any significant collateral benefits from them. The Board noted that the Advisor receives proprietary research from broker-dealers that execute fund portfolio transactions and concluded that this research is likely to benefit Fund shareholders. The Board also determined that the Advisor is able to provide investment management services to certain clients other than the Fund, at least in part, due to its existing infrastructure built to serve the fund complex. The Board concluded, however, that the assets of those other clients are not material to the analysis and, where applicable, may be included with the assets of the Fund to determine breakpoints in the management fee schedule.
Existing Relationship. The Board also considered whether there was any reason for not continuing the existing arrangement with the Advisor. In this regard, the Board was mindful of the potential disruptions of the Fund’s operations and various risks, uncertainties, and other effects that could occur as a result of a decision not to continue such relationship. In particular, the Board recognized that most shareholders have invested in the Fund on the strength of the Advisor’s industry standing and reputation and in the expectation that the Advisor will have a continuing role in providing advisory services to the Fund.
Conclusion of the Directors. As a result of this process, the Board, including all of the independent directors and assisted by the advice of independent legal counsel, taking into account all of the factors discussed above and the information provided by the Advisor and others, concluded that the management agreement between the Fund and the Advisor is fair and reasonable in light of the services provided and should be renewed.
Additional Information |
Proxy Voting Guidelines
American Century Investment Management, Inc., the fund’s investment advisor, is responsible for exercising the voting rights associated with the securities purchased and/or held by the fund. A description of the policies and procedures the advisor uses in fulfilling this responsibility is available without charge, upon request, by calling 1-800-345-2021. It is also available on American Century Investments’ website at americancentury.com and on the Securities and Exchange Commission’s website at sec.gov. Information regarding how the investment advisor voted proxies relating to portfolio securities during the most recent 12-month period ended June 30 is available on the “About Us” page at americancentury.com. It is also available at sec.gov.
Quarterly Portfolio Disclosure
The fund files its complete schedule of portfolio holdings with the Securities and Exchange Commission (SEC) for the first and third quarters of each fiscal year on Form N-Q. The fund’s Forms N-Q are available on the SEC’s website at sec.gov, and may be reviewed and copied at the SEC’s Public Reference Room in Washington, DC. Information on the operation of the Public Reference Room may be obtained by calling 1-800-SEC-0330. The fund also makes its complete schedule of portfolio holdings for the most recent quarter of its fiscal year available on its website at americancentury.com and, upon request, by calling 1-800-345-2021.
Other Tax Information
The following information is provided pursuant to provisions of the Internal Revenue Code.
The fund designates $13,427,189 as exempt interest dividends for the fiscal year ended August 31, 2013.
Notes |
Contact Us | americancentury.com |
Automated Information Line | 1-800-345-8765 |
Investor Services Representative | 1-800-345-2021 |
Investors Using Advisors | 1-800-378-9878 |
Business, Not-For-Profit, Employer-Sponsored Retirement Plans | 1-800-345-3533 |
Banks and Trust Companies, Broker-Dealers, Financial Professionals, Insurance Companies | 1-800-345-6488 |
Telecommunications Device for the Deaf | 1-800-634-4113 |
American Century California Tax-Free and Municipal Funds
Investment Advisor:
American Century Investment Management, Inc.
Kansas City, Missouri
This report and the statements it contains are submitted for the general information of our shareholders. The report is not authorized for distribution to prospective investors unless preceded or accompanied by an effective prospectus.
©2013 American Century Proprietary Holdings, Inc. All rights reserved.
CL-ANN-79624 1310
ANNUAL REPORT | AUGUST 31, 2013 |
California Tax-Free Money Market Fund
Table of Contents |
President’s Letter | 2 |
Market Perspective | 3 |
Performance | 4 |
Fund Characteristics | 5 |
Shareholder Fee Example | 6 |
Schedule of Investments | 8 |
Statement of Assets and Liabilities | 11 |
Statement of Operations | 12 |
Statement of Changes in Net Assets | 13 |
Notes to Financial Statements | 14 |
Financial Highlights | 17 |
Report of Independent Registered Public Accounting Firm | 18 |
Management | 19 |
Approval of Management Agreement | 22 |
Additional Information | 27 |
Any opinions expressed in this report reflect those of the author as of the date of the report, and do not necessarily represent the opinions of American Century Investments® or any other person in the American Century Investments organization. Any such opinions are subject to change at any time based upon market or other conditions and American Century Investments disclaims any responsibility to update such opinions. These opinions may not be relied upon as investment advice and, because investment decisions made by American Century Investments funds are based on numerous factors, may not be relied upon as an indication of trading intent on behalf of any American Century Investments fund. Security examples are used for representational purposes only and are not intended as recommendations to purchase or sell securities. Performance information for comparative indices and securities is provided to American Century Investments by third party vendors. To the best of American Century Investments’ knowledge, such information is accurate at the time of printing.
President’s Letter |
Jonathan Thomas
Dear Investor:
Thank you for reviewing this annual report for the 12 months ended August 31, 2013. It provides investment performance, market analysis, and portfolio information, presented with the expert perspective of our portfolio management team.
Annual reports remain important vehicles for conveying information about fund returns, including key factors that affected fund performance. For additional, updated investment and market insights, we encourage you to visit our website, americancentury.com.
U.S. Government Bond Yields and Stock Indices Soared
U.S. government bond yields and stock indices traced roughly parallel upward paths during the 12 months ended August 31, 2013. The 10-year U.S. Treasury yield began the period at just 1.55%, compressed in large part by the scale of the Federal Reserve’s (the Fed’s) bond-buying program ($85 billion of quantitative easing, or QE, each month).
Hints from the Fed that it might taper QE sent bond yields soaring from early May to the end of August—the 10-year U.S. Treasury yield closed the period at 2.78%. The 10-year U.S. Treasury note and the Barclays U.S. Aggregate Bond Index (representing the broad taxable U.S. bond market) returned –7.52% and –2.47%, respectively, for the 12 months. Municipal bonds generally trailed taxable bonds—the Barclays Municipal Bond Index returned –3.70%.
U.S. stocks also experienced volatility from mid-May to mid-June as a result of the “Taper Tantrum,” but it was a relatively small setback in an otherwise solid 12-month performance period. The S&P 500 Index gained 18.70% as the U.S. economy showed signs of attaining sustainable growth. Improvements in the housing and job markets helped trigger optimism, though absolute levels still remain well below where they were prior to 2008.
Recovery from 2008 remains a major hurdle. Economic growth is still subpar compared with past recession recoveries, and the outlook is uncertain. Therefore, we continue to believe in a disciplined, diversified, long-term investment approach, using professionally managed stock and bond portfolios—as appropriate—for meeting financial goals. We appreciate your continued trust in us in this challenging environment.
Sincerely,
Jonathan Thomas
President and Chief Executive Officer
American Century Investments
Market Perspective |
By David MacEwen, Chief Investment Officer, Fixed Income
Federal Reserve Policy Drove Market Sentiment
The municipal bond (muni) market began the 12-month period on a fairly upbeat note, supported by stable-to-improving credit trends, robust issuance, healthy demand, and an accommodative Federal Reserve (Fed). Early in the period, the Fed also launched its third and most aggressive quantitative easing program (QE3), a strategy to purchase $85 billion of U.S. government securities each month until economic growth and employment improve. The Fed also kept its overnight interest rate target near 0%. These actions supported the U.S. bond market in general at the start of the period.
Beginning in spring 2013, investor sentiment shifted dramatically, as fears of a change in Fed policy triggered a broad market sell-off. Since 2008, the Fed’s massive QE programs have helped keep longer-term interest rates low and encouraged risk-taking. But Fed statements throughout the spring and summer indicated the central bank may start tapering its bond purchases this year. In addition, select economic data modestly improved, fueling further speculation that the Fed would change course. In response, bond yields soared, generating negative returns throughout the fixed income market.
Munis Underperformed Treasuries, Broad Bond Market
Despite outperforming during the first half of the period, munis underperformed their Treasury counterparts and the taxable investment-grade bond market for the entire 12-month period. Overall, market volatility, rising-rate worries, liquidity concerns, and a weaker supply/demand backdrop in the second half drove down 12-month returns. The most-liquid and shortest-duration (least price-sensitive to interest rate changes) fixed-income securities generally fared best.
Additionally, the City of Detroit bankruptcy filing on July 18, 2013, combined with mounting debt problems in Puerto Rico, which is among the largest muni issuers, further pressured the muni market. Although the Detroit bankruptcy was big news, it was not a big surprise, coming after decades of financial mismanagement and population declines. Nevertheless, the negative headlines surrounding the record-setting bankruptcy and growing concerns for Puerto Rico’s debt exacerbated the selling pressures in the muni market and led to additional price deterioration.
U.S. Fixed-Income Total Returns | ||||
For the 12 months ended August 31, 2013 | ||||
Barclays Municipal Market Indices | Barclays U.S. Taxable Market Indices | |||
7 Year Municipal Bond | -1.76% | Aggregate Bond | -2.47% | |
California Tax-Exempt Bond | -3.03% | Treasury Bond | -3.07% | |
Municipal Bond | -3.70% | |||
Municipal High Yield Bond | -3.91% | |||
Long-Term Municipal Bond | -7.43% | |||
Performance |
Total Returns as of August 31, 2013 | ||||||
Average Annual Returns | ||||||
Ticker Symbol | 1 year | 5 years | 10 years | Since Inception | Inception Date | |
Investor Class | BCTXX | 0.01%(1) | 0.17%(1) | 1.11%(1) | 2.61% | 11/9/83 |
(1) | Returns would have been lower if a portion of the management fee had not been waived. |
Total Annual Fund Operating Expenses |
Investor Class 0.50% |
The total annual fund operating expenses shown is as stated in the fund’s prospectus current as of the date of this report. The prospectus may vary from the expense ratio shown elsewhere in this report because it is based on a different time period, includes acquired fund fees and expenses, and, if applicable, does not include fee waivers or expense reimbursements.
Data presented reflect past performance. Past performance is no guarantee of future results. Current performance may be higher or lower than the performance shown. To obtain performance data current to the most recent month end, please call 1-800-345-2021 or visit americancentury.com. The fund concentrates its investments in a single state and therefore may have more exposure to credit risk related to the state of California than a fund with a broader geographical diversification. Investment income may be subject to certain state and local taxes and, depending on your tax status, the federal alternative minimum tax (AMT). Capital gains are not exempt from state and federal income tax.
An investment in the fund is not insured or guaranteed by the Federal Deposit Insurance Corporation or any other government agency. Although the fund seeks to preserve the value of your investment at $1.00 per share, it is possible to lose money by investing in the fund.
The 7-day current yield more closely reflects the current earnings of the fund than the total return.
Fund Characteristics |
AUGUST 31, 2013
| |
7-Day Current Yield | |
After waiver(1) | 0.01% |
Before waiver | -0.32% |
7-Day Effective Yield | |
After waiver(1) | 0.01% |
(1)Yields would have been lower if a portion of the management fee had not been waived. | |
Portfolio at a Glance | |
Weighted Average Maturity | 27 days |
Weighted Average Life | 60 days |
Portfolio Composition by Maturity | % of fund investments |
1-30 days | 89% |
31-90 days | 4% |
91-180 days | 1% |
More than 180 days | 6% |
Shareholder Fee Example |
Fund shareholders may incur two types of costs: (1) transaction costs, including sales charges (loads) on purchase payments and redemption/exchange fees; and (2) ongoing costs, including management fees; distribution and service (12b-1) fees; and other fund expenses. This example is intended to help you understand your ongoing costs (in dollars) of investing in your fund and to compare these costs with the ongoing cost of investing in other mutual funds.
The example is based on an investment of $1,000 made at the beginning of the period and held for the entire period from March 1, 2013 to August 31, 2013.
Actual Expenses
The table provides information about actual account values and actual expenses for each class. You may use the information, together with the amount you invested, to estimate the expenses that you paid over the period. First, identify the share class you own. Then simply divide your account value by $1,000 (for example, an $8,600 account value divided by $1,000 = 8.6), then multiply the result by the number under the heading “Expenses Paid During Period” to estimate the expenses you paid on your account during this period.
If you hold Investor Class shares of any American Century Investments fund, or Institutional Class shares of the American Century Diversified Bond Fund, in an American Century Investments account (i.e., not a financial intermediary or retirement plan account), American Century Investments may charge you a $12.50 semiannual account maintenance fee if the value of those shares is less than $10,000. We will redeem shares automatically in one of your accounts to pay the $12.50 fee. In determining your total eligible investment amount, we will include your investments in all personal accounts (including American Century Investments Brokerage accounts) registered under your Social Security number. Personal accounts include individual accounts, joint accounts, UGMA/UTMA accounts, personal trusts, Coverdell Education Savings Accounts and IRAs (including traditional, Roth, Rollover, SEP-, SARSEP- and SIMPLE-IRAs), and certain other retirement accounts. If you have only business, business retirement, employer-sponsored or American Century Investments Brokerage accounts, you are currently not subject to this fee. If you are subject to the Account Maintenance Fee, your account value could be reduced by the fee amount.
Hypothetical Example for Comparison Purposes
The table also provides information about hypothetical account values and hypothetical expenses based on the actual expense ratio of each class of your fund and an assumed rate of return of 5% per year before expenses, which is not the actual return of a fund’s share class. The hypothetical account values and expenses may not be used to estimate the actual ending account balance or expenses you paid for the period. You may use this information to compare the ongoing costs of investing in your fund and other funds. To do so, compare this 5% hypothetical example with the 5% hypothetical examples that appear in the shareholder reports of the other funds.
Please note that the expenses shown in the table are meant to highlight your ongoing costs only and do not reflect any transactional costs, such as sales charges (loads) or redemption/exchange fees. Therefore, the table is useful in comparing ongoing costs only, and will not help you determine the relative total costs of owning different funds. In addition, if these transactional costs were included, your costs would have been higher.
Beginning 3/1/13 | Ending 8/31/13 | Expenses Paid During Period(1) 3/1/13 – 8/31/13 | Annualized | |
Actual | ||||
Investor Class | $1,000 | $1,000.10 | $1.11 | 0.22% |
Investor Class | $1,000 | $1,000.10(2) | $2.52 | 0.50% |
Hypothetical | ||||
Investor Class | $1,000 | $1,024.10 | $1.12 | 0.22% |
Investor Class | $1,000 | $1,022.69 | $2.55 | 0.50% |
(1) | Expenses are equal to the class’s annualized expense ratio listed in the table above, multiplied by the average account value over the period, multiplied by 184, the number of days in the most recent fiscal half-year, divided by 365, to reflect the one-half year period. |
| (2) | Ending account value assumes the return earned after waiver and would have been lower if a portion of the management fee had not been waived. |
Schedule of Investments |
AUGUST 31, 2013
Principal Amount | Value | |||||
Municipal Securities — 97.0% | ||||||
CALIFORNIA — 97.0% | ||||||
ABAG Finance Authority for Nonprofit Corps. Rev., (899 Charleston LLC), VRDN, 0.10%, 9/3/13 (LOC: Bank of America N.A.) | $ 1,675,000 | $ 1,675,000 | ||||
California Infrastructure & Economic Development Bank Rev., (Bay Area Toll Bridges), VRDN, 0.14%, 9/5/13 (LOC: Bank of the West) | 2,830,000 | 2,830,000 | ||||
California Infrastructure & Economic Development Bank Rev., (Goodwill Industries of Orange County), VRDN, 0.11%, 9/5/13 (LOC: Wells Fargo Bank N.A.) | 2,720,000 | 2,720,000 | ||||
California Infrastructure & Economic Development Bank Rev., (Kennfoods USA), VRDN, 0.23%, 9/5/13 (LOC: Bank of the West) | 1,950,000 | 1,950,000 | ||||
California Infrastructure & Economic Development Bank Rev., (Loyola High School), VRDN, 0.06%, 9/5/13 (LOC: First Republic Bank and FHLB) | 3,845,000 | 3,845,000 | ||||
California Infrastructure & Economic Development Bank Rev., (SRI International), VRDN, 0.07%, 9/5/13 (LOC: Wells Fargo Bank N.A.) | 6,600,000 | 6,600,000 | ||||
California Infrastructure & Economic Development Bank Rev., Series 2008 A, (iWorks, Inc.), VRDN, 0.15%, 9/5/13 (LOC: City National Bank and FHLB) | 1,335,000 | 1,335,000 | ||||
California Municipal Finance Authority Rev., (Central Coast YMCA), VRDN, 0.06%, 9/5/13 (LOC: Pacific Capital Bank N.A. and FHLB) | 3,305,000 | 3,305,000 | ||||
California Municipal Finance Authority Rev., Series 2010 A, (Southwest Community Health Center), VRDN, 0.09%, 9/5/13 (LOC: Comerica Bank) | 4,000,000 | 4,000,000 | ||||
California Municipal Finance Authority Rev., Series 2012 A, (High Desert Partnership in Academic Excellence Foundation), VRDN, 0.09%, 9/5/13 (LOC: Union | 2,000,000 | 2,000,000 | ||||
California Pollution Control Financing Authority Rev., (BLT Enterprises), VRDN, 0.08%, 9/4/13 (LOC: Union Bank N.A.) | 2,750,000 | 2,750,000 | ||||
California Pollution Control Financing Authority Rev., (Musco Family Olive), VRDN, 0.16%, 9/5/13 (LOC: Bank of the West) | 3,200,000 | 3,200,000 | ||||
California Pollution Control Financing Authority Rev., Series 2010 A, (Alameda Country Industries), VRDN, 0.24%, 9/4/13 (LOC: Bank of the West) | 2,460,000 | 2,460,000 | ||||
California School Cash Reserve Program Authority Rev., Series 2013 X, 2.00%, 10/1/13 | 6,000,000 | 6,008,900 | ||||
California State Enterprise Development Authority Rev., (Community Hospice Inc.), VRDN, 0.07%, 9/5/13 (LOC: Bank of Stockton and FHLB) | 3,995,000 | 3,995,000 | ||||
California State Enterprise Development Authority Rev., (Humane Society Silicon Valley), VRDN, 0.07%, 9/5/13 (LOC: First Republic Bank and FHLB) | 6,985,000 | 6,985,000 | ||||
California State Enterprise Development Authority Rev., (LBM Partnership LP), VRDN, 0.07%, 9/5/13 (LOC: Wells Fargo Bank N.A.) | 2,900,000 | 2,900,000 | ||||
California State University PUTTERs Rev., Series 2008-2646Z, VRDN, 0.14%, 9/5/13 (LIQ FAC: JPMorgan Chase Bank N.A.) | 4,670,000 | 4,670,000 | ||||
California Statewide Communities Development Authority Rev., (Encanto Homes Apartments), VRDN, 0.07%, 9/5/13 (LOC: East West Bank and FHLB) | 8,900,000 | 8,900,000 | ||||
Principal Amount | Value |
California Statewide Communities Development Authority Rev., (Goodwill of Santa Cruz), VRDN, 0.11%, 9/5/13 (LOC: Wells Fargo Bank N.A.) | $ 2,200,000 | $ 2,200,000 | ||||
California Statewide Communities Development Authority Rev., (Trinity Children & Family), VRDN, 0.08%, 9/4/13 (LOC: Citizens Business Bank and California State Teacher’s Retirement System) | 3,920,000 | 3,920,000 | ||||
California Statewide Communities Development Authority COP, VRDN, 0.08%, 9/4/13 (LOC: Union Bank N.A.) | 1,895,000 | 1,895,000 | ||||
City & County of San Francisco COP, Series 2010 A, 4.00%, 10/1/13 | 2,675,000 | 2,683,283 | ||||
City of Hanford Sewer System Rev., Series 1996 A, VRDN, 0.09%, 9/5/13 (LOC: Union Bank N.A.) | 840,000 | 840,000 | ||||
City of Oroville Rev., Series 2012 A, (Oroville Hospital), VRDN, 0.09%, 9/5/13 (LOC: Comerica Bank) | 7,055,000 | 7,055,000 | ||||
City of Reedley COP, (Mennonite Brethren Homes), VRDN, 0.07%, 9/5/13 (LOC: Bank of the Sierra and FHLB) | 7,980,000 | 7,980,000 | ||||
City of Riverside Water Rev., Series 2011 A, VRN, 0.08%, 9/5/13 | 9,850,000 | 9,850,000 | ||||
County of San Bernardino Rev., Series 2004 A, (WLP Parkview Place Apartments), VRDN, 0.10%, 9/5/13 (LOC: FNMA) | 3,420,000 | 3,420,000 | ||||
County of Yolo Rev., (Beckett Hall, Inc.), VRDN, 0.13%, 9/5/13 (LOC: Bank of the West and California State Teacher’s Retirement System) | 7,145,000 | 7,145,000 | ||||
East Bay Municipal Utility District Wastewater System Rev., Series 2008 C, VRDN 0.06%, 9/4/13 (SBBPA: Bank of America N.A.) | 5,400,000 | 5,400,000 | ||||
East Bay Municipal Utility District Water System Rev., Series 2009 A-2, VRN, 0.06%, 9/5/13 | 3,035,000 | 3,035,000 | ||||
Eastern Municipal Water District Rev., Series 2012 A, VRN, 0.08%, 9/5/13 | 5,000,000 | 5,000,000 | ||||
Eastern Municipal Water District Rev., Series 2013 A, VRN, 0.08%, 9/5/13 | 2,000,000 | 2,000,000 | ||||
Hesperia Public Financing Authority Rev., Series 1998 B, VRDN, 0.15%, 9/4/13 (LOC: Bank of America N.A.) | 605,000 | 605,000 | ||||
Irvine Ranch Water District Special Assessment Rev., Series 2011 A1, VRN, 0.06%, 9/5/13 | 1,500,000 | 1,500,000 | ||||
Irvine Ranch Water District Special Assessment Rev., Series 2011 A2, VRN, 0.06%, 9/5/13 | 4,000,000 | 4,000,000 | ||||
Irvine Unified School District Special Tax Rev., Series 2012 B, (Community Facilities District No. 09-1), VRDN, 0.06%, 9/3/13 (LOC: Bank of America N.A.) | 900,000 | 900,000 | ||||
JP Morgan Chase PUTTERs/DRIVERs Trust, Series 2011-4003Z, VRDN, 0.07%, 9/5/13 (LIQ FAC: JPMorgan Chase Bank N.A.)(1) | 5,000,000 | 5,000,000 | ||||
JP Morgan Chase PUTTERs/DRIVERs Trust, Series 2011-4005Z, VRDN, 0.14%, 9/5/13 (AGM)(LIQ FAC: JPMorgan Chase Bank N.A.)(1) | 6,590,000 | 6,590,000 | ||||
Los Angeles County Community Development Commission COP, (Willowbrook Partnership), VRDN, 0.13%, 9/4/13 (LOC: Wells Fargo Bank N.A.) | 2,300,000 | 2,300,000 | ||||
Manteca Redevelopment Agency Tax Allocation Rev., VRDN 0.05%, 9/3/13 (LOC: State Street Bank & Trust Co.) | 1,280,000 | 1,280,000 | ||||
Metropolitan Water District of Southern California Rev., Series 2009 A-2, VRN, 0.06%, 9/5/13 | 3,020,000 | 3,020,000 | ||||
Metropolitan Water District of Southern California Rev., Series 2013 E, VRN, 0.08%, 3/28/14 | 4,820,000 | 4,820,000 | ||||
Metropolitan Water District of Southern California Rev., Series A1, VRN, 0.06%, 9/5/13 | 6,440,000 | 6,440,000 |
Principal Amount | Value |
Pittsburg Public Financing Authority Rev., VRDN, 0.11%, 9/5/13 (LOC: Bank of the West) | $ 2,920,000 | $2,920,000 | ||||
Sacramento County Sanitation Districts Financing Authority Rev., 5.00%, 12/1/13 | 1,000,000 | 1,011,861 | ||||
San Francisco City and County Redevelopment Agency Special Tax Rev., Series 2005 A, VRDN, 0.07%, 9/5/13 (LOC: JPMorgan Chase Bank N.A.) | 3,400,000 | 3,400,000 | ||||
Santa Clara County Housing Authority Rev., Series 2003 A, VRDN, 0.11%, 9/5/13 (LOC: Citibank N.A.) | 1,725,000 | 1,725,000 | ||||
Southern California Public Power Authority Rev., Series 2011 A, (Southern Transmission), 5.00%, 7/1/14 | 5,000,000 | 5,196,132 | ||||
State of California Puttable Floating Options Rev., VRDN, 0.13%, 9/25/13 (AGM)(LIQ FAC: Bank of America N.A.)(1) | 3,480,000 | 3,480,000 | ||||
State of California Rev., Series 2013 A-2, 2.00%, 6/23/14 | 10,000,000 | 10,142,761 | ||||
Three Valleys Municipal Water District COP, (Miramar Water Treatment), VRDN, 0.06%, 9/4/13 (LOC: Wells Fargo Bank N.A.) | 2,600,000 | 2,600,000 | ||||
Town of Apple Valley COP, (Public Facilities Financing), VRDN, 0.07%, 9/5/13 (LOC: Union Bank N.A. and California State Teacher’s Retirement System) | 2,170,000 | 2,170,000 | ||||
Town of Hillsborough COP, Series 2006 A, (Water & Sewer System), VRDN, 0.13%, 9/5/13 (SBBPA: JPMorgan Chase Bank N.A.) | 8,240,000 | 8,240,000 | ||||
Victorville Joint Powers Finance Authority Lease Rev., Series 2007 A, (Cogeneration Facility), VRDN, 1.56%, 9/5/13 (LOC: BNP Paribas) | 12,475,000 | 12,475,000 | ||||
West Basin Municipal Water District COP, Series 2008 A1, VRDN, 0.10%, 9/4/13 (SBBPA: Citibank N.A.) | 9,500,000 | 9,500,000 | ||||
TOTAL MUNICIPAL SECURITIES | 233,867,937 | |||||
Commercial Paper(2) — 2.1% | ||||||
San Diego County Water Authority, 0.08%, 9/10/13 | 5,000,000 | 5,000,000 | ||||
TOTAL INVESTMENT SECURITIES — 99.1% | 238,867,937 | |||||
OTHER ASSETS AND LIABILITIES — 0.9% | 2,213,241 | |||||
TOTAL NET ASSETS — 100.0% | $241,081,178 | |||||
Notes to Schedule of Investments
AGM = Assured Guaranty Municipal Corporation
COP = Certificates of Participation
DRIVERs = Derivative Inverse Tax-Exempt Receipts
FHLB = Federal Home Loan Bank
FNMA = Federal National Mortgage Association
LIQ FAC = Liquidity Facilities
LOC = Letter of Credit
PUTTERs = Puttable Tax-Exempt Receipts
SBBPA = Standby Bond Purchase Agreement
VRDN = Variable Rate Demand Note. Interest reset date is indicated. Rate shown is effective at the period end.
VRN = Variable Rate Note. Interest reset date is indicated. Rate shown is effective at the period end.
(1) | Security was purchased under Rule 144A or Section 4(2) of the Securities Act of 1933 or is a private placement and, unless registered under the Act or exempted from registration, may only be sold to qualified institutional investors. The aggregate value of these securities at the period end was $15,070,000, which represented 6.3% of total net assets. |
(2) | The rate indicated is the yield to maturity at purchase. |
See Notes to Financial Statements.
Statement of Assets and Liabilities |
AUGUST 31, 2013 | |||
Assets | |||
Investment securities, at value (amortized cost and cost for federal income tax purposes) | $238,867,937 | ||
Cash | 932,116 | ||
Receivable for investments sold | 995,000 | ||
Receivable for capital shares sold | 182,941 | ||
Interest receivable | 206,261 | ||
| 241,184,255 | |||
Liabilities | |||
Payable for capital shares redeemed | 71,774 | ||
Accrued management fees | 31,303 | ||
| 103,077 | |||
Net Assets | $241,081,178 | ||
Investor Class Capital Shares | |||
Shares outstanding (unlimited number of shares authorized) | 241,088,279 | ||
Net Asset Value Per Share | $1.00 | ||
Net Assets Consist of: | |||
Capital paid in | $241,088,285 | ||
Accumulated net realized loss | (7,107 | ) | |
| $241,081,178 | |||
See Notes to Financial Statements.
Statement of Operations |
YEAR ENDED AUGUST 31, 2013 | |||
Investment Income (Loss) | |||
Income: | |||
Interest | $718,702 | ||
Expenses: | |||
Management fees | 1,228,995 | ||
Trustees’ fees and expenses | 13,178 | ||
Other expenses | 234 | ||
| 1,242,407 | |||
Fees waived | (548,409 | ) | |
| 693,998 | |||
Net investment income (loss) | 24,704 | ||
Net realized gain (loss) on investment transactions | — | ||
Net Increase (Decrease) in Net Assets Resulting from Operations | $ 24,704 | ||
See Notes to Financial Statements.
Statement of Changes in Net Assets |
YEARS ENDED AUGUST 31, 2013 AND AUGUST 31, 2012 | |||||
Increase (Decrease) in Net Assets | August 31, 2013 | August 31, 2012 | |||
Operations | |||||
Net investment income (loss) | $ 24,704 | $ 28,806 | |||
Net realized gain (loss) | — | (7,107 | ) | ||
Net increase (decrease) in net assets resulting from operations | 24,704 | 21,699 | |||
Distributions to Shareholders | |||||
From net investment income | (24,704 | ) | (28,806 | ) | |
From net realized gains | — | (9,097 | ) | ||
Decrease in net assets from distributions | (24,704 | ) | (37,903 | ) | |
Capital Share Transactions | |||||
Proceeds from shares sold | 77,817,102 | 59,620,301 | |||
Proceeds from reinvestment of distributions | 23,561 | 36,488 | |||
Payments for shares redeemed | (100,156,625 | ) | (95,609,541 | ) | |
Net increase (decrease) in net assets from capital share transactions | (22,315,962 | ) | (35,952,752 | ) | |
Net increase (decrease) in net assets | (22,315,962 | ) | (35,968,956 | ) | |
Net Assets | |||||
Beginning of period | 263,397,140 | 299,366,096 | |||
End of period | $241,081,178 | $263,397,140 | |||
Transactions in Shares of the Fund | |||||
Sold | 77,817,102 | 59,620,301 | |||
Issued in reinvestment of distributions | 23,561 | 36,488 | |||
Redeemed | (100,156,635 | ) | (95,609,541 | ) | |
Net increase (decrease) in shares of the fund | (22,315,972 | ) | (35,952,752 | ) | |
See Notes to Financial Statements.
Notes to Financial Statements |
August 31, 2013
1. Organization
American Century California Tax-Free and Municipal Funds (the trust) is registered under the Investment Company Act of 1940, as amended (the 1940 Act), as an open-end management investment company and is organized as a Massachusetts business trust. California Tax-Free Money Market Fund (the fund) is one fund in a series issued by the trust. The fund is diversified as defined under Rule 2a-7 of the 1940 Act. The fund’s investment objectives are to seek safety of principal and high current income that is exempt from federal and California income taxes.
2. Significant Accounting Policies
The following is a summary of significant accounting policies consistently followed by the fund in preparation of its financial statements. The financial statements are prepared in conformity with accounting principles generally accepted in the United States of America, which may require management to make certain estimates and assumptions at the date of the financial statements. Actual results could differ from these estimates.
Investment Valuations — The fund determines the fair value of its investments and computes its net asset value per share as of the close of regular trading (usually 4 p.m. Eastern time) on the New York Stock Exchange (NYSE) on each day the NYSE is open. Securities are generally valued at amortized cost, which approximates fair value. When such valuations do not reflect fair value, securities are valued as determined in good faith by the Board of Trustees or its designee, in accordance with procedures adopted by the Board of Trustees.
Security Transactions — Security transactions are accounted for as of the trade date. Net realized gains and losses are determined on the identified cost basis, which is also used for federal income tax purposes.
Investment Income — Interest income is recorded on the accrual basis and includes accretion of discounts and amortization of premiums.
Income Tax Status — It is the fund’s policy to distribute substantially all net investment income and net realized gains to shareholders and to otherwise qualify as a regulated investment company under provisions of the Internal Revenue Code. Accordingly, no provision has been made for income taxes. The fund files U.S. federal, state, local and non-U.S. tax returns as applicable. The fund’s tax returns are subject to examination by the relevant taxing authority until expiration of the applicable statute of limitations, which is generally three years from the date of filing but can be longer in certain jurisdictions. At this time, management believes there are no uncertain tax positions which, based on their technical merit, would not be sustained upon examination and for which it is reasonably possible that the total amounts of unrecognized tax benefits will significantly change in the next twelve months.
Distributions to Shareholders — Distributions from net investment income are declared daily and paid monthly. The fund may make short-term capital gains distributions to comply with the distribution requirements of the Internal Revenue Code. The fund does not expect to realize any long-term capital gains, and accordingly, does not expect to pay any long-term capital gains distributions.
Indemnifications — Under the trust’s organizational documents, its officers and trustees are indemnified against certain liabilities arising out of the performance of their duties to the fund. In addition, in the normal course of business, the fund enters into contracts that provide general indemnifications. The maximum exposure under these arrangements is unknown as this would involve future claims that may be made against a fund. The risk of material loss from such claims is considered by management to be remote.
3. Fees and Transactions with Related Parties
Management Fees — The trust has entered into a management agreement with American Century Investment Management, Inc., (ACIM) (the investment advisor), under which ACIM provides the fund with investment advisory and management services in exchange for a single, unified management fee (the fee). The agreement provides that all expenses of managing and operating the fund, except distribution and service fees, brokerage expenses, taxes, interest, fees and expenses of the independent trustees (including legal counsel fees), and extraordinary expenses, will be paid by ACIM. The fee is computed and accrued daily based on the daily net assets of the fund and paid monthly in arrears. The fee consists of (1) an Investment Category Fee based on the daily net assets of the fund and certain other accounts managed by the investment advisor that are in the same broad investment category as the fund and (2) a Complex Fee based on the assets of all the funds in the American Century Investments family of funds. The rates for the Investment Category Fee range from 0.1570% to 0.2700%. The rates for the Complex Fee range from 0.2500% to 0.3100%. In order to maintain a positive yield, ACIM may voluntarily waive a portion of its management fee on a daily basis. The fee waiver may be revised or terminated at any time without notice. The effective annual management fee for the year ended August 31, 2013 was 0.49% before waiver and 0.27% after waiver.
Related Parties — Certain officers and trustees of the trust are also officers and/or directors of American Century Companies, Inc. (ACC). The trust’s investment advisor, ACIM, the trust’s distributor, American Century Investment Services, Inc., and the trust’s transfer agent, American Century Services, LLC are wholly owned, directly or indirectly, by ACC.
4. Fair Value Measurements
The fund’s securities valuation process is based on several considerations and may use multiple inputs to determine the fair value of the positions held by the fund. In conformity with accounting principles generally accepted in the United States of America, the inputs used to determine a valuation are classified into three broad levels as follows:
• | Level 1 valuation inputs consist of unadjusted quoted prices in an active market for identical securities; |
• | Level 2 valuation inputs consist of direct or indirect observable market data (including quoted prices for similar securities, evaluations of subsequent market events, interest rates, prepayment speeds, credit risk, etc.); or |
• | Level 3 valuation inputs consist of unobservable data (including a fund’s own assumptions). |
The level classification is based on the lowest level input that is significant to the fair valuation measurement. The valuation inputs are not necessarily an indication of the risks associated with investing in these securities or other financial instruments.
As of period end, the fund’s investment securities were classified as Level 2. The Schedule of Investments provides additional information on the fund’s portfolio holdings.
5. Risk Factors
The fund concentrates its investments in a single state and therefore may have more exposure to credit risk related to the state of California than a fund with a broader geographical diversification.
6. Federal Tax Information
The tax character of distributions paid during the years ended August 31, 2013 and August 31, 2012 were as follows:
2013 | 2012 | |
Distributions Paid From | ||
Exempt income | $24,704 | $28,806 |
Taxable ordinary income | — | $9,097 |
Long-term capital gains | — | — |
The book-basis character of distributions made during the year from net investment income or net realized gains may differ from their ultimate characterization for federal income tax purposes. These differences reflect the differing character of certain income items and net realized gains and losses for financial statement and tax purposes, and may result in reclassification among certain capital accounts on the financial statements.
As of August 31, 2013, the fund had accumulated short-term capital losses of $(7,107), which represent net capital loss carryovers that may be used to offset future realized capital gains for federal income tax purposes. The capital loss carryovers may be carried forward for an unlimited period. Future capital loss carryover utilization in any given year may be subject to Internal Revenue Code limitations.
Financial Highlights |
For a Share Outstanding Throughout the Years Ended August 31 (except as noted) | ||||||||||||
Per-Share Data | Ratios and Supplemental Data | |||||||||||
Distributions From: | Ratio to Average Net Assets of: | |||||||||||
Net Asset | Income From Investment Operations: Net Income | Net Income | Net | Total Distributions | Net Asset | Total | Operating Expenses | Operating Expenses (before expense waiver) | Net Income | Net Income | Net Assets, | |
Investor Class | ||||||||||||
2013 | $1.00 | —(2) | —(2) | — | —(2) | $1.00 | 0.01% | 0.28% | 0.50% | 0.01% | (0.21)% | $241,081 |
2012 | $1.00 | —(2) | —(2) | —(2) | —(2) | $1.00 | 0.01% | 0.40% | 0.50% | 0.01% | (0.09)% | $263,397 |
2011 | $1.00 | —(2) | —(2) | —(2) | —(2) | $1.00 | 0.01% | 0.38% | 0.50% | 0.01% | (0.11)% | $299,366 |
2010 | $1.00 | —(2) | —(2) | —(2) | —(2) | $1.00 | 0.03% | 0.34% | 0.50% | 0.01% | (0.15)% | $345,565 |
2009 | $1.00 | 0.01 | (0.01) | — | (0.01) | $1.00 | 0.77% | 0.49% | 0.55% | 0.83% | 0.77% | $439,637 |
Notes to Financial Highlights
(1) | Total returns are calculated based on the net asset value of the last business day. Total returns for periods less than one year are not annualized. |
(2) | Per-share amount was less than $0.005. |
Report of Independent Registered Public Accounting Firm |
To the Trustees of the American Century California Tax-Free and Municipal Funds and Shareholders of the California Tax-Free Money Market Fund:
In our opinion, the accompanying statement of assets and liabilities, including the schedule of investments, and the related statements of operations and of changes in net assets and the financial highlights present fairly, in all material respects, the financial position of the California Tax-Free Money Market Fund (one of the four funds in the American Century California Tax-Free and Municipal Funds, hereafter referred to as the “Fund”) at August 31, 2013, the results of its operations for the year then ended, the changes in its net assets for each of the two years in the period then ended and the financial highlights for each of the five years in the period then ended, in conformity with accounting principles generally accepted in the United States of America. These financial statements and financial highlights (hereafter referred to as “financial statements”) are the responsibility of the Fund’s management; our responsibility is to express an opinion on these financial statements based on our audits. We conducted our audits of these financial statements in accordance with the standards of the Public Company Accounting Oversight Board (United States). Those standards require that we plan and perform the audit to obtain reasonable assurance about whether the financial statements are free of material misstatement. An audit includes examining, on a test basis, evidence supporting the amounts and disclosures in the financial statements, assessing the accounting principles used and significant estimates made by management, and evaluating the overall financial statement presentation. We believe that our audits, which included confirmation of securities at August 31, 2013 by correspondence with the custodian, provide a reasonable basis for our opinion.
PricewaterhouseCoopers LLP
Kansas City, Missouri
October 21, 2013
Management |
Board of Trustees
The individuals listed below serve as trustees of the funds. Each trustee will continue to serve in this capacity until death, retirement, resignation or removal from office. The board has adopted a mandatory retirement age for trustees who are not “interested persons,” as that term is defined in the Investment Company Act (independent trustees). Independent trustees shall retire on December 31 of the year in which they reach their 75th birthday; provided, however, that on or after January 1, 2022, independent trustees shall retire on December 31 of the year in which they reach their 76th birthday.
Mr. Thomas is the only trustee who is an “interested person” because he currently serves as President and Chief Executive Officer of American Century Companies, Inc. (ACC), the parent company of American Century Investment Management, Inc. (ACIM or the advisor).
The other trustees (more than three-fourths of the total number) are independent; that is, they have never been employees, directors or officers of, and have no financial interest in, ACC or any of its wholly owned, direct or indirect, subsidiaries, including ACIM, American Century Investment Services, Inc. (ACIS) and American Century Services, LLC (ACS). The trustees serve in this capacity for eight (in the case of Mr. Thomas, 15) registered investment companies in the American Century Investments family of funds.
The following table presents additional information about the trustees. The mailing address for each trustee other than Mr. Thomas is 1665 Charleston Road, Mountain View, California 94043. The mailing address for Mr. Thomas is 4500 Main Street, Kansas City, Missouri 64111.
Name | Position(s) Held with Funds | Length of Time Served | Principal Occupation(s) During Past 5 Years | Number of American Century Portfolios Overseen by Trustee | Other Directorships Held During Past 5 Years | |
Independent Trustees | ||||||
Tanya S. Beder (1955) | Trustee | Since 2011 | Chairman, SBCC Group Inc. (independent advisory services) (2006 to present) | 41 | CYS Investments, Inc. (specialty finance company) | |
Jeremy I. Bulow (1954) | Trustee | Since 2011 | Professor of Economics, Stanford University, Graduate School of Business (1979 to present) | 41 | None | |
Ronald J. Gilson (1946) | Trustee and Chairman of the Board | Since 1995 | Charles J. Meyers Professor of Law and Business, Stanford Law School (1979 to present); Marc and Eva Stern Professor of Law and Business, Columbia University School of Law (1992 to present) | 41 | None | |
Frederick L. A. Grauer | Trustee | Since 2008 | Senior Advisor, BlackRock, Inc. (investment management firm) (2010 to 2011); Senior Advisor, Barclays Global Investors (investment management firm) (2003 to 2009) | 41 | None | |
Name | Position(s) Held with Funds | Length of Time Served | Principal Occupation(s) During Past 5 Years | Number of American Century Portfolios Overseen by Trustee | Other Directorships Held During Past 5 Years | |
Independent Trustees | ||||||
Peter F. Pervere (1947) | Trustee | Since 2007 | Retired | 41 | Intraware, Inc. (2003 to 2009) | |
Myron S. Scholes (1941) | Trustee | Since 1980 | Chairman, Platinum Grove Asset Management, L.P. (asset manager) (1999 to 2009); Frank E. Buck Professor of Finance-Emeritus, Stanford Graduate School of Business (1996 to present) | 41 | Dimensional Fund Advisors (investment advisor); CME Group, Inc. (futures and options exchange) | |
John B. Shoven (1947) | Trustee | Since 2002 | Professor of Economics, Stanford University (1973 to present) | 41 | Cadence Design Systems; Exponent; Financial Engines
| |
Interested Trustee | ||||||
Jonathan S. Thomas | Trustee and President | Since 2007 | President and Chief Executive Officer, ACC (March 2007 to present). Also serves as Chief Executive Officer and Manager, ACS; Executive Vice President, ACIM; Director, ACC, ACIM and other ACC subsidiaries | 116 | None | |
Officers
The following table presents certain information about the executive officers of the funds. Each officer serves as an officer for each of the 15 investment companies in the American Century family of funds, unless otherwise noted. No officer is compensated for his or her service as an officer of the funds. The listed officers are interested persons of the funds and are appointed or re-appointed on an annual basis. The mailing address for each of the officers listed below is 4500 Main Street, Kansas City, Missouri 64111.
Name | Offices with the Funds | Principal Occupation(s) During the Past Five Years |
Jonathan S. Thomas | Trustee and President since 2007 | President and Chief Executive Officer, ACC (March 2007 to present). Also serves as Chief Executive Officer and Manager, ACS; Executive Vice President, ACIM; Director, ACC, ACIM and other ACC subsidiaries |
Maryanne L. Roepke | Chief Compliance Officer since 2006 and Senior Vice President since 2000 | Chief Compliance Officer, American Century funds, ACIM and ACS (August 2006 to present). Also serves as Senior Vice President, ACS |
Charles A. Etherington (1957) | General Counsel since 2007 and Senior Vice President since 2006 | Attorney, ACC (February 1994 to present); Vice President, ACC (November 2005 to present); General Counsel, ACC (March 2007 to present). Also serves as General Counsel, ACIM, ACS, ACIS and other ACC subsidiaries; and Senior Vice President, ACIM and ACS |
C. Jean Wade (1964) | Vice President, Treasurer and Chief Financial Officer since 2012 | Vice President, ACS (February 2000 to present) |
Robert J. Leach (1966) | Vice President since 2006 and Assistant Treasurer since 2012 | Vice President, ACS (February 2000 to present) |
David H. Reinmiller (1963) | Vice President since 2001 | Attorney, ACC (January 1994 to present); Associate General Counsel, ACC (January 2001 to present). Also serves as Vice President, ACIM and ACS |
Ward D. Stauffer (1960) | Secretary since 2005 | Attorney, ACC (June 2003 to present) |
The Statement of Additional Information has additional information about the fund’s trustees and is available without charge, upon request, by calling 1-800-345-2021.
Approval of Management Agreement |
At a meeting held on June 11, 2013, the Fund’s Board of Directors/Trustees unanimously approved the renewal of the management agreement pursuant to which American Century Investment Management, Inc. (the “Advisor”) acts as the investment advisor for the Fund. Under Section 15(c) of the Investment Company Act, contracts for investment advisory services are required to be reviewed, evaluated, and approved by a majority of a fund’s directors/trustees (the “Directors”), including a majority of the independent Directors each year. The Board regards this annual evaluation and renewal as one of its most important responsibilities.
In connection with their annual review and evaluation, the independent Directors memorialized a statement regarding the relationship between their ongoing obligations to oversee and evaluate the performance of the Advisor and their consideration of renewal of the management agreement. In that statement, the independent Directors noted that their assessment of the Advisor’s performance is an ongoing process that takes place over the entire year and is informed by all of the information that the Board and its committees receive and consider over time. This information, together with the materials provided in connection with the review, are central to the Board’s assessment of the Advisor’s performance and its determination whether to renew the Fund’s management agreement.
Prior to its consideration of the renewal of the management agreement, the Board requested and reviewed extensive data and analysis relating to the proposed renewal. This information and analysis was compiled by the Advisor and certain independent providers of evaluation data concerning the Fund and the services provided to the Fund by the Advisor.
In connection with its consideration of the renewal of the management agreement, the Board’s review and evaluation of the services provided by the Advisor included, but was not limited to, the following:
• | the nature, extent, and quality of investment management, shareholder services, and other services provided by the Advisor to the Fund; |
• | the wide range of other programs and services the Advisor provides to the Fund and its shareholders on a routine and non-routine basis; |
• | the investment performance of the Fund, including data comparing the Fund’s performance to appropriate benchmarks and/or a peer group of other mutual funds with similar investment objectives and strategies; |
• | data comparing the cost of owning the Fund to the cost of owning similar funds; |
• | the Advisor’s compliance policies, procedures, and regulatory experience; |
• | financial data showing the cost of services provided to the Fund, the profitability of the Fund to the Advisor, and the overall profitability of the Advisor; |
• | possible economies of scale associated with the Advisor’s management of the Fund and other accounts under its management; |
• | data comparing services provided and charges to other investment management clients of the Advisor; and |
• | consideration of collateral benefits derived by the Advisor from the management of the Fund. |
In keeping with its practice, the Board held two in-person meetings to review and discuss the information provided. The Board also had the benefit of the advice of its independent counsel throughout the period.
Factors Considered
The Directors considered all of the information provided by the Advisor, the independent data providers, and the Board’s independent counsel in connection with the review, and evaluated such information for the Fund. In connection with their review, the Directors did not identify any single factor as being all-important or controlling and each Director may have attributed different levels of importance to different factors. In deciding to renew the management agreement, the Board based its decision on a number of factors, including the following:
Nature, Extent and Quality of Services - Generally. Under the management agreement, the Advisor is responsible for providing or arranging for all services necessary for the operation of the Fund. The Board noted that under the management agreement, the Advisor provides or arranges at its own expense a wide variety of services including:
• | constructing and designing the Fund |
• | portfolio research and security selection |
• | initial capitalization/funding |
• | securities trading |
• | Fund administration |
• | custody of Fund assets |
• | daily valuation of the Fund’s portfolio |
• | shareholder servicing and transfer agency, including shareholder confirmations, recordkeeping, and communications |
• | legal services |
• | regulatory and portfolio compliance |
• | financial reporting |
• | marketing and distribution |
The Board noted that many of these services have expanded over time both in terms of quantity and complexity in response to shareholder demands, competition in the industry, changing distribution channels, and the changing regulatory environment.
Investment Management Services. The nature of the investment management services provided to the Fund is quite complex and allows Fund shareholders access to professional money management, instant diversification of their investments within an asset class, the opportunity to easily diversify among asset classes by investing in or exchanging among various American Century Investments funds, and liquidity. In evaluating investment performance, the Board expects the Advisor to manage the Fund in accordance with its investment objectives and approved strategies. Further, the Directors recognize that the Advisor has an obligation to seek the best execution of fund trades. In providing these services, the Advisor utilizes teams of investment professionals (portfolio managers, analysts, research assistants, and securities traders) who require extensive information technology, research, training, compliance and other systems to conduct their business. The Board, directly and through its Portfolio Committee, regularly reviews investment performance information for the Fund, together with comparative information for appropriate benchmarks and/or peer groups of similarly-managed funds, over different time horizons. The Directors also review detailed performance information during the management agreement approval process. If performance concerns are identified, the Fund receives special reviews until performance improves, during which the Board discusses with the Advisor the reasons for such results (e.g., market conditions, security selection) and any efforts being undertaken to improve performance. The Board found the investment management services provided by the Advisor to the Fund to meet or exceed industry standards. More detailed information about the Fund’s performance can be found in the Performance section of this report.
Shareholder and Other Services. Under the management agreement, the Advisor provides the Fund with a comprehensive package of transfer agency, shareholder, and other services. The Board, directly and through various committees of the Board, regularly reviews reports and evaluations of such services at its regular meetings. These reports include, but are not limited to, information regarding the operational efficiency and accuracy of the shareholder and transfer agency services provided, staffing levels, shareholder satisfaction (as measured by external as well as internal sources), technology support, new products and services offered to Fund shareholders, securities trading activities, portfolio valuation services, auditing services, and legal and operational compliance activities. Certain aspects of shareholder and transfer agency service level efficiency and the quality of securities trading activities are measured by independent third party providers and are presented in comparison to other fund groups not managed by the Advisor. The Board found the services provided by the Advisor to the Fund under the management agreement to be competitive and of high quality.
Costs of Services and Profitability. The Advisor provides detailed information concerning its cost of providing various services to the Fund, its profitability in managing the Fund, its overall profitability, and its financial condition. The Directors have reviewed with the Advisor the methodology used to prepare this financial information. The financial information regarding the Advisor is considered in evaluating the Advisor’s financial condition, its ability to continue to provide services under the management agreement, and the reasonableness of the current management fee. The Board concluded that the Advisor’s profits were reasonable in light of the services provided to the Fund.
Ethics. The Board generally considers the Advisor’s commitment to providing quality services to shareholders and to conducting its business ethically. They noted that the Advisor’s practices generally meet or exceed industry best practices.
Economies of Scale. The Board also reviewed information provided by the Advisor regarding the possible existence of economies of scale in connection with the management of the Fund. The Board concluded that economies of scale are difficult to measure and predict with precision, especially on a fund-by-fund basis. The Board concluded that the Advisor is appropriately sharing economies of scale through its competitive fee structure, offering competitive fees from fund inception, and through reinvestment in its business to provide shareholders additional content and services.
Comparison to Other Funds’ Fees. The management agreement provides that the Fund pay the Advisor a single, all-inclusive (or unified) management fee for providing all services necessary for the management and operation of the Fund, other than brokerage expenses, taxes, interest, extraordinary expenses, and the fees and expenses of the Fund’s independent directors (including their independent legal counsel) and expenses incurred in connection with the provision of shareholder services and distribution services under a plan adopted pursuant to Rule 12b-1 under the 1940 Act. Under the unified fee structure, the Advisor is responsible for providing all investment advisory, custody, audit, administrative, compliance, recordkeeping, marketing and shareholder services, or arranging and supervising third parties to provide such services. By contrast, most other funds are charged a variety of fees, including an investment advisory fee, a transfer agency fee, an administrative fee, distribution charges and other expenses. Other than their investment advisory fees and any applicable Rule 12b-1 distribution fees, all other components of the total fees charged by these other funds may be increased without shareholder approval. The Board believes the unified fee structure is a benefit to Fund shareholders because it clearly discloses to shareholders the cost of owning Fund shares, and, since the unified fee cannot be increased without a vote of Fund shareholders, it shifts to the Advisor the risk of increased costs of operating the Fund and provides a direct incentive to minimize administrative inefficiencies. Part of the Board’s analysis of fee levels involves reviewing certain evaluative data compiled by an independent provider and comparing the Fund’s unified fee to the total expense ratio of other funds in the Fund’s peer group. The Board concluded that the management fee paid by the Fund to the Advisor under the management agreement is reasonable in light of the services provided to the Fund.
Comparison to Fees and Services Provided to Other Clients of the Advisor. The Board also requested and received information from the Advisor concerning the nature of the services, fees, costs and profitability of its advisory services to advisory clients other than the Fund. They observed that these varying types of client accounts require different services and involve different regulatory and entrepreneurial risks than the management of the Fund. The Board analyzed this information and concluded that the fees charged and services provided to the Fund were reasonable by comparison.
Collateral or “Fall-Out” Benefits Derived by the Advisor. The Board considered the existence of collateral benefits the Advisor may receive as a result of its relationship with the Fund. They concluded that the Advisor’s primary business is managing mutual funds and it generally does not use fund or shareholder information to generate profits in other lines of business, and therefore does not derive any significant collateral benefits from them. The Board noted that the Advisor receives proprietary research from broker-dealers that execute fund portfolio transactions and concluded that this research is likely to benefit Fund shareholders. The Board also determined that the Advisor is able to provide investment management services to certain clients other than the Fund, at least in part, due to its existing infrastructure built to serve the fund complex. The Board concluded, however, that the assets of those other clients are not material to the analysis and, where applicable, may be included with the assets of the Fund to determine breakpoints in the management fee schedule.
Existing Relationship. The Board also considered whether there was any reason for not continuing the existing arrangement with the Advisor. In this regard, the Board was mindful of the potential disruptions of the Fund’s operations and various risks, uncertainties, and other effects that could occur as a result of a decision not to continue such relationship. In particular, the Board recognized that most shareholders have invested in the Fund on the strength of the Advisor’s industry standing and reputation and in the expectation that the Advisor will have a continuing role in providing advisory services to the Fund.
Conclusion of the Directors. As a result of this process, the Board, including all of the independent directors and assisted by the advice of independent legal counsel, taking into account all of the factors discussed above and the information provided by the Advisor and others, concluded that the management agreement between the Fund and the Advisor is fair and reasonable in light of the services provided and should be renewed.
Additional Information |
Proxy Voting Guidelines
American Century Investment Management, Inc., the fund’s investment advisor, is responsible for exercising the voting rights associated with the securities purchased and/or held by the fund. A description of the policies and procedures the advisor uses in fulfilling this responsibility is available without charge, upon request, by calling 1-800-345-2021. It is also available on American Century Investments’ website at americancentury.com and on the Securities and Exchange Commission’s website at sec.gov. Information regarding how the investment advisor voted proxies relating to portfolio securities during the most recent 12-month period ended June 30 is available on the “About Us” page at americancentury.com. It is also available at sec.gov.
Quarterly Portfolio Disclosure
The fund files its complete schedule of portfolio holdings with the Securities and Exchange Commission (SEC) for the first and third quarters of each fiscal year on Form N-Q. The fund’s Forms N-Q are available on the SEC’s website at sec.gov, and may be reviewed and copied at the SEC’s Public Reference Room in Washington, DC. Information on the operation of the Public Reference Room may be obtained by calling 1-800-SEC-0330. The fund also makes its complete schedule of portfolio holdings for the most recent quarter of its fiscal year available on its website at americancentury.com and, upon request, by calling 1-800-345-2021.
Other Tax Information
The following information is provided pursuant to provisions of the Internal Revenue Code.
The fund designates $24,704 as exempt interest dividends for the fiscal year ended August 31, 2013.
Notes |
Contact Us | americancentury.com |
Automated Information Line | 1-800-345-8765 |
Investor Services Representative | 1-800-345-2021 |
Investors Using Advisors | 1-800-378-9878 |
Business, Not-For-Profit, Employer-Sponsored Retirement Plans | 1-800-345-3533 |
Banks and Trust Companies, Broker-Dealers, Financial Professionals, Insurance Companies | 1-800-345-6488 |
Telecommunications Device for the Deaf | 1-800-634-4113 |
American Century California Tax-Free and Municipal Funds
Investment Advisor:
American Century Investment Management, Inc.
Kansas City, Missouri
This report and the statements it contains are submitted for the general information of our shareholders. The report is not authorized for distribution to prospective investors unless preceded or accompanied by an effective prospectus.
©2013 American Century Proprietary Holdings, Inc. All rights reserved.
CL-ANN-79626 1310
ITEM 2. CODE OF ETHICS.
(a) | The registrant has adopted a Code of Ethics for Senior Financial Officers that applies to the registrant’s principal executive officer, principal financial officer, principal accounting officer, and persons performing similar functions. |
(b) | No response required. |
(c) | None. |
(d) | None. |
(e) | Not applicable. |
(f) | The registrant’s Code of Ethics for Senior Financial Officers was filed as Exhibit 12 (a)(1) to American Century Asset Allocation Portfolios, Inc.’s Annual Certified Shareholder Report on Form N-CSR, File No. 811-21591, on September 29, 2005, and is incorporated herein by reference. |
ITEM 3. AUDIT COMMITTEE FINANCIAL EXPERT.
(a)(1) | The registrant's board has determined that the registrant has at least one audit committee financial expert serving on its audit committee. |
(a)(2) | Tanya S. Beder, Peter F. Pervere and Ronald J. Gilson are the registrant's designated audit committee financial experts. They are "independent" as defined in Item 3 of Form N-CSR. |
(a)(3) | Not applicable. |
(b) | No response required. |
(c) | No response required. |
(d) | No response required. |
ITEM 4. PRINCIPAL ACCOUNTANT FEES AND SERVICES.
(a) | Audit Fees. |
The aggregate fees billed for each of the last two fiscal years for professional services rendered by the principal accountant for the audit of the registrant’s annual financial statements or services that are normally provided by the accountant in connection with statutory and regulatory filings or engagements for those fiscal years were as follows:
FY 2012: $105,779
FY 2013: $106,714
(b) | Audit-Related Fees. |
The aggregate fees billed in each of the last two fiscal years for assurance and related services by the principal accountant that are reasonably related to the performance of the audit of the registrant’s financial statements and are not reported under paragraph (a) of this Item were as follows:
For services rendered to the registrant:
FY 2012: $0 FY 2013: $0 |
Fees required to be approved pursuant to paragraph (c)(7)(ii) of Rule 2-01 of Regulation S-X (relating to certain engagements for non-audit services with the registrant’s investment adviser and its affiliates):
FY 2012: $0 FY 2013: $0 |
(c) | Tax Fees. |
The aggregate fees billed in each of the last two fiscal years for professional services rendered by the principal accountant for tax compliance, tax advice, and tax planning were as follows:
For services rendered to the registrant:
FY 2012: $0
FY 2013: $0
Fees required to be approved pursuant to paragraph (c)(7)(ii) of Rule 2-01 of Regulation S-X (relating to certain engagements for non-audit services with the registrant’s investment adviser and its affiliates):
FY 2012: $0
FY 2013: $0
(d) | All Other Fees. |
The aggregate fees billed in each of the last two fiscal years for products and services provided by the principal accountant, other than the services reported in paragraphs (a) through (c) of this Item were as follows:
For services rendered to the registrant:
FY 2012: $0 FY 2013: $0 |
Fees required to be approved pursuant to paragraph (c)(7)(ii) of Rule 2-01 of Regulation S-X (relating to certain engagements for non-audit services with the registrant’s investment adviser and its affiliates):
FY 2012: $0 FY 2013: $0 |
(e)(1) | In accordance with paragraph (c)(7)(i)(A) of Rule 2-01 of Regulation S-X, before the accountant is engaged by the registrant to render audit or non-audit services, the engagement is approved by the registrant’s audit committee. Pursuant to paragraph (c)(7)(ii) of Rule 2-01 of Regulation S-X, the registrant’s audit committee also pre-approves its accountant’s engagements for non-audit services with the registrant’s investment adviser, its parent company, and any entity controlled by, or under common control with the investment adviser that provides ongoing services to the registrant, if the engagement relates directly to the operations and financial reporting of the registrant. |
(e)(2) | All services described in each of paragraphs (b) through (d) of this Item were pre-approved before the engagement by the registrant’s audit committee pursuant to paragraph (c)(7)(i)(A) of Rule 2-01 of Regulation S-X. Consequently, none of such services were required to be approved by the audit committee pursuant to paragraph (c)(7)(i)(C). |
(f) | The percentage of hours expended on the principal accountant’s engagement to audit the registrant’s financial statements for the most recent fiscal year that were attributed to work performed by persons other than the principal accountant’s full-time, permanent employees was less than 50%. |
(g) | The aggregate non-audit fees billed by the registrant’s accountant for services rendered to the registrant, and rendered to the registrant’s investment adviser (not including any sub-adviser whose role is primarily portfolio management and is subcontracted with or overseen by another investment adviser), and any entity controlling, controlled by, or under common control with the adviser that provides ongoing services to the registrant for each of the last two fiscal years of the registrant were as follows: |
FY 2012: $187,686
FY 2013: $155,250
(h) | The registrant’s investment adviser and accountant have notified the registrant’s audit committee of all non-audit services that were rendered by the registrant’s accountant to the registrant’s investment adviser, its parent company, and any entity controlled by, or under common control with the investment adviser that provides services to the registrant, which services were not required to be pre-approved pursuant to paragraph (c)(7)(ii) of Rule 2-01 of Regulation S-X. The notification provided to the registrant’s audit committee included sufficient details regarding such services to allow the registrant’s audit committee to consider the continuing independence of its principal accountant. |
ITEM 5. AUDIT COMMITTEE OF LISTED REGISTRANTS.
Not applicable.
ITEM 6. INVESTMENTS.
(a) | The schedule of investments is included as part of the report to stockholders filed under Item 1 of this Form. |
(b) | Not applicable. |
ITEM 7. DISCLOSURE OF PROXY VOTING POLICIES AND PROCEDURES FOR CLOSED-END MANAGEMENT INVESTMENT COMPANIES.
Not applicable.
ITEM 8. PORTFOLIO MANAGERS OF CLOSED-END MANAGEMENT INVESTMENT COMPANIES.
Not applicable.
ITEM 9. PURCHASES OF EQUITY SECURITIES BY CLOSED-END MANAGEMENT INVESTMENT COMPANY AND AFFILIATED PURCHASERS.
Not applicable.
ITEM 10. SUBMISSION OF MATTERS TO A VOTE OF SECURITY HOLDERS.
During the reporting period, there were no material changes to the procedures by which shareholders may recommend nominees to the registrant’s board.
ITEM 11. CONTROLS AND PROCEDURES.
(a) | The registrant's principal executive officer and principal financial officer have concluded that the registrant's disclosure controls and procedures (as defined in Rule 30a-3(c) under the Investment Company Act of 1940) are effective based on their evaluation of these controls and procedures as of a date within 90 days of the filing date of this report. |
(b) | There were no changes in the registrant's internal control over financial reporting (as defined in Rule 30a-3(d) under the Investment Company Act of 1940) that occurred during the registrant's second fiscal quarter of the period covered by this report that have materially affected, or are reasonably likely to materially affect, the registrant's internal control over financial reporting. |
ITEM 12. EXHIBITS.
(a)(1) | Registrant’s Code of Ethics for Senior Financial Officers, which is the subject of the disclosure required by Item 2 of Form N-CSR, was filed as Exhibit 12(a)(1) to American Century Asset Allocation Portfolios, Inc.’s Certified Shareholder Report on Form N-CSR, File No. 811-21591, on September 29, 2005. |
(a)(2) | Separate certifications by the registrant’s principal executive officer and principal financial officer, pursuant to Section 302 of the Sarbanes-Oxley Act of 2002 and Rule 30a-2(a) under the Investment Company Act of 1940, are filed and attached hereto as EX-99.CERT. |
(a)(3) | Not applicable. |
(b) | A certification by the registrant’s chief executive officer and chief financial officer, pursuant to Section 906 of the Sarbanes-Oxley Act of 2002, is furnished and attached hereto as EX-99.906CERT. |
SIGNATURES
Pursuant to the requirements of the Securities Exchange Act of 1934 and the Investment Company Act of 1940, the registrant has duly caused this report to be signed on its behalf by the undersigned, thereunto duly authorized.
Registrant: | American Century California Tax-Free and Municipal Funds | |||
By: | /s/ Jonathan S. Thomas | |||
Name: | Jonathan S. Thomas | |||
Title: | President | |||
Date: | October 30, 2013 | |||
Pursuant to the requirements of the Securities Exchange Act of 1934 and the Investment Company Act of 1940, this report has been signed below by the following persons on behalf of the registrant and in the capacities and on the dates indicated.
By: | /s/ Jonathan S. Thomas | ||
Name: | Jonathan S. Thomas | ||
Title: | President | ||
(principal executive officer) | |||
Date: | October 30, 2013 | ||
By: | /s/ C. Jean Wade | ||
Name: | C. Jean Wade | ||
Title: | Vice President, Treasurer, and | ||
Chief Financial Officer | |||
(principal financial officer) | |||
Date: | October 30, 2013 | ||