Table of Contents
SECURITIES AND EXCHANGE COMMISSION
Washington, D.C. 20549
FORM6-K
REPORT OF FOREIGN ISSUER
Pursuant to Rule 13a-16 or 15d-16 of
the Securities Exchange Act of 1934
February 1, 2018
Commission File Number
000-12033
LM ERICSSON TELEPHONE COMPANY
(Translation of registrant’s name into English)
Torshamnsgatan 21, Kista
SE-164 83, Stockholm, Sweden
(Address of principal executive offices)
Indicate by check mark whether the registrant files or will file annual reports under cover Form20-F or Form40-F.Form 20-F ☒ Form 40-F ☐
Indicate by check mark if the registrant is submitting the Form6-K in paper as permitted by RegulationS-T Rule 101(b)(1): ☐
Indicate by check mark if the registrant is submitting the Form6-K in paper as permitted by RegulationS-T Rule 101(b)(7): ☐
THIS REPORT ON FORM 6-K SHALL BE DEEMED TO BE INCORPORATED BY REFERENCE IN THE REGISTRATION STATEMENTS ON FORM F-3 (NO. 333-203977) AND ON FORM S-8 (Nos. 333-196453, 333-161683 AND 333-161684 ) OF TELEFONAKTIEBOLAGET LM ERICSSON (PUBL.) AND TO BE A PART THEREOF FROM THE DATE ON WHICH THIS REPORT IS FURNISHED TO THE SECURITIES AND EXCHANGE COMMISSION, TO THE EXTENT NOT SUPERSEDED BY DOCUMENTS OR REPORTS SUBSEQUENTLY FILED WITH OR FURNISHED TO THE SECURITIES AND EXCHANGE COMMISSION.
Table of Contents
SIGNATURES
Pursuant to the requirements of the Securities Exchange Act of 1934, the registrant has duly caused this report to be signed on its behalf by the undersigned, thereunto duly authorized.
| TELEFONAKTIEBOLAGET LM ERICSSON (publ) | ||
| By: | /s/ NINAMACPHERSON | |
| Nina Macpherson | ||
| Senior Vice President & Chief Legal Officer | ||
| By: | /s/ HELENANORRMAN | |
| Helena Norrman | ||
| Senior Vice President | ||
| Corporate Marketing & Communications Officer | ||
Date:February 1, 2018
Table of Contents

FOURTH QUARTER AND
FULL-YEAR REPORT 2017,
as adjusted for incorporation by reference
Stockholm, January 31, 2018
FOURTH QUARTER HIGHLIGHTS | See page | |||
| • | Reported sales decreased by-12%. | 3 | ||
| • | As earlier communicated, write-down of assets was made in the quarter, with a final impact on the result of SEK -14.5 b. In addition, provisions and customer project adjustments amounted to SEK-3.2 b. and restructuring charges amounted to SEK-2.4(-4.6) b. | 4 | ||
| • | Gross margin was 21.0% (26.1%). | 4 | ||
| • | Networks gross margin was stable QoQ, supported by a higher share of software sales and increased hardware margins. The success of the5G-ready portfolio continued with several new contract wins. | 8 | ||
| • | Operating income was SEK-19.8(-0.3) b. Higher amortization than capitalization of development expenses and higher recognition than deferral of hardware costs had a negative impact of SEK-1.4 (0.8) b. | 4 | ||
| • | Cash flow from operating activities was SEK 11.2 (19.4) b. | 16 | ||
FULL-YEAR HIGHLIGHTS | ||||
| • | Reported sales decreased by-10% with a decline in all segments. | 5 | ||
| • | IPR licensing revenues amounted to SEK 7.9 (10.0) b. The baseline for current IPR licensing contract portfolio is approximately SEK 7 b. on an annual basis. | 6 | ||
| • | Operating income declined to SEK-38.1 (6.3) b., mainly due to write-down of assets as well as provisions and customer project adjustments. | 6 | ||
| • | Cash flow from operating activities was SEK 9.6 (14.0) b. | 16 | ||
| • | The Board of Directors will propose a dividend for 2017 of SEK 1.00 (1.00) per share to the AGM. | 16 | ||
REPORTED SEK b. | Q4 2017 | Q4 2016 | YoY change | Q3 2017 | QoQ change | Full-year 2017 | Full-year 2016 | |||||||||||||||||||||
Net sales | 57.2 | 65.2 | -12 | % | 47.8 | 20 | % | 201.3 | 222.6 | |||||||||||||||||||
Gross margin | 21.0 | % | 26.1 | % | — | 25.4 | % | — | 22.1 | % | 29.8 | % | ||||||||||||||||
Operating income | -19.8 | -0.3 | — | -4.8 | — | -38.1 | 6.3 | |||||||||||||||||||||
Operating margin | -34.5 | % | -0.4 | % | — | -10.0 | % | — | -18.9 | % | 2.8 | % | ||||||||||||||||
Net income | -18.9 | -1.6 | — | -4.3 | — | -35.1 | 1.9 | |||||||||||||||||||||
EPS diluted, SEK | -5.68 | -0.48 | — | -1.34 | — | -10.61 | 0.52 | |||||||||||||||||||||
Cash flow from operating activities | 11.2 | 19.4 | -43 | % | 0.0 | — | 9.6 | 14.0 | ||||||||||||||||||||
1 Ericsson | Fourth Quarter and Full-Year Report 2017
Table of Contents
CEO COMMENTS
During a challenging 2017, we have developed and started to execute on a focused strategy, strengthening our R&D while at the same time introducing robust measures to reduce cost and commercial risk. We have now laid the foundation for achieving our financial targets. The fourth quarter was in line with our overall expectation, with gradual improving performance in Networks and continued significant losses in Digital Services. The result is however far below our long-term ambition.
For 2018, the Radio Access Network (RAN) equipment market is expected to decline by-2%, compared with estimated-8% in 2017. The Chinese market is expected to continue to decline due to reduced LTE investments, while there is positive momentum in North America.
We further reduced commercial risks, resulting in provisions and adjustments relating to customer projects of SEK-3.2 b. in the quarter. As a consequence of our focused business strategy and as earlier communicated, we have impaired assets, impacting the result by SEK-14.5 b. in the quarter, without impacting cash flow. After concluding this review, we do not see a need for additional adjustments or write-downs.
We continued to execute on efficiency improvements with a net reduction of 10,000 employees and external workforce in the quarter. To date, the annualrun-rate effect of cost savings is approximately SEK 6 b. compared with the target of SEK 10 b. formid-2018. The impact on the results in the quarter is limited, but will be increasingly visible in the first half 2018.
We increased our focus on free cash flow during the year. By raising new debt on favorable terms and extending the average maturity, we have further improved our resilience and financial flexibility.
Segment Networks showed stable performance with theramp-up of Ericsson Radio System (ERS), representing 71% of radio unit deliveries in the quarter, and efficiency gains in service delivery as key drivers. The success of our5G-ready portfolio continues. In the quarter, we made deliveries related to our market share gain in Mainland China and we signed several breakthrough contracts, including with Verizon and Deutsche Telekom. We have continued to increase our R&D efforts to safeguard a future leading portfolio and to significantly improve our gross margin.
Segment Digital Services had another challenging quarter with significant losses, mainly due to higher costs in ongoing large transformation projects. As previously communicated, our turnaround plan builds on stability, profitability and growth – in that order. The initial focus has been on stabilizing both product roadmaps and challenging customer contracts. We have identified 45 critical ornon-strategic customer contracts and the plan is to complete or exit approximately half of these contracts in 2018. The actions to improve profitability in Digital Services are expected to generate positive effects on gross margin in the second half of 2018.
The refocus of Managed Services to improve profitability is underway, with 23 out of the 42 under-performing contracts completed, resulting in an annualized profit improvement of SEK 0.5 b.One-time effects and seasonality in operating expenses impacted operating income negatively.
For our Media Solutions portfolio, reported in segment Other, we have executed on a profit improvement program while continuing to invest in the product offering. This has significantly improved operating performance during the year, thereby improving our strategic flexibility as we have completed our strategic review of the business. We have evaluated various options including partnerships, divestments and continuedin-house development, with the objective to maximize shareholder value.
We have decided to partner with One Equity Partners (OEP) to further develop the Media Solutions business through retaining a 49% ownership stake. This allows us to capture the upside of the business while at the same time taking active part in the expected consolidation of the industry.
We have decided to keep Red Bee Media (former Broadcast and Media Services) as the bids received did not reflect the value of the business. We will develop the business as an independent entity within Ericsson, building on the improved operations.
The Board will propose a dividend of SEK 1.00 per share to the AGM. The Board expresses confidence in the ongoing actions to improve profitability, and has the ambition to increase the dividend over time as the financial performance improves.
The focus during 2017 has been on reshaping overall strategy and on improving company structure and performance. 2017 was also the year when 5G went from vision to real business opportunities while we at the same time had good traction for our 4G portfolio. We are fully committed to our plans and our targets and expect to see tangible results of our turnaround in 2018.
Börje Ekholm
President and CEO
2 Ericsson | Fourth Quarter and Full-Year Report 2017
Table of Contents
FINANCIAL HIGHLIGHTS
REPORTED SEK b. | Q4 2017 | Q4 2016 | YoY change | Q3 2017 | QoQ change | Full-year 2017 | Full-year 2016 | |||||||||||||||||||||
Net sales | 57.2 | 65.2 | -12 | % | 47.8 | 20 | % | 201.3 | 222.6 | |||||||||||||||||||
Gross income | 12.0 | 17.0 | -29 | % | 12.1 | -1 | % | 44.5 | 66.4 | |||||||||||||||||||
Gross margin (%) | 21.0 | % | 26.1 | % | — | 25.4 | % | — | 22.1 | % | 29.8 | % | ||||||||||||||||
Research and development expenses | -9.9 | -8.9 | 12 | % | -10.5 | -6 | % | -37.9 | -31.6 | |||||||||||||||||||
Selling and administrative expenses | -8.9 | -8.8 | 1 | % | -6.8 | 31 | % | -32.7 | -28.9 | |||||||||||||||||||
Other operating income and expenses | -12.9 | 0.4 | — | 0.4 | — | -12.1 | 0.4 | |||||||||||||||||||||
Operating income | -19.8 | -0.3 | — | -4.8 | — | -38.1 | 6.3 | |||||||||||||||||||||
Operating margin (%) | -34.5 | % | -0.4 | % | — | -10.0 | % | — | -18.9 | % | 2.8 | % | ||||||||||||||||
Financial net | -0.5 | -0.7 | -24 | % | -0.3 | 64 | % | -1.2 | -2.3 | |||||||||||||||||||
Taxes | 1.4 | -0.6 | — | 0.8 | 84 | % | 4.3 | -2.1 | ||||||||||||||||||||
Net income | -18.9 | -1.6 | — | -4.3 | — | -35.1 | 1.9 | |||||||||||||||||||||
Restructuring charges | -2.4 | -4.6 | -48 | % | -2.8 | -14 | % | -8.5 | -7.6 | |||||||||||||||||||
FOURTH QUARTER COMMENTS
Net sales
Sales as reported decreased by-12% YoY. Networks sales declined by-14% YoY, mainly due to lower mobile broadband investments in Mainland China and earlier completion of larger mobile broadband projects in South East Asia & India as well as in the Middle East & Africa.
The YoY sales decline in segments Digital Services and Other was-9% and-18% respectively, mainly due to the continued decline in legacy product sales and related services. Managed Services sales declined by-7%, mainly as a result of the ongoing contract review targeted at improving profitability.
Sequential sales were up 20%, supported by seasonality and higher exchange rate between USD and SEK. The sales increase was partly offset by lower than normal seasonal sales growth in market area South East Asia & India and in Mainland China.
IPR licensing revenues
IPR licensing revenues were flat YoY at SEK 2.0 b. and increased QoQ from SEK 1.9 b., supported by currency effects.
Provisions and customer project adjustments
As announced in the Q2 report, 2017, the company identified a risk of further market and customer project adjustments, which would have a negative impact on income. The review of such risks was completed and resulted in total provisions and customer project adjustments of SEK 5.5 b. This exceeds the previous estimate which was at the high end of SEK3-5 b.
In Q4 2017, SEK 3.2 b. of provisions and customer project adjustments were made, of which SEK 3.0 b. had no impact on a cash outflow. The SEK 3.2 b. relates to provisions for additional project costs, reassessment of trade receivables and customer settlements.
Write-down of assets
The impairment testing of assets, according to the new segment structure, resulted in write-downs, impacting the result by SEK-14.5 b. in the quarter, with no impact on cash flow. The difference to the previously announced and estimated write-down
3 Ericsson | Fourth Quarter and Full-Year Report 2017
Table of Contents
effect of SEK-14.2 b. is due to currency translation effects. The results were impacted by write-down of goodwill of SEK-13.0 b., intangible assets of SEK-0.6 b., fixed assets of SEK-0.4 b., deferred costs of SEK-0.3 b. and capitalized development expenses of SEK-0.3 b.
The asset write-down impacted the segments Digital Services by SEK-7.2 b., Other by SEK-6.8 b., Managed Services by SEK-0.3 b. and Networks by SEK-0.2 b. In addition, revaluation of U.S. deferred tax assets following the change in U.S corporate income tax rate, resulted in a charge of SEK-1.0 b. None of the asset write-downs had an impact on cash flow.
Gross margin
Reported gross margin declined to 21.0% (26.1%), negatively impacted by additional provisions and customer project adjustments of SEK-2.4 b. as well as asset write-downs of SEK-0.7 b. Restructuring charges amounted to SEK-2.0(-2.1) b.
Sequentially, reported gross margin declined due to the additional provisions and customer project adjustments, restructuring charges and write-down of assets made in the quarter.
Operating expenses
Reported operating expenses increased to SEK 18.9 (17.7) b. YoY, mainly due to additional provisions and customer project adjustments of SEK-0.9 b., write-down of assets of SEK-0.8 b. and higher amortized than capitalized R&D expenses of-0.6 b. Restructuring charges decreased to SEK-0.4(-2.5) b., including a reversal of SEK 0.3 b. related to the sale of the global ICT center in Montreal.
Reported operating expenses increased sequentially mainly due to seasonality. Additional provisions and customer project adjustments made in the quarter were partly offset by lower restructuring charges of SEK-0.4(-2.5) b.
Other operating income and expenses
Other operating income and expenses increased both YoY and QoQ due to write-down of goodwill of SEK-13.0 b.
As of Q1 2017, the funding of foreign exchange forecast hedging is managed through foreign exchange loans (USD) instead of foreign exchange derivatives. Therefore the revaluation and realization effects are included in financial expenses instead of in other operating income and expenses. Revaluation and realization effects of currency hedge contracts impacted other operating income and expenses by SEK-0.4 b. in Q4 2016.
Consequences of technology and portfolio shifts
Due to technology and portfolio shifts the company is reducing the capitalization of development expenses for product platforms and software releases and the deferral of hardware costs. As a consequence, higher amortization than capitalization of development expenses and higher recognition than deferral of hardware costs had a negative impact on operating income of SEK-1.4 (0.8) b. in the quarter. For full-year 2017 the impact was SEK-2.9 (3.8) b. and is estimated to be SEK-0.8 (0.3) b. for Q1 2018, SEK-3(-3.5) b. for full-year 2018 and SEK-1 to-2 b. for full-year 2019.
IMPACT FROM AMORTIZATION AND CAPITALIZATION OF DEVELOPMENT EXPENSES AND FROM RECOGNITION AND DEFERRAL OF HARDWARE COSTS
SEK b. | Q4 2017 | Q4 2016 | Q3 2017 | FY 2017 | FY 2016 | |||||||||||||||
Cost of sales | -0.8 | -0.2 | -0.9 | -2.6 | -0.5 | |||||||||||||||
R&D expenses | -0.6 | 1.0 | -0.6 | -0.3 | 4.3 | |||||||||||||||
Total impact | -1.4 | 0.8 | -1.5 | -2.9 | 3.8 | |||||||||||||||
Restructuring charges
Restructuring charges were SEK-2.4(-4.6) b. Following the sale of the global ICT center in Montreal, a reversal of SEK 0.3 b. in restructuring charges was made in the quarter. Restructuring charges in Q3 2017 were SEK-2.8 b.
Operating income
Reported operating income decreased YoY to SEK-19.8(-0.3) b., negatively impacted by write-down of assets of SEK-14.5 b., additional provisions and customer project adjustments of SEK-3.2 b. and lower sales. The decrease was partly offset by lower restructuring charges of SEK-2.4(-4.6) b. Operating income declined sequentially from SEK-4.8 b., due to write-down of assets and higher additional provisions and customer projects adjustments.
Financial net
Financial net was SEK-0.5(-0.7) b. The YoY improvement was mainly related to lower negative foreign exchange revaluation effects. Sequentially, financial net declined from SEK-0.3 b. to SEK-0.5 b. The decline was mainly related to revaluation and realization effects of foreign exchange forecast hedging of SEK-0.1 b., compared with SEK 0.2 b. in Q3. The SEK weakened against the USD between Sep 30, 2017 (SEK/USD rate 8.15) and Dec 31, 2017 (SEK/USD rate 8.20). The hedge loan balance is in USD.
Taxes
Taxes were positive in the quarter following the negative income. The positive tax effect was partly offset bynon-deductible expenses (mainly goodwill impairment), revaluation of deferred tax assets due to the change in U.S. corporate income tax rate and an allowance related to certain Swedish tax assets.
Net income and EPS
Net income and EPS diluted decreased significantly both YoY and QoQ following the lower operating income. EPS diluted was SEK-5.68(-0.48).
Employees
The number of employees on Dec 31, 2017, was 100,735 – a net reduction of more than 5,100 employees in Q4. In addition, the external workforce was reduced by 5,100 resources in the quarter. The total workforce decrease was mainly a result of the cost and efficiency activities.
4 Ericsson | Fourth Quarter and Full-Year Report 2017
Table of Contents
Focused strategy execution
The company has so far identified four indicators to measure the progress of strategy execution.
| Area | Activity | Status Q4 2017 | ||
| Networks | Transition to new Ericsson Radio System | 61% (Q3: 55% YTD) accumulated for full-year 2017 (ERS radio unit deliveries out of total radio unit deliveries) | ||
| Digital Services | -Growth in sales of new product portfolio -New KPI: Adressing critical contracts | -Net sales declined by-4% (Q3:-5% 12 months rolling) full-year 2017 -Out of 45 contracts identified, 2 have been completed or exited in Q417 | ||
| Managed Services | Addressinglow-performing contracts | Out of 42 contracts identified, 23 (Q3: 13 YTD ) have been renegotiated to result in an annualized profit improvement of SEK 0.5 b. (Q3: SEK 0.4 b.) |
FULL-YEAR COMMENTS
Net sales
Reported sales decreased by SEK-21.3 b. or-10%, with a SEK-13.0 b. or-9% decrease in Networks, SEK-4.3 b. or-10% decrease in Digital Services, SEK-3.0 b. or-11% in Managed Services and SEK-1.0 b. or-11% in segment Other. The sales decrease in Networks was mainly due to lower demand for radio access network (RAN) equipment, which was estimated by an external source to decline by-8% for full-year 2017. The sales decrease in segments Digital Services and Other was mainly due to lower sales of legacy products. The sales decline in Managed Services was mainly due to a renewed contract in North America in 2016 that was reduced in scope.
IPR licensing revenues amounted to SEK 7.9 (10.0) b. Sales in 2016 were positively impacted by two signed contracts which included certainone-time items. The baseline for the current IPR licensing contract portfolio is approximately SEK 7 b. on an annual basis.
Currency exchange rates had no material impact on full-year sales.
The sales mix by commodity was: software 21% (22%), hardware 34% (33%) and services 45% (45%).
Gross margin
Gross margin declined to 22.1% (29.8%) due to provisions and customer projects adjustments of SEK-10.4 b., write-down of assets of SEK-0.7 b. and lower IPR licensing revenues at SEK 7.9 (10.0) b. In addition, restructuring charges included in the gross margin increased to SEK-5.2(-3.5) b.
Operating expenses
Operating expenses increased to SEK 70.6 (60.5) b., mainly as a result of provisions, customer project adjustments and write-down of assets of SEK-7.6 b. In addition, operating expenses increased due to higher amortized than capitalized development expenses with a negative effect on operating expenses of SEK-0.3 (4.3) b. Operating expenses included restructuring charges of SEK-3.3(-4.1) b. of which the sale of the global ICT center in Montreal generated a restructuring charge of SEK-1.3 b.
Other operating income and expenses
Other operating income and expenses were SEK-12.1 (0.4) b., negatively impacted by write-down of goodwill of SEK-13.0 b. In 2017, the power modules business was divested, which resulted in a gain of SEK 0.3 b.
As of 2017, the funding of foreign exchange forecast hedging is managed through foreign exchange loans (USD) instead of foreign exchange derivates. Therefore, revaluation and realization effects are included in financial expenses instead of other operating income and expenses. In 2016, the currency hedge contract effects impacted other operating income and expenses by SEK-0.9 b.
5 Ericsson | Fourth Quarter and Full-Year Report 2017
Table of Contents
Restructuring charges and cost savings
Restructuring charges amounted to SEK 8.5 (7.6) b., to be compared with the earlier estimate of SEK9-10 b. The restructuring charges mainly relate to cost savings. The ambition is to implement such savings with an annual run rate effect of at least SEK 10 b. bymid-2018. Approximately 30% of the cost savings are targeted at administrative expenses and 70% at cost of sales. By the end of 2017, SEK 6.0 b. in annualrun-rate effect of cost savings had been achieved, of which one fourth is in administrative expenses.
Efforts continue in order to reduce costs. Total restructuring charges for 2018 are estimated to be SEK5-7 b.
Operating income
Operating income decreased to SEK-38.1 (6.3) b., mainly due to write-down of assets of SEK-17.8 b., provisions and customer project adjustments of SEK-13.9 b. and lower sales.
In addition, due to technology and portfolio shifts, the company has reduced the capitalization of development expenses for product platforms and software releases and the deferral of hardware costs. As a consequence, higher amortization than capitalization of development expenses and higher recognition than deferral of hardware costs had a negative impact on operating income of SEK-2.9 (3.8) b. Operating margin was-18.9% (2.8%).
Financial net
The financial net improved to SEK-1.2(-2.3) b., mainly due to lower negative effects of foreign exchange revaluation. Lower interest rates partly offset the improvement. New borrowings have been signed on more favorable terms and risk reduction, in both currency exchange and interest rates, has been improved in 2017.
The currency hedge effects, which derive from the hedge loan balance in USD, impacted financial net by SEK 0.5 b. The SEK has strengthened against the USD between Dec 31, 2016 (SEK/ USD rate 9.06) and Dec 31, 2017 (SEK/USD rate 8.20).
Taxes
Taxes were SEK 4.3(-2.1) b. following the negative net income. The effective tax rate was 11%, negatively impacted bynon-deductible expenses (mainly goodwill impairment), by revaluation of deferred tax assets due to the change in U.S. corporate income tax rate, and by an allowance related to certain Swedish tax assets.
Net income and EPS
Net income decreased to SEK-35.1 (1.9) b., for the same reasons as for the decrease in operating income. EPS diluted was SEK-10.61 (0.52).
Employees
The number of employees on Dec 31, 2017 was 100,735, a net reduction of more than 10,000 employees in 2017.
PLANNING ASSUMPTIONS GOING FORWARD
Market related
| • | In line with previous estimate and that of an external source, the Radio Access Network (RAN) equipment market is estimated to decline by-2% for full-year 2018. The Chinese market is expected to continue to decline due to reduced LTE investments, while there is positive momentum in North America. |
Currency exposure
| • | A weakening by 10% of USD to SEK would have a negative impact of approximately-5% on net sales and approximately-1 percentage point on operating margin. For historical rates, seewww.erics-son.com/en/investors |
Ericsson related
| • | Focusing the business and addressinglow-performing operations are expected to reduce full-year sales by up to SEK 10 b. in 2019 compared with 2016. |
| • | The baseline for current IPR licensing contract portfolio is approximately SEK 7 b. on an annual basis. |
| • | The plan is to implement cost savings with an annualrun-rate effect of at least SEK 10 b. bymid-2018 compared with the Q2 2017 annual run rate. |
| • | Actions to improve profitability in Digital Services are expected to generate positive effects on gross margin in second half of 2018. |
| • | To further strengthen technology leadership, R&D expenses will increase, primarily in Networks. |
| • | Operating expenses typically vary between quarters due to seasonality. |
| • | Restructuring charges for full-year 2018 are estimated to be SEK5-7 b. |
| • | Actual and estimated Impact from amortization and capitalization of development expenses and from recognition and deferral of hardware costs: |
SEK b. | Q1 2017 Actual | Q4 2017 Actual | Q1 2018 Estimate | FY 2017 Actual | FY 2018 Estimate | FY 2019 Estimate | ||||||||||||||||||
Cost of sales | -0.5 | -0.8 | -0.3 | -2.6 | -1 | |||||||||||||||||||
R&D expenses | 0.7 | -0.6 | -0.5 | -0.3 | -2 | |||||||||||||||||||
|
|
|
|
|
|
|
|
|
|
|
| |||||||||||||
Total impact | 0.3 | -1.4 | -0.8 | -2.9 | -3 | -1 to -2 | ||||||||||||||||||
|
|
|
|
|
|
|
|
|
|
|
| |||||||||||||
6 Ericsson | Fourth Quarter and Full-Year Report 2017
Table of Contents
MARKET AREA SALES
| Fourth quarter 2017 | Change | |||||||||||||||||||||||||||
SEK b. | Networks | Digital Services | Managed Services | Other | Total | YoY | QoQ | |||||||||||||||||||||
South East Asia, Oceania and India | 5.7 | 1.3 | 0.6 | 0.0 | 7.6 | -21 | % | 3 | % | |||||||||||||||||||
North East Asia | 4.4 | 1.7 | 0.5 | 0.0 | 6.7 | -30 | % | 21 | % | |||||||||||||||||||
North America | 11.7 | 2.0 | 0.7 | 0.0 | 14.5 | 2 | % | 25 | % | |||||||||||||||||||
Europe and Latin America | 8.4 | 4.6 | 3.5 | 0.1 | 16.5 | -8 | % | 24 | % | |||||||||||||||||||
Middle East and Africa | 4.1 | 2.6 | 0.9 | -0.1 | 7.6 | -16 | % | 22 | % | |||||||||||||||||||
Other1) | 1.8 | 0.5 | 0.0 | 1.9 | 4.3 | -9 | % | 14 | % | |||||||||||||||||||
|
|
|
|
|
|
|
|
|
|
|
|
|
| |||||||||||||||
Total | 36.2 | 12.9 | 6.2 | 2.0 | 57.2 | -12 | % | 20 | % | |||||||||||||||||||
|
|
|
|
|
|
|
|
|
|
|
|
|
| |||||||||||||||
| 1) | Market Area “Other” includes licensing revenues, the majority of segment Other business and other businesses. |
FOURTH QUARTER COMMENTS
South East Asia, Oceania and India
Sales declined YoY due to lower Networks sales in Vietnam, India and Indonesia and an exit from a Managed Services contract in India. Digital Services sales increased slightly due to growth in Australia and Indonesia.
North East Asia
Sales declined YoY due to lower Networks sales in Mainland China because of reduced LTE investments. Sales in the quarter included deliveries related to the newly signed narrowband IoT contract in Mainland China. Operators in Mainland China and Japan are awaiting results of spectrum allocations, which impacted sales negatively in the quarter.
North America
North America sales grew slightly YoY. Networks sales growth was driven by network expansions to cater for increased data traffic. Digital Services sales declined YoY. Managed Services sales declined.
Europe and Latin America
The sales decline YoY was due to timing of major projects in Mexico, an earlier termination of a large contract in Italy and continued capex pressure among operators across most of Europe. The decline was partially offset by network modernizations in Brazil and increased network sales in Russia and France.
Middle East and Africa
Sales declined YoY, impacted by a continued weak macroeconomic environment with low operator investments, primarily in Networks. This was partly offset by growth in Digital Services.
Other
Sales declined YoY due to a continued sales decline for legacy products in Media Solutions. IPR licensing revenues amounted to SEK 2.0 (2.0) b.
| Full-year 2017 | Change | |||||||||||||||||||||||
SEK b. | Networks | Digital Services | Managed Services | Other | Total | YoY | ||||||||||||||||||
South East Asia, Oceania and India | 22.5 | 4.9 | 3.2 | 0.0 | 30.6 | -6 | % | |||||||||||||||||
North East Asia | 16.0 | 5.7 | 1.8 | 0.0 | 23.5 | -14 | % | |||||||||||||||||
North America | 38.8 | 7.5 | 3.3 | 0.1 | 49.6 | -5 | % | |||||||||||||||||
Europe and Latin America | 29.2 | 14.1 | 12.6 | 0.3 | 56.2 | -10 | % | |||||||||||||||||
Middle East and Africa | 14.0 | 7.3 | 3.7 | 0.0 | 25.1 | -11 | % | |||||||||||||||||
Other1) | 7.4 | 1.5 | — | 7.4 | 16.4 | -19 | % | |||||||||||||||||
|
|
|
|
|
|
|
|
|
|
|
| |||||||||||||
Total | 128.0 | 41.0 | 24.5 | 7.9 | 201.3 | -10 | % | |||||||||||||||||
|
|
|
|
|
|
|
|
|
|
|
| |||||||||||||
| 1) | Market Area “Other” includes licensing revenues, the majority of segment Other business and other businesses. |
FULL-YEAR COMMENTS
South East Asia, Oceania and India
Sales declined due to lower mobile broadband investments in Thailand, Indonesia and India. Growth in Digital Services was driven by growth i Australia, Singapore and Indonesia, mainly related to core network solutions.
North East Asia
Sales in Mainland China declined due to reduced LTE investments. Sales in Taiwan declined following a new network deployment for one operator in 2016. The markets in Korea and Japan stabilized and Ericsson increased its market share in Japan.
North America
North America sales declined, due to the earlier communicated rescoped managed services contract. Networks sales increased slightly, driven by network expansions to cater for increased data traffic. Digital Services sales declined slightly.
Europe and Latin America
Sales declined, mainly due to timing of major projects in Mexico and termination of a large contract in Italy. In addition, capex constraints in mobile broadband in Europe impacted sales negatively, as operators focus investments in fixed infrastructure. The decline was partially offset by network modernizations in Brazil.
Middle East and Africa
Sales declined in a challenging macroeconomic environment with cautious investments in broadband.Digital Services sales declined slightly. Managed Services sales declined due to effects of completed contract reviews.
Other
Sales declined due to lower IPR licensing revenues and lower sales in Media Solutions, where sales of legacy products and related services declined. IPR licensing revenues amounted to SEK 7.9 (10.0) b. IPR licensing revenues in 2016 were positively impacted by two signed contracts which included certain onetime items.
7 Ericsson | Fourth Quarter and Full-Year Report 2017
Table of Contents
SEGMENT RESULTS
| NETWORKS |
REPORTED SEK b. | Q4 2017 | Q4 2016 | YoY change | Q3 2017 | QoQ change | Full-year 2017 | Full-year 2016 | |||||||||||||||||||||
Net sales | 36.2 | 42.1 | -14 | % | 30.3 | 19 | % | 128.0 | 141.0 | |||||||||||||||||||
Of which products | 24.6 | 28.2 | -13 | % | 20.2 | 21 | % | 86.1 | 94.9 | |||||||||||||||||||
Of which IPR licensing revenues | 1.7 | 1.7 | 1 | % | 1.6 | 7 | % | 6.5 | 8.2 | |||||||||||||||||||
Of which services | 11.6 | 13.9 | -16 | % | 10.1 | 16 | % | 41.8 | 46.1 | |||||||||||||||||||
Gross income | 11.5 | 12.2 | -5 | % | 9.8 | 18 | % | 40.6 | 47.1 | |||||||||||||||||||
Gross margin (%) | 31.9 | % | 29.0 | % | — | 32.2 | % | — | 31.7 | % | 33.4 | % | ||||||||||||||||
Operating income | 1.6 | 3.4 | -53 | % | 1.5 | 10 | % | 7.6 | 17.6 | |||||||||||||||||||
Operating margin (%) | 4.5 | % | 8.2 | % | — | 4.9 | % | — | 6.0 | % | 12.5 | % | ||||||||||||||||
Restructuring charges | -1.3 | -2.1 | -41 | % | -1.4 | -11 | % | -4.8 | -3.4 | |||||||||||||||||||
FOURTH QUARTER COMMENTS
Net sales
Sales as reported declined by-14% YoY. The YoY decline is mainly due to lower LTE investments in Mainland China and earlier completion of larger projects in South East Asia, Oceania & India as well as in the Middle East & Africa. The decline was partly offset by sales growth in North America, driven by network expansions.
Reported sales increased by 19% QoQ. This is lower than normal seasonality and is mainly due to lower sales in Mainland China and South East Asia, Oceania & India, partly offset by strong sequential sales growth in North America.
Gross margin
Reported gross margin increased to 31.9% (29.0%) YoY, due to a higher share of software and increased margins of hardware and services, partly driven by cost reductions. The increase was partly offset by additional provisions and customer project adjustments of SEK-0.4 b. as well as by higher recognition than deferral of hardware costs and higher amortization than capitalization of software development expenses, together amounting to SEK-0.5 (0.0) b.
Gross margin was flat QoQ.
Operating income
Reported operating income and margin decreased YoY, due to lower sales, additional provisions and customer project adjustments of SEK-1.1 b. as well as write-down of assets of SEK-0.2 b. made in the quarter. Lower restructuring charges and improved gross margin partly offset the YoY sales decrease. Operating income was flat sequentially.
IMPACT FROM AMORTIZATION AND CAPITALIZATION OF DEVELOPMENT EXPENSES AND FROM RECOGNITION AND DEFERRAL OF HARDWARE COSTS
SEK b. | Q4 2017 | Q4 2016 | Q3 2017 | FY 2017 | FY 2016 | |||||||||||||||
Cost of Sales | -0.5 | — | -0.6 | -1.5 | 0.2 | |||||||||||||||
R&D expenses | -0.1 | 0.3 | -0.1 | — | 0.9 | |||||||||||||||
|
|
|
|
|
|
|
|
|
| |||||||||||
Total impact | -0.6 | 0.3 | -0.7 | -1.5 | 1.0 | |||||||||||||||
|
|
|
|
|
|
|
|
|
| |||||||||||
8 Ericsson | Fourth Quarter and Full-Year Report 2017
Table of Contents
Strategy execution
As presented at the 2017 Capital Markets Day, the ambition for Networks is to improve the operating margin to15%-17% in 2020. Two important activities for profitability improvements are to invest in R&D to safeguard a future leading portfolio and to fully transition the radio unit portfolio to Ericsson Radio System (ERS) in order to increase competitiveness.
The ERS, which was introduced to the market in 2016, has proven to be competitive, contributing to both improved earnings and a stronger market position. For the full-year 2017, the ERS accounted for 61% of total radio unit deliveries. The plan is to have fully transitioned the radio unit deliveries to ERS by the end of 2018.
FULL-YEAR COMMENTS
Net sales
Sales as reported decreased by-9%. Networks sales declined in all market areas except for North America, where sales grew slightly. The decrease was mainly due to lower operator investments in mobile broadband, both products and services. In addition, the IPR licensing business declined to SEK 6.5 (8.2) b.
Gross margin
Gross margin decreased to 32% (33%), mainly due to provisions and customer project adjustments made in the year. Higher amortization than capitalization of development expenses and higher recognition than deferral of hardware costs, together amounting to SEK-1.5 (0.2) b., also had a negative impact on gross margin. This is a consequence of technology and portfolio shifts. Gross margin was positively impacted by higher hardware margins.
Operating income
Operating income decreased to SEK 7.6 (17.6) b. due to lower sales with lower IPR licensing revenues, provisions and customer project adjustments, write-down of assets made in the year as well as increased operating expenses. The higher operating expenses are mainly due to the strategic decision to increase investments in R&D. Higher amortization than capitalization of development expenses and higher recognition than deferral of hardware costs together amounted to SEK-1.5 (1.0) b. Restructuring charges were SEK-4.8(-3.4) b.
9 Ericsson | Fourth Quarter and Full-Year Report 2017
Table of Contents
DIGITAL SERVICES
REPORTED SEK b. | Q4 2017 | Q4 2016 | YoY change | Q3 2017 | QoQ change | Full-year 2017 | Full-year 2016 | |||||||||||||||||||||
Net sales | 12.9 | 14.1 | -9 | % | 9.3 | 38 | % | 41.0 | 45.3 | |||||||||||||||||||
Of which products | 6.8 | 7.3 | -7 | % | 5.1 | 33 | % | 21.7 | 24.5 | |||||||||||||||||||
Of which IPR licensing revenues | 0.4 | 0.4 | 1 | % | 0.3 | 6 | % | 1.4 | 1.8 | |||||||||||||||||||
Of which services | 6.1 | 6.8 | -10 | % | 4.3 | 44 | % | 19.2 | 20.8 | |||||||||||||||||||
Gross income | 1.0 | 4.6 | -79 | % | 2.5 | -61 | % | 4.4 | 16.1 | |||||||||||||||||||
Gross margin (%) | 7.5 | % | 32.4 | % | — | 26.5 | % | — | 10.6 | % | 35.5 | % | ||||||||||||||||
Operating income | -12.4 | -2.0 | — | -3.9 | 216 | % | -27.7 | -6.7 | ||||||||||||||||||||
Operating margin (%) | -96.7 | % | -14.4 | % | — | -42.1 | % | — | -67.5 | % | -14.7 | % | ||||||||||||||||
Restructuring charges | -0.7 | -1.8 | -63 | % | -1.1 | -38 | % | -2.5 | -3.2 | |||||||||||||||||||
FOURTH QUARTER COMMENTS
Net sales
Sales as reported declined by-9% YoY. Due to the ongoing technology shift in the portfolio, sales of legacy portfolio products and related services continued to decline, primarily in OSS, BSS and Packet Core.
Sales increased by 38% QoQ, driven primarily by growth in the new product portfolio and strong seasonal sales in services and software.
Gross margin
Reported gross margin declined YoY, mainly due to provisions and customer project adjustments, amounting to SEK-1.6 b. in total. In addition, the margin was negatively impacted by increased services costs in ongoing large transformation projects and by reduced sales of legacy products including related services.
Reported gross margin declined QoQ, mainly due to provisions and customer project adjustments. In addition, increased restructuring charges of SEK-0.6 b., compared with SEK-0.2 b. in Q3 2017, and lower software margins had a negative impact.
Operating income
Reported operating income declined YoY, mainly due to write-down of assets as well as provisions and customer project adjustments, together amounting to SEK-9.1 b. In addition, reduced gross margin and lower sales had a negative impact. The decline was partly offset by reduced restructuring charges of SEK-0.7(-1.8) b. Higher amortized than capitalized development expenses had a negative impact of SEK-0.7 (0.4) b. YoY.
Reported operating income declined QoQ, mainly due to write-down of assets as well as provisions and customer project adjustments, together amounting to SEK-9.1 b. in Q4 2017. The decline was partly offset by increased sales and reduced restructuring charges.
10 Ericsson | Fourth Quarter and Full-Year Report 2017
Table of Contents
IMPACT FROM AMORTIZATION AND CAPITALIZATION OF DEVELOPMENT EXPENSES
SEK b. | Q4 2017 | Q4 2016 | Q3 2017 | FY 2017 | FY 2016 | |||||||||||||||
Cost of Sales | -0.3 | -0.2 | -0.3 | -1.1 | -0.7 | |||||||||||||||
R&D expenses | -0.5 | 0.6 | -0.4 | -0.2 | 2.7 | |||||||||||||||
|
|
|
|
|
|
|
|
|
| |||||||||||
Total impact | -0.7 | 0.4 | -0.7 | -1.3 | 2.1 | |||||||||||||||
|
|
|
|
|
|
|
|
|
| |||||||||||
Strategy execution
Focus for Digital Services is stability, profitability and growth, in that order. Stability in product roadmaps has improved during the year and several new products were delivered in Q4 2017, as planned.
As presented at the 2017 Capital Markets Day, the ambition for Digital Services is to improve the operating margin to positive low single digits in 2020. A key activity for profitability turnaround is to manage and complete 34 identified critical multi-year customer contracts and to either exit or complete 11 identifiednon-strategic contracts. These 45 contracts had a significant impact on reported results in 2017. During the year, the governance of contracts has been strengthened and in Q4 2017 two of the 45 contracts were finalized (either completed or exited). A number of contracts are multi-year commitments with strategically important customers. However, the plan is to finalize approximately half of the contracts in 2018.
Sales of the new product portfolio declined by-3% YoY, negatively impacted by currency effects. New product sales grew by 59% QoQ, driven by seasonality and new product introductions. Full-year sales in the new product portfolio declined by-4%.
FULL-YEAR COMMENTS
Net sales
Sales as reported decreased by-10% YoY, due to lower sales of legacy products and related services, primarily in OSS, BSS and Packet Core.
IPR and licensing revenues were SEK 1.4 (1.8) b.
Gross margin
Gross margin declined, mainly due to write-down of assets as well as provisions and customer project adjustments. In addition, there was a negative impact from higher costs in ongoing large transformation projects and from reduced sales of legacy products including related services.
Operating income
Operating income declined, mainly due to write-down of assets as well as provisions and customer project adjustments. In addition, operating income was negatively impacted by lower gross margin and lower sales.
The full-year negative impact of higher amortized than capitalized development expenses was SEK-1.3 (2.1) b. This was partly offset by cost reductions, impacting both R&D and selling and administrative expenses.
11 Ericsson | Fourth Quarter and Full-Year Report 2017
Table of Contents
MANAGED SERVICES
REPORTED SEK b. | Q4 2017 | Q4 2016 | YoY change | Q3 2017 | QoQ change | Full-year 2017 | Full-year 2016 | |||||||||||||||||||||
Net sales | 6.2 | 6.7 | -7 | % | 6.1 | 1 | % | 24.5 | 27.5 | |||||||||||||||||||
Gross income | -0.7 | -0.1 | — | -0.5 | 64 | % | -1.8 | 1.1 | ||||||||||||||||||||
Gross margin (%) | -12.1 | % | -1.0 | % | — | -7.4 | % | — | -7.4 | % | 3.9 | % | ||||||||||||||||
Operating income | -1.3 | -0.5 | 165 | % | -0.8 | 60 | % | -4.3 | -0.5 | |||||||||||||||||||
Operating margin (%) | -21.1 | % | -7.4 | % | — | -13.2 | % | — | -17.4 | % | -1.8 | % | ||||||||||||||||
Restructuring charges | -0.4 | -0.2 | 53 | % | -0.1 | — | -0.7 | -0.4 | ||||||||||||||||||||
FOURTH QUARTER COMMENTS
Net sales
Sales as reported declined by-7% YoY, as a consequence of contract reviews and reduced variable sales in certain large Managed Services Networks contracts. Sales in Managed Services IT showed good growth.
Sales as reported increased by 1% QoQ. Good growth in Managed Services IT and Network Design & Optimization more than offset a decline in Managed Services Networks.
Gross margin
Reported gross margin declined to-12.1%(-1.0%) YoY, mainly due to write-down of assets of SEK-0.3 b. and increased restructuring charges of SEK-0.3(-0.2) b. Sequentially, gross margin decreased from-7.4%.
Operating income
Reported operating income declined to SEK-1.3(-0.5) b. YoY, due to lower gross margin, lower sales and increased operating expenses. Provisions and customer project adjustments of SEK-0.3 b. and write-down of assets of SEK-0.3 b. were made in the quarter. Restructuring charges were SEK-0.4(-0.2) b.
Sequentially, reported operating income declined from SEK-0.8 b., mainly due to increased restructuring charges and increased operating expenses. However, temporary costs created significantly higher operating expenses than normal seasonality in Q4.
Strategy execution
As part of the focused business strategy, Managed Services has its full attention on turning the business around from the negative result in 2016, addressinglow-performing operations andnon-strategic contracts.
As presented at the 2017 Capital Markets Day, the ambition for Managed Services is to improve the operating margin to4%-6% in 2020 from the Q4 2017 level of-5%. In order to focus the business and improve profitability, 42 managed services contracts (out of >300) have been identified for exit, renegotiation or transformation. During 2017, 23 of the 42 contracts have been completed, resulting in an annualized profit improvement of approximately SEK 0.5 b. going forward.
12 Ericsson | Fourth Quarter and Full-Year Report 2017
Table of Contents
FULL-YEAR COMMENTS
Net sales
Sales as reported decreased by-11% YoY, mainly a result of the earlier communicated rescoped Managed Services Networks contract in North America. In addition, sales were negatively impacted by completion of 23 contracts, out of the 42 identified to be exited, renegotiated or transformed. Sales in Managed Services IT showed good growth.
Gross margin
Gross margin was negatively affected by provisions and customer project adjustments as well as an asset write-down made in the year. In addition, gross margin was negatively impacted by lower sales and negative development in contracts identified to be exited, renegotiated or transformed.
Operating income
Operating income decreased to SEK-4.3 b.(-0.5 b.) due to lower sales, reduced gross margin and increased operating expenses. Restructuring charges amounted to SEK-0.7 b.(-0.4 b.).
13 Ericsson | Fourth Quarter and Full-Year Report 2017
Table of Contents
OTHER (INCLUDES MEDIA SOLUTIONS, RED BEE MEDIA, ICONECTIV AND EMERGING BUSINESS)
REPORTED SEK b. | Q4 2017 | Q4 2016 | YoY change | Q3 2017 | QoQ change | Full-year 2017 | Full-year 2016 | |||||||||||||||||||||
Net sales | 2.0 | 2.4 | -18 | % | 2.0 | -3 | % | 7.9 | 8.8 | |||||||||||||||||||
Gross income | 0.3 | 0.3 | -13 | % | 0.4 | -21 | % | 1.4 | 2.1 | |||||||||||||||||||
Gross margin (%) | 14.4 | % | 13.6 | % | — | 17.6 | % | — | 17.5 | % | 24.1 | % | ||||||||||||||||
Operating income | -7.6 | -1.2 | — | -1.5 | — | -13.8 | -4.1 | |||||||||||||||||||||
Operating margin (%) | — | -50.3 | % | — | -75.9 | % | — | -176 | % | -46.5 | % | |||||||||||||||||
Restructuring charges | -0.1 | -0.4 | -75 | % | -0.2 | -50 | % | -0.5 | -0.6 | |||||||||||||||||||
FOURTH QUARTER COMMENTS
Net sales
Sales as reported declined by-18% YoY, with a continued sales decline in legacy products in Media Solutions. The decline was partly offset by growth in Emerging Business, where particularly IoT platforms showed strong growth YoY. The iconectiv business continued to show sales growth while Red Bee Media (Broadcast and Media Services) sales were stable.
Sales as reported declined by-3% QoQ, due to lower sales in Emerging Business. There is good traction for the Unified Delivery Network (UDN) solution, with a strong pipeline of new customers. In IoT, there is strong customer interest in the Device Connectivity Platform where sales can be volatile between quarters, depending on timing of customer deployment activities.
Gross margin
Reported gross margin increased slightly YoY. Write-down of assets related to Red Bee Media of SEK-0.3 b. was more than offset by a higher share of software sales in Media Solutions, reduced costs in both Media Solutions and Red Bee Media and by lower restructuring charges.
Reported gross margin declined QoQ, due to the write-down of assets in Red Bee Media. The decline was partly offset by improved gross margin in Media Solutions, driven by reduced costs and a higher share of software sales.
Operating income
Reported operating income declined YoY, due to SEK-6.8 b. in write-down of assets. Restructuring charges were SEK-0.1(-0.4) b. Effects of improved gross margin were offset by lower sales and increased operating expenses. Due to technology changes, there was a negative impact of higher amortized than capitalized development expenses of SEK-0.1 (0.2) b. YoY.
IMPACT FROM AMORTIZATION AND CAPITALIZATION OF DEVELOPMENT EXPENSES
SEK b. | Q4 2017 | Q4 2016 | Q3 2017 | FY 2017 | FY 2016 | |||||||||||||||
Cost of Sales | 0.0 | 0.0 | 0.0 | 0.0 | 0.0 | |||||||||||||||
R&D expenses | -0.1 | 0.2 | -0.1 | -0.1 | 0.7 | |||||||||||||||
|
|
|
|
|
|
|
|
|
| |||||||||||
Total impact | -0.1 | 0.2 | -0.1 | -0.1 | 0.7 | |||||||||||||||
|
|
|
|
|
|
|
|
|
| |||||||||||
Reported operating income declined QoQ, due to SEK-6.8 b. in write-down of assets, mainly goodwill.
14 Ericsson | Fourth Quarter and Full-Year Report 2017
Table of Contents
Strategy execution
A profit improvement program for the Media Solutions portfolio has been carried out during the year, while at the same time investments have been made in the product offering. Together, this has significantly improved operating performance, thereby also improving the strategic flexibility. The outcome of the strategic review is to partner with One Equity Partners (OEP) to further develop the Media Solutions business through retaining a 49% ownership stake. This allows Ericsson to capture the upside of the business while at the same time taking active part in the expected consolidation of the industry.
In addition, the company has decided to keep Red Bee Media (former Broadcast and Media Services) as the bids received did not reflect the value of the business. Red Bee Media will be further developed as an independent entity within Ericsson, building on the improved operations.
FULL-YEAR COMMENTS
Net sales
Sales as reported decreased by-11% YoY, due to lower sales in Media Solutions, where sales of legacy products and related services declined. Red Bee Media sales declined by-8% YoY, due to renegotiations and scope changes of contracts. The decline was partly offset by growth in Emerging Business and iconectiv.
Gross margin
Gross margin declined, mainly due to write-down of assets of SEK-0.4 b.
Operating income
Operating income declined, mainly due to write-down of assets of SEK-8.5 b. Operating income excluding asset write-downs declined, mainly due to increased investments in Emerging Business, higher amortized than capitalized development expenses of SEK-0.8 b. and lower sales. The decline was partly offset by cost reductions in both Media Solutions and Red Bee Media.
15 Ericsson | Fourth Quarter and Full-Year Report 2017
Table of Contents
CASH FLOW
SEK b. | Q4 2017 | Q4 2016 | Q3 2017 | Full year 2017 | Full year 2016 | |||||||||||||||
Net income reconciled to cash | -4.5 | 1.6 | -1.9 | -16.5 | 8.0 | |||||||||||||||
Changes in operating net assets | 15.6 | 17.9 | 1.9 | 26.1 | 6.0 | |||||||||||||||
Cash flow from operating activities | 11.2 | 19.4 | 0.0 | 9.6 | 14.0 | |||||||||||||||
Cash flow from investing activities | -3.8 | -6.6 | 3.3 | -16.1 | -8.3 | |||||||||||||||
Cash flow from financing activities | 2.1 | -1.0 | 1.4 | 5.5 | -11.7 | |||||||||||||||
Net change in cash and cash equivalents | 9.7 | 12.6 | 4.8 | -1.1 | -3.3 | |||||||||||||||
FOURTH QUARTER COMMENTS
Operating activities
Cash flow from operating activities was SEK 11.2 b., driven by good collection and reduction of inventories. Sale of trade receivables were significantly lower than the same period last year. Cash outlays related to restructuring charges were SEK-1.2(-0.8) b. in the quarter.
Investing activities
Cash flow from investing activities was SEK-3.8 b. Cash flow from investing activities was impacted by investments and sale of property, plant and equipment with a net effect of SEK-0.2 b. Cash flow from capitalized development expenses amounted to SEK-0.1 b. – a significant reduction from SEK-1.3 b. a year earlier. The company received payment for the divested ICT center in Montreal of SEK 0.9 b. in the quarter.
Financing activities
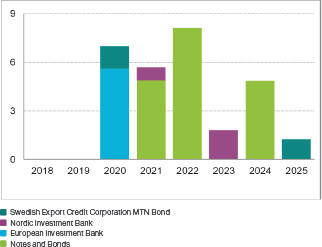
Cash flow from financing activities was positive at SEK 2.1 b., driven by increased borrowings. In the quarter, Ericsson raised credits of USD 220 million from the Nordic Investment Bank (NIB) and USD 150 million from the Swedish Export Credit Corporation (SEK) of which USD 98 million replaced a credit with the NIB, which was set to mature in 2019.
Working capital KPIs, number of days | Jan-Dec 2017 | Jan-Sep 2017 | Jan-Jun 2017 | Jan-Mar 2017 | Jan-Dec 2016 | |||||||||||||||
Sales outstanding (target: <90) | 101 | 112 | 114 | 117 | 95 | |||||||||||||||
Inventory (target: <65) | 64 | 77 | 78 | 73 | 69 | |||||||||||||||
Payable (target: >60) | 60 | 60 | 60 | 58 | 56 | |||||||||||||||
FULL-YEAR COMMENTS
Operating activities
Cash flow from operating activities was SEK 9.6 (14.0) b. The decline was due to lower income and increased cash outlays related to restructuring charges. The cash flow was supported by a reduction of operating assets through good collection and decreased inventory.
Cash outlays related to restructuring charges were SEK-5.3(-2.4) b. during the year.
Investing activities
Cash flow from investing activities was impacted by investments and sale of property, plant and equipment with a net effect of SEK-2.9(-5.6) b. In addition, product development decreased by SEK-1.4(-4.5) b., due to reduced capitalization of product platform development following technology shifts. The cash flow was supported by the sale of Power Modules and the ICT center in Montreal.
Financing activities
Cash flow from financing activities was positive at SEK 5.5(-11.7) b., due to increased net borrowings of SEK 8.6 b. Borrowings increased through issued Euro bonds as well as credits from Nordic Investment Bank (NIB) and the Swedish Export Credit Corporation (SEK). In addition, the company received a payment from Francisco Partners for a 16.7% ownership in Ericsson’s independent subsidiary iconectiv. Due to the structure of the investment, IFRS accounting standards stipulate that the main part of the USD 200 million should be treated as financing, i.e as borrowings and the corresponding cash flow as financing activities.
Dividends of SEK 3.4 (12.3) b. were paid out.
16 Ericsson | Fourth Quarter and Full-Year Report 2017
Table of Contents
FINANCIAL POSITION
SEK b. | Dec 31 2017 | Sep 30 2017 | Jun 30 2017 | Mar 31 2017 | Dec 31 2016 | |||||||||||||||
+ Cash and cash equivalents | 35.9 | 26.2 | 21.4 | 33.0 | 37.0 | |||||||||||||||
+ Interest-bearing securities, current | 6.7 | 6.5 | 10.8 | 13.5 | 13.3 | |||||||||||||||
+ Interest-bearing securities,non-current | 25.1 | 22.4 | 22.1 | 19.1 | 7.6 | |||||||||||||||
Gross cash | 67.7 | 55.1 | 54.3 | 65.6 | 57.9 | |||||||||||||||
– Borrowings, current | 2.5 | 3.0 | 3.2 | 9.5 | 8.0 | |||||||||||||||
– Borrowings,non-current | 30.5 | 28.0 | 27.1 | 27.8 | 18.7 | |||||||||||||||
Equity | 100.2 | 115.7 | 123.8 | 126.8 | 140.5 | |||||||||||||||
Total assets | 260.5 | 267.2 | 274.9 | 292.2 | 283.3 | |||||||||||||||
FOURTH QUARTER COMMENTS
Post-employments benefits were SEK 25.0 b. compared with SEK 26.5 b. on Sep 30, 2017. The decrease was mainly due to the update of all assumptions and, as a result, the duration of the liabilities decreased.
Ericsson raised credits of USD 220 million from the Nordic Investment Bank (NIB) and USD 150 million from the Swedish Export Credit Corporation (SEK) in the quarter. The credit agreements will mature in 2023 and 2025 respectively, and extend Ericsson’s debt maturity profile. Of these new funds, USD 98 million replaced a credit with NIB that was set to mature in 2019. In addition to strengthening Ericsson’s balance sheet and financial flexibility, these new funds support R&D activities in further developing 5G and other mobile innovations.
Debt maturity profile, Parent Company
SEK b.
FULL-YEAR COMMENTS
Post-employments benefits increased by SEK 1.3 b., due to decreased discount rates.
The average maturity of long-term borrowings as of Dec 31, 2017, was 4.4 years, compared with 3.8 years 12 months earlier.
Ericsson has an unutilized Revolving Credit Facility of USD 2.0 b. The facility will expire in 2022.
In 2017, Ericsson concluded the following financing activities to strengthen the balance sheet and extend the average debt maturity profile:
- In Q1, issue of one EUR 500 million4-year bond
- In Q1, issue of one EUR 500 million7-year bond
- In Q2, repayment of one EUR 500 million bond at maturity date.
- In Q3 the company received a USD 200 million payment relating to Francisco Partners’ investments for a 16.7% ownership in Ericsson’s independent subsidiary iconectiv. Due to the structure of the investment, IFRS accounting standards stipulate that the main part of the USD 200 million should be treated as borrowings,non-current.
- In Q4, Ericsson raised USD 220 million from the Nordic Investment Bank (NIB) and USD 150 million from the Swedish Export Credit Corporation (SEK). The credit agreements mature in 2023 and 2025 respectively. Of these new funds, USD 98 million replaced a credit with NIB that was set to mature in 2019.
17 Ericsson | Fourth Quarter and Full-Year Report 2017
Table of Contents
DIVIDEND, AGM
AND ANNUAL REPORT
Dividend proposal
The Board of Directors will propose to the Annual General Meeting to resolve on a dividend of SEK 1.00 (1.00) per share, representing some SEK 3.3 (3.3) b., and April 3, 2018, as the record date for payment of dividend. The dividend reflects this year’s earnings and balance sheet structure, as well as coming years’ business plans and expected economic development.
Ericsson Annual General Meeting
The Annual General Meeting of shareholders will be held on March 28, 2018, 15.00 (CET) at Kistamässan, Stockholm, Sweden.
Annual Report
The annual report will be made available on the Ericssonweb-site www.ericsson.com and at the Ericsson headquarters, Torshamnsgatan 21, Kista, Stockholm, Sweden, in the first week of March.
18 Ericsson | Fourth Quarter and Full-Year Report 2017
Table of Contents
OTHER INFORMATION
Changes to Ericsson’s Executive Team
On November 7, 2017, Ericsson’s Board of Directors appointed Fredrik Jejdling as Executive Vice President of Ericsson, effective November 7, 2017. This appointment is made in addition to his current role as Head of Business Area Networks and member of the Ericsson Executive Team. The company also announced that Jan Frykhammar and Magnus Mandersson, both Executive Vice Presidents and advisors to the CEO, would leave their roles as Executive Vice Presidents and the Ericsson Executive Team, effective November 7, 2017. Magnus Mandersson left the company atyear-end 2017 after leaving his position as chairman of Red Bee Media. Jan Frykhammar will leave the company at the end of Q1 2018.
Capital Markets Day 2017
On November 8, 2017, Ericsson held its Capital Markets Day, giving an overview of its focused business strategy and deep dives in execution in all business segments. Further, the presentations included updates on company strategy, progress in strategy execution and planning assumptions going forward.
Restated segment financials and impairment testing
On December 8, 2017, Ericsson announced the company’s new segment structure, to be effective in the financial reporting as of the fourth quarter 2017. To facilitateyear-on-year comparisons, restated financials for full-year 2015, each quarter of 2016 and the three first quarters of 2017 were to be disclosed. Following the restated financials, goodwillre-allocation and impairment testing would begin and be completed in the Q4 closing.
DISCLOSURE PURSUANT TO SECTION 219 OF THE IRAN THREAT REDUCTION AND SYRIA HUMAN RIGHTS ACT OF 2012 (ITRA)
During the fourth quarter of 2017, Ericsson made sales of communications infrastructure related products and services in Iran to Farabord Dadehavare Iranian, Mobile Communication Company of Iran, MTNIrancell and Hiweb, which generated gross revenues (reported as net sales) of approximately SEK 506 million.
Ericsson does not normally allocate quarterly net profit (reported as net income) on acountry-by-country oractivity-by-activity basis, other than as set forth in Ericsson’s consolidated financial statements prepared in accordance with IFRS as issued by the IASB. However, Ericsson has estimated that its operating income (income before taxes and financial net) from such sales, after internal cost allocation, during the fourth quarter of 2017 would be substantially lower than such gross revenues.
During the fourth quarter of 2017, Ericsson and Telecommunications Company of Iran (“TCI”) has had discussions relating to potential future sales by Ericsson of telecommunications infrastructure related products and services to TCI. During the fourth quarter of 2017, Maskan Bank, Post Bank of Iran and Tejarat Bank (local banks in Iran) issued bank guarantees to secure Iranian customers’ payment obligations to Ericsson.
19 Ericsson | Fourth Quarter and Full-Year Report 2017
Table of Contents
RISK FACTORS
Ericsson’s operational and financial risk factors and uncertainties are described in our Annual Report 2016.
Risk factors and uncertainties in focus short term for the Parent Company and the Ericsson Group include, but are not limited to:
| • | Potential negative effects on operators’ willingness to invest in network development due to uncertainty in the financial markets and a weak economic business environment, or reduced consumer telecom spending, or increased pressure on us to provide financing, or delayed auctions of spectrums |
| • | Uncertainty regarding the financial stability of suppliers, for example due to lack of financing |
| • | Effects on gross margins and/or working capital of the business mix in the Networks segment between capacity sales and new coverage build-outs |
| • | Effects on gross margins of the business mix in the Networks and Digital Serivces segments including new network build-outs and new managed services or digital transformation deals with initial transition costs |
| • | Effects of the ongoing industry consolidation among our customers as well as between our largest competitors, e.g. with postponed investments and intensified price competition as a consequence |
| • | New and ongoing partnerships which may not be successful and expose us to future costs |
| • | Changes in foreign exchange rates, in particular USD |
| • | Political unrest and uncertainty in certain markets |
| • | Effects on production and sales from restrictions with respect to timely and adequate supply of materials, components and production capacity and other vital services on competitive terms |
| • | No guarantees that strategy execution, specific restructuring or cost-savings initiatives, profitability restoring efforts and/or organizational changes will be sufficient, successful or executed in time to deliver any improvements in earnings |
| • | Cybersecurity incidents, which may have a material negative impact. |
Ericsson stringently monitors the compliance with all relevant trade regulations and trade embargoes applicable to dealings with customers operating in countries where there are trade restrictions or trade restrictions are discussed. Ericsson operates globally in accordance with Group policies and directives for business ethics and conduct and has a dedicated anti- corruption program. However, in some of the countries where the company operates, corruption risks can be high and compliance failure could have a material adverse impact on our business, financial condition and brand.
Stockholm, January 31, 2018
Telefonaktiebolaget LM Ericsson
Board of Directors
Date for next report: April 20, 2018
20 Ericsson | Fourth Quarter and Full-Year Report 2017
Table of Contents
AUDITORS’ REVIEW REPORT
Introduction
We have reviewed the condensed interim financial information (interim report) of Telefonaktiebolaget LM Ericsson (publ) as of December 31, 2017, and the twelve months period then ended. The board of directors and the CEO are responsible for the preparation and presentation of the interim financial report in accordance with IAS 34 and the Swedish Annual Accounts Act. Our responsibility is to express a conclusion on this interim report based on our review.
Scope of review
We conducted our review in accordance with the International Standard on Review Engagements ISRE 2410, Review of Interim Report Performed by the Independent Auditor of the Entity.
A review consists of making inquiries, primarily of persons responsible for financial and accounting matters, and applying analytical and other review procedures. A review is substantially less in scope than an audit conducted in accordance with International Standards on Auditing, ISA, and other generally accepted auditing standards in Sweden. The procedures performed in a review do not enable us to obtain assurance that we would become aware of all significant matters that might be identified in an audit. Accordingly, we do not express an audit opinion.
Conclusion
Based on our review, nothing has come to our attention that causes us to believe that the interim report is not prepared, in all material respects, in accordance with IAS 34 and the Swedish Annual Accounts Act, regarding the Group, and with the Swedish Annual Accounts Act, regarding the Parent Company.
Stockholm, January 31, 2018
PricewaterhouseCoopers AB
Bo Hjalmarsson
Authorized Public Accountant
Auditor in Charge
Johan Engstam
Authorized Public Accountant
21 Ericsson | Fourth Quarter and Full-Year Report 2017
Table of Contents
EDITOR’S NOTE
For further information, please contact:
Helena Norrman, Senior Vice President, Chief Marketing and Communications Officer
Phone: +46 10 719 34 72
E-mail: investor.relations@ericsson.com or
media.relations@ericsson.com
Telefonaktiebolaget LM Ericsson
Org. number: 556016-0680
Torshamnsgatan 21
SE-164 83 Stockholm
Phone: +46 10 719 00 00
| Investors | ||
| Peter Nyquist, Vice President, | ||
| Head of Investor Relations | ||
| Phone: | +46 10 714 64 49, +46 70 575 29 06 | |
| E-mail: | peter.nyquist@ericsson.com | |
| Stefan Jelvin, Director, | ||
| Investor Relations | ||
| Phone: | +46 10 714 20 39, +46 70 986 02 27 | |
| E-mail: | stefan.jelvin@ericsson.com | |
| Åsa Konnbjer, Director, | ||
| Investor Relations | ||
| Phone: | +46 10 713 39 28, +46 73 082 59 28 | |
| E-mail: | asa.konnbjer@ericsson.com | |
| Rikard Tunedal, Director, | ||
| Investor Relations | ||
| Phone: | +46 10 714 54 00, +46 761 005 400 | |
| E-mail: | rikard.tunedal@ericsson.com | |
| Media | ||
| Ola Rembe, Vice President, | ||
| Head of External Communications | ||
| Phone: | +46 10 719 97 27, +46 73 024 48 73 | |
| E-mail: | media.relations@ericsson.com | |
| Corporate Communications | ||
| Phone: | +46 10 719 69 92 | |
| E-mail: | media.relations@ericsson.com | |
22 Ericsson | Fourth Quarter and Full-Year Report 2017
Table of Contents
FORWARD-LOOKING STATEMENTS
This report includes forward-looking statements, including statements reflecting management’s current views relating to the growth of the market, future market conditions, future events, financial condition, and expected operational and financial performance, including, in particular the following:
| • | Our goals, strategies, planning assumptions and operational or financial performance expectations |
| • | Industry trends, future characteristics and development of the markets in which we operate |
| • | Our future liquidity, capital resources, capital expenditures, cost savings and profitability |
| • | The expected demand for our existing and new products and services as well as plans to launch new products and services including research and development expenditures |
| • | The ability to deliver on future plans and to realize potential for future growth |
| • | The expected operational or financial performance of strategic cooperation activities and joint ventures |
| • | The time until acquired entities and businesses will be integrated and accretive to income |
| • | Technology and industry trends including the regulatory and standardization environment in which we operate, competition and our customer structure. |
The words “believe,” “expect,” “foresee,” “anticipate,” “assume,” “intend,” “likely,” “projects,” “may,” “could,” “plan,” “estimate,” “forecast,” “will,” “should,” “would,” “predict,” “aim,” “ambition,” “seek,” “potential,” “target,” “might,” “continue,” or, in each case, their negative or variations, and similar words or expressions are used to identify forward-looking statements. Any statement that refers to expectations, projections or other characterizations of future events or circumstances, including any underlying assumptions, are forward-looking statements.
We caution investors that these statements are subject to risks and uncertainties many of which are difficult to predict and generally beyond our control that could cause actual results to differ materially from those expressed in, or implied or projected by, the forward-looking information and statements.
Important factors that could affect whether and to what extent any of our forward-looking statements materialize include but are not limited to the factors described in the section “Risk Factors”, and in “Risk Factors” in the Annual Report 2016.
These forward-looking statements also represent our estimates and assumptions only as of the date that they were made. We expressly disclaim a duty to provide updates to these forward-looking statements, and the estimates and assumptions associated with them, after the date of this report, to reflect events or changes in circumstances or changes in expectations or the occurrence of anticipated events, whether as a result of new information, future events or otherwise, except as required by applicable law or stock exchange regulation.
23 Ericsson | Fourth Quarter and Full-Year Report 2017
Table of Contents
FINANCIAL STATEMENTS AND
OTHER INFORMATION
Financial statements | ||||
| 25 | ||||
| 25 | ||||
| 26 | ||||
| 27 | ||||
| 28 | ||||
| 28 | ||||
| 29 | ||||
Additional information | ||||
| 30 | ||||
| 33 | ||||
| 34 | ||||
| 35 | ||||
| 36 | ||||
| 37 | ||||
| 37 | ||||
| 37 | ||||
| 38 | ||||
| 38 | ||||
| 39 | ||||
| 39 | ||||
24 Ericsson | Fourth Quarter and Full-Year Report 2017
Table of Contents
CONSOLIDATED INCOME STATEMENT
| Oct-Dec | Jan-Dec | |||||||||||||||||||||||
SEK million | 2017 | 2016 | Change | 2017 | 2016 | Change | ||||||||||||||||||
Net sales | 57,199 | 65,215 | -12 | % | 201,303 | 222,608 | -10 | % | ||||||||||||||||
Cost of sales | -45,160 | -48,195 | -6 | % | -156,758 | -156,243 | 0 | % | ||||||||||||||||
|
|
|
|
|
|
|
|
|
|
|
| |||||||||||||
Gross income | 12,039 | 17,020 | -29 | % | 44,545 | 66,365 | -33 | % | ||||||||||||||||
Gross margin (%) | 21.0 | % | 26.1 | % | 22.1 | % | 29.8 | % | ||||||||||||||||
Research and development expenses | -9,934 | -8,890 | 12 | % | -37,887 | -31,635 | 20 | % | ||||||||||||||||
Selling and administrative expenses | -8,929 | -8,799 | 1 | % | -32,676 | -28,866 | 13 | % | ||||||||||||||||
|
|
|
|
|
|
|
|
|
|
|
| |||||||||||||
Operating expenses | -18,863 | -17,689 | 7 | % | -70,563 | -60,501 | 17 | % | ||||||||||||||||
Other operating income and expenses | -12,927 | 1) | 364 | -12,132 | 1) | 404 | ||||||||||||||||||
Shares in earnings of JV and associated companies | -5 | 25 | 24 | 31 | ||||||||||||||||||||
|
|
|
|
|
|
|
|
|
|
|
| |||||||||||||
Operating income | -19,756 | -280 | -38,126 | 6,299 | ||||||||||||||||||||
Financial income | -122 | 61 | -361 | -115 | ||||||||||||||||||||
Financial expenses | -395 | -744 | -843 | -2,158 | ||||||||||||||||||||
|
|
|
|
|
|
|
|
|
|
|
| |||||||||||||
Income after financial items | -20,273 | -963 | -39,330 | 4,026 | ||||||||||||||||||||
Taxes | 1,409 | -634 | 4,267 | -2,131 | ||||||||||||||||||||
|
|
|
|
|
|
|
|
|
|
|
| |||||||||||||
Net income | -18,864 | -1,597 | -35,063 | 1,895 | ||||||||||||||||||||
|
|
|
|
|
|
|
|
|
|
|
| |||||||||||||
Net income attributable to: | ||||||||||||||||||||||||
Stockholders of the Parent Company | -18,847 | -1,604 | -35,206 | 1,716 | ||||||||||||||||||||
Non-controlling interests | -17 | 7 | 143 | 179 | ||||||||||||||||||||
Other information | ||||||||||||||||||||||||
Average number of shares, basic (million) | 3,283 | 3,268 | 3,277 | 3,263 | ||||||||||||||||||||
Earnings per share, basic (SEK)2) | -5.75 | -0.49 | -10.74 | 0.53 | ||||||||||||||||||||
Earnings per share, diluted (SEK)2) | -5.68 | -0.48 | -10.61 | 0.52 | ||||||||||||||||||||
| 1) | Includes write-down of goodwill of SEK-13.0 billion. |
| 2) | Based on Net income attributable to stockholders of the Parent Company. |
STATEMENT OF COMPREHENSIVE INCOME
| Oct-Dec | Jan-Dec | |||||||||||||||
SEK million | 2017 | 2016 | 2017 | 2016 | ||||||||||||
Net income | -18,864 | -1,597 | -35,063 | 1,895 | ||||||||||||
Other comprehensive income | ||||||||||||||||
Items that will not be reclassified to profit or loss | ||||||||||||||||
Remeasurements of defined benefits pension plans incl. asset ceiling | 2,616 | 8,024 | 970 | -1,766 | ||||||||||||
Tax on items that will not be reclassified to profit or loss | -764 | -1,886 | -547 | 520 | ||||||||||||
Items that may be reclassified to profit or loss | ||||||||||||||||
Available-for-sale financial assets | ||||||||||||||||
Gains/losses arising during the period | -10 | -7 | 68 | -7 | ||||||||||||
Reclassification adjustments on gains/losses included in profit or loss | 0 | — | 5 | — | ||||||||||||
Revaluation of other investments in shares and participations | ||||||||||||||||
Fair value remeasurement | 102 | 2 | 99 | -2 | ||||||||||||
Changes in cumulative translation adjustments | 1,144 | 1,867 | -3,378 | 4,235 | ||||||||||||
Share of other comprehensive income on JV and associated companies | 7 | -7 | 0 | -362 | ||||||||||||
Tax on items that may be reclassified to profit or loss | 1 | 1 | -16 | 1 | ||||||||||||
|
|
|
|
|
|
|
| |||||||||
Total other comprehensive income, net of tax | 3,096 | 7,994 | -2,799 | 2,619 | ||||||||||||
|
|
|
|
|
|
|
| |||||||||
Total comprehensive income | -15,768 | 6,397 | -37,862 | 4,514 | ||||||||||||
|
|
|
|
|
|
|
| |||||||||
Total comprehensive income attributable to: | ||||||||||||||||
Stockholders of the Parent Company | -15,790 | 6,406 | -37,987 | 4,285 | ||||||||||||
Non-controlling interest | 22 | -9 | 125 | 229 | ||||||||||||
25 Ericsson | Fourth Quarter and Full-Year Report 2017
Table of Contents
SEK million | Dec 31 2017 | Sep 30 2017 | Dec 31 2016 | |||||||||
ASSETS | ||||||||||||
Non-current assets | ||||||||||||
Intangible assets | ||||||||||||
Capitalized development expenses | 4,593 | 5,337 | 8,076 | |||||||||
Goodwill | 27,815 | 40,200 | 43,387 | |||||||||
Intellectual property rights, brands and other intangible assets | 4,148 | 4,776 | 7,747 | |||||||||
Property, plant and equipment | 12,857 | 13,884 | 16,734 | |||||||||
Financial assets | ||||||||||||
Equity in JV and associated companies | 624 | 627 | 775 | |||||||||
Other investments in shares and participations | 1,279 | 1,192 | 1,179 | |||||||||
Customer finance,non-current | 2,178 | 1,993 | 2,128 | |||||||||
Interest-bearing securities,non-current | 25,105 | 22,405 | 7,586 | |||||||||
Other financial assets,non-current | 5,897 | 5,063 | 4,442 | |||||||||
Deferred tax assets | 21,228 | 19,275 | 15,522 | |||||||||
|
|
|
|
|
| |||||||
| 105,724 | 114,752 | 107,576 | ||||||||||
Current assets | ||||||||||||
Inventories | 24,960 | 32,758 | 30,307 | |||||||||
Trade receivables | 63,210 | 59,802 | 68,117 | |||||||||
Customer finance, current | 1,753 | 1,961 | 2,625 | |||||||||
Other current receivables | 22,300 | 25,231 | 24,431 | |||||||||
Interest-bearing securities, current | 6,713 | 6,526 | 13,325 | |||||||||
Cash and cash equivalents | 35,884 | 26,210 | 36,966 | |||||||||
|
|
|
|
|
| |||||||
| 154,820 | 152,488 | 175,771 | ||||||||||
|
|
|
|
|
| |||||||
Total assets | 260,544 | 267,240 | 283,347 | |||||||||
|
|
|
|
|
| |||||||
EQUITY AND LIABILITIES | ||||||||||||
Equity | ||||||||||||
Stockholders’ equity | 99,540 | 115,072 | 139,817 | |||||||||
Non-controlling interest in equity of subsidiaries | 636 | 615 | 675 | |||||||||
|
|
|
|
|
| |||||||
| 100,176 | 115,687 | 140,492 | ||||||||||
Non–current liabilities | ||||||||||||
Post-employment benefits | 25,009 | 26,534 | 23,723 | |||||||||
Provisions,non-current | 3,596 | 3,930 | 946 | |||||||||
Deferred tax liabilities | 901 | 1,736 | 2,147 | |||||||||
Borrowings,non-current | 30,500 | 28,039 | 18,653 | |||||||||
Othernon-current liabilities | 2,776 | 2,563 | 2,621 | |||||||||
|
|
|
|
|
| |||||||
| 62,782 | 62,802 | 48,090 | ||||||||||
Current liabilities | ||||||||||||
Provisions, current | 6,350 | 5,646 | 5,411 | |||||||||
Borrowings, current | 2,545 | 3,004 | 8,033 | |||||||||
Trade payables | 26,321 | 23,560 | 25,318 | |||||||||
Other current liabilities | 62,370 | 56,541 | 56,003 | |||||||||
|
|
|
|
|
| |||||||
| 97,586 | 88,751 | 94,765 | ||||||||||
|
|
|
|
|
| |||||||
Total equity and liabilities | 260,544 | 267,240 | 283,347 | |||||||||
|
|
|
|
|
| |||||||
Of which interest-bearing liabilities | 33,045 | 31,043 | 26,686 | |||||||||
Assets pledged as collateral | 5,215 | 5,215 | 2,584 | |||||||||
Contingent liabilities | 1,561 | 1,547 | 1,186 | |||||||||
26 Ericsson | Fourth Quarter and Full-Year Report 2017
Table of Contents
CONSOLIDATED STATEMENT OF CASH FLOWS
| Oct-Dec | Jan-Dec | |||||||||||||||
SEK million | 2017 | 2016 | 2017 | 2016 | ||||||||||||
Operating activities | ||||||||||||||||
Net income | -18,864 | -1,597 | -35,063 | 1,895 | ||||||||||||
Adjustments to reconcile net income to cash | ||||||||||||||||
Taxes | -1,908 | -300 | -9,805 | -6,200 | ||||||||||||
Earnings/dividends in JV and associated companies | -2 | -21 | 56 | 58 | ||||||||||||
Depreciation, amortization and impairment losses | 16,118 | 2,610 | 27,892 | 9,119 | ||||||||||||
Other | 179 | 865 | 440 | 3,135 | ||||||||||||
|
|
|
|
|
|
|
| |||||||||
Net income reconciled to cash | -4,477 | 1,557 | -16,480 | 8,007 | ||||||||||||
Changes in operating net assets | ||||||||||||||||
Inventories | 8,144 | 4,286 | 3,995 | -613 | ||||||||||||
Customer finance, current andnon-current | 36 | -106 | 798 | -950 | ||||||||||||
Trade receivables | -2,591 | 3,713 | 1,380 | 5,933 | ||||||||||||
Trade payables | 2,565 | 3,306 | 2,413 | 2,775 | ||||||||||||
Provisions and post-employment benefits | 417 | 2,772 | 4,785 | 3,106 | ||||||||||||
Other operating assets and liabilities, net | 7,065 | 3,884 | 12,710 | -4,248 | ||||||||||||
|
|
|
|
|
|
|
| |||||||||
| 15,636 | 17,855 | 26,081 | 6,003 | |||||||||||||
Cash flow from operating activities | 11,159 | 19,412 | 9,601 | 14,010 | ||||||||||||
Investing activities | ||||||||||||||||
Investments in property, plant and equipment | -1,105 | -1,699 | -3,877 | -6,129 | ||||||||||||
Sales of property, plant and equipment | 898 | 277 | 1,016 | 482 | ||||||||||||
Acquisitions/divestments of subsidiaries and other operations, net | -107 | -50 | 276 | -622 | ||||||||||||
Product development | -138 | -1,291 | -1,444 | -4,483 | ||||||||||||
Other investing activities | -573 | -2,341 | -463 | -3,004 | ||||||||||||
Interest-bearing securities | -2,772 | -1,505 | -11,578 | 5,473 | ||||||||||||
|
|
|
|
|
|
|
| |||||||||
Cash flow from investing activities | -3,797 | -6,609 | -16,070 | -8,283 | ||||||||||||
Cash flow before financing activities | 7,362 | 12,803 | -6,469 | 5,727 | ||||||||||||
Financing activities | ||||||||||||||||
Dividends paid | -1 | — | -3,424 | -12,263 | ||||||||||||
Other financing activities | 2,073 | -1,039 | 8,902 | 521 | ||||||||||||
|
|
|
|
|
|
|
| |||||||||
Cash flow from financing activities | 2,072 | -1,039 | 5,478 | -11,742 | ||||||||||||
Effect of exchange rate changes on cash | 240 | 801 | -91 | 2,757 | ||||||||||||
|
|
|
|
|
|
|
| |||||||||
Net change in cash and cash equivalents | 9,674 | 12,565 | -1,082 | -3,258 | ||||||||||||
|
|
|
|
|
|
|
| |||||||||
Cash and cash equivalents, beginning of period | 26,210 | 24,401 | 36,966 | 40,224 | ||||||||||||
|
|
|
|
|
|
|
| |||||||||
Cash and cash equivalents, end of period | 35,884 | 36,966 | 35,884 | 36,966 | ||||||||||||
|
|
|
|
|
|
|
| |||||||||
27 Ericsson | Fourth Quarter and Full-Year Report 2017
Table of Contents
OF CHANGES IN EQUITY
| Jan-Dec | ||||||||
SEK million | 2017 | 2016 | ||||||
Opening balance | 140,492 | 147,366 | ||||||
Total comprehensive income | -37,862 | 4,514 | ||||||
Sale/repurchase of own shares | -5 | -216 | ||||||
Stock issue (net) | 15 | 131 | ||||||
Stock purchase plan | 885 | 957 | ||||||
Dividends paid | -3,424 | -12,263 | ||||||
Transactions withnon-controlling interests | 75 | 3 | ||||||
|
|
|
| |||||
Closing balance | 100,176 | 140,492 | ||||||
|
|
|
| |||||
- ISOLATED QUARTERS
| 2017 | 2016 | |||||||||||||||||||||||||||||||
Isolated quarters, SEK million | Q4 | Q3 | Q2 | Q1 | Q4 | Q3 | Q2 | Q1 | ||||||||||||||||||||||||
Net sales | 57,199 | 47,796 | 49,939 | 46,369 | 65,215 | 51,076 | 54,108 | 52,209 | ||||||||||||||||||||||||
Cost of sales | -45,160 | -35,661 | -36,006 | -39,931 | -48,195 | -36,616 | -36,613 | -34,819 | ||||||||||||||||||||||||
|
|
|
|
|
|
|
|
|
|
|
|
|
|
|
| |||||||||||||||||
Gross income | 12,039 | 12,135 | 13,933 | 6,438 | 17,020 | 14,460 | 17,495 | 17,390 | ||||||||||||||||||||||||
Gross margin (%) | 21.0 | % | 25.4 | % | 27,9 | % | 13.9 | % | 26.1 | % | 28.3 | % | 32.3 | % | 33.3 | % | ||||||||||||||||
Research and development expenses | -9,934 | -10,520 | -8,365 | -9,068 | -8,890 | -7,855 | -7,405 | -7,485 | ||||||||||||||||||||||||
Selling and administrative expenses | -8,929 | -6,834 | -7,052 | -9,861 | -8,799 | -6,238 | -7,109 | -6,720 | ||||||||||||||||||||||||
|
|
|
|
|
|
|
|
|
|
|
|
|
|
|
| |||||||||||||||||
Operating expenses | -18,863 | -17,354 | -15,417 | -18,929 | -17,689 | -14,093 | -14,514 | -14,205 | ||||||||||||||||||||||||
Other operating income and expenses | -12,927 | 1) | 415 | 239 | 141 | 364 | -3 | -230 | 273 | |||||||||||||||||||||||
Shares in earnings of JV and associated companies | -5 | 6 | 12 | 11 | 25 | -23 | 12 | 17 | ||||||||||||||||||||||||
|
|
|
|
|
|
|
|
|
|
|
|
|
|
|
| |||||||||||||||||
Operating income | -19,756 | -4,798 | -1,233 | -12,339 | -280 | 341 | 2,763 | 3,475 | ||||||||||||||||||||||||
Financial income | -122 | -135 | -22 | -82 | 61 | -226 | 139 | -89 | ||||||||||||||||||||||||
Financial expenses | -395 | -181 | 83 | -350 | -744 | -371 | -666 | -377 | ||||||||||||||||||||||||
|
|
|
|
|
|
|
|
|
|
|
|
|
|
|
| |||||||||||||||||
Income after financial items | -20,273 | -5,114 | -1,172 | -12,771 | -963 | -256 | 2,236 | 3,009 | ||||||||||||||||||||||||
Taxes | 1,409 | 766 | 176 | 1,916 | -634 | 76 | -670 | -903 | ||||||||||||||||||||||||
|
|
|
|
|
|
|
|
|
|
|
|
|
|
|
| |||||||||||||||||
Net income | -18,864 | -4,348 | -996 | -10,855 | -1,597 | -180 | 1,566 | 2,106 | ||||||||||||||||||||||||
|
|
|
|
|
|
|
|
|
|
|
|
|
|
|
| |||||||||||||||||
Net income attributable to: | ||||||||||||||||||||||||||||||||
Stockholders of the Parent Company | -18,847 | -4,452 | -1,010 | -10,897 | -1,604 | -233 | 1,587 | 1,966 | ||||||||||||||||||||||||
Non-controlling interests | -17 | 104 | 14 | 42 | 7 | 53 | -21 | 140 | ||||||||||||||||||||||||
Other information | ||||||||||||||||||||||||||||||||
Average number of shares, basic (million) | 3,283 | 3,279 | 3,275 | 3,272 | 3,268 | 3,264 | 3,261 | 3,258 | ||||||||||||||||||||||||
Earnings per share, basic (SEK)2) | -5.75 | -1.35 | -0.31 | -3.33 | -0.49 | -0.07 | 0.49 | 0.60 | ||||||||||||||||||||||||
Earnings per share, diluted (SEK)2) | -5.68 | -1.34 | -0.30 | -3.29 | -0.48 | -0.07 | 0.48 | 0.60 | ||||||||||||||||||||||||
| 1) | Includes write-down of goodwill of SEK-13.0 billion. |
| 2) | Based on Net income attributable to stockholders of the Parent Company. |
28 Ericsson | Fourth Quarter and Full-Year Report 2017
Table of Contents
OF CASH FLOWS – ISOLATED QUARTERS
| 2017 | 2016 | |||||||||||||||||||||||||||||||
Isolated quarters, SEK million | Q4 | Q3 | Q2 | Q1 | Q4 | Q3 | Q2 | Q1 | ||||||||||||||||||||||||
Operating activities | ||||||||||||||||||||||||||||||||
Net income | -18,864 | -4,348 | -996 | -10,855 | -1,597 | -180 | 1,566 | 2,106 | ||||||||||||||||||||||||
Adjustments to reconcile net income to cash | ||||||||||||||||||||||||||||||||
Taxes | -1,908 | -1,574 | -1,978 | -4,345 | -300 | -1,282 | -3,410 | -1,208 | ||||||||||||||||||||||||
Earnings/dividends in JV and associated companies | -2 | 73 | -8 | -7 | -21 | 22 | 73 | -16 | ||||||||||||||||||||||||
Depreciation, amortization and impairment losses | 16,118 | 4,146 | 2,197 | 5,431 | 2,610 | 2,308 | 2,104 | 2,097 | ||||||||||||||||||||||||
Other | 179 | -218 | -48 | 527 | 865 | 630 | 988 | 652 | ||||||||||||||||||||||||
|
|
|
|
|
|
|
|
|
|
|
|
|
|
|
| |||||||||||||||||
Net income reconciled to cash | -4,477 | -1,921 | -833 | -9,249 | 1,557 | 1,498 | 1,321 | 3,631 | ||||||||||||||||||||||||
Changes in operating net assets | ||||||||||||||||||||||||||||||||
Inventories | 8,144 | 582 | -1,146 | -3,585 | 4,286 | 980 | -1,667 | -4,212 | ||||||||||||||||||||||||
Customer finance, current andnon-current | 36 | 456 | 1,140 | -834 | -106 | 223 | -816 | -251 | ||||||||||||||||||||||||
Trade receivables | -2,591 | 1,124 | 450 | 2,397 | 3,713 | -624 | -564 | 3,408 | ||||||||||||||||||||||||
Trade payables | 2,565 | -819 | 41 | 626 | 3,306 | -2,371 | 2,457 | -617 | ||||||||||||||||||||||||
Provisions and post-employment benefits | 417 | -601 | 324 | 4,645 | 2,772 | 130 | 218 | -14 | ||||||||||||||||||||||||
Other operating assets and liabilities, net | 7,065 | 1,161 | 25 | 4,459 | 3,884 | -2,153 | -1,662 | -4,317 | ||||||||||||||||||||||||
|
|
|
|
|
|
|
|
|
|
|
|
|
|
|
| |||||||||||||||||
| 15,636 | 1,903 | 834 | 7,708 | 17,855 | -3,815 | -2,034 | -6,003 | |||||||||||||||||||||||||
Cash flow from operating activities | 11,159 | -18 | 1 | -1,541 | 19,412 | -2,317 | -713 | -2,372 | ||||||||||||||||||||||||
Investing activities | ||||||||||||||||||||||||||||||||
Investments in property, plant and equipment | -1,105 | -739 | -1,018 | -1,015 | -1,699 | -1,384 | -1,572 | -1,474 | ||||||||||||||||||||||||
Sales of property, plant and equipment | 898 | 12 | 37 | 69 | 277 | 111 | 50 | 44 | ||||||||||||||||||||||||
Acquisitions/divestments of subsidiaries and other operations, net | -107 | 371 | 9 | 3 | -50 | 16 | -480 | -108 | ||||||||||||||||||||||||
Product development | -138 | -126 | -315 | -865 | -1,291 | -885 | -1,099 | -1,208 | ||||||||||||||||||||||||
Other investing activities | -573 | 42 | -42 | 110 | -2,341 | -508 | -890 | 735 | ||||||||||||||||||||||||
Interest-bearing securities | -2,772 | 3,756 | -676 | -11,886 | -1,505 | 610 | 5,355 | 1,013 | ||||||||||||||||||||||||
|
|
|
|
|
|
|
|
|
|
|
|
|
|
|
| |||||||||||||||||
Cash flow from investing activities | -3,797 | 3,316 | -2,005 | -13,584 | -6,609 | -2,040 | 1,364 | -998 | ||||||||||||||||||||||||
Cash flow before financing activities | 7,362 | 3,298 | -2,004 | -15,125 | 12,803 | -4,357 | 651 | -3,370 | ||||||||||||||||||||||||
Financing activities | ||||||||||||||||||||||||||||||||
Dividends paid | -1 | -145 | -3,274 | -4 | — | -163 | -12,067 | -33 | ||||||||||||||||||||||||
Other financing activities | 2,073 | 1,563 | -5,636 | 10,902 | -1,039 | -1,295 | 2,761 | 94 | ||||||||||||||||||||||||
|
|
|
|
|
|
|
|
|
|
|
|
|
|
|
| |||||||||||||||||
Cash flow from financing activities | 2,072 | 1,418 | -8,910 | 10,898 | -1,039 | -1,458 | -9,306 | 61 | ||||||||||||||||||||||||
Effect of exchange rate changes on cash | 240 | 48 | -594 | 215 | 801 | 1,285 | 1,652 | -981 | ||||||||||||||||||||||||
|
|
|
|
|
|
|
|
|
|
|
|
|
|
|
| |||||||||||||||||
Net change in cash and cash equivalents | 9,674 | 4,764 | -11,508 | -4,012 | 12,565 | -4,530 | -7,003 | -4,290 | ||||||||||||||||||||||||
|
|
|
|
|
|
|
|
|
|
|
|
|
|
|
| |||||||||||||||||
Cash and cash equivalents, beginning of period | 26,210 | 21,446 | 32,954 | 36,966 | 24,401 | 28,931 | 35,934 | 40,224 | ||||||||||||||||||||||||
|
|
|
|
|
|
|
|
|
|
|
|
|
|
|
| |||||||||||||||||
Cash and cash equivalents, end of period | 35,884 | 26,210 | 21,446 | 32,954 | 36,966 | 24,401 | 28,931 | 35,934 | ||||||||||||||||||||||||
|
|
|
|
|
|
|
|
|
|
|
|
|
|
|
| |||||||||||||||||
29 Ericsson | Fourth Quarter and Full-Year Report 2017
Table of Contents
ADDITIONAL INFORMATION
THE GROUP
This interim report is prepared in accordance with IAS 34. The term “IFRS” used in this document refers to the application of IAS and IFRS as well as interpretations of these standards as issued by IASB’s Standards Interpretation Committee (SIC) and IFRS Interpretations Committee (IFRIC). The accounting policies adopted are consistent with those of the annual report for the year ended December 31, 2016, and should be read in conjunction with that annual report.
New or amended standards and interpretations applicable from January 1, 2017
There is no significant difference between IFRS effective as per December 31, 2017 and IFRS as endorsed by the EU.
None of the new or amended standards and interpretations that became effective January 1, 2017, have had a significant impact on the financial result or position of the Company.
Alternative Performance Measures (APM)
Free cash flow has been added as an Alternative Performance Measure (APM). Free cash flow represents the cash generated by operations less net capital expenditures and other investments. Free cash flow can be used to expand the business, pay dividends and reduce debt. Free cash flow is reconciled to IFRS measures, see APMs at the end of the report.
IFRS 15, REVENUE FROM CONTRACTS WITH CUSTOMERS, AND IFRS 9, FINANCIAL INSTRUMENTS
IFRS 15 “Revenue from Contracts with Customers” and IFRS 9 “Financial Instruments” are effective from January 1, 2018.
The following table illustrates the estimated impact of the implementation of IFRS 9 and IFRS 15 on Equity and other balance sheet items at the transition date of January 1, 2018. IFRS 15 will be applied on a full retrospective basis which means that the comparative financial statements will be restated. IFRS 9 will be applied at January 1, 2018 which means that the opening balances at January 1, 2018 will be adjusted, but the previous periods will not be restated.
ESTIMATED IMPACT OF IFRS 9 AND IFRS 15 ON
BALANCE SHEET ITEMS
SEK billion | As reported Dec 31, 2017 | IFRS 15 restatement | Restated balance Dec 31, 2017 | IFRS 9 adjustment | Adjusted balance Jan 1, 2018 | |||||||||||||||
Assets | ||||||||||||||||||||
Non-current assets | ||||||||||||||||||||
Deferred tax assets | 21.2 | 0.8 | 22.0 | 0.4 | 22.4 | |||||||||||||||
Current assets | ||||||||||||||||||||
Inventories | 25.0 | 0.7 | 25.7 | — | 25.7 | |||||||||||||||
Contract assets | — | 13.1 | 13.1 | — | 13.1 | |||||||||||||||
Trade receivables | 63.2 | -15.1 | 48.1 | -1.2 | 46.9 | |||||||||||||||
Equity and liabilities | ||||||||||||||||||||
Equity | 100.2 | -2.7 | 97.5 | -1.4 | 96.1 | |||||||||||||||
Non-current liabilities | ||||||||||||||||||||
Borrowings,non-current | 30.5 | — | 30.5 | 0.6 | 31.1 | |||||||||||||||
Current liabilities | ||||||||||||||||||||
Contract liabilities | — | 22.4 | 22.4 | — | 22.4 | |||||||||||||||
Other current liabilities | 54.5 | -20.2 | 34.3 | — | 34.3 | |||||||||||||||
30 Ericsson | Fourth Quarter and Full-Year Report 2017
Table of Contents
IFRS 15 - REVENUE FROM CONTRACTS WITH CUSTOMERS
IFRS 15 replaces guidance in IAS 18 and IAS 11. This standard establishes a new principle-based model of recognizing revenue from customer contracts. It introduces a five-step model that requires revenue to be recognized when control over goods and services are transferred to the customer. The Company will adopt the full retrospective method for transition which requires restatement of prior year comparatives and adjustment to equity in the earliest presented comparative period, i.e. January 1, 2016 (‘initial application date’). The Company has completed its assessment of the impact of IFRS 15 to its financial statements for all relevant comparative periods. Additional processes were implemented as part of the quantification exercise to accurately identify material transition impact, thus enabling it to be disclosed as part of the financial reporting process. The estimated impact of IFRS 15 is a net reduction to equity at transition date, January 1, 2018, of SEK 2.7 b. The main impacted areas are as follows:
Discount in a contract
The definition of a contract in IFRS 15 is stricter than standards effective prior to 2018 (previous standards) in that a contract exists only when enforceable rights and obligations are present. The majority of the Company’s business is conducted via frame agreements. Typically, a customer purchase order, together with a frame agreement, creates a firm enforceable commitment. The stricter definition of a contract affects how discounts are accounted for, as discounts shall be applied over the value and duration of a contract. Under the previous standards, the Company considers a broader interpretation of a contract from which it reasonably expects to derive benefit. For a business covered by frame agreement this may result in a longer timeframe for recognition of related discounts as future expected purchases are included in the assessment. The impact of IFRS 15 is that these discounts shall be recognized as a reduction in revenue earlier.
Customized solution contract
Under IFRS 15 revenue for customized solution contracts shall be recognized over time if certain criteria are met. These contracts relate to the construction of assets specifically customized for the customer and with no alternative use to the Company. IFRS 15 also requires the Company to have enforceable right to payment for performance completed to date. The Company recognized revenue under previous standards over the duration of these contracts based on defined delivery milestones. No significant changes are expected in the method of measuring progress of completion over the duration of the contract. However, the additional requirement under IFRS 15 will ensure that revenue is recognized for performance completed to date based on enforceable right to payment that exists at that point. The Company has identified ongoing contracts where revenue will be deferred as the performance completed to date is restricted under IFRS 15 to enforceable billing rights under the contracts.
Transfer of control for equipment
Under IFRS 15, revenue shall be recognized when control over the equipment is transferred to the customer at a point in time. This assessment shall be viewed from a customer’s perspective
considering indicators such as transfer of titles and risks, customer acceptance, physical possession, and billing rights. For hardware sale, transfer of control is usually deemed to occur when equipment arrives at the customer site and for software sale, when the licences are made available to the customer. Contractual terms may vary, therefore judgment will be applied when assessing the indicators of transfer of control. The accounting treatment under previous standards focused on a risk and reward assessment. The Company has identified contracts where the transfer of control under IFRS 15 differs from the previous risk and reward assessment. The resulting impact is a delay in revenue recognition on these contracts.
Presentation of contract related balances
The new requirement for classification and presentation of contract related balances under IFRS 15 will result in a separate presentation of the contract asset and contract liability balances. At transition date, contract asset balance, estimated to be SEK 13.1 b. will be presented separately within current assets. Under previous standards these balances have been included within trade receivables as the accounting policy for 2017 states that trade receivables include amounts where risks and rewards have been transferred to the customer but not yet invoiced. Under IFRS 15, these balances will be presented as contract assets as the Company concluded that they relate to contract assets that are conditional on something other than the passage of time. At transition date, contract liability balance, estimated to be SEK 22.4 b. will be presented separately within current liabilities. Under previous standards these balances have been disclosed as deferred revenue within other current liabilities, and the Company concluded that they meet the definition of contract liability under IFRS 15.
The Company has considered the key areas impacted above and implemented the significant changes to the accounting principles, internal processes and internal controls framework to reflect the new revenue recognition model from January 1, 2018. The Company expects to use a number of estimates and judgments in determining the amount and timing of revenue under IFRS 15, particularly when determining the transaction price and its allocation to performance obligations identified under the contract. Transaction price may consist of variable elements such as performance related prices and contract penalties that are estimated at the commencement of the contract (and periodically thereafter). Judgment is used in the estimation process based on historical experience with the type of business and customer.
IFRS 15 also requires revenue to be allocated to each performance obligations by reference to their standalone selling prices. The Company considers that an adjusted market assessment approach should be used to estimate stand-alone selling prices for its products and services for the purposes of allocating transaction price. As the Company will adopt the full retrospective method for IFRS 15 implementation, the impact on equity (at initial application date of January 1, 2016) and on income statement (for years 2016 and 2017) is presented in the tables below:
31 Ericsson | Fourth Quarter and Full-Year Report 2017
Table of Contents
IFRS 15 - ESTIMATED IMPACT ON EQUITY
SEK billion | As reported | Impact of IFRS 15 | Restated | |||||||||
Dec. 31, 2015 | 147.4 | -4.4 | 143.0 | |||||||||
Dec. 31, 2016 | 140.5 | -5.2 | 135.3 | |||||||||
IFRS 15 - ESTIMATED IMPACT ON INCOME
STATEMENT ITEMS
SEK billion | As reported | Impact of IFRS 15 | Restated | |||||||||
2017 | ||||||||||||
Net sales | 201.3 | 3.8 | 205.1 | |||||||||
Cost of sales | -156.8 | -0.6 | -157.3 | |||||||||
Gross income | 44.5 | 3.3 | 47.8 | |||||||||
Operating income | -38.1 | 3.3 | -34.9 | |||||||||
Taxes | 4.3 | -0.7 | 3.6 | |||||||||
Net income | -35.1 | 2.5 | -32.5 | |||||||||
2016 | ||||||||||||
Net sales | 222.6 | -2.3 | 220.3 | |||||||||
Cost of sales | -156.2 | 1.2 | -155.1 | |||||||||
Gross income | 66.4 | -1.1 | 65.2 | |||||||||
Operating income | 6.3 | -1.1 | 5.2 | |||||||||
Taxes | -2.1 | 0.2 | -1.9 | |||||||||
Net income | 1.9 | –0.9 | 1.0 | |||||||||
IFRS 9 - FINANCIAL INSTRUMENTS
The complete version of IFRS 9 replaces most of the guidance in IAS 39. IFRS 9 updates the classification, measurement and impairment of financial assets as well as provides new requirements for hedge accounting. The Company will apply IFRS 9 retrospectively on the required effective date, January 1, 2018, and will not restate comparative information. The transition to IFRS 9 is estimated to reduce equity by SEK 1.4 b. on January 1, 2018. The main impact from adopting IFRS 9 will be that impairment losses for trade receivables and contract assets will be calculated based on lifetime expected credit losses (ECL) instead of objective evidence that the Company will not be able to collect, as under the previous standards. This does not represent a change in expected cash flows collected by the Company. Rather, this represents a change in the timing of the recognition of losses, which in most cases is earlier under IFRS 9 compared to the previous standards. At transition, the loss allowance for trade receivables is estimated to increase by SEK 1.2 b. The other changes from implementing IFRS 9 are as follows:
Investments in liquid bonds with low credit risk which are not held for trading were classified asavailable-for-sale under the previous standards. These instruments are held in a portfolio managed on a fair value basis and will therefore be classified fair value through profit or loss (FVTPL). There will be no change in the valuation of these assets.
Trade receivables are managed in a business model whose objective is achieved through both collection of contractual cash flows and selling of assets. Therefore, trade receivables will be classified as fair value through other comprehensive income (FVOCI).
Customer finance assets are managed in a business model with the objective to realize cash flows through the sale of assets. Therefore, customer finance will be classified FVTPL. There will be no change in the carrying value of these assets at transition.
Investments in equity instruments, which were classifiedavailable-for-sale under previous standards, will be classified as FVTPL with no impact on carrying value.
Notes, bonds, and loans issued by the Parent Company are managed on a fair value basis and will therefore be designated as FVTPL with changes in fair value due to changes in credit risk realized in OCI. As a result, the carrying value of borrowings is estimated to increase by SEK 0.6 b. Fair value hedge accounting will not be applied to any borrowings as from 2018.
32 Ericsson | Fourth Quarter and Full-Year Report 2017
Table of Contents
NET SALES BY SEGMENT BY QUARTER*
| 2017 | 2016 | |||||||||||||||||||||||||||||||
Isolated quarters, SEK million | Q4 | Q3 | Q2 | Q1 | Q4 | Q3 | Q2 | Q1 | ||||||||||||||||||||||||
Networks | 36,185 | 30,300 | 31,685 | 29,796 | 42,078 | 31,047 | 34,108 | 33,751 | ||||||||||||||||||||||||
Of which Products | 24,569 | 20,248 | 21,316 | 20,004 | 28,219 | 19,812 | 23,501 | 23,325 | ||||||||||||||||||||||||
Of which Services | 11,616 | 10,052 | 10,369 | 9,792 | 13,859 | 11,235 | 10,607 | 10,426 | ||||||||||||||||||||||||
Digital Services | 12,865 | 9,329 | 10,007 | 8,780 | 14,079 | 11,032 | 10,794 | 9,393 | ||||||||||||||||||||||||
Of which Products | 6,753 | 5,074 | 5,476 | 4,446 | 7,289 | 6,102 | 5,691 | 5,438 | ||||||||||||||||||||||||
Of which Services | 6,112 | 4,255 | 4,531 | 4,334 | 6,790 | 4,930 | 5,103 | 3,955 | ||||||||||||||||||||||||
Managed Services | 6,185 | 6,138 | 6,192 | 5,979 | 6,662 | 6,862 | 7,015 | 6,962 | ||||||||||||||||||||||||
Other | 1,964 | 2,029 | 2,055 | 1,814 | 2,396 | 2,135 | 2,191 | 2,103 | ||||||||||||||||||||||||
|
|
|
|
|
|
|
|
|
|
|
|
|
|
|
| |||||||||||||||||
Total | 57,199 | 47,796 | 49,939 | 46,369 | 65,215 | 51,076 | 54,108 | 52,209 | ||||||||||||||||||||||||
|
|
|
|
|
|
|
|
|
|
|
|
|
|
|
| |||||||||||||||||
| 2017 | 2016 | |||||||||||||||||||||||||||||||
Sequential change, percent | Q4 | Q3 | Q2 | Q1 | Q4 | Q3 | Q2 | Q1 | ||||||||||||||||||||||||
Networks | 19 | % | -4 | % | 6 | % | -29 | % | 36 | % | -9 | % | 1 | % | — | |||||||||||||||||
Of which Products | 21 | % | -5 | % | 7 | % | -29 | % | 42 | % | -16 | % | 1 | % | — | |||||||||||||||||
Of which Services | 16 | % | -3 | % | 6 | % | -29 | % | 23 | % | 6 | % | 2 | % | — | |||||||||||||||||
Digital Services | 38 | % | -7 | % | 14 | % | -38 | % | 28 | % | 2 | % | 15 | % | — | |||||||||||||||||
Of which Products | 33 | % | -7 | % | 23 | % | -39 | % | 19 | % | 7 | % | 5 | % | — | |||||||||||||||||
Of which Services | 44 | % | -6 | % | 5 | % | -36 | % | 38 | % | -3 | % | 29 | % | — | |||||||||||||||||
Managed Services | 1 | % | -1 | % | 4 | % | -10 | % | -3 | % | -2 | % | 1 | % | — | |||||||||||||||||
Other | -3 | % | -1 | % | 13 | % | -24 | % | 12 | % | -3 | % | 4 | % | — | |||||||||||||||||
|
|
|
|
|
|
|
|
|
|
|
|
|
|
|
| |||||||||||||||||
Total | 20 | % | -4 | % | 8 | % | -29 | % | 28 | % | -6 | % | 4 | % | -29 | % | ||||||||||||||||
|
|
|
|
|
|
|
|
|
|
|
|
|
|
|
| |||||||||||||||||
| 2017 | 2016 | |||||||||||||||||||||||||||||||
Year over year change, percent | Q4 | Q3 | Q2 | Q1 | Q4 | Q3 | Q2 | Q1 | ||||||||||||||||||||||||
Networks | -14 | % | -2 | % | -7 | % | -12 | % | — | — | — | — | ||||||||||||||||||||
Of which Products | -13 | % | 2 | % | -9 | % | -14 | % | — | — | — | — | ||||||||||||||||||||
Of which Services | -16 | % | -11 | % | -2 | % | -6 | % | — | — | — | — | ||||||||||||||||||||
Digital Services | -9 | % | -15 | % | -7 | % | -7 | % | — | — | — | — | ||||||||||||||||||||
Of which Products | -7 | % | -17 | % | -4 | % | -18 | % | — | — | — | — | ||||||||||||||||||||
Of which Services | -10 | % | -14 | % | -11 | % | 10 | % | — | — | — | — | ||||||||||||||||||||
Managed Services | -7 | % | -11 | % | -12 | % | -14 | % | — | — | — | — | ||||||||||||||||||||
Other | -18 | % | -5 | % | -6 | % | -14 | % | — | — | — | — | ||||||||||||||||||||
|
|
|
|
|
|
|
|
|
|
|
|
|
|
|
| |||||||||||||||||
Total | -12 | % | -6 | % | -8 | % | -11 | % | -11 | % | -14 | % | -11 | % | -2 | % | ||||||||||||||||
|
|
|
|
|
|
|
|
|
|
|
|
|
|
|
| |||||||||||||||||
| 2017 | 2016 | |||||||||||||||||||||||||||||||
Year to date, SEK million | Jan-Dec | Jan-Sep | Jan-Jun | Jan-Mar | Jan-Dec | Jan-Sep | Jan-Jun | Jan-Mar | ||||||||||||||||||||||||
Networks | 127,966 | 91,781 | 61,481 | 29,796 | 140,984 | 98,906 | 67,859 | 33,751 | ||||||||||||||||||||||||
Of which Products | 86,137 | 61,568 | 41,320 | 20,004 | 94,857 | 66,638 | 46,826 | 23,325 | ||||||||||||||||||||||||
Of which Services | 41,829 | 30,213 | 20,161 | 9,792 | 46,127 | 32,268 | 21,033 | 10,426 | ||||||||||||||||||||||||
Digital Services | 40,981 | 28,116 | 18,787 | 8,780 | 45,298 | 31,219 | 20,187 | 9,393 | ||||||||||||||||||||||||
Of which Products | 21,749 | 14,996 | 9,922 | 4,446 | 24,520 | 17,231 | 11,129 | 5,438 | ||||||||||||||||||||||||
Of which Services | 19,232 | 13,120 | 8,865 | 4,334 | 20,778 | 13,988 | 9,058 | 3,955 | ||||||||||||||||||||||||
Managed Services | 24,494 | 18,309 | 12,171 | 5,979 | 27,501 | 20,839 | 13,977 | 6,962 | ||||||||||||||||||||||||
Other | 7,862 | 5,898 | 3,869 | 1,814 | 8,825 | 6,429 | 4,294 | 2,103 | ||||||||||||||||||||||||
|
|
|
|
|
|
|
|
|
|
|
|
|
|
|
| |||||||||||||||||
Total | 201,303 | 144,104 | 96,308 | 46,369 | 222,608 | 157,393 | 106,317 | 52,209 | ||||||||||||||||||||||||
|
|
|
|
|
|
|
|
|
|
|
|
|
|
|
| |||||||||||||||||
| 2017 | 2016 | |||||||||||||||||||||||||||||||
Year over year change, percent | Jan-Dec | Jan-Sep | Jan-Jun | Jan-Mar | Jan-Dec | Jan-Sep | Jan-Jun | Jan-Mar | ||||||||||||||||||||||||
Networks | -9 | % | -7 | % | -9 | % | -12 | % | -11 | % | — | — | — | |||||||||||||||||||
Of which Products | -9 | % | -8 | % | -12 | % | -14 | % | -13 | % | — | — | — | |||||||||||||||||||
Of which Services | -9 | % | -6 | % | -4 | % | -6 | % | -6 | % | — | — | — | |||||||||||||||||||
Digital Services | -10 | % | -10 | % | -7 | % | -7 | % | -8 | % | — | — | — | |||||||||||||||||||
Of which Products | -11 | % | -13 | % | -11 | % | -18 | % | -15 | % | — | — | — | |||||||||||||||||||
Of which Services | -7 | % | -6 | % | -2 | % | 10 | % | 2 | % | — | — | — | |||||||||||||||||||
Managed Services | -11 | % | -12 | % | -13 | % | -14 | % | -10 | % | — | — | — | |||||||||||||||||||
Other | -11 | % | -8 | % | -10 | % | -14 | % | -3 | % | — | — | — | |||||||||||||||||||
|
|
|
|
|
|
|
|
|
|
|
|
|
|
|
| |||||||||||||||||
Total | -10 | % | -8 | % | -9 | % | -11 | % | -10 | % | -9 | % | -7 | % | -2 | % | ||||||||||||||||
|
|
|
|
|
|
|
|
|
|
|
|
|
|
|
| |||||||||||||||||
| * | Net sales by segment has been restated for the first three quarters of 2017, each quarter of 2016 and for the full year 2015. Comparisons against isolated quarters in 2015 are not available by segment. Segment Other includes Emerging Business, iconectiv and Media. |
33 Ericsson | Fourth Quarter and Full-Year Report 2017
Table of Contents
GROSS INCOME AND GROSS MARGIN BY SEGMENT BY QUARTER
| 2017 | 2016 | |||||||||||||||||||||||||||||||
Isolated quarters, SEK million | Q4 | Q3 | Q2 | Q1 | Q4 | Q3 | Q2 | Q1 | ||||||||||||||||||||||||
Networks | 11,534 | 9,765 | 10,644 | 8,679 | 12,194 | 9,750 | 12,196 | 12,959 | ||||||||||||||||||||||||
Digital Services | 971 | 2,469 | 2,940 | -2,019 | 4,564 | 3,975 | 4,074 | 3,468 | ||||||||||||||||||||||||
Managed Services | -748 | -456 | -65 | -547 | -64 | 233 | 599 | 294 | ||||||||||||||||||||||||
Other | 282 | 357 | 414 | 325 | 326 | 502 | 626 | 669 | ||||||||||||||||||||||||
|
|
|
|
|
|
|
|
|
|
|
|
|
|
|
| |||||||||||||||||
Total | 12,039 | 12,135 | 13,933 | 6,438 | 17,020 | 14,460 | 17,495 | 17,390 | ||||||||||||||||||||||||
|
|
|
|
|
|
|
|
|
|
|
|
|
|
|
| |||||||||||||||||
| 2017 | 2016 | |||||||||||||||||||||||||||||||
Isolated quarters, As percentage of net sales | Q4 | Q3 | Q2 | Q1 | Q4 | Q3 | Q2 | Q1 | ||||||||||||||||||||||||
Networks | 31.9 | % | 32.2 | % | 33.6 | % | 29.1 | % | 29.0 | % | 31.4 | % | 35.8 | % | 38.4 | % | ||||||||||||||||
Digital Services | 7.5 | % | 26.5 | % | 29.4 | % | -23.0 | % | 32.4 | % | 36.0 | % | 37.7 | % | 36.9 | % | ||||||||||||||||
Managed Services | -12.1 | % | -7.4 | % | -1.0 | % | -9.1 | % | -1.0 | % | 3.4 | % | 8.5 | % | 4.2 | % | ||||||||||||||||
Other | 14.4 | % | 17.6 | % | 20.1 | % | 17.9 | % | 13.6 | % | 23.5 | % | 28.6 | % | 31.8 | % | ||||||||||||||||
|
|
|
|
|
|
|
|
|
|
|
|
|
|
|
| |||||||||||||||||
Total | 21.0 | % | 25.4 | % | 27.9 | % | 13.9 | % | 26.1 | % | 28.3 | % | 32.3 | % | 33.3 | % | ||||||||||||||||
|
|
|
|
|
|
|
|
|
|
|
|
|
|
|
| |||||||||||||||||
| 2017 | 2016 | |||||||||||||||||||||||||||||||
Year to date, SEK million | Jan-Dec | Jan-Sep | Jan-Jun | Jan-Mar | Jan-Dec | Jan-Sep | Jan-Jun | Jan-Mar | ||||||||||||||||||||||||
Networks | 40,622 | 29,088 | 19,323 | 8,679 | 47,099 | 34,905 | 25,155 | 12,959 | ||||||||||||||||||||||||
Digital Services | 4,361 | 3,390 | 921 | -2,019 | 16,081 | 11,517 | 7,542 | 3,468 | ||||||||||||||||||||||||
Managed Services | -1,816 | -1,068 | -612 | -547 | 1,062 | 1,126 | 893 | 294 | ||||||||||||||||||||||||
Other | 1,378 | 1,096 | 739 | 325 | 2,123 | 1,797 | 1,295 | 669 | ||||||||||||||||||||||||
|
|
|
|
|
|
|
|
|
|
|
|
|
|
|
| |||||||||||||||||
Total | 44,545 | 32,506 | 20,371 | 6,438 | 66,365 | 49,345 | 34,885 | 17,390 | ||||||||||||||||||||||||
|
|
|
|
|
|
|
|
|
|
|
|
|
|
|
| |||||||||||||||||
| 2017 | 2016 | |||||||||||||||||||||||||||||||
Year to date, As percentage of net sales | Jan-Dec | Jan-Sep | Jan-Jun | Jan-Mar | Jan-Dec | Jan-Sep | Jan-Jun | Jan-Mar | ||||||||||||||||||||||||
Networks | 31.7 | % | 31.7 | % | 31.4 | % | 29.1 | % | 33.4 | % | 35.3 | % | 37.1 | % | 38.4 | % | ||||||||||||||||
Digital Services | 10.6 | % | 12.1 | % | 4.9 | % | -23.0 | % | 35.5 | % | 36.9 | % | 37.4 | % | 36.9 | % | ||||||||||||||||
Managed Services | -7.4 | % | -5.8 | % | -5.0 | % | -9.1 | % | 3.9 | % | 5.4 | % | 6.4 | % | 4.2 | % | ||||||||||||||||
Other | 17.5 | % | 18.6 | % | 19.1 | % | 17.9 | % | 24.1 | % | 28.0 | % | 30.2 | % | 31.8 | % | ||||||||||||||||
|
|
|
|
|
|
|
|
|
|
|
|
|
|
|
| |||||||||||||||||
Total | 22.1 | % | 22.6 | % | 21.2 | % | 13.9 | % | 29.8 | % | 31.4 | % | 32.8 | % | 33.3 | % | ||||||||||||||||
|
|
|
|
|
|
|
|
|
|
|
|
|
|
|
| |||||||||||||||||
34 Ericsson | Fourth Quarter and Full-Year Report 2017
Table of Contents
OPERATING INCOME AND OPERATING MARGIN BY SEGMENT BY QUARTER
| Isolated quarters, | 2017 | 2016 | ||||||||||||||||||||||||||||||
SEK million | Q4 | Q3 | Q2 | Q1 | Q4 | Q3 | Q2 | Q1 | ||||||||||||||||||||||||
Networks | 1,627 | 1,485 | 3,173 | 1,359 | 3,447 | 3,136 | 4,908 | 6,079 | ||||||||||||||||||||||||
Digital Services | -12,440 | -3,931 | -2,590 | -8,711 | -2,029 | -1,479 | -1,416 | -1,739 | ||||||||||||||||||||||||
Managed Services | -1,302 | -813 | -337 | -1,822 | -492 | -177 | 182 | -20 | ||||||||||||||||||||||||
Other | -7,641 | -1,539 | -1,479 | -3,165 | -1,206 | -1,139 | -911 | -845 | ||||||||||||||||||||||||
|
|
|
|
|
|
|
|
|
|
|
|
|
|
|
| |||||||||||||||||
Total | -19,756 | -4,798 | -1,233 | -12,339 | -280 | 341 | 2,763 | 3,475 | ||||||||||||||||||||||||
|
|
|
|
|
|
|
|
|
|
|
|
|
|
|
| |||||||||||||||||
| Isolated quarters, | 2017 | 2016 | ||||||||||||||||||||||||||||||
As percentage of net sales | Q4 | Q3 | Q2 | Q1 | Q4 | Q3 | Q2 | Q1 | ||||||||||||||||||||||||
Networks | 4.5 | % | 4.9 | % | 10.0 | % | 4.6 | % | 8.2 | % | 10.1 | % | 14.4 | % | 18.0 | % | ||||||||||||||||
Digital Services | -96.7 | % | -42.1 | % | -25.9 | % | -99.2 | % | -14.4 | % | -13.4 | % | -13.1 | % | -18.5 | % | ||||||||||||||||
Managed Services | -21.1 | % | -13.2 | % | -5.4 | % | -30.5 | % | -7.4 | % | -2.6 | % | 2.6 | % | -0.3 | % | ||||||||||||||||
Other | -389.1 | % | -75.9 | % | -72.0 | % | -174.5 | % | -50.3 | % | -53.3 | % | -41.6 | % | -40.2 | % | ||||||||||||||||
|
|
|
|
|
|
|
|
|
|
|
|
|
|
|
| |||||||||||||||||
Total | -34.5 | % | -10.0 | % | -2.5 | % | -26.6 | % | -0.4 | % | 0.7 | % | 5.1 | % | 6.7 | % | ||||||||||||||||
|
|
|
|
|
|
|
|
|
|
|
|
|
|
|
| |||||||||||||||||
| Year to date, | 2017 | 2016 | ||||||||||||||||||||||||||||||
SEK million | Jan-Dec | Jan-Sep | Jan-Jun | Jan-Mar | Jan-Dec | Jan-Sep | Jan-Jun | Jan-Mar | ||||||||||||||||||||||||
Networks | 7,644 | 6,017 | 4,532 | 1,359 | 17,570 | 14,123 | 10,987 | 6,079 | ||||||||||||||||||||||||
Digital Services | -27,672 | -15,232 | -11,301 | -8,711 | -6,663 | -4,634 | -3,155 | -1,739 | ||||||||||||||||||||||||
Managed Services | -4,274 | -2,972 | -2,159 | -1,822 | -507 | -15 | 162 | -20 | ||||||||||||||||||||||||
Other | -13,824 | -6,183 | -4,644 | -3,165 | -4,101 | -2,895 | -1,756 | -845 | ||||||||||||||||||||||||
|
|
|
|
|
|
|
|
|
|
|
|
|
|
|
| |||||||||||||||||
Total | -38,126 | -18,370 | -13,572 | -12,339 | 6,299 | 6,579 | 6,238 | 3,475 | ||||||||||||||||||||||||
|
|
|
|
|
|
|
|
|
|
|
|
|
|
|
| |||||||||||||||||
| Year to date | 2017 | 2016 | ||||||||||||||||||||||||||||||
As percentage of net sales | Jan-Dec | Jan-Sep | Jan-Jun | Jan-Mar | Jan-Dec | Jan-Sep | Jan-Jun | Jan-Mar | ||||||||||||||||||||||||
Networks | 6.0 | % | 6.6 | % | 7.4 | % | 4.6 | % | 12.5 | % | 14.3 | % | 16.2 | % | 18.0 | % | ||||||||||||||||
Digital Services | -67.5 | % | -54.2 | % | -60.2 | % | -99.2 | % | -14.7 | % | -14.8 | % | -15.6 | % | -18.5 | % | ||||||||||||||||
Managed Services | -17.4 | % | -16.2 | % | -17.7 | % | -30.5 | % | -1.8 | % | -0.1 | % | 1.2 | % | -0.3 | % | ||||||||||||||||
Other | -175.8 | % | -104.8 | % | -120.0 | % | -174.5 | % | -46.5 | % | -45.0 | % | -40.9 | % | -40.2 | % | ||||||||||||||||
|
|
|
|
|
|
|
|
|
|
|
|
|
|
|
| |||||||||||||||||
Total | -18.9 | % | -12.7 | % | -14.1 | % | -26.6 | % | 2.8 | % | 4.2 | % | 5.9 | % | 6.7 | % | ||||||||||||||||
|
|
|
|
|
|
|
|
|
|
|
|
|
|
|
| |||||||||||||||||
35 Ericsson | Fourth Quarter and Full-Year Report 2017
Table of Contents
BY MARKET AREA BY QUARTER*
| 2017 | 2016 | |||||||||||||||||||||||||||||||
Isolated quarters, SEK million | Q4 | Q3 | Q2 | Q1 | Q4 | Q3 | Q2 | Q1 | ||||||||||||||||||||||||
South East Asia, Oceania and India | 7,634 | 7,391 | 7,608 | 7,935 | 9,607 | 7,548 | 7,620 | 7,822 | ||||||||||||||||||||||||
North East Asia | 6,664 | 5,517 | 5,811 | 5,514 | 9,566 | 6,079 | 6,006 | 5,534 | ||||||||||||||||||||||||
North America | 14,486 | 11,597 | 12,022 | 11,516 | 14,245 | 12,571 | 12,645 | 12,542 | ||||||||||||||||||||||||
Europe and Latin America1)2) | 16,545 | 13,334 | 14,381 | 11,915 | 18,020 | 14,209 | 16,152 | 14,162 | ||||||||||||||||||||||||
Middle East and Africa | 7,578 | 6,189 | 5,971 | 5,335 | 9,047 | 6,241 | 7,208 | 5,608 | ||||||||||||||||||||||||
Other1)2) | 4,292 | 3,768 | 4,146 | 4,154 | 4,730 | 4,428 | 4,477 | 6,541 | ||||||||||||||||||||||||
|
|
|
|
|
|
|
|
|
|
|
|
|
|
|
| |||||||||||||||||
Total | 57,199 | 47,796 | 49,939 | 46,369 | 65,215 | 51,076 | 54,108 | 52,209 | ||||||||||||||||||||||||
|
|
|
|
|
|
|
|
|
|
|
|
|
|
|
| |||||||||||||||||
1)Of which in Sweden | 795 | 568 | 701 | 925 | 843 | 690 | 477 | 1,113 | ||||||||||||||||||||||||
2)Of which in EU | 10,534 | 8,459 | 8,840 | 8,239 | 11,154 | 8,507 | 9,635 | 9,229 | ||||||||||||||||||||||||
| 2017 | 2016 | |||||||||||||||||||||||||||||||
Sequential change, percent | Q4 | Q3 | Q2 | Q1 | Q4 | Q3 | Q2 | Q1 | ||||||||||||||||||||||||
South East Asia, Oceania and India | 3 | % | -3 | % | -4 | % | -17 | % | 27 | % | -1 | % | -3 | % | — | |||||||||||||||||
North East Asia | 21 | % | -5 | % | 5 | % | -42 | % | 57 | % | 1 | % | 9 | % | — | |||||||||||||||||
North America | 25 | % | -4 | % | 4 | % | -19 | % | 13 | % | -1 | % | 1 | % | — | |||||||||||||||||
Europe and Latin America1)2) | 24 | % | -7 | % | 21 | % | -34 | % | 27 | % | -12 | % | 14 | % | — | |||||||||||||||||
Middle East and Africa | 22 | % | 4 | % | 12 | % | -41 | % | 45 | % | -13 | % | 29 | % | — | |||||||||||||||||
Other1)2) | 14 | % | -9 | % | 0 | % | -12 | % | 7 | % | -1 | % | -32 | % | — | |||||||||||||||||
|
|
|
|
|
|
|
|
|
|
|
|
|
|
|
| |||||||||||||||||
Total | 20 | % | -4 | % | 8 | % | -29 | % | 28 | % | -6 | % | 4 | % | -29 | % | ||||||||||||||||
|
|
|
|
|
|
|
|
|
|
|
|
|
|
|
| |||||||||||||||||
1)Of which in Sweden | 40 | % | -19 | % | -24 | % | 10 | % | 22 | % | 45 | % | -57 | % | 15 | % | ||||||||||||||||
2)Of which in EU | 25 | % | -4 | % | 7 | % | -26 | % | 31 | % | -12 | % | 4 | % | -27 | % | ||||||||||||||||
| 2017 | 2016 | |||||||||||||||||||||||||||||||
Year-over-year change, percent | Q4 | Q3 | Q2 | Q1 | Q4 | Q3 | Q2 | Q1 | ||||||||||||||||||||||||
South East Asia, Oceania and India | -21 | % | -2 | % | 0 | % | 1 | % | — | — | — | — | ||||||||||||||||||||
North East Asia | -30 | % | -9 | % | -3 | % | 0 | % | — | — | — | — | ||||||||||||||||||||
North America | 2 | % | -8 | % | -5 | % | -8 | % | — | — | — | — | ||||||||||||||||||||
Europe and Latin America1)2) | -8 | % | -6 | % | -11 | % | -16 | % | — | — | — | — | ||||||||||||||||||||
Middle East and Africa | -16 | % | -1 | % | -17 | % | -5 | % | — | — | — | — | ||||||||||||||||||||
Other1)2) | -9 | % | -15 | % | -7 | % | -36 | % | — | — | — | — | ||||||||||||||||||||
|
|
|
|
|
|
|
|
|
|
|
|
|
|
|
| |||||||||||||||||
Total | -12 | % | -6 | % | -8 | % | -11 | % | -11 | % | -14 | % | -11 | % | -2 | % | ||||||||||||||||
|
|
|
|
|
|
|
|
|
|
|
|
|
|
|
| |||||||||||||||||
1)Of which in Sweden | -6 | % | -18 | % | 47 | % | -17 | % | -13 | % | -39 | % | -20 | % | 2 | % | ||||||||||||||||
2)Of which in EU | -6 | % | -1 | % | -8 | % | -11 | % | -12 | % | -20 | % | -16 | % | -15 | % | ||||||||||||||||
| 2017 | 2016 | |||||||||||||||||||||||||||||||
Year to date, SEK million | Jan-Dec | Jan-Sep | Jan-Jun | Jan-Mar | Jan-Dec | Jan-Sep | Jan-Jun | Jan-Mar | ||||||||||||||||||||||||
South East Asia, Oceania and India | 30,568 | 22,934 | 15,543 | 7,935 | 32,597 | 22,990 | 15,442 | 7,822 | ||||||||||||||||||||||||
North East Asia | 23,506 | 16,842 | 11,325 | 5,514 | 27,185 | 17,619 | 11,540 | 5,534 | ||||||||||||||||||||||||
North America | 49,621 | 35,135 | 23,538 | 11,516 | 52,003 | 37,758 | 25,187 | 12,542 | ||||||||||||||||||||||||
Europe and Latin America1)2) | 56,175 | 39,630 | 26,296 | 11,915 | 62,543 | 44,523 | 30,314 | 14,162 | ||||||||||||||||||||||||
Middle East and Africa | 25,073 | 17,495 | 11,306 | 5,335 | 28,104 | 19,057 | 12,816 | 5,608 | ||||||||||||||||||||||||
Other1)2) | 16,360 | 12,068 | 8,300 | 4,154 | 20,176 | 15,446 | 11,018 | 6,541 | ||||||||||||||||||||||||
|
|
|
|
|
|
|
|
|
|
|
|
|
|
|
| |||||||||||||||||
Total | 201,303 | 144,104 | 96,308 | 46,369 | 222,608 | 157,393 | 106,317 | 52,209 | ||||||||||||||||||||||||
|
|
|
|
|
|
|
|
|
|
|
|
|
|
|
| |||||||||||||||||
1)Of which in Sweden | 2,989 | 2,194 | 1,626 | 925 | 3,123 | 2,280 | 1,590 | 1,113 | ||||||||||||||||||||||||
2)Of which in EU | 36,072 | 25,538 | 17,079 | 8,239 | 38,525 | 27,371 | 18,864 | 9,229 | ||||||||||||||||||||||||
| 2017 | 2016 | |||||||||||||||||||||||||||||||
Year to date, year-over-year change, percent | Jan-Dec | Jan-Sep | Jan-Jun | Jan-Mar | Jan-Dec | Jan-Sep | Jan-Jun | Jan-Mar | ||||||||||||||||||||||||
South East Asia, Oceania and India | -6 | % | 0 | % | 1 | % | 1 | % | 1 | % | — | — | — | |||||||||||||||||||
North East Asia | -14 | % | -4 | % | -2 | % | 0 | % | -3 | % | — | — | — | |||||||||||||||||||
North America | -5 | % | -7 | % | -7 | % | -8 | % | -6 | % | — | — | — | |||||||||||||||||||
Europe and Latin America1)2) | -10 | % | -11 | % | -13 | % | -16 | % | -15 | % | — | — | — | |||||||||||||||||||
Middle East and Africa | -11 | % | -8 | % | -12 | % | -5 | % | -15 | % | — | — | — | |||||||||||||||||||
Other1)2) | -19 | % | -22 | % | -25 | % | -36 | % | -19 | % | — | — | — | |||||||||||||||||||
|
|
|
|
|
|
|
|
|
|
|
|
|
|
|
| |||||||||||||||||
Total | -10 | % | -8 | % | -9 | % | -11 | % | -10 | % | -9 | % | -7 | % | -2 | % | ||||||||||||||||
|
|
|
|
|
|
|
|
|
|
|
|
|
|
|
| |||||||||||||||||
1)Of which in Sweden | -4 | % | -4 | % | 2 | % | -17 | % | -18 | % | -19 | % | -6 | % | 2 | % | ||||||||||||||||
2)Of which in EU | -6 | % | -7 | % | -9 | % | -11 | % | -15 | % | -17 | % | -16 | % | -15 | % | ||||||||||||||||
| * | Net sales by geographical area has been restated. Media and Emerging Business, previously reported per geographical area, are reported in Other. All changes have been applied retrospectively to ensure valid comparisons between periods. |
36 Ericsson | Fourth Quarter and Full-Year Report 2017
Table of Contents
| Country | Q4 | Jan-Dec | ||||||||||||||
Percentage of Net sales | 2017 | 2016 | 2017 | 2016 | ||||||||||||
United States | 26 | % | 23 | % | 26 | % | 25 | % | ||||||||
China | 7 | % | 9 | % | 7 | % | 9 | % | ||||||||
India | 4 | % | 5 | % | 5 | % | 5 | % | ||||||||
Japan | 4 | % | 4 | % | 4 | % | 3 | % | ||||||||
Australia | 3 | % | 3 | % | 4 | % | 3 | % | ||||||||
NET SALES BY MARKET AREA BY SEGMENT BY QUARTER
| Q4 2017 | Jan-Dec 2017 | |||||||||||||||||||||||||||||||||||||||
SEK million | Networks | Digital Services | Managed Services | Other | Total | Networks | Digital Services | Managed Services | Other | Total | ||||||||||||||||||||||||||||||
South East Asia, Oceania and India | 5,665 | 1,340 | 623 | 6 | 7,634 | 22,512 | 4,878 | 3,171 | 7 | 30,568 | ||||||||||||||||||||||||||||||
North East Asia | 4,435 | 1,716 | 510 | 3 | 6,664 | 16,000 | 5,717 | 1,776 | 13 | 23,506 | ||||||||||||||||||||||||||||||
North America | 11,716 | 2,045 | 687 | 38 | 14,486 | 38,769 | 7,492 | 3,253 | 107 | 49,621 | ||||||||||||||||||||||||||||||
Europe and Latin America | 8,389 | 4,619 | 3,460 | 77 | 16,545 | 29,211 | 14,100 | 12,599 | 265 | 56,175 | ||||||||||||||||||||||||||||||
Middle East and Africa | 4,139 | 2,623 | 905 | -89 | 7,578 | 14,033 | 7,305 | 3,695 | 40 | 25,073 | ||||||||||||||||||||||||||||||
Other | 1,841 | 522 | — | 1,929 | 4,292 | 7,441 | 1,489 | — | 7,430 | 16,360 | ||||||||||||||||||||||||||||||
|
|
|
|
|
|
|
|
|
|
|
|
|
|
|
|
|
|
|
| |||||||||||||||||||||
Total | 36,185 | 12,865 | 6,185 | 1,964 | 57,199 | 127,966 | 40,981 | 24,494 | 7,862 | 201,303 | ||||||||||||||||||||||||||||||
|
|
|
|
|
|
|
|
|
|
|
|
|
|
|
|
|
|
|
| |||||||||||||||||||||
Share of total | 63 | % | 23 | % | 11 | % | 3 | % | 100 | % | 64 | % | 20 | % | 12 | % | 4 | % | 100 | % | ||||||||||||||||||||
|
|
|
|
|
|
|
|
|
|
|
|
|
|
|
|
|
|
|
| |||||||||||||||||||||
| Q4 2017 | ||||||||||||||||||||
Sequential change, percent | Networks | Digital Services | Managed Services | Other | Total | |||||||||||||||
South East Asia, Oceania and India | 6 | % | 28 | % | -39 | % | — | 3 | % | |||||||||||
North East Asia | 21 | % | 20 | % | 19 | % | -57 | % | 21 | % | ||||||||||
North America | 29 | % | 19 | % | -12 | % | 46 | % | 25 | % | ||||||||||
Europe and Latin America | 20 | % | 45 | % | 15 | % | -37 | % | 24 | % | ||||||||||
Middle East and Africa | 18 | % | 54 | % | 0 | % | -262 | % | 22 | % | ||||||||||
Other | 7 | % | 120 | % | — | 6 | % | 14 | % | |||||||||||
|
|
|
|
|
|
|
|
|
| |||||||||||
Total | 19 | % | 38 | % | 1 | % | -3 | % | 20 | % | ||||||||||
|
|
|
|
|
|
|
|
|
| |||||||||||
| Q4 2017 | Jan-Dec 2017 | |||||||||||||||||||||||||||||||||||||||
Year over year change, percent | Networks | Digital Services | Managed Services | Other | Total | Networks | Digital Services | Managed Services | Other | Total | ||||||||||||||||||||||||||||||
South East Asia, Oceania and India | -25 | % | 2 | % | -17 | % | 500 | % | -21 | % | -9 | % | 9 | % | -5 | % | 17 | % | -6 | % | ||||||||||||||||||||
North East Asia | -34 | % | -28 | % | 2 | % | 50 | % | -30 | % | -14 | % | -20 | % | 18 | % | 44 | % | -14 | % | ||||||||||||||||||||
North America | 6 | % | -8 | % | -23 | % | 19 | % | 2 | % | 2 | % | -2 | % | -47 | % | 26 | % | -5 | % | ||||||||||||||||||||
Europe and Latin America | -8 | % | -15 | % | 2 | % | 75 | % | -8 | % | -13 | % | -13 | % | 0 | % | 89 | % | -10 | % | ||||||||||||||||||||
Middle East and Africa | -28 | % | 20 | % | -19 | % | -990 | % | -16 | % | -16 | % | -1 | % | -7 | % | -52 | % | -11 | % | ||||||||||||||||||||
Other | -2 | % | -3 | % | — | -16 | % | -9 | % | -20 | % | -37 | % | — | -13 | % | -19 | % | ||||||||||||||||||||||
|
|
|
|
|
|
|
|
|
|
|
|
|
|
|
|
|
|
|
| |||||||||||||||||||||
Total | -14 | % | -9 | % | -7 | % | -18 | % | -12 | % | -9 | % | -10 | % | -11 | % | -11 | % | -10 | % | ||||||||||||||||||||
|
|
|
|
|
|
|
|
|
|
|
|
|
|
|
|
|
|
|
| |||||||||||||||||||||
IPR LICENSING REVENUES BY SEGMENT BY QUARTER
| 2017 | 2016 | |||||||||||||||||||||||||||||||
Isolated quarters, SEK million | Q4 | Q3 | Q2 | Q1 | Q4 | Q3 | Q2 | Q1 | ||||||||||||||||||||||||
Networks | 1,668 | 1,564 | 1,601 | 1,649 | 1,653 | 1,649 | 1,768 | 3,141 | ||||||||||||||||||||||||
Digital Services | 366 | 344 | 351 | 362 | 363 | 363 | 388 | 689 | ||||||||||||||||||||||||
|
|
|
|
|
|
|
|
|
|
|
|
|
|
|
| |||||||||||||||||
Total | 2,034 | 1,908 | 1,952 | 2,011 | 2,016 | 2,012 | 2,156 | 3,830 | ||||||||||||||||||||||||
|
|
|
|
|
|
|
|
|
|
|
|
|
|
|
| |||||||||||||||||
| 2017 | 2016 | |||||||||||||||||||||||||||||||
Year to date, SEK million | Jan-Dec | Jan-Sep | Jan-Jun | Jan-Mar | Jan-Dec | Jan-Sep | Jan-Jun | Jan-Mar | ||||||||||||||||||||||||
Networks | 6,482 | 4,814 | 3,250 | 1,649 | 8,211 | 6,558 | 4,909 | 3,141 | ||||||||||||||||||||||||
Digital Services | 1,423 | 1,057 | 713 | 362 | 1,803 | 1,440 | 1,077 | 689 | ||||||||||||||||||||||||
|
|
|
|
|
|
|
|
|
|
|
|
|
|
|
| |||||||||||||||||
Total | 7,905 | 5,871 | 3,963 | 2,011 | 10,014 | 7,998 | 5,986 | 3,830 | ||||||||||||||||||||||||
|
|
|
|
|
|
|
|
|
|
|
|
|
|
|
| |||||||||||||||||
37 Ericsson | Fourth Quarter and Full-Year Report 2017
Table of Contents
| 2017 | 2016 | |||||||||||||||||||||||||||||||
Isolated quarters, SEK million | Q4 | Q3 | Q2 | Q1 | Q4 | Q3 | Q2 | Q1 | ||||||||||||||||||||||||
Opening balance | 9,576 | 10,412 | 10,560 | 6,357 | 3,245 | 3,387 | 3,532 | 3,838 | ||||||||||||||||||||||||
Additions | 2,769 | 1,942 | 1,403 | 6,365 | 4,349 | 666 | 839 | 492 | ||||||||||||||||||||||||
Utilization/Cash out | -2,186 | -2,626 | -1,324 | -2,085 | -976 | -716 | -794 | -667 | ||||||||||||||||||||||||
Of which restructuring | -1,204 | -1,461 | -1,075 | -1,586 | -785 | -529 | -639 | -487 | ||||||||||||||||||||||||
Reversal of excess amounts | -199 | -32 | -65 | -66 | -253 | -129 | -240 | -67 | ||||||||||||||||||||||||
Reclassification, translation difference and other | -14 | -120 | -162 | -11 | -8 | 37 | 50 | -64 | ||||||||||||||||||||||||
|
|
|
|
|
|
|
|
|
|
|
|
|
|
|
| |||||||||||||||||
Closing balance | 9,946 | 9,576 | 10,412 | 10,560 | 6,357 | 3,245 | 3,387 | 3,532 | ||||||||||||||||||||||||
|
|
|
|
|
|
|
|
|
|
|
|
|
|
|
| |||||||||||||||||
Of which restructuring | 4,043 | 3,458 | 4,003 | 4,059 | 4,163 | 1,190 | 1,173 | 1,237 | ||||||||||||||||||||||||
|
|
|
|
|
|
|
|
|
|
|
|
|
|
|
| |||||||||||||||||
| 2017 | 2016 | |||||||||||||||||||||||||||||||
Year to date, SEK million | Jan-Dec | Jan-Sep | Jan-Jun | Jan-Mar | Jan-Dec | Jan-Sep | Jan-Jun | Jan-Mar | ||||||||||||||||||||||||
Opening balance | 6,357 | 6,357 | 6,357 | 6,357 | 3,838 | 3,838 | 3,838 | 3,838 | ||||||||||||||||||||||||
Additions | 12,479 | 9,710 | 7,768 | 6,365 | 6,346 | 1,997 | 1,331 | 492 | ||||||||||||||||||||||||
Utilization/Cash out | -8,221 | -6,035 | -3,409 | -2,085 | -3,153 | -2,177 | -1,461 | -667 | ||||||||||||||||||||||||
Of which restructuring | -5,326 | -4,122 | -2,661 | -1,586 | -2,440 | -1,655 | -1,126 | -487 | ||||||||||||||||||||||||
Reversal of excess amounts | -362 | -163 | -131 | -66 | -689 | -436 | -307 | -67 | ||||||||||||||||||||||||
Reclassification, translation difference and other | -307 | -293 | -173 | -11 | 15 | 23 | -14 | -64 | ||||||||||||||||||||||||
|
|
|
|
|
|
|
|
|
|
|
|
|
|
|
| |||||||||||||||||
Closing balance | 9,946 | 9,576 | 10,412 | 10,560 | 6,357 | 3,245 | 3,387 | 3,532 | ||||||||||||||||||||||||
|
|
|
|
|
|
|
|
|
|
|
|
|
|
|
| |||||||||||||||||
Of which restructuring | 4,043 | 3,458 | 4,003 | 4,059 | 4,163 | 1,190 | 1,173 | 1,237 | ||||||||||||||||||||||||
|
|
|
|
|
|
|
|
|
|
|
|
|
|
|
| |||||||||||||||||
Investments in assets subject to depreciation, amortization, impairment and write-downs
| 2017 | 2016 | |||||||||||||||||||||||||||||||
Isolated quarters, SEK million | Q4 | Q3 | Q2 | Q1 | Q4 | Q3 | Q2 | Q1 | ||||||||||||||||||||||||
Additions | ||||||||||||||||||||||||||||||||
Property, plant and equipment | 1,105 | 739 | 1,018 | 1,015 | 1,699 | 1,384 | 1,572 | 1,474 | ||||||||||||||||||||||||
Capitalized development expenses1) | 138 | 126 | 315 | 865 | 1,291 | 885 | 1,099 | 1,208 | ||||||||||||||||||||||||
Goodwill, IPR, brands and other intangi ble assets | 315 | 1 | 19 | 1 | 0 | -4 | 13 | 5 | ||||||||||||||||||||||||
|
|
|
|
|
|
|
|
|
|
|
|
|
|
|
| |||||||||||||||||
Total | 1,558 | 866 | 1,352 | 1,881 | 2,990 | 2,265 | 2,684 | 2,687 | ||||||||||||||||||||||||
|
|
|
|
|
|
|
|
|
|
|
|
|
|
|
| |||||||||||||||||
Depreciation, amortization and impairment losses | ||||||||||||||||||||||||||||||||
Property, plant and equipment | 1,284 | 2,894 | 1,061 | 1,075 | 1,318 | 1,106 | 1,083 | 1,062 | ||||||||||||||||||||||||
Capitalized development expenses | 881 | 874 | 690 | 2,481 | 652 | 511 | 386 | 351 | ||||||||||||||||||||||||
Goodwill, IPR, brands and other intangi ble assets | 13,953 | 378 | 446 | 1,875 | 640 | 691 | 635 | 684 | ||||||||||||||||||||||||
|
|
|
|
|
|
|
|
|
|
|
|
|
|
|
| |||||||||||||||||
Total | 16,118 | 4,146 | 2,197 | 5,431 | 2,610 | 2,308 | 2,104 | 2,097 | ||||||||||||||||||||||||
|
|
|
|
|
|
|
|
|
|
|
|
|
|
|
| |||||||||||||||||
| 1) | Including reclassification |
| 2017 | 2016 | |||||||||||||||||||||||||||||||
Year to date, SEK million | Jan-Dec | Jan-Sep | Jan-Jun | Jan-Mar | Jan-Dec | Jan-Sep | Jan-Jun | Jan-Mar | ||||||||||||||||||||||||
Additions | ||||||||||||||||||||||||||||||||
Property, plant and equipment | 3,877 | 2,772 | 2,033 | 1,015 | 6,129 | 4,430 | 3,046 | 1,474 | ||||||||||||||||||||||||
Capitalized development expenses1) | 1,444 | 1,306 | 1,180 | 865 | 4,483 | 3,192 | 2,307 | 1,208 | ||||||||||||||||||||||||
Goodwill, IPR, brands and other intangi ble assets | 336 | 21 | 20 | 1 | 14 | 14 | 18 | 5 | ||||||||||||||||||||||||
|
|
|
|
|
|
|
|
|
|
|
|
|
|
|
| |||||||||||||||||
Total | 5,657 | 4,099 | 3,233 | 1,881 | 10,626 | 7,636 | 5,371 | 2,687 | ||||||||||||||||||||||||
|
|
|
|
|
|
|
|
|
|
|
|
|
|
|
| |||||||||||||||||
Depreciation, amortization and impairment losses | ||||||||||||||||||||||||||||||||
Property, plant and equipment | 6,314 | 5,030 | 2,136 | 1,075 | 4,569 | 3,251 | 2,145 | 1,062 | ||||||||||||||||||||||||
Capitalized development expenses | 4,926 | 4,045 | 3,171 | 2,481 | 1,900 | 1,248 | 737 | 351 | ||||||||||||||||||||||||
Goodwill, IPR, brands and other intangi ble assets | 16,652 | 2,699 | 2,321 | 1,875 | 2,650 | 2,010 | 1,319 | 684 | ||||||||||||||||||||||||
|
|
|
|
|
|
|
|
|
|
|
|
|
|
|
| |||||||||||||||||
Total | 27,892 | 11,774 | 7,628 | 5,431 | 9,119 | 6,509 | 4,201 | 2,097 | ||||||||||||||||||||||||
|
|
|
|
|
|
|
|
|
|
|
|
|
|
|
| |||||||||||||||||
| 1) | Including reclassification |
38 Ericsson | Fourth Quarter and Full-Year Report 2017
Table of Contents
| Oct-Dec | Jan-Dec | |||||||||||||||
SEK million | 2017 | 2016 | 2017 | 2016 | ||||||||||||
Number of shares and earnings per share | ||||||||||||||||
Number of shares, end of period (million) | 3,334 | 3,331 | 3,334 | 3,331 | ||||||||||||
Of which classA-shares (million) | 262 | 262 | 262 | 262 | ||||||||||||
Of which classB-shares (million) | 3,072 | 3,069 | 3,072 | 3,069 | ||||||||||||
Number of treasury shares, end of period (million) | 50 | 62 | 50 | 62 | ||||||||||||
Number of shares outstanding, basic, end of period (million) | 3,284 | 3,269 | 3,284 | 3,269 | ||||||||||||
Numbers of shares outstanding, diluted, end of period (million) | 3,324 | 3,309 | 3,324 | 3,309 | ||||||||||||
Average number of treasury shares (million) | 52 | 63 | 56 | 60 | ||||||||||||
Average number of shares outstanding, basic (million) | 3,283 | 3,268 | 3,277 | 3,263 | ||||||||||||
Average number of shares outstanding, diluted (million)1) | 3,322 | 3,308 | 3,317 | 3,303 | ||||||||||||
Earnings per share, basic (SEK) | -5.75 | -0.49 | -10.74 | 0.53 | ||||||||||||
Earnings per share, diluted (SEK)1) | -5.68 | -0.48 | -10.61 | 0.52 | ||||||||||||
Ratios | ||||||||||||||||
Days sales outstanding | — | — | 101 | 95 | ||||||||||||
Inventory turnover days | 58 | 61 | 64 | 69 | ||||||||||||
Payable days | 50 | 44 | 60 | 56 | ||||||||||||
Exchange rates used in the consolidation | ||||||||||||||||
SEK/EUR-closing rate | — | — | 9.83 | 9.56 | ||||||||||||
SEK/USD-closing rate | — | — | 8.20 | 9.06 | ||||||||||||
Other | ||||||||||||||||
Regional inventory, end of period | 13,893 | 16,231 | 13,893 | 16,231 | ||||||||||||
Export sales from Sweden | 23,415 | 33,396 | 86,812 | 107,036 | ||||||||||||
| 1) | Potential ordinary shares are not considered when their conversion to ordinary shares would increase earnings per share. |
| 2017 | 2016 | |||||||||||||||||||||||||||||||
End of period | Dec 31 | Sep 30 | Jun 30 | Mar 31 | Dec 31 | Sep 30 | Jun 30 | Mar 31 | ||||||||||||||||||||||||
South East Asia, Oceania and India | 24,495 | 26,396 | 26,748 | 27,221 | 26,570 | 26,453 | 26,725 | 26,602 | ||||||||||||||||||||||||
North East Asia | 12,456 | 12,945 | 12,972 | 12,962 | 13,042 | 13,434 | 13,547 | 13,623 | ||||||||||||||||||||||||
North America | 10,009 | 10,665 | 11,073 | 11,253 | 11,547 | 12,229 | 13,838 | 14,081 | ||||||||||||||||||||||||
Europe and Latin America1) | 49,231 | 50,832 | 53,173 | 54,194 | 54,873 | 56,035 | 56,477 | 55,009 | ||||||||||||||||||||||||
Middle East and Africa | 4,544 | 5,014 | 5,161 | 5,268 | 5,432 | 5,646 | 5,920 | 5,985 | ||||||||||||||||||||||||
|
|
|
|
|
|
|
|
|
|
|
|
|
|
|
| |||||||||||||||||
Total | 100,735 | 105,852 | 109,127 | 110,898 | 111,464 | 113,797 | 116,507 | 115,300 | ||||||||||||||||||||||||
|
|
|
|
|
|
|
|
|
|
|
|
|
|
|
| |||||||||||||||||
1)Of which in Sweden | 13,864 | 14,195 | 14,483 | 14,712 | 15,303 | 15,872 | 16,190 | 16,290 | ||||||||||||||||||||||||
39 Ericsson | Fourth Quarter and Full-Year Report 2017