Exhibit 99.1

| Management’s discussion and analysis | 1 |
1 | Overview | 2 |
| | 1.1 | Financial highlights | 2 |
| | 1.2 | Key corporate and business developments | 3 |
| | 1.3 | Assumptions | 4 |
2 | Consolidated financial analysis | 5 |
| | 2.1 | BCE consolidated income statements | 5 |
| | 2.2 | Customer connections | 5 |
| | 2.3 | Operating revenues | 6 |
| | 2.4 | Operating costs | 8 |
| | 2.5 | Net earnings | 9 |
| | 2.6 | Adjusted EBITDA | 9 |
| | 2.7 | Severance, acquisition and other costs | 10 |
| | 2.8 | Depreciation and amortization | 10 |
| | 2.9 | Finance costs | 11 |
| | 2.10 | Other (expense) income | 11 |
| | 2.11 | Income taxes | 11 |
| | 2.12 | Net earnings attributable to common shareholders and EPS | 11 |
3 | Business segment analysis | 12 |
| | 3.1 | Bell Wireless | 12 |
| | 3.2 | Bell Wireline | 16 |
| | 3.3 | Bell Media | 21 |
4 | Financial and capital management | 24 |
| | 4.1 | Net debt | 24 |
| | 4.2 | Outstanding share data | 24 |
| | 4.3 | Cash flows | 25 |
| | 4.4 | Post-employment benefit plans | 27 |
| | 4.5 | Financial risk management | 27 |
| | 4.6 | Credit ratings | 28 |
| | 4.7 | Liquidity | 28 |
5 | Quarterly financial information | 29 |
6 | Regulatory environment | 30 |
7 | Business risks | 32 |
8 | Accounting policies, financial measures and controls | 34 |
| | 8.1 | Our accounting policies | 34 |
| | 8.2 | Non-GAAP financial measures and key performance indicators (KPIs) | 35 |
| | 8.3 | Controls and procedures | 37 |
Consolidated financial statements | 38 |
| | Consolidated income statements | 38 |
| | Consolidated statements of comprehensive income | 39 |
| | Consolidated statements of financial position | 40 |
| | Consolidated statements of changes in equity | 41 |
| | Consolidated statements of cash flows | 42 |
| Notes to the consolidated financial statements | 43 |
| | Note 1 | Corporate information | 43 |
| | Note 2 | Basis of presentation and significant accounting policies | 43 |
| | Note 3 | Business acquisitions and dispositions | 44 |
| | Note 4 | Segmented information | 46 |
| | Note 5 | Operating costs | 47 |
| | Note 6 | Severance, acquisition and other costs | 48 |
| | Note 7 | Other (expense) income | 48 |
| | Note 8 | Earnings per share | 48 |
| | Note 9 | Income taxes | 49 |
| | Note 10 | Debt | 49 |
| | Note 11 | Post-employment benefit plans | 50 |
| | Note 12 | Financial assets and liabilities | 50 |
| | Note 13 | Share capital | 52 |
| Note 14 | Share-based payments | 52 |
| BCE Inc. 2017 THIRD QUARTER SHAREHOLDER REPORT | | | |
|
| | | | |
| | | | MD&A |
| Management’s discussion and analysis |
In this management’s discussion and analysis of financial condition and results of operations (MD&A),we,us,our,BCEandthe companymean, as the context may require, either BCE Inc. or, collectively, BCE Inc., Bell Canada, their subsidiaries, joint arrangements and associates.Bellmeans, as the context may require, either Bell Canada or, collectively, Bell Canada, its subsidiaries, joint arrangements and associates.MTSmeans, as the context may require, until March 17, 2017, either Manitoba Telecom Services Inc. or, collectively, Manitoba Telecom Services Inc. and its subsidiaries; andBell MTSmeans, from March 17, 2017, the combined operations of MTS and Bell Canada in Manitoba.
All amounts in this MD&A are in millions of Canadian dollars, except where noted. Please refer to section 8.2,Non-GAAP financial measures and key performance indicators (KPIs)on pages 35 to 37 for a list of defined non-GAAP financial measures and key performance indicators.
Please refer to BCE’s unaudited consolidated financial statements for the third quarter of 2017 (Q3 2017 Financial Statements) when reading this MD&A. We also encourage you to read BCE’s MD&A for the year ended December 31, 2016 dated March 2, 2017 (BCE 2016 Annual MD&A) as updated in BCE’s MD&A for the first quarter of 2017 dated April 25, 2017 (BCE 2017 First Quarter MD&A) and BCE’s MD&A for the second quarter of 2017 dated August 2, 2017 (BCE 2017 Second Quarter MD&A). In preparing this MD&A, we have taken into account information available to us up to November 1, 2017, the date of this MD&A, unless otherwise stated.
You will find more information about us, including BCE’s annual information form for the year ended December 31, 2016 dated March 2, 2017 (BCE 2016 AIF) and recent financial reports, including the BCE 2016 Annual MD&A, the BCE 2017 First Quarter MD&A and the BCE 2017 Second Quarter MD&A, on BCE’s website at BCE.ca, on SEDAR at sedar.com and on EDGAR at sec.gov.
This MD&A comments on our business operations, performance, financial position and other matters for the three months (Q3) and nine months (YTD) ended September 30, 2017 and 2016.
| CAUTION REGARDING FORWARD-LOOKING STATEMENTS |
This MD&A including, in particular, but without limitation, the section and sub-sections entitledAssumptions, section 1.2,Key corporate and business developments, section 3.1,Bell Wireless – Key business developments, section 3.2,Bell Wireline – Key business developments, section 3.3,Bell Media – Key business developmentsand section 6,Regulatory environment, contain forward-looking statements. These forward-looking statements include, but are not limited to, statements relating to our network deployment plans, the expected timing and completion of the proposed acquisition of the Séries+ and Historia French-language specialty channels from Corus Entertainment Inc. (Corus) and certain benefits expected to result from such proposed transaction, and our business outlook, objectives, plans and strategies. Forward-looking statements also include any other statements that do not refer to historical facts. A statement we make is forward-looking when it uses what we know and expect today to make a statement about the future. Forward-looking statements are typically identified by the wordsassumption,goal,guidance,objective,outlook,project,strategy,targetand other similar expressions or future or conditional verbs such asaim,anticipate,believe,could,expect,intend,may,plan,seek,should,striveandwill. All such forward-looking statements are made pursuant to the safe harbour provisions of applicable Canadian securities laws and of the United States (U.S.)Private Securities Litigation Reform Act of 1995.
Unless otherwise indicated by us, forward-looking statements in this MD&A describe our expectations as at November 1, 2017 and, accordingly, are subject to change after this date. Except as may be required by Canadian securities laws, we do not undertake any obligation to update or revise any forward-looking statements, whether as a result of new information, future events or otherwise.
Forward-looking statements, by their very nature, are subject to inherent risks and uncertainties and are based on several assumptions, both general and specific, which give rise to the possibility that actual results or events could differ materially from our expectations expressed in, or implied by, such forward-looking statements and that our business outlook, objectives, plans and strategic priorities may not be achieved. As a result, we cannot guarantee that any forward-looking statement will materialize and we caution you against relying on any of these forward-looking statements. Forward-looking statements are presented in this MD&A for the purpose of assisting investors and others in understanding our business outlook, objectives, plans and strategic priorities as well as our anticipated operating environment. Readers are cautioned, however, that such information may not be appropriate for other purposes.
We have made certain economic, market and operational assumptions in preparing forward-looking statements contained in this MD&A. These assumptions include, without limitation, the assumptions described in the section and various sub-sections of this MD&A entitledAssumptions, which section and sub-sections are incorporated by reference in this cautionary statement. We believe that these assumptions were reasonable at November 1, 2017. If our assumptions turn out to be inaccurate, our actual results could be materially different from what we expect. Unless otherwise indicated in this MD&A, in the BCE 2017 First Quarter MD&A or in the BCE 2017 Second Quarter MD&A, the strategic priorities, business outlook and assumptions described in the BCE 2016 Annual MD&A remain substantially unchanged.
Important risk factors including, without limitation, regulatory, competitive, economic, financial, operational, technological and other risks that could cause actual results or events to differ materially from those expressed in, or implied by, the above-mentioned forward-looking statements and other forward-looking statements in this MD&A, include, but are not limited to, the risks described or referred to in section 6,Regulatory environmentand section 7,Business risks, which sections are incorporated by reference in this cautionary statement.
We caution readers that the risks described in the above-mentioned sections and in other sections of this MD&A are not the only ones that could affect us. Additional risks and uncertainties not currently known to us or that we currently deem to be immaterial may also have a material adverse effect on our financial position, financial performance, cash flows, business or reputation. Except as otherwise indicated by us, forward-looking statements do not reflect the potential impact of any special items or of any dispositions, monetizations, mergers, acquisitions, other business combinations or other transactions that may be announced or that may occur after November 1, 2017. The financial impact of these transactions and special items can be complex and depends on the facts particular to each of them. We therefore cannot describe the expected impact in a meaningful way, or in the same way we present known risks affecting our business.
| | | | BCE Inc. 2017 THIRD QUARTER SHAREHOLDER REPORT 1 |
|
| | | | |
| 1 | Overview | MD&A | |
BCE Q3 2017 selected quarterly information
| BCE income statements – selected information |
| Q3 2017 | | Q3 2016 | | $ CHANGE | | % CHANGE | | YTD 2017 | | YTD 2016 | | $ CHANGE | | % CHANGE | |
Operating revenues | | | | | | | | | | | | | | | | |
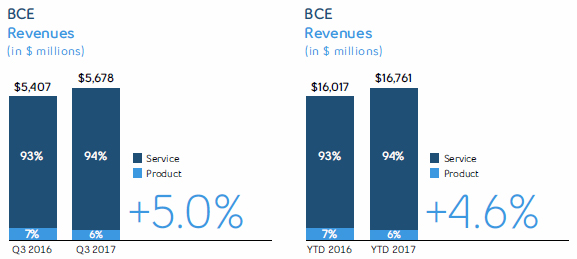
Service | 5,322 | | 5,025 | | 297 | | 5.9% | | 15,708 | | 14,921 | | 787 | | 5.3% | |
Product | 356 | | 382 | | (26 | ) | (6.8% | ) | 1,053 | | 1,096 | | (43 | ) | (3.9% | ) |
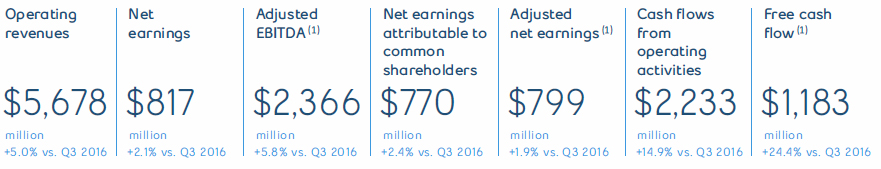
Total operating revenues | 5,678 | | 5,407 | | 271 | | 5.0% | | 16,761 | | 16,017 | | 744 | | 4.6% | |
Operating costs | (3,312 | ) | (3,171 | ) | (141 | ) | (4.4% | ) | (9,800 | ) | (9,350 | ) | (450 | ) | (4.8% | ) |
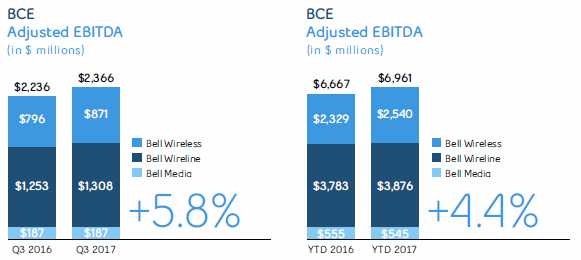
Adjusted EBITDA | 2,366 | | 2,236 | | 130 | | 5.8% | | 6,961 | | 6,667 | | 294 | | 4.4% | |
Adjusted EBITDA margin(1) | 41.7 | % | 41.4 | % | | | 0.3 pts | | 41.5 | % | 41.6 | % | | | (0.1) pts | |
Net earnings attributable to: | | | | | | | | | | | | | | | | |
Common shareholders | 770 | | 752 | | 18 | | 2.4% | | 2,211 | | 2,237 | | (26 | ) | (1.2% | ) |
Preferred shareholders | 31 | | 32 | | (1 | ) | (3.1% | ) | 94 | | 104 | | (10 | ) | (9.6% | ) |
Non-controlling interest (NCI) | 16 | | 16 | | – | | – | | 48 | | 47 | | 1 | | 2.1% | |
Net earnings | 817 | | 800 | | 17 | | 2.1% | | 2,353 | | 2,388 | | (35 | ) | (1.5% | ) |
Adjusted net earnings | 799 | | 784 | | 15 | | 1.9% | | 2,349 | | 2,342 | | 7 | | 0.3% | |
Net earnings per common share (EPS) | 0.86 | | 0.87 | | (0.01 | ) | (1.1% | ) | 2.48 | | 2.58 | | (0.10 | ) | (3.9% | ) |
Adjusted EPS(1) | 0.88 | | 0.91 | | (0.03 | ) | (3.3% | ) | 2.63 | | 2.70 | | (0.07 | ) | (2.6% | ) |
| (1) | Adjusted EBITDA, adjusted EBITDA margin, adjusted net earnings, adjusted EPS and free cash flow are non-GAAP financial measures and do not have any standardized meaning under International Financial Reporting Standards (IFRS). Therefore, they are unlikely to be comparable to similar measures presented by other issuers. See section 8.2, Non-GAAP financial measures and key performance indicators (KPIs) – Adjusted EBITDA and adjusted EBITDA margin, Adjusted net earnings and adjusted EPS and Free cash flow and dividend payout ratio in this MD&A for more details, including reconciliations to the most comparable IFRS financial measures. |
| (2) | As a result of the acquisition of MTS on March 17, 2017, our wireless, high-speed Internet, TV and NAS subscriber bases increased by 476,932 (418,427 postpaid), 229,470, 108,107 (104,661 Internet protocol television (IPTV)) and 419,816 (223,663 residential and 196,153 business) subscribers, respectively. Subsequently, in Q2 2017, Bell’s wireless subscriber base reflected the divestiture of 104,833 postpaid subscribaers to TELUS Communications Inc. (TELUS) related to BCE’s acquisition of MTS. Bell’s wireless subscriber base in Q2 2017 also reflected the removal of 7,268 subscribers (2,450 postpaid and 4,818 prepaid), due to the decommissioning of the code division multiple access (CDMA) network in western Canada. |
| (3) | Following a review of customer accounts by a wholesale reseller, we adjusted our high-speed Internet subscriber base at the beginning of Q1 2017 to remove 3,751 non-revenue generating units. |
| 2 BCE Inc. 2017 THIRD QUARTER SHAREHOLDER REPORT | | | |
|
| | | | |
| | 1 | Overview | MD&A |
| BCE statements of cash flows – selected information |
| Q3 2017 | | Q3 2016 | | $ CHANGE | | % CHANGE | | YTD 2017 | | YTD 2016 | | $ CHANGE | | % CHANGE | |
Cash flows from operating activities | 2,233 | | 1,943 | | 290 | | 14.9% | | 5,700 | | 5,123 | | 577 | | 11.3% | |
Capital expenditures | (1,040 | ) | (976 | ) | (64 | ) | (6.6% | ) | (2,934 | ) | (2,778 | ) | (156 | ) | (5.6% | ) |
Free cash flow | 1,183 | | 951 | | 232 | | 24.4% | | 2,766 | | 2,303 | | 463 | | 20.1% | |
| Q3 2017 financial highlights |
BCE delivered revenue growth of 5.0% in Q3 2017, compared to the same period last year, driven by higher service revenue of 5.9% from growth across all three of our segments due to higher wireless, Internet, IPTV and media revenues and the contribution from the acquisition of MTS on March 17, 2017 and Q9 Networks Inc. (Q9) in Q4 2016. This was moderated by significant regulatory pressures in our wireless and wireline segments, as well as by ongoing erosion in our voice, satellite TV, and legacy data revenues, including continued competitive re-pricing and reduced customer spending in our business markets. Product revenues declined by 6.8% year over year due to pressures in the Bell Wireline segment.
Net earnings increased by 2.1% in the third quarter of 2017, compared to the same period last year, due to increased operating revenues, which contributed to higher adjusted EBITDA, and lower income taxes, partly offset by increased depreciation and amortization expense, higher other expense and an increase in finance costs.
Adjusted EBITDA increased by 5.8% in Q3 2017, compared to prior year, resulting from service revenue growth, combined with ongoing disciplined cost containment at Bell Wireline. The increase in adjusted EBITDA was moderated by greater investment in wireless subscriber retention and acquisition, as well as by higher programming and content costs in our Bell Media segment.
BCE’s EPS of $0.86 in Q3 2017 decreased by $0.01 compared to the same period last year. The average number of BCE common shares outstanding increased as a result of shares issued for the acquisition of MTS which further diluted EPS as compared to Q3 2016.
Excluding the impact of severance, acquisition and other costs, net gains (losses) on investments, impairment charges, and early debt redemption costs, adjusted net earnings in the third quarter of 2017 was $799 million, or $0.88 per common share, compared to $784 million, or $0.91 per common share, for the same period last year.
Cash flows from operating activities in the third quarter of 2017 increased by $290 million, compared to Q3 2016, due to higher adjusted EBITDA, improved working capital and lower income taxes paid, partly offset by higher interest payments, all of which reflected the contributions from the MTS acquisition.
Free cash flow in Q3 2017 increased by $232 million, compared to the same period last year, due to an increase in cash flows from operating activities, partly offset by higher capital expenditures.
| 1.2 Key corporate and business developments |
$1.5 billion public debt offering
On September 29, 2017, Bell Canada completed a public offering of $1.5 billion of medium-term note (MTN) debentures in two series pursuant to its MTN program. Bell Canada issued, as a re-opening of an existing series, $700 million of Series M-40 MTN debentures which mature on October 3, 2022 and carry an annual interest rate of 3.00%, and $800 million of Series M-46 MTN debentures which mature on September 29, 2027 and carry an annual interest rate of 3.60%. The MTN debentures are fully and unconditionally guaranteed by BCE Inc. The net proceeds of the offering were used to fund the early redemption in October 2017 of two series of Bell Canada debentures maturing in 2018 and totalling $1.3 billion in aggregate principal amount ($1 billion of 4.40% Series M-22 MTN debentures due March 16, 2018; and $300 million of 4.88% Series M-36 debentures due April 26, 2018), as well as for other general corporate purposes.
| Broadband services to be expanded in Nunavut |
On September 18, 2017, Bell and our subsidiary Northwestel Inc. announced that 15 megabits per second (Mbps) Internet is planned to be available in all 25 Nunavut communities in 2019, providing Nunavut residents and businesses with access to the same broadband service levels as those in most remote Northern communities in Canada. Bell Mobility Inc.’s (Bell Mobility) Fourth Generation (4G) wireless service is also expected to be expanded to every community in the territory, providing a greatly enhanced wireless experience for residents. The improved broadband services will be offered once work on building the higher-capacity backhaul networks connecting Nunavut’s communities is completed. The project will harness a new open-access satellite network supported by the federal government’s Connect to Innovate program, as well as Telesat Canada’s new Telstar 19 VANTAGE satellite, scheduled to launch in 2018, to achieve the increased broadband speeds.
| | | | BCE Inc. 2017 THIRD QUARTER SHAREHOLDER REPORT 3 |
|
| | | | |
| 1 | Overview | MD&A | |
As at the date of this MD&A, our forward-looking statements set out in the BCE 2016 Annual MD&A, as updated or supplemented in the BCE 2017 First Quarter MD&A, in the BCE 2017 Second Quarter MD&A and in this MD&A, are based on certain assumptions including, without limitation, the following economic and market assumptions as well as the various assumptions referred to under the sub-sections entitledAssumptionsset out in section 3,Business segment analysis of this MD&A.
ASSUMPTIONS ABOUT THE CANADIAN ECONOMY
- Gradual improvement in economic growth, given the Bank of Canada’s most recent estimated growth in Canadian gross domestic product of 3.1% in 2017, representing a 30 basis point increase from the earlier estimate of 2.8%
- Modest employment growth, as the overall level of business investment is expected to remain soft
- Canadian dollar expected to remain at or around near current levels. Further movements may be impacted by the degree of strength of the U.S. dollar, interest rates and changes in commodity prices.
MARKET ASSUMPTIONS
- A higher level of wireline and wireless competition in consumer, business and wholesale markets
- Higher, but slowing, wireless industry penetration and smartphone adoption
- Soft media advertising market expected, due to variable demand, and escalating costs to secure TV programming
| 4 BCE Inc. 2017 THIRD QUARTER SHAREHOLDER REPORT | | | |
|
| | | | |
| | 2 | Consolidated financial analysis | MD&A |
| 2 Consolidated financial analysis |
This section provides detailed information and analysis about BCE’s performance in Q3 and YTD 2017 compared to Q3 and YTD 2016. It focuses on BCE’s consolidated operating results and provides financial information for our Bell Wireless, Bell Wireline and Bell Media business segments. For further discussion and analysis of our business segments, refer to section 3, Business segment analysis.
| 2.1 BCE consolidated income statements |
| Q3 2017 | | Q3 2016 | | $ CHANGE | | % CHANGE | | YTD 2017 | | YTD 2016 | | $ CHANGE | | % CHANGE | |
Operating revenues | | | | | | | | | | | | | | | | |
Service | 5,322 | | 5,025 | | 297 | | 5.9% | | 15,708 | | 14,921 | | 787 | | 5.3% | |
Product | 356 | | 382 | | (26 | ) | (6.8% | ) | 1,053 | | 1,096 | | (43 | ) | (3.9% | ) |
Total operating revenues | 5,678 | | 5,407 | | 271 | | 5.0% | | 16,761 | | 16,017 | | 744 | | 4.6% | |
Operating costs | (3,312 | ) | (3,171 | ) | (141 | ) | (4.4% | ) | (9,800 | ) | (9,350 | ) | (450 | ) | (4.8% | ) |
Adjusted EBITDA | 2,366 | | 2,236 | | 130 | | 5.8% | | 6,961 | | 6,667 | | 294 | | 4.4% | |
Adjusted EBITDA margin | 41.7 | % | 41.4 | % | | | 0.3 pts | | 41.5 | % | 41.6 | % | | | (0.1) pts | |
Severance, acquisition and other costs | (23 | ) | (25 | ) | 2 | | 8.0% | | (143 | ) | (124 | ) | (19 | ) | (15.3% | ) |
Depreciation | (765 | ) | (706 | ) | (59 | ) | (8.4% | ) | (2,256 | ) | (2,158 | ) | (98 | ) | (4.5% | ) |
Amortization | (208 | ) | (161 | ) | (47 | ) | (29.2% | ) | (604 | ) | (466 | ) | (138 | ) | (29.6% | ) |
Finance costs | | | | | | | | | | | | | | | | |
Interest expense | (242 | ) | (227 | ) | (15 | ) | (6.6% | ) | (714 | ) | (663 | ) | (51 | ) | (7.7% | ) |
Interest on post-employment benefit obligations | (18 | ) | (20 | ) | 2 | | 10.0% | | (54 | ) | (61 | ) | 7 | | 11.5% | |
Other (expense) income | (56 | ) | (13 | ) | (43 | ) | n.m. | | (40 | ) | 51 | | (91 | ) | n.m. | |
Income taxes | (237 | ) | (284 | ) | 47 | | 16.5% | | (797 | ) | (858 | ) | 61 | | 7.1% | |
Net earnings | 817 | | 800 | | 17 | | 2.1% | | 2,353 | | 2,388 | | (35 | ) | (1.5% | ) |
Net earnings attributable to: | | | | | | | | | | | | | | | | |
Common shareholders | 770 | | 752 | | 18 | | 2.4% | | 2,211 | | 2,237 | | (26 | ) | (1.2% | ) |
Preferred shareholders | 31 | | 32 | | (1 | ) | (3.1% | ) | 94 | | 104 | | (10 | ) | (9.6% | ) |
Non-controlling interest | 16 | | 16 | | – | | – | | 48 | | 47 | | 1 | | 2.1% | |
Net earnings | 817 | | 800 | | 17 | | 2.1% | | 2,353 | | 2,388 | | (35 | ) | (1.5% | ) |
Adjusted net earnings | 799 | | 784 | | 15 | | 1.9% | | 2,349 | | 2,342 | | 7 | | 0.3% | |
EPS | 0.86 | | 0.87 | | (0.01 | ) | (1.1% | ) | 2.48 | | 2.58 | | (0.10 | ) | (3.9% | ) |
Adjusted EPS | 0.88 | | 0.91 | | (0.03 | ) | (3.3% | ) | 2.63 | | 2.70 | | (0.07 | ) | (2.6% | ) |
n.m.: not meaningful
TOTAL BCE CONNECTIONS
| Q3 2017 | | Q3 2016 | | % CHANGE | |
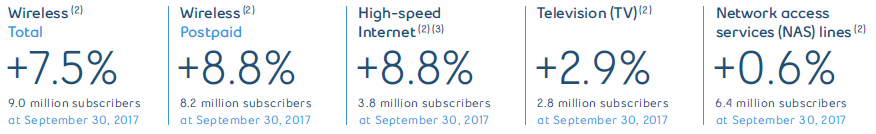
Wireless subscribers(1) | 9,008,273 | | 8,380,949 | | 7.5% | |
Postpaid(1) | 8,243,446 | | 7,578,334 | | 8.8% | |
High-speed Internet subscribers(1) (2) | 3,763,101 | | 3,458,160 | | 8.8% | |
TV (Satellite and IPTV subscribers)(1) | 2,825,754 | | 2,745,873 | | 2.9% | |
IPTV(1) | 1,517,833 | | 1,302,039 | | 16.6% | |
Total growth services | 15,597,128 | | 14,584,982 | | 6.9% | |
Wireline NAS lines(1) | 6,394,553 | | 6,358,362 | | 0.6% | |
Total services | 21,991,681 | | 20,943,344 | | 5.0% | |
| (1) | As a result of the acquisition of MTS on March 17, 2017, our wireless, high-speed Internet, TV and NAS subscriber bases increased by 476,932 (418,427 postpaid), 229,470, 108,107 (104,661 IPTV) and 419,816 (223,663 residential and 196,153 business) subscribers, respectively. Subsequently, in Q2 2017, Bell’s wireless subscriber base reflected the divestiture of 104,833 postpaid subscribers to TELUS related to BCE’s acquisition of MTS. Bell’s wireless subscriber base in Q2 2017 also reflected the removal of 7,268 subscribers (2,450 postpaid and 4,818 prepaid), due to the decommissioning of the CDMA network in western Canada. |
| (2) | Following a review of customer accounts by a wholesale reseller, we adjusted our high-speed Internet subscriber base at the beginning of Q1 2017 to remove 3,751 non-revenue generating units. |
| | | | BCE Inc. 2017 THIRD QUARTER SHAREHOLDER REPORT 5 |
|
| | | | |
| 2 | Consolidated financial analysis | MD&A | |
BCE NET ACTIVATIONS (LOSSES)
| Q3 2017 | | Q3 2016 | | % CHANGE | | YTD 2017 | | YTD 2016 | | % CHANGE | |
Wireless subscribers | 106,982 | | 100,256 | | 6.7% | | 174,570 | | 135,118 | | 29.2% | |
Postpaid | 117,182 | | 107,265 | | 9.2% | | 241,575 | | 202,918 | | 19.1% | |
High-speed Internet subscribers | 44,424 | | 39,375 | | 12.8% | | 60,820 | | 66,697 | | (8.8% | ) |
TV (Satellite and IPTV subscribers) | 1,738 | | (4,723 | ) | 136.8% | | (27,262 | ) | 7,377 | | (469.6% | ) |
IPTV | 36,399 | | 36,253 | | 0.4% | | 75,228 | | 119,248 | | (36.9% | ) |
Total growth services | 153,144 | | 134,908 | | 13.5% | | 208,128 | | 209,192 | | (0.5% | ) |
Wireline NAS lines | (84,762 | ) | (118,321 | ) | 28.4% | | (282,995 | ) | (314,778 | ) | 10.1% | |
Total services | 68,382 | | 16,587 | | 312.3% | | (74,867 | ) | (105,586 | ) | 29.1% | |
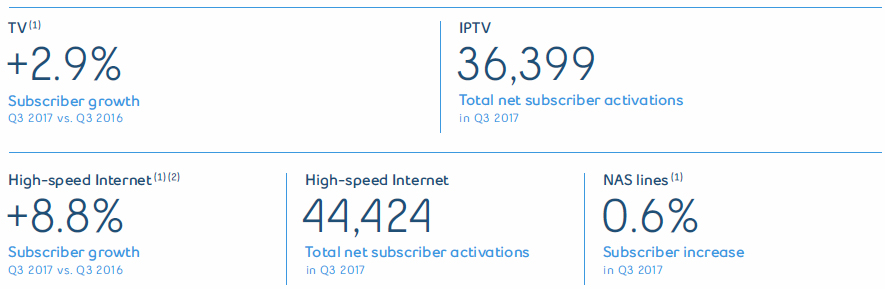
BCE added 153,144 net new customer connections to its growth services in Q3 2017, representing a 13.5% improvement over Q3 2016. This consisted of:
- 117,182 postpaid wireless customers, partly offset by the net loss of 10,200 prepaid wireless customers
- 44,424 high-speed Internet customers
- 36,399 IPTV customer connections, offset in part by 34,661 satellite TV net customer losses
In the first nine months of the year, BCE added 208,128 net new growth service customers, representing a decrease of 0.5%. This consisted of:
- 241,575 postpaid wireless customers, partly offset by the net loss of 67,005 prepaid wireless customers
- 60,820 high-speed Internet customers
- 75,228 IPTV customer connections more than offset by 102,490 satellite TV net customer losses
NAS net losses were 84,762 in Q3 2017 and 282,995 in the first nine months of 2017, decreasing by 28.4% and 10.1%, respectively, over the same periods last year.
Total BCE customer connections across all services increased by 5.0% in Q3 2017, compared to the same period last year, driven by the subscribers acquired from MTS, as well as an increase in our growth services customer base, moderated by ongoing erosion in traditional wireline NAS lines.
At September 30, 2017, BCE customer connections totalled 21,991,681 and were comprised of the following:
- 9,008,273 wireless subscribers, up 7.5% compared to Q3 2016, and included 8,243,446 postpaid wireless subscribers, an increase of 8.8% compared to prior year
- 3,763,101 high-speed Internet subscribers, 8.8% higher year over year
- 2,825,754 total TV subscribers, up 2.9% compared to Q3 2016, and included 1,517,833 IPTV customers, up 16.6% year over year
- 6,394,553 total NAS lines, an increase of 0.6% compared to the third quarter of 2016
| Q3 2017 | | Q3 2016 | | $ CHANGE | | % CHANGE | | YTD 2017 | | YTD 2016 | | $ CHANGE | | % CHANGE | |
Bell Wireless | 2,040 | | 1,848 | | 192 | | 10.4% | | 5,813 | | 5,276 | | 537 | | 10.2% | |
Bell Wireline | 3,092 | | 3,005 | | 87 | | 2.9% | | 9,193 | | 8,967 | | 226 | | 2.5% | |
Bell Media | 723 | | 716 | | 7 | | 1.0% | | 2,270 | | 2,236 | | 34 | | 1.5% | |
Inter-segment eliminations | (177 | ) | (162 | ) | (15 | ) | (9.3% | ) | (515 | ) | (462 | ) | (53 | ) | (11.5% | ) |
Total BCE operating revenues | 5,678 | | 5,407 | | 271 | | 5.0% | | 16,761 | | 16,017 | | 744 | | 4.6% | |
| 6 BCE Inc. 2017 THIRD QUARTER SHAREHOLDER REPORT | | | |
|
| | | | |
| | 2 | Consolidated financial analysis | MD&A |
BCE
Total operating revenues for BCE increased by 5.0% in the third quarter of 2017 and by 4.6% in the first nine months of the year, compared to the same periods in 2016, resulting from growth across all three of our segments. This consisted of service revenues of $5,322 million in Q3 2017 and $15,708 million in the first nine months of the year, increasing by 5.9% and 5.3%, respectively, over the same periods last year. Product revenues of $356 million in the third quarter of 2017 and of $1,053 million in the first nine months of the year, declined by 6.8% and 3.9%, respectively, over the corresponding periods in 2016.
BELL WIRELESS
Bell Wireless operating revenues improved by 10.4% in Q3 2017 and 10.2% year to date, compared to the same periods in 2016, due to continued growth in service revenues of 11.2% and 10.7%, respectively. The growth in service revenue was driven by an increase in the postpaid subscriber base, higher blended average revenue per user (ARPU) and the contribution from the acquisition of MTS. The increase in blended ARPU was due to the larger proportion of postpaid customers in our total subscriber base, higher average monthly rates mainly from the flow-through of 2016 pricing changes, and increased smartphone penetration along with a growing base of postpaid Long-term Evolution (LTE) and LTE Advanced (LTE-A) customers in our subscriber mix, which continued to drive greater data consumption and demand for larger data plans. The year-over-year increase in service revenues was partially offset by the unfavourable impact from Telecom Decision CRTC 2016-171 (Telecom Decision CRTC 2016-171), issued by the Canadian Radio-television and Telecommunications Commission (CRTC) on May 5, 2016, related to 30-day cancellation policies which clarified that service providers must provide pro-rated refunds, based on the number of days left in the last monthly billing cycle after cancellation (certain aspects of which are currently the subject matter of an application for clarification by TELUS Communications Company pursuant to the Telecommunications Act and Part 1 of the CRTC Rules of Practice). The year-over-year growth in service revenues was also moderated by the increased adoption of all-inclusive voice and text rate plans resulting in lower out of bundle usage. The increase in year-to-date operating revenues also benefitted from higher product revenues driven by a larger proportion of high end devices in our sales mix and an increase in the customer upgrades and gross activations, along with the favourable contribution from the MTS acquisition, moderated in part by increased promotional offers due to a competitive marketplace.
BELL WIRELINE
Bell Wireline operating revenues increased by 2.9% in Q3 2017 and by 2.5% in the first nine months of the year, compared to the same periods last year, reflecting service revenue growth of 4.1% and 3.4%, respectively, offset in part by a decline in product revenues of 9.7%, and 6.6%, respectively. The growth in service revenues was driven by the acquisitions of MTS and Q9, along with Internet and IPTV subscriber growth, coupled with higher household ARPU. This was moderated by significant regulatory pressures due to unfavourable CRTC rulings in 2016 relating to Internet tariffs for aggregated wholesale high-speed access services and Telecom Decision CRTC 2016-171, ongoing erosion in our voice, satellite TV and legacy data services, along with higher acquisition, retention and bundle discounts to match aggressive cable competitor offers. The decline in product revenues was driven by lower demand from large business customers for equipment due to market softness and an increased level of competition in the market, offset in part by the favourable impact of the acquisition of MTS.
BELL MEDIA
Bell Media operating revenues grew by 1.0% in Q3 2017, and by 1.5% in the first nine months of 2017, compared to the same periods in 2016. The growth in Q3 2017 was driven by higher advertising revenues primarily from our out-of-home (OOH) business due to the contribution from new contract wins and the acquisition of Cieslok Media Ltd. (Cieslok Media) in January 2017, and also reflected the return of advertising dollars in conventional TV following the shift in 2016 to the principal broadcaster of the Rio 2016 Summer Olympics Games. The growth in advertising revenues was moderated by ongoing market softness and declines in audience levels which unfavourably impacted advertising revenues across both conventional and specialty TV and radio media platforms. The higher subscriber revenues also contributed to the increased operating revenues due to the growth in our subscriber base from our TV Everywhere GO Products and CraveTV, and rate increases on contract renewals. For the first nine months of the year, the growth in subscriber revenues also benefitted from the expansion of The Movie Network (TMN) into a national pay TV service in March 2016, partially offset by a decline in advertising revenues mainly due to the negative impact on conventional TV advertising revenues from the CRTC’s decision to eliminate simultaneous substitution for the National Football League (NFL) Super Bowl.
| | | | BCE Inc. 2017 THIRD QUARTER SHAREHOLDER REPORT 7 |
|
| | | | |
| 2 | Consolidated financial analysis | MD&A | |
| | Q3 2017 | | Q3 2016 | | $ CHANGE | | % CHANGE | | YTD 2017 | | YTD 2016 | | $ CHANGE | | % CHANGE | |
Bell Wireless | (1,169 | ) | (1,052 | ) | (117 | ) | (11.1% | ) | (3,273 | ) | (2,947 | ) | (326 | ) | (11.1% | ) |
Bell Wireline | (1,784 | ) | (1,752 | ) | (32 | ) | (1.8% | ) | (5,317 | ) | (5,184 | ) | (133 | ) | (2.6% | ) |
Bell Media | (536 | ) | (529 | ) | (7 | ) | (1.3% | ) | (1,725 | ) | (1,681 | ) | (44 | ) | (2.6% | ) |
Inter-segment eliminations | 177 | | 162 | | 15 | | 9.3% | | 515 | | 462 | | 53 | | 11.5% | |
Total BCE operating costs | (3,312 | ) | (3,171 | ) | (141 | ) | (4.4% | ) | (9,800 | ) | (9,350 | ) | (450 | ) | (4.8% | ) |
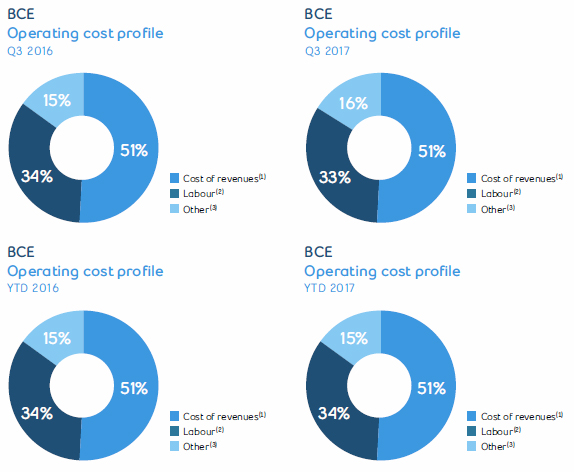
| (1) | Cost of revenues includes costs of wireless devices and other equipment sold, network and content costs, and payments to other carriers. |
| (2) | Labour costs (net of capitalized costs) include wages, salaries, and related taxes and benefits, post-employment benefit plans service cost, and other labour costs, including contractor and outsourcing costs. |
| (3) | Other operating costs include marketing, advertising and sales commission costs, bad debt expense, taxes other than income taxes, information technology (IT) costs, professional service fees and rent. |
BCE
Total BCE operating costs increased by 4.4% in Q3 2017 and by 4.8% in the first nine months of the year, compared to the same periods in 2016, reflecting higher costs in all three of our segments.
BELL WIRELESS
Bell Wireless operating costs increased by 11.1% in both Q3 2017 and for the first nine months of the year, compared to the same periods in 2016, as a result of:
- Higher customer retention spending from increased promotional pricing due to a competitive marketplace, a larger proportion of high-end smartphone devices in our upgrade mix, higher handset costs and a greater number of subsidized upgrades due to a larger number of contract expiries
- Increased subscriber acquisition costs from greater promotional pricing due to a competitive marketplace, a higher proportion of premium smartphones in our sales mix, higher handset costs, a greater proportion of postpaid gross activations in our mix and higher gross activations
- The acquisition of MTS
- Increased network operating costs attributable to larger LTE and LTE-A network usage
- An increase in labour costs to support the growth of the business
BELL WIRELINE
Bell Wireline operating costs increased by 1.8%, in Q3 2017, and by 2.6% in the first nine months of 2017, compared to the same periods last year, as a result of:
- The impact from the acquisitions of MTS and Q9
- Greater programming and production costs in our TV business to support a larger subscriber base, combined with contractual rate increases
- Higher fleet related expenses driven by increased fuel and refurbishment expenses as well as higher utility costs
| 8 BCE Inc. 2017 THIRD QUARTER SHAREHOLDER REPORT | | | |
|
| | | | |
| | 2 | Consolidated financial analysis | MD&A |
These factors were partially offset by:
- Reduced labour costs resulting from workforce reductions, vendor contract savings, and lower call volumes to our customer service centres
- Decreased cost of goods sold consistent with lower product sales
- Lower payments to other carriers attributable to decreased sales of international long distance minutes in our wholesale market
- Reduced bad debt expense
Year-to-date operating expenses were also unfavourably impacted by higher marketing costs from our retail market to support subscriber acquisitions, mitigated in part by higher advertising costs incurred in Q3 2016 due to the Rio 2016 Summer Olympic Games.
BELL MEDIA
Bell Media operating costs increased by 1.3% in the third quarter of 2017 and by 2.6% in the first nine months of the year, compared to the corresponding periods last year, mainly due to higher programming and content costs primarily related to the ongoing ramp up of content for CraveTV and pay TV, deal renewals for specialty TV, greater expenses resulting from the Cieslok Media acquisition and the execution of newly awarded contracts in OOH. This increase in operating costs was partially mitigated by reduced labour costs driven mainly by workforce reductions.
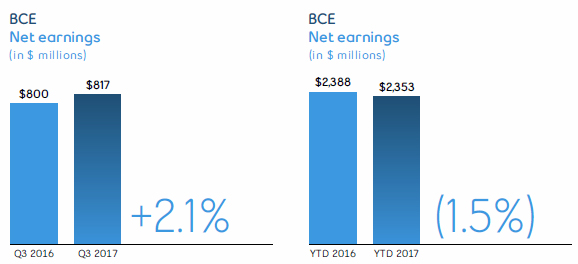
Net earnings increased by 2.1% in the third quarter of 2017, compared to the same period last year, due to increased operating revenues, which contributed to higher adjusted EBITDA, and lower income taxes, partly offset by increased depreciation and amortization expense, higher other expense and an increase in finance costs.
Year-to-date, net earnings of $2,353 million decreased by 1.5%, compared to the same period last year, due to increased depreciation and amortization expense, higher other expense, an increase in finance costs and higher severance, acquisition and other costs which reflected the acquisition of MTS. This was partly offset by an increase in adjusted EBITDA, as growing revenues more than offset an increase in operating costs, and by lower income taxes.
| | | | BCE Inc. 2017 THIRD QUARTER SHAREHOLDER REPORT 9 |
|
| | | | |
| 2 | Consolidated financial analysis | MD&A | |
ADJUSTED EBITDA
| Q3 2017 | | Q3 2016 | | $ CHANGE | | % CHANGE | | YTD 2017 | | YTD 2016 | | $ CHANGE | | % CHANGE | |
Bell Wireless | 871 | | 796 | | 75 | | 9.4% | | 2,540 | | 2,329 | | 211 | | 9.1% | |
Bell Wireline | 1,308 | | 1,253 | | 55 | | 4.4% | | 3,876 | | 3,783 | | 93 | | 2.5% | |
Bell Media | 187 | | 187 | | – | | – | | 545 | | 555 | | (10 | ) | (1.8% | ) |
Total BCE adjusted EBITDA | 2,366 | | 2,236 | | 130 | | 5.8% | | 6,961 | | 6,667 | | 294 | | 4.4% | |
BCE adjusted EBITDA margin | 41.7 | % | 41.4 | % | | | 0.3 pts | | 41.5 | % | 41.6 | % | | | (0.1 pts | ) |
BCE
BCE’s adjusted EBITDA grew by 5.8% in Q3 2017, and by 4.4% in the first nine months of the year, compared to the corresponding periods in 2016, driven by growth in our Bell Wireless and Bell Wireline segments. Bell Media’s adjusted EBITDA remained stable in Q3 2017 compared to last year, and declined by 1.8% during the first nine months of the year compared to the same period in 2016. This resulted in an increase in adjusted EBITDA margin to 41.7% in Q3 2017, over the 41.4% experienced in Q3 2016. In the first nine months of the year, BCE adjusted EBITDA margin was relatively stable when compared to last year.
The growth in adjusted EBITDA was driven by the higher wireless, Internet, IPTV and media revenues, the contribution from the acquisitions of MTS and Q9 and disciplined cost containment in our Bell Wireline segment. This was moderated by significant regulatory pressures, continued erosion in our voice, satellite TV and legacy data revenues, increased investment in wireless subscriber retention and acquisition, as well as higher programming and content costs in our Bell Media segment.
BELL WIRELESS
Bell Wireless adjusted EBITDA was up by 9.4% in Q3 2017 and by 9.1% year to date, compared to the same periods in 2016, reflecting the flow-through of increased operating revenues from a larger subscriber base and the continued growth in blended ARPU along with the favourable contribution from the acquisition of MTS, moderated in part by increased year-over-year operating expenses driven primarily by our greater investment in customer retention and acquisition. Adjusted EBITDA margin, based on wireless operating service revenues, declined to 45.5%, in Q3 2017, and to 46.6% year to date, compared to 46.3% in Q3 2016 and 47.3% for the first nine months of last year.
BELL WIRELINE
Bell Wireline adjusted EBITDA increased by 4.4% in Q3 2017 and by 2.5% in the first nine months of the year, compared to the same periods in 2016, attributable to the acquisitions of MTS and Q9, revenue growth from our Internet and IPTV businesses, as well as effective cost management. This was offset in part by significant regulatory pressures, coupled with the ongoing decline of voice, satellite TV and legacy data revenues, including continued competitive re-pricing and reduced customer spending in our business markets.
BELL MEDIA
Bell Media adjusted EBITDA remained stable in Q3 2017, compared to the same period last year, as the growth in operating revenues combined with labour savings offset higher programming and content costs. However, on a year-to-date basis, these factors were more than offset by the flow-through of advertising revenue pressure primarily due to the negative impact of the CRTC’s decision to eliminate simultaneous substitution for the NFL Super Bowl, which resulted in a 1.8% year-over-year decline in the first nine months of the year.
| 2.7 Severance, acquisition and other costs |
2017
Severance, acquisition and other costs of $23 million in the third quarter of 2017 and $143 million on a year-to-date basis included:
- Severance costs related to workforce reduction initiatives of $14 million in Q3 2017 and $61 million on a year-to-date basis
- Acquisition and other costs of $9 million in Q3 2017 and $82 million on a year-to-date basis, including transaction costs, such as legal and financial advisory fees, related to completed or potential acquisitions, severance and integration costs relating to the MTS acquisition as well as a loss on sale of spectrum licences to Xplornet Communications Inc. incurred in Q1 2017
2016
Severance, acquisition and other costs of $25 million in the third quarter of 2016 and $124 million on a year-to-date basis included:
- Severance costs related to workforce reduction initiatives of $17 million in Q3 2016 and $74 million on a year-to-date basis
- Acquisition and other costs of $8 million in Q3 2016 and $50 million on a year-to-date basis, which includes transaction costs, such as legal and financial advisory fees, related to completed or potential acquisitions as well as severance and integration costs relating to the privatization of Bell Aliant Inc.
| 2.8 Depreciation and amortization |
DEPRECIATION
Depreciation in the third quarter and on a year-to-date basis in 2017 increased by $59 million and $98 million, respectively, compared to the same periods in 2016, mainly due to the acquisition of MTS and a higher asset base as we continued to invest in our broadband and wireless networks as well as our IPTV service. The increase was partly offset by lower depreciation as a result of an increase in the estimate of useful lives of certain assets as a result of our ongoing annual review process. The changes in useful lives have been applied prospectively, effective January 1, 2017, and are not expected to have a significant impact on our financial statements.
| 10 BCE Inc. 2017 THIRD QUARTER SHAREHOLDER REPORT | | | |
|
| | | | |
| | 2 | Consolidated financial analysis | MD&A |
AMORTIZATION
Amortization in the third quarter and on a year-to-date basis in 2017 increased by $47 million and $138 million, respectively, compared to the same periods in 2016, due mainly to the acquisition of MTS and a higher asset base.
INTEREST EXPENSE
Interest expense in the third quarter of 2017 and on a year-to-date basis in 2017 increased by $15 million and $51 million, respectively, compared to the same periods last year, mainly as a result of higher average debt levels due in part to the acquisition of MTS, partly offset by lower average interest rates.
INTEREST ON POST-EMPLOYMENT BENEFIT OBLIGATIONS
Interest on our post-employment benefit obligations is based on market conditions that existed at the beginning of the year. On January 1, 2017, the discount rate was 4.0% as compared to 4.2% on January 1, 2016.
In the third quarter and on a year-to-date basis in 2017, interest on post-employment benefit obligations decreased by $2 million and $7 million, respectively, compared to the same periods last year, due to a lower net post-employment benefit obligation at the beginning of the year.
The impacts of changes in market conditions during the year are recognized in other comprehensive income (loss) (OCI).
| 2.10 Other (expense) income |
2017
Other expense of $56 million in the third quarter of 2017 included losses from our equity investments of $39 million and early debt redemption costs of $16 million.
Other expense of $40 million on a year-to-date basis in 2017 included losses on retirements and disposals of property, plant and equipment and intangible assets of $34 million, early debt redemption costs of $20 million, losses on investments of $12 million and losses from our equity investments of $10 million, partly offset by mark-to-market gains on derivatives used as economic hedges of share-based compensation and U.S. dollar purchases of $41 million.
2016
Other expense of $13 million in the third quarter of 2016 included losses from our equity investments of $80 million due in large part to our share of the loss recorded by one of our equity investments on the sale of a portion of its operations of $46 million. This was partly offset by related gains on investments of $34 million and net mark-to-market gains of $24 million on derivatives used as economic hedges of U.S. dollar purchases.
Other income of $51 million on a year-to-date basis in 2016 included mark-to-market gains of $68 million on derivatives used as economic hedges of share-based compensation, partly offset by mark-to-market losses on derivatives used as economic hedges of U.S. dollar purchases and gains on investments of $48 million. These were partly offset by losses of $81 million on equity investments due in large part to our share of the loss recorded by one of our equity investments on the sale of a portion of its operations of $46 million.
Income taxes in the third quarter and on a year-to-date basis in 2017 decreased by $47 million and by $61 million, respectively, compared to the same period last year, due in part to favourable resolution of uncertain tax positions and lower taxable income.
| 2.12 Net earnings attributable to common shareholders and EPS |
Net earnings attributable to common shareholders of $770 million in the third quarter of 2017 increased by $18 million, compared to the same period last year, due to increased operating revenues, which contributed to higher adjusted EBITDA, and lower income taxes, partly offset by increased depreciation and amortization expense, higher other expense and an increase in finance costs.
Year to date, net earnings attributable to common shareholders of $2,211 million decreased by $26 million, compared to the same period last year, due to increased depreciation and amortization expense, higher other expense, an increase in finance costs and higher severance, acquisition and other costs which reflected the acquisition of MTS. This was partly offset by an increase in adjusted EBITDA, as growing revenues more than offset an increase in operating costs, and by lower income taxes.
BCE’s EPS of $0.86 in Q3 2017 and $2.48 on a year-to-date basis in 2017 decreased by $0.01 and $0.10, respectively, compared to the same periods last year. The average number of BCE common shares outstanding increased principally as a result of shares issued for the acquisition of MTS which further diluted EPS as compared to both Q3 2016 and YTD 2016.
Excluding the impact of severance, acquisition and other costs, net (losses) on investments, impairment charges, and early debt redemption costs, adjusted net earnings in the third quarter of 2017 was $799 million, or $0.88 per common share, compared to $784 million, or $0.91 per common share, for the same period last year. Adjusted net earnings in the first nine months of 2017 was $2,349 million, or $2.63 per common share, compared to $2,342 million, or $2.70 per common share, for the first nine months of 2016.
| | | | BCE Inc. 2017 THIRD QUARTER SHAREHOLDER REPORT 11 |
|
| | | | |
| 3 | Business segment analysis
Bell Wireless | MD&A | |
| 3 Business segment analysis |
Key business developments
LTE NETWORK LEADERSHIP
Bell’s mobile LTE network provided coverage to 99% of Canadians at the end of Q3 2017 with download speeds ranging from 75 Mbps to 150 Mbps (expected average download speeds of 12 to 40 Mbps), including 82% of the population covered by LTE-A service that provides data download speeds up to 260 Mbps (expected average download speeds of 18 to 74 Mbps). In addition, our Tri-band LTE-A footprint now covers 33% of Canadians delivering download speeds of up to 335 Mbps (expected average download speeds of 25 to 100 Mbps). Combined with enhanced 256 QAM (quadrature amplitude modulation) technology, Bell’s Quad Band LTE-A network delivers mobile data speeds of up to 750 Mbps, with expected average download speeds of 25 to 230 Mbps in select areas. Bell’s Quad Band service has now expanded to 21% of Canadians, encompassing 64 cities and towns in 8 provinces.
MOBILE DEVICE LINEUP EXPANDED
Bell Mobility’s extensive device lineup continued to expand in Q3 2017 with the addition of a number of new 4G LTE and LTE-A devices from leading handset manufacturers, including the Samsung Galaxy Note8 smartphone, Google’s Pixel 2 smartphone (with the larger Pixel 2 XL to arrive November 15), Apple’s iPhone 8 and 8 Plus and the Apple Watch Series 3, which adds built-in cellular to the world’s number one watch.
BELL FIRST CANADIAN CARRIER TO OFFER CELLULAR SERVICE FOR NEW APPLE WATCH
Bell is the first Canadian wireless provider to support the LTE network capabilities of the new Apple Watch Series 3. In addition to providing Voice over LTE (VoLTE) technology, Bell launched NumberShare, a service that enables customers to pair their Apple Watch Series 3 with their iPhone using the same phone number. Bell customers can add the new Apple Watch Series 3 to select smartphone data plans with Bell’s $5/month Smartwatch plan featuring NumberShare.
BELL MOBILITY FIRST TO LAUNCH INTEGRATED ADVANCED MESSAGING EXPERIENCE ON SAMSUNG DEVICES FOR CANADIAN SMARTPHONE USERS
On August 30, 2017, Bell Mobility launched the first integrated Advanced Messaging service on Samsung devices, offering a suite of mobile messaging features previously available through specialized third-party applications. Advanced Messaging offers: enhanced delivery notifications; longer messages and group chat; file transfers that support higher-resolution pictures, longer videos and additional file types; and one messaging inbox and conversation history.
BELL FIRST IN NORTH AMERICA TO INSTALL MICROCELLS ON NEWSPAPER BOXES
Through an exclusive partnership with Metro News, Bell Mobility is installing mini wireless towers, known as microcells, on existing newspaper boxes. This innovative solution allows Bell to quickly and cost-effectively increase our network capacity by using existing real estate. Microcells add network capacity in busy areas, increasing reliability and browsing speed during peak usage times, further strengthening the performance of Bell’s LTE mobile network. Creating more LTE access points is an important step in preparing Canadian cities for future Fifth Generation (5G) connectivity. Bell recently installed small cells on 10 Astral Out of Home (AOOH) advertising signs across the Greater Toronto Area.
BELL LAUNCHES GLOBAL INTERNET OF THINGS CONNECTIVITY SOLUTION
In August 2017, Bell became the first Canadian carrier to offer global connectivity for our leading-edge Internet of Things (IoT) platforms and applications. Bell’s new Global IoT connectivity solutions offer our customers uninterrupted worldwide network access and the ability to manage all of their international devices remotely from a single web platform. Previously when businesses shipped IoT products across a border they needed to physically swap the device’s SIM card to a local carrier. Now, by embedding Bell’s new Global SIM cards into their products, our customers can use a single web-based platform to remotely switch their devices onto any of our 70+ international partners’ networks and receive localized support for their devices in more than 120 countries. International customers with assets in Canada can also use Global SIM cards to remotely switch their devices to the Bell network, allowing us to provide them with localized support.
| 12 BCE Inc. 2017 THIRD QUARTER SHAREHOLDER REPORT | | | |
|
| | | | |
| | 3 | Business segment analysis
Bell Wireless | MD&A |
| Financial performance analysis |
2017 PERFORMANCE HIGHLIGHTS
| (1) | As a result of the acquisition of MTS on March 17, 2017, our wireless subscriber base in Q1 2017 increased by 476,932 subscribers (418,427 postpaid). Subsequently, in Q2 2017, Bell’s wireless subscriber base reflected the divestiture of 104,833 postpaid subscribers to TELUS related to BCE’s acquisition of MTS. Bell’s wireless subscriber base in Q2 2017 also reflected the removal of 7,268 subscribers (2,450 postpaid and 4,818 prepaid), due to the decommissioning of the CDMA network in western Canada. |
BELL WIRELESS RESULTS
REVENUES
| Q3 2017 | | Q3 2016 | | $ CHANGE | | % CHANGE | | YTD 2017 | | YTD 2016 | | $ CHANGE | | % CHANGE | |
External service revenues | 1,901 | | 1,711 | | 190 | | 11.1% | | 5,424 | | 4,900 | | 524 | | 10.7% | |
Inter-segment service revenues | 12 | | 10 | | 2 | | 20.0% | | 32 | | 29 | | 3 | | 10.3% | |
Total operating service revenues | 1,913 | | 1,721 | | 192 | | 11.2% | | 5,456 | | 4,929 | | 527 | | 10.7% | |
External product revenues | 126 | | 127 | | (1 | ) | (0.8% | ) | 354 | | 345 | | 9 | | 2.6% | |
Inter-segment product revenues | 1 | | – | | 1 | | n.m. | | 3 | | 2 | | 1 | | 50.0% | |
Total operating product revenues | 127 | | 127 | | – | | – | | 357 | | 347 | | 10 | | 2.9% | |
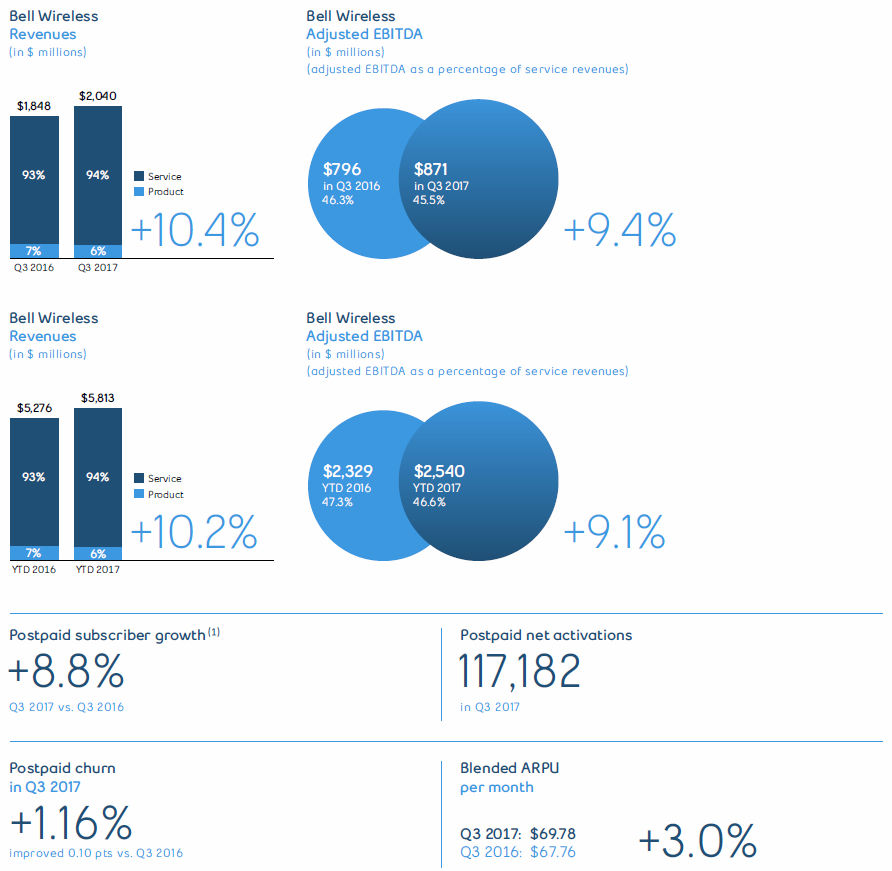
Total Bell Wireless revenues | 2,040 | | 1,848 | | 192 | | 10.4% | | 5,813 | | 5,276 | | 537 | | 10.2% | |
| | | | BCE Inc. 2017 THIRD QUARTER SHAREHOLDER REPORT 13 |
|
| | | | |
| 3 | Business segment analysis
Bell Wireless | MD&A | |
Bell Wireless operating revenues improved by 10.4% in Q3 2017 and by 10.2% year to date, compared to the same periods in 2016, mainly driven by growth in service revenues.
- Service revenues increased by 11.2% in the third quarter of 2017 and by 10.7% for the first nine months of the year, compared to the same periods last year, driven by an increase in the postpaid subscriber base, continued growth in blended ARPU and the contribution from the MTS acquisition. The increase in blended ARPU was due to the larger proportion of postpaid customers in our total subscriber base, higher average monthly rates mainly from the flow-through of 2016 pricing changes, and increased smartphone penetration combined with a growing base of postpaid LTE and LTE-A customers in our subscriber mix, which continued to drive greater data consumption and demand for larger data plans. The year-over-year increase in service revenues was partially offset by the unfavourable impact of Telecom Decision CRTC 2016-171 and the increased adoption of all-inclusive voice and text rate plans resulting in lower out of bundle usage.
- Product revenues were stable in Q3 2017 but grew by 2.9% year to date, compared to the same periods in 2016. The revenue growth in the first nine months of the year was driven by a larger proportion of more expensive devices in our sales mix and an increase in customer upgrades and gross activations, along with the favourable contribution from the MTS acquisition, moderated in part by increased promotional offers due to a highly competitive marketplace.
OPERATING COSTS AND ADJUSTED EBITDA
| Q3 2017 | | Q3 2016 | | $ CHANGE | | % CHANGE | | YTD 2017 | | YTD 2016 | | $ CHANGE | | % CHANGE | |
Operating costs | (1,169 | ) | (1,052 | ) | (117 | ) | (11.1% | ) | (3,273 | ) | (2,947 | ) | (326 | ) | (11.1% | ) |
Adjusted EBITDA | 871 | | 796 | | 75 | | 9.4% | | 2,540 | | 2,329 | | 211 | | 9.1% | |
Total adjusted EBITDA margin | 42.7 | % | 43.1 | % | | | (0.4 pts | ) | 43.7 | % | 44.1 | % | | | (0.4 pts | ) |
Adjusted EBITDA margin (service revenues) | 45.5 | % | 46.3 | % | | | (0.8 pts | ) | 46.6 | % | 47.3 | % | | | (0.7 pts | ) |
Bell Wireless operating costs increased by 11.1% in both Q3 2017 and for the first nine months of the year, compared to the same periods in 2016, as a result of:
- Higher customer retention spending from increased promotional pricing due to a competitive marketplace, a larger proportion of high-end smartphone devices in our upgrade mix, higher handset costs and a greater number of subsidized upgrades driven by a larger number of contract expiries
- Increased subscriber acquisition costs from higher promotional pricing due to a competitive marketplace, a higher proportion of premium smartphones in our sales mix, higher handset costs, a greater proportion of postpaid gross activations in our mix and higher gross activations
- The acquisition of MTS
- Increased network operating costs driven by greater LTE and LTE-A network usage
- An increase in labour costs to support the growth of the business
Bell Wireless adjusted EBITDA was up by 9.4% in Q3 2017 and by 9.1% year to date, compared to the same periods in 2016, reflecting the flow-through of increased operating revenues from a larger subscriber base and the continued growth in blended ARPU along with the favourable contribution from the acquisition of MTS, moderated in part by higher year-over-year operating expenses driven primarily by our greater investment in customer retention and acquisition. Adjusted EBITDA margin, based on wireless operating service revenues, declined to 45.5%, in Q3 2017, and to 46.6% year to date, compared to 46.3% in Q3 2016 and 47.3% for the first nine months of last year.
BELL WIRELESS OPERATING METRICS
| Q3 2017 | | Q3 2016 | | CHANGE | | % CHANGE | | YTD 2017 | | YTD 2016 | | CHANGE | | % CHANGE | |
Blended ARPU ($/month) | 69.78 | | 67.76 | | 2.02 | | 3.0% | | 67.60 | | 65.04 | | 2.56 | | 3.9% | |
Gross activations | 460,053 | | 453,078 | | 6,975 | | 1.5% | | 1,211,923 | | 1,163,934 | | 47,989 | | 4.1% | |
Postpaid | 390,985 | | 381,630 | | 9,355 | | 2.5% | | 1,026,993 | | 974,022 | | 52,971 | | 5.4% | |
Prepaid | 69,068 | | 71,448 | | (2,380 | ) | (3.3% | ) | 184,930 | | 189,912 | | (4,982 | ) | (2.6% | ) |
Net activations (losses) | 106,982 | | 100,256 | | 6,726 | | 6.7% | | 174,570 | | 135,118 | | 39,452 | | 29.2% | |
Postpaid | 117,182 | | 107,265 | | 9,917 | | 9.2% | | 241,575 | | 202,918 | | 38,657 | | 19.1% | |
Prepaid | (10,200 | ) | (7,009 | ) | (3,191 | ) | (45.5% | ) | (67,005 | ) | (67,800 | ) | 795 | | 1.2% | |
Blended churn % (average per month) | 1.32 | % | 1.41 | % | | | 0.09 pts | | 1.31 | % | 1.38 | % | | | 0.07 pts | |
Postpaid | 1.16 | % | 1.26 | % | | | 0.10 pts | | 1.14 | % | 1.18 | % | | | 0.04 pts | |
Prepaid | 2.95 | % | 2.86 | % | | | (0.09 pts | ) | 3.15 | % | 3.17 | % | | | 0.02 pts | |
Subscribers(1) | 9,008,273 | | 8,380,949 | | 627,324 | | 7.5% | | 9,008,273 | | 8,380,949 | | 627,324 | | 7.5% | |
Postpaid(1) | 8,243,446 | | 7,578,334 | | 665,112 | | 8.8% | | 8,243,446 | | 7,578,334 | | 665,112 | | 8.8% | |
Prepaid | 764,827 | | 802,615 | | (37,788 | ) | (4.7% | ) | 764,827 | | 802,615 | | (37,788 | ) | (4.7% | ) |
| (1) | As a result of the acquisition of MTS on March 17, 2017, our wireless subscriber base in Q1 2017 increased by 476,932 subscribers (418,427 postpaid). Subsequently, in Q2 2017, Bell’s wireless subscriber base reflected the divestiture of 104,833 postpaid subscribers to TELUS related to BCE’s acquisition of MTS. Bell’s wireless subscriber base in Q2 2017 also reflected the removal of 7,268 subscribers (2,450 postpaid and 4,818 prepaid), due to the decommissioning of the CDMA network in western Canada. |
Blended ARPU grew by 3.0% to $69.78 in Q3 2017, and by 3.9% to $67.60 year to date, compared to the same periods in 2016. The increase in blended ARPU was due to a larger proportion of postpaid customers in our total subscriber base and from postpaid ARPU strength driven by the flow-through of 2016 pricing changes and an increase in the mix of customers with smartphones and other data devices in our total subscriber base increasing the demand for larger data plans due to greater data consumption from e-mail, web browsing, social networking, mobile banking, messaging, mobile TV, as well as entertainment services such as video streaming, music downloads and gaming. The growth in ARPU was also favourably impacted by greater data consumption from the higher speeds enabled by the continued expansion of our LTE and LTE-A networks. The year-over-year increase
| 14 BCE Inc. 2017 THIRD QUARTER SHAREHOLDER REPORT | | | |
|
| | | | |
| | 3 | Business segment analysis
Bell Wireless | MD&A |
in blended ARPU was moderated by the negative impact of Telecom Decision CRTC 2016-171 along with the unfavourable impact of larger plans with higher data usage thresholds, unlimited local and long distance calling, and a greater mix of shared plans.
Total gross wireless activations increased by 1.5% in Q3 2017 and by 4.1% in the first nine months of 2017, compared to the same periods last year, due to higher postpaid gross activations, offset in part by lower prepaid gross activations.
- Postpaid gross activations increased by 2.5% in Q3 2017 and by 5.4% year to date, driven by Bell’s mobile network speed and technology leadership, effective sales execution of targeted promotions across all our retail channels and the contribution of Bell MTS
- Prepaid gross activations declined by 3.3% in Q3 2017 and by 2.6% for the first nine months of the year
Blended wireless churn improved by 0.09 pts to 1.32% in Q3 2017, compared to last year, reflecting lower postpaid churn, in part offset by higher prepaid churn. For the first nine months of 2017, blended wireless churn improved by 0.07 pts to 1.31%, compared to the same period in 2016, reflecting both lower postpaid and prepaid churn.
- Postpaid churn improved by 0.10 pts to 1.16% in the third quarter and by 0.04 pts to 1.14% year to date, driven by the favourable impact of our ongoing investment in customer retention and improved client experience
- Prepaid churn increased by 0.09 pts to 2.95% in Q3 2017, due to a relatively stable level of deactivations over a declining subscriber base. For the first nine months of the year, prepaid churn improved by 0.02 pts to 3.15%, due to fewer year-over-year customer deactivations.
Postpaid net activations increased by 9.2% in the current quarter and by 19.1% year to date, compared to the same periods in 2016, driven by greater gross activations offset in part by higher customer deactivations.
Prepaid net customer losses increased by 45.5% in Q3 2017 but decreased by 1.2% in the first nine months of the year, compared to last year. The increase in net customer losses in Q3 2017 was mainly due to lower gross activations.
Wireless subscribers totalled 9,008,273 at September 30, 2017, including the subscribers acquired through the acquisition of MTS, net of those divested to TELUS. The proportion of Bell Wireless customers subscribing to postpaid service increased to 92% in Q3 2017 from 90% in Q3 2016.
As at the date of this MD&A, our forward-looking statements set out in the BCE 2016 Annual MD&A, as updated or supplemented in the BCE 2017 First Quarter MD&A, in the BCE 2017 Second Quarter MD&A and in this MD&A, are based on certain assumptions including, without limitation, the following assumptions and the assumptions referred to in each of the other business segment discussions set out in this section 3,Business segment analysis, as well as the economic and market assumptions referred to in section 1.3,Assumptions, of this MD&A.
- Maintain our market share of incumbent wireless postpaid net additions
- Continued adoption of smartphone devices, tablets and data applications, as well as the introduction of more 4G LTE devices and new data services
- Higher subscriber acquisition and retention spending, driven by higher handset costs and more customer device upgrades, reflecting a higher number of off-contract subscribers due to earlier expiries under two-year contracts
- Higher blended ARPU, driven by a higher postpaid smartphone mix, increased data consumption on 4G LTE and LTE-A networks, and higher access rates from 2016 pricing changes
- Completion of the LTE network buildout to 99% of the Canadian population and expansion of the LTE-A network coverage to approximately 87% of the Canadian population, including Manitoba
- Ability to monetize increasing data usage and customer subscriptions to new data services
- Ongoing technological improvements by handset manufacturers and from faster data network speeds that allow customers to optimize the use of our services
- No material financial, operational or competitive consequences of changes in regulations affecting our wireless business
| | | | BCE Inc. 2017 THIRD QUARTER SHAREHOLDER REPORT 15 |
|
| | | | |
| 3 | Business segment analysis
Bell Wireline | MD&A | |
Key business developments
EXPANDING BROADBAND FIBRE FOOTPRINT
Bell’s broadband fibre footprint reached more than 9.1 million homes and businesses at the end of Q3 2017, including approximately 3.8 million fibre-to-the-premise (FTTP) locations, up from 2.8 million one year earlier. Forty percent of our long-term broadband fibre program is expected to be completed by the end of 2017 with direct fibre connections to more than 3.7 million locations in 7 provinces, including most homes and businesses in the City of Toronto.
NEW NATIONAL SERVICE CENTRE IN ATLANTIC CANADA
In a partnership with the Government of New Brunswick, Bell plans to establish 150 new full-time positions over the next 5 years at a new national service centre in Fredericton, supporting the technical requirements of enterprise customers in Atlantic Canada and across the country. These new positions include technical, business and security analysts, quality assurance, developers, and project management resources.
ENHANCED SUITE OF WEB SECURITY SOLUTIONS
On October 18, 2017, Bell announced a partnership with Akamai Technologies Inc. (Akamai), a global leader in content delivery and cloud services, to expand our portfolio of integrated web security solutions for business customers. Complementing Bell solutions to help businesses increase productivity, minimize risk, and maximize service differentiation, Akamai’s leading cloud security, web performance, and media delivery products strengthen our ability to identify security threats, proactively prevent attacks, and support customers in optimizing their online presence.
| Financial performance analysis |
2017 PERFORMANCE HIGHLIGHTS
| 16 BCE Inc. 2017 THIRD QUARTER SHAREHOLDER REPORT | | | |
|
| | | | |
| | 3 | Business segment analysis
Bell Wireline | MD&A |
| (1) | As a result of the acquisition of MTS on March 17, 2017, our high-speed Internet, TV and NAS subscriber bases increased by 229,470, 108,107 (104,661 IPTV) and 419,816 (223,663 residential and 196,153 business) subscribers, respectively. |
| (2) | Following a review of customer accounts by a wholesale reseller, we adjusted our high-speed Internet subscriber base at the beginning of Q1 2017 to remove 3,751 non-revenue generating units. |
BELL WIRELINE RESULTS
REVENUES
| Q3 2017 | | Q3 2016 | | $ CHANGE | | % CHANGE | | YTD 2017 | | YTD 2016 | | $ CHANGE | | % CHANGE | |
Data | 1,806 | | 1,704 | | 102 | | 6.0% | | 5,311 | | 5,046 | | 265 | | 5.3% | |
Local and access | 796 | | 766 | | 30 | | 3.9% | | 2,384 | | 2,336 | | 48 | | 2.1% | |
Long distance | 156 | | 189 | | (33 | ) | (17.5% | ) | 491 | | 563 | | (72 | ) | (12.8% | ) |
Other services | 53 | | 39 | | 14 | | 35.9% | | 152 | | 137 | | 15 | | 10.9% | |
Total external service revenues | 2,811 | | 2,698 | | 113 | | 4.2% | | 8,338 | | 8,082 | | 256 | | 3.2% | |
Inter-segment service revenues | 49 | | 50 | | (1 | ) | (2.0% | ) | 148 | | 128 | | 20 | | 15.6% | |
Total operating service revenues | 2,860 | | 2,748 | | 112 | | 4.1% | | 8,486 | | 8,210 | | 276 | | 3.4% | |
Data | 106 | | 129 | | (23 | ) | (17.8% | ) | 354 | | 388 | | (34 | ) | (8.8% | ) |
Equipment and other | 123 | | 126 | | (3 | ) | (2.4% | ) | 345 | | 363 | | (18 | ) | (5.0% | ) |
Total external product revenues | 229 | | 255 | | (26 | ) | (10.2% | ) | 699 | | 751 | | (52 | ) | (6.9% | ) |
Inter-segment product revenues | 3 | | 2 | | 1 | | 50.0% | | 8 | | 6 | | 2 | | 33.3% | |
Total operating product revenues | 232 | | 257 | | (25 | ) | (9.7% | ) | 707 | | 757 | | (50 | ) | (6.6% | ) |
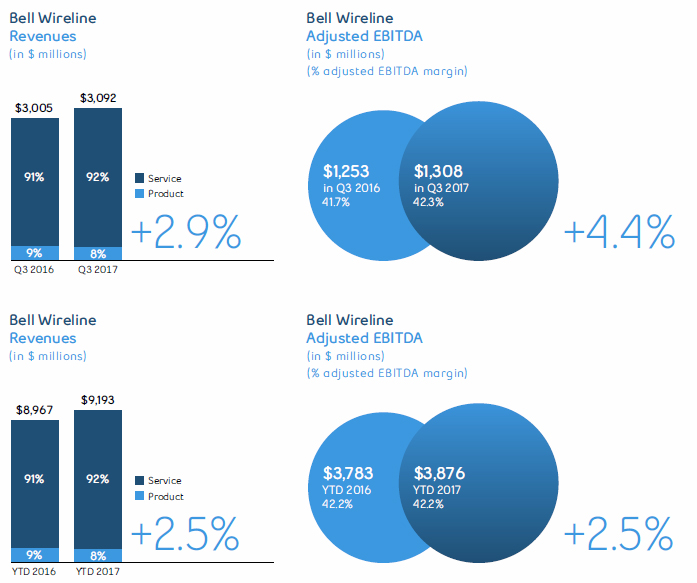
Total Bell Wireline revenues | 3,092 | | 3,005 | | 87 | | 2.9% | | 9,193 | | 8,967 | | 226 | | 2.5% | |
Bell Wireline operating revenues increased by 2.9% in Q3 2017 and by 2.5% in the first nine months of the year, compared to the same periods in 2016, as a result of growth in data, local and access and other services revenues, moderated by declines in long distance and product revenues.
Bell Wireline service revenues increased by 4.1% in Q3 of 2017, and by 3.4% in the first nine months of the year, compared to the same periods last year, driven by the acquisitions of MTS and Q9, along with Internet and IPTV subscriber growth combined with higher household ARPU. The growth was moderated by significant regulatory pressures due to unfavourable CRTC rulings in 2016 relating to Internet tariffs for aggregated wholesale high-speed access services and Telecom Decision CRTC 2016-171. Additionally, the continued erosion in our voice, satellite TV and legacy data services, along with greater customer acquisition, retention and bundle discounts to match aggressive offers from cable competitors, further pressured service revenues.
- Data revenues increased by 6.0% in Q3 2017 and by 5.3% in the first nine months of 2017, compared to the same periods in 2016, driven by the acquisition of MTS, growth in Internet and IPTV subscribers, residential rate increases and higher business solutions services reflecting the acquisition of Q9 and Internet Protocol (IP) based services growth. This was mitigated in part by unfavourable CRTC regulatory impacts relating to lower revised interim rates for aggregated wholesale high-speed Internet access services and Telecom Decision CRTC 2016-171. Data revenues were also unfavourably impacted by lower subscribers in satellite TV, ongoing declines and competitive pricing pressures in legacy data within our business and wholesale markets, together with increased acquisition, retention and bundle discounts on residential TV and Internet services due to aggressive offers from cable competitors.
- Local and access revenues increased by 3.9% in Q3 2017 and by 2.1% in the first nine months of 2017, compared to the same periods last year, as a result of the acquisition of MTS and residential rate increases. This was offset in part by ongoing NAS line erosion attributable to technological substitution to wireless and Internet-based services, large business customer conversions to IP-based data services coupled with competitive pricing pressures and the negative impact from Telecom Decision CRTC 2016-171.
- Long distance revenues declined by 17.5% in the third quarter of 2017 and by 12.8% in the first nine months of the year, compared to the corresponding periods in 2016, as a result of reduced minutes of use by residential and business customers due to NAS line erosion, technology substitution to wireless and over-the-top (OTT) Internet-based services, ongoing rate pressures in our residential market from customer adoption of premium rate plans and decreased sales of international long distance minutes in our wholesale market, partly offset by the contribution from the acquisition of MTS
- Other services revenues increased by 35.9% in the third quarter of 2017 and by 10.9% in the first nine months of the year, compared to last year, driven by the acquisition of MTS
| | | | BCE Inc. 2017 THIRD QUARTER SHAREHOLDER REPORT 17 |
|
| | | | |
| 3 | Business segment analysis
Bell Wireline | MD&A | |
Bell Wireline product revenues decreased by 9.7% in Q3 2017 and by 6.6% in the first nine months of the year, compared to the same periods last year, due to reduced large business customer demand for equipment due to market softness and an increased level of competition in the market, mitigated in part by the favourable impact of the acquisition of MTS.
OPERATING COSTS AND ADJUSTED EBITDA
| Q3 2017 | | Q3 2016 | | $ CHANGE | | % CHANGE | | YTD 2017 | | YTD 2016 | | $ CHANGE | | % CHANGE | |
Operating costs | (1,784 | ) | (1,752 | ) | (32 | ) | (1.8% | ) | (5,317 | ) | (5,184 | ) | (133 | ) | (2.6% | ) |
Adjusted EBITDA | 1,308 | | 1,253 | | 55 | | 4.4% | | 3,876 | | 3,783 | | 93 | | 2.5% | |
Adjusted EBITDA margin | 42.3 | % | 41.7 | % | | | 0.6 pts | | 42.2 | % | 42.2 | % | | | – | |
Bell Wireline operating costs increased by 1.8%, in Q3 2017, and by 2.6%, in the first nine months of 2017, compared to the same periods last year, as a result of:
- The acquisitions of MTS and Q9
- Greater programming and production costs in our TV business to support a greater subscriber base, coupled with contractual rate increases
- Higher fleet related expenses due to increased fuel and refurbishment expenses as well as higher utility costs
These factors were partially offset by:
- Reduced labour costs driven by workforce reductions, vendor contract savings, and lower call volumes to our customer service centres
- Decreased cost of goods sold consistent with reduced product sales
- Lower payments to other carriers attributable to decreased sales of international long distance minutes
- Lower bad debt expense
Year-to-date operating expenses were also unfavourably impacted by higher marketing costs from our retail market to support subscriber acquisitions, mitigated in part by higher advertising costs incurred in Q3 2016 due to the Rio 2016 Summer Olympic Games.
Bell Wireline adjusted EBITDA increased by 4.4% in Q3 2017 and by 2.5% in the first nine months of the year, compared to the same periods in 2016. Adjusted EBITDA margin increased to 42.3% in Q3 2017 compared to 41.7% achieved last year and year-to-date adjusted EBITDA margin of 42.2% remained stable year over year. The increase in adjusted EBITDA was driven by:
- The contribution from the MTS and Q9 acquisitions
- Continued growth from our Internet and IPTV businesses in a highly competitive environment
- Disciplined cost management
These factors were partially offset by:
- Unfavourable CRTC regulatory rulings from 2016 relating to Internet tariffs for aggregated wholesale high-speed access services and Telecom Decision CRTC 2016-171
- The ongoing decline of voice, satellite TV and legacy data revenues, including continued competitive re-pricing and reduced customer spending in our business market
BELL WIRELINE OPERATING METRICS
Data
High-speed Internet
| | Q3 2017 | | Q3 2016 | | CHANGE | | % CHANGE | | YTD 2017 | | YTD 2016 | | CHANGE | | % CHANGE | |
| High-speed Internet net activations | 44,424 | | 39,375 | | 5,049 | | 12.8% | | 60,820 | | 66,697 | | (5,877 | ) | (8.8% | ) |
High-speed Internet subscribers(1) (2) | 3,763,101 | | 3,458,160 | | 304,941 | | 8.8% | | 3,763,101 | | 3,458,160 | | 304,941 | | 8.8% | |
| (1) | As a result of the acquisition of MTS on March 17, 2017, our high-speed Internet subscriber base increased by 229,470. |
| (2) | Following a review of customer accounts by a wholesale reseller, we adjusted our high-speed Internet subscriber base at the beginning of Q1 2017 to remove 3,751 non-revenue generating units. |
High-speed Internet subscriber net activations increased by 12.8% in Q3 2017 due to greater retail gross activations mainly in our fibre-to-the-home (FTTH) footprint, increased pull-through of our IPTV service bundle offers, the ramp-up of activations from Home Internet service by Virgin Mobile Canada which launched in July 2016, higher back to school activations, richer retention offers and modest growth from our business market. Conversely, in the first nine months of the year, net activations decreased by 8.8% compared to 2016, as these factors were more than offset by increased residential churn driven by aggressive offers from cable competitors, particularly in our non-FTTH footprint.
High-speed Internet subscribers at September 30, 2017 totalled 3,763,101, up 8.8% from the end of Q3 2016, including the subscribers acquired from MTS.
| 18 BCE Inc. 2017 THIRD QUARTER SHAREHOLDER REPORT | | | |
|
| | | | |
| | 3 | Business segment analysis
Bell Wireline | MD&A |
TV
| Q3 2017 | | Q3 2016 | | CHANGE | | % CHANGE | | YTD 2017 | | YTD 2016 | | CHANGE | | % CHANGE | |
Net subscriber activations (losses) | 1,738 | | (4,723 | ) | 6,461 | | 136.8% | | (27,262 | ) | 7,377 | | (34,639 | ) | (469.6% | ) |
IPTV | 36,399 | | 36,253 | | 146 | | 0.4% | | 75,228 | | 119,248 | | (44,020 | ) | (36.9% | ) |
Total subscribers(1) | 2,825,754 | | 2,745,873 | | 79,881 | | 2.9% | | 2,825,754 | | 2,745,873 | | 79,881 | | 2.9% | |
IPTV(1) | 1,517,833 | | 1,302,039 | | 215,794 | | 16.6% | | 1,517,833 | | 1,302,039 | | 215,794 | | 16.6% | |
| (1) | As a result of the acquisition of MTS on March 17, 2017, our TV subscriber base increased by 108,107 (104,661 IPTV). |
IPTV net subscriber activations remained essentially stable in the third quarter of 2017 compared to last year, as higher activations due to the launch of Fibe Alt TV on May 15, 2017, our application based live TV streaming, and greater retail gross activations, particularly in our FTTH footprint, were offset by increased deactivations due to aggressive residential offers for service bundles from cable competitors, the impact of maturing Fibe TV markets, reduced footprint expansion in 2017, increased substitution of traditional TV services with OTT services, and reduced customer migrations from satellite TV. The unfavourable factors described above along with the impact of a higher number of retail customers coming off promotional offers more than offset the benefits from higher gross activations, resulting in a year-over-year decline of 36.9% during the first nine months of the year.
Satellite TV net customer losses improved by 15.4% in Q3 2017 and by 8.4% in the first nine months of the year, compared to the corresponding periods in 2016, driven by lower residential deactivations attributable to a more mature subscriber base and fewer migrations to IPTV, moderated by the impact of aggressive residential promotional offers from cable competitors.
Total TV net subscriber activations (IPTV and satellite TV combined) increased by 6,461 in Q3 2017 compared to prior year, driven by stable IPTV net activations and by reduced satellite TV net losses. Conversely, during the first nine months of the year, total TV net subscriber activations declined by 34,639 compared to the same period in 2016, due to lower IPTV net activations, partly offset by fewer satellite TV net losses.
IPTV subscribers at September 30, 2017 totalled 1,517,833, up 16.6% from 1,302,039 subscribers reported at the end of Q3 2016, including the subscribers acquired from MTS.
Satellite TV subscribers at September 30, 2017 totalled 1,307,921, down 9.4% from 1,443,834 subscribers at the end of Q3 of last year.
Total TV subscribers (IPTV and satellite TV combined) at September 30, 2017 were 2,825,754, representing a 2.9% increase since the end of the third quarter of 2016, which included subscribers acquired from MTS.
Local and access
| Q3 2017 | | Q3 2016 | | CHANGE | | % CHANGE | | YTD 2017 | | YTD 2016 | | CHANGE | | % CHANGE | |
NAS LINES | | | | | | | | | | | | | | | | |
Residential(1) | 3,275,589 | | 3,317,124 | | (41,535 | ) | (1.3% | ) | 3,275,589 | | 3,317,124 | | (41,535 | ) | (1.3% | ) |
Business(1) | 3,118,964 | | 3,041,238 | | 77,726 | | 2.6% | | 3,118,964 | | 3,041,238 | | 77,726 | | 2.6% | |
Total | 6,394,553 | | 6,358,362 | | 36,191 | | 0.6% | | 6,394,553 | | 6,358,362 | | 36,191 | | 0.6% | |
NAS NET LOSSES | | | | | | | | | | | | | | | | |
Residential | (57,387 | ) | (80,587 | ) | 23,200 | | 28.8% | | (197,813 | ) | (216,608 | ) | 18,795 | | 8.7% | |
Business | (27,375 | ) | (37,734 | ) | 10,359 | | 27.5% | | (85,182 | ) | (98,170 | ) | 12,988 | | 13.2% | |
Total | (84,762 | ) | (118,321 | ) | 33,559 | | 28.4% | | (282,995 | ) | (314,778 | ) | 31,783 | | 10.1% | |
| (1) | As a result of the acquisition of MTS on March 17, 2017, our NAS subscriber base increased by 419,816 (223,663 residential and 196,153 business) subscribers. |
NAS net losses decreased by 28.4% in Q3 2017 and by 10.1% during the first nine months of the year, compared to the corresponding periods in 2016, due to both lower residential and business net losses.
Residential NAS net losses improved by 28.8% in the third quarter of 2017 and by 8.7% in the first nine months of the year, compared to the same periods last year, driven by greater acquisition and retention of three-product households, increased pull-through from our IPTV service bundle offers and lower customer deactivations. This improvement was partially offset by aggressive competitive offers from cable TV providers, continued wireless and Internet-based technology substitution and the inclusion of Bell MTS net losses.
Business NAS net losses decreased by 27.5% in Q3 2017 and by 13.2% in the first nine months of the year, compared to the same periods in the prior year, driven by lower net losses from our small business market coupled with fewer competitive losses in our wholesale and large business markets. This was moderated by reduced demand for new access lines from large business customers.
NAS subscribers at September 30, 2017 totalled 6,394,553, representing a 0.6% increase compared to the 6,358,362 subscribers reported at the end of Q3 2016, including subscribers acquired from MTS. This was a significant improvement over the 6.4% subscriber base decrease in the third quarter of 2016.
| | | | BCE Inc. 2017 THIRD QUARTER SHAREHOLDER REPORT 19 |
|
| | | | |
| 3 | Business segment analysis
Bell Wireline | MD&A | |
As at the date of this MD&A, our forward-looking statements set out in the BCE 2016 Annual MD&A, as updated or supplemented in the BCE 2017 First Quarter MD&A, in the BCE 2017 Second Quarter MD&A and in this MD&A, are based on certain assumptions including, without limitation, the following assumptions and the assumptions referred to in each of the other business segment discussions set out in this section 3,Business segment analysis, as well as the economic and market assumptions referred to in section 1.3,Assumptions, of this MD&A.
- Positive full-year adjusted EBITDA growth
- Continued growth in residential IPTV and Internet subscribers
- Increasing wireless and Internet-based technological substitution
- Residential services household ARPU growth from increased penetration of multi-product households and price increases
- Aggressive residential service bundle offers from cable TV competitors in our local wireline areas
- Continued large business customer migration to IP-based systems
- Ongoing competitive repricing pressures in our business and wholesale markets
- Continued competitive intensity in our small and mid-sized business markets as cable operators and other telecom competitors continue to intensify their focus on business customers
- Growing consumption of OTT TV services and on-demand streaming video, as well as the proliferation of devices, such as tablets, that consume vast quantities of bandwidth, will require considerable ongoing capital investment
- TV unbundling will not materially accelerate the downsizing of TV packages by customers
- Realization of cost savings related to management workforce attrition and retirements, lower contracted rates from our suppliers, reduction of traffic that is not on our network and operating synergies from the integration of MTS
- Softer wholesale financial performance due to a CRTC decision in October 2016 that significantly lowered capacity-based billing rates for aggregated wholesale high-speed Internet access services
- No other changes in regulations affecting our wireline business having material financial, operational or competitive consequences
| 20 BCE Inc. 2017 THIRD QUARTER SHAREHOLDER REPORT | | | |
|
| | | | |
| | 3 | Business segment analysis
Bell Media | MD&A |
Key business developments
BELL MEDIA’S TSN AND RDS TO DELIVER EXPANDED NHL COVERAGE
Bell Media’s English and French-language sports networks, TSN and RDS, have expanded regional NHL coverage this year with TSN to deliver 191 regular-season games in four markets, and RDS set to broadcast 119 Montréal Canadiens and Ottawa Senators games. TSN will also bring a total of 60 Winnipeg Jets regular season games to viewers in Manitoba.
BELL MEDIA TO ACQUIRE SÉRIES+ AND HISTORIA SPECIALTY CHANNELS
On October 17, 2017, BCE entered into an agreement with Corus to acquire French-language specialty channels Séries+ and Historia. The transaction is valued at approximately $200 million. Subject to closing conditions, including approval by the CRTC and the Competition Bureau, the transaction is expected to close in mid-2018.
Séries+ is a fiction channel, offering locally produced dramas as well as foreign series. Historia broadcasts a suite of locally produced original content including documentaries, reality series and drama series.
The acquisition of Séries+ and Historia is expected to further enhance our competitiveness in the Québec media landscape.
BELL MEDIA TO ACQUIRE FOUR ONTARIO RADIO STATIONS FROM LARCHE COMMUNICATIONS
On August 9, 2017, Bell Media signed an agreement to acquire four FM radio stations in Ontario from Larche Communications Inc. Pending CRTC approval, the addition of these stations to Bell Media’s existing 105 iHeartRadio Canada properties will broaden the network’s industry-leading reach across the country.
CRAVETV PARTNERS WITH JUST FOR LAUGHS TO CREATE ORIGINAL STAND-UP COMEDY SPECIALS
On September 26, 2017, Bell Media’s TV streaming service CraveTV announced a partnership with Just For Laughs on three CraveTV Original Stand-Up comedy specials for its streaming audiences in Canada. This marks CraveTV’s first commission of original stand-up comedy, which will stream on CraveTV in 2018 and anchor the streaming service’s popular Stand-Up Comedy Collection.
STRATEGIC DEVELOPMENT AND PRODUCTION PARTNERSHIP WITH MOTION CONTENT GROUP
On September 11, 2017, Bell Media Studios joined forces with Motion Content Group, GroupM’s new global content investment and rights management company, in a strategic development and production partnership that will create a slate of original programs for international markets. Working together, Bell Media Studios and Motion Content Group will develop, fund, and produce original programming that will include scripted and unscripted content across a wide range of genres.
NEW ASTRAL OUT OF HOME DIGITAL SUPERBOARDS AT TORONTO’S PEARSON AIRPORT
On August 2, 2017, AOOH, in partnership with Toronto Pearson International Airport, introduced two new large-format digital superboards in close proximity to the country’s largest airport. The new structures provide information about the airport while offering an advertising opportunity reaching millions of commuters and passengers annually. The four faces of the new advertising structures deliver a daily circulation of close to 800,000. The addition of these two digital structures puts AOOH in a stronger position in the Toronto market with more than 40 large digital faces. AOOH is the exclusive OOH advertising operator at Toronto Pearson International Airport.
| | | | BCE Inc. 2017 THIRD QUARTER SHAREHOLDER REPORT 21 |
|
| | | | |
| 3 | Business segment analysis
Bell Media | MD&A | |
| Financial performance analysis |
2017 PERFORMANCE HIGHLIGHTS
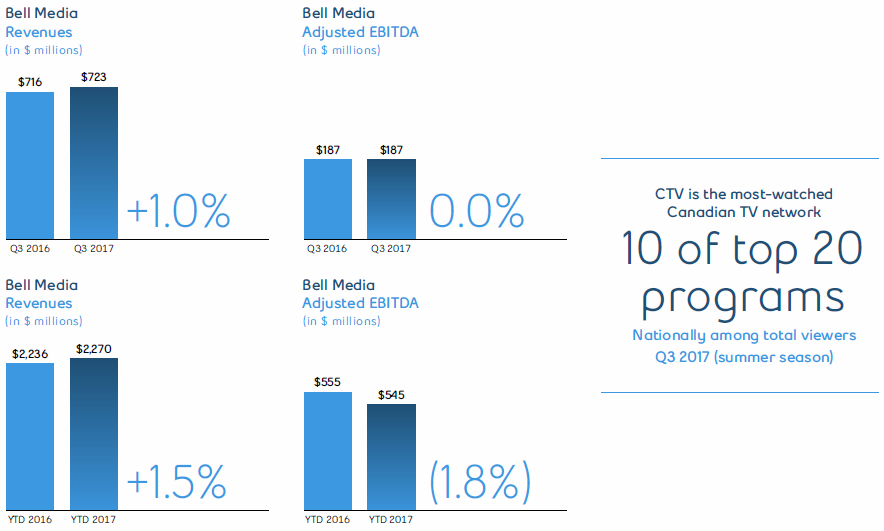
BELL MEDIA RESULTS
REVENUES
| Q3 2017 | | Q3 2016 | | $ CHANGE | | % CHANGE | | YTD 2017 | | YTD 2016 | | $ CHANGE | | % CHANGE | |
Total external revenues | 611 | | 616 | | (5 | ) | (0.8% | ) | 1,946 | | 1,939 | | 7 | | 0.4% | |
Inter-segment revenues | 112 | | 100 | | 12 | | 12.0% | | 324 | | 297 | | 27 | | 9.1% | |
Total Bell Media revenues | 723 | | 716 | | 7 | | 1.0% | | 2,270 | | 2,236 | | 34 | | 1.5% | |
Bell Media operating revenues increased by 1.0% in the third quarter of 2017 and by 1.5% in the first nine months of the year, compared to the same periods in 2016.
Advertising revenues increased year over year in Q3 2017, but declined in the first nine months of 2017, compared to the same periods last year. The growth in Q3 2017 was driven by higher OOH advertising revenues as a result of the contribution from newly awarded contracts and the Cieslok Media acquisition in January 2017. The ongoing market softness and declines in audience levels unfavourably impacted advertising revenues across both conventional and specialty TV and radio media platforms. These pressures were moderated by the year-over-year favourability in conventional TV from the return of advertising dollars following the shift in 2016 to the principal broadcaster of the Rio 2016 Summer Olympics Games. The year-to-date decline in advertising revenues was also unfavourably impacted by the CRTC’s decision to eliminate simultaneous substitution for the NFL Super Bowl.
Subscriber revenues were up in both the third quarter and in the first nine months of 2017, compared to the same periods last year, driven by the growth in our subscriber base from our TV Everywhere GO Products and CraveTV and rate increases on contract renewals. Year-to-date growth in subscriber revenues also reflected the favourability from the expansion of TMN into a national pay TV service in March 2016.
OPERATING COSTS AND ADJUSTED EBITDA
| Q3 2017 | | Q3 2016 | | $ CHANGE | | % CHANGE | | YTD 2017 | | YTD 2016 | | $ CHANGE | | % CHANGE | |
Operating costs | (536 | ) | (529 | ) | (7 | ) | (1.3% | ) | (1,725 | ) | (1,681 | ) | (44 | ) | (2.6% | ) |
Adjusted EBITDA | 187 | | 187 | | – | | – | | 545 | | 555 | | (10 | ) | (1.8% | ) |
Adjusted EBITDA margin | 25.9 | % | 26.1 | % | | | (0.2) pts | | 24.0 | % | 24.8 | % | | | (0.8) pts | |
| 22 BCE Inc. 2017 THIRD QUARTER SHAREHOLDER REPORT | | | |
|
| | | | |
| | 3 | Business segment analysis
Bell Media | MD&A |
Bell Media operating costs increased by 1.3% in the third quarter of 2017 and by 2.6% in the first nine months of 2017, compared to the corresponding periods last year, mainly due to higher programming and content costs primarily relating to the ongoing ramp up of content for CraveTV and pay TV, deal renewals for specialty TV, greater expenses resulting from the Cieslok Media acquisition in OOH, along with the execution of newly awarded contracts. This increase in operating costs was partially mitigated by reduced labour costs driven mainly by workforce reductions.
Bell Media adjusted EBITDA was stable in Q3 2017, compared to last year, as the growth in operating revenues combined with labour savings offset the higher programming and content costs. However, on a year-to-date basis, these factors were more than offset by the flow-through of the advertising revenue pressure primarily resulting from the negative impact of the CRTC’s decision to eliminate simultaneous substitution for the NFL Super Bowl, which drove a 1.8% decline in adjusted EBITDA for the first nine months of the year.
BELL MEDIA OPERATING METRICS
- CTV was the top ranked network in Canada for the 13th consecutive summer season among total viewers and among key viewers aged 18 to 49 and 25 to 54. CTV led Canadian networks with 10 of the top 20 programs among total viewers.
- Bell Media’s English specialty and pay TV properties reached 82% of all Canadian English specialty and pay TV viewers in the average week. Bell Media had 5 of the top 10 English entertainment specialty and pay TV channels among viewers aged 25 to 54 (Space, Discovery, TMN, Comedy and CP24).
- In Québec, Bell Media maintained its leadership position in the French specialty and pay TV markets, reaching 70% of French-language TV viewers in the average week
- Bell Media continued to lead the digital media landscape among Canadian broadcast and video network competitors, reaching 67% of the digital audience with an average of 21 million unique visitors per month, 1.1 billion minutes spent and 358 million videos viewed
- Bell Media remained Canada’s top radio broadcaster, reaching an average of 17.8 million listeners who spent over 77.1 million hours tuned in each week
- AOOH is one of Canada’s leading out-of-home advertising companies with an offering of five innovative product lines and more than 31,000 advertising faces strategically located in the British Columbia, Alberta, Manitoba, Ontario, Québec and Nova Scotia markets
As at the date of this MD&A, our forward-looking statements set out in the BCE 2016 Annual MD&A, as updated or supplemented in the BCE 2017 First Quarter MD&A, in the BCE 2017 Second Quarter MD&A and in this MD&A, are based on certain assumptions including, without limitation, the following assumptions and the assumptions referred to in each of the other business segment discussions set out in this section 3,Business segment analysis, as well as the economic and market assumptions referred to in section 1.3,Assumptions, of this MD&A.
- Higher year-over-year revenue, reflecting further CraveTV subscriber growth, TMN’s national expansion that began in March 2016, and growth in outdoor advertising supported by acquisitions and new contract wins
- Operating cost growth driven by higher TV programming and sports broadcast rights costs, as well as continued investment in CraveTV content
- Continued scaling of CraveTV
- Ability to successfully acquire and produce highly rated programming and differentiated content
- Building and maintaining strategic supply arrangements for content across all screens and platforms
- Increased revenue generation from monetization of content rights and Bell Media properties across all platforms
- TV unbundling and growth in OTT viewing expected to result in lower subscriber levels for many Bell Media TV properties
- No material financial, operational or competitive consequences of changes in regulations affecting our media business
| | | | BCE Inc. 2017 THIRD QUARTER SHAREHOLDER REPORT 23 |
|
| | | | |
| 4 | Financial and capital management | MD&A | |
| 4 Financial and capital management |
This section describes how we manage our cash and capital resources to carry out our strategy and deliver financial results. It provides an analysis of our financial condition, cash flows and liquidity on a consolidated basis.
| SEPTEMBER 30, 2017 | | DECEMBER 31, 2016 | | $ CHANGE | | % CHANGE | |
Debt due within one year | 6,083 | | 4,887 | | 1,196 | | 24.5% | |
Long-term debt | 18,456 | | 16,572 | | 1,884 | | 11.4% | |
Preferred shares(2) | 2,002 | | 2,002 | | – | | – | |
Cash and cash equivalents | (1,979 | ) | (853 | ) | (1,126 | ) | n.m. | |
Net debt | 24,562 | | 22,608 | | 1,954 | | 8.6% | |
n.m.: | not meaningful |
| (1) | Net debt is a non-GAAP financial measure and does not have a standardized meaning under IFRS. Therefore, it is unlikely to be comparable to similar measures presented by other issuers. See section 8.2, Non-GAAP financial measures and key performance indicators (KPIs) – Net debt in this MD&A for more details including a reconciliation to the most comparable IFRS financial measure. |
| (2) | 50% of outstanding preferred shares of $4,004 million in 2017 and 2016 are classified as debt consistent with the treatment by some credit rating agencies. |
The increase of $3,080 million in total debt comprised of debt due within one year and long-term debt was due to:
- the issuance of Series M-40, M-44, M-45 and M-46 MTN debentures at Bell Canada with total principal amounts of $700 million, $1 billion, $500 million and $800 million, respectively
- an increase in our debt of $972 million due to the acquisition of MTS
- an increase in our notes payable (net of repayments) of $56 million
Partly offset by:
- the repayment of borrowings under our unsecured committed term credit facility of $480 million
- the early redemption of Series M-35 debentures in the principal amount of $350 million
- a net decrease of $118 million in our finance lease obligations and other debt
The increase in cash and cash equivalents of $1,126 million was due mainly to cash from operating activities of $5,700 million, $1,839 million of debt issuance (net of repayments) and $323 million from the divestiture of approximately one-quarter of postpaid wireless subscribers and 15 retail locations previously held by MTS, as well as certain Manitoba network assets, to TELUS. This was partly offset by $2,934 million of capital expenditures, dividends paid on BCE common and preferred shares of $1,960 million, $1,635 million paid for business acquisitions mainly related to the acquisitions of MTS and Cieslok Media, and $179 million paid for the purchase on the open market of shares for the settlement of share-based payments.
| 4.2 Outstanding share data |
| COMMON SHARES OUTSTANDING | NUMBER OF SHARES | |
Outstanding, January 1, 2017 | 870,706,332 | |
Shares issued under employee stock option plan | 1,995,896 | |
Shares issued under employee savings plan (ESP) | 91,731 | |
Shares issued for the acquisition of MTS | 27,642,714 | |
Outstanding, September 30, 2017 | 900,436,673 | |
| STOCK OPTIONS OUTSTANDING | NUMBER OF OPTIONS | | WEIGHTED AVERAGE
EXERCISE PRICE ($) | |
Outstanding, January 1, 2017 | 10,242,162 | | 52 | |
Granted | 3,027,986 | | 59 | |
Exercised(1) | (1,995,896 | ) | 46 | |
Forfeited | (239,498 | ) | 58 | |
Outstanding, September 30, 2017 | 11,034,754 | | 55 | |
Exercisable, September 30, 2017 | 2,573,950 | | 45 | |
| (1) | The weighted average share price for options exercised during the nine months ended September 30, 2017 was $60. |
| 24 BCE Inc. 2017 THIRD QUARTER SHAREHOLDER REPORT | | | |
|
| | | | |
| | 4 | Financial and capital management | MD&A |
| Q3 2017 | | Q3 2016 | | $ CHANGE | | % CHANGE | | YTD 2017 | | YTD 2016 | | $ CHANGE | | % CHANGE | |
Cash flows from operating activities | 2,233 | | 1,943 | | 290 | | 14.9% | | 5,700 | | 5,123 | | 577 | | 11.3% | |
Capital expenditures | (1,040 | ) | (976 | ) | (64 | ) | (6.6% | ) | (2,934 | ) | (2,778 | ) | (156 | ) | (5.6% | ) |
Cash dividends paid on preferred shares | (21 | ) | (34 | ) | 13 | | 38.2% | | (94 | ) | (105 | ) | 11 | | 10.5% | |
Cash dividends paid by subsidiaries to NCI | (13 | ) | (13 | ) | – | | – | | (34 | ) | (35 | ) | 1 | | 2.9% | |
Acquisition and other costs paid | 24 | | 31 | | (7 | ) | (22.6% | ) | 128 | | 98 | | 30 | | 30.6% | |
Free cash flow | 1,183 | | 951 | | 232 | | 24.4% | | 2,766 | | 2,303 | | 463 | | 20.1% | |
Business acquisitions | – | | – | | – | | – | | (1,635 | ) | (246 | ) | (1,389 | ) | n.m. | |
Acquisition and other costs paid | (24 | ) | (31 | ) | 7 | | 22.6% | | (128 | ) | (98 | ) | (30 | ) | (30.6% | ) |
Business dispositions | – | | 2 | | (2 | ) | (100.0% | ) | – | | 20 | | (20 | ) | (100.0% | ) |
Decrease in investments | – | | 22 | | (22 | ) | (100.0% | ) | – | | 22 | | (22 | ) | (100.0% | ) |
Loan to related party | – | | (510 | ) | 510 | | 100.0% | | – | | (510 | ) | 510 | | 100.0% | |
Disposition of intangibles and other assets | – | | – | | – | | – | | 323 | | – | | 323 | | n.m. | |
Other investing activities | (37 | ) | (21 | ) | (16 | ) | (76.2% | ) | (51 | ) | (1 | ) | (50 | ) | n.m. | |
(Decrease) increase in notes payable and bank advance | (379 | ) | 4 | | (383 | ) | n.m. | | 56 | | 902 | | (846 | ) | (93.8% | ) |
Increase (reduction) in securitized trade receivables | – | | 305 | | (305 | ) | (100.0% | ) | (10 | ) | 305 | | (315 | ) | n.m. | |
Issue of long-term debt | 1,515 | | 1,497 | | 18 | | 1.2% | | 3,011 | | 2,244 | | 767 | | 34.2% | |
Repayment of long-term debt | (142 | ) | (812 | ) | 670 | | 82.5% | | (1,218 | ) | (2,392 | ) | 1,174 | | 49.1% | |
Issue of common shares | 4 | | 6 | | (2 | ) | (33.3% | ) | 93 | | 98 | | (5 | ) | (5.1% | ) |
Repurchase of shares for settlement of share-based payments | (38 | ) | (15 | ) | (23 | ) | n.m. | | (179 | ) | (94 | ) | (85 | ) | (90.4% | ) |
Cash dividends paid on common shares | (646 | ) | (594 | ) | (52 | ) | (8.8% | ) | (1,866 | ) | (1,712 | ) | (154 | ) | (9.0% | ) |
Other financing activities | (14 | ) | (26 | ) | 12 | | 46.2% | | (36 | ) | (61 | ) | 25 | | 41.0% | |
Net increase in cash and cash equivalents | 1,422 | | 778 | | 644 | | 82.8% | | 1,126 | | 780 | | 346 | | 44.4% | |
n.m.: not meaningful
| Cash flows from operating activities and free cash flow |
Cash flows from operating activities in the third quarter of 2017 increased by $290 million, compared to Q3 2016, due to higher adjusted EBITDA, improved working capital and lower income taxes paid, partly offset by higher interest payments, all of which reflected the contributions from MTS.
The increase in cash flows from operating activities of $577 million for the first nine months of 2017, compared to the same period last year, reflects improved working capital, higher adjusted EBITDA and lower severance payments, partly offset by higher interest payments, all of which reflected the contributions from MTS.
Free cash flow in the third quarter and on a year-to-date basis in 2017 increased by $232 million and $463 million, respectively, compared to the same periods last year, due to an increase in cash flows from operating activities, partly offset by higher capital expenditures.
| Q3 2017 | | Q3 2016 | | $ CHANGE | | % CHANGE | | YTD 2017 | | YTD 2016 | | $ CHANGE | | % CHANGE | |
Bell Wireless | 186 | | 195 | | 9 | | 4.6% | | 513 | | 540 | | 27 | | 5.0% | |
Capital intensity ratio | 9.1 | % | 10.6 | % | | | 1.5 pts | | 8.8 | % | 10.2 | % | | | 1.4 pts | |
Bell Wireline | 820 | | 756 | | (64 | ) | (8.5% | ) | 2,329 | | 2,158 | | (171 | ) | (7.9% | ) |
Capital intensity ratio | 26.5 | % | 25.2 | % | | | (1.3) pts | | 25.3 | % | 24.1 | % | | | (1.2) pts | |
Bell Media | 34 | | 25 | | (9 | ) | (36.0% | ) | 92 | | 80 | | (12 | ) | (15.0% | ) |
Capital intensity ratio | 4.7 | % | 3.5 | % | | | (1.2) pts | | 4.1 | % | 3.6 | % | | | (0.5) pts | |
BCE | 1,040 | | 976 | | (64 | ) | (6.6% | ) | 2,934 | | 2,778 | | (156 | ) | (5.6% | ) |
Capital intensity ratio | 18.3 | % | 18.1 | % | | | (0.2) pts | | 17.5 | % | 17.3 | % | | | (0.2) pts | |
BCE capital expenditures increased by $64 million and $156 million in Q3 2017 and in the first nine months of the year, respectively, compared to the same periods last year. Capital expenditures as a percentage of revenue (capital intensity ratio) was 18.3% and 17.5% in Q3 2017 and year to date, respectively, compared to 18.1% and 17.3% in the same respective periods last year. The growth in capital expenditures reflected higher capital spending in our wireline and media segments, moderated by lower capital spending in our wireless segment as follows:
- Higher spending in our wireline segment of $64 million and $171 million in Q3 2017 and year to date, respectively, was driven by our ongoing investment in the deployment of broadband fibre directly to more homes and businesses, including the rollout of Gigabit Fibe infrastructure in the city of Toronto and other urban areas along with the commencement of the FTTP build-out in the city of Montréal that was announced on March 27, 2017. The year-over-year increase in capital expenditures also reflected the impact of the MTS acquisition and integration.
| | | | BCE Inc. 2017 THIRD QUARTER SHAREHOLDER REPORT 25 |
|
| | | | |
| 4 | Financial and capital management | MD&A | |
- Greater capital spending at Bell Media of $9 million in Q3 2017 and $12 million in the first nine months of the year, due to the Cieslok Media acquisition, the execution of contract wins in AOOH and upgrades to Bell Media broadcast studios and TV production equipment
- Lower wireless capital spending of $9 million in Q3 2017 and $27 million year to date, due to the slower pace of spending compared to last year, offset in part by the acquisition and integration of MTS. Our wireless capital investments reflected the continued roll–out of the LTE-A mobile network and the substantial completion of our 4G LTE network which reached 82% and 99% of the Canadian population, respectively, at September 30, 2017. Additionally, we focused on delivering faster speeds through carrier aggregation, enhancing customer experience and the deployment of small-cell technology to optimize coverage, signal quality and data capacity.
On March 17, 2017, BCE acquired all of the issued and outstanding common shares of MTS for a total consideration of $2,933 million, of which $1,339 million was paid in cash and the remaining $1,594 million through the issuance of approximately 27.6 million BCE common shares.
On January 3, 2017, BCE acquired all of the issued and outstanding common shares of Cieslok Media, for a total cash consideration of $161 million.
In Q1 2016, BCE completed a transaction with Corus under which Corus waived its HBO content rights in Canada and ceased operations of its Movie Central and Encore Avenue pay TV services in Western and Northern Canada, thereby allowing Bell Media to become the sole operator of HBO Canada nationally across all platforms and to expand TMN into a national pay TV service. TMN was successfully launched nationally on March 1, 2016. BCE paid to Corus a total consideration of $218 million, of which $21 million was paid in 2015.
On October 3, 2016, BCE acquired the remaining 64.6% of the issued and outstanding shares of Q9 that it did not already own for a total cash consideration of approximately $170 million. In Q3 2016, prior to the transaction closing, Bell Canada provided a loan of $510 million to Q9 for the repayment of its debt.
| Disposition of intangibles and other assets |
During Q2 2017, BCE completed the previously announced divestiture of approximately one-quarter of postpaid wireless subscribers and 15 retail locations previously held by MTS, as well as certain Manitoba network assets, to TELUS for total proceeds of $323 million.
2017
In the third quarter of 2017, we issued $994 million of debt, net of repayments. This included the issuances of Series M-40 and M-46 MTN debentures at Bell Canada with principal amounts of $700 million and $800 million, respectively, partly offset by the repayment (net of issuances) of $379 million of notes payable and payments of finance leases and other debt of $127 million.
In the first nine months of 2017, we issued $1,839 million of debt, net of repayments. This included the issuances of Series M-40, M-44, M-45 and M-46 MTN debentures at Bell Canada with principal amounts of $700 million, $1 billion, $500 million and $800 million, respectively and the issuance (net of repayments) of $56 million of notes payable. These issuances were partly offset by the repayment of borrowings under our unsecured committed term credit facility of $480 million, payments of finance leases and other debt of $387 million and the early redemption of Series M-35 debentures with a principal amount of $350 million.
2016
In the third quarter of 2016, we issued $994 million of debt, net of repayments. This included the issuance of Series M-42 MTN and M-43 MTN debentures at Bell Canada with principal amounts of $850 million and $650 million, respectively, and an increase in our loans secured by trade receivables of $305 million, partly offset by the early debt redemption of Series M-18 MTN debentures with a principal amount of $700 million and payments of finance leases and other debt of $111 million.
In the first nine months of 2016, we issued $1,059 million of debt, net of repayments. This included the issuance of Series M-41 MTN, M-42 MTN and M-43 MTN debentures at Bell Canada with principal amounts of $750 million, $850 million and $650 million, respectively, the issuance (net of repayments) of $902 million of notes payable and an increase in our loans secured by trade receivables of $305 million. These issuances were partly offset by the early debt redemption of Series M-18 MTN, M-19 MTN, M-23 MTN and Series M-32 debentures, with principal amounts of $700 million, $200 million, $500 million and $500 million, respectively, the repayment of Series M-38 debentures of $150 million and payments of finance leases and other debt of $348 million.
| Cash dividends paid on common shares |
In the third quarter of 2017, cash dividends paid on common shares increased by $52 million compared to Q3 2016, due to a higher dividend paid in Q3 2017 of $0.7175 per common share compared to $0.6825 per common share in Q3 2016 and a higher number of outstanding common shares principally as a result of shares issued for the acquisition of MTS.
In the first nine months of 2017, cash dividends paid on common shares increased by $154 million compared to 2016, due to a higher dividend paid in the first nine months of 2017 of $2.1175 per common share compared to $2.015 per common share for the same period last year and a higher number of outstanding common shares principally as a result of shares issued for the acquisition of MTS.
| 26 BCE Inc. 2017 THIRD QUARTER SHAREHOLDER REPORT | | | |
|
| | | | |
| | 4 | Financial and capital management | MD&A |
| 4.4 Post-employment benefit plans |
For the three months ended September 30, 2017, we recorded a decrease in our post-employment benefit obligations and a gain, before taxes and non-controlling interest (NCI), in OCI of $643 million. This was due to a higher actual discount rate of 3.9% at September 30, 2017, as compared to 3.6% at June 30, 2017. The gain was partly offset by a lower-than-expected return on plan assets.
For the nine months ended September 30, 2017, we recorded an increase in our post-employment benefit obligations and a loss, before taxes and NCI, in OCI of $150 million. This was due to a lower actual discount rate of 3.9% at September 30, 2017, as compared to 4.0% at December 31, 2016. The loss was partly offset by a higher-than-expected return on plan assets.
For the three and nine months ended September 30, 2016, we recorded an increase in our post-employment benefit obligations and a loss, before taxes and NCI, in OCI of $276 million and $1,622 million, respectively. This was due to a lower actual discount rate of 3.4% at September 30, 2016, as compared to 3.6% at June 30, 2016 and 4.2% at December 31, 2015. The loss was partly offset by a higher-than-expected return on plan assets.
| 4.5 Financial risk management |
Fair value
The following table provides the fair value details of financial instruments measured at amortized cost in the statements of financial position.
| | | SEPTEMBER 30, 2017 | DECEMBER 31, 2016 |
| | CLASSIFICATION | FAIR VALUE METHODOLOGY | CARRYING
VALUE | | FAIR
VALUE | | CARRYING
VALUE | | FAIR
VALUE | |
CRTC tangible benefits obligation | Trade payables and other liabilities and non-current liabilities | Present value of estimated future cash flows discounted using observable market interest rates | 129 | | 129 | | 166 | | 169 | |
CRTC deferral account obligation | Trade payables and other liabilities and non-current liabilities | Present value of estimated future cash flows discounted using observable market interest rates | 127 | | 132 | | 136 | | 145 | |
Debentures, finance leases and other debt | Debt due within one year and long-term debt | Quoted market price of debt or present value of future cash flows discounted using observable market interest rates | 20,667 | | 22,518 | | 17,879 | | 20,093 | |
The following table provides the fair value details of financial instruments measured at fair value in the statements of financial position.
| | | | | FAIR VALUE |
| CLASSIFICATION | CARRYING VALUE OF
ASSET (LIABILITY) | | QUOTED PRICES IN
ACTIVE MARKETS FOR
IDENTICAL ASSETS
(LEVEL 1) | | OBSERVABLE
MARKET DATA
(LEVEL 2)(1) | | NON-OBSERVABLE
MARKET INPUTS
(LEVEL 3)(2) | |
September 30, 2017 | | | | | | | | | |
Available-for-sale (AFS) publicly-traded and privately-held investments(3) | Other non-current assets | 103 | | 1 | | – | | 102 | |
Derivative financial instruments | Other current assets, trade payables and other liabilities, other non-current assets and liabilities | (29 | ) | – | | (29 | ) | – | |
MLSE financial liability (4) | Trade payables and other liabilities | (135 | ) | – | | – | | (135 | ) |
Other | Other non-current assets and liabilities | 43 | | – | | 99 | | (56 | ) |
December 31, 2016 | | | | | | | | | |
AFS publicly-traded and privately-held investments(3) | Other non-current assets | 103 | | 1 | | – | | 102 | |
Derivative financial instruments | Other current assets, trade payables and other liabilities, other non-current assets and liabilities | 166 | | – | | 166 | | – | |
MLSE financial liability(4) | Trade payables and other liabilities | (135 | ) | – | | – | | (135 | ) |
Other | Other non-current assets and liabilities | 35 | | – | | 88 | | (53 | ) |
| (1) | Observable market data such as equity prices, interest rates, swap rate curves and foreign currency exchange rates. |
| (2) | Non-observable market inputs such as discounted cash flows and earnings multiples. A reasonable change in our assumptions would not result in a significant increase (decrease) to our level 3 financial instruments. |
| (3) | Unrealized gains and losses on AFS financial assets are recorded in OCI and are reclassified to Other (expense) income in the income statements when realized or when an impairment is determined. |
| (4) | Represents BCE’s obligation to repurchase the BCE Master Trust Fund’s (Master Trust) 9% interest in Maple Leaf Sports & Entertainment Ltd. (MLSE) at a price not less than an agreed minimum price should the Master Trust exercise its put option. The obligation to repurchase is marked to market each reporting period and the gain or loss is recorded in Other (expense) income in the income statements. |
| | | | BCE Inc. 2017 THIRD QUARTER SHAREHOLDER REPORT 27 |
|
| | | | |
| 4 | Financial and capital management | MD&A | |
We use foreign currency forward contracts, options and cross currency basis swaps to manage foreign currency risk related to anticipated transactions and certain foreign currency debt. During Q1 2017, we settled a cross currency basis swap with a notional amount of $357 million in U.S. dollars used to hedge borrowings under a credit facility. Refer to Note 10,Debt, in BCE’s Q3 2017 Financial Statements.
A 10% depreciation (appreciation) in the value of the Canadian dollar relative to the U.S. dollar would result in a gain (loss) of $2 million recognized in net earnings at September 30, 2017 and a gain (loss) of $156 million recognized in other comprehensive income at September 30, 2017, with all other variables held constant.
The following table provides further details on our outstanding foreign currency forward contracts at September 30, 2017.
| TYPE OF HEDGE | BUY CURRENCY | | AMOUNTS
TO RECEIVE | | SELL CURRENCY | | AMOUNTS
TO PAY | | MATURITY | | HEDGED ITEM | |
Cash flow | USD | | 2,345 | | CAD | | 2,905 | | 2017 | | Commercial paper | |
Cash flow | USD | | 240 | | CAD | | 312 | | 2017 | | Anticipated transactions | |
Cash flow | USD | | 901 | | CAD | | 1,172 | | 2018 | | Anticipated transactions | |
Cash flow | CAD | | 97 | | USD | | 75 | | 2018-2019 | | Anticipated transactions | |
Cash flow | USD | | 542 | | CAD | | 678 | | 2019 | | Anticipated transactions | |
Cash flow | USD | | 109 | | CAD | | 139 | | 2020-2021 | | Anticipated transactions | |
Economic | CAD | | 56 | | USD | | 44 | | 2017 | | Anticipated transactions | |
Economic | USD | | 81 | | CAD | | 108 | | 2017-2018 | | Anticipated transactions | |
A 1% increase (decrease) in interest rates would result in a decrease (increase) of $24 million in net earnings at September 30, 2017, with all other variables held constant.
We use equity forward contracts on BCE’s common shares to economically hedge the cash flow exposure related to the settlement of share-based payment plans. The fair value of our equity forward contracts at September 30, 2017 was $12 million.
A 5% increase (decrease) in the market price of BCE’s common shares at September 30, 2017 would result in a gain (loss) of $37 million recognized in net earnings, with all other variables held constant.
BCE’s and Bell Canada’s key credit ratings remain unchanged from those described in the BCE 2016 Annual MD&A.
In Q3 2017, Bell Canada extended the terms of its $2.5 billion committed revolving facility from November 2021 to November 2022 and its $1 billion committed expansion facility from November 2019 to November 2020.
On November 1, 2017, subsequent to quarter end, Bell Canada extended the term of its $1.3 billion securitized trade receivables program from December 31, 2018 to November 1, 2020.
All other cash requirements remain substantially unchanged from those described in the BCE 2016 Annual MD&A.
| Commitments (Off-balance sheet) |
On October 17, 2017, BCE entered into an agreement with Corus to acquire French-language specialty channels Séries+ and Historia. The transaction is valued at approximately $200 million. Subject to closing conditions, including approval by the CRTC and the Competition Bureau, the transaction is expected to close in mid-2018.
As a result of the acquisition of MTS, our commitments for operating leases and purchase obligations increased by approximately $180 million on March 17, 2017.
| 28 BCE Inc. 2017 THIRD QUARTER SHAREHOLDER REPORT | | | |
|
| | | | |
| | 5 | Quarterly financial information | MD&A |
| 5 Quarterly financial information |
BCE’s Q3 2017 Financial Statements were prepared in accordance with IFRS, as issued by the International Accounting Standards Board (IASB), under International Accounting Standard (IAS) 34 - Interim Financial Reporting and were approved by BCE’s board of directors on November 1, 2017.
The following table, which was also prepared in accordance with IFRS, shows selected consolidated financial data of BCE for the eight most recent completed quarters.
| | 2017 | 2016 | 2015 |
| | Q3 | | Q2 | | Q1 | | Q4 | | Q3 | | Q2 | | Q1 | | Q4 | |
Operating revenues | | | | | | | | | | | | | | | | |
Service | 5,322 | | 5,335 | | 5,051 | | 5,169 | | 5,025 | | 4,988 | | 4,908 | | 5,053 | |
Product | 356 | | 364 | | 333 | | 533 | | 382 | | 352 | | 362 | | 550 | |
Total operating revenues | 5,678 | | 5,699 | | 5,384 | | 5,702 | | 5,407 | | 5,340 | | 5,270 | | 5,603 | |
Adjusted EBITDA | 2,366 | | 2,381 | | 2,214 | | 2,121 | | 2,236 | | 2,268 | | 2,163 | | 2,073 | |
Severance, acquisition and other costs | (23 | ) | (36 | ) | (84 | ) | (11 | ) | (25 | ) | (57 | ) | (42 | ) | (152 | ) |
Depreciation | (765 | ) | (769 | ) | (722 | ) | (719 | ) | (706 | ) | (713 | ) | (739 | ) | (731 | ) |
Amortization | (208 | ) | (211 | ) | (185 | ) | (165 | ) | (161 | ) | (156 | ) | (149 | ) | (136 | ) |
Net earnings | 817 | | 811 | | 725 | | 699 | | 800 | | 830 | | 758 | | 542 | |
Net earnings attributable to common shareholders | 770 | | 762 | | 679 | | 657 | | 752 | | 778 | | 707 | | 496 | |
Net earnings per common share | | | | | | | | | | | | | | | | |
Basic | 0.86 | | 0.84 | | 0.78 | | 0.75 | | 0.87 | | 0.89 | | 0.82 | | 0.58 | |
Diluted | 0.86 | | 0.84 | | 0.78 | | 0.75 | | 0.87 | | 0.89 | | 0.82 | | 0.58 | |
Included in net earnings attributable to common shareholders: | | | | | | | | | | | | | | | | |
Severance, acquisition and other costs | (17 | ) | (27 | ) | (65 | ) | (9 | ) | (20 | ) | (44 | ) | (31 | ) | (112 | ) |
Net (losses) gains on investments | – | | – | | (14 | ) | (1 | ) | (12 | ) | (2 | ) | 12 | | (1 | ) |
Early debt redemption costs | (12 | ) | (3 | ) | – | | – | | – | | – | | (8 | ) | (6 | ) |
Adjusted net earnings | 799 | | 792 | | 758 | | 667 | | 784 | | 824 | | 734 | | 615 | |
Adjusted EPS | 0.88 | | 0.88 | | 0.87 | | 0.76 | | 0.91 | | 0.94 | | 0.85 | | 0.72 | |
Average number of common shares outstanding – basic (millions) | 900.4 | | 900.1 | | 875.7 | | 870.5 | | 869.9 | | 869.1 | | 867.1 | | 853.5 | |
| | | | BCE Inc. 2017 THIRD QUARTER SHAREHOLDER REPORT 29 |
|
| | | | |
| 6 | Regulatory environment | MD&A | |
The following is an update to the regulatory initiatives and proceedings described in the BCE 2016 Annual MD&A under section 3.3, Principal business risks and section 8, Regulatory environment, as subsequently updated in the BCE 2017 First Quarter MD&A and the BCE 2017 Second Quarter MD&A.
MANDATED WHOLESALE ACCESS TO FTTP NETWORKS
On August 29, 2017, in Telecom Order CRTC 2017-312, the CRTC determined that disaggregated wholesale high-speed access services should be made available, on an interim basis, by Bell Canada and certain other telecom service providers to competitors in Ontario and Québec, and determined the interim rates for these services. The interim rates determined by the CRTC for our service are essentially similar to those we proposed. However, the final rates remain to be determined. The mandating of final rates for our new disaggregated wholesale high-speed access service that are materially different from the rates we proposed could improve the business position of our competitors and further impact our investment strategy.
LICENCE RENEWALS
On May 15, 2017, the CRTC issued decisions (Decisions) in which it renewed the TV licences held by the large English-language and French-language media groups, including those owned by Bell Media. No adverse conditions of licence were imposed that could have negatively affected our business and financial performance.
Several of the associations that represent creative groups and, in the case of the Decisions relating to French-language television, the Government of Québec, filed petitions pursuant to section 28(1) of theBroadcasting Act, requesting that the Federal Cabinet set aside or refer the Decisions back to the CRTC.
On August 14, 2017, the Federal Cabinet referred the Decisions back to the CRTC for reconsideration to ensure that appropriate contributions are made to the creation and presentation of programs of national interest, original French-language programming and music programming, as well as short films and documentaries. The CRTC’s review process will take several months and in the meantime, the Decisions remain in effect. If adverse conditions of licence are imposed, it could have a negative effect on Bell Media’s business and financial performance going forward.
CRTC REPORT ON FUTURE PROGRAMMING DISTRIBUTION MODELS
On September 27, 2017, the Governor in Council, at the recommendation of the Minister of Canadian Heritage, issued a direction to the CRTC, asking it to examine the distribution model or models of programming that are likely to exist in the future, how Canadians would access that programming, and the extent to which those models will ensure a vibrant domestic market that is capable of supporting the continued creation, production and distribution of Canadian programming, including original entertainment and information programming. On October 12, 2017, the CRTC initiated its public consultation with comments due on November 24, 2017. The CRTC has indicated that it intends to publish further documents and details in a second phase of consultation, based on the comments received in its initial consultation. The CRTC is required to provide its report no later than June 1, 2018. The Minister of Canadian Heritage indicated that the CRTC’s report would be used to inform a future review of theBroadcasting Actand theTelecommunications Act. At this time, it is unclear how the CRTC’s report, or a future legislative review, may impact our business.
600 MHZ SPECTRUM CONSULTATION
As part of its initiative to repurpose the 600 megahertz (MHz) broadcasting band for mobile use, in April 2017, the department of Innovation, Science and Economic Development Canada (ISED) announced and released the new digital television (DTV) allotment plan developed jointly with the United States. The allotment plan provides an allotment for each existing Canadian regular power and low power TV station in operation on August 3, 2015. The repurposing of 600 MHz spectrum will have an impact on existing Bell Media TV broadcasting stations, which will need to transition to alternative spectrum. The extent of such impact is not yet known.
On August 4, 2017, ISED released a consultation paper seeking input regarding a technical, policy and licensing framework which will govern the auction of spectrum licences in the 600 MHz band. The date of the auction has not been determined at this time. The consultation paper indicates that ISED is proposing to auction 70 MHz of spectrum using a combinatorial-clock auction format similar to the format used in the 700 MHz and 2500 MHz spectrum auctions. The spectrum licence areas will be on a Tier 2 basis (essentially a provincial/regional basis) and on a Tier 4 basis in Northern Canada (essentially a regional basis in the North).
ISED is also proposing that 30 MHz (in three separate paired-blocks) be reserved for set-aside eligible entities which are bidders with less than 10% of national wireless subscriber market share, that are registered with the CRTC as facilities-based providers and are actively providing commercial telecommunications services to the general public in the licence area of interest as of the date of the application to participate in the auction (“Set-Aside Eligible Entities”). The remaining 40 MHz (in four separate paired-blocks) are available to any bidder. ISED proposes that the auctioned licences will have a 20 year-term, but will only be transferable to a Set-Aside Eligible Entity during the first five years of the licence term. In addition, licences will be subject to certain deployment requirements which require licensees to provide network coverage to a certain percentage of the population in each licence area at 5, 10 and 20 years following licence issuance.
While the overall impact of these policies is not known at the present time, the set-aside provisions outlined in the consultation paper limit the amount of spectrum that Bell Mobility can bid on.
| 30 BCE Inc. 2017 THIRD QUARTER SHAREHOLDER REPORT | | | |
|
| | | | |
| | 6 | Regulatory environment | MD&A |
CONSULTATION ON THE SPECTRUM OUTLOOK 2018 TO 2022
On October 6, 2017, ISED initiated a consultation entitled “Consultation on the Spectrum Outlook 2018 to 2022”. The outcome of the consultation is intended to provide a roadmap of ISED’s plans to make spectrum available over the next five years. Among the questions on which ISED is seeking feedback are: what changes should be made to its licensing regime, views on increased demands for spectrum, technology developments and trends and operational measures to respond to the increasing demands for spectrum. It is unclear what, if any, impacts this consultation could have on our business.
| | | | BCE Inc. 2017 THIRD QUARTER SHAREHOLDER REPORT 31 |
|
| | | | |
| 7 | Business risks | MD&A | |
A risk is the possibility that an event might happen in the future that could have a negative effect on our financial position, financial performance, cash flows, business or reputation. Part of managing our business is to understand what these potential risks could be and to mitigate them where we can.
The actual effect of any event could be materially different from what we currently anticipate. The risks described in this MD&A are not the only ones that could affect us. Additional risks and uncertainties not currently known to us or that we currently deem to be immaterial may also materially and adversely affect our financial position, financial performance, cash flows, business or reputation.
In the BCE 2016 Annual MD&A we provided a detailed review of risks that could affect our financial position, financial performance, cash flows, business or reputation and that could cause actual results or events to differ materially from our expectations expressed in or implied by our forward-looking statements. This detailed description of risks is updated in the BCE 2017 First Quarter MD&A, in the BCE 2017 Second Quarter MD&A and this MD&A. The risks described in the BCE 2016 Annual MD&A, as updated in the BCE 2017 First Quarter MD&A, in the BCE 2017 Second Quarter MD&A and in this MD&A, include, without limitation, risks associated with:
- regulatory initiatives, proceedings and decisions, government consultations and government positions that affect us and influence our business, including, in particular, those relating to mandatory access to networks, net neutrality, spectrum auctions, approval of acquisitions, broadcast licensing and foreign ownership requirements
- the intensity of competitive activity, including from new and emerging competitors, and the resulting impact on the cost of retaining existing customers and attracting new ones, as well as on our market shares, service volumes and pricing strategies
- the level of technological substitution and the presence of alternative service providers contributing to reduced utilization of our traditional wireline services
- the adverse effect of the fundamental separation of content and connectivity, which is changing our TV and media ecosystems and may accelerate the disconnection of TV services and the reduction of TV spending, as well as the fragmentation of, and changes in, the advertising market
- competition with global competitors, in addition to traditional Canadian competitors, for programming content could drive significant increases in content acquisition costs and challenge our ability to secure key content
- adverse economic and financial market conditions, a declining level of retail and commercial activity, and the resulting negative impact on the demand for, and prices of, our products and services and the level of bad debts
- the inability to protect our assets, including networks, IT systems, offices and sensitive information, from events and attacks such as cyber threats, and damage from fire and natural disasters
- the failure to optimize network and IT deployment and upgrading timelines, accurately assess the potential of new technologies, and invest and evolve in the appropriate direction
- the failure to continue investment in a disciplined and strategic manner in next-generation capabilities, including real-time information-based customer service strategies
- the inability to drive a positive customer experience resulting, in particular, from the failure to embrace new approaches and challenge operational limitations
- the complexity in our operations resulting from multiple technology platforms, billing systems, marketing databases and a myriad of rate plans, promotions and product offerings
- the failure to maintain optimal network operating performance in the context of significant increases in capacity demands on our Internet and wireless networks
- the failure to implement or maintain highly effective IT systems supported by an effective governance and operating framework
- the risk that we may need to incur significant capital expenditures beyond our capital intensity target in order to provide additional capacity and reduce network congestion
- the failure to generate anticipated benefits from our corporate restructurings, system replacements and upgrades, process redesigns and the integration of business acquisitions
- events affecting the functionality of, and our ability to protect, test, maintain and replace, our networks, IT systems, equipment and other facilities
- in-orbit and other operational risks to which the satellites used to provide our satellite TV services are subject
- the failure to attract and retain employees with the appropriate skill sets and to drive their performance in a safe and secure environment
- labour disruptions
- the inability to access adequate sources of capital and generate sufficient cash flows from operations to meet our cash requirements, fund capital expenditures and provide for planned growth
- uncertainty as to whether dividends will be declared by BCE’s board of directors or whether BCE’s dividend payout policy will be maintained
- the inability to manage various credit, liquidity and market risks
- pension obligation volatility and increased contributions to post-employment benefit plans
- higher taxes due to new tax laws or changes thereto or in the interpretation thereof, and the inability to predict the outcome of government audits
- the failure to reduce costs as well as unexpected increases in costs
| 32 BCE Inc. 2017 THIRD QUARTER SHAREHOLDER REPORT | | | |
|
| | | | |
| | 7 | Business risks | MD&A |
- the failure to evolve practices to effectively monitor and control fraudulent activities, including unauthorized use of our content and the theft of our TV services
- events affecting the continuity of supply of products and services that we need to operate our business from our third-party suppliers and outsourcers
- the failure of our procurement and vendor management practices to address risk exposures associated with existing and new supplier models
- the quality of our products and services and the extent to which they may be subject to manufacturing defects or fail to comply with applicable government regulations and standards
- security and data leakage exposure if security control protocols applicable to our cloud-based solutions are bypassed
- unfavourable resolution of legal proceedings and, in particular, class actions
- unfavourable changes in applicable laws and the failure to proactively address our legal and regulatory obligations
- health concerns about radiofrequency emissions from wireless communications devices
- the inability to maintain customer service and our networks operational in the event of the occurrence of epidemics, pandemics and other health risks
- the failure to recognize and adequately respond to climate change concerns or public and governmental expectations on environmental matters
- the expected timing and completion of the proposed acquisition of the Séries+ and Historia French-language specialty channels from Corus are subject to closing conditions, termination rights and other risks and uncertainties, including approval by the CRTC and the Competition Bureau, and there can be no certainty that the anticipated benefits of the proposed acquisition will be realized
Please see section 9,Business risksof the BCE 2016 Annual MD&A for a more complete description of the above-mentioned and other risks, which section, and the other sections of the BCE 2016 Annual MD&A referred to therein, are incorporated by reference in this section 7.
In addition, please see section 4.7,Liquidity – Litigationin the BCE 2017 First Quarter MD&A and in the BCE 2017 Second Quarter MD&A for an update to the legal proceedings described in the BCE 2016 AIF, which sections 4.7 are incorporated by reference in this section 7. Please also see section 6,Regulatory environmentin this MD&A, in the BCE 2017 First Quarter MD&A and in the BCE 2017 Second Quarter MD&A for an update to the regulatory initiatives and proceedings described in the BCE 2016 Annual MD&A, which sections 6 are incorporated by reference in this section 7.
Except for the updates set out in section 6, Regulatory environment in this MD&A; in section 4.7,Liquidity – Litigation, in section 6,Regulatory environmentand in section 7,Business risksin the BCE 2017 Second Quarter MD&A and in section 4.7,Liquidity – Litigationand in section 6,Regulatory environmentin the BCE 2017 First Quarter MD&A, the risks described in the BCE 2016 Annual MD&A remain substantially unchanged.
| | | | BCE Inc. 2017 THIRD QUARTER SHAREHOLDER REPORT 33 |
|
| | | | |
| 8 | Accounting policies, financial measures and controls | MD&A | |
| 8 Accounting policies, financial measures and controls |
| 8.1 Our accounting policies |
BCE’s Q3 2017 Financial Statements were prepared in accordance with IFRS, as issued by the IASB, under IAS 34 – Interim Financial Reporting and were approved by BCE’s board of directors on November 1, 2017. The financial statements were prepared using the same basis of presentation, accounting policies and methods of computations as outlined in Note 2, Significant accounting policies in BCE’s consolidated financial statements for the year ended December 31, 2016. BCE’s Q3 2017 Financial Statements do not include all of the notes required in the annual financial statements.
| Future changes to accounting standards |
The following new standard and interpretation were issued by the IASB and have not yet been adopted by BCE.
| STANDARD | DESCRIPTION | IMPACT | EFFECTIVE DATE |
IFRS 15 – Revenue from Contracts with Customers | Establishes principles to record revenues from contracts for the sale of goods or services, unless the contracts are in the scope of IAS 17 – Leases or other IFRSs. Under IFRS 15, revenue is recognized at an amount that reflects the expected consideration receivable in exchange for transferring goods or services to a customer, applying the following five steps: 1. Identify the contract with a customer
2. Identify the performance obligations in the contract
3. Determine the transaction price
4. Allocate the transaction price to the performance obligations in the contract
5. Recognize revenue when (or as) the entity satisfies a performance obligation The new standard also provides guidance relating to principal versus agent relationships, licences of intellectual property, contract costs and the measurement and recognition of gains and losses on the sale of certain non-financial assets such as property and equipment. Additional disclosures will also be required under the new standard. | IFRS 15 will principally affect the timing of revenue recognition, how we classify revenues between product and service and how we account for costs to obtain and fulfill a contract. Under multiple-element arrangements, although the total revenue recognized during the term of a contract will be largely unaffected, the revenue allocated to a delivered item will no longer be limited to the non-contingent amount. This may accelerate the recognition of revenue ahead of the associated cash inflows and result in a corresponding contract asset recorded on the balance sheet, to be realized over the term of the customer contract. We continue to make progress towards adoption of IFRS 15 according to our detailed implementation plan. Changes and enhancements to our existing IT systems, business processes, and systems of internal control are being designed, tested and implemented. A dedicated project team that leverages key resources throughout the company is also in place to effect the necessary changes. We expect to continue our testing and data validation process through the end of 2017 and to be in a position to disclose the preliminary estimate of the impact of IFRS 15 in our 2017 annual report. Accordingly, it is not yet possible to make a reliable estimate of the impact of the new standard on our financial statements. We expect that the impact of the new standard will be most pronounced in our Bell Wireless segment. While total revenue recognized over the term of a customer contract is not expected to change significantly, revenue recognition will be accelerated for certain customer contracts and a greater proportion of revenue will be classified to product revenue. A contract asset for the unbilled up-front revenue and a corresponding tax liability will also be reflected in the consolidated statement of financial position. | Annual periods beginning on or after January 1, 2018, using either a full retrospective approach for all periods presented in the period of adoption or a modified retrospective approach. |
International Financial Reporting Interpretations Committee (IFRIC) 23 – Uncertainty over Income Tax Treatments | IFRIC 23 clarifies the application of recognition and measurement requirements in IAS 12 – Income Taxes when there is uncertainty over income tax treatments. It specifically addresses whether an entity considers uncertain tax treatments separately or as a group, the assumptions an entity makes about the examination of tax treatments by taxation authorities, how an entity determines taxable profit (tax loss), tax bases, unused tax losses, unused tax credits and tax rates and how an entity considers changes in facts and circumstances.
| We are currently evaluating the impact of IFRIC 23 on our financial statements. | Annual periods beginning on or after January 1, 2019, with early adoption permitted, using either a full retrospective or a modified retrospective approach. |
| 34 BCE Inc. 2017 THIRD QUARTER SHAREHOLDER REPORT | | | |
|
| | | | |
| | 8 | Accounting policies, financial measures and controls | MD&A |
| 8.2 Non-GAAP financial measures and key performance indicators (KPIs) |
This section describes the non-GAAP financial measures and KPIs we use to explain our financial results. It also provides reconciliations of the non-GAAP financial measures to the most comparable IFRS financial measures.
In Q1 2017, we updated our definition of adjusted net earnings and adjusted EPS to also exclude impairment charges as they may affect the comparability of our financial results and could potentially distort the analysis of trends in business performance.
| Adjusted EBITDA and adjusted EBITDA margin |
The terms adjusted EBITDA and adjusted EBITDA margin do not have any standardized meaning under IFRS. Therefore, they are unlikely to be comparable to similar measures presented by other issuers.
We define adjusted EBITDA as operating revenues less operating costs, as shown in BCE’s consolidated income statements. Adjusted EBITDA for BCE’s segments is the same as segment profit as reported in Note 4,Segmented information, to BCE’s Q3 2017 Financial Statements. We define adjusted EBITDA margin as adjusted EBITDA divided by operating revenues.
We use adjusted EBITDA and adjusted EBITDA margin to evaluate the performance of our businesses as they reflect their ongoing profitability. We believe that certain investors and analysts use adjusted EBITDA to measure a company’s ability to service debt and to meet other payment obligations or as a common measurement to value companies in the telecommunications industry. We believe that certain investors and analysts also use adjusted EBITDA and adjusted EBITDA margin to evaluate the performance of our businesses. Adjusted EBITDA is also one component in the determination of short-term incentive compensation for all management employees.
Adjusted EBITDA and adjusted EBITDA margin have no directly comparable IFRS financial measure. Alternatively, the following table provides a reconciliation of net earnings to adjusted EBITDA.
| Q3 2017 | | Q3 2016 | | YTD 2017 | | YTD 2016 | |
Net earnings | 817 | | 800 | | 2,353 | | 2,388 | |
Severance, acquisition and other costs | 23 | | 25 | | 143 | | 124 | |
Depreciation | 765 | | 706 | | 2,256 | | 2,158 | |
Amortization | 208 | | 161 | | 604 | | 466 | |
Finance costs | | | | | | | | |
Interest expense | 242 | | 227 | | 714 | | 663 | |
Interest on post-employment benefit obligations | 18 | | 20 | | 54 | | 61 | |
Other expense (income) | 56 | | 13 | | 40 | | (51 | ) |
Income taxes | 237 | | 284 | | 797 | | 858 | |
Adjusted EBITDA | 2,366 | | 2,236 | | 6,961 | | 6,667 | |
BCE operating revenues | 5,678 | | 5,407 | | 16,761 | | 16,017 | |
Adjusted EBITDA margin | 41.7 | % | 41.4 | % | 41.5 | % | 41.6 | % |
| Adjusted net earnings and adjusted EPS |
The terms adjusted net earnings and adjusted EPS do not have any standardized meaning under IFRS. Therefore, they are unlikely to be comparable to similar measures presented by other issuers.
We define adjusted net earnings as net earnings attributable to common shareholders before severance, acquisition and other costs, net losses (gains) on investments, impairment charges, and early debt redemption costs. We define adjusted EPS as adjusted net earnings per BCE common share.
We use adjusted net earnings and adjusted EPS, and we believe that certain investors and analysts use these measures, among other ones, to assess the performance of our businesses without the effects of severance, acquisition and other costs, net losses (gains) on investments, impairment charges, and early debt redemption costs, net of tax and NCI. We exclude these items because they affect the comparability of our financial results and could potentially distort the analysis of trends in business performance. Excluding these items does not imply they are non-recurring.
The most comparable IFRS financial measures are net earnings attributable to common shareholders and EPS. The following table is a reconciliation of net earnings attributable to common shareholders and EPS to adjusted net earnings on a consolidated basis and per BCE common share (adjusted EPS), respectively.
| Q3 2017 | Q3 2016 | YTD 2017 | YTD 2016 |
| TOTAL | | PER SHARE | | TOTAL | | PER SHARE | | TOTAL | | PER SHARE | | TOTAL | | PER SHARE | |
Net earnings attributable to common shareholders | 770 | | 0.86 | | 752 | | 0.87 | | 2,211 | | 2.48 | | 2,237 | | 2.58 | |
Severance, acquisition and other costs | 17 | | 0.01 | | 20 | | 0.03 | | 109 | | 0.12 | | 95 | | 0.11 | |
Net losses on investments | – | | – | | 12 | | 0.01 | | 14 | | 0.01 | | 2 | | – | |
Early debt redemption costs | 12 | | 0.01 | | – | | – | | 15 | | 0.02 | | 8 | | 0.01 | |
Adjusted net earnings | 799 | | 0.88 | | 784 | | 0.91 | | 2,349 | | 2.63 | | 2,342 | | 2.70 | |
| | | | BCE Inc. 2017 THIRD QUARTER SHAREHOLDER REPORT 35 |
|
| | | | |
| 8 | Accounting policies, financial measures and controls | MD&A | |
| Free cash flow and dividend payout ratio |
The terms free cash flow and dividend payout ratio do not have any standardized meaning under IFRS. Therefore, they are unlikely to be comparable to similar measures presented by other issuers.
We define free cash flow as cash flows from operating activities, excluding acquisition and other costs paid (which include significant litigation costs) and voluntary pension funding, less capital expenditures, preferred share dividends and dividends paid by subsidiaries to NCI. We exclude acquisition and other costs paid and voluntary pension funding because they affect the comparability of our financial results and could potentially distort the analysis of trends in business performance. Excluding these items does not imply they are non-recurring.
We consider free cash flow to be an important indicator of the financial strength and performance of our businesses because it shows how much cash is available to pay dividends, repay debt and reinvest in our company. We believe that certain investors and analysts use free cash flow to value a business and its underlying assets and to evaluate the financial strength and performance of our businesses. The most comparable IFRS financial measure is cash flows from operating activities.
We define dividend payout ratio as dividends paid on common shares divided by free cash flow. We consider dividend payout ratio to be an important indicator of the financial strength and performance of our businesses because it shows the sustainability of the company’s dividend payments.
The following table is a reconciliation of cash flows from operating activities to free cash flow on a consolidated basis.
| Q3 2017 | | Q3 2016 | | YTD 2017 | | YTD 2016 | |
Cash flows from operating activities | 2,233 | | 1,943 | | 5,700 | | 5,123 | |
Capital expenditures | (1,040 | ) | (976 | ) | (2,934 | ) | (2,778 | ) |
Cash dividends paid on preferred shares | (21 | ) | (34 | ) | (94 | ) | (105 | ) |
Cash dividends paid by subsidiaries to NCI | (13 | ) | (13 | ) | (34 | ) | (35 | ) |
Acquisition and other costs paid | 24 | | 31 | | 128 | | 98 | |
Free cash flow | 1,183 | | 951 | | 2,766 | | 2,303 | |
The term net debt does not have any standardized meaning under IFRS. Therefore, it is unlikely to be comparable to similar measures presented by other issuers.
We define net debt as debt due within one year plus long-term debt and 50% of preferred shares, less cash and cash equivalents, as shown in BCE’s consolidated statements of financial position. We include 50% of outstanding preferred shares in our net debt as it is consistent with the treatment by certain credit rating agencies.
We consider net debt to be an important indicator of the company’s financial leverage because it represents the amount of debt that is not covered by available cash and cash equivalents. We believe that certain investors and analysts use net debt to determine a company’s financial leverage.
Net debt has no directly comparable IFRS financial measure, but rather is calculated using several asset and liability categories from the statements of financial position, as shown in the following table.
| SEPTEMBER 30, 2017 | | DECEMBER 31, 2016 | |
Debt due within one year | 6,083 | | 4,887 | |
Long-term debt | 18,456 | | 16,572 | |
50% of outstanding preferred shares | 2,002 | | 2,002 | |
Cash and cash equivalents | (1,979 | ) | (853 | ) |
Net debt | 24,562 | | 22,608 | |
The net debt leverage ratio does not have any standardized meaning under IFRS. Therefore, it is unlikely to be comparable to similar measures presented by other issuers. We use, and believe that certain investors and analysts use, the net debt leverage ratio as a measure of financial leverage.
The net debt leverage ratio represents net debt divided by adjusted EBITDA. For the purposes of calculating our net debt leverage ratio, adjusted EBITDA is twelve-month trailing adjusted EBITDA.
| Adjusted EBITDA to net interest expense ratio |
The ratio of adjusted EBITDA to net interest expense does not have any standardized meaning under IFRS. Therefore, it is unlikely to be comparable to similar measures presented by other issuers. We use, and believe that certain investors and analysts use, the adjusted EBITDA to net interest expense ratio as a measure of financial health of the company.
The adjusted EBITDA to net interest expense ratio represents adjusted EBITDA divided by net interest expense. For the purposes of calculating our adjusted EBITDA to net interest expense ratio, adjusted EBITDA is twelve-month trailing adjusted EBITDA. Net interest expense is twelve-month trailing net interest expense as shown in our statements of cash flows, plus 50% of declared preferred share dividends as shown in our income statements.
| 36 BCE Inc. 2017 THIRD QUARTER SHAREHOLDER REPORT | | | |
|
| | | | |
| | 8 | Accounting policies, financial measures and controls | MD&A |
In addition to the non-GAAP financial measures described previously, we use a number of KPIs to measure the success of our strategic imperatives. These KPIs are not accounting measures and may not be comparable to similar measures presented by other issuers.
| KPI | DEFINITION |
| ARPU | Average revenue per user (ARPU) or subscriber is a measure used to track our recurring revenue streams. Wireless blended ARPU is calculated by dividing certain service revenues by the average subscriber base for the specified period and is expressed as a dollar unit per month. |
| Capital intensity | Capital expenditures divided by operating revenues. |
| Churn | Churn is the rate at which existing subscribers cancel their services. It is a measure of our ability to retain our customers. Wireless churn is calculated by dividing the number of deactivations during a given period by the average number of subscribers in the base for the specified period and is expressed as a percentage per month. |
| Subscriber unit | Wireless subscriber unit is comprised of an active revenue-generating unit (e.g. mobile device, tablet or wireless Internet products), with a unique identifier (typically International Mobile Equipment Identity (IMEI) number), that has access to our wireless networks. We report wireless subscriber units in two categories: postpaid and prepaid. Prepaid subscriber units are considered active for a period of 120 days following the expiry of the subscriber’s prepaid balance. Wireline subscriber unit consists of an active revenue-generating unit with access to our services, including Internet, satellite TV, IPTV, and/or NAS. A subscriber is included in our subscriber base when the service has been installed and is operational at the customer premise and a billing relationship has been established. - Internet, IPTV and satellite TV subscribers have access to stand-alone services, and are primarily represented by a dwelling unit
- NAS subscribers are based on a line count and are represented by a unique telephone number
|
| 8.3 Controls and procedures |
Disclosure controls and procedures and internal control over financial reporting
In accordance with the provisions of National Instrument 52-109 – Certification of Disclosure in Issuers’ Annual and Interim Filings, the Chief Executive Officer and the Chief Financial Officer of BCE Inc. have limited the scope of their design of our disclosure controls and procedures and internal control over financial reporting to exclude the controls, policies and procedures of MTS, which we acquired on March 17, 2017. The contribution of the acquired MTS operations to our consolidated financial statements for the nine months ended September 30, 2017 was 3% of consolidated revenues and 3% of consolidated net earnings. Additionally, at September 30, 2017, the current assets of the acquired MTS operations represented approximately 2% of consolidated current assets and their current liabilities represented approximately 2% of consolidated current liabilities. The non-current assets of the acquired MTS operations represented approximately 8% of consolidated non-current assets and their non-current liabilities represented approximately 3% of consolidated non-current liabilities. The design of the disclosure controls and procedures and internal control over financial reporting of the acquired MTS operations will be completed for the first quarter of 2018.
Further details related to the acquisition of MTS are disclosed in Note 3,Business acquisitions and dispositions, in BCE’s Q3 2017 Financial Statements.
| Changes in internal control over financial reporting |
No changes were made in our internal control over financial reporting during the quarter ended September 30, 2017 that have materially affected, or are reasonably likely to materially affect, our internal control over financial reporting.
| | | | BCE Inc. 2017 THIRD QUARTER SHAREHOLDER REPORT 37 |
|
| | | | |
| Consolidated financial statements | | |
| Consolidated financial statements |
| Consolidated income statements |
| | | | THREE MONTHS | NINE MONTHS |
FOR THE PERIOD ENDED SEPTEMBER 30
(IN MILLIONS OF CANADIAN DOLLARS, EXCEPT SHARE AMOUNTS) (UNAUDITED) | NOTE | | 2017 | | 2016 | | 2017 | | 2016 | |
Operating revenues | 4 | | 5,678 | | 5,407 | | 16,761 | | 16,017 | |
Operating costs | 4, 5 | | (3,312 | ) | (3,171 | ) | (9,800 | ) | (9,350 | ) |
Severance, acquisition and other costs | 4, 6 | | (23 | ) | (25 | ) | (143 | ) | (124 | ) |
Depreciation | 4 | | (765 | ) | (706 | ) | (2,256 | ) | (2,158 | ) |
Amortization | 4 | | (208 | ) | (161 | ) | (604 | ) | (466 | ) |
Finance costs | | | | | | | | | | |
Interest expense | | | (242 | ) | (227 | ) | (714 | ) | (663 | ) |
Interest on post-employment benefit obligations | 11 | | (18 | ) | (20 | ) | (54 | ) | (61 | ) |
Other (expense) income | 7 | | (56 | ) | (13 | ) | (40 | ) | 51 | |
Income taxes | 9 | | (237 | ) | (284 | ) | (797 | ) | (858 | ) |
Net earnings | | | 817 | | 800 | | 2,353 | | 2,388 | |
Net earnings attributable to: | | | | | | | | | | |
Common shareholders | | | 770 | | 752 | | 2,211 | | 2,237 | |
Preferred shareholders | | | 31 | | 32 | | 94 | | 104 | |
Non-controlling interest | | | 16 | | 16 | | 48 | | 47 | |
Net earnings | | | 817 | | 800 | | 2,353 | | 2,388 | |
Net earnings per common share – basic and diluted | 8 | | 0.86 | | 0.87 | | 2.48 | | 2.58 | |
Average number of common shares outstanding – basic (millions) | | | 900.4 | | 869.9 | | 892.2 | | 868.7 | |
| 38 BCE Inc. 2017 THIRD QUARTER SHAREHOLDER REPORT | | | |
|
| | | | |
| | Consolidated financial statements | |
| Consolidated statements of comprehensive income |
| | THREE MONTHS | NINE MONTHS |
FOR THE PERIOD ENDED SEPTEMBER 30
(IN MILLIONS OF CANADIAN DOLLARS) (UNAUDITED) | 2017 | | 2016 | | 2017 | | 2016 | |
Net earnings | 817 | | 800 | | 2,353 | | 2,388 | |
Other comprehensive income (loss), net of income taxes | | | | | | | | |
Items that will be subsequently reclassified to net earnings | | | | | | | | |
Net change in value of available-for-sale (AFS) financial assets, net of income taxes of nil for the three months and nine months ended September 30, 2017 and 2016, respectively | – | | (12 | ) | – | | (7 | ) |
Net change in value of derivatives designated as cash flow hedges, net of income taxes of $15 million and $3 million for the three months ended September 30, 2017 and 2016, respectively, and $27 million and $30 million for the nine months ended September 30, 2017 and 2016, respectively | (44 | ) | (4 | ) | (83 | ) | (83 | ) |
Items that will not be reclassified to net earnings | | | | | | | | |
Actuarial gains (losses) on post-employment benefit plans, net of income taxes of ($173) million and $73 million for the three months ended September 30, 2017 and 2016, respectively, and $41 million and $440 million for the nine months ended September 30, 2017 and 2016, respectively(1) | 470 | | (203 | ) | (109 | ) | (1,182 | ) |
Other comprehensive income (loss) | 426 | | (219 | ) | (192 | ) | (1,272 | ) |
Total comprehensive income | 1,243 | | 581 | | 2,161 | | 1,116 | |
Total comprehensive income attributable to: | | | | | | | | |
Common shareholders | 1,198 | | 533 | | 2,021 | | 968 | |
Preferred shareholders | 31 | | 32 | | 94 | | 104 | |
Non-controlling interest | 14 | | 16 | | 46 | | 44 | |
Total comprehensive income | 1,243 | | 581 | | 2,161 | | 1,116 | |
| (1) | The discount rate used to value our post-employment benefit obligations at September 30, 2017 was 3.9% compared to 3.6% at June 30, 2017 and 4.0% at December 31, 2016. The discount rate used to value our post-employment benefit obligations at September 30, 2016 was 3.4% compared to 3.6% at June 30, 2016 and 4.2% at December 31, 2015. |
| | | | BCE Inc. 2017 THIRD QUARTER SHAREHOLDER REPORT 39 |
|
| | | | |
| Consolidated financial statements | | |
| Consolidated statements of financial position |
| (IN MILLIONS OF CANADIAN DOLLARS) (UNAUDITED) | NOTE | | SEPTEMBER 30, 2017 | | DECEMBER 31, 2016 | |
ASSETS | | | | | | |
Current assets | | | | | | |
Cash | | | 1,460 | | 603 | |
Cash equivalents | | | 519 | | 250 | |
Trade and other receivables | | | 2,864 | | 2,979 | |
Inventory | | | 437 | | 403 | |
Prepaid expenses | | | 494 | | 420 | |
Other current assets | | | 159 | | 200 | |
Total current assets | | | 5,933 | | 4,855 | |
Non-current assets | | | | | | |
Property, plant and equipment | | | 23,754 | | 22,346 | |
Intangible assets | | | 13,495 | | 11,998 | |
Deferred tax assets | | | 186 | | 89 | |
Investments in associates and joint ventures | | | 828 | | 852 | |
Other non-current assets | | | 947 | | 1,010 | |
Goodwill | 3 | | 10,422 | | 8,958 | |
Total non-current assets | | | 49,632 | | 45,253 | |
Total assets | | | 55,565 | | 50,108 | |
LIABILITIES | | | | | | |
Current liabilities | | | | | | |
Trade payables and other liabilities | | | 4,470 | | 4,326 | |
Interest payable | | | 172 | | 156 | |
Dividends payable | | | 667 | | 617 | |
Current tax liabilities | | | 242 | | 122 | |
Debt due within one year | 10 | | 6,083 | | 4,887 | |
Total current liabilities | | | 11,634 | | 10,108 | |
Non-current liabilities | | | | | | |
Long-term debt | 10 | | 18,456 | | 16,572 | |
Deferred tax liabilities | | | 2,403 | | 2,192 | |
Post-employment benefit obligations | 11 | | 2,169 | | 2,105 | |
Other non-current liabilities | | | 1,260 | | 1,277 | |
Total non-current liabilities | | | 24,288 | | 22,146 | |
Total liabilities | | | 35,922 | | 32,254 | |
EQUITY | | | | | | |
Equity attributable to BCE shareholders | | | | | | |
Preferred shares | 13 | | 4,004 | | 4,004 | |
Common shares | 13 | | 20,066 | | 18,370 | |
Contributed surplus | | | 1,156 | | 1,160 | |
Accumulated other comprehensive (loss) income | | | (35 | ) | 46 | |
Deficit | | | (5,873 | ) | (6,040 | ) |
Total equity attributable to BCE shareholders | | | 19,318 | | 17,540 | |
Non-controlling interest | | | 325 | | 314 | |
Total equity | | | 19,643 | | 17,854 | |
Total liabilities and equity | | | 55,565 | | 50,108 | |
| 40 BCE Inc. 2017 THIRD QUARTER SHAREHOLDER REPORT | | | |
|
| | | | |
| | Consolidated financial statements | |
| Consolidated statements of changes in equity |
FOR THE PERIOD ENDED SEPTEMBER 30, 2017
(IN MILLIONS OF CANADIAN DOLLARS) (UNAUDITED) | NOTE | | ATTRIBUTABLE TO BCE SHAREHOLDERS | | | | |
PREFERRED
SHARES | | COMMON
SHARES | | CONTRI-
BUTED
SURPLUS | | ACCUMU-
LATED
OTHER
COMPRE-
HENSIVE
INCOME
(LOSS) | | DEFICIT | | TOTAL | | NON-
CONTROL-
LING
INTEREST | | TOTAL
EQUITY | |
Balance at January 1, 2017 | | | 4,004 | | 18,370 | | 1,160 | | 46 | | (6,040 | ) | 17,540 | | 314 | | 17,854 | |
Net earnings | | | – | | – | | – | | | | 2,305 | | 2,305 | | 48 | | 2,353 | |
Other comprehensive loss | | | – | | – | | – | | (81 | ) | (109 | ) | (190 | ) | (2 | ) | (192 | ) |
Total comprehensive (loss) income | | | – | | – | | – | | (81 | ) | 2,196 | | 2,115 | | 46 | | 2,161 | |
Common shares issued under employee stock option plan | | | – | | 97 | | (5 | ) | – | | – | | 92 | | – | | 92 | |
Common shares issued under employee savings plan | | | – | | 5 | | – | | – | | – | | 5 | | – | | 5 | |
Other share-based compensation | | | – | | – | | 1 | | – | | (18 | ) | (17 | ) | – | | (17 | ) |
Common shares issued for the acquisition of Manitoba Telecom Services Inc. (MTS) | 3, 13 | | – | | 1,594 | | – | | – | | – | | 1,594 | | – | | 1,594 | |
Dividends declared on BCE common and preferred shares | | | – | | – | | – | | – | | (2,011 | ) | (2,011 | ) | – | | (2,011 | ) |
Dividends declared by subsidiaries to non-controlling interest | | | – | | – | | – | | – | | – | | – | | (35 | ) | (35 | ) |
Balance at September 30, 2017 | | | 4,004 | | 20,066 | | 1,156 | | (35 | ) | (5,873 | ) | 19,318 | | 325 | | 19,643 | |
FOR THE PERIOD ENDED SEPTEMBER 30, 2016
(IN MILLIONS OF CANADIAN DOLLARS) (UNAUDITED) | ATTRIBUTABLE TO BCE SHAREHOLDERS | | | | |
PREFERRED
SHARES | | COMMON
SHARES | | CONTRI-
BUTED
SURPLUS | | ACCUMU-
LATED
OTHER
COMPRE-
HENSIVE
INCOME
(LOSS) | | DEFICIT | | TOTAL | | NON-
CONTROL-
LING
INTEREST | | TOTAL
EQUITY | |
Balance at January 1, 2016 | 4,004 | | 18,100 | | 1,150 | | 119 | | (6,350 | ) | 17,023 | | 306 | | 17,329 | |
Net earnings | – | | – | | – | | – | | 2,341 | | 2,341 | | 47 | | 2,388 | |
Other comprehensive loss | – | | – | | – | | (87 | ) | (1,182 | ) | (1,269 | ) | (3 | ) | (1,272 | ) |
Total comprehensive (loss) income | – | | – | | – | | (87 | ) | 1,159 | | 1,072 | | 44 | | 1,116 | |
Common shares issued under employee stock option plan | – | | 103 | | (6 | ) | – | | – | | 97 | | – | | 97 | |
Common shares issued under dividend reinvestment plan | – | | 38 | | – | | – | | – | | 38 | | – | | 38 | |
Common shares issued under employee savings plan | – | | 99 | | – | | – | | – | | 99 | | – | | 99 | |
Other share-based compensation | – | | – | | 7 | | – | | (11 | ) | (4 | ) | – | | (4 | ) |
Dividends declared on BCE common and preferred shares | – | | – | | – | | – | | (1,884 | ) | (1,884 | ) | – | | (1,884 | ) |
Dividends declared by subsidiaries to non-controlling interest | – | | – | | – | | – | | – | | – | | (37 | ) | (37 | ) |
Balance at September 30, 2016 | 4,004 | | 18,340 | | 1,151 | | 32 | | (7,086 | ) | 16,441 | | 313 | | 16,754 | |
| | | | BCE Inc. 2017 THIRD QUARTER SHAREHOLDER REPORT 41 |
|
| | | | |
| Consolidated financial statements | | |
| Consolidatedstatements of cash flows |
FOR THE PERIOD ENDED SEPTEMBER 30
(IN MILLIONS OF CANADIAN DOLLARS) (UNAUDITED) | | | THREE MONTHS | NINE MONTHS |
| NOTE | | 2017 | | 2016 | | 2017 | | 2016 | |
Cash flows from operating activities | | | | | | | | | | |
Net earnings | | | 817 | | 800 | | 2,353 | | 2,388 | |
Adjustments to reconcile net earnings to cash flows from operating activities | | | | | | | | | | |
Severance, acquisition and other costs | 6 | | 23 | | 25 | | 143 | | 124 | |
Depreciation and amortization | | | 973 | | 867 | | 2,860 | | 2,624 | |
Post-employment benefit plans cost | 11 | | 82 | | 80 | | 232 | | 225 | |
Net interest expense | | | 239 | | 222 | | 704 | | 655 | |
(Gains) losses on investments | 7 | | – | | (34 | ) | 12 | | (48 | ) |
Income taxes | | | 237 | | 284 | | 797 | | 858 | |
Contributions to post-employment benefit plans | | | (64 | ) | (78 | ) | (238 | ) | (248 | ) |
Payments under other post-employment benefit plans | | | (20 | ) | (17 | ) | (58 | ) | (55 | ) |
Severance and other costs paid | | | (30 | ) | (48 | ) | (111 | ) | (195 | ) |
Interest paid | | | (242 | ) | (219 | ) | (714 | ) | (661 | ) |
Income taxes paid (net of refunds) | | | (66 | ) | (123 | ) | (468 | ) | (463 | ) |
Acquisition and other costs paid | | | (24 | ) | (31 | ) | (128 | ) | (98 | ) |
Net change in operating assets and liabilities | | | 308 | | 215 | | 316 | | 17 | |
Cash flows from operating activities | | | 2,233 | | 1,943 | | 5,700 | | 5,123 | |
Cash flows used in investing activities | | | | | | | | | | |
Capital expenditures | | | (1,040 | ) | (976 | ) | (2,934 | ) | (2,778 | ) |
Business acquisitions | 3 | | – | | – | | (1,635 | ) | (246 | ) |
Business dispositions | | | – | | 2 | | – | | 20 | |
Loan to related party | 3 | | – | | (510 | ) | – | | (510 | ) |
Disposition of intangibles and other assets | 3 | | – | | – | | 323 | | – | |
Other investing activities | | | (37 | ) | 1 | | (51 | ) | 21 | |
Cash flows used in investing activities | | | (1,077 | ) | (1,483 | ) | (4,297 | ) | (3,493 | ) |
Cash flows from (used in) financing activities | | | | | | | | | | |
(Decrease) increase in notes payable | | | (379 | ) | 4 | | 56 | | 902 | |
Increase (reduction) in securitized trade receivables | | | – | | 305 | | (10 | ) | 305 | |
Issue of long-term debt | 10 | | 1,515 | | 1,497 | | 3,011 | | 2,244 | |
Repayment of long-term debt | 10 | | (142 | ) | (812 | ) | (1,218 | ) | (2,392 | ) |
Issue of common shares | | | 4 | | 6 | | 93 | | 98 | |
Repurchase of shares for settlement of share-based payments | | | (38 | ) | (15 | ) | (179 | ) | (94 | ) |
Cash dividends paid on common shares | | | (646 | ) | (594 | ) | (1,866 | ) | (1,712 | ) |
Cash dividends paid on preferred shares | | | (21 | ) | (34 | ) | (94 | ) | (105 | ) |
Cash dividends paid by subsidiaries to non-controlling interest | | | (13 | ) | (13 | ) | (34 | ) | (35 | ) |
Other financing activities | | | (14 | ) | (26 | ) | (36 | ) | (61 | ) |
Cash flows from (used in) financing activities | | | 266 | | 318 | | (277 | ) | (850 | ) |
Net increase in cash | | | 1,040 | | 421 | | 857 | | 640 | |
Cash at beginning of period | | | 420 | | 319 | | 603 | | 100 | |
Cash at end of period | | | 1,460 | | 740 | | 1,460 | | 740 | |
Net increase in cash equivalents | | | 382 | | 357 | | 269 | | 140 | |
Cash equivalents at beginning of period | | | 137 | | 296 | | 250 | | 513 | |
Cash equivalents at end of period | | | 519 | | 653 | | 519 | | 653 | |
| 42 BCE Inc. 2017 THIRD QUARTER SHAREHOLDER REPORT | | | |
|
| | | | |
| | Notes to the consolidated financial statements | |
| Notes to the consolidated financial statements |
These consolidated interim financial statements (financial statements) should be read in conjunction with BCE’s 2016 annual consolidated financial statements, approved by BCE’s board of directors on March 2, 2017.
These notes are unaudited.
We, us, our, BCE and the company mean, as the context may require, either BCE Inc. or, collectively, BCE Inc., Bell Canada, their subsidiaries, joint arrangements and associates. MTS means, as the context may require, until March 17, 2017, either Manitoba Telecom Services Inc. or, collectively, Manitoba Telecom Services Inc. and its subsidiaries; and Bell MTS means, from March 17, 2017, the combined operations of MTS and Bell Canada in Manitoba.
| Note 1 Corporate information |
BCE is incorporated and domiciled in Canada. BCE’s head office is located at 1, Carrefour Alexander-Graham-Bell, Verdun, Québec, Canada. BCE is a telecommunications and media company providing wireless, wireline, Internet and television (TV) services to residential, business and wholesale customers in Canada. Our Bell Media segment provides conventional, specialty and pay TV, digital media, radio broadcasting services and out-of-home advertising services to customers nationally across Canada.
| Note 2 Basis of presentation and significant accounting policies |
The financial statements were prepared in accordance with International Financial Reporting Standards (IFRS), as issued by the International Accounting Standards Board (IASB), under International Accounting Standard (IAS) 34 – Interim Financial Reporting and were approved by BCE’s board of directors on November 1, 2017. The financial statements were prepared using the same basis of presentation, accounting policies and methods of computation as outlined in Note 2, Significant accounting policies in our consolidated financial statements for the year ended December 31, 2016. The financial statements do not include all of the notes required in annual financial statements.
All amounts are in millions of Canadian dollars, except where noted.
| Future changes to accounting standards |
The following new standard and interpretation were issued by the IASB and have not yet been adopted by BCE.
| STANDARD | DESCRIPTION | IMPACT | EFFECTIVE DATE |
| IFRS 15 – Revenue from Contracts with Customers | Establishes principles to record revenues from contracts for the sale of goods or services, unless the contracts are in the scope of IAS 17 – Leases or other IFRSs. Under IFRS 15, revenue is recognized at an amount that reflects the expected consideration receivable in exchange for transferring goods or services to a customer, applying the following five steps: 1. Identify the contract with a customer 2. Identify the performance obligations in the contract 3. Determine the transaction price 4. Allocate the transaction price to the performance obligations in the contract 5. Recognize revenue when (or as) the entity satisfies a performance obligation The new standard also provides guidance relating to principal versus agent relationships, licences of intellectual property, contract costs and the measurement and recognition of gains and losses on the sale of certain non-financial assets such as property and equipment. Additional disclosures will also be required under the new standard. | IFRS 15 will principally affect the timing of revenue recognition, how we classify revenues between product and service and how we account for costs to obtain and fulfill a contract. Under multiple-element arrangements, although the total revenue recognized during the term of a contract will be largely unaffected, the revenue allocated to a delivered item will no longer be limited to the non-contingent amount. This may accelerate the recognition of revenue ahead of the associated cash inflows and result in a corresponding contract asset recorded on the balance sheet, to be realized over the term of the customer contract. We continue to make progress towards adoption of IFRS 15 according to our detailed implementation plan. Changes and enhancements to our existing information technology systems, business processes, and systems of internal control are being designed, tested and implemented. A dedicated project team that leverages key resources throughout the company is also in place to effect the necessary changes. We expect to continue our testing and data validation process through the end of 2017 and to be in a position to disclose the preliminary estimate of the impact of IFRS 15 in our 2017 annual report. Accordingly, it is not yet possible to make a reliable estimate of the impact of the new standard on our financial statements. We expect that the impact of the new standard will be most pronounced in our Bell Wireless segment. While total revenue recognized over the term of a customer contract is not expected to change significantly, revenue recognition will be accelerated for certain customer contracts and a greater proportion of revenue will be classified to product revenue. A contract asset for the unbilled up-front revenue and a corresponding tax liability will also be reflected in the consolidated statement of financial position. | Annual periods beginning on or after January 1, 2018, using either a full retrospective approach for all periods presented in the period of adoption or a modified retrospective approach. |
| | | | BCE Inc. 2017 THIRD QUARTER SHAREHOLDER REPORT 43 |
|
| | | | |
| Notes to the consolidated financial statements | | |
| STANDARD | DESCRIPTION | IMPACT | EFFECTIVE DATE |
| International Financial Reporting Interpretations Committee (IFRIC) 23 – Uncertainty over Income Tax Treatments | IFRIC 23 clarifies the application of recognition and measurement requirements in IAS 12 – Income Taxes when there is uncertainty over income tax treatments. It specifically addresses whether an entity considers uncertain tax treatments separately or as a group, the assumptions an entity makes about the examination of tax treatments by taxation authorities, how an entity determines taxable profit (tax loss), tax bases, unused tax losses, unused tax credits and tax rates and how an entity considers changes in facts and circumstances. | We are currently evaluating the impact of IFRIC 23 on our financial statements. | Annual periods beginning on or after January 1, 2019, with early adoption permitted, using either a full retrospective or a modified retrospective approach. |
| Note 3 Business acquisitions and dispositions |
2017
Acquisition of MTS
On March 17, 2017, BCE acquired all of the issued and outstanding common shares of MTS for a total consideration of $2,933 million, of which $1,339 million was paid in cash and the remaining $1,594 million through the issuance of approximately 27.6 million BCE common shares. BCE funded the cash component of the transaction through debt financing.
Bell MTS is an information and communications technology provider offering wireless, Internet, TV, phone services, security systems and information solutions including unified cloud and managed services to residential and business customers in Manitoba.
The acquisition of MTS will allow us to reach more Canadians through the expansion of our wireless and wireline broadband networks while supporting our goal of being recognized by customers as Canada’s leading communications company.
The results from the acquired MTS operations are included in our Bell Wireline and Bell Wireless segments from the date of acquisition.
The following table summarizes the fair value of the consideration paid and the fair value assigned to each major class of assets and liabilities.
| | NOTE | | TOTAL | |
Cash consideration | | | 1,339 | |
Issuance of 27.6 million BCE common shares(1) | | | 1,594 | |
Total cost to be allocated | | | 2,933 | |
Trade and other receivables | | | 91 | |
Other non-cash working capital | | | (164 | ) |
Assets held for sale(2) | | | 302 | |
Property, plant and equipment | | | 978 | |
Finite-life intangible assets(3) | | | 979 | |
Indefinite-life intangible assets(4) | | | 280 | |
Deferred tax assets | | | 32 | |
Other non-current assets | | | 129 | |
Debt due within one year | | | (251 | ) |
Long-term debt | 10 | | (721 | ) |
Other non-current liabilities | | | (49 | ) |
| | | 1,606 | |
Cash and cash equivalents | | | (16 | ) |
Fair value of net assets acquired | | | 1,590 | |
Goodwill(5) | | | 1,343 | |
| (1) | Recorded at fair value based on the market price of BCE common shares on the acquisition date. |
| (2) | Consists of finite and indefinite-life intangible assets recorded at fair value less costs to sell. |
| (3) | Consists mainly of customer relationships. |
| (4) | Indefinite-life intangible assets of $228 million and $52 million were allocated to our Bell Wireless and Bell Wireline groups of cash generating units (CGUs), respectively. |
| (5) | Goodwill arises principally from the assembled workforce, expected synergies and future growth. Goodwill is not deductible for tax purposes. Goodwill arising from the transaction of $677 million and $666 million was allocated to our Bell Wireless and Bell Wireline groups of CGUs, respectively. |
As a result of the acquisition of MTS, we acquired non-capital tax loss carryforwards of approximately $1.5 billion and recognized a deferred tax asset of approximately $300 million. These non-capital tax loss carryforwards expire in varying amounts from 2026 to 2033.
Also as a result of the acquisition of MTS, our commitments for operating leases and purchase obligations increased by approximately $180 million.
| 44 BCE Inc. 2017 THIRD QUARTER SHAREHOLDER REPORT | | | |
|
| | | | |
| | Notes to the consolidated financial statements | |
Revenues of $499 million and net earnings of $63 million from the acquired MTS operations are included in the consolidated income statements from the date of acquisition. BCE’s consolidated operating revenues and net earnings for the nine months ended September 30, 2017 would have been $16,956 million and $2,361 million, respectively, had the acquisition of MTS occurred on January 1, 2017. These proforma amounts reflect the elimination of intercompany transactions, financing costs and the amortization of certain elements of the purchase price allocation and related tax adjustments.
Subsequent to the acquisition of MTS, on March 17, 2017, BCE transferred to Xplornet Communications Inc. a total of 40 Megahertz (MHz) of 700 MHz, advanced wireless services-1 and 2500 MHz wireless spectrum which was previously held by MTS.
During Q2 2017, BCE completed the previously announced divestiture of approximately one-quarter of postpaid wireless subscribers and 15 retail locations previously held by MTS, as well as certain Manitoba network assets, to TELUS Communications Inc. for total proceeds of $323 million.
| Acquisition of Cieslok Media Ltd. (Cieslok Media) |
On January 3, 2017, BCE acquired all of the issued and outstanding common shares of Cieslok Media for a total cash consideration of $161 million.
Cieslok Media specializes in large-format outdoor advertising in key urban areas across Canada. This acquisition will contribute to growing and strengthening our digital presence in out-of-home advertising. Cieslok Media is included in our Bell Media segment in our consolidated financial statements.
The following table summarizes the fair value of the consideration paid and the fair value assigned to each major class of assets and liabilities.
| | TOTAL | |
Cash consideration | 161 | |
Total cost to be allocated | 161 | |
Trade and other receivables | 11 | |
Other non-cash working capital | (4 | ) |
Property, plant and equipment | 13 | |
Finite-life intangible assets | 6 | |
Indefinite-life intangible assets | 76 | |
Deferred tax liabilities | (20 | ) |
Other non-current liabilities | (1 | ) |
| 81 | |
Cash and cash equivalents | 1 | |
Fair value of net assets acquired | 82 | |
Goodwill(1) | 79 | |
| (1) | Goodwill arises principally from the assembled workforce, expected synergies and future growth. Goodwill is not deductible for tax purposes. The goodwill arising from the transaction was allocated to our Bell Media group of CGUs. |
This transaction did not have a significant impact on our consolidated operating revenues and net earnings for the nine months ended September 30, 2017.
| Proposed acquisition of Séries+ and Historia specialty channels |
On October 17, 2017, BCE entered into an agreement with Corus Entertainment Inc. (Corus) to acquire French-language specialty channels Séries+ and Historia. The transaction is valued at approximately $200 million. Subject to closing conditions, including approval by the Canadian Radio-television and Telecommunications Commission and the Competition Bureau, the transaction is expected to close in mid-2018.
Séries+ is a fiction channel, offering locally produced dramas as well as foreign series. Historia broadcasts a suite of locally produced original content including documentaries, reality series and drama series.
The acquisition of Séries+ and Historia is expected to further enhance our competitiveness in the Québec media landscape.
2016
| Acquisition of Q9 Networks Inc. (Q9) |
On October 3, 2016, BCE acquired the remaining 64.6% of the issued and outstanding shares of Q9 that it did not already own for a total cash consideration of approximately $170 million. In Q3 2016, prior to the transaction closing, Bell Canada provided a loan of $510 million to Q9 for the repayment of its debt.
| National expansion of HBO and The Movie Network (TMN) |
In Q1 2016, BCE completed a transaction with Corus under which Corus waived its HBO content rights in Canada and ceased operations of its Movie Central and Encore Avenue pay TV services in Western and Northern Canada, thereby allowing Bell Media to become the sole operator of HBO Canada nationally across all platforms and to expand TMN into a national pay TV service. TMN was successfully launched nationally on March 1, 2016. BCE paid to Corus a total cash consideration of $218 million, of which $21 million was paid in 2015.
| | | | BCE Inc. 2017 THIRD QUARTER SHAREHOLDER REPORT 45 |
|
| | | | |
| Notes to the consolidated financial statements | | |
| Note 4 Segmented information |
Our results are reported in three segments: Bell Wireless, Bell Wireline and Bell Media. Our segments reflect how we manage our business and how we classify our operations for planning and measuring performance.
On March 17, 2017, BCE acquired all of the issued and outstanding common shares of MTS. The results from the acquired MTS operations are included in our Bell Wireless and Bell Wireline segments from the date of acquisition.
The following tables present financial information by segment for the three month periods ended September 30, 2017 and 2016.
| FOR THE THREE MONTH PERIOD ENDED SEPTEMBER 30, 2017 | | | BELL | | BELL | | BELL | | INTERSEGMENT | | | |
| NOTE | | WIRELESS | | WIRELINE | | MEDIA | | ELIMINATIONS | | BCE | |
Operating revenues | | | | | | | | | | | | |
External customers | | | 2,027 | | 3,040 | | 611 | | – | | 5,678 | |
Inter-segment | | | 13 | | 52 | | 112 | | (177 | ) | – | |
Total operating revenues | | | 2,040 | | 3,092 | | 723 | | (177 | ) | 5,678 | |
Operating costs | 5 | | (1,169 | ) | (1,784 | ) | (536 | ) | 177 | | (3,312 | ) |
Segment profit(1) | | | 871 | | 1,308 | | 187 | | – | | 2,366 | |
Severance, acquisition and other costs | 6 | | (3 | ) | (19 | ) | (1 | ) | – | | (23 | ) |
Depreciation and amortization | | | (167 | ) | (769 | ) | (37 | ) | – | | (973 | ) |
Finance costs | | | | | | | | | | | | |
Interest expense | | | | | | | | | | | (242 | ) |
Interest on post-employment benefit obligations | 11 | | | | | | | | | | (18 | ) |
Other expense | 7 | | | | | | | | | | (56 | ) |
Income taxes | | | | | | | | | | | (237 | ) |
Net earnings | | | | | | | | | | | 817 | |
| (1) | The chief operating decision maker uses primarily one measure of profit to make decisions and assess performance, being operating revenues less operating costs. |
FOR THE THREE MONTH PERIOD ENDED SEPTEMBER 30, 2016 | | | BELL | | BELL | | BELL | | INTERSEGMENT | | | |
| NOTE | | WIRELESS | | WIRELINE | | MEDIA | | ELIMINATIONS | | BCE | |
Operating revenues | | | | | | | | | | | | |
External customers | | | 1,838 | | 2,953 | | 616 | | – | | 5,407 | |
Inter-segment | | | 10 | | 52 | | 100 | | (162 | ) | – | |
Total operating revenues | | | 1,848 | | 3,005 | | 716 | | (162 | ) | 5,407 | |
Operating costs | 5 | | (1,052 | ) | (1,752 | ) | (529 | ) | 162 | | (3,171 | ) |
Segment profit(1) | | | 796 | | 1,253 | | 187 | | – | | 2,236 | |
Severance, acquisition and other costs | 6 | | (1 | ) | (25 | ) | 1 | | – | | (25 | ) |
Depreciation and amortization | | | (137 | ) | (696 | ) | (34 | ) | – | | (867 | ) |
Finance costs | | | | | | | | | | | | |
Interest expense | | | | | | | | | | | (227 | ) |
Interest on post-employment benefit obligations | 11 | | | | | | | | | | (20 | ) |
Other expense | 7 | | | | | | | | | | (13 | ) |
Income taxes | | | | | | | | | | | (284 | ) |
Net earnings | | | | | | | | | | | 800 | |
| (1) | The chief operating decision maker uses primarily one measure of profit to make decisions and assess performance, being operating revenues less operating costs. |
| 46 BCE Inc. 2017 THIRD QUARTER SHAREHOLDER REPORT | | | |
|
| | | | |
| | Notes to the consolidated financial statements | |
The following tables present financial information by segment for the nine month periods ended September 30, 2017 and 2016.
| FOR THE NINE MONTH PERIOD ENDED SEPTEMBER 30, 2017 | | | BELL | | BELL | | BELL | | INTERSEGMENT | | | |
| NOTE | | WIRELESS | | WIRELINE | | MEDIA | | ELIMINATIONS | | BCE | |
Operating revenues | | | | | | | | | | | | |
External customers | | | 5,778 | | 9,037 | | 1,946 | | – | | 16,761 | |
Inter-segment | | | 35 | | 156 | | 324 | | (515 | ) | – | |
Total operating revenues | | | 5,813 | | 9,193 | | 2,270 | | (515 | ) | 16,761 | |
Operating costs | 5 | | (3,273 | ) | (5,317 | ) | (1,725 | ) | 515 | | (9,800 | ) |
Segment profit(1) | | | 2,540 | | 3,876 | | 545 | | – | | 6,961 | |
Severance, acquisition and other costs | 6 | | (8 | ) | (121 | ) | (14 | ) | – | | (143 | ) |
Depreciation and amortization | | | (449 | ) | (2,301 | ) | (110 | ) | – | | (2,860 | ) |
Finance costs | | | | | | | | | | | | |
Interest expense | | | | | | | | | | | (714 | ) |
Interest on post-employment benefit obligations | 11 | | | | | | | | | | (54 | ) |
Other expense | 7 | | | | | | | | | | (40 | ) |
Income taxes | | | | | | | | | | | (797 | ) |
Net earnings | | | | | | | | | | | 2,353 | |
| (1) | The chief operating decision maker uses primarily one measure of profit to make decisions and assess performance, being operating revenues less operating costs. |
| FOR THE NINE MONTH PERIOD ENDED SEPTEMBER 30, 2016 | | | BELL | | BELL | | BELL | | INTERSEGMENT | | | |
| NOTE | | WIRELESS | | WIRELINE | | MEDIA | | ELIMINATIONS | | BCE | |
Operating revenues | | | | | | | | | | | | |
External customers | | | 5,245 | | 8,833 | | 1,939 | | – | | 16,017 | |
Inter-segment | | | 31 | | 134 | | 297 | | (462 | ) | – | |
Total operating revenues | | | 5,276 | | 8,967 | | 2,236 | | (462 | ) | 16,017 | |
Operating costs | 5 | | (2,947 | ) | (5,184 | ) | (1,681 | ) | 462 | | (9,350 | ) |
Segment profit(1) | | | 2,329 | | 3,783 | | 555 | | – | | 6,667 | |
Severance, acquisition and other costs | 6 | | (5 | ) | (116 | ) | (3 | ) | – | | (124 | ) |
Depreciation and amortization | | | (418 | ) | (2,100 | ) | (106 | ) | – | | (2,624 | ) |
Finance costs | | | | | | | | | | | | |
Interest expense | | | | | | | | | | | (663 | ) |
Interest on post-employment benefit obligations | 11 | | | | | | | | | | (61 | ) |
Other income | 7 | | | | | | | | | | 51 | |
Income taxes | | | | | | | | | | | (858 | ) |
Net earnings | | | | | | | | | | | 2,388 | |
| (1) | The chief operating decision maker uses primarily one measure of profit to make decisions and assess performance, being operating revenues less operating costs. |
| | | | THREE MONTHS | NINE MONTHS |
| FOR THE PERIOD ENDED SEPTEMBER 30 | NOTE | | 2017 | | 2016 | | 2017 | | 2016 | |
Labour costs | | | | | | | | | | |
Wages, salaries and related taxes and benefits | | | (1,047 | ) | (1,002 | ) | (3,119 | ) | (3,031 | ) |
Post-employment benefit plans service cost (net of capitalized amounts) | 11 | | (64 | ) | (60 | ) | (178 | ) | (164 | ) |
Other labour costs(1) | | | (259 | ) | (263 | ) | (776 | ) | (758 | ) |
Less: | | | | | | | | | | |
Capitalized labour | | | 270 | | 244 | | 783 | | 723 | |
Total labour costs | | | (1,100 | ) | (1,081 | ) | (3,290 | ) | (3,230 | ) |
Cost of revenues(2) | | | (1,687 | ) | (1,610 | ) | (5,007 | ) | (4,733 | ) |
Other operating costs(3) | | | (525 | ) | (480 | ) | (1,503 | ) | (1,387 | ) |
Total operating costs | | | (3,312 | ) | (3,171 | ) | (9,800 | ) | (9,350 | ) |
| (1) | Other labour costs include contractor and outsourcing costs. |
| (2) | Cost of revenues includes costs of wireless devices and other equipment sold, network and content costs, and payments to other carriers. |
| (3) | Other operating costs include marketing, advertising and sales commission costs, bad debt expense, taxes other than income taxes, information technology costs, professional service fees and rent. |
| | | | BCE Inc. 2017 THIRD QUARTER SHAREHOLDER REPORT 47 |
|
| | | | |
| Notes to the consolidated financial statements | | |
| Note 6 Severance, acquisition and other costs |
| THREE MONTHS | NINE MONTHS |
FOR THE PERIOD ENDED SEPTEMBER 30 | 2017 | | 2016 | | 2017 | | 2016 | |
Severance | (14 | ) | (17 | ) | (61 | ) | (74 | ) |
Acquisition and other | (9 | ) | (8 | ) | (82 | ) | (50 | ) |
Total severance, acquisition and other costs | (23 | ) | (25 | ) | (143 | ) | (124 | ) |
| Acquisition and other costs |
Acquisition and other costs consist of transaction costs, such as legal and financial advisory fees, related to completed or potential acquisitions, employee severance costs related to the purchase of a business, the costs to integrate acquired companies into our operations and litigation costs, when they are significant. Acquisition costs also include in 2017 a loss on sale of spectrum licences relating to the MTS acquisition and in 2016 severance and integration costs relating to the privatization of Bell Aliant Inc.
| Note 7 Other (expense) income |
| | | THREE MONTHS | NINE MONTHS |
FOR THE PERIOD ENDED SEPTEMBER 30 | NOTE | | 2017 | | 2016 | | 2017 | | 2016 | |
Net mark-to-market gains on derivatives used as economic hedges | | | 15 | | 24 | | 41 | | 68 | |
Equity losses from investments in associates and joint ventures | | | | | | | | | | |
Operations | | | (39 | ) | (34 | ) | (8 | ) | (35 | ) |
Loss on investment(1) | | | – | | (46 | ) | (2 | ) | (46 | ) |
Early debt redemption costs | 10 | | (16 | ) | – | | (20 | ) | (11 | ) |
Losses on retirements and disposals of property, plant and equipment and intangible assets | | | (8 | ) | (4 | ) | (34 | ) | (18 | ) |
Gains (losses) on investments | | | – | | 34 | | (12 | ) | 48 | |
Other | | | (8 | ) | 13 | | (5 | ) | 45 | |
Total other (expense) income | | | (56 | ) | (13 | ) | (40 | ) | 51 | |
| (1) | The $46 million loss in 2016 represents BCE’s share of the loss recorded by one of our equity investments on the sale of a portion of its operations. |
| Note 8 Earnings per share |
The following table shows the components used in the calculation of basic and diluted earnings per common share for earnings attributable to common shareholders.
| THREE MONTHS | NINE MONTHS |
FOR THE PERIOD ENDED SEPTEMBER 30 | 2017 | | 2016 | | 2017 | | 2016 | |
Net earnings attributable to common shareholders – basic | 770 | | 752 | | 2,211 | | 2,237 | |
Dividends declared per common share (in dollars) | 0.7175 | | 0.6825 | | 2.1525 | | 2.0475 | |
Weighted average number of common shares outstanding (in millions) | | | | | | | | |
Weighted average number of common shares outstanding – basic | 900.4 | | 869.9 | | 892.2 | | 868.7 | |
Assumed exercise of stock options(1) | 0.7 | | 1.5 | | 0.7 | | 1.2 | |
Weighted average number of common shares outstanding – diluted (in millions) | 901.1 | | 871.4 | | 892.9 | | 869.9 | |
| (1) | The calculation of the assumed exercise of stock options includes the effect of the average unrecognized future compensation cost of dilutive options. It excludes options for which the exercise price is higher than the average market value of a BCE common share. The number of excluded options was 5,808,258 for both the third quarter and the first nine months of 2017, compared to 31,722 for the third quarter of 2016 and 2,932,470 for the first nine months of 2016. |
| 48 BCE Inc. 2017 THIRD QUARTER SHAREHOLDER REPORT | | | |
|
| | | | |
| | Notes to the consolidated financial statements | |
During Q3 2017, various uncertain tax positions were settled, which resulted in the reversal of deferred tax liabilities.
On September 29, 2017, Bell Canada issued 3.00% Series M-40 medium-term note (MTN) debentures (Series M-40 debentures) under its 1997 trust indenture, with a principal amount of $700 million, which mature on October 3, 2022. The Series M-40 debentures were issued as part of an existing series of MTN debentures. In addition, on the same date, Bell Canada issued 3.60% Series M-46 MTN debentures under its 1997 trust indenture, with a principal amount of $800 million, which mature on September 29, 2027.
In Q3 2017, Bell Canada reclassified its $400 million 3.5% Series M-28 MTN debentures, which mature on September 10, 2018, from long-term debt to short-term debt.
On May 12, 2017, Bell Canada redeemed, prior to maturity, its 4.37% Series M-35 debentures, having an outstanding principal amount of $350 million which were due on September 13, 2017. We incurred a $4 million early debt redemption charge which was recorded in Other (expense) income in Q2 2017 in the income statement.
In Q2 2017, Bell Canada reclassified its $300 million 4.88% Series M-36 debentures, which had an April 26, 2018 maturity date, from long-term debt to short-term debt.
On February 27, 2017, Bell Canada issued 2.70% Series M-44 MTN debentures under its 1997 trust indenture, with a principal amount of $1 billion, which mature on February 27, 2024. In addition, on the same date, Bell Canada issued 4.45% Series M-45 MTN debentures under its 1997 trust indenture, with a principal amount of $500 million, which mature on February 27, 2047.
In Q1 2017, Bell Canada repaid $357 million in U.S. dollars (approximately $480 million in Canadian dollars) representing all of the borrowings outstanding under its unsecured committed term credit facility. Accordingly, this credit facility was closed and the cross currency basis swap which was used to hedge the U.S. currency exposure under such credit facility was settled. See Note 12,Financial assets and liabilitiesfor additional details.
In Q1 2017, Bell Canada reclassified its $1 billion 4.40% Series M-22 MTN debentures, which had a March 16, 2018 maturity date, from long-term debt to short-term debt.
In Q1 2017, as a result of the acquisition of MTS on March 17, 2017, Bell Canada assumed MTS’ outstanding unsecured medium-term notes. The following table provides details for the principal amounts and fair values assigned to the medium-term notes assumed at acquisition.
| INTEREST RATE | | MATURITY | | AMOUNT | |
Medium-term note | 4.59% | | October 1, 2018 | | 200 | |
Medium-term note | 5.625% | | December 16, 2019 | | 200 | |
Medium-term note | 4.00% | | May 27, 2024 | | 225 | |
Total long-term debt | | | | | 625 | |
Fair value adjustment | | | | | 45 | |
Total long-term debt | | | | | 670 | |
The trust indentures under which these MTS medium-term notes were issued require us to meet specific new issue tests, to make an offer to repurchase the notes upon the occurrence of a change of control event as defined in the trust indentures and impose certain other covenants. We are in compliance with all conditions and restrictions under such trust indentures.
Also as a result of the acquisition of MTS, Bell Canada assumed MTS’ notes payable of $250 million and finance leases of $52 million.
Subsequent to quarter end, on October 9, 2017, Bell Canada redeemed, prior to maturity, its 4.88% Series M-36 debentures, having an outstanding principal amount of $300 million, which were due on April 26, 2018. We recognized a $5 million early debt redemption charge which was recorded inOther (expense) incomein Q3 2017 in the income statement. In addition, on October 30, 2017, Bell Canada redeemed, prior to maturity, its 4.40% Series M-22 MTN debentures, having an outstanding principal amount of $1 billion, which were due on March 16, 2018. We recognized an $11 million early debt redemption charge which was recorded inOther (expense) incomein Q3 2017 in the income statement.
| | | | BCE Inc. 2017 THIRD QUARTER SHAREHOLDER REPORT 49 |
|
| | | | |
| Notes to the consolidated financial statements | | |
| Note 11 Post-employment benefit plans |
Post-employment benefit plans cost
We provide pension and other benefits for most of our employees. These include defined benefit (DB) pension plans, defined contribution (DC) pension plans and other post-employment benefits (OPEBs). The costs of these plans are tabled below.
COMPONENTS OF POST-EMPLOYMENT BENEFIT PLANS SERVICE COST
| THREE MONTHS | NINE MONTHS |
FOR THE PERIOD ENDED SEPTEMBER 30 | 2017 | | 2016 | | 2017 | | 2016 | |
DB pension | (54 | ) | (50 | ) | (155 | ) | (153 | ) |
DC pension | (23 | ) | (23 | ) | (78 | ) | (77 | ) |
OPEBs | (1 | ) | (2 | ) | (4 | ) | (5 | ) |
Plan amendment gain on OPEBs and DB pension | – | | – | | 16 | | 27 | |
Less: | | | | | | | | |
Capitalized benefit plans cost | 14 | | 15 | | 43 | | 44 | |
Total post-employment benefit plans service cost included in operating costs | (64 | ) | (60 | ) | (178 | ) | (164 | ) |
Other costs recognized in severance, acquisition and other costs | – | | – | | (4 | ) | 5 | |
Total post-employment benefit plans service cost | (64 | ) | (60 | ) | (182 | ) | (159 | ) |
COMPONENTS OF POST-EMPLOYMENT BENEFIT PLANS FINANCING COST
| | THREE MONTHS | NINE MONTHS |
| FOR THE PERIOD ENDED SEPTEMBER 30 | 2017 | | 2016 | | 2017 | | 2016 | |
DB pension | (5 | ) | (6 | ) | (14 | ) | (18 | ) |
OPEBs | (13 | ) | (14 | ) | (40 | ) | (43 | ) |
Total interest on post-employment benefit obligations | (18 | ) | (20 | ) | (54 | ) | (61 | ) |
MTS’ net post-employment benefit asset was $53 million ($2,735 million fair value of plan assets and $2,682 million post-employment benefit obligations) at the acquisition date of March 17, 2017.
On January 15, 2016, MTS completed the sale of its wholly-owned subsidiaries Allstream Inc., Allstream Fibre U.S., and Delphi Solutions Corp (collectively, Allstream), to Zayo Group Holdings Inc. As part of the sale agreement, MTS retained Allstream’s two existing DB pension plans including the benefit obligations for retirees and other former employees. On October 31, 2017, we completed the transfer of assets and liabilities related to pre-closing service obligations for Allstream’s active employees from the existing Allstream DB pension plans to two new Zayo Canada Inc. pension plans.
| Note 12 Financial assets and liabilities |
Fair value
The following table provides the fair value details of financial instruments measured at amortized cost in the statements of financial position.
| | | SEPTEMBER 30, 2017 | DECEMBER 31, 2016 |
| | CLASSIFICATION | FAIR VALUE METHODOLOGY | CARRYING
VALUE | | FAIR
VALUE | | CARRYING
VALUE | | FAIR
VALUE | |
CRTC tangible benefits obligation | Trade payables and other liabilities and non-current liabilities | Present value of estimated future cash flows discounted using observable market interest rates | 129 | | 129 | | 166 | | 169 | |
CRTC deferral account obligation | Trade payables and other liabilities and non-current liabilities | Present value of estimated future cash flows discounted using observable market interest rates | 127 | | 132 | | 136 | | 145 | |
Debentures, finance leases and other debt | Debt due within one year and long-term debt | Quoted market price of debt or present value of future cash flows discounted using observable market interest rates | 20,667 | | 22,518 | | 17,879 | | 20,093 | |
| 50 BCE Inc. 2017 THIRD QUARTER SHAREHOLDER REPORT | | | |
|
| | | | |
| | Notes to the consolidated financial statements | |
The following table provides the fair value details of financial instruments measured at fair value in the statements of financial position.
| | | | | FAIR VALUE |
| CLASSIFICATION | CARRYING VALUE OF
ASSET (LIABILITY) | | QUOTED PRICES IN
ACTIVE MARKETS FOR
IDENTICAL ASSETS
(LEVEL 1) | | OBSERVABLE
MARKET DATA
(LEVEL 2)(1) | | NON-OBSERVABLE
MARKET INPUTS
(LEVEL 3)(2) | |
September 30, 2017 | | | | | | | | | |
AFS publicly-traded and privately-held investments | Other non-current assets | 103 | | 1 | | – | | 102 | |
Derivative financial instruments | Other current assets, trade payables and other liabilities, other non-current assets and liabilities | (29 | ) | – | | (29 | ) | – | |
MLSE financial liability (3) | Trade payables and other liabilities | (135 | ) | – | | – | | (135 | ) |
Other | Other non-current assets and liabilities | 43 | | – | | 99 | | (56 | ) |
December 31, 2016 | | | | | | | | | |
AFS publicly-traded and privately-held investments | Other non-current assets | 103 | | 1 | | – | | 102 | |
Derivative financial instruments | Other current assets, trade payables and other liabilities, other non-current assets and liabilities | 166 | | – | | 166 | | – | |
MLSE financial liability(3) | Trade payables and other liabilities | (135 | ) | – | | – | | (135 | ) |
Other | Other non-current assets and liabilities | 35 | | – | | 88 | | (53 | ) |
| (1) | Observable market data such as equity prices, interest rates, swap rate curves and foreign currency exchange rates. |
| (2) | Non-observable market inputs such as discounted cash flows and earnings multiples. A reasonable change in our assumptions would not result in a significant increase (decrease) to our level 3 financial instruments. |
| (3) | Represents BCE’s obligation to repurchase the BCE Master Trust Fund’s (Master Trust) 9% interest in Maple Leaf Sports & Entertainment Ltd. (MLSE) at a price not less than an agreed minimum price should the Master Trust exercise its put option. The obligation to repurchase is marked to market each reporting period and the gain or loss is recorded in Other (expense) income in the income statements. |
We use foreign currency forward contracts, options and cross currency basis swaps to manage foreign currency risk related to anticipated transactions and certain foreign currency debt. During Q1 2017, we settled a cross currency basis swap with a notional amount of $357 million in U.S. dollars used to hedge borrowings under a credit facility. Refer to Note 10, Debt.
A 10% depreciation (appreciation) in the value of the Canadian dollar relative to the U.S. dollar would result in a gain (loss) of $2 million recognized in net earnings at September 30, 2017 and a gain (loss) of $156 million recognized in other comprehensive income at September 30, 2017, with all other variables held constant.
The following table provides further details on our outstanding foreign currency forward contracts at September 30, 2017.
| | | AMOUNTS | | AMOUNTS | | |
| TYPE OF HEDGE | BUY CURRENCY | TO RECEIVE | SELL CURRENCY | TO PAY | MATURITY | HEDGED ITEM |
| Cash flow | USD | 2,345 | CAD | 2,905 | 2017 | Commercial paper |
| Cash flow | USD | 240 | CAD | 312 | 2017 | Anticipated transactions |
| Cash flow | USD | 901 | CAD | 1,172 | 2018 | Anticipated transactions |
| Cash flow | CAD | 97 | USD | 75 | 2018-2019 | Anticipated transactions |
| Cash flow | USD | 542 | CAD | 678 | 2019 | Anticipated transactions |
| Cash flow | USD | 109 | CAD | 139 | 2020-2021 | Anticipated transactions |
| Economic | CAD | 56 | USD | 44 | 2017 | Anticipated transactions |
| Economic | USD | 81 | CAD | 108 | 2017-2018 | Anticipated transactions |
A 1% increase (decrease) in interest rates would result in a decrease (increase) of $24 million in net earnings at September 30, 2017, with all other variables held constant.
We use equity forward contracts on BCE’s common shares to economically hedge the cash flow exposure related to the settlement of share-based payment plans. The fair value of our equity forward contracts at September 30, 2017 was $12 million.
A 5% increase (decrease) in the market price of BCE’s common shares at September 30, 2017 would result in a gain (loss) of $37 million recognized in net earnings, with all other variables held constant.
| | | | BCE Inc. 2017 THIRD QUARTER SHAREHOLDER REPORT 51 |
|
| | | | |
| Notes to the consolidated financial statements | | |
Issuance of common shares
On March 17, 2017, 27.6 million BCE common shares were issued in payment of the equity portion of the purchase price for the acquisition of MTS. See Note 3,Business acquisitions and dispositionsfor additional details.
| Conversion and dividend rate reset of first preferred shares |
On September 1, 2017, 965,769 of BCE’s 10,144,302 fixed-rate Cumulative Redeemable First Preferred Shares, Series AA (Series AA Preferred Shares) were converted, on a one-for-one basis, into floating rate Cumulative Redeemable First Preferred Shares, Series AB (Series AB Preferred Shares). In addition, on September 1, 2017, 2,219,863 of BCE’s 9,855,698 Series AB Preferred Shares were converted, on a one-for-one basis, into Series AA Preferred Shares. As a result, 11,398,396 Series AA Preferred Shares and 8,601,604 Series AB Preferred Shares are issued and outstanding since September 1, 2017.
The annual fixed dividend rate on the Series AA Preferred Shares was reset for the next five years, effective on September 1, 2017, at 3.61% from 3.45%. The Series AB Preferred Shares continue to pay a monthly floating cash dividend.
On March 31, 2017, the annual fixed dividend rate on BCE’s Cumulative Redeemable First Preferred Shares, Series AO was reset for the next five years at 4.26% from 4.55%.
Dividends will be paid as and when declared by the board of directors of BCE.
| Note 14 Share-based payments |
The following share-based payment amounts are included in the consolidated income statements as operating costs.
| THREE MONTHS | NINE MONTHS |
FOR THE PERIOD ENDED SEPTEMBER 30 | 2017 | | 2016 | | 2017 | | 2016 | |
Employee savings plan (ESP) | (7 | ) | (8 | ) | (21 | ) | (22 | ) |
Restricted share units (RSUs) and performance share units (PSUs) | (10 | ) | (12 | ) | (37 | ) | (40 | ) |
Other(1) | (2 | ) | (2 | ) | (7 | ) | (9 | ) |
Total share-based payments | (19 | ) | (22 | ) | (65 | ) | (71 | ) |
| (1) | Includes deferred share units (DSUs), deferred share plan (DSP) and stock options. |
The following tables summarize the change in outstanding ESP shares, RSUs/PSUs, DSUs and stock options for the period ended September 30, 2017.
ESP
| | NUMBER OF | |
| | ESP SHARES | |
Unvested contributions, January 1, 2017 | 1,073,212 | |
Contributions(1) | 472,301 | |
Dividends credited | 36,914 | |
Vested | (435,931 | ) |
Forfeited | (107,446 | ) |
Unvested contributions, September 30, 2017 | 1,039,050 | |
| (1) | The weighted average fair value of the shares contributed during the nine months ended September 30, 2017 was $59. |
RSUs/PSUs
| NUMBER OF | |
| RSUs/PSUs | |
Oustanding, January 1, 2017 | 2,928,698 | |
Granted(1) | 876,543 | |
Dividends credited | 99,245 | |
Settled | (1,093,786 | ) |
Forfeited | (90,968 | ) |
Outstanding, September 30, 2017 | 2,719,732 | |
| (1) | The weighted average fair value of the RSUs/PSUs granted during the nine months ended September 30, 2017 was $58. |
| 52 BCE Inc. 2017 THIRD QUARTER SHAREHOLDER REPORT | | | |
|
| | | | |
| | Notes to the consolidated financial statements | |
DSUs
| NUMBER | |
| OF DSUs | |
Outstanding, January 1, 2017 | 4,131,229 | |
Issued(1) | 58,822 | |
Settlement of RSUs/PSUs | 101,066 | |
Dividends credited | 151,017 | |
Settled | (111,947 | ) |
Outstanding, September 30, 2017 | 4,330,187 | |
| (1) | The weighted average fair value of the DSUs issued during the nine months ended September 30, 2017 was $59. |
STOCK OPTIONS
| | | WEIGHTED AVERAGE | |
| NUMBER | | EXERCISE PRICE | |
| OF OPTIONS | | ($) | |
Outstanding, January 1, 2017 | 10,242,162 | | 52 | |
Granted | 3,027,986 | | 59 | |
Exercised(1) | (1,995,896 | ) | 46 | |
Forfeited | (239,498 | ) | 58 | |
Outstanding, September 30, 2017 | 11,034,754 | | 55 | |
Exercisable, September 30, 2017 | 2,573,950 | | 45 | |
| (1) | The weighted average share price for options exercised during the nine months ended September 30, 2017 was $60. |
ASSUMPTIONS USED IN STOCK OPTION PRICING MODEL
The fair value of options granted was determined using a variation of a binomial option pricing model that takes into account factors specific to the share incentive plans, such as the vesting period. The following table shows the principal assumptions used in the valuation.
| 2017 | |
Weighted average fair value per option granted | $1.97 | |
Weighted average share price | $58 | |
Weighted average exercise price | $59 | |
Dividend yield | 5.0 | % |
Expected volatility | 13 | % |
Risk-free interest rate | 1.0 | % |
Expected life (years) | 4.0 | |
Expected volatilities are based on the historical volatility of BCE’s share price. The risk-free rate used is equal to the yield available on Government of Canada bonds at the date of grant with a term equal to the expected life of the options.
| | | | BCE Inc. 2017 THIRD QUARTER SHAREHOLDER REPORT 53 |
|
| This document has been filed by BCE Inc. with the Canadian provincial securities regulatory authorities and the U.S. Securities and Exchange Commission. It can be found on BCE Inc.’s website at BCE.ca, on SEDAR at www.sedar.com and on EDGAR at www.sec.gov or is available upon request from: INVESTOR RELATIONS
Building A, 8th floor
1 Carrefour Alexander-Graham-Bell
Verdun, Québec H3E 3B3 e-mail: investor.relations@bce.ca
tel: 1-800-339-6353
fax: 514-786-3970 BCE.ca For additional copies of this document, please contact investor relations. Pour obtenir un exemplaire de la version française de ce document, contactez les Relations avec les investisseurs. | For further information concerning BCE Inc.’s Dividend Reinvestment and Stock Purchase Plan (DRP), direct deposit of dividend payments, the elimination of multiple mailings or the receipt of quarterly reports, please contact: CST TRUST COMPANY
320 Bay Street, 3rd floor
Toronto, Ontario M5H 4A6
tel: 416-360-7725 or 1-800-561-0934
fax: 416-643-5501 or 1-888-249-6189
e-mail: bce@canstockta.com |