Exhibit 99.1

| Management’s discussion and analysis | 1 |
1 | Overview | 2 |
| | 1.1 | Financial highlights | 2 |
| | 1.2 | Key corporate and business developments | 3 |
| | 1.3 | Assumptions | 4 |
2 | Consolidated financial analysis | 5 |
| | 2.1 | BCE consolidated income statements | 5 |
| | 2.2 | Customer connections | 5 |
| | 2.3 | Operating revenues | 6 |
| | 2.4 | Operating costs | 7 |
| | 2.5 | Net earnings | 8 |
| | 2.6 | Adjusted EBITDA | 8 |
| | 2.7 | Severance, acquisition and other costs | 9 |
| | 2.8 | Depreciation and amortization | 9 |
| | 2.9 | Finance costs | 9 |
| | 2.10 | Other (expense) income | 10 |
| | 2.11 | Income taxes | 10 |
| | 2.12 | Net earnings attributable to common shareholders and EPS | 10 |
3 | Business segment analysis | 11 |
| | 3.1 | Bell Wireless | 11 |
| | 3.2 | Bell Wireline | 15 |
| | 3.3 | Bell Media | 19 |
4 | Financial and capital management | 21 |
| | 4.1 | Net debt | 21 |
| | 4.2 | Outstanding share data | 21 |
| | 4.3 | Cash flows | 22 |
| | 4.4 | Post-employment benefit plans | 23 |
| | 4.5 | Financial risk management | 24 |
| | 4.6 | Credit ratings | 25 |
| | 4.7 | Liquidity | 25 |
5 | Quarterly financial information | 26 |
6 | Regulatory environment | 27 |
7 | Business risks | 28 |
8 | Accounting policies, financial measures and controls | 30 |
| | 8.1 | Our accounting policies | 30 |
| | 8.2 | Non-GAAP financial measures and key performance indicators (KPIs) | 34 |
| | 8.3 | Controls and procedures | 36 |
| Consolidated financial statements | 37 |
| Consolidated income statements | 37 |
| Consolidated statements of comprehensive income | 38 |
| Consolidated statements of financial position | 39 |
| Consolidated statements of changes in equity | 40 |
| Consolidated statements of cash flows | 41 |
| Notes to consolidated financial statements | 42 |
| Note 1 | Corporate information | 42 |
| Note 2 | Basis of presentation and significant accounting policies | 42 |
| Note 3 | Adoption of IFRS 15 | 43 |
| Note 4 | Business acquisitions and dispositions | 49 |
| Note 5 | Segmented information | 50 |
| Note 6 | Operating costs | 51 |
| Note 7 | Severance, acquisition and other costs | 51 |
| Note 8 | Other (expense) income | 52 |
| Note 9 | Earnings per share | 52 |
| Note 10 | Debt | 52 |
| Note 11 | Post-employment benefit plans | 53 |
| Note 12 | Financial assets and liabilities | 53 |
| Note 13 | Share capital | 55 |
| Note 14 | Share-based payments | 55 |
| BCE Inc. 2018 FIRST QUARTER SHAREHOLDER REPORT |
|
| | | |
| | MD&A | |
| Management’s discussion and analysis |
In this management’s discussion and analysis of financial condition and results of operations (MD&A),we,us,our,BCE andthe companymean, as the context may require, either BCE Inc. or, collectively, BCE Inc., Bell Canada, their subsidiaries, joint arrangements and associates.Bellmeans, as the context may require, either Bell Canada or, collectively, Bell Canada, its subsidiaries, joint arrangements and associates.MTSmeans, as the context may require, until March 17, 2017, either Manitoba Telecom Services Inc. or, collectively, Manitoba Telecom Services Inc. and its subsidiaries; andBell MTSmeans, from March 17, 2017, the combined operations of MTS and Bell Canada in Manitoba.
All amounts in this MD&A are in millions of Canadian dollars, except where noted. Please refer to section 8.2,Non-GAAP financial measures and key performance indicators (KPIs)on pages 34 to 36 for a list of defined non-GAAP financial measures and KPIs.
Please refer to BCE’s unaudited consolidated financial statements for the first quarter of 2018 (Q1 2018 Financial Statements) when reading this MD&A. We also encourage you to read BCE’s MD&A for the year ended December 31, 2017 dated March 8, 2018 (BCE 2017 Annual MD&A). In preparing this MD&A, we have taken into account information available to us up to May 2, 2018, the date of this MD&A, unless otherwise stated.
As required by International Financial Reporting Standards (IFRS), effective January 1, 2018, we have adopted IFRS 15, Revenue from Contracts with Customers, as described in section 8.1,Our accounting policies, retrospectively to each period in 2017 previously reported. We have also reclassified some amounts from previous periods to make them consistent with the presentation for the current period. As a result of the adoption of IFRS 15, we have also updated certain of our assumptions set out in the BCE 2017 Annual MD&A.
You will find more information about us, including BCE’s annual information form for the year ended December 31, 2017 dated March 8, 2018 (BCE 2017 AIF) and recent financial reports, including the BCE 2017 Annual MD&A, on BCE’s website atBCE.ca, on SEDAR atsedar.comand on EDGAR atsec.gov.
Please also refer to BCE’s press release announcing its results for the first quarter of 2018 to be issued on May 3, 2018, available on BCE’s website atBCE.ca, on SEDAR atsedar.comand on EDGAR atsec.gov.
This MD&A comments on our business operations, performance, financial position and other matters for the three months (Q1) ended March 31, 2018 and 2017.
| CAUTION REGARDING FORWARD-LOOKING STATEMENTS |
This MD&A, and in particular, but without limitation, the section and sub-sections entitledAssumptions, section 1.2,Key corporate and business developments, section 3.1,Bell Wireless – Key business developments, section 3.2,Bell Wireline – Key business developments, section 3.3,Bell Media – Key business developments, and section 6,Regulatory environment, contain forward-looking statements. These forward-looking statements include, without limitation, statements relating to our network deployment plans and related capital investments, BCE’s 2018 annualized common share dividend, BCE’s business outlook, objectives, plans and strategic priorities, and other statements that do not refer to historical facts. A statement we make is forward-looking when it uses what we know and expect today to make a statement about the future. Forward-looking statements are typically identified by the wordsassumption,goal,guidance,objective,outlook,project,strategy,target, and other similar expressions or future or conditional verbs such asaim,anticipate,believe,could,expect,intend,may,plan,seek,should,striveandwill. All such forward-looking statements are made pursuant to the safe harbour provisions of applicable Canadian securities laws and of the United States (U.S.)Private Securities Litigation Reform Act of 1995.
Unless otherwise indicated by us, forward-looking statements in this MD&A describe our expectations as at May 2, 2018 and, accordingly, are subject to change after that date. Except as may be required by Canadian securities laws, we do not undertake any obligation to update or revise any forward-looking statements, whether as a result of new information, future events or otherwise.
Forward-looking statements, by their very nature, are subject to inherent risks and uncertainties and are based on several assumptions both general and specific, which give rise to the possibility that actual results or events could differ materially from our expectations expressed in, or implied by, such forward-looking statements and that our business outlook, objectives, plans and strategic priorities may not be achieved. As a result, we cannot guarantee that any forward-looking statement will materialize and we caution you against relying on any of these forward-looking statements. Forward-looking statements are presented in this MD&A for the purpose of assisting investors and others in understanding our objectives, strategic priorities and business outlook as well as our anticipated operating environment. Readers are cautioned, however, that such information may not be appropriate for other purposes.
We have made certain economic, market and operational assumptions in preparing the forward-looking statements contained in this MD&A and, in particular, but without limitation, the forward-looking statements contained in the previously mentioned sections of this MD&A. These assumptions include, without limitation, the assumptions described in the various sections of this MD&A entitledAssumptions, which sections are incorporated by reference in this cautionary statement. We believe that our assumptions were reasonable at May 2, 2018. If our assumptions turn out to be inaccurate, our actual results could be materially different from what we expect.
Important risk factors including, without limitation, competitive, regulatory, economic, financial, operational, technological and other risks that could cause actual results or events to differ materially from those expressed in, or implied by, the previously-mentioned forward looking statements and other forward-looking statements contained in this MD&A, include, but are not limited to, the risks described or referred to in section 6,Regulatory environment, and section 7,Business risks, which sections are incorporated by reference in this cautionary statement.
We caution readers that the risks described in the previously mentioned section and in other sections of this MD&A are not the only ones that could affect us. Additional risks and uncertainties not currently known to us or that we currently deem to be immaterial may also have a material adverse effect on our financial position, financial performance, cash flows, business or reputation. Except as otherwise indicated by us, forward-looking statements do not reflect the potential impact of any special items or of any dispositions, monetizations, mergers, acquisitions, other business combinations or other transactions that may be announced or that may occur after May 2, 2018. The financial impact of these transactions and special items can be complex and depends on facts particular to each of them. We therefore cannot describe the expected impact in a meaningful way, or in the same way we present known risks affecting our business.
BCE Inc. 2018 FIRST QUARTER SHAREHOLDER REPORT 1 |
|
| | | | |
1 | MD&A | Overview | |
As required by IFRS, effective January 1, 2018, we have adopted IFRS 15, Revenue from Contracts with Customers, as described in section 8.1, Our accounting policies, retrospectively to each period in 2017 previously reported. We have also reclassified some amounts from previous periods to make them consistent with the presentation for the current period.
BCE Q1 2018 SELECTED QUARTERLY INFORMATION
| BCE INCOME STATEMENTS – SELECTED INFORMATION |
| Q1 2018 | | Q1 2017 | | $ CHANGE | | % CHANGE | |
Operating revenues | | | | | | | | |
Service | 4,964 | | 4,811 | | 153 | | 3.2 | % |
Product | 626 | | 525 | | 101 | | 19.2 | % |
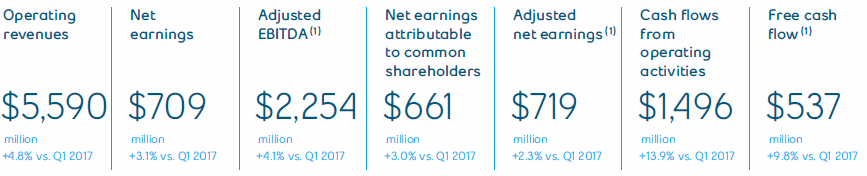
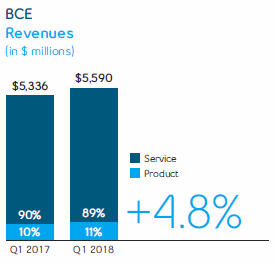
Total operating revenues | 5,590 | | 5,336 | | 254 | | 4.8 | % |
Operating costs | (3,336 | ) | (3,170 | ) | (166 | ) | (5.2 | %) |
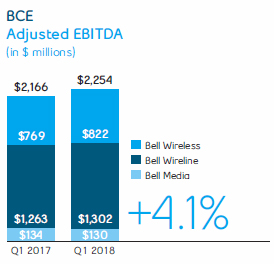
Adjusted EBITDA | 2,254 | | 2,166 | | 88 | | 4.1 | % |
Adjusted EBITDA margin(1) | 40.3 | % | 40.6 | % | | | (0.3 | ) pts |
Net earnings attributable to: | | | | | | | | |
Common shareholders | 661 | | 642 | | 19 | | 3.0 | % |
Preferred shareholders | 36 | | 31 | | 5 | | 16.1 | % |
Non-controlling interest | 12 | | 15 | | (3 | ) | (20.0 | %) |
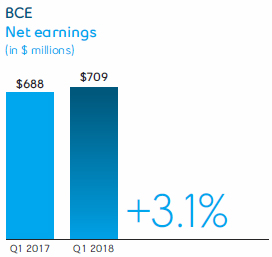
Net earnings | 709 | | 688 | | 21 | | 3.1 | % |
Adjusted net earnings | 719 | | 703 | | 16 | | 2.3 | % |
Net earnings per common share (EPS) | 0.73 | | 0.73 | | – | | – | |
Adjusted EPS(1) | 0.80 | | 0.80 | | – | | – | |
| (1) | Adjusted EBITDA, adjusted EBITDA margin, adjusted net earnings, adjusted EPS and free cash flow are non-GAAP financial measures and do not have any standardized meaning under IFRS. Therefore, they are unlikely to be comparable to similar measures presented by other issuers. See section 8.2,Non-GAAP financial measures and key performance indicators (KPIs) – Adjusted EBITDA and adjusted EBITDA margin, Adjusted net earnings and adjusted EPSandFree cash flow and dividend payout ratioin this MD&A for more details, including reconciliations to the most comparable IFRS financial measure. |
| (2) | At the beginning of Q1 2018, we adjusted our postpaid wireless subscriber base to remove 16,116 subscribers with a corresponding increase to our high-speed Internet subscribers to reflect the transfer of fixed wireless Internet subscribers. |
| (3) | At the beginning of Q1 2018, our high-speed Internet subscriber base was increased by 19,835, our Internet protocol television (IPTV) by 14,599 and our residential NAS by 23,441, mainly as a result of a small acquisition made in the quarter. |
| (4) | As of January 1, 2018, business NAS was removed from our NAS subscriber base due to its declining relevance as a KPI given migrations from voice to Internet protocol (IP) result in NAS losses without a corresponding decline in revenues. Previously reported periods were retroactively adjusted. |
| 2 BCE Inc. 2018 FIRST QUARTER SHAREHOLDER REPORT |
|
| | | | |
| | 1 | MD&A | Overview |
| BCE STATEMENTS OF CASH FLOWS – SELECTED INFORMATION |
| Q1 2018 | | Q1 2017 | | $ CHANGE | | % CHANGE | |
Cash flows from operating activities | 1,496 | | 1,313 | | 183 | | 13.9 | % |
Capital expenditures | (931 | ) | (852 | ) | (79 | ) | (9.3 | %) |
Free cash flow | 537 | | 489 | | 48 | | 9.8 | % |
| Q1 2018 FINANCIAL HIGHLIGHTS |
BCE delivered revenue growth of 4.8%, compared to Q1 2017, resulting from higher service revenues of 3.2%, coupled with increased product revenues of 19.2%. The growth was driven by higher wireless and wireline revenues, while Bell Media revenues remained relatively stable year over year. The growth continues to be led by our wireless segment, increasing 10.1% year over year despite a $14 million retroactive regulatory impact from the recent Canadian Radio-television and Telecommunications Commission (CRTC) decision on wholesale wireless domestic roaming rates in Q1 2018. Both our wireless and wireline segments were favourably impacted by the acquisition of MTS on March 17, 2017. The increase in our wireline segment also reflected the continued growth in Internet and IPTV, moderated by the ongoing erosion in voice, satellite TV and legacy data revenues including continued but diminishing pressures in our business market. Product revenues grew as a result of the increased sales mix of premium devices and higher volumes in our wireless segment, the contribution from the acquisition of MTS, as well as greater demand from the government sector.
Net earnings increased by 3.1% in the first quarter of 2018, compared to the same period last year, due to higher adjusted EBITDA, as growing revenues more than offset an increase in operating costs, and lower severance, acquisition and other costs, partly offset by higher depreciation and amortization expense and higher other expense mainly as a result of net mark-to-market losses on derivatives used to economically hedge equity settled share-based compensation plans.
Q1 2018 adjusted EBITDA was up 4.1%, compared to last year, mainly due to service revenue flow-through including the unfavourable retroactive impact of the recent CRTC decision of $14 million in Q1 2018, the contribution from the acquisition of MTS and continued disciplined cost containment, which was moderated by higher pension expense due to a gain realized in Q1 2017 and escalating content and programming costs.
BCE’s EPS of $0.73 in Q1 2018 remained stable compared to the same period last year.
Excluding the impact of severance, acquisition and other costs, net mark-to-market (losses) gains on derivatives used to economically hedge equity settled share-based compensation plans, net (losses) gains on investments, early debt redemption costs and impairment charges, adjusted net earnings in the first quarter of 2018 was $719 million, or $0.80 per common share, compared to $703 million, or $0.80 per common share, for the same period last year.
Cash flows from operating activities in the first quarter of 2018 increased by $183 million, compared to Q1 2017, due mainly to improved working capital, lower acquisition and other costs paid and higher adjusted EBITDA.
Free cash flow in Q1 2018 increased by $48 million, compared to the same period last year, due to higher cash flows from operating activities excluding acquisition and other costs paid, partly offset by higher capital expenditures.
| 1.2Key corporate and business developments |
COMMON SHARE DIVIDEND INCREASE
On February 7, 2018, BCE’s board of directors approved a 5.2%, or 15 cents per share, increase in the annual common share dividend from $2.87 per share to $3.02 per share, effective with BCE’s 2018 first quarter dividend paid on April 15, 2018 to common shareholders of record on March 15, 2018. This dividend increase represents BCE’s 14th increase to its annual common share dividend since the fourth quarter of 2008, representing a 107% overall increase.
| COMPLETION OF NORMAL COURSE ISSUER BID |
On February 8, 2018, BCE announced a normal course issuer bid (NCIB) program under which BCE could purchase for cancellation up to 3.5 million common shares, subject to a maximum aggregate purchase price of $175 million, during the twelve-month period starting February 13, 2018 and ending no later than February 12, 2019. On March 13, 2018, BCE completed its NCIB program, having repurchased and cancelled 3,085,697 common shares, at an average price of $56.71 per share, for a total cost of $175 million. The repurchase of common shares was conducted for the purpose of offsetting share dilution resulting from the exercise of stock options.
BCE Inc. 2018 FIRST QUARTER SHAREHOLDER REPORT 3 |
|
| | | | |
1 | MD&A | Overview | |
| PUBLIC DEBT OFFERINGS AND REDEMPTIONS |
On March 12, 2018, Bell Canada completed a public offering of $500 million of medium term notes (MTN) debentures pursuant to its MTN program. The $500 million Series M-47 MTN debentures will mature on March 12, 2025 and carry an annual interest rate of 3.35%. The MTN debentures are fully and unconditionally guaranteed by BCE Inc. The net proceeds of the offering were used to fund the early redemption in April 2018 of Bell Canada’s $300 million principal amount of 5.52% Series M-33 debentures due February 26, 2019 and for the repayment of other short-term debt.
On March 29, 2018, Bell Canada completed a public offering of US $750 million of Series US-1 Notes. The Notes will mature on April 1, 2048 and carry an annual interest rate of 4.464%. This financing represents the first public debt issuance by Bell Canada in the U.S. market in more than 20 years. The Notes are fully and unconditionally guaranteed by BCE Inc. The net proceeds of the offering were used to fund the early redemption in April 2018 of Bell Canada’s $200 million principal amount of 4.59% Series 9 medium term notes due October 1, 2018 and will be used to fund the early redemption in May 2018 of Bell Canada’s $400 million principal amount of 3.50% Series M-28 debentures due September 10, 2018, as well as for general corporate purposes.
| BELL NAMED ONE OF CANADA’S BEST DIVERSITY EMPLOYERS |
For the second year in a row, Bell has been named one of Canada’s Best Diversity Employers in Mediacorp’s 2018 report on workplace diversity and inclusion. The award recognizes Bell’s commitment to providing an inclusive and accessible workplace that reflects Canada’s diversity and highlights our wide range of initiatives to support women, persons with disabilities, Aboriginal people, visible minorities and other groups.
As at the date of this MD&A, our forward-looking statements set out in the BCE 2017 Annual MD&A, as updated or supplemented in this MD&A, are based on certain assumptions including, without limitation, the following economic and market assumptions as well as the various assumptions referred to under the sub-sections entitled Assumptions set out in section 3, Business segment analysis of this MD&A.
ASSUMPTIONS ABOUT THE CANADIAN ECONOMY
- Lower economic growth, given the Bank of Canada’s most recent estimated growth in Canadian gross domestic product of 2.0% in 2018, representing a slight decrease from the earlier estimate of 2.2%.
- Employment gains expected to slow in 2018, as the overall level of business investment is expected to remain soft
- Interest rates expected to increase modestly in 2018
- Canadian dollar expected to remain at near current levels. Further movements may be impacted by the degree of strength of the U.S. dollar, interest rates and changes in commodity prices
MARKET ASSUMPTIONS
- A higher level of wireline and wireless competition in consumer, business and wholesale markets
- Higher, but slowing, wireless industry penetration and smartphone adoption
- A soft media advertising market, due to variable demand, and continued escalation of costs to secure TV programming
- Ongoing linear TV subscriber erosion, due to growing cord-cutter and cord-never customer segments
| 4 BCE Inc. 2018 FIRST QUARTER SHAREHOLDER REPORT |
|
| | | | |
| | 2 | MD&A | Consolidated financial analysis |
| 2 Consolidated financial analysis |
This section provides detailed information and analysis about BCE’s performance in Q1 2018 compared with Q1 2017. It focuses on BCE’s consolidated operating results and provides financial information for our Bell Wireless, Bell Wireline and Bell Media business segments. For further discussion and analysis of our business segments, refer to section 3,Business segment analysis.
As required by IFRS, effective January 1, 2018, we have adopted IFRS 15, Revenue from Contracts with Customers, as described in section 8.1,Our accounting policies, retrospectively to each period in 2017 previously reported. We have also reclassified some amounts from previous periods to make them consistent with the presentation for the current period.
| 2.1 BCE consolidated income statements |
| Q1 2018 | | Q1 2017 | | $ CHANGE | | % CHANGE | |
Operating revenues | | | | | | | | |
Service | 4,964 | | 4,811 | | 153 | | 3.2 | % |
Product | 626 | | 525 | | 101 | | 19.2 | % |
Total operating revenues | 5,590 | | 5,336 | | 254 | | 4.8 | % |
Operating costs | (3,336 | ) | (3,170 | ) | (166 | ) | (5.2 | %) |
Adjusted EBITDA | 2,254 | | 2,166 | | 88 | | 4.1 | % |
Adjusted EBITDA margin | 40.3 | % | 40.6 | % | | | (0.3 | ) pts |
Severance, acquisition and other costs | – | | (84 | ) | 84 | | 100.0 | % |
Depreciation | (780 | ) | (724 | ) | (56 | ) | (7.7 | %) |
Amortization | (212 | ) | (185 | ) | (27 | ) | (14.6 | %) |
Finance costs | | | | | | | | |
Interest expense | (240 | ) | (234 | ) | (6 | ) | (2.6 | %) |
Interest on post-employment benefit obligations | (17 | ) | (18 | ) | 1 | | 5.6 | % |
Other (expense) income | (61 | ) | 17 | | (78 | ) | n.m. | |
Income taxes | (235 | ) | (250 | ) | 15 | | 6.0 | % |
Net earnings | 709 | | 688 | | 21 | | 3.1 | % |
Net earnings attributable to: | | | | | | | | |
Common shareholders | 661 | | 642 | | 19 | | 3.0 | % |
Preferred shareholders | 36 | | 31 | | 5 | | 16.1 | % |
Non-controlling interest | 12 | | 15 | | (3 | ) | (20.0 | %) |
Net earnings | 709 | | 688 | | 21 | | 3.1 | % |
Adjusted net earnings | 719 | | 703 | | 16 | | 2.3 | % |
EPS | 0.73 | | 0.73 | | – | | – | |
Adjusted EPS | 0.80 | | 0.80 | | – | | – | |
n.m.: not meaningful
TOTAL BCE CONNECTIONS
| Q1 2018 | | Q1 2017 | | % CHANGE | |
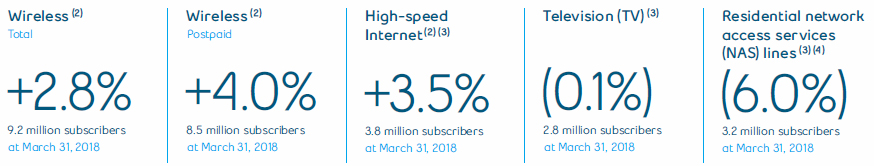
Wireless subscribers(1) | 9,195,048 | | 8,946,476 | | 2.8 | % |
Postpaid(1) | 8,471,021 | | 8,144,936 | | 4.0 | % |
High-speed Internet subscribers(1)(2) | 3,845,739 | | 3,717,270 | | 3.5 | % |
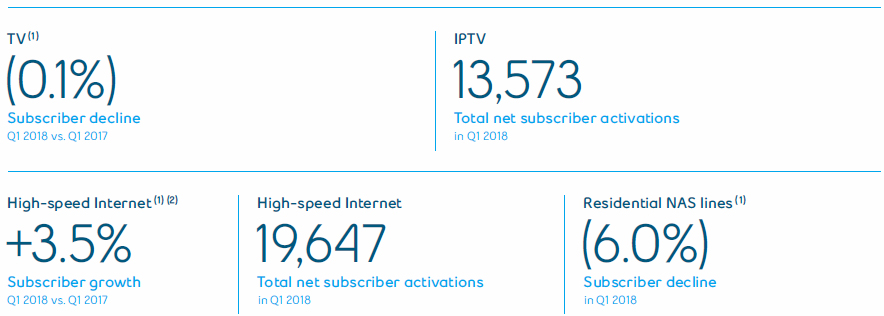
TV (Satellite and IPTV subscribers)(2) | 2,834,418 | | 2,837,353 | | (0.1 | %) |
IPTV(2) | 1,578,489 | | 1,465,007 | | 7.7 | % |
Total growth services | 15,875,205 | | 15,501,099 | | 2.4 | % |
Wireline residential NAS lines(2) | 3,197,216 | | 3,399,981 | | (6.0 | %) |
Total services(3) | 19,072,421 | | 18,901,080 | | 0.9 | % |
| (1) | At the beginning of Q1 2018, we adjusted our postpaid wireless subscriber base to remove 16,116 subscribers with a corresponding increase to our high-speed Internet subscribers to reflect the transfer of fixed wireless Internet subscribers. |
| (2) | At the beginning of Q1 2018, our high-speed Internet subscriber base was increased by 19,835, our IPTV by 14,599 and our residential NAS by 23,441, mainly as a result of a small acquisition made in the quarter. |
| (3) | As of January 1, 2018, business NAS was removed from our NAS subscriber base due to its declining relevance as a KPI given migrations from voice to IP result in NAS losses without a corresponding decline in revenues. Previously reported periods were retroactively adjusted. |
BCE Inc. 2018 FIRST QUARTER SHAREHOLDER REPORT 5 |
|
| | | | |
2 | MD&A | Consolidated financial analysis | |
BCE NET ACTIVATIONS (LOSSES)
| Q1 2018 | | Q1 2017 | | % CHANGE | |
Wireless subscribers | 44,377 | | 672 | | n.m. | |
Postpaid | 68,487 | | 35,782 | | 91.4 | % |
High-speed Internet subscribers | 19,647 | | 14,989 | | 31.1 | % |
TV (Satellite and IPTV subscribers) | (12,481 | ) | (15,663 | ) | 20.3 | % |
IPTV | 13,573 | | 22,402 | | (39.4 | %) |
Total growth services | 51,543 | | (2 | ) | n.m. | |
Wireline residential NAS lines | (57,533 | ) | (73,421 | ) | 21.6 | % |
Total services | (5,990 | ) | (73,423 | ) | 91.8 | % |
n.m.: not meaningful
BCE added 51,543 net new customer connections to its growth services in Q1 2018, a significant improvement over the net losses of 2 customers experienced in the first quarter of 2017. This was comprised of:
- 68,487 postpaid wireless customers, and the net loss of 24,110 prepaid wireless customers
- 19,647 high-speed Internet customers
- 13,573 IPTV customers and 26,054 satellite TV net customer losses
Residential NAS net losses were 57,533 in Q1 2018, an improvement of 21.6% over Q1 2017.
Total BCE customer connections across all services increased by 0.9% in Q1 2018 compared to last year, driven by a higher growth services customer base, offset in part by the ongoing erosion in residential NAS lines.
At March 31, 2018, BCE customer connections totaled 19,072,421 and consisted of the following:
- 9,195,048 wireless subscribers, up 2.8% compared to Q1 2017, and included 8,471,021 postpaid wireless subscribers, an increase of 4.0% compared to the prior year
- 3,845,739 high-speed Internet subscribers, 3.5% higher year over year
- 2,834,418 total TV subscribers, down 0.1% compared to Q1 2017, and included 1,578,489 IPTV customers, up 7.7% year over year
- 3,197,216 residential NAS lines, a decline of 6.0% compared to Q1 2017
| Q1 2018 | | Q1 2017 | | $ CHANGE | | % CHANGE | |
Bell Wireless | 1,946 | | 1,767 | | 179 | | 10.1 | % |
Bell Wireline | 3,084 | | 2,977 | | 107 | | 3.6 | % |
Bell Media | 749 | | 751 | | (2 | ) | (0.3 | %) |
Inter-segment eliminations | (189 | ) | (159 | ) | (30 | ) | (18.9 | %) |
Total BCE operating revenues | 5,590 | | 5,336 | | 254 | | 4.8 | % |
BCE
Total operating revenues at BCE grew by 4.8% in Q1 2018, compared to Q1 2017, driven by growth in both our Bell Wireless and Bell Wireline segments, while our Bell Media segment remained relatively stable compared to last year. This consisted of service revenues of $4,964 million in Q1 2018, which increased by 3.2% year over year, and product revenues of $626 million, which grew by 19.2% compared to last year.
BELL WIRELESS
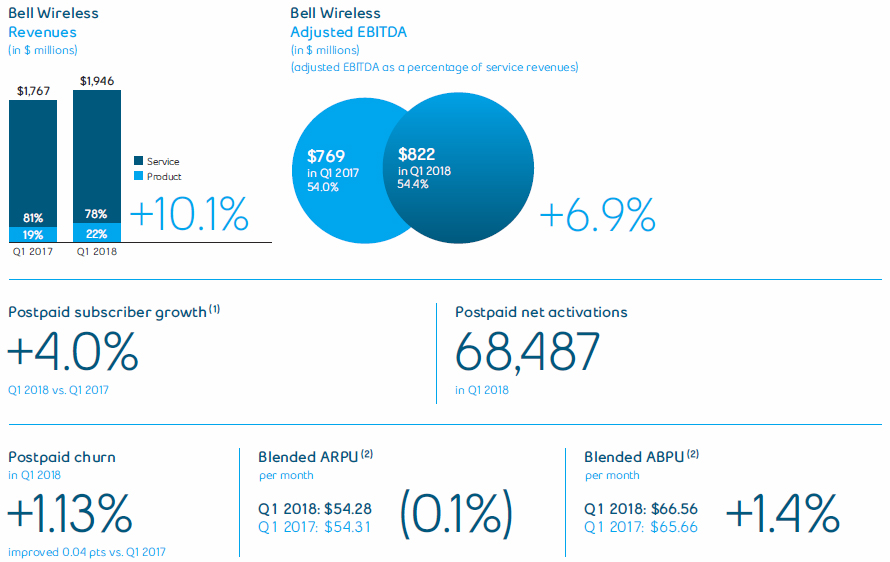
Bell Wireless operating revenues grew 10.1% in Q1 2018, compared to Q1 2017, due to both higher service revenues of 6.1% and product revenues of 26.9%. Excluding the unfavourable retroactive impact of the recent CRTC decision on wholesale wireless domestic roaming rates of $14 million in Q1 2018, operating revenues and service revenues increased by 10.9% and 7.1%, respectively, in Q1 2018, compared to the same period in 2017. The increase in service revenues reflected the continued growth in our postpaid subscriber base and the contribution from the acquisition of MTS on March 17, 2017, as blended average revenue per user (ARPU) remained relatively unchanged compared to last year. The higher year-over-year product revenues were driven by greater premium devices in our sales mix resulting in a higher allocation to product revenues and higher sales volumes driven by increased number of gross activations and device upgrades along with the contribution from the acquisition of MTS.
| 6 BCE Inc. 2018 FIRST QUARTER SHAREHOLDER REPORT |
|
| | | | |
| | 2 | MD&A | Consolidated financial analysis |
BELL WIRELINE
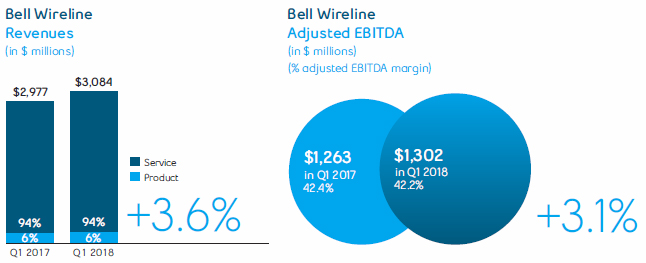
Bell Wireline operating revenues increased by 3.6% in the first quarter of 2018, compared to last year, driven by service revenue growth of 3.5% and product revenue growth of 4.3%. The increase in service revenues was driven by the contribution from Bell MTS, growth in Internet and IPTV subscribers, higher household ARPU, greater IP-based services revenue and the acquisition of AlarmForce Industries Inc. (AlarmForce) on January 5, 2018. This was moderated by the ongoing erosion in our voice, satellite TV and legacy data services, along with increased residential customer acquisition, retention and bundle discounts to match aggressive offers from cable competitors. The increase in product revenues was attributable to the contribution from the acquisition of MTS, and higher sales of telecommunication equipment mainly due to greater demand from the government sector, offset in part by lower sales of consumer electronics at The Source (Bell) Electronics Inc. (The Source).
BELL MEDIA
Bell Media operating revenues decreased by 0.3% in Q1 2018, compared to Q1 2017, driven by lower advertising revenues mainly due to continued general market softness and declines in audience levels impacting our TV and radio platforms as well as an ongoing shift in customer spending to over-the-top (OTT) and digital platforms. The shift in advertising dollars to the main broadcaster of the PyeongChang 2018 Winter Olympics also unfavourably impacted advertising revenues across both conventional and specialty TV. The year-over-year decline in advertising revenues was moderated by growth in our digital TV properties and higher out-of-home (OOH) advertising revenues mainly as a result of increased demand on digital faces. Subscriber revenues increased in Q1 2018, compared to last year, mainly due to the growth in our subscriber base from our CraveTV and TV Everywhere GO Products and contract renewals with TV distributors.

| Q1 2018 | | Q1 2017 | | $ CHANGE | | % CHANGE | |
Bell Wireless | (1,124 | ) | (998 | ) | (126 | ) | (12.6 | %) |
Bell Wireline | (1,782 | ) | (1,714 | ) | (68 | ) | (4.0 | %) |
Bell Media | (619 | ) | (617 | ) | (2 | ) | (0.3 | %) |
Inter-segment eliminations | 189 | | 159 | | 30 | | 18.9 | % |
Total BCE operating costs | (3,336 | ) | (3,170 | ) | (166 | ) | (5.2 | %) |
| (1) | Cost of revenues includes costs of wireless devices and other equipment sold, network and content costs, and payments to other carriers. |
| (2) | Labour costs (net of capitalized costs) include wages, salaries and related taxes and benefits, post-employment benefit plans service cost, and other labour costs, including contractor and outsourcing costs. |
| (3) | Other operating costs include marketing, advertising and sales commission costs, bad debt expense, taxes other than income taxes, information technology (IT) costs, professional service fees and rent. |
BCE
Total BCE operating costs grew by 5.2% in Q1 2018, compared to Q1 2017, due to increases in both our Bell Wireless and Bell Wireline segments, while Bell Media costs remained relatively stable year over year.
BELL WIRELESS
Bell Wireless operating costs increased by 12.6% in the first quarter of 2018, compared to the same period last year, as a result of:
- Higher product cost of goods sold due to greater sales volumes and higher handset costs
- The acquisition of MTS on March 17, 2017
- Higher advertising expense due to the PyeongChang 2018 Winter Olympics
- Greater labour costs to support the growth of the business
- Increased network operating costs driven by the expansion of network capacity to support subscriber growth and increased data consumption
These factors were partially offset by:
BCE Inc. 2018 FIRST QUARTER SHAREHOLDER REPORT 7 |
|
| | | | |
2 | MD&A | Consolidated financial analysis | |
BELL WIRELINE
Bell Wireline operating costs increased by 4.0% in Q1 2018, compared to Q1 2017, as a result of:
- Higher expenses from the acquisition of MTS and AlarmForce
- Greater pension expense due to a gain in Q1 2017 on post-employment benefit expense related to an alignment of certain Bell Aliant Inc. (Bell Aliant) defined benefit (DB) pension plans with those of Bell Canada
- Increased programming and content costs in our TV business from contractual rate increases
- Higher advertising expense in our residential market due to the PyeongChang 2018 Winter Olympics
These factors were partially offset by:
- Decreased labour costs resulting from workforce reductions, savings from lower call volumes and improved call handle times, as well as vendor contract savings
- Lower payments to other carriers driven by reduced sales of international long distance minutes
BELL MEDIA
Bell Media operating costs increased by 0.3% in Q1 2018, compared to the same period last year, as a result of:
- Continued escalation of programming and content costs relating to sports rights and content expansion for CraveTV
- Higher OOH expenses resulting from the increased demand on digital faces
These factors were partially offset by:
- Regulatory fee reductions
- Lower labour costs driven mainly by workforce reductions
Net earnings increased by 3.1% in the first quarter of 2018, compared to the same period last year, due to higher adjusted EBITDA, as growing revenues more than offset an increase in operating costs, and lower severance, acquisition and other costs, partly offset by higher depreciation and amortization expense and higher other expense mainly as a result of net mark-to-market losses on derivatives used to economically hedge equity settled share-based compensation plans.
| Q1 2018 | | Q1 2017 | | $ CHANGE | | % CHANGE | |
Bell Wireless | 822 | | 769 | | 53 | | 6.9 | % |
Bell Wireline | 1,302 | | 1,263 | | 39 | | 3.1 | % |
Bell Media | 130 | | 134 | | (4 | ) | (3.0 | %) |
Total BCE adjusted EBITDA | 2,254 | | 2,166 | | 88 | | 4.1 | % |
BCE
BCE’s adjusted EBITDA increased by 4.1% in Q1 2018, compared to Q1 2017, as a result of growth in both our Bell Wireless and Bell Wireline segments, offset in part by a decline in our Bell Media segment. The adjusted EBITDA margin declined from 40.6% in Q1 2017 to 40.3% in Q1 2018, reflecting a $14 million retroactive regulatory impact from the recent CRTC decision on wholesale wireless domestic roaming rates in Q1 2018.
The growth in adjusted EBITDA was driven by higher wireless, Internet and IPTV revenues, the contribution from the acquisitions of MTS and continued effective cost containment. This was offset in part by the continued erosion in our voice, satellite TV and legacy data revenues, higher pension expense due to a gain realized in Q1 2017, regulatory pressures in our Bell Wireless segment, as well as higher programming and content costs.
| 8 BCE Inc. 2018 FIRST QUARTER SHAREHOLDER REPORT |
|
| | | | |
| | 2 | MD&A | Consolidated financial analysis |
BELL WIRELESS
Bell Wireless adjusted EBITDA increased by 6.9% in Q1 2018, compared to the same period last year. Excluding the unfavourable retroactive impact of $14 million related to the recent CRTC decision on wholesale wireless domestic roaming rates, adjusted EBITDA grew 8.7% year over year. This increase reflected the growth in operating revenues and the overall contribution from the acquisition of MTS, which more than offset the higher year-over-year operating expenses, mainly higher product cost of goods sold, advertising, labour and network operating costs. This resulted in an improvement to adjusted EBITDA margin, based on wireless operating service revenues of 0.4 pts to 54.4% in Q1 2018, compared to the 54.0% in Q1 2017. Additionally, a higher proportion of low-margin product sales in our total revenues base led to a decline of 1.3 pts in total adjusted EBITDA margin to 42.2% in Q1 2018, compared to 43.5% in Q1 2017.
BELL WIRELINE
Bell Wireline adjusted EBITDA grew by 3.1% in the first quarter of 2018, compared to the same period last year, driven by the contribution from the acquisition of MTS, growth in Internet and IPTV revenues, and continued effective cost containment. This growth was moderated by the continued erosion of voice, satellite TV and legacy data revenues, including continued but diminishing pressures in our business market and higher pension expense as a result of a gain in Q1 2017 relating to post-employment benefit expense.
BELL MEDIA
Bell Media adjusted EBITDA decreased by 3.0% in Q1 2018, compared to Q1 of the previous year, due to lower operating revenues along with an increase in operating expenses primarily from escalating programming and content costs, moderated by regulatory fee reductions and lower labour costs.
| 2.7Severance, acquisition and other costs |
2018
Severance, acquisition and other costs were nil in the first quarter of 2018.
2017
Severance, acquisition and other costs of $84 million in the first quarter of 2017 included:
- Severance costs related to workforce reduction initiatives of $31 million
- Acquisition and other costs of $53 million in Q1 2017, including transaction costs, such as legal and financial advisory fees, related to completed or potential acquisitions, as well as a loss on sale of spectrum licences to Xplornet Communications Inc. relating to the MTS acquisition
| 2.8Depreciation and amortization |
DEPRECIATION
Depreciation in Q1 2018 increased by $56 million, compared to Q1 2017, mainly due to the acquisition of MTS and a higher asset base as we continued to invest in our broadband and wireless networks as well as our IPTV service.
AMORTIZATION
Amortization in Q1 2018 increased by $27 million, compared to Q1 2017, due mainly to the acquisition of MTS and a higher asset base.
INTEREST EXPENSE
Interest expense in the first quarter of 2018 increased by $6 million, compared to the same period last year, mainly as a result of higher average debt levels due in part to the acquisition of MTS, partly offset by lower average interest rates.
INTEREST ON POST-EMPLOYMENT BENEFIT OBLIGATIONS
Interest on our post-employment benefit obligations is based on market conditions that existed at the beginning of the year. On January 1, 2018, the discount rate was 3.6% compared to 4.0% on January 1, 2017.
In the first quarter of 2018, interest expense decreased by $1 million, compared to the same period last year, due to a lower discount rate partly offset by a higher post-employment benefit obligation at the beginning of the year.
The impacts of changes in market conditions during the year are recognized in the other comprehensive income (loss) (OCI).
BCE Inc. 2018 FIRST QUARTER SHAREHOLDER REPORT 9 |
|
| | | | |
2 | MD&A | Consolidated financial analysis | |
| 2.10Other (expense) income |
2018
Other expense of $61 million included net mark-to-market losses on derivatives used to economically hedge equity settled share-based compensation plans, partly offset by income from our equity investments.
2017
Other income of $17 million in the first quarter of 2017 included net mark-to-market gains on derivatives used to economically hedge equity settled share-based compensation plans and U.S. dollar purchases and income from our equity investments, partly offset by losses on retirements and disposals of property, plant and equipment and intangible assets and losses on investments.
Income taxes of $235 million in the first quarter of 2018 decreased by $15 million, compared to the same period last year, due mainly to a higher value of uncertain tax positions favourably resolved in Q1 2018 compared to Q1 2017 and lower taxable income.
| 2.12Net earnings attributable to common shareholders and EPS |
Net earnings attributable to common shareholders of $661 million in the first quarter of 2018 increased by $19 million, compared to the same period last year, due to higher adjusted EBITDA, as growing revenues more than offset an increase in operating costs, and lower severance, acquisition and other costs, partly offset by higher depreciation and amortization expense and higher other expense mainly as a result of net mark-to-market losses on derivatives used to economically hedge equity settled share-based compensation plans.
BCE’s EPS of $0.73 in Q1 2018 remained stable compared to the same period last year.
Excluding the impact of severance, acquisition and other costs, net mark-to-market (losses) gains on derivatives used to economically hedge equity settled share-based compensation plans, net (losses) gains on investments, early debt redemption costs and impairment charges, adjusted net earnings in the first quarter of 2018 was $719 million, or $0.80 per common share, compared to $703 million, or $0.80 per common share, for the same period last year.
| 10 BCE Inc. 2018 FIRST QUARTER SHAREHOLDER REPORT |
|
| | | | |
| | 3 | MD&A | Business segment analysis
Bell Wireless |
| 3 Business segment analysis |
KEY BUSINESS DEVELOPMENTS
BELL IS THE FIRST WIRELESS PROVIDER IN CANADA TO ACHIEVE GIGABIT LTE SPEEDS
Bell successfully tested Gigabit LTE-A in Mississauga, Ontario and will roll out its enhanced network to locations throughout Canada in 2018 as smartphones that support these advanced speeds come to market. To boost Long-term Evolution (LTE) Advanced (LTE-A) speeds to the Gigabit (Gb) level, Bell is employing a combination of carrier aggregation and 4X4 Multiple Input Multiple Output (MIMO) technology to increase spectrum efficiency and multiply capacity. Bell will also support Licensed Assisted Access (LAA) technology to aggregate unlicensed 5 Gigahertz (GHz) spectrum with LTE in licensed bands to provide higher transfer speeds. At the end of Q1 2018, Bell reached 87% coverage of the population with broadband LTE-A mobile service with plans to expand the footprint to approximately 92% of Canadians by the end of 2018.
LUCKY MOBILE LOW-COST WIRELESS SERVICE AVAILABLE IN MANITOBA AND SASKATCHEWAN
Bell expanded the availability of Lucky Mobile, Canada’s new low-cost prepaid wireless service, to residents of Manitoba and Saskatchewan. Launched initially in Ontario, Alberta and British Columbia in December, Lucky Mobile puts budget-conscious Canadians in complete control of their mobile services with simple, no surprises prepaid plans starting at just $20 for unlimited local calling with no long-term commitment. Lucky Mobile offers service in 19 zones covering most major cities across the country, now including Winnipeg, Regina and Saskatoon. Data access is included with certain plans.
BELL CONDUCTS SUCCESSFUL WTTH CUSTOMER TRIALS
In February 2018, Bell successfully completed wireless-to-the-home (WTTH) trials in the 3.5 GHz and 28 GHz spectrum bands leveraging Huawei’s innovative technologies that will play a part in bringing Fifth Generation (5G) speeds to rural communities. The trials were conducted in the small Ontario communities of Orangeville, Feversham and Bethany to test and refine the capabilities of WTTH services for rural areas. Bell plans to roll out service in more than 20 other Ontario and Québec communities this year. WTTH technology is new fixed wireless technology that will take full advantage of 5G to deliver high-speed Internet service to residents in smaller and underserved communities.
EXPANDED LINEUP OF INTERNET OF THINGS APPLICATIONS
Bell expanded its extensive lineup of innovative Internet of Things (IoT) applications, which enable the interconnection of a range of devices and applications that send and receive data. Building on our other IoT collaborations such as our Smart City pilot with the city of Kingston and Connected Cars partnership with Hyundai and Kia, Bell is taking the lead in this strategic growth market and leveraging our network strengths and broad wireless and business solutions expertise.
- Bell is working with Echologics, an industry leader in leak detection technology, to implement a water management solution for Medicine Hat, Alberta based on our Smart City platform. The system will include more than 150 smart nodes throughout the city connected over Bell’s broadband wireless network to monitor water infrastructure for leaks and provide data to support decision-making about the municipal water system.
- Bell is integrating systems developed by Icicle Technologies into our IoT platform to offer a comprehensive production management solution for Canada’s food industry. Leveraging our unparalleled connectivity, the solution will reduce waste and improve food safety by monitoring temperature and air quality, enhancing traceability and providing real-time operational data.
BCE Inc. 2018 FIRST QUARTER SHAREHOLDER REPORT 11 |
|
| | | | |
3 | MD&A | Business segment analysis
Bell Wireless | |
| FINANCIAL PERFORMANCE ANALYSIS |
Q1 2018 PERFORMANCE HIGHLIGHTS
| (1) | At the beginning of Q1 2018, we adjusted our postpaid wireless subscriber base to remove 16,116 subscribers with a corresponding increase to our high-speed Internet subscribers to reflect the transfer of fixed wireless Internet subscribers. |
| (2) | Our Q1 2018 blended ARPU and blended average billing per user (ABPU) were adjusted to exclude the unfavourable retroactive impact of the recent CRTC decision on wholesale wireless domestic roaming rates of $14 million. See section 8.2,Non-GAAP financial measures and key performance indicators (KPIs) – KPIsin this MD&A for more details, including our definition of ABPU. |
BELL WIRELESS RESULTS
REVENUES
| Q1 2018 | | Q1 2017 | | $ CHANGE | | % CHANGE | |
External service revenues | 1,500 | | 1,415 | | 85 | | 6.0 | % |
Inter-segment service revenues | 12 | | 10 | | 2 | | 20.0 | % |
Total operating service revenues | 1,512 | | 1,425 | | 87 | | 6.1 | % |
External product revenues | 434 | | 341 | | 93 | | 27.3 | % |
Inter-segment product revenues | – | | 1 | | (1 | ) | (100.0 | %) |
Total operating product revenues | 434 | | 342 | | 92 | | 26.9 | % |
Total Bell Wireless revenues | 1,946 | | 1,767 | | 179 | | 10.1 | % |
Bell Wireless operating revenuesgrew 10.1% in Q1 2018, compared to Q1 2017, due to both higher service revenues of 6.1% and product revenues of 26.9%. Excluding the unfavourable retroactive impact of the recent CRTC decision on wholesale wireless domestic roaming rates of $14 million, operating revenues and service revenues increased by 10.9% and 7.1%, respectively, in Q1 2018, compared to the same period in 2017.
- Service revenuegrowth reflected a higher year-over-year postpaid subscriber base and the contribution from the acquisition of MTS on March 17, 2017, as blended ARPU remained relatively unchanged compared to last year.
- Product revenuesgrew by 26.9% in Q1 2018, compared to the same period in 2017, due to greater premium devices in our sales mix resulting in a greater allocation to product revenues and higher sales volumes driven by increased number of gross activations and device upgrades along with the contribution from the acquisition of MTS.
| 12 BCE Inc. 2018 FIRST QUARTER SHAREHOLDER REPORT |
|
| | | | |
| | 3 | MD&A | Business segment analysis
Bell Wireless |
OPERATING COSTS AND ADJUSTED EBITDA
| Q1 2018 | | Q1 2017 | | $ CHANGE | | % CHANGE | |
Operating costs | (1,124 | ) | (998 | ) | (126 | ) | (12.6 | %) |
Adjusted EBITDA | 822 | | 769 | | 53 | | 6.9 | % |
Total adjusted EBITDA margin | 42.2 | % | 43.5 | % | | | (1.3 | ) pts |
Adjusted EBITDA margin (service revenues) | 54.4 | % | 54.0 | % | | | 0.4 | pts |
Bell Wireless operating costsincreased by 12.6% in the first quarter of 2018, compared to the same period last year, as a result of:
- Higher product cost of goods sold due to greater sales volumes and higher handset costs
- The acquisition of MTS on March 17, 2017
- Higher advertising expense due to the PyeongChang 2018 Winter Olympics
- Greater labour costs to support the growth of the business
- Increased network operating costs driven by the expansion of network capacity to support subscriber growth and increased data consumption
These factors were partially offset by:
Bell Wireless adjusted EBITDAincreased by 6.9% in Q1 2018, compared to the same period last year. Excluding the unfavourable retroactive impact of $14 million related to the recent CRTC decision on wholesale wireless domestic roaming rates, adjusted EBITDA grew 8.7% year over year. This increase reflected the growth in operating revenues and the overall contribution from the acquisition of MTS, which more than offset the higher year-over-year operating expenses, mainly higher product cost of goods sold, advertising, labour and network operating costs. This resulted in an improvement to adjusted EBITDA margin, based on wireless operating service revenues of 0.4 pts to 54.4% in Q1 2018, compared to the 54.0% in Q1 2017. Additionally, a higher proportion of low-margin product sales in our total revenues base led to a decline of 1.3 pts in total adjusted EBITDA margin to 42.2% in Q1 2018, compared to 43.5% in Q1 2017.
BELL WIRELESS OPERATING METRICS
| Q1 2018 | | Q1 2017 | | CHANGE | | % CHANGE | |
Blended ARPU ($/month)(1) | 54.28 | | 54.31 | | (0.03 | ) | (0.1 | %) |
Blended ABPU ($/month)(1) | 66.56 | | 65.66 | | 0.90 | | 1.4 | % |
Gross activations | 404,790 | | 348,452 | | 56,338 | | 16.2 | % |
Postpaid | 347,319 | | 296,616 | | 50,703 | | 17.1 | % |
Prepaid | 57,471 | | 51,836 | | 5,635 | | 10.9 | % |
Net activations (losses) | 44,377 | | 672 | | 43,705 | | n.m. | |
Postpaid | 68,487 | | 35,782 | | 32,705 | | 91.4 | % |
Prepaid | (24,110 | ) | (35,110 | ) | 11,000 | | 31.3 | % |
Blended churn % (average per month) | 1.31 | % | 1.36 | % | | | 0.05 | pts |
Postpaid | 1.13 | % | 1.17 | % | | | 0.04 | pts |
Prepaid | 3.40 | % | 3.29 | % | | | (0.11 | ) pts |
Subscribers(2) | 9,195,048 | | 8,946,476 | | 248,572 | | 2.8 | % |
Postpaid(2) | 8,471,021 | | 8,144,936 | | 326,085 | | 4.0 | % |
Prepaid | 724,027 | | 801,540 | | (77,513 | ) | (9.7 | %) |
| n.m.: not meaningful |
| (1) | Our Q1 2018 blended ARPU and ABPU were adjusted to exclude the unfavourable retroactive impact of the recent CRTC decision on wholesale wireless domestic roaming rates of $14 million. |
| (2) | At the beginning of Q1 2018, we adjusted our postpaid wireless subscriber base to remove 16,116 subscribers with a corresponding increase to our high-speed Internet subscribers to reflect the transfer of fixed wireless Internet subscribers. |
Blended ARPU, excluding the unfavourable retroactive impact of the recent CRTC decision on wholesale wireless domestic roaming rates, of $54.28 in Q1 2018, remained essentially flat compared to the same period in 2017. This was driven by a higher proportion of postpaid customers in our total subscriber base, the flow-through of 2017 pricing changes and increased demand for larger data plans due to greater data consumption from e-mail, web browsing, social networking, mobile banking, messaging, mobile TV, and entertainment services such as video streaming, music downloads and gaming. Greater data consumption driven by the higher speeds enabled by the continued expansion of our LTE and LTE-A networks, also favourably impacted blended ARPU. This was offset by lower overage due to greater take rate of plans with higher data usage thresholds, lower ARPU from the long-term mobile services contract with Shared Services Canada and the dilutive impact on blended ARPU from the ramp up in our new low-cost prepaid mobile service, Lucky Mobile, as well as the unfavourable impact of the shift in handset mix to more premium devices which resulted in a greater allocation to product revenues.
Blended ABPUis a new KPI that we are introducing which approximates the average amount billed to customers on a monthly basis and is the same as blended ARPU prior to the adoption of IFRS 15. Blended ABPU, excluding the unfavourable retroactive impact of the recent CRTC decision on wholesale wireless domestic roaming rates, of $66.56 in Q1 2018, increased by 1.4% compared to the same period in 2017. The increase in blended ABPU was similarly impacted by the items affecting ARPU. However, since ABPU is based on average billing, it is not unfavorably impacted by the shift in handset mix to more premium devices which resulted in a greater allocation to product revenues.
BCE Inc. 2018 FIRST QUARTER SHAREHOLDER REPORT 13 |
|
| | | | |
3 | MD&A | Business segment analysis
Bell Wireless | |
Total gross wireless activations increased by 16.2% in the first quarter of 2018, compared to Q1 2017, due to both higher postpaid and prepaid gross activations.
- Postpaid gross activationsincreased by 17.1% in this quarter, reflecting our mobile network speed and technology leadership, effective sales execution across our retail channels, the on-boarding of customers from a long-term mobile services contract win with Shared Services Canada, and the contribution from the acquisition of MTS.
- Prepaid gross activationsincreased by 10.9% in Q1 2018, driven by the contribution from Lucky Mobile, our new low-cost prepaid mobile service, and Bell MTS
Blended wireless churnof 1.31% improved by 0.05 pts in Q1 2018, compared to the same period in 2017, due to lower postpaid churn, partially offset by higher prepaid churn.
- Postpaid churnof 1.13% improved by 0.04 pts this quarter, driven by greater business customer deactivations in Q1 2017 and the favourable impact of our ongoing investment in network speeds and customer retention
- Prepaid churnof 3.40% increased by 0.11 pts in Q1 2018, due to relatively stable deactivations over a declining subscriber base
Postpaid net activationsincreased by 91.4% in the first quarter of 2018, compared to Q1 2017, due to an increase in gross activations, partially offset by an increase in customer deactivations and lower migrations from prepaid services.
Prepaid net customer lossesimproved by 31.3% in Q1 2018, compared to the same period last year, due to an increase in gross activations and lower migrations to postpaid services.
Wireless subscribersat March 31, 2018 totaled 9,195,048, up 2.8% from 8,946,476 subscribers reported at the end of Q1 2017. At the beginning of Q1 2018, we adjusted our postpaid wireless subscriber base to remove 16,116 subscribers with a corresponding increase to our high-speed Internet subscribers to reflect the transfer of fixed wireless Internet subscribers. The proportion of Bell Wireless customers subscribing to postpaid services increased to 92% in Q1 2018 from 91% in Q1 2017.
As at the date of this MD&A, our forward-looking statements set out in the BCE 2017 Annual MD&A, as updated or supplemented in this MD&A, are based on certain assumptions including, without limitation, the following assumptions and the assumptions referred to in each of the other business segment discussions set out in this section 3,Business segment analysis, as well as the economic and market assumptions referred to in section 1.3,Assumptions, of this MD&A.
- Maintain our market share of incumbent wireless postpaid net additions
- Continued adoption of smartphone devices, tablets and data applications, as well as the introduction of more Fourth Generation (4G) LTE and LTE-A devices and new data services
- Higher product cost of goods sold, driven by a higher sales mix of premium devices, increased new customer activations and more customer device upgrades attributable to a higher number of off-contract subscribers due to earlier expiries under two-year contracts
- Wireless revenue growth driven by postpaid subscriber base expansion and a higher volume of handset sales
- Expansion of the LTE-A network coverage to approximately 92% of the Canadian population
- Ability to monetize increasing data usage and customer subscriptions to new data services
- Ongoing technological improvements by handset manufacturers and from faster data network speeds that allow customers to optimize the use of our services
- No material financial, operational or competitive consequences of changes in regulations affecting our wireless business
| 14 BCE Inc. 2018 FIRST QUARTER SHAREHOLDER REPORT |
|
| | | | |
| | 3 | MD&A | Business segment analysis
Bell Wireline |
KEY BUSINESS DEVELOPMENTS
ALL-FIBRE NETWORK LAUNCHED IN THE CITY OF TORONTO
On April 5, 2018, Bell announced that its all-fibre optic broadband network is on in Toronto, enabling fast Internet speeds, advanced TV and business connectivity to a majority of homes and business locations. The $1.5 billion Toronto fibre project is part of Bell’s reinvention of its network footprint with next-generation broadband fibre connections. Bell fibre-to-the-premise (FTTP) service now delivers Internet access speeds of up to 1 Gb per second (Gpbs) with symmetrical upload and download speeds. Fully symmetrical speeds are available at all FTTP Internet speed tiers including up to a Gb, where top upload speed is currently 940 megabits per second (Mbps). Uploads are expected to increase to a full Gb next year when commercial modem technology catches up to fibre network capabilities in 2019. Speeds are expected to increase ultimately to 40 Gbps and beyond in the future. Bell began the Toronto project in 2015, working closely with the city of Toronto and Toronto Hydro and employing innovative installation techniques and new heavy equipment to roll out the network as efficiently and quickly as possible. The build consists of more than 10,000 kilometres of new fibre installed to date on approximately 90,000 Bell and Toronto Hydro poles and underground via more than 10,000 manhole access points, as well as technology enhancements to 27 Bell central offices throughout the city.
BELL BROADBAND INNOVATION IN RESIDENTIAL INTERNET AND TV
In January 2018, we introduced an exclusive Whole Home Wi-Fi service that combines wireless fidelity (Wi-Fi) access points, called Plume pods, with the cloud-based networking intelligence of Bell’s Home Hub 3000 modem to learn how households use the Internet and ensure all devices receive the strongest signal and fastest speeds possible. Initially available to qualifying customers in Ontario and Québec, Whole Home Wi-Fi also offers mobile remote management including parental control over every Wi-Fi connected device.
In the first quarter of 2018, we also announced the extension of our partnership with Ericsson to deliver the next generation Fibe TV experience. The multiyear agreement will leverage Ericsson’s next generation, cloud-based MediaFirst platform to enable an even more personalized and converged multiscreen TV experience for Fibe TV customers.
ALT TV AVAILABLE ON AMAZON FIRE TV STICK
Bell became the first Canadian TV provider to offer an app on Amazon’s streaming media player. Alt TV customers can now access over 500 live and on demand channels on their big screens with the Amazon Fire TV Stick. The innovative Alt TV service requires no traditional subscription, installation or set-top box to watch TV on smartphones, laptops, tablets or traditional TV. Bell Fibe TV and satellite TV customers can also access their content on the Fibe TV app via the Fire TV Stick, which simply plugs into a TV’s high-definition multimedia interface port.
ENHANCED CLOUD SERVICES FOR BUSINESS
Bell now offers access to Amazon Web Services as part of our leading lineup of cloud solutions for Canadian businesses. Bell Cloud Connect provides flexible cloud computing and storage solutions from Bell and partners like Microsoft, IBM, and now Amazon over Bell’s broadband networks, offering unrivalled reliability, faster speeds and enhanced security with private end-to-end connections. With 28 data centres across the country, Bell is Canada’s largest provider of secure and reliable hosting and storage services that support the digital transformation of business.
| FINANCIAL PERFORMANCE ANALYSIS |
Q1 2018 PERFORMANCE HIGHLIGHTS
BCE Inc. 2018 FIRST QUARTER SHAREHOLDER REPORT 15 |
|
| | | | |
3 | MD&A | Business segment analysis
Bell Wireline | |
| (1) | At the beginning of Q1 2018, our high-speed Internet subscriber base was increased by 19,835, our IPTV by 14,599 and our residential NAS by 23,441, mainly as a result of a small acquisition made in the quarter. |
| (2) | At the beginning of Q1 2018, we adjusted our high-speed Internet subscriber base to add 16,116 subscribers with a corresponding decrease to our postpaid wireless subscribers to reflect the transfer of fixed wireless Internet subscribers. |
BELL WIRELINE RESULTS
REVENUES
| Q1 2018 | | Q1 2017 | | $ CHANGE | | % CHANGE | |
Data | 1,820 | | 1,719 | | 101 | | 5.9 | % |
Voice | 950 | | 981 | | (31 | ) | (3.2 | %) |
Other services | 63 | | 44 | | 19 | | 43.2 | % |
Total external service revenues | 2,833 | | 2,744 | | 89 | | 3.2 | % |
Inter-segment service revenues | 59 | | 49 | | 10 | | 20.4 | % |
Total operating service revenues | 2,892 | | 2,793 | | 99 | | 3.5 | % |
Data | 104 | | 99 | | 5 | | 5.1 | % |
Equipment and other | 88 | | 85 | | 3 | | 3.5 | % |
Total external product revenues | 192 | | 184 | | 8 | | 4.3 | % |
Inter-segment product revenues | – | | – | | – | | – | |
Total operating product revenues | 192 | | 184 | | 8 | | 4.3 | % |
Total Bell Wireline revenues | 3,084 | | 2,977 | | 107 | | 3.6 | % |
Bell Wireline operating revenuesincreased by 3.6% in Q1 2018, compared to Q1 2017, as a result of growth in data, other services and product revenues, moderated by the continued decline in voice revenue.
Bell Wireline operating service revenuesincreased by 3.5% in the first quarter of 2018, compared to the same period last year, due to the acquisition of MTS and AlarmForce, growth in Internet and IPTV subscribers, higher household ARPU and greater IP-based services revenue. This was offset in part by continued erosion in our voice, satellite TV and legacy data services, along with increased residential customer acquisition, retention and bundle discounts to match aggressive offers from cable competitors.
- Data revenuesincreased by 5.9% in Q1 2018, compared to Q1 2017, attributable to the contribution from the acquisition of MTS, growth in Internet and IPTV subscribers together with rate increases, as well as higher IP-based services revenue. This was moderated by increased acquisition, retention and bundle discounts on residential services as a result of aggressive offers from cable competitors, the ongoing decline in our satellite TV subscriber base, as well as continued legacy data erosion due in part to migrations to IP-based services and competitive pricing pressures within our business and wholesale markets.
- Voice revenuesdecreased by 3.2% in Q1 2018, compared to the same period last year, driven by ongoing NAS line erosion from technological substitution to wireless and Internet-based services, large business customer conversions to IP-based data services, as well as competitive pricing pressures, which unfavourably impacted local and access and long distance revenues. Additionally, ongoing long distance rate pressures in our residential market from customer adoption of premium rate plans and fewer sales of international long distance minutes in our wholesale market, further pressured long distance revenues. This was offset in part by the contribution from the acquisition of MTS and rate increases.
- Other services revenuesincreased by 43.2% in Q1 2018, compared to the same period last year, due to the contribution from the acquisitions of AlarmForce and MTS
Bell Wireline product revenuesincreased by 4.3% in Q1 2018, compared to Q1 2017, due to the contribution from the acquisition of MTS and higher sales of telecommunication equipment mainly due to greater demand from the government sector, offset in part by lower sales of consumer electronics at The Source.
| 16 BCE Inc. 2018 FIRST QUARTER SHAREHOLDER REPORT |
|
| | | | |
| | 3 | MD&A | Business segment analysis
Bell Wireline |
OPERATING COSTS AND ADJUSTED EBITDA
| Q1 2018 | | Q1 2017 | | $ CHANGE | | % CHANGE | |
Operating costs | (1,782 | ) | (1,714 | ) | (68 | ) | (4.0 | %) |
Adjusted EBITDA | 1,302 | | 1,263 | | 39 | | 3.1 | % |
Adjusted EBITDA margin | 42.2 | % | 42.4 | % | | | (0.2 | ) pts |
Bell Wireline operating costsgrew by 4.0% in Q1 2018, compared to the same period last year, driven by:
- Higher expenses from the acquisitions of MTS and AlarmForce
- Greater pension expense due to a gain in Q1 2017 on post-employment benefit expense related to an alignment of certain Bell Aliant DB pension plans with those of Bell Canada
- Increased programming and content costs in our TV business from contractual rate increases
- Higher advertising expense in our residential market due to the PyeongChang 2018 Winter Olympics
These factors were partially offset by:
- Decreased labour costs resulting from workforce reductions, savings from lower call volumes and improved call handle times, as well as vendor contract savings
- Lower payments to other carriers driven by reduced sales of international long distance minutes
Bell Wireline adjusted EBITDAincreased by 3.1% in Q1 2018, compared to Q1 2017, whereas adjusted EBITDA margin decreased to 42.2% in Q1 2018 compared to 42.4% in Q1 2017. The year-over-year increase in adjusted EBITDA was attributable to:
- The contribution from the acquisition of MTS
- Continued growth in Internet and IPTV revenues in a highly competitive environment
- Effective cost containment
These factors were partially offset by:
- The ongoing erosion of voice, satellite TV and legacy data revenues, including continued but diminishing pressures in our business market
- Higher pension expense as a result of a gain in Q1 2017 relating to post-employment benefit expense due to an alignment of certain Bell Aliant DB pension plans with those of Bell Canada
BELL WIRELINE OPERATING METRICS
DATA
High-speed Internet
| Q1 2018 | | Q1 2017 | | CHANGE | | % CHANGE | |
High-speed Internet net activations | 19,647 | | 14,989 | | 4,658 | | 31.1 | % |
High-speed Internet subscribers(1)(2) | 3,845,739 | | 3,717,270 | | 128,469 | | 3.5 | % |
| (1) | At the beginning of Q1 2018, our high-speed Internet subscriber base was increased by 19,835, mainly as a result of a small acquisition made in the quarter. |
| (2) | At the beginning of Q1 2018, we adjusted our high-speed Internet subscriber base to add 16,116 subscribers with a corresponding decrease to our postpaid wireless subscribers to reflect the transfer of fixed wireless Internet subscribers. |
High-speed Internet subscriber net activationsgrew by 31.1% in Q1 2018, compared to Q1 2017, driven by lower deactivations reflecting the benefit of our fibre-to-the-home (FTTH) footprint expansion, higher net activations from Home Internet service by Virgin Mobile Canada, greater retail gross activations in our FTTH footprint, pull-through from Alt TV and the contribution from the acquisition of MTS. The growth was partly offset by aggressive offers from cable competitors in both our retail and wholesale markets.
High-speed Internet subscribersat March 31, 2018 totaled 3,845,739 up 3.5% from the end of Q1 of last year. At the beginning of Q1 2018, our high-speed Internet subscriber base was increased by 19,835, mainly as a result of a small acquisition made in the quarter. We further adjusted our subscriber base to add 16,116 subscribers with a corresponding decrease to our postpaid wireless subscribers to reflect the transfer of fixed wireless Internet subscribers.
TV
| Q1 2018 | | Q1 2017 | | CHANGE | | % CHANGE | |
Net subscriber (losses) activations | (12,481 | ) | (15,663 | ) | 3,182 | | 20.3 | % |
IPTV | 13,573 | | 22,402 | | (8,829 | ) | (39.4 | %) |
Total subscribers(1) | 2,834,418 | | 2,837,353 | | (2,935 | ) | (0.1 | %) |
IPTV(1) | 1,578,489 | | 1,465,007 | | 113,482 | | 7.7 | % |
| (1) | At the beginning of Q1 2018, our IPTV subscriber base was increased by 14,599 as a result of a small acquisition made in the quarter. |
IPTV net subscriber activationsdecreased by 39.4% in Q1 2018, compared to Q1 2017, attributable to increased deactivations resulting from aggressive residential offers for service bundles from cable competitors, particularly in our non-FTTH footprint, a greater number of retail customers coming off promotional offers, greater substitution of traditional TV services with OTT services, lower customer migrations from satellite TV, the impact of maturing Fibe TV markets, as well as lower footprint expansion in 2018. This was mitigated in part by higher activations from the launch of Fibe Alt TV on May 15, 2017, our application-based live TV streaming service.
Satellite TV net subscriber lossesimproved by 31.6% in Q1 2018, compared to prior year, driven by fewer residential deactivations and migrations reflecting a more mature subscriber base geographically better-suited for satellite TV service, and a lower number of customers coming off promotional offers, partly offset by aggressive residential promotional offers from cable competitors, primarily in our non-FTTH footprint.
BCE Inc. 2018 FIRST QUARTER SHAREHOLDER REPORT 17 |
|
| | | | |
3 | MD&A | Business segment analysis
Bell Wireline | |
Total TV net subscriber losses(IPTV and satellite TV combined) improved by 3,182 in Q1 2018, compared to Q1 2017, resulting from fewer satellite TV net losses, offset in part by lower IPTV net activations.
IPTV subscribersat March 31, 2018 totaled 1,578,489, up 7.7% from 1,465,007 subscribers reported at the end of Q1 2017. At the beginning of Q1 2018, our IPTV subscriber base was increased by 14,599, as a result of a small acquisition made in the quarter.
Satellite TV subscribersat March 31, 2018 totaled 1,255,929, down 8.5% from 1,372,346 subscribers at the end of Q1 2017.
Total TV subscribers(IPTV and satellite TV combined) at March 31, 2018 were 2,834,418, representing a modest decline of 0.1% since Q1 2017. At the beginning of Q1 2018, our total TV subscriber base was increased by 14,599, as a result of a small acquisition made in the quarter.
Voice
| Q1 2018 | | Q1 2017 | | CHANGE | | % CHANGE | |
Residential NAS lines(1) | 3,197,216 | | 3,399,981 | | (202,765 | ) | (6.0 | %) |
Residential NAS net losses | (57,533 | ) | (73,421 | ) | 15,888 | | 21.6 | % |
| (1) | At the beginning of Q1 2018, our residential NAS subscriber base was increased by 23,441 as a result of a small acquisition made in the quarter. |
Residential NAS net lossesimproved by 21.6% in Q1 2018, compared to Q1 2017, resulting from fewer customer deactivations reflecting a reduced number of retail customers coming off of promotional offers and greater pull-through from our IPTV service bundle offers. This was offset in part by aggressive competitive offers from cable TV providers, continued wireless and Internet-based technology substitution and the inclusion of Bell MTS net losses.
Residential NAS subscribersat March 31, 2018 totaled 3,197,216, down 6.0% from 3,399,981 subscribers reported at the end of Q1 2017. This represents a significant increase in the NAS erosion rate compared to the 1.9% erosion experienced in the first quarter of 2017, mainly attributable to the year-over-year increase in subscribers in Q1 2017 from the acquisition of MTS. At the beginning of Q1 2018, our residential NAS subscriber base was increased by 23,441, as a result of a small acquisition made in the quarter.
As at the date of this MD&A, our forward-looking statements set out in the BCE 2017 Annual MD&A, as updated or supplemented in this MD&A, are based on certain assumptions including, without limitation, the following assumptions and the assumptions referred to in each of the other business segment discussions set out in this section 3,Business segment analysis, as well as the economic and market assumptions referred to in section 1.3,Assumptions, of this MD&A.
- Positive full-year adjusted EBITDA growth
- Continued growth in residential IPTV and Internet subscribers
- Increasing wireless and Internet-based technological substitution
- Residential services household ARPU growth from increased penetration of multi-product households and price increases
- Aggressive residential service bundle offers from cable TV competitors in our local wireline areas
- Continued large business customer migration to IP-based systems
- Ongoing competitive repricing pressures in our business and wholesale markets
- Continued competitive intensity in our small and mid-sized business markets as cable operators and other telecom competitors continue to intensify their focus on business customers
- Traditional high-margin product categories challenged by large global cloud and OTT providers of business voice and data solutions expanding into Canada with on-demand services
- Ongoing deployment of direct fibre and growing consumption of OTT TV services and on-demand streaming video, as well as the proliferation of devices, such as tablets, that consume vast quantities of bandwidth, will require considerable ongoing capital investment
- Accelerating customer adoption of OTT services resulting in downsizing of TV packages
- Realization of cost savings related to management workforce attrition and retirements, lower contracted rates from our suppliers, reduction of traffic that is not on our network and operating synergies from the integration of MTS
- No material financial, operational or competitive consequences of changes in regulations affecting our wireline business
| 18 BCE Inc. 2018 FIRST QUARTER SHAREHOLDER REPORT |
|
| | | | |
| | 3 | MD&A | Business segment analysis
Bell Media |
KEY BUSINESS DEVELOPMENTS
BELL MEDIA SUPPORTS FAIRPLAY CANADA PROPOSAL TO ADDRESS CONTENT THEFT
On January 29, 2018, FairPlay Canada, a coalition of more than 25 companies and organizations representing Canadian artists, content creators, unions, guilds, producers, performers, broadcasters, distributors, and exhibitors, filed an application asking the CRTC to take action to address the theft of digital content by illegal piracy websites. Currently in Canada there is an absence of effective legal recourses to combat online content theft. Under the FairPlay Canada proposal, the CRTC would establish an Independent Piracy Review Agency (IPRA) to consider applications identifying piracy sites, hear evidence from all sides, conduct a hearing if necessary, and make recommendations to the CRTC on which sites should be addressed. If the CRTC followed the IPRA’s recommendation, all Internet service providers would then be required to disable access to the identified sites, making it more difficult for them to reach Canadians. Bell Media is a member of FairPlay Canada and proud to support its efforts to modernize the tools that are available to protect all stakeholders in Canada’s creative industries.
BELL MEDIA RECOGNIZED FOR EXCELLENCE IN PROGRAMMING
Bell Media and its production partners were honoured with 52 awards by the Academy of Canadian Cinema and Television at the recent annual Canadian Screen Awards, which recognizes excellence in Canadian film, TV and digital media productions. Showcasing its ongoing commitment to creating exceptional original Canadian content, Bell Media and its partners took home 33 TV and digital awards, with wins in major categories including Best National Newscast for the CTV National News with Lisa Laflamme, Best Live Entertainment Special, Best Talk Program or Series, Best Factual Series, and Best Reality/Competition Program or Series for The Amazing Race Canada. TSN garnered a total of seven awards, more than all other sports broadcasters combined, including Best Live Sports Event for the 2016 Major League Soccer Cup. Bell Media-supported films won 19 awards, including Best Motion Picture, Performance by an Actress in a Leading Role, Performance by an Actor in a Supporting Role and Achievement in Direction.
BELL MEDIA TO ACQUIRE MAJORITY INTEREST IN PINEWOOD TORONTO STUDIOS
On March 29, 2018, Bell Media entered into an agreement to acquire a majority stake in Pinewood Toronto Studios, in partnership with Comweb Studio Holdings, Castlepoint and the city of Toronto. Pinewood Toronto Studios is one of the largest purpose-built production studios in Canada and the preferred choice for domestic and international producers of film and TV content in Toronto.
EXCLUSIVE DEAL FOR WORLDWIDE DISTRIBUTION OF CTV’S THE LAUNCH
On February 22, 2018, Bell Media, Big Machine Label Group (BMLG), and Sony Pictures Television (SPT) announced that SPT secured international distribution rights to the new music TV format The Launch. As Bell Media and BMLG’s exclusive partner, SPT will distribute The Launch format worldwide, excluding Canada, and has its production company, Electric Ray, on board to produce the format in the United Kingdom. The historic deal represents the first time a Bell Media original TV format for CTV Inc. (CTV) has been sold for international distribution. In addition, SPT will also distribute the Canadian series, which wrapped up its inaugural season on CTV on February 21, for sale outside of Canada. In Canada, the inaugural season of The Launch debuted #1 in its timeslot on CTV and delivered a series of consecutive #1 hits. The series’ original songs have already surpassed 5.5 million streams worldwide and continue to grow.
| FINANCIAL PERFORMANCE ANALYSIS |
Q1 2018 PERFORMANCE HIGHLIGHTS

BELL MEDIA RESULTS
REVENUES
| Q1 2018 | | Q1 2017 | | $ CHANGE | | % CHANGE | |
Total external revenues | 631 | | 652 | | (21 | ) | (3.2 | %) |
Inter-segment revenues | 118 | | 99 | | 19 | | 19.2 | % |
Total Bell Media revenues | 749 | | 751 | | (2 | ) | (0.3 | %) |
BCE Inc. 2018 FIRST QUARTER SHAREHOLDER REPORT 19 |
|
| | | | |
3 | MD&A | Business segment analysis
Bell Media | |
Bell Media operating revenuesdecreased by $2 million, or 0.3%, in Q1 2018, compared to Q1 2017, driven by lower advertising revenues, offset in part by higher subscriber revenues.
Advertising revenuesdecreased in Q1 2018, compared to last year, reflecting continued general market softness and declining audience levels unfavourably impacting our TV and radio platforms as well as an ongoing shift in customer spending to OTT and digital platforms. Additionally, the shift in advertising dollars to the main broadcaster of the PyeongChang 2018 Winter Olympics unfavourably impacted advertising revenues across both conventional and specialty TV. The year-over-year decline in advertising revenues was moderated by growth in our TV digital properties and higher OOH advertising revenues mainly as a result of increased demand on digital faces.
Subscriber revenuesgrew in Q1 2018, compared to the same period last year, mainly due to the continued growth in our CraveTV and TV Everywhere GO Products primarily driven by higher subscribers and also reflected the favourable impact of contract renewals with TV distributors.
OPERATING COSTS AND ADJUSTED EBITDA
| Q1 2018 | | Q1 2017 | | $ CHANGE | | % CHANGE | |
Operating costs | (619 | ) | (617 | ) | (2 | ) | (0.3 | %) |
Adjusted EBITDA | 130 | | 134 | | (4 | ) | (3.0 | %) |
Adjusted EBITDA margin | 17.4 | % | 17.8 | % | | | (0.4 | ) pts |
Bell Media operating costs increased$2 million or 0.3% in Q1 2018, compared to the same period last year, mainly due to:
- Continued escalation of programming and content costs relating to sports rights and content expansion for CraveTV
- Higher OOH expenses resulting from the increased demand on digital faces
These factors were partially offset by:
- Regulatory fee reductions
- Lower labour costs driven mainly by workforce reductions
Bell Media adjusted EBITDAdecreased by 3.0% in Q1 2018, compared to Q1 of the previous year, due to the flow-through of the decline in operating revenues along with an increase in operating expenses primarily due to escalating programming and content costs, moderated by regulatory fee reductions and lower labour costs.
BELL MEDIA OPERATING METRICS
- CTV was the top ranked network in Canada for the 14th consecutive winter season among all key adult demographics in primetime, with nine of the top 20 programs nationally in key demographics. Among viewers aged 25 to 54, CTV had more shows in the winter top 20 than any other network.
- Bell Media continued to lead the Canadian TV media digital landscape in views, minutes watched, and videos served, with monthly averages of 482 million total views, 1 billion minutes spent, and 58 million videos served. Bell Media was seventh among online properties in the country, with 20 million unique visitors per month, reaching 65% of the digital audience.
- Bell Media remained Canada’s top radio broadcaster, reaching over 16.8 million listeners who spent more than 71 million hours tuned in each week
- Astral is one of Canada’s leading OOH advertising companies, reaching 14 million consumers weekly, with an offering of five innovative product lines and more than 31,000 advertising faces strategically located in key urban cities across the country
As at the date of this MD&A, our forward-looking statements set out in the BCE 2017 Annual MD&A, as updated or supplemented in this MD&A, are based on certain assumptions including, without limitation, the following assumptions and the assumptions referred to in each of the other business segment discussions set out in this section 3,Business segment analysis, as well as the economic and market assumptions referred to in section 1.3,Assumptions, of this MD&A.
- Revenue performance is expected to reflect an improving TV advertising sales trajectory supported by our broadcast of the 2018 FIFA World Cup, further CraveTV subscriber growth and continued growth in outdoor advertising
- Operating cost growth driven by higher TV programming and sports broadcast rights costs, as well as continued investment in CraveTV content
- Continued scaling of CraveTV
- Ability to successfully acquire and produce highly rated programming and differentiated content
- Building and maintaining strategic supply arrangements for content across all screens and platforms
- Increased revenue generation from monetization of content rights and Bell Media properties across all platforms
- TV unbundling and growth in OTT viewing expected to result in lower subscriber levels for many Bell Media TV properties
- No material financial, operational or competitive consequences of changes in regulations affecting our media business
| 20 BCE Inc. 2018 FIRST QUARTER SHAREHOLDER REPORT |
|
| | | | |
| | 4 | MD&A | Financial and capital management |
| 4 Financial and capital management |
This section tells you how we manage our cash and capital resources to carry out our strategy and deliver financial results. It provides an analysis of our financial condition, cash flows and liquidity on a consolidated basis.
| MARCH 31, 2018 | | DECEMBER 31, 2017 | | $ CHANGE | | % CHANGE | |
Debt due within one year | 5,520 | | 5,178 | | 342 | | 6.6 | % |
Long-term debt | 19,347 | | 18,215 | | 1,132 | | 6.2 | % |
Preferred shares(2) | 2,002 | | 2,002 | | – | | – | |
Cash and cash equivalents | (1,199 | ) | (625 | ) | (574 | ) | (91.8 | %) |
Net debt | 25,670 | | 24,770 | | 900 | | 3.6 | % |
| (1) | Net debt is a non-GAAP financial measure and does not have a standardized meaning under IFRS. Therefore, it is unlikely to be comparable to similar measures presented by other issuers. See section 8.2,Non-GAAP financial measures and key performance indicators (KPIs) – Net debt in this MD&A for more details including a reconciliation to the most comparable IFRS financial measure. |
| (2) | 50% of outstanding preferred shares of $4,004 million in 2018 and 2017 are classified as debt consistent with the treatment by some credit rating agencies. |
The increase of $1,474 million in total debt comprised of debt due within one year and long-term debt was due to:
- the issuance by Bell Canada of Series M-47 MTN debentures and Series US-1 Notes with total principal amounts of $500 million and US $750 million (CAD $967 million), respectively
- a net increase of $64 million in our finance lease obligations and other debt
Partly offset by:
- a decrease in our notes payable (net of repayments) of $57 million
The increase in cash and cash equivalents of $574 million was due mainly to:
- $1,236 million of debt issuances (net of repayments)
- $537 million of free cash flow
Partly offset by:
- $646 million of dividends paid on BCE common shares
- $223 million paid for business acquisitions mainly related to the acquisition of AlarmForce
- $175 million paid for the repurchase of common shares through a NCIB
- $88 million paid for the purchase on the open market of shares for the settlement of share-based payments
| 4.2Outstanding share data |
COMMON SHARES OUTSTANDING | NUMBER OF SHARES | |
Outstanding, January 1, 2018 | 900,996,640 | |
Shares issued for the acquisition of AlarmForce | 22,531 | |
Shares issued under employee stock option plan | 35,408 | |
Repurchase of common shares | (3,085,697 | ) |
Outstanding, March 31, 2018 | 897,968,882 | |
| NUMBER OF | | WEIGHTED AVERAGE | |
STOCK OPTIONS OUTSTANDING | OPTIONS | | EXERCISE PRICE ($) | |
Outstanding, January 1, 2018 | 10,490,249 | | 55 | |
Granted | 3,637,626 | | 57 | |
Exercised(1) | (35,408 | ) | 36 | |
Forfeited | (4,641 | ) | 59 | |
Outstanding, March 31, 2018 | 14,087,826 | | 56 | |
Exercisable, March 31, 2018 | 4,631,121 | | 52 | |
| (1) | The weighted average share price for options exercised during the quarter was $57. |
BCE Inc. 2018 FIRST QUARTER SHAREHOLDER REPORT 21 |
|
| | | | |
4 | MD&A | Financial and capital management | |
| Q12018 | | Q12017 | | $ CHANGE | | % CHANGE | |
Cash flows from operating activities | 1,496 | | 1,313 | | 183 | | 13.9 | % |
Capital expenditures | (931 | ) | (852 | ) | (79 | ) | (9.3 | %) |
Cash dividends paid on preferred shares | (33 | ) | (43 | ) | 10 | | 23.3 | % |
Cash dividends paid by subsidiaries to non-controlling interest | (13 | ) | (12 | ) | (1 | ) | (8.3 | %) |
Acquisition and other costs paid | 18 | | 83 | | (65 | ) | (78.3 | %) |
Free cash flow | 537 | | 489 | | 48 | | 9.8 | % |
Business acquisitions | (223 | ) | (1,635 | ) | 1,412 | | 86.4 | % |
Acquisition and other costs paid | (18 | ) | (83 | ) | 65 | | 78.3 | % |
Disposition of intangibles and other assets | 68 | | – | | 68 | | n.m. | |
Acquisition of spectrum licences | (36 | ) | – | | (36 | ) | n.m. | |
Other investing activities | (35 | ) | (9 | ) | (26 | ) | n.m. | |
Net issuance of debt instruments | 1,236 | | 1,550 | | (314 | ) | (20.3 | %) |
Issue of common shares | 1 | | 48 | | (47 | ) | (97.9 | %) |
Repurchase of shares for settlement of share-based payments | (88 | ) | (96 | ) | 8 | | 8.3 | % |
Repurchase of common shares | (175 | ) | – | | (175 | ) | n.m. | |
Cash dividends paid on common shares | (646 | ) | (594 | ) | (52 | ) | (8.8 | %) |
Return of capital to non-controlling interest | (29 | ) | – | | (29 | ) | n.m. | |
Other financing activities | (18 | ) | (13 | ) | (5 | ) | (38.5 | %) |
Net increase (decrease) in cash and cash equivalents | 574 | | (343 | ) | 917 | | n.m. | |
n.m.: not meaningful
| CASH FLOWS FROM OPERATING ACTIVITIES AND FREE CASH FLOW |
Cash flows from operating activities in the first quarter of 2018 increased by $183 million, compared to Q1 2017, due mainly to improved working capital, lower acquisition and other costs paid and higher adjusted EBITDA.
Free cash flow in Q1 2018 increased by $48 million, compared to the same period last year, due to higher cash flows from operating activities excluding acquisition and other costs paid, partly offset by higher capital expenditures.
| Q1 2018 | | Q1 2017 | | $ CHANGE | | % CHANGE | |
Bell Wireless | 164 | | 136 | | (28 | ) | (20.6 | %) |
Capital intensity ratio | 8.4 | % | 7.7 | % | | | (0.7 | ) pts |
Bell Wireline | 747 | | 691 | | (56 | ) | (8.1 | %) |
Capital intensity ratio | 24.2 | % | 23.2 | % | | | (1.0 | ) pts |
Bell Media | 20 | | 25 | | 5 | | 20.0 | % |
Capital intensity ratio | 2.7 | % | 3.3 | % | | | 0.6 | pts |
BCE | 931 | | 852 | | (79 | ) | (9.3 | %) |
Capital intensity ratio | 16.7 | % | 16.0 | % | | | (0.7 | ) pts |
BCE capital expendituresof $931 million in Q1 2018 increased $79 million or 9.3% over the same period last year, driven by higher investments at Bell Wireline and Bell Wireless, moderated by reduced year-over-year spending at Bell Media. Capital expenditures as a percentage of revenue (capital intensity ratio) increased to 16.7% in Q1 2018 compared to 16.0% in the previous year. Capital expenditures reflected:
- Higher wireline capital spending of $56 million compared to last year, driven by our continued focus on expanding broadband fibre directly to more homes and businesses, including the rollout of Gigabit Fibe infrastructure in the city of Toronto and other urban areas combined with the FTTP build-out in the city of Montréal. The year-over-year increase also reflected the acquisition and integration of Bell MTS.
- Greater spending in our wireless segment of $28 million reflected our ongoing investment in network infrastructure, including the increase of LTE-A speeds, deployment of wireless small cells to optimize mobile coverage, signal quality and data backhaul, as well as the expansion of network capacity to support the growth in subscribers and data consumption. The acquisition and integration of Bell MTS also drove up year-over-year wireless capital expenditures.
- Lower capital spending at Bell Media of $5 million due to higher spending in 2017 in OOH
| 22 BCE Inc. 2018 FIRST QUARTER SHAREHOLDER REPORT |
|
| | | | |
| | 4 | MD&A | Financial and capital management |
On January 5, 2018, BCE acquired all of the issued and outstanding shares of AlarmForce for a total consideration of $182 million, of which $181 million was paid in cash and the remaining $1 million through the issuance of 22,531 BCE common shares.
On March 17, 2017, BCE acquired all of the issued and outstanding common shares of MTS for a total consideration of $2,933 million, of which $1,339 million was paid in cash and the remaining $1,594 million through the issuance of approximately 27.6 million BCE common shares.
On January 3, 2017, BCE acquired all of the issued and outstanding common shares of Cieslok Media Ltd., for a total cash consideration of $161 million.
| DISPOSITION OF INTANGIBLE AND OTHER ASSETS |
During Q1 2018, BCE sold AlarmForce’s approximate 39,000 customer accounts in British Columbia, Alberta and Saskatchewan to TELUS Communications Inc. (Telus) for total proceeds of approximately $68 million.
2018
In the first quarter of 2018, we issued $1,236 million of debt, net of repayments. This included the issuances of Series M-47 MTN debentures and Series US-1 Notes at Bell Canada with total principal amounts of $500 million and US $750 million (CAD $967 million), respectively. These issuances were partly offset by the repayments (net of issuances) of $57 million of notes payable and payments of finance leases and other debt of $174 million.
2017
In the first quarter of 2017, we issued $1,550 million of debt, net of repayments. This included the issuance of Series M-44 and M-45 MTN debentures at Bell Canada with principal amounts of $1 billion and $500 million, respectively, an increase in our loans secured by trade receivables of $350 million and the issuance (net of repayments) of $308 million of notes payable. These issuances were partly offset by the repayment of borrowings under our unsecured committed term credit facility of $480 million and payments of finance leases and other debt of $128 million.
| REPURCHASE OF COMMON SHARES |
In Q1 2018, BCE repurchased and cancelled 3,085,697 common shares for a total cost of $175 million. Of the total cost, $69 million represents stated capital and $3 million represents the reduction of the contributed surplus attributable to these common shares. The remaining $103 million was charged to the deficit.
| CASH DIVIDENDS PAID ON COMMON SHARES |
In the first quarter of 2018, cash dividends paid on common shares increased by $52 million compared to Q1 2017, due to a higher dividend paid in Q1 2018, of $0.7175 per common share compared to $0.6825 per common share in Q1 2017, and a higher number of outstanding common shares principally as a result of shares issued for the acquisition of MTS.
| 4.4Post-employment benefit plans |
For the three months ended March 31, 2018, we recorded an increase in our post-employment benefit obligations and a loss, before taxes, in OCI of $154 million. This was due to a lower-than-expected return on plan assets. The discount rate at March 31, 2018 was 3.6%, unchanged from December 31, 2017.
For the three months ended March 31, 2017, we recorded an increase in our post-employment benefit obligations and a loss, before taxes, in OCI of $442 million. This was due to a lower discount rate of 3.8% at March 31, 2017, compared to 4.0% at December 31, 2016. The loss was partly offset by a higher-than-expected return on plan assets.
BCE Inc. 2018 FIRST QUARTER SHAREHOLDER REPORT 23 |
|
| | | | |
4 | MD&A | Financial and capital management | |
| 4.5Financial risk management |
FAIR VALUE
The following table provides the fair value details of financial instruments measured at amortized cost in the statements of financial position.
| | | | MARCH 31, 2018 | DECEMBER 31, 2017 |
| | | | CARRYING | | FAIR | | CARRYING | | FAIR | |
| | CLASSIFICATION | FAIR VALUE METHODOLOGY | VALUE | | VALUE | | VALUE | | VALUE | |
CRTC tangible benefits obligation | Trade payables and other liabilities and non-current liabilities | Present value of estimated future cash flows discounted using observable market interest rates | 99 | | 99 | | 111 | | 110 | |
CRTC deferral account obligation | Trade payables and other liabilities and non-current liabilities | Present value of estimated future cash flows discounted using observable market interest rates | 121 | | 125 | | 124 | | 128 | |
Debt securities, finance leases and other debt | Debt due within one year and long-term debt | Quoted market price of debt or present value of future cash flows discounted using observable market interest rates | 20,761 | | 22,623 | | 19,321 | | 21,298 | |
The following table provides the fair value details of financial instruments measured at fair value in the statements of financial position.
| | CLASSIFICATION | CARRYING VALUE
OF ASSET (LIABILITY) | | FAIR VALUE |
QUOTED PRICES IN
ACTIVE MARKETS
FOR IDENTICAL
ASSETS (LEVEL 1) | | OBSERVABLE
MARKET DATA
(LEVEL 2)(1) | | NON-OBSERVABLE
MARKET
INPUTS (LEVEL 3)(2) | |
March 31, 2018 | | | | | | | | | |
Publicly-traded and privately-held investments(3) | Other non-current assets | 103 | | 1 | | – | | 102 | |
Derivative financial instruments | Other current assets, trade payables and other liabilities, other non-current assets and liabilities | (29 | ) | – | | (29 | ) | – | |
Maple Leaf Sports & Entertainment Ltd. (MLSE) financial liability(4) | Trade payables and other liabilities | (135 | ) | – | | – | | (135 | ) |
Other | Other non-current assets and liabilities | 65 | | – | | 111 | | (46 | ) |
December 31, 2017 | | | | | | | | | |
Publicly-traded and privately-held investments(3) | Other non-current assets | 103 | | 1 | | – | | 102 | |
Derivative financial instruments | Other current assets, trade payables and other liabilities, other non-current assets and liabilities | (48 | ) | – | | (48 | ) | – | |
MLSE financial liability(4) | Trade payables and other liabilities | (135 | ) | – | | – | | (135 | ) |
Other | Other non-current assets and liabilities | 60 | | – | | 106 | | (46 | ) |
| (1) | Observable market data such as equity prices, interest rates, swap rate curves and foreign currency exchange rates. |
| (2) | Non-observable market inputs such as discounted cash flows and earnings multiples. A reasonable change in our assumptions would not result in a significant increase (decrease) to our level 3 financial instruments. |
| (3) | Unrealized gains and losses are recorded in OCI and impairment charges are recorded inOther (expense) income in the income statements. |
| (4) | Represents BCE’s obligation to repurchase the BCE Master Trust Fund’s (Master Trust) 9% interest in MLSE at a price not less than an agreed minimum price should the Master Trust exercise its put option. The obligation to repurchase is marked to market each reporting period and the gain or loss is recorded in Other (expense) income in the income statements. The option is exercisable in 2018 and thereafter. |
| 24 BCE Inc. 2018 FIRST QUARTER SHAREHOLDER REPORT |
|
| | | | |
| | 4 | MD&A | Financial and capital management |
We use forward contracts, options and cross currency interest rate swaps to manage foreign currency risk related to anticipated purchases and sales and certain foreign currency denominated debt.
A 10% depreciation (appreciation) in the value of the Canadian dollar relative to the U.S. dollar would result in a gain (loss) of $3 million ($5 million) recognized in net earnings at March 31, 2018 and a gain (loss) of $155 million ($149 million) recognized in OCI at March 31, 2018, with all other variables held constant.
In 2018, we entered into a cross currency interest rate swap with a notional amount of $750 million in U.S. dollars ($967 million in Canadian dollars) to hedge the U.S. currency exposure of our US-1 Notes maturing in 2048. See Note 10, Debt, in BCE’s Q1 2018 Financial Statements.
The following table provides further details on our outstanding foreign currency forward contracts and options as at March 31, 2018.
| | | AMOUNT | | AMOUNT | | |
| TYPE OF HEDGE | BUY CURRENCY | TO RECEIVE | SELL CURRENCY | TO PAY | MATURITY | HEDGED ITEM |
| Cash flow | USD | 2,456 | CAD | 3,142 | 2018 | Commercial paper |
| Cash flow | USD | 667 | CAD | 869 | 2018 | Anticipated transactions |
| Cash flow | CAD | 97 | USD | 75 | 2018-2019 | Anticipated transactions |
| Cash flow | USD | 775 | CAD | 968 | 2019 | Anticipated transactions |
| Cash flow | USD | 76 | CAD | 96 | 2020-2021 | Anticipated transactions |
| Economic | USD | 27 | CAD | 35 | 2018 | Anticipated transactions |
| Economic – call options | USD | 50 | CAD | 61 | 2018 | Anticipated transactions |
| Economic – put options | USD | 115 | CAD | 139 | 2018 | Anticipated transactions |
A 1% increase (decrease) in interest rates would result in a decrease (increase) of $29 million in net earnings at March 31, 2018.
We use equity forward contracts on BCE’s common shares to economically hedge the cash flow exposure related to the settlement of equity settled share-based compensation plans and the equity price risk related to a cash-settled share-based payment plan. The fair value of our equity forward contracts at March 31, 2018 was a liability of $42 million.
A 5% increase (decrease) in the market price of BCE’s common shares at March 31, 2018 would result in a gain (loss) of $35 million recognized in net earnings, with all other variables held constant.
BCE’s and Bell Canada’s key credit ratings remain unchanged from those described in the BCE 2017 Annual MD&A.
Our cash requirements remain substantially unchanged from those described in the BCE 2017 Annual MD&A.
BCE Inc. 2018 FIRST QUARTER SHAREHOLDER REPORT 25 |
|
| | | | |
5 | MD&A | Quarterly financial information | |
| 5 Quarterly financial information |
BCE’s Q1 2018 financial statements were prepared in accordance with IFRS, as issued by the International Accounting Standards Board (IASB), under International Accounting Standard (IAS) 34, Interim Financial Reporting and were approved by BCE’s board of directors on May 2, 2018.
The following table, which was also prepared in accordance with IFRS, shows selected consolidated financial data of BCE for the eight most recent completed quarters.
| 2018 | | 2017 | 2016 PRIOR TO THE ADOPTION OF IFRS 15 |
| Q1 | | Q4 | | Q3 | | Q2 | | Q1 | | Q4 | | Q3 | | Q2 | |
Operating revenues | | | | | | | | | | | | | | | | |
Service | 4,964 | | 5,152 | | 5,054 | | 5,078 | | 4,811 | | 5,169 | | 5,025 | | 4,988 | |
Product | 626 | | 884 | | 643 | | 610 | | 525 | | 533 | | 382 | | 352 | |
Total operating revenues | 5,590 | | 6,036 | | 5,697 | | 5,688 | | 5,336 | | 5,702 | | 5,407 | | 5,340 | |
Adjusted EBITDA | 2,254 | | 2,329 | | 2,405 | | 2,382 | | 2,166 | | 2,121 | | 2,236 | | 2,268 | |
Severance, acquisition and other costs | – | | (47 | ) | (23 | ) | (36 | ) | (84 | ) | (11 | ) | (25 | ) | (57 | ) |
Depreciation | (780 | ) | (783 | ) | (760 | ) | (767 | ) | (724 | ) | (719 | ) | (706 | ) | (713 | ) |
Amortization | (212 | ) | (208 | ) | (207 | ) | (210 | ) | (185 | ) | (165 | ) | (161 | ) | (156 | ) |
Net earnings | 709 | | 698 | | 850 | | 814 | | 688 | | 699 | | 800 | | 830 | |
Net earnings attributable to common shareholders | 661 | | 656 | | 803 | | 765 | | 642 | | 657 | | 752 | | 778 | |
Net earnings per common share | | | | | | | | | | | | | | | | |
Basic | 0.73 | | 0.72 | | 0.90 | | 0.85 | | 0.73 | | 0.75 | | 0.87 | | 0.89 | |
Diluted | 0.73 | | 0.72 | | 0.90 | | 0.85 | | 0.73 | | 0.75 | | 0.87 | | 0.89 | |
Average number of common shares outstanding – basic (millions) | 900.2 | | 900.6 | | 900.4 | | 900.1 | | 875.7 | | 870.5 | | 869.9 | | 869.1 | |
| 26 BCE Inc. 2018 FIRST QUARTER SHAREHOLDER REPORT |
|
| | | | |
| | 6 | MD&A | Regulatory environment |
The following is an update to the regulatory initiatives and proceedings described in the BCE 2017 Annual MD&A under section 3.3,Principal business risksand section 8,Regulatory environment.
PROCEEDINGS REGARDING WHOLESALE DOMESTIC WIRELESS SERVICES
On March 22, 2018, the CRTC released Telecom Decision 2018-97 in relation to its reconsideration of Telecom Decision 2017-56. In Telecom Decision 2018-97, the CRTC maintained its previous determination that the use of generally available public Wi-Fi could not be considered to be part of the home network of a non-national wireless provider in order to access the mandated wholesale domestic roaming services of Bell Mobility Inc. (Bell Mobility), Rogers Communications Canada Inc. (Rogers) or Telus. The CRTC determined that permitting such access would negatively impact investments in wireless networks by wireless carriers and run against the long-standing policy to encourage facilities-based competition.
Instead of mandating access for Wi-Fi-based wireless service providers, the CRTC initiated Telecom Notice of Consultation 2018-98, in which it directed Bell Mobility, Rogers, and Telus to file proposals for affordable data-only plans that they could offer in the market. Through this proceeding, the CRTC intends to determine the attributes that such plans should have and may mandate Bell Mobility, Rogers and Telus to make such plans available to consumers. Bell Mobility, Rogers and Telus filed proposed plans on April 23, 2018. A decision is expected later this year. We are unable to assess the potential impact that Telecom Notice of Consultation 2018-98 may have, if any, on our business at the present time.
Also on March 22, 2018, the CRTC released Telecom Decision 2018-99 establishing final rates for the wholesale domestic roaming services of Bell Mobility, Rogers and Telus. The rates are retroactive to May 5, 2015.
600 MHZ SPECTRUM CONSULTATION
On March 28, 2018, Innovation, Science and Economic Development Canada (ISED) released the “Technical, Policy and Licensing Framework for Spectrum in the 600 MHz Band”. In this framework, ISED confirmed that it will auction 70 Megahertz (MHz) of spectrum, 30 MHz of which will be set-aside for set-aside-eligible entities. Set-aside-eligible entities must: (i) be registered with the CRTC as facilities-based providers; (ii) not be national incumbent service providers; and (iii) be actively providing commercial telecommunications services to the general public in the relevant service area of interest as of the application date to participate in the auction. The set-aside spectrum can only be transferred to set-aside-eligible entities for the first five years. All auctioned licences will have a 20-year term and be subject to certain deployment requirements which require licensees to provide network coverage to a certain percentage of the population in each licence area at five, 10 and 20 years following licence issuance. While the adoption of set-aside provisions limits the spectrum that Bell Mobility can bid on, no further restrictions were adopted that would limit Bell Mobility’s participation in the auction process. Bidding in the auction is scheduled to begin March 12, 2019.
PERSONAL INFORMATION PROTECTION AND ELECTRONIC DOCUMENTS ACT
On June 18, 2015, thePersonal Information Protection and Electronic Documents Actwas amended to include mandatory notification requirements that must be followed in relation to the loss or unauthorized disclosure of personal information held by an organization resulting from a breach of the organization’s security safeguards. Failure to comply with these notification requirements, or to record security breaches, may result in a fine of up to $100,000 per occurrence. These provisions dealing with notification and record keeping requirements will come into force on November 1, 2018 when related regulations are scheduled to come into force.
BCE Inc. 2018 FIRST QUARTER SHAREHOLDER REPORT 27 |
|
| | | | |
7 | MD&A | Business risks | |
A risk is the possibility that an event might happen in the future that could have a negative effect on our financial position, financial performance, cash flows, business or reputation. Part of managing our business is to understand what these potential risks could be and to mitigate them where we can.
The actual effect of any event could be materially different from what we currently anticipate. The risks described in this MD&A are not the only ones that could affect us. Additional risks and uncertainties not currently known to us or that we currently deem to be immaterial may also materially and adversely affect our financial position, financial performance, cash flows, business or reputation.
In the BCE 2017 Annual MD&A we provided a detailed review of risks that could affect our financial position, financial performance, cash flows, business or reputation and that could cause actual results or events to differ materially from our expectations expressed in or implied by our forward-looking statements. This detailed description of risks is updated in this MD&A. The risks described in the BCE 2017 Annual MD&A, as updated in this MD&A, include, without limitation, risks associated with:
- the intensity of competitive activity, including from new and emerging competitors, and the resulting impact on the cost of retaining existing customers and attracting new ones, as well as on our market shares, service volumes and pricing strategies
- the level of technological substitution and the presence of alternative service providers contributing to reduced utilization of our traditional wireline services
- regulatory initiatives, proceedings and decisions, government consultations and government positions that affect us and influence our business, including, in particular, those relating to mandatory access to networks, spectrum auctions, approval of acquisitions, broadcast licensing and foreign ownership requirements
- the inability to protect our physical and non-physical assets, including networks, IT systems, offices, corporate stores and sensitive information, from events and attacks such as cyber threats, and damage from fire and natural disasters
- security and data leakage exposure if security control protocols applicable to our cloud-based solutions are bypassed
- the adverse effect of the fundamental separation of content and connectivity, which is changing our TV and media ecosystems and may accelerate the disconnection of TV services and the reduction of TV spending, as well as the fragmentation of, and changes in, the advertising market
- competition with global competitors, in addition to traditional Canadian competitors, for programming content could drive significant increases in content acquisition costs and challenge our ability to secure key content
- adverse economic and financial market conditions, a declining level of retail and commercial activity, and the resulting negative impact on the demand for, and prices of, our products and services and the level of bad debts
- the failure to optimize network and IT deployment and upgrade timelines, accurately assess the potential of new technologies, and invest and evolve in the appropriate direction
- the failure to continue investment in a disciplined and strategic manner in next-generation capabilities, including real-time information-based customer service strategies
- the inability to drive a positive customer experience resulting, in particular, from the failure to embrace new approaches and challenge operational limitations
- the complexity in our operations resulting from multiple technology platforms, billing systems, marketing databases and a myriad of rate plans, promotions and product offerings
- the failure to maintain optimal network operating performance in the context of significant increases in capacity demands on our Internet and wireless networks
- the failure to implement or maintain highly effective IT systems supported by an effective governance and operating framework
- the risk that we may need to incur significant capital expenditures beyond our capital intensity target in order to provide additional capacity and reduce network congestion
- the failure to generate anticipated benefits from our corporate restructurings, system replacements and upgrades, process redesigns and the integration of business acquisitions
- events affecting the functionality of, and our ability to protect, test, maintain and replace, our networks, IT systems, equipment and other facilities
- in-orbit and other operational risks to which the satellites used to provide our satellite TV services are subject
- the failure to attract and retain employees with the appropriate skill sets and to drive their performance in a safe and secure environment
- labour disruptions
- the inability to access adequate sources of capital and generate sufficient cash flows from operations to meet our cash requirements, fund capital expenditures and provide for planned growth
- uncertainty as to whether dividends will be declared by BCE’s board of directors or whether BCE’s dividend payout policy will be maintained
- the inability to manage various credit, liquidity and market risks
- pension obligation volatility and increased contributions to post-employment benefit plans
- higher taxes due to new tax laws or changes thereto or in the interpretation thereof, and the inability to predict the outcome of government audits
- the failure to reduce costs as well as unexpected increases in costs
- the failure to evolve practices to effectively monitor and control fraudulent activities
- online content theft and piracy and the absence of effective legal recourses to combat them
- events affecting the continuity of supply of products and services that we need to operate our business and to comply with various obligations from our third-party suppliers, outsourcers and consultants
- the failure of our procurement and vendor management practices to address risk exposures associated with existing and new supplier models
| 28 BCE Inc. 2018 FIRST QUARTER SHAREHOLDER REPORT |
|
| | | | |
| | 7 | MD&A | Business risks |
- the quality of our products and services and the extent to which they may be subject to manufacturing defects or fail to comply with applicable government regulations and standards
- unfavourable resolution of legal proceedings and, in particular, class actions
- unfavourable changes in applicable laws and the failure to proactively address our legal and regulatory obligations
- health concerns about radiofrequency emissions from wireless communications devices
- the inability to maintain customer service and our networks operational in the event of the occurrence of epidemics, pandemics and other health risks
- the failure to recognize and adequately respond to climate change concerns or public and governmental expectations on environmental matters
We caution that the foregoing list of risk factors is not exhaustive and other factors could also adversely affect our results.
Please see section 9,Business risks, of the BCE 2017 Annual MD&A for a more complete description of the above-mentioned and other risks, which section, and the other sections of the BCE 2017 Annual MD&A referred to therein, are incorporated by reference in this section 7.
Please also see section 6,Regulatory environment, in this MD&A for an update to the regulatory initiatives and proceedings described in the BCE 2017 Annual MD&A, which section 6 is incorporated by reference in this section 7.
Except for the updates set out in section 6,Regulatory environment, in this MD&A, the risks described in the BCE 2017 Annual MD&A remain substantially unchanged.
BCE Inc. 2018 FIRST QUARTER SHAREHOLDER REPORT 29 |
|
| | | | |
8 | MD&A | Accounting policies, financial measures and controls | |
| 8 Accounting policies, financial measures and controls |
| 8.1Our accounting policies |
BCE’s Q1 2018 Financial Statements were prepared in accordance with IFRS, as issued by the IASB, under IAS 34 – Interim Financial Reporting and were approved by BCE’s board of directors on May 2, 2018. These financial statements were prepared using the same basis of presentation, accounting policies and methods of computations as outlined in Note 2,Significant accounting policiesin BCE’s consolidated financial statements for the year ended December 31, 2017, except as noted below. BCE’s Q1 2018 Financial Statements do not include all of the notes required in the annual financial statements.
| ADOPTION OF NEW ACCOUNTING STANDARDS |
As required, effective January 1, 2018, we adopted the following new accounting standards.
IFRS 15
We applied IFRS 15, Revenue from Contracts with Customers, retrospectively to each prior reporting period presented. IFRS 15 establishes principles to record revenues from contracts for the sale of products or services, unless the contracts are in the scope of other IFRSs.
IFRS 15 principally affects the timing of revenue recognition and how we classify revenues between product and service in our Bell Wireless segment. IFRS 15 also affects how we account for costs to obtain a contract.
- Under multiple-element arrangements, revenue allocated to a satisfied performance obligation is no longer limited to the amount that is not contingent upon the satisfaction of additional performance obligations. Although the total revenue recognized during the term of a contract is largely unaffected, revenue recognition may be accelerated and reflected ahead of the associated cash inflows. This results in the recognition of a contract asset on the balance sheet, corresponding to the amount of revenue recognized and not yet billed to a customer. The contract asset is realized over the term of the customer contract.
- As revenues allocated to a satisfied performance obligation are no longer limited to the non-contingent amount, a greater proportion of the total revenue recognized during the term of certain customer contracts may be attributed to a delivered product, resulting in a corresponding decrease in service revenue
- Sales commissions and any other incremental costs of obtaining a contract with a customer are recognized on the statement of financial position and amortized on a systematic basis that is consistent with the period and pattern of transfer to the customer of the related products or services, except as noted below
Under IFRS 15, we apply the following practical expedients.
- Completed contracts that begin and end within the same annual reporting period and those completed before January 1, 2017 are not restated
- Contracts modified prior to January 1, 2017 are not restated. The aggregate effect of these modifications is reflected when identifying the satisfied and unsatisfied performance obligations, determining the transaction price and allocating the transaction price to the satisfied and unsatisfied performance obligations.
- When our right to consideration from a customer corresponds directly with the value to the customer of the products and services transferred to date, we recognize revenue in the amount to which we have a right to invoice. For such contracts and for performance obligations that are part of a contract that has an original expected duration of one year or less, the transaction price amount allocated to the remaining performance obligations and an explanation of when we expect to recognise that amount as revenue are not disclosed.
- Costs of obtaining a contract that would be amortized within one year or less are immediately expensed
IFRS 9
We applied IFRS 9, Financial Instruments (as revised in July 2014) and the related consequential amendments to other IFRSs retrospectively, except for the changes to hedge accounting described below which are applied prospectively. In accordance with the transition requirements, comparative periods have not been restated. The adoption of IFRS 9 did not have a significant impact on the carrying amounts of our financial instruments as at January 1, 2018. As a result of the adoption of IFRS 9, our January 1, 2018 deficit increased by $4 million.
IFRS 9 replaces the classification and measurement models in IAS 39, Financial Instruments: Recognition and Measurement, with a single model under which financial assets are classified and measured at amortized cost, fair value through other comprehensive income (FVOCI) or fair value through profit or loss (FVTPL). This classification is based on the business model in which a financial asset is managed and its contractual cash flow characteristics and eliminates the IAS 39 categories of held-to-maturity, loans and receivables and available-for-sale. The adoption of IFRS 9 did not, however, change the measurement bases of our financial assets.
- Cash and cash equivalents and derivative instruments measured at FVTPL under IAS 39 continue to be measured as such under IFRS 9
- Portfolio investments in equity securities and certain derivative instruments that qualify for cash flow hedge accounting measured at FVOCI under IAS 39 continue to be measured as such under IFRS 9
- Trade and other receivables continue to be measured at amortized cost under IFRS 9
The impairment of financial assets under IFRS 9 is based on an expected credit loss (ECL) model, as opposed to the incurred loss model in IAS 39. IFRS 9 applies to financial assets measured at amortized cost and contract assets and requires that we consider factors that include historical, current and forward-looking information when measuring the ECL. We use the simplified approach for measuring losses based on the lifetime ECL for trade receivables and contract assets. Amounts considered uncollectible are written off and recognized in Operating costs in the income statement.
| 30 BCE Inc. 2018 FIRST QUARTER SHAREHOLDER REPORT |
|
| | | | |
| | 8 | MD&A | Accounting policies, financial measures and controls |
We have adopted the general hedge accounting model in IFRS 9 which requires that we ensure hedge accounting relationships are consistent with our risk management objectives and strategies. We also apply a more qualitative and forward-looking approach in assessing hedge effectiveness as a retrospective assessment is no longer required.
- Under IFRS 9, amounts related to cash flow hedges of anticipated purchases of non-financial assets settled during the period are reclassified from Accumulated OCI to the initial cost of the non-financial asset when it is recognized. Under IAS 39, such amounts were reclassified from OCI. Amounts related to cash flow hedges of other anticipated purchases continue to be reclassified from OCI to net earnings under IFRS 9.
As a result of adopting IFRS 15, we have changed the comparative figures for the period ended March 31, 2017, the year ended December 31, 2017 and the opening statement of financial position as at January 1, 2017. The impacts of adopting IFRS 15 and updated 2017 disclosures are provided below.
CONSOLIDATED INCOME STATEMENTS
The table below shows the impacts of adopting IFRS 15 on our previously reported 2017 consolidated income statements.
| | THREE MONTHS ENDED MARCH 31, 2017 | YEAR ENDED DECEMBER 31, 2017 |
| | 2017 AS | | | | 2017 UPON | | 2017 AS | | | | 2017 UPON | |
| | PREVIOUSLY | | | | ADOPTION | | PREVIOUSLY | | | | ADOPTION | |
| (IN MILLIONS OF CANADIAN DOLLARS, EXCEPT SHARE AMOUNTS) | REPORTED | | IFRS 15 IMPACTS | | OF IFRS 15 | | REPORTED | | IFRS 15 IMPACTS | | OF IFRS 15 | |
Operating revenues | 5,384 | | (48 | ) | 5,336 | | 22,719 | | 38 | | 22,757 | |
Operating costs | (3,170 | ) | – | | (3,170 | ) | (13,541 | ) | 66 | | (13,475 | ) |
Severance, acquisition and other costs | (84 | ) | – | | (84 | ) | (190 | ) | – | | (190 | ) |
Depreciation | (722 | ) | (2 | ) | (724 | ) | (3,037 | ) | 3 | | (3,034 | ) |
Amortization | (185 | ) | – | | (185 | ) | (813 | ) | 3 | | (810 | ) |
Finance costs | | | | | | | | | | | | |
Interest expense | (234 | ) | – | | (234 | ) | (955 | ) | – | | (955 | ) |
Interest on post-employment benefit obligations | (18 | ) | – | | (18 | ) | (72 | ) | – | | (72 | ) |
Other income (expense) | 17 | | – | | 17 | | (102 | ) | – | | (102 | ) |
Income taxes | (263 | ) | 13 | | (250 | ) | (1,039 | ) | (30 | ) | (1,069 | ) |
Net earnings | 725 | | (37 | ) | 688 | | 2,970 | | 80 | | 3,050 | |
Net earnings attributable to: | | | | | | | | | | | | |
Common shareholders | 679 | | (37 | ) | 642 | | 2,786 | | 80 | | 2,866 | |
Preferred shareholders | 31 | | – | | 31 | | 128 | | – | | 128 | |
Non-controlling interest | 15 | | – | | 15 | | 56 | | – | | 56 | |
Net earnings | 725 | | (37 | ) | 688 | | 2,970 | | 80 | | 3,050 | |
Net earnings per common share – basic | 0.78 | | (0.05 | ) | 0.73 | | 3.12 | | 0.08 | | 3.20 | |
Net earnings per common share – diluted | 0.78 | | (0.05 | ) | 0.73 | | 3.11 | | 0.09 | | 3.20 | |
Average number of common shares outstanding – basic (millions) | 875.7 | | – | | 875.7 | | 894.3 | | – | | 894.3 | |
BCE Inc. 2018 FIRST QUARTER SHAREHOLDER REPORT 31 |
|
| | | | |
8 | MD&A | Accounting policies, financial measures and controls | |
CONSOLIDATED STATEMENT OF FINANCIAL POSITIONThe table below shows the effects of adopting IFRS 15 on our previously reported 2017 consolidated statement of financial position.
| 2017 AS | | | | | | 2017 UPON | |
| PREVIOUSLY | | | | | | ADOPTION | |
FOR THE YEAR ENDED DECEMBER 31 | REPORTED | | IFRS 15 IMPACTS | | RECLASSIFICATIONS(1) | | OF IFRS 15 | |
Cash | 442 | | – | | – | | 442 | |
Cash equivalents | 183 | | – | | – | | 183 | |
Trade and other receivables | 3,135 | | 9 | | (15 | ) | 3,129 | |
Inventory | 380 | | – | | – | | 380 | |
Contract assets | – | | 923 | | (91 | ) | 832 | |
Contract costs | – | | 206 | | 144 | | 350 | |
Prepaid expenses | 375 | | – | | (158 | ) | 217 | |
Other current assets | 124 | | – | | (2 | ) | 122 | |
Total current assets | 4,639 | | 1,138 | | (122 | ) | 5,655 | |
Contract assets | – | | 400 | | 31 | | 431 | |
Contract costs | – | | 162 | | 124 | | 286 | |
Property, plant and equipment | 24,033 | | (4 | ) | – | | 24,029 | |
Intangible assets | 13,305 | | – | | (47 | ) | 13,258 | |
Deferred tax assets | 144 | | – | | – | | 144 | |
Investments in associates and joint ventures | 814 | | – | | – | | 814 | |
Other non-current assets | 900 | | – | | (143 | ) | 757 | |
Goodwill | 10,428 | | – | | – | | 10,428 | |
Total non-current assets | 49,624 | | 558 | | (35 | ) | 50,147 | |
Total assets | 54,263 | | 1,696 | | (157 | ) | 55,802 | |
Trade payables and other liabilities | 4,623 | | – | | (748 | ) | 3,875 | |
Contract liabilities | – | | 97 | | 596 | | 693 | |
Interest payable | 168 | | – | | – | | 168 | |
Dividends payable | 678 | | – | | – | | 678 | |
Current tax liabilities | 140 | | – | | – | | 140 | |
Debt due within one year | 5,178 | | – | | – | | 5,178 | |
Total current liabilities | 10,787 | | 97 | | (152 | ) | 10,732 | |
Contract liabilities | – | | 34 | | 167 | | 201 | |
Long-term debt | 18,215 | | – | | – | | 18,215 | |
Deferred tax liabilities | 2,447 | | 423 | | – | | 2,870 | |
Post-employment benefit obligations | 2,108 | | – | | – | | 2,108 | |
Other non-current liabilities | 1,223 | | – | | (172 | ) | 1,051 | |
Total non-current liabilities | 23,993 | | 457 | | (5 | ) | 24,445 | |
Total liabilities | 34,780 | | 554 | | (157 | ) | 35,177 | |
Preferred shares | 4,004 | | – | | – | | 4,004 | |
Common shares | 20,091 | | – | | – | | 20,091 | |
Contributed surplus | 1,162 | | – | | – | | 1,162 | |
Accumulated other comprehensive loss | (17 | ) | – | | – | | (17 | ) |
Deficit | (6,080 | ) | 1,142 | | – | | (4,938 | ) |
Total equity attributable to BCE shareholders | 19,160 | | 1,142 | | – | | 20,302 | |
Non-controlling interest | 323 | | – | | – | | 323 | |
Total equity | 19,483 | | 1,142 | | – | | 20,625 | |
Total liabilities and equity | 54,263 | | 1,696 | | (157 | ) | 55,802 | |
| (1) | We have reclassified some of the amounts for previous periods to conform with IFRS 15 presentation requirements. |
| 32 BCE Inc. 2018 FIRST QUARTER SHAREHOLDER REPORT |
|
| | | | |
| | 8 | MD&A | Accounting policies, financial measures and controls |
The table below shows the impacts of adopting IFRS 15 on our January 1, 2017 consolidated statement of financial position.
| | | | | | | JANUARY 1, 2017 | |
| | | | | | | UPON ADOPTION | |
AS AT | JANUARY 1, 2017 | | IFRS 15 IMPACTS | | RECLASSIFICATIONS(1) | | OF IFRS 15 | |
Cash | 603 | | – | | – | | 603 | |
Cash equivalents | 250 | | – | | – | | 250 | |
Trade and other receivables | 2,979 | | 11 | | (2 | ) | 2,988 | |
Inventory | 403 | | – | | – | | 403 | |
Contract assets | – | | 851 | | (113 | ) | 738 | |
Contract costs | – | | 195 | | 148 | | 343 | |
Prepaid expenses | 420 | | – | | (189 | ) | 231 | |
Other current assets | 200 | | – | | (2 | ) | 198 | |
Total current assets | 4,855 | | 1,057 | | (158 | ) | 5,754 | |
Contract assets | – | | 357 | | 26 | | 383 | |
Contract costs | – | | 151 | | 124 | | 275 | |
Property, plant and equipment | 22,346 | | (5 | ) | – | | 22,341 | |
Intangible assets | 11,998 | | – | | – | | 11,998 | |
Deferred tax assets | 89 | | – | | – | | 89 | |
Investments in associates and joint ventures | 852 | | – | | – | | 852 | |
Other non-current assets | 1,010 | | – | | (113 | ) | 897 | |
Goodwill | 8,958 | | – | | – | | 8,958 | |
Total non-current assets | 45,253 | | 503 | | 37 | | 45,793 | |
Total assets | 50,108 | | 1,560 | | (121 | ) | 51,547 | |
Trade payables and other liabilities | 4,326 | | – | | (655 | ) | 3,671 | |
Contract liabilities | – | | 71 | | 574 | | 645 | |
Interest payable | 156 | | – | | – | | 156 | |
Dividends payable | 617 | | – | | – | | 617 | |
Current tax liabilities | 122 | | – | | – | | 122 | |
Debt due within one year | 4,887 | | – | | – | | 4,887 | |
Total current liabilities | 10,108 | | 71 | | (81 | ) | 10,098 | |
Contract liabilities | – | | 34 | | 169 | | 203 | |
Long-term debt | 16,572 | | – | | – | | 16,572 | |
Deferred tax liabilities | 2,192 | | 393 | | – | | 2,585 | |
Post-employment benefit obligations | 2,105 | | – | | – | | 2,105 | |
Other non-current liabilities | 1,277 | | – | | (209 | ) | 1,068 | |
Total non-current liabilities | 22,146 | | 427 | | (40 | ) | 22,533 | |
Total liabilities | 32,254 | | 498 | | (121 | ) | 32,631 | |
Preferred shares | 4,004 | | – | | – | | 4,004 | |
Common shares | 18,370 | | – | | – | | 18,370 | |
Contributed surplus | 1,160 | | – | | – | | 1,160 | |
Accumulated other comprehensive income | 46 | | – | | – | | 46 | |
Deficit | (6,040 | ) | 1,062 | | – | | (4,978 | ) |
Total equity attributable to BCE shareholders | 17,540 | | 1,062 | | – | | 18,602 | |
Non-controlling interest | 314 | | – | | – | | 314 | |
Total equity | 17,854 | | 1,062 | | – | | 18,916 | |
Total liabilities and equity | 50,108 | | 1,560 | | (121 | ) | 51,547 | |
| (1) | We have reclassified some of the amounts for previous periods to conform with IFRS 15 presentation requirements. |
BCE Inc. 2018 FIRST QUARTER SHAREHOLDER REPORT 33 |
|
| | | | |
8 | MD&A | Accounting policies, financial measures and controls | |
CONSOLIDATED STATEMENT OF CASH FLOWS
The table below shows the impacts of adopting IFRS 15 on select line items of our previously reported 2017 statement of cash flows.
| THREE MONTHS ENDED MARCH 31, 2017 | YEAR ENDED DECEMBER 31, 2017 |
| 2017 AS | | | | 2017 UPON | | 2017 AS | | | | 2017 UPON | |
| PREVIOUSLY | | IFRS 15 | | ADOPTION | | PREVIOUSLY | | IFRS 15 | | ADOPTION | |
| REPORTED | | IMPACTS | | OF IFRS 15 | | REPORTED | | IMPACTS | | OF IFRS 15 | |
Cash flows from operating activities | | | | | | | | | | | | |
Net earnings | 725 | | (37 | ) | 688 | | 2,970 | | 80 | | 3,050 | |
Depreciation and amortization | 907 | | 2 | | 909 | | 3,850 | | (6 | ) | 3,844 | |
Income taxes | 263 | | (13 | ) | 250 | | 1,039 | | 30 | | 1,069 | |
Net change in operating assets and liabilities | (234 | ) | 48 | | (186 | ) | 480 | | (104 | ) | 376 | |
Cash flows from operating activities | 1,313 | | – | | 1,313 | | 7,358 | | – | | 7,358 | |
| 8.2Non-GAAP financial measures and key performance indicators (KPIs) |
This section describes the non-GAAP financial measures and KPIs we use in this MD&A to explain our financial results. It also provides reconciliations of the non-GAAP financial measures to the most comparable IFRS financial measures.
In Q1 2018, we updated our definition of adjusted net earnings and adjusted EPS to exclude net mark-to-market losses (gains) on derivatives used to economically hedge equity settled share-based compensation plans as they may affect the comparability of our financial results and could potentially distort the analysis of trends in business performance. Adjusted net earnings and adjusted EPS for 2017 have also been updated for comparability purposes.
| ADJUSTED EBITDA AND ADJUSTED EBITDA MARGIN |
The terms adjusted EBITDA and adjusted EBITDA margin do not have any standardized meaning under IFRS. Therefore, they are unlikely to be comparable to similar measures presented by other issuers.
We define adjusted EBITDA as operating revenues less operating costs, as shown in BCE’s consolidated income statements. Adjusted EBITDA for BCE’s segments is the same as segment profit as reported in Note 5,Segmented information, in BCE’s Q1 2018 Financial Statements. We define adjusted EBITDA margin as adjusted EBITDA divided by operating revenues.
We use adjusted EBITDA and adjusted EBITDA margin to evaluate the performance of our businesses as they reflect their ongoing profitability. We believe that certain investors and analysts use adjusted EBITDA to measure a company’s ability to service debt and to meet other payment obligations or as a common measurement to value companies in the telecommunications industry. We believe that certain investors and analysts also use adjusted EBITDA and adjusted EBITDA margin to evaluate the performance of our businesses. Adjusted EBITDA is also one component in the determination of short-term incentive compensation for all management employees.
Adjusted EBITDA and adjusted EBITDA margin have no directly comparable IFRS financial measure. Alternatively, the following table provides a reconciliation of net earnings to adjusted EBITDA.
| Q1 2018 | | Q1 2017 | |
Net earnings | 709 | | 688 | |
Severance, acquisition and other costs | – | | 84 | |
Depreciation | 780 | | 724 | |
Amortization | 212 | | 185 | |
Finance costs | | | | |
Interest expense | 240 | | 234 | |
Interest on post-employment benefit obligations | 17 | | 18 | |
Other expense (income) | 61 | | (17 | ) |
Income taxes | 235 | | 250 | |
Adjusted EBITDA | 2,254 | | 2,166 | |
BCE operating revenues | 5,590 | | 5,336 | |
Adjusted EBITDA margin | 40.3 | % | 40.6 | % |
| ADJUSTED NET EARNINGS AND ADJUSTED EPS |
The terms adjusted net earnings and adjusted EPS do not have any standardized meaning under IFRS. Therefore, they are unlikely to be comparable to similar measures presented by other issuers.
We define adjusted net earnings as net earnings attributable to common shareholders before severance, acquisition and other costs, net mark-to-market losses (gains) on derivatives used to economically hedge equity settled share-based compensation plans, net losses (gains) on investments, early debt redemption costs and impairment charges. We define adjusted EPS as adjusted net earnings per BCE common share.
| 34 BCE Inc. 2018 FIRST QUARTER SHAREHOLDER REPORT |
|
| | | | |
| | 8 | MD&A | Accounting policies, financial measures and controls |
We use adjusted net earnings and adjusted EPS, and we believe that certain investors and analysts use these measures, among other ones, to assess the performance of our businesses without the effects of severance, acquisition and other costs, net mark-to-market losses (gains) on derivatives used to economically hedge equity settled share-based compensation plans, net losses (gains) on investments, early debt redemption costs and impairment charges, net of tax and non-controlling (NCI). We exclude these items because they affect the comparability of our financial results and could potentially distort the analysis of trends in business performance. Excluding these items does not imply they are non-recurring.
The most comparable IFRS financial measures are net earnings attributable to common shareholders and EPS. The following table is a reconciliation of net earnings attributable to common shareholders and EPS to adjusted net earnings on a consolidated basis and per BCE common share (adjusted EPS), respectively.
| Q1 2018 | Q1 2017 |
| TOTAL | | PER SHARE | | TOTAL | | PER SHARE | |
Net earnings attributable to common shareholders | 661 | | 0.73 | | 642 | | 0.73 | |
Severance, acquisition and other costs | (1 | ) | – | | 65 | | 0.07 | |
Net mark-to-market losses (gains) on derivatives used to economically hedge equity settled share-based compensation plans | 56 | | 0.07 | | (18 | ) | (0.02 | ) |
Net losses on investments | – | | – | | 14 | | 0.02 | |
Impairment charges | 3 | | – | | – | | – | |
Adjusted net earnings | 719 | | 0.80 | | 703 | | 0.80 | |
| FREE CASH FLOW AND DIVIDEND PAYOUT RATIO |
The terms free cash flow and dividend payout ratio do not have any standardized meaning under IFRS. Therefore, they are unlikely to be comparable to similar measures presented by other issuers.
We define free cash flow as cash flows from operating activities, excluding acquisition and other costs paid (which include significant litigation costs) and voluntary pension funding, less capital expenditures, preferred share dividends and dividends paid by subsidiaries to NCI. We exclude acquisition and other costs paid and voluntary pension funding because they affect the comparability of our financial results and could potentially distort the analysis of trends in business performance. Excluding these items does not imply they are non-recurring.
We consider free cash flow to be an important indicator of the financial strength and performance of our businesses because it shows how much cash is available to pay dividends, repay debt and reinvest in our company. We believe that certain investors and analysts use free cash flow to value a business and its underlying assets and to evaluate the financial strength and performance of our businesses. The most comparable IFRS financial measure is cash flows from operating activities.
We define dividend payout ratio as dividends paid on common shares divided by free cash flow. We consider dividend payout ratio to be an important indicator of the financial strength and performance of our businesses because it shows the sustainability of the company’s dividend payments.
The following table is a reconciliation of cash flows from operating activities to free cash flow on a consolidated basis.
| Q1 2018 | | Q1 2017 | |
Cash flows from operating activities | 1,496 | | 1,313 | |
Capital expenditures | (931 | ) | (852 | ) |
Cash dividends paid on preferred shares | (33 | ) | (43 | ) |
Cash dividends paid by subsidiaries to NCI | (13 | ) | (12 | ) |
Acquisition and other costs paid | 18 | | 83 | |
Free cash flow | 537 | | 489 | |
The term net debt does not have any standardized meaning under IFRS. Therefore, it is unlikely to be comparable to similar measures presented by other issuers.
We define net debt as debt due within one year plus long-term debt and 50% of preferred shares, less cash and cash equivalents, as shown in BCE’s consolidated statements of financial position. We include 50% of outstanding preferred shares in our net debt as it is consistent with the treatment by certain credit rating agencies.
We consider net debt to be an important indicator of the company’s financial leverage because it represents the amount of debt that is not covered by available cash and cash equivalents. We believe that certain investors and analysts use net debt to determine a company’s financial leverage.
BCE Inc. 2018 FIRST QUARTER SHAREHOLDER REPORT 35 |
|
| | | | |
8 | MD&A | Accounting policies, financial measures and controls | |
Net debt has no directly comparable IFRS financial measure, but rather is calculated using several asset and liability categories from the statements of financial position, as shown in the following table.
| MARCH 31, 2018 | | DECEMBER 31, 2017 | |
Debt due within one year | 5,520 | | 5,178 | |
Long-term debt | 19,347 | | 18,215 | |
50% of outstanding preferred shares | 2,002 | | 2,002 | |
Cash and cash equivalents | (1,199 | ) | (625 | ) |
Net debt | 25,670 | | 24,770 | |
The net debt leverage ratio does not have any standardized meaning under IFRS. Therefore, it is unlikely to be comparable to similar measures presented by other issuers. We use, and believe that certain investors and analysts use, the net debt leverage ratio as a measure of financial leverage.
The net debt leverage ratio represents net debt divided by adjusted EBITDA. For the purposes of calculating our net debt leverage ratio, adjusted EBITDA is twelve-month trailing adjusted EBITDA.
ADJUSTED EBITDA TO NET INTEREST EXPENSE RATIO |
The ratio of adjusted EBITDA to net interest expense does not have any standardized meaning under IFRS. Therefore, it is unlikely to be comparable to similar measures presented by other issuers. We use, and believe that certain investors and analysts use, the adjusted EBITDA to net interest expense ratio as a measure of financial health of the company.
The adjusted EBITDA to net interest expense ratio represents adjusted EBITDA divided by net interest expense. For the purposes of calculating our adjusted EBITDA to net interest expense ratio, adjusted EBITDA is twelve-month trailing adjusted EBITDA. Net interest expense is twelve-month trailing net interest expense as shown in our statements of cash flows, plus 50% of declared preferred share dividends as shown in our income statements.
In addition to the non-GAAP financial measures described previously, we use a number of KPIs to measure the success of our strategic imperatives. These KPIs are not accounting measures and may not be comparable to similar measures presented by other issuers.
KPI | DEFINITION |
ARPU | Average revenue per user (ARPU) or subscriber is a measure used to track our recurring revenue streams, which has been updated to reflect the adoption of IFRS 15. Wireless blended ARPU is calculated by dividing certain service revenues by the average subscriber base for the specified period and is expressed as a dollar unit per month. |
ABPU | Average billing per user (ABPU) approximates the average amount billed to customers on a monthly basis, which is used to track our recurring billing streams. This measure is the same as blended ARPU prior to the adoption of IFRS 15. Wireless blended ABPU is calculated by dividing certain customer billings by the average subscriber base for the specified period and is expressed as a dollar unit per month. |
Capital intensity | Capital expenditures divided by operating revenues. |
Churn | Churn is the rate at which existing subscribers cancel their services. It is a measure of our ability to retain our customers. Wireless churn is calculated by dividing the number of deactivations during a given period by the average number of subscribers in the base for the specified period and is expressed as a percentage per month. |
Subscriber unit | Wireless subscriber unit is comprised of an active revenue-generating unit (e.g. mobile device, tablet or wireless Internet products), with a unique identifier (typically International Mobile Equipment Identity (IMEI) number), that has access to our wireless networks. We report wireless subscriber units in two categories: postpaid and prepaid. Prepaid subscriber units are considered active for a period of 120 days following the expiry of the subscriber’s prepaid balance. Wireline subscriber unit consists of an active revenue-generating unit with access to our services, including Internet, satellite TV, IPTV, and/or NAS. A subscriber is included in our subscriber base when the service has been installed and is operational at the customer premise and a billing relationship has been established. Internet, IPTV and satellite TV subscribers have access to stand-alone services, and are primarily represented by a dwelling unit NAS subscribers are based on a line count and are represented by a unique telephone number
|
8.3Controls and procedures |
CHANGES IN INTERNAL CONTROL OVER FINANCIAL REPORTING
No changes were made in our internal control over financial reporting during the quarter ended March 31, 2018 that have materially affected, or are reasonably likely to materially affect, our internal control over financial reporting. The adoption of IFRS 15, Revenue from Contracts with Customers, required the implementation of new accounting processes, which changed the company’s internal controls over revenue recognition, contract acquisition costs and financial reporting. We have completed the design of these controls and there were no significant changes to our internal control over financial reporting due to the adoption of the new standard in 2018.
| 36 BCE Inc. 2018 FIRST QUARTER SHAREHOLDER REPORT | | | |
|
| | | | |
| | Consolidated financial statements | |
| Consolidated financial statements |
| Consolidated income statements |
| FOR THE PERIOD ENDED | | | | | | |
| (IN MILLIONS OF CANADIAN DOLLARS, EXCEPT SHARE AMOUNTS) (UNAUDITED) | NOTE | | MARCH 31, 2018 | | MARCH 31, 2017 | |
Operating revenues | 5 | | 5,590 | | 5,336 | |
Operating costs | 5, 6 | | (3,336 | ) | (3,170 | ) |
Severance, acquisition and other costs | 5, 7 | | – | | (84 | ) |
Depreciation | 5 | | (780 | ) | (724 | ) |
Amortization | 5 | | (212 | ) | (185 | ) |
Finance costs | | | | | | |
Interest expense | | | (240 | ) | (234 | ) |
Interest on post-employment benefit obligations | 11 | | (17 | ) | (18 | ) |
Other (expense) income | 8 | | (61 | ) | 17 | |
Income taxes | | | (235 | ) | (250 | ) |
Net earnings | | | 709 | | 688 | |
Net earnings attributable to: | | | | | | |
Common shareholders | | | 661 | | 642 | |
Preferred shareholders | | | 36 | | 31 | |
Non-controlling interest | | | 12 | | 15 | |
Net earnings | | | 709 | | 688 | |
Net earnings per common share – basic and diluted | 9 | | 0.73 | | 0.73 | |
Average number of common shares outstanding – basic (millions) | | | 900.2 | | 875.7 | |
| | | | BCE Inc. 2018 FIRST QUARTER SHAREHOLDER REPORT 37 |
|
| | | | |
| Consolidated financial statements | | |
| Consolidated statements of comprehensive income |
| FOR THE PERIOD ENDED | | | | |
| (IN MILLIONS OF CANADIAN DOLLARS) (UNAUDITED) | MARCH 31, 2018 | | MARCH 31, 2017 | |
Net earnings | 709 | | 688 | |
Other comprehensive income (loss), net of income taxes | | | | |
Items that will be subsequently reclassified to net earnings | | | | |
Net change in value of derivatives designated as cash flow hedges, net of income taxes of ($3) million and $3 million at March 31, 2018 and 2017, respectively(1) | 7 | | (9 | ) |
Items that will not be reclassified to net earnings | | | | |
Actuarial losses on post-employment benefit plans, net of income taxes of $42 million and $119 million at March 31, 2018 and 2017, respectively(2) | (112 | ) | (323 | ) |
Net change in value of derivatives designated as cash flow hedges, net of income taxes of ($7) million and nil at March 31, 2018 and 2017, respectively(1) | 19 | | – | |
Other comprehensive loss | (86 | ) | (332 | ) |
Total comprehensive income | 623 | | 356 | |
Total comprehensive income attributable to: | | | | |
Common shareholders | 574 | | 310 | |
Preferred shareholders | 36 | | 31 | |
Non-controlling interest | 13 | | 15 | |
Total comprehensive income | 623 | | 356 | |
| (1) | Amounts relating to the net change in value of derivatives for the period ended March 31, 2017 have not been restated, in accordance with the transition requirements upon adoption ofIFRS 9 –Financial Instrumentson January 1, 2018. See Note 2,Basis of presentation and significant accounting policiesfor further details. |
| (2) | The discount rate used to value our post-employment benefit obligations at March 31, 2018 and December 31, 2017 was 3.6%. The discount rate used to value our post-employment benefit obligations at March 31, 2017 was 3.8% compared to 4.0% at December 31, 2016. |
| 38 BCE Inc. 2018 FIRST QUARTER SHAREHOLDER REPORT | | | |
|
| | | | |
| | Consolidated financial statements | |
| Consolidated statements of financial position |
| (IN MILLIONS OF CANADIAN DOLLARS) (UNAUDITED) | NOTE | | MARCH 31, 2018 | | DECEMBER 31, 2017 | | JANUARY 1, 2017 | |
ASSETS | | | | | | | | |
Current assets | | | | | | | | |
Cash | | | 675 | | 442 | | 603 | |
Cash equivalents | | | 524 | | 183 | | 250 | |
Trade and other receivables | | | 2,938 | | 3,129 | | 2,988 | |
Inventory | | | 443 | | 380 | | 403 | |
Contract assets | 2, 3 | | 836 | | 832 | | 738 | |
Contract costs | 2, 3 | | 337 | | 350 | | 343 | |
Prepaid expenses | | | 344 | | 217 | | 231 | |
Other current assets | | | 169 | | 122 | | 198 | |
Total current assets | | | 6,266 | | 5,655 | | 5,754 | |
Non-current assets | | | | | | | | |
Contract assets | 2, 3 | | 414 | | 431 | | 383 | |
Contract costs | 2, 3 | | 280 | | 286 | | 275 | |
Property, plant and equipment | | | 24,169 | | 24,029 | | 22,341 | |
Intangible assets | | | 13,410 | | 13,258 | | 11,998 | |
Deferred tax assets | | | 153 | | 144 | | 89 | |
Investments in associates and joint ventures | | | 829 | | 814 | | 852 | |
Other non-current assets | | | 584 | | 757 | | 897 | |
Goodwill | 4 | | 10,543 | | 10,428 | | 8,958 | |
Total non-current assets | | | 50,382 | | 50,147 | | 45,793 | |
Total assets | | | 56,648 | | 55,802 | | 51,547 | |
LIABILITIES | | | | | | | | |
Current liabilities | | | | | | | | |
Trade payables and other liabilities | | | 3,534 | | 3,875 | | 3,671 | |
Contract liabilities | 3 | | 706 | | 693 | | 645 | |
Interest payable | | | 176 | | 168 | | 156 | |
Dividends payable | | | 701 | | 678 | | 617 | |
Current tax liabilities | | | 49 | | 140 | | 122 | |
Debt due within one year | 10 | | 5,520 | | 5,178 | | 4,887 | |
Total current liabilities | | | 10,686 | | 10,732 | | 10,098 | |
Non-current liabilities | | | | | | | | |
Contract liabilities | 3 | | 196 | | 201 | | 203 | |
Long-term debt | 10 | | 19,347 | | 18,215 | | 16,572 | |
Deferred tax liabilities | | | 2,916 | | 2,870 | | 2,585 | |
Post-employment benefit obligations | 11 | | 2,124 | | 2,108 | | 2,105 | |
Other non-current liabilities | | | 1,083 | | 1,051 | | 1,068 | |
Total non-current liabilities | | | 25,666 | | 24,445 | | 22,533 | |
Total liabilities | | | 36,352 | | 35,177 | | 32,631 | |
EQUITY | | | | | | | | |
Equity attributable to BCE shareholders | | | | | | | | |
Preferred shares | 13 | | 4,004 | | 4,004 | | 4,004 | |
Common shares | 13 | | 20,026 | | 20,091 | | 18,370 | |
Contributed surplus | | | 1,141 | | 1,162 | | 1,160 | |
Accumulated other comprehensive income (loss) | | | 9 | | (17 | ) | 46 | |
Deficit | 2, 3 | | (5,192 | ) | (4,938 | ) | (4,978 | ) |
Total equity attributable to BCE shareholders | | | 19,988 | | 20,302 | | 18,602 | |
Non-controlling interest | | | 308 | | 323 | | 314 | |
Total equity | | | 20,296 | | 20,625 | | 18,916 | |
Total liabilities and equity | | | 56,648 | | 55,802 | | 51,547 | |
| | | | BCE Inc. 2018 FIRST QUARTER SHAREHOLDER REPORT 39 |
|
| | | | |
| Consolidated financial statements | | |
| Consolidated statements of changes in equity |
FOR THE PERIOD ENDED MARCH 31, 2018
(IN MILLIONS OF CANADIAN DOLLARS) (UNAUDITED) | NOTE | | | | | | ATTRIBUTABLE TO BCE SHAREHOLDERS | | | | | | | | | |
PREFERRED
SHARES | | COMMON
SHARES | | CONTRI-
BUTED
SURPLUS | | ACCUMU-
LATED
OTHER
COMPRE-
HENSIVE
(LOSS)
INCOME | | DEFICIT | | TOTAL | | NON-
CONTROL-
LING
INTEREST | | TOTAL
EQUITY | |
Balance at December 31, 2017 | | | 4,004 | | 20,091 | | 1,162 | | (17 | ) | (4,938 | ) | 20,302 | | 323 | | 20,625 | |
Adoption of IFRS 9 | 2 | | – | | – | | – | | – | | (4 | ) | (4 | ) | – | | (4 | ) |
Balance at January 1, 2018 | | | 4,004 | | 20,091 | | 1,162 | | (17 | ) | (4,942 | ) | 20,298 | | 323 | | 20,621 | |
Net earnings | | | – | | – | | – | | – | | 697 | | 697 | | 12 | | 709 | |
Other comprehensive income (loss) | | | – | | – | | – | | 25 | | (112 | ) | (87 | ) | 1 | | (86 | ) |
Total comprehensive income | | | – | | – | | – | | 25 | | 585 | | 610 | | 13 | | 623 | |
Common shares issued under employee stock option plan | | | – | | 3 | | – | | – | | – | | 3 | | – | | 3 | |
Other share-based compensation | | | – | | – | | (18 | ) | – | | (14 | ) | (32 | ) | – | | (32 | ) |
Repurchase of common shares | 13 | | – | | (69 | ) | (3 | ) | – | | (103 | ) | (175 | ) | – | | (175 | ) |
Common shares issued for the acquisition of AlarmForce Industries Inc. (AlarmForce) | 4 | | – | | 1 | | – | | – | | – | | 1 | | – | | 1 | |
Dividends declared on BCE common and preferred shares | | | – | | – | | – | | – | | (714 | ) | (714 | ) | – | | (714 | ) |
Dividends declared by subsidiaries to non-controlling interest | | | – | | – | | – | | – | | – | | – | | (3 | ) | (3 | ) |
Settlement of cash flow hedges transferred to the cost basis of hedged items | | | – | | – | | – | | 1 | | – | | 1 | | – | | 1 | |
Return of capital to non-controlling interest | | | – | | – | | – | | – | | (4 | ) | (4 | ) | (25 | ) | (29 | ) |
Balance at March 31, 2018 | | | 4,004 | | 20,026 | | 1,141 | | 9 | | (5,192 | ) | 19,988 | | 308 | | 20,296 | |
FOR THE PERIOD ENDED MARCH 31, 2017
(IN MILLIONS OF CANADIAN DOLLARS) (UNAUDITED) | NOTE | | | | | | ATTRIBUTABLE TO BCE SHAREHOLDERS | | | | | | | | | |
PREFERRED
SHARES | | COMMON
SHARES | | CONTRI-
BUTED
SURPLUS | | ACCUMU-
LATED
OTHER
COMPRE-
HENSIVE
INCOME
(LOSS) | | DEFICIT | | TOTAL | | NON-
CONTROL-
LING
INTEREST | | TOTAL
EQUITY | |
Balance at January 1, 2017 | | | 4,004 | | 18,370 | | 1,160 | | 46 | | (4,978 | ) | 18,602 | | 314 | | 18,916 | |
Net earnings | | | – | | – | | – | | – | | 673 | | 673 | | 15 | | 688 | |
Other comprehensive loss | | | – | | – | | – | | (9 | ) | (323 | ) | (332 | ) | – | | (332 | ) |
Total comprehensive (loss) income | | | – | | – | | – | | (9 | ) | 350 | | 341 | | 15 | | 356 | |
Common shares issued under employee stock option plan | | | – | | 54 | | (3 | ) | – | | – | | 51 | | – | | 51 | |
Common shares issued under employee savings plan | | | – | | 5 | | – | | – | | – | | 5 | | – | | 5 | |
Other share-based compensation | | | – | | – | | (20 | ) | – | | (14 | ) | (34 | ) | – | | (34 | ) |
Common shares issued for the acquisition of Manitoba Telecom Services Inc. (MTS) | 4 | | – | | 1,594 | | – | | – | | – | | 1,594 | | – | | 1,594 | |
Dividends declared on BCE common and preferred shares | | | – | | – | | – | | – | | (657 | ) | (657 | ) | – | | (657 | ) |
Dividends declared by subsidiaries to non-controlling interest | | | – | | – | | – | | – | | – | | – | | (13 | ) | (13 | ) |
Balance at March 31, 2017 | | | 4,004 | | 20,023 | | 1,137 | | 37 | | (5,299 | ) | 19,902 | | 316 | | 20,218 | |
| 40 BCE Inc. 2018 FIRST QUARTER SHAREHOLDER REPORT | | | |
|
| | | | |
| | Consolidated financial statements | |
| Consolidated statements of cash flows |
FOR THE PERIOD ENDED
(IN MILLIONS OF CANADIAN DOLLARS) (UNAUDITED) | | | | | | |
| NOTE | | MARCH 31, 2018 | | MARCH 31, 2017 | |
Cash flows from operating activities | | | | | | |
Net earnings | | | 709 | | 688 | |
Adjustments to reconcile net earnings to cash flows from operating activities | | | | | | |
Severance, acquisition and other costs | 7 | | – | | 84 | |
Depreciation and amortization | | | 992 | | 909 | |
Post-employment benefit plans cost | 11 | | 90 | | 68 | |
Net interest expense | | | 238 | | 230 | |
Losses on investments | 8 | | – | | 12 | |
Income taxes | | | 235 | | 250 | |
Contributions to post-employment benefit plans | | | (87 | ) | (88 | ) |
Payments under other post-employment benefit plans | | | (19 | ) | (19 | ) |
Severance and other costs paid | | | (35 | ) | (41 | ) |
Interest paid | | | (236 | ) | (223 | ) |
Income taxes paid (net of refunds) | | | (284 | ) | (288 | ) |
Acquisition and other costs paid | | | (18 | ) | (83 | ) |
Net change in operating assets and liabilities | | | (89 | ) | (186 | ) |
Cash flows from operating activities | | | 1,496 | | 1,313 | |
Cash flows used in investing activities | | | | | | |
Capital expenditures | | | (931 | ) | (852 | ) |
Business acquisitions | 4 | | (223 | ) | (1,635 | ) |
Disposition of intangibles and other assets | 4 | | 68 | | – | |
Acquisition of spectrum licences | | | (36 | ) | – | |
Other investing activities | | | (35 | ) | (9 | ) |
Cash flows used in investing activities | | | (1,157 | ) | (2,496 | ) |
Cash flows from financing activities | | | | | | |
(Decrease) increase in notes payable | | | (57 | ) | 308 | |
Increase in securitized trade receivables | | | – | | 350 | |
Issue of long-term debt | 10 | | 1,466 | | 1,496 | |
Repayment of long-term debt | 10 | | (173 | ) | (604 | ) |
Issue of common shares | | | 1 | | 48 | |
Repurchase of shares for settlement of share-based payments | | | (88 | ) | (96 | ) |
Repurchase of common shares | 13 | | (175 | ) | – | |
Cash dividends paid on common shares | | | (646 | ) | (594 | ) |
Cash dividends paid on preferred shares | | | (33 | ) | (43 | ) |
Cash dividends paid by subsidiaries to non-controlling interest | | | (13 | ) | (12 | ) |
Return of capital to non-controlling interest | | | (29 | ) | – | |
Other financing activities | | | (18 | ) | (13 | ) |
Cash flows from financing activities | | | 235 | | 840 | |
Net increase (decrease) in cash | | | 233 | | (164 | ) |
Cash at beginning of period | | | 442 | | 603 | |
Cash at end of period | | | 675 | | 439 | |
Net increase (decrease) in cash equivalents | | | 341 | | (179 | ) |
Cash equivalents at beginning of period | | | 183 | | 250 | |
Cash equivalents at end of period | | | 524 | | 71 | |
| | | | BCE Inc. 2018 FIRST QUARTER SHAREHOLDER REPORT 41 |
|
| | | | |
| Notes to consolidated financial statements | | |
| Notes to consolidated financial statements |
These consolidated interim financial statements (financial statements) should be read in conjunction with BCE’s 2017 annual consolidated financial statements, approved by BCE’s board of directors on March 8, 2018.
These notes are unaudited.
We, us, our, BCE and the company mean, as the context may require, either BCE Inc. or, collectively, BCE Inc., Bell Canada, their subsidiaries, joint arrangements and associates. MTS means, as the context may require, until March 17, 2017, either Manitoba Telecom Services Inc. or, collectively, Manitoba Telecom Services Inc. and its subsidiaries; and Bell MTS means, from March 17, 2017, the combined operations of MTS and Bell Canada in Manitoba.
| Note 1 Corporate information |
BCE is incorporated and domiciled in Canada. BCE’s head office is located at 1, Carrefour Alexander-Graham-Bell, Verdun, Québec, Canada. BCE is a telecommunications and media company providing wireless, wireline, Internet and television (TV) services to residential, business and wholesale customers nationally across Canada. Our Bell Media segment provides conventional, specialty and pay TV, digital media, radio broadcasting services and out-of-home (OOH) advertising services to customers nationally across Canada.
| Note 2 Basis of presentation and significant accounting policies |
The financial statements were prepared in accordance with International Financial Reporting Standards (IFRS), as issued by the International Accounting Standards Board (IASB), under International Accounting Standard (IAS) 34 – Interim Financial Reporting and were approved by BCE’s board of directors on May 2, 2018. The financial statements were prepared using the same basis of presentation, accounting policies and methods of computation as outlined in Note 2, Significant accounting policies in our consolidated financial statements for the year ended December 31, 2017, except as noted below and described in Note 3, Adoption of IFRS 15. The financial statements do not include all of the notes required in annual financial statements.
All amounts are in millions of Canadian dollars, except where noted.
| ADOPTION OF NEW ACCOUNTING STANDARDS |
As required, effective January 1, 2018, we adopted the following new accounting standards.
IFRS 15
We applied IFRS 15, Revenue from Contracts with Customers, retrospectively to each prior reporting period presented. IFRS 15 establishes principles to record revenues from contracts for the sale of products or services, unless the contracts are in the scope of other IFRSs.
IFRS 15 principally affects the timing of revenue recognition and how we classify revenues between product and service in our Bell Wireless segment. IFRS 15 also affects how we account for costs to obtain a contract.
- Under multiple-element arrangements, revenue allocated to a satisfied performance obligation is no longer limited to the amount that is not contingent upon the satisfaction of additional performance obligations. Although the total revenue recognized during the term of a contract is largely unaffected, revenue recognition may be accelerated and reflected ahead of the associated cash inflows. This results in the recognition of a contract asset on the balance sheet, corresponding to the amount of revenue recognized and not yet billed to a customer. The contract asset is realized over the term of the customer contract.
- As revenues allocated to a satisfied performance obligation are no longer limited to the non-contingent amount, a greater proportion of the total revenue recognized during the term of certain customer contracts may be attributed to a delivered product, resulting in a corresponding decrease in service revenue
- Sales commissions and any other incremental costs of obtaining a contract with a customer are recognized on the statement of financial position and amortized on a systematic basis that is consistent with the period and pattern of transfer to the customer of the related products or services, except as noted below
Under IFRS 15, we apply the following practical expedients.
- Completed contracts that begin and end within the same annual reporting period and those completed before January 1, 2017 are not restated
- Contracts modified prior to January 1, 2017 are not restated. The aggregate effect of these modifications is reflected when identifying the satisfied and unsatisfied performance obligations, determining the transaction price and allocating the transaction price to the satisfied and unsatisfied performance obligations.
- When our right to consideration from a customer corresponds directly with the value to the customer of the products and services transferred to date, we recognize revenue in the amount to which we have a right to invoice. For such contracts and for performance obligations that are part of a contract that has an original expected duration of one year or less, the transaction price amount allocated to the remaining performance obligations and an explanation of when we expect to recognise that amount as revenue are not disclosed.
- Costs of obtaining a contract that would be amortized within one year or less are immediately expensed
| 42 BCE Inc. 2018 FIRST QUARTER SHAREHOLDER REPORT | | | |
|
| | | | |
| | Notes to consolidated financial statements | |
IFRS 9
We applied IFRS 9, Financial Instruments (as revised in July 2014) and the related consequential amendments to other IFRSs retrospectively, except for the changes to hedge accounting described below which are applied prospectively. In accordance with the transition requirements, comparative periods have not been restated. The adoption of IFRS 9 did not have a significant impact on the carrying amounts of our financial instruments as at January 1, 2018. As a result of the adoption of IFRS 9, our January 1, 2018 deficit increased by $4 million.
IFRS 9 replaces the classification and measurement models in IAS 39, Financial Instruments: Recognition and Measurement, with a single model under which financial assets are classified and measured at amortized cost, fair value through other comprehensive income (FVOCI) or fair value through profit or loss (FVTPL). This classification is based on the business model in which a financial asset is managed and its contractual cash flow characteristics and eliminates the IAS 39 categories of held-to-maturity, loans and receivables and available-for-sale. The adoption of IFRS 9 did not, however, change the measurement bases of our financial assets.
- Cash and cash equivalents and derivative instruments measured at FVTPL under IAS 39 continue to be measured as such under IFRS 9
- Portfolio investments in equity securities and certain derivative instruments that qualify for cash flow hedge accounting measured at FVOCI under IAS 39 continue to be measured as such under IFRS 9
- Trade and other receivables continue to be measured at amortized cost under IFRS 9
The impairment of financial assets under IFRS 9 is based on an expected credit loss (ECL) model, as opposed to the incurred loss model in IAS 39. IFRS 9 applies to financial assets measured at amortized cost and contract assets and requires that we consider factors that include historical, current and forward-looking information when measuring the ECL. We use the simplified approach for measuring losses based on the lifetime ECL for trade receivables and contract assets. Amounts considered uncollectible are written off and recognized in Operating costs in the income statement.
We have adopted the general hedge accounting model in IFRS 9 which requires that we ensure hedge accounting relationships are consistent with our risk management objectives and strategies. We also apply a more qualitative and forward-looking approach in assessing hedge effectiveness as a retrospective assessment is no longer required.
- Under IFRS 9, amounts related to cash flow hedges of anticipated purchases of non-financial assets settled during the period are reclassified from Accumulated other comprehensive income to the initial cost of the non-financial asset when it is recognized. Under IAS 39, such amounts were reclassified from Other comprehensive income. Amounts related to cash flow hedges of other anticipated purchases continue to be reclassified from Other comprehensive income to net earnings under IFRS 9.
| Note 3 Adoption of IFRS 15 |
As a result of adopting IFRS 15, we have changed the comparative figures for the period ended March 31, 2017, the year ended December 31, 2017 and the opening statement of financial position as at January 1, 2017. The impacts of adopting IFRS 15 and updated 2017 disclosures are provided below.
| CONSOLIDATED INCOME STATEMENTS |
The table below shows the impacts of adopting IFRS 15 on our previously reported 2017 consolidated income statements.
(IN MILLIONS OF CANADIAN DOLLARS,
EXCEPT SHARE AMOUNTS) | THREE MONTHS ENDED MARCH 31, 2017 | YEAR ENDED DECEMBER 31, 2017 |
| 2017 AS | | | | 2017 UPON | | 2017 AS | | | | 2017 UPON | |
| PREVIOUSLY | | IFRS 15 | | ADOPTION | | PREVIOUSLY | | IFRS 15 | | ADOPTION | |
| REPORTED | | IMPACTS | | OF IFRS 15 | | REPORTED | | IMPACTS | | OF IFRS 15 | |
Operating revenues | 5,384 | | (48 | ) | 5,336 | | 22,719 | | 38 | | 22,757 | |
Operating costs | (3,170 | ) | – | | (3,170 | ) | (13,541 | ) | 66 | | (13,475 | ) |
Severance, acquisition and other costs | (84 | ) | – | | (84 | ) | (190 | ) | – | | (190 | ) |
Depreciation | (722 | ) | (2 | ) | (724 | ) | (3,037 | ) | 3 | | (3,034 | ) |
Amortization | (185 | ) | – | | (185 | ) | (813 | ) | 3 | | (810 | ) |
Finance costs | | | | | | | | | | | | |
Interest expense | (234 | ) | – | | (234 | ) | (955 | ) | – | | (955 | ) |
Interest on post-employment benefit obligations | (18 | ) | – | | (18 | ) | (72 | ) | – | | (72 | ) |
Other income (expense) | 17 | | – | | 17 | | (102 | ) | – | | (102 | ) |
Income taxes | (263 | ) | 13 | | (250 | ) | (1,039 | ) | (30 | ) | (1,069 | ) |
Net earnings | 725 | | (37 | ) | 688 | | 2,970 | | 80 | | 3,050 | |
Net earnings attributable to: | | | | | | | | | | | | |
Common shareholders | 679 | | (37 | ) | 642 | | 2,786 | | 80 | | 2,866 | |
Preferred shareholders | 31 | | – | | 31 | | 128 | | – | | 128 | |
Non-controlling interest | 15 | | – | | 15 | | 56 | | – | | 56 | |
Net earnings | 725 | | (37 | ) | 688 | | 2,970 | | 80 | | 3,050 | |
Net earnings per common share – basic | 0.78 | | (0.05 | ) | 0.73 | | 3.12 | | 0.08 | | 3.20 | |
Net earnings per common share – diluted | 0.78 | | (0.05 | ) | 0.73 | | 3.11 | | 0.09 | | 3.20 | |
Average number of common shares outstanding – basic (millions) | 875.7 | | – | | 875.7 | | 894.3 | | – | | 894.3 | |
| | | | BCE Inc. 2018 FIRST QUARTER SHAREHOLDER REPORT 43 |
|
| | | | |
| Notes to consolidated financial statements | | |
| CONSOLIDATED STATEMENT OF FINANCIAL POSITION |
The table below shows the impacts of adopting IFRS 15 on our previously reported 2017 consolidated statement of financial position.
| 2017 AS | | | | | | 2017 UPON | |
| PREVIOUSLY | | | | | | ADOPTION | |
| FOR THE YEAR ENDED DECEMBER 31 | REPORTED | | IFRS 15 IMPACTS | | RECLASSIFICATIONS(1) | | OF IFRS 15 | |
Cash | 442 | | – | | – | | 442 | |
Cash equivalents | 183 | | – | | – | | 183 | |
Trade and other receivables | 3,135 | | 9 | | (15 | ) | 3,129 | |
Inventory | 380 | | – | | – | | 380 | |
Contract assets | – | | 923 | | (91 | ) | 832 | |
Contract costs | – | | 206 | | 144 | | 350 | |
Prepaid expenses | 375 | | – | | (158 | ) | 217 | |
Other current assets | 124 | | – | | (2 | ) | 122 | |
Total current assets | 4,639 | | 1,138 | | (122 | ) | 5,655 | |
Contract assets | – | | 400 | | 31 | | 431 | |
Contract costs | – | | 162 | | 124 | | 286 | |
Property, plant and equipment | 24,033 | | (4 | ) | – | | 24,029 | |
Intangible assets | 13,305 | | – | | (47 | ) | 13,258 | |
Deferred tax assets | 144 | | – | | – | | 144 | |
Investments in associates and joint ventures | 814 | | – | | – | | 814 | |
Other non-current assets | 900 | | – | | (143 | ) | 757 | |
Goodwill | 10,428 | | – | | – | | 10,428 | |
Total non-current assets | 49,624 | | 558 | | (35 | ) | 50,147 | |
Total assets | 54,263 | | 1,696 | | (157 | ) | 55,802 | |
Trade payables and other liabilities | 4,623 | | – | | (748 | ) | 3,875 | |
Contract liabilities | – | | 97 | | 596 | | 693 | |
Interest payable | 168 | | – | | – | | 168 | |
Dividends payable | 678 | | – | | – | | 678 | |
Current tax liabilities | 140 | | – | | – | | 140 | |
Debt due within one year | 5,178 | | – | | – | | 5,178 | |
Total current liabilities | 10,787 | | 97 | | (152 | ) | 10,732 | |
Contract liabilities | – | | 34 | | 167 | | 201 | |
Long-term debt | 18,215 | | – | | – | | 18,215 | |
Deferred tax liabilities | 2,447 | | 423 | | – | | 2,870 | |
Post-employment benefit obligations | 2,108 | | – | | – | | 2,108 | |
Other non-current liabilities | 1,223 | | – | | (172 | ) | 1,051 | |
Total non-current liabilities | 23,993 | | 457 | | (5 | ) | 24,445 | |
Total liabilities | 34,780 | | 554 | | (157 | ) | 35,177 | |
Preferred shares | 4,004 | | – | | – | | 4,004 | |
Common shares | 20,091 | | – | | – | | 20,091 | |
Contributed surplus | 1,162 | | – | | – | | 1,162 | |
Accumulated other comprehensive loss | (17 | ) | – | | – | | (17 | ) |
Deficit | (6,080 | ) | 1,142 | | – | | (4,938 | ) |
Total equity attributable to BCE shareholders | 19,160 | | 1,142 | | – | | 20,302 | |
Non-controlling interest | 323 | | – | | – | | 323 | |
Total equity | 19,483 | | 1,142 | | – | | 20,625 | |
Total liabilities and equity | 54,263 | | 1,696 | | (157 | ) | 55,802 | |
| (1) | We have reclassified some of the amounts for previous periods to conform with IFRS 15 presentation requirements. |
| 44 BCE Inc. 2018 FIRST QUARTER SHAREHOLDER REPORT | | | |
|
| | | | |
| | Notes to consolidated financial statements | |
The table below shows the impacts of adopting IFRS 15 on our January 1, 2017 consolidated statement of financial position.
| | | | | | | | JANUARY 1, 2017 | |
| | | | | | | | UPON ADOPTION | |
| AS AT | JANUARY 1, 2017 | | IFRS 15 IMPACTS | | RECLASSIFICATIONS(1) | | OF IFRS 15 | |
Cash | 603 | | – | | – | | 603 | |
Cash equivalents | 250 | | – | | – | | 250 | |
Trade and other receivables | 2,979 | | 11 | | (2 | ) | 2,988 | |
Inventory | 403 | | – | | – | | 403 | |
Contract assets | – | | 851 | | (113 | ) | 738 | |
Contract costs | – | | 195 | | 148 | | 343 | |
Prepaid expenses | 420 | | – | | (189 | ) | 231 | |
Other current assets | 200 | | – | | (2 | ) | 198 | |
Total current assets | 4,855 | | 1,057 | | (158 | ) | 5,754 | |
Contract assets | – | | 357 | | 26 | | 383 | |
Contract costs | – | | 151 | | 124 | | 275 | |
Property, plant and equipment | 22,346 | | (5 | ) | – | | 22,341 | |
Intangible assets | 11,998 | | – | | – | | 11,998 | |
Deferred tax assets | 89 | | – | | – | | 89 | |
Investments in associates and joint ventures | 852 | | – | | – | | 852 | |
Other non-current assets | 1,010 | | – | | (113 | ) | 897 | |
Goodwill | 8,958 | | – | | – | | 8,958 | |
Total non-current assets | 45,253 | | 503 | | 37 | | 45,793 | |
Total assets | 50,108 | | 1,560 | | (121 | ) | 51,547 | |
Trade payables and other liabilities | 4,326 | | – | | (655 | ) | 3,671 | |
Contract liabilities | – | | 71 | | 574 | | 645 | |
Interest payable | 156 | | – | | – | | 156 | |
Dividends payable | 617 | | – | | – | | 617 | |
Current tax liabilities | 122 | | – | | – | | 122 | |
Debt due within one year | 4,887 | | – | | – | | 4,887 | |
Total current liabilities | 10,108 | | 71 | | (81 | ) | 10,098 | |
Contract liabilities | – | | 34 | | 169 | | 203 | |
Long-term debt | 16,572 | | – | | – | | 16,572 | |
Deferred tax liabilities | 2,192 | | 393 | | – | | 2,585 | |
Post-employment benefit obligations | 2,105 | | – | | – | | 2,105 | |
Other non-current liabilities | 1,277 | | – | | (209 | ) | 1,068 | |
Total non-current liabilities | 22,146 | | 427 | | (40 | ) | 22,533 | |
Total liabilities | 32,254 | | 498 | | (121 | ) | 32,631 | |
Preferred shares | 4,004 | | – | | – | | 4,004 | |
Common shares | 18,370 | | – | | – | | 18,370 | |
Contributed surplus | 1,160 | | – | | – | | 1,160 | |
Accumulated other comprehensive income | 46 | | – | | – | | 46 | |
Deficit | (6,040 | ) | 1,062 | | – | | (4,978 | ) |
Total equity attributable to BCE shareholders | 17,540 | | 1,062 | | – | | 18,602 | |
Non-controlling interest | 314 | | – | | – | | 314 | |
Total equity | 17,854 | | 1,062 | | – | | 18,916 | |
Total liabilities and equity | 50,108 | | 1,560 | | (121 | ) | 51,547 | |
| (1) | We have reclassified some of the amounts for previous periods to conform with IFRS 15 presentation requirements. |
| | | | BCE Inc. 2018 FIRST QUARTER SHAREHOLDER REPORT 45 |
|
| | | | |
| Notes to consolidated financial statements | | |
The table below provides a reconciliation of our deficit at January 1, 2017, March 31, 2017 and December 31, 2017 from amounts previously reported in 2017 to the amounts reported under IFRS 15. All amounts are after tax.
| AT
DECEMBER 31, 2017 | | AT
MARCH 31, 2017 | | AT
JANUARY 1, 2017 | |
Total deficit as previously reported | (6,080 | ) | (6,324 | ) | (6,040 | ) |
Timing of revenue recognition | 873 | | 776 | | 809 | |
Cost to obtain a contract | 269 | | 249 | | 253 | |
Total deficit upon adoption of IFRS 15 | (4,938 | ) | (5,299 | ) | (4,978 | ) |
| CONSOLIDATED STATEMENT OF CASH FLOWS |
The table below shows the impacts of adopting IFRS 15 on select line items of our previously reported 2017 statement of cash flows.
| THREE MONTHS ENDED MARCH 31, 2017 | YEAR ENDED DECEMBER 31, 2017 |
| 2017 AS | | | | 2017 UPON | | 2017 AS | | | | 2017 UPON | |
| PREVIOUSLY | | | | ADOPTION | | PREVIOUSLY | | | | ADOPTION | |
| REPORTED | | IFRS 15 IMPACTS | | OF IFRS 15 | | REPORTED | | IFRS 15 IMPACTS | | OF IFRS 15 | |
Cash flows from operating activities | | | | | | | | | | | | |
Net earnings | 725 | | (37 | ) | 688 | | 2,970 | | 80 | | 3,050 | |
Depreciation and amortization | 907 | | 2 | | 909 | | 3,850 | | (6 | ) | 3,844 | |
Income taxes | 263 | | (13 | ) | 250 | | 1,039 | | 30 | | 1,069 | |
Net change in operating assets and liabilities | (234 | ) | 48 | | (186 | ) | 480 | | (104 | ) | 376 | |
Cash flows from operating activities | 1,313 | | – | | 1,313 | | 7,358 | | – | | 7,358 | |
2017 ANNUAL DISCLOSURES UPDATED FOR IFRS 15
The following IFRS 15 disclosures for the year ended December 31, 2017 are presented in our 2018 first quarter financial report to provide a better understanding of how the adoption of IFRS 15 impacts our policies and disclosures.
| SIGNIFICANT ACCOUNTING POLICIES – REVENUE FROM CONTRACTS WITH CUSTOMERS |
Revenue is measured based on the value of the expected consideration in a contract with a customer and excludes sales taxes and other amounts we collect on behalf of third parties. We recognize revenue when control of a product or service is transferred to a customer. When our right to consideration from a customer corresponds directly with the value to the customer of the products and services transferred to date, we recognize revenue in the amount to which we have a right to invoice.
For bundled arrangements, we account for individual products and services when they are separately identifiable and the customer can benefit from the product or service on its own. The total arrangement consideration is allocated to each product or service included in the contract with the customer based on its stand-alone selling price. We generally determine stand-alone selling prices based on the observable prices at which we sell products separately without a service contract and prices for non-bundled service offers with the same range of services, adjusted for market conditions and other factors, as appropriate. When similar products and services are not sold separately, we use the expected cost plus margin approach to determine stand-alone selling prices. Products and services purchased by a customer in excess of those included in the bundled arrangement are accounted for separately.
A contract asset is recognized when our right to consideration from the transfer of products or services to a customer is conditional on our obligation to transfer other products or services. Contract assets are transferred to trade receivables when our right to consideration becomes conditional only as to the passage of time. A contract liability is recognized when we receive consideration in advance of the transfer of products or services to the customer. Contract assets and liabilities relating to the same contract are presented on a net basis.
We may enter into arrangements with subcontractors and others who provide services to our customers. When we act as the principal in these arrangements, we recognize revenues based on the amounts billed to our customers. Otherwise, we recognize the net amount that we retain as revenues.
Incremental costs of obtaining a contract with a customer, principally comprised of sales commissions, and prepaid contract fulfillment costs are recognized on the statement of financial position, except as noted below. Capitalized costs are amortized on a systematic basis that is consistent with the period and pattern of transfer to the customer of the related products or services. Where the amortization period is one year or less, costs of obtaining a contract are immediately expensed.
WIRELESS SEGMENT REVENUES
Our Wireless segment principally generates revenue from providing integrated digital wireless voice and data communications products and services to residential and business customers.
We recognize product revenues from the sale of wireless handsets and devices when a customer takes possession of the product. We recognize wireless service revenues over time, as the services are provided. For bundled arrangements, stand-alone selling prices are determined using observable prices adjusted for market conditions and other factors, as appropriate.
For wireless products and services that are sold separately, customers usually pay in full at the point of sale for products and on a monthly basis for services. For wireless products and services sold in bundled arrangements, customers pay monthly over a contract term of up to 24 months for residential customers and up to 36 months for business customers.
| 46 BCE Inc. 2018 FIRST QUARTER SHAREHOLDER REPORT | | | |
|
| | | | |
| | Notes to consolidated financial statements | |
WIRELINE SEGMENT REVENUES
Our Wireline segment principally generates revenue from providing data, including Internet access and Internet protocol television (IPTV), local telephone, long distance, satellite TV service and connectivity, as well as other communications services and products to residential and business customers. Our Wireline segment also includes revenues from our wholesale business, which buys and sells local telephone, long distance, data and other services from or to resellers and other carriers.
We recognize product revenues from the sale of wireline equipment when a customer takes possession of the product. We recognize service revenues over time, as the services are provided. Revenues on certain long-term contracts are recognized using output methods based on products delivered, performance completed to date, time elapsed or milestones met. For bundled arrangements, stand-alone selling prices are determined using observable prices adjusted for market conditions and other factors, as appropriate, or the expected cost plus margin approach for customized business arrangements.
For wireline customers, products are usually paid in full at the point of sale and services are paid on a monthly basis except where a billing schedule has been established with certain business customers under long-term contracts that can generally extend up to 7 years.
MEDIA SEGMENT REVENUES
Our Media segment principally generates revenue from conventional, specialty TV, digital media, radio broadcasting and out of home advertising and subscriber fees from specialty TV and pay TV.
We recognize advertising revenue when advertisements are aired on the radio or TV, posted on our website or appear on our advertising panels and street furniture. Revenues relating to subscriber fees are recorded on a monthly basis as the services are provided. Customer payments are due monthly as the services are provided.
| ESTIMATES AND KEY JUDGMENTS |
SIGNIFICANT JUDGEMENTS AND ESTIMATES RELATING TO THE APPLICATION OF IFRS 15
The application of IFRS 15 requires BCE to make judgments and estimates that affect the amount and timing of revenue from contracts with customers, including estimates of the stand-alone selling prices of wireless products and services, the identification of performance obligations within a contract and the timing of satisfaction of performance obligations under long-term contracts. The determination of costs to obtain a contract including the identification of incremental costs also requires judgment.
| CONTRACT ASSETS AND CONTRACT LIABILITIES |
The table below provides a reconciliation of the significant changes in the contract assets and the contract liabilities balances during the period.
| | CONTRACT | | CONTRACT | |
| FOR THE YEAR ENDED DECEMBER 31 | ASSETS | | LIABILITIES | |
Opening balance, as at January 1, 2017 | 1,121 | | 848 | |
Revenue recognized included in contract liabilities at the beginning of the year | – | | (634 | ) |
Revenue recognized from contract liabilities included in contract assets at the beginning of the year | 139 | | – | |
Increase in contract liabilities during the year | – | | 658 | |
Increase in contract liabilities included in contract assets during the year | (144 | ) | – | |
Increase in contract assets from revenue recognized during the year | 1,483 | | – | |
Contract assets transferred to trade receivables | (1,172 | ) | – | |
Acquisition of MTS | 50 | | 29 | |
Contract terminations transferred to trade receivables | (207 | ) | (2 | ) |
Other | (7 | ) | (5 | ) |
Ending balance, as at December 31, 2017 | 1,263 | | 894 | |
The table below provides a reconciliation of the contract costs balance during the period.
| | CONTRACT | |
| FOR THE YEAR ENDED DECEMBER 31 | COSTS | |
Opening balance, as at January 1, 2017 | 618 | |
Incremental costs of obtaining a contract and contract fulfillment costs | 526 | |
Amortization included in operating costs | (508 | ) |
Ending balance, as at December 31, 2017 | 636 | |
Contract costs are amortized over a period ranging from 18 to 84 months.
| | | | BCE Inc. 2018 FIRST QUARTER SHAREHOLDER REPORT 47 |
|
| | | | |
| Notes to consolidated financial statements | | |
We recorded a net deferred tax liability of $393 million upon the adoption of IFRS 15 in our January 1, 2017 opening statement of financial position.
| REVENUES BY SERVICES AND PRODUCTS |
The following table presents our revenues disaggregated by type.
| 2017 AS | | | | | | 2017 UPON | |
| PREVIOUSLY | | | | | | ADOPTION | |
| FOR THE YEAR ENDED DECEMBER 31 | REPORTED | | IFRS 15 IMPACTS | | OTHER(3) | | OF IFRS 15 | |
Services(1) | | | | | | | | |
Wireless | 7,308 | | (1,260 | ) | – | | 6,048 | |
Data | 7,146 | | (5 | ) | 51 | | 7,192 | |
Voice | 3,800 | | 3 | | 165 | | 3,968 | |
Media | 2,676 | | – | | – | | 2,676 | |
Other services | 213 | | (2 | ) | – | | 211 | |
Total services | 21,143 | | (1,264 | ) | 216 | | 20,095 | |
Products(2) | | | | | | | | |
Wireless | 530 | | 1,303 | | – | | 1,833 | |
Data | 519 | | 1 | | (110 | ) | 410 | |
Equipment and other | 527 | | (2 | ) | (106 | ) | 419 | |
Total products | 1,576 | | 1,302 | | (216 | ) | 2,662 | |
Total operating revenues | 22,719 | | 38 | | – | | 22,757 | |
| (1) | Our service revenues are generally recognized over time. |
| (2) | Our product revenues are generally recognized at a point in time. |
| (3) | We have reclassified some of the amounts for previous periods to make them consistent with the presentation for the current period. |
| REMAINING PERFORMANCE OBLIGATIONS |
The following table includes revenues expected to be recognized in the future related to performance obligations that are unsatisfied (or partially unsatisfied) as at December 31, 2017.
| 2018 | | 2019 | | 2020 | | 2021 | | 2022 | | THEREAFTER | | TOTAL | |
Wireline | 1,328 | | 893 | | 507 | | 292 | | 107 | | 95 | | 3,222 | |
Wireless | 1,606 | | 734 | | 106 | | 44 | | 44 | | 89 | | 2,623 | |
Total | 2,934 | | 1,627 | | 613 | | 336 | | 151 | | 184 | | 5,845 | |
When estimating minimum transaction prices allocated to the remaining unfulfilled, or partially unfulfilled, performance obligations, BCE applied the practical expedient to not disclose information about remaining performance obligations that have original expected duration of one year or less and for those contracts where we bill the same value as that which is transferred to the customer.
| 48 BCE Inc. 2018 FIRST QUARTER SHAREHOLDER REPORT | | | |
|
| | | | |
| | Notes to consolidated financial statements | |
| Note 4 Business acquisitions and dispositions |
2018
ACQUISITION OF ALARMFORCE
On January 5, 2018, BCE acquired all of the issued and outstanding shares of AlarmForce for a total consideration of $182 million, of which $181 million was paid in cash and the remaining $1 million through the issuance of 22,531 BCE common shares.
Subsequent to the acquisition of AlarmForce, on January 5, 2018, BCE sold AlarmForce’s approximate 39,000 customer accounts in British Columbia, Alberta and Saskatchewan to TELUS Communications Inc. for total proceeds of approximately $68 million.
AlarmForce provides security alarm monitoring, personal emergency response monitoring, video surveillance and related services to residential and commercial subscribers. The acquisition of AlarmForce supports our strategic expansion in the Connected Home marketplace.
AlarmForce is included in our Bell Wireline segment in our consolidated financial statements.
The purchase price allocation includes provisional estimates, in particular for finite-life intangible assets. The following table summarizes the fair value of the consideration paid and the fair value assigned to each major class of assets and liabilities.
| TOTAL | |
Cash consideration | 181 | |
Issuance of 22,531 BCE common shares(1) | 1 | |
Total cost to be allocated | 182 | |
Assets held for sale(2) | 68 | |
Property, plant and equipment | 8 | |
Finite-life intangible assets(3) | 34 | |
Indefinite-life intangible assets | 1 | |
Deferred tax liabilities | (7 | ) |
Other non-current liabilities | (1 | ) |
| 103 | |
Cash and cash equivalents | 4 | |
Fair value of net assets acquired | 107 | |
Goodwill(4) | 75 | |
| (1) | Recorded at fair value based on the market price of BCE common shares on the acquisition date. |
| (2) | Consists mainly of customer relationships recorded at fair value less costs to sell. |
| (3) | Consists mainly of customer relationships. |
| (4) | Goodwill arises principally from expected synergies and future growth and is not deductible for tax purposes. Goodwill arising from the transaction was allocated to our Bell Wireline group of CGUs. |
Revenues of $12 million from AlarmForce are included in the consolidated income statements from the date of acquisition. Net earnings for the three months ended March 31, 2018 were not significant. These amounts reflect the amortization of certain elements of the purchase price allocation and related tax adjustments.
2017
ACQUISITION OF MTS
On March 17, 2017, BCE acquired all of the issued and outstanding common shares of MTS for a total consideration of $2,933 million, of which $1,339 million was paid in cash and the remaining $1,594 million through the issuance of approximately 27.6 million BCE common shares. BCE funded the cash component of the transaction through debt financing.
Revenues of $40 million and net earnings of $3 million from the acquired MTS operations are included in the consolidated income statements from the date of acquisition. BCE’s consolidated operating revenues and net earnings for the three months ended March 31, 2017 would have been $5,530 million and $699 million, respectively, had the acquisition of MTS occurred on January 1, 2017. These amounts reflect the elimination of intercompany transactions, financing costs and the amortization of certain elements of the purchase price allocation and related tax adjustments.
| ACQUISITION OF CIESLOK MEDIA LTD. (CIESLOK MEDIA) |
On January 3, 2017, BCE acquired all of the issued and outstanding common shares of Cieslok Media for a total cash consideration of $161 million.
The transaction did not have a significant impact on our consolidated operating revenues and net earnings for the three months ended March 31, 2017.
| | | | BCE Inc. 2018 FIRST QUARTER SHAREHOLDER REPORT 49 |
|
| | | | |
| Notes to consolidated financial statements | | |
| Note 5 Segmented information |
Our results are reported in three segments: Bell Wireless, Bell Wireline and Bell Media. Our segments reflect how we manage our business and how we classify our operations for planning and measuring performance.
On March 17, 2017, BCE acquired all of the issued and outstanding common shares of MTS. The results from the acquired MTS operations are included in our Bell Wireless and Bell Wireline segments from the date of acquisition.
The following tables present financial information by segment for the periods ended March 31, 2018 and 2017.
| | | | BELL | | BELL | | BELL | | INTERSEGMENT | | | |
| FOR THE PERIOD ENDED MARCH 31, 2018 | NOTE | | WIRELESS | | WIRELINE | | MEDIA | | ELIMINATIONS | | BCE | |
Operating revenues | | | | | | | | | | | | |
External customers | | | 1,934 | | 3,025 | | 631 | | – | | 5,590 | |
Inter-segment | | | 12 | | 59 | | 118 | | (189 | ) | – | |
Total operating revenues | | | 1,946 | | 3,084 | | 749 | | (189 | ) | 5,590 | |
Operating costs | 6 | | (1,124 | ) | (1,782 | ) | (619 | ) | 189 | | (3,336 | ) |
Segment profit(1) | | | 822 | | 1,302 | | 130 | | – | | 2,254 | |
Severance, acquisition and other costs | 7 | | (3 | ) | 5 | | (2 | ) | – | | – | |
Depreciation and amortization | | | (160 | ) | (795 | ) | (37 | ) | – | | (992 | ) |
Finance costs | | | | | | | | | | | | |
Interest expense | | | | | | | | | | | (240 | ) |
Interest on post-employment benefit obligations | 11 | | | | | | | | | | (17 | ) |
Other expense | 8 | | | | | | | | | | (61 | ) |
Income taxes | | | | | | | | | | | (235 | ) |
Net earnings | | | | | | | | | | | 709 | |
| (1) | The chief operating decision maker uses primarily one measure of profit to make decisions and assess performance, being operating revenues less operating costs. |
| | | | BELL | | BELL | | BELL | | INTERSEGMENT | | | |
| FOR THE PERIOD ENDED MARCH 31, 2017 | NOTE | | WIRELESS | | WIRELINE | | MEDIA | | ELIMINATIONS | | BCE | |
Operating revenues | | | | | | | | | | | | |
External customers | | | 1,756 | | 2,928 | | 652 | | – | | 5,336 | |
Inter-segment | | | 11 | | 49 | | 99 | | (159 | ) | – | |
Total operating revenues | | | 1,767 | | 2,977 | | 751 | | (159 | ) | 5,336 | |
Operating costs | 6 | | (998 | ) | (1,714 | ) | (617 | ) | 159 | | (3,170 | ) |
Segment profit(1) | | | 769 | | 1,263 | | 134 | | – | | 2,166 | |
Severance, acquisition and other costs | 7 | | (5 | ) | (67 | ) | (12 | ) | – | | (84 | ) |
Depreciation and amortization | | | (138 | ) | (736 | ) | (35 | ) | – | | (909 | ) |
Finance costs | | | | | | | | | | | | |
Interest expense | | | | | | | | | | | (234 | ) |
Interest on post-employment benefit obligations | 11 | | | | | | | | | | (18 | ) |
Other income | 8 | | | | | | | | | | 17 | |
Income taxes | | | | | | | | | | | (250 | ) |
Net earnings | | | | | | | | | | | 688 | |
| (1) | The chief operating decision maker uses primarily one measure of profit to make decisions and assess performance, being operating revenues less operating costs. |
| 50 BCE Inc. 2018 FIRST QUARTER SHAREHOLDER REPORT | | | |
|
| | | | |
| | Notes to consolidated financial statements | |
| REVENUES BY SERVICES AND PRODUCTS |
| FOR THE PERIOD ENDED MARCH 31 | 2018 | | 2017 | |
Services(1) | | | | |
Wireless | 1,500 | | 1,415 | |
Data | 1,820 | | 1,719 | |
Voice | 950 | | 981 | |
Media | 631 | | 652 | |
Other services | 63 | | 44 | |
Total services | 4,964 | | 4,811 | |
Products(2) | | | | |
Wireless | 434 | | 341 | |
Data | 104 | | 99 | |
Equipment and other | 88 | | 85 | |
Total products | 626 | | 525 | |
Total operating revenues | 5,590 | | 5,336 | |
| (1) | Our service revenues are generally recognized over time. |
| (2) | Our product revenues are generally recognized at a point in time. |
| FOR THE PERIOD ENDED MARCH 31 | NOTE | | 2018 | | 2017 | |
Labour costs | | | | | | |
Wages, salaries and related taxes and benefits | | | (1,058 | ) | (1,003 | ) |
Post-employment benefit plans service cost (net of capitalized amounts) | 11 | | (73 | ) | (50 | ) |
Other labour costs(1) | | | (248 | ) | (253 | ) |
Less: | | | | | | |
Capitalized labour | | | 255 | | 245 | |
Total labour costs | | | (1,124 | ) | (1,061 | ) |
Cost of revenues(2) | | | (1,710 | ) | (1,627 | ) |
Other operating costs(3) | | | (502 | ) | (482 | ) |
Total operating costs | | | (3,336 | ) | (3,170 | ) |
| (1) | Other labour costs include contractor and outsourcing costs. |
| (2) | Cost of revenues includes costs of wireless devices and other equipment sold, network and content costs, and payments to other carriers. |
| (3) | Other operating costs include marketing, advertising and sales commission costs, bad debt expense, taxes other than income taxes, IT costs, professional service fees and rent. |
| Note 7 Severance, acquisition and other costs |
FOR THE PERIOD ENDED MARCH 31 | 2018 | | 2017 | |
Severance | (9 | ) | (31 | ) |
Acquisition and other | 9 | | (53 | ) |
Total severance, acquisition and other costs | – | | (84 | ) |
Severance costs consist of charges related to involuntary and voluntary employee terminations.
| ACQUISITION AND OTHER COSTS |
Acquisition and other costs consist of transaction costs, such as legal and financial advisory fees, related to completed or potential acquisitions, employee severance costs related to the purchase of a business, the costs to integrate acquired companies into our operations and litigation costs, when they are significant. Acquisition costs also include a loss on transfer of spectrum licences relating to the MTS acquisition in 2017.
| | | | BCE Inc. 2018 FIRST QUARTER SHAREHOLDER REPORT 51 |
|
| | | | |
| Notes to consolidated financial statements | | |
| Note 8 Other (expense) income |
| FOR THE PERIOD ENDED MARCH 31 | 2018 | | 2017 | |
Net mark-to-market (losses) gains on derivatives used to economically hedge equity settled share-based compensation plans(1) | (77 | ) | 24 | |
Equity income (losses) from investments in associates and joint ventures | | | | |
Operations | 17 | | 19 | |
Losses on investments | – | | (2 | ) |
Impairment of assets | (4 | ) | – | |
Gains (losses) on retirements and disposals of property, plant and equipment and intangible assets | 1 | | (17 | ) |
Losses on investments | – | | (12 | ) |
Other(1) | 2 | | 5 | |
Total other (expense) income | (61 | ) | 17 | |
| (1) | We have reclassified amounts from the previous period to make them consistent with the presentation for the current period. |
| Note 9 Earnings per share |
The following table shows the components used in the calculation of basic and diluted earnings per common share for earnings attributable to common shareholders.
| FOR THE PERIOD ENDED MARCH 31 | 2018 | | 2017 | |
Net earnings attributable to common shareholders – basic | 661 | | 642 | |
Dividends declared per common share (in dollars) | 0.7550 | | 0.7175 | |
Weighted average number of common shares outstanding (in millions) | | | | |
Weighted average number of common shares outstanding – basic | 900.2 | | 875.7 | |
Assumed exercise of stock options(1) | 0.4 | | 0.9 | |
Weighted average number of common shares outstanding – diluted (in millions) | 900.6 | | 876.6 | |
| (1) | The calculation of the assumed exercise of stock options includes the effect of the average unrecognized future compensation cost of dilutive options. It excludes options for which the exercise price is higher than the average market value of a BCE common share. The number of excluded options was 9,472,068 for the first quarter of 2018 and 5,816,905 for the first quarter of 2017. |
2018
On March 12, 2018, Bell Canada issued 3.35% Series M-47 medium-term note (MTN) debentures under its 1997 trust indenture, with a principal amount of $500 million, which mature on March 12, 2025.
On March 29, 2018, Bell Canada issued 4.464% Series US-1 Notes under its 2016 trust indenture, with a principal amount of US $750 million (CAD $967 million), which mature on April 1, 2048. The Series US-1 Notes have been hedged for foreign currency fluctuations through a cross currency interest rate swap. See Note 12,Financial assets and liabilities, for additional details.
In Q1 2018, Bell Canada reclassified its $300 million 5.52% Series M-33 debentures, which mature on February 26, 2019, from long-term debt to debt due within one year.
On April 4, 2018, Bell Canada announced that it will redeem, prior to maturity, on May 4, 2018, its 3.50% Series M-28 debentures, having an outstanding principal amount of $400 million which are due on September 10, 2018.
On April 16, 2018, Bell Canada redeemed, prior to maturity, its 4.59% Series 9 medium term notes, having an outstanding principal amount of $200 million which were due on October 1, 2018. In addition, on the same date, Bell Canada redeemed, prior to maturity, its 5.52% Series M-33 debentures, having an outstanding principal amount of $300 million, which were due on February 26, 2019.
| 52 BCE Inc. 2018 FIRST QUARTER SHAREHOLDER REPORT | | | |
|
| | | | |
| | Notes to consolidated financial statements | |
| Note 11 Post-employment benefit plans |
POST-EMPLOYMENT BENEFIT PLANS COST
We provide pension and other benefits for most of our employees. These include defined benefit (DB) pension plans, defined contribution (DC) pension plans and other post-employment benefits (OPEBs).
COMPONENTS OF POST-EMPLOYMENT BENEFIT PLANS SERVICE COST
| FOR THE PERIOD ENDED MARCH 31 | 2018 | | 2017 | |
DB pension | (53 | ) | (48 | ) |
DC pension | (33 | ) | (31 | ) |
OPEBs | (1 | ) | (2 | ) |
Plan amendment gain on OPEBs and DB pension | – | | 16 | |
Less: | | | | |
Capitalized benefit plans cost | 14 | | 15 | |
Total post-employment benefit plans service cost included in operating costs | (73 | ) | (50 | ) |
Other costs recognized in severance, acquisition and other costs | (4 | ) | – | |
Total post-employment benefit plans service cost | (77 | ) | (50 | ) |
COMPONENTS OF POST-EMPLOYMENT BENEFIT PLANS FINANCING COST
| FOR THE PERIOD ENDED MARCH 31 | 2018 | | 2017 | |
DB pension | (6 | ) | (4 | ) |
OPEBs | (11 | ) | (14 | ) |
Total interest on post-employment benefit obligations | (17 | ) | (18 | ) |
| Note 12 Financial assets and liabilities |
FAIR VALUE
The following table provides the fair value details of financial instruments measured at amortized cost in the statements of financial position.
| | | | MARCH 31, 2018 | DECEMBER 31, 2017 |
| | | | CARRYING | | FAIR | | CARRYING | | FAIR | |
| | CLASSIFICATION | FAIR VALUE METHODOLOGY | VALUE | | VALUE | | VALUE | | VALUE | |
CRTC tangible benefits obligation | Trade payables and other liabilities and non-current liabilities | Present value of estimated future cash flows discounted using observable market interest rates | 99 | | 99 | | 111 | | 110 | |
CRTC deferral account obligation | Trade payables and other liabilities and non-current liabilities | Present value of estimated future cash flows discounted using observable market interest rates | 121 | | 125 | | 124 | | 128 | |
Debt securities, finance leases and other debt | Debt due within one year and long-term debt | Quoted market price of debt or present value of future cash flows discounted using observable market interest rates | 20,761 | | 22,623 | | 19,321 | | 21,298 | |
| | | | BCE Inc. 2018 FIRST QUARTER SHAREHOLDER REPORT 53 |
|
| | | | |
| Notes to consolidated financial statements | | |
The following table provides the fair value details of financial instruments measured at fair value in the statements of financial position.
| | CLASSIFICATION | CARRYING VALUE
OF ASSET (LIABILITY) | | FAIR VALUE |
QUOTED PRICES IN
ACTIVE MARKETS
FOR IDENTICAL
ASSETS (LEVEL 1) | | OBSERVABLE
MARKET DATA
(LEVEL 2)(1) | | NON-OBSERVABLE
MARKET
INPUTS
(LEVEL 3)(2) | |
March 31, 2018 | | | | | | | | | |
Publicly-traded and privately-held investments | Other non-current assets | 103 | | 1 | | – | | 102 | |
Derivative financial instruments | Other current assets, trade payables and other liabilities, other non-current assets and liabilities | (29 | ) | – | | (29 | ) | – | |
MLSE financial liability(3) | Trade payables and other liabilities | (135 | ) | – | | – | | (135 | ) |
Other | Other non-current assets and liabilities | 65 | | – | | 111 | | (46 | ) |
December 31, 2017 | | | | | | | | | |
Publicly-traded and privately-held investments | Other non-current assets | 103 | | 1 | | – | | 102 | |
Derivative financial instruments | Other current assets, trade payables and other liabilities, other non-current assets and liabilities | (48 | ) | – | | (48 | ) | – | |
MLSE financial liability(3) | Trade payables and other liabilities | (135 | ) | – | | – | | (135 | ) |
Other | Other non-current assets and liabilities | 60 | | – | | 106 | | (46 | ) |
| (1) | Observable market data such as equity prices, interest rates, swap rate curves and foreign currency exchange rates. |
| (2) | Non-observable market inputs such as discounted cash flows and earnings multiples. A reasonable change in our assumptions would not result in a significant increase (decrease) to our level 3 financial instruments. |
| (3) | Represents BCE’s obligation to repurchase the BCE Master Trust Fund’s (Master Trust) 9% interest in MLSE at a price not less than an agreed minimum price should the Master Trust exercise its put option. The obligation to repurchase is marked to market each reporting period and the gain or loss is recorded in Other (expense) income in the income statements. The option is exercisable in 2018 and thereafter. |
We use forward contracts, options and cross currency interest rate swaps to manage foreign currency risk related to anticipated purchases and sales and certain foreign currency denominated debt.
A 10% depreciation (appreciation) in the value of the Canadian dollar relative to the U.S. dollar would result in a gain (loss) of $3 million ($5 million) recognized in net earnings at March 31, 2018 and a gain (loss) of $155 million ($149 million) recognized inOther comprehensive lossat March 31, 2018, with all other variables held constant.
In 2018, we entered into a cross currency interest rate swap with a notional amount of $750 million in U.S. dollars ($967 million in Canadian dollars) to hedge the U.S. currency exposure of our US-1 Notes maturing in 2048. See Note 10,Debt, for additional details.
The following table provides further details on our outstanding foreign currency forward contracts and options as at March 31, 2018.
| TYPE OF HEDGE | BUY CURRENCY | | AMOUNT TO RECEIVE | | SELL CURRENCY | | AMOUNT TO PAY | | MATURITY | | HEDGED ITEM | |
| Cash flow | USD | | 2,456 | | CAD | | 3,142 | | 2018 | | Commercial paper | |
| Cash flow | USD | | 667 | | CAD | | 869 | | 2018 | | Anticipated transactions | |
| Cash flow | CAD | | 97 | | USD | | 75 | | 2018-2019 | | Anticipated transactions | |
| Cash flow | USD | | 775 | | CAD | | 968 | | 2019 | | Anticipated transactions | |
| Cash flow | USD | | 76 | | CAD | | 96 | | 2020-2021 | | Anticipated transactions | |
| Economic | USD | | 27 | | CAD | | 35 | | 2018 | | Anticipated transactions | |
| Economic – call options | USD | | 50 | | CAD | | 61 | | 2018 | | Anticipated transactions | |
| Economic – put options | USD | | 115 | | CAD | | 139 | | 2018 | | Anticipated transactions | |
A 1% increase (decrease) in interest rates would result in a decrease (increase) of $29 million in net earnings at March 31, 2018.
We use equity forward contracts on BCE’s common shares to economically hedge the cash flow exposure related to the settlement of equity settled share-based compensation plans and the equity price risk related to a cash-settled share-based payment plan. The fair value of our equity forward contracts at March 31, 2018 was a liability of $42 million.
A 5% increase (decrease) in the market price of BCE’s common shares at March 31, 2018 would result in a gain (loss) of $35 million recognized in net earnings, with all other variables held constant.
| 54 BCE Inc. 2018 FIRST QUARTER SHAREHOLDER REPORT | | | |
|
| | | | |
| | Notes to consolidated financial statements | |
NORMAL COURSE ISSUER BID PROGRAM (NCIB)
In Q1 2018, BCE repurchased and cancelled 3,085,697 common shares for a total cost of $175 million. Of the total cost, $69 million represents stated capital and $3 million represents the reduction of the contributed surplus attributable to these common shares. The remaining $103 million was charged to the deficit.
| CONVERSION OF FIRST PREFERRED SHARES |
On March 1, 2018, 397,181 of BCE’s 5,069,935 fixed-rate Cumulative Redeemable First Preferred Shares, Series AC (Series AC Preferred Shares) were converted, on a one-for-one basis, into floating rate Cumulative Redeemable First Preferred Shares, Series AD (Series AD Preferred Shares). In addition, on March 1, 2018, 5,356,937 of BCE’s 14,930,065 Series AD Preferred Shares were converted, on a one-for-one basis, into Series AC Preferred Shares.
The annual fixed dividend rate on BCE’s Series AC Preferred Shares was reset for the next five years, effective March 1, 2018, at 4.38% from 3.55%. The Series AD Preferred Shares continue to pay a monthly floating cash dividend.
| Note 14 Share-based payments |
The following share-based payment amounts are included in the income statements as operating costs.
| FOR THE PERIOD ENDED MARCH 31 | 2018 | | 2017 | |
Employee savings plan (ESP) | (7 | ) | (7 | ) |
Restricted share units (RSUs) and performance share units (PSUs) | (19 | ) | (17 | ) |
Other(1) | (4 | ) | (3 | ) |
Total share-based payments | (30 | ) | (27 | ) |
| (1) | Includes DSP, DSUs and stock options. |
The following tables summarize the change in outstanding ESP shares, RSUs/PSUs, DSUs and stock options for the period ended March 31, 2018.
ESP
| NUMBER OF | |
| ESP SHARES | |
Unvested contributions, January 1, 2018 | 1,039,030 | |
Contributions(1) | 172,636 | |
Dividends credited | 12,585 | |
Vested | (139,430 | ) |
Forfeited | (31,868 | ) |
Unvested contributions, March 31, 2018 | 1,052,953 | |
| (1) | The weighted average fair value of the shares contributed during the quarter was $57. |
RSUs/PSUs
| NUMBER OF | |
| RSUs/PSUs | |
Outstanding, January 1, 2018 | 2,740,392 | |
Granted(1) | 947,294 | |
Dividends credited | 33,845 | |
Settled | (999,934 | ) |
Forfeited | (6,606 | ) |
Outstanding, March 31, 2018 | 2,714,991 | |
| (1) | The weighted average fair value of the RSUs/PSUs granted during the quarter was $57. |
| | | | BCE Inc. 2018 FIRST QUARTER SHAREHOLDER REPORT 55 |
|
| | | | |
| Notes to consolidated financial statements | | |
DSUs
| NUMBER OF DSUs | |
Outstanding, January 1, 2018 | 4,309,528 | |
Issued(1) | 57,227 | |
Settlement of RSUs/PSUs | 112,675 | |
Dividends credited | 53,076 | |
Settled | (16,972 | ) |
Outstanding, March 31, 2018 | 4,515,534 | |
| (1) | The weighted average fair value of the DSUs issued during the quarter was $56. |
STOCK OPTIONS
| | NUMBER OF | | WEIGHTED AVERAGE | |
| | OPTIONS | | EXERCISE PRICE ($) | |
Outstanding, January 1, 2018 | 10,490,249 | | 55 | |
Granted | 3,637,626 | | 57 | |
Exercised(1) | (35,408 | ) | 36 | |
Forfeited | (4,641 | ) | 59 | |
Outstanding, March 31, 2018 | 14,087,826 | | 56 | |
Exercisable, March 31, 2018 | 4,631,121 | | 52 | |
| (1) | The weighted average share price for options exercised during the quarter was $57. |
ASSUMPTIONS USED IN STOCK OPTION PRICING MODEL
The fair value of options granted was determined using a variation of a binomial option pricing model that takes into account factors specific to the share incentive plans, such as the vesting period. The following table shows the principal assumptions used in the valuation.
| 2018 | |
Weighted average fair value per option granted | $2.13 | |
Weighted average share price | $57 | |
Weighted average exercise price | $57 | |
Dividend yield | 5 | % |
Expected volatility | 12 | % |
Risk-free interest rate | 2 | % |
Expected life (years) | 4 | |
Expected volatilities are based on the historical volatility of BCE’s share price. The risk-free rate used is equal to the yield available on Government of Canada bonds at the date of grant with a term equal to the expected life of the options.
| 56 BCE Inc. 2018 FIRST QUARTER SHAREHOLDER REPORT | | | |
|
| This document has been filed by BCE Inc. with the Canadian provincial securities regulatory authorities and the U.S. Securities and Exchange Commission. It can be found on BCE Inc.’s website at BCE.ca, on SEDAR at www.sedar.com and on EDGAR at www.sec.gov or is available upon request from: INVESTOR RELATIONS
Building A, 8th floor
1 Carrefour Alexander-Graham-Bell
Verdun, Québec H3E 3B3 e-mail: investor.relations@bce.ca
tel: 1-800-339-6353
fax: 514-786-3970 BCE.ca
For additional copies of this document, please contact investor relations. Pour obtenir un exemplaire de la version française de ce document, contactez les Relations avec les investisseurs. | For further information concerning BCE Inc.’s Dividend Reinvestment and Stock Purchase Plan (DRP), direct deposit of dividend payments, the elimination of multiple mailings or the receipt of quarterly reports, please contact: AST TRUST COMPANY (CANADA)
1 Toronto Street, Suite 1200
Toronto, Ontario M5C 2V6 tel: 416 682-3861 or 1 800 561-0934
fax: 514 985-8843 or 1 888 249-6189
e-mail: bce@astfinancial.com |