 Third Quarter 2011 Exhibit 99.1 |
 Todd Brice President and Chief Executive Officer Mark Kochvar Sr. EVP and Chief Financial Officer |
 3 Forward Looking Statement and Risk Factor • This presentation contains certain forward-looking statements within the meaning of Section 27A of the Securities Act of 1933 and Section 21E of the Securities Exchange Act of 1934. Forward- looking statements include, among others, statements regarding trends, strategies, plans, beliefs, intentions, expectations, goals and opportunities. Forward looking statements are typically identified by words or phrases such as believe, expect, anticipate, intend, estimate, assume, strategy, plan, outlook, outcome, continue, remain, trend and variations of such words and similar expressions, or future or conditional verbs such as will, would, should, could, may or similar expressions. Actual results and performance could differ materially from those anticipated by these forward-looking statements. Factors that could cause such a difference include, but are not limited to, general economic conditions, changes in interest rates, deposit flows, loan demand, asset quality, including real estate and other collateral values, and competition. • S&T cautions that these forward-looking statements are subject to numerous assumptions, risks and uncertainties, which change over time. These forward-looking statements speak only as of the date hereof, and S&T assumes no duty to update forward-looking statements. Subsequent written or oral statements attributable to S&T or persons acting on its behalf are expressly qualified in their entirety by the cautionary statements contained herein and those in S&T’s reports previously and subsequently filed with the Securities and Exchange Commission. |
 4 Non-GAAP Financial Measures • In addition to the results of operations presented in accordance with Generally Accepted Accounting Principles (GAAP), S&T management uses and this presentation contains or references, certain non-GAAP financial measures, such as net interest income on a fully taxable equivalent basis, that S&T believes provide information useful to investors in understanding our underlying operational performance and our business and performance trends as they facilitate comparisons with the performance of others in the financial services industry. Although S&T believes that these non-GAAP financial measures enhance investors’ understanding of S&T’s business and performance, these non-GAAP financial measures should not be considered an alternative to GAAP. The non-GAAP financial measures contained therein should be read in conjunction with the audited financial statements and analysis as presented in the Annual Report on Form 10-K as well as the unaudited financial statements and analyses as presented in the respective Quarterly Reports on Forms 10-Q for S&T Bancorp, Inc. and subsidiaries. |
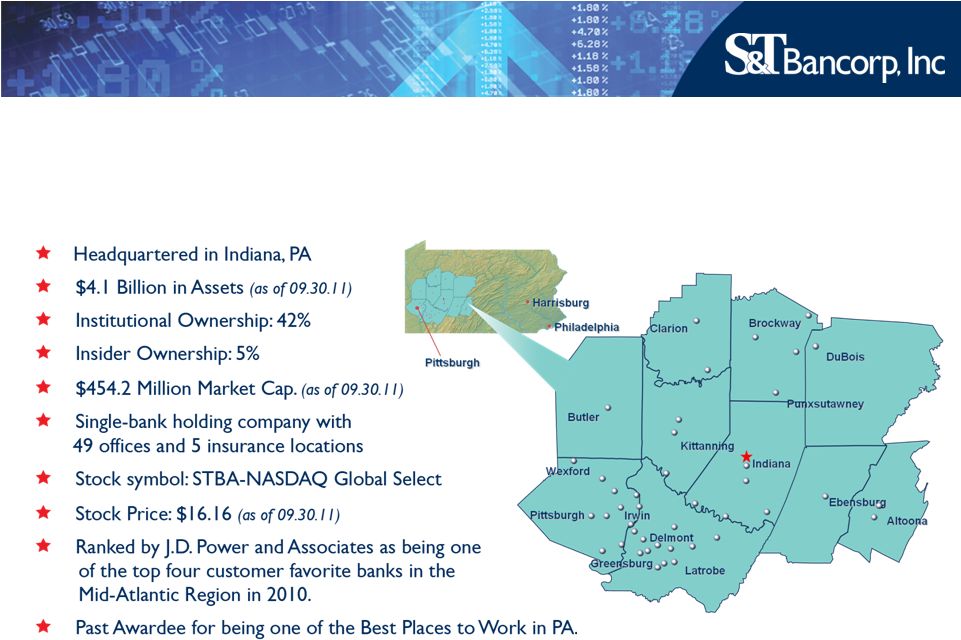 5 S&T Bancorp Corporate Profile |
 Investor Highlights • Historically High Performing Bank • Experienced Management Team • Relationship Banking Model • Well-Positioned for Growth 6 |
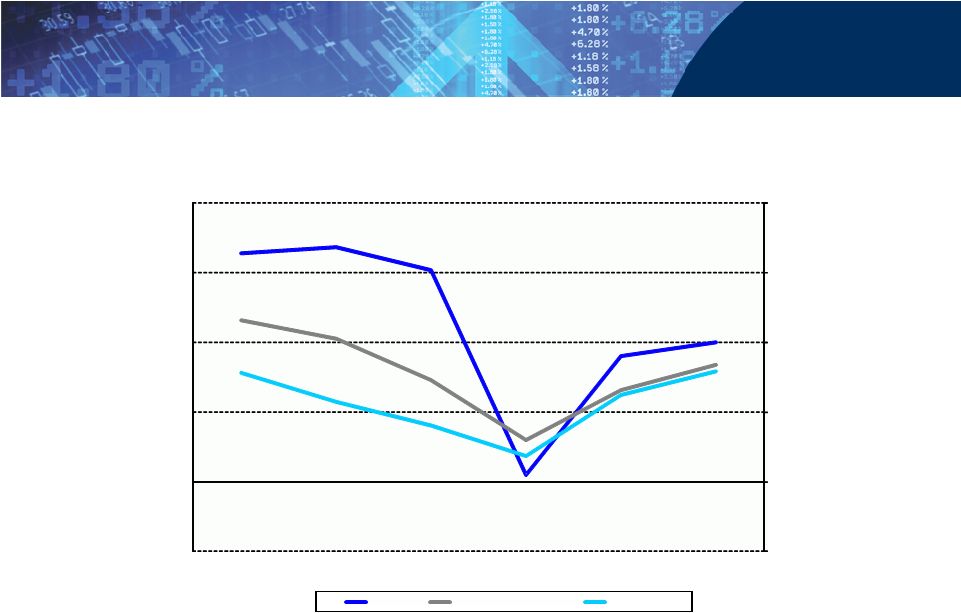 7 * 2011 peer banks per 2011 proxy statement * * Annualized Return on Assets -0.5% 0.0% 0.5% 1.0% 1.5% 2.0% -0.5% 0.0% 0.5% 1.0% 1.5% 2.0% 2006 2007 2008 2009 2010 2011 YTD** PA Banks Peer Bank Median* STBA |
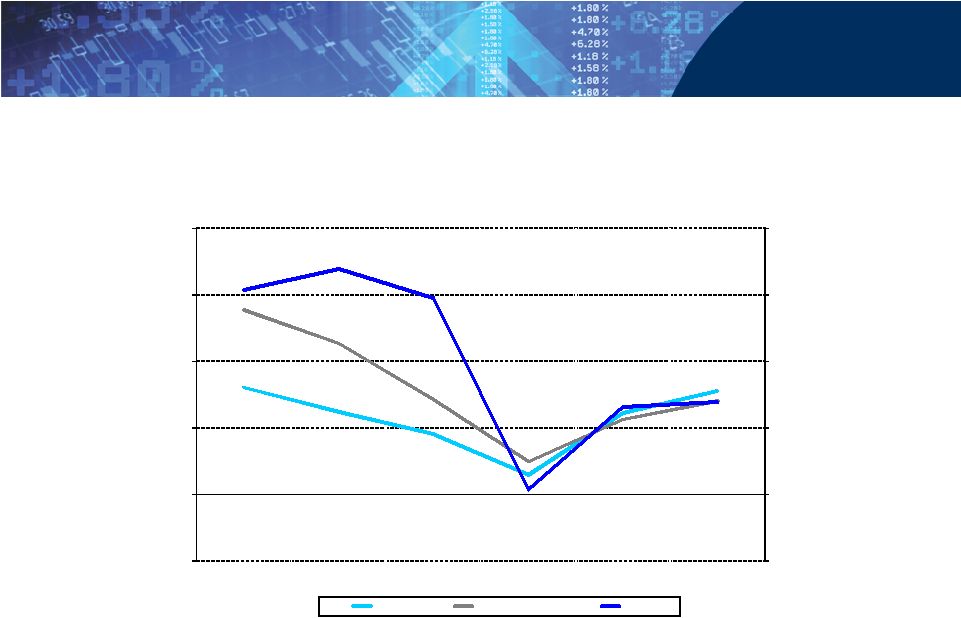 8 Return on Equity * 2011 peer banks per 2011 proxy statement * * Annualized -5% 0% 5% 10% 15% 20% -5% 0% 5% 10% 15% 20% 2006 2007 2008 2009 2010 2011 YTD** PA Banks Peer Bank Median* STBA |
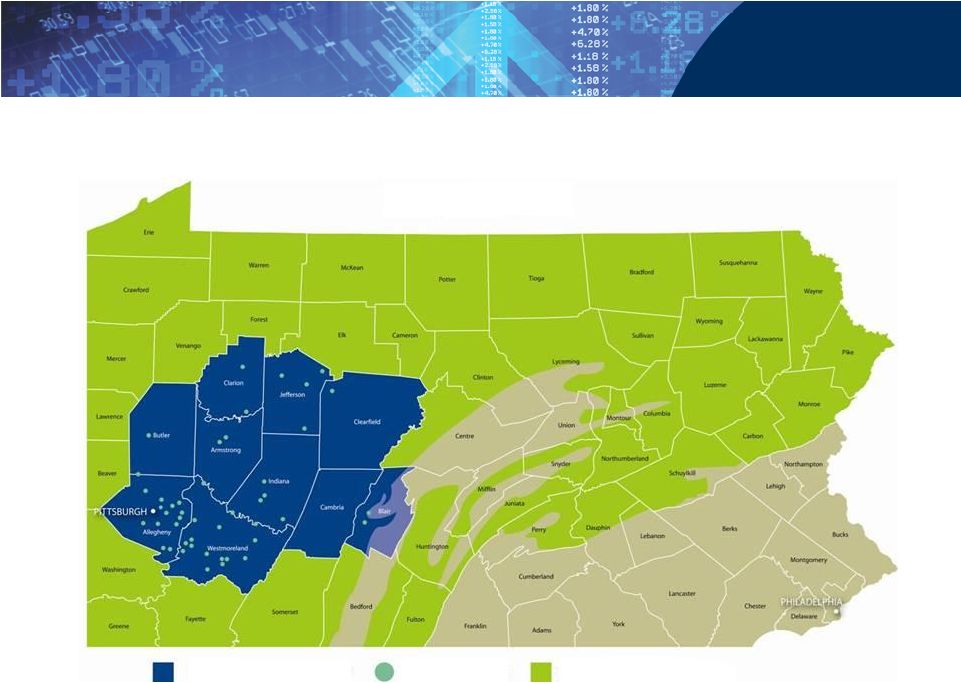 9 Marcellus Shale Distribution Pennsylvania S&T Bank Regional Footprint S&T Bank Locations Marcellus Shale Formation |
 Marcellus Activity in S&T’s Market Area Permits Issued Wells Drilled 2009 283 114 2010 358 170 2011 * 456 213 * January – October 2011 Source: Pennsylvania DEP 10 |
 11 |
 12 12 Quarterly Summary 2011 2011 2010 Third Quarter Second Quarter Third Quarter Net Income $12.2 $13.4 $10.9 Diluted Earnings per Common Share $0.44 $0.48 $0.39 Common Return on Average Assets * 1.20% 1.31% 1.06% Common Return on Average Equity * 8.12% 9.15% 7.61% Dollars in millions * Annualized |
 13 13 Income Statement Dollars in millions * Refer to appendix for reconciliation of Non-GAAP financial measures 2011 2011 2010 Third Quarter Second Quarter Third Quarter Net Interest Income – FTE * $34.9 $35.6 $38.1 Noninterest Income 10.4 11.2 12.3 Total Revenue 45.3 46.8 50.4 Noninterest Expense (24.2) (25.6) (24.9) Security (Losses) Gains (0.1) (0.1) - Provision for Loan Losses (1.5) (1.1) (8.3) Net Income Before Taxes 19.5 20.0 17.2 Taxes (5.7) (5.0) (4.7) Preferred Stock Dividends (1.6) (1.6) (1.6) Net Income Available to Common Shareholders $ 12.2 $13.4 $10.9 Diluted Earnings per Common Share $ 0.44 $0.48 $0.39 |
 14 14 Balance Sheet Dollars in millions Sept. 30, 2011 June 30, 2011 Sept. 30, 2010 Securities $359 $358 $301 Loans, Net 3,085 3,145 3,315 Other 648 555 482 Total Assets $4,092 $4,058 $4,098 Deposits $3,271 $3,254 $3,304 Borrowings 165 164 169 Other Liabilities 52 47 50 Equity 604 593 575 Total Liabilities & Equity $4,092 $4,058 $4,098 |
 15 15 Loan Portfolio Dollars in millions Sept. 30, 2011 June 30, 2011 Sept. 30, 2010 Consumer Home Equity $ 423 $ 432 $ 451 Residential Mortgage 351 346 362 Installment and Other Consumer 68 70 76 Construction 3 3 7 Total Consumer 845 851 896 Commercial Commercial Real Estate 1,414 1,442 1,437 Commercial & Industrial 682 691 728 Construction 191 208 306 Total Commercial 2,287 2,341 2,471 Total Portfolio Loans 3,132 3,192 3,367 Total Loans Held for Sale 4 11 4 Total Loans $3,136 $3,203 $ 3,371 |
 16 16 Asset Quality * YTD September 30, 2011 Annualized Sept. 30, December 31, 2011 2010 2009 2008 2007 Nonperforming Loans / Total Loans 1.89% 1.90% 2.67% 1.19% 0.60% Nonperforming Assets / Total Loans Plus OREO 2.08 2.07 2.80 1.21 0.62 Net Charge-offs / Average Loans * 0.54 1.11 1.60 0.31 0.17 Loan Loss Reserve / Total Loans 1.64 1.53 1.75 1.20 1.23 Loan Loss Reserve / Nonperforming Loans 87 80 66 101 204 |
 17 Nonperforming Loans 83 2.15 49.2 Total Commercial 15 4.56 8.7 Construction 10 0.88 6.0 Commercial & Industrial 58 2.44 34.5 Commercial Real Estate Commercial 17 1.18 10.0 Total Consumer 1 5.82 0.2 Construction - - - Installment and Other Consumer 11 1.92 6.7 Residential Mortgage 5 0.73 $ 3.1 Home Equity % of Total NPL Consumer % NPL Sept. 30, 2011 Total Nonperforming Loans 100 1.89 $ 59.2 Nonperforming Loans (NPL) are loans where collection of interest or principal is doubtful or generally when interest or principal payments are 90 days or more past due. Dollars in millions Specific reserves $2.9 USDA Guarantee $6.8 17 |
 18 Construction & CRE by Type Type Sept. 30, 2011 % of Total Sept. 30, 2010 Change Retail/Strip Malls $ 286 18 $ 299 $(13) Miscellaneous 243 15 273 (30) Offices 217 14 228 (11) Residential Rental Properties 199 12 218 (19) Hotels 186 11 196 (10) Healthcare/Education 108 7 92 16 Manuf/Industrial/Warehouse 99 6 129 (30) RE Develop – CL 98 6 103 (5) Flex/Mixed Used 96 6 112 (16) RE Develop – Residential 73 5 93 (20) Total $1,605 100 $1,743 ($138) 18 Dollars in millions |
 19 Construction & CRE – NPL by Type Type Sept. 30, 2011 % NPL % of Total NPL Retail/Strip Malls $ 2.4 0.83 6 Miscellaneous 16.0 6.60 37 Offices 5.1 2.36 12 Residential Rental Properties 3.4 1.70 8 Hotels 1.1 0.59 2 Healthcare/Education - - - Manuf/Industrial/Warehouse 5.2 5.22 12 RE Develop – CL 1.7 1.69 4 Flex/Mixed Use - - - RE Develop – Residential 8.3 11.42 19 Total $43.2 2.69 100 19 Dollars in millions |
 20 Net Interest Margin 2011 2011 2010 Third Quarter Second Quarter Third Quarter Securities - FTE 2.39% 2.76% 3.82% Loans - FTE 4.85 4.89 5.10 Total Earning Assets 4.51 4.63 4.99 Deposits 0.93 0.97 1.08 Borrowings 2.97 3.10 2.90 Total Costing Liabilities 1.06 1.10 1.21 Net Interest Margin – FTE * 3.76 3.85 4.09 * Refer to appendix for reconciliation of Non-GAAP financial measures |
 21 Noninterest Income Dollars in millions 2011 2011 2010 Third Quarter Second Quarter Third Quarter Community Banking $ 6.3 $ 5.9 $ 6.0 Wealth Management 2.0 2.1 1.9 Insurance 2.2 2.2 2.1 Letters of Credit / Loan 0.6 0.7 0.6 Mortgage Banking (0.5) 0.2 1.6 Other (0.2) 0.1 0.1 Total $10.4 $11.2 $12.3 |
 22 Securities Sept. 30, 2011 June 30, 2011 Sept. 30, 2010 Agencies $153 $142 $100 Agency CMO 70 71 45 Agency MBS 52 55 49 Municipals 53 58 73 Equities 12 12 11 FHLB Stock 19 20 23 Total $359 $358 $301 All securities are classified as available-for sale Dollars in millions |
 23 Deposits Dollars in millions Sept. 30, 2011 June 30, 2011 Sept. 30, 2010 Noninterest-bearing Demand $ 817 $ 802 $ 744 Interest-bearing Demand 292 284 277 Money Market 255 237 247 Savings 773 753 746 Certificates of Deposit < $100K 745 769 823 Certificates Of Deposit > $100K 389 409 468 Total $3,271 $3,254 $3,305 |
 24 24 Capital Ratios Sept. 30, 2011 June 30, 2011 Sept. 30, 2010 Well- Capitalized Leverage ** 11.80% 11.49% 10.92% 5.00% Tier 1 – Risk-Based Capital ** 14.95 14.31 12.97 6.00 Total – Risk-Based Capital ** 18.51 17.83 16.35 10.00 Tangible Common Equity / Tangible Assets * 8.30 8.08 7.53 NA ** Includes CPP of $108.7 million * Refer to appendix for reconciliation of Non-GAAP financial measures |
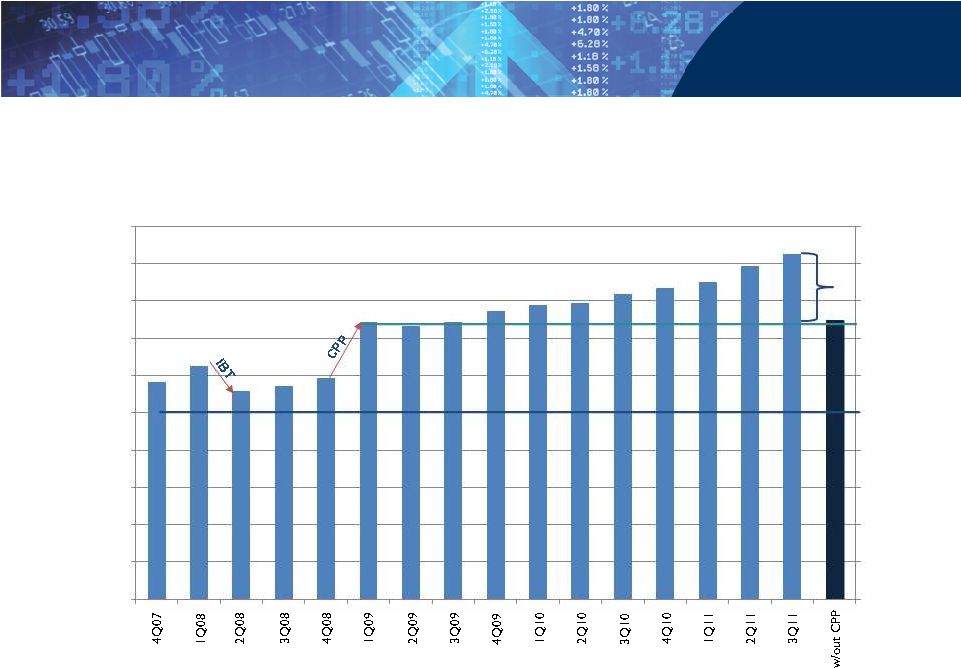 25 S&T Bancorp Capital * * Total Risk-Based Capital Well Capitalized +3.69% 0% 2% 4% 6% 8% 10% 12% 14% 16% 18% 20% 0% 2% 4% 6% 8% 10% 12% 14% 16% 18% 20% |
 26 |
 2011 2011 2010 Third Quarter Second Quarter Third Quarter Interest Income per Consolidated Statements of Income $40.9 $41.8 $45.3 Adjustment to Fully Taxable-equivalent Basis 1.0 1.0 1.1 Interest Income Adjusted to Fully Taxable-equivalent Basis 41.9 42.8 46.4 Interest Expense per Consolidated Statements of Income 7.0 7.2 8.3 Net Interest Income Adjusted to Fully Taxable- equivalent Basis (non-GAAP) $34.9 $35.6 $38.1 APPENDIX – Non-GAAP Measures Dollars in millions |
 2011 2011 2010 Third Quarter Second Quarter Third Quarter Tangible Common Equity/Tangible Assets Common Equity/Assets (GAAP Basis) 12.14% 11.98% 11.43% Effect of Excluding Intangible Assets -3.84% -3.90% -3.90% Tangible Common Equity/Tangible Assets 8.30% 8.08% 7.53% APPENDIX – Non-GAAP Measures /cont./ Dollars in millions |