Exhibit 99.1

Investor PresentationMay 2017
Forward-Looking Statements The Company makes forward-looking statements that are subject to risks and uncertainties. These forward-looking statements include statements regarding profitability, liquidity, adequacy of capital, the allowance for loan losses, interest rate sensitivity, market risk, growth strategy, and financial and other goals. The words, “believes,” “expects,” “may,” “will,” “should,” “projects,” “contemplates,” “anticipates,” “forecasts,” “intends,” or other similar words or terms are intended to identify forward-looking statements. These forward-looking statements are subject to significant uncertainties. Because of these uncertainties, actual future results may be materially different from the results indicated by these forward-looking statements. In addition, past results of operations do not necessarily indicate future results. The following presentation should be read in conjunction with the consolidated financial statements and related notes included in Part II, Item 8, and Item 1A. Risk Factors of the Company’s Form 10-K for the year ended December 31, 2016. 2

Corporate Profile 3 Branch Map Overview Shares of common stock quoted under “FXNC” on OTC Markets Group exchangeCommunity banking since 190714 branches across 6 counties and 3 MSAs throughout VirginiaWealth management division $196 million AUM Financial Highlights Total assets $727.3Total loans held for investment 497.8Total deposits 654.8Shareholders’ equity 54.0Market capitalization 68.4 ($ Millions) Ratios Return on average assets 0.88%Return on average equity 11.78%Net interest margin 3.70%Efficiency ratio 69.52%NPAs/assets 0.25%Tangible common equity / tang. assets 7.24% Financial information at or for the quarter ended March 31, 2017
Strengths Low-cost deposit portfolio at 0.24%Non-interest income at 1.10% of average assetsSuperior asset quality with NPAs/Assets of 0.25%Management team with track record of successWealth management with full trust powersDeep relationships in growing Virginia marketsDemonstrated ability to execute acquisitions 4 Financial information as of March 31, 2017
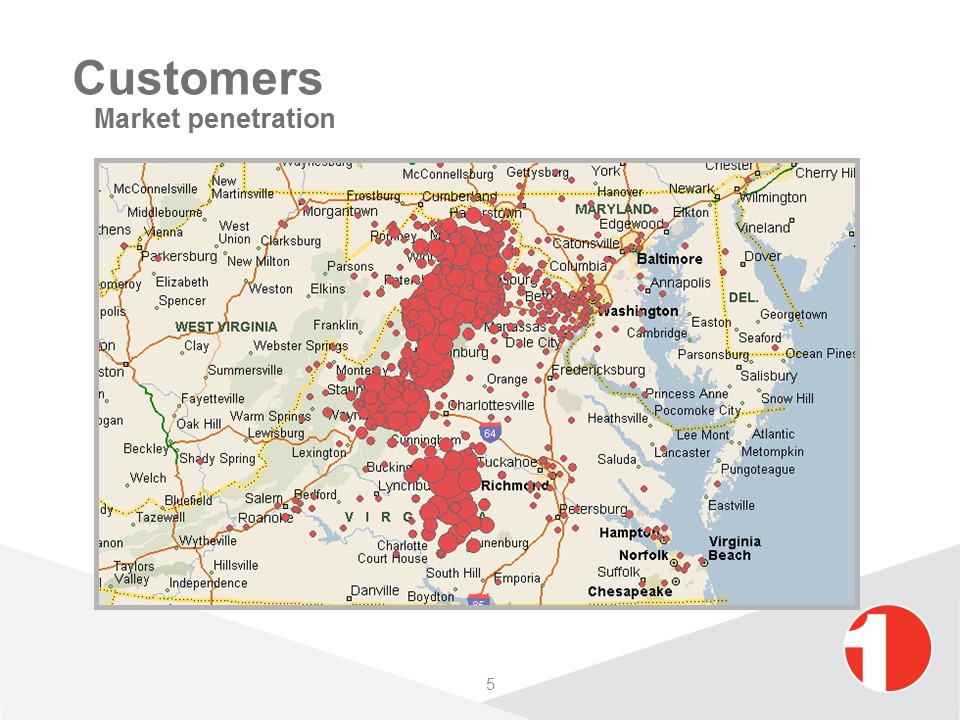
Customers Market penetration 5
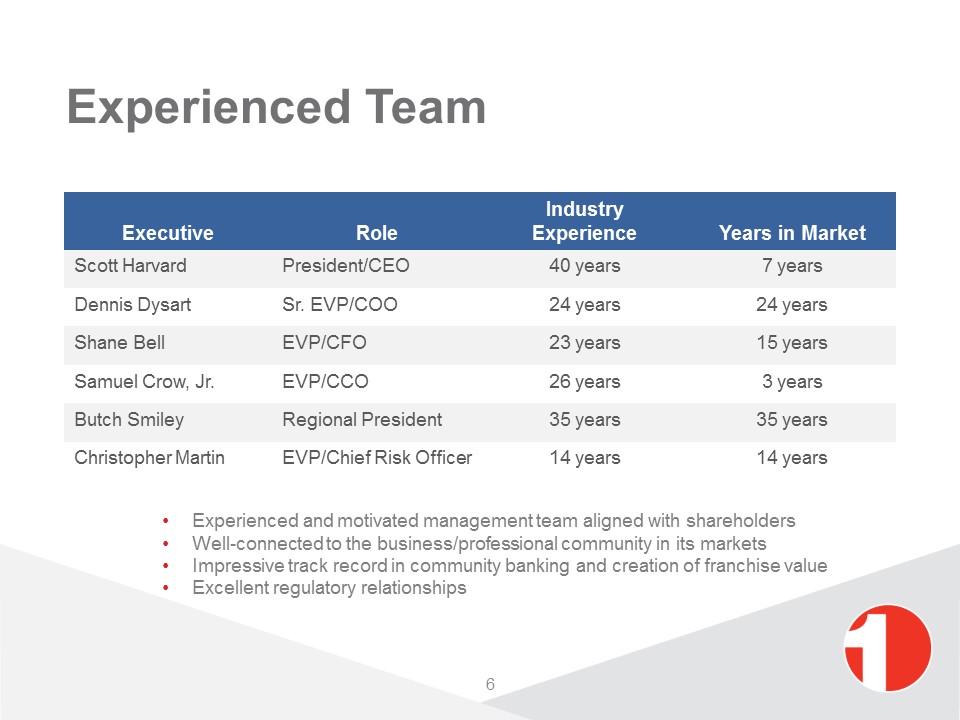
Experienced Team Executive Role Industry Experience Years in Market Scott Harvard President/CEO 40 years 7 years Dennis Dysart Sr. EVP/COO 24 years 24 years Shane Bell EVP/CFO 23 years 15 years Samuel Crow, Jr. EVP/CCO 26 years 3 years Butch Smiley Regional President 35 years 35 years Christopher Martin EVP/Chief Risk Officer 14 years 14 years Experienced and motivated management team aligned with shareholdersWell-connected to the business/professional community in its marketsImpressive track record in community banking and creation of franchise valueExcellent regulatory relationships 6
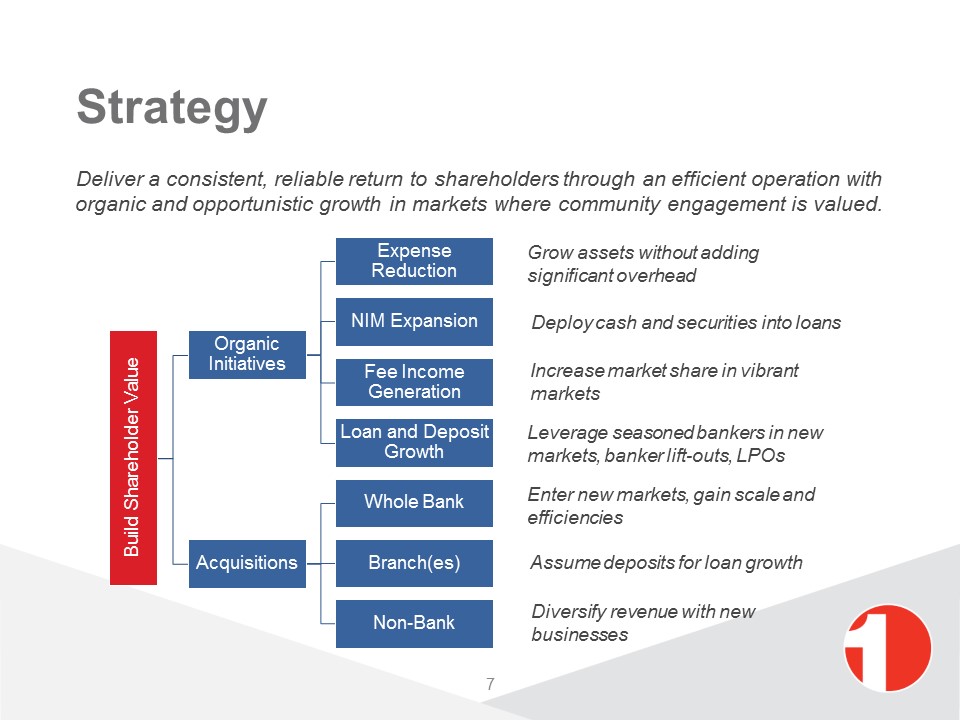
Strategy Grow assets without adding significant overhead Deploy cash and securities into loans Increase market share in vibrant markets Leverage seasoned bankers in new markets, banker lift-outs, LPOs Enter new markets, gain scale and efficiencies Assume deposits for loan growth Diversify revenue with new businesses Deliver a consistent, reliable return to shareholders through an efficient operation with organic and opportunistic growth in markets where community engagement is valued. 7
Strategy Execution Successful integration of branch acquisitionRemix of assets post acquisition requiring only moderate organic growthSuccessful team lift out in south region marketWell-executed drive to improve efficiencyGrowth of non-interest bearing depositsReinvigorated loan production with superior asset quality metrics 8
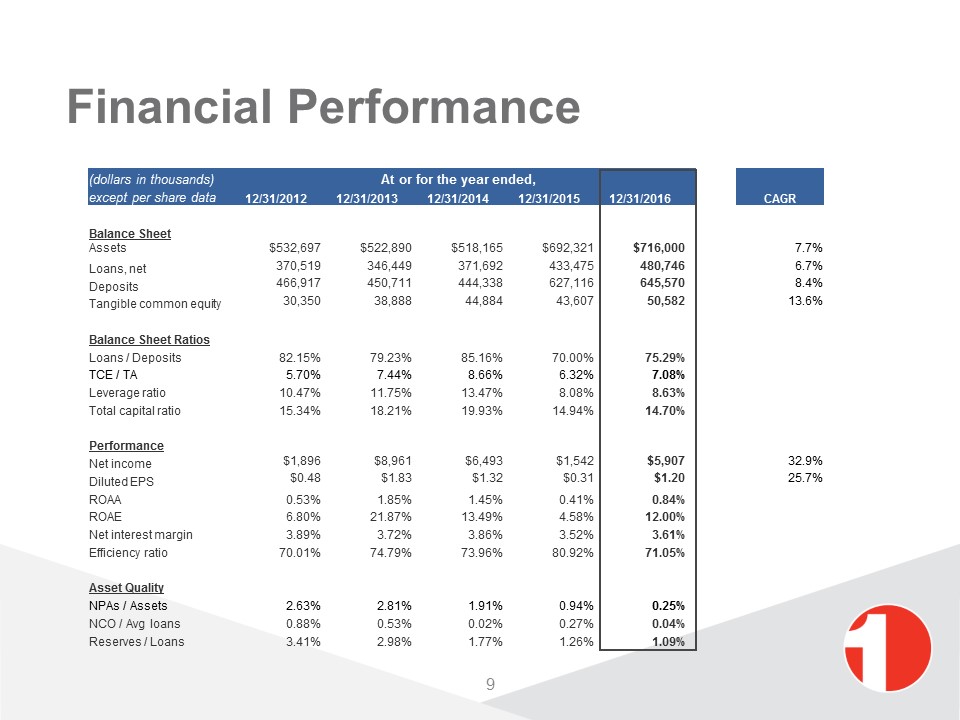
Financial Performance 9 (dollars in thousands) At or for the year ended, except per share data 12/31/2012 12/31/2013 12/31/2014 12/31/2015 12/31/2016 CAGR Balance Sheet Assets $532,697 $522,890 $518,165 $692,321 $716,000 7.7% Loans, net 370,519 346,449 371,692 433,475 480,746 6.7% Deposits 466,917 450,711 444,338 627,116 645,570 8.4% Tangible common equity 30,350 38,888 44,884 43,607 50,582 13.6% Balance Sheet Ratios Loans / Deposits 82.15% 79.23% 85.16% 70.00% 75.29% TCE / TA 5.70% 7.44% 8.66% 6.32% 7.08% Leverage ratio 10.47% 11.75% 13.47% 8.08% 8.63% Total capital ratio 15.34% 18.21% 19.93% 14.94% 14.70% Performance Net income $1,896 $8,961 $6,493 $1,542 $5,907 32.9% Diluted EPS $0.48 $1.83 $1.32 $0.31 $1.20 25.7% ROAA 0.53% 1.85% 1.45% 0.41% 0.84% ROAE 6.80% 21.87% 13.49% 4.58% 12.00% Net interest margin 3.89% 3.72% 3.86% 3.52% 3.61% Efficiency ratio 70.01% 74.79% 73.96% 80.92% 71.05% Asset Quality NPAs / Assets 2.63% 2.81% 1.91% 0.94% 0.25% NCO / Avg loans 0.88% 0.53% 0.02% 0.27% 0.04% Reserves / Loans 3.41% 2.98% 1.77% 1.26% 1.09%

Peer Comparison Source: SNL Financial. Peers defined as banks in Virginia with assets between $500 million and $1 billion as of 12/31/16. Capital ratios are for bank subsidiaries at 12/31/16. 10 Return on Assets Return on Equity Efficiency Ratio Net Interest Margin Loans / Deposits Cash & Securities / Deposits NPAs / Assets Reserves / Loans Peer 0.77% FXNC 0.94% Peer 7.8% FXNC 13.0% Peer 70.6% FXNC 67.2% Peer 3.66% FXNC 3.60% Peer 87.5% FXNC 75.3% Peer 19.1% FXNC 29.6% Peer 1.60% FXNC 0.25% Peer 1.08% FXNC 1.09% Median of peer group FXNC 1 standard deviation from the mean 1-4 Family / Loans CRE & Multi / Loans C&I / Loans Non-interest bearing / Deposits Savings & MMDA / Deposits Time / Deposits Total Risk-Based Capital Leverage Ratio Peer 44.3% FXNC 40.9% Peer 40.7% FXNC 43.4% Peer 7.3% FXNC 6.2% Peer 22.2% FXNC 26.0% Peer 55.5% FXNC 44.3% Peer 29.2% FXNC 19.9% Peer 13.3% First Bank 13.5% Peer 10.3% First Bank 8.5%
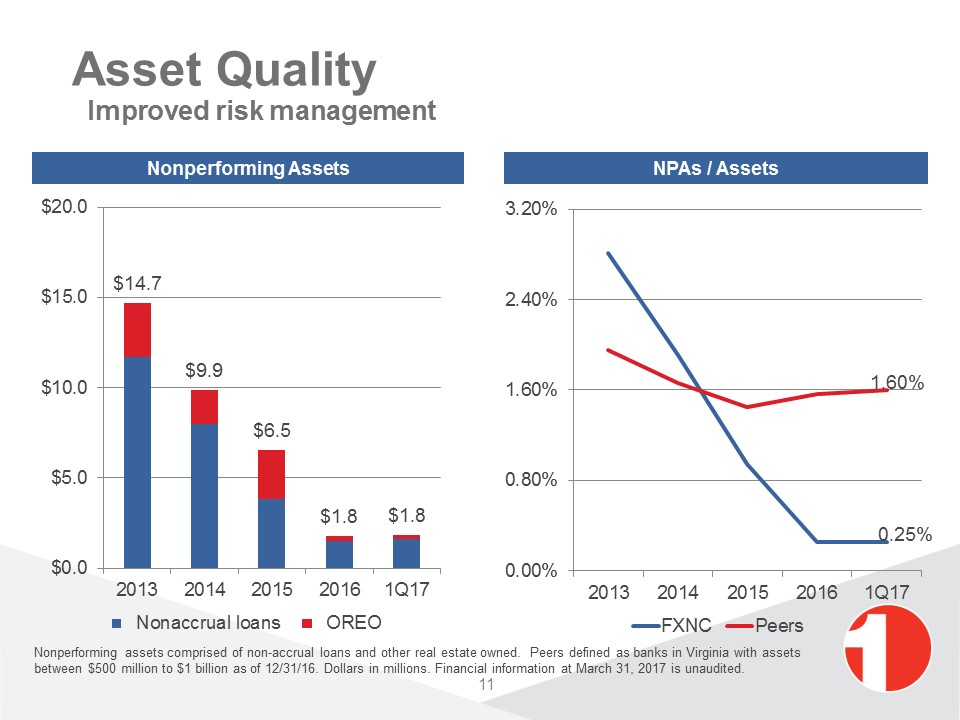
Asset Quality Improved risk management Nonperforming assets comprised of non-accrual loans and other real estate owned. Peers defined as banks in Virginia with assets between $500 million to $1 billion as of 12/31/16. Dollars in millions. Financial information at March 31, 2017 is unaudited. NPAs / Assets Nonperforming Assets 11
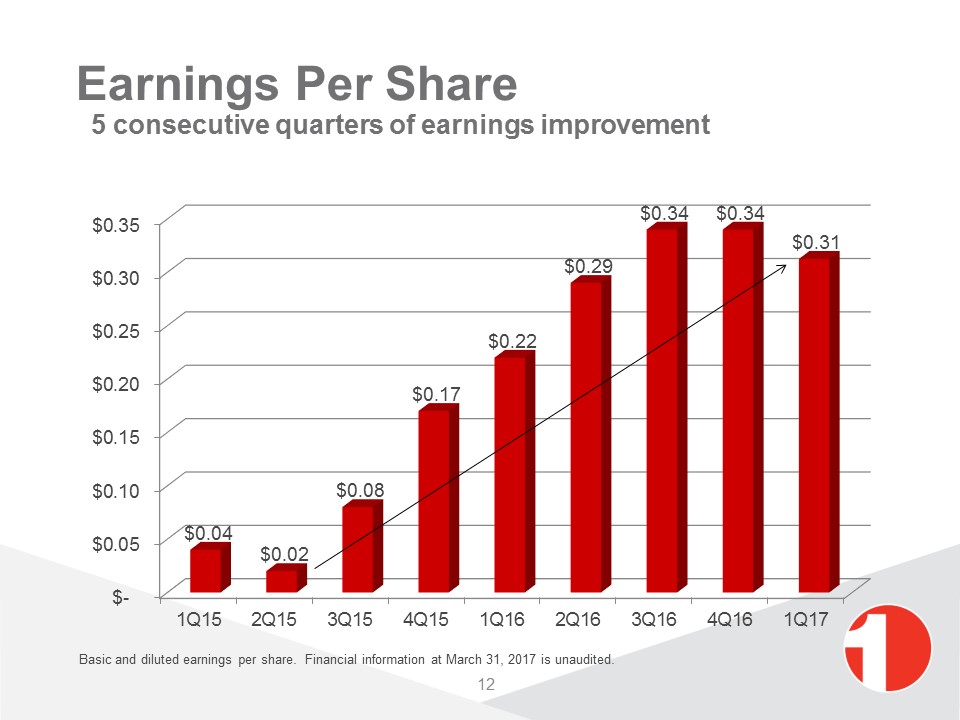
Earnings Per Share 5 consecutive quarters of earnings improvement Basic and diluted earnings per share. Financial information at March 31, 2017 is unaudited. 12
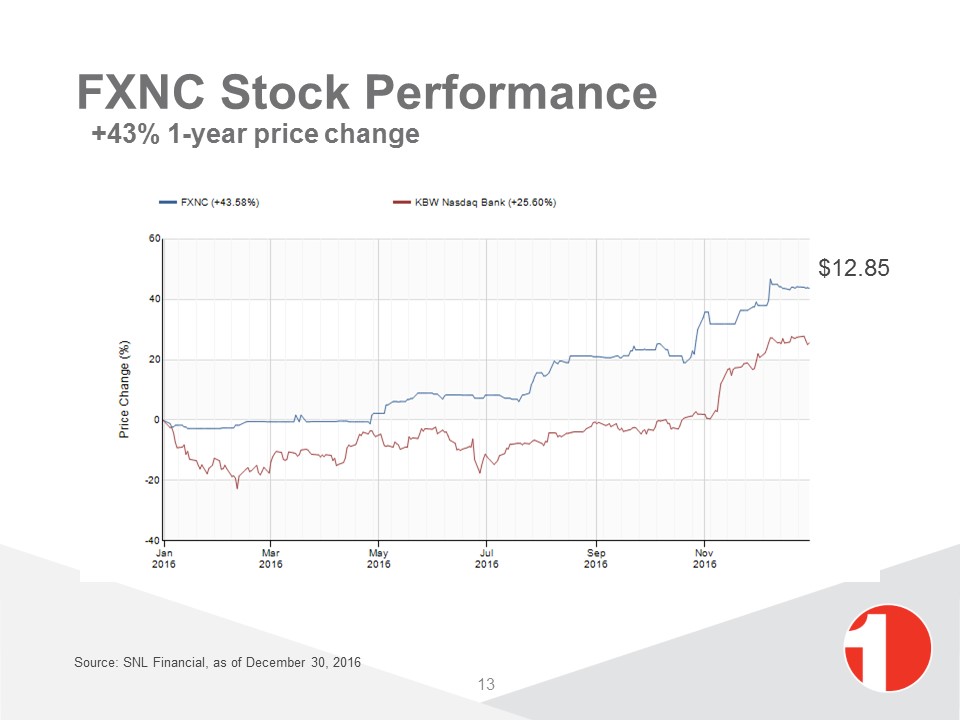
FXNC Stock Performance +43% 1-year price change 13 $12.85 Source: SNL Financial, as of December 30, 2016
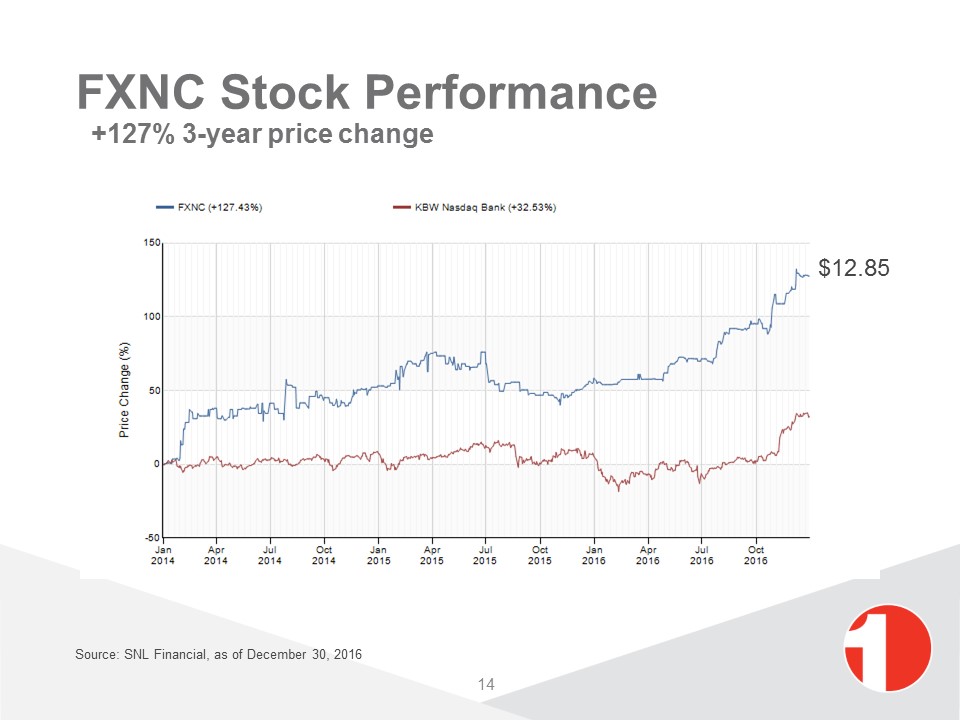
FXNC Stock Performance +127% 3-year price change 14 Source: SNL Financial, as of December 30, 2016 $12.85
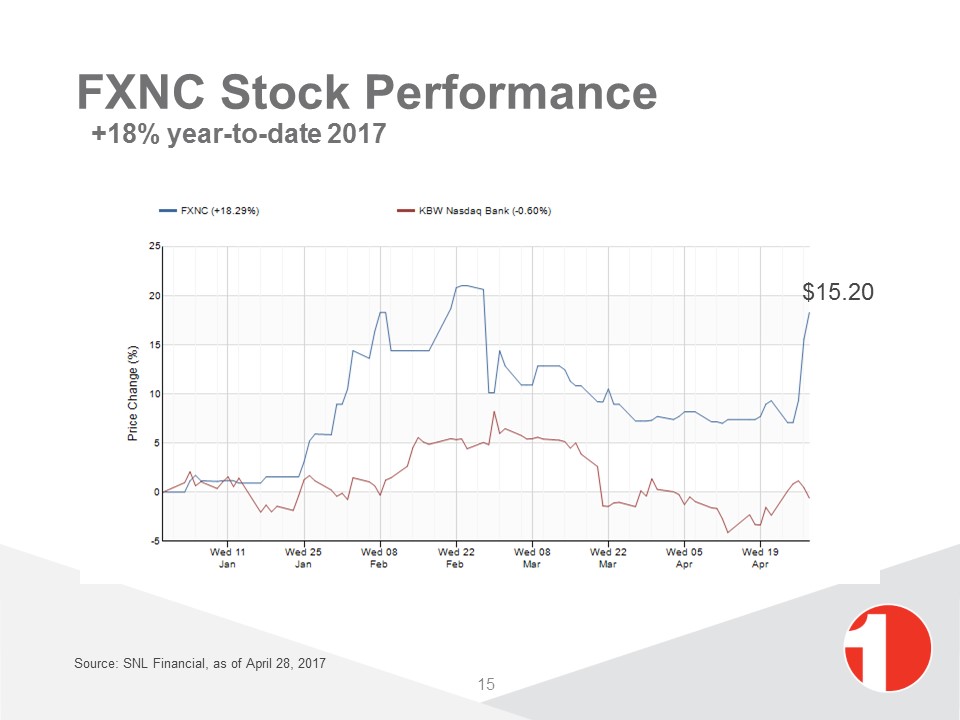
FXNC Stock Performance +18% year-to-date 2017 15 Source: SNL Financial, as of April 28, 2017 $15.20
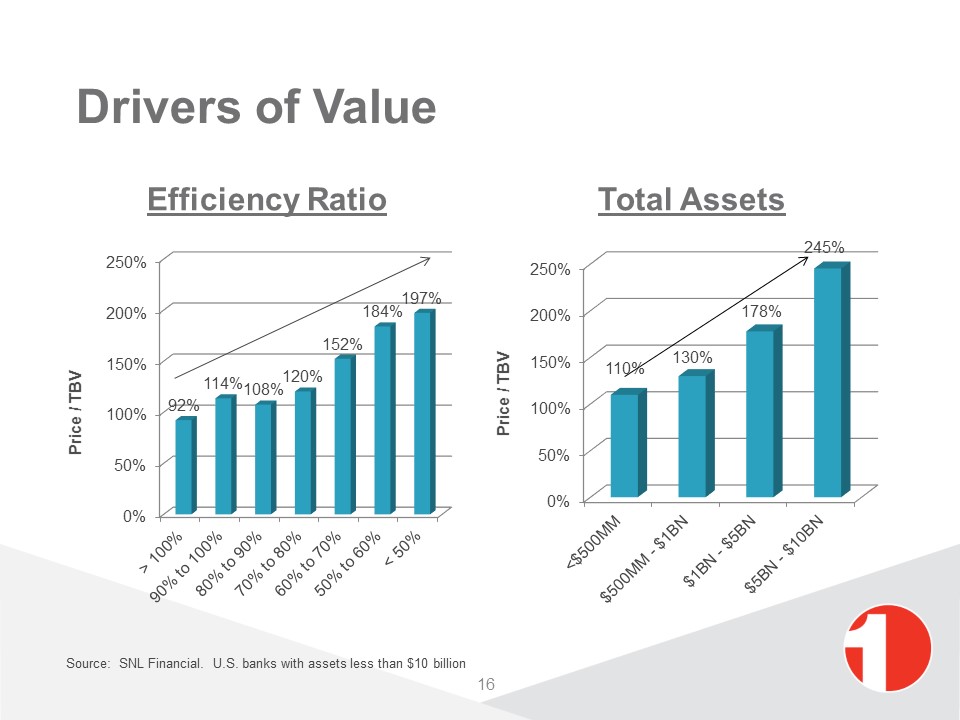
Efficiency Ratio Total Assets Drivers of Value 16 Source: SNL Financial. U.S. banks with assets less than $10 billion
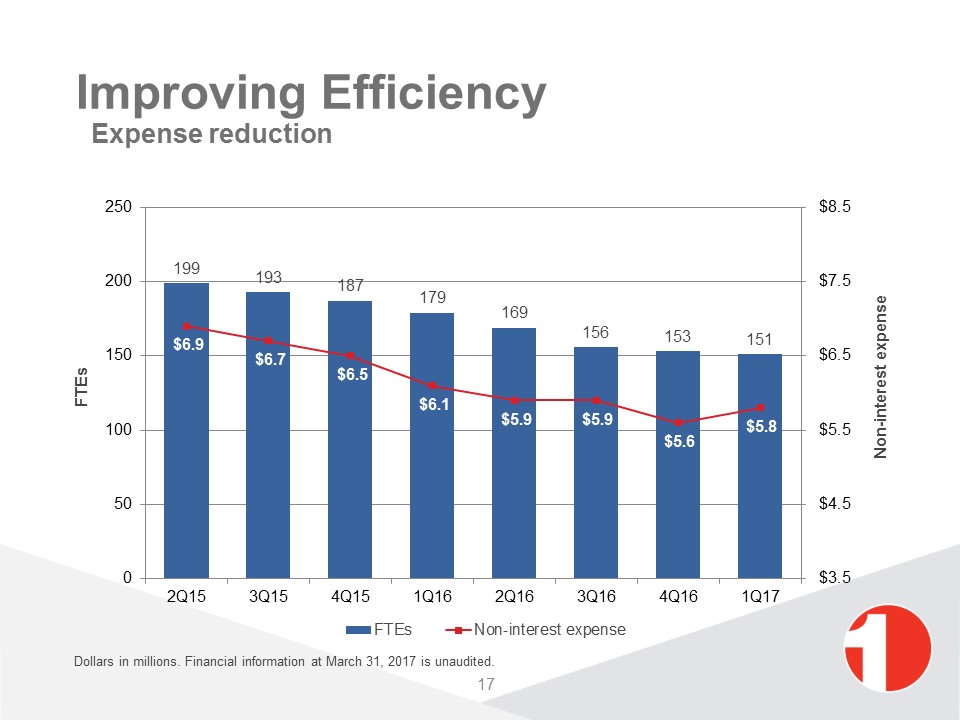
Improving Efficiency Expense reduction Dollars in millions. Financial information at March 31, 2017 is unaudited. 17
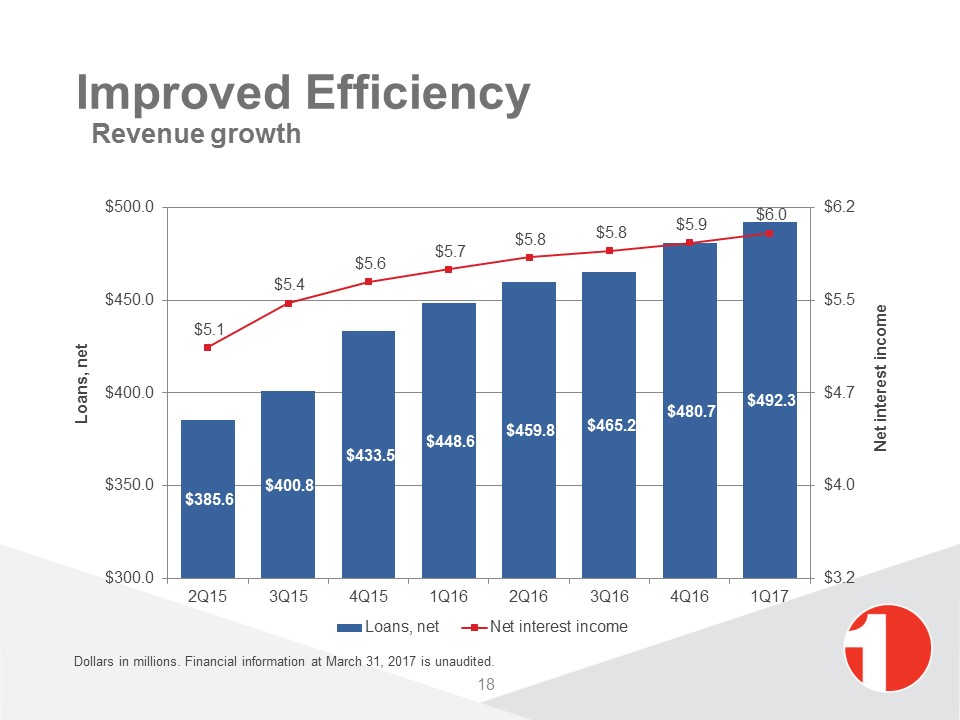
Improved Efficiency Revenue growth 18 Dollars in millions. Financial information at March 31, 2017 is unaudited.
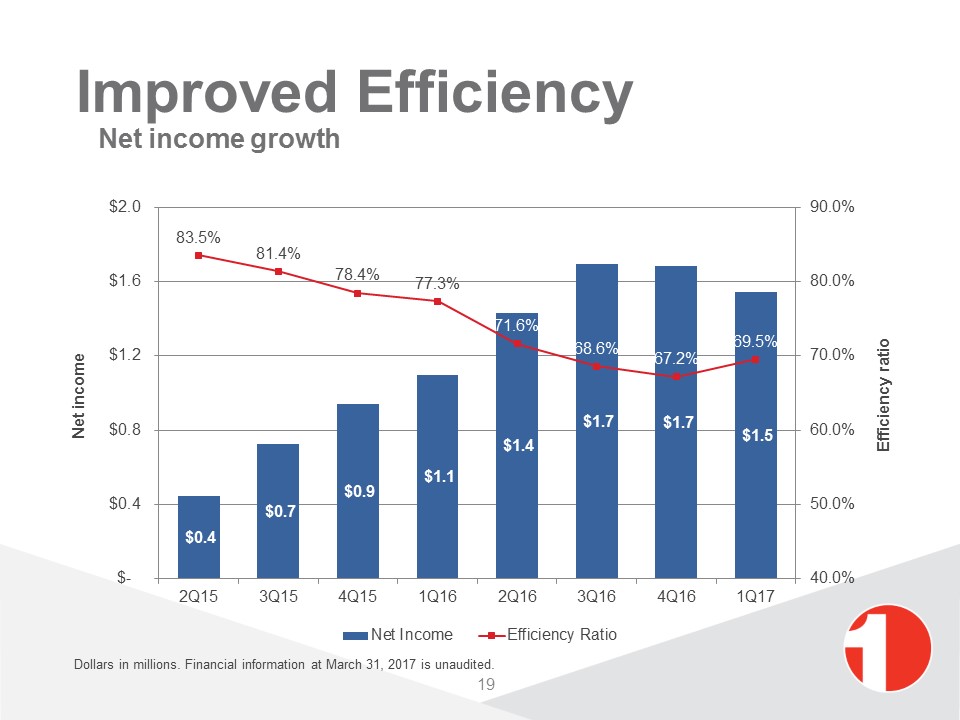
Improved Efficiency Net income growth 19 Dollars in millions. Financial information at March 31, 2017 is unaudited.
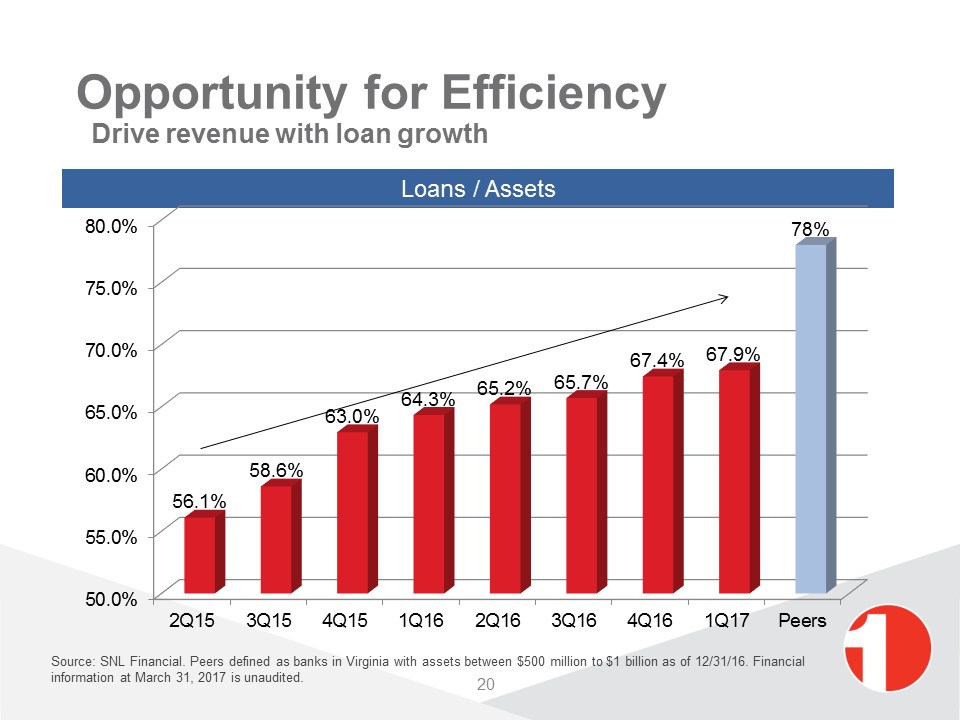
Opportunity for Efficiency Drive revenue with loan growth Loans / Assets 20 Source: SNL Financial. Peers defined as banks in Virginia with assets between $500 million to $1 billion as of 12/31/16. Financial information at March 31, 2017 is unaudited.
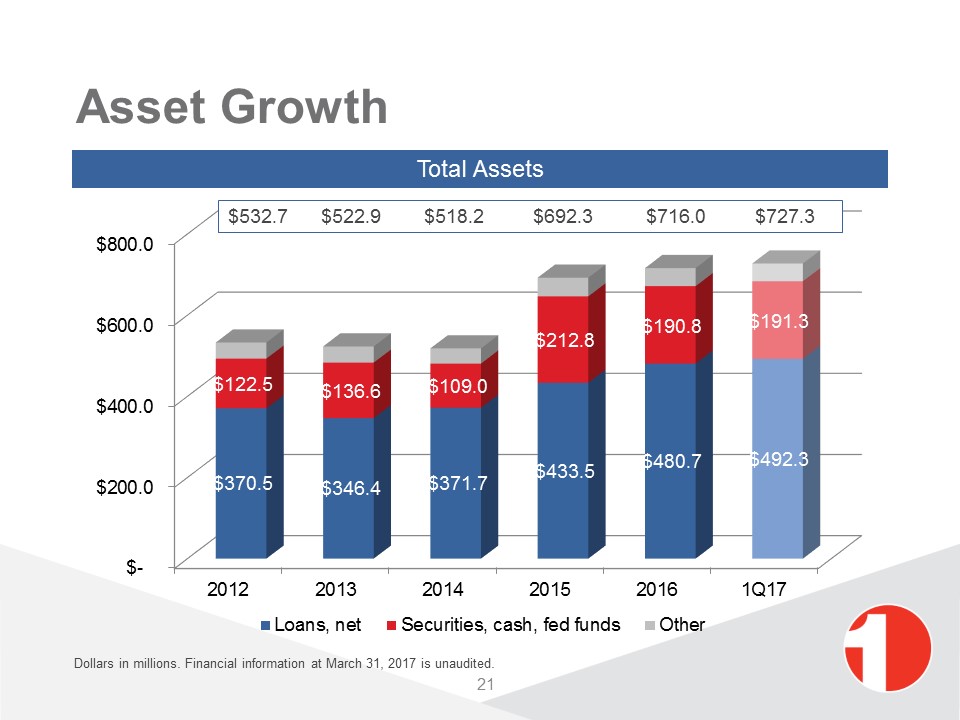
Asset Growth Total Assets 21 $532.7 $522.9 $518.2 $692.3 $716.0 $727.3 Dollars in millions. Financial information at March 31, 2017 is unaudited.
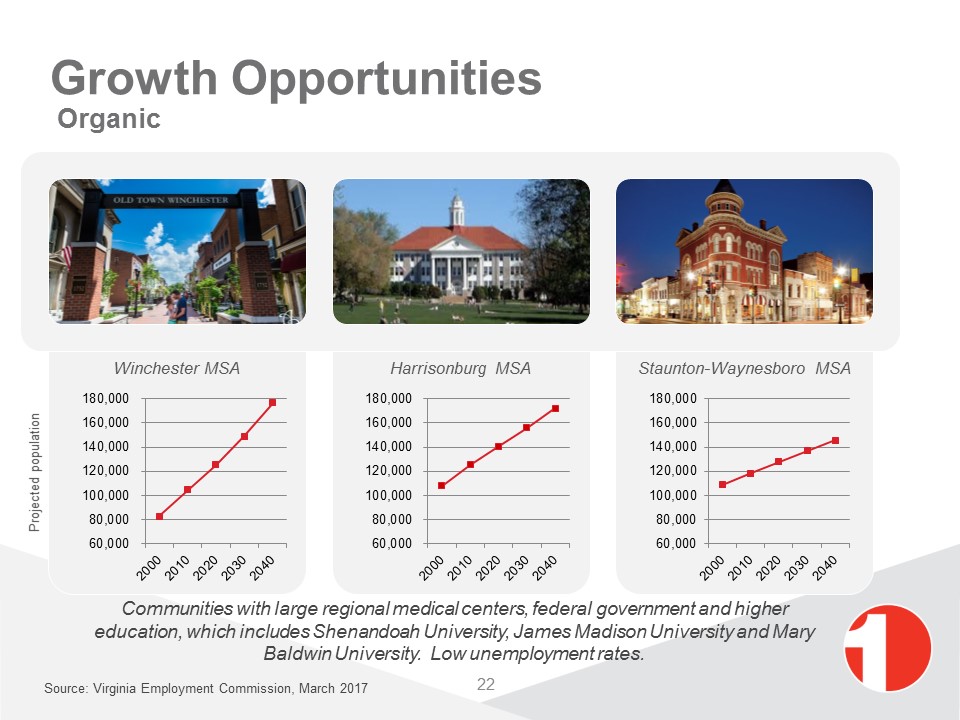
Growth Opportunities Organic Communities with large regional medical centers, federal government and higher education, which includes Shenandoah University, James Madison University and Mary Baldwin University. Low unemployment rates. Projected population 22 Source: Virginia Employment Commission, March 2017
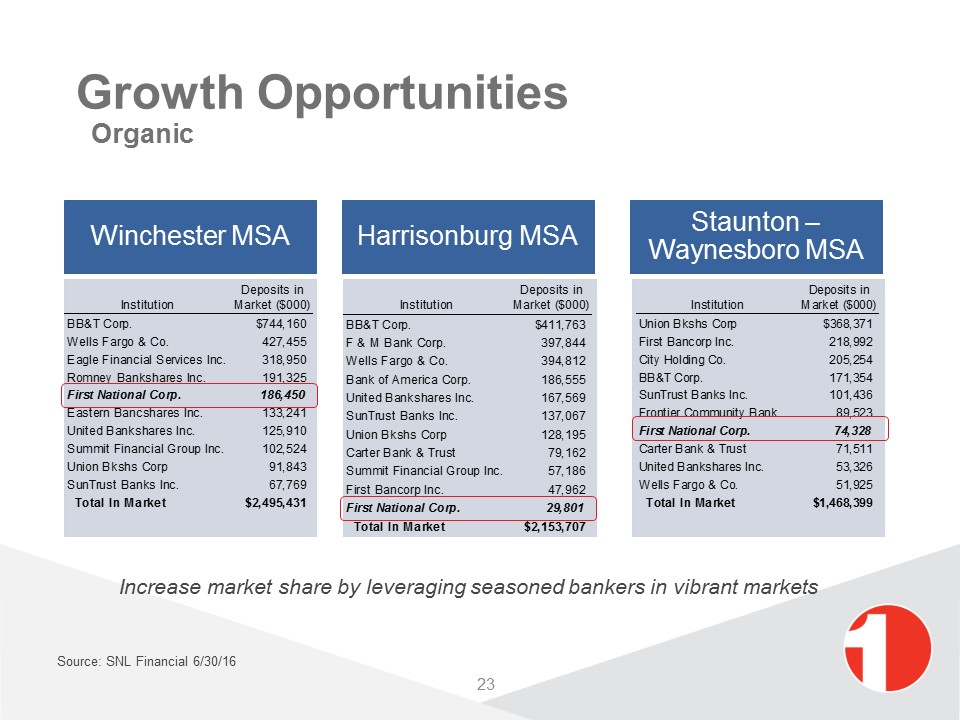
23 Growth Opportunities Organic Increase market share by leveraging seasoned bankers in vibrant markets Source: SNL Financial 6/30/16
Branch/deposit purchasesTeam lift outsLoan production officesPotential MarketsCharlottesvilleRoanokeFauquier County, Northern VirginiaRichmondHarrisonburgMartinsburg 24 Growth Opportunities Expansion
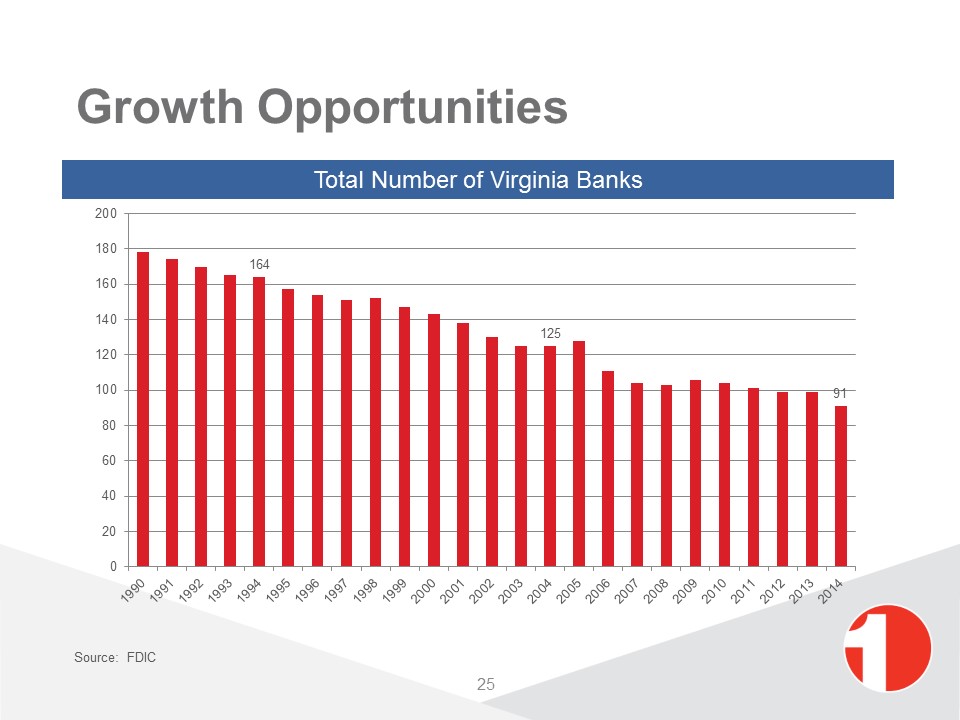
25 Growth Opportunities Total Number of Virginia Banks Source: FDIC

Growth Opportunities Whole bank acquisitions Source: SNL Financial Number of Virginia Banks by Asset Size 26
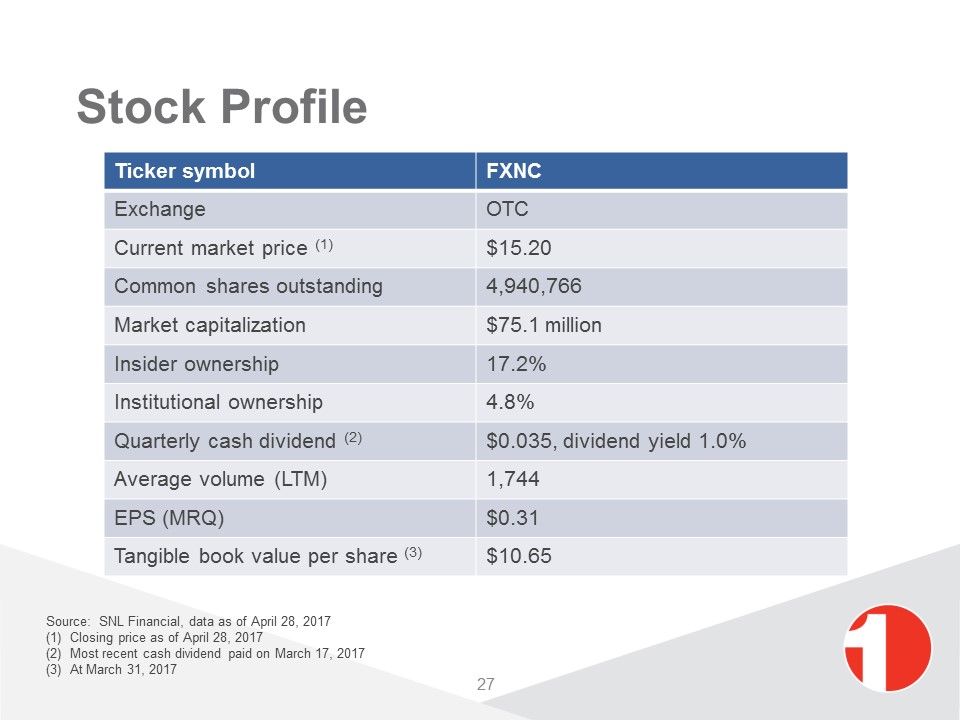
Stock Profile Source: SNL Financial, data as of April 28, 2017Closing price as of April 28, 2017Most recent cash dividend paid on March 17, 2017At March 31, 2017 Ticker symbol FXNC Exchange OTC Current market price (1) $15.20 Common shares outstanding 4,940,766 Market capitalization $75.1 million Insider ownership 17.2% Institutional ownership 4.8% Quarterly cash dividend (2) $0.035, dividend yield 1.0% Average volume (LTM) 1,744 EPS (MRQ) $0.31 Tangible book value per share (3) $10.65 27

Value Proposition Proven management teamLow-cost deposit funding available for loan growthHigh level of non-interest incomeDeep relationships in robust growing marketsFocus on efficiency as a driver of valueDisciplined loan growth with low levels of NPAs 28
Appendix 29
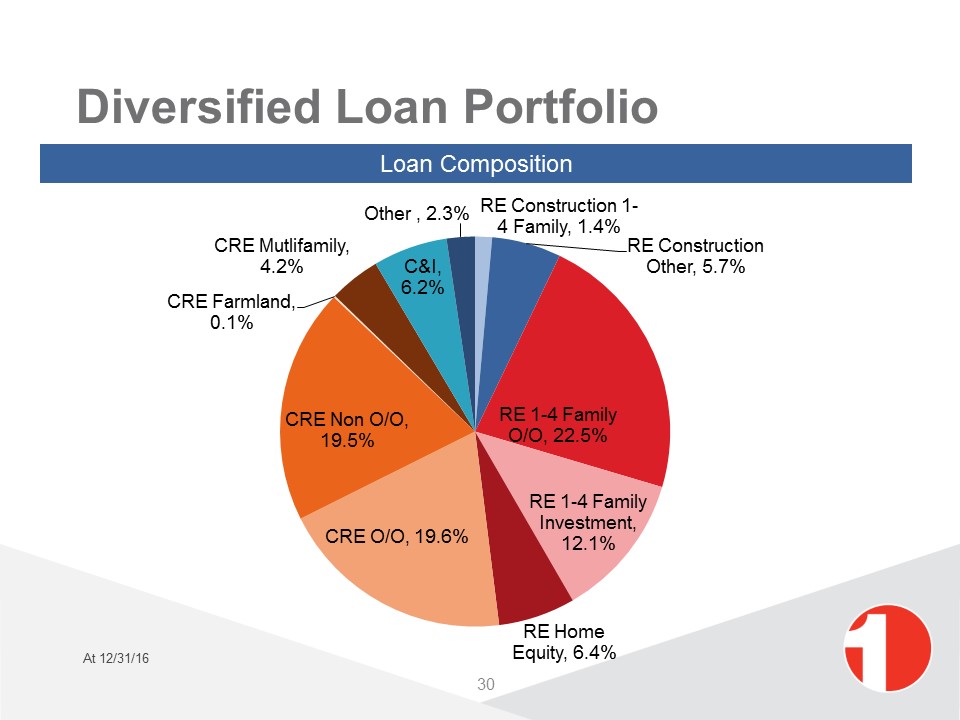
Diversified Loan Portfolio Loan Composition 30 At 12/31/16
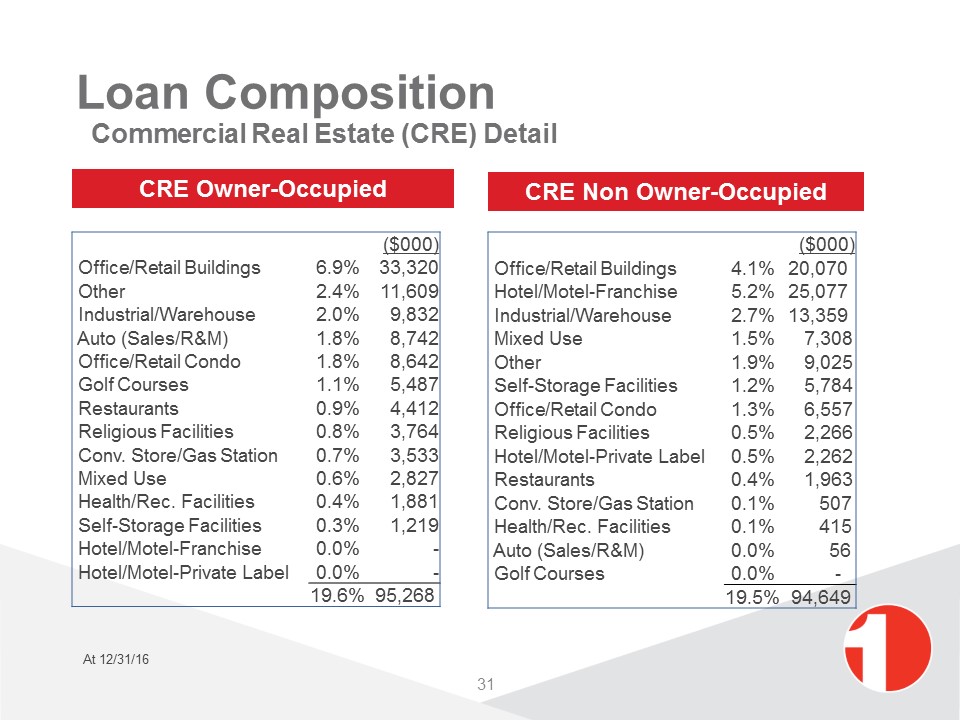
Loan Composition Commercial Real Estate (CRE) Detail CRE Owner-Occupied CRE Non Owner-Occupied ($000) Office/Retail Buildings 6.9% 33,320 Other 2.4% 11,609 Industrial/Warehouse 2.0% 9,832 Auto (Sales/R&M) 1.8% 8,742 Office/Retail Condo 1.8% 8,642 Golf Courses 1.1% 5,487 Restaurants 0.9% 4,412 Religious Facilities 0.8% 3,764 Conv. Store/Gas Station 0.7% 3,533 Mixed Use 0.6% 2,827 Health/Rec. Facilities 0.4% 1,881 Self-Storage Facilities 0.3% 1,219 Hotel/Motel-Franchise 0.0% - Hotel/Motel-Private Label 0.0% - 19.6% 95,268 ($000) Office/Retail Buildings 4.1% 20,070 Hotel/Motel-Franchise 5.2% 25,077 Industrial/Warehouse 2.7% 13,359 Mixed Use 1.5% 7,308 Other 1.9% 9,025 Self-Storage Facilities 1.2% 5,784 Office/Retail Condo 1.3% 6,557 Religious Facilities 0.5% 2,266 Hotel/Motel-Private Label 0.5% 2,262 Restaurants 0.4% 1,963 Conv. Store/Gas Station 0.1% 507 Health/Rec. Facilities 0.1% 415 Auto (Sales/R&M) 0.0% 56 Golf Courses 0.0% - 19.5% 94,649 At 12/31/16 31
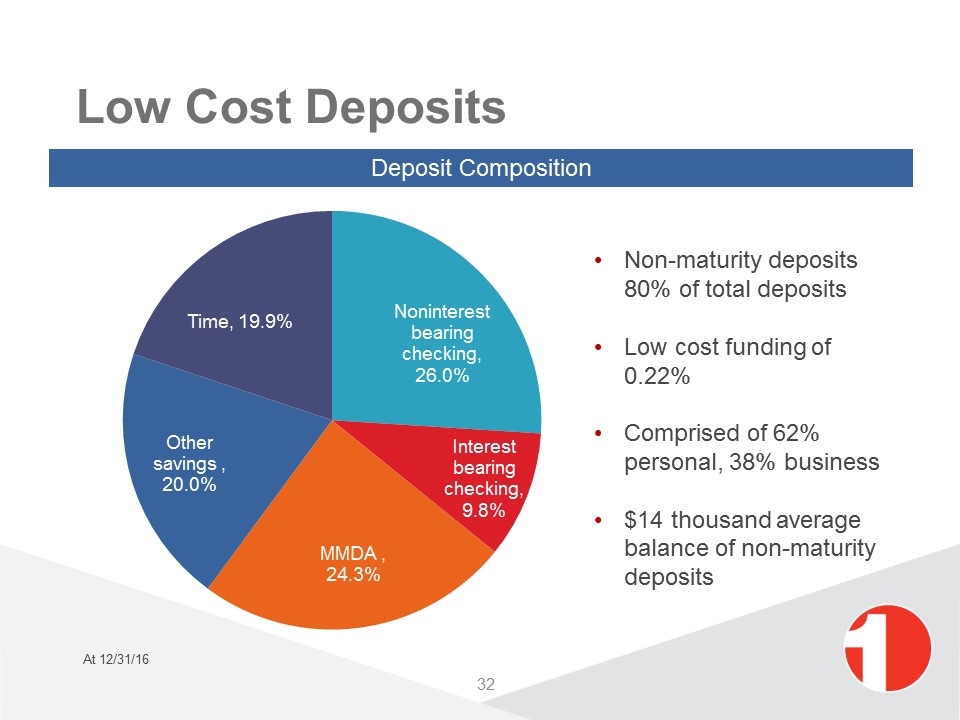
Low Cost Deposits Deposit Composition Non-maturity deposits 80% of total depositsLow cost funding of 0.22%Comprised of 62% personal, 38% business$14 thousand average balance of non-maturity deposits 32 At 12/31/16
Scott Harvard, President and CEO(540) 465-6121sharvard@fbvirginia.comShane Bell, Executive VP and CFO(540) 465-6130sbell@fbvirginia.com 33