UNITED STATES
SECURITIES AND EXCHANGE COMMISSION
Washington, D.C. 20549
FORM N-CSR
CERTIFIED SHAREHOLDER REPORT OF REGISTERED
MANAGEMENT INVESTMENT COMPANIES
Investment Company Act file number 811-03785
Fidelity Advisor Series I
(Exact name of registrant as specified in charter)
245 Summer St., Boston, Massachusetts 02210
(Address of principal executive offices) (Zip code)
Cynthia Lo Bessette, Secretary
245 Summer St.
Boston, Massachusetts 02210
(Name and address of agent for service)
Registrant's telephone number, including area code:
617-563-7000
Date of fiscal year end: | November 30 |
Date of reporting period: | November 30, 2022 |
Item 1.
Reports to Stockholders


Contents
| Average Annual Total Returns | |||
Periods ended November 30, 2022 | Past 1 year | Past 5 years | Past 10 years |
| Class A (incl.5.75% sales charge) | -23.46% | 12.13% | 14.38% |
| Class M (incl.3.50% sales charge) | -21.79% | 12.40% | 14.39% |
Class C (incl. contingent deferred sales charge) | -20.07% | 12.60% | 14.36% |
| Class I | -18.62% | 13.75% | 15.37% |
| Class Z | -18.46% | 13.91% | 15.52% |
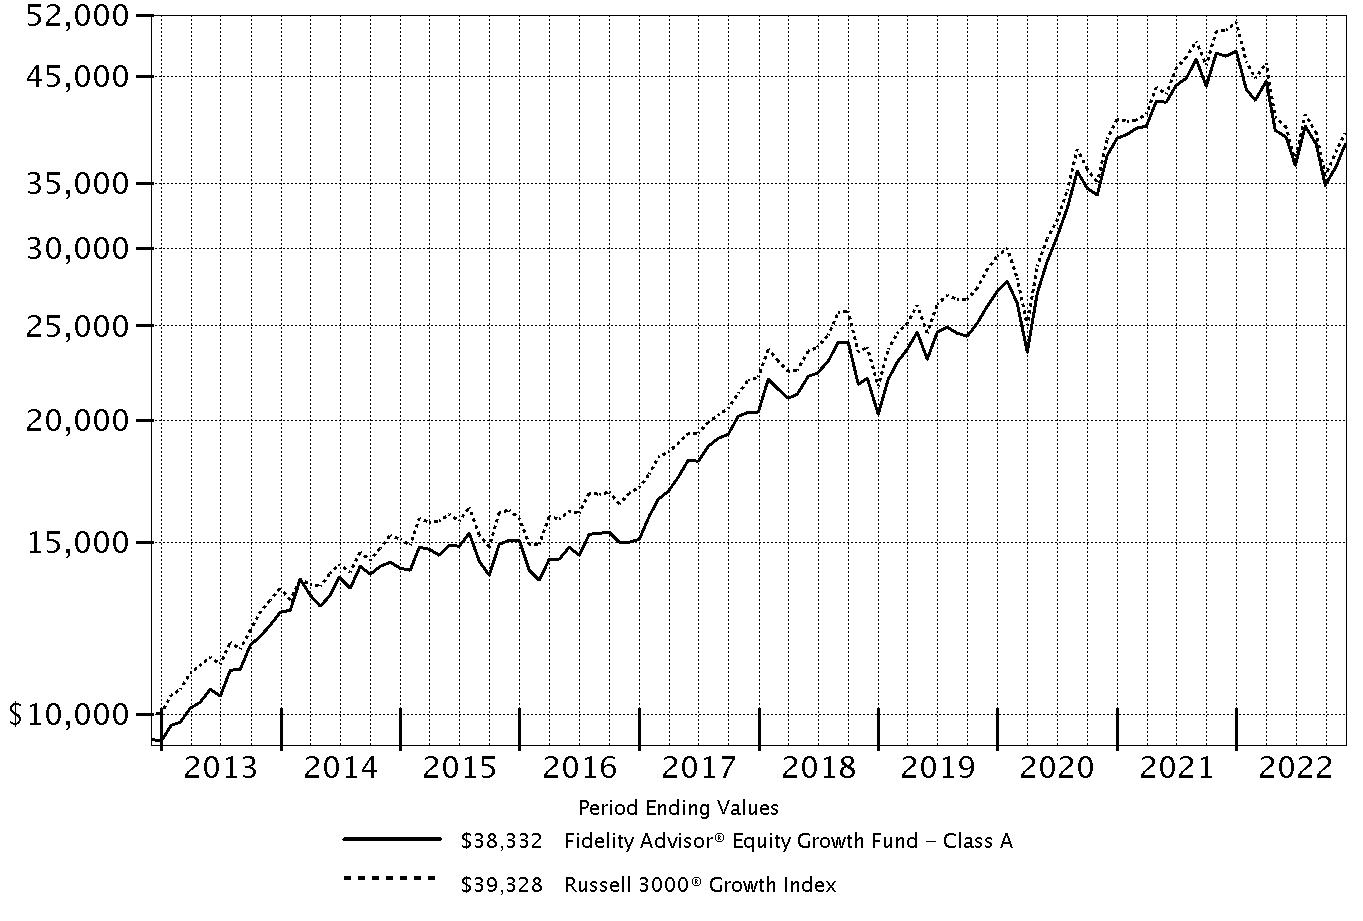
| $10,000 Over 10 Years |
Let's say hypothetically that $10,000 was invested in Fidelity Advisor® Equity Growth Fund - Class A, on November 30, 2012, and the current 5.75% sales charge was paid. The chart shows how the value of your investment would have changed, and also shows how the Russell 3000® Growth Index performed over the same period. |
 |
Top Holdings (% of Fund's net assets) | ||
| Microsoft Corp. | 10.0 | |
| UnitedHealth Group, Inc. | 5.6 | |
| Alphabet, Inc. Class A | 5.1 | |
| Apple, Inc. | 4.1 | |
| Amazon.com, Inc. | 3.5 | |
| Vertex Pharmaceuticals, Inc. | 3.1 | |
| Universal Music Group NV | 2.1 | |
| Warner Music Group Corp. Class A | 1.9 | |
| Meta Platforms, Inc. Class A | 1.9 | |
| Uber Technologies, Inc. | 1.9 | |
| 39.2 | ||
| Market Sectors (% of Fund's net assets) | ||
| Information Technology | 26.7 | |
| Health Care | 19.6 | |
| Communication Services | 12.8 | |
| Consumer Discretionary | 11.2 | |
| Industrials | 8.0 | |
| Financials | 5.9 | |
| Energy | 5.5 | |
| Materials | 4.6 | |
| Consumer Staples | 4.4 | |
| Real Estate | 0.1 | |
| Utilities | 0.0 | |
Asset Allocation (% of Fund's net assets) |
 |
Foreign investments - 10.2% |
Geographic Diversification (% of Fund's net assets) |
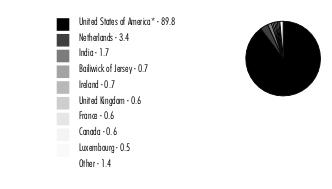 |
* Includes Short-Term investments and Net Other Assets (Liabilities). Percentages are based on country or territory of incorporation and are adjusted for the effect of futures contracts, if applicable. |
| Common Stocks - 98.5% | |||
| Shares | Value ($) (000s) | ||
| COMMUNICATION SERVICES - 12.8% | |||
| Entertainment - 4.5% | |||
| Liberty Media Corp. Liberty Formula One Group Series C (a) | 227,671 | 13,874 | |
| Netflix, Inc. (a) | 27,400 | 8,372 | |
| Universal Music Group NV | 4,379,149 | 104,140 | |
| Warner Music Group Corp. Class A | 2,662,533 | 91,245 | |
| 217,631 | |||
| Interactive Media & Services - 7.3% | |||
| Alphabet, Inc. Class A (a) | 2,450,960 | 247,522 | |
| Bumble, Inc. (a) | 410,300 | 9,995 | |
| Epic Games, Inc. (a)(b)(c) | 3,289 | 2,785 | |
| Meta Platforms, Inc. Class A (a) | 767,595 | 90,653 | |
| Zoominfo Technologies, Inc. (a) | 254,100 | 7,267 | |
| 358,222 | |||
| Media - 1.0% | |||
| Charter Communications, Inc. Class A (a) | 120,381 | 47,104 | |
| Innovid Corp. (a)(b) | 242,614 | 718 | |
| 47,822 | |||
TOTAL COMMUNICATION SERVICES | 623,675 | ||
| CONSUMER DISCRETIONARY - 11.2% | |||
| Auto Components - 0.0% | |||
| Mobileye Global, Inc. | 39,900 | 1,138 | |
| Automobiles - 0.6% | |||
| Ferrari NV | 141,665 | 31,598 | |
| XPeng, Inc. ADR (a)(d) | 19,500 | 211 | |
| 31,809 | |||
| Diversified Consumer Services - 0.2% | |||
| Laureate Education, Inc. Class A | 1,091,744 | 11,441 | |
| Hotels, Restaurants & Leisure - 1.6% | |||
| Airbnb, Inc. Class A (a) | 294,066 | 30,036 | |
| Chipotle Mexican Grill, Inc. (a) | 7,500 | 12,202 | |
| Flutter Entertainment PLC (a) | 189,353 | 28,194 | |
| Wingstop, Inc. (d) | 52,700 | 8,722 | |
| 79,154 | |||
| Household Durables - 0.0% | |||
| Blu Investments LLC (a)(b)(c) | 12,123,162 | 4 | |
| Internet & Direct Marketing Retail - 5.4% | |||
| Amazon.com, Inc. (a) | 1,774,391 | 171,300 | |
| Uber Technologies, Inc. (a) | 3,108,815 | 90,591 | |
| 261,891 | |||
| Multiline Retail - 0.1% | |||
| Dollarama, Inc. | 47,700 | 2,919 | |
| Specialty Retail - 2.2% | |||
| Aritzia, Inc. (a) | 89,600 | 3,408 | |
| Five Below, Inc. (a) | 213,458 | 34,337 | |
| TJX Companies, Inc. | 484,163 | 38,757 | |
| Victoria's Secret & Co. (a) | 627,380 | 28,859 | |
| 105,361 | |||
| Textiles, Apparel & Luxury Goods - 1.1% | |||
| LVMH Moet Hennessy Louis Vuitton SE | 39,545 | 30,688 | |
| On Holding AG (a) | 11,400 | 221 | |
| Samsonite International SA (a)(e) | 9,209,700 | 24,964 | |
| 55,873 | |||
TOTAL CONSUMER DISCRETIONARY | 549,590 | ||
| CONSUMER STAPLES - 4.4% | |||
| Beverages - 4.4% | |||
| Boston Beer Co., Inc. Class A (a) | 49,200 | 18,911 | |
| Constellation Brands, Inc. Class A (sub. vtg.) | 115,083 | 29,617 | |
| Keurig Dr. Pepper, Inc. | 742,358 | 28,707 | |
| Monster Beverage Corp. (a) | 453,689 | 46,666 | |
| The Coca-Cola Co. | 1,399,708 | 89,035 | |
| 212,936 | |||
| ENERGY - 5.5% | |||
| Energy Equipment & Services - 1.1% | |||
| Baker Hughes Co. Class A | 842,057 | 24,436 | |
| Cactus, Inc. | 130,600 | 7,103 | |
| Championx Corp. | 494,052 | 15,237 | |
| Helmerich & Payne, Inc. | 130,700 | 6,676 | |
| TechnipFMC PLC (a) | 66,700 | 827 | |
| 54,279 | |||
| Oil, Gas & Consumable Fuels - 4.4% | |||
| Canadian Natural Resources Ltd. | 319,944 | 19,107 | |
| Cheniere Energy, Inc. | 408,600 | 71,652 | |
| Denbury, Inc. (a) | 96,800 | 8,689 | |
| New Fortress Energy, Inc. | 291,815 | 14,853 | |
| Ovintiv, Inc. | 84,700 | 4,723 | |
| Range Resources Corp. | 587,732 | 16,968 | |
| Reliance Industries Ltd. | 2,323,225 | 78,207 | |
| 214,199 | |||
TOTAL ENERGY | 268,478 | ||
| FINANCIALS - 5.9% | |||
| Banks - 1.1% | |||
| Bank of America Corp. | 1,182,393 | 44,754 | |
| HDFC Bank Ltd. (a) | 135,292 | 2,685 | |
| Signature Bank | 43,600 | 6,082 | |
| 53,521 | |||
| Capital Markets - 2.0% | |||
| CME Group, Inc. | 419,080 | 73,968 | |
| MSCI, Inc. | 47,786 | 24,267 | |
| 98,235 | |||
| Insurance - 2.7% | |||
| American Financial Group, Inc. | 191,024 | 27,167 | |
| Arthur J. Gallagher & Co. | 292,052 | 58,150 | |
| BRP Group, Inc. (a) | 304,200 | 9,138 | |
| Marsh & McLennan Companies, Inc. | 216,199 | 37,441 | |
| 131,896 | |||
| Thrifts & Mortgage Finance - 0.1% | |||
| Rocket Companies, Inc. (d) | 407,700 | 3,384 | |
TOTAL FINANCIALS | 287,036 | ||
| HEALTH CARE - 19.6% | |||
| Biotechnology - 6.6% | |||
| 2seventy bio, Inc. (a) | 57,100 | 895 | |
| Adamas Pharmaceuticals, Inc.: | |||
| rights (a)(c) | 1,000,100 | 60 | |
| rights (a)(c) | 1,000,100 | 60 | |
| Affimed NV (a) | 337,485 | 722 | |
| Alnylam Pharmaceuticals, Inc. (a) | 118,022 | 26,034 | |
| Applied Therapeutics, Inc. (a) | 82,690 | 93 | |
| Arcellx, Inc. | 42,000 | 837 | |
| Beam Therapeutics, Inc. (a)(d) | 45,900 | 2,120 | |
| Cytokinetics, Inc. (a) | 124,200 | 5,279 | |
| EQRx, Inc. (a) | 243,811 | 917 | |
| Erasca, Inc. (a) | 95,000 | 717 | |
| Evelo Biosciences, Inc. (a) | 268,200 | 561 | |
| Galapagos NV sponsored ADR (a) | 288,500 | 11,474 | |
| Gamida Cell Ltd. (a)(d) | 1,496,668 | 2,395 | |
| Genmab A/S (a) | 10,800 | 5,005 | |
| Hookipa Pharma, Inc. (a) | 669,700 | 710 | |
| Immunocore Holdings PLC ADR (a) | 76,500 | 4,805 | |
| Innovent Biologics, Inc. (a)(e) | 615,500 | 2,486 | |
| Insmed, Inc. (a) | 514,189 | 9,507 | |
| Legend Biotech Corp. ADR (a) | 84,500 | 4,353 | |
| Prelude Therapeutics, Inc. (a) | 17,000 | 113 | |
| Regeneron Pharmaceuticals, Inc. (a) | 77,403 | 58,184 | |
| Rubius Therapeutics, Inc. (a) | 80,596 | 18 | |
| Seagen, Inc. (a) | 209,169 | 25,391 | |
| Seres Therapeutics, Inc. (a) | 235,000 | 1,528 | |
| Synlogic, Inc. (a) | 670,300 | 401 | |
| Vertex Pharmaceuticals, Inc. (a) | 477,781 | 151,170 | |
| Vor Biopharma, Inc. (a) | 252,839 | 1,163 | |
| XOMA Corp. (a)(d) | 264,700 | 5,604 | |
| 322,602 | |||
| Health Care Equipment & Supplies - 0.6% | |||
| Edwards Lifesciences Corp. (a) | 257,730 | 19,910 | |
| Insulet Corp. (a) | 5,000 | 1,497 | |
| Nevro Corp. (a) | 38,600 | 1,803 | |
| Penumbra, Inc. (a) | 37,386 | 7,833 | |
| 31,043 | |||
| Health Care Providers & Services - 6.9% | |||
| Guardant Health, Inc. (a) | 259,715 | 13,593 | |
| HealthEquity, Inc. (a) | 792,322 | 50,297 | |
| Option Care Health, Inc. (a) | 46,500 | 1,400 | |
| UnitedHealth Group, Inc. | 499,201 | 273,442 | |
| 338,732 | |||
| Health Care Technology - 0.3% | |||
| Certara, Inc. (a) | 434,623 | 7,380 | |
| Doximity, Inc. (a) | 72,200 | 2,454 | |
| Simulations Plus, Inc. (d) | 81,500 | 3,308 | |
| 13,142 | |||
| Life Sciences Tools & Services - 2.5% | |||
| Bio-Techne Corp. | 151,314 | 12,860 | |
| Bruker Corp. | 358,904 | 24,194 | |
| Charles River Laboratories International, Inc. (a) | 20,400 | 4,663 | |
| Codexis, Inc. (a) | 365,704 | 2,000 | |
| Danaher Corp. | 195,082 | 53,337 | |
| Nanostring Technologies, Inc. (a) | 62,300 | 435 | |
| Thermo Fisher Scientific, Inc. | 39,269 | 21,999 | |
| 119,488 | |||
| Pharmaceuticals - 2.7% | |||
| Aclaris Therapeutics, Inc. (a) | 156,900 | 2,388 | |
| AstraZeneca PLC sponsored ADR | 446,262 | 30,332 | |
| Eli Lilly & Co. | 237,907 | 88,283 | |
| Nuvation Bio, Inc. (a) | 186,501 | 356 | |
| Revance Therapeutics, Inc. (a) | 424,700 | 9,220 | |
| 130,579 | |||
TOTAL HEALTH CARE | 955,586 | ||
| INDUSTRIALS - 8.0% | |||
| Aerospace & Defense - 2.4% | |||
| Axon Enterprise, Inc. (a) | 71,400 | 13,140 | |
| Northrop Grumman Corp. | 80,390 | 42,871 | |
| The Boeing Co. (a) | 347,339 | 62,132 | |
| 118,143 | |||
| Electrical Equipment - 1.4% | |||
| AMETEK, Inc. | 114,010 | 16,237 | |
| Bloom Energy Corp. Class A (a)(d) | 87,000 | 1,852 | |
| Eaton Corp. PLC | 38,400 | 6,276 | |
| Hubbell, Inc. Class B | 44,000 | 11,179 | |
| Rockwell Automation, Inc. | 124,635 | 32,931 | |
| 68,475 | |||
| Machinery - 1.8% | |||
| Chart Industries, Inc. (a) | 49,500 | 7,078 | |
| Ingersoll Rand, Inc. | 850,924 | 45,924 | |
| Parker Hannifin Corp. | 66,622 | 19,916 | |
| Westinghouse Air Brake Tech Co. | 129,100 | 13,051 | |
| 85,969 | |||
| Professional Services - 1.4% | |||
| ASGN, Inc. (a) | 108,100 | 9,794 | |
| KBR, Inc. | 1,008,557 | 52,112 | |
| Kforce, Inc. | 42,200 | 2,493 | |
| Upwork, Inc. (a) | 365,088 | 4,472 | |
| 68,871 | |||
| Road & Rail - 0.3% | |||
| Old Dominion Freight Lines, Inc. | 52,128 | 15,774 | |
| Trading Companies & Distributors - 0.7% | |||
| Ferguson PLC | 307,753 | 34,890 | |
TOTAL INDUSTRIALS | 392,122 | ||
| INFORMATION TECHNOLOGY - 26.7% | |||
| IT Services - 1.4% | |||
| Cloudflare, Inc. (a) | 236,854 | 11,639 | |
| MasterCard, Inc. Class A | 105,387 | 37,560 | |
| MongoDB, Inc. Class A (a) | 122,933 | 18,771 | |
| Snowflake, Inc. (a) | 7,500 | 1,072 | |
| 69,042 | |||
| Semiconductors & Semiconductor Equipment - 5.2% | |||
| Aixtron AG | 526,996 | 17,374 | |
| Allegro MicroSystems LLC (a) | 135,600 | 4,223 | |
| ASML Holding NV | 41,560 | 25,273 | |
| eMemory Technology, Inc. | 36,000 | 1,763 | |
| Enphase Energy, Inc. (a) | 152,772 | 48,977 | |
| Monolithic Power Systems, Inc. | 7,600 | 2,903 | |
| NVIDIA Corp. | 386,198 | 65,356 | |
| NXP Semiconductors NV | 56,300 | 9,900 | |
| Qualcomm, Inc. | 333,208 | 42,147 | |
| Silicon Laboratories, Inc. (a) | 7,320 | 1,065 | |
| SiTime Corp. (a) | 131,743 | 13,894 | |
| Universal Display Corp. | 178,707 | 20,126 | |
| 253,001 | |||
| Software - 16.0% | |||
| Adobe, Inc. (a) | 257,298 | 88,750 | |
| Confluent, Inc. (a)(d) | 250,200 | 5,762 | |
| Elastic NV (a) | 3,012 | 184 | |
| HashiCorp, Inc. (d) | 190,300 | 5,195 | |
| HubSpot, Inc. (a) | 25,800 | 7,818 | |
| Intuit, Inc. | 101,261 | 41,273 | |
| Manhattan Associates, Inc. (a) | 187,464 | 23,609 | |
| Microsoft Corp. | 1,913,512 | 488,219 | |
| Oracle Corp. | 629,006 | 52,226 | |
| Palo Alto Networks, Inc. (a) | 381,686 | 64,848 | |
| Volue A/S (a) | 1,027,700 | 3,210 | |
| 781,094 | |||
| Technology Hardware, Storage & Peripherals - 4.1% | |||
| Apple, Inc. | 1,366,202 | 202,239 | |
TOTAL INFORMATION TECHNOLOGY | 1,305,376 | ||
| MATERIALS - 4.3% | |||
| Chemicals - 3.8% | |||
| Albemarle Corp. | 227,464 | 63,233 | |
| Aspen Aerogels, Inc. (a) | 467,000 | 5,632 | |
| CF Industries Holdings, Inc. | 499,997 | 54,095 | |
| Sherwin-Williams Co. | 248,470 | 61,914 | |
| 184,874 | |||
| Metals & Mining - 0.5% | |||
| Lynas Rare Earths Ltd. (a) | 2,036,363 | 12,080 | |
| MP Materials Corp. (a)(d) | 335,100 | 11,142 | |
| 23,222 | |||
TOTAL MATERIALS | 208,096 | ||
| REAL ESTATE - 0.1% | |||
| Real Estate Management & Development - 0.1% | |||
| Doma Holdings, Inc. (a)(b) | 487,314 | 192 | |
| WeWork, Inc. (a)(d) | 2,621,500 | 7,235 | |
| 7,427 | |||
| UTILITIES - 0.0% | |||
| Independent Power and Renewable Electricity Producers - 0.0% | |||
| Brookfield Renewable Partners LP | 82,400 | 2,331 | |
| TOTAL COMMON STOCKS (Cost $3,460,862) | 4,812,653 | ||
| Convertible Preferred Stocks - 0.3% | |||
| Shares | Value ($) (000s) | ||
| HEALTH CARE - 0.0% | |||
| Biotechnology - 0.0% | |||
| ElevateBio LLC Series C (a)(b)(c) | 111,100 | 508 | |
| INFORMATION TECHNOLOGY - 0.0% | |||
| IT Services - 0.0% | |||
| AppNexus, Inc. Series E (Escrow) (a)(b)(c) | 105,425 | 3 | |
| Software - 0.0% | |||
| ASAPP, Inc. Series C (a)(b)(c) | 367,427 | 1,400 | |
TOTAL INFORMATION TECHNOLOGY | 1,403 | ||
| MATERIALS - 0.3% | |||
| Metals & Mining - 0.3% | |||
| Illuminated Holdings, Inc.: | |||
| Series C2 (a)(b)(c) | 76,285 | 3,595 | |
| Series C3 (a)(b)(c) | 95,356 | 4,493 | |
| Series C4 (a)(b)(c) | 27,230 | 1,283 | |
| Series C5 (a)(b)(c) | 53,844 | 2,537 | |
| 11,908 | |||
| TOTAL CONVERTIBLE PREFERRED STOCKS (Cost $10,964) | 13,819 | ||
| Money Market Funds - 3.1% | |||
| Shares | Value ($) (000s) | ||
| Fidelity Cash Central Fund 3.86% (f) | 121,702,858 | 121,727 | |
| Fidelity Securities Lending Cash Central Fund 3.86% (f)(g) | 30,148,787 | 30,152 | |
| TOTAL MONEY MARKET FUNDS (Cost $151,879) | 151,879 | ||
| TOTAL INVESTMENT IN SECURITIES - 101.9% (Cost $3,623,705) | 4,978,351 |
NET OTHER ASSETS (LIABILITIES) - (1.9)% | (92,537) |
| NET ASSETS - 100.0% | 4,885,814 |
| (a) | Non-income producing |
| (b) | Restricted securities (including private placements) - Investment in securities not registered under the Securities Act of 1933 (excluding 144A issues). At the end of the period, the value of restricted securities (excluding 144A issues) amounted to $17,518,000 or 0.4% of net assets. |
| (c) | Level 3 security |
| (d) | Security or a portion of the security is on loan at period end. |
| (e) | Security exempt from registration under Rule 144A of the Securities Act of 1933. These securities may be resold in transactions exempt from registration, normally to qualified institutional buyers. At the end of the period, the value of these securities amounted to $27,450,000 or 0.6% of net assets. |
| (f) | Affiliated fund that is generally available only to investment companies and other accounts managed by Fidelity Investments. The rate quoted is the annualized seven-day yield of the fund at period end. A complete unaudited listing of the fund's holdings as of its most recent quarter end is available upon request. In addition, each Fidelity Central Fund's financial statements, which are not covered by the Fund's Report of Independent Registered Public Accounting Firm, are available on the SEC's website or upon request. |
| (g) | Investment made with cash collateral received from securities on loan. |
| Additional information on each restricted holding is as follows: | ||
| Security | Acquisition Date | Acquisition Cost ($) (000s) |
| AppNexus, Inc. Series E (Escrow) | 8/01/14 | 0 |
| ASAPP, Inc. Series C | 4/30/21 | 2,424 |
| Blu Investments LLC | 5/21/20 | 21 |
| Doma Holdings, Inc. | 3/02/21 | 4,873 |
| ElevateBio LLC Series C | 3/09/21 | 466 |
| Epic Games, Inc. | 3/29/21 | 2,911 |
| Illuminated Holdings, Inc. Series C2 | 7/07/20 | 1,907 |
| Illuminated Holdings, Inc. Series C3 | 7/07/20 | 2,861 |
| Illuminated Holdings, Inc. Series C4 | 1/08/21 | 980 |
| Illuminated Holdings, Inc. Series C5 | 6/16/21 | 2,326 |
| Innovid Corp. | 6/24/21 | 2,426 |
| Affiliate (Amounts in thousands) | Value, beginning of period ($) | Purchases ($) | Sales Proceeds ($) | Dividend Income ($) | Realized Gain (loss) ($) | Change in Unrealized appreciation (depreciation) ($) | Value, end of period ($) | % ownership, end of period |
| Fidelity Cash Central Fund 3.86% | 47,883 | 1,383,077 | 1,309,233 | 1,419 | - | - | 121,727 | 0.3% |
| Fidelity Securities Lending Cash Central Fund 3.86% | 15,138 | 474,578 | 459,564 | 384 | - | - | 30,152 | 0.1% |
| Total | 63,021 | 1,857,655 | 1,768,797 | 1,803 | - | - | 151,879 | |
| Valuation Inputs at Reporting Date: | ||||
Description (Amounts in thousands) | Total ($) | Level 1 ($) | Level 2 ($) | Level 3 ($) |
Investments in Securities: | ||||
| Equities: | ||||
Communication Services | 623,675 | 516,750 | 104,140 | 2,785 |
Consumer Discretionary | 549,590 | 465,740 | 83,846 | 4 |
Consumer Staples | 212,936 | 212,936 | - | - |
Energy | 268,478 | 190,271 | 78,207 | - |
Financials | 287,036 | 284,351 | 2,685 | - |
Health Care | 956,094 | 947,975 | 7,491 | 628 |
Industrials | 392,122 | 357,232 | 34,890 | - |
Information Technology | 1,306,779 | 1,283,029 | 22,347 | 1,403 |
Materials | 220,004 | 196,016 | 12,080 | 11,908 |
Real Estate | 7,427 | 7,427 | - | - |
Utilities | 2,331 | 2,331 | - | - |
| Money Market Funds | 151,879 | 151,879 | - | - |
| Total Investments in Securities: | 4,978,351 | 4,615,937 | 345,686 | 16,728 |
| Statement of Assets and Liabilities | ||||
| Amounts in thousands (except per-share amounts) | November 30, 2022 | |||
| Assets | ||||
| Investment in securities, at value (including securities loaned of $31,013) - See accompanying schedule: | ||||
Unaffiliated issuers (cost $3,471,826) | $4,826,472 | |||
Fidelity Central Funds (cost $151,879) | 151,879 | |||
| Total Investment in Securities (cost $3,623,705) | $ | 4,978,351 | ||
| Receivable for investments sold | 12,133 | |||
| Receivable for fund shares sold | 9,386 | |||
| Dividends receivable | 4,318 | |||
| Distributions receivable from Fidelity Central Funds | 469 | |||
| Prepaid expenses | 6 | |||
| Other receivables | 24 | |||
Total assets | 5,004,687 | |||
| Liabilities | ||||
| Payable for investments purchased | $78,475 | |||
| Payable for fund shares redeemed | 2,379 | |||
| Accrued management fee | 2,011 | |||
| Distribution and service plan fees payable | 933 | |||
| Other affiliated payables | 632 | |||
| Other payables and accrued expenses | 4,296 | |||
| Collateral on securities loaned | 30,147 | |||
| Total Liabilities | 118,873 | |||
| Net Assets | $ | 4,885,814 | ||
| Net Assets consist of: | ||||
| Paid in capital | $ | 3,458,997 | ||
| Total accumulated earnings (loss) | 1,426,817 | |||
| Net Assets | $ | 4,885,814 | ||
| Net Asset Value and Maximum Offering Price | ||||
| Class A : | ||||
Net Asset Value and redemption price per share ($1,421,852 ÷ 102,682 shares) (a) | $ | 13.85 | ||
| Maximum offering price per share (100/94.25 of $13.85) | $ | 14.69 | ||
| Class M : | ||||
Net Asset Value and redemption price per share ($1,436,622 ÷ 107,402 shares) (a) | $ | 13.38 | ||
| Maximum offering price per share (100/96.50 of $13.38) | $ | 13.87 | ||
| Class C : | ||||
Net Asset Value and offering price per share ($97,630 ÷ 9,266 shares) (a) | $ | 10.54 | ||
| Class I : | ||||
Net Asset Value , offering price and redemption price per share ($1,284,799 ÷ 80,531 shares) | $ | 15.95 | ||
| Class Z : | ||||
Net Asset Value , offering price and redemption price per share ($644,911 ÷ 39,894 shares) | $ | 16.17 | ||
(a)Redemption price per share is equal to net asset value less any applicable contingent deferred sales charge. | ||||
| Statement of Operations | ||||
| Amounts in thousands | Year ended November 30, 2022 | |||
| Investment Income | ||||
| Dividends | $ | 36,450 | ||
| Income from Fidelity Central Funds (including $384 from security lending) | 1,803 | |||
| Total Income | 38,253 | |||
| Expenses | ||||
| Management fee | $ | 23,564 | ||
| Transfer agent fees | 6,807 | |||
| Distribution and service plan fees | 12,546 | |||
| Accounting fees | 998 | |||
| Custodian fees and expenses | 91 | |||
| Independent trustees' fees and expenses | 16 | |||
| Registration fees | 206 | |||
| Audit | 71 | |||
| Legal | 6 | |||
| Interest | 1 | |||
| Miscellaneous | 20 | |||
| Total expenses before reductions | 44,326 | |||
| Expense reductions | (149) | |||
| Total expenses after reductions | 44,177 | |||
| Net Investment income (loss) | (5,924) | |||
| Realized and Unrealized Gain (Loss) | ||||
| Net realized gain (loss) on: | ||||
| Investment Securities: | ||||
| Unaffiliated issuers(net of foreign taxes of $300) | 101,827 | |||
| Foreign currency transactions | (63) | |||
| Total net realized gain (loss) | 101,764 | |||
| Change in net unrealized appreciation (depreciation) on: | ||||
| Investment Securities: | ||||
| Unaffiliated issuers (net of increase in deferred foreign taxes of $430) | (1,034,466) | |||
| Unfunded commitments | 253 | |||
| Assets and liabilities in foreign currencies | 28 | |||
| Total change in net unrealized appreciation (depreciation) | (1,034,185) | |||
| Net gain (loss) | (932,421) | |||
| Net increase (decrease) in net assets resulting from operations | $ | (938,345) | ||
| Statement of Changes in Net Assets | ||||
| Amount in thousands | Year ended November 30, 2022 | Year ended November 30, 2021 | ||
| Increase (Decrease) in Net Assets | ||||
| Operations | ||||
| Net investment income (loss) | $ | (5,924) | $ | (3,171) |
| Net realized gain (loss) | 101,764 | 641,521 | ||
| Change in net unrealized appreciation (depreciation) | (1,034,185) | 464,667 | ||
| Net increase (decrease) in net assets resulting from operations | (938,345) | 1,103,017 | ||
| Distributions to shareholders | (584,982) | (476,279) | ||
| Share transactions - net increase (decrease) | 1,234,456 | 241,772 | ||
| Total increase (decrease) in net assets | (288,871) | 868,510 | ||
| Net Assets | ||||
| Beginning of period | 5,174,685 | 4,306,175 | ||
| End of period | $ | 4,885,814 | $ | 5,174,685 |
| Fidelity Advisor® Equity Growth Fund Class A |
| Years ended November 30, | 2022 | 2021 | 2020 | 2019 | 2018 A | |||||
Selected Per-Share Data | ||||||||||
| Net asset value, beginning of period | $ | 19.23 | $ | 17.06 | $ | 13.07 | $ | 11.84 | $ | 12.26 |
| Income from Investment Operations | ||||||||||
Net investment income (loss) B,C | (.02) | - D | (.05) | (.02) | (.01) | |||||
| Net realized and unrealized gain (loss) | (3.14) | 4.08 | 5.22 | 1.97 | .93 | |||||
| Total from investment operations | (3.16) | 4.08 | 5.17 | 1.95 | .92 | |||||
| Distributions from net realized gain | (2.22) | (1.91) | (1.18) | (.72) | (1.34) | |||||
| Total distributions | (2.22) | (1.91) | (1.18) | (.72) | (1.34) | |||||
| Net asset value, end of period | $ | 13.85 | $ | 19.23 | $ | 17.06 | $ | 13.07 | $ | 11.84 |
Total Return E,F | (18.79)% | 26.35% | 42.92% | 18.34% | 8.38% | |||||
Ratios to Average Net Assets C,G,H | ||||||||||
| Expenses before reductions | .97% | .97% | .99% | 1.01% | 1.02% | |||||
| Expenses net of fee waivers, if any | .97% | .97% | .99% | 1.01% | 1.01% | |||||
| Expenses net of all reductions | .97% | .97% | .99% | 1.01% | 1.01% | |||||
| Net investment income (loss) | (.11)% | (.02)% D | (.33)% | (.16)% | (.09)% | |||||
| Supplemental Data | ||||||||||
| Net assets, end of period (in millions) | $ | 1,422 | $ | 1,752 | $ | 1,477 | $ | 1,049 | $ | 865 |
Portfolio turnover rate I | 40% | 44% | 52% | 49% J | 37% |
| Fidelity Advisor® Equity Growth Fund Class M |
| Years ended November 30, | 2022 | 2021 | 2020 | 2019 | 2018 A | |||||
Selected Per-Share Data | ||||||||||
| Net asset value, beginning of period | $ | 18.64 | $ | 16.60 | $ | 12.78 | $ | 11.61 | $ | 12.05 |
| Income from Investment Operations | ||||||||||
Net investment income (loss) B,C | (.05) | (.04) D | (.08) | (.05) | (.04) | |||||
| Net realized and unrealized gain (loss) | (3.04) | 3.95 | 5.08 | 1.94 | .91 | |||||
| Total from investment operations | (3.09) | 3.91 | 5.00 | 1.89 | .87 | |||||
| Distributions from net realized gain | (2.17) | (1.87) | (1.18) | (.72) | (1.31) | |||||
| Total distributions | (2.17) | (1.87) | (1.18) | (.72) | (1.31) | |||||
| Net asset value, end of period | $ | 13.38 | $ | 18.64 | $ | 16.60 | $ | 12.78 | $ | 11.61 |
Total Return E,F | (18.95)% | 25.99% | 42.54% | 18.18% | 8.07% | |||||
Ratios to Average Net Assets C,G,H | ||||||||||
| Expenses before reductions | 1.21% | 1.21% | 1.23% | 1.25% | 1.25% | |||||
| Expenses net of fee waivers, if any | 1.21% | 1.21% | 1.23% | 1.25% | 1.25% | |||||
| Expenses net of all reductions | 1.21% | 1.21% | 1.23% | 1.24% | 1.24% | |||||
| Net investment income (loss) | (.36)% | (.26)% D | (.57)% | (.40)% | (.32)% | |||||
| Supplemental Data | ||||||||||
| Net assets, end of period (in millions) | $ | 1,437 | $ | 1,938 | $ | 1,747 | $ | 1,417 | $ | 1,332 |
Portfolio turnover rate I | 40% | 44% | 52% | 49% J | 37% |
| Fidelity Advisor® Equity Growth Fund Class C |
| Years ended November 30, | 2022 | 2021 | 2020 | 2019 | 2018 A | |||||
Selected Per-Share Data | ||||||||||
| Net asset value, beginning of period | $ | 15.14 | $ | 13.84 | $ | 10.90 | $ | 10.07 | $ | 10.63 |
| Income from Investment Operations | ||||||||||
Net investment income (loss) B,C | (.10) | (.11) D | (.13) | (.09) | (.09) | |||||
| Net realized and unrealized gain (loss) | (2.39) | 3.24 | 4.25 | 1.64 | .80 | |||||
| Total from investment operations | (2.49) | 3.13 | 4.12 | 1.55 | .71 | |||||
| Distributions from net realized gain | (2.11) | (1.83) | (1.18) | (.72) | (1.27) | |||||
| Total distributions | (2.11) | (1.83) | (1.18) | (.72) | (1.27) | |||||
| Net asset value, end of period | $ | 10.54 | $ | 15.14 | $ | 13.84 | $ | 10.90 | $ | 10.07 |
Total Return E,F | (19.38)% | 25.36% | 41.73% | 17.53% | 7.50% | |||||
Ratios to Average Net Assets C,G,H | ||||||||||
| Expenses before reductions | 1.75% | 1.74% | 1.78% | 1.80% | 1.78% | |||||
| Expenses net of fee waivers, if any | 1.75% | 1.74% | 1.77% | 1.80% | 1.78% | |||||
| Expenses net of all reductions | 1.75% | 1.74% | 1.77% | 1.79% | 1.77% | |||||
| Net investment income (loss) | (.89)% | (.79)% D | (1.12)% | (.95)% | (.85)% | |||||
| Supplemental Data | ||||||||||
| Net assets, end of period (in millions) | $ | 98 | $ | 134 | $ | 131 | $ | 101 | $ | 196 |
Portfolio turnover rate I | 40% | 44% | 52% | 49% J | 37% |
| Fidelity Advisor® Equity Growth Fund Class I |
| Years ended November 30, | 2022 | 2021 | 2020 | 2019 | 2018 A | |||||
Selected Per-Share Data | ||||||||||
| Net asset value, beginning of period | $ | 21.82 | $ | 19.10 | $ | 14.46 | $ | 12.98 | $ | 13.32 |
| Income from Investment Operations | ||||||||||
Net investment income (loss) B,C | .02 | .05 D | (.01) | .01 | .02 | |||||
| Net realized and unrealized gain (loss) | (3.63) | 4.61 | 5.83 | 2.19 | 1.01 | |||||
| Total from investment operations | (3.61) | 4.66 | 5.82 | 2.20 | 1.03 | |||||
| Distributions from net realized gain | (2.26) | (1.94) | (1.18) | (.72) | (1.37) | |||||
| Total distributions | (2.26) | (1.94) | (1.18) | (.72) | (1.37) | |||||
| Net asset value, end of period | $ | 15.95 | $ | 21.82 | $ | 19.10 | $ | 14.46 | $ | 12.98 |
Total Return E | (18.62)% | 26.65% | 43.32% | 18.68% | 8.65% | |||||
Ratios to Average Net Assets C,F,G | ||||||||||
| Expenses before reductions | .72% | .71% | .74% | .75% | .75% | |||||
| Expenses net of fee waivers, if any | .71% | .71% | .73% | .75% | .75% | |||||
| Expenses net of all reductions | .71% | .71% | .73% | .75% | .75% | |||||
| Net investment income (loss) | .14% | .24% D | (.07)% | .10% | .17% | |||||
| Supplemental Data | ||||||||||
| Net assets, end of period (in millions) | $ | 1,285 | $ | 1,067 | $ | 770 | $ | 548 | $ | 679 |
Portfolio turnover rate H | 40% | 44% | 52% | 49% I | 37% |
| Fidelity Advisor® Equity Growth Fund Class Z |
| Years ended November 30, | 2022 | 2021 | 2020 | 2019 | 2018 A | |||||
Selected Per-Share Data | ||||||||||
| Net asset value, beginning of period | $ | 22.07 | $ | 19.30 | $ | 14.59 | $ | 13.07 | $ | 13.40 |
| Income from Investment Operations | ||||||||||
Net investment income (loss) B,C | .04 | .07 D | .01 | .03 | .04 | |||||
| Net realized and unrealized gain (loss) | (3.66) | 4.66 | 5.88 | 2.21 | 1.02 | |||||
| Total from investment operations | (3.62) | 4.73 | 5.89 | 2.24 | 1.06 | |||||
| Distributions from net realized gain | (2.28) | (1.96) | (1.18) | (.72) | (1.39) | |||||
| Total distributions | (2.28) | (1.96) | (1.18) | (.72) | (1.39) | |||||
| Net asset value, end of period | $ | 16.17 | $ | 22.07 | $ | 19.30 | $ | 14.59 | $ | 13.07 |
Total Return E | (18.46)% | 26.77% | 43.43% | 18.87% | 8.80% | |||||
Ratios to Average Net Assets C,F,G | ||||||||||
| Expenses before reductions | .60% | .60% | .61% | .62% | .62% | |||||
| Expenses net of fee waivers, if any | .60% | .60% | .61% | .62% | .62% | |||||
| Expenses net of all reductions | .60% | .60% | .61% | .62% | .62% | |||||
| Net investment income (loss) | .26% | .35% D | .05% | .23% | .30% | |||||
| Supplemental Data | ||||||||||
| Net assets, end of period (in millions) | $ | 645 | $ | 285 | $ | 180 | $ | 112 | $ | 87 |
Portfolio turnover rate H | 40% | 44% | 52% | 49% I | 37% |
| Fidelity Central Fund | Investment Manager | Investment Objective | Investment Practices | Expense Ratio A |
| Fidelity Money Market Central Funds | Fidelity Management & Research Company LLC (FMR) | Each fund seeks to obtain a high level of current income consistent with the preservation of capital and liquidity. | Short-term Investments | Less than .005% |
| Fidelity Advisor Equity Growth Fund | $24 |
| Gross unrealized appreciation | $1,581,459 |
| Gross unrealized depreciation | (246,693) |
| Net unrealized appreciation (depreciation) | $1,334,766 |
| Tax Cost | $3,643,585 |
| Undistributed long-term capital gain | $102,671 |
| Net unrealized appreciation (depreciation) on securities and other investments | $1,334,803 |
| November 30, 2022 | November 30, 2021 | |
| Ordinary Income | $62,096 | $19,253 |
| Long-term Capital Gains | 522,886 | 457,026 |
| Total | $584,982 | $476,279 |
| Purchases ($) | Sales ($) | |
| Fidelity Advisor Equity Growth Fund | 2,367,671 | 1,783,284 |
| Distribution Fee | Service Fee | Total Fees | Retained by FDC | |
| Class A | - % | .25% | $3,652 | $48 |
| Class M | .25% | .25% | 7,847 | 13 |
| Class C | .75% | .25% | 1,047 | 121 |
| $12,546 | $182 |
| Retained by FDC | |
| Class A | $335 |
| Class M | 31 |
Class C A | 2 |
| $368 |
| Amount | % of Class-Level Average Net Assets | |
| Class A | $2,392 | .16 |
| Class M | 2,455 | .16 |
| Class C | 202 | .19 |
| Class I | 1,621 | .16 |
| Class Z | 137 | .04 |
| $6,807 |
| % of Average Net Assets | |
| Fidelity Advisor Equity Growth Fund | .02 |
| Amount | |
| Fidelity Advisor Equity Growth Fund | $34 |
| Borrower or Lender | Average Loan Balance | Weighted Average Interest Rate | Interest Expense | |
| Fidelity Advisor Equity Growth Fund | Borrower | $12,647 | .32% | $1 |
| Purchases ($) | Sales ($) | Realized Gain (Loss) ($) | |
| Fidelity Advisor Equity Growth Fund | 147,457 | 91,838 | 4,520 |
| Amount | |
| Fidelity Advisor Equity Growth Fund | $8 |
| Total Security Lending Fees Paid to NFS | Security Lending Income From Securities Loaned to NFS | Value of Securities Loaned to NFS at Period End | |
| Fidelity Advisor Equity Growth Fund | $41 | $2 | $36 |
| Year ended November 30, 2022 | Year ended November 30, 2021 | |
| Fidelity Advisor Equity Growth Fund | ||
| Distributions to shareholders | ||
| Class A | $201,902 | $165,526 |
| Class M | 224,409 | 196,250 |
| Class C | 18,487 | 17,503 |
| Class I | 110,672 | 77,607 |
| Class Z | 29,512 | 19,393 |
| Total | $584,982 | $476,279 |
| Shares | Shares | Dollars | Dollars | |
| Year ended November 30, 2022 | Year ended November 30, 2021 | Year ended November 30, 2022 | Year ended November 30, 2021 | |
| Fidelity Advisor Equity Growth Fund | ||||
| Class A | ||||
| Shares sold | 16,685 | 10,433 | $238,232 | $181,362 |
| Reinvestment of distributions | 10,895 | 9,810 | 189,362 | 155,004 |
| Shares redeemed | (16,000) | (15,717) | (233,550) | (273,966) |
| Net increase (decrease) | 11,580 | 4,526 | $194,044 | $62,400 |
| Class M | ||||
| Shares sold | 8,496 | 8,240 | $121,186 | $138,409 |
| Reinvestment of distributions | 13,013 | 12,449 | 218,886 | 191,216 |
| Shares redeemed | (18,044) | (22,005) | (258,376) | (373,922) |
| Net increase (decrease) | 3,465 | (1,316) | $81,696 | $(44,297) |
| Class C | ||||
| Shares sold | 2,281 | 1,699 | $25,246 | $23,445 |
| Reinvestment of distributions | 1,360 | 1,378 | 18,111 | 17,283 |
| Shares redeemed | (3,196) | (3,751) | (36,259) | (51,874) |
| Net increase (decrease) | 445 | (674) | $7,098 | $(11,146) |
| Class I | ||||
| Shares sold | 45,700 | 15,368 | $738,514 | $307,950 |
| Reinvestment of distributions | 5,203 | 4,008 | 103,900 | 71,711 |
| Shares redeemed | (19,286) | (10,810) | (320,943) | (214,558) |
| Net increase (decrease) | 31,617 | 8,566 | $521,471 | $165,103 |
| Class Z | ||||
| Shares sold | 29,802 | 4,967 | $472,459 | $99,995 |
| Reinvestment of distributions | 1,400 | 1,033 | 28,312 | 18,669 |
| Shares redeemed | (4,204) | (2,454) | (70,624) | (48,952) |
| Net increase (decrease) | 26,998 | 3,546 | $430,147 | $69,712 |
| The Example is based on an investment of $1,000 invested at the beginning of the period and held for the entire period (June 1, 2022 to November 30, 2022). |
Annualized Expense Ratio- A | Beginning Account Value June 1, 2022 | Ending Account Value November 30, 2022 | Expenses Paid During Period- C June 1, 2022 to November 30, 2022 | |||||||
| Fidelity Advisor® Equity Growth Fund | ||||||||||
| Class A | .97% | |||||||||
| Actual | $ 1,000 | $ 983.00 | $ 4.82 | |||||||
Hypothetical- B | $ 1,000 | $ 1,020.21 | $ 4.91 | |||||||
| Class M | 1.21% | |||||||||
| Actual | $ 1,000 | $ 982.40 | $ 6.01 | |||||||
Hypothetical- B | $ 1,000 | $ 1,019.00 | $ 6.12 | |||||||
| Class C | 1.75% | |||||||||
| Actual | $ 1,000 | $ 979.60 | $ 8.68 | |||||||
Hypothetical- B | $ 1,000 | $ 1,016.29 | $ 8.85 | |||||||
| Class I | .72% | |||||||||
| Actual | $ 1,000 | $ 984.00 | $ 3.58 | |||||||
Hypothetical- B | $ 1,000 | $ 1,021.46 | $ 3.65 | |||||||
| Class Z | .60% | |||||||||
| Actual | $ 1,000 | $ 985.40 | $ 2.99 | |||||||
Hypothetical- B | $ 1,000 | $ 1,022.06 | $ 3.04 | |||||||
|


Contents
| Average Annual Total Returns | |||
Periods ended November 30, 2022 | Past 1 year | Past 5 years | Past 10 years |
| Class A (incl.5.75% sales charge) | -0.87% | 8.13% | 10.26% |
| Class M (incl.3.50% sales charge) | 1.27% | 8.39% | 10.28% |
Class C (incl. contingent deferred sales charge) | 3.42% | 8.56% | 10.23% |
| Fidelity® Value Strategies Fund | 5.48% | 9.72% | 11.23% |
| Class K | 5.59% | 9.85% | 11.38% |
| Class I | 5.44% | 9.69% | 11.19% |
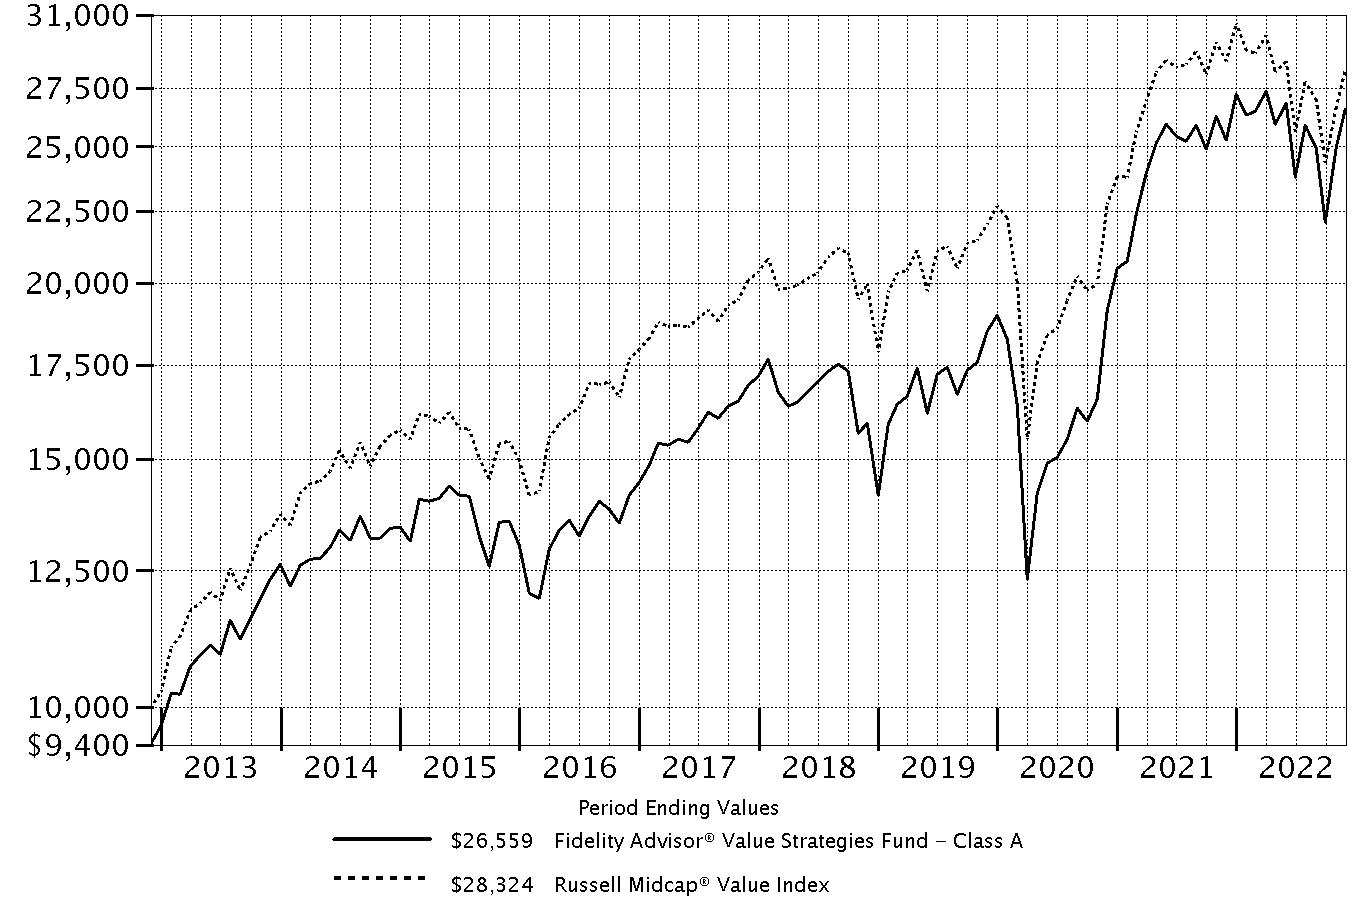
| $10,000 Over 10 Years |
Let's say hypothetically that $10,000 was invested in Fidelity Advisor® Value Strategies Fund - Class A, on November 30, 2012, and the current 5.75% sales charge was paid. The chart shows how the value of your investment would have changed, and also shows how the Russell Midcap® Value Index performed over the same period. |
 |
Top Holdings (% of Fund's net assets) | ||
| Canadian Natural Resources Ltd. | 2.8 | |
| Hess Corp. | 2.0 | |
| Cigna Corp. | 1.8 | |
| PG&E Corp. | 1.7 | |
| Halliburton Co. | 1.7 | |
| Ameriprise Financial, Inc. | 1.6 | |
| LPL Financial | 1.6 | |
| Flex Ltd. | 1.6 | |
| The Travelers Companies, Inc. | 1.5 | |
| The AES Corp. | 1.5 | |
| 17.8 | ||
| Market Sectors (% of Fund's net assets) | ||
| Industrials | 16.5 | |
| Financials | 16.2 | |
| Consumer Discretionary | 12.6 | |
| Materials | 10.4 | |
| Energy | 9.5 | |
| Utilities | 8.3 | |
| Health Care | 7.7 | |
| Real Estate | 7.4 | |
| Information Technology | 4.7 | |
| Consumer Staples | 3.5 | |
| Communication Services | 3.1 | |
Asset Allocation (% of Fund's net assets) |
 |
Foreign investments - 17.3% |
Geographic Diversification (% of Fund's net assets) |
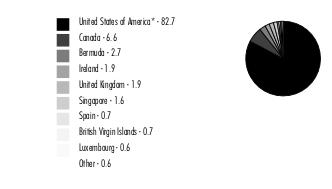 |
* Includes Short-Term investments and Net Other Assets (Liabilities). Percentages are based on country or territory of incorporation and are adjusted for the effect of futures contracts, if applicable. |
| Common Stocks - 99.9% | |||
| Shares | Value ($) (000s) | ||
| COMMUNICATION SERVICES - 3.1% | |||
| Diversified Telecommunication Services - 0.7% | |||
| Cellnex Telecom SA (a) | 336,900 | 11,586 | |
| Interactive Media & Services - 0.6% | |||
| Ziff Davis, Inc. (b) | 97,800 | 9,023 | |
| Media - 1.8% | |||
| Interpublic Group of Companies, Inc. | 274,000 | 9,415 | |
| Liberty Broadband Corp. Class C (b) | 128,000 | 11,630 | |
| Nexstar Broadcasting Group, Inc. Class A | 35,800 | 6,786 | |
| 27,831 | |||
TOTAL COMMUNICATION SERVICES | 48,440 | ||
| CONSUMER DISCRETIONARY - 12.6% | |||
| Auto Components - 1.5% | |||
| Adient PLC (b) | 324,700 | 12,644 | |
| Autoliv, Inc. | 114,900 | 10,157 | |
| 22,801 | |||
| Diversified Consumer Services - 0.9% | |||
| Adtalem Global Education, Inc. (b) | 351,237 | 14,611 | |
| Hotels, Restaurants & Leisure - 0.8% | |||
| Caesars Entertainment, Inc. (b) | 258,800 | 13,150 | |
| Household Durables - 2.0% | |||
| Mohawk Industries, Inc. (b) | 87,200 | 8,836 | |
| Taylor Morrison Home Corp. (b) | 249,100 | 7,570 | |
| Tempur Sealy International, Inc. | 448,700 | 14,255 | |
| 30,661 | |||
| Internet & Direct Marketing Retail - 0.8% | |||
| eBay, Inc. | 282,600 | 12,841 | |
| Leisure Products - 0.5% | |||
| Mattel, Inc. (b) | 432,300 | 7,881 | |
| Multiline Retail - 1.8% | |||
| Dollar Tree, Inc. (b) | 106,400 | 15,991 | |
| Kohl's Corp. | 195,900 | 6,284 | |
| Nordstrom, Inc. (c) | 231,100 | 4,846 | |
| 27,121 | |||
| Specialty Retail - 3.6% | |||
| American Eagle Outfitters, Inc. (c) | 1,047,222 | 16,567 | |
| Lithia Motors, Inc. Class A (sub. vtg.) (c) | 39,800 | 9,525 | |
| Rent-A-Center, Inc. | 301,700 | 7,268 | |
| Sally Beauty Holdings, Inc. (b) | 427,900 | 5,032 | |
| Victoria's Secret & Co. (b) | 379,100 | 17,439 | |
| 55,831 | |||
| Textiles, Apparel & Luxury Goods - 0.7% | |||
| Capri Holdings Ltd. (b) | 176,100 | 10,099 | |
TOTAL CONSUMER DISCRETIONARY | 194,996 | ||
| CONSUMER STAPLES - 3.5% | |||
| Beverages - 0.9% | |||
| Primo Water Corp. | 839,700 | 13,141 | |
| Food & Staples Retailing - 1.4% | |||
| U.S. Foods Holding Corp. (b) | 589,100 | 21,549 | |
| Food Products - 1.2% | |||
| Darling Ingredients, Inc. (b) | 261,722 | 18,799 | |
TOTAL CONSUMER STAPLES | 53,489 | ||
| ENERGY - 9.5% | |||
| Energy Equipment & Services - 2.4% | |||
| Halliburton Co. | 709,300 | 26,875 | |
| Liberty Oilfield Services, Inc. Class A | 643,187 | 10,632 | |
| 37,507 | |||
| Oil, Gas & Consumable Fuels - 7.1% | |||
| Canadian Natural Resources Ltd. | 722,000 | 43,110 | |
| Hess Corp. | 219,800 | 31,631 | |
| HF Sinclair Corp. | 237,200 | 14,787 | |
| Tourmaline Oil Corp. | 324,200 | 19,732 | |
| 109,260 | |||
TOTAL ENERGY | 146,767 | ||
| FINANCIALS - 16.2% | |||
| Banks - 3.3% | |||
| East West Bancorp, Inc. | 300,700 | 21,112 | |
| First Citizens Bancshares, Inc. (c) | 18,800 | 15,349 | |
| Signature Bank | 110,500 | 15,415 | |
| 51,876 | |||
| Capital Markets - 4.0% | |||
| Ameriprise Financial, Inc. | 73,800 | 24,498 | |
| Lazard Ltd. Class A (c) | 347,800 | 12,733 | |
| LPL Financial | 102,700 | 24,310 | |
| 61,541 | |||
| Consumer Finance - 1.9% | |||
| OneMain Holdings, Inc. | 306,700 | 12,072 | |
| SLM Corp. | 990,184 | 17,289 | |
| 29,361 | |||
| Diversified Financial Services - 1.4% | |||
| Apollo Global Management, Inc. | 318,500 | 22,101 | |
| Insurance - 4.8% | |||
| American Financial Group, Inc. | 76,800 | 10,922 | |
| Arch Capital Group Ltd. (b) | 303,800 | 18,201 | |
| Assurant, Inc. | 102,900 | 13,194 | |
| Reinsurance Group of America, Inc. | 60,033 | 8,669 | |
| The Travelers Companies, Inc. | 119,000 | 22,587 | |
| 73,573 | |||
| Thrifts & Mortgage Finance - 0.8% | |||
| Walker & Dunlop, Inc. | 136,300 | 12,173 | |
TOTAL FINANCIALS | 250,625 | ||
| HEALTH CARE - 7.7% | |||
| Biotechnology - 1.0% | |||
| United Therapeutics Corp. (b) | 56,000 | 15,674 | |
| Health Care Providers & Services - 5.2% | |||
| AdaptHealth Corp. (b) | 550,800 | 12,288 | |
| Centene Corp. (b) | 189,900 | 16,531 | |
| Cigna Corp. | 83,200 | 27,364 | |
| Laboratory Corp. of America Holdings | 52,700 | 12,685 | |
| Tenet Healthcare Corp. (b) | 238,200 | 11,000 | |
| 79,868 | |||
| Life Sciences Tools & Services - 0.4% | |||
| Syneos Health, Inc. (b) | 177,100 | 6,248 | |
| Pharmaceuticals - 1.1% | |||
| Jazz Pharmaceuticals PLC (b) | 108,500 | 17,025 | |
TOTAL HEALTH CARE | 118,815 | ||
| INDUSTRIALS - 16.5% | |||
| Air Freight & Logistics - 0.9% | |||
| FedEx Corp. | 74,100 | 13,503 | |
| Building Products - 1.3% | |||
| Builders FirstSource, Inc. (b) | 315,700 | 20,183 | |
| Commercial Services & Supplies - 0.9% | |||
| The Brink's Co. | 235,100 | 14,047 | |
| Construction & Engineering - 4.1% | |||
| Fluor Corp. (b)(c) | 604,100 | 20,304 | |
| Granite Construction, Inc. (c) | 330,400 | 11,901 | |
| MDU Resources Group, Inc. | 394,900 | 12,435 | |
| Willscot Mobile Mini Holdings (b) | 405,100 | 19,530 | |
| 64,170 | |||
| Electrical Equipment - 1.4% | |||
| Regal Rexnord Corp. | 126,419 | 16,575 | |
| Sensata Technologies, Inc. PLC | 132,669 | 5,983 | |
| 22,558 | |||
| Machinery - 3.9% | |||
| Allison Transmission Holdings, Inc. | 277,200 | 12,419 | |
| Crane Holdings Co. | 119,200 | 12,628 | |
| Flowserve Corp. | 609,700 | 19,120 | |
| Kennametal, Inc. (c) | 596,400 | 15,757 | |
| 59,924 | |||
| Professional Services - 1.1% | |||
| Manpower, Inc. | 187,300 | 16,392 | |
| Road & Rail - 2.0% | |||
| RXO, Inc. (b) | 309,700 | 5,884 | |
| TFI International, Inc. (Canada) | 126,900 | 13,773 | |
| XPO Logistics, Inc. (b) | 309,700 | 11,961 | |
| 31,618 | |||
| Trading Companies & Distributors - 0.9% | |||
| Beacon Roofing Supply, Inc. (b) | 230,300 | 13,447 | |
TOTAL INDUSTRIALS | 255,842 | ||
| INFORMATION TECHNOLOGY - 4.7% | |||
| Electronic Equipment & Components - 2.0% | |||
| Flex Ltd. (b) | 1,095,300 | 24,075 | |
| Vontier Corp. | 344,600 | 6,764 | |
| 30,839 | |||
| IT Services - 2.1% | |||
| Fidelity National Information Services, Inc. | 220,900 | 16,033 | |
| SS&C Technologies Holdings, Inc. | 239,900 | 12,897 | |
| Unisys Corp. (b) | 703,132 | 3,023 | |
| 31,953 | |||
| Software - 0.6% | |||
| NCR Corp. (b) | 428,800 | 10,235 | |
TOTAL INFORMATION TECHNOLOGY | 73,027 | ||
| MATERIALS - 10.4% | |||
| Chemicals - 3.8% | |||
| Axalta Coating Systems Ltd. (b) | 436,500 | 11,716 | |
| Methanex Corp. (c) | 275,600 | 10,751 | |
| Olin Corp. | 297,783 | 16,968 | |
| Tronox Holdings PLC | 544,400 | 7,692 | |
| Westlake Corp. (c) | 113,100 | 12,175 | |
| 59,302 | |||
| Construction Materials - 0.5% | |||
| Eagle Materials, Inc. | 58,100 | 7,921 | |
| Containers & Packaging - 2.2% | |||
| Berry Global Group, Inc. | 157,000 | 9,200 | |
| Crown Holdings, Inc. | 165,954 | 13,643 | |
| O-I Glass, Inc. (b) | 664,200 | 10,900 | |
| 33,743 | |||
| Metals & Mining - 3.1% | |||
| ArcelorMittal SA Class A unit GDR | 347,300 | 9,394 | |
| Arconic Corp. (b) | 732,700 | 17,460 | |
| Constellium NV (b) | 753,797 | 9,385 | |
| Freeport-McMoRan, Inc. | 273,700 | 10,893 | |
| 47,132 | |||
| Paper & Forest Products - 0.8% | |||
| Louisiana-Pacific Corp. | 195,700 | 12,486 | |
TOTAL MATERIALS | 160,584 | ||
| REAL ESTATE - 7.4% | |||
| Equity Real Estate Investment Trusts (REITs) - 5.0% | |||
| CubeSmart | 527,500 | 21,833 | |
| Equinix, Inc. | 13,700 | 9,462 | |
| Equity Lifestyle Properties, Inc. | 236,800 | 15,728 | |
| Prologis (REIT), Inc. | 100,937 | 11,889 | |
| Welltower, Inc. | 260,400 | 18,496 | |
| 77,408 | |||
| Real Estate Management & Development - 2.4% | |||
| Cushman & Wakefield PLC (b) | 1,287,400 | 14,702 | |
| Jones Lang LaSalle, Inc. (b) | 110,100 | 18,516 | |
| WeWork, Inc. (b)(c) | 1,236,300 | 3,412 | |
| 36,630 | |||
TOTAL REAL ESTATE | 114,038 | ||
| UTILITIES - 8.3% | |||
| Electric Utilities - 6.1% | |||
| Constellation Energy Corp. | 219,100 | 21,060 | |
| Edison International | 259,300 | 17,285 | |
| Entergy Corp. | 159,000 | 18,487 | |
| FirstEnergy Corp. | 255,500 | 10,537 | |
| PG&E Corp. (b) | 1,728,115 | 27,131 | |
| 94,500 | |||
| Independent Power and Renewable Electricity Producers - 2.2% | |||
| The AES Corp. | 779,600 | 22,546 | |
| Vistra Corp. | 461,000 | 11,216 | |
| 33,762 | |||
TOTAL UTILITIES | 128,262 | ||
| TOTAL COMMON STOCKS (Cost $1,276,548) | 1,544,885 | ||
| Money Market Funds - 3.4% | |||
| Shares | Value ($) (000s) | ||
| Fidelity Cash Central Fund 3.86% (d) | 1,323,598 | 1,324 | |
| Fidelity Securities Lending Cash Central Fund 3.86% (d)(e) | 51,748,900 | 51,754 | |
| TOTAL MONEY MARKET FUNDS (Cost $53,078) | 53,078 | ||
| TOTAL INVESTMENT IN SECURITIES - 103.3% (Cost $1,329,626) | 1,597,963 |
NET OTHER ASSETS (LIABILITIES) - (3.3)% | (51,405) |
| NET ASSETS - 100.0% | 1,546,558 |
| (a) | Security exempt from registration under Rule 144A of the Securities Act of 1933. These securities may be resold in transactions exempt from registration, normally to qualified institutional buyers. At the end of the period, the value of these securities amounted to $11,586,000 or 0.7% of net assets. |
| (b) | Non-income producing |
| (c) | Security or a portion of the security is on loan at period end. |
| (d) | Affiliated fund that is generally available only to investment companies and other accounts managed by Fidelity Investments. The rate quoted is the annualized seven-day yield of the fund at period end. A complete unaudited listing of the fund's holdings as of its most recent quarter end is available upon request. In addition, each Fidelity Central Fund's financial statements, which are not covered by the Fund's Report of Independent Registered Public Accounting Firm, are available on the SEC's website or upon request. |
| (e) | Investment made with cash collateral received from securities on loan. |
| Affiliate (Amounts in thousands) | Value, beginning of period ($) | Purchases ($) | Sales Proceeds ($) | Dividend Income ($) | Realized Gain (loss) ($) | Change in Unrealized appreciation (depreciation) ($) | Value, end of period ($) | % ownership, end of period |
| Fidelity Cash Central Fund 3.86% | 42,802 | 367,632 | 409,110 | 177 | - | - | 1,324 | 0.0% |
| Fidelity Securities Lending Cash Central Fund 3.86% | 17,043 | 655,667 | 620,956 | 160 | - | - | 51,754 | 0.2% |
| Total | 59,845 | 1,023,299 | 1,030,066 | 337 | - | - | 53,078 | |
| Valuation Inputs at Reporting Date: | ||||
Description (Amounts in thousands) | Total ($) | Level 1 ($) | Level 2 ($) | Level 3 ($) |
Investments in Securities: | ||||
| Equities: | ||||
Communication Services | 48,440 | 36,854 | 11,586 | - |
Consumer Discretionary | 194,996 | 194,996 | - | - |
Consumer Staples | 53,489 | 53,489 | - | - |
Energy | 146,767 | 146,767 | - | - |
Financials | 250,625 | 250,625 | - | - |
Health Care | 118,815 | 118,815 | - | - |
Industrials | 255,842 | 255,842 | - | - |
Information Technology | 73,027 | 73,027 | - | - |
Materials | 160,584 | 160,584 | - | - |
Real Estate | 114,038 | 114,038 | - | - |
Utilities | 128,262 | 128,262 | - | - |
| Money Market Funds | 53,078 | 53,078 | - | - |
| Total Investments in Securities: | 1,597,963 | 1,586,377 | 11,586 | - |
| Statement of Assets and Liabilities | ||||
| Amounts in thousands (except per-share amounts) | November 30, 2022 | |||
| Assets | ||||
| Investment in securities, at value (including securities loaned of $50,716) - See accompanying schedule: | ||||
Unaffiliated issuers (cost $1,276,548) | $1,544,885 | |||
Fidelity Central Funds (cost $53,078) | 53,078 | |||
| Total Investment in Securities (cost $1,329,626) | $ | 1,597,963 | ||
| Receivable for investments sold | 29,252 | |||
| Receivable for fund shares sold | 662 | |||
| Dividends receivable | 1,651 | |||
| Distributions receivable from Fidelity Central Funds | 30 | |||
| Prepaid expenses | 2 | |||
Total assets | 1,629,560 | |||
| Liabilities | ||||
| Payable for investments purchased | $28,799 | |||
| Payable for fund shares redeemed | 1,194 | |||
| Accrued management fee | 843 | |||
| Distribution and service plan fees payable | 170 | |||
| Other affiliated payables | 231 | |||
| Other payables and accrued expenses | 11 | |||
| Collateral on securities loaned | 51,754 | |||
| Total Liabilities | 83,002 | |||
| Net Assets | $ | 1,546,558 | ||
| Net Assets consist of: | ||||
| Paid in capital | $ | 1,249,274 | ||
| Total accumulated earnings (loss) | 297,284 | |||
| Net Assets | $ | 1,546,558 | ||
| Net Asset Value and Maximum Offering Price | ||||
| Class A : | ||||
Net Asset Value and redemption price per share ($317,773 ÷ 7,707 shares) (a) | $ | 41.23 | ||
| Maximum offering price per share (100/94.25 of $41.23) | $ | 43.75 | ||
| Class M : | ||||
Net Asset Value and redemption price per share ($231,490 ÷ 5,242 shares) (a) | $ | 44.16 | ||
| Maximum offering price per share (100/96.50 of $44.16) | $ | 45.76 | ||
| Class C : | ||||
Net Asset Value and offering price per share ($18,076 ÷ 534 shares) (a)(b) | $ | 33.87 | ||
| Fidelity Value Strategies Fund : | ||||
Net Asset Value , offering price and redemption price per share ($565,088 ÷ 11,157 shares) | $ | 50.65 | ||
| Class K : | ||||
Net Asset Value , offering price and redemption price per share ($61,703 ÷ 1,219 shares) (b) | $ | 50.61 | ||
| Class I : | ||||
Net Asset Value , offering price and redemption price per share ($352,428 ÷ 7,569 shares) | $ | 46.56 | ||
(a)Redemption price per share is equal to net asset value less any applicable contingent deferred sales charge. | ||||
(b)Corresponding Net Asset Value does not calculate due to rounding of fractional net assets and/or shares. | ||||
| Statement of Operations | ||||
| Amounts in thousands | Year ended November 30, 2022 | |||
| Investment Income | ||||
| Dividends | $ | 24,944 | ||
| Income from Fidelity Central Funds (including $160 from security lending) | 337 | |||
| Total Income | 25,281 | |||
| Expenses | ||||
| Management fee | ||||
| Basic fee | $ | 7,621 | ||
| Performance adjustment | 2,054 | |||
| Transfer agent fees | 2,342 | |||
| Distribution and service plan fees | 2,028 | |||
| Accounting fees | 430 | |||
| Custodian fees and expenses | 15 | |||
| Independent trustees' fees and expenses | 5 | |||
| Registration fees | 147 | |||
| Audit | 59 | |||
| Legal | 3 | |||
| Interest | 1 | |||
| Miscellaneous | 7 | |||
| Total expenses before reductions | 14,712 | |||
| Expense reductions | (47) | |||
| Total expenses after reductions | 14,665 | |||
| Net Investment income (loss) | 10,616 | |||
| Realized and Unrealized Gain (Loss) | ||||
| Net realized gain (loss) on: | ||||
| Investment Securities: | ||||
| Unaffiliated issuers | 32,417 | |||
| Foreign currency transactions | (17) | |||
| Total net realized gain (loss) | 32,400 | |||
| Change in net unrealized appreciation (depreciation) on investment securities | 24,245 | |||
| Net gain (loss) | 56,645 | |||
| Net increase (decrease) in net assets resulting from operations | $ | 67,261 | ||
| Statement of Changes in Net Assets | ||||
| Amount in thousands | Year ended November 30, 2022 | Year ended November 30, 2021 | ||
| Increase (Decrease) in Net Assets | ||||
| Operations | ||||
| Net investment income (loss) | $ | 10,616 | $ | 11,648 |
| Net realized gain (loss) | 32,400 | 140,353 | ||
| Change in net unrealized appreciation (depreciation) | 24,245 | 103,632 | ||
| Net increase (decrease) in net assets resulting from operations | 67,261 | 255,633 | ||
| Distributions to shareholders | (104,569) | (6,556) | ||
| Share transactions - net increase (decrease) | 256,598 | 289,262 | ||
| Total increase (decrease) in net assets | 219,290 | 538,339 | ||
| Net Assets | ||||
| Beginning of period | 1,327,268 | 788,929 | ||
| End of period | $ | 1,546,558 | $ | 1,327,268 |
| Fidelity Advisor® Value Strategies Fund Class A |
| Years ended November 30, | 2022 | 2021 | 2020 | 2019 | 2018 | |||||
Selected Per-Share Data | ||||||||||
| Net asset value, beginning of period | $ | 42.62 | $ | 32.58 | $ | 33.23 | $ | 33.48 | $ | 38.91 |
| Income from Investment Operations | ||||||||||
Net investment income (loss) A,B | .24 | .37 C | .29 | .42 D | .35 | |||||
| Net realized and unrealized gain (loss) | 2.05 | 9.96 | .87 | 3.66 | (2.50) | |||||
| Total from investment operations | 2.29 | 10.33 | 1.16 | 4.08 | (2.15) | |||||
| Distributions from net investment income | (.39) | (.29) | (.46) E | (.29) | (.51) | |||||
| Distributions from net realized gain | (3.29) | - | (1.34) E | (4.04) | (2.77) | |||||
| Total distributions | (3.68) | (.29) | (1.81) F | (4.33) | (3.28) | |||||
| Net asset value, end of period | $ | 41.23 | $ | 42.62 | $ | 32.58 | $ | 33.23 | $ | 33.48 |
Total Return G,H | 5.18% | 31.91% | 3.53% | 16.34% | (6.16)% | |||||
Ratios to Average Net Assets B,I,J | ||||||||||
| Expenses before reductions | 1.14% | 1.13% | 1.03% | 1.02% | .91% | |||||
| Expenses net of fee waivers, if any | 1.13% | 1.13% | 1.02% | 1.02% | .91% | |||||
| Expenses net of all reductions | 1.13% | 1.13% | 1.01% | 1.01% | .90% | |||||
| Net investment income (loss) | .61% | .90% C | 1.03% | 1.39% D | .98% K | |||||
| Supplemental Data | ||||||||||
| Net assets, end of period (in millions) | $ | 318 | $ | 254 | $ | 191 | $ | 204 | $ | 175 |
Portfolio turnover rate L | 46% | 53% | 72% | 66% | 72% |
| Fidelity Advisor® Value Strategies Fund Class M |
| Years ended November 30, | 2022 | 2021 | 2020 | 2019 | 2018 | |||||
Selected Per-Share Data | ||||||||||
| Net asset value, beginning of period | $ | 45.37 | $ | 34.67 | $ | 35.23 | $ | 35.16 | $ | 40.69 |
| Income from Investment Operations | ||||||||||
Net investment income (loss) A,B | .16 | .29 C | .24 | .37 D | .28 | |||||
| Net realized and unrealized gain (loss) | 2.17 | 10.61 | .92 | 3.93 | (2.63) | |||||
| Total from investment operations | 2.33 | 10.90 | 1.16 | 4.30 | (2.35) | |||||
| Distributions from net investment income | (.25) | (.20) | (.37) E | (.19) | (.41) | |||||
| Distributions from net realized gain | (3.29) | - | (1.34) E | (4.04) | (2.77) | |||||
| Total distributions | (3.54) | (.20) | (1.72) F | (4.23) | (3.18) | |||||
| Net asset value, end of period | $ | 44.16 | $ | 45.37 | $ | 34.67 | $ | 35.23 | $ | 35.16 |
Total Return G,H | 4.95% | 31.59% | 3.32% | 16.07% | (6.38)% | |||||
Ratios to Average Net Assets B,I,J | ||||||||||
| Expenses before reductions | 1.37% | 1.37% | 1.25% | 1.25% | 1.14% | |||||
| Expenses net of fee waivers, if any | 1.37% | 1.37% | 1.25% | 1.24% | 1.14% | |||||
| Expenses net of all reductions | 1.37% | 1.37% | 1.24% | 1.24% | 1.13% | |||||
| Net investment income (loss) | .37% | .66% C | .81% | 1.16% D | .75% | |||||
| Supplemental Data | ||||||||||
| Net assets, end of period (in millions) | $ | 231 | $ | 237 | $ | 204 | $ | 234 | $ | 225 |
Portfolio turnover rate K | 46% | 53% | 72% | 66% | 72% |
| Fidelity Advisor® Value Strategies Fund Class C |
| Years ended November 30, | 2022 | 2021 | 2020 | 2019 | 2018 | |||||
Selected Per-Share Data | ||||||||||
| Net asset value, beginning of period | $ | 35.64 | $ | 27.33 | $ | 28.07 | $ | 28.95 | $ | 34.09 |
| Income from Investment Operations | ||||||||||
Net investment income (loss) A,B | (.06) | .04 C | .05 | .15 D | .06 | |||||
| Net realized and unrealized gain (loss) | 1.72 | 8.37 | .71 | 3.04 | (2.16) | |||||
| Total from investment operations | 1.66 | 8.41 | .76 | 3.19 | (2.10) | |||||
| Distributions from net investment income | (.14) | (.10) | (.16) E | (.03) | (.27) | |||||
| Distributions from net realized gain | (3.29) | - | (1.34) E | (4.04) | (2.77) | |||||
| Total distributions | (3.43) | (.10) | (1.50) | (4.07) | (3.04) | |||||
| Net asset value, end of period | $ | 33.87 | $ | 35.64 | $ | 27.33 | $ | 28.07 | $ | 28.95 |
Total Return F,G | 4.37% | 30.84% | 2.73% | 15.41% | (6.89)% | |||||
Ratios to Average Net Assets B,H,I | ||||||||||
| Expenses before reductions | 1.92% | 1.92% | 1.83% | 1.82% | 1.68% | |||||
| Expenses net of fee waivers, if any | 1.91% | 1.91% | 1.83% | 1.82% | 1.68% | |||||
| Expenses net of all reductions | 1.91% | 1.91% | 1.82% | 1.82% | 1.67% | |||||
| Net investment income (loss) | (.17)% | .11% C | .23% | .58% D | .21% | |||||
| Supplemental Data | ||||||||||
| Net assets, end of period (in millions) | $ | 18 | $ | 14 | $ | 11 | $ | 14 | $ | 34 |
Portfolio turnover rate J | 46% | 53% | 72% | 66% | 72% |
| Fidelity® Value Strategies Fund |
| Years ended November 30, | 2022 | 2021 | 2020 | 2019 | 2018 | |||||
Selected Per-Share Data | ||||||||||
| Net asset value, beginning of period | $ | 51.53 | $ | 39.30 | $ | 39.68 | $ | 39.04 | $ | 44.81 |
| Income from Investment Operations | ||||||||||
Net investment income (loss) A,B | .43 | .58 C | .43 | .60 D | .52 | |||||
| Net realized and unrealized gain (loss) | 2.47 | 12.00 | 1.07 | 4.46 | (2.92) | |||||
| Total from investment operations | 2.90 | 12.58 | 1.50 | 5.06 | (2.40) | |||||
| Distributions from net investment income | (.49) | (.35) | (.54) E | (.38) | (.61) | |||||
| Distributions from net realized gain | (3.29) | - | (1.34) E | (4.04) | (2.77) | |||||
| Total distributions | (3.78) | (.35) | (1.88) | (4.42) | (3.37) F | |||||
| Net asset value, end of period | $ | 50.65 | $ | 51.53 | $ | 39.30 | $ | 39.68 | $ | 39.04 |
Total Return G | 5.48% | 32.24% | 3.85% | 16.63% | (5.89)% | |||||
Ratios to Average Net Assets B,H,I | ||||||||||
| Expenses before reductions | .88% | .86% | .76% | .74% | .63% | |||||
| Expenses net of fee waivers, if any | .87% | .86% | .76% | .74% | .63% | |||||
| Expenses net of all reductions | .87% | .86% | .75% | .74% | .62% | |||||
| Net investment income (loss) | .87% | 1.17% C | 1.30% | 1.66% D | 1.26% | |||||
| Supplemental Data | ||||||||||
| Net assets, end of period (in millions) | $ | 565 | $ | 513 | $ | 285 | $ | 332 | $ | 324 |
Portfolio turnover rate J | 46% | 53% | 72% | 66% | 72% |
| Fidelity® Value Strategies Fund Class K |
| Years ended November 30, | 2022 | 2021 | 2020 | 2019 | 2018 | |||||
Selected Per-Share Data | ||||||||||
| Net asset value, beginning of period | $ | 51.49 | $ | 39.27 | $ | 39.65 | $ | 39.03 | $ | 44.82 |
| Income from Investment Operations | ||||||||||
Net investment income (loss) A,B | .49 | .64 C | .48 | .64 D | .58 | |||||
| Net realized and unrealized gain (loss) | 2.46 | 11.98 | 1.07 | 4.46 | (2.93) | |||||
| Total from investment operations | 2.95 | 12.62 | 1.55 | 5.10 | (2.35) | |||||
| Distributions from net investment income | (.54) | (.40) | (.59) E | (.44) | (.67) | |||||
| Distributions from net realized gain | (3.29) | - | (1.34) E | (4.04) | (2.77) | |||||
| Total distributions | (3.83) | (.40) | (1.93) | (4.48) | (3.44) | |||||
| Net asset value, end of period | $ | 50.61 | $ | 51.49 | $ | 39.27 | $ | 39.65 | $ | 39.03 |
Total Return F | 5.59% | 32.41% | 3.99% | 16.80% | (5.80)% | |||||
Ratios to Average Net Assets B,G,H | ||||||||||
| Expenses before reductions | .75% | .75% | .62% | .61% | .50% | |||||
| Expenses net of fee waivers, if any | .75% | .75% | .61% | .61% | .50% | |||||
| Expenses net of all reductions | .75% | .75% | .60% | .61% | .49% | |||||
| Net investment income (loss) | .99% | 1.28% C | 1.44% | 1.79% D | 1.39% | |||||
| Supplemental Data | ||||||||||
| Net assets, end of period (in millions) | $ | 62 | $ | 54 | $ | 37 | $ | 49 | $ | 49 |
Portfolio turnover rate I | 46% | 53% | 72% | 66% | 72% |
| Fidelity Advisor® Value Strategies Fund Class I |
| Years ended November 30, | 2022 | 2021 | 2020 | 2019 | 2018 | |||||
Selected Per-Share Data | ||||||||||
| Net asset value, beginning of period | $ | 47.69 | $ | 36.40 | $ | 36.90 | $ | 36.64 | $ | 42.27 |
| Income from Investment Operations | ||||||||||
Net investment income (loss) A,B | .39 | .54 C | .40 | .55 D | .48 | |||||
| Net realized and unrealized gain (loss) | 2.28 | 11.10 | .98 | 4.12 | (2.75) | |||||
| Total from investment operations | 2.67 | 11.64 | 1.38 | 4.67 | (2.27) | |||||
| Distributions from net investment income | (.51) | (.35) | (.53) E | (.37) | (.59) | |||||
| Distributions from net realized gain | (3.29) | - | (1.34) E | (4.04) | (2.77) | |||||
| Total distributions | (3.80) | (.35) | (1.88) F | (4.41) | (3.36) | |||||
| Net asset value, end of period | $ | 46.56 | $ | 47.69 | $ | 36.40 | $ | 36.90 | $ | 36.64 |
Total Return G | 5.44% | 32.23% | 3.80% | 16.64% | (5.95)% | |||||
Ratios to Average Net Assets B,H,I | ||||||||||
| Expenses before reductions | .89% | .88% | .78% | .78% | .67% | |||||
| Expenses net of fee waivers, if any | .88% | .88% | .78% | .78% | .67% | |||||
| Expenses net of all reductions | .88% | .88% | .77% | .77% | .66% | |||||
| Net investment income (loss) | .86% | 1.15% C | 1.27% | 1.63% D | 1.22% | |||||
| Supplemental Data | ||||||||||
| Net assets, end of period (in millions) | $ | 352 | $ | 256 | $ | 61 | $ | 72 | $ | 62 |
Portfolio turnover rate J | 46% | 53% | 72% | 66% | 72% |
| Fidelity Central Fund | Investment Manager | Investment Objective | Investment Practices | Expense Ratio A |
| Fidelity Money Market Central Funds | Fidelity Management & Research Company LLC (FMR) | Each fund seeks to obtain a high level of current income consistent with the preservation of capital and liquidity. | Short-term Investments | Less than .005% |
| Gross unrealized appreciation | $372,574 |
| Gross unrealized depreciation | (105,814) |
| Net unrealized appreciation (depreciation) | $266,760 |
| Tax Cost | $1,331,203 |
| Undistributed ordinary income | $8,391 |
| Undistributed long-term capital gain | $22,133 |
| Net unrealized appreciation (depreciation) on securities and other investments | $266,760 |
| November 30, 2022 | November 30, 2021 | |
| Ordinary Income | $16,274 | $6,556 |
| Long-term Capital Gains | 88,295 | - |
| Total | $104,569 | $6,556 |
| Purchases ($) | Sales ($) | |
| Fidelity Advisor Value Strategies Fund | 834,128 | 655,866 |
| Distribution Fee | Service Fee | Total Fees | Retained by FDC | |
| Class A | - % | .25% | $703 | $19 |
| Class M | .25% | .25% | 1,158 | 6 |
| Class C | .75% | .25% | 167 | 46 |
| $2,028 | $71 |
| Retained by FDC | |
| Class A | $77 |
| Class M | 7 |
Class C A | - B |
| $84 |
| Amount | % of Class-Level Average Net Assets | |
| Class A | $486 | .17 |
| Class M | 371 | .16 |
| Class C | 34 | .20 |
| Fidelity Value Strategies Fund | 880 | .16 |
| Class K | 24 | .04 |
| Class I | 547 | .17 |
| $2,342 |
| % of Average Net Assets | |
| Fidelity Advisor Value Strategies Fund | .03 |
| Amount | |
| Fidelity Advisor Value Strategies Fund | $18 |
| Borrower or Lender | Average Loan Balance | Weighted Average Interest Rate | Interest Expense | |
Fidelity Advisor Value Strategies Fund | Borrower | $6,352 | 2.68% | $1 |
| Purchases ($) | Sales ($) | Realized Gain (Loss) ($) | |
| Fidelity Advisor Value Strategies Fund | 94,975 | 103,613 | 7,405 |
| Amount | |
| Fidelity Advisor Value Strategies Fund | $2 |
| Total Security Lending Fees Paid to NFS | Security Lending Income From Securities Loaned to NFS | Value of Securities Loaned to NFS at Period End | |
| Fidelity Advisor Value Strategies Fund | $17 | $- | $- |
Year ended November 30, 2022 | Year ended November 30, 2021 | |
| Fidelity Advisor Value Strategies Fund | ||
| Distributions to shareholders | ||
| Class A | $21,936 | $1,656 |
| Class M | 18,416 | 1,180 |
| Class C | 1,360 | 40 |
| Fidelity Value Strategies Fund | 37,615 | 2,562 |
| Class K | 4,029 | 519 |
| Class I | 21,213 | 599 |
Total | $104,569 | $6,556 |
| Shares | Shares | Dollars | Dollars | |
| Year ended November 30, 2022 | Year ended November 30, 2021 | Year ended November 30, 2022 | Year ended November 30, 2021 | |
| Fidelity Advisor Value Strategies Fund | ||||
| Class A | ||||
| Shares sold | 2,196 | 923 | $89,027 | $38,968 |
| Reinvestment of distributions | 488 | 46 | 20,592 | 1,564 |
| Shares redeemed | (926) | (886) | (36,950) | (36,228) |
| Net increase (decrease) | 1,758 | 83 | $72,669 | $4,304 |
| Class M | ||||
| Shares sold | 311 | 264 | $13,538 | $11,691 |
| Reinvestment of distributions | 374 | 30 | 16,915 | 1,087 |
| Shares redeemed | (668) | (946) | (28,828) | (41,613) |
| Net increase (decrease) | 17 | (652) | $1,625 | $(28,835) |
| Class C | ||||
| Shares sold | 242 | 176 | $8,153 | $6,181 |
| Reinvestment of distributions | 38 | 1 | 1,324 | 39 |
| Shares redeemed | (141) | (199) | (4,671) | (6,868) |
| Net increase (decrease) | 139 | (22) | $4,806 | $(648) |
| Fidelity Value Strategies Fund | ||||
| Shares sold | 4,143 | 5,709 | $207,243 | $286,521 |
| Reinvestment of distributions | 684 | 59 | 35,310 | 2,426 |
| Shares redeemed | (3,616) | (3,070) | (176,732) | (154,252) |
| Net increase (decrease) | 1,211 | 2,698 | $65,821 | $134,695 |
| Class K | ||||
| Shares sold | 569 | 940 | $28,021 | $42,621 |
| Reinvestment of distributions | 78 | 13 | 4,029 | 519 |
| Shares redeemed | (485) | (838) | (23,528) | (38,317) |
| Net increase (decrease) | 162 | 115 | $8,522 | $4,823 |
| Class I | ||||
| Shares sold | 4,791 | 4,762 | $217,077 | $225,688 |
| Reinvestment of distributions | 430 | 15 | 20,448 | 571 |
| Shares redeemed | (3,013) | (1,086) | (134,370) | (51,336) |
| Net increase (decrease) | 2,208 | 3,691 | $103,155 | $174,923 |
| The Example is based on an investment of $1,000 invested at the beginning of the period and held for the entire period (June 1, 2022 to November 30, 2022). |
Annualized Expense Ratio- A | Beginning Account Value June 1, 2022 | Ending Account Value November 30, 2022 | Expenses Paid During Period- C June 1, 2022 to November 30, 2022 | |||||||
| Fidelity Advisor® Value Strategies Fund | ||||||||||
| Class A | 1.14% | |||||||||
| Actual | $ 1,000 | $ 989.40 | $ 5.69 | |||||||
Hypothetical- B | $ 1,000 | $ 1,019.35 | $ 5.77 | |||||||
| Class M | 1.37% | |||||||||
| Actual | $ 1,000 | $ 988.40 | $ 6.83 | |||||||
Hypothetical- B | $ 1,000 | $ 1,018.20 | $ 6.93 | |||||||
| Class C | 1.92% | |||||||||
| Actual | $ 1,000 | $ 985.50 | $ 9.56 | |||||||
Hypothetical- B | $ 1,000 | $ 1,015.44 | $ 9.70 | |||||||
| Fidelity® Value Strategies Fund | .88% | |||||||||
| Actual | $ 1,000 | $ 990.80 | $ 4.39 | |||||||
Hypothetical- B | $ 1,000 | $ 1,020.66 | $ 4.46 | |||||||
| Class K | .76% | |||||||||
| Actual | $ 1,000 | $ 991.40 | $ 3.79 | |||||||
Hypothetical- B | $ 1,000 | $ 1,021.26 | $ 3.85 | |||||||
| Class I | .89% | |||||||||
| Actual | $ 1,000 | $ 990.60 | $ 4.44 | |||||||
Hypothetical- B | $ 1,000 | $ 1,020.61 | $ 4.51 | |||||||
|


Contents
| Average Annual Total Returns | |||
Periods ended November 30, 2022 | Past 1 year | Past 5 years | Past 10 years |
| Class A (incl.5.75% sales charge) | -4.35% | 8.61% | 11.87% |
| Class M (incl.3.50% sales charge) | -2.31% | 8.84% | 11.85% |
Class C (incl. contingent deferred sales charge) | -0.24% | 9.06% | 11.86% |
| Class I | 1.77% | 10.20% | 12.84% |
| Class Z | 1.88% | 10.33% | 12.92% |
| $10,000 Over 10 Years |
Let's say hypothetically that $10,000 was invested in Fidelity Advisor® Large Cap Fund - Class A, on November 30, 2012, and the current 5.75% sales charge was paid. The chart shows how the value of your investment would have changed, and also shows how the S&P 500® Index performed over the same period. |
 |
Top Holdings (% of Fund's net assets) | ||
| Exxon Mobil Corp. | 7.8 | |
| General Electric Co. | 6.2 | |
| Microsoft Corp. | 5.8 | |
| Wells Fargo & Co. | 5.7 | |
| Bank of America Corp. | 3.1 | |
| Apple, Inc. | 3.0 | |
| Hess Corp. | 2.3 | |
| Bristol-Myers Squibb Co. | 2.2 | |
| Comcast Corp. Class A | 1.9 | |
| The Boeing Co. | 1.9 | |
| 39.9 | ||
| Market Sectors (% of Fund's net assets) | ||
| Information Technology | 17.4 | |
| Financials | 16.4 | |
| Industrials | 14.4 | |
| Energy | 13.8 | |
| Health Care | 13.7 | |
| Communication Services | 7.5 | |
| Consumer Staples | 4.6 | |
| Consumer Discretionary | 3.6 | |
| Materials | 3.1 | |
| Real Estate | 0.8 | |
| Utilities | 0.6 | |
Asset Allocation (% of Fund's net assets) |
 |
Foreign investments - 9.8% |
| Common Stocks - 95.8% | |||
| Shares | Value ($) | ||
| COMMUNICATION SERVICES - 7.5% | |||
| Diversified Telecommunication Services - 0.4% | |||
| Cellnex Telecom SA (a) | 42,300 | 1,454,636 | |
| Verizon Communications, Inc. | 54,276 | 2,115,678 | |
| 3,570,314 | |||
| Entertainment - 1.3% | |||
| Activision Blizzard, Inc. | 16,611 | 1,228,383 | |
| Nintendo Co. Ltd. ADR | 138,900 | 1,490,397 | |
| The Walt Disney Co. (b) | 62,775 | 6,143,789 | |
| Universal Music Group NV | 214,634 | 5,104,164 | |
| 13,966,733 | |||
| Interactive Media & Services - 3.4% | |||
| Alphabet, Inc.: | |||
| Class A (b) | 140,880 | 14,227,471 | |
| Class C (b) | 127,460 | 12,930,817 | |
| Match Group, Inc. (b) | 4,600 | 232,576 | |
| Meta Platforms, Inc. Class A (b) | 56,500 | 6,672,650 | |
| Snap, Inc. Class A (b) | 105,800 | 1,090,798 | |
| 35,154,312 | |||
| Media - 2.4% | |||
| Comcast Corp. Class A | 560,523 | 20,537,563 | |
| Interpublic Group of Companies, Inc. | 146,420 | 5,030,991 | |
| 25,568,554 | |||
TOTAL COMMUNICATION SERVICES | 78,259,913 | ||
| CONSUMER DISCRETIONARY - 3.6% | |||
| Auto Components - 0.2% | |||
| BorgWarner, Inc. | 63,616 | 2,704,316 | |
| Automobiles - 0.1% | |||
| General Motors Co. | 22,800 | 924,768 | |
| Hotels, Restaurants & Leisure - 1.4% | |||
| Booking Holdings, Inc. (b) | 4,019 | 8,357,310 | |
| Expedia, Inc. (b) | 17,900 | 1,912,436 | |
| Marriott International, Inc. Class A | 19,400 | 3,207,790 | |
| Starbucks Corp. | 12,700 | 1,297,940 | |
| 14,775,476 | |||
| Household Durables - 0.4% | |||
| Mohawk Industries, Inc. (b) | 23,906 | 2,422,395 | |
| Sony Group Corp. sponsored ADR | 14,500 | 1,204,515 | |
| Whirlpool Corp. | 3,234 | 473,878 | |
| 4,100,788 | |||
| Internet & Direct Marketing Retail - 0.2% | |||
| Amazon.com, Inc. (b) | 19,300 | 1,863,222 | |
| Multiline Retail - 0.1% | |||
| Target Corp. | 5,000 | 835,350 | |
| Specialty Retail - 1.1% | |||
| Lowe's Companies, Inc. | 54,630 | 11,611,607 | |
| Textiles, Apparel & Luxury Goods - 0.1% | |||
| NIKE, Inc. Class B | 7,200 | 789,768 | |
TOTAL CONSUMER DISCRETIONARY | 37,605,295 | ||
| CONSUMER STAPLES - 4.6% | |||
| Beverages - 1.7% | |||
| Diageo PLC sponsored ADR | 26,000 | 4,850,300 | |
| Keurig Dr. Pepper, Inc. | 88,700 | 3,430,029 | |
| The Coca-Cola Co. | 158,981 | 10,112,781 | |
| 18,393,110 | |||
| Food & Staples Retailing - 1.5% | |||
| Costco Wholesale Corp. | 1,300 | 701,025 | |
| Performance Food Group Co. (b) | 37,100 | 2,262,358 | |
| Sysco Corp. | 88,500 | 7,656,135 | |
| U.S. Foods Holding Corp. (b) | 47,800 | 1,748,524 | |
| Walmart, Inc. | 20,700 | 3,155,094 | |
| 15,523,136 | |||
| Household Products - 0.1% | |||
| Colgate-Palmolive Co. | 1,000 | 77,480 | |
| Spectrum Brands Holdings, Inc. | 18,467 | 983,737 | |
| 1,061,217 | |||
| Personal Products - 0.3% | |||
| Estee Lauder Companies, Inc. Class A | 400 | 94,316 | |
| Haleon PLC ADR (b) | 374,138 | 2,577,811 | |
| 2,672,127 | |||
| Tobacco - 1.0% | |||
| Altria Group, Inc. | 221,180 | 10,302,564 | |
TOTAL CONSUMER STAPLES | 47,952,154 | ||
| ENERGY - 13.8% | |||
| Energy Equipment & Services - 0.0% | |||
| Baker Hughes Co. Class A | 7,900 | 229,258 | |
| Oil, Gas & Consumable Fuels - 13.8% | |||
| Canadian Natural Resources Ltd. | 34,900 | 2,083,648 | |
| Cenovus Energy, Inc. (Canada) | 765,462 | 15,222,175 | |
| EQT Corp. | 25,500 | 1,081,455 | |
| Exxon Mobil Corp. | 730,668 | 81,352,572 | |
| Hess Corp. | 169,535 | 24,397,782 | |
| Imperial Oil Ltd. | 88,900 | 5,057,813 | |
| Kosmos Energy Ltd. (b) | 972,495 | 6,467,092 | |
| Phillips 66 Co. | 14,400 | 1,561,536 | |
| Tourmaline Oil Corp. | 125,400 | 7,632,233 | |
| 144,856,306 | |||
TOTAL ENERGY | 145,085,564 | ||
| FINANCIALS - 16.4% | |||
| Banks - 12.4% | |||
| Bank of America Corp. | 845,314 | 31,995,135 | |
| JPMorgan Chase & Co. | 81,818 | 11,305,611 | |
| M&T Bank Corp. | 12,828 | 2,181,017 | |
| PNC Financial Services Group, Inc. | 65,241 | 10,977,451 | |
| Truist Financial Corp. | 156,127 | 7,308,305 | |
| U.S. Bancorp | 135,490 | 6,149,891 | |
| Wells Fargo & Co. | 1,248,903 | 59,884,899 | |
| 129,802,309 | |||
| Capital Markets - 2.7% | |||
| KKR & Co. LP | 102,191 | 5,305,757 | |
| Morgan Stanley | 61,525 | 5,726,132 | |
| Northern Trust Corp. | 102,391 | 9,533,626 | |
| Raymond James Financial, Inc. | 27,793 | 3,249,002 | |
| State Street Corp. | 55,119 | 4,391,331 | |
| 28,205,848 | |||
| Consumer Finance - 0.2% | |||
| Discover Financial Services | 23,200 | 2,513,952 | |
| Diversified Financial Services - 0.0% | |||
| Acacia Research Corp. (b) | 36,900 | 152,397 | |
| Insurance - 0.2% | |||
| Chubb Ltd. | 10,495 | 2,304,597 | |
| Thrifts & Mortgage Finance - 0.9% | |||
| MGIC Investment Corp. | 152,476 | 2,093,495 | |
| Radian Group, Inc. | 366,031 | 7,163,227 | |
| 9,256,722 | |||
TOTAL FINANCIALS | 172,235,825 | ||
| HEALTH CARE - 13.7% | |||
| Biotechnology - 0.5% | |||
| ADC Therapeutics SA (b) | 18,900 | 69,174 | |
| Alnylam Pharmaceuticals, Inc. (b) | 12,119 | 2,673,330 | |
| Argenx SE ADR (b) | 1,100 | 437,767 | |
| Crinetics Pharmaceuticals, Inc. (b) | 28,300 | 505,721 | |
| Insmed, Inc. (b) | 47,497 | 878,220 | |
| Vaxcyte, Inc. (b) | 17,300 | 796,838 | |
| Verve Therapeutics, Inc. (b) | 14,800 | 343,804 | |
| 5,704,854 | |||
| Health Care Equipment & Supplies - 1.6% | |||
| Abbott Laboratories | 4,000 | 430,320 | |
| Becton, Dickinson & Co. | 10,797 | 2,692,124 | |
| Boston Scientific Corp. (b) | 279,026 | 12,631,507 | |
| iRhythm Technologies, Inc. (b) | 100 | 10,905 | |
| Koninklijke Philips Electronics NV (depositary receipt) (NY Reg.) | 48,305 | 726,507 | |
| 16,491,363 | |||
| Health Care Providers & Services - 6.6% | |||
| Cardinal Health, Inc. | 90,982 | 7,294,027 | |
| Centene Corp. (b) | 8,400 | 731,220 | |
| Cigna Corp. | 48,703 | 16,017,930 | |
| CVS Health Corp. | 102,268 | 10,419,064 | |
| Guardant Health, Inc. (b) | 22,800 | 1,193,352 | |
| Humana, Inc. | 3,600 | 1,979,640 | |
| McKesson Corp. | 35,106 | 13,399,258 | |
| Oak Street Health, Inc. (b) | 14,800 | 319,976 | |
| UnitedHealth Group, Inc. | 31,999 | 17,527,772 | |
| 68,882,239 | |||
| Life Sciences Tools & Services - 0.2% | |||
| Danaher Corp. | 9,600 | 2,624,736 | |
| Pharmaceuticals - 4.8% | |||
| Bayer AG | 38,556 | 2,237,671 | |
| Bristol-Myers Squibb Co. | 289,717 | 23,258,481 | |
| Eli Lilly & Co. | 10,600 | 3,933,448 | |
| GSK PLC sponsored ADR | 212,030 | 7,334,118 | |
| Johnson & Johnson | 70,584 | 12,563,952 | |
| Pliant Therapeutics, Inc. (b) | 16,400 | 301,432 | |
| Sanofi SA sponsored ADR | 17,700 | 802,695 | |
| Viatris, Inc. | 11,800 | 130,154 | |
| 50,561,951 | |||
TOTAL HEALTH CARE | 144,265,143 | ||
| INDUSTRIALS - 14.3% | |||
| Aerospace & Defense - 3.2% | |||
| Airbus Group NV | 49,300 | 5,659,420 | |
| General Dynamics Corp. | 13,129 | 3,313,628 | |
| Huntington Ingalls Industries, Inc. | 9,319 | 2,161,635 | |
| MTU Aero Engines AG | 3,600 | 759,108 | |
| Raytheon Technologies Corp. | 15,092 | 1,489,882 | |
| Safran SA | 7,200 | 889,817 | |
| The Boeing Co. (b) | 108,167 | 19,348,913 | |
| 33,622,403 | |||
| Air Freight & Logistics - 1.9% | |||
| FedEx Corp. | 22,892 | 4,171,380 | |
| United Parcel Service, Inc. Class B | 85,463 | 16,214,895 | |
| 20,386,275 | |||
| Airlines - 0.1% | |||
| Copa Holdings SA Class A (b) | 3,200 | 280,416 | |
| Ryanair Holdings PLC sponsored ADR (b) | 9,400 | 711,486 | |
| 991,902 | |||
| Building Products - 0.2% | |||
| Johnson Controls International PLC | 26,000 | 1,727,440 | |
| Commercial Services & Supplies - 0.1% | |||
| ACV Auctions, Inc. Class A (b)(c) | 95,900 | 847,756 | |
| Electrical Equipment - 1.0% | |||
| Acuity Brands, Inc. | 18,456 | 3,475,080 | |
| Hubbell, Inc. Class B | 11,785 | 2,994,097 | |
| Regal Rexnord Corp. | 1,400 | 183,554 | |
| Vertiv Holdings Co. | 303,100 | 4,197,935 | |
| 10,850,666 | |||
| Industrial Conglomerates - 6.3% | |||
| 3M Co. | 9,559 | 1,204,147 | |
| General Electric Co. | 749,913 | 64,470,021 | |
| 65,674,168 | |||
| Machinery - 0.9% | |||
| Cummins, Inc. | 6,000 | 1,506,960 | |
| Flowserve Corp. | 60,619 | 1,901,012 | |
| Fortive Corp. | 30,400 | 2,053,520 | |
| Otis Worldwide Corp. | 19,696 | 1,538,061 | |
| Stanley Black & Decker, Inc. | 8,500 | 694,620 | |
| Westinghouse Air Brake Tech Co. | 21,345 | 2,157,766 | |
| 9,851,939 | |||
| Professional Services - 0.1% | |||
| Equifax, Inc. | 3,700 | 730,269 | |
| Road & Rail - 0.5% | |||
| Knight-Swift Transportation Holdings, Inc. Class A (c) | 95,658 | 5,302,323 | |
| Trading Companies & Distributors - 0.0% | |||
| Beijer Ref AB (B Shares) | 15,900 | 276,103 | |
TOTAL INDUSTRIALS | 150,261,244 | ||
| INFORMATION TECHNOLOGY - 17.4% | |||
| Electronic Equipment & Components - 0.2% | |||
| Mirion Technologies, Inc. (b)(d) | 232,270 | 1,481,883 | |
| IT Services - 3.8% | |||
| Amadeus IT Holding SA Class A (b) | 28,700 | 1,551,738 | |
| Edenred SA | 66,000 | 3,625,973 | |
| Fidelity National Information Services, Inc. | 43,100 | 3,128,198 | |
| Genpact Ltd. | 38,000 | 1,752,180 | |
| Global Payments, Inc. | 5,500 | 570,790 | |
| IBM Corp. | 11,500 | 1,712,350 | |
| MasterCard, Inc. Class A | 10,315 | 3,676,266 | |
| PayPal Holdings, Inc. (b) | 27,900 | 2,187,639 | |
| Sabre Corp. (b)(c) | 152,200 | 929,942 | |
| Snowflake, Inc. (b) | 800 | 114,320 | |
| Twilio, Inc. Class A (b) | 23,200 | 1,137,264 | |
| Unisys Corp. (b) | 141,362 | 607,857 | |
| Visa, Inc. Class A | 86,827 | 18,841,459 | |
| 39,835,976 | |||
| Semiconductors & Semiconductor Equipment - 2.4% | |||
| Analog Devices, Inc. | 11,118 | 1,911,295 | |
| Applied Materials, Inc. | 23,416 | 2,566,394 | |
| Intel Corp. | 91,800 | 2,760,426 | |
| Lam Research Corp. | 4,500 | 2,125,710 | |
| Marvell Technology, Inc. | 55,601 | 2,586,559 | |
| NVIDIA Corp. | 7,800 | 1,319,994 | |
| Qualcomm, Inc. | 94,201 | 11,915,484 | |
| 25,185,862 | |||
| Software - 7.9% | |||
| Adobe, Inc. (b) | 12,900 | 4,449,597 | |
| Autodesk, Inc. (b) | 11,041 | 2,229,730 | |
| Coupa Software, Inc. (b) | 6,700 | 423,708 | |
| DoubleVerify Holdings, Inc. (b) | 16,500 | 432,300 | |
| Dynatrace, Inc. (b) | 34,665 | 1,343,269 | |
| Elastic NV (b) | 30,900 | 1,890,771 | |
| Intuit, Inc. | 2,800 | 1,141,252 | |
| Microsoft Corp. | 238,653 | 60,889,926 | |
| PTC, Inc. (b) | 9,300 | 1,183,053 | |
| Salesforce.com, Inc. (b) | 4,500 | 721,125 | |
| SAP SE sponsored ADR (c) | 70,817 | 7,851,481 | |
| Workday, Inc. Class A (b) | 3,300 | 554,070 | |
| 83,110,282 | |||
| Technology Hardware, Storage & Peripherals - 3.1% | |||
| Apple, Inc. | 215,068 | 31,836,516 | |
| Samsung Electronics Co. Ltd. | 22,520 | 1,094,108 | |
| 32,930,624 | |||
TOTAL INFORMATION TECHNOLOGY | 182,544,627 | ||
| MATERIALS - 3.1% | |||
| Chemicals - 0.7% | |||
| Axalta Coating Systems Ltd. (b) | 16,800 | 450,912 | |
| DuPont de Nemours, Inc. | 91,000 | 6,416,410 | |
| 6,867,322 | |||
| Metals & Mining - 2.4% | |||
| First Quantum Minerals Ltd. | 287,600 | 6,837,489 | |
| Freeport-McMoRan, Inc. | 346,804 | 13,802,799 | |
| Glencore PLC | 706,600 | 4,821,920 | |
| 25,462,208 | |||
TOTAL MATERIALS | 32,329,530 | ||
| REAL ESTATE - 0.8% | |||
| Equity Real Estate Investment Trusts (REITs) - 0.8% | |||
| American Tower Corp. | 12,509 | 2,767,616 | |
| Equinix, Inc. | 442 | 305,267 | |
| Simon Property Group, Inc. | 44,000 | 5,255,360 | |
| 8,328,243 | |||
| UTILITIES - 0.6% | |||
| Electric Utilities - 0.5% | |||
| Entergy Corp. | 8,900 | 1,034,803 | |
| PG&E Corp. (b) | 75,500 | 1,185,350 | |
| Southern Co. | 48,600 | 3,287,304 | |
| 5,507,457 | |||
| Multi-Utilities - 0.1% | |||
| Sempra Energy | 2,034 | 338,030 | |
TOTAL UTILITIES | 5,845,487 | ||
| TOTAL COMMON STOCKS (Cost $665,789,626) | 1,004,713,025 | ||
| Preferred Stocks - 0.1% | |||
| Shares | Value ($) | ||
| Convertible Preferred Stocks - 0.0% | |||
| COMMUNICATION SERVICES - 0.0% | |||
| Interactive Media & Services - 0.0% | |||
| Reddit, Inc. Series E (b)(d)(e) | 1,200 | 49,320 | |
| Nonconvertible Preferred Stocks - 0.1% | |||
| INDUSTRIALS - 0.1% | |||
| Aerospace & Defense - 0.1% | |||
| Embraer SA sponsored ADR (b) | 119,400 | 1,268,028 | |
| TOTAL PREFERRED STOCKS (Cost $1,471,102) | 1,317,348 | ||
| Money Market Funds - 4.2% | |||
| Shares | Value ($) | ||
| Fidelity Cash Central Fund 3.86% (f) | 40,536,499 | 40,544,606 | |
| Fidelity Securities Lending Cash Central Fund 3.86% (f)(g) | 3,678,663 | 3,679,031 | |
| TOTAL MONEY MARKET FUNDS (Cost $44,223,637) | 44,223,637 | ||
| TOTAL INVESTMENT IN SECURITIES - 100.1% (Cost $711,484,365) | 1,050,254,010 |
NET OTHER ASSETS (LIABILITIES) - (0.1)% | (687,285) |
| NET ASSETS - 100.0% | 1,049,566,725 |
| (a) | Security exempt from registration under Rule 144A of the Securities Act of 1933. These securities may be resold in transactions exempt from registration, normally to qualified institutional buyers. At the end of the period, the value of these securities amounted to $1,454,636 or 0.1% of net assets. |
| (b) | Non-income producing |
| (c) | Security or a portion of the security is on loan at period end. |
| (d) | Restricted securities (including private placements) - Investment in securities not registered under the Securities Act of 1933 (excluding 144A issues). At the end of the period, the value of restricted securities (excluding 144A issues) amounted to $1,531,203 or 0.1% of net assets. |
| (e) | Level 3 security |
| (f) | Affiliated fund that is generally available only to investment companies and other accounts managed by Fidelity Investments. The rate quoted is the annualized seven-day yield of the fund at period end. A complete unaudited listing of the fund's holdings as of its most recent quarter end is available upon request. In addition, each Fidelity Central Fund's financial statements, which are not covered by the Fund's Report of Independent Registered Public Accounting Firm, are available on the SEC's website or upon request. |
| (g) | Investment made with cash collateral received from securities on loan. |
| Additional information on each restricted holding is as follows: | ||
| Security | Acquisition Date | Acquisition Cost ($) |
| Mirion Technologies, Inc. | 6/16/21 | 2,322,700 |
| Reddit, Inc. Series E | 5/18/21 | 50,969 |
| Affiliate | Value, beginning of period ($) | Purchases ($) | Sales Proceeds ($) | Dividend Income ($) | Realized Gain (loss) ($) | Change in Unrealized appreciation (depreciation) ($) | Value, end of period ($) | % ownership, end of period |
| Fidelity Cash Central Fund 3.86% | 1,030,319 | 139,289,838 | 99,775,551 | 501,338 | - | - | 40,544,606 | 0.1% |
| Fidelity Securities Lending Cash Central Fund 3.86% | 3,967,656 | 32,433,879 | 32,722,504 | 9,755 | - | - | 3,679,031 | 0.0% |
| Total | 4,997,975 | 171,723,717 | 132,498,055 | 511,093 | - | - | 44,223,637 | |
| Valuation Inputs at Reporting Date: | ||||
| Description | Total ($) | Level 1 ($) | Level 2 ($) | Level 3 ($) |
Investments in Securities: | ||||
| Equities: | ||||
Communication Services | 78,309,233 | 71,701,113 | 6,558,800 | 49,320 |
Consumer Discretionary | 37,605,295 | 37,605,295 | - | - |
Consumer Staples | 47,952,154 | 47,952,154 | - | - |
Energy | 145,085,564 | 145,085,564 | - | - |
Financials | 172,235,825 | 172,235,825 | - | - |
Health Care | 144,265,143 | 142,027,472 | 2,237,671 | - |
Industrials | 151,529,272 | 143,944,824 | 7,584,448 | - |
Information Technology | 182,544,627 | 176,272,808 | 6,271,819 | - |
Materials | 32,329,530 | 27,507,610 | 4,821,920 | - |
Real Estate | 8,328,243 | 8,328,243 | - | - |
Utilities | 5,845,487 | 5,845,487 | - | - |
| Money Market Funds | 44,223,637 | 44,223,637 | - | - |
| Total Investments in Securities: | 1,050,254,010 | 1,022,730,032 | 27,474,658 | 49,320 |
| Statement of Assets and Liabilities | ||||
| November 30, 2022 | ||||
| Assets | ||||
| Investment in securities, at value (including securities loaned of $3,762,158) - See accompanying schedule: | ||||
Unaffiliated issuers (cost $667,260,728) | $1,006,030,373 | |||
Fidelity Central Funds (cost $44,223,637) | 44,223,637 | |||
| Total Investment in Securities (cost $711,484,365) | $ | 1,050,254,010 | ||
| Restricted cash | 171,214 | |||
| Foreign currency held at value (cost $290) | 290 | |||
| Receivable for investments sold | ||||
Regular delivery | 404,825 | |||
Delayed delivery | 951,523 | |||
| Receivable for fund shares sold | 878,557 | |||
| Dividends receivable | 2,679,601 | |||
| Distributions receivable from Fidelity Central Funds | 142,739 | |||
| Prepaid expenses | 1,306 | |||
Total assets | 1,055,484,065 | |||
| Liabilities | ||||
| Payable for fund shares redeemed | $1,363,974 | |||
| Distributions payable | 4 | |||
| Accrued management fee | 463,240 | |||
| Distribution and service plan fees payable | 239,716 | |||
| Other affiliated payables | 160,747 | |||
| Other payables and accrued expenses | 8,484 | |||
| Collateral on securities loaned | 3,681,175 | |||
| Total Liabilities | 5,917,340 | |||
| Net Assets | $ | 1,049,566,725 | ||
| Net Assets consist of: | ||||
| Paid in capital | $ | 693,245,394 | ||
| Total accumulated earnings (loss) | 356,321,331 | |||
| Net Assets | $ | 1,049,566,725 | ||
| Net Asset Value and Maximum Offering Price | ||||
| Class A : | ||||
Net Asset Value and redemption price per share ($532,911,174 ÷ 14,684,596 shares) (a) | $ | 36.29 | ||
| Maximum offering price per share (100/94.25 of $36.29) | $ | 38.50 | ||
| Class M : | ||||
Net Asset Value and redemption price per share ($166,367,737 ÷ 4,602,896 shares) (a) | $ | 36.14 | ||
| Maximum offering price per share (100/96.50 of $36.14) | $ | 37.45 | ||
| Class C : | ||||
Net Asset Value and offering price per share ($81,508,979 ÷ 2,600,425 shares) (a) | $ | 31.34 | ||
| Class I : | ||||
Net Asset Value , offering price and redemption price per share ($224,889,398 ÷ 5,792,081 shares) | $ | 38.83 | ||
| Class Z : | ||||
Net Asset Value , offering price and redemption price per share ($43,889,437 ÷ 1,130,904 shares) | $ | 38.81 | ||
(a)Redemption price per share is equal to net asset value less any applicable contingent deferred sales charge. | ||||
| Statement of Operations | ||||
Year ended November 30, 2022 | ||||
| Investment Income | ||||
| Dividends | $ | 19,762,987 | ||
| Income from Fidelity Central Funds (including $9,755 from security lending) | 511,093 | |||
| Total Income | 20,274,080 | |||
| Expenses | ||||
| Management fee | ||||
| Basic fee | $ | 5,367,345 | ||
| Performance adjustment | (839,164) | |||
| Transfer agent fees | 1,697,090 | |||
| Distribution and service plan fees | 2,890,391 | |||
| Accounting fees | 320,378 | |||
| Custodian fees and expenses | 22,001 | |||
| Independent trustees' fees and expenses | 3,544 | |||
| Registration fees | 91,027 | |||
| Audit | 59,503 | |||
| Legal | 4,456 | |||
| Miscellaneous | 4,569 | |||
| Total expenses before reductions | 9,621,140 | |||
| Expense reductions | (33,163) | |||
| Total expenses after reductions | 9,587,977 | |||
| Net Investment income (loss) | 10,686,103 | |||
| Realized and Unrealized Gain (Loss) | ||||
| Net realized gain (loss) on: | ||||
| Investment Securities: | ||||
| Unaffiliated issuers | 12,661,402 | |||
| Foreign currency transactions | 147,462 | |||
| Total net realized gain (loss) | 12,808,864 | |||
| Change in net unrealized appreciation (depreciation) on: | ||||
| Investment Securities: | ||||
| Unaffiliated issuers | (9,387,063) | |||
| Assets and liabilities in foreign currencies | (18,625) | |||
| Total change in net unrealized appreciation (depreciation) | (9,405,688) | |||
| Net gain (loss) | 3,403,176 | |||
| Net increase (decrease) in net assets resulting from operations | $ | 14,089,279 | ||
| Statement of Changes in Net Assets | ||||
Year ended November 30, 2022 | Year ended November 30, 2021 | |||
| Increase (Decrease) in Net Assets | ||||
| Operations | ||||
| Net investment income (loss) | $ | 10,686,103 | $ | 16,398,318 |
| Net realized gain (loss) | 12,808,864 | 56,660,801 | ||
| Change in net unrealized appreciation (depreciation) | (9,405,688) | 142,314,488 | ||
| Net increase (decrease) in net assets resulting from operations | 14,089,279 | 215,373,607 | ||
| Distributions to shareholders | (67,019,635) | (46,442,509) | ||
| Share transactions - net increase (decrease) | 70,348,927 | (5,167,538) | ||
| Total increase (decrease) in net assets | 17,418,571 | 163,763,560 | ||
| Net Assets | ||||
| Beginning of period | 1,032,148,154 | 868,384,594 | ||
| End of period | $ | 1,049,566,725 | $ | 1,032,148,154 |
| Fidelity Advisor® Large Cap Fund Class A |
| Years ended November 30, | 2022 | 2021 | 2020 | 2019 | 2018 | |||||
Selected Per-Share Data | ||||||||||
| Net asset value, beginning of period | $ | 38.14 | $ | 31.98 | $ | 32.80 | $ | 33.76 | $ | 34.98 |
| Income from Investment Operations | ||||||||||
Net investment income (loss) A,B | .38 | .62 C | .50 | .51 | .40 | |||||
| Net realized and unrealized gain (loss) | .28 | 7.29 | 1.36 | 2.97 | .89 | |||||
| Total from investment operations | .66 | 7.91 | 1.86 | 3.48 | 1.29 | |||||
| Distributions from net investment income | (.61) | (.57) | (.60) | (.45) | (.38) | |||||
| Distributions from net realized gain | (1.90) | (1.18) | (2.08) | (3.99) | (2.13) | |||||
| Total distributions | (2.51) | (1.75) | (2.68) | (4.44) | (2.51) | |||||
| Net asset value, end of period | $ | 36.29 | $ | 38.14 | $ | 31.98 | $ | 32.80 | $ | 33.76 |
Total Return D,E | 1.49% | 25.87% | 5.91% | 14.19% | 3.77% | |||||
Ratios to Average Net Assets B,F,G | ||||||||||
| Expenses before reductions | .92% | .80% | .75% | .91% | .92% | |||||
| Expenses net of fee waivers, if any | .91% | .80% | .75% | .91% | .92% | |||||
| Expenses net of all reductions | .91% | .80% | .75% | .90% | .92% | |||||
| Net investment income (loss) | 1.07% | 1.67% C | 1.76% | 1.71% | 1.17% | |||||
| Supplemental Data | ||||||||||
| Net assets, end of period (000 omitted) | $ | 532,911 | $ | 468,894 | $ | 389,143 | $ | 423,325 | $ | 401,495 |
Portfolio turnover rate H | 11% | 17% | 22% | 28% I | 37% |
| Fidelity Advisor® Large Cap Fund Class M |
| Years ended November 30, | 2022 | 2021 | 2020 | 2019 | 2018 | |||||
Selected Per-Share Data | ||||||||||
| Net asset value, beginning of period | $ | 37.99 | $ | 31.86 | $ | 32.69 | $ | 33.63 | $ | 34.86 |
| Income from Investment Operations | ||||||||||
Net investment income (loss) A,B | .29 | .52 C | .42 | .43 | .31 | |||||
| Net realized and unrealized gain (loss) | .27 | 7.28 | 1.35 | 2.98 | .89 | |||||
| Total from investment operations | .56 | 7.80 | 1.77 | 3.41 | 1.20 | |||||
| Distributions from net investment income | (.52) | (.49) | (.52) | (.36) | (.29) | |||||
| Distributions from net realized gain | (1.90) | (1.18) | (2.08) | (3.99) | (2.13) | |||||
| Total distributions | (2.41) D | (1.67) | (2.60) | (4.35) | (2.43) D | |||||
| Net asset value, end of period | $ | 36.14 | $ | 37.99 | $ | 31.86 | $ | 32.69 | $ | 33.63 |
Total Return E,F | 1.23% | 25.55% | 5.62% | 13.93% | 3.50% | |||||
Ratios to Average Net Assets B,G,H | ||||||||||
| Expenses before reductions | 1.17% | 1.05% | 1.01% | 1.17% | 1.18% | |||||
| Expenses net of fee waivers, if any | 1.16% | 1.05% | 1.01% | 1.16% | 1.18% | |||||
| Expenses net of all reductions | 1.16% | 1.05% | 1.00% | 1.16% | 1.18% | |||||
| Net investment income (loss) | .83% | 1.42% C | 1.50% | 1.46% | .92% | |||||
| Supplemental Data | ||||||||||
| Net assets, end of period (000 omitted) | $ | 166,368 | $ | 176,983 | $ | 153,918 | $ | 175,139 | $ | 173,195 |
Portfolio turnover rate I | 11% | 17% | 22% | 28% J | 37% |
| Fidelity Advisor® Large Cap Fund Class C |
| Years ended November 30, | 2022 | 2021 | 2020 | 2019 | 2018 | |||||
Selected Per-Share Data | ||||||||||
| Net asset value, beginning of period | $ | 33.25 | $ | 28.08 | $ | 29.09 | $ | 30.44 | $ | 31.78 |
| Income from Investment Operations | ||||||||||
Net investment income (loss) A,B | .09 | .29 C | .25 | .25 | .13 | |||||
| Net realized and unrealized gain (loss) | .24 | 6.40 | 1.18 | 2.60 | .81 | |||||
| Total from investment operations | .33 | 6.69 | 1.43 | 2.85 | .94 | |||||
| Distributions from net investment income | (.34) | (.34) | (.36) | (.21) | (.15) | |||||
| Distributions from net realized gain | (1.90) | (1.18) | (2.08) | (3.99) | (2.13) | |||||
| Total distributions | (2.24) | (1.52) | (2.44) | (4.20) | (2.28) | |||||
| Net asset value, end of period | $ | 31.34 | $ | 33.25 | $ | 28.08 | $ | 29.09 | $ | 30.44 |
Total Return D,E | .70% | 24.90% | 5.10% | 13.33% | 3.01% | |||||
Ratios to Average Net Assets B,F,G | ||||||||||
| Expenses before reductions | 1.69% | 1.57% | 1.53% | 1.67% | 1.69% | |||||
| Expenses net of fee waivers, if any | 1.68% | 1.57% | 1.52% | 1.67% | 1.69% | |||||
| Expenses net of all reductions | 1.68% | 1.57% | 1.52% | 1.67% | 1.68% | |||||
| Net investment income (loss) | .30% | .90% C | .98% | .95% | .41% | |||||
| Supplemental Data | ||||||||||
| Net assets, end of period (000 omitted) | $ | 81,509 | $ | 89,886 | $ | 88,926 | $ | 119,072 | $ | 158,775 |
Portfolio turnover rate H | 11% | 17% | 22% | 28% I | 37% |
| Fidelity Advisor® Large Cap Fund Class I |
| Years ended November 30, | 2022 | 2021 | 2020 | 2019 | 2018 | |||||
Selected Per-Share Data | ||||||||||
| Net asset value, beginning of period | $ | 40.63 | $ | 33.94 | $ | 34.63 | $ | 35.37 | $ | 36.53 |
| Income from Investment Operations | ||||||||||
Net investment income (loss) A,B | .51 | .76 C | .61 | .62 | .51 | |||||
| Net realized and unrealized gain (loss) | .30 | 7.76 | 1.44 | 3.17 | .93 | |||||
| Total from investment operations | .81 | 8.52 | 2.05 | 3.79 | 1.44 | |||||
| Distributions from net investment income | (.71) | (.64) | (.66) | (.54) | (.47) | |||||
| Distributions from net realized gain | (1.90) | (1.18) | (2.08) | (3.99) | (2.13) | |||||
| Total distributions | (2.61) | (1.83) D | (2.74) | (4.53) | (2.60) | |||||
| Net asset value, end of period | $ | 38.83 | $ | 40.63 | $ | 33.94 | $ | 34.63 | $ | 35.37 |
Total Return E | 1.77% | 26.22% | 6.17% | 14.54% | 4.05% | |||||
Ratios to Average Net Assets B,F,G | ||||||||||
| Expenses before reductions | .65% | .54% | .48% | .64% | .66% | |||||
| Expenses net of fee waivers, if any | .65% | .54% | .48% | .64% | .66% | |||||
| Expenses net of all reductions | .65% | .54% | .48% | .64% | .66% | |||||
| Net investment income (loss) | 1.34% | 1.93% C | 2.03% | 1.98% | 1.44% | |||||
| Supplemental Data | ||||||||||
| Net assets, end of period (000 omitted) | $ | 224,889 | $ | 257,331 | $ | 206,090 | $ | 301,067 | $ | 459,962 |
Portfolio turnover rate H | 11% | 17% | 22% | 28% I | 37% |
| Fidelity Advisor® Large Cap Fund Class Z |
| Years ended November 30, | 2022 | 2021 | 2020 | 2019 | 2018 | |||||
Selected Per-Share Data | ||||||||||
| Net asset value, beginning of period | $ | 40.61 | $ | 33.93 | $ | 34.64 | $ | 35.41 | $ | 36.57 |
| Income from Investment Operations | ||||||||||
Net investment income (loss) A,B | .55 | .81 C | .64 | .66 | .56 | |||||
| Net realized and unrealized gain (loss) | .30 | 7.74 | 1.45 | 3.16 | .93 | |||||
| Total from investment operations | .85 | 8.55 | 2.09 | 3.82 | 1.49 | |||||
| Distributions from net investment income | (.76) | (.69) | (.72) | (.60) | (.52) | |||||
| Distributions from net realized gain | (1.90) | (1.18) | (2.08) | (3.99) | (2.13) | |||||
| Total distributions | (2.65) D | (1.87) | (2.80) | (4.59) | (2.65) | |||||
| Net asset value, end of period | $ | 38.81 | $ | 40.61 | $ | 33.93 | $ | 34.64 | $ | 35.41 |
Total Return E,F | 1.88% | 26.36% | 6.30% | 14.67% | 4.19% | |||||
Ratios to Average Net Assets B,G,H | ||||||||||
| Expenses before reductions | .53% | .42% | .36% | .51% | .53% | |||||
| Expenses net of fee waivers, if any | .53% | .42% | .36% | .51% | .53% | |||||
| Expenses net of all reductions | .53% | .42% | .36% | .51% | .53% | |||||
| Net investment income (loss) | 1.46% | 2.05% C | 2.15% | 2.11% | 1.57% | |||||
| Supplemental Data | ||||||||||
| Net assets, end of period (000 omitted) | $ | 43,889 | $ | 39,055 | $ | 30,308 | $ | 28,596 | $ | 17,711 |
Portfolio turnover rate I | 11% | 17% | 22% | 28% J | 37% |
| Fidelity Central Fund | Investment Manager | Investment Objective | Investment Practices | Expense Ratio A |
| Fidelity Money Market Central Funds | Fidelity Management & Research Company LLC (FMR) | Each fund seeks to obtain a high level of current income consistent with the preservation of capital and liquidity. | Short-term Investments | Less than .005% |
| Gross unrealized appreciation | $393,188,358 |
| Gross unrealized depreciation | (57,355,408) |
| Net unrealized appreciation (depreciation) | $335,832,950 |
| Tax Cost | $714,421,060 |
| Undistributed ordinary income | $9,810,612 |
| Undistributed long-term capital gain | $10,695,546 |
| Net unrealized appreciation (depreciation) on securities and other investments | $335,815,174 |
| November 30, 2022 | November 30, 2021 | |
| Ordinary Income | $17,244,942 | $14,724,707 |
| Long-term Capital Gains | 49,774,693 | 31,717,802 |
| Total | $67,019,635 | $46,442,509 |
| Purchases ($) | Sales ($) | |
| Fidelity Advisor Large Cap Fund | 113,687,577 | 140,062,502 |
| Distribution Fee | Service Fee | Total Fees | Retained by FDC | |
| Class A | -% | .25% | $1,229,091 | $30,625 |
| Class M | .25% | .25% | 833,668 | 516 |
| Class C | .75% | .25% | 827,632 | 90,980 |
| $2,890,391 | $122,121 |
| Retained by FDC | |
| Class A | $142,718 |
| Class M | 9,714 |
Class C A | 1,738 |
| $154,170 |
| Amount | % of Class-Level Average Net Assets | |
| Class A | $848,958 | .17 |
| Class M | 286,477 | .17 |
| Class C | 160,127 | .19 |
| Class I | 385,181 | .16 |
| Class Z | 16,347 | .04 |
| $1,697,090 |
| % of Average Net Assets | |
| Fidelity Advisor Large Cap Fund | .03 |
| Amount | |
| Fidelity Advisor Large Cap Fund | $2,105 |
| Purchases ($) | Sales ($) | Realized Gain (Loss) ($) | |
| Fidelity Advisor Large Cap Fund | 13,430,861 | 11,120,387 | 2,962,547 |
| Amount | |
| Fidelity Advisor Large Cap Fund | $1,758 |
| Total Security Lending Fees Paid to NFS | Security Lending Income From Securities Loaned to NFS | Value of Securities Loaned to NFS at Period End | |
| Fidelity Advisor Large Cap Fund | $953 | $159 | $- |
Year ended November 30, 2022 | Year ended November 30, 2021 | |
| Fidelity Advisor Large Cap Fund | ||
| Distributions to shareholders | ||
| Class A | $30,944,684 | $21,133,066 |
| Class M | 11,170,201 | 7,961,413 |
| Class C | 5,966,361 | 4,686,944 |
| Class I | 16,368,054 | 11,009,981 |
| Class Z | 2,570,335 | 1,651,105 |
Total | $67,019,635 | $46,442,509 |
| Shares | Shares | Dollars | Dollars | |
| Year ended November 30, 2022 | Year ended November 30, 2021 | Year ended November 30, 2022 | Year ended November 30, 2021 | |
| Fidelity Advisor Large Cap Fund | ||||
| Class A | ||||
| Shares sold | 3,626,974 | 2,060,479 | $128,966,334 | $75,956,104 |
| Reinvestment of distributions | 779,090 | 634,564 | 29,356,126 | 20,064,924 |
| Shares redeemed | (2,014,687) | (2,570,290) | (70,920,013) | (93,883,684) |
| Net increase (decrease) | 2,391,377 | 124,753 | $87,402,447 | $2,137,344 |
| Class M | ||||
| Shares sold | 379,641 | 506,912 | $13,633,890 | $18,689,115 |
| Reinvestment of distributions | 292,695 | 249,228 | 11,008,245 | 7,868,112 |
| Shares redeemed | (727,664) | (929,141) | (25,981,535) | (33,377,285) |
| Net increase (decrease) | (55,328) | (173,001) | $(1,339,400) | $(6,820,058) |
| Class C | ||||
| Shares sold | 660,665 | 417,057 | $20,016,036 | $13,434,532 |
| Reinvestment of distributions | 175,143 | 165,245 | 5,739,439 | 4,587,186 |
| Shares redeemed | (938,456) | (1,046,168) | (28,835,259) | (33,381,868) |
| Net increase (decrease) | (102,648) | (463,866) | $(3,079,784) | $(15,360,150) |
| Class I | ||||
| Shares sold | 2,154,388 | 2,266,950 | $82,102,984 | $89,737,732 |
| Reinvestment of distributions | 355,420 | 280,570 | 14,291,444 | 9,427,141 |
| Shares redeemed | (3,050,691) | (2,286,098) | (115,517,358) | (86,887,431) |
| Net increase (decrease) | (540,883) | 261,422 | $(19,122,930) | $12,277,442 |
| Class Z | ||||
| Shares sold | 296,020 | 210,356 | $11,181,715 | $8,284,923 |
| Reinvestment of distributions | 57,903 | 45,813 | 2,324,789 | 1,537,037 |
| Shares redeemed | (184,633) | (187,738) | (7,017,910) | (7,224,076) |
| Net increase (decrease) | 169,290 | 68,431 | $6,488,594 | $2,597,884 |
| The Example is based on an investment of $1,000 invested at the beginning of the period and held for the entire period (June 1, 2022 to November 30, 2022). |
Annualized Expense Ratio- A | Beginning Account Value June 1, 2022 | Ending Account Value November 30, 2022 | Expenses Paid During Period- C June 1, 2022 to November 30, 2022 | |||||||
| Fidelity Advisor® Large Cap Fund | ||||||||||
| Class A | .97% | |||||||||
| Actual | $ 1,000 | $ 1,016.20 | $ 4.90 | |||||||
Hypothetical- B | $ 1,000 | $ 1,020.21 | $ 4.91 | |||||||
| Class M | 1.23% | |||||||||
| Actual | $ 1,000 | $ 1,014.90 | $ 6.21 | |||||||
Hypothetical- B | $ 1,000 | $ 1,018.90 | $ 6.23 | |||||||
| Class C | 1.75% | |||||||||
| Actual | $ 1,000 | $ 1,012.30 | $ 8.83 | |||||||
Hypothetical- B | $ 1,000 | $ 1,016.29 | $ 8.85 | |||||||
| Class I | .72% | |||||||||
| Actual | $ 1,000 | $ 1,017.60 | $ 3.64 | |||||||
Hypothetical- B | $ 1,000 | $ 1,021.46 | $ 3.65 | |||||||
| Class Z | .59% | |||||||||
| Actual | $ 1,000 | $ 1,018.10 | $ 2.98 | |||||||
Hypothetical- B | $ 1,000 | $ 1,022.11 | $ 2.99 | |||||||
|


Contents
| Average Annual Total Returns | |||
Periods ended November 30, 2022 | Past 1 year | Past 5 years | Past 10 years |
| Class A (incl.5.75% sales charge) | -9.01% | 6.30% | 9.71% |
| Class M (incl.3.50% sales charge) | -7.07% | 6.54% | 9.71% |
Class C (incl. contingent deferred sales charge) | -5.09% | 6.73% | 9.69% |
| Class I | -3.23% | 7.83% | 10.63% |
| Class Z | -3.10% | 7.99% | 10.79% |
| $10,000 Over 10 Years |
Let's say hypothetically that $10,000 was invested in Fidelity Advisor® Dividend Growth Fund - Class A, on November 30, 2012, and the current 5.75% sales charge was paid. The chart shows how the value of your investment would have changed, and also shows how the S&P 500® Index performed over the same period. |
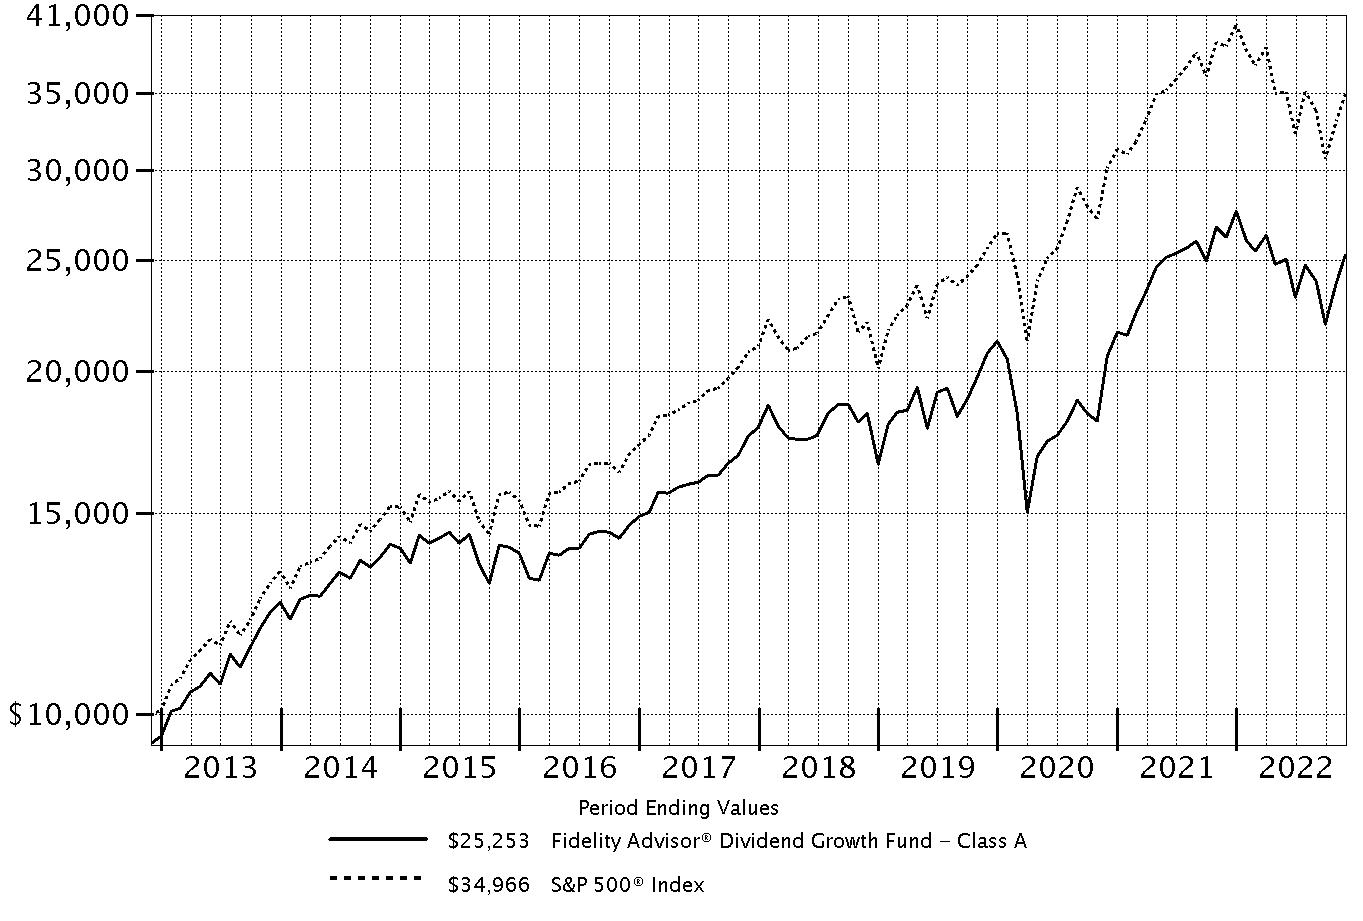 |
Top Holdings (% of Fund's net assets) | ||
| Microsoft Corp. | 5.7 | |
| UnitedHealth Group, Inc. | 2.4 | |
| Cigna Corp. | 2.3 | |
| Visa, Inc. Class A | 2.0 | |
| Bristol-Myers Squibb Co. | 1.9 | |
| Exxon Mobil Corp. | 1.8 | |
| Wells Fargo & Co. | 1.5 | |
| Domino's Pizza, Inc. | 1.4 | |
| Humana, Inc. | 1.4 | |
| Allison Transmission Holdings, Inc. | 1.4 | |
| 21.8 | ||
| Market Sectors (% of Fund's net assets) | ||
| Information Technology | 17.4 | |
| Health Care | 15.0 | |
| Energy | 10.2 | |
| Industrials | 9.3 | |
| Consumer Staples | 9.2 | |
| Financials | 7.7 | |
| Utilities | 6.5 | |
| Consumer Discretionary | 6.2 | |
| Communication Services | 5.2 | |
| Materials | 4.9 | |
| Real Estate | 4.4 | |
Asset Allocation (% of Fund's net assets) |
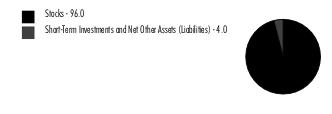 |
Foreign investments - 12.1% |
Geographic Diversification (% of Fund's net assets) |
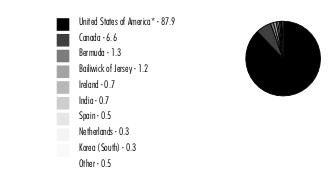 |
* Includes Short-Term investments and Net Other Assets (Liabilities). Percentages are based on country or territory of incorporation and are adjusted for the effect of futures contracts, if applicable. |
| Common Stocks - 96.0% | |||
| Shares | Value ($) (000s) | ||
| COMMUNICATION SERVICES - 5.2% | |||
| Diversified Telecommunication Services - 1.8% | |||
| Cellnex Telecom SA (a) | 154,200 | 5,303 | |
| Verizon Communications, Inc. | 377,700 | 14,723 | |
| 20,026 | |||
| Entertainment - 1.1% | |||
| Activision Blizzard, Inc. | 169,400 | 12,527 | |
| Interactive Media & Services - 1.4% | |||
| Alphabet, Inc. Class A (b) | 97,000 | 9,796 | |
| Meta Platforms, Inc. Class A (b) | 51,600 | 6,094 | |
| 15,890 | |||
| Media - 0.9% | |||
| Comcast Corp. Class A | 278,950 | 10,221 | |
TOTAL COMMUNICATION SERVICES | 58,664 | ||
| CONSUMER DISCRETIONARY - 6.2% | |||
| Diversified Consumer Services - 0.5% | |||
| H&R Block, Inc. | 132,500 | 5,792 | |
| Hotels, Restaurants & Leisure - 2.5% | |||
| Churchill Downs, Inc. | 15,700 | 3,485 | |
| Domino's Pizza, Inc. | 41,800 | 16,249 | |
| Hilton Worldwide Holdings, Inc. | 8,500 | 1,212 | |
| Krispy Kreme, Inc. | 67,100 | 1,035 | |
| Restaurant Brands International, Inc. (c) | 100,700 | 6,681 | |
| Starbucks Corp. | 100 | 10 | |
| 28,672 | |||
| Household Durables - 1.7% | |||
| D.R. Horton, Inc. | 96,600 | 8,308 | |
| Lennar Corp. Class A | 119,300 | 10,478 | |
| 18,786 | |||
| Multiline Retail - 0.9% | |||
| Dollar General Corp. | 40,500 | 10,355 | |
| Specialty Retail - 0.6% | |||
| TJX Companies, Inc. | 80,500 | 6,444 | |
TOTAL CONSUMER DISCRETIONARY | 70,049 | ||
| CONSUMER STAPLES - 9.2% | |||
| Beverages - 3.5% | |||
| Constellation Brands, Inc. Class A (sub. vtg.) | 39,600 | 10,191 | |
| Keurig Dr. Pepper, Inc. | 399,000 | 15,429 | |
| The Coca-Cola Co. | 220,800 | 14,045 | |
| 39,665 | |||
| Food & Staples Retailing - 2.0% | |||
| Alimentation Couche-Tard, Inc. Class A (multi-vtg.) | 163,700 | 7,458 | |
| Sysco Corp. | 11,500 | 995 | |
| Walmart, Inc. | 90,800 | 13,840 | |
| 22,293 | |||
| Food Products - 0.9% | |||
| Archer Daniels Midland Co. | 29,000 | 2,828 | |
| The J.M. Smucker Co. | 42,600 | 6,561 | |
| 9,389 | |||
| Household Products - 1.1% | |||
| Reynolds Consumer Products, Inc. (c) | 394,500 | 12,608 | |
| Tobacco - 1.7% | |||
| Altria Group, Inc. | 260,273 | 12,124 | |
| Philip Morris International, Inc. | 74,500 | 7,425 | |
| 19,549 | |||
TOTAL CONSUMER STAPLES | 103,504 | ||
| ENERGY - 10.2% | |||
| Energy Equipment & Services - 0.8% | |||
| Baker Hughes Co. Class A | 325,400 | 9,443 | |
| Oil, Gas & Consumable Fuels - 9.4% | |||
| ARC Resources Ltd. | 801,800 | 11,909 | |
| Arch Resources, Inc. | 56,700 | 8,774 | |
| Cameco Corp. | 46,600 | 1,136 | |
| Canadian Natural Resources Ltd. | 231,800 | 13,843 | |
| Cool Co. Ltd. (b) | 271,400 | 3,437 | |
| Energy Transfer LP | 982,100 | 12,316 | |
| Enterprise Products Partners LP | 488,000 | 12,107 | |
| Exxon Mobil Corp. | 184,122 | 20,500 | |
| Reliance Industries Ltd. sponsored GDR (a) | 112,500 | 7,487 | |
| Sitio Royalties Corp. (c) | 161,900 | 5,106 | |
| Viper Energy Partners LP | 275,053 | 9,085 | |
| 105,700 | |||
TOTAL ENERGY | 115,143 | ||
| FINANCIALS - 7.7% | |||
| Banks - 2.1% | |||
| Bank of America Corp. | 197,200 | 7,464 | |
| Wells Fargo & Co. | 344,390 | 16,514 | |
| 23,978 | |||
| Capital Markets - 2.2% | |||
| BlackRock, Inc. Class A | 4,300 | 3,079 | |
| Brookfield Asset Management, Inc. Class A | 86,600 | 4,083 | |
| Intercontinental Exchange, Inc. | 122,900 | 13,311 | |
| S&P Global, Inc. | 12,548 | 4,427 | |
| 24,900 | |||
| Diversified Financial Services - 0.2% | |||
| Apollo Global Management, Inc. | 38,800 | 2,692 | |
| Insurance - 3.2% | |||
| Arthur J. Gallagher & Co. | 63,900 | 12,723 | |
| Brookfield Asset Management Reinsurance Partners Ltd. | 491 | 23 | |
| Marsh & McLennan Companies, Inc. | 50,700 | 8,780 | |
| The Travelers Companies, Inc. | 74,800 | 14,198 | |
| 35,724 | |||
TOTAL FINANCIALS | 87,294 | ||
| HEALTH CARE - 15.0% | |||
| Biotechnology - 0.4% | |||
| AbbVie, Inc. | 29,100 | 4,690 | |
| Health Care Equipment & Supplies - 1.4% | |||
| Baxter International, Inc. | 162,800 | 9,203 | |
| Becton, Dickinson & Co. | 25,100 | 6,258 | |
| 15,461 | |||
| Health Care Providers & Services - 7.7% | |||
| Cigna Corp. | 80,500 | 26,476 | |
| CVS Health Corp. | 103,100 | 10,504 | |
| Elevance Health, Inc. | 3,400 | 1,812 | |
| HCA Holdings, Inc. | 24,300 | 5,837 | |
| Humana, Inc. | 28,700 | 15,782 | |
| UnitedHealth Group, Inc. | 49,197 | 26,948 | |
| 87,359 | |||
| Life Sciences Tools & Services - 1.4% | |||
| Danaher Corp. | 12,700 | 3,472 | |
| Thermo Fisher Scientific, Inc. | 23,000 | 12,885 | |
| 16,357 | |||
| Pharmaceuticals - 4.1% | |||
| Bristol-Myers Squibb Co. | 265,600 | 21,322 | |
| Eli Lilly & Co. | 26,100 | 9,685 | |
| Perrigo Co. PLC | 261,800 | 8,438 | |
| Pfizer, Inc. | 40,900 | 2,050 | |
| Roche Holding AG (participation certificate) | 9,100 | 2,972 | |
| Royalty Pharma PLC | 38,000 | 1,671 | |
| 46,138 | |||
TOTAL HEALTH CARE | 170,005 | ||
| INDUSTRIALS - 9.3% | |||
| Aerospace & Defense - 2.7% | |||
| Airbus Group NV | 10,900 | 1,251 | |
| L3Harris Technologies, Inc. | 15,800 | 3,588 | |
| Lockheed Martin Corp. | 9,100 | 4,415 | |
| Northrop Grumman Corp. | 17,000 | 9,066 | |
| The Boeing Co. (b) | 69,900 | 12,504 | |
| �� | 30,824 | ||
| Air Freight & Logistics - 0.2% | |||
| United Parcel Service, Inc. Class B | 13,700 | 2,599 | |
| Commercial Services & Supplies - 0.9% | |||
| GFL Environmental, Inc. (c) | 367,900 | 10,667 | |
| Industrial Conglomerates - 1.2% | |||
| General Electric Co. | 157,487 | 13,539 | |
| Machinery - 2.7% | |||
| Allison Transmission Holdings, Inc. | 348,443 | 15,610 | |
| Caterpillar, Inc. | 7,000 | 1,655 | |
| Deere & Co. | 18,200 | 8,026 | |
| Fortive Corp. | 23,800 | 1,608 | |
| PACCAR, Inc. | 39,700 | 4,205 | |
| 31,104 | |||
| Marine - 0.2% | |||
| 2020 Bulkers Ltd. (c) | 202,600 | 1,729 | |
| Professional Services - 0.6% | |||
| Equifax, Inc. | 21,300 | 4,204 | |
| Leidos Holdings, Inc. | 21,000 | 2,296 | |
| 6,500 | |||
| Road & Rail - 0.8% | |||
| Canadian Pacific Railway Ltd. | 73,000 | 5,979 | |
| TFI International, Inc. (Canada) | 25,600 | 2,779 | |
| 8,758 | |||
TOTAL INDUSTRIALS | 105,720 | ||
| INFORMATION TECHNOLOGY - 17.4% | |||
| Electronic Equipment & Components - 0.2% | |||
| Jabil, Inc. | 42,400 | 3,061 | |
| IT Services - 6.2% | |||
| DXC Technology Co. (b) | 67,800 | 2,012 | |
| Fidelity National Information Services, Inc. | 107,700 | 7,817 | |
| Genpact Ltd. | 239,400 | 11,039 | |
| Global Payments, Inc. | 19,900 | 2,065 | |
| MasterCard, Inc. Class A | 36,100 | 12,866 | |
| SS&C Technologies Holdings, Inc. | 217,900 | 11,714 | |
| Visa, Inc. Class A | 102,700 | 22,286 | |
| 69,799 | |||
| Semiconductors & Semiconductor Equipment - 2.7% | |||
| Broadcom, Inc. | 14,500 | 7,990 | |
| KLA Corp. | 6,900 | 2,713 | |
| Lam Research Corp. | 3,900 | 1,842 | |
| Marvell Technology, Inc. | 229,700 | 10,686 | |
| Microchip Technology, Inc. | 13,400 | 1,061 | |
| NVIDIA Corp. | 12,100 | 2,048 | |
| NXP Semiconductors NV | 14,500 | 2,550 | |
| Universal Display Corp. | 12,300 | 1,385 | |
| 30,275 | |||
| Software - 7.3% | |||
| Intuit, Inc. | 21,700 | 8,845 | |
| Microsoft Corp. | 252,700 | 64,474 | |
| Oracle Corp. | 107,800 | 8,951 | |
| 82,270 | |||
| Technology Hardware, Storage & Peripherals - 1.0% | |||
| Apple, Inc. | 56,196 | 8,319 | |
| Samsung Electronics Co. Ltd. | 62,290 | 3,026 | |
| 11,345 | |||
TOTAL INFORMATION TECHNOLOGY | 196,750 | ||
| MATERIALS - 4.9% | |||
| Chemicals - 1.3% | |||
| CF Industries Holdings, Inc. | 44,500 | 4,814 | |
| Valvoline, Inc. | 284,100 | 9,370 | |
| 14,184 | |||
| Metals & Mining - 2.9% | |||
| Barrick Gold Corp. | 209,600 | 3,421 | |
| Freeport-McMoRan, Inc. | 178,600 | 7,108 | |
| Glencore PLC | 1,948,700 | 13,298 | |
| Newmont Corp. | 184,700 | 8,768 | |
| 32,595 | |||
| Paper & Forest Products - 0.7% | |||
| Louisiana-Pacific Corp. | 130,800 | 8,345 | |
TOTAL MATERIALS | 55,124 | ||
| REAL ESTATE - 4.4% | |||
| Equity Real Estate Investment Trusts (REITs) - 4.4% | |||
| American Tower Corp. | 42,100 | 9,315 | |
| Crown Castle International Corp. | 44,100 | 6,237 | |
| CubeSmart | 61,200 | 2,533 | |
| Digital Realty Trust, Inc. | 49,000 | 5,511 | |
| Four Corners Property Trust, Inc. | 221,200 | 6,003 | |
| National Retail Properties, Inc. | 119,300 | 5,531 | |
| Park Hotels & Resorts, Inc. | 83,200 | 1,067 | |
| Prologis (REIT), Inc. | 31,000 | 3,651 | |
| Public Storage | 14,100 | 4,201 | |
| Simon Property Group, Inc. | 43,400 | 5,184 | |
| 49,233 | |||
| UTILITIES - 6.5% | |||
| Electric Utilities - 3.2% | |||
| Constellation Energy Corp. | 79,133 | 7,606 | |
| Edison International | 128,400 | 8,559 | |
| Exelon Corp. | 138,400 | 5,726 | |
| FirstEnergy Corp. | 183,000 | 7,547 | |
| PG&E Corp. (b) | 50,466 | 792 | |
| Southern Co. | 86,400 | 5,844 | |
| 36,074 | |||
| Gas Utilities - 0.6% | |||
| Brookfield Infrastructure Corp. A Shares | 135,800 | 6,366 | |
| Independent Power and Renewable Electricity Producers - 2.1% | |||
| NextEra Energy Partners LP | 91,300 | 7,349 | |
| The AES Corp. | 423,700 | 12,253 | |
| Vistra Corp. | 156,400 | 3,805 | |
| 23,407 | |||
| Multi-Utilities - 0.6% | |||
| CenterPoint Energy, Inc. | 133,500 | 4,153 | |
| Dominion Energy, Inc. | 54,400 | 3,324 | |
| 7,477 | |||
TOTAL UTILITIES | 73,324 | ||
| TOTAL COMMON STOCKS (Cost $925,283) | 1,084,810 | ||
| Money Market Funds - 6.1% | |||
| Shares | Value ($) (000s) | ||
| Fidelity Cash Central Fund 3.86% (d) | 43,405,959 | 43,415 | |
| Fidelity Securities Lending Cash Central Fund 3.86% (d)(e) | 26,106,064 | 26,109 | |
| TOTAL MONEY MARKET FUNDS (Cost $69,524) | 69,524 | ||
| TOTAL INVESTMENT IN SECURITIES - 102.1% (Cost $994,807) | 1,154,334 |
NET OTHER ASSETS (LIABILITIES) - (2.1)% | (23,826) |
| NET ASSETS - 100.0% | 1,130,508 |
| (a) | Security exempt from registration under Rule 144A of the Securities Act of 1933. These securities may be resold in transactions exempt from registration, normally to qualified institutional buyers. At the end of the period, the value of these securities amounted to $12,790,000 or 1.1% of net assets. |
| (b) | Non-income producing |
| (c) | Security or a portion of the security is on loan at period end. |
| (d) | Affiliated fund that is generally available only to investment companies and other accounts managed by Fidelity Investments. The rate quoted is the annualized seven-day yield of the fund at period end. A complete unaudited listing of the fund's holdings as of its most recent quarter end is available upon request. In addition, each Fidelity Central Fund's financial statements, which are not covered by the Fund's Report of Independent Registered Public Accounting Firm, are available on the SEC's website or upon request. |
| (e) | Investment made with cash collateral received from securities on loan. |
| Affiliate (Amounts in thousands) | Value, beginning of period ($) | Purchases ($) | Sales Proceeds ($) | Dividend Income ($) | Realized Gain (loss) ($) | Change in Unrealized appreciation (depreciation) ($) | Value, end of period ($) | % ownership, end of period |
| Fidelity Cash Central Fund 3.86% | 2,542 | 249,921 | 209,048 | 602 | - | - | 43,415 | 0.1% |
| Fidelity Securities Lending Cash Central Fund 3.86% | 25,359 | 168,775 | 168,025 | 112 | - | - | 26,109 | 0.1% |
| Total | 27,901 | 418,696 | 377,073 | 714 | - | - | 69,524 | |
| Valuation Inputs at Reporting Date: | ||||
Description (Amounts in thousands) | Total ($) | Level 1 ($) | Level 2 ($) | Level 3 ($) |
Investments in Securities: | ||||
| Equities: | ||||
Communication Services | 58,664 | 53,361 | 5,303 | - |
Consumer Discretionary | 70,049 | 70,049 | - | - |
Consumer Staples | 103,504 | 103,504 | - | - |
Energy | 115,143 | 104,219 | 10,924 | - |
Financials | 87,294 | 87,294 | - | - |
Health Care | 170,005 | 167,033 | 2,972 | - |
Industrials | 105,720 | 102,740 | 2,980 | - |
Information Technology | 196,750 | 193,724 | 3,026 | - |
Materials | 55,124 | 41,826 | 13,298 | - |
Real Estate | 49,233 | 49,233 | - | - |
Utilities | 73,324 | 73,324 | - | - |
| Money Market Funds | 69,524 | 69,524 | - | - |
| Total Investments in Securities: | 1,154,334 | 1,115,831 | 38,503 | - |
| Statement of Assets and Liabilities | ||||
| Amounts in thousands (except per-share amounts) | November 30, 2022 | |||
| Assets | ||||
| Investment in securities, at value (including securities loaned of $25,693) - See accompanying schedule: | ||||
Unaffiliated issuers (cost $925,283) | $1,084,810 | |||
Fidelity Central Funds (cost $69,524) | 69,524 | |||
| Total Investment in Securities (cost $994,807) | $ | 1,154,334 | ||
| Foreign currency held at value (cost $51) | 52 | |||
| Receivable for investments sold | 1,000 | |||
| Receivable for fund shares sold | 426 | |||
| Dividends receivable | 2,037 | |||
| Distributions receivable from Fidelity Central Funds | 163 | |||
| Prepaid expenses | 1 | |||
Total assets | 1,158,013 | |||
| Liabilities | ||||
| Payable for fund shares redeemed | $594 | |||
| Accrued management fee | 301 | |||
| Distribution and service plan fees payable | 264 | |||
| Other affiliated payables | 180 | |||
| Other payables and accrued expenses | 57 | |||
| Collateral on securities loaned | 26,109 | |||
| Total Liabilities | 27,505 | |||
| Net Assets | $ | 1,130,508 | ||
| Net Assets consist of: | ||||
| Paid in capital | $ | 891,396 | ||
| Total accumulated earnings (loss) | 239,112 | |||
| Net Assets | $ | 1,130,508 | ||
| Net Asset Value and Maximum Offering Price | ||||
| Class A : | ||||
Net Asset Value and redemption price per share ($452,208 ÷ 24,578 shares) (a) | $ | 18.40 | ||
| Maximum offering price per share (100/94.25 of $18.40) | $ | 19.52 | ||
| Class M : | ||||
Net Asset Value and redemption price per share ($341,442 ÷ 18,668 shares) (a) | $ | 18.29 | ||
| Maximum offering price per share (100/96.50 of $18.29) | $ | 18.95 | ||
| Class C : | ||||
Net Asset Value and offering price per share ($44,807 ÷ 2,610 shares) (a) | $ | 17.17 | ||
| Class I : | ||||
Net Asset Value , offering price and redemption price per share ($238,655 ÷ 12,080 shares) | $ | 19.76 | ||
| Class Z : | ||||
Net Asset Value , offering price and redemption price per share ($53,396 ÷ 2,650 shares) | $ | 20.15 | ||
(a)Redemption price per share is equal to net asset value less any applicable contingent deferred sales charge. | ||||
| Statement of Operations | ||||
| Amounts in thousands | Year ended November 30, 2022 | |||
| Investment Income | ||||
| Dividends | $ | 21,435 | ||
| Income from Fidelity Central Funds (including $112 from security lending) | 714 | |||
| Total Income | 22,149 | |||
| Expenses | ||||
| Management fee | ||||
| Basic fee | $ | 5,895 | ||
| Performance adjustment | (2,074) | |||
| Transfer agent fees | 1,951 | |||
| Distribution and service plan fees | 3,319 | |||
| Accounting fees | 346 | |||
| Custodian fees and expenses | 36 | |||
| Independent trustees' fees and expenses | 4 | |||
| Registration fees | 89 | |||
| Audit | 65 | |||
| Legal | 4 | |||
| Interest | 1 | |||
| Miscellaneous | 5 | |||
| Total expenses before reductions | 9,641 | |||
| Expense reductions | (37) | |||
| Total expenses after reductions | 9,604 | |||
| Net Investment income (loss) | 12,545 | |||
| Realized and Unrealized Gain (Loss) | ||||
| Net realized gain (loss) on: | ||||
| Investment Securities: | ||||
| Unaffiliated issuers | 88,852 | |||
| Foreign currency transactions | 364 | |||
| Total net realized gain (loss) | 89,216 | |||
| Change in net unrealized appreciation (depreciation) on: | ||||
| Investment Securities: | ||||
| Unaffiliated issuers | (141,323) | |||
| Assets and liabilities in foreign currencies | (10) | |||
| Total change in net unrealized appreciation (depreciation) | (141,333) | |||
| Net gain (loss) | (52,117) | |||
| Net increase (decrease) in net assets resulting from operations | $ | (39,572) | ||
| Statement of Changes in Net Assets | ||||
| Amount in thousands | Year ended November 30, 2022 | Year ended November 30, 2021 | ||
| Increase (Decrease) in Net Assets | ||||
| Operations | ||||
| Net investment income (loss) | $ | 12,545 | $ | 7,898 |
| Net realized gain (loss) | 89,216 | 127,310 | ||
| Change in net unrealized appreciation (depreciation) | (141,333) | 126,363 | ||
| Net increase (decrease) in net assets resulting from operations | (39,572) | 261,571 | ||
| Distributions to shareholders | (73,614) | (13,817) | ||
| Share transactions - net increase (decrease) | 41,161 | (26,125) | ||
| Total increase (decrease) in net assets | (72,025) | 221,629 | ||
| Net Assets | ||||
| Beginning of period | 1,202,533 | 980,904 | ||
| End of period | $ | 1,130,508 | $ | 1,202,533 |
| Fidelity Advisor® Dividend Growth Fund Class A |
| Years ended November 30, | 2022 | 2021 | 2020 | 2019 | 2018 | |||||
Selected Per-Share Data | ||||||||||
| Net asset value, beginning of period | $ | 20.29 | $ | 16.20 | $ | 17.06 | $ | 17.97 | $ | 20.01 |
| Income from Investment Operations | ||||||||||
Net investment income (loss) A,B | .21 | .14 | .27 | .24 C | .28 | |||||
| Net realized and unrealized gain (loss) | (.83) | 4.19 | (.35) | 1.39 | .58 | |||||
| Total from investment operations | (.62) | 4.33 | (.08) | 1.63 | .86 | |||||
| Distributions from net investment income | (.28) | (.24) | (.25) | (.27) | (.26) | |||||
| Distributions from net realized gain | (.99) | - | (.54) | (2.27) | (2.65) | |||||
| Total distributions | (1.27) | (.24) | (.78) D | (2.54) | (2.90) D | |||||
| Net asset value, end of period | $ | 18.40 | $ | 20.29 | $ | 16.20 | $ | 17.06 | $ | 17.97 |
Total Return E,F | (3.46)% | 27.06% | (.60)% | 12.84% | 4.69% | |||||
Ratios to Average Net Assets B,G,H | ||||||||||
| Expenses before reductions | .82% | .83% | .81% | .82% | .84% | |||||
| Expenses net of fee waivers, if any | .81% | .83% | .81% | .82% | .84% | |||||
| Expenses net of all reductions | .81% | .83% | .80% | .81% | .83% | |||||
| Net investment income (loss) | 1.16% | .73% | 1.84% | 1.53% C | 1.58% | |||||
| Supplemental Data | ||||||||||
| Net assets, end of period (in millions) | $ | 452 | $ | 477 | $ | 374 | $ | 421 | $ | 353 |
Portfolio turnover rate I | 57% | 54% | 113% | 75% | 110% |
| Fidelity Advisor® Dividend Growth Fund Class M |
| Years ended November 30, | 2022 | 2021 | 2020 | 2019 | 2018 | |||||
Selected Per-Share Data | ||||||||||
| Net asset value, beginning of period | $ | 20.14 | $ | 16.08 | $ | 16.94 | $ | 17.85 | $ | 19.90 |
| Income from Investment Operations | ||||||||||
Net investment income (loss) A,B | .17 | .09 | .23 | .20 C | .24 | |||||
| Net realized and unrealized gain (loss) | (.83) | 4.17 | (.35) | 1.39 | .57 | |||||
| Total from investment operations | (.66) | 4.26 | (.12) | 1.59 | .81 | |||||
| Distributions from net investment income | (.20) | (.20) | (.21) | (.23) | (.21) | |||||
| Distributions from net realized gain | (.99) | - | (.54) | (2.27) | (2.65) | |||||
| Total distributions | (1.19) | (.20) | (.74) D | (2.50) | (2.86) | |||||
| Net asset value, end of period | $ | 18.29 | $ | 20.14 | $ | 16.08 | $ | 16.94 | $ | 17.85 |
Total Return E,F | (3.70)% | 26.77% | (.85)% | 12.59% | 4.38% | |||||
Ratios to Average Net Assets B,G,H | ||||||||||
| Expenses before reductions | 1.06% | 1.07% | 1.05% | 1.07% | 1.09% | |||||
| Expenses net of fee waivers, if any | 1.06% | 1.07% | 1.05% | 1.07% | 1.09% | |||||
| Expenses net of all reductions | 1.06% | 1.07% | 1.04% | 1.06% | 1.08% | |||||
| Net investment income (loss) | .92% | .49% | 1.59% | 1.28% C | 1.33% | |||||
| Supplemental Data | ||||||||||
| Net assets, end of period (in millions) | $ | 341 | $ | 368 | $ | 316 | $ | 376 | $ | 363 |
Portfolio turnover rate I | 57% | 54% | 113% | 75% | 110% |
| Fidelity Advisor® Dividend Growth Fund Class C |
| Years ended November 30, | 2022 | 2021 | 2020 | 2019 | 2018 | |||||
Selected Per-Share Data | ||||||||||
| Net asset value, beginning of period | $ | 18.89 | $ | 15.10 | $ | 15.92 | $ | 16.92 | $ | 19.00 |
| Income from Investment Operations | ||||||||||
Net investment income (loss) A,B | .06 | (.01) | .14 | .11 C | .14 | |||||
| Net realized and unrealized gain (loss) | (.77) | 3.92 | (.34) | 1.29 | .54 | |||||
| Total from investment operations | (.71) | 3.91 | (.20) | 1.40 | .68 | |||||
| Distributions from net investment income | (.05) | (.12) | (.08) | (.14) | (.12) | |||||
| Distributions from net realized gain | (.96) | - | (.54) | (2.27) | (2.65) | |||||
| Total distributions | (1.01) | (.12) | (.62) | (2.40) D | (2.76) D | |||||
| Net asset value, end of period | $ | 17.17 | $ | 18.89 | $ | 15.10 | $ | 15.92 | $ | 16.92 |
Total Return E,F | (4.18)% | 26.03% | (1.41)% | 11.98% | 3.86% | |||||
Ratios to Average Net Assets B,G,H | ||||||||||
| Expenses before reductions | 1.60% | 1.62% | 1.61% | 1.62% | 1.61% | |||||
| Expenses net of fee waivers, if any | 1.60% | 1.62% | 1.61% | 1.61% | 1.61% | |||||
| Expenses net of all reductions | 1.60% | 1.62% | 1.60% | 1.61% | 1.60% | |||||
| Net investment income (loss) | .38% | (.06)% | 1.04% | .73% C | .81% | |||||
| Supplemental Data | ||||||||||
| Net assets, end of period (in millions) | $ | 45 | $ | 53 | $ | 56 | $ | 71 | $ | 137 |
Portfolio turnover rate I | 57% | 54% | 113% | 75% | 110% |
| Fidelity Advisor® Dividend Growth Fund Class I |
| Years ended November 30, | 2022 | 2021 | 2020 | 2019 | 2018 | |||||
Selected Per-Share Data | ||||||||||
| Net asset value, beginning of period | $ | 21.72 | $ | 17.32 | $ | 18.18 | $ | 18.97 | $ | 20.97 |
| Income from Investment Operations | ||||||||||
Net investment income (loss) A,B | .27 | .20 | .32 | .29 C | .34 | |||||
| Net realized and unrealized gain (loss) | (.89) | 4.48 | (.36) | 1.50 | .61 | |||||
| Total from investment operations | (.62) | 4.68 | (.04) | 1.79 | .95 | |||||
| Distributions from net investment income | (.35) | (.28) | (.28) | (.31) | (.30) | |||||
| Distributions from net realized gain | (.99) | - | (.54) | (2.27) | (2.65) | |||||
| Total distributions | (1.34) | (.28) | (.82) | (2.58) | (2.95) | |||||
| Net asset value, end of period | $ | 19.76 | $ | 21.72 | $ | 17.32 | $ | 18.18 | $ | 18.97 |
Total Return D | (3.23)% | 27.37% | (.36)% | 13.13% | 4.93% | |||||
Ratios to Average Net Assets B,E,F | ||||||||||
| Expenses before reductions | .59% | .60% | .57% | .58% | .60% | |||||
| Expenses net of fee waivers, if any | .58% | .60% | .57% | .58% | .60% | |||||
| Expenses net of all reductions | .58% | .60% | .56% | .57% | .59% | |||||
| Net investment income (loss) | 1.39% | .96% | 2.08% | 1.77% C | 1.82% | |||||
| Supplemental Data | ||||||||||
| Net assets, end of period (in millions) | $ | 239 | $ | 245 | $ | 180 | $ | 173 | $ | 166 |
Portfolio turnover rate G | 57% | 54% | 113% | 75% | 110% |
| Fidelity Advisor® Dividend Growth Fund Class Z |
| Years ended November 30, | 2022 | 2021 | 2020 | 2019 | 2018 �� | |||||
Selected Per-Share Data | ||||||||||
| Net asset value, beginning of period | $ | 22.15 | $ | 17.65 | $ | 18.51 | $ | 19.28 | $ | 21.27 |
| Income from Investment Operations | ||||||||||
Net investment income (loss) A,B | .31 | .23 | .35 | .32 C | .38 | |||||
| Net realized and unrealized gain (loss) | (.91) | 4.57 | (.37) | 1.52 | .62 | |||||
| Total from investment operations | (.60) | 4.80 | (.02) | 1.84 | 1.00 | |||||
| Distributions from net investment income | (.41) | (.30) | (.31) | (.34) | (.34) | |||||
| Distributions from net realized gain | (.99) | - | (.54) | (2.27) | (2.65) | |||||
| Total distributions | (1.40) | (.30) | (.84) D | (2.61) | (2.99) | |||||
| Net asset value, end of period | $ | 20.15 | $ | 22.15 | $ | 17.65 | $ | 18.51 | $ | 19.28 |
Total Return E | (3.10)% | 27.61% | (.22)% | 13.25% | 5.10% | |||||
Ratios to Average Net Assets B,F,G | ||||||||||
| Expenses before reductions | .43% | .45% | .41% | .43% | .45% | |||||
| Expenses net of fee waivers, if any | .43% | .44% | .41% | .43% | .45% | |||||
| Expenses net of all reductions | .43% | .44% | .40% | .42% | .44% | |||||
| Net investment income (loss) | 1.55% | 1.12% | 2.23% | 1.92% C | 1.98% | |||||
| Supplemental Data | ||||||||||
| Net assets, end of period (in millions) | $ | 53 | $ | 60 | $ | 55 | $ | 13 | $ | 10 |
Portfolio turnover rate H | 57% | 54% | 113% | 75% | 110% |
| Fidelity Central Fund | Investment Manager | Investment Objective | Investment Practices | Expense Ratio A |
| Fidelity Money Market Central Funds | Fidelity Management & Research Company LLC (FMR) | Each fund seeks to obtain a high level of current income consistent with the preservation of capital and liquidity. | Short-term Investments | Less than .005% |
| Gross unrealized appreciation | $203,813 |
| Gross unrealized depreciation | (46,493) |
| Net unrealized appreciation (depreciation) | $157,320 |
| Tax Cost | $997,014 |
| Undistributed ordinary income | $3,183 |
| Undistributed long-term capital gain | $79,128 |
| Net unrealized appreciation (depreciation) on securities and other investments | $156,802 |
| November 30, 2022 | November 30, 2021 | |
| Ordinary Income | $33,582 | $13,817 |
| Long-term Capital Gains | 40,032 | - |
| Total | $73,614 | $13,817 |
| Purchases ($) | Sales ($) | |
| Fidelity Advisor Dividend Growth Fund | 628,162 | 687,378 |
| Distribution Fee | Service Fee | Total Fees | Retained by FDC | |
| Class A | - % | .25% | $1,120 | $25 |
| Class M | .25% | .25% | 1,720 | - |
| Class C | .75% | .25% | 479 | 64 |
| $3,319 | $89 |
| Retained by FDC | |
| Class A | $107 |
| Class M | 11 |
Class C A | 2 |
| $120 |
| Amount | % of Class-Level Average Net Assets | |
| Class A | $791 | .18 |
| Class M | 581 | .17 |
| Class C | 102 | .21 |
| Class I | 457 | .20 |
| Class Z | 20 | .04 |
| $1,951 |
| % of Average Net Assets | |
| Fidelity Advisor Dividend Growth Fund | .03 |
| Amount | |
| Fidelity Advisor Dividend Growth Fund | $15 |
| Borrower or Lender | Average Loan Balance | Weighted Average Interest Rate | Interest Expense | |
| Fidelity Advisor Dividend Growth Fund | Borrower | $6,777 | .57% | $1 |
| Purchases ($) | Sales ($) | Realized Gain (Loss) ($) | |
| Fidelity Advisor Dividend Growth Fund | 41,003 | 59,783 | 6,096 |
| Amount | |
| Fidelity Advisor Dividend Growth Fund | $2 |
| Total Security Lending Fees Paid to NFS | Security Lending Income From Securities Loaned to NFS | Value of Securities Loaned to NFS at Period End | |
| Fidelity Advisor Dividend Growth Fund | $12 | $- A | $- |
Year ended November 30, 2022 | Year ended November 30, 2021 | |
| Fidelity Advisor Dividend Growth Fund | ||
| Distributions to shareholders | ||
| Class A | $30,177 | $5,509 |
| Class M | 21,723 | 3,924 |
| Class C | 2,797 | 420 |
| Class I | 15,231 | 2,927 |
| Class Z | 3,686 | 1,037 |
Total | $73,614 | $13,817 |
| Shares | Shares | Dollars | Dollars | |
| Year ended November 30, 2022 | Year ended November 30, 2021 | Year ended November 30, 2022 | Year ended November 30, 2021 | |
| Fidelity Advisor Dividend Growth Fund | ||||
| Class A | ||||
| Shares sold | 2,949 | 3,355 | $54,415 | $63,645 |
| Reinvestment of distributions | 1,428 | 310 | 28,351 | 5,141 |
| Shares redeemed | (3,325) | (3,233) | (60,441) | (61,088) |
| Net increase (decrease) | 1,052 | 432 | $22,325 | $7,698 |
| Class M | ||||
| Shares sold | 2,522 | 2,366 | $46,215 | $44,125 |
| Reinvestment of distributions | 1,082 | 233 | 21,418 | 3,856 |
| Shares redeemed | (3,192) | (3,994) | (57,906) | (74,106) |
| Net increase (decrease) | 412 | (1,395) | $9,727 | $(26,125) |
| Class C | ||||
| Shares sold | 549 | 504 | $9,531 | $8,942 |
| Reinvestment of distributions | 148 | 27 | 2,774 | 415 |
| Shares redeemed | (877) | (1,422) | (14,974) | (25,006) |
| Net increase (decrease) | (180) | (891) | $(2,669) | $(15,649) |
| Class I | ||||
| Shares sold | 3,084 | 5,289 | $60,164 | $104,795 |
| Reinvestment of distributions | 699 | 160 | 14,853 | 2,841 |
| Shares redeemed | (2,971) | (4,578) | (59,219) | (91,107) |
| Net increase (decrease) | 812 | 871 | $15,798 | $16,529 |
| Class Z | ||||
| Shares sold | 2,158 | 2,974 | $42,043 | $60,196 |
| Reinvestment of distributions | 157 | 51 | 3,397 | 917 |
| Shares redeemed | (2,387) | (3,433) | (49,460) | (69,691) |
| Net increase (decrease) | (72) | (408) | $(4,020) | $(8,578) |
| The Example is based on an investment of $1,000 invested at the beginning of the period and held for the entire period (June 1, 2022 to November 30, 2022). |
Annualized Expense Ratio- A | Beginning Account Value June 1, 2022 | Ending Account Value November 30, 2022 | Expenses Paid During Period- C June 1, 2022 to November 30, 2022 | |||||||
| Fidelity Advisor® Dividend Growth Fund | ||||||||||
| Class A | .81% | |||||||||
| Actual | $ 1,000 | $ 1,008.40 | $ 4.08 | |||||||
Hypothetical- B | $ 1,000 | $ 1,021.01 | $ 4.10 | |||||||
| Class M | 1.05% | |||||||||
| Actual | $ 1,000 | $ 1,007.10 | $ 5.28 | |||||||
Hypothetical- B | $ 1,000 | $ 1,019.80 | $ 5.32 | |||||||
| Class C | 1.59% | |||||||||
| Actual | $ 1,000 | $ 1,004.70 | $ 7.99 | |||||||
Hypothetical- B | $ 1,000 | $ 1,017.10 | $ 8.04 | |||||||
| Class I | .58% | |||||||||
| Actual | $ 1,000 | $ 1,009.50 | $ 2.92 | |||||||
Hypothetical- B | $ 1,000 | $ 1,022.16 | $ 2.94 | |||||||
| Class Z | .42% | |||||||||
| Actual | $ 1,000 | $ 1,010.20 | $ 2.12 | |||||||
Hypothetical- B | $ 1,000 | $ 1,022.96 | $ 2.13 | |||||||
|


Contents
| Average Annual Total Returns | |||
Periods ended November 30, 2022 | Past 1 year | Past 5 years | Past 10 years |
| Class A (incl.5.75% sales charge) | 0.50% | 7.16% | 10.37% |
| Class M (incl.3.50% sales charge) | 2.60% | 7.38% | 10.34% |
Class C (incl. contingent deferred sales charge) | 4.81% | 7.59% | 10.34% |
| Class I | 6.86% | 8.72% | 11.35% |
| Class Z | 7.02% | 8.87% | 11.44% |
| $10,000 Over 10 Years |
Let's say hypothetically that $10,000 was invested in Fidelity Advisor® Equity Value Fund - Class A, on November 30, 2012, and the current 5.75% sales charge was paid. The chart shows how the value of your investment would have changed, and also shows how the Russell 3000® Value Index performed over the same period. |
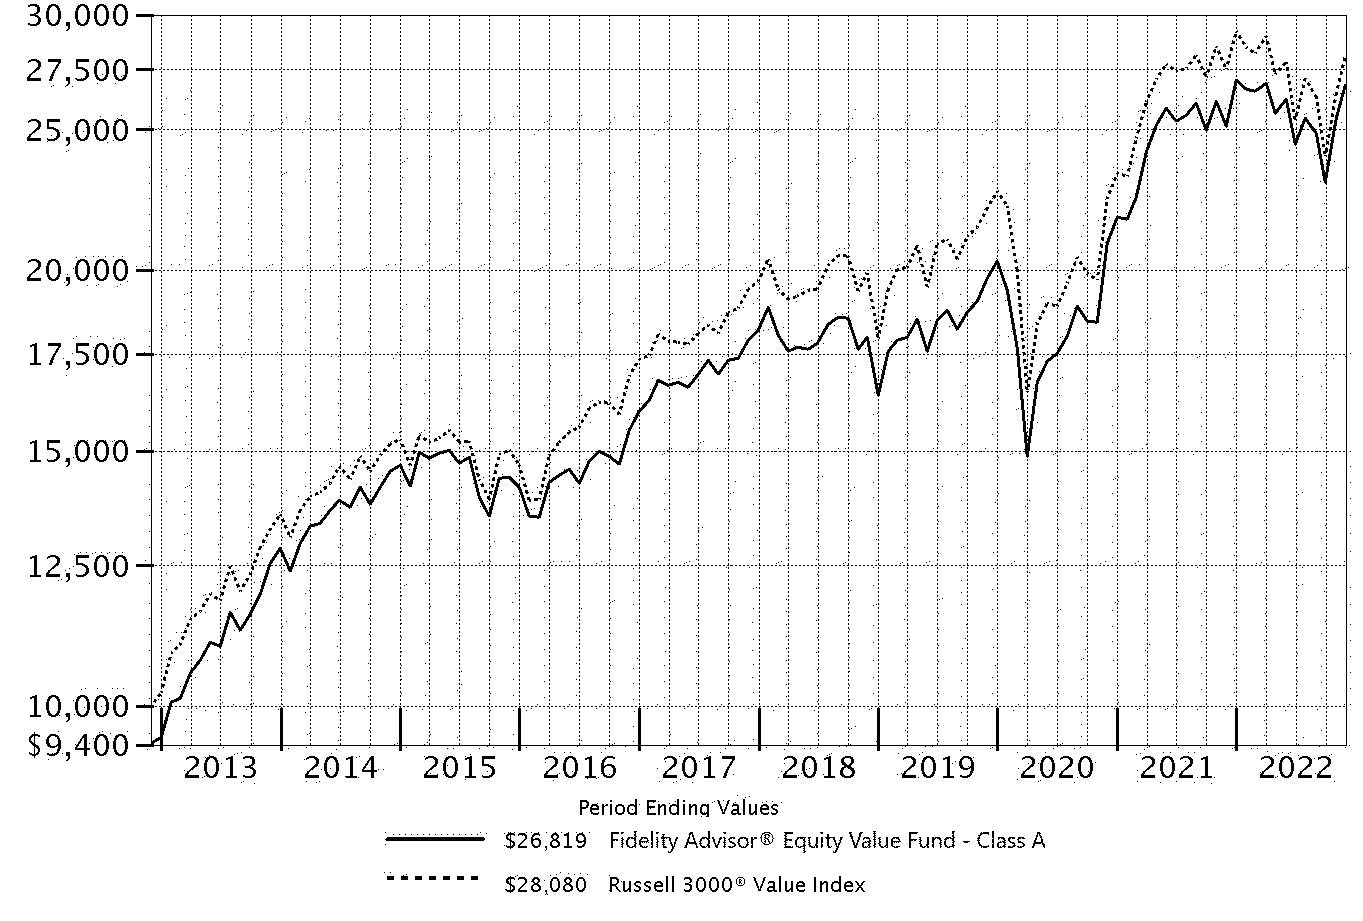 |
Top Holdings (% of Fund's net assets) | ||
| Berkshire Hathaway, Inc. Class B | 4.9 | |
| Exxon Mobil Corp. | 4.7 | |
| Cigna Corp. | 2.9 | |
| Bristol-Myers Squibb Co. | 2.7 | |
| JPMorgan Chase & Co. | 2.6 | |
| Centene Corp. | 2.6 | |
| Comcast Corp. Class A | 2.5 | |
| UnitedHealth Group, Inc. | 2.5 | |
| Bank of America Corp. | 2.2 | |
| PG&E Corp. | 2.1 | |
| 29.7 | ||
| Market Sectors (% of Fund's net assets) | ||
| Financials | 22.2 | |
| Health Care | 20.1 | |
| Utilities | 9.7 | |
| Industrials | 9.3 | |
| Energy | 8.7 | |
| Consumer Staples | 7.1 | |
| Information Technology | 7.1 | |
| Communication Services | 6.6 | |
| Consumer Discretionary | 4.3 | |
| Materials | 3.1 | |
| Real Estate | 0.6 | |
Asset Allocation (% of Fund's net assets) |
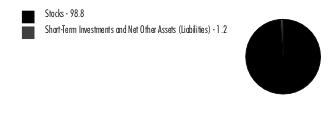 |
Foreign investments - 14.8% |
Geographic Diversification (% of Fund's net assets) |
 |
* Includes Short-Term investments and Net Other Assets (Liabilities). Percentages are based on country or territory of incorporation and are adjusted for the effect of futures contracts, if applicable. |
| Common Stocks - 97.6% | |||
| Shares | Value ($) | ||
| COMMUNICATION SERVICES - 6.6% | |||
| Entertainment - 1.4% | |||
| Activision Blizzard, Inc. | 45,784 | 3,385,727 | |
| Interactive Media & Services - 1.8% | |||
| Alphabet, Inc. Class A (a) | 43,000 | 4,342,570 | |
| Media - 3.4% | |||
| Charter Communications, Inc. Class A (a) | 5,466 | 2,138,791 | |
| Comcast Corp. Class A | 166,447 | 6,098,618 | |
| 8,237,409 | |||
TOTAL COMMUNICATION SERVICES | 15,965,706 | ||
| CONSUMER DISCRETIONARY - 4.3% | |||
| Diversified Consumer Services - 1.5% | |||
| H&R Block, Inc. | 84,562 | 3,696,205 | |
| Internet & Direct Marketing Retail - 0.4% | |||
| eBay, Inc. | 22,595 | 1,026,717 | |
| Multiline Retail - 1.5% | |||
| Dollar General Corp. | 13,895 | 3,552,674 | |
| Specialty Retail - 0.9% | |||
| Ross Stores, Inc. | 18,918 | 2,226,081 | |
TOTAL CONSUMER DISCRETIONARY | 10,501,677 | ||
| CONSUMER STAPLES - 7.1% | |||
| Beverages - 0.6% | |||
| Coca-Cola European Partners PLC | 27,980 | 1,485,458 | |
| Food & Staples Retailing - 0.7% | |||
| U.S. Foods Holding Corp. (a) | 49,881 | 1,824,647 | |
| Food Products - 2.4% | |||
| Mondelez International, Inc. | 67,136 | 4,539,065 | |
| Tyson Foods, Inc. Class A | 17,596 | 1,166,263 | |
| 5,705,328 | |||
| Household Products - 3.1% | |||
| Procter & Gamble Co. | 22,435 | 3,346,405 | |
| Reckitt Benckiser Group PLC | 23,505 | 1,686,801 | |
| Spectrum Brands Holdings, Inc. | 21,660 | 1,153,828 | |
| The Clorox Co. | 8,718 | 1,295,931 | |
| 7,482,965 | |||
| Personal Products - 0.3% | |||
| Unilever PLC sponsored ADR | 14,481 | 729,553 | |
TOTAL CONSUMER STAPLES | 17,227,951 | ||
| ENERGY - 8.7% | |||
| Oil, Gas & Consumable Fuels - 8.7% | |||
| ConocoPhillips Co. | 28,929 | 3,573,021 | |
| Equinor ASA sponsored ADR | 37,871 | 1,457,276 | |
| Exxon Mobil Corp. | 103,267 | 11,497,748 | |
| Occidental Petroleum Corp. | 31,582 | 2,194,633 | |
| Ovintiv, Inc. | 25,827 | 1,440,114 | |
| Parex Resources, Inc. | 70,200 | 1,005,131 | |
| 21,167,923 | |||
| FINANCIALS - 22.2% | |||
| Banks - 8.8% | |||
| Bank of America Corp. | 142,402 | 5,389,916 | |
| Cullen/Frost Bankers, Inc. | 4,694 | 680,959 | |
| JPMorgan Chase & Co. | 46,025 | 6,359,735 | |
| M&T Bank Corp. | 16,053 | 2,729,331 | |
| PNC Financial Services Group, Inc. | 16,804 | 2,827,441 | |
| Wells Fargo & Co. | 70,785 | 3,394,141 | |
| 21,381,523 | |||
| Capital Markets - 3.1% | |||
| Affiliated Managers Group, Inc. | 10,404 | 1,669,010 | |
| BlackRock, Inc. Class A | 5,682 | 4,068,312 | |
| Invesco Ltd. | 20,478 | 391,335 | |
| Northern Trust Corp. | 15,025 | 1,398,978 | |
| 7,527,635 | |||
| Diversified Financial Services - 4.9% | |||
| Berkshire Hathaway, Inc. Class B (a) | 37,006 | 11,790,108 | |
| Insurance - 5.0% | |||
| Chubb Ltd. | 20,009 | 4,393,776 | |
| The Travelers Companies, Inc. | 22,774 | 4,322,733 | |
| Willis Towers Watson PLC | 13,781 | 3,392,331 | |
| 12,108,840 | |||
| Mortgage Real Estate Investment Trusts - 0.4% | |||
| AGNC Investment Corp. | 25,600 | 255,744 | |
| Annaly Capital Management, Inc. | 12,600 | 273,042 | |
| MFA Financial, Inc. | 26,800 | 299,624 | |
| 828,410 | |||
TOTAL FINANCIALS | 53,636,516 | ||
| HEALTH CARE - 20.1% | |||
| Biotechnology - 2.5% | |||
| Regeneron Pharmaceuticals, Inc. (a) | 4,303 | 3,234,565 | |
| Vertex Pharmaceuticals, Inc. (a) | 8,658 | 2,739,391 | |
| 5,973,956 | |||
| Health Care Providers & Services - 11.1% | |||
| Centene Corp. (a) | 72,931 | 6,348,644 | |
| Cigna Corp. | 20,968 | 6,896,166 | |
| Elevance Health, Inc. | 7,305 | 3,892,981 | |
| Humana, Inc. | 6,643 | 3,652,986 | |
| UnitedHealth Group, Inc. | 11,019 | 6,035,767 | |
| 26,826,544 | |||
| Pharmaceuticals - 6.5% | |||
| AstraZeneca PLC sponsored ADR | 51,249 | 3,483,395 | |
| Bristol-Myers Squibb Co. | 81,331 | 6,529,253 | |
| Roche Holding AG (participation certificate) | 10,194 | 3,329,604 | |
| Sanofi SA sponsored ADR | 53,238 | 2,414,343 | |
| 15,756,595 | |||
TOTAL HEALTH CARE | 48,557,095 | ||
| INDUSTRIALS - 9.3% | |||
| Aerospace & Defense - 5.3% | |||
| Airbus Group NV | 5,687 | 652,842 | |
| L3Harris Technologies, Inc. | 9,759 | 2,216,074 | |
| Lockheed Martin Corp. | 4,952 | 2,402,661 | |
| Northrop Grumman Corp. | 8,551 | 4,560,163 | |
| The Boeing Co. (a) | 16,532 | 2,957,244 | |
| 12,788,984 | |||
| Air Freight & Logistics - 0.2% | |||
| Deutsche Post AG | 11,279 | 450,576 | |
| Electrical Equipment - 1.0% | |||
| Eaton Corp. PLC | 3,200 | 523,040 | |
| Regal Rexnord Corp. | 15,538 | 2,037,187 | |
| 2,560,227 | |||
| Industrial Conglomerates - 0.5% | |||
| Siemens AG | 9,304 | 1,290,324 | |
| Machinery - 2.3% | |||
| Crane Holdings Co. | 3,300 | 349,602 | |
| ITT, Inc. | 8,237 | 696,191 | |
| Oshkosh Corp. | 24,745 | 2,278,272 | |
| Parker Hannifin Corp. | 1,600 | 478,304 | |
| Pentair PLC | 27,249 | 1,247,187 | |
| Stanley Black & Decker, Inc. | 6,249 | 510,668 | |
| 5,560,224 | |||
TOTAL INDUSTRIALS | 22,650,335 | ||
| INFORMATION TECHNOLOGY - 5.9% | |||
| Communications Equipment - 1.5% | |||
| Cisco Systems, Inc. | 73,344 | 3,646,664 | |
| Electronic Equipment & Components - 0.3% | |||
| TE Connectivity Ltd. | 5,545 | 699,335 | |
| IT Services - 2.6% | |||
| Amdocs Ltd. | 27,501 | 2,443,739 | |
| Capgemini SA | 5,295 | 957,323 | |
| Cognizant Technology Solutions Corp. Class A | 26,587 | 1,653,977 | |
| Maximus, Inc. | 17,184 | 1,208,035 | |
| 6,263,074 | |||
| Semiconductors & Semiconductor Equipment - 0.2% | |||
| NXP Semiconductors NV | 2,722 | 478,636 | |
| Software - 1.3% | |||
| Aspen Technology, Inc. (a) | 3,731 | 859,996 | |
| NortonLifeLock, Inc. | 73,124 | 1,678,927 | |
| Open Text Corp. | 26,375 | 774,898 | |
| 3,313,821 | |||
TOTAL INFORMATION TECHNOLOGY | 14,401,530 | ||
| MATERIALS - 3.1% | |||
| Chemicals - 2.2% | |||
| DuPont de Nemours, Inc. | 50,914 | 3,589,946 | |
| International Flavors & Fragrances, Inc. | 12,390 | 1,311,110 | |
| The Scotts Miracle-Gro Co. Class A (b) | 5,600 | 313,208 | |
| 5,214,264 | |||
| Metals & Mining - 0.9% | |||
| Lundin Mining Corp. | 241,440 | 1,486,171 | |
| Newmont Corp. | 15,428 | 732,367 | |
| 2,218,538 | |||
TOTAL MATERIALS | 7,432,802 | ||
| REAL ESTATE - 0.6% | |||
| Real Estate Management & Development - 0.6% | |||
| CBRE Group, Inc. (a) | 17,495 | 1,392,602 | |
| UTILITIES - 9.7% | |||
| Electric Utilities - 8.0% | |||
| Constellation Energy Corp. | 43,056 | 4,138,543 | |
| Duke Energy Corp. | 13,593 | 1,358,348 | |
| Evergy, Inc. | 38,689 | 2,290,776 | |
| Exelon Corp. | 19,193 | 794,014 | |
| NextEra Energy, Inc. | 22,248 | 1,884,406 | |
| PG&E Corp. (a) | 326,553 | 5,126,882 | |
| Portland General Electric Co. (b) | 26,487 | 1,303,955 | |
| Southern Co. | 36,650 | 2,479,006 | |
| 19,375,930 | |||
| Independent Power and Renewable Electricity Producers - 0.7% | |||
| The AES Corp. | 54,735 | 1,582,936 | |
| Multi-Utilities - 1.0% | |||
| Dominion Energy, Inc. | 41,198 | 2,517,610 | |
TOTAL UTILITIES | 23,476,476 | ||
| TOTAL COMMON STOCKS (Cost $189,191,375) | 236,410,613 | ||
| Nonconvertible Preferred Stocks - 1.2% | |||
| Shares | Value ($) | ||
| INFORMATION TECHNOLOGY - 1.2% | |||
| Technology Hardware, Storage & Peripherals - 1.2% | |||
Samsung Electronics Co. Ltd. (Cost $2,919,983) | 64,753 | 2,815,484 | |
| Money Market Funds - 1.6% | |||
| Shares | Value ($) | ||
| Fidelity Cash Central Fund 3.86% (c) | 2,498,139 | 2,498,638 | |
| Fidelity Securities Lending Cash Central Fund 3.86% (c)(d) | 1,345,615 | 1,345,750 | |
| TOTAL MONEY MARKET FUNDS (Cost $3,844,388) | 3,844,388 | ||
| TOTAL INVESTMENT IN SECURITIES - 100.4% (Cost $195,955,746) | 243,070,485 |
NET OTHER ASSETS (LIABILITIES) - (0.4)% | (1,000,450) |
| NET ASSETS - 100.0% | 242,070,035 |
| (a) | Non-income producing |
| (b) | Security or a portion of the security is on loan at period end. |
| (c) | Affiliated fund that is generally available only to investment companies and other accounts managed by Fidelity Investments. The rate quoted is the annualized seven-day yield of the fund at period end. A complete unaudited listing of the fund's holdings as of its most recent quarter end is available upon request. In addition, each Fidelity Central Fund's financial statements, which are not covered by the Fund's Report of Independent Registered Public Accounting Firm, are available on the SEC's website or upon request. |
| (d) | Investment made with cash collateral received from securities on loan. |
| Affiliate | Value, beginning of period ($) | Purchases ($) | Sales Proceeds ($) | Dividend Income ($) | Realized Gain (loss) ($) | Change in Unrealized appreciation (depreciation) ($) | Value, end of period ($) | % ownership, end of period |
| Fidelity Cash Central Fund 3.86% | 2,898,565 | 48,835,429 | 49,235,356 | 59,005 | - | - | 2,498,638 | 0.0% |
| Fidelity Securities Lending Cash Central Fund 3.86% | - | 9,500,612 | 8,154,862 | 279 | - | - | 1,345,750 | 0.0% |
| Total | 2,898,565 | 58,336,041 | 57,390,218 | 59,284 | - | - | 3,844,388 | |
| Valuation Inputs at Reporting Date: | ||||
| Description | Total ($) | Level 1 ($) | Level 2 ($) | Level 3 ($) |
Investments in Securities: | ||||
| Equities: | ||||
Communication Services | 15,965,706 | 15,965,706 | - | - |
Consumer Discretionary | 10,501,677 | 10,501,677 | - | - |
Consumer Staples | 17,227,951 | 15,541,150 | 1,686,801 | - |
Energy | 21,167,923 | 21,167,923 | - | - |
Financials | 53,636,516 | 53,636,516 | - | - |
Health Care | 48,557,095 | 45,227,491 | 3,329,604 | - |
Industrials | 22,650,335 | 20,256,593 | 2,393,742 | - |
Information Technology | 17,217,014 | 13,444,207 | 3,772,807 | - |
Materials | 7,432,802 | 7,432,802 | - | - |
Real Estate | 1,392,602 | 1,392,602 | - | - |
Utilities | 23,476,476 | 23,476,476 | - | - |
| Money Market Funds | 3,844,388 | 3,844,388 | - | - |
| Total Investments in Securities: | 243,070,485 | 231,887,531 | 11,182,954 | - |
| Statement of Assets and Liabilities | ||||
| November 30, 2022 | ||||
| Assets | ||||
| Investment in securities, at value (including securities loaned of $1,353,359) - See accompanying schedule: | ||||
Unaffiliated issuers (cost $192,111,358) | $239,226,097 | |||
Fidelity Central Funds (cost $3,844,388) | 3,844,388 | |||
| Total Investment in Securities (cost $195,955,746) | $ | 243,070,485 | ||
| Cash | 2,592 | |||
| Foreign currency held at value (cost $96) | 1,043 | |||
| Receivable for fund shares sold | 259,473 | |||
| Dividends receivable | 455,607 | |||
| Distributions receivable from Fidelity Central Funds | 9,263 | |||
| Prepaid expenses | 298 | |||
| Receivable from investment adviser for expense reductions | 6,705 | |||
Total assets | 243,805,466 | |||
| Liabilities | ||||
| Payable for fund shares redeemed | $160,154 | |||
| Accrued management fee | 130,118 | |||
| Distribution and service plan fees payable | 50,732 | |||
| Other affiliated payables | 38,546 | |||
| Other payables and accrued expenses | 10,131 | |||
| Collateral on securities loaned | 1,345,750 | |||
| Total Liabilities | 1,735,431 | |||
| Net Assets | $ | 242,070,035 | ||
| Net Assets consist of: | ||||
| Paid in capital | $ | 191,857,210 | ||
| Total accumulated earnings (loss) | 50,212,825 | |||
| Net Assets | $ | 242,070,035 | ||
| Net Asset Value and Maximum Offering Price | ||||
| Class A : | ||||
Net Asset Value and redemption price per share ($117,378,540 ÷ 5,036,607 shares) (a) | $ | 23.31 | ||
| Maximum offering price per share (100/94.25 of $23.31) | $ | 24.73 | ||
| Class M : | ||||
Net Asset Value and redemption price per share ($33,508,537 ÷ 1,439,130 shares) (a) | $ | 23.28 | ||
| Maximum offering price per share (100/96.50 of $23.28) | $ | 24.12 | ||
| Class C : | ||||
Net Asset Value and offering price per share ($17,461,396 ÷ 770,957 shares) (a) | $ | 22.65 | ||
| Class I : | ||||
Net Asset Value , offering price and redemption price per share ($52,404,654 ÷ 2,186,750 shares) | $ | 23.96 | ||
| Class Z : | ||||
Net Asset Value , offering price and redemption price per share ($21,316,908 ÷ 894,805 shares) | $ | 23.82 | ||
(a)Redemption price per share is equal to net asset value less any applicable contingent deferred sales charge. | ||||
| Statement of Operations | ||||
Year ended November 30, 2022 | ||||
| Investment Income | ||||
| Dividends | $ | 4,516,354 | ||
| Income from Fidelity Central Funds (including $279 from security lending) | 59,284 | |||
| Total Income | 4,575,638 | |||
| Expenses | ||||
| Management fee | ||||
| Basic fee | $ | 1,176,747 | ||
| Performance adjustment | 274,632 | |||
| Transfer agent fees | 380,474 | |||
| Distribution and service plan fees | 581,003 | |||
| Accounting fees | 83,111 | |||
| Custodian fees and expenses | 18,639 | |||
| Independent trustees' fees and expenses | 768 | |||
| Registration fees | 77,743 | |||
| Audit | 62,517 | |||
| Legal | 2,314 | |||
| Interest | 546 | |||
| Miscellaneous | 874 | |||
| Total expenses before reductions | 2,659,368 | |||
| Expense reductions | (103,088) | |||
| Total expenses after reductions | 2,556,280 | |||
| Net Investment income (loss) | 2,019,358 | |||
| Realized and Unrealized Gain (Loss) | ||||
| Net realized gain (loss) on: | ||||
| Investment Securities: | ||||
| Unaffiliated issuers | 2,606,804 | |||
| Foreign currency transactions | (1,237) | |||
| Total net realized gain (loss) | 2,605,567 | |||
| Change in net unrealized appreciation (depreciation) on: | ||||
| Investment Securities: | ||||
| Unaffiliated issuers | 11,332,640 | |||
| Assets and liabilities in foreign currencies | (4,288) | |||
| Total change in net unrealized appreciation (depreciation) | 11,328,352 | |||
| Net gain (loss) | 13,933,919 | |||
| Net increase (decrease) in net assets resulting from operations | $ | 15,953,277 | ||
| Statement of Changes in Net Assets | ||||
Year ended November 30, 2022 | Year ended November 30, 2021 | |||
| Increase (Decrease) in Net Assets | ||||
| Operations | ||||
| Net investment income (loss) | $ | 2,019,358 | $ | 1,225,298 |
| Net realized gain (loss) | 2,605,567 | 12,948,747 | ||
| Change in net unrealized appreciation (depreciation) | 11,328,352 | 10,771,250 | ||
| Net increase (decrease) in net assets resulting from operations | 15,953,277 | 24,945,295 | ||
| Distributions to shareholders | (7,393,417) | (1,211,161) | ||
| Share transactions - net increase (decrease) | 5,051,034 | 81,076,800 | ||
| Total increase (decrease) in net assets | 13,610,894 | 104,810,934 | ||
| Net Assets | ||||
| Beginning of period | 228,459,141 | 123,648,207 | ||
| End of period | $ | 242,070,035 | $ | 228,459,141 |
| Fidelity Advisor® Equity Value Fund Class A |
| Years ended November 30, | 2022 | 2021 | 2020 | 2019 | 2018 | |||||
Selected Per-Share Data | ||||||||||
| Net asset value, beginning of period | $ | 22.52 | $ | 18.87 | $ | 18.81 | $ | 18.77 | $ | 18.84 |
| Income from Investment Operations | ||||||||||
Net investment income (loss) A,B | .20 | .16 | .24 C | .26 | .26 | |||||
| Net realized and unrealized gain (loss) | 1.30 | 3.69 | .80 | 1.25 | (.16) | |||||
| Total from investment operations | 1.50 | 3.85 | 1.04 | 1.51 | .10 | |||||
| Distributions from net investment income | (.11) | (.20) | (.45) | (.28) | (.13) | |||||
| Distributions from net realized gain | (.60) | - | (.53) | (1.19) | (.05) | |||||
| Total distributions | (.71) | (.20) | (.98) | (1.47) | (.17) D | |||||
| Net asset value, end of period | $ | 23.31 | $ | 22.52 | $ | 18.87 | $ | 18.81 | $ | 18.77 |
Total Return E,F | 6.63% | 20.58% | 5.68% | 9.75% | .53% | |||||
Ratios to Average Net Assets B,G,H | ||||||||||
| Expenses before reductions | 1.19% | 1.14% | 1.11% | 1.00% | 1.00% | |||||
| Expenses net of fee waivers, if any | 1.15% | 1.14% | 1.10% | 1.00% | 1.00% | |||||
| Expenses net of all reductions | 1.15% | 1.14% | 1.09% | .99% | 1.00% | |||||
| Net investment income (loss) | .90% | .73% | 1.44% C | 1.47% | 1.39% | |||||
| Supplemental Data | ||||||||||
| Net assets, end of period (000 omitted) | $ | 117,379 | $ | 96,669 | $ | 67,291 | $ | 71,916 | $ | 67,457 |
Portfolio turnover rate I | 40% | 35% | 75% | 43% J | 33% |
| Fidelity Advisor® Equity Value Fund Class M |
| Years ended November 30, | 2022 | 2021 | 2020 | 2019 | 2018 | |||||
Selected Per-Share Data | ||||||||||
| Net asset value, beginning of period | $ | 22.50 | $ | 18.85 | $ | 18.79 | $ | 18.73 | $ | 18.80 |
| Income from Investment Operations | ||||||||||
Net investment income (loss) A,B | .14 | .11 | .20 C | .21 | .21 | |||||
| Net realized and unrealized gain (loss) | 1.29 | 3.69 | .79 | 1.26 | (.16) | |||||
| Total from investment operations | 1.43 | 3.80 | .99 | 1.47 | .05 | |||||
| Distributions from net investment income | (.05) | (.15) | (.40) | (.23) | (.07) | |||||
| Distributions from net realized gain | (.60) | - | (.53) | (1.19) | (.05) | |||||
| Total distributions | (.65) | (.15) | (.93) | (1.41) D | (.12) | |||||
| Net asset value, end of period | $ | 23.28 | $ | 22.50 | $ | 18.85 | $ | 18.79 | $ | 18.73 |
Total Return E,F | 6.32% | 20.31% | 5.37% | 9.51% | .25% | |||||
Ratios to Average Net Assets B,G,H | ||||||||||
| Expenses before reductions | 1.44% | 1.39% | 1.37% | 1.26% | 1.27% | |||||
| Expenses net of fee waivers, if any | 1.40% | 1.38% | 1.36% | 1.26% | 1.27% | |||||
| Expenses net of all reductions | 1.40% | 1.38% | 1.35% | 1.26% | 1.26% | |||||
| Net investment income (loss) | .65% | .48% | 1.19% C | 1.21% | 1.12% | |||||
| Supplemental Data | ||||||||||
| Net assets, end of period (000 omitted) | $ | 33,509 | $ | 31,217 | $ | 25,905 | $ | 28,791 | $ | 30,030 |
Portfolio turnover rate I | 40% | 35% | 75% | 43% J | 33% |
| Fidelity Advisor® Equity Value Fund Class C |
| Years ended November 30, | 2022 | 2021 | 2020 | 2019 | 2018 | |||||
Selected Per-Share Data | ||||||||||
| Net asset value, beginning of period | $ | 21.89 | $ | 18.33 | $ | 18.29 | $ | 18.25 | $ | 18.33 |
| Income from Investment Operations | ||||||||||
Net investment income (loss) A,B | .03 | (.01) | .10 C | .12 | .11 | |||||
| Net realized and unrealized gain (loss) | 1.25 | 3.61 | .76 | 1.24 | (.16) | |||||
| Total from investment operations | 1.28 | 3.60 | .86 | 1.36 | (.05) | |||||
| Distributions from net investment income | - | (.04) | (.29) | (.13) | - | |||||
| Distributions from net realized gain | (.52) | - | (.53) | (1.19) | (.03) | |||||
| Total distributions | (.52) | (.04) | (.82) | (1.32) | (.03) | |||||
| Net asset value, end of period | $ | 22.65 | $ | 21.89 | $ | 18.33 | $ | 18.29 | $ | 18.25 |
Total Return D,E | 5.81% | 19.67% | 4.78% | 8.95% | (.29)% | |||||
Ratios to Average Net Assets B,F,G | ||||||||||
| Expenses before reductions | 1.98% | 1.93% | 1.91% | 1.79% | 1.78% | |||||
| Expenses net of fee waivers, if any | 1.90% | 1.93% | 1.90% | 1.79% | 1.78% | |||||
| Expenses net of all reductions | 1.90% | 1.93% | 1.89% | 1.79% | 1.78% | |||||
| Net investment income (loss) | .15% | (.06)% | .64% C | .68% | .61% | |||||
| Supplemental Data | ||||||||||
| Net assets, end of period (000 omitted) | $ | 17,461 | $ | 14,096 | $ | 11,555 | $ | 15,819 | $ | 21,206 |
Portfolio turnover rate H | 40% | 35% | 75% | 43% I | 33% |
| Fidelity Advisor® Equity Value Fund Class I |
| Years ended November 30, | 2022 | 2021 | 2020 | 2019 | 2018 | |||||
Selected Per-Share Data | ||||||||||
| Net asset value, beginning of period | $ | 23.14 | $ | 19.39 | $ | 19.16 | $ | 19.09 | $ | 19.18 |
| Income from Investment Operations | ||||||||||
Net investment income (loss) A,B | .26 | .22 | .30 C | .31 | .32 | |||||
| Net realized and unrealized gain (loss) | 1.33 | 3.79 | .81 | 1.28 | (.17) | |||||
| Total from investment operations | 1.59 | 4.01 | 1.11 | 1.59 | .15 | |||||
| Distributions from net investment income | (.18) | (.26) | (.35) | (.34) | (.19) | |||||
| Distributions from net realized gain | (.60) | - | (.53) | (1.19) | (.05) | |||||
| Total distributions | (.77) D | (.26) | (.88) | (1.52) D | (.24) | |||||
| Net asset value, end of period | $ | 23.96 | $ | 23.14 | $ | 19.39 | $ | 19.16 | $ | 19.09 |
Total Return E | 6.86% | 20.93% | 5.95% | 10.12% | .75% | |||||
Ratios to Average Net Assets B,F,G | ||||||||||
| Expenses before reductions | .94% | .90% | .77% | .72% | .73% | |||||
| Expenses net of fee waivers, if any | .90% | .90% | .76% | .72% | .72% | |||||
| Expenses net of all reductions | .90% | .90% | .75% | .72% | .72% | |||||
| Net investment income (loss) | 1.15% | .97% | 1.78% C | 1.75% | 1.66% | |||||
| Supplemental Data | ||||||||||
| Net assets, end of period (000 omitted) | $ | 52,405 | $ | 51,171 | $ | 16,291 | $ | 18,538 | $ | 122,603 |
Portfolio turnover rate H | 40% | 35% | 75% | 43% I | 33% |
| Fidelity Advisor® Equity Value Fund Class Z |
| Years ended November 30, | 2022 | 2021 | 2020 | 2019 | 2018 | |||||
Selected Per-Share Data | ||||||||||
| Net asset value, beginning of period | $ | 23.00 | $ | 19.26 | $ | 19.18 | $ | 19.12 | $ | 19.20 |
| Income from Investment Operations | ||||||||||
Net investment income (loss) A,B | .30 | .26 | .32 C | .33 | .34 | |||||
| Net realized and unrealized gain (loss) | 1.32 | 3.75 | .82 | 1.28 | (.16) | |||||
| Total from investment operations | 1.62 | 4.01 | 1.14 | 1.61 | .18 | |||||
| Distributions from net investment income | (.20) | (.27) | (.52) | (.37) | (.21) | |||||
| Distributions from net realized gain | (.60) | - | (.53) | (1.19) | (.05) | |||||
| Total distributions | (.80) | (.27) | (1.06) D | (1.55) D | (.26) | |||||
| Net asset value, end of period | $ | 23.82 | $ | 23.00 | $ | 19.26 | $ | 19.18 | $ | 19.12 |
Total Return E | 7.02% | 21.07% | 6.09% | 10.27% | .91% | |||||
Ratios to Average Net Assets B,F,G | ||||||||||
| Expenses before reductions | .79% | .74% | .70% | .58% | .59% | |||||
| Expenses net of fee waivers, if any | .75% | .74% | .69% | .58% | .59% | |||||
| Expenses net of all reductions | .75% | .74% | .68% | .58% | .58% | |||||
| Net investment income (loss) | 1.30% | 1.12% | 1.86% C | 1.89% | 1.80% | |||||
| Supplemental Data | ||||||||||
| Net assets, end of period (000 omitted) | $ | 21,317 | $ | 35,306 | $ | 2,606 | $ | 3,852 | $ | 2,406 |
Portfolio turnover rate H | 40% | 35% | 75% | 43% I | 33% |
| Fidelity Central Fund | Investment Manager | Investment Objective | Investment Practices | Expense Ratio A |
| Fidelity Money Market Central Funds | Fidelity Management & Research Company LLC (FMR) | Each fund seeks to obtain a high level of current income consistent with the preservation of capital and liquidity. | Short-term Investments | Less than .005% |
| Gross unrealized appreciation | $55,401,652 |
| Gross unrealized depreciation | (8,747,605) |
| Net unrealized appreciation (depreciation) | $46,654,047 |
| Tax cost | $196,416,438 |
| Undistributed ordinary income | $1,801,358 |
| Undistributed long-term capital gain | $1,759,298 |
| Net unrealized appreciation (depreciation) on securities and other investments | $46,652,170 |
| November 30, 2022 | November 30, 2021 | |
| Ordinary Income | $3,074,115 | $1,211,161 |
| Long-term Capital Gains | 4,319,301 | - |
| Total | $7,393,416 | $1,211,161 |
| Purchases ($) | Sales ($) | |
| Fidelity Advisor Equity Value Fund | 89,040,308 | 89,089,529 |
| Distribution Fee | Service Fee | Total Fees | Retained by FDC | |
| Class A | - % | .25% | $265,444 | $10,001 |
| Class M | .25% | .25% | 159,088 | 668 |
| Class C | .75% | .25% | 156,471 | 32,168 |
| $581,003 | $42,837 |
| Retained by FDC | |
| Class A | $45,066 |
| Class M | 3,624 |
Class C A | 705 |
| $49,395 |
| Amount | % of Class-Level Average Net Assets | |
| Class A | $192,147 | .18 |
| Class M | 55,649 | .17 |
| Class C | 34,421 | .22 |
| Class I | 89,417 | .19 |
| Class Z | 8,840 | .04 |
| $380,474 |
| % of Average Net Assets | |
| Fidelity Advisor Equity Value Fund | .04 |
| Amount | |
| Fidelity Advisor Equity Value Fund | $1,420 |
| Borrower or Lender | Average Loan Balance | Weighted Average Interest Rate | Interest Expense | |
| Fidelity Advisor Equity Value Fund | Borrower | $ 8,963,571 | .31% | $ 546 |
| Purchases ($) | Sales ($) | Realized Gain (Loss) ($) | |
| Fidelity Advisor Equity Value Fund | 5,829,355 | 4,697,129 | 283,369 |
| Amount | |
| Fidelity Advisor Equity Value Fund | $377 |
| Total Security Lending Fees Paid to NFS | Security Lending Income From Securities Loaned to NFS | Value of Securities Loaned to NFS at Period End | |
| Fidelity Advisor Equity Value Fund | $29 | $- | $- |
| Expense Limitations | Reimbursement | |
| Class A | 1.15% | $43,190 |
| Class M | 1.40% | 11,284 |
| Class C | 1.90% | 12,436 |
| Class I | .90% | 19,932 |
| Class Z | .75% | 8,831 |
| $95,673 |
Year ended November 30, 2022 | Year ended November 30, 2021 | |
| Fidelity Advisor Equity Value Fund | ||
| Distributions to shareholders | ||
| Class A | $3,052,916 | $709,752 |
| Class M | 897,128 | 208,993 |
| Class C | 335,659 | 24,421 |
| Class I | 1,735,387 | 224,961 |
| Class Z | 1,372,327 | 43,034 |
Total | $7,393,417 | $1,211,161 |
| Shares | Shares | Dollars | Dollars | |
| Year ended November 30, 2022 | Year ended November 30, 2021 | Year ended November 30, 2022 | Year ended November 30, 2021 | |
| Fidelity Advisor Equity Value Fund | ||||
| Class A | ||||
| Shares sold | 1,322,626 | 1,299,687 | $ 29,846,718 | $ 28,834,825 |
| Reinvestment of distributions | 125,386 | 35,675 | 2,944,057 | 686,391 |
| Shares redeemed | (704,458) | (608,816) | (15,754,356) | (13,399,891) |
| Net increase (decrease) | 743,554 | 726,546 | $17,036,419 | $16,121,325 |
| Class M | ||||
| Shares sold | 236,755 | 208,702 | $ 5,321,237 | $ 4,624,895 |
| Reinvestment of distributions | 37,646 | 10,601 | 885,059 | 204,174 |
| Shares redeemed | (222,986) | (205,820) | (4,958,113) | (4,482,792) |
| Net increase (decrease) | 51,415 | 13,483 | $1,248,183 | $346,277 |
| Class C | ||||
| Shares sold | 326,262 | 320,493 | $ 7,171,335 | $ 6,900,532 |
| Reinvestment of distributions | 14,355 | 1,282 | 329,881 | 24,143 |
| Shares redeemed | (213,704) | (308,019) | (4,679,466) | (6,686,187) |
| Net increase (decrease) | 126,913 | 13,756 | $2,821,750 | $238,488 |
| Class I | ||||
| Shares sold | 1,266,409 | 2,160,884 | $ 29,316,775 | $ 49,834,773 |
| Reinvestment of distributions | 68,071 | 10,646 | 1,639,827 | 209,931 |
| Shares redeemed | (1,359,296) | (799,903) | (31,653,830) | (18,344,141) |
| Net increase (decrease) | (24,816) | 1,371,627 | $(697,228) | $ 31,700,563 |
| Class Z | ||||
| Shares sold | 677,338 | 1,464,624 | $ 15,778,041 | $ 34,162,637 |
| Reinvestment of distributions | 49,426 | 1,708 | 1,181,767 | 33,426 |
| Shares redeemed | (1,367,272) | (66,358) | (32,317,898) | (1,525,916) |
| Net increase (decrease) | (640,508) | 1,399,974 | $(15,358,090) | $ 32,670,147 |
| The Example is based on an investment of $1,000 invested at the beginning of the period and held for the entire period (June 1, 2022 to November 30, 2022). |
Annualized Expense Ratio- A | Beginning Account Value June 1, 2022 | Ending Account Value November 30, 2022 | Expenses Paid During Period- C June 1, 2022 to November 30, 2022 | |||||||
| Fidelity Advisor® Equity Value Fund | ||||||||||
| Class A | 1.15% | |||||||||
| Actual | $ 1,000 | $ 1,021.90 | $ 5.83 | |||||||
Hypothetical- B | $ 1,000 | $ 1,019.30 | $ 5.82 | |||||||
| Class M | 1.40% | |||||||||
| Actual | $ 1,000 | $ 1,020.20 | $ 7.09 | |||||||
Hypothetical- B | $ 1,000 | $ 1,018.05 | $ 7.08 | |||||||
| Class C | 1.90% | |||||||||
| Actual | $ 1,000 | $ 1,018.00 | $ 9.61 | |||||||
Hypothetical- B | $ 1,000 | $ 1,015.54 | $ 9.60 | |||||||
| Class I | .90% | |||||||||
| Actual | $ 1,000 | $ 1,022.60 | $ 4.56 | |||||||
Hypothetical- B | $ 1,000 | $ 1,020.56 | $ 4.56 | |||||||
| Class Z | .75% | |||||||||
| Actual | $ 1,000 | $ 1,023.60 | $ 3.80 | |||||||
Hypothetical- B | $ 1,000 | $ 1,021.31 | $ 3.80 | |||||||
|


Contents
| Average Annual Total Returns | |||
Periods ended November 30, 2022 | Past 1 year | Past 5 years | Past 10 years |
| Class A (incl.5.75% sales charge) | -1.38% | 8.74% | 11.18% |
| Class M (incl.3.50% sales charge) | 0.72% | 8.98% | 11.18% |
Class C (incl. contingent deferred sales charge) | 2.81% | 9.19% | 11.18% |
| Class I | 4.86% | 10.31% | 12.16% |
| Class Z | 5.03% | 10.47% | 12.25% |
| $10,000 Over 10 Years |
Let's say hypothetically that $10,000 was invested in Fidelity Advisor® Growth & Income Fund - Class A, on November 30, 2012, and the current 5.75% sales charge was paid. The chart shows how the value of your investment would have changed, and also shows how the S&P 500® Index performed over the same period. |
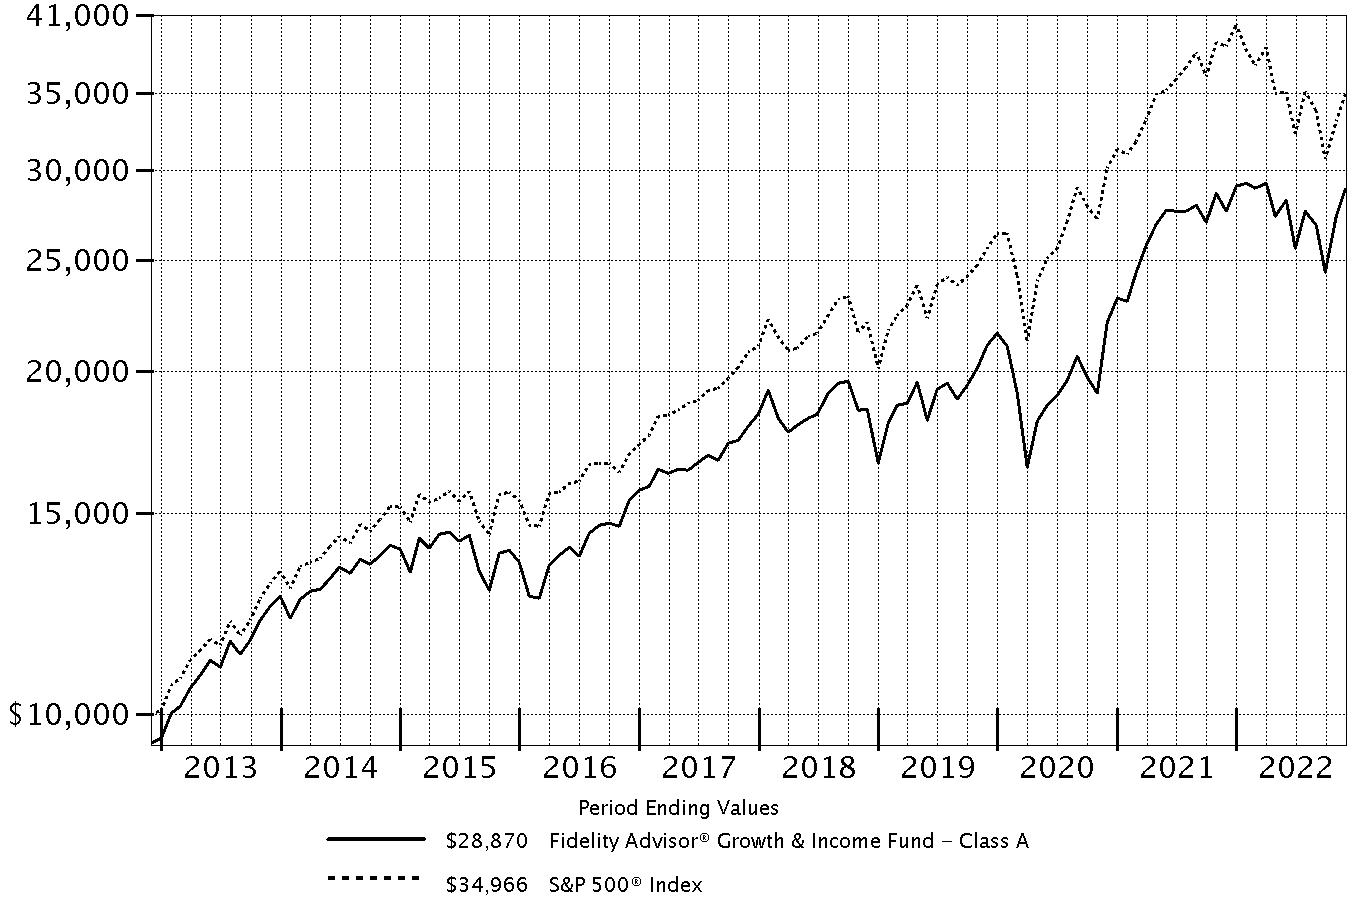 |
Top Holdings (% of Fund's net assets) | ||
| Exxon Mobil Corp.* | 7.6 | |
| Microsoft Corp. | 5.8 | |
| Wells Fargo & Co.* | 5.3 | |
| General Electric Co. | 4.7 | |
| Bank of America Corp. | 2.9 | |
| Apple, Inc. | 2.9 | |
| Bristol-Myers Squibb Co. | 1.9 | |
| Visa, Inc. Class A | 1.8 | |
| Hess Corp. | 1.8 | |
| Comcast Corp. Class A | 1.8 | |
| 36.5 | ||
| Market Sectors (% of Fund's net assets) | ||
| Information Technology | 17.5 | |
| Financials | 15.6 | |
| Industrials | 15.0 | |
| Energy | 13.0 | |
| Health Care | 12.2 | |
| Consumer Staples | 5.0 | |
| Communication Services | 4.5 | |
| Consumer Discretionary | 2.8 | |
| Materials | 2.7 | |
| Utilities | 1.4 | |
| Real Estate | 1.1 | |
Asset Allocation (% of Fund's net assets) |
 |
Foreign investments - 12.6% |
Written options - 0.0% |
Percentages shown as 0.0% may reflect amounts less than 0.05%. |
Geographic Diversification (% of Fund's net assets) |
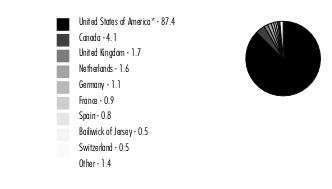 |
* Includes Short-Term investments and Net Other Assets (Liabilities). Percentages are based on country or territory of incorporation and are adjusted for the effect of futures contracts, if applicable. |
| Common Stocks - 90.6% | |||
| Shares | Value ($) (000s) | ||
| COMMUNICATION SERVICES - 4.5% | |||
| Diversified Telecommunication Services - 0.7% | |||
| Cellnex Telecom SA (a) | 67,300 | 2,314 | |
| Elisa Corp. (A Shares) | 9,700 | 505 | |
| Verizon Communications, Inc. | 70,709 | 2,756 | |
| 5,575 | |||
| Entertainment - 1.4% | |||
| Activision Blizzard, Inc. | 13,200 | 976 | |
| Nintendo Co. Ltd. ADR | 100,900 | 1,083 | |
| The Walt Disney Co. (b) | 42,500 | 4,159 | |
| Universal Music Group NV | 168,800 | 4,014 | |
| Warner Music Group Corp. Class A | 39,100 | 1,340 | |
| 11,572 | |||
| Media - 2.4% | |||
| Comcast Corp. Class A | 398,158 | 14,589 | |
| Interpublic Group of Companies, Inc. | 149,500 | 5,137 | |
| 19,726 | |||
TOTAL COMMUNICATION SERVICES | 36,873 | ||
| CONSUMER DISCRETIONARY - 2.8% | |||
| Auto Components - 0.4% | |||
| BorgWarner, Inc. (c) | 71,300 | 3,031 | |
| Hotels, Restaurants & Leisure - 0.7% | |||
| Churchill Downs, Inc. | 10,800 | 2,397 | |
| Marriott International, Inc. Class A | 10,300 | 1,703 | |
| Starbucks Corp. | 13,300 | 1,359 | |
| 5,459 | |||
| Household Durables - 0.2% | |||
| Sony Group Corp. sponsored ADR | 11,400 | 947 | |
| Whirlpool Corp. | 3,500 | 513 | |
| 1,460 | |||
| Multiline Retail - 0.2% | |||
| Target Corp. | 11,200 | 1,871 | |
| Specialty Retail - 1.1% | |||
| Lowe's Companies, Inc. (c) | 39,457 | 8,387 | |
| TJX Companies, Inc. | 2,400 | 192 | |
| Williams-Sonoma, Inc. | 1,000 | 117 | |
| 8,696 | |||
| Textiles, Apparel & Luxury Goods - 0.2% | |||
| NIKE, Inc. Class B | 12,000 | 1,316 | |
| Puma AG | 14,944 | 773 | |
| Tapestry, Inc. | 300 | 11 | |
| 2,100 | |||
TOTAL CONSUMER DISCRETIONARY | 22,617 | ||
| CONSUMER STAPLES - 5.0% | |||
| Beverages - 2.1% | |||
| Diageo PLC sponsored ADR (d) | 20,100 | 3,750 | |
| Keurig Dr. Pepper, Inc. | 94,200 | 3,643 | |
| Pernod Ricard SA | 5,600 | 1,111 | |
| Remy Cointreau SA | 3,444 | 596 | |
| The Coca-Cola Co. | 133,484 | 8,491 | |
| 17,591 | |||
| Food & Staples Retailing - 1.3% | |||
| Alimentation Couche-Tard, Inc. Class A (multi-vtg.) | 3,700 | 169 | |
| Sysco Corp. | 69,100 | 5,978 | |
| Walmart, Inc. | 28,200 | 4,298 | |
| 10,445 | |||
| Food Products - 0.2% | |||
| Lamb Weston Holdings, Inc. (c) | 21,500 | 1,868 | |
| Household Products - 0.2% | |||
| Colgate-Palmolive Co. | 5,100 | 395 | |
| Kimberly-Clark Corp. | 1,000 | 136 | |
| Spectrum Brands Holdings, Inc. | 15,200 | 810 | |
| 1,341 | |||
| Personal Products - 0.2% | |||
| Estee Lauder Companies, Inc. Class A | 1,500 | 354 | |
| Haleon PLC ADR (b) | 232,609 | 1,603 | |
| 1,957 | |||
| Tobacco - 1.0% | |||
| Altria Group, Inc. | 173,020 | 8,059 | |
TOTAL CONSUMER STAPLES | 41,261 | ||
| ENERGY - 13.0% | |||
| Energy Equipment & Services - 0.0% | |||
| Baker Hughes Co. Class A | 5,700 | 165 | |
| Oil, Gas & Consumable Fuels - 13.0% | |||
| Canadian Natural Resources Ltd. (d) | 47,500 | 2,836 | |
| Cenovus Energy, Inc. (Canada) | 522,900 | 10,399 | |
| Energy Transfer LP | 31,300 | 393 | |
| Enterprise Products Partners LP | 19,800 | 491 | |
| Exxon Mobil Corp. (c) | 563,600 | 62,747 | |
| Hess Corp. | 102,600 | 14,765 | |
| Imperial Oil Ltd. | 91,100 | 5,183 | |
| Kosmos Energy Ltd. (b) | 396,100 | 2,634 | |
| Phillips 66 Co. | 13,300 | 1,442 | |
| Tourmaline Oil Corp. | 87,500 | 5,326 | |
| 106,216 | |||
TOTAL ENERGY | 106,381 | ||
| FINANCIALS - 15.6% | |||
| Banks - 11.6% | |||
| Bank of America Corp. | 631,742 | 23,911 | |
| JPMorgan Chase & Co. | 57,443 | 7,937 | |
| M&T Bank Corp. | 10,900 | 1,853 | |
| PNC Financial Services Group, Inc. | 47,916 | 8,062 | |
| Truist Financial Corp. | 130,149 | 6,092 | |
| U.S. Bancorp | 94,830 | 4,304 | |
| Wells Fargo & Co. (c) | 903,850 | 43,340 | |
| 95,499 | |||
| Capital Markets - 2.7% | |||
| Ashmore Group PLC | 104,500 | 287 | |
| Brookfield Asset Management, Inc. Class A | 26,401 | 1,245 | |
| Intercontinental Exchange, Inc. | 1,100 | 119 | |
| KKR & Co. LP | 54,813 | 2,846 | |
| Morgan Stanley | 30,230 | 2,814 | |
| Northern Trust Corp. | 74,837 | 6,968 | |
| Raymond James Financial, Inc. | 36,350 | 4,249 | |
| S&P Global, Inc. | 100 | 35 | |
| State Street Corp. | 43,570 | 3,471 | |
| 22,034 | |||
| Consumer Finance - 0.2% | |||
| Discover Financial Services | 12,700 | 1,376 | |
| Insurance - 0.8% | |||
| American Financial Group, Inc. | 3,400 | 484 | |
| Brookfield Asset Management Reinsurance Partners Ltd. | 172 | 8 | |
| Chubb Ltd. | 9,800 | 2,152 | |
| Marsh & McLennan Companies, Inc. | 14,766 | 2,557 | |
| Old Republic International Corp. | 17,800 | 436 | |
| The Travelers Companies, Inc. | 6,600 | 1,253 | |
| 6,890 | |||
| Thrifts & Mortgage Finance - 0.3% | |||
| Essent Group Ltd. | 20,500 | 822 | |
| Radian Group, Inc. | 62,890 | 1,231 | |
| 2,053 | |||
TOTAL FINANCIALS | 127,852 | ||
| HEALTH CARE - 12.0% | |||
| Health Care Equipment & Supplies - 1.2% | |||
| Abbott Laboratories | 3,500 | 377 | |
| Becton, Dickinson & Co. | 8,975 | 2,238 | |
| Boston Scientific Corp. (b) | 117,200 | 5,306 | |
| GN Store Nord A/S | 4,000 | 97 | |
| Koninklijke Philips Electronics NV (depositary receipt) (NY Reg.) | 100,539 | 1,512 | |
| Sonova Holding AG | 2,263 | 588 | |
| 10,118 | |||
| Health Care Providers & Services - 5.9% | |||
| Cardinal Health, Inc. (c) | 70,100 | 5,620 | |
| Cigna Corp. | 34,200 | 11,248 | |
| CVS Health Corp. (c) | 74,651 | 7,605 | |
| Humana, Inc. | 3,300 | 1,815 | |
| McKesson Corp. (c) | 25,633 | 9,784 | |
| UnitedHealth Group, Inc. (c) | 22,000 | 12,051 | |
| 48,123 | |||
| Life Sciences Tools & Services - 0.4% | |||
| Danaher Corp. | 12,200 | 3,336 | |
| Pharmaceuticals - 4.5% | |||
| Bayer AG | 13,573 | 788 | |
| Bristol-Myers Squibb Co. | 188,200 | 15,109 | |
| Eli Lilly & Co. | 7,500 | 2,783 | |
| GSK PLC sponsored ADR | 157,347 | 5,443 | |
| Johnson & Johnson | 55,201 | 9,826 | |
| Perrigo Co. PLC | 6,100 | 197 | |
| Sanofi SA sponsored ADR | 19,500 | 884 | |
| UCB SA | 22,100 | 1,784 | |
| Viatris, Inc. | 7,200 | 79 | |
| Zoetis, Inc. Class A | 1,200 | 185 | |
| 37,078 | |||
TOTAL HEALTH CARE | 98,655 | ||
| INDUSTRIALS - 15.0% | |||
| Aerospace & Defense - 3.0% | |||
| Airbus Group NV | 36,700 | 4,213 | |
| General Dynamics Corp. | 12,500 | 3,155 | |
| Huntington Ingalls Industries, Inc. | 9,000 | 2,088 | |
| MTU Aero Engines AG | 4,600 | 970 | |
| Raytheon Technologies Corp. | 16,631 | 1,642 | |
| Safran SA | 10,500 | 1,298 | |
| The Boeing Co. (b) | 61,710 | 11,039 | |
| 24,405 | |||
| Air Freight & Logistics - 1.7% | |||
| DSV A/S | 4,600 | 736 | |
| Expeditors International of Washington, Inc. | 700 | 81 | |
| FedEx Corp. | 11,700 | 2,132 | |
| United Parcel Service, Inc. Class B | 59,679 | 11,323 | |
| 14,272 | |||
| Airlines - 0.0% | |||
| Copa Holdings SA Class A (b) | 2,300 | 202 | |
| Building Products - 0.4% | |||
| A.O. Smith Corp. | 11,800 | 717 | |
| Johnson Controls International PLC | 42,100 | 2,797 | |
| 3,514 | |||
| Commercial Services & Supplies - 0.5% | |||
| GFL Environmental, Inc. | 114,200 | 3,311 | |
| Healthcare Services Group, Inc. | 61,700 | 861 | |
| Ritchie Bros. Auctioneers, Inc. | 1,300 | 71 | |
| 4,243 | |||
| Electrical Equipment - 1.0% | |||
| Acuity Brands, Inc. | 12,600 | 2,372 | |
| Hubbell, Inc. Class B | 11,912 | 3,026 | |
| Regal Rexnord Corp. | 2,100 | 275 | |
| Rockwell Automation, Inc. | 1,600 | 423 | |
| Vertiv Holdings Co. (d) | 139,100 | 1,927 | |
| 8,023 | |||
| Industrial Conglomerates - 4.8% | |||
| 3M Co. | 10,800 | 1,360 | |
| General Electric Co. | 447,436 | 38,466 | |
| 39,826 | |||
| Machinery - 1.7% | |||
| Allison Transmission Holdings, Inc. | 25,800 | 1,156 | |
| Barnes Group, Inc. | 2,300 | 98 | |
| Caterpillar, Inc. | 3,300 | 780 | |
| Cummins, Inc. | 4,900 | 1,231 | |
| Donaldson Co., Inc. | 57,000 | 3,472 | |
| Epiroc AB (A Shares) | 2,700 | 52 | |
| Flowserve Corp. | 30,600 | 960 | |
| Fortive Corp. | 24,600 | 1,662 | |
| Kardex AG | 550 | 91 | |
| Nordson Corp. | 9,000 | 2,128 | |
| Otis Worldwide Corp. | 8,265 | 645 | |
| Stanley Black & Decker, Inc. | 4,800 | 392 | |
| Westinghouse Air Brake Tech Co. | 11,931 | 1,206 | |
| 13,873 | |||
| Professional Services - 0.5% | |||
| Equifax, Inc. | 8,000 | 1,579 | |
| RELX PLC (London Stock Exchange) | 77,838 | 2,183 | |
| Robert Half International, Inc. | 800 | 63 | |
| 3,825 | |||
| Road & Rail - 0.5% | |||
| Knight-Swift Transportation Holdings, Inc. Class A (c) | 70,000 | 3,880 | |
| Trading Companies & Distributors - 0.8% | |||
| Brenntag SE | 7,000 | 445 | |
| Fastenal Co. | 12,000 | 618 | |
| MSC Industrial Direct Co., Inc. Class A | 1,500 | 129 | |
| Watsco, Inc. (d) | 19,364 | 5,209 | |
| WESCO International, Inc. (b) | 2,700 | 348 | |
| 6,749 | |||
| Transportation Infrastructure - 0.1% | |||
| Aena SME SA (a)(b) | 5,100 | 658 | |
TOTAL INDUSTRIALS | 123,470 | ||
| INFORMATION TECHNOLOGY - 17.5% | |||
| Electronic Equipment & Components - 0.2% | |||
| CDW Corp. | 9,300 | 1,754 | |
| IT Services - 4.0% | |||
| Amadeus IT Holding SA Class A (b) | 54,600 | 2,952 | |
| DXC Technology Co. (b) | 9,400 | 279 | |
| Edenred SA | 57,400 | 3,153 | |
| Fidelity National Information Services, Inc. | 46,400 | 3,368 | |
| Genpact Ltd. | 51,800 | 2,388 | |
| Global Payments, Inc. | 11,200 | 1,162 | |
| IBM Corp. | 17,800 | 2,650 | |
| MasterCard, Inc. Class A | 5,500 | 1,960 | |
| Unisys Corp. (b) | 70,792 | 304 | |
| Visa, Inc. Class A | 69,040 | 14,982 | |
| 33,198 | |||
| Semiconductors & Semiconductor Equipment - 3.2% | |||
| Analog Devices, Inc. | 13,900 | 2,390 | |
| Applied Materials, Inc. | 16,895 | 1,852 | |
| Intel Corp. | 68,200 | 2,051 | |
| Lam Research Corp. | 4,200 | 1,984 | |
| Marvell Technology, Inc. | 71,500 | 3,326 | |
| Microchip Technology, Inc. | 2,300 | 182 | |
| NVIDIA Corp. | 10,000 | 1,692 | |
| NXP Semiconductors NV | 18,600 | 3,271 | |
| Qualcomm, Inc. | 68,498 | 8,664 | |
| Taiwan Semiconductor Manufacturing Co. Ltd. sponsored ADR | 2,200 | 183 | |
| Teradyne, Inc. | 6,800 | 635 | |
| 26,230 | |||
| Software - 7.1% | |||
| Intuit, Inc. | 9,900 | 4,035 | |
| Microsoft Corp. | 185,353 | 47,291 | |
| Open Text Corp. | 15,400 | 452 | |
| SAP SE sponsored ADR (d) | 52,900 | 5,865 | |
| Temenos Group AG | 10,960 | 675 | |
| 58,318 | |||
| Technology Hardware, Storage & Peripherals - 3.0% | |||
| Apple, Inc. | 159,492 | 23,610 | |
| FUJIFILM Holdings Corp. | 5,200 | 280 | |
| Samsung Electronics Co. Ltd. | 14,620 | 710 | |
| 24,600 | |||
TOTAL INFORMATION TECHNOLOGY | 144,100 | ||
| MATERIALS - 2.7% | |||
| Chemicals - 0.6% | |||
| DuPont de Nemours, Inc. | 62,300 | 4,393 | |
| PPG Industries, Inc. | 5,200 | 703 | |
| 5,096 | |||
| Metals & Mining - 2.1% | |||
| First Quantum Minerals Ltd. | 189,700 | 4,510 | |
| Freeport-McMoRan, Inc. | 196,000 | 7,801 | |
| Glencore PLC | 628,900 | 4,292 | |
| 16,603 | |||
| Paper & Forest Products - 0.0% | |||
| Louisiana-Pacific Corp. | 2,800 | 179 | |
TOTAL MATERIALS | 21,878 | ||
| REAL ESTATE - 1.1% | |||
| Equity Real Estate Investment Trusts (REITs) - 1.1% | |||
| American Tower Corp. | 17,400 | 3,850 | |
| Crown Castle International Corp. | 2,200 | 311 | |
| Equinix, Inc. | 110 | 76 | |
| Public Storage | 200 | 60 | |
| Simon Property Group, Inc. | 38,600 | 4,610 | |
| 8,907 | |||
| UTILITIES - 1.4% | |||
| Electric Utilities - 1.3% | |||
| Constellation Energy Corp. | 4,400 | 423 | |
| Duke Energy Corp. | 10,400 | 1,039 | |
| Entergy Corp. | 11,900 | 1,384 | |
| Exelon Corp. | 13,200 | 546 | |
| NextEra Energy, Inc. | 3,000 | 254 | |
| PG&E Corp. (b) | 102,500 | 1,609 | |
| Southern Co. | 75,900 | 5,134 | |
| 10,389 | |||
| Multi-Utilities - 0.1% | |||
| Sempra Energy | 6,300 | 1,047 | |
TOTAL UTILITIES | 11,436 | ||
| TOTAL COMMON STOCKS (Cost $499,091) | 743,430 | ||
| Convertible Preferred Stocks - 0.2% | |||
| Shares | Value ($) (000s) | ||
| HEALTH CARE - 0.2% | |||
| Health Care Equipment & Supplies - 0.2% | |||
| Becton, Dickinson & Co. 6.50% | 14,200 | 705 | |
| Boston Scientific Corp. Series A, 5.50% | 8,400 | 949 | |
| TOTAL CONVERTIBLE PREFERRED STOCKS (Cost $1,564) | 1,654 | ||
| Convertible Bonds - 0.0% | |||
Principal Amount (e) (000s) | Value ($) (000s) | ||
| COMMUNICATION SERVICES - 0.0% | |||
| Interactive Media & Services - 0.0% | |||
Snap, Inc. 0.125% 3/1/28 (a) (Cost $374) | 521 | 350 | |
| Money Market Funds - 10.4% | |||
| Shares | Value ($) (000s) | ||
| Fidelity Cash Central Fund 3.86% (f) | 73,078,034 | 73,093 | |
| Fidelity Securities Lending Cash Central Fund 3.86% (f)(g) | 12,460,329 | 12,462 | |
| TOTAL MONEY MARKET FUNDS (Cost $85,555) | 85,555 | ||
| TOTAL INVESTMENT IN SECURITIES - 101.2% (Cost $586,584) | 830,989 |
NET OTHER ASSETS (LIABILITIES) - (1.2)% | (10,001) |
| NET ASSETS - 100.0% | 820,988 |
| Written Options | ||||||
| Counterparty | Number of Contracts | Notional Amount ($) (000s) | Exercise Price ($) | Expiration Date | Value ($) (000s) | |
| Call Options | ||||||
| BorgWarner, Inc. | Chicago Board Options Exchange | 70 | 298 | 45.00 | 01/20/23 | (7) |
| Cardinal Health, Inc. | Chicago Board Options Exchange | 69 | 553 | 77.50 | 12/16/22 | (23) |
| CVS Health Corp. | Chicago Board Options Exchange | 36 | 367 | 105.00 | 01/20/23 | (7) |
| Exxon Mobil Corp. | Chicago Board Options Exchange | 282 | 3,140 | 110.00 | 01/20/23 | (171) |
| Knight-Swift Transportation Holdings, Inc. | Chicago Board Options Exchange | 64 | 355 | 60.00 | 01/20/23 | (6) |
| Lamb Weston Holdings, Inc. | Chicago Board Options Exchange | 192 | 1,668 | 90.00 | 12/16/22 | (12) |
| Lowe's Companies, Inc. | Chicago Board Options Exchange | 20 | 425 | 220.00 | 12/16/22 | (7) |
| McKesson Corp. | Chicago Board Options Exchange | 7 | 267 | 380.00 | 01/20/23 | (11) |
| UnitedHealth Group, Inc. | Chicago Board Options Exchange | 6 | 329 | 560.00 | 12/16/22 | (2) |
| Wells Fargo & Co. | Chicago Board Options Exchange | 446 | 2,139 | 47.50 | 12/16/22 | (61) |
| TOTAL WRITTEN OPTIONS | (307) | |||||
| (a) | Security exempt from registration under Rule 144A of the Securities Act of 1933. These securities may be resold in transactions exempt from registration, normally to qualified institutional buyers. At the end of the period, the value of these securities amounted to $3,322,000 or 0.4% of net assets. |
| (b) | Non-income producing |
| (c) | Security or a portion of the security is pledged as collateral for call options written. At period end, the value of securities pledged amounted to $9,541,000. |
| (d) | Security or a portion of the security is on loan at period end. |
| (e) | Amount is stated in United States dollars unless otherwise noted. |
| (f) | Affiliated fund that is generally available only to investment companies and other accounts managed by Fidelity Investments. The rate quoted is the annualized seven-day yield of the fund at period end. A complete unaudited listing of the fund's holdings as of its most recent quarter end is available upon request. In addition, each Fidelity Central Fund's financial statements, which are not covered by the Fund's Report of Independent Registered Public Accounting Firm, are available on the SEC's website or upon request. |
| (g) | Investment made with cash collateral received from securities on loan. |
| Affiliate (Amounts in thousands) | Value, beginning of period ($) | Purchases ($) | Sales Proceeds ($) | Dividend Income ($) | Realized Gain (loss) ($) | Change in Unrealized appreciation (depreciation) ($) | Value, end of period ($) | % ownership, end of period |
| Fidelity Cash Central Fund 3.86% | 11,071 | 146,873 | 84,851 | 635 | - | - | 73,093 | 0.2% |
| Fidelity Securities Lending Cash Central Fund 3.86% | 727 | 71,733 | 59,998 | 7 | - | - | 12,462 | 0.0% |
| Total | 11,798 | 218,606 | 144,849 | 642 | - | - | 85,555 | |
| Valuation Inputs at Reporting Date: | ||||
Description (Amounts in thousands) | Total ($) | Level 1 ($) | Level 2 ($) | Level 3 ($) |
Investments in Securities: | ||||
| Equities: | ||||
Communication Services | 36,873 | 30,040 | 6,833 | - |
Consumer Discretionary | 22,617 | 21,844 | 773 | - |
Consumer Staples | 41,261 | 39,554 | 1,707 | - |
Energy | 106,381 | 106,381 | - | - |
Financials | 127,852 | 127,565 | 287 | - |
Health Care | 100,309 | 95,398 | 4,911 | - |
Industrials | 123,470 | 112,824 | 10,646 | - |
Information Technology | 144,100 | 136,330 | 7,770 | - |
Materials | 21,878 | 17,586 | 4,292 | - |
Real Estate | 8,907 | 8,907 | - | - |
Utilities | 11,436 | 11,436 | - | - |
| Corporate Bonds | 350 | - | 350 | - |
| Money Market Funds | 85,555 | 85,555 | - | - |
| Total Investments in Securities: | 830,989 | 793,420 | 37,569 | - |
Derivative Instruments: | ||||
| Liabilities | ||||
Written Options | (307) | (307) | - | - |
| Total Liabilities | (307) | (307) | - | - |
| Total Derivative Instruments: | (307) | (307) | - | - |
Primary Risk Exposure / Derivative Type | Value | |
| (Amounts in thousands) | Asset ($) | Liability ($) |
| Equity Risk | ||
Written Options (a) | 0 | (307) |
| Total Equity Risk | 0 | (307) |
| Total Value of Derivatives | 0 | (307) |
| Statement of Assets and Liabilities | ||||
| Amounts in thousands (except per-share amounts) | November 30, 2022 | |||
| Assets | ||||
| Investment in securities, at value (including securities loaned of $12,439) - See accompanying schedule: | ||||
Unaffiliated issuers (cost $501,029) | $745,434 | |||
Fidelity Central Funds (cost $85,555) | 85,555 | |||
| Total Investment in Securities (cost $586,584) | $ | 830,989 | ||
| Restricted cash | 76 | |||
| Receivable for investments sold | ||||
Regular delivery | 319 | |||
Delayed delivery | 424 | |||
| Receivable for fund shares sold | 956 | |||
| Dividends receivable | 1,983 | |||
| Distributions receivable from Fidelity Central Funds | 191 | |||
| Prepaid expenses | 1 | |||
Total assets | 834,939 | |||
| Liabilities | ||||
| Payable for investments purchased | $362 | |||
| Payable for fund shares redeemed | 223 | |||
| Accrued management fee | 278 | |||
| Distribution and service plan fees payable | 191 | |||
| Written options, at value (premium received $220) | 307 | |||
| Other affiliated payables | 121 | |||
| Other payables and accrued expenses | 7 | |||
| Collateral on securities loaned | 12,462 | |||
| Total Liabilities | 13,951 | |||
| Net Assets | $ | 820,988 | ||
| Net Assets consist of: | ||||
| Paid in capital | $ | 573,737 | ||
| Total accumulated earnings (loss) | 247,251 | |||
| Net Assets | $ | 820,988 | ||
| Net Asset Value and Maximum Offering Price | ||||
| Class A : | ||||
Net Asset Value and redemption price per share ($405,638 ÷ 12,331 shares) (a) | $ | 32.90 | ||
| Maximum offering price per share (100/94.25 of $32.90) | $ | 34.91 | ||
| Class M : | ||||
Net Asset Value and redemption price per share ($180,063 ÷ 5,462 shares) (a) | $ | 32.97 | ||
| Maximum offering price per share (100/96.50 of $32.97) | $ | 34.17 | ||
| Class C : | ||||
Net Asset Value and offering price per share ($47,170 ÷ 1,560 shares) (a) | $ | 30.24 | ||
| Class I : | ||||
Net Asset Value , offering price and redemption price per share ($127,725 ÷ 3,778 shares) | $ | 33.81 | ||
| Class Z : | ||||
Net Asset Value , offering price and redemption price per share ($60,392 ÷ 1,783 shares) (b) | $ | 33.88 | ||
(a)Redemption price per share is equal to net asset value less any applicable contingent deferred sales charge. | ||||
(b)Corresponding Net Asset Value does not calculate due to rounding of fractional net assets and/or shares. | ||||
| Statement of Operations | ||||
| Amounts in thousands | Year ended November 30, 2022 | |||
| Investment Income | ||||
| Dividends | $ | 15,387 | ||
| Interest | 51 | |||
| Income from Fidelity Central Funds (including $7 from security lending) | 642 | |||
| Total Income | 16,080 | |||
| Expenses | ||||
| Management fee | $ | 3,091 | ||
| Transfer agent fees | 1,205 | |||
| Distribution and service plan fees | 2,222 | |||
| Accounting fees | 244 | |||
| Custodian fees and expenses | 20 | |||
| Independent trustees' fees and expenses | 2 | |||
| Registration fees | 91 | |||
| Audit | 60 | |||
| Legal | 4 | |||
| Miscellaneous | 2 | |||
| Total expenses before reductions | 6,941 | |||
| Expense reductions | (23) | |||
| Total expenses after reductions | 6,918 | |||
| Net Investment income (loss) | 9,162 | |||
| Realized and Unrealized Gain (Loss) | ||||
| Net realized gain (loss) on: | ||||
| Investment Securities: | ||||
| Unaffiliated issuers | 1,454 | |||
| Foreign currency transactions | 145 | |||
| Written options | 570 | |||
| Total net realized gain (loss) | 2,169 | |||
| Change in net unrealized appreciation (depreciation) on: | ||||
| Investment Securities: | ||||
| Unaffiliated issuers | 21,285 | |||
| Assets and liabilities in foreign currencies | (10) | |||
| Written options | (166) | |||
| Total change in net unrealized appreciation (depreciation) | 21,109 | |||
| Net gain (loss) | 23,278 | |||
| Net increase (decrease) in net assets resulting from operations | $ | 32,440 | ||
| Statement of Changes in Net Assets | ||||
| Amount in thousands | Year ended November 30, 2022 | Year ended November 30, 2021 | ||
| Increase (Decrease) in Net Assets | ||||
| Operations | ||||
| Net investment income (loss) | $ | 9,162 | $ | 10,833 |
| Net realized gain (loss) | 2,169 | 18,231 | ||
| Change in net unrealized appreciation (depreciation) | 21,109 | 97,851 | ||
| Net increase (decrease) in net assets resulting from operations | 32,440 | 126,915 | ||
| Distributions to shareholders | (33,061) | (25,162) | ||
| Share transactions - net increase (decrease) | 173,331 | 27,651 | ||
| Total increase (decrease) in net assets | 172,710 | 129,404 | ||
| Net Assets | ||||
| Beginning of period | 648,278 | 518,874 | ||
| End of period | $ | 820,988 | $ | 648,278 |
| Fidelity Advisor® Growth & Income Fund Class A |
| Years ended November 30, | 2022 | 2021 | 2020 | 2019 | 2018 | |||||
Selected Per-Share Data | ||||||||||
| Net asset value, beginning of period | $ | 33.01 | $ | 27.71 | $ | 28.32 | $ | 28.69 | $ | 30.29 |
| Income from Investment Operations | ||||||||||
Net investment income (loss) A,B | .42 | .59 C | .44 | .49 | .43 | |||||
| Net realized and unrealized gain (loss) | 1.09 | 6.08 | .90 | 2.48 | .58 | |||||
| Total from investment operations | 1.51 | 6.67 | 1.34 | 2.97 | 1.01 | |||||
| Distributions from net investment income | (.83) | (.48) | (.48) | (.47) | (.36) | |||||
| Distributions from net realized gain | (.80) | (.89) | (1.47) | (2.87) | (2.26) | |||||
| Total distributions | (1.62) D | (1.37) | (1.95) | (3.34) | (2.61) D | |||||
| Net asset value, end of period | $ | 32.90 | $ | 33.01 | $ | 27.71 | $ | 28.32 | $ | 28.69 |
Total Return E,F | 4.64% | 25.08% | 4.86% | 13.65% | 3.42% | |||||
Ratios to Average Net Assets B,G,H | ||||||||||
| Expenses before reductions | .91% | .92% | .95% | .96% | .96% | |||||
| Expenses net of fee waivers, if any | .91% | .92% | .95% | .96% | .96% | |||||
| Expenses net of all reductions | .91% | .92% | .95% | .95% | .95% | |||||
| Net investment income (loss) | 1.31% | 1.85% C | 1.78% | 1.93% | 1.49% | |||||
| Supplemental Data | ||||||||||
| Net assets, end of period (in millions) | $ | 406 | $ | 344 | $ | 277 | $ | 288 | $ | 243 |
Portfolio turnover rate I | 8% | 15% | 28% | 29% | 40% |
| Fidelity Advisor® Growth & Income Fund Class M |
| Years ended November 30, | 2022 | 2021 | 2020 | 2019 | 2018 | |||||
Selected Per-Share Data | ||||||||||
| Net asset value, beginning of period | $ | 33.01 | $ | 27.71 | $ | 28.31 | $ | 28.67 | $ | 30.26 |
| Income from Investment Operations | ||||||||||
Net investment income (loss) A,B | .34 | .51 C | .38 | .43 | .36 | |||||
| Net realized and unrealized gain (loss) | 1.10 | 6.10 | .89 | 2.47 | .59 | |||||
| Total from investment operations | 1.44 | 6.61 | 1.27 | 2.90 | .95 | |||||
| Distributions from net investment income | (.68) | (.42) | (.40) | (.39) | (.28) | |||||
| Distributions from net realized gain | (.80) | (.89) | (1.47) | (2.87) | (2.26) | |||||
| Total distributions | (1.48) | (1.31) | (1.87) | (3.26) | (2.54) | |||||
| Net asset value, end of period | $ | 32.97 | $ | 33.01 | $ | 27.71 | $ | 28.31 | $ | 28.67 |
Total Return D,E | 4.38% | 24.77% | 4.61% | 13.33% | 3.19% | |||||
Ratios to Average Net Assets B,F,G | ||||||||||
| Expenses before reductions | 1.15% | 1.16% | 1.20% | 1.21% | 1.21% | |||||
| Expenses net of fee waivers, if any | 1.15% | 1.16% | 1.20% | 1.21% | 1.21% | |||||
| Expenses net of all reductions | 1.15% | 1.16% | 1.20% | 1.20% | 1.20% | |||||
| Net investment income (loss) | 1.07% | 1.61% C | 1.53% | 1.68% | 1.24% | |||||
| Supplemental Data | ||||||||||
| Net assets, end of period (in millions) | $ | 180 | $ | 173 | $ | 153 | $ | 172 | $ | 175 |
Portfolio turnover rate H | 8% | 15% | 28% | 29% | 40% |
| Fidelity Advisor® Growth & Income Fund Class C |
| Years ended November 30, | 2022 | 2021 | 2020 | 2019 | 2018 | |||||
Selected Per-Share Data | ||||||||||
| Net asset value, beginning of period | $ | 30.33 | $ | 25.56 | $ | 26.22 | $ | 26.79 | $ | 28.45 |
| Income from Investment Operations | ||||||||||
Net investment income (loss) A,B | .16 | .32 C | .23 | .27 | .20 | |||||
| Net realized and unrealized gain (loss) | 1.00 | 5.62 | .82 | 2.28 | .55 | |||||
| Total from investment operations | 1.16 | 5.94 | 1.05 | 2.55 | .75 | |||||
| Distributions from net investment income | (.45) | (.28) | (.24) | (.26) | (.15) | |||||
| Distributions from net realized gain | (.80) | (.89) | (1.47) | (2.87) | (2.26) | |||||
| Total distributions | (1.25) | (1.17) | (1.71) | (3.12) D | (2.41) | |||||
| Net asset value, end of period | $ | 30.24 | $ | 30.33 | $ | 25.56 | $ | 26.22 | $ | 26.79 |
Total Return E,F | 3.80% | 24.14% | 4.07% | 12.74% | 2.64% | |||||
Ratios to Average Net Assets B,G,H | ||||||||||
| Expenses before reductions | 1.67% | 1.69% | 1.73% | 1.73% | 1.72% | |||||
| Expenses net of fee waivers, if any | 1.67% | 1.69% | 1.73% | 1.73% | 1.71% | |||||
| Expenses net of all reductions | 1.67% | 1.69% | 1.73% | 1.73% | 1.71% | |||||
| Net investment income (loss) | .55% | 1.09% C | 1.00% | 1.15% | .73% | |||||
| Supplemental Data | ||||||||||
| Net assets, end of period (in millions) | $ | 47 | $ | 41 | $ | 34 | $ | 41 | $ | 75 |
Portfolio turnover rate I | 8% | 15% | 28% | 29% | 40% |
| Fidelity Advisor® Growth & Income Fund Class I |
| Years ended November 30, | 2022 | 2021 | 2020 | 2019 | 2018 | |||||
Selected Per-Share Data | ||||||||||
| Net asset value, beginning of period | $ | 33.95 | $ | 28.45 | $ | 29.01 | $ | 29.33 | $ | 30.91 |
| Income from Investment Operations | ||||||||||
Net investment income (loss) A,B | .51 | .69 C | .52 | .57 | .52 | |||||
| Net realized and unrealized gain (loss) | 1.12 | 6.24 | .93 | 2.52 | .60 | |||||
| Total from investment operations | 1.63 | 6.93 | 1.45 | 3.09 | 1.12 | |||||
| Distributions from net investment income | (.97) | (.55) | (.54) | (.54) | (.44) | |||||
| Distributions from net realized gain | (.80) | (.89) | (1.47) | (2.87) | (2.26) | |||||
| Total distributions | (1.77) | (1.43) D | (2.01) | (3.41) | (2.70) | |||||
| Net asset value, end of period | $ | 33.81 | $ | 33.95 | $ | 28.45 | $ | 29.01 | $ | 29.33 |
Total Return E | 4.86% | 25.40% | 5.16% | 13.89% | 3.71% | |||||
Ratios to Average Net Assets B,F,G | ||||||||||
| Expenses before reductions | .66% | .67% | .70% | .70% | .69% | |||||
| Expenses net of fee waivers, if any | .66% | .67% | .70% | .69% | .69% | |||||
| Expenses net of all reductions | .66% | .67% | .69% | .69% | .69% | |||||
| Net investment income (loss) | 1.56% | 2.10% C | 2.03% | 2.19% | 1.75% | |||||
| Supplemental Data | ||||||||||
| Net assets, end of period (in millions) | $ | 128 | $ | 76 | $ | 45 | $ | 48 | $ | 47 |
Portfolio turnover rate H | 8% | 15% | 28% | 29% | 40% |
| Fidelity Advisor® Growth & Income Fund Class Z |
| Years ended November 30, | 2022 | 2021 | 2020 | 2019 | 2018 | |||||
Selected Per-Share Data | ||||||||||
| Net asset value, beginning of period | $ | 34.04 | $ | 28.52 | $ | 29.09 | $ | 29.35 | $ | 30.94 |
| Income from Investment Operations | ||||||||||
Net investment income (loss) A,B | .55 | .73 C | .55 | .62 | .56 | |||||
| Net realized and unrealized gain (loss) | 1.13 | 6.26 | .93 | 2.53 | .59 | |||||
| Total from investment operations | 1.68 | 6.99 | 1.48 | 3.15 | 1.15 | |||||
| Distributions from net investment income | (1.05) | (.59) | (.58) | (.54) | (.49) | |||||
| Distributions from net realized gain | (.80) | (.89) | (1.47) | (2.87) | (2.26) | |||||
| Total distributions | (1.84) D | (1.47) D | (2.05) | (3.41) | (2.74) D | |||||
| Net asset value, end of period | $ | 33.88 | $ | 34.04 | $ | 28.52 | $ | 29.09 | $ | 29.35 |
Total Return E | 5.03% | 25.59% | 5.26% | 14.11% | 3.84% | |||||
Ratios to Average Net Assets B,F,G | ||||||||||
| Expenses before reductions | .53% | .53% | .55% | .56% | .56% | |||||
| Expenses net of fee waivers, if any | .52% | .53% | .55% | .56% | .56% | |||||
| Expenses net of all reductions | .52% | .53% | .55% | .55% | .55% | |||||
| Net investment income (loss) | 1.69% | 2.24% C | 2.18% | 2.33% | 1.89% | |||||
| Supplemental Data | ||||||||||
| Net assets, end of period (in millions) | $ | 60 | $ | 14 | $ | 11 | $ | 7 | $ | 22 |
Portfolio turnover rate H | 8% | 15% | 28% | 29% | 40% |
| Fidelity Central Fund | Investment Manager | Investment Objective | Investment Practices | Expense Ratio A |
| Fidelity Money Market Central Funds | Fidelity Management & Research Company LLC (FMR) | Each fund seeks to obtain a high level of current income consistent with the preservation of capital and liquidity. | Short-term Investments | Less than .005% |
| Gross unrealized appreciation | $272,382 |
| Gross unrealized depreciation | (30,112) |
| Net unrealized appreciation (depreciation) | $242,270 |
| Tax Cost | $588,412 |
| Undistributed ordinary income | $3,178 |
| Undistributed long-term capital gain | $1,811 |
| Net unrealized appreciation (depreciation) on securities and other investments | $242,262 |
| November 30, 2022 | November 30, 2021 | |
| Ordinary Income | $18,783 | $8,545 |
| Long-term Capital Gains | 14,278 | 16,617 |
| Total | $33,061 | $25,162 |
| Equity Risk | Equity risk relates to the fluctuations in the value of financial instruments as a result of changes in market prices (other than those arising from interest rate risk or foreign exchange risk), whether caused by factors specific to an individual investment, its issuer, or all factors affecting all instruments traded in a market or market segment. |
| Purchases ($) | Sales ($) | |
| Fidelity Advisor Growth & Income Fund | 143,652 | 57,418 |
| Distribution Fee | Service Fee | Total Fees | Retained by FDC | |
| Class A | - % | .25% | $921 | $25 |
| Class M | .25% | .25% | 874 | 5 |
| Class C | .75% | .25% | 427 | 88 |
| $2,222 | $118 |
| Retained by FDC | |
| Class A | $188 |
| Class M | 12 |
Class C A | 1 |
| $201 |
| Amount | % of Class-Level Average Net Assets | |
| Class A | $646 | .18 |
| Class M | 293 | .17 |
| Class C | 81 | .19 |
| Class I | 166 | .17 |
| Class Z | 19 | .04 |
| $1,205 |
| % of Average Net Assets | |
| Fidelity Advisor Growth & Income Fund | .03 |
| Amount | |
| Fidelity Advisor Growth & Income Fund | $1 |
| Purchases ($) | Sales ($) | Realized Gain (Loss) ($) | |
| Fidelity Advisor Growth & Income Fund | 11,051 | 2,957 | 318 |
| Amount | |
| Fidelity Advisor Growth & Income Fund | $1 |
| Total Security Lending Fees Paid to NFS | Security Lending Income From Securities Loaned to NFS | Value of Securities Loaned to NFS at Period End | |
| Fidelity Advisor Growth & Income Fund | $1 | $- | $- |
Year ended November 30, 2022 | Year ended November 30, 2021 | |
| Fidelity Advisor Growth & Income Fund | ||
| Distributions to shareholders | ||
| Class A | $17,363 | $13,601 |
| Class M | 7,787 | 7,162 |
| Class C | 1,696 | 1,554 |
| Class I | 4,201 | 2,271 |
| Class Z | 2,014 | 574 |
Total | $33,061 | $25,162 |
| Shares | Shares | Dollars | Dollars | |
| Year ended November 30, 2022 | Year ended November 30, 2021 | Year ended November 30, 2022 | Year ended November 30, 2021 | |
| Fidelity Advisor Growth & Income Fund | ||||
| Class A | ||||
| Shares sold | 2,812 | 1,486 | $90,084 | $47,727 |
| Reinvestment of distributions | 504 | 466 | 16,493 | 12,807 |
| Shares redeemed | (1,415) | (1,503) | (44,767) | (47,472) |
| Net increase (decrease) | 1,901 | 449 | $61,810 | $13,062 |
| Class M | ||||
| Shares sold | 643 | 324 | $20,917 | $10,258 |
| Reinvestment of distributions | 231 | 254 | 7,629 | 6,998 |
| Shares redeemed | (650) | (859) | (20,594) | (27,103) |
| Net increase (decrease) | 224 | (281) | $7,952 | $(9,847) |
| Class C | ||||
| Shares sold | 649 | 366 | $19,167 | $10,922 |
| Reinvestment of distributions | 55 | 60 | 1,666 | 1,533 |
| Shares redeemed | (486) | (423) | (14,200) | (12,405) |
| Net increase (decrease) | 218 | 3 | $6,633 | $50 |
| Class I | ||||
| Shares sold | 2,275 | 1,111 | $74,876 | $36,641 |
| Reinvestment of distributions | 112 | 72 | 3,758 | 2,022 |
| Shares redeemed | (850) | (507) | (27,709) | (16,185) |
| Net increase (decrease) | 1,537 | 676 | $50,925 | $22,478 |
| Class Z | ||||
| Shares sold | 1,643 | 374 | $55,104 | $12,347 |
| Reinvestment of distributions | 56 | 16 | 1,860 | 460 |
| Shares redeemed | (334) | (344) | (10,953) | (10,899) |
| Net increase (decrease) | 1,365 | 46 | $46,011 | $1,908 |
| The Example is based on an investment of $1,000 invested at the beginning of the period and held for the entire period (June 1, 2022 to November 30, 2022). |
Annualized Expense Ratio- A | Beginning Account Value June 1, 2022 | Ending Account Value November 30, 2022 | Expenses Paid During Period- C June 1, 2022 to November 30, 2022 | |||||||
| Fidelity Advisor® Growth & Income Fund | ||||||||||
| Class A | .91% | |||||||||
| Actual | $ 1,000 | $ 1,022.90 | $ 4.61 | |||||||
Hypothetical- B | $ 1,000 | $ 1,020.51 | $ 4.61 | |||||||
| Class M | 1.15% | |||||||||
| Actual | $ 1,000 | $ 1,021.70 | $ 5.83 | |||||||
Hypothetical- B | $ 1,000 | $ 1,019.30 | $ 5.82 | |||||||
| Class C | 1.67% | |||||||||
| Actual | $ 1,000 | $ 1,018.80 | $ 8.45 | |||||||
Hypothetical- B | $ 1,000 | $ 1,016.70 | $ 8.44 | |||||||
| Class I | .66% | |||||||||
| Actual | $ 1,000 | $ 1,024.30 | $ 3.35 | |||||||
Hypothetical- B | $ 1,000 | $ 1,021.76 | $ 3.35 | |||||||
| Class Z | .52% | |||||||||
| Actual | $ 1,000 | $ 1,025.00 | $ 2.64 | |||||||
Hypothetical- B | $ 1,000 | $ 1,022.46 | $ 2.64 | |||||||
|


Contents
| Average Annual Total Returns | |||
Periods ended November 30, 2022 | Past 1 year | Past 5 years | Past 10 years |
| Class A (incl.5.75% sales charge) | -10.14% | 6.93% | 9.99% |
| Class M (incl.3.50% sales charge) | -8.23% | 7.18% | 9.99% |
Class C (incl. contingent deferred sales charge) | -6.24% | 7.37% | 9.97% |
| Fidelity Advisor® Stock Selector Mid Cap Fund | -4.43% | 8.45% | 10.89% |
| Class I | -4.45% | 8.47% | 10.90% |
| Class Z | -4.30% | 8.63% | 11.00% |
| $10,000 Over 10 Years |
Let's say hypothetically that $10,000 was invested in Fidelity Advisor® Stock Selector Mid Cap Fund - Class A, on November 30, 2012, and the current 5.75% sales charge was paid. The chart shows how the value of your investment would have changed, and also shows how the S&P MidCap 400® Index performed over the same period. |
 |
Top Holdings (% of Fund's net assets) | ||
| Steel Dynamics, Inc. | 1.5 | |
| CACI International, Inc. Class A | 1.2 | |
| Penumbra, Inc. | 1.2 | |
| Willscot Mobile Mini Holdings | 1.1 | |
| Bancorp, Inc., Delaware | 1.1 | |
| Churchill Downs, Inc. | 1.1 | |
| Carlisle Companies, Inc. | 1.1 | |
| RPM International, Inc. | 1.0 | |
| Landstar System, Inc. | 1.0 | |
| Masimo Corp. | 1.0 | |
| 11.3 | ||
| Market Sectors (% of Fund's net assets) | ||
| Industrials | 18.6 | |
| Financials | 14.5 | |
| Consumer Discretionary | 13.5 | |
| Information Technology | 12.6 | |
| Health Care | 9.2 | |
| Materials | 7.7 | |
| Real Estate | 7.0 | |
| Consumer Staples | 4.5 | |
| Energy | 4.2 | |
| Utilities | 3.8 | |
| Communication Services | 1.7 | |
Asset Allocation (% of Fund's net assets) |
 |
Foreign investments - 5% |
| Common Stocks - 97.2% | |||
| Shares | Value ($) (000s) | ||
| COMMUNICATION SERVICES - 1.7% | |||
| Diversified Telecommunication Services - 0.3% | |||
| Frontier Communications Parent, Inc. (a)(b) | 60,100 | 1,549 | |
| Iridium Communications, Inc. (a) | 99,500 | 5,283 | |
| 6,832 | |||
| Entertainment - 0.3% | |||
| Endeavor Group Holdings, Inc. (a) | 81,300 | 1,788 | |
| Liberty Media Corp. Liberty Formula One Series C (a) | 30,300 | 1,846 | |
| Warner Music Group Corp. Class A | 62,600 | 2,145 | |
| 5,779 | |||
| Interactive Media & Services - 0.2% | |||
| TripAdvisor, Inc. (a)(b) | 47,900 | 977 | |
| Ziff Davis, Inc. (a) | 33,800 | 3,118 | |
| 4,095 | |||
| Media - 0.9% | |||
| Cable One, Inc. | 6,600 | 4,780 | |
| Gray Television, Inc. | 73,300 | 858 | |
| Interpublic Group of Companies, Inc. | 88,851 | 3,053 | |
| Nexstar Broadcasting Group, Inc. Class A | 23,800 | 4,512 | |
| S4 Capital PLC (a) | 204,200 | 471 | |
| The New York Times Co. Class A | 125,100 | 4,585 | |
| 18,259 | |||
TOTAL COMMUNICATION SERVICES | 34,965 | ||
| CONSUMER DISCRETIONARY - 13.5% | |||
| Auto Components - 1.3% | |||
| Adient PLC (a) | 261,000 | 10,163 | |
| Lear Corp. | 114,453 | 16,509 | |
| Novem Group SA | 184,100 | 1,447 | |
| 28,119 | |||
| Automobiles - 0.8% | |||
| Harley-Davidson, Inc. | 342,272 | 16,131 | |
| Distributors - 0.3% | |||
| LKQ Corp. | 101,198 | 5,498 | |
| Diversified Consumer Services - 0.0% | |||
| Cairo Mezz PLC (a) | 6,899,871 | 649 | |
| Hotels, Restaurants & Leisure - 4.7% | |||
| ARAMARK Holdings Corp. | 285,000 | 11,856 | |
| Brinker International, Inc. (a) | 127,100 | 4,251 | |
| Caesars Entertainment, Inc. (a) | 298,202 | 15,152 | |
| Churchill Downs, Inc. | 102,547 | 22,761 | |
| Domino's Pizza, Inc. | 33,400 | 12,984 | |
| Planet Fitness, Inc. (a) | 72,300 | 5,665 | |
| Vail Resorts, Inc. | 30,600 | 7,881 | |
| Wyndham Hotels & Resorts, Inc. | 249,633 | 18,303 | |
| 98,853 | |||
| Household Durables - 1.7% | |||
| Leggett & Platt, Inc. (b) | 216,940 | 7,725 | |
| Mohawk Industries, Inc. (a) | 80,640 | 8,171 | |
| NVR, Inc. (a) | 1,578 | 7,320 | |
| Taylor Morrison Home Corp. (a) | 384,664 | 11,690 | |
| 34,906 | |||
| Multiline Retail - 0.7% | |||
| Nordstrom, Inc. | 236,834 | 4,966 | |
| Ollie's Bargain Outlet Holdings, Inc. (a)(b) | 147,900 | 9,007 | |
| 13,973 | |||
| Specialty Retail - 1.5% | |||
| Burlington Stores, Inc. (a) | 67,600 | 13,228 | |
| Camping World Holdings, Inc. (b) | 87,200 | 2,401 | |
| Five Below, Inc. (a) | 98,200 | 15,796 | |
| 31,425 | |||
| Textiles, Apparel & Luxury Goods - 2.5% | |||
| Capri Holdings Ltd. (a) | 301,664 | 17,300 | |
| Prada SpA | 965,200 | 5,316 | |
| PVH Corp. | 157,154 | 10,558 | |
| Tapestry, Inc. | 505,949 | 19,110 | |
| 52,284 | |||
TOTAL CONSUMER DISCRETIONARY | 281,838 | ||
| CONSUMER STAPLES - 4.5% | |||
| Beverages - 0.5% | |||
| Boston Beer Co., Inc. Class A (a) | 13,400 | 5,151 | |
| Celsius Holdings, Inc. (a) | 43,600 | 4,854 | |
| 10,005 | |||
| Food & Staples Retailing - 2.0% | |||
| Albertsons Companies, Inc. | 14,600 | 306 | |
| BJ's Wholesale Club Holdings, Inc. (a) | 145,000 | 10,910 | |
| Casey's General Stores, Inc. | 16,400 | 3,986 | |
| Grocery Outlet Holding Corp. (a) | 59,784 | 1,810 | |
| Performance Food Group Co. (a) | 226,500 | 13,812 | |
| Sprouts Farmers Market LLC (a) | 151,800 | 5,211 | |
| U.S. Foods Holding Corp. (a) | 138,200 | 5,055 | |
| �� | 41,090 | ||
| Food Products - 1.3% | |||
| Bunge Ltd. | 17,100 | 1,793 | |
| Darling Ingredients, Inc. (a) | 162,800 | 11,694 | |
| Freshpet, Inc. (a)(b) | 28,900 | 1,937 | |
| Ingredion, Inc. | 79,500 | 7,789 | |
| Nomad Foods Ltd. (a) | 76,000 | 1,329 | |
| Post Holdings, Inc. (a) | 25,826 | 2,418 | |
| Sovos Brands, Inc. (a) | 77,700 | 1,118 | |
| 28,078 | |||
| Household Products - 0.3% | |||
| Energizer Holdings, Inc. | 119,000 | 4,057 | |
| Reynolds Consumer Products, Inc. | 66,400 | 2,122 | |
| 6,179 | |||
| Personal Products - 0.4% | |||
| BellRing Brands, Inc. (a) | 80,746 | 2,011 | |
| Olaplex Holdings, Inc. (a) | 67,700 | 404 | |
| The Beauty Health Co. (a)(b) | 576,187 | 6,194 | |
| 8,609 | |||
TOTAL CONSUMER STAPLES | 93,961 | ||
| ENERGY - 4.2% | |||
| Energy Equipment & Services - 1.0% | |||
| Championx Corp. | 393,800 | 12,145 | |
| Liberty Oilfield Services, Inc. Class A | 539,260 | 8,914 | |
| 21,059 | |||
| Oil, Gas & Consumable Fuels - 3.2% | |||
| Antero Resources Corp. (a) | 179,025 | 6,543 | |
| APA Corp. | 216,302 | 10,134 | |
| Denbury, Inc. (a) | 83,502 | 7,495 | |
| EQT Corp. | 178,492 | 7,570 | |
| HF Sinclair Corp. | 291,106 | 18,148 | |
| Northern Oil & Gas, Inc. | 240,700 | 8,759 | |
| Targa Resources Corp. | 121,300 | 9,024 | |
| 67,673 | |||
TOTAL ENERGY | 88,732 | ||
| FINANCIALS - 14.5% | |||
| Banks - 5.4% | |||
| Associated Banc-Corp. | 533,148 | 13,115 | |
| Bancorp, Inc., Delaware (a) | 761,000 | 22,807 | |
| BankUnited, Inc. | 32,294 | 1,186 | |
| Cadence Bank | 341,507 | 9,849 | |
| East West Bancorp, Inc. | 204,611 | 14,366 | |
| First Horizon National Corp. | 298,697 | 7,423 | |
| First Interstate Bancsystem, Inc. | 73,700 | 3,215 | |
| PacWest Bancorp | 531,100 | 13,872 | |
| Pathward Financial, Inc. | 200,603 | 8,732 | |
| Pinnacle Financial Partners, Inc. | 101,219 | 8,491 | |
| Piraeus Financial Holdings SA (a) | 1,079,500 | 1,608 | |
| Silvergate Capital Corp. (a)(b) | 7,478 | 205 | |
| Wintrust Financial Corp. | 89,748 | 8,206 | |
| 113,075 | |||
| Capital Markets - 0.3% | |||
| Lazard Ltd. Class A | 90,169 | 3,301 | |
| Patria Investments Ltd. | 199,600 | 2,725 | |
| 6,026 | |||
| Consumer Finance - 1.3% | |||
| FirstCash Holdings, Inc. | 68,766 | 6,454 | |
| NerdWallet, Inc. | 551,822 | 7,008 | |
| OneMain Holdings, Inc. | 353,431 | 13,911 | |
| 27,373 | |||
| Diversified Financial Services - 0.3% | |||
| Cannae Holdings, Inc. (a) | 279,570 | 6,478 | |
| Sunrisemezz Ltd. (a) | 154,214 | 19 | |
| 6,497 | |||
| Insurance - 5.0% | |||
| American Financial Group, Inc. | 110,162 | 15,667 | |
| Assurant, Inc. | 52,674 | 6,754 | |
| BRP Group, Inc. (a) | 389,840 | 11,711 | |
| Fairfax Financial Holdings Ltd. (sub. vtg.) | 12,200 | 7,000 | |
| Globe Life, Inc. | 163,573 | 19,622 | |
| Primerica, Inc. | 72,100 | 10,745 | |
| Reinsurance Group of America, Inc. | 99,900 | 14,426 | |
| Talanx AG | 75,551 | 3,359 | |
| Unum Group | 356,600 | 15,041 | |
| 104,325 | |||
| Mortgage Real Estate Investment Trusts - 0.7% | |||
| Rithm Capital Corp. | 1,636,699 | 14,812 | |
| Thrifts & Mortgage Finance - 1.5% | |||
| Essent Group Ltd. | 313,200 | 12,556 | |
| MGIC Investment Corp. | 1,047,811 | 14,386 | |
| UWM Holdings Corp. Class A (b) | 1,297,744 | 5,775 | |
| 32,717 | |||
TOTAL FINANCIALS | 304,825 | ||
| HEALTH CARE - 9.2% | |||
| Biotechnology - 1.4% | |||
| Exelixis, Inc. (a) | 680,000 | 11,614 | |
| United Therapeutics Corp. (a) | 62,000 | 17,353 | |
| 28,967 | |||
| Health Care Equipment & Supplies - 3.7% | |||
| Insulet Corp. (a) | 32,800 | 9,819 | |
| Masimo Corp. (a) | 150,000 | 21,741 | |
| Nevro Corp. (a) | 185,000 | 8,641 | |
| Penumbra, Inc. (a) | 115,000 | 24,094 | |
| Tandem Diabetes Care, Inc. (a) | 300,000 | 12,615 | |
| 76,910 | |||
| Health Care Providers & Services - 3.1% | |||
| agilon health, Inc. (a) | 600,000 | 10,536 | |
| Alignment Healthcare, Inc. (a) | 671,100 | 8,926 | |
| Molina Healthcare, Inc. (a) | 30,000 | 10,103 | |
| Oak Street Health, Inc. (a) | 420,709 | 9,096 | |
| Option Care Health, Inc. (a) | 367,000 | 11,050 | |
| Privia Health Group, Inc. (a) | 220,000 | 5,265 | |
| Surgery Partners, Inc. (a) | 360,000 | 10,192 | |
| 65,168 | |||
| Life Sciences Tools & Services - 1.0% | |||
| Bruker Corp. | 220,000 | 14,830 | |
| West Pharmaceutical Services, Inc. | 26,000 | 6,101 | |
| 20,931 | |||
TOTAL HEALTH CARE | 191,976 | ||
| INDUSTRIALS - 18.6% | |||
| Aerospace & Defense - 1.8% | |||
| HEICO Corp. Class A | 152,613 | 19,348 | |
| Howmet Aerospace, Inc. | 223,600 | 8,423 | |
| Spirit AeroSystems Holdings, Inc. Class A | 398,700 | 10,450 | |
| 38,221 | |||
| Air Freight & Logistics - 0.7% | |||
| Air Transport Services Group, Inc. (a) | 548,800 | 15,388 | |
| Airlines - 0.2% | |||
| JetBlue Airways Corp. (a) | 510,400 | 4,063 | |
| Building Products - 1.1% | |||
| Carlisle Companies, Inc. | 84,640 | 22,270 | |
| Commercial Services & Supplies - 0.6% | |||
| The Brink's Co. | 213,192 | 12,738 | |
| Construction & Engineering - 1.2% | |||
| MDU Resources Group, Inc. | 32,000 | 1,008 | |
| Willscot Mobile Mini Holdings (a) | 497,898 | 24,004 | |
| 25,012 | |||
| Electrical Equipment - 1.0% | |||
| Regal Rexnord Corp. | 161,533 | 21,179 | |
| Machinery - 5.8% | |||
| AGCO Corp. | 132,700 | 17,612 | |
| Allison Transmission Holdings, Inc. | 112,663 | 5,047 | |
| Chart Industries, Inc. (a) | 62,300 | 8,908 | |
| Crane Holdings Co. | 123,700 | 13,105 | |
| Dover Corp. | 62,700 | 8,900 | |
| ESAB Corp. | 278,300 | 13,175 | |
| Flowserve Corp. | 598,894 | 18,781 | |
| IDEX Corp. | 89,975 | 21,368 | |
| ITT, Inc. | 173,887 | 14,697 | |
| 121,593 | |||
| Marine - 0.7% | |||
| Kirby Corp. (a) | 192,994 | 13,469 | |
| Professional Services - 2.1% | |||
| CACI International, Inc. Class A (a) | 83,600 | 26,108 | |
| KBR, Inc. | 360,200 | 18,612 | |
| 44,720 | |||
| Road & Rail - 1.8% | |||
| Landstar System, Inc. | 127,011 | 21,970 | |
| RXO, Inc. (a) | 267,200 | 5,077 | |
| XPO Logistics, Inc. (a) | 267,200 | 10,319 | |
| 37,366 | |||
| Trading Companies & Distributors - 1.6% | |||
| Air Lease Corp. Class A | 324,600 | 12,536 | |
| Beacon Roofing Supply, Inc. (a) | 49,831 | 2,910 | |
| WESCO International, Inc. (a) | 144,913 | 18,682 | |
| 34,128 | |||
TOTAL INDUSTRIALS | 390,147 | ||
| INFORMATION TECHNOLOGY - 12.5% | |||
| Electronic Equipment & Components - 2.5% | |||
| Avnet, Inc. | 353,300 | 15,959 | |
| Cognex Corp. | 248,371 | 12,364 | |
| Jabil, Inc. | 109,000 | 7,869 | |
| Trimble, Inc. (a) | 102,200 | 6,106 | |
| TTM Technologies, Inc. (a) | 439,600 | 7,064 | |
| Vishay Intertechnology, Inc. (b) | 108,400 | 2,498 | |
| 51,860 | |||
| IT Services - 3.5% | |||
| Akamai Technologies, Inc. (a) | 104,200 | 9,884 | |
| Cyxtera Technologies, Inc. Class A (a) | 1,027,100 | 2,013 | |
| ExlService Holdings, Inc. (a) | 13,673 | 2,560 | |
| GoDaddy, Inc. (a) | 133,300 | 10,548 | |
| MongoDB, Inc. Class A (a) | 59,100 | 9,024 | |
| Nuvei Corp. (a)(c) | 128,418 | 3,958 | |
| Paya Holdings, Inc. (a) | 234,200 | 2,180 | |
| Repay Holdings Corp. (a) | 386,410 | 3,424 | |
| Twilio, Inc. Class A (a) | 179,800 | 8,814 | |
| WEX, Inc. (a) | 67,700 | 11,451 | |
| Wix.com Ltd. (a) | 107,700 | 9,746 | |
| 73,602 | |||
| Semiconductors & Semiconductor Equipment - 1.2% | |||
| Cirrus Logic, Inc. (a) | 176,200 | 13,164 | |
| SolarEdge Technologies, Inc. (a) | 35,900 | 10,729 | |
| 23,893 | |||
| Software - 5.1% | |||
| Aspen Technology, Inc. (a) | 27,048 | 6,235 | |
| Black Knight, Inc. (a) | 32,467 | 2,013 | |
| Blackbaud, Inc. (a) | 185,500 | 10,995 | |
| Blend Labs, Inc. (a)(b) | 252,385 | 333 | |
| Ceridian HCM Holding, Inc. (a) | 177,000 | 12,114 | |
| Coupa Software, Inc. (a) | 155,100 | 9,809 | |
| Elastic NV (a) | 131,600 | 8,053 | |
| Five9, Inc. (a) | 114,900 | 7,366 | |
| Guidewire Software, Inc. (a) | 75,800 | 4,496 | |
| HubSpot, Inc. (a) | 29,800 | 9,030 | |
| Liveramp Holdings, Inc. (a) | 23,400 | 514 | |
| NortonLifeLock, Inc. | 404,300 | 9,283 | |
| PTC, Inc. (a) | 91,000 | 11,576 | |
| Tenable Holdings, Inc. (a) | 300,900 | 11,488 | |
| Workiva, Inc. (a) | 43,832 | 3,531 | |
| 106,836 | |||
| Technology Hardware, Storage & Peripherals - 0.2% | |||
| Western Digital Corp. (a) | 130,500 | 4,796 | |
TOTAL INFORMATION TECHNOLOGY | 260,987 | ||
| MATERIALS - 7.7% | |||
| Chemicals - 2.9% | |||
| Ashland, Inc. (b) | 130,900 | 14,644 | |
| RPM International, Inc. | 212,100 | 21,978 | |
| The Chemours Co. LLC | 376,100 | 11,678 | |
| Valvoline, Inc. | 352,204 | 11,616 | |
| 59,916 | |||
| Construction Materials - 0.9% | |||
| Eagle Materials, Inc. | 146,800 | 20,015 | |
| Metals & Mining - 3.1% | |||
| Alcoa Corp. | 305,800 | 15,330 | |
| Cleveland-Cliffs, Inc. (a) | 719,900 | 11,144 | |
| Steel Dynamics, Inc. | 308,200 | 32,029 | |
| Yamana Gold, Inc. | 1,208,200 | 6,597 | |
| 65,100 | |||
| Paper & Forest Products - 0.8% | |||
| Louisiana-Pacific Corp. (b) | 248,200 | 15,835 | |
TOTAL MATERIALS | 160,866 | ||
| REAL ESTATE - 7.0% | |||
| Equity Real Estate Investment Trusts (REITs) - 6.5% | |||
| American Homes 4 Rent Class A | 117,100 | 3,872 | |
| CubeSmart | 349,172 | 14,452 | |
| Douglas Emmett, Inc. | 269,200 | 4,663 | |
| EastGroup Properties, Inc. | 108,800 | 16,890 | |
| Equity Lifestyle Properties, Inc. | 87,100 | 5,785 | |
| Essex Property Trust, Inc. | 35,000 | 7,713 | |
| Healthcare Trust of America, Inc. | 507,000 | 10,409 | |
| Lamar Advertising Co. Class A | 95,400 | 9,553 | |
| Phillips Edison & Co., Inc. | 36,800 | 1,186 | |
| Postal Realty Trust, Inc. | 704,900 | 10,919 | |
| Ryman Hospitality Properties, Inc. | 68,800 | 6,297 | |
| SITE Centers Corp. | 801,700 | 10,895 | |
| Spirit Realty Capital, Inc. | 239,200 | 9,908 | |
| Terreno Realty Corp. | 119,100 | 6,984 | |
| Ventas, Inc. | 333,800 | 15,532 | |
| 135,058 | |||
| Real Estate Management & Development - 0.5% | |||
| Cushman & Wakefield PLC (a) | 822,411 | 9,392 | |
| Doma Holdings, Inc. Class A (a)(b) | 1,424,267 | 563 | |
| WeWork, Inc. (a) | 440,400 | 1,216 | |
| 11,171 | |||
TOTAL REAL ESTATE | 146,229 | ||
| UTILITIES - 3.8% | |||
| Electric Utilities - 1.7% | |||
| Allete, Inc. | 73,100 | 4,839 | |
| IDACORP, Inc. | 86,700 | 9,583 | |
| OGE Energy Corp. | 318,600 | 12,891 | |
| PNM Resources, Inc. | 144,100 | 7,061 | |
| 34,374 | |||
| Gas Utilities - 0.7% | |||
| National Fuel Gas Co. | 105,100 | 6,961 | |
| ONE Gas, Inc. | 52,818 | 4,593 | |
| UGI Corp. | 88,600 | 3,424 | |
| 14,978 | |||
| Independent Power and Renewable Electricity Producers - 0.1% | |||
| Ormat Technologies, Inc. (b) | 21,300 | 1,926 | |
| Multi-Utilities - 0.6% | |||
| NiSource, Inc. | 176,200 | 4,923 | |
| NorthWestern Energy Corp. | 141,400 | 8,259 | |
| 13,182 | |||
| Water Utilities - 0.7% | |||
| Essential Utilities, Inc. | 299,015 | 14,424 | |
TOTAL UTILITIES | 78,884 | ||
| TOTAL COMMON STOCKS (Cost $1,840,291) | 2,033,410 | ||
| Convertible Bonds - 0.1% | |||
Principal Amount (d) (000s) | Value ($) (000s) | ||
| INFORMATION TECHNOLOGY - 0.1% | |||
| IT Services - 0.1% | |||
Affirm Holdings, Inc. 0% 11/15/26 (Cost $1,662) | 2,649 | 1,546 | |
| U.S. Treasury Obligations - 0.1% | |||
Principal Amount (d) (000s) | Value ($) (000s) | ||
U.S. Treasury Bills, yield at date of purchase 3.21% to 3.34% 12/29/22 to 1/5/23 (e) (Cost $1,745) | 1,750 | 1,744 | |
| Money Market Funds - 4.1% | |||
| Shares | Value ($) (000s) | ||
| Fidelity Cash Central Fund 3.86% (f) | 56,949,872 | 56,961 | |
| Fidelity Securities Lending Cash Central Fund 3.86% (f)(g) | 29,700,266 | 29,703 | |
| TOTAL MONEY MARKET FUNDS (Cost $86,661) | 86,664 | ||
| TOTAL INVESTMENT IN SECURITIES - 101.5% (Cost $1,930,359) | 2,123,364 |
NET OTHER ASSETS (LIABILITIES) - (1.5)% | (30,913) |
| NET ASSETS - 100.0% | 2,092,451 |
| Futures Contracts | |||||
Number of contracts | Expiration Date | Notional Amount ($) (000s) | Value ($) (000s) | Unrealized Appreciation/ (Depreciation) ($) (000s) | |
| Purchased | |||||
| Equity Index Contracts | |||||
| CME E-mini S&P MidCap 400 Index Contracts (United States) | 58 | Dec 2022 | 14,963 | 1,258 | 1,258 |
| The notional amount of futures purchased as a percentage of Net Assets is 0.7% | |||||
| (a) | Non-income producing |
| (b) | Security or a portion of the security is on loan at period end. |
| (c) | Security exempt from registration under Rule 144A of the Securities Act of 1933. These securities may be resold in transactions exempt from registration, normally to qualified institutional buyers. At the end of the period, the value of these securities amounted to $3,958,000 or 0.2% of net assets. |
| (d) | Amount is stated in United States dollars unless otherwise noted. |
| (e) | Security or a portion of the security was pledged to cover margin requirements for futures contracts. At period end, the value of securities pledged amounted to $977,000. |
| (f) | Affiliated fund that is generally available only to investment companies and other accounts managed by Fidelity Investments. The rate quoted is the annualized seven-day yield of the fund at period end. A complete unaudited listing of the fund's holdings as of its most recent quarter end is available upon request. In addition, each Fidelity Central Fund's financial statements, which are not covered by the Fund's Report of Independent Registered Public Accounting Firm, are available on the SEC's website or upon request. |
| (g) | Investment made with cash collateral received from securities on loan. |
| Affiliate (Amounts in thousands) | Value, beginning of period ($) | Purchases ($) | Sales Proceeds ($) | Dividend Income ($) | Realized Gain (loss) ($) | Change in Unrealized appreciation (depreciation) ($) | Value, end of period ($) | % ownership, end of period |
| Fidelity Cash Central Fund 3.86% | 51,479 | 849,202 | 843,719 | 692 | - | (1) | 56,961 | 0.1% |
| Fidelity Securities Lending Cash Central Fund 3.86% | 60,537 | 703,824 | 734,658 | 361 | - | - | 29,703 | 0.1% |
| Total | 112,016 | 1,553,026 | 1,578,377 | 1,053 | - | (1) | 86,664 | |
| Valuation Inputs at Reporting Date: | ||||
Description (Amounts in thousands) | Total ($) | Level 1 ($) | Level 2 ($) | Level 3 ($) |
Investments in Securities: | ||||
| Equities: | ||||
Communication Services | 34,965 | 34,494 | 471 | - |
Consumer Discretionary | 281,838 | 274,426 | 7,412 | - |
Consumer Staples | 93,961 | 93,961 | - | - |
Energy | 88,732 | 88,732 | - | - |
Financials | 304,825 | 299,839 | 4,986 | - |
Health Care | 191,976 | 191,976 | - | - |
Industrials | 390,147 | 390,147 | - | - |
Information Technology | 260,987 | 260,987 | - | - |
Materials | 160,866 | 160,866 | - | - |
Real Estate | 146,229 | 146,229 | - | - |
Utilities | 78,884 | 78,884 | - | - |
| Corporate Bonds | 1,546 | - | 1,546 | - |
| U.S. Government and Government Agency Obligations | 1,744 | - | 1,744 | - |
| Money Market Funds | 86,664 | 86,664 | - | - |
| Total Investments in Securities: | 2,123,364 | 2,107,205 | 16,159 | - |
Derivative Instruments: | ||||
| Assets | ||||
Futures Contracts | 1,258 | 1,258 | - | - |
| Total Assets | 1,258 | 1,258 | - | - |
| Total Derivative Instruments: | 1,258 | 1,258 | - | - |
Primary Risk Exposure / Derivative Type | Value | |
| (Amounts in thousands) | Asset ($) | Liability ($) |
| Equity Risk | ||
Futures Contracts (a) | 1,258 | 0 |
| Total Equity Risk | 1,258 | 0 |
| Total Value of Derivatives | 1,258 | 0 |
| Statement of Assets and Liabilities | ||||
| Amounts in thousands (except per-share amounts) | November 30, 2022 | |||
| Assets | ||||
| Investment in securities, at value (including securities loaned of $29,602) - See accompanying schedule: | ||||
Unaffiliated issuers (cost $1,843,698) | $2,036,700 | |||
Fidelity Central Funds (cost $86,661) | 86,664 | |||
| Total Investment in Securities (cost $1,930,359) | $ | 2,123,364 | ||
| Cash | 95 | |||
| Receivable for investments sold | 12,721 | |||
| Receivable for fund shares sold | 742 | |||
| Dividends receivable | 1,695 | |||
| Distributions receivable from Fidelity Central Funds | 212 | |||
| Receivable for daily variation margin on futures contracts | 344 | |||
| Prepaid expenses | 3 | |||
Total assets | 2,139,176 | |||
| Liabilities | ||||
| Payable for investments purchased | $14,050 | |||
| Payable for fund shares redeemed | 1,601 | |||
| Accrued management fee | 706 | |||
| Distribution and service plan fees payable | 335 | |||
| Other affiliated payables | 311 | |||
| Other payables and accrued expenses | 17 | |||
| Collateral on securities loaned | 29,705 | |||
| Total Liabilities | 46,725 | |||
| Net Assets | $ | 2,092,451 | ||
| Net Assets consist of: | ||||
| Paid in capital | $ | 1,731,089 | ||
| Total accumulated earnings (loss) | 361,362 | |||
| Net Assets | $ | 2,092,451 | ||
| Net Asset Value and Maximum Offering Price | ||||
| Class A : | ||||
Net Asset Value and redemption price per share ($654,237 ÷ 17,132 shares) (a) | $ | 38.19 | ||
| Maximum offering price per share (100/94.25 of $38.19) | $ | 40.52 | ||
| Class M : | ||||
Net Asset Value and redemption price per share ($464,165 ÷ 12,056 shares) (a) | $ | 38.50 | ||
| Maximum offering price per share (100/96.50 of $38.50) | $ | 39.90 | ||
| Class C : | ||||
Net Asset Value and offering price per share ($22,019 ÷ 661 shares) (a)(b) | $ | 33.33 | ||
| Fidelity Stock Selector Mid Cap Fund : | ||||
Net Asset Value , offering price and redemption price per share ($349,497 ÷ 8,574 shares) | $ | 40.76 | ||
| Class I : | ||||
Net Asset Value , offering price and redemption price per share ($385,919 ÷ 9,440 shares) | $ | 40.88 | ||
| Class Z : | ||||
Net Asset Value , offering price and redemption price per share ($216,614 ÷ 5,302 shares) | $ | 40.86 | ||
(a)Redemption price per share is equal to net asset value less any applicable contingent deferred sales charge. | ||||
(b)Corresponding Net Asset Value does not calculate due to rounding of fractional net assets and/or shares. | ||||
| Statement of Operations | ||||
| Amounts in thousands | Year ended November 30, 2022 | |||
| Investment Income | ||||
| Dividends | $ | 28,955 | ||
| Interest | 97 | |||
| Income from Fidelity Central Funds (including $361 from security lending) | 1,053 | |||
| Total Income | 30,105 | |||
| Expenses | ||||
| Management fee | ||||
| Basic fee | $ | 10,644 | ||
| Performance adjustment | (274) | |||
| Transfer agent fees | 3,345 | |||
| Distribution and service plan fees | 4,363 | |||
| Accounting fees | 580 | |||
| Custodian fees and expenses | 39 | |||
| Independent trustees' fees and expenses | 7 | |||
| Registration fees | 128 | |||
| Audit | 57 | |||
| Legal | 6 | |||
| Miscellaneous | 10 | |||
| Total expenses before reductions | 18,905 | |||
| Expense reductions | (68) | |||
| Total expenses after reductions | 18,837 | |||
| Net Investment income (loss) | 11,268 | |||
| Realized and Unrealized Gain (Loss) | ||||
| Net realized gain (loss) on: | ||||
| Investment Securities: | ||||
| Unaffiliated issuers | 174,752 | |||
| Foreign currency transactions | 60 | |||
| Futures contracts | 182 | |||
| Total net realized gain (loss) | 174,994 | |||
| Change in net unrealized appreciation (depreciation) on: | ||||
| Investment Securities: | ||||
| Unaffiliated issuers | (277,311) | |||
| Fidelity Central Funds | (1) | |||
| Assets and liabilities in foreign currencies | (15) | |||
| Futures contracts | 1,491 | |||
| Total change in net unrealized appreciation (depreciation) | (275,836) | |||
| Net gain (loss) | (100,842) | |||
| Net increase (decrease) in net assets resulting from operations | $ | (89,574) | ||
| Statement of Changes in Net Assets | ||||
| Amount in thousands | Year ended November 30, 2022 | Year ended November 30, 2021 | ||
| Increase (Decrease) in Net Assets | ||||
| Operations | ||||
| Net investment income (loss) | $ | 11,268 | $ | 10,499 |
| Net realized gain (loss) | 174,994 | 283,803 | ||
| Change in net unrealized appreciation (depreciation) | (275,836) | 138,328 | ||
| Net increase (decrease) in net assets resulting from operations | (89,574) | 432,630 | ||
| Distributions to shareholders | (266,942) | (44,080) | ||
| Share transactions - net increase (decrease) | 259,019 | (136,229) | ||
| Total increase (decrease) in net assets | (97,497) | 252,321 | ||
| Net Assets | ||||
| Beginning of period | 2,189,948 | 1,937,627 | ||
| End of period | $ | 2,092,451 | $ | 2,189,948 |
| Fidelity Advisor® Stock Selector Mid Cap Fund Class A |
| Years ended November 30, | 2022 | 2021 | 2020 | 2019 | 2018 | |||||
Selected Per-Share Data | ||||||||||
| Net asset value, beginning of period | $ | 45.46 | $ | 37.74 | $ | 36.07 | $ | 39.28 | $ | 39.74 |
| Income from Investment Operations | ||||||||||
Net investment income (loss) A,B | .20 | .20 | .30 C | .25 | .26 | |||||
| Net realized and unrealized gain (loss) | (1.76) | 8.40 | 2.85 | 2.80 D | 1.04 | |||||
| Total from investment operations | (1.56) | 8.60 | 3.15 | 3.05 | 1.30 | |||||
| Distributions from net investment income | (.21) | (.35) | (.21) | (.25) | (.11) | |||||
| Distributions from net realized gain | (5.50) | (.54) | (1.27) | (6.01) | (1.65) | |||||
| Total distributions | (5.71) | (.88) E | (1.48) | (6.26) | (1.76) | |||||
| Net asset value, end of period | $ | 38.19 | $ | 45.46 | $ | 37.74 | $ | 36.07 | $ | 39.28 |
Total Return F,G | (4.66)% | 23.19% | 8.99% | 12.13% D | 3.36% | |||||
Ratios to Average Net Assets B,H,I | ||||||||||
| Expenses before reductions | .97% | 1.05% | 1.14% | 1.14% | .93% | |||||
| Expenses net of fee waivers, if any | .97% | 1.05% | 1.14% | 1.14% | .92% | |||||
| Expenses net of all reductions | .97% | 1.05% | 1.13% | 1.14% | .91% | |||||
| Net investment income (loss) | .52% | .45% | .94% C | .75% | .64% | |||||
| Supplemental Data | ||||||||||
| Net assets, end of period (in millions) | $ | 654 | $ | 736 | $ | 626 | $ | 623 | $ | 532 |
Portfolio turnover rate J | 64% | 43% | 86% | 57% | 81% |
| Fidelity Advisor® Stock Selector Mid Cap Fund Class M |
| Years ended November 30, | 2022 | 2021 | 2020 | 2019 | 2018 | |||||
Selected Per-Share Data | ||||||||||
| Net asset value, beginning of period | $ | 45.77 | $ | 37.99 | $ | 36.30 | $ | 39.43 | $ | 39.89 |
| Income from Investment Operations | ||||||||||
Net investment income (loss) A,B | .11 | .09 | .22 C | .17 | .16 | |||||
| Net realized and unrealized gain (loss) | (1.80) | 8.48 | 2.86 | 2.85 D | 1.04 | |||||
| Total from investment operations | (1.69) | 8.57 | 3.08 | 3.02 | 1.20 | |||||
| Distributions from net investment income | (.09) | (.25) | (.12) | (.14) | (.01) | |||||
| Distributions from net realized gain | (5.50) | (.54) | (1.27) | (6.01) | (1.65) | |||||
| Total distributions | (5.58) E | (.79) | (1.39) | (6.15) | (1.66) | |||||
| Net asset value, end of period | $ | 38.50 | $ | 45.77 | $ | 37.99 | $ | 36.30 | $ | 39.43 |
Total Return F,G | (4.90)% | 22.91% | 8.71% | 11.88% D | 3.10% | |||||
Ratios to Average Net Assets B,H,I | ||||||||||
| Expenses before reductions | 1.22% | 1.29% | 1.38% | 1.38% | 1.17% | |||||
| Expenses net of fee waivers, if any | 1.21% | 1.29% | 1.38% | 1.38% | 1.17% | |||||
| Expenses net of all reductions | 1.21% | 1.29% | 1.37% | 1.38% | 1.15% | |||||
| Net investment income (loss) | .27% | .20% | .70% C | .51% | .39% | |||||
| Supplemental Data | ||||||||||
| Net assets, end of period (in millions) | $ | 464 | $ | 552 | $ | 496 | $ | 544 | $ | 536 |
Portfolio turnover rate J | 64% | 43% | 86% | 57% | 81% |
| Fidelity Advisor® Stock Selector Mid Cap Fund Class C |
| Years ended November 30, | 2022 | 2021 | 2020 | 2019 | 2018 | |||||
Selected Per-Share Data | ||||||||||
| Net asset value, beginning of period | $ | 40.31 | $ | 33.58 | $ | 32.15 | $ | 35.67 | $ | 36.25 |
| Income from Investment Operations | ||||||||||
Net investment income (loss) A,B | (.09) | (.14) | .04 C | (.01) | (.05) | |||||
| Net realized and unrealized gain (loss) | (1.53) | 7.51 | 2.50 | 2.46 D | .96 | |||||
| Total from investment operations | (1.62) | 7.37 | 2.54 | 2.45 | .91 | |||||
| Distributions from net investment income | - | (.10) | - | - | - | |||||
| Distributions from net realized gain | (5.36) | (.54) | (1.11) | (5.97) | (1.49) | |||||
| Total distributions | (5.36) | (.64) | (1.11) | (5.97) | (1.49) | |||||
| Net asset value, end of period | $ | 33.33 | $ | 40.31 | $ | 33.58 | $ | 32.15 | $ | 35.67 |
Total Return E,F | (5.41)% | 22.25% | 8.10% | 11.27% D | 2.59% | |||||
Ratios to Average Net Assets B,G,H | ||||||||||
| Expenses before reductions | 1.77% | 1.84% | 1.93% | 1.93% | 1.69% | |||||
| Expenses net of fee waivers, if any | 1.76% | 1.84% | 1.93% | 1.93% | 1.69% | |||||
| Expenses net of all reductions | 1.76% | 1.84% | 1.92% | 1.93% | 1.67% | |||||
| Net investment income (loss) | (.28)% | (.35)% | .15% C | (.04)% | (.12)% | |||||
| Supplemental Data | ||||||||||
| Net assets, end of period (in millions) | $ | 22 | $ | 27 | $ | 30 | $ | 35 | $ | 114 |
Portfolio turnover rate I | 64% | 43% | 86% | 57% | 81% |
| Fidelity® Stock Selector Mid Cap Fund |
| Years ended November 30, | 2022 | 2021 | 2020 | 2019 | 2018 | |||||
Selected Per-Share Data | ||||||||||
| Net asset value, beginning of period | $ | 48.16 | $ | 39.90 | $ | 38.00 | $ | 41.00 | $ | 41.43 |
| Income from Investment Operations | ||||||||||
Net investment income (loss) A,B | .32 | .34 | .40 C | .34 | .33 | |||||
| Net realized and unrealized gain (loss) | (1.90) | 8.88 | 3.01 | 2.99 D | 1.09 | |||||
| Total from investment operations | (1.58) | 9.22 | 3.41 | 3.33 | 1.42 | |||||
| Distributions from net investment income | (.33) | (.42) | (.24) | (.32) | (.20) | |||||
| Distributions from net realized gain | (5.50) | (.54) | (1.27) | (6.01) | (1.65) | |||||
| Total distributions | (5.82) E | (.96) | (1.51) | (6.33) | (1.85) | |||||
| Net asset value, end of period | $ | 40.76 | $ | 48.16 | $ | 39.90 | $ | 38.00 | $ | 41.00 |
Total Return F | (4.43)% | 23.52% | 9.24% | 12.38% D | 3.53% | |||||
Ratios to Average Net Assets B,G,H | ||||||||||
| Expenses before reductions | .72% | .79% | .89% | .94% | .77% | |||||
| Expenses net of fee waivers, if any | .72% | .79% | .89% | .94% | .76% | |||||
| Expenses net of all reductions | .72% | .79% | .88% | .94% | .75% | |||||
| Net investment income (loss) | .77% | .71% | 1.19% C | .95% | .80% | |||||
| Supplemental Data | ||||||||||
| Net assets, end of period (in millions) | $ | 349 | $ | 395 | $ | 342 | $ | 362 | $ | 502 |
Portfolio turnover rate I | 64% | 43% | 86% | 57% | 81% |
| Fidelity Advisor® Stock Selector Mid Cap Fund Class I |
| Years ended November 30, | 2022 | 2021 | 2020 | 2019 | 2018 | |||||
Selected Per-Share Data | ||||||||||
| Net asset value, beginning of period | $ | 48.29 | $ | 40.01 | $ | 38.15 | $ | 41.11 | $ | 41.51 |
| Income from Investment Operations | ||||||||||
Net investment income (loss) A,B | .31 | .33 | .40 C | .35 | .36 | |||||
| Net realized and unrealized gain (loss) | (1.90) | 8.91 | 3.02 | 3.01 D | 1.10 | |||||
| Total from investment operations | (1.59) | 9.24 | 3.42 | 3.36 | 1.46 | |||||
| Distributions from net investment income | (.32) | (.42) | (.29) | (.31) | (.21) | |||||
| Distributions from net realized gain | (5.50) | (.54) | (1.27) | (6.01) | (1.65) | |||||
| Total distributions | (5.82) | (.96) | (1.56) | (6.32) | (1.86) | |||||
| Net asset value, end of period | $ | 40.88 | $ | 48.29 | $ | 40.01 | $ | 38.15 | $ | 41.11 |
Total Return E | (4.45)% | 23.50% | 9.23% | 12.41% D | 3.62% | |||||
Ratios to Average Net Assets B,F,G | ||||||||||
| Expenses before reductions | .74% | .82% | .90% | .91% | .69% | |||||
| Expenses net of fee waivers, if any | .74% | .81% | .90% | .91% | .69% | |||||
| Expenses net of all reductions | .74% | .81% | .89% | .91% | .67% | |||||
| Net investment income (loss) | .75% | .68% | 1.18% C | .98% | .87% | |||||
| Supplemental Data | ||||||||||
| Net assets, end of period (in millions) | $ | 386 | $ | 413 | $ | 293 | $ | 312 | $ | 279 |
Portfolio turnover rate H | 64% | 43% | 86% | 57% | 81% |
| Fidelity Advisor® Stock Selector Mid Cap Fund Class Z |
| Years ended November 30, | 2022 | 2021 | 2020 | 2019 | 2018 | |||||
Selected Per-Share Data | ||||||||||
| Net asset value, beginning of period | $ | 48.26 | $ | 39.97 | $ | 38.12 | $ | 41.15 | $ | 41.57 |
| Income from Investment Operations | ||||||||||
Net investment income (loss) A,B | .36 | .38 | .44 C | .41 | .43 | |||||
| Net realized and unrealized gain (loss) | (1.88) | 8.92 | 3.03 | 2.99 D | 1.08 | |||||
| Total from investment operations | (1.52) | 9.30 | 3.47 | 3.40 | 1.51 | |||||
| Distributions from net investment income | (.38) | (.47) | (.35) | (.42) | (.28) | |||||
| Distributions from net realized gain | (5.50) | (.54) | (1.27) | (6.01) | (1.65) | |||||
| Total distributions | (5.88) | (1.01) | (1.62) | (6.43) | (1.93) | |||||
| Net asset value, end of period | $ | 40.86 | $ | 48.26 | $ | 39.97 | $ | 38.12 | $ | 41.15 |
Total Return E | (4.30)% | 23.69% | 9.39% | 12.59% D | 3.75% | |||||
Ratios to Average Net Assets B,F,G | ||||||||||
| Expenses before reductions | .59% | .67% | .75% | .75% | .53% | |||||
| Expenses net of fee waivers, if any | .59% | .67% | .75% | .75% | .53% | |||||
| Expenses net of all reductions | .59% | .67% | .73% | .75% | .52% | |||||
| Net investment income (loss) | .90% | .82% | 1.33% C | 1.14% | 1.03% | |||||
| Supplemental Data | ||||||||||
| Net assets, end of period (in millions) | $ | 217 | $ | 67 | $ | 150 | $ | 245 | $ | 18 |
Portfolio turnover rate H | 64% | 43% | 86% | 57% | 81% |
| Fidelity Central Fund | Investment Manager | Investment Objective | Investment Practices | Expense Ratio A |
| Fidelity Money Market Central Funds | Fidelity Management & Research Company LLC (FMR) | Each fund seeks to obtain a high level of current income consistent with the preservation of capital and liquidity. | Short-term Investments | Less than .005% |
| Gross unrealized appreciation | $351,169 |
| Gross unrealized depreciation | (163,704) |
| Net unrealized appreciation (depreciation) | $187,465 |
| Tax Cost | $1,935,899 |
| Undistributed ordinary income | $7,942 |
| Undistributed long-term capital gain | $165,970 |
| Net unrealized appreciation (depreciation) on securities and other investments | $187,450 |
| November 30, 2022 | November 30, 2021 | |
| Ordinary Income | $101,427 | $18,934 |
| Long-term Capital Gains | 165,515 | 25,146 |
| Total | $266,942 | $44,080 |
| Equity Risk | Equity risk relates to the fluctuations in the value of financial instruments as a result of changes in market prices (other than those arising from interest rate risk or foreign exchange risk), whether caused by factors specific to an individual investment, its issuer, or all factors affecting all instruments traded in a market or market segment. |
| Purchases ($) | Sales ($) | |
| Fidelity Advisor Stock Selector Mid Cap Fund | 1,305,344 | 1,268,854 |
| Distribution Fee | Service Fee | Total Fees | Retained by FDC | |
| Class A | - % | .25% | $1,677 | $26 |
| Class M | .25% | .25% | 2,448 | 4 |
| Class C | .75% | .25% | 238 | 27 |
| $4,363 | $57 |
| Retained by FDC | |
| Class A | $48 |
| Class M | 9 |
Class C A | - B |
| $57 |
| Amount | % of Class-Level Average Net Assets | |
| Class A | $1,145 | .17 |
| Class M | 804 | .16 |
| Class C | 51 | .22 |
| Fidelity Stock Selector Mid Cap Fund | 597 | .17 |
| Class I | 704 | .19 |
| Class Z | 44 | .04 |
| $3,345 |
| % of Average Net Assets | |
| Fidelity Advisor Stock Selector Mid Cap Fund | .03 |
| Amount | |
| Fidelity Advisor Stock Selector Mid Cap Fund | $34 |
| Purchases ($) | Sales ($) | Realized Gain (Loss) ($) | |
| Fidelity Advisor Stock Selector Mid Cap Fund | 98,899 | 82,768 | 23,546 |
| Amount | |
| Fidelity Advisor Stock Selector Mid Cap Fund | $4 |
| Total Security Lending Fees Paid to NFS | Security Lending Income From Securities Loaned to NFS | Value of Securities Loaned to NFS at Period End | |
| Fidelity Advisor Stock Selector Mid Cap Fund | $38 | $91 | $339 |
Year ended November 30, 2022 | Year ended November 30, 2021 | |
| Fidelity Advisor Stock Selector Mid Cap Fund | ||
| Distributions to shareholders | ||
| Class A | $91,386 | $14,523 |
| Class M | 66,607 | 10,221 |
| Class C | 3,596 | 574 |
| Fidelity Stock Selector Mid Cap Fund | 47,323 | 7,971 |
| Class I | 49,700 | 6,942 |
| Class Z | 8,330 | 3,849 |
Total | $266,942 | $44,080 |
| Shares | Shares | Dollars | Dollars | |
| Year ended November 30, 2022 | Year ended November 30, 2021 | Year ended November 30, 2022 | Year ended November 30, 2021 | |
| Fidelity Advisor Stock Selector Mid Cap Fund | ||||
| Class A | ||||
| Shares sold | 1,111 | 1,510 | $42,903 | $68,096 |
| Reinvestment of distributions | 2,014 | 347 | 85,227 | 13,497 |
| Shares redeemed | (2,177) | (2,269) | (85,105) | (100,086) |
| Net increase (decrease) | 948 | (412) | $43,025 | $(18,493) |
| Class M | ||||
| Shares sold | 651 | 1,065 | $25,411 | $47,155 |
| Reinvestment of distributions | 1,517 | 253 | 64,852 | 9,912 |
| Shares redeemed | (2,178) | (2,314) | (84,679) | (103,273) |
| Net increase (decrease) | (10) | (996) | $5,584 | $(46,206) |
| Class C | ||||
| Shares sold | 65 | 205 | $2,165 | $8,344 |
| Reinvestment of distributions | 96 | 17 | 3,589 | 574 |
| Shares redeemed | (178) | (446) | (6,017) | (17,717) |
| Net increase (decrease) | (17) | (224) | $(263) | $(8,799) |
| Fidelity Stock Selector Mid Cap Fund | ||||
| Shares sold | 668 | 1,545 | $27,209 | $73,171 |
| Reinvestment of distributions | 1,010 | 188 | 45,509 | 7,734 |
| Shares redeemed | (1,295) | (2,112) | (53,611) | (96,277) |
| Net increase (decrease) | 383 | (379) | $19,107 | $(15,372) |
| Class I | ||||
| Shares sold | 1,936 | 2,690 | $77,354 | $128,891 |
| Reinvestment of distributions | 1,062 | 159 | 48,006 | 6,540 |
| Shares redeemed | (2,110) | (1,625) | (87,273) | (76,943) |
| Net increase (decrease) | 888 | 1,224 | $38,087 | $58,488 |
| Class Z | ||||
| Shares sold | 4,138 | 715 | $161,875 | $33,175 |
| Reinvestment of distributions | 168 | 91 | 7,560 | 3,740 |
| Shares redeemed | (396) | (3,160) | (15,956) | (142,762) |
| Net increase (decrease) | 3,910 | (2,354) | $153,479 | $(105,847) |
| The Example is based on an investment of $1,000 invested at the beginning of the period and held for the entire period (June 1, 2022 to November 30, 2022). |
Annualized Expense Ratio- A | Beginning Account Value June 1, 2022 | Ending Account Value November 30, 2022 | Expenses Paid During Period- C June 1, 2022 to November 30, 2022 | |||||||
| Fidelity Advisor® Stock Selector Mid Cap Fund | ||||||||||
| Class A | .93% | |||||||||
| Actual | $ 1,000 | $ 984.30 | $ 4.63 | |||||||
Hypothetical- B | $ 1,000 | $ 1,020.41 | $ 4.71 | |||||||
| Class M | 1.17% | |||||||||
| Actual | $ 1,000 | $ 982.90 | $ 5.82 | |||||||
Hypothetical- B | $ 1,000 | $ 1,019.20 | $ 5.92 | |||||||
| Class C | 1.72% | |||||||||
| Actual | $ 1,000 | $ 980.60 | $ 8.54 | |||||||
Hypothetical- B | $ 1,000 | $ 1,016.44 | $ 8.69 | |||||||
| Fidelity Advisor® Stock Selector Mid Cap Fund | .69% | |||||||||
| Actual | $ 1,000 | $ 985.50 | $ 3.43 | |||||||
Hypothetical- B | $ 1,000 | $ 1,021.61 | $ 3.50 | |||||||
| Class I | .70% | |||||||||
| Actual | $ 1,000 | $ 985.30 | $ 3.48 | |||||||
Hypothetical- B | $ 1,000 | $ 1,021.56 | $ 3.55 | |||||||
| Class Z | .58% | |||||||||
| Actual | $ 1,000 | $ 986.20 | $ 2.89 | |||||||
Hypothetical- B | $ 1,000 | $ 1,022.16 | $ 2.94 | |||||||
|


Contents
| Average Annual Total Returns | |||
Periods ended November 30, 2022 | Past 1 year | Past 5 years | Past 10 years |
| Class A (incl.5.75% sales charge) | 3.05% | 6.57% | 9.07% |
| Class M (incl.3.50% sales charge) | 5.26% | 6.82% | 9.07% |
Class C (incl. contingent deferred sales charge) | 7.48% | 6.99% | 9.04% |
| Class I | 9.62% | 8.11% | 10.00% |
| Class Z | 9.77% | 8.26% | 10.14% |
| $10,000 Over 10 Years |
Let's say hypothetically that $10,000 was invested in Fidelity Advisor® Equity Income Fund - Class A, on November 30, 2012, and the current 5.75% sales charge was paid. The chart shows how the value of your investment would have changed, and also shows how the Russell 3000® Value Index performed over the same period. |
 |
Top Holdings (% of Fund's net assets) | ||
| Wells Fargo & Co. | 3.0 | |
| Johnson & Johnson | 2.9 | |
| Unilever PLC sponsored ADR | 2.8 | |
| Exxon Mobil Corp. | 2.6 | |
| Verizon Communications, Inc. | 2.6 | |
| Sanofi SA sponsored ADR | 2.4 | |
| Comcast Corp. Class A | 2.4 | |
| Cisco Systems, Inc. | 2.2 | |
| Bristol-Myers Squibb Co. | 2.1 | |
| Merck & Co., Inc. | 2.1 | |
| 25.1 | ||
| Market Sectors (% of Fund's net assets) | ||
| Financials | 18.4 | |
| Health Care | 15.1 | |
| Information Technology | 12.9 | |
| Consumer Staples | 10.5 | |
| Industrials | 9.6 | |
| Communication Services | 7.3 | |
| Energy | 6.5 | |
| Utilities | 6.0 | |
| Consumer Discretionary | 4.4 | |
| Materials | 3.0 | |
| Real Estate | 2.1 | |
Asset Allocation (% of Fund's net assets) |
 |
Foreign investments - 18.6% |
Geographic Diversification (% of Fund's net assets) |
 |
* Includes Short-Term investments and Net Other Assets (Liabilities). Percentages are based on country or territory of incorporation and are adjusted for the effect of futures contracts, if applicable. |
| Common Stocks - 95.8% | |||
| Shares | Value ($) (000s) | ||
| COMMUNICATION SERVICES - 7.3% | |||
| Diversified Telecommunication Services - 3.4% | |||
| Deutsche Telekom AG | 779,600 | 15,859 | |
| Verizon Communications, Inc. | 1,229,990 | 47,945 | |
| 63,804 | |||
| Entertainment - 0.8% | |||
| Activision Blizzard, Inc. | 193,100 | 14,280 | |
| Media - 3.1% | |||
| Comcast Corp. Class A | 1,213,100 | 44,448 | |
| Omnicom Group, Inc. | 175,000 | 13,958 | |
| 58,406 | |||
TOTAL COMMUNICATION SERVICES | 136,490 | ||
| CONSUMER DISCRETIONARY - 4.4% | |||
| Auto Components - 0.4% | |||
| Lear Corp. | 49,300 | 7,111 | |
| Household Durables - 0.7% | |||
| Leggett & Platt, Inc. (a) | 128,800 | 4,587 | |
| Whirlpool Corp. (a) | 57,500 | 8,425 | |
| 13,012 | |||
| Internet & Direct Marketing Retail - 1.1% | |||
| eBay, Inc. | 451,100 | 20,498 | |
| Specialty Retail - 1.7% | |||
| Best Buy Co., Inc. | 64,600 | 5,510 | |
| Lowe's Companies, Inc. | 55,700 | 11,839 | |
| Williams-Sonoma, Inc. (a) | 116,400 | 13,607 | |
| 30,956 | |||
| Textiles, Apparel & Luxury Goods - 0.5% | |||
| Columbia Sportswear Co. | 41,000 | 3,673 | |
| Tapestry, Inc. | 174,900 | 6,606 | |
| 10,279 | |||
TOTAL CONSUMER DISCRETIONARY | 81,856 | ||
| CONSUMER STAPLES - 10.5% | |||
| Beverages - 4.0% | |||
| Anheuser-Busch InBev SA NV ADR (a) | 361,500 | 21,289 | |
| Coca-Cola European Partners PLC | 278,800 | 14,801 | |
| Keurig Dr. Pepper, Inc. | 206,200 | 7,974 | |
| The Coca-Cola Co. | 484,300 | 30,806 | |
| 74,870 | |||
| Food & Staples Retailing - 0.3% | |||
| Albertsons Companies, Inc. | 220,800 | 4,626 | |
| Household Products - 2.2% | |||
| Energizer Holdings, Inc. | 149,400 | 5,093 | |
| Procter & Gamble Co. | 87,300 | 13,022 | |
| Reckitt Benckiser Group PLC | 92,300 | 6,624 | |
| Reynolds Consumer Products, Inc. (a) | 523,000 | 16,715 | |
| 41,454 | |||
| Personal Products - 2.8% | |||
| Unilever PLC sponsored ADR | 1,013,600 | 51,065 | |
| Tobacco - 1.2% | |||
| Philip Morris International, Inc. | 229,100 | 22,834 | |
TOTAL CONSUMER STAPLES | 194,849 | ||
| ENERGY - 6.5% | |||
| Oil, Gas & Consumable Fuels - 6.5% | |||
| Enterprise Products Partners LP | 1,117,900 | 27,735 | |
| Exxon Mobil Corp. | 441,900 | 49,201 | |
| Parkland Corp. | 481,300 | 10,255 | |
| Shell PLC ADR | 395,500 | 23,125 | |
| TotalEnergies SE (a) | 170,600 | 10,663 | |
| 120,979 | |||
| FINANCIALS - 18.4% | |||
| Banks - 11.4% | |||
| Citigroup, Inc. | 362,300 | 17,539 | |
| Huntington Bancshares, Inc. | 1,333,600 | 20,644 | |
| JPMorgan Chase & Co. | 203,900 | 28,175 | |
| M&T Bank Corp. | 170,800 | 29,039 | |
| PNC Financial Services Group, Inc. | 176,700 | 29,732 | |
| U.S. Bancorp | 685,500 | 31,115 | |
| Wells Fargo & Co. | 1,152,250 | 55,250 | |
| 211,494 | |||
| Capital Markets - 2.8% | |||
| Bank of New York Mellon Corp. | 219,400 | 10,070 | |
| BlackRock, Inc. Class A | 12,800 | 9,165 | |
| CME Group, Inc. | 52,300 | 9,231 | |
| LPL Financial | 32,700 | 7,740 | |
| State Street Corp. | 197,999 | 15,775 | |
| 51,981 | |||
| Insurance - 4.2% | |||
| Assurant, Inc. | 51,900 | 6,655 | |
| AXA SA | 686,000 | 19,392 | |
| Chubb Ltd. | 81,684 | 17,937 | |
| Fairfax Financial Holdings Ltd. (sub. vtg.) | 16,400 | 9,410 | |
| First American Financial Corp. | 145,200 | 7,935 | |
| The Travelers Companies, Inc. | 86,000 | 16,324 | |
| 77,653 | |||
TOTAL FINANCIALS | 341,128 | ||
| HEALTH CARE - 15.1% | |||
| Health Care Equipment & Supplies - 0.6% | |||
| Smith & Nephew PLC sponsored ADR | 376,800 | 9,993 | |
| Health Care Providers & Services - 3.8% | |||
| AmerisourceBergen Corp. | 150,500 | 25,689 | |
| Cigna Corp. | 63,400 | 20,852 | |
| Elevance Health, Inc. | 21,100 | 11,245 | |
| UnitedHealth Group, Inc. | 23,500 | 12,872 | |
| 70,658 | |||
| Pharmaceuticals - 10.7% | |||
| Bristol-Myers Squibb Co. | 488,300 | 39,201 | |
| Johnson & Johnson | 305,718 | 54,418 | |
| Merck & Co., Inc. | 350,300 | 38,575 | |
| Organon & Co. | 305,730 | 7,955 | |
| Royalty Pharma PLC | 327,700 | 14,409 | |
| Sanofi SA sponsored ADR | 983,639 | 44,608 | |
| 199,166 | |||
TOTAL HEALTH CARE | 279,817 | ||
| INDUSTRIALS - 9.6% | |||
| Aerospace & Defense - 1.0% | |||
| General Dynamics Corp. | 72,500 | 18,298 | |
| Air Freight & Logistics - 0.8% | |||
| C.H. Robinson Worldwide, Inc. | 72,700 | 7,286 | |
| United Parcel Service, Inc. Class B | 39,400 | 7,475 | |
| 14,761 | |||
| Building Products - 1.1% | |||
| Owens Corning | 229,200 | 20,362 | |
| Electrical Equipment - 1.3% | |||
| Regal Rexnord Corp. | 187,900 | 24,636 | |
| Industrial Conglomerates - 1.2% | |||
| General Electric Co. | 63,094 | 5,424 | |
| Hitachi Ltd. | 321,800 | 17,210 | |
| 22,634 | |||
| Machinery - 2.3% | |||
| Allison Transmission Holdings, Inc. | 451,600 | 20,232 | |
| Parker Hannifin Corp. | 72,800 | 21,763 | |
| 41,995 | |||
| Professional Services - 1.5% | |||
| Manpower, Inc. | 102,200 | 8,945 | |
| Robert Half International, Inc. | 83,200 | 6,554 | |
| Science Applications International Corp. | 121,300 | 13,356 | |
| 28,855 | |||
| Trading Companies & Distributors - 0.4% | |||
| Brenntag SE | 105,200 | 6,689 | |
TOTAL INDUSTRIALS | 178,230 | ||
| INFORMATION TECHNOLOGY - 12.9% | |||
| Communications Equipment - 2.2% | |||
| Cisco Systems, Inc. | 800,453 | 39,799 | |
| IT Services - 6.6% | |||
| Amadeus IT Holding SA Class A (b) | 72,600 | 3,925 | |
| Amdocs Ltd. | 349,622 | 31,067 | |
| Capgemini SA | 63,200 | 11,426 | |
| Cognizant Technology Solutions Corp. Class A | 121,000 | 7,527 | |
| Fidelity National Information Services, Inc. | 274,900 | 19,952 | |
| Genpact Ltd. | 180,700 | 8,332 | |
| Global Payments, Inc. | 164,300 | 17,051 | |
| SS&C Technologies Holdings, Inc. | 168,000 | 9,032 | |
| Visa, Inc. Class A | 64,700 | 14,040 | |
| 122,352 | |||
| Semiconductors & Semiconductor Equipment - 2.7% | |||
| Microchip Technology, Inc. | 443,300 | 35,105 | |
| Taiwan Semiconductor Manufacturing Co. Ltd. sponsored ADR | 188,500 | 15,642 | |
| 50,747 | |||
| Software - 1.4% | |||
| Microsoft Corp. | 67,400 | 17,196 | |
| Open Text Corp. | 300,100 | 8,812 | |
| 26,008 | |||
TOTAL INFORMATION TECHNOLOGY | 238,906 | ||
| MATERIALS - 3.0% | |||
| Chemicals - 2.6% | |||
| Akzo Nobel NV | 63,900 | 4,598 | |
| Celanese Corp. Class A | 126,200 | 13,541 | |
| CF Industries Holdings, Inc. | 115,300 | 12,474 | |
| DuPont de Nemours, Inc. | 189,766 | 13,380 | |
| Olin Corp. | 92,000 | 5,242 | |
| 49,235 | |||
| Containers & Packaging - 0.4% | |||
| Berry Global Group, Inc. | 116,600 | 6,833 | |
TOTAL MATERIALS | 56,068 | ||
| REAL ESTATE - 2.1% | |||
| Equity Real Estate Investment Trusts (REITs) - 2.1% | |||
| Alexandria Real Estate Equities, Inc. | 73,200 | 11,391 | |
| American Tower Corp. | 43,800 | 9,691 | |
| Corporate Office Properties Trust (SBI) | 424,000 | 11,774 | |
| Gaming & Leisure Properties | 102,500 | 5,393 | |
| 38,249 | |||
| UTILITIES - 6.0% | |||
| Electric Utilities - 3.9% | |||
| Constellation Energy Corp. | 23,799 | 2,288 | |
| Duke Energy Corp. | 237,200 | 23,703 | |
| Edison International | 373,964 | 24,928 | |
| Exelon Corp. | 173,600 | 7,182 | |
| FirstEnergy Corp. | 337,800 | 13,931 | |
| 72,032 | |||
| Independent Power and Renewable Electricity Producers - 1.0% | |||
| The AES Corp. | 199,000 | 5,755 | |
| Vistra Corp. | 563,200 | 13,703 | |
| 19,458 | |||
| Multi-Utilities - 1.1% | |||
| Dominion Energy, Inc. | 151,600 | 9,264 | |
| Sempra Energy | 70,100 | 11,650 | |
| 20,914 | |||
TOTAL UTILITIES | 112,404 | ||
| TOTAL COMMON STOCKS (Cost $1,555,879) | 1,778,976 | ||
| Money Market Funds - 5.5% | |||
| Shares | Value ($) (000s) | ||
| Fidelity Cash Central Fund 3.86% (c) | 71,452,279 | 71,467 | |
| Fidelity Securities Lending Cash Central Fund 3.86% (c)(d) | 30,793,322 | 30,796 | |
| TOTAL MONEY MARKET FUNDS (Cost $102,263) | 102,263 | ||
| TOTAL INVESTMENT IN SECURITIES - 101.3% (Cost $1,658,142) | 1,881,239 |
NET OTHER ASSETS (LIABILITIES) - (1.3)% | (24,022) |
| NET ASSETS - 100.0% | 1,857,217 |
| (a) | Security or a portion of the security is on loan at period end. |
| (b) | Non-income producing |
| (c) | Affiliated fund that is generally available only to investment companies and other accounts managed by Fidelity Investments. The rate quoted is the annualized seven-day yield of the fund at period end. A complete unaudited listing of the fund's holdings as of its most recent quarter end is available upon request. In addition, each Fidelity Central Fund's financial statements, which are not covered by the Fund's Report of Independent Registered Public Accounting Firm, are available on the SEC's website or upon request. |
| (d) | Investment made with cash collateral received from securities on loan. |
| Affiliate (Amounts in thousands) | Value, beginning of period ($) | Purchases ($) | Sales Proceeds ($) | Dividend Income ($) | Realized Gain (loss) ($) | Change in Unrealized appreciation (depreciation) ($) | Value, end of period ($) | % ownership, end of period |
| Fidelity Cash Central Fund 3.86% | 35,910 | 365,123 | 329,566 | 779 | - | - | 71,467 | 0.1% |
| Fidelity Securities Lending Cash Central Fund 3.86% | 11,224 | 295,984 | 276,412 | 99 | - | - | 30,796 | 0.1% |
| Total | 47,134 | 661,107 | 605,978 | 878 | - | - | 102,263 | |
| Valuation Inputs at Reporting Date: | ||||
Description (Amounts in thousands) | Total ($) | Level 1 ($) | Level 2 ($) | Level 3 ($) |
Investments in Securities: | ||||
| Equities: | ||||
Communication Services | 136,490 | 120,631 | 15,859 | - |
Consumer Discretionary | 81,856 | 81,856 | - | - |
Consumer Staples | 194,849 | 188,225 | 6,624 | - |
Energy | 120,979 | 110,316 | 10,663 | - |
Financials | 341,128 | 321,736 | 19,392 | - |
Health Care | 279,817 | 279,817 | - | - |
Industrials | 178,230 | 154,331 | 23,899 | - |
Information Technology | 238,906 | 223,555 | 15,351 | - |
Materials | 56,068 | 51,470 | 4,598 | - |
Real Estate | 38,249 | 38,249 | - | - |
Utilities | 112,404 | 112,404 | - | - |
| Money Market Funds | 102,263 | 102,263 | - | - |
| Total Investments in Securities: | 1,881,239 | 1,784,853 | 96,386 | - |
| Statement of Assets and Liabilities | ||||
| Amounts in thousands (except per-share amounts) | November 30, 2022 | |||
| Assets | ||||
| Investment in securities, at value (including securities loaned of $30,416) - See accompanying schedule: | ||||
Unaffiliated issuers (cost $1,555,879) | $1,778,976 | |||
Fidelity Central Funds (cost $102,263) | 102,263 | |||
| Total Investment in Securities (cost $1,658,142) | $ | 1,881,239 | ||
| Restricted cash | 304 | |||
| Receivable for investments sold | ||||
Regular delivery | 15,490 | |||
Delayed delivery | 1,690 | |||
| Receivable for fund shares sold | 1,504 | |||
| Dividends receivable | 4,759 | |||
| Distributions receivable from Fidelity Central Funds | 214 | |||
| Prepaid expenses | 2 | |||
| Other receivables | 28 | |||
Total assets | 1,905,230 | |||
| Liabilities | ||||
| Payable for investments purchased | $14,251 | |||
| Payable for fund shares redeemed | 1,590 | |||
| Accrued management fee | 635 | |||
| Distribution and service plan fees payable | 432 | |||
| Other affiliated payables | 276 | |||
| Other payables and accrued expenses | 33 | |||
| Collateral on securities loaned | 30,796 | |||
| Total Liabilities | 48,013 | |||
| Net Assets | $ | 1,857,217 | ||
| Net Assets consist of: | ||||
| Paid in capital | $ | 1,557,795 | ||
| Total accumulated earnings (loss) | 299,422 | |||
| Net Assets | $ | 1,857,217 | ||
| Net Asset Value and Maximum Offering Price | ||||
| Class A : | ||||
Net Asset Value and redemption price per share ($741,312 ÷ 23,329 shares) (a) | $ | 31.78 | ||
| Maximum offering price per share (100/94.25 of $31.78) | $ | 33.72 | ||
| Class M : | ||||
Net Asset Value and redemption price per share ($571,256 ÷ 17,393 shares) (a) | $ | 32.84 | ||
| Maximum offering price per share (100/96.50 of $32.84) | $ | 34.03 | ||
| Class C : | ||||
Net Asset Value and offering price per share ($68,428 ÷ 2,123 shares) (a) | $ | 32.23 | ||
| Class I : | ||||
Net Asset Value , offering price and redemption price per share ($359,047 ÷ 10,590 shares) (b) | $ | 33.91 | ||
| Class Z : | ||||
Net Asset Value , offering price and redemption price per share ($117,174 ÷ 3,461 shares) | $ | 33.86 | ||
(a)Redemption price per share is equal to net asset value less any applicable contingent deferred sales charge. | ||||
(b)Corresponding Net Asset Value does not calculate due to rounding of fractional net assets and/or shares. | ||||
| Statement of Operations | ||||
| Amounts in thousands | Year ended November 30, 2022 | |||
| Investment Income | ||||
| Dividends | $ | 48,521 | ||
| Income from Fidelity Central Funds (including $99 from security lending) | 878 | |||
| Total Income | 49,399 | |||
| Expenses | ||||
| Management fee | $ | 7,342 | ||
| Transfer agent fees | 2,865 | |||
| Distribution and service plan fees | 5,222 | |||
| Accounting fees | 500 | |||
| Custodian fees and expenses | 30 | |||
| Independent trustees' fees and expenses | 6 | |||
| Registration fees | 109 | |||
| Audit | 59 | |||
| Legal | 5 | |||
| Miscellaneous | 8 | |||
| Total expenses before reductions | 16,146 | |||
| Expense reductions | (56) | |||
| Total expenses after reductions | 16,090 | |||
| Net Investment income (loss) | 33,309 | |||
| Realized and Unrealized Gain (Loss) | ||||
| Net realized gain (loss) on: | ||||
| Investment Securities: | ||||
| Unaffiliated issuers | 72,439 | |||
| Foreign currency transactions | (26) | |||
| Total net realized gain (loss) | 72,413 | |||
| Change in net unrealized appreciation (depreciation) on: | ||||
| Investment Securities: | ||||
| Unaffiliated issuers | 41,468 | |||
| Assets and liabilities in foreign currencies | (22) | |||
| Total change in net unrealized appreciation (depreciation) | 41,446 | |||
| Net gain (loss) | 113,859 | |||
| Net increase (decrease) in net assets resulting from operations | $ | 147,168 | ||
| Statement of Changes in Net Assets | ||||
| Amount in thousands | Year ended November 30, 2022 | Year ended November 30, 2021 | ||
| Increase (Decrease) in Net Assets | ||||
| Operations | ||||
| Net investment income (loss) | $ | 33,309 | $ | 27,247 |
| Net realized gain (loss) | 72,413 | 150,302 | ||
| Change in net unrealized appreciation (depreciation) | 41,446 | 75,048 | ||
| Net increase (decrease) in net assets resulting from operations | 147,168 | 252,597 | ||
| Distributions to shareholders | (167,060) | (30,150) | ||
| Share transactions - net increase (decrease) | 316,498 | (54,783) | ||
| Total increase (decrease) in net assets | 296,606 | 167,664 | ||
| Net Assets | ||||
| Beginning of period | 1,560,611 | 1,392,947 | ||
| End of period | $ | 1,857,217 | $ | 1,560,611 |
| Fidelity Advisor® Equity Income Fund Class A |
| Years ended November 30, | 2022 | 2021 | 2020 | 2019 | 2018 | |||||
Selected Per-Share Data | ||||||||||
| Net asset value, beginning of period | $ | 32.34 | $ | 27.88 | $ | 30.22 | $ | 31.53 | $ | 34.96 |
| Income from Investment Operations | ||||||||||
Net investment income (loss) A,B | .61 | .58 | .65 | .67 | .68 | |||||
| Net realized and unrealized gain (loss) | 2.32 | 4.53 | (.67) | 2.08 | (.37) C | |||||
| Total from investment operations | 2.93 | 5.11 | (.02) | 2.75 | .31 | |||||
| Distributions from net investment income | (.58) | (.65) | (.66) | (.65) | (.78) | |||||
| Distributions from net realized gain | (2.91) | - D | (1.67) | (3.41) | (2.95) | |||||
| Total distributions | (3.49) | (.65) | (2.32) E | (4.06) | (3.74) E | |||||
| Net asset value, end of period | $ | 31.78 | $ | 32.34 | $ | 27.88 | $ | 30.22 | $ | 31.53 |
Total Return F,G | 9.34% | 18.46% | .02% | 11.73% | .77% C | |||||
Ratios to Average Net Assets B,H,I | ||||||||||
| Expenses before reductions | .89% | .90% | .92% | .93% | .93% | |||||
| Expenses net of fee waivers, if any | .89% | .89% | .92% | .92% | .93% | |||||
| Expenses net of all reductions | .89% | .89% | .92% | .92% | .91% | |||||
| Net investment income (loss) | 1.98% | 1.80% | 2.51% | 2.37% | 2.11% | |||||
| Supplemental Data | ||||||||||
| Net assets, end of period (in millions) | $ | 741 | $ | 675 | $ | 591 | $ | 660 | $ | 609 |
Portfolio turnover rate J | 47% | 48% | 65% | 48% | 59% |
| Fidelity Advisor® Equity Income Fund Class M |
| Years ended November 30, | 2022 | 2021 | 2020 | 2019 | 2018 | |||||
Selected Per-Share Data | ||||||||||
| Net asset value, beginning of period | $ | 33.30 | $ | 28.69 | $ | 31.02 | $ | 32.24 | $ | 35.65 |
| Income from Investment Operations | ||||||||||
Net investment income (loss) A,B | .56 | .52 | .60 | .62 | .62 | |||||
| Net realized and unrealized gain (loss) | 2.38 | 4.66 | (.68) | 2.15 | (.38) C | |||||
| Total from investment operations | 2.94 | 5.18 | (.08) | 2.77 | .24 | |||||
| Distributions from net investment income | (.49) | (.57) | (.59) | (.58) | (.70) | |||||
| Distributions from net realized gain | (2.91) | - D | (1.67) | (3.41) | (2.95) | |||||
| Total distributions | (3.40) | (.57) | (2.25) E | (3.99) | (3.65) | |||||
| Net asset value, end of period | $ | 32.84 | $ | 33.30 | $ | 28.69 | $ | 31.02 | $ | 32.24 |
Total Return F,G | 9.08% | 18.16% | (.22)% | 11.46% | .56% C | |||||
Ratios to Average Net Assets B,H,I | ||||||||||
| Expenses before reductions | 1.13% | 1.14% | 1.16% | 1.16% | 1.16% | |||||
| Expenses net of fee waivers, if any | 1.13% | 1.13% | 1.16% | 1.16% | 1.16% | |||||
| Expenses net of all reductions | 1.13% | 1.13% | 1.15% | 1.16% | 1.15% | |||||
| Net investment income (loss) | 1.74% | 1.56% | 2.28% | 2.14% | 1.88% | |||||
| Supplemental Data | ||||||||||
| Net assets, end of period (in millions) | $ | 571 | $ | 555 | $ | 534 | $ | 642 | $ | 662 |
Portfolio turnover rate J | 47% | 48% | 65% | 48% | 59% |
| Fidelity Advisor® Equity Income Fund Class C |
| Years ended November 30, | 2022 | 2021 | 2020 | 2019 | 2018 | |||||
Selected Per-Share Data | ||||||||||
| Net asset value, beginning of period | $ | 32.75 | $ | 28.21 | $ | 30.52 | $ | 31.73 | $ | 35.15 |
| Income from Investment Operations | ||||||||||
Net investment income (loss) A,B | .37 | .32 | .45 | .45 | .44 | |||||
| Net realized and unrealized gain (loss) | 2.35 | 4.60 | (.66) | 2.12 | (.39) C | |||||
| Total from investment operations | 2.72 | 4.92 | (.21) | 2.57 | .05 | |||||
| Distributions from net investment income | (.32) | (.37) | (.43) | (.37) | (.52) | |||||
| Distributions from net realized gain | (2.91) | - D | (1.67) | (3.41) | (2.95) | |||||
| Total distributions | (3.24) E | (.38) E | (2.10) | (3.78) | (3.47) | |||||
| Net asset value, end of period | $ | 32.23 | $ | 32.75 | $ | 28.21 | $ | 30.52 | $ | 31.73 |
Total Return F,G | 8.46% | 17.51% | (.77)% | 10.86% | (.01)% C | |||||
Ratios to Average Net Assets B,H,I | ||||||||||
| Expenses before reductions | 1.68% | 1.70% | 1.72% | 1.72% | 1.70% | |||||
| Expenses net of fee waivers, if any | 1.68% | 1.69% | 1.72% | 1.71% | 1.69% | |||||
| Expenses net of all reductions | 1.68% | 1.69% | 1.72% | 1.71% | 1.68% | |||||
| Net investment income (loss) | 1.19% | 1.00% | 1.71% | 1.58% | 1.34% | |||||
| Supplemental Data | ||||||||||
| Net assets, end of period (in millions) | $ | 68 | $ | 52 | $ | 63 | $ | 84 | $ | 160 |
Portfolio turnover rate J | 47% | 48% | 65% | 48% | 59% |
| Fidelity Advisor® Equity Income Fund Class I |
| Years ended November 30, | 2022 | 2021 | 2020 | 2019 | 2018 | |||||
Selected Per-Share Data | ||||||||||
| Net asset value, beginning of period | $ | 34.28 | $ | 29.51 | $ | 31.85 | $ | 32.99 | $ | 36.40 |
| Income from Investment Operations | ||||||||||
Net investment income (loss) A,B | .73 | .70 | .75 | .78 | .80 | |||||
| Net realized and unrealized gain (loss) | 2.47 | 4.80 | (.70) | 2.21 | (.39) C | |||||
| Total from investment operations | 3.20 | 5.50 | .05 | 2.99 | .41 | |||||
| Distributions from net investment income | (.65) | (.73) | (.72) | (.72) | (.87) | |||||
| Distributions from net realized gain | (2.91) | - D | (1.67) | (3.41) | (2.95) | |||||
| Total distributions | (3.57) E | (.73) | (2.39) | (4.13) | (3.82) | |||||
| Net asset value, end of period | $ | 33.91 | $ | 34.28 | $ | 29.51 | $ | 31.85 | $ | 32.99 |
Total Return F | 9.62% | 18.75% | .27% | 12.00% | 1.05% C | |||||
Ratios to Average Net Assets B,G,H | ||||||||||
| Expenses before reductions | .65% | .65% | .67% | .67% | .67% | |||||
| Expenses net of fee waivers, if any | .65% | .65% | .67% | .67% | .67% | |||||
| Expenses net of all reductions | .65% | .65% | .66% | .67% | .66% | |||||
| Net investment income (loss) | 2.22% | 2.05% | 2.77% | 2.63% | 2.37% | |||||
| Supplemental Data | ||||||||||
| Net assets, end of period (in millions) | $ | 359 | $ | 244 | $ | 178 | $ | 227 | $ | 243 |
Portfolio turnover rate I | 47% | 48% | 65% | 48% | 59% |
| Fidelity Advisor® Equity Income Fund Class Z |
| Years ended November 30, | 2022 | 2021 | 2020 | 2019 | 2018 | |||||
Selected Per-Share Data | ||||||||||
| Net asset value, beginning of period | $ | 34.24 | $ | 29.48 | $ | 31.82 | $ | 32.96 | $ | 36.38 |
| Income from Investment Operations | ||||||||||
Net investment income (loss) A,B | .77 | .75 | .79 | .82 | .85 | |||||
| Net realized and unrealized gain (loss) | 2.46 | 4.78 | (.70) | 2.21 | (.40) C | |||||
| Total from investment operations | 3.23 | 5.53 | .09 | 3.03 | .45 | |||||
| Distributions from net investment income | (.70) | (.77) | (.76) | (.77) | (.91) | |||||
| Distributions from net realized gain | (2.91) | - D | (1.67) | (3.41) | (2.95) | |||||
| Total distributions | (3.61) | (.77) | (2.43) | (4.17) E | (3.87) E | |||||
| Net asset value, end of period | $ | 33.86 | $ | 34.24 | $ | 29.48 | $ | 31.82 | $ | 32.96 |
Total Return F | 9.77% | 18.89% | .43% | 12.18% | 1.16% C | |||||
Ratios to Average Net Assets B,G,H | ||||||||||
| Expenses before reductions | .51% | .51% | .53% | .53% | .53% | |||||
| Expenses net of fee waivers, if any | .51% | .51% | .52% | .53% | .53% | |||||
| Expenses net of all reductions | .51% | .51% | .52% | .52% | .52% | |||||
| Net investment income (loss) | 2.36% | 2.18% | 2.91% | 2.77% | 2.51% | |||||
| Supplemental Data | ||||||||||
| Net assets, end of period (in millions) | $ | 117 | $ | 35 | $ | 26 | $ | 27 | $ | 22 |
Portfolio turnover rate I | 47% | 48% | 65% | 48% | 59% |
| Fidelity Central Fund | Investment Manager | Investment Objective | Investment Practices | Expense Ratio A |
| Fidelity Money Market Central Funds | Fidelity Management & Research Company LLC (FMR) | Each fund seeks to obtain a high level of current income consistent with the preservation of capital and liquidity. | Short-term Investments | Less than .005% |
| Fidelity Advisor Equity Income Fund | $24 |
| Gross unrealized appreciation | $313,832 |
| Gross unrealized depreciation | (84,150) |
| Net unrealized appreciation (depreciation) | $229,682 |
| Tax Cost | $1,651,557 |
| Undistributed ordinary income | $8,657 |
| Undistributed long-term capital gain | $66,814 |
| Net unrealized appreciation (depreciation) on securities and other investments | $223,949 |
| November 30, 2022 | November 30, 2021 | |
| Ordinary Income | $62,201 | $30,150 |
| Long-term Capital Gains | 104,859 | - |
| Total | $167,060 | $30,150 |
| Purchases ($) | Sales ($) | |
| Fidelity Advisor Equity Income Fund | 919,894 | 777,521 |
| Distribution Fee | Service Fee | Total Fees | Retained by FDC | |
| Class A | - % | .25% | $1,779 | $28 |
| Class M | .25% | .25% | 2,834 | - |
| Class C | .75% | .25% | 609 | 99 |
| $5,222 | $127 |
| Retained by FDC | |
| Class A | $106 |
| Class M | 17 |
Class C A | 2 |
| $125 |
| Amount | % of Class-Level Average Net Assets | |
| Class A | $1,232 | .17 |
| Class M | 925 | .16 |
| Class C | 131 | .21 |
| Class I | 542 | .18 |
| Class Z | 35 | .04 |
| $2,865 |
| % of Average Net Assets | |
| Fidelity Advisor Equity Income Fund | .03 |
| Amount | |
| Fidelity Advisor Equity Income Fund | $17 |
| Purchases ($) | Sales ($) | Realized Gain (Loss) ($) | |
| Fidelity Advisor Equity Income Fund | 88,771 | 88,333 | 16,728 |
| Amount | |
| Fidelity Advisor Equity Income Fund | $3 |
| Total Security Lending Fees Paid to NFS | Security Lending Income From Securities Loaned to NFS | Value of Securities Loaned to NFS at Period End | |
| Fidelity Advisor Equity Income Fund | $10 | $- | $- |
Year ended November 30, 2022 | Year ended November 30, 2021 | |
| Fidelity Advisor Equity Income Fund | ||
| Distributions to shareholders | ||
| Class A | $73,516 | $13,793 |
| Class M | 56,803 | 10,202 |
| Class C | 5,145 | 748 |
| Class I | 26,327 | 4,681 |
| Class Z | 5,269 | 726 |
Total | $167,060 | $30,150 |
| Shares | Shares | Dollars | Dollars | |
| Year ended November 30, 2022 | Year ended November 30, 2021 | Year ended November 30, 2022 | Year ended November 30, 2021 | |
| Fidelity Advisor Equity Income Fund | ||||
| Class A | ||||
| Shares sold | 3,323 | 2,209 | $103,218 | $71,294 |
| Reinvestment of distributions | 2,230 | 420 | 69,823 | 13,047 |
| Shares redeemed | (3,106) | (2,950) | (96,136) | (94,556) |
| Net increase (decrease) | 2,447 | (321) | $76,905 | $(10,215) |
| Class M | ||||
| Shares sold | 1,876 | 1,292 | $60,326 | $42,524 |
| Reinvestment of distributions | 1,720 | 313 | 55,712 | 9,978 |
| Shares redeemed | (2,857) | (3,554) | (91,349) | (117,076) |
| Net increase (decrease) | 739 | (1,949) | $24,689 | $(64,574) |
| Class C | ||||
| Shares sold | 990 | 331 | $ 31,165 | $ 10,767 |
| Reinvestment of distributions | 159 | 24 | 5,070 | 733 |
| Shares redeemed | (608) | (1,023) | (19,033) | (33,534) |
| Net increase (decrease) | 541 | (668) | $17,202 | $(22,034) |
| Class I | ||||
| Shares sold | 4,297 | 2,020 | $141,287 | $69,683 |
| Reinvestment of distributions | 735 | 129 | 24,455 | 4,280 |
| Shares redeemed | (1,562) | (1,069) | (51,041) | (36,136) |
| Net increase (decrease) | 3,470 | 1,080 | $114,701 | $37,827 |
| Class Z | ||||
| Shares sold | 3,004 | 299 | $101,219 | $10,184 |
| Reinvestment of distributions | 149 | 20 | 4,916 | 650 |
| Shares redeemed | (710) | (197) | (23,134) | (6,621) |
| Net increase (decrease) | 2,443 | 122 | $83,001 | $4,213 |
| The Example is based on an investment of $1,000 invested at the beginning of the period and held for the entire period (June 1, 2022 to November 30, 2022). |
Annualized Expense Ratio- A | Beginning Account Value June 1, 2022 | Ending Account Value November 30, 2022 | Expenses Paid During Period- C June 1, 2022 to November 30, 2022 | |||||||
| Fidelity Advisor® Equity Income Fund | ||||||||||
| Class A | .89% | |||||||||
| Actual | $ 1,000 | $ 1,000.90 | $ 4.46 | |||||||
Hypothetical- B | $ 1,000 | $ 1,020.61 | $ 4.51 | |||||||
| Class M | 1.13% | |||||||||
| Actual | $ 1,000 | $ 999.50 | $ 5.66 | |||||||
Hypothetical- B | $ 1,000 | $ 1,019.40 | $ 5.72 | |||||||
| Class C | 1.68% | |||||||||
| Actual | $ 1,000 | $ 996.80 | $ 8.41 | |||||||
Hypothetical- B | $ 1,000 | $ 1,016.65 | $ 8.49 | |||||||
| Class I | .65% | |||||||||
| Actual | $ 1,000 | $ 1,002.40 | $ 3.26 | |||||||
Hypothetical- B | $ 1,000 | $ 1,021.81 | $ 3.29 | |||||||
| Class Z | .51% | |||||||||
| Actual | $ 1,000 | $ 1,002.90 | $ 2.56 | |||||||
Hypothetical- B | $ 1,000 | $ 1,022.51 | $ 2.59 | |||||||
|


Contents
| Average Annual Total Returns | |||
Periods ended November 30, 2022 | Past 1 year | Past 5 years | Past 10 years |
| Class A (incl.5.75% sales charge) | -18.77% | 5.82% | 9.44% |
| Class M (incl.3.50% sales charge) | -17.04% | 6.06% | 9.45% |
Class C (incl. contingent deferred sales charge) | -15.24% | 6.23% | 9.41% |
| Class I | -13.61% | 7.35% | 10.39% |
| Class Z | -13.47% | 7.51% | 10.54% |
| $10,000 Over 10 Years |
Let's say hypothetically that $10,000 was invested in Fidelity Advisor® Small Cap Fund - Class A, on November 30, 2012, and the current 5.75% sales charge was paid. The chart shows how the value of your investment would have changed, and also shows how the Russell 2000® Index performed over the same period. |
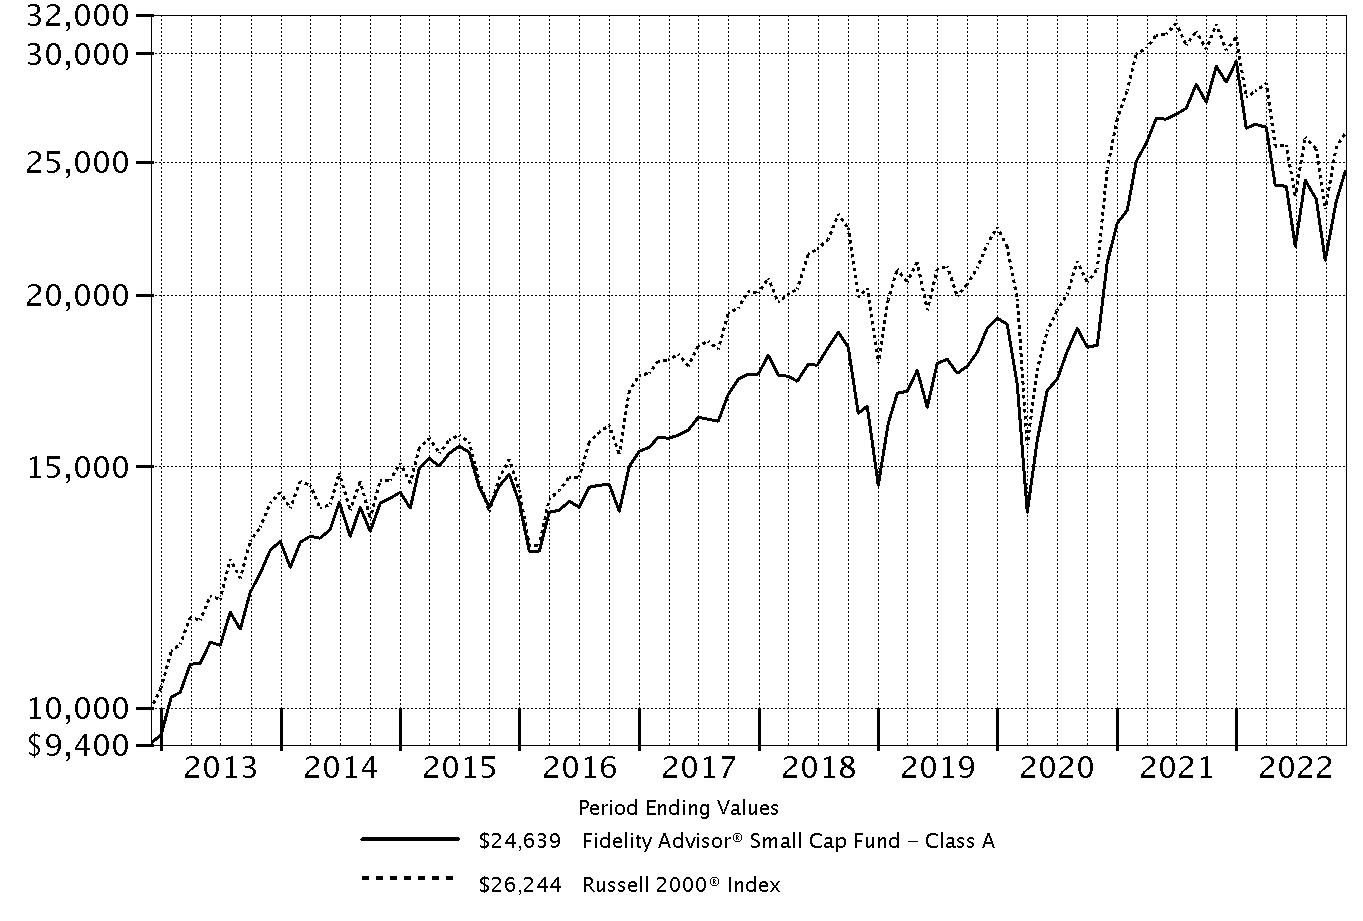 |
Top Holdings (% of Fund's net assets) | ||
| Commercial Metals Co. | 1.8 | |
| Extreme Networks, Inc. | 1.8 | |
| EMCOR Group, Inc. | 1.7 | |
| Antero Resources Corp. | 1.6 | |
| Chemed Corp. | 1.4 | |
| Insight Enterprises, Inc. | 1.4 | |
| First Interstate Bancsystem, Inc. | 1.4 | |
| KBR, Inc. | 1.4 | |
| NV5 Global, Inc. | 1.4 | |
| Denbury, Inc. | 1.4 | |
| 15.3 | ||
| Market Sectors (% of Fund's net assets) | ||
| Industrials | 18.5 | |
| Financials | 15.9 | |
| Information Technology | 14.8 | |
| Health Care | 13.3 | |
| Consumer Discretionary | 11.0 | |
| Materials | 7.1 | |
| Energy | 4.8 | |
| Real Estate | 4.7 | |
| Consumer Staples | 3.8 | |
| Communication Services | 2.9 | |
| Utilities | 1.7 | |
Asset Allocation (% of Fund's net assets) |
 |
Foreign investments - 15% |
Geographic Diversification (% of Fund's net assets) |
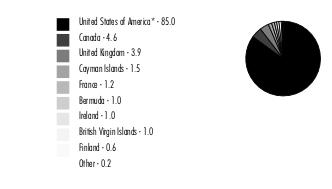 |
* Includes Short-Term investments and Net Other Assets (Liabilities). Percentages are based on country or territory of incorporation and are adjusted for the effect of futures contracts, if applicable. |
| Common Stocks - 98.5% | |||
| Shares | Value ($) (000s) | ||
| COMMUNICATION SERVICES - 2.9% | |||
| Interactive Media & Services - 1.6% | |||
| Cars.com, Inc. (a) | 1,145,900 | 16,936 | |
| Ziff Davis, Inc. (a) | 153,800 | 14,190 | |
| 31,126 | |||
| Media - 0.7% | |||
| TechTarget, Inc. (a) | 268,500 | 12,260 | |
| Wireless Telecommunication Services - 0.6% | |||
| Gogo, Inc. (a) | 725,000 | 11,375 | |
TOTAL COMMUNICATION SERVICES | 54,761 | ||
| CONSUMER DISCRETIONARY - 11.0% | |||
| Auto Components - 2.8% | |||
| Adient PLC (a) | 498,400 | 19,408 | |
| Fox Factory Holding Corp. (a) | 135,100 | 14,334 | |
| Patrick Industries, Inc. | 341,664 | 19,109 | |
| 52,851 | |||
| Hotels, Restaurants & Leisure - 1.8% | |||
| Brinker International, Inc. (a) | 299,300 | 10,012 | |
| Churchill Downs, Inc. | 91,800 | 20,376 | |
| Lindblad Expeditions Holdings (a) | 508,900 | 4,621 | |
| 35,009 | |||
| Household Durables - 2.0% | |||
| Skyline Champion Corp. (a) | 450,586 | 23,426 | |
| Tempur Sealy International, Inc. | 459,700 | 14,605 | |
| 38,031 | |||
| Internet & Direct Marketing Retail - 0.2% | |||
| Vivid Seats, Inc. Class A (b) | 467,980 | 3,650 | |
| Leisure Products - 0.3% | |||
| Clarus Corp. | 665,653 | 5,538 | |
| Specialty Retail - 3.0% | |||
| Academy Sports & Outdoors, Inc. | 153,505 | 7,749 | |
| Aritzia, Inc. (a) | 257,300 | 9,788 | |
| Lithia Motors, Inc. Class A (sub. vtg.) (b) | 28,300 | 6,772 | |
| Murphy U.S.A., Inc. | 75,200 | 22,245 | |
| Musti Group OYJ | 663,393 | 10,606 | |
| 57,160 | |||
| Textiles, Apparel & Luxury Goods - 0.9% | |||
| Crocs, Inc. (a) | 179,221 | 18,101 | |
TOTAL CONSUMER DISCRETIONARY | 210,340 | ||
| CONSUMER STAPLES - 3.8% | |||
| Food & Staples Retailing - 2.8% | |||
| BJ's Wholesale Club Holdings, Inc. (a) | 205,730 | 15,479 | |
| Performance Food Group Co. (a) | 419,400 | 25,575 | |
| Sprouts Farmers Market LLC (a) | 387,700 | 13,310 | |
| 54,364 | |||
| Food Products - 1.0% | |||
| Nomad Foods Ltd. (a)(b) | 1,053,200 | 18,420 | |
TOTAL CONSUMER STAPLES | 72,784 | ||
| ENERGY - 4.8% | |||
| Energy Equipment & Services - 0.9% | |||
| TechnipFMC PLC (a) | 1,301,300 | 16,136 | |
| Oil, Gas & Consumable Fuels - 3.9% | |||
| Antero Resources Corp. (a) | 841,700 | 30,764 | |
| Denbury, Inc. (a) | 291,700 | 26,183 | |
| Enviva, Inc. (b) | 144,800 | 8,217 | |
| Hess Midstream LP (b) | 317,548 | 9,917 | |
| 75,081 | |||
TOTAL ENERGY | 91,217 | ||
| FINANCIALS - 15.9% | |||
| Banks - 8.2% | |||
| ConnectOne Bancorp, Inc. | 815,500 | 21,399 | |
| First Interstate Bancsystem, Inc. | 616,500 | 26,892 | |
| Independent Bank Group, Inc. | 306,500 | 20,211 | |
| Metropolitan Bank Holding Corp. (a) | 229,800 | 14,601 | |
| PacWest Bancorp | 534,700 | 13,966 | |
| Pinnacle Financial Partners, Inc. | 249,800 | 20,956 | |
| ServisFirst Bancshares, Inc. | 256,400 | 19,440 | |
| Trico Bancshares | 343,300 | 18,710 | |
| 156,175 | |||
| Capital Markets - 2.6% | |||
| Houlihan Lokey | 141,400 | 13,907 | |
| LPL Financial | 69,100 | 16,357 | |
| Morningstar, Inc. | 39,709 | 9,734 | |
| Patria Investments Ltd. | 784,600 | 10,710 | |
| 50,708 | |||
| Consumer Finance - 0.6% | |||
| PROG Holdings, Inc. (a) | 599,114 | 11,797 | |
| Insurance - 2.9% | |||
| Old Republic International Corp. | 690,200 | 16,910 | |
| Primerica, Inc. | 124,800 | 18,599 | |
| Selective Insurance Group, Inc. | 208,300 | 20,022 | |
| 55,531 | |||
| Thrifts & Mortgage Finance - 1.6% | |||
| Essent Group Ltd. | 487,123 | 19,529 | |
| Walker & Dunlop, Inc. | 126,100 | 11,262 | |
| 30,791 | |||
TOTAL FINANCIALS | 305,002 | ||
| HEALTH CARE - 13.3% | |||
| Biotechnology - 3.6% | |||
| Avid Bioservices, Inc. (a)(b) | 279,011 | 4,369 | |
| Blueprint Medicines Corp. (a) | 113,200 | 5,410 | |
| Celldex Therapeutics, Inc. (a) | 69,400 | 2,574 | |
| Cerevel Therapeutics Holdings (a) | 195,600 | 5,665 | |
| Cytokinetics, Inc. (a) | 204,000 | 8,670 | |
| Day One Biopharmaceuticals, Inc. (a) | 130,800 | 2,777 | |
| Erasca, Inc. (a) | 427,751 | 3,230 | |
| Exelixis, Inc. (a) | 246,300 | 4,207 | |
| Instil Bio, Inc. (a)(b) | 383,700 | 510 | |
| Janux Therapeutics, Inc. (a) | 171,000 | 2,332 | |
| Keros Therapeutics, Inc. (a) | 58,000 | 2,891 | |
| Legend Biotech Corp. ADR (a) | 77,800 | 4,007 | |
| Mirati Therapeutics, Inc. (a) | 28,000 | 2,559 | |
| PepGen, Inc. | 96,900 | 1,450 | |
| Prelude Therapeutics, Inc. (a)(b) | 254,637 | 1,698 | |
| PTC Therapeutics, Inc. (a) | 111,200 | 4,614 | |
| Relay Therapeutics, Inc. (a) | 178,800 | 3,322 | |
| Xenon Pharmaceuticals, Inc. (a) | 206,600 | 7,619 | |
| Zentalis Pharmaceuticals, Inc. (a) | 48,346 | 1,069 | |
| 68,973 | |||
| Health Care Equipment & Supplies - 3.0% | |||
| Envista Holdings Corp. (a) | 469,500 | 16,019 | |
| Heska Corp. (a)(b) | 48,300 | 3,108 | |
| Inspire Medical Systems, Inc. (a) | 41,900 | 10,122 | |
| Merit Medical Systems, Inc. (a) | 177,100 | 12,751 | |
| Tandem Diabetes Care, Inc. (a) | 173,200 | 7,283 | |
| TransMedics Group, Inc. (a) | 130,200 | 8,055 | |
| 57,338 | |||
| Health Care Providers & Services - 4.8% | |||
| Acadia Healthcare Co., Inc. (a) | 263,400 | 23,458 | |
| Chemed Corp. | 52,400 | 27,248 | |
| Option Care Health, Inc. (a) | 426,237 | 12,834 | |
| Owens & Minor, Inc. | 292,600 | 6,030 | |
| The Ensign Group, Inc. (b) | 236,400 | 22,458 | |
| 92,028 | |||
| Life Sciences Tools & Services - 1.0% | |||
| BioLife Solutions, Inc. (a)(b) | 240,100 | 5,083 | |
| Medpace Holdings, Inc. (a) | 44,100 | 9,256 | |
| Olink Holding AB ADR (a) | 196,602 | 4,685 | |
| 19,024 | |||
| Pharmaceuticals - 0.9% | |||
| Arvinas Holding Co. LLC (a) | 139,200 | 5,713 | |
| DICE Therapeutics, Inc. (a) | 139,800 | 4,866 | |
| Edgewise Therapeutics, Inc. (a) | 277,000 | 2,479 | |
| Intra-Cellular Therapies, Inc. (a) | 77,022 | 4,176 | |
| 17,234 | |||
TOTAL HEALTH CARE | 254,597 | ||
| INDUSTRIALS - 18.5% | |||
| Aerospace & Defense - 0.6% | |||
| V2X, Inc. (a) | 304,997 | 12,325 | |
| Building Products - 1.6% | |||
| CSW Industrials, Inc. (b) | 89,234 | 10,793 | |
| Masonite International Corp. (a) | 277,600 | 20,895 | |
| 31,688 | |||
| Commercial Services & Supplies - 0.7% | |||
| Tetra Tech, Inc. | 82,400 | 12,738 | |
| Construction & Engineering - 3.1% | |||
| EMCOR Group, Inc. | 210,400 | 32,591 | |
| NV5 Global, Inc. (a) | 182,880 | 26,428 | |
| 59,019 | |||
| Electrical Equipment - 2.0% | |||
| Array Technologies, Inc. (a) | 719,132 | 15,059 | |
| Atkore, Inc. (a) | 197,100 | 24,076 | |
| 39,135 | |||
| Machinery - 1.9% | |||
| ITT, Inc. | 177,200 | 14,977 | |
| Luxfer Holdings PLC sponsored | 660,300 | 9,680 | |
| Oshkosh Corp. | 123,000 | 11,325 | |
| 35,982 | |||
| Professional Services - 4.0% | |||
| ASGN, Inc. (a) | 190,300 | 17,241 | |
| FTI Consulting, Inc. (a)(b) | 84,800 | 14,655 | |
| KBR, Inc. | 518,700 | 26,801 | |
| TriNet Group, Inc. (a) | 240,300 | 17,415 | |
| 76,112 | |||
| Road & Rail - 0.8% | |||
| TFI International, Inc. | 137,100 | 14,882 | |
| Trading Companies & Distributors - 3.8% | |||
| Applied Industrial Technologies, Inc. | 127,000 | 16,826 | |
| Beacon Roofing Supply, Inc. (a) | 191,200 | 11,164 | |
| Custom Truck One Source, Inc. Class A (a)(b) | 948,974 | 6,491 | |
| GMS, Inc. (a) | 409,718 | 20,117 | |
| Rush Enterprises, Inc. Class A | 360,894 | 18,597 | |
| 73,195 | |||
TOTAL INDUSTRIALS | 355,076 | ||
| INFORMATION TECHNOLOGY - 14.8% | |||
| Communications Equipment - 1.8% | |||
| Extreme Networks, Inc. (a) | 1,604,300 | 33,642 | |
| Electronic Equipment & Components - 5.2% | |||
| Advanced Energy Industries, Inc. | 183,000 | 16,953 | |
| Fabrinet (a) | 113,500 | 15,142 | |
| Insight Enterprises, Inc. (a) | 262,172 | 27,242 | |
| Napco Security Technologies, Inc. | 702,102 | 18,521 | |
| TD SYNNEX Corp. | 210,841 | 21,569 | |
| 99,427 | |||
| IT Services - 2.2% | |||
| Concentrix Corp. | 176,041 | 21,544 | |
| Endava PLC ADR (a) | 147,308 | 11,300 | |
| Perficient, Inc. (a) | 127,700 | 9,073 | |
| 41,917 | |||
| Semiconductors & Semiconductor Equipment - 3.2% | |||
| AEHR Test Systems (a)(b) | 346,300 | 9,028 | |
| Ichor Holdings Ltd. (a) | 456,900 | 13,606 | |
| MACOM Technology Solutions Holdings, Inc. (a) | 300,800 | 20,662 | |
| SiTime Corp. (a) | 63,000 | 6,644 | |
| Synaptics, Inc. (a) | 111,545 | 11,820 | |
| 61,760 | |||
| Software - 1.8% | |||
| Five9, Inc. (a) | 103,600 | 6,642 | |
| Intapp, Inc. (a) | 575,339 | 13,296 | |
| Rapid7, Inc. (a) | 147,100 | 4,325 | |
| Tenable Holdings, Inc. (a) | 288,000 | 10,996 | |
| 35,259 | |||
| Technology Hardware, Storage & Peripherals - 0.6% | |||
| Avid Technology, Inc. (a) | 402,500 | 11,302 | |
TOTAL INFORMATION TECHNOLOGY | 283,307 | ||
| MATERIALS - 7.1% | |||
| Chemicals - 2.8% | |||
| Element Solutions, Inc. | 937,100 | 18,330 | |
| Tronox Holdings PLC | 657,000 | 9,283 | |
| Valvoline, Inc. | 783,800 | 25,850 | |
| 53,463 | |||
| Construction Materials - 1.3% | |||
| Eagle Materials, Inc. | 176,400 | 24,050 | |
| Metals & Mining - 3.0% | |||
| Commercial Metals Co. | 712,000 | 35,049 | |
| Constellium NV (a) | 1,805,400 | 22,477 | |
| 57,526 | |||
TOTAL MATERIALS | 135,039 | ||
| REAL ESTATE - 4.7% | |||
| Equity Real Estate Investment Trusts (REITs) - 4.0% | |||
| Essential Properties Realty Trust, Inc. | 947,101 | 21,982 | |
| Lamar Advertising Co. Class A | 254,800 | 25,516 | |
| Summit Industrial Income REIT | 931,100 | 15,609 | |
| Urban Edge Properties | 848,600 | 13,348 | |
| 76,455 | |||
| Real Estate Management & Development - 0.7% | |||
| Cushman & Wakefield PLC (a) | 1,202,300 | 13,730 | |
TOTAL REAL ESTATE | 90,185 | ||
| UTILITIES - 1.7% | |||
| Gas Utilities - 1.0% | |||
| Brookfield Infrastructure Corp. A Shares | 398,767 | 18,694 | |
| Multi-Utilities - 0.7% | |||
| Telecom Plus PLC | 457,043 | 13,819 | |
TOTAL UTILITIES | 32,513 | ||
| TOTAL COMMON STOCKS (Cost $1,551,628) | 1,884,821 | ||
| Money Market Funds - 3.4% | |||
| Shares | Value ($) (000s) | ||
| Fidelity Cash Central Fund 3.86% (c) | 14,939,115 | 14,942 | |
| Fidelity Securities Lending Cash Central Fund 3.86% (c)(d) | 50,378,860 | 50,384 | |
| TOTAL MONEY MARKET FUNDS (Cost $65,326) | 65,326 | ||
| Equity Funds - 0.7% | |||
| Shares | Value ($) (000s) | ||
| Small Blend Funds - 0.7% | |||
iShares Russell 2000 Index ETF (b) (Cost $10,237) | 64,900 | 12,160 | |
| TOTAL INVESTMENT IN SECURITIES - 102.6% (Cost $1,627,191) | 1,962,307 |
NET OTHER ASSETS (LIABILITIES) - (2.6)% | (48,904) |
| NET ASSETS - 100.0% | 1,913,403 |
| ETF | - | EXCHANGE-TRADED FUND |
| (a) | Non-income producing |
| (b) | Security or a portion of the security is on loan at period end. |
| (c) | Affiliated fund that is generally available only to investment companies and other accounts managed by Fidelity Investments. The rate quoted is the annualized seven-day yield of the fund at period end. A complete unaudited listing of the fund's holdings as of its most recent quarter end is available upon request. In addition, each Fidelity Central Fund's financial statements, which are not covered by the Fund's Report of Independent Registered Public Accounting Firm, are available on the SEC's website or upon request. |
| (d) | Investment made with cash collateral received from securities on loan. |
| Affiliate (Amounts in thousands) | Value, beginning of period ($) | Purchases ($) | Sales Proceeds ($) | Dividend Income ($) | Realized Gain (loss) ($) | Change in Unrealized appreciation (depreciation) ($) | Value, end of period ($) | % ownership, end of period |
| Fidelity Cash Central Fund 3.86% | 15,879 | 559,750 | 560,687 | 167 | - | - | 14,942 | 0.0% |
| Fidelity Securities Lending Cash Central Fund 3.86% | 158,795 | 661,845 | 770,256 | 379 | - | - | 50,384 | 0.2% |
| Total | 174,674 | 1,221,595 | 1,330,943 | 546 | - | - | 65,326 | |
| Valuation Inputs at Reporting Date: | ||||
Description (Amounts in thousands) | Total ($) | Level 1 ($) | Level 2 ($) | Level 3 ($) |
Investments in Securities: | ||||
| Equities: | ||||
Communication Services | 54,761 | 54,761 | - | - |
Consumer Discretionary | 210,340 | 199,734 | 10,606 | - |
Consumer Staples | 72,784 | 72,784 | - | - |
Energy | 91,217 | 91,217 | - | - |
Financials | 305,002 | 305,002 | - | - |
Health Care | 254,597 | 254,597 | - | - |
Industrials | 355,076 | 355,076 | - | - |
Information Technology | 283,307 | 283,307 | - | - |
Materials | 135,039 | 135,039 | - | - |
Real Estate | 90,185 | 90,185 | - | - |
Utilities | 32,513 | 18,694 | 13,819 | - |
| Money Market Funds | 65,326 | 65,326 | - | - |
| Equity Funds | 12,160 | 12,160 | - | - |
| Total Investments in Securities: | 1,962,307 | 1,937,882 | 24,425 | - |
| Statement of Assets and Liabilities | ||||
| Amounts in thousands (except per-share amounts) | November 30, 2022 | |||
| Assets | ||||
| Investment in securities, at value (including securities loaned of $50,569) - See accompanying schedule: | ||||
Unaffiliated issuers (cost $1,561,865) | $1,896,981 | |||
Fidelity Central Funds (cost $65,326) | 65,326 | |||
| Total Investment in Securities (cost $1,627,191) | $ | 1,962,307 | ||
| Receivable for investments sold | 4,360 | |||
| Receivable for fund shares sold | 529 | |||
| Dividends receivable | 1,266 | |||
| Distributions receivable from Fidelity Central Funds | 90 | |||
| Prepaid expenses | 3 | |||
Total assets | 1,968,555 | |||
| Liabilities | ||||
| Payable for investments purchased | $1,203 | |||
| Payable for fund shares redeemed | 1,501 | |||
| Accrued management fee | 1,356 | |||
| Distribution and service plan fees payable | 370 | |||
| Other affiliated payables | 292 | |||
| Other payables and accrued expenses | 49 | |||
| Collateral on securities loaned | 50,381 | |||
| Total Liabilities | 55,152 | |||
| Net Assets | $ | 1,913,403 | ||
| Net Assets consist of: | ||||
| Paid in capital | $ | 1,506,201 | ||
| Total accumulated earnings (loss) | 407,202 | |||
| Net Assets | $ | 1,913,403 | ||
| Net Asset Value and Maximum Offering Price | ||||
| Class A : | ||||
Net Asset Value and redemption price per share ($676,037 ÷ 25,350 shares) (a) | $ | 26.67 | ||
| Maximum offering price per share (100/94.25 of $26.67) | $ | 28.30 | ||
| Class M : | ||||
Net Asset Value and redemption price per share ($477,111 ÷ 20,146 shares) (a) | $ | 23.68 | ||
| Maximum offering price per share (100/96.50 of $23.68) | $ | 24.54 | ||
| Class C : | ||||
Net Asset Value and offering price per share ($50,464 ÷ 2,965 shares) (a) | $ | 17.02 | ||
| Class I : | ||||
Net Asset Value , offering price and redemption price per share ($455,676 ÷ 14,910 shares) | $ | 30.56 | ||
| Class Z : | ||||
Net Asset Value , offering price and redemption price per share ($254,115 ÷ 8,266 shares) | $ | 30.74 | ||
(a)Redemption price per share is equal to net asset value less any applicable contingent deferred sales charge. | ||||
| Statement of Operations | ||||
| Amounts in thousands | Year ended November 30, 2022 | |||
| Investment Income | ||||
| Dividends | $ | 17,691 | ||
| Income from Fidelity Central Funds (including $379 from security lending) | 546 | |||
| Total Income | 18,237 | |||
| Expenses | ||||
| Management fee | ||||
| Basic fee | $ | 13,312 | ||
| Performance adjustment | 3,398 | |||
| Transfer agent fees | 3,328 | |||
| Distribution and service plan fees | 4,841 | |||
| Accounting fees | 566 | |||
| Custodian fees and expenses | 48 | |||
| Independent trustees' fees and expenses | 7 | |||
| Registration fees | 137 | |||
| Audit | 56 | |||
| Legal | 4 | |||
| Interest | 11 | |||
| Miscellaneous | 7 | |||
| Total expenses before reductions | 25,715 | |||
| Expense reductions | (65) | |||
| Total expenses after reductions | 25,650 | |||
| Net Investment income (loss) | (7,413) | |||
| Realized and Unrealized Gain (Loss) | ||||
| Net realized gain (loss) on: | ||||
| Investment Securities: | ||||
| Unaffiliated issuers | 107,290 | |||
| Foreign currency transactions | 14 | |||
| Total net realized gain (loss) | 107,304 | |||
| Change in net unrealized appreciation (depreciation) on: | ||||
| Investment Securities: | ||||
| Unaffiliated issuers | (416,187) | |||
| Assets and liabilities in foreign currencies | (4) | |||
| Total change in net unrealized appreciation (depreciation) | (416,191) | |||
| Net gain (loss) | (308,887) | |||
| Net increase (decrease) in net assets resulting from operations | $ | (316,300) | ||
| Statement of Changes in Net Assets | ||||
| Amount in thousands | Year ended November 30, 2022 | Year ended November 30, 2021 | ||
| Increase (Decrease) in Net Assets | ||||
| Operations | ||||
| Net investment income (loss) | $ | (7,413) | $ | (11,349) |
| Net realized gain (loss) | 107,304 | 269,757 | ||
| Change in net unrealized appreciation (depreciation) | (416,191) | 322,581 | ||
| Net increase (decrease) in net assets resulting from operations | (316,300) | 580,989 | ||
| Distributions to shareholders | (224,659) | (47,913) | ||
| Share transactions - net increase (decrease) | 289,457 | (48,584) | ||
| Total increase (decrease) in net assets | (251,502) | 484,492 | ||
| Net Assets | ||||
| Beginning of period | 2,164,905 | 1,680,413 | ||
| End of period | $ | 1,913,403 | $ | 2,164,905 |
| Fidelity Advisor® Small Cap Fund Class A |
| Years ended November 30, | 2022 | 2021 | 2020 | 2019 | 2018 | |||||
Selected Per-Share Data | ||||||||||
| Net asset value, beginning of period | $ | 34.34 | $ | 26.09 | $ | 24.25 | $ | 24.46 | $ | 29.35 |
| Income from Investment Operations | ||||||||||
Net investment income (loss) A,B | (.11) | (.17) | (.08) | (.03) | (.04) | |||||
| Net realized and unrealized gain (loss) | (4.04) | 9.15 | 2.85 | 2.56 | (1.28) | |||||
| Total from investment operations | (4.15) | 8.98 | 2.77 | 2.53 | (1.32) | |||||
| Distributions from net realized gain | (3.52) | (.73) | (.93) | (2.74) | (3.57) | |||||
| Total distributions | (3.52) | (.73) | (.93) | (2.74) | (3.57) | |||||
| Net asset value, end of period | $ | 26.67 | $ | 34.34 | $ | 26.09 | $ | 24.25 | $ | 24.46 |
Total Return C,D | (13.82)% | 35.20% | 11.78% | 13.97% | (5.18)% | |||||
Ratios to Average Net Assets B,E,F | ||||||||||
| Expenses before reductions | 1.33% | 1.22% | 1.22% | .98% | .97% | |||||
| Expenses net of fee waivers, if any | 1.32% | 1.22% | 1.22% | .98% | .97% | |||||
| Expenses net of all reductions | 1.32% | 1.22% | 1.22% | .98% | .96% | |||||
| Net investment income (loss) | (.40)% | (.53)% | (.36)% | (.13)% | (.13)% | |||||
| Supplemental Data | ||||||||||
| Net assets, end of period (in millions) | $ | 676 | $ | 837 | $ | 638 | $ | 654 | $ | 640 |
Portfolio turnover rate G | 47% | 41% | 47% | 56% | 74% |
| Fidelity Advisor® Small Cap Fund Class M |
| Years ended November 30, | 2022 | 2021 | 2020 | 2019 | 2018 | |||||
Selected Per-Share Data | ||||||||||
| Net asset value, beginning of period | $ | 30.88 | $ | 23.58 | $ | 22.06 | $ | 22.58 | $ | 27.43 |
| Income from Investment Operations | ||||||||||
Net investment income (loss) A,B | (.15) | (.22) | (.12) | (.07) | (.09) | |||||
| Net realized and unrealized gain (loss) | (3.59) | 8.25 | 2.57 | 2.29 | (1.19) | |||||
| Total from investment operations | (3.74) | 8.03 | 2.45 | 2.22 | (1.28) | |||||
| Distributions from net realized gain | (3.46) | (.73) | (.93) | (2.74) | (3.57) | |||||
| Total distributions | (3.46) | (.73) | (.93) | (2.74) | (3.57) | |||||
| Net asset value, end of period | $ | 23.68 | $ | 30.88 | $ | 23.58 | $ | 22.06 | $ | 22.58 |
Total Return C,D | (14.03)% | 34.91% | 11.49% | 13.73% | (5.42)% | |||||
Ratios to Average Net Assets B,E,F | ||||||||||
| Expenses before reductions | 1.57% | 1.46% | 1.45% | 1.22% | 1.20% | |||||
| Expenses net of fee waivers, if any | 1.56% | 1.46% | 1.45% | 1.22% | 1.20% | |||||
| Expenses net of all reductions | 1.56% | 1.46% | 1.45% | 1.21% | 1.19% | |||||
| Net investment income (loss) | (.64)% | (.77)% | (.59)% | (.36)% | (.37)% | |||||
| Supplemental Data | ||||||||||
| Net assets, end of period (in millions) | $ | 477 | $ | 619 | $ | 503 | $ | 542 | $ | 580 |
Portfolio turnover rate G | 47% | 41% | 47% | 56% | 74% |
| Fidelity Advisor® Small Cap Fund Class C |
| Years ended November 30, | 2022 | 2021 | 2020 | 2019 | 2018 | |||||
Selected Per-Share Data | ||||||||||
| Net asset value, beginning of period | $ | 23.16 | $ | 17.96 | $ | 17.11 | $ | 18.32 | $ | 23.02 |
| Income from Investment Operations | ||||||||||
Net investment income (loss) A,B | (.21) | (.29) | (.18) | (.15) | (.18) | |||||
| Net realized and unrealized gain (loss) | (2.56) | 6.22 | 1.96 | 1.68 | (.95) | |||||
| Total from investment operations | (2.77) | 5.93 | 1.78 | 1.53 | (1.13) | |||||
| Distributions from net realized gain | (3.37) | (.73) | (.93) | (2.74) | (3.57) | |||||
| Total distributions | (3.37) | (.73) | (.93) | (2.74) | (3.57) | |||||
| Net asset value, end of period | $ | 17.02 | $ | 23.16 | $ | 17.96 | $ | 17.11 | $ | 18.32 |
Total Return C,D | (14.51)% | 34.12% | 10.87% | 13.05% | (5.88)% | |||||
Ratios to Average Net Assets B,E,F | ||||||||||
| Expenses before reductions | 2.15% | 2.03% | 2.04% | 1.79% | 1.74% | |||||
| Expenses net of fee waivers, if any | 2.14% | 2.03% | 2.04% | 1.79% | 1.74% | |||||
| Expenses net of all reductions | 2.14% | 2.03% | 2.03% | 1.78% | 1.73% | |||||
| Net investment income (loss) | (1.22)% | (1.34)% | (1.18)% | (.93)% | (.90)% | |||||
| Supplemental Data | ||||||||||
| Net assets, end of period (in millions) | $ | 50 | $ | 73 | $ | 81 | $ | 96 | $ | 196 |
Portfolio turnover rate G | 47% | 41% | 47% | 56% | 74% |
| Fidelity Advisor® Small Cap Fund Class I |
| Years ended November 30, | 2022 | 2021 | 2020 | 2019 | 2018 | |||||
Selected Per-Share Data | ||||||||||
| Net asset value, beginning of period | $ | 38.84 | $ | 29.34 | $ | 27.09 | $ | 26.89 | $ | 31.84 |
| Income from Investment Operations | ||||||||||
Net investment income (loss) A,B | (.05) | (.10) | (.02) | .03 | .04 | |||||
| Net realized and unrealized gain (loss) | (4.63) | 10.33 | 3.20 | 2.91 | (1.42) | |||||
| Total from investment operations | (4.68) | 10.23 | 3.18 | 2.94 | (1.38) | |||||
| Distributions from net realized gain | (3.60) | (.73) | (.93) | (2.74) | (3.57) | |||||
| Total distributions | (3.60) | (.73) | (.93) | (2.74) | (3.57) | |||||
| Net asset value, end of period | $ | 30.56 | $ | 38.84 | $ | 29.34 | $ | 27.09 | $ | 26.89 |
Total Return C | (13.61)% | 35.57% | 12.07% | 14.26% | (4.93)% | |||||
Ratios to Average Net Assets B,D,E | ||||||||||
| Expenses before reductions | 1.08% | .97% | .96% | .72% | .71% | |||||
| Expenses net of fee waivers, if any | 1.07% | .96% | .95% | .72% | .71% | |||||
| Expenses net of all reductions | 1.07% | .96% | .95% | .72% | .70% | |||||
| Net investment income (loss) | (.15)% | (.27)% | (.09)% | .14% | .12% | |||||
| Supplemental Data | ||||||||||
| Net assets, end of period (in millions) | $ | 456 | $ | 519 | $ | 378 | $ | 434 | $ | 604 |
Portfolio turnover rate F | 47% | 41% | 47% | 56% | 74% |
| Fidelity Advisor® Small Cap Fund Class Z |
| Years ended November 30, | 2022 | 2021 | 2020 | 2019 | 2018 | |||||
Selected Per-Share Data | ||||||||||
| Net asset value, beginning of period | $ | 39.04 | $ | 29.45 | $ | 27.15 | $ | 26.90 | $ | 31.81 |
| Income from Investment Operations | ||||||||||
Net investment income (loss) A,B | - | (.05) | .01 | .07 | .08 | |||||
| Net realized and unrealized gain (loss) | (4.65) | 10.37 | 3.22 | 2.92 | (1.42) | |||||
| Total from investment operations | (4.65) | 10.32 | 3.23 | 2.99 | (1.34) | |||||
| Distributions from net realized gain | (3.65) | (.73) | (.93) | (2.74) | (3.57) | |||||
| Total distributions | (3.65) | (.73) | (.93) | (2.74) | (3.57) | |||||
| Net asset value, end of period | $ | 30.74 | $ | 39.04 | $ | 29.45 | $ | 27.15 | $ | 26.90 |
Total Return C | (13.47)% | 35.75% | 12.23% | 14.46% | (4.80)% | |||||
Ratios to Average Net Assets B,D,E | ||||||||||
| Expenses before reductions | .93% | .83% | .81% | .57% | .56% | |||||
| Expenses net of fee waivers, if any | .93% | .83% | .81% | .57% | .56% | |||||
| Expenses net of all reductions | .93% | .83% | .80% | .57% | .55% | |||||
| Net investment income (loss) | -% | (.14)% | .05% | .29% | .28% | |||||
| Supplemental Data | ||||||||||
| Net assets, end of period (in millions) | $ | 254 | $ | 117 | $ | 79 | $ | 117 | $ | 71 |
Portfolio turnover rate F | 47% | 41% | 47% | 56% | 74% |
| Fidelity Central Fund | Investment Manager | Investment Objective | Investment Practices | Expense Ratio A |
| Fidelity Money Market Central Funds | Fidelity Management & Research Company LLC (FMR) | Each fund seeks to obtain a high level of current income consistent with the preservation of capital and liquidity. | Short-term Investments | Less than .005% |
| Gross unrealized appreciation | $494,083 |
| Gross unrealized depreciation | (163,673) |
| Net unrealized appreciation (depreciation) | $330,410 |
| Tax Cost | $1,631,897 |
| Undistributed long-term capital gain | $89,299 |
| Net unrealized appreciation (depreciation) on securities and other investments | $325,523 |
| November 30, 2022 | November 30, 2021 | |
| Ordinary Income | $9,286 | $- |
| Long-term Capital Gains | 215,373 | 47,913 |
| Total | $224,659 | $47,913 |
| Purchases ($) | Sales ($) | |
| Fidelity Advisor Small Cap Fund | 988,737 | 934,256 |
| Distribution Fee | Service Fee | Total Fees | Retained by FDC | |
| Class A | - % | .25% | $1,742 | $16 |
| Class M | .25% | .25% | 2,537 | 2 |
| Class C | .75% | .25% | 562 | 47 |
| $4,841 | $65 |
| Retained by FDC | |
| Class A | $63 |
| Class M | 7 |
Class C A | 1 |
| $71 |
| Amount | % of Class-Level Average Net Assets | |
| Class A | $1,308 | .19 |
| Class M | 887 | .17 |
| Class C | 143 | .25 |
| Class I | 898 | .18 |
| Class Z | 92 | .04 |
| $3,328 |
| % of Average Net Assets | |
| Fidelity Advisor Small Cap Fund | .03 |
| Amount | |
| Fidelity Advisor Small Cap Fund | $33 |
| Borrower or Lender | Average Loan Balance | Weighted Average Interest Rate | Interest Expense | |
| Fidelity Advisor Small Cap Fund | Borrower | $ 15,033 | 3.32% | $ 11 |
| Purchases ($) | Sales ($) | Realized Gain (Loss) ($) | |
| Fidelity Advisor Small Cap Fund | 76,847 | 75,190 | 1,675 |
| Amount | |
| Fidelity Advisor Small Cap Fund | $3 |
| Total Security Lending Fees Paid to NFS | Security Lending Income From Securities Loaned to NFS | Value of Securities Loaned to NFS at Period End | |
| Fidelity Advisor Small Cap Fund | $41 | $4 | $- |
Year ended November 30, 2022 | Year ended November 30, 2021 | |
| Fidelity Advisor Small Cap Fund | ||
| Distributions to shareholders | ||
| Class A | $85,485 | $17,774 |
| Class M | 68,964 | 15,471 |
| Class C | 10,451 | 3,281 |
| Class I | 48,341 | 9,390 |
| Class Z | 11,418 | 1,997 |
Total | $224,659 | $47,913 |
| Shares | Shares | Dollars | Dollars | |
| Year ended November 30, 2022 | Year ended November 30, 2021 | Year ended November 30, 2022 | Year ended November 30, 2021 | |
| Fidelity Advisor Small Cap Fund | ||||
| Class A | ||||
| Shares sold | 2,491 | 3,148 | $68,027 | $99,730 |
| Reinvestment of distributions | 2,567 | 638 | 82,352 | 17,138 |
| Shares redeemed | (4,082) | (3,876) | (111,179) | (122,469) |
| Net increase (decrease) | 976 | (90) | $39,200 | $(5,601) |
| Class M | ||||
| Shares sold | 2,126 | 2,602 | $52,266 | $73,949 |
| Reinvestment of distributions | 2,378 | 630 | 67,891 | 15,247 |
| Shares redeemed | (4,400) | (4,539) | (106,286) | (129,194) |
| Net increase (decrease) | 104 | (1,307) | $13,871 | $(39,998) |
| Class C | ||||
| Shares sold | 392 | 418 | $6,792 | $8,936 |
| Reinvestment of distributions | 503 | 178 | 10,385 | 3,255 |
| Shares redeemed | (1,082) | (1,979) | (18,975) | (42,426) |
| Net increase (decrease) | (187) | (1,383) | $(1,798) | $(30,235) |
| Class I | ||||
| Shares sold | 5,582 | 3,396 | $181,303 | $120,358 |
| Reinvestment of distributions | 1,244 | 292 | 45,641 | 8,856 |
| Shares redeemed | (5,276) | (3,212) | (159,279) | (113,589) |
| Net increase (decrease) | 1,550 | 476 | $67,665 | $15,625 |
| Class Z | ||||
| Shares sold | 8,202 | 1,309 | $253,540 | $47,880 |
| Reinvestment of distributions | 267 | 50 | 9,831 | 1,528 |
| Shares redeemed | (3,209) | (1,044) | (92,852) | (37,783) |
| Net increase (decrease) | 5,260 | 315 | $170,519 | $11,625 |
| The Example is based on an investment of $1,000 invested at the beginning of the period and held for the entire period (June 1, 2022 to November 30, 2022). |
Annualized Expense Ratio- A | Beginning Account Value June 1, 2022 | Ending Account Value November 30, 2022 | Expenses Paid During Period- C June 1, 2022 to November 30, 2022 | |||||||
| Fidelity Advisor® Small Cap Fund | ||||||||||
| Class A | 1.32% | |||||||||
| Actual | $ 1,000 | $ 1,025.80 | $ 6.70 | |||||||
Hypothetical- B | $ 1,000 | $ 1,018.45 | $ 6.68 | |||||||
| Class M | 1.56% | |||||||||
| Actual | $ 1,000 | $ 1,024.70 | $ 7.92 | |||||||
Hypothetical- B | $ 1,000 | $ 1,017.25 | $ 7.89 | |||||||
| Class C | 2.14% | |||||||||
| Actual | $ 1,000 | $ 1,021.60 | $ 10.85 | |||||||
Hypothetical- B | $ 1,000 | $ 1,014.34 | $ 10.81 | |||||||
| Class I | 1.07% | |||||||||
| Actual | $ 1,000 | $ 1,027.20 | $ 5.44 | |||||||
Hypothetical- B | $ 1,000 | $ 1,019.70 | $ 5.42 | |||||||
| Class Z | .93% | |||||||||
| Actual | $ 1,000 | $ 1,028.10 | $ 4.73 | |||||||
Hypothetical- B | $ 1,000 | $ 1,020.41 | $ 4.71 | |||||||
|


Contents
| Average Annual Total Returns | |||
Periods ended November 30, 2022 | Past 1 year | Past 5 years | Past 10 years |
| Class A (incl.5.75% sales charge) | -37.15% | 14.14% | 15.21% |
| Class M (incl.3.50% sales charge) | -35.80% | 14.41% | 15.22% |
Class C (incl. contingent deferred sales charge) | -34.41% | 14.63% | 15.20% |
| Class I | -33.15% | 15.80% | 16.21% |
| Class Z | -33.06% | 15.94% | 16.34% |
| $10,000 Over 10 Years |
Let's say hypothetically that $10,000 was invested in Fidelity Advisor® Growth Opportunities Fund - Class A, on November 30, 2012, and the current 5.75% sales charge was paid. The chart shows how the value of your investment would have changed, and also shows how the Russell 1000® Growth Index performed over the same period. |
 |
Top Holdings (% of Fund's net assets) | ||
| Microsoft Corp. | 7.9 | |
| Alphabet, Inc. Class C | 5.1 | |
| Amazon.com, Inc. | 4.1 | |
| T-Mobile U.S., Inc. | 4.0 | |
| NVIDIA Corp. | 3.4 | |
| Apple, Inc. | 3.0 | |
| Antero Resources Corp. | 2.6 | |
| Uber Technologies, Inc. | 2.4 | |
| UnitedHealth Group, Inc. | 2.1 | |
| Tesla, Inc. | 2.0 | |
| 36.6 | ||
| Market Sectors (% of Fund's net assets) | ||
| Information Technology | 39.7 | |
| Communication Services | 15.9 | |
| Health Care | 12.5 | |
| Consumer Discretionary | 12.2 | |
| Energy | 9.9 | |
| Utilities | 2.7 | |
| Materials | 2.6 | |
| Industrials | 2.1 | |
| Financials | 1.9 | |
| Consumer Staples | 0.4 | |
| Real Estate | 0.2 | |
Asset Allocation (% of Fund's net assets) |
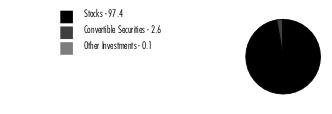 |
Short-Term Investments and Net Other Assets (Liabilities) - (0.1)%* |
Foreign investments - 13.1% |
*Short-Term Investments and Net Other Assets (Liabilities) are not available in the pie chart. |
Geographic Diversification (% of Fund's net assets) |
 |
* Includes Short-Term investments and Net Other Assets (Liabilities). Percentages are based on country or territory of incorporation and are adjusted for the effect of futures contracts, if applicable. |
| Common Stocks - 96.4% | |||
| Shares | Value ($) (000s) | ||
| COMMUNICATION SERVICES - 15.5% | |||
| Diversified Telecommunication Services - 0.1% | |||
| AT&T, Inc. | 169,500 | 3,268 | |
| Cellnex Telecom SA (a) | 48,400 | 1,664 | |
| Starry Group Holdings, Inc. Class A (b)(c) | 1,084,026 | 204 | |
| 5,136 | |||
| Entertainment - 1.3% | |||
| Netflix, Inc. (b) | 90,900 | 27,773 | |
| Roku, Inc. Class A (b)(c) | 1,135,420 | 67,410 | |
| Sea Ltd. ADR (b) | 1,765,684 | 103,063 | |
| 198,246 | |||
| Interactive Media & Services - 8.9% | |||
| Alphabet, Inc.: | |||
| Class A (b) | 2,705,760 | 273,255 | |
| Class C (b) | 7,438,480 | 754,634 | |
| Epic Games, Inc. (b)(d)(e) | 56,200 | 47,593 | |
| Meta Platforms, Inc. Class A (b) | 1,353,985 | 159,906 | |
| Snap, Inc. Class A (b) | 1,808,000 | 18,640 | |
| Zoominfo Technologies, Inc. (b) | 2,711,000 | 77,535 | |
| 1,331,563 | |||
| Media - 1.2% | |||
| Charter Communications, Inc. Class A (b) | 77,300 | 30,247 | |
| Innovid Corp. (b)(d) | 1,017,722 | 3,012 | |
| Magnite, Inc. (b)(c) | 4,921,531 | 54,678 | |
| TechTarget, Inc. (b) | 983,227 | 44,894 | |
| The Trade Desk, Inc. (b) | 821,410 | 42,828 | |
| 175,659 | |||
| Wireless Telecommunication Services - 4.0% | |||
| T-Mobile U.S., Inc. (b) | 3,945,925 | 597,650 | |
TOTAL COMMUNICATION SERVICES | 2,308,254 | ||
| CONSUMER DISCRETIONARY - 11.3% | |||
| Auto Components - 0.1% | |||
| Aptiv PLC (b) | 95,000 | 10,134 | |
| Mobileye Global, Inc. (c) | 132,400 | 3,775 | |
| 13,909 | |||
| Automobiles - 2.0% | |||
| General Motors Co. | 84,000 | 3,407 | |
| Neutron Holdings, Inc. (b)(d)(e) | 474,927 | 10 | |
| Rad Power Bikes, Inc. (b)(d)(e) | 382,384 | 1,667 | |
| Rivian Automotive, Inc. | 40,600 | 1,301 | |
| Tesla, Inc. (b) | 1,533,140 | 298,502 | |
| 304,887 | |||
| Diversified Consumer Services - 0.0% | |||
| Duolingo, Inc. (b) | 34,000 | 2,369 | |
| Hotels, Restaurants & Leisure - 0.1% | |||
| Airbnb, Inc. Class A (b) | 65,100 | 6,649 | |
| Domino's Pizza, Inc. | 4,400 | 1,710 | |
| Sonder Holdings, Inc. (b)(c) | 1,297,021 | 2,296 | |
| Sonder Holdings, Inc.: | |||
| rights (b)(e) | 15,489 | 11 | |
| rights (b)(e) | 15,488 | 9 | |
| rights (b)(e) | 15,488 | 8 | |
| rights (b)(e) | 15,488 | 7 | |
| rights (b)(e) | 15,488 | 6 | |
| rights (b)(e) | 15,488 | 5 | |
| 10,701 | |||
| Household Durables - 0.0% | |||
| Lennar Corp. Class A | 19,600 | 1,721 | |
| Internet & Direct Marketing Retail - 8.0% | |||
| Amazon.com, Inc. (b) | 6,273,040 | 605,599 | |
| Cazoo Group Ltd. Class A (b)(c) | 12,453,403 | 3,362 | |
| Doordash, Inc. (b) | 1,083,500 | 63,114 | |
| FSN E-Commerce Ventures Private Ltd. | 13,951,800 | 29,731 | |
| Global-e Online Ltd. (b)(c) | 2,273,808 | 49,046 | |
| Lyft, Inc. (b) | 6,185,902 | 69,406 | |
| Uber Technologies, Inc. (b) | 12,144,581 | 353,893 | |
| Wayfair LLC Class A (b) | 433,529 | 15,885 | |
| 1,190,036 | |||
| Specialty Retail - 0.6% | |||
| Auto1 Group SE (a)(b) | 9,692,179 | 84,682 | |
| Carvana Co. Class A (b)(c) | 1,182,600 | 9,118 | |
| 93,800 | |||
| Textiles, Apparel & Luxury Goods - 0.5% | |||
| Bombas LLC (b)(d)(e) | 5,086,874 | 18,058 | |
| lululemon athletica, Inc. (b) | 134,110 | 51,003 | |
| 69,061 | |||
TOTAL CONSUMER DISCRETIONARY | 1,686,484 | ||
| CONSUMER STAPLES - 0.2% | |||
| Beverages - 0.1% | |||
| Boston Beer Co., Inc. Class A (b) | 48,000 | 18,450 | |
| Food Products - 0.1% | |||
| Local Bounti Corp. (b)(c) | 3,652,755 | 7,671 | |
| Tobacco - 0.0% | |||
| JUUL Labs, Inc. Class B (b)(d)(e) | 2,772 | 12 | |
| Philip Morris International, Inc. | 37,100 | 3,698 | |
| 3,710 | |||
TOTAL CONSUMER STAPLES | 29,831 | ||
| ENERGY - 9.9% | |||
| Oil, Gas & Consumable Fuels - 9.9% | |||
| Antero Resources Corp. (b) | 10,794,947 | 394,555 | |
| Canadian Natural Resources Ltd. | 2,974,400 | 177,582 | |
| Cenovus Energy, Inc. (Canada) | 6,346,600 | 126,210 | |
| Cheniere Energy, Inc. | 80,600 | 14,134 | |
| Exxon Mobil Corp. | 2,345,900 | 261,193 | |
| Hess Corp. | 1,462,545 | 210,475 | |
| Imperial Oil Ltd. | 428,500 | 24,379 | |
| Ovintiv, Inc. | 2,731,500 | 152,308 | |
| Range Resources Corp. | 286,800 | 8,280 | |
| Tourmaline Oil Corp. | 1,793,900 | 109,182 | |
| 1,478,298 | |||
| FINANCIALS - 1.8% | |||
| Banks - 1.5% | |||
| Starling Bank Ltd. Series D (b)(d)(e) | 6,988,700 | 25,017 | |
| Wells Fargo & Co. | 4,228,200 | 202,742 | |
| 227,759 | |||
| Capital Markets - 0.1% | |||
| LPL Financial | 45,500 | 10,770 | |
| Diversified Financial Services - 0.2% | |||
| Rapyd Financial Network 2016 Ltd. (b)(d)(e) | 340,545 | 24,686 | |
TOTAL FINANCIALS | 263,215 | ||
| HEALTH CARE - 12.4% | |||
| Biotechnology - 2.5% | |||
| ADC Therapeutics SA (b) | 238,174 | 872 | |
| Agios Pharmaceuticals, Inc. (b) | 671,100 | 20,227 | |
| Alnylam Pharmaceuticals, Inc. (b) | 206,135 | 45,471 | |
| ALX Oncology Holdings, Inc. (b) | 653,300 | 7,252 | |
| Arcutis Biotherapeutics, Inc. (b) | 235,100 | 4,051 | |
| Argenx SE ADR (b) | 142,699 | 56,790 | |
| Ascendis Pharma A/S sponsored ADR (b) | 67,662 | 8,326 | |
| Blueprint Medicines Corp. (b) | 89,800 | 4,292 | |
| Celldex Therapeutics, Inc. (b) | 804,000 | 29,820 | |
| Cytokinetics, Inc. (b) | 1,015,500 | 43,159 | |
| Erasca, Inc. (b) | 1,287,400 | 9,720 | |
| Exelixis, Inc. (b) | 1,277,900 | 21,827 | |
| Gilead Sciences, Inc. | 36,800 | 3,232 | |
| Icosavax, Inc. (b) | 736,800 | 2,461 | |
| Instil Bio, Inc. (b) | 1,581,200 | 2,103 | |
| Keros Therapeutics, Inc. (b) | 277,800 | 13,846 | |
| Moderna, Inc. (b) | 8,200 | 1,442 | |
| Monte Rosa Therapeutics, Inc. (b) | 396,100 | 3,359 | |
| Morphic Holding, Inc. (b) | 208,036 | 5,725 | |
| Natera, Inc. (b) | 31,500 | 1,295 | |
| Nuvalent, Inc. Class A (b) | 283,376 | 9,317 | |
| PTC Therapeutics, Inc. (b) | 58,900 | 2,444 | |
| Relay Therapeutics, Inc. (b)(c) | 1,742 | 32 | |
| Tenaya Therapeutics, Inc. (b) | 421,700 | 1,118 | |
| TG Therapeutics, Inc. (b) | 666,361 | 5,877 | |
| Vaxcyte, Inc. (b) | 1,088,743 | 50,148 | |
| Verve Therapeutics, Inc. (b) | 217,300 | 5,048 | |
| Zentalis Pharmaceuticals, Inc. (b) | 686,100 | 15,177 | |
| 374,431 | |||
| Health Care Equipment & Supplies - 2.2% | |||
| Blink Health LLC Series A1 (b)(d)(e) | 56,119 | 2,171 | |
| Boston Scientific Corp. (b) | 3,880,074 | 175,651 | |
| Insulet Corp. (b) | 113,310 | 33,922 | |
| Penumbra, Inc. (b) | 190,763 | 39,967 | |
| TransMedics Group, Inc. (b) | 1,220,217 | 75,495 | |
| 327,206 | |||
| Health Care Providers & Services - 6.8% | |||
| agilon health, Inc. (b)(c) | 5,366,700 | 94,239 | |
| Alignment Healthcare, Inc. (b) | 986,100 | 13,115 | |
| Centene Corp. (b) | 2,101,444 | 182,931 | |
| Guardant Health, Inc. (b) | 805,700 | 42,170 | |
| Humana, Inc. | 407,260 | 223,952 | |
| LifeStance Health Group, Inc. (b) | 4,628,581 | 23,559 | |
| Oak Street Health, Inc. (b)(c) | 4,714,900 | 101,936 | |
| P3 Health Partners, Inc. (b)(d)(f) | 2,032,510 | 9,715 | |
| The Oncology Institute, Inc. (b)(d) | 814,767 | 1,149 | |
| UnitedHealth Group, Inc. | 574,767 | 314,834 | |
| 1,007,600 | |||
| Life Sciences Tools & Services - 0.8% | |||
| Danaher Corp. | 228,200 | 62,392 | |
| Sartorius Stedim Biotech | 86,800 | 29,625 | |
| Thermo Fisher Scientific, Inc. | 51,800 | 29,019 | |
| 121,036 | |||
| Pharmaceuticals - 0.1% | |||
| Arvinas Holding Co. LLC (b) | 316,700 | 12,997 | |
| AstraZeneca PLC sponsored ADR | 25,400 | 1,726 | |
| Eli Lilly & Co. | 21,300 | 7,904 | |
| 22,627 | |||
TOTAL HEALTH CARE | 1,852,900 | ||
| INDUSTRIALS - 1.4% | |||
| Aerospace & Defense - 1.4% | |||
| Lockheed Martin Corp. | 147,700 | 71,663 | |
| Northrop Grumman Corp. | 110,600 | 58,982 | |
| Space Exploration Technologies Corp. Class A (b)(d)(e) | 85,000 | 5,950 | |
| The Boeing Co. (b) | 403,600 | 72,196 | |
| 208,791 | |||
| Air Freight & Logistics - 0.0% | |||
| Delhivery Private Ltd. | 1,039,700 | 4,315 | |
| FedEx Corp. | 6,400 | 1,166 | |
| 5,481 | |||
| Road & Rail - 0.0% | |||
| Bird Global, Inc.: | |||
| rights (b)(e) | 106,001 | 4 | |
| rights (b)(e) | 106,001 | 3 | |
| rights (b)(e) | 106,001 | 2 | |
| 9 | |||
TOTAL INDUSTRIALS | 214,281 | ||
| INFORMATION TECHNOLOGY - 38.5% | |||
| Electronic Equipment & Components - 1.3% | |||
| Flex Ltd. (b) | 5,054,699 | 111,102 | |
| Jabil, Inc. | 1,241,600 | 89,631 | |
| 200,733 | |||
| IT Services - 8.3% | |||
| Block, Inc. Class A (b) | 616,500 | 41,780 | |
| Cloudflare, Inc. (b) | 621,600 | 30,545 | |
| Cyxtera Technologies, Inc. Class A (b) | 969,061 | 1,899 | |
| Dlocal Ltd. (b)(c) | 4,828,617 | 70,498 | |
| EPAM Systems, Inc. (b) | 224,300 | 82,672 | |
| Euronet Worldwide, Inc. (b) | 38,100 | 3,541 | |
| Fiserv, Inc. (b) | 15,400 | 1,607 | |
| Flywire Corp. (b) | 962,273 | 20,872 | |
| Globant SA (b) | 78,900 | 14,784 | |
| GoDaddy, Inc. (b) | 1,811,504 | 143,344 | |
| Marqeta, Inc. Class A (b) | 6,320,252 | 42,282 | |
| MasterCard, Inc. Class A | 558,812 | 199,161 | |
| MongoDB, Inc. Class A (b) | 567,200 | 86,606 | |
| Nuvei Corp. (a)(b) | 3,078,574 | 94,887 | |
| Okta, Inc. (b) | 120,000 | 6,398 | |
| Payoneer Global, Inc. (b)(d) | 442,000 | 2,387 | |
| Repay Holdings Corp. (b)(f) | 5,214,727 | 46,202 | |
| Shift4 Payments, Inc. (b)(c) | 1,274,100 | 59,042 | |
| Snowflake, Inc. (b) | 44,800 | 6,402 | |
| TaskUs, Inc. (b)(c) | 2,364,774 | 46,515 | |
| Visa, Inc. Class A | 1,054,361 | 228,796 | |
| Wix.com Ltd. (b) | 18,100 | 1,638 | |
| 1,231,858 | |||
| Semiconductors & Semiconductor Equipment - 12.7% | |||
| Advanced Micro Devices, Inc. (b) | 3,698,300 | 287,099 | |
| Applied Materials, Inc. | 1,159,101 | 127,037 | |
| ASML Holding NV (Netherlands) | 3,500 | 2,137 | |
| BE Semiconductor Industries NV | 64,900 | 4,227 | |
| GlobalFoundries, Inc. (b) | 3,686,200 | 237,207 | |
| Lam Research Corp. | 199,976 | 94,465 | |
| Marvell Technology, Inc. | 3,155,557 | 146,797 | |
| Microchip Technology, Inc. | 109,100 | 8,640 | |
| Micron Technology, Inc. | 379,172 | 21,859 | |
| NVIDIA Corp. | 2,952,872 | 499,715 | |
| NXP Semiconductors NV | 1,142,472 | 200,892 | |
| onsemi (b) | 3,415,761 | 256,865 | |
| Taiwan Semiconductor Manufacturing Co. Ltd. sponsored ADR | 177,800 | 14,754 | |
| 1,901,694 | |||
| Software - 13.2% | |||
| Adobe, Inc. (b) | 26,100 | 9,003 | |
| Bill.Com Holdings, Inc. (b) | 522,200 | 62,883 | |
| Confluent, Inc. (b)(c) | 604,000 | 13,910 | |
| Datadog, Inc. Class A (b) | 758,100 | 57,449 | |
| DoubleVerify Holdings, Inc. (b) | 2,059,045 | 53,947 | |
| Dynatrace, Inc. (b) | 3,710,664 | 143,788 | |
| Elastic NV (b) | 920,540 | 56,328 | |
| Five9, Inc. (b) | 626,300 | 40,152 | |
| HubSpot, Inc. (b) | 162,949 | 49,378 | |
| Intapp, Inc. (b) | 1,512,074 | 34,944 | |
| Intuit, Inc. | 190,908 | 77,812 | |
| Microsoft Corp. | 4,623,215 | 1,179,573 | |
| Oracle Corp. | 476,600 | 39,572 | |
| Pegasystems, Inc. | 44,200 | 1,602 | |
| Pine Labs Private Ltd. (b)(d)(e) | 16,636 | 8,992 | |
| Salesforce.com, Inc. (b) | 315,938 | 50,629 | |
| SentinelOne, Inc. (b) | 284,300 | 4,122 | |
| ServiceNow, Inc. (b) | 156,058 | 64,967 | |
| Stripe, Inc. Class B (b)(d)(e) | 73,500 | 1,865 | |
| Viant Technology, Inc. (b) | 1,347,314 | 5,147 | |
| Zscaler, Inc. (b) | 44,500 | 5,939 | |
| 1,962,002 | |||
| Technology Hardware, Storage & Peripherals - 3.0% | |||
| Apple, Inc. | 3,025,960 | 447,933 | |
TOTAL INFORMATION TECHNOLOGY | 5,744,220 | ||
| MATERIALS - 2.5% | |||
| Chemicals - 1.0% | |||
| CF Industries Holdings, Inc. | 587,900 | 63,605 | |
| Nutrien Ltd. | 874,300 | 70,294 | |
| The Mosaic Co. | 298,200 | 15,298 | |
| 149,197 | |||
| Metals & Mining - 1.5% | |||
| Alcoa Corp. | 1,358,900 | 68,122 | |
| ArcelorMittal SA Class A unit GDR (c) | 2,709,400 | 73,289 | |
| Freeport-McMoRan, Inc. | 2,053,500 | 81,729 | |
| MP Materials Corp. (b)(c) | 151,700 | 5,044 | |
| 228,184 | |||
TOTAL MATERIALS | 377,381 | ||
| REAL ESTATE - 0.2% | |||
| Real Estate Management & Development - 0.2% | |||
| Opendoor Technologies, Inc. (b)(c) | 10,341,700 | 19,132 | |
| WeWork, Inc. (b) | 3,113,000 | 8,592 | |
| 27,724 | |||
| UTILITIES - 2.7% | |||
| Electric Utilities - 1.8% | |||
| Constellation Energy Corp. | 677,833 | 65,153 | |
| ORSTED A/S (a) | 680,656 | 59,599 | |
| PG&E Corp. (b) | 9,099,100 | 142,856 | |
| 267,608 | |||
| Independent Power and Renewable Electricity Producers - 0.9% | |||
| NextEra Energy Partners LP | 1,641,100 | 132,092 | |
TOTAL UTILITIES | 399,700 | ||
| TOTAL COMMON STOCKS (Cost $11,486,938) | 14,382,288 | ||
| Preferred Stocks - 3.5% | |||
| Shares | Value ($) (000s) | ||
| Convertible Preferred Stocks - 2.5% | |||
| COMMUNICATION SERVICES - 0.4% | |||
| Interactive Media & Services - 0.4% | |||
| ByteDance Ltd. Series E1 (b)(d)(e) | 116,411 | 21,421 | |
| Reddit, Inc. Series F (b)(d)(e) | 793,873 | 32,628 | |
| 54,049 | |||
| CONSUMER DISCRETIONARY - 0.3% | |||
| Automobiles - 0.0% | |||
| Rad Power Bikes, Inc.: | |||
| Series A(b)(d)(e) | 49,852 | 217 | |
| Series C(b)(d)(e) | 196,163 | 855 | |
| Series D(b)(d)(e) | 415,700 | 1,812 | |
| 2,884 | |||
| Internet & Direct Marketing Retail - 0.3% | |||
| Circle Internet Financial Ltd. Series F (d) | 155,650 | 7,647 | |
| Instacart, Inc.: | |||
| Series H(b)(d)(e) | 267,054 | 11,777 | |
| Series I(b)(d)(e) | 90,554 | 3,993 | |
| Meesho Series F (b)(d)(e) | 243,800 | 18,268 | |
| 41,685 | |||
| Textiles, Apparel & Luxury Goods - 0.0% | |||
| CelLink Corp. Series D (d)(e) | 380,829 | 6,009 | |
TOTAL CONSUMER DISCRETIONARY | 50,578 | ||
| CONSUMER STAPLES - 0.2% | |||
| Food & Staples Retailing - 0.1% | |||
| GoBrands, Inc. Series G (b)(d)(e) | 70,400 | 11,110 | |
| Food Products - 0.1% | |||
| Bowery Farming, Inc. Series C1 (b)(d)(e) | 404,785 | 9,189 | |
| Tobacco - 0.0% | |||
| JUUL Labs, Inc.: | |||
| Series C(b)(d)(e) | 566,439 | 2,532 | |
| Series D(b)(d)(e) | 3,671 | 16 | |
| 2,548 | |||
TOTAL CONSUMER STAPLES | 22,847 | ||
| HEALTH CARE - 0.1% | |||
| Health Care Equipment & Supplies - 0.1% | |||
| Blink Health LLC Series C (b)(d)(e) | 234,164 | 9,057 | |
| Health Care Technology - 0.0% | |||
| Aledade, Inc. Series E1 (d)(e) | 153,312 | 7,364 | |
TOTAL HEALTH CARE | 16,421 | ||
| INDUSTRIALS - 0.7% | |||
| Aerospace & Defense - 0.5% | |||
| Relativity Space, Inc. Series E (b)(d)(e) | 1,068,417 | 21,860 | |
| Space Exploration Technologies Corp.: | |||
| Series I(b)(d)(e) | 16,438 | 11,507 | |
| Series N(b)(d)(e) | 51,400 | 35,980 | |
| 69,347 | |||
| Construction & Engineering - 0.2% | |||
| Beta Technologies, Inc. Series A (b)(d)(e) | 441,839 | 36,416 | |
TOTAL INDUSTRIALS | 105,763 | ||
| INFORMATION TECHNOLOGY - 0.7% | |||
| Electronic Equipment & Components - 0.0% | |||
| Enevate Corp. Series E (b)(d)(e) | 7,873,996 | 4,331 | |
| IT Services - 0.1% | |||
| Yanka Industries, Inc.: | |||
| Series E(b)(d)(e) | 341,047 | 3,796 | |
| Series F(b)(d)(e) | 380,955 | 4,240 | |
| 8,036 | |||
| Semiconductors & Semiconductor Equipment - 0.1% | |||
| GaN Systems, Inc.: | |||
| Series F1(d)(e) | 339,534 | 1,871 | |
| Series F2(d)(e) | 179,288 | 988 | |
| SiMa.ai: | |||
| Series B(b)(d)(e) | 1,198,500 | 7,479 | |
| Series B1(d)(e) | 171,099 | 1,249 | |
| Xsight Labs Ltd. Series D (b)(d)(e) | 501,100 | 3,528 | |
| 15,115 | |||
| Software - 0.5% | |||
| Bolt Technology OU Series E (d)(e) | 290,611 | 37,178 | |
| Convoy, Inc. Series D (b)(d)(e) | 1,038,289 | 9,853 | |
| Databricks, Inc.: | |||
| Series G(b)(d)(e) | 181,200 | 8,562 | |
| Series H(b)(d)(e) | 32,352 | 1,529 | |
| Mountain Digital, Inc. Series D (d)(e) | 896,466 | 10,578 | |
| Skyryse, Inc. Series B (b)(d)(e) | 244,100 | 4,909 | |
| Stripe, Inc. Series H (b)(d)(e) | 30,700 | 779 | |
| Tenstorrent, Inc. Series C1 (b)(d)(e) | 32,900 | 1,758 | |
| 75,146 | |||
TOTAL INFORMATION TECHNOLOGY | 102,628 | ||
| MATERIALS - 0.1% | |||
| Metals & Mining - 0.1% | |||
| Diamond Foundry, Inc. Series C (b)(d)(e) | 674,317 | 21,868 | |
| TOTAL CONVERTIBLE PREFERRED STOCKS | 374,154 | ||
| Nonconvertible Preferred Stocks - 1.0% | |||
| CONSUMER DISCRETIONARY - 0.5% | |||
| Automobiles - 0.0% | |||
| Neutron Holdings, Inc. Series 1C (b)(d)(e) | 6,477,300 | 139 | |
| Waymo LLC Series A2 (b)(d)(e) | 47,838 | 2,205 | |
| 2,344 | |||
| Internet & Direct Marketing Retail - 0.5% | |||
| Circle Internet Financial Ltd. Series E (d) | 1,497,818 | 73,585 | |
TOTAL CONSUMER DISCRETIONARY | 75,929 | ||
| FINANCIALS - 0.1% | |||
| Diversified Financial Services - 0.1% | |||
| Thriveworks TopCo LLC Series B (b)(d)(e)(g) | 764,320 | 13,284 | |
| INFORMATION TECHNOLOGY - 0.4% | |||
| IT Services - 0.1% | |||
| Gupshup, Inc. (b)(d)(e) | 509,400 | 9,042 | |
| Software - 0.3% | |||
| Pine Labs Private Ltd.: | |||
| Series 1(b)(d)(e) | 39,764 | 21,493 | |
| Series A(b)(d)(e) | 9,936 | 5,371 | |
| Series B(b)(d)(e) | 10,808 | 5,842 | |
| Series B2(b)(d)(e) | 8,745 | 4,727 | |
| Series C(b)(d)(e) | 16,265 | 8,791 | |
| Series C1(b)(d)(e) | 3,427 | 1,852 | |
| Series D(b)(d)(e) | 3,667 | 1,982 | |
| 50,058 | |||
TOTAL INFORMATION TECHNOLOGY | 59,100 | ||
| TOTAL NONCONVERTIBLE PREFERRED STOCKS | 148,313 | ||
| TOTAL PREFERRED STOCKS (Cost $546,611) | 522,467 | ||
| Convertible Bonds - 0.1% | |||
Principal Amount (h) (000s) | Value ($) (000s) | ||
| CONSUMER DISCRETIONARY - 0.1% | |||
| Automobiles - 0.1% | |||
| Neutron Holdings, Inc.: | |||
| 4% 10/27/25 (d)(e)(i) | 12,391 | 11,030 | |
| 4% 5/22/27 (d)(e) | 843 | 725 | |
| 4% 6/12/27 (d)(e) | 232 | 199 | |
| (Cost $13,466) | 11,954 | ||
| Preferred Securities - 0.1% | |||
Principal Amount (h) (000s) | Value ($) (000s) | ||
| INFORMATION TECHNOLOGY - 0.1% | |||
| Electronic Equipment & Components - 0.0% | |||
| Enevate Corp. 0% 1/29/23 (d)(e) | 3,352 | 3,155 | |
| Semiconductors & Semiconductor Equipment - 0.1% | |||
| GaN Systems, Inc. 0% (d)(e)(j) | 7,958 | 5,034 | |
| Software - 0.0% | |||
| Tenstorrent, Inc. 0% (d)(e)(j) | 1,830 | 1,645 | |
| TOTAL PREFERRED SECURITIES (Cost $13,140) | 9,834 | ||
| Money Market Funds - 1.1% | |||
| Shares | Value ($) (000s) | ||
| Fidelity Cash Central Fund 3.86% (k) | 4,560,580 | 4,561 | |
| Fidelity Securities Lending Cash Central Fund 3.86% (k)(l) | 168,924,131 | 168,941 | |
| TOTAL MONEY MARKET FUNDS (Cost $173,502) | 173,502 | ||
| TOTAL INVESTMENT IN SECURITIES - 101.2% (Cost $12,233,657) | 15,100,045 |
NET OTHER ASSETS (LIABILITIES) - (1.2)% | (184,085) |
| NET ASSETS - 100.0% | 14,915,960 |
| (a) | Security exempt from registration under Rule 144A of the Securities Act of 1933. These securities may be resold in transactions exempt from registration, normally to qualified institutional buyers. At the end of the period, the value of these securities amounted to $240,832,000 or 1.6% of net assets. |
| (b) | Non-income producing |
| (c) | Security or a portion of the security is on loan at period end. |
| (d) | Restricted securities (including private placements) - Investment in securities not registered under the Securities Act of 1933 (excluding 144A issues). At the end of the period, the value of restricted securities (excluding 144A issues) amounted to $696,539,000 or 4.7% of net assets. |
| (e) | Level 3 security |
| (f) | Affiliated company |
| (g) | Investment is owned by a wholly-owned subsidiary (Subsidiary) that is treated as a corporation for U.S. tax purposes. |
| (h) | Amount is stated in United States dollars unless otherwise noted. |
| (i) | Security initially issued at one coupon which converts to a higher coupon at a specified date. The rate shown is the rate at period end. |
| (j) | Security is perpetual in nature with no stated maturity date. |
| (k) | Affiliated fund that is generally available only to investment companies and other accounts managed by Fidelity Investments. The rate quoted is the annualized seven-day yield of the fund at period end. A complete unaudited listing of the fund's holdings as of its most recent quarter end is available upon request. In addition, each Fidelity Central Fund's financial statements, which are not covered by the Fund's Report of Independent Registered Public Accounting Firm, are available on the SEC's website or upon request. |
| (l) | Investment made with cash collateral received from securities on loan. |
| Additional information on each restricted holding is as follows: | ||
| Security | Acquisition Date | Acquisition Cost ($) (000s) |
| Aledade, Inc. Series E1 | 5/20/22 | 7,637 |
| Beta Technologies, Inc. Series A | 4/09/21 | 32,374 |
| Blink Health LLC Series A1 | 12/30/20 | 1,520 |
| Blink Health LLC Series C | 11/07/19 - 7/14/21 | 8,939 |
| Bolt Technology OU Series E | 1/03/22 | 75,500 |
| Bombas LLC | 2/16/21 - 11/12/21 | 24,316 |
| Bowery Farming, Inc. Series C1 | 5/18/21 | 24,388 |
| ByteDance Ltd. Series E1 | 11/18/20 | 12,756 |
| CelLink Corp. Series D | 1/20/22 | 7,930 |
| Circle Internet Financial Ltd. Series E | 5/11/21 | 24,310 |
| Circle Internet Financial Ltd. Series F | 5/09/22 | 6,559 |
| Convoy, Inc. Series D | 10/30/19 | 14,058 |
| Databricks, Inc. Series G | 2/01/21 | 10,713 |
| Databricks, Inc. Series H | 8/31/21 | 2,377 |
| Diamond Foundry, Inc. Series C | 3/15/21 | 16,184 |
| Enevate Corp. Series E | 1/29/21 | 8,730 |
| Enevate Corp. 0% 1/29/23 | 1/29/21 | 3,352 |
| Epic Games, Inc. | 7/13/20 - 3/29/21 | 45,615 |
| GaN Systems, Inc. Series F1 | 11/30/21 | 2,879 |
| GaN Systems, Inc. Series F2 | 11/30/21 | 1,520 |
| GaN Systems, Inc. 0% | 11/30/21 | 7,958 |
| GoBrands, Inc. Series G | 3/02/21 | 17,580 |
| Gupshup, Inc. | 6/08/21 | 11,648 |
| Innovid Corp. | 6/24/21 | 10,177 |
| Instacart, Inc. Series H | 11/13/20 | 16,023 |
| Instacart, Inc. Series I | 2/26/21 | 11,319 |
| JUUL Labs, Inc. Class B | 11/21/17 | 0 |
| JUUL Labs, Inc. Series C | 5/22/15 | 0 |
| JUUL Labs, Inc. Series D | 6/25/18 | 0 |
| Meesho Series F | 9/21/21 | 18,693 |
| Mountain Digital, Inc. Series D | 11/05/21 | 20,588 |
| Neutron Holdings, Inc. | 2/04/21 | 5 |
| Neutron Holdings, Inc. Series 1C | 7/03/18 | 1,184 |
| Neutron Holdings, Inc. 4% 10/27/25 | 10/29/21 | 12,391 |
| Neutron Holdings, Inc. 4% 5/22/27 | 6/04/20 | 843 |
| Neutron Holdings, Inc. 4% 6/12/27 | 6/12/20 | 232 |
| P3 Health Partners, Inc. | 5/25/21 | 20,325 |
| Payoneer Global, Inc. | 2/03/21 | 4,420 |
| Pine Labs Private Ltd. | 6/30/21 | 6,203 |
| Pine Labs Private Ltd. Series 1 | 6/30/21 | 14,826 |
| Pine Labs Private Ltd. Series A | 6/30/21 | 3,705 |
| Pine Labs Private Ltd. Series B | 6/30/21 | 4,030 |
| Pine Labs Private Ltd. Series B2 | 6/30/21 | 3,261 |
| Pine Labs Private Ltd. Series C | 6/30/21 | 6,065 |
| Pine Labs Private Ltd. Series C1 | 6/30/21 | 1,278 |
| Pine Labs Private Ltd. Series D | 6/30/21 | 1,367 |
| Rad Power Bikes, Inc. | 1/21/21 | 1,845 |
| Rad Power Bikes, Inc. Series A | 1/21/21 | 240 |
| Rad Power Bikes, Inc. Series C | 1/21/21 | 946 |
| Rad Power Bikes, Inc. Series D | 9/17/21 | 3,984 |
| Rapyd Financial Network 2016 Ltd. | 3/30/21 | 25,000 |
| Reddit, Inc. Series F | 8/11/21 | 49,057 |
| Relativity Space, Inc. Series E | 5/27/21 | 24,397 |
| SiMa.ai Series B | 5/10/21 | 6,145 |
| SiMa.ai Series B1 | 4/25/22 - 10/17/22 | 1,213 |
| Skyryse, Inc. Series B | 10/21/21 | 6,024 |
| Space Exploration Technologies Corp. Class A | 2/16/21 | 3,570 |
| Space Exploration Technologies Corp. Series I | 4/05/18 | 2,778 |
| Space Exploration Technologies Corp. Series N | 8/04/20 | 13,878 |
| Starling Bank Ltd. Series D | 6/18/21 - 4/05/22 | 13,359 |
| Stripe, Inc. Class B | 5/18/21 | 2,949 |
| Stripe, Inc. Series H | 3/15/21 | 1,232 |
| Tenstorrent, Inc. Series C1 | 4/23/21 | 1,956 |
| Tenstorrent, Inc. 0% | 4/23/21 | 1,830 |
| The Oncology Institute, Inc. | 6/28/21 | 8,148 |
| Thriveworks TopCo LLC Series B | 7/23/21 - 2/25/22 | 21,942 |
| Waymo LLC Series A2 | 5/08/20 | 4,108 |
| Xsight Labs Ltd. Series D | 2/16/21 | 4,007 |
| Yanka Industries, Inc. Series E | 5/15/20 | 4,120 |
| Yanka Industries, Inc. Series F | 4/08/21 | 12,144 |
| Affiliate (Amounts in thousands) | Value, beginning of period ($) | Purchases ($) | Sales Proceeds ($) | Dividend Income ($) | Realized Gain (loss) ($) | Change in Unrealized appreciation (depreciation) ($) | Value, end of period ($) | % ownership, end of period |
| Fidelity Cash Central Fund 3.86% | 90,946 | 3,326,897 | 3,413,282 | 692 | - | - | 4,561 | 0.0% |
| Fidelity Securities Lending Cash Central Fund 3.86% | 856,362 | 2,778,596 | 3,466,017 | 2,311 | - | - | 168,941 | 0.5% |
| Total | 947,308 | 6,105,493 | 6,879,299 | 3,003 | - | - | 173,502 | |
| Affiliate (Amounts in thousands) | Value, beginning of period ($) | Purchases ($) | Sales Proceeds ($) | Dividend Income ($) | Realized Gain (loss) ($) | Change in Unrealized appreciation (depreciation) ($) | Value, end of period ($) |
| Intapp, Inc. | 88,631 | 55 | 30,247 | - | (23,289) | (206) | - |
| Magnite, Inc. | 122,205 | 25,791 | 43,234 | - | (68,263) | 18,181 | - |
| P3 Health Partners, Inc. | - | - | - | - | - | (10,610) | 9,715 |
| Repay Holdings Corp. | 54,502 | 18,657 | 4,170 | - | (1,879) | (20,908) | 46,202 |
| TransMedics Group, Inc. | 51,730 | - | 47,627 | - | 18,294 | 53,097 | - |
| Total | 317,068 | 44,503 | 125,278 | - | (75,137) | 39,554 | 55,917 |
| Valuation Inputs at Reporting Date: | ||||
Description (Amounts in thousands) | Total ($) | Level 1 ($) | Level 2 ($) | Level 3 ($) |
Investments in Securities: | ||||
| Equities: | ||||
Communication Services | 2,362,303 | 2,258,997 | 1,664 | 101,642 |
Consumer Discretionary | 1,812,991 | 1,552,290 | 195,645 | 65,056 |
Consumer Staples | 52,678 | 29,819 | - | 22,859 |
Energy | 1,478,298 | 1,478,298 | - | - |
Financials | 276,499 | 213,512 | - | 62,987 |
Health Care | 1,869,321 | 1,821,104 | 29,625 | 18,592 |
Industrials | 320,044 | 204,007 | 4,315 | 111,722 |
Information Technology | 5,905,948 | 5,726,999 | 6,364 | 172,585 |
Materials | 399,249 | 377,381 | - | 21,868 |
Real Estate | 27,724 | 27,724 | - | - |
Utilities | 399,700 | 340,101 | 59,599 | - |
| Corporate Bonds | 11,954 | - | - | 11,954 |
| Preferred Securities | 9,834 | - | - | 9,834 |
| Money Market Funds | 173,502 | 173,502 | - | - |
| Total Investments in Securities: | 15,100,045 | 14,203,734 | 297,212 | 599,099 |
| Net Unrealized Depreciation on Unfunded Commitments | (1,118) | - | - | (1,118) |
| Total | (1,118) | - | - | (1,118) |
| (Amounts in thousands) | |||
| Investments in Securities: | |||
| Consumer Discretionary | |||
| Beginning Balance | $ | 168,352 | |
| Net Realized Gain (Loss) on Investment Securities | - | ||
| Net Unrealized Gain (Loss) on Investment Securities | (111,823) | ||
| Cost of Purchases | 7,930 | ||
| Proceeds of Sales | - | ||
| Amortization/Accretion | - | ||
| Transfers into Level 3 | 597 | ||
| Transfers out of Level 3 | - | ||
| Ending Balance | $ | 65,056 | |
| The change in unrealized gain (loss) for the period attributable to Level 3 securities held at November 30, 2022 | $ | (111,823) | |
| Information Technology | |||
| Beginning Balance | $ | 229,248 | |
| Net Realized Gain (Loss) on Investment Securities | - | ||
| Net Unrealized Gain (Loss) on Investment Securities | (133,376) | ||
| Cost of Purchases | 76,713 | ||
| Proceeds of Sales | - | ||
| Amortization/Accretion | - | ||
| Transfers into Level 3 | - | ||
| Transfers out of Level 3 | - | ||
| Ending Balance | $ | 172,585 | |
| The change in unrealized gain (loss) for the period attributable to Level 3 securities held at November 30, 2022 | $ | (133,376) | |
| Other Investments in Securities | |||
| Beginning Balance | $ | 291,554 | |
| Net Realized Gain (Loss) on Investment Securities | - | ||
| Net Unrealized Gain (Loss) on Investment Securities | 62,475 | ||
| Cost of Purchases | 12,365 | ||
| Proceeds of Sales | - | ||
| Amortization/Accretion | - | ||
| Transfers into Level 3 | - | ||
| Transfers out of Level 3 | (4,936) | ||
| Ending Balance | $ | 361,458 | |
| The change in unrealized gain (loss) for the period attributable to Level 3 securities held at November 30, 2022 | $ | 62,475 | |
| The information used in the above reconciliation represents fiscal year to date activity for any Investments in Securities identified as using Level 3 inputs at either the beginning or the end of the current fiscal period. Cost of purchases and proceeds of sales may include securities received and/or delivered through in-kind transactions. Transfers into Level 3 were attributable to a lack of observable market data resulting from decreases in market activity, decreases in liquidity, security restructurings or corporate actions. Transfers out of Level 3 were attributable to observable market data becoming available for those securities. Transfers in or out of Level 3 represent the beginning value of any Security or Instrument where a change in the pricing level occurred from the beginning to the end of the period. The cost of purchases and the proceeds of sales may include securities received or delivered through corporate actions or exchanges. Realized and unrealized gains (losses) disclosed in the reconciliation are included in Net Gain (Loss) on the Fund's Statement of Operations. | |||
| Statement of Assets and Liabilities | ||||
| Amounts in thousands (except per-share amounts) | November 30, 2022 | |||
| Assets | ||||
| Investment in securities, at value (including securities loaned of $170,806) - See accompanying schedule: | ||||
Unaffiliated issuers (cost $11,950,671) | $14,870,626 | |||
Fidelity Central Funds (cost $173,502) | 173,502 | |||
Other affiliated issuers (cost $109,484) | 55,917 | |||
| Total Investment in Securities (cost $12,233,657) | $ | 15,100,045 | ||
| Foreign currency held at value (cost $2) | 2 | |||
| Receivable for investments sold | 18,581 | |||
| Receivable for fund shares sold | 15,106 | |||
| Dividends receivable | 9,905 | |||
| Interest receivable | 402 | |||
| Distributions receivable from Fidelity Central Funds | 101 | |||
| Prepaid expenses | 21 | |||
| Other receivables | 19 | |||
Total assets | 15,144,182 | |||
| Liabilities | ||||
| Payable for investments purchased | $11,676 | |||
| Unrealized depreciation on unfunded commitments | 1,118 | |||
| Payable for fund shares redeemed | 35,805 | |||
| Accrued management fee | 3,373 | |||
| Distribution and service plan fees payable | 2,074 | |||
| Other affiliated payables | 1,888 | |||
| Other payables and accrued expenses | 3,366 | |||
| Collateral on securities loaned | 168,922 | |||
| Total Liabilities | 228,222 | |||
| Net Assets | $ | 14,915,960 | ||
| Net Assets consist of: | ||||
| Paid in capital | $ | 14,112,506 | ||
| Total accumulated earnings (loss) | 803,454 | |||
| Net Assets | $ | 14,915,960 | ||
| Net Asset Value and Maximum Offering Price | ||||
| Class A : | ||||
Net Asset Value and redemption price per share ($2,749,192 ÷ 28,380 shares) (a) | $ | 96.87 | ||
| Maximum offering price per share (100/94.25 of $96.87) | $ | 102.78 | ||
| Class M : | ||||
Net Asset Value and redemption price per share ($2,136,186 ÷ 22,395 shares) (a) | $ | 95.39 | ||
| Maximum offering price per share (100/96.50 of $95.39) | $ | 98.85 | ||
| Class C : | ||||
Net Asset Value and offering price per share ($827,607 ÷ 10,570 shares) (a) | $ | 78.30 | ||
| Class I : | ||||
Net Asset Value , offering price and redemption price per share ($6,873,035 ÷ 64,135 shares) (b) | $ | 107.16 | ||
| Class Z : | ||||
Net Asset Value , offering price and redemption price per share ($2,329,940 ÷ 21,466 shares) | $ | 108.54 | ||
(a)Redemption price per share is equal to net asset value less any applicable contingent deferred sales charge. | ||||
(b)Corresponding Net Asset Value does not calculate due to rounding of fractional net assets and/or shares. | ||||
| Statement of Operations | ||||
| Amounts in thousands | Year ended November 30, 2022 | |||
| Investment Income | ||||
| Dividends | $ | 93,719 | ||
| Interest | 341 | |||
| Income from Fidelity Central Funds (including $2,311 from security lending) | 3,003 | |||
| Total Income | 97,063 | |||
| Expenses | ||||
| Management fee | ||||
| Basic fee | $ | 94,769 | ||
| Performance adjustment | (11,763) | |||
| Transfer agent fees | 26,062 | |||
| Distribution and service plan fees | 30,271 | |||
| Accounting fees | 1,554 | |||
| Custodian fees and expenses | 234 | |||
| Independent trustees' fees and expenses | 66 | |||
| Registration fees | 432 | |||
| Audit | 77 | |||
| Legal | 19 | |||
| Interest | 132 | |||
| Miscellaneous | 89 | |||
| Total expenses before reductions | 141,942 | |||
| Expense reductions | (633) | |||
| Total expenses after reductions | 141,309 | |||
| Net Investment income (loss) | (44,246) | |||
| Realized and Unrealized Gain (Loss) | ||||
| Net realized gain (loss) on: | ||||
| Investment Securities: | ||||
| Unaffiliated issuers(net of foreign taxes of $16,872) | (1,846,064) | |||
| Affiliated issuers | (75,137) | |||
| Foreign currency transactions | (1,025) | |||
| Total net realized gain (loss) | (1,922,226) | |||
| Change in net unrealized appreciation (depreciation) on: | ||||
| Investment Securities: | ||||
| Unaffiliated issuers (net of decrease in deferred foreign taxes of $21,540) | (6,325,472) | |||
| Affiliated issuers | 39,554 | |||
| Unfunded commitments | (2,322) | |||
| Assets and liabilities in foreign currencies | (54) | |||
| Total change in net unrealized appreciation (depreciation) | (6,288,294) | |||
| Net gain (loss) | (8,210,520) | |||
| Net increase (decrease) in net assets resulting from operations | $ | (8,254,766) | ||
| Statement of Changes in Net Assets | ||||
| Amount in thousands | Year ended November 30, 2022 | Year ended November 30, 2021 | ||
| Increase (Decrease) in Net Assets | ||||
| Operations | ||||
| Net investment income (loss) | $ | (44,246) | $ | (137,686) |
| Net realized gain (loss) | (1,922,226) | 2,645,340 | ||
| Change in net unrealized appreciation (depreciation) | (6,288,294) | 1,254,700 | ||
| Net increase (decrease) in net assets resulting from operations | (8,254,766) | 3,762,354 | ||
| Distributions to shareholders | (2,251,740) | (1,000,273) | ||
| Share transactions - net increase (decrease) | (103,196) | 4,306,628 | ||
| Total increase (decrease) in net assets | (10,609,702) | 7,068,709 | ||
| Net Assets | ||||
| Beginning of period | 25,525,662 | 18,456,953 | ||
| End of period | $ | 14,915,960 | $ | 25,525,662 |
| Fidelity Advisor® Growth Opportunities Fund Class A |
| Years ended November 30, | 2022 | 2021 | 2020 | 2019 | 2018 | |||||
Selected Per-Share Data | ||||||||||
| Net asset value, beginning of period | $ | 159.95 | $ | 141.06 | $ | 90.00 | $ | 76.87 | $ | 68.76 |
| Income from Investment Operations | ||||||||||
Net investment income (loss) A,B | (.38) | (1.06) | (.56) | (.18) C | (.25) | |||||
| Net realized and unrealized gain (loss) | (48.08) | 27.68 | 55.26 | 21.21 | 13.33 | |||||
| Total from investment operations | (48.46) | 26.62 | 54.70 | 21.03 | 13.08 | |||||
| Distributions from net realized gain | (14.62) | (7.73) | (3.64) | (7.90) | (4.97) | |||||
| Total distributions | (14.62) | (7.73) | (3.64) | (7.90) | (4.97) | |||||
| Net asset value, end of period | $ | 96.87 | $ | 159.95 | $ | 141.06 | $ | 90.00 | $ | 76.87 |
Total Return D,E | (33.31)% | 19.60% | 63.12% | 31.29% | 20.35% | |||||
Ratios to Average Net Assets B,F,G | ||||||||||
| Expenses before reductions | .89% | 1.04% | 1.06% | 1.11% | 1.05% | |||||
| Expenses net of fee waivers, if any | .89% | 1.04% | 1.06% | 1.11% | 1.05% | |||||
| Expenses net of all reductions | .89% | 1.04% | 1.06% | 1.10% | 1.05% | |||||
| Net investment income (loss) | (.35)% | (.68)% | (.52)% | (.22)% C | (.33)% | |||||
| Supplemental Data | ||||||||||
| Net assets, end of period (in millions) | $ | 2,749 | $ | 4,184 | $ | 3,037 | $ | 1,349 | $ | 673 |
Portfolio turnover rate H | 75% | 66% | 47% | 37% I | 46% |
| Fidelity Advisor® Growth Opportunities Fund Class M |
| Years ended November 30, | 2022 | 2021 | 2020 | 2019 | 2018 | |||||
Selected Per-Share Data | ||||||||||
| Net asset value, beginning of period | $ | 157.62 | $ | 139.13 | $ | 89.03 | $ | 76.28 | $ | 68.27 |
| Income from Investment Operations | ||||||||||
Net investment income (loss) A,B | (.64) | (1.41) | (.79) | (.37) C | (.41) | |||||
| Net realized and unrealized gain (loss) | (47.42) | 27.31 | 54.53 | 21.02 | 13.24 | |||||
| Total from investment operations | (48.06) | 25.90 | 53.74 | 20.65 | 12.83 | |||||
| Distributions from net realized gain | (14.17) | (7.41) | (3.64) | (7.90) | (4.82) | |||||
| Total distributions | (14.17) | (7.41) | (3.64) | (7.90) | (4.82) | |||||
| Net asset value, end of period | $ | 95.39 | $ | 157.62 | $ | 139.13 | $ | 89.03 | $ | 76.28 |
Total Return D,E | (33.47)% | 19.31% | 62.71% | 31.01% | 20.07% | |||||
Ratios to Average Net Assets B,F,G | ||||||||||
| Expenses before reductions | 1.13% | 1.28% | 1.30% | 1.34% | 1.28% | |||||
| Expenses net of fee waivers, if any | 1.13% | 1.28% | 1.30% | 1.34% | 1.28% | |||||
| Expenses net of all reductions | 1.13% | 1.28% | 1.30% | 1.34% | 1.28% | |||||
| Net investment income (loss) | (.59)% | (.93)% | (.76)% | (.46)% C | (.57)% | |||||
| Supplemental Data | ||||||||||
| Net assets, end of period (in millions) | $ | 2,136 | $ | 3,481 | $ | 3,153 | $ | 2,094 | $ | 1,671 |
Portfolio turnover rate H | 75% | 66% | 47% | 37% I | 46% |
| Fidelity Advisor® Growth Opportunities Fund Class C |
| Years ended November 30, | 2022 | 2021 | 2020 | 2019 | 2018 | |||||
Selected Per-Share Data | ||||||||||
| Net asset value, beginning of period | $ | 132.10 | $ | 118.14 | $ | 76.50 | $ | 67.03 | $ | 60.60 |
| Income from Investment Operations | ||||||||||
Net investment income (loss) A,B | (.99) | (1.85) | (1.15) | (.67) C | (.70) | |||||
| Net realized and unrealized gain (loss) | (39.09) | 23.04 | 46.43 | 18.04 | 11.68 | |||||
| Total from investment operations | (40.08) | 21.19 | 45.28 | 17.37 | 10.98 | |||||
| Distributions from net realized gain | (13.72) | (7.23) | (3.64) | (7.90) | (4.55) | |||||
| Total distributions | (13.72) | (7.23) | (3.64) | (7.90) | (4.55) | |||||
| Net asset value, end of period | $ | 78.30 | $ | 132.10 | $ | 118.14 | $ | 76.50 | $ | 67.03 |
Total Return D,E | (33.81)% | 18.70% | 61.89% | 30.31% | 19.44% | |||||
Ratios to Average Net Assets B,F,G | ||||||||||
| Expenses before reductions | 1.65% | 1.80% | 1.81% | 1.86% | 1.81% | |||||
| Expenses net of fee waivers, if any | 1.64% | 1.80% | 1.81% | 1.86% | 1.81% | |||||
| Expenses net of all reductions | 1.64% | 1.80% | 1.81% | 1.86% | 1.80% | |||||
| Net investment income (loss) | (1.10)% | (1.44)% | (1.27)% | (.98)% C | (1.09)% | |||||
| Supplemental Data | ||||||||||
| Net assets, end of period (in millions) | $ | 828 | $ | 1,413 | $ | 1,159 | $ | 483 | $ | 244 |
Portfolio turnover rate H | 75% | 66% | 47% | 37% I | 46% |
| Fidelity Advisor® Growth Opportunities Fund Class I |
| Years ended November 30, | 2022 | 2021 | 2020 | 2019 | 2018 | |||||
Selected Per-Share Data | ||||||||||
| Net asset value, beginning of period | $ | 175.33 | $ | 153.77 | $ | 97.56 | $ | 82.42 | $ | 73.38 |
| Income from Investment Operations | ||||||||||
Net investment income (loss) A,B | (.12) | (.74) | (.31) | .03 C | (.05) | |||||
| Net realized and unrealized gain (loss) | (53.08) | 30.27 | 60.16 | 23.01 | 14.25 | |||||
| Total from investment operations | (53.20) | 29.53 | 59.85 | 23.04 | 14.20 | |||||
| Distributions from net realized gain | (14.97) | (7.97) | (3.64) | (7.90) | (5.16) | |||||
| Total distributions | (14.97) | (7.97) | (3.64) | (7.90) | (5.16) | |||||
| Net asset value, end of period | $ | 107.16 | $ | 175.33 | $ | 153.77 | $ | 97.56 | $ | 82.42 |
Total Return D | (33.15)% | 19.90% | 63.52% | 31.66% | 20.67% | |||||
Ratios to Average Net Assets B,E,F | ||||||||||
| Expenses before reductions | .64% | .79% | .80% | .84% | .78% | |||||
| Expenses net of fee waivers, if any | .64% | .79% | .80% | .84% | .78% | |||||
| Expenses net of all reductions | .64% | .79% | .80% | .84% | .78% | |||||
| Net investment income (loss) | (.10)% | (.43)% | (.26)% | .04% C | (.06)% | |||||
| Supplemental Data | ||||||||||
| Net assets, end of period (in millions) | $ | 6,873 | $ | 12,620 | $ | 8,282 | $ | 2,819 | $ | 850 |
Portfolio turnover rate G | 75% | 66% | 47% | 37% H | 46% |
| Fidelity Advisor® Growth Opportunities Fund Class Z |
| Years ended November 30, | 2022 | 2021 | 2020 | 2019 | 2018 | |||||
Selected Per-Share Data | ||||||||||
| Net asset value, beginning of period | $ | 177.37 | $ | 155.40 | $ | 98.44 | $ | 83.00 | $ | 73.88 |
| Income from Investment Operations | ||||||||||
Net investment income (loss) A,B | .03 | (.54) | (.17) | .14 C | .04 | |||||
| Net realized and unrealized gain (loss) | (53.71) | 30.58 | 60.77 | 23.20 | 14.35 | |||||
| Total from investment operations | (53.68) | 30.04 | 60.60 | 23.34 | 14.39 | |||||
| Distributions from net investment income | - | - | - | - | (.05) | |||||
| Distributions from net realized gain | (15.15) | (8.07) | (3.64) | (7.90) | (5.22) | |||||
| Total distributions | (15.15) | (8.07) | (3.64) | (7.90) | (5.27) | |||||
| Net asset value, end of period | $ | 108.54 | $ | 177.37 | $ | 155.40 | $ | 98.44 | $ | 83.00 |
Total Return D | (33.06)% | 20.04% | 63.72% | 31.81% | 20.82% | |||||
Ratios to Average Net Assets B,E,F | ||||||||||
| Expenses before reductions | .52% | .67% | .69% | .72% | .66% | |||||
| Expenses net of fee waivers, if any | .51% | .67% | .68% | .72% | .66% | |||||
| Expenses net of all reductions | .51% | .67% | .68% | .72% | .65% | |||||
| Net investment income (loss) | .03% | (.31)% | (.15)% | .16% C | .06% | |||||
| Supplemental Data | ||||||||||
| Net assets, end of period (in millions) | $ | 2,330 | $ | 3,828 | $ | 2,826 | $ | 1,114 | $ | 88 |
Portfolio turnover rate G | 75% | 66% | 47% | 37% H | 46% |
| Fidelity Central Fund | Investment Manager | Investment Objective | Investment Practices | Expense Ratio A |
| Fidelity Money Market Central Funds | Fidelity Management & Research Company LLC (FMR) | Each fund seeks to obtain a high level of current income consistent with the preservation of capital and liquidity. | Short-term Investments | Less than .005% |
| Asset Type | Fair Value | Valuation Technique(s) | Unobservable Input | Amount or Range/Weighted Average | Impact to Valuation from an Increase in Input A |
| Equities | $577,311 | Recovery value | Recovery value | $0.00 | Increase |
| Market comparable | Enterprise value/Revenue multiple (EV/R) | 2.2 - 24.0 / 8.1 | Increase | ||
| Enterprise value/Net income multiple (EV/NI) | 14.8 | Increase | |||
| Enterprise value/Gross profit multiple (EV/GP) | 7.5 | Increase | |||
| Premium rate | 5.0% | Increase | |||
| Probability rate | 20.0% - 80.0% / 50.0% | Increase | |||
| Market approach | Discount rate | 10.0% - 50.0% / 33.6% | Decrease | ||
| Transaction price | $1.11 - $85.87 / $27.65 | Increase | |||
| Probability rate | 25.0% - 75.0% / 50.0% | Increase | |||
| Discounted cash flow | Weighted average cost of capital (WACC) | 30.0% | Decrease | ||
| Exit multiple | 2.5 | Increase | |||
| Black scholes | Volatility | 60.0% - 100.0% / 81.0% | Increase | ||
| Term | 2.0 - 5.0 / 4.3 | Increase | |||
| Corporate Bonds | $11,954 | Market comparable | Discount rate | 29.2% | Decrease |
Enterprise value/Revenue multiple (EV/R) | 2.9 | Increase | |||
Probability rate | 10.0% - 50.0% / 33.3% | Increase | |||
| Black scholes | Volatility | 75.0% | Increase | ||
Term | 1.1 | Increase | |||
| Preferred Securities | $9,834 | Market comparable | Enterprise value/Revenue multiple (EV/R) | 4.8 | Increase |
| Probability rate | 10.0% - 90.0% / 50.0% | Increase | |||
| Market approach | Discount rate | 10.0% - 50.0% / 36.3% | Decrease | ||
| Transaction price | $1.11 - $100.00 / $35.00 | Increase | |||
| Probability rate | 25.0% - 75.0% / 50.0% | Increase | |||
| Black scholes | Volatility | 70.0% - 100.0% / 89.7% | Increase | ||
| Term | 2.0 - 3.0 / 2.7 | Increase |
| Fidelity Advisor Growth Opportunities Fund | $12 |
| Gross unrealized appreciation | $4,607,734 |
| Gross unrealized depreciation | (1,856,535) |
| Net unrealized appreciation (depreciation) | $2,751,199 |
| Tax Cost | $12,347,728 |
| Capital loss carryforward | $(1,897,510) |
| Net unrealized appreciation (depreciation) on securities and other investments | $2,751,159 |
| Short-term | $(1,897,510) |
| Long-term | (-) |
| Total capital loss carryforward | $(1,897,510) |
| November 30, 2022 | November 30, 2021 | |
| Ordinary Income | $167,720 | $ 170,667 |
| Long-term Capital Gains | 2,084,020 | 829,606 |
| Total | $2,251,740 | $ 1,000,273 |
| $ Amount | % of Net Assets | |
| Fidelity Advisor Growth Opportunities Fund | 13,284 | .09 |
| Investment to be Acquired | Commitment Amount | Unrealized Appreciation (Depreciation) | |
| Fidelity Advisor Growth Opportunities Fund | Stripe, Inc. | $1,118 | $(1,118) |
| Purchases ($) | Sales ($) | |
| Fidelity Advisor Growth Opportunities Fund | 13,633,041 | 16,095,415 |
| Distribution Fee | Service Fee | Total Fees | Retained by FDC | |
| Class A | - % | .25% | $7,808 | $230 |
| Class M | .25% | .25% | 12,466 | 8 |
| Class C | .75% | .25% | 9,997 | 1,819 |
| $30,271 | $2,057 |
| Retained by FDC | |
| Class A | $1,770 |
| Class M | 88 |
Class C A | 12 |
| $1,870 |
| Amount | % of Class-Level Average Net Assets | |
| Class A | $5,201 | .17 |
| Class M | 3,885 | .16 |
| Class C | 1,712 | .17 |
| Class I | 14,102 | .16 |
| Class Z | 1,162 | .04 |
| $26,062 |
| % of Average Net Assets | |
| Fidelity Advisor Growth Opportunities Fund | .01 |
| Amount | |
| Fidelity Advisor Growth Opportunities Fund | $338 |
| Borrower or Lender | Average Loan Balance | Weighted Average Interest Rate | Interest Expense | |
| Fidelity Advisor Growth Opportunities Fund | Borrower | $35,439 | .98% | $125 |
| Purchases ($) | Sales ($) | Realized Gain (Loss) ($) | |
| Fidelity Advisor Growth Opportunities Fund | 1,379,364 | 1,191,672 | (28,247) |
| Amount ($) | |
| Fidelity Advisor Growth Opportunities Fund | 22 |
| Amount | |
| Fidelity Advisor Growth Opportunities Fund | $34 |
| Total Security Lending Fees Paid to NFS | Security Lending Income From Securities Loaned to NFS | Value of Securities Loaned to NFS at Period End | |
| Fidelity Advisor Growth Opportunities Fund | $243 | $295 | $1,857 |
| Average Loan Balance | Weighted Average Interest Rate | Interest Expense | |
| Fidelity Advisor Growth Opportunities Fund | $26,329 | 2.23% | $7 |
Year ended November 30, 2022 | Year ended November 30, 2021 | |
| Fidelity Advisor Growth Opportunities Fund | ||
| Distributions to shareholders | ||
| Class A | $383,847 | $169,745 |
| Class M | 311,608 | 168,099 |
| Class C | 146,868 | 72,157 |
| Class I | 1,065,687 | 439,475 |
| Class Z | 343,730 | 150,797 |
| Total | $2,251,740 | $1,000,273 |
| Shares | Shares | Dollars | Dollars | |
| Year ended November 30, 2022 | Year ended November 30, 2021 | Year ended November 30, 2022 | Year ended November 30, 2021 | |
| Fidelity Advisor Growth Opportunities Fund | ||||
| Class A | ||||
| Shares sold | 7,278 | 8,318 | $794,992 | $1,283,675 |
| Reinvestment of distributions | 2,511 | 1,142 | 362,972 | 161,306 |
| Shares redeemed | (7,570) | (4,829) | (828,468) | (742,467) |
| Net increase (decrease) | 2,219 | 4,631 | $329,496 | $702,514 |
| Class M | ||||
| Shares sold | 2,024 | 2,549 | $223,304 | $385,475 |
| Reinvestment of distributions | 2,107 | 1,163 | 300,595 | 162,126 |
| Shares redeemed | (3,818) | (4,290) | (419,272) | (654,784) |
| Net increase (decrease) | 313 | (578) | $104,627 | $(107,183) |
| Class C | ||||
| Shares sold | 1,830 | 3,273 | $171,562 | $416,992 |
| Reinvestment of distributions | 1,177 | 581 | 138,522 | 68,282 |
| Shares redeemed | (3,130) | (2,973) | (280,287) | (379,808) |
| Net increase (decrease) | (123) | 881 | $29,797 | $105,466 |
| Class I | ||||
| Shares sold | 25,262 | 34,051 | $3,147,620 | $5,739,683 |
| Reinvestment of distributions | 6,084 | 2,534 | 970,856 | 391,310 |
| Shares redeemed | (39,190) | (18,463) | (4,835,461) | (3,082,104) |
| Net increase (decrease) | (7,844) | 18,122 | $(716,985) | $3,048,889 |
| Class Z | ||||
| Shares sold | 10,960 | 12,098 | $1,437,835 | $2,064,123 |
| Reinvestment of distributions | 1,870 | 860 | 301,936 | 134,230 |
| Shares redeemed | (12,944) | (9,566) | (1,589,902) | (1,641,411) |
| Net increase (decrease) | (114) | 3,392 | $149,869 | $556,942 |
| The Example is based on an investment of $1,000 invested at the beginning of the period and held for the entire period (June 1, 2022 to November 30, 2022). |
Annualized Expense Ratio- A | Beginning Account Value June 1, 2022 | Ending Account Value November 30, 2022 | Expenses Paid During Period- C June 1, 2022 to November 30, 2022 | |||||||
| Fidelity Advisor® Growth Opportunities Fund | ||||||||||
| Class A | .81% | |||||||||
| Actual | $ 1,000 | $ 942.10 | $ 3.94 | |||||||
Hypothetical- B | $ 1,000 | $ 1,021.01 | $ 4.10 | |||||||
| Class M | 1.04% | |||||||||
| Actual | $ 1,000 | $ 941.10 | $ 5.06 | |||||||
Hypothetical- B | $ 1,000 | $ 1,019.85 | $ 5.27 | |||||||
| Class C | 1.55% | |||||||||
| Actual | $ 1,000 | $ 938.60 | $ 7.53 | |||||||
Hypothetical- B | $ 1,000 | $ 1,017.30 | $ 7.84 | |||||||
| Class I | .55% | |||||||||
| Actual | $ 1,000 | $ 943.30 | $ 2.68 | |||||||
Hypothetical- B | $ 1,000 | $ 1,022.31 | $ 2.79 | |||||||
| Class Z | .43% | |||||||||
| Actual | $ 1,000 | $ 943.90 | $ 2.10 | |||||||
Hypothetical- B | $ 1,000 | $ 1,022.91 | $ 2.18 | |||||||
|


Contents
| Average Annual Total Returns | |||
Periods ended November 30, 2022 | Past 1 year | Past 5 years | Past 10 years |
| Fidelity® Real Estate High Income Fund | -8.84% | 1.00% | 3.17% |
| $1,000,000 Over 10 Years |
Let's say hypothetically that $1,000,000 was invested in Fidelity® Real Estate High Income Fund on November 30, 2012. The chart shows how the value of your investment would have changed, and also shows how the Bloomberg U.S. CMBS ex AAA Index performed over the same period. |
 | |
| Top Bond Issuers (% of Fund's net assets) | ||
(with maturities greater than one year) | ||
| BX Trust | 7.3 | |
| GS Mortgage Securities Trust | 4.5 | |
| Morgan Stanley Capital I Trust | 4.5 | |
| BANK | 3.9 | |
| Morgan Stanley BAML Trust | 3.8 | |
| BX Commercial Mortgage Trust | 3.6 | |
| COMM Mortgage Trust | 3.5 | |
| Benchmark Mortgage Trust | 3.5 | |
| JPMorgan Chase Commercial Mortgage Securities Trust | 3.0 | |
| Citigroup Commercial Mortgage Trust | 3.0 | |
| 40.6 | ||
| Market Sectors (% of Fund's net assets) | ||
| Diversified Financial Services | 3.4 | |
| Homebuilders/Real Estate | 3.4 | |
| Hotels | 1.1 | |
| Gaming | 0.6 | |
| Telecommunications | 0.4 | |
Quality Diversification (% of Fund's net assets) |
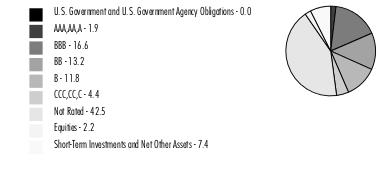 |
Percentages shown as 0.0% may reflect amounts less than 0.05%. |
| We have used ratings from Moody's Investors Service, Inc. Where Moody's® ratings are not available, we have used S&P® ratings. All ratings are as of the date indicated and do not reflect subsequent changes. |
Asset Allocation (% of Fund's net assets) |
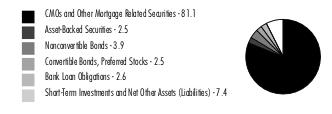 |
| Corporate Bonds - 4.2% | |||
Principal Amount (a) | Value ($) | ||
| Convertible Bonds - 0.3% | |||
| Diversified Financial Services - 0.3% | |||
| Colony Capital Operating Co. LLC 5.75% 7/15/25 (b) | 1,264,000 | 2,130,598 | |
| Nonconvertible Bonds - 3.9% | |||
| Gaming - 0.6% | |||
| Caesars Entertainment, Inc.: | |||
| 6.25% 7/1/25 (b) | 1,690,000 | 1,670,231 | |
| 8.125% 7/1/27 (b) | 2,315,000 | 2,323,797 | |
| 3,994,028 | |||
| Healthcare - 0.1% | |||
| CTR Partnership LP/CareTrust Capital Corp. 3.875% 6/30/28 (b) | 1,085,000 | 926,916 | |
| Homebuilders/Real Estate - 1.7% | |||
| Adams Homes, Inc. 7.5% 2/15/25 (b) | 1,215,000 | 1,012,730 | |
| American Finance Trust, Inc./American Finance Operating Partnership LP 4.5% 9/30/28 (b) | 3,195,000 | 2,444,175 | |
| American Tower Corp. 4.05% 3/15/32 | 1,785,000 | 1,623,051 | |
| DTZ U.S. Borrower LLC 6.75% 5/15/28 (b) | 685,000 | 654,237 | |
| Global Net Lease, Inc. / Global Net Lease Operating Partnership LP 3.75% 12/15/27 (b) | 2,290,000 | 1,894,545 | |
| Kennedy-Wilson, Inc.: | |||
| 4.75% 3/1/29 | 1,520,000 | 1,233,860 | |
| 4.75% 2/1/30 | 2,545,000 | 2,016,913 | |
| Realogy Group LLC/Realogy Co-Issuer Corp. 5.75% 1/15/29 (b) | 385,000 | 294,044 | |
| Service Properties Trust 7.5% 9/15/25 | 1,095,000 | 1,059,413 | |
| 12,232,968 | |||
| Hotels - 1.1% | |||
| Hilton Grand Vacations Borrower Escrow LLC 4.875% 7/1/31 (b) | 3,200,000 | 2,641,280 | |
| Marriott Ownership Resorts, Inc.: | |||
| 4.5% 6/15/29 (b) | 900,000 | 758,234 | |
| 4.75% 1/15/28 | 3,250,000 | 2,851,000 | |
| Times Square Hotel Trust 8.528% 8/1/26 (b) | 1,548,416 | 1,524,637 | |
| 7,775,151 | |||
| Telecommunications - 0.4% | |||
| Uniti Group, Inc.: | |||
| 6% 1/15/30 (b) | 2,395,000 | 1,728,088 | |
| 7.875% 2/15/25 (b) | 1,195,000 | 1,200,023 | |
| 2,928,111 | |||
TOTAL NONCONVERTIBLE BONDS | 27,857,174 | ||
| TOTAL CORPORATE BONDS (Cost $33,088,106) | 29,987,772 | ||
| Asset-Backed Securities - 2.5% | |||
Principal Amount (a) | Value ($) | ||
| American Homes 4 Rent Series 2015-SFR2 Class XS, 0% 10/17/52 (b)(c)(d)(e) | 2,544,766 | 25 | |
| Capital Trust RE CDO Ltd. Series 2005-1A: | |||
| Class D, 1 month U.S. LIBOR + 1.500% 3.3464% 3/20/50 (b)(c)(e)(f) | 750,000 | 75 | |
| Class E, 1 month U.S. LIBOR + 2.100% 3.9464% 3/20/50 (b)(c)(e)(f) | 2,670,000 | 267 | |
| Crest Ltd. Series 2004-1A Class H1, 3 month U.S. LIBOR + 3.690% 6.4829% 1/28/40 (b)(c)(e)(f) | 3,107,938 | 311 | |
| DataBank Issuer, LLC Series 2021-1A Class C, 4.43% 2/27/51 (b) | 1,500,000 | 1,250,949 | |
| Diamond Infrastructure Funding LLC Series 2021-1A Class C, 3.475% 4/15/49 (b) | 859,000 | 665,274 | |
| FirstKey Homes Trust Series 2021-SFR1 Class F1, 3.238% 8/17/38 (b) | 1,068,000 | 875,641 | |
| Home Partners of America Trust: | |||
| Series 2019-2 Class F, 3.866% 10/19/39 (b) | 2,039,503 | 1,686,804 | |
| Series 2021-1 Class F, 3.325% 9/17/41 (b) | 913,110 | 716,006 | |
| Series 2021-2 Class G, 4.505% 12/17/26 (b) | 5,389,027 | 4,402,138 | |
| Series 2021-3 Class F, 4.242% 1/17/41 (b) | 1,242,078 | 1,019,591 | |
| Merit Securities Corp. Series 13 Class M1, 7.88% 12/28/33 (c) | 591,296 | 580,726 | |
| Progress Residential Trust: | |||
| Series 2019-SFR3: | |||
Class F, 3.867% 9/17/36 (b) | 1,228,000 | 1,154,762 | |
Class G, 4.116% 9/17/36 (b) | 998,000 | 935,944 | |
| Series 2020-SFR1: | |||
Class G, 4.028% 4/17/37 (b) | 1,638,000 | 1,481,538 | |
Class H, 5.268% 4/17/37 (b) | 462,000 | 421,726 | |
| Series 2020-SFR3 Class H, 6.234% 10/17/27 (b) | 966,000 | 892,590 | |
| Taberna Preferred Funding VI Ltd. Series 2006-6A Class F1, 3 month U.S. LIBOR + 4.500% 9.0316% 12/5/36 (b)(c)(e)(f) | 5,856,569 | 439 | |
| Tricon American Homes: | |||
| Series 2017-SFR2 Class F, 5.104% 1/17/36 (b) | 664,000 | 641,425 | |
| Series 2020-SFR1 Class F, 4.882% 7/17/38 (b) | 574,000 | 507,537 | |
| Tricon Residential Trust Series 2021-SFR1 Class G, 4.133% 7/17/38 (b) | 672,000 | 557,606 | |
| TOTAL ASSET-BACKED SECURITIES (Cost $28,004,985) | 17,791,374 | ||
| Collateralized Mortgage Obligations - 0.0% | |||
Principal Amount (a) | Value ($) | ||
| Private Sponsor - 0.0% | |||
| Countrywide Home Loans, Inc. Series 2003-R1 Class 2B4, 3.3614% 2/25/43 (b)(c)(e) | 27,816 | 3,616 | |
| U.S. Government Agency - 0.0% | |||
| Fannie Mae REMIC Trust: | |||
| Series 2002-W1 subordinate REMIC pass thru certificates, Class 3B3, 3.4206% 2/25/42 (b)(c)(e) | 24,704 | 5,460 | |
| Series 2002-W6 subordinate REMIC pass thru certificates, Class 3B4, 3.675% 1/25/42 (b)(c)(e) | 20,064 | 1,737 | |
| Series 2003-W10 subordinate REMIC pass thru certificates: | |||
Class 2B4, 3.4275% 6/25/43 (c)(g) | 88,680 | 34,944 | |
Class 2B5, 3.4275% 6/25/43 (c)(e)(g) | 9,340 | 94 | |
TOTAL U.S. GOVERNMENT AGENCY | 42,235 | ||
| TOTAL COLLATERALIZED MORTGAGE OBLIGATIONS (Cost $43,970) | 45,851 | ||
| Commercial Mortgage Securities - 81.1% | |||
Principal Amount (a) | Value ($) | ||
| BAMLL Commercial Mortgage Securities Trust: | |||
| floater Series 2019-RLJ Class D, 1 month U.S. LIBOR + 1.950% 5.825% 4/15/36 (b)(c)(f) | 4,028,000 | 3,850,646 | |
| Series 2015-200P Class F, 3.7157% 4/14/33 (b)(c) | 2,588,000 | 2,105,548 | |
| BANK: | |||
| sequential payer Series 2022-BNK42: | |||
Class D, 2.5% 6/15/55 (b) | 1,664,000 | 983,241 | |
Class E, 2.5% 6/15/55 (b) | 1,302,000 | 694,306 | |
| Series 2017-BNK4 Class D, 3.357% 5/15/50 (b) | 4,416,000 | 3,152,294 | |
| Series 2017-BNK6 Class D, 3.1% 7/15/60 (b) | 2,593,000 | 1,896,693 | |
| Series 2017-BNK8: | |||
Class D, 2.6% 11/15/50 (b) | 4,653,000 | 3,131,983 | |
Class E, 2.8% 11/15/50 (b) | 2,625,000 | 1,493,626 | |
| Series 2018-BN12 Class D, 3% 5/15/61 (b) | 2,082,000 | 1,409,437 | |
| Series 2019-BN18 Class D, 3% 5/15/62 (b) | 4,284,000 | 2,979,555 | |
| Series 2019-BN19 Class D, 3% 8/15/61 (b) | 3,753,000 | 2,546,520 | |
| Series 2019-BN22 Class D, 2.5% 11/15/62 (b) | 2,465,000 | 1,631,303 | |
| Series 2020-BN26 Class D, 2.5% 3/15/63 (b) | 1,269,000 | 807,901 | |
| Series 2020-BN27 Class D, 2.5% 4/15/63 (b) | 921,000 | 594,812 | |
| Series 2020-BN28 Class E, 2.5% 3/15/63 (b) | 903,000 | 523,956 | |
| Series 2020-BN29 Class E, 2.5% 11/15/53 (b) | 1,064,000 | 611,452 | |
| Series 2020-BN30: | |||
Class E, 2.5% 12/15/53 (b) | 735,000 | 405,960 | |
Class MCDG, 3.0155% 12/15/53 (c) | 3,921,000 | 2,353,814 | |
| Series 2022-BNK43 Class D, 3% 8/15/55 (b) | 2,614,000 | 1,563,376 | |
| Series 2022-BNK44 Class C, 5.7462% 11/15/32 (c) | 2,079,000 | 1,741,248 | |
| Bank of America Commercial Mortgage Securities Trust Series 2017-BNK3 Class D, 3.25% 2/15/50 (b) | 2,201,000 | 1,659,931 | |
| Bank of America Commercial Mortgage Trust Series 2016-UB10 Class D, 3% 7/15/49 (b) | 726,000 | 558,080 | |
| Barclays Commercial Mortgage Securities LLC Series 2019-C5: | |||
| Class D, 2.5% 11/15/52 (b) | 726,000 | 476,125 | |
| Class E, 2.5% 11/15/52 (b) | 2,545,000 | 1,554,734 | |
| BBCMS Mortgage Trust: | |||
| sequential payer: | |||
Series 2020-C8 Class E, 2.25% 10/15/53 (b) | 3,013,000 | 1,706,878 | |
Series 2022-C14 Class A5, 2.946% 2/15/55 | 1,486,000 | 1,249,932 | |
Series 2022-C17 Class D, 2.5% 9/15/55 (b) | 1,200,000 | 701,217 | |
| Series 2016-ETC Class D, 3.7292% 8/14/36 (b)(c) | 1,749,000 | 1,395,465 | |
| Series 2020-C6 Class E, 2.4% 2/15/53 (b) | 1,512,000 | 904,923 | |
| Series 2020-C7 Class D, 3.7169% 4/15/53 (b)(c) | 840,000 | 554,886 | |
| Series 2022-C16 Class A5, 4.6% 6/15/55 | 2,793,000 | 2,683,953 | |
| Series 2022-C17 Class B, 4.889% 9/15/55 | 1,491,000 | 1,346,089 | |
| Series 2022-C18 Class B, 6.1482% 12/15/55 (c) | 1,890,000 | 1,895,720 | |
| Benchmark Mortgage Trust: | |||
| sequential payer: | |||
Series 2019-B14: | |||
| Class 225D, 3.4041% 12/15/62 (b)(c) | 1,680,000 | 1,392,930 | |
| Class 225E, 3.4041% 12/15/62 (b)(c) | 1,132,000 | 942,321 | |
Series 2020-B20 Class E, 2% 10/15/53 (b) | 2,100,000 | 1,158,513 | |
| Series 2018-B6 Class D, 3.2587% 10/10/51 (b)(c) | 1,877,000 | 1,355,771 | |
| Series 2018-B7: | |||
Class D, 3% 5/15/53 (b)(c) | 833,000 | 595,101 | |
Class E, 3% 5/15/53 (b)(c) | 833,000 | 555,918 | |
| Series 2019-B12 Class B, 3.5702% 8/15/52 | 1,186,000 | 984,047 | |
| Series 2020-B18: | |||
Class AGNG, 4.5348% 7/15/53 (b)(c) | 4,074,000 | 3,279,878 | |
Class D, 2.25% 7/15/53 (b) | 1,500,000 | 938,211 | |
| Series 2020-B21: | |||
Class D, 2% 12/17/53 (b) | 1,638,000 | 962,314 | |
Class E, 2% 12/17/53 (b) | 1,533,000 | 806,008 | |
| Series 2020-B22 Class E, 2% 1/15/54 (b) | 1,826,000 | 994,532 | |
| Series 2020-IG3 Class 825E, 3.0763% 9/15/48 (b)(c) | 3,049,000 | 2,154,261 | |
| Series 2021-B25: | |||
Class 300D, 3.094% 4/15/54 (b)(c) | 6,055,000 | 4,199,781 | |
Class 300E, 3.094% 4/15/54 (b)(c) | 1,113,000 | 751,350 | |
| Series 2022-B35 Class D, 2.5% 5/15/55 (b) | 3,003,000 | 1,734,087 | |
| Series 2022-B36 Class D, 2.5% 7/15/55 (b) | 1,872,000 | 1,022,973 | |
| Series 2022-B37 Class C, 5.9431% 11/15/55 | 2,090,000 | 1,850,201 | |
| BHP Trust floater Series 2019-BXHP Class F, 1 month U.S. LIBOR + 2.930% 6.813% 8/15/36 (b)(c)(f) | 1,165,500 | 1,073,496 | |
| BMO Mortgage Trust Series 2022-C1: | |||
| Class 360D, 4.0699% 2/15/42 (b)(c) | 1,638,000 | 1,046,617 | |
| Class 360E, 4.0699% 2/15/42 (b)(c) | 1,970,000 | 1,258,157 | |
| Bx 2021-Xl2 floater Series 2021-XL2 Class J, 1 month U.S. LIBOR + 3.890% 7.765% 10/15/38 (b)(c)(f) | 6,640,840 | 6,079,214 | |
| BX Commercial Mortgage Trust: | |||
| floater: | |||
Series 2021-CIP Class G, 1 month U.S. LIBOR + 3.960% 7.844% 12/15/38 (b)(c)(f) | 2,187,000 | 1,886,256 | |
Series 2021-MC Class G, 1 month U.S. LIBOR + 3.080% 6.9618% 4/15/34 (b)(c)(f) | 1,572,000 | 1,338,509 | |
Series 2021-PAC Class G, 1 month U.S. LIBOR + 2.940% 6.8221% 10/15/36 (b)(c)(f) | 3,192,000 | 2,866,796 | |
Series 2021-VINO: | |||
| Class F, 1 month U.S. LIBOR + 2.800% 6.6773% 5/15/38 (b)(c)(f) | 2,627,000 | 2,383,308 | |
| Class G, 1 month U.S. LIBOR + 3.950% 7.8273% 5/15/38 (b)(c)(f) | 4,994,000 | 4,548,331 | |
| Series 2020-VIVA: | |||
Class D, 3.667% 3/11/44 (b)(c) | 9,422,000 | 6,909,741 | |
Class E, 3.667% 3/11/44 (b)(c) | 8,563,000 | 5,988,157 | |
| Bx Commercial Mortgage Trust 2 floater Series 2022-LP2 Class G, CME Term SOFR 1 Month Index + 4.100% 7.9001% 2/15/39 (b)(c)(f) | 3,510,248 | 3,236,348 | |
| BX Trust: | |||
| floater: | |||
Series 2017-APPL Class F, 1 month U.S. LIBOR + 4.250% 8.25% 7/15/34 (b)(c)(f) | 2,249,924 | 2,200,477 | |
Series 2019-IMC Class G, 1 month U.S. LIBOR + 3.600% 7.473% 4/15/34 (b)(c)(f) | 3,255,000 | 2,995,943 | |
Series 2019-XL Class J, CME Term SOFR 1 Month Index + 2.760% 6.5587% 10/15/36 (b)(c)(f) | 16,482,350 | 15,551,471 | |
Series 2021-ACNT Class G, 1 month U.S. LIBOR + 3.290% 7.171% 11/15/38 (b)(c)(f) | 2,541,000 | 2,336,121 | |
Series 2021-ARIA Class G, 1 month U.S. LIBOR + 3.140% 7.0171% 10/15/36 (b)(c)(f) | 2,500,000 | 2,164,607 | |
Series 2021-BXMF Class G, 1 month U.S. LIBOR + 3.340% 7.2245% 10/15/26 (b)(c)(f) | 4,374,000 | 3,840,857 | |
Series 2021-MFM1: | |||
| Class F, 1 month U.S. LIBOR + 3.000% 6.8753% 1/15/34 (b)(c)(f) | 834,000 | 770,664 | |
| Class G, 1 month U.S. LIBOR + 3.900% 7.7753% 1/15/34 (b)(c)(f) | 417,000 | 377,438 | |
Series 2021-SOAR: | |||
| Class G, 6.676% 6/15/38 (b)(c) | 1,271,369 | 1,165,709 | |
| Class J, 7.626% 6/15/38 (b)(c) | 2,542,738 | 2,331,255 | |
Series 2021-VOLT: | |||
| Class E, 1 month U.S. LIBOR + 2.000% 5.8753% 9/15/36 (b)(c)(f) | 1,785,000 | 1,660,850 | |
| Class G, 1 month U.S. LIBOR + 2.850% 6.7253% 9/15/36 (b)(c)(f) | 2,448,000 | 2,237,105 | |
Series 2022-LBA6: | |||
| Class C, CME Term SOFR 1 Month Index + 1.600% 5.3942% 1/15/39 (b)(c)(f) | 1,456,000 | 1,358,648 | |
| Class F, CME Term SOFR 1 Month Index + 3.350% 7.1443% 1/15/39 (b)(c)(f) | 4,315,000 | 3,930,262 | |
| Class G, CME Term SOFR 1 Month Index + 4.200% 7.9943% 1/15/39 (b)(c)(f) | 1,381,000 | 1,257,712 | |
| floater sequential payer Series 2021-LGCY Class J, 1 month U.S. LIBOR + 3.190% 7.068% 10/15/36 (b)(c)(f) | 1,390,000 | 1,209,739 | |
| Series 2019-OC11 Class E, 4.0755% 12/9/41 (b)(c) | 9,367,000 | 7,242,790 | |
| BXP Trust Series 2021-601L Class E, 2.868% 1/15/44 (b)(c) | 709,000 | 412,708 | |
| BXSC Commercial Mortgage Trust floater Series 2022-WSS Class F, 9.124% 3/15/35 (b)(c) | 2,283,000 | 2,117,087 | |
| CALI Mortgage Trust Series 2019-101C Class F, 4.4686% 3/10/39 (b)(c) | 3,093,000 | 2,150,192 | |
| CAMB Commercial Mortgage Trust floater Series 2019-LIFE Class G, 1 month U.S. LIBOR + 3.250% 7.123% 12/15/37 (b)(c)(f) | 10,526,000 | 9,608,890 | |
| Camb Commercial Mortgage Trust Series 2021-CX2 Class D, 2.8636% 11/10/46 (b)(c) | 736,000 | 505,194 | |
| CD Mortgage Trust Series 2017-CD3 Class D, 3.25% 2/10/50 (b) | 4,073,000 | 2,708,087 | |
| Citigroup Commercial Mortgage Trust: | |||
| Series 2013-GC15 Class D, 5.3345% 9/10/46 (b)(c) | 7,323,000 | 6,871,637 | |
| Series 2016-C3 Class D, 3% 11/15/49 (b) | 4,412,000 | 2,760,554 | |
| Series 2019-GC41: | |||
Class D, 3% 8/10/56 (b) | 2,273,000 | 1,520,753 | |
Class E, 3% 8/10/56 (b) | 1,848,000 | 1,177,625 | |
| Series 2019-GC43 Class E, 3% 11/10/52 (b) | 2,772,000 | 1,768,990 | |
| Series 2020-420K Class E, 3.4222% 11/10/42 (b)(c) | 2,081,000 | 1,463,123 | |
| Series 2020-GC46: | |||
Class D, 2.6% 2/15/53 (b) | 2,756,000 | 1,809,487 | |
Class E, 2.6% 2/15/53 (b) | 329,000 | 199,615 | |
| Series 2022-GC48: | |||
Class D, 2.5% 6/15/55 (b) | 3,129,000 | 1,806,788 | |
Class E, 2.5% 6/15/55 (b) | 2,562,000 | 1,345,610 | |
| Cologix Data Centers U.S. Issuer, LLC / Cologix Data Centers U.S. Co.-Issuer, LLC Series 2021-1A Class C, 5.99% 12/26/51 (b) | 1,500,000 | 1,257,543 | |
| COMM Mortgage Trust: | |||
| floater Series 2018-HCLV Class G, 1 month U.S. LIBOR + 5.150% 9.0293% 9/15/33 (b)(c)(f) | 1,487,000 | 1,212,909 | |
| sequential payer Series 2013-LC6 Class E, 3.5% 1/10/46 (b) | 2,840,000 | 2,430,581 | |
| Series 2012-CR1: | |||
Class D, 5.4718% 5/15/45 (b)(c) | 7,226,000 | 5,302,045 | |
Class G, 2.462% 5/15/45 (b)(e) | 2,322,000 | 648,107 | |
| Series 2013-CR10 Class D, 5.0312% 8/10/46 (b)(c) | 3,673,000 | 3,463,552 | |
| Series 2014-CR15 Class D, 4.8183% 2/10/47 (b)(c) | 1,060,000 | 1,002,965 | |
| Series 2014-CR17 Class E, 5.0066% 5/10/47 (b)(c) | 589,000 | 395,244 | |
| Series 2014-UBS2 Class D, 5.1457% 3/10/47 (b)(c) | 3,454,000 | 3,045,876 | |
| Series 2015-3BP Class F, 3.3463% 2/10/35 (b)(c) | 4,405,000 | 3,622,868 | |
| Series 2017-CD4 Class D, 3.3% 5/10/50 (b) | 3,969,000 | 2,974,611 | |
| Series 2019-CD4 Class C, 4.3497% 5/10/50 (c) | 1,920,000 | 1,599,527 | |
| COMM Trust Series 2017-COR2 Class D, 3% 9/10/50 (b) | 1,146,000 | 836,115 | |
| Commercial Mortgage Trust Series 2016-CD2 Class D, 2.8632% 11/10/49 (c) | 1,680,000 | 941,315 | |
| Commercial Mortgage Trust pass-thru certificates: | |||
| Series 2012-CR2: | |||
Class D, 5.0709% 8/15/45 (b)(c) | 789,000 | 732,981 | |
Class E, 5.0709% 8/15/45 (b)(c) | 5,385,400 | 4,558,471 | |
Class F, 4.25% 8/15/45 (b) | 7,162,000 | 5,345,990 | |
| Series 2014-CR2 Class G, 4.25% 8/15/45 (b)(e) | 1,556,000 | 854,878 | |
| Core Industrial Trust floater Series 2019-CORE Class E, 1 month U.S. LIBOR + 1.900% 5.775% 12/15/31 (b)(c)(f) | 2,385,600 | 2,164,906 | |
| CPT Mortgage Trust sequential payer Series 2019-CPT: | |||
| Class E, 3.0967% 11/13/39 (b)(c) | 1,785,000 | 1,213,281 | |
| Class F, 3.0967% 11/13/39 (b)(c) | 2,772,000 | 1,778,176 | |
| Credit Suisse Commercial Mortgage Trust floater Series 2021-SOP2 Class F, 1 month U.S. LIBOR + 4.210% 8.0922% 6/15/34 (b)(f) | 2,561,600 | 2,312,580 | |
| Credit Suisse First Boston Mortgage Securities Corp. Series 1998-C1 Class H, 6% 5/17/40 (b) | 25,212 | 25,204 | |
| Credit Suisse Mortgage Trust: | |||
| floater: | |||
Series 2021-4SZN Class A, CME Term SOFR 1 Month Index + 3.960% 7.7615% 11/15/23 (b)(c)(f) | 7,098,000 | 6,675,037 | |
Series 2021-BPNY Class A, 1 month U.S. LIBOR + 3.710% 7.5904% 8/15/23 (b)(c)(f) | 2,289,000 | 2,188,929 | |
| Series 2019-UVIL Class E, 3.3928% 12/15/41 (b)(c) | 2,289,000 | 1,521,817 | |
| Series 2020-NET Class F, 3.8277% 8/15/37 (b)(c) | 918,000 | 797,704 | |
| Series 2021-BRIT Class A, CME Term SOFR 1 Month Index + 3.570% 7.3677% 5/15/23 (b)(c)(f) | 3,724,760 | 3,465,254 | |
| CRSNT Trust floater Series 2021-MOON: | |||
| Class F, 1 month U.S. LIBOR + 3.500% 7.38% 4/15/36 (b)(c)(f) | 840,000 | 745,671 | |
| Class G, 1 month U.S. LIBOR + 4.500% 8.38% 4/15/36 (b)(c)(f) | 493,000 | 437,256 | |
| CSAIL Commercial Mortgage Trust: | |||
| Series 2017-C8 Class D, 4.5867% 6/15/50 (b)(c) | 3,902,000 | 2,855,845 | |
| Series 2017-CX9 Class D, 4.1944% 9/15/50 (b)(c) | 1,615,000 | 1,205,561 | |
| DBCCRE Mortgage Trust Series 2014-ARCP: | |||
| Class D, 5.099% 1/10/34 (b)(c) | 833,000 | 765,092 | |
| Class E, 5.099% 1/10/34 (b)(c) | 4,264,000 | 3,763,705 | |
| DBGS Mortgage Trust: | |||
| Series 2018-C1: | |||
Class C, 4.7807% 10/15/51 (c) | 777,000 | 662,242 | |
Class D, 3.0307% 10/15/51 (b)(c) | 3,459,000 | 2,472,435 | |
| Series 2019-1735 Class F, 4.3344% 4/10/37 (b)(c) | 1,000,000 | 662,607 | |
| DC Office Trust Series 2019-MTC Class E, 3.1744% 9/15/45 (b)(c) | 1,029,000 | 677,965 | |
| ELP Commercial Mortgage Trust floater Series 2021-ELP Class J, 1 month U.S. LIBOR + 3.610% 7.4909% 11/15/38 (b)(c)(f) | 2,289,000 | 2,003,543 | |
| GS Mortgage Securities Corp. II Series 2010-C1 Class B, 5.148% 8/10/43 (b) | 193,730 | 190,391 | |
| GS Mortgage Securities Corp. Trust floater Series 2019-70P Class F, 1 month U.S. LIBOR + 2.650% 6.525% 10/15/36 (b)(c)(f) | 2,550,000 | 2,303,338 | |
| GS Mortgage Securities Trust: | |||
| Series 2011-GC5: | |||
Class D, 5.299% 8/10/44 (b)(c) | 1,929,752 | 795,593 | |
Class E, 5.299% 8/10/44 (b)(c)(e) | 2,432,000 | 209,656 | |
Class F, 4.5% 8/10/44 (b)(e) | 4,308,000 | 15,112 | |
| Series 2012-GCJ9 Class D, 4.6339% 11/10/45 (b)(c) | 4,238,000 | 4,193,077 | |
| Series 2013-GC12 Class D, 4.5614% 6/10/46 (b)(c) | 869,000 | 838,585 | |
| Series 2013-GC16: | |||
Class D, 5.4881% 11/10/46 (b)(c) | 3,923,000 | 3,672,904 | |
Class F, 3.5% 11/10/46 (b) | 2,530,000 | 2,273,570 | |
| Series 2016-GS2 Class D, 2.753% 5/10/49 (b) | 2,058,050 | 1,590,989 | |
| Series 2017-GS6 Class D, 3.243% 5/10/50 (b) | 4,676,000 | 3,520,022 | |
| Series 2019-GC38 Class D, 3% 2/10/52 (b) | 1,162,000 | 819,012 | |
| Series 2019-GC39 Class D, 3% 5/10/52 (b) | 2,830,000 | 1,960,042 | |
| Series 2019-GC40 Class D, 3% 7/10/52 (b) | 2,079,000 | 1,454,044 | |
| Series 2019-GC42: | |||
Class D, 2.8% 9/1/52 (b) | 4,807,000 | 3,256,290 | |
Class E, 2.8% 9/1/52 (b) | 2,519,000 | 1,597,834 | |
| Series 2019-GS5 Class C, 4.299% 3/10/50 (c) | 2,499,000 | 2,081,103 | |
| Series 2019-GSA1 Class E, 2.8% 11/10/52 (b) | 1,655,000 | 1,044,807 | |
| Series 2020-GC45: | |||
Class D, 2.85% 2/13/53 (b) | 2,289,000 | 1,530,419 | |
Class SWD, 3.3258% 12/13/39 (b)(c) | 1,764,000 | 1,136,346 | |
| Series 2020-GC47 Class D, 3.5696% 5/12/53 (b)(c) | 756,000 | 528,833 | |
| Hilton U.S.A. Trust: | |||
| Series 2016-HHV: | |||
Class E, 4.3333% 11/5/38 (b)(c) | 3,079,000 | 2,634,149 | |
Class F, 4.3333% 11/5/38 (b)(c) | 5,977,000 | 5,050,483 | |
| Series 2016-SFP Class F, 6.1552% 11/5/35 (b) | 3,595,000 | 3,330,547 | |
| Home Partners of America Trust Series 2019-1: | |||
| Class E, 3.604% 9/17/39 (b) | 1,317,003 | 1,123,181 | |
| Class F, 4.101% 9/17/39 (b) | 213,700 | 182,848 | |
| Hudson Yards Mortgage Trust: | |||
| Series 2019-30HY Class E, 3.5579% 7/10/39 (b)(c) | 1,947,000 | 1,380,767 | |
| Series 2019-55HY Class F, 3.0409% 12/10/41 (b)(c) | 1,617,000 | 1,097,542 | |
| ILPT Commercial Mortgage Trust floater Series 2022-LPF2: | |||
| Class D, CME Term SOFR 1 Month Index + 4.190% 7.9863% 10/15/39 (b)(c)(f) | 1,150,000 | 1,124,832 | |
| Class E, CME Term SOFR 1 Month Index + 5.940% 9.7343% 10/15/39 (b)(c)(f) | 2,058,000 | 2,027,863 | |
| Independence Plaza Trust Series 2018-INDP Class E, 4.996% 7/10/35 (b) | 2,083,000 | 1,826,155 | |
| Intown Mortgage Trust floater Series 2022-STAY Class E, CME Term SOFR 1 Month Index + 5.030% 8.8254% 8/15/39 (b)(c)(f) | 1,623,000 | 1,571,332 | |
| J.P. Morgan Chase Commercial Mortgage Securities floater Series 2022-NXSS Class D, CME Term SOFR 1 Month Index + 4.120% 7.9233% 8/15/39 (b)(c)(f) | 1,000,000 | 992,473 | |
| JPMBB Commercial Mortgage Securities Trust: | |||
| Series 2014-C23 Class UH5, 4.7094% 9/15/47 (b) | 604,000 | 443,504 | |
| Series 2014-C26 Class D, 4.0155% 1/15/48 (b)(c) | 2,329,000 | 1,966,580 | |
| Series 2015-C32 Class C, 4.8052% 11/15/48 (c) | 1,500,000 | 1,085,431 | |
| JPMCC Commercial Mortgage Securities Trust Series 2016-JP4 Class D, 3.5203% 12/15/49 (b)(c) | 2,418,000 | 1,802,812 | |
| JPMDB Commercial Mortgage Securities Trust: | |||
| Series 2017-C7 Class D, 3% 10/15/50 (b) | 3,285,000 | 2,353,737 | |
| Series 2018-C8 Class D, 3.4712% 6/15/51 (b)(c) | 1,171,000 | 794,353 | |
| Series 2019-COR6: | |||
Class D, 2.5% 11/13/52 (b) | 1,354,000 | 907,124 | |
Class E, 2.5% 11/13/52 (b) | 2,582,000 | 1,611,068 | |
| Series 2020-COR7 Class D, 1.75% 5/13/53 (b) | 1,535,000 | 908,812 | |
| JPMorgan Chase Commercial Mortgage Securities Trust: | |||
| floater: | |||
Series 2019-MFP Class F, 1 month U.S. LIBOR + 3.000% 6.875% 7/15/36 (b)(c)(f) | 777,000 | 713,128 | |
Series 2021-MHC Class E, 1 month U.S. LIBOR + 2.450% 6.325% 4/15/38 (b)(c)(f) | 3,060,000 | 2,875,777 | |
| Series 2011-C3: | |||
Class E, 5.709% 2/15/46 (b)(c) | 3,008,000 | 1,300,508 | |
Class G, 4.409% 2/15/46 (b)(c) | 1,082,000 | 85,856 | |
Class H, 4.409% 2/15/46 (b)(c)(e) | 2,622,000 | 252,812 | |
| Series 2012-CBX: | |||
Class E, 4.8344% 6/15/45 (b)(c) | 2,744,008 | 2,348,319 | |
Class F, 4% 6/15/45 (b)(e) | 3,743,000 | 1,410,706 | |
Class G 4% 6/15/45 (b) | 4,129,000 | 1,000,923 | |
| Series 2013-LC11: | |||
Class D, 4.3719% 4/15/46 (c) | 3,677,000 | 3,051,575 | |
Class E, 3.25% 4/15/46 (b)(c) | 104,000 | 71,239 | |
Class F, 3.25% 4/15/46 (b)(c)(e) | 5,894,000 | 1,192,946 | |
| Series 2014-DSTY: | |||
Class D, 3.9314% 6/10/27 (b)(c)(e) | 3,213,000 | 8,032 | |
Class E, 3.9314% 6/10/27 (b)(c)(e) | 4,232,000 | 10,551 | |
| Series 2018-AON Class F, 4.767% 7/5/31 (b)(c) | 2,150,000 | 1,734,653 | |
| Series 2019-OSB Class E, 3.9089% 6/5/39 (b)(c) | 2,350,000 | 1,794,213 | |
| Series 2020-NNN: | |||
Class EFX, 3.972% 1/16/37 (b) | 2,771,000 | 2,348,649 | |
Class FFX, 4.6254% 1/16/37 (b) | 2,388,000 | 1,958,304 | |
Class GFX, 4.8445% 1/16/37 (b)(c) | 942,000 | 758,687 | |
| KNDR Trust floater Series 2021-KIND Class F, 1 month U.S. LIBOR + 3.950% 7.825% 8/15/38 (b)(c)(f) | 4,439,911 | 3,919,396 | |
| La Quita Mortgage Trust floater Series 2022-LAQ Class F, CME Term SOFR 1 Month Index + 5.970% 9.7818% 3/15/39 (b)(c)(f) | 1,764,000 | 1,666,195 | |
| Liberty Street Trust Series 2016-225L Class E, 4.8035% 2/10/36 (b)(c) | 2,063,000 | 1,715,530 | |
| LIFE Mortgage Trust floater Series 2021-BMR Class G, 1 month U.S. LIBOR + 2.950% 6.825% 3/15/38 (b)(c)(f) | 11,211,758 | 10,452,594 | |
| Market Mortgage Trust Series 2020-525M Class F, 3.0386% 2/12/40 (b)(c) | 1,976,000 | 1,082,011 | |
| MED Trust floater Series 2021-MDLN Class G, 1 month U.S. LIBOR + 5.250% 9.126% 11/15/38 (b)(c)(f) | 7,774,000 | 6,848,165 | |
| Merit floater Series 2021-STOR: | |||
| Class G, 1 month U.S. LIBOR + 2.750% 6.625% 7/15/38 (b)(c)(f) | 735,000 | 672,358 | |
| Class J, 1 month U.S. LIBOR + 3.950% 7.825% 7/15/38 (b)(c)(f) | 458,000 | 410,934 | |
| MHC Commercial Mortgage Trust floater Series 2021-MHC Class G, 1 month U.S. LIBOR + 3.200% 7.076% 4/15/38 (b)(c)(f) | 14,000,000 | 12,838,430 | |
| MHC Trust floater Series 2021-MHC2 Class F, 1 month U.S. LIBOR + 2.400% 6.275% 5/15/38 (b)(c)(f) | 3,850,000 | 3,541,104 | |
| MHP Commercial Mortgage Trust floater Series 2022-MHIL Class G, CME Term SOFR 1 Month Index + 3.950% 7.7518% 1/15/27 (b)(c)(f) | 2,285,341 | 2,075,082 | |
| MOFT Trust Series 2020-ABC: | |||
| Class D, 3.5926% 2/10/42 (b)(c) | 1,144,000 | 761,737 | |
| Class E, 3.5926% 2/10/42 (b)(c) | 841,000 | 528,457 | |
| Morgan Stanley BAML Trust: | |||
| sequential payer Series 2014-C18 Class 300E, 4.6896% 8/15/31 | 1,666,000 | 1,412,996 | |
| Series 2012-C5 Class E, 4.7919% 8/15/45 (b)(c) | 889,000 | 821,086 | |
| Series 2012-C6 Class D, 4.6472% 11/15/45 (b)(c) | 3,633,000 | 3,353,016 | |
| Series 2012-C6, Class F, 4.6472% 11/15/45 (b)(c) | 1,575,000 | 1,268,557 | |
| Series 2013-C12 Class D, 4.9148% 10/15/46 (b)(c) | 3,996,000 | 3,572,492 | |
| Series 2013-C13: | |||
Class D, 5.0587% 11/15/46 (b)(c) | 5,150,000 | 4,709,806 | |
Class E, 5.0587% 11/15/46 (b)(c) | 1,666,000 | 1,426,184 | |
| Series 2013-C8 Class D, 4.2065% 12/15/48 (b)(c) | 1,883,000 | 1,775,547 | |
| Series 2013-C9: | |||
Class D, 4.2346% 5/15/46 (b)(c) | 4,440,000 | 4,054,704 | |
Class E, 4.2346% 5/15/46 (b)(c) | 1,594,370 | 1,415,147 | |
| Series 2016-C30 Class D, 3% 9/15/49 (b) | 798,000 | 514,403 | |
| Series 2017-C33 Class D, 3.356% 5/15/50 (b) | 2,932,000 | 2,191,111 | |
| Morgan Stanley Capital I Trust: | |||
| Series 1998-CF1 Class G, 7.35% 7/15/32 (b)(c) | 10,678 | 10,558 | |
| Series 2011-C2: | |||
Class D, 5.385% 6/15/44 (b)(c) | 3,951,280 | 3,711,913 | |
Class F, 5.385% 6/15/44 (b)(c)(e) | 3,015,000 | 1,942,084 | |
| Series 2011-C3: | |||
Class C, 5.2525% 7/15/49 (b)(c) | 342,407 | 336,774 | |
Class D, 5.2525% 7/15/49 (b)(c) | 8,074,000 | 7,752,733 | |
Class E, 5.2525% 7/15/49 (b)(c)(e) | 2,610,000 | 2,306,733 | |
Class F, 5.2525% 7/15/49 (b)(c)(e) | 984,000 | 655,837 | |
Class G, 5.2525% 7/15/49 (b)(c)(e) | 3,536,800 | 1,819,151 | |
| Series 2012-C4 Class D, 5.3359% 3/15/45 (b)(c) | 888,566 | 821,916 | |
| Series 2015-MS1 Class D, 4.1581% 5/15/48 (b)(c) | 4,300,000 | 3,535,952 | |
| Series 2016-BNK2 Class C, 3% 11/15/49 (b)(e) | 4,506,000 | 3,350,383 | |
| Series 2017-H1 Class D, 2.546% 6/15/50 (b) | 5,262,000 | 3,742,557 | |
| Series 2018-MP Class E, 4.4185% 7/11/40 (b)(c) | 2,499,000 | 1,794,651 | |
| Series 2020-CNP Class D, 2.5085% 4/5/42 (b)(c) | 1,043,000 | 664,027 | |
| MSCCG Trust floater sequential payer Series 2018-SELF Class F, 1 month U.S. LIBOR + 3.050% 6.923% 10/15/37 (b)(c)(f) | 935,805 | 877,313 | |
| MSJP Commercial Securities Mortgage Trust Series 2015-HAUL Class E, 5.0127% 9/5/47 (b)(c) | 1,014,000 | 701,431 | |
| Natixis Commercial Mortgage Securities Trust: | |||
| floater Series 2018-FL1 Class WAN2, 1 month U.S. LIBOR + 3.750% 7.6253% 6/15/35 (b)(c)(f) | 222,000 | 168,638 | |
| Series 2018-TECH: | |||
Class E, 1 month U.S. LIBOR + 2.250% 6.276% 11/15/34 (b)(c)(f) | 638,000 | 610,708 | |
Class F, 1 month U.S. LIBOR + 3.000% 7.026% 11/15/34 (b)(c)(f) | 96,000 | 90,106 | |
Class G, 1 month U.S. LIBOR + 4.000% 8.026% 11/15/34 (b)(c)(f) | 572,000 | 537,029 | |
| Series 2019-10K: | |||
Class E, 4.2724% 5/15/39 (b)(c) | 984,000 | 756,699 | |
Class F, 4.2724% 5/15/39 (b)(c) | 3,014,000 | 2,114,300 | |
| Series 2020-2PAC: | |||
Class AMZ2, 3.6167% 1/15/37 (b)(c) | 1,754,950 | 1,525,341 | |
Class AMZ3, 3.6167% 1/15/37 (b)(c) | 822,675 | 708,822 | |
| OPG Trust floater Series 2021-PORT: | |||
| Class G, 1 month U.S. LIBOR + 2.390% 6.273% 10/15/36 (b)(c)(f) | 912,918 | 835,133 | |
| Class J, 1 month U.S. LIBOR + 3.340% 7.221% 10/15/36 (b)(c)(f) | 1,516,733 | 1,359,482 | |
| PKHL Commercial Mortgage Trust floater Series 2021-MF: | |||
| Class F, 1 month U.S. LIBOR + 3.350% 7.226% 7/15/38 (b)(c)(f) | 2,225,000 | 1,994,331 | |
| Class NR, 1 month U.S. LIBOR + 6.000% 9.876% 7/15/38 (b)(c)(f) | 631,000 | 559,870 | |
| Prima Capital Ltd. floater Series 2021-9A Class C, 1 month U.S. LIBOR + 2.350% 6.2886% 12/15/37 (b)(c)(f) | 1,000,000 | 934,552 | |
| Providence Place Group Ltd. Partnership Series 2000-C1 Class A2, 7.75% 7/20/28 (b) | 1,557,513 | 1,598,622 | |
| SFO Commercial Mortgage Trust floater Series 2021-555 Class F, 1 month U.S. LIBOR + 3.650% 7.525% 5/15/38 (b)(c)(f) | 1,383,000 | 1,180,264 | |
| SG Commercial Mortgage Securities Trust: | |||
| Series 2019-PREZ Class F, 3.593% 9/15/39 (b)(c) | 3,206,000 | 2,263,993 | |
| Series 2020-COVE: | |||
Class F, 3.8518% 3/15/37 (b)(c) | 3,855,000 | 3,299,322 | |
Class G, 3.8518% 3/15/37 (b)(c) | 1,782,000 | 1,463,379 | |
| SLG Office Trust Series 2021-OVA Class G, 2.8506% 7/15/41 (b) | 8,069,000 | 4,997,851 | |
| SMRT Commercial Mortgage Trust floater Series 2022-MINI Class F, CME Term SOFR 1 Month Index + 3.350% 7.145% 1/15/39 (b)(c)(f) | 3,360,000 | 3,065,237 | |
| SOHO Trust Series 2021-SOHO Class D, 2.7865% 8/10/38 (b)(c) | 2,499,000 | 1,670,240 | |
| SREIT Trust floater: | |||
| Series 2021-IND Class G, 1 month U.S. LIBOR + 3.260% 7.1408% 10/15/38 (b)(c)(f) | 3,339,000 | 2,952,500 | |
| Series 2021-MFP: | |||
Class E, 1 month U.S. LIBOR + 2.020% 5.9021% 11/15/38 (b)(c)(f) | 3,297,000 | 3,090,447 | |
Class F, 1 month U.S. LIBOR + 2.620% 6.5002% 11/15/38 (b)(c)(f) | 1,405,000 | 1,309,941 | |
| Series 2021-MFP2: | |||
Class G, 1 month U.S. LIBOR + 2.960% 6.8425% 11/15/36 (b)(c)(f) | 3,024,000 | 2,796,677 | |
Class J, 1 month U.S. LIBOR + 3.910% 7.7905% 11/15/36 (b)(c)(f) | 1,803,000 | 1,657,213 | |
| STWD Trust floater sequential payer Series 2021-LIH: | |||
| Class F, 1 month U.S. LIBOR + 3.550% 7.426% 11/15/36 (b)(c)(f) | 2,500,000 | 2,285,261 | |
| Class G, 1 month U.S. LIBOR + 4.200% 8.075% 11/15/36 (b)(c)(f) | 1,134,000 | 1,037,052 | |
| TPGI Trust floater Series 2021-DGWD Class G, 1 month U.S. LIBOR + 3.850% 7.73% 6/15/26 (b)(c)(f) | 1,008,000 | 927,703 | |
| UBS Commercial Mortgage Trust: | |||
| Series 2012-C1: | |||
Class D, 6.6606% 5/10/45 (b)(c)(e) | 457,821 | 416,612 | |
Class E, 5% 5/10/45 (b)(c)(e) | 1,911,000 | 745,290 | |
Class F, 5% 5/10/45 (b)(c)(e) | 2,484,000 | 128,709 | |
| Series 2018-C8 Class C, 4.8664% 2/15/51 (c) | 756,000 | 653,561 | |
| UBS-BAMLL Trust: | |||
| Series 12-WRM Class D, 4.3793% 6/10/30 (b)(c)(e) | 2,090,000 | 1,880,786 | |
| Series 2012-WRM Class C, 4.3793% 6/10/30 (b)(c)(e) | 890,000 | 845,371 | |
| VASA Trust: | |||
| floater Series 2021-VASA Class G, 1 month U.S. LIBOR + 5.000% 8.875% 7/15/39 (b)(c)(f) | 693,000 | 630,882 | |
| floater sequential payer Series 2021-VASA Class F, 1 month U.S. LIBOR + 3.900% 7.775% 7/15/39 (b)(c)(f) | 3,009,000 | 2,746,477 | |
| VMC Finance Ltd. floater Series 2021-HT1 Class B, 1 month U.S. LIBOR + 4.500% 8.4386% 1/18/37 (b)(c)(f) | 9,895,000 | 9,127,390 | |
| Wells Fargo Commercial Mortgage Trust: | |||
| floater Series 2021-SAVE Class E, 1 month U.S. LIBOR + 3.650% 7.525% 2/15/40 (b)(c)(f) | 511,779 | 446,886 | |
| sequential payer Series 2020-C57 Class D, 2.5% 8/15/53 (b) | 2,108,000 | 1,351,915 | |
| Series 2015-NXS4 Class D, 3.8415% 12/15/48 (c) | 1,834,000 | 1,556,471 | |
| Series 2016-BNK1 Class D, 3% 8/15/49 (b) | 1,526,000 | 912,872 | |
| Series 2016-NXS6 Class D, 3.059% 11/15/49 (b) | 4,250,000 | 3,217,004 | |
| Series 2017-RB1 Class D, 3.401% 3/15/50 (b) | 1,824,000 | 1,318,796 | |
| Series 2018-C44 Class D, 3% 5/15/51 (b) | 3,949,000 | 2,721,040 | |
| WF-RBS Commercial Mortgage Trust: | |||
| sequential payer Series 2011-C4I Class G, 5% 6/15/44 (c)(e) | 1,252,600 | 89,446 | |
| Series 2011-C3: | |||
Class D, 5.4196% 3/15/44 (b)(c) | 3,921,839 | 1,568,735 | |
Class E, 5% 3/15/44 (b)(e) | 1,258,000 | 6,290 | |
Class F, 5% 3/15/44 (b)(e) | 1,384,543 | 122 | |
| Series 2011-C4: | |||
Class D, 4.9882% 6/15/44 (b)(c) | 1,616,000 | 1,443,802 | |
Class E, 4.9882% 6/15/44 (b)(c) | 1,274,000 | 1,020,062 | |
| Series 2011-C5: | |||
Class E, 5.7043% 11/15/44 (b)(c) | 1,727,064 | 1,640,711 | |
Class F, 5.25% 11/15/44 (b)(c) | 3,930,000 | 3,576,611 | |
Class G, 5.25% 11/15/44 (b)(c) | 1,255,150 | 1,092,127 | |
| Series 2012-C7 Class E, 4.806% 6/15/45 (b)(c) | 1,461,203 | 111,636 | |
| Series 2013-C11: | |||
Class D, 4.4052% 3/15/45 (b)(c) | 1,865,000 | 1,719,141 | |
Class E, 4.4052% 3/15/45 (b)(c) | 4,999,000 | 4,155,791 | |
| Series 2013-C13 Class D, 4.2887% 5/15/45 (b)(c) | 1,499,000 | 1,441,970 | |
| Series 2013-C16 Class D, 5.148% 9/15/46 (b)(c) | 668,000 | 600,844 | |
| WFCM Series 2022-C62 Class D, 2.5% 4/15/55 (b) | 2,352,000 | 1,342,936 | |
| Worldwide Plaza Trust Series 2017-WWP Class F, 3.7154% 11/10/36 (b)(c) | 1,695,000 | 955,571 | |
| WP Glimcher Mall Trust Series 2015-WPG: | |||
| Class PR1, 3.6332% 6/5/35 (b)(c) | 1,638,000 | 1,296,907 | |
| Class PR2, 3.6332% 6/5/35 (b)(c) | 4,354,000 | 3,230,144 | |
| TOTAL COMMERCIAL MORTGAGE SECURITIES (Cost $692,971,832) | 585,916,221 | ||
| Common Stocks - 0.0% | |||
| Shares | Value ($) | ||
| Diversified Financial Services - 0.0% | |||
Cyxtera Technologies, Inc. Class A (h) (Cost $919,192) | 92,200 | 180,712 | |
| Preferred Stocks - 2.2% | |||
| Shares | Value ($) | ||
| Convertible Preferred Stocks - 0.2% | |||
| Homebuilders/Real Estate - 0.2% | |||
| RLJ Lodging Trust Series A, 1.95% | 70,550 | 1,742,585 | |
| Nonconvertible Preferred Stocks - 2.0% | |||
| Diversified Financial Services - 0.5% | |||
| AGNC Investment Corp. Series E, 6.50% (c) | 97,792 | 2,116,219 | |
| MFA Financial, Inc. Series B, 7.50% | 80,525 | 1,585,537 | |
| 3,701,756 | |||
| Homebuilders/Real Estate - 1.5% | |||
| Arbor Realty Trust, Inc. Series F, 6.25% (c) | 92,000 | 1,829,880 | |
| DiamondRock Hospitality Co. 8.25% | 25,800 | 637,260 | |
| Digitalbridge Group, Inc.: | |||
| Series H, 7.125% | 59,229 | 1,102,844 | |
| Series I, 7.15% | 71,600 | 1,351,092 | |
| Dynex Capital, Inc. Series C 6.90% (c) | 57,707 | 1,251,665 | |
| Franklin BSP Realty Trust, Inc. 7.50% | 87,175 | 1,638,018 | |
| iStar Financial, Inc. Series G, 7.65% | 20,700 | 509,427 | |
| Rexford Industrial Realty, Inc. Series B, 5.875% | 91,475 | 2,074,653 | |
| 10,394,839 | |||
TOTAL NONCONVERTIBLE PREFERRED STOCKS | 14,096,595 | ||
| TOTAL PREFERRED STOCKS (Cost $18,383,049) | 15,839,180 | ||
| Bank Loan Obligations - 2.6% | |||
Principal Amount (a) | Value ($) | ||
| Diversified Financial Services - 2.6% | |||
| Agellan Portfolio 9% 8/7/25 (e)(i) | 908,000 | 908,000 | |
| Mhp 2022-Mhil Mezz U.S. Secured Overnight Fin. Rate (SOFR) Index + 5.000% 8.7943% 1/9/24 (c)(e)(f)(i) | 4,858,250 | 4,615,338 | |
| Sunbelt Mezz U.S. Secured Overnight Fin. Rate (SOFR) Index + 4.450% 8.3085% 1/21/27 (c)(e)(f)(i) | 2,792,918 | 2,792,918 | |
| Veritas Multifamily Portfolio 1 month U.S. LIBOR + 8.500% 12.3753% 11/15/23 (c)(e)(f)(i) | 11,130,675 | 10,685,448 | |
| TOTAL BANK LOAN OBLIGATIONS (Cost $19,686,253) | 19,001,704 | ||
| Preferred Securities - 0.0% | |||
Principal Amount (a) | Value ($) | ||
| Homebuilders/Real Estate - 0.0% | |||
| Crest Clarendon Street 2002-1 Ltd. Series 2002-1A Class PS, 12/28/35 (b)(e) | 3,000,000 | 60,000 | |
| Crest Dartmouth Street 2003-1 Ltd. Series 2003-1A Class PS, 6/28/38 (b)(e) | 3,100,000 | 310 | |
| TOTAL PREFERRED SECURITIES (Cost $6,004,704) | 60,310 | ||
| Money Market Funds - 7.1% | |||
| Shares | Value ($) | ||
Fidelity Cash Central Fund 3.86% (j) (Cost $51,234,326) | 51,224,081 | 51,234,326 | |
| TOTAL INVESTMENT IN SECURITIES - 99.7% (Cost $850,336,417) | 720,057,450 |
NET OTHER ASSETS (LIABILITIES) - 0.3% | 2,155,546 |
| NET ASSETS - 100.0% | 722,212,996 |
| (a) | Amount is stated in United States dollars unless otherwise noted. |
| (b) | Security exempt from registration under Rule 144A of the Securities Act of 1933. These securities may be resold in transactions exempt from registration, normally to qualified institutional buyers. At the end of the period, the value of these securities amounted to $597,162,856 or 82.7% of net assets. |
| (c) | Coupon rates for floating and adjustable rate securities reflect the rates in effect at period end. |
| (d) | Interest Only (IO) security represents the right to receive only monthly interest payments on an underlying pool of mortgages or assets. Principal shown is the outstanding par amount of the pool as of the end of the period. |
| (e) | Level 3 security |
| (f) | Coupon is indexed to a floating interest rate which may be multiplied by a specified factor and/or subject to caps or floors. |
| (g) | Restricted securities (including private placements) - Investment in securities not registered under the Securities Act of 1933 (excluding 144A issues). At the end of the period, the value of restricted securities (excluding 144A issues) amounted to $35,038 or 0.0% of net assets. |
| (h) | Non-income producing |
| (i) | Remaining maturities of bank loan obligations may be less than the stated maturities shown as a result of contractual or optional prepayments by the borrower. Such prepayments cannot be predicted with certainty. |
| (j) | Affiliated fund that is generally available only to investment companies and other accounts managed by Fidelity Investments. The rate quoted is the annualized seven-day yield of the fund at period end. A complete unaudited listing of the fund's holdings as of its most recent quarter end is available upon request. In addition, each Fidelity Central Fund's financial statements, which are not covered by the Fund's Report of Independent Registered Public Accounting Firm, are available on the SEC's website or upon request. |
| Additional information on each restricted holding is as follows: | ||
| Security | Acquisition Date | Acquisition Cost ($) |
| Fannie Mae REMIC Trust Series 2003-W10 subordinate REMIC pass thru certificates, Class 2B4, 3.4275% 6/25/43 | 9/29/03 | 36,013 |
| Fannie Mae REMIC Trust Series 2003-W10 subordinate REMIC pass thru certificates, Class 2B5, 3.4275% 6/25/43 | 9/29/03 | 1,275 |
| Affiliate | Value, beginning of period ($) | Purchases ($) | Sales Proceeds ($) | Dividend Income ($) | Realized Gain (loss) ($) | Change in Unrealized appreciation (depreciation) ($) | Value, end of period ($) | % ownership, end of period |
| Fidelity Cash Central Fund 3.86% | 52,745,879 | 238,534,508 | 240,046,061 | 379,564 | - | - | 51,234,326 | 0.1% |
| Total | 52,745,879 | 238,534,508 | 240,046,061 | 379,564 | - | - | 51,234,326 | |
| Valuation Inputs at Reporting Date: | ||||
| Description | Total ($) | Level 1 ($) | Level 2 ($) | Level 3 ($) |
Investments in Securities: | ||||
| Equities: | ||||
Financials | 8,421,319 | 8,421,319 | - | - |
Information Technology | 180,712 | 180,712 | - | - |
Real Estate | 7,417,861 | 5,675,276 | 1,742,585 | - |
| Corporate Bonds | 29,987,772 | - | 29,987,772 | - |
| Asset-Backed Securities | 17,791,374 | - | 17,790,257 | 1,117 |
| Collateralized Mortgage Obligations | 45,851 | - | 34,944 | 10,907 |
| Commercial Mortgage Securities | 585,916,221 | - | 567,126,607 | 18,789,614 |
| Bank Loan Obligations | 19,001,704 | - | - | 19,001,704 |
| Preferred Securities | 60,310 | - | - | 60,310 |
| Money Market Funds | 51,234,326 | 51,234,326 | - | - |
| Total Investments in Securities: | 720,057,450 | 65,511,633 | 616,682,165 | 37,863,652 |
| Investments in Securities: | |||
| Commercial Mortgage Securities | |||
| Beginning Balance | $ | 18,382,360 | |
| Net Realized Gain (Loss) on Investment Securities | (5,637,313) | ||
| Net Unrealized Gain (Loss) on Investment Securities | 4,803,300 | ||
| Cost of Purchases | - | ||
| Proceeds of Sales | (10,614,823) | ||
| Amortization/Accretion | (536,064) | ||
| Transfers into Level 3 | 16,016,006 | ||
| Transfers out of Level 3 | (3,623,852) | ||
| Ending Balance | $ | 18,789,614 | |
| The change in unrealized gain (loss) for the period attributable to Level 3 securities held at November 30, 2022 | $ | (887,798) | |
| Bank Loan Obligations | |||
| Beginning Balance | $ | 19,322,516 | |
| Net Realized Gain (Loss) on Investment Securities | 6,276 | ||
| Net Unrealized Gain (Loss) on Investment Securities | (738,249) | ||
| Cost of Purchases | 9,692,950 | ||
| Proceeds of Sales | (9,293,964) | ||
| Amortization/Accretion | 12,175 | ||
| Transfers into Level 3 | - | ||
| Transfers out of Level 3 | - | ||
| Ending Balance | $ | 19,001,704 | |
| The change in unrealized gain (loss) for the period attributable to Level 3 securities held at November 30, 2022 | $ | (702,710) | |
| Other Investments in Securities | |||
| Beginning Balance | $ | 68,384 | |
| Net Realized Gain (Loss) on Investment Securities | 1,760 | ||
| Net Unrealized Gain (Loss) on Investment Securities | (106,743) | ||
| Cost of Purchases | 118,617 | ||
| Proceeds of Sales | 320,176 | ||
| Amortization/Accretion | (337,586) | ||
| Transfers into Level 3 | 7,726 | ||
| Transfers out of Level 3 | - | ||
| Ending Balance | $ | 72,334 | |
| The change in unrealized gain (loss) for the period attributable to Level 3 securities held at November 30, 2022 | $ | (106,743) | |
| The information used in the above reconciliation represents fiscal year to date activity for any Investments in Securities identified as using Level 3 inputs at either the beginning or the end of the current fiscal period. Cost of purchases and proceeds of sales may include securities received and/or delivered through in-kind transactions. Transfers into Level 3 were attributable to a lack of observable market data resulting from decreases in market activity, decreases in liquidity, security restructurings or corporate actions. Transfers out of Level 3 were attributable to observable market data becoming available for those securities. Transfers in or out of Level 3 represent the beginning value of any Security or Instrument where a change in the pricing level occurred from the beginning to the end of the period. The cost of purchases and the proceeds of sales may include securities received or delivered through corporate actions or exchanges. Realized and unrealized gains (losses) disclosed in the reconciliation are included in Net Gain (Loss) on the Fund's Statement of Operations. | |||
| Statement of Assets and Liabilities | ||||
| November 30, 2022 | ||||
| Assets | ||||
| Investment in securities, at value - See accompanying schedule: | ||||
Unaffiliated issuers (cost $799,102,091) | $668,823,124 | |||
Fidelity Central Funds (cost $51,234,326) | 51,234,326 | |||
| Total Investment in Securities (cost $850,336,417) | $ | 720,057,450 | ||
| Cash | 20,454 | |||
| Receivable for investments sold | 1,288,628 | |||
| Dividends receivable | 9,897 | |||
| Interest receivable | 3,548,923 | |||
| Distributions receivable from Fidelity Central Funds | 154,465 | |||
| Prepaid expenses | 1,066 | |||
Total assets | 725,080,883 | |||
| Liabilities | ||||
| Payable for investments purchased | $1,873,249 | |||
| Distributions payable | 386,720 | |||
| Accrued management fee | 417,849 | |||
| Other affiliated payables | 31,714 | |||
| Audit fee payable | 156,980 | |||
| Other payables and accrued expenses | 1,375 | |||
| Total Liabilities | 2,867,887 | |||
| Net Assets | $ | 722,212,996 | ||
| Net Assets consist of: | ||||
| Paid in capital | $ | 887,160,463 | ||
| Total accumulated earnings (loss) | (164,947,467) | |||
| Net Assets | $ | 722,212,996 | ||
Net Asset Value , offering price and redemption price per share ($722,212,996 ÷ 100,683,668 shares) | $ | 7.17 | ||
| Statement of Operations | ||||
Year ended November 30, 2022 | ||||
| Investment Income | ||||
| Dividends | $ | 1,182,314 | ||
| Interest | 42,353,470 | |||
| Income from Fidelity Central Funds | 379,564 | |||
| Total Income | 43,915,348 | |||
| Expenses | ||||
| Management fee | $ | 5,831,556 | ||
| Transfer agent fees | 125,380 | |||
| Accounting fees and expenses | 338,395 | |||
| Custodian fees and expenses | 6,334 | |||
| Independent trustees' fees and expenses | 2,949 | |||
| Audit | 186,045 | |||
| Legal | 592 | |||
| Miscellaneous | 8,715 | |||
| Total expenses before reductions | 6,499,966 | |||
| Expense reductions | (17,038) | |||
| Total expenses after reductions | 6,482,928 | |||
| Net Investment income (loss) | 37,432,420 | |||
| Realized and Unrealized Gain (Loss) | ||||
| Net realized gain (loss) on: | ||||
| Investment Securities: | ||||
| Unaffiliated issuers | (18,182,556) | |||
| Total net realized gain (loss) | (18,182,556) | |||
| Change in net unrealized appreciation (depreciation) on investment securities | (98,119,750) | |||
| Net gain (loss) | (116,302,306) | |||
| Net increase (decrease) in net assets resulting from operations | $ | (78,869,886) | ||
| Statement of Changes in Net Assets | ||||
Year ended November 30, 2022 | Year ended November 30, 2021 | |||
| Increase (Decrease) in Net Assets | ||||
| Operations | ||||
| Net investment income (loss) | $ | 37,432,420 | $ | 32,403,728 |
| Net realized gain (loss) | (18,182,556) | 1,569,874 | ||
| Change in net unrealized appreciation (depreciation) | (98,119,750) | 45,558,308 | ||
| Net increase (decrease) in net assets resulting from operations | (78,869,886) | 79,531,910 | ||
| Distributions to shareholders | (35,148,510) | (35,060,206) | ||
| Distributions to shareholders from tax return of capital | (3,443,243) | - | ||
| Total Distributions | (38,591,753) | (35,060,206) | ||
| Share transactions | ||||
| Proceeds from sales of shares | 1,542,700 | 118,054,500 | ||
| Reinvestment of distributions | 34,056,356 | 31,502,367 | ||
| Cost of shares redeemed | (141,867,241) | (5,109,731) | ||
Net increase (decrease) in net assets resulting from share transactions | (106,268,185) | 144,447,136 | ||
| Total increase (decrease) in net assets | (223,729,824) | 188,918,840 | ||
| Net Assets | ||||
| Beginning of period | 945,942,820 | 757,023,980 | ||
| End of period | $ | 722,212,996 | $ | 945,942,820 |
| Other Information | ||||
| Shares | ||||
| Sold | 206,697 | 14,527,015 | ||
| Issued in reinvestment of distributions | 4,453,015 | 3,876,956 | ||
| Redeemed | (18,754,870) | (626,815) | ||
| Net increase (decrease) | (14,095,158) | 17,777,156 | ||
| Fidelity® Real Estate High Income Fund |
| Years ended November 30, | 2022 | 2021 | 2020 | 2019 | 2018 | |||||
Selected Per-Share Data | ||||||||||
| Net asset value, beginning of period | $ | 8.24 | $ | 7.80 | $ | 8.77 | $ | 8.44 | $ | 8.60 |
| Income from Investment Operations | ||||||||||
Net investment income (loss) A,B | .345 | .305 | .341 | .418 | .417 | |||||
| Net realized and unrealized gain (loss) | (1.059) | .469 | (.972) | .338 | (.148) | |||||
| Total from investment operations | (.714) | .774 | (.631) | .756 | .269 | |||||
| Distributions from net investment income | (.324) | (.334) | (.339) | (.426) | (.429) | |||||
| Tax return of capital | (.032) | - | - | - | - | |||||
| Total distributions | (.356) | (.334) | (.339) | (.426) | (.429) | |||||
| Net asset value, end of period | $ | 7.17 | $ | 8.24 | $ | 7.80 | $ | 8.77 | $ | 8.44 |
Total Return C | (8.84)% | 10.07% | (7.06)% | 9.15% | 3.23% | |||||
Ratios to Average Net Assets B,D,E | ||||||||||
| Expenses before reductions | .78% | .78% | .79% | .80% | .80% | |||||
| Expenses net of fee waivers, if any | .78% | .78% | .79% | .80% | .80% | |||||
| Expenses net of all reductions | .78% | .78% | .79% | .79% | .80% | |||||
| Net investment income (loss) | 4.48% | 3.74% | 4.41% | 4.83% | 4.91% | |||||
| Supplemental Data | ||||||||||
| Net assets, end of period (000 omitted) | $ | 722,213 | $ | 945,943 | $ | 757,024 | $ | 821,523 | $ | 732,992 |
Portfolio turnover rate F | 16% | 22% | 27% | 26% | 13% G |
| Fidelity Central Fund | Investment Manager | Investment Objective | Investment Practices | Expense Ratio A |
| Fidelity Money Market Central Funds | Fidelity Management & Research Company LLC (FMR) | Each fund seeks to obtain a high level of current income consistent with the preservation of capital and liquidity. | Short-term Investments | Less than .005% |
| Asset Type | Fair Value | Valuation Technique(s) | Unobservable Input | Amount or Range/Weighted Average | Impact to Valuation from an Increase in Input A |
| Bank Loan Obligations | $19,001,704 | Discounted cash flow | Yield | 8.8% - 20.4% / 15.8% | Decrease |
| Preferred Securities | $60,310 | Indicative market price | Evaluated bid | $0.00 - $2.00 / $1.99 | Increase |
| Asset-Backed Securities | $1,117 | Indicative market price | Evaluated bid | $0.00 - $0.01 / $0.01 | Increase |
| Commercial Mortgage Securities | $18,789,614 | Indicative market price | Evaluated bid | $0.01 - $94.99 / $62.79 | Increase |
| Collateralized Mortgage Obligations | $10,907 | Indicative market price | Evaluated bid | $1.01 - $22.10 / $16.76 | Increase |
| Gross unrealized appreciation | $ 5,932,153 |
| Gross unrealized depreciation | (136,280,387) |
| Net unrealized appreciation (depreciation) | $(130,348,234) |
| Tax Cost | $850,405,684 |
| Capital loss carryforward | $(31,437,629) |
| Net unrealized appreciation (depreciation) on securities and other investments | $(130,348,234) |
| Short-term | $(10,443,799) |
| Long-term | (20,993,830) |
| Total capital loss carryforward | $(31,437,629) |
| November 30, 2022 | November 30, 2021 | |
| Ordinary Income | $ 35,148,510 | $35,060,206 |
| Return of Capital | $3,443,243 | $- |
| Total | $38,591,753 | $35,060,206 |
| Purchases ($) | Sales ($) | |
| Fidelity Real Estate High Income Fund | 133,110,322 | 252,328,662 |
| % of Average Net Assets | |
| Fidelity Real Estate High Income Fund | .04 |
| Amount | |
| Fidelity Real Estate High Income Fund | $71 |
| Amount | |
| Fidelity Real Estate High Income Fund | $1,471 |
| Fund | Number of Unaffiliated Shareholders | Unaffiliated Shareholders % |
Fidelity Real Estate High Income Fund | 3 | 61% |
| The Example is based on an investment of $1,000 invested at the beginning of the period and held for the entire period (June 1, 2022 to November 30, 2022). |
Annualized Expense Ratio- A | Beginning Account Value June 1, 2022 | Ending Account Value November 30, 2022 | Expenses Paid During Period- C June 1, 2022 to November 30, 2022 | |||||||
| Fidelity® Real Estate High Income Fund | .77% | |||||||||
| Actual | $ 1,000 | $ 962.20 | $ 3.79 | |||||||
Hypothetical- B | $ 1,000 | $ 1,021.21 | $ 3.90 | |||||||
|


Contents
| Average Annual Total Returns | |||
Periods ended November 30, 2022 | Past 1 year | Past 5 years | Life of Fund A |
| Fidelity Advisor® Series Growth Opportunities Fund | -32.42% | 16.76% | 15.15% |
| $10,000 Over Life of Fund |
Let's say hypothetically that $10,000 was invested in Fidelity Advisor® Series Growth Opportunities Fund, on November 07, 2013, when the fund started. The chart shows how the value of your investment would have changed, and also shows how the Russell 3000® Growth Index performed over the same period. |
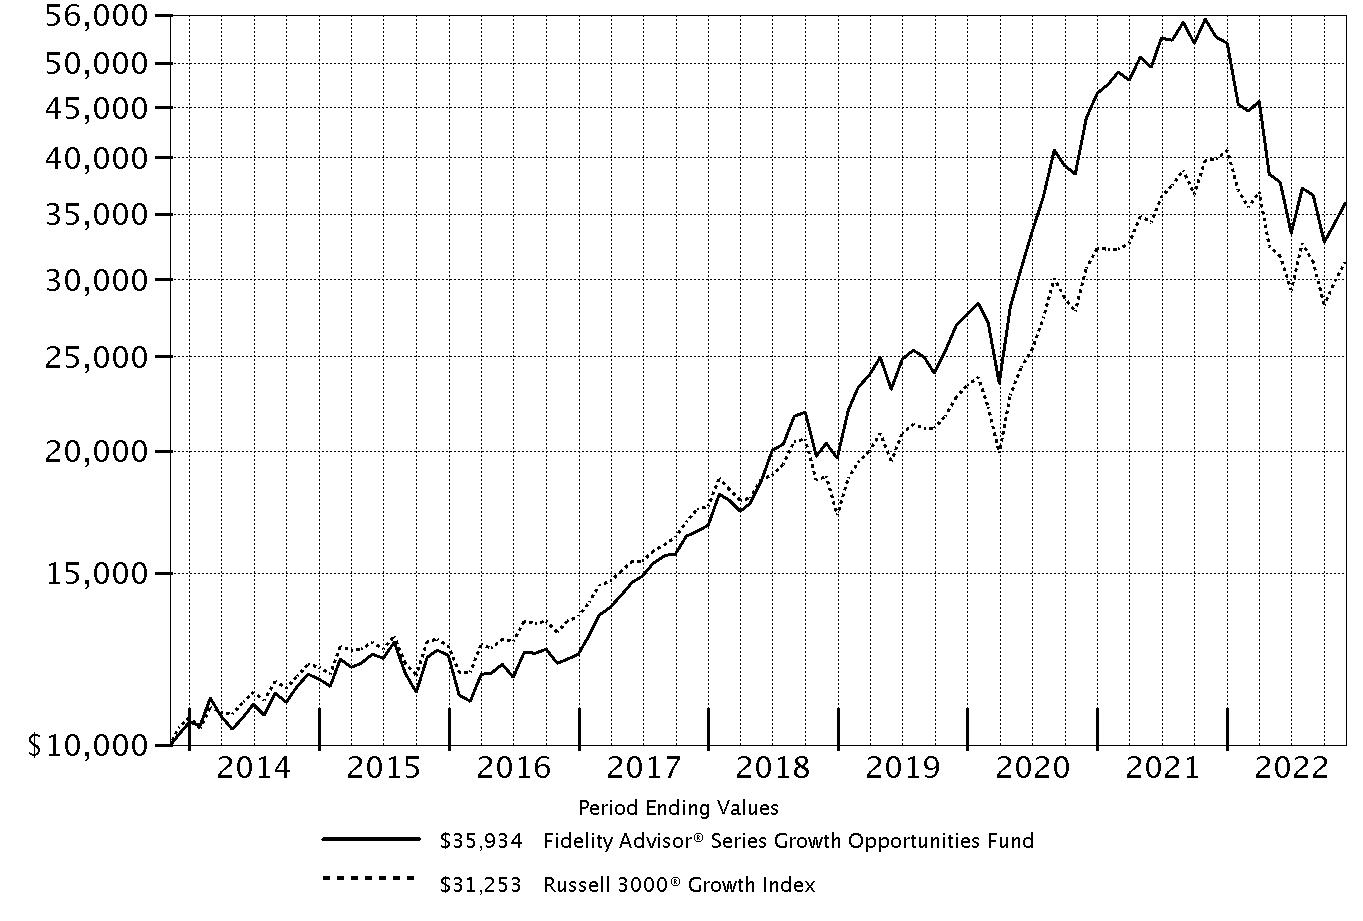 |
Top Holdings (% of Fund's net assets) | ||
| Microsoft Corp. | 8.0 | |
| Alphabet, Inc. Class C | 5.1 | |
| Amazon.com, Inc. | 4.1 | |
| T-Mobile U.S., Inc. | 4.1 | |
| NVIDIA Corp. | 3.4 | |
| Apple, Inc. | 3.0 | |
| Antero Resources Corp. | 2.7 | |
| Uber Technologies, Inc. | 2.4 | |
| UnitedHealth Group, Inc. | 2.1 | |
| Tesla, Inc. | 2.1 | |
| 37.0 | ||
| Market Sectors (% of Fund's net assets) | ||
| Information Technology | 39.2 | |
| Communication Services | 15.7 | |
| Health Care | 12.6 | |
| Consumer Discretionary | 12.4 | |
| Energy | 10.0 | |
| Materials | 2.7 | |
| Utilities | 2.6 | |
| Industrials | 2.4 | |
| Financials | 1.6 | |
| Consumer Staples | 0.3 | |
| Real Estate | 0.2 | |
Asset Allocation (% of Fund's net assets) |
 |
Foreign investments - 12.3% |
Geographic Diversification (% of Fund's net assets) |
 |
* Includes Short-Term investments and Net Other Assets (Liabilities). Percentages are based on country or territory of incorporation and are adjusted for the effect of futures contracts, if applicable. |
| Common Stocks - 97.3% | |||
| Shares | Value ($) | ||
| COMMUNICATION SERVICES - 15.6% | |||
| Diversified Telecommunication Services - 0.0% | |||
| AT&T, Inc. | 7,300 | 140,744 | |
| Cellnex Telecom SA (a) | 2,100 | 72,216 | |
| Starry Group Holdings, Inc. Class A (b) | 54,022 | 10,156 | |
| 223,116 | |||
| Entertainment - 1.3% | |||
| Netflix, Inc. (b) | 4,400 | 1,344,332 | |
| Roku, Inc. Class A (b) | 50,096 | 2,974,200 | |
| Sea Ltd. ADR (b) | 84,540 | 4,934,600 | |
| 9,253,132 | |||
| Interactive Media & Services - 9.0% | |||
| Alphabet, Inc.: | |||
| Class A (b) | 129,500 | 13,078,205 | |
| Class C (b) | 356,060 | 36,122,287 | |
| Epic Games, Inc. (b)(c)(d) | 2,200 | 1,863,070 | |
| Meta Platforms, Inc. Class A (b) | 64,789 | 7,651,581 | |
| Snap, Inc. Class A (b) | 86,500 | 891,815 | |
| Zoominfo Technologies, Inc. (b) | 129,784 | 3,711,822 | |
| 63,318,780 | |||
| Media - 1.2% | |||
| Charter Communications, Inc. Class A (b) | 3,700 | 1,447,773 | |
| Innovid Corp. (b)(c) | 35,509 | 105,107 | |
| Magnite, Inc. (b) | 235,602 | 2,617,538 | |
| TechTarget, Inc. (b) | 47,100 | 2,150,586 | |
| The Trade Desk, Inc. (b) | 39,355 | 2,051,970 | |
| 8,372,974 | |||
| Wireless Telecommunication Services - 4.1% | |||
| T-Mobile U.S., Inc. (b) | 188,824 | 28,599,283 | |
TOTAL COMMUNICATION SERVICES | 109,767,285 | ||
| CONSUMER DISCRETIONARY - 11.7% | |||
| Auto Components - 0.1% | |||
| Aptiv PLC (b) | 4,800 | 512,016 | |
| Mobileye Global, Inc. | 5,700 | 162,507 | |
| 674,523 | |||
| Automobiles - 2.1% | |||
| General Motors Co. | 3,600 | 146,016 | |
| Neutron Holdings, Inc. (b)(c)(d) | 77,208 | 1,652 | |
| Rad Power Bikes, Inc. (b)(c)(d) | 13,874 | 60,491 | |
| Rivian Automotive, Inc. | 1,700 | 54,468 | |
| Tesla, Inc. (b) | 73,360 | 14,283,192 | |
| 14,545,819 | |||
| Diversified Consumer Services - 0.0% | |||
| Duolingo, Inc. (b) | 1,500 | 104,505 | |
| Hotels, Restaurants & Leisure - 0.1% | |||
| Airbnb, Inc. Class A (b) | 2,827 | 288,750 | |
| Domino's Pizza, Inc. | 200 | 77,746 | |
| Sonder Holdings, Inc. (b)(e) | 53,918 | 95,435 | |
| Sonder Holdings, Inc.: | |||
| rights (b)(d) | 1,133 | 804 | |
| rights (b)(d) | 1,132 | 679 | |
| rights (b)(d) | 1,132 | 589 | |
| rights (b)(d) | 1,132 | 509 | |
| rights (b)(d) | 1,132 | 441 | |
| rights (b)(d) | 1,132 | 396 | |
| 465,349 | |||
| Household Durables - 0.0% | |||
| Lennar Corp. Class A | 800 | 70,264 | |
| Internet & Direct Marketing Retail - 8.1% | |||
| Amazon.com, Inc. (b) | 300,280 | 28,989,031 | |
| Cazoo Group Ltd. Class A (b)(e) | 518,358 | 139,957 | |
| Doordash, Inc. (b) | 51,872 | 3,021,544 | |
| FSN E-Commerce Ventures Private Ltd. | 607,320 | 1,294,184 | |
| Global-e Online Ltd. (b) | 108,831 | 2,347,485 | |
| Lyft, Inc. (b) | 276,072 | 3,097,528 | |
| Uber Technologies, Inc. (b) | 581,276 | 16,938,383 | |
| Wayfair LLC Class A (b) | 26,186 | 959,455 | |
| 56,787,567 | |||
| Specialty Retail - 0.6% | |||
| Auto1 Group SE (a)(b) | 463,968 | 4,053,752 | |
| Carvana Co. Class A (b)(e) | 60,800 | 468,768 | |
| 4,522,520 | |||
| Textiles, Apparel & Luxury Goods - 0.7% | |||
| Bombas LLC (b)(c)(d) | 174,908 | 620,923 | |
| lululemon athletica, Inc. (b) | 12,101 | 4,602,131 | |
| 5,223,054 | |||
TOTAL CONSUMER DISCRETIONARY | 82,393,601 | ||
| CONSUMER STAPLES - 0.2% | |||
| Beverages - 0.1% | |||
| Boston Beer Co., Inc. Class A (b) | 2,000 | 768,740 | |
| Food Products - 0.1% | |||
| Local Bounti Corp. (b)(e) | 187,297 | 393,324 | |
| Tobacco - 0.0% | |||
| JUUL Labs, Inc. Class B (b)(c)(d) | 709 | 3,169 | |
| Philip Morris International, Inc. | 2,100 | 209,307 | |
| 212,476 | |||
TOTAL CONSUMER STAPLES | 1,374,540 | ||
| ENERGY - 10.0% | |||
| Oil, Gas & Consumable Fuels - 10.0% | |||
| Antero Resources Corp. (b) | 516,700 | 18,885,385 | |
| Canadian Natural Resources Ltd. | 142,400 | 8,501,761 | |
| Cenovus Energy, Inc. (Canada) | 303,800 | 6,041,445 | |
| Cheniere Energy, Inc. | 3,900 | 683,904 | |
| Exxon Mobil Corp. | 112,300 | 12,503,482 | |
| Hess Corp. | 70,000 | 10,073,700 | |
| Imperial Oil Ltd. | 18,056 | 1,027,265 | |
| Ovintiv, Inc. | 130,700 | 7,287,832 | |
| Range Resources Corp. | 14,400 | 415,728 | |
| Tourmaline Oil Corp. | 85,900 | 5,228,140 | |
| 70,648,642 | |||
| FINANCIALS - 1.6% | |||
| Banks - 1.5% | |||
| Starling Bank Ltd. Series D (b)(c)(d) | 244,400 | 874,852 | |
| Wells Fargo & Co. | 202,400 | 9,705,080 | |
| 10,579,932 | |||
| Capital Markets - 0.1% | |||
| LPL Financial | 2,300 | 544,433 | |
TOTAL FINANCIALS | 11,124,365 | ||
| HEALTH CARE - 12.5% | |||
| Biotechnology - 2.5% | |||
| ADC Therapeutics SA (b) | 9,700 | 35,502 | |
| Agios Pharmaceuticals, Inc. (b)(e) | 32,141 | 968,730 | |
| Alnylam Pharmaceuticals, Inc. (b) | 9,863 | 2,175,679 | |
| ALX Oncology Holdings, Inc. (b) | 25,200 | 279,720 | |
| Arcutis Biotherapeutics, Inc. (b) | 7,700 | 132,671 | |
| Argenx SE ADR (b) | 6,290 | 2,503,231 | |
| Ascendis Pharma A/S sponsored ADR (b) | 8,116 | 998,755 | |
| Blueprint Medicines Corp. (b) | 4,400 | 210,276 | |
| Celldex Therapeutics, Inc. (b) | 22,700 | 841,943 | |
| Cytokinetics, Inc. (b) | 48,641 | 2,067,243 | |
| Erasca, Inc. (b) | 61,629 | 465,299 | |
| Exelixis, Inc. (b) | 61,209 | 1,045,450 | |
| Gilead Sciences, Inc. | 1,600 | 140,528 | |
| Icosavax, Inc. (b) | 29,300 | 97,862 | |
| Instil Bio, Inc. (b) | 68,500 | 91,105 | |
| Keros Therapeutics, Inc. (b) | 14,100 | 702,744 | |
| Moderna, Inc. (b) | 400 | 70,364 | |
| Monte Rosa Therapeutics, Inc. (b) | 20,023 | 169,795 | |
| Morphic Holding, Inc. (b) | 17,000 | 467,840 | |
| Natera, Inc. (b) | 1,400 | 57,568 | |
| Nuvalent, Inc. Class A (b) | 16,700 | 549,096 | |
| PTC Therapeutics, Inc. (b) | 1,500 | 62,235 | |
| Relay Therapeutics, Inc. (b) | 53 | 985 | |
| Tenaya Therapeutics, Inc. (b) | 14,500 | 38,425 | |
| TG Therapeutics, Inc. (b) | 32,000 | 282,240 | |
| Vaxcyte, Inc. (b) | 52,102 | 2,399,818 | |
| Verve Therapeutics, Inc. (b) | 9,400 | 218,362 | |
| Zentalis Pharmaceuticals, Inc. (b) | 32,800 | 725,536 | |
| 17,799,002 | |||
| Health Care Equipment & Supplies - 2.3% | |||
| Blink Health LLC Series A1 (b)(c)(d) | 1,597 | 61,772 | |
| Boston Scientific Corp. (b) | 173,201 | 7,840,809 | |
| Insulet Corp. (b) | 4,845 | 1,450,448 | |
| Penumbra, Inc. (b) | 15,695 | 3,288,259 | |
| TransMedics Group, Inc. (b) | 58,399 | 3,613,146 | |
| 16,254,434 | |||
| Health Care Providers & Services - 6.7% | |||
| agilon health, Inc. (b)(e) | 244,983 | 4,301,901 | |
| Alignment Healthcare, Inc. (b) | 35,100 | 466,830 | |
| Centene Corp. (b) | 100,587 | 8,756,098 | |
| Guardant Health, Inc. (b) | 35,400 | 1,852,836 | |
| Humana, Inc. | 19,519 | 10,733,498 | |
| LifeStance Health Group, Inc. (b) | 166,816 | 849,093 | |
| Oak Street Health, Inc. (b) | 225,702 | 4,879,677 | |
| P3 Health Partners, Inc. (b)(c) | 68,956 | 329,610 | |
| The Oncology Institute, Inc. (b)(c) | 28,268 | 39,858 | |
| UnitedHealth Group, Inc. | 27,491 | 15,058,470 | |
| 47,267,871 | |||
| Life Sciences Tools & Services - 0.8% | |||
| Danaher Corp. | 10,897 | 2,979,349 | |
| Sartorius Stedim Biotech | 4,169 | 1,422,893 | |
| Thermo Fisher Scientific, Inc. | 2,500 | 1,400,550 | |
| 5,802,792 | |||
| Pharmaceuticals - 0.2% | |||
| Arvinas Holding Co. LLC (b) | 15,139 | 621,305 | |
| AstraZeneca PLC sponsored ADR | 1,100 | 74,767 | |
| Eli Lilly & Co. | 1,100 | 408,188 | |
| 1,104,260 | |||
TOTAL HEALTH CARE | 88,228,359 | ||
| INDUSTRIALS - 1.5% | |||
| Aerospace & Defense - 1.4% | |||
| Lockheed Martin Corp. | 7,100 | 3,444,849 | |
| Northrop Grumman Corp. | 5,300 | 2,826,437 | |
| Space Exploration Technologies Corp. Class A (b)(c)(d) | 3,000 | 210,000 | |
| The Boeing Co. (b) | 19,300 | 3,452,384 | |
| 9,933,670 | |||
| Air Freight & Logistics - 0.1% | |||
| Delhivery Private Ltd. | 35,800 | 148,566 | |
| FedEx Corp. | 300 | 54,666 | |
| 203,232 | |||
| Road & Rail - 0.0% | |||
| Bird Global, Inc.: | |||
| rights (b)(d) | 3,816 | 153 | |
| rights (b)(d) | 3,816 | 114 | |
| rights (b)(d) | 3,815 | 76 | |
| 343 | |||
TOTAL INDUSTRIALS | 10,137,245 | ||
| INFORMATION TECHNOLOGY - 38.8% | |||
| Electronic Equipment & Components - 1.4% | |||
| Flex Ltd. (b) | 241,890 | 5,316,742 | |
| Jabil, Inc. | 59,400 | 4,288,086 | |
| 9,604,828 | |||
| IT Services - 8.3% | |||
| Block, Inc. Class A (b) | 29,479 | 1,997,792 | |
| Cloudflare, Inc. (b) | 29,800 | 1,464,372 | |
| Cyxtera Technologies, Inc. Class A (b) | 33,716 | 66,083 | |
| Dlocal Ltd. (b)(e) | 231,129 | 3,374,483 | |
| EPAM Systems, Inc. (b) | 10,700 | 3,943,806 | |
| Euronet Worldwide, Inc. (b) | 1,600 | 148,720 | |
| Fiserv, Inc. (b) | 700 | 73,052 | |
| Flywire Corp. (b) | 46,039 | 998,586 | |
| Globant SA (b) | 3,800 | 712,044 | |
| GoDaddy, Inc. (b) | 86,684 | 6,859,305 | |
| Marqeta, Inc. Class A (b) | 302,488 | 2,023,645 | |
| MasterCard, Inc. Class A | 26,801 | 9,551,876 | |
| MongoDB, Inc. Class A (b) | 27,200 | 4,153,168 | |
| Nuvei Corp. (a)(b) | 147,385 | 4,542,677 | |
| Okta, Inc. (b) | 6,400 | 341,248 | |
| Payoneer Global, Inc. (b)(c) | 15,500 | 83,700 | |
| Repay Holdings Corp. (b) | 221,030 | 1,958,326 | |
| Shift4 Payments, Inc. (b)(e) | 61,000 | 2,826,740 | |
| Snowflake, Inc. (b) | 1,900 | 271,510 | |
| TaskUs, Inc. (b) | 89,984 | 1,769,985 | |
| Visa, Inc. Class A | 50,426 | 10,942,442 | |
| Wix.com Ltd. (b) | 800 | 72,392 | |
| 58,175,952 | |||
| Semiconductors & Semiconductor Equipment - 12.9% | |||
| Advanced Micro Devices, Inc. (b) | 177,000 | 13,740,510 | |
| Applied Materials, Inc. | 55,466 | 6,079,074 | |
| ASML Holding NV (Netherlands) | 100 | 61,052 | |
| BE Semiconductor Industries NV | 2,800 | 182,385 | |
| GlobalFoundries, Inc. (b) | 176,400 | 11,351,340 | |
| Lam Research Corp. | 9,619 | 4,543,823 | |
| Marvell Technology, Inc. | 143,639 | 6,682,086 | |
| Microchip Technology, Inc. | 5,700 | 451,383 | |
| Micron Technology, Inc. | 18,760 | 1,081,514 | |
| NVIDIA Corp. | 141,376 | 23,925,060 | |
| NXP Semiconductors NV | 54,728 | 9,623,372 | |
| onsemi (b) | 163,442 | 12,290,838 | |
| Taiwan Semiconductor Manufacturing Co. Ltd. sponsored ADR | 8,600 | 713,628 | |
| 90,726,065 | |||
| Software - 13.2% | |||
| Adobe, Inc. (b) | 1,400 | 482,902 | |
| Bill.Com Holdings, Inc. (b) | 25,000 | 3,010,500 | |
| Confluent, Inc. (b)(e) | 28,900 | 665,567 | |
| Datadog, Inc. Class A (b) | 36,300 | 2,750,814 | |
| DoubleVerify Holdings, Inc. (b) | 98,540 | 2,581,748 | |
| Dynatrace, Inc. (b) | 177,647 | 6,883,821 | |
| Elastic NV (b) | 44,013 | 2,693,155 | |
| Five9, Inc. (b) | 30,000 | 1,923,300 | |
| HubSpot, Inc. (b) | 7,774 | 2,355,755 | |
| Intapp, Inc. (b) | 54,979 | 1,270,565 | |
| Intuit, Inc. | 9,113 | 3,714,368 | |
| Microsoft Corp. | 221,283 | 56,458,148 | |
| Oracle Corp. | 22,800 | 1,893,084 | |
| Pegasystems, Inc. | 1,900 | 68,875 | |
| Salesforce.com, Inc. (b) | 15,079 | 2,416,410 | |
| SentinelOne, Inc. (b) | 11,927 | 172,942 | |
| ServiceNow, Inc. (b) | 7,468 | 3,108,928 | |
| Stripe, Inc. Class B (b)(c)(d) | 2,500 | 63,450 | |
| Viant Technology, Inc. (b) | 58,358 | 222,928 | |
| Zscaler, Inc. (b) | 1,900 | 253,555 | |
| 92,990,815 | |||
| Technology Hardware, Storage & Peripherals - 3.0% | |||
| Apple, Inc. | 144,813 | 21,436,668 | |
TOTAL INFORMATION TECHNOLOGY | 272,934,328 | ||
| MATERIALS - 2.6% | |||
| Chemicals - 1.0% | |||
| CF Industries Holdings, Inc. | 28,100 | 3,040,139 | |
| Nutrien Ltd. | 41,900 | 3,368,760 | |
| The Mosaic Co. | 14,300 | 733,590 | |
| 7,142,489 | |||
| Metals & Mining - 1.6% | |||
| Alcoa Corp. | 65,000 | 3,258,450 | |
| ArcelorMittal SA Class A unit GDR | 129,700 | 3,508,385 | |
| Freeport-McMoRan, Inc. | 98,273 | 3,911,265 | |
| MP Materials Corp. (b)(e) | 6,500 | 216,125 | |
| 10,894,225 | |||
TOTAL MATERIALS | 18,036,714 | ||
| REAL ESTATE - 0.2% | |||
| Real Estate Management & Development - 0.2% | |||
| Opendoor Technologies, Inc. (b) | 494,900 | 915,565 | |
| WeWork, Inc. (b) | 161,500 | 445,740 | |
| 1,361,305 | |||
| UTILITIES - 2.6% | |||
| Electric Utilities - 1.7% | |||
| Constellation Energy Corp. | 32,433 | 3,117,460 | |
| ORSTED A/S (a) | 32,626 | 2,856,746 | |
| PG&E Corp. (b) | 391,000 | 6,138,700 | |
| 12,112,906 | |||
| Independent Power and Renewable Electricity Producers - 0.9% | |||
| NextEra Energy Partners LP | 78,590 | 6,325,709 | |
TOTAL UTILITIES | 18,438,615 | ||
| TOTAL COMMON STOCKS (Cost $533,640,382) | 684,444,999 | ||
| Preferred Stocks - 2.3% | |||
| Shares | Value ($) | ||
| Convertible Preferred Stocks - 1.9% | |||
| COMMUNICATION SERVICES - 0.1% | |||
| Interactive Media & Services - 0.1% | |||
| ByteDance Ltd. Series E1 (b)(c)(d) | 4,644 | 854,542 | |
| CONSUMER DISCRETIONARY - 0.2% | |||
| Automobiles - 0.0% | |||
| Rad Power Bikes, Inc.: | |||
| Series A(b)(c)(d) | 1,809 | 7,887 | |
| Series C(b)(c)(d) | 7,117 | 31,030 | |
| Series D(b)(c)(d) | 12,697 | 55,359 | |
| 94,276 | |||
| Internet & Direct Marketing Retail - 0.1% | |||
| Circle Internet Financial Ltd. Series F (c) | 5,401 | 265,342 | |
| Instacart, Inc.: | |||
| Series H(b)(c)(d) | 10,566 | 465,961 | |
| Series I(b)(c)(d) | 3,119 | 137,548 | |
| 868,851 | |||
| Textiles, Apparel & Luxury Goods - 0.1% | |||
| CelLink Corp. Series D (c)(d) | 12,100 | 190,938 | |
TOTAL CONSUMER DISCRETIONARY | 1,154,065 | ||
| CONSUMER STAPLES - 0.1% | |||
| Food & Staples Retailing - 0.1% | |||
| GoBrands, Inc. Series G (b)(c)(d) | 2,400 | 378,744 | |
| Food Products - 0.0% | |||
| Bowery Farming, Inc. Series C1 (b)(c)(d) | 13,745 | 312,012 | |
| Tobacco - 0.0% | |||
| JUUL Labs, Inc.: | |||
| Series C(b)(c)(d) | 70,175 | 313,682 | |
| Series D(b)(c)(d) | 938 | 4,193 | |
| 317,875 | |||
TOTAL CONSUMER STAPLES | 1,008,631 | ||
| HEALTH CARE - 0.1% | |||
| Health Care Equipment & Supplies - 0.1% | |||
| Blink Health LLC Series C (b)(c)(d) | 15,631 | 604,607 | |
| Health Care Technology - 0.0% | |||
| Aledade, Inc. Series E1 (c)(d) | 5,837 | 280,351 | |
TOTAL HEALTH CARE | 884,958 | ||
| INDUSTRIALS - 0.9% | |||
| Aerospace & Defense - 0.7% | |||
| Relativity Space, Inc. Series E (b)(c)(d) | 36,263 | 741,941 | |
| Space Exploration Technologies Corp.: | |||
| Series I(b)(c)(d) | 3,290 | 2,303,000 | |
| Series N(b)(c)(d) | 2,559 | 1,791,300 | |
| 4,836,241 | |||
| Construction & Engineering - 0.2% | |||
| Beta Technologies, Inc. Series A (b)(c)(d) | 15,188 | 1,251,795 | |
TOTAL INDUSTRIALS | 6,088,036 | ||
| INFORMATION TECHNOLOGY - 0.4% | |||
| Electronic Equipment & Components - 0.0% | |||
| Enevate Corp. Series E (b)(c)(d) | 285,844 | 157,214 | |
| IT Services - 0.1% | |||
| Yanka Industries, Inc.: | |||
| Series E(b)(c)(d) | 19,716 | 219,439 | |
| Series F(b)(c)(d) | 13,160 | 146,471 | |
| 365,910 | |||
| Semiconductors & Semiconductor Equipment - 0.1% | |||
| GaN Systems, Inc.: | |||
| Series F1(c)(d) | 10,622 | 58,527 | |
| Series F2(c)(d) | 5,609 | 30,906 | |
| SiMa.ai: | |||
| Series B(b)(c)(d) | 40,700 | 253,968 | |
| Series B1(c)(d) | 5,810 | 42,413 | |
| Xsight Labs Ltd. Series D (b)(c)(d) | 17,400 | 122,496 | |
| 508,310 | |||
| Software - 0.2% | |||
| Convoy, Inc. Series D (b)(c)(d) | 93,888 | 890,997 | |
| Databricks, Inc. Series G (b)(c)(d) | 6,600 | 311,850 | |
| Mountain Digital, Inc. Series D (c)(d) | 28,106 | 331,651 | |
| Stripe, Inc. Series H (b)(c)(d) | 1,100 | 27,918 | |
| Tenstorrent, Inc. Series C1 (b)(c)(d) | 1,200 | 64,128 | |
| 1,626,544 | |||
TOTAL INFORMATION TECHNOLOGY | 2,657,978 | ||
| MATERIALS - 0.1% | |||
| Metals & Mining - 0.1% | |||
| Diamond Foundry, Inc. Series C (b)(c)(d) | 23,194 | 752,181 | |
| TOTAL CONVERTIBLE PREFERRED STOCKS | 13,400,391 | ||
| Nonconvertible Preferred Stocks - 0.4% | |||
| CONSUMER DISCRETIONARY - 0.4% | |||
| Automobiles - 0.0% | |||
| Neutron Holdings, Inc. Series 1C (b)(c)(d) | 1,387,600 | 29,695 | |
| Waymo LLC Series A2 (b)(c)(d) | 2,896 | 133,477 | |
| 163,172 | |||
| Internet & Direct Marketing Retail - 0.4% | |||
| Circle Internet Financial Ltd. Series E (c) | 53,240 | 2,615,591 | |
TOTAL CONSUMER DISCRETIONARY | 2,778,763 | ||
| INFORMATION TECHNOLOGY - 0.0% | |||
| IT Services - 0.0% | |||
| Gupshup, Inc. (b)(c)(d) | 17,900 | 317,725 | |
| TOTAL NONCONVERTIBLE PREFERRED STOCKS | 3,096,488 | ||
| TOTAL PREFERRED STOCKS (Cost $13,935,824) | 16,496,879 | ||
| Convertible Bonds - 0.1% | |||
Principal Amount (f) | Value ($) | ||
| CONSUMER DISCRETIONARY - 0.1% | |||
| Automobiles - 0.1% | |||
| Neutron Holdings, Inc.: | |||
| 4% 10/27/25 (c)(d)(g) | 380,900 | 339,077 | |
| 4% 5/22/27 (c)(d) | 47,700 | 41,055 | |
| 4% 6/12/27 (c)(d) | 13,100 | 11,275 | |
| (Cost $441,700) | 391,407 | ||
| Preferred Securities - 0.0% | |||
Principal Amount (f) | Value ($) | ||
| INFORMATION TECHNOLOGY - 0.0% | |||
| Electronic Equipment & Components - 0.0% | |||
| Enevate Corp. 0% 1/29/23 (c)(d) | 121,700 | 114,520 | |
| Semiconductors & Semiconductor Equipment - 0.0% | |||
| GaN Systems, Inc. 0% (c)(d)(h) | 248,956 | 157,465 | |
| Software - 0.0% | |||
| Tenstorrent, Inc. 0% (c)(d)(h) | 63,300 | 56,894 | |
| TOTAL PREFERRED SECURITIES (Cost $433,956) | 328,879 | ||
| Money Market Funds - 1.3% | |||
| Shares | Value ($) | ||
| Fidelity Cash Central Fund 3.86% (i) | 2,313,908 | 2,314,371 | |
| Fidelity Securities Lending Cash Central Fund 3.86% (i)(j) | 6,707,467 | 6,708,138 | |
| TOTAL MONEY MARKET FUNDS (Cost $9,022,509) | 9,022,509 | ||
| TOTAL INVESTMENT IN SECURITIES - 101.0% (Cost $557,474,371) | 710,684,673 |
NET OTHER ASSETS (LIABILITIES) - (1.0)% | (7,007,857) |
| NET ASSETS - 100.0% | 703,676,816 |
| (a) | Security exempt from registration under Rule 144A of the Securities Act of 1933. These securities may be resold in transactions exempt from registration, normally to qualified institutional buyers. At the end of the period, the value of these securities amounted to $11,525,391 or 1.6% of net assets. |
| (b) | Non-income producing |
| (c) | Restricted securities (including private placements) - Investment in securities not registered under the Securities Act of 1933 (excluding 144A issues). At the end of the period, the value of restricted securities (excluding 144A issues) amounted to $21,534,819 or 3.1% of net assets. |
| (d) | Level 3 security |
| (e) | Security or a portion of the security is on loan at period end. |
| (f) | Amount is stated in United States dollars unless otherwise noted. |
| (g) | Security initially issued at one coupon which converts to a higher coupon at a specified date. The rate shown is the rate at period end. |
| (h) | Security is perpetual in nature with no stated maturity date. |
| (i) | Affiliated fund that is generally available only to investment companies and other accounts managed by Fidelity Investments. The rate quoted is the annualized seven-day yield of the fund at period end. A complete unaudited listing of the fund's holdings as of its most recent quarter end is available upon request. In addition, each Fidelity Central Fund's financial statements, which are not covered by the Fund's Report of Independent Registered Public Accounting Firm, are available on the SEC's website or upon request. |
| (j) | Investment made with cash collateral received from securities on loan. |
| Additional information on each restricted holding is as follows: | ||
| Security | Acquisition Date | Acquisition Cost ($) |
| Aledade, Inc. Series E1 | 5/20/22 | 290,767 |
| Beta Technologies, Inc. Series A | 4/09/21 | 1,112,825 |
| Blink Health LLC Series A1 | 12/30/20 | 43,263 |
| Blink Health LLC Series C | 11/07/19 - 7/14/21 | 596,729 |
| Bombas LLC | 2/16/21 - 11/12/21 | 830,401 |
| Bowery Farming, Inc. Series C1 | 5/18/21 | 828,127 |
| ByteDance Ltd. Series E1 | 11/18/20 | 508,862 |
| CelLink Corp. Series D | 1/20/22 | 251,969 |
| Circle Internet Financial Ltd. Series E | 5/11/21 | 864,100 |
| Circle Internet Financial Ltd. Series F | 5/09/22 | 227,598 |
| Convoy, Inc. Series D | 10/30/19 | 1,271,244 |
| Databricks, Inc. Series G | 2/01/21 | 390,209 |
| Diamond Foundry, Inc. Series C | 3/15/21 | 556,656 |
| Enevate Corp. Series E | 1/29/21 | 316,911 |
| Enevate Corp. 0% 1/29/23 | 1/29/21 | 121,700 |
| Epic Games, Inc. | 7/13/20 - 3/29/21 | 1,730,000 |
| GaN Systems, Inc. Series F1 | 11/30/21 | 90,075 |
| GaN Systems, Inc. Series F2 | 11/30/21 | 47,564 |
| GaN Systems, Inc. 0% | 11/30/21 | 248,956 |
| GoBrands, Inc. Series G | 3/02/21 | 599,322 |
| Gupshup, Inc. | 6/08/21 | 409,287 |
| Innovid Corp. | 6/24/21 | 355,090 |
| Instacart, Inc. Series H | 11/13/20 | 633,960 |
| Instacart, Inc. Series I | 2/26/21 | 389,875 |
| JUUL Labs, Inc. Class B | 11/21/17 | 0 |
| JUUL Labs, Inc. Series C | 5/22/15 | 0 |
| JUUL Labs, Inc. Series D | 6/25/18 | 0 |
| Mountain Digital, Inc. Series D | 11/05/21 | 645,463 |
| Neutron Holdings, Inc. | 2/04/21 | 772 |
| Neutron Holdings, Inc. Series 1C | 7/03/18 | 253,709 |
| Neutron Holdings, Inc. 4% 10/27/25 | 10/29/21 | 380,900 |
| Neutron Holdings, Inc. 4% 5/22/27 | 6/04/20 | 47,700 |
| Neutron Holdings, Inc. 4% 6/12/27 | 6/12/20 | 13,100 |
| P3 Health Partners, Inc. | 5/25/21 | 689,560 |
| Payoneer Global, Inc. | 2/03/21 | 155,000 |
| Rad Power Bikes, Inc. | 1/21/21 | 66,926 |
| Rad Power Bikes, Inc. Series A | 1/21/21 | 8,726 |
| Rad Power Bikes, Inc. Series C | 1/21/21 | 34,331 |
| Rad Power Bikes, Inc. Series D | 9/17/21 | 121,686 |
| Relativity Space, Inc. Series E | 5/27/21 | 828,069 |
| SiMa.ai Series B | 5/10/21 | 208,685 |
| SiMa.ai Series B1 | 4/25/22 - 10/17/22 | 41,198 |
| Space Exploration Technologies Corp. Class A | 2/16/21 | 125,997 |
| Space Exploration Technologies Corp. Series I | 4/05/18 | 556,010 |
| Space Exploration Technologies Corp. Series N | 8/04/20 | 690,930 |
| Starling Bank Ltd. Series D | 6/18/21 - 4/05/22 | 468,193 |
| Stripe, Inc. Class B | 5/18/21 | 100,321 |
| Stripe, Inc. Series H | 3/15/21 | 44,138 |
| Tenstorrent, Inc. Series C1 | 4/23/21 | 71,345 |
| Tenstorrent, Inc. 0% | 4/23/21 | 63,300 |
| The Oncology Institute, Inc. | 6/28/21 | 282,680 |
| Waymo LLC Series A2 | 5/08/20 | 248,671 |
| Xsight Labs Ltd. Series D | 2/16/21 | 139,130 |
| Yanka Industries, Inc. Series E | 5/15/20 | 238,154 |
| Yanka Industries, Inc. Series F | 4/08/21 | 419,499 |
| Affiliate | Value, beginning of period ($) | Purchases ($) | Sales Proceeds ($) | Dividend Income ($) | Realized Gain (loss) ($) | Change in Unrealized appreciation (depreciation) ($) | Value, end of period ($) | % ownership, end of period |
| Fidelity Cash Central Fund 3.86% | 2,387,842 | 374,022,798 | 374,096,269 | 61,306 | - | - | 2,314,371 | 0.0% |
| Fidelity Securities Lending Cash Central Fund 3.86% | 47,492,497 | 308,469,741 | 349,254,100 | 141,347 | - | - | 6,708,138 | 0.0% |
| Total | 49,880,339 | 682,492,539 | 723,350,369 | 202,653 | - | - | 9,022,509 | |
| Valuation Inputs at Reporting Date: | ||||
| Description | Total ($) | Level 1 ($) | Level 2 ($) | Level 3 ($) |
Investments in Securities: | ||||
| Equities: | ||||
Communication Services | 110,621,827 | 107,831,999 | 72,216 | 2,717,612 |
Consumer Discretionary | 86,326,429 | 76,359,181 | 8,228,869 | 1,738,379 |
Consumer Staples | 2,383,171 | 1,371,371 | - | 1,011,800 |
Energy | 70,648,642 | 70,648,642 | - | - |
Financials | 11,124,365 | 10,249,513 | - | 874,852 |
Health Care | 89,113,317 | 86,743,694 | 1,422,893 | 946,730 |
Industrials | 16,225,281 | 9,778,336 | 148,566 | 6,298,379 |
Information Technology | 275,910,031 | 272,627,441 | 243,437 | 3,039,153 |
Materials | 18,788,895 | 18,036,714 | - | 752,181 |
Real Estate | 1,361,305 | 1,361,305 | - | - |
Utilities | 18,438,615 | 15,581,869 | 2,856,746 | - |
| Corporate Bonds | 391,407 | - | - | 391,407 |
| Preferred Securities | 328,879 | - | - | 328,879 |
| Money Market Funds | 9,022,509 | 9,022,509 | - | - |
| Total Investments in Securities: | 710,684,673 | 679,612,574 | 12,972,727 | 18,099,372 |
| Net Unrealized Depreciation on Unfunded Commitments | (38,467) | - | - | (38,467) |
| Total | (38,467) | - | - | (38,467) |
| Investments in Securities: | |||
| Industrials | |||
| Beginning Balance | $ | 7,139,469 | |
| Net Realized Gain (Loss) on Investment Securities | - | ||
| Net Unrealized Gain (Loss) on Investment Securities | (671,123) | ||
| Cost of Purchases | - | ||
| Proceeds of Sales | - | ||
| Amortization/Accretion | - | ||
| Transfers into Level 3 | - | ||
| Transfers out of Level 3 | (169,967) | ||
| Ending Balance | $ | 6,298,379 | |
| The change in unrealized gain (loss) for the period attributable to Level 3 securities held at November 30, 2022 | $ | (671,123) | |
| Other Investments in Securities | |||
| Beginning Balance | $ | 17,135,400 | |
| Net Realized Gain (Loss) on Investment Securities | - | ||
| Net Unrealized Gain (Loss) on Investment Securities | (6,036,333) | ||
| Cost of Purchases | 658,256 | ||
| Proceeds of Sales | - | ||
| Amortization/Accretion | - | ||
| Transfers into Level 3 | 43,670 | ||
| Transfers out of Level 3 | - | ||
| Ending Balance | $ | 11,800,993 | |
| The change in unrealized gain (loss) for the period attributable to Level 3 securities held at November 30, 2022 | $ | (6,036,333) | |
| The information used in the above reconciliation represents fiscal year to date activity for any Investments in Securities identified as using Level 3 inputs at either the beginning or the end of the current fiscal period. Cost of purchases and proceeds of sales may include securities received and/or delivered through in-kind transactions. Transfers into Level 3 were attributable to a lack of observable market data resulting from decreases in market activity, decreases in liquidity, security restructurings or corporate actions. Transfers out of Level 3 were attributable to observable market data becoming available for those securities. Transfers in or out of Level 3 represent the beginning value of any Security or Instrument where a change in the pricing level occurred from the beginning to the end of the period. The cost of purchases and the proceeds of sales may include securities received or delivered through corporate actions or exchanges. Realized and unrealized gains (losses) disclosed in the reconciliation are included in Net Gain (Loss) on the Fund's Statement of Operations. | |||
| Statement of Assets and Liabilities | ||||
| November 30, 2022 | ||||
| Assets | ||||
| Investment in securities, at value (including securities loaned of $6,582,000) - See accompanying schedule: | ||||
Unaffiliated issuers (cost $548,451,862) | $701,662,164 | |||
Fidelity Central Funds (cost $9,022,509) | 9,022,509 | |||
| Total Investment in Securities (cost $557,474,371) | $ | 710,684,673 | ||
| Foreign currency held at value (cost $189) | 192 | |||
| Receivable for investments sold | 721,782 | |||
| Receivable for fund shares sold | 50,071,258 | |||
| Dividends receivable | 436,177 | |||
| Interest receivable | 15,139 | |||
| Distributions receivable from Fidelity Central Funds | 13,117 | |||
| Receivable from investment adviser for expense reductions | 1,150 | |||
Total assets | 761,943,488 | |||
| Liabilities | ||||
| Payable for investments purchased | $51,346,197 | |||
| Unrealized depreciation on unfunded commitments | 38,467 | |||
| Payable for fund shares redeemed | 21,326 | |||
| Other payables and accrued expenses | 151,492 | |||
| Collateral on securities loaned | 6,709,190 | |||
| Total Liabilities | 58,266,672 | |||
| Net Assets | $ | 703,676,816 | ||
| Net Assets consist of: | ||||
| Paid in capital | $ | 598,105,446 | ||
| Total accumulated earnings (loss) | 105,571,370 | |||
| Net Assets | $ | 703,676,816 | ||
Net Asset Value , offering price and redemption price per share ($703,676,816 ÷ 73,092,221 shares) | $ | 9.63 | ||
| Statement of Operations | ||||
Year ended November 30, 2022 | ||||
| Investment Income | ||||
| Dividends | $ | 3,722,229 | ||
| Interest | 11,510 | |||
| Income from Fidelity Central Funds (including $141,347 from security lending) | 202,653 | |||
| Total Income | 3,936,392 | |||
| Expenses | ||||
| Custodian fees and expenses | 49,524 | |||
| Independent trustees' fees and expenses | 2,434 | |||
| Interest | 5,185 | |||
| Total expenses before reductions | 57,143 | |||
| Expense reductions | (28,991) | |||
| Total expenses after reductions | 28,152 | |||
| Net Investment income (loss) | 3,908,240 | |||
| Realized and Unrealized Gain (Loss) | ||||
| Net realized gain (loss) on: | ||||
| Investment Securities: | ||||
| Unaffiliated issuers(net of foreign taxes of $531,748) | (46,069,635) | |||
| Foreign currency transactions | (12,332) | |||
| Total net realized gain (loss) | (46,081,967) | |||
| Change in net unrealized appreciation (depreciation) on: | ||||
| Investment Securities: | ||||
| Unaffiliated issuers (net of decrease in deferred foreign taxes of $745,387) | (225,454,725) | |||
| Unfunded commitments | (97,355) | |||
| Assets and liabilities in foreign currencies | 10,519 | |||
| Total change in net unrealized appreciation (depreciation) | (225,541,561) | |||
| Net gain (loss) | (271,623,528) | |||
| Net increase (decrease) in net assets resulting from operations | $ | (267,715,288) | ||
| Statement of Changes in Net Assets | ||||
Year ended November 30, 2022 | Year ended November 30, 2021 | |||
| Increase (Decrease) in Net Assets | ||||
| Operations | ||||
| Net investment income (loss) | $ | 3,908,240 | $ | 2,756,361 |
| Net realized gain (loss) | (46,081,967) | 178,515,563 | ||
| Change in net unrealized appreciation (depreciation) | (225,541,561) | (30,179,053) | ||
| Net increase (decrease) in net assets resulting from operations | (267,715,288) | 151,092,871 | ||
| Distributions to shareholders | (182,406,087) | (183,832,859) | ||
| Share transactions | ||||
| Proceeds from sales of shares | 362,824,993 | 152,602,013 | ||
| Reinvestment of distributions | 182,406,087 | 183,832,858 | ||
| Cost of shares redeemed | (167,505,935) | (240,907,112) | ||
Net increase (decrease) in net assets resulting from share transactions | 377,725,145 | 95,527,759 | ||
| Total increase (decrease) in net assets | (72,396,230) | 62,787,771 | ||
| Net Assets | ||||
| Beginning of period | 776,073,046 | 713,285,275 | ||
| End of period | $ | 703,676,816 | $ | 776,073,046 |
| Other Information | ||||
| Shares | ||||
| Sold | 33,624,140 | 8,681,006 | ||
| Issued in reinvestment of distributions | 13,132,188 | 11,496,739 | ||
| Redeemed | (15,229,553) | (13,323,687) | ||
| Net increase (decrease) | 31,526,775 | 6,854,058 | ||
| Fidelity Advisor® Series Growth Opportunities Fund |
| Years ended November 30, | 2022 | 2021 | 2020 | 2019 | 2018 | |||||
Selected Per-Share Data | ||||||||||
| Net asset value, beginning of period | $ | 18.67 | $ | 20.55 | $ | 16.27 | $ | 15.46 | $ | 13.86 |
| Income from Investment Operations | ||||||||||
Net investment income (loss) A,B | .06 | .06 | .08 | .11 C | .10 | |||||
| Net realized and unrealized gain (loss) | (4.79) | 3.39 | 7.91 | 3.56 | 2.83 | |||||
| Total from investment operations | (4.73) | 3.45 | 7.99 | 3.67 | 2.93 | |||||
| Distributions from net investment income | (.06) | (.11) | (.13) | (.11) | (.11) | |||||
| Distributions from net realized gain | (4.25) | (5.22) | (3.59) | (2.75) | (1.22) | |||||
| Total distributions | (4.31) | (5.33) | (3.71) D | (2.86) | (1.33) | |||||
| Net asset value, end of period | $ | 9.63 | $ | 18.67 | $ | 20.55 | $ | 16.27 | $ | 15.46 |
Total Return E | (32.42)% | 21.11% | 63.04% | 32.07% | 23.13% | |||||
Ratios to Average Net Assets B,F,G | ||||||||||
| Expenses before reductions | .01% | .01% | .01% | .01% | .01% | |||||
| Expenses net of fee waivers, if any | -% H | -% H | .01% | .01% | .01% | |||||
| Expenses net of all reductions | -% H | -% H | .01% | .01% | .01% | |||||
| Net investment income (loss) | .57% | .35% | .54% | .77% C | .69% | |||||
| Supplemental Data | ||||||||||
| Net assets, end of period (000 omitted) | $ | 703,677 | $ | 776,073 | $ | 713,285 | $ | 647,544 | $ | 636,343 |
Portfolio turnover rate I | 97% | 84% | 78% | 78% J | 47% |
| Fidelity Central Fund | Investment Manager | Investment Objective | Investment Practices | Expense Ratio A |
| Fidelity Money Market Central Funds | Fidelity Management & Research Company LLC (FMR) | Each fund seeks to obtain a high level of current income consistent with the preservation of capital and liquidity. | Short-term Investments | Less than .005% |
| Asset Type | Fair Value | Valuation Technique(s) | Unobservable Input | Amount or Range/Weighted Average | Impact to Valuation from an Increase in Input A |
| Equities | $17,379,086 | Recovery value | Recovery value | $0.00 | Increase |
| Market comparable | Enterprise value/Revenue multiple (EV/R) | 2.3 - 24.0 / 6.3 | Increase | ||
| Enterprise value/Net income multiple (EV/NI) | 14.8 | Increase | |||
| Enterprise value/Gross profit multiple (EV/GP) | 7.5 | Increase | |||
| Premium rate | 5.0% | Increase | |||
| Probability rate | 20.0% - 80.0% / 50.0% | Increase | |||
| Market approach | Discount rate | 10.0% - 50.0% / 35.6% | Decrease | ||
| Transaction price | $1.11 - $85.87 / $34.42 | Increase | |||
| Probability rate | 25.0% - 75.0% / 50.0% | Increase | |||
| Discounted cash flow | Weighted average cost of capital (WACC) | 30.0% | Decrease | ||
| Exit multiple | 2.5 | Increase | |||
| Black scholes | Volatility | 60.0% - 100.0% / 81.1% | Increase | ||
| Term | 2.0 - 5.0 / 4.3 | Increase | |||
| Corporate Bonds | $391,407 | Market comparable | Discount rate | 29.2% | Decrease |
| Enterprise value/Revenue multiple (EV/R) | 2.9 | Increase | |||
| Probability rate | 10.0% - 50.0% / 33.3% | Increase | |||
| Black scholes | Volatility | 75.0% | Increase | ||
| Term | 1.1 | Increase | |||
| Preferred Securities | $328,879 | Market comparable | Enterprise value/Revenue multiple (EV/R) | 4.8 | Increase |
| Probability rate | 10.0% - 90.0% / 50.0% | Increase | |||
| Market approach | Discount rate | 10.0% - 50.0% / 36.7% | De crease | ||
| Transaction price | $1.11 - $100.00 / $33.93 | Increase | |||
| Probability rate | 25.0% - 75.0% / 50.0% | Increase | |||
| Black scholes | Volatility | 70.0% - 100.0% / 90.0% | Increase | ||
| Term | 2.0 - 3.0 / 2.7 | Increase |
| Gross unrealized appreciation | $211,360,084 |
| Gross unrealized depreciation | (69,349,116) |
| Net unrealized appreciation (depreciation) | $142,010,968 |
| Tax Cost | $568,635,238 |
| Undistributed ordinary income | $2,942,518 |
| Capital loss carryforward | $(39,249,621) |
| Net unrealized appreciation (depreciation) on securities and other investments | $142,022,600 |
| Short-term | $(39,249,621) |
| Total capital loss carryforward | $(39,249,621) |
| November 30, 2022 | November 30, 2021 | |
| Ordinary Income | $31,798,276 | $42,178,700 |
| Long-term Capital Gains | 150,607,811 | 141,654,159 |
| Total | $182,406,087 | $183,832,859 |
| Investment to be Acquired | Commitment Amount | Unrealized Appreciation (Depreciation) | |
| Fidelity Advisor Series Growth Opportunities Fund | Stripe, Inc. | $38,467 | $(38,467) |
| Purchases ($) | Sales ($) | |
| Fidelity Advisor Series Growth Opportunities Fund | 871,935,380 | 676,826,382 |
| Amount | |
| Fidelity Advisor Series Growth Opportunities Fund | $13,624 |
| Borrower or Lender | Average Loan Balance | Weighted Average Interest Rate | Interest Expense | |
Fidelity Advisor Series Growth Opportunities Fund | Borrower | $11,645,550 | .80% | $5,185 |
| Purchases ($) | Sales ($) | Realized Gain (Loss) ($) | |
| Fidelity Advisor Series Growth Opportunities Fund | 100,956,969 | 40,780,020 | 1,239,515 |
| Amount ($) | |
| Fidelity Advisor Series Growth Opportunities Fund | 2,255 |
| Total Security Lending Fees Paid to NFS | Security Lending Income From Securities Loaned to NFS | Value of Securities Loaned to NFS at Period End | |
| Fidelity Advisor Series Growth Opportunities Fund | $15,110 | $254 | $- |
| The Example is based on an investment of $1,000 invested at the beginning of the period and held for the entire period (June 1, 2022 to November 30, 2022). |
Annualized Expense Ratio- A | Beginning Account Value June 1, 2022 | Ending Account Value November 30, 2022 | Expenses Paid During Period- C June 1, 2022 to November 30, 2022 | |||||||
| Fidelity Advisor® Series Growth Opportunities Fund | -%- D | |||||||||
| Actual | $ 1,000 | $ 952.50 | $- E | |||||||
Hypothetical- B | $ 1,000 | $ 1,025.07 | $- E | |||||||
|


Contents
| Average Annual Total Returns | |||
Periods ended November 30, 2022 | Past 1 year | Past 5 years | Life of Fund A |
| Fidelity Advisor® Series Small Cap Fund | -13.01% | 8.29% | 8.40% |
| $10,000 Over Life of Fund |
Let's say hypothetically that $10,000 was invested in Fidelity Advisor® Series Small Cap Fund, on November 07, 2013, when the fund started. The chart shows how the value of your investment would have changed, and also shows how the Russell 2000® Index performed over the same period. |
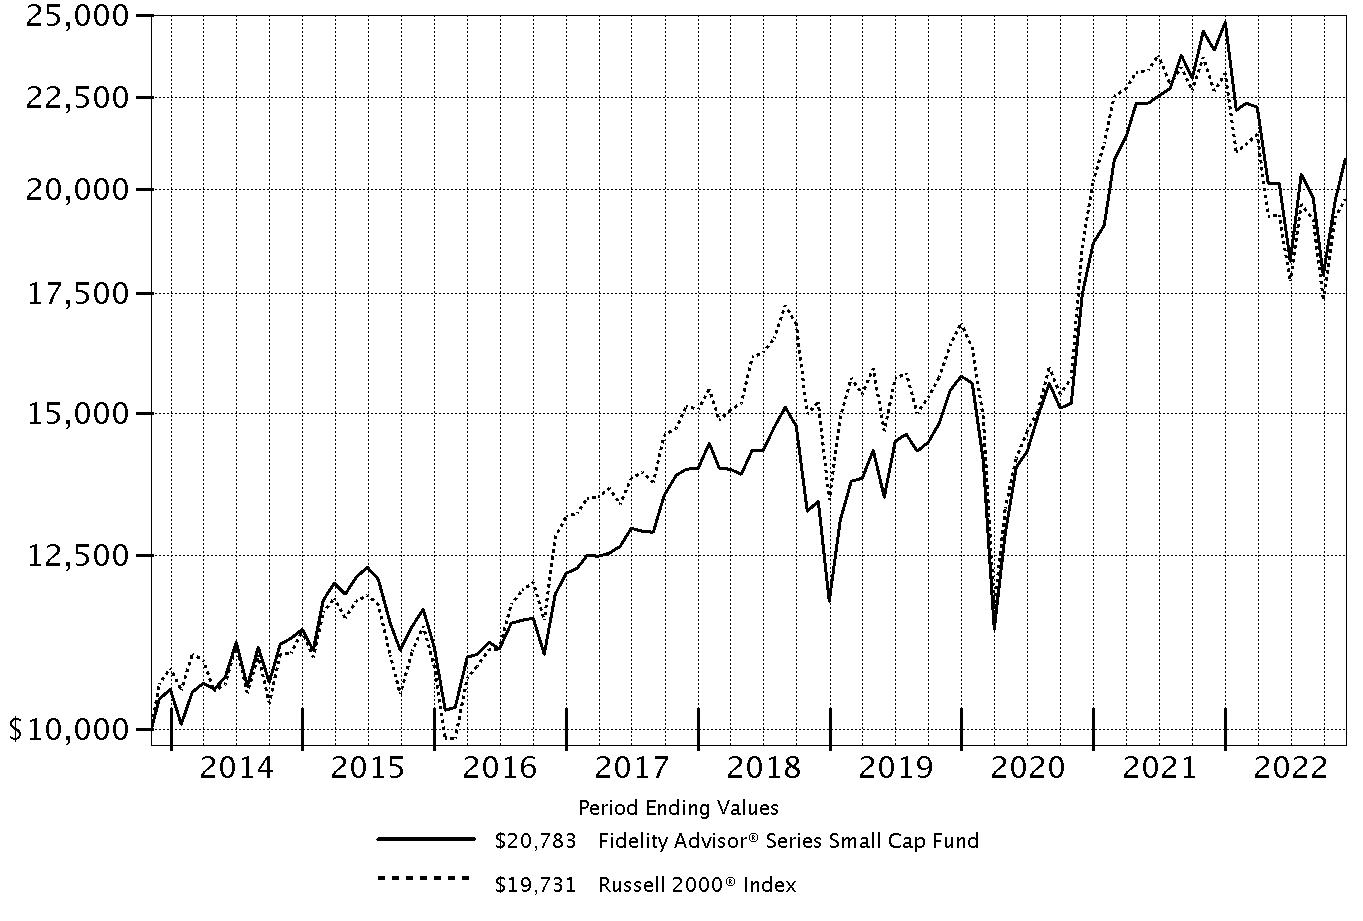 |
Top Holdings (% of Fund's net assets) | ||
| Commercial Metals Co. | 1.7 | |
| EMCOR Group, Inc. | 1.6 | |
| Extreme Networks, Inc. | 1.6 | |
| Antero Resources Corp. | 1.5 | |
| Insight Enterprises, Inc. | 1.5 | |
| Chemed Corp. | 1.4 | |
| First Interstate Bancsystem, Inc. | 1.4 | |
| Lamar Advertising Co. Class A | 1.4 | |
| Valvoline, Inc. | 1.4 | |
| Performance Food Group Co. | 1.4 | |
| 14.9 | ||
| Market Sectors (% of Fund's net assets) | ||
| Industrials | 18.3 | |
| Financials | 16.7 | |
| Information Technology | 14.9 | |
| Health Care | 13.3 | |
| Consumer Discretionary | 11.0 | |
| Materials | 6.9 | |
| Real Estate | 4.9 | |
| Energy | 4.4 | |
| Consumer Staples | 3.8 | |
| Communication Services | 2.8 | |
| Utilities | 1.7 | |
| Investment Companies | 0.8 | |
Asset Allocation (% of Fund's net assets) |
 |
Foreign investments - 15% |
Geographic Diversification (% of Fund's net assets) |
 |
* Includes Short-Term investments and Net Other Assets (Liabilities). Percentages are based on country or territory of incorporation and are adjusted for the effect of futures contracts, if applicable. |
| Common Stocks - 98.7% | |||
| Shares | Value ($) | ||
| COMMUNICATION SERVICES - 2.8% | |||
| Interactive Media & Services - 1.5% | |||
| Cars.com, Inc. (a) | 242,000 | 3,576,760 | |
| Ziff Davis, Inc. (a) | 29,584 | 2,729,420 | |
| 6,306,180 | |||
| Media - 0.7% | |||
| TechTarget, Inc. (a) | 59,500 | 2,716,770 | |
| Wireless Telecommunication Services - 0.6% | |||
| Gogo, Inc. (a) | 156,100 | 2,449,209 | |
TOTAL COMMUNICATION SERVICES | 11,472,159 | ||
| CONSUMER DISCRETIONARY - 11.0% | |||
| Auto Components - 2.9% | |||
| Adient PLC (a) | 116,300 | 4,528,722 | |
| Fox Factory Holding Corp. (a) | 30,400 | 3,225,440 | |
| Patrick Industries, Inc. | 74,581 | 4,171,315 | |
| 11,925,477 | |||
| Hotels, Restaurants & Leisure - 1.8% | |||
| Brinker International, Inc. (a) | 59,900 | 2,003,655 | |
| Churchill Downs, Inc. | 19,400 | 4,306,024 | |
| Lindblad Expeditions Holdings (a) | 105,200 | 955,216 | |
| 7,264,895 | |||
| Household Durables - 2.1% | |||
| Skyline Champion Corp. (a) | 98,591 | 5,125,746 | |
| Tempur Sealy International, Inc. | 101,800 | 3,234,186 | |
| 8,359,932 | |||
| Internet & Direct Marketing Retail - 0.2% | |||
| Vivid Seats, Inc. Class A (b) | 105,298 | 821,324 | |
| Leisure Products - 0.3% | |||
| Clarus Corp. | 134,190 | 1,116,461 | |
| Specialty Retail - 2.8% | |||
| Academy Sports & Outdoors, Inc. | 37,450 | 1,890,476 | |
| Aritzia, Inc. (a) | 43,500 | 1,654,756 | |
| Lithia Motors, Inc. Class A (sub. vtg.) (b) | 6,000 | 1,435,860 | |
| Murphy U.S.A., Inc. | 15,200 | 4,496,312 | |
| Musti Group OYJ | 129,279 | 2,066,880 | |
| 11,544,284 | |||
| Textiles, Apparel & Luxury Goods - 0.9% | |||
| Crocs, Inc. (a) | 35,682 | 3,603,882 | |
TOTAL CONSUMER DISCRETIONARY | 44,636,255 | ||
| CONSUMER STAPLES - 3.8% | |||
| Food & Staples Retailing - 2.9% | |||
| BJ's Wholesale Club Holdings, Inc. (a) | 40,820 | 3,071,297 | |
| Performance Food Group Co. (a) | 90,600 | 5,524,788 | |
| Sprouts Farmers Market LLC (a) | 87,600 | 3,007,308 | |
| 11,603,393 | |||
| Food Products - 0.9% | |||
| Nomad Foods Ltd. (a) | 216,100 | 3,779,589 | |
TOTAL CONSUMER STAPLES | 15,382,982 | ||
| ENERGY - 4.4% | |||
| Energy Equipment & Services - 0.7% | |||
| TechnipFMC PLC (a) | 222,400 | 2,757,760 | |
| Oil, Gas & Consumable Fuels - 3.7% | |||
| Antero Resources Corp. (a) | 170,000 | 6,213,500 | |
| Denbury, Inc. (a) | 55,300 | 4,963,728 | |
| Enviva, Inc. (b) | 31,200 | 1,770,600 | |
| Hess Midstream LP (b) | 66,999 | 2,092,379 | |
| 15,040,207 | |||
TOTAL ENERGY | 17,797,967 | ||
| FINANCIALS - 16.7% | |||
| Banks - 8.5% | |||
| ConnectOne Bancorp, Inc. | 173,776 | 4,559,882 | |
| First Interstate Bancsystem, Inc. | 127,900 | 5,578,998 | |
| Independent Bank Group, Inc. | 65,034 | 4,288,342 | |
| Metropolitan Bank Holding Corp. (a) | 50,200 | 3,189,708 | |
| PacWest Bancorp | 154,300 | 4,030,316 | |
| Pinnacle Financial Partners, Inc. | 53,200 | 4,462,948 | |
| ServisFirst Bancshares, Inc. | 56,000 | 4,245,920 | |
| Trico Bancshares | 77,300 | 4,212,850 | |
| 34,568,964 | |||
| Capital Markets - 2.8% | |||
| Houlihan Lokey | 31,900 | 3,137,365 | |
| LPL Financial | 14,900 | 3,526,979 | |
| Morningstar, Inc. | 8,564 | 2,099,293 | |
| Patria Investments Ltd. | 189,043 | 2,580,437 | |
| 11,344,074 | |||
| Consumer Finance - 0.6% | |||
| PROG Holdings, Inc. (a) | 117,908 | 2,321,609 | |
| Insurance - 3.0% | |||
| Old Republic International Corp. | 150,800 | 3,694,600 | |
| Primerica, Inc. | 28,800 | 4,292,064 | |
| Selective Insurance Group, Inc. | 44,927 | 4,318,383 | |
| 12,305,047 | |||
| Thrifts & Mortgage Finance - 1.8% | |||
| Essent Group Ltd. | 121,500 | 4,870,935 | |
| Walker & Dunlop, Inc. | 27,900 | 2,491,749 | |
| 7,362,684 | |||
TOTAL FINANCIALS | 67,902,378 | ||
| HEALTH CARE - 13.3% | |||
| Biotechnology - 3.8% | |||
| Avid Bioservices, Inc. (a) | 60,515 | 947,665 | |
| Blueprint Medicines Corp. (a) | 22,900 | 1,094,391 | |
| Celldex Therapeutics, Inc. (a) | 16,700 | 619,403 | |
| Cerevel Therapeutics Holdings (a) | 45,700 | 1,323,472 | |
| Cytokinetics, Inc. (a) | 44,700 | 1,899,750 | |
| Day One Biopharmaceuticals, Inc. (a) | 28,100 | 596,563 | |
| Erasca, Inc. (a) | 93,800 | 708,190 | |
| Exelixis, Inc. (a) | 51,900 | 886,452 | |
| Instil Bio, Inc. (a) | 89,300 | 118,769 | |
| Janux Therapeutics, Inc. (a) | 38,300 | 522,412 | |
| Keros Therapeutics, Inc. (a) | 13,800 | 687,792 | |
| Legend Biotech Corp. ADR (a) | 17,800 | 916,878 | |
| Mirati Therapeutics, Inc. (a) | 6,400 | 584,832 | |
| PepGen, Inc. | 20,500 | 306,680 | |
| Prelude Therapeutics, Inc. (a) | 59,465 | 396,632 | |
| PTC Therapeutics, Inc. (a) | 32,400 | 1,344,276 | |
| Relay Therapeutics, Inc. (a) | 35,800 | 665,164 | |
| Xenon Pharmaceuticals, Inc. (a) | 45,100 | 1,663,288 | |
| Zentalis Pharmaceuticals, Inc. (a) | 9,130 | 201,956 | |
| 15,484,565 | |||
| Health Care Equipment & Supplies - 3.0% | |||
| Envista Holdings Corp. (a) | 104,300 | 3,558,716 | |
| Heska Corp. (a) | 9,968 | 641,441 | |
| Inspire Medical Systems, Inc. (a) | 9,000 | 2,174,130 | |
| Merit Medical Systems, Inc. (a) | 38,300 | 2,757,600 | |
| Tandem Diabetes Care, Inc. (a) | 35,800 | 1,505,390 | |
| TransMedics Group, Inc. (a) | 27,400 | 1,695,238 | |
| 12,332,515 | |||
| Health Care Providers & Services - 4.8% | |||
| Acadia Healthcare Co., Inc. (a) | 53,100 | 4,729,086 | |
| Chemed Corp. | 11,300 | 5,876,000 | |
| Option Care Health, Inc. (a) | 95,166 | 2,865,448 | |
| Owens & Minor, Inc. | 62,400 | 1,286,064 | |
| The Ensign Group, Inc. | 50,500 | 4,797,500 | |
| 19,554,098 | |||
| Life Sciences Tools & Services - 0.8% | |||
| BioLife Solutions, Inc. (a) | 51,700 | 1,094,489 | |
| Olink Holding AB ADR (a) | 50,528 | 1,204,082 | |
| Syneos Health, Inc. (a) | 26,100 | 920,808 | |
| 3,219,379 | |||
| Pharmaceuticals - 0.9% | |||
| Arvinas Holding Co. LLC (a) | 30,000 | 1,231,200 | |
| DICE Therapeutics, Inc. (a) | 30,100 | 1,047,781 | |
| Edgewise Therapeutics, Inc. (a) | 59,600 | 533,420 | |
| Intra-Cellular Therapies, Inc. (a) | 17,731 | 961,375 | |
| 3,773,776 | |||
TOTAL HEALTH CARE | 54,364,333 | ||
| INDUSTRIALS - 18.3% | |||
| Aerospace & Defense - 0.7% | |||
| V2X, Inc. (a) | 67,400 | 2,723,634 | |
| Building Products - 1.7% | |||
| CSW Industrials, Inc. | 19,685 | 2,380,901 | |
| Masonite International Corp. (a) | 59,000 | 4,440,930 | |
| 6,821,831 | |||
| Commercial Services & Supplies - 0.7% | |||
| Tetra Tech, Inc. | 18,200 | 2,813,538 | |
| Construction & Engineering - 2.9% | |||
| EMCOR Group, Inc. | 43,300 | 6,707,170 | |
| NV5 Global, Inc. (a) | 36,968 | 5,342,246 | |
| 12,049,416 | |||
| Electrical Equipment - 1.9% | |||
| Array Technologies, Inc. (a) | 157,888 | 3,306,175 | |
| Atkore, Inc. (a) | 36,600 | 4,470,690 | |
| 7,776,865 | |||
| Machinery - 1.9% | |||
| ITT, Inc. | 39,200 | 3,313,184 | |
| Luxfer Holdings PLC sponsored | 138,800 | 2,034,808 | |
| Oshkosh Corp. | 24,600 | 2,264,922 | |
| 7,612,914 | |||
| Professional Services - 3.9% | |||
| ASGN, Inc. (a) | 40,200 | 3,642,120 | |
| FTI Consulting, Inc. (a) | 19,000 | 3,283,580 | |
| KBR, Inc. | 104,600 | 5,404,682 | |
| TriNet Group, Inc. (a) | 52,400 | 3,797,428 | |
| 16,127,810 | |||
| Road & Rail - 0.8% | |||
| TFI International, Inc. | 30,100 | 3,267,355 | |
| Trading Companies & Distributors - 3.8% | |||
| Applied Industrial Technologies, Inc. | 27,400 | 3,630,226 | |
| Beacon Roofing Supply, Inc. (a) | 36,100 | 2,107,879 | |
| Custom Truck One Source, Inc. Class A (a) | 209,002 | 1,429,574 | |
| GMS, Inc. (a) | 86,600 | 4,252,060 | |
| Rush Enterprises, Inc. Class A | 75,632 | 3,897,317 | |
| 15,317,056 | |||
TOTAL INDUSTRIALS | 74,510,419 | ||
| INFORMATION TECHNOLOGY - 14.9% | |||
| Communications Equipment - 1.6% | |||
| Extreme Networks, Inc. (a) | 318,900 | 6,687,333 | |
| Electronic Equipment & Components - 5.3% | |||
| Advanced Energy Industries, Inc. | 40,000 | 3,705,600 | |
| Fabrinet (a) | 25,600 | 3,415,296 | |
| Insight Enterprises, Inc. (a) | 56,798 | 5,901,880 | |
| Napco Security Technologies, Inc. | 149,482 | 3,943,335 | |
| TD SYNNEX Corp. | 44,913 | 4,594,600 | |
| 21,560,711 | |||
| IT Services - 2.3% | |||
| Concentrix Corp. | 38,313 | 4,688,745 | |
| Endava PLC ADR (a) | 33,201 | 2,546,849 | |
| Perficient, Inc. (a) | 27,500 | 1,953,875 | |
| 9,189,469 | |||
| Semiconductors & Semiconductor Equipment - 3.3% | |||
| AEHR Test Systems (a)(b) | 62,500 | 1,629,375 | |
| Ichor Holdings Ltd. (a) | 103,600 | 3,085,208 | |
| MACOM Technology Solutions Holdings, Inc. (a) | 64,700 | 4,444,243 | |
| SiTime Corp. (a) | 13,300 | 1,402,618 | |
| Synaptics, Inc. (a) | 25,058 | 2,655,396 | |
| 13,216,840 | |||
| Software - 1.8% | |||
| Five9, Inc. (a) | 21,900 | 1,404,009 | |
| Intapp, Inc. (a) | 124,419 | 2,875,323 | |
| Rapid7, Inc. (a) | 31,000 | 911,400 | |
| Tenable Holdings, Inc. (a) | 60,800 | 2,321,344 | |
| 7,512,076 | |||
| Technology Hardware, Storage & Peripherals - 0.6% | |||
| Avid Technology, Inc. (a) | 84,900 | 2,383,992 | |
TOTAL INFORMATION TECHNOLOGY | 60,550,421 | ||
| MATERIALS - 6.9% | |||
| Chemicals - 2.8% | |||
| Element Solutions, Inc. | 200,100 | 3,913,956 | |
| Tronox Holdings PLC | 147,700 | 2,087,001 | |
| Valvoline, Inc. | 167,900 | 5,537,342 | |
| 11,538,299 | |||
| Construction Materials - 1.3% | |||
| Eagle Materials, Inc. | 37,700 | 5,140,018 | |
| Metals & Mining - 2.8% | |||
| Commercial Metals Co. | 141,900 | 6,984,317 | |
| Constellium NV (a) | 367,600 | 4,576,620 | |
| 11,560,937 | |||
TOTAL MATERIALS | 28,239,254 | ||
| REAL ESTATE - 4.9% | |||
| Equity Real Estate Investment Trusts (REITs) - 4.1% | |||
| Essential Properties Realty Trust, Inc. | 204,392 | 4,743,938 | |
| Lamar Advertising Co. Class A | 55,700 | 5,577,798 | |
| Summit Industrial Income REIT | 209,200 | 3,507,014 | |
| Urban Edge Properties | 187,300 | 2,946,229 | |
| 16,774,979 | |||
| Real Estate Management & Development - 0.8% | |||
| Cushman & Wakefield PLC (a) | 271,633 | 3,102,049 | |
TOTAL REAL ESTATE | 19,877,028 | ||
| UTILITIES - 1.7% | |||
| Gas Utilities - 1.0% | |||
| Brookfield Infrastructure Corp. A Shares | 88,557 | 4,151,552 | |
| Multi-Utilities - 0.7% | |||
| Telecom Plus PLC | 90,462 | 2,735,186 | |
TOTAL UTILITIES | 6,886,738 | ||
| TOTAL COMMON STOCKS (Cost $325,319,366) | 401,619,934 | ||
| Money Market Funds - 2.6% | |||
| Shares | Value ($) | ||
| Fidelity Cash Central Fund 3.86% (c) | 3,752,713 | 3,753,464 | |
| Fidelity Securities Lending Cash Central Fund 3.86% (c)(d) | 7,057,530 | 7,058,236 | |
| TOTAL MONEY MARKET FUNDS (Cost $10,811,700) | 10,811,700 | ||
| Equity Funds - 0.8% | |||
| Shares | Value ($) | ||
| Small Blend Funds - 0.8% | |||
iShares Russell 2000 Index ETF (b) (Cost $2,990,672) | 16,700 | 3,129,079 | |
| TOTAL INVESTMENT IN SECURITIES - 102.1% (Cost $339,121,738) | 415,560,713 |
NET OTHER ASSETS (LIABILITIES) - (2.1)% | (8,678,601) |
| NET ASSETS - 100.0% | 406,882,112 |
| ETF | - | EXCHANGE-TRADED FUND |
| (a) | Non-income producing |
| (b) | Security or a portion of the security is on loan at period end. |
| (c) | Affiliated fund that is generally available only to investment companies and other accounts managed by Fidelity Investments. The rate quoted is the annualized seven-day yield of the fund at period end. A complete unaudited listing of the fund's holdings as of its most recent quarter end is available upon request. In addition, each Fidelity Central Fund's financial statements, which are not covered by the Fund's Report of Independent Registered Public Accounting Firm, are available on the SEC's website or upon request. |
| (d) | Investment made with cash collateral received from securities on loan. |
| Affiliate | Value, beginning of period ($) | Purchases ($) | Sales Proceeds ($) | Dividend Income ($) | Realized Gain (loss) ($) | Change in Unrealized appreciation (depreciation) ($) | Value, end of period ($) | % ownership, end of period |
| Fidelity Cash Central Fund 3.86% | 1,448,899 | 145,376,343 | 143,071,778 | 71,456 | - | - | 3,753,464 | 0.0% |
| Fidelity Securities Lending Cash Central Fund 3.86% | 22,495,735 | 114,960,088 | 130,397,587 | 63,644 | - | - | 7,058,236 | 0.0% |
| Total | 23,944,634 | 260,336,431 | 273,469,365 | 135,100 | - | - | 10,811,700 | |
| Valuation Inputs at Reporting Date: | ||||
| Description | Total ($) | Level 1 ($) | Level 2 ($) | Level 3 ($) |
Investments in Securities: | ||||
| Equities: | ||||
Communication Services | 11,472,159 | 11,472,159 | - | - |
Consumer Discretionary | 44,636,255 | 42,569,375 | 2,066,880 | - |
Consumer Staples | 15,382,982 | 15,382,982 | - | - |
Energy | 17,797,967 | 17,797,967 | - | - |
Financials | 67,902,378 | 67,902,378 | - | - |
Health Care | 54,364,333 | 54,364,333 | - | - |
Industrials | 74,510,419 | 74,510,419 | - | - |
Information Technology | 60,550,421 | 60,550,421 | - | - |
Materials | 28,239,254 | 28,239,254 | - | - |
Real Estate | 19,877,028 | 19,877,028 | - | - |
Utilities | 6,886,738 | 4,151,552 | 2,735,186 | - |
| Money Market Funds | 10,811,700 | 10,811,700 | - | - |
| Equity Funds | 3,129,079 | 3,129,079 | - | - |
| Total Investments in Securities: | 415,560,713 | 410,758,647 | 4,802,066 | - |
| Statement of Assets and Liabilities | ||||
| November 30, 2022 | ||||
| Assets | ||||
| Investment in securities, at value (including securities loaned of $7,129,030) - See accompanying schedule: | ||||
Unaffiliated issuers (cost $328,310,038) | $404,749,013 | |||
Fidelity Central Funds (cost $10,811,700) | 10,811,700 | |||
| Total Investment in Securities (cost $339,121,738) | $ | 415,560,713 | ||
| Foreign currency held at value (cost $22) | 23 | |||
| Receivable for investments sold | 16,410 | |||
| Receivable for fund shares sold | 193,072 | |||
| Dividends receivable | 298,133 | |||
| Distributions receivable from Fidelity Central Funds | 15,237 | |||
| Receivable from investment adviser for expense reductions | 924 | |||
Total assets | 416,084,512 | |||
| Liabilities | ||||
| Payable for investments purchased | $121,690 | |||
| Payable for fund shares redeemed | 2,018,510 | |||
| Other payables and accrued expenses | 4,474 | |||
| Collateral on securities loaned | 7,057,726 | |||
| Total Liabilities | 9,202,400 | |||
| Net Assets | $ | 406,882,112 | ||
| Net Assets consist of: | ||||
| Paid in capital | $ | 299,095,405 | ||
| Total accumulated earnings (loss) | 107,786,707 | |||
| Net Assets | $ | 406,882,112 | ||
Net Asset Value , offering price and redemption price per share ($406,882,112 ÷ 33,472,695 shares) | $ | 12.16 | ||
| Statement of Operations | ||||
Year ended November 30, 2022 | ||||
| Investment Income | ||||
| Dividends | $ | 3,951,833 | ||
| Income from Fidelity Central Funds (including $63,644 from security lending) | 135,100 | |||
| Total Income | �� | 4,086,933 | ||
| Expenses | ||||
| Custodian fees and expenses | 25,648 | |||
| Independent trustees' fees and expenses | 1,587 | |||
| Interest | 1,658 | |||
| Total expenses before reductions | 28,893 | |||
| Expense reductions | (12,335) | |||
| Total expenses after reductions | 16,558 | |||
| Net Investment income (loss) | 4,070,375 | |||
| Realized and Unrealized Gain (Loss) | ||||
| Net realized gain (loss) on: | ||||
| Investment Securities: | ||||
| Unaffiliated issuers | 36,747,588 | |||
| Foreign currency transactions | 6,501 | |||
| Total net realized gain (loss) | 36,754,089 | |||
| Change in net unrealized appreciation (depreciation) on: | ||||
| Investment Securities: | ||||
| Unaffiliated issuers | (107,069,564) | |||
| Assets and liabilities in foreign currencies | 242 | |||
| Total change in net unrealized appreciation (depreciation) | (107,069,322) | |||
| Net gain (loss) | (70,315,233) | |||
| Net increase (decrease) in net assets resulting from operations | $ | (66,244,858) | ||
| Statement of Changes in Net Assets | ||||
Year ended November 30, 2022 | Year ended November 30, 2021 | |||
| Increase (Decrease) in Net Assets | ||||
| Operations | ||||
| Net investment income (loss) | $ | 4,070,375 | $ | 3,510,593 |
| Net realized gain (loss) | 36,754,089 | 89,406,819 | ||
| Change in net unrealized appreciation (depreciation) | (107,069,322) | 63,748,699 | ||
| Net increase (decrease) in net assets resulting from operations | (66,244,858) | 156,666,111 | ||
| Distributions to shareholders | (92,151,608) | (15,797,916) | ||
| Share transactions | ||||
| Proceeds from sales of shares | 93,304,376 | 48,457,272 | ||
| Reinvestment of distributions | 92,151,608 | 15,797,916 | ||
| Cost of shares redeemed | (128,622,536) | (163,890,152) | ||
Net increase (decrease) in net assets resulting from share transactions | 56,833,448 | (99,634,964) | ||
| Total increase (decrease) in net assets | (101,563,018) | 41,233,231 | ||
| Net Assets | ||||
| Beginning of period | 508,445,130 | 467,211,899 | ||
| End of period | $ | 406,882,112 | $ | 508,445,130 |
| Other Information | ||||
| Shares | ||||
| Sold | 7,557,448 | 3,108,160 | ||
| Issued in reinvestment of distributions | 6,549,510 | 1,196,812 | ||
| Redeemed | (10,479,350) | (10,736,498) | ||
| Net increase (decrease) | 3,627,608 | (6,431,526) | ||
| Fidelity Advisor® Series Small Cap Fund |
| Years ended November 30, | 2022 | 2021 | 2020 | 2019 | 2018 | |||||
Selected Per-Share Data | ||||||||||
| Net asset value, beginning of period | $ | 17.04 | $ | 12.88 | $ | 11.72 | $ | 11.41 | $ | 12.72 |
| Income from Investment Operations | ||||||||||
Net investment income (loss) A,B | .11 | .11 | .09 | .09 | .10 | |||||
| Net realized and unrealized gain (loss) | (1.91) | 4.49 | 1.42 | 1.32 | (.58) | |||||
| Total from investment operations | (1.80) | 4.60 | 1.51 | 1.41 | (.48) | |||||
| Distributions from net investment income | (.12) | (.12) | (.07) | (.11) C | (.07) | |||||
| Distributions from net realized gain | (2.97) | (.32) | (.28) | (.99) C | (.76) | |||||
| Total distributions | (3.08) D | (.44) | (.35) | (1.10) | (.83) | |||||
| Net asset value, end of period | $ | 12.16 | $ | 17.04 | $ | 12.88 | $ | 11.72 | $ | 11.41 |
Total Return E | (13.01)% | 36.69% | 13.21% | 15.27% | (4.02)% | |||||
Ratios to Average Net Assets B,F,G | ||||||||||
| Expenses before reductions | .01% | .01% | .01% | .01% | .01% | |||||
| Expenses net of fee waivers, if any | -% H | -% H | .01% | .01% | .01% | |||||
| Expenses net of all reductions | -% H | -% H | .01% | .01% | -% H | |||||
| Net investment income (loss) | .92% | .68% | .85% | .89% | .83% | |||||
| Supplemental Data | ||||||||||
| Net assets, end of period (000 omitted) | $ | 406,882 | $ | 508,445 | $ | 467,212 | $ | 469,471 | $ | 441,154 |
Portfolio turnover rate I | 57% | 51% | 58% | 76% | 82% |
| Fidelity Central Fund | Investment Manager | Investment Objective | Investment Practices | Expense Ratio A |
| Fidelity Money Market Central Funds | Fidelity Management & Research Company LLC (FMR) | Each fund seeks to obtain a high level of current income consistent with the preservation of capital and liquidity. | Short-term Investments | Less than .005% |
| Gross unrealized appreciation | $108,353,566 |
| Gross unrealized depreciation | (34,199,106) |
| Net unrealized appreciation (depreciation) | $74,154,460 |
| Tax Cost | $341,406,253 |
| Undistributed ordinary income | $3,226,883 |
| Undistributed long-term capital gain | $31,231,825 |
| Net unrealized appreciation (depreciation) on securities and other investments | $73,327,999 |
| November 30, 2022 | November 30, 2021 | |
| Ordinary Income | $22,701,419 | $4,292,128 |
| Long-term Capital Gains | 69,450,189 | 11,505,788 |
| Total | $92,151,608 | $15,797,916 |
| Purchases ($) | Sales ($) | |
| Fidelity Advisor Series Small Cap Fund | 249,920,839 | 280,386,054 |
| Amount | |
| Fidelity Advisor Series Small Cap Fund | $7,818 |
| Borrower or Lender | Average Loan Balance | Weighted Average Interest Rate | Interest Expense | |
| Fidelity Advisor Series Small Cap Fund | Borrower | $9,867,429 | .86% | $1,658 |
| Purchases ($) | Sales ($) | Realized Gain (Loss) ($) | |
| Fidelity Advisor Series Small Cap Fund | 17,844,118 | 28,096,867 | 2,966,662 |
| Total Security Lending Fees Paid to NFS | Security Lending Income From Securities Loaned to NFS | Value of Securities Loaned to NFS at Period End | |
| Fidelity Advisor Series Small Cap Fund | $6,806 | $50 | $- |
| The Example is based on an investment of $1,000 invested at the beginning of the period and held for the entire period (June 1, 2022 to November 30, 2022). |
Annualized Expense Ratio- A | Beginning Account Value June 1, 2022 | Ending Account Value November 30, 2022 | Expenses Paid During Period- C June 1, 2022 to November 30, 2022 | |||||||
| Fidelity Advisor® Series Small Cap Fund | -%- D | |||||||||
| Actual | $ 1,000 | $ 1,032.30 | $- E | |||||||
Hypothetical- B | $ 1,000 | $ 1,025.07 | $- E | |||||||
|


Contents
| Average Annual Total Returns | |||
Periods ended November 30, 2022 | Past 1 year | Past 5 years | Life of Fund A |
| Fidelity Advisor® Series Equity Growth Fund | -17.55% | 14.64% | 14.09% |
| $10,000 Over Life of Fund |
Let's say hypothetically that $10,000 was invested in Fidelity Advisor® Series Equity Growth Fund, on June 06, 2014, when the fund started. The chart shows how the value of your investment would have changed, and also shows how the Russell 3000® Growth Index performed over the same period. |
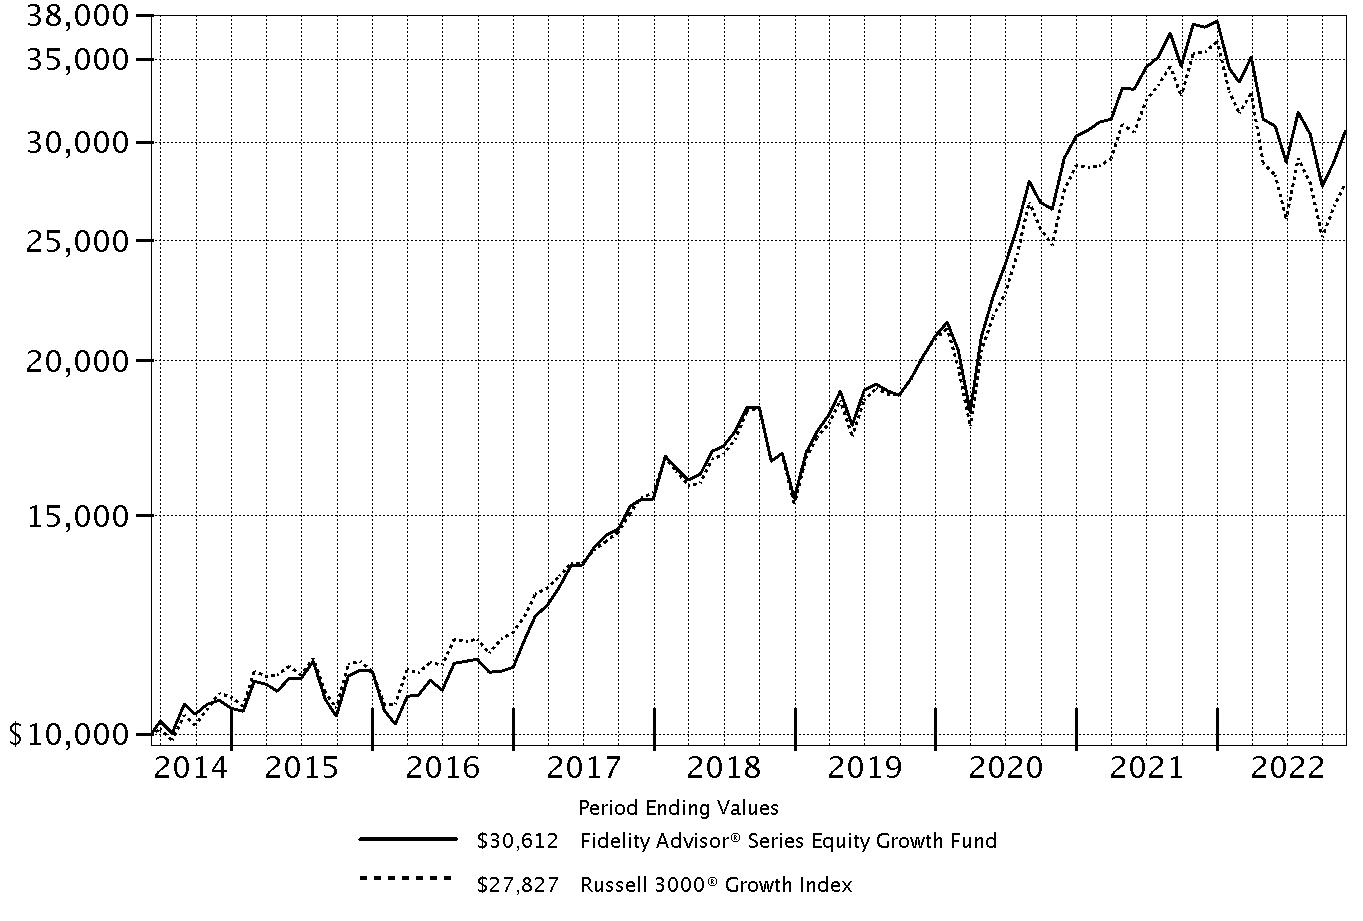 |
Top Holdings (% of Fund's net assets) | ||
| Microsoft Corp. | 10.0 | |
| UnitedHealth Group, Inc. | 5.6 | |
| Alphabet, Inc. Class A | 5.1 | |
| Apple, Inc. | 4.2 | |
| Amazon.com, Inc. | 3.5 | |
| Vertex Pharmaceuticals, Inc. | 3.1 | |
| Universal Music Group NV | 2.1 | |
| Warner Music Group Corp. Class A | 1.9 | |
| Meta Platforms, Inc. Class A | 1.9 | |
| Uber Technologies, Inc. | 1.9 | |
| 39.3 | ||
| Market Sectors (% of Fund's net assets) | ||
| Information Technology | 26.9 | |
| Health Care | 19.8 | |
| Communication Services | 12.9 | |
| Consumer Discretionary | 11.3 | |
| Industrials | 8.1 | |
| Financials | 5.8 | |
| Energy | 5.5 | |
| Materials | 4.5 | |
| Consumer Staples | 4.4 | |
| Real Estate | 0.1 | |
| Utilities | 0.0 | |
Asset Allocation (% of Fund's net assets) |
 |
Foreign investments - 10.2% |
Geographic Diversification (% of Fund's net assets) |
 |
* Includes Short-Term investments and Net Other Assets (Liabilities). Percentages are based on country or territory of incorporation and are adjusted for the effect of futures contracts, if applicable. |
| Common Stocks - 98.9% | |||
| Shares | Value ($) | ||
| COMMUNICATION SERVICES - 12.9% | |||
| Entertainment - 4.5% | |||
| Liberty Media Corp. Liberty Formula One Series C (a) | 46,003 | 2,803,423 | |
| Netflix, Inc. (a) | 5,536 | 1,691,414 | |
| Universal Music Group NV | 884,850 | 21,042,422 | |
| Warner Music Group Corp. Class A | 537,991 | 18,436,952 | |
| 43,974,211 | |||
| Interactive Media & Services - 7.4% | |||
| Alphabet, Inc. Class A (a) | 495,240 | 50,014,288 | |
| Bumble, Inc. (a) | 84,822 | 2,066,264 | |
| Epic Games, Inc. (a)(b)(c) | 805 | 681,714 | |
| Meta Platforms, Inc. Class A (a) | 155,100 | 18,317,310 | |
| Zoominfo Technologies, Inc. (a) | 53,390 | 1,526,954 | |
| 72,606,530 | |||
| Media - 1.0% | |||
| Charter Communications, Inc. Class A (a) | 24,324 | 9,517,738 | |
| Innovid Corp. (a)(b) | 59,313 | 175,566 | |
| 9,693,304 | |||
TOTAL COMMUNICATION SERVICES | 126,274,045 | ||
| CONSUMER DISCRETIONARY - 11.3% | |||
| Auto Components - 0.0% | |||
| Mobileye Global, Inc. | 8,200 | 233,782 | |
| Automobiles - 0.7% | |||
| Ferrari NV | 28,624 | 6,384,583 | |
| XPeng, Inc. ADR (a) | 4,400 | 47,564 | |
| 6,432,147 | |||
| Diversified Consumer Services - 0.2% | |||
| Laureate Education, Inc. Class A | 218,019 | 2,284,839 | |
| Hotels, Restaurants & Leisure - 1.6% | |||
| Airbnb, Inc. Class A (a) | 59,418 | 6,068,955 | |
| Chipotle Mexican Grill, Inc. (a) | 1,500 | 2,440,440 | |
| Flutter Entertainment PLC (a) | 38,260 | 5,696,821 | |
| Wingstop, Inc. (d) | 10,648 | 1,762,350 | |
| 15,968,566 | |||
| Internet & Direct Marketing Retail - 5.4% | |||
| Amazon.com, Inc. (a) | 358,533 | 34,612,776 | |
| Uber Technologies, Inc. (a) | 628,167 | 18,304,786 | |
| 52,917,562 | |||
| Multiline Retail - 0.1% | |||
| Dollarama, Inc. | 9,100 | 556,966 | |
| Specialty Retail - 2.2% | |||
| Aritzia, Inc. (a) | 18,344 | 697,813 | |
| Five Below, Inc. (a) | 43,131 | 6,938,053 | |
| TJX Companies, Inc. | 97,829 | 7,831,211 | |
| Victoria's Secret & Co. (a) | 126,768 | 5,831,328 | |
| 21,298,405 | |||
| Textiles, Apparel & Luxury Goods - 1.1% | |||
| LVMH Moet Hennessy Louis Vuitton SE | 7,990 | 6,200,470 | |
| On Holding AG (a) | 2,600 | 50,492 | |
| Samsonite International SA (a)(e) | 1,815,704 | 4,921,662 | |
| 11,172,624 | |||
TOTAL CONSUMER DISCRETIONARY | 110,864,891 | ||
| CONSUMER STAPLES - 4.4% | |||
| Beverages - 4.4% | |||
| Boston Beer Co., Inc. Class A (a) | 9,880 | 3,797,576 | |
| Constellation Brands, Inc. Class A (sub. vtg.) | 23,253 | 5,984,160 | |
| Keurig Dr. Pepper, Inc. | 150,000 | 5,800,500 | |
| Monster Beverage Corp. (a) | 91,672 | 9,429,382 | |
| The Coca-Cola Co. | 282,824 | 17,990,435 | |
| 43,002,053 | |||
| ENERGY - 5.5% | |||
| Energy Equipment & Services - 1.1% | |||
| Baker Hughes Co. Class A | 170,146 | 4,937,637 | |
| Cactus, Inc. | 26,389 | 1,435,298 | |
| Championx Corp. | 99,828 | 3,078,696 | |
| Helmerich & Payne, Inc. | 26,409 | 1,348,972 | |
| TechnipFMC PLC (a) | 15,700 | 194,680 | |
| 10,995,283 | |||
| Oil, Gas & Consumable Fuels - 4.4% | |||
| Canadian Natural Resources Ltd. | 64,647 | 3,860,719 | |
| Cheniere Energy, Inc. | 82,500 | 14,467,200 | |
| Denbury, Inc. (a) | 21,200 | 1,902,912 | |
| New Fortress Energy, Inc. | 58,964 | 3,001,268 | |
| Ovintiv, Inc. | 18,026 | 1,005,130 | |
| Range Resources Corp. | 118,756 | 3,428,486 | |
| Reliance Industries Ltd. | 453,368 | 15,261,843 | |
| 42,927,558 | |||
TOTAL ENERGY | 53,922,841 | ||
| FINANCIALS - 5.8% | |||
| Banks - 1.1% | |||
| Bank of America Corp. | 238,914 | 9,042,895 | |
| HDFC Bank Ltd. (a) | 24,372 | 483,740 | |
| Signature Bank | 8,600 | 1,199,700 | |
| 10,726,335 | |||
| Capital Markets - 1.9% | |||
| CME Group, Inc. | 81,607 | 14,403,636 | |
| MSCI, Inc. | 9,655 | 4,903,099 | |
| 19,306,735 | |||
| Insurance - 2.7% | |||
| American Financial Group, Inc. | 38,598 | 5,489,408 | |
| Arthur J. Gallagher & Co. | 59,012 | 11,749,879 | |
| BRP Group, Inc. (a) | 60,821 | 1,827,063 | |
| Marsh & McLennan Companies, Inc. | 43,685 | 7,565,368 | |
| 26,631,718 | |||
| Thrifts & Mortgage Finance - 0.1% | |||
| Rocket Companies, Inc. (d) | 83,000 | 688,900 | |
TOTAL FINANCIALS | 57,353,688 | ||
| HEALTH CARE - 19.8% | |||
| Biotechnology - 6.6% | |||
| 2seventy bio, Inc. (a) | 11,500 | 180,205 | |
| Adamas Pharmaceuticals, Inc.: | |||
| rights (a)(c) | 220,830 | 13,250 | |
| rights (a)(c) | 220,830 | 13,250 | |
| Affimed NV (a) | 69,014 | 147,690 | |
| Alnylam Pharmaceuticals, Inc. (a) | 23,788 | 5,247,395 | |
| Applied Therapeutics, Inc. (a) | 8,800 | 9,856 | |
| Arcellx, Inc. | 8,500 | 169,490 | |
| Beam Therapeutics, Inc. (a)(d) | 8,525 | 393,770 | |
| Cytokinetics, Inc. (a) | 25,500 | 1,083,750 | |
| EQRx, Inc. (a) | 57,568 | 216,456 | |
| Erasca, Inc. (a) | 22,300 | 168,365 | |
| Evelo Biosciences, Inc. (a) | 61,000 | 127,490 | |
| Galapagos NV sponsored ADR (a) | 57,390 | 2,282,400 | |
| Gamida Cell Ltd. (a)(d) | 312,401 | 499,842 | |
| Genmab A/S (a) | 2,100 | 973,129 | |
| Hookipa Pharma, Inc. (a) | 157,000 | 166,420 | |
| Immunocore Holdings PLC ADR (a) | 15,100 | 948,431 | |
| Innovent Biologics, Inc. (a)(e) | 124,005 | 500,772 | |
| Insmed, Inc. (a) | 102,686 | 1,898,664 | |
| Legend Biotech Corp. ADR (a) | 16,600 | 855,066 | |
| Prelude Therapeutics, Inc. (a) | 4,000 | 26,680 | |
| Regeneron Pharmaceuticals, Inc. (a) | 15,640 | 11,756,588 | |
| Rubius Therapeutics, Inc. (a) | 28,487 | 6,324 | |
| Seagen, Inc. (a) | 42,264 | 5,130,427 | |
| Seres Therapeutics, Inc. (a) | 54,600 | 354,900 | |
| Synlogic, Inc. (a) | 165,200 | 98,823 | |
| Vertex Pharmaceuticals, Inc. (a) | 96,540 | 30,545,256 | |
| Vor Biopharma, Inc. (a) | 56,431 | 259,583 | |
| XOMA Corp. (a)(d) | 52,786 | 1,117,480 | |
| 65,191,752 | |||
| Health Care Equipment & Supplies - 0.7% | |||
| Edwards Lifesciences Corp. (a) | 48,029 | 3,710,240 | |
| Insulet Corp. (a) | 1,500 | 449,055 | |
| Nevro Corp. (a) | 8,055 | 376,249 | |
| Penumbra, Inc. (a) | 12,414 | 2,600,857 | |
| 7,136,401 | |||
| Health Care Providers & Services - 7.0% | |||
| Guardant Health, Inc. (a) | 61,501 | 3,218,962 | |
| HealthEquity, Inc. (a) | 160,096 | 10,162,894 | |
| Option Care Health, Inc. (a) | 10,500 | 316,155 | |
| UnitedHealth Group, Inc. | 100,868 | 55,251,456 | |
| 68,949,467 | |||
| Health Care Technology - 0.3% | |||
| Certara, Inc. (a) | 86,208 | 1,463,812 | |
| Doximity, Inc. (a) | 14,000 | 475,860 | |
| Simulations Plus, Inc. | 17,721 | 719,295 | |
| 2,658,967 | |||
| Life Sciences Tools & Services - 2.5% | |||
| Bio-Techne Corp. | 30,574 | 2,598,484 | |
| Bruker Corp. | 72,520 | 4,888,573 | |
| Charles River Laboratories International, Inc. (a) | 4,200 | 959,994 | |
| Codexis, Inc. (a) | 75,001 | 410,255 | |
| Danaher Corp. | 39,418 | 10,777,275 | |
| Nanostring Technologies, Inc. (a) | 14,449 | 100,999 | |
| Thermo Fisher Scientific, Inc. | 7,934 | 4,444,785 | |
| 24,180,365 | |||
| Pharmaceuticals - 2.7% | |||
| Aclaris Therapeutics, Inc. (a) | 31,400 | 477,908 | |
| AstraZeneca PLC sponsored ADR | 90,171 | 6,128,923 | |
| Eli Lilly & Co. | 48,071 | 17,838,187 | |
| Nuvation Bio, Inc. (a) | 41,625 | 79,504 | |
| Revance Therapeutics, Inc. (a) | 85,814 | 1,863,022 | |
| 26,387,544 | |||
TOTAL HEALTH CARE | 194,504,496 | ||
| INDUSTRIALS - 8.1% | |||
| Aerospace & Defense - 2.5% | |||
| Axon Enterprise, Inc. (a) | 14,427 | 2,655,001 | |
| Northrop Grumman Corp. | 16,243 | 8,662,229 | |
| The Boeing Co. (a) | 70,183 | 12,554,335 | |
| 23,871,565 | |||
| Electrical Equipment - 1.4% | |||
| AMETEK, Inc. | 23,036 | 3,280,787 | |
| Bloom Energy Corp. Class A (a)(d) | 20,256 | 431,250 | |
| Eaton Corp. PLC | 7,785 | 1,272,458 | |
| Hubbell, Inc. Class B | 8,900 | 2,261,134 | |
| Rockwell Automation, Inc. | 25,183 | 6,653,852 | |
| 13,899,481 | |||
| Machinery - 1.8% | |||
| Chart Industries, Inc. (a) | 9,828 | 1,405,306 | |
| Ingersoll Rand, Inc. | 171,937 | 9,279,440 | |
| Parker Hannifin Corp. | 13,461 | 4,024,031 | |
| Westinghouse Air Brake Tech Co. | 25,400 | 2,567,686 | |
| 17,276,463 | |||
| Professional Services - 1.4% | |||
| ASGN, Inc. (a) | 21,419 | 1,940,561 | |
| KBR, Inc. | 203,387 | 10,509,006 | |
| Kforce, Inc. | 9,430 | 557,030 | |
| Upwork, Inc. (a) | 75,654 | 926,762 | |
| 13,933,359 | |||
| Road & Rail - 0.3% | |||
| Old Dominion Freight Lines, Inc. | 10,532 | 3,187,089 | |
| Trading Companies & Distributors - 0.7% | |||
| Ferguson PLC | 62,184 | 7,049,860 | |
TOTAL INDUSTRIALS | 79,217,817 | ||
| INFORMATION TECHNOLOGY - 26.8% | |||
| IT Services - 1.4% | |||
| Cloudflare, Inc. (a) | 48,089 | 2,363,093 | |
| MasterCard, Inc. Class A | 21,294 | 7,589,182 | |
| MongoDB, Inc. Class A (a) | 24,839 | 3,792,667 | |
| Snowflake, Inc. (a) | 1,700 | 242,930 | |
| 13,987,872 | |||
| Semiconductors & Semiconductor Equipment - 5.1% | |||
| Aixtron AG | 106,484 | 3,510,498 | |
| Allegro MicroSystems LLC (a) | 27,500 | 856,350 | |
| ASML Holding NV | 8,397 | 5,106,384 | |
| eMemory Technology, Inc. | 7,897 | 386,738 | |
| Enphase Energy, Inc. (a) | 29,210 | 9,364,434 | |
| Monolithic Power Systems, Inc. | 1,600 | 611,136 | |
| NVIDIA Corp. | 78,035 | 13,205,863 | |
| NXP Semiconductors NV | 11,539 | 2,029,018 | |
| Qualcomm, Inc. | 63,476 | 8,029,079 | |
| Silicon Laboratories, Inc. (a) | 1,900 | 276,336 | |
| SiTime Corp. (a) | 26,619 | 2,807,240 | |
| Universal Display Corp. | 36,109 | 4,066,596 | |
| 50,249,672 | |||
| Software - 16.1% | |||
| Adobe, Inc. (a) | 51,989 | 17,932,566 | |
| Confluent, Inc. (a)(d) | 50,090 | 1,153,573 | |
| Elastic NV (a) | 988 | 60,456 | |
| HashiCorp, Inc. (d) | 37,467 | 1,022,849 | |
| HubSpot, Inc. (a) | 5,228 | 1,584,241 | |
| Intuit, Inc. | 20,460 | 8,339,291 | |
| Manhattan Associates, Inc. (a) | 37,878 | 4,770,355 | |
| Microsoft Corp. | 386,644 | 98,648,343 | |
| Oracle Corp. | 127,096 | 10,552,781 | |
| Palo Alto Networks, Inc. (a) | 77,123 | 13,103,198 | |
| Volue A/S (a) | 214,702 | 670,520 | |
| 157,838,173 | |||
| Technology Hardware, Storage & Peripherals - 4.2% | |||
| Apple, Inc. | 276,054 | 40,864,274 | |
TOTAL INFORMATION TECHNOLOGY | 262,939,991 | ||
| MATERIALS - 4.2% | |||
| Chemicals - 3.7% | |||
| Albemarle Corp. | 43,724 | 12,154,835 | |
| Aspen Aerogels, Inc. (a) | 97,779 | 1,179,215 | |
| CF Industries Holdings, Inc. | 101,029 | 10,930,328 | |
| Sherwin-Williams Co. | 50,205 | 12,510,082 | |
| 36,774,460 | |||
| Metals & Mining - 0.5% | |||
| Lynas Rare Earths Ltd. (a) | 400,856 | 2,377,889 | |
| MP Materials Corp. (a)(d) | 69,143 | 2,299,005 | |
| 4,676,894 | |||
TOTAL MATERIALS | 41,451,354 | ||
| REAL ESTATE - 0.1% | |||
| Real Estate Management & Development - 0.1% | |||
| Doma Holdings, Inc. (a)(b) | 115,014 | 45,431 | |
| WeWork, Inc. (a)(d) | 522,414 | 1,441,863 | |
| 1,487,294 | |||
| UTILITIES - 0.0% | |||
| Independent Power and Renewable Electricity Producers - 0.0% | |||
| Brookfield Renewable Partners LP | 17,267 | 488,483 | |
| TOTAL COMMON STOCKS (Cost $669,703,264) | 971,506,953 | ||
| Convertible Preferred Stocks - 0.4% | |||
| Shares | Value ($) | ||
| HEALTH CARE - 0.0% | |||
| Biotechnology - 0.0% | |||
| ElevateBio LLC Series C (a)(b)(c) | 26,300 | 120,270 | |
| INFORMATION TECHNOLOGY - 0.1% | |||
| IT Services - 0.0% | |||
| AppNexus, Inc. Series E (Escrow) (a)(b)(c) | 38,419 | 1,203 | |
| Software - 0.1% | |||
| ASAPP, Inc. Series C (a)(b)(c) | 90,925 | 346,424 | |
TOTAL INFORMATION TECHNOLOGY | 347,627 | ||
| MATERIALS - 0.3% | |||
| Metals & Mining - 0.3% | |||
| Illuminated Holdings, Inc.: | |||
| Series C2 (a)(b)(c) | 21,131 | 995,693 | |
| Series C3 (a)(b)(c) | 26,414 | 1,244,628 | |
| Series C4 (a)(b)(c) | 6,345 | 298,976 | |
| Series C5 (a)(b)(c) | 13,150 | 619,628 | |
| 3,158,925 | |||
| TOTAL CONVERTIBLE PREFERRED STOCKS (Cost $2,827,365) | 3,626,822 | ||
| Money Market Funds - 1.6% | |||
| Shares | Value ($) | ||
| Fidelity Cash Central Fund 3.86% (f) | 8,263,760 | 8,265,413 | |
| Fidelity Securities Lending Cash Central Fund 3.86% (f)(g) | 7,580,547 | 7,581,305 | |
| TOTAL MONEY MARKET FUNDS (Cost $15,846,718) | 15,846,718 | ||
| TOTAL INVESTMENT IN SECURITIES - 100.9% (Cost $688,377,347) | 990,980,493 |
NET OTHER ASSETS (LIABILITIES) - (0.9)% | (8,619,258) |
| NET ASSETS - 100.0% | 982,361,235 |
| (a) | Non-income producing |
| (b) | Restricted securities (including private placements) - Investment in securities not registered under the Securities Act of 1933 (excluding 144A issues). At the end of the period, the value of restricted securities (excluding 144A issues) amounted to $4,529,533 or 0.5% of net assets. |
| (c) | Level 3 security |
| (d) | Security or a portion of the security is on loan at period end. |
| (e) | Security exempt from registration under Rule 144A of the Securities Act of 1933. These securities may be resold in transactions exempt from registration, normally to qualified institutional buyers. At the end of the period, the value of these securities amounted to $5,422,434 or 0.6% of net assets. |
| (f) | Affiliated fund that is generally available only to investment companies and other accounts managed by Fidelity Investments. The rate quoted is the annualized seven-day yield of the fund at period end. A complete unaudited listing of the fund's holdings as of its most recent quarter end is available upon request. In addition, each Fidelity Central Fund's financial statements, which are not covered by the Fund's Report of Independent Registered Public Accounting Firm, are available on the SEC's website or upon request. |
| (g) | Investment made with cash collateral received from securities on loan. |
| Additional information on each restricted holding is as follows: | ||
| Security | Acquisition Date | Acquisition Cost ($) |
| AppNexus, Inc. Series E (Escrow) | 8/01/14 | 0 |
| ASAPP, Inc. Series C | 4/30/21 | 599,841 |
| Doma Holdings, Inc. | 3/02/21 | 1,150,140 |
| ElevateBio LLC Series C | 3/09/21 | 110,329 |
| Epic Games, Inc. | 3/29/21 | 712,425 |
| Illuminated Holdings, Inc. Series C2 | 7/07/20 | 528,275 |
| Illuminated Holdings, Inc. Series C3 | 7/07/20 | 792,420 |
| Illuminated Holdings, Inc. Series C4 | 1/08/21 | 228,420 |
| Illuminated Holdings, Inc. Series C5 | 6/16/21 | 568,080 |
| Innovid Corp. | 6/24/21 | 593,130 |
| Affiliate | Value, beginning of period ($) | Purchases ($) | Sales Proceeds ($) | Dividend Income ($) | Realized Gain (loss) ($) | Change in Unrealized appreciation (depreciation) ($) | Value, end of period ($) | % ownership, end of period |
| Fidelity Cash Central Fund 3.86% | 5,815,026 | 333,981,194 | 331,530,807 | 94,502 | - | - | 8,265,413 | 0.0% |
| Fidelity Securities Lending Cash Central Fund 3.86% | 3,733,005 | 174,078,552 | 170,230,252 | 97,547 | - | - | 7,581,305 | 0.0% |
| Total | 9,548,031 | 508,059,746 | 501,761,059 | 192,049 | - | - | 15,846,718 | |
| Valuation Inputs at Reporting Date: | ||||
| Description | Total ($) | Level 1 ($) | Level 2 ($) | Level 3 ($) |
Investments in Securities: | ||||
| Equities: | ||||
Communication Services | 126,274,045 | 104,549,909 | 21,042,422 | 681,714 |
Consumer Discretionary | 110,864,891 | 94,045,938 | 16,818,953 | - |
Consumer Staples | 43,002,053 | 43,002,053 | - | - |
Energy | 53,922,841 | 38,660,998 | 15,261,843 | - |
Financials | 57,353,688 | 56,869,948 | 483,740 | - |
Health Care | 194,624,766 | 193,004,095 | 1,473,901 | 146,770 |
Industrials | 79,217,817 | 72,167,957 | 7,049,860 | - |
Information Technology | 263,287,618 | 258,372,235 | 4,567,756 | 347,627 |
Materials | 44,610,279 | 39,073,465 | 2,377,889 | 3,158,925 |
Real Estate | 1,487,294 | 1,487,294 | - | - |
Utilities | 488,483 | 488,483 | - | - |
| Money Market Funds | 15,846,718 | 15,846,718 | - | - |
| Total Investments in Securities: | 990,980,493 | 917,569,093 | 69,076,364 | 4,335,036 |
| Statement of Assets and Liabilities | ||||
| November 30, 2022 | ||||
| Assets | ||||
| Investment in securities, at value (including securities loaned of $7,777,084) - See accompanying schedule: | ||||
Unaffiliated issuers (cost $672,530,629) | $975,133,775 | |||
Fidelity Central Funds (cost $15,846,718) | 15,846,718 | |||
| Total Investment in Securities (cost $688,377,347) | $ | 990,980,493 | ||
| Receivable for investments sold | 2,856,296 | |||
| Receivable for fund shares sold | 47,536,842 | |||
| Dividends receivable | 835,484 | |||
| Distributions receivable from Fidelity Central Funds | 30,784 | |||
| Receivable from investment adviser for expense reductions | 344 | |||
| Other receivables | 1,521 | |||
Total assets | 1,042,241,764 | |||
| Liabilities | ||||
| Payable for investments purchased | $51,420,579 | |||
| Payable for fund shares redeemed | 30,152 | |||
| Other payables and accrued expenses | 849,273 | |||
| Collateral on securities loaned | 7,580,525 | |||
| Total Liabilities | 59,880,529 | |||
| Net Assets | $ | 982,361,235 | ||
| Net Assets consist of: | ||||
| Paid in capital | $ | 635,299,158 | ||
| Total accumulated earnings (loss) | 347,062,077 | |||
| Net Assets | $ | 982,361,235 | ||
Net Asset Value , offering price and redemption price per share ($982,361,235 ÷ 73,063,279 shares) | $ | 13.45 | ||
| Statement of Operations | ||||
Year ended November 30, 2022 | ||||
| Investment Income | ||||
| Dividends | $ | 8,168,234 | ||
| Income from Fidelity Central Funds (including $97,547 from security lending) | 192,049 | |||
| Total Income | 8,360,283 | |||
| Expenses | ||||
| Custodian fees and expenses | 32,975 | |||
| Independent trustees' fees and expenses | 3,533 | |||
| Interest | 6,162 | |||
| Total expenses before reductions | 42,670 | |||
| Expense reductions | (3,233) | |||
| Total expenses after reductions | 39,437 | |||
| Net Investment income (loss) | 8,320,846 | |||
| Realized and Unrealized Gain (Loss) | ||||
| Net realized gain (loss) on: | ||||
| Investment Securities: | ||||
| Unaffiliated issuers(net of foreign taxes of $299,964) | 45,052,472 | |||
| Foreign currency transactions | 853 | |||
| Total net realized gain (loss) | 45,053,325 | |||
| Change in net unrealized appreciation (depreciation) on: | ||||
| Investment Securities: | ||||
| Unaffiliated issuers (net of decrease in deferred foreign taxes of $143,378) | (251,303,168) | |||
| Unfunded commitments | 59,640 | |||
| Assets and liabilities in foreign currencies | 20,963 | |||
| Total change in net unrealized appreciation (depreciation) | (251,222,565) | |||
| Net gain (loss) | (206,169,240) | |||
| Net increase (decrease) in net assets resulting from operations | $ | (197,848,394) | ||
| Statement of Changes in Net Assets | ||||
Year ended November 30, 2022 | Year ended November 30, 2021 | |||
| Increase (Decrease) in Net Assets | ||||
| Operations | ||||
| Net investment income (loss) | $ | 8,320,846 | $ | 10,798,695 |
| Net realized gain (loss) | 45,053,325 | 187,264,860 | ||
| Change in net unrealized appreciation (depreciation) | (251,222,565) | 78,025,985 | ||
| Net increase (decrease) in net assets resulting from operations | (197,848,394) | 276,089,540 | ||
| Distributions to shareholders | (197,714,407) | (221,400,049) | ||
| Share transactions | ||||
| Proceeds from sales of shares | 273,453,496 | 185,720,214 | ||
| Reinvestment of distributions | 197,714,406 | 221,400,048 | ||
| Cost of shares redeemed | (216,449,387) | (346,246,254) | ||
Net increase (decrease) in net assets resulting from share transactions | 254,718,515 | 60,874,008 | ||
| Total increase (decrease) in net assets | (140,844,286) | 115,563,499 | ||
| Net Assets | ||||
| Beginning of period | 1,123,205,521 | 1,007,642,022 | ||
| End of period | $ | 982,361,235 | $ | 1,123,205,521 |
| Other Information | ||||
| Shares | ||||
| Sold | 19,207,680 | 10,636,009 | ||
| Issued in reinvestment of distributions | 12,026,424 | 13,907,038 | ||
| Redeemed | (15,067,731) | (18,706,744) | ||
| Net increase (decrease) | 16,166,373 | 5,836,303 | ||
| Fidelity Advisor® Series Equity Growth Fund |
| Years ended November 30, | 2022 | 2021 | 2020 | 2019 | 2018 | |||||
Selected Per-Share Data | ||||||||||
| Net asset value, beginning of period | $ | 19.74 | $ | 19.73 | $ | 15.53 | $ | 14.20 | $ | 15.41 |
| Income from Investment Operations | ||||||||||
Net investment income (loss) A,B | .12 | .17 C | .10 | .12 | .13 | |||||
| Net realized and unrealized gain (loss) | (2.96) | 4.20 | 6.02 | 2.33 | 1.05 | |||||
| Total from investment operations | (2.84) | 4.37 | 6.12 | 2.45 | 1.18 | |||||
| Distributions from net investment income | (.20) | (.13) | (.13) | (.13) | (.09) | |||||
| Distributions from net realized gain | (3.26) | (4.23) | (1.79) | (.99) | (2.30) | |||||
| Total distributions | (3.45) D | (4.36) | (1.92) | (1.12) | (2.39) | |||||
| Net asset value, end of period | $ | 13.45 | $ | 19.74 | $ | 19.73 | $ | 15.53 | $ | 14.20 |
Total Return E | (17.55)% | 27.43% | 44.43% | 19.73% | 8.96% | |||||
Ratios to Average Net Assets B,F,G | ||||||||||
| Expenses before reductions | -% H | .01% | .01% | .01% | .01% | |||||
| Expenses net of fee waivers, if any | -% H | -% H | .01% | .01% | .01% | |||||
| Expenses net of all reductions | -% H | -% H | .01% | .01% | -% H | |||||
| Net investment income (loss) | .84% | .95% C | .65% | .84% | .92% | |||||
| Supplemental Data | ||||||||||
| Net assets, end of period (000 omitted) | $ | 982,361 | $ | 1,123,206 | $ | 1,007,642 | $ | 977,722 | $ | 947,353 |
Portfolio turnover rate I | 49% | 51% | 56% | 52% J | 38% |
| Fidelity Central Fund | Investment Manager | Investment Objective | Investment Practices | Expense Ratio A |
| Fidelity Money Market Central Funds | Fidelity Management & Research Company LLC (FMR) | Each fund seeks to obtain a high level of current income consistent with the preservation of capital and liquidity. | Short-term Investments | Less than .005% |
| Gross unrealized appreciation | $343,279,895 |
| Gross unrealized depreciation | (43,310,690) |
| Net unrealized appreciation (depreciation) | $299,969,205 |
| Tax Cost | $691,011,288 |
| Undistributed ordinary income | $7,034,228 |
| Undistributed long-term capital gain | $40,879,665 |
| Net unrealized appreciation (depreciation) on securities and other investments | $299,991,935 |
| November 30, 2022 | November 30, 2021 | |
| Ordinary Income | $46,480,631 | $36,586,650 |
| Long-term Capital Gains | 151,233,776 | 184,813,399 |
| Total | $197,714,407 | $221,400,049 |
| Purchases ($) | Sales ($) | |
| Fidelity Advisor Series Equity Growth Fund | 545,220,024 | 490,977,302 |
| Amount | |
| Fidelity Advisor Series Equity Growth Fund | $8,028 |
| Borrower or Lender | Average Loan Balance | Weighted Average Interest Rate | Interest Expense | |
Fidelity Advisor Series Equity Growth Fund | Borrower | $24,782,667 | .74% | $4,578 |
| Purchases ($) | Sales ($) | Realized Gain (Loss) ($) | |
| Fidelity Advisor Series Equity Growth Fund | 43,245,421 | 30,707,258 | 2,251,837 |
| Total Security Lending Fees Paid to NFS | Security Lending Income From Securities Loaned to NFS | Value of Securities Loaned to NFS at Period End | |
| Fidelity Advisor Series Equity Growth Fund | $10,346 | $2,541 | $444,570 |
| Average Loan Balance | Weighted Average Interest Rate | Interest Expense | |
| Fidelity Advisor Series Equity Growth Fund | $2,654,833 | 3.58% | $1,584 |
| The Example is based on an investment of $1,000 invested at the beginning of the period and held for the entire period (June 1, 2022 to November 30, 2022). |
Annualized Expense Ratio- A | Beginning Account Value June 1, 2022 | Ending Account Value November 30, 2022 | Expenses Paid During Period- C June 1, 2022 to November 30, 2022 | |||||||
| Fidelity Advisor® Series Equity Growth Fund | -%- D | |||||||||
| Actual | $ 1,000 | $ 991.20 | $- E | |||||||
Hypothetical- B | $ 1,000 | $ 1,025.07 | $- E | |||||||
|
Item 2.
Code of Ethics
As of the end of the period, November 30, 2022, Fidelity Advisor Series I (the trust) has adopted a code of ethics, as defined in Item 2 of Form N-CSR, that applies to its President and Treasurer and its Chief Financial Officer. A copy of the code of ethics is filed as an exhibit to this Form N-CSR.
Item 3.
Audit Committee Financial Expert
The Board of Trustees of the trust has determined that Donald F. Donahue is an audit committee financial expert, as defined in Item 3 of Form N-CSR. Mr. Donahue is independent for purposes of Item 3 of Form N-CSR.
Item 4.
Principal Accountant Fees and Services
Fees and Services
The following table presents fees billed by Deloitte & Touche LLP, the member firms of Deloitte Touche Tohmatsu, and their respective affiliates (collectively, “Deloitte Entities”) in each of the last two fiscal years for services rendered to Fidelity Advisor Equity Growth Fund, Fidelity Advisor Equity Income Fund, Fidelity Advisor Equity Value Fund, Fidelity Advisor Growth & Income Fund, Fidelity Advisor Growth Opportunities Fund, Fidelity Advisor Large Cap Fund, Fidelity Advisor Series Growth Opportunities Fund, Fidelity Advisor Stock Selector Mid Cap Fund, and Fidelity Advisor Value Strategies Fund (the “Funds”):
Services Billed by Deloitte Entities
November 30, 2022 FeesA
Audit Fees | Audit-Related Fees | Tax Fees | All Other Fees | |
Fidelity Advisor Equity Growth Fund | $46,900 | $- | $8,500 | $1,100 |
Fidelity Advisor Equity Income Fund | $43,300 | $- | $8,800 | $1,000 |
Fidelity Advisor Equity Value Fund | $41,200 | $- | $10,000 | $1,000 |
Fidelity Advisor Growth & Income Fund | $43,000 | $- | $7,100 | $1,000 |
Fidelity Advisor Growth Opportunities Fund | $50,500 | $- | $9,700 | $1,200 |
Fidelity Advisor Large Cap Fund | $44,100 | $- | $7,300 | $1,000 |
Fidelity Advisor Series Growth Opportunities Fund | $47,400 | $- | $8,800 | $1,100 |
Fidelity Advisor Stock Selector Mid Cap Fund | $43,000 | $- | $7,100 | $1,000 |
Fidelity Advisor Value Strategies Fund | $41,900 | $- | $10,500 | $1,100 |
November 30, 2021 FeesA
Audit Fees | Audit-Related Fees | Tax Fees | All Other Fees | |
Fidelity Advisor Equity Growth Fund | $44,900 | $- | $8,500 | $1,100 |
Fidelity Advisor Equity Income Fund | $41,800 | $- | $9,200 | $1,000 |
Fidelity Advisor Equity Value Fund | $39,700 | $- | $9,900 | $1,000 |
Fidelity Advisor Growth & Income Fund | $41,400 | $- | $7,400 | $1,000 |
Fidelity Advisor Growth Opportunities Fund | $48,700 | $- | $9,000 | $1,200 |
Fidelity Advisor Large Cap Fund | $42,500 | $- | $7,300 | $1,000 |
Fidelity Advisor Series Growth Opportunities Fund | $45,600 | $- | $9,000 | $1,100 |
Fidelity Advisor Stock Selector Mid Cap Fund | $41,100 | $- | $7,600 | $1,000 |
Fidelity Advisor Value Strategies Fund | $40,600 | $- | $10,900 | $1,100 |
A Amounts may reflect rounding.
The following table presents fees billed by PricewaterhouseCoopers LLP (“PwC”) in each of the last two fiscal years for services rendered to Fidelity Advisor Dividend Growth Fund, Fidelity Advisor Series Equity Growth Fund, Fidelity Advisor Series Small Cap Fund, Fidelity Advisor Small Cap Fund, and Fidelity Real Estate High Income Fund (the “Funds”):
Services Billed by PwC
November 30, 2022 FeesA
Audit Fees | Audit-Related Fees | Tax Fees | All Other Fees | |
Fidelity Advisor Dividend Growth Fund | $45,500 | $4,000 | $8,200 | $1,400 |
Fidelity Advisor Series Equity Growth Fund | $25,100 | $2,400 | $6,800 | $800 |
Fidelity Advisor Series Small Cap Fund | $34,600 | $3,200 | $8,300 | $1,100 |
Fidelity Advisor Small Cap Fund | $36,500 | $3,300 | $9,000 | $1,100 |
Fidelity Real Estate High Income Fund | $151,500 | $12,400 | $14,200 | $4,200 |
November 30, 2021 FeesA
Audit Fees | Audit-Related Fees | Tax Fees | All Other Fees | |
Fidelity Advisor Dividend Growth Fund | $44,300 | $4,300 | $7,800 | $1,400 |
Fidelity Advisor Series Equity Growth Fund | $24,400 | $2,500 | $6,400 | $800 |
Fidelity Advisor Series Small Cap Fund | $33,700 | $3,400 | $8,700 | $1,100 |
Fidelity Advisor Small Cap Fund | $35,600 | $3,600 | $8,600 | $1,200 |
Fidelity Real Estate High Income Fund | $148,300 | $13,300 | $15,200 | $4,400 |
A Amounts may reflect rounding.
The following table(s) present(s) fees billed by Deloitte Entities and PwC that were required to be approved by the Audit Committee for services that relate directly to the operations and financial reporting of the Fund(s) and that are rendered on behalf of Fidelity Management & Research Company LLC ("FMR") and entities controlling, controlled by, or under common control with FMR (not including any sub-adviser whose role is primarily portfolio management and is subcontracted with or overseen by another investment adviser) that provide ongoing services to the Fund(s) (“Fund Service Providers”):
Services Billed by Deloitte Entities
November 30, 2022A | November 30, 2021A | |
Audit-Related Fees | $- | $- |
Tax Fees | $- | $- |
All Other Fees | $- | $- |
A Amounts may reflect rounding.
Services Billed by PwC
November 30, 2022A | November 30, 2021A | |
Audit-Related Fees | $7,914,600 | $8,522,600 |
Tax Fees | $1,000 | $354,200 |
All Other Fees | $- | $- |
A Amounts may reflect rounding.
“Audit-Related Fees” represent fees billed for assurance and related services that are reasonably related to the performance of the fund audit or the review of the fund's financial statements and that are not reported under Audit Fees.
“Tax Fees” represent fees billed for tax compliance, tax advice or tax planning that relate directly to the operations and financial reporting of the fund.
“All Other Fees” represent fees billed for services provided to the fund or Fund Service Provider, a significant portion of which are assurance related, that relate directly to the operations and financial reporting of the fund, excluding those services that are reported under Audit Fees, Audit-Related Fees or Tax Fees.
Assurance services must be performed by an independent public accountant.
* * *
The aggregate non-audit fees billed by Deloitte Entities and PwC for services rendered to the Fund(s), FMR (not including any sub-adviser whose role is primarily portfolio management and is subcontracted with or overseen by another investment adviser), and any Fund Service Provider for each of the last two fiscal years of the Fund(s) are as follows:
Billed By | November 30, 2022A | November 30, 2021A |
Deloitte Entities | $544,900 | $609,900 |
PwC | $12,963,400 | $14,202,200 |
A Amounts may reflect rounding.
The trust's Audit Committee has considered non-audit services that were not pre-approved that were provided by Deloitte Entities and PwC to Fund Service Providers to be compatible with maintaining the independence of Deloitte Entities and PwC in its(their) audit of the Fund(s), taking into account representations from Deloitte Entities and PwC, in accordance with Public Company Accounting Oversight Board rules,
regarding its independence from the Fund(s) and its(their) related entities and FMR’s review of the appropriateness and permissibility under applicable law of such non-audit services prior to their provision to the Fund(s) Service Providers.
Audit Committee Pre-Approval Policies and Procedures
The trust’s Audit Committee must pre-approve all audit and non-audit services provided by a fund’s independent registered public accounting firm relating to the operations or financial reporting of the fund. Prior to the commencement of any audit or non-audit services to a fund, the Audit Committee reviews the services to determine whether they are appropriate and permissible under applicable law.
The Audit Committee has adopted policies and procedures to, among other purposes, provide a framework for the Committee’s consideration of non-audit services by the audit firms that audit the Fidelity funds. The policies and procedures require that any non-audit service provided by a fund audit firm to a Fidelity fund and any non-audit service provided by a fund auditor to a Fund Service Provider that relates directly to the operations and financial reporting of a Fidelity fund (“Covered Service”) are subject to approval by the Audit Committee before such service is provided.
All Covered Services must be approved in advance of provision of the service either: (i) by formal resolution of the Audit Committee, or (ii) by oral or written approval of the service by the Chair of the Audit Committee (or if the Chair is unavailable, such other member of the Audit Committee as may be designated by the Chair to act in the Chair’s absence). The approval contemplated by (ii) above is permitted where the Treasurer determines that action on such an engagement is necessary before the next meeting of the Audit Committee.
Non-audit services provided by a fund audit firm to a Fund Service Provider that do not relate directly to the operations and financial reporting of a Fidelity fund are reported to the Audit Committee periodically.
Non-Audit Services Approved Pursuant to Rule 2-01(c)(7)(i)(C) and (ii) of Regulation S-X (“De Minimis Exception”)
There were no non-audit services approved or required to be approved by the Audit Committee pursuant to the De Minimis Exception during the Fund’s(s’) last two fiscal years relating to services provided to (i) the Fund(s) or (ii) any Fund Service Provider that relate directly to the operations and financial reporting of the Fund(s).
Item 5.
Audit Committee of Listed Registrants
Not applicable.
Item 6.
Investments
(a)
Not applicable.
(b)
Not applicable.
Item 7.
Disclosure of Proxy Voting Policies and Procedures for Closed-End Management Investment Companies
Not applicable.
Item 8.
Portfolio Managers of Closed-End Management Investment Companies
Not applicable.
Item 9.
Purchase of Equity Securities by Closed-End Management Investment Company and Affiliated Purchasers
Not applicable.
Item 10.
Submission of Matters to a Vote of Security Holders
There were no material changes to the procedures by which shareholders may recommend nominees to the trust’s Board of Trustees.
Item 11.
Controls and Procedures
(a)(i) The President and Treasurer and the Chief Financial Officer have concluded that the trust’s disclosure controls and procedures (as defined in Rule 30a-3(c) under the Investment Company Act) provide reasonable assurances that material information relating to the trust is made known to them by the appropriate persons, based on their evaluation of these controls and procedures as of a date within 90 days of the filing date of this report.
(a)(ii) There was no change in the trust’s internal control over financial reporting (as defined in Rule 30a-3(d) under the Investment Company Act) that occurred during the period covered by this report that has materially affected, or is reasonably likely to materially affect, the trust’s internal control over financial reporting.
Item 12.
Disclosure of Securities Lending Activities for Closed-End Management
Investment Companies
Not applicable.
Item 13.
Exhibits
(a) | (1) | Code of Ethics pursuant to Item 2 of Form N-CSR is filed and attached hereto as EX-99.CODE ETH. |
(a) | (2) | |
(a) | (3) | Not applicable. |
(b) |
SIGNATURES
Pursuant to the requirements of the Securities Exchange Act of 1934 and the Investment Company Act of 1940, the registrant has duly caused this report to be signed on its behalf by the undersigned, thereunto duly authorized.
Fidelity Advisor Series I
By: | /s/Stacie M. Smith |
Stacie M. Smith | |
President and Treasurer | |
Date: | January 19, 2023 |
Pursuant to the requirements of the Securities Exchange Act of 1934 and the Investment Company Act of 1940, this report has been signed below by the following persons on behalf of the registrant and in the capacities and on the dates indicated.
By: | /s/Stacie M. Smith |
Stacie M. Smith | |
President and Treasurer | |
Date: | January 19, 2023 |
By: | /s/John J. Burke III |
John J. Burke III | |
Chief Financial Officer | |
Date: | January 19, 2023 |