UNITED STATES
SECURITIES AND EXCHANGE COMMISSION
Washington, D.C. 20549
FORM N-CSR
CERTIFIED SHAREHOLDER REPORT OF REGISTERED
MANAGEMENT INVESTMENT COMPANIES
Investment Company Act file number 811-03785
Fidelity Advisor Series I
(Exact name of registrant as specified in charter)
245 Summer St., Boston, MA 02210
(Address of principal executive offices) (Zip code)
Margaret Carey, Secretary
245 Summer St.
Boston, Massachusetts 02210
(Name and address of agent for service)
Registrant's telephone number, including area code:
617-563-7000
Date of fiscal year end: | August 31 |
Date of reporting period: | February 29, 2024 |
Item 1.
Reports to Stockholders


Contents
Top Holdings (% of Fund's net assets) | ||
| Microsoft Corp. | 5.3 | |
| NVIDIA Corp. | 3.3 | |
| Apple, Inc. | 3.2 | |
| Amazon.com, Inc. | 2.9 | |
| Meta Platforms, Inc. Class A | 2.0 | |
| Alphabet, Inc. Class A | 1.4 | |
| Eli Lilly & Co. | 1.1 | |
| JPMorgan Chase & Co. | 1.1 | |
| Exxon Mobil Corp. | 1.0 | |
| UnitedHealth Group, Inc. | 0.9 | |
| 22.2 | ||
| Top Bond Issuers (% of Fund's net assets) | ||
(with maturities greater than one year) | ||
| U.S. Treasury Obligations | 15.0 | |
| Fannie Mae | 2.6 | |
| Freddie Mac | 2.5 | |
| Uniform Mortgage Backed Securities | 1.9 | |
| Ginnie Mae | 1.8 | |
| JPMorgan Chase & Co. | 0.7 | |
| Morgan Stanley | 0.6 | |
| Bank of America Corp. | 0.4 | |
| BX Commercial Mortgage Trust | 0.4 | |
| Citigroup, Inc. | 0.3 | |
| 26.2 | ||
| Market Sectors (% of Fund's net assets) | ||
| Information Technology | 18.0 | |
| Financials | 13.2 | |
| Health Care | 8.4 | |
| Consumer Discretionary | 7.1 | |
| Communication Services | 6.6 | |
| Industrials | 5.9 | |
| Consumer Staples | 4.2 | |
| Energy | 3.3 | |
| Real Estate | 2.4 | |
| Utilities | 1.8 | |
| Materials | 1.4 | |
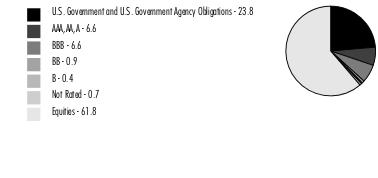
Quality Diversification (% of Fund's net assets) |
 |
Short-Term Investments and Net Other Assets (Liabilities) - (1.8)% |
| We have used ratings from Moody's Investors Service, Inc. Where Moody's® ratings are not available, we have used S&P® ratings. All ratings are as of the date indicated and do not reflect subsequent changes. |
Asset Allocation (% of Fund's net assets) |
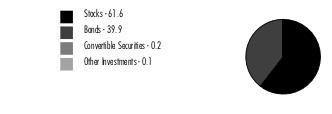 |
Short-Term Investments and Net Other Assets (Liabilities) - (1.8)% |
Written options - (0.1)% |
Futures and Swaps - 0.4% |
| Common Stocks - 61.6% | |||
| Shares | Value ($) (000s) | ||
| COMMUNICATION SERVICES - 5.7% | |||
| Diversified Telecommunication Services - 0.3% | |||
| AT&T, Inc. | 1,359,600 | 23,018 | |
| Cellnex Telecom SA (a) | 67,700 | 2,448 | |
| Liberty Global Ltd. Class C (b) | 93,269 | 1,730 | |
| 27,196 | |||
| Entertainment - 1.0% | |||
| Capcom Co. Ltd. | 35,900 | 1,444 | |
| Netflix, Inc. (c) | 39,087 | 23,566 | |
| Roku, Inc. Class A (c) | 23,700 | 1,497 | |
| Sea Ltd. ADR (c) | 174,700 | 8,476 | |
| Spotify Technology SA (c) | 12,000 | 3,077 | |
| Take-Two Interactive Software, Inc. (c) | 13,780 | 2,025 | |
| The Walt Disney Co. | 280,525 | 31,301 | |
| TKO Group Holdings, Inc. | 79,500 | 6,657 | |
| Ubisoft Entertainment SA (c) | 138,200 | 3,167 | |
| 81,210 | |||
| Interactive Media & Services - 4.0% | |||
| Alphabet, Inc.: | |||
| Class A (c) | 833,740 | 115,440 | |
| Class C (c) | 216,320 | 30,237 | |
| Epic Games, Inc. (c)(d)(e) | 1,715 | 1,177 | |
| Match Group, Inc. (c) | 146,300 | 5,273 | |
| Meta Platforms, Inc. Class A | 327,475 | 160,505 | |
| Snap, Inc. Class A (c) | 519,230 | 5,722 | |
| 318,354 | |||
| Media - 0.3% | |||
| Altice U.S.A., Inc. Class A (c) | 750,702 | 2,230 | |
| Charter Communications, Inc. Class A (c) | 14,600 | 4,291 | |
| Comcast Corp. Class A | 160,726 | 6,887 | |
| Liberty Broadband Corp.: | |||
| Class A (c) | 120,501 | 7,248 | |
| Class C (c) | 5,762 | 347 | |
| Paramount Global Class B | 29,300 | 323 | |
| 21,326 | |||
| Wireless Telecommunication Services - 0.1% | |||
| T-Mobile U.S., Inc. | 47,995 | 7,838 | |
TOTAL COMMUNICATION SERVICES | 455,924 | ||
| CONSUMER DISCRETIONARY - 6.7% | |||
| Automobile Components - 0.1% | |||
| Adient PLC (c) | 114,100 | 3,873 | |
| Aptiv PLC (c) | 53,800 | 4,277 | |
| 8,150 | |||
| Automobiles - 0.6% | |||
| Tesla, Inc. (c) | 260,000 | 52,489 | |
| Broadline Retail - 2.9% | |||
| Amazon.com, Inc. (c) | 1,322,900 | 233,836 | |
| Etsy, Inc. (c) | 19,001 | 1,362 | |
| 235,198 | |||
| Distributors - 0.1% | |||
| LKQ Corp. | 112,000 | 5,856 | |
| Hotels, Restaurants & Leisure - 1.2% | |||
| Airbnb, Inc. Class A (c) | 46,100 | 7,259 | |
| Booking Holdings, Inc. | 5,000 | 17,344 | |
| Caesars Entertainment, Inc. (c) | 111,100 | 4,830 | |
| Churchill Downs, Inc. | 65,600 | 7,995 | |
| Domino's Pizza, Inc. | 15,900 | 7,129 | |
| Flutter Entertainment PLC (c) | 18,800 | 4,059 | |
| Marriott International, Inc. Class A | 60,700 | 15,167 | |
| McDonald's Corp. | 47,700 | 13,942 | |
| Red Rock Resorts, Inc. | 33,100 | 1,919 | |
| Sweetgreen, Inc. Class A (c) | 11,300 | 144 | |
| Yum! Brands, Inc. | 114,800 | 15,891 | |
| 95,679 | |||
| Household Durables - 0.1% | |||
| D.R. Horton, Inc. | 5,800 | 867 | |
| Mohawk Industries, Inc. (c) | 31,700 | 3,760 | |
| 4,627 | |||
| Leisure Products - 0.0% | |||
| Brunswick Corp. | 26,000 | 2,272 | |
| Specialty Retail - 1.2% | |||
| Burlington Stores, Inc. (c) | 16,400 | 3,364 | |
| Cazoo Group Ltd. (c)(d) | 26 | 0 | |
| Cazoo Group Ltd.: | |||
| warrants (c) | 28 | 0 | |
| warrants (c) | 30 | 0 | |
| warrants (c) | 34 | 0 | |
| Foot Locker, Inc. | 41,700 | 1,436 | |
| Lowe's Companies, Inc. | 121,700 | 29,290 | |
| The Home Depot, Inc. | 60,609 | 23,068 | |
| TJX Companies, Inc. | 321,630 | 31,886 | |
| Valvoline, Inc. (c) | 94,100 | 4,012 | |
| 93,056 | |||
| Textiles, Apparel & Luxury Goods - 0.5% | |||
| Levi Strauss & Co. Class A | 127,200 | 2,311 | |
| NIKE, Inc. Class B | 169,964 | 17,664 | |
| PVH Corp. | 67,400 | 9,212 | |
| Tapestry, Inc. | 187,000 | 8,888 | |
| 38,075 | |||
TOTAL CONSUMER DISCRETIONARY | 535,402 | ||
| CONSUMER STAPLES - 3.7% | |||
| Beverages - 1.1% | |||
| Boston Beer Co., Inc. Class A (c) | 9,000 | 2,773 | |
| Brown-Forman Corp. Class B (non-vtg.) | 41,200 | 2,481 | |
| Celsius Holdings, Inc. (c) | 10,700 | 873 | |
| Constellation Brands, Inc. Class A (sub. vtg.) | 43,700 | 10,860 | |
| Diageo PLC | 70,200 | 2,625 | |
| Keurig Dr. Pepper, Inc. | 200,200 | 5,988 | |
| Monster Beverage Corp. | 208,750 | 12,337 | |
| PepsiCo, Inc. | 112,900 | 18,667 | |
| The Coca-Cola Co. | 520,300 | 31,228 | |
| 87,832 | |||
| Consumer Staples Distribution & Retail - 1.2% | |||
| Alimentation Couche-Tard, Inc. Class A (multi-vtg.) | 66,400 | 4,118 | |
| BJ's Wholesale Club Holdings, Inc. (c) | 13,600 | 993 | |
| Costco Wholesale Corp. | 56,400 | 41,955 | |
| Dollar Tree, Inc. (c) | 11,000 | 1,613 | |
| Maplebear, Inc. (NASDAQ) | 2,600 | 85 | |
| Sprouts Farmers Market LLC (c) | 18,500 | 1,155 | |
| Target Corp. | 64,200 | 9,817 | |
| U.S. Foods Holding Corp. (c) | 149,672 | 7,602 | |
| Walmart, Inc. | 473,700 | 27,764 | |
| 95,102 | |||
| Food Products - 0.4% | |||
| Freshpet, Inc. (b)(c) | 18,100 | 2,046 | |
| Lamb Weston Holdings, Inc. | 40,000 | 4,088 | |
| McCormick & Co., Inc. (non-vtg.) | 57,800 | 3,980 | |
| Mondelez International, Inc. | 199,000 | 14,541 | |
| The Hershey Co. | 28,300 | 5,318 | |
| The J.M. Smucker Co. | 27,700 | 3,329 | |
| 33,302 | |||
| Household Products - 0.7% | |||
| Procter & Gamble Co. | 326,200 | 51,846 | |
| Personal Care Products - 0.2% | |||
| elf Beauty, Inc. (c) | 18,700 | 3,900 | |
| Estee Lauder Companies, Inc. Class A | 42,500 | 6,315 | |
| Kenvue, Inc. | 380,300 | 7,226 | |
| Olaplex Holdings, Inc. (c) | 483,400 | 899 | |
| 18,340 | |||
| Tobacco - 0.1% | |||
| Altria Group, Inc. | 263,200 | 10,768 | |
TOTAL CONSUMER STAPLES | 297,190 | ||
| ENERGY - 2.3% | |||
| Energy Equipment & Services - 0.2% | |||
| Expro Group Holdings NV (c) | 168,000 | 3,006 | |
| Schlumberger Ltd. | 90,600 | 4,379 | |
| Weatherford International PLC (c) | 57,300 | 5,880 | |
| 13,265 | |||
| Oil, Gas & Consumable Fuels - 2.1% | |||
| Africa Oil Corp. | 2,356,776 | 3,629 | |
| Athabasca Oil Corp. (c) | 1,553,400 | 5,631 | |
| Canadian Natural Resources Ltd. | 29,900 | 2,084 | |
| Eco Atlantic Oil & Gas Ltd. (c) | 384,000 | 47 | |
| Exxon Mobil Corp. | 777,591 | 81,274 | |
| Galp Energia SGPS SA Class B | 277,100 | 4,364 | |
| Hess Corp. | 24,600 | 3,585 | |
| Imperial Oil Ltd. | 261,285 | 16,349 | |
| Kosmos Energy Ltd. (c) | 621,600 | 3,817 | |
| MEG Energy Corp. (c) | 631,100 | 13,509 | |
| Phillips 66 Co. | 87,174 | 12,423 | |
| Shell PLC ADR | 203,100 | 12,761 | |
| Valero Energy Corp. | 87,000 | 12,307 | |
| 171,780 | |||
TOTAL ENERGY | 185,045 | ||
| FINANCIALS - 8.2% | |||
| Banks - 2.8% | |||
| AIB Group PLC | 557,520 | 2,583 | |
| Bank of America Corp. | 638,627 | 22,045 | |
| Citigroup, Inc. | 389,803 | 21,630 | |
| DNB Bank ASA | 180,200 | 3,608 | |
| Eurobank Ergasias Services and Holdings SA (c) | 3,048,895 | 6,299 | |
| HDFC Bank Ltd. | 127,600 | 2,156 | |
| JPMorgan Chase & Co. | 463,174 | 86,178 | |
| KeyCorp | 619,961 | 8,847 | |
| M&T Bank Corp. | 59,430 | 8,305 | |
| Pathward Financial, Inc. | 62,200 | 3,162 | |
| Piraeus Financial Holdings SA (c) | 864,400 | 3,802 | |
| PNC Financial Services Group, Inc. | 98,305 | 14,470 | |
| Starling Bank Ltd. Series D (c)(d)(e) | 659,301 | 2,613 | |
| Wells Fargo & Co. | 740,166 | 41,146 | |
| 226,844 | |||
| Capital Markets - 1.5% | |||
| Bank of New York Mellon Corp. | 232,449 | 13,038 | |
| BlackRock, Inc. Class A | 21,746 | 17,643 | |
| Brookfield Corp. Class A | 77,619 | 3,203 | |
| Cboe Global Markets, Inc. | 30,035 | 5,767 | |
| CME Group, Inc. | 57,457 | 12,661 | |
| Interactive Brokers Group, Inc. | 42,583 | 4,630 | |
| London Stock Exchange Group PLC | 30,632 | 3,440 | |
| LPL Financial | 30,149 | 8,077 | |
| MarketAxess Holdings, Inc. | 33,210 | 7,087 | |
| Moody's Corp. | 32,331 | 12,267 | |
| Morgan Stanley | 190,625 | 16,401 | |
| StepStone Group, Inc. Class A | 89,539 | 3,110 | |
| Tradeweb Markets, Inc. Class A | 33,600 | 3,556 | |
| UBS Group AG | 352,418 | 10,026 | |
| Virtu Financial, Inc. Class A | 101,717 | 1,836 | |
| 122,742 | |||
| Consumer Finance - 0.2% | |||
| Discover Financial Services | 93,589 | 11,296 | |
| OneMain Holdings, Inc. | 71,296 | 3,367 | |
| Shriram Transport Finance Co. Ltd. | 110,584 | 3,253 | |
| 17,916 | |||
| Financial Services - 2.2% | |||
| Apollo Global Management, Inc. | 189,469 | 21,183 | |
| Berkshire Hathaway, Inc. Class A (c) | 11 | 6,782 | |
| Block, Inc. Class A (c) | 351,600 | 27,942 | |
| Corebridge Financial, Inc. | 79,500 | 1,974 | |
| Fiserv, Inc. (c) | 88,690 | 13,239 | |
| FleetCor Technologies, Inc. (c) | 21,473 | 5,997 | |
| Global Payments, Inc. | 86,869 | 11,267 | |
| Jumo World Holding Ltd. (d)(e) | 162,299 | 269 | |
| Jumo World Ltd. (c)(e) | 162 | 0 | |
| MasterCard, Inc. Class A | 25,686 | 12,195 | |
| UWM Holdings Corp. Class A (b) | 386,382 | 2,465 | |
| Visa, Inc. Class A | 231,493 | 65,429 | |
| Voya Financial, Inc. | 47,143 | 3,223 | |
| 171,965 | |||
| Insurance - 1.5% | |||
| Arthur J. Gallagher & Co. | 62,469 | 15,238 | |
| Chubb Ltd. | 82,356 | 20,727 | |
| Direct Line Insurance Group PLC (c) | 1,618,076 | 4,126 | |
| Everest Re Group Ltd. | 22,534 | 8,312 | |
| Fairfax Financial Holdings Ltd. (sub. vtg.) | 9,524 | 10,166 | |
| Globe Life, Inc. | 35,269 | 4,477 | |
| Hartford Financial Services Group, Inc. | 146,532 | 14,044 | |
| Marsh & McLennan Companies, Inc. | 81,984 | 16,583 | |
| Progressive Corp. | 90,531 | 17,161 | |
| Prudential PLC | 150,643 | 1,484 | |
| Unum Group | 158,736 | 7,849 | |
| 120,167 | |||
TOTAL FINANCIALS | 659,634 | ||
| HEALTH CARE - 7.7% | |||
| Biotechnology - 1.0% | |||
| Cytokinetics, Inc. (c) | 13,400 | 968 | |
| Gilead Sciences, Inc. | 344,400 | 24,831 | |
| Moderna, Inc. (c) | 129,100 | 11,908 | |
| Regeneron Pharmaceuticals, Inc. (c) | 36,977 | 35,723 | |
| Vertex Pharmaceuticals, Inc. (c) | 11,503 | 4,840 | |
| 78,270 | |||
| Health Care Equipment & Supplies - 1.9% | |||
| Abbott Laboratories | 56,902 | 6,751 | |
| Boston Scientific Corp. (c) | 919,062 | 60,851 | |
| Intuitive Surgical, Inc. (c) | 70,793 | 27,298 | |
| Penumbra, Inc. (c) | 28,217 | 6,629 | |
| Shockwave Medical, Inc. (c) | 24,490 | 6,389 | |
| Stryker Corp. | 132,893 | 46,389 | |
| 154,307 | |||
| Health Care Providers & Services - 1.8% | |||
| Acadia Healthcare Co., Inc. (c) | 72,300 | 6,033 | |
| Cencora, Inc. | 142,568 | 33,589 | |
| CVS Health Corp. | 198,139 | 14,736 | |
| Surgery Partners, Inc. (c) | 407,005 | 12,629 | |
| UnitedHealth Group, Inc. | 151,061 | 74,564 | |
| 141,551 | |||
| Life Sciences Tools & Services - 0.4% | |||
| 10X Genomics, Inc. (c) | 35,900 | 1,674 | |
| Danaher Corp. | 75,900 | 19,213 | |
| Sartorius Stedim Biotech | 6,700 | 1,841 | |
| Thermo Fisher Scientific, Inc. | 17,606 | 10,039 | |
| 32,767 | |||
| Pharmaceuticals - 2.6% | |||
| AstraZeneca PLC sponsored ADR | 320,568 | 20,568 | |
| Eli Lilly & Co. | 116,341 | 87,684 | |
| Indivior PLC (c) | 316,555 | 6,853 | |
| Merck & Co., Inc. | 507,810 | 64,568 | |
| Royalty Pharma PLC | 454,648 | 13,794 | |
| UCB SA | 148,300 | 17,070 | |
| 210,537 | |||
TOTAL HEALTH CARE | 617,432 | ||
| INDUSTRIALS - 5.6% | |||
| Aerospace & Defense - 1.1% | |||
| Howmet Aerospace, Inc. | 181,000 | 12,046 | |
| Lockheed Martin Corp. | 52,930 | 22,667 | |
| Northrop Grumman Corp. | 18,946 | 8,734 | |
| RTX Corp. | 64,252 | 5,761 | |
| Space Exploration Technologies Corp. Class A (c)(d)(e) | 16,000 | 1,552 | |
| The Boeing Co. (c) | 114,382 | 23,302 | |
| TransDigm Group, Inc. | 12,500 | 14,722 | |
| 88,784 | |||
| Air Freight & Logistics - 0.1% | |||
| FedEx Corp. | 31,700 | 7,892 | |
| Building Products - 0.5% | |||
| Trane Technologies PLC | 133,881 | 37,750 | |
| Construction & Engineering - 0.1% | |||
| Quanta Services, Inc. | 38,900 | 9,395 | |
| Electrical Equipment - 0.6% | |||
| AMETEK, Inc. | 174,632 | 31,465 | |
| Eaton Corp. PLC | 74,900 | 21,646 | |
| 53,111 | |||
| Ground Transportation - 0.9% | |||
| CSX Corp. | 446,950 | 16,957 | |
| Old Dominion Freight Lines, Inc. | 49,800 | 22,036 | |
| Uber Technologies, Inc. (c) | 172,804 | 13,738 | |
| Union Pacific Corp. | 68,400 | 17,352 | |
| 70,083 | |||
| Industrial Conglomerates - 0.5% | |||
| General Electric Co. | 240,198 | 37,685 | |
| Machinery - 1.7% | |||
| Caterpillar, Inc. | 64,113 | 21,411 | |
| Deere & Co. | 17,000 | 6,206 | |
| Dover Corp. | 135,400 | 22,392 | |
| Fortive Corp. | 228,831 | 19,480 | |
| Ingersoll Rand, Inc. | 300,700 | 27,463 | |
| Parker Hannifin Corp. | 70,037 | 37,501 | |
| 134,453 | |||
| Passenger Airlines - 0.0% | |||
| Delta Air Lines, Inc. | 83,000 | 3,508 | |
| Professional Services - 0.1% | |||
| Dun & Bradstreet Holdings, Inc. | 486,445 | 5,127 | |
TOTAL INDUSTRIALS | 447,788 | ||
| INFORMATION TECHNOLOGY - 17.6% | |||
| Electronic Equipment, Instruments & Components - 0.1% | |||
| Amphenol Corp. Class A | 87,900 | 9,602 | |
| IT Services - 0.7% | |||
| Capgemini SA | 56,100 | 13,646 | |
| EPAM Systems, Inc. (c) | 31,700 | 9,649 | |
| Infosys Ltd. sponsored ADR | 141,900 | 2,832 | |
| MongoDB, Inc. Class A (c) | 37,400 | 16,739 | |
| Snowflake, Inc. (c) | 38,200 | 7,192 | |
| Twilio, Inc. Class A (c) | 96,900 | 5,774 | |
| 55,832 | |||
| Semiconductors & Semiconductor Equipment - 5.5% | |||
| Advanced Micro Devices, Inc. (c) | 133,100 | 25,626 | |
| ASML Holding NV (Netherlands) | 19,900 | 18,885 | |
| Lattice Semiconductor Corp. (c) | 97,100 | 7,439 | |
| Marvell Technology, Inc. | 205,500 | 14,726 | |
| Micron Technology, Inc. | 384,887 | 34,875 | |
| NVIDIA Corp. | 331,200 | 262,019 | |
| NXP Semiconductors NV | 69,297 | 17,306 | |
| ON Semiconductor Corp. (c) | 183,700 | 14,498 | |
| Renesas Electronics Corp. | 488,800 | 8,076 | |
| SolarEdge Technologies, Inc. (c) | 140,100 | 9,411 | |
| Taiwan Semiconductor Manufacturing Co. Ltd. | 1,047,000 | 22,914 | |
| Teradyne, Inc. | 54,800 | 5,677 | |
| 441,452 | |||
| Software - 8.0% | |||
| Adobe, Inc. (c) | 89,800 | 50,313 | |
| Autodesk, Inc. (c) | 67,300 | 17,375 | |
| CCC Intelligent Solutions Holdings, Inc. (c)(d) | 34,443 | 403 | |
| Elastic NV (c) | 56,996 | 7,627 | |
| Five9, Inc. (c) | 95,500 | 5,826 | |
| HubSpot, Inc. (c) | 25,700 | 15,903 | |
| Intuit, Inc. | 49,000 | 32,482 | |
| Microsoft Corp. | 1,027,000 | 424,806 | |
| Salesforce, Inc. | 164,989 | 50,952 | |
| Stripe, Inc. Class B (c)(d)(e) | 15,600 | 396 | |
| Synopsys, Inc. (c) | 37,300 | 21,400 | |
| Tenable Holdings, Inc. (c) | 101,900 | 4,908 | |
| Workday, Inc. Class A (c) | 43,200 | 12,729 | |
| 645,120 | |||
| Technology Hardware, Storage & Peripherals - 3.3% | |||
| Apple, Inc. | 1,402,120 | 253,433 | |
| Samsung Electronics Co. Ltd. (c) | 197,780 | 10,871 | |
| 264,304 | |||
TOTAL INFORMATION TECHNOLOGY | 1,416,310 | ||
| MATERIALS - 1.4% | |||
| Chemicals - 1.0% | |||
| Air Products & Chemicals, Inc. | 20,377 | 4,769 | |
| Cabot Corp. | 28,080 | 2,385 | |
| Celanese Corp. Class A | 19,720 | 2,997 | |
| Chemtrade Logistics Income Fund | 28,450 | 169 | |
| Corteva, Inc. | 88,950 | 4,761 | |
| Dow, Inc. | 136,080 | 7,604 | |
| DuPont de Nemours, Inc. | 32,502 | 2,249 | |
| Ecolab, Inc. | 34,720 | 7,806 | |
| Element Solutions, Inc. | 52,290 | 1,229 | |
| Koppers Holdings, Inc. | 18,540 | 1,050 | |
| Linde PLC | 65,443 | 29,372 | |
| LyondellBasell Industries NV Class A | 40,890 | 4,100 | |
| Olin Corp. | 33,202 | 1,786 | |
| Sherwin-Williams Co. | 15,920 | 5,286 | |
| The Chemours Co. LLC | 115,070 | 2,263 | |
| The Mosaic Co. | 59,280 | 1,847 | |
| Tronox Holdings PLC | 160,060 | 2,353 | |
| Westlake Corp. | 12,760 | 1,770 | |
| 83,796 | |||
| Construction Materials - 0.1% | |||
| Martin Marietta Materials, Inc. | 4,557 | 2,633 | |
| Vulcan Materials Co. | 9,610 | 2,555 | |
| 5,188 | |||
| Containers & Packaging - 0.1% | |||
| Aptargroup, Inc. | 11,920 | 1,674 | |
| Crown Holdings, Inc. | 6,290 | 482 | |
| Greif, Inc. Class A | 25,500 | 1,644 | |
| 3,800 | |||
| Metals & Mining - 0.2% | |||
| First Quantum Minerals Ltd. | 184,090 | 1,743 | |
| Franco-Nevada Corp. | 12,180 | 1,275 | |
| Freeport-McMoRan, Inc. | 179,068 | 6,771 | |
| Ivanhoe Mines Ltd. (c) | 167,710 | 1,783 | |
| Newmont Corp. | 20,140 | 629 | |
| Nucor Corp. | 33,700 | 6,481 | |
| Teck Resources Ltd. Class B | 29,310 | 1,126 | |
| 19,808 | |||
TOTAL MATERIALS | 112,592 | ||
| REAL ESTATE - 1.4% | |||
| Equity Real Estate Investment Trusts (REITs) - 1.4% | |||
| Alexandria Real Estate Equities, Inc. | 2,900 | 362 | |
| American Tower Corp. | 58,900 | 11,713 | |
| COPT Defense Properties (SBI) | 74,700 | 1,810 | |
| Crown Castle, Inc. | 68,100 | 7,487 | |
| CubeSmart | 82,900 | 3,615 | |
| Digital Realty Trust, Inc. | 49,100 | 7,208 | |
| Equinix, Inc. | 15,900 | 14,132 | |
| Equity Lifestyle Properties, Inc. | 104,200 | 7,015 | |
| Essex Property Trust, Inc. | 15,600 | 3,610 | |
| Extra Space Storage, Inc. | 1,611 | 227 | |
| Invitation Homes, Inc. | 198,000 | 6,746 | |
| Mid-America Apartment Communities, Inc. | 25,300 | 3,180 | |
| Omega Healthcare Investors, Inc. | 90,300 | 2,810 | |
| Prologis, Inc. | 123,300 | 16,432 | |
| Simon Property Group, Inc. | 65,100 | 9,644 | |
| Sun Communities, Inc. | 25,600 | 3,424 | |
| Ventas, Inc. | 95,500 | 4,039 | |
| Welltower, Inc. | 89,900 | 8,285 | |
| 111,739 | |||
| UTILITIES - 1.3% | |||
| Electric Utilities - 1.1% | |||
| American Electric Power Co., Inc. | 38,100 | 3,246 | |
| Constellation Energy Corp. | 50,944 | 8,582 | |
| Edison International | 128,800 | 8,761 | |
| Entergy Corp. | 59,600 | 6,054 | |
| Evergy, Inc. | 67,700 | 3,354 | |
| Eversource Energy | 108,356 | 6,360 | |
| Exelon Corp. | 57,900 | 2,075 | |
| FirstEnergy Corp. | 149,000 | 5,455 | |
| NextEra Energy, Inc. | 292,600 | 16,149 | |
| NRG Energy, Inc. | 45,200 | 2,500 | |
| PG&E Corp. | 656,062 | 10,950 | |
| PPL Corp. | 209,200 | 5,517 | |
| Southern Co. | 108,500 | 7,297 | |
| Xcel Energy, Inc. | 20,300 | 1,070 | |
| 87,370 | |||
| Independent Power and Renewable Electricity Producers - 0.0% | |||
| The AES Corp. | 203,000 | 3,086 | |
| Multi-Utilities - 0.2% | |||
| NiSource, Inc. | 173,100 | 4,511 | |
| Sempra | 163,748 | 11,561 | |
| 16,072 | |||
TOTAL UTILITIES | 106,528 | ||
| TOTAL COMMON STOCKS (Cost $2,946,525) | 4,945,584 | ||
| Preferred Stocks - 0.2% | |||
| Shares | Value ($) (000s) | ||
| Convertible Preferred Stocks - 0.2% | |||
| COMMUNICATION SERVICES - 0.1% | |||
| Interactive Media & Services - 0.1% | |||
| ByteDance Ltd. Series E1 (c)(d)(e) | 18,992 | 4,200 | |
| FINANCIALS - 0.0% | |||
| Financial Services - 0.0% | |||
| Circle Internet Financial Ltd. Series F (c)(d)(e) | 38,272 | 1,017 | |
| INDUSTRIALS - 0.0% | |||
| Aerospace & Defense - 0.0% | |||
| ABL Space Systems: | |||
| Series B(c)(d)(e) | 16,809 | 491 | |
| Series B2(c)(d)(e) | 8,427 | 268 | |
| 759 | |||
| Construction & Engineering - 0.0% | |||
| Beta Technologies, Inc. Series A (c)(d)(e) | 6,703 | 762 | |
TOTAL INDUSTRIALS | 1,521 | ||
| INFORMATION TECHNOLOGY - 0.1% | |||
| Communications Equipment - 0.0% | |||
| Astranis Space Technologies Corp. Series C (c)(d)(e) | 56,066 | 618 | |
| Semiconductors & Semiconductor Equipment - 0.0% | |||
| Astera Labs, Inc. Series C (c)(d)(e) | 70,350 | 1,493 | |
| Xsight Labs Ltd. Series D (c)(d)(e) | 60,136 | 308 | |
| 1,801 | |||
| Software - 0.1% | |||
| Algolia, Inc. Series D (c)(d)(e) | 28,657 | 481 | |
| Bolt Technology OU Series E (c)(d)(e) | 6,388 | 747 | |
| Databricks, Inc.: | |||
| Series G(c)(d)(e) | 4,077 | 335 | |
| Series H(c)(d)(e) | 19,485 | 1,599 | |
| Skyryse, Inc. Series B (c)(d)(e) | 50,800 | 1,032 | |
| Stripe, Inc. Series H (c)(d)(e) | 18,549 | 471 | |
| 4,665 | |||
TOTAL INFORMATION TECHNOLOGY | 7,084 | ||
| TOTAL CONVERTIBLE PREFERRED STOCKS | 13,822 | ||
| Nonconvertible Preferred Stocks - 0.0% | |||
| FINANCIALS - 0.0% | |||
| Financial Services - 0.0% | |||
| Circle Internet Financial Ltd. Series E (c)(d)(e) | 62,279 | 1,654 | |
| INDUSTRIALS - 0.0% | |||
| Professional Services - 0.0% | |||
| Checkr, Inc. Series E (c)(e) | 91,236 | 813 | |
| INFORMATION TECHNOLOGY - 0.0% | |||
| IT Services - 0.0% | |||
| Gupshup, Inc. (c)(d)(e) | 58,730 | 659 | |
| TOTAL NONCONVERTIBLE PREFERRED STOCKS | 3,126 | ||
| TOTAL PREFERRED STOCKS (Cost $17,863) | 16,948 | ||
| Nonconvertible Bonds - 0.0% | |||
Principal Amount (f) (000s) | Value ($) (000s) | ||
| FINANCIALS - 0.0% | |||
| Financial Services - 0.0% | |||
Ant International Co. Ltd. 3.55% 8/14/24 (d)(e) (Cost $941) | 941 | 942 | |
| U.S. Treasury Obligations - 0.1% | |||
Principal Amount (f) (000s) | Value ($) (000s) | ||
U.S. Treasury Bills, yield at date of purchase 5.26% to 5.31% 3/14/24 to 4/11/24 (g) (Cost $5,123) | 5,140 | 5,123 | |
| Fixed-Income Funds - 36.3% | |||
| Shares | Value ($) (000s) | ||
Fidelity Investment Grade Bond Central Fund (h) (Cost $3,248,342) | 30,052,465 | 2,915,991 | |
| Money Market Funds - 1.7% | |||
| Shares | Value ($) (000s) | ||
| Fidelity Cash Central Fund 5.39% (i) | 132,038,857 | 132,065 | |
| Fidelity Securities Lending Cash Central Fund 5.39% (i)(j) | 2,652,660 | 2,653 | |
| TOTAL MONEY MARKET FUNDS (Cost $134,718) | 134,718 | ||
| TOTAL INVESTMENT IN SECURITIES - 99.9% (Cost $6,353,512) | 8,019,306 |
NET OTHER ASSETS (LIABILITIES) - 0.1% | 6,870 |
| NET ASSETS - 100.0% | 8,026,176 |
| Futures Contracts | |||||
Number of contracts | Expiration Date | Notional Amount ($) (000s) | Value ($) (000s) | Unrealized Appreciation/ (Depreciation) ($) (000s) | |
| Purchased | |||||
| Equity Index Contracts | |||||
| CME Micro E-mini S&P 500 Index Contracts (United States) | 360 | Mar 2024 | 91,868 | 6,007 | 6,007 |
| The notional amount of futures purchased as a percentage of Net Assets is 1.1% | |||||
| (a) | Security exempt from registration under Rule 144A of the Securities Act of 1933. These securities may be resold in transactions exempt from registration, normally to qualified institutional buyers. At the end of the period, the value of these securities amounted to $2,448,000 or 0.0% of net assets. |
| (b) | Security or a portion of the security is on loan at period end. |
| (c) | Non-income producing |
| (d) | Restricted securities (including private placements) - Investment in securities not registered under the Securities Act of 1933 (excluding 144A issues). At the end of the period, the value of restricted securities (excluding 144A issues) amounted to $23,487,000 or 0.3% of net assets. |
| (e) | Level 3 security |
| (f) | Amount is stated in United States dollars unless otherwise noted. |
| (g) | Security or a portion of the security was pledged to cover margin requirements for futures contracts. At period end, the value of securities pledged amounted to $4,480,000. |
| (h) | Affiliated fund that is generally available only to investment companies and other accounts managed by Fidelity Investments. A complete unaudited schedule of portfolio holdings for each Fidelity Central Fund is filed with the SEC for the first and third quarters of each fiscal year on Form N-PORT and is available upon request or at the SEC's website at www.sec.gov. An unaudited holdings listing for the Fund, which presents direct holdings as well as the pro-rata share of securities and other investments held indirectly through its investment in underlying non-money market Fidelity Central Funds, is available at fidelity.com and/or institutional.fidelity.com, as applicable. In addition, each Fidelity Central Fund's financial statements are available on the SEC's website or upon request. |
| (i) | Affiliated fund that is generally available only to investment companies and other accounts managed by Fidelity Investments. The rate quoted is the annualized seven-day yield of the fund at period end. A complete unaudited listing of the fund's holdings as of its most recent quarter end is available upon request. In addition, each Fidelity Central Fund's financial statements are available on the SEC's website or upon request. |
| (j) | Investment made with cash collateral received from securities on loan. |
| Additional information on each restricted holding is as follows: | ||
| Security | Acquisition Date | Acquisition Cost ($) (000s) |
| ABL Space Systems Series B | 3/24/21 | 757 |
| ABL Space Systems Series B2 | 10/22/21 | 573 |
| Algolia, Inc. Series D | 7/23/21 | 838 |
| Ant International Co. Ltd. 3.55% 8/14/24 | 8/14/23 | 941 |
| Astera Labs, Inc. Series C | 8/24/21 | 473 |
| Astranis Space Technologies Corp. Series C | 3/19/21 | 1,229 |
| Beta Technologies, Inc. Series A | 4/09/21 | 491 |
| Bolt Technology OU Series E | 1/03/22 | 1,660 |
| ByteDance Ltd. Series E1 | 11/18/20 | 2,081 |
| Cazoo Group Ltd. | 3/28/21 | 533 |
| CCC Intelligent Solutions Holdings, Inc. | 2/02/21 | 344 |
| Circle Internet Financial Ltd. Series E | 5/11/21 | 1,011 |
| Circle Internet Financial Ltd. Series F | 5/09/22 | 1,613 |
| Databricks, Inc. Series G | 2/01/21 | 241 |
| Databricks, Inc. Series H | 8/31/21 | 1,432 |
| Epic Games, Inc. | 3/29/21 | 1,518 |
| Gupshup, Inc. | 6/08/21 | 1,343 |
| Jumo World Holding Ltd. | 9/06/23 | 162 |
| Skyryse, Inc. Series B | 10/21/21 | 1,254 |
| Space Exploration Technologies Corp. Class A | 2/16/21 | 672 |
| Starling Bank Ltd. Series D | 6/18/21 | 1,179 |
| Stripe, Inc. Class B | 5/18/21 | 626 |
| Stripe, Inc. Series H | 3/15/21 - 5/25/23 | 744 |
| Xsight Labs Ltd. Series D | 2/16/21 | 481 |
| Affiliate (Amounts in thousands) | Value, beginning of period ($) | Purchases ($) | Sales Proceeds ($) | Dividend Income ($) | Realized Gain (loss) ($) | Change in Unrealized appreciation (depreciation) ($) | Value, end of period ($) | % ownership, end of period |
| Fidelity Cash Central Fund 5.39% | 177,072 | 751,144 | 796,151 | 4,228 | - | - | 132,065 | 0.2% |
| Fidelity Investment Grade Bond Central Fund | 2,528,957 | 366,829 | - | 54,898 | - | 20,205 | 2,915,991 | 7.3% |
| Fidelity Securities Lending Cash Central Fund 5.39% | 1,120 | 54,642 | 53,109 | 19 | - | - | 2,653 | 0.0% |
| Total | 2,707,149 | 1,172,615 | 849,260 | 59,145 | - | 20,205 | 3,050,709 | |
| Valuation Inputs at Reporting Date: | ||||
Description (Amounts in thousands) | Total ($) | Level 1 ($) | Level 2 ($) | Level 3 ($) |
Investments in Securities: | ||||
| Equities: | ||||
Communication Services | 460,124 | 452,299 | 2,448 | 5,377 |
Consumer Discretionary | 535,402 | 535,402 | - | - |
Consumer Staples | 297,190 | 297,190 | - | - |
Energy | 185,045 | 185,045 | - | - |
Financials | 662,305 | 646,064 | 10,688 | 5,553 |
Health Care | 617,432 | 617,432 | - | - |
Industrials | 450,122 | 446,236 | - | 3,886 |
Information Technology | 1,424,053 | 1,352,393 | 63,521 | 8,139 |
Materials | 112,592 | 112,592 | - | - |
Real Estate | 111,739 | 111,739 | - | - |
Utilities | 106,528 | 106,528 | - | - |
| Corporate Bonds | 942 | - | - | 942 |
| U.S. Government and Government Agency Obligations | 5,123 | - | 5,123 | - |
| Fixed-Income Funds | 2,915,991 | 2,915,991 | - | - |
| Money Market Funds | 134,718 | 134,718 | - | - |
| Total Investments in Securities: | 8,019,306 | 7,913,629 | 81,780 | 23,897 |
| Net Unrealized Depreciation on Unfunded Commitments | (37) | - | (37) | - |
| Total | (37) | - | (37) | - |
Derivative Instruments: Assets | ||||
Futures Contracts | 6,007 | 6,007 | - | - |
| Total Assets | 6,007 | 6,007 | - | - |
| Total Derivative Instruments: | 6,007 | 6,007 | - | - |
Primary Risk Exposure / Derivative Type | Value | |
| (Amounts in thousands) | Asset ($) | Liability ($) |
| Equity Risk | ||
Futures Contracts (a) | 6,007 | 0 |
| Total Equity Risk | 6,007 | 0 |
| Total Value of Derivatives | 6,007 | 0 |
| Statement of Assets and Liabilities | ||||
| Amounts in thousands (except per-share amounts) | February 29, 2024 (Unaudited) | |||
| Assets | ||||
| Investment in securities, at value (including securities loaned of $2,600) - See accompanying schedule: | ||||
Unaffiliated issuers (cost $2,970,452) | $ | 4,968,597 | ||
Fidelity Central Funds (cost $3,383,060) | 3,050,709 | |||
| Total Investment in Securities (cost $6,353,512) | $ | 8,019,306 | ||
| Cash | 37 | |||
| Foreign currency held at value (cost $11) | 11 | |||
| Receivable for investments sold | 16,041 | |||
| Receivable for fund shares sold | 10,051 | |||
| Dividends receivable | 6,812 | |||
| Interest receivable | 14 | |||
| Distributions receivable from Fidelity Central Funds | 591 | |||
| Receivable for daily variation margin on futures contracts | 410 | |||
| Prepaid expenses | 5 | |||
| Other receivables | 25 | |||
Total assets | 8,053,303 | |||
| Liabilities | ||||
| Payable for investments purchased | $ | 11,603 | ||
| Unrealized depreciation on unfunded commitments | 37 | |||
| Payable for fund shares redeemed | 7,089 | |||
| Accrued management fee | 2,440 | |||
| Distribution and service plan fees payable | 1,990 | |||
| Other affiliated payables | 1,105 | |||
| Other payables and accrued expenses | 210 | |||
| Collateral on securities loaned | 2,653 | |||
| Total Liabilities | 27,127 | |||
| Net Assets | $ | 8,026,176 | ||
| Net Assets consist of: | ||||
| Paid in capital | $ | 6,281,945 | ||
| Total accumulated earnings (loss) | 1,744,231 | |||
| Net Assets | $ | 8,026,176 | ||
| Net Asset Value and Maximum Offering Price | ||||
| Class A : | ||||
Net Asset Value and redemption price per share ($2,109,355 ÷ 76,523 shares)(a) | $ | 27.56 | ||
| Maximum offering price per share (100/94.25 of $27.56) | $ | 29.24 | ||
| Class M : | ||||
Net Asset Value and redemption price per share ($1,637,018 ÷ 58,447 shares)(a) | $ | 28.01 | ||
| Maximum offering price per share (100/96.50 of $28.01) | $ | 29.03 | ||
| Class C : | ||||
Net Asset Value and offering price per share ($1,071,729 ÷ 39,348 shares)(a) | $ | 27.24 | ||
| Class I : | ||||
Net Asset Value, offering price and redemption price per share ($2,158,708 ÷ 76,270 shares) | $ | 28.30 | ||
| Class Z : | ||||
Net Asset Value, offering price and redemption price per share ($1,049,366 ÷ 37,061 shares) | $ | 28.31 | ||
(a)Redemption price per share is equal to net asset value less any applicable contingent deferred sales charge. | ||||
| Statement of Operations | ||||
| Amounts in thousands | Six months ended February 29, 2024 (Unaudited) | |||
| Investment Income | ||||
| Dividends | $ | 28,221 | ||
| Interest | 209 | |||
| Income from Fidelity Central Funds (including $19 from security lending) | 59,145 | |||
| Total Income | 87,575 | |||
| Expenses | ||||
| Management fee | $ | 13,500 | ||
| Transfer agent fees | 5,384 | |||
| Distribution and service plan fees | 11,174 | |||
| Accounting fees | 723 | |||
| Custodian fees and expenses | 64 | |||
| Independent trustees' fees and expenses | 18 | |||
| Registration fees | 186 | |||
| Audit | 70 | |||
| Legal | 12 | |||
| Miscellaneous | 13 | |||
| Total expenses before reductions | 31,144 | |||
| Expense reductions | (307) | |||
| Total expenses after reductions | 30,837 | |||
| Net Investment income (loss) | 56,738 | |||
| Realized and Unrealized Gain (Loss) | ||||
| Net realized gain (loss) on: | ||||
| Investment Securities: | ||||
| Unaffiliated issuers | 93,016 | |||
| Foreign currency transactions | 14 | |||
| Futures contracts | 3,631 | |||
| Total net realized gain (loss) | 96,661 | |||
| Change in net unrealized appreciation (depreciation) on: | ||||
| Investment Securities: | ||||
| Unaffiliated issuers (net of decrease in deferred foreign taxes of $138) | 568,633 | |||
| Fidelity Central Funds | 20,205 | |||
| Unfunded commitments | (37) | |||
| Assets and liabilities in foreign currencies | (1) | |||
| Futures contracts | 4,268 | |||
| Total change in net unrealized appreciation (depreciation) | 593,068 | |||
| Net gain (loss) | 689,729 | |||
| Net increase (decrease) in net assets resulting from operations | $ | 746,467 | ||
| Statement of Changes in Net Assets | ||||
| Amount in thousands | Six months ended February 29, 2024 (Unaudited) | Year ended August 31, 2023 | ||
| Increase (Decrease) in Net Assets | ||||
| Operations | ||||
| Net investment income (loss) | $ | 56,738 | $ | 84,126 |
| Net realized gain (loss) | 96,661 | 57,007 | ||
| Change in net unrealized appreciation (depreciation) | 593,068 | 533,770 | ||
| Net increase (decrease) in net assets resulting from operations | 746,467 | 674,903 | ||
| Distributions to shareholders | (61,953) | (324,847) | ||
| Share transactions - net increase (decrease) | 368,034 | 248,165 | ||
| Total increase (decrease) in net assets | 1,052,548 | 598,221 | ||
| Net Assets | ||||
| Beginning of period | 6,973,628 | 6,375,407 | ||
| End of period | $ | 8,026,176 | $ | 6,973,628 |
| Fidelity Advisor® Balanced Fund Class A |
Six months ended (Unaudited) February 29, 2024 | Years ended August 31, 2023 | 2022 | 2021 | 2020 | 2019 | |||||||
Selected Per-Share Data | ||||||||||||
| Net asset value, beginning of period | $ | 25.20 | $ | 23.98 | $ | 29.67 | $ | 24.87 | $ | 21.14 | $ | 22.22 |
| Income from Investment Operations | ||||||||||||
Net investment income (loss) A,B | .21 | .33 | .19 | .17 | .27 | .30 | ||||||
| Net realized and unrealized gain (loss) | 2.38 | 2.15 | (3.87) | 5.67 | 4.10 | .08 | ||||||
| Total from investment operations | 2.59 | 2.48 | (3.68) | 5.84 | 4.37 | .38 | ||||||
| Distributions from net investment income | (.21) | (.32) | (.17) | (.17) | (.29) | (.29) | ||||||
| Distributions from net realized gain | (.02) | (.95) | (1.84) | (.88) | (.35) | (1.18) | ||||||
| Total distributions | (.23) | (1.26) C | (2.01) | (1.04) C | (.64) | (1.46) C | ||||||
| Net asset value, end of period | $ | 27.56 | $ | 25.20 | $ | 23.98 | $ | 29.67 | $ | 24.87 | $ | 21.14 |
Total Return D,E,F | 10.35% | 11.33% | (13.19)% | 24.38% | 21.16% | 2.15% | ||||||
Ratios to Average Net Assets B,G,H | ||||||||||||
| Expenses before reductions | .82% I | .82% | .81% | .83% | .85% | .86% | ||||||
| Expenses net of fee waivers, if any | .81% I | .82% | .81% | .83% | .85% | .86% | ||||||
| Expenses net of all reductions | .81% I | .82% | .81% | .82% | .84% | .86% | ||||||
| Net investment income (loss) | 1.61% I | 1.39% | .72% | .63% | 1.21% | 1.46% | ||||||
| Supplemental Data | ||||||||||||
| Net assets, end of period (in millions) | $ | 2,109 | $ | 1,839 | $ | 1,621 | $ | 1,723 | $ | 1,080 | $ | 818 |
Portfolio turnover rate J | 23% I | 30% | 35% | 37% | 92% | 57% |
| Fidelity Advisor® Balanced Fund Class M |
Six months ended (Unaudited) February 29, 2024 | Years ended August 31, 2023 | 2022 | 2021 | 2020 | 2019 | |||||||
Selected Per-Share Data | ||||||||||||
| Net asset value, beginning of period | $ | 25.59 | $ | 24.34 | $ | 30.08 | $ | 25.19 | $ | 21.40 | $ | 22.47 |
| Income from Investment Operations | ||||||||||||
Net investment income (loss) A,B | .18 | .27 | .13 | .10 | .22 | .25 | ||||||
| Net realized and unrealized gain (loss) | 2.43 | 2.18 | (3.94) | 5.76 | 4.15 | .09 | ||||||
| Total from investment operations | 2.61 | 2.45 | (3.81) | 5.86 | 4.37 | .34 | ||||||
| Distributions from net investment income | (.17) | (.26) | (.09) | (.10) | (.23) | (.23) | ||||||
| Distributions from net realized gain | (.02) | (.95) | (1.84) | (.88) | (.35) | (1.18) | ||||||
| Total distributions | (.19) | (1.20) C | (1.93) | (.97) C | (.58) | (1.41) | ||||||
| Net asset value, end of period | $ | 28.01 | $ | 25.59 | $ | 24.34 | $ | 30.08 | $ | 25.19 | $ | 21.40 |
Total Return D,E,F | 10.28% | 11.00% | (13.41)% | 24.11% | 20.85% | 1.91% | ||||||
Ratios to Average Net Assets B,G,H | ||||||||||||
| Expenses before reductions | 1.06% I | 1.07% | 1.06% | 1.07% | 1.10% | 1.11% | ||||||
| Expenses net of fee waivers, if any | 1.06% I | 1.06% | 1.06% | 1.07% | 1.10% | 1.11% | ||||||
| Expenses net of all reductions | 1.06% I | 1.06% | 1.06% | 1.07% | 1.09% | 1.11% | ||||||
| Net investment income (loss) | 1.36% I | 1.14% | .47% | .38% | .97% | 1.21% | ||||||
| Supplemental Data | ||||||||||||
| Net assets, end of period (in millions) | $ | 1,637 | $ | 1,521 | $ | 1,427 | $ | 1,744 | $ | 1,455 | $ | 1,273 |
Portfolio turnover rate J | 23% I | 30% | 35% | 37% | 92% | 57% |
| Fidelity Advisor® Balanced Fund Class C |
Six months ended (Unaudited) February 29, 2024 | Years ended August 31, 2023 | 2022 | 2021 | 2020 | 2019 | |||||||
Selected Per-Share Data | ||||||||||||
| Net asset value, beginning of period | $ | 24.90 | $ | 23.71 | $ | 29.37 | $ | 24.67 | $ | 20.97 | $ | 22.05 |
| Income from Investment Operations | ||||||||||||
Net investment income (loss) A,B | .11 | .15 | (.01) | (.03) | .10 | .14 | ||||||
| Net realized and unrealized gain (loss) | 2.36 | 2.13 | (3.82) | 5.62 | 4.07 | .09 | ||||||
| Total from investment operations | 2.47 | 2.28 | (3.83) | 5.59 | 4.17 | .23 | ||||||
| Distributions from net investment income | (.11) | (.14) | (.01) | (.02) | (.13) | (.13) | ||||||
| Distributions from net realized gain | (.02) | (.95) | (1.82) | (.87) | (.35) | (1.18) | ||||||
| Total distributions | (.13) | (1.09) | (1.83) | (.89) | (.47) C | (1.31) | ||||||
| Net asset value, end of period | $ | 27.24 | $ | 24.90 | $ | 23.71 | $ | 29.37 | $ | 24.67 | $ | 20.97 |
Total Return D,E,F | 9.98% | 10.46% | (13.82)% | 23.43% | 20.25% | 1.40% | ||||||
Ratios to Average Net Assets B,G,H | ||||||||||||
| Expenses before reductions | 1.57% I | 1.57% | 1.57% | 1.58% | 1.60% | 1.62% | ||||||
| Expenses net of fee waivers, if any | 1.56% I | 1.57% | 1.57% | 1.58% | 1.60% | 1.62% | ||||||
| Expenses net of all reductions | 1.56% I | 1.57% | 1.57% | 1.58% | 1.60% | 1.62% | ||||||
| Net investment income (loss) | .85% I | .64% | (.04)% | (.13)% | .46% | .70% | ||||||
| Supplemental Data | ||||||||||||
| Net assets, end of period (in millions) | $ | 1,072 | $ | 982 | $ | 980 | $ | 1,118 | $ | 769 | $ | 635 |
Portfolio turnover rate J | 23% I | 30% | 35% | 37% | 92% | 57% |
| Fidelity Advisor® Balanced Fund Class I |
Six months ended (Unaudited) February 29, 2024 | Years ended August 31, 2023 | 2022 | 2021 | 2020 | 2019 | |||||||
Selected Per-Share Data | ||||||||||||
| Net asset value, beginning of period | $ | 25.86 | $ | 24.58 | $ | 30.36 | $ | 25.42 | $ | 21.59 | $ | 22.66 |
| Income from Investment Operations | ||||||||||||
Net investment income (loss) A,B | .24 | .40 | .26 | .24 | .33 | .36 | ||||||
| Net realized and unrealized gain (loss) | 2.46 | 2.20 | (3.97) | 5.81 | 4.19 | .08 | ||||||
| Total from investment operations | 2.70 | 2.60 | (3.71) | 6.05 | 4.52 | .44 | ||||||
| Distributions from net investment income | (.24) | (.37) | (.23) | (.23) | (.34) | (.34) | ||||||
| Distributions from net realized gain | (.02) | (.95) | (1.84) | (.88) | (.35) | (1.18) | ||||||
| Total distributions | (.26) | (1.32) | (2.07) | (1.11) | (.69) | (1.51) C | ||||||
| Net asset value, end of period | $ | 28.30 | $ | 25.86 | $ | 24.58 | $ | 30.36 | $ | 25.42 | $ | 21.59 |
Total Return D,E | 10.53% | 11.58% | (12.98)% | 24.68% | 21.48% | 2.41% | ||||||
Ratios to Average Net Assets B,F,G | ||||||||||||
| Expenses before reductions | .57% H | .57% | .56% | .57% | .59% | .61% | ||||||
| Expenses net of fee waivers, if any | .56% H | .57% | .56% | .57% | .59% | .61% | ||||||
| Expenses net of all reductions | .56% H | .57% | .56% | .57% | .58% | .60% | ||||||
| Net investment income (loss) | 1.86% H | 1.64% | .97% | .88% | 1.47% | 1.71% | ||||||
| Supplemental Data | ||||||||||||
| Net assets, end of period (in millions) | $ | 2,159 | $ | 1,763 | $ | 1,621 | $ | 1,831 | $ | 1,070 | $ | 785 |
Portfolio turnover rate I | 23% H | 30% | 35% | 37% | 92% | 57% |
| Fidelity Advisor® Balanced Fund Class Z |
Six months ended (Unaudited) February 29, 2024 | Years ended August 31, 2023 | 2022 | 2021 | 2020 | 2019 | |||||||
Selected Per-Share Data | ||||||||||||
| Net asset value, beginning of period | $ | 25.87 | $ | 24.59 | $ | 30.37 | $ | 25.43 | $ | 21.60 | $ | 22.66 |
| Income from Investment Operations | ||||||||||||
Net investment income (loss) A,B | .26 | .43 | .30 | .28 | .36 | .38 | ||||||
| Net realized and unrealized gain (loss) | 2.46 | 2.20 | (3.98) | 5.80 | 4.19 | .10 | ||||||
| Total from investment operations | 2.72 | 2.63 | (3.68) | 6.08 | 4.55 | .48 | ||||||
| Distributions from net investment income | (.26) | (.40) | (.27) | (.26) | (.37) | (.36) | ||||||
| Distributions from net realized gain | (.02) | (.95) | (1.84) | (.88) | (.35) | (1.18) | ||||||
| Total distributions | (.28) | (1.35) | (2.10) C | (1.14) | (.72) | (1.54) | ||||||
| Net asset value, end of period | $ | 28.31 | $ | 25.87 | $ | 24.59 | $ | 30.37 | $ | 25.43 | $ | 21.60 |
Total Return D,E | 10.60% | 11.71% | (12.87)% | 24.82% | 21.62% | 2.57% | ||||||
Ratios to Average Net Assets B,F,G | ||||||||||||
| Expenses before reductions | .44% H | .45% | .45% | .45% | .47% | .48% | ||||||
| Expenses net of fee waivers, if any | .44% H | .44% | .44% | .45% | .47% | .48% | ||||||
| Expenses net of all reductions | .44% H | .44% | .44% | .45% | .46% | .48% | ||||||
| Net investment income (loss) | 1.98% H | 1.77% | 1.09% | 1.00% | 1.59% | 1.84% | ||||||
| Supplemental Data | ||||||||||||
| Net assets, end of period (in millions) | $ | 1,049 | $ | 869 | $ | 726 | $ | 749 | $ | 388 | $ | 280 |
Portfolio turnover rate I | 23% H | 30% | 35% | 37% | 92% | 57% |
| Fidelity Central Fund | Investment Manager | Investment Objective | Investment Practices | Expense RatioA |
| Fidelity Investment Grade Bond Central Fund | Fidelity Management & Research Company LLC (FMR) | Seeks a high level of income by normally investing in investment-grade debt securities. | Delayed Delivery & When Issued Securities Futures Options Restricted Securities Swaps | Less than .005% |
| Fidelity Money Market Central Funds | Fidelity Management & Research Company LLC (FMR) | Each fund seeks to obtain a high level of current income consistent with the preservation of capital and liquidity. | Short-term Investments | Less than .005% |
| Fidelity Advisor Balanced Fund | $4 |
| Gross unrealized appreciation | $2,100,076 |
| Gross unrealized depreciation | (439,073) |
| Net unrealized appreciation (depreciation) | $1,661,003 |
| Tax cost | $6,364,310 |
Short-term | $(24,293) |
| Investment to be Acquired | Shares | Commitment Amount | |
| Fidelity Advisor Balanced Fund | Lions Gate Entertainment Corp. | 64 | $618 |
| Equity Risk | Equity risk relates to the fluctuations in the value of financial instruments as a result of changes in market prices (other than those arising from interest rate risk or foreign exchange risk), whether caused by factors specific to an individual investment, its issuer, or all factors affecting all instruments traded in a market or market segment. |
| Purchases ($) | Sales ($) | |
| Fidelity Advisor Balanced Fund | 1,221,262 | 814,911 |
| Distribution Fee | Service Fee | Total Fees | Retained by FDC | |
| Class A | - % | .25% | $2,393 | $79 |
| Class M | .25% | .25% | 3,815 | 19 |
| Class C | .75% | .25% | 4,966 | 804 |
| $11,174 | $902 |
| Retained by FDC | |
| Class A | $ 534 |
| Class M | 35 |
Class CA | 6 |
| $575 |
% of Class-Level Average Net AssetsA | |
| Class A | .1634 |
| Class M | .1620 |
| Class C | .1672 |
| Class I | .1640 |
| Amount | % of Class-Level Average Net AssetsA | |
| Class A | $ 1,567 | .16 |
| Class M | 1,234 | .16 |
| Class C | 831 | .17 |
| Class I | 1,557 | .16 |
| Class Z | 195 | .04 |
| $5,384 |
| % of Average Net Assets | |
| Fidelity Advisor Balanced Fund | .0199 |
| % of Average Net Assets | |
| Fidelity Advisor Balanced Fund | .02 |
| Maximum Management Fee Rate % | |
| Class A | 0.53 |
| Class M | 0.52 |
| Class C | 0.53 |
| Class I | 0.53 |
| Class Z | 0.40 |
| Amount | |
| Fidelity Advisor Balanced Fund | $ 10 |
| Purchases ($) | Sales ($) | Realized Gain (Loss) ($) | |
| Fidelity Advisor Balanced Fund | 54,977 | 48,187 | 1,570 |
| Amount | |
| Fidelity Advisor Balanced Fund | $6 |
| Total Security Lending Fees Paid to NFS | Security Lending Income From Securities Loaned to NFS | Value of Securities Loaned to NFS at Period End | |
| Fidelity Advisor Balanced Fund | $2 | $1 | $- |
Six months ended February 29, 2024 | Year ended August 31, 2023 | |
| Fidelity Advisor Balanced Fund | ||
| Distributions to shareholders | ||
| Class A | $ 17,080 | $85,742 |
| Class M | 11,369 | 70,360 |
| Class C | 5,229 | 44,045 |
| Class I | 18,599 | 84,507 |
| Class Z | 9,676 | 40,193 |
Total | $61,953 | $324,847 |
| Shares | Shares | Dollars | Dollars | |
Six months ended February 29, 2024 | Year ended August 31, 2023 | Six months ended February 29, 2024 | Year ended August 31, 2023 | |
| Fidelity Advisor Balanced Fund | ||||
| Class A | ||||
| Shares sold | 10,064 | 16,287 | $257,641 | $384,875 |
| Reinvestment of distributions | 649 | 3,850 | 16,468 | 82,618 |
| Shares redeemed | (7,193) | (14,741) | (184,437) | (343,394) |
| Net increase (decrease) | 3,520 | 5,396 | $89,672 | $124,099 |
| Class M | ||||
| Shares sold | 4,488 | 8,756 | $117,057 | $208,749 |
| Reinvestment of distributions | 435 | 3,195 | 11,228 | 69,457 |
| Shares redeemed | (5,883) | (11,194) | (153,021) | (266,754) |
| Net increase (decrease) | (960) | 757 | $(24,736) | $11,452 |
| Class C | ||||
| Shares sold | 4,628 | 6,717 | $117,391 | $157,452 |
| Reinvestment of distributions | 198 | 1,983 | 5,003 | 41,691 |
| Shares redeemed | (4,906) | (10,602) | (124,156) | (244,550) |
| Net increase (decrease) | (80) | (1,902) | $(1,762) | $(45,407) |
| Class I | ||||
| Shares sold | 14,631 | 20,812 | $385,157 | $505,743 |
| Reinvestment of distributions | 628 | 3,379 | 16,345 | 74,537 |
| Shares redeemed | (7,141) | (21,962) | (188,155) | (521,438) |
| Net increase (decrease) | 8,118 | 2,229 | $213,347 | $58,842 |
| Class Z | ||||
| Shares sold | 7,383 | 11,325 | $195,146 | $276,134 |
| Reinvestment of distributions | 336 | 1,654 | 8,744 | 36,564 |
| Shares redeemed | (4,253) | (8,904) | (112,377) | (213,519) |
| Net increase (decrease) | 3,466 | 4,075 | $91,513 | $99,179 |
| The Example is based on an investment of $1,000 invested at the beginning of the period and held for the entire period (September 1, 2023 to February 29, 2024). |
Annualized Expense Ratio- A | Beginning Account Value September 1, 2023 | Ending Account Value February 29, 2024 | Expenses Paid During Period- C September 1, 2023 to February 29, 2024 | |||||||
| Fidelity Advisor® Balanced Fund | ||||||||||
| Class A | .81% | |||||||||
| Actual | $ 1,000 | $ 1,103.50 | $ 4.24 | |||||||
Hypothetical-B | $ 1,000 | $ 1,020.84 | $ 4.07 | |||||||
| Class M | 1.06% | |||||||||
| Actual | $ 1,000 | $ 1,102.80 | $ 5.54 | |||||||
Hypothetical-B | $ 1,000 | $ 1,019.59 | $ 5.32 | |||||||
| Class C | 1.56% | |||||||||
| Actual | $ 1,000 | $ 1,099.80 | $ 8.14 | |||||||
Hypothetical-B | $ 1,000 | $ 1,017.11 | $ 7.82 | |||||||
| Class I | .56% | |||||||||
| Actual | $ 1,000 | $ 1,105.30 | $ 2.93 | |||||||
Hypothetical-B | $ 1,000 | $ 1,022.08 | $ 2.82 | |||||||
Class Z ** | .44% | |||||||||
| Actual | $ 1,000 | $ 1,106.00 | $ 2.30 | |||||||
Hypothetical-B | $ 1,000 | $ 1,022.68 | $ 2.21 | |||||||
Annualized Expense Ratio- A | Expenses Paid | |||||
| Fidelity Advisor® Balanced Fund | ||||||
| Class Z | .41% | |||||
| Actual | $ 2.15 | |||||
Hypothetical- B | $ 2.06 | |||||
| A Annualized expense ratio reflects expenses net of applicable fee waivers. | ||||||
| B 5% return per year before expenses |
- Highly liquid investments - cash or convertible to cash within three business days or less
- Moderately liquid investments - convertible to cash in three to seven calendar days
- Less liquid investments - can be sold or disposed of, but not settled, within seven calendar days
- Illiquid investments - cannot be sold or disposed of within seven calendar days
 |
Item 2.
Code of Ethics
Not applicable.
Item 3.
Audit Committee Financial Expert
Not applicable.
Item 4.
Principal Accountant Fees and Services
Not applicable.
Item 5.
Audit Committee of Listed Registrants
Not applicable.
Item 6.
Investments
(a)
Not applicable.
(b)
Not applicable
Item 7.
Disclosure of Proxy Voting Policies and Procedures for Closed-End Management Investment Companies
Not applicable.
Item 8.
Portfolio Managers of Closed-End Management Investment Companies
Not applicable.
Item 9.
Purchase of Equity Securities by Closed-End Management Investment Company and Affiliated Purchasers
Not applicable.
Item 10.
Submission of Matters to a Vote of Security Holders
There were no material changes to the procedures by which shareholders may recommend nominees to the Fidelity Advisor Series I’s Board of Trustees.
Item 11.
Controls and Procedures
(a)(i) The President and Treasurer and the Chief Financial Officer have concluded that the Fidelity Advisor Series I’s (the “Trust”) disclosure controls and procedures (as defined in Rule 30a-3(c) under the Investment Company Act) provide reasonable
assurances that material information relating to the Trust is made known to them by the appropriate persons, based on their evaluation of these controls and procedures as of a date within 90 days of the filing date of this report.
(a)(ii) There was no change in the Trust’s internal control over financial reporting (as defined in Rule 30a-3(d) under the Investment Company Act) that occurred during the period covered by this report that has materially affected, or is reasonably likely to materially affect, the Trust’s internal control over financial reporting.
Item 12.
Disclosure of Securities Lending Activities for Closed-End Management
Investment Companies
Not applicable.
Item 18.
Recovery of Erroneously Awarded Compensation
(a)
Not applicable.
(b)
Not applicable.
Item 19.
Exhibits
(a) | (1) | Not applicable. |
(a) | (2) | |
(a) | (3) | Not applicable. |
(b) |
SIGNATURES
Pursuant to the requirements of the Securities Exchange Act of 1934 and the Investment Company Act of 1940, the registrant has duly caused this report to be signed on its behalf by the undersigned, thereunto duly authorized.
Fidelity Advisor Series I
By: | /s/Stacie M. Smith |
Stacie M. Smith | |
President and Treasurer (Principal Executive Officer) | |
Date: | April 22, 2024 |
Pursuant to the requirements of the Securities Exchange Act of 1934 and the Investment Company Act of 1940, this report has been signed below by the following persons on behalf of the registrant and in the capacities and on the dates indicated.
By: | /s/Stacie M. Smith |
Stacie M. Smith | |
President and Treasurer (Principal Executive Officer) | |
Date: | April 22, 2024 |
By: | /s/John J. Burke III |
John J. Burke III | |
Chief Financial Officer (Principal Financial Officer) | |
Date: | April 22, 2024 |